Alienware x15 R1笔记本电脑评测。戴尔最薄的UFO已经着陆
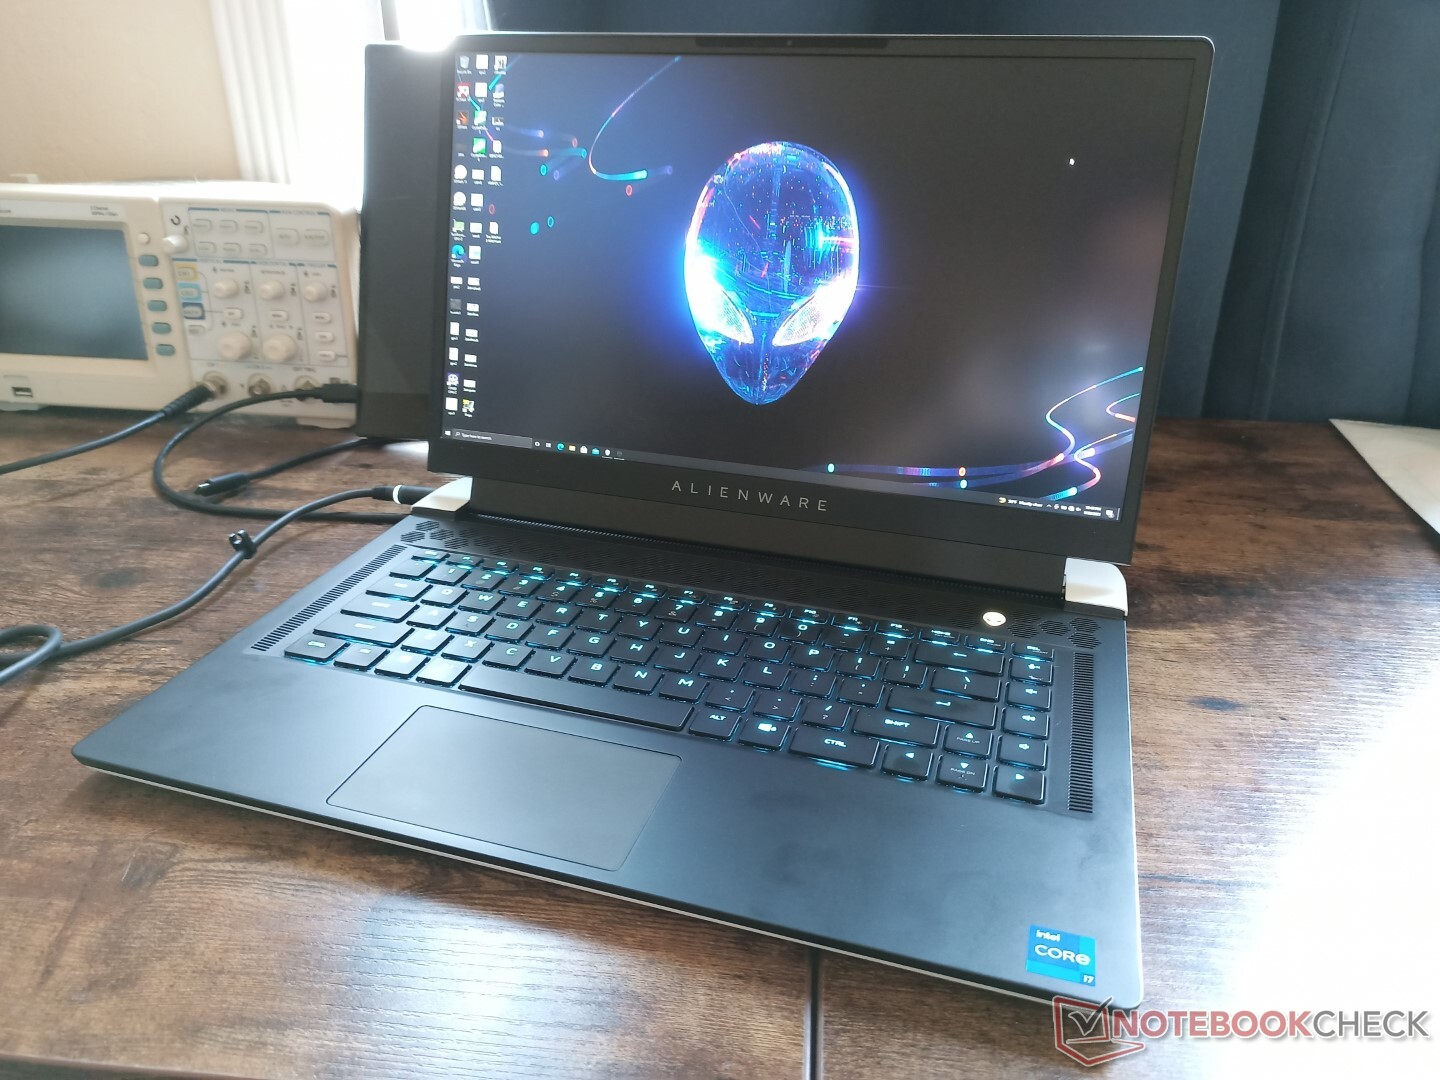
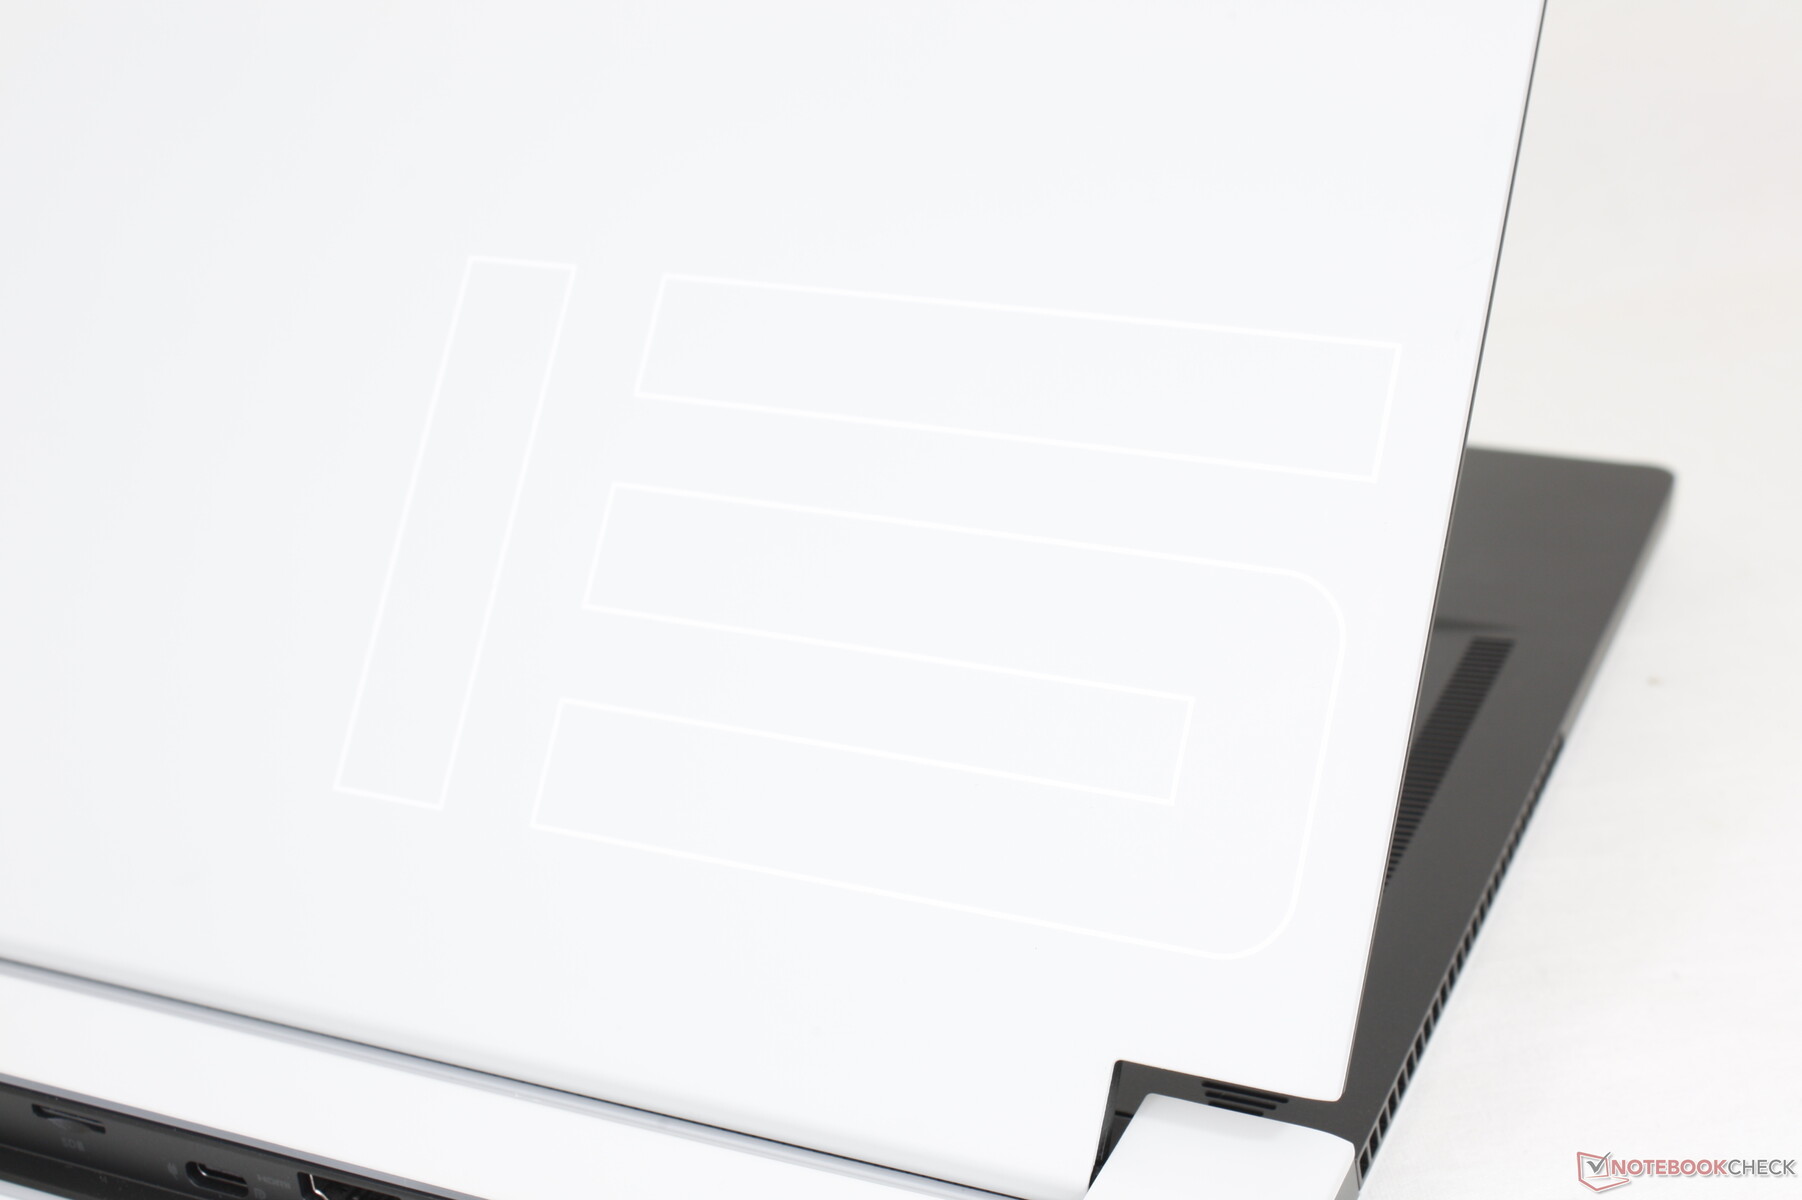
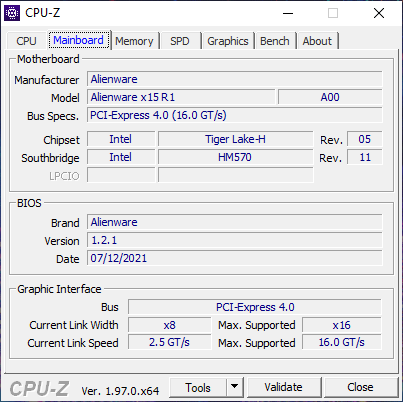
Alienware x15 R1拉开了新一代15.6英寸Alienware笔记本电脑的序幕,以取代旧的Alienware m15系列。正如在 原本的公告这款最新机型完全改进了Legend机箱的设计。 笔记本更薄、更时尚的外观。
目前的SKU范围从第11代酷睿i7-11800H CPU与GeForce RTX 3060显卡和165 Hz FHD显示屏,价格约为2000美元,到酷睿i9-11900H与RTX 3070和360 Hz FHD显示屏,价格约为3000美元。戴尔正计划在未来几个月内推出RTX 3080选项。我们审查的配置是中间的SKU,配备i7-11800H、RTX 3070和240赫兹QHD显示器,价格约为2700美元。
Alienware x15 R1的竞争对手包括其他超薄的15.6英寸游戏笔记本电脑,如Razer Blade 15,MSI GS66,Asus Zephyrus S15, Acer Predator Triton 700,或Aorus 15G 。x15 R1有一个更大的17.3英寸版本,叫做Alienware x17 R1。
更多戴尔评论。
potential competitors in comparison
Rating | Date | Model | Weight | Height | Size | Resolution | Price |
|---|---|---|---|---|---|---|---|
| 87.2 % v7 (old) | 10 / 2021 | Alienware x15 RTX 3070 P111F i7-11800H, GeForce RTX 3070 Laptop GPU | 2.4 kg | 15.9 mm | 15.60" | 2560x1440 | |
| 86.1 % v7 (old) | 09 / 2021 | Alienware m15 R4 RTX 3080 i9-10980HK, GeForce RTX 3080 Laptop GPU | 2.4 kg | 20 mm | 15.60" | 1920x1080 | |
| 84 % v7 (old) | 09 / 2021 | MSI GS66 Stealth 10UG i7-10870H, GeForce RTX 3070 Laptop GPU | 2.1 kg | 19.8 mm | 15.60" | 1920x1080 | |
| 88.9 % v7 (old) | 10 / 2021 | Razer Blade 15 Advanced (Mid 2021) i7-11800H, GeForce RTX 3080 Laptop GPU | 2 kg | 16.99 mm | 15.60" | 1920x1080 | |
| 82.9 % v7 (old) | Asus Zephyrus S15 GX502L i7-10875H, GeForce RTX 2070 Super Mobile | 2.1 kg | 19 mm | 15.60" | 1920x1080 | ||
| 83.8 % v7 (old) | 09 / 2021 | Acer Predator Helios 300 PH315-53-786B i7-10750H, GeForce RTX 3070 Laptop GPU | 2.2 kg | 22.9 mm | 15.60" | 1920x1080 |
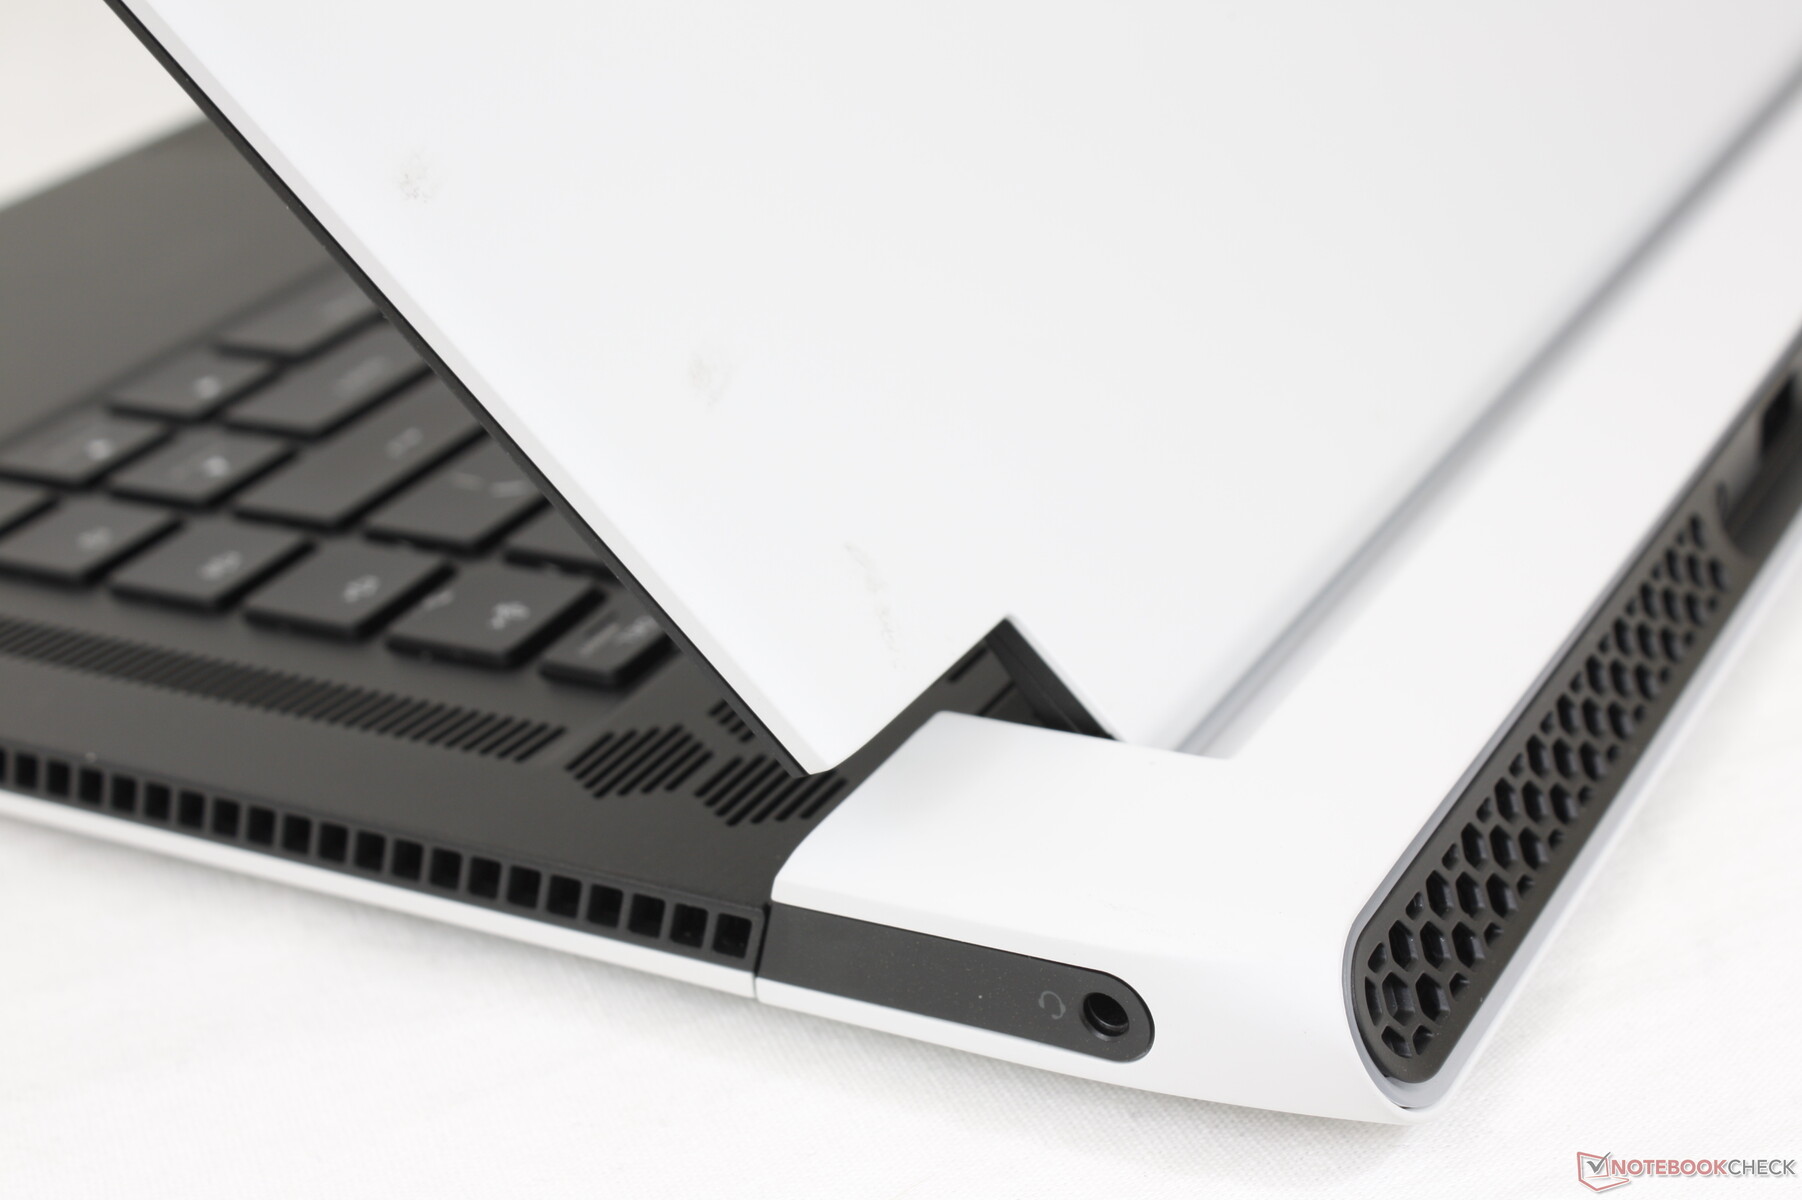
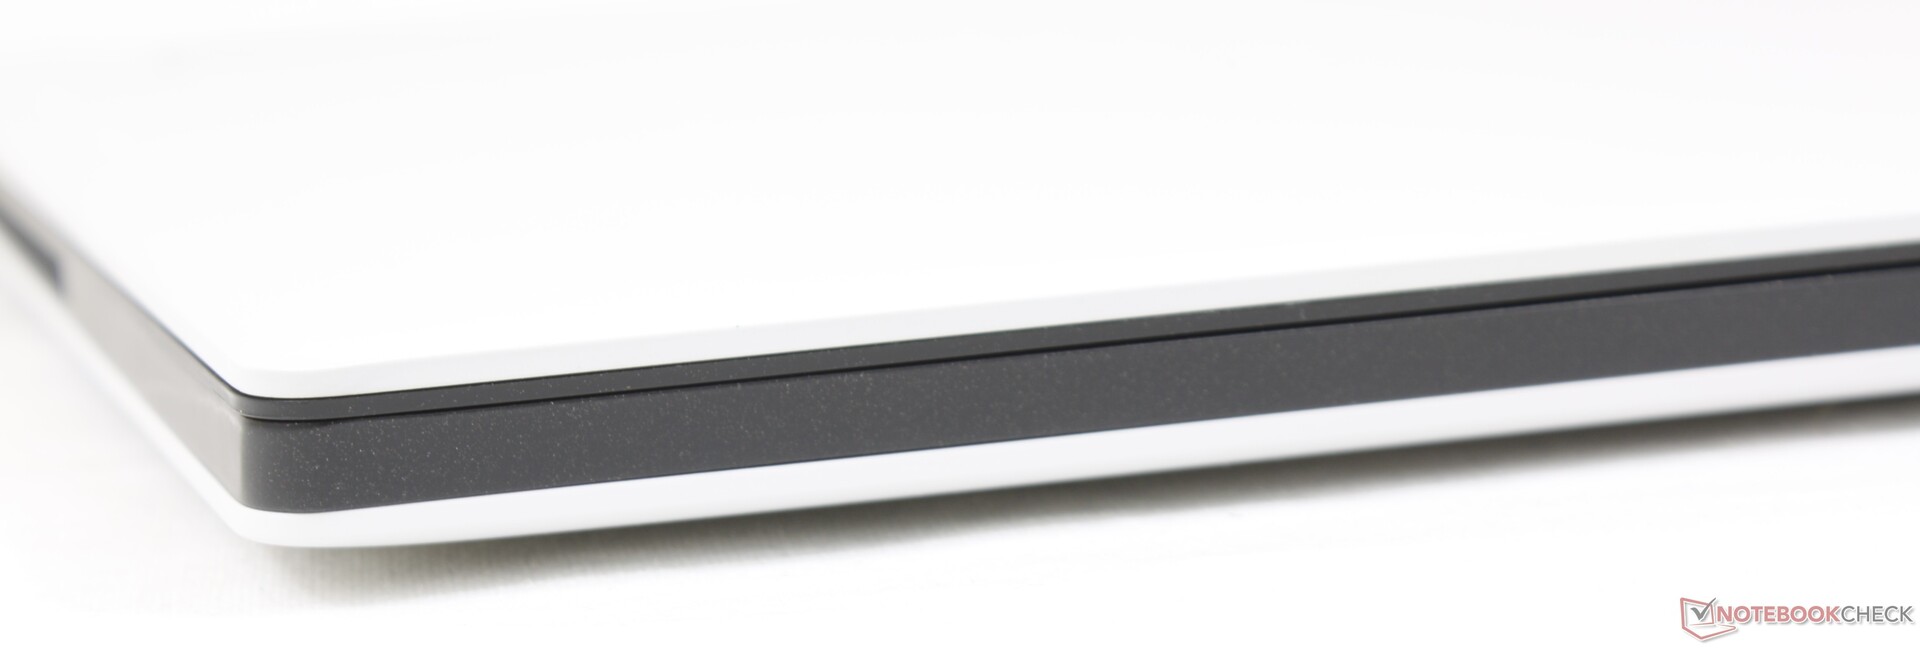
外壳 - 更薄但更宽
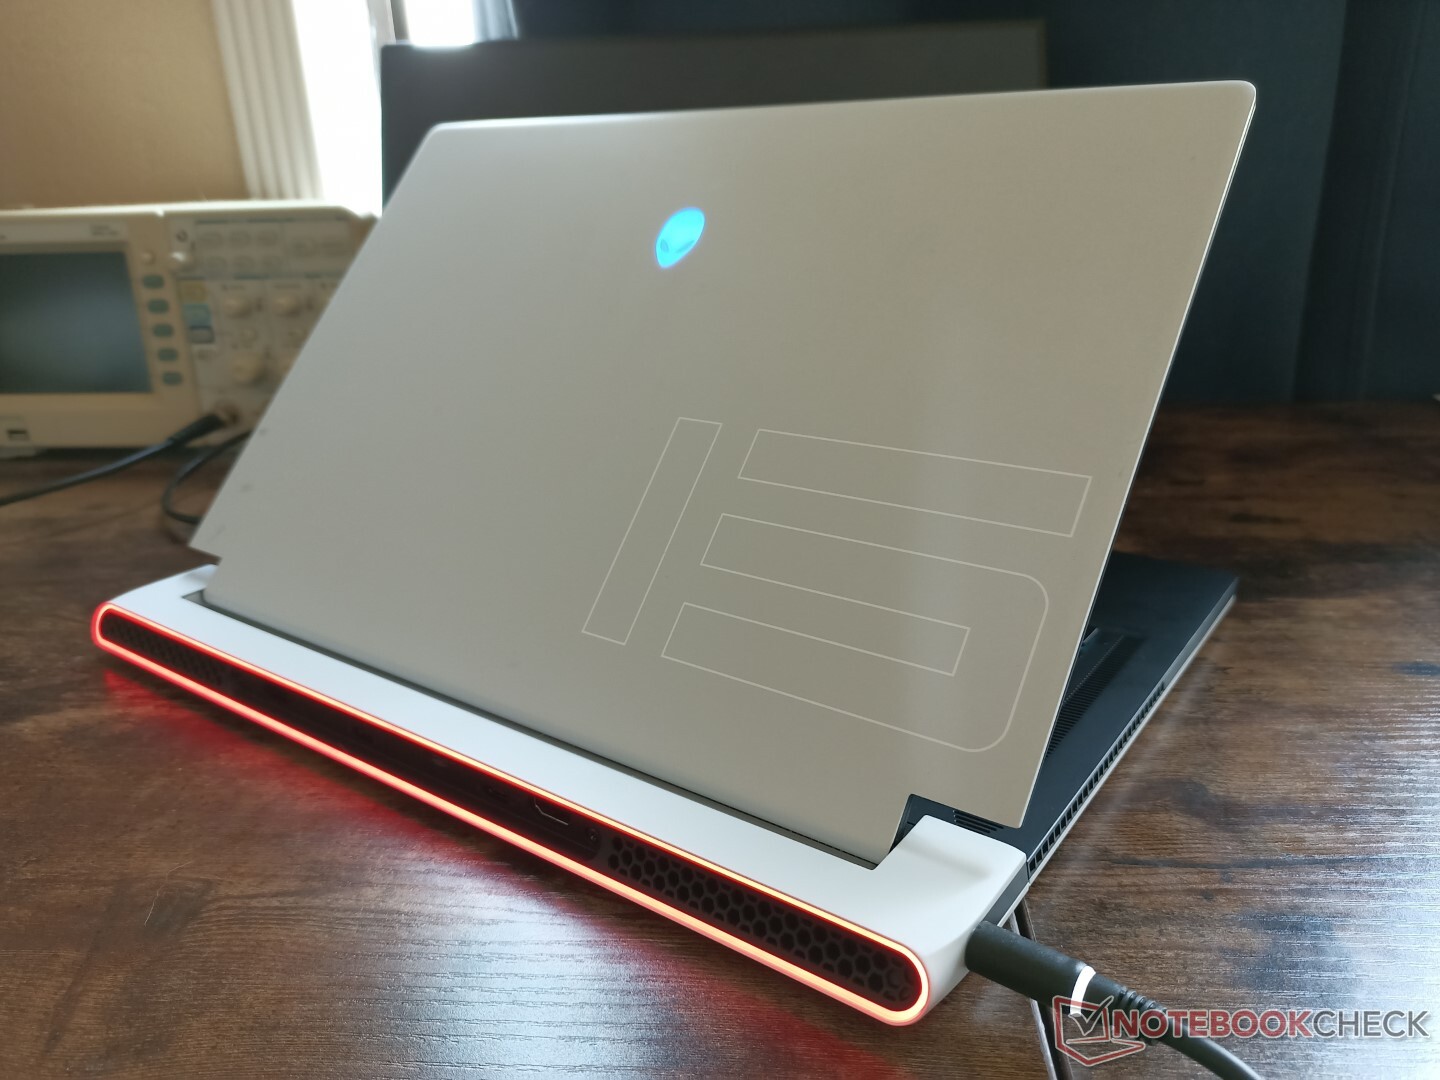
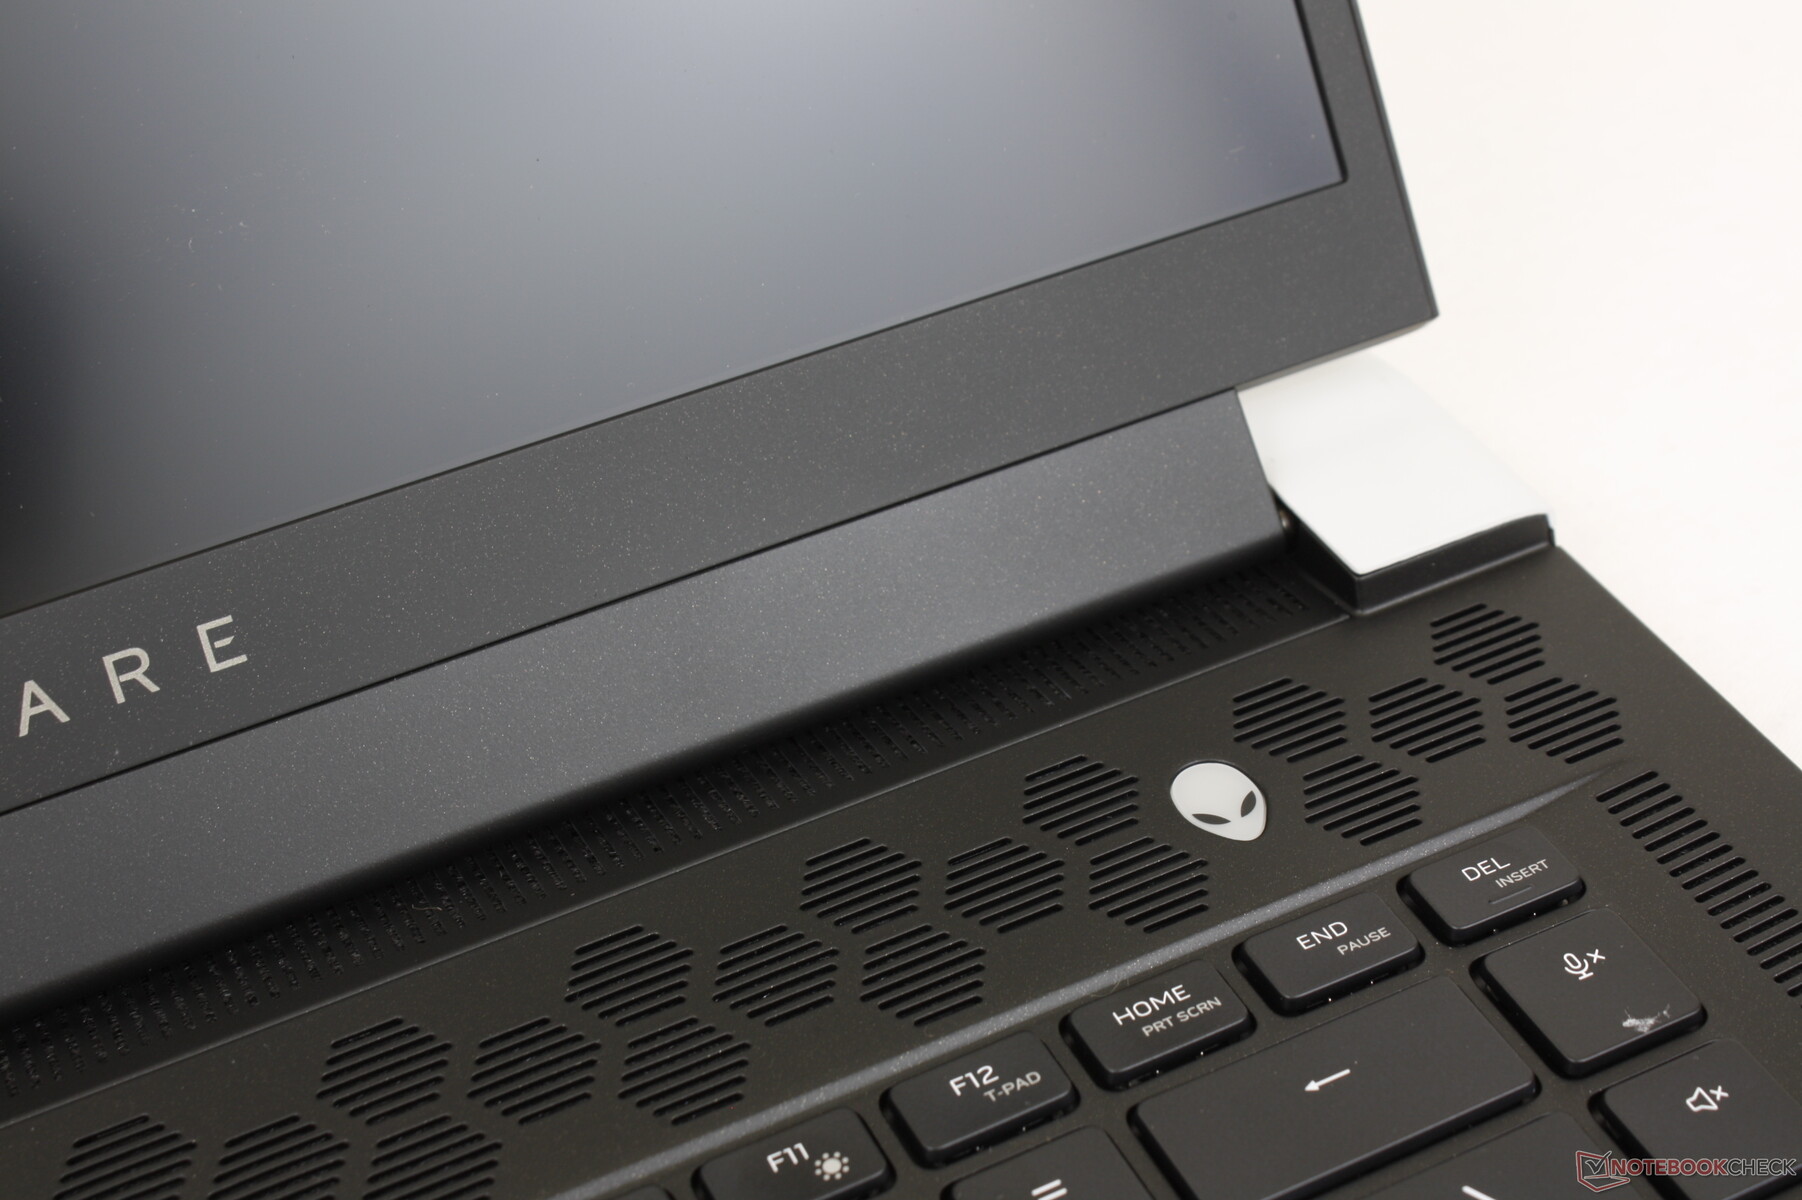
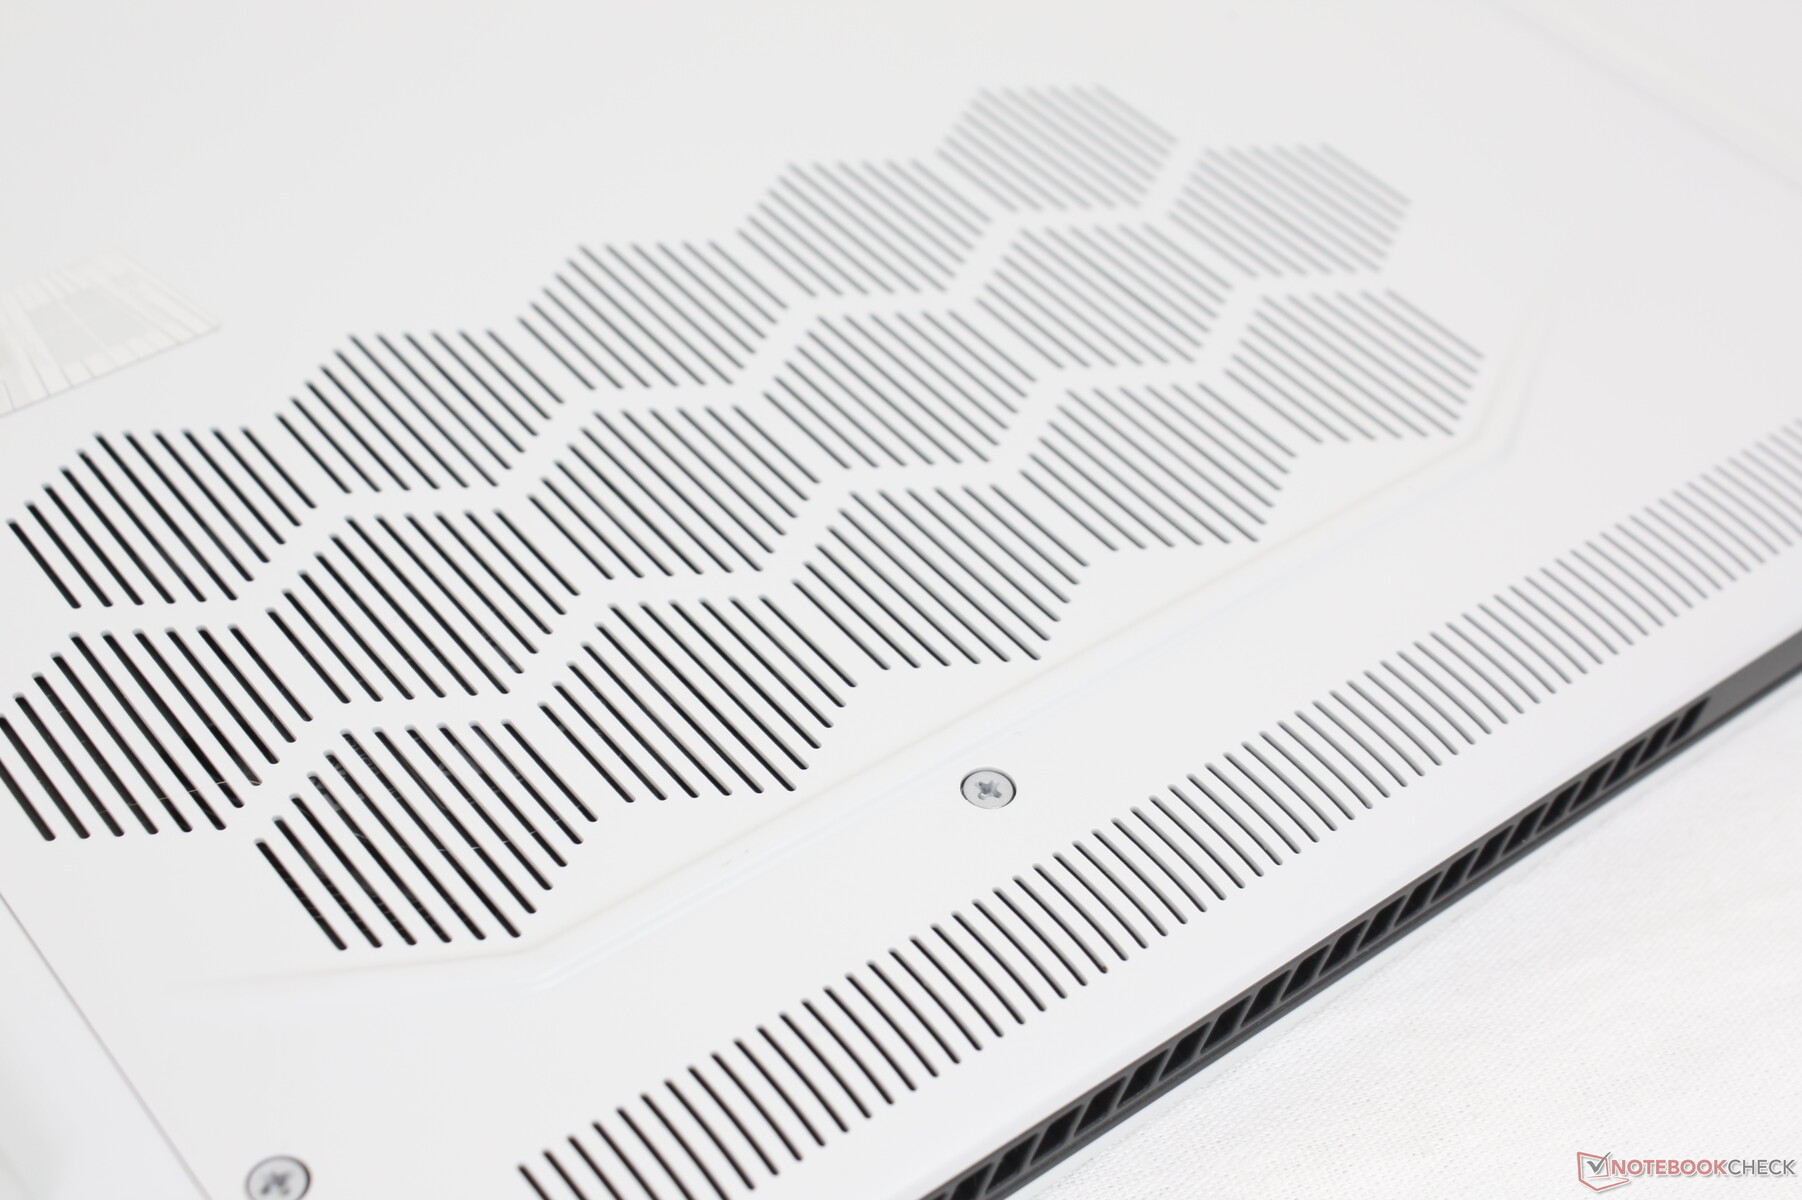
新机箱可以说是Alienware m15 R2,但更扁平,因为x15 R1在长度和宽度方面几乎是一样的,它使用了几乎相同的机箱材料,具有类似的感觉。沿着前缘和底边框的俗气的光面塑料条不见了,取而代之的是更均匀的哑光结构。机箱相当接近超极本的外观,同时保持了m15 R2 Legend设计的所有原始方面,如蜂窝状格栅和后部RGB LED环。
机箱刚度比m15 R2/R3/R4/R5略有下降。底座和盖子都更容易从各自的角上弯曲,而且比老式的厚实设计的吱吱作响要多一些。在键盘中心或外盖上施加压力也会导致一些弯曲。我们发现整体的构造可以与 微星GS66同时比Razer Blade 15低了几个档次。
与Alienware x17 R1不同的是,Alienware x15 R1实际上比其取代的老款Alienware m17 R4略厚且重,而Alienware x15 R1比Alienware m15 R5更薄,同时重量也差不多。这也意味着x15仍然是同尺寸类别中最大和最重的超薄游戏笔记本电脑之一,因为竞争机型如 Zephyrus S15或Razer Blade 15等竞争机型更小、更轻,有明显的优势。x15的大尺寸也许是为如此薄的外形所付出的代价。
某些采用FHD 165Hz面板的SKU将比我们的QHD SKU厚几分之一毫米(16.3对15.9毫米)。
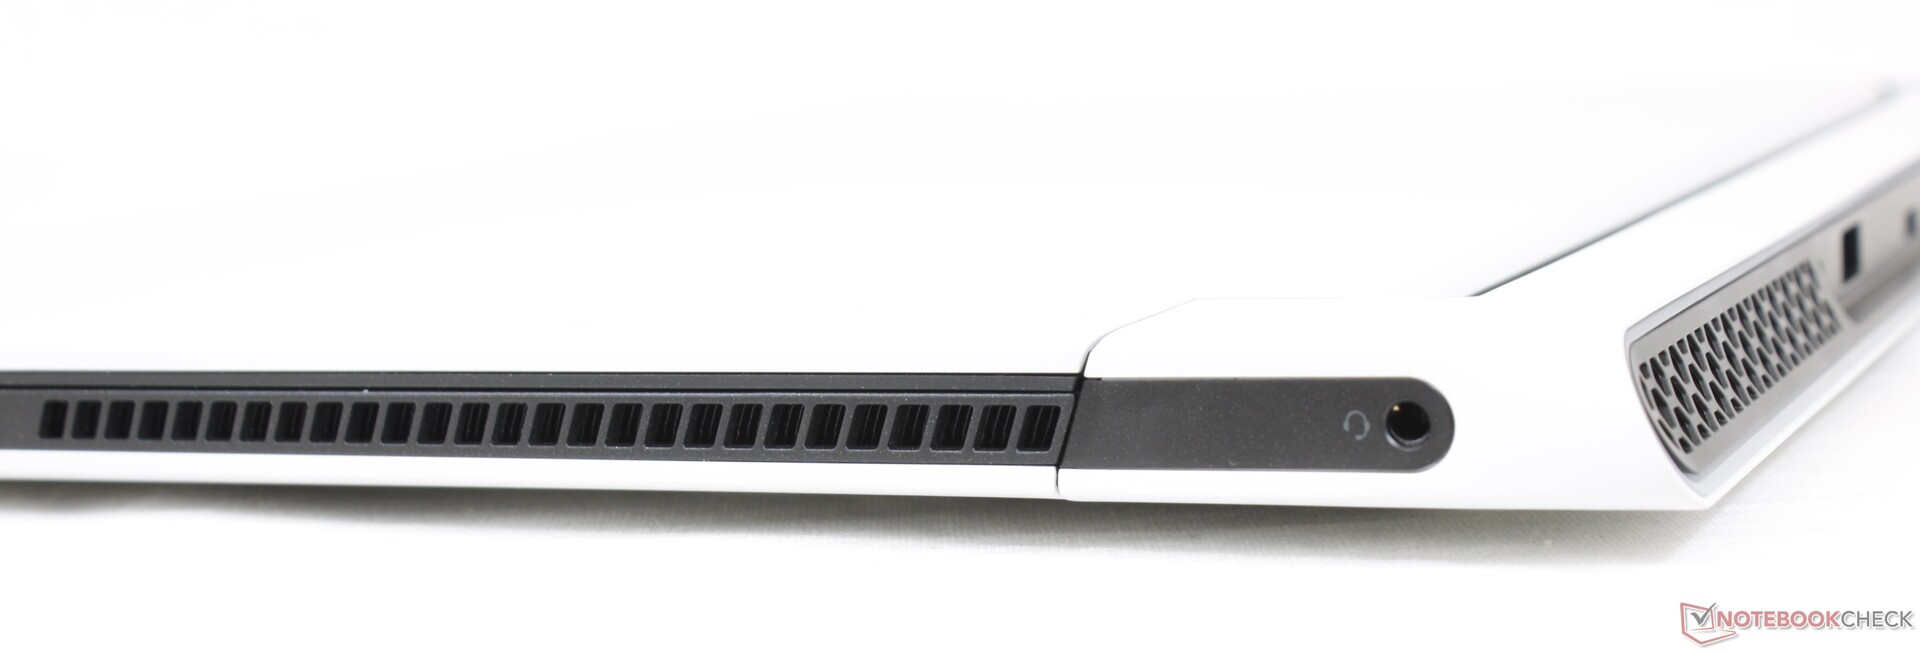
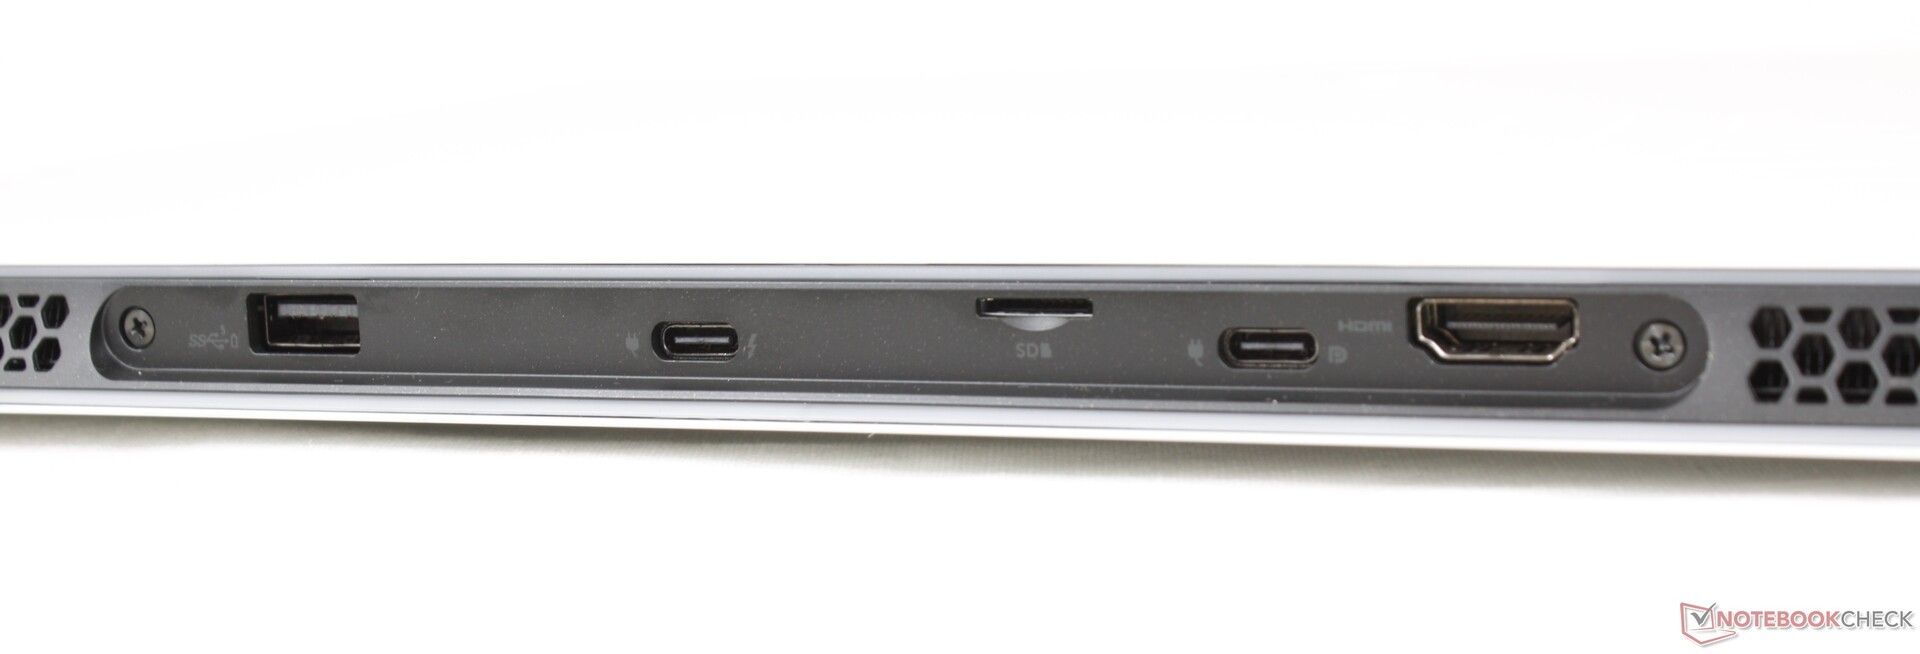
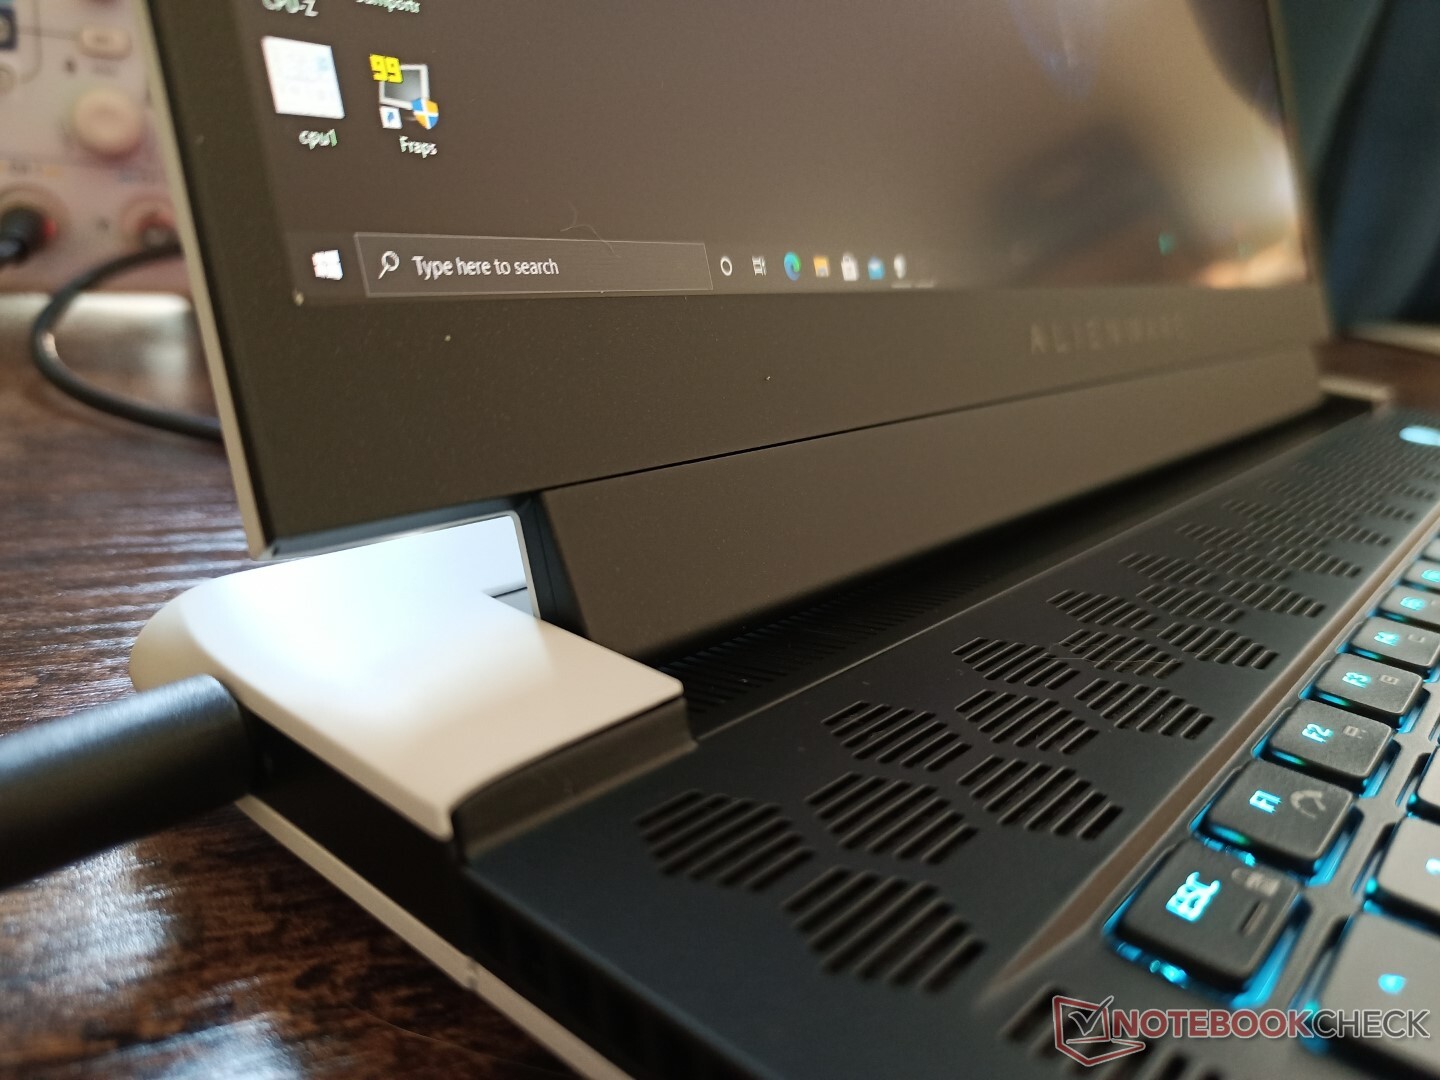
连接性 - 比以前更多和更少
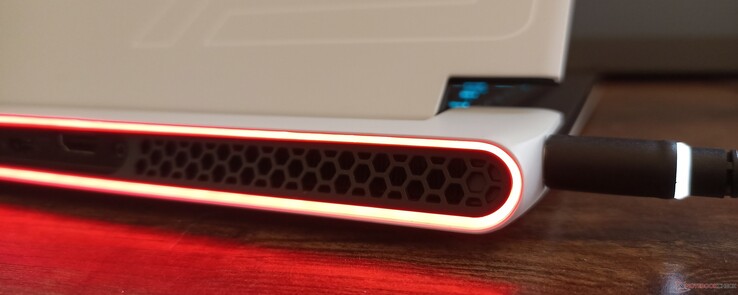
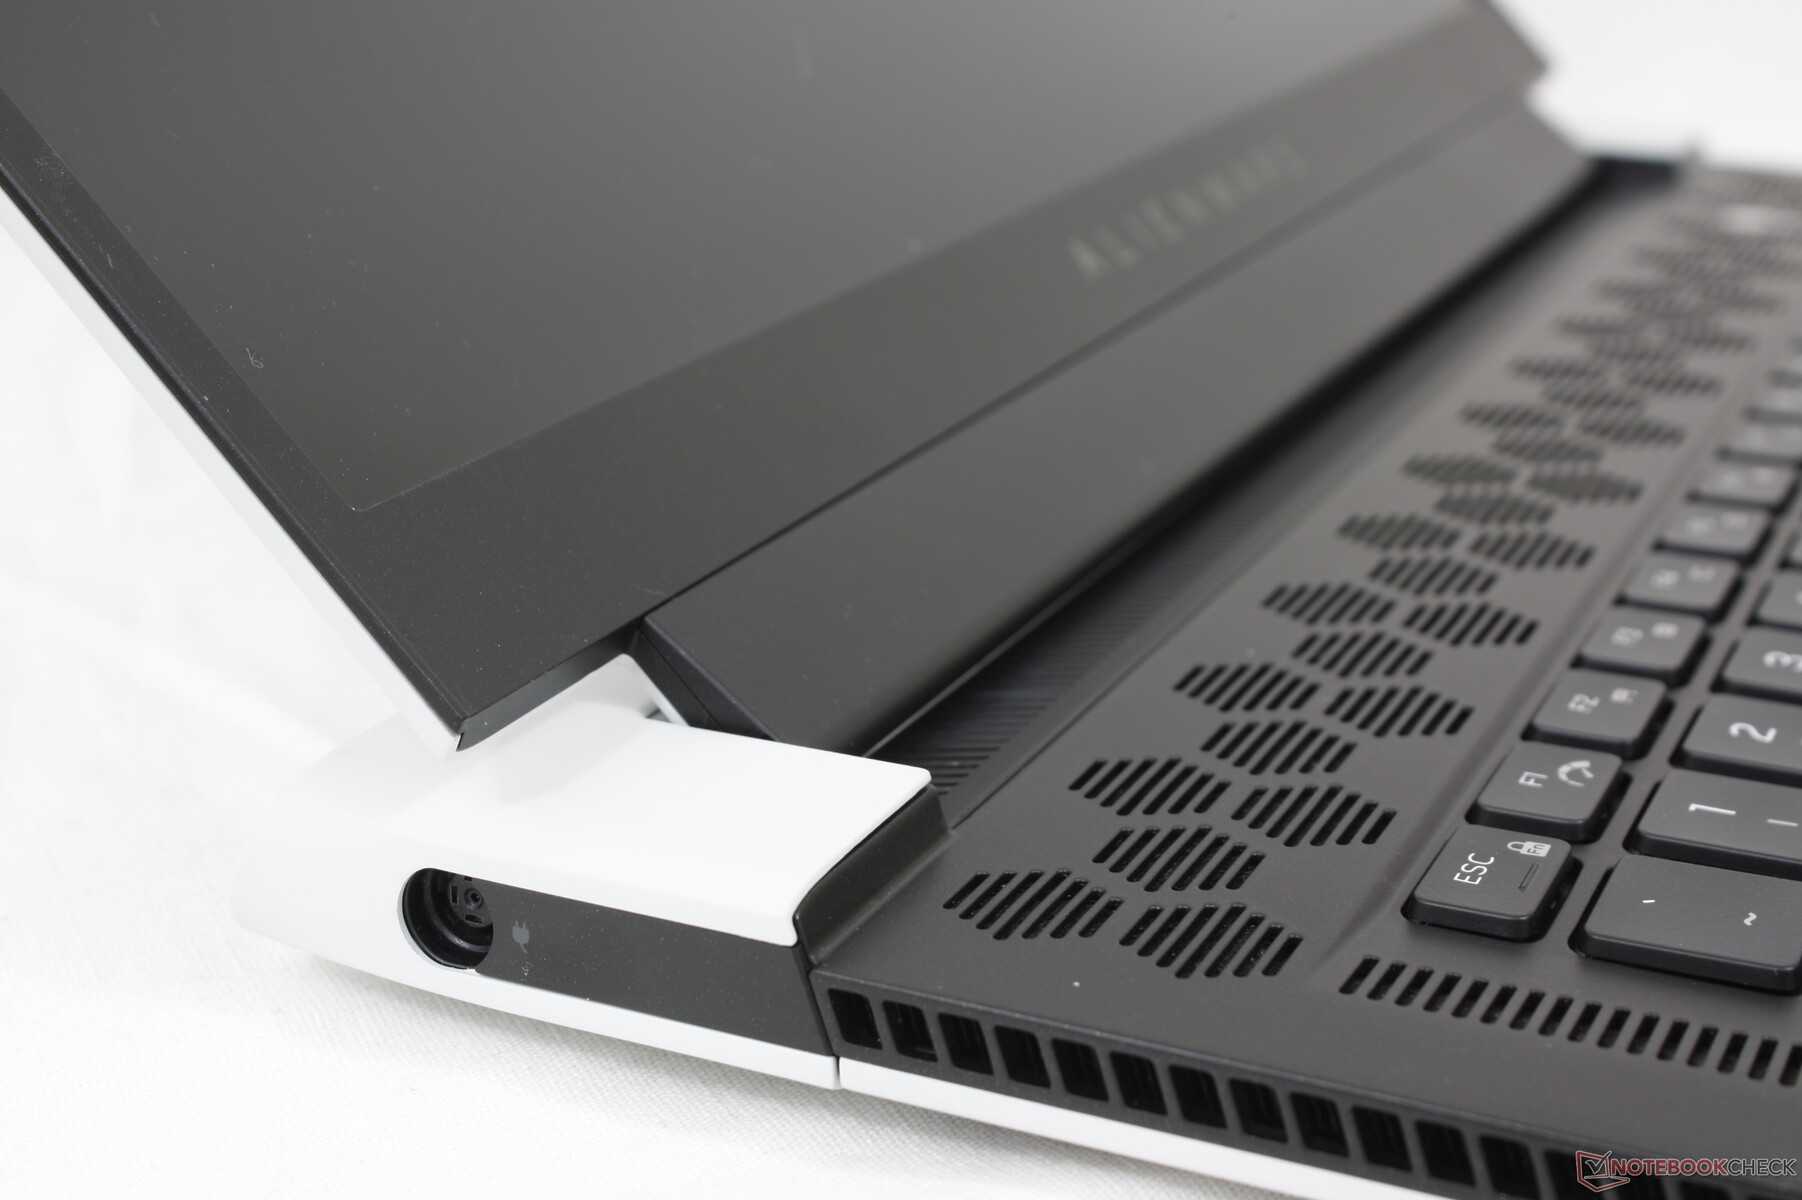
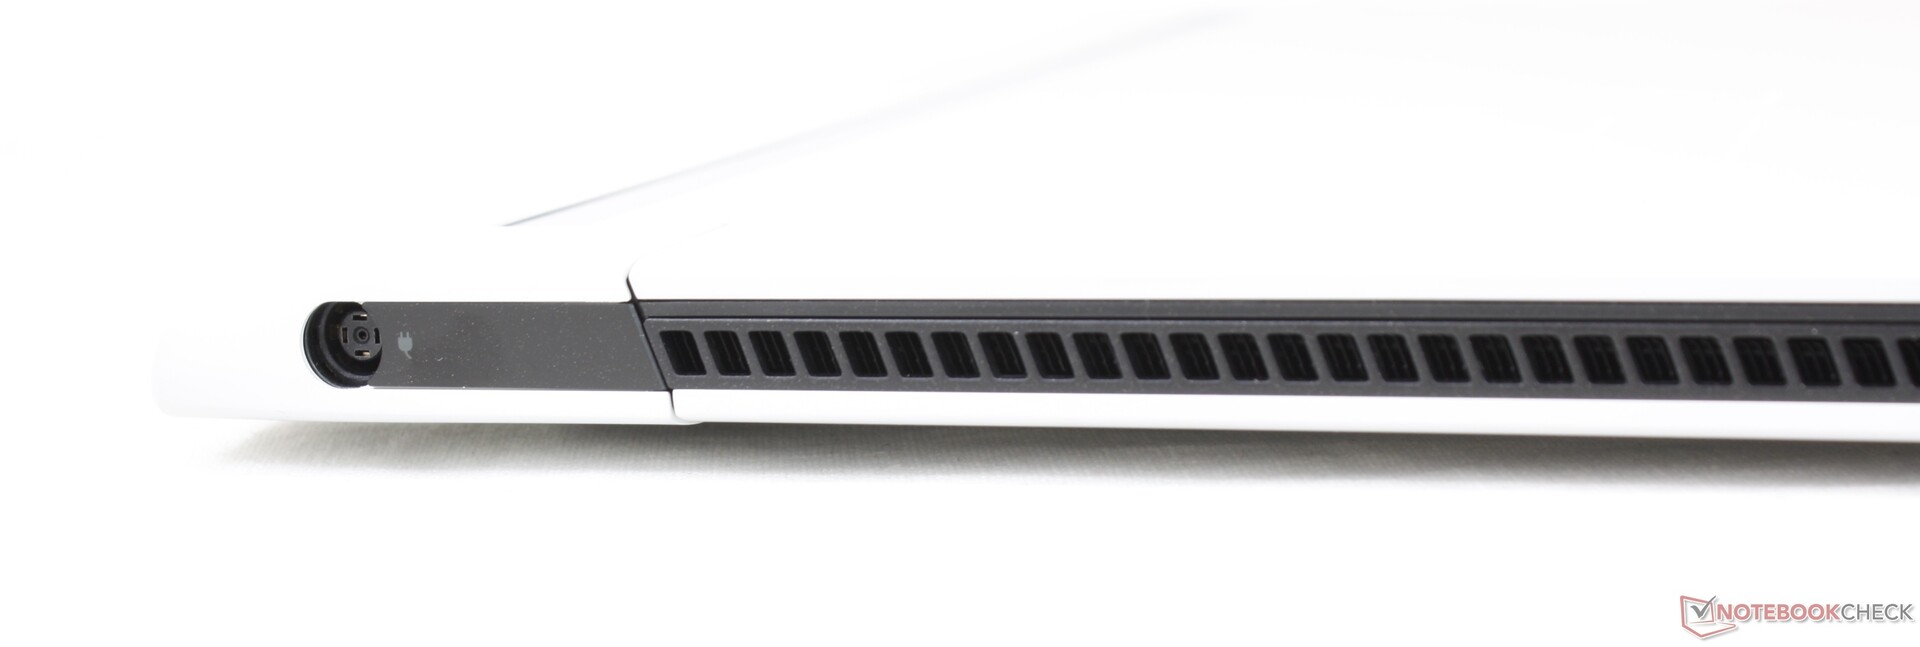
老款Alienware m15 R4的端口选项已经被削减。用户现在只有一个USB-A端口,而不是三个,同时RJ-45、迷你DisplayPort和图形放大器端口都被取消。该系统获得了第二个USB-C端口,这可以说是更通用的,这取决于不同的场景。
几乎所有的端口都在机箱的后部,这可能会使访问变得困难。此外,这些端口可能很难看到,因为它们不亮或没有易读的符号。
SD卡阅读器
我们赞扬戴尔集成了一个MicroSD读卡器,因为大多数超薄的15.6英寸游戏笔记本根本没有这个读卡器,包括华硕Zephyrus S15、微星GS66或Razer Blade 15。我们的UHS-II测试卡的传输速率非常快,约为200MB/s。

| SD Card Reader | |
| average JPG Copy Test (av. of 3 runs) | |
| Alienware x15 RTX 3070 P111F (AV Pro V60) | |
| Alienware m15 R4 RTX 3080 (AV PRO microSD 128 GB V60) | |
| maximum AS SSD Seq Read Test (1GB) | |
| Alienware x15 RTX 3070 P111F (AV Pro V60) | |
| Alienware m15 R4 RTX 3080 (AV PRO microSD 128 GB V60) | |
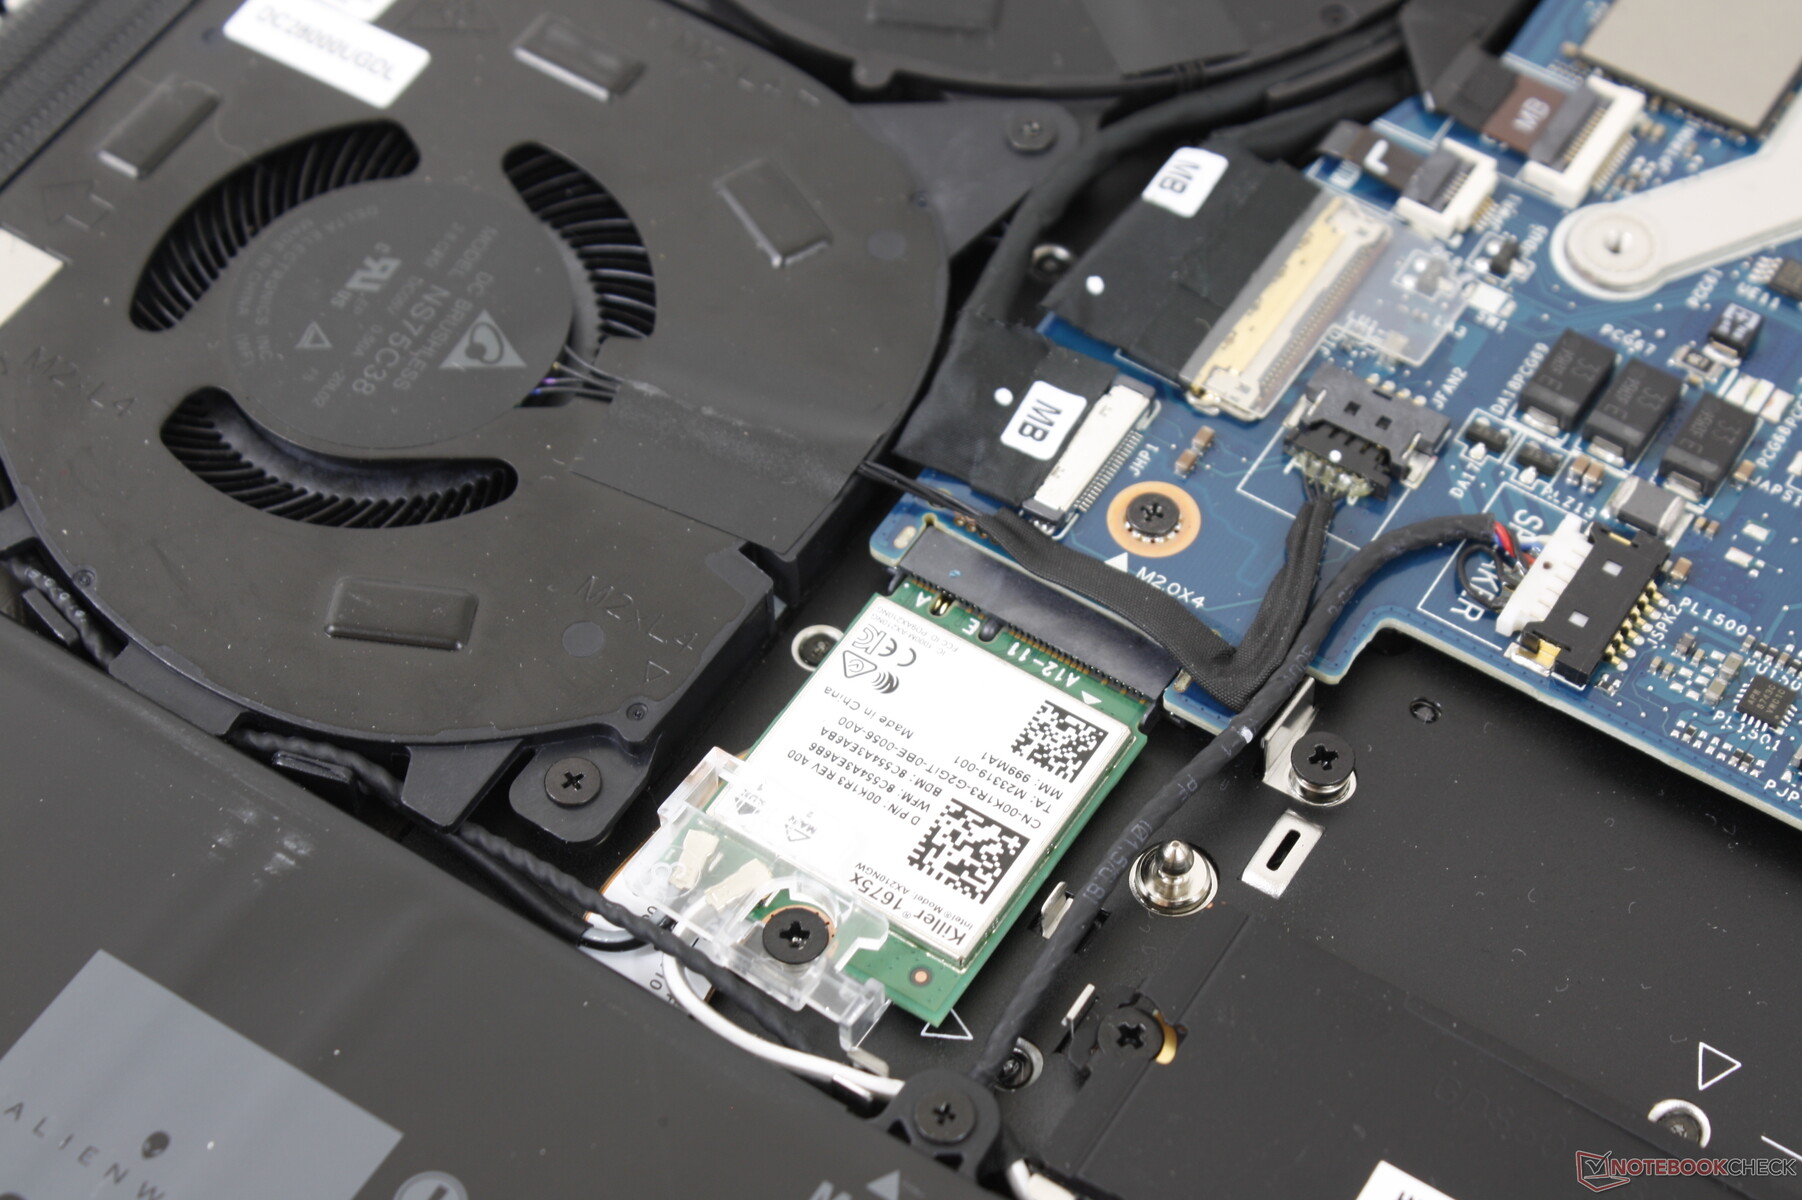
通信 - W-Fi 6E标准
所有SKU都配备了Killer Wi-Fi 6E AX1675x WLAN模块,以取代去年的Killer AX1650w。与英特尔AX210不同,这些杀手模块与 杀手性能套件和其所有的软件功能。
| Networking | |
| iperf3 transmit AX12 | |
| Acer Predator Helios 300 PH315-53-786B | |
| Asus Zephyrus S15 GX502L | |
| MSI GS66 Stealth 10UG | |
| Alienware x15 RTX 3070 P111F | |
| Alienware m15 R4 RTX 3080 | |
| Razer Blade 15 Advanced (Mid 2021) | |
| iperf3 receive AX12 | |
| Alienware x15 RTX 3070 P111F | |
| Asus Zephyrus S15 GX502L | |
| Razer Blade 15 Advanced (Mid 2021) | |
| Acer Predator Helios 300 PH315-53-786B | |
| MSI GS66 Stealth 10UG | |
| Alienware m15 R4 RTX 3080 | |
网络摄像头
摄像头质量仍然很差,只有720p,而且没有网络摄像头快门。支持Windows Hello的红外技术也包括在内。


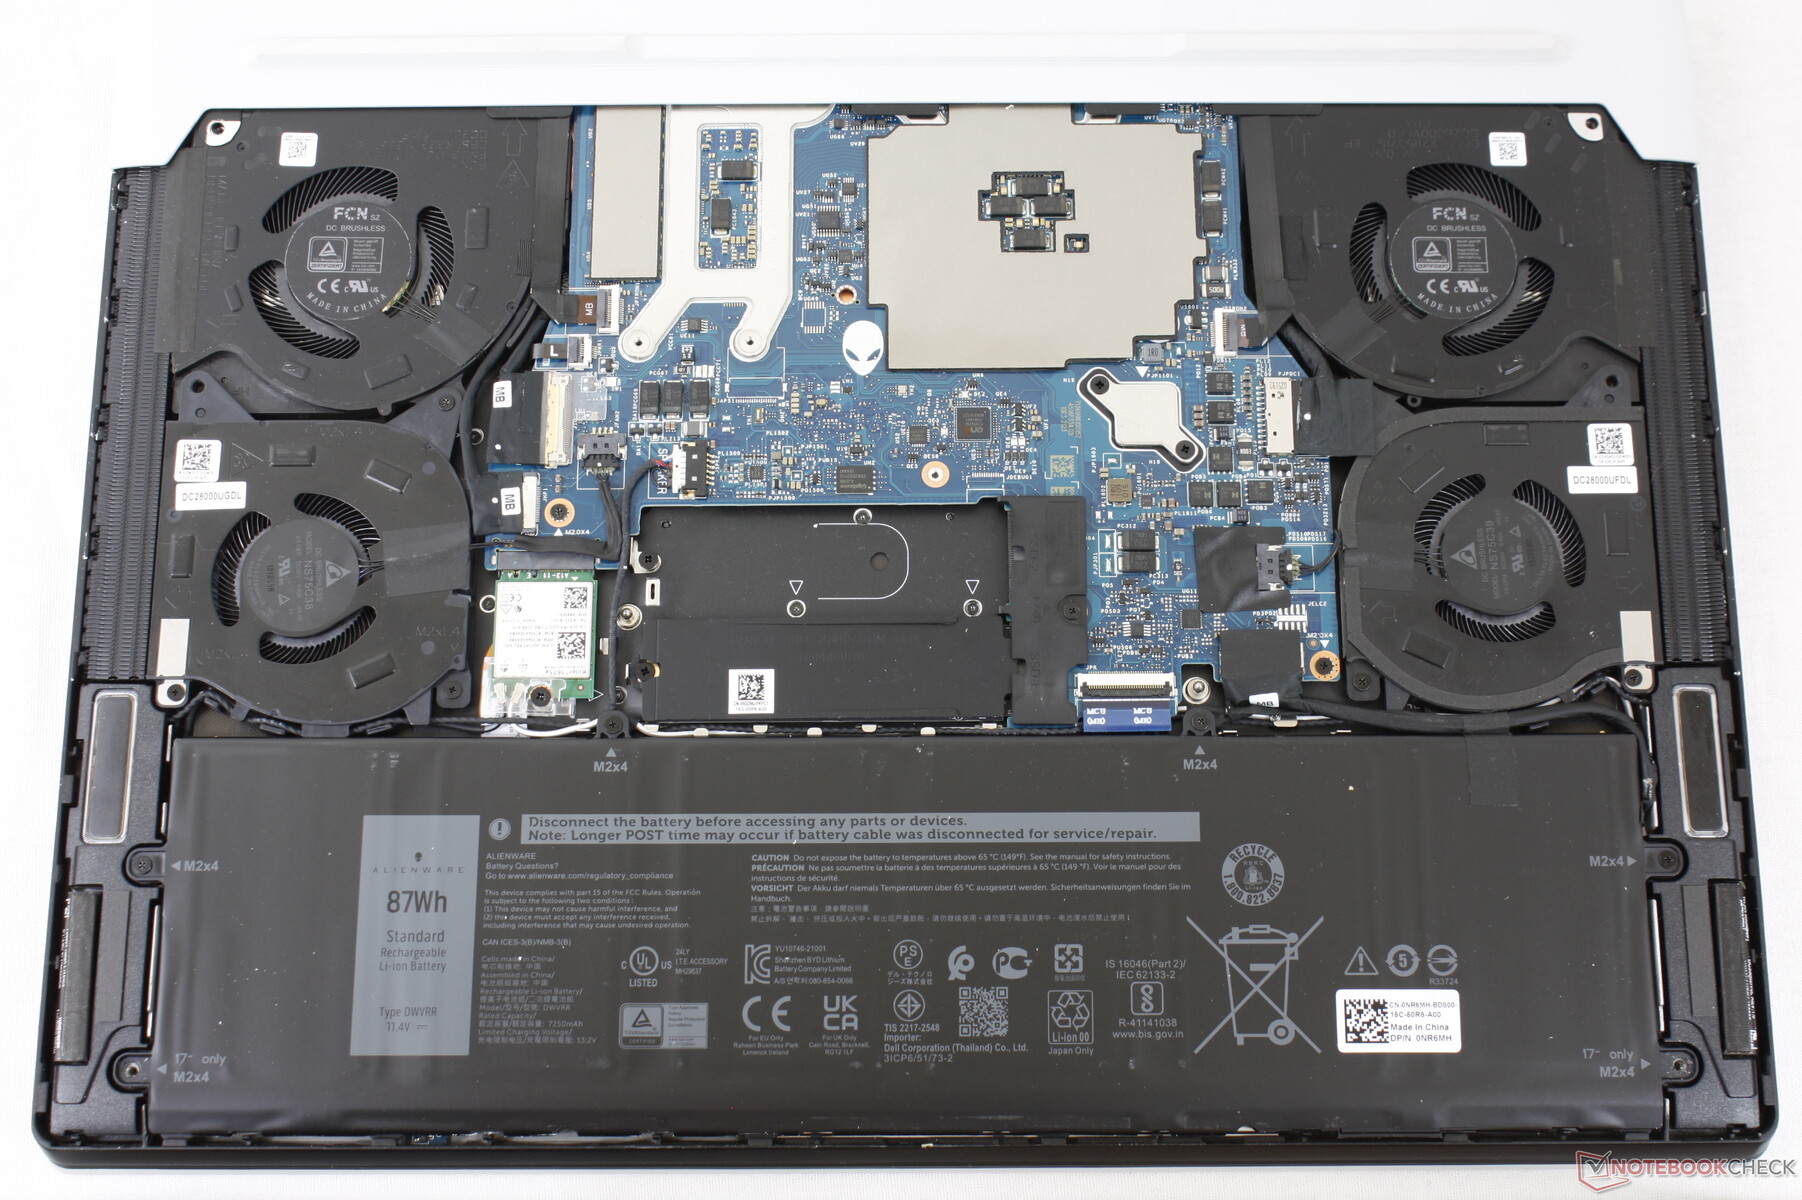
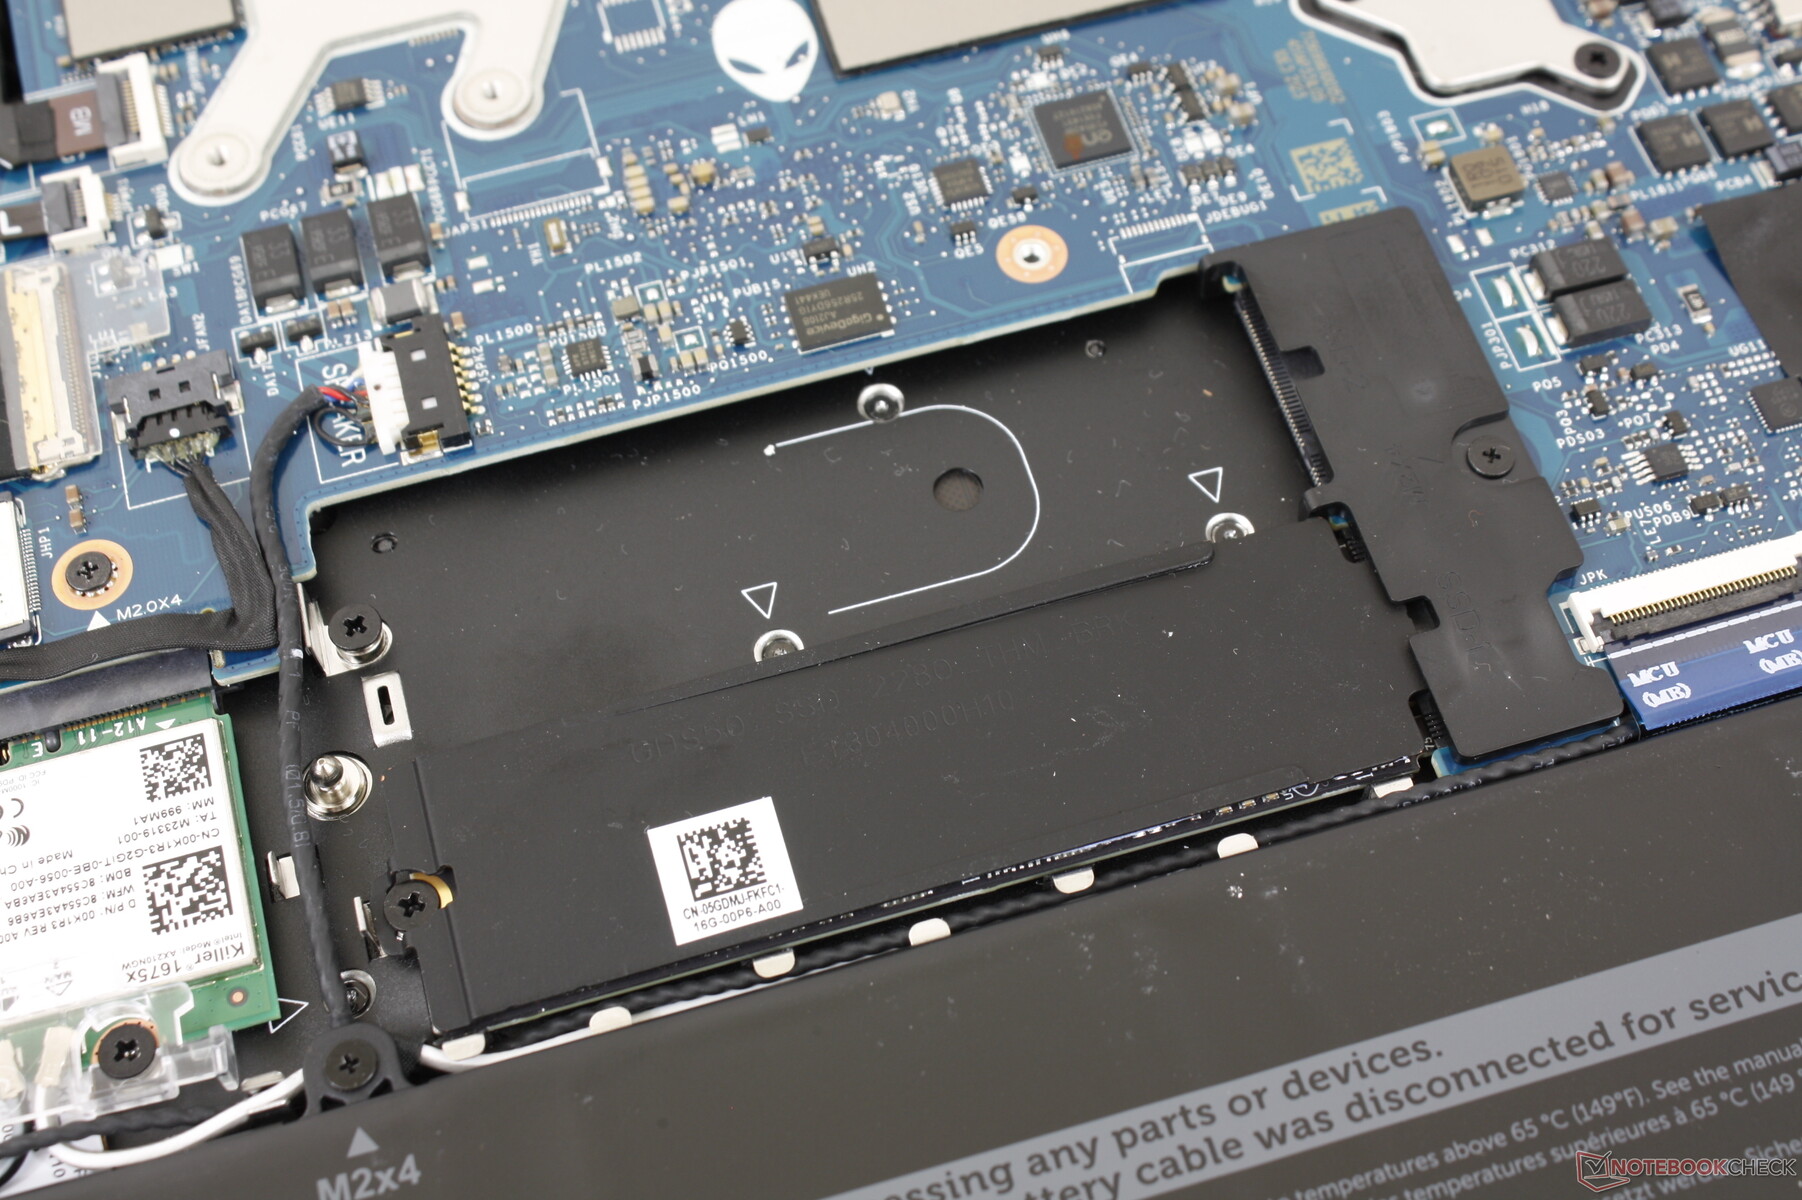
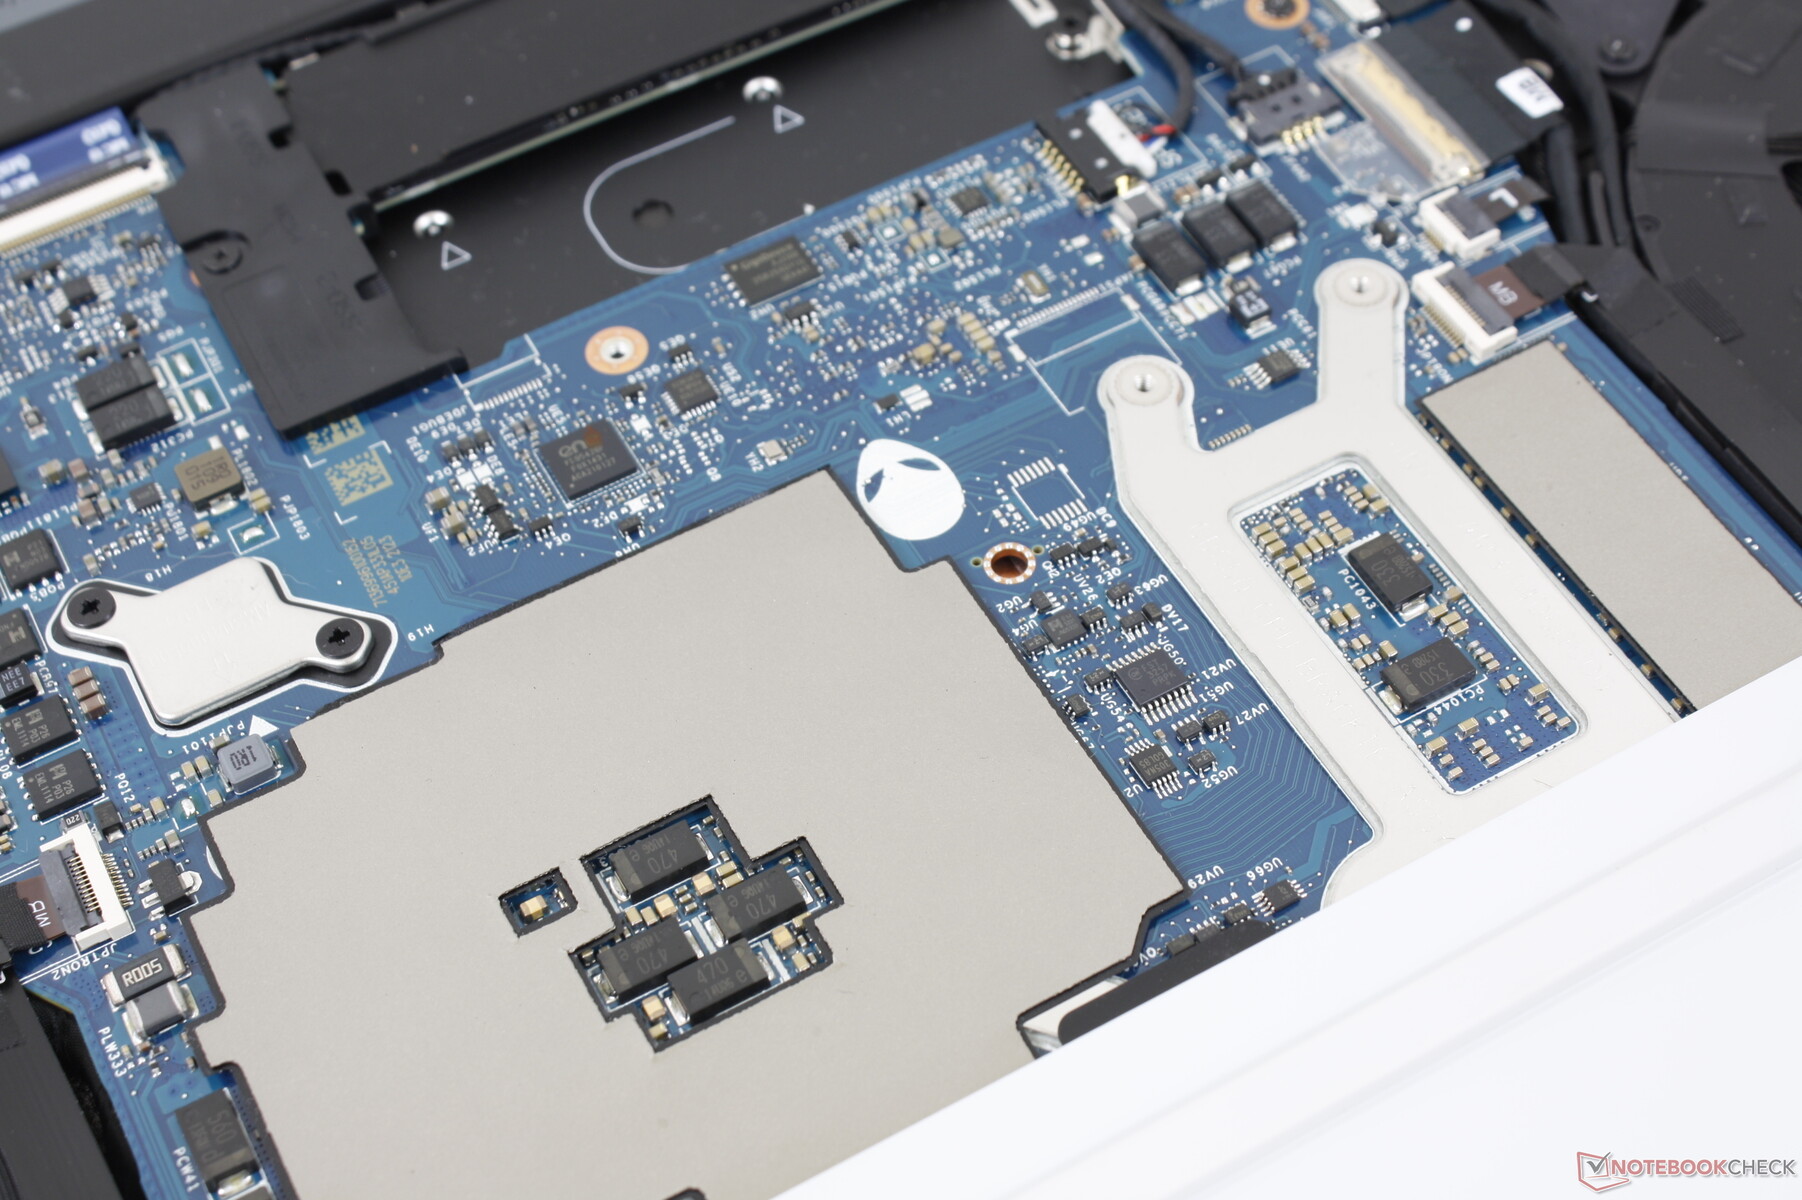
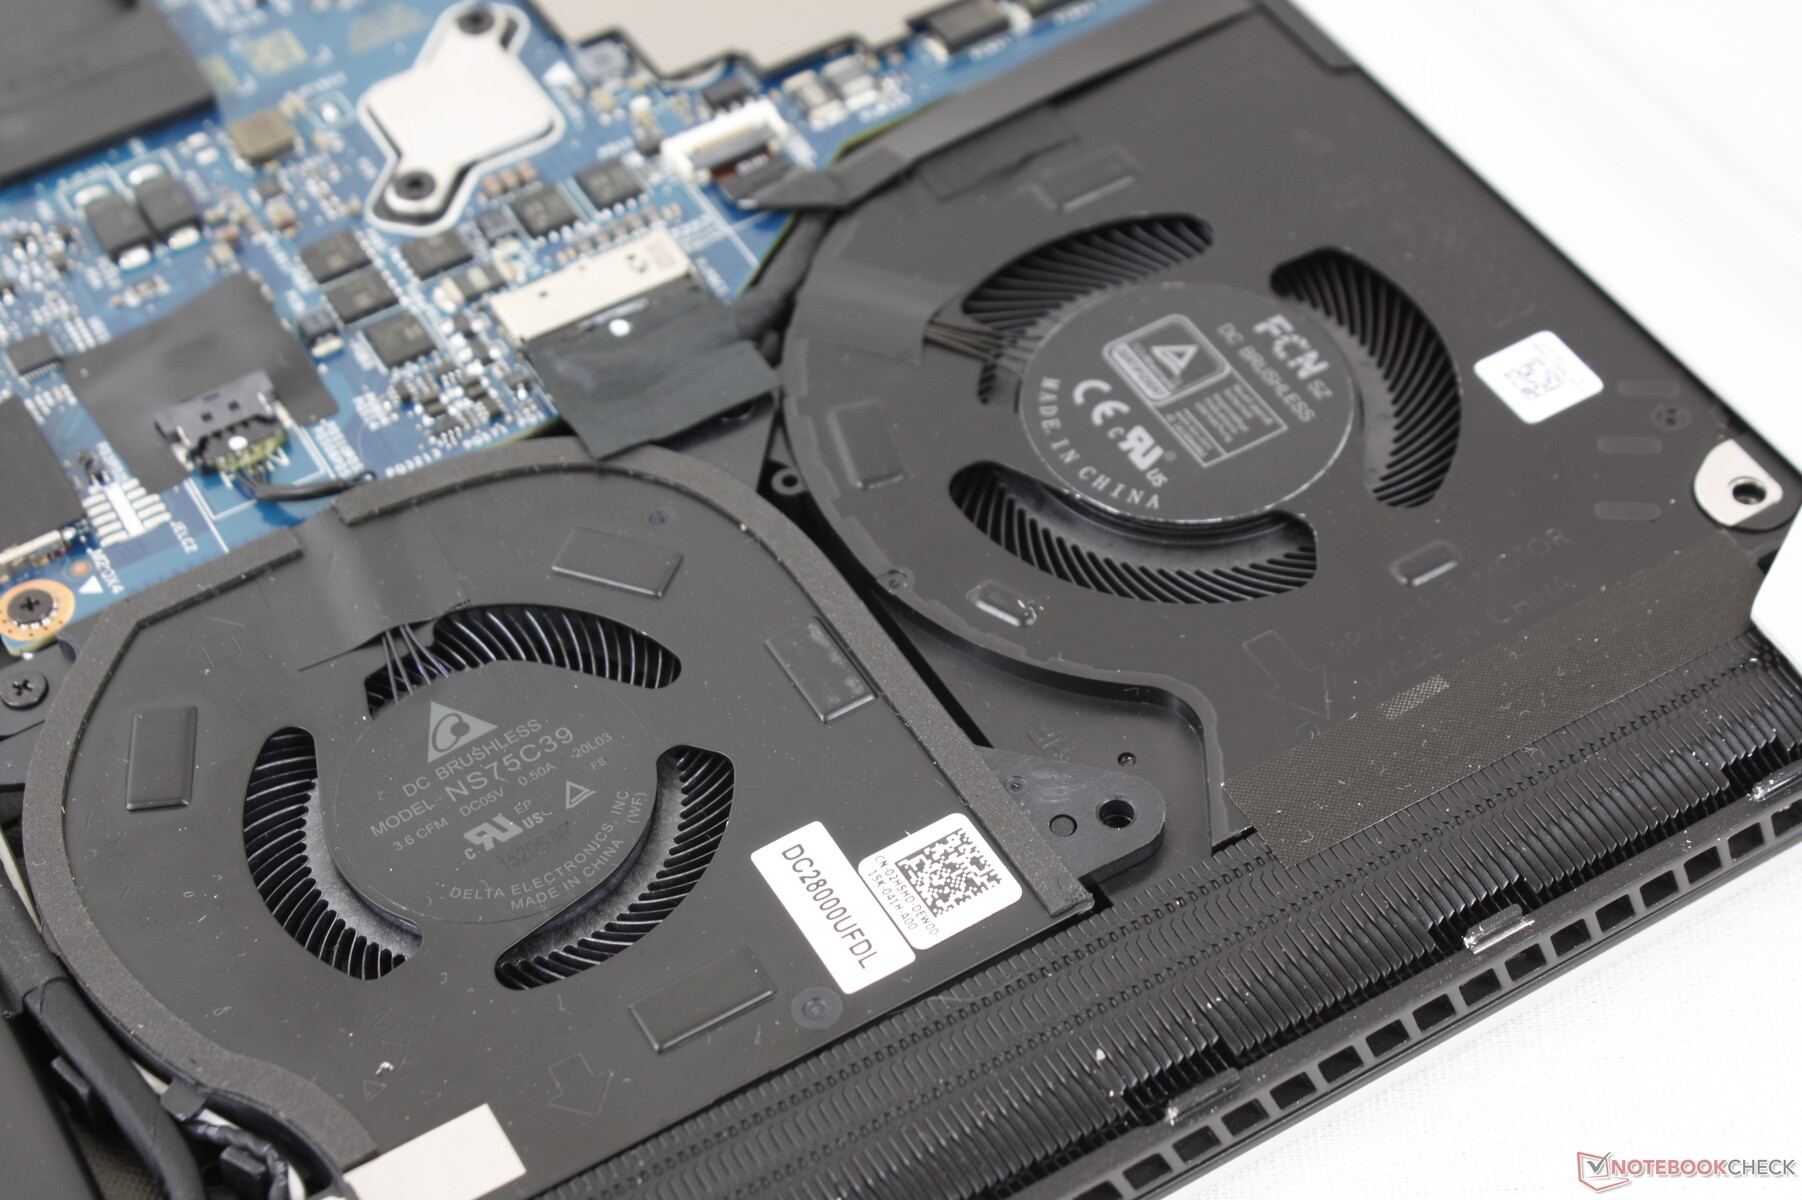
维护
底部面板仅由六个飞利浦螺钉固定,便于维修和升级。然而,内存是焊接的,所以用户只能升级M.2 SSD。相比之下,雷蛇Blade 15或微星GS66等竞争机型有SODIMM插槽供用户升级。
配件和保修
除了交流电适配器和文件之外,盒子里没有其他的东西。如果从戴尔订购,通常的一年有限保修期适用于大量的额外费用。
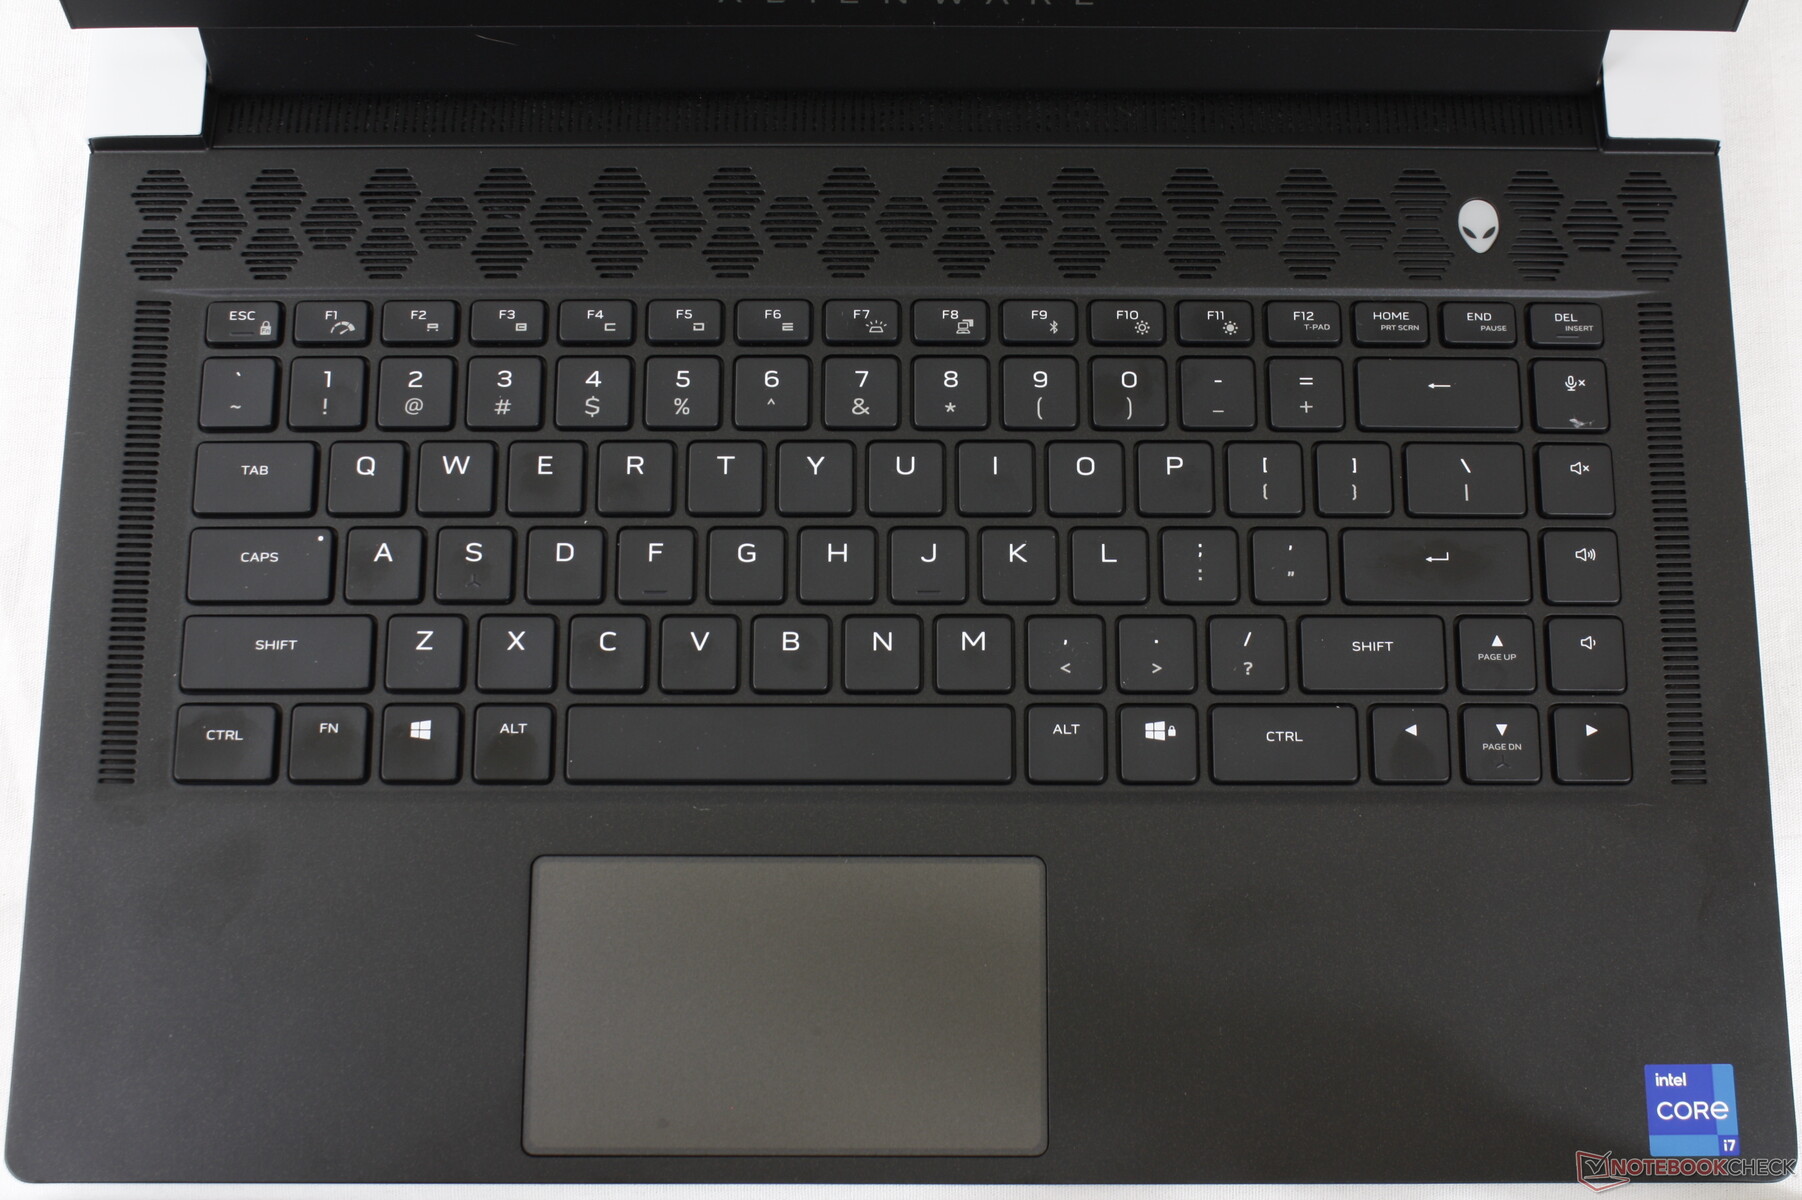
输入设备 - 脆皮键
键盘
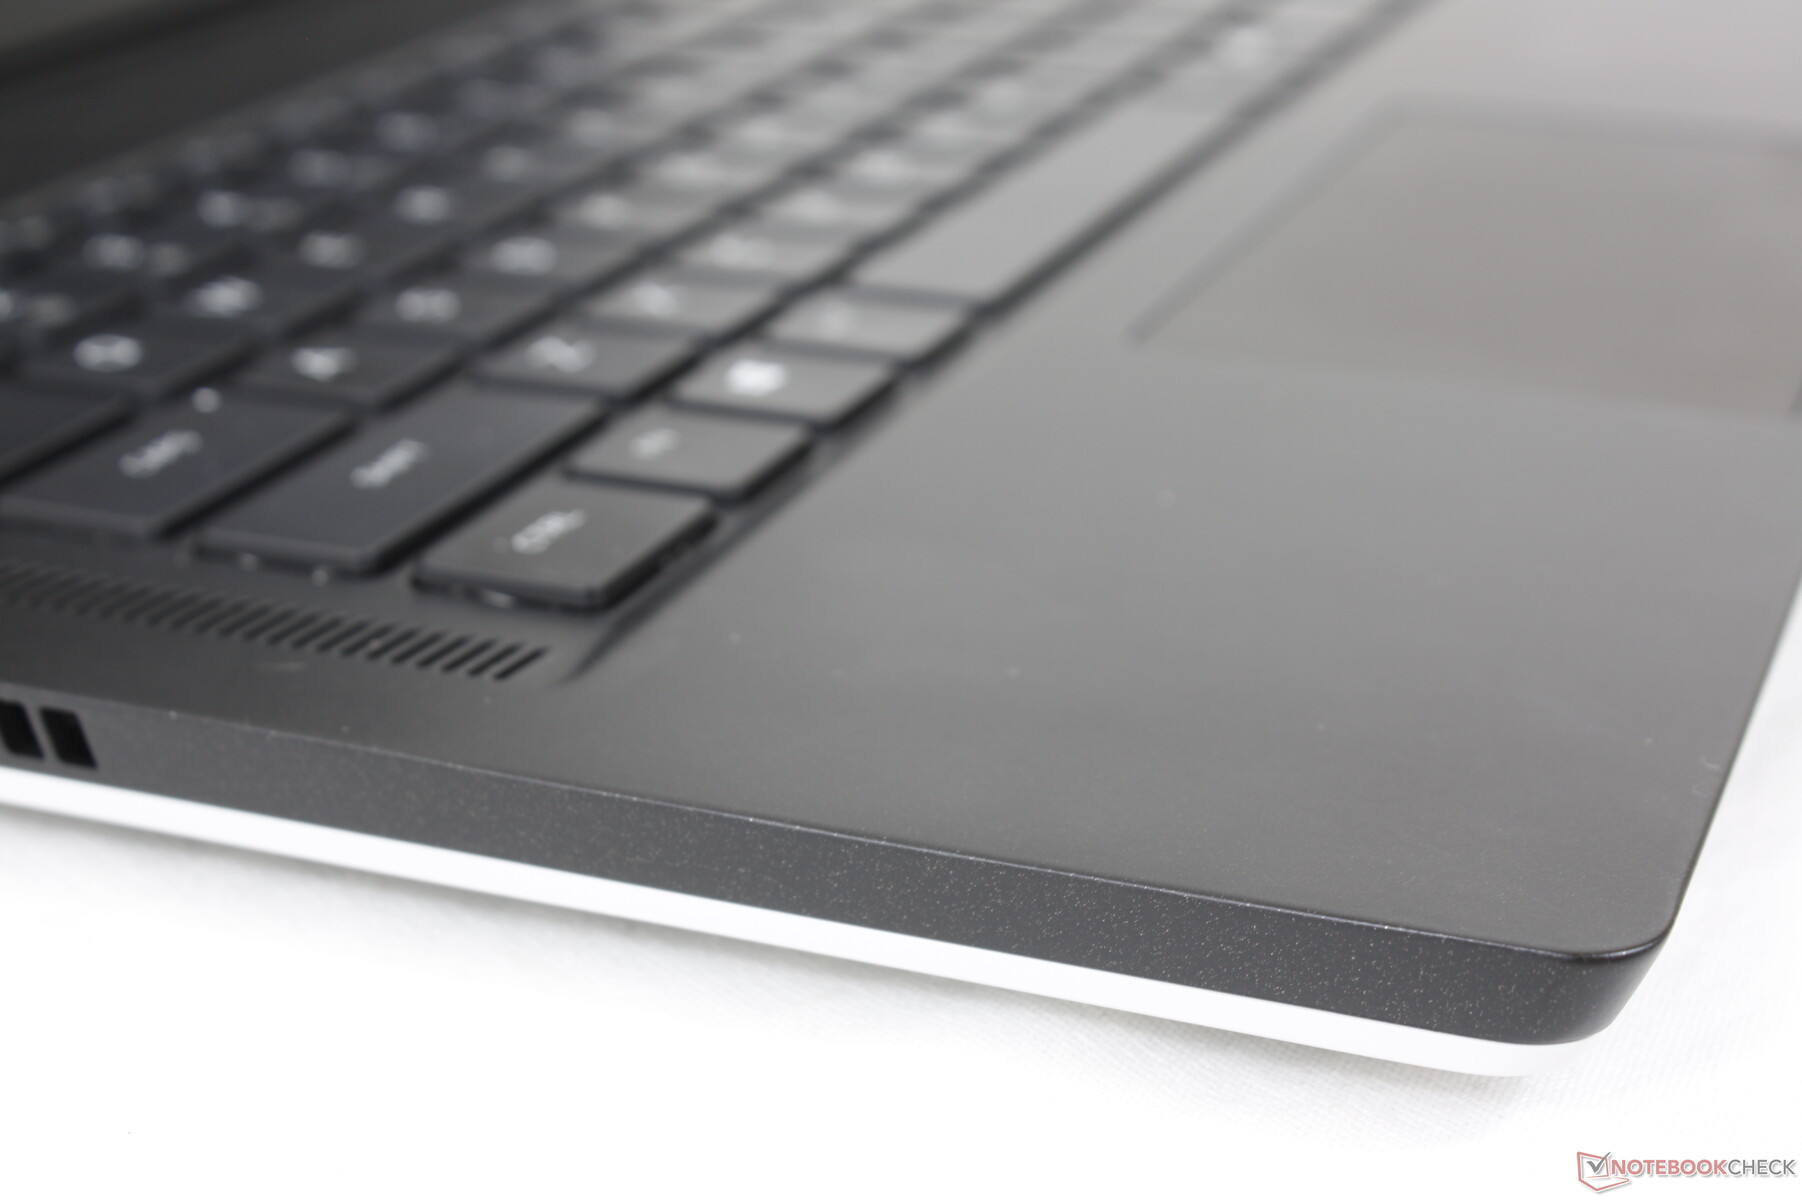
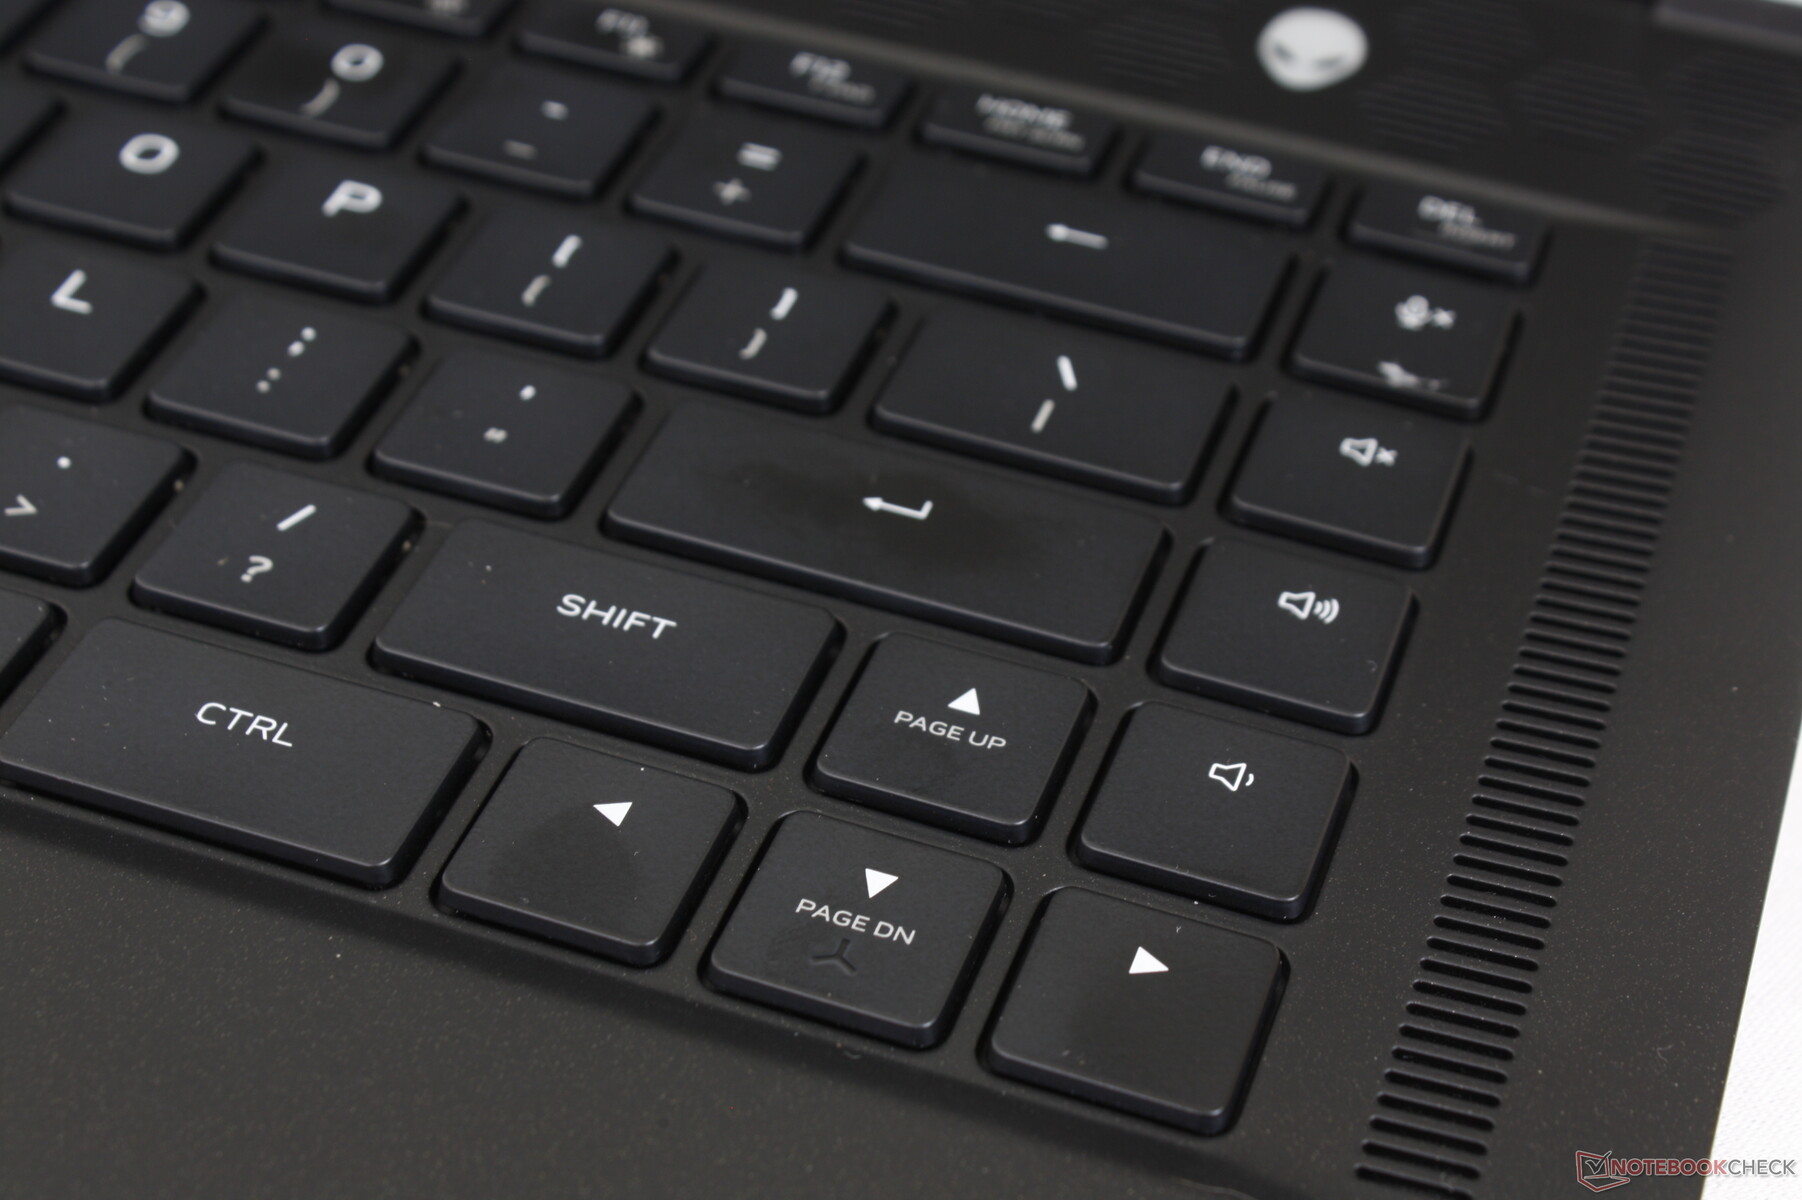
x15采用了标准的膜基键,每个键都有RGB背光,这是对Alienware m15 R4的四区照明的一种升级。反馈比预期的更清晰、更坚定,其1.5毫米的键程避免了大多数超极本上柔软和过浅的按键。我们发现该系统在打字时比华硕Zephyrus系列或Razer Blade 15更加舒适。然而,回车键和空格键的声音明显比安静的QWERTY键大。
副键符号不亮,不像老款的m15系列那样令人讨厌。x17 R1键盘也有这个问题。
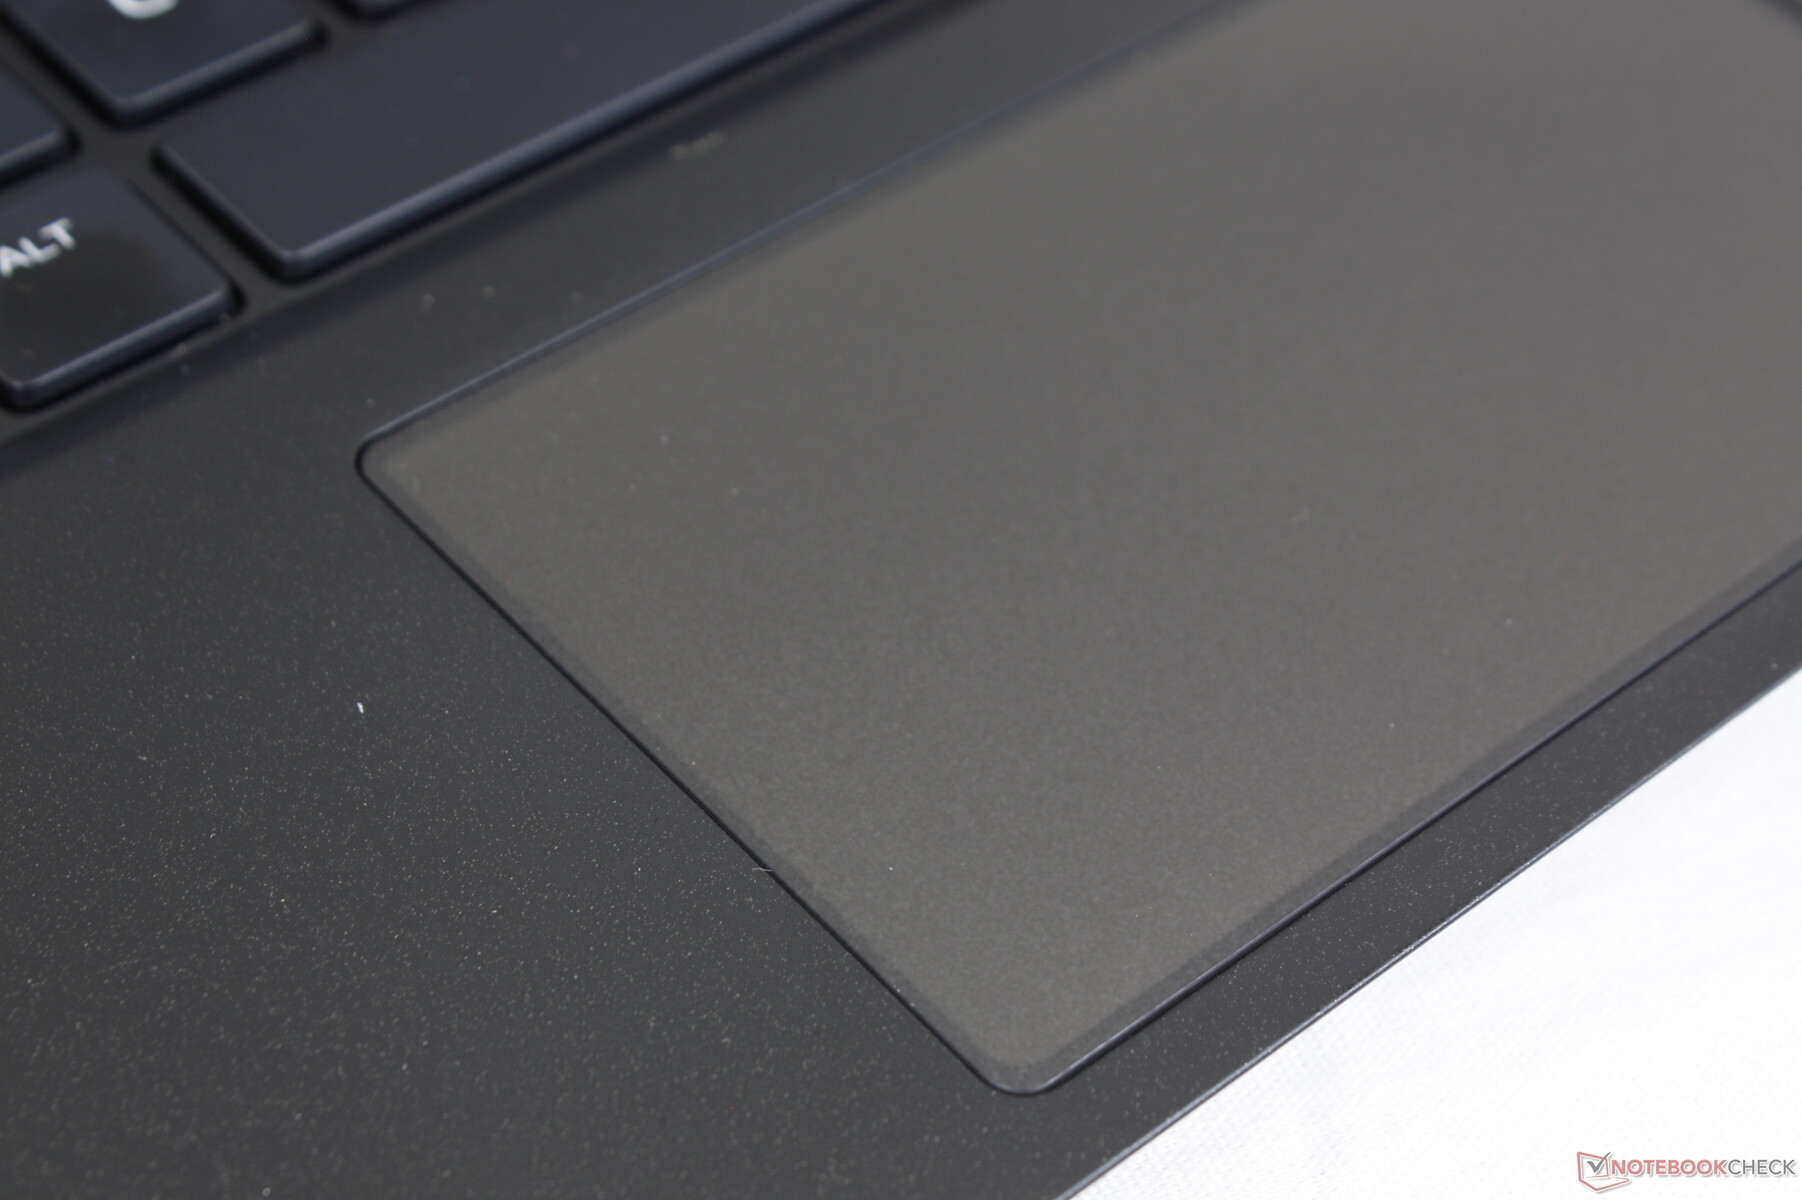
触摸板
点击板的表面积与去年的型号没有变化,只有10.5 x 6厘米。当以中等或较快的速度滑行时,牵引力是平稳的,而较慢的速度会有一点粘性,以便更准确地点击。不幸的是,点击仍然是海绵状的,反馈有点令人不满意。此外,与去年Alienware m15系列的白色点击板相比,深灰色将更容易突出指纹。

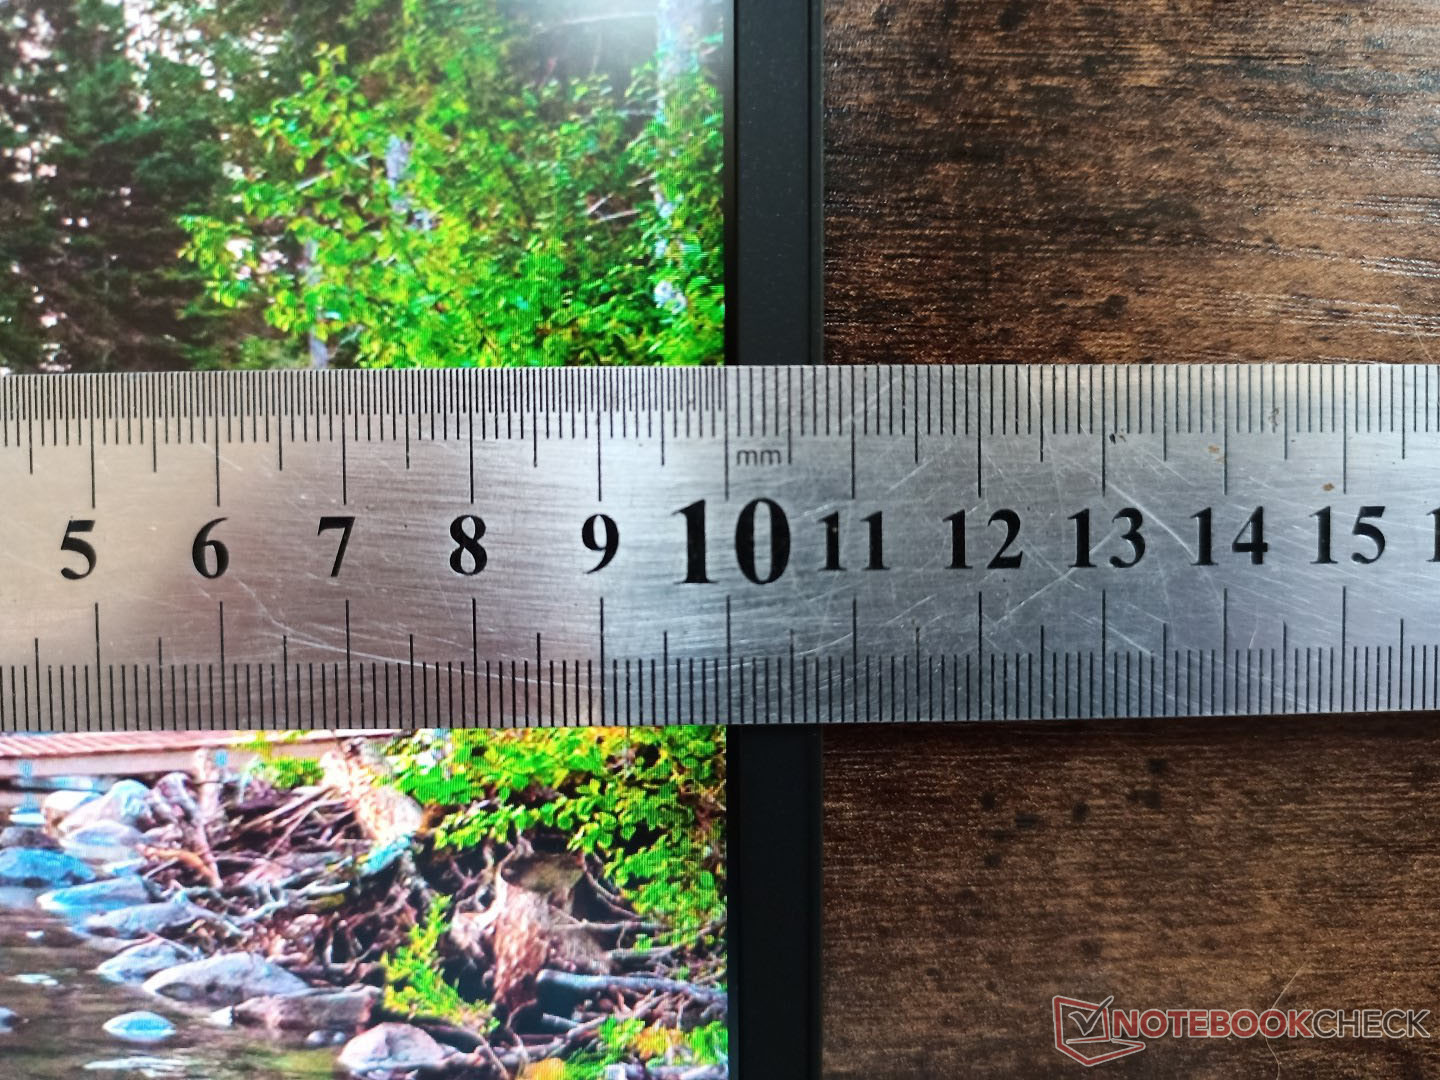
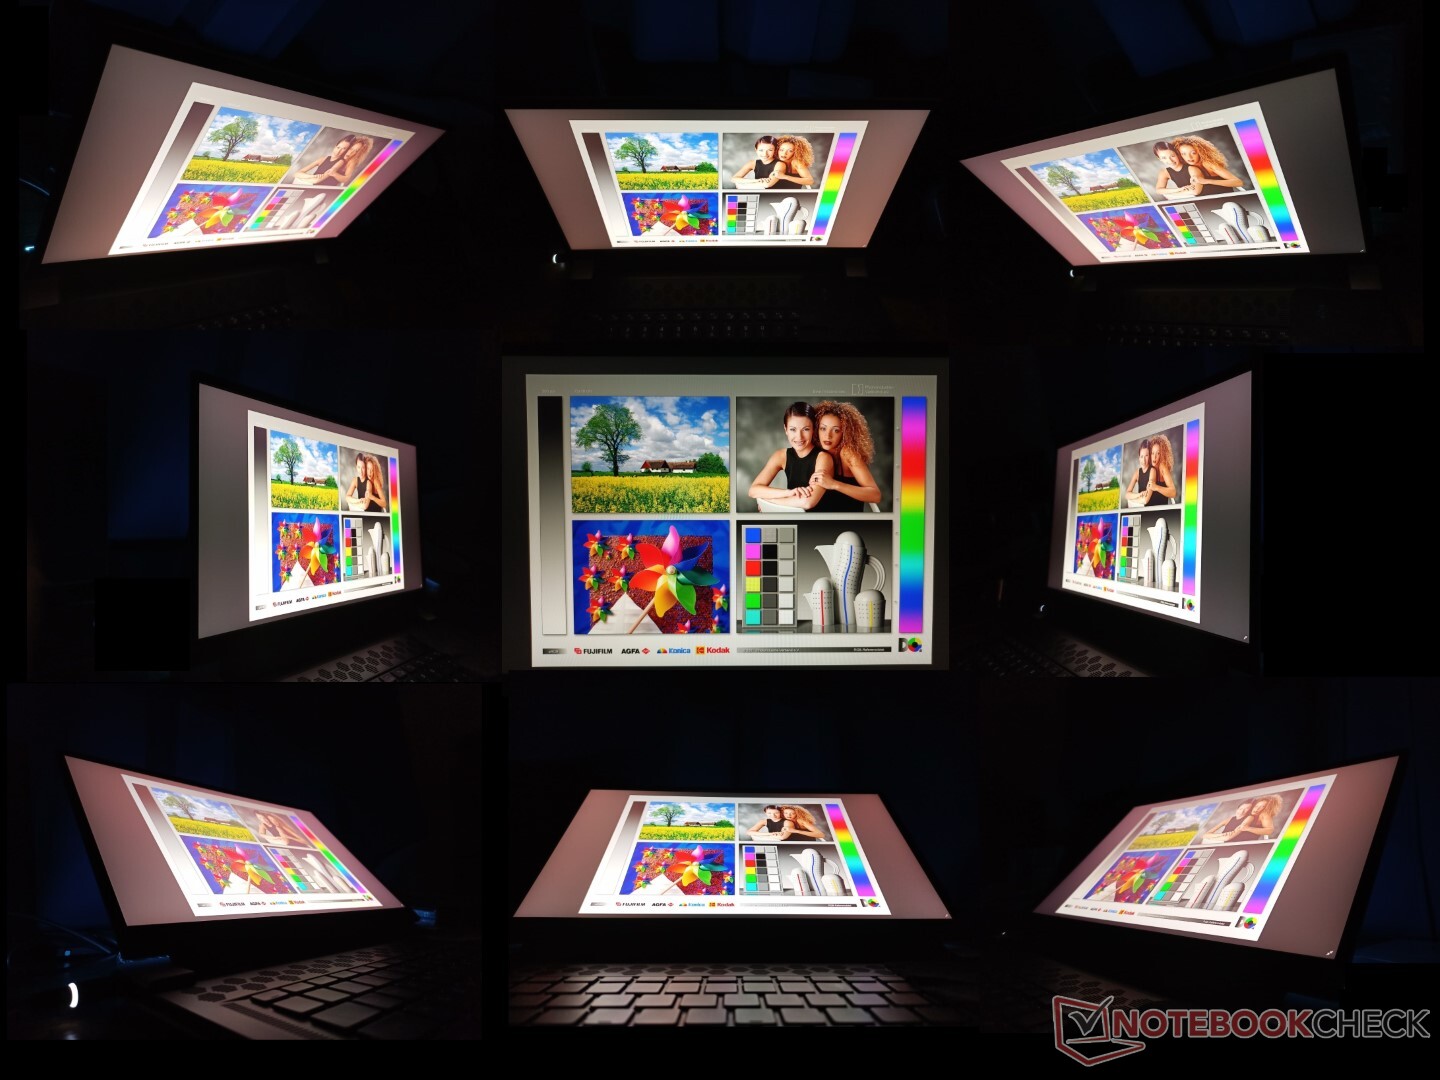
显示器 - 不再有OLED选项
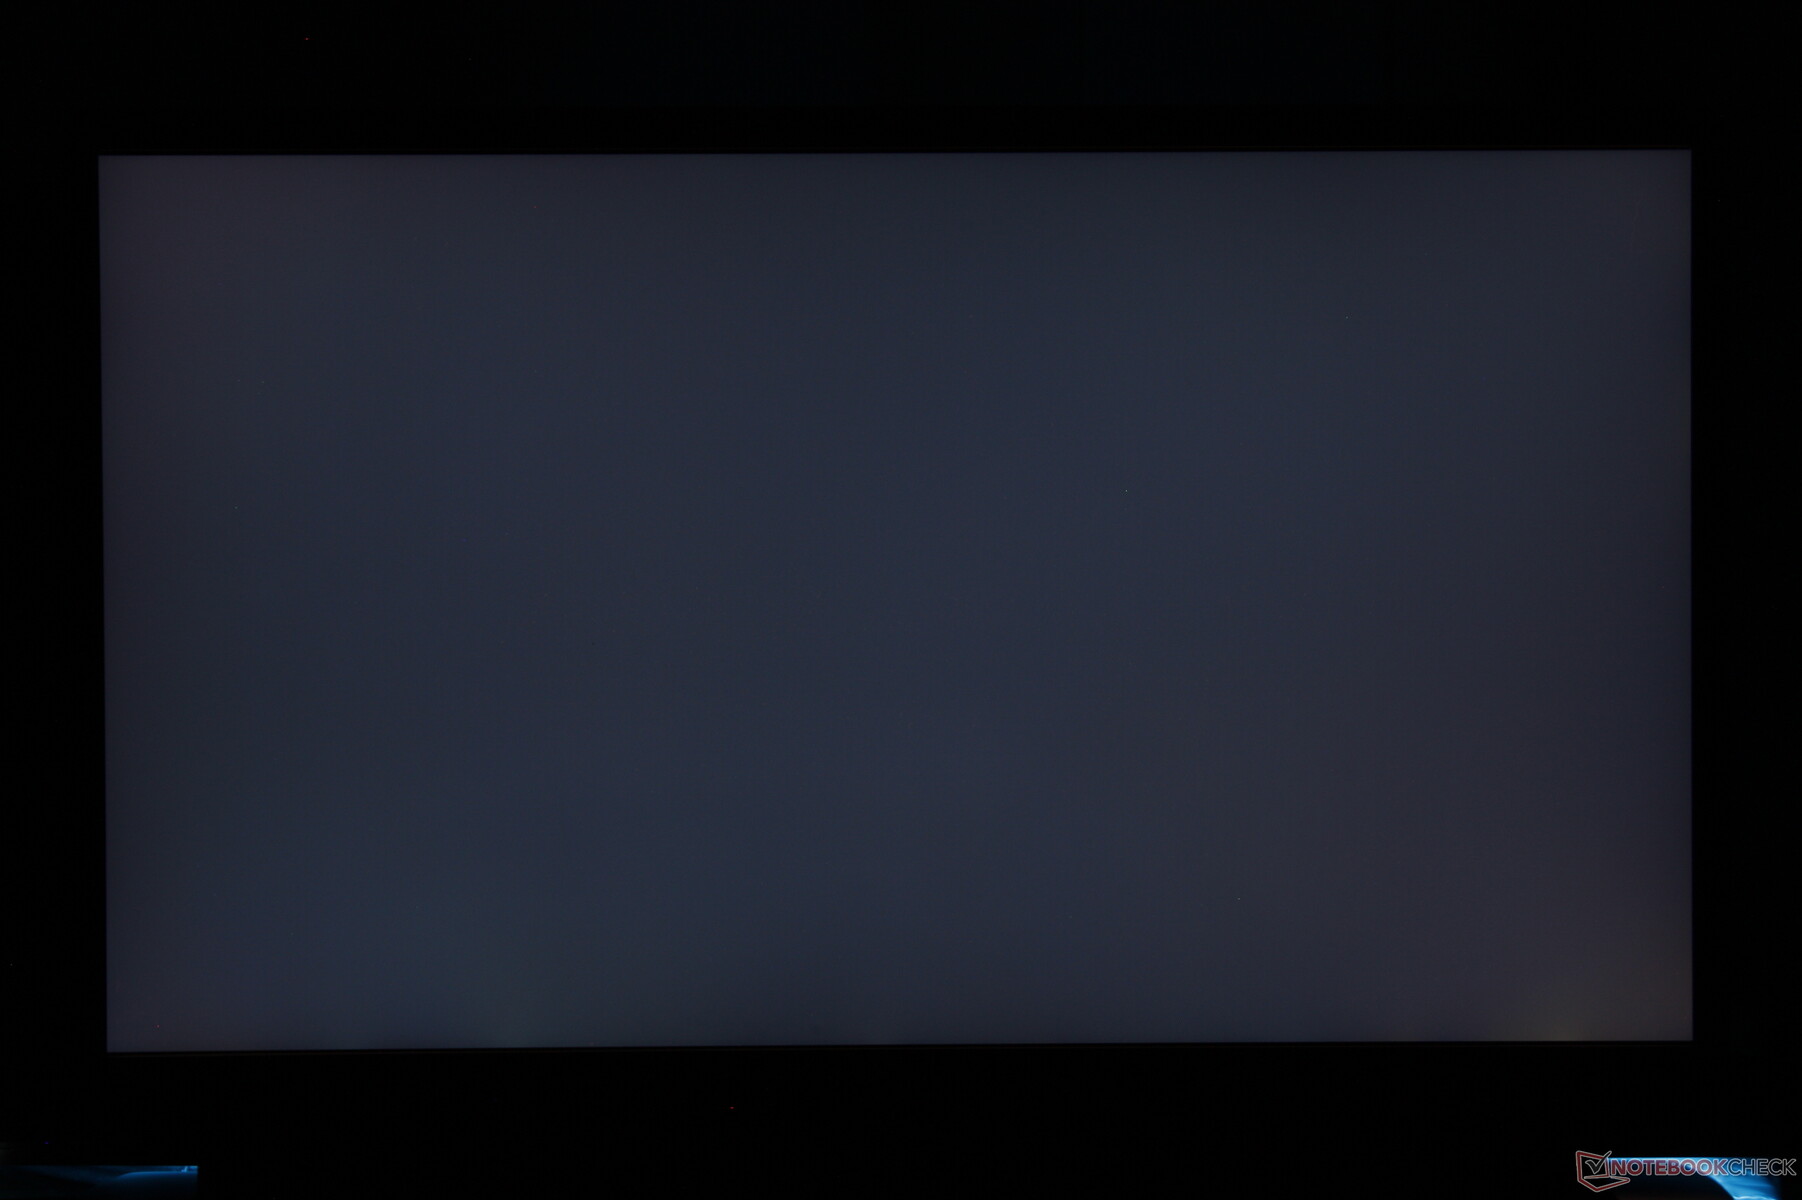
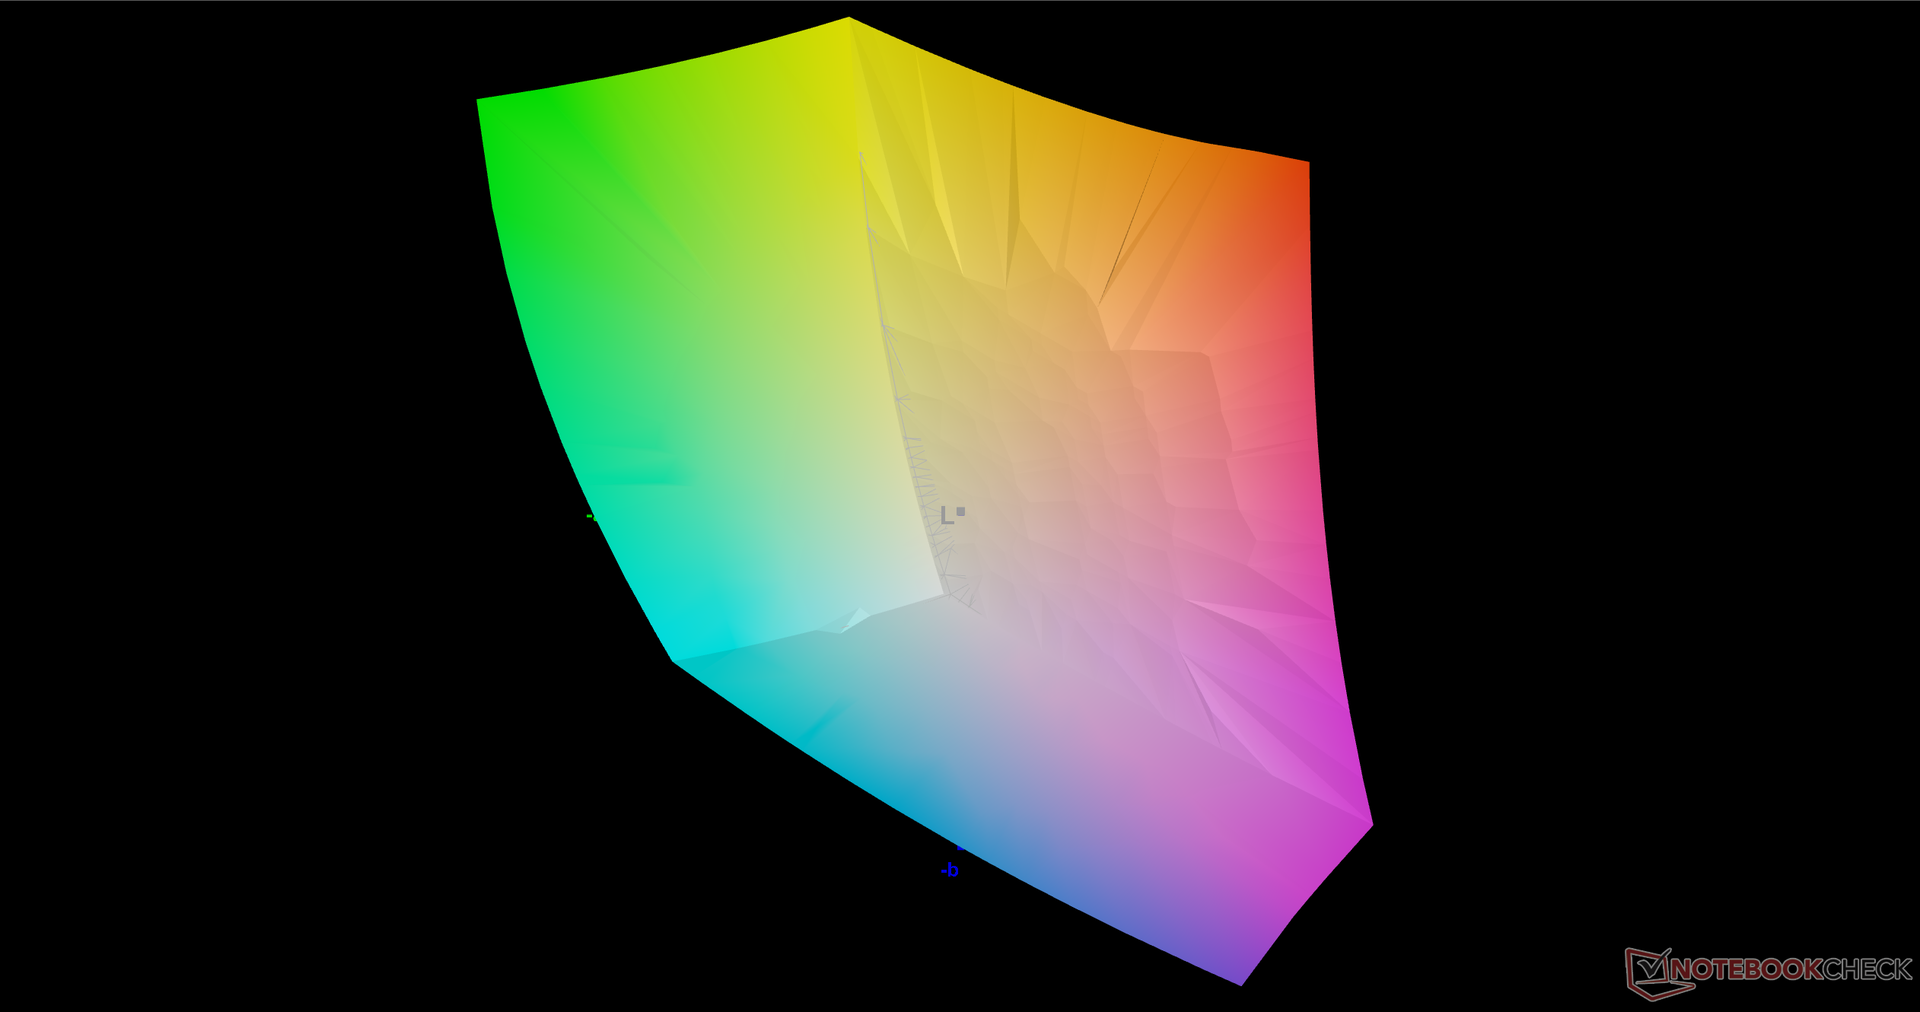
LG飞利浦156QHG 1440p IPS面板是第一个出现在我们数据库中的。它的属性非常好,有6毫秒的快速响应时间,快速的240赫兹刷新率,DCI-P3的近100%的广泛色彩覆盖,以及明亮的400尼特背光,比许多其他15.6英寸的游戏笔记本电脑更亮,包括新的微星GS66.也许它最大的缺点是它的对比度并不突出,约为900:1,考虑到要价,这比较中规中矩。
| |||||||||||||||||||||||||
Brightness Distribution: 88 %
Center on Battery: 409.5 cd/m²
Contrast: 871:1 (Black: 0.47 cd/m²)
ΔE ColorChecker Calman: 3.48 | ∀{0.5-29.43 Ø4.72}
calibrated: 0.89
ΔE Greyscale Calman: 5 | ∀{0.09-98 Ø4.97}
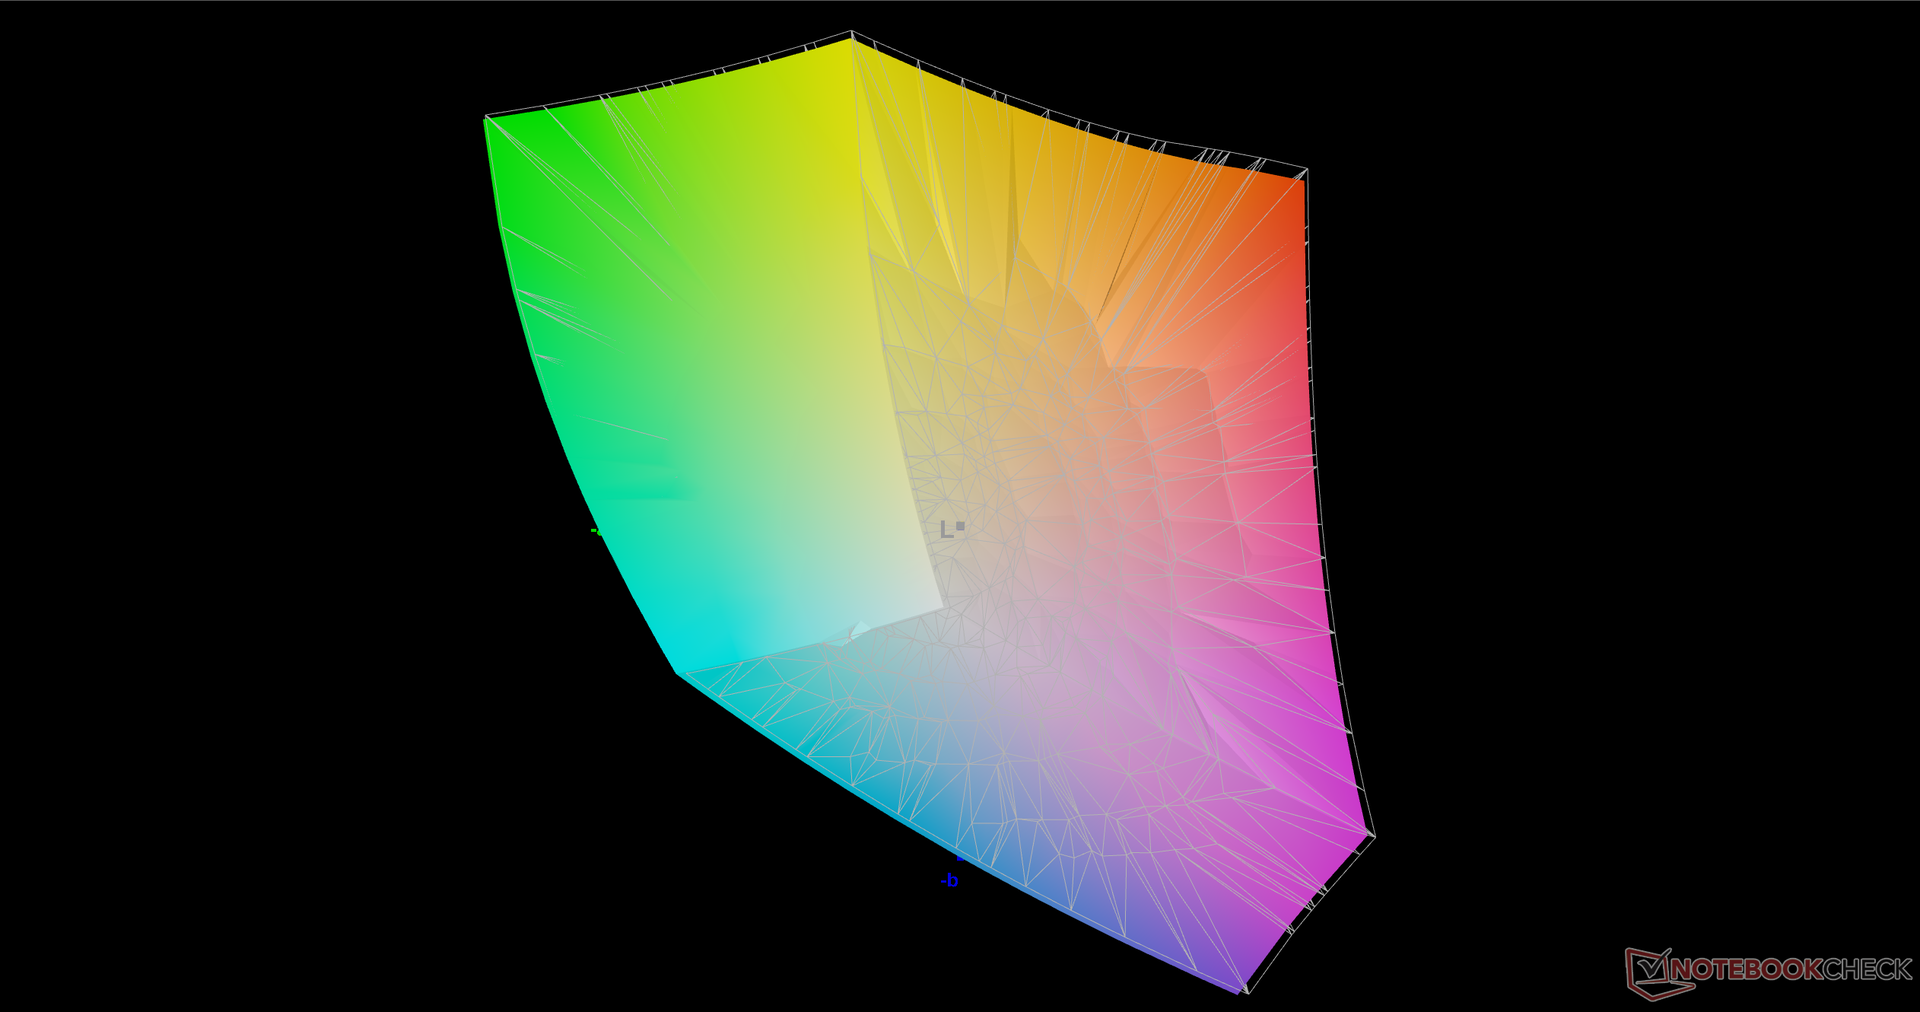
99.9% sRGB (Argyll 3D)
97.8% Display P3 (Argyll 3D)
Gamma: 2.16
CCT: 6591 K
| Alienware x15 RTX 3070 P111F LG Philips 156QHG, IPS, 15.6", 2560x1440 | Alienware m15 R4 RTX 3080 LG Philips LGD066E (156WFG), IPS, 15.6", 1920x1080 | MSI GS66 Stealth 10UG AU Optronics B156HAN12.0, IPS, 15.6", 1920x1080 | Razer Blade 15 Advanced (Mid 2021) TL156VDXP02-0, IPS, 15.6", 1920x1080 | Asus Zephyrus S15 GX502L B156HAN12.0 (AUOBC8C), IPS, 15.6", 1920x1080 | Acer Predator Helios 300 PH315-53-786B Sharp LQ156M1JW09, IPS, 15.6", 1920x1080 | |
|---|---|---|---|---|---|---|
| Display | -14% | -17% | -18% | -15% | -16% | |
| Display P3 Coverage (%) | 97.8 | 70.1 -28% | 67.7 -31% | 66.9 -32% | 69.7 -29% | 68.4 -30% |
| sRGB Coverage (%) | 99.9 | 99.8 0% | 98.4 -2% | 97.1 -3% | 99.7 0% | 99.4 -1% |
| AdobeRGB 1998 Coverage (%) | 71.5 | 69.1 | 69 | 71.1 | 70.4 | |
| Response Times | 23% | -16% | 35% | -5% | -8% | |
| Response Time Grey 50% / Grey 80% * (ms) | 12 ? | 7.6 ? 37% | 14.4 ? -20% | 4.2 ? 65% | 14 ? -17% | 15.2 ? -27% |
| Response Time Black / White * (ms) | 10.4 ? | 9.6 ? 8% | 11.6 ? -12% | 10 ? 4% | 9.6 ? 8% | 9.2 ? 12% |
| PWM Frequency (Hz) | 23580 ? | |||||
| Screen | 19% | -1% | 12% | 9% | 3% | |
| Brightness middle (cd/m²) | 409.5 | 347 -15% | 259.5 -37% | 353.4 -14% | 283 -31% | 312 -24% |
| Brightness (cd/m²) | 390 | 318 -18% | 264 -32% | 340 -13% | 289 -26% | 290 -26% |
| Brightness Distribution (%) | 88 | 86 -2% | 90 2% | 92 5% | 90 2% | 87 -1% |
| Black Level * (cd/m²) | 0.47 | 0.31 34% | 0.25 47% | 0.31 34% | 0.24 49% | 0.32 32% |
| Contrast (:1) | 871 | 1119 28% | 1038 19% | 1140 31% | 1179 35% | 975 12% |
| Colorchecker dE 2000 * | 3.48 | 1.68 52% | 2.52 28% | 2.17 38% | 2.26 35% | 3.03 13% |
| Colorchecker dE 2000 max. * | 6.31 | 3.03 52% | 5.55 12% | 5.69 10% | 5.64 11% | 6.81 -8% |
| Colorchecker dE 2000 calibrated * | 0.89 | 1.08 -21% | 1.93 -117% | 1.05 -18% | 1.11 -25% | 0.71 20% |
| Greyscale dE 2000 * | 5 | 1.8 64% | 1.7 66% | 3.4 32% | 3.4 32% | 4.7 6% |
| Gamma | 2.16 102% | 2.262 97% | 2.04 108% | 2.2 100% | 2.228 99% | 2.177 101% |
| CCT | 6591 99% | 6592 99% | 6414 101% | 6830 95% | 7249 90% | 6676 97% |
| Color Space (Percent of AdobeRGB 1998) (%) | 71 | 63.3 | 71 | |||
| Color Space (Percent of sRGB) (%) | 94 | 98.8 | 93 | |||
| Total Average (Program / Settings) | 9% /
15% | -11% /
-6% | 10% /
11% | -4% /
3% | -7% /
-2% |
* ... smaller is better
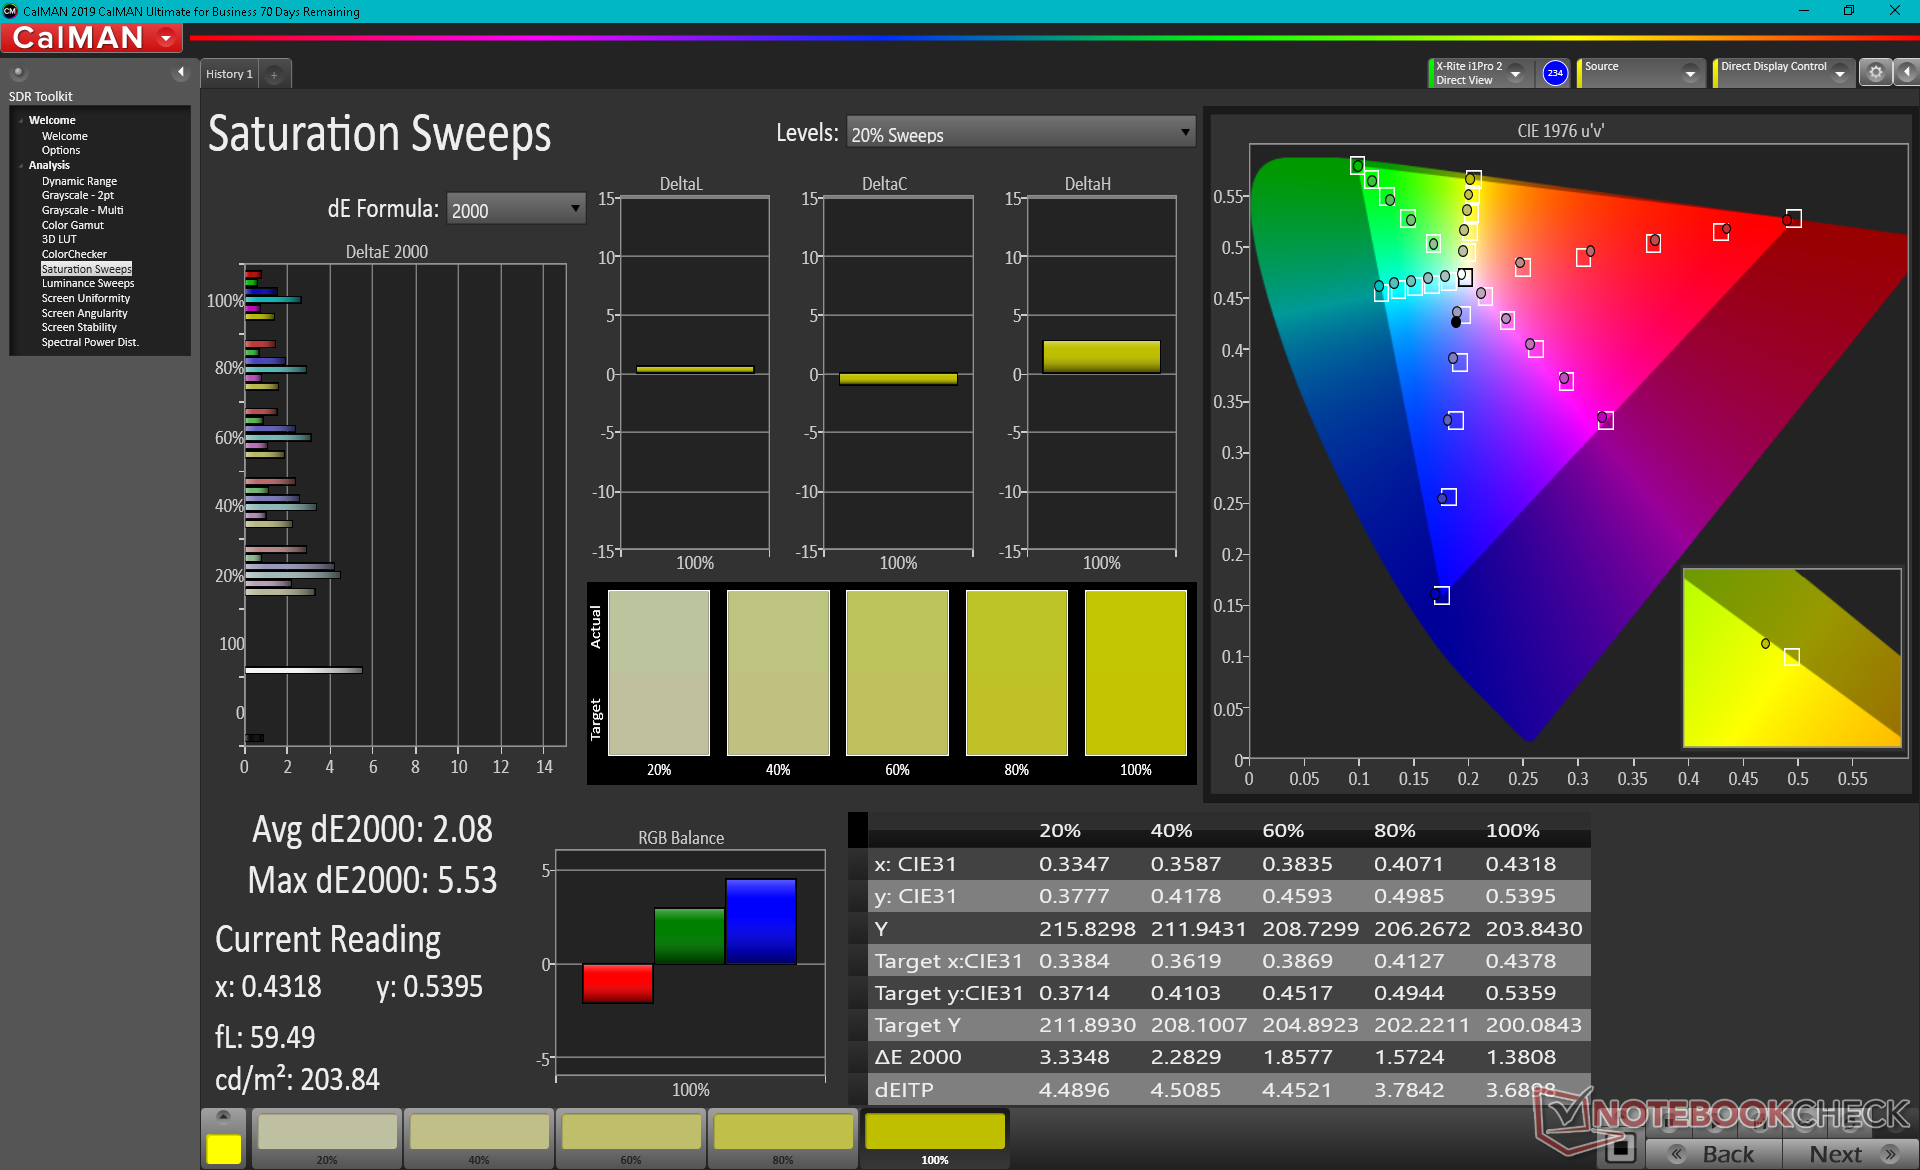
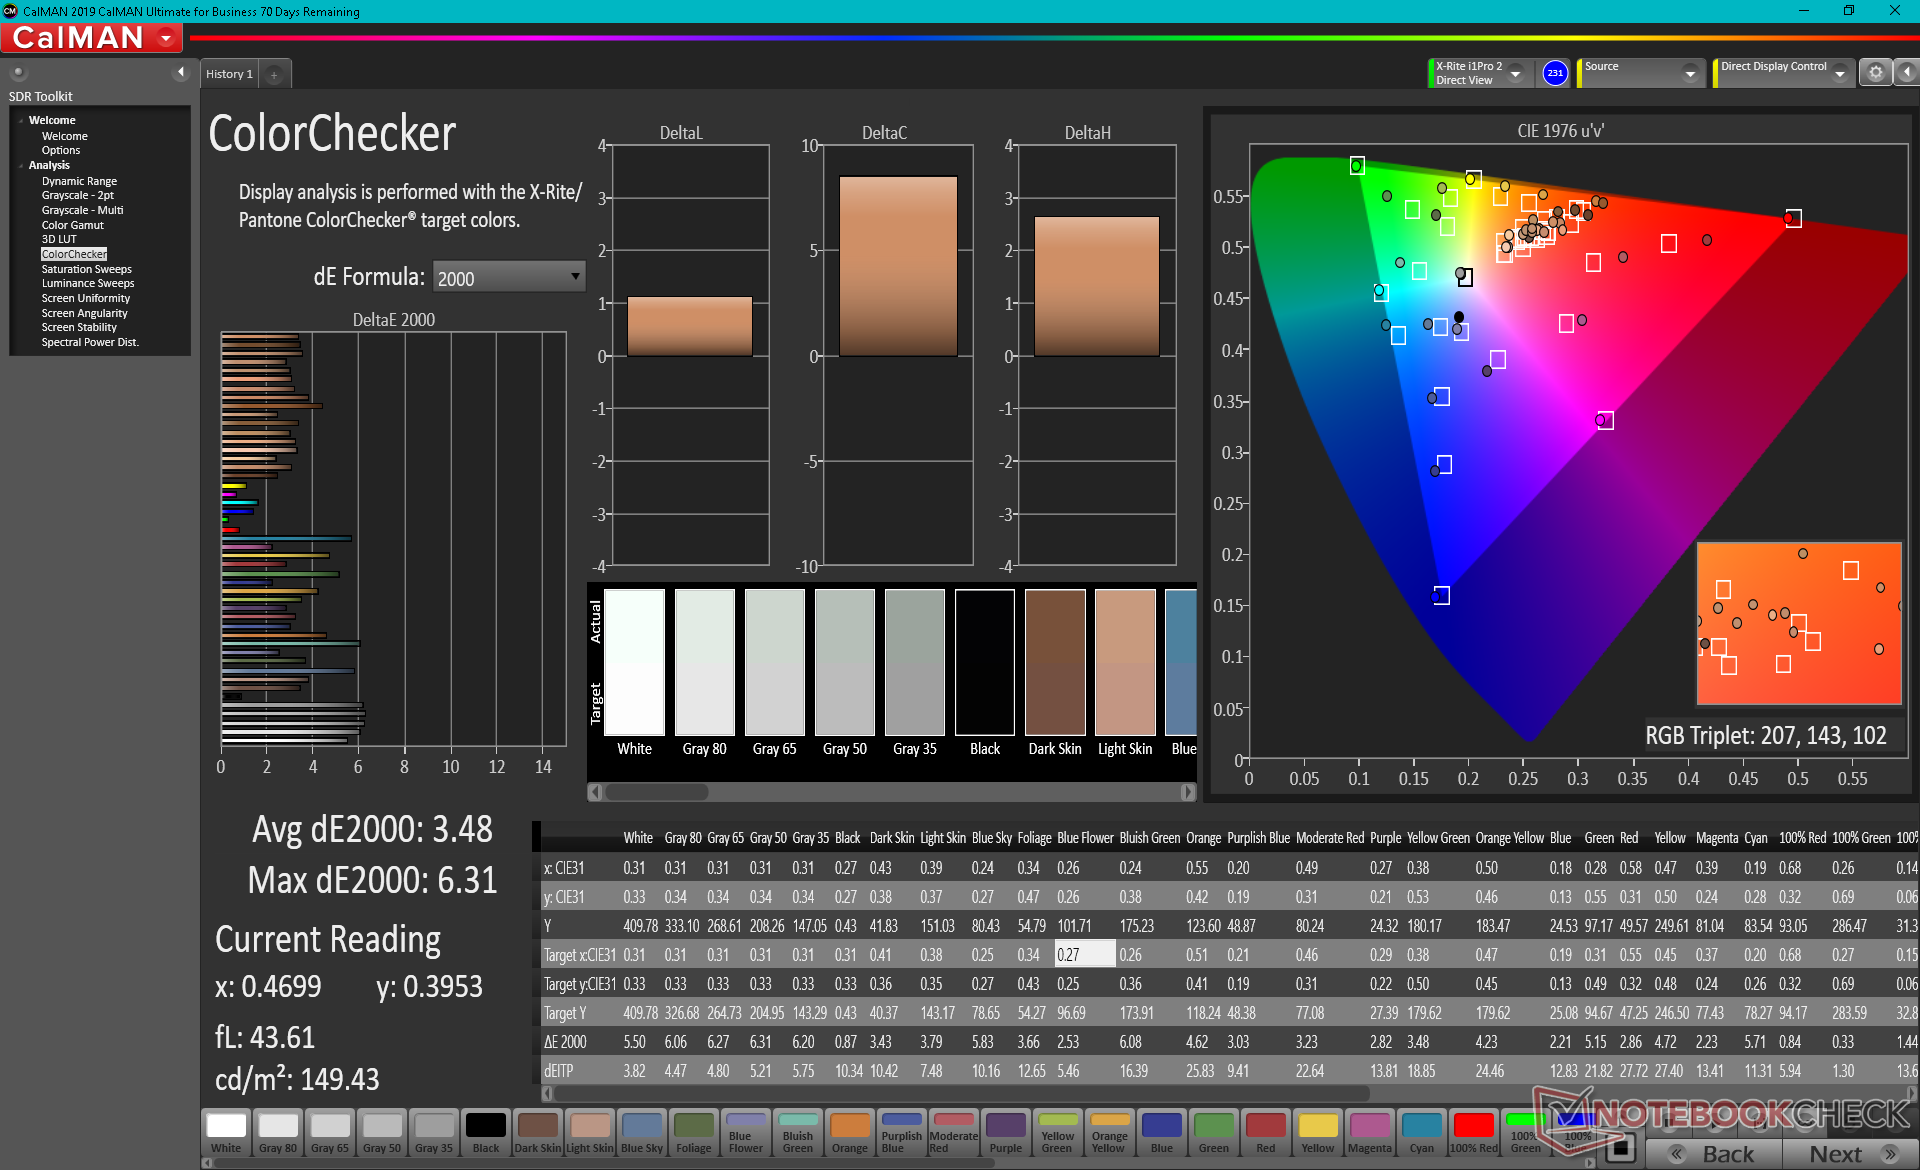
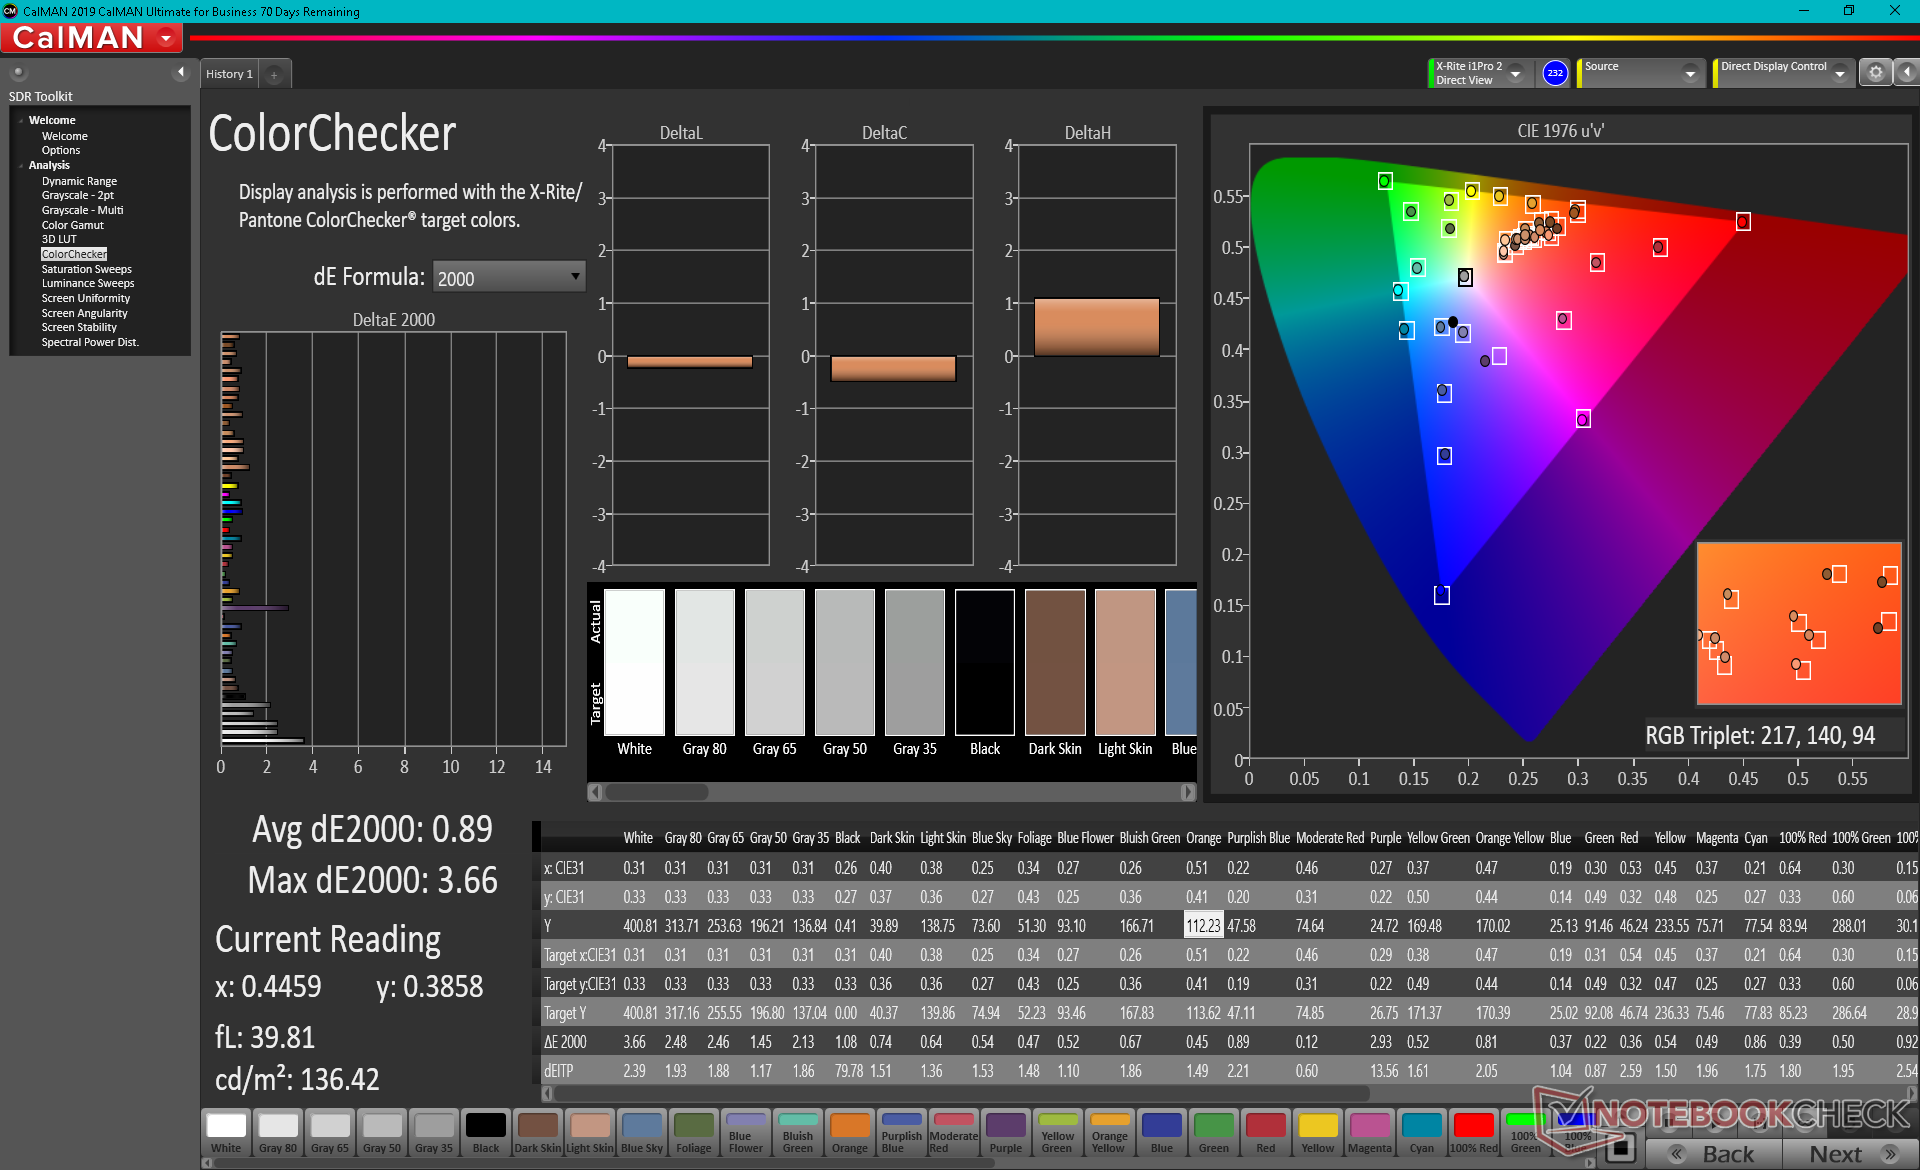
戴尔宣传的DCI-P3覆盖率为99%,我们可以通过自己的独立测量来确认。因此,这块8位面板以其深邃的色彩和快速的响应时间适用于游戏和大多数图形编辑。
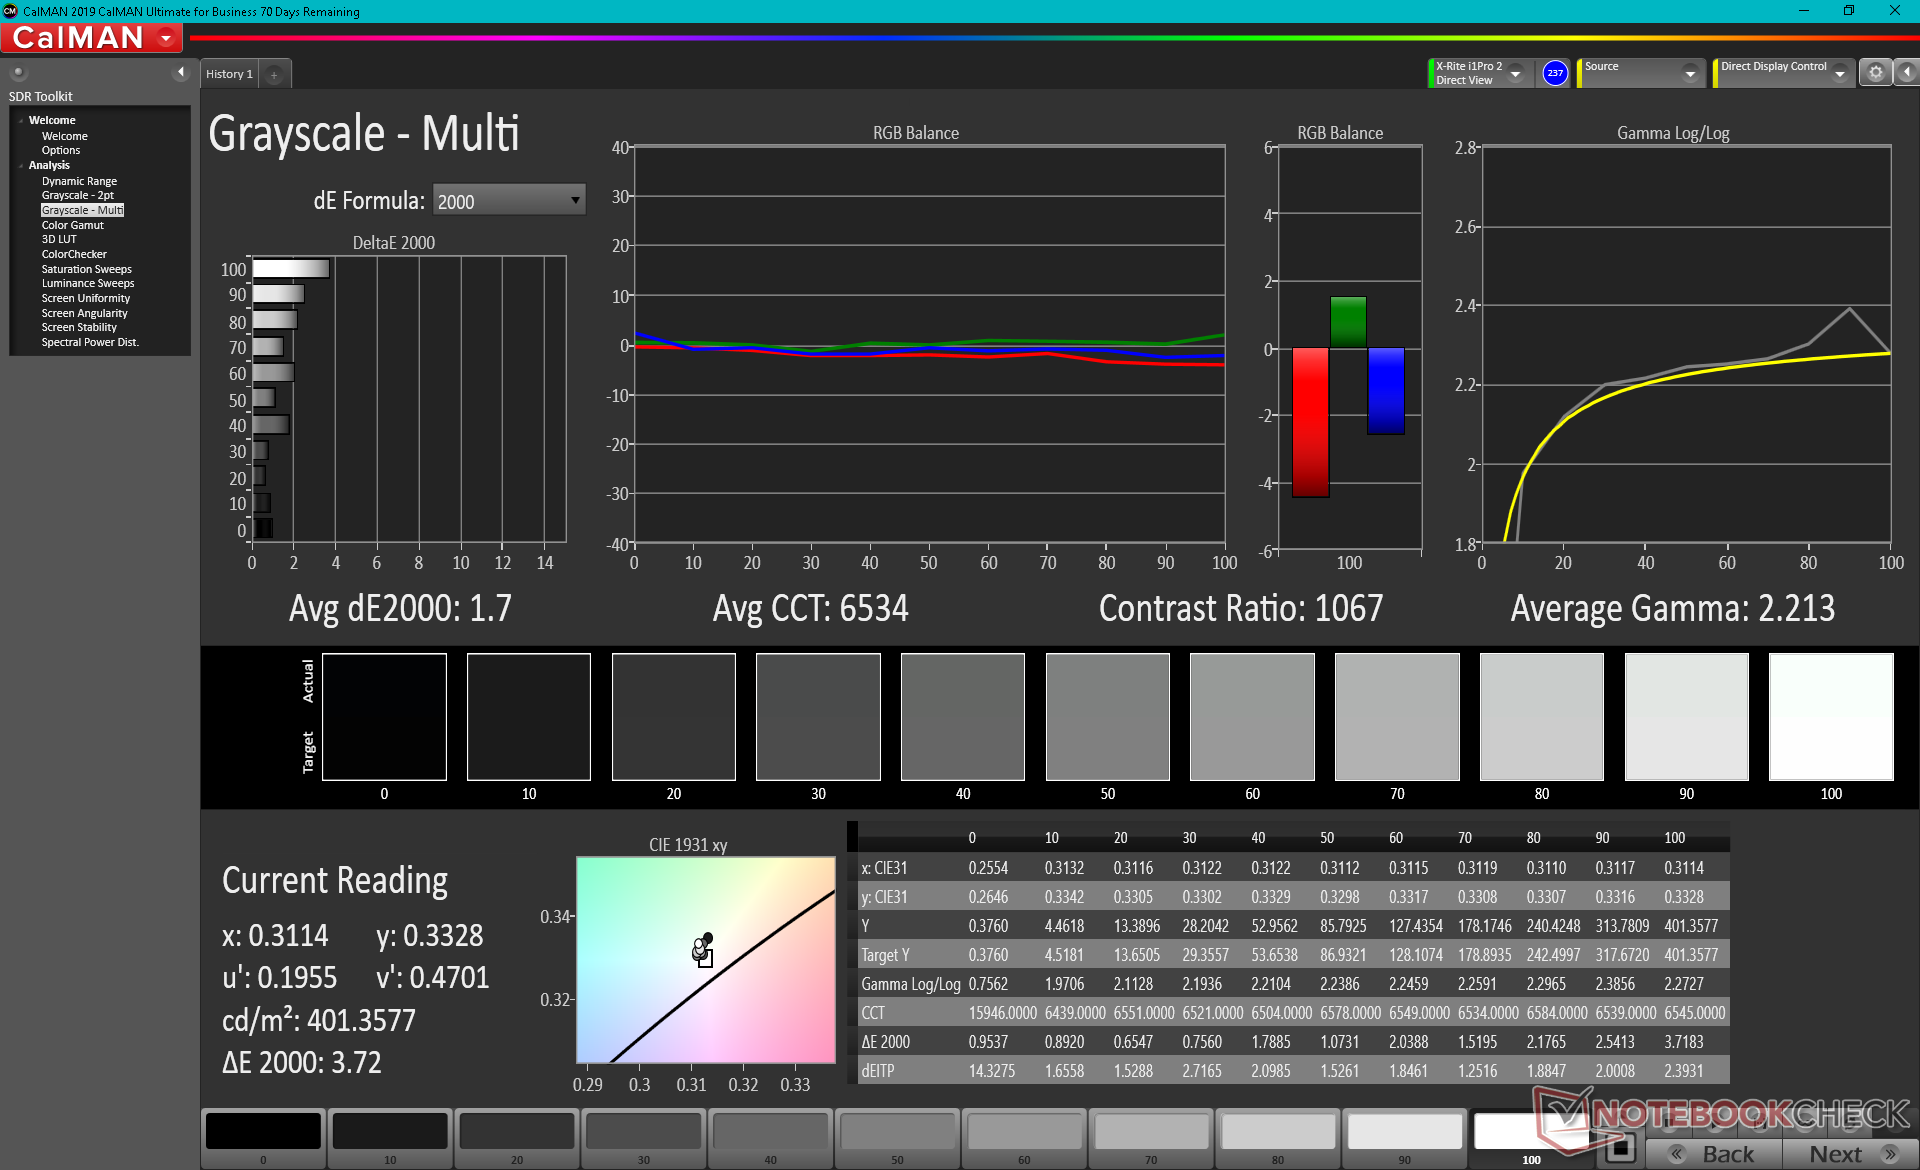
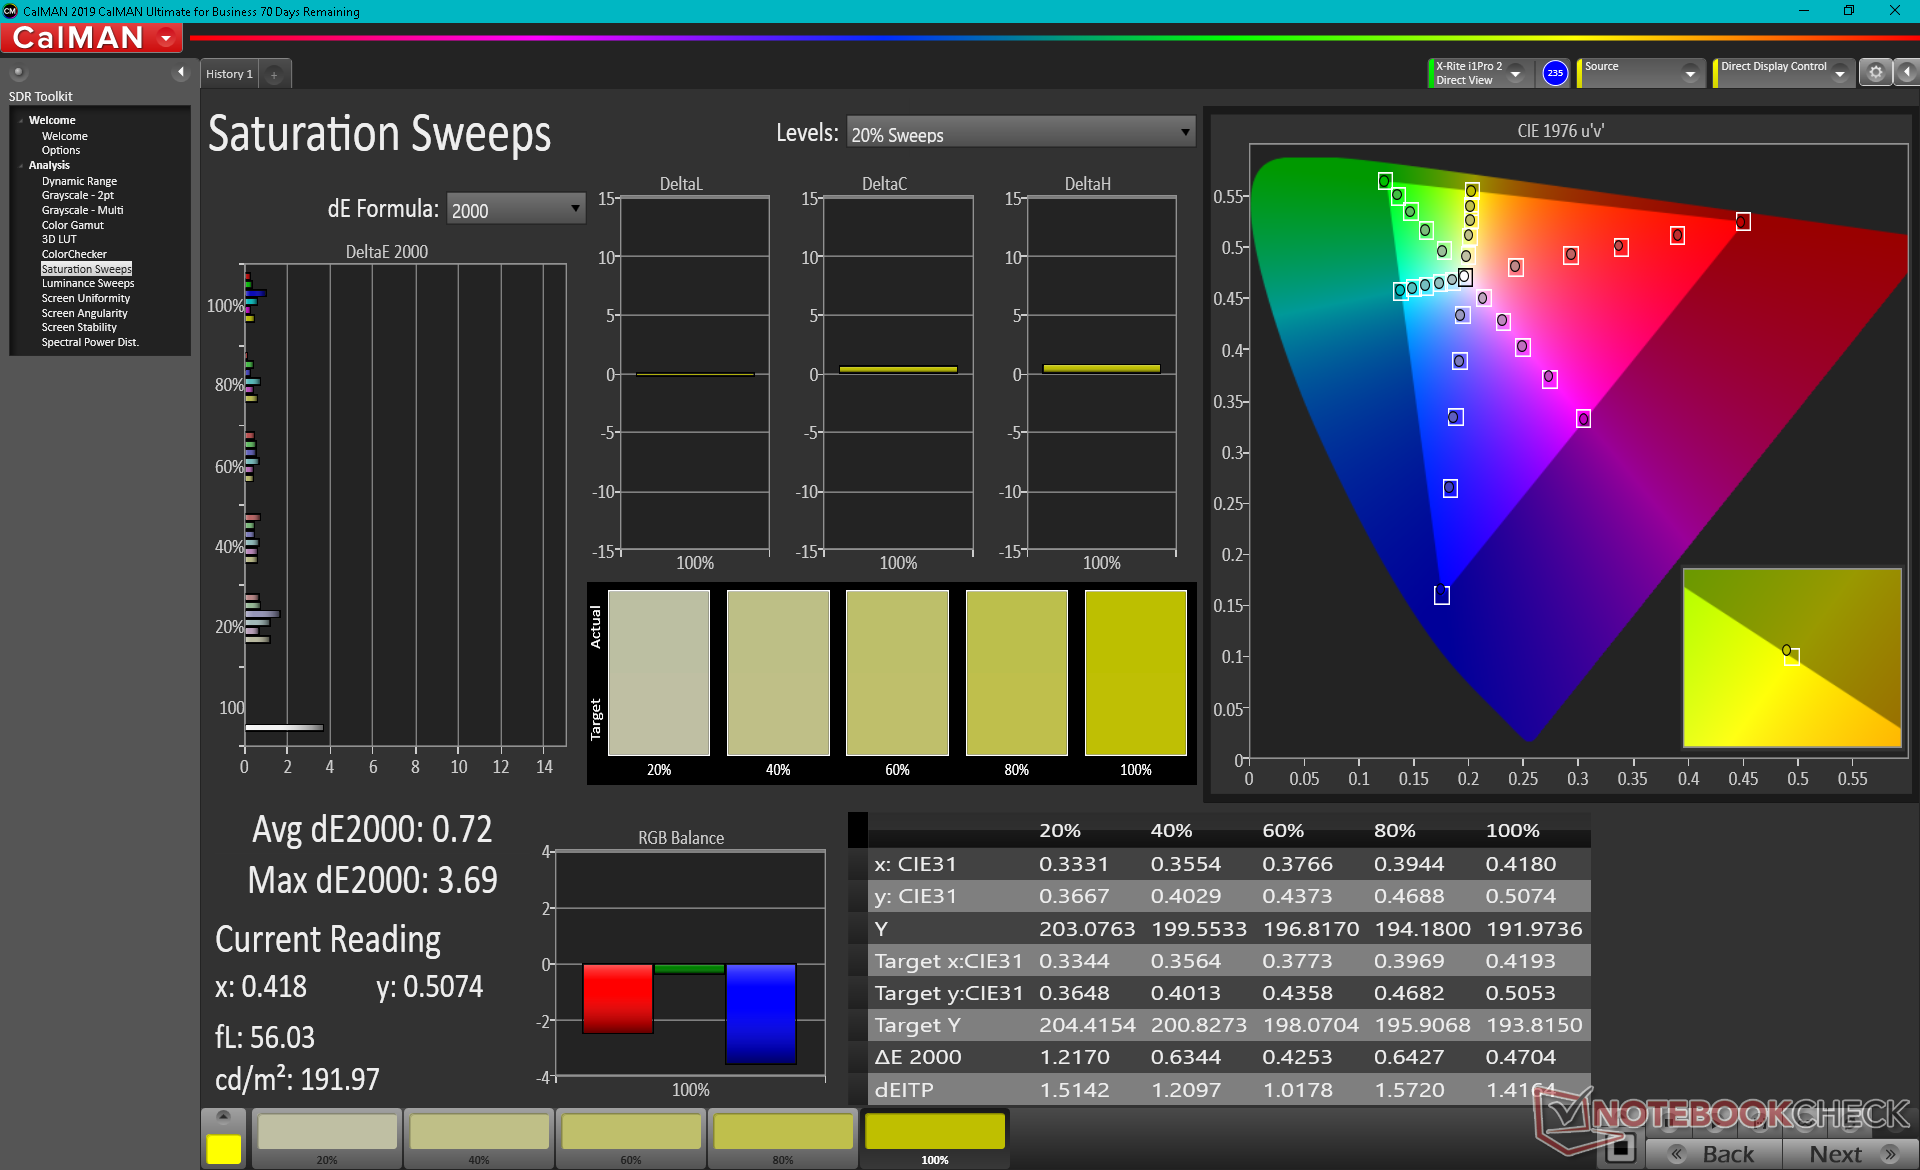
该显示器在开箱时就被校准得很好,平均灰度和色彩deltaE值分别为5和3.48。由于上述广泛的色彩覆盖,额外的校准工作可以使这些值下降,正如我们下面的CalMan结果所示。

Display Response Times
| ↔ Response Time Black to White | ||
|---|---|---|
| 10.4 ms ... rise ↗ and fall ↘ combined | ↗ 6 ms rise | 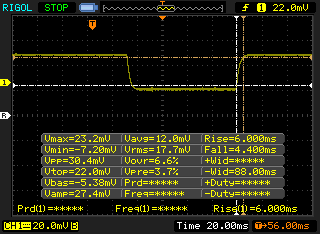 |
| ↘ 4.4 ms fall | ||
| The screen shows good response rates in our tests, but may be too slow for competitive gamers. In comparison, all tested devices range from 0.1 (minimum) to 240 (maximum) ms. » 28 % of all devices are better. This means that the measured response time is better than the average of all tested devices (19.8 ms). | ||
| ↔ Response Time 50% Grey to 80% Grey | ||
| 12 ms ... rise ↗ and fall ↘ combined | ↗ 6 ms rise | 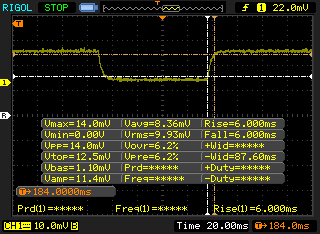 |
| ↘ 6 ms fall | ||
| The screen shows good response rates in our tests, but may be too slow for competitive gamers. In comparison, all tested devices range from 0.165 (minimum) to 636 (maximum) ms. » 25 % of all devices are better. This means that the measured response time is better than the average of all tested devices (31 ms). | ||
Screen Flickering / PWM (Pulse-Width Modulation)
| Screen flickering / PWM not detected | 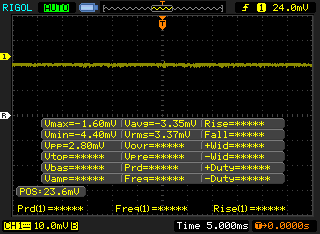 | ||
In comparison: 52 % of all tested devices do not use PWM to dim the display. If PWM was detected, an average of 7763 (minimum: 5 - maximum: 343500) Hz was measured. | |||
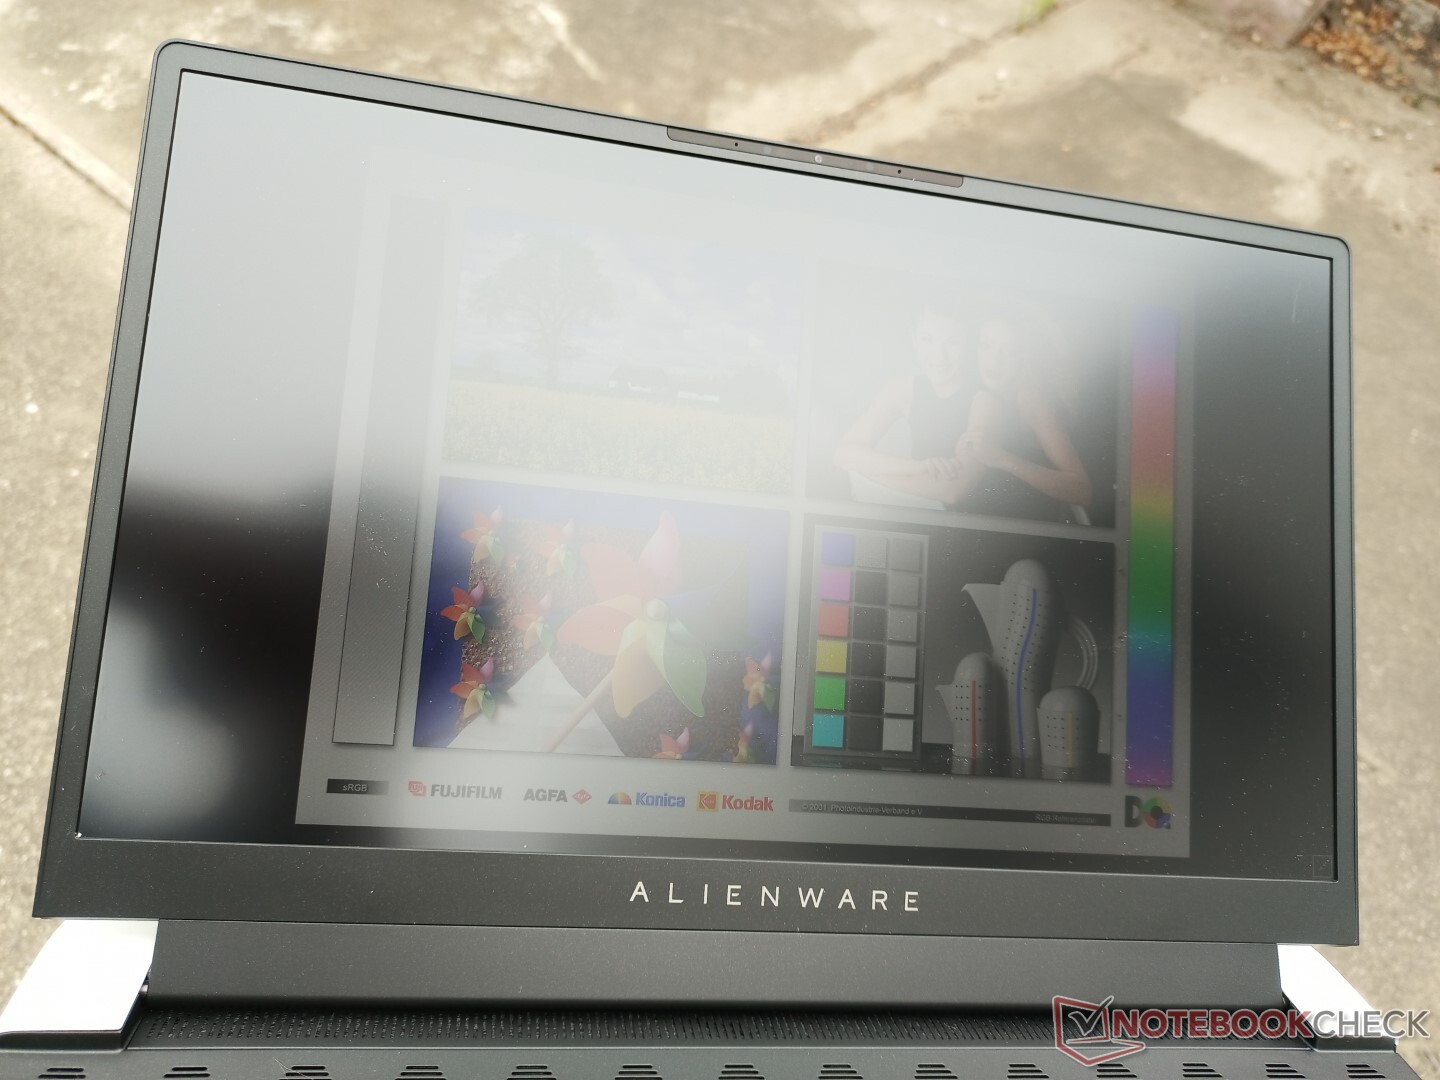
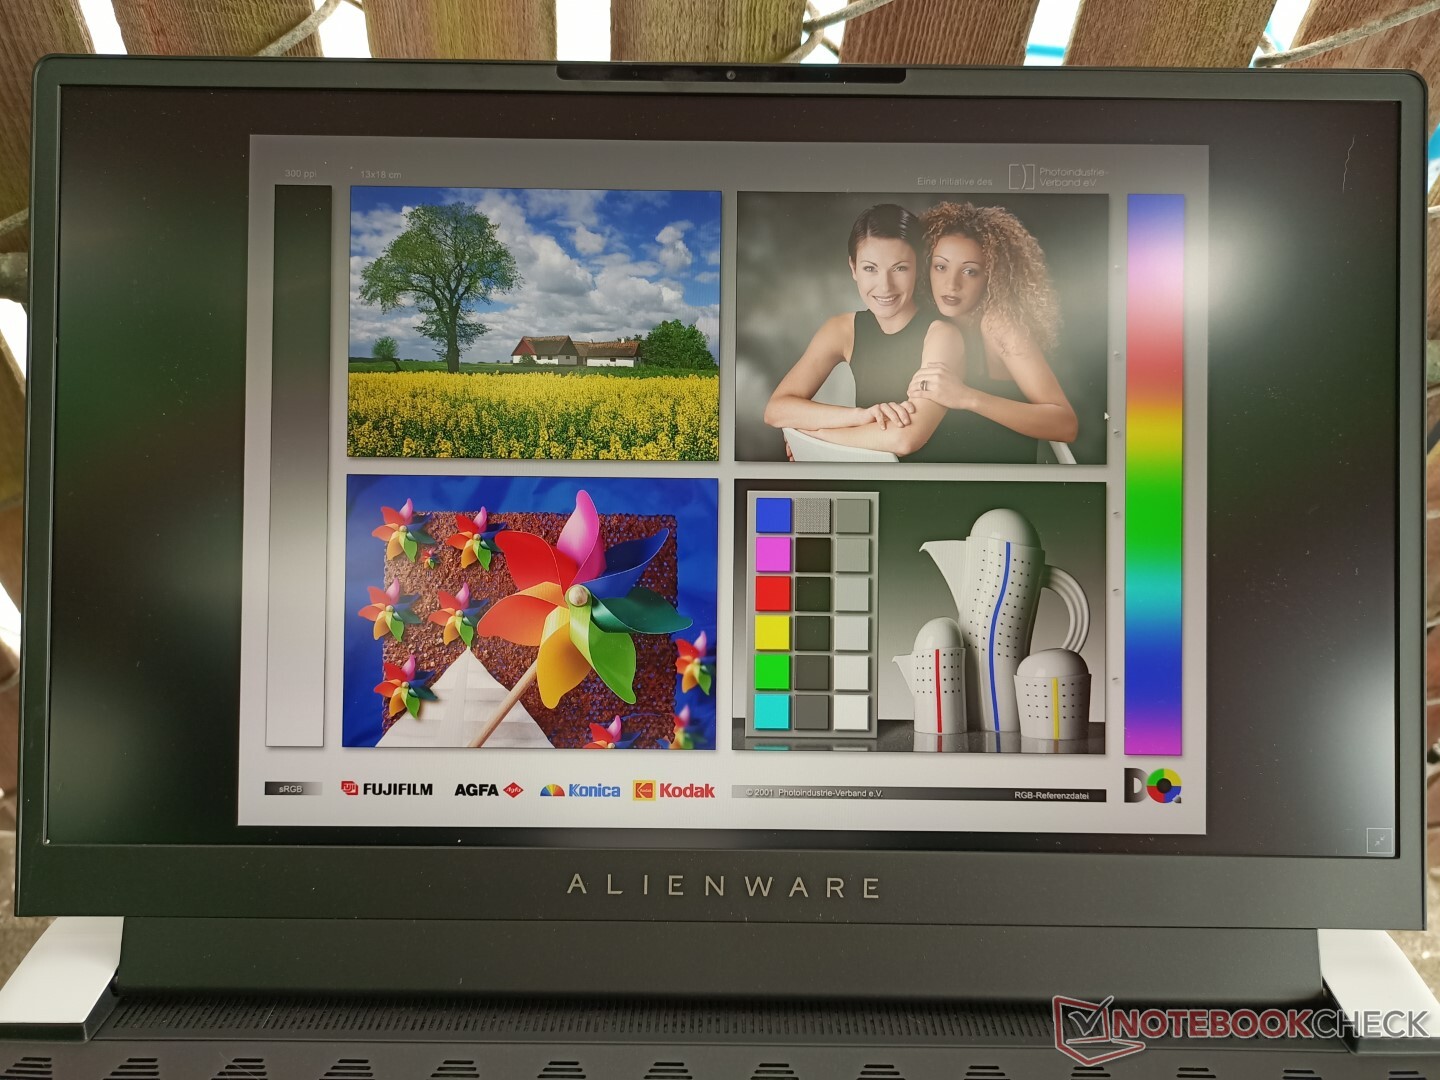
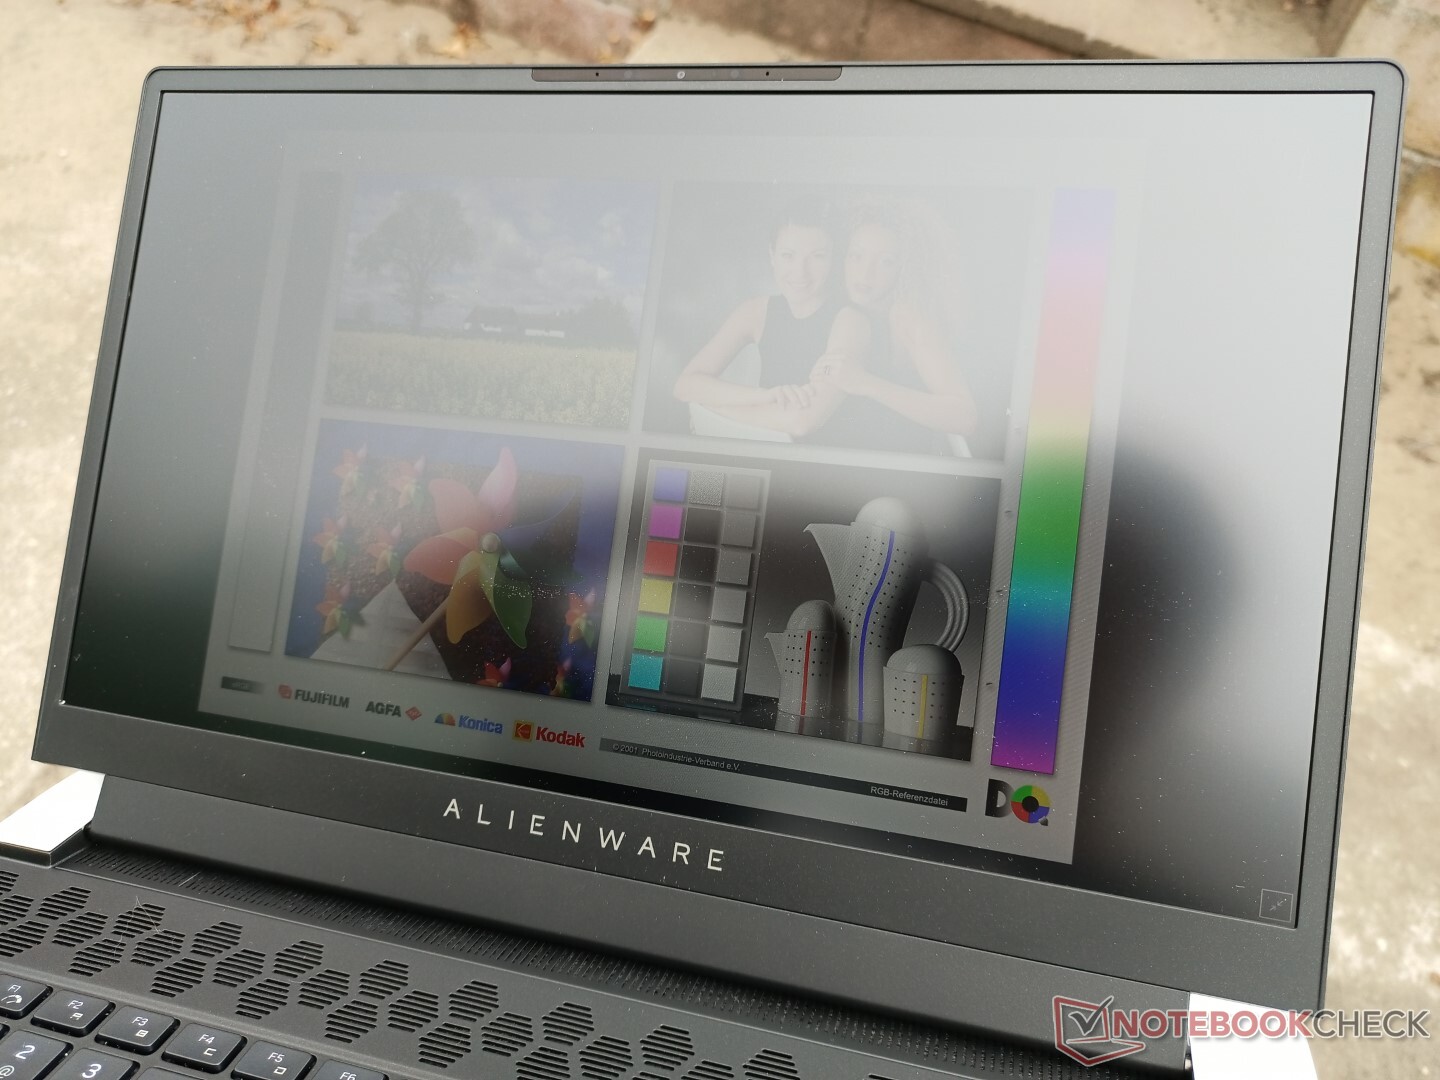
室外能见度比许多其他游戏笔记本电脑要好,这仅仅是因为与该类别的平均300尼特相比,400尼特的背光更亮。在阴影下,显示屏是可用的,就像在 戴尔XPS 15但用户仍应尽可能避免阳光直射。
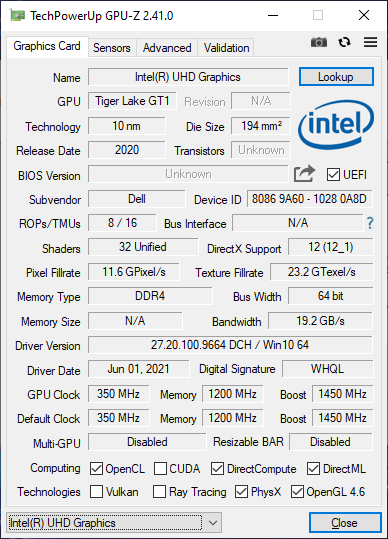
性能 - GPU TGP被轻微降级
用户可以选择第11代Tiger Lake Core i7-11800H或Core i9-11900H,搭配GeForce RTX 3060、RTX 3070或RTX 3080安培显卡,分别针对90 W、110 W或110 W TGP。这实际上是对去年的 外星人m15 R4 的GPU可以达到140 W TGP。尽管 "Max-Q "不再是名称的一部分,但就所有意图和目的而言,它是一个Max-Q GPU。
Dynamic Boost 2.0、WhisperMode 2.0和Advanced Optimus与G-Sync都是支持的。事实上,Alienware x15是极少数拥有高级优化功能的游戏笔记本电脑之一。请记住,该功能仅适用于240 Hz QHD和360 Hz FHD SKU。用户还应该安装 最新的1.3.0 BIOS 补丁,只允许在独立GPU模式下运行。
在运行以下基准测试之前,我们的测试设备通过Alienware指挥中心软件被设置为高性能模式,以获得尽可能高的分数。
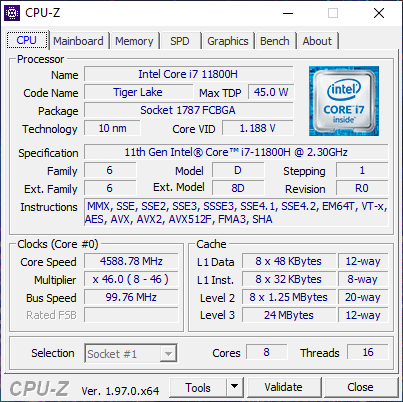
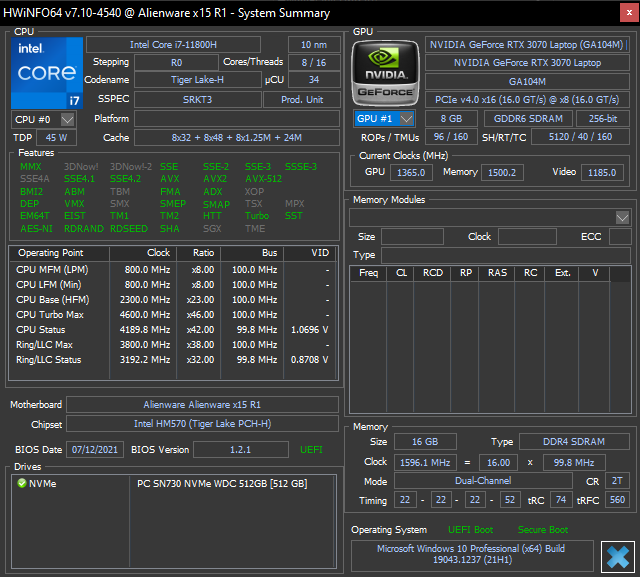
处理器 - 比预期的要快
原始的CPU性能非常好,多线程结果比我们数据库中配备相同酷睿i7-11800H的平均笔记本电脑快15%。 同样的Core i7-11800HCPU,包括Razer Blade 15。这使我们的系统与竞争性的 Ryzen 9 5900HX它通常比i7-11800H更快。性能的可持续性也很好,正如我们下面稳定的CineBench R15 xT结果所示。
升级到 酷睿i9-11900H根据我们在其他笔记本电脑上使用该处理器的经验,升级到酷睿i9-11900H预计只会比我们的i7-11800H带来非常微弱的性能优势,如 华硕Zephyrus S17.
Cinebench R15 Multi Loop
Cinebench R23: Multi Core | Single Core
Cinebench R15: CPU Multi 64Bit | CPU Single 64Bit
Blender: v2.79 BMW27 CPU
7-Zip 18.03: 7z b 4 -mmt1 | 7z b 4
Geekbench 5.5: Single-Core | Multi-Core
HWBOT x265 Benchmark v2.2: 4k Preset
LibreOffice : 20 Documents To PDF
R Benchmark 2.5: Overall mean
| Cinebench R20 / CPU (Multi Core) | |
| Alienware x15 RTX 3070 P111F | |
| Asus ROG Strix Scar 15 G533QS | |
| Asus ROG Zephyrus S17 GX703HSD | |
| Acer Nitro 5 AN515-45-R1JH | |
| Average Intel Core i7-11800H (2498 - 5408, n=50) | |
| Dell G5 15 SE 5505 P89F | |
| Alienware m15 R4 RTX 3080 | |
| MSI GS66 Stealth 10UG | |
| Razer Blade 15 Advanced Model Early 2021 | |
| Schenker XMG Pro 15 | |
| Cinebench R20 / CPU (Single Core) | |
| Asus ROG Zephyrus S17 GX703HSD | |
| Alienware x15 RTX 3070 P111F | |
| Average Intel Core i7-11800H (520 - 586, n=47) | |
| Asus ROG Strix Scar 15 G533QS | |
| Acer Nitro 5 AN515-45-R1JH | |
| Dell G5 15 SE 5505 P89F | |
| Alienware m15 R4 RTX 3080 | |
| Razer Blade 15 Advanced Model Early 2021 | |
| MSI GS66 Stealth 10UG | |
| Schenker XMG Pro 15 | |
| Cinebench R23 / Multi Core | |
| Alienware x15 RTX 3070 P111F | |
| Asus ROG Strix Scar 15 G533QS | |
| Asus ROG Zephyrus S17 GX703HSD | |
| Acer Nitro 5 AN515-45-R1JH | |
| Average Intel Core i7-11800H (6508 - 14088, n=48) | |
| Alienware m15 R4 RTX 3080 | |
| MSI GS66 Stealth 10UG | |
| Razer Blade 15 Advanced Model Early 2021 | |
| Cinebench R23 / Single Core | |
| Asus ROG Zephyrus S17 GX703HSD | |
| Alienware x15 RTX 3070 P111F | |
| Average Intel Core i7-11800H (1386 - 1522, n=45) | |
| Asus ROG Strix Scar 15 G533QS | |
| Acer Nitro 5 AN515-45-R1JH | |
| MSI GS66 Stealth 10UG | |
| Alienware m15 R4 RTX 3080 | |
| Razer Blade 15 Advanced Model Early 2021 | |
| Cinebench R15 / CPU Multi 64Bit | |
| Asus ROG Strix Scar 15 G533QS | |
| Asus ROG Zephyrus S17 GX703HSD | |
| Alienware x15 RTX 3070 P111F | |
| Acer Nitro 5 AN515-45-R1JH | |
| Dell G5 15 SE 5505 P89F | |
| Average Intel Core i7-11800H (1342 - 2173, n=50) | |
| Alienware m15 R4 RTX 3080 | |
| MSI GS66 Stealth 10UG | |
| Razer Blade 15 Advanced Model Early 2021 | |
| Schenker XMG Pro 15 | |
| Cinebench R15 / CPU Single 64Bit | |
| Asus ROG Zephyrus S17 GX703HSD | |
| Asus ROG Strix Scar 15 G533QS | |
| Acer Nitro 5 AN515-45-R1JH | |
| Alienware x15 RTX 3070 P111F | |
| Average Intel Core i7-11800H (201 - 231, n=46) | |
| MSI GS66 Stealth 10UG | |
| Razer Blade 15 Advanced Model Early 2021 | |
| Alienware m15 R4 RTX 3080 | |
| Dell G5 15 SE 5505 P89F | |
| Schenker XMG Pro 15 | |
| Blender / v2.79 BMW27 CPU | |
| Schenker XMG Pro 15 | |
| Razer Blade 15 Advanced Model Early 2021 | |
| MSI GS66 Stealth 10UG | |
| Alienware m15 R4 RTX 3080 | |
| Average Intel Core i7-11800H (217 - 454, n=46) | |
| Dell G5 15 SE 5505 P89F | |
| Acer Nitro 5 AN515-45-R1JH | |
| Asus ROG Strix Scar 15 G533QS | |
| Asus ROG Zephyrus S17 GX703HSD | |
| Alienware x15 RTX 3070 P111F | |
| 7-Zip 18.03 / 7z b 4 -mmt1 | |
| Asus ROG Zephyrus S17 GX703HSD | |
| Asus ROG Strix Scar 15 G533QS | |
| Acer Nitro 5 AN515-45-R1JH | |
| Average Intel Core i7-11800H (5138 - 5732, n=46) | |
| Alienware x15 RTX 3070 P111F | |
| Alienware m15 R4 RTX 3080 | |
| MSI GS66 Stealth 10UG | |
| Razer Blade 15 Advanced Model Early 2021 | |
| Dell G5 15 SE 5505 P89F | |
| Schenker XMG Pro 15 | |
| 7-Zip 18.03 / 7z b 4 | |
| Asus ROG Strix Scar 15 G533QS | |
| Asus ROG Zephyrus S17 GX703HSD | |
| Acer Nitro 5 AN515-45-R1JH | |
| Alienware x15 RTX 3070 P111F | |
| Dell G5 15 SE 5505 P89F | |
| Alienware m15 R4 RTX 3080 | |
| Average Intel Core i7-11800H (33718 - 56758, n=46) | |
| MSI GS66 Stealth 10UG | |
| Razer Blade 15 Advanced Model Early 2021 | |
| Schenker XMG Pro 15 | |
| Geekbench 5.5 / Single-Core | |
| Asus ROG Zephyrus S17 GX703HSD | |
| Average Intel Core i7-11800H (1429 - 1625, n=40) | |
| Acer Nitro 5 AN515-45-R1JH | |
| Alienware m15 R4 RTX 3080 | |
| Razer Blade 15 Advanced Model Early 2021 | |
| MSI GS66 Stealth 10UG | |
| Dell G5 15 SE 5505 P89F | |
| Schenker XMG Pro 15 | |
| Geekbench 5.5 / Multi-Core | |
| Asus ROG Zephyrus S17 GX703HSD | |
| Average Intel Core i7-11800H (4655 - 9851, n=40) | |
| Alienware m15 R4 RTX 3080 | |
| Dell G5 15 SE 5505 P89F | |
| MSI GS66 Stealth 10UG | |
| Acer Nitro 5 AN515-45-R1JH | |
| Razer Blade 15 Advanced Model Early 2021 | |
| Schenker XMG Pro 15 | |
| HWBOT x265 Benchmark v2.2 / 4k Preset | |
| Asus ROG Zephyrus S17 GX703HSD | |
| Alienware x15 RTX 3070 P111F | |
| Asus ROG Strix Scar 15 G533QS | |
| Acer Nitro 5 AN515-45-R1JH | |
| Average Intel Core i7-11800H (7.38 - 17.4, n=46) | |
| Alienware m15 R4 RTX 3080 | |
| Dell G5 15 SE 5505 P89F | |
| MSI GS66 Stealth 10UG | |
| Razer Blade 15 Advanced Model Early 2021 | |
| Schenker XMG Pro 15 | |
| LibreOffice / 20 Documents To PDF | |
| Alienware m15 R4 RTX 3080 | |
| Acer Nitro 5 AN515-45-R1JH | |
| Dell G5 15 SE 5505 P89F | |
| Razer Blade 15 Advanced Model Early 2021 | |
| Asus ROG Strix Scar 15 G533QS | |
| Alienware x15 RTX 3070 P111F | |
| MSI GS66 Stealth 10UG | |
| Average Intel Core i7-11800H (38.6 - 59.9, n=45) | |
| Asus ROG Zephyrus S17 GX703HSD | |
| R Benchmark 2.5 / Overall mean | |
| Schenker XMG Pro 15 | |
| MSI GS66 Stealth 10UG | |
| Alienware m15 R4 RTX 3080 | |
| Razer Blade 15 Advanced Model Early 2021 | |
| Dell G5 15 SE 5505 P89F | |
| Alienware x15 RTX 3070 P111F | |
| Average Intel Core i7-11800H (0.548 - 0.615, n=46) | |
| Asus ROG Zephyrus S17 GX703HSD | |
| Acer Nitro 5 AN515-45-R1JH | |
| Asus ROG Strix Scar 15 G533QS | |
* ... smaller is better
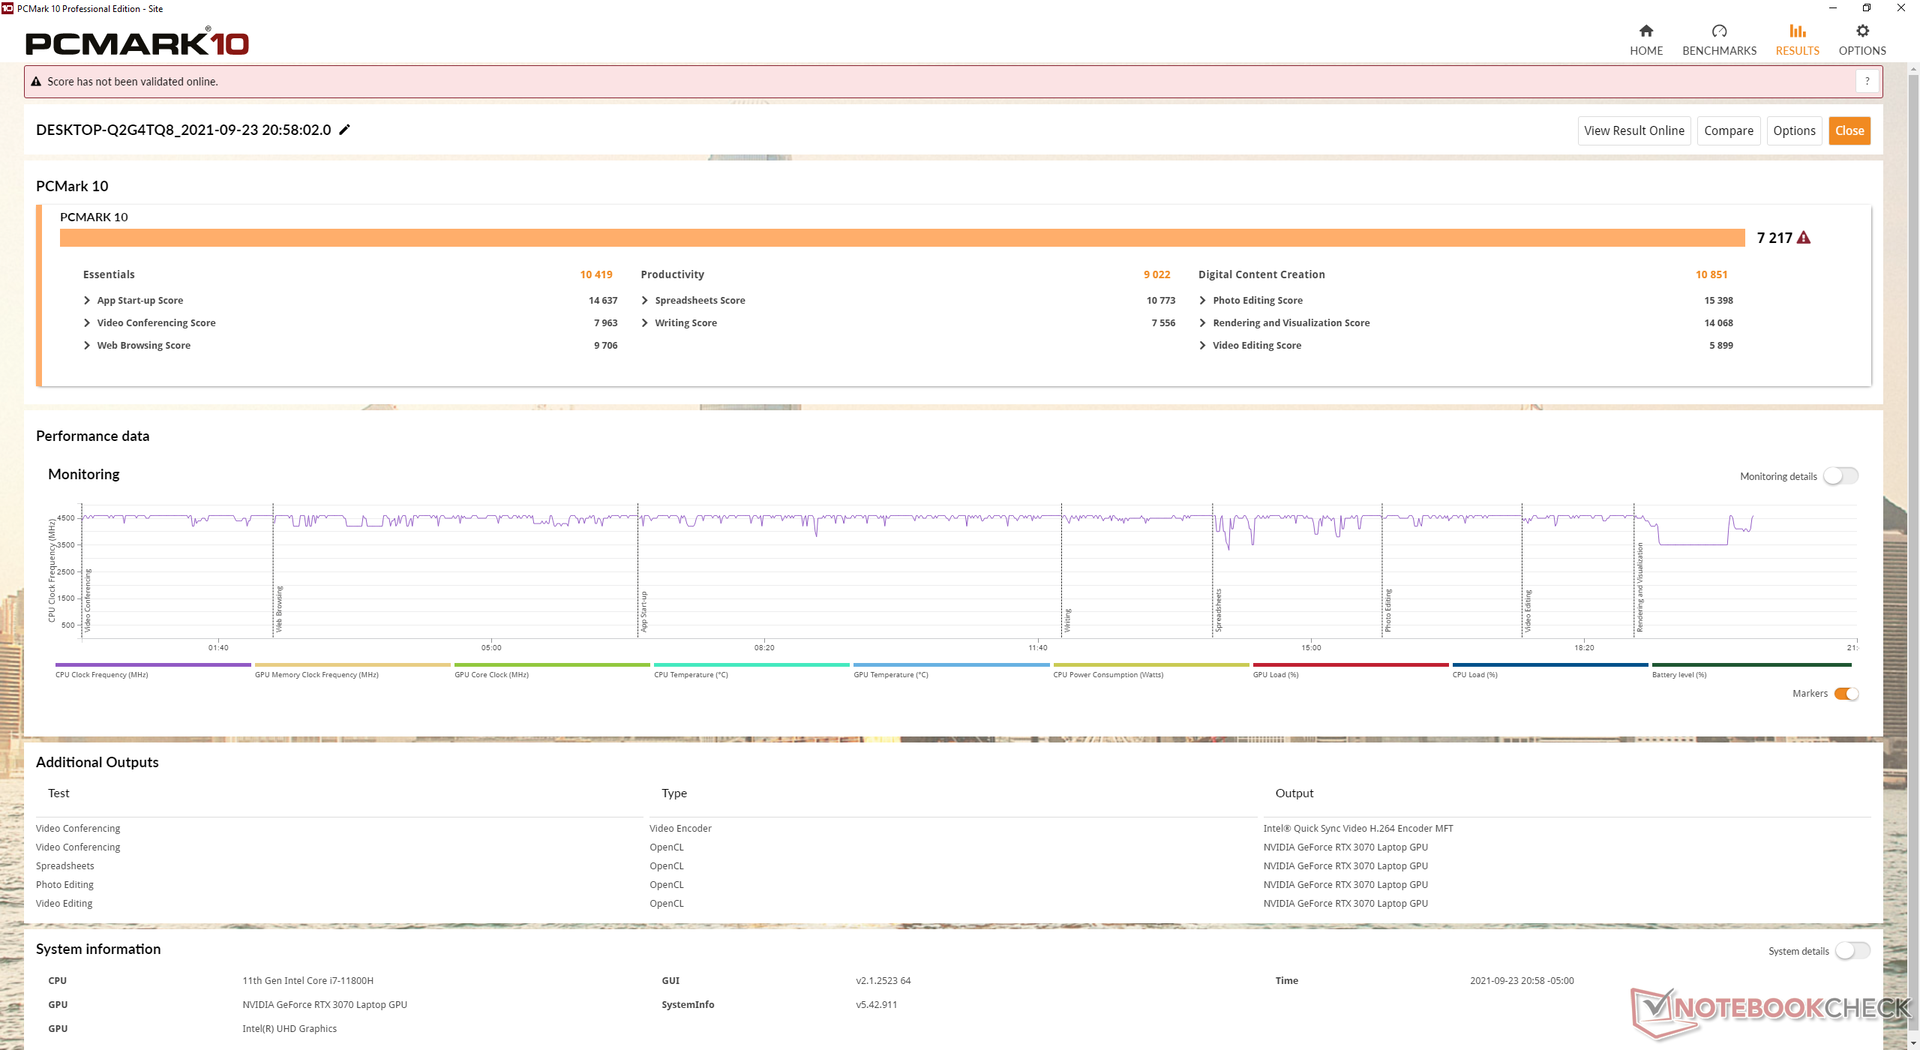
系统性能
PCMark 10的成绩非常好,除了生产力类别外,一直领先于去年的Alienware m15 R4,因为我们的m15 R4配备了更快的RAID 0驱动器。
我们的测试设备遇到了一个问题,在通过Alienware命令中心软件改变热配置文件时,屏幕会突然变黑,因此需要硬重启。虽然我们无法可靠地重复这个问题,但还是值得一提,特别是由于我们的 x17测试单元上周没有这样的问题。
| PCMark 10 / Score | |
| Razer Blade 15 Advanced (Mid 2021) | |
| Alienware x15 RTX 3070 P111F | |
| Alienware m15 R4 RTX 3080 | |
| Average Intel Core i7-11800H, NVIDIA GeForce RTX 3070 Laptop GPU (6126 - 7311, n=11) | |
| MSI GS66 Stealth 10UG | |
| Acer Predator Helios 300 PH315-53-786B | |
| Asus Zephyrus S15 GX502L | |
| PCMark 10 / Essentials | |
| Razer Blade 15 Advanced (Mid 2021) | |
| Alienware x15 RTX 3070 P111F | |
| Average Intel Core i7-11800H, NVIDIA GeForce RTX 3070 Laptop GPU (9248 - 10832, n=11) | |
| Alienware m15 R4 RTX 3080 | |
| Asus Zephyrus S15 GX502L | |
| MSI GS66 Stealth 10UG | |
| Acer Predator Helios 300 PH315-53-786B | |
| PCMark 10 / Productivity | |
| Alienware m15 R4 RTX 3080 | |
| Average Intel Core i7-11800H, NVIDIA GeForce RTX 3070 Laptop GPU (8571 - 9669, n=11) | |
| Alienware x15 RTX 3070 P111F | |
| Razer Blade 15 Advanced (Mid 2021) | |
| Asus Zephyrus S15 GX502L | |
| Acer Predator Helios 300 PH315-53-786B | |
| MSI GS66 Stealth 10UG | |
| PCMark 10 / Digital Content Creation | |
| Alienware x15 RTX 3070 P111F | |
| Razer Blade 15 Advanced (Mid 2021) | |
| Alienware m15 R4 RTX 3080 | |
| Average Intel Core i7-11800H, NVIDIA GeForce RTX 3070 Laptop GPU (7627 - 10851, n=11) | |
| MSI GS66 Stealth 10UG | |
| Acer Predator Helios 300 PH315-53-786B | |
| Asus Zephyrus S15 GX502L | |
| PCMark 10 Score | 7217 points | |
Help | ||
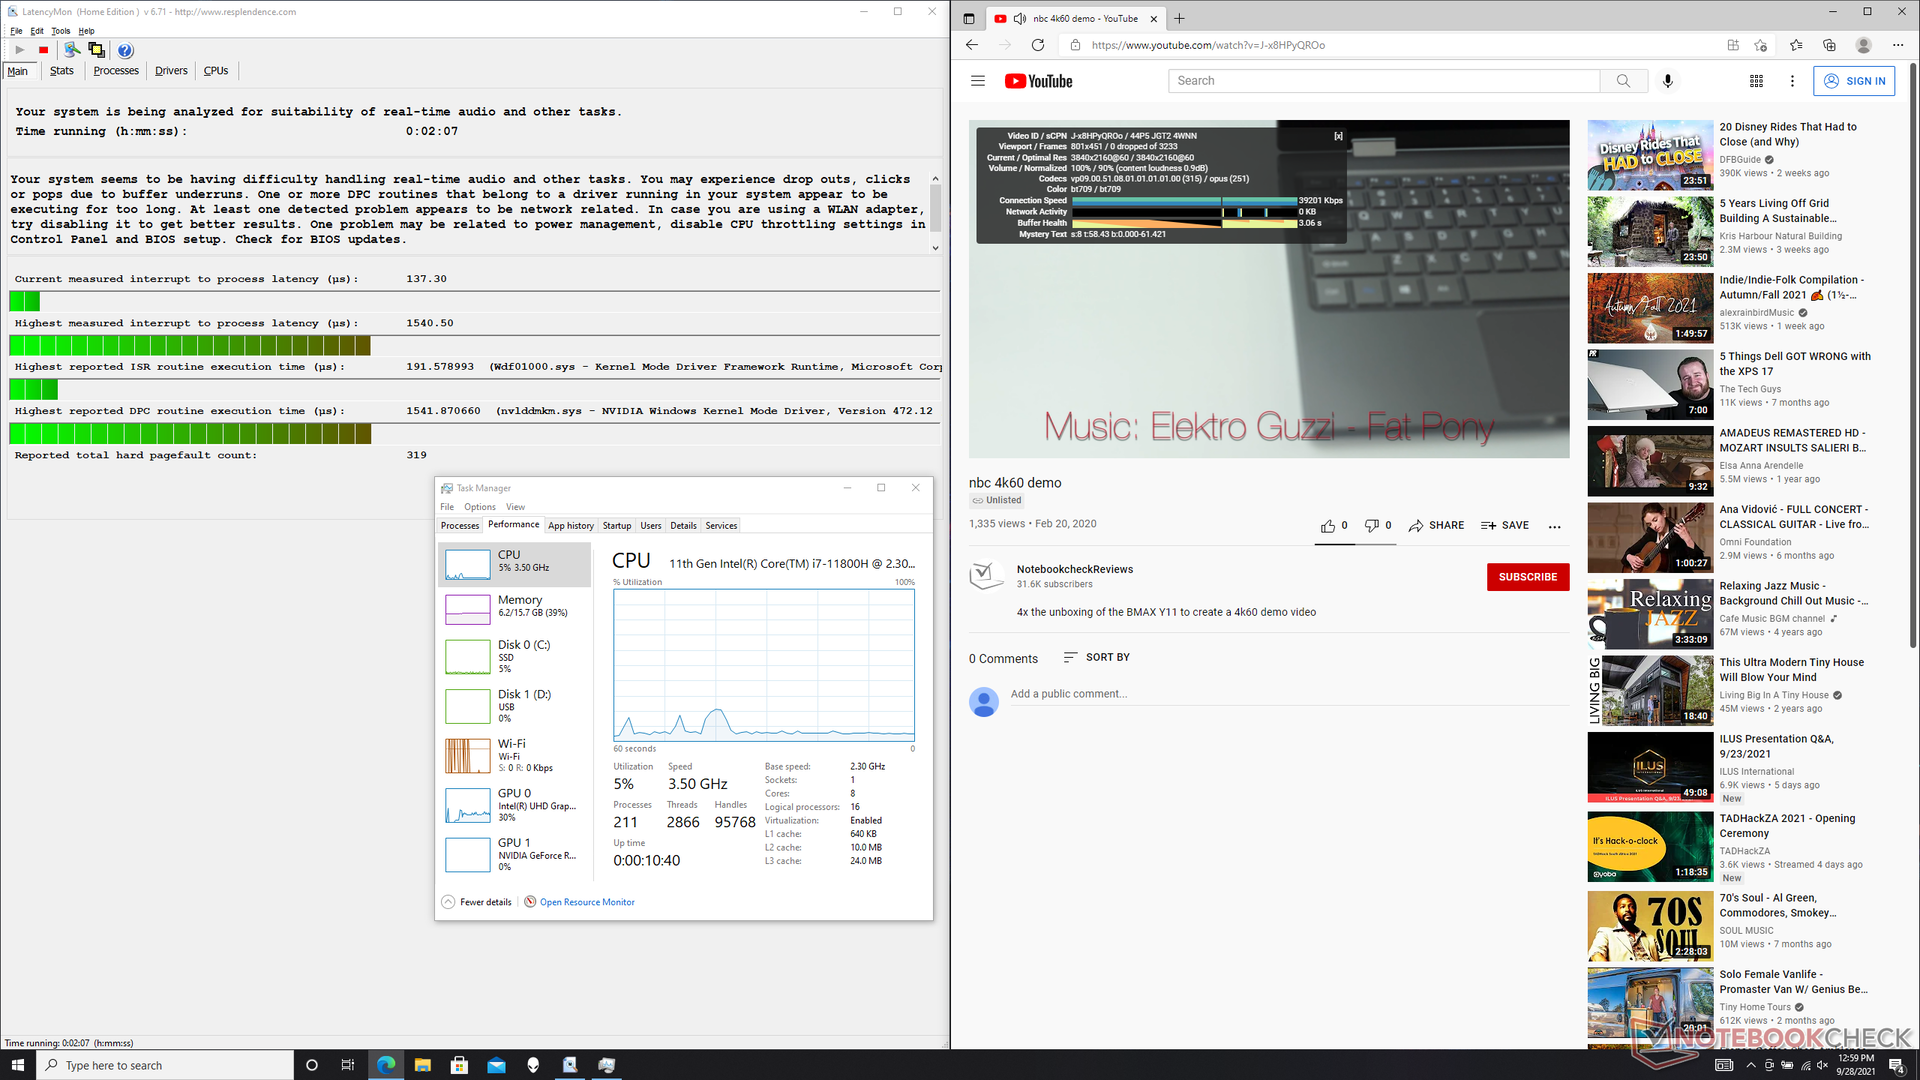
DPC延时
LatencyMon显示,在我们的主页上打开多个浏览器标签和运行Prime95给CPU施加压力时,存在轻微的DPC延迟问题。在iGPU模式下,以60 FPS播放4K视频是完美的,没有丢帧。
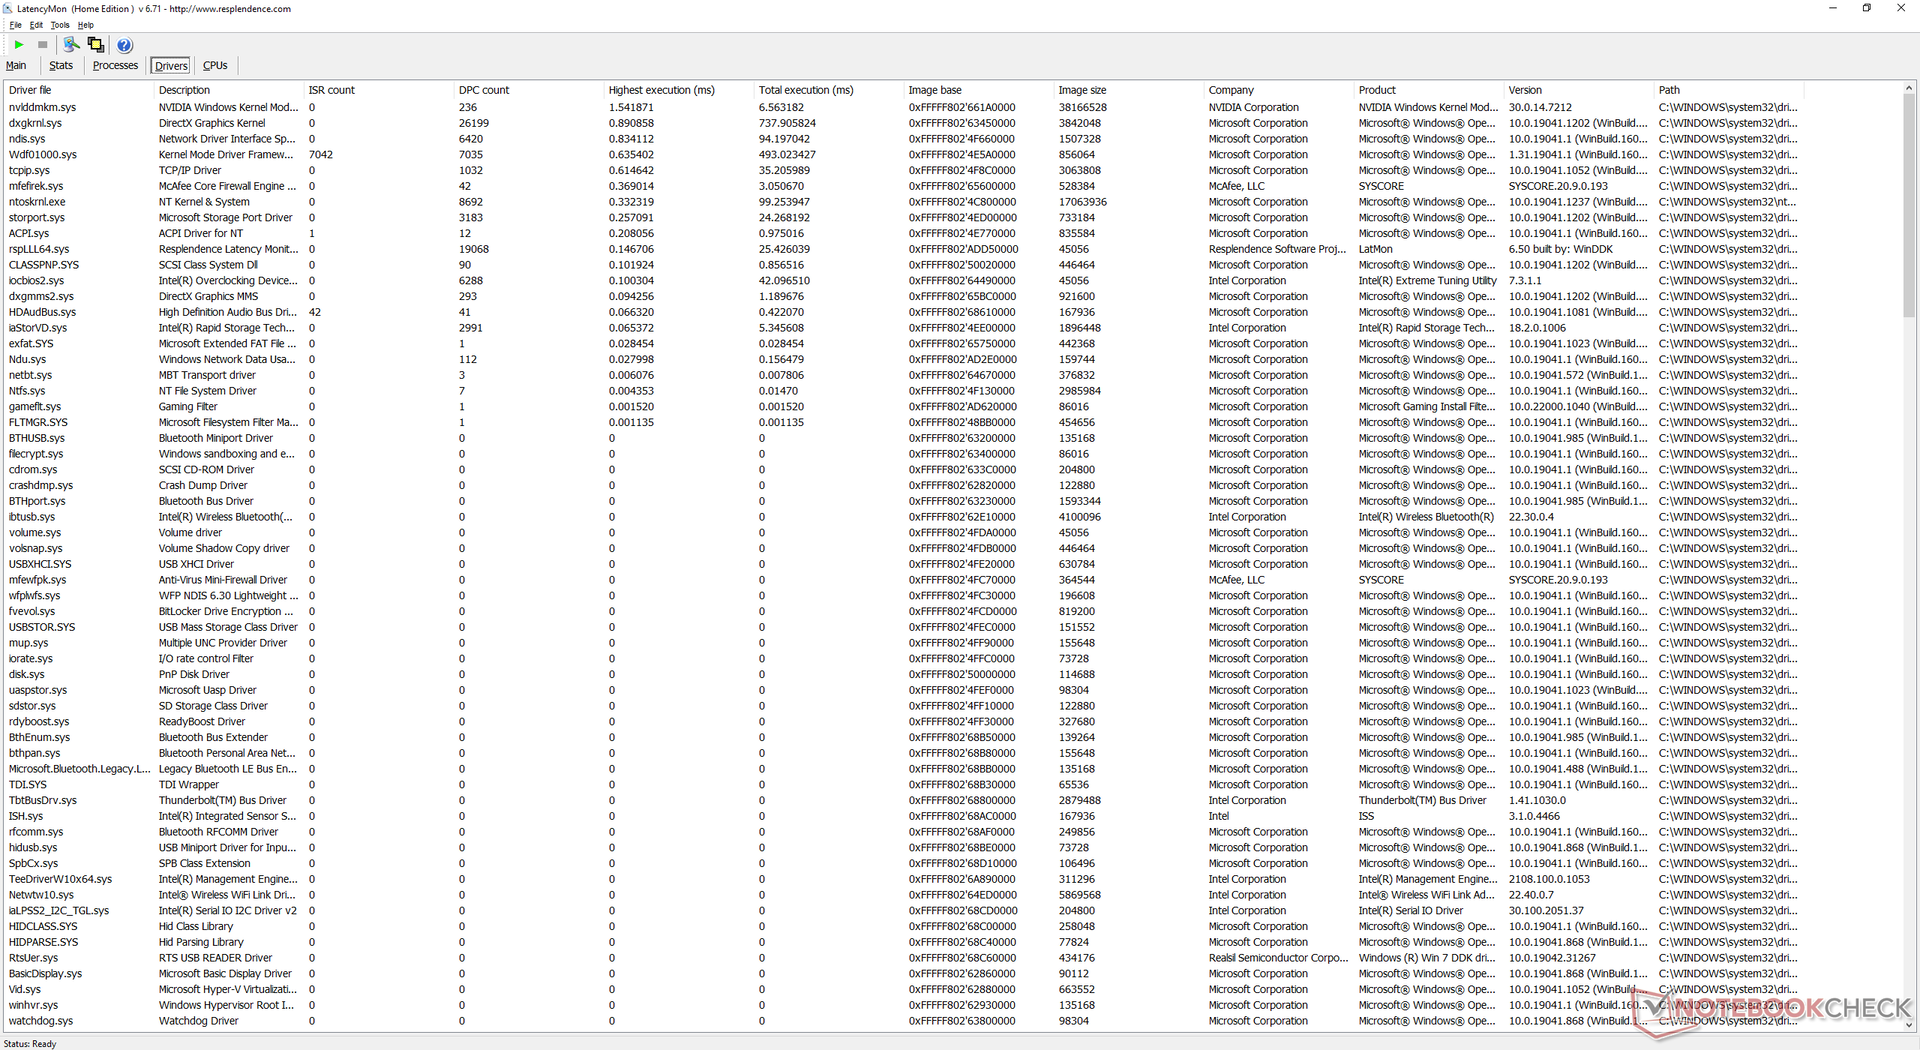
| DPC Latencies / LatencyMon - interrupt to process latency (max), Web, Youtube, Prime95 | |
| Asus Zephyrus S15 GX502L | |
| Razer Blade 15 Advanced (Mid 2021) | |
| Alienware x15 RTX 3070 P111F | |
| Alienware m15 R4 RTX 3080 | |
| MSI GS66 Stealth 10UG | |
| Acer Predator Helios 300 PH315-53-786B | |
* ... smaller is better
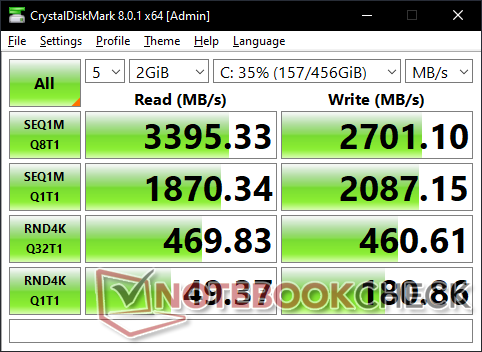
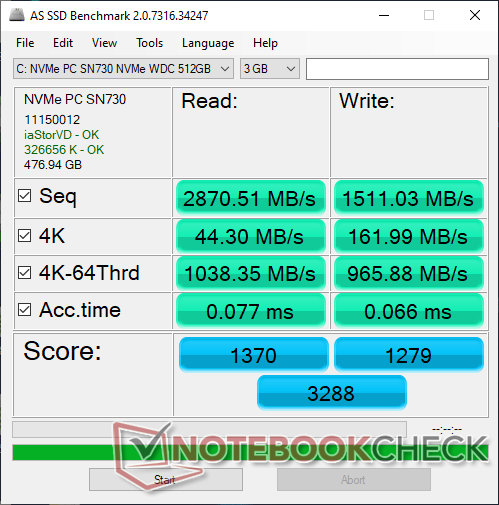
存储设备 - 支持PCIe4 x4
用户可以在RAID 0配置中最多安装两个M.2硬盘。然而,只有一个插槽与PCIe4兼容,而另一个插槽可以支持PCIe3,与Alienware x17 R1的情况很相似。目前的x15 R1 SKU只配备PCIe3 NVMe固态硬盘,就像512 GB的 WD SN730在我们的测试设备上。传输速率一般与其他高端游戏机(如Razer Blade系列)上的三星PM981a相当。
| Alienware x15 RTX 3070 P111F WDC PC SN730 SDBPNTY-512G | Alienware m15 R4 RTX 3080 2x WDC PC SN730 SDBPNTY-512G (RAID 0) | MSI GS66 Stealth 10UG WDC PC SN730 SDBPNTY-1T00 | Razer Blade 15 Advanced (Mid 2021) SSSTC CA6-8D1024 | Acer Predator Helios 300 PH315-53-786B Samsung PM981a MZVLB1T0HBLR | |
|---|---|---|---|---|---|
| AS SSD | 29% | 37% | 90% | 34% | |
| Seq Read (MB/s) | 2871 | 2888 1% | 2198 -23% | 5739 100% | 2792 -3% |
| Seq Write (MB/s) | 1511 | 2786 84% | 2596 72% | 4201 178% | 2311 53% |
| 4K Read (MB/s) | 44.3 | 41.98 -5% | 43.81 -1% | 53.8 21% | 48.34 9% |
| 4K Write (MB/s) | 162 | 108 -33% | 115.5 -29% | 179.2 11% | 93.9 -42% |
| 4K-64 Read (MB/s) | 1038 | 1396 34% | 1692 63% | 2959 185% | 1516 46% |
| 4K-64 Write (MB/s) | 966 | 1234 28% | 2162 124% | 1891 96% | 1940 101% |
| Access Time Read * (ms) | 0.077 | 0.056 27% | 0.056 27% | 0.027 65% | |
| Access Time Write * (ms) | 0.066 | 0.035 47% | 0.098 -48% | 0.154 -133% | 0.04 39% |
| Score Read (Points) | 1370 | 1727 26% | 1956 43% | 3587 162% | 1843 35% |
| Score Write (Points) | 1279 | 1621 27% | 2537 98% | 2490 95% | 2265 77% |
| Score Total (Points) | 3288 | 4227 29% | 5513 68% | 7821 138% | 5030 53% |
| Copy ISO MB/s (MB/s) | 1962 | 1868 -5% | 2236 14% | 3027 54% | 1921 -2% |
| Copy Program MB/s (MB/s) | 407.9 | 812 99% | 690 69% | 1177 189% | 581 42% |
| Copy Game MB/s (MB/s) | 1105 | 1596 44% | 1546 40% | 2170 96% | 1454 32% |
| CrystalDiskMark 5.2 / 6 | -1% | 4% | 81% | -29% | |
| Write 4K (MB/s) | 179.6 | 114.2 -36% | 163.1 -9% | 295.6 65% | 76.2 -58% |
| Read 4K (MB/s) | 49.21 | 43.77 -11% | 48.97 0% | 85.7 74% | 34.32 -30% |
| Write Seq (MB/s) | 2062 | 2607 26% | 4149 101% | 776 -62% | |
| Read Seq (MB/s) | 1849 | 2316 25% | 4203 127% | 2169 17% | |
| Write 4K Q32T1 (MB/s) | 462.9 | 464.5 0% | 338 -27% | 715 54% | 357.3 -23% |
| Read 4K Q32T1 (MB/s) | 470.2 | 546 16% | 475.6 1% | 709 51% | 429.6 -9% |
| Write Seq Q32T1 (MB/s) | 2702 | 3233 20% | 3090 14% | 4681 73% | 788 -71% |
| Read Seq Q32T1 (MB/s) | 3371 | 3473 3% | 3421 1% | 6905 105% | 3542 5% |
| Write 4K Q8T8 (MB/s) | 1375 | ||||
| Read 4K Q8T8 (MB/s) | 1447 | ||||
| Total Average (Program / Settings) | 14% /
20% | 21% /
25% | 86% /
87% | 3% /
10% |
* ... smaller is better

Disk Throttling: DiskSpd Read Loop, Queue Depth 8
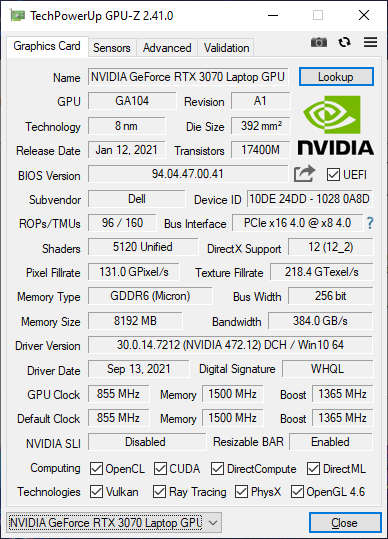
GPU性能
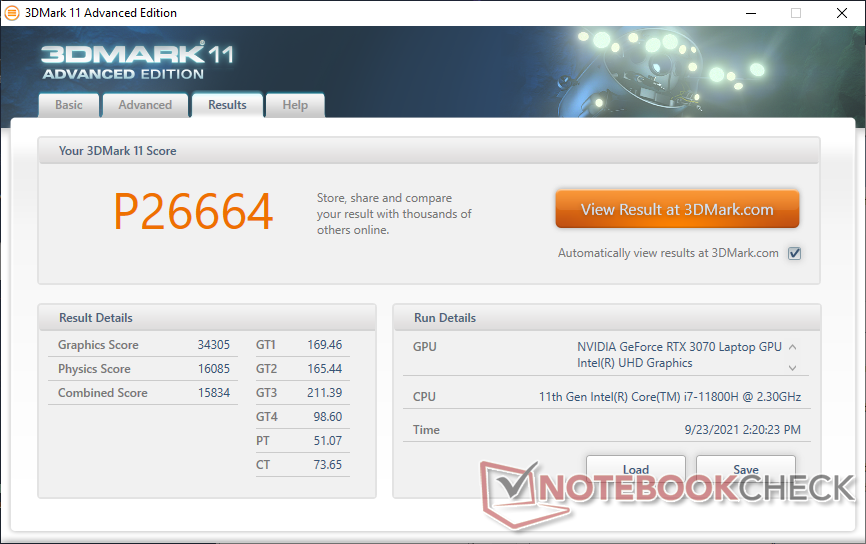
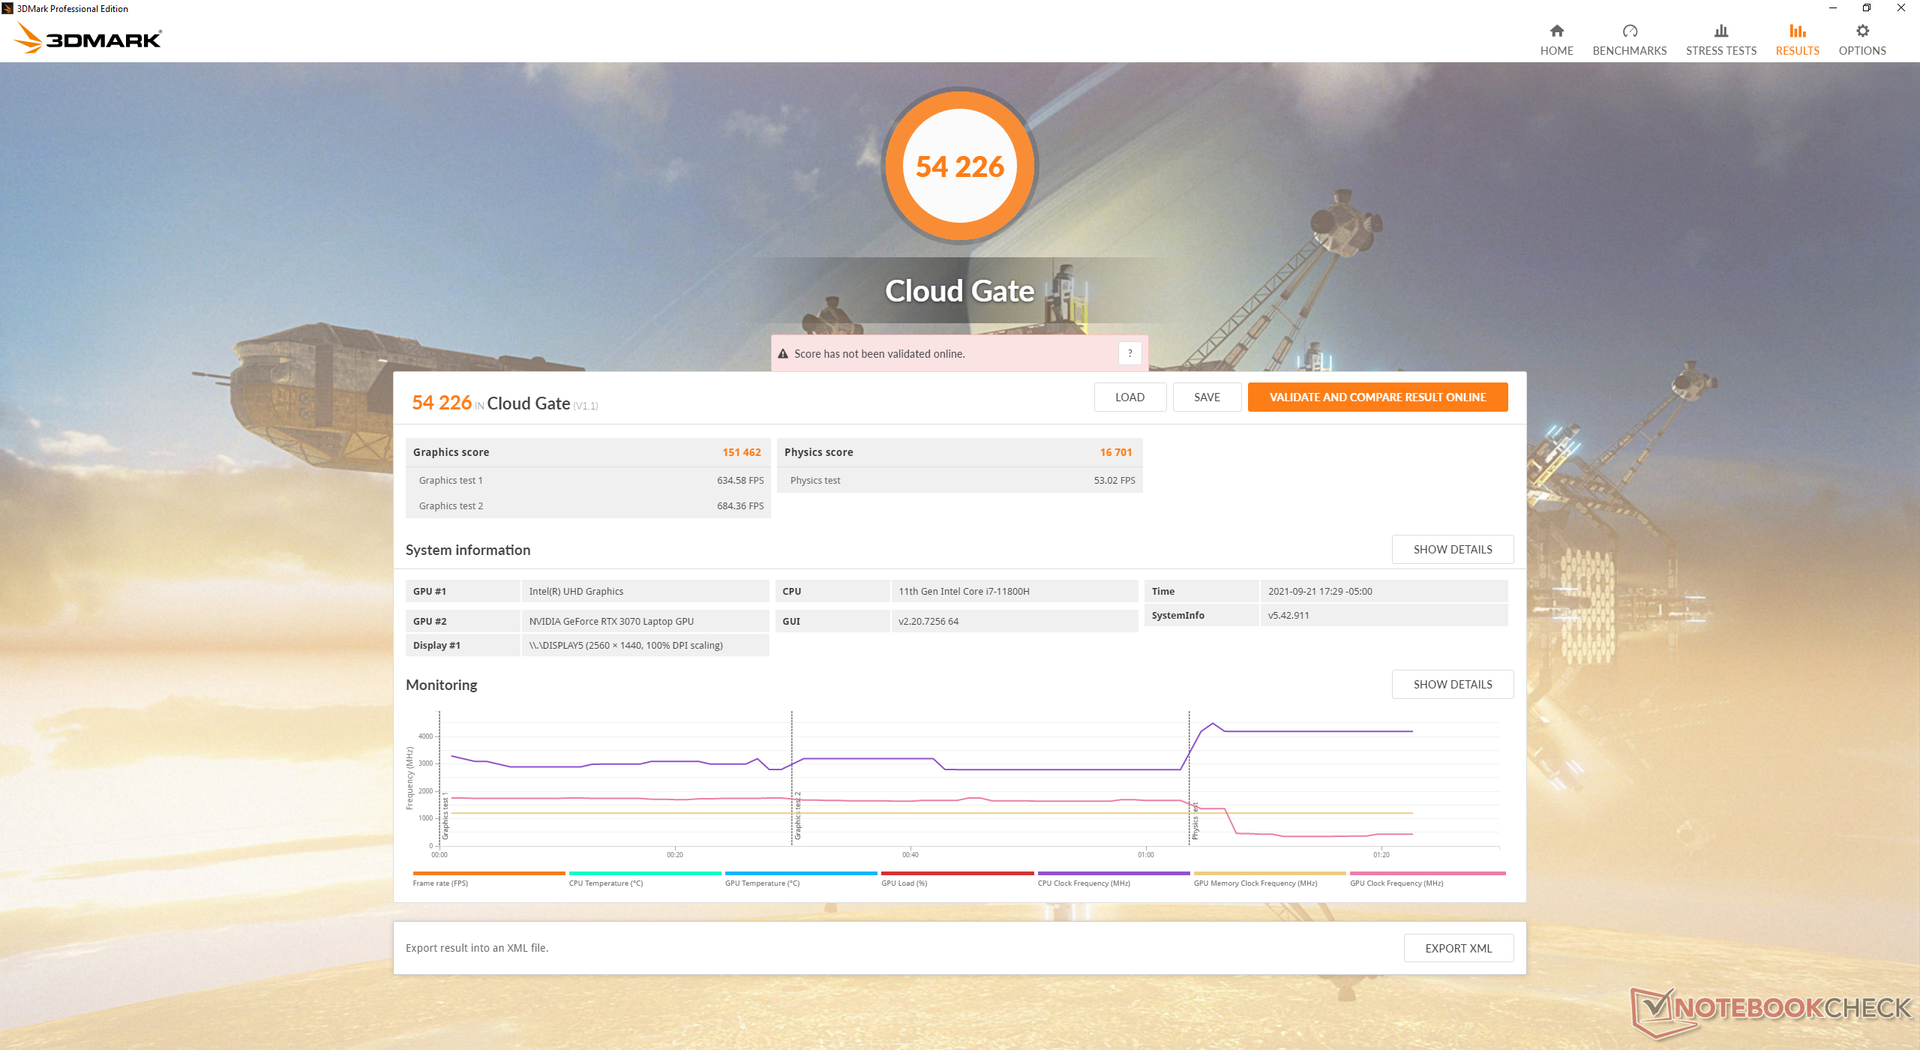
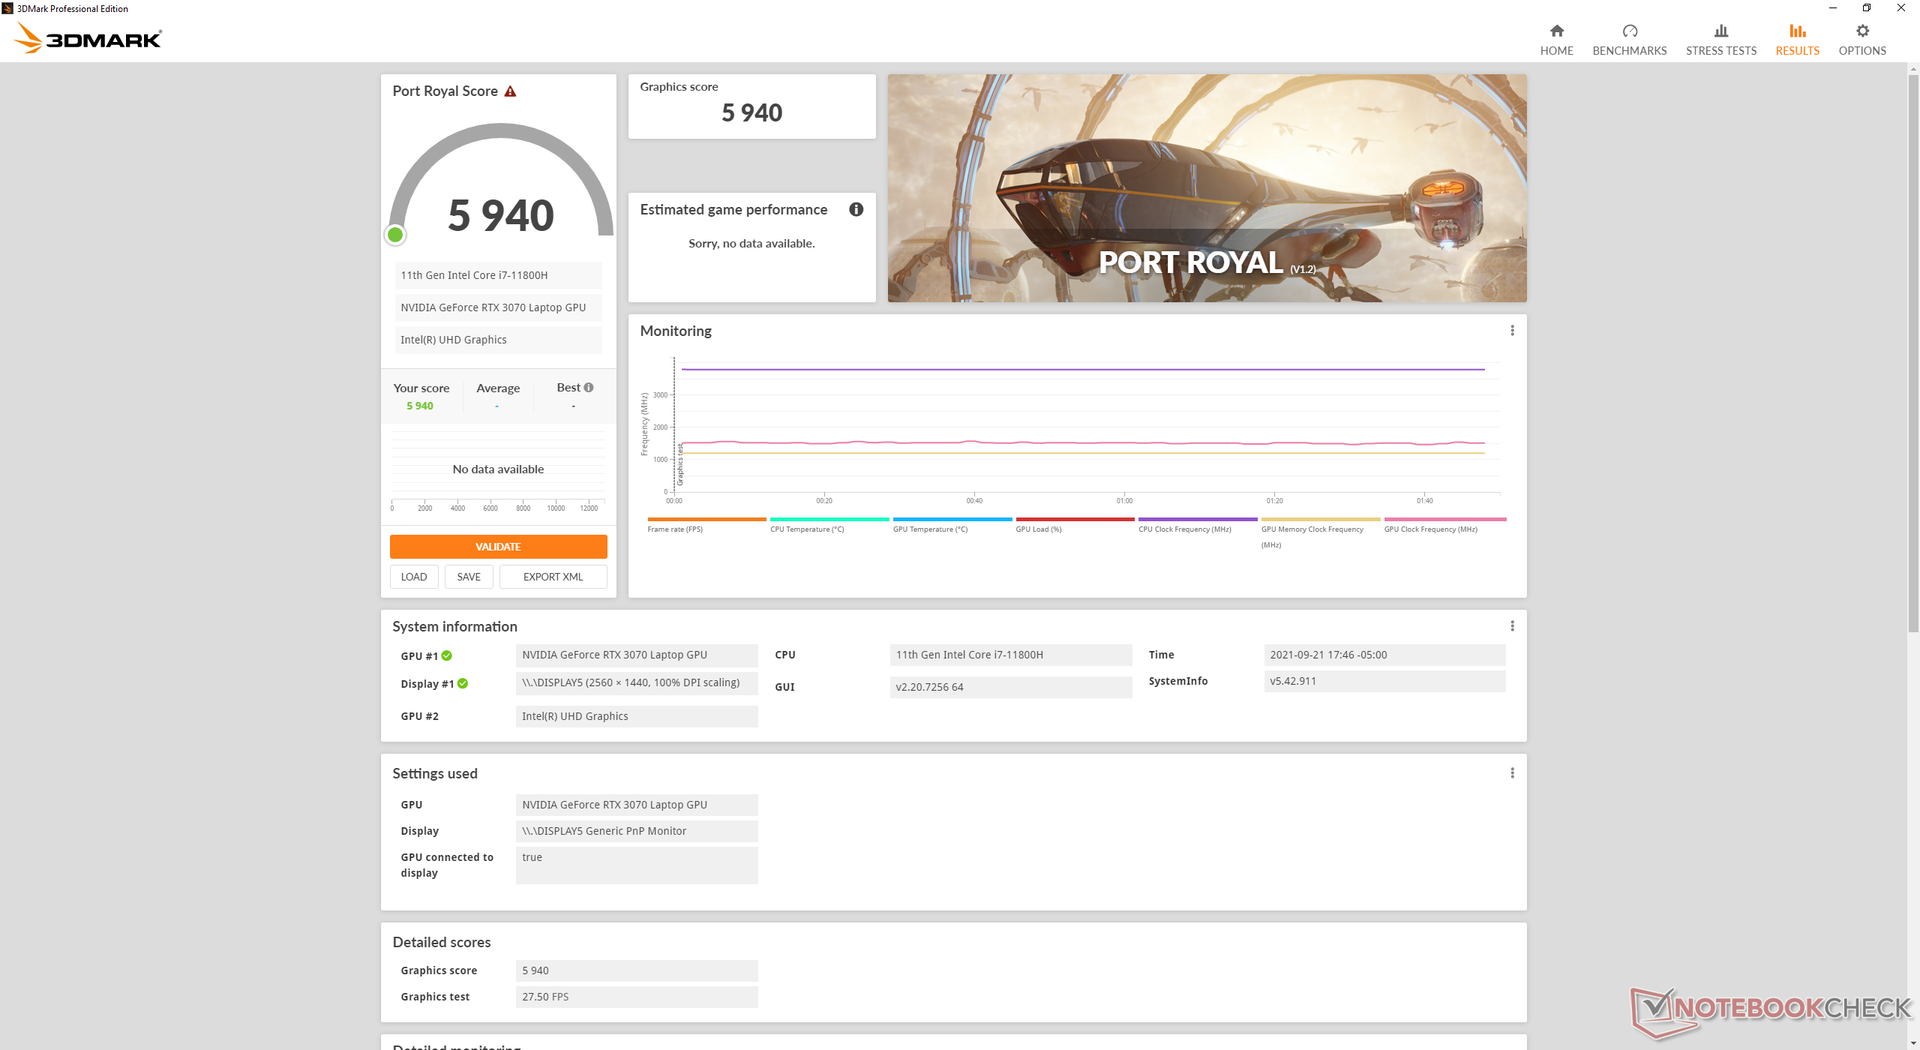
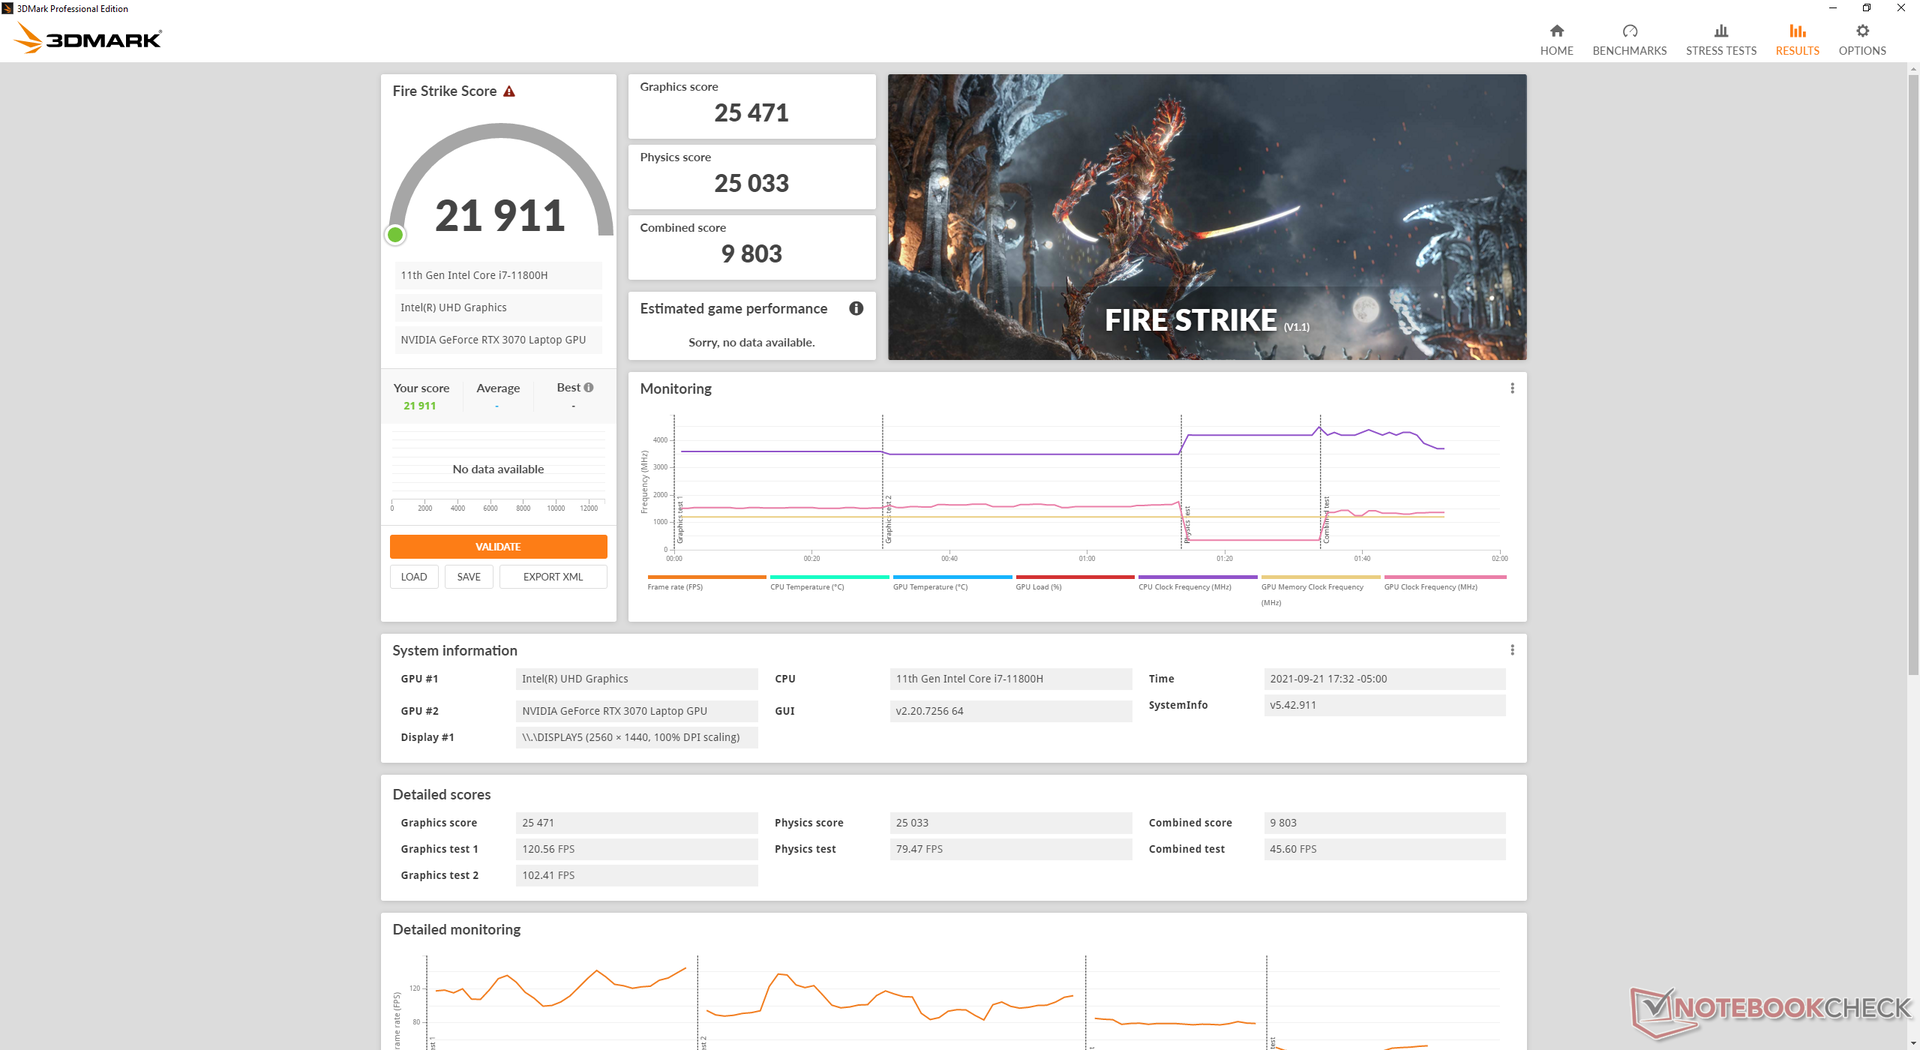
我们的 移动GeForce RTX 3070相对于其他具有相同GPU的笔记本电脑,它的表现是我们所期望的。不幸的是,这有点令人失望,因为在所有3DMark基准测试中,配备RTX 3070的老款Alienware m15 R4的得分一直比我们较新的x15 R1高出10%。我们怀疑x15 R1的TGP目标相对较低(110瓦对140瓦)是造成整体图形性能较慢的原因。
升级到 RTX 3080SKU预计不会比我们的RTX 3070显著提高图形性能,特别是由于它的目标是完全相同的110 W TGP限制。相反,较大的收益将是在 RTX 3060和3070 SKU之间。
| 3DMark 11 | |
| 1280x720 Performance GPU | |
| MSI GeForce RTX 3070 Gaming X Trio | |
| Alienware m15 R4 | |
| Razer Blade 15 Advanced (Mid 2021) | |
| Alienware x15 RTX 3070 P111F | |
| Average NVIDIA GeForce RTX 3070 Laptop GPU (12535 - 38275, n=54) | |
| Razer Blade 15 RTX 2080 Super Max-Q | |
| Asus TUF Gaming F15 FX506HM | |
| Asus ROG Strix G15 G512LW | |
| Asus ROG Zephyrus M15 GU502LU-BI7N4 | |
| HP Omen 15-en0375ng | |
| Schenker XMG Focus 15 | |
| Asus Zephyrus S GX531GM | |
| 1280x720 Performance Combined | |
| Razer Blade 15 Advanced (Mid 2021) | |
| Schenker XMG Focus 15 | |
| Alienware m15 R4 | |
| Alienware x15 RTX 3070 P111F | |
| Asus TUF Gaming F15 FX506HM | |
| Average NVIDIA GeForce RTX 3070 Laptop GPU (3715 - 22517, n=53) | |
| MSI GeForce RTX 3070 Gaming X Trio | |
| HP Omen 15-en0375ng | |
| Asus ROG Zephyrus M15 GU502LU-BI7N4 | |
| Razer Blade 15 RTX 2080 Super Max-Q | |
| Asus ROG Strix G15 G512LW | |
| Asus Zephyrus S GX531GM | |
| 3DMark 11 Performance | 26664 points | |
| 3DMark Cloud Gate Standard Score | 54226 points | |
| 3DMark Fire Strike Score | 21911 points | |
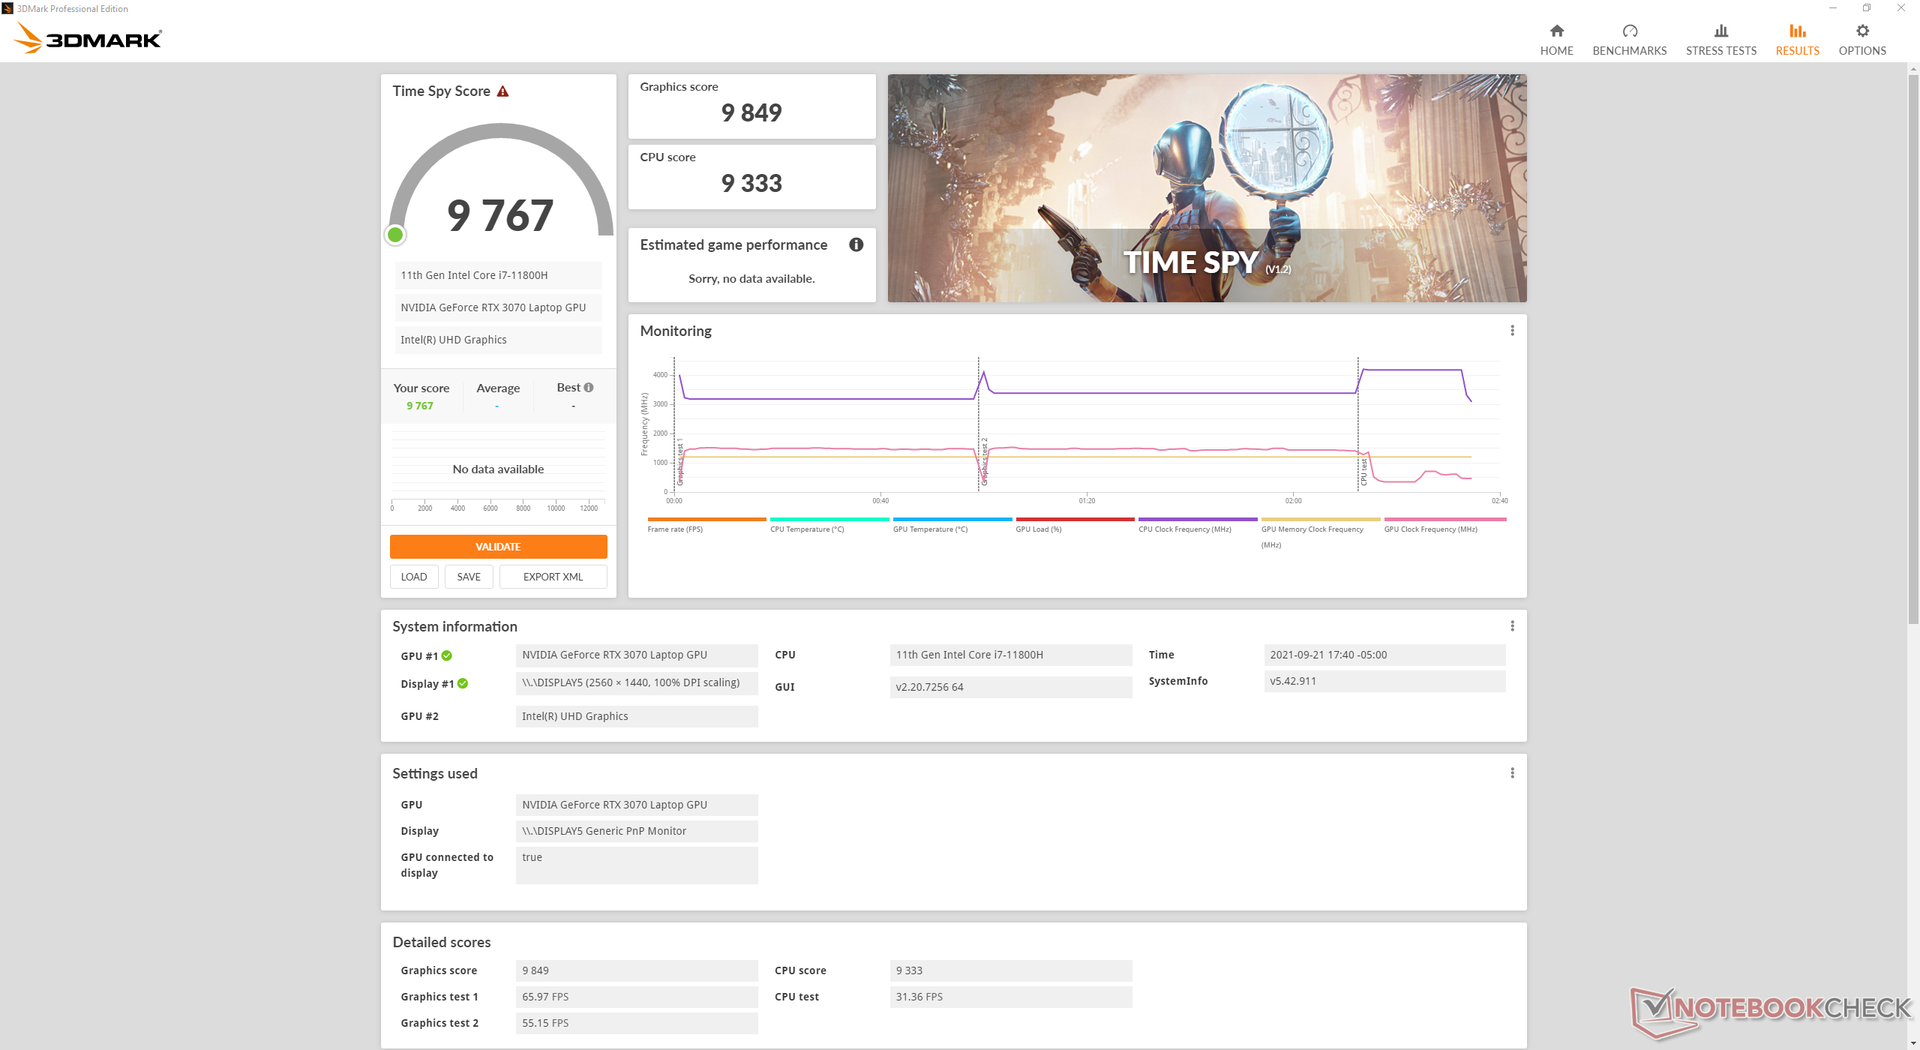
| 3DMark Time Spy Score | 9767 points | |
Help | ||
Witcher 3 FPS Chart
| low | med. | high | ultra | QHD | |
|---|---|---|---|---|---|
| GTA V (2015) | 181 | 174 | 166 | 95.8 | 83.7 |
| The Witcher 3 (2015) | 415.4 | 279.4 | 197.7 | 100.2 | |
| Dota 2 Reborn (2015) | 167 | 148 | 143 | 130 | |
| Final Fantasy XV Benchmark (2018) | 150 | 123 | 93.7 | 73.8 | |
| X-Plane 11.11 (2018) | 129 | 114 | 89.9 | ||
| Far Cry 5 (2018) | 143 | 125 | 118 | 113 | 96 |
| Strange Brigade (2018) | 467 | 253 | 206 | 178 | 132 |
Emissions
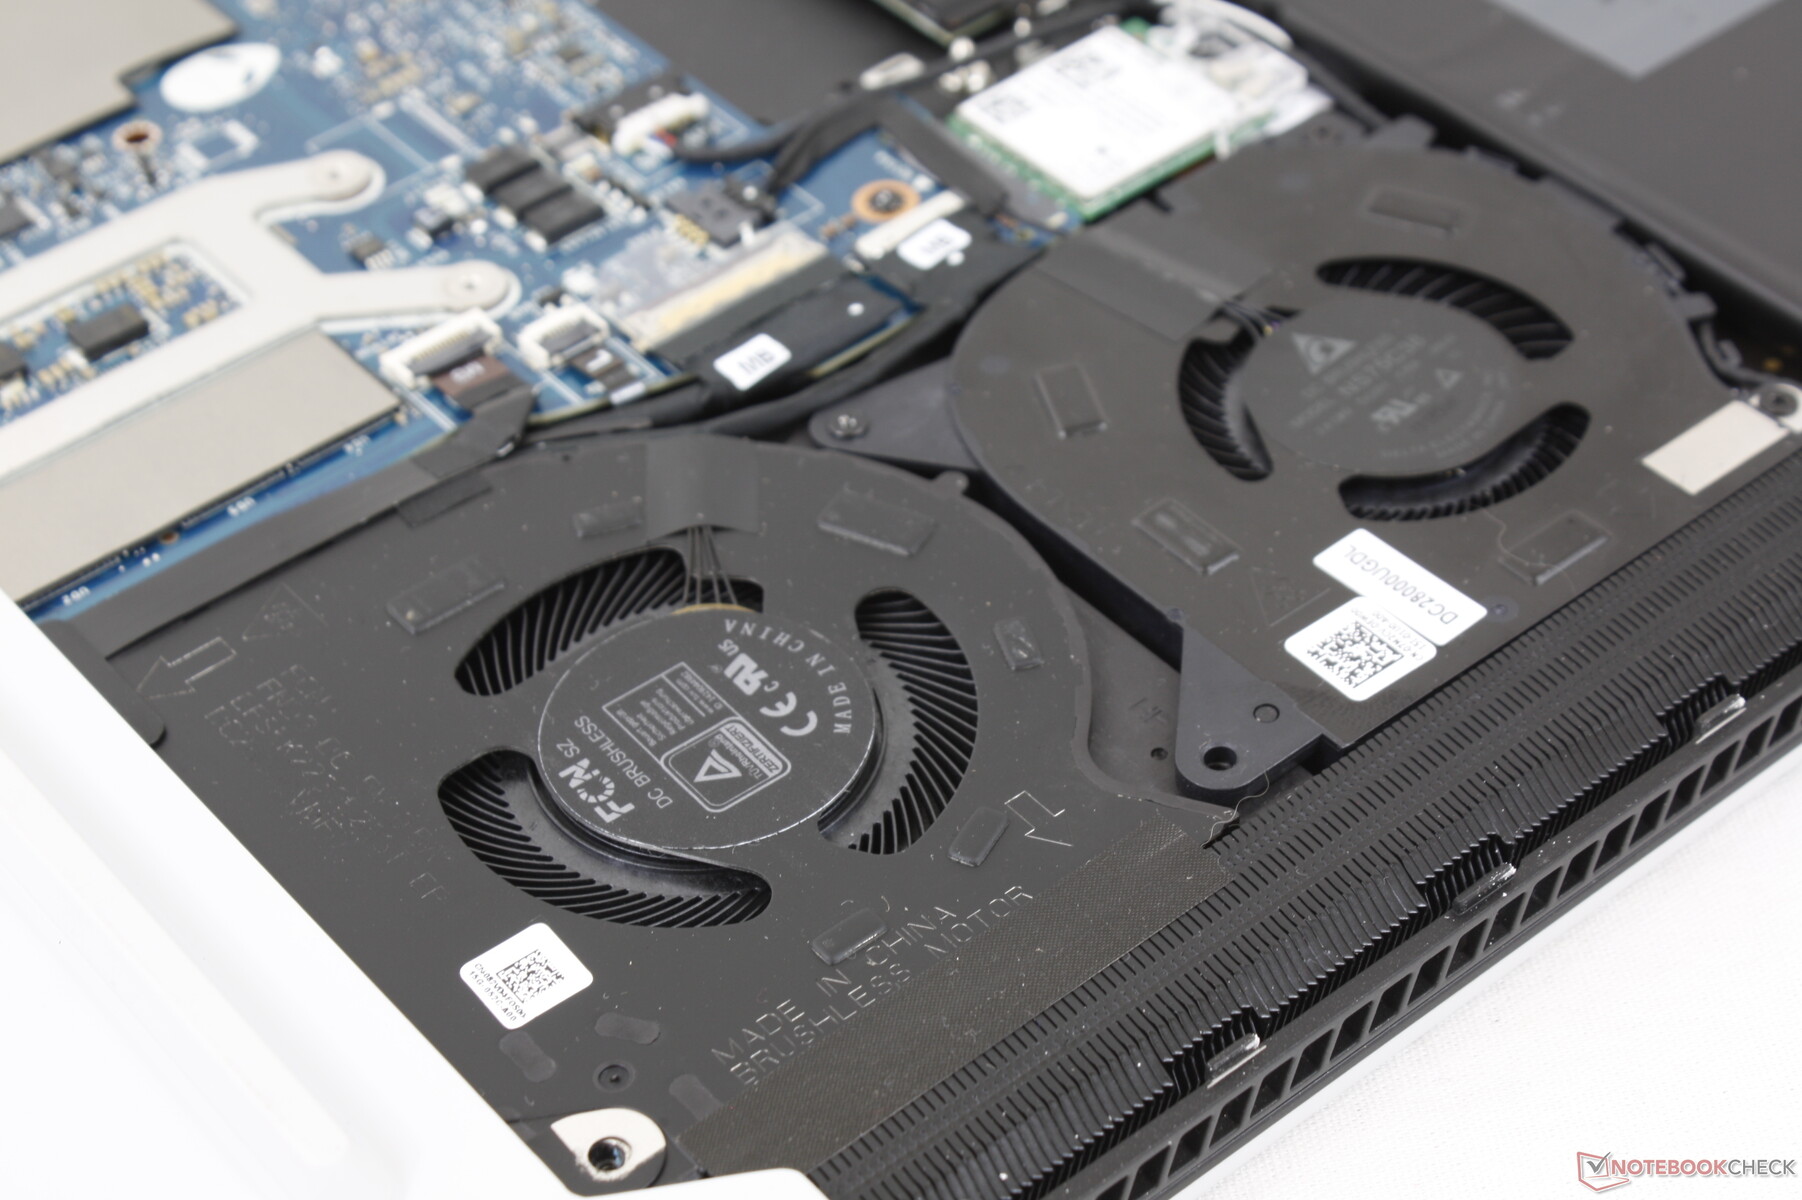
系统噪音 - 只有在游戏时才会很响
Alienware x15 R1的CPU和Alienware命令中心的风扇设置(安静、性能和全速)使用了与x17 R1相同的镓硅散热膏。像网页浏览或视频流等要求不高的应用可能会引起仅26至31 dB(A)的风扇噪音,而安静的背景则为24.1 dB(A),基本不会引起注意,比我们在Alienware m15 R4上观察到的要安静得多,因为后者的风扇会更频繁地脉冲。
当游戏时,风扇噪音将接近我们在x17 R1上记录的,在平衡或性能模式下几乎为50 dB(A)。如果风扇被设置为全速模式,那么风扇噪音上限将增加到55 dB(A)。x15 R1在这方面并不一定比其他大多数15.6英寸游戏笔记本更安静或更响亮,尽管它的风扇比大多数风扇多。
| Alienware x15 RTX 3070 P111F GeForce RTX 3070 Laptop GPU, i7-11800H, WDC PC SN730 SDBPNTY-512G | Alienware m15 R4 RTX 3080 GeForce RTX 3080 Laptop GPU, i9-10980HK, 2x WDC PC SN730 SDBPNTY-512G (RAID 0) | MSI GS66 Stealth 10UG GeForce RTX 3070 Laptop GPU, i7-10870H, WDC PC SN730 SDBPNTY-1T00 | Razer Blade 15 Advanced (Mid 2021) GeForce RTX 3080 Laptop GPU, i7-11800H, SSSTC CA6-8D1024 | Asus Zephyrus S15 GX502L GeForce RTX 2070 Super Mobile, i7-10875H, WDC PC SN730 SDBPNTY-1T00 | Acer Predator Helios 300 PH315-53-786B GeForce RTX 3070 Laptop GPU, i7-10750H, Samsung PM981a MZVLB1T0HBLR | |
|---|---|---|---|---|---|---|
| Noise | -10% | -21% | -2% | -23% | -11% | |
| off / environment * (dB) | 24.1 | 25 -4% | 26.2 -9% | 25.1 -4% | 25 -4% | 25 -4% |
| Idle Minimum * (dB) | 26.6 | 25 6% | 34 -28% | 25.3 5% | 28 -5% | 25 6% |
| Idle Average * (dB) | 26.6 | 29 -9% | 34 -28% | 25.3 5% | 31 -17% | 27 -2% |
| Idle Maximum * (dB) | 26.6 | 33 -24% | 34 -28% | 25.3 5% | 36 -35% | 35 -32% |
| Load Average * (dB) | 30.9 | 48 -55% | 47.2 -53% | 42 -36% | 56 -81% | 46 -49% |
| Witcher 3 ultra * (dB) | 49.9 | 46 8% | 46.3 7% | 45.6 9% | 55 -10% | 49 2% |
| Load Maximum * (dB) | 53.5 | 49 8% | 58.2 -9% | 51.6 4% | 57 -7% | 51 5% |
* ... smaller is better
Noise level
| Idle |
| 26.6 / 26.6 / 26.6 dB(A) |
| Load |
| 30.9 / 53.5 dB(A) |
 | ||
30 dB silent 40 dB(A) audible 50 dB(A) loud |
||
min: | ||
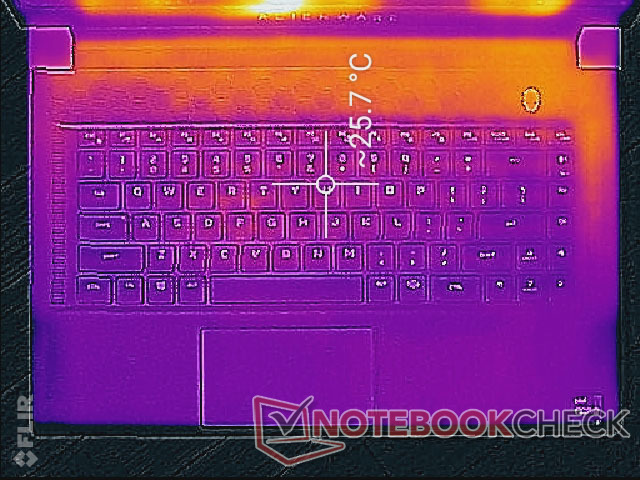
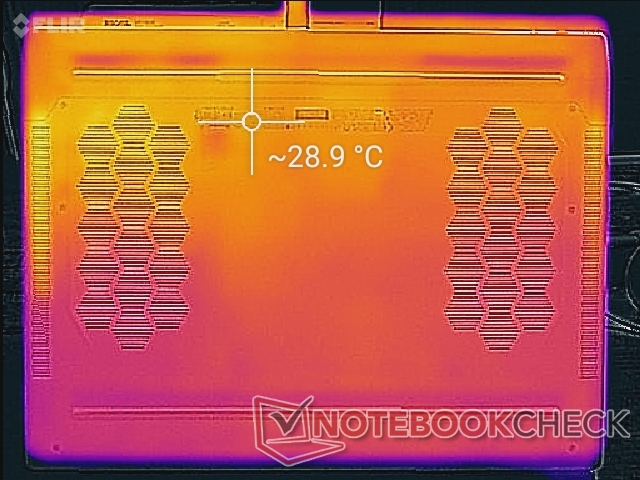
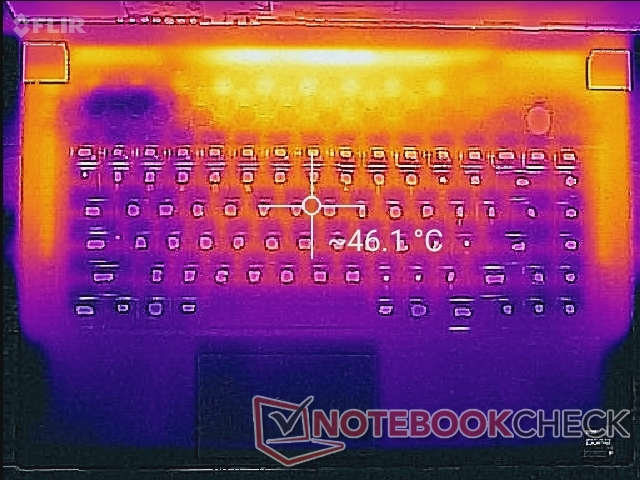
温度 - 热后部
老款Alienware m15笔记本电脑在运行游戏时,掌托温度非常高,接近40℃。值得庆幸的是,x15 R1的掌托相比之下明显凉了8摄氏度左右,使手和手指更加舒适。请注意,虽然WASD键不像以前那么热了,但机箱边缘和键盘边缘之间的表面可能非常热,因为下面有铜热管。
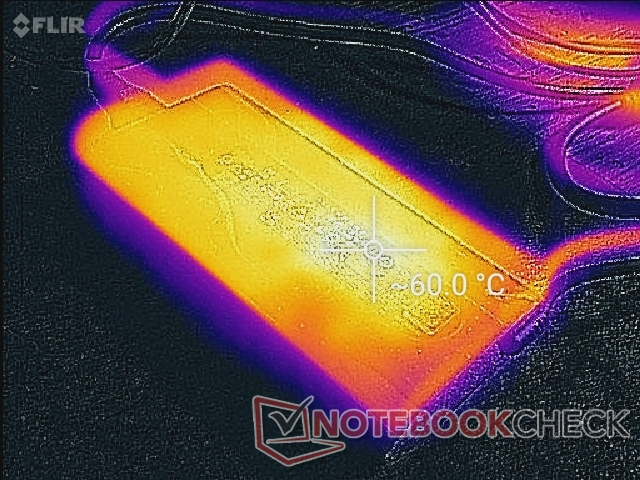
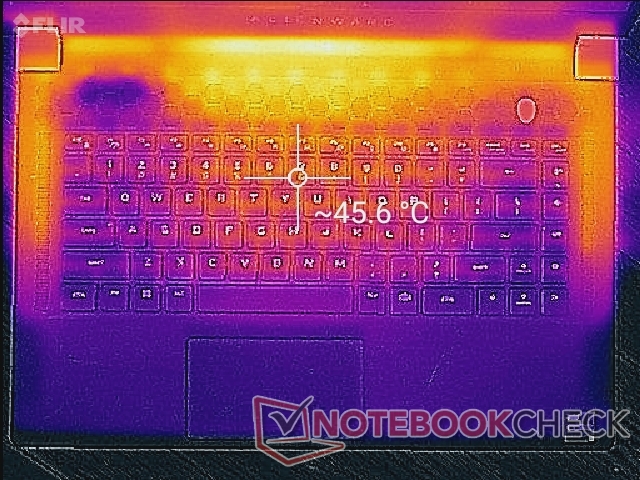
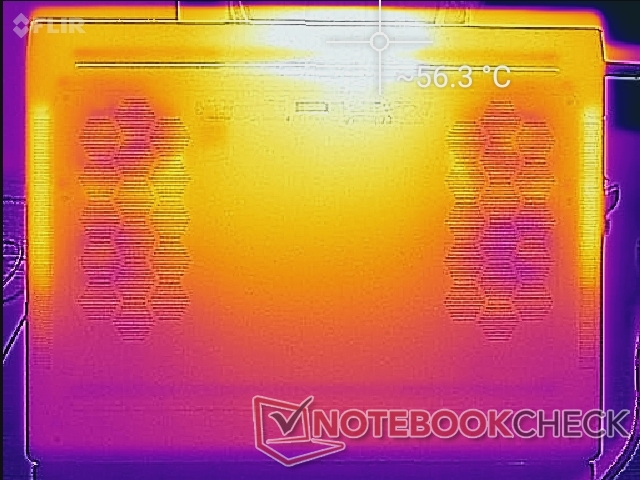
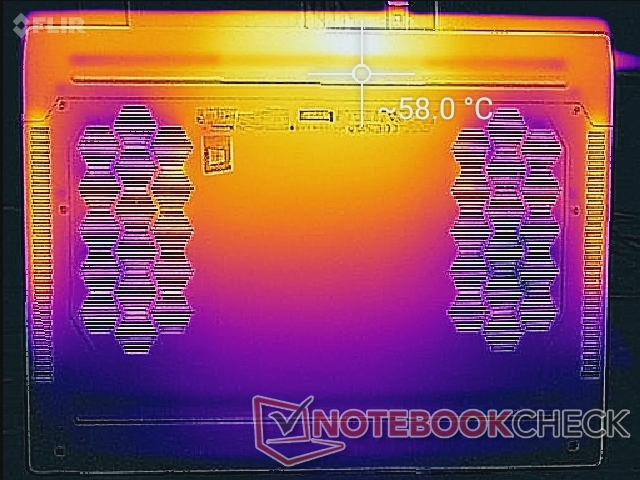
机箱顶部和底部的热点可以达到近60摄氏度,这与我们在旧版m15设计上记录的最高温度相似。幸运的是,这些点都在后面,手不太可能碰到。
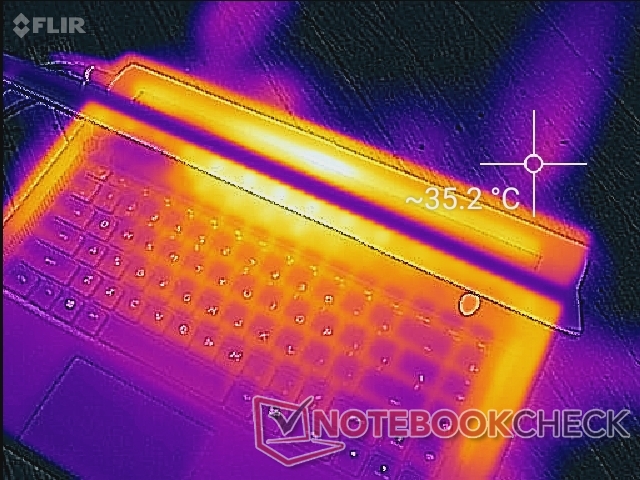
(-) The maximum temperature on the upper side is 59.2 °C / 139 F, compared to the average of 40.4 °C / 105 F, ranging from 21.2 to 68.8 °C for the class Gaming.
(-) The bottom heats up to a maximum of 58 °C / 136 F, compared to the average of 43.2 °C / 110 F
(+) In idle usage, the average temperature for the upper side is 26.2 °C / 79 F, compared to the device average of 33.9 °C / 93 F.
(-) Playing The Witcher 3, the average temperature for the upper side is 43.2 °C / 110 F, compared to the device average of 33.9 °C / 93 F.
(+) The palmrests and touchpad are reaching skin temperature as a maximum (32.2 °C / 90 F) and are therefore not hot.
(-) The average temperature of the palmrest area of similar devices was 28.8 °C / 83.8 F (-3.4 °C / -6.2 F).
压力测试
当运行Prime95对CPU施加压力时,时钟速率和温度将分别在3.5至4.2 GHz和90 C至100 C之间循环,CPU封装功率在79 W至95 W之间。在Alienware x17 R1上,当受到同样的条件时,也可以观察到这种循环行为。这里的处理器的运行速度和温度都比其他大多数具有相同CPU的笔记本电脑要高,如在 Razer Blade 15 Advanced Model它的i7-11800H CPU将稳定在 "只有 "2.9 GHz和83 C。
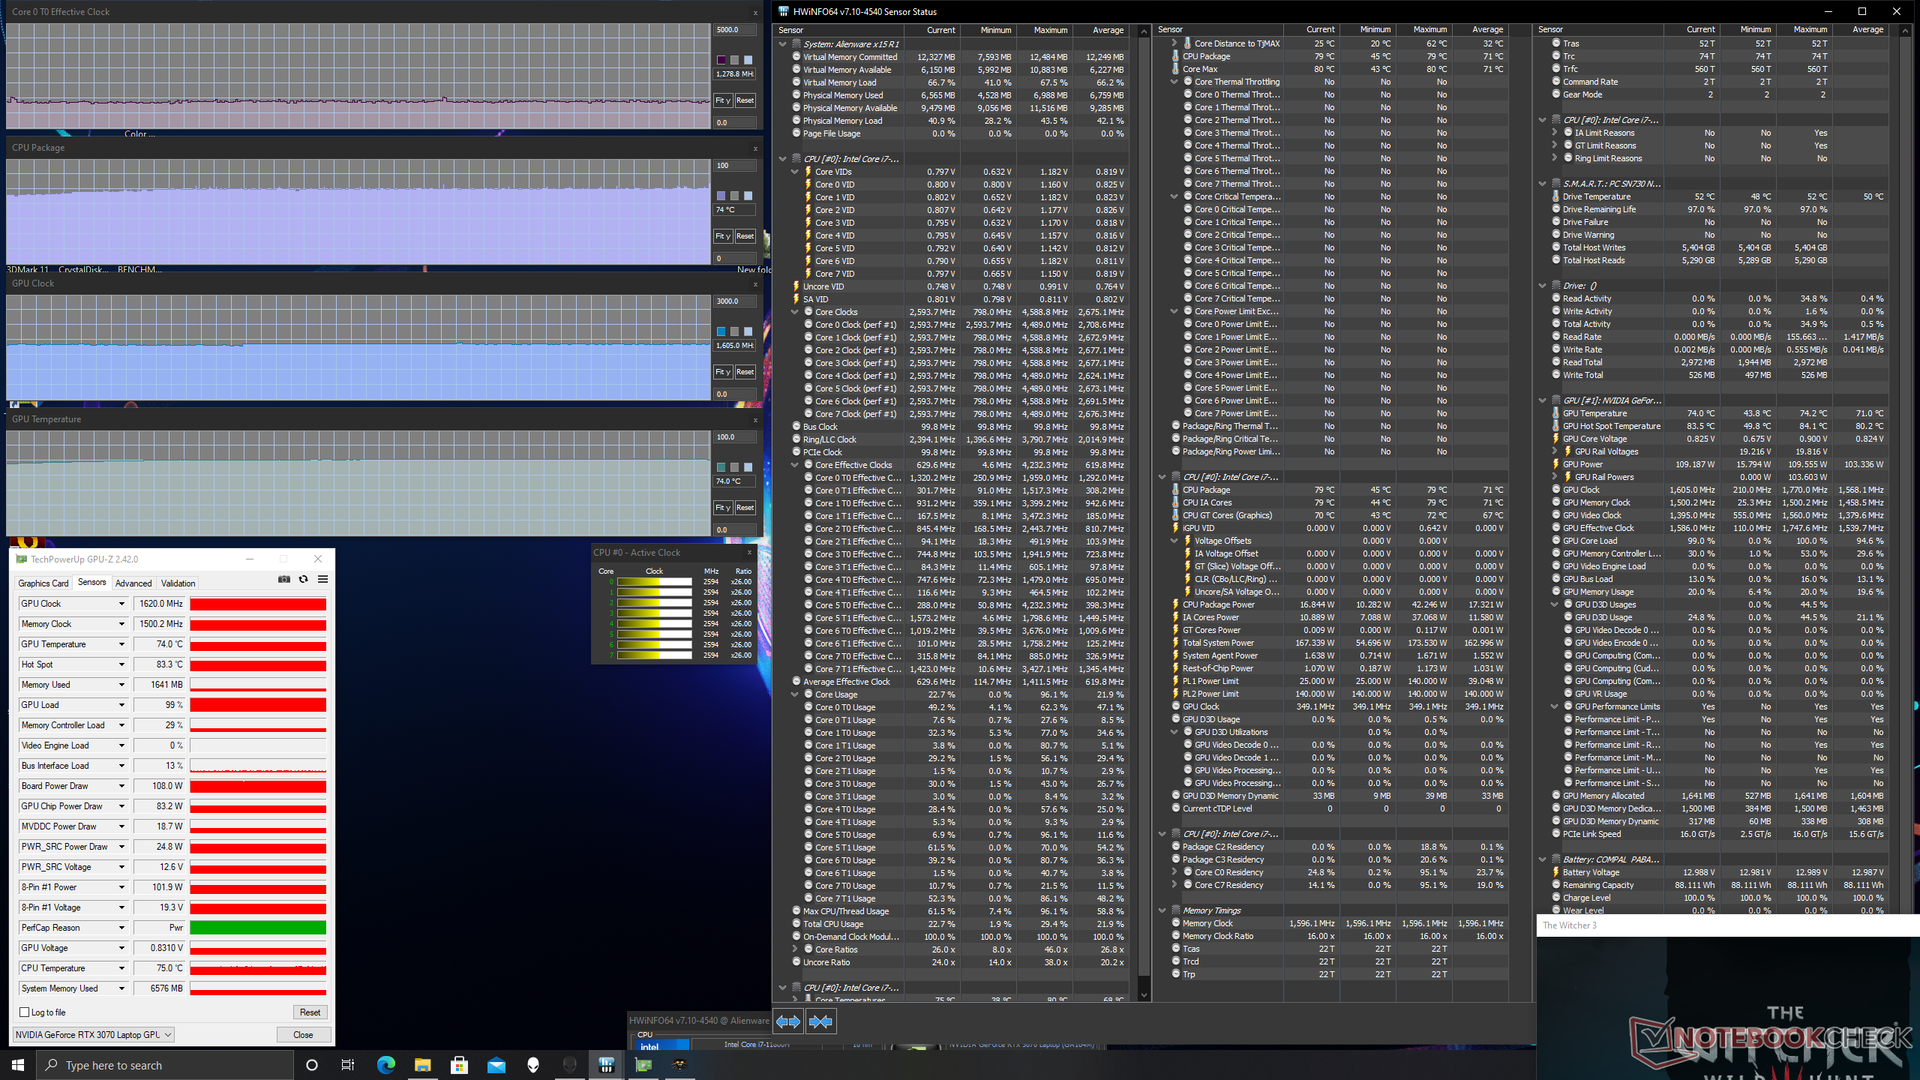
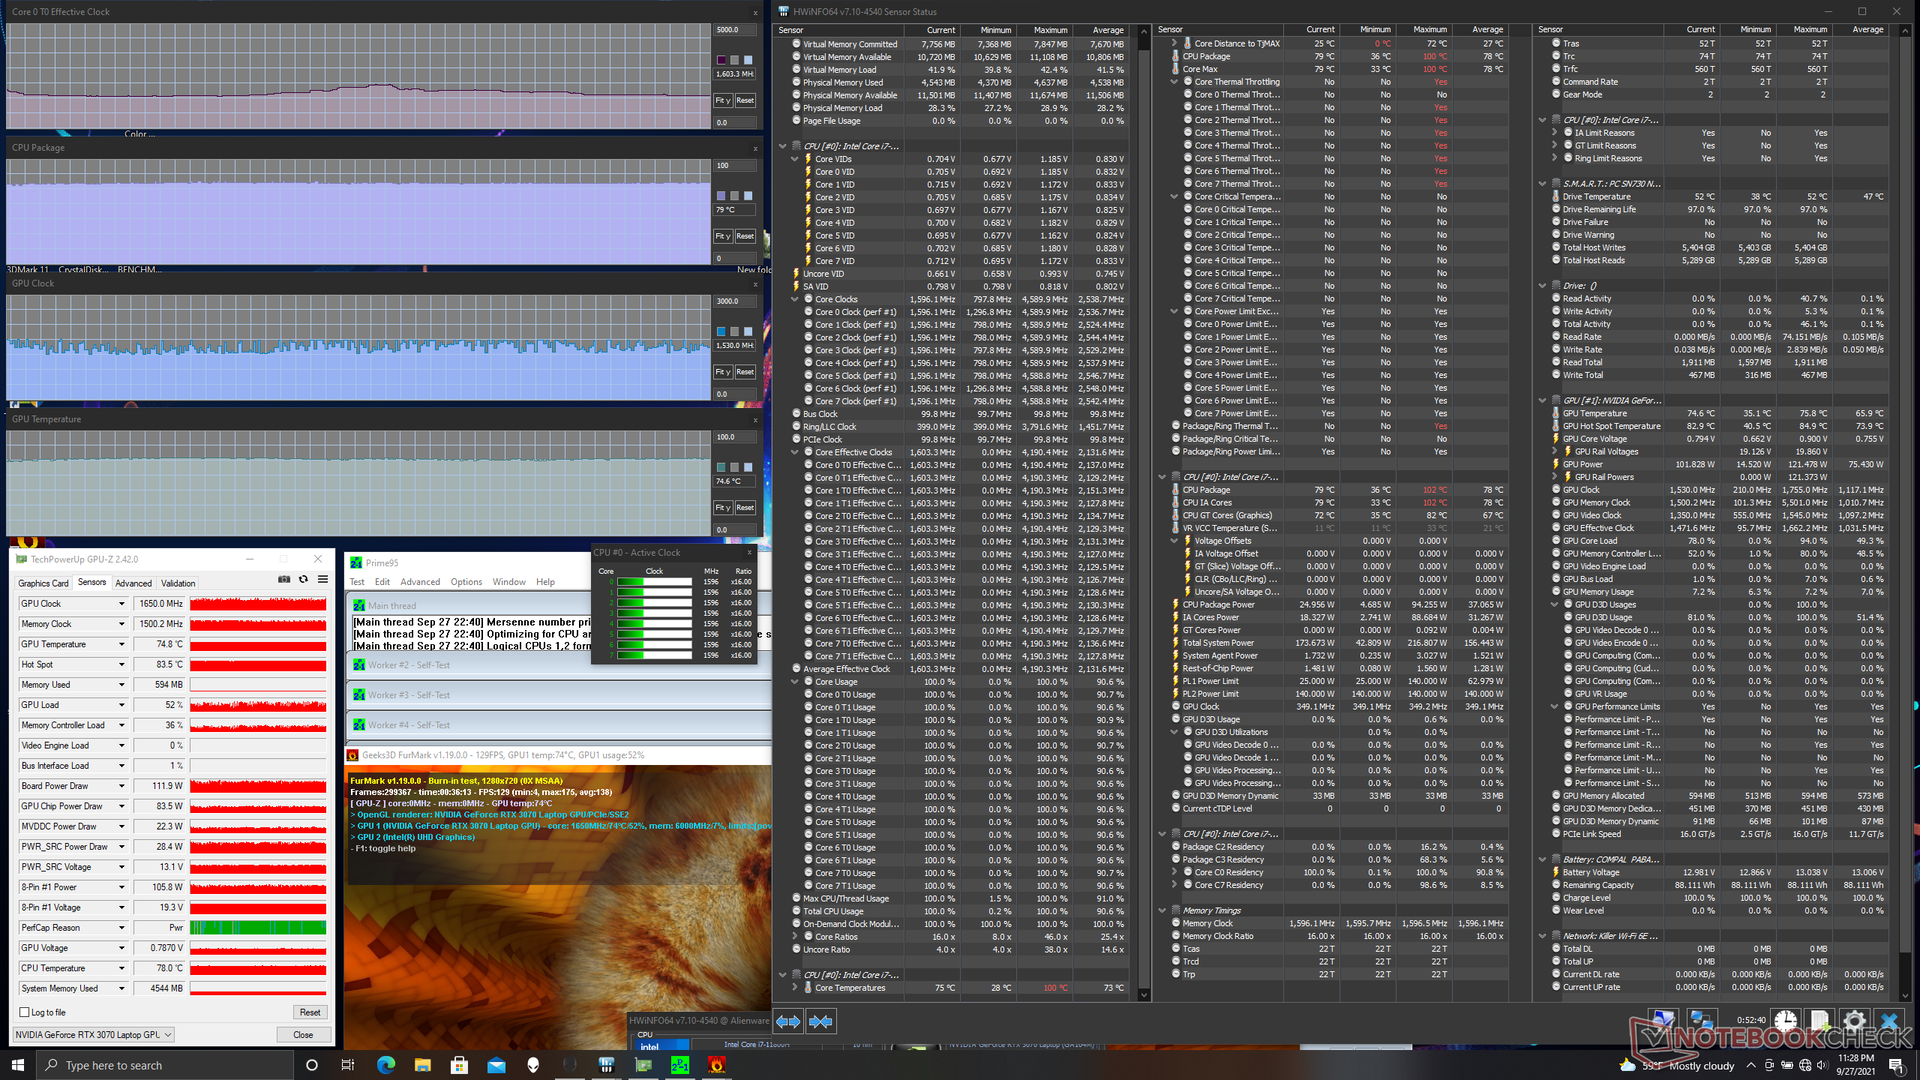
这里的GPU在运行时将稳定在1605 MHz和74 C。 Witcher 3而Alienware m15 R4 RTX 3070则是1680 MHz和80 C。与我们较新的x15 R1相比,老款m15 R4的内存时钟速率尤其明显快(根据GPU-Z,1750 MHz与1500 MHz)。考虑到上面提到的稍快的3DMark结果,老款Alienware型号上稍快的时钟是有意义的。
在运行时,TGP将稳定在108 W Witcher 3这非常接近最大110瓦的目标。戴尔将GPU的功率定为90W,涡轮增压为20W,但似乎机箱在游戏时保持接近图形芯片的高端范围的性能水平没有问题。
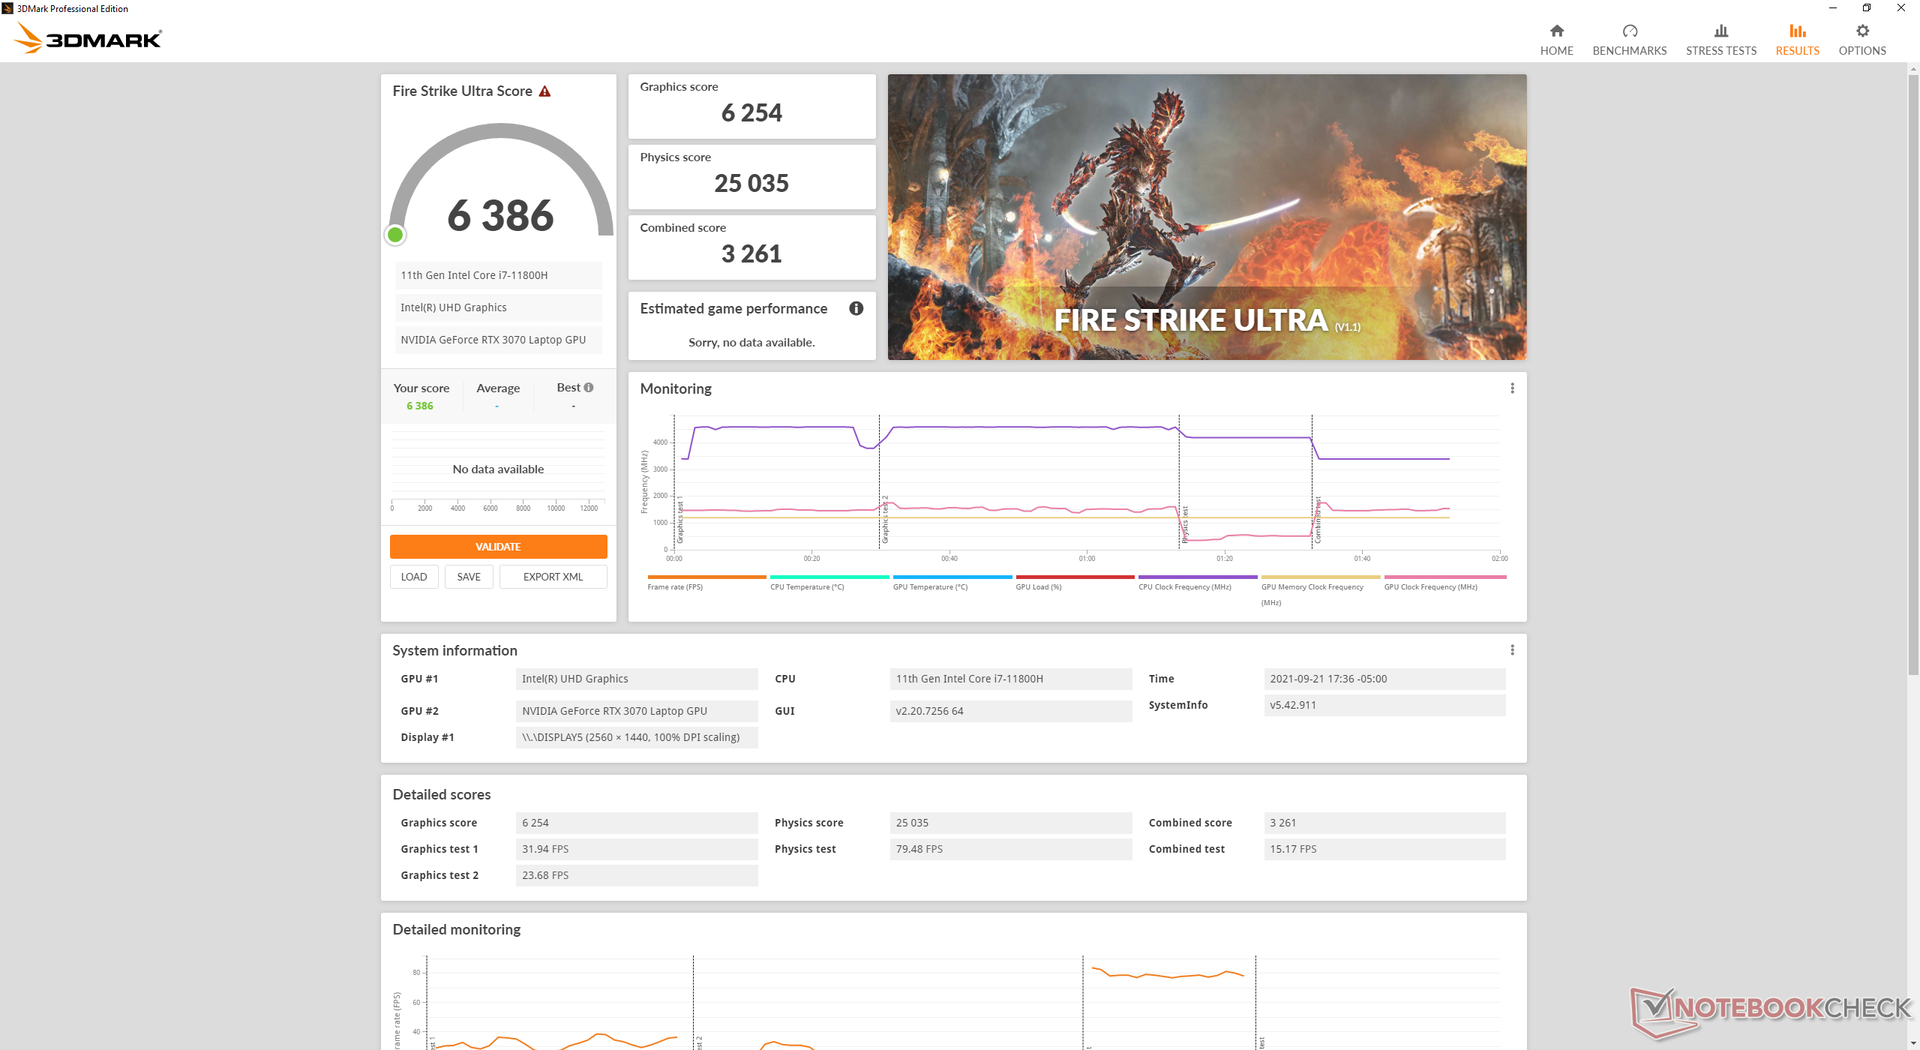
用电池供电运行将严重限制图形性能。在电池上进行的Fire Strike 测试将返回物理和图形分数,分别为24234和16281分,而在主电源上则为25033和25471分。
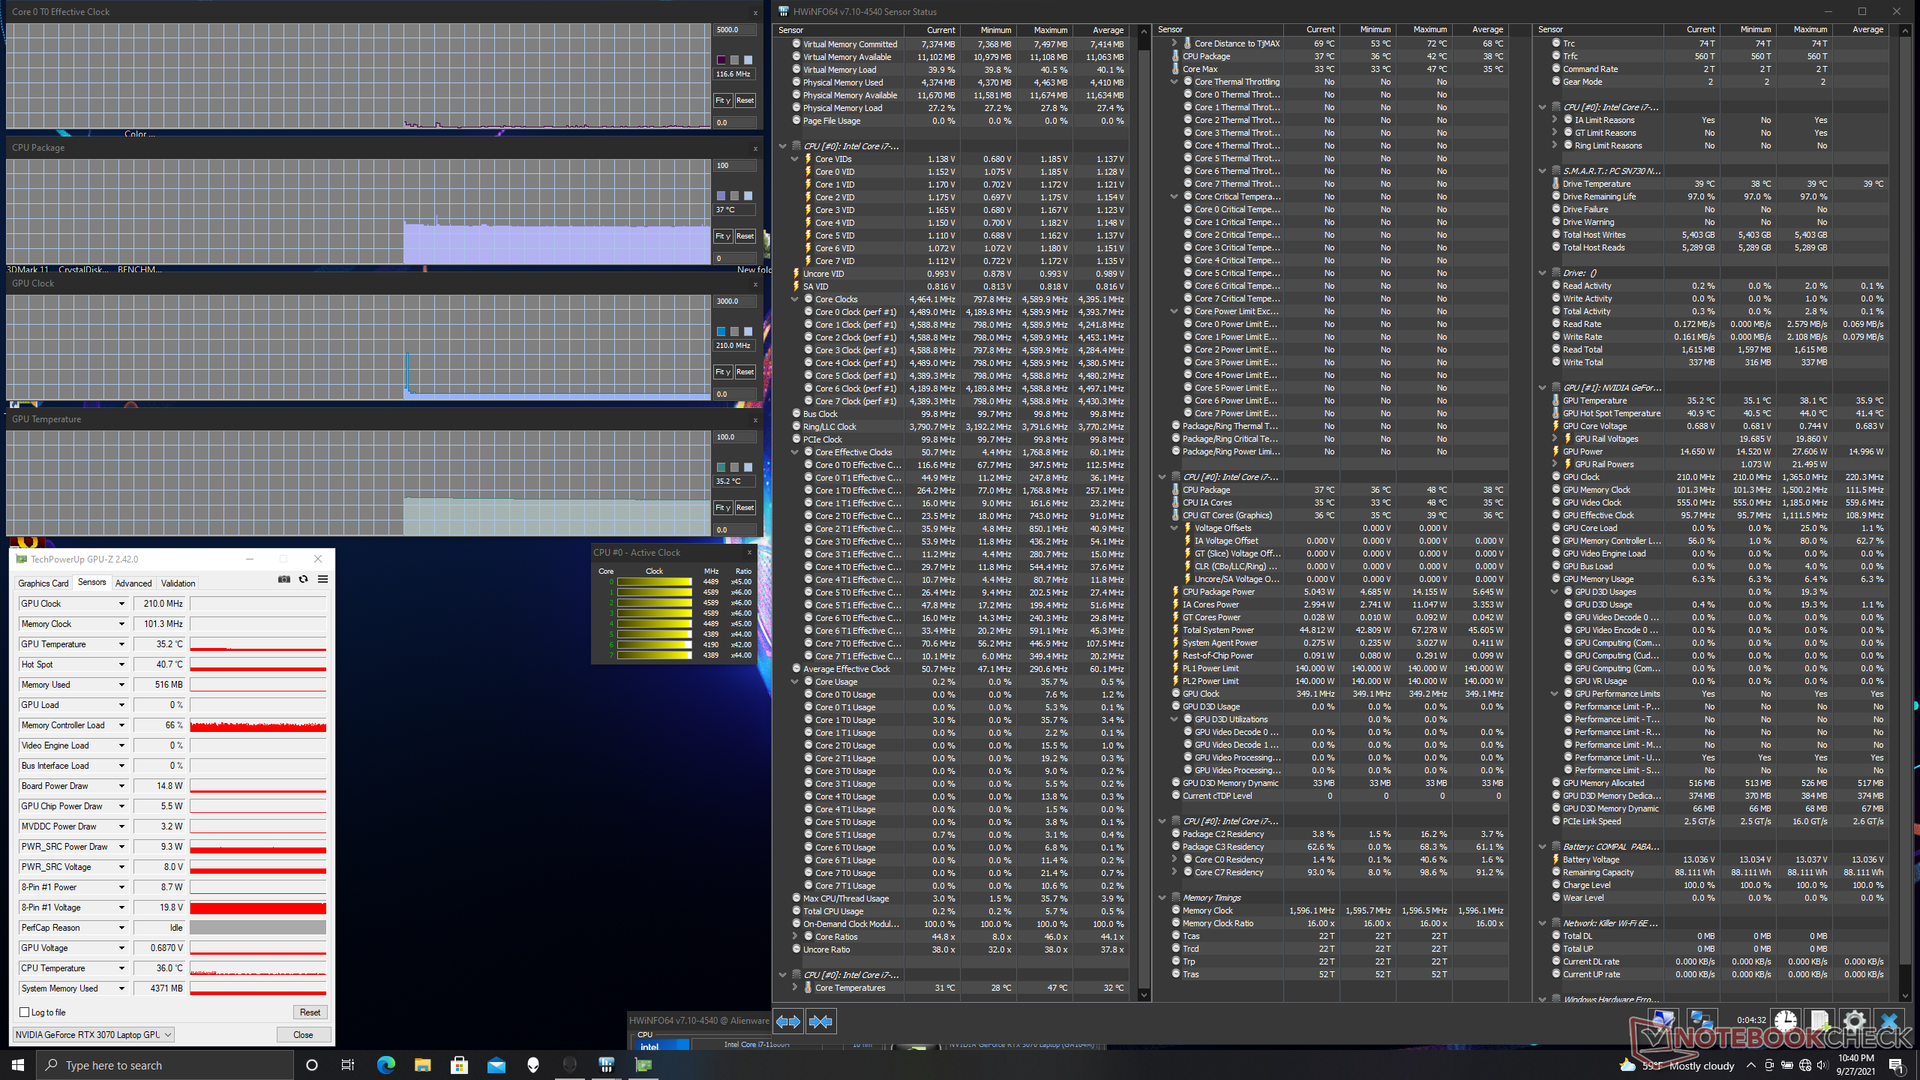
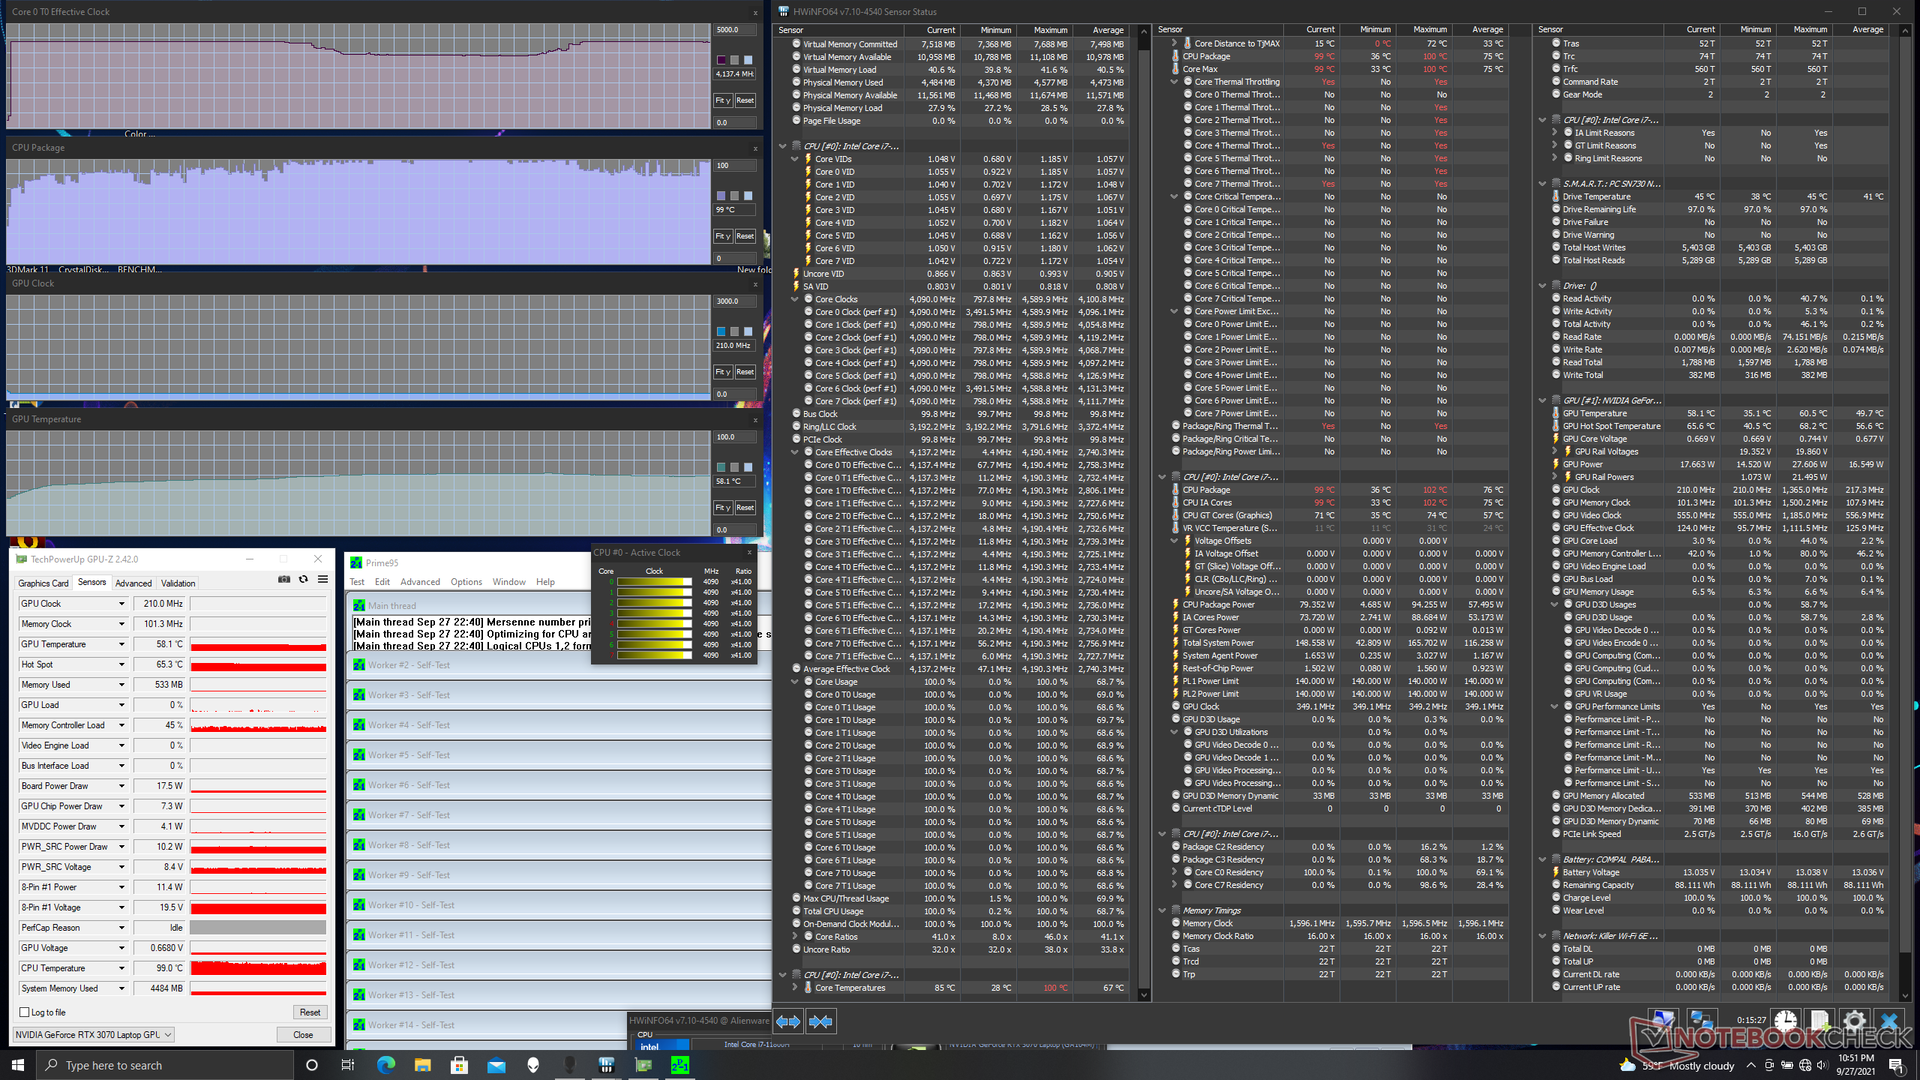
| CPU时钟(GHz) | GPU时钟(MHz) | CPU平均温度(℃) | GPU平均温度(℃) | |
| 系统空闲时 | -- | -- | 37 | 35 |
| Prime95压力 | 3.5 - 4.2 | 90 - 100 | -- | 58 |
| Prime95 + FurMark压力 | 1.6 - 2.0 | 79 | ~1530 | 75 |
| Witcher 3 Stress | 2.6 | 1605 | 74 | 74 |
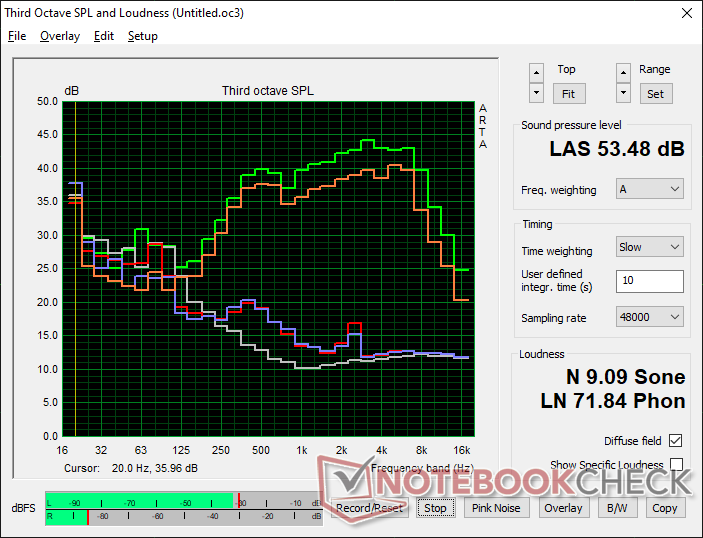
扬声器 - 超极本般的音频质量
扬声器靠近前角。音频质量不错,但在音量和轰动性方面都有所欠缺。")

Alienware x15 RTX 3070 P111F audio analysis
(+) | speakers can play relatively loud (82.7 dB)
Bass 100 - 315 Hz
(-) | nearly no bass - on average 24.2% lower than median
(±) | linearity of bass is average (11.8% delta to prev. frequency)
Mids 400 - 2000 Hz
(±) | higher mids - on average 10.3% higher than median
(±) | linearity of mids is average (8.8% delta to prev. frequency)
Highs 2 - 16 kHz
(±) | higher highs - on average 6.1% higher than median
(±) | linearity of highs is average (8.6% delta to prev. frequency)
Overall 100 - 16.000 Hz
(±) | linearity of overall sound is average (29.3% difference to median)
Compared to same class
» 95% of all tested devices in this class were better, 2% similar, 3% worse
» The best had a delta of 6%, average was 18%, worst was 132%
Compared to all devices tested
» 87% of all tested devices were better, 3% similar, 10% worse
» The best had a delta of 4%, average was 24%, worst was 134%
Apple MacBook 12 (Early 2016) 1.1 GHz audio analysis
(+) | speakers can play relatively loud (83.6 dB)
Bass 100 - 315 Hz
(±) | reduced bass - on average 11.3% lower than median
(±) | linearity of bass is average (14.2% delta to prev. frequency)
Mids 400 - 2000 Hz
(+) | balanced mids - only 2.4% away from median
(+) | mids are linear (5.5% delta to prev. frequency)
Highs 2 - 16 kHz
(+) | balanced highs - only 2% away from median
(+) | highs are linear (4.5% delta to prev. frequency)
Overall 100 - 16.000 Hz
(+) | overall sound is linear (10.2% difference to median)
Compared to same class
» 7% of all tested devices in this class were better, 2% similar, 91% worse
» The best had a delta of 5%, average was 18%, worst was 53%
Compared to all devices tested
» 5% of all tested devices were better, 1% similar, 94% worse
» The best had a delta of 4%, average was 24%, worst was 134%
Energy Management
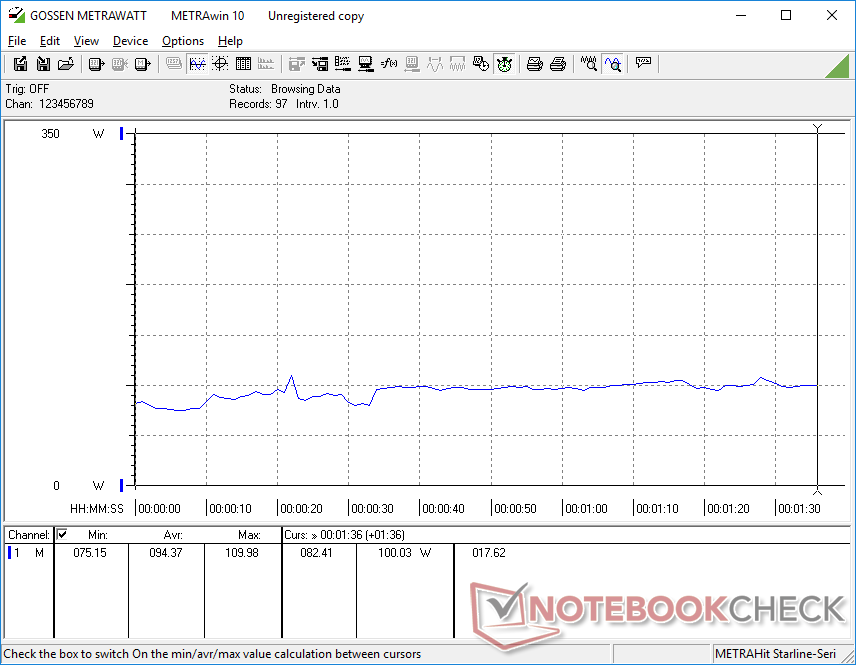
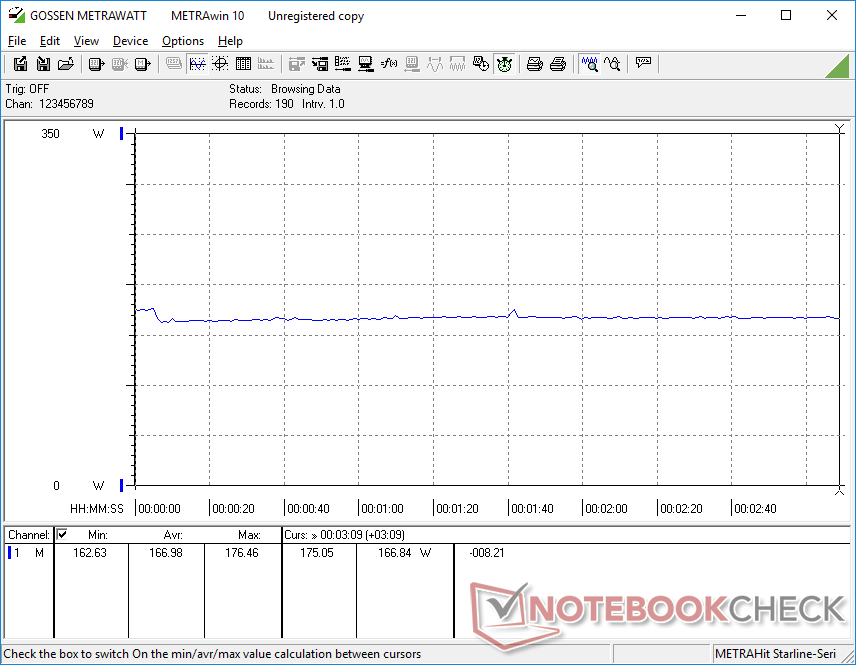
消耗功率
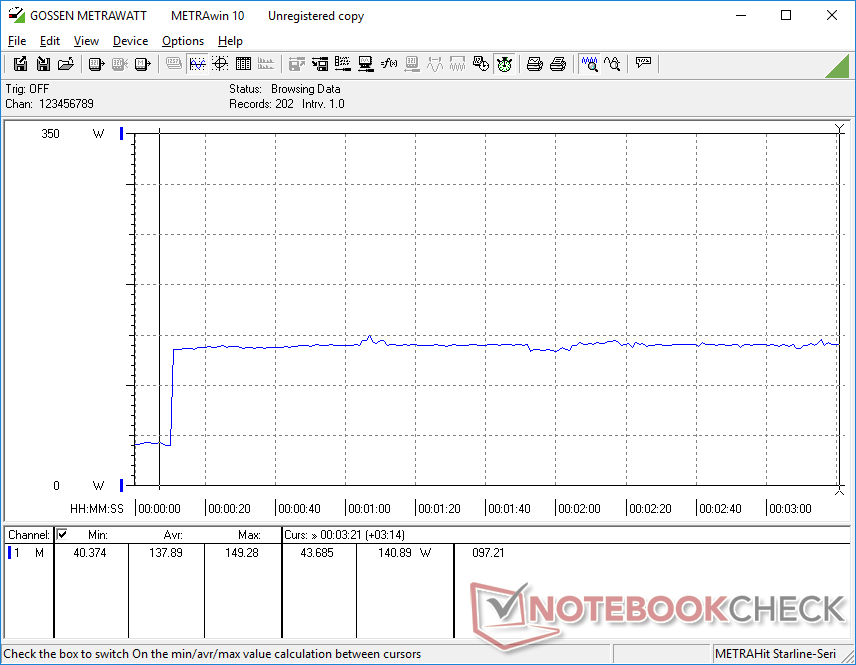
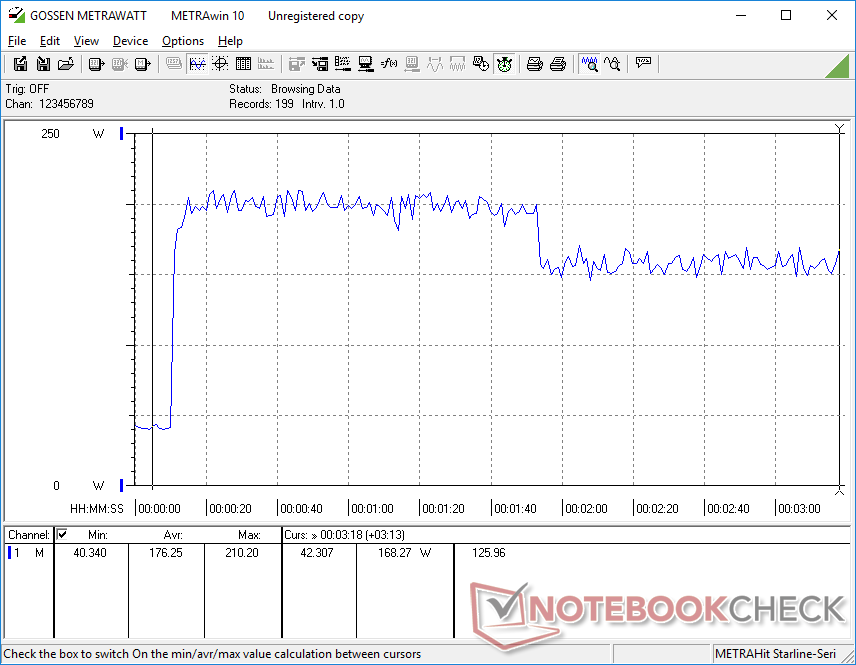
与去年的Alienware m15 R4相比,功耗有了明显改善。在没有运行任何应用程序的情况下,在桌面上空转只消耗16瓦,而旧型号的消耗量是旧型号的2倍多。此外,运行Witcher 3 ,功耗约为167瓦,而配备相同RTX 3070 GPU的m15 R4的功耗为194瓦,尽管性能下降了10%,但却节省了14%的电力。也许不是巧合,194瓦和167瓦之间的差异几乎等同于两台笔记本电脑之间的TGP差异。
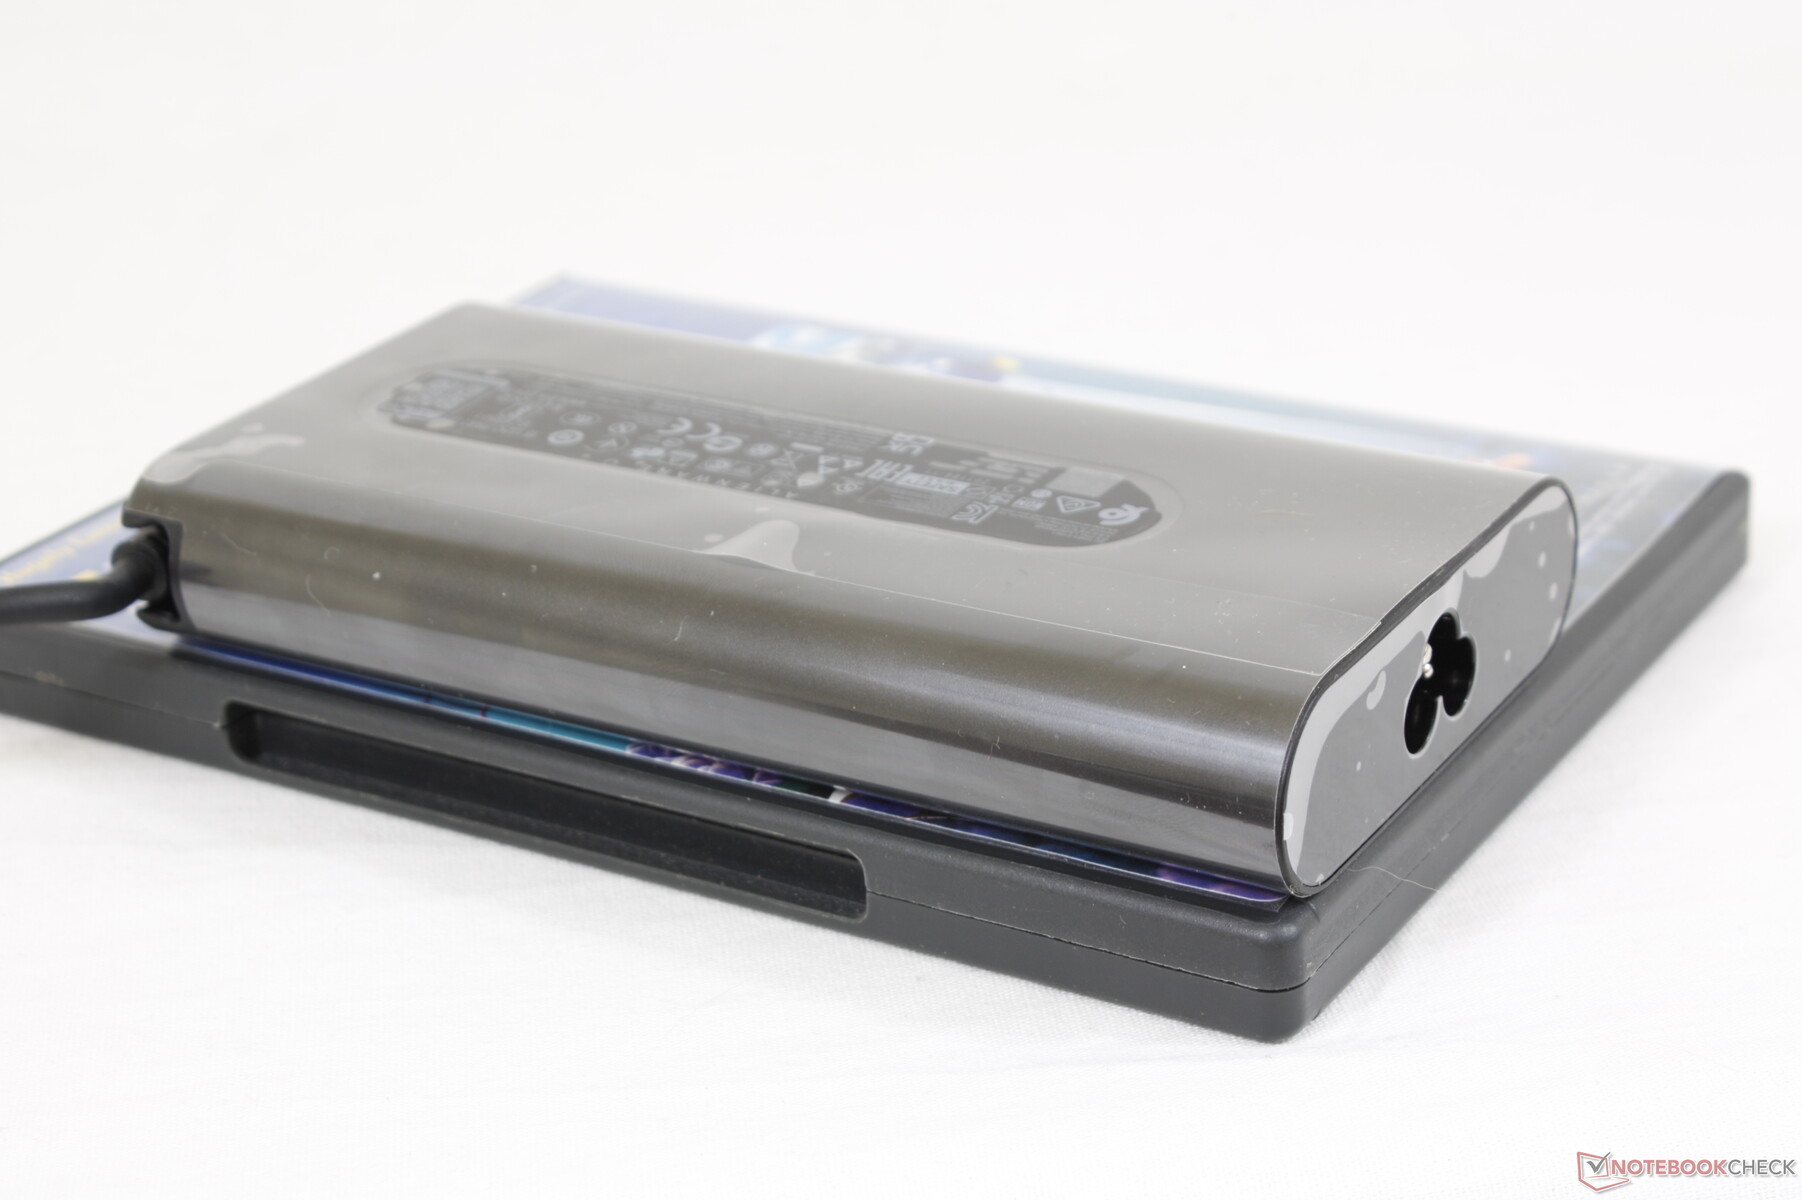
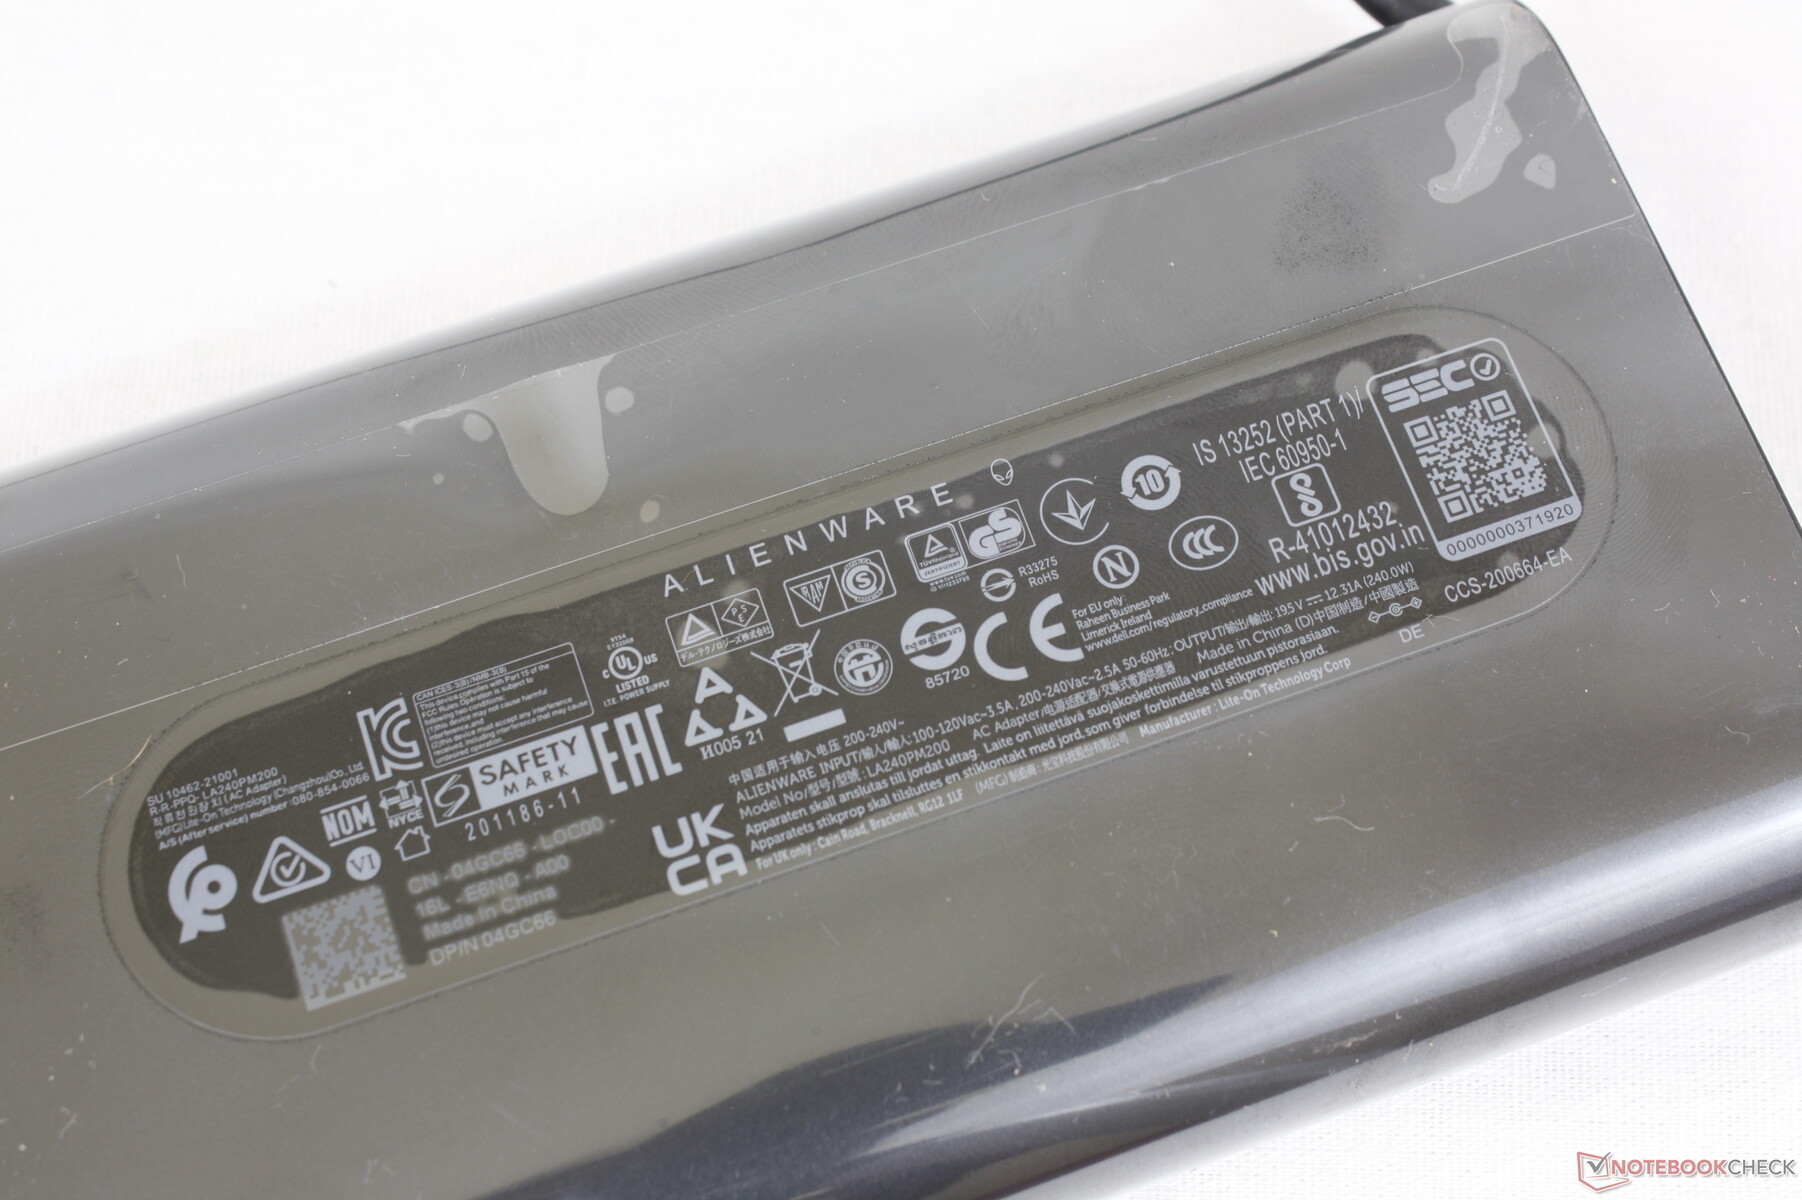
我们能够从中型(约15.2 x 7.6 x 2.4厘米)的240瓦交流适配器中记录到184瓦的临时最大消耗。这个交流适配器也随Alienware x17 R1的某些低端SKU一起提供。
| Off / Standby | |
| Idle | |
| Load |
|
Key:
min: | |
| Alienware x15 RTX 3070 P111F i7-11800H, GeForce RTX 3070 Laptop GPU, WDC PC SN730 SDBPNTY-512G, IPS, 2560x1440, 15.6" | Alienware m15 R4 i9-10980HK, GeForce RTX 3070 Laptop GPU, Micron 2300 1TB MTFDHBA1T0TDV, IPS, 1920x1080, 15.6" | MSI GS66 Stealth 10UG i7-10870H, GeForce RTX 3070 Laptop GPU, WDC PC SN730 SDBPNTY-1T00, IPS, 1920x1080, 15.6" | Razer Blade 15 Advanced (Mid 2021) i7-11800H, GeForce RTX 3080 Laptop GPU, SSSTC CA6-8D1024, IPS, 1920x1080, 15.6" | Asus Zephyrus S15 GX502L i7-10875H, GeForce RTX 2070 Super Mobile, WDC PC SN730 SDBPNTY-1T00, IPS, 1920x1080, 15.6" | Acer Predator Helios 300 PH315-53-786B i7-10750H, GeForce RTX 3070 Laptop GPU, Samsung PM981a MZVLB1T0HBLR, IPS, 1920x1080, 15.6" | |
|---|---|---|---|---|---|---|
| Power Consumption | -54% | 8% | -10% | 8% | 25% | |
| Idle Minimum * (Watt) | 15.7 | 35 -123% | 12.9 18% | 19.5 -24% | 7 55% | 4 75% |
| Idle Average * (Watt) | 20.3 | 39 -92% | 15.4 24% | 23.3 -15% | 13 36% | 11 46% |
| Idle Maximum * (Watt) | 43 | 48 -12% | 27.1 37% | 40.1 7% | 25 42% | 24 44% |
| Load Average * (Watt) | 94.4 | 135 -43% | 98.2 -4% | 98.9 -5% | 148 -57% | 91 4% |
| Witcher 3 ultra * (Watt) | 167 | 194 -16% | 164.9 1% | 174 -4% | 175 -5% | 164 2% |
| Load Maximum * (Watt) | 183.4 | 252 -37% | 232.9 -27% | 214 -17% | 232 -26% | 220 -20% |
* ... smaller is better
Power Consumption Witcher 3 / Stresstest
电池寿命--比以前长多了
与从Alienware m17到x17的跳跃一样,从Alienware m15到x15的跳跃也导致了整体电池寿命的显著提升,这是因为上文提到的电源效率的提高。我们记录的WLAN总运行时间刚刚超过6小时,而Alienware m15 R4的运行时间不到2小时,尽管电池容量几乎保持在87Wh。
使用附带的AC桶式适配器,从空到满的充电速度很快,约为75分钟。支持用USB-C充电,但充电速度较慢。
| Alienware x15 RTX 3070 P111F i7-11800H, GeForce RTX 3070 Laptop GPU, 87 Wh | Alienware m15 R4 RTX 3080 i9-10980HK, GeForce RTX 3080 Laptop GPU, 86 Wh | MSI GS66 Stealth 10UG i7-10870H, GeForce RTX 3070 Laptop GPU, 99.9 Wh | Razer Blade 15 Advanced (Mid 2021) i7-11800H, GeForce RTX 3080 Laptop GPU, 80 Wh | Asus Zephyrus S15 GX502L i7-10875H, GeForce RTX 2070 Super Mobile, 76 Wh | Acer Predator Helios 300 PH315-53-786B i7-10750H, GeForce RTX 3070 Laptop GPU, 58.75 Wh | |
|---|---|---|---|---|---|---|
| Battery runtime | -41% | 57% | -3% | 2% | 27% | |
| Reader / Idle (h) | 9.7 | 10.8 11% | 8.7 -10% | 10.6 9% | ||
| WiFi v1.3 (h) | 6.1 | 1.8 -70% | 7.1 16% | 5.9 -3% | 3 -51% | 6.4 5% |
| Load (h) | 0.9 | 0.8 -11% | 2.2 144% | 1.5 67% | 1.5 67% | |
| Witcher 3 ultra (h) | 0.8 |
Pros
Cons
结论 - 巨大的飞跃,少数的退步
戴尔力图打造的不仅是最薄的15.6英寸Alienware笔记本电脑,也是目前最薄的15.6英寸游戏笔记本电脑,配有GeForce RTX图形。Alienware x15 R1在这方面值得肯定,但它也有一些缺点,用户应该注意。
首先,GPU TGP已经从Alienware m15 R4的140W调低到较新的x15 R1上的仅90-110W,图形性能同比略微减慢。其次,该系统比许多竞争性的15.6英寸游戏笔记本(如Razer Blade 15)更重,占地面积更大。 Razer Blade 15或 微星GS66尽管对冷却有额外的关注。第三,用户无法升级内存,这可能会使发烧友感到不快。最后,不寻常的端口定位可能对许多用户不利。
Alienware x15 R1比Alienware m15 R5更薄、更精简、更冷、更持久。然而,就原始图形潜力而言,它不一定更快。
然而,在其他许多方面,x15 R1比m15系列有很大的改进。电池寿命、功耗、风扇行为,特别是表面温度,这次都要好得多,尽管新设计更薄,而且有许多相同的显示选项。处理器性能和关键反馈也都比预期的好。如果你重视最大限度地提高CPU性能,而不满足于更厚的型号,如 Area-51m或 微星GT系列,那么Alienware x15将是你的最佳解决方案。如果你打算经常旅行,那么更轻、更紧凑的 刀片15可以提供非常相似的游戏性能。
价格和可用性
Alienware x15 RTX 3070 P111F
- 09/30/2021 v7 (old)
Allen Ngo
Price comparison

