Gigabyte A7 X1在审查中。游戏笔记本提供稳定的续航性能

通过Gigabyte G5 KC ,我们最近审查了该制造商的一台笔记本电脑,其价格略低于1,000欧元(约合1,162美元),但仍然是一个强大的设备。价格在2,400欧元(约合2,789美元)左右,技嘉还提供相当昂贵的型号,如Aero 15 OLED XD 。
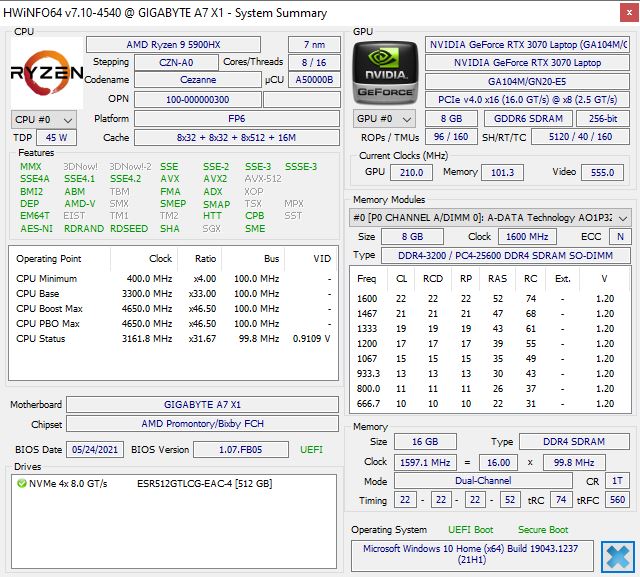
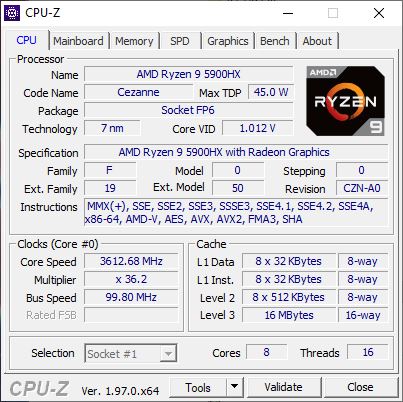
我们目前的评测样品在定价方面处于中间位置,约为1800欧元(约2,092美元),配备了AMD Ryzen 9 5900HX和NvidiaGeForce RTX 3070 。它还配备了16GB内存和512GB固态硬盘。
Possible contenders in comparison
Rating | Date | Model | Weight | Height | Size | Resolution | Price |
|---|---|---|---|---|---|---|---|
| 83.2 % v7 (old) | 10 / 2021 | Gigabyte A7 X1 R9 5900HX, GeForce RTX 3070 Laptop GPU | 2.5 kg | 34 mm | 17.30" | 1920x1080 | |
| 85 % v7 (old) | 08 / 2021 | Medion Erazer Beast X25 R9 5900HX, GeForce RTX 3080 Laptop GPU | 2.3 kg | 23 mm | 17.30" | 1920x1080 | |
| 85.5 % v7 (old) | Medion Erazer Beast X20 i7-10870H, GeForce RTX 3070 Laptop GPU | 2.2 kg | 23 mm | 17.30" | 2560x1440 | ||
| 82.8 % v7 (old) | 10 / 2021 | Asus TUF Gaming F17 FX706HM i9-11900H, GeForce RTX 3060 Laptop GPU | 2.7 kg | 26 mm | 17.30" | 1920x1080 | |
| 85.1 % v7 (old) | Schenker XMG Neo 17 (Early 2021, RTX 3070, 5800H) R7 5800H, GeForce RTX 3070 Laptop GPU | 2.5 kg | 27 mm | 17.30" | 2560x1440 |
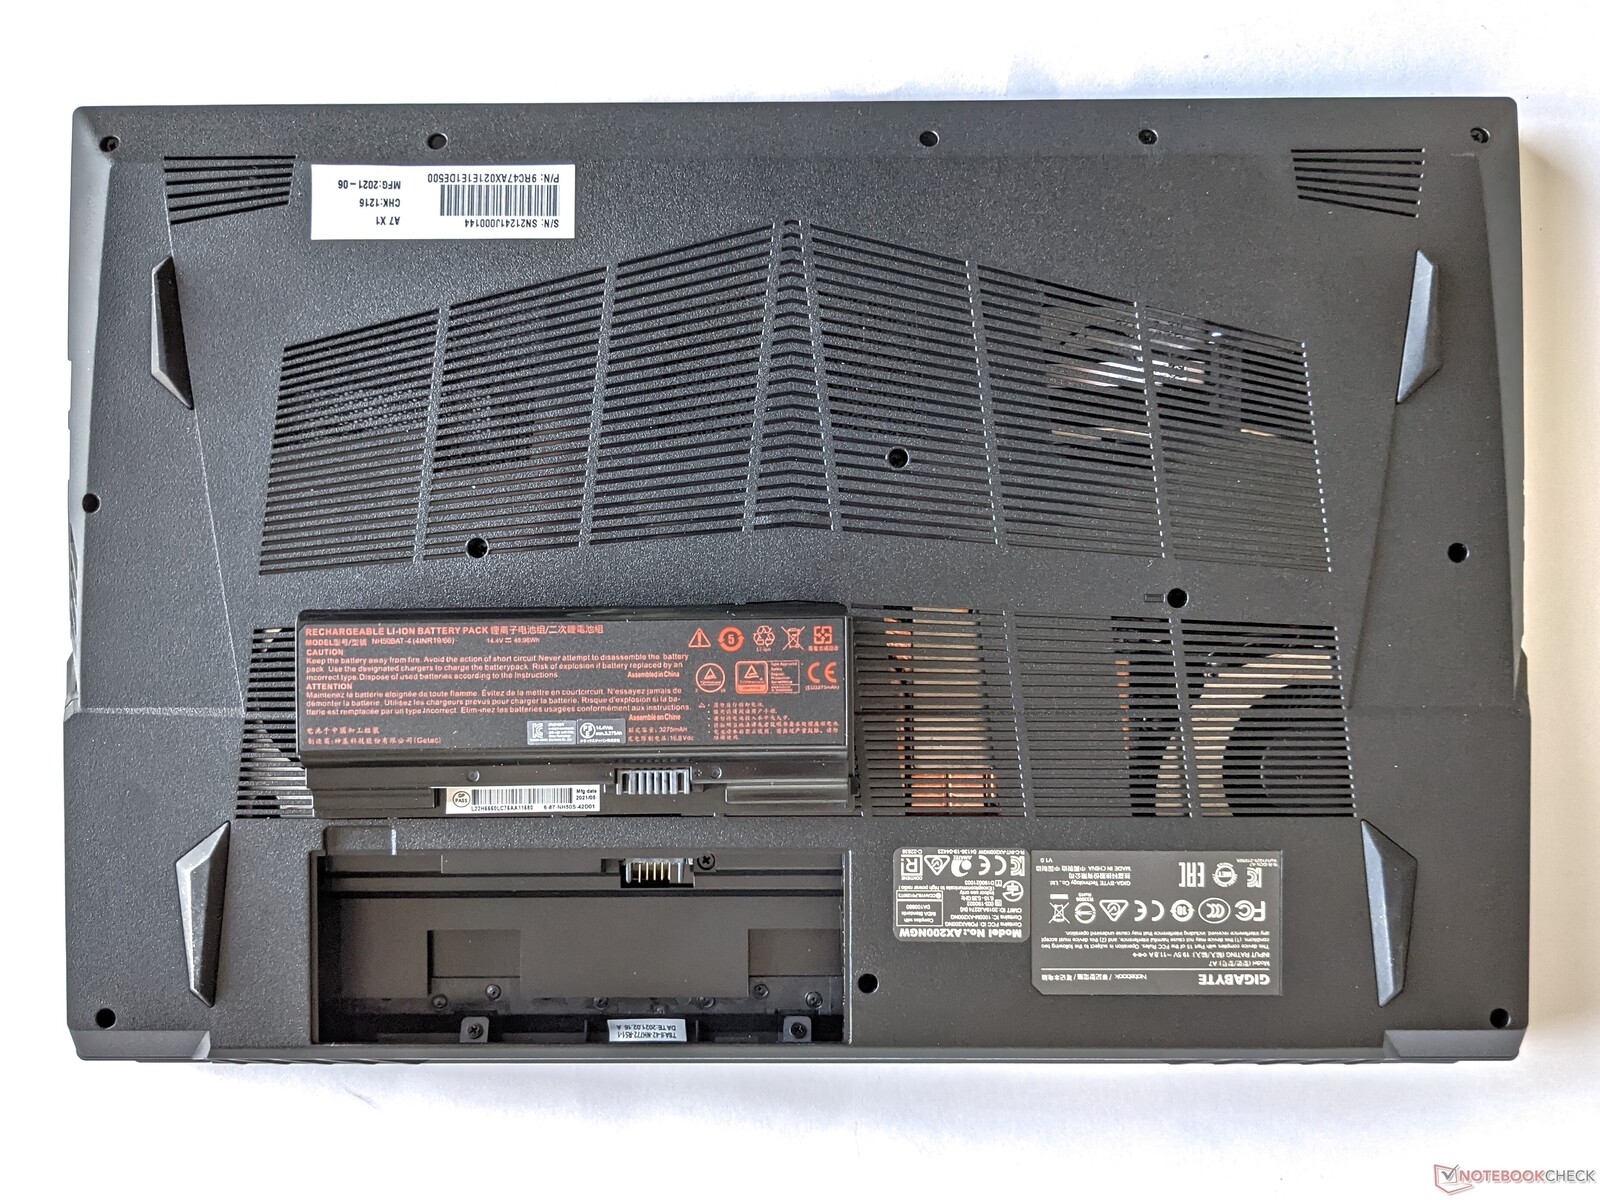
案例 - 可更换电池的游戏笔记本
技嘉为A7 X1使用了一个塑料外壳,它的制造质量不错,看起来很结实。显示屏可以打开到大约135°的最大角度,并通过铰链牢牢固定在每个位置。底部有宽敞的通风口,电池也在这里,不需要任何工具就可以取出。
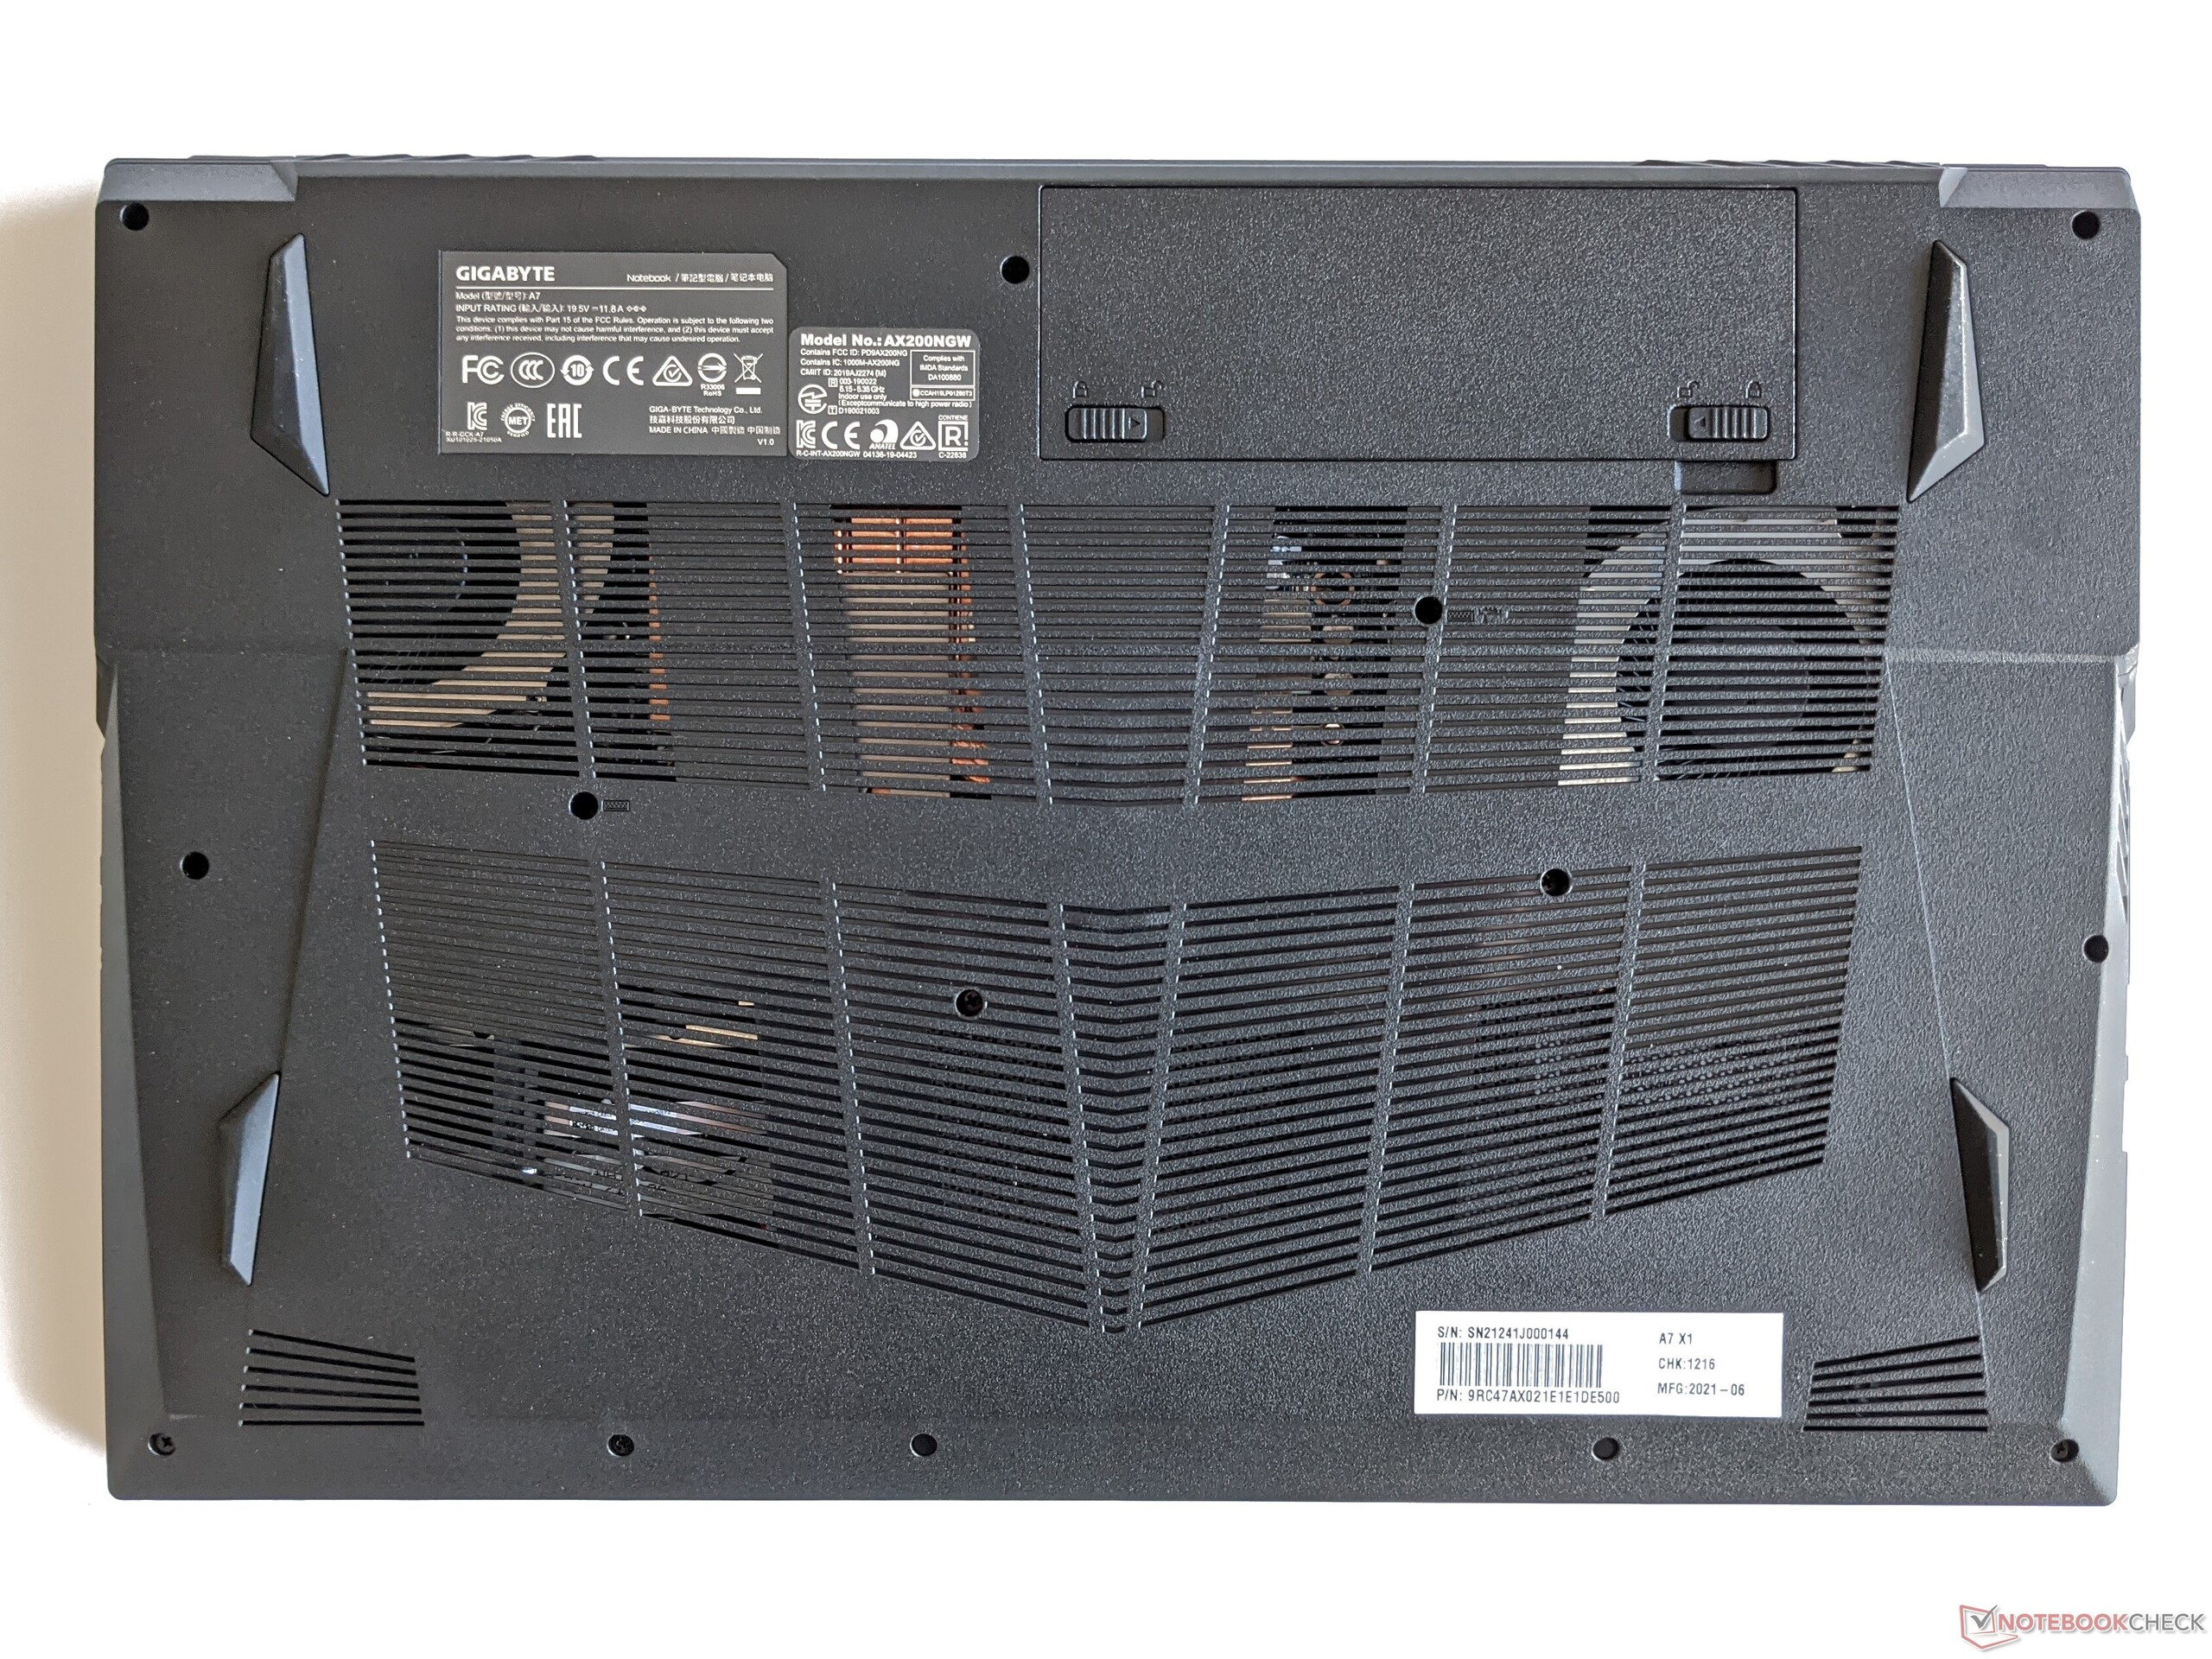
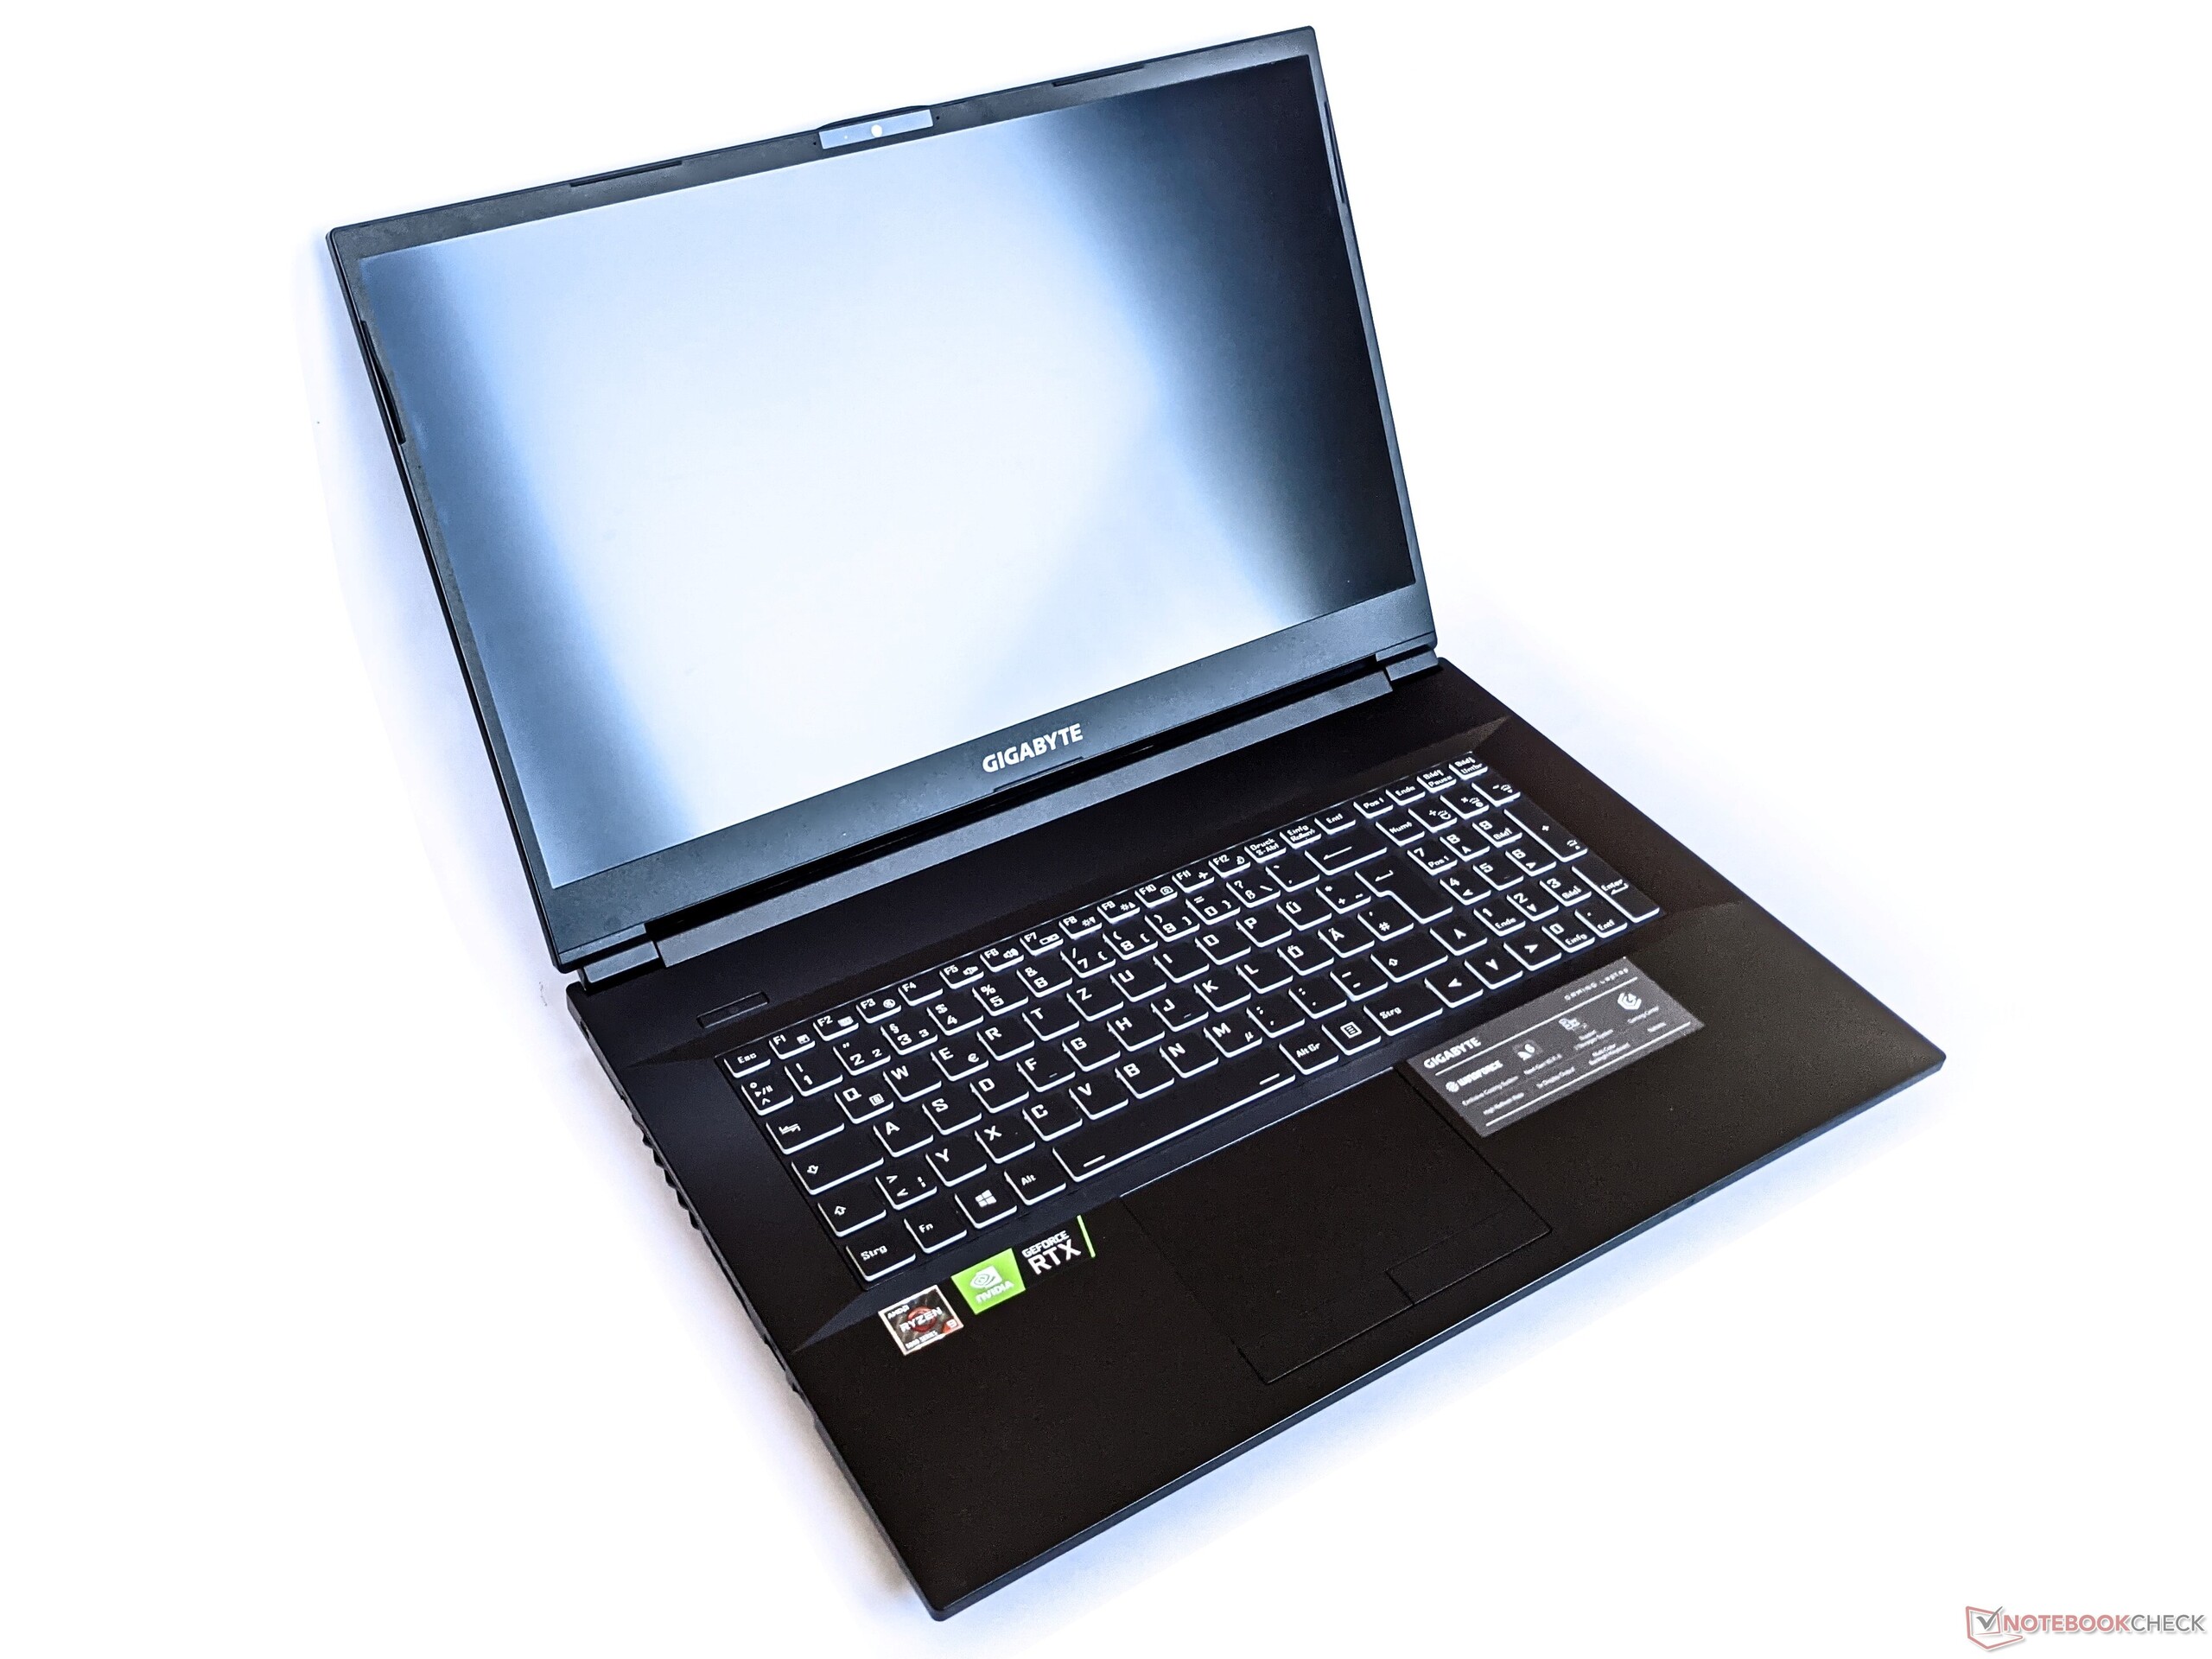
在长度和宽度方面,技嘉A7 X1与其他17英寸游戏笔记本电脑没有什么不同。然而,它的厚度明显高于大多数竞争对手,为3.4厘米。
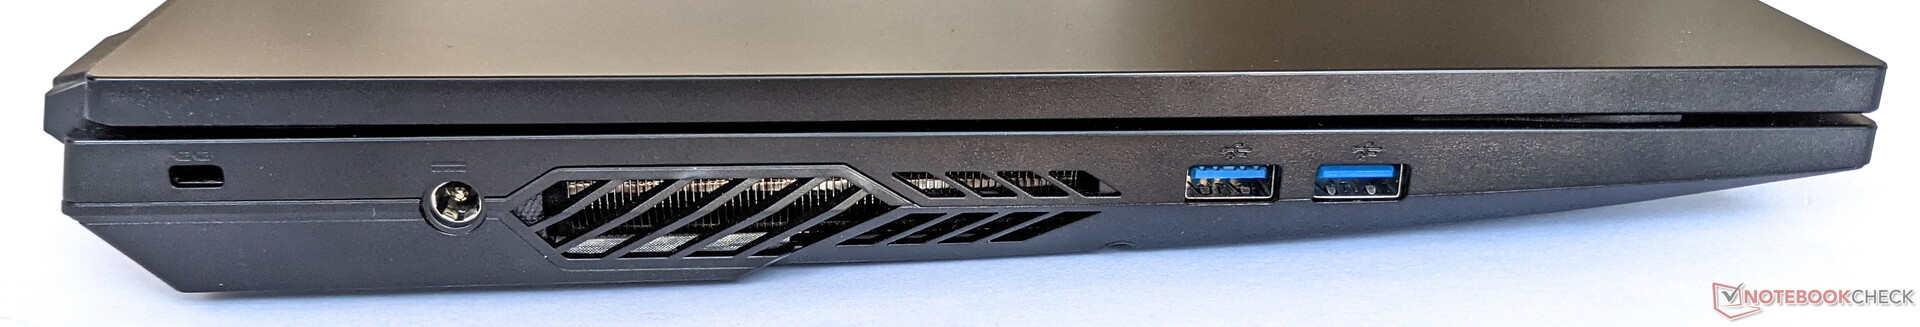
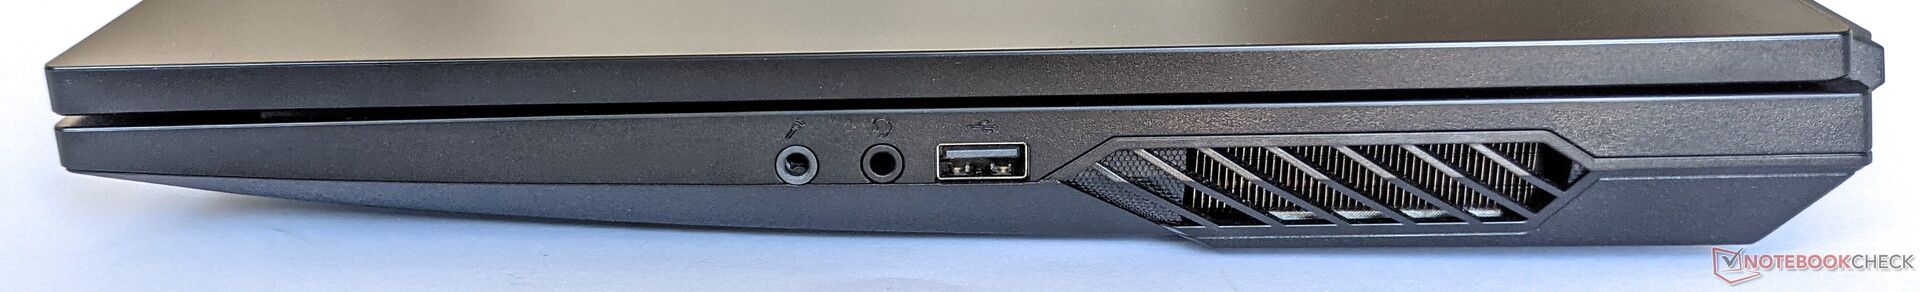
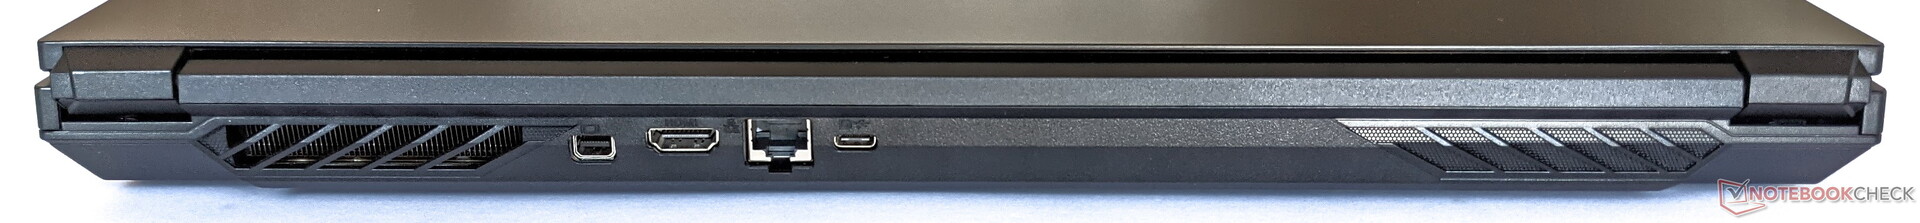
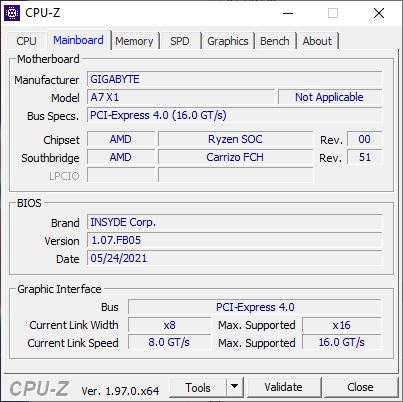
连接性 - 笔记本电脑支持连接多个显示器
技嘉A7 X1提供了基本的各种端口。这里值得注意的是背面的USB-C端口,它也支持DisplayPort 1.4。结合Mini DP和HDMI,有许多外部显示器的连接选项。
沟通
技嘉A7 X1可以通过千兆网络、蓝牙5.2和Wi-Fi 6建立网络连接。与我们的Netgear Nighthawk AX12参考路由器相结合,后者发送数据的平均速度为988 Mb/s,接收数据的平均速度为1,432 Mb/s。虽然第一个数值只够在我们的测试领域中排名倒数第二,但在接收数据方面,A7 X1超过了我们选择的竞争设备。
| Networking | |
| iperf3 transmit AX12 | |
| Medion Erazer Beast X25 | |
| Medion Erazer Beast X20 | |
| Schenker XMG Neo 17 (Early 2021, RTX 3070, 5800H) | |
| Average Intel Wi-Fi 6 AX200 (447 - 1645, n=127) | |
| Gigabyte A7 X1 | |
| Asus TUF Gaming F17 FX706HM | |
| iperf3 receive AX12 | |
| Gigabyte A7 X1 | |
| Medion Erazer Beast X25 | |
| Schenker XMG Neo 17 (Early 2021, RTX 3070, 5800H) | |
| Average Intel Wi-Fi 6 AX200 (523 - 1684, n=128) | |
| Medion Erazer Beast X20 | |
| Asus TUF Gaming F17 FX706HM | |
网络摄像头
像大多数其他制造商一样,技嘉在A7 X1中安装了一个低分辨率的90万像素网络摄像头。即使在良好的照明条件下,网络摄像头也会显示模糊的图像和过于苍白的颜色。


辅料
Gigabyte A7 X1除了笔记本外,还配备了相应的电源适配器。其他配件和更换电池等,可以直接向技嘉公司订购。
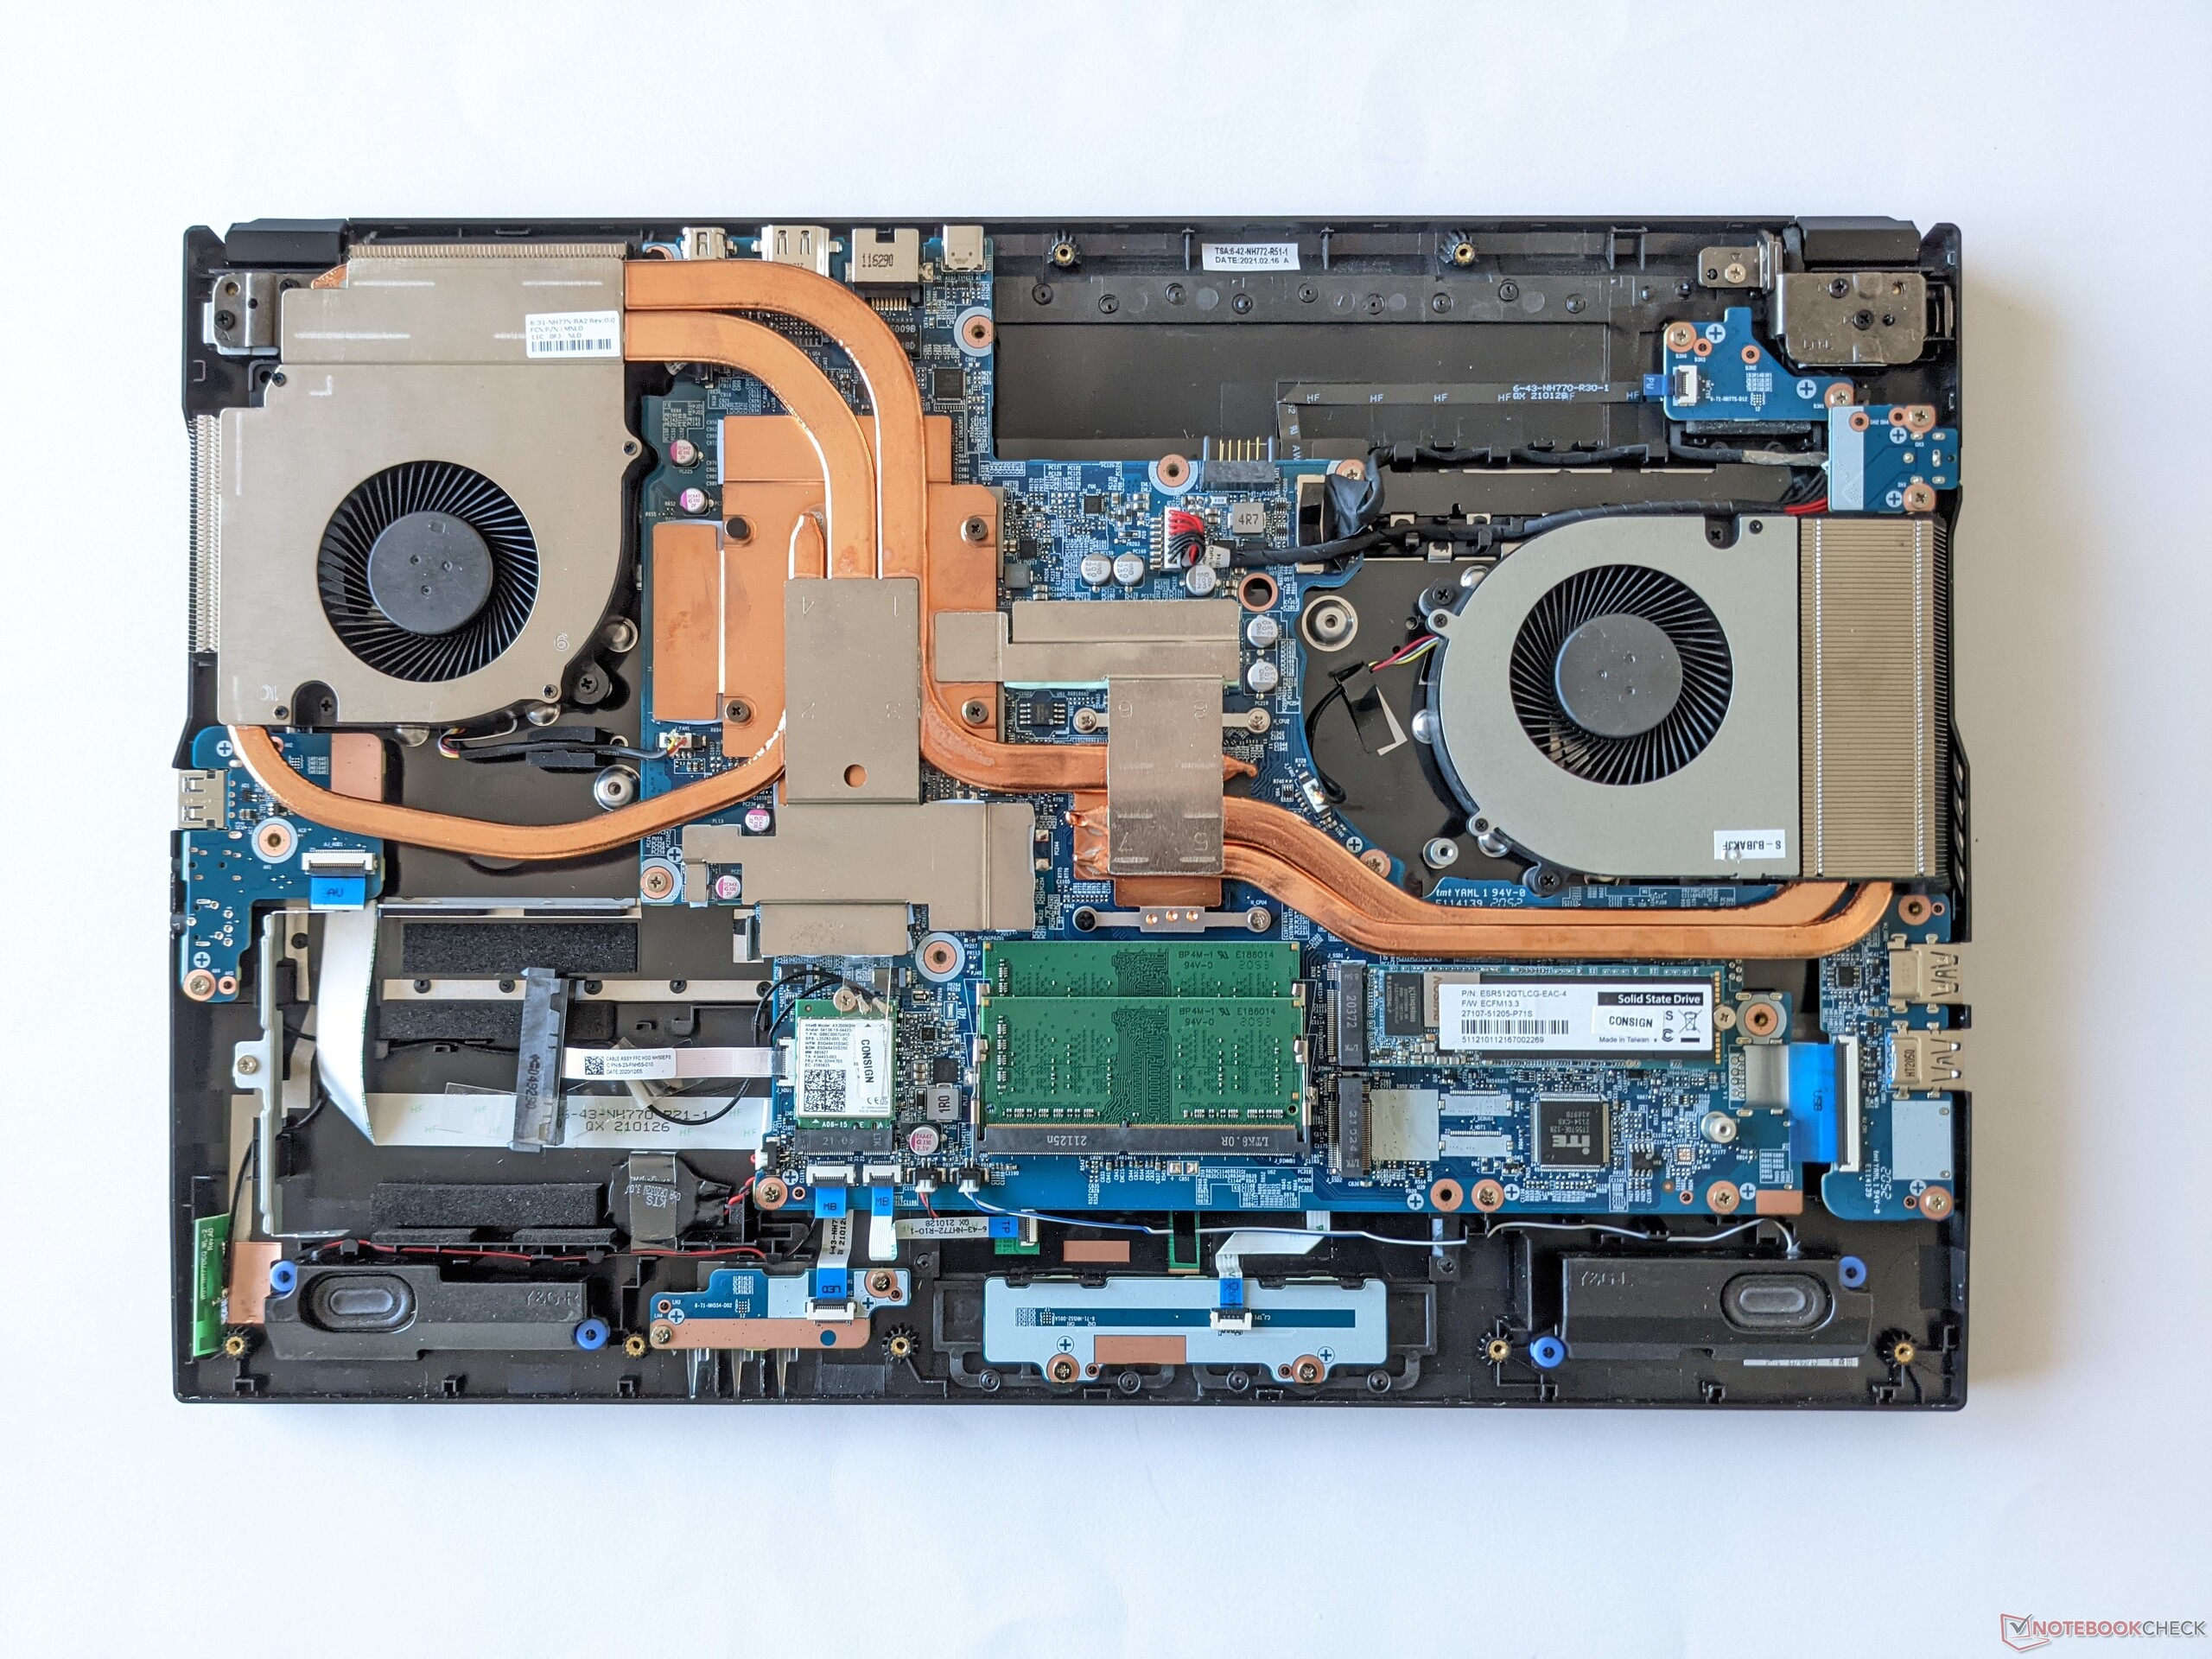
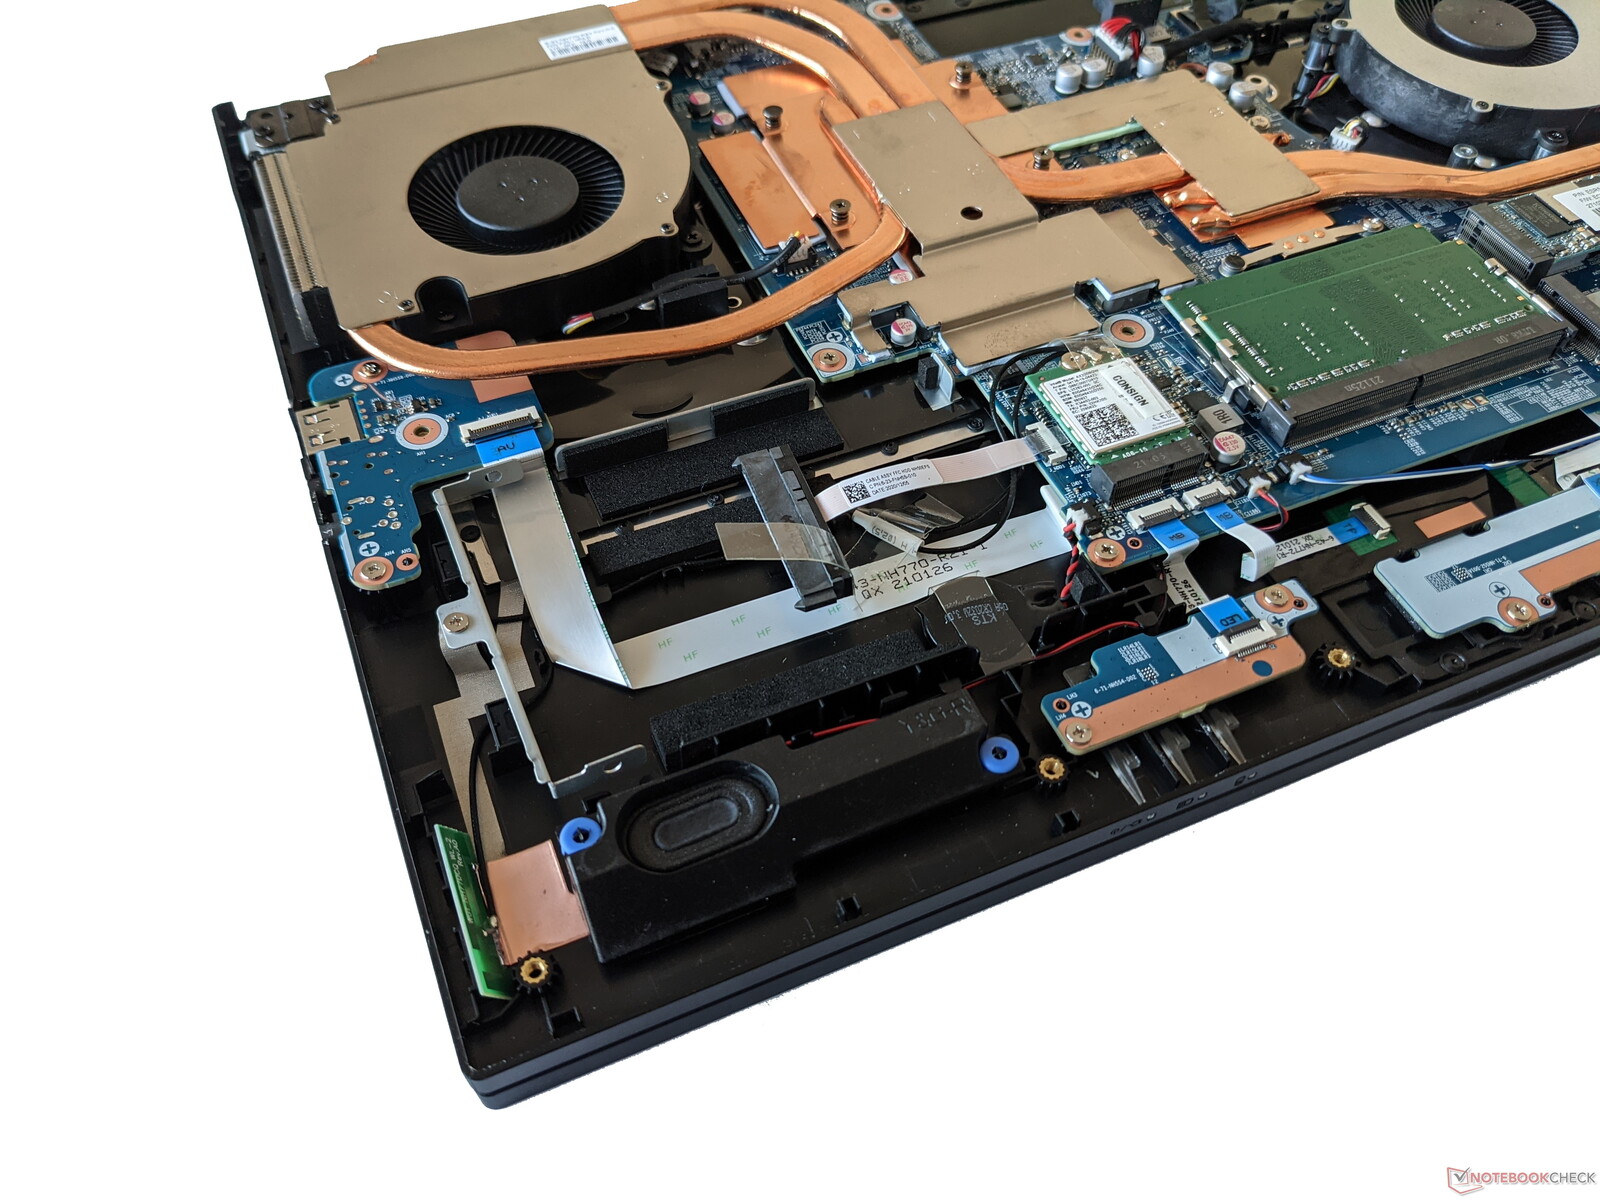
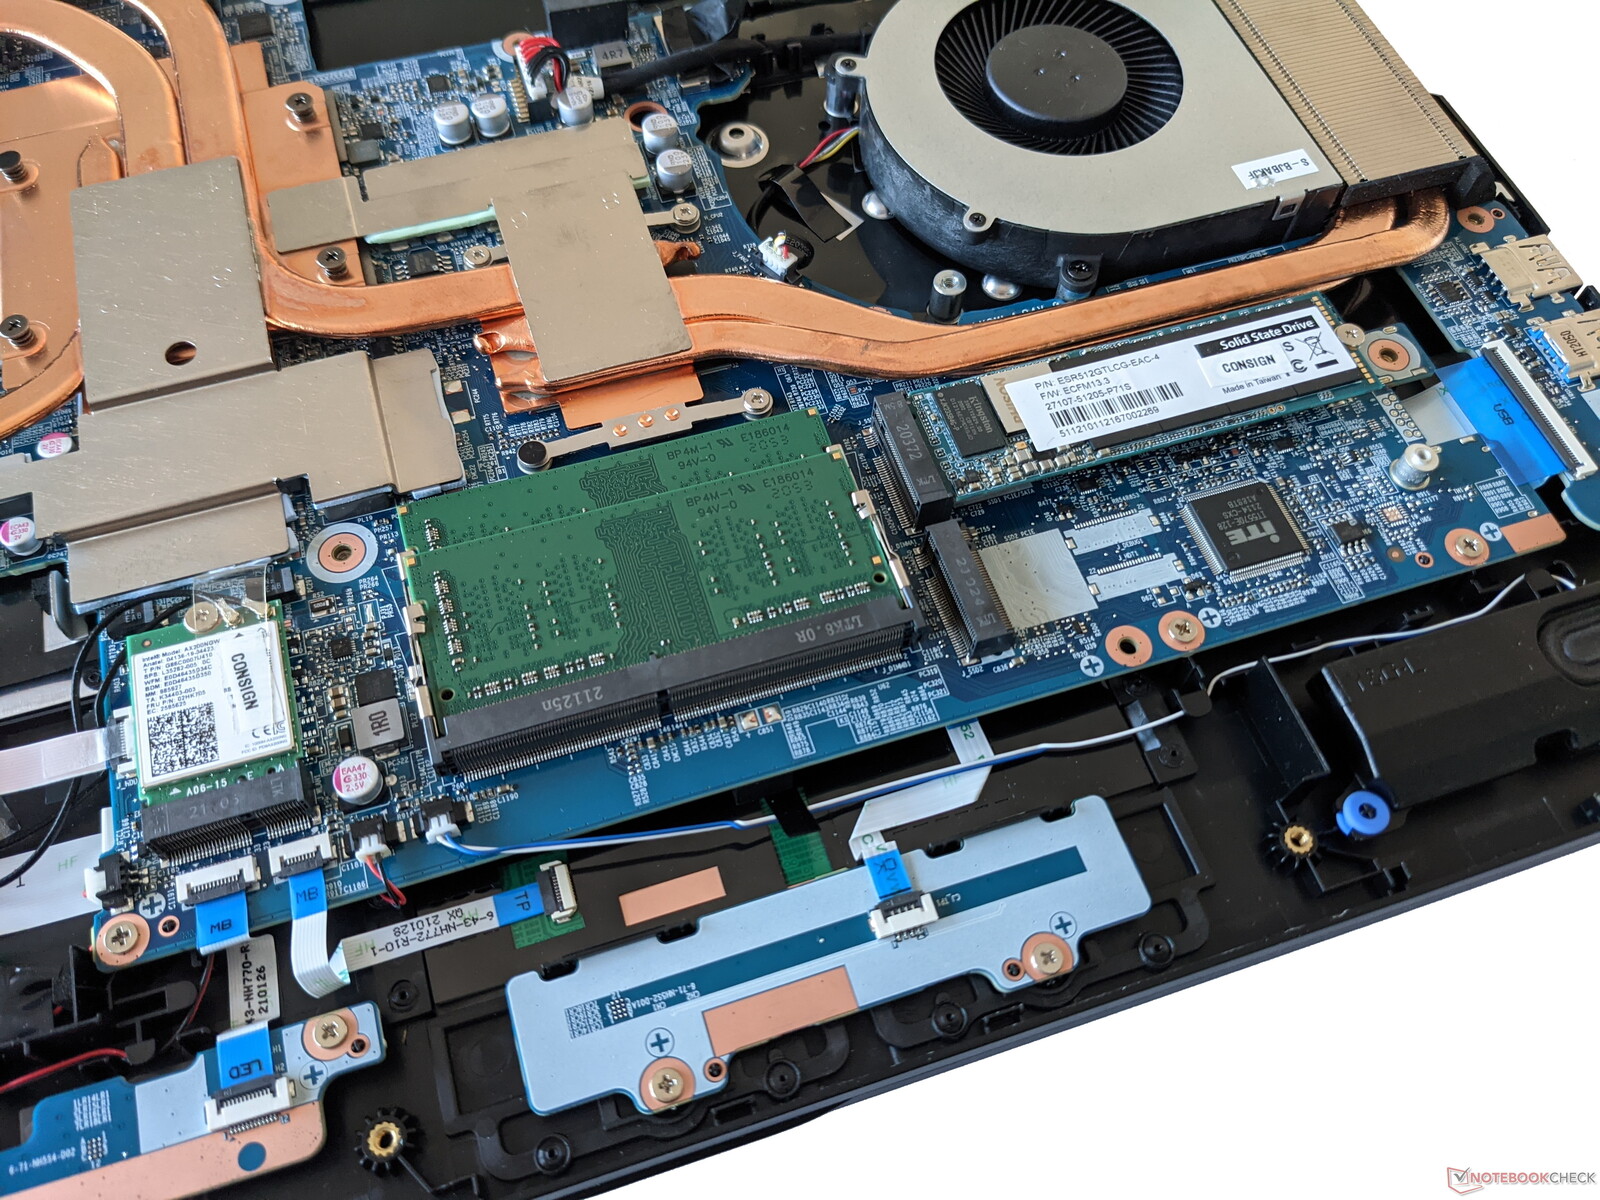
维护
Gigabyte A7 X1的底盖在卸下所有可见的螺丝后可以取下。内部可以看到一个空的2.5英寸驱动器插槽。WLAN模块和RAM也可以被替换。此外,在工厂安装的固态硬盘旁边还有第二个M.2插槽。
担保
Gigabyte为A7 X1提供了24个月的保修期。
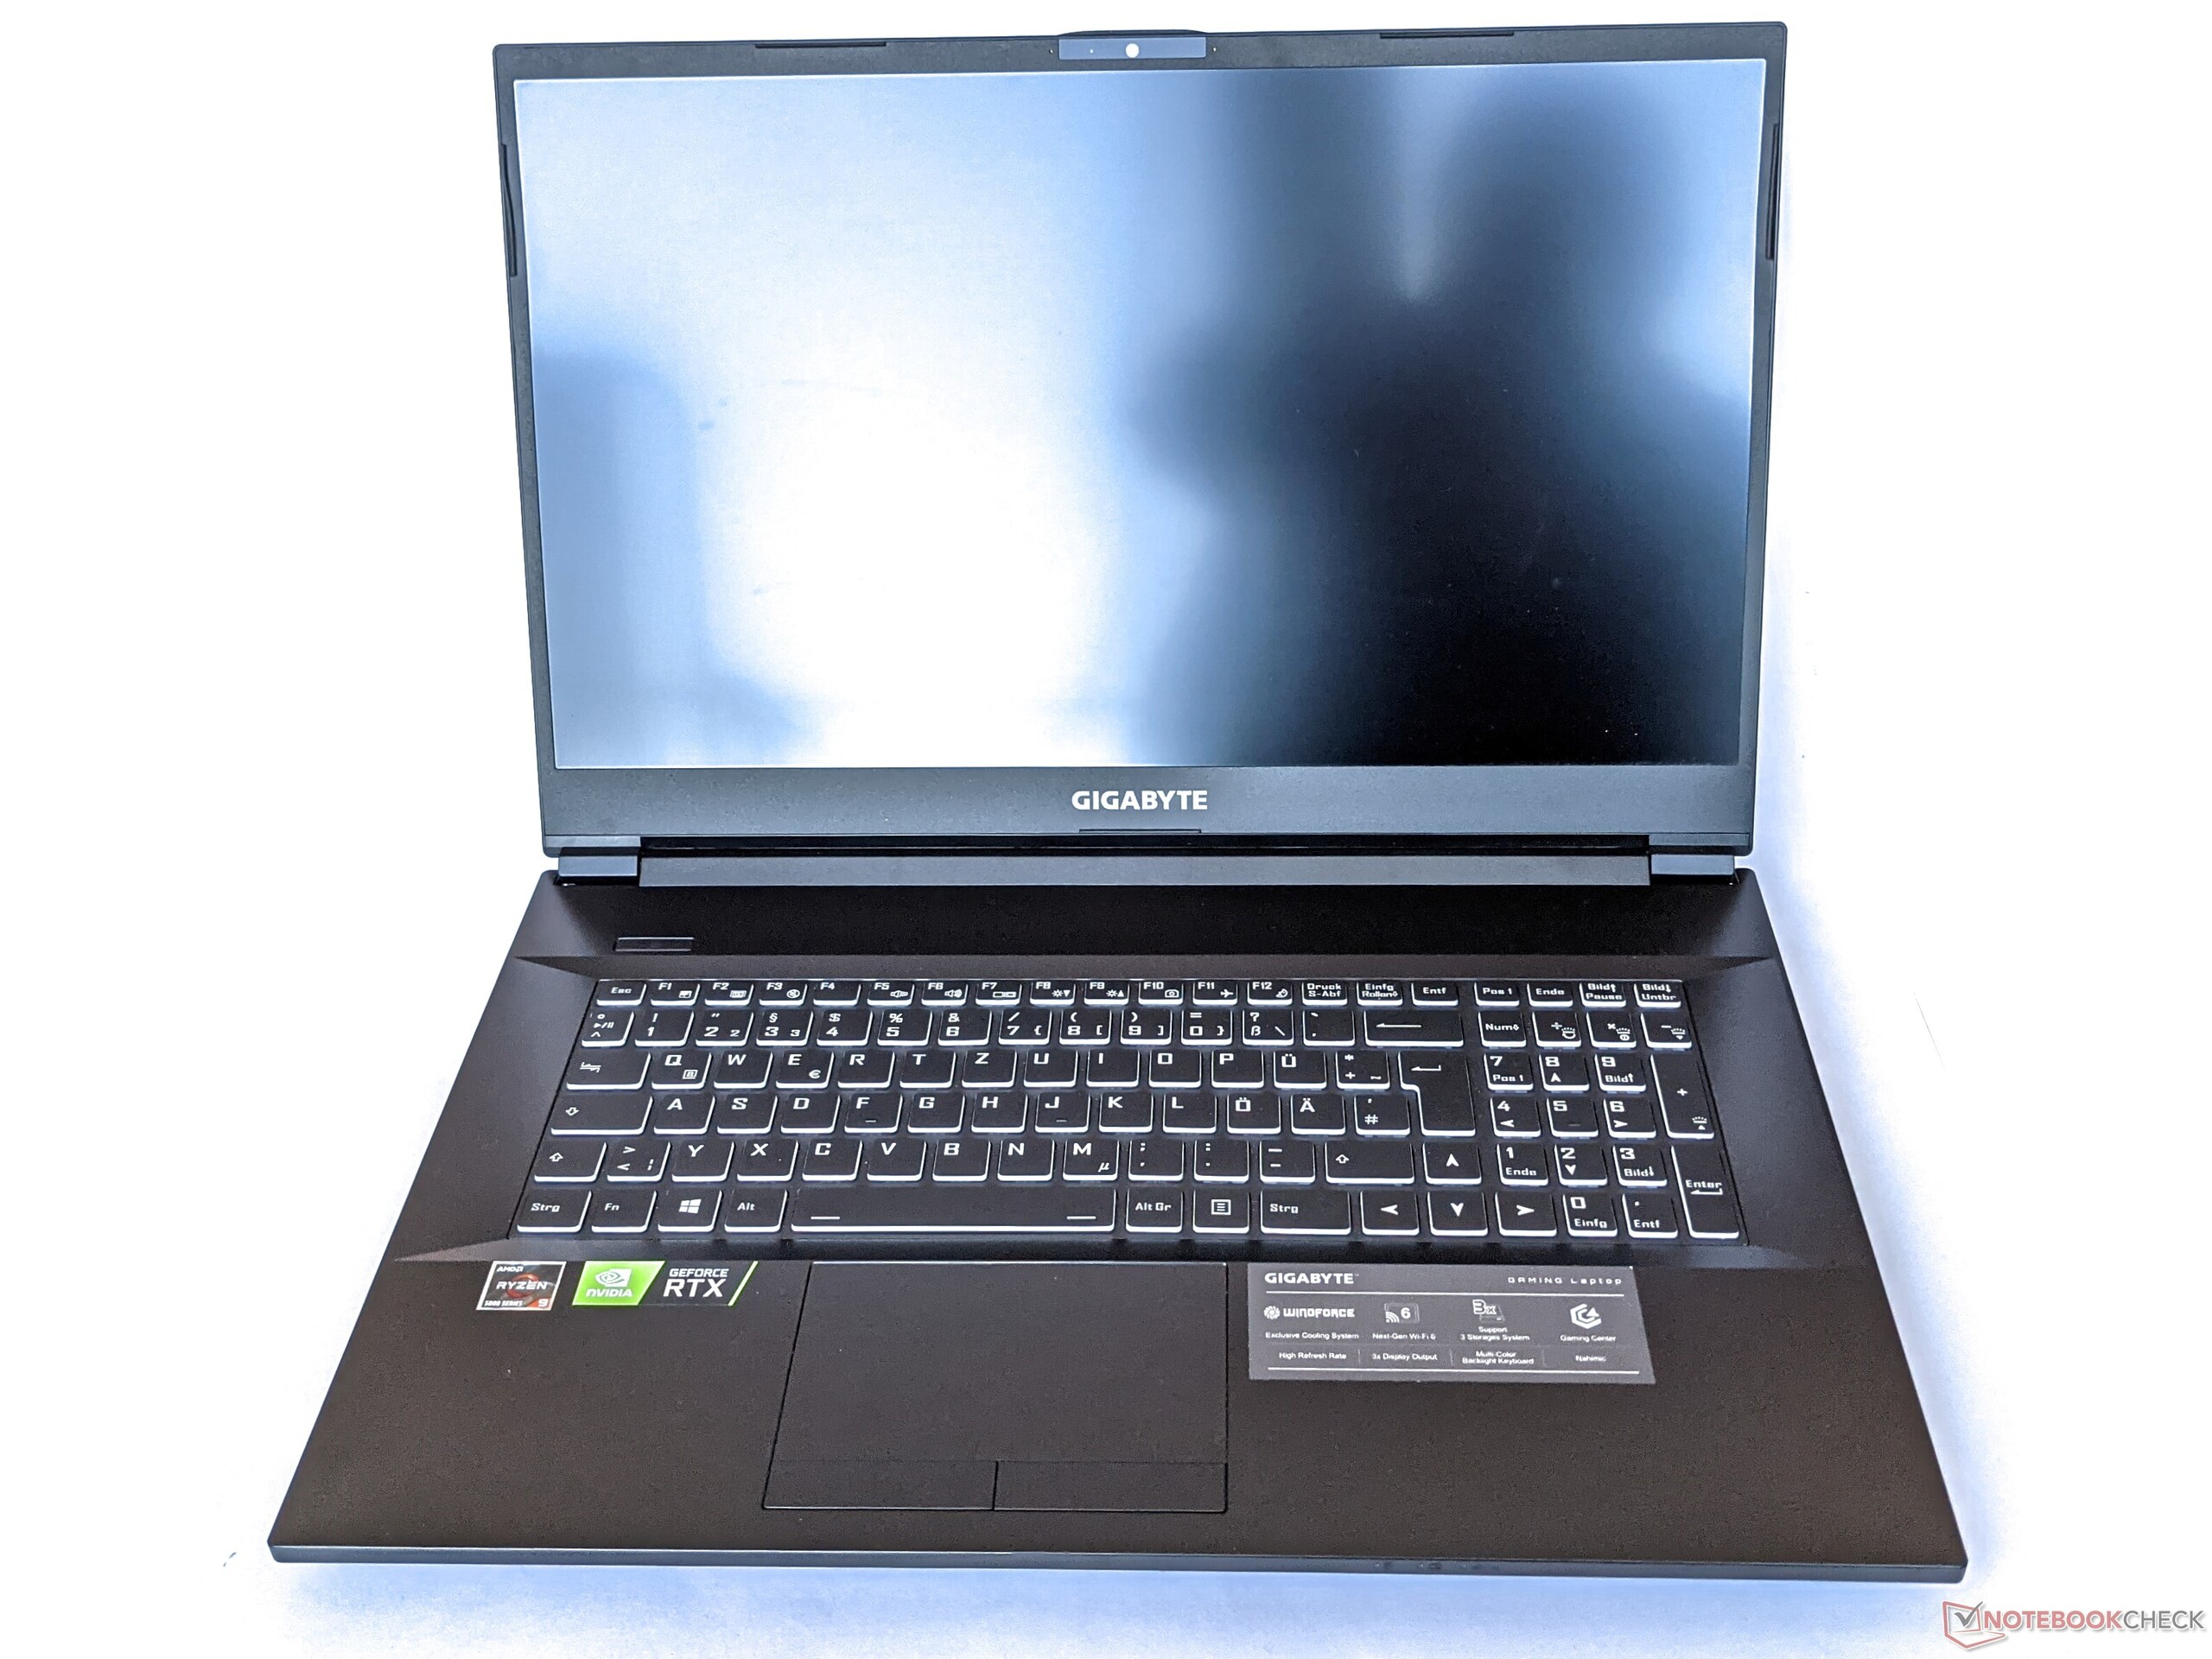
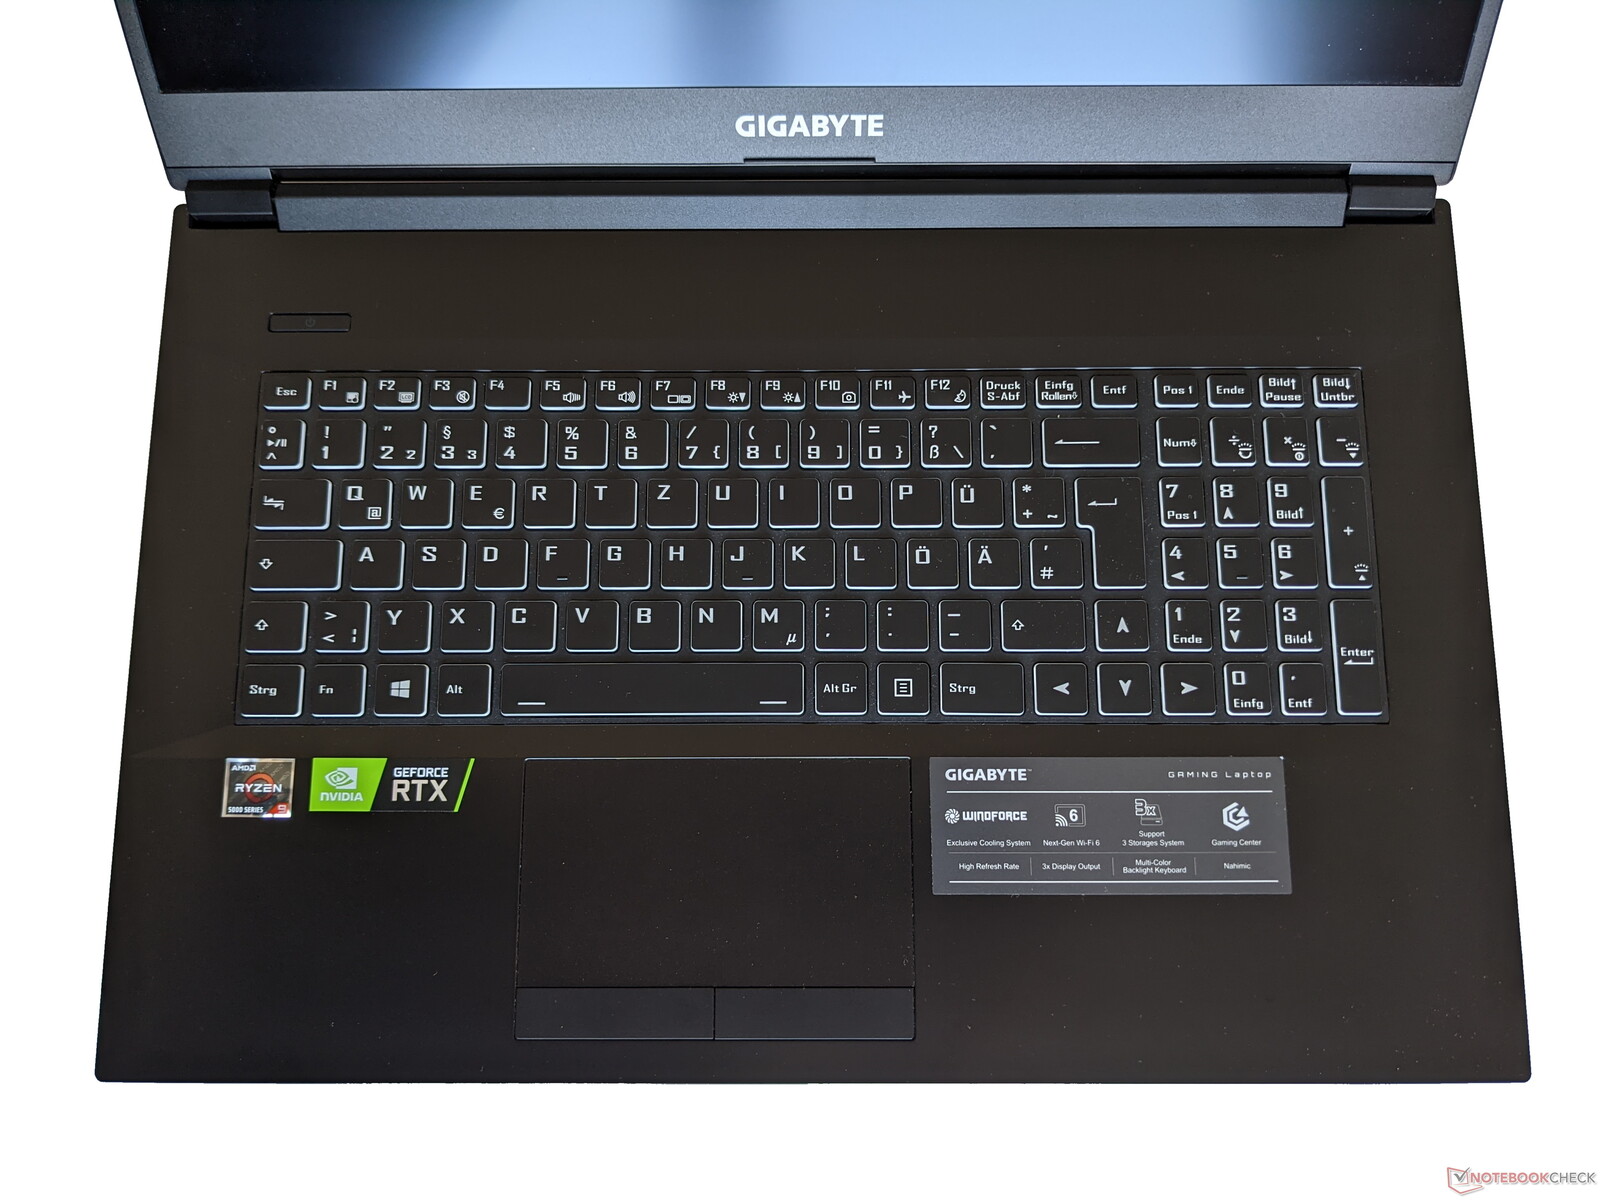
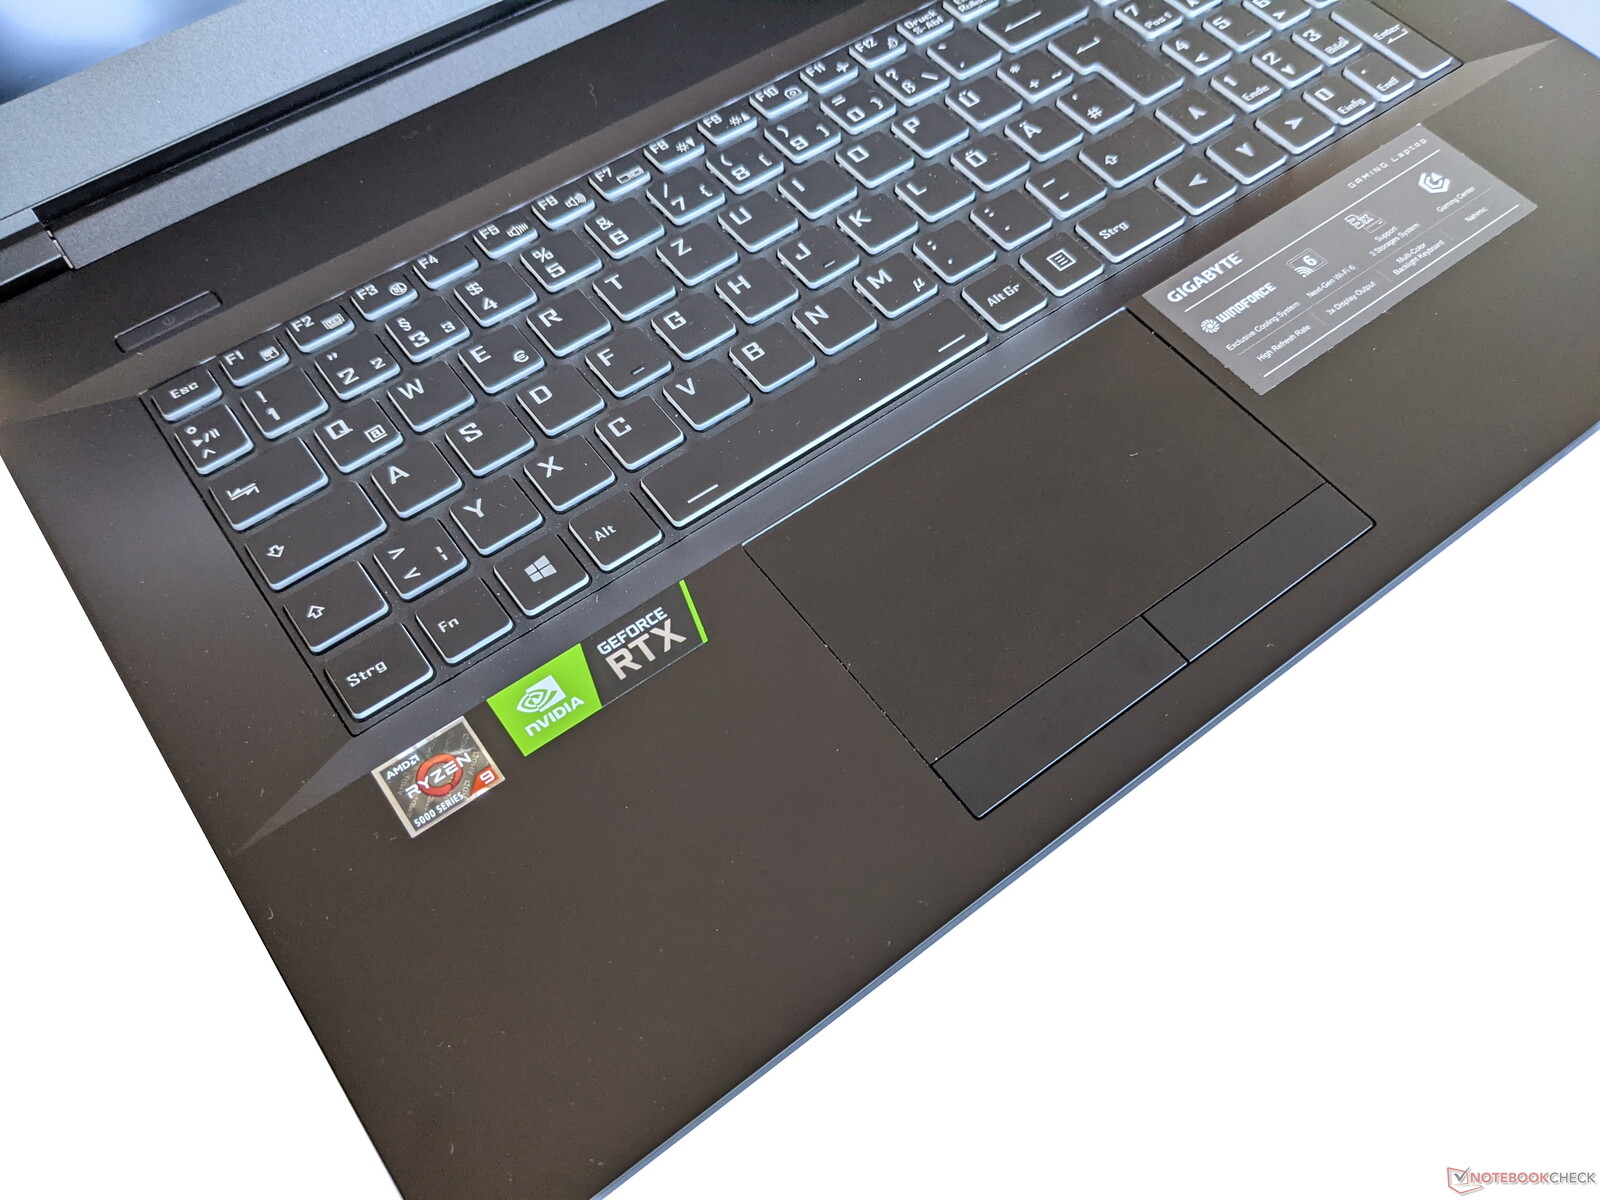
输入设备 - 带键盘背光的技嘉笔记本电脑
键盘
A7 X1的键盘为手指提供了良好的抓握感,因此也适合输入长篇文字。此外,方向键是正常大小的,只有F键和数字键盘的键比较窄。由于使用了完整的键盘布局,也不需要进行双重分配。
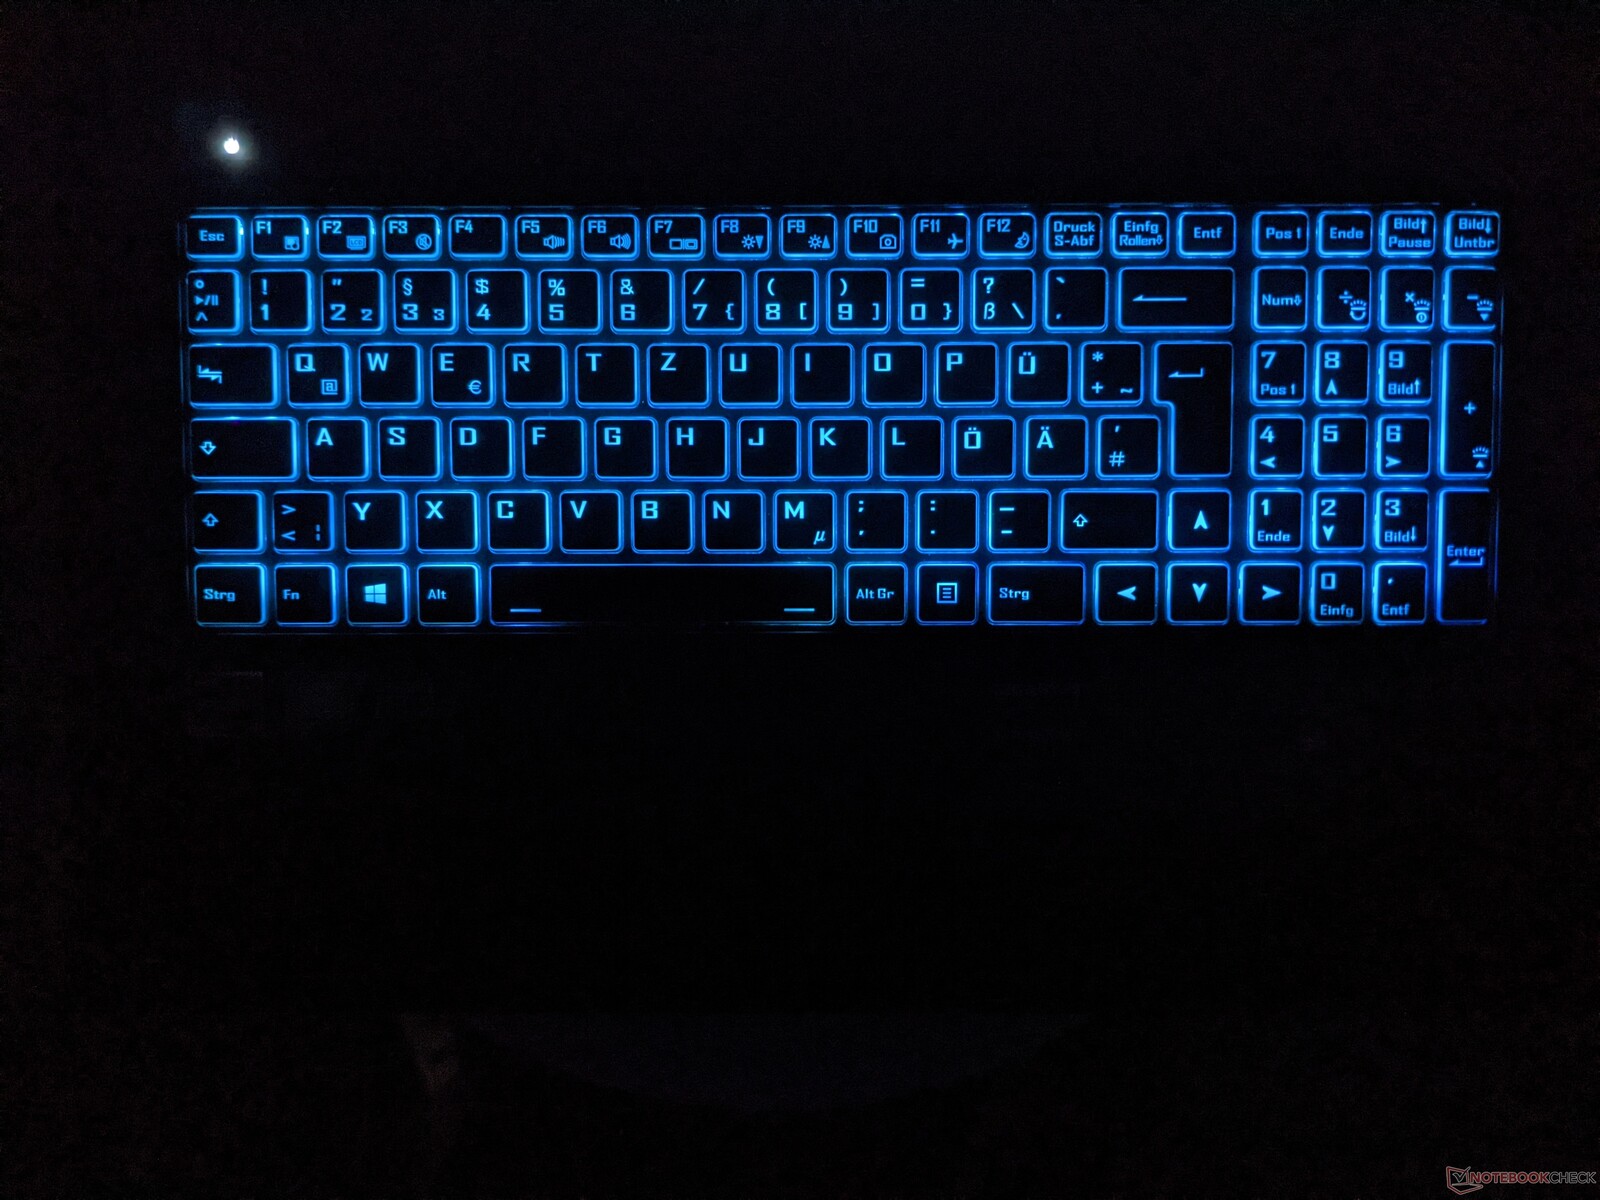
键盘还具有背光功能,尽管颜色不能定制。字母被均匀地照亮,没有眩光。
触摸板
技嘉选择了一个带有独立鼠标按键的触摸板作为鼠标的替代品。虽然触摸板的表面完全适合导航鼠标指针,但鼠标按钮感觉有点软,取决于你按下它们的位置。不过,触摸板对触发的输入有声音的反应。
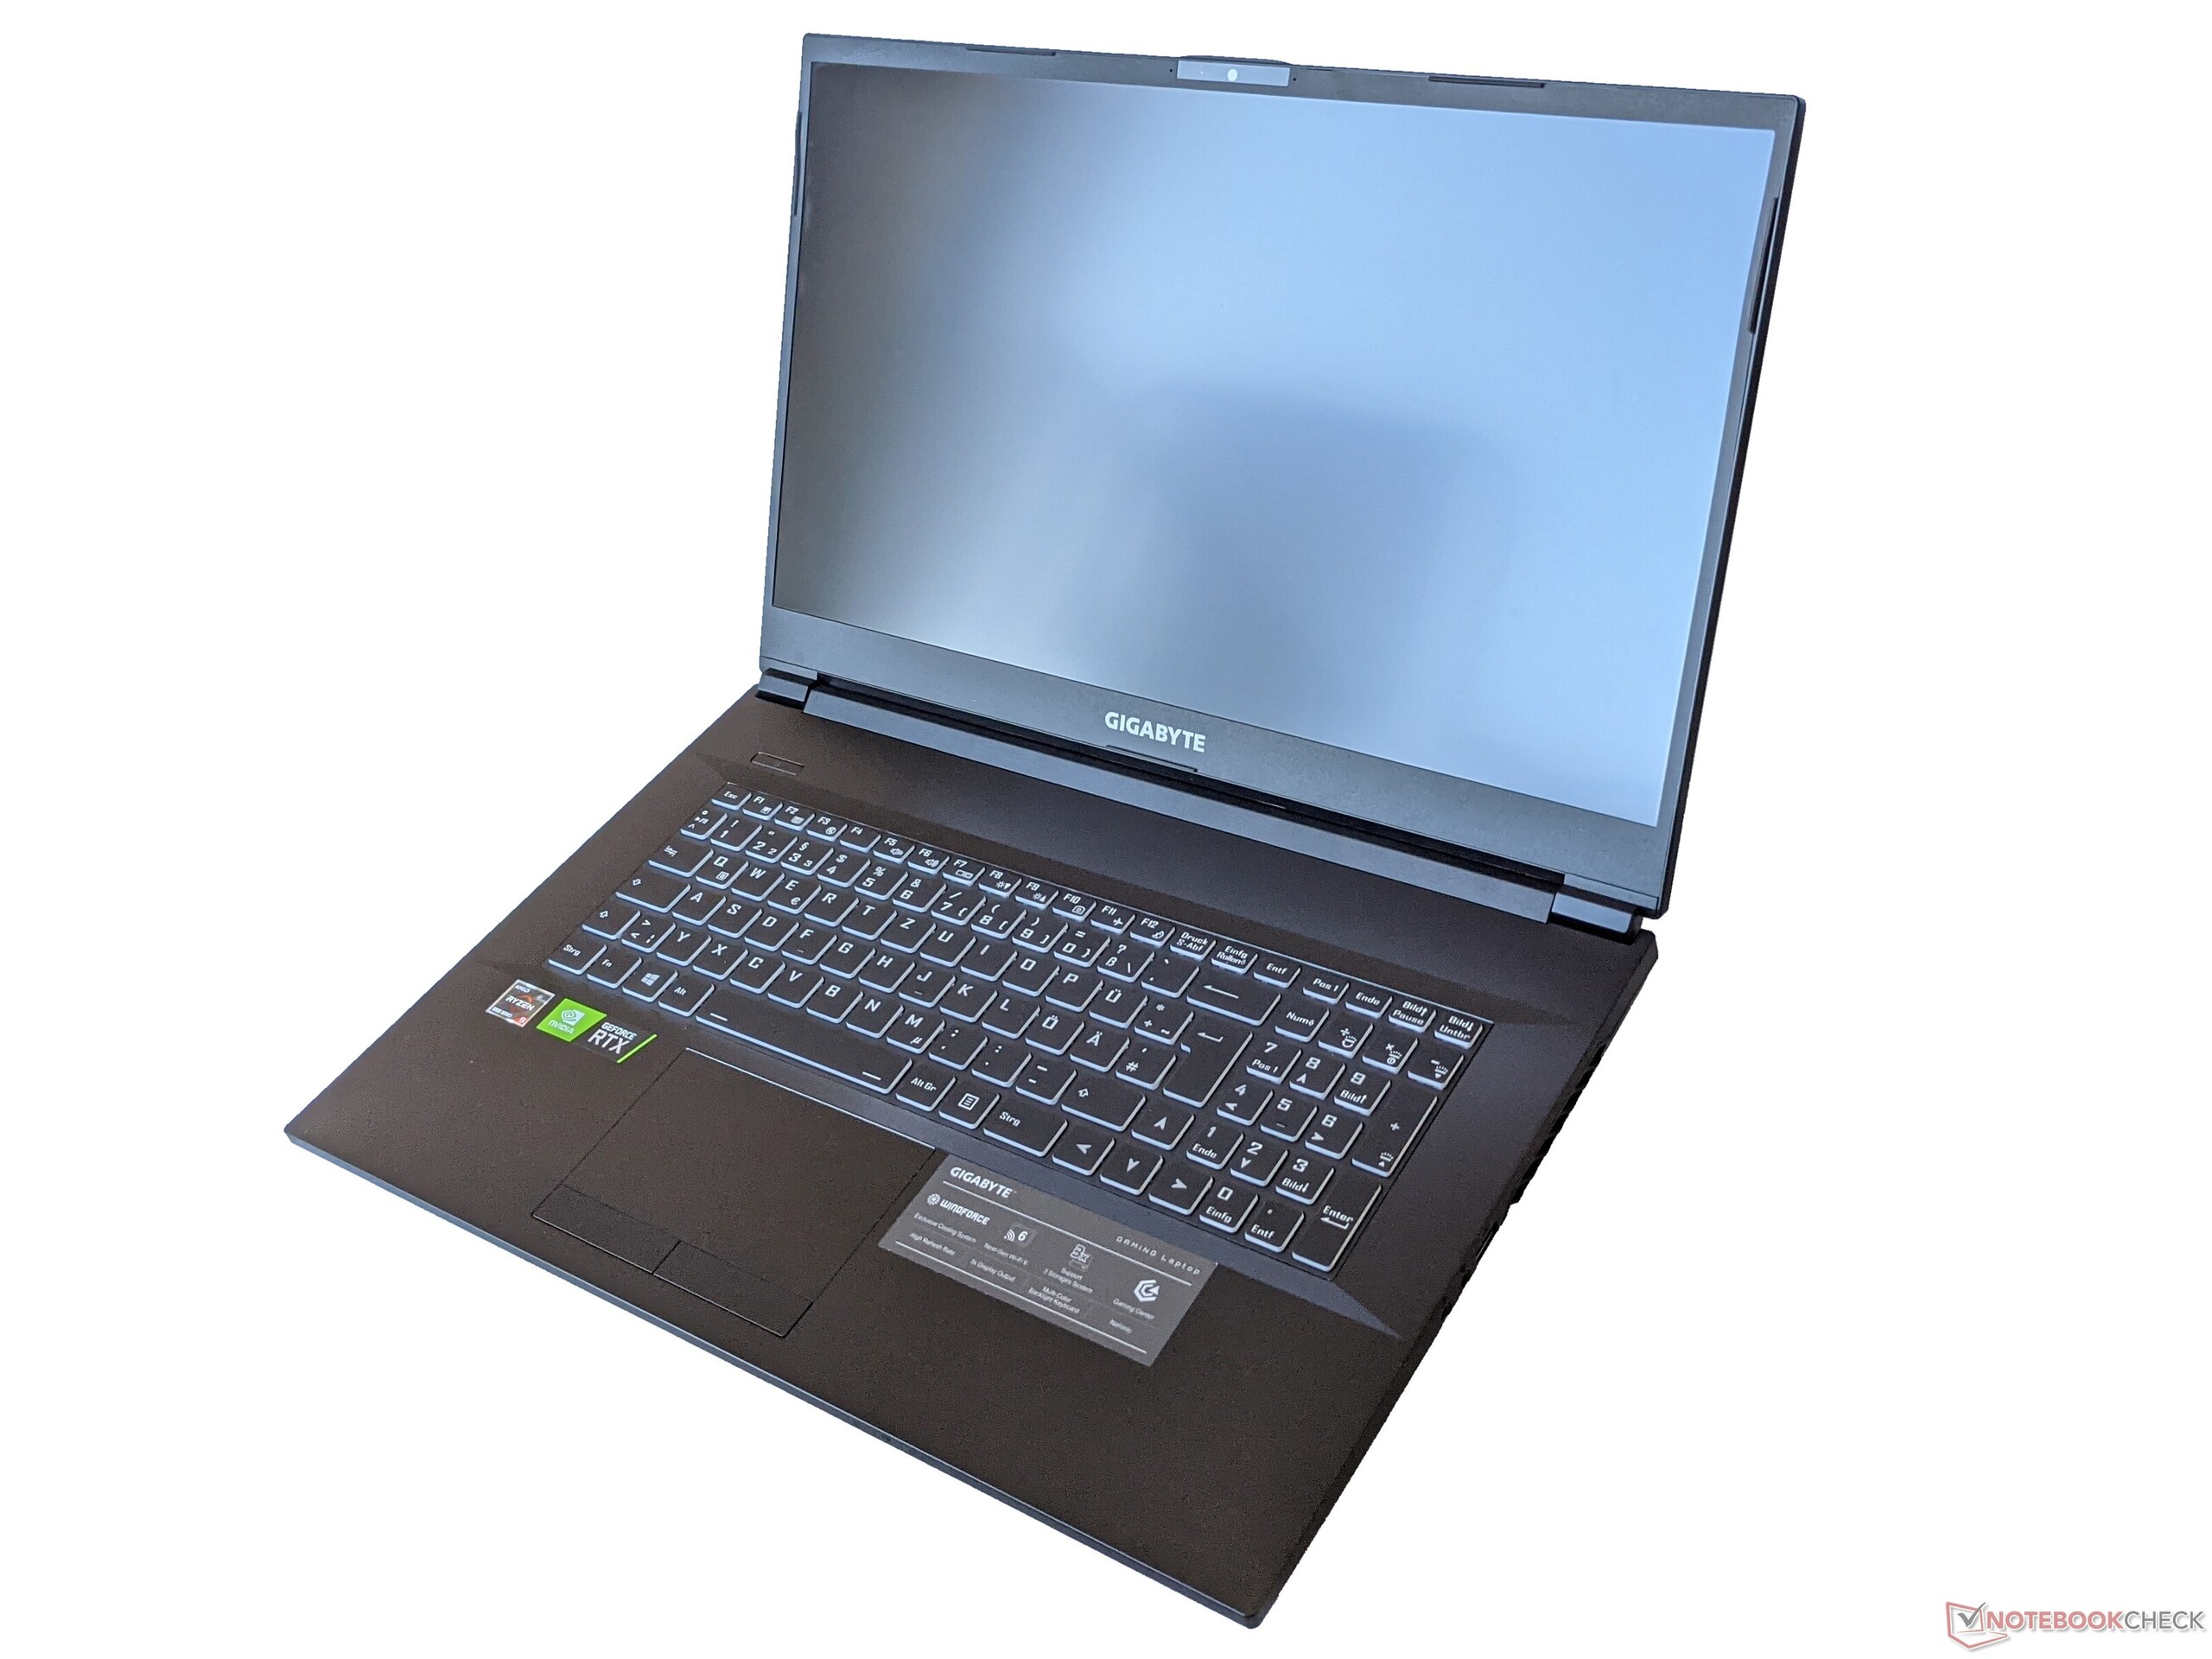
显示器 - 144赫兹IPS面板
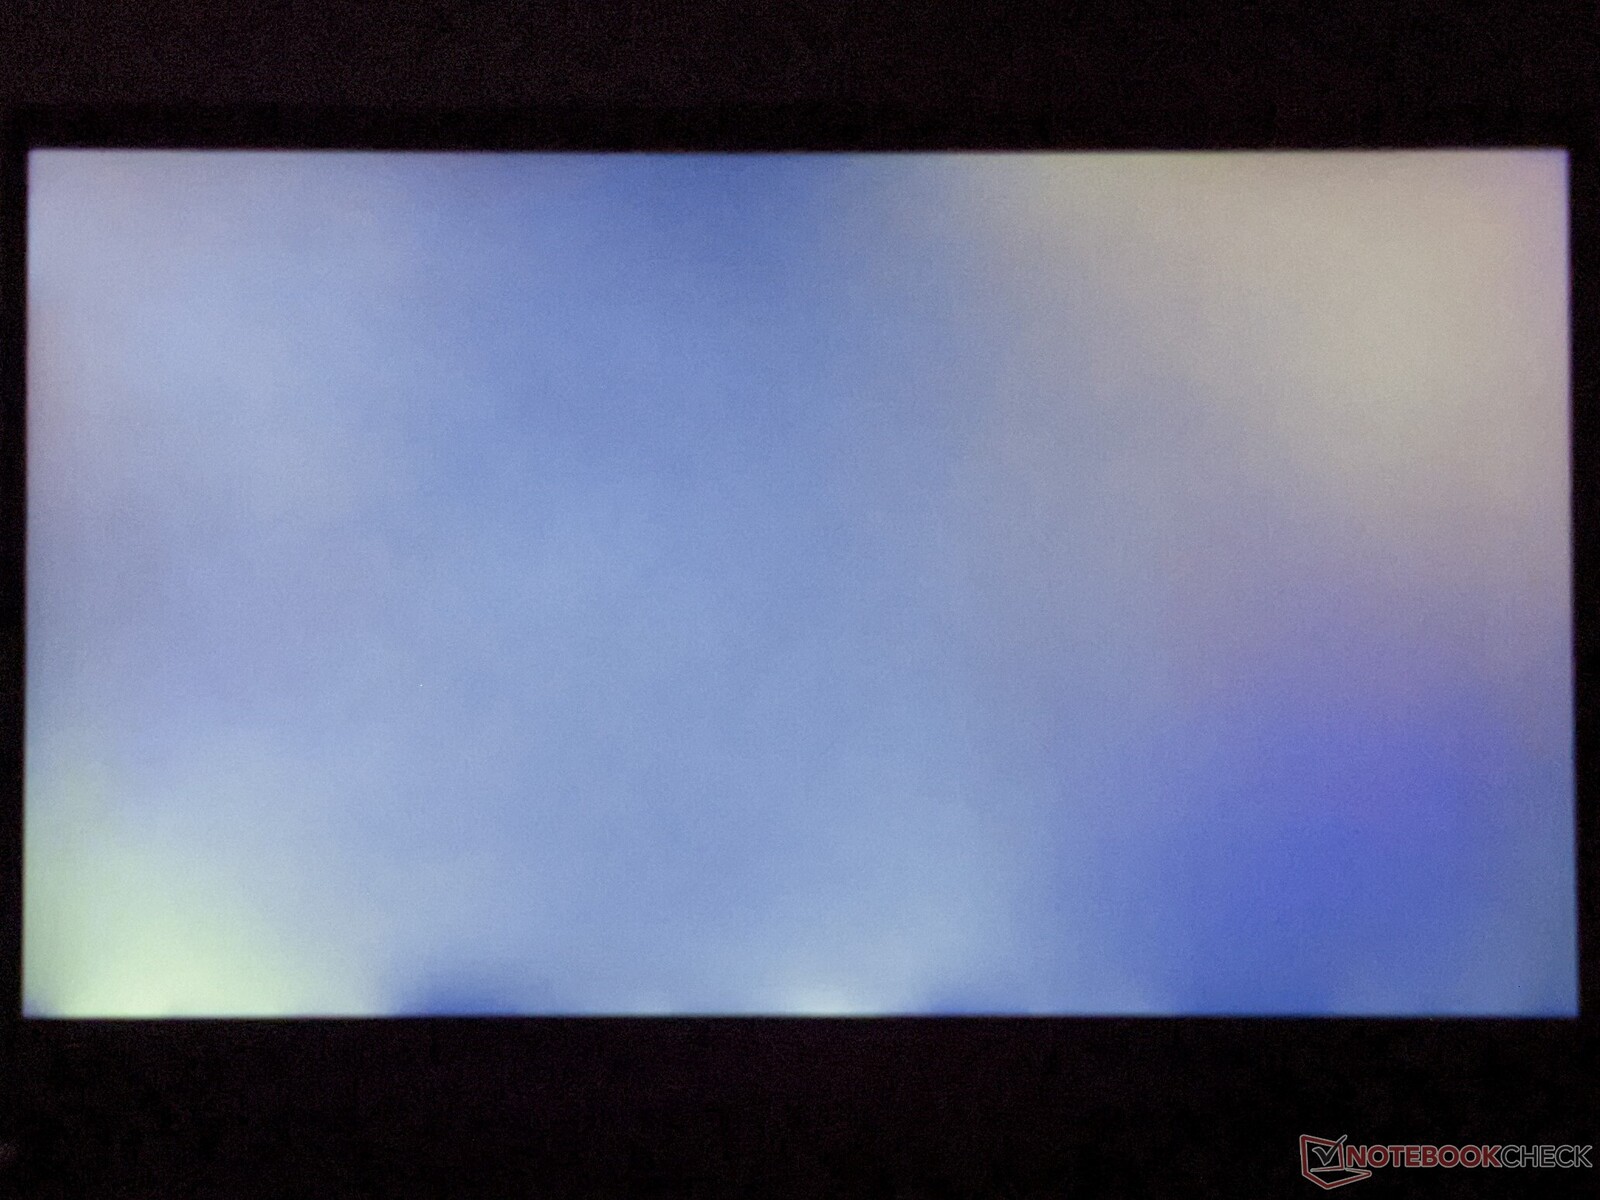
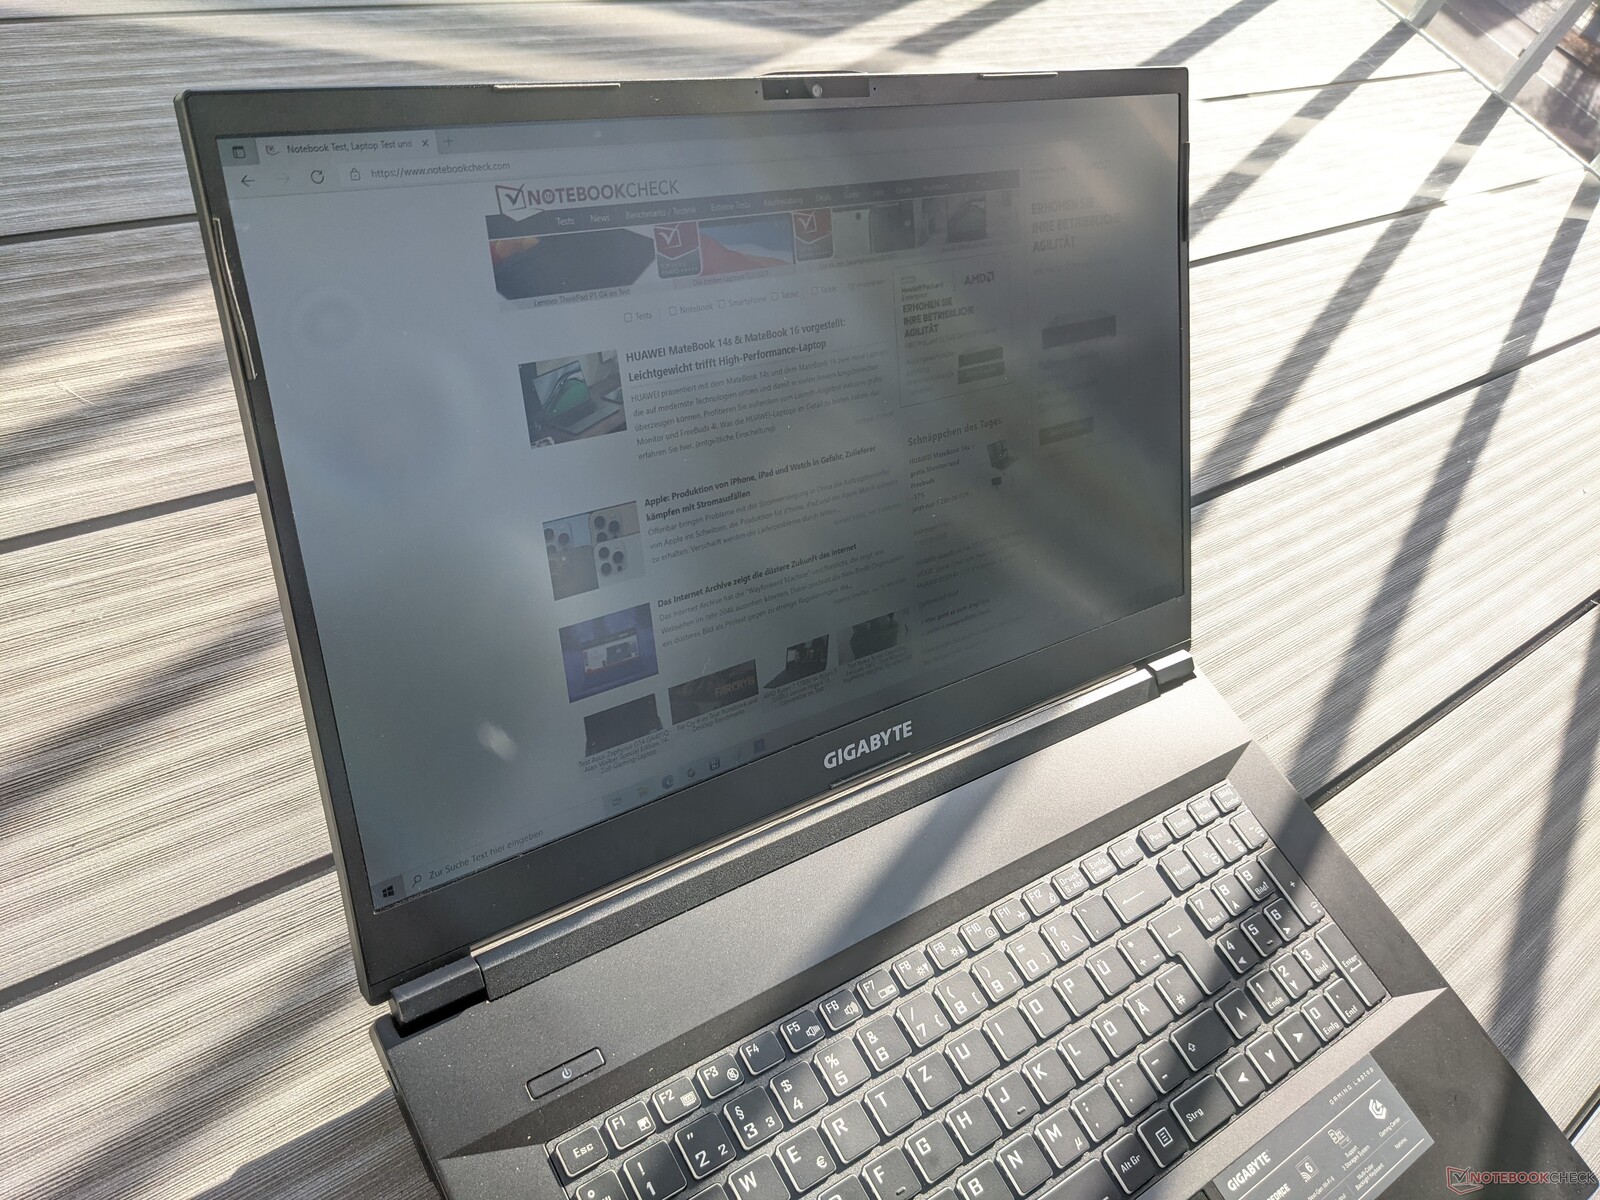
技嘉A7 X1的屏幕包括一个17.3英寸的IPS面板,提供1920x1080像素的分辨率。平均最大亮度为318cd/m²,相当于我们测试领域的中等水平。另一方面,95%的亮度分布是我们选择的竞争者设备中最高的。
没有PWM,用于亮度控制,这对眼睛敏感的用户是有帮助的。
| |||||||||||||||||||||||||
Brightness Distribution: 95 %
Center on Battery: 325 cd/m²
Contrast: 1121:1 (Black: 0.29 cd/m²)
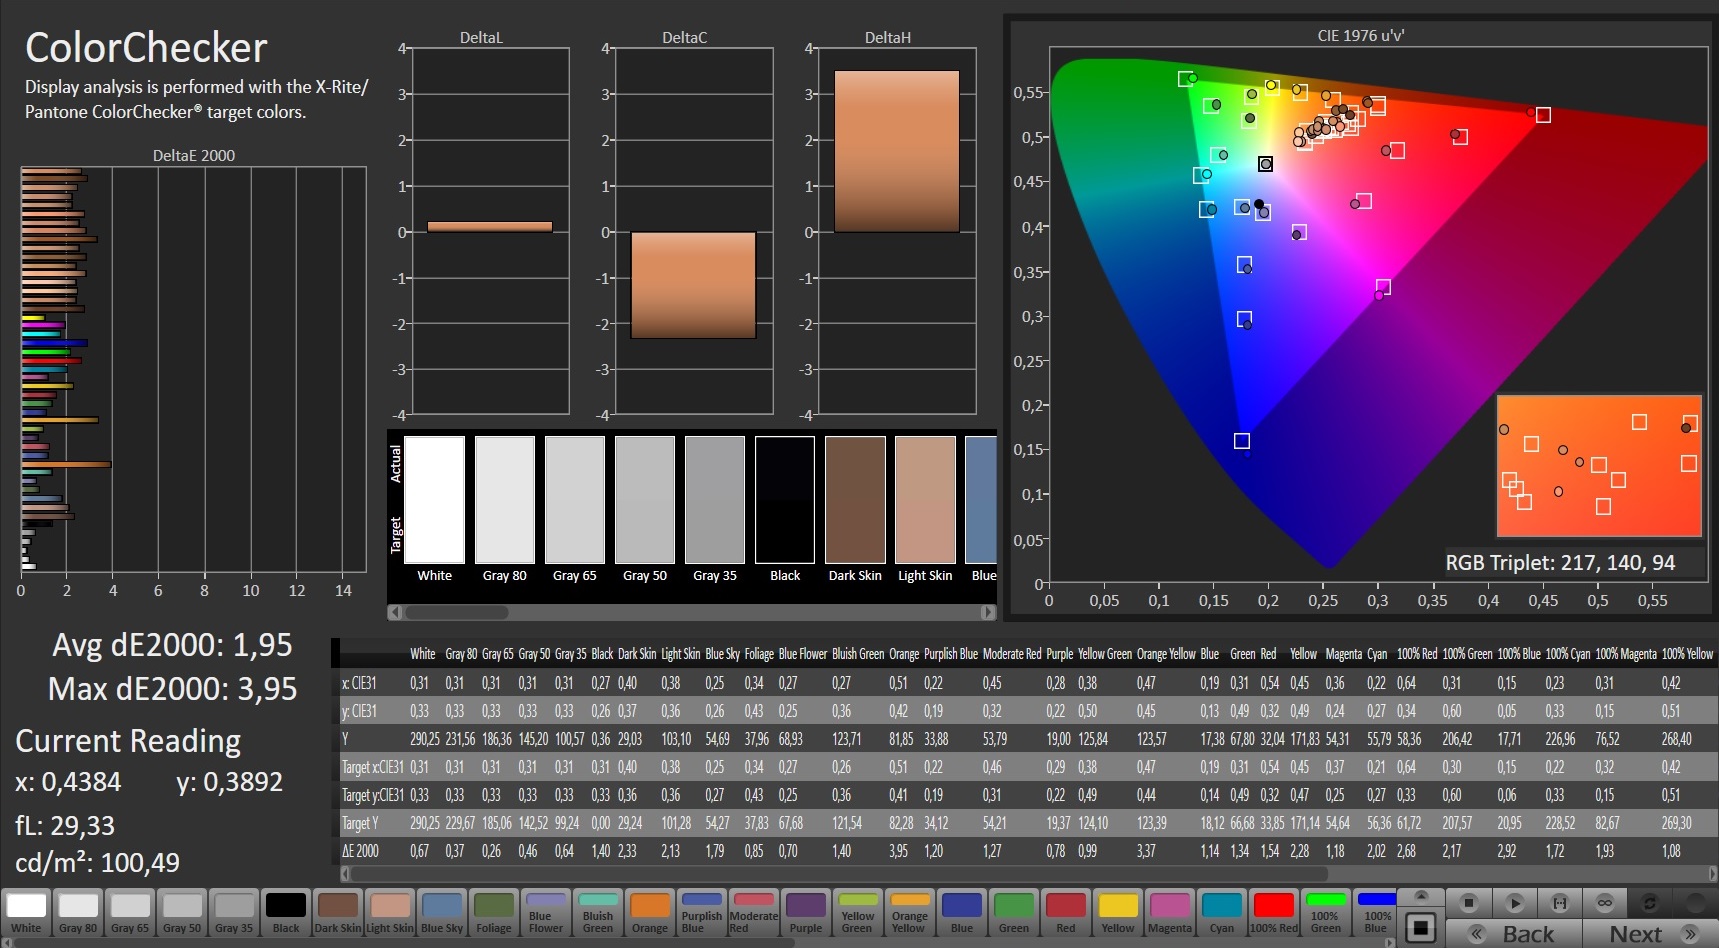
ΔE ColorChecker Calman: 4.33 | ∀{0.5-29.43 Ø4.71}
calibrated: 1.95
ΔE Greyscale Calman: 5.5 | ∀{0.09-98 Ø4.96}
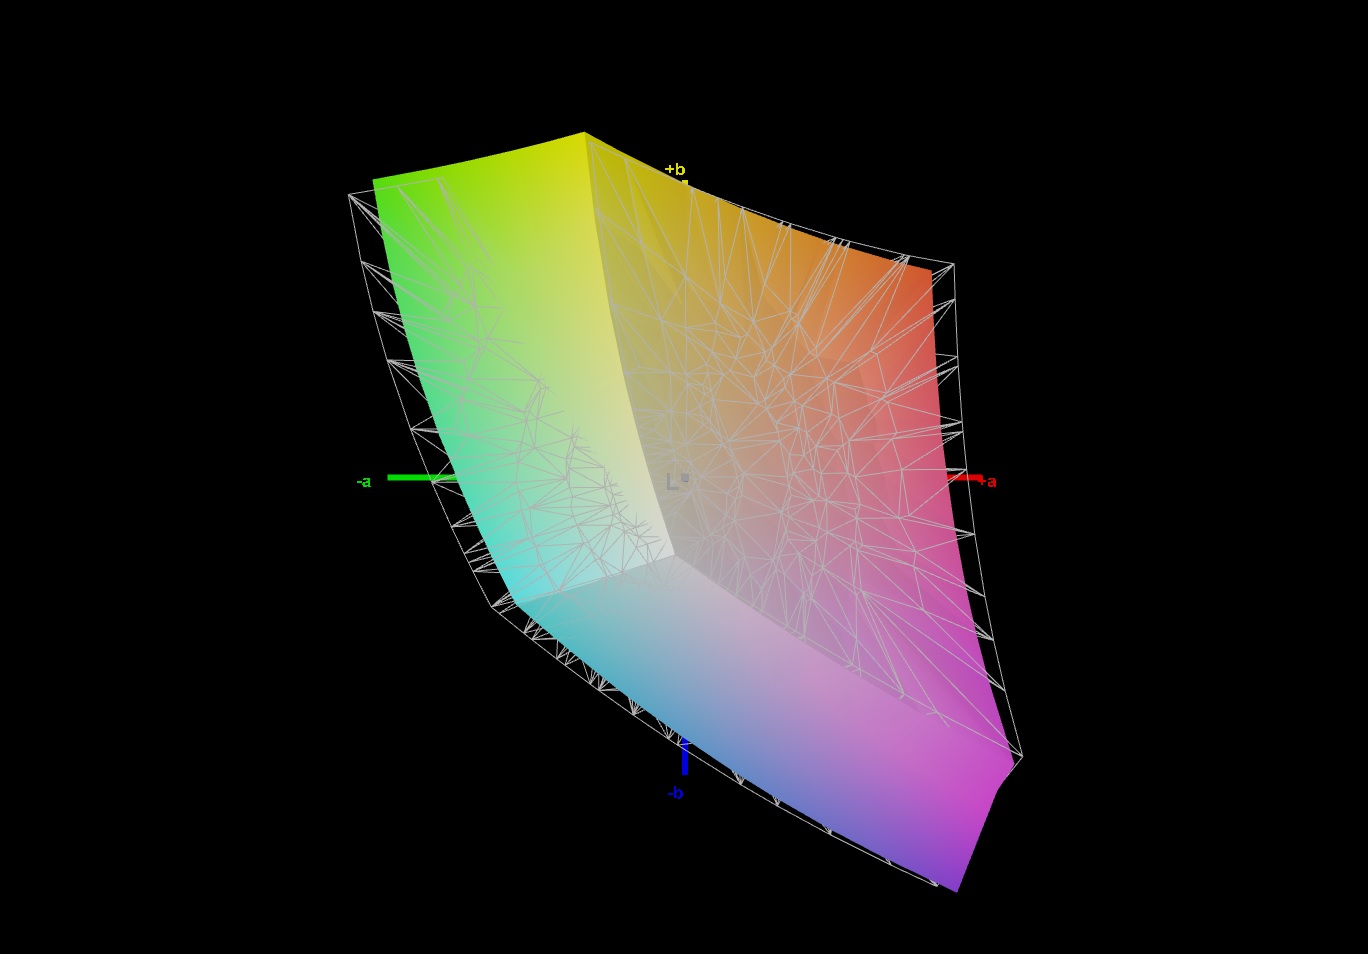
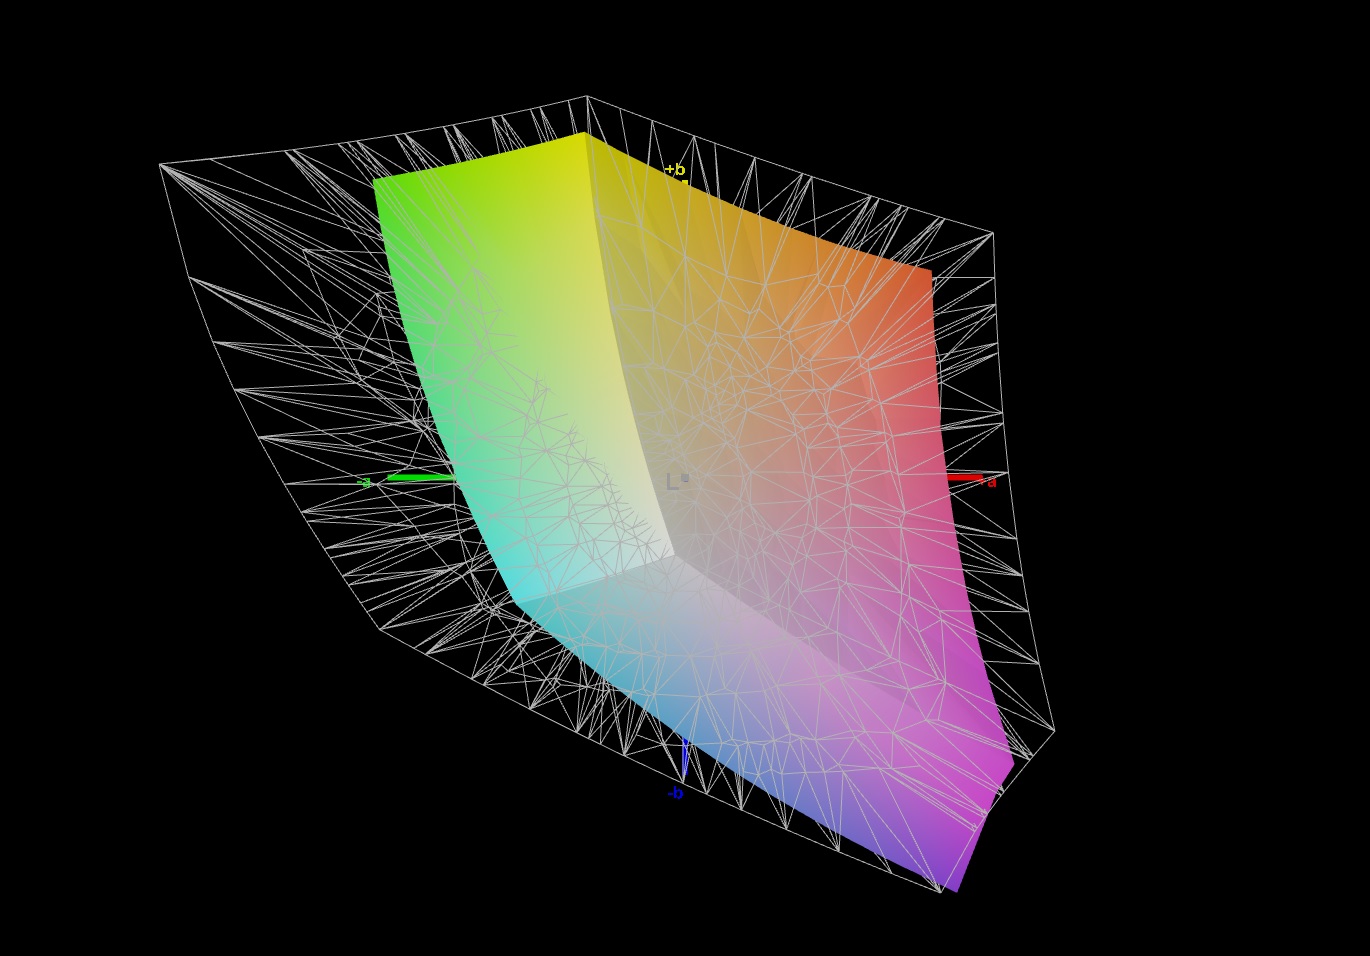
63.2% AdobeRGB 1998 (Argyll 3D)
90.9% sRGB (Argyll 3D)
61.5% Display P3 (Argyll 3D)
Gamma: 2.142
CCT: 7893 K
| Gigabyte A7 X1 AU Optronics AUO8E8D, IPS, 1920x1080, 17.3" | Medion Erazer Beast X25 BOE NE173FHM-NZ1 (BOE0884), IPS, 1920x1080, 17.3" | Medion Erazer Beast X20 BOE CQ NE173QHM-NY2, IPS, 2560x1440, 17.3" | Asus TUF Gaming F17 FX706HM AU Optronics AUI8294 (B173HAN04.9), IPS, 1920x1080, 17.3" | Schenker XMG Neo 17 (Early 2021, RTX 3070, 5800H) BOE NE173QHM-NY2 (BOE0977), IPS, 2560x1440, 17.3" | |
|---|---|---|---|---|---|
| Display | 12% | 12% | -34% | 13% | |
| Display P3 Coverage (%) | 61.5 | 70.4 14% | 70.1 14% | 40.1 -35% | 70.5 15% |
| sRGB Coverage (%) | 90.9 | 99.8 10% | 99 9% | 60 -34% | 99.5 9% |
| AdobeRGB 1998 Coverage (%) | 63.2 | 71.6 13% | 71.3 13% | 41.4 -34% | 71.8 14% |
| Response Times | 46% | 6% | -105% | 1% | |
| Response Time Grey 50% / Grey 80% * (ms) | 16 ? | 9.2 ? 43% | 16 ? -0% | 32.4 -103% | 16.8 ? -5% |
| Response Time Black / White * (ms) | 10.8 ? | 5.6 ? 48% | 9.6 ? 11% | 22.4 -107% | 10 ? 7% |
| PWM Frequency (Hz) | |||||
| Screen | 17% | 19% | -11% | 19% | |
| Brightness middle (cd/m²) | 325 | 329 1% | 370 14% | 266 -18% | 410 26% |
| Brightness (cd/m²) | 318 | 315 -1% | 341 7% | 264 -17% | 381 20% |
| Brightness Distribution (%) | 95 | 88 -7% | 82 -14% | 79 -17% | 88 -7% |
| Black Level * (cd/m²) | 0.29 | 0.33 -14% | 0.42 -45% | 0.32 -10% | 0.37 -28% |
| Contrast (:1) | 1121 | 997 -11% | 881 -21% | 831 -26% | 1108 -1% |
| Colorchecker dE 2000 * | 4.33 | 2.03 53% | 1.76 59% | 3.97 8% | 2.55 41% |
| Colorchecker dE 2000 max. * | 8.6 | 5.5 36% | 2.88 67% | 8.93 -4% | 4.33 50% |
| Colorchecker dE 2000 calibrated * | 1.95 | 0.82 58% | 1.3 33% | 3.5 -79% | 1.28 34% |
| Greyscale dE 2000 * | 5.5 | 3.5 36% | 1.8 67% | 1.8 67% | 3.4 38% |
| Gamma | 2.142 103% | 2.223 99% | 2.176 101% | 2.31 95% | 2.275 97% |
| CCT | 7893 82% | 6526 100% | 6543 99% | 6754 96% | 6637 98% |
| Color Space (Percent of AdobeRGB 1998) (%) | 41.4 | 72 | |||
| Color Space (Percent of sRGB) (%) | 60 | 95 | |||
| Total Average (Program / Settings) | 25% /
20% | 12% /
15% | -50% /
-29% | 11% /
15% |
* ... smaller is better
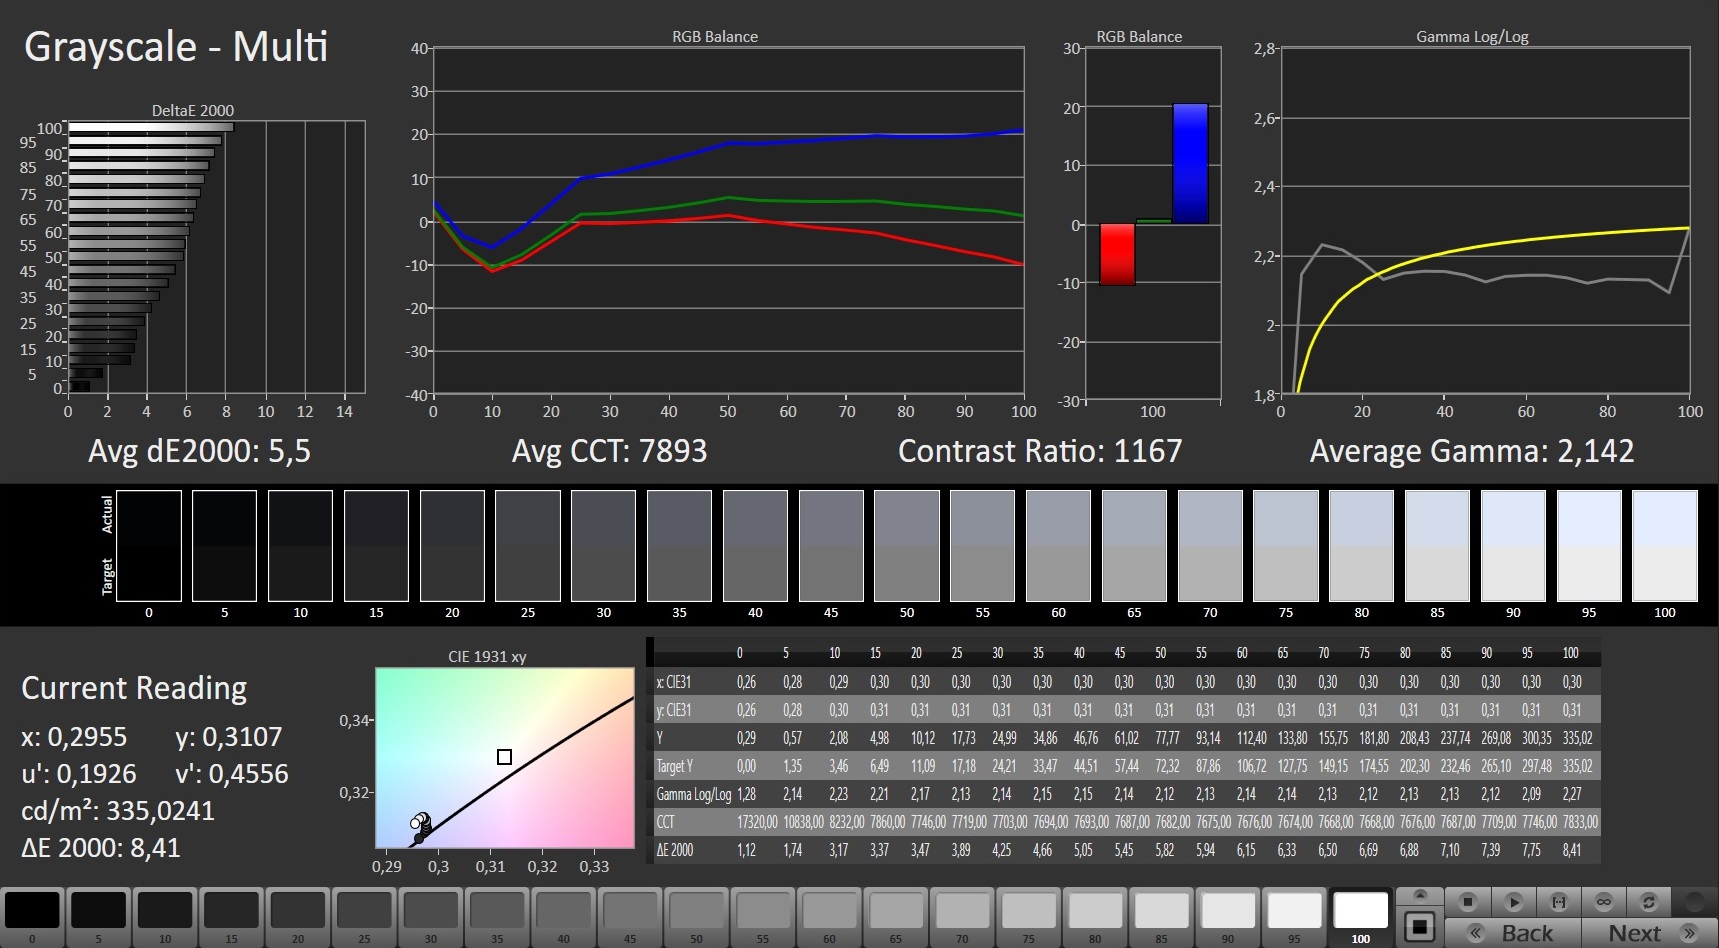
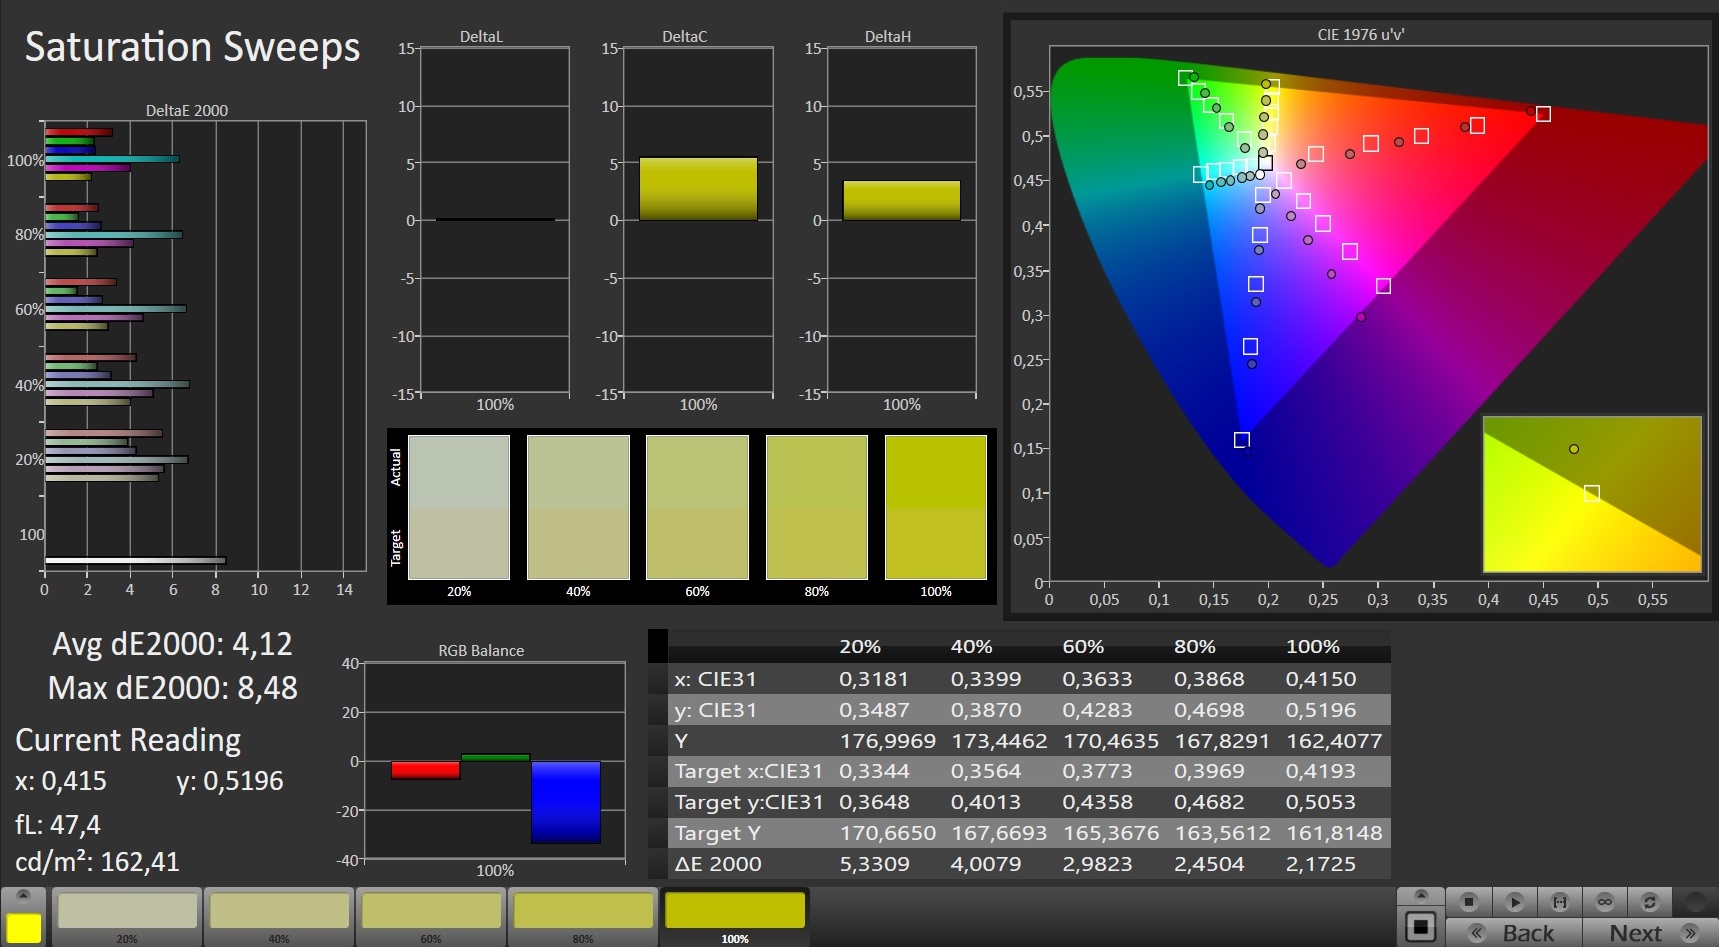
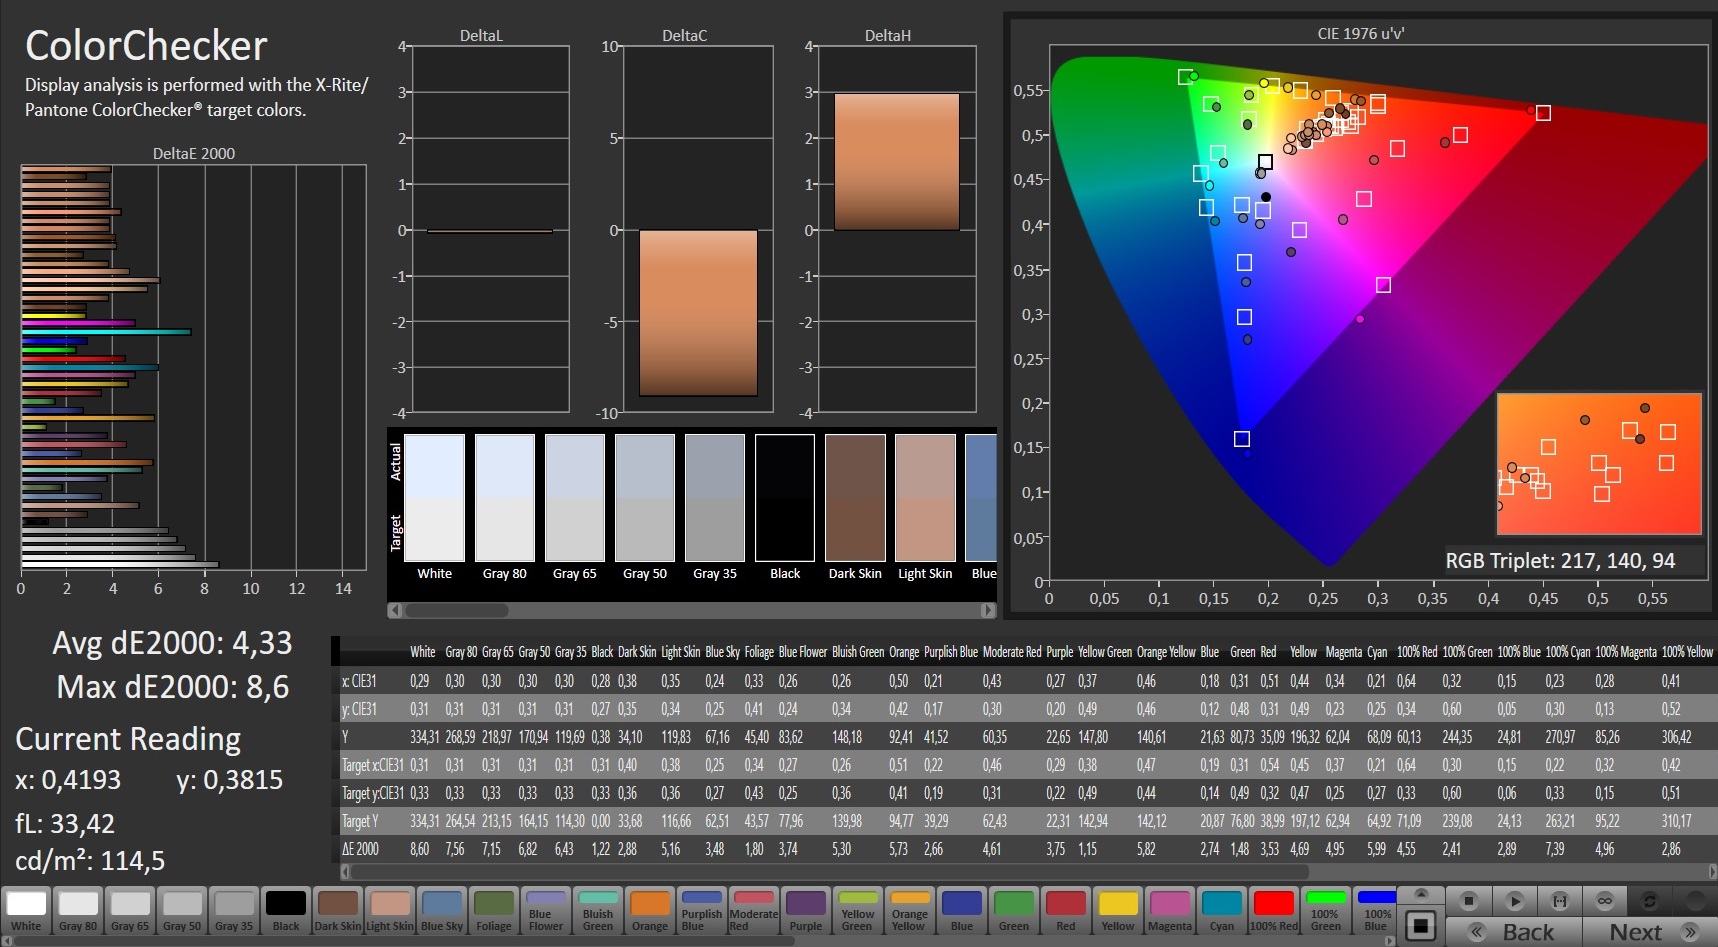
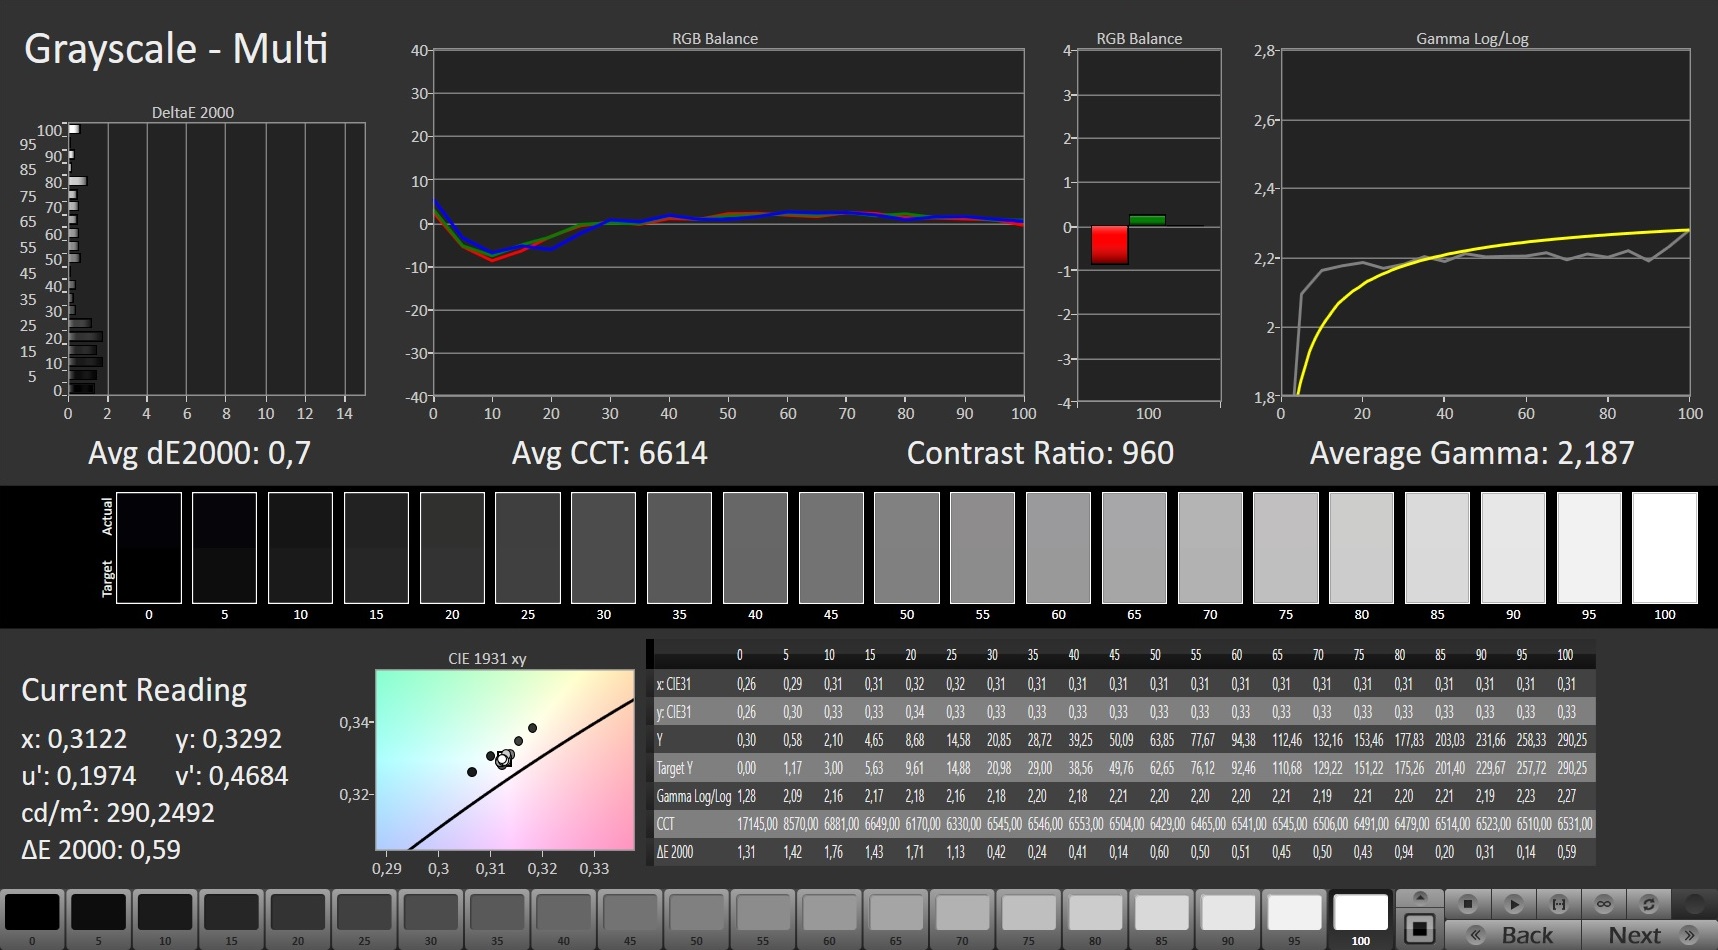
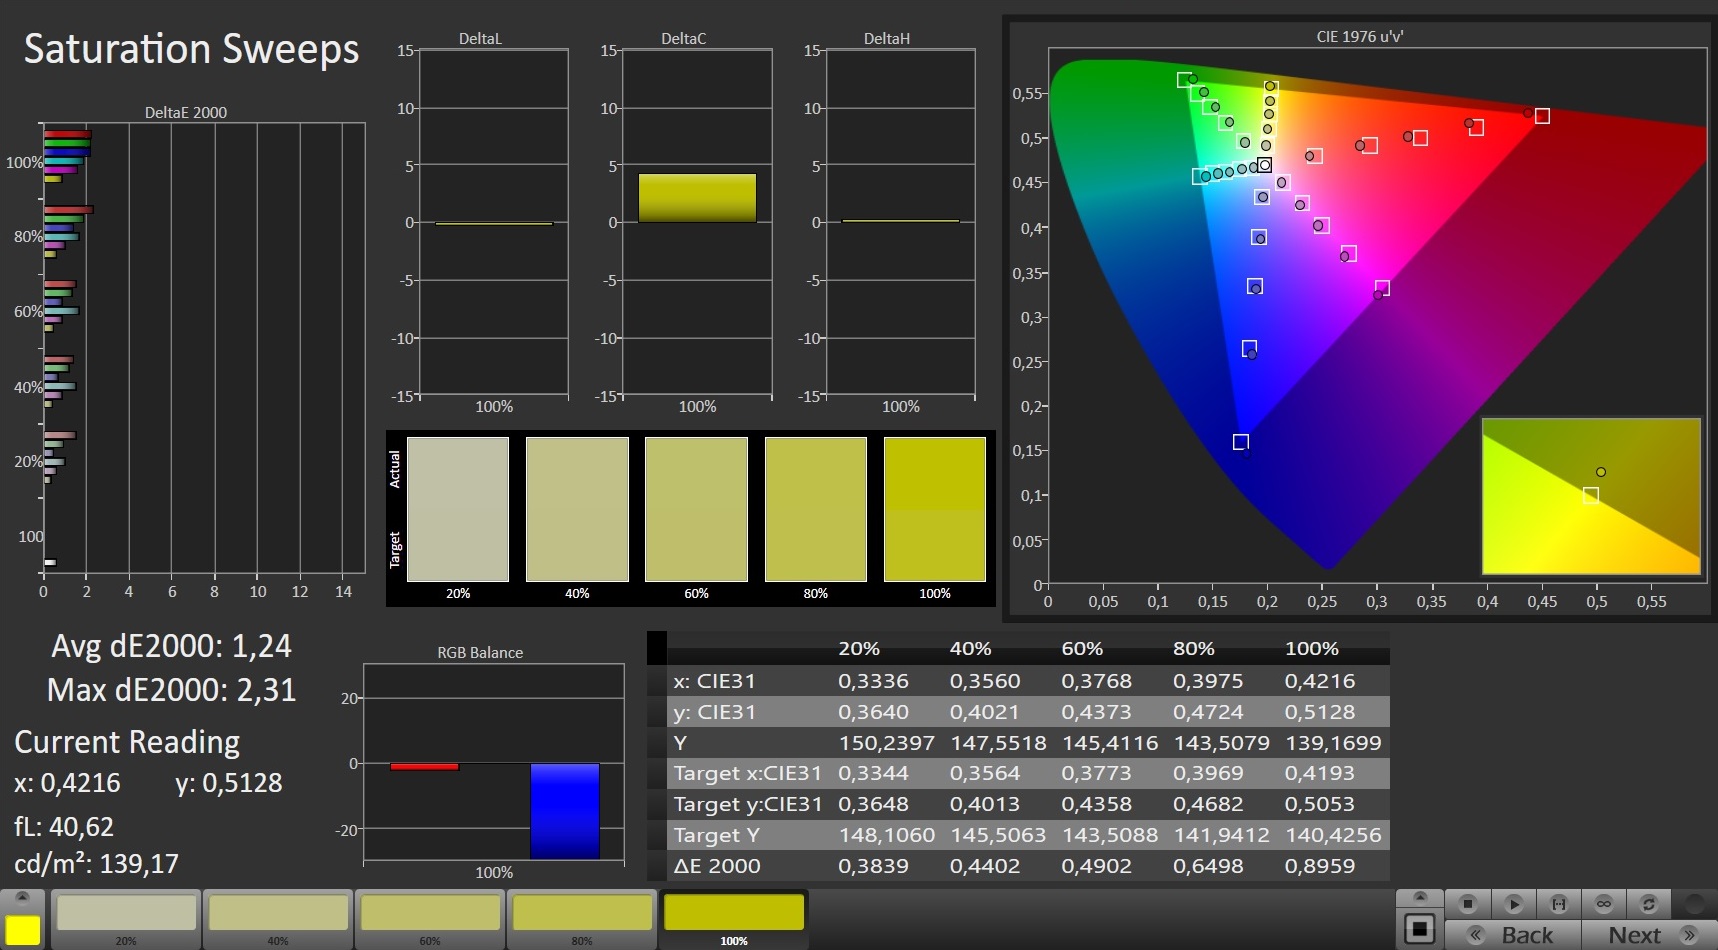
技嘉的游戏笔记本电脑也能够在我们的测试领域中领先,其对比度为1,121:1,黑度为0.29 cd/m²。90.9%(sRGB)和63.2%(AdobeRGB)的色彩空间覆盖率略低,但图像看起来仍然很生动。
CalMAN分析还显示,显示的颜色的蓝色比例过高,开箱就有。然而,这几乎可以通过校准来完全纠正。相应的ICC文件可以在位于顶部、显示器亮度分布图右侧的窗口中下载。
只要看好有阴凉的地方,技嘉的游戏笔记本绝对可以在户外使用。哑光屏幕不反光,但显示亮度不足以补偿强烈的环境光线。
Display Response Times
| ↔ Response Time Black to White | ||
|---|---|---|
| 10.8 ms ... rise ↗ and fall ↘ combined | ↗ 6.4 ms rise | 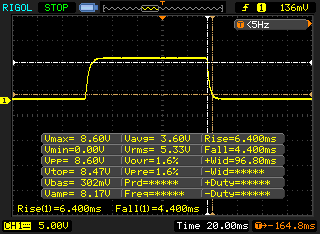 |
| ↘ 4.4 ms fall | ||
| The screen shows good response rates in our tests, but may be too slow for competitive gamers. In comparison, all tested devices range from 0.1 (minimum) to 240 (maximum) ms. » 29 % of all devices are better. This means that the measured response time is better than the average of all tested devices (19.8 ms). | ||
| ↔ Response Time 50% Grey to 80% Grey | ||
| 16 ms ... rise ↗ and fall ↘ combined | ↗ 7.6 ms rise | 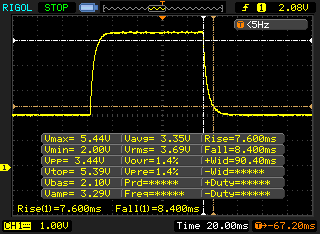 |
| ↘ 8.4 ms fall | ||
| The screen shows good response rates in our tests, but may be too slow for competitive gamers. In comparison, all tested devices range from 0.165 (minimum) to 636 (maximum) ms. » 30 % of all devices are better. This means that the measured response time is better than the average of all tested devices (30.9 ms). | ||
Screen Flickering / PWM (Pulse-Width Modulation)
| Screen flickering / PWM not detected | 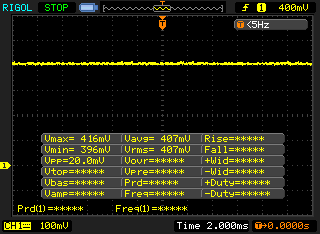 | ||
In comparison: 52 % of all tested devices do not use PWM to dim the display. If PWM was detected, an average of 7741 (minimum: 5 - maximum: 343500) Hz was measured. | |||
Gigabyte A7 X1的IPS面板是非常稳定的可视角度。这使得即使从非常平坦的角度观看内容也不会出现失真或不准确的颜色。

性能 - 即使在长时间的负载下也很稳定
Gigabyte为A7 X1配备了最新的游戏硬件。我们的评测配置配备了强大的AMD CPU,但这个模型也可以作为技嘉K7的Intel Core i7-10870H 和NvidiaGeForce RTX 3060 。
处理器
Cinebench R15 Multi endurance test
| Cinebench R23 | |
| Multi Core | |
| Average of class Gaming (10488 - 42661, n=104, last 2 years) | |
| Average AMD Ryzen 9 5900HX (6622 - 14363, n=30) | |
| Gigabyte A7 X1 | |
| Medion Erazer Beast X25 | |
| Schenker XMG Neo 17 (Early 2021, RTX 3070, 5800H) | |
| Asus TUF Gaming F17 FX706HM | |
| Medion Erazer Beast X20 | |
| Single Core | |
| Average of class Gaming (1601 - 2415, n=104, last 2 years) | |
| Asus TUF Gaming F17 FX706HM | |
| Medion Erazer Beast X25 | |
| Gigabyte A7 X1 | |
| Average AMD Ryzen 9 5900HX (1218 - 1499, n=29) | |
| Schenker XMG Neo 17 (Early 2021, RTX 3070, 5800H) | |
| Medion Erazer Beast X20 | |
| Cinebench R20 | |
| CPU (Multi Core) | |
| Average of class Gaming (4029 - 16433, n=103, last 2 years) | |
| Gigabyte A7 X1 | |
| Average AMD Ryzen 9 5900HX (2242 - 5476, n=30) | |
| Medion Erazer Beast X25 | |
| Schenker XMG Neo 17 (Early 2021, RTX 3070, 5800H) | |
| Asus TUF Gaming F17 FX706HM | |
| Medion Erazer Beast X20 | |
| CPU (Single Core) | |
| Average of class Gaming (622 - 913, n=103, last 2 years) | |
| Asus TUF Gaming F17 FX706HM | |
| Medion Erazer Beast X25 | |
| Gigabyte A7 X1 | |
| Average AMD Ryzen 9 5900HX (471 - 584, n=29) | |
| Schenker XMG Neo 17 (Early 2021, RTX 3070, 5800H) | |
| Medion Erazer Beast X20 | |
| Cinebench R15 | |
| CPU Multi 64Bit | |
| Average of class Gaming (1578 - 6330, n=102, last 2 years) | |
| Schenker XMG Neo 17 (Early 2021, RTX 3070, 5800H) | |
| Gigabyte A7 X1 | |
| Average AMD Ryzen 9 5900HX (1076 - 2267, n=29) | |
| Medion Erazer Beast X25 | |
| Asus TUF Gaming F17 FX706HM | |
| Medion Erazer Beast X20 | |
| CPU Single 64Bit | |
| Average of class Gaming (188.8 - 350, n=103, last 2 years) | |
| Asus TUF Gaming F17 FX706HM | |
| Gigabyte A7 X1 | |
| Medion Erazer Beast X25 | |
| Average AMD Ryzen 9 5900HX (197 - 243, n=25) | |
| Schenker XMG Neo 17 (Early 2021, RTX 3070, 5800H) | |
| Medion Erazer Beast X20 | |
| Blender - v2.79 BMW27 CPU | |
| Medion Erazer Beast X20 | |
| Medion Erazer Beast X25 | |
| Average AMD Ryzen 9 5900HX (219 - 442, n=29) | |
| Gigabyte A7 X1 | |
| Schenker XMG Neo 17 (Early 2021, RTX 3070, 5800H) | |
| Asus TUF Gaming F17 FX706HM | |
| Average of class Gaming (79 - 330, n=101, last 2 years) | |
| 7-Zip 18.03 | |
| 7z b 4 | |
| Average of class Gaming (33491 - 148086, n=102, last 2 years) | |
| Medion Erazer Beast X25 | |
| Schenker XMG Neo 17 (Early 2021, RTX 3070, 5800H) | |
| Average AMD Ryzen 9 5900HX (36011 - 62503, n=29) | |
| Gigabyte A7 X1 | |
| Asus TUF Gaming F17 FX706HM | |
| Medion Erazer Beast X20 | |
| 7z b 4 -mmt1 | |
| Average of class Gaming (4824 - 7436, n=102, last 2 years) | |
| Asus TUF Gaming F17 FX706HM | |
| Average AMD Ryzen 9 5900HX (4791 - 5905, n=29) | |
| Gigabyte A7 X1 | |
| Medion Erazer Beast X25 | |
| Schenker XMG Neo 17 (Early 2021, RTX 3070, 5800H) | |
| Medion Erazer Beast X20 | |
| Geekbench 5.5 | |
| Multi-Core | |
| Average of class Gaming (6460 - 28263, n=102, last 2 years) | |
| Medion Erazer Beast X25 | |
| Average AMD Ryzen 9 5900HX (5057 - 9294, n=27) | |
| Schenker XMG Neo 17 (Early 2021, RTX 3070, 5800H) | |
| Asus TUF Gaming F17 FX706HM | |
| Gigabyte A7 X1 | |
| Medion Erazer Beast X20 | |
| Single-Core | |
| Average of class Gaming (1403 - 2474, n=102, last 2 years) | |
| Asus TUF Gaming F17 FX706HM | |
| Gigabyte A7 X1 | |
| Medion Erazer Beast X25 | |
| Average AMD Ryzen 9 5900HX (1271 - 1574, n=27) | |
| Schenker XMG Neo 17 (Early 2021, RTX 3070, 5800H) | |
| Medion Erazer Beast X20 | |
| HWBOT x265 Benchmark v2.2 - 4k Preset | |
| Average of class Gaming (11.5 - 44.4, n=102, last 2 years) | |
| Medion Erazer Beast X25 | |
| Schenker XMG Neo 17 (Early 2021, RTX 3070, 5800H) | |
| Average AMD Ryzen 9 5900HX (8.26 - 17.1, n=29) | |
| Asus TUF Gaming F17 FX706HM | |
| Gigabyte A7 X1 | |
| Medion Erazer Beast X20 | |
| LibreOffice - 20 Documents To PDF | |
| Gigabyte A7 X1 | |
| Average AMD Ryzen 9 5900HX (44.1 - 87.4, n=29) | |
| Medion Erazer Beast X20 | |
| Schenker XMG Neo 17 (Early 2021, RTX 3070, 5800H) | |
| Average of class Gaming (33.2 - 88.8, n=102, last 2 years) | |
| Medion Erazer Beast X25 | |
| Asus TUF Gaming F17 FX706HM | |
| R Benchmark 2.5 - Overall mean | |
| Medion Erazer Beast X20 | |
| Asus TUF Gaming F17 FX706HM | |
| Schenker XMG Neo 17 (Early 2021, RTX 3070, 5800H) | |
| Average AMD Ryzen 9 5900HX (0.48 - 0.599, n=29) | |
| Gigabyte A7 X1 | |
| Medion Erazer Beast X25 | |
| Average of class Gaming (0.3439 - 0.59, n=102, last 2 years) | |
* ... smaller is better
系统性能
在评估系统性能的PCMark 10测试中,技嘉A7 X1在我们的测试领域中取得了中间的分数。虽然它在 "生产力 "和 "数字内容创作 "子类别中达到了第一名,但 "基本要素 "得分不高,使总体评分下降。
在我们的测试期间,系统运行非常流畅,对输入的反应非常快。应用程序和文件夹的启动和打开都没有延迟。
| PCMark 10 / Score | |
| Average of class Gaming (5828 - 12414, n=93, last 2 years) | |
| Schenker XMG Neo 17 (Early 2021, RTX 3070, 5800H) | |
| Average AMD Ryzen 9 5900HX, NVIDIA GeForce RTX 3070 Laptop GPU (6875 - 6967, n=4) | |
| Asus TUF Gaming F17 FX706HM | |
| Gigabyte A7 X1 | |
| Medion Erazer Beast X25 | |
| Medion Erazer Beast X20 | |
| PCMark 10 / Essentials | |
| Average of class Gaming (8810 - 11935, n=97, last 2 years) | |
| Asus TUF Gaming F17 FX706HM | |
| Average AMD Ryzen 9 5900HX, NVIDIA GeForce RTX 3070 Laptop GPU (9991 - 10413, n=3) | |
| Schenker XMG Neo 17 (Early 2021, RTX 3070, 5800H) | |
| Medion Erazer Beast X25 | |
| Gigabyte A7 X1 | |
| Medion Erazer Beast X20 | |
| PCMark 10 / Productivity | |
| Average of class Gaming (6845 - 25323, n=95, last 2 years) | |
| Average AMD Ryzen 9 5900HX, NVIDIA GeForce RTX 3070 Laptop GPU (9301 - 9381, n=3) | |
| Gigabyte A7 X1 | |
| Medion Erazer Beast X25 | |
| Asus TUF Gaming F17 FX706HM | |
| Schenker XMG Neo 17 (Early 2021, RTX 3070, 5800H) | |
| Medion Erazer Beast X20 | |
| PCMark 10 / Digital Content Creation | |
| Average of class Gaming (7602 - 19954, n=95, last 2 years) | |
| Schenker XMG Neo 17 (Early 2021, RTX 3070, 5800H) | |
| Gigabyte A7 X1 | |
| Average AMD Ryzen 9 5900HX, NVIDIA GeForce RTX 3070 Laptop GPU (9383 - 9561, n=3) | |
| Medion Erazer Beast X25 | |
| Asus TUF Gaming F17 FX706HM | |
| Medion Erazer Beast X20 | |
| PCMark 10 Score | 6898 points | |
Help | ||
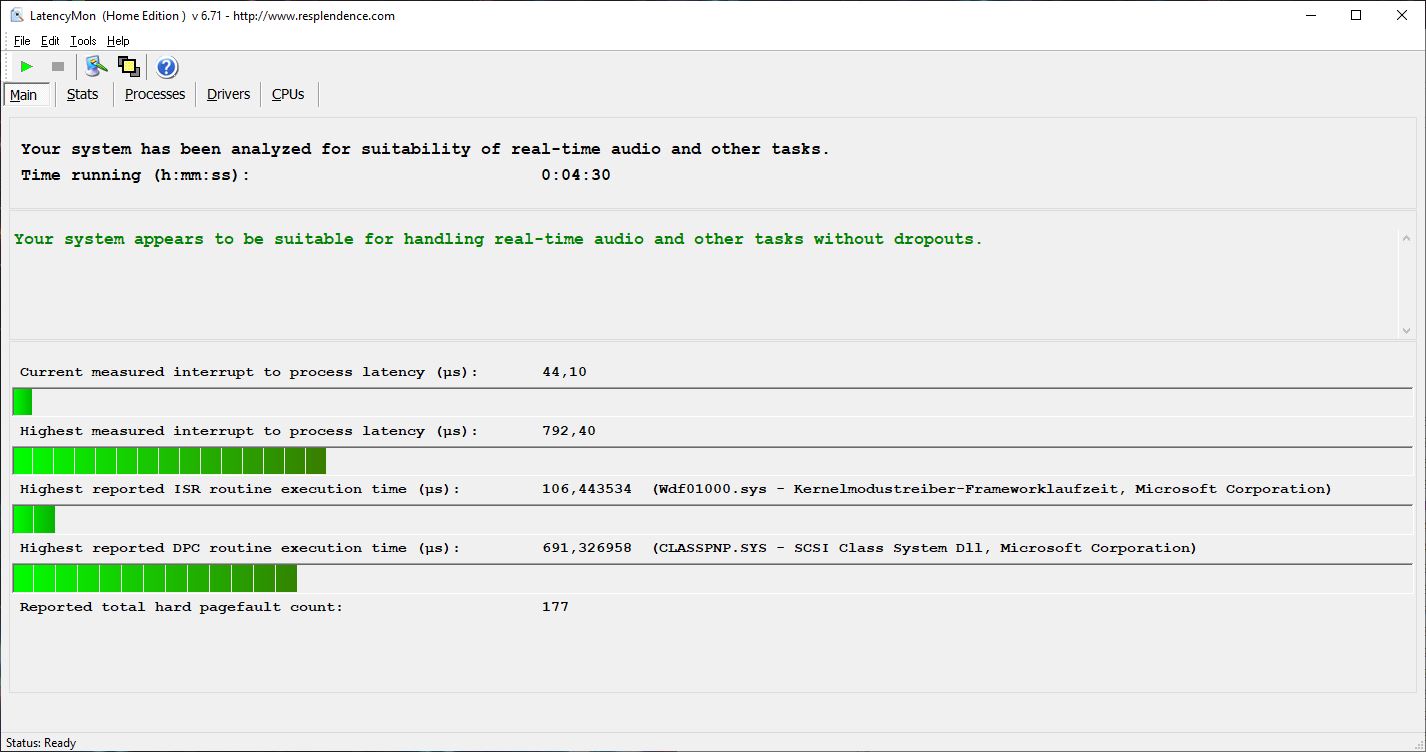
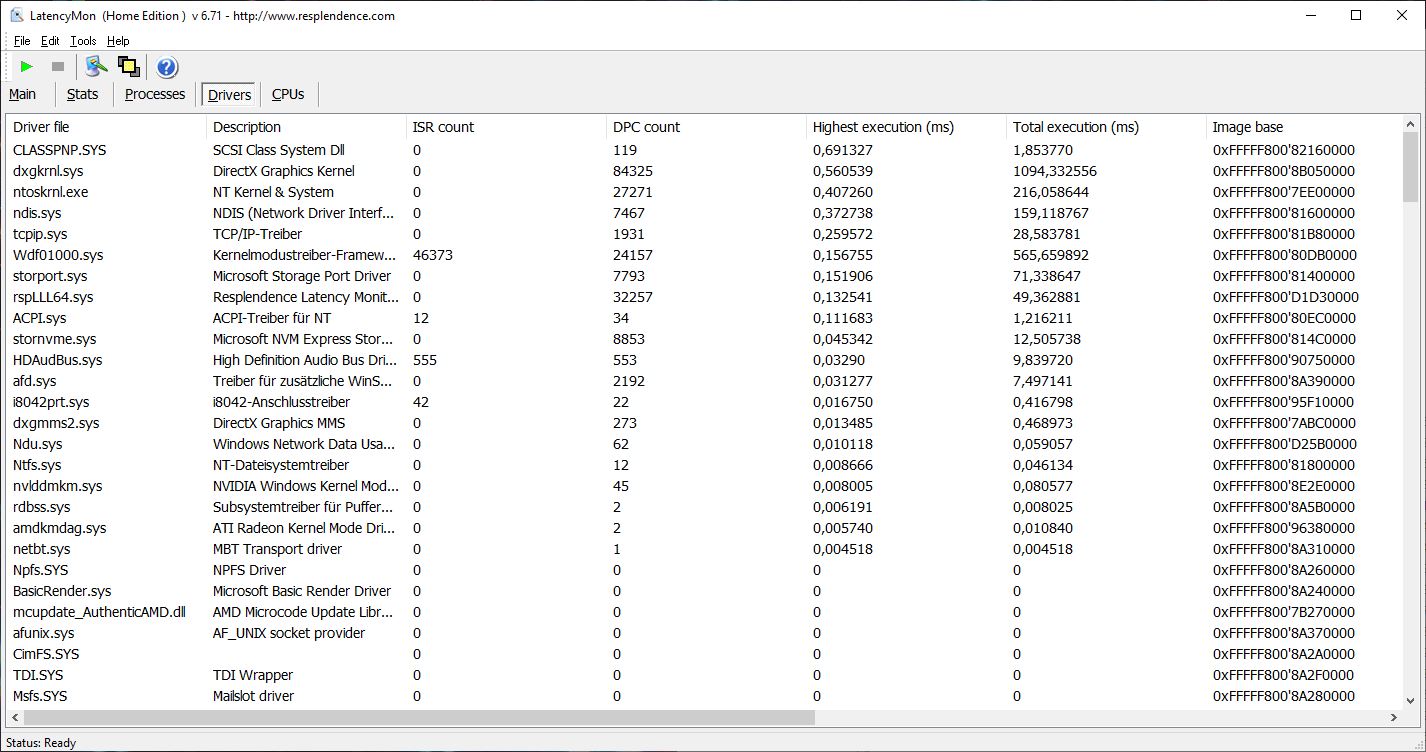
DPC延迟
在我们的测试配置中,技嘉A7 X1在LatencyMon测试中显示出非常低的延迟。这使它很适合实时应用。
| DPC Latencies / LatencyMon - interrupt to process latency (max), Web, Youtube, Prime95 | |
| Schenker XMG Neo 17 (Early 2021, RTX 3070, 5800H) | |
| Asus TUF Gaming F17 FX706HM | |
| Medion Erazer Beast X25 | |
| Medion Erazer Beast X20 | |
| Gigabyte A7 X1 | |
* ... smaller is better
储存
在我们的测试配置中,技嘉使用的固态硬盘显示出非常好的读写速率,在大多数情况下,它只被我们测试领域的其他产品略微超越。
关于与其他大容量存储设备的比较,请参阅我们的HDD/SSD基准测试文章 。
| Gigabyte A7 X1 ESR512GTLCG-EAC-4 | Medion Erazer Beast X25 Samsung PM9A1 MZVL22T0HBLB | Medion Erazer Beast X20 Phison E12S-2TB-Phison-SSD-BICS4 | Asus TUF Gaming F17 FX706HM SK Hynix HFM001TD3JX013N | Schenker XMG Neo 17 (Early 2021, RTX 3070, 5800H) Samsung SSD 970 EVO Plus 500GB | Average ESR512GTLCG-EAC-4 | |
|---|---|---|---|---|---|---|
| CrystalDiskMark 5.2 / 6 | 14% | 3% | 18% | 27% | 3% | |
| Write 4K (MB/s) | 125.1 | 129.7 4% | 155.5 24% | 168.8 35% | 206.1 65% | 131.6 ? 5% |
| Read 4K (MB/s) | 43.51 | 62.4 43% | 47.96 10% | 72 65% | 53 22% | 45.4 ? 4% |
| Write Seq (MB/s) | 2128 | 2436 14% | 1591 -25% | 3018 42% | 2303 ? 8% | |
| Read Seq (MB/s) | 1958 | 2354 20% | 1371 -30% | 2575 32% | 1716 ? -12% | |
| Write 4K Q32T1 (MB/s) | 579 | 512 -12% | 532 -8% | 459.5 -21% | 535 -8% | 525 ? -9% |
| Read 4K Q32T1 (MB/s) | 464.4 | 436.2 -6% | 627 35% | 473.1 2% | 608 31% | 581 ? 25% |
| Write Seq Q32T1 (MB/s) | 2501 | 3541 42% | 3017 21% | 3129 25% | 3242 30% | 2515 ? 1% |
| Read Seq Q32T1 (MB/s) | 3473 | 3568 3% | 3440 -1% | 3529 2% | 3617 4% | 3417 ? -2% |
| AS SSD | 16% | 15% | 10% | 26% | 6% | |
| Seq Read (MB/s) | 2859 | 2591 -9% | 2849 0% | 2837 -1% | 3020 6% | 2643 ? -8% |
| Seq Write (MB/s) | 1530 | 1900 24% | 2831 85% | 1565 2% | 2631 72% | 2134 ? 39% |
| 4K Read (MB/s) | 41.47 | 53.9 30% | 51.3 24% | 55.4 34% | 60.3 45% | 48.3 ? 16% |
| 4K Write (MB/s) | 133.9 | 112.6 -16% | 106.3 -21% | 152.9 14% | 171.6 28% | 116.4 ? -13% |
| 4K-64 Read (MB/s) | 1218 | 1335 10% | 1763 45% | 1327 9% | 1410 16% | 1586 ? 30% |
| 4K-64 Write (MB/s) | 2108 | 2966 41% | 2010 -5% | 1922 -9% | 2324 10% | 1975 ? -6% |
| Access Time Read * (ms) | 0.098 | 0.038 61% | 0.093 5% | 0.035 64% | 0.045 54% | 0.09975 ? -2% |
| Access Time Write * (ms) | 0.028 | 0.036 -29% | 0.035 -25% | 0.028 -0% | 0.024 14% | 0.03325 ? -19% |
| Score Read (Points) | 1545 | 1648 7% | 2099 36% | 1666 8% | 1773 15% | 1899 ? 23% |
| Score Write (Points) | 2395 | 3269 36% | 2399 0% | 2232 -7% | 2759 15% | 2305 ? -4% |
| Score Total (Points) | 4666 | 5733 23% | 5573 19% | 4695 1% | 5429 16% | 5151 ? 10% |
| Total Average (Program / Settings) | 15% /
15% | 9% /
10% | 14% /
13% | 27% /
27% | 5% /
5% |
* ... smaller is better

Continuous load read: DiskSpd Read Loop, Queue Depth 8
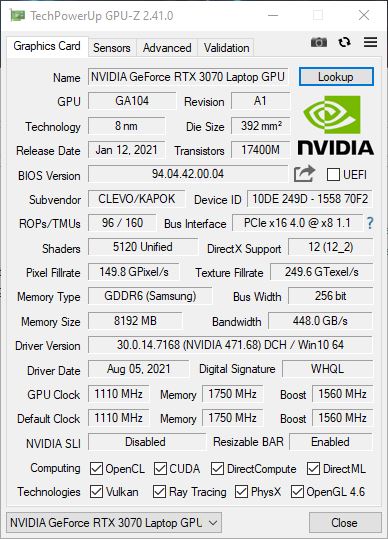
图形卡
一个NvidiaGeForce RTX 3070,负责在A7 X1中渲染要求高的图像内容。后者可以以140瓦的TDP运行,从而在3DMark测试中取得非常好的结果,这与我们测试领域的顶尖位置之一只差一点点。另一方面,当涉及到3DMark 11基准测试时,技嘉笔记本电脑可以引领我们的测试领域。
要看其他显卡的对比表现,请看我们的GPU基准测试文章 。
| 3DMark 11 - 1280x720 Performance GPU | |
| Average of class Gaming (21841 - 80022, n=103, last 2 years) | |
| Gigabyte A7 X1 | |
| Medion Erazer Beast X25 | |
| Medion Erazer Beast X20 | |
| Average NVIDIA GeForce RTX 3070 Laptop GPU (12535 - 38275, n=54) | |
| Asus TUF Gaming F17 FX706HM | |
| 3DMark | |
| 1280x720 Cloud Gate Standard Graphics | |
| Schenker XMG Neo 17 (Early 2021, RTX 3070, 5800H) | |
| Average of class Gaming (86886 - 223650, n=60, last 2 years) | |
| Gigabyte A7 X1 | |
| Average NVIDIA GeForce RTX 3070 Laptop GPU (45531 - 179716, n=33) | |
| Asus TUF Gaming F17 FX706HM | |
| Medion Erazer Beast X20 | |
| Medion Erazer Beast X25 | |
| 1920x1080 Fire Strike Graphics | |
| Average of class Gaming (18629 - 62849, n=112, last 2 years) | |
| Schenker XMG Neo 17 (Early 2021, RTX 3070, 5800H) | |
| Medion Erazer Beast X25 | |
| Medion Erazer Beast X20 | |
| Gigabyte A7 X1 | |
| Average NVIDIA GeForce RTX 3070 Laptop GPU (7178 - 29128, n=52) | |
| Asus TUF Gaming F17 FX706HM | |
| 2560x1440 Time Spy Graphics | |
| Average of class Gaming (6387 - 26212, n=112, last 2 years) | |
| Schenker XMG Neo 17 (Early 2021, RTX 3070, 5800H) | |
| Medion Erazer Beast X25 | |
| Gigabyte A7 X1 | |
| Medion Erazer Beast X20 | |
| Average NVIDIA GeForce RTX 3070 Laptop GPU (2644 - 11019, n=53) | |
| Asus TUF Gaming F17 FX706HM | |
| 3DMark 11 Performance | 26404 points | |
| 3DMark Cloud Gate Standard Score | 54931 points | |
| 3DMark Fire Strike Score | 23233 points | |
| 3DMark Time Spy Score | 10315 points | |
Help | ||
游戏性能
在我们测试的游戏中,技嘉A7 X1在全高清分辨率和最大细节方面始终实现了流畅和高帧率。这意味着最近和即将推出的游戏都能顺利运行,没有任何问题。与我们的测试领域相比,所取得的速率处于中等水平,略低于其他游戏笔记本电脑的平均水平,有时会有NvidiaGeForce RTX 3070。
我们的GPU基准测试文章,显示了在其他游戏中可以从NvidiaGeForce RTX 3070的性能预期。
| The Witcher 3 - 1920x1080 Ultra Graphics & Postprocessing (HBAO+) | |
| Average of class Gaming (104.7 - 240, n=7, last 2 years) | |
| Medion Erazer Beast X20 | |
| Schenker XMG Neo 17 (Early 2021, RTX 3070, 5800H) | |
| Medion Erazer Beast X25 | |
| Gigabyte A7 X1 | |
| Average NVIDIA GeForce RTX 3070 Laptop GPU (34.9 - 109, n=52) | |
| Asus TUF Gaming F17 FX706HM | |
| Dota 2 Reborn - 1920x1080 ultra (3/3) best looking | |
| Average of class Gaming (84.8 - 252, n=104, last 2 years) | |
| Schenker XMG Neo 17 (Early 2021, RTX 3070, 5800H) | |
| Asus TUF Gaming F17 FX706HM | |
| Average NVIDIA GeForce RTX 3070 Laptop GPU (26.9 - 163.9, n=58) | |
| Medion Erazer Beast X25 | |
| Medion Erazer Beast X20 | |
| Gigabyte A7 X1 | |
| Final Fantasy XV Benchmark - 1920x1080 High Quality | |
| Average of class Gaming (64.2 - 215, n=91, last 2 years) | |
| Medion Erazer Beast X25 | |
| Medion Erazer Beast X20 | |
| Average NVIDIA GeForce RTX 3070 Laptop GPU (27.9 - 107, n=49) | |
| Asus TUF Gaming F17 FX706HM | |
| GTA V - 1920x1080 Highest AA:4xMSAA + FX AF:16x | |
| Average of class Gaming (67.1 - 186.9, n=90, last 2 years) | |
| Schenker XMG Neo 17 (Early 2021, RTX 3070, 5800H) | |
| Medion Erazer Beast X25 | |
| Average NVIDIA GeForce RTX 3070 Laptop GPU (21.7 - 125.8, n=50) | |
| Medion Erazer Beast X20 | |
| Gigabyte A7 X1 | |
| Asus TUF Gaming F17 FX706HM | |
| Strange Brigade - 1920x1080 ultra AA:ultra AF:16 | |
| Average of class Gaming (113.6 - 458, n=83, last 2 years) | |
| Gigabyte A7 X1 | |
| Medion Erazer Beast X20 | |
| Medion Erazer Beast X25 | |
| Average NVIDIA GeForce RTX 3070 Laptop GPU (36.2 - 194, n=46) | |
| Asus TUF Gaming F17 FX706HM | |
| X-Plane 11.11 - 1920x1080 high (fps_test=3) | |
| Average of class Gaming (55.5 - 148.5, n=106, last 2 years) | |
| Average NVIDIA GeForce RTX 3070 Laptop GPU (12.4 - 118.8, n=61) | |
| Asus TUF Gaming F17 FX706HM | |
| Schenker XMG Neo 17 (Early 2021, RTX 3070, 5800H) | |
| Gigabyte A7 X1 | |
| Medion Erazer Beast X25 | |
| Medion Erazer Beast X20 | |
我们用TheWitcher 3进行的耐力测试也表明,即使在长时间的游戏过程中,性能也不会受到明显的影响,而且系统能够很好地补偿波动的影响。
The Witcher 3 FPS diagram
| low | med. | high | ultra | |
|---|---|---|---|---|
| GTA V (2015) | 174 | 164 | 139 | 83.6 |
| The Witcher 3 (2015) | 95.9 | |||
| Dota 2 Reborn (2015) | 139 | 125 | 119 | 113 |
| X-Plane 11.11 (2018) | 98.9 | 86.8 | 72.2 | |
| Strange Brigade (2018) | 311 | 232 | 208 | 185 |
| Cyberpunk 2077 1.0 (2020) | 104.5 | 89.6 | 77.1 | 66.3 |
排放 - 笔记本电脑也能安静地运行
噪声排放
当技嘉A7 X1只用于运行浏览器和执行办公任务时,笔记本电脑通常是安静的,风扇很少上升到安静的35 dB(A)。然而,在负载和游戏模式下,噪音水平会变得相当大,而且很烦人,最高可达59 dB(A)。
我们无法检测到任何其他背景噪音,如线圈啸叫或类似情况。
Noise level
| Idle |
| 25 / 29 / 35 dB(A) |
| Load |
| 58 / 59 dB(A) |
 | ||
30 dB silent 40 dB(A) audible 50 dB(A) loud |
||
min: | ||
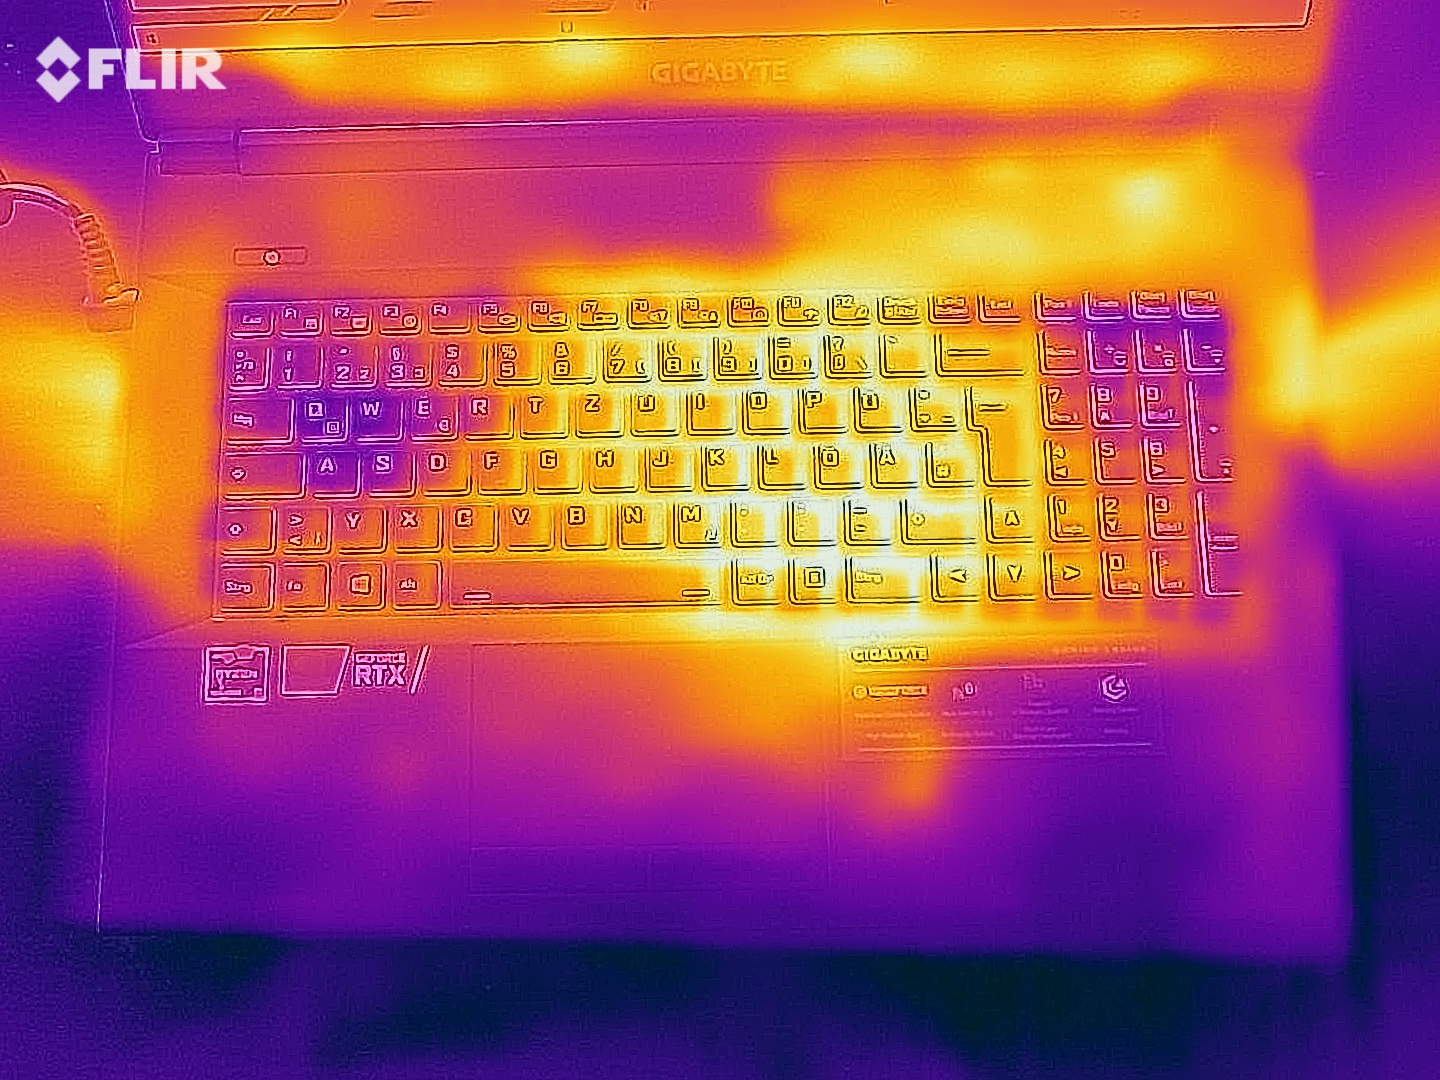
温度
根据我们的测量,技嘉A7 X1的表面加热到49℃(约120°F)。最热的地方是在左下角,但游戏笔记本从未感觉太热。掌托也只是适度发热。
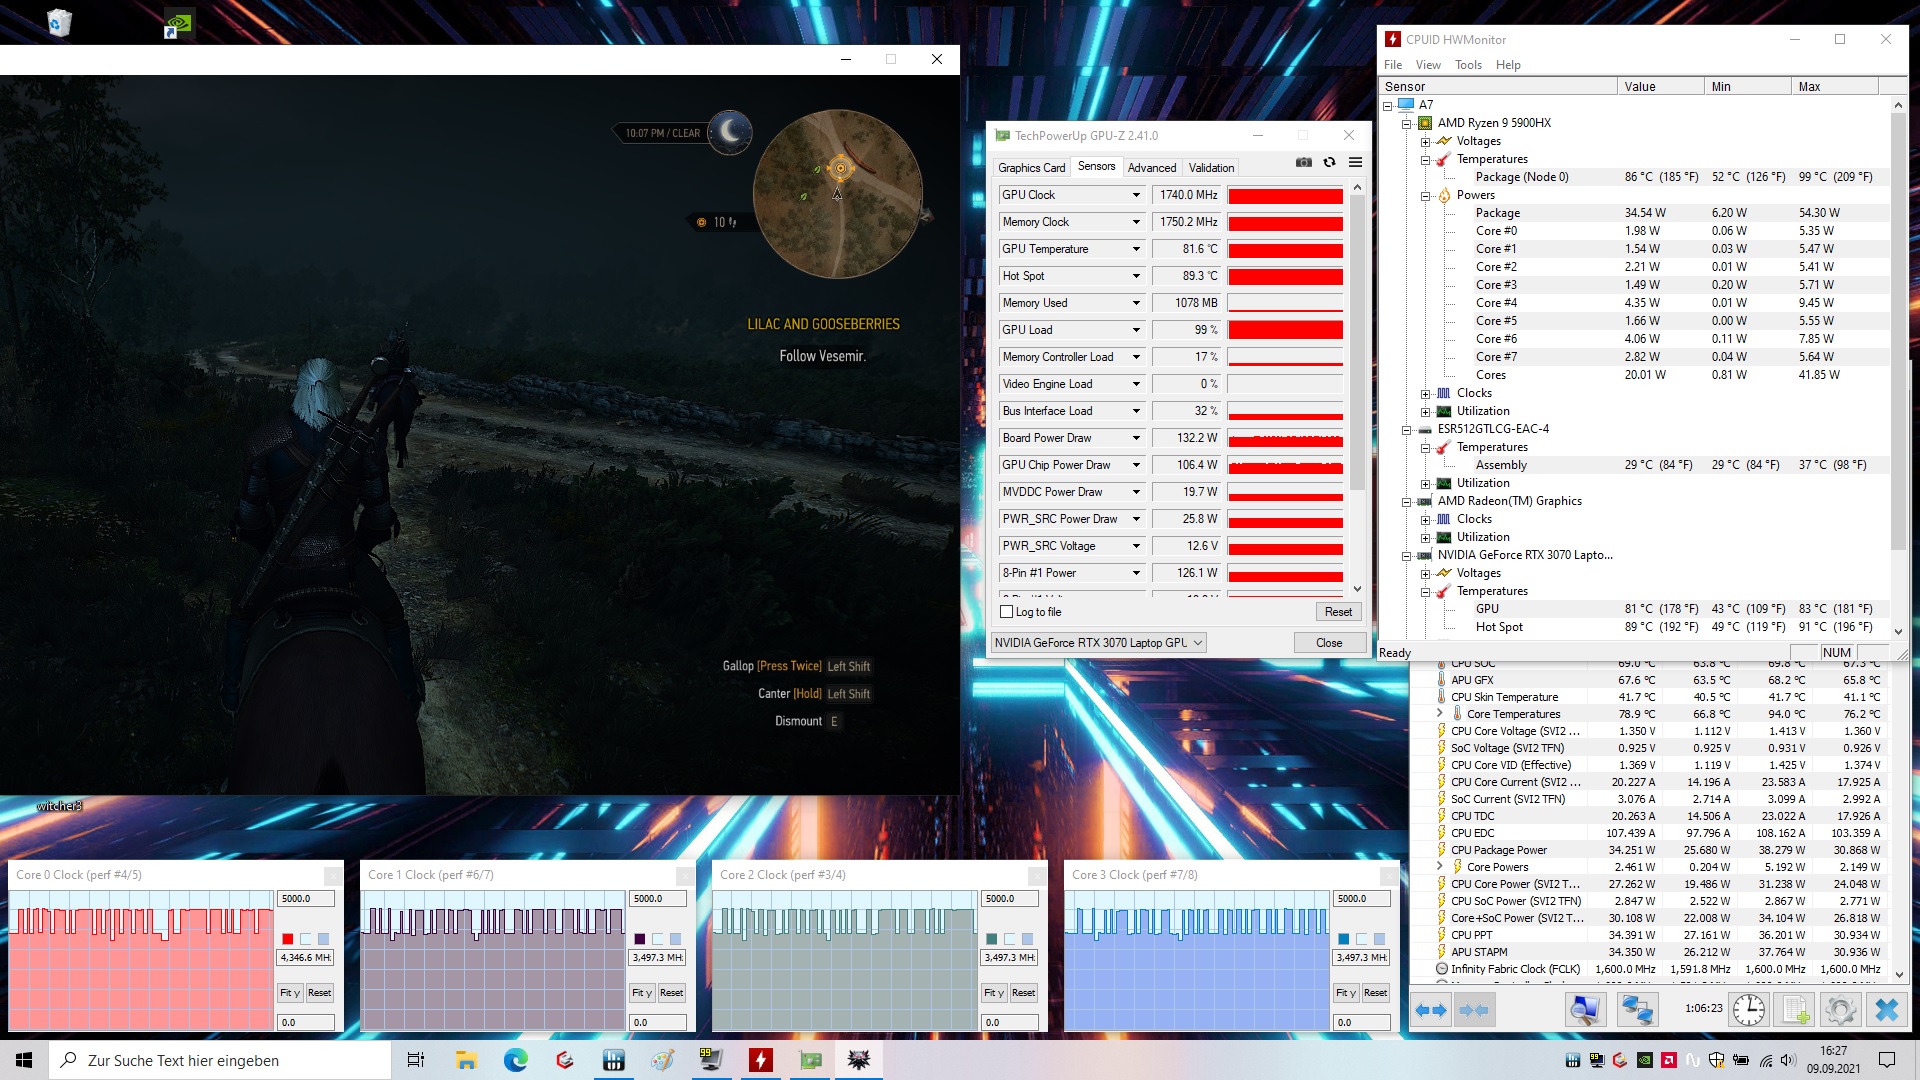
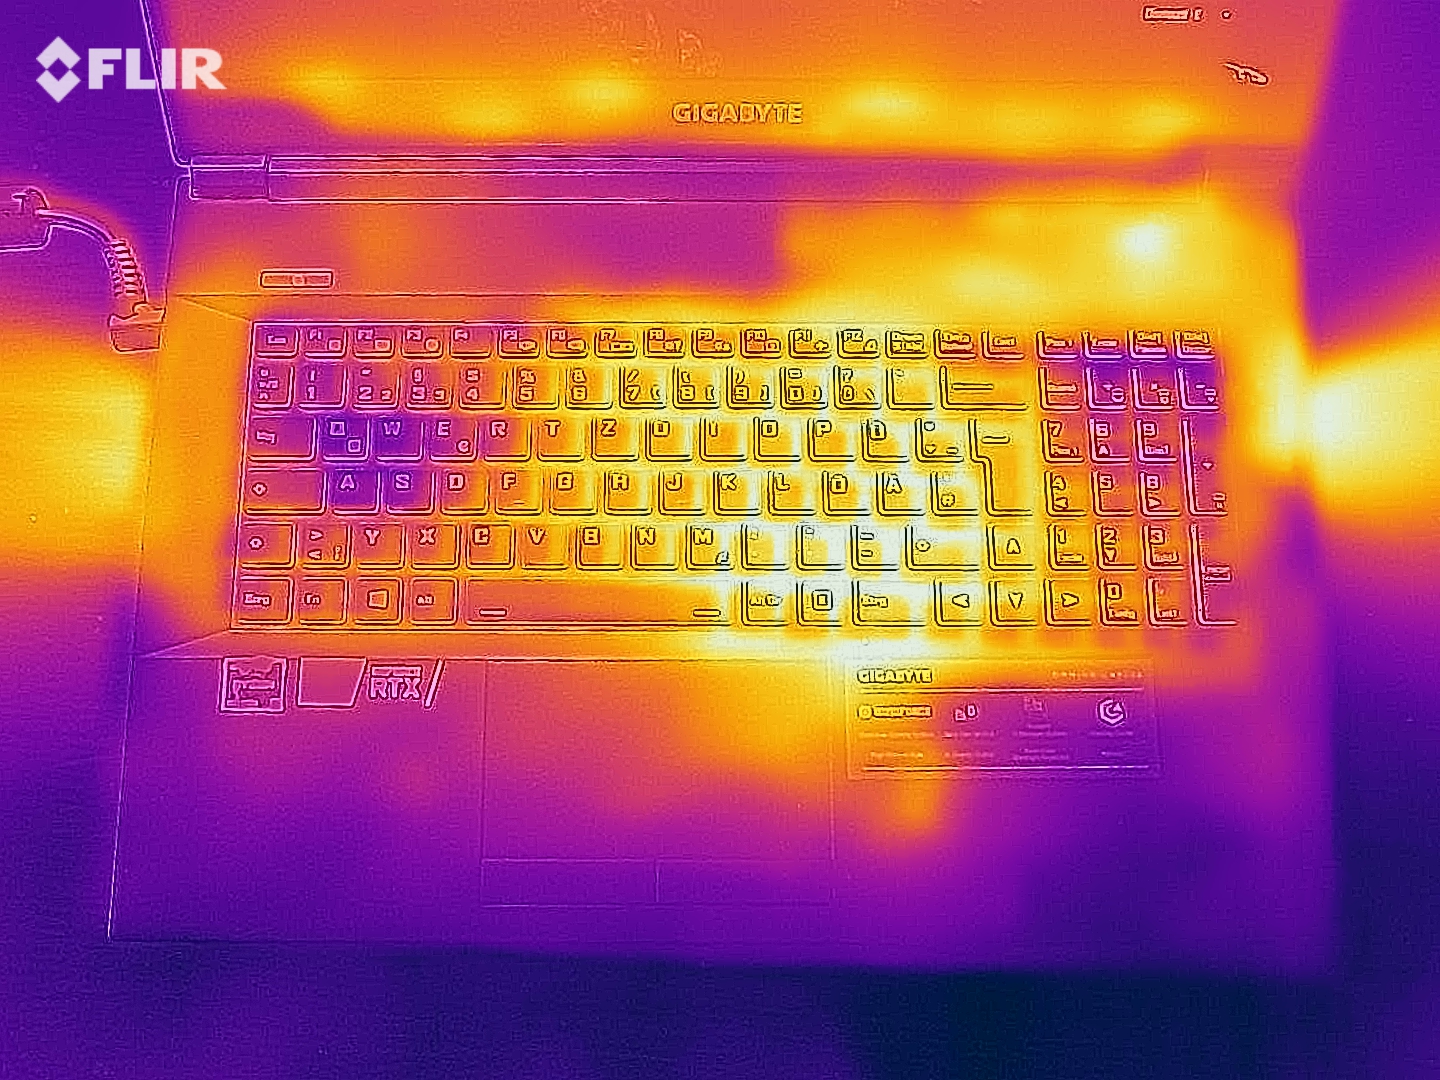
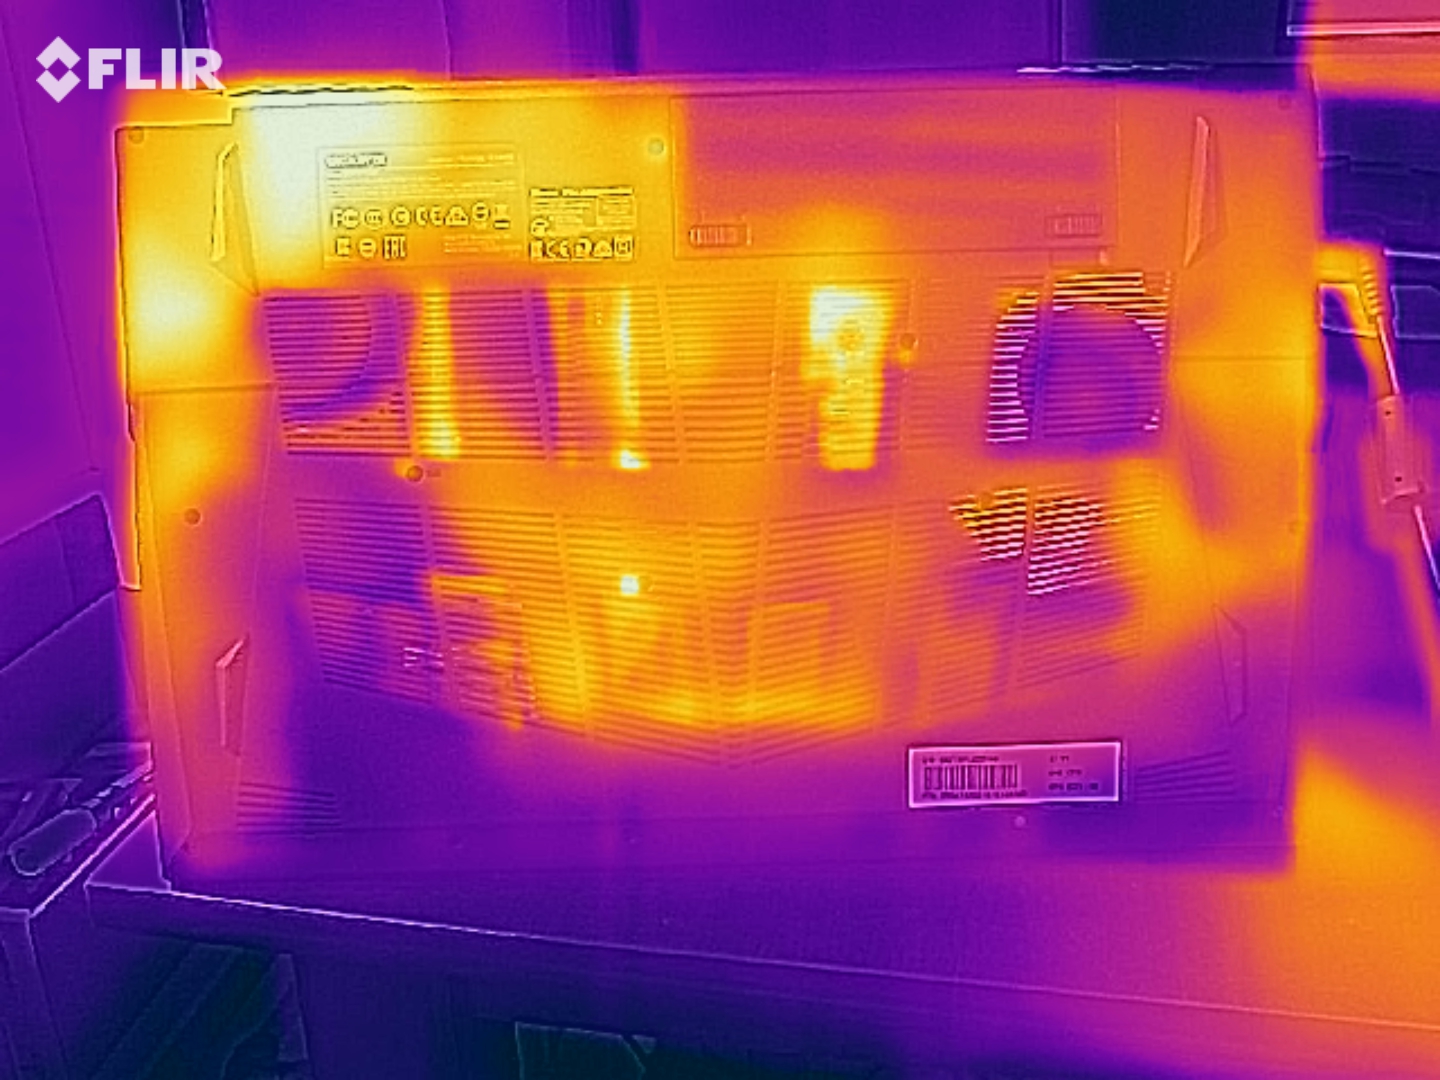
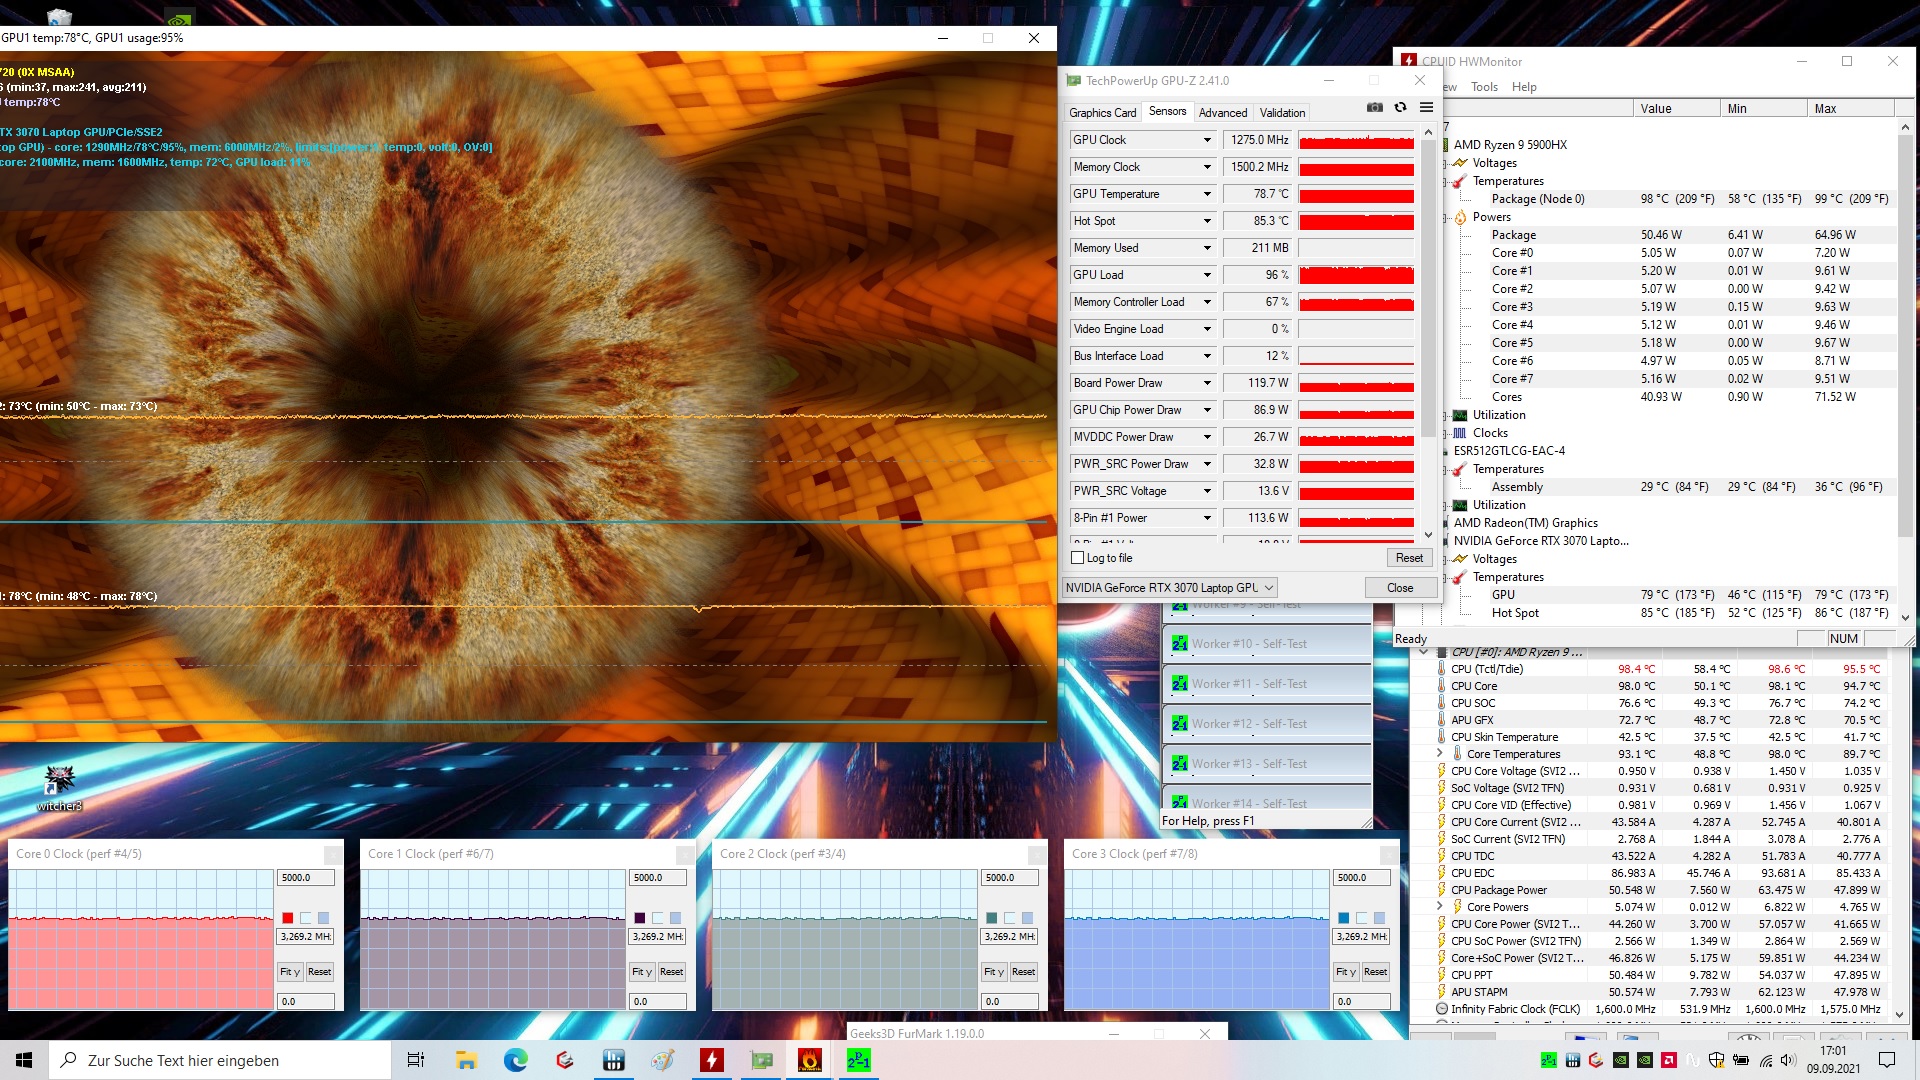
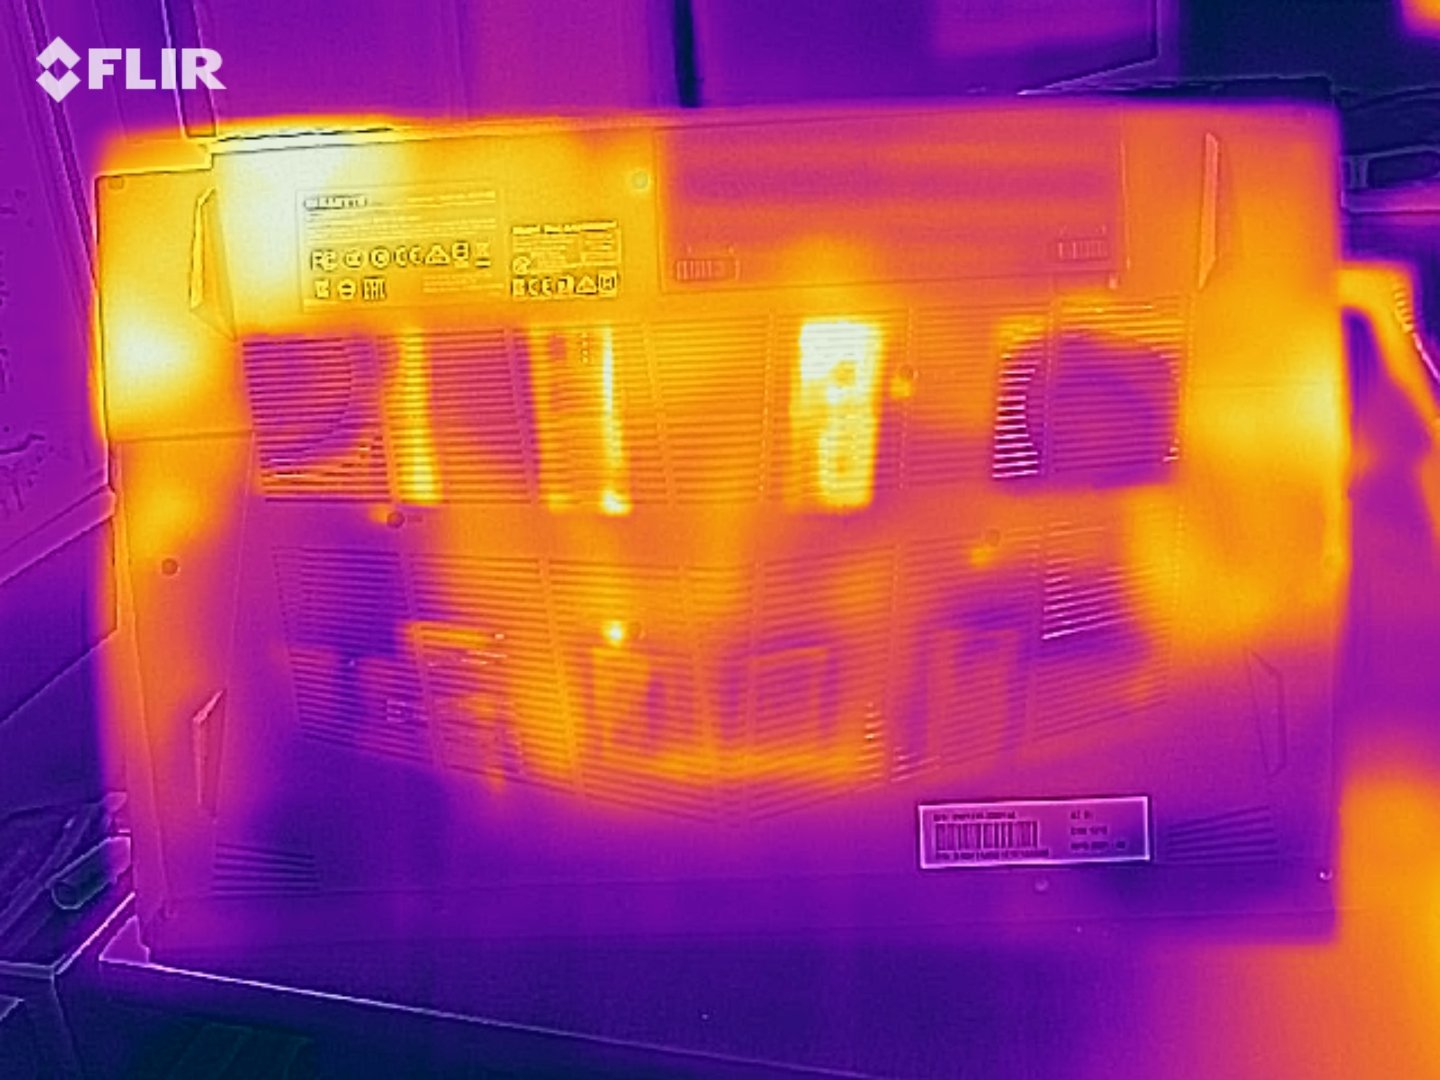
在我们持续约一小时的耐久压力测试中,技嘉A7 X1内部的温度攀升至99℃(约210°F)。然而,CPU时钟速率从未低于3.3GHz的基本值,系统继续平稳运行。我们在TheWitcher 3 的耐力压力测试中也可以看到这种行为,尽管这里的时钟频率甚至略高,约为3.5 GHz。
(±) The maximum temperature on the upper side is 44 °C / 111 F, compared to the average of 40.4 °C / 105 F, ranging from 21.2 to 68.8 °C for the class Gaming.
(-) The bottom heats up to a maximum of 49 °C / 120 F, compared to the average of 43.2 °C / 110 F
(+) In idle usage, the average temperature for the upper side is 26.1 °C / 79 F, compared to the device average of 33.9 °C / 93 F.
(-) Playing The Witcher 3, the average temperature for the upper side is 40.6 °C / 105 F, compared to the device average of 33.9 °C / 93 F.
(-) The palmrests and touchpad can get very hot to the touch with a maximum of 41 °C / 105.8 F.
(-) The average temperature of the palmrest area of similar devices was 28.8 °C / 83.8 F (-12.2 °C / -22 F).
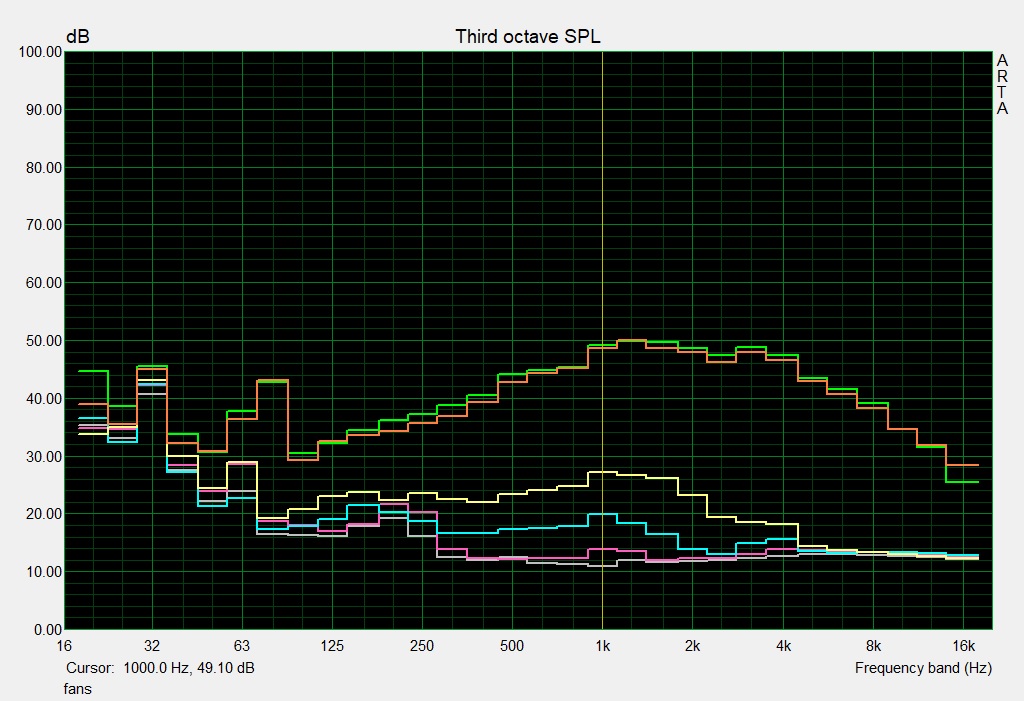
发言人
技嘉A7 X1的扬声器提供了一个相对较高的音量和一个以中音和高音为主的声谱。这使得它们完全适合播放媒体内容。然而,从长远来看,建议使用外部扬声器或耳机。
Gigabyte A7 X1 audio analysis
(+) | speakers can play relatively loud (85 dB)
Bass 100 - 315 Hz
(-) | nearly no bass - on average 30.3% lower than median
(±) | linearity of bass is average (13.4% delta to prev. frequency)
Mids 400 - 2000 Hz
(±) | higher mids - on average 6.8% higher than median
(±) | linearity of mids is average (11.3% delta to prev. frequency)
Highs 2 - 16 kHz
(+) | balanced highs - only 4.4% away from median
(+) | highs are linear (5.4% delta to prev. frequency)
Overall 100 - 16.000 Hz
(±) | linearity of overall sound is average (23.5% difference to median)
Compared to same class
» 85% of all tested devices in this class were better, 5% similar, 10% worse
» The best had a delta of 6%, average was 18%, worst was 132%
Compared to all devices tested
» 70% of all tested devices were better, 6% similar, 24% worse
» The best had a delta of 4%, average was 23%, worst was 134%
Schenker XMG Neo 17 (Early 2021, RTX 3070, 5800H) audio analysis
(+) | speakers can play relatively loud (84 dB)
Bass 100 - 315 Hz
(-) | nearly no bass - on average 20.8% lower than median
(±) | linearity of bass is average (12.3% delta to prev. frequency)
Mids 400 - 2000 Hz
(+) | balanced mids - only 2.9% away from median
(+) | mids are linear (5.1% delta to prev. frequency)
Highs 2 - 16 kHz
(+) | balanced highs - only 2.7% away from median
(±) | linearity of highs is average (7.6% delta to prev. frequency)
Overall 100 - 16.000 Hz
(+) | overall sound is linear (14.5% difference to median)
Compared to same class
» 27% of all tested devices in this class were better, 7% similar, 66% worse
» The best had a delta of 6%, average was 18%, worst was 132%
Compared to all devices tested
» 19% of all tested devices were better, 4% similar, 77% worse
» The best had a delta of 4%, average was 23%, worst was 134%
能源管理--电池寿命略显不足
能源消耗
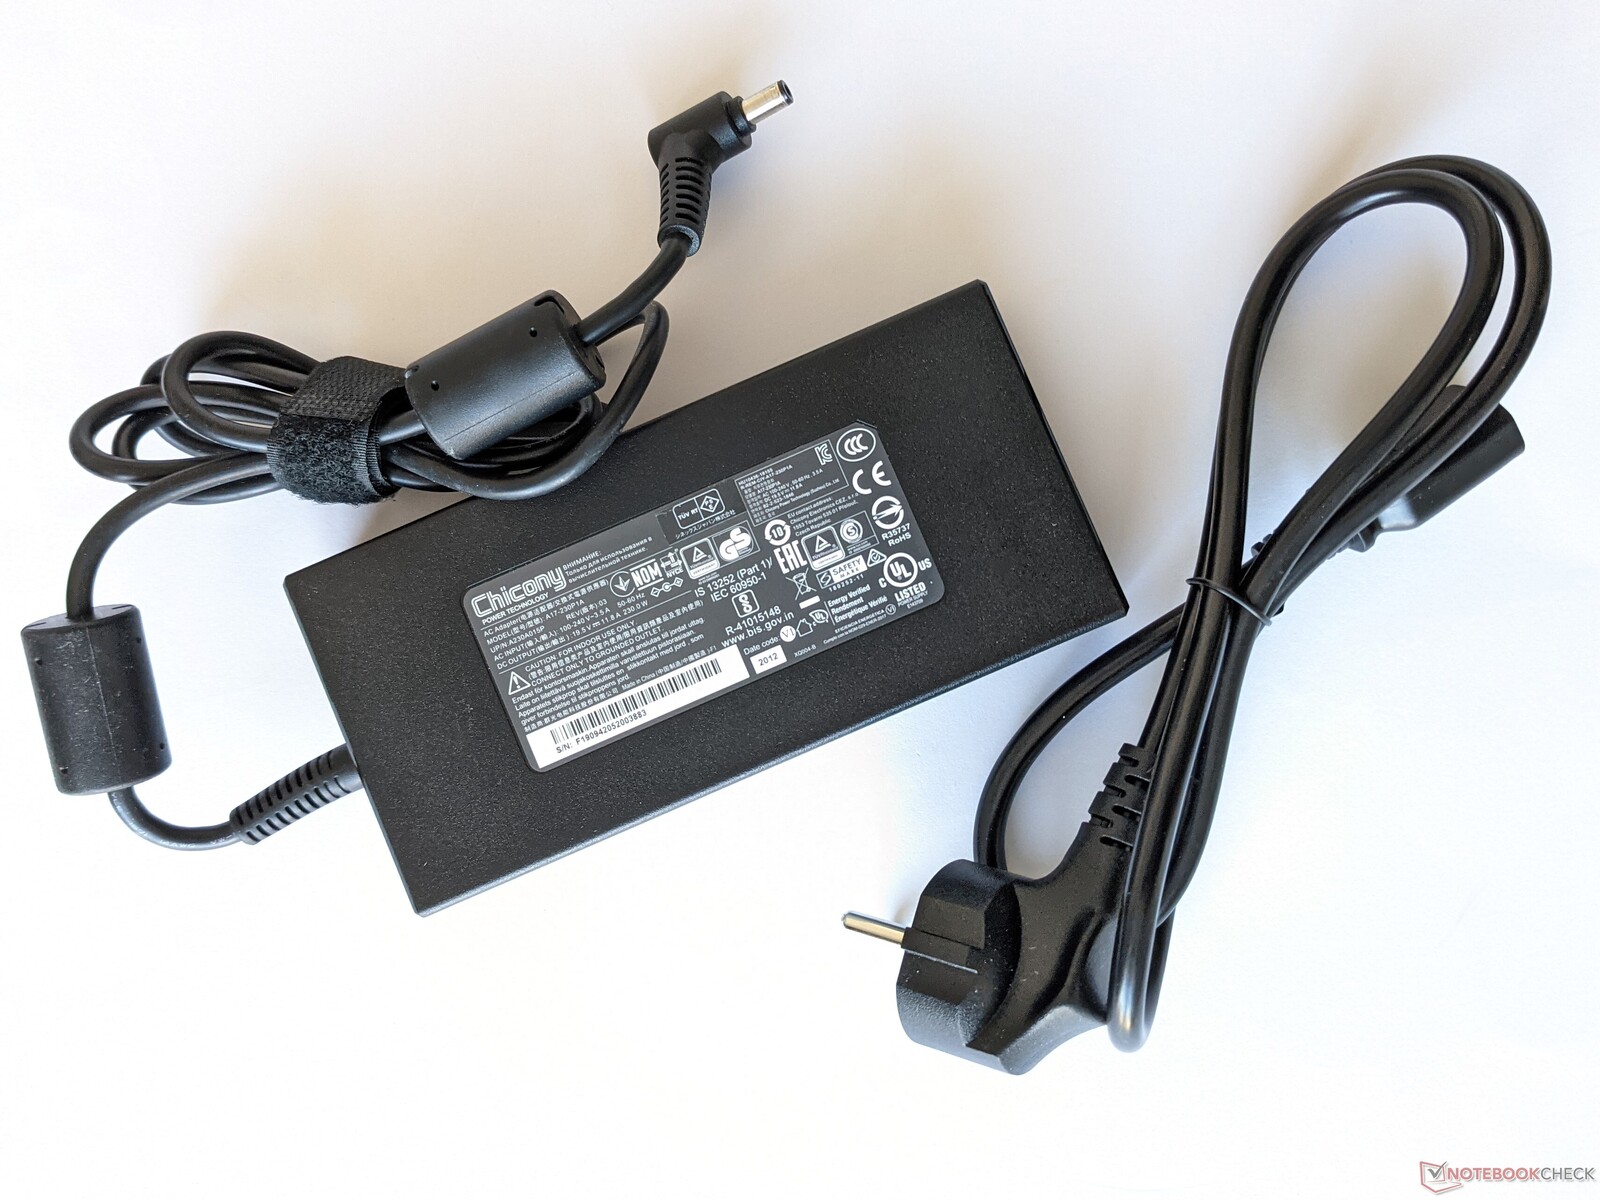
在我们的空闲情况下,平均功耗为14瓦,技嘉A7 X1是我们测试领域中最节俭的笔记本电脑之一。不过,在负载情况下,功耗可以达到229瓦的短峰值。在游戏过程中,大约205瓦的数值是可以预期的。
附带的电源适配器可以处理230瓦的输出,这是一个足够高的容量。
| Off / Standby | |
| Idle | |
| Load |
|
Key:
min: | |
| Gigabyte A7 X1 R9 5900HX, GeForce RTX 3070 Laptop GPU | Medion Erazer Beast X25 R9 5900HX, GeForce RTX 3080 Laptop GPU | Medion Erazer Beast X20 i7-10870H, GeForce RTX 3070 Laptop GPU | Asus TUF Gaming F17 FX706HM i9-11900H, GeForce RTX 3060 Laptop GPU | Schenker XMG Neo 17 (Early 2021, RTX 3070, 5800H) R7 5800H, GeForce RTX 3070 Laptop GPU | Average of class Gaming | |
|---|---|---|---|---|---|---|
| Power Consumption | -41% | -15% | 17% | -12% | -16% | |
| Idle Minimum * (Watt) | 12 | 22 -83% | 13 -8% | 10.3 14% | 13 -8% | 13.1 ? -9% |
| Idle Average * (Watt) | 14 | 26 -86% | 18 -29% | 13.1 6% | 16 -14% | 19 ? -36% |
| Idle Maximum * (Watt) | 19 | 34 -79% | 32 -68% | 14.1 26% | 26 -37% | 24.6 ? -29% |
| Load Average * (Watt) | 118 | 120 -2% | 106 10% | 110 7% | 125 -6% | 111.3 ? 6% |
| Witcher 3 ultra * (Watt) | 205 | 189 8% | 192 6% | 138 33% | 187 9% | |
| Load Maximum * (Watt) | 229 | 231 -1% | 232 -1% | 190 17% | 259 -13% | 260 ? -14% |
* ... smaller is better
Energy consumption during The Witcher 3 / stress test
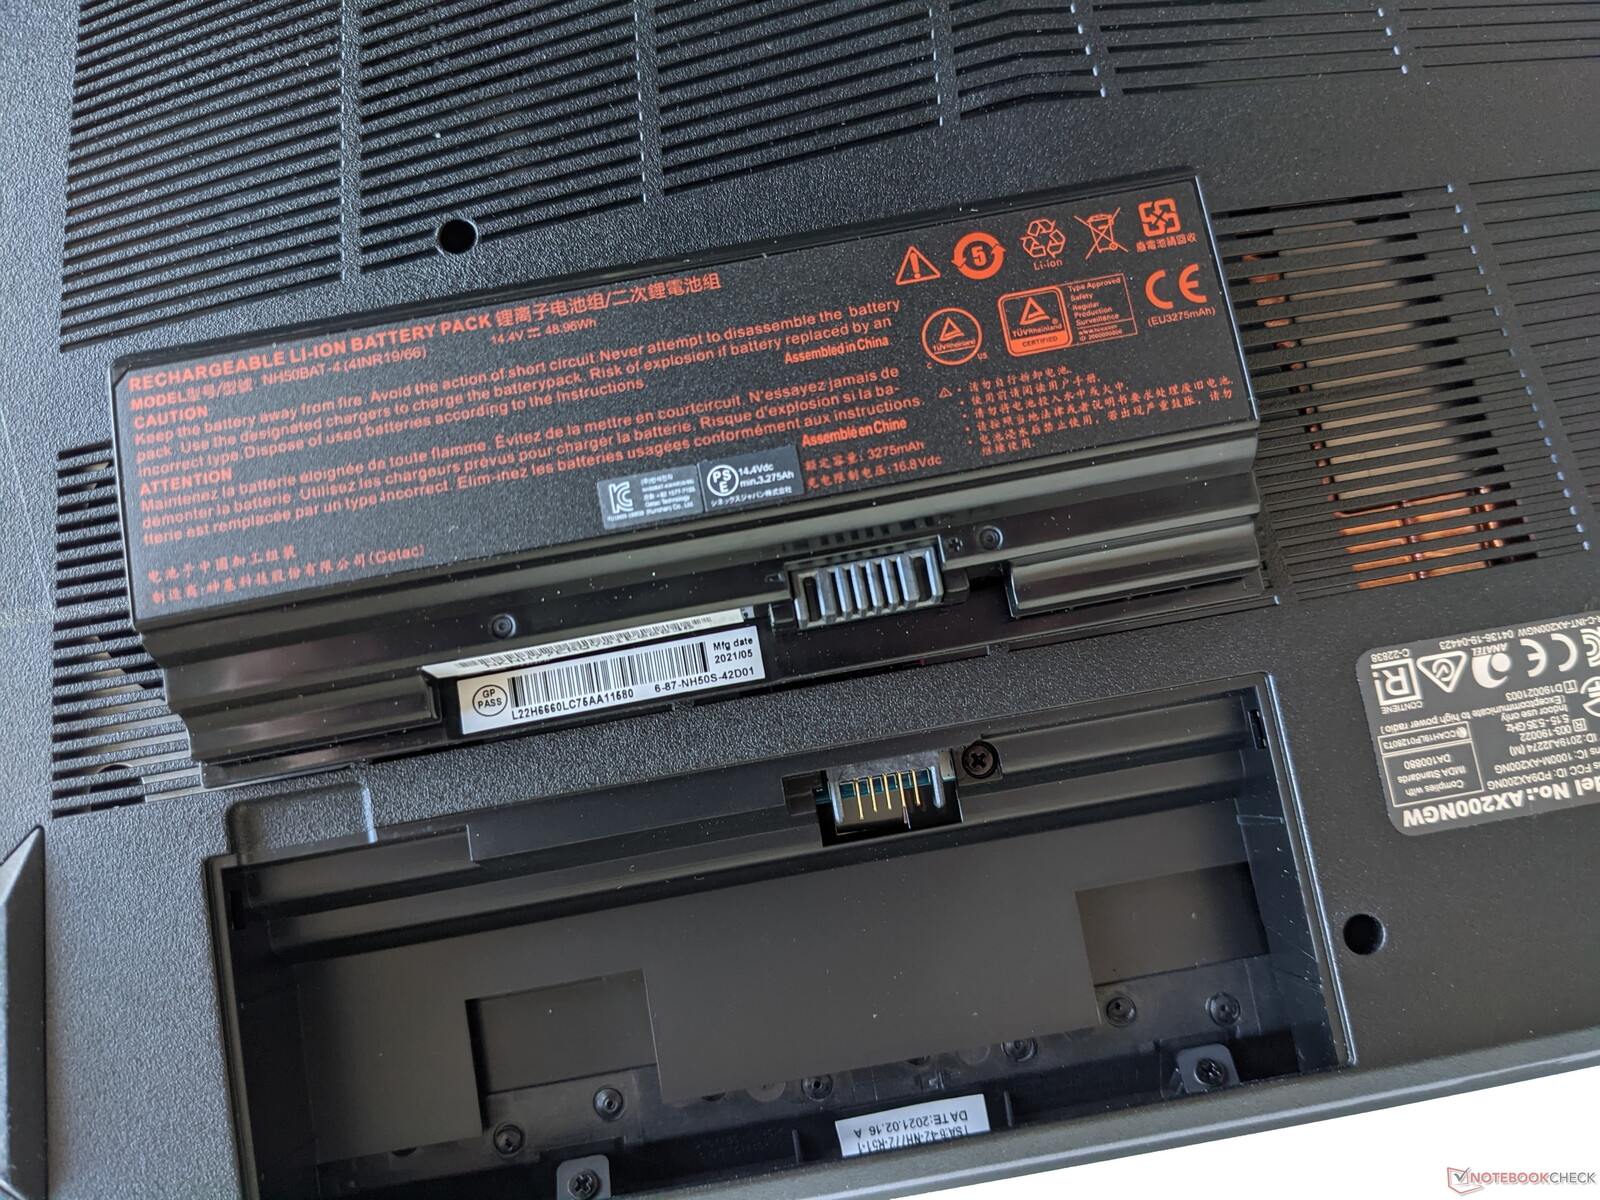
电池寿命
在我们的真实世界Wi-Fi测试中,技嘉A7 X1实现了4:40小时的运行时间。这意味着它很好地利用了其48.96Wh的电池,但它没有达到我们选择的竞争对手的速率。作为回报,这款游戏笔记本的电池可以在不需要工具的情况下拆下,必要时可以更换。
| Gigabyte A7 X1 R9 5900HX, GeForce RTX 3070 Laptop GPU, 48.96 Wh | Medion Erazer Beast X25 R9 5900HX, GeForce RTX 3080 Laptop GPU, 91 Wh | Medion Erazer Beast X20 i7-10870H, GeForce RTX 3070 Laptop GPU, 91 Wh | Asus TUF Gaming F17 FX706HM i9-11900H, GeForce RTX 3060 Laptop GPU, 90 Wh | Schenker XMG Neo 17 (Early 2021, RTX 3070, 5800H) R7 5800H, GeForce RTX 3070 Laptop GPU, 62 Wh | Average of class Gaming | |
|---|---|---|---|---|---|---|
| Battery runtime | 31% | 62% | 85% | -34% | 38% | |
| WiFi v1.3 (h) | 4.7 | 6.8 45% | 6.2 32% | 7.6 62% | 3.5 -26% | 7.08 ? 51% |
| Load (h) | 1.2 | 1.4 17% | 2.3 92% | 2.5 108% | 0.7 -42% | 1.496 ? 25% |
Pros
Cons
评语 - 强大且可升级
就外观而言,技嘉A7 X1当然不是一款时尚、纤薄、超移动的游戏笔记本。但它做了它应该做的事情,即把游戏流畅地带到屏幕上,非常好。处理器和GeForce RTX 3070,都能够不受限制地释放其性能,这要归功于通风良好的机箱。
技嘉A7 X1将现代游戏流畅地呈现在屏幕上,并提供出色的维护选项。
大型结构的另一个优点是许多组件可以很容易地升级或更换。例如,不仅可以完全更换电池而不需要工具,而且内部还有额外的免费插槽用于大容量存储设备,你还可以获得WLAN模块和RAM。
如果你觉得A7 X1太笨重,你可以看看15英寸的技嘉G5 KC对应产品,它配备了英特尔CPU。Schenker XMG Neo 17,它更苗条一些,但也更贵。
Gigabyte A7 X1
- 10/13/2021 v7 (old)
Mike Wobker
Price comparison

