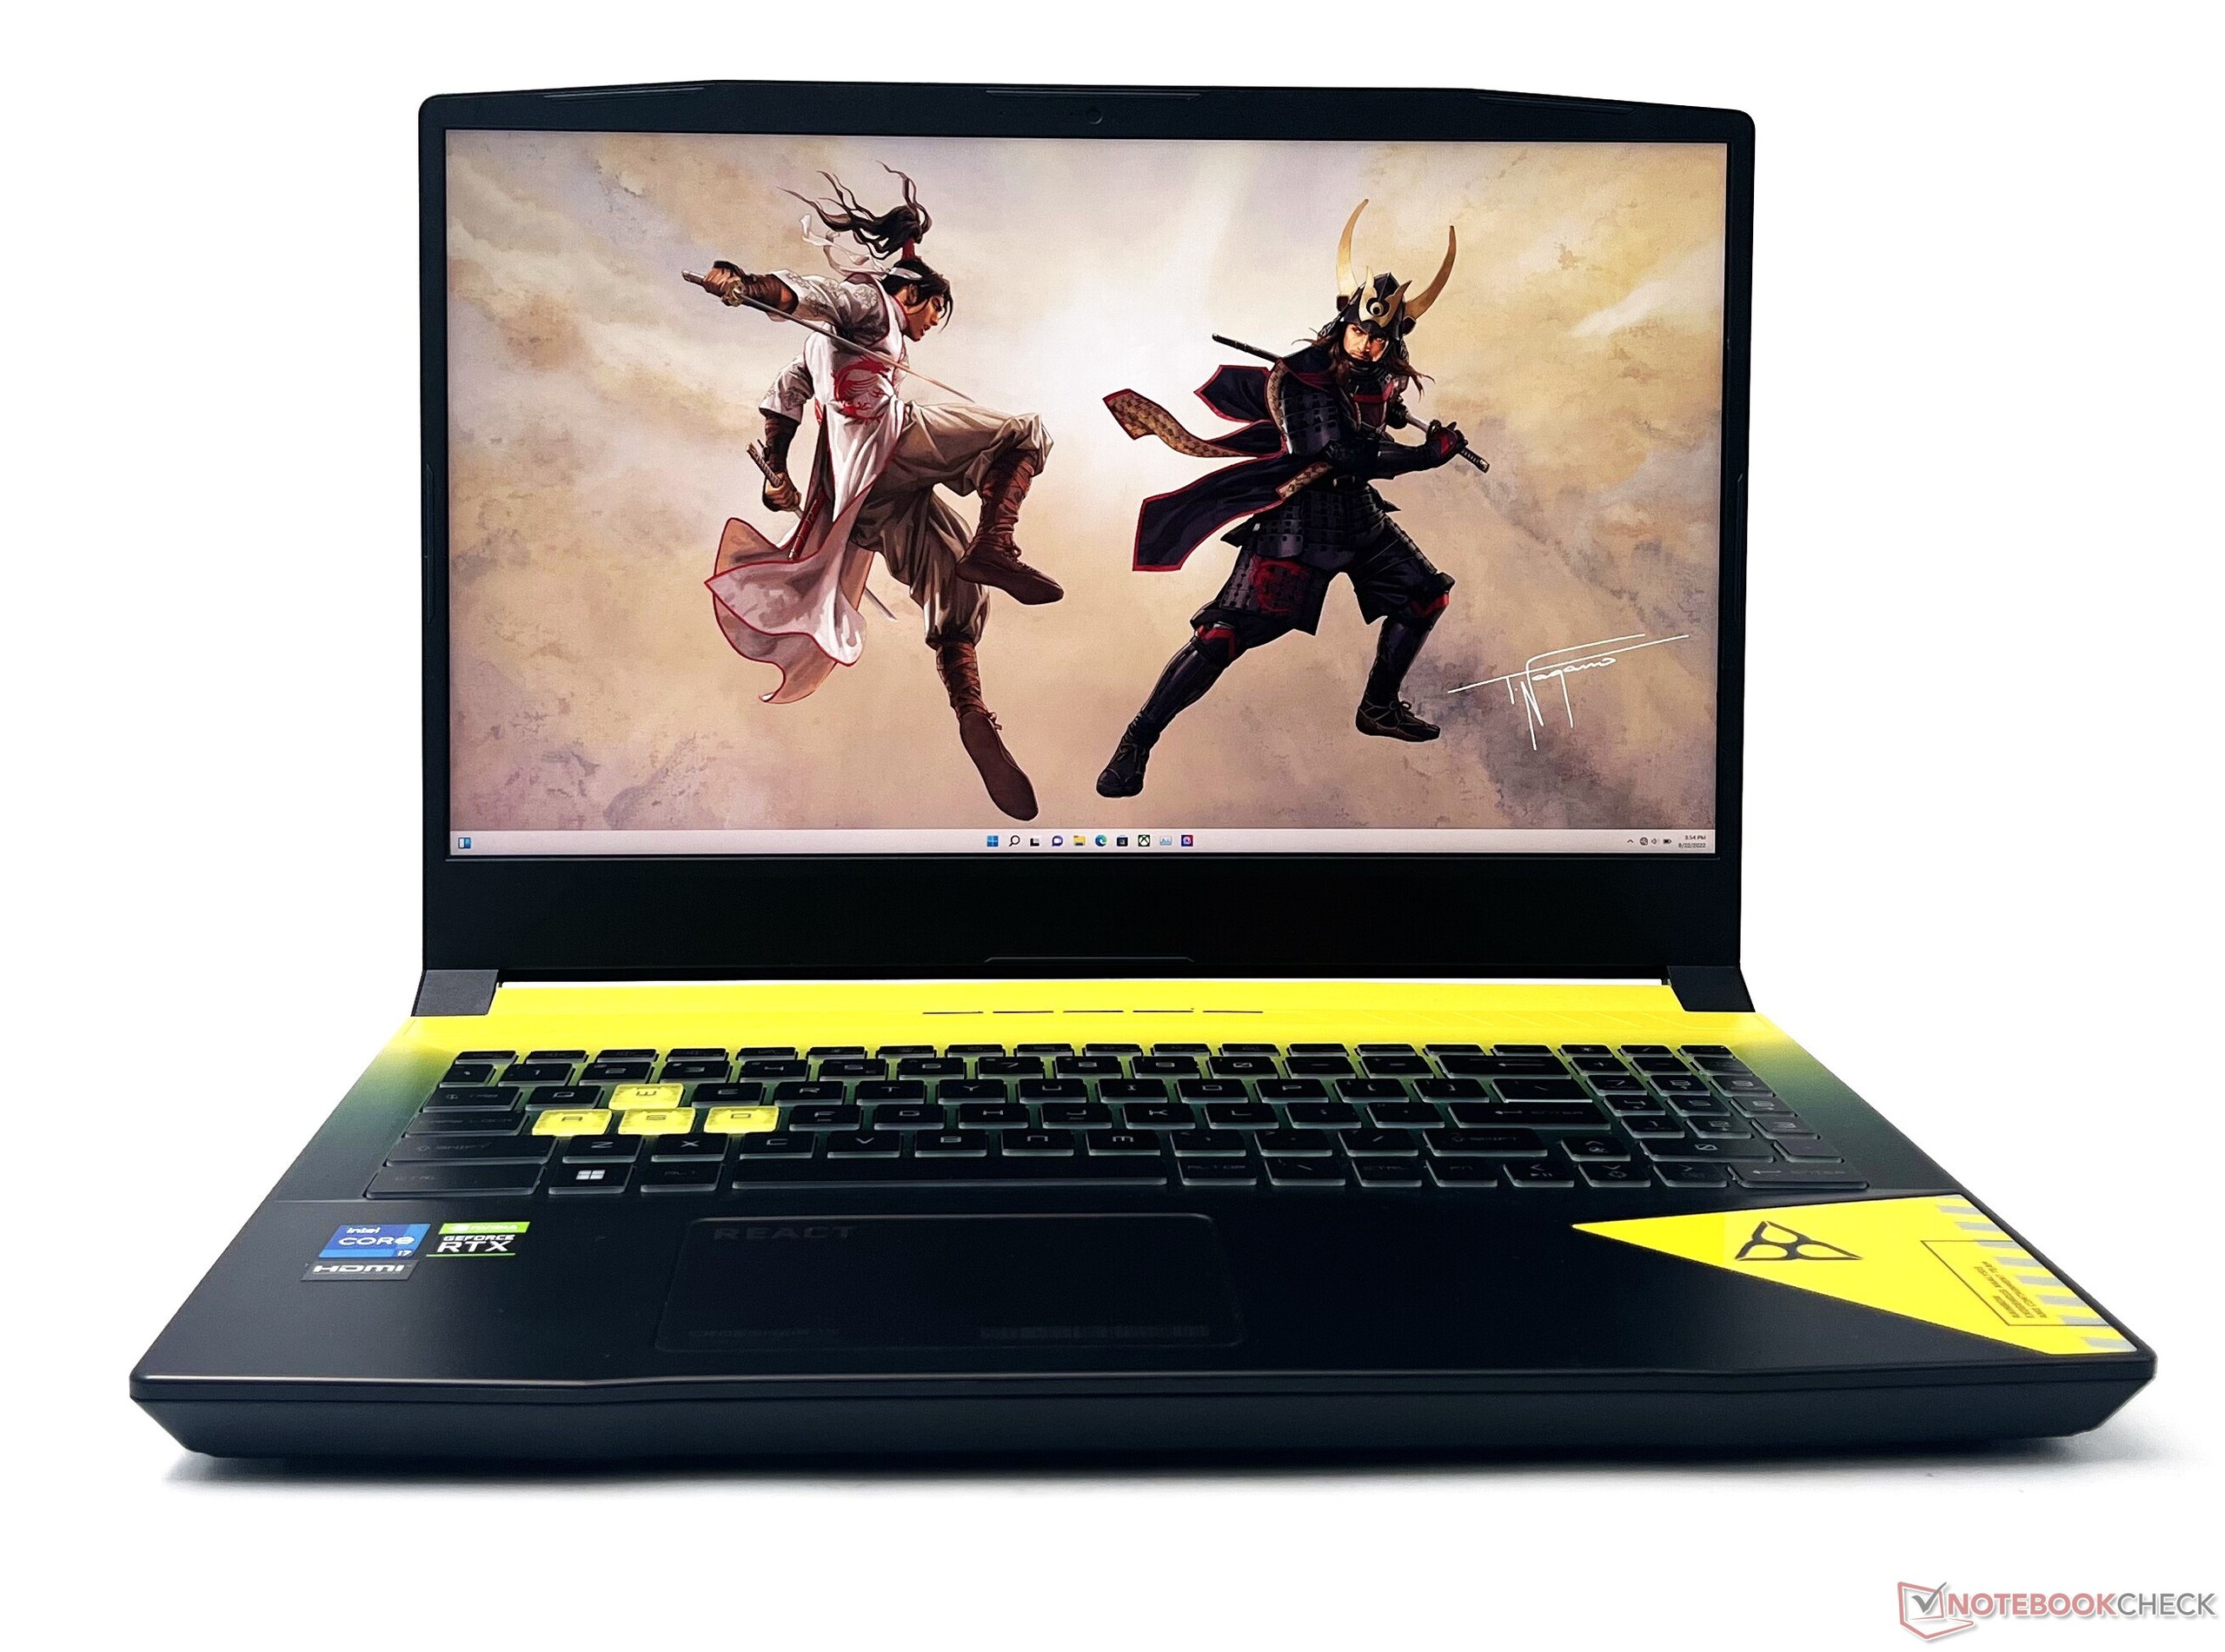
微星Crosshair 15彩虹六号提取版评论。超越主题的QHD 165 Hz中端机的能力

如今,以游戏为主题的笔记本电脑已经很难见到了。Alienware庆祝Cyberpunk 2077的推出,并推出了主题的 m17 R3庆祝,但那更多的是为了美化设计的一个皮肤。在Crosshair 15中,微星从头开始设计笔记本电脑,将育碧的《彩虹六号》灌入其中。在设计的各个方面都注入了育碧的 "彩虹六号"的气息。
以游戏为主题的笔记本电脑的问题是,它们只吸引了投资于特定游戏的小众人群。彩虹六号。提取》,赢得了,评论家和粉丝们褒贬不一。因此,以这款游戏为主题的笔记本电脑可能不会在第一眼就引起所有人的兴趣。
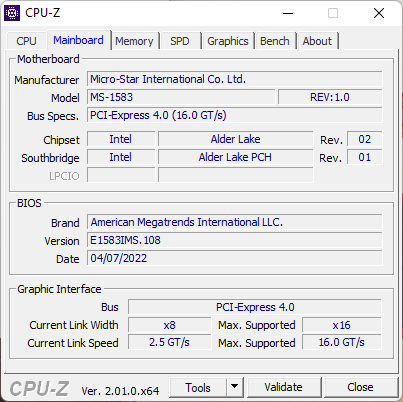
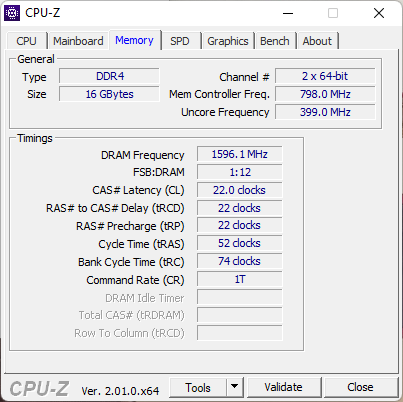
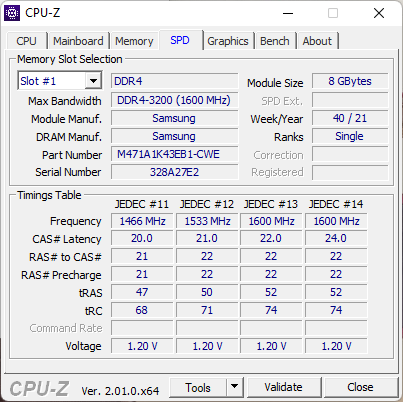
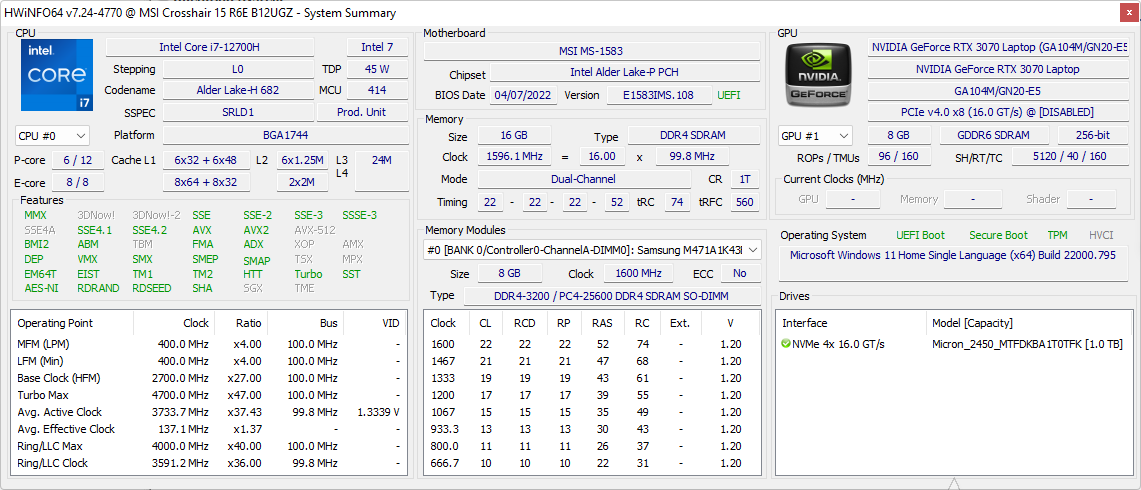
然而,超越主题,我们发现微星在包装中提供了很多东西。我们的微星Crosshair 15彩虹六号。提取版(R6E)配备了一个 英特尔酷睿i7-12700H处理器。 NvidiaGeForce RTX 3070 笔记本电脑GPU,16GB DDR4-3200内存,1TB NVMe SSD,以及165Hz QHD显示屏。
Alder Lake-H处理器和RTX 3070笔记本GPU的组合并不常见,因为Nvidia已经用RTX 3070 Ti笔记本GPU取代了这个GPU。 RTX 3070 Ti笔记本GPU.尽管如此,这个Crosshair 15的配置将使你在印度花费1,90,990(2,312美元)。
在这次审查中,我们评估了微星Crosshair 15彩虹六号。提取版,看看它作为中档以上的游戏笔记本在竞争中的表现如何。
潜在的竞争对手比较
Rating | Date | Model | Weight | Height | Size | Resolution | Price |
|---|---|---|---|---|---|---|---|
| 85.8 % v7 (old) | 12 / 2022 | MSI Crosshair 15 R6E B12UGZ-050 i7-12700H, GeForce RTX 3070 Laptop GPU | 2.5 kg | 26.9 mm | 15.60" | 2560x1440 | |
| 84.5 % v7 (old) | 02 / 2022 | MSI Stealth GS66 12UGS i7-12700H, GeForce RTX 3070 Ti Laptop GPU | 2.2 kg | 19.8 mm | 15.60" | 2560x1440 | |
| 88 % v7 (old) | 03 / 2022 | Lenovo Legion 5 Pro 16 G7 i7 RTX 3070Ti i7-12700H, GeForce RTX 3070 Ti Laptop GPU | 2.6 kg | 26.6 mm | 16.00" | 2560x1600 | |
| 80.3 % v7 (old) | 06 / 2022 | MSI Katana GF66 12UGS i7-12700H, GeForce RTX 3070 Ti Laptop GPU | 2.3 kg | 27.5 mm | 15.60" | 1920x1080 | |
| 80.7 % v7 (old) | 04 / 2022 | MSI Pulse GL66 12UEK i9-12900H, GeForce RTX 3060 Laptop GPU | 2.3 kg | 25 mm | 15.60" | 1920x1080 | |
| 84 % v7 (old) | 06 / 2022 | Acer Nitro 5 AN515-58-72QR i7-12700H, GeForce RTX 3070 Ti Laptop GPU | 2.5 kg | 26.8 mm | 15.60" | 2560x1440 | |
| 85.5 % v7 (old) | 12 / 2022 | Aorus 15 XE5 i7-12700H, GeForce RTX 3070 Ti Laptop GPU | 2.3 kg | 24 mm | 15.60" | 2560x1440 | |
| 88.4 % v7 (old) | 07 / 2022 | Schenker XMG Neo 15 (i7-12700H, RTX 3080 Ti) i7-12700H, GeForce RTX 3080 Ti Laptop GPU | 2.3 kg | 26.6 mm | 15.60" | 2560x1440 | |
| 85.8 % v7 (old) | 07 / 2022 | Asus TUF Dash F15 FX517ZR i7-12650H, GeForce RTX 3070 Laptop GPU | 2 kg | 20.7 mm | 15.60" | 2560x1440 | |
| 88 % v7 (old) | 11 / 2022 | Schenker XMG Neo 15 (Ryzen 9 6900HX, RTX 3070 Ti) R9 6900HX, GeForce RTX 3070 Ti Laptop GPU | 2.3 kg | 26.6 mm | 15.60" | 2560x1440 |
案例。脉冲GL66涂有彩虹六号。萃取的颜色
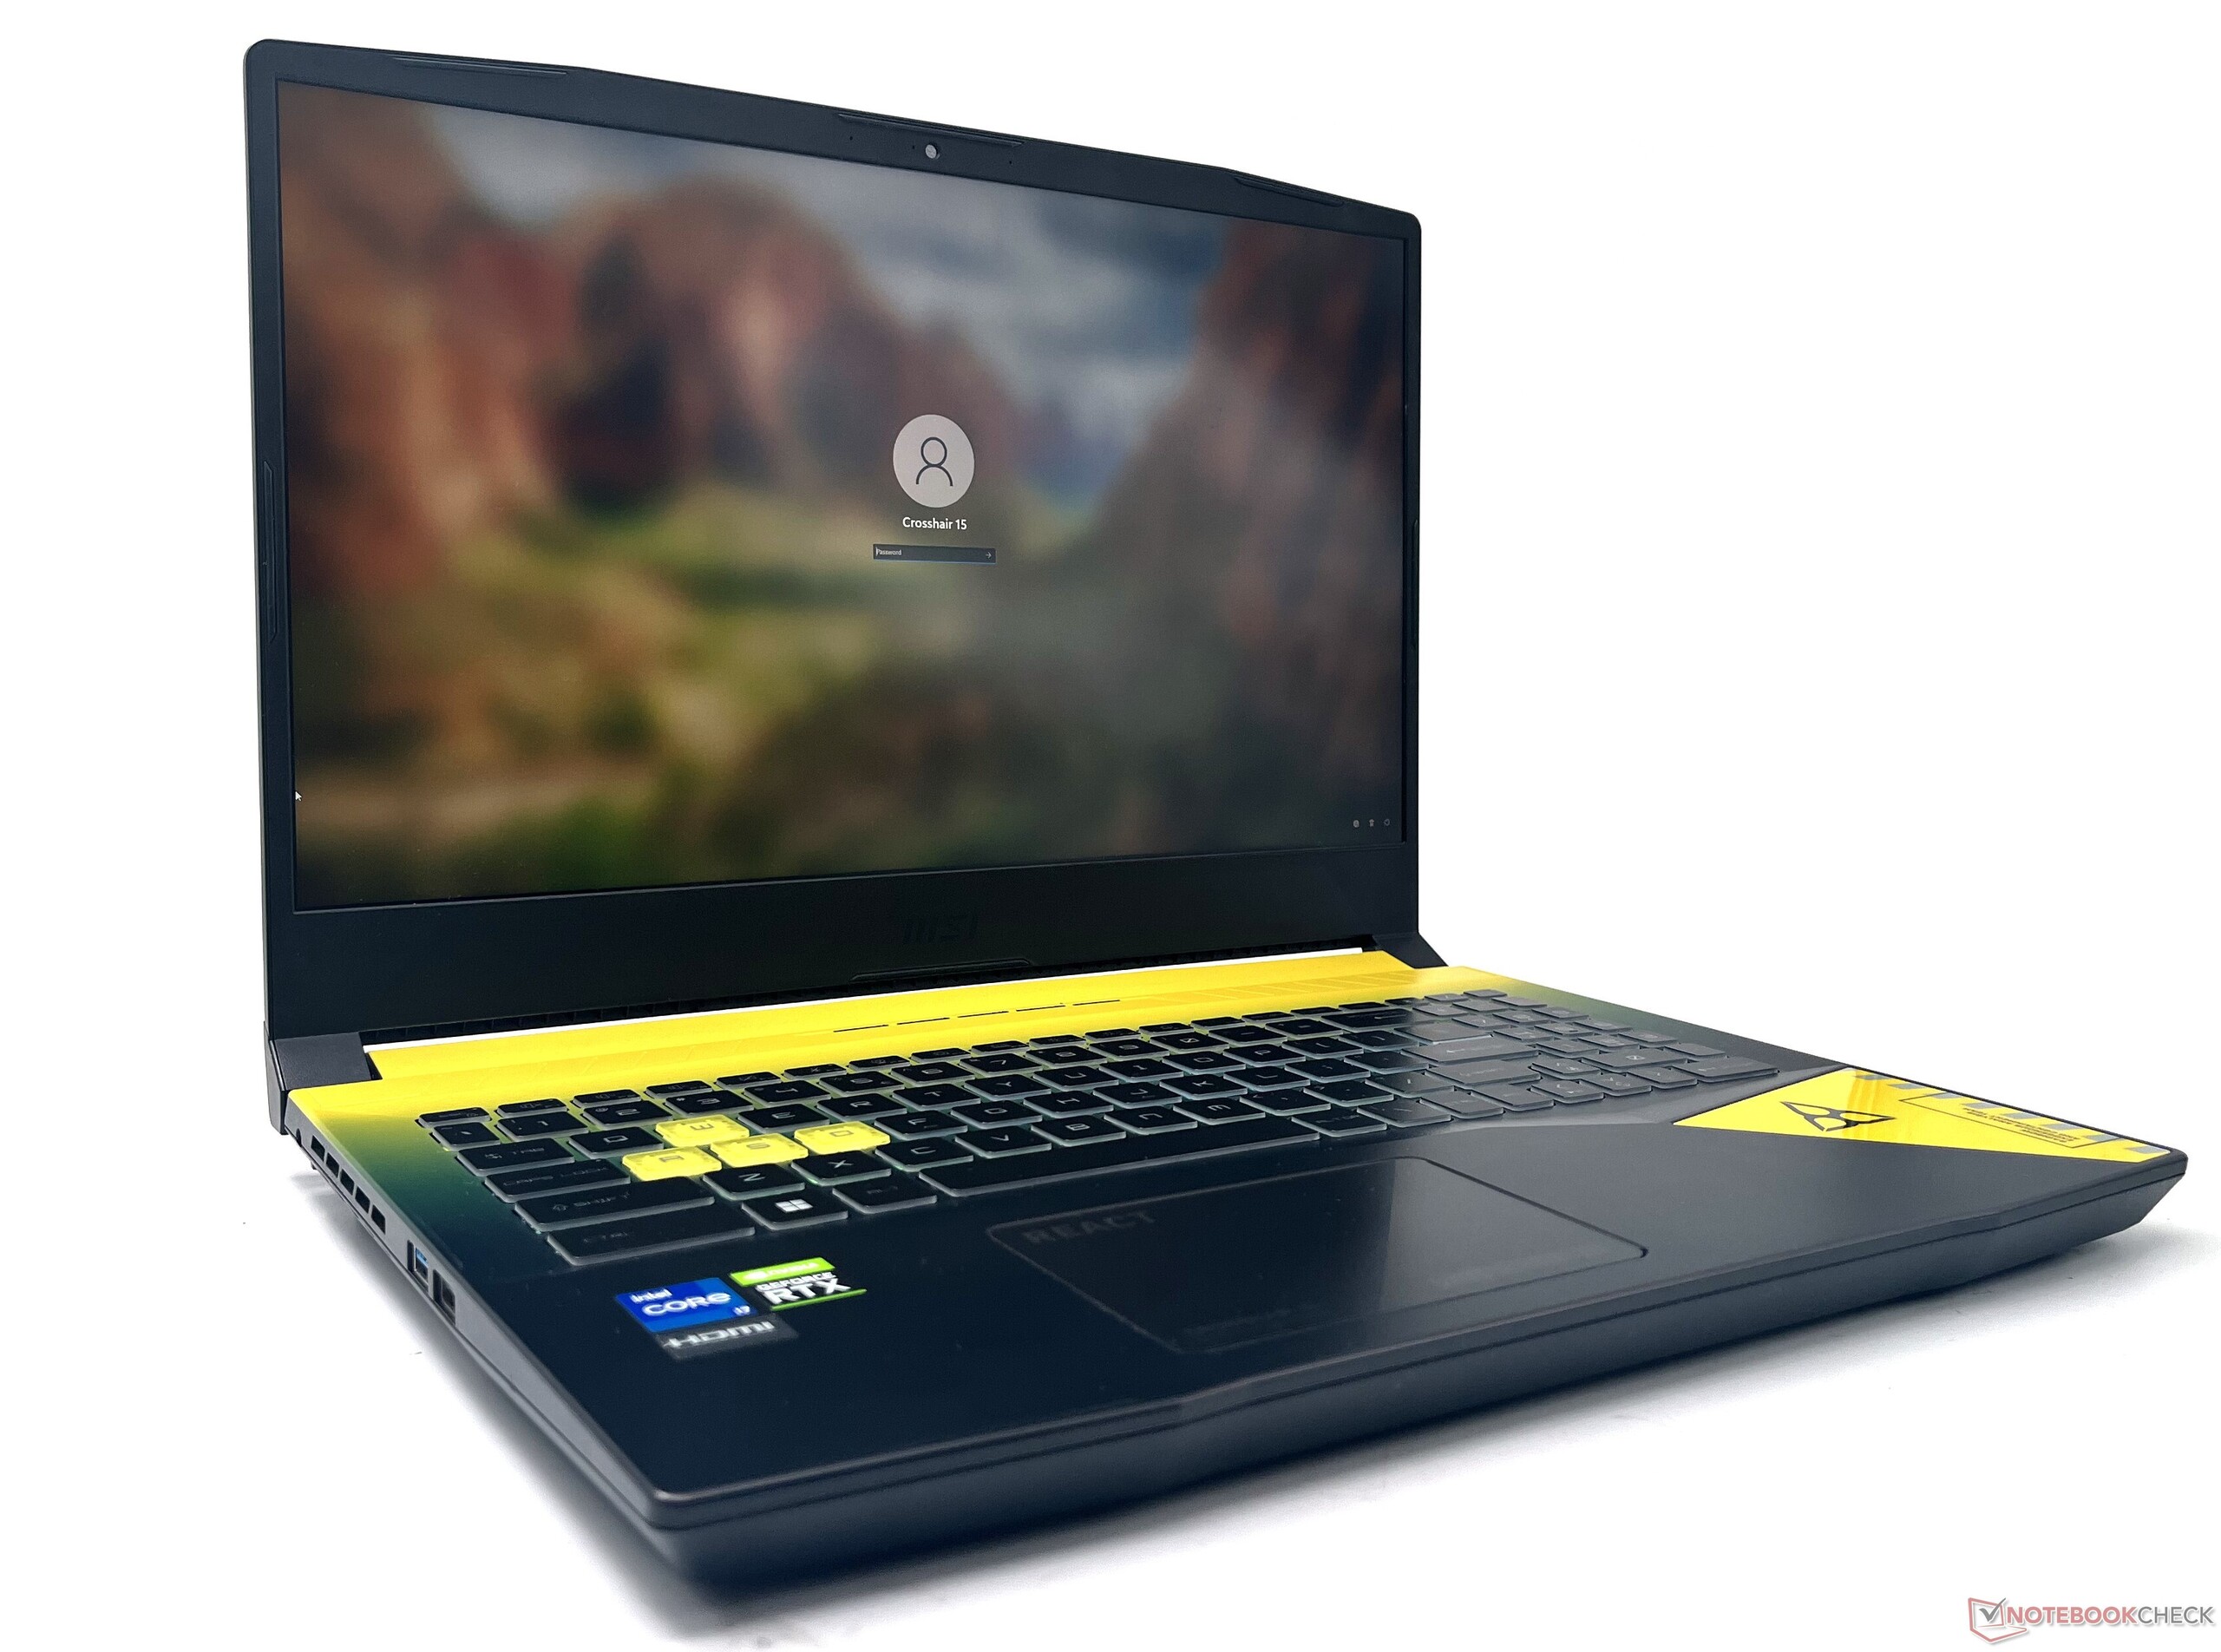
微星Crosshair 15 R6E的机箱主要由塑料制成。它的构造并没有真正散发出任何高级的气息,但感觉足够坚固,适合日常使用。键盘台面有明显的弯曲,但这并不妨碍正常使用。
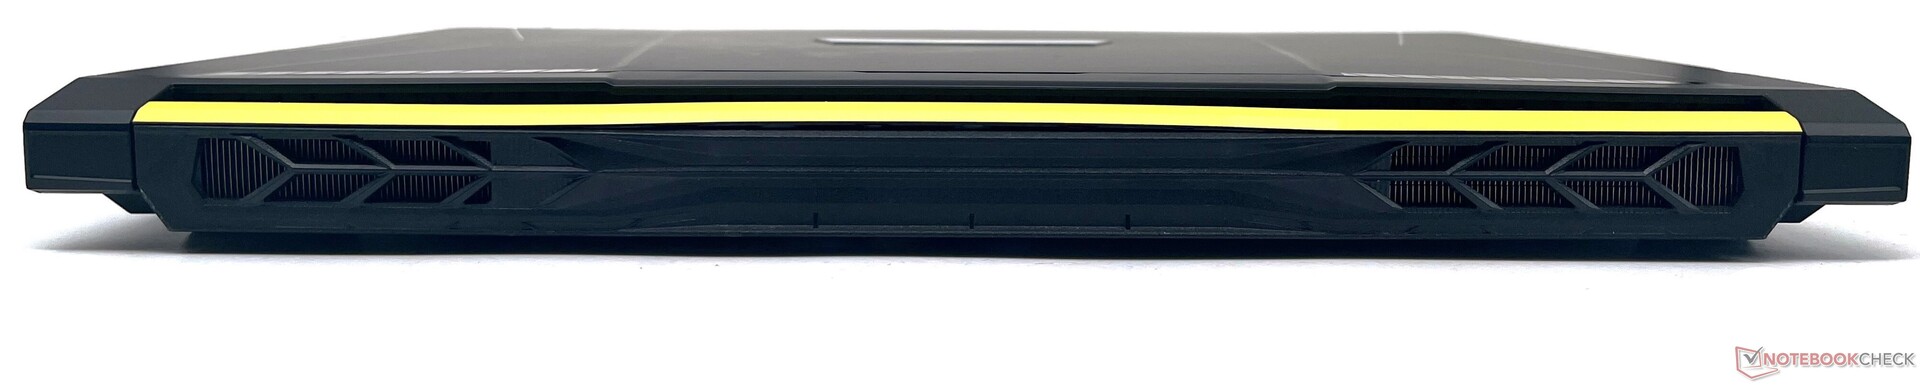
Crosshair 15 R6E大量使用了黄黑双色方案和游戏中的REACT设计元素,从包装到机箱都是如此,从而宣告了它对彩虹六号的忠诚。提取的忠诚。
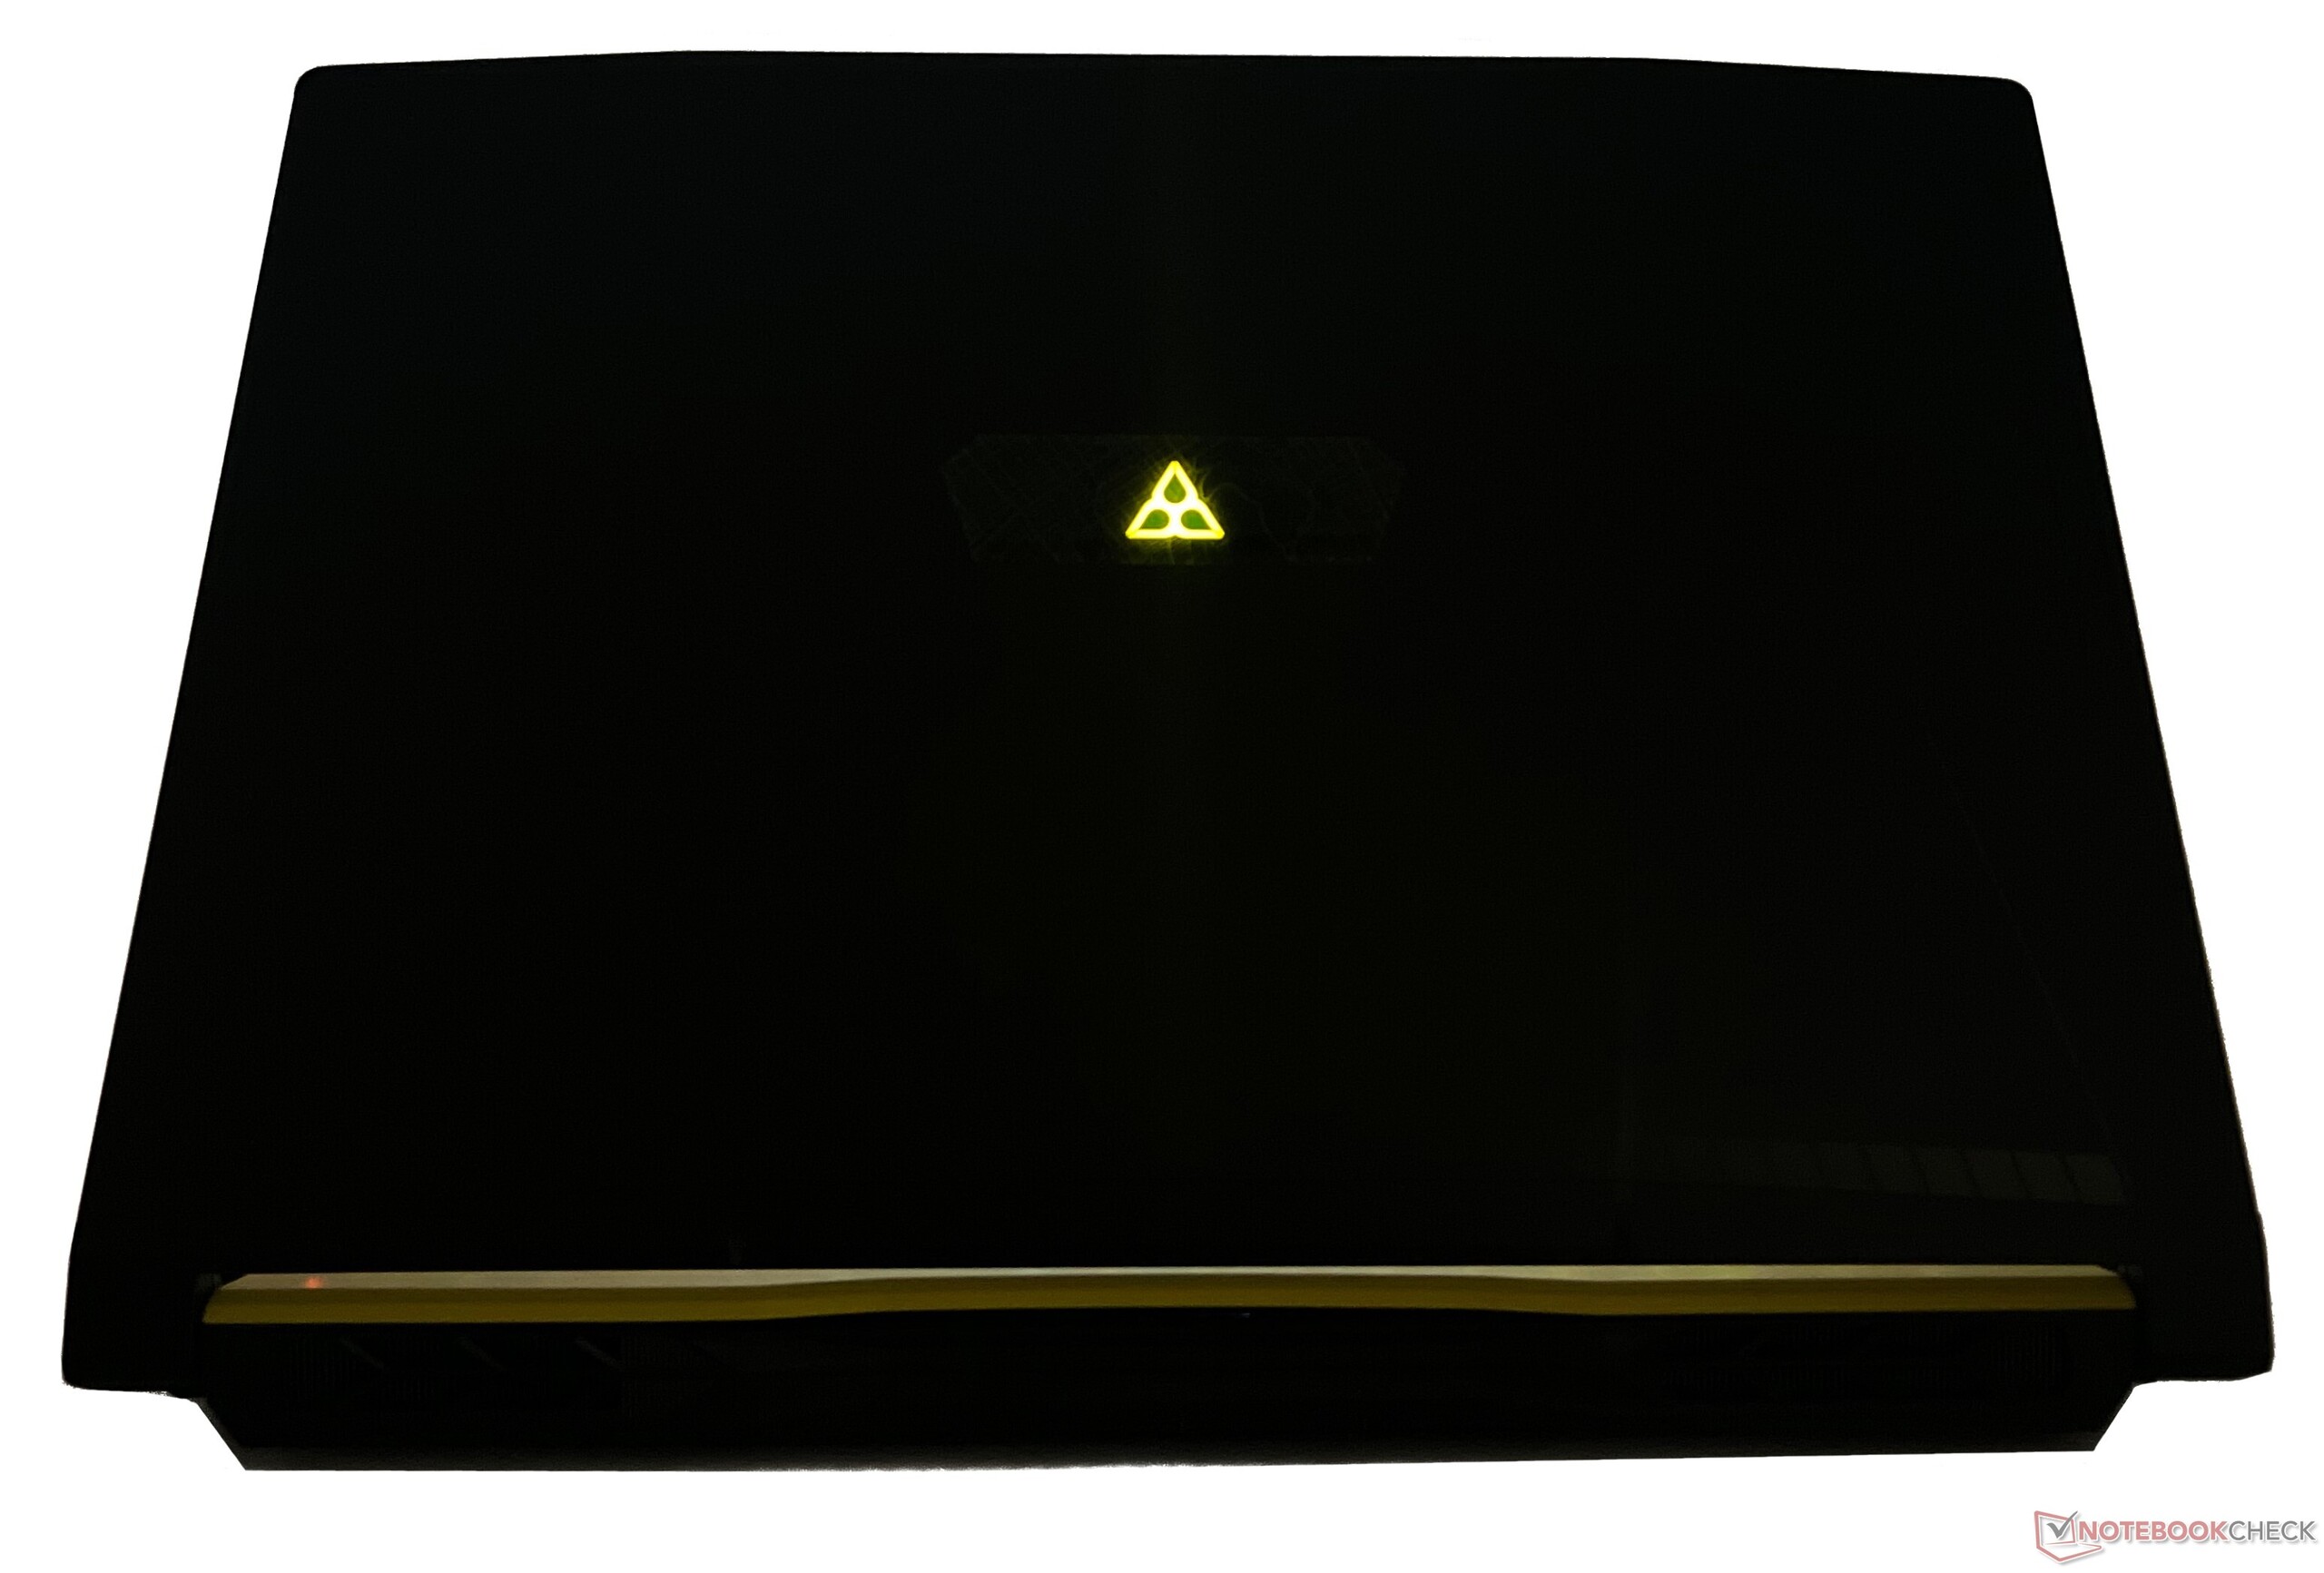
因此,微星甚至在显示器的背面用游戏的标志取代了它的标志。彩虹六号。提取"的标志不是太大,但足够显眼,并以亮黄色发光。没有RGB照明模式,所以你将不得不与所提供的颜色方案相抗衡。
在26.9毫米的厚度上,它不是同类产品中最薄的笔记本电脑--这要归功于 MSI Stealth GS66和 Razer Blade 15.尽管如此,它仍然足够便携,可以滑入背包,2.5公斤的重量也不会让人感觉太重。
总的来说,微星Crosshair 15彩虹六号。提取版的机箱对于这个价格来说是合适的,而且基本上是作为彩虹六号的翻版来出现的。 脉冲GL66的翻版,并且在很多方面与 卡塔纳GF66的翻版,并涂上了一层新的油漆。

连接性。涵盖了基本要素
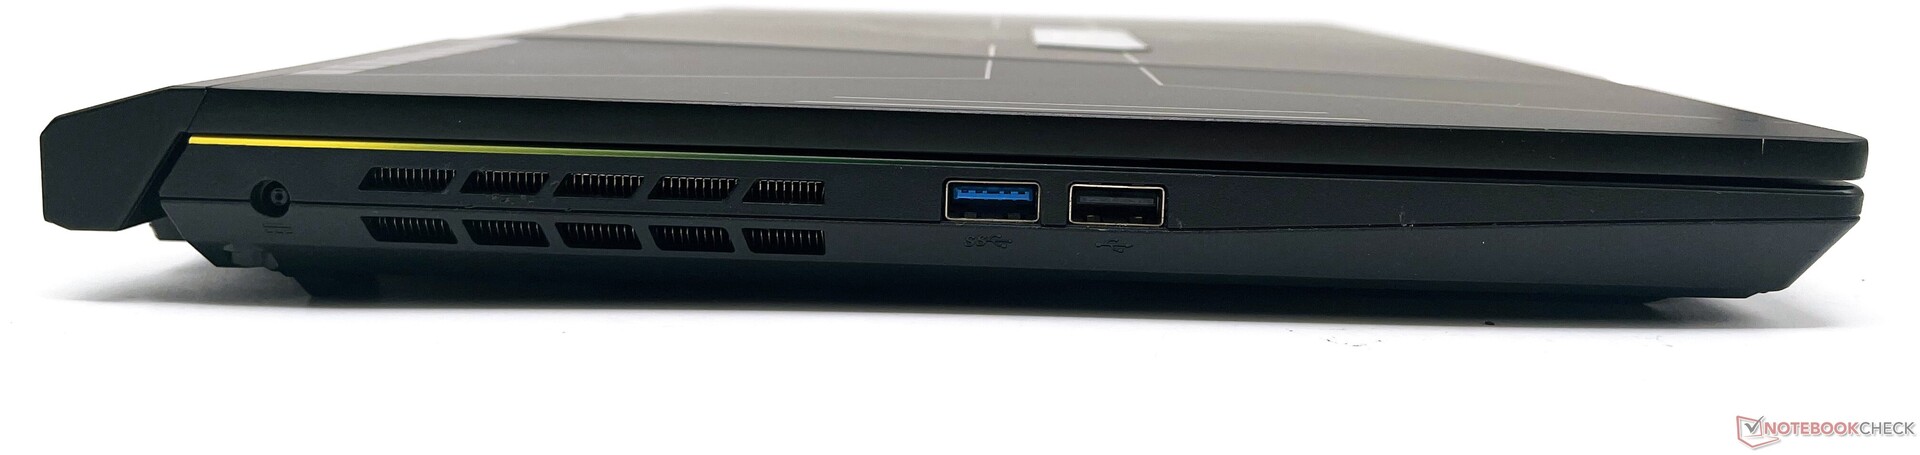
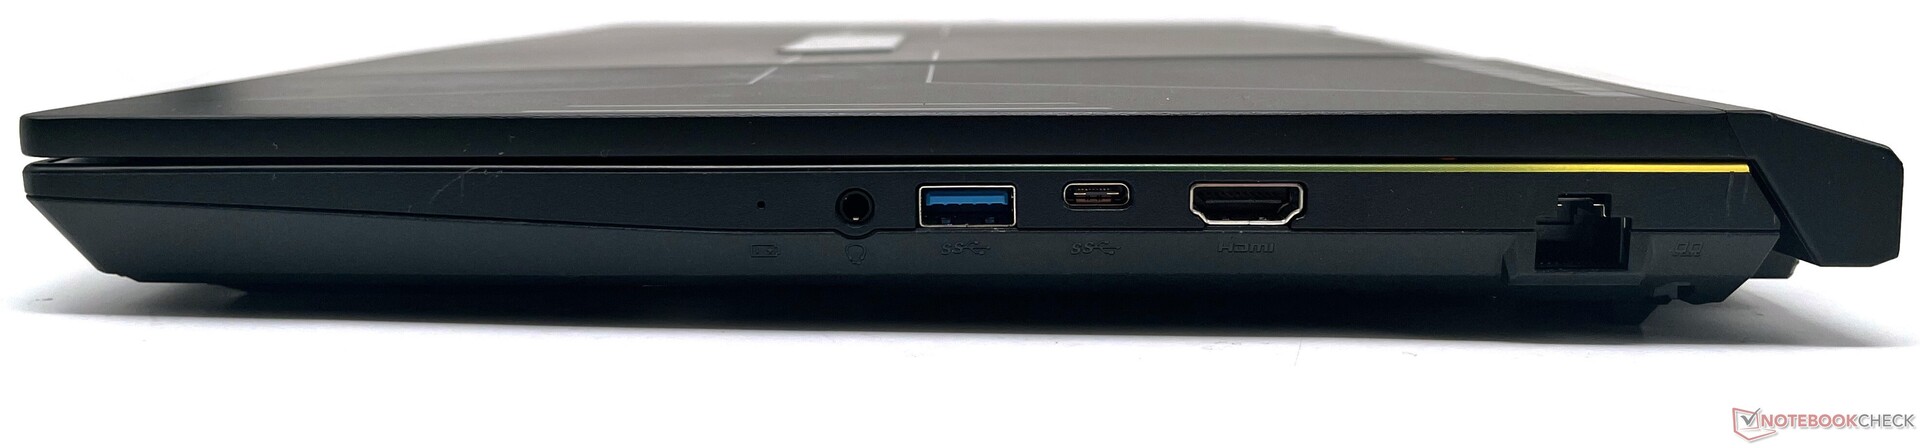
Crosshair 15 R6E没有提供广泛的端口选择,但涵盖了基本要素。在左边,我们有USB 3.2 Gen1 Type-A和USB 2.0 Type-A端口。在右边,我们有一个3.5毫米组合音频插孔,另一个USB 3.2 Gen1 Type-A,一个USB 3.2 Gen1 Type-C端口,HDMI输出,以及千兆以太网。
HDMI端口只支持4K 60 Hz输出。没有读卡器、Thunderbolt 4或Kensington锁插槽可用。
端口的位置其实并不理想,因为大部分的端口都位于设备的右侧。左边的端口可以使用一些额外的间距,因为有大量的空间没有使用。也就是说,在连接多个外围设备时,没有任何障碍。
沟通
Crosshair 15 R6E配备了英特尔Wi-Fi 6 AX201无线局域网模块与蓝牙5.2。这款笔记本电脑在我们的Wi-Fi排行榜上排名靠后,华硕ROG Rapture GT-AXE11000参考路由器。
也就是说,它的吞吐量仍然比Pulse GL66要好。接收速度相当稳定,但我们注意到在传输过程中出现了下滑。
| Networking / iperf3 transmit AXE11000 | |
| Schenker XMG Neo 15 (i7-12700H, RTX 3080 Ti) | |
| Acer Nitro 5 AN515-58-72QR | |
| Schenker XMG Neo 15 (Ryzen 9 6900HX, RTX 3070 Ti) | |
| MSI Katana GF66 12UGS | |
| Asus TUF Dash F15 FX517ZR | |
| Average Intel Wi-Fi 6 AX201 (438 - 1715, n=74) | |
| Average of class Gaming (560 - 1862, n=87, last 2 years) | |
| MSI Crosshair 15 R6E B12UGZ-050 | |
| Networking / iperf3 receive AXE11000 | |
| Acer Nitro 5 AN515-58-72QR | |
| MSI Katana GF66 12UGS | |
| Schenker XMG Neo 15 (i7-12700H, RTX 3080 Ti) | |
| Asus TUF Dash F15 FX517ZR | |
| MSI Stealth GS66 12UGS | |
| Schenker XMG Neo 15 (Ryzen 9 6900HX, RTX 3070 Ti) | |
| Average of class Gaming (680 - 1745, n=87, last 2 years) | |
| Average Intel Wi-Fi 6 AX201 (390 - 1734, n=79) | |
| MSI Crosshair 15 R6E B12UGZ-050 | |
| Networking / iperf3 transmit AX12 | |
| Lenovo Legion 5 Pro 16 G7 i7 RTX 3070Ti | |
| Average Intel Wi-Fi 6 AX201 (49.8 - 1775, n=324) | |
| MSI Pulse GL66 12UEK | |
| Networking / iperf3 receive AX12 | |
| Lenovo Legion 5 Pro 16 G7 i7 RTX 3070Ti | |
| Average Intel Wi-Fi 6 AX201 (136 - 1743, n=324) | |
| MSI Pulse GL66 12UEK | |
网络摄像头
720p的网络摄像头对于偶尔的视频通话来说是可用的。正如我们在下面的ColorChecker Passport和测试图表中所注意到的,Crosshair 15的网络摄像头显示出大量的噪音和整体缺乏清晰度。
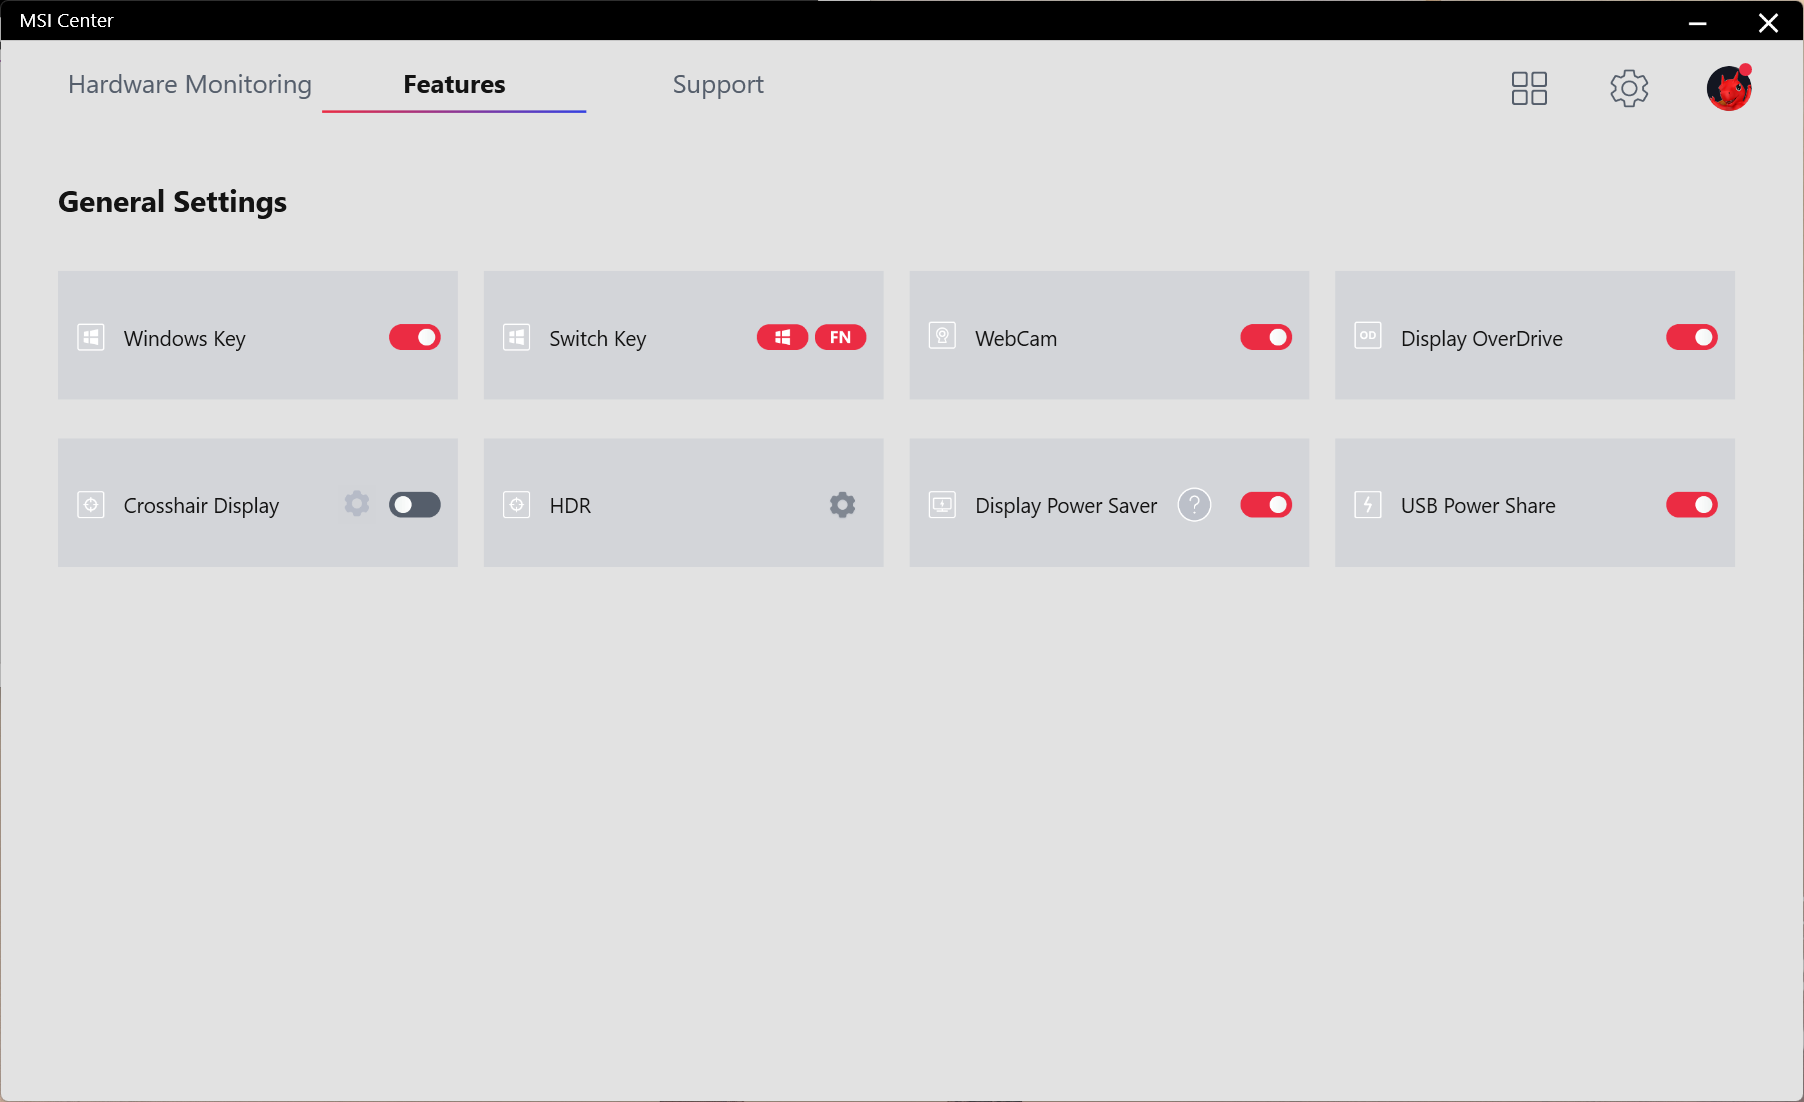
没有实体的隐私快门,但可以使用F6功能键上的快捷键或通过微星中心启用或禁用网络摄像头。


安全问题
Crosshair 15 R6E上没有提供生物识别登录。板载的唯一主要安全组件是TPM 2.0模块。
辅料
微星试图通过一些额外的配件进一步将你拉入彩虹六号。提取》宇宙中的一些额外配件。包装中包括一个鼠标垫和一个以游戏为主题的游戏鼠标。买家还可以通过育碧公司免费兑换《彩虹六号》的副本。Extraction豪华版。
鼠标是微星M99的定制版本。该鼠标使用Avago 3050传感器,分辨率为4000DPI,轮询频率为500Hz。这显然不是在一个联盟中的 Corsair IronClaw RGB或甚至是 疯狂的Catz R.A.T. Air但它仍然是一个体面的免费产品。


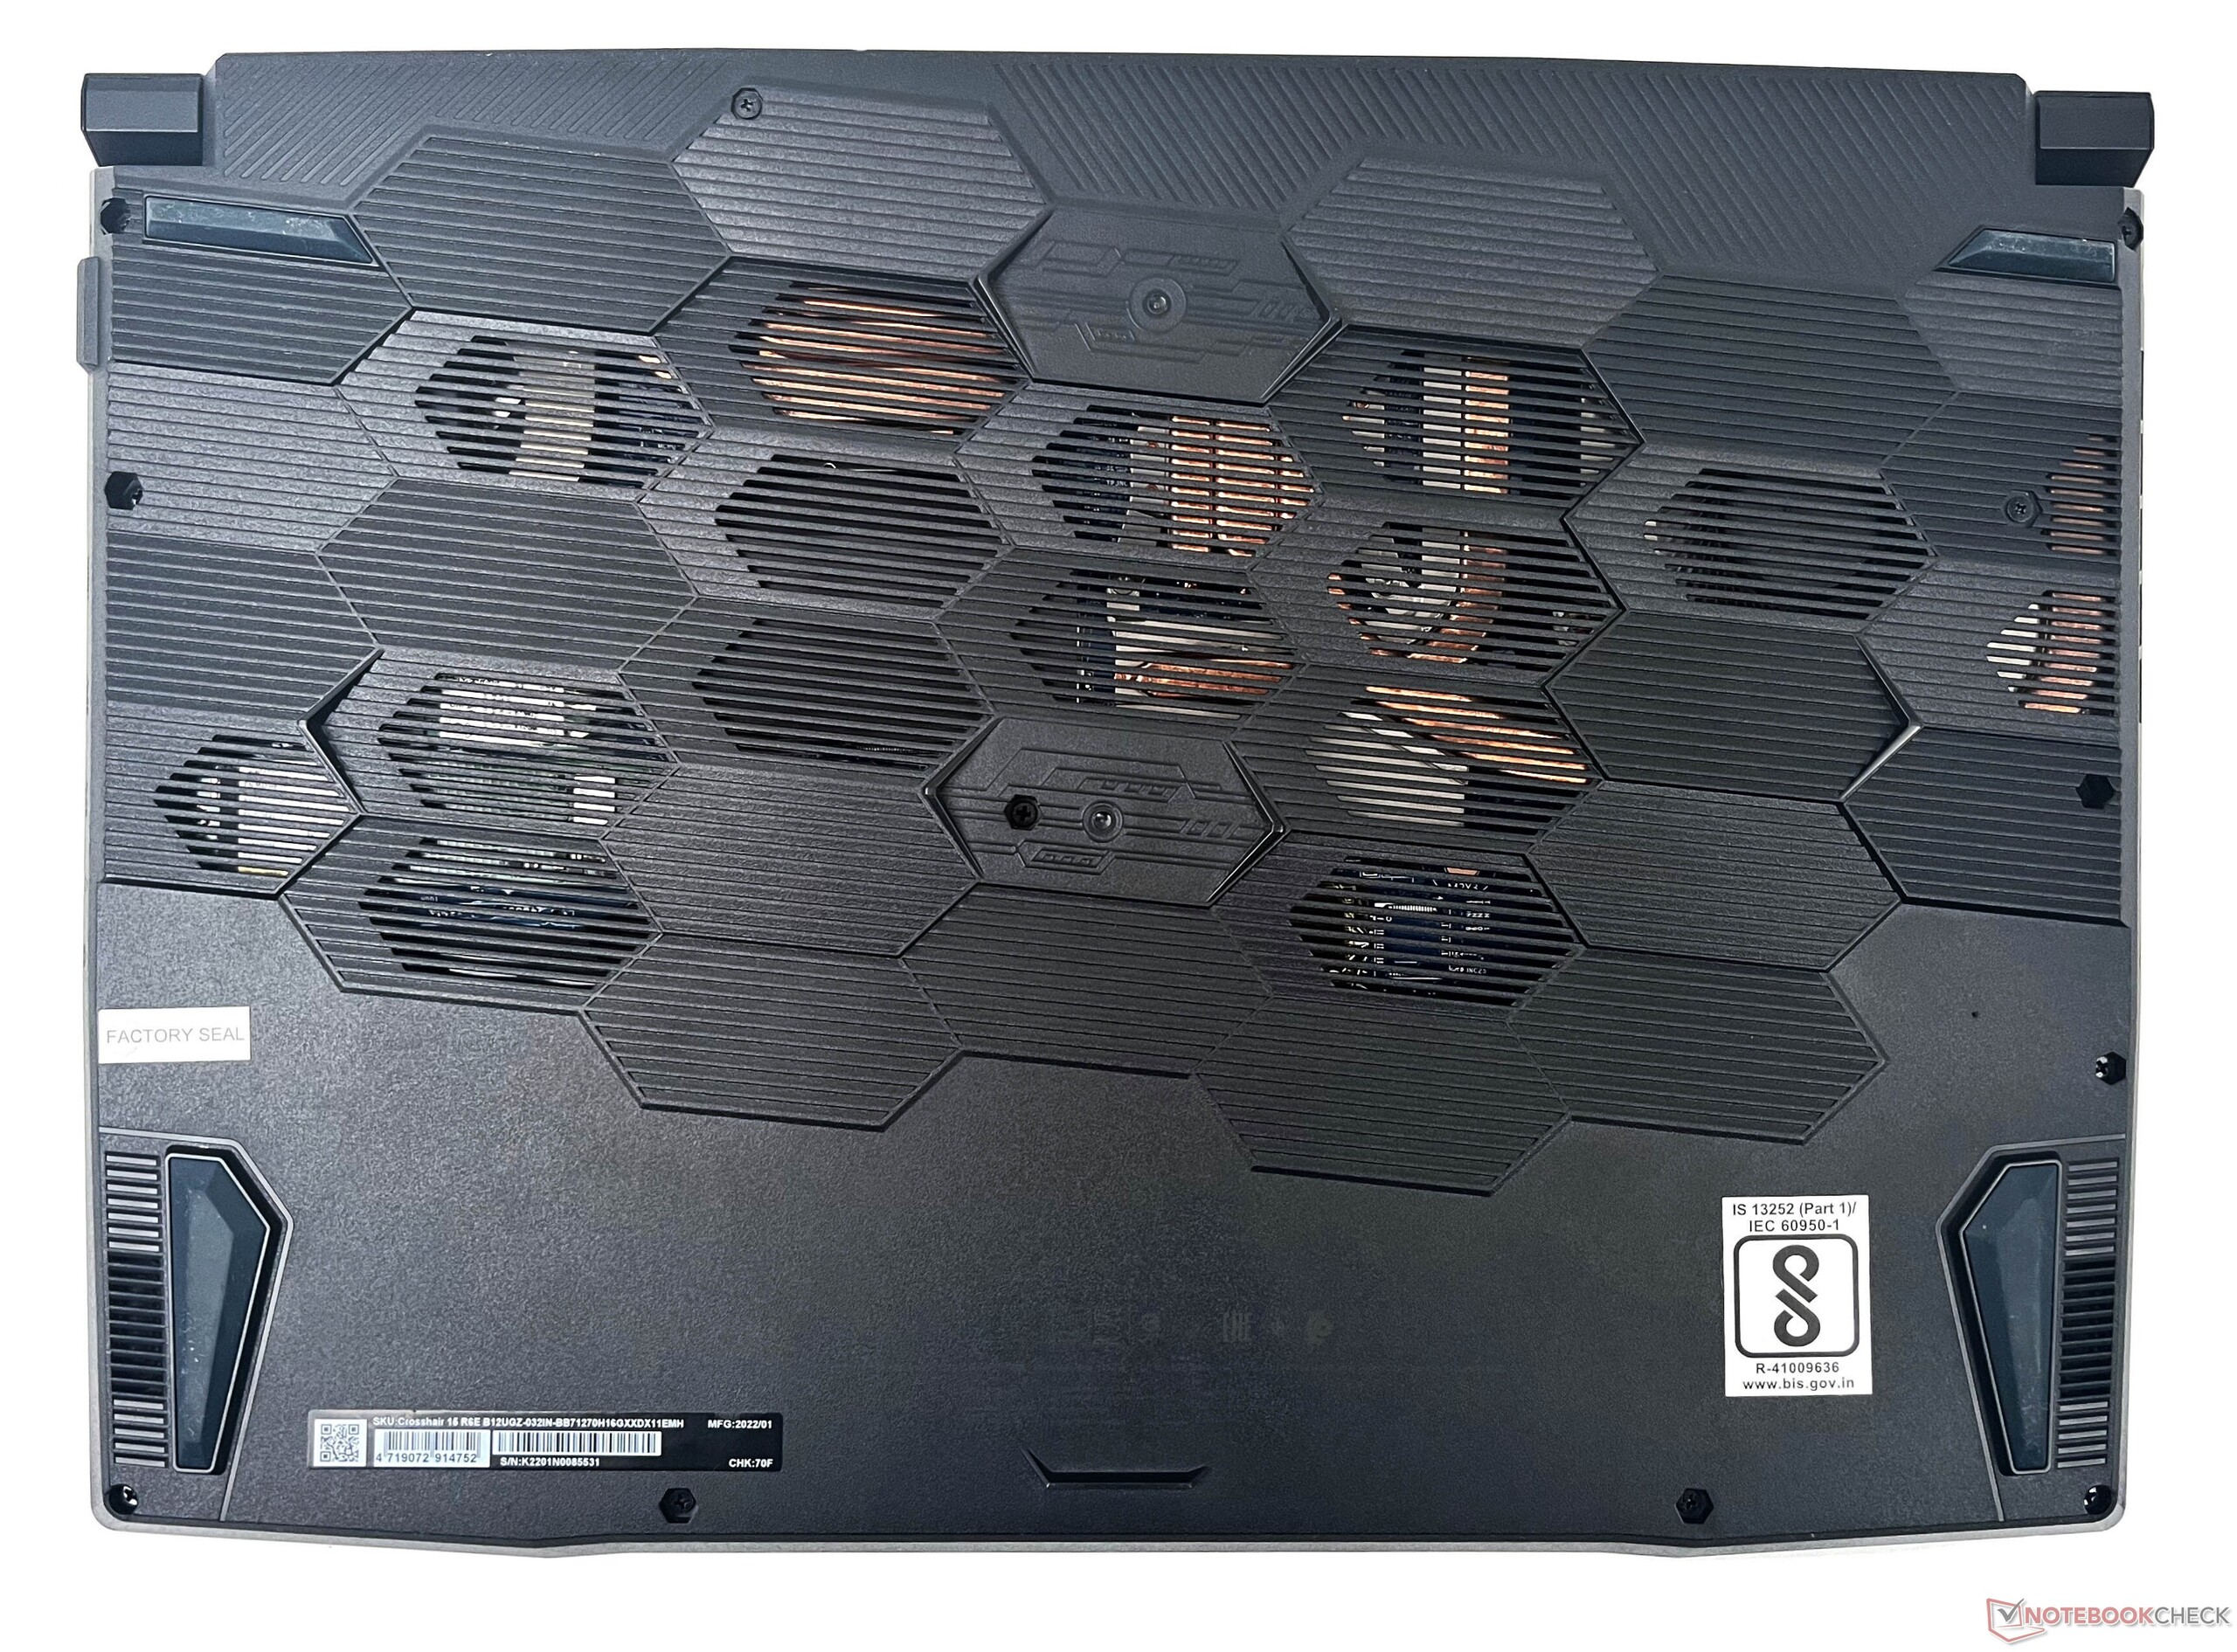
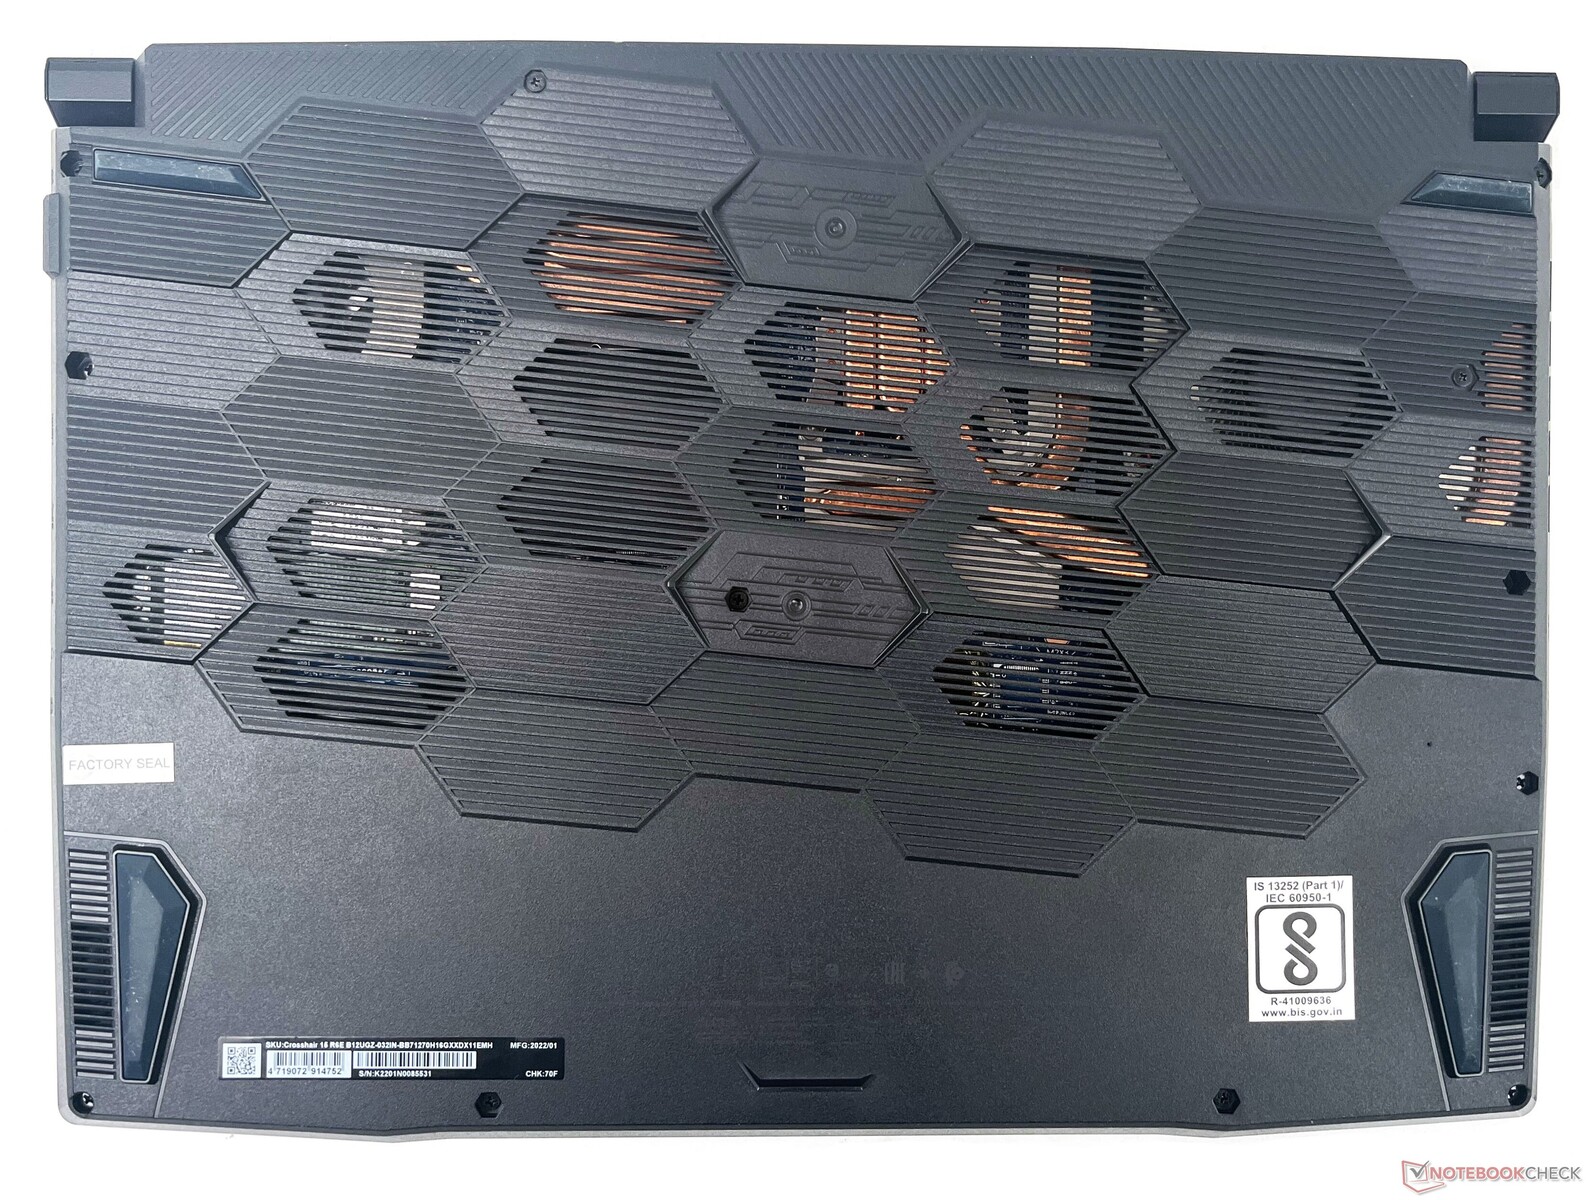
维护
按照微星评测样品的惯例,我们被阻止取下隐藏其中一个螺丝的工厂密封贴纸。这就是说,打开背板是相当直接的,用户应该能够顺利地进行升级。
担保
微星为Crosshair 15 R6E提供了两年的保修服务,其中还包括在微星授权服务中心的一年的全球旅行保险。
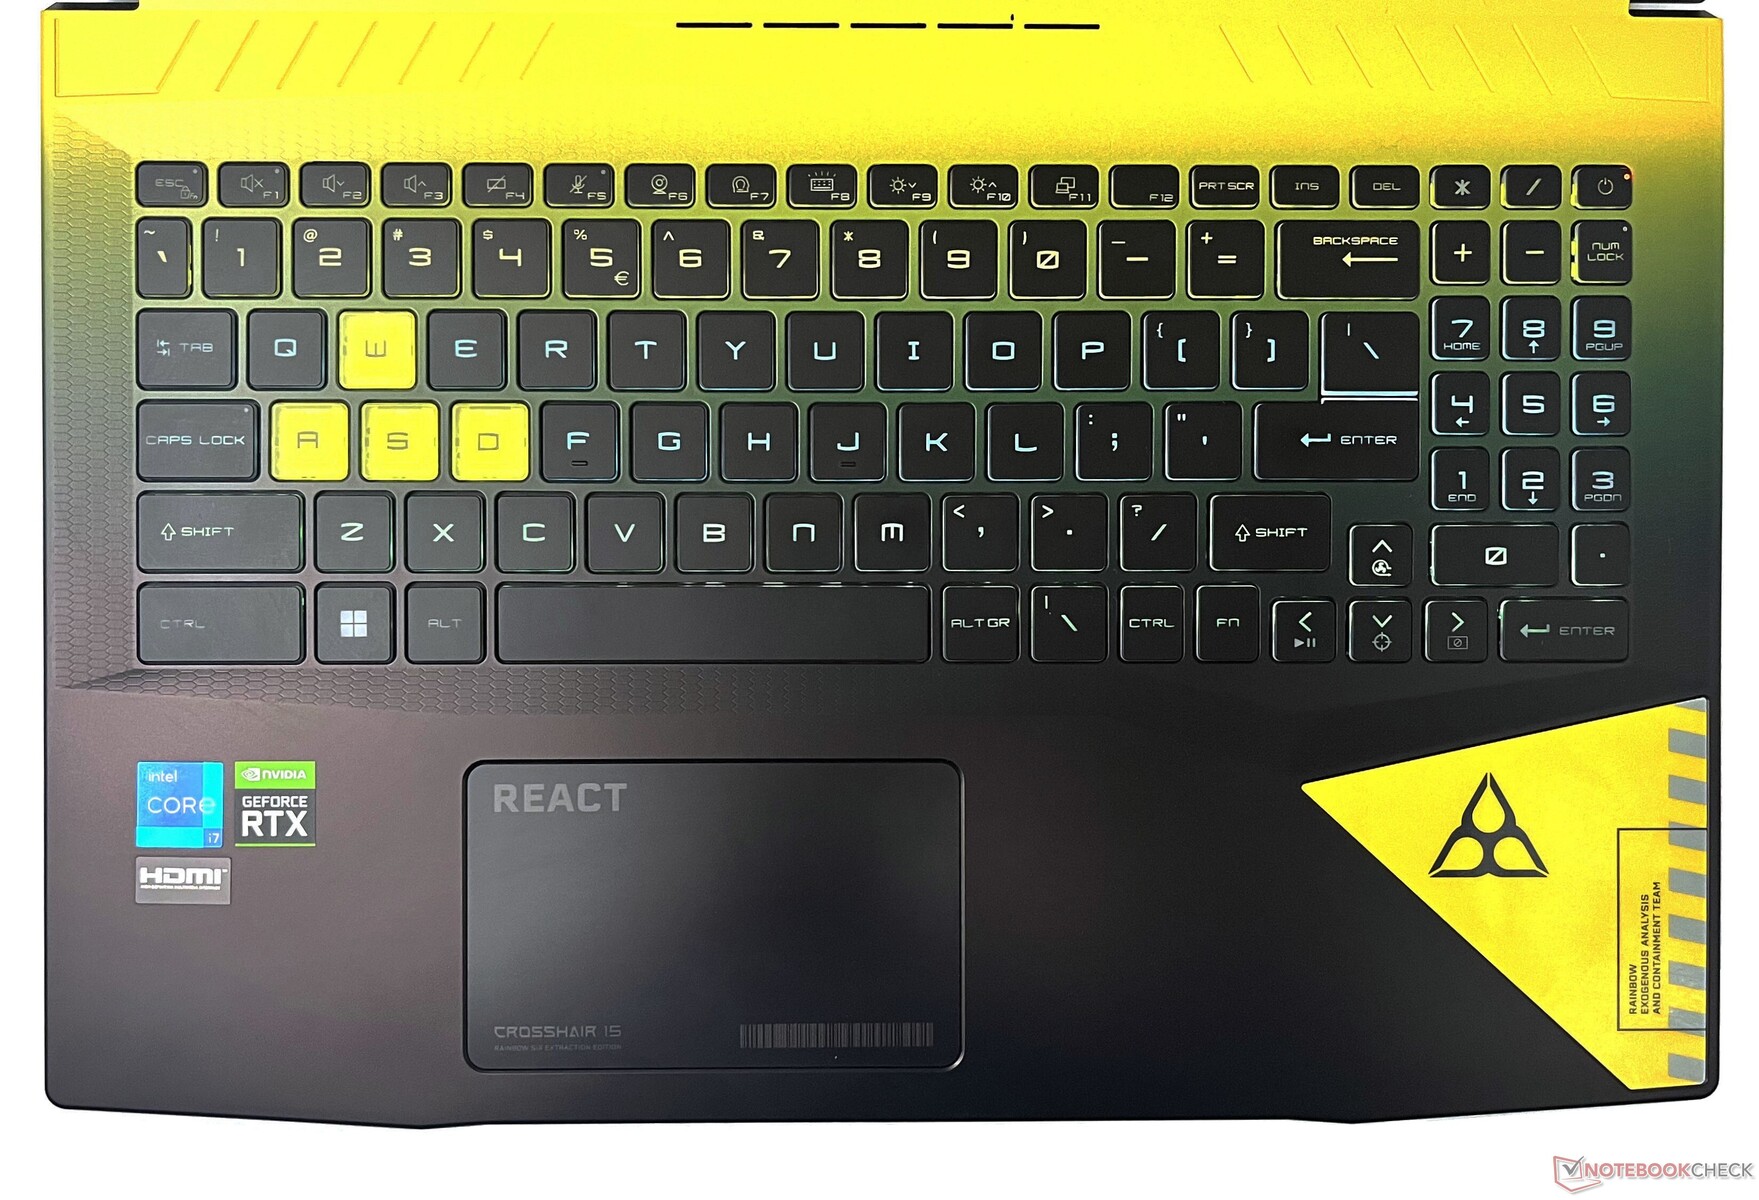
输入设备。修正了主题背光颜色
键盘
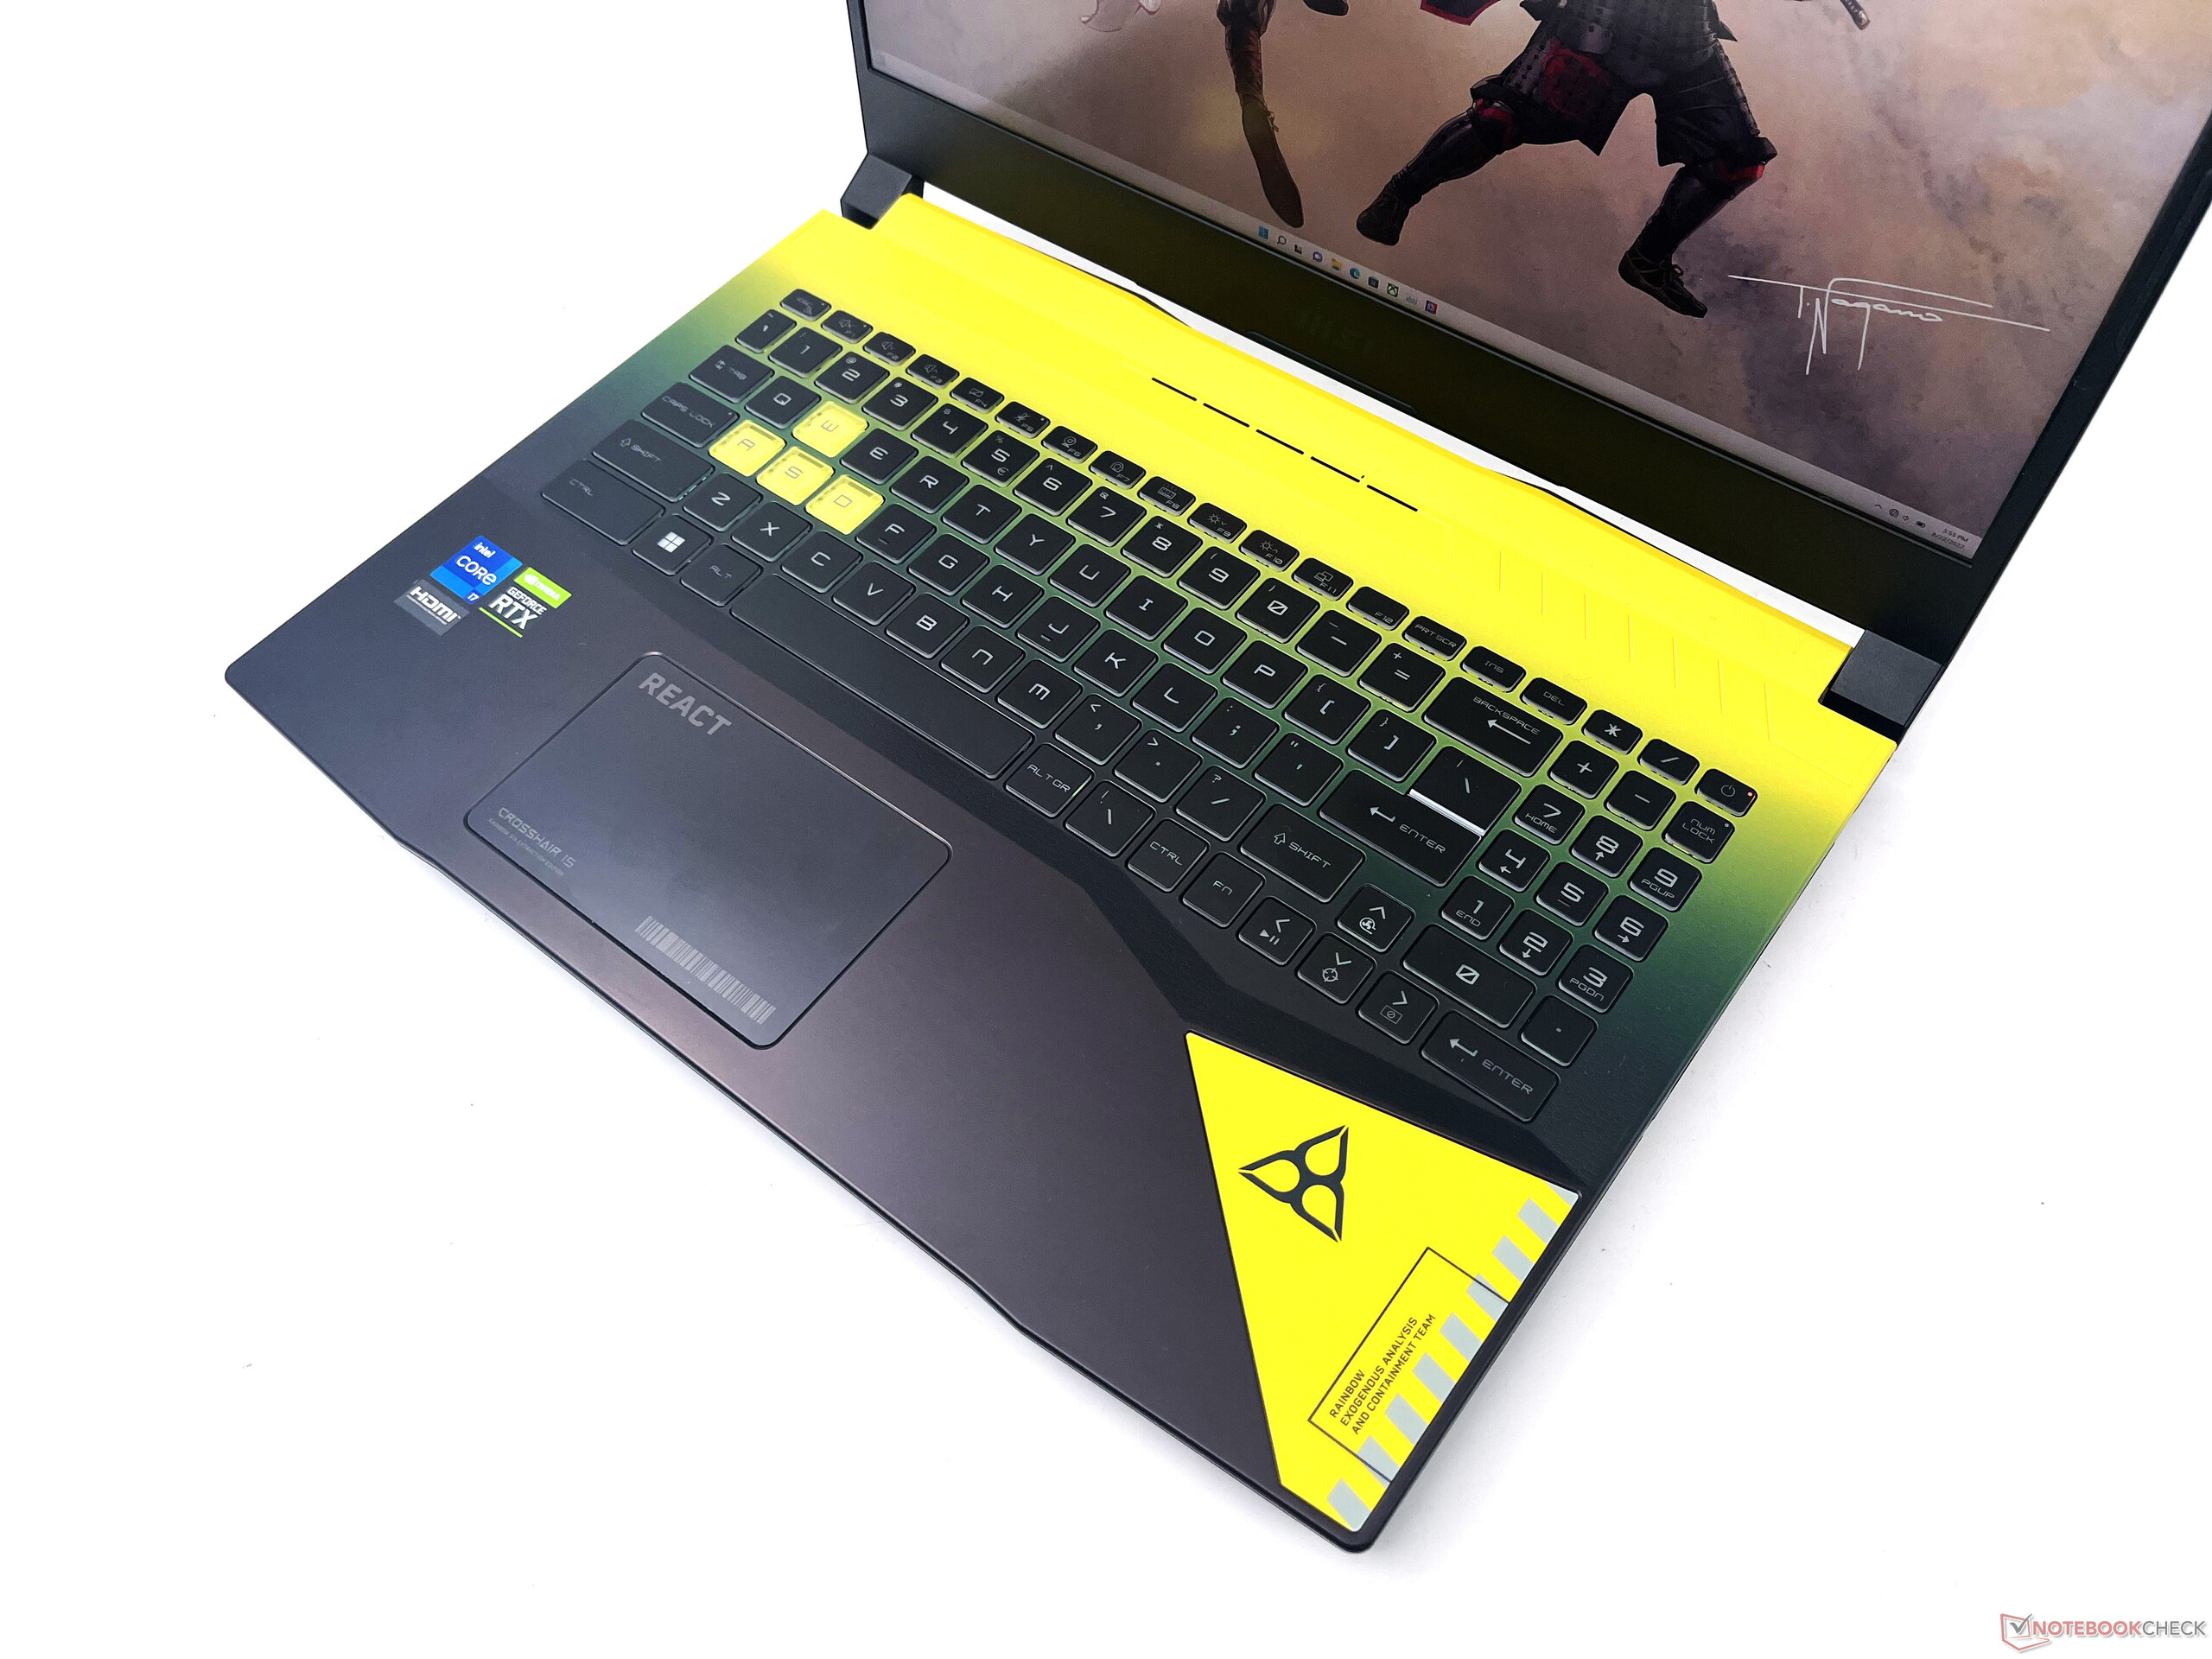
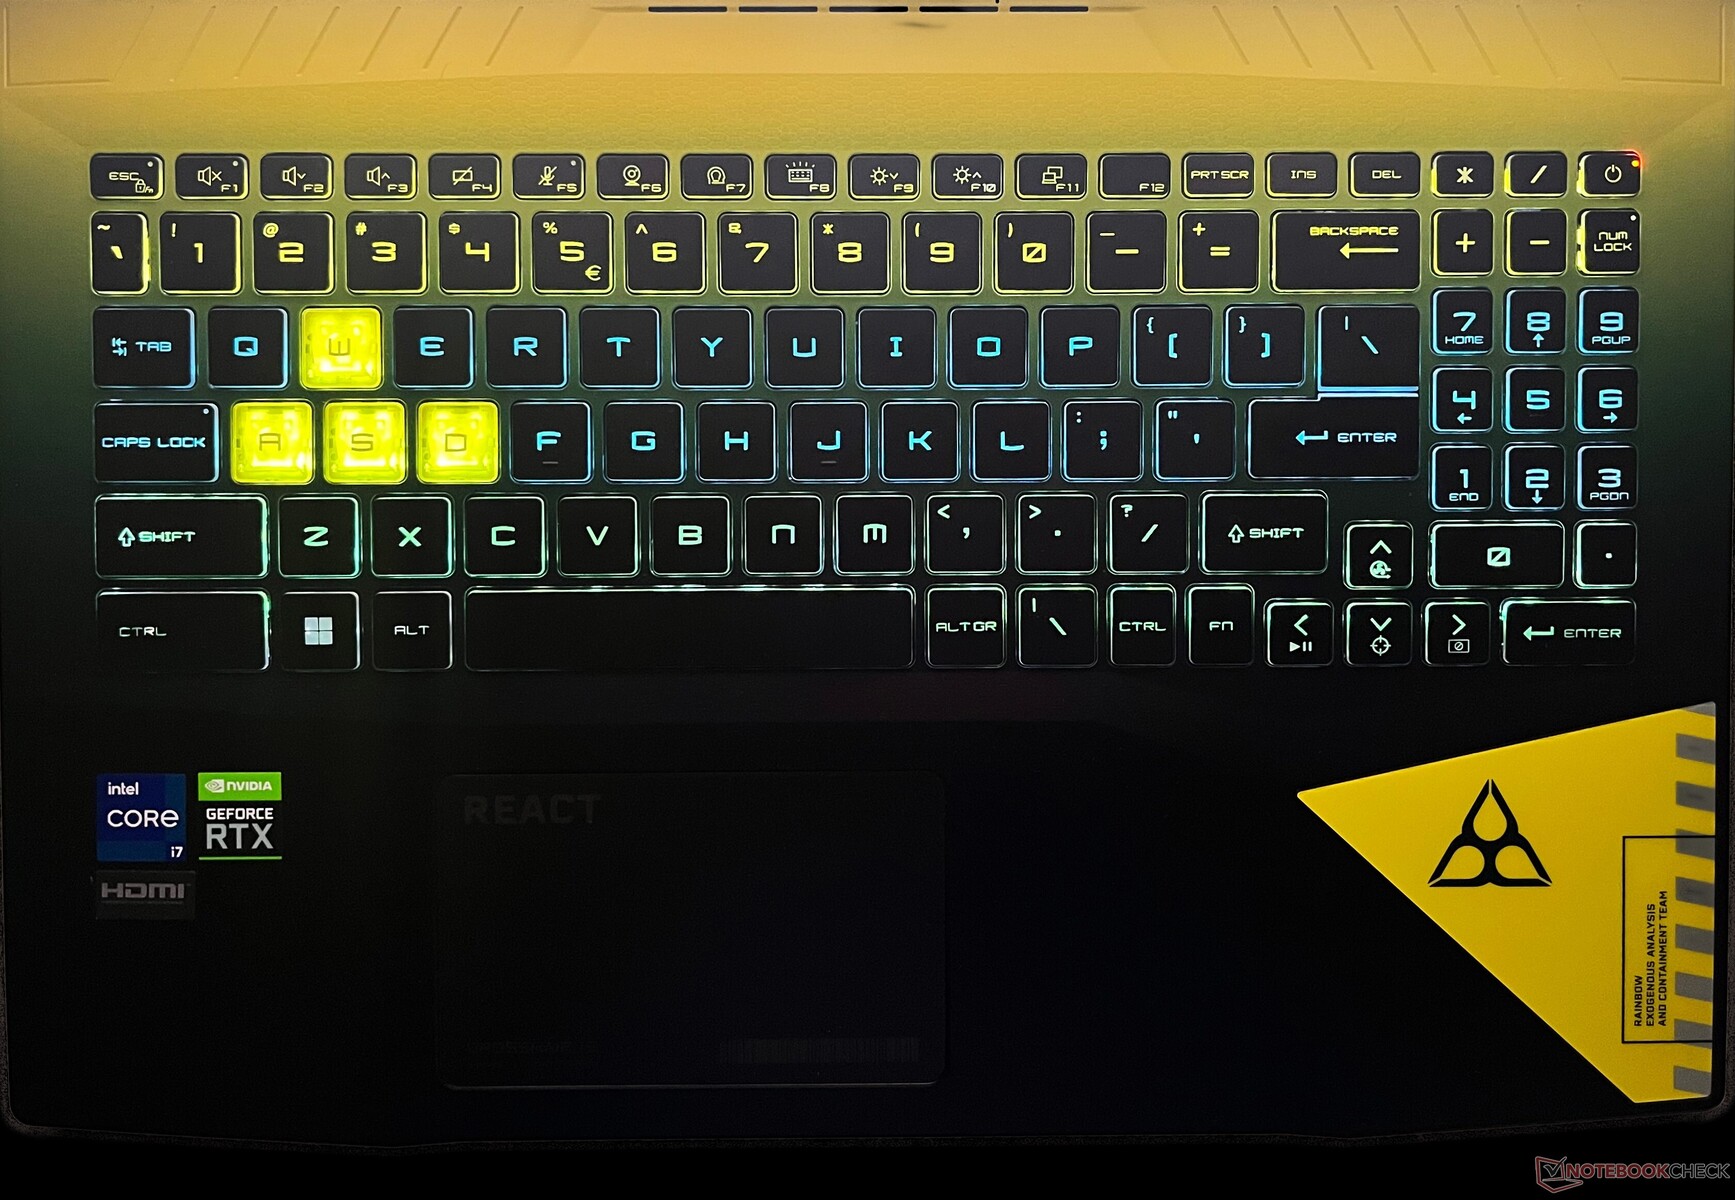
Crosshair 15 R6E的键盘不具备RGB或任何花哨的SteelSeries功能,但微星加入了它所谓的光谱背光键盘。基本上,键盘灯光的灵感来自于--你猜对了--《彩虹六号》。提取》游戏中的黄色和蓝色。
每个键都有固定的灯光,不能自定义,尽管整体背光的强度本身可以通过键盘快捷键来调整。键的行程为1.7毫米,触觉反馈良好。
包括数字键盘是值得欢迎的,而且方向键也没有被压扁。值得庆幸的是,次要功能被点亮,这使得它们在黑暗中容易识别。
如果你是微星笔记本电脑的新手,你应该注意到尴尬的Fn键放置在右边而不是通常的位置。
触摸板
10.5厘米×6.5厘米的触摸板上有游戏的REACT标志和Crosshair 15标签。就功能而言,它类似于我们在Pulse和Katana表兄弟身上看到的触摸板。
触摸板的反应很好,由于WindowsPrecision 驱动程序,手势工作得很好。鼠标左键和右键与触摸板齐平,尽管有一些噪音,但点击起来毫不费力。
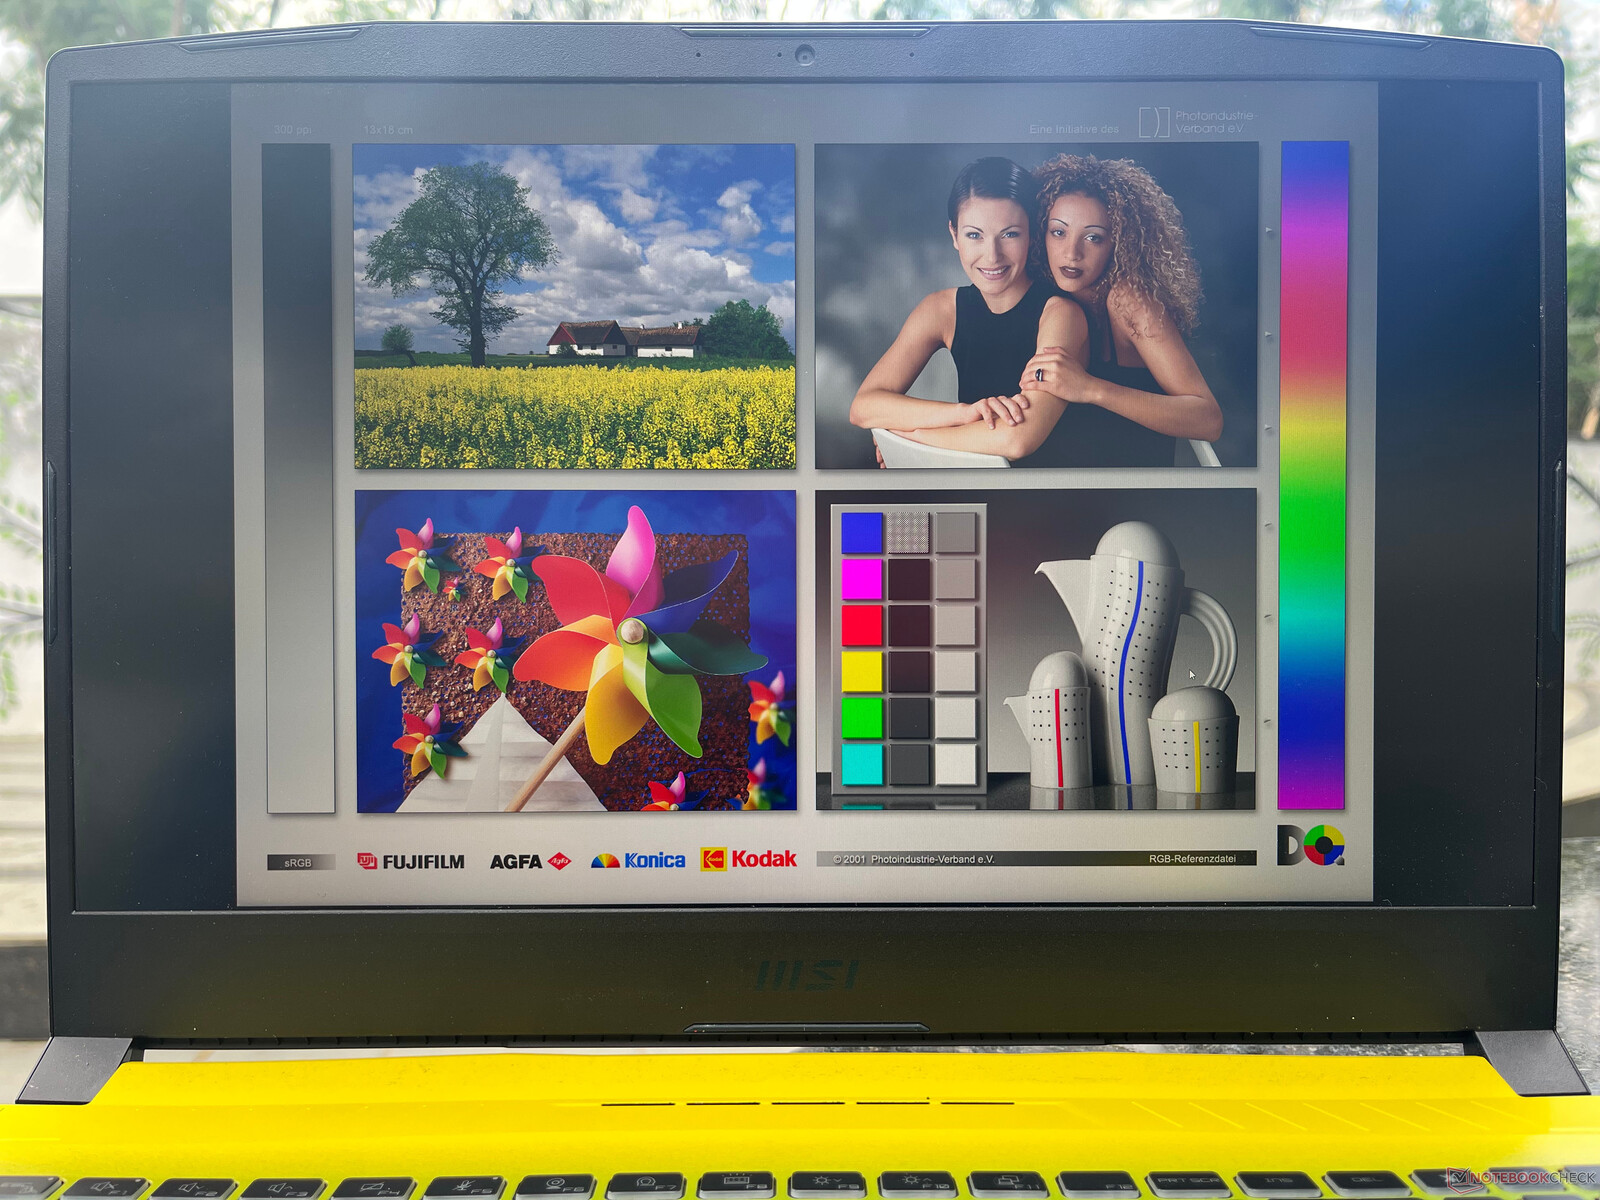
显示。QHD 165 Hz面板,广色域覆盖,无PWM
微星在Crosshair 15 R6E两个SKU中提供了一个15.6英寸的QHD IPS级面板,刷新率为165Hz。没有HDR10或杜比视界的支持。我们记录了342尼特的最大亮度,这对室内使用来说应该是合适的。
89%的亮度分布和1069:1的测量对比度提供了一个体面的观看体验。这与我们之前在华硕ROG Zephyrus上观察到的情况相似。 华硕ROG Zephyrus G15和 Acer Nitro 5,它们使用相同的面板。
然而,我们在显示器的下角附近看到了明显的背光出血。


| |||||||||||||||||||||||||
Brightness Distribution: 89 %
Center on Battery: 341 cd/m²
Contrast: 1069:1 (Black: 0.32 cd/m²)
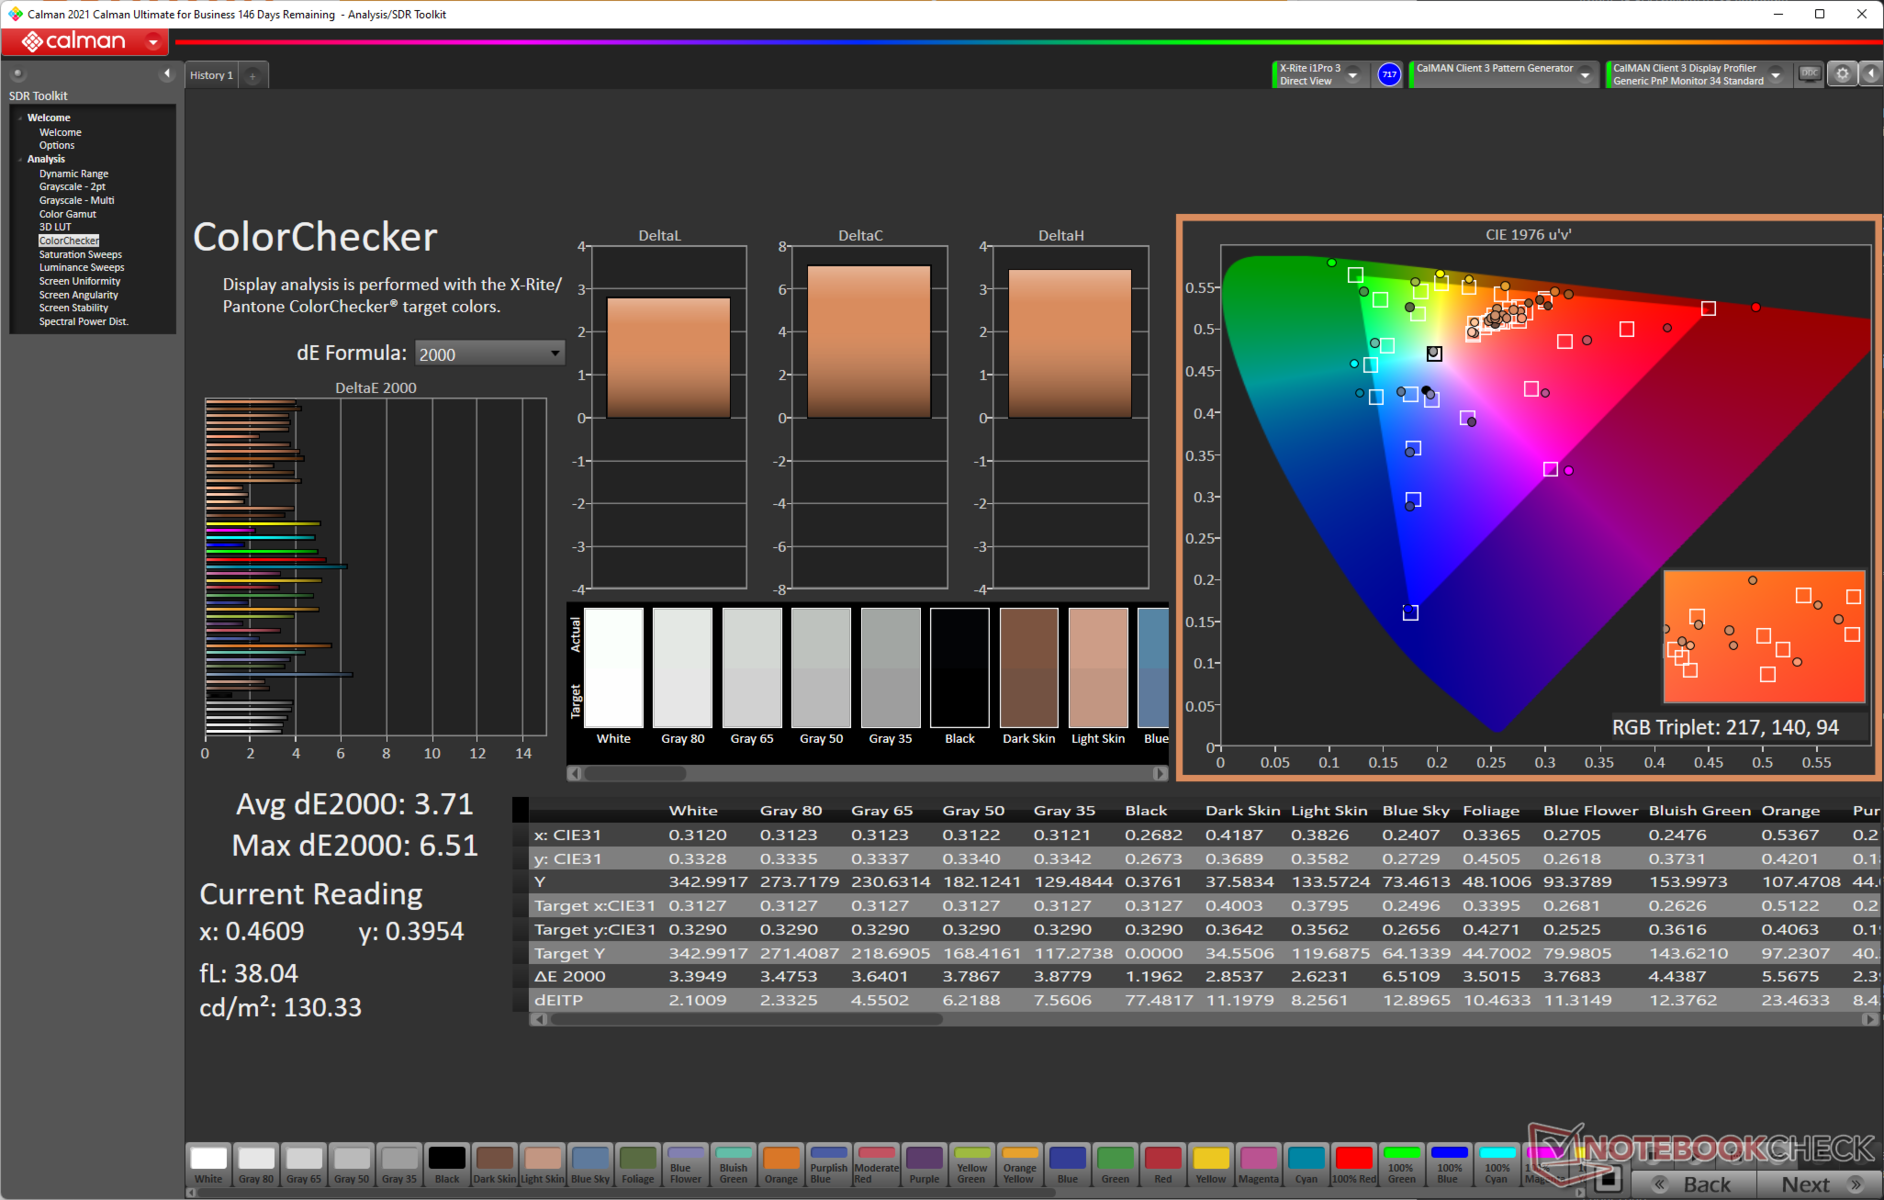
ΔE ColorChecker Calman: 3.71 | ∀{0.5-29.43 Ø4.71}
calibrated: 2.59
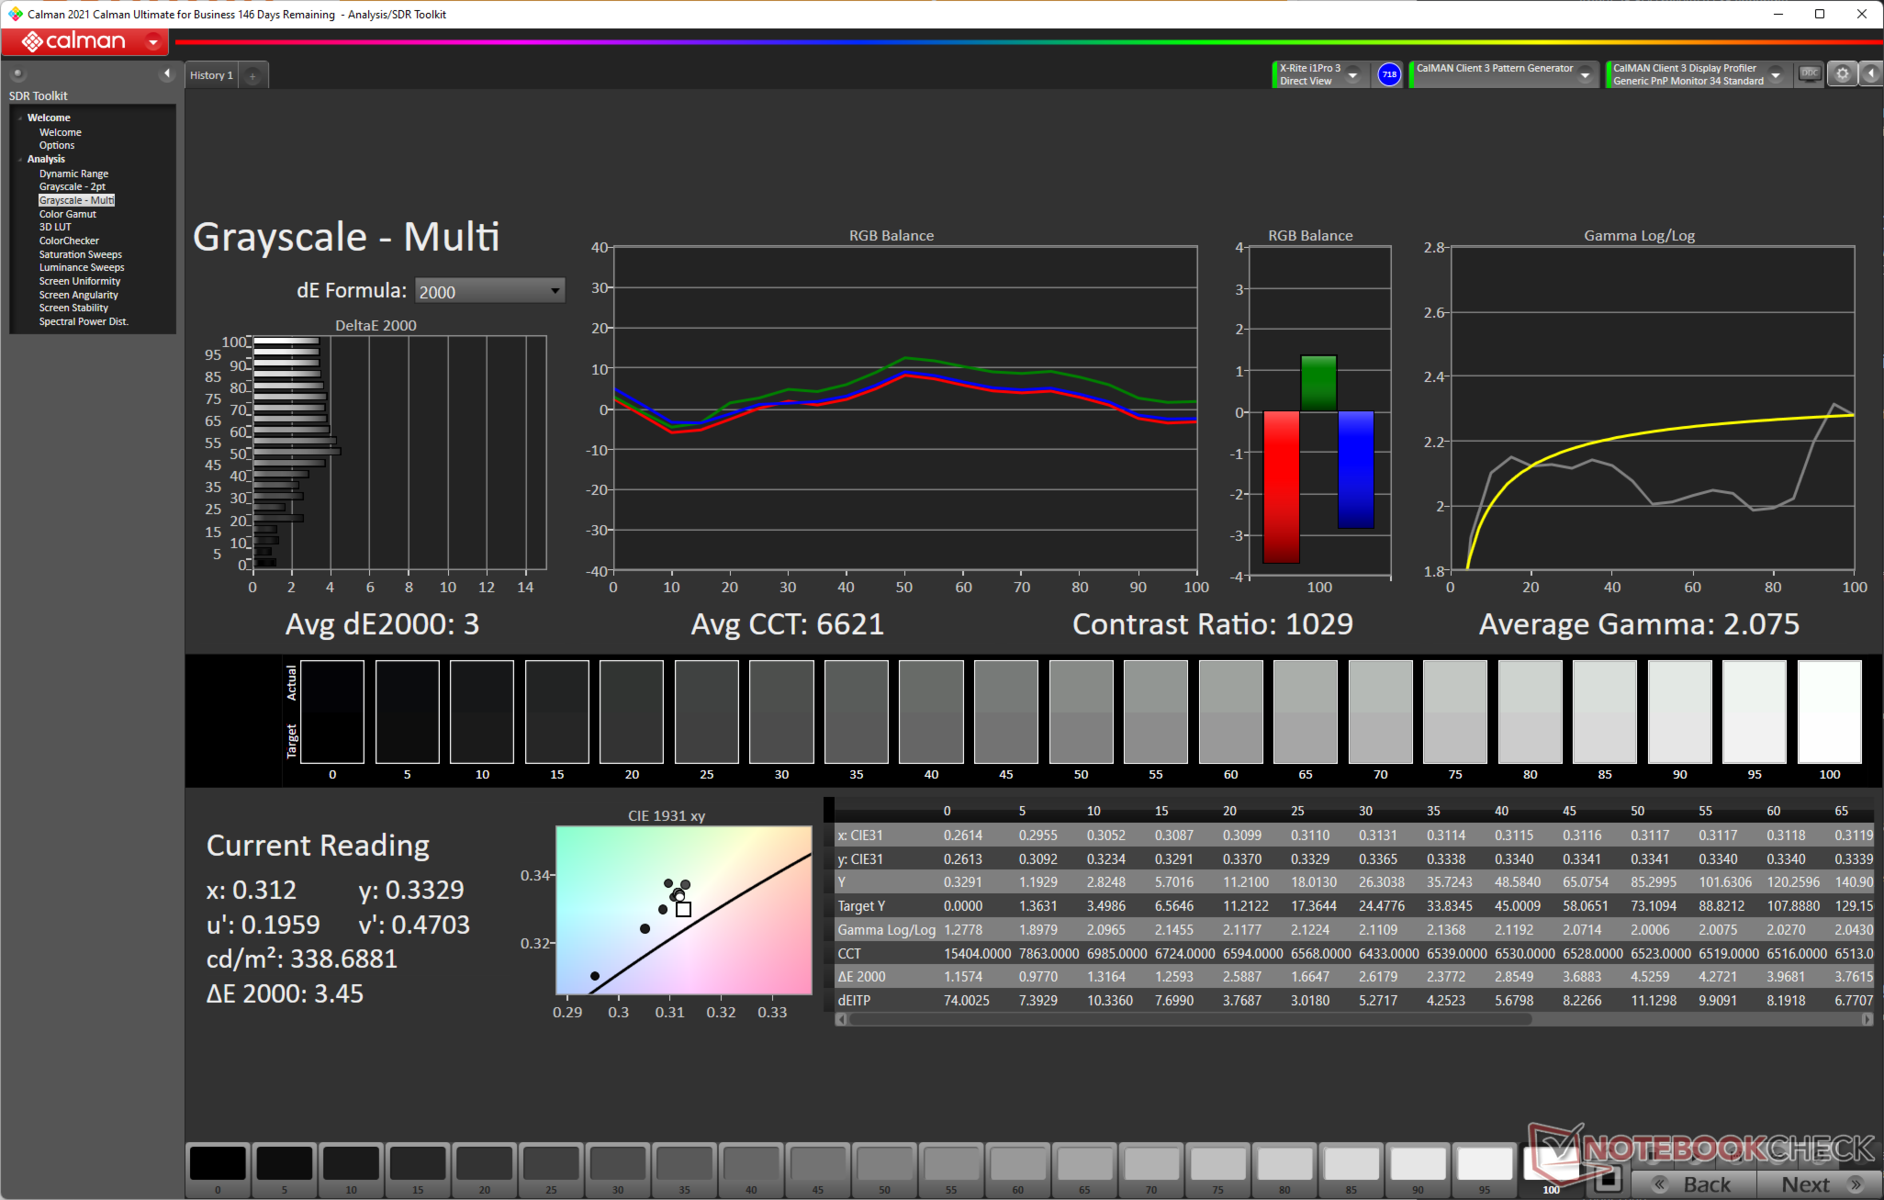
ΔE Greyscale Calman: 3 | ∀{0.09-98 Ø4.96}
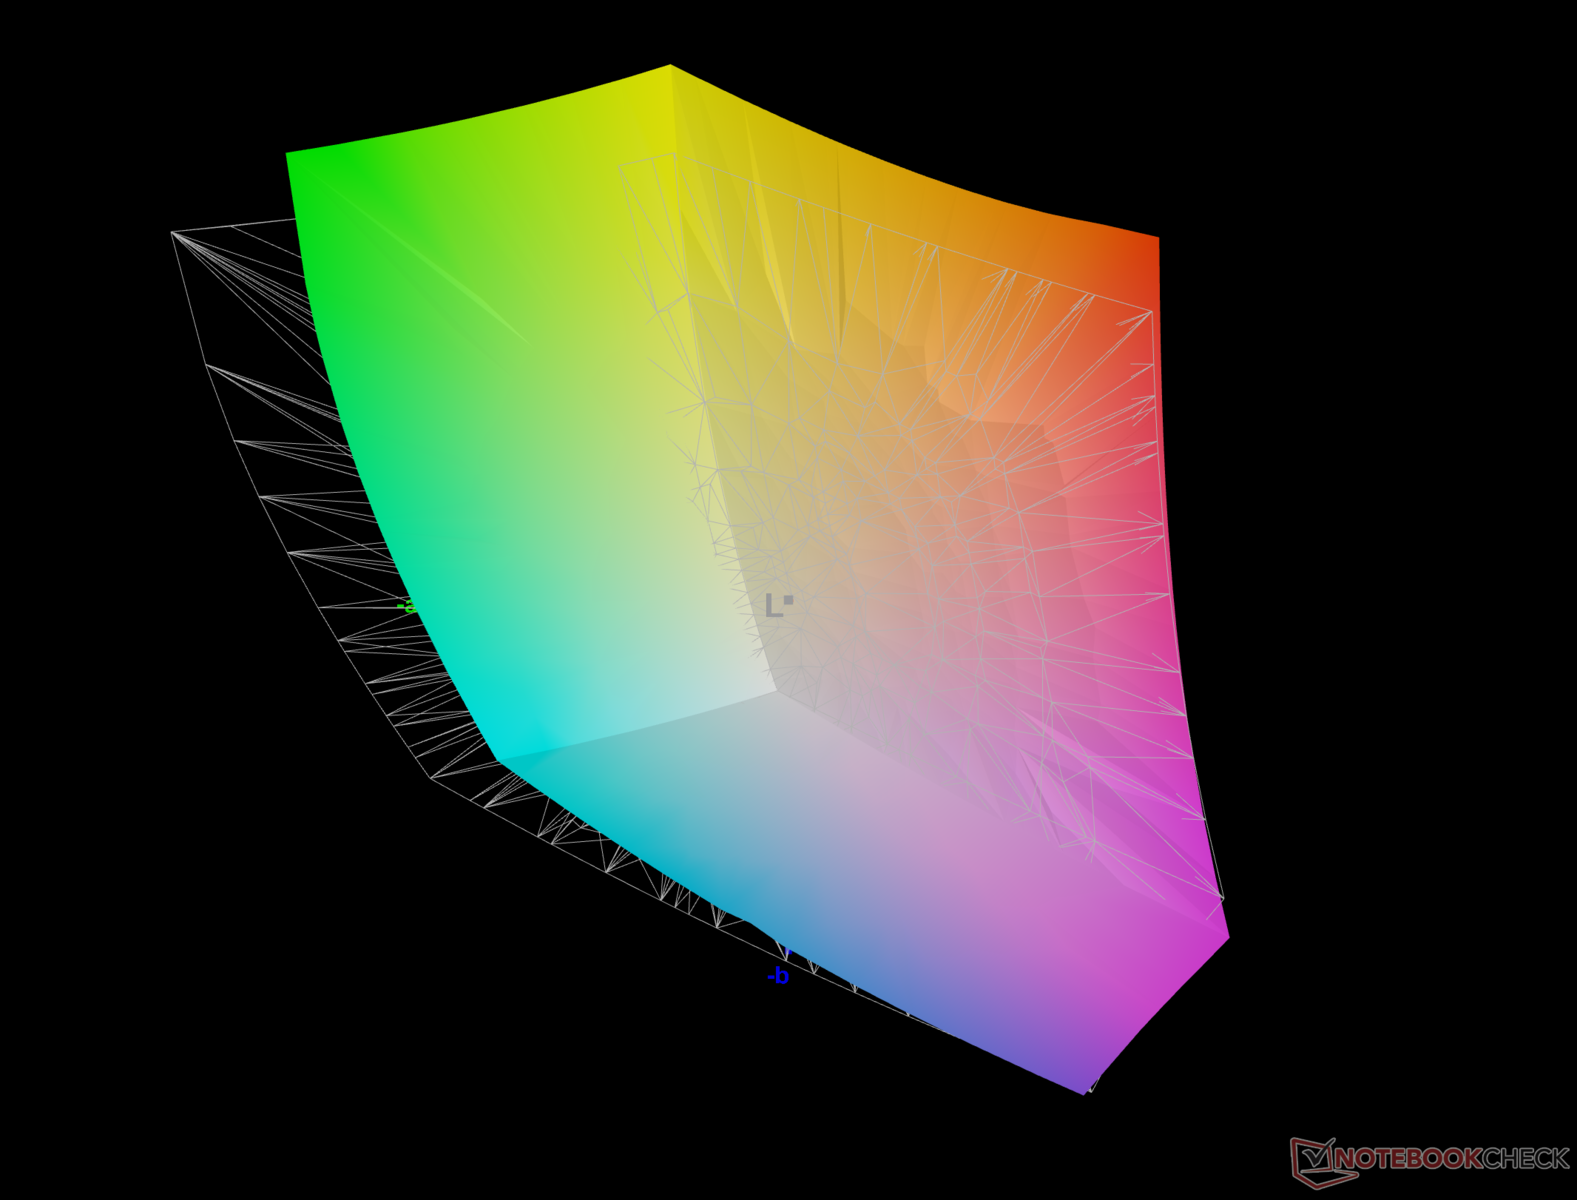
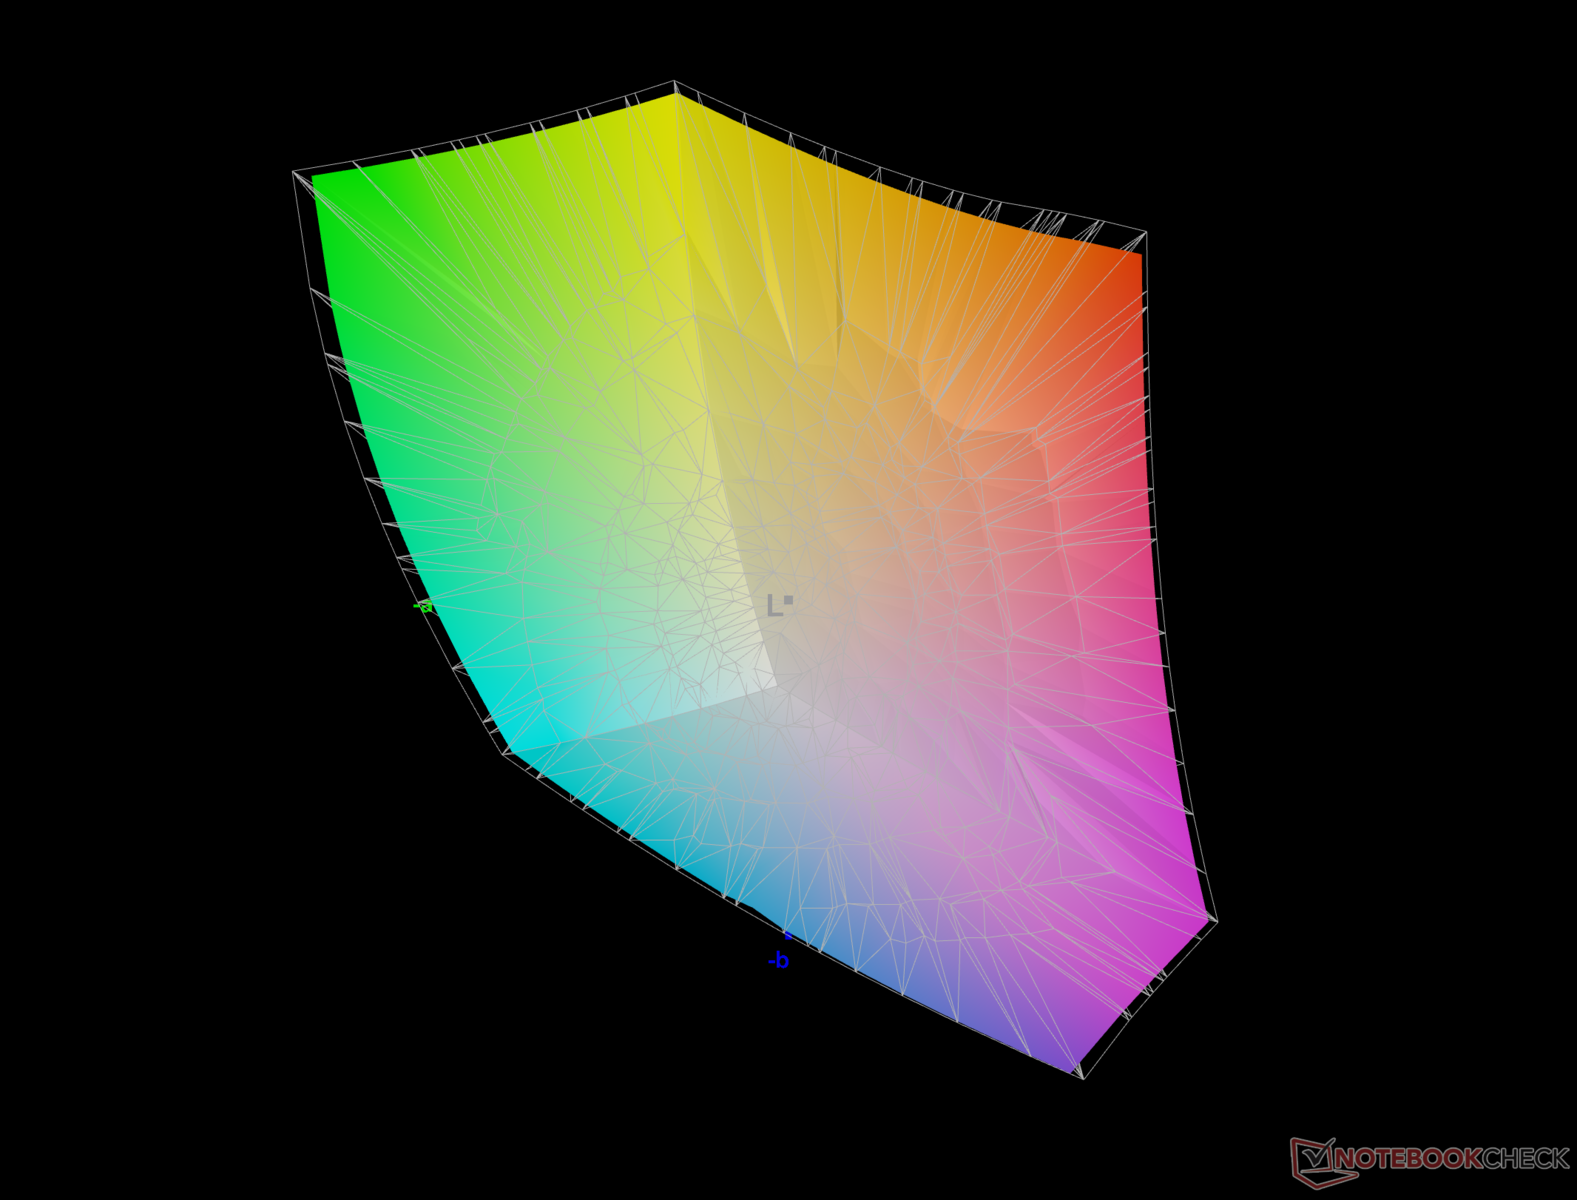
84.7% AdobeRGB 1998 (Argyll 3D)
99.8% sRGB (Argyll 3D)
94.8% Display P3 (Argyll 3D)
Gamma: 2.07
CCT: 6621 K
| MSI Crosshair 15 R6E B12UGZ-050 CMN N156KME-GNA, IPS-Level, 2560x1440, 15.6" | MSI Stealth GS66 12UGS Sharp LQ156T1JW04 (SHP153C), IPS-Level, 2560x1440, 15.6" | Lenovo Legion 5 Pro 16 G7 i7 RTX 3070Ti NE160QDM-NY1, IPS, 2560x1600, 16" | Acer Nitro 5 AN515-58-72QR Chi Mei N156KME-GNA, IPS, 2560x1440, 15.6" | Schenker XMG Neo 15 (Ryzen 9 6900HX, RTX 3070 Ti) BOE0A67, IPS, 2560x1440, 15.6" | |
|---|---|---|---|---|---|
| Display | 1% | -15% | 1% | -15% | |
| Display P3 Coverage (%) | 94.8 | 96.4 2% | 68.7 -28% | 95.6 1% | 68.9 -27% |
| sRGB Coverage (%) | 99.8 | 99.7 0% | 97.6 -2% | 99.8 0% | 97.7 -2% |
| AdobeRGB 1998 Coverage (%) | 84.7 | 85.6 1% | 70.9 -16% | 85.2 1% | 70.4 -17% |
| Response Times | -8% | -112% | -110% | -70% | |
| Response Time Grey 50% / Grey 80% * (ms) | 5.36 ? | 6 ? -12% | 17.6 ? -228% | 15.7 ? -193% | 12.4 ? -131% |
| Response Time Black / White * (ms) | 8.04 ? | 8.4 ? -4% | 7.6 ? 5% | 10.2 ? -27% | 8.8 ? -9% |
| PWM Frequency (Hz) | |||||
| Screen | -13% | 25% | -1% | 14% | |
| Brightness middle (cd/m²) | 342 | 272 -20% | 502 47% | 332 -3% | 370 8% |
| Brightness (cd/m²) | 326 | 253 -22% | 491 51% | 303 -7% | 343 5% |
| Brightness Distribution (%) | 89 | 87 -2% | 91 2% | 86 -3% | 82 -8% |
| Black Level * (cd/m²) | 0.32 | 0.25 22% | 0.37 -16% | 0.29 9% | 0.28 12% |
| Contrast (:1) | 1069 | 1088 2% | 1357 27% | 1145 7% | 1321 24% |
| Colorchecker dE 2000 * | 3.71 | 3.73 -1% | 2.7 27% | 3.61 3% | 2.31 38% |
| Colorchecker dE 2000 max. * | 6.51 | 9.43 -45% | 4.5 31% | 7.71 -18% | 4.03 38% |
| Colorchecker dE 2000 calibrated * | 2.59 | 0.98 62% | 1.4 46% | 0.59 77% | |
| Greyscale dE 2000 * | 3 | 6.5 -117% | 2.7 10% | 5.2 -73% | 3.28 -9% |
| Gamma | 2.07 106% | 2.172 101% | 2.44 90% | 2.155 102% | 2.47 89% |
| CCT | 6621 98% | 6485 100% | 6326 103% | 6724 97% | 6206 105% |
| Total Average (Program / Settings) | -7% /
-10% | -34% /
-3% | -37% /
-16% | -24% /
-6% |
* ... smaller is better
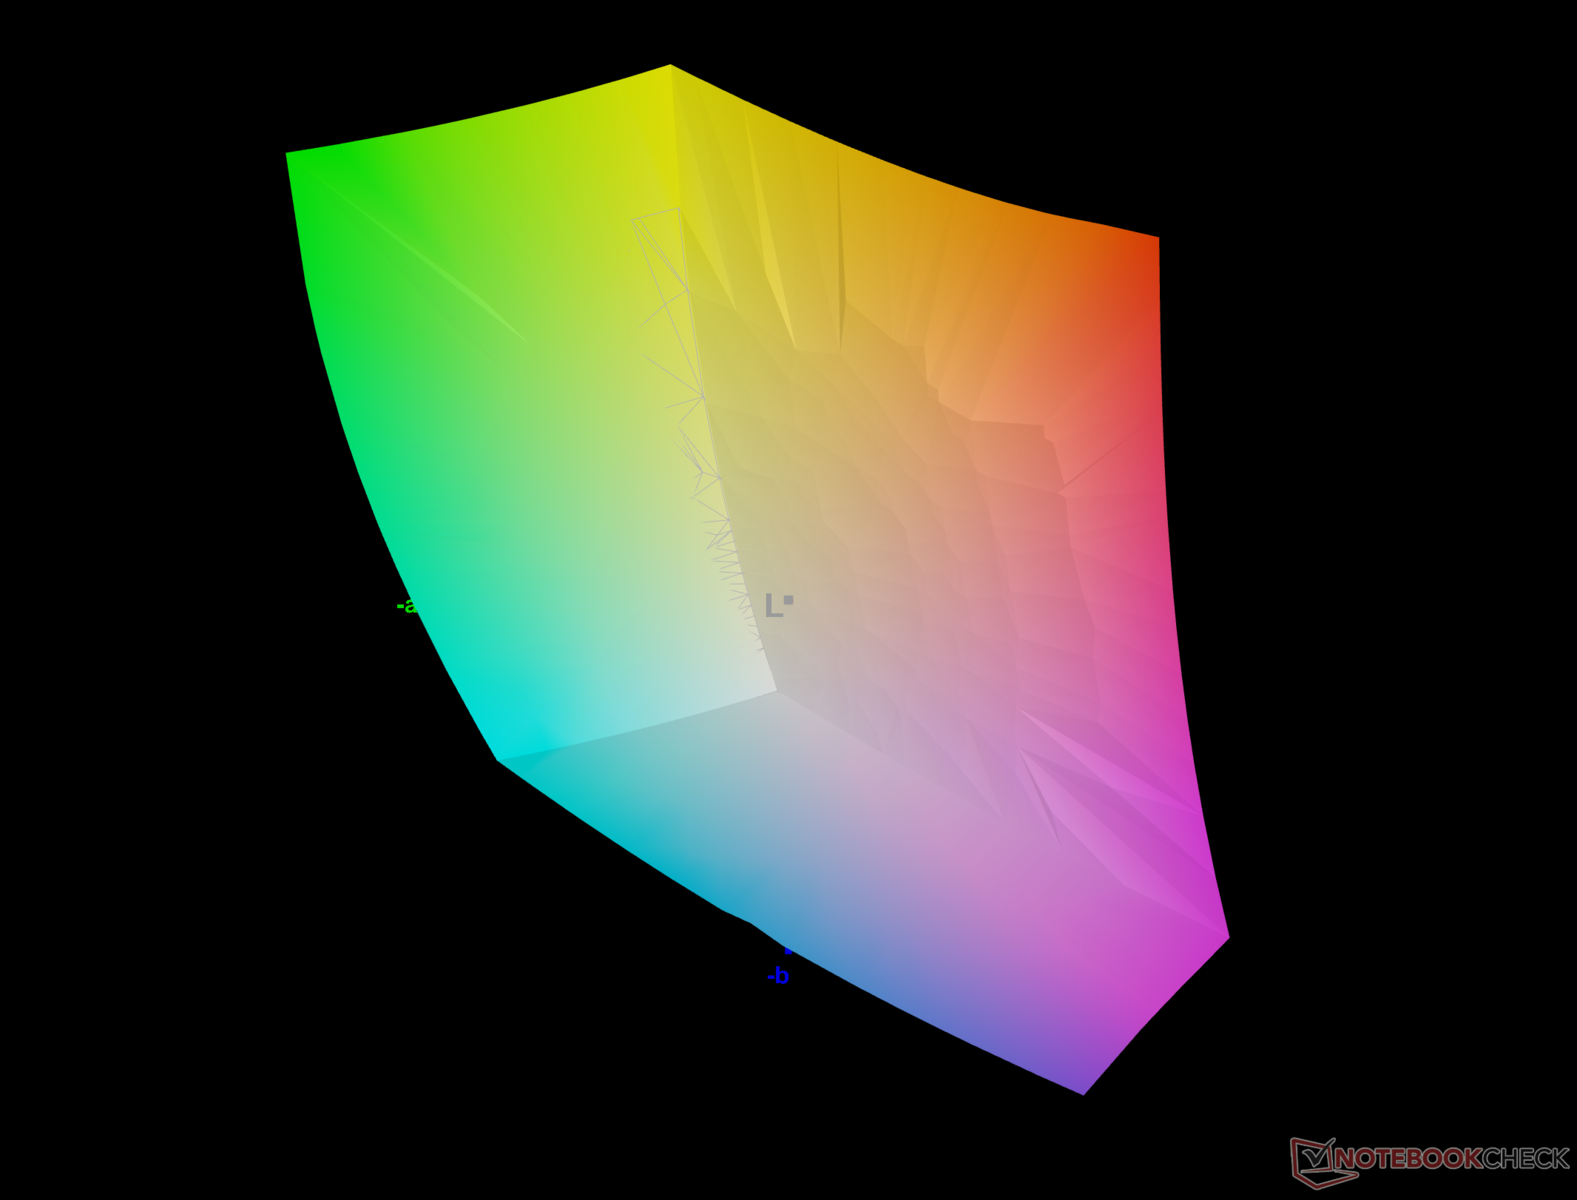
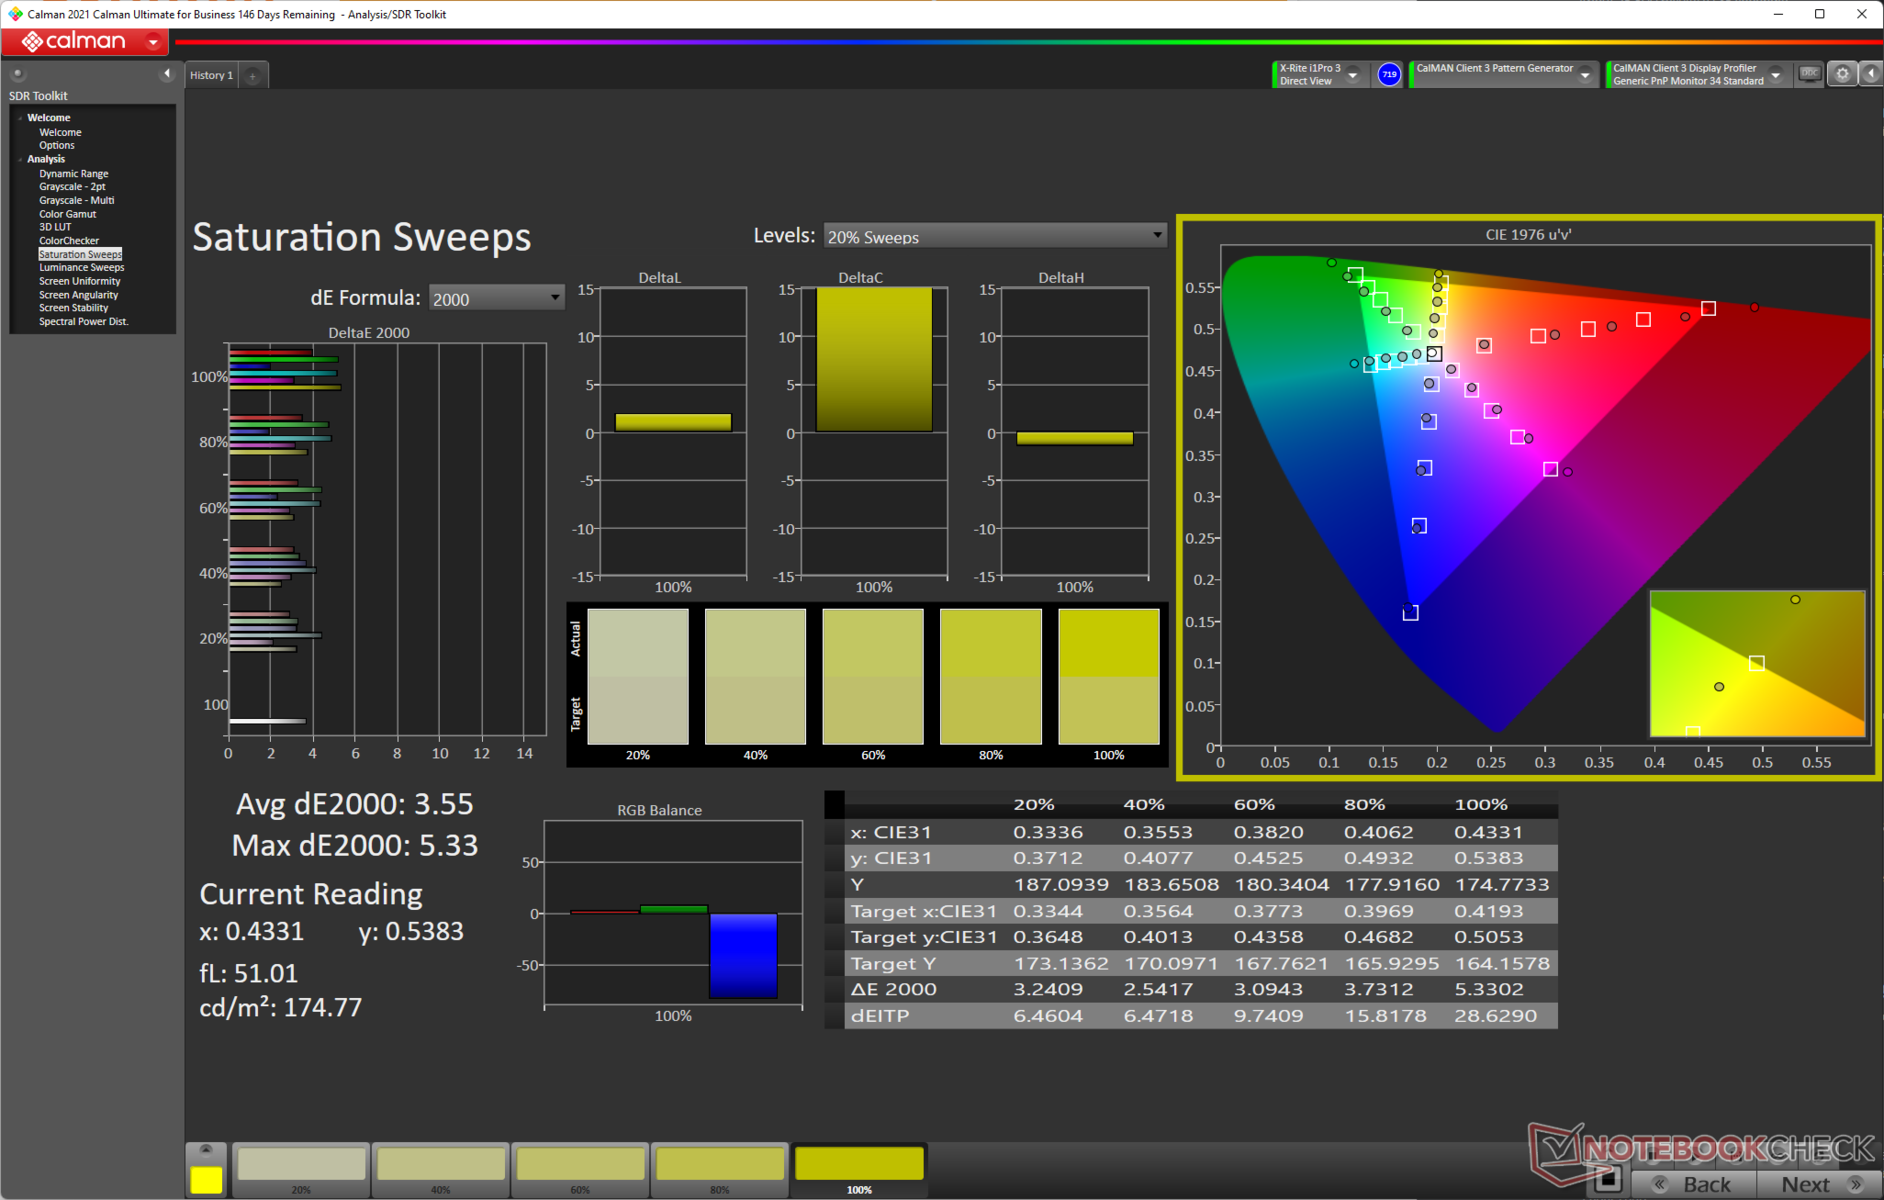
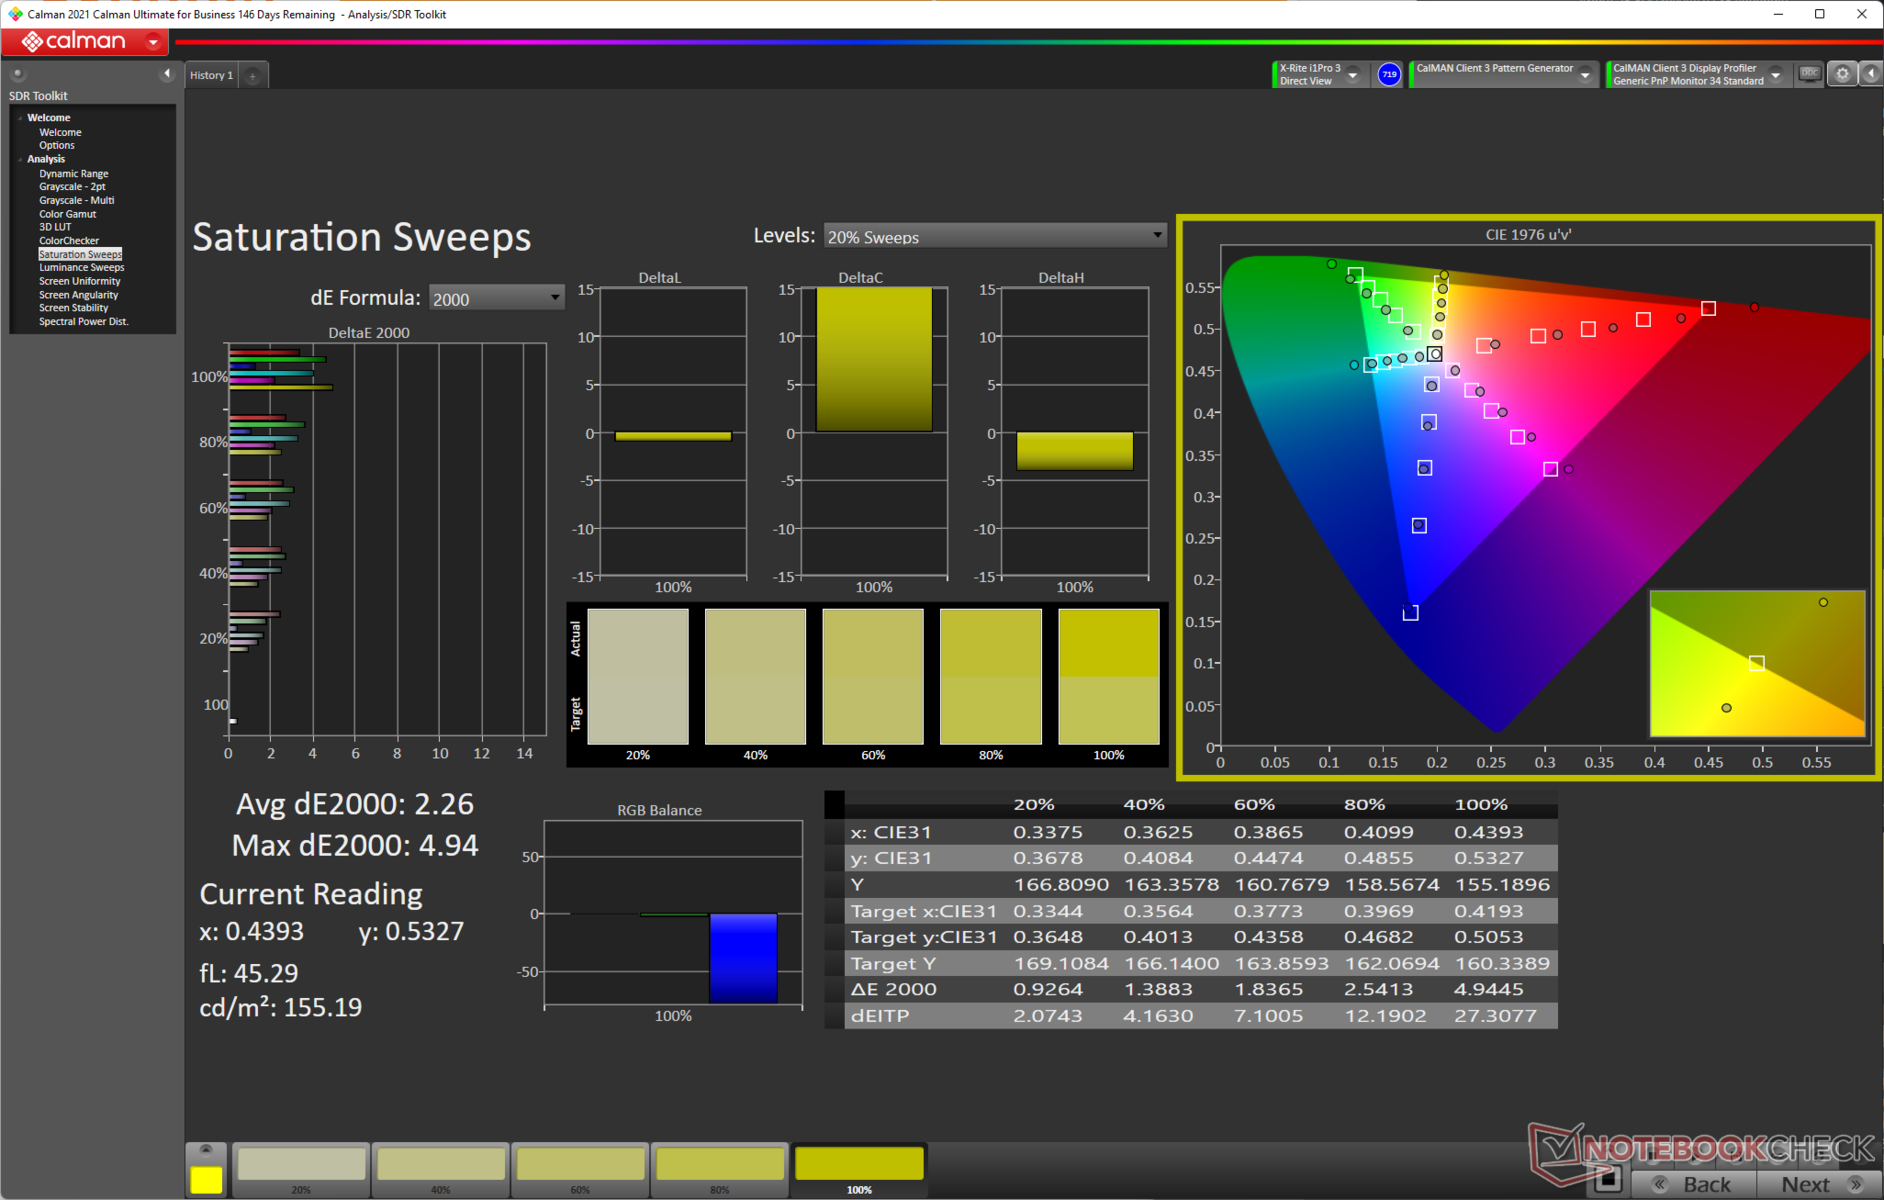
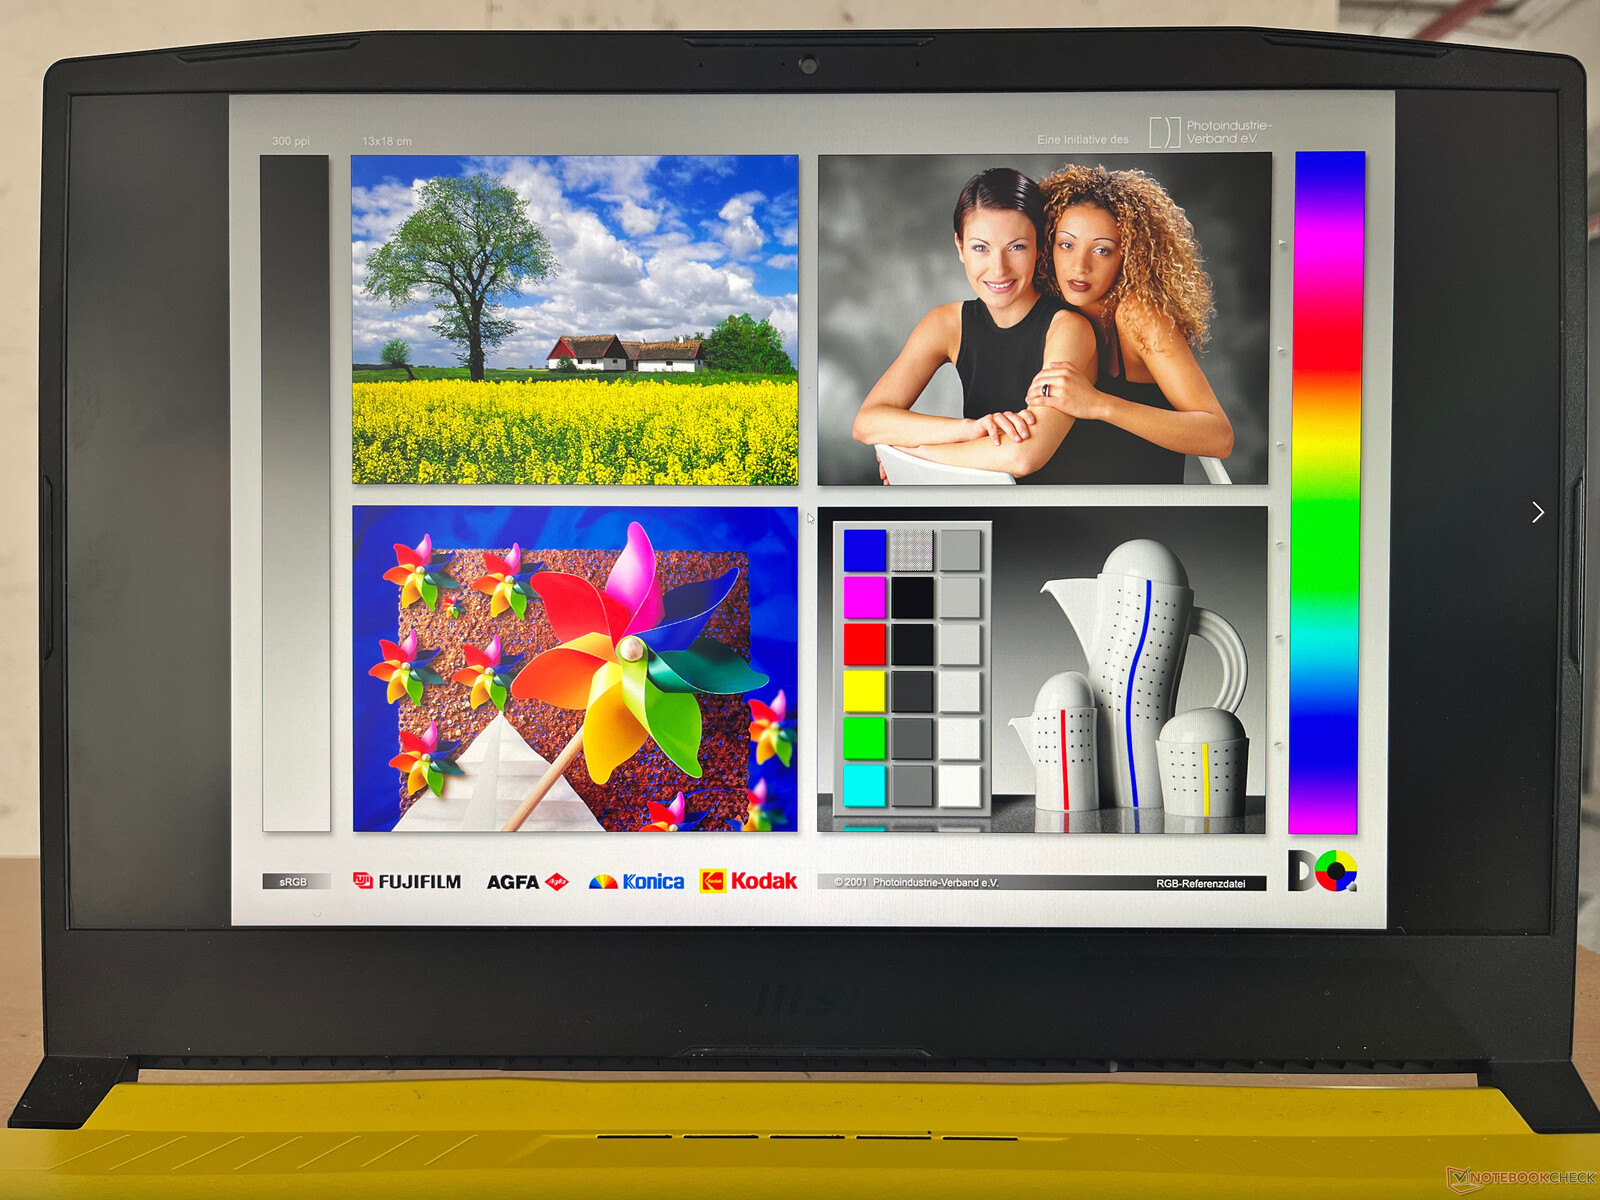
微星声称Crosshair 15的面板可以覆盖100%的DCI-P3色彩空间。在我们的测试中,我们发现它可以做到近95%的Display P3,这应该引起内容创作者的兴趣。该面板覆盖完整的sRGB色域。Adobe RGB的覆盖率也相当不错,接近85%。
我们观察到,其色域覆盖率与宏碁Nitro 5和XE5相当。 Aorus 15 XE5它们也采用了相同的奇美N156KME-GNA面板。很高兴看到制造商最终在这些价格上考虑良好的色彩性能。
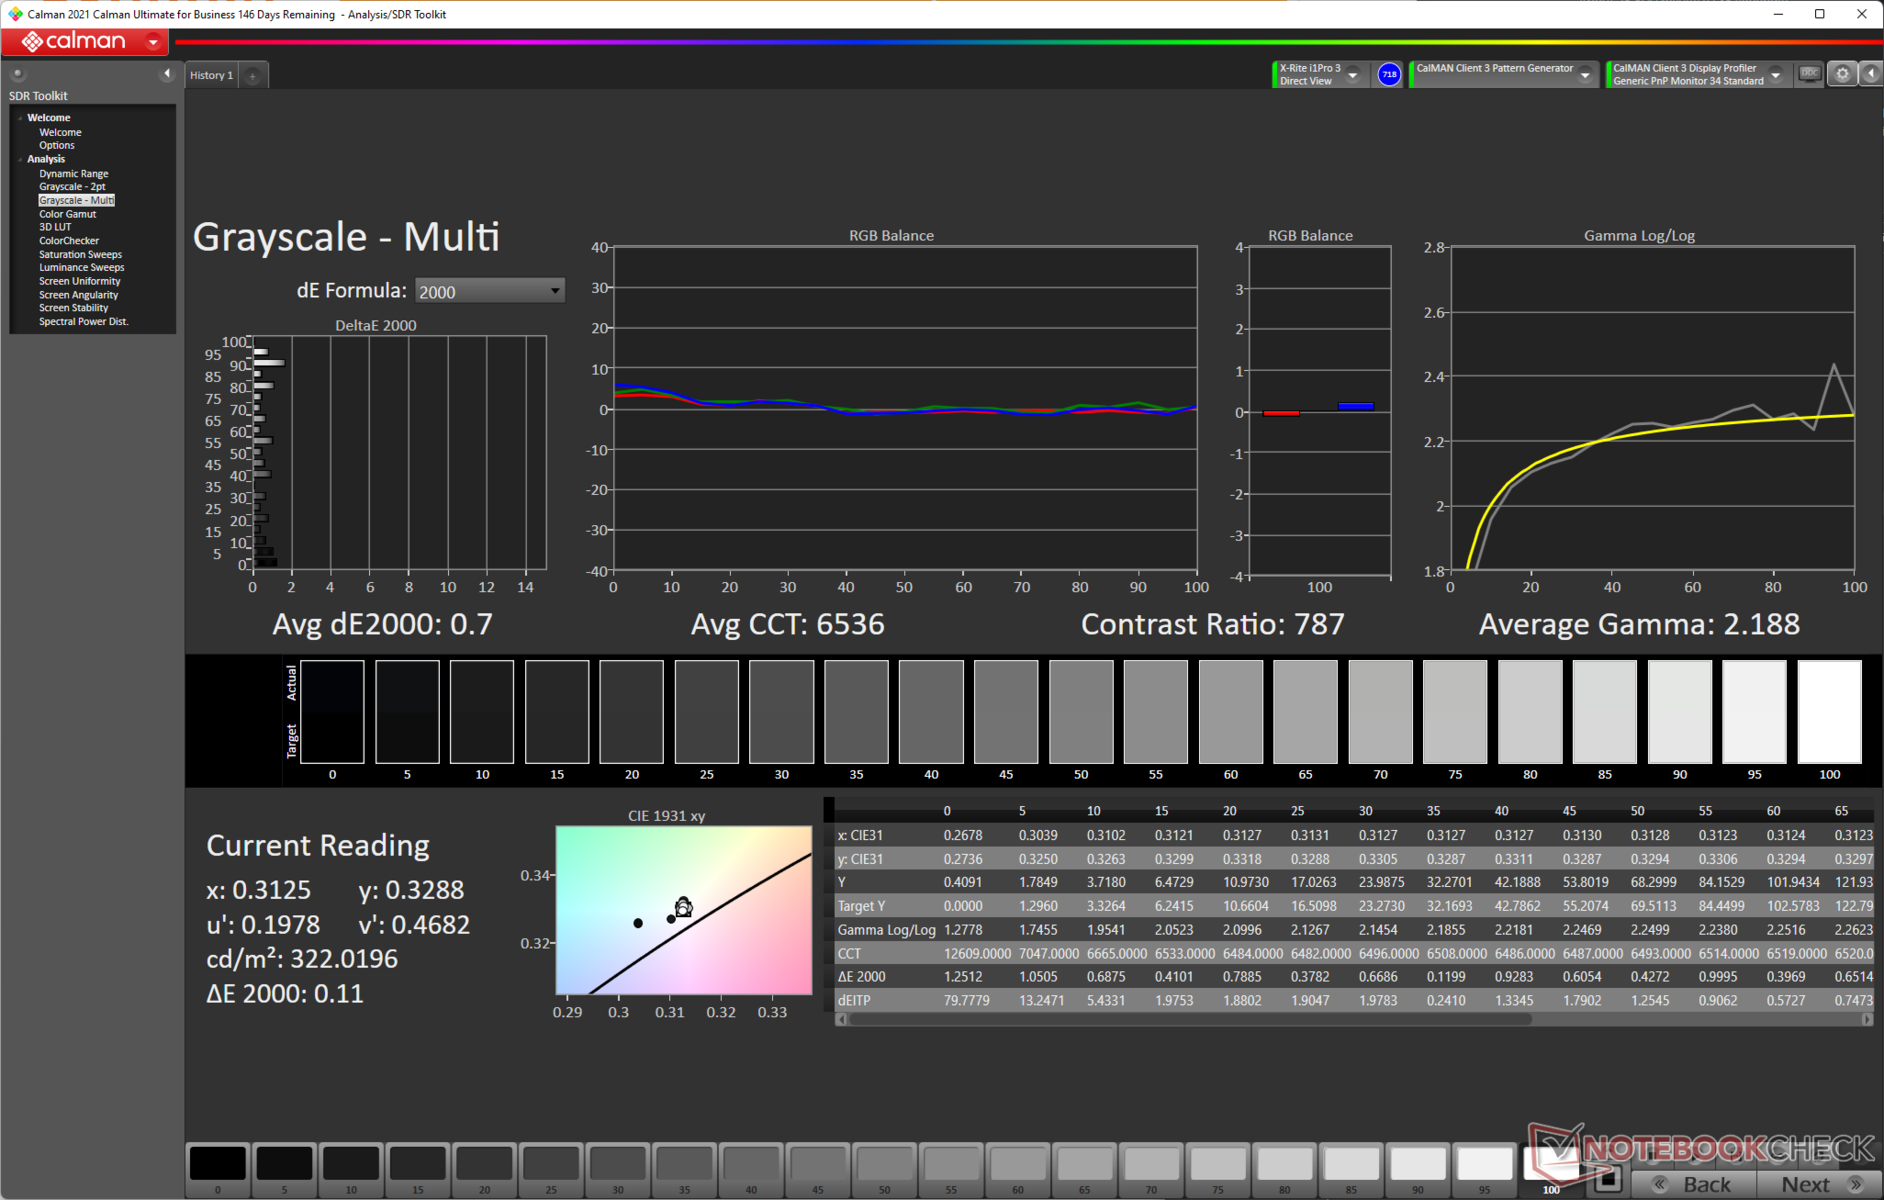
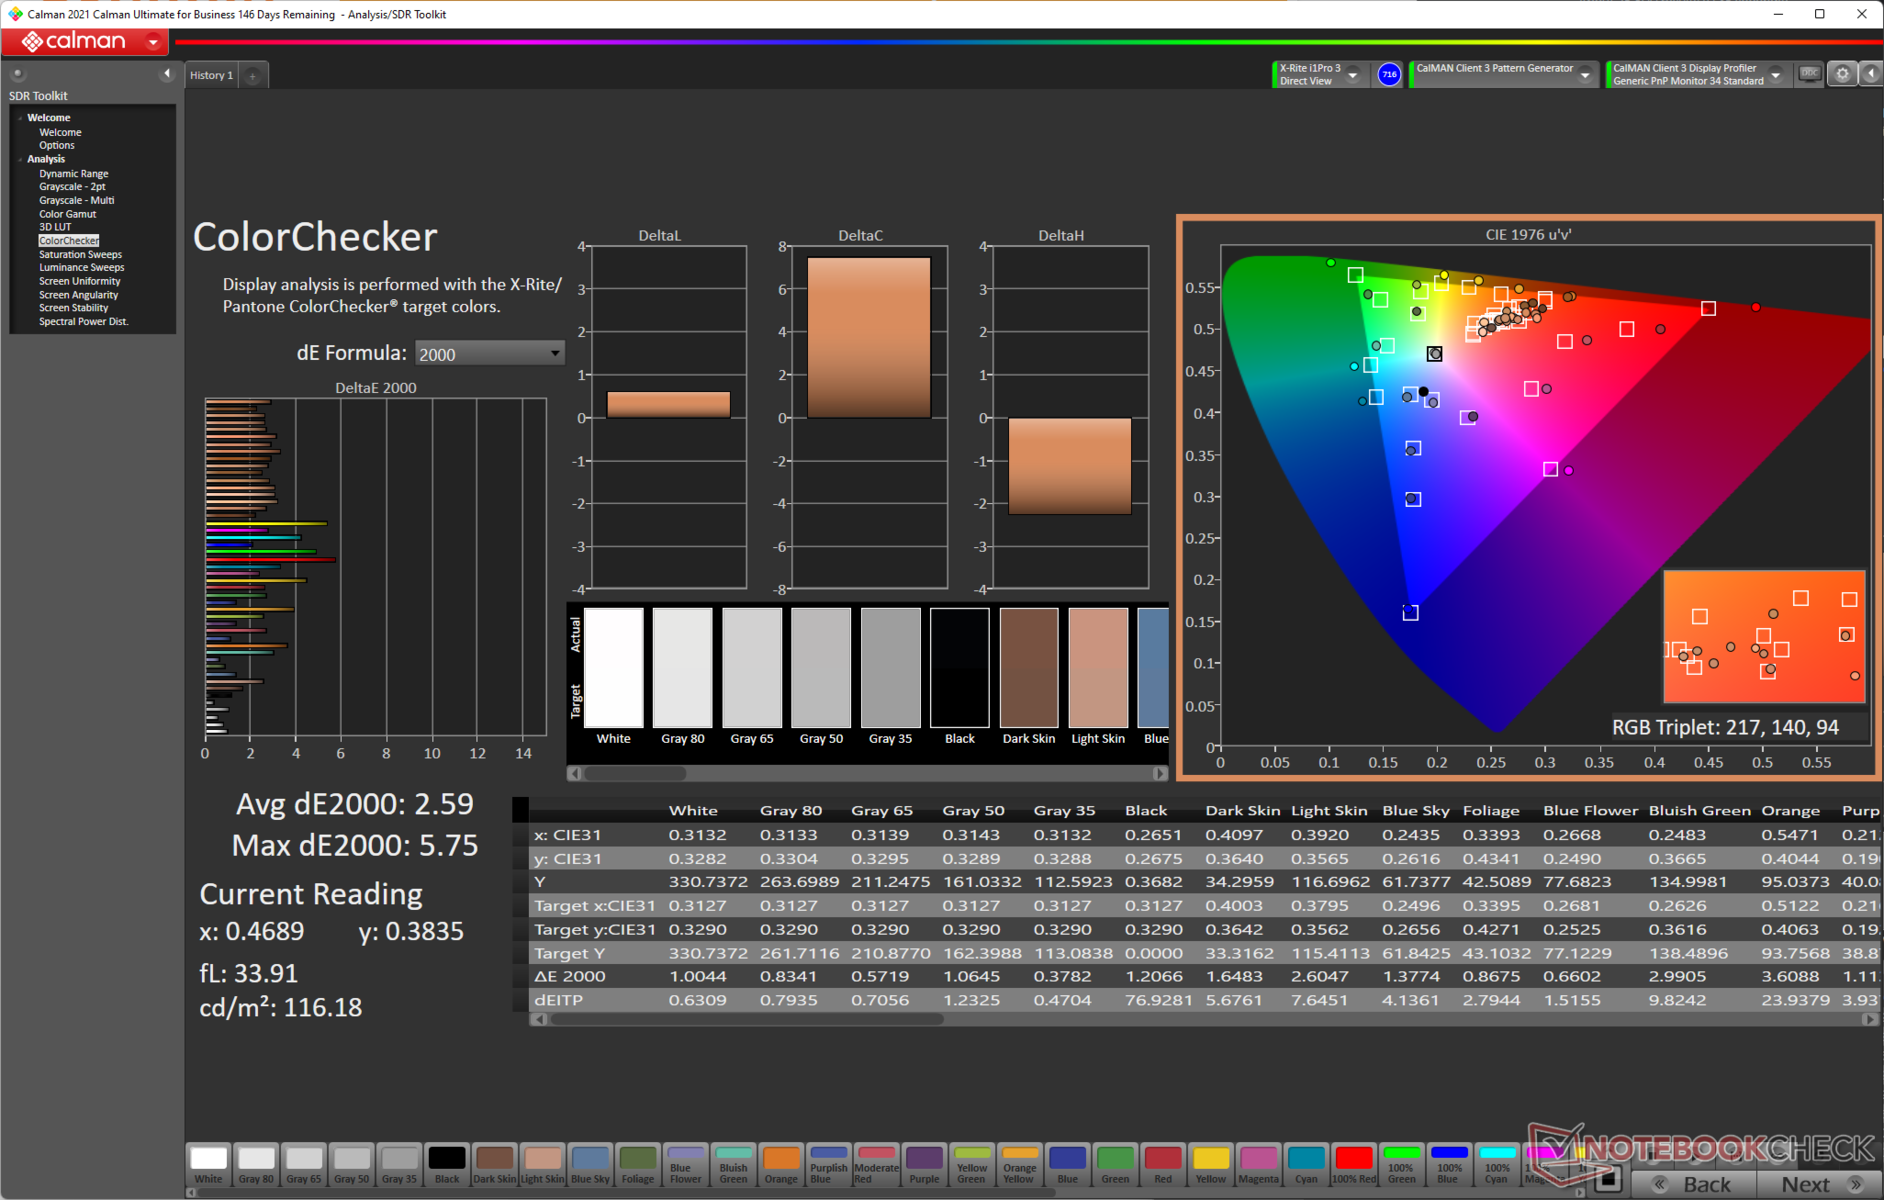
开箱即用的色彩准确度绝对可以使用,灰度Delta E为3,ColorChecker平均Delta E为3.71。
我们用X-rite i1Basic Pro 3分光光度计和Portrait Displays公司的Calman Ultimate色彩校准软件进行校准,结果灰度Delta E明显降低了0.7,ColorChecker的平均Delta E提高到2.59。红色的偏离度更高。
校准后的ICC文件可以从上面的链接中下载。
Display Response Times
| ↔ Response Time Black to White | ||
|---|---|---|
| 8.04 ms ... rise ↗ and fall ↘ combined | ↗ 4.72 ms rise | 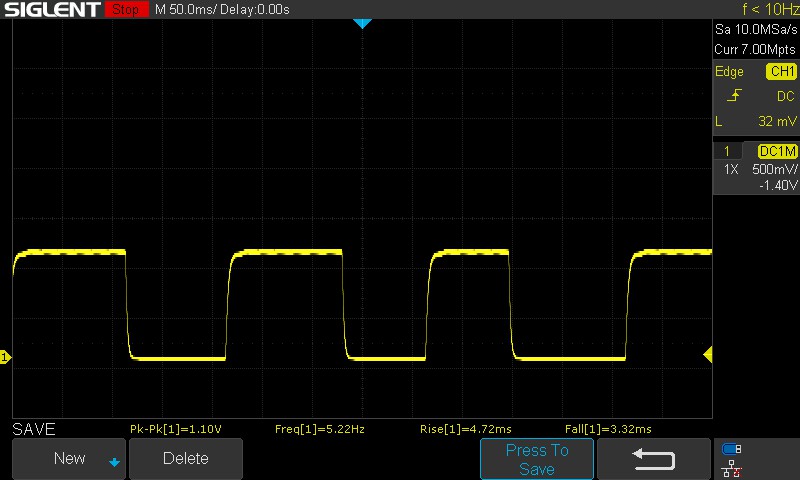 |
| ↘ 3.32 ms fall | ||
| The screen shows fast response rates in our tests and should be suited for gaming. In comparison, all tested devices range from 0.1 (minimum) to 240 (maximum) ms. » 24 % of all devices are better. This means that the measured response time is better than the average of all tested devices (19.8 ms). | ||
| ↔ Response Time 50% Grey to 80% Grey | ||
| 5.36 ms ... rise ↗ and fall ↘ combined | ↗ 2.71 ms rise | 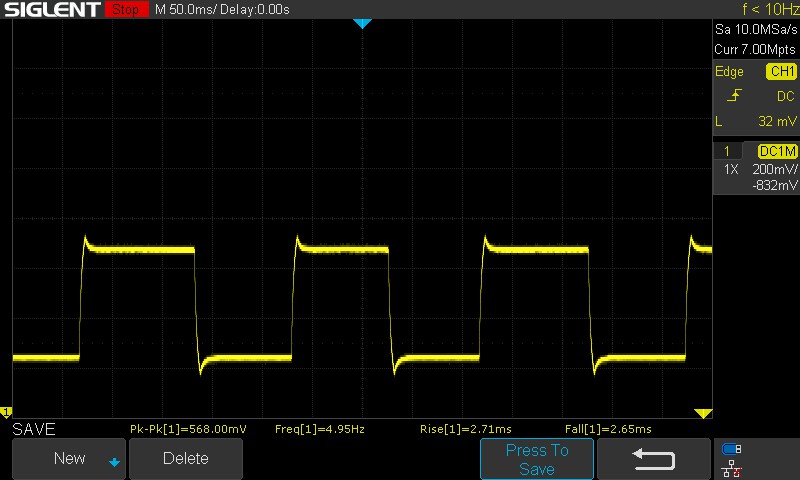 |
| ↘ 2.65 ms fall | ||
| The screen shows very fast response rates in our tests and should be very well suited for fast-paced gaming. In comparison, all tested devices range from 0.165 (minimum) to 636 (maximum) ms. » 18 % of all devices are better. This means that the measured response time is better than the average of all tested devices (30.9 ms). | ||
响应时间很好,尽管我们希望看到100%黑色到100%白色过渡的数值更低。
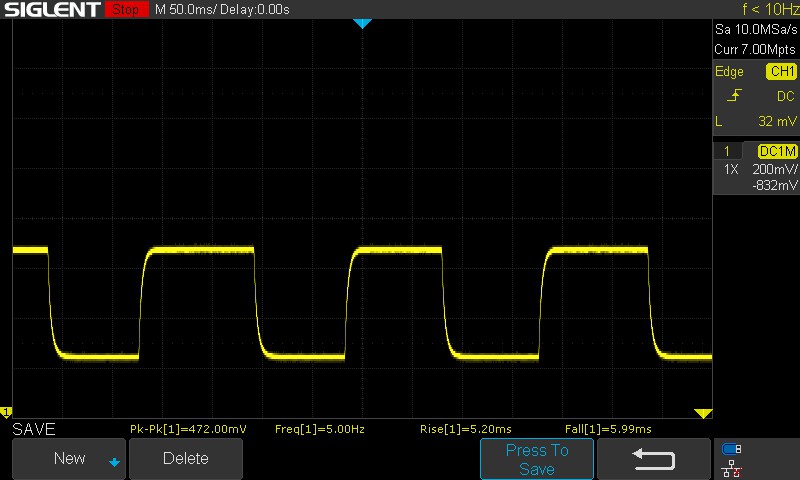
面板在默认情况下使用超速,这在50%灰色到80%灰色的示波器模式中被视为一个 "喇叭"。
在没有启用超速的情况下,这个值可以增加到11.19毫秒。
Screen Flickering / PWM (Pulse-Width Modulation)
| Screen flickering / PWM not detected | ≤ 100 % brightness setting | 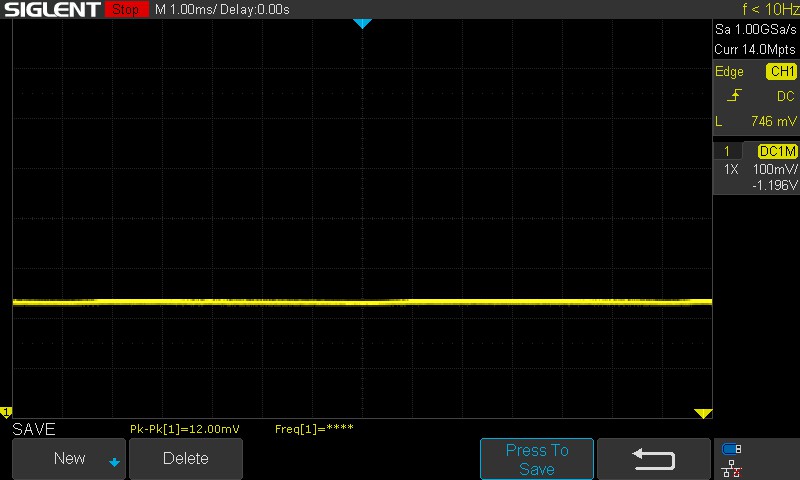 | |
In comparison: 52 % of all tested devices do not use PWM to dim the display. If PWM was detected, an average of 7741 (minimum: 5 - maximum: 343500) Hz was measured. | |||
在所有测试的亮度水平上,我们没有观察到PWM闪烁,所以在长时间工作或游戏过程中,可以少担心一件事。
请看我们的文章:"为什么脉冲宽度调制(PWM)是如此令人头痛",以及我们的 PWM排名表以了解所有评测设备之间的比较。
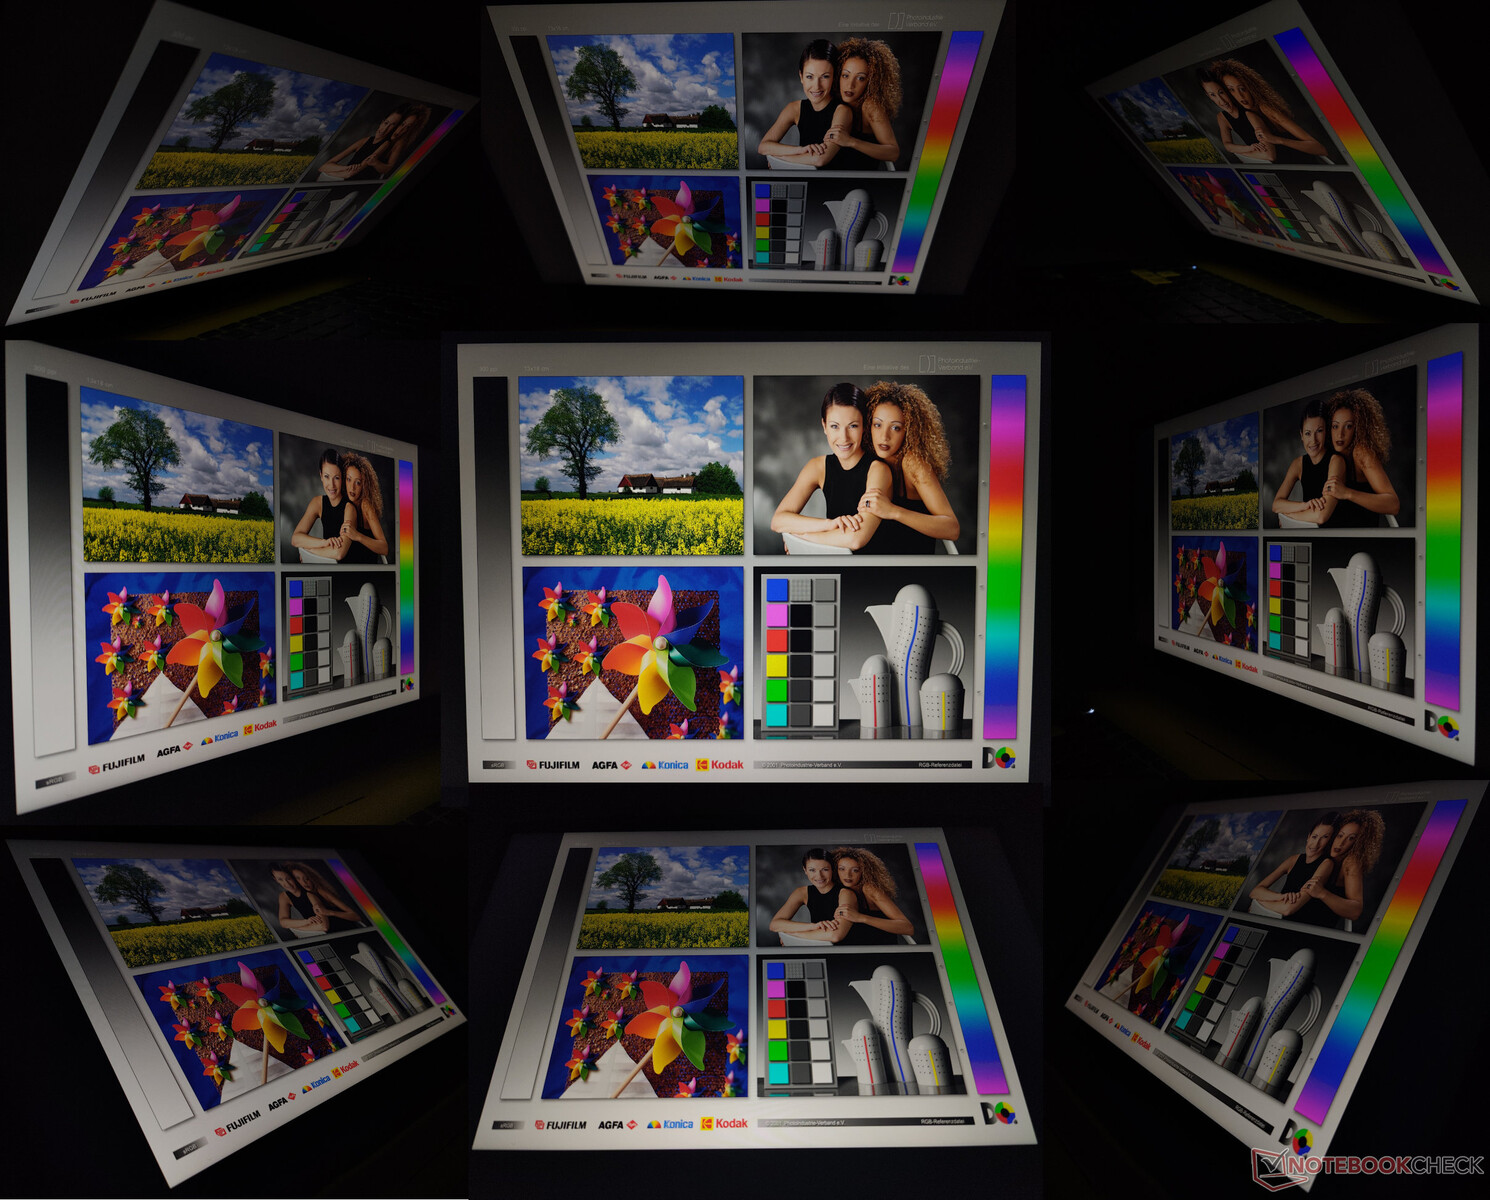
只要没有阳光直接落在显示屏上,户外观看是可以辨认的。然而,可视角度并不特别令人印象深刻。我们观察到极端视角下的亮度和色彩损失。
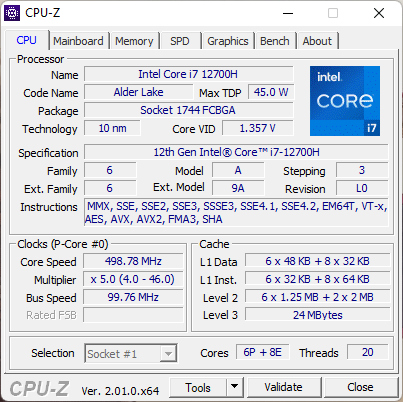
性能。不是我们见过的最快的Core i7-12700H
我们的Crosshair 15 R6E设备采用了一个 英特尔酷睿i7-12700H处理器和一个140瓦的 NvidiaGeForce RTX 3070 笔记本电脑GPU.买家还可以选择将笔记本电脑配置成一个 RTX 3060笔记本电脑GPU或高达Alder Lake Core i9的CPU选项。
测试条件
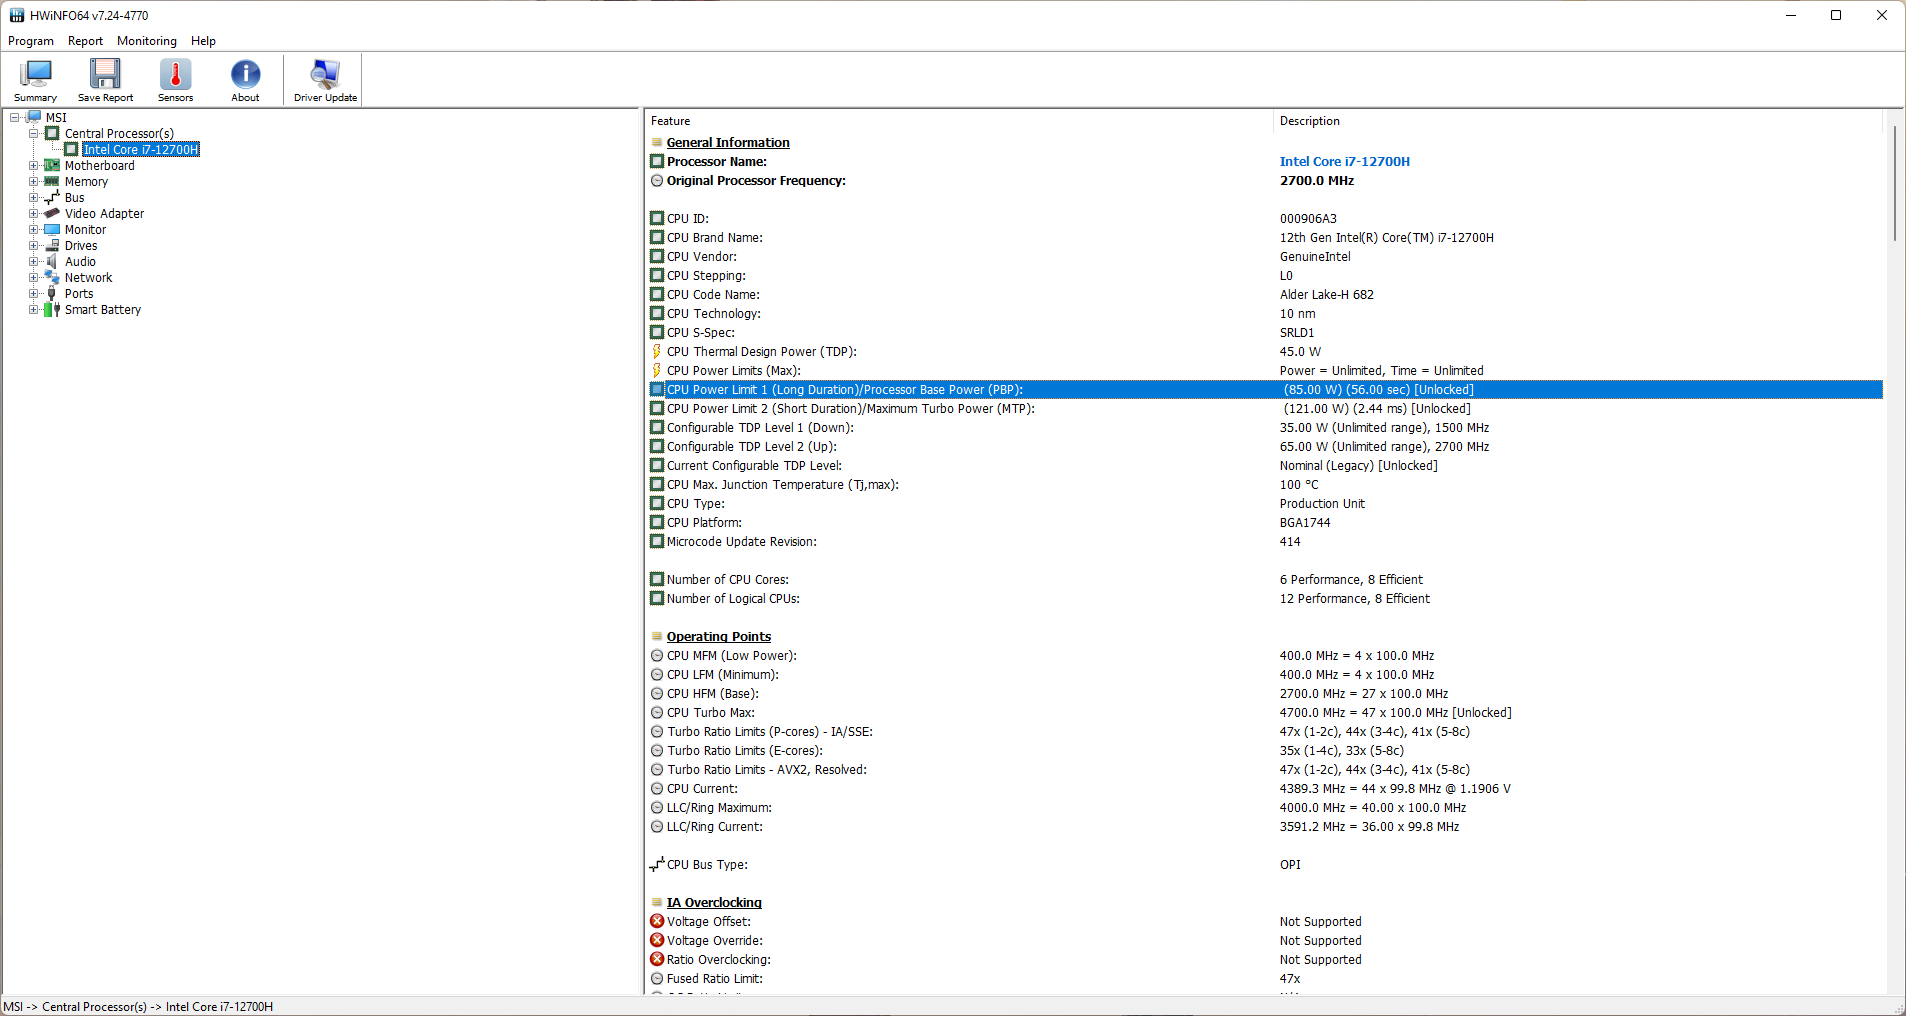
微星中心为调整Crosshair 15 R6E的各种性能参数提供了一个一站式服务。我们使用极端性能预设,让酷睿i7-12700H充分施展其肌肉。这允许处理器以85W的持续PL1和121W的短期PL2运行。
除非另有说明,所有测试都是在极限性能配置文件中进行的。
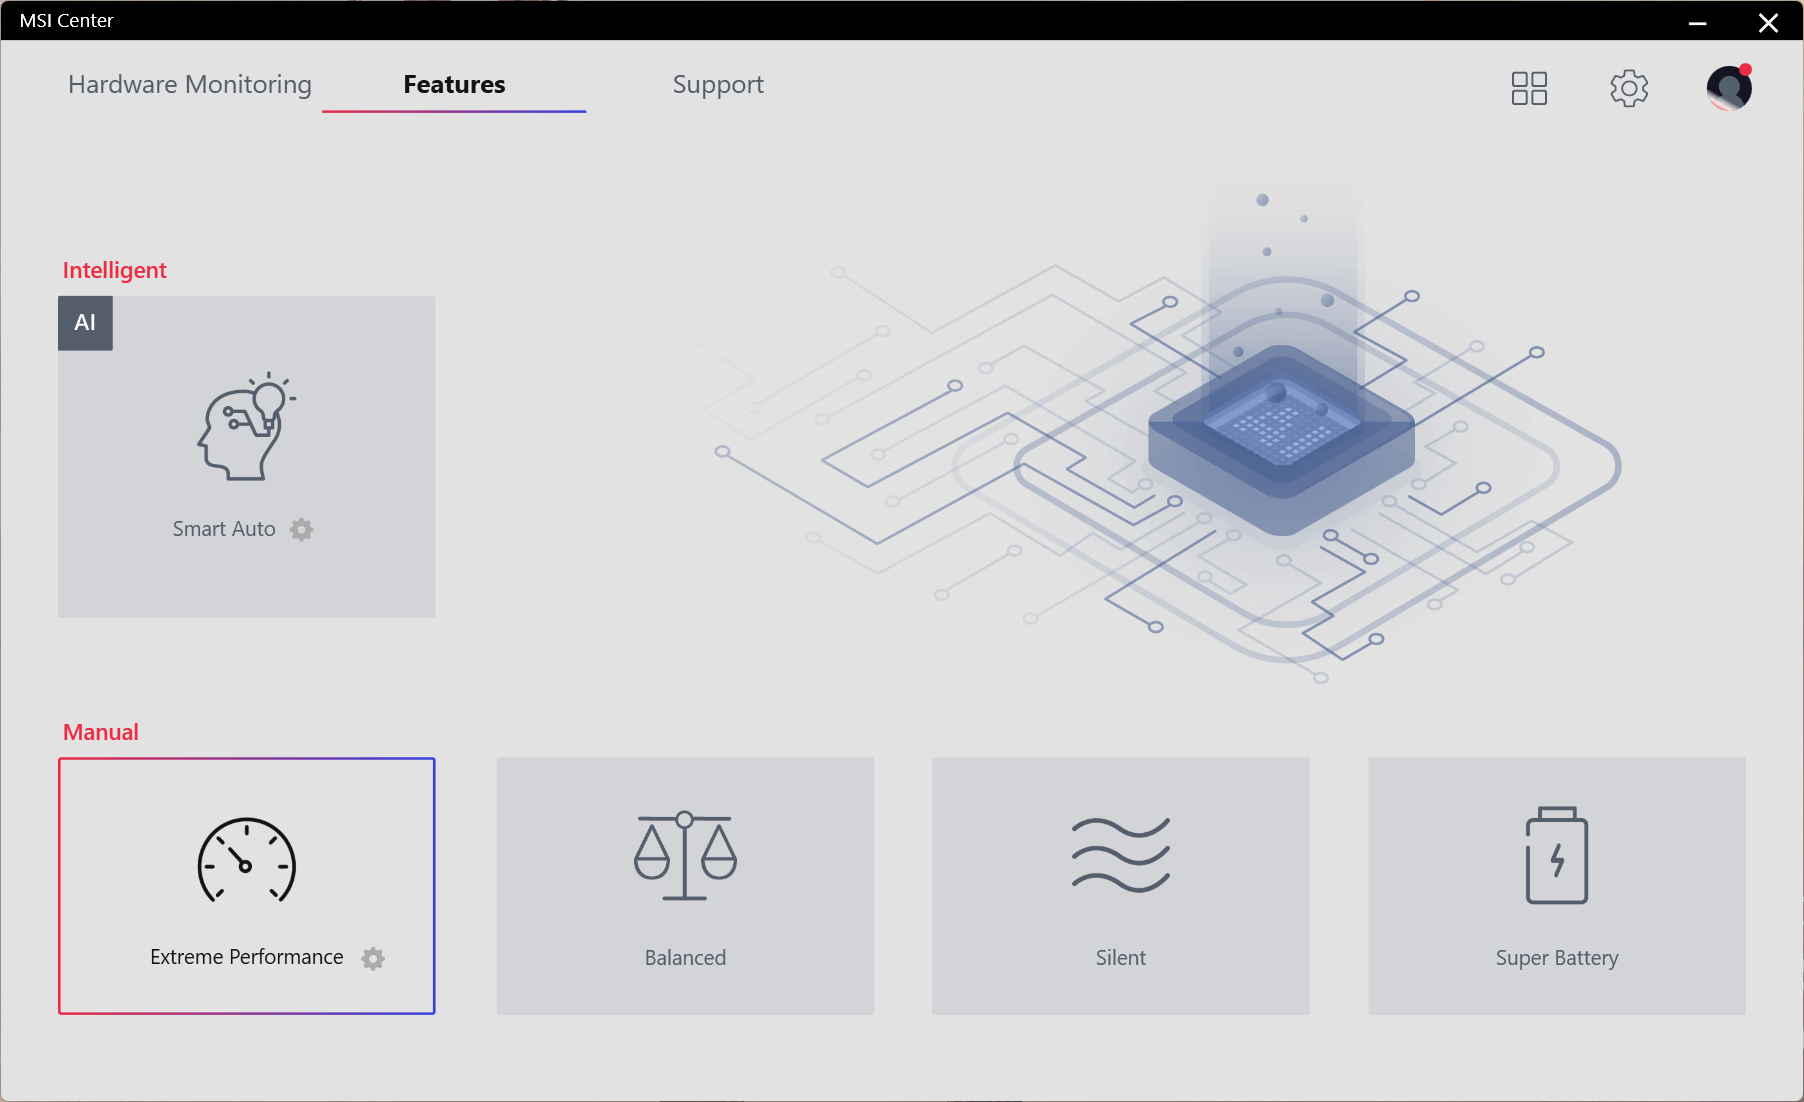
下表显示了处理器基本功率(PBP,PL1)和最大涡轮增压功率(MTP,PL2)在每种性能模式下的变化。平衡模式应能满足大多数需求。那些希望从酷睿i7-12700H中提取最大可能性能的人可以选择极限性能模式。
| 性能模式 | PL1(PBP)/ Tau | PL2(MTP)/ Tau |
|---|---|---|
| 超级电池 | 13 W / 56 s | 121 W / 2.44 ms |
| 静音 | 23 W / 56 s | 121 W / 2.44 ms |
| 平衡型 | 38 W / 56 s | 121 W / 2.44 ms |
| 极端性能 | 85 W / 56 s | 121 W / 2.44 ms |
处理器
酷睿i7-12700H是一款Alder Lake-H处理器,有六个P核和八个E核。在我们的Cinebench R15多核循环测试中,Crosshair 15 R6E能够让这个处理器有一个体面的持续性能,与 AMD Ryzen 9 6900HX在 Schenker XMG Neo 15.
不过,这不是我们所见过的最快的Core i7-12700H。该处理器在微星Stealth GS66和 联想Legion 5i Pro 16 G7由于更高的PL1和PL2值而获得更好的分数。
Cinebench R15 Multi Loop
下图说明了在Cinebench R15多核循环测试中CPU参数的变化。由于121 W PL2在所有三种性能模式下都保持不变,考虑到P核和E核,Core i7-12700H能够提升到接近3.8 GHz。P核和E核可以分别单独提升到4.6GHz和3.5GHz。
虽然在所测试的性能模式中,峰值封装功率和内核温度或多或少地相似,但平均值显示出明显的差异。在极限性能模式下,运行期间的平均封装功率接近75W,温度在84℃左右。平衡设置的平均温度在69 °C左右,平均封装功率为40.5 W。
在比较中,静音模式的排放最少,平均封装功率仅接近25W,平均核心温度接近57℃。
尽管与联想Legion 5i Pro 16 G7中的Core i7-12700H相比,多核性能受到15%的打击,但Crosshair 15 R6E在整体CPU性能上只落后约8%。
Crosshair 15 R6E比搭载Ryzen 9 6900HX的XMG Neo 15快13%,但后者在AIDA64测试中的性能评分高出32%。
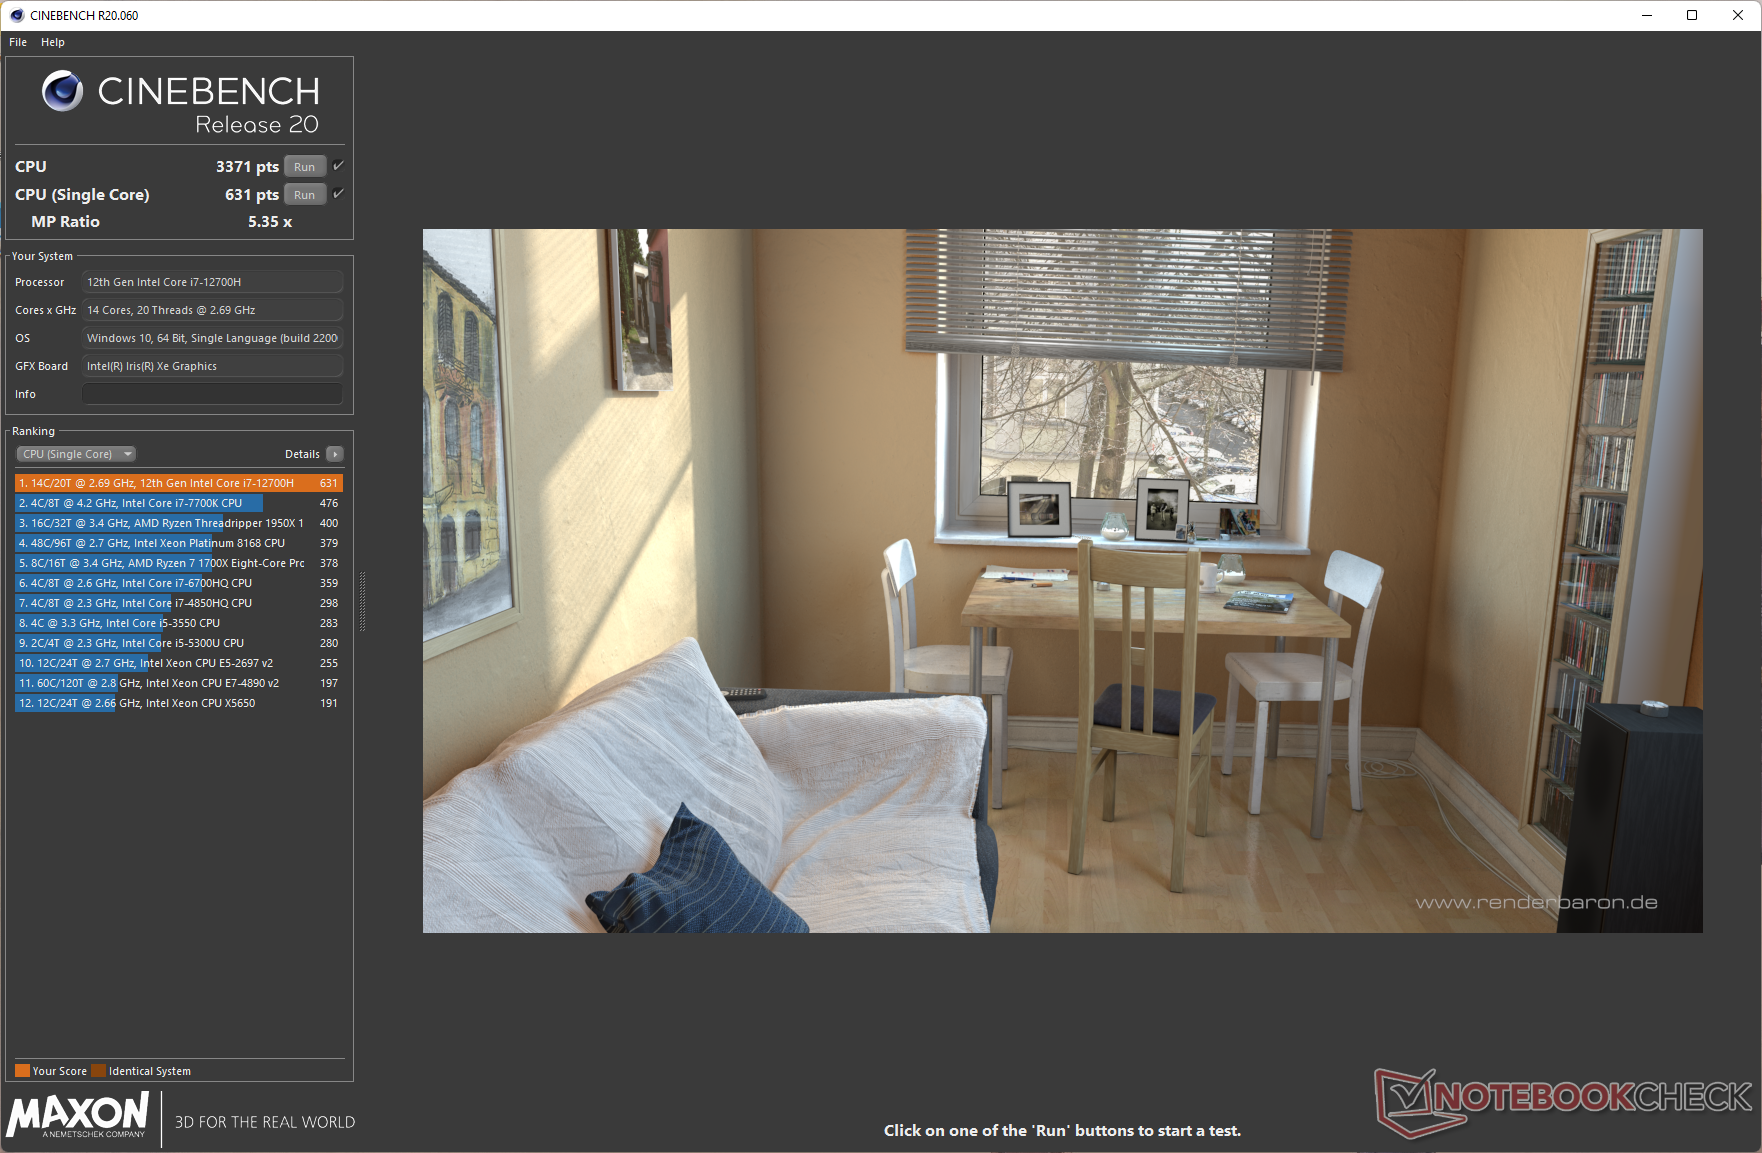
Cinebench R20的多核性能在电池供电时大幅下降45%,不过单核分数只下降了10%。
Cinebench R23: Multi Core | Single Core
Cinebench R20: CPU (Multi Core) | CPU (Single Core)
Cinebench R15: CPU Multi 64Bit | CPU Single 64Bit
Blender: v2.79 BMW27 CPU
7-Zip 18.03: 7z b 4 | 7z b 4 -mmt1
Geekbench 5.5: Multi-Core | Single-Core
HWBOT x265 Benchmark v2.2: 4k Preset
LibreOffice : 20 Documents To PDF
R Benchmark 2.5: Overall mean
| CPU Performance rating | |
| Average of class Gaming | |
| Lenovo Legion 5 Pro 16 G7 i7 RTX 3070Ti | |
| MSI Pulse GL66 12UEK | |
| MSI Stealth GS66 12UGS | |
| Schenker XMG Neo 15 (i7-12700H, RTX 3080 Ti) | |
| MSI Crosshair 15 R6E B12UGZ-050 | |
| Acer Nitro 5 AN515-58-72QR | |
| Aorus 15 XE5 | |
| MSI Katana GF66 12UGS | |
| Average Intel Core i7-12700H | |
| Asus TUF Dash F15 FX517ZR | |
| Schenker XMG Neo 15 (Ryzen 9 6900HX, RTX 3070 Ti) | |
| Cinebench R23 / Single Core | |
| Average of class Gaming (1601 - 2415, n=104, last 2 years) | |
| MSI Pulse GL66 12UEK | |
| MSI Katana GF66 12UGS | |
| Lenovo Legion 5 Pro 16 G7 i7 RTX 3070Ti | |
| Acer Nitro 5 AN515-58-72QR | |
| Schenker XMG Neo 15 (i7-12700H, RTX 3080 Ti) | |
| Asus TUF Dash F15 FX517ZR | |
| MSI Stealth GS66 12UGS | |
| MSI Crosshair 15 R6E B12UGZ-050 | |
| Aorus 15 XE5 | |
| Average Intel Core i7-12700H (778 - 1826, n=63) | |
| Schenker XMG Neo 15 (Ryzen 9 6900HX, RTX 3070 Ti) | |
| Cinebench R20 / CPU (Multi Core) | |
| Average of class Gaming (4029 - 16433, n=103, last 2 years) | |
| Lenovo Legion 5 Pro 16 G7 i7 RTX 3070Ti | |
| Schenker XMG Neo 15 (i7-12700H, RTX 3080 Ti) | |
| MSI Pulse GL66 12UEK | |
| MSI Stealth GS66 12UGS | |
| Acer Nitro 5 AN515-58-72QR | |
| MSI Katana GF66 12UGS | |
| MSI Crosshair 15 R6E B12UGZ-050 | |
| Aorus 15 XE5 | |
| Average Intel Core i7-12700H (1576 - 7407, n=64) | |
| Schenker XMG Neo 15 (Ryzen 9 6900HX, RTX 3070 Ti) | |
| Asus TUF Dash F15 FX517ZR | |
| Cinebench R20 / CPU (Single Core) | |
| Average of class Gaming (622 - 913, n=103, last 2 years) | |
| MSI Pulse GL66 12UEK | |
| MSI Katana GF66 12UGS | |
| Lenovo Legion 5 Pro 16 G7 i7 RTX 3070Ti | |
| Asus TUF Dash F15 FX517ZR | |
| MSI Crosshair 15 R6E B12UGZ-050 | |
| Acer Nitro 5 AN515-58-72QR | |
| MSI Stealth GS66 12UGS | |
| Schenker XMG Neo 15 (i7-12700H, RTX 3080 Ti) | |
| Aorus 15 XE5 | |
| Average Intel Core i7-12700H (300 - 704, n=64) | |
| Schenker XMG Neo 15 (Ryzen 9 6900HX, RTX 3070 Ti) | |
| Cinebench R15 / CPU Single 64Bit | |
| Average of class Gaming (188.8 - 350, n=103, last 2 years) | |
| MSI Pulse GL66 12UEK | |
| Lenovo Legion 5 Pro 16 G7 i7 RTX 3070Ti | |
| MSI Katana GF66 12UGS | |
| MSI Katana GF66 12UGS | |
| Acer Nitro 5 AN515-58-72QR | |
| Schenker XMG Neo 15 (i7-12700H, RTX 3080 Ti) | |
| MSI Crosshair 15 R6E B12UGZ-050 | |
| Asus TUF Dash F15 FX517ZR | |
| MSI Stealth GS66 12UGS | |
| Aorus 15 XE5 | |
| Average Intel Core i7-12700H (113 - 263, n=65) | |
| Schenker XMG Neo 15 (Ryzen 9 6900HX, RTX 3070 Ti) | |
| Geekbench 5.5 / Single-Core | |
| Average of class Gaming (1403 - 2474, n=102, last 2 years) | |
| MSI Pulse GL66 12UEK | |
| MSI Crosshair 15 R6E B12UGZ-050 | |
| Asus TUF Dash F15 FX517ZR | |
| Acer Nitro 5 AN515-58-72QR | |
| MSI Katana GF66 12UGS | |
| Schenker XMG Neo 15 (i7-12700H, RTX 3080 Ti) | |
| Lenovo Legion 5 Pro 16 G7 i7 RTX 3070Ti | |
| Average Intel Core i7-12700H (803 - 1851, n=64) | |
| Aorus 15 XE5 | |
| MSI Stealth GS66 12UGS | |
| Schenker XMG Neo 15 (Ryzen 9 6900HX, RTX 3070 Ti) | |
| HWBOT x265 Benchmark v2.2 / 4k Preset | |
| Average of class Gaming (11.5 - 44.4, n=102, last 2 years) | |
| Lenovo Legion 5 Pro 16 G7 i7 RTX 3070Ti | |
| Schenker XMG Neo 15 (i7-12700H, RTX 3080 Ti) | |
| MSI Stealth GS66 12UGS | |
| MSI Pulse GL66 12UEK | |
| Acer Nitro 5 AN515-58-72QR | |
| MSI Crosshair 15 R6E B12UGZ-050 | |
| Schenker XMG Neo 15 (Ryzen 9 6900HX, RTX 3070 Ti) | |
| Asus TUF Dash F15 FX517ZR | |
| Average Intel Core i7-12700H (4.67 - 21.8, n=64) | |
| Aorus 15 XE5 | |
| MSI Katana GF66 12UGS | |
| LibreOffice / 20 Documents To PDF | |
| Schenker XMG Neo 15 (Ryzen 9 6900HX, RTX 3070 Ti) | |
| Average of class Gaming (33.2 - 88.8, n=102, last 2 years) | |
| Schenker XMG Neo 15 (i7-12700H, RTX 3080 Ti) | |
| Average Intel Core i7-12700H (34.2 - 95.3, n=63) | |
| MSI Crosshair 15 R6E B12UGZ-050 | |
| Lenovo Legion 5 Pro 16 G7 i7 RTX 3070Ti | |
| MSI Pulse GL66 12UEK | |
| Acer Nitro 5 AN515-58-72QR | |
| MSI Stealth GS66 12UGS | |
| Asus TUF Dash F15 FX517ZR | |
| Aorus 15 XE5 | |
| MSI Katana GF66 12UGS | |
| R Benchmark 2.5 / Overall mean | |
| Schenker XMG Neo 15 (Ryzen 9 6900HX, RTX 3070 Ti) | |
| Average Intel Core i7-12700H (0.4441 - 1.052, n=63) | |
| Aorus 15 XE5 | |
| Asus TUF Dash F15 FX517ZR | |
| Schenker XMG Neo 15 (i7-12700H, RTX 3080 Ti) | |
| Acer Nitro 5 AN515-58-72QR | |
| MSI Katana GF66 12UGS | |
| Lenovo Legion 5 Pro 16 G7 i7 RTX 3070Ti | |
| MSI Stealth GS66 12UGS | |
| MSI Crosshair 15 R6E B12UGZ-050 | |
| MSI Pulse GL66 12UEK | |
| Average of class Gaming (0.3439 - 0.59, n=102, last 2 years) | |
* ... smaller is better
AIDA64: FP32 Ray-Trace | FPU Julia | CPU SHA3 | CPU Queen | FPU SinJulia | FPU Mandel | CPU AES | CPU ZLib | FP64 Ray-Trace | CPU PhotoWorxx
查看我们专门的 英特尔酷睿i7-12700H页面,了解更多信息和性能比较。
系统性能
竞争对手的设备能够在PCMark 10得分中超越Crosshair 15 R6E,但差距不大。CrossMark看到Crosshair 15 R6E的性能有很大的提高。
AIDA64测试显示,Crosshair 15 R6E落后于其他采用Core i7-12700H的笔记本电脑。在日常生产力任务或网络浏览方面,我们没有遇到任何特别的性能问题。
CrossMark: Overall | Productivity | Creativity | Responsiveness
| PCMark 10 / Score | |
| Average of class Gaming (5828 - 12414, n=93, last 2 years) | |
| Aorus 15 XE5 | |
| MSI Stealth GS66 12UGS | |
| Schenker XMG Neo 15 (i7-12700H, RTX 3080 Ti) | |
| Lenovo Legion 5 Pro 16 G7 i7 RTX 3070Ti | |
| MSI Katana GF66 12UGS | |
| Average Intel Core i7-12700H, NVIDIA GeForce RTX 3070 Laptop GPU (7082 - 7647, n=2) | |
| Schenker XMG Neo 15 (Ryzen 9 6900HX, RTX 3070 Ti) | |
| MSI Pulse GL66 12UEK | |
| MSI Crosshair 15 R6E B12UGZ-050 | |
| Acer Nitro 5 AN515-58-72QR | |
| Asus TUF Dash F15 FX517ZR | |
| PCMark 10 / Essentials | |
| MSI Stealth GS66 12UGS | |
| Aorus 15 XE5 | |
| Average of class Gaming (8810 - 11935, n=97, last 2 years) | |
| Schenker XMG Neo 15 (i7-12700H, RTX 3080 Ti) | |
| Average Intel Core i7-12700H, NVIDIA GeForce RTX 3070 Laptop GPU (10076 - 10926, n=2) | |
| Schenker XMG Neo 15 (Ryzen 9 6900HX, RTX 3070 Ti) | |
| MSI Pulse GL66 12UEK | |
| MSI Katana GF66 12UGS | |
| MSI Crosshair 15 R6E B12UGZ-050 | |
| Asus TUF Dash F15 FX517ZR | |
| Lenovo Legion 5 Pro 16 G7 i7 RTX 3070Ti | |
| Acer Nitro 5 AN515-58-72QR | |
| PCMark 10 / Productivity | |
| Average of class Gaming (6845 - 25323, n=95, last 2 years) | |
| Aorus 15 XE5 | |
| MSI Katana GF66 12UGS | |
| Lenovo Legion 5 Pro 16 G7 i7 RTX 3070Ti | |
| MSI Pulse GL66 12UEK | |
| Average Intel Core i7-12700H, NVIDIA GeForce RTX 3070 Laptop GPU (9460 - 9877, n=2) | |
| Schenker XMG Neo 15 (Ryzen 9 6900HX, RTX 3070 Ti) | |
| Asus TUF Dash F15 FX517ZR | |
| MSI Stealth GS66 12UGS | |
| MSI Crosshair 15 R6E B12UGZ-050 | |
| Schenker XMG Neo 15 (i7-12700H, RTX 3080 Ti) | |
| Acer Nitro 5 AN515-58-72QR | |
| PCMark 10 / Digital Content Creation | |
| Average of class Gaming (7602 - 19954, n=95, last 2 years) | |
| Schenker XMG Neo 15 (i7-12700H, RTX 3080 Ti) | |
| Lenovo Legion 5 Pro 16 G7 i7 RTX 3070Ti | |
| MSI Stealth GS66 12UGS | |
| Aorus 15 XE5 | |
| MSI Katana GF66 12UGS | |
| Average Intel Core i7-12700H, NVIDIA GeForce RTX 3070 Laptop GPU (10113 - 11245, n=2) | |
| Acer Nitro 5 AN515-58-72QR | |
| MSI Crosshair 15 R6E B12UGZ-050 | |
| Schenker XMG Neo 15 (Ryzen 9 6900HX, RTX 3070 Ti) | |
| MSI Pulse GL66 12UEK | |
| Asus TUF Dash F15 FX517ZR | |
| CrossMark / Overall | |
| MSI Pulse GL66 12UEK | |
| MSI Crosshair 15 R6E B12UGZ-050 | |
| Average of class Gaming (1366 - 2409, n=94, last 2 years) | |
| Lenovo Legion 5 Pro 16 G7 i7 RTX 3070Ti | |
| Aorus 15 XE5 | |
| MSI Katana GF66 12UGS | |
| Average Intel Core i7-12700H, NVIDIA GeForce RTX 3070 Laptop GPU (1844 - 2003, n=2) | |
| Asus TUF Dash F15 FX517ZR | |
| Schenker XMG Neo 15 (i7-12700H, RTX 3080 Ti) | |
| Acer Nitro 5 AN515-58-72QR | |
| Schenker XMG Neo 15 (Ryzen 9 6900HX, RTX 3070 Ti) | |
| CrossMark / Productivity | |
| MSI Pulse GL66 12UEK | |
| MSI Crosshair 15 R6E B12UGZ-050 | |
| MSI Katana GF66 12UGS | |
| Aorus 15 XE5 | |
| Average Intel Core i7-12700H, NVIDIA GeForce RTX 3070 Laptop GPU (1785 - 1971, n=2) | |
| Lenovo Legion 5 Pro 16 G7 i7 RTX 3070Ti | |
| Average of class Gaming (1386 - 2254, n=94, last 2 years) | |
| Acer Nitro 5 AN515-58-72QR | |
| Asus TUF Dash F15 FX517ZR | |
| Schenker XMG Neo 15 (i7-12700H, RTX 3080 Ti) | |
| Schenker XMG Neo 15 (Ryzen 9 6900HX, RTX 3070 Ti) | |
| CrossMark / Creativity | |
| Average of class Gaming (1343 - 2786, n=94, last 2 years) | |
| MSI Pulse GL66 12UEK | |
| Lenovo Legion 5 Pro 16 G7 i7 RTX 3070Ti | |
| Schenker XMG Neo 15 (i7-12700H, RTX 3080 Ti) | |
| Asus TUF Dash F15 FX517ZR | |
| Aorus 15 XE5 | |
| MSI Crosshair 15 R6E B12UGZ-050 | |
| Average Intel Core i7-12700H, NVIDIA GeForce RTX 3070 Laptop GPU (1912 - 1979, n=2) | |
| MSI Katana GF66 12UGS | |
| Acer Nitro 5 AN515-58-72QR | |
| Schenker XMG Neo 15 (Ryzen 9 6900HX, RTX 3070 Ti) | |
| CrossMark / Responsiveness | |
| MSI Pulse GL66 12UEK | |
| MSI Crosshair 15 R6E B12UGZ-050 | |
| MSI Katana GF66 12UGS | |
| Aorus 15 XE5 | |
| Average Intel Core i7-12700H, NVIDIA GeForce RTX 3070 Laptop GPU (1824 - 2182, n=2) | |
| Lenovo Legion 5 Pro 16 G7 i7 RTX 3070Ti | |
| Average of class Gaming (1226 - 2334, n=94, last 2 years) | |
| Acer Nitro 5 AN515-58-72QR | |
| Asus TUF Dash F15 FX517ZR | |
| Schenker XMG Neo 15 (i7-12700H, RTX 3080 Ti) | |
| Schenker XMG Neo 15 (Ryzen 9 6900HX, RTX 3070 Ti) | |
| PCMark 8 Home Score Accelerated v2 | 6083 points | |
| PCMark 8 Creative Score Accelerated v2 | 9960 points | |
| PCMark 8 Work Score Accelerated v2 | 6346 points | |
| PCMark 10 Score | 7082 points | |
Help | ||
| AIDA64 / Memory Latency | |
| Average of class Gaming (75.3 - 165.4, n=102, last 2 years) | |
| Lenovo Legion 5 Pro 16 G7 i7 RTX 3070Ti | |
| MSI Katana GF66 12UGS | |
| Asus TUF Dash F15 FX517ZR | |
| Aorus 15 XE5 | |
| MSI Stealth GS66 12UGS | |
| MSI Crosshair 15 R6E B12UGZ-050 | |
| MSI Pulse GL66 12UEK | |
| Schenker XMG Neo 15 (Ryzen 9 6900HX, RTX 3070 Ti) | |
| Average Intel Core i7-12700H (76.2 - 133.9, n=62) | |
| Acer Nitro 5 AN515-58-72QR | |
| Acer Nitro 5 AN515-58-72QR | |
* ... smaller is better
DPC延时
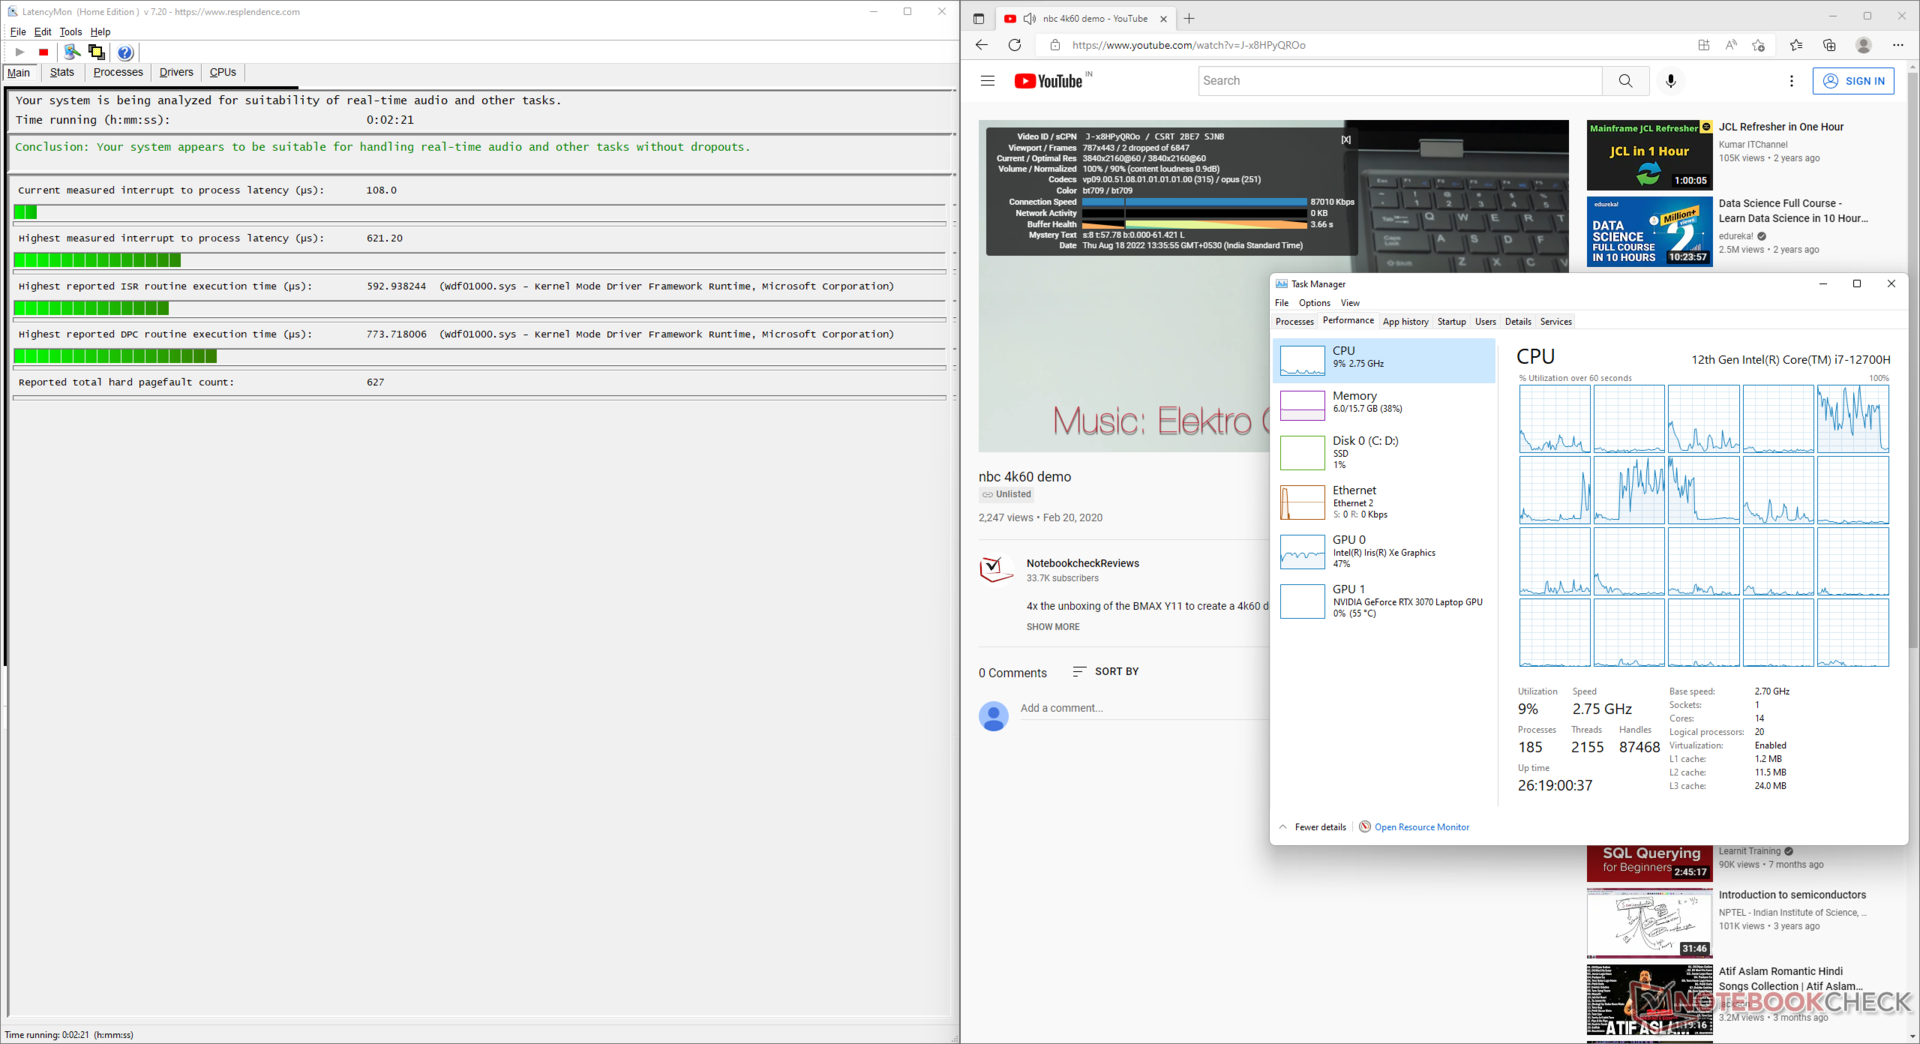
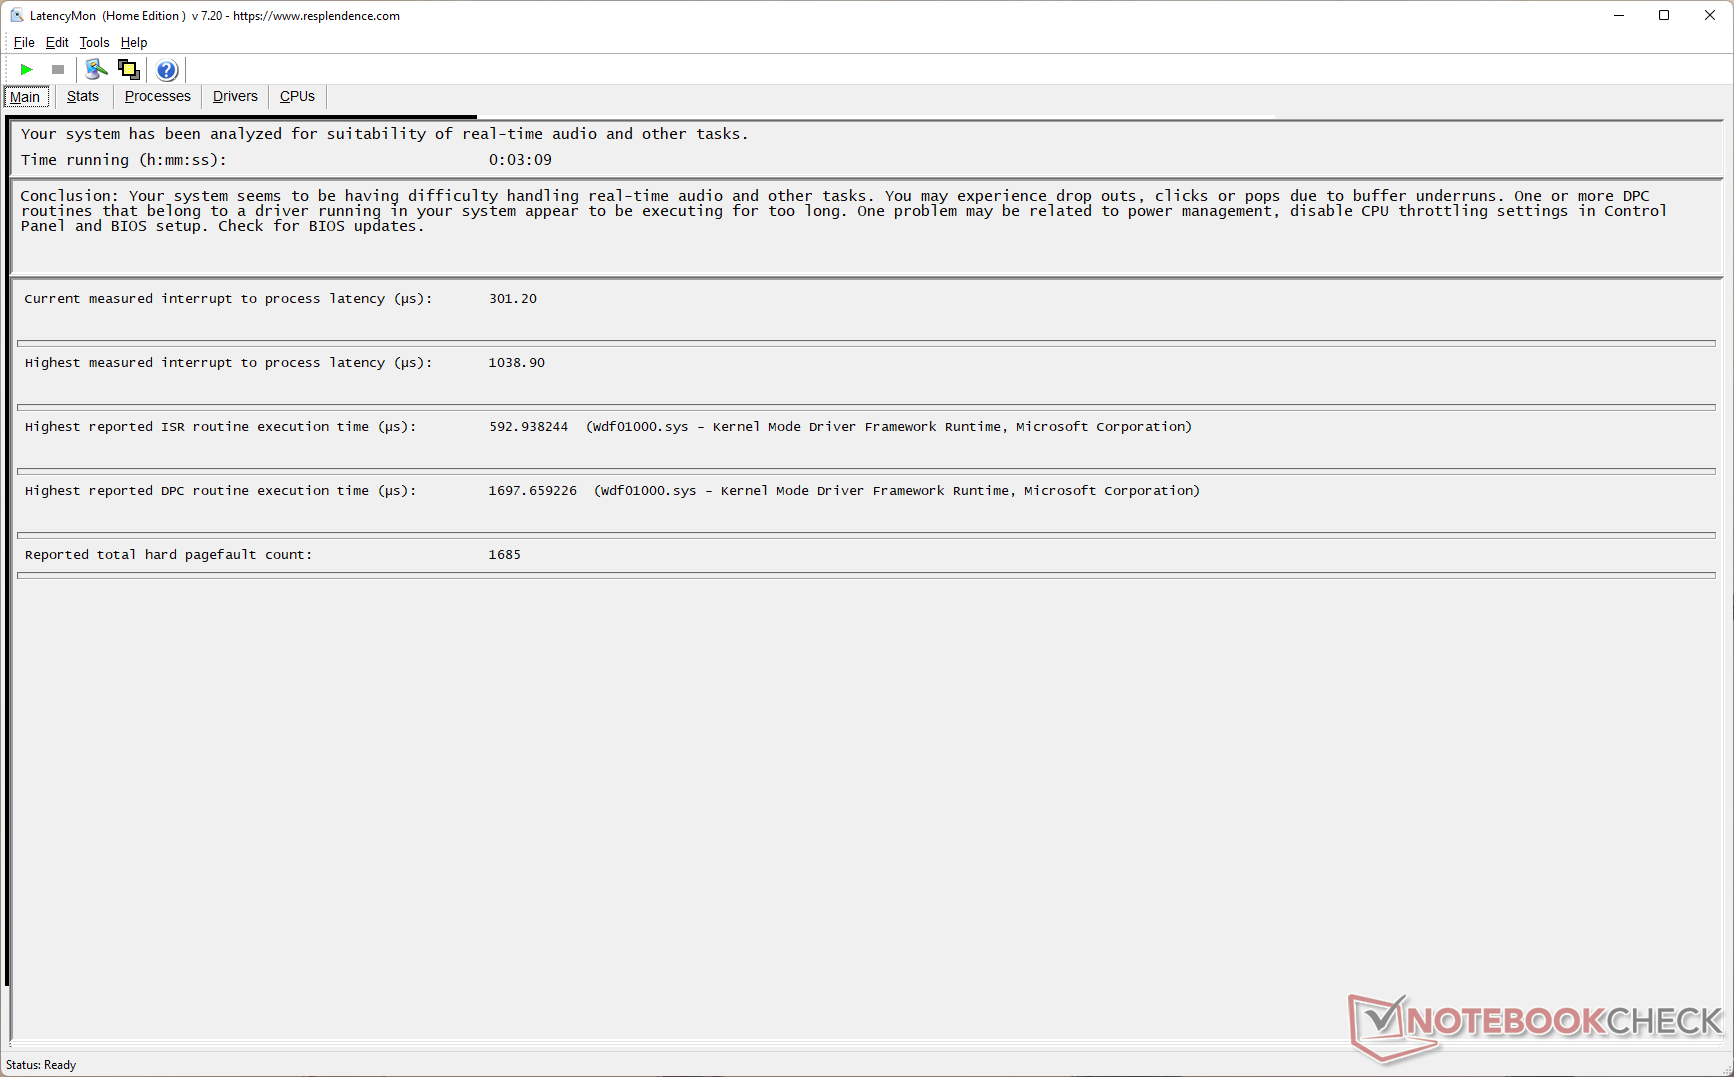
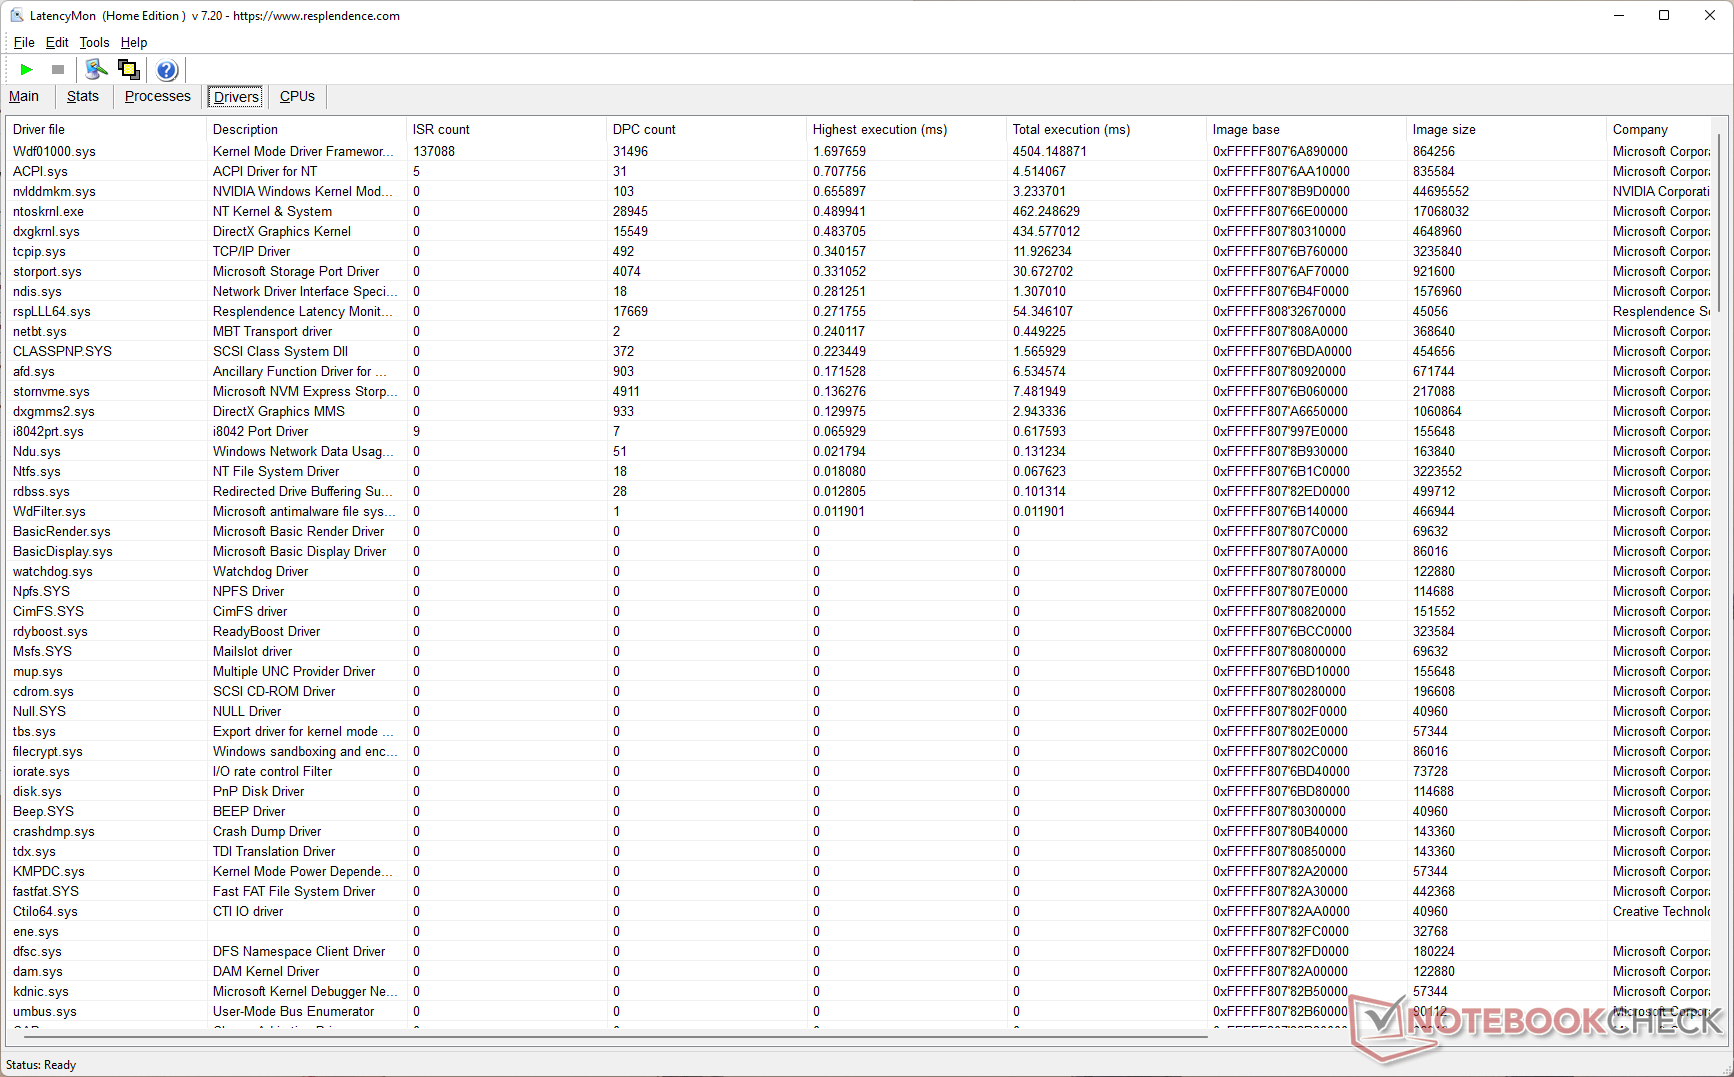
我们的标准化LatencyMon测试发现,Crosshair 15 R6E的DPC延迟比其他搭载Core i7-12700H的笔记本电脑要高一些。在我们的YouTube基准测试之后,我们观察到在运行Prime95原地大型FFTs测试之后,延迟增加。
Windows内核模式驱动框架似乎是延迟值增加的原因。
| DPC Latencies / LatencyMon - interrupt to process latency (max), Web, Youtube, Prime95 | |
| Schenker XMG Neo 15 (i7-12700H, RTX 3080 Ti) | |
| MSI Stealth GS66 12UGS | |
| Schenker XMG Neo 15 (Ryzen 9 6900HX, RTX 3070 Ti) | |
| Aorus 15 XE5 | |
| MSI Crosshair 15 R6E B12UGZ-050 | |
| MSI Pulse GL66 12UEK | |
| Acer Nitro 5 AN515-58-72QR | |
| Lenovo Legion 5 Pro 16 G7 i7 RTX 3070Ti | |
| MSI Katana GF66 12UGS | |
| Asus TUF Dash F15 FX517ZR | |
* ... smaller is better
更多被评测设备的延迟比较可以在我们的 DPC延时排名页面。
存储设备
美光2450 1 TB NVMe PCIe固态硬盘并没有打破任何速度记录。Crosshair 15 R6E的两个NVMe M.2插槽和美光驱动器本身支持PCIe Gen 4,但性能更符合PCIe Gen 3的速度。也就是说,该硬盘在大多数情况下能够接近其额定的I/O规格。
在我们的DiskSpd读取循环测试中,该硬盘在队列深度为8时没有表现出节流。 没有添加2.5英寸SATA存储扩展的范围。

* ... smaller is better
Disk Throttling: DiskSpd Read Loop, Queue Depth 8
GPU性能
我们的Crosshair 15 R6E测试装置使用140 W RTX 3070笔记本电脑GPU,配备8 GB GDDR6 VRAM。微星并没有为这个GPU指定确切的动态提升。
3DMark性能落后于一些 RTX 3070 Ti-驱动的笔记本电脑,但差距不大。Crosshair 15 R6E落后于 RTX 3080 Ti-驱动的XMG Neo 15在3DMarkFire Strike Graphics和Time Spy Graphics测试中分别落后11%和13%。
华硕 华硕TUF Dash F15由于105W的TGP较低,采用相同GPU的华硕TUF Dash F15比Crosshair 15 R6E中的GPU慢19%。
| 3DMark 11 Performance | 30240 points | |
| 3DMark Ice Storm Standard Score | 158460 points | |
| 3DMark Cloud Gate Standard Score | 56797 points | |
| 3DMark Fire Strike Score | 24233 points | |
| 3DMark Fire Strike Extreme Score | 12959 points | |
| 3DMark Time Spy Score | 10496 points | |
Help | ||
与RTX 3070 Laptop GPU记录的平均时间相比,Crosshair 15 R6E在Blender Classroom Optix和Classroom CUDA中花费的时间分别少了42%和33%。
| Blender / v3.3 Classroom OPTIX/RTX | |
| Asus TUF Dash F15 FX517ZR | |
| Average NVIDIA GeForce RTX 3070 Laptop GPU (26 - 30, n=8) | |
| MSI Crosshair 15 R6E B12UGZ-050 | |
| Aorus 15 XE5 | |
| Schenker XMG Neo 15 (Ryzen 9 6900HX, RTX 3070 Ti) | |
| Average of class Gaming (9 - 32, n=103, last 2 years) | |
| Blender / v3.3 Classroom CUDA | |
| Asus TUF Dash F15 FX517ZR | |
| Average NVIDIA GeForce RTX 3070 Laptop GPU (43 - 51, n=9) | |
| MSI Crosshair 15 R6E B12UGZ-050 | |
| Aorus 15 XE5 | |
| Schenker XMG Neo 15 (Ryzen 9 6900HX, RTX 3070 Ti) | |
| Average of class Gaming (15 - 228, n=103, last 2 years) | |
| Blender / v3.3 Classroom CPU | |
| Average NVIDIA GeForce RTX 3070 Laptop GPU (329 - 698, n=12) | |
| Asus TUF Dash F15 FX517ZR | |
| Aorus 15 XE5 | |
| MSI Crosshair 15 R6E B12UGZ-050 | |
| Schenker XMG Neo 15 (Ryzen 9 6900HX, RTX 3070 Ti) | |
| Average of class Gaming (122 - 565, n=99, last 2 years) | |
* ... smaller is better
游戏性能
在1080p Ultra设置下的测试游戏中,游戏性能仅比搭载RTX 3080 Ti的XMG Neo 15落后约8%。配备RTX 3070 Ti的联想Legion 5i Pro 16 G7在大多数游戏中显示出可感知的领先优势,特别是在QHD Ultra下。
搭载RTX 3080 Ti的XMG Neo 15在Far Cry 5QHD Ultra中可以达到17%,但这个差距在以下情况下增加到45%: 在Witcher 3在1080p高的情况下。在《彩虹六号》中。提取》中,Crosshair 15 R6E在1080p和QHD Ultra设置中比配备RTX 3070 Ti笔记本GPU的Stealth GS66显示出良好的领先优势。
| F1 2021 | |
| 1920x1080 High Preset AA:T AF:16x | |
| Lenovo Legion 5 Pro 16 G7 i7 RTX 3070Ti | |
| MSI Stealth GS66 12UGS | |
| MSI Crosshair 15 R6E B12UGZ-050 | |
| Average NVIDIA GeForce RTX 3070 Laptop GPU (66.1 - 256, n=16) | |
| Asus TUF Dash F15 FX517ZR | |
| Acer Nitro 5 AN515-58-72QR | |
| 1920x1080 Ultra High Preset + Raytracing AA:T AF:16x | |
| Lenovo Legion 5 Pro 16 G7 i7 RTX 3070Ti | |
| MSI Crosshair 15 R6E B12UGZ-050 | |
| MSI Stealth GS66 12UGS | |
| Acer Nitro 5 AN515-58-72QR | |
| Average NVIDIA GeForce RTX 3070 Laptop GPU (33.1 - 123.1, n=23) | |
| Asus TUF Dash F15 FX517ZR | |
| 2560x1440 Ultra High Preset + Raytracing AA:T AF:16x | |
| Lenovo Legion 5 Pro 16 G7 i7 RTX 3070Ti | |
| MSI Crosshair 15 R6E B12UGZ-050 | |
| Average NVIDIA GeForce RTX 3070 Laptop GPU (67.1 - 90.2, n=11) | |
| Acer Nitro 5 AN515-58-72QR | |
| MSI Stealth GS66 12UGS | |
| Asus TUF Dash F15 FX517ZR | |
| Rainbow Six Extraction | |
| 1920x1080 High Preset (with Fixed Resolution Quality) | |
| Average NVIDIA GeForce RTX 3070 Laptop GPU (171 - 202, n=4) | |
| MSI Stealth GS66 12UGS | |
| MSI Crosshair 15 R6E B12UGZ-050 | |
| 1920x1080 Ultra Preset (with Fixed Resolution Quality) | |
| MSI Crosshair 15 R6E B12UGZ-050 | |
| Average NVIDIA GeForce RTX 3070 Laptop GPU (149 - 157, n=4) | |
| MSI Stealth GS66 12UGS | |
| 2560x1440 Ultra Preset (with Fixed Resolution Quality) | |
| MSI Crosshair 15 R6E B12UGZ-050 | |
| Average NVIDIA GeForce RTX 3070 Laptop GPU (97 - 103, n=3) | |
| MSI Stealth GS66 12UGS | |
Witcher 3 FPS图表
RTX 3070笔记本GPU在1080p Ultra下的《Witcher 3》中显示出良好的持续性能,角色在测试过程中保持静止状态。我们确实看到了帧率的波动,但它们不是很剧烈。
| low | med. | high | ultra | QHD | 4K | |
|---|---|---|---|---|---|---|
| GTA V (2015) | 184.2 | 182 | 173.8 | 113.7 | 97.1 | |
| The Witcher 3 (2015) | 368 | 294 | 168 | 105.7 | ||
| Dota 2 Reborn (2015) | 177.7 | 161.4 | 150.4 | 142.7 | 127.2 | |
| Final Fantasy XV Benchmark (2018) | 166.6 | 127.5 | 98 | 79 | 46.9 | |
| X-Plane 11.11 (2018) | 150.1 | 133.1 | 106.3 | 98.7 | ||
| Far Cry 5 (2018) | 137 | 125 | 122 | 118 | 99 | |
| Strange Brigade (2018) | 444 | 251 | 211 | 185.5 | 140.5 | |
| F1 2021 (2021) | 319 | 228 | 192.6 | 115.4 | 86.3 | |
| Rainbow Six Extraction (2022) | 225 | 189 | 171 | 155 | 103 | |
| Cyberpunk 2077 1.6 (2022) | 123 | 111.6 | 90.8 | 76.9 | 49.5 |
查看我们专门的 NvidiaGeForce RTX 3070 笔记本电脑GPU页面了解更多信息和性能比较。
排放物。在平衡状态下可容忍的噪音水平
系统噪音
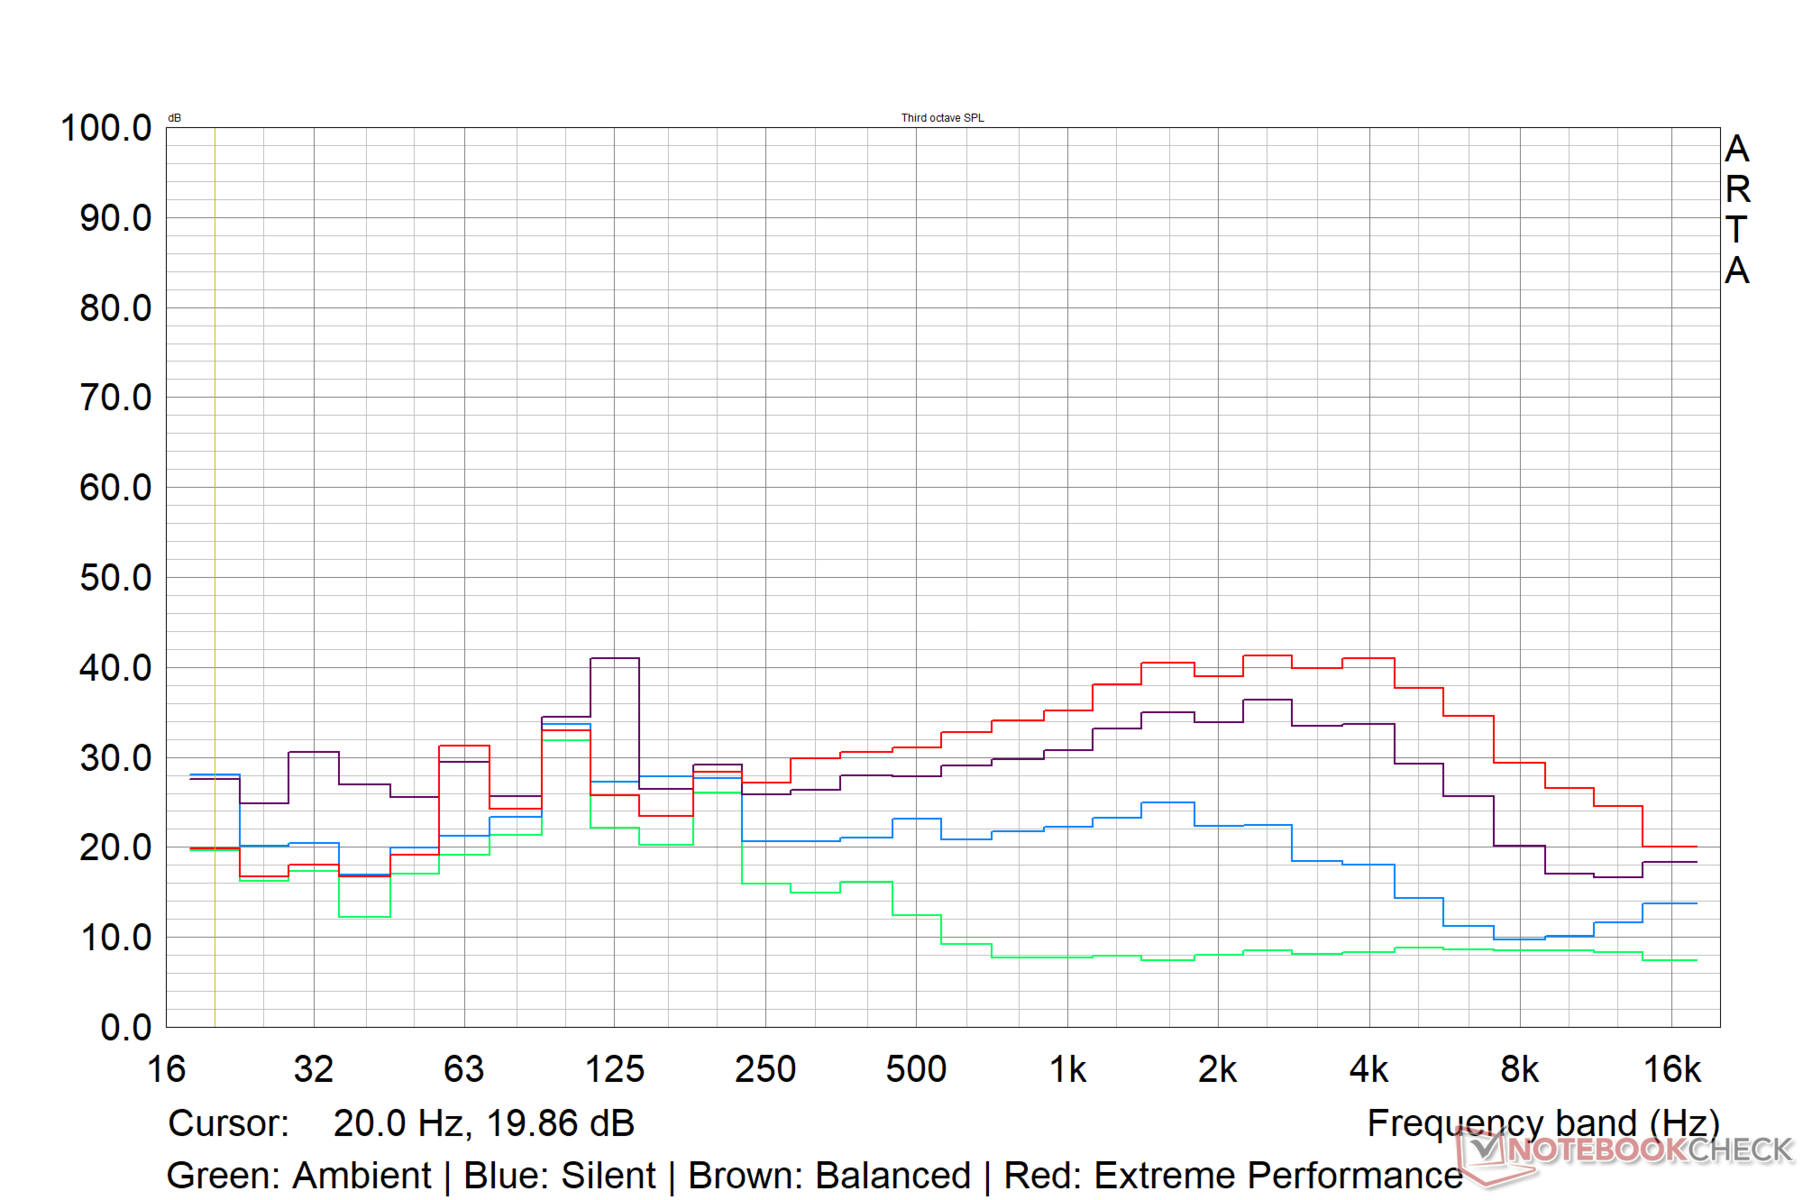
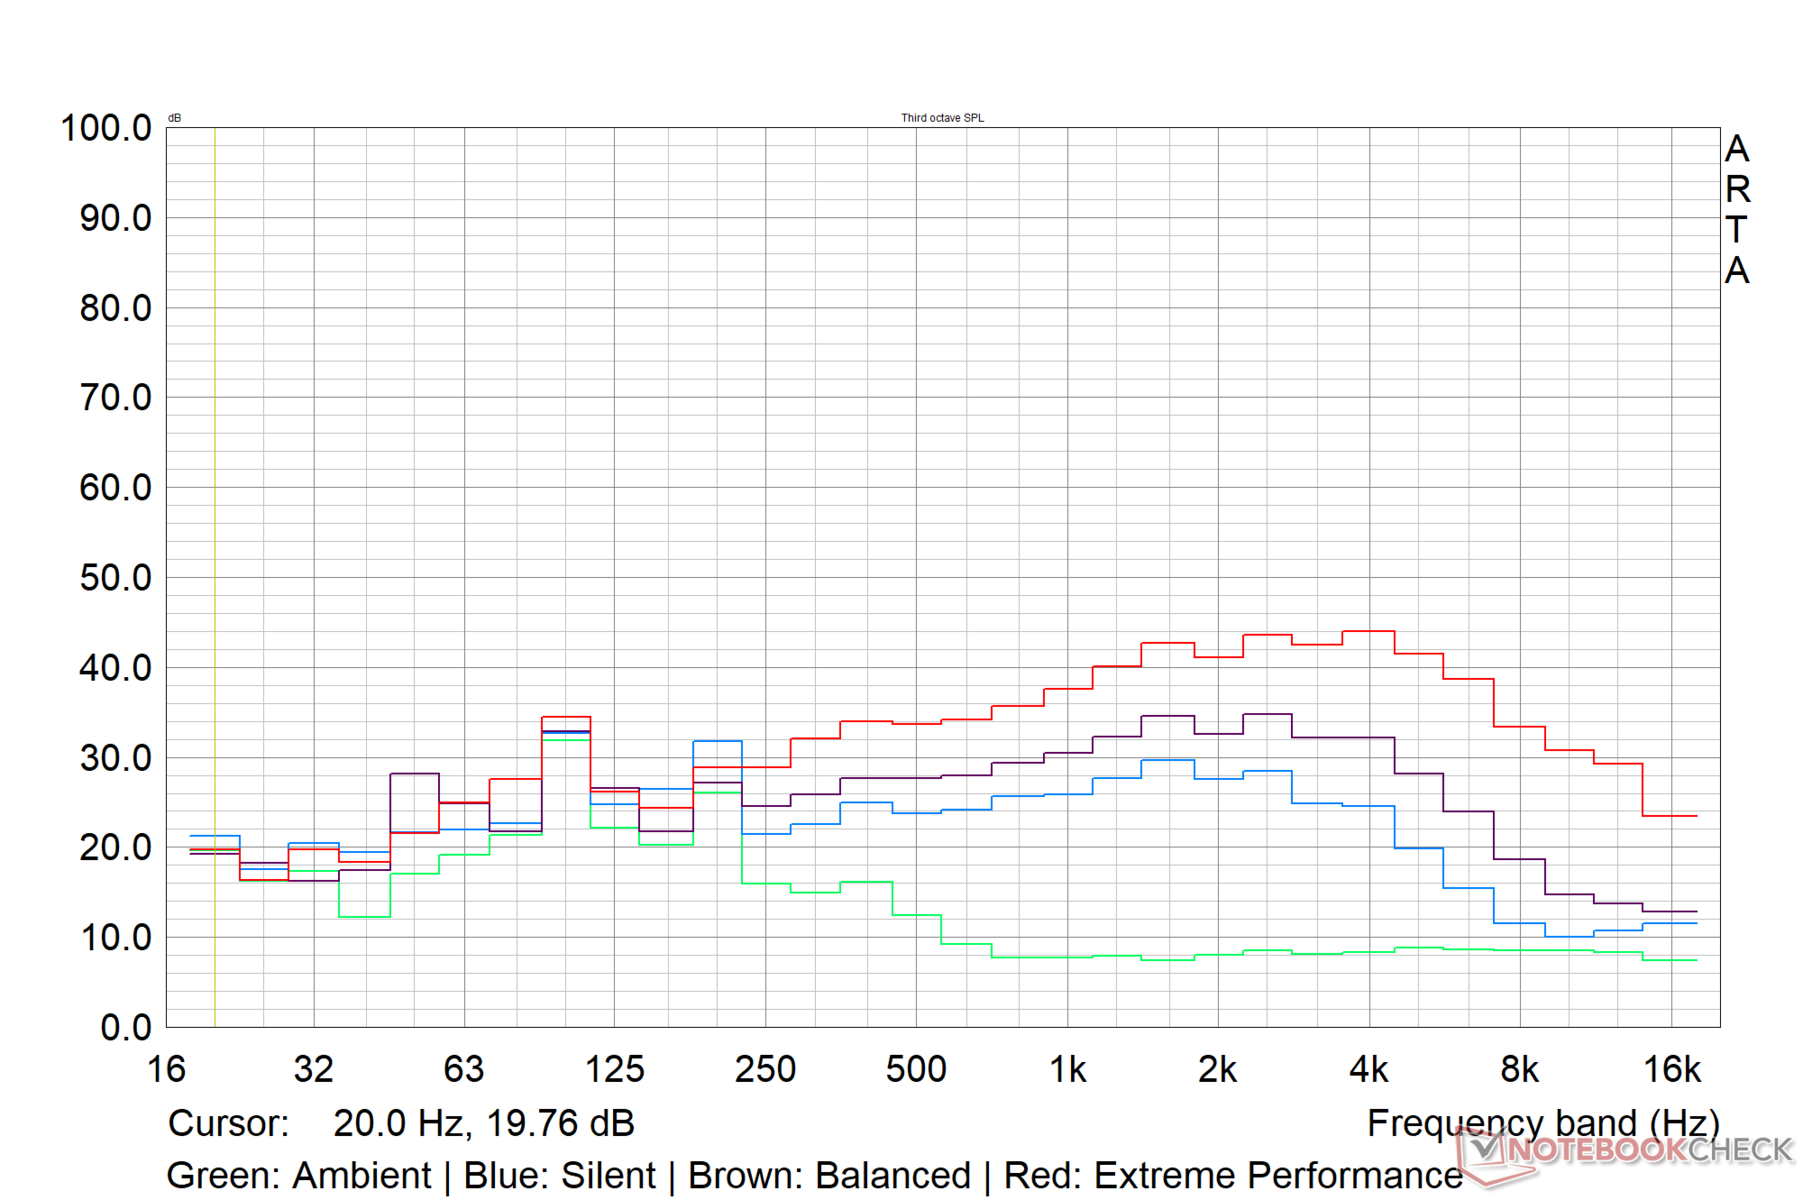
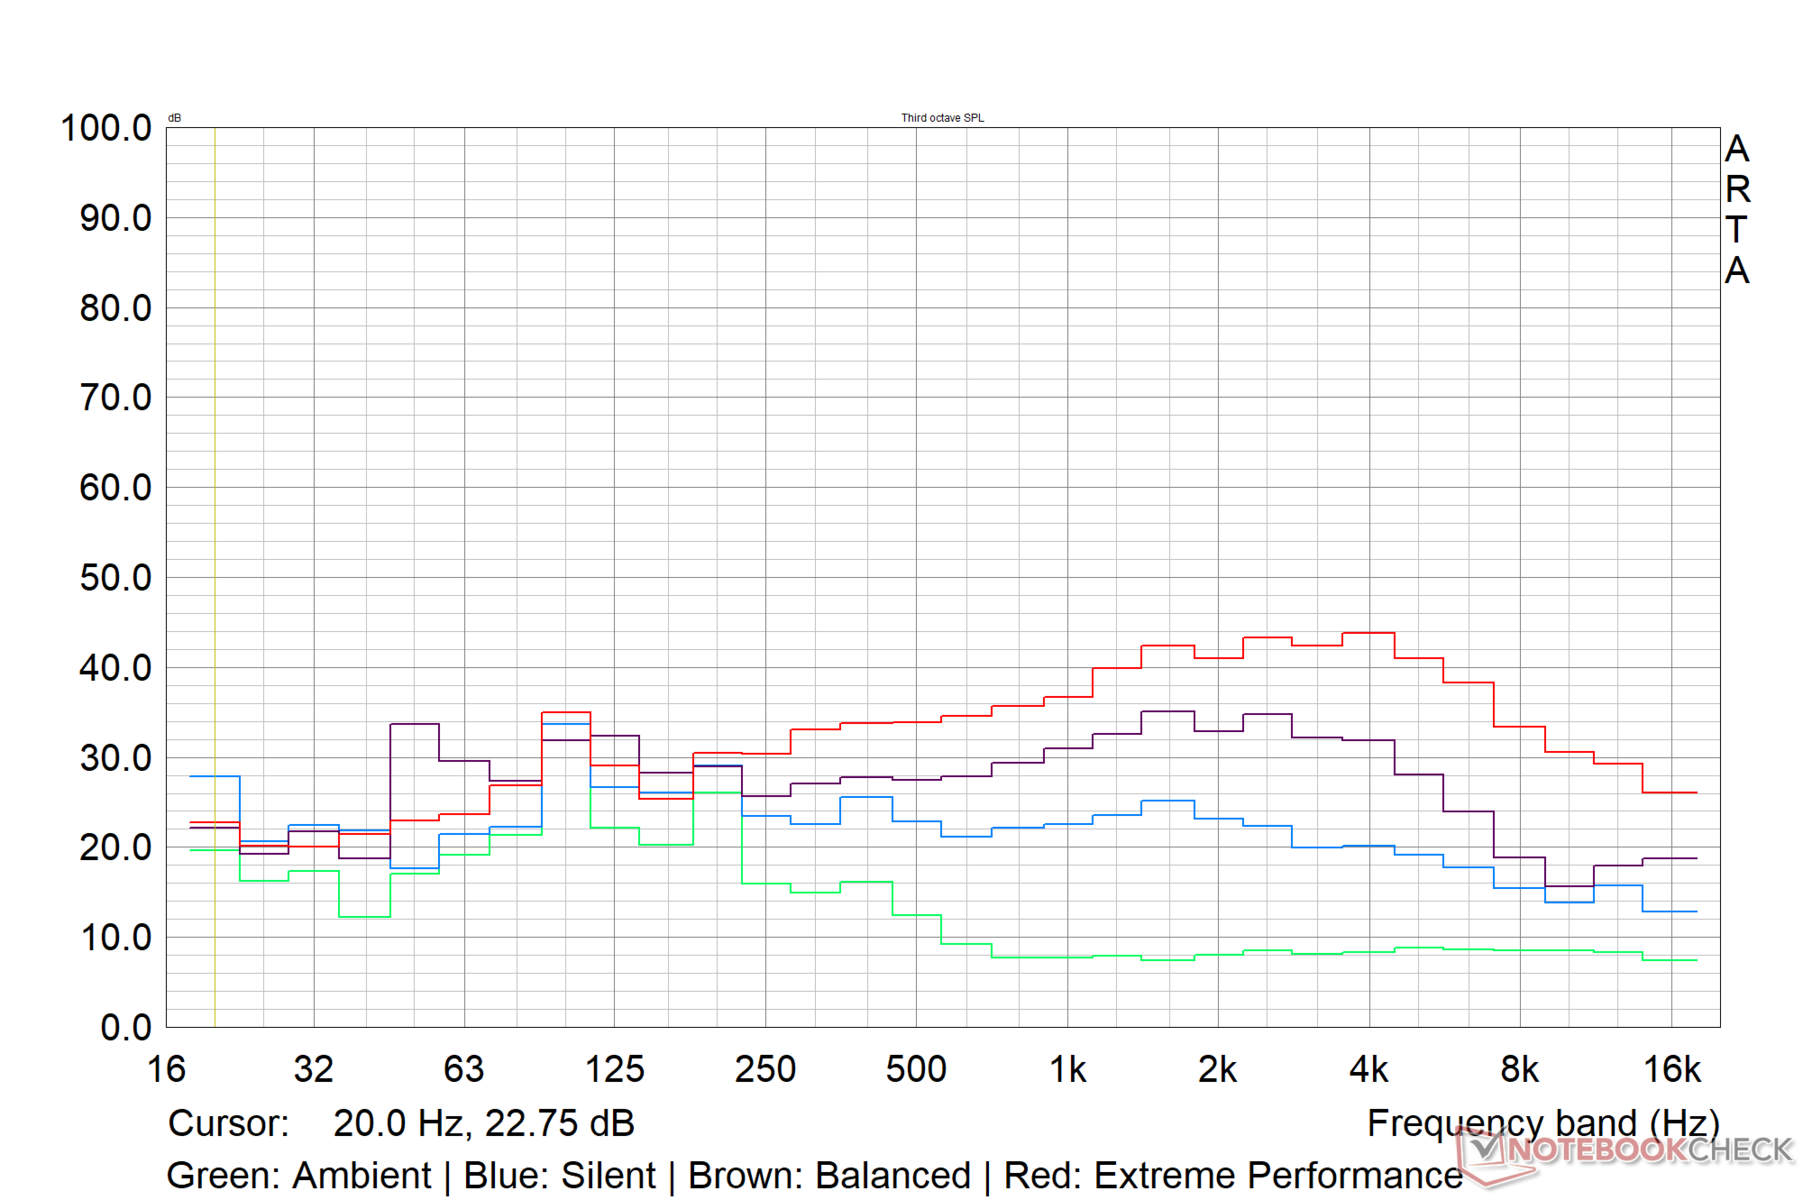
在默认的平衡设置下,即使在负载下,风扇的噪音也是相当可以忍受的。微星似乎已经将Crosshair 15 R6E在这种模式下的最大风扇噪音控制在45分贝(A)左右。
在极限性能设置中,声压级(SPL)增加到52 dB(A)。在静音模式下,声压级被限制在40 dB(A)以下。
| 性能设置 | 空闲分贝(A) | 负载平均分贝(A) | 负载最大分贝(A) | Witcher 3 分贝(A) |
|---|---|---|---|---|
| 静音 | 25.98 | 33.09 | 37.69 | 34 |
| 平衡 | 26.14 | 44.33 | 43.20 | 43.34 |
| 极端性能 | 26.14 | 50.07 | 52.66 | 52.43 |
Noise level
| Idle |
| 26.14 / 26.14 / 26.14 dB(A) |
| Load |
| 44.33 / 43.2 dB(A) |
 | ||
30 dB silent 40 dB(A) audible 50 dB(A) loud |
||
min: | ||
| MSI Crosshair 15 R6E B12UGZ-050 Intel Core i7-12700H, NVIDIA GeForce RTX 3070 Laptop GPU | MSI Stealth GS66 12UGS Intel Core i7-12700H, NVIDIA GeForce RTX 3070 Ti Laptop GPU | Lenovo Legion 5 Pro 16 G7 i7 RTX 3070Ti Intel Core i7-12700H, NVIDIA GeForce RTX 3070 Ti Laptop GPU | Asus TUF Dash F15 FX517ZR Intel Core i7-12650H, NVIDIA GeForce RTX 3070 Laptop GPU | Schenker XMG Neo 15 (Ryzen 9 6900HX, RTX 3070 Ti) AMD Ryzen 9 6900HX, NVIDIA GeForce RTX 3070 Ti Laptop GPU | |
|---|---|---|---|---|---|
| Noise | -14% | -12% | -13% | -7% | |
| off / environment * (dB) | 22.82 | 24 -5% | 24.6 -8% | 26 -14% | 23 -1% |
| Idle Minimum * (dB) | 26.14 | 31 -19% | 28.4 -9% | 26 1% | 23 12% |
| Idle Average * (dB) | 26.14 | 32 -22% | 28.4 -9% | 32 -22% | 25.82 1% |
| Idle Maximum * (dB) | 26.14 | 35 -34% | 28.4 -9% | 33 -26% | 27.3 -4% |
| Load Average * (dB) | 44.33 | 48 -8% | 49.4 -11% | 48 -8% | 42.7 4% |
| Witcher 3 ultra * (dB) | 43.3 | 43 1% | 49.4 -14% | 47 -9% | 56 -29% |
| Load Maximum * (dB) | 43.2 | 48 -11% | 54.7 -27% | 49 -13% | 56 -30% |
* ... smaller is better
温度
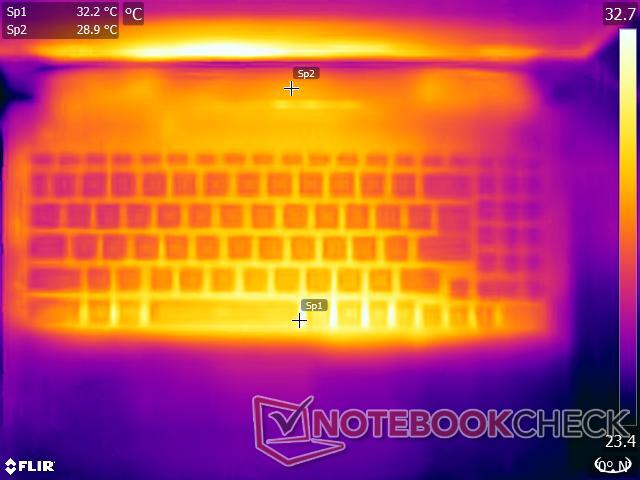
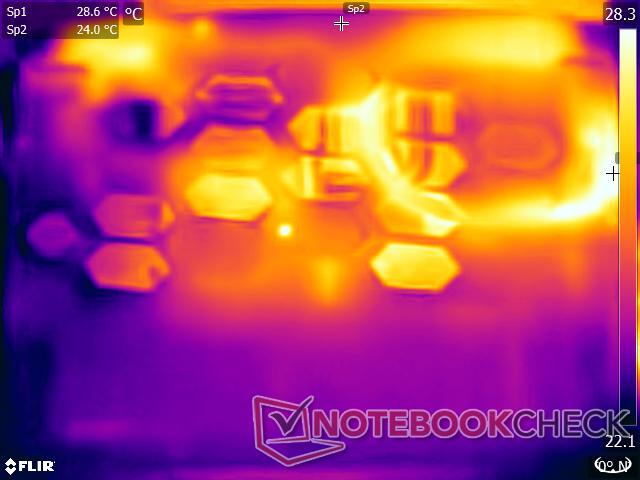
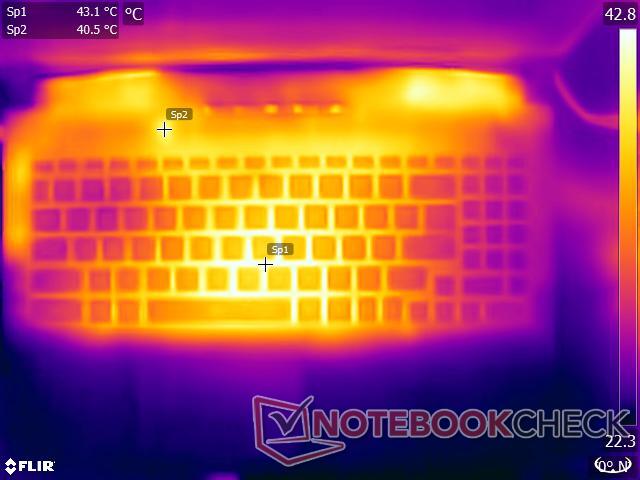
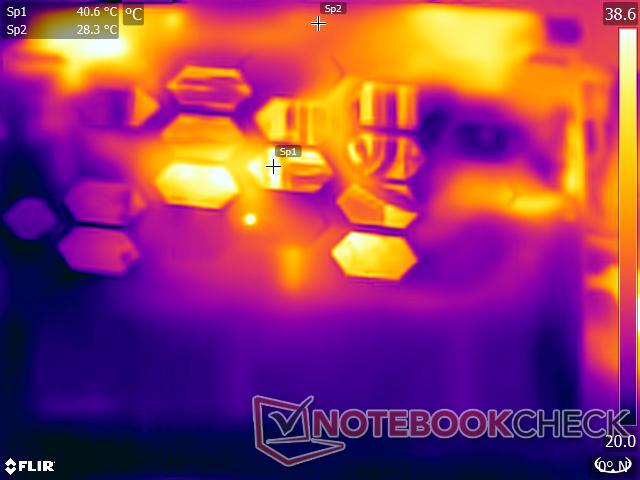
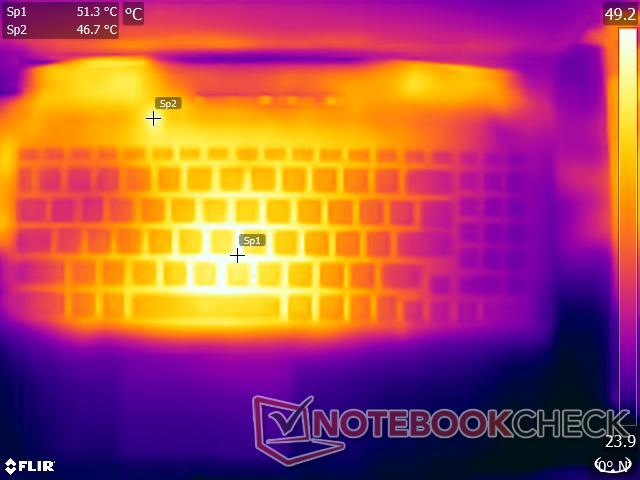
在大多数不把CPU和GPU推到极限的生产力任务中,表面温度是可以容忍的。在Prime95和FurMark的综合负载下,我们在设备的两边记录了高达48℃的表面温度。当在1080p Ultra条件下使用TheWitcher 3时,这一温度增加到近55℃。
在整个测试过程中,触摸板和掌托区域保持相对凉爽。
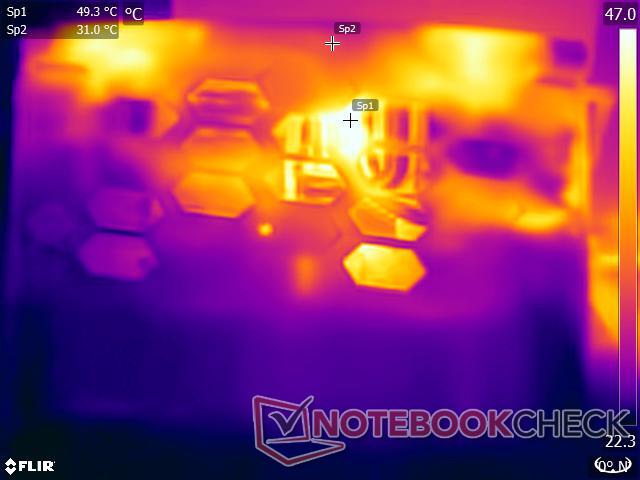
(-) The maximum temperature on the upper side is 48.4 °C / 119 F, compared to the average of 40.4 °C / 105 F, ranging from 21.2 to 68.8 °C for the class Gaming.
(-) The bottom heats up to a maximum of 48.2 °C / 119 F, compared to the average of 43.2 °C / 110 F
(+) In idle usage, the average temperature for the upper side is 30.6 °C / 87 F, compared to the device average of 33.9 °C / 93 F.
(-) Playing The Witcher 3, the average temperature for the upper side is 43.5 °C / 110 F, compared to the device average of 33.9 °C / 93 F.
(+) The palmrests and touchpad are reaching skin temperature as a maximum (32.8 °C / 91 F) and are therefore not hot.
(-) The average temperature of the palmrest area of similar devices was 28.8 °C / 83.8 F (-4 °C / -7.2 F).
尽管我们的压力测试代表了极端情况,但如果你想在膝上使用设备,我们建议选择静音或平衡性能模式。
| MSI Crosshair 15 R6E B12UGZ-050 Intel Core i7-12700H, NVIDIA GeForce RTX 3070 Laptop GPU | MSI Stealth GS66 12UGS Intel Core i7-12700H, NVIDIA GeForce RTX 3070 Ti Laptop GPU | Lenovo Legion 5 Pro 16 G7 i7 RTX 3070Ti Intel Core i7-12700H, NVIDIA GeForce RTX 3070 Ti Laptop GPU | Asus TUF Dash F15 FX517ZR Intel Core i7-12650H, NVIDIA GeForce RTX 3070 Laptop GPU | Schenker XMG Neo 15 (Ryzen 9 6900HX, RTX 3070 Ti) AMD Ryzen 9 6900HX, NVIDIA GeForce RTX 3070 Ti Laptop GPU | |
|---|---|---|---|---|---|
| Heat | 2% | -1% | -6% | 6% | |
| Maximum Upper Side * (°C) | 48.4 | 54 -12% | 45.3 6% | 52 -7% | 41 15% |
| Maximum Bottom * (°C) | 48.2 | 59 -22% | 61.2 -27% | 52 -8% | 57 -18% |
| Idle Upper Side * (°C) | 34 | 26 24% | 28.6 16% | 33 3% | 28 18% |
| Idle Bottom * (°C) | 32.4 | 27 17% | 31.4 3% | 36 -11% | 30 7% |
* ... smaller is better
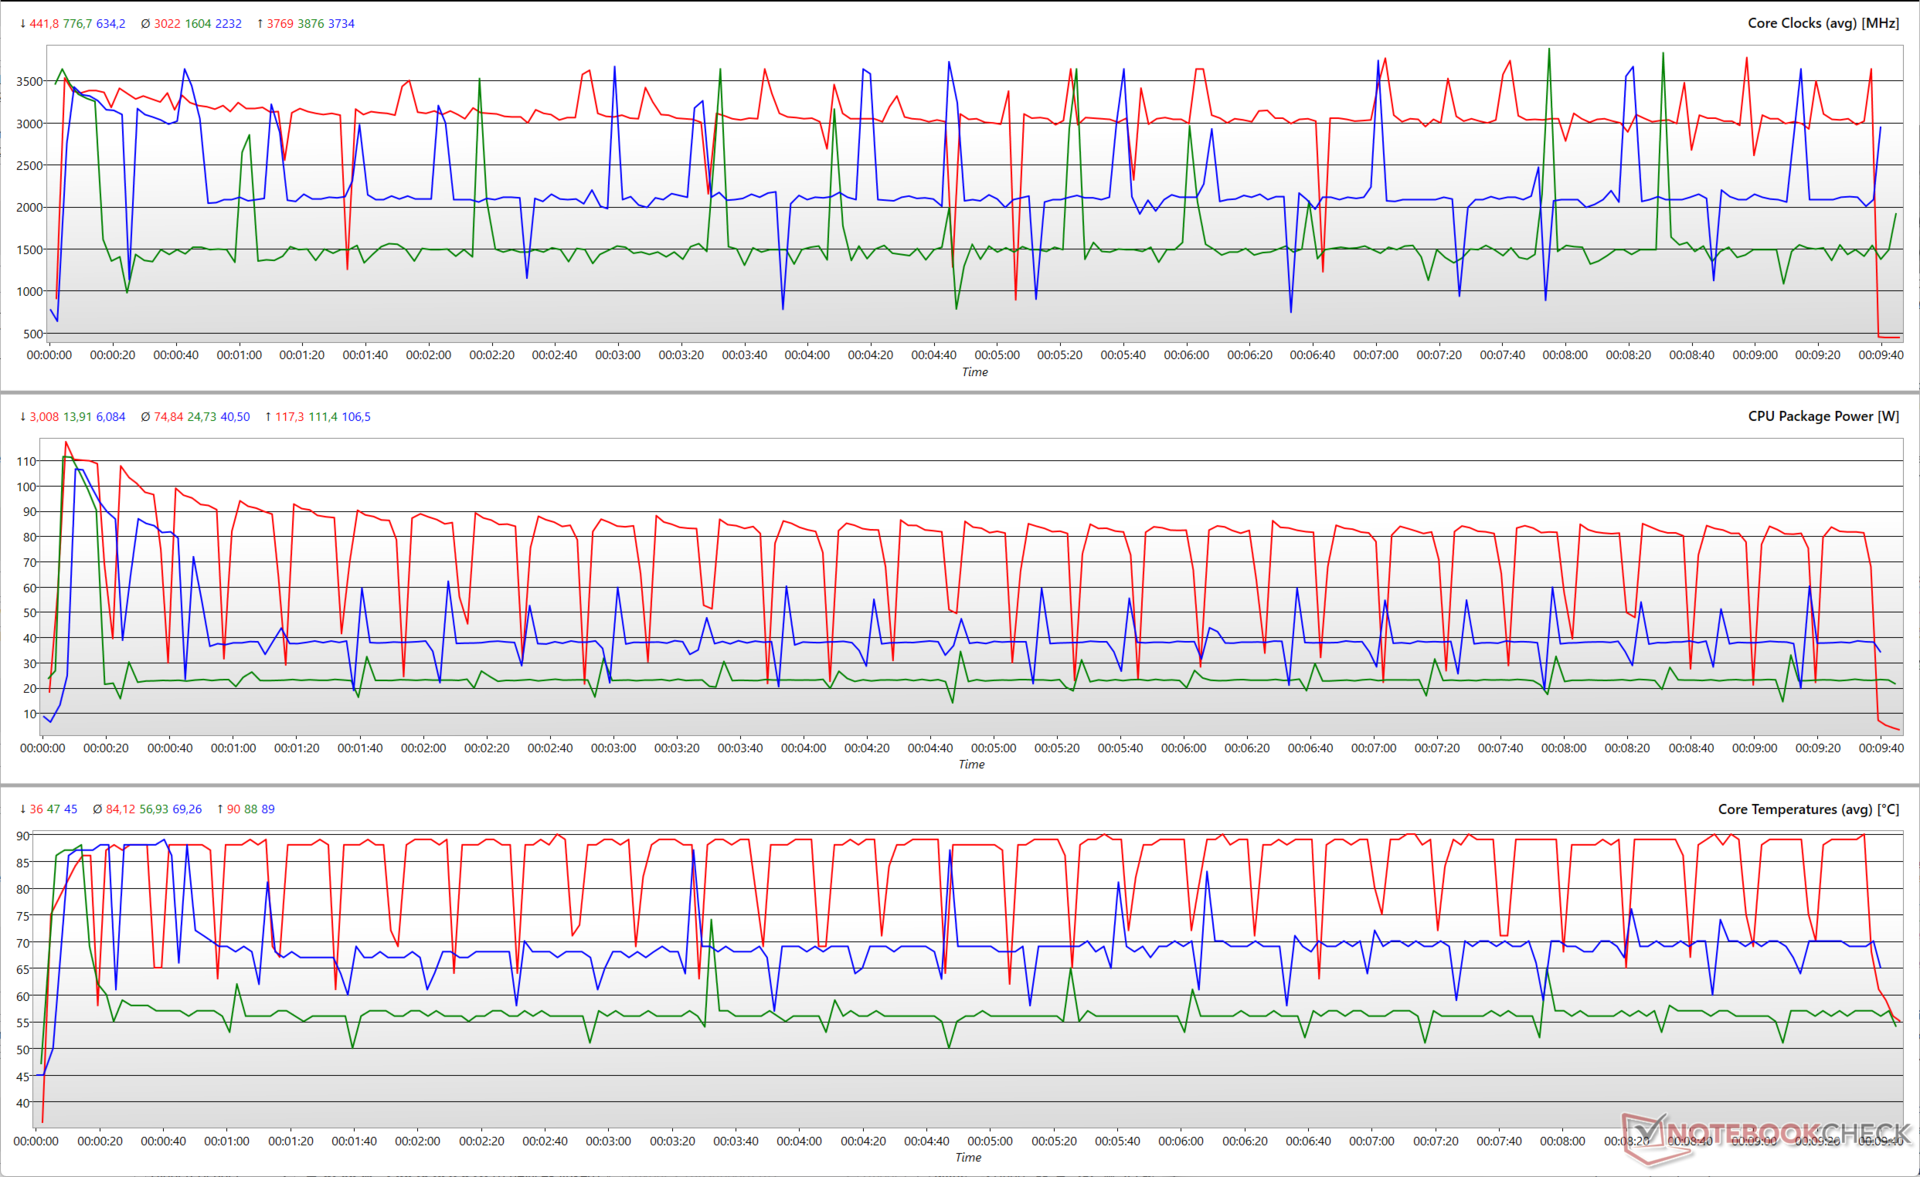
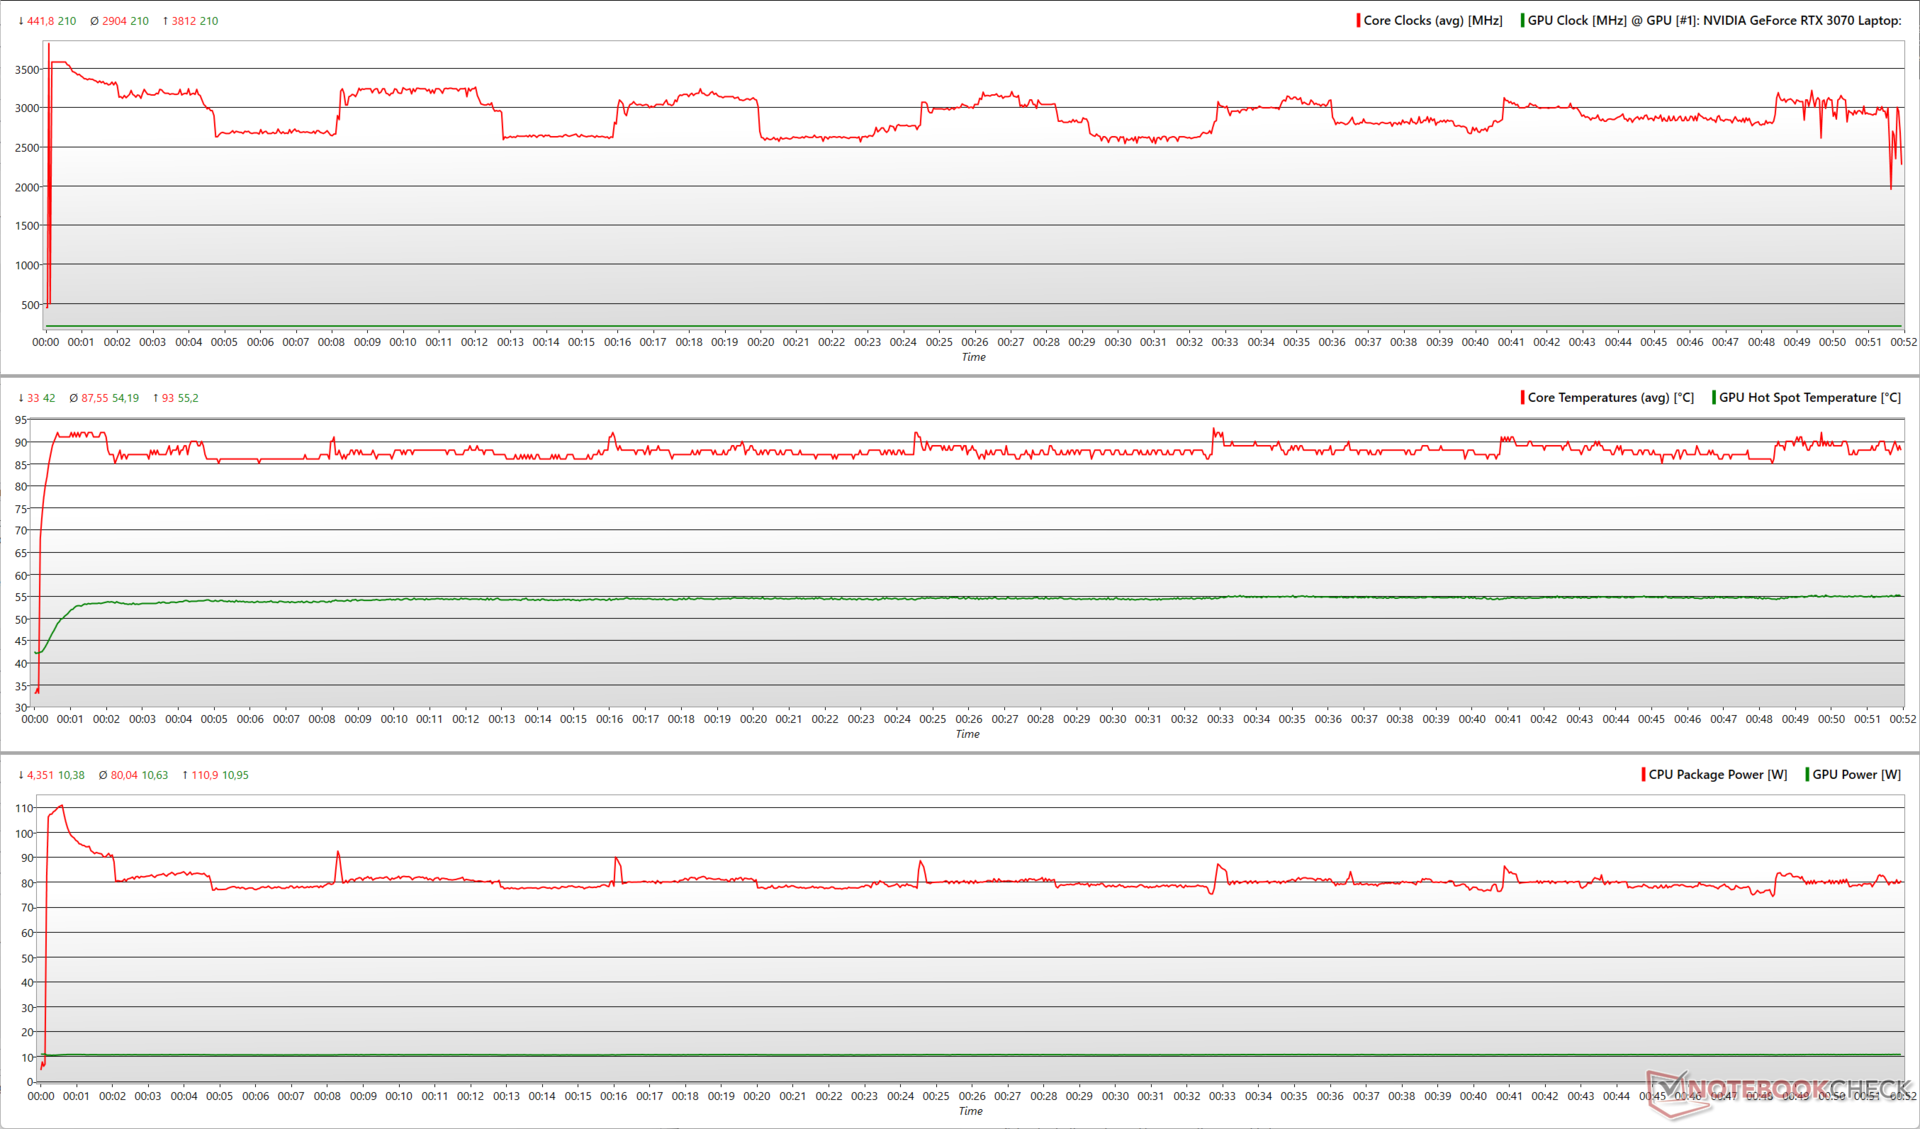
压力测试
在Prime95压力下,我们看到Core i7-12700H能够提升到3.8 GHz,同时消耗111 W。然而,平均核心时钟更多的是在2.9 GHz范围内,平均封装功率约为80 W。
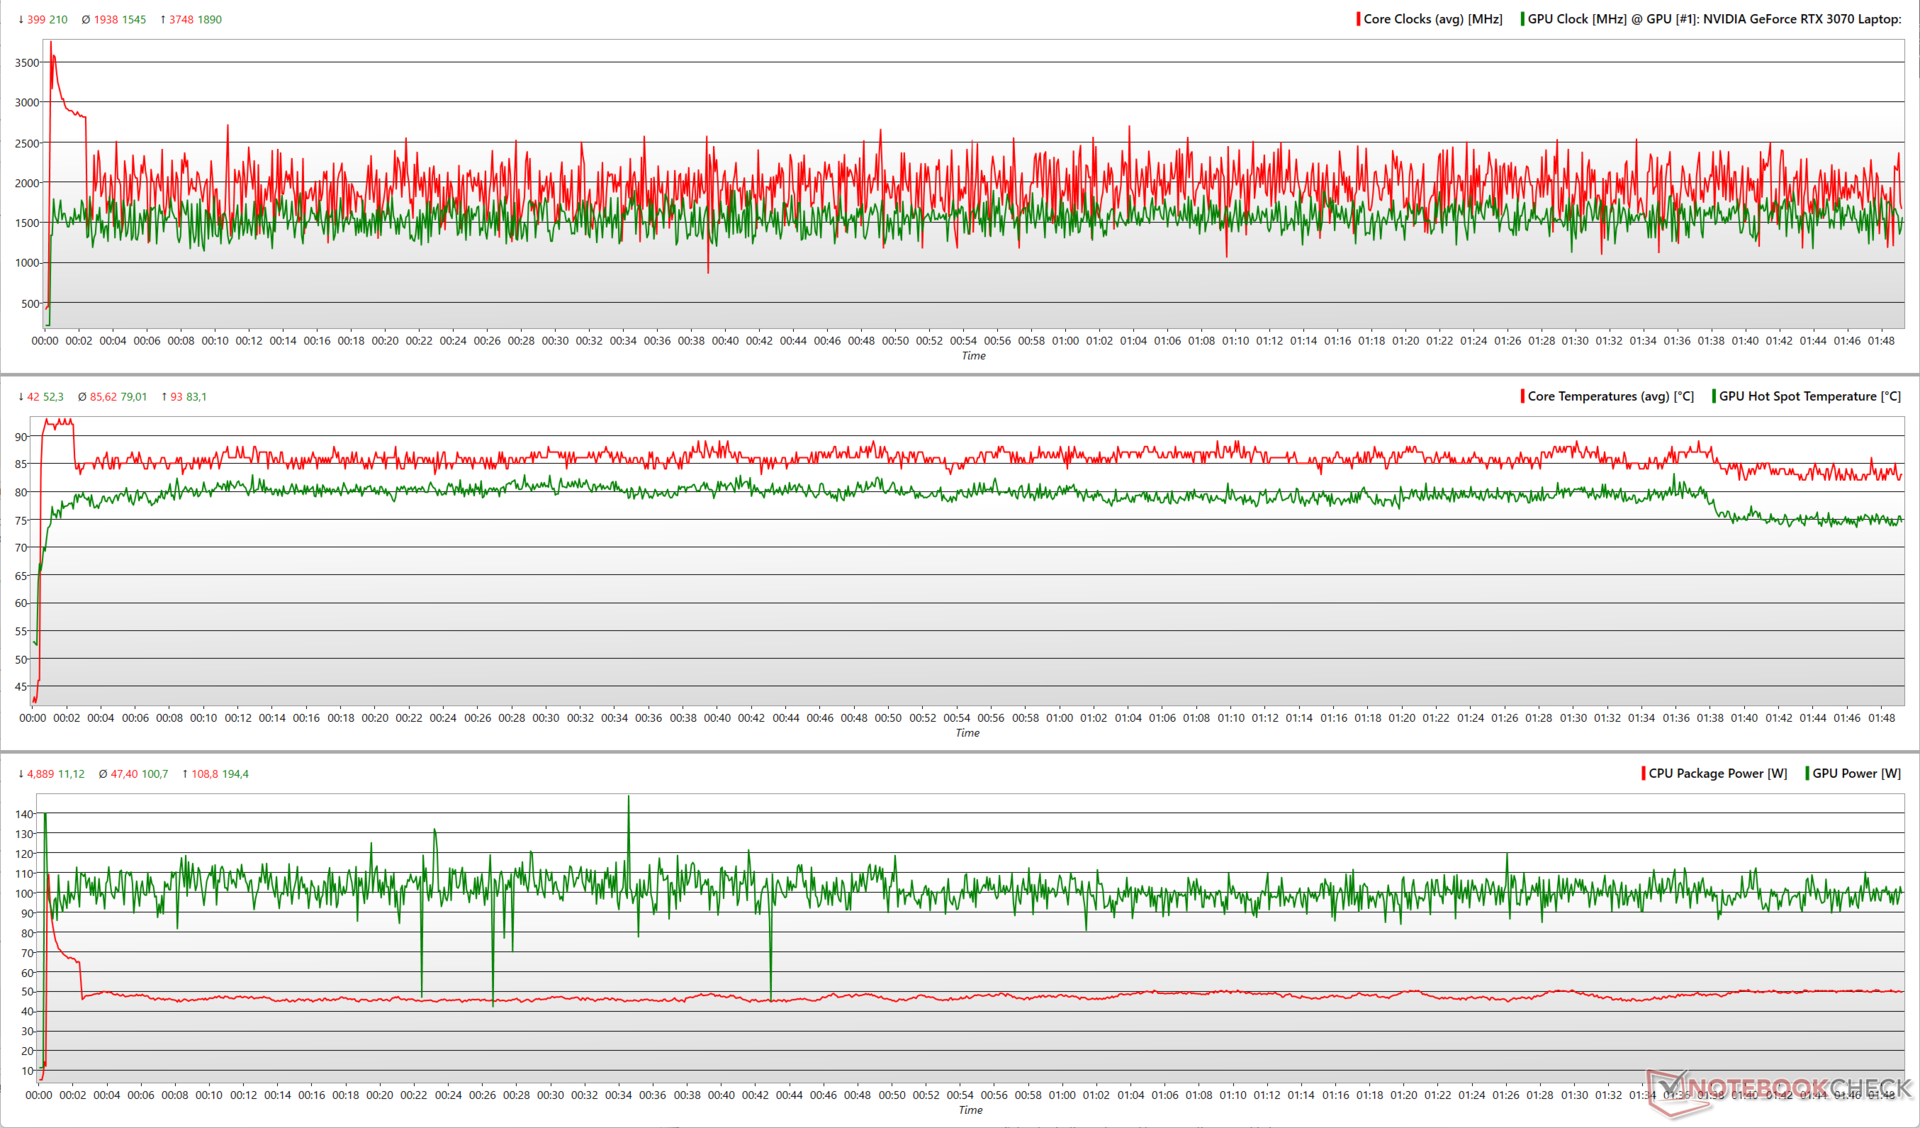
添加FurMark导致Crosshair 15 R6E将总功率预算的一部分转移到RTX 3070身上。这导致CPU平均核心时钟降低到1.9 GHz,平均封装功率下降到47.4 W。RTX 3070能够达到接近其峰值的1.9 GHz时钟,并维持在1.54 GHz。在这样做的时候,GPU消耗了接近195W的峰值功率和大约101W的平均功率。CPU和GPU的平均温度分别徘徊在85.6℃和79℃左右。
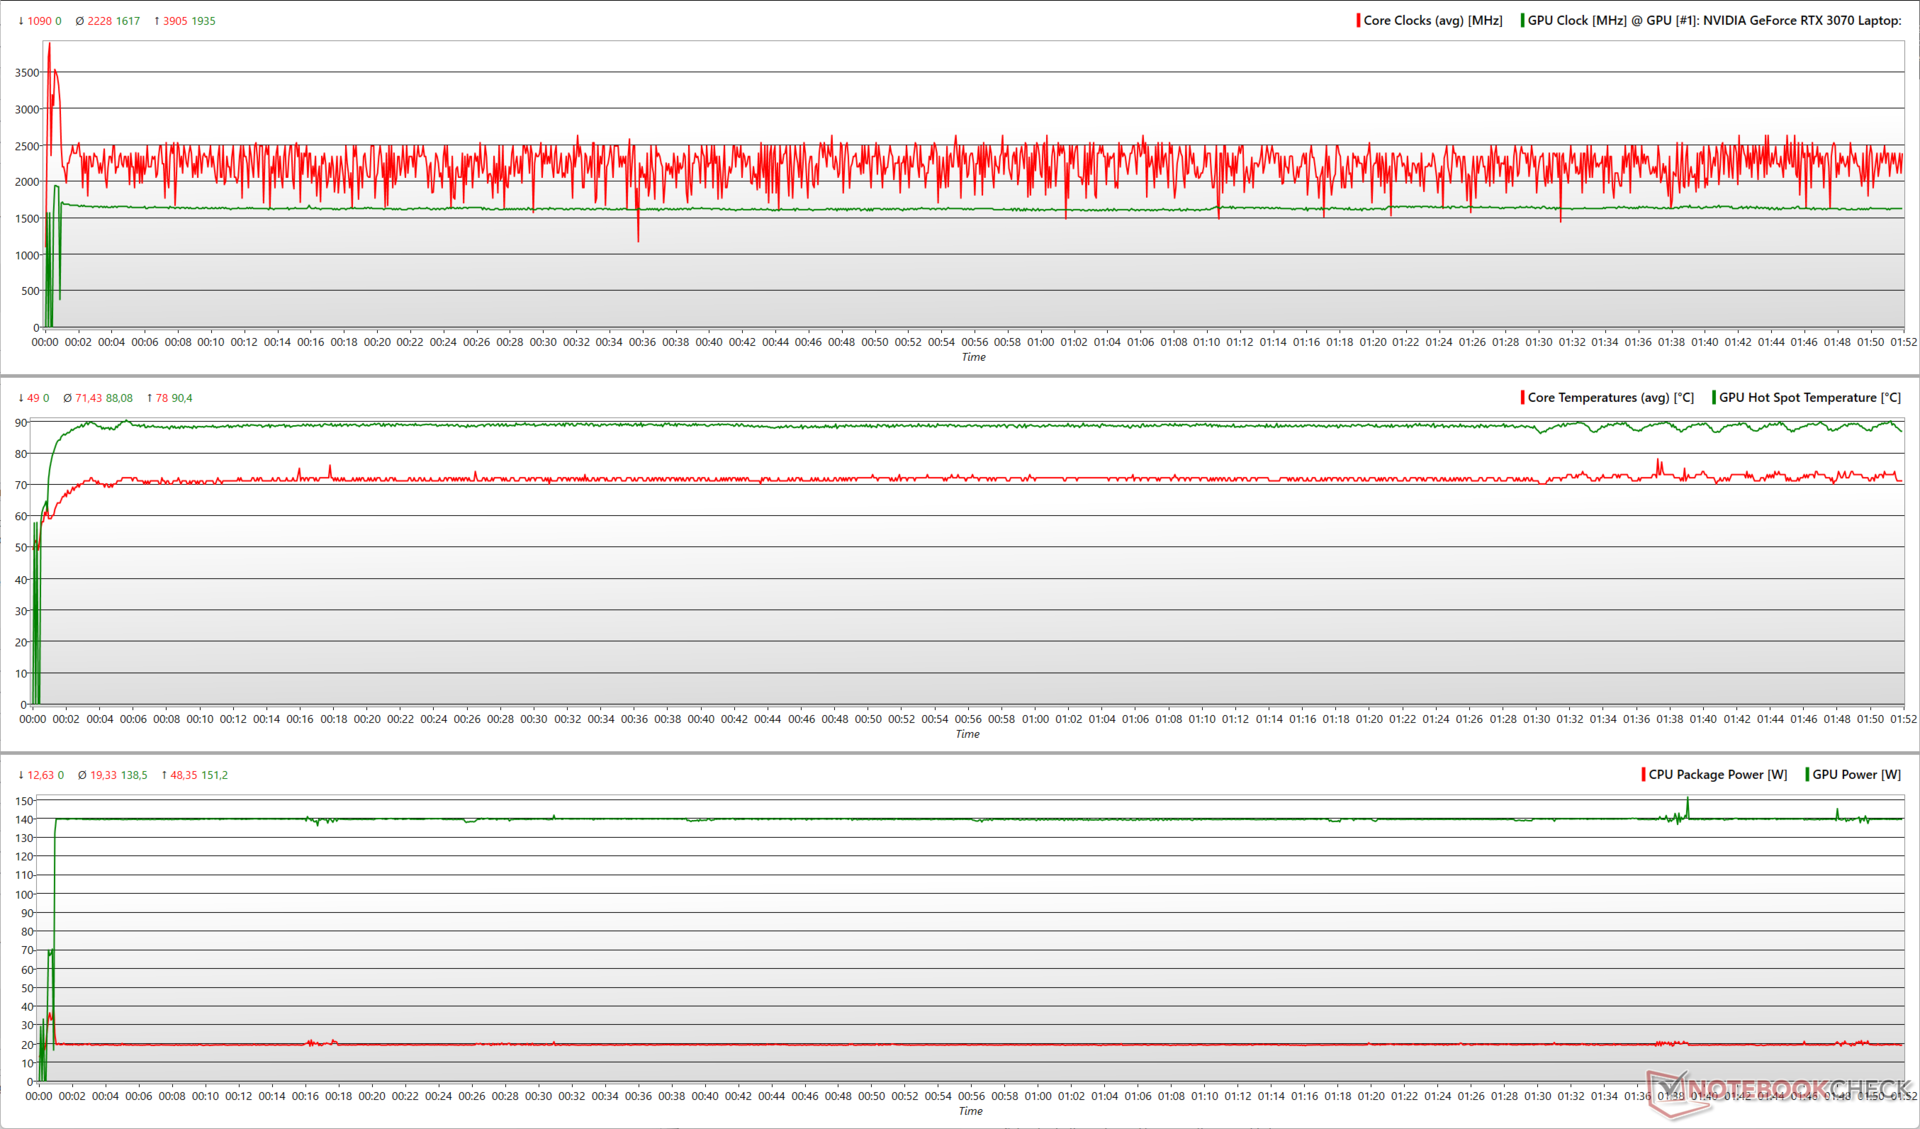
Witcher 3在1080p Ultra下的压力看到了更公平的功率分配,Core i7-12700H现在能够以2.2 GHz的平均速度工作,RTX 3070也略微提高到1.6 GHz。更高的平均GPU时钟是以更高的平均功耗为代价的,即138.5瓦。
有趣的是,我们观察到,酷睿i7-12700H能够以略低于20W的平均封装功率达到更高的时钟。在 Witcher 3,CPU和GPU的平均温度分别为71.4℃和88℃左右。
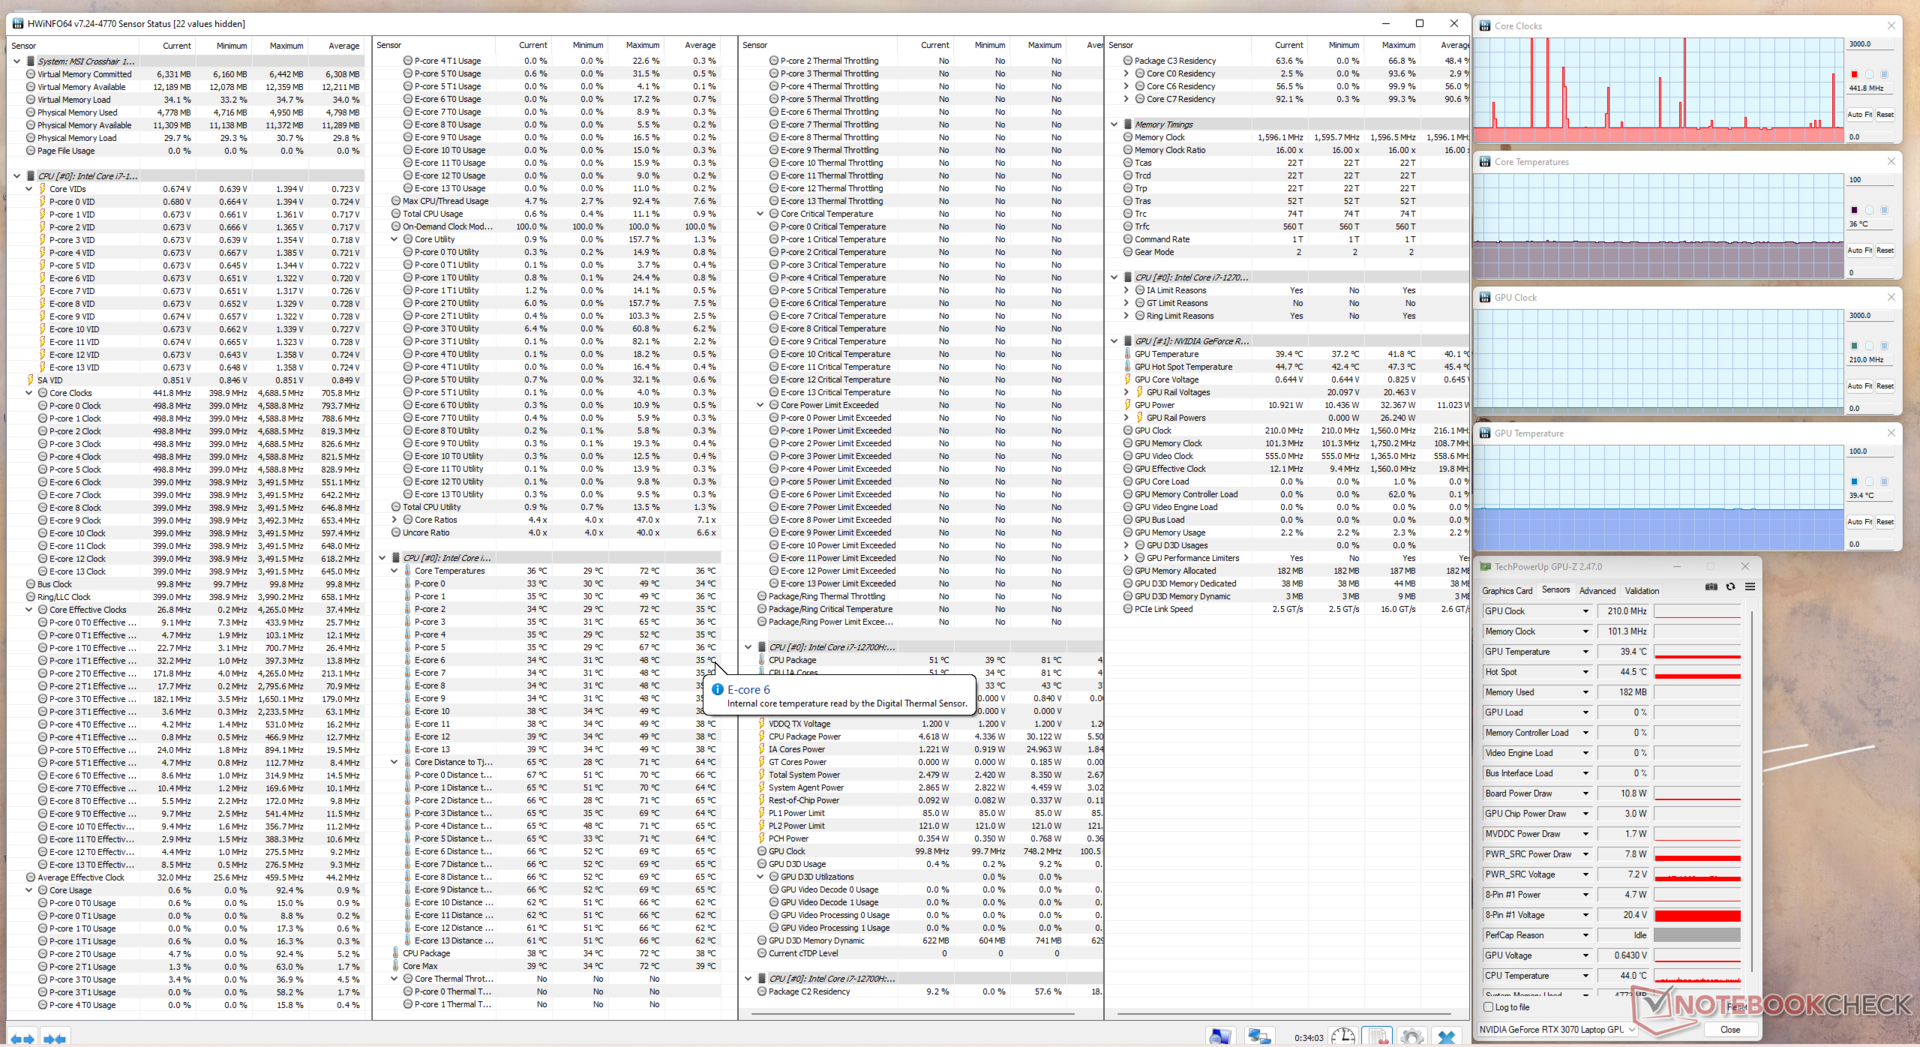
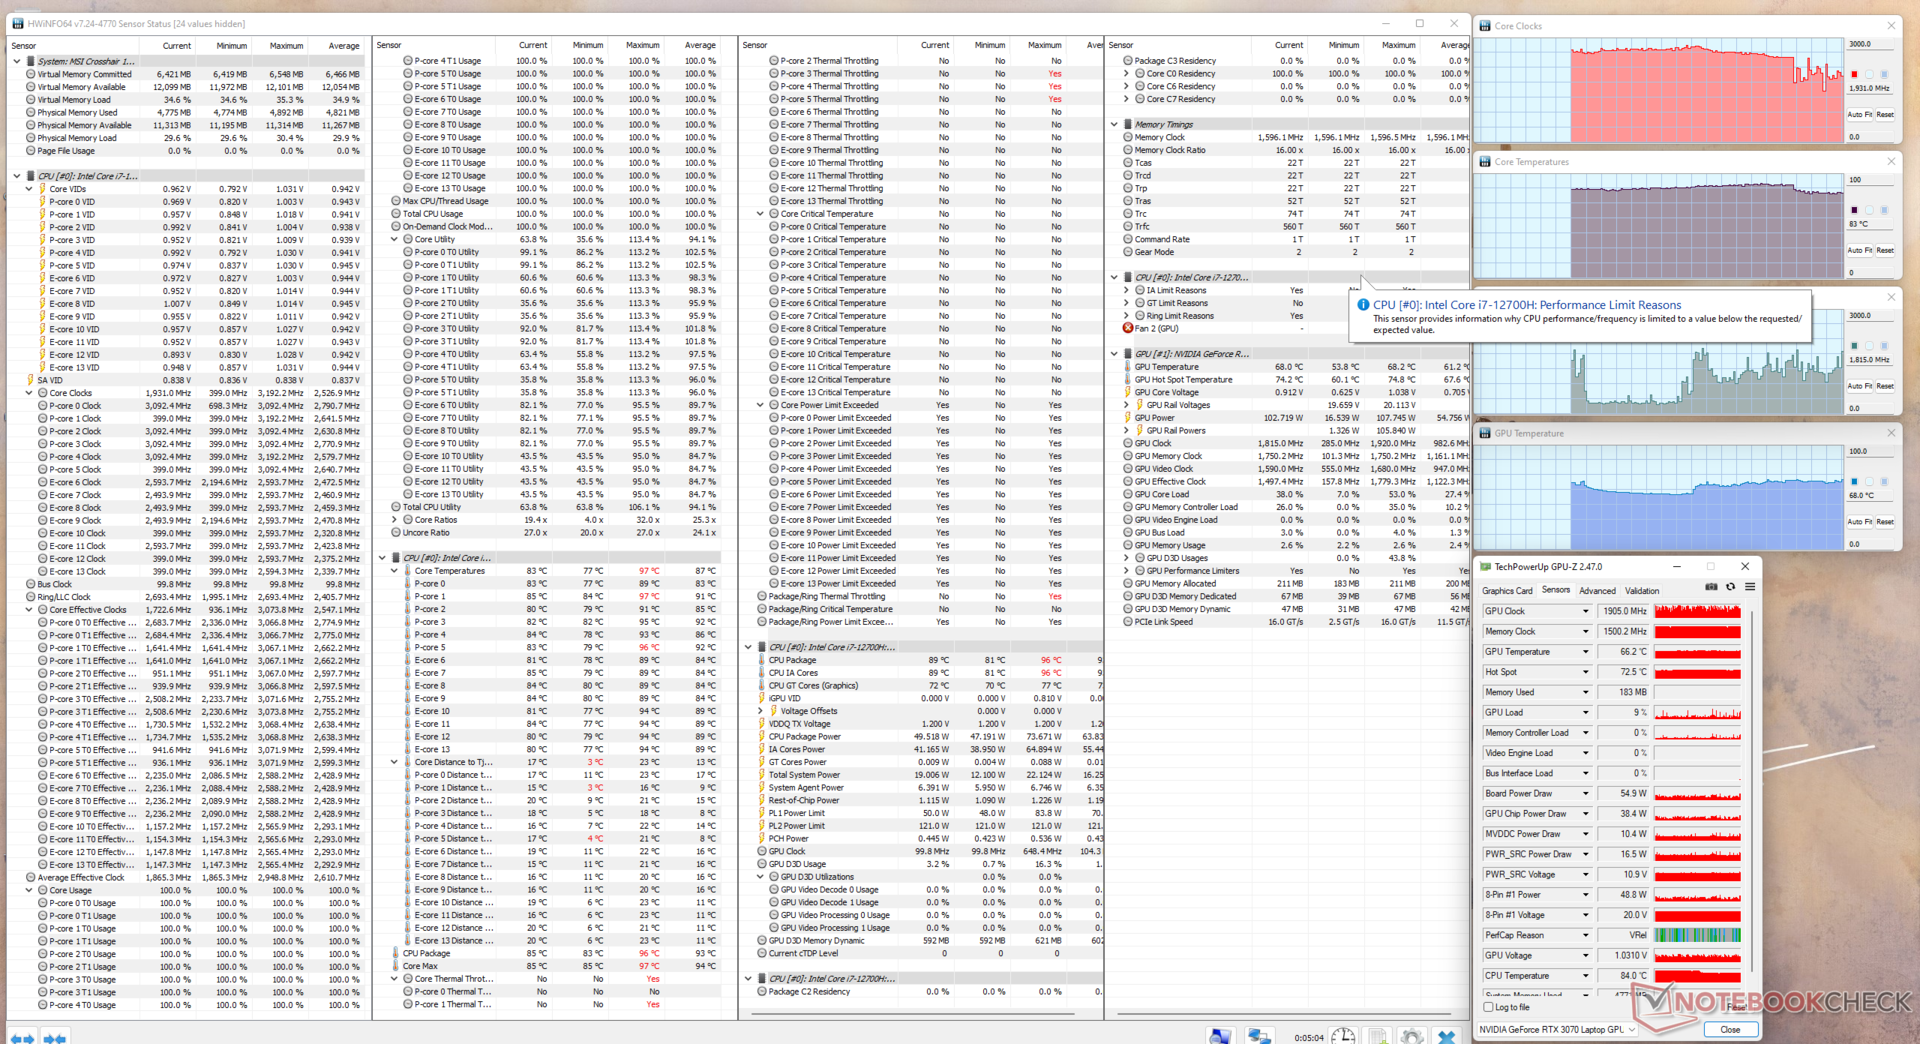
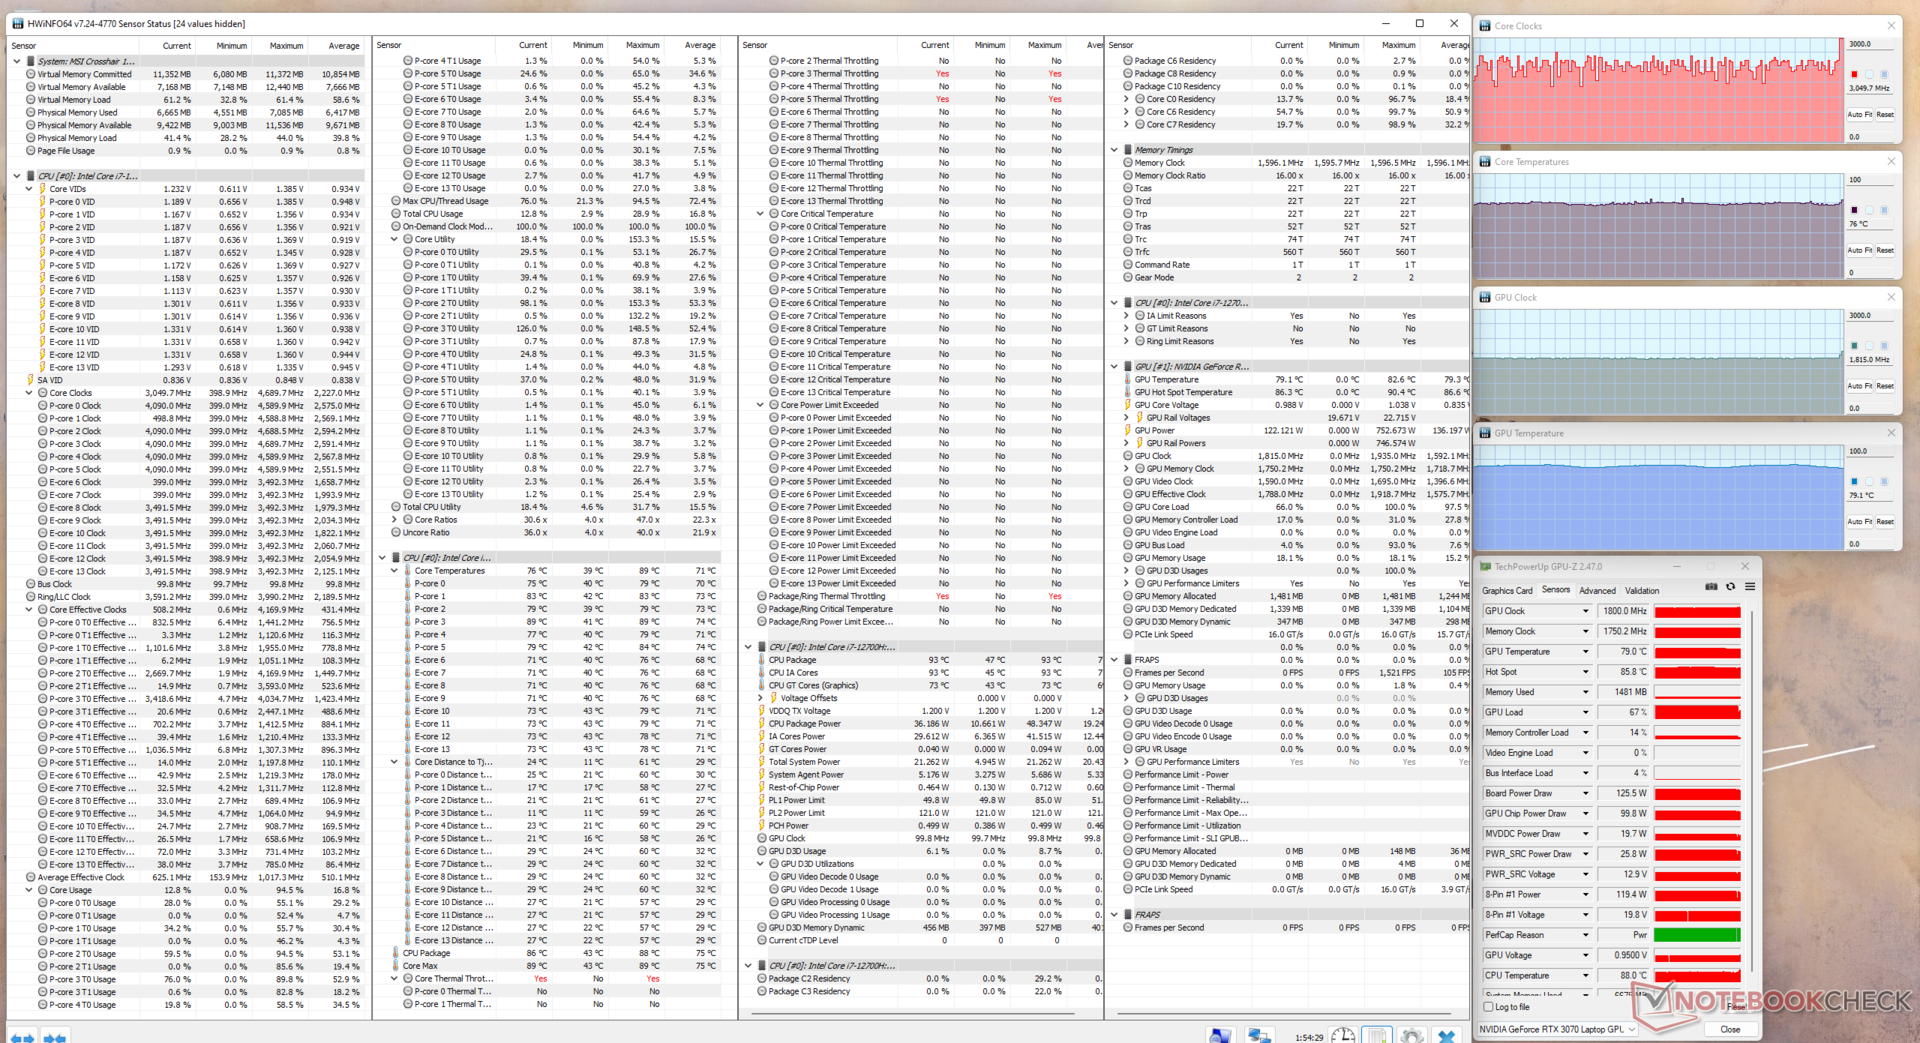
| 压力测试 | CPU时钟(GHz) | GPU时钟(MHz) | CPU平均温度(℃) | GPU平均温度(℃) |
| 系统空闲 | 0.4 | 210 | 36 | 40.1 |
| Prime95 | 2.53 | 210 | 51 | 41.3 |
| Prime95 + FurMark | 1.93 | 1.81 | 87 | 61.2 |
| TheWitcher 3 | 3.04 | 1.81 | 71 | 79.3 |
发言人
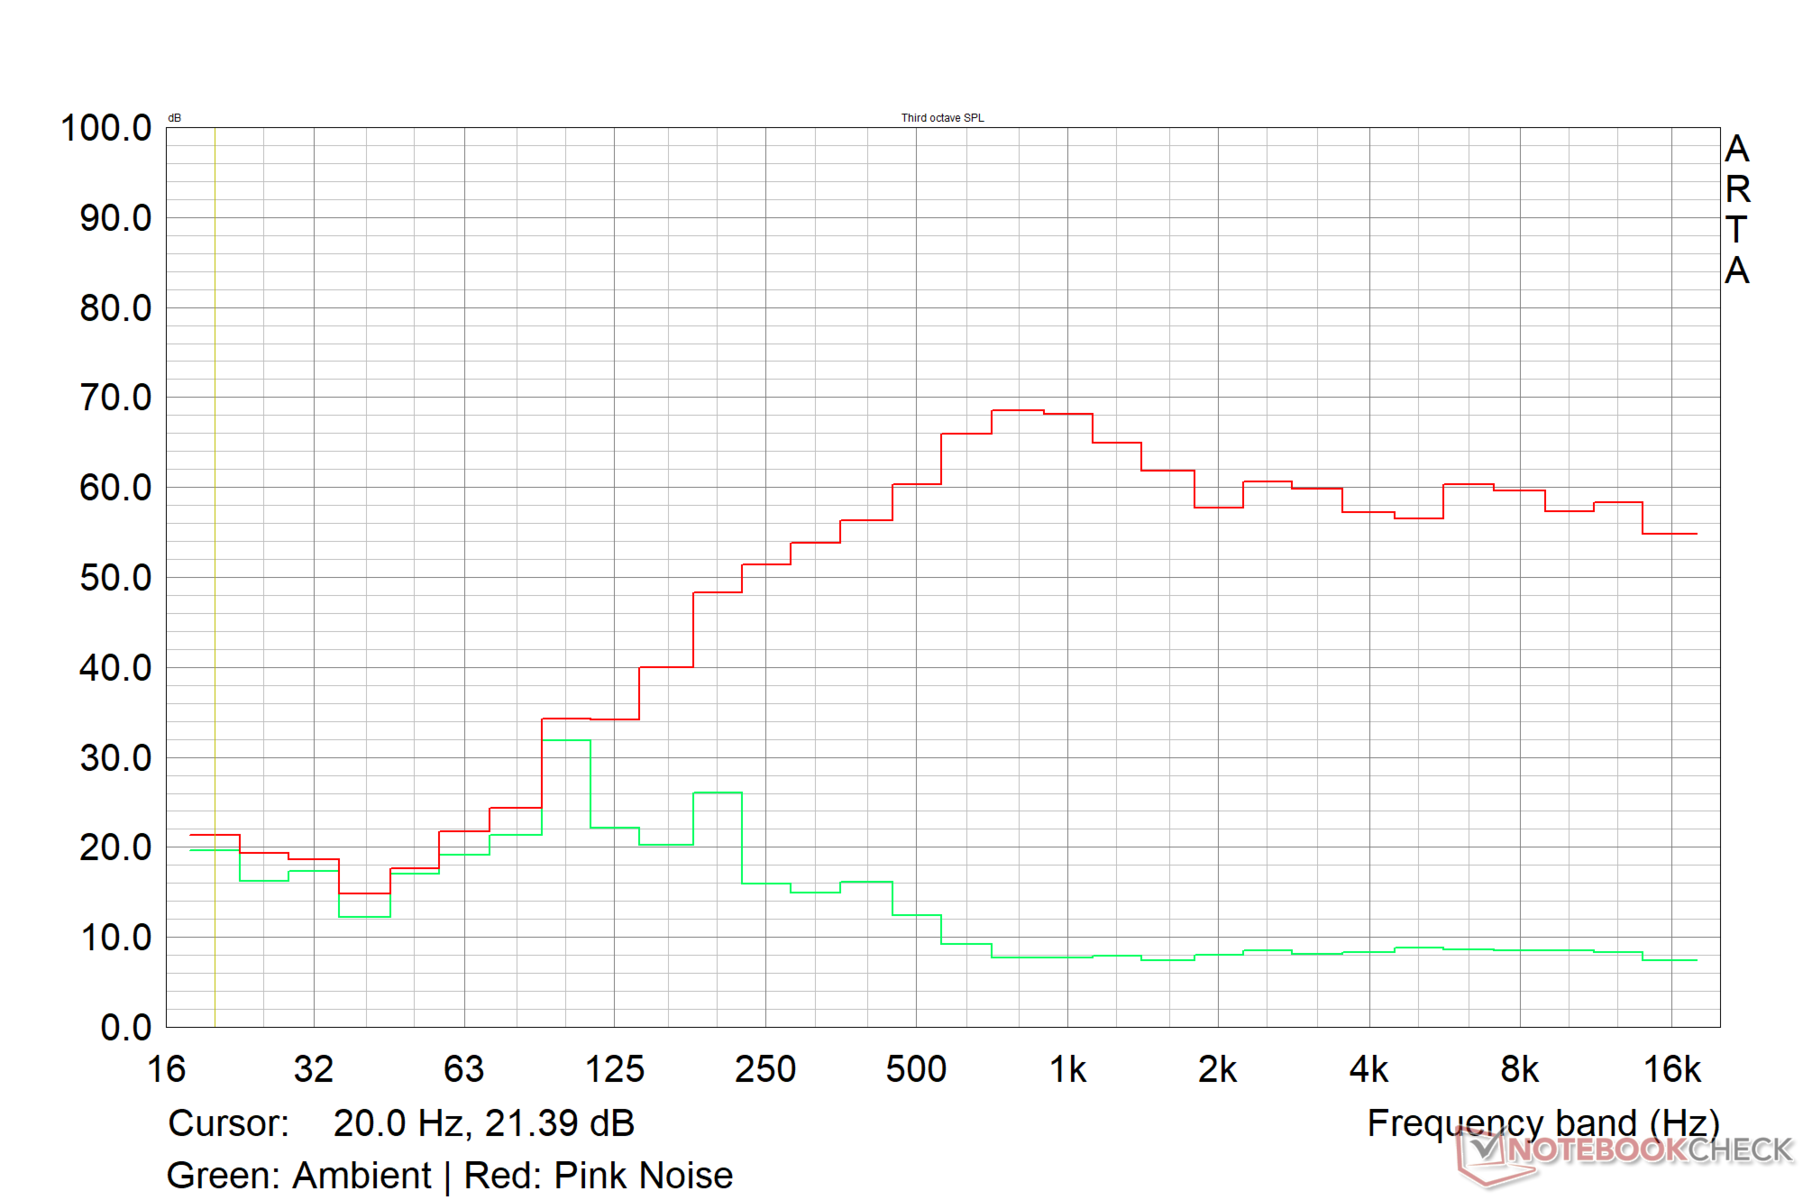
Crosshair 15 R6E具有2个2W的扬声器,可产生74.6 dB(A)的响度。低音响应是合格的,但中音和高音是清晰可辨的,没有失真。对于普通大小的房间的基本多媒体消费来说,其音质是可以接受的。
外部音频可以通过蓝牙5.2或3.5毫米组合音频插孔连接。
MSI Crosshair 15 R6E B12UGZ-050 audio analysis
(±) | speaker loudness is average but good (74.6 dB)
Bass 100 - 315 Hz
(±) | reduced bass - on average 14.1% lower than median
(±) | linearity of bass is average (10% delta to prev. frequency)
Mids 400 - 2000 Hz
(±) | higher mids - on average 5.6% higher than median
(+) | mids are linear (6.5% delta to prev. frequency)
Highs 2 - 16 kHz
(+) | balanced highs - only 1.7% away from median
(+) | highs are linear (4% delta to prev. frequency)
Overall 100 - 16.000 Hz
(±) | linearity of overall sound is average (15.1% difference to median)
Compared to same class
» 32% of all tested devices in this class were better, 6% similar, 61% worse
» The best had a delta of 6%, average was 18%, worst was 132%
Compared to all devices tested
» 21% of all tested devices were better, 4% similar, 75% worse
» The best had a delta of 4%, average was 23%, worst was 134%
Apple MacBook Pro 16 2021 M1 Pro audio analysis
(+) | speakers can play relatively loud (84.7 dB)
Bass 100 - 315 Hz
(+) | good bass - only 3.8% away from median
(+) | bass is linear (5.2% delta to prev. frequency)
Mids 400 - 2000 Hz
(+) | balanced mids - only 1.3% away from median
(+) | mids are linear (2.1% delta to prev. frequency)
Highs 2 - 16 kHz
(+) | balanced highs - only 1.9% away from median
(+) | highs are linear (2.7% delta to prev. frequency)
Overall 100 - 16.000 Hz
(+) | overall sound is linear (4.6% difference to median)
Compared to same class
» 0% of all tested devices in this class were better, 0% similar, 100% worse
» The best had a delta of 5%, average was 17%, worst was 45%
Compared to all devices tested
» 0% of all tested devices were better, 0% similar, 100% worse
» The best had a delta of 4%, average was 23%, worst was 134%
能源管理。最大负荷时的高功率消耗
消耗功率
即使在极限性能测试中,对于所提供的硬件来说,功耗似乎也相对经济。华硕TUF Dash F15比Crosshair 15 R6E在最大负载和 Witcher 3,由于其较低的CPU和GPU瓦数,所以比Crosshair 15 R6E要经济30%。
该电源的额定功率为240W,但我们观察到在Prime95和FurMark的综合负载中的功耗高达290W。在这个运行过程中的功耗波动与我们在上述压力测试中观察到的CPU和GPU时钟波动是一致的。
| Off / Standby | |
| Idle | |
| Load |
|
Key:
min: | |
| MSI Crosshair 15 R6E B12UGZ-050 i7-12700H, GeForce RTX 3070 Laptop GPU, IPS-Level, 2560x1440, 15.6" | MSI Stealth GS66 12UGS i7-12700H, GeForce RTX 3070 Ti Laptop GPU, IPS-Level, 2560x1440, 15.6" | Lenovo Legion 5 Pro 16 G7 i7 RTX 3070Ti i7-12700H, GeForce RTX 3070 Ti Laptop GPU, IPS, 2560x1600, 16" | Asus TUF Dash F15 FX517ZR i7-12650H, GeForce RTX 3070 Laptop GPU, IPS, 2560x1440, 15.6" | Schenker XMG Neo 15 (Ryzen 9 6900HX, RTX 3070 Ti) R9 6900HX, GeForce RTX 3070 Ti Laptop GPU, IPS, 2560x1440, 15.6" | Average NVIDIA GeForce RTX 3070 Laptop GPU | Average of class Gaming | |
|---|---|---|---|---|---|---|---|
| Power Consumption | -7% | -10% | 2% | -11% | -36% | -26% | |
| Idle Minimum * (Watt) | 9.6 | 11 -15% | 8.6 10% | 10 -4% | 13 -35% | 15.6 ? -63% | 13.1 ? -36% |
| Idle Average * (Watt) | 14.1 | 16 -13% | 17.6 -25% | 14 1% | 17 -21% | 20.1 ? -43% | 19 ? -35% |
| Idle Maximum * (Watt) | 14.96 | 23 -54% | 18.5 -24% | 20 -34% | 20 -34% | 29.4 ? -97% | 24.6 ? -64% |
| Load Average * (Watt) | 107.3 | 110 -3% | 110 -3% | 122 -14% | 89 17% | 110.8 ? -3% | 111.3 ? -4% |
| Witcher 3 ultra * (Watt) | 197 | 151 23% | 227 -15% | 138.6 30% | 200 -2% | ||
| Load Maximum * (Watt) | 289.93 | 230 21% | 294.6 -2% | 189 35% | 260 10% | 214 ? 26% | 260 ? 10% |
* ... smaller is better
Power Consumption - The Witcher 3 / Stress test
Power Consumption - External monitor
电池寿命
电池测试是在平衡模式下进行的,显示刷新率设置为60 Hz。我们的Crosshair 15 R6E B12UGZ配备了一个4芯90瓦时的电池,在我们150尼特的标准化Wi-Fi浏览测试中提供了不错的运行时间。在关闭所有无线电的情况下,在150尼特的情况下,视频播放的备份时间只差9小时。
微星还提供Crosshair R6E B12UEZ变体,配备3芯56.5WHr电池。
| MSI Crosshair 15 R6E B12UGZ-050 i7-12700H, GeForce RTX 3070 Laptop GPU, 90 Wh | MSI Stealth GS66 12UGS i7-12700H, GeForce RTX 3070 Ti Laptop GPU, 99.9 Wh | Lenovo Legion 5 Pro 16 G7 i7 RTX 3070Ti i7-12700H, GeForce RTX 3070 Ti Laptop GPU, 80 Wh | Asus TUF Dash F15 FX517ZR i7-12650H, GeForce RTX 3070 Laptop GPU, 76 Wh | Schenker XMG Neo 15 (Ryzen 9 6900HX, RTX 3070 Ti) R9 6900HX, GeForce RTX 3070 Ti Laptop GPU, 93 Wh | Average of class Gaming | |
|---|---|---|---|---|---|---|
| Battery runtime | 4% | -35% | 18% | 34% | 5% | |
| H.264 (h) | 8.9 | 6.3 -29% | 5.8 -35% | 10.7 20% | 8.27 ? -7% | |
| WiFi v1.3 (h) | 7.3 | 5.4 -26% | 5.4 -26% | 7 -4% | 10.9 49% | 7.08 ? -3% |
| Witcher 3 ultra (h) | 1.6 | |||||
| Load (h) | 1.2 | 1.6 33% | 0.6 -50% | 2.3 92% | 1.6 33% | 1.496 ? 25% |
| Reader / Idle (h) | 7.8 | 10.8 | 7.84 ? |
Pros
Cons
评语。脉冲GL66的重塑,得到了很多东西的权利

以特定游戏为主题的笔记本电脑,除了上述游戏的粉丝之外,吸引力一般都很有限。微星Crosshair 15彩虹六号。提取版,以育碧流行的合作FPS系列命名,是今年唯一的Crosshair 15产品。
该机箱基本上是Pulse GL66的翻版,大量借用了游戏中的设计元素。微星甚至不惜在显示器盖子上用彩虹六号的标志取代自己的标志。提取》的标志。盒子里还有一些好东西,包括一个游戏主题的鼠标,一个鼠标垫,以及一个游戏本身的豪华版。
因此,Crosshair 15 R6E继承了Pulse GL66设计的一些不足之处,如键盘甲板的弯曲和非理想的端口分布。然而,这款笔记本电脑配备了高度实用的QHD 165 Hz显示屏,对于游戏和内容创作来说应该是个好兆头。
MSI Crosshair 15 Rainbow Six:提取 "的设计可能吸引力有限,但在皮肤之下,你得到的是一个具有良好显示特性和可容忍排放的高能力中端机"。
Crosshair 15 R6E对Core i7-12700H的实现并不是我们所见过的最快的。该 微星Stealth GS66和 联想Legion 5i Pro 16 G7采用相同的处理器,在多核测试中表现明显更好。Crosshair 15 R6E在游戏中的整体表现可以优于或等于一些搭载RTX 3070 Ti的笔记本电脑,如 申科XMG Neo 15, Acer Nitro 5, 和 MSI Katana GF66.
只要你能接受平衡的性能配置,热能和噪音排放基本上是可以容忍的。然而,功耗是偏高的,特别是在最大负荷和游戏下的耗电。
即使你不是一个游戏迷,微星Crosshair 15 Rainbow Six:提取版确实值得考虑,考虑到提供的性能和相对于竞争对手的定价。
价格和可用性
微星Crosshair 15彩虹六号。提取版在美国亚马逊上出售售价2,149美元。在印度,这款笔记本的售价约为1,90,990美元,但目前在Amazon India和Flipkart.
MSI Crosshair 15 R6E B12UGZ-050
- 12/19/2022 v7 (old)
Vaidyanathan Subramaniam
Price comparison

