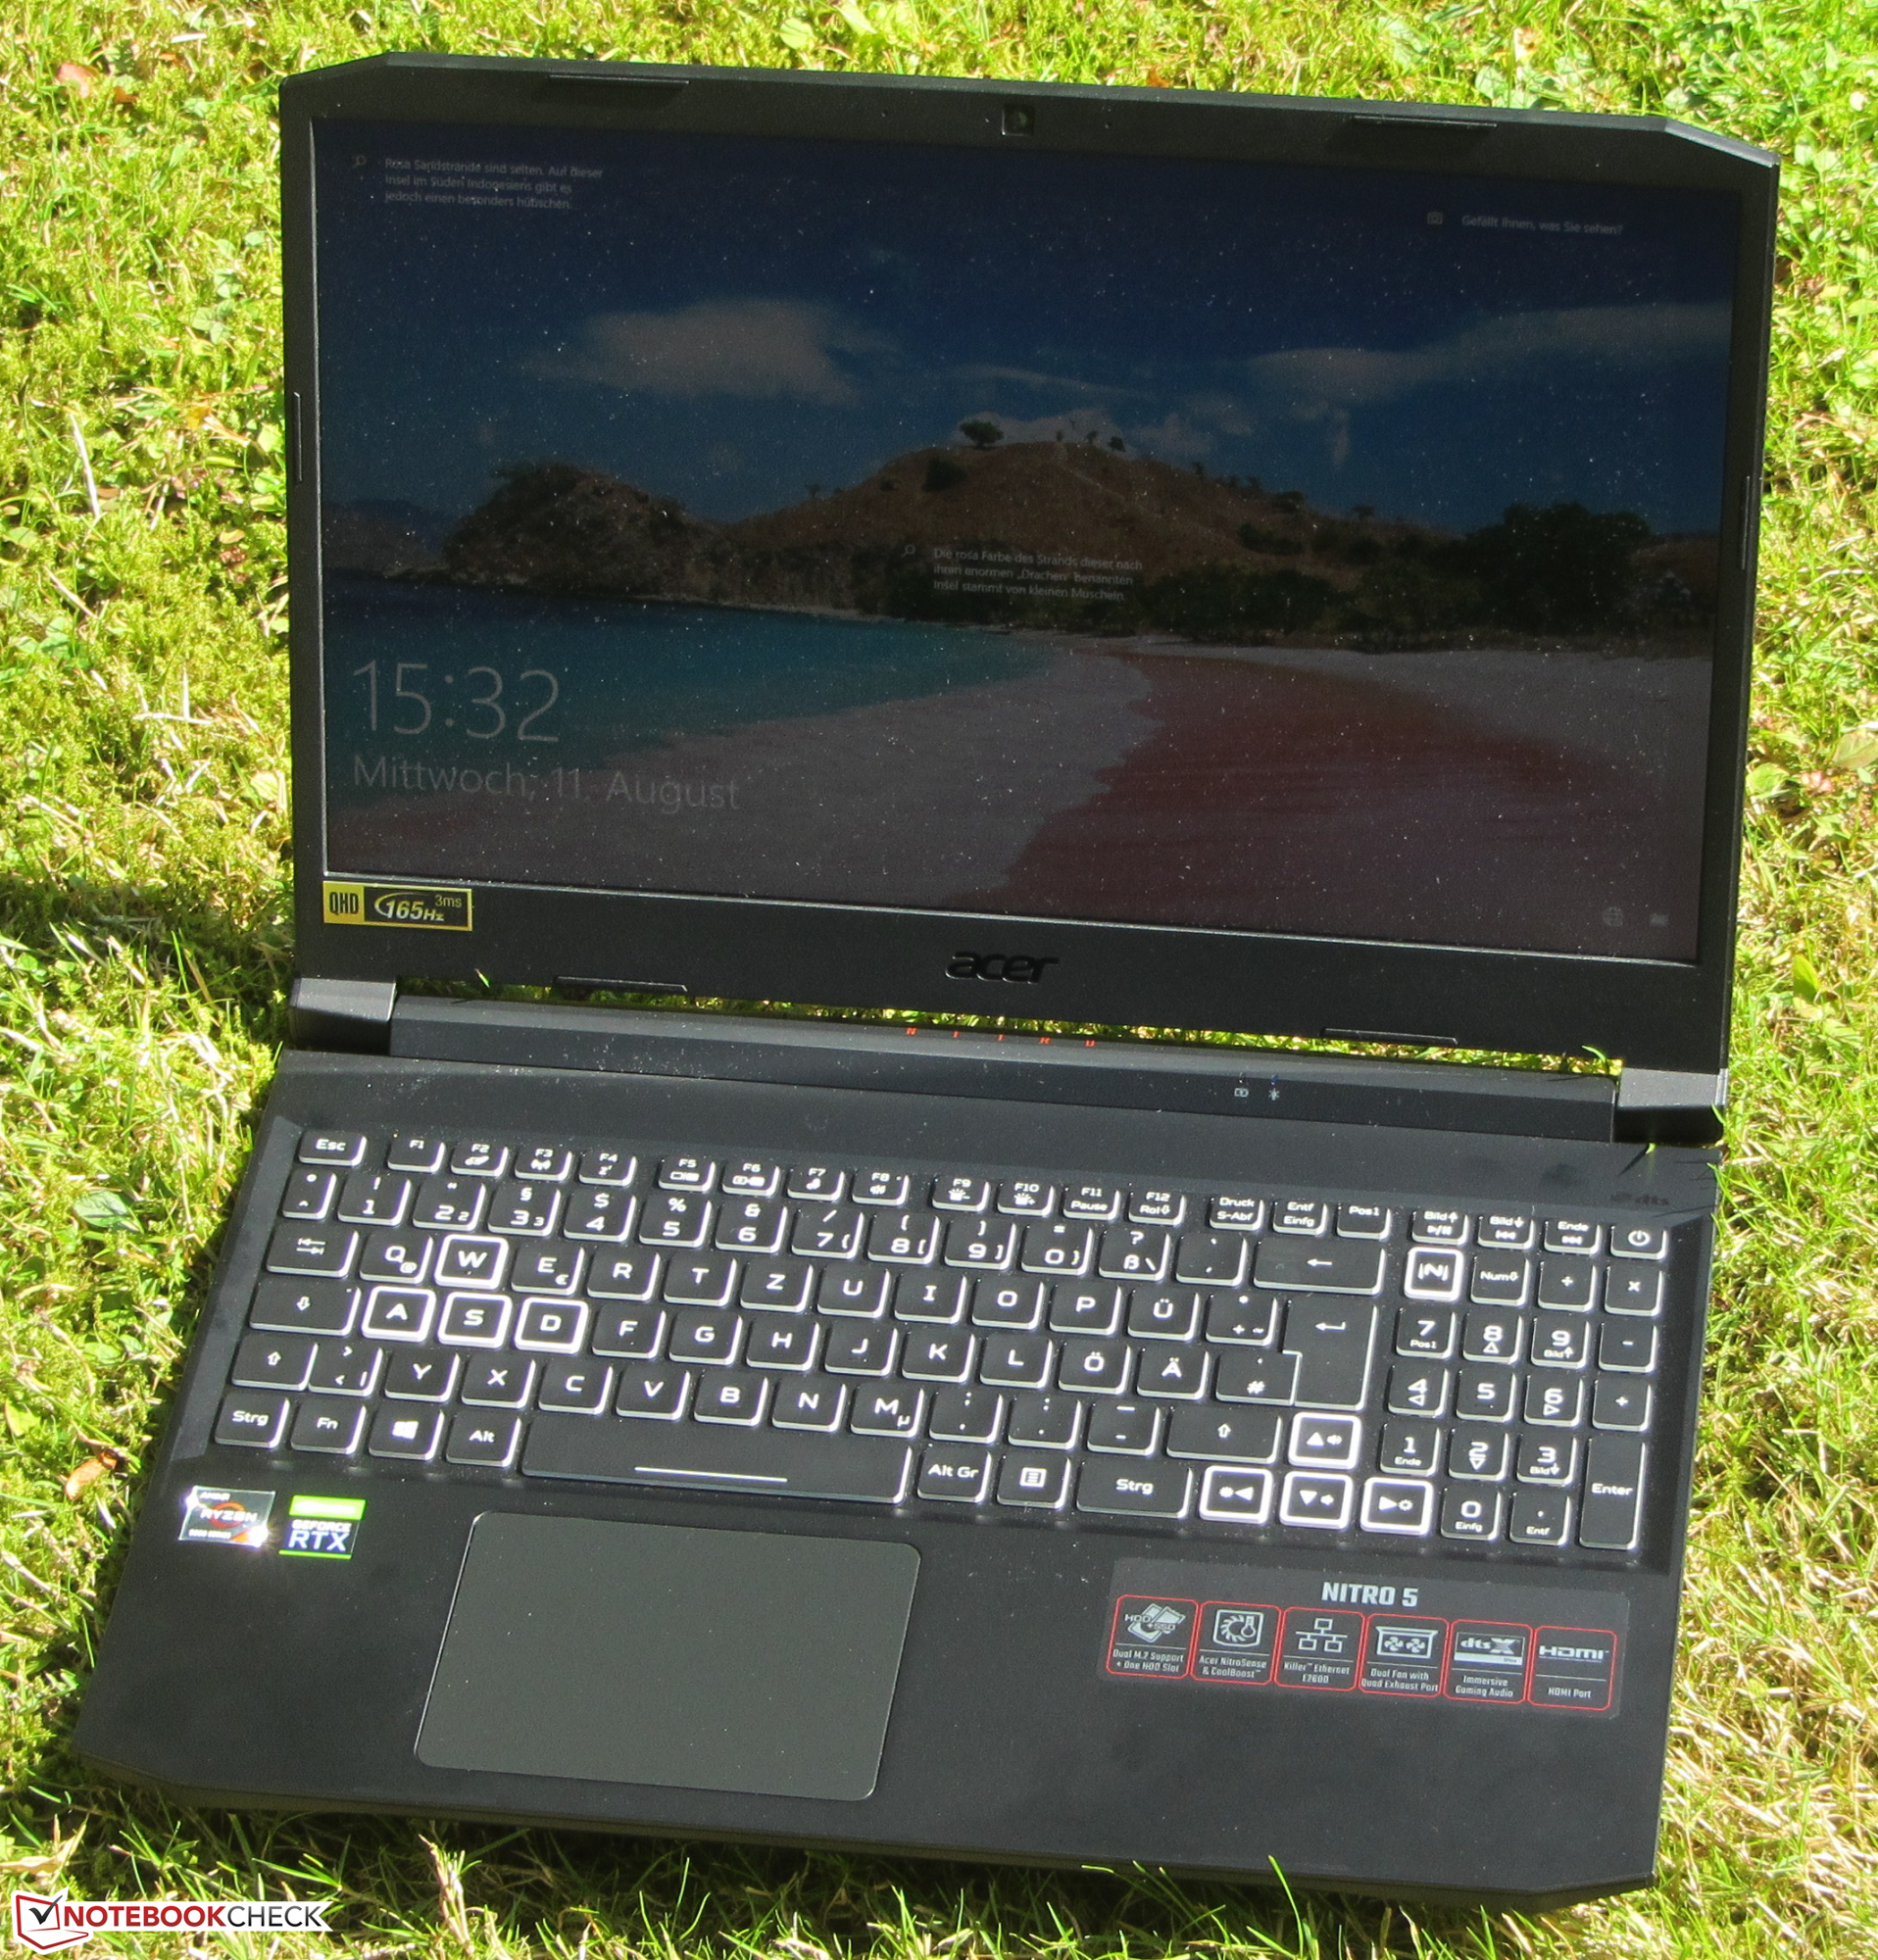
Acer Nitro 5 AN515-45在审查中。紧凑型QHD游戏笔记本

宏碁的15.6英寸游戏笔记本电脑由一个Ryzen 7 5800HAPU和一个GeForce RTX 3070 LaptopGPU驱动。我们的配置变体的价格略低于1700欧元(约合1,993美元)。在竞争对手中,有像华硕ROG Strix G15 G513QY ,Aorus 15P XC ,微星GF65 Thin 10UE ,华硕TUF Gaming A15 FA506QR ,以及Razer Blade 15 Base Edition 2021 。
Possible contenders in comparison
Rating | Date | Model | Weight | Height | Size | Resolution | Price |
|---|---|---|---|---|---|---|---|
| 82.2 % v7 (old) | 08 / 2021 | Acer Nitro 5 AN515-45-R1JH R7 5800H, GeForce RTX 3070 Laptop GPU | 2.3 kg | 23.9 mm | 15.60" | 2560x1440 | |
| 84.7 % v7 (old) | 08 / 2021 | Asus ROG Strix G15 G513QY R9 5900HX, Radeon RX 6800M | 2.4 kg | 27.9 mm | 15.60" | 1920x1080 | |
| 86.1 % v7 (old) | 02 / 2021 | Aorus 15P XC i7-10870H, GeForce RTX 3070 Laptop GPU | 2.2 kg | 27 mm | 15.60" | 1920x1080 | |
| 80.4 % v7 (old) | 05 / 2021 | MSI GF65 Thin 10UE i7-10750H, GeForce RTX 3060 Laptop GPU | 1.9 kg | 21.7 mm | 15.60" | 1920x1080 | |
| 85 % v7 (old) | Asus TUF Gaming A15 FA506QR-AZ061T R7 5800H, GeForce RTX 3070 Laptop GPU | 2.3 kg | 24 mm | 15.60" | 1920x1080 | ||
| 85.5 % v7 (old) | 04 / 2021 | Razer Blade 15 Base Edition 2021, i7-10750H RTX 3060 i7-10750H, GeForce RTX 3060 Laptop GPU | 2.1 kg | 19.9 mm | 15.60" | 1920x1080 |
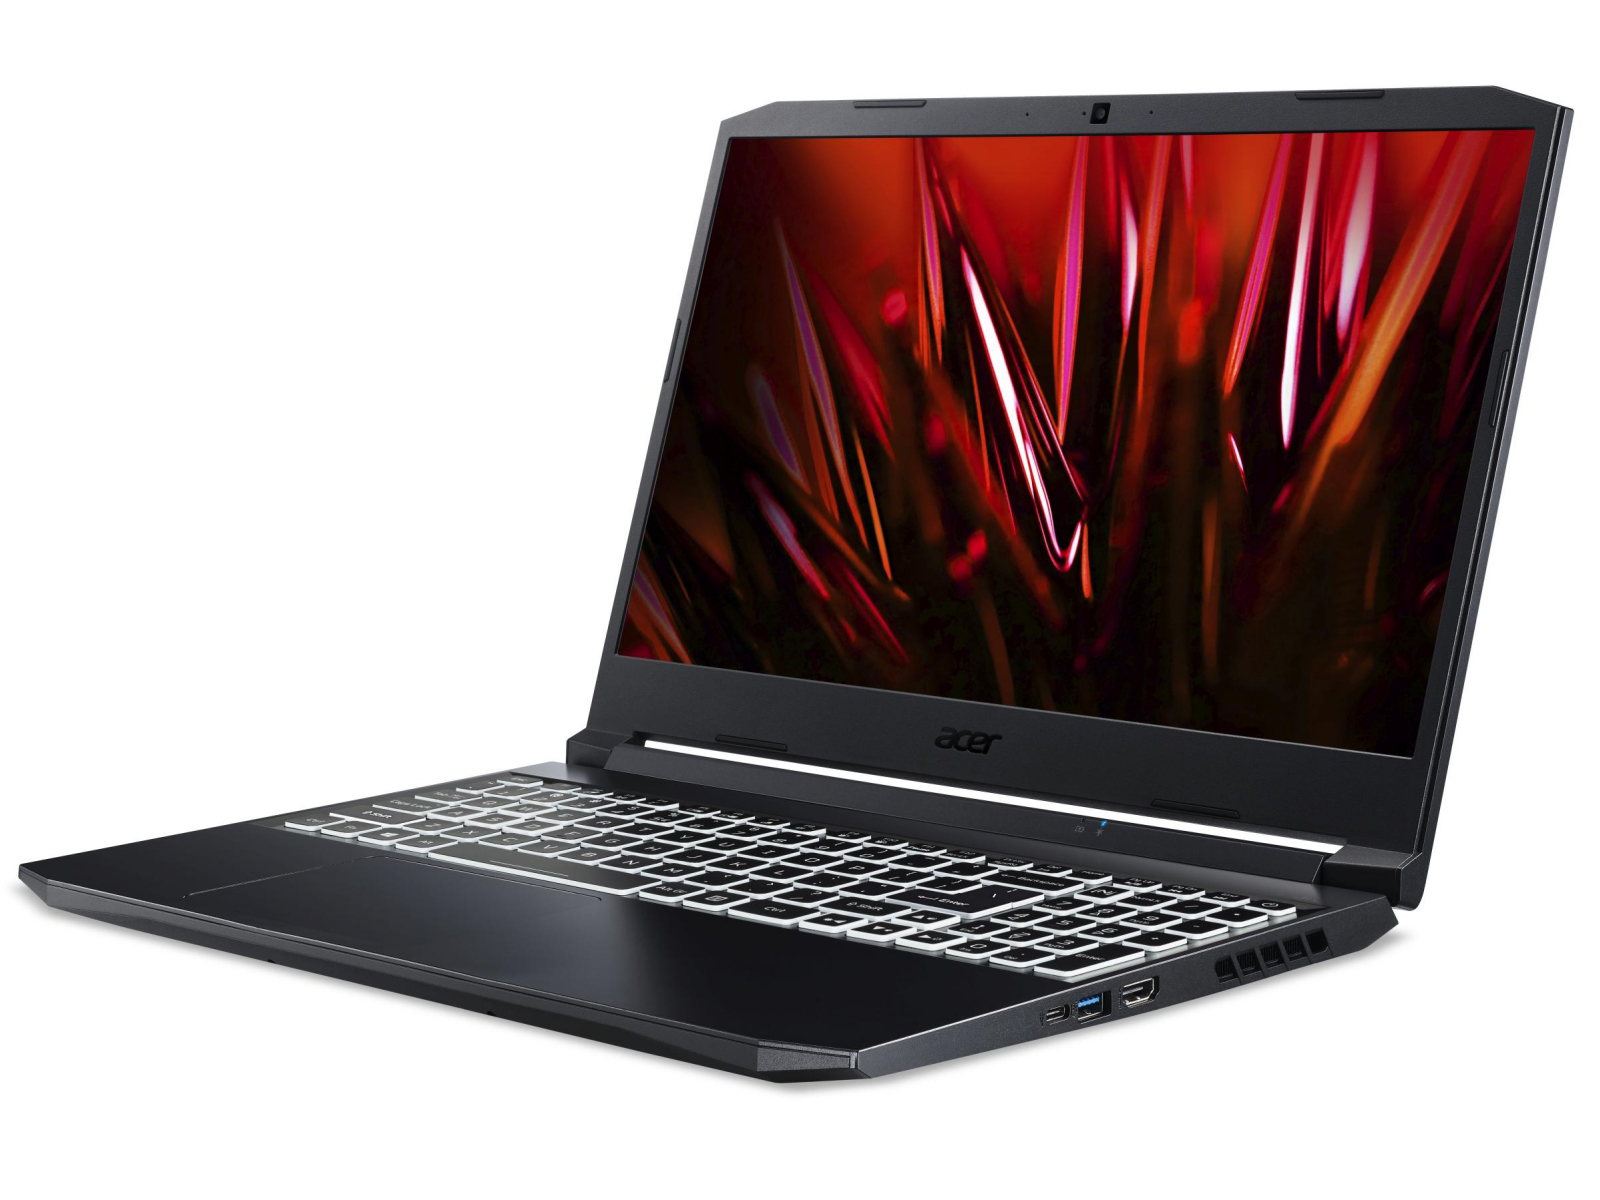
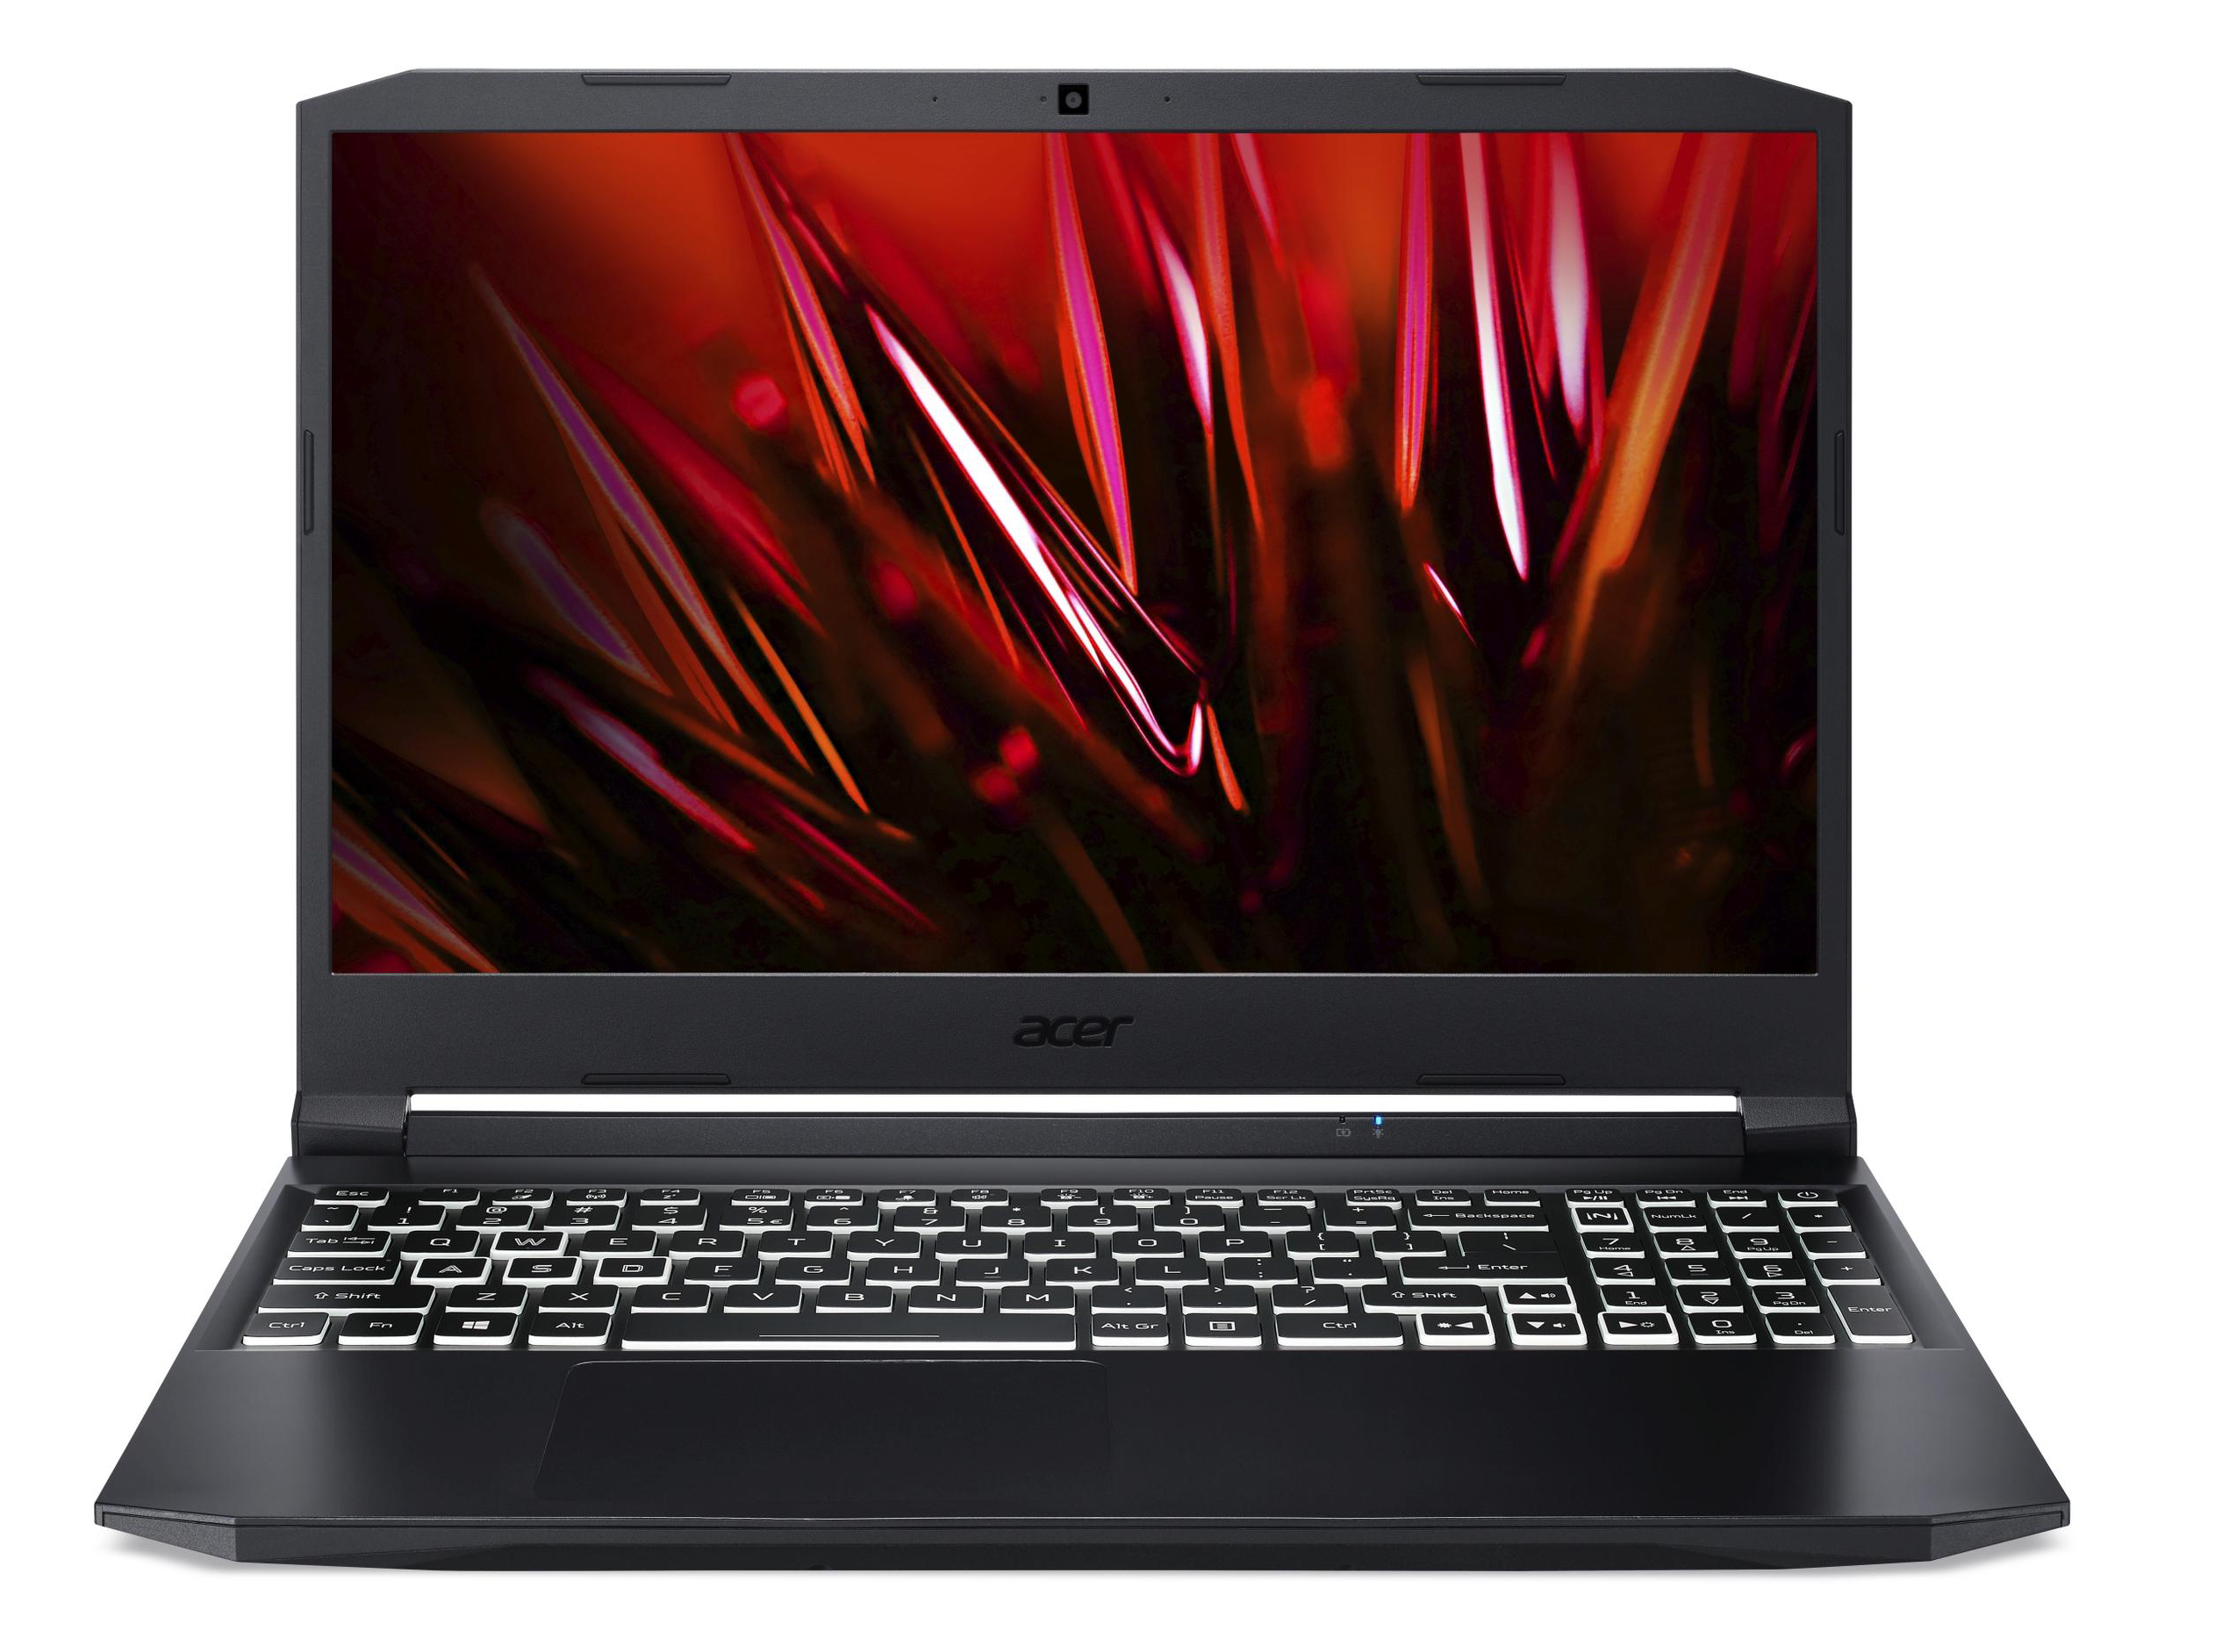
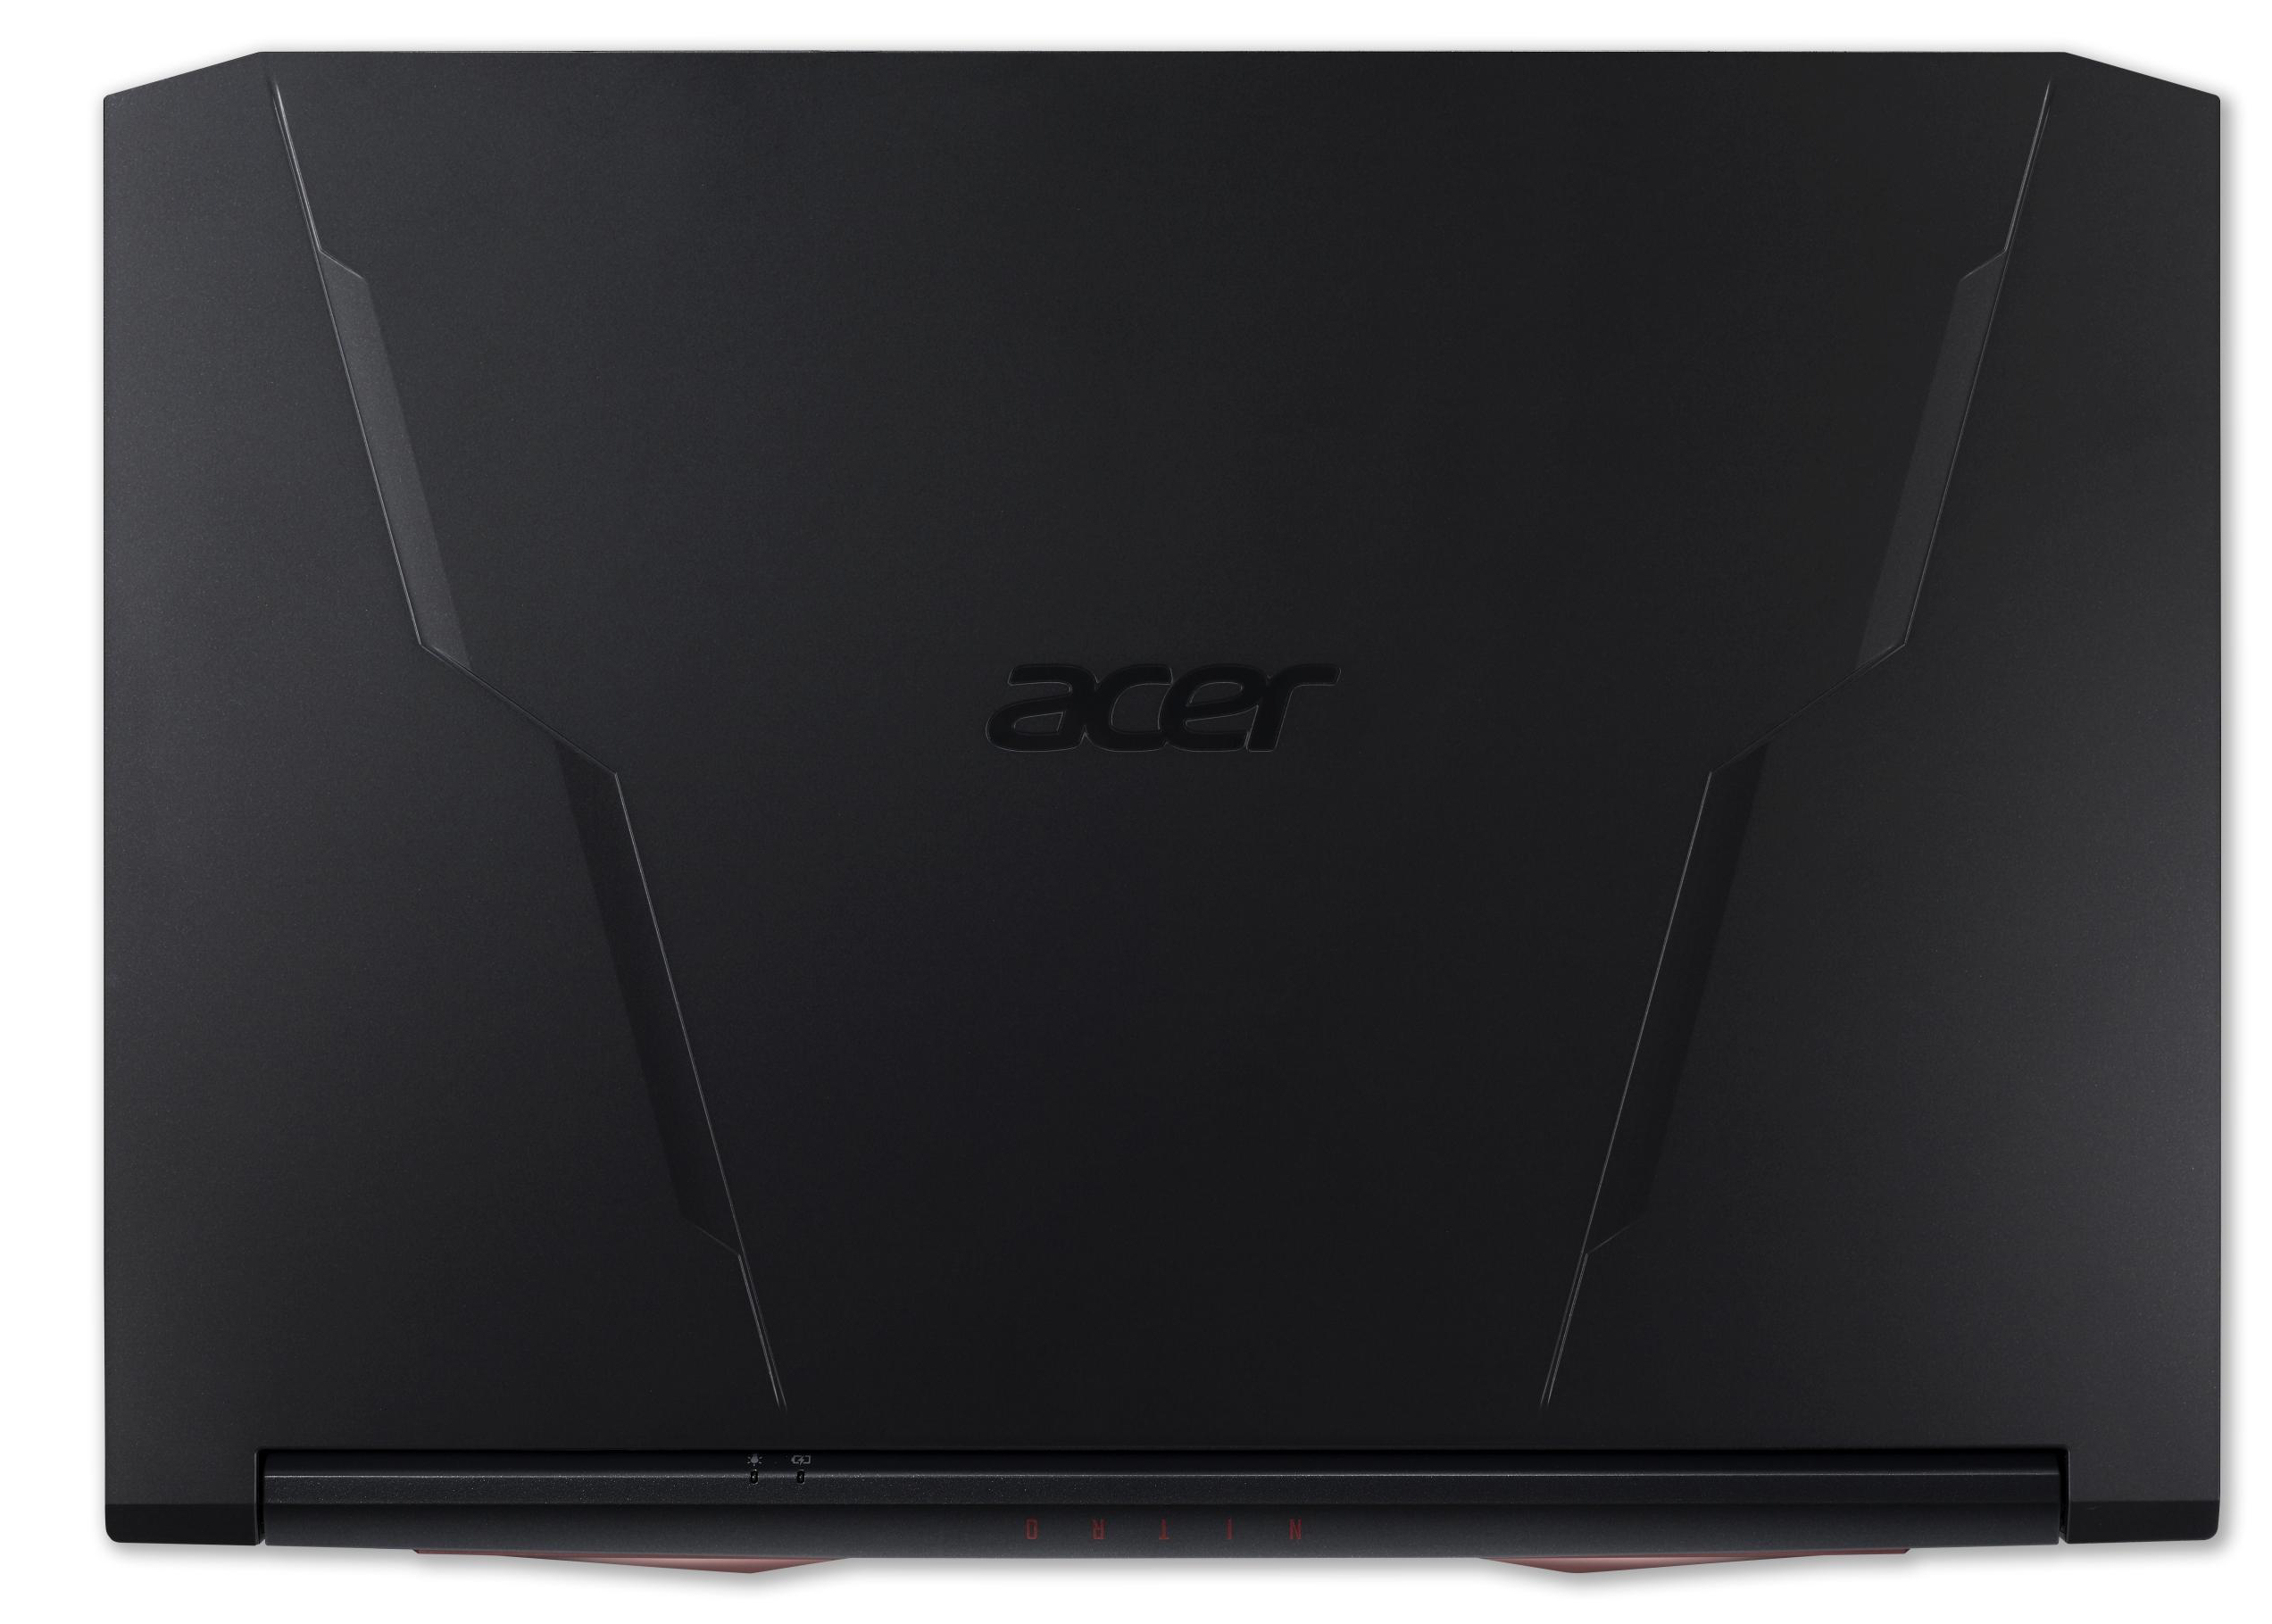
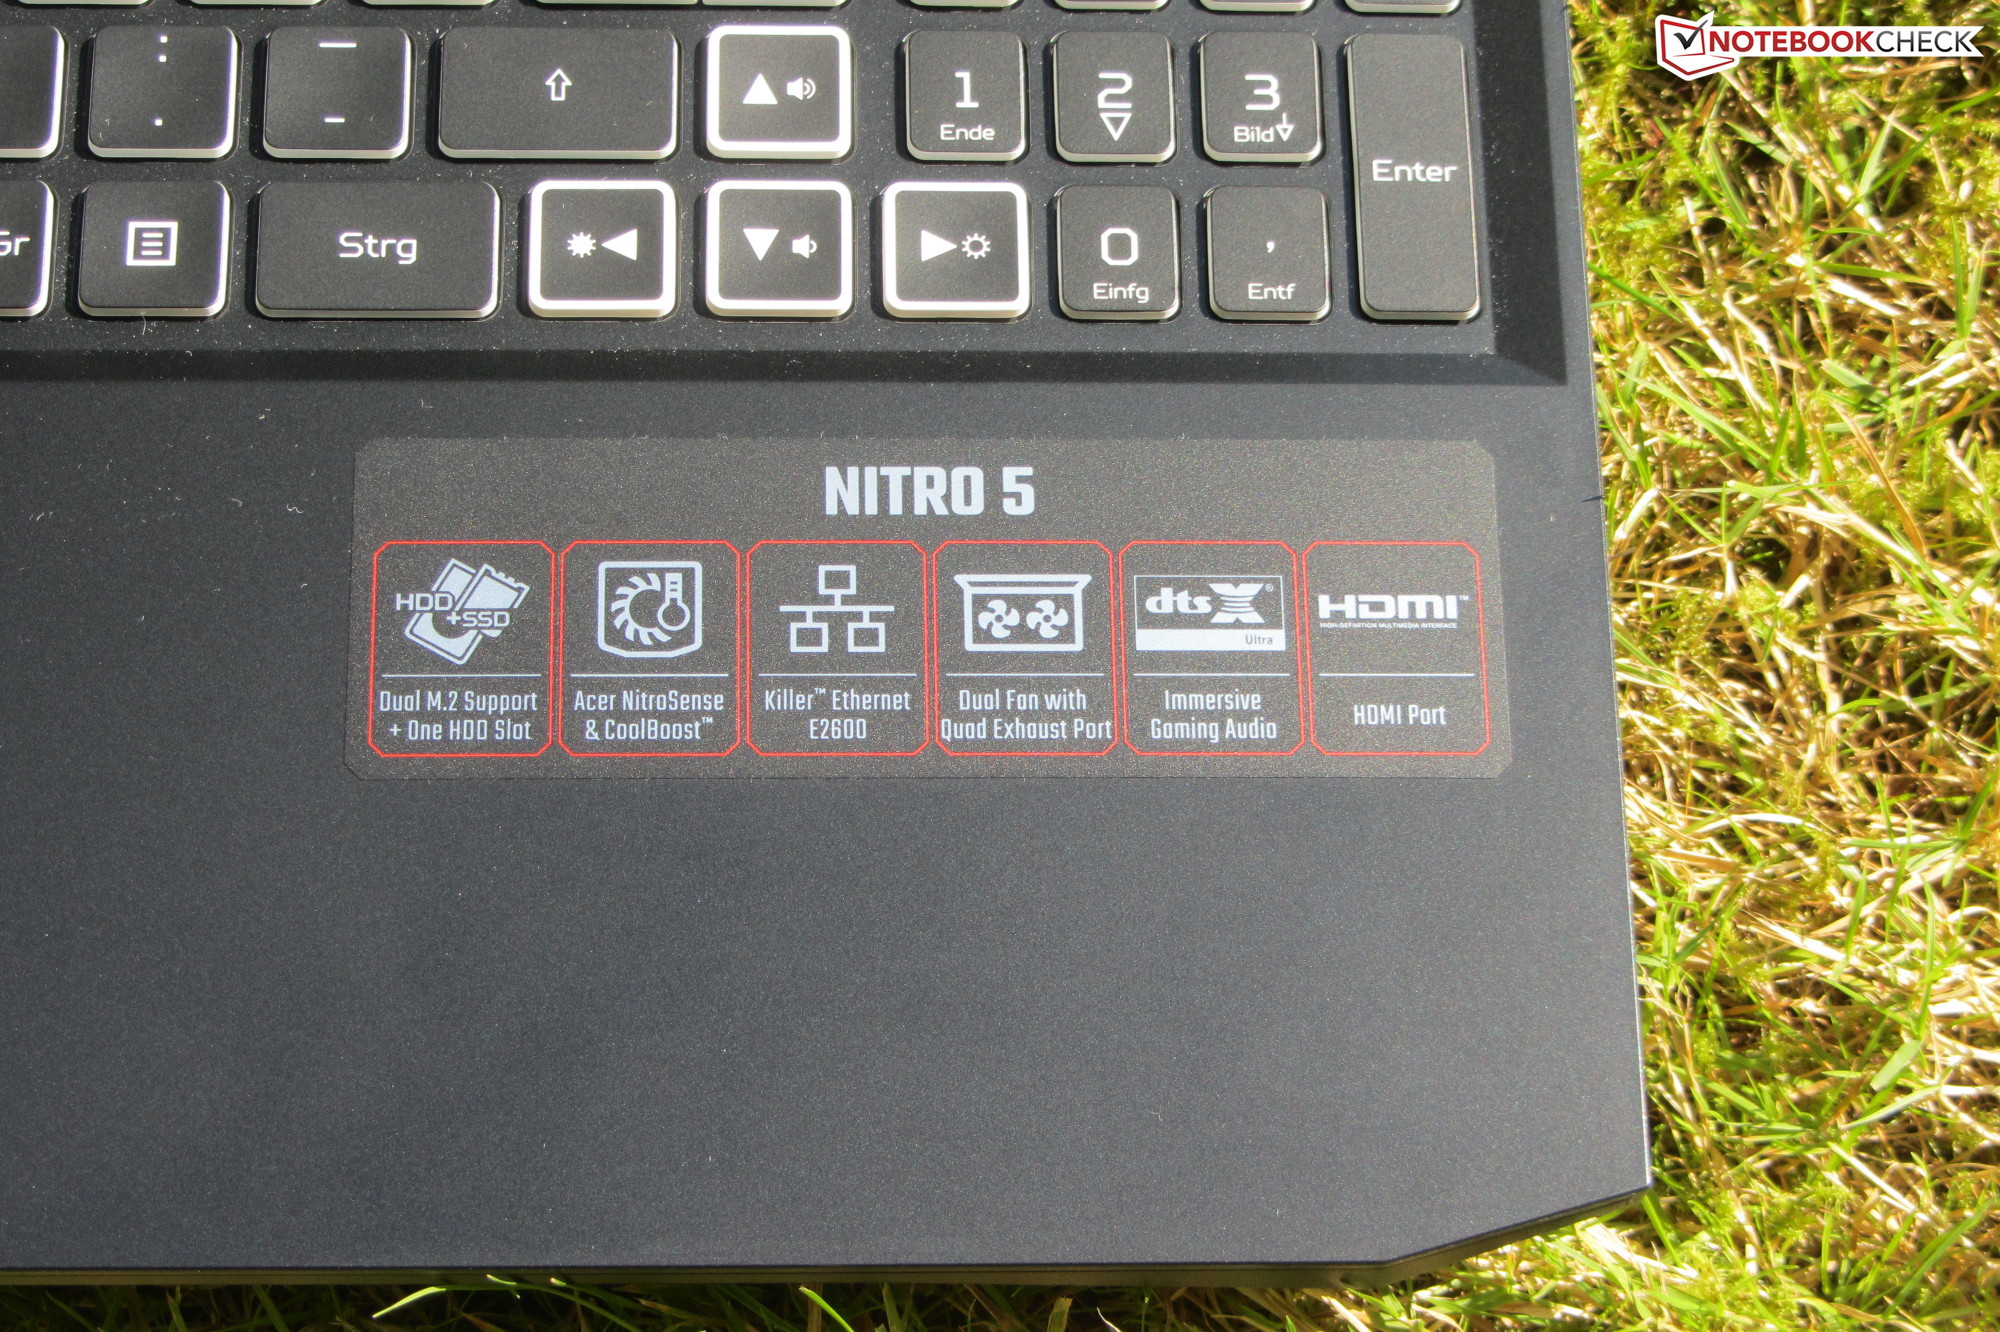
外壳 - 宏碁选择了塑料
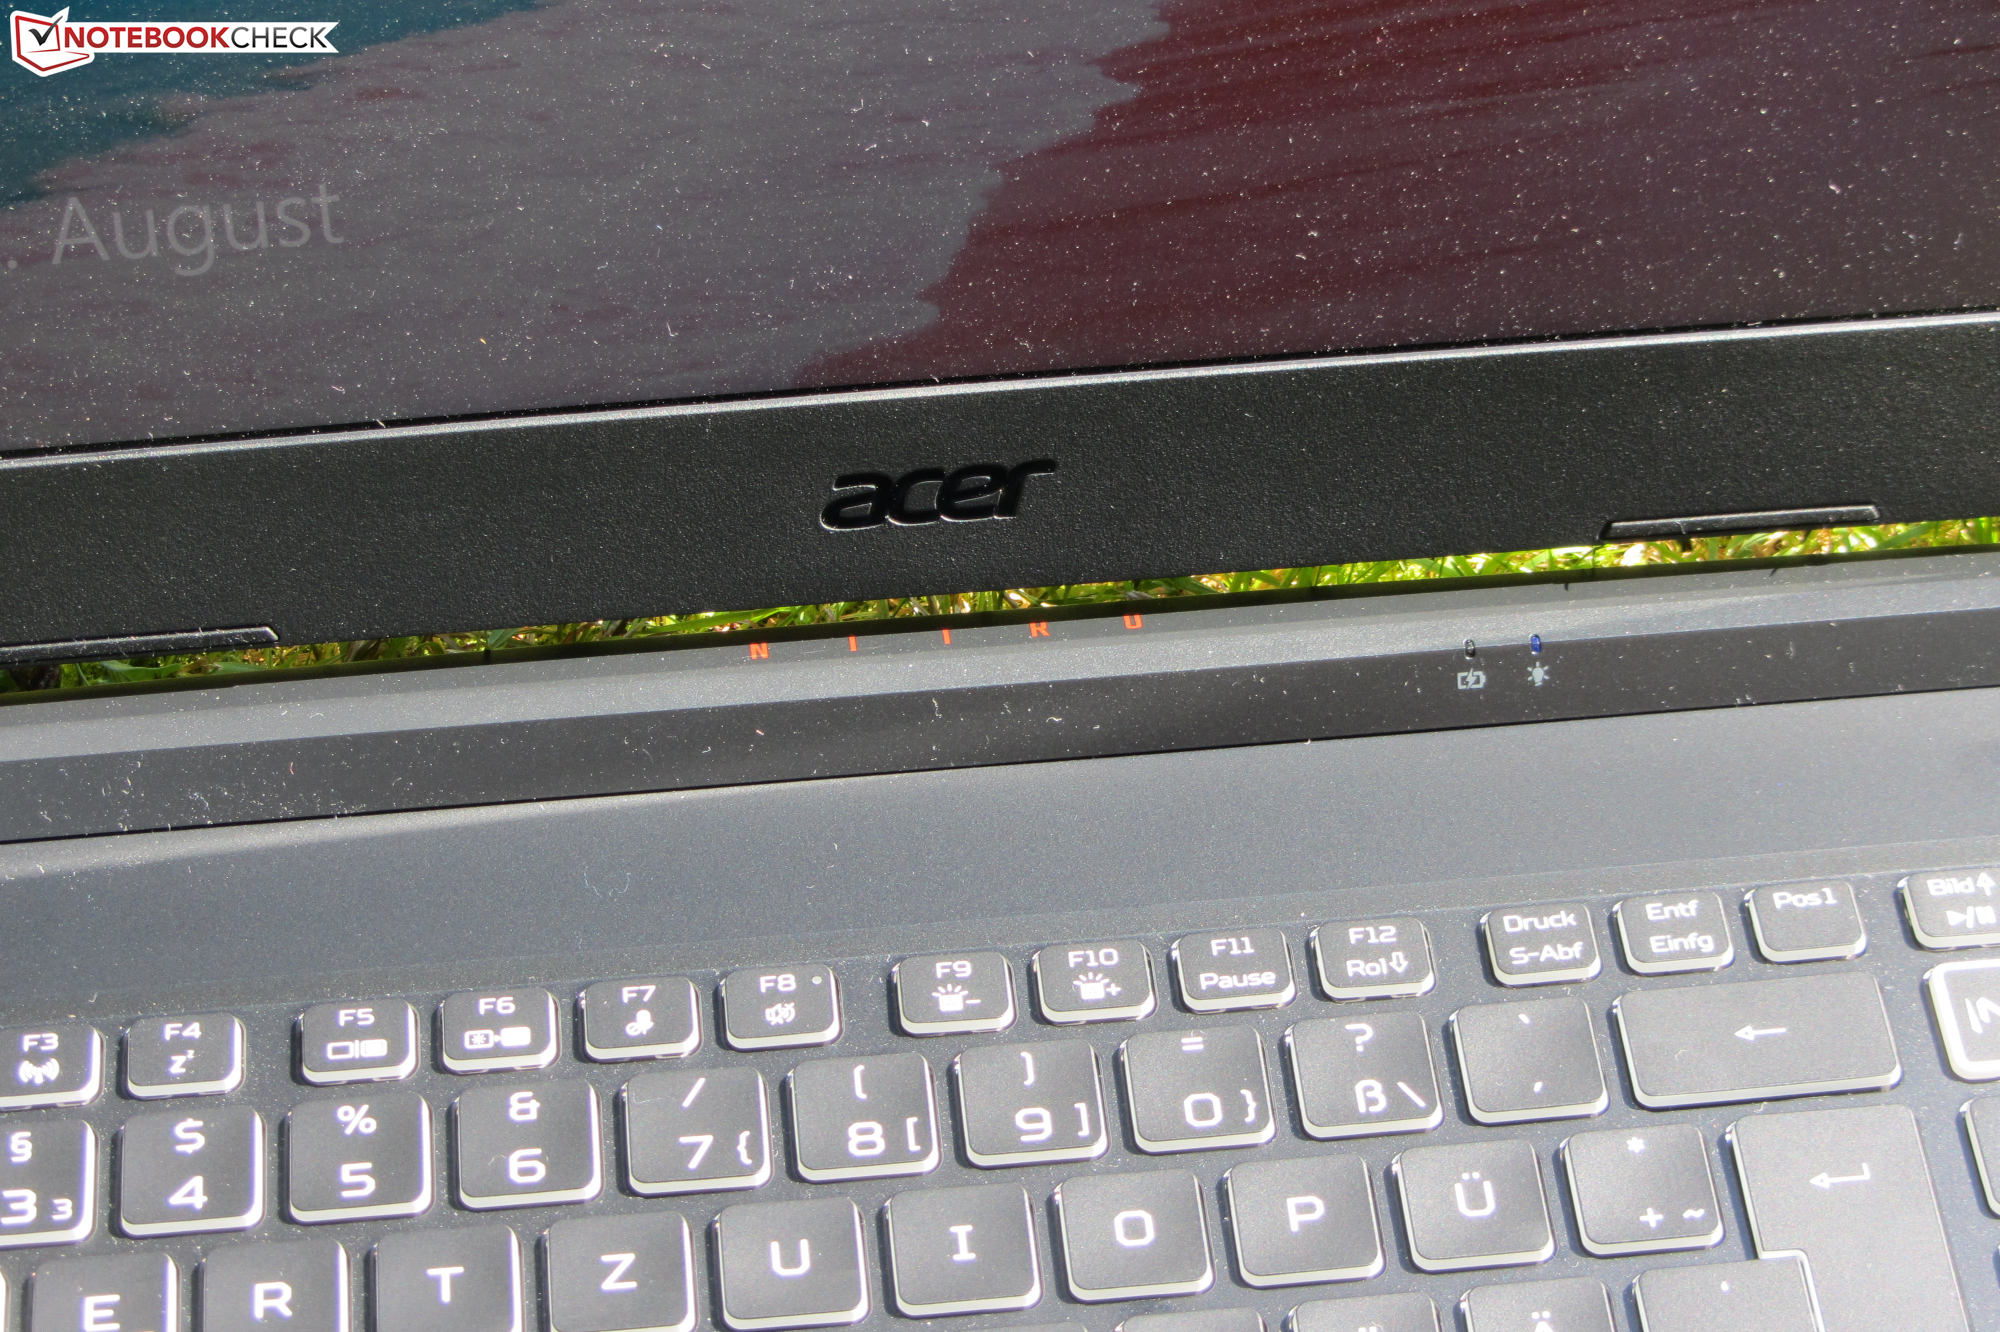
Nitro 5的整个外壳是由哑光黑色塑料制成的。除了RGB按键照明外,后部通风口之间的酒红色区域和铰链盖上的红色 "Nitro "标志为它增添了一些色彩。事实证明,机箱的光滑表面很容易沾染指纹。没有维护舱口,电池被牢牢地内置在设备中。
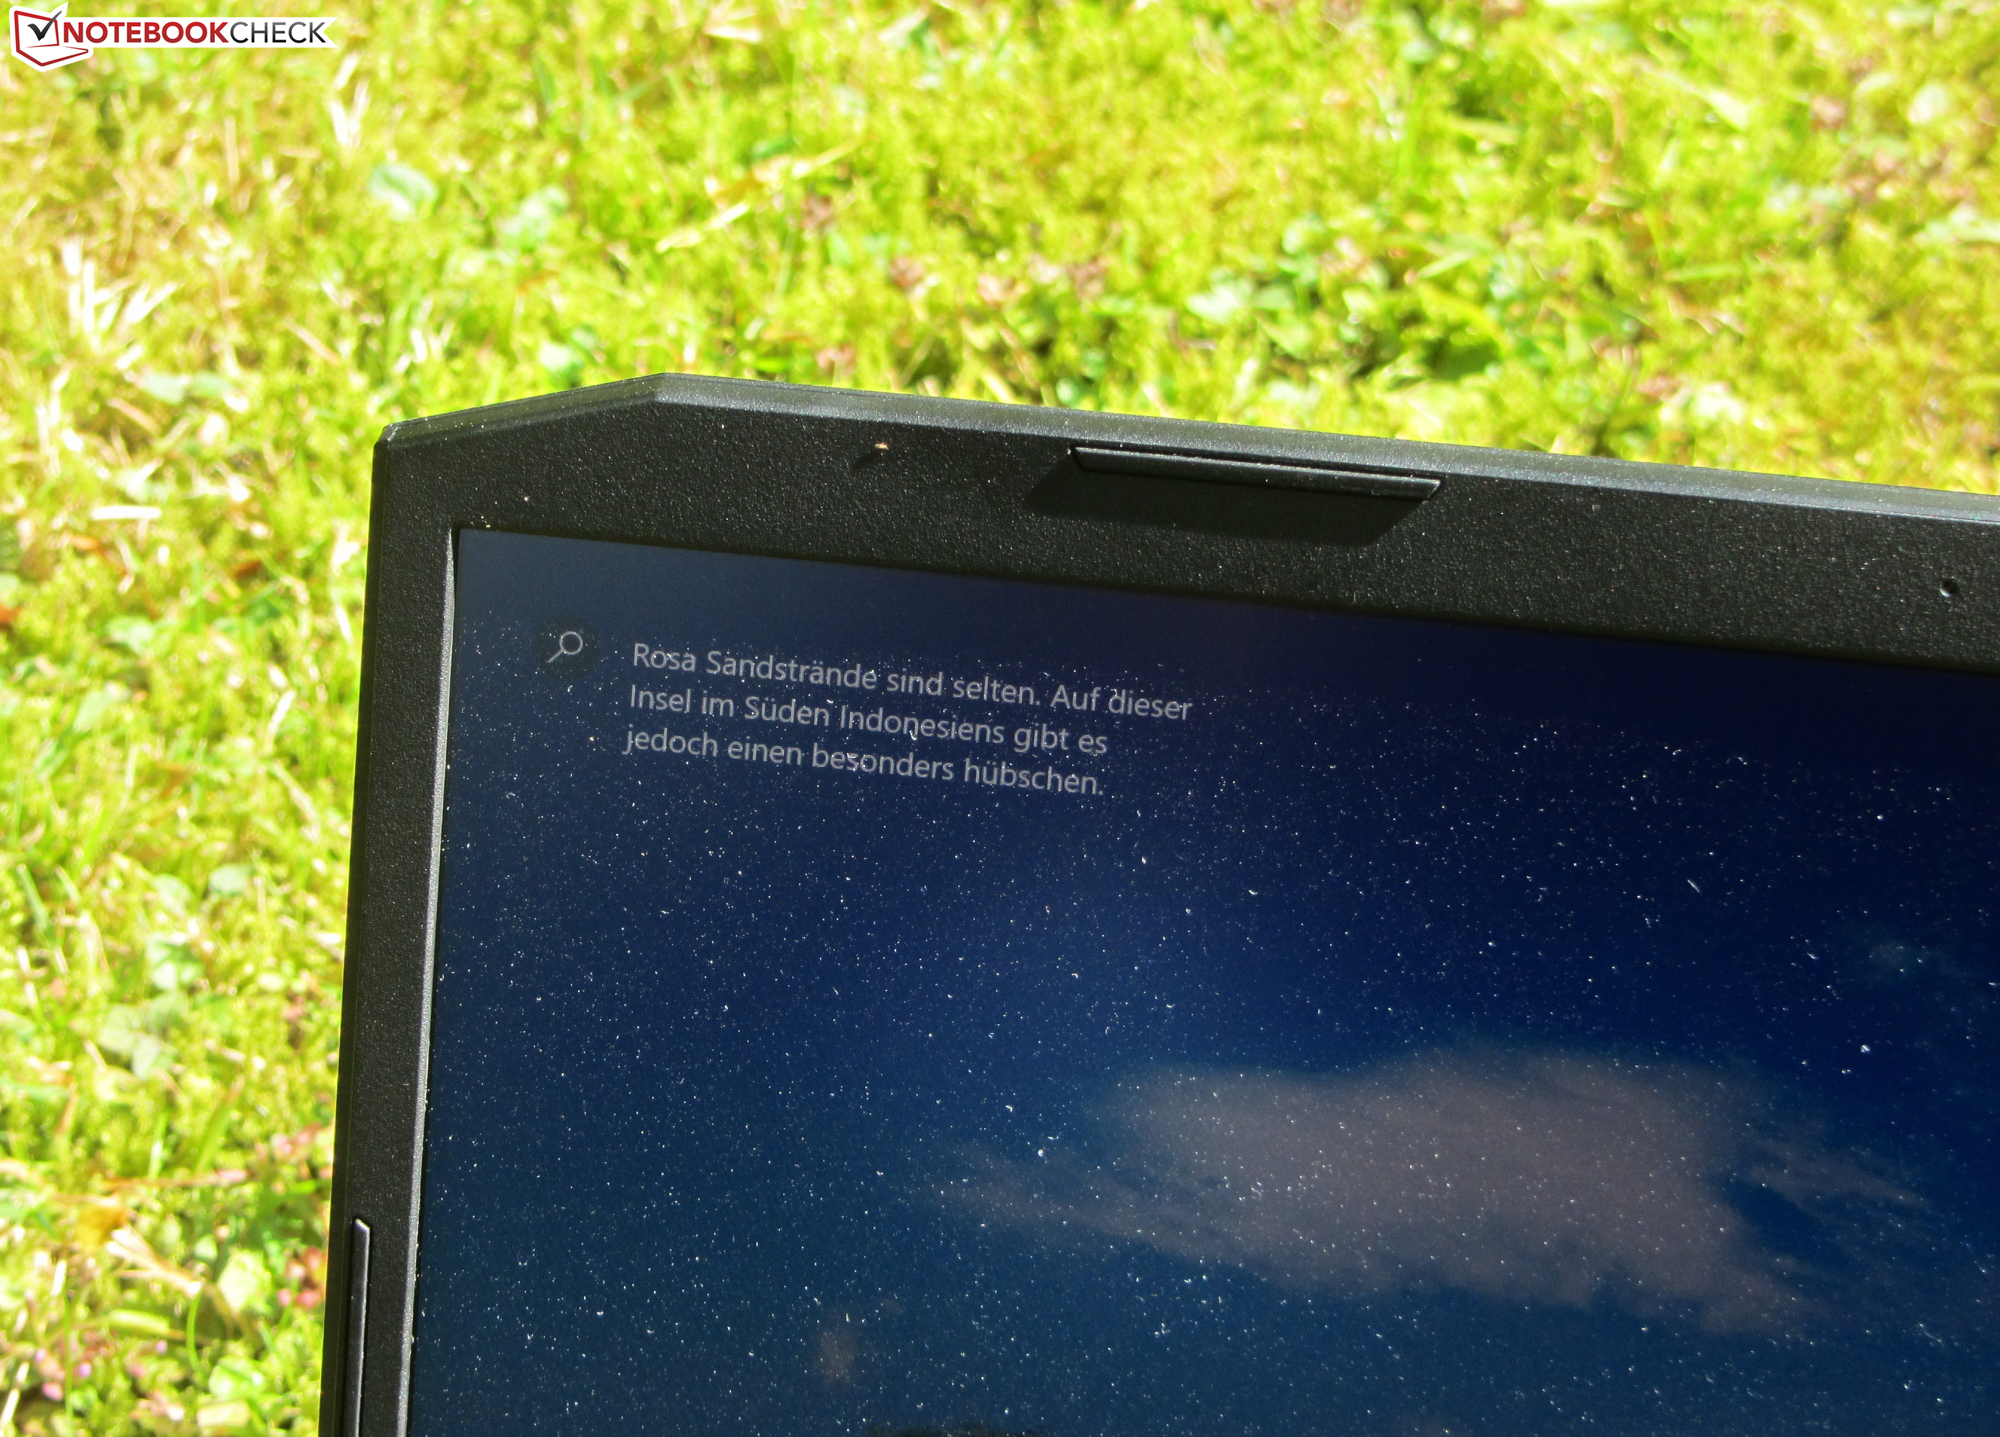
这台笔记本电脑在做工方面没有表现出任何重大的弱点。缝隙尺寸准确,没有材料突起。底座单元可以扭动一下,但整个情况都保持在一定范围内。另一方面,盖子可以更加坚硬。此外,在盖子的背面施加压力并不会导致显示屏的改变。铰链将屏幕牢牢固定在位置上,单手打开盖子是可能的。最大开孔角度约为150度。
就尺寸和重量而言,在我们的比较领域中的大多数设备之间没有太多的差异。Razer Blade 15作为最紧凑的设备脱颖而出,而MSI GF65 Thin 10UE的重量最低。
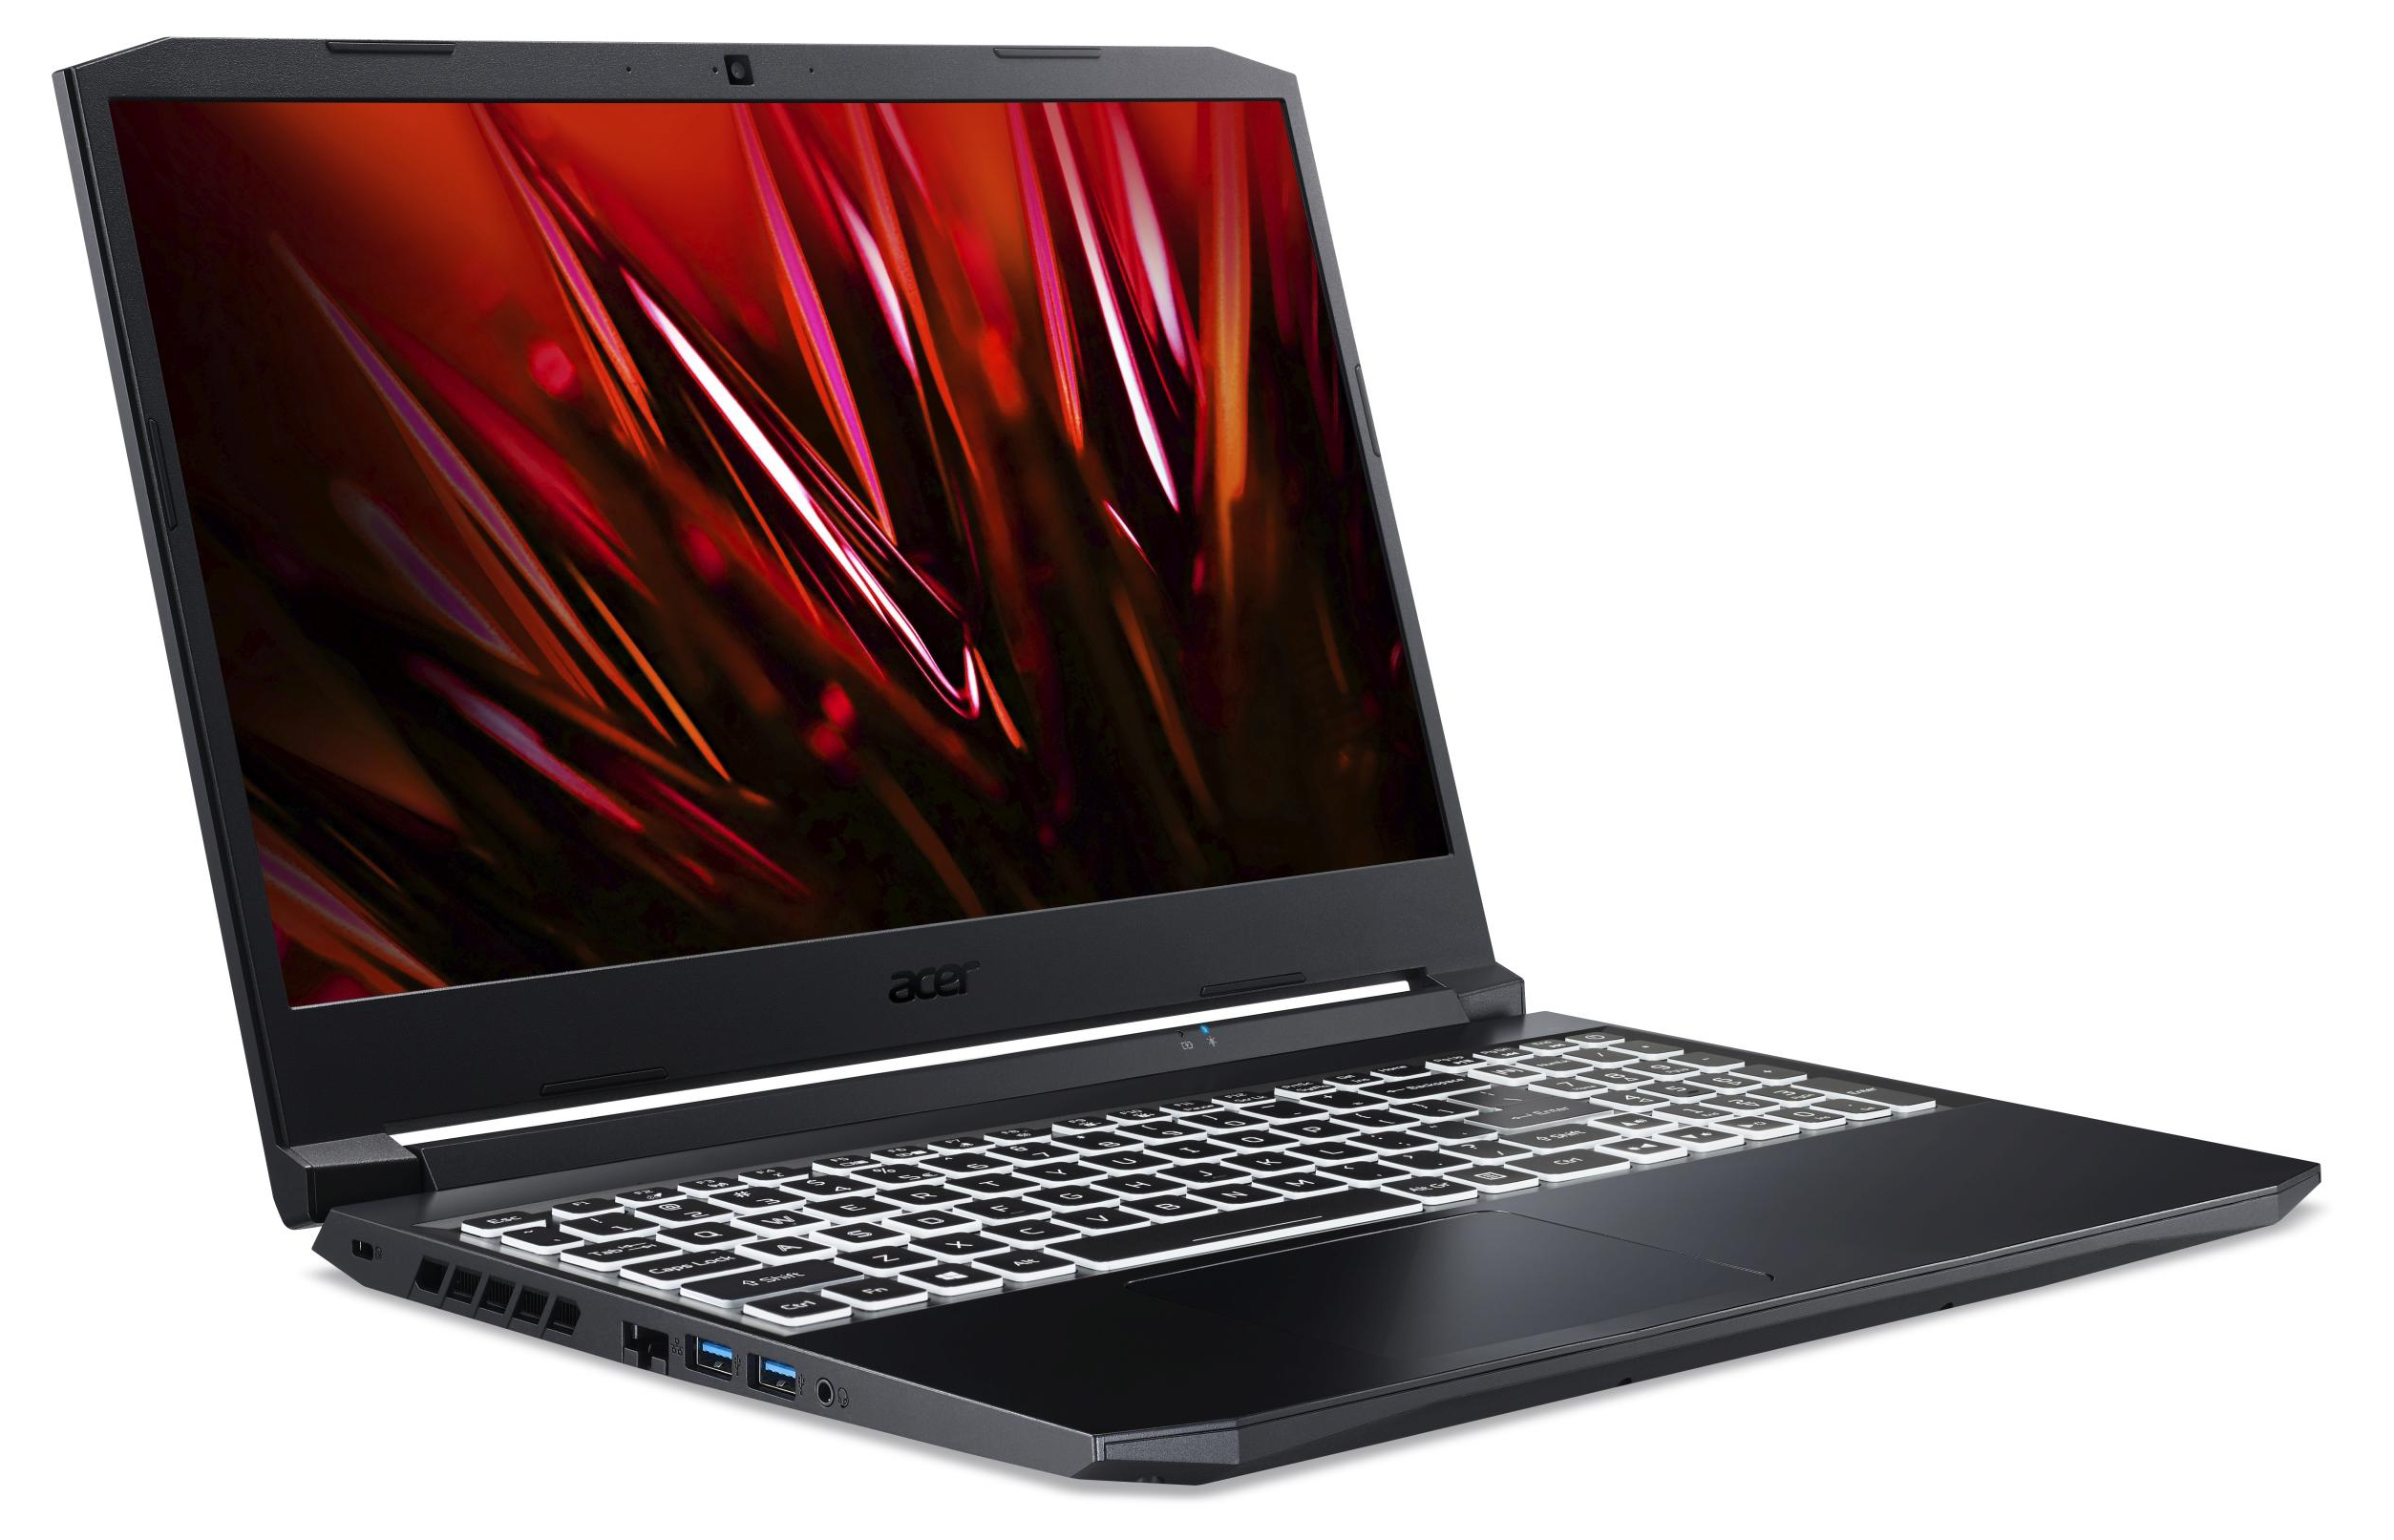
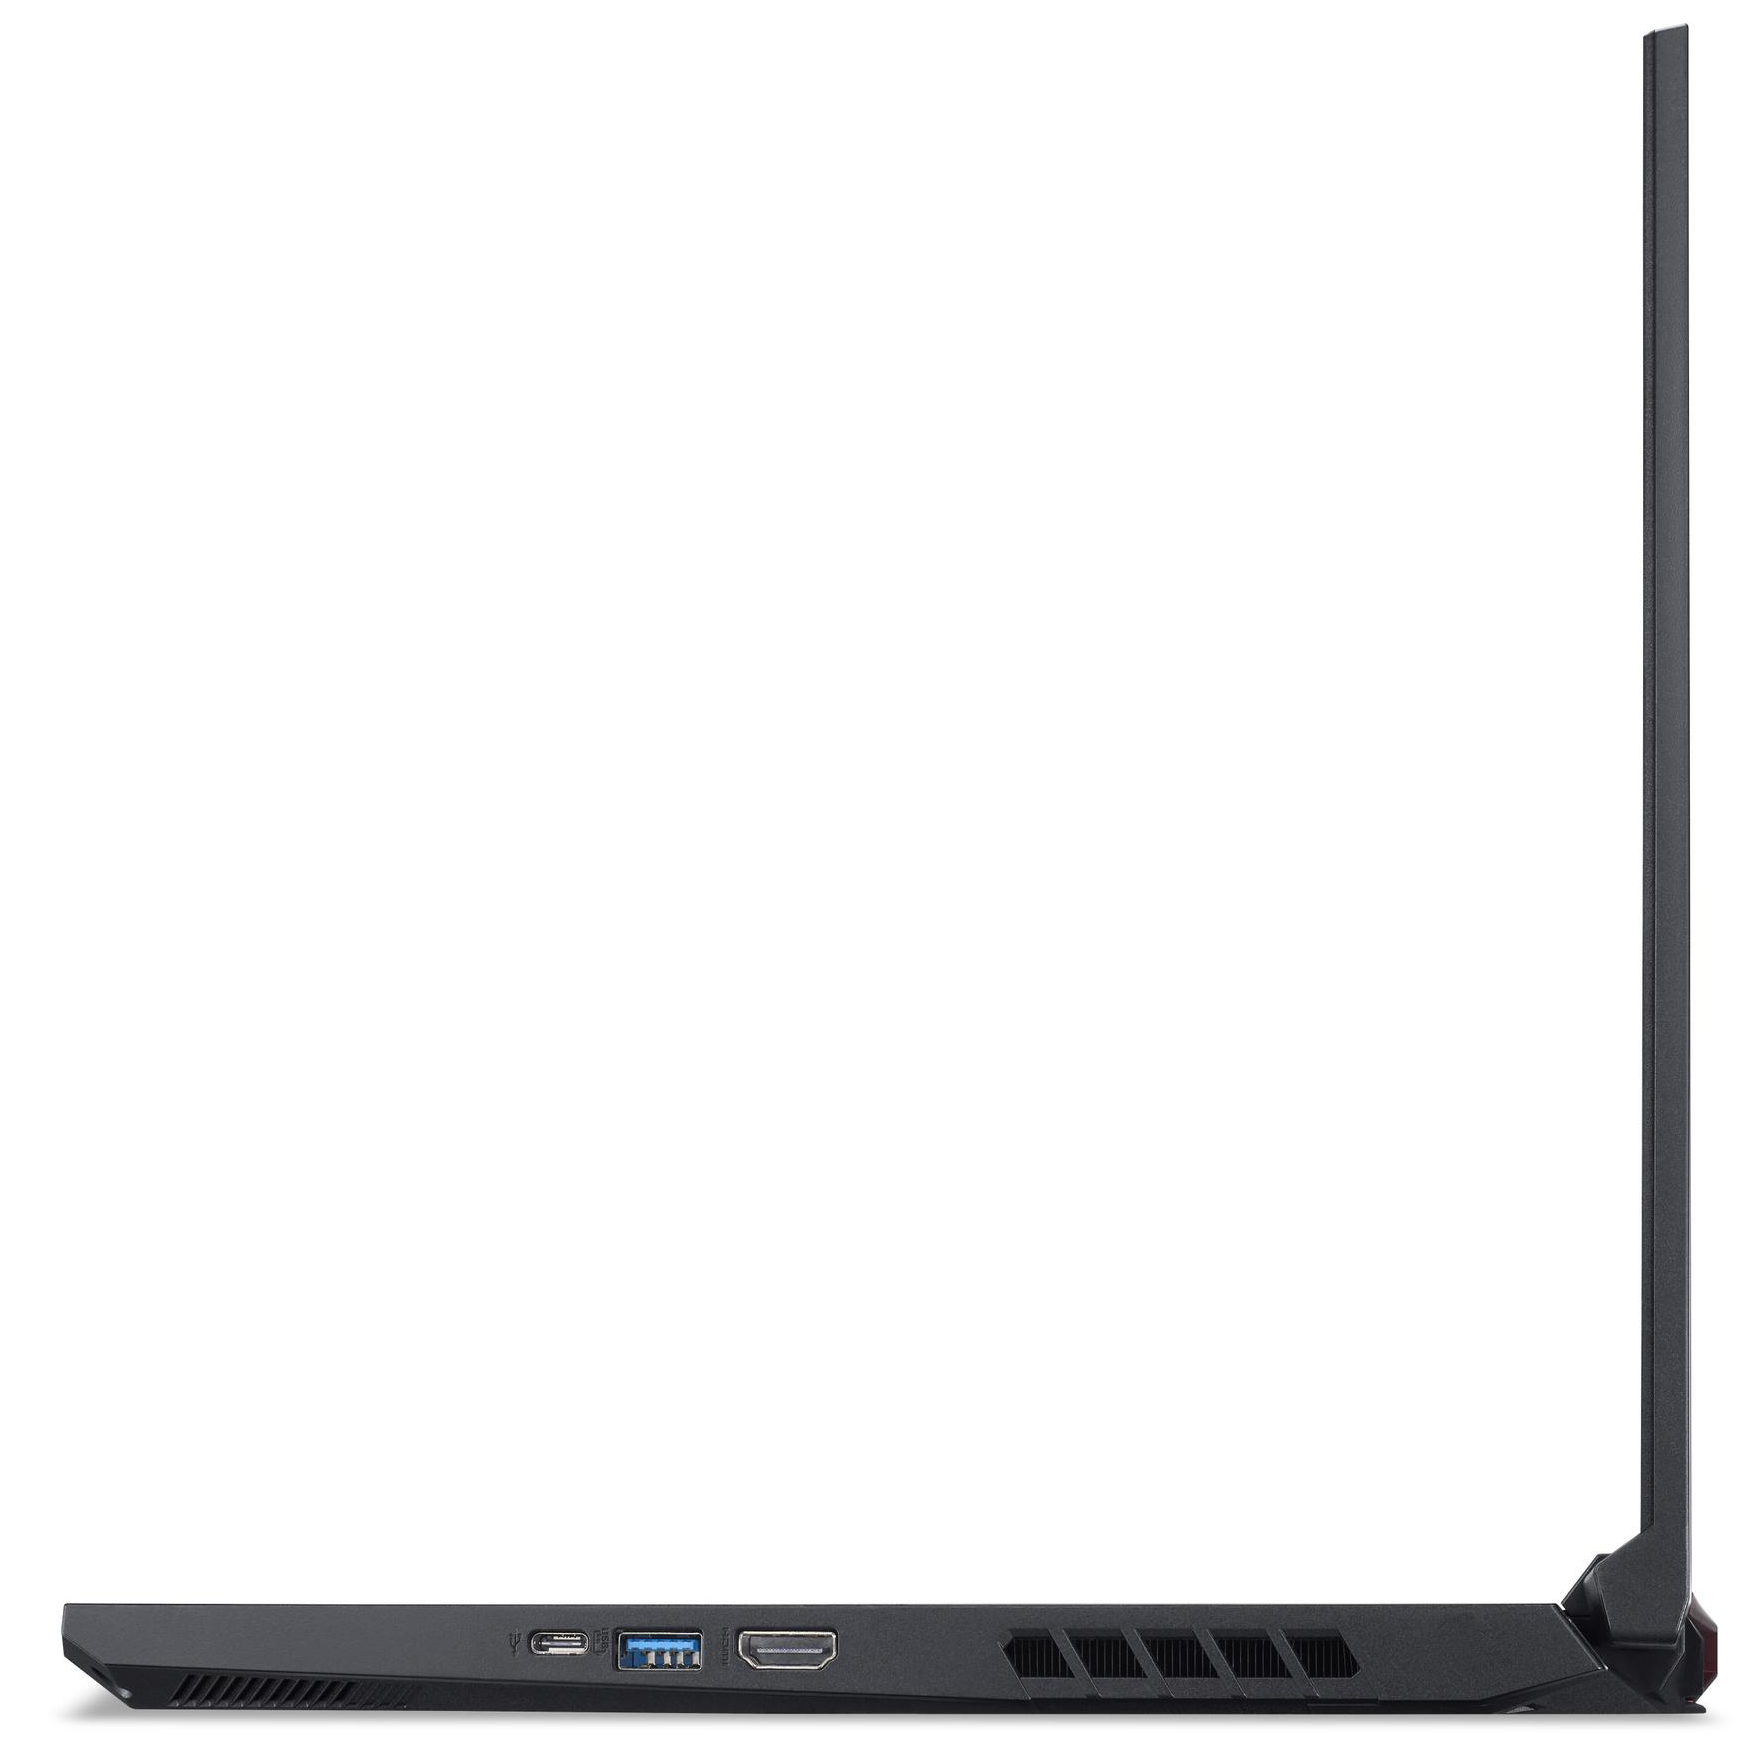
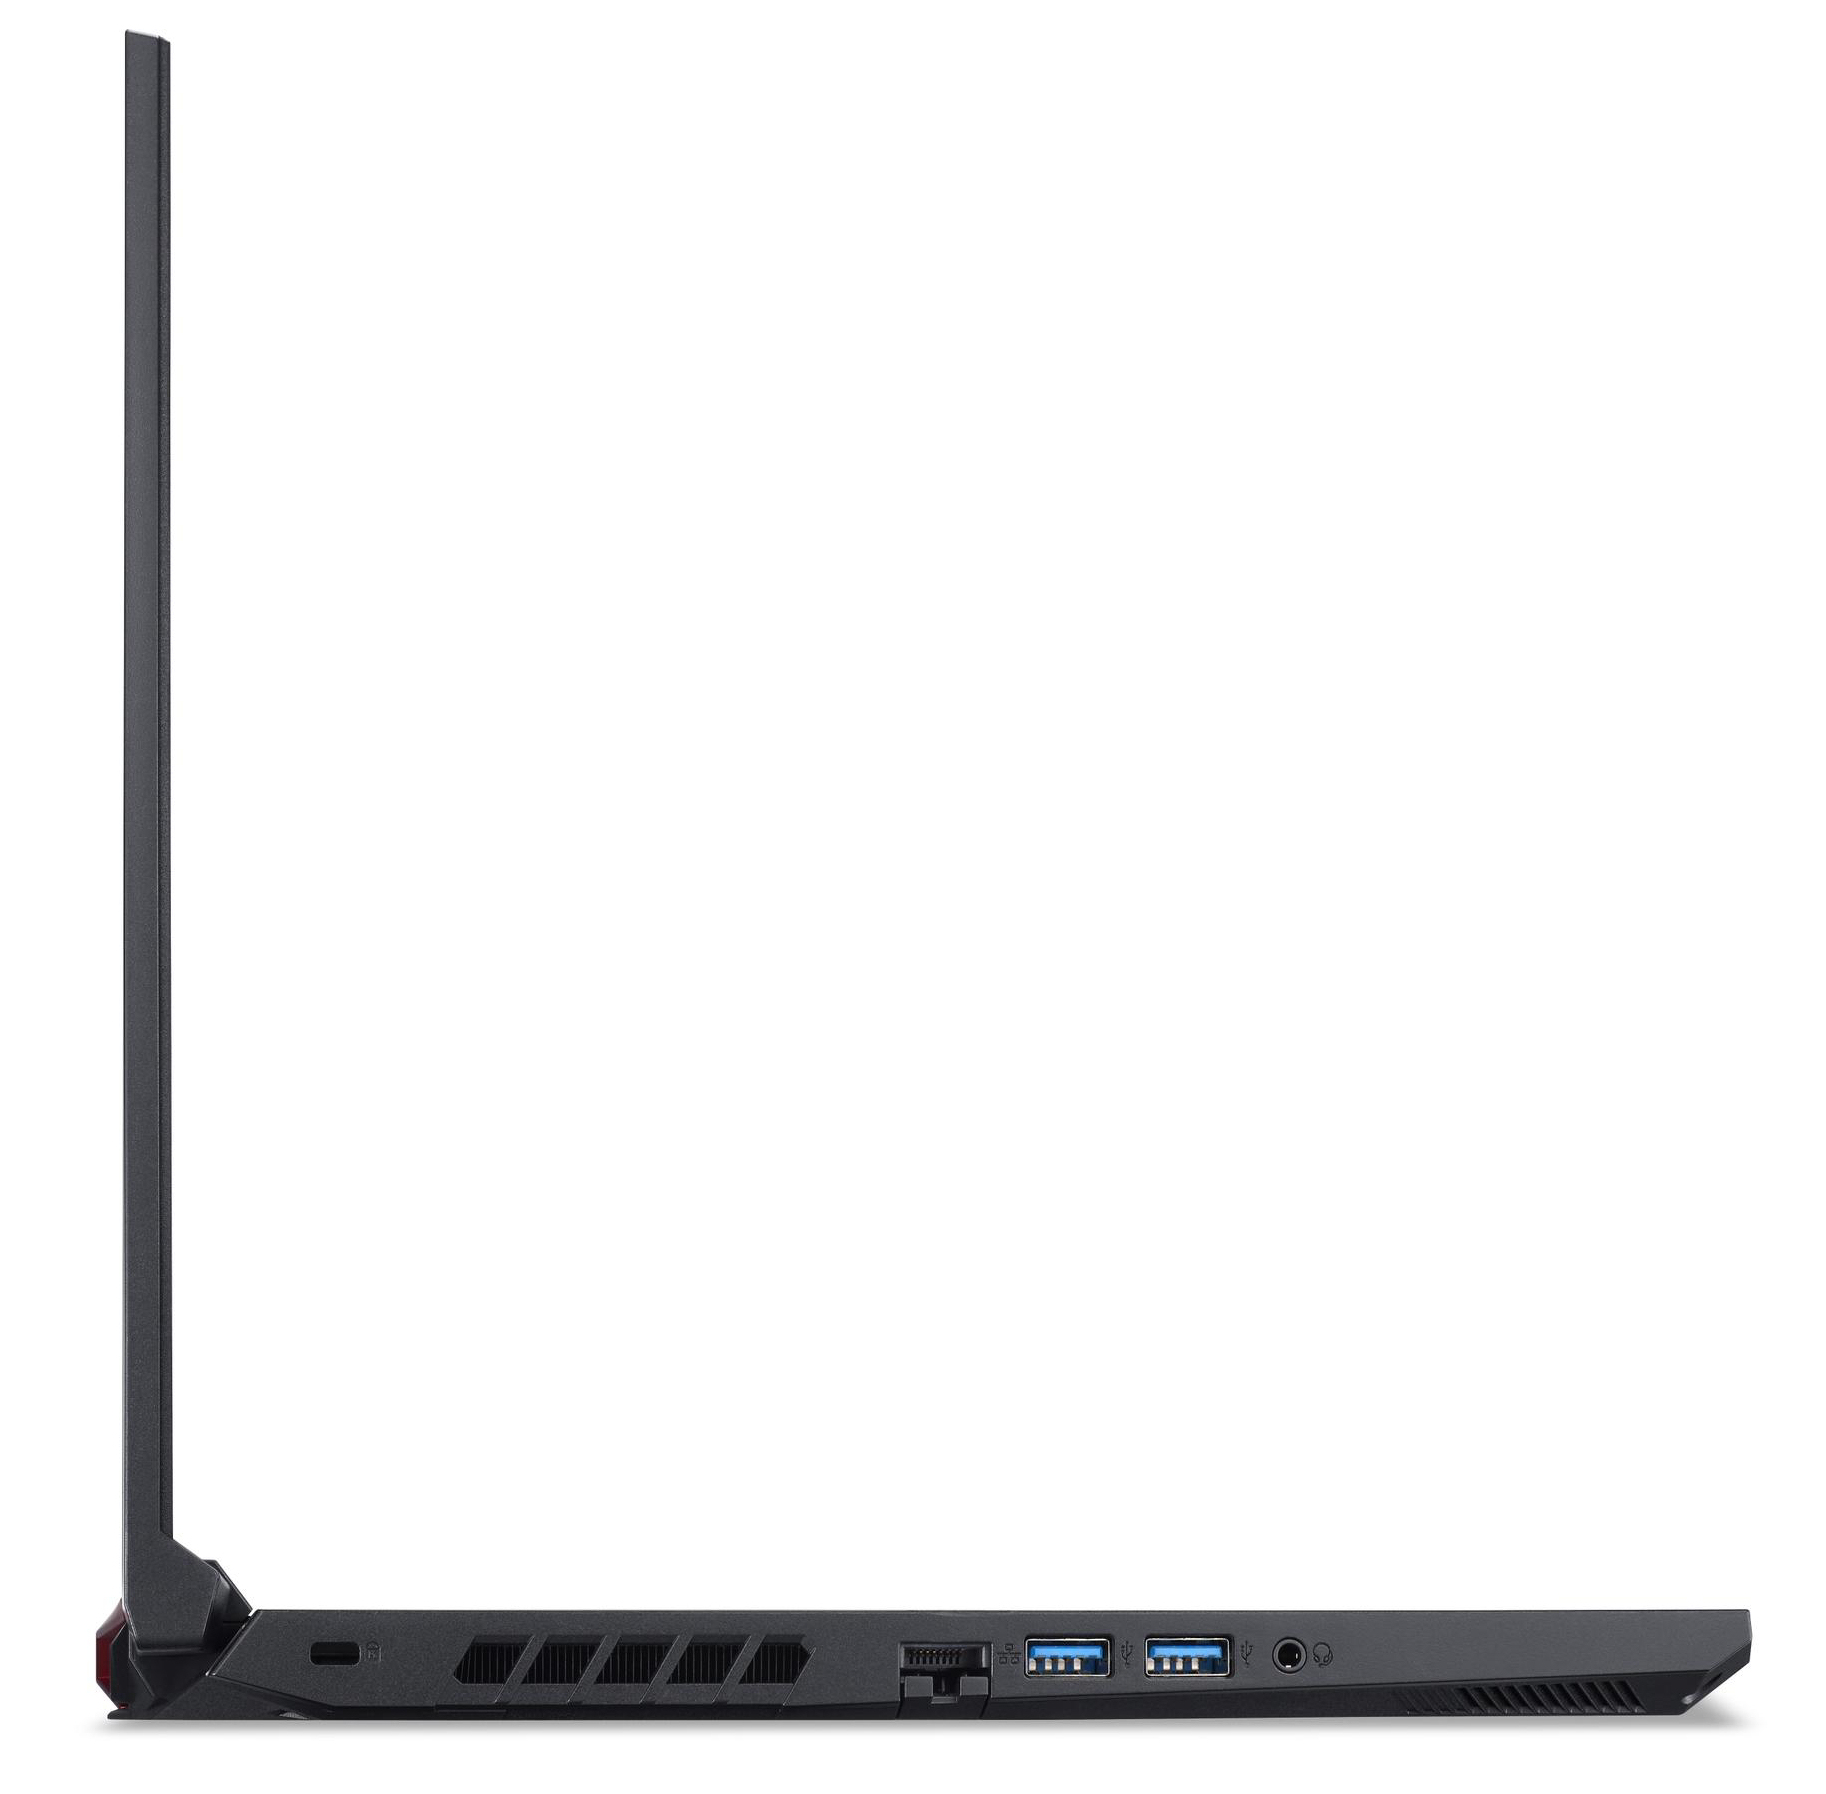
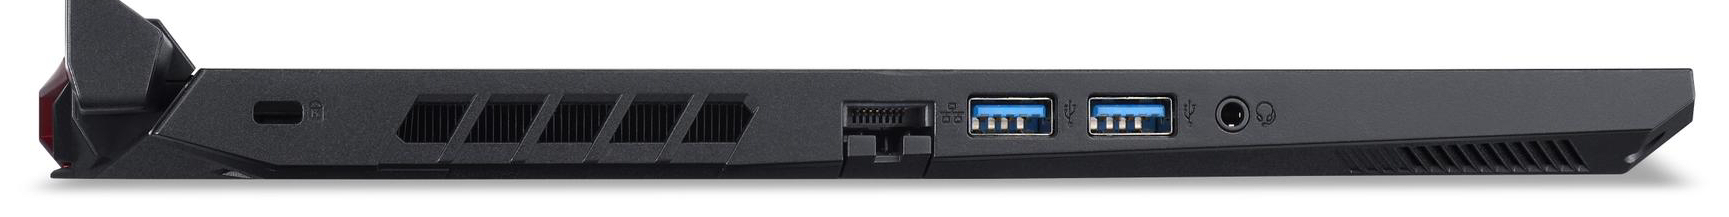
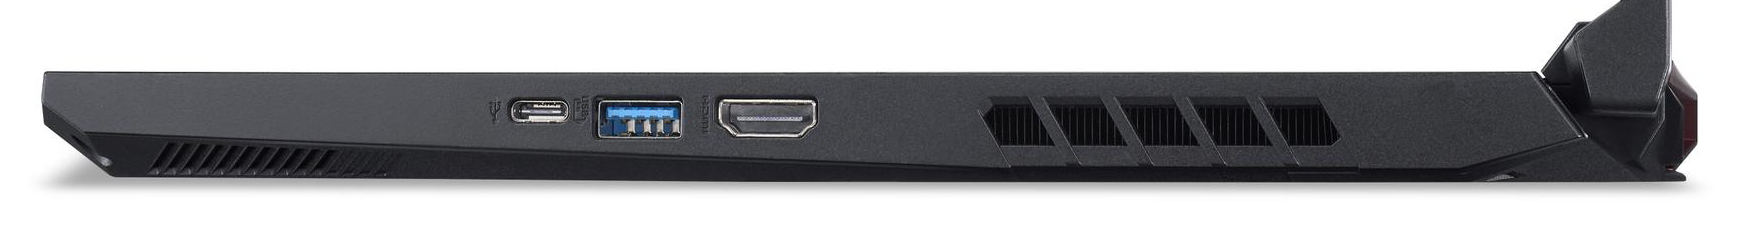
连接性 - Nitro 5不含Thunderbolt
Nitro 5有三个USB-A端口(2个USB 3.2 Gen 1,1个USB 3.2 Gen 2)和一个USB-C端口(USB 3.2 Gen 2)。后者不支持Power Delivery或通过USB-C的DisplayPort。因此,只有一个HDMI连接的视频输出。也没有存储卡读卡器。
沟通
WLAN芯片(联发科MT7921)支持802.11ax标准并提供蓝牙5功能。在最佳条件下确定的数据速率(附近没有其他WLAN设备,笔记本电脑和服务器PC之间的距离很短)落后于芯片的能力。测试以时间间隔重复进行--最终结果没有任何变化。我们怀疑是驱动程序的问题。此外,有线网络连接是由Killer E2600千兆以太网控制器处理的。它顺利地执行了任务。
| Networking | |
| iperf3 transmit AX12 | |
| Razer Blade 15 Base Edition 2021, i7-10750H RTX 3060 | |
| Asus TUF Gaming A15 FA506QR-AZ061T | |
| Aorus 15P XC | |
| Acer Aspire Nitro 5 AN515-55-57GF | |
| MSI GF65 Thin 10UE | |
| Acer Nitro 5 AN515-45-R1JH | |
| Average MediaTek MT7921 (548 - 985, n=16) | |
| iperf3 receive AX12 | |
| Asus TUF Gaming A15 FA506QR-AZ061T | |
| Razer Blade 15 Base Edition 2021, i7-10750H RTX 3060 | |
| Aorus 15P XC | |
| MSI GF65 Thin 10UE | |
| Acer Aspire Nitro 5 AN515-55-57GF | |
| Average MediaTek MT7921 (90 - 972, n=16) | |
| Acer Nitro 5 AN515-45-R1JH | |
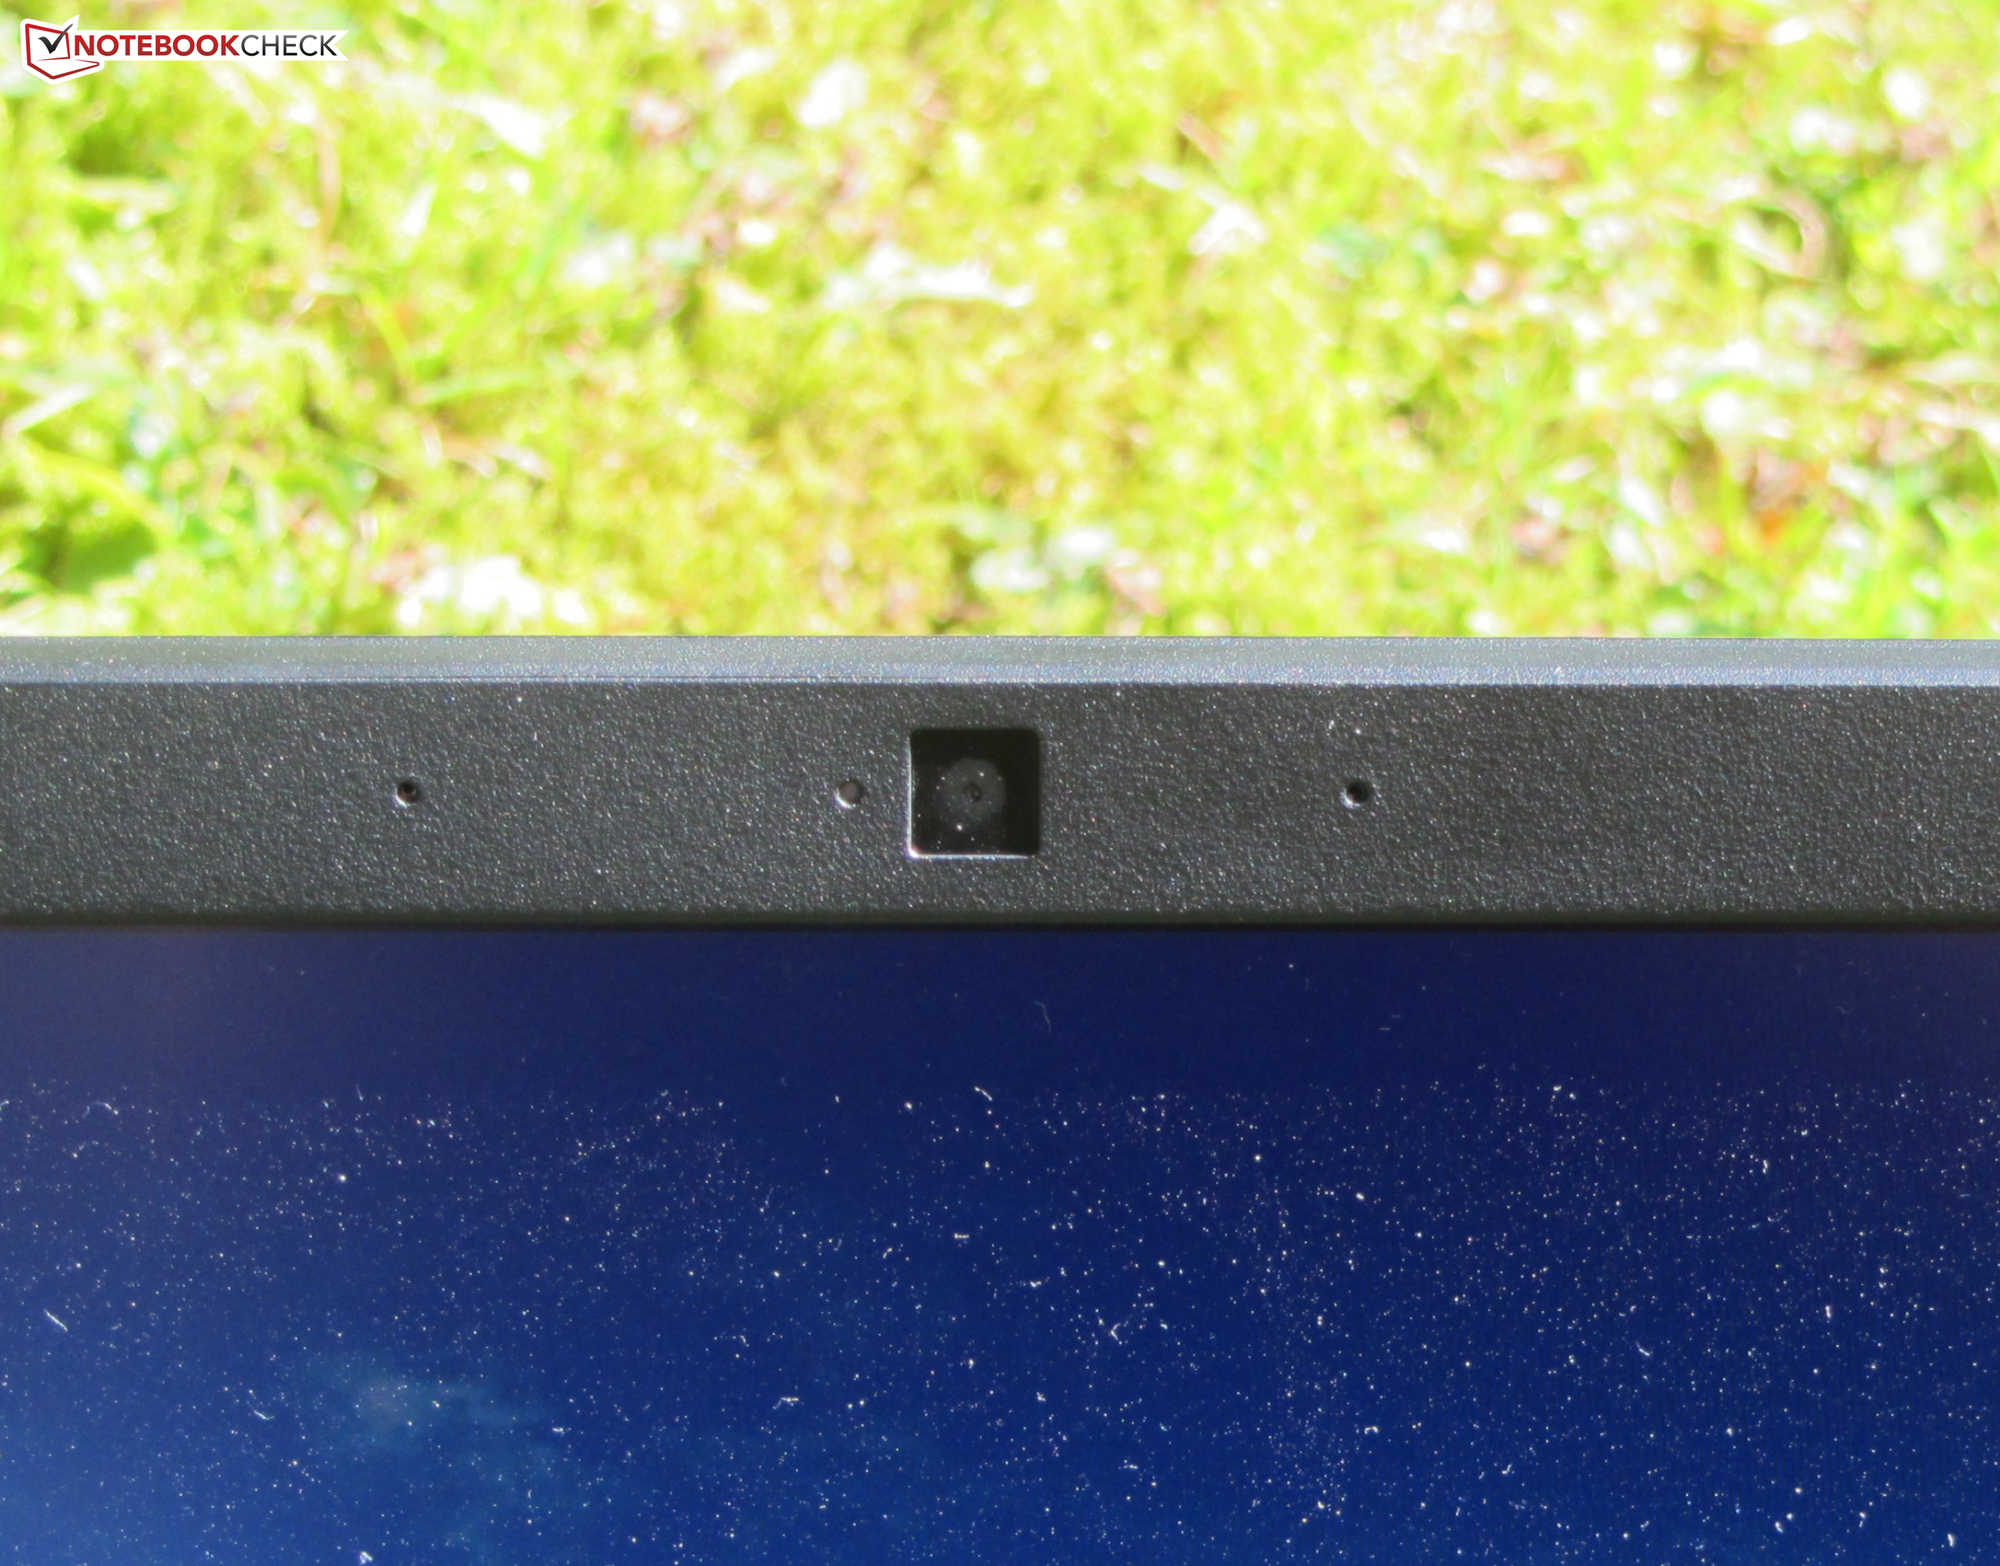
网络摄像头
网络摄像头(0.9MP)生成的图像的最大分辨率为1280x720像素。色彩准确性方面存在问题。偏差几乎达到12,明显错过了目标(DeltaE小于3)。


辅料
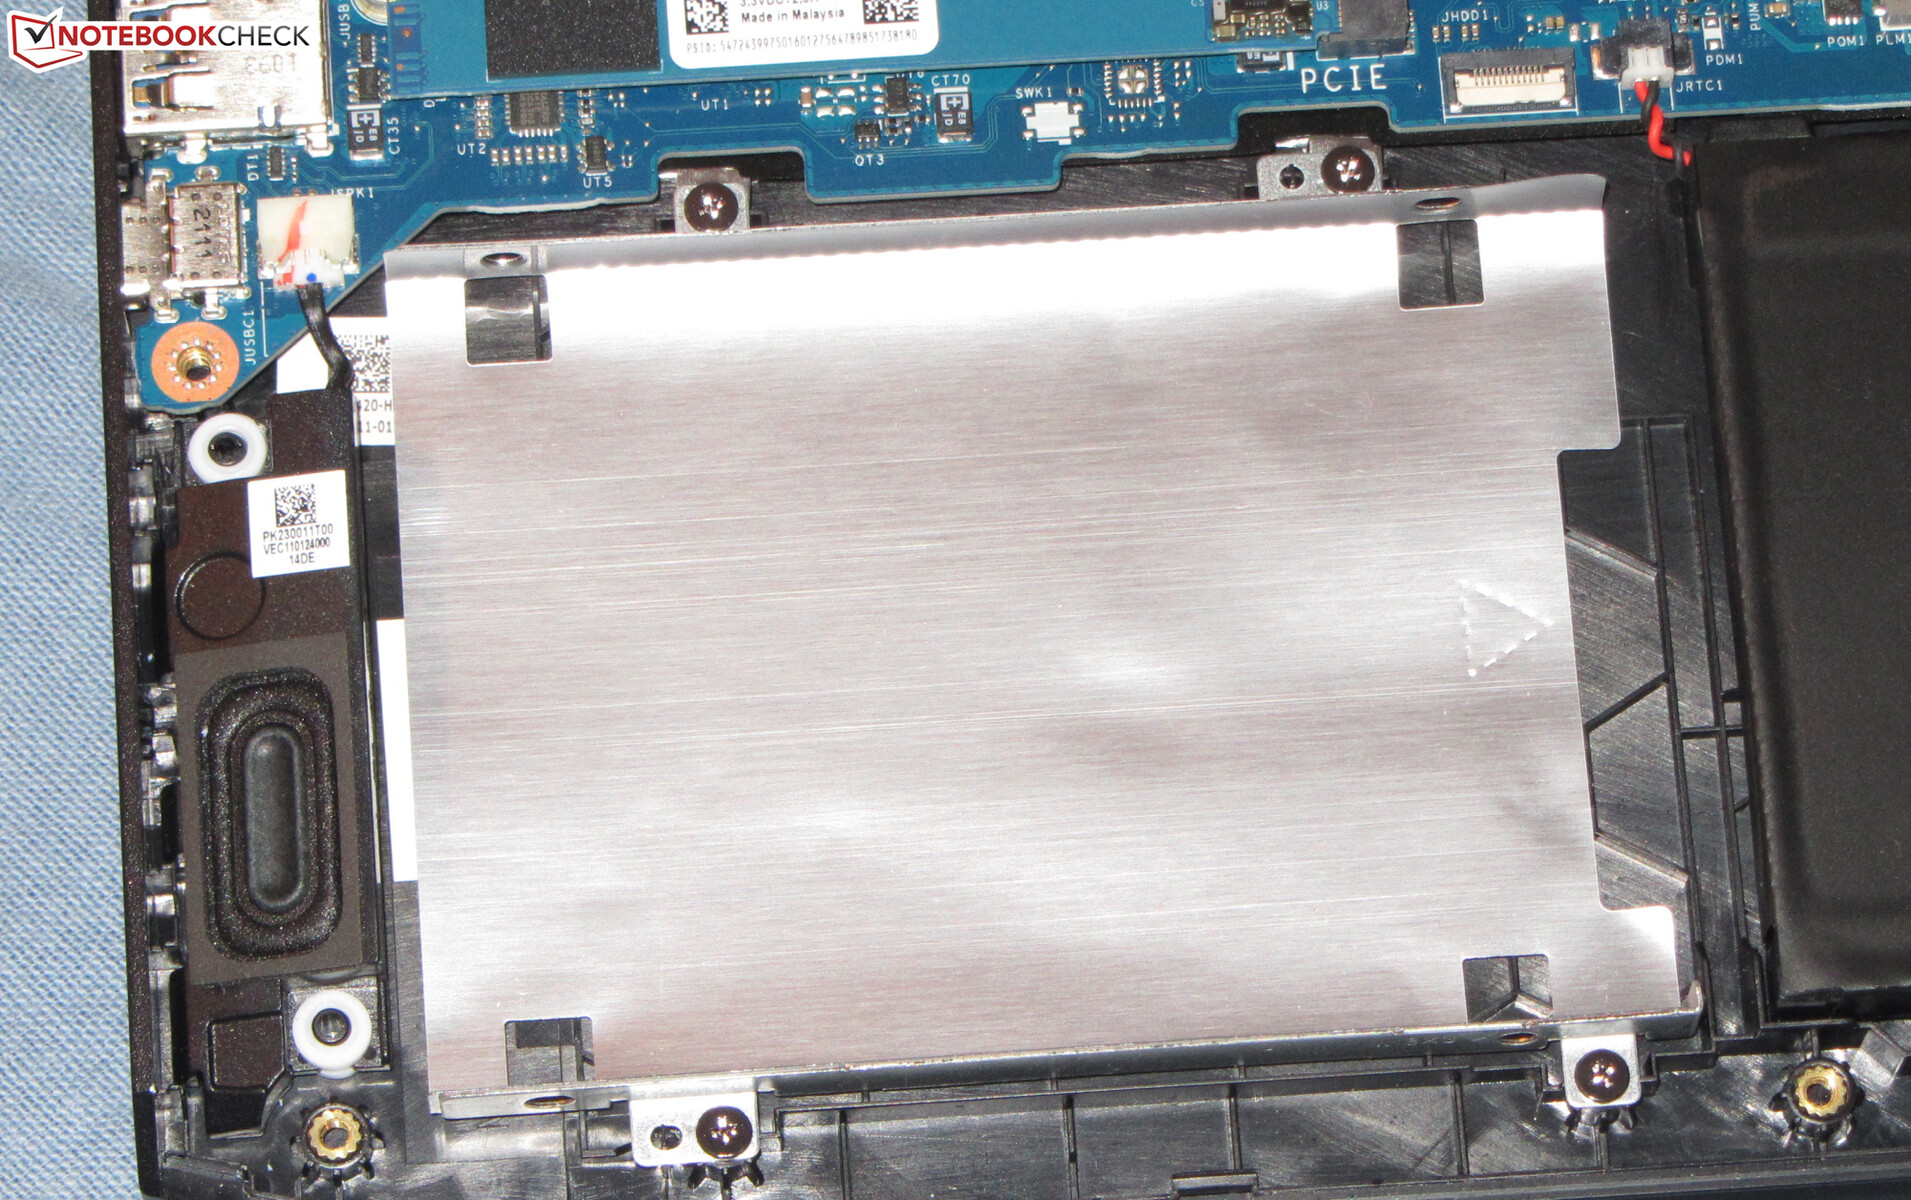
这台笔记本电脑带有通常的文件。一份快速启动指南和保修信息。此外,还包括一条包括SATA接口的短带状电缆,安装2.5英寸的存储驱动器时需要用到。相应的安装框架已经集成在笔记本电脑内部。
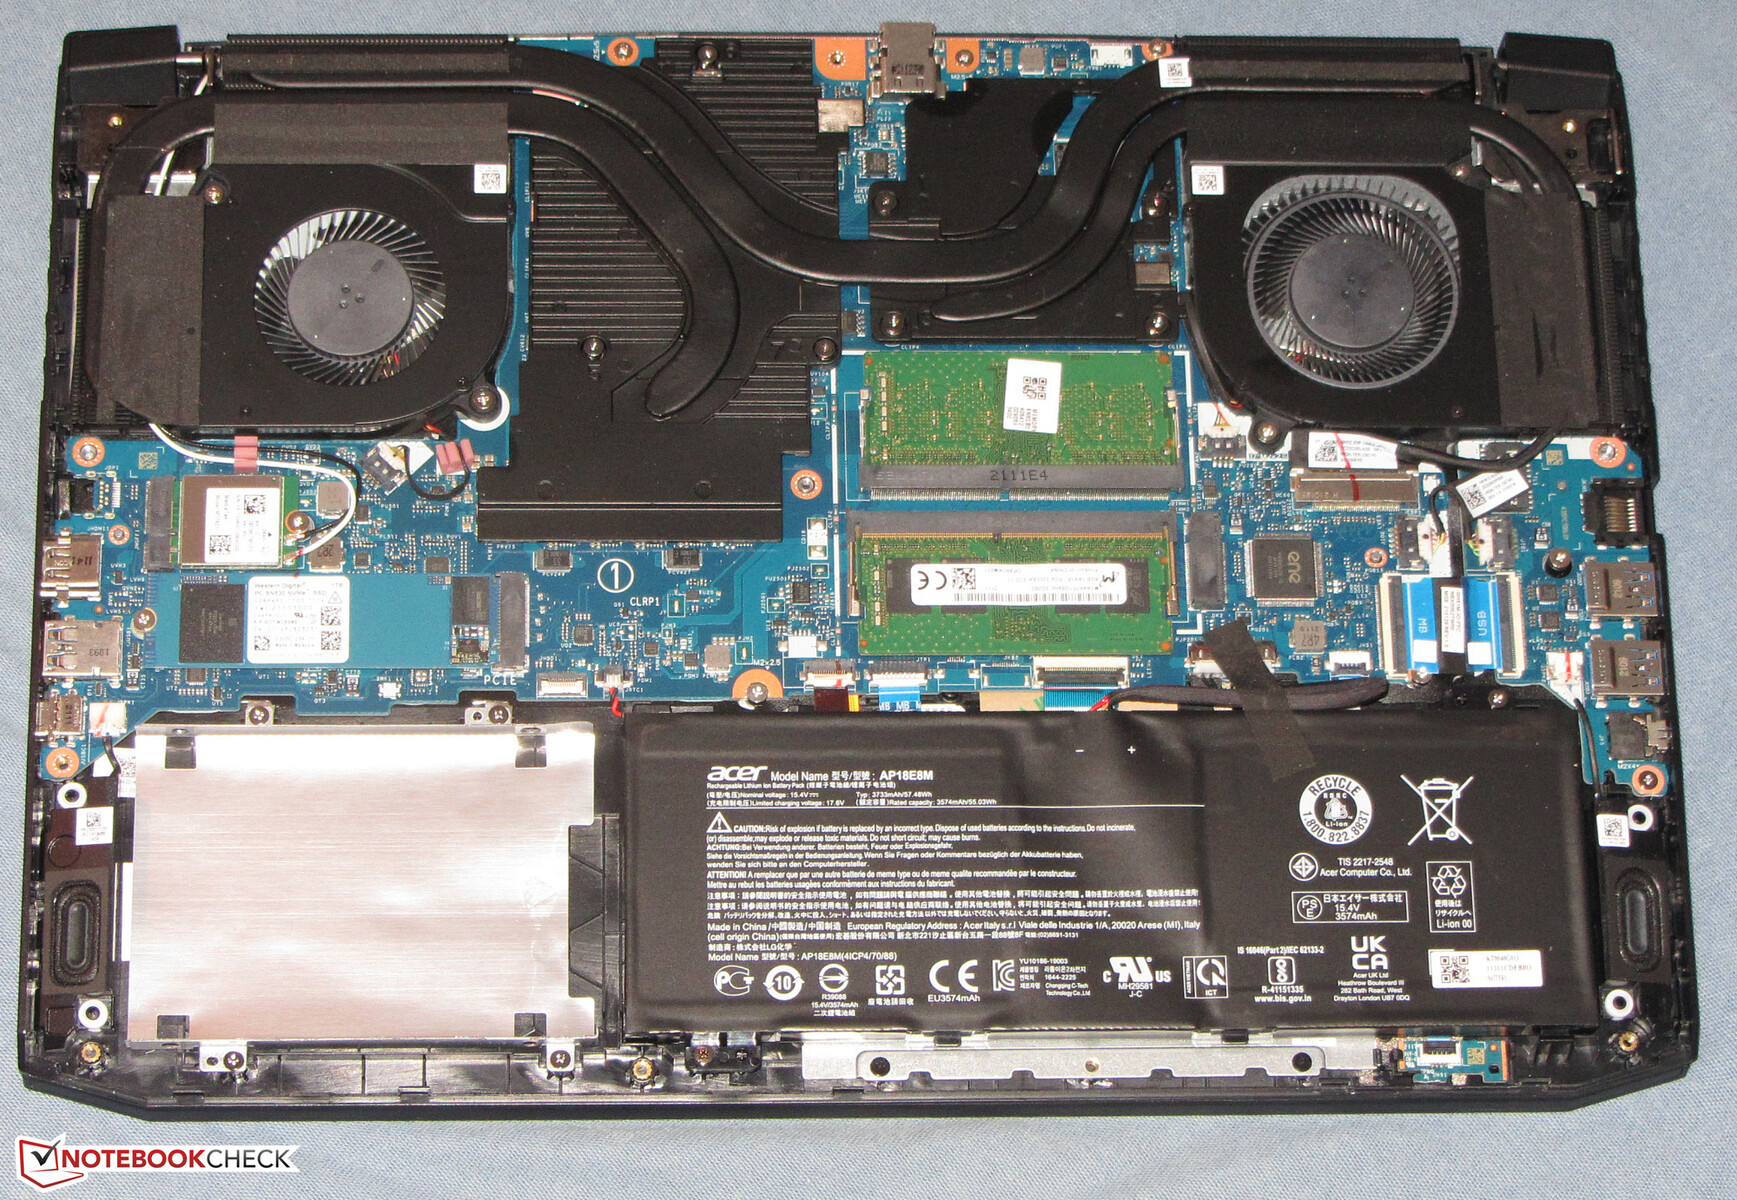
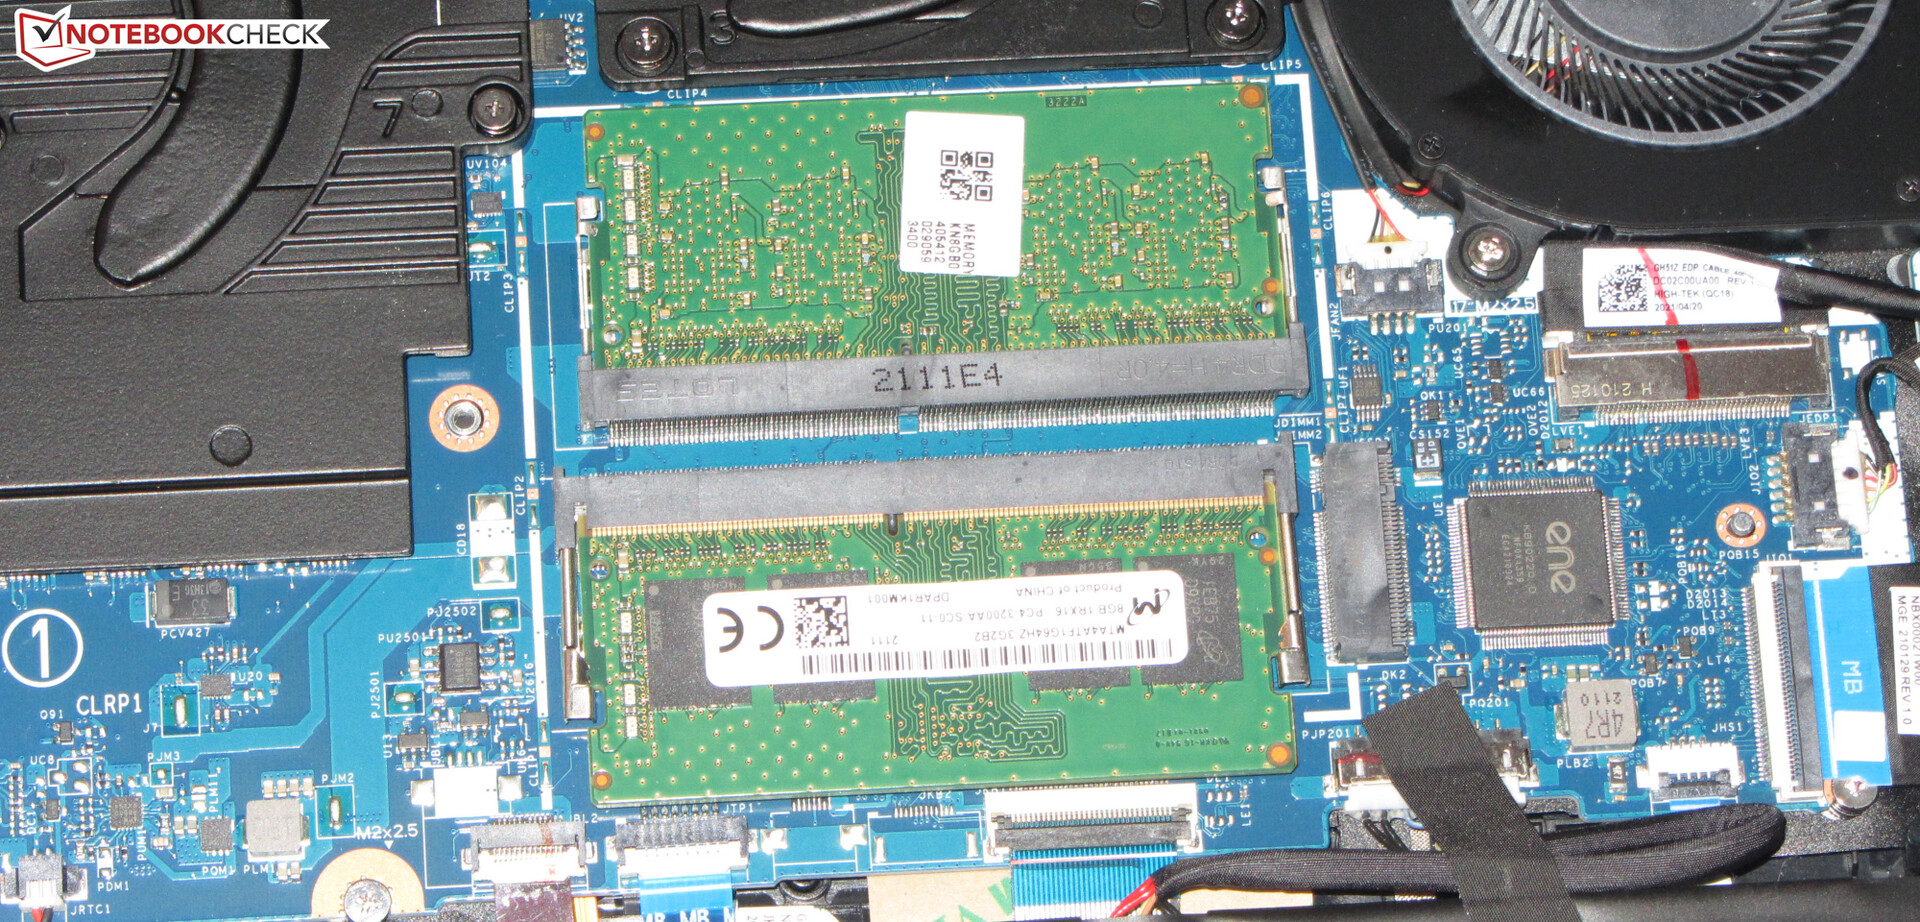
维护
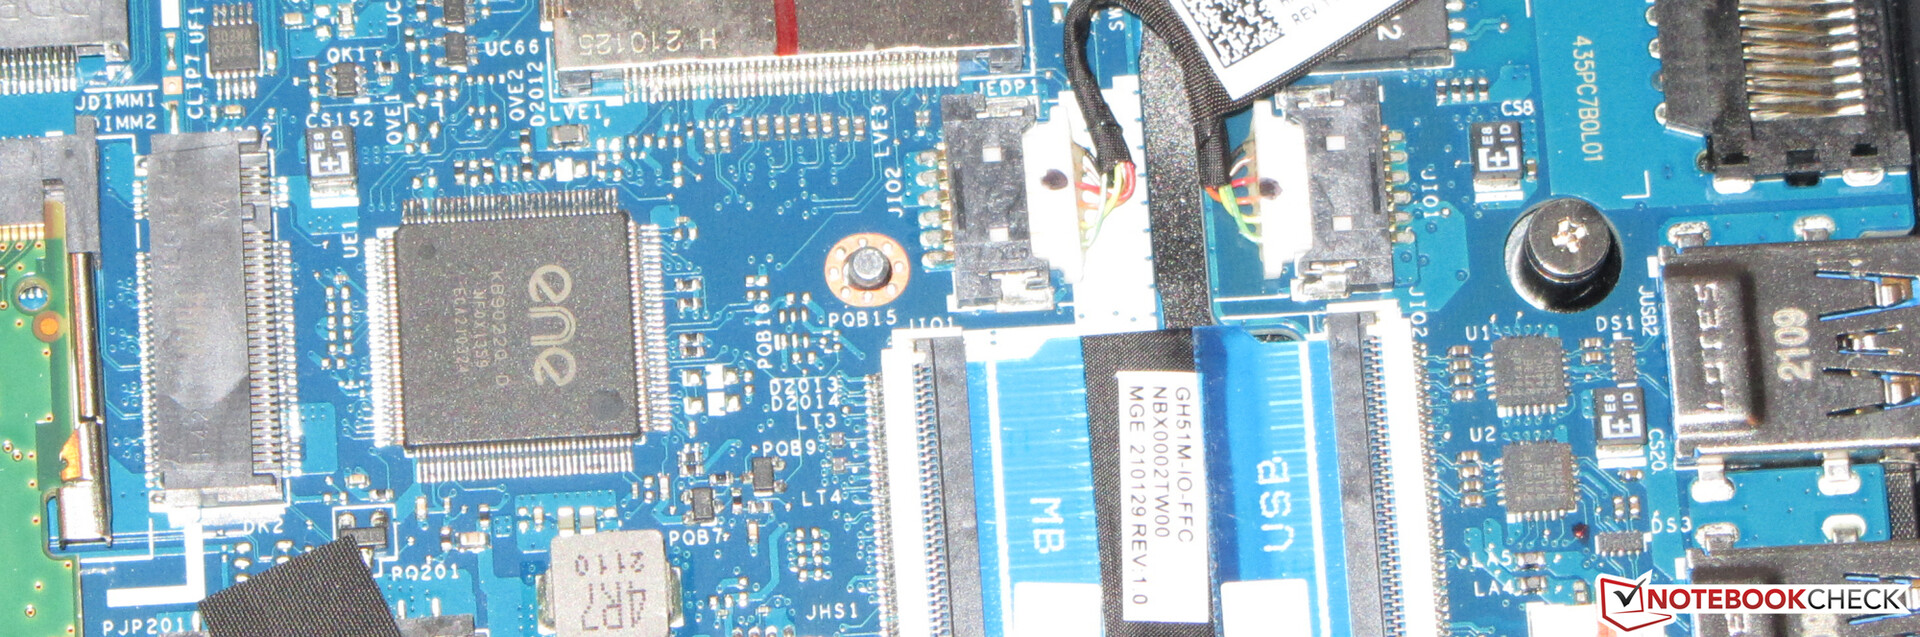
在卸下设备底部的所有螺丝后,可以用平铲子或关节平滑器帮助掀开底盖--底盖在某些部分的位置上坐得很紧。然后你就可以接触到固态硬盘、WLAN模块、内存、电池和风扇。
担保
宏碁为这款15.6英寸的设备提供了两年的保修期。将保修期延长至三年的费用略低于100欧元(约117美元)。
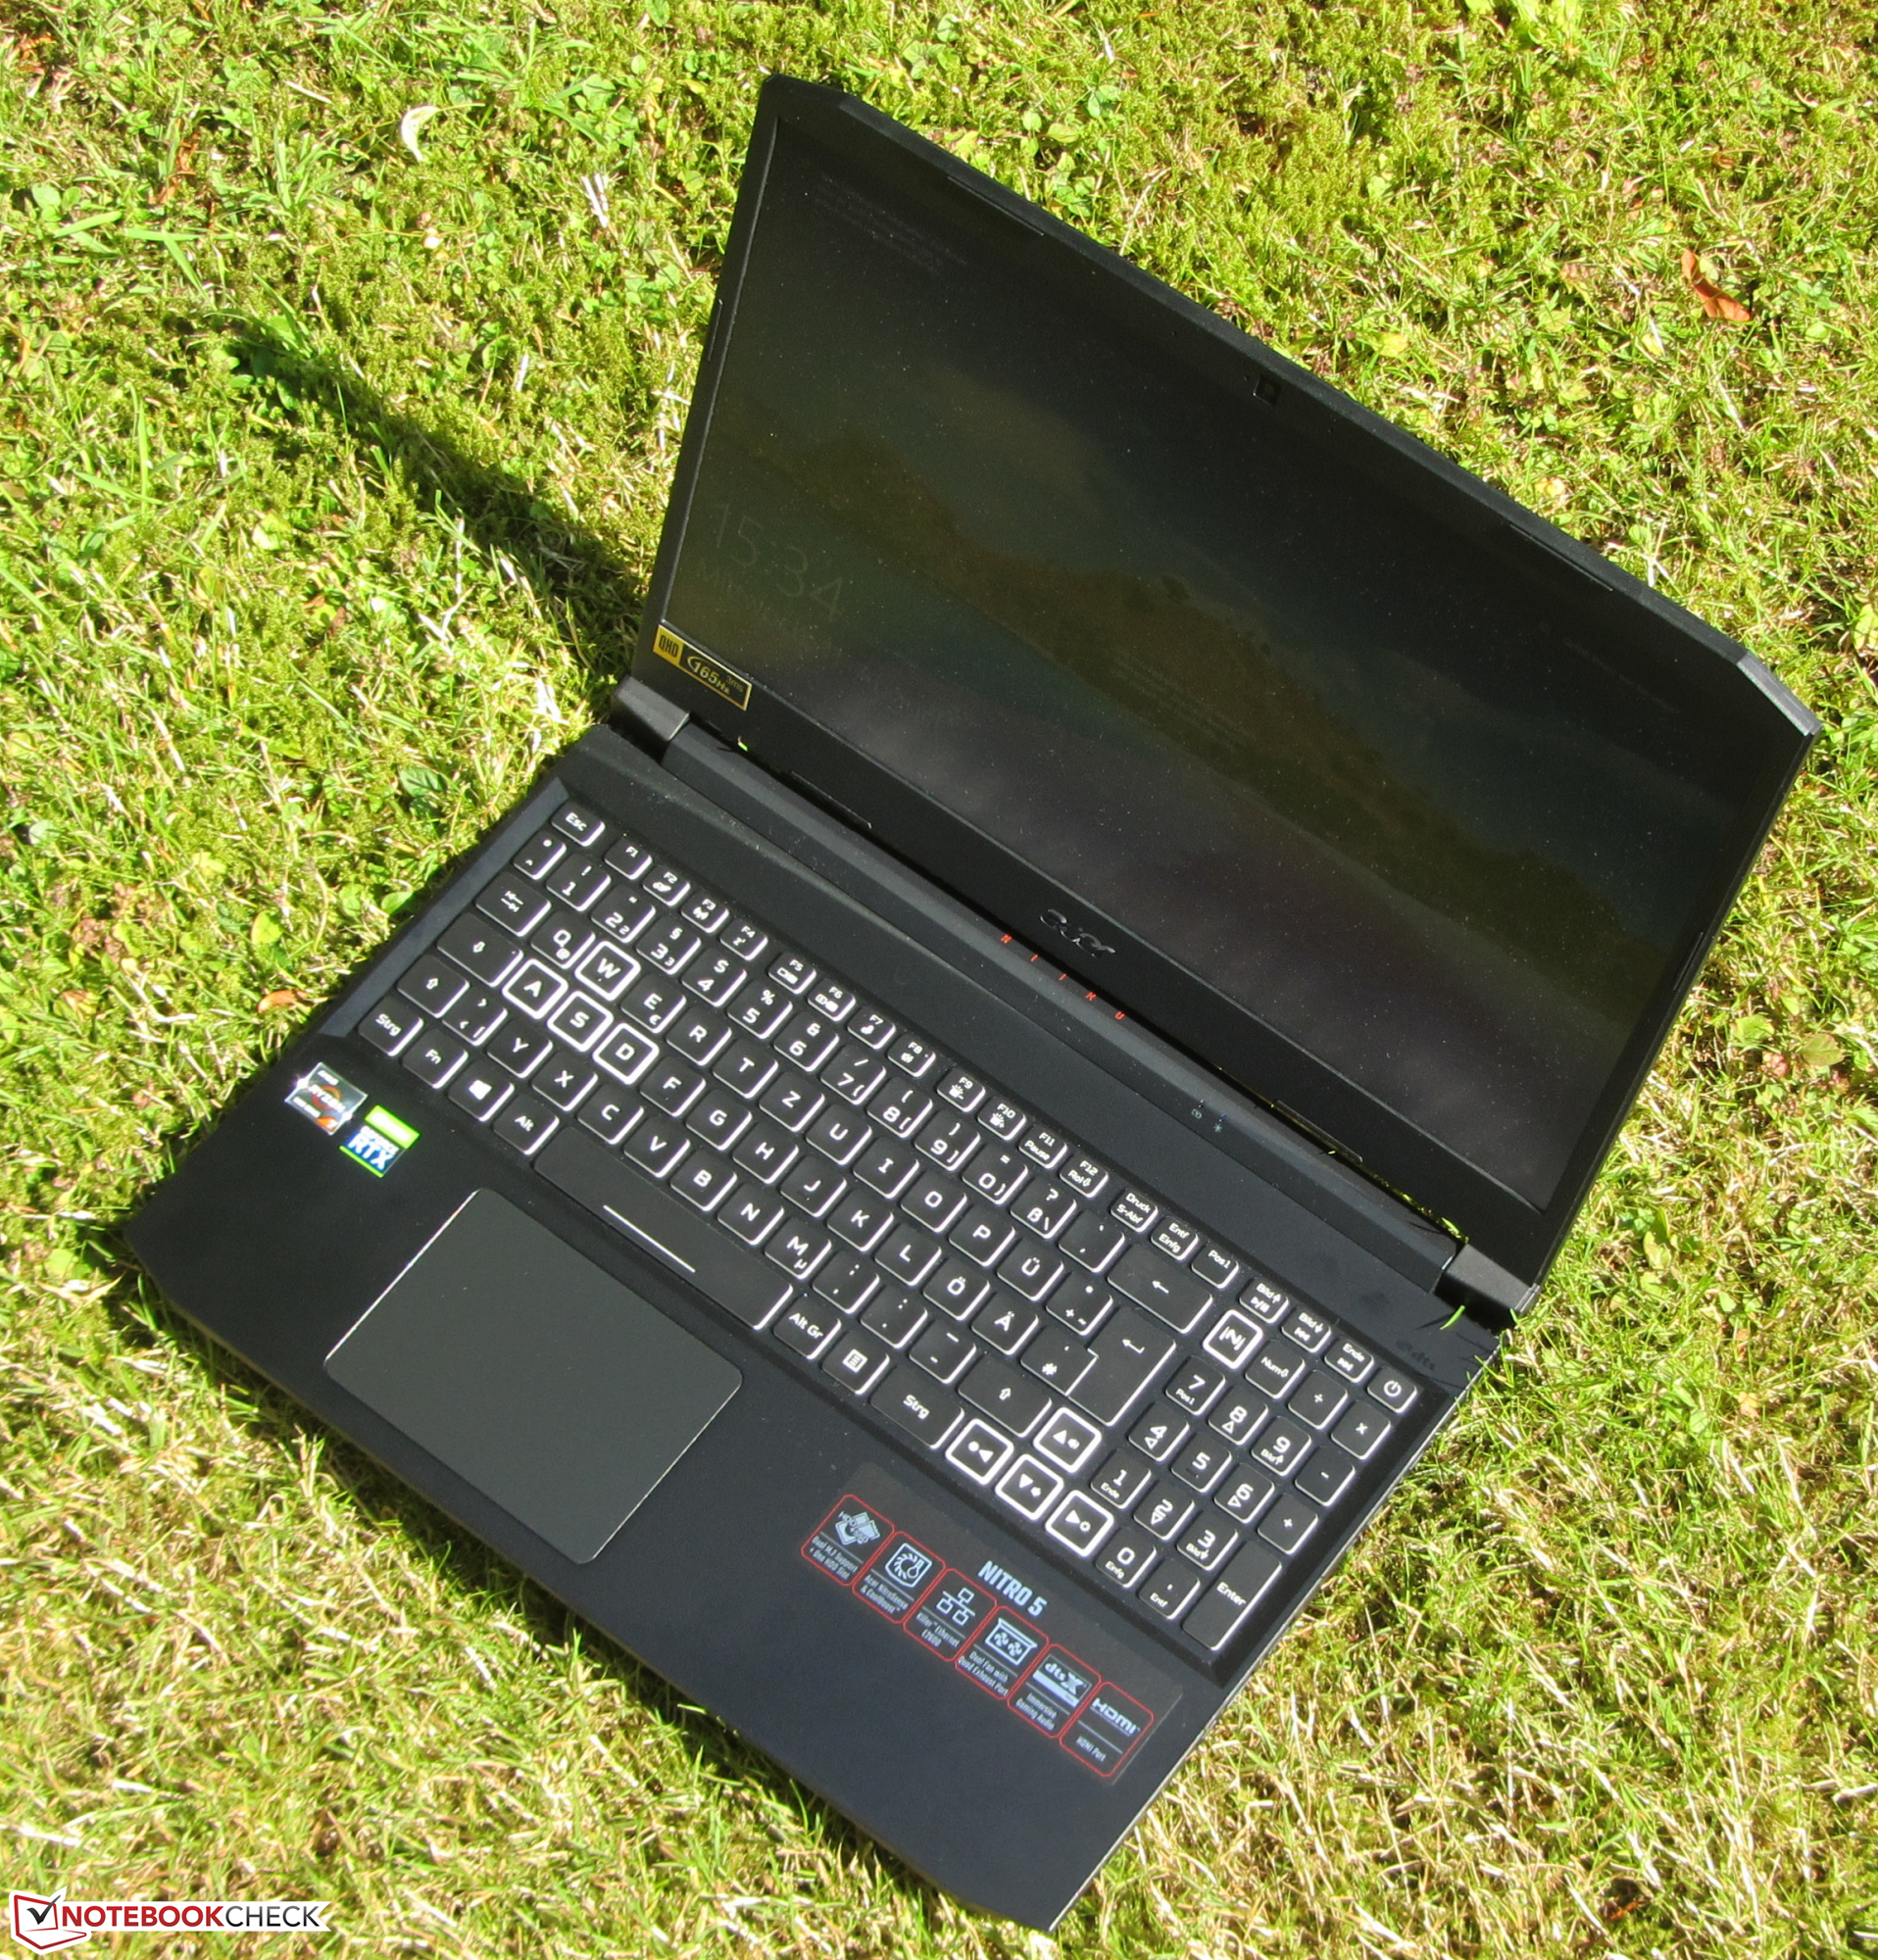
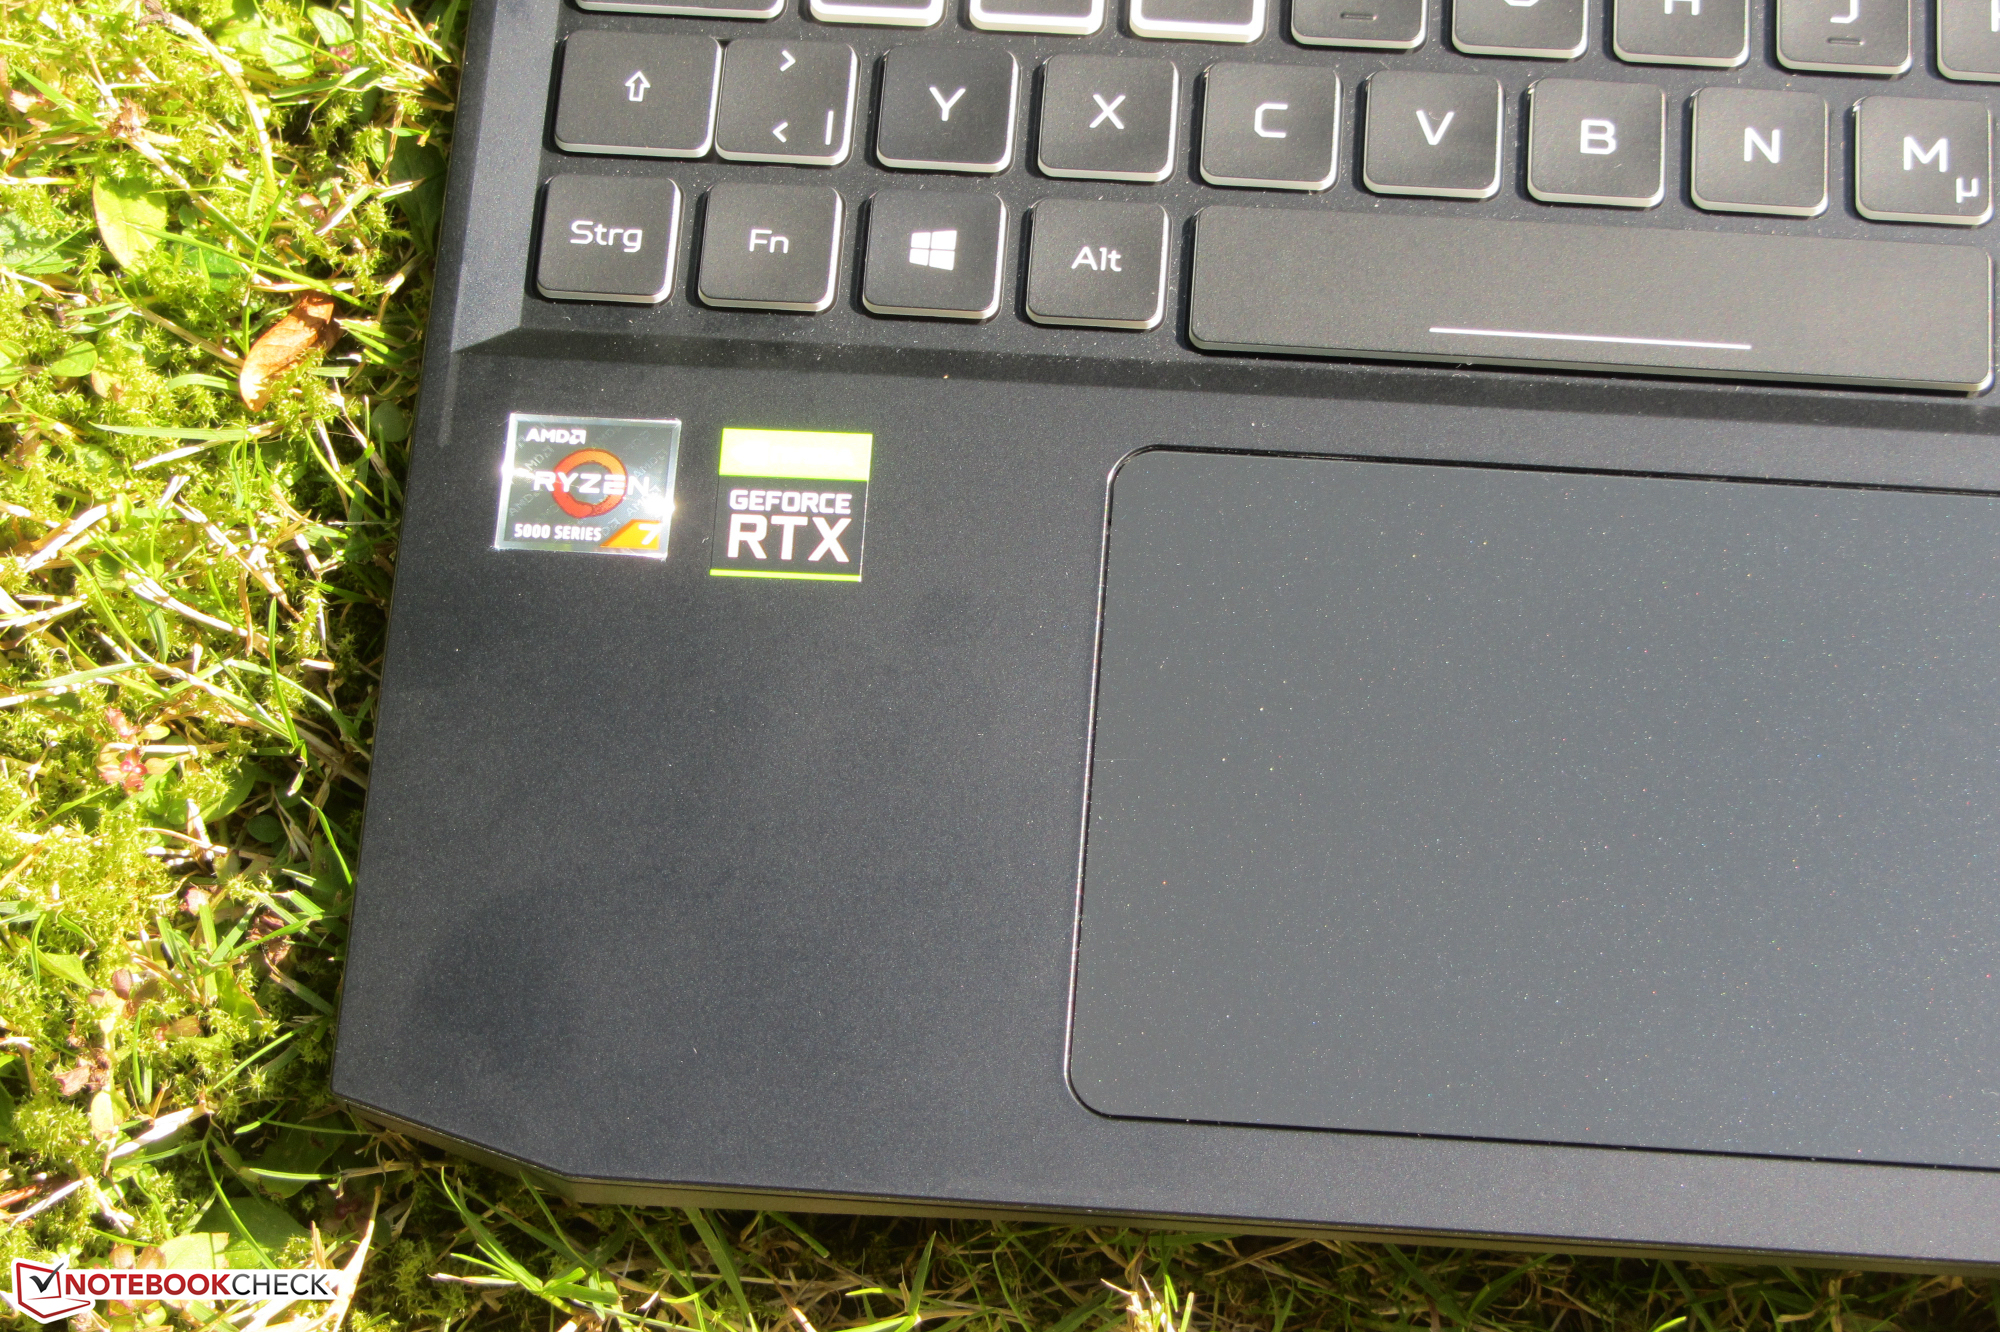
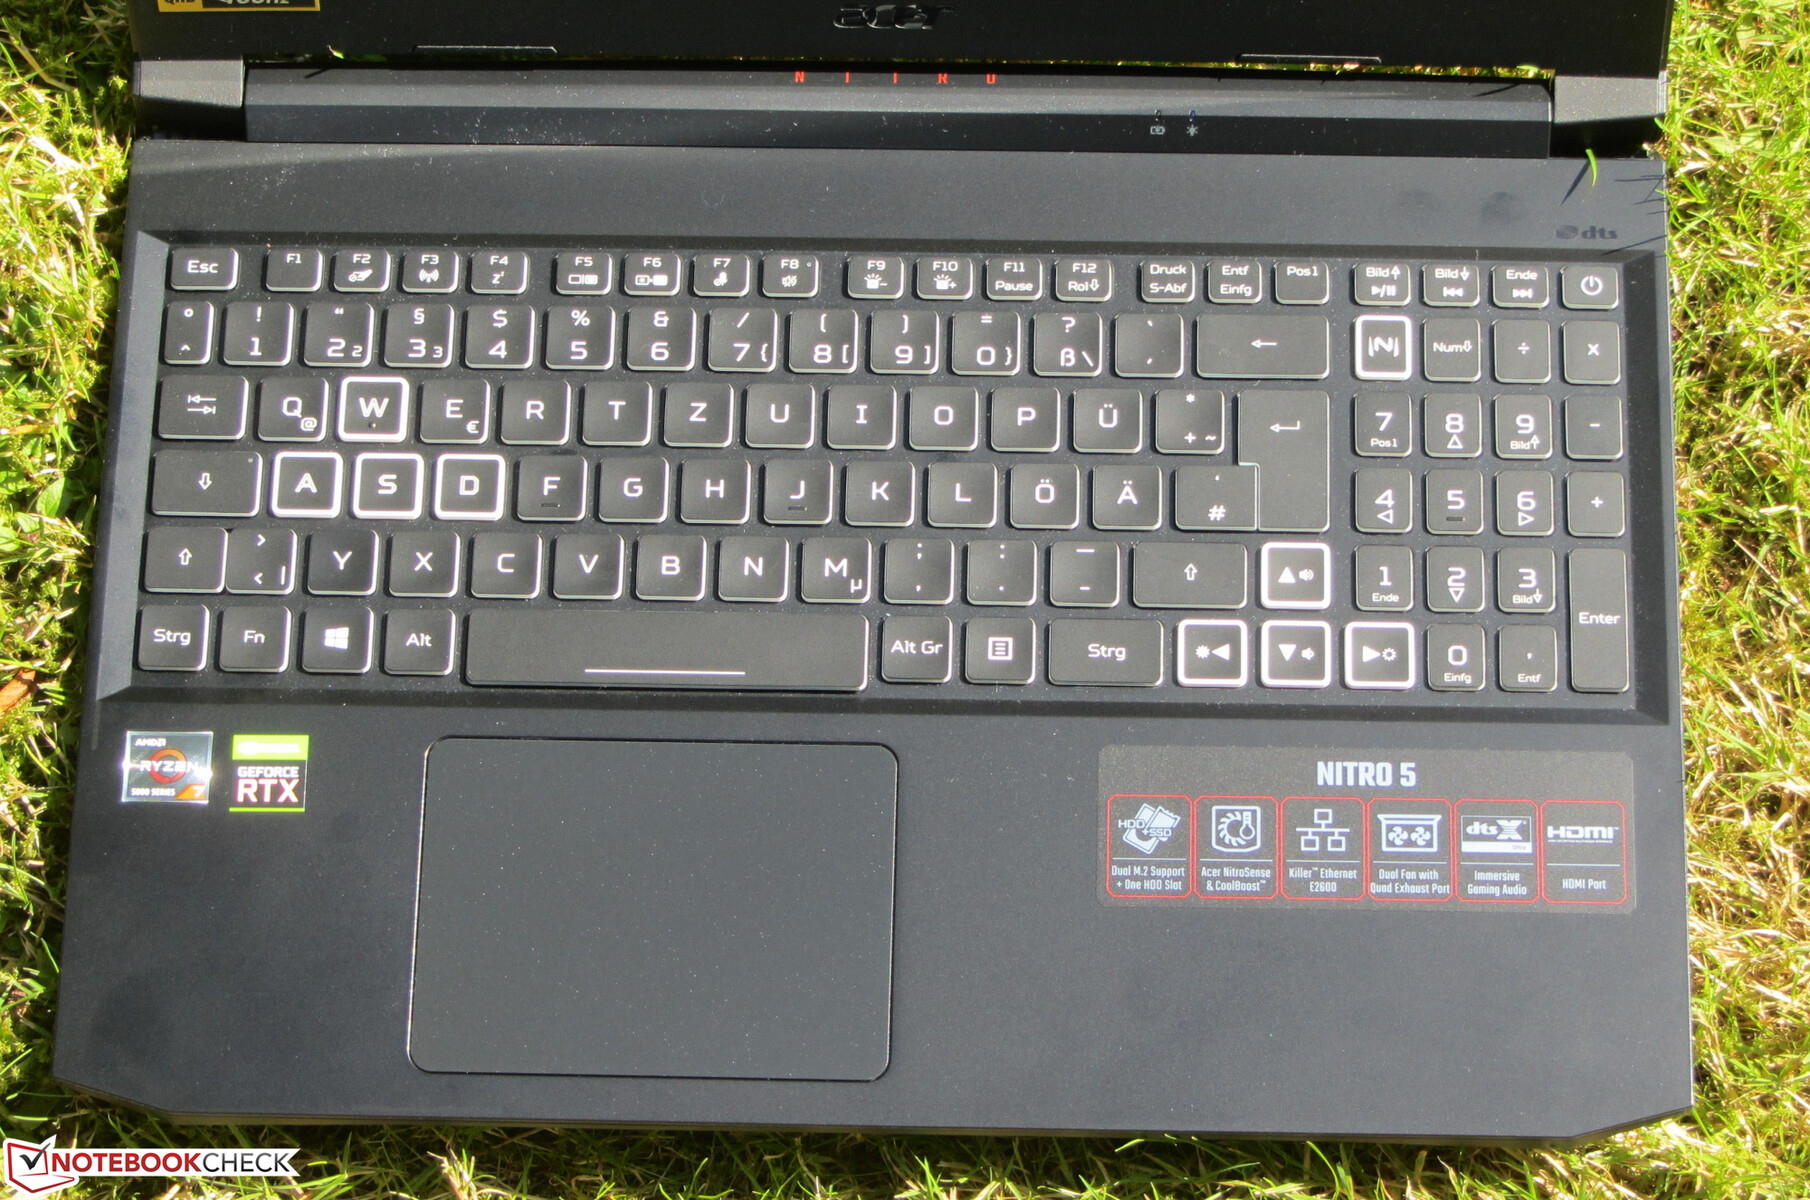
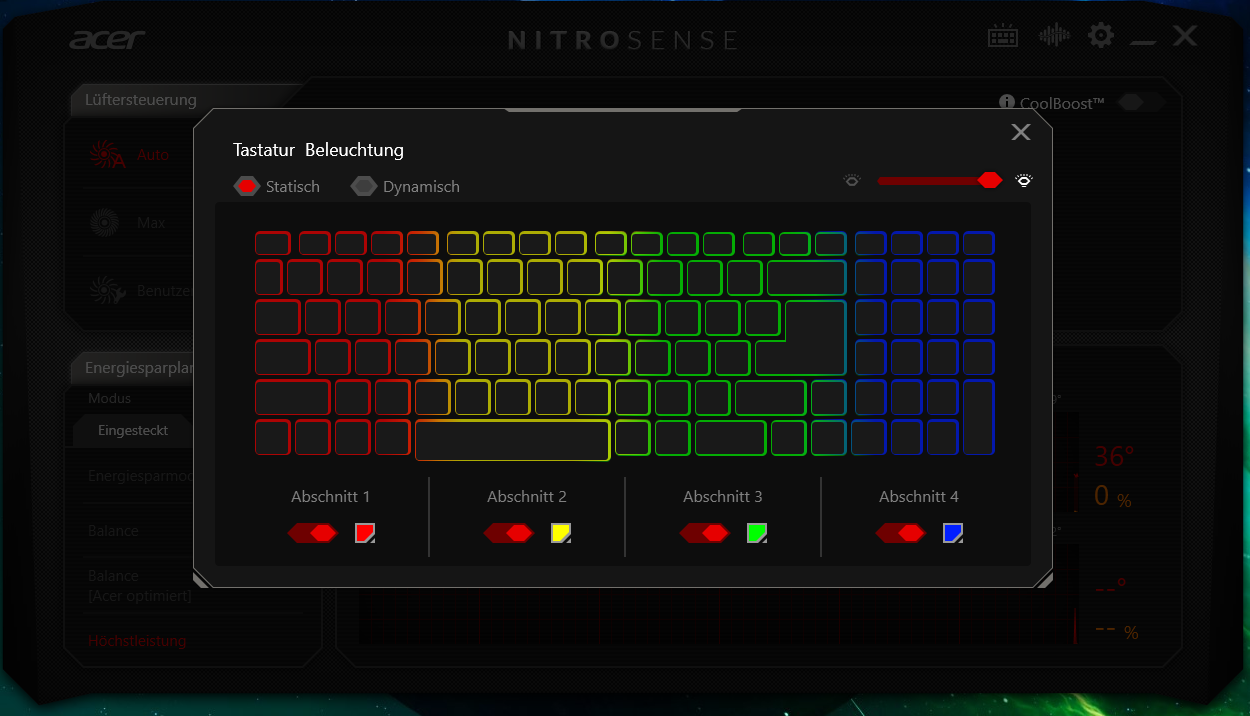
输入设备 - 带RGB照明的键盘
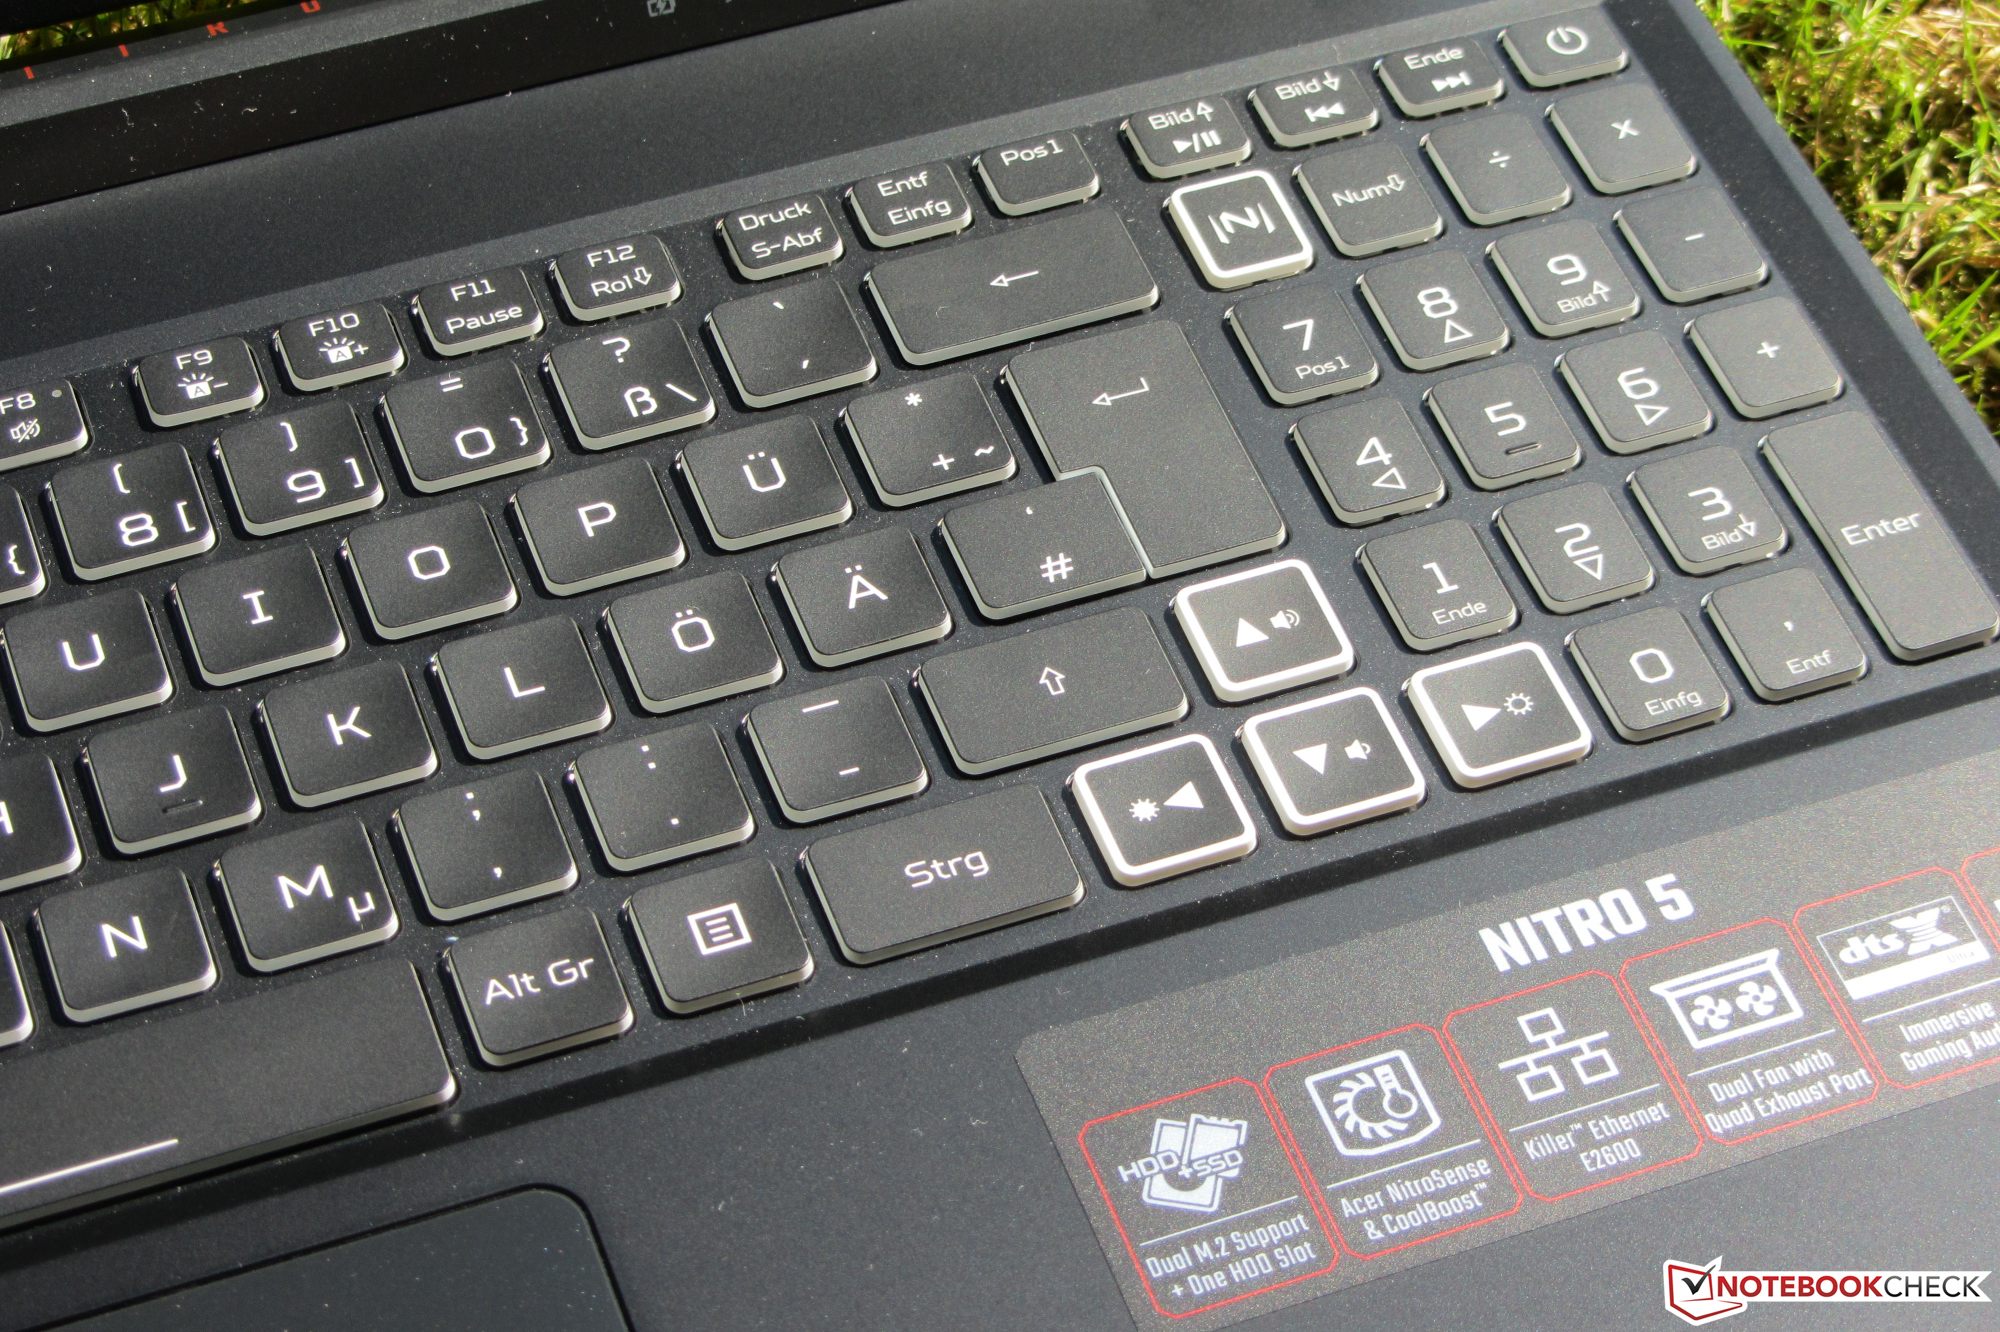
键盘
背光Chiclet键盘由不同形状的按键组成。凹形的主键(字母、数字行)和其余的平形键(功能键、数字键盘)。在我们看来,这些按键提供的阻力可以更清晰。此外,键盘在打字过程中会有一点倾斜。不过,这并没有被证明是一个麻烦。总而言之,宏碁在这里提供了一个适合日常使用的键盘。
触摸板
具有多点触摸功能的ClickPad(约10.6 x 7.8厘米)的光滑表面使手指很容易在上面滑行。它对角落里的输入也有反应。垫子的行程很短,压力点很明显。
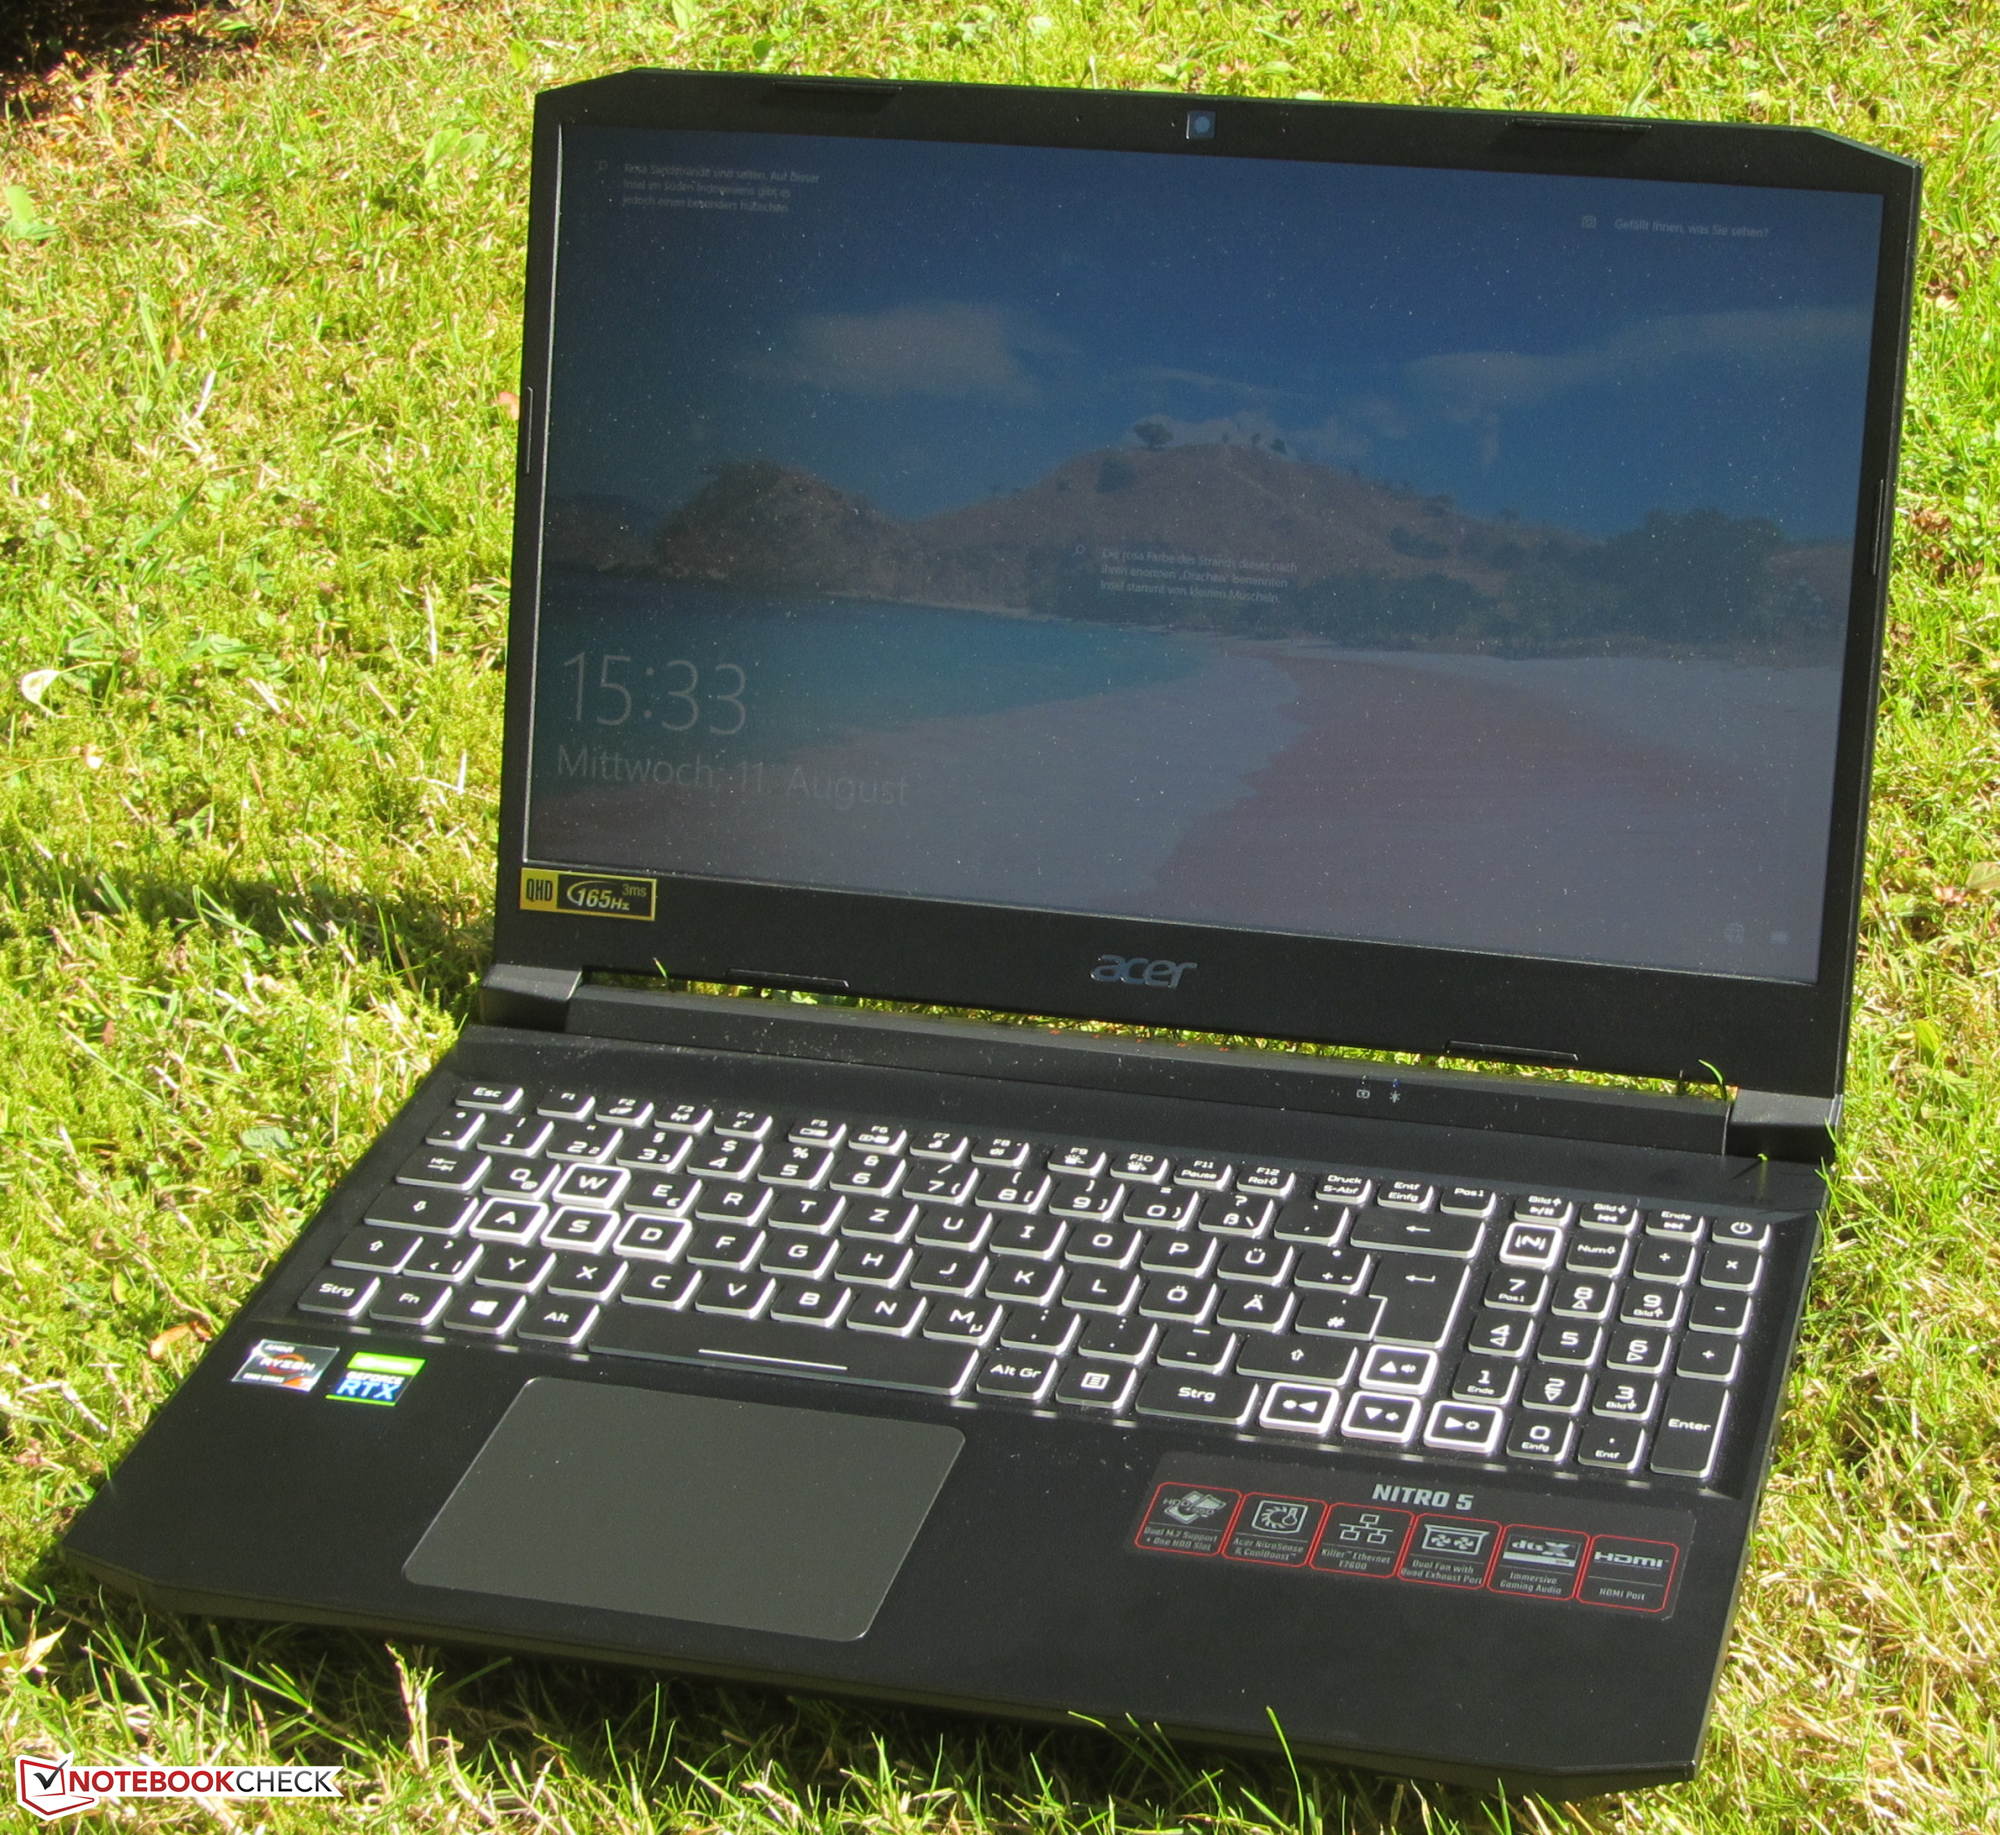
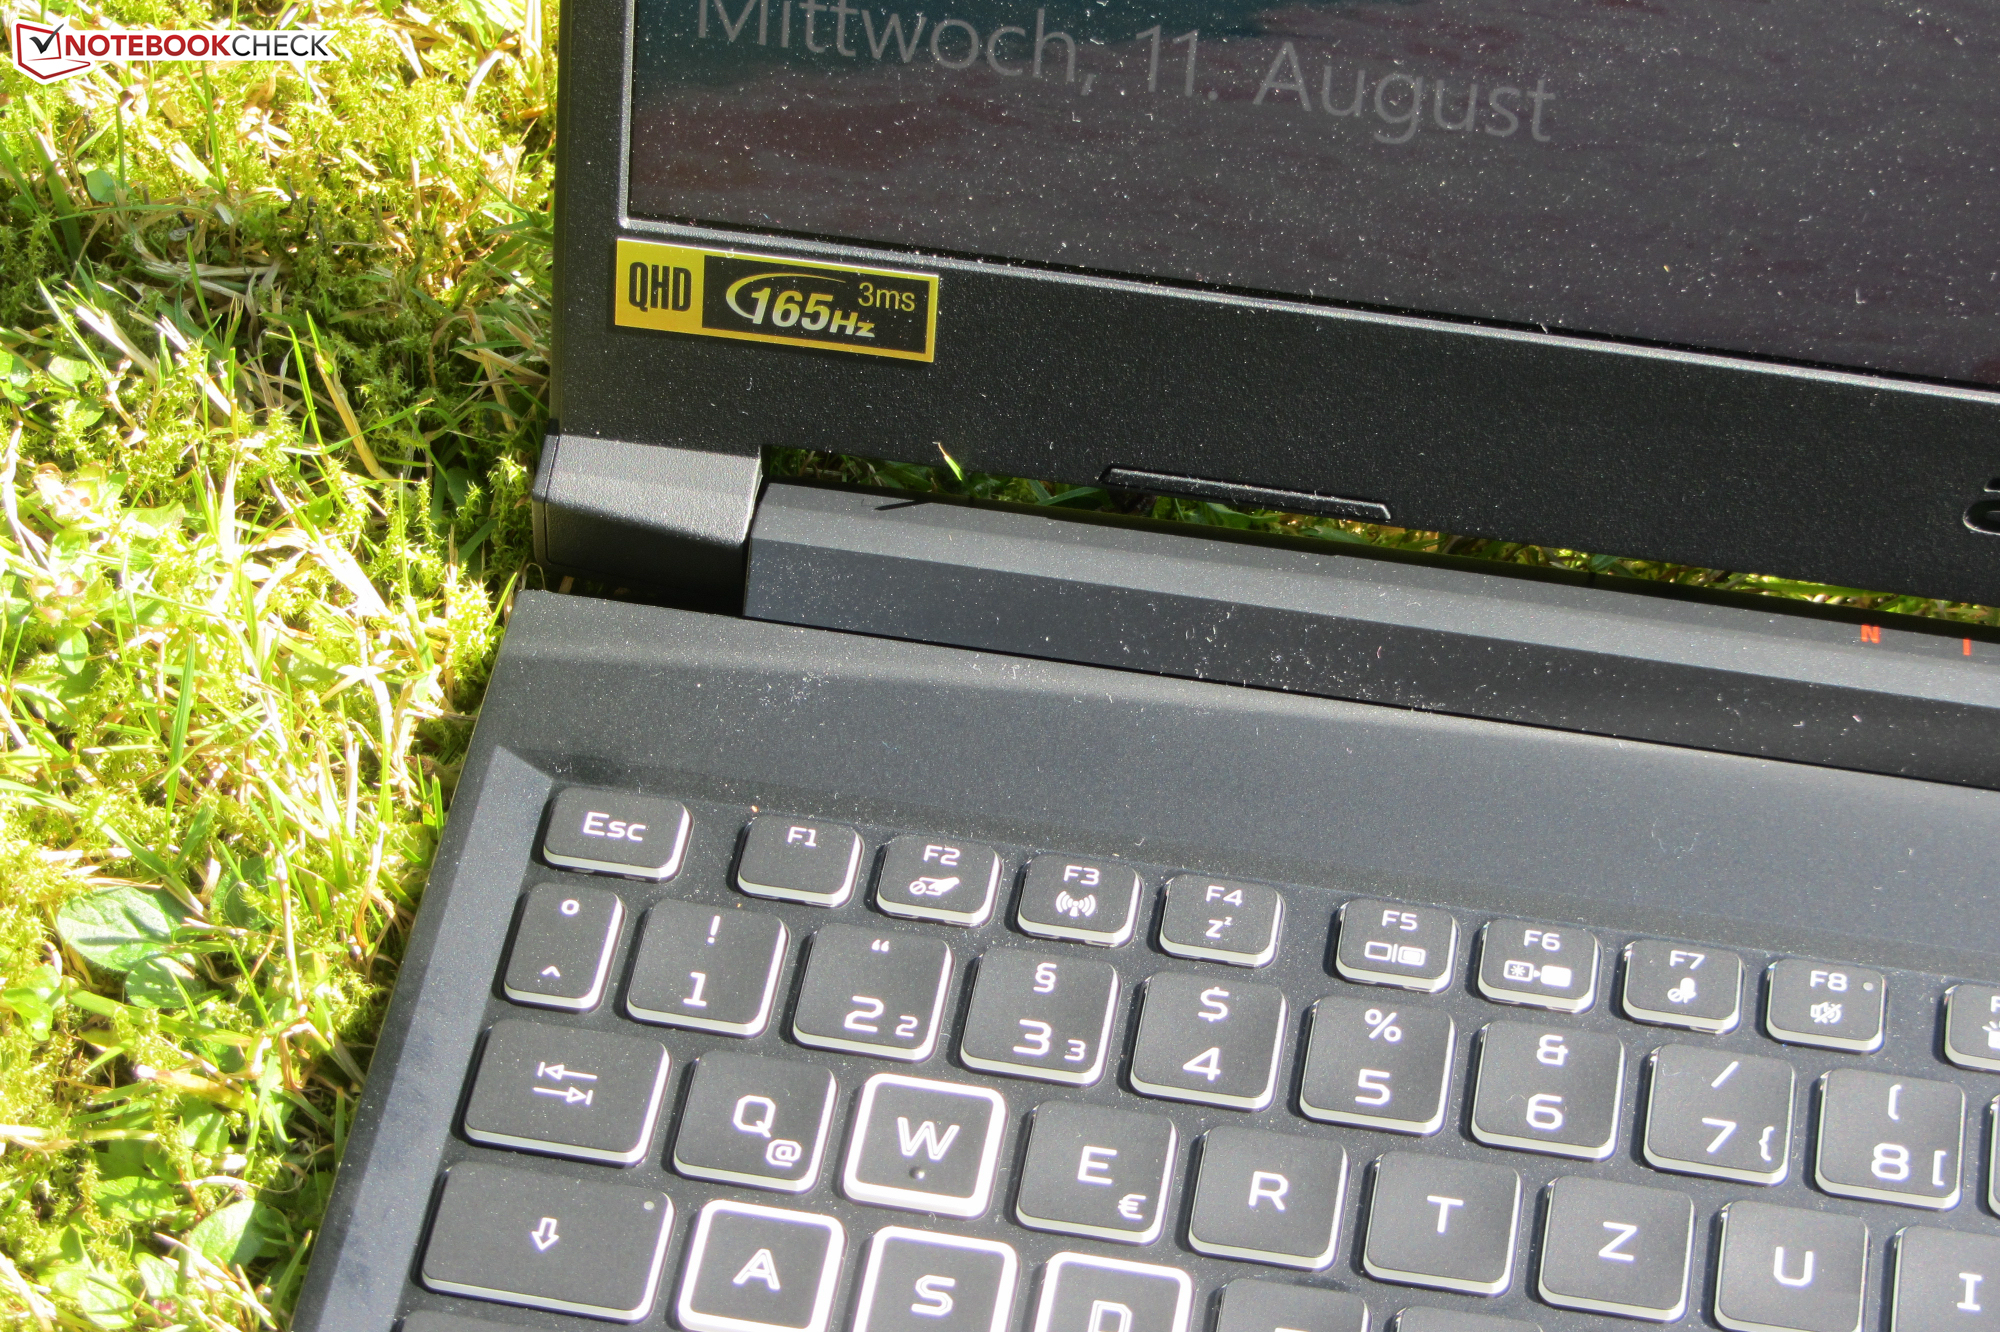
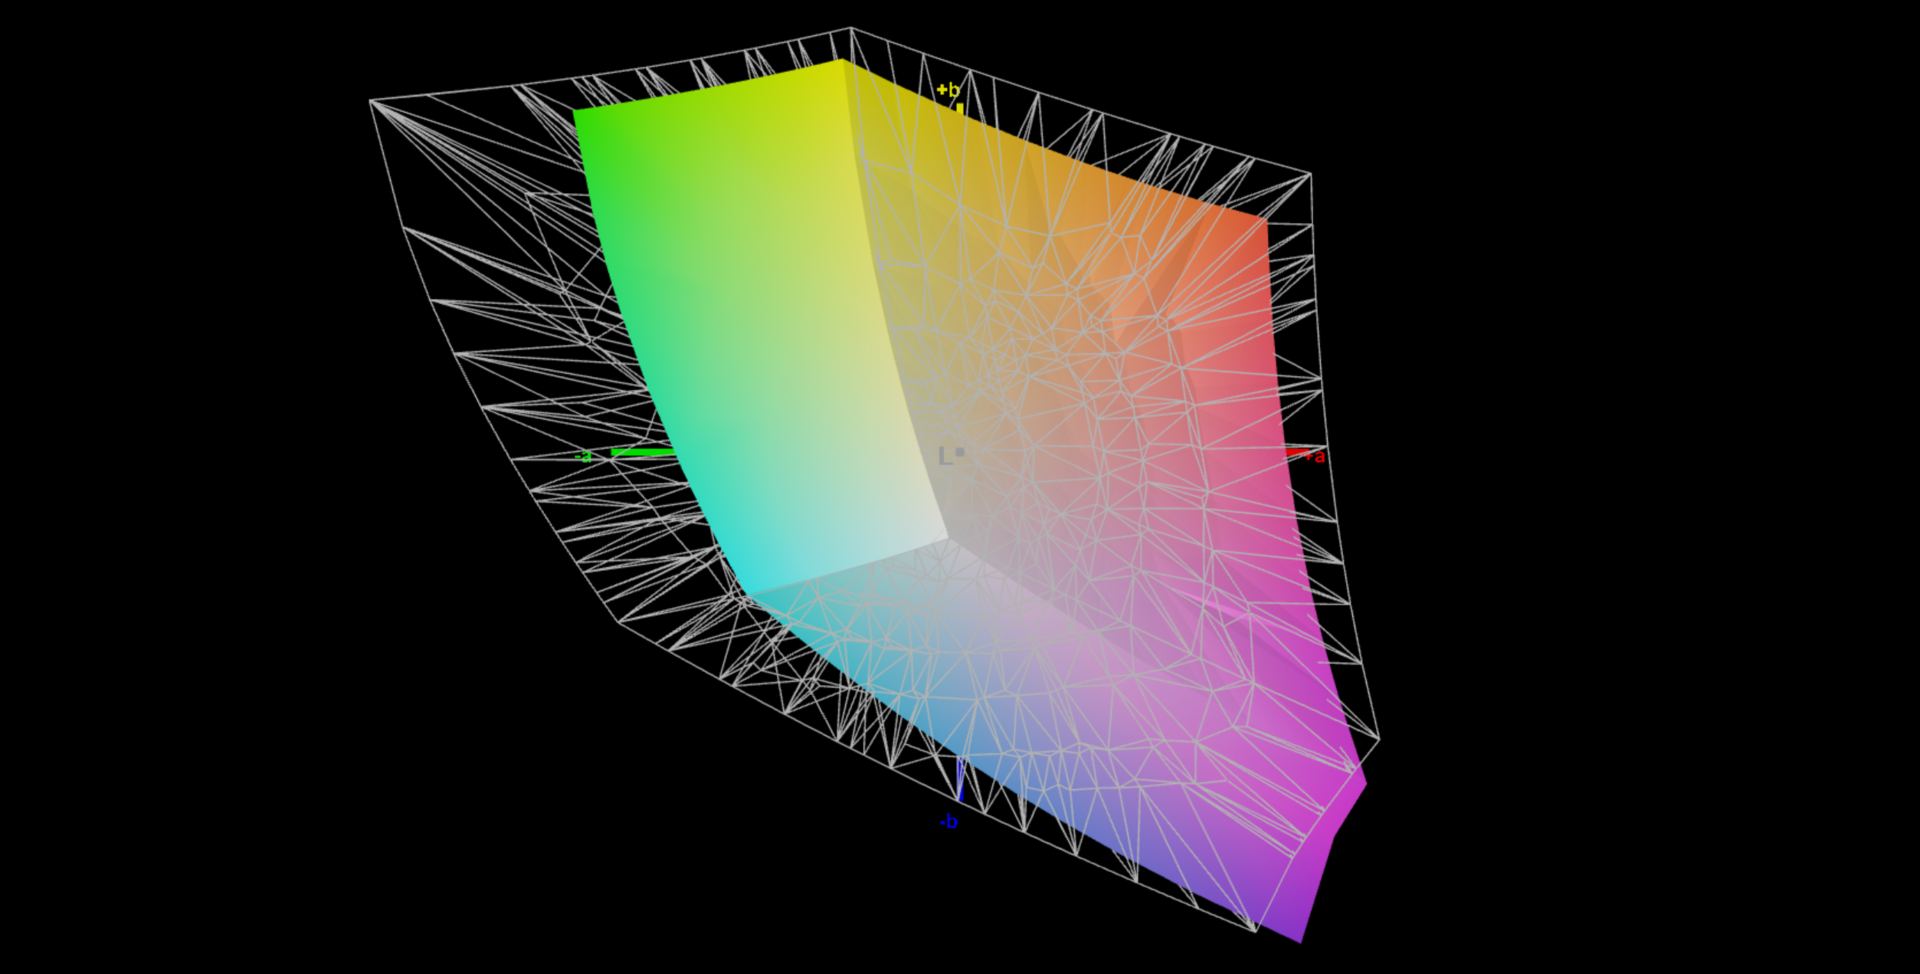
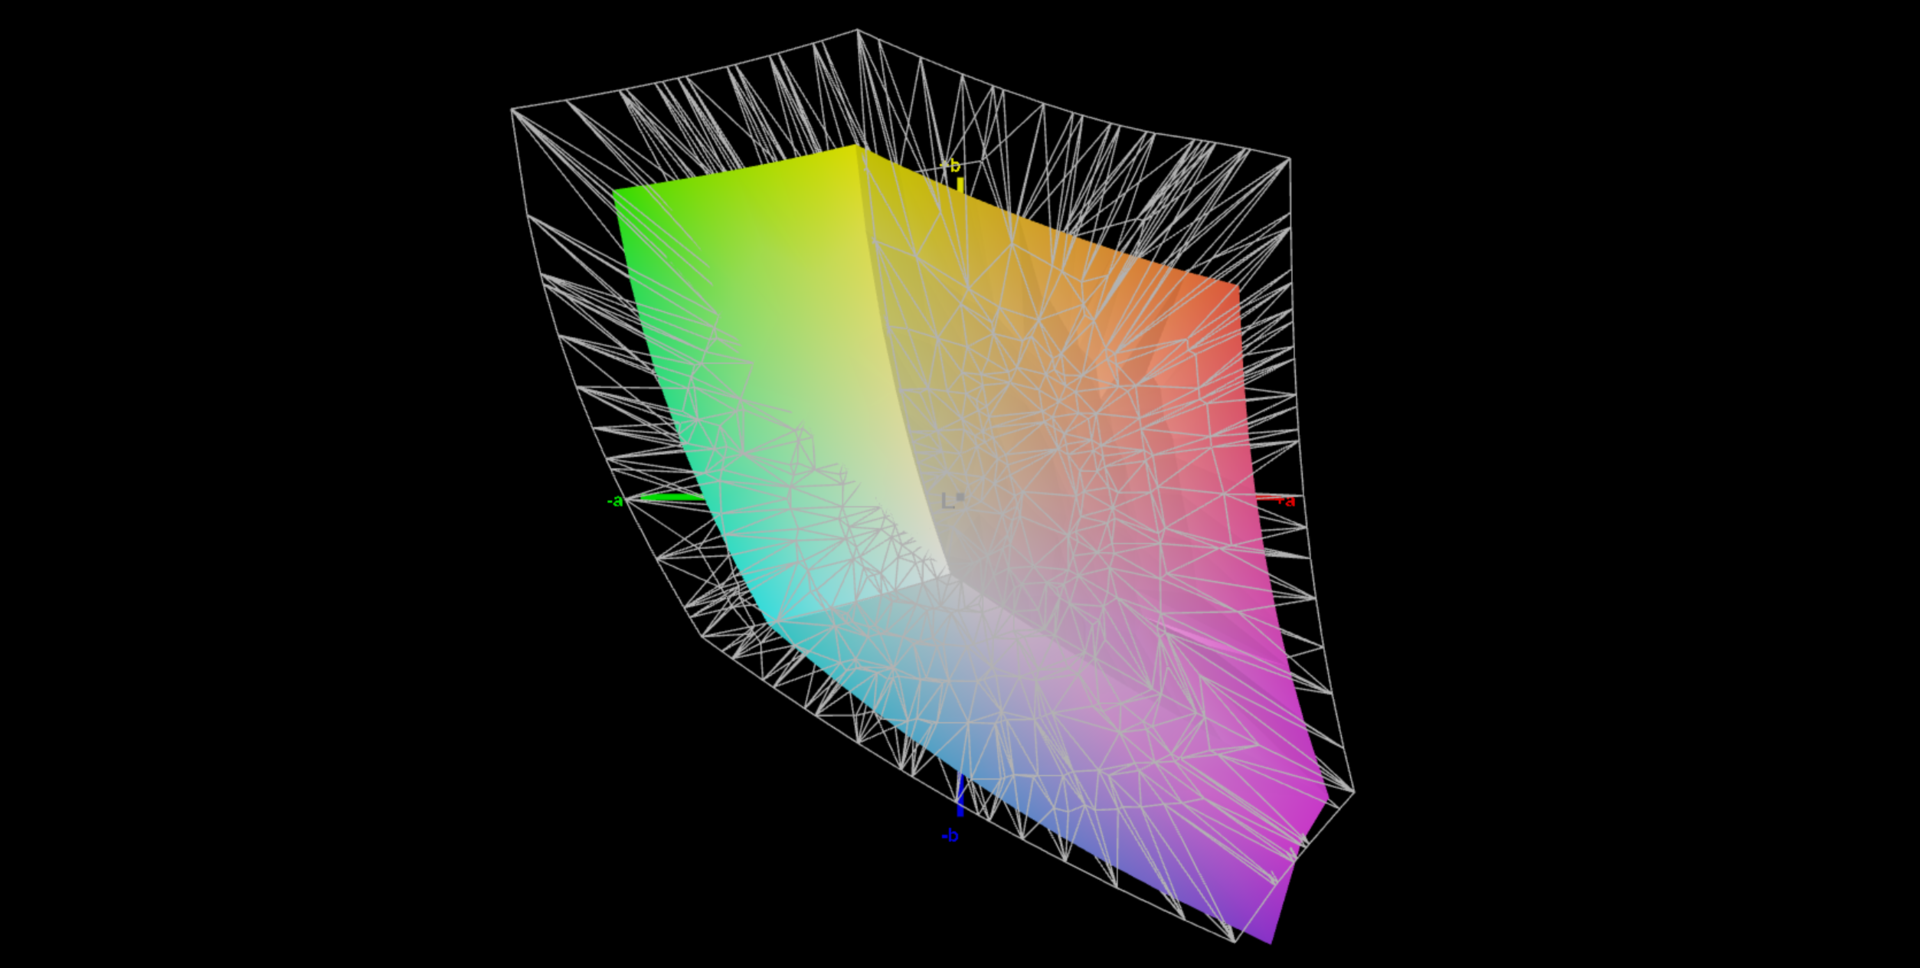
显示屏 - 快速的QHD面板
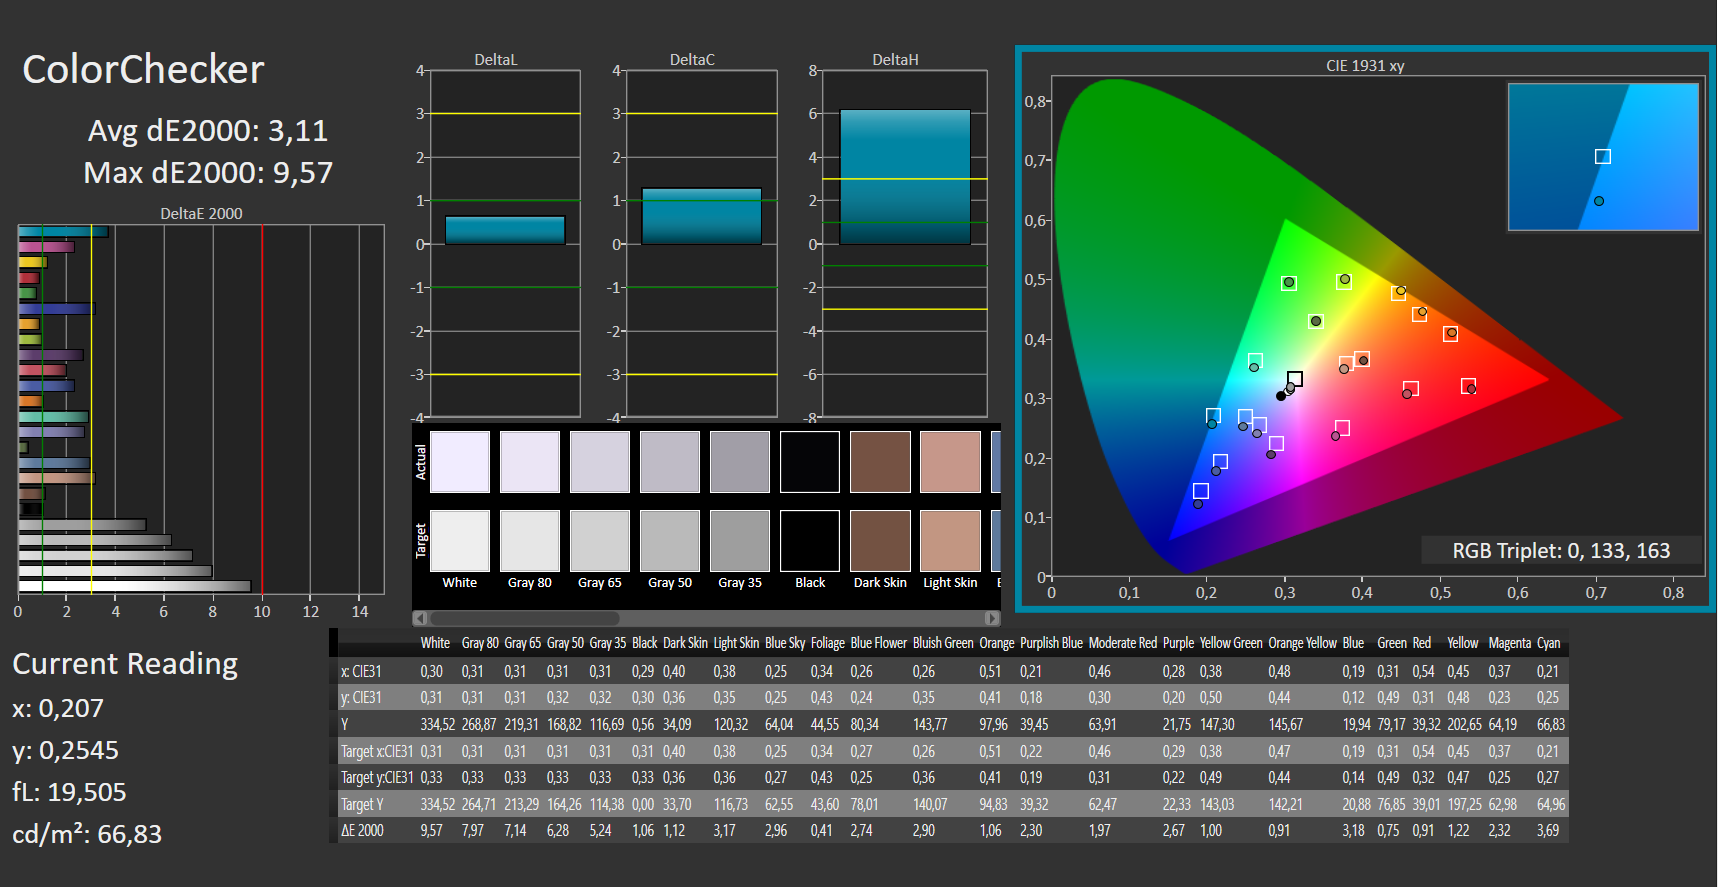
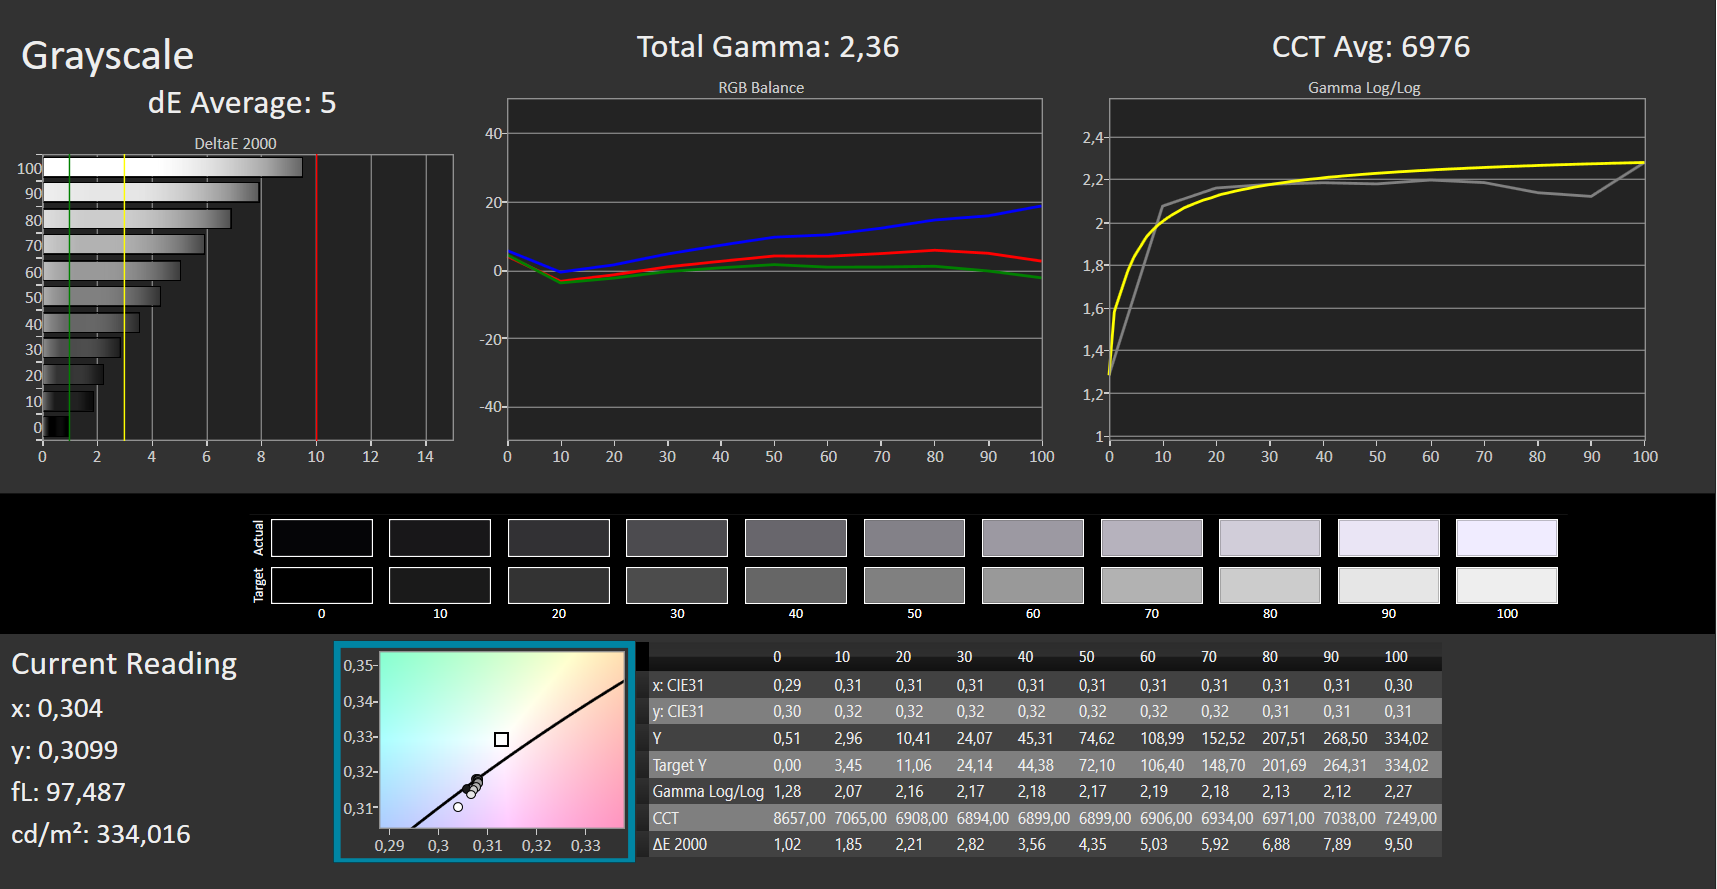
虽然哑光的15.6英寸显示屏(2560x1440像素)提供了良好的平均亮度(304.4cd/m²),但对比度(652:1)太低。我们认为超过1,000:1的数值才是好的。144Hz的面板提供了快速的响应时间。我们没有发现任何PWM的闪烁。


| |||||||||||||||||||||||||
Brightness Distribution: 79 %
Center on Battery: 349 cd/m²
Contrast: 652:1 (Black: 0.535 cd/m²)
ΔE ColorChecker Calman: 3.11 | ∀{0.5-29.43 Ø4.71}
ΔE Greyscale Calman: 5 | ∀{0.09-98 Ø4.96}
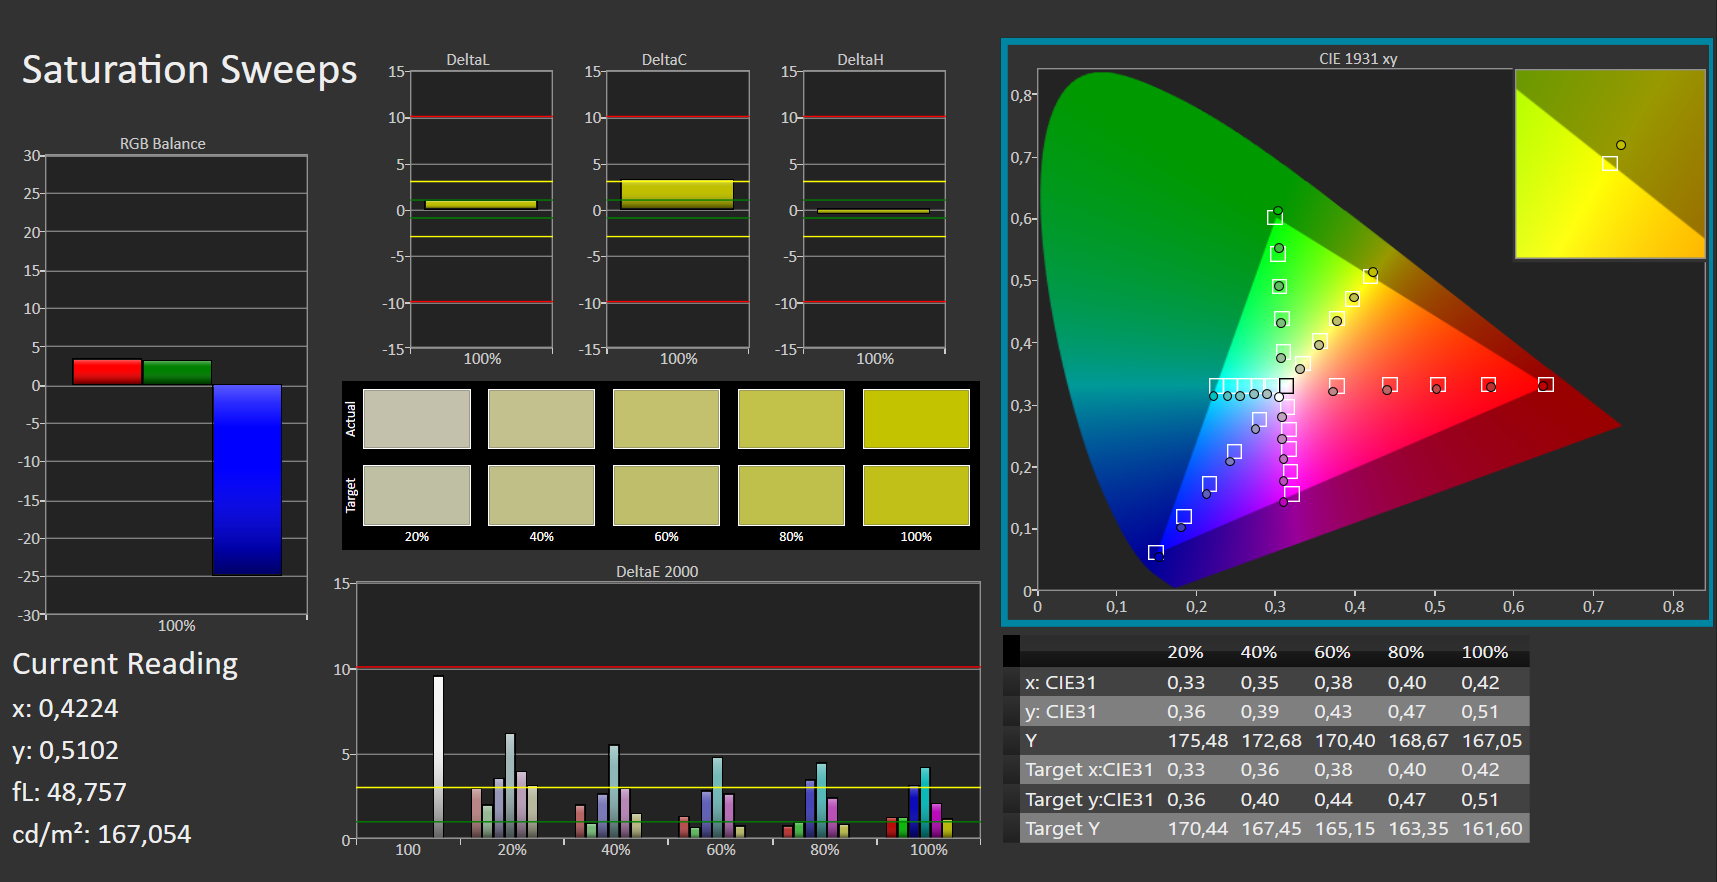
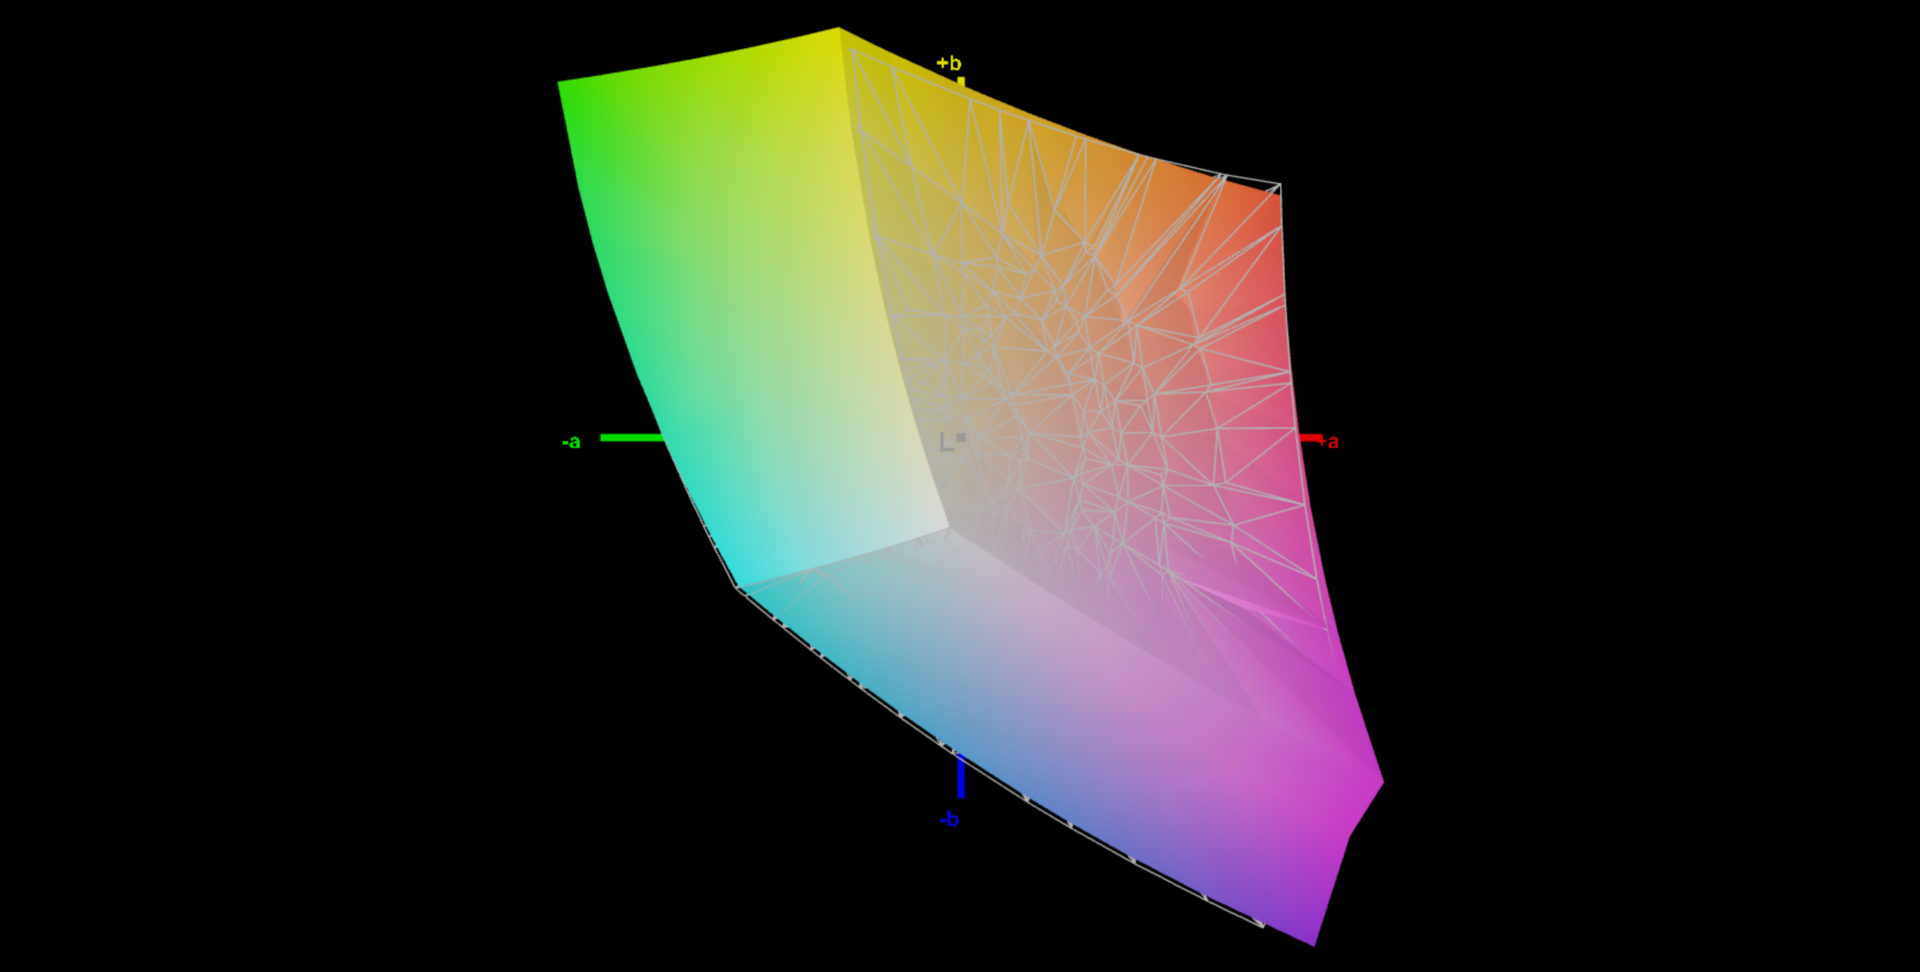
67.1% AdobeRGB 1998 (Argyll 3D)
96.3% sRGB (Argyll 3D)
66.2% Display P3 (Argyll 3D)
Gamma: 2.36
CCT: 6976 K
| Acer Nitro 5 AN515-45-R1JH BOE BOE09B8, IPS, 2560x1440, 15.6" | Asus ROG Strix G15 G513QY Sharp SHP152C, IPS, 1920x1080, 15.6" | Aorus 15P XC Sharp LQ156M1JW03, IPS, 1920x1080, 15.6" | MSI GF65 Thin 10UE AU Optronics B156HAN08.4, IPS, 1920x1080, 15.6" | Asus TUF Gaming A15 FA506QR-AZ061T Sharp SHP1532, IPS, 1920x1080, 15.6" | Razer Blade 15 Base Edition 2021, i7-10750H RTX 3060 BOE NV156FHM-N4K, IPS, 1920x1080, 15.6" | |
|---|---|---|---|---|---|---|
| Display | 1% | 2% | -42% | -3% | ||
| Display P3 Coverage (%) | 66.2 | 66.5 0% | 67.2 2% | 37.65 -43% | 64.3 -3% | |
| sRGB Coverage (%) | 96.3 | 97.7 1% | 98.7 2% | 56.3 -42% | 91.8 -5% | |
| AdobeRGB 1998 Coverage (%) | 67.1 | 67.6 1% | 68.6 2% | 38.9 -42% | 65.5 -2% | |
| Response Times | 9% | 0% | -229% | 7% | 6% | |
| Response Time Grey 50% / Grey 80% * (ms) | 14 ? | 8 ? 43% | 11.2 ? 20% | 36.8 ? -163% | 12 ? 14% | 8.8 ? 37% |
| Response Time Black / White * (ms) | 8 ? | 10 ? -25% | 9.6 ? -20% | 31.6 ? -295% | 8 ? -0% | 10 ? -25% |
| PWM Frequency (Hz) | 24040 ? | 1250 ? | 1000 ? | |||
| Screen | 3% | 38% | 2% | 40% | 13% | |
| Brightness middle (cd/m²) | 349 | 306 -12% | 298 -15% | 266.5 -24% | 297 -15% | 317.2 -9% |
| Brightness (cd/m²) | 304 | 283 -7% | 278 -9% | 262 -14% | 268 -12% | 306 1% |
| Brightness Distribution (%) | 79 | 86 9% | 88 11% | 91 15% | 84 6% | 89 13% |
| Black Level * (cd/m²) | 0.535 | 0.25 53% | 0.29 46% | 0.18 66% | 0.22 59% | 0.31 42% |
| Contrast (:1) | 652 | 1224 88% | 1028 58% | 1481 127% | 1350 107% | 1023 57% |
| Colorchecker dE 2000 * | 3.11 | 4.97 -60% | 0.96 69% | 5.33 -71% | 1.36 56% | 4.37 -41% |
| Colorchecker dE 2000 max. * | 9.57 | 10.12 -6% | 3.22 66% | 18.28 -91% | 3.82 60% | 6.62 31% |
| Greyscale dE 2000 * | 5 | 7.2 -44% | 1.3 74% | 4.5 10% | 1.88 62% | 4.5 10% |
| Gamma | 2.36 93% | 2.23 99% | 2.242 98% | 2.35 94% | 2.48 89% | 2.4 92% |
| CCT | 6976 93% | 7784 84% | 6519 100% | 6289 103% | 6768 96% | 7418 88% |
| Colorchecker dE 2000 calibrated * | 0.7 | 0.83 | 4.36 | 2.67 | ||
| Color Space (Percent of AdobeRGB 1998) (%) | 67.6 | 69 | 35.6 | 63 | 59.2 | |
| Color Space (Percent of sRGB) (%) | 97.7 | 91 | 55.8 | 99 | 91.4 | |
| Total Average (Program / Settings) | 4% /
3% | 13% /
24% | -90% /
-44% | 24% /
34% | 5% /
8% |
* ... smaller is better
开箱后,显示器显示了非常体面的色彩再现,只是刚刚错过了目标,色彩偏差为3.11(DeltaE小于3)。它没有受到蓝色色调的影响。AdobeRGB(67%)、sRGB(96%)和DCI-P3(66%)色彩空间并没有完全映射出来。
Display Response Times
| ↔ Response Time Black to White | ||
|---|---|---|
| 8 ms ... rise ↗ and fall ↘ combined | ↗ 4 ms rise |  |
| ↘ 4 ms fall | ||
| The screen shows fast response rates in our tests and should be suited for gaming. In comparison, all tested devices range from 0.1 (minimum) to 240 (maximum) ms. » 22 % of all devices are better. This means that the measured response time is better than the average of all tested devices (19.8 ms). | ||
| ↔ Response Time 50% Grey to 80% Grey | ||
| 14 ms ... rise ↗ and fall ↘ combined | ↗ 7 ms rise |  |
| ↘ 7 ms fall | ||
| The screen shows good response rates in our tests, but may be too slow for competitive gamers. In comparison, all tested devices range from 0.165 (minimum) to 636 (maximum) ms. » 28 % of all devices are better. This means that the measured response time is better than the average of all tested devices (30.9 ms). | ||
Screen Flickering / PWM (Pulse-Width Modulation)
| Screen flickering / PWM not detected |  | ||
In comparison: 52 % of all tested devices do not use PWM to dim the display. If PWM was detected, an average of 7748 (minimum: 5 - maximum: 343500) Hz was measured. | |||
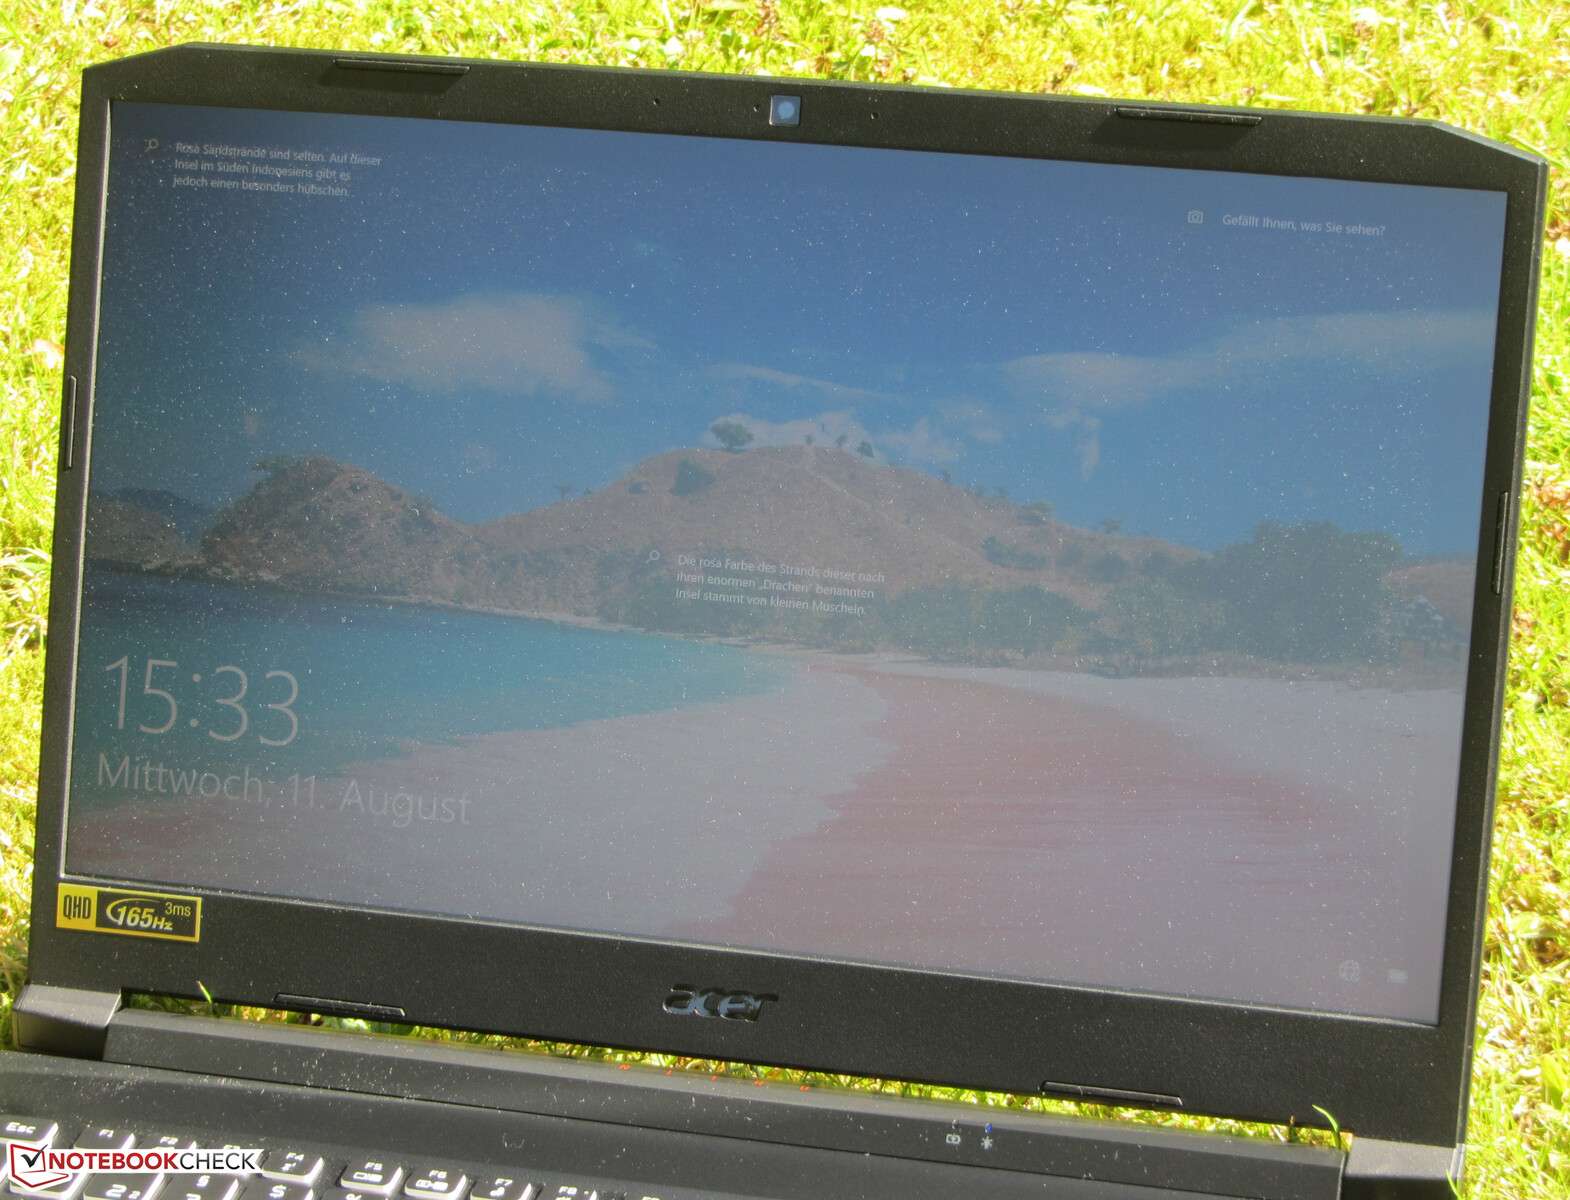
视角稳定的IPS面板在任何位置都能看清。在户外,当阳光不太强烈时,也可以阅读显示屏。

性能 - RTX 3070,低TGP
有了Nitro 5 AN515-45,宏碁在其产品线中拥有了一台15.6英寸的游戏笔记本电脑,将每一个现代游戏流畅地呈现在屏幕上。
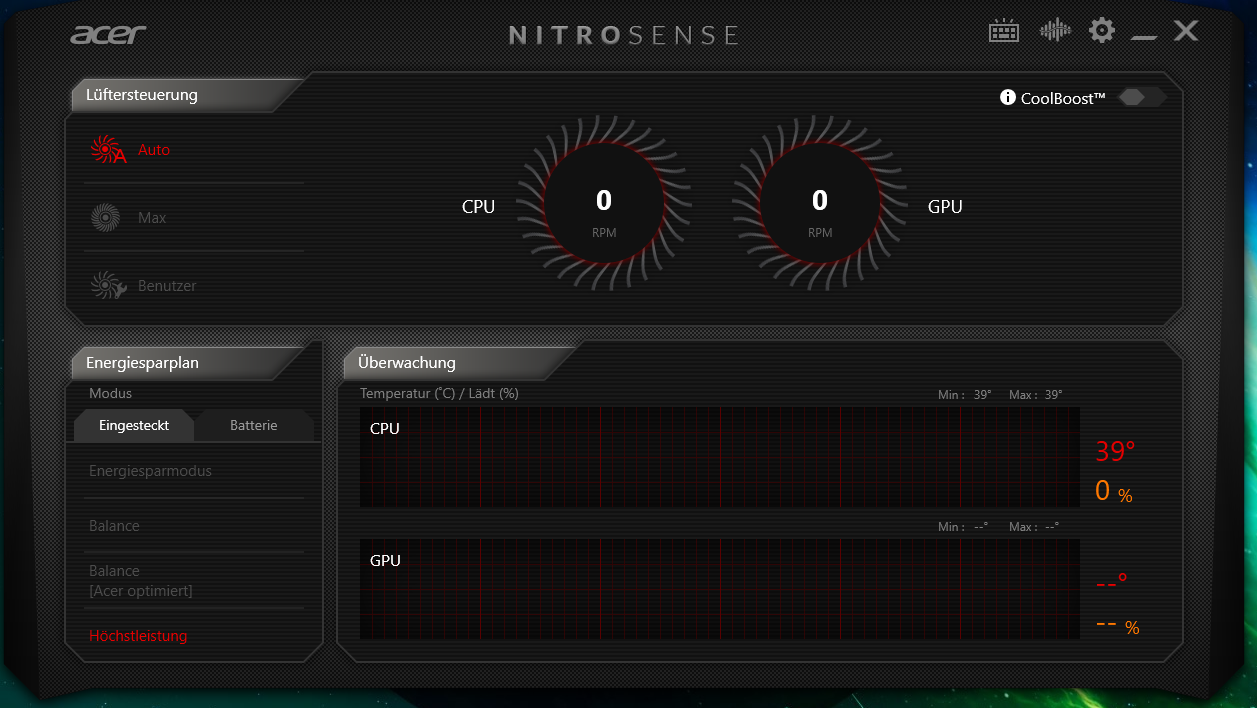
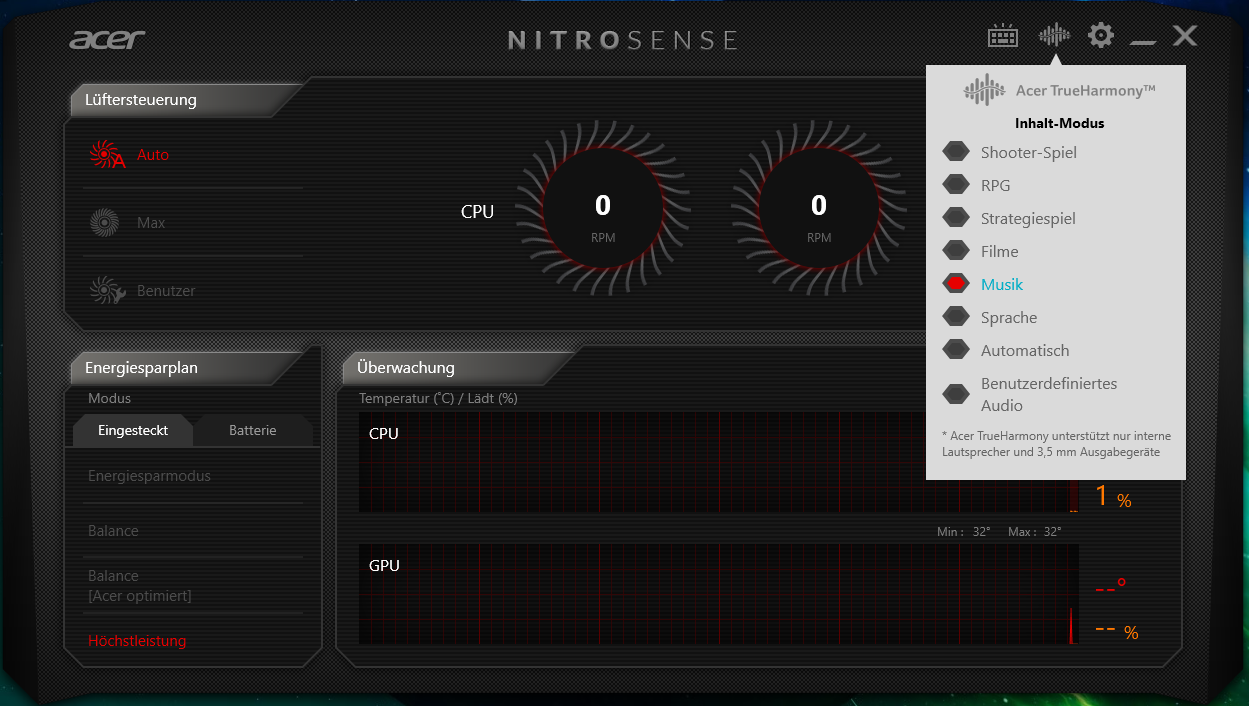
测试条件
预装的NitroSense软件提供各种性能配置,并允许用户调整两个风扇。我们使用性能配置文件 "高性能 "运行所有的基准测试,并启用了自动风扇控制。这些性能配置文件对应于标准的Windows 10配置文件。
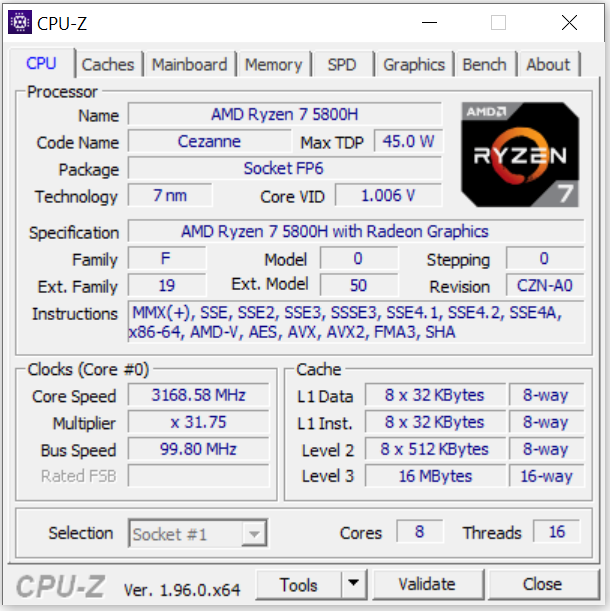
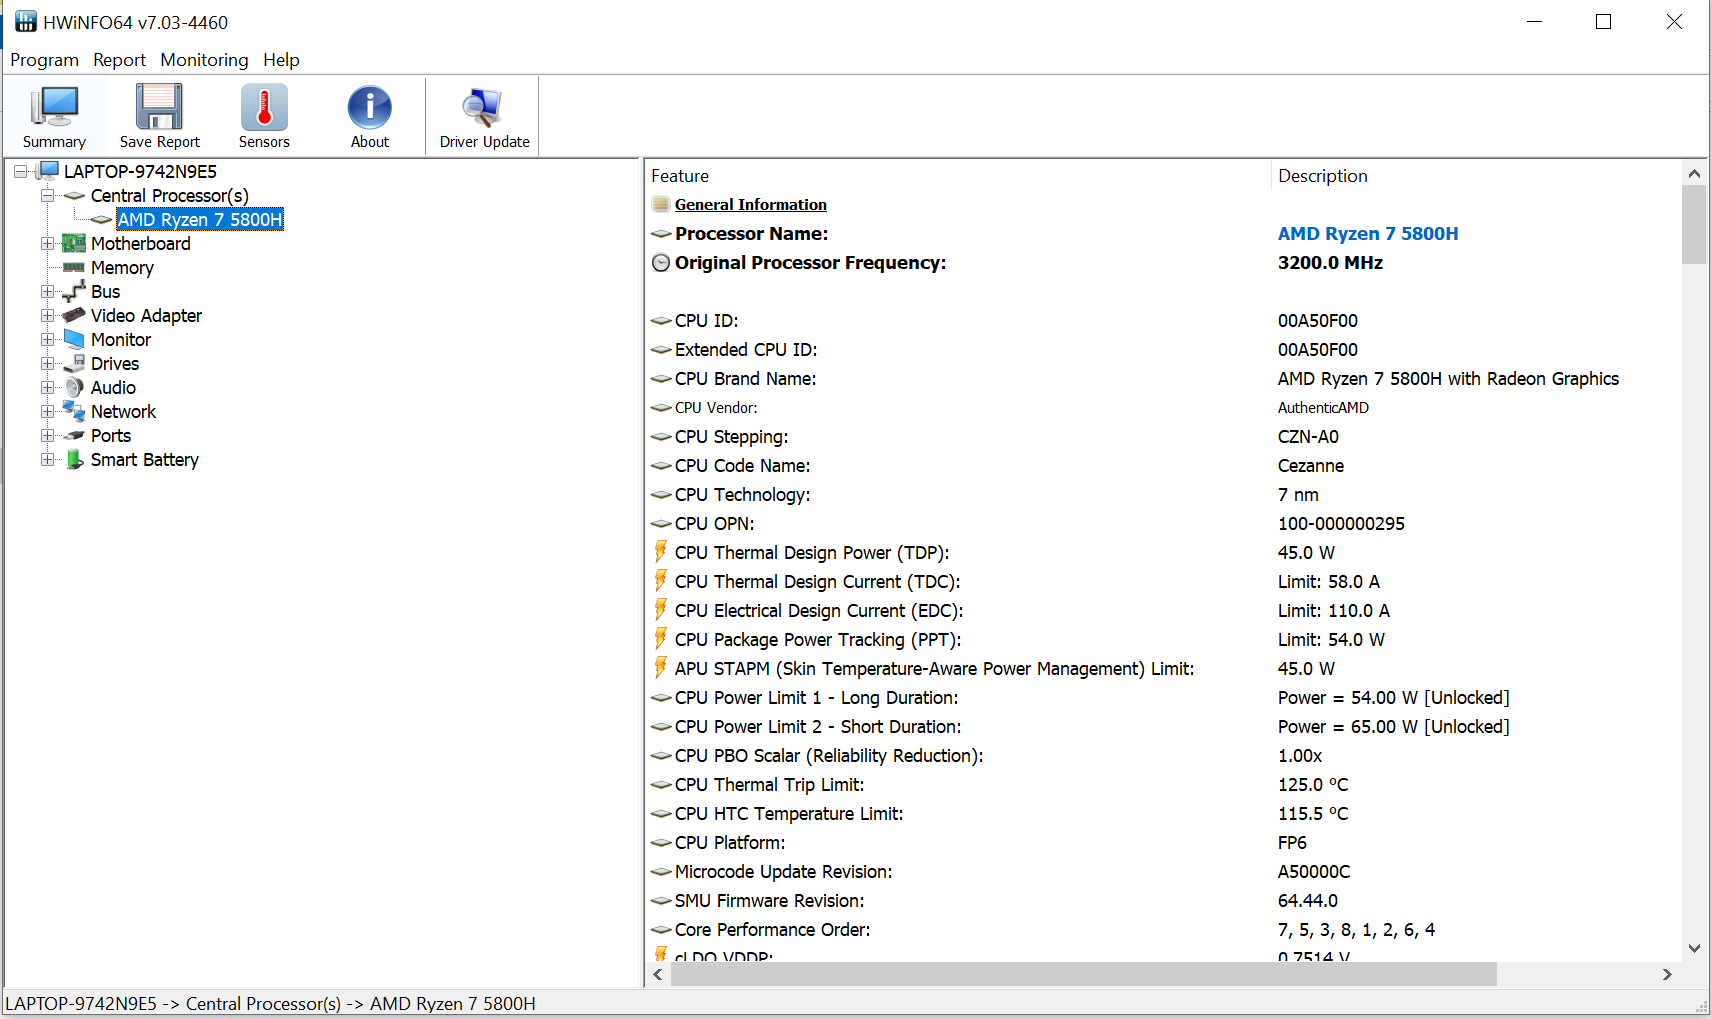
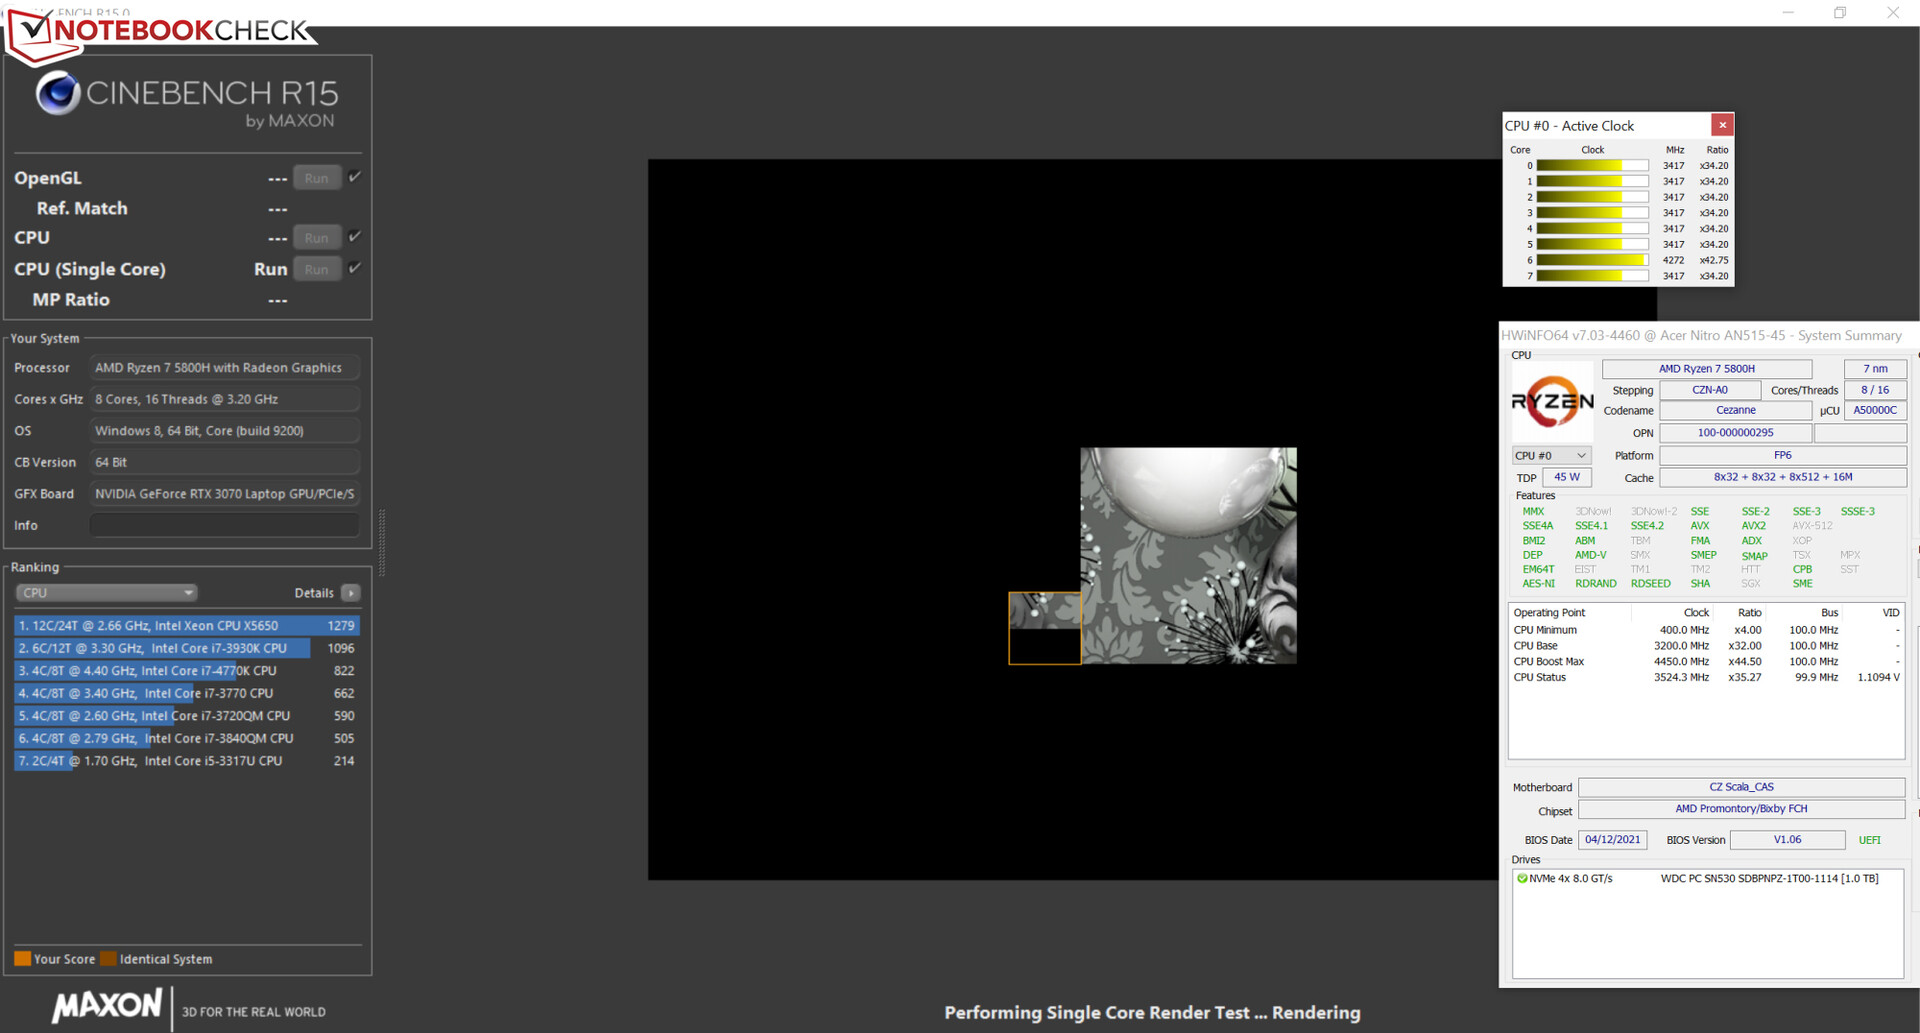
处理器
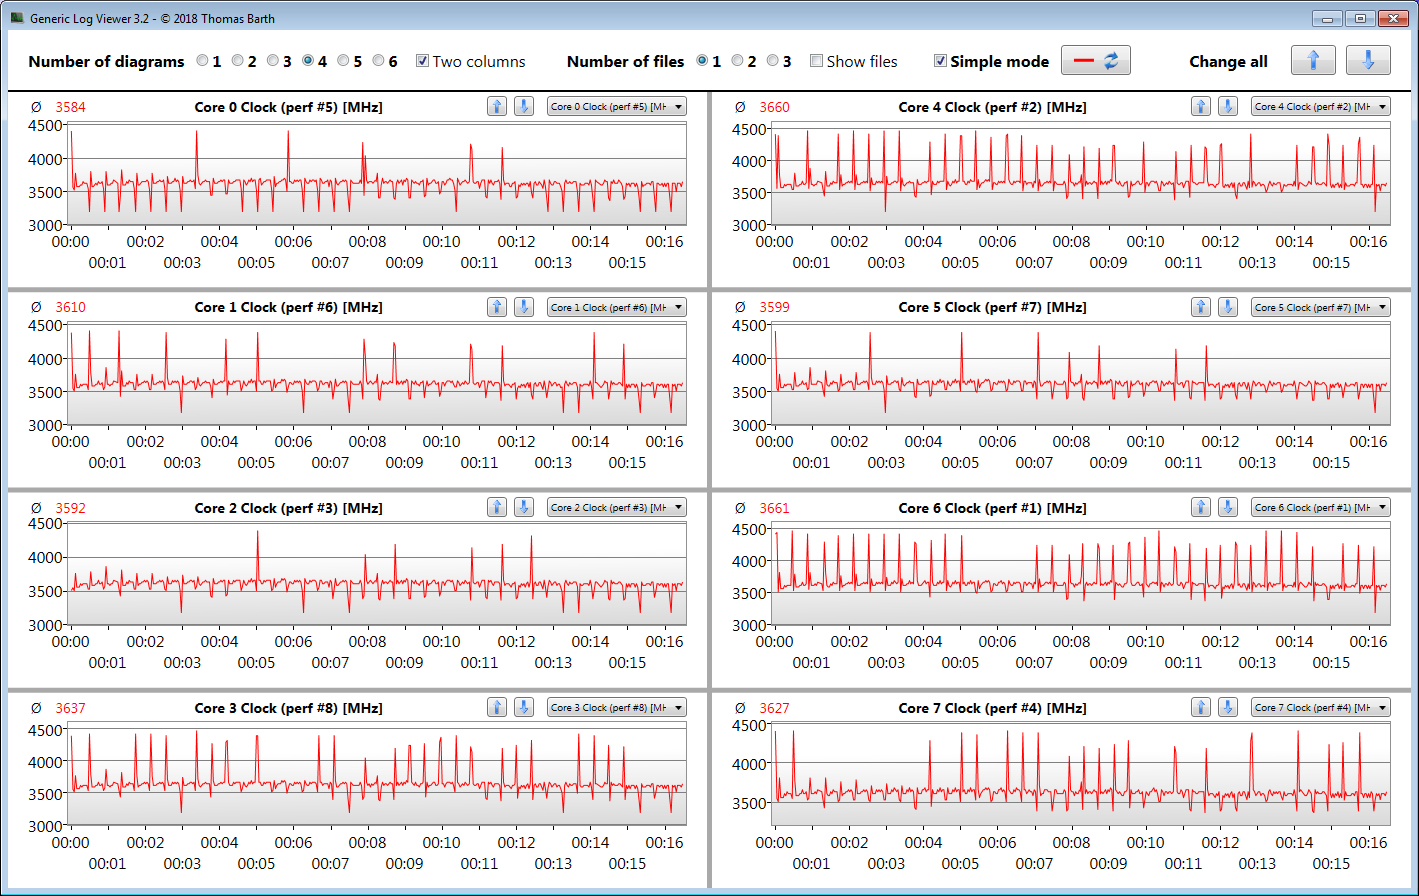
Cinebench R15基准的多线程测试分别在3.6至3.8GHz(插电)和2.5至3.3GHz(电池供电)下处理。单线程测试总是在3.4至4.4GHz下运行。
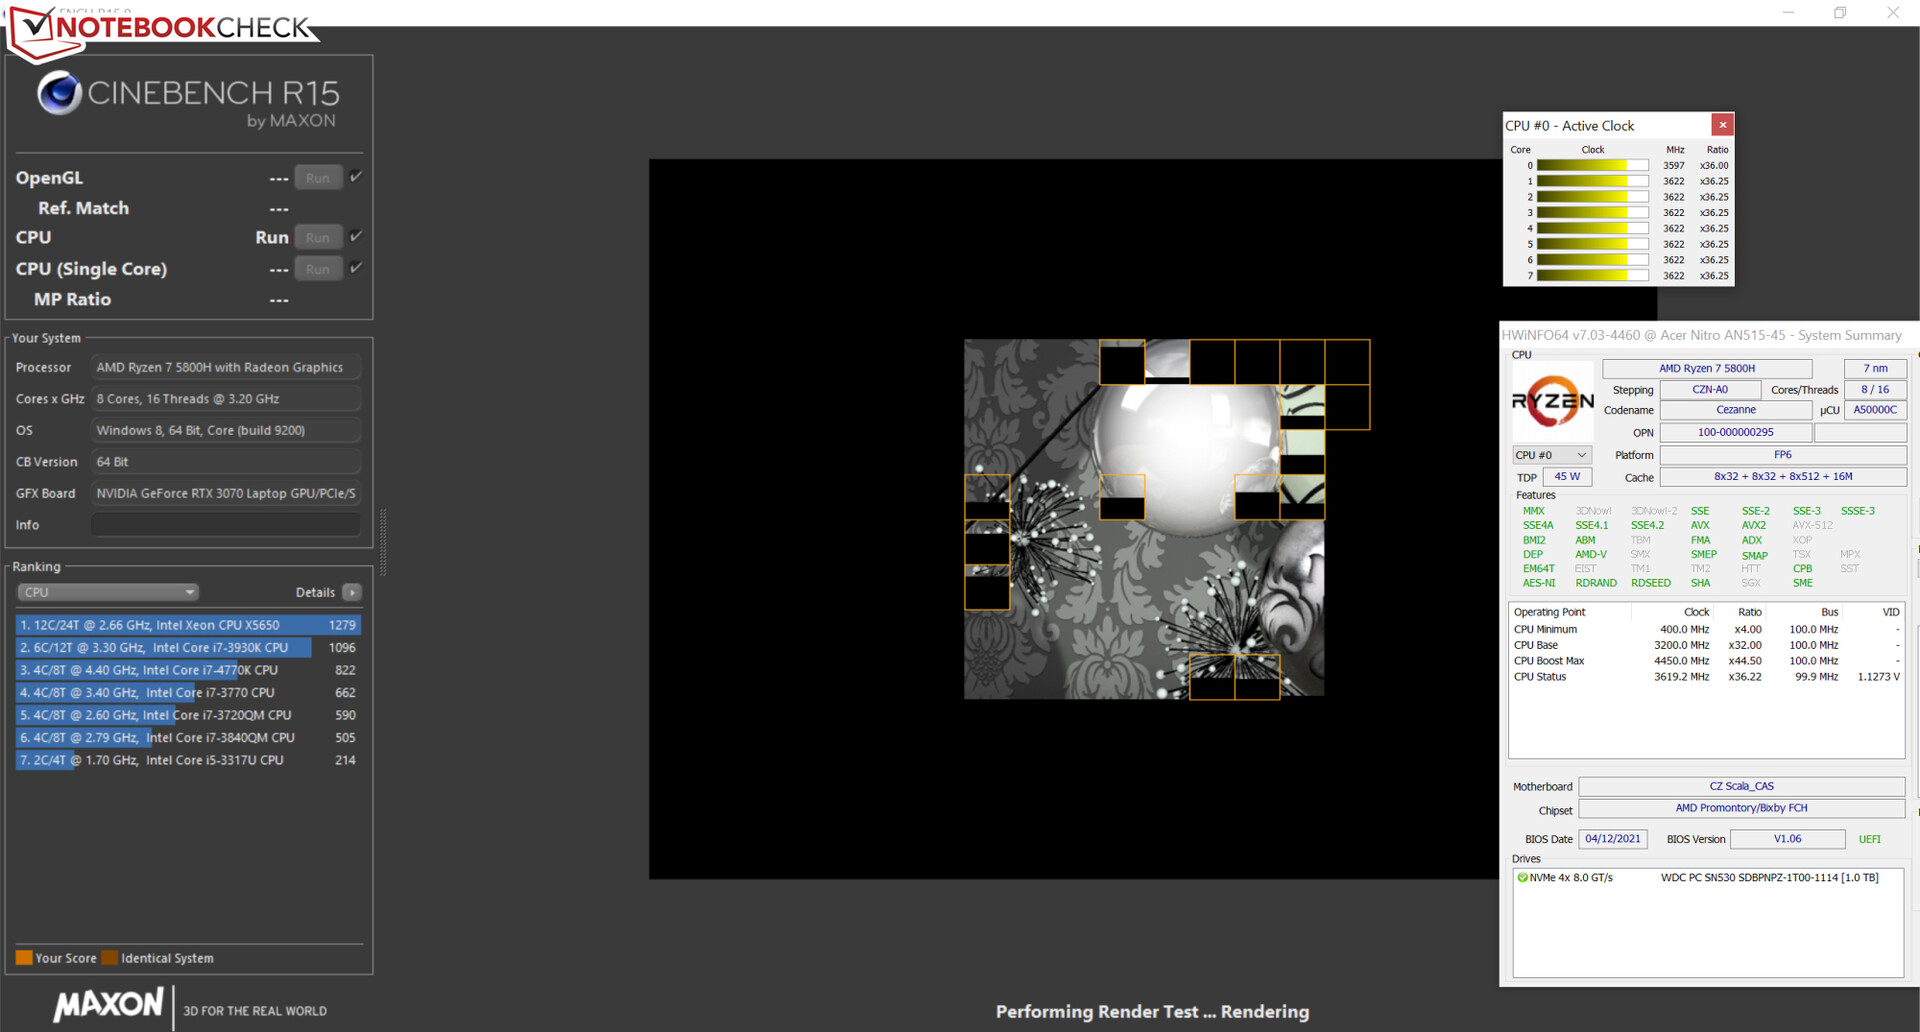
我们通过连续循环运行Cinebench R15基准测试的多线程测试至少30分钟来验证CPU Turbo在插电时是否也被持续使用。Turbo的使用程度是适度的。
Cinebench R15 Multi endurance test
| Blender - v2.79 BMW27 CPU | |
| Razer Blade 15 Base Edition 2021, i7-10750H RTX 3060 | |
| Acer Aspire Nitro 5 AN515-55-57GF | |
| MSI GF65 Thin 10UE | |
| Aorus 15P XC | |
| Asus TUF Gaming A15 FA506QR-AZ061T | |
| Average AMD Ryzen 7 5800H (237 - 340, n=29) | |
| Acer Nitro 5 AN515-45-R1JH | |
| Asus ROG Strix G15 G513QY | |
| Average of class Gaming (79 - 330, n=105, last 2 years) | |
| HWBOT x265 Benchmark v2.2 - 4k Preset | |
| Average of class Gaming (11.5 - 44.4, n=106, last 2 years) | |
| Asus ROG Strix G15 G513QY | |
| Acer Nitro 5 AN515-45-R1JH | |
| Average AMD Ryzen 7 5800H (11.6 - 16.1, n=29) | |
| Asus TUF Gaming A15 FA506QR-AZ061T | |
| Aorus 15P XC | |
| MSI GF65 Thin 10UE | |
| Razer Blade 15 Base Edition 2021, i7-10750H RTX 3060 | |
| Acer Aspire Nitro 5 AN515-55-57GF | |
| LibreOffice - 20 Documents To PDF | |
| Acer Nitro 5 AN515-45-R1JH | |
| Average AMD Ryzen 7 5800H (47.4 - 113, n=29) | |
| Acer Aspire Nitro 5 AN515-55-57GF | |
| Aorus 15P XC | |
| Asus ROG Strix G15 G513QY | |
| Average of class Gaming (33.2 - 88.8, n=106, last 2 years) | |
| Asus TUF Gaming A15 FA506QR-AZ061T | |
| Razer Blade 15 Base Edition 2021, i7-10750H RTX 3060 | |
| MSI GF65 Thin 10UE | |
| R Benchmark 2.5 - Overall mean | |
| Acer Aspire Nitro 5 AN515-55-57GF | |
| Razer Blade 15 Base Edition 2021, i7-10750H RTX 3060 | |
| MSI GF65 Thin 10UE | |
| Aorus 15P XC | |
| Average AMD Ryzen 7 5800H (0.511 - 0.559, n=28) | |
| Acer Nitro 5 AN515-45-R1JH | |
| Asus TUF Gaming A15 FA506QR-AZ061T | |
| Asus ROG Strix G15 G513QY | |
| Average of class Gaming (0.3439 - 0.759, n=107, last 2 years) | |
* ... smaller is better
系统性能
快速而流畅的系统有足够的计算能力来满足所有常见的应用领域。游戏、视频编辑和图像处理对Nitro不构成大的挑战。这一点在PCMark的良好成绩中得到了补充。
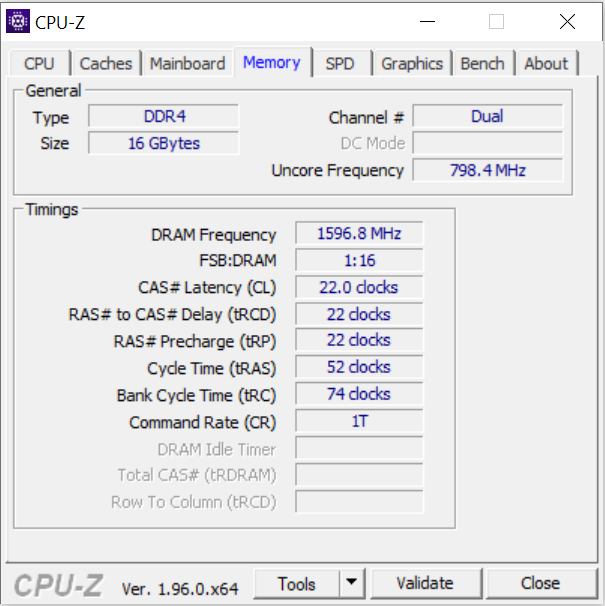
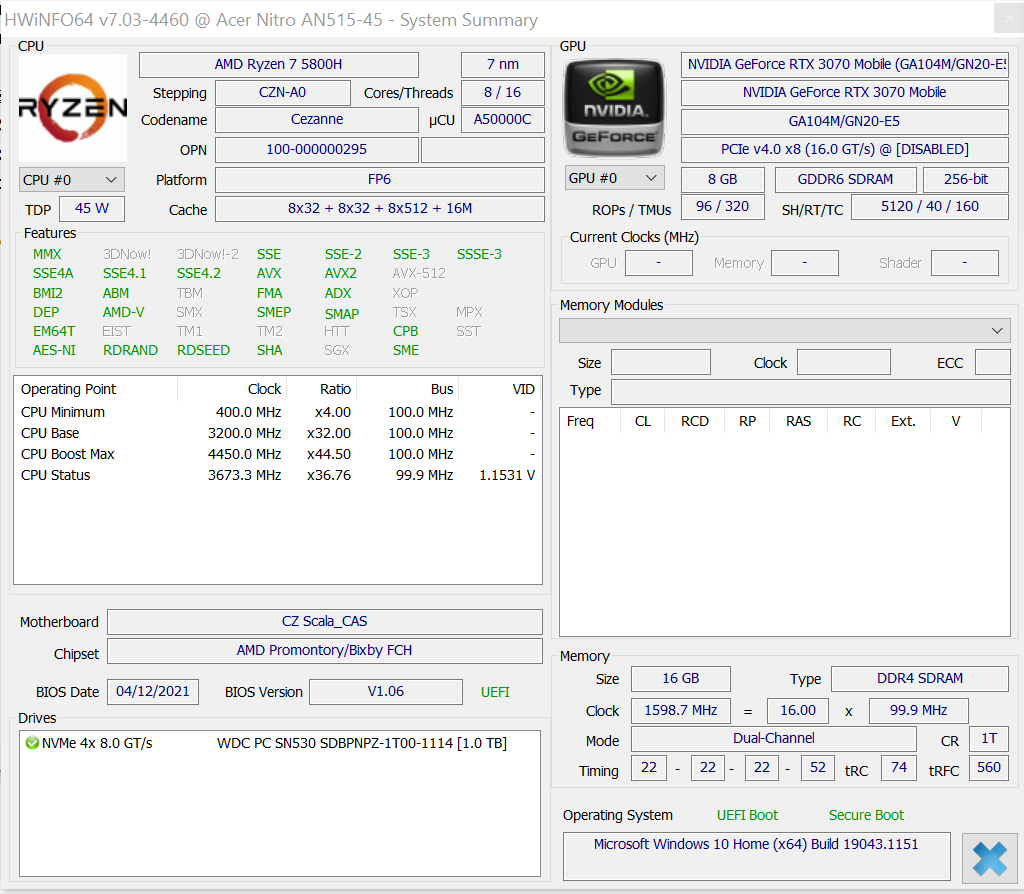
宏碁为该笔记本电脑配备了两个单面8GB内存模块(DDR4-3200),其传输速率和内存定时相对较慢。在我们迄今为止测试过的采用这种CPU-GPU组合的笔记本电脑中,内存在表格中的排名较低。
平均而言,低值会导致游戏性能下降达10%。将内存模块更换为具有更好定时的型号可以进一步略微提高游戏性能。
| PCMark 8 Home Score Accelerated v2 | 4995 points | |
| PCMark 8 Creative Score Accelerated v2 | 6161 points | |
| PCMark 8 Work Score Accelerated v2 | 5916 points | |
| PCMark 10 Score | 6738 points | |
Help | ||
| PCMark 10 / Score | |
| Average of class Gaming (5828 - 12414, n=94, last 2 years) | |
| Asus ROG Strix G15 G513QY | |
| Asus TUF Gaming A15 FA506QR-AZ061T | |
| Average AMD Ryzen 7 5800H, NVIDIA GeForce RTX 3070 Laptop GPU (6717 - 6983, n=6) | |
| Acer Nitro 5 AN515-45-R1JH | |
| Aorus 15P XC | |
| Razer Blade 15 Base Edition 2021, i7-10750H RTX 3060 | |
| MSI GF65 Thin 10UE | |
| Acer Aspire Nitro 5 AN515-55-57GF | |
| PCMark 10 / Essentials | |
| Average of class Gaming (8810 - 11935, n=98, last 2 years) | |
| Asus ROG Strix G15 G513QY | |
| Asus TUF Gaming A15 FA506QR-AZ061T | |
| Razer Blade 15 Base Edition 2021, i7-10750H RTX 3060 | |
| Average AMD Ryzen 7 5800H, NVIDIA GeForce RTX 3070 Laptop GPU (9548 - 10226, n=6) | |
| Acer Nitro 5 AN515-45-R1JH | |
| Aorus 15P XC | |
| MSI GF65 Thin 10UE | |
| Acer Aspire Nitro 5 AN515-55-57GF | |
| PCMark 10 / Productivity | |
| Average of class Gaming (6845 - 25323, n=96, last 2 years) | |
| Asus TUF Gaming A15 FA506QR-AZ061T | |
| Acer Nitro 5 AN515-45-R1JH | |
| Average AMD Ryzen 7 5800H, NVIDIA GeForce RTX 3070 Laptop GPU (8849 - 9514, n=6) | |
| Asus ROG Strix G15 G513QY | |
| Aorus 15P XC | |
| Razer Blade 15 Base Edition 2021, i7-10750H RTX 3060 | |
| MSI GF65 Thin 10UE | |
| Acer Aspire Nitro 5 AN515-55-57GF | |
| PCMark 10 / Digital Content Creation | |
| Average of class Gaming (7602 - 19954, n=96, last 2 years) | |
| Asus ROG Strix G15 G513QY | |
| Aorus 15P XC | |
| Average AMD Ryzen 7 5800H, NVIDIA GeForce RTX 3070 Laptop GPU (8948 - 10389, n=6) | |
| Asus TUF Gaming A15 FA506QR-AZ061T | |
| Acer Nitro 5 AN515-45-R1JH | |
| Razer Blade 15 Base Edition 2021, i7-10750H RTX 3060 | |
| MSI GF65 Thin 10UE | |
| Acer Aspire Nitro 5 AN515-55-57GF | |
| Acer Nitro 5 AN515-45-R1JH R7 5800H, GeForce RTX 3070 Laptop GPU | Asus ROG Strix G15 G513QY R9 5900HX, Radeon RX 6800M | Aorus 15P XC i7-10870H, GeForce RTX 3070 Laptop GPU | Asus TUF Gaming A15 FA506QR-AZ061T R7 5800H, GeForce RTX 3070 Laptop GPU | Average NVIDIA GeForce RTX 3070 Laptop GPU | Average AMD Ryzen 7 5800H | |
|---|---|---|---|---|---|---|
| AIDA64 | -5% | 8% | 1% | 14% | 2% | |
| Memory Write (MB/s) | 34298 | 32536 -5% | 40730 19% | 33705 -2% | 43176 ? 26% | 37769 ? 10% |
| Memory Read (MB/s) | 43642 | 41984 -4% | 40189 -8% | 45970 5% | 45987 ? 5% | 44498 ? 2% |
| Memory Latency * (ns) | 76.3 | 81.3 -7% | 57.9 24% | 79.2 -4% | 66.4 ? 13% | 83.3 ? -9% |
| Memory Copy (MB/s) | 37654 | 36725 -2% | 35818 -5% | 39623 5% | 41820 ? 11% | 39512 ? 5% |
* ... smaller is better
DPC延迟
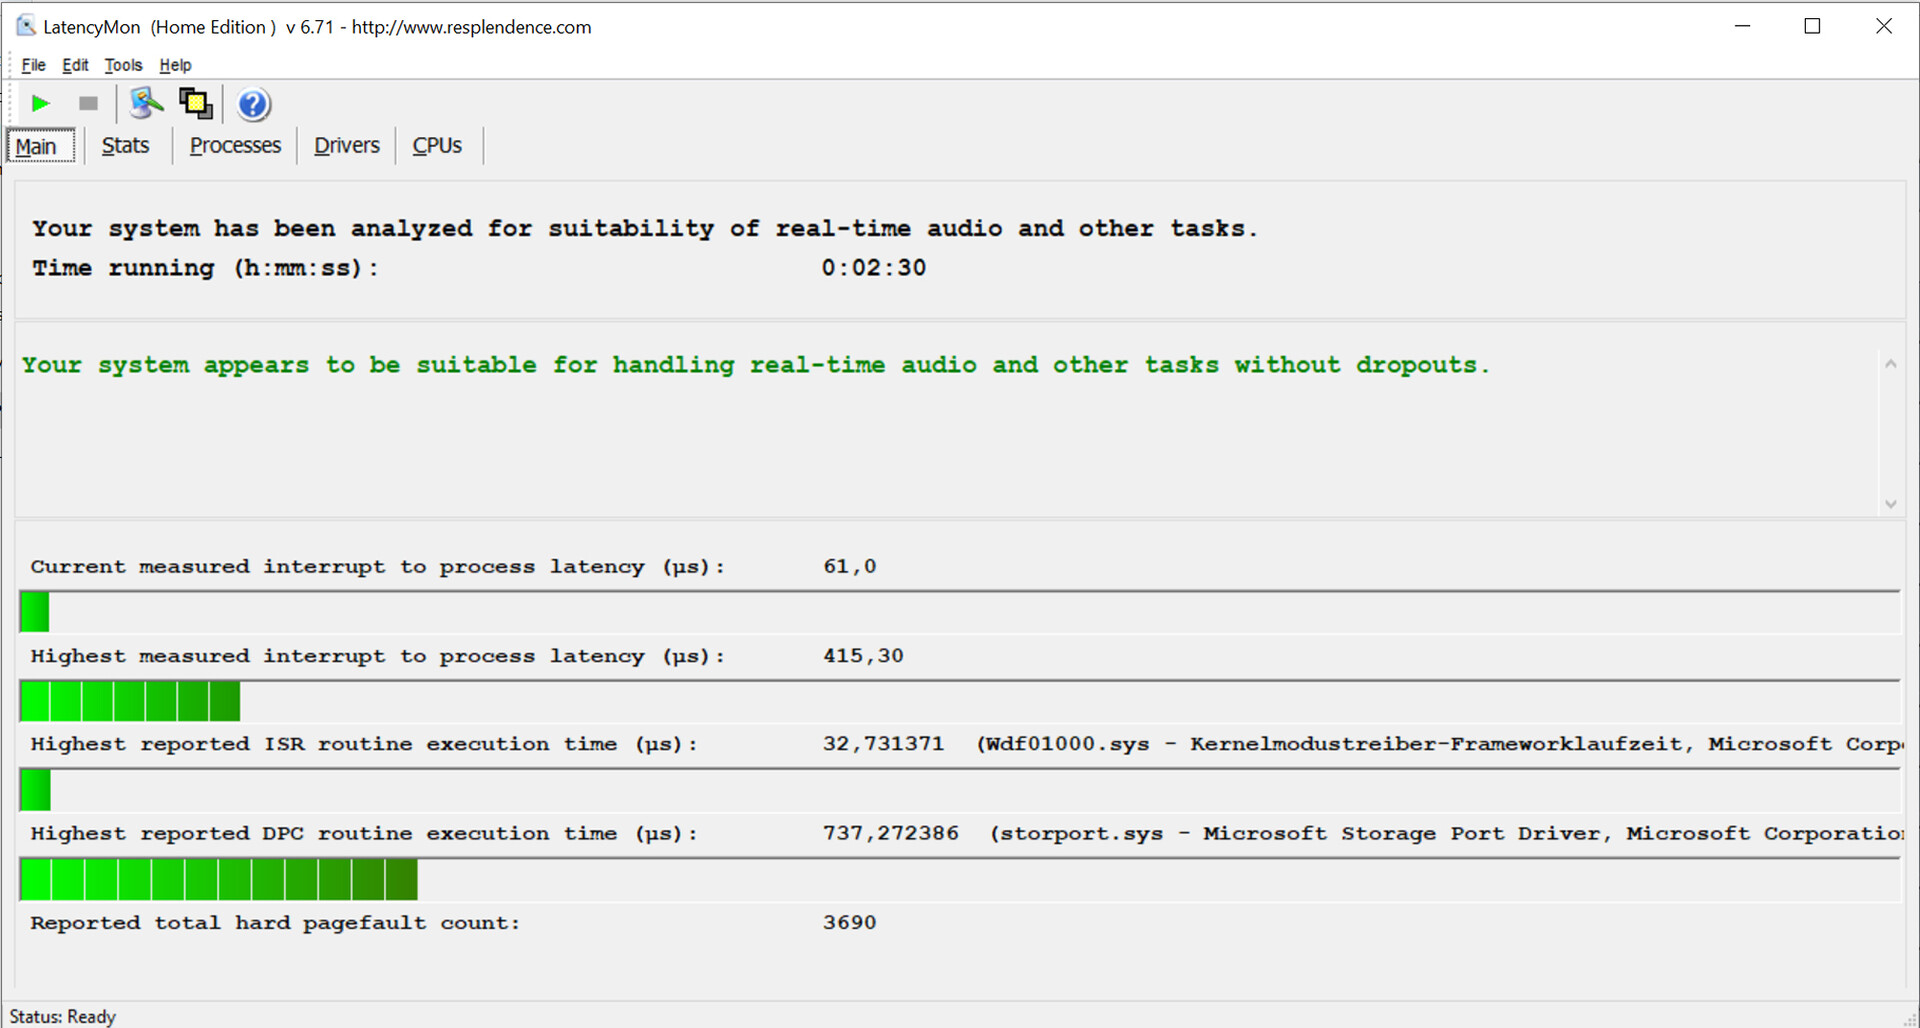
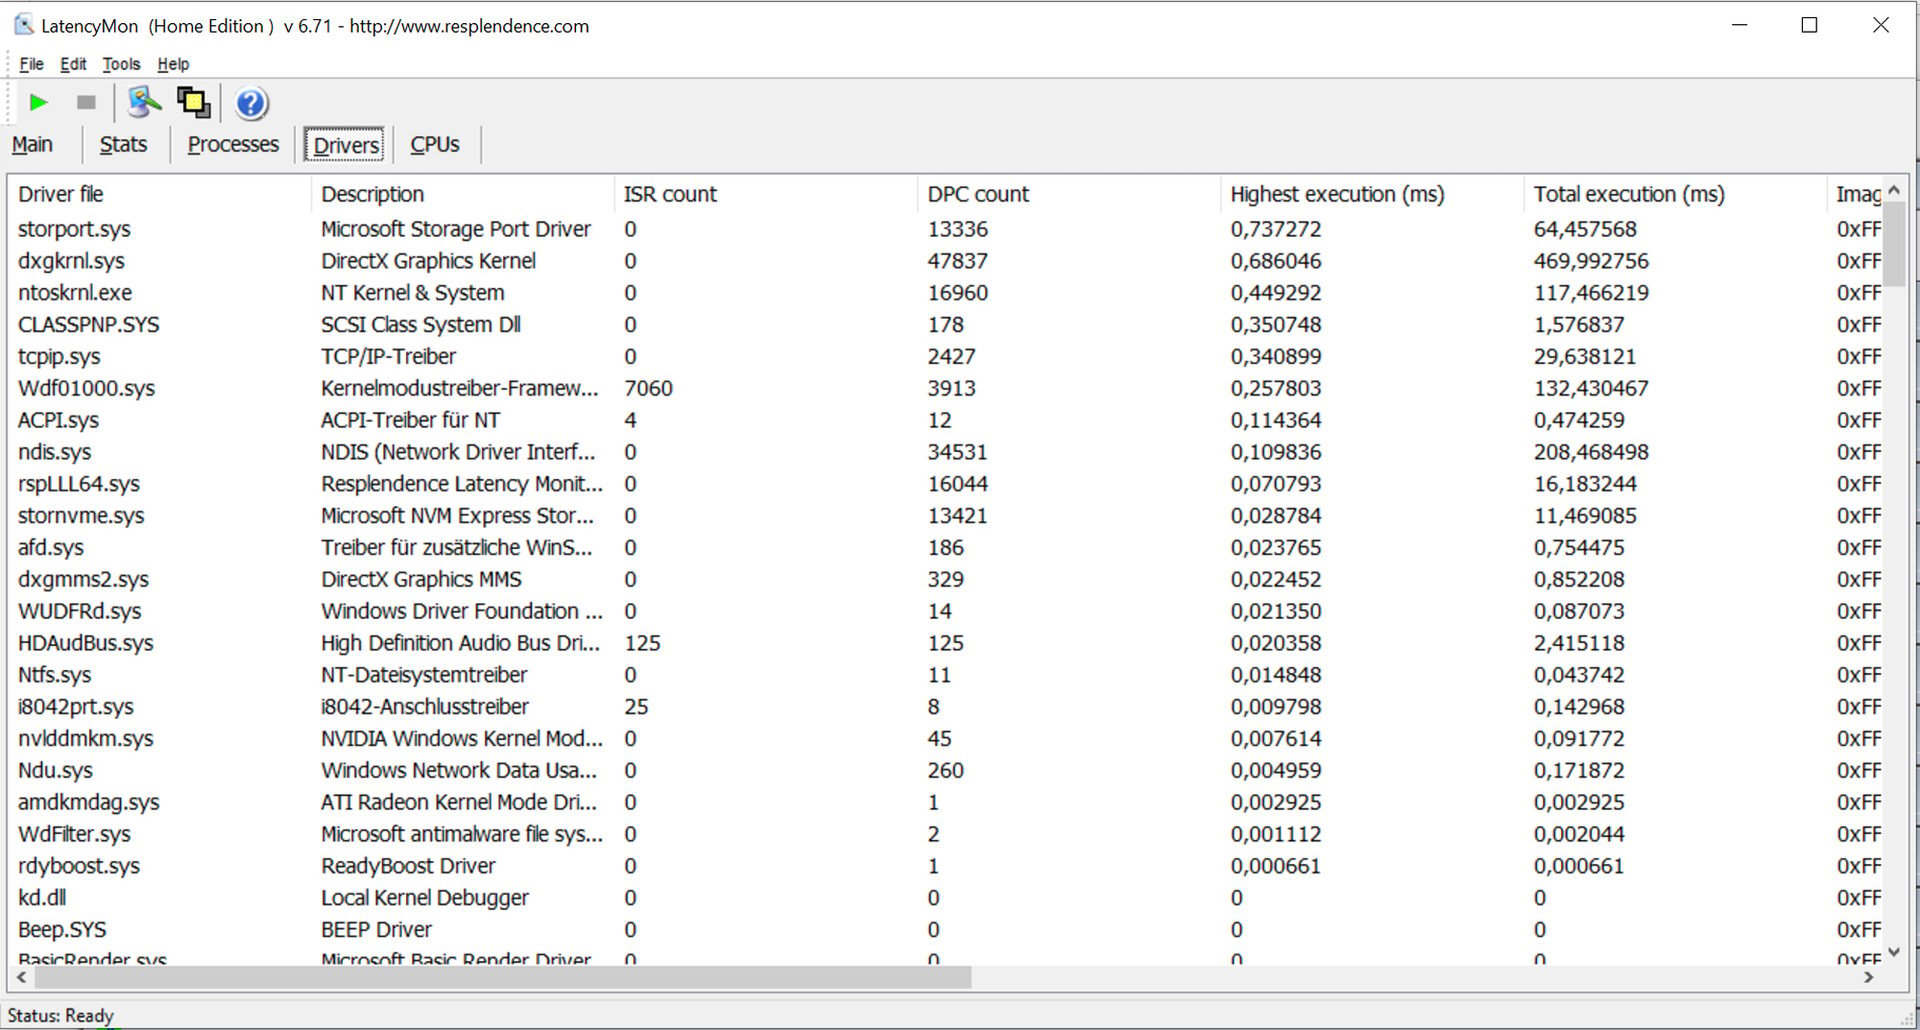
标准化的延迟监测测试(网页浏览、4K视频播放、高负荷的Prime95)没有发现DPC延迟的任何不正常现象。该系统似乎适用于实时视频和音频编辑。这一评估是基于我们的测试设备运行测试时可用的最新软件。未来的更新可能会带来改进,甚至导致性能下降。
| DPC Latencies / LatencyMon - interrupt to process latency (max), Web, Youtube, Prime95 | |
| Asus ROG Strix G15 G513QY | |
| Aorus 15P XC | |
| Asus TUF Gaming A15 FA506QR-AZ061T | |
| MSI GF65 Thin 10UE | |
| Razer Blade 15 Base Edition 2021, i7-10750H RTX 3060 | |
| Acer Aspire Nitro 5 AN515-55-57GF | |
| Acer Nitro 5 AN515-45-R1JH | |
* ... smaller is better
储存
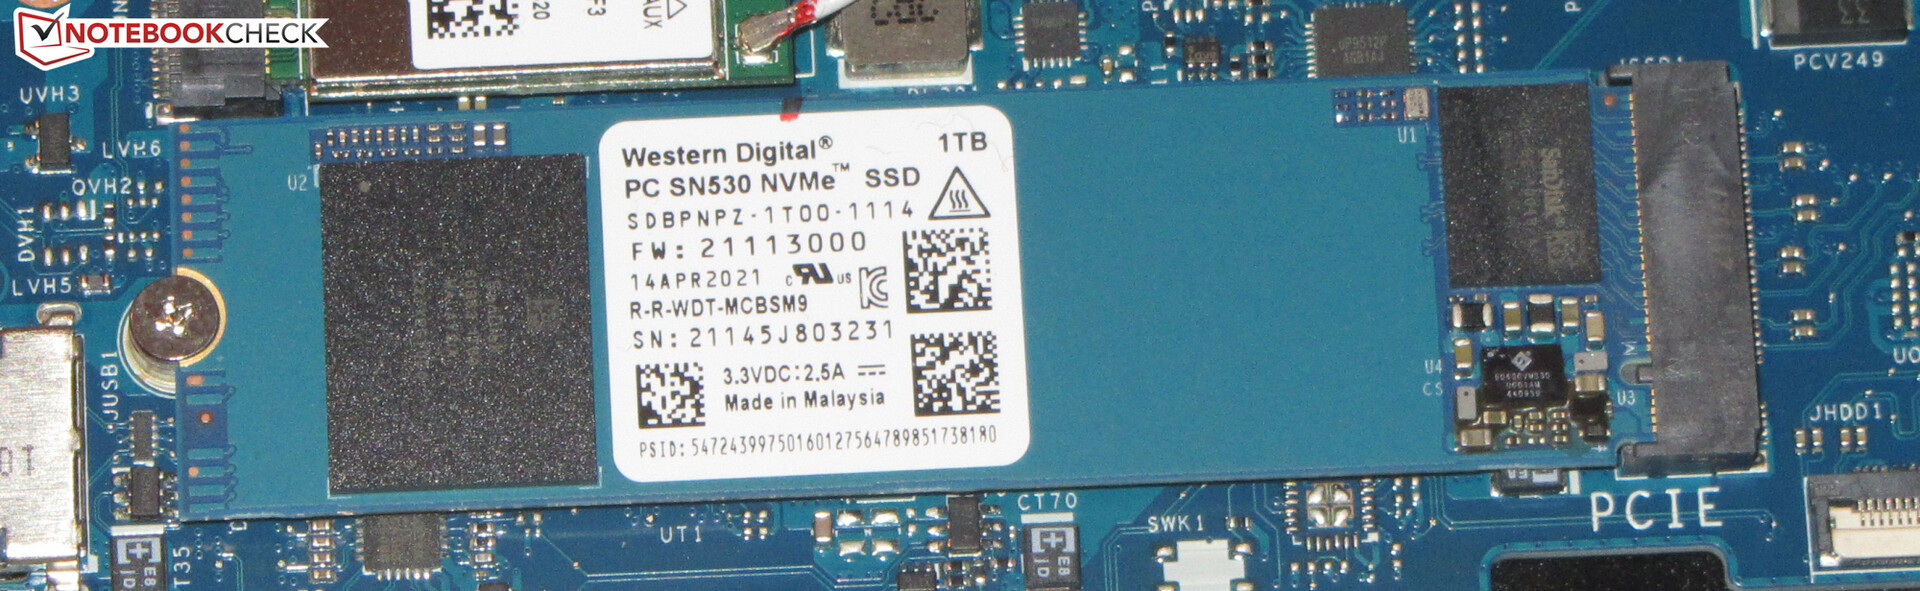
西部数据的NVMe SSD(M.2-2280)作为系统驱动器。它提供1TB的存储空间,并提供良好的传输速率。此外,该笔记本电脑还为第二块M.2-2280固态硬盘(NVMe)以及2.5英寸存储设备提供了空间(SATA插槽和螺丝在盒子里,而安装框架在笔记本电脑内)。

| Acer Nitro 5 AN515-45-R1JH WDC PC SN530 SDBPNPZ-1T00 | Asus ROG Strix G15 G513QY Samsung PM991 MZVLQ512HALU | Aorus 15P XC ESR512GTLCG-EAC-4 | MSI GF65 Thin 10UE Samsung SSD PM981 MZVLB1T0HALR | Asus TUF Gaming A15 FA506QR-AZ061T SK Hynix HFM001TD3JX013N | Razer Blade 15 Base Edition 2021, i7-10750H RTX 3060 Samsung SSD PM981a MZVLB512HBJQ | Average WDC PC SN530 SDBPNPZ-1T00 | |
|---|---|---|---|---|---|---|---|
| CrystalDiskMark 5.2 / 6 | -0% | 11% | 10% | 28% | 10% | 3% | |
| Write 4K (MB/s) | 161.3 | 140.4 -13% | 130.2 -19% | 157.3 -2% | 182.5 13% | 123.8 -23% | 182.7 ? 13% |
| Read 4K (MB/s) | 49.49 | 48.91 -1% | 45.47 -8% | 46.69 -6% | 73.2 48% | 45.53 -8% | 48.6 ? -2% |
| Write Seq (MB/s) | 1970 | 1613 -18% | 2269 15% | 2389 21% | 3005 53% | 2132 8% | 1979 ? 0% |
| Read Seq (MB/s) | 2007 | 2043 2% | 1643 -18% | 2196 9% | 2358 17% | 2067 3% | 1828 ? -9% |
| Write 4K Q32T1 (MB/s) | 416.8 | 482.5 16% | 547 31% | 407.6 -2% | 389.5 -7% | 462.9 11% | 498 ? 19% |
| Read 4K Q32T1 (MB/s) | 554 | 553 0% | 654 18% | 519 -6% | 463.8 -16% | 553 0% | 573 ? 3% |
| Write Seq Q32T1 (MB/s) | 1965 | 1612 -18% | 2512 28% | 2401 22% | 3166 61% | 2955 50% | 1980 ? 1% |
| Read Seq Q32T1 (MB/s) | 2369 | 3105 31% | 3382 43% | 3344 41% | 3590 52% | 3246 37% | 2336 ? -1% |
| Write 4K Q8T8 (MB/s) | 1202 | 563 ? | |||||
| Read 4K Q8T8 (MB/s) | 1451 | 1498 ? | |||||
| AS SSD | 98% | 135% | 143% | 173% | 120% | 54% | |
| Seq Read (MB/s) | 2217 | 2706 22% | 2694 22% | 3002 35% | 3133 41% | 2401 8% | 2059 ? -7% |
| Seq Write (MB/s) | 1929 | 1652 -14% | 2327 21% | 2420 25% | 2969 54% | 2087 8% | 1812 ? -6% |
| 4K Read (MB/s) | 28.71 | 45.46 58% | 47.77 66% | 48.46 69% | 55.2 92% | 49.58 73% | 37.4 ? 30% |
| 4K Write (MB/s) | 146.3 | 128.5 -12% | 98.8 -32% | 114.3 -22% | 129.7 -11% | 98.8 -32% | 164.6 ? 13% |
| 4K-64 Read (MB/s) | 215.9 | 1342 522% | 1746 709% | 1873 768% | 1891 776% | 1601 642% | 765 ? 254% |
| 4K-64 Write (MB/s) | 1475 | 1066 -28% | 2267 54% | 1882 28% | 1795 22% | 1862 26% | 1431 ? -3% |
| Access Time Read * (ms) | 0.095 | 0.079 | 0.045 | 0.052 | 0.06 | 0.0364 ? | |
| Access Time Write * (ms) | 0.105 | 0.03 71% | 0.039 63% | 0.101 4% | 0.028 73% | 0.11 -5% | 0.07029 ? 33% |
| Score Read (Points) | 466 | 1658 256% | 2063 343% | 2221 377% | 2259 385% | 1890 306% | 1008 ? 116% |
| Score Write (Points) | 814 | 1360 67% | 2598 219% | 2238 175% | 2221 173% | 2170 167% | 1677 ? 106% |
| Score Total (Points) | 2513 | 3818 52% | 5698 127% | 5565 121% | 5630 124% | 5015 100% | 3337 ? 33% |
| Copy ISO MB/s (MB/s) | 1698 | 1838 8% | 1877 11% | 2421 43% | 2206 30% | 1653 ? -3% | |
| Copy Program MB/s (MB/s) | 284.7 | 848 198% | 555 95% | 705 148% | 694 144% | 528 ? 85% | |
| Copy Game MB/s (MB/s) | 786 | 1409 79% | 1201 53% | 1490 90% | 1555 98% | 1173 ? 49% | |
| Total Average (Program / Settings) | 49% /
61% | 73% /
88% | 77% /
92% | 101% /
108% | 65% /
78% | 29% /
34% |
* ... smaller is better
Continuous load read: DiskSpd Read Loop, Queue Depth 8
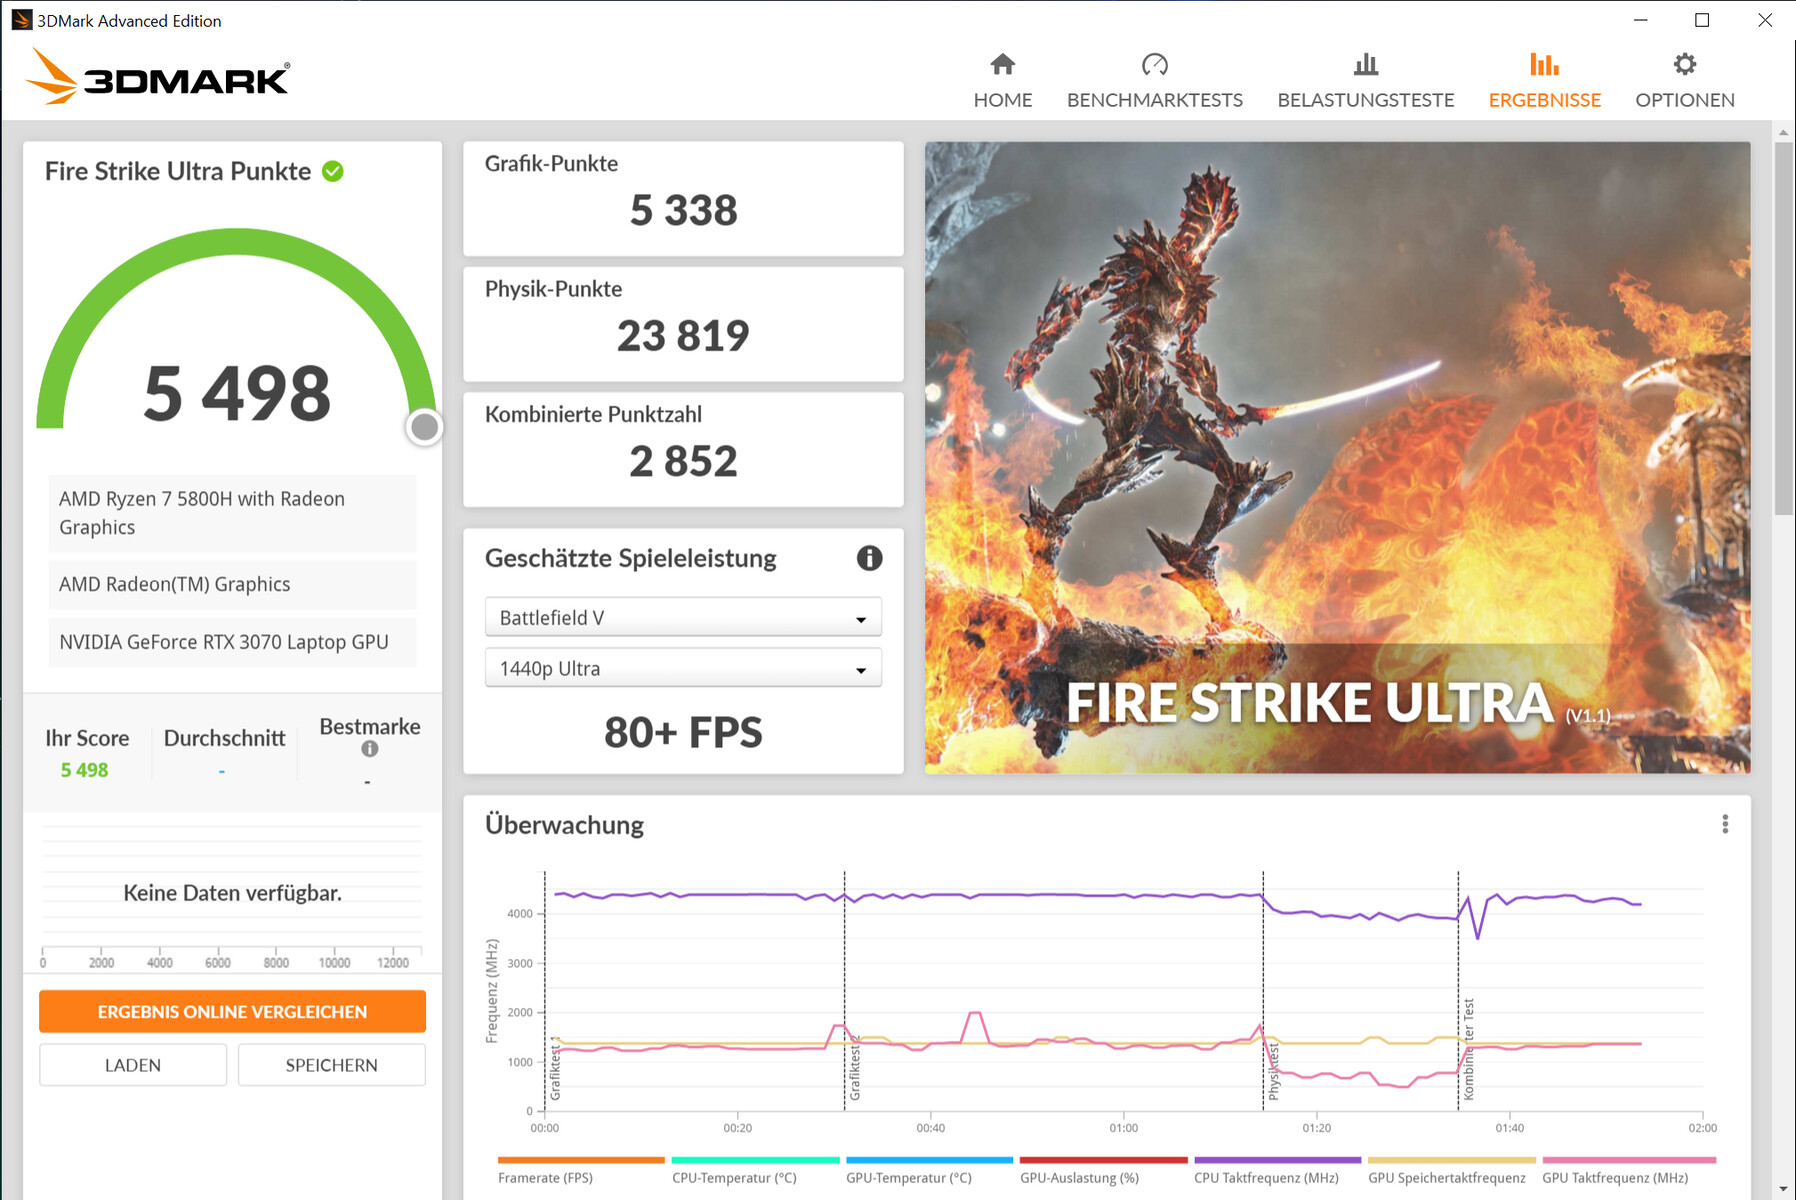
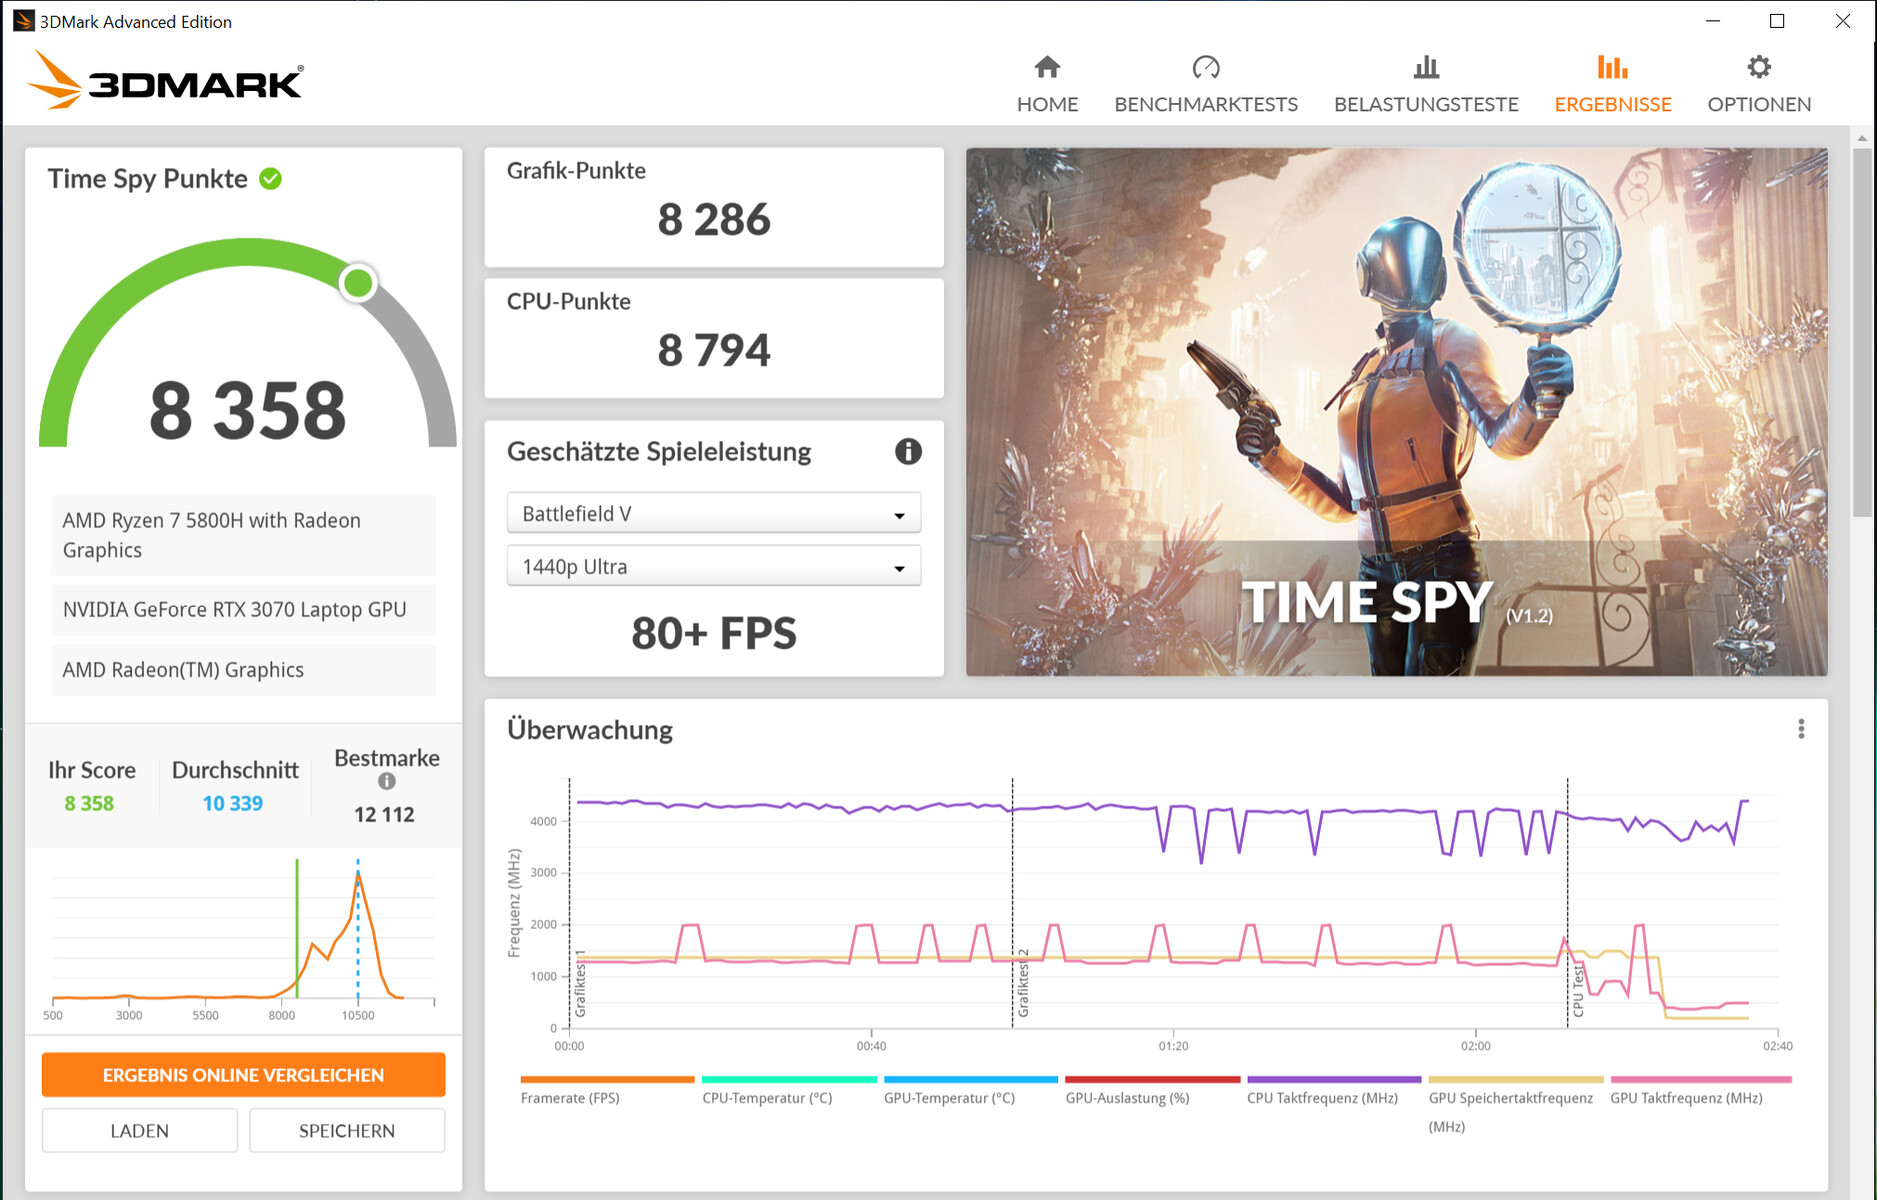
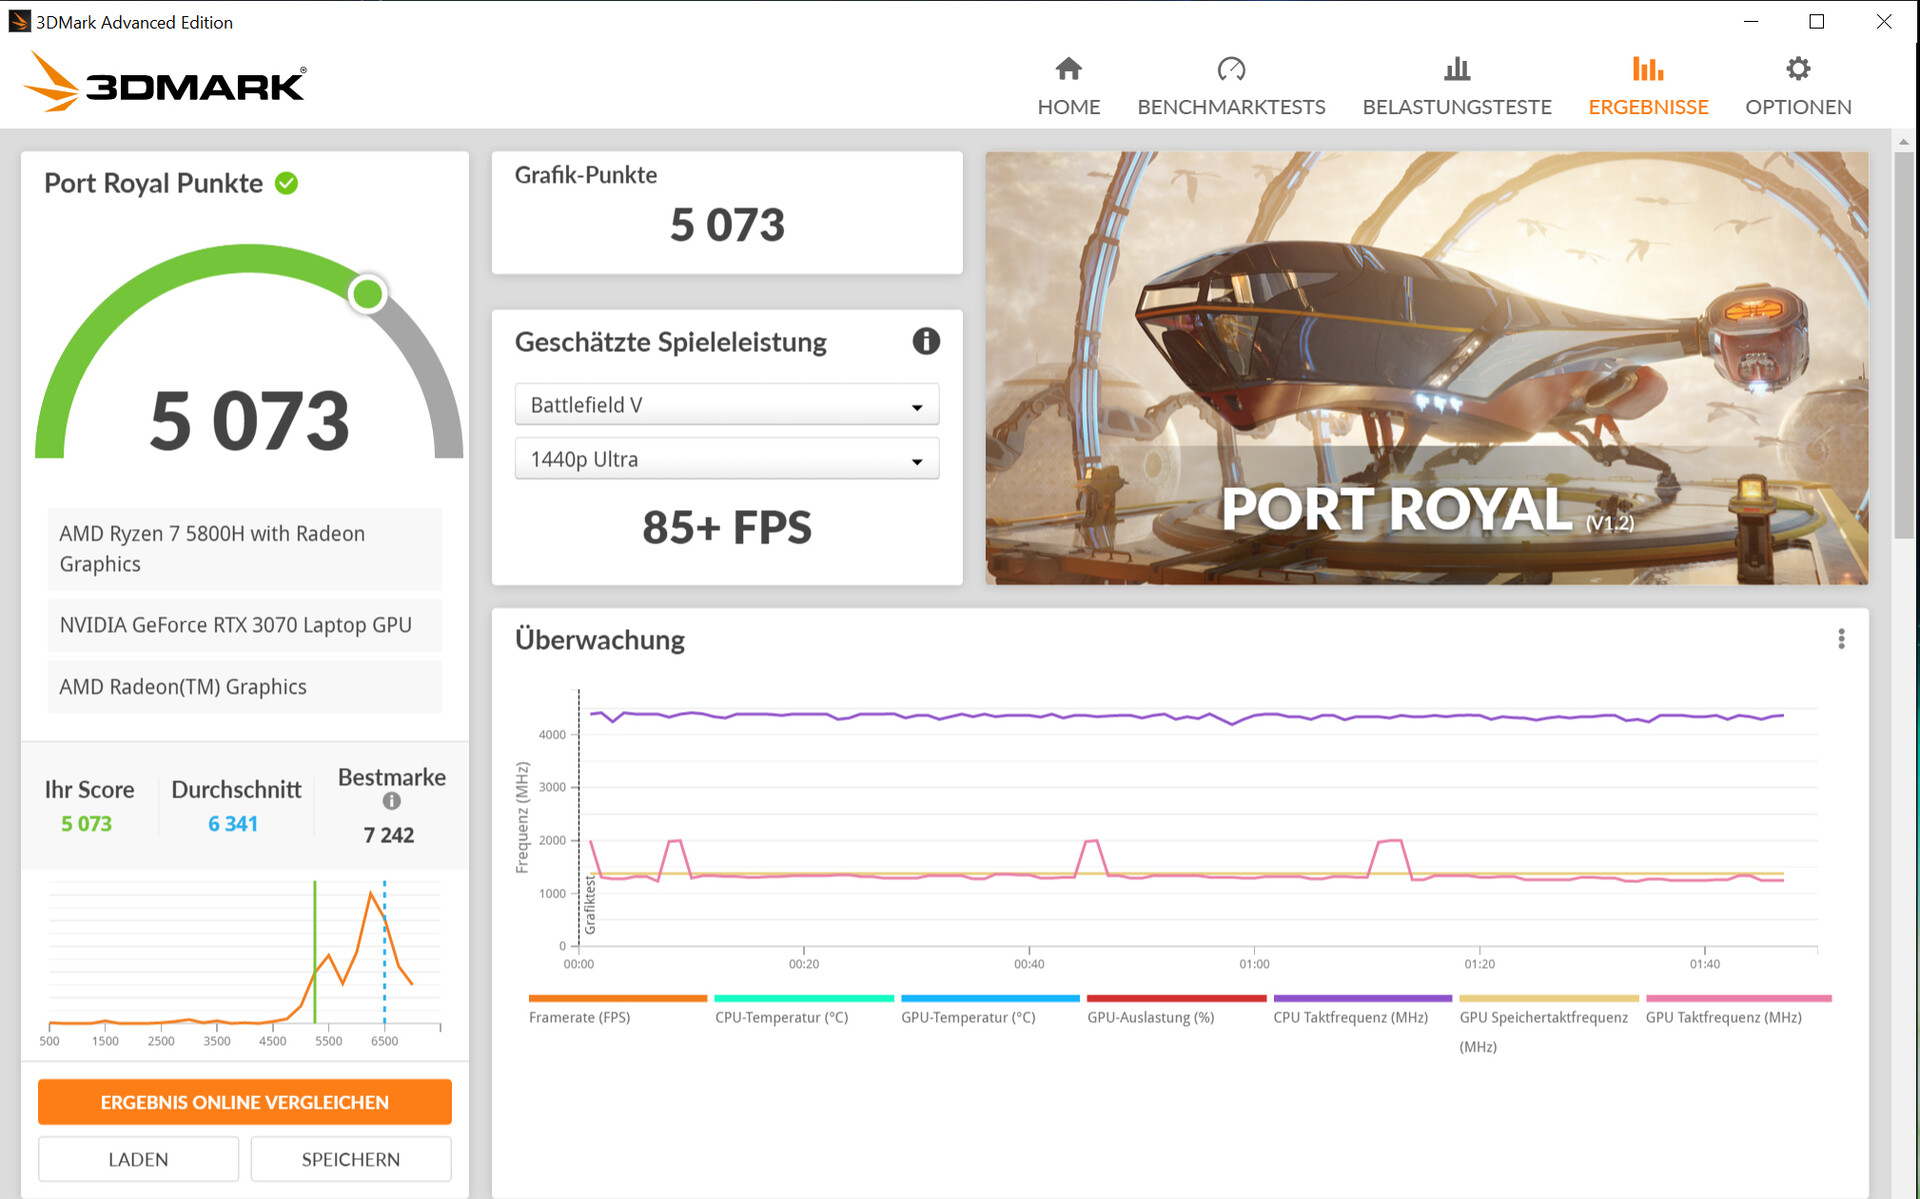
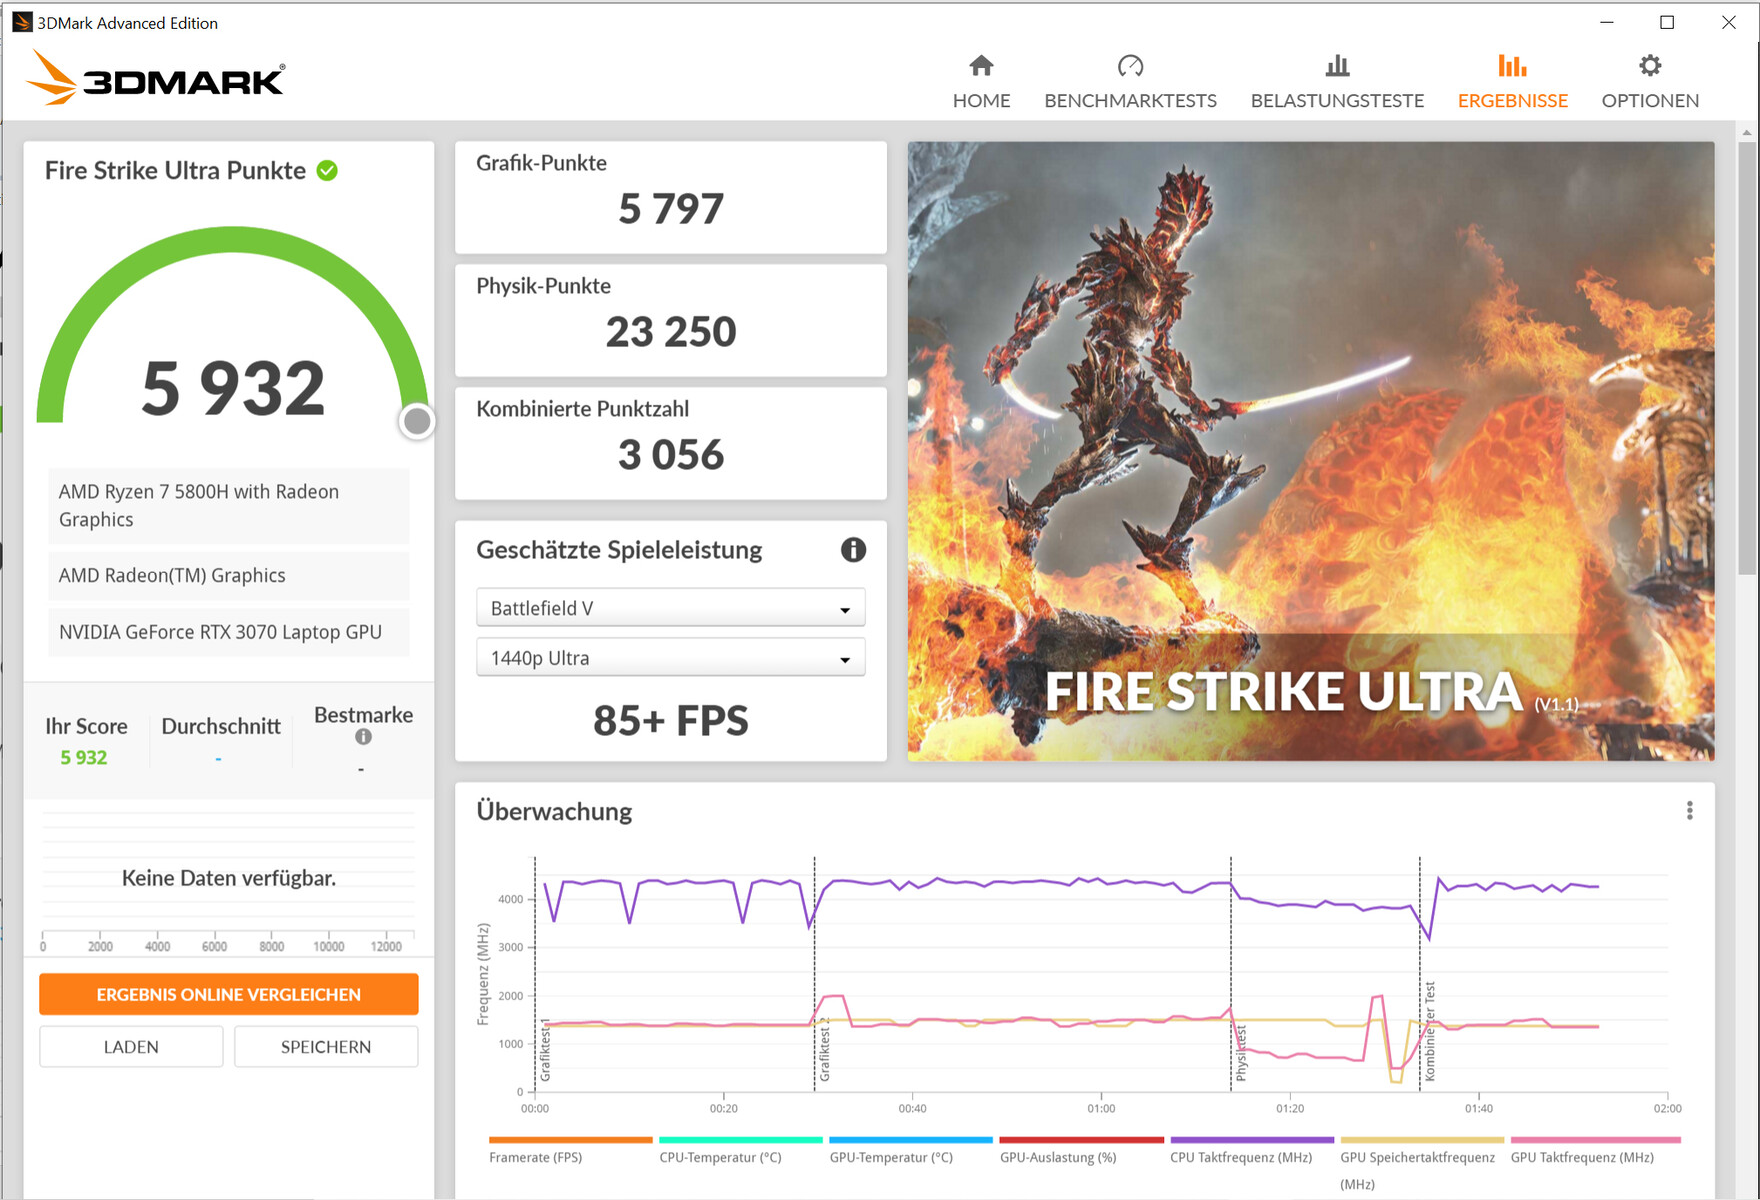
图形卡
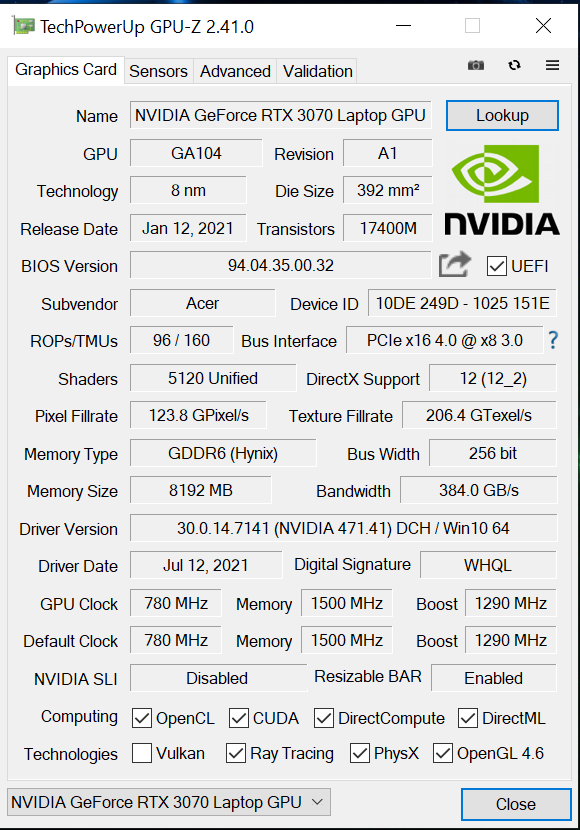
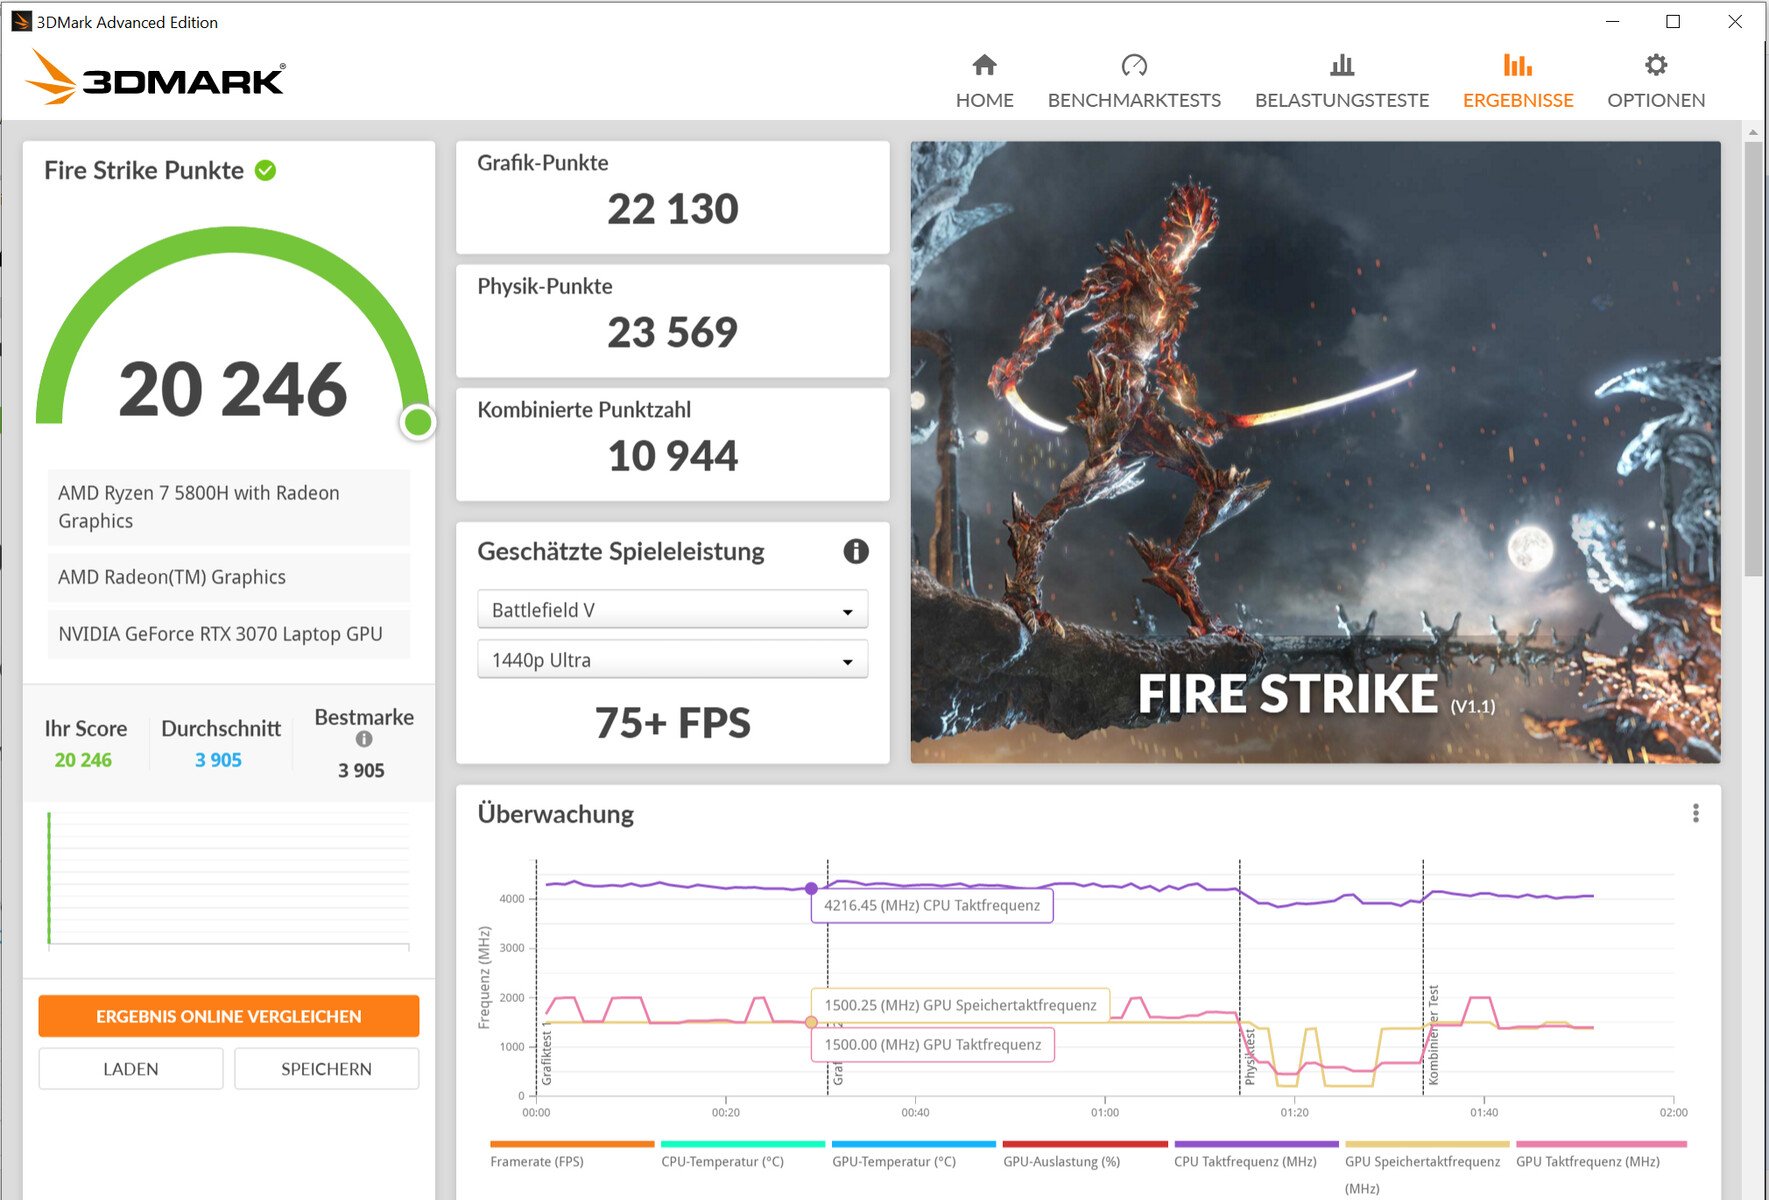
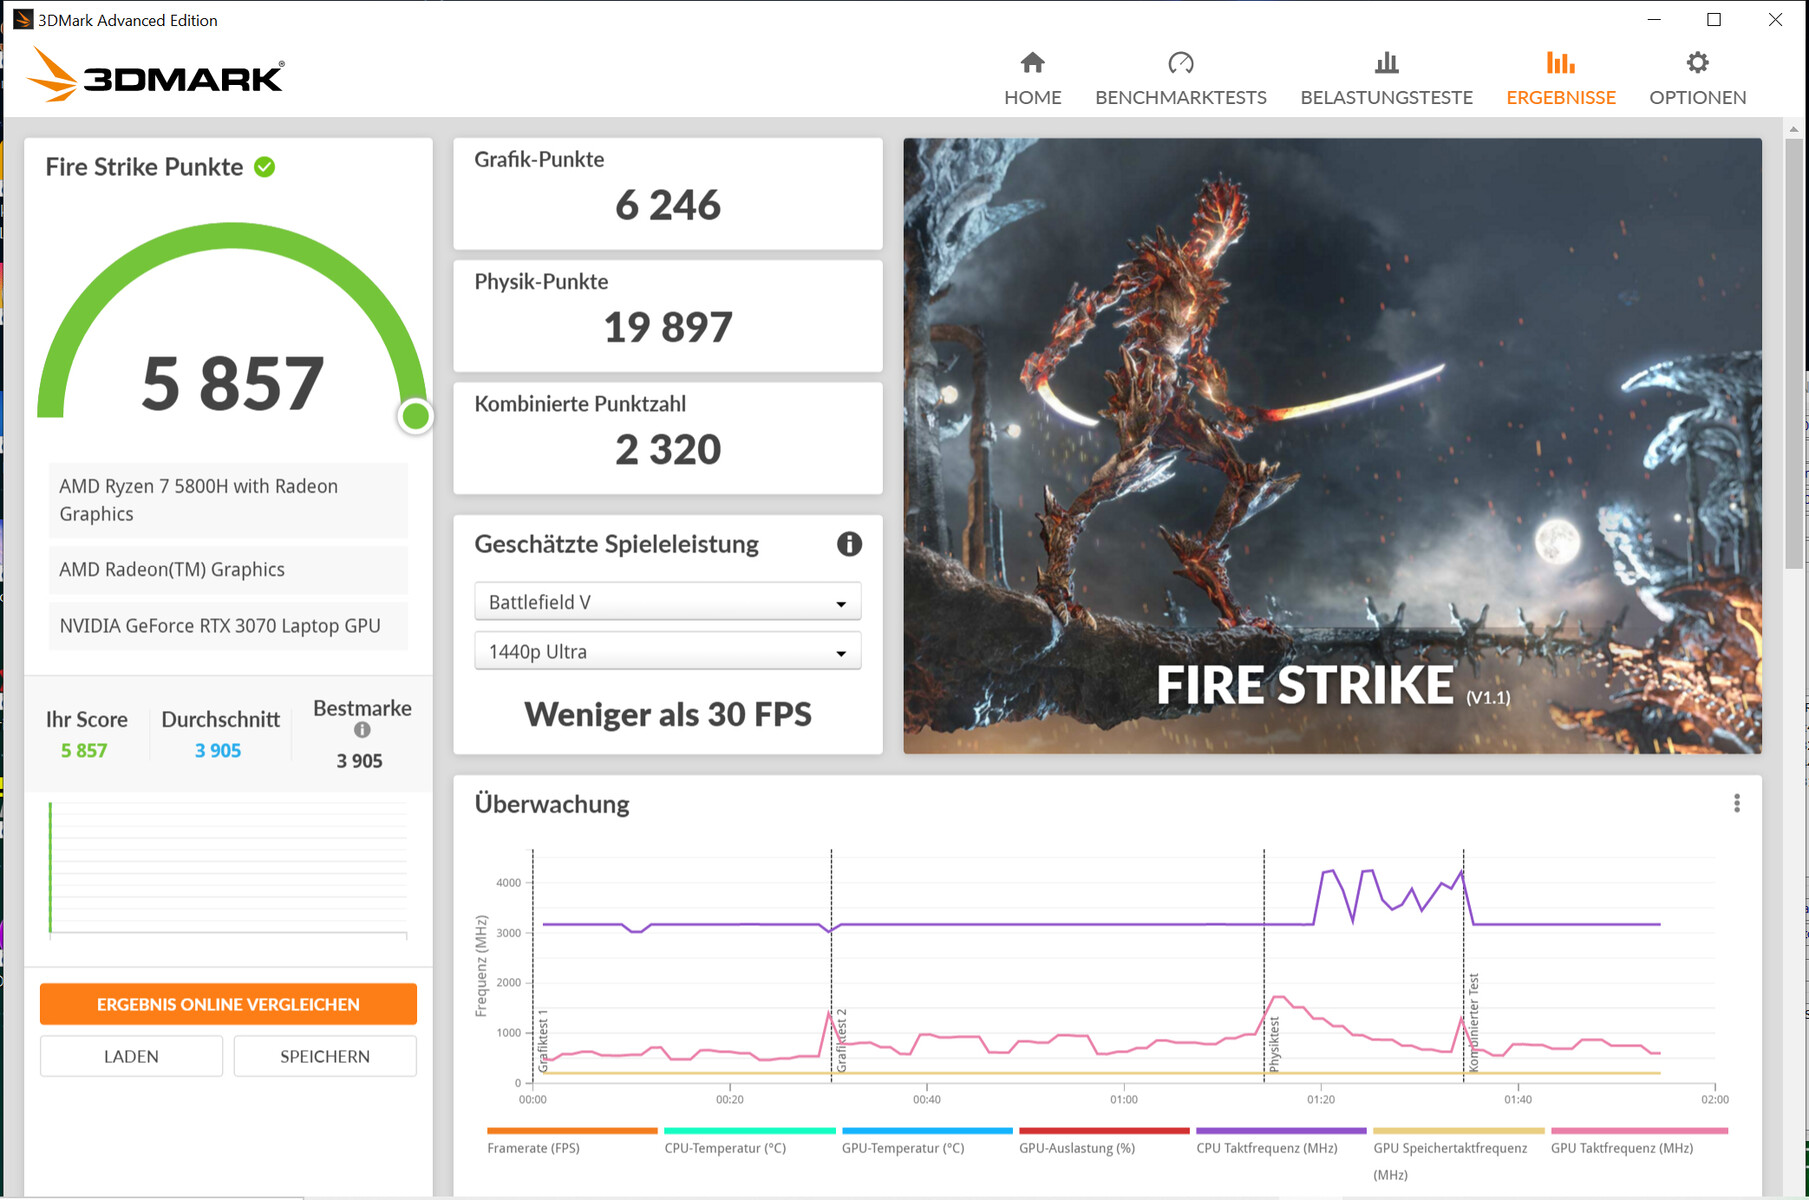
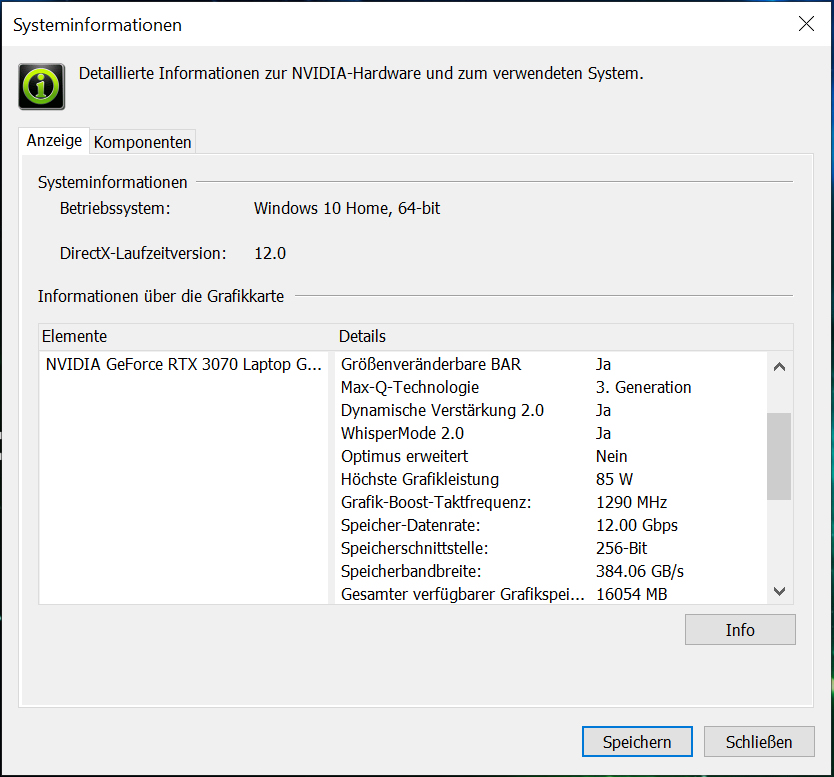
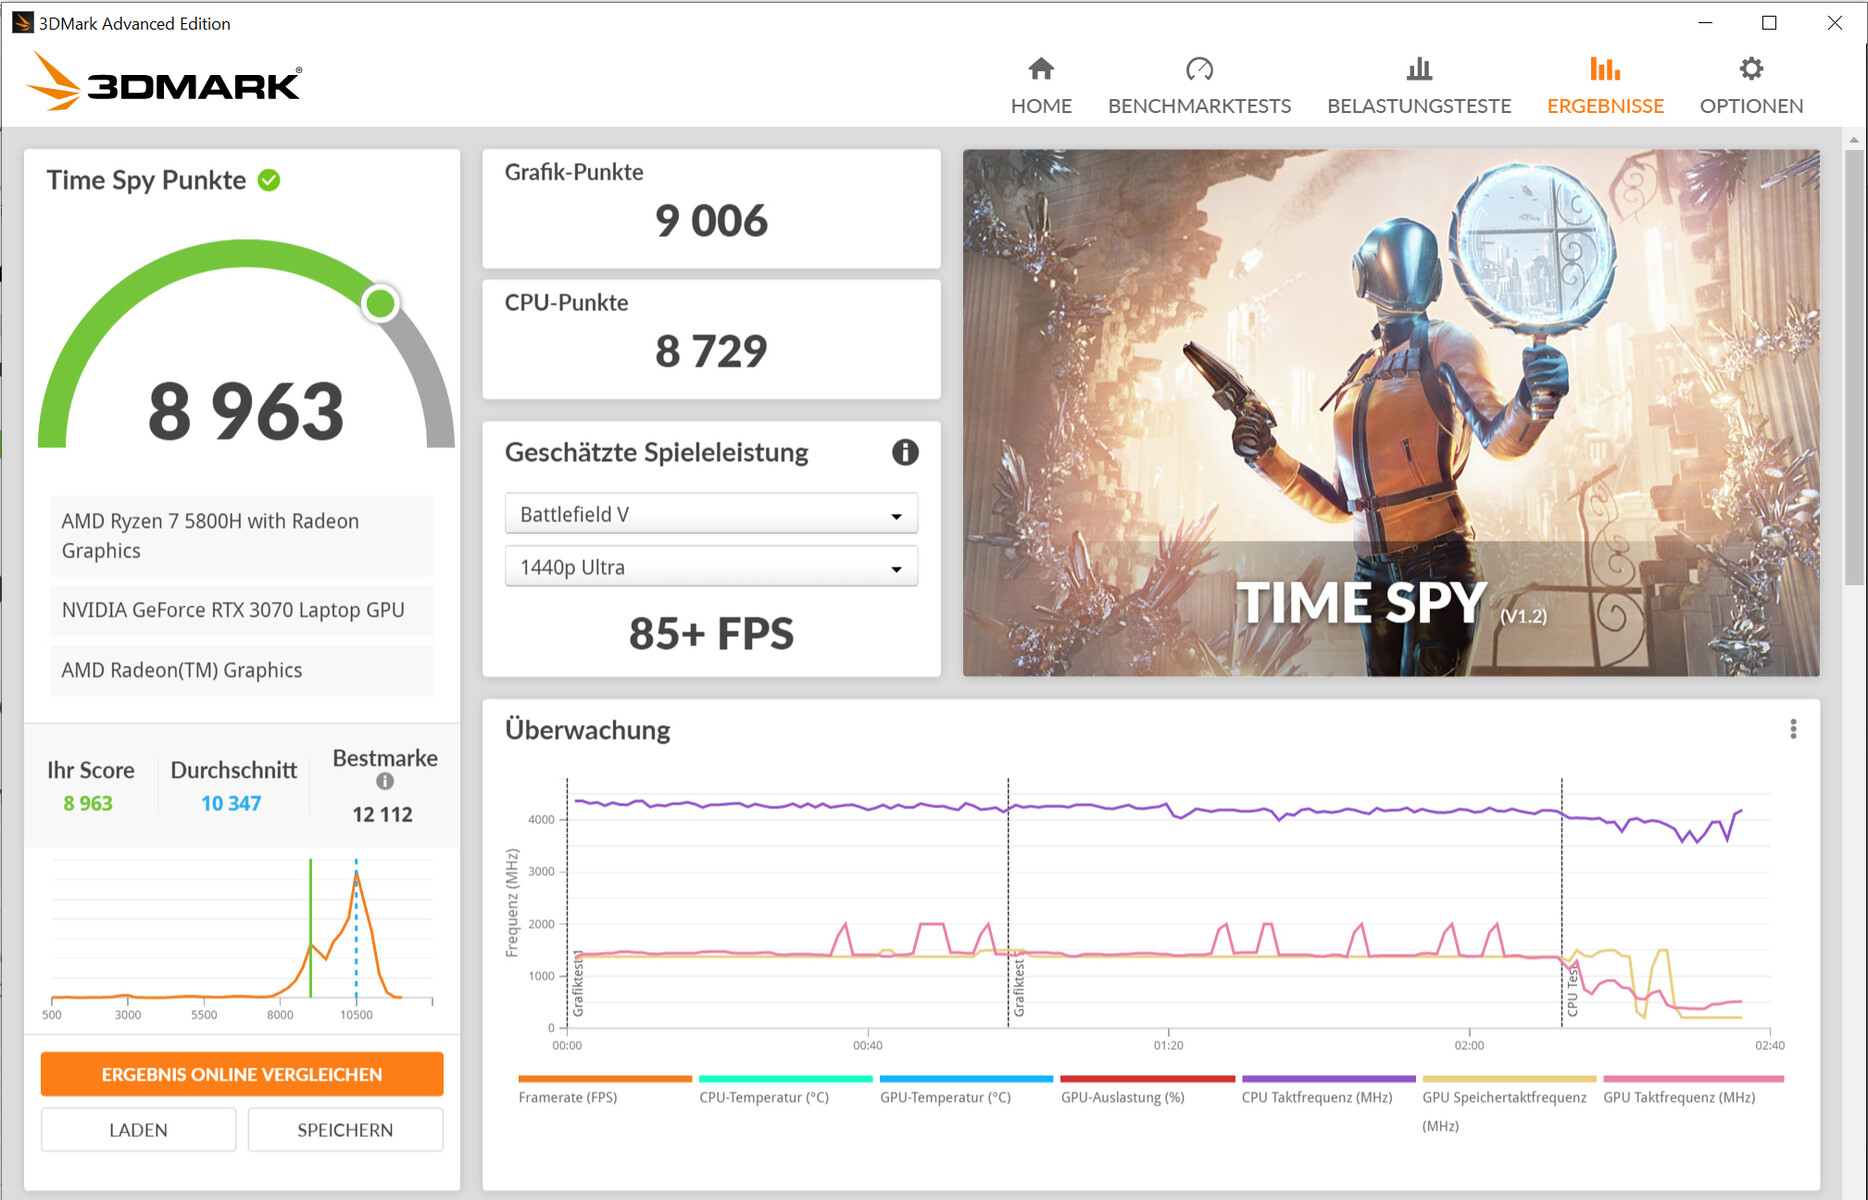
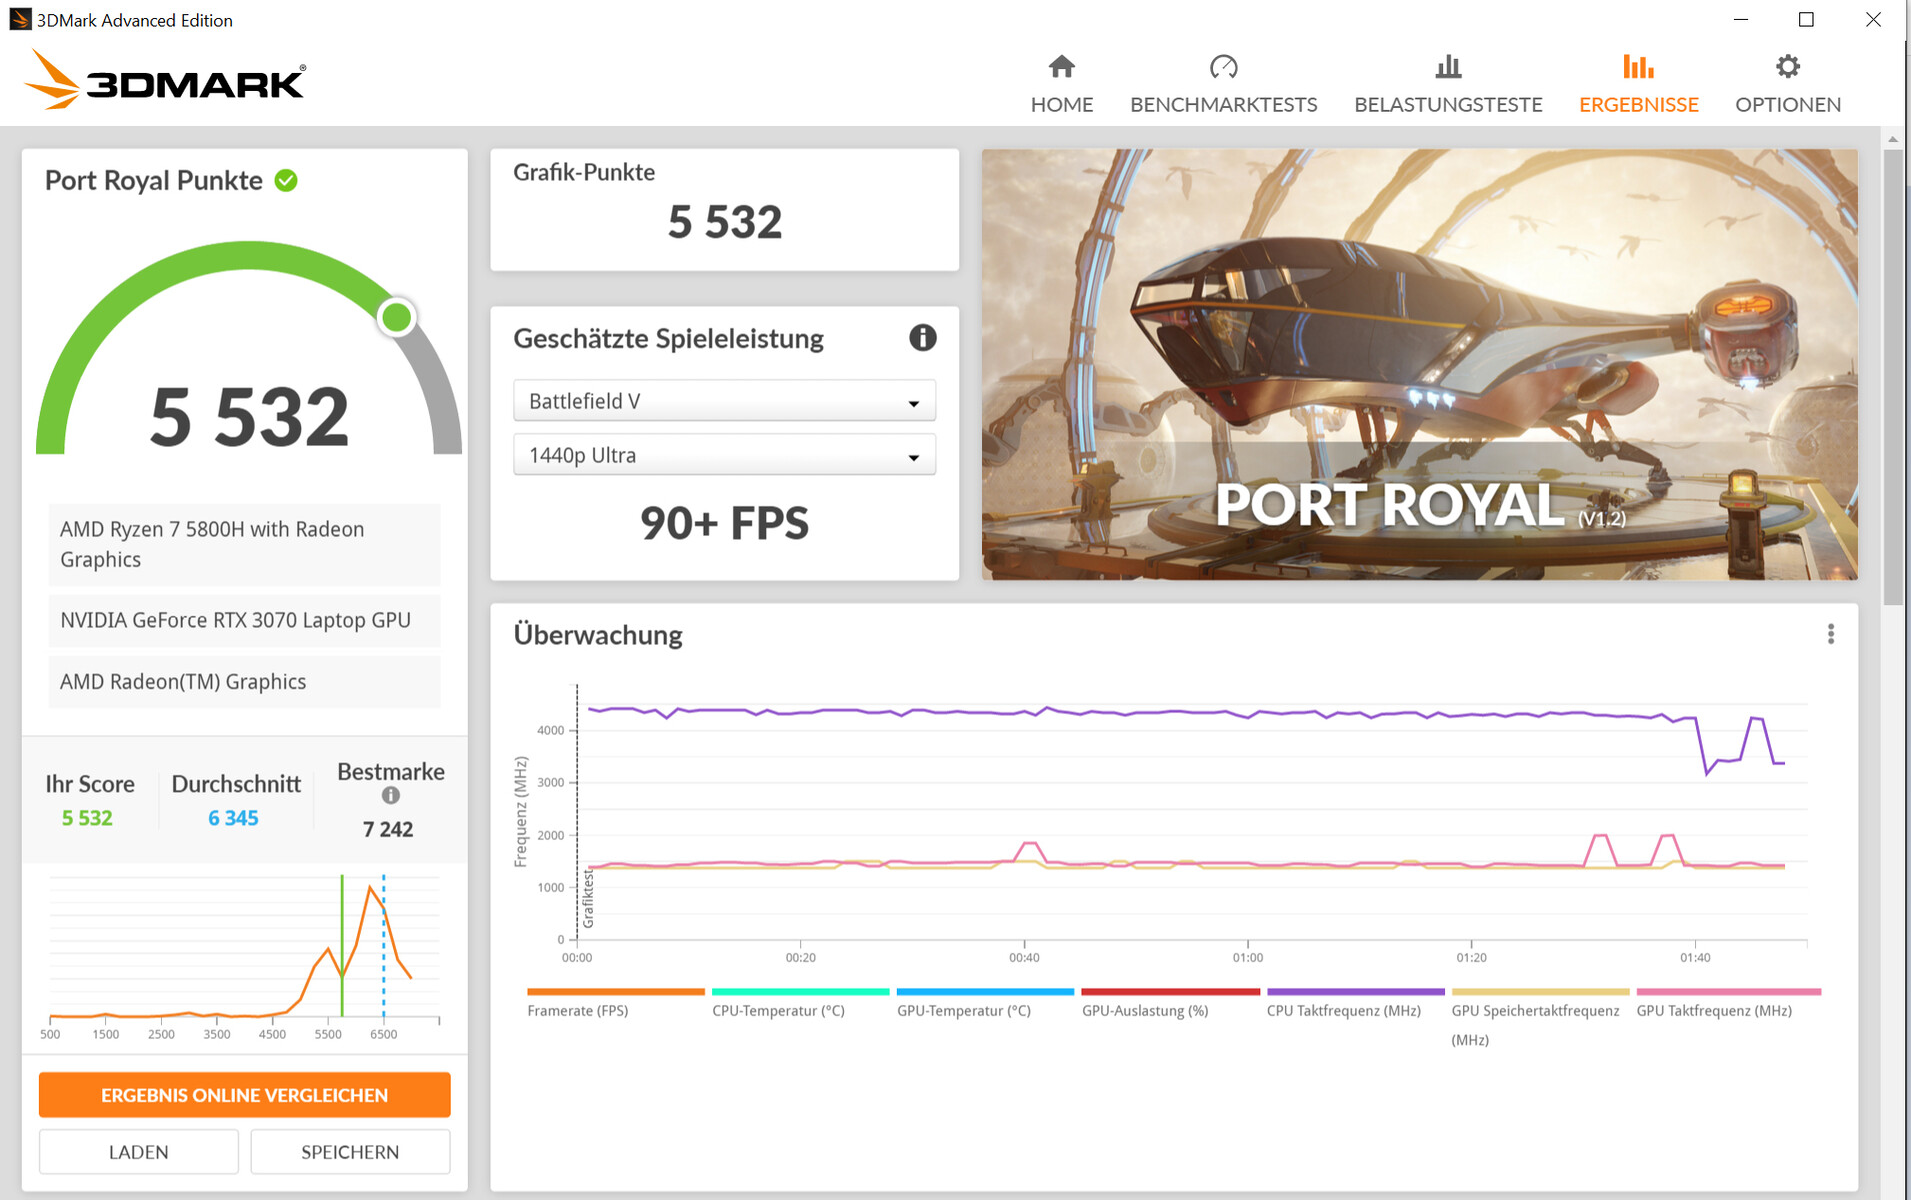
RTX 3000 GPU的实际性能取决于几个因素。冷却,内存配置,以及笔记本电脑制造商在Nvidia定义的限制范围内选择的最大TGP。宏碁允许GeForce RTX 3070笔记本电脑GPU(所有RTX 3070笔记本电脑概览,包括其TGP
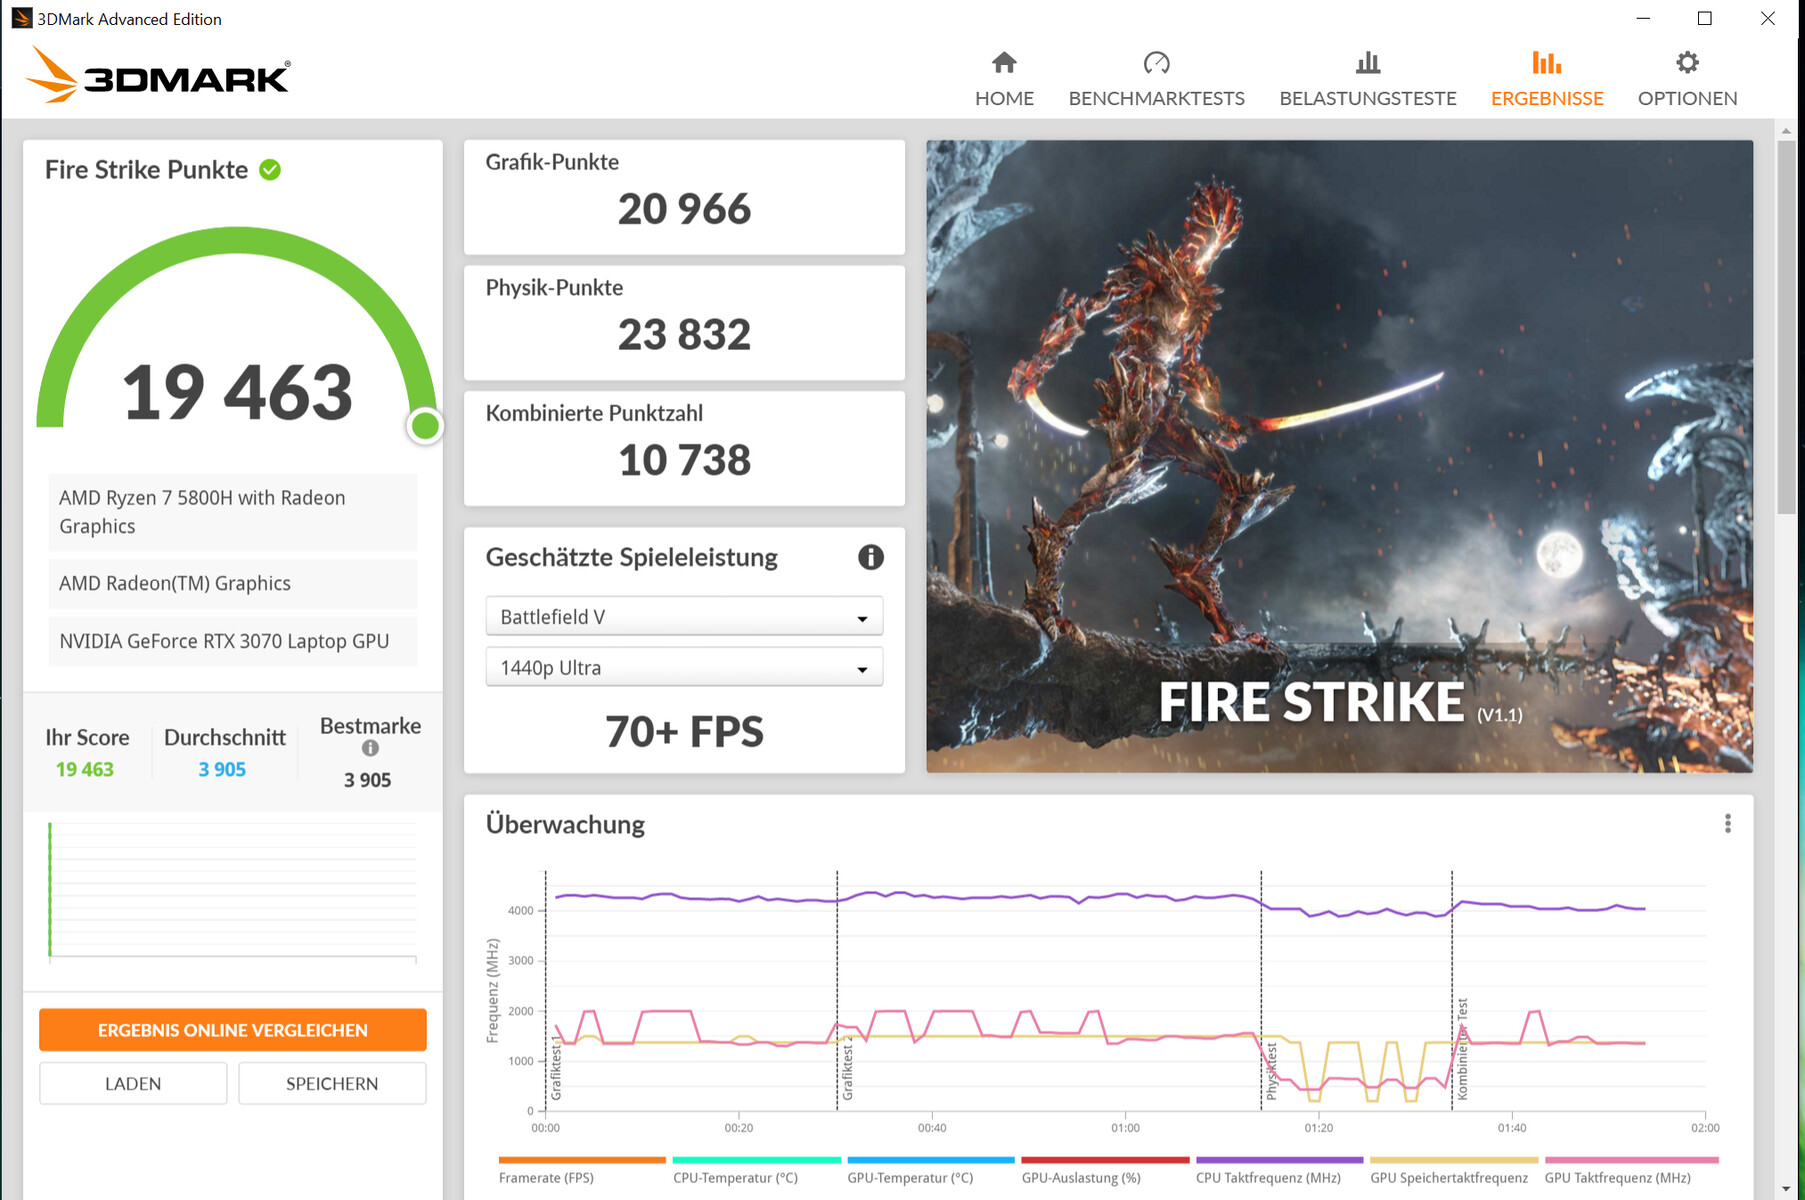
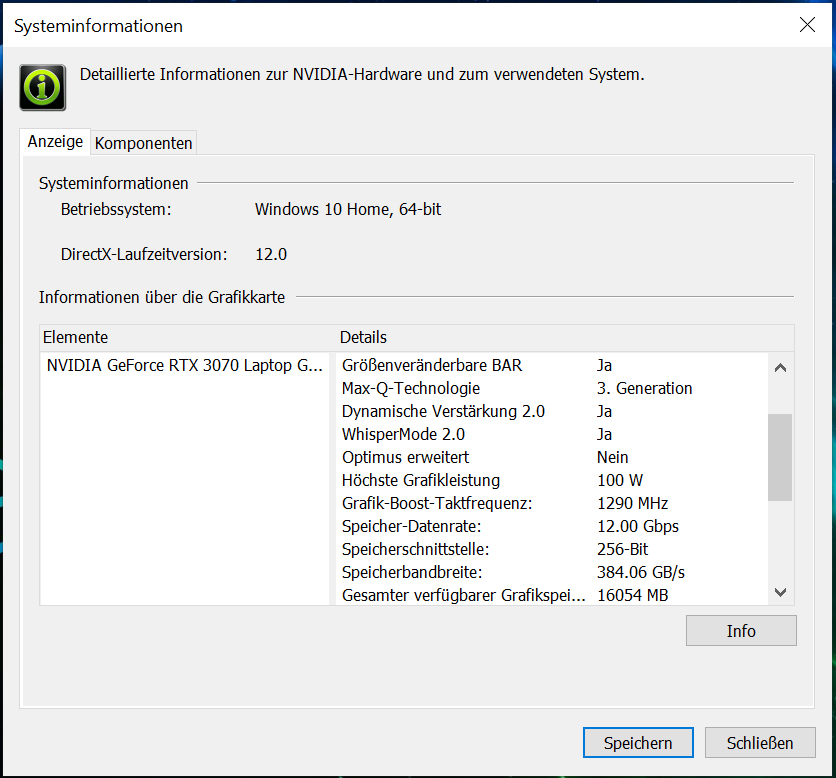
)的最大TGP为85瓦。该GPU提供的基准测试结果明显低于RTX 3070的平均值。因此,还有改进的余地。一个固件更新将TGP提高到100瓦,使结果更接近于平均RTX 3070的结果。新的最大TGP可以在很长一段时间内保持(见我们的TheWitcher 3测试)。
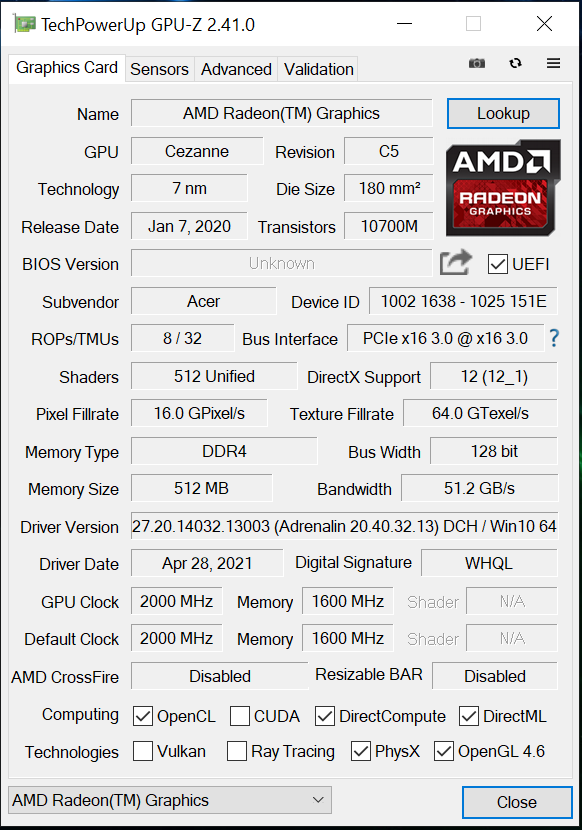
RTX 3070可以访问快速的GDDR6显存(8,192 MB)。集成在处理器中的Vega 8图形核心是活跃的,该笔记本与Nvidia的Optimus图形切换解决方案一起工作。
| 3DMark 11 Performance | 23271 points | |
| 3DMark Cloud Gate Standard Score | 40183 points | |
| 3DMark Fire Strike Score | 19463 points | |
| 3DMark Time Spy Score | 8358 points | |
Help | ||
| 3DMark 11 - 1280x720 Performance GPU | |
| Average of class Gaming (21841 - 80022, n=105, last 2 years) | |
| Asus ROG Strix G15 G513QY | |
| Aorus 15P XC | |
| Average NVIDIA GeForce RTX 3070 Laptop GPU (12535 - 38275, n=54) | |
| Acer Nitro 5 AN515-45-R1JH (FW-Update) | |
| Asus TUF Gaming A15 FA506QR-AZ061T | |
| Acer Nitro 5 AN515-45-R1JH | |
| Razer Blade 15 Base Edition 2021, i7-10750H RTX 3060 | |
| Acer Aspire Nitro 5 AN515-55-57GF | |
| MSI GF65 Thin 10UE | |
游戏性能
笔记本电脑可以将所有现代游戏流畅地显示在屏幕上。通常可以选择全屏分辨率(2560x1440像素)和高至最高质量设置。与RTX 3070相比,帧率低于平均水平。在许多情况下,Nitro不得不向名义上较弱的RTX-3060笔记本电脑认输,如Razer Blade 15 Base模型
。在安装了之前提到的固件更新后,帧率最多增加10%。不过,无法观察到整体性能的提高。即使在执行更新后,Nitro 5的性能也无法超过Blade 15。
| The Witcher 3 - 1920x1080 Ultra Graphics & Postprocessing (HBAO+) | |
| Average of class Gaming (104.7 - 240, n=7, last 2 years) | |
| Asus ROG Strix G15 G513QY | |
| Aorus 15P XC | |
| Average NVIDIA GeForce RTX 3070 Laptop GPU (34.9 - 109, n=52) | |
| Acer Nitro 5 AN515-45-R1JH (FW-Update) | |
| Acer Nitro 5 AN515-45-R1JH | |
| Razer Blade 15 Base Edition 2021, i7-10750H RTX 3060 | |
| Asus TUF Gaming A15 FA506QR-AZ061T | |
| Acer Aspire Nitro 5 AN515-55-57GF | |
| MSI GF65 Thin 10UE | |
| Dota 2 Reborn - 1920x1080 ultra (3/3) best looking | |
| Average of class Gaming (84.8 - 252, n=108, last 2 years) | |
| Razer Blade 15 Base Edition 2021, i7-10750H RTX 3060 | |
| Average NVIDIA GeForce RTX 3070 Laptop GPU (26.9 - 163.9, n=58) | |
| Aorus 15P XC | |
| Acer Aspire Nitro 5 AN515-55-57GF | |
| Acer Nitro 5 AN515-45-R1JH | |
| Asus TUF Gaming A15 FA506QR-AZ061T | |
| Acer Nitro 5 AN515-45-R1JH (FW-Update) | |
| MSI GF65 Thin 10UE | |
| X-Plane 11.11 - 1920x1080 high (fps_test=3) | |
| Average of class Gaming (55.5 - 148.5, n=110, last 2 years) | |
| Average NVIDIA GeForce RTX 3070 Laptop GPU (12.4 - 118.8, n=61) | |
| Aorus 15P XC | |
| Razer Blade 15 Base Edition 2021, i7-10750H RTX 3060 | |
| Acer Nitro 5 AN515-45-R1JH | |
| Acer Nitro 5 AN515-45-R1JH (FW-Update) | |
| Asus TUF Gaming A15 FA506QR-AZ061T | |
| Acer Aspire Nitro 5 AN515-55-57GF | |
| MSI GF65 Thin 10UE | |
| Asus ROG Strix G15 G513QY | |
| Final Fantasy XV Benchmark | |
| 1920x1080 High Quality | |
| Average of class Gaming (41 - 215, n=95, last 2 years) | |
| Asus ROG Strix G15 G513QY (1.3) | |
| Average NVIDIA GeForce RTX 3070 Laptop GPU (27.9 - 107, n=49) | |
| Acer Nitro 5 AN515-45-R1JH (1.3, FW-Update) | |
| Razer Blade 15 Base Edition 2021, i7-10750H RTX 3060 (1.3) | |
| Asus TUF Gaming A15 FA506QR-AZ061T (1.3) | |
| Acer Nitro 5 AN515-45-R1JH (1.3) | |
| Acer Aspire Nitro 5 AN515-55-57GF (1.3) | |
| MSI GF65 Thin 10UE (1.3) | |
| 2560x1440 High Quality | |
| Average of class Gaming (32.5 - 184.3, n=87, last 2 years) | |
| Average NVIDIA GeForce RTX 3070 Laptop GPU (19.8 - 79.9, n=25) | |
| Acer Nitro 5 AN515-45-R1JH (1.3, FW-Update) | |
| Acer Nitro 5 AN515-45-R1JH (1.3) | |
| MSI GF65 Thin 10UE (1.3) | |
| GTA V | |
| 1920x1080 Highest AA:4xMSAA + FX AF:16x | |
| Average of class Gaming (48.3 - 186.9, n=94, last 2 years) | |
| Average NVIDIA GeForce RTX 3070 Laptop GPU (21.7 - 125.8, n=50) | |
| Razer Blade 15 Base Edition 2021, i7-10750H RTX 3060 | |
| Asus TUF Gaming A15 FA506QR-AZ061T | |
| Acer Nitro 5 AN515-45-R1JH (FW-Update) | |
| Acer Nitro 5 AN515-45-R1JH | |
| Asus ROG Strix G15 G513QY | |
| Acer Aspire Nitro 5 AN515-55-57GF | |
| MSI GF65 Thin 10UE | |
| 2560x1440 Highest AA:4xMSAA + FX AF:16x | |
| Average of class Gaming (36.9 - 183.9, n=72, last 2 years) | |
| Average NVIDIA GeForce RTX 3070 Laptop GPU (70.8 - 97.1, n=19) | |
| Acer Nitro 5 AN515-45-R1JH (FW-Update) | |
| Acer Nitro 5 AN515-45-R1JH | |
| Strange Brigade | |
| 1920x1080 ultra AA:ultra AF:16 | |
| Average of class Gaming (76.3 - 458, n=87, last 2 years) | |
| Asus ROG Strix G15 G513QY (1.47.22.14 D3D12) | |
| Average NVIDIA GeForce RTX 3070 Laptop GPU (36.2 - 194, n=46) | |
| Acer Nitro 5 AN515-45-R1JH (1.47.22.14 D3D12, FW-Update) | |
| Razer Blade 15 Base Edition 2021, i7-10750H RTX 3060 (1.47.22.14 D3D12) | |
| Acer Nitro 5 AN515-45-R1JH (1.47.22.14 D3D12) | |
| Asus TUF Gaming A15 FA506QR-AZ061T (1.47.22.14 D3D12) | |
| Acer Aspire Nitro 5 AN515-55-57GF (1.47.22.14 D3D12) | |
| MSI GF65 Thin 10UE (1.47.22.14 D3D12) | |
| 2560x1440 ultra AA:ultra AF:16 | |
| Average of class Gaming (52.8 - 354, n=76, last 2 years) | |
| Average NVIDIA GeForce RTX 3070 Laptop GPU (82.3 - 140.5, n=18) | |
| Acer Nitro 5 AN515-45-R1JH (1.47.22.14 D3D12, FW-Update) | |
| Acer Nitro 5 AN515-45-R1JH (1.47.22.14 D3D12) | |
| Far Cry 5 | |
| 1920x1080 Ultra Preset AA:T | |
| Average of class Gaming (70 - 151, n=6, last 2 years) | |
| Average NVIDIA GeForce RTX 3070 Laptop GPU (89 - 140, n=36) | |
| Aorus 15P XC | |
| Asus TUF Gaming A15 FA506QR-AZ061T | |
| MSI GF65 Thin 10UE | |
| Acer Nitro 5 AN515-45-R1JH (FW-Update) | |
| Acer Nitro 5 AN515-45-R1JH | |
| Acer Aspire Nitro 5 AN515-55-57GF | |
| Asus ROG Strix G15 G513QY | |
| 2560x1440 Ultra Preset AA:T | |
| Average of class Gaming (93 - 149, n=5, last 2 years) | |
| Average NVIDIA GeForce RTX 3070 Laptop GPU (81 - 101, n=18) | |
| Acer Nitro 5 AN515-45-R1JH | |
| Acer Nitro 5 AN515-45-R1JH | |
| Dirt 5 | |
| 1920x1080 Ultra High Preset | |
| Average NVIDIA GeForce RTX 3070 Laptop GPU (50 - 96, n=11) | |
| Acer Nitro 5 AN515-45-R1JH (FW-Update) | |
| Acer Nitro 5 AN515-45-R1JH | |
| 2560x1440 Ultra High Preset | |
| Average NVIDIA GeForce RTX 3070 Laptop GPU (58.6 - 75, n=6) | |
| Acer Nitro 5 AN515-45-R1JH (FW-Update) | |
| Acer Nitro 5 AN515-45-R1JH | |
为了验证帧率是否在很长一段时间内保持基本稳定,我们让游戏《Witcher 3》在全高清分辨率和最高质量设置下运行了约60分钟。角色没有被移动。没有发现帧率的下降。
The Witcher 3 FPS diagram
| low | med. | high | ultra | QHD | |
|---|---|---|---|---|---|
| GTA V (2015) | 174 | 165 | 136 | 80.7 | 70.8 |
| The Witcher 3 (2015) | 262 | 217 | 141 | 81.5 | |
| Dota 2 Reborn (2015) | 139 | 131 | 115 | 111 | |
| Final Fantasy XV Benchmark (2018) | 144 | 104 | 79.2 | 61 | |
| X-Plane 11.11 (2018) | 95.3 | 85.5 | 70.7 | ||
| Far Cry 5 (2018) | 125 | 106 | 101 | 95 | 81 |
| Strange Brigade (2018) | 309 | 173 | 157 | 141 | 107 |
| Dirt 5 (2020) | 181 | 107 | 86 | 72.2 | 58.6 |
排放--宏碁的笔记本电脑与其他同类产品持平
噪声排放
考虑到这里安装的硬件,在整个负载范围内,噪音发展处于正常水平。在日常使用中,风扇以低速运行,几乎听不到。不时地,它们会停顿下来。最大声压级为49.1 dB(A) - 在压力测试中确定。笔记本电脑在游戏过程中产生的噪音略小。
Noise level
| Idle |
| 25 / 25 / 32.2 dB(A) |
| Load |
| 45.8 / 49.1 dB(A) |
 | ||
30 dB silent 40 dB(A) audible 50 dB(A) loud |
||
min: | ||
| Acer Nitro 5 AN515-45-R1JH R7 5800H, GeForce RTX 3070 Laptop GPU | Asus ROG Strix G15 G513QY R9 5900HX, Radeon RX 6800M | Aorus 15P XC i7-10870H, GeForce RTX 3070 Laptop GPU | MSI GF65 Thin 10UE i7-10750H, GeForce RTX 3060 Laptop GPU | Asus TUF Gaming A15 FA506QR-AZ061T R7 5800H, GeForce RTX 3070 Laptop GPU | Razer Blade 15 Base Edition 2021, i7-10750H RTX 3060 i7-10750H, GeForce RTX 3060 Laptop GPU | Average NVIDIA GeForce RTX 3070 Laptop GPU | Average of class Gaming | |
|---|---|---|---|---|---|---|---|---|
| Noise | -6% | -4% | -13% | 0% | 3% | -4% | -2% | |
| off / environment * (dB) | 25 | 26 -4% | 24 4% | 24.7 1% | 26 -4% | 25.3 -1% | 24.9 ? -0% | 24.1 ? 4% |
| Idle Minimum * (dB) | 25 | 26 -4% | 25 -0% | 33.1 -32% | 26 -4% | 25.4 -2% | 26.7 ? -7% | 26 ? -4% |
| Idle Average * (dB) | 25 | 31 -24% | 29 -16% | 33.1 -32% | 26 -4% | 25.4 -2% | 28.7 ? -15% | 27.5 ? -10% |
| Idle Maximum * (dB) | 32.2 | 34 -6% | 34 -6% | 33.1 -3% | 27.4 15% | 25.4 21% | 31.7 ? 2% | 30.1 ? 7% |
| Load Average * (dB) | 45.8 | 44 4% | 44 4% | 42.7 7% | 46.6 -2% | 42.5 7% | 45 ? 2% | 43.8 ? 4% |
| Load Maximum * (dB) | 49.1 | 49 -0% | 53 -8% | 59.4 -21% | 49.3 -0% | 52.2 -6% | 52.6 ? -7% | 54.3 ? -11% |
| Witcher 3 ultra * (dB) | 48.5 | 49 | 40.6 | 42 |
* ... smaller is better
温度
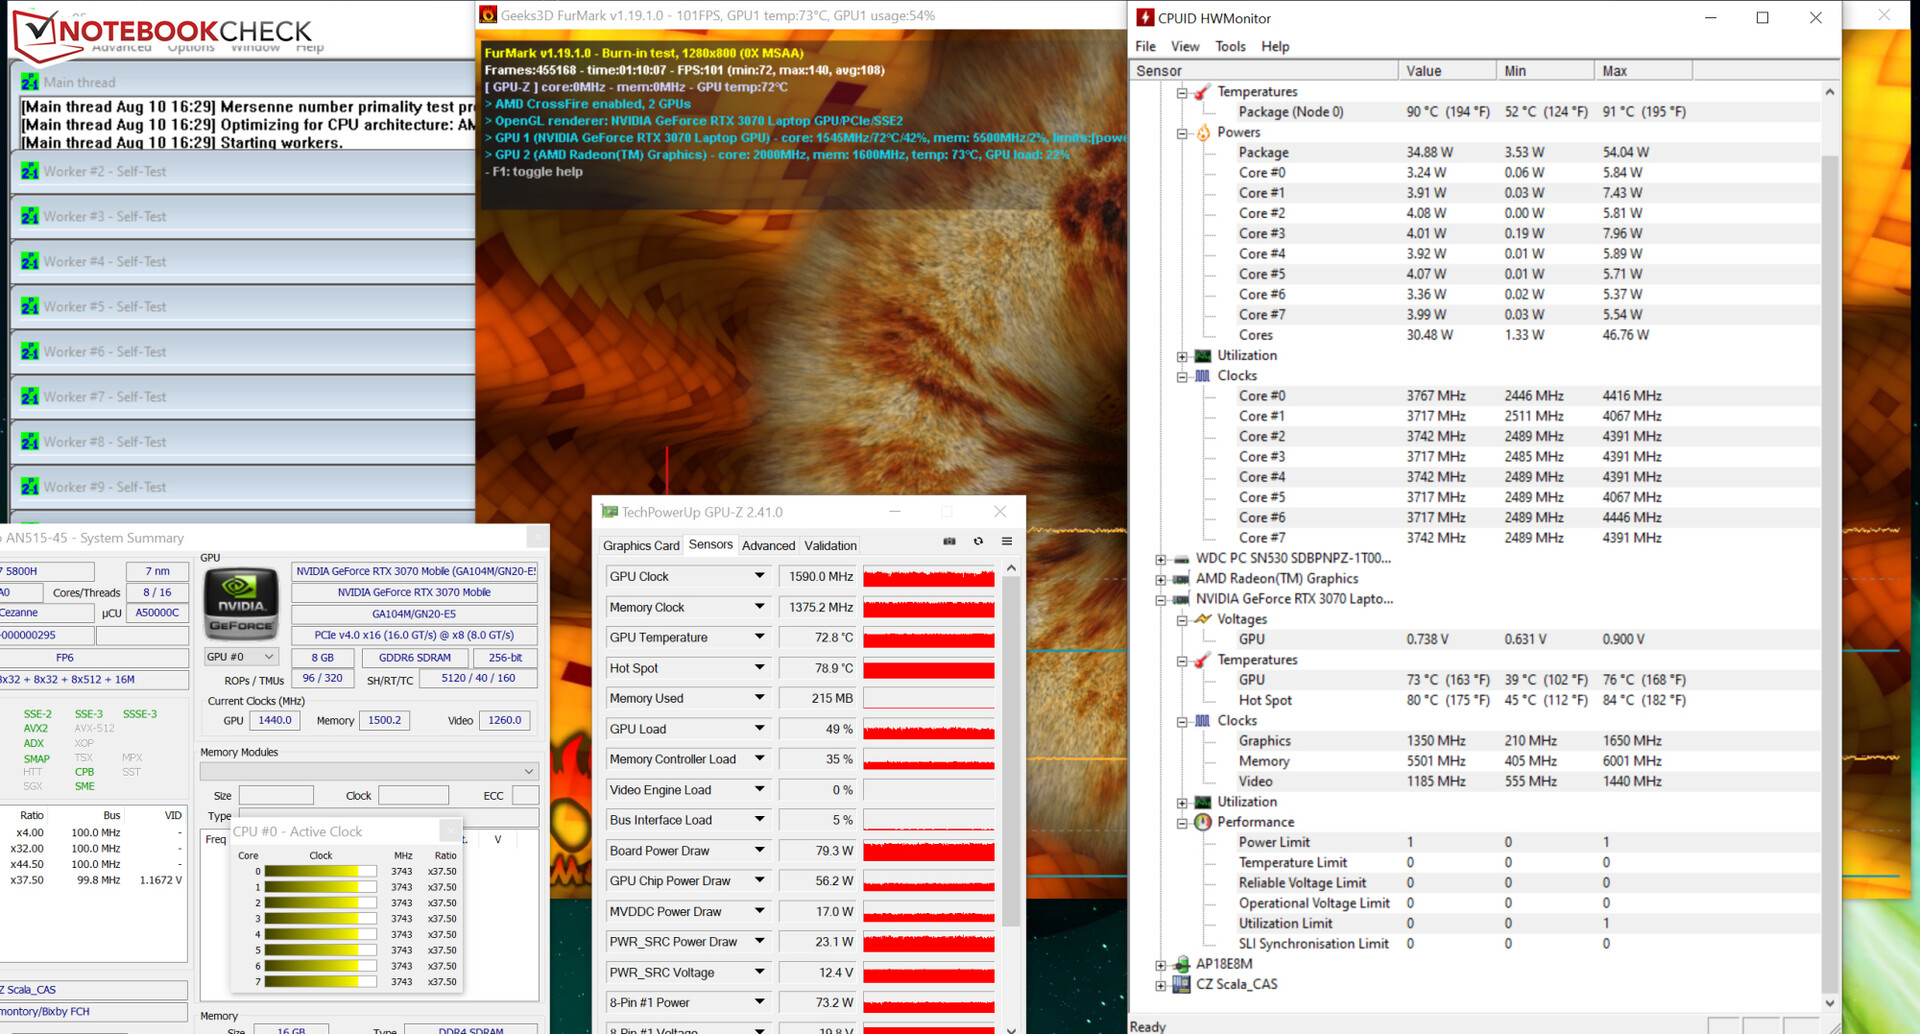
我们的压力测试(Prime95和FurMark至少运行一个小时)是由CPU和GPU分别以3.7GHz和1,590MHz的频率进行的。压力测试代表了一种极端情况。通过这个测试,我们检查系统是否在全负荷下保持稳定。
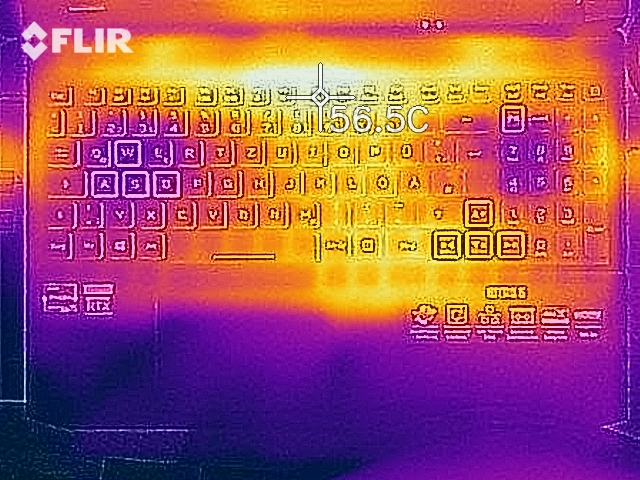
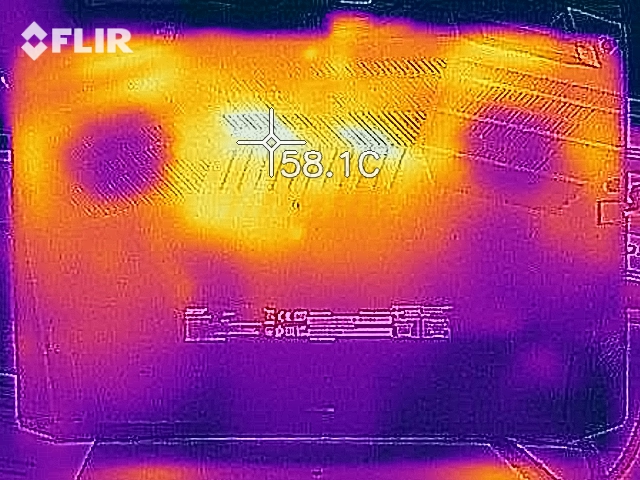
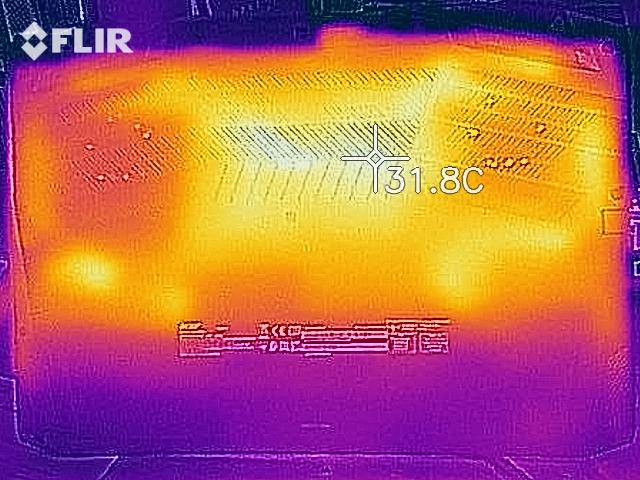
笔记本电脑在负载下明显发热,但不是过度的。在压力测试中,有三个测量点超过了50°C(约122°F)的标志。在日常使用中,温度保持在绿色范围内。
(-) The maximum temperature on the upper side is 53.2 °C / 128 F, compared to the average of 40.4 °C / 105 F, ranging from 21.2 to 68.8 °C for the class Gaming.
(-) The bottom heats up to a maximum of 58.2 °C / 137 F, compared to the average of 43.2 °C / 110 F
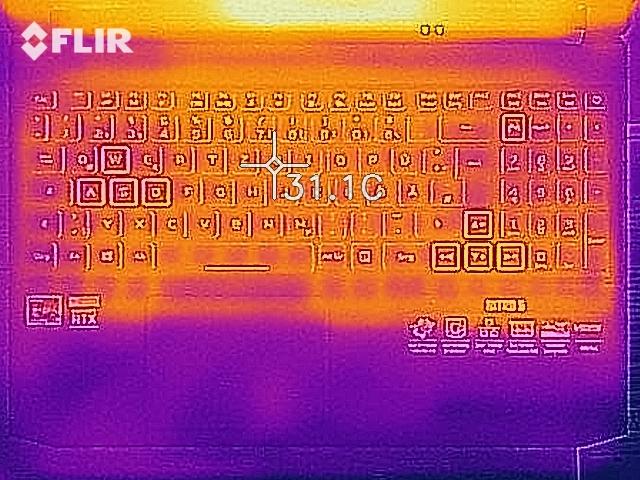
(+) In idle usage, the average temperature for the upper side is 26.2 °C / 79 F, compared to the device average of 33.9 °C / 93 F.
(+) The palmrests and touchpad are cooler than skin temperature with a maximum of 26.2 °C / 79.2 F and are therefore cool to the touch.
(+) The average temperature of the palmrest area of similar devices was 28.8 °C / 83.8 F (+2.6 °C / 4.6 F).
| Acer Nitro 5 AN515-45-R1JH R7 5800H, GeForce RTX 3070 Laptop GPU | Asus ROG Strix G15 G513QY R9 5900HX, Radeon RX 6800M | Aorus 15P XC i7-10870H, GeForce RTX 3070 Laptop GPU | MSI GF65 Thin 10UE i7-10750H, GeForce RTX 3060 Laptop GPU | Asus TUF Gaming A15 FA506QR-AZ061T R7 5800H, GeForce RTX 3070 Laptop GPU | Razer Blade 15 Base Edition 2021, i7-10750H RTX 3060 i7-10750H, GeForce RTX 3060 Laptop GPU | Average NVIDIA GeForce RTX 3070 Laptop GPU | Average of class Gaming | |
|---|---|---|---|---|---|---|---|---|
| Heat | 10% | 10% | 13% | -8% | -1% | -0% | 4% | |
| Maximum Upper Side * (°C) | 53.2 | 38.9 27% | 47 12% | 43.4 18% | 46.7 12% | 45.2 15% | 47.8 ? 10% | 45.2 ? 15% |
| Maximum Bottom * (°C) | 58.2 | 34.6 41% | 57 2% | 41.8 28% | 55.9 4% | 48 18% | 52.9 ? 9% | 48.2 ? 17% |
| Idle Upper Side * (°C) | 29.5 | 34.4 -17% | 26 12% | 30.2 -2% | 37.1 -26% | 34.4 -17% | 32.4 ? -10% | 31 ? -5% |
| Idle Bottom * (°C) | 31.2 | 34.4 -10% | 27 13% | 28.4 9% | 38.1 -22% | 37.2 -19% | 34.2 ? -10% | 34.2 ? -10% |
* ... smaller is better
发言人
立体声扬声器产生的声音还不错,但缺乏低音。我们建议使用耳机或外部扬声器以获得更好的声音体验。
Acer Nitro 5 AN515-45-R1JH audio analysis
(±) | speaker loudness is average but good (75.5 dB)
Bass 100 - 315 Hz
(-) | nearly no bass - on average 33.4% lower than median
(±) | linearity of bass is average (12.8% delta to prev. frequency)
Mids 400 - 2000 Hz
(+) | balanced mids - only 3.4% away from median
(±) | linearity of mids is average (8.6% delta to prev. frequency)
Highs 2 - 16 kHz
(±) | higher highs - on average 5% higher than median
(±) | linearity of highs is average (7.3% delta to prev. frequency)
Overall 100 - 16.000 Hz
(±) | linearity of overall sound is average (25.1% difference to median)
Compared to same class
» 90% of all tested devices in this class were better, 3% similar, 7% worse
» The best had a delta of 6%, average was 18%, worst was 132%
Compared to all devices tested
» 77% of all tested devices were better, 5% similar, 18% worse
» The best had a delta of 4%, average was 23%, worst was 134%
Asus TUF Gaming A15 FA506QR-AZ061T audio analysis
(±) | speaker loudness is average but good (74 dB)
Bass 100 - 315 Hz
(-) | nearly no bass - on average 22.4% lower than median
(±) | linearity of bass is average (10.8% delta to prev. frequency)
Mids 400 - 2000 Hz
(+) | balanced mids - only 2.4% away from median
(+) | mids are linear (5.9% delta to prev. frequency)
Highs 2 - 16 kHz
(±) | higher highs - on average 5.8% higher than median
(+) | highs are linear (5.6% delta to prev. frequency)
Overall 100 - 16.000 Hz
(±) | linearity of overall sound is average (20.1% difference to median)
Compared to same class
» 71% of all tested devices in this class were better, 6% similar, 23% worse
» The best had a delta of 6%, average was 18%, worst was 132%
Compared to all devices tested
» 52% of all tested devices were better, 8% similar, 40% worse
» The best had a delta of 4%, average was 23%, worst was 134%
能源管理--具有坚实的电池寿命的游戏笔记本电脑
能源消耗
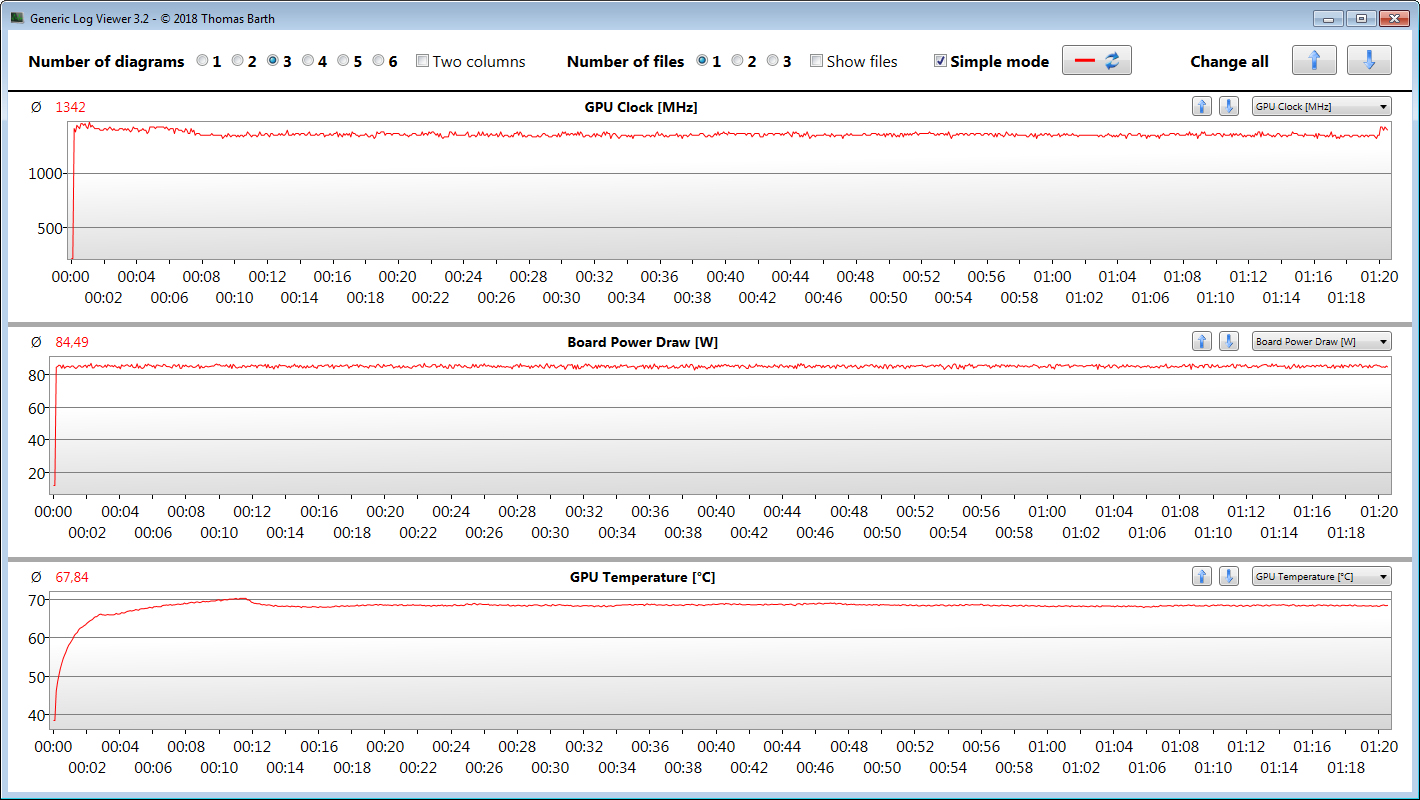
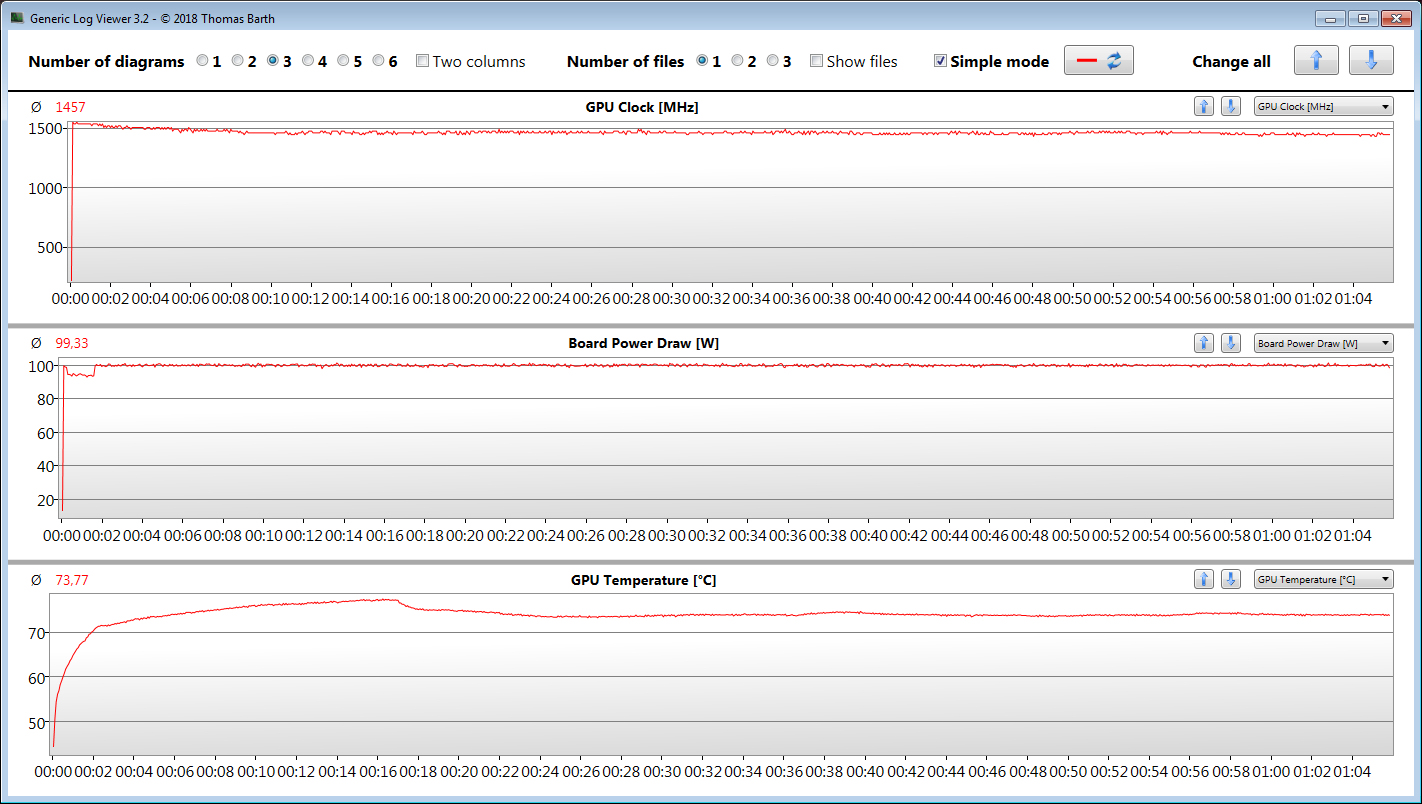
总而言之,考虑到这里安装的硬件,Nitro的功耗在整个负载范围内处于正常水平。我们登记的空闲使用时的最大功耗为14.6瓦特。像Razer Blade 15 和 Aorus 15P XC
这样的竞争对手需要的能量要大得多。压力测试和我们的TheWitcher 3测试让宏碁笔记本电脑的能耗分别上升到164瓦和平均134瓦。这使AN515成为我们比较领域中比较节俭的笔记本电脑之一。下图说明了笔记本电脑在我们的Witcher 3 测试和压力测试中相当稳定的耗电量。电源适配器的额定容量为180瓦。
| Off / Standby | |
| Idle | |
| Load |
|
Key:
min: | |
Energy consumption during The Witcher 3 / Stress test
| Acer Nitro 5 AN515-45-R1JH R7 5800H, GeForce RTX 3070 Laptop GPU | Asus ROG Strix G15 G513QY R9 5900HX, Radeon RX 6800M | Aorus 15P XC i7-10870H, GeForce RTX 3070 Laptop GPU | MSI GF65 Thin 10UE i7-10750H, GeForce RTX 3060 Laptop GPU | Asus TUF Gaming A15 FA506QR-AZ061T R7 5800H, GeForce RTX 3070 Laptop GPU | Razer Blade 15 Base Edition 2021, i7-10750H RTX 3060 i7-10750H, GeForce RTX 3060 Laptop GPU | Average NVIDIA GeForce RTX 3070 Laptop GPU | Average of class Gaming | |
|---|---|---|---|---|---|---|---|---|
| Power Consumption | -19% | -46% | 8% | -5% | -26% | -49% | -41% | |
| Idle Minimum * (Watt) | 8.8 | 12.1 -37% | 14 -59% | 5.4 39% | 10.2 -16% | 11.7 -33% | 15.6 ? -77% | 13 ? -48% |
| Idle Average * (Watt) | 13 | 13 -0% | 17 -31% | 12.8 2% | 12.8 2% | 16 -23% | 20.1 ? -55% | 19 ? -46% |
| Idle Maximum * (Watt) | 14.6 | 14.7 -1% | 33 -126% | 19.5 -34% | 15 -3% | 29.3 -101% | 29.4 ? -101% | 24.5 ? -68% |
| Load Average * (Watt) | 133 | 90.3 32% | 96 28% | 86.6 35% | 130 2% | 95.6 28% | 110.8 ? 17% | 111.1 ? 16% |
| Witcher 3 ultra * (Watt) | 134 | 200 -49% | 179 -34% | 115.7 14% | 137 -2% | 141.3 -5% | ||
| Load Maximum * (Watt) | 164 | 263.4 -61% | 256 -56% | 175.2 -7% | 184 -12% | 197 -20% | 214 ? -30% | 260 ? -59% |
* ... smaller is better
电池寿命
在我们的Wi-Fi测试(使用脚本访问网站)和视频测试(短片Big Buck Bunny(H.264编码,全高清)循环运行)中,这台15.6英寸的笔记本电脑分别达到了5:40小时和6:53小时的运行时间。在这两项测试中,笔记本电脑的省电功能被禁用,显示屏亮度被设置为约150cd/m²。在视频测试中,无线模块也被禁用。
在我们的比较范围内,Nitro 5是电池容量最低的笔记本电脑之一。尽管如此,该设备的电池寿命还算不错。然而,它并没有接近两台华硕笔记本电脑的优秀率。这两台机器得益于其90Wh的电池。
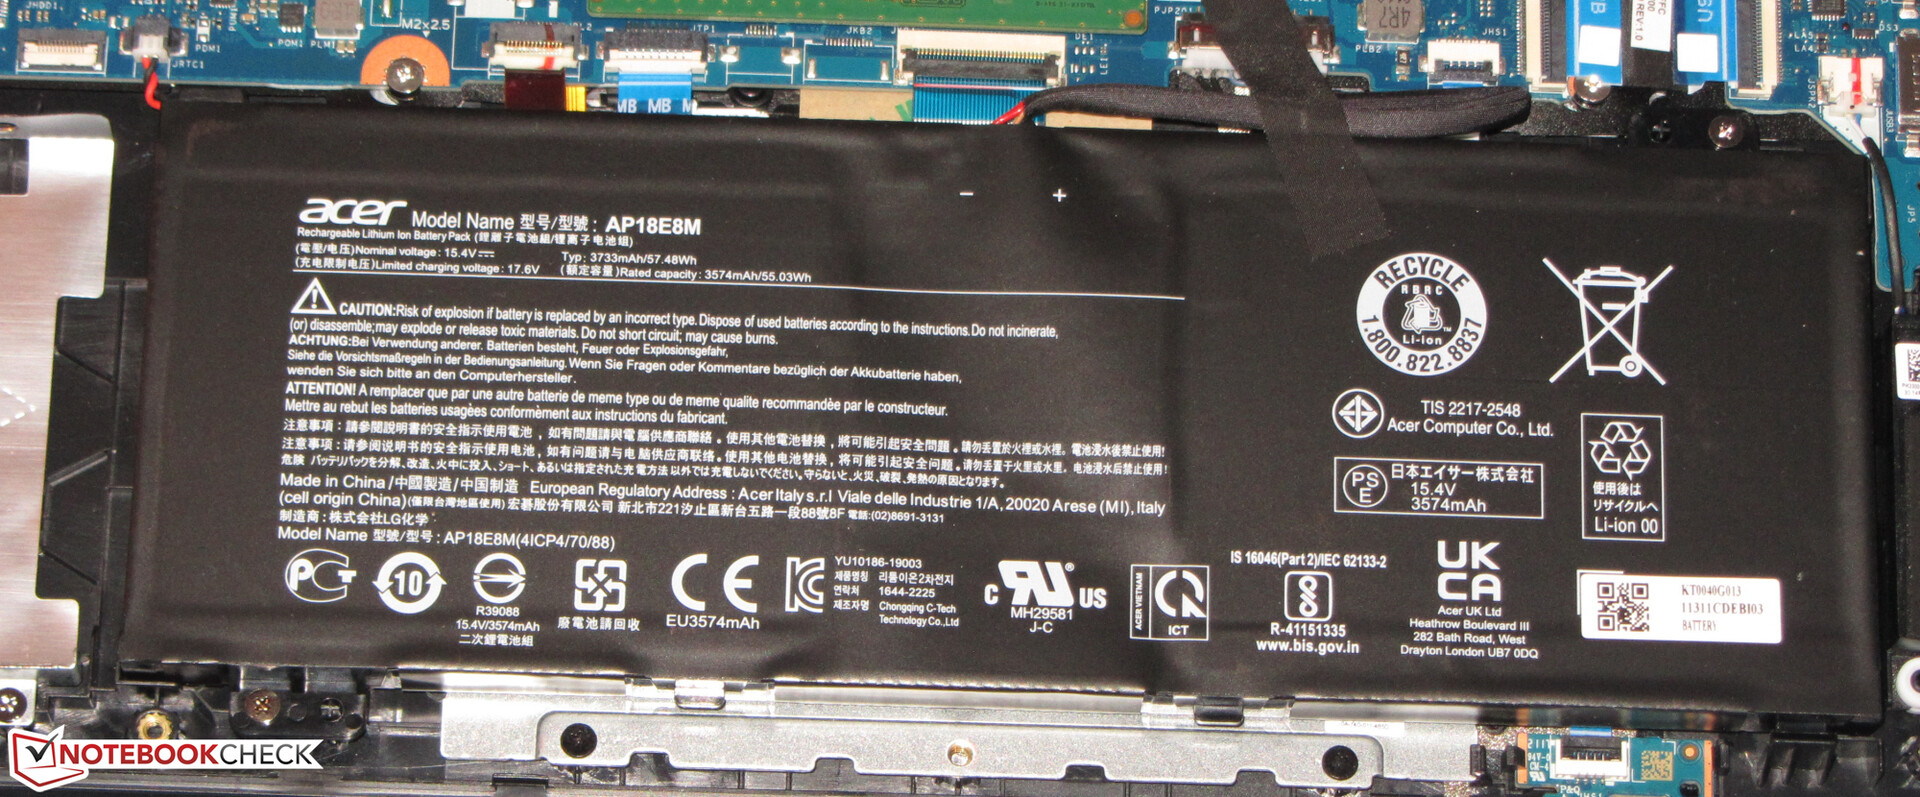
| Acer Nitro 5 AN515-45-R1JH R7 5800H, GeForce RTX 3070 Laptop GPU, 57.5 Wh | Asus ROG Strix G15 G513QY R9 5900HX, Radeon RX 6800M, 90 Wh | Aorus 15P XC i7-10870H, GeForce RTX 3070 Laptop GPU, 99 Wh | MSI GF65 Thin 10UE i7-10750H, GeForce RTX 3060 Laptop GPU, 51 Wh | Asus TUF Gaming A15 FA506QR-AZ061T R7 5800H, GeForce RTX 3070 Laptop GPU, 90 Wh | Razer Blade 15 Base Edition 2021, i7-10750H RTX 3060 i7-10750H, GeForce RTX 3060 Laptop GPU, 65 Wh | Average of class Gaming | |
|---|---|---|---|---|---|---|---|
| Battery runtime | 89% | 18% | 4% | 110% | 6% | 22% | |
| Reader / Idle (h) | 9.2 | 16.1 75% | 9.5 3% | 11.1 21% | 17.4 89% | 7.8 -15% | 8.27 ? -10% |
| H.264 (h) | 6.9 | 7 1% | 8.32 ? 21% | ||||
| WiFi v1.3 (h) | 5.7 | 9.2 61% | 6.7 18% | 4.6 -19% | 11.4 100% | 4.8 -16% | 7.11 ? 25% |
| Load (h) | 1 | 2.3 130% | 1.5 50% | 1.1 10% | 2.4 140% | 1.5 50% | 1.502 ? 50% |
Pros
Cons
结论 - 全面的QHD游戏笔记本电脑


紧凑的Nitro 5总体表现不错,但与我们迄今为止评测过的RTX 3070笔记本相比,它的帧率低于平均水平。这方面的原因是。宏碁选择了允许范围的低端的TGP--85瓦。GPU的性能可以通过固件更新稍微提高。
宏碁的Nitro 5 AN515-45是其阵容中一个坚实的游戏笔记本电脑。
在性能发展方面没有出现问题。CPU和GPU可以在持续的高时钟率下工作。笔记本电脑在负载下会明显发热,但不会过度。噪音发展符合等级标准。安装固件更新应导致热量和噪音发展的轻微增加。
显示屏(QHD,IPS,144Hz)提供稳定的视角,良好的平均亮度,哑光表面,快速的响应时间,体面的色彩再现,以及良好的色域覆盖。不过,对比度太低了。
Nitro 5的一个替代品可能是 华硕TUF Gaming A15 FA506QR.它在性能和价格方面与Nitro相当,但它的电池寿命要好得多。
价格和可用性
在撰写本文时,你可以在亚马逊上找到 Acer Nitro 5 AN515-45 在亚马逊上(Ryzen 7 5800H,GeForce RTX 3070, 16 GB RAM, 1 TB SSD, QHD 165 Hz IPS显示屏, Windows 10 Home),价格为1699.99美元。
Acer Nitro 5 AN515-45-R1JH
- 08/14/2021 v7 (old)
Sascha Mölck
Price comparison

