微星Katana GF66 11UG评论。浪费了潜力的游戏笔记本

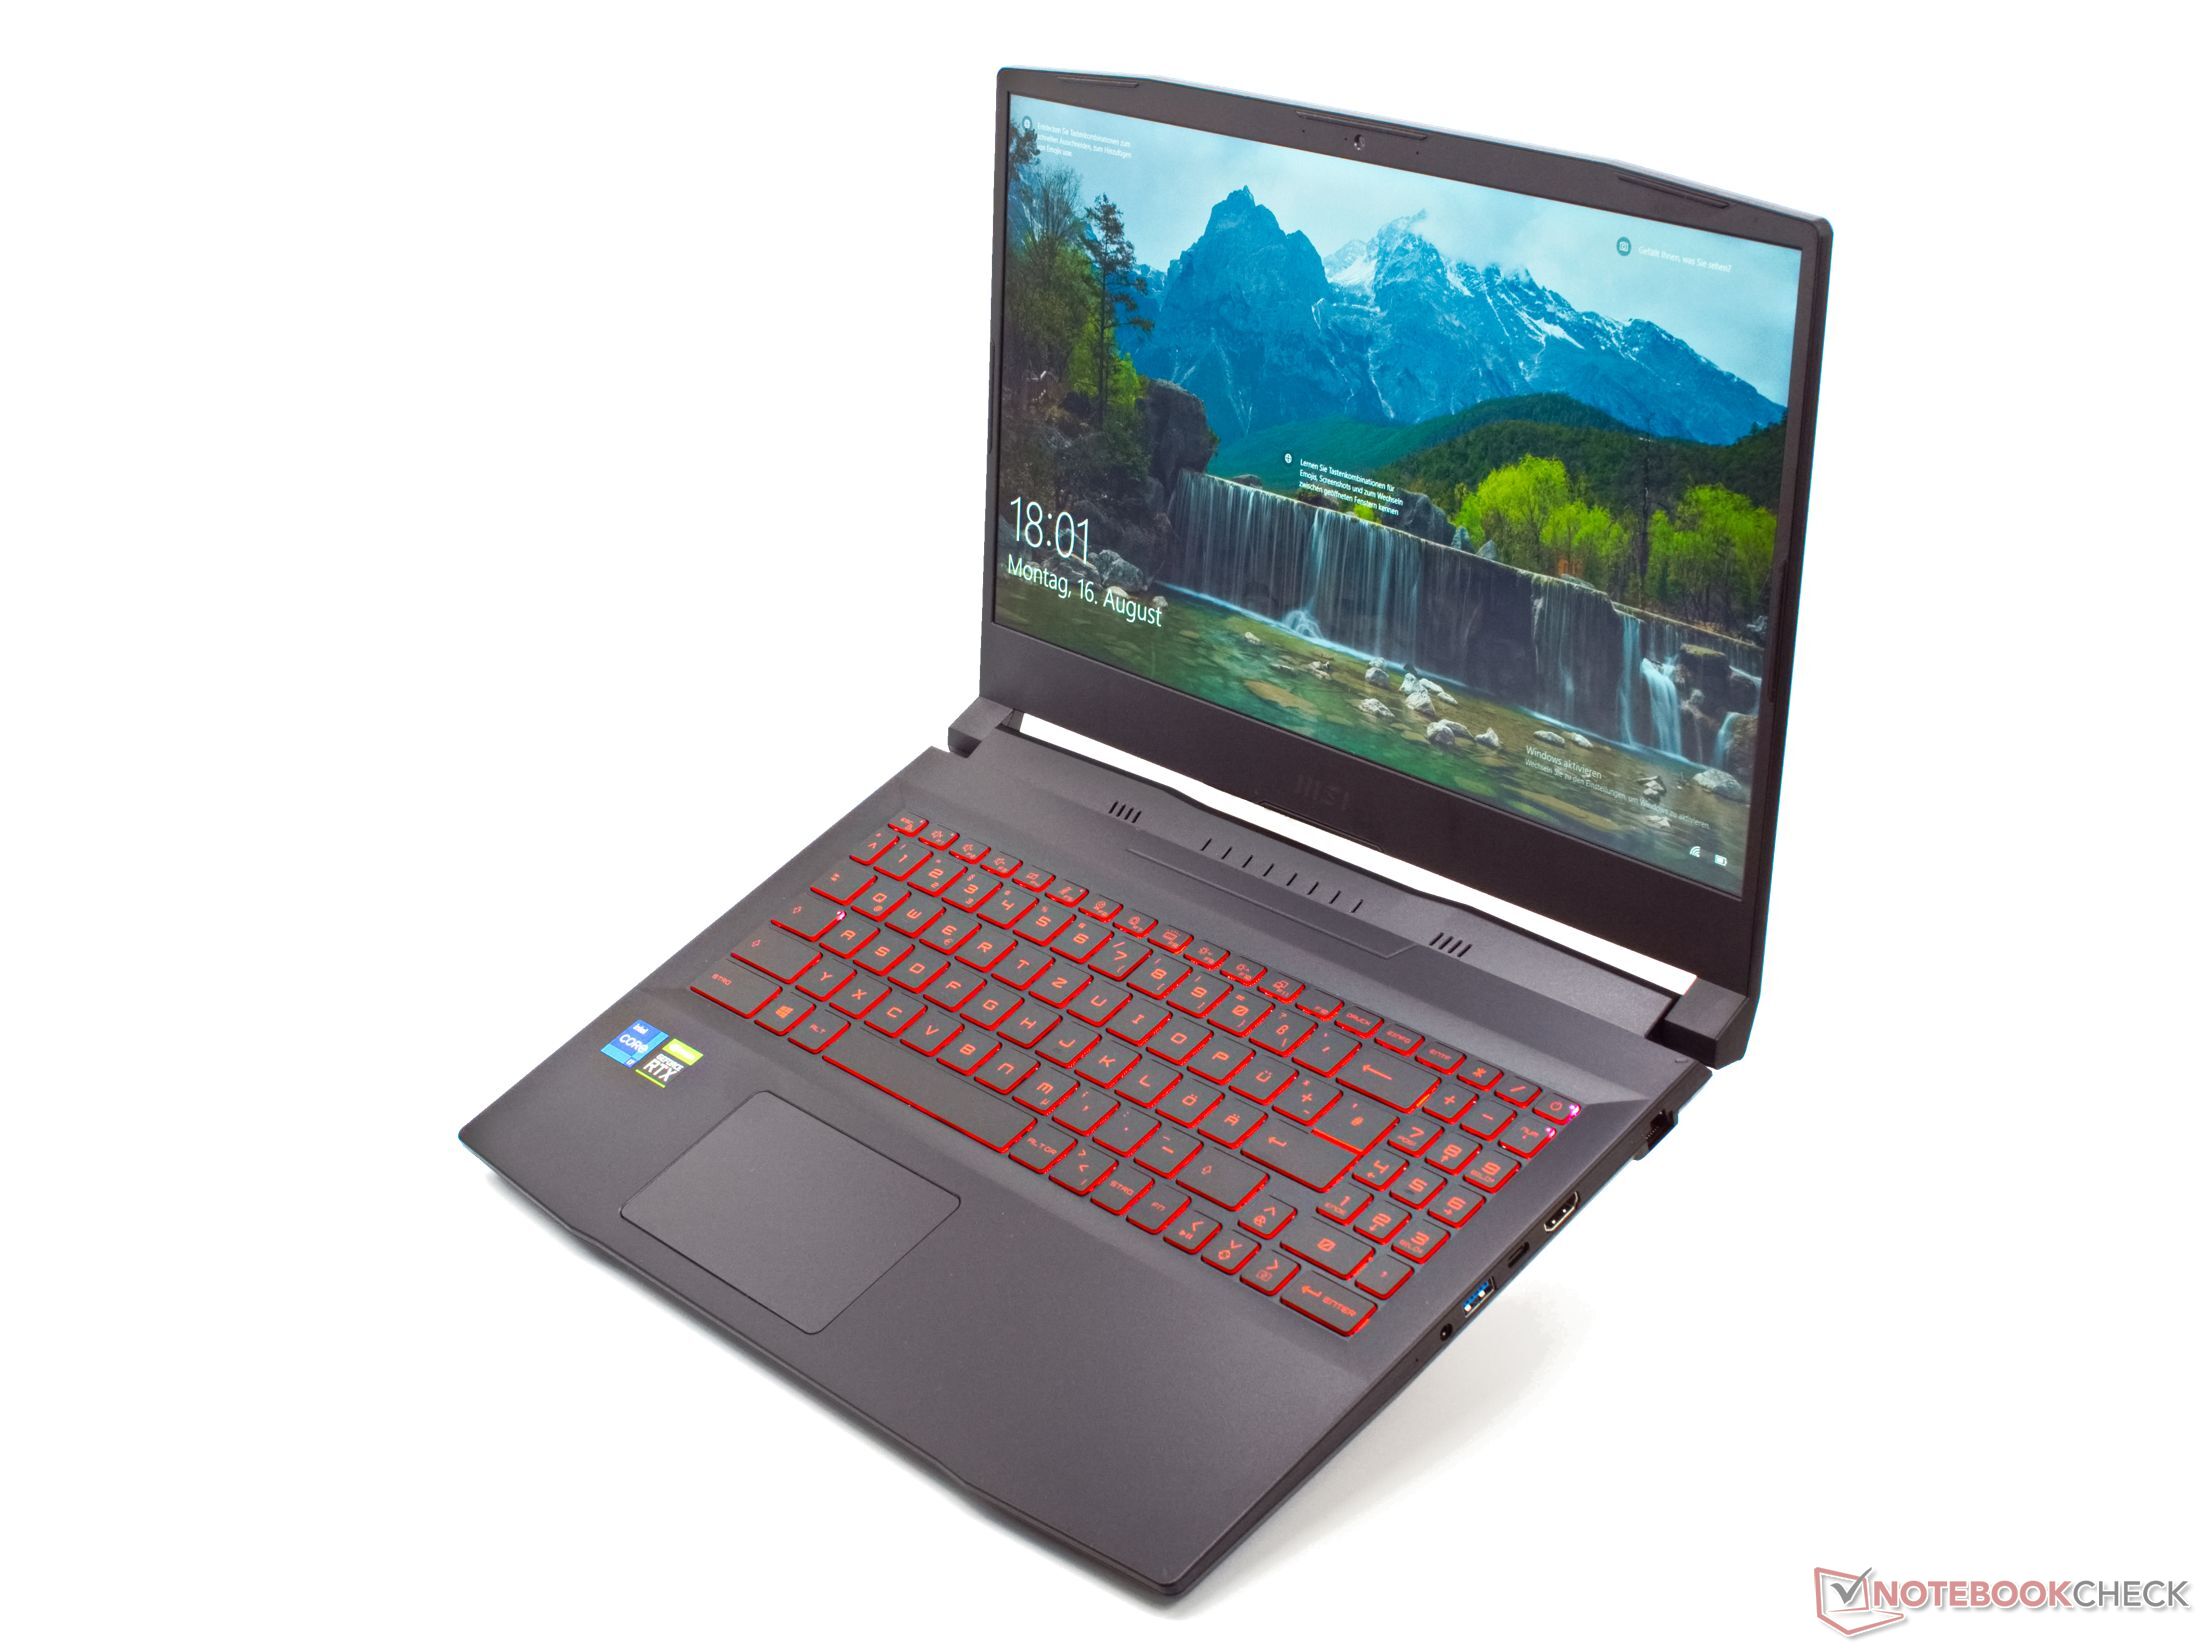
微星Katana GF66 11UG-220是微星公司在2021年5月才推出的配备英特尔第11代处理器和RTX 3000系列显卡的整个系列新游戏笔记本电脑之一。这款简单而优雅的笔记本电脑的外观是由插画师长野刚设计的,这位艺术家在日本也因其《星球大战》封面而闻名。
根据微星公司的说法,Katana笔记本电脑是以创造著名日本剑所需的高超工艺创造的。至少,测试配置中的英特尔酷睿i7-11800H,16GB内存,NvidiaGeForce RTX 3070,以及512GB NVMe固态硬盘,有望实现高性能。作为操作系统,只预装了FreeOS。对于我们的测试,我们在系统上安装了Windows 10 Home。这项测试的竞争对手包括 华硕TUF Dash F15,以及联想Legion 5 Pro 16,以及Gigabyte Aero 15 OLED的Razer Blade 15,以及 申克XMG Neo 15.
Possible Competitors in Comparison
Rating | Date | Model | Weight | Height | Size | Resolution | Price |
|---|---|---|---|---|---|---|---|
| 79.2 % v7 (old) | 09 / 2021 | MSI Katana GF66 11UG-220 i7-11800H, GeForce RTX 3070 Laptop GPU | 2.3 kg | 25 mm | 15.60" | 1920x1080 | |
| 87.4 % v7 (old) | 08 / 2021 | Lenovo Legion 5 Pro 16ACH6H (82JQ001PGE) R7 5800H, GeForce RTX 3070 Laptop GPU | 2.6 kg | 26.85 mm | 16.00" | 2560x1600 | |
| 85.6 % v7 (old) | 08 / 2021 | Gigabyte Aero 15 OLED XD i7-11800H, GeForce RTX 3070 Laptop GPU | 2.2 kg | 20 mm | 15.60" | 3840x2160 | |
| 82.4 % v7 (old) | 02 / 2021 | Asus TUF Dash F15 FX516PR i7-11370H, GeForce RTX 3070 Laptop GPU | 2 kg | 20 mm | 15.60" | 1920x1080 | |
| 88.9 % v7 (old) | 10 / 2021 | Razer Blade 15 Advanced (Mid 2021) i7-11800H, GeForce RTX 3080 Laptop GPU | 2 kg | 16.99 mm | 15.60" | 1920x1080 | |
| 87 % v7 (old) | Schenker XMG Neo 15 Tiger Lake i7-11800H, GeForce RTX 3080 Laptop GPU | 2.2 kg | 26 mm | 15.60" | 2560x1440 |
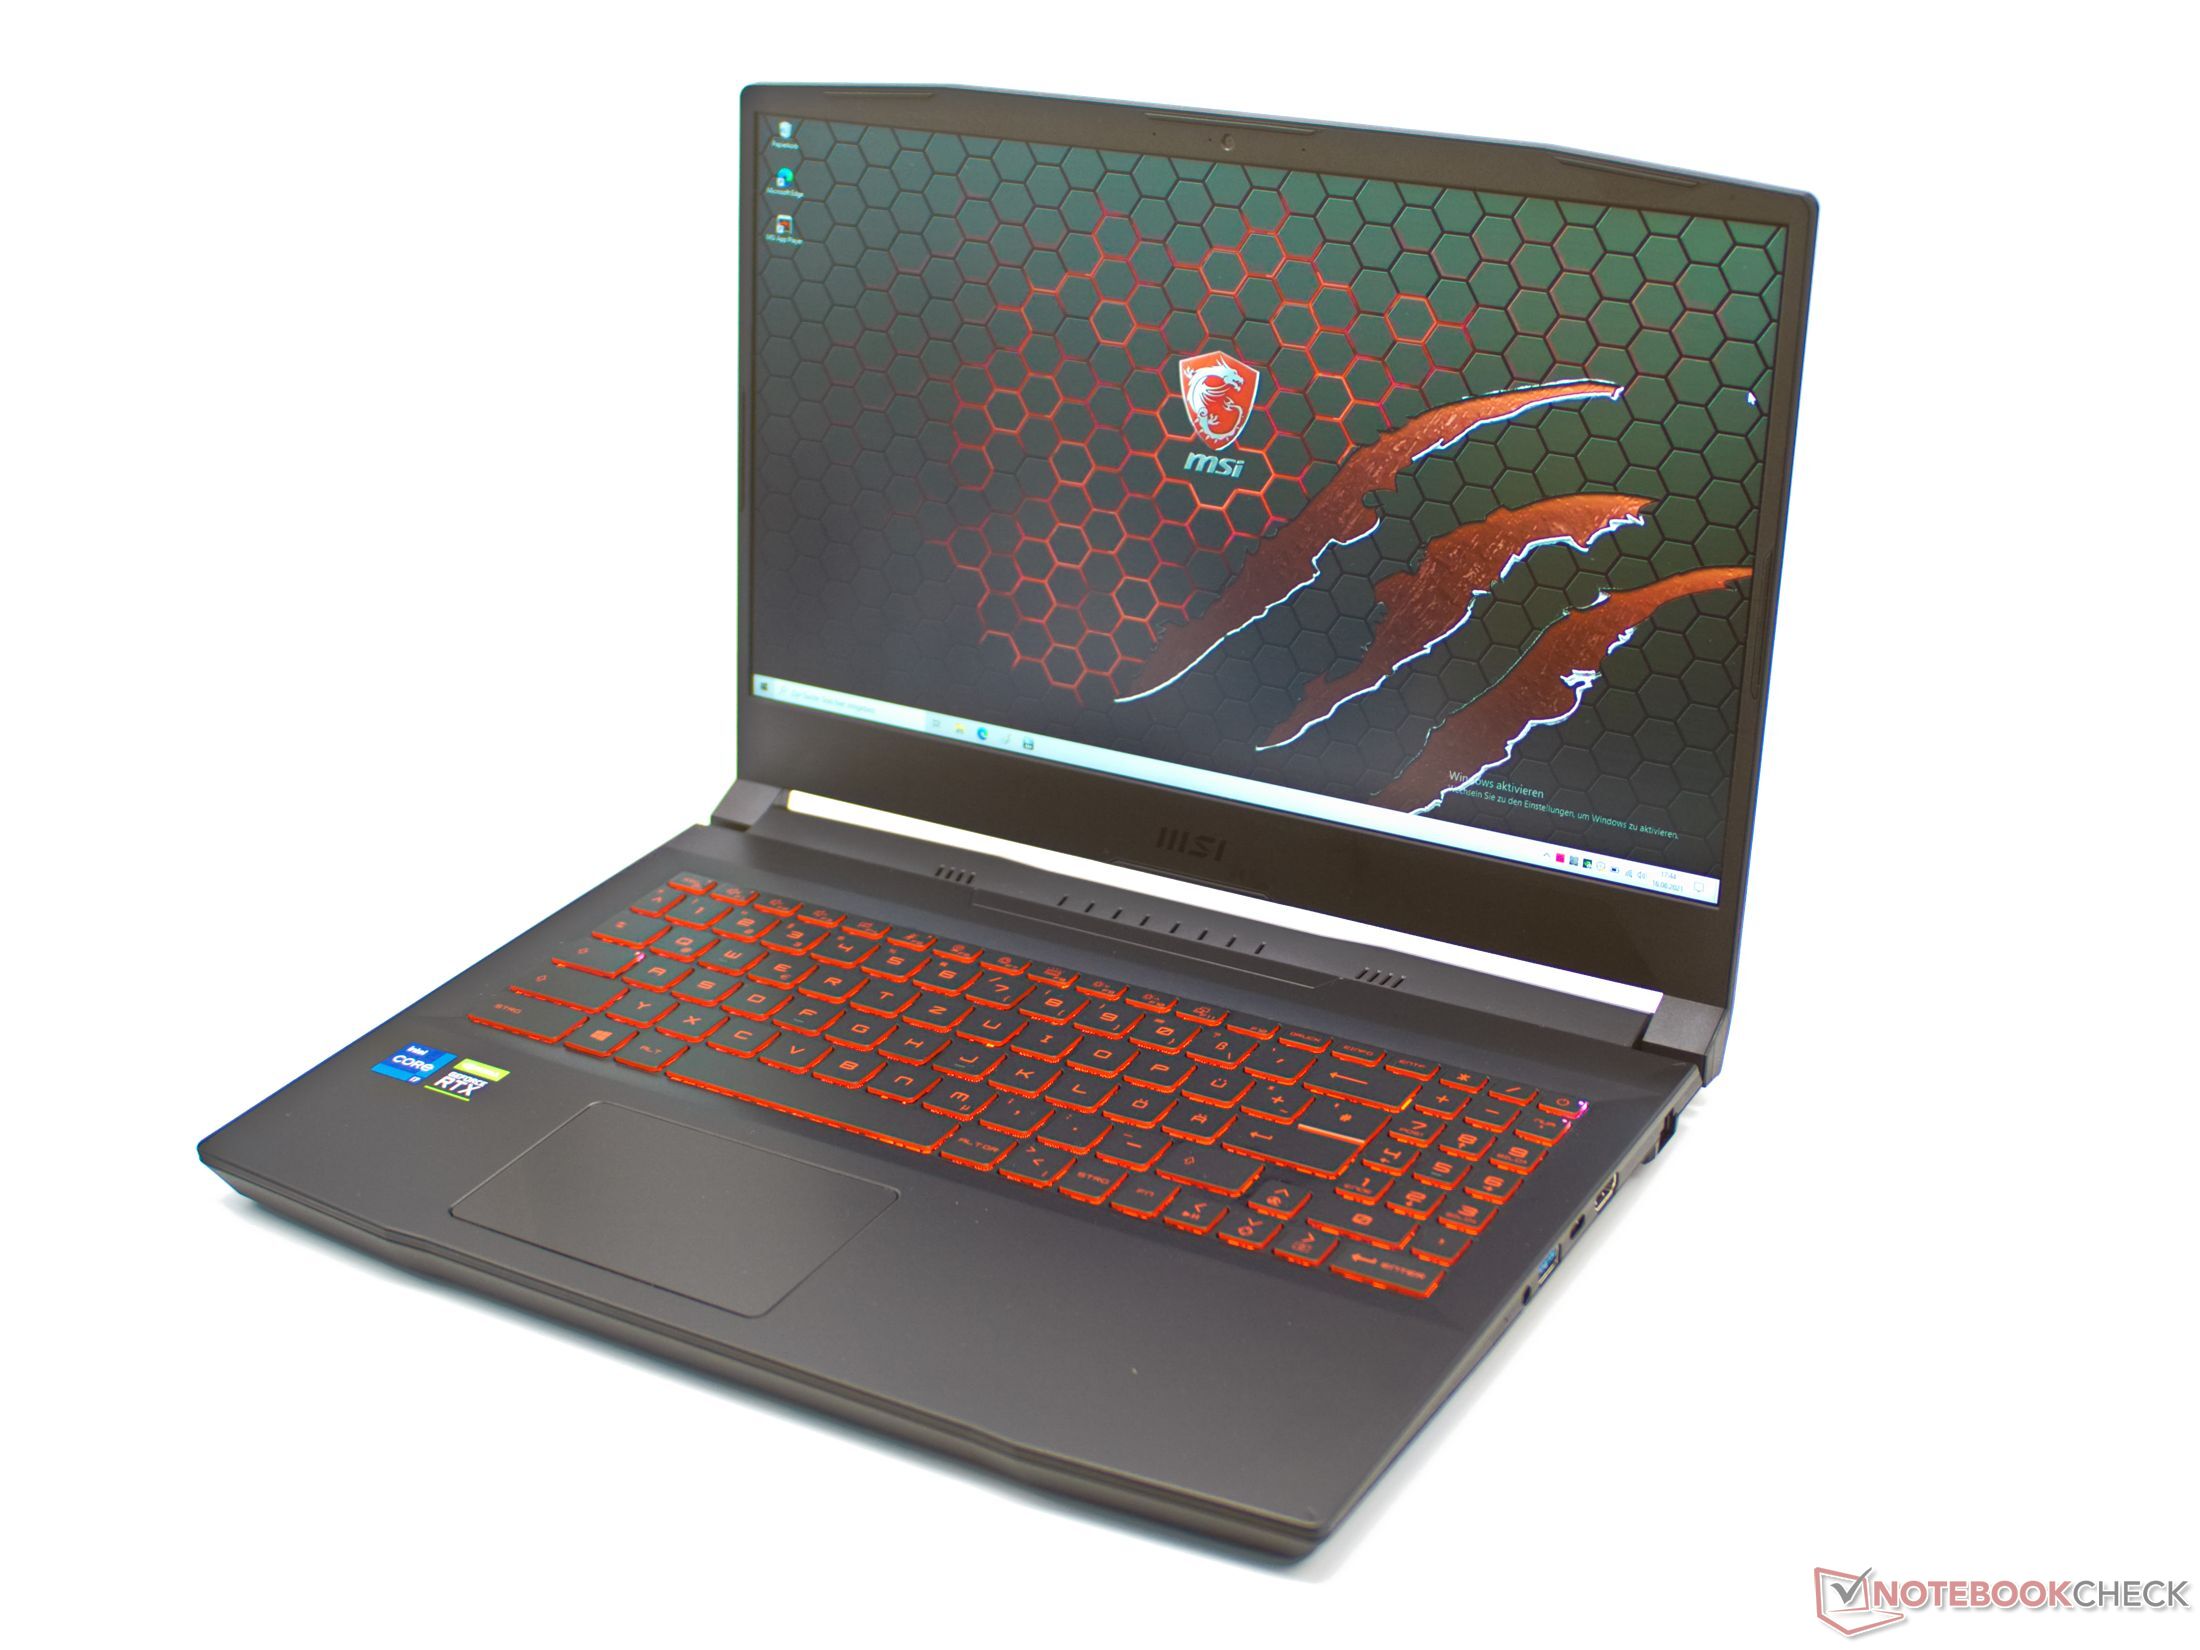
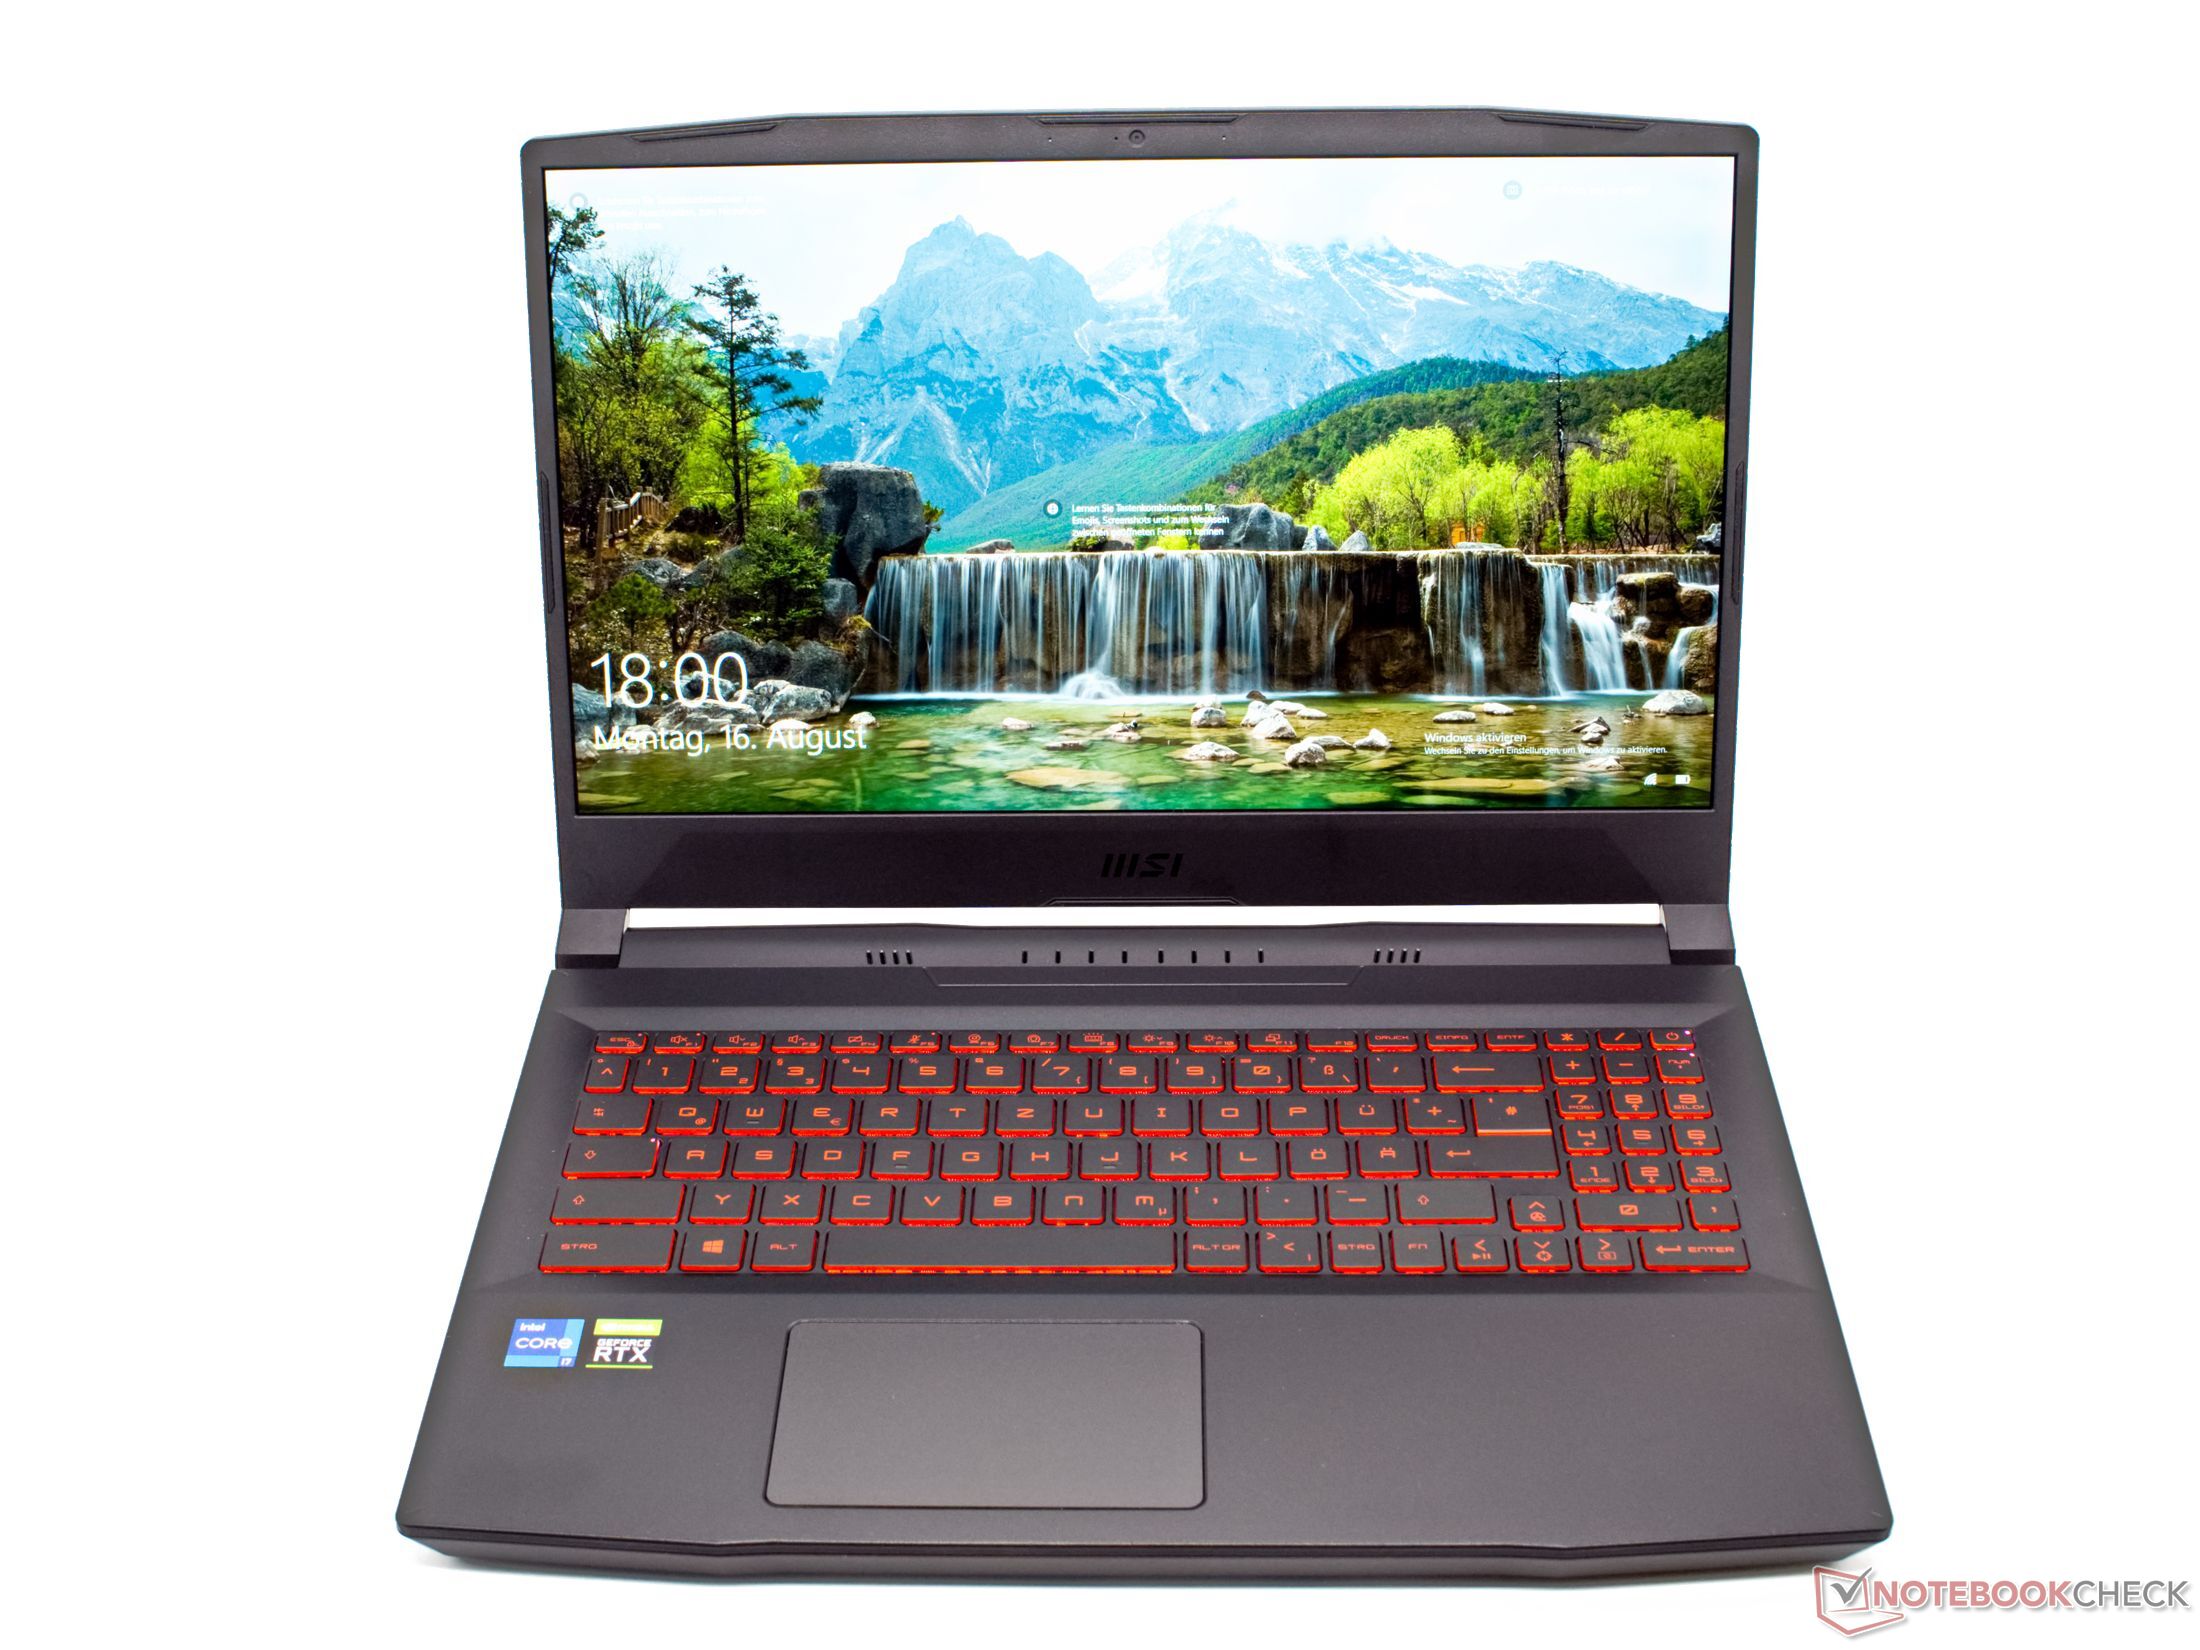
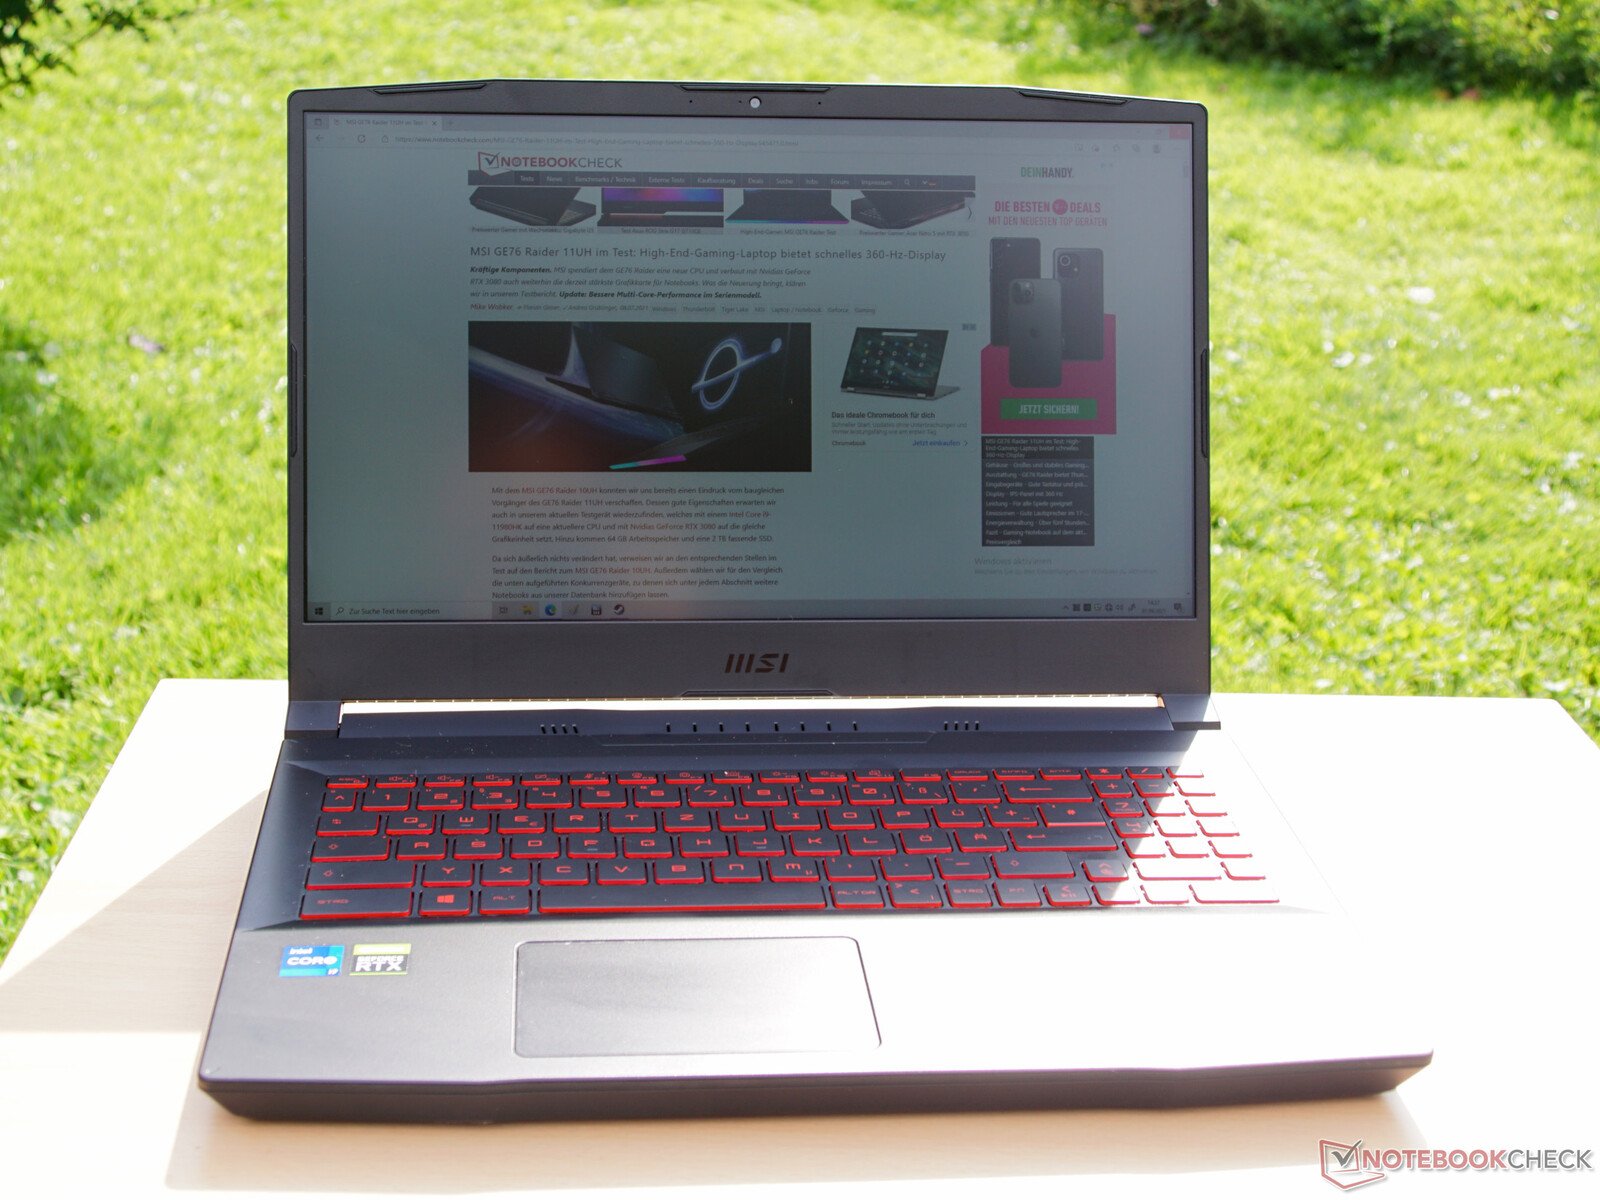
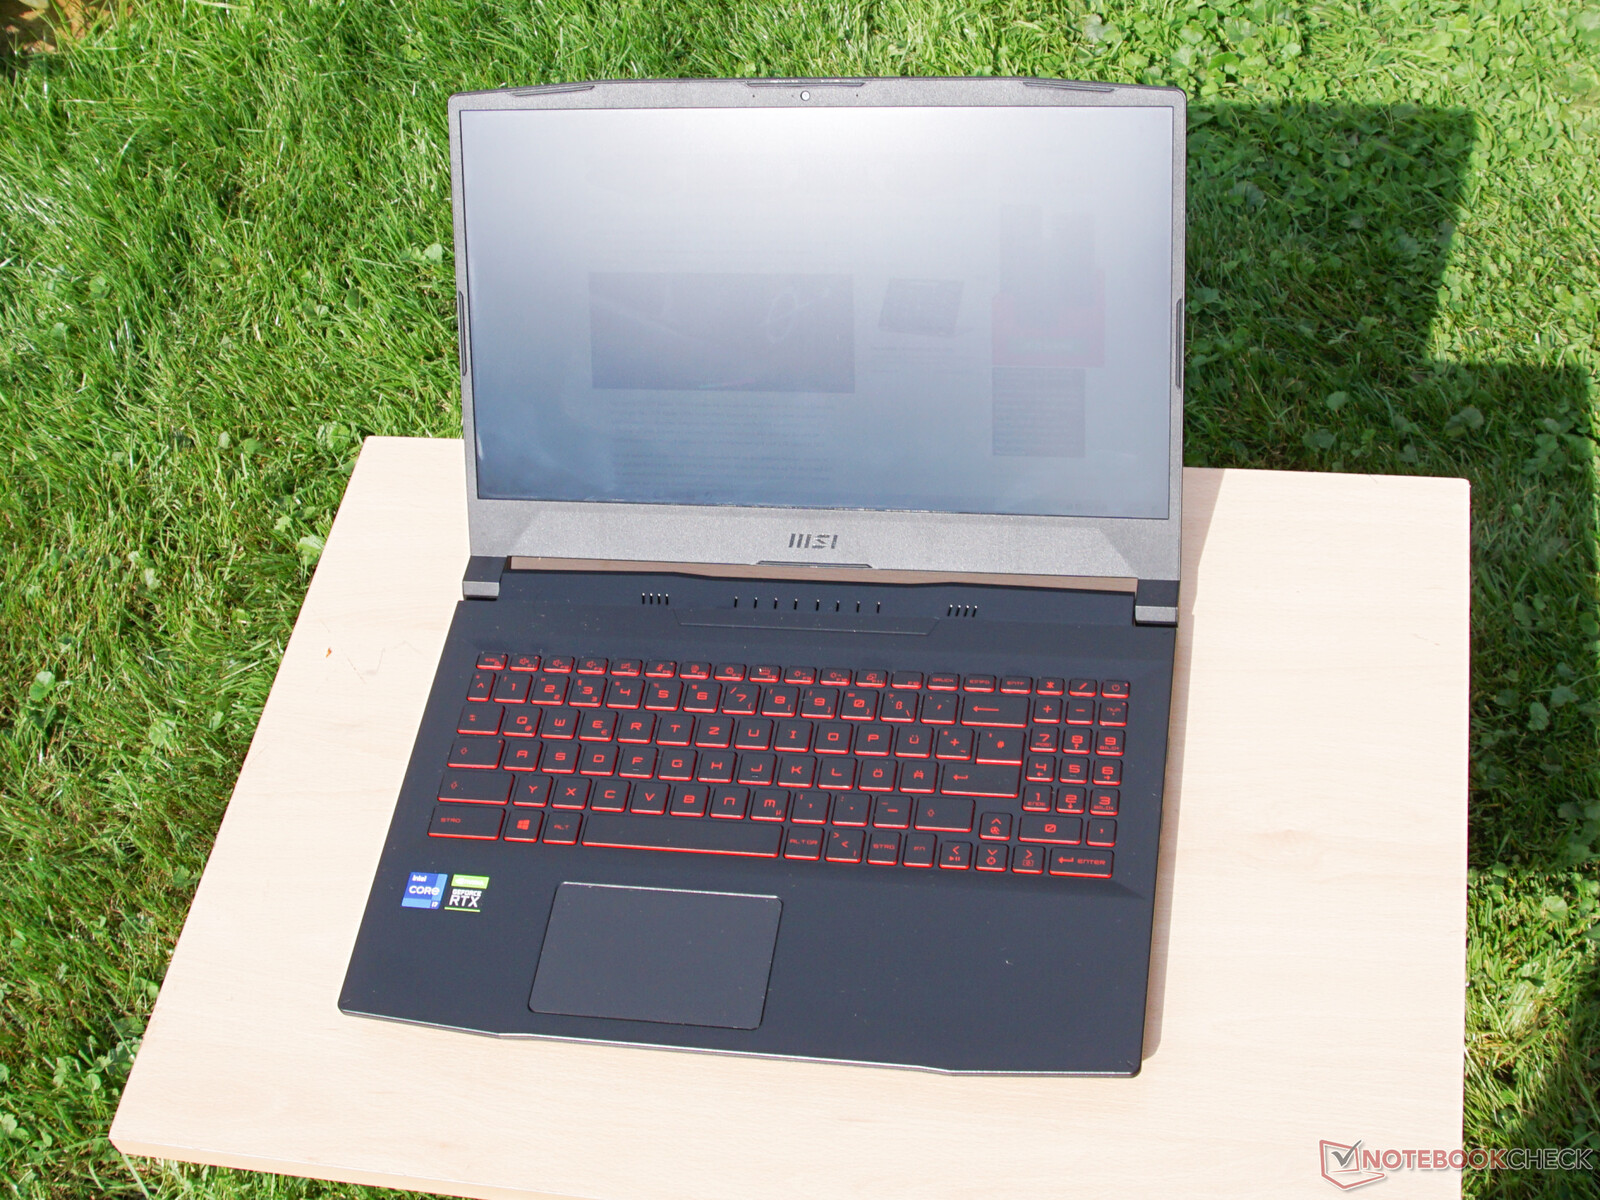
外壳 - 游戏笔记本电脑的外壳简单而优雅
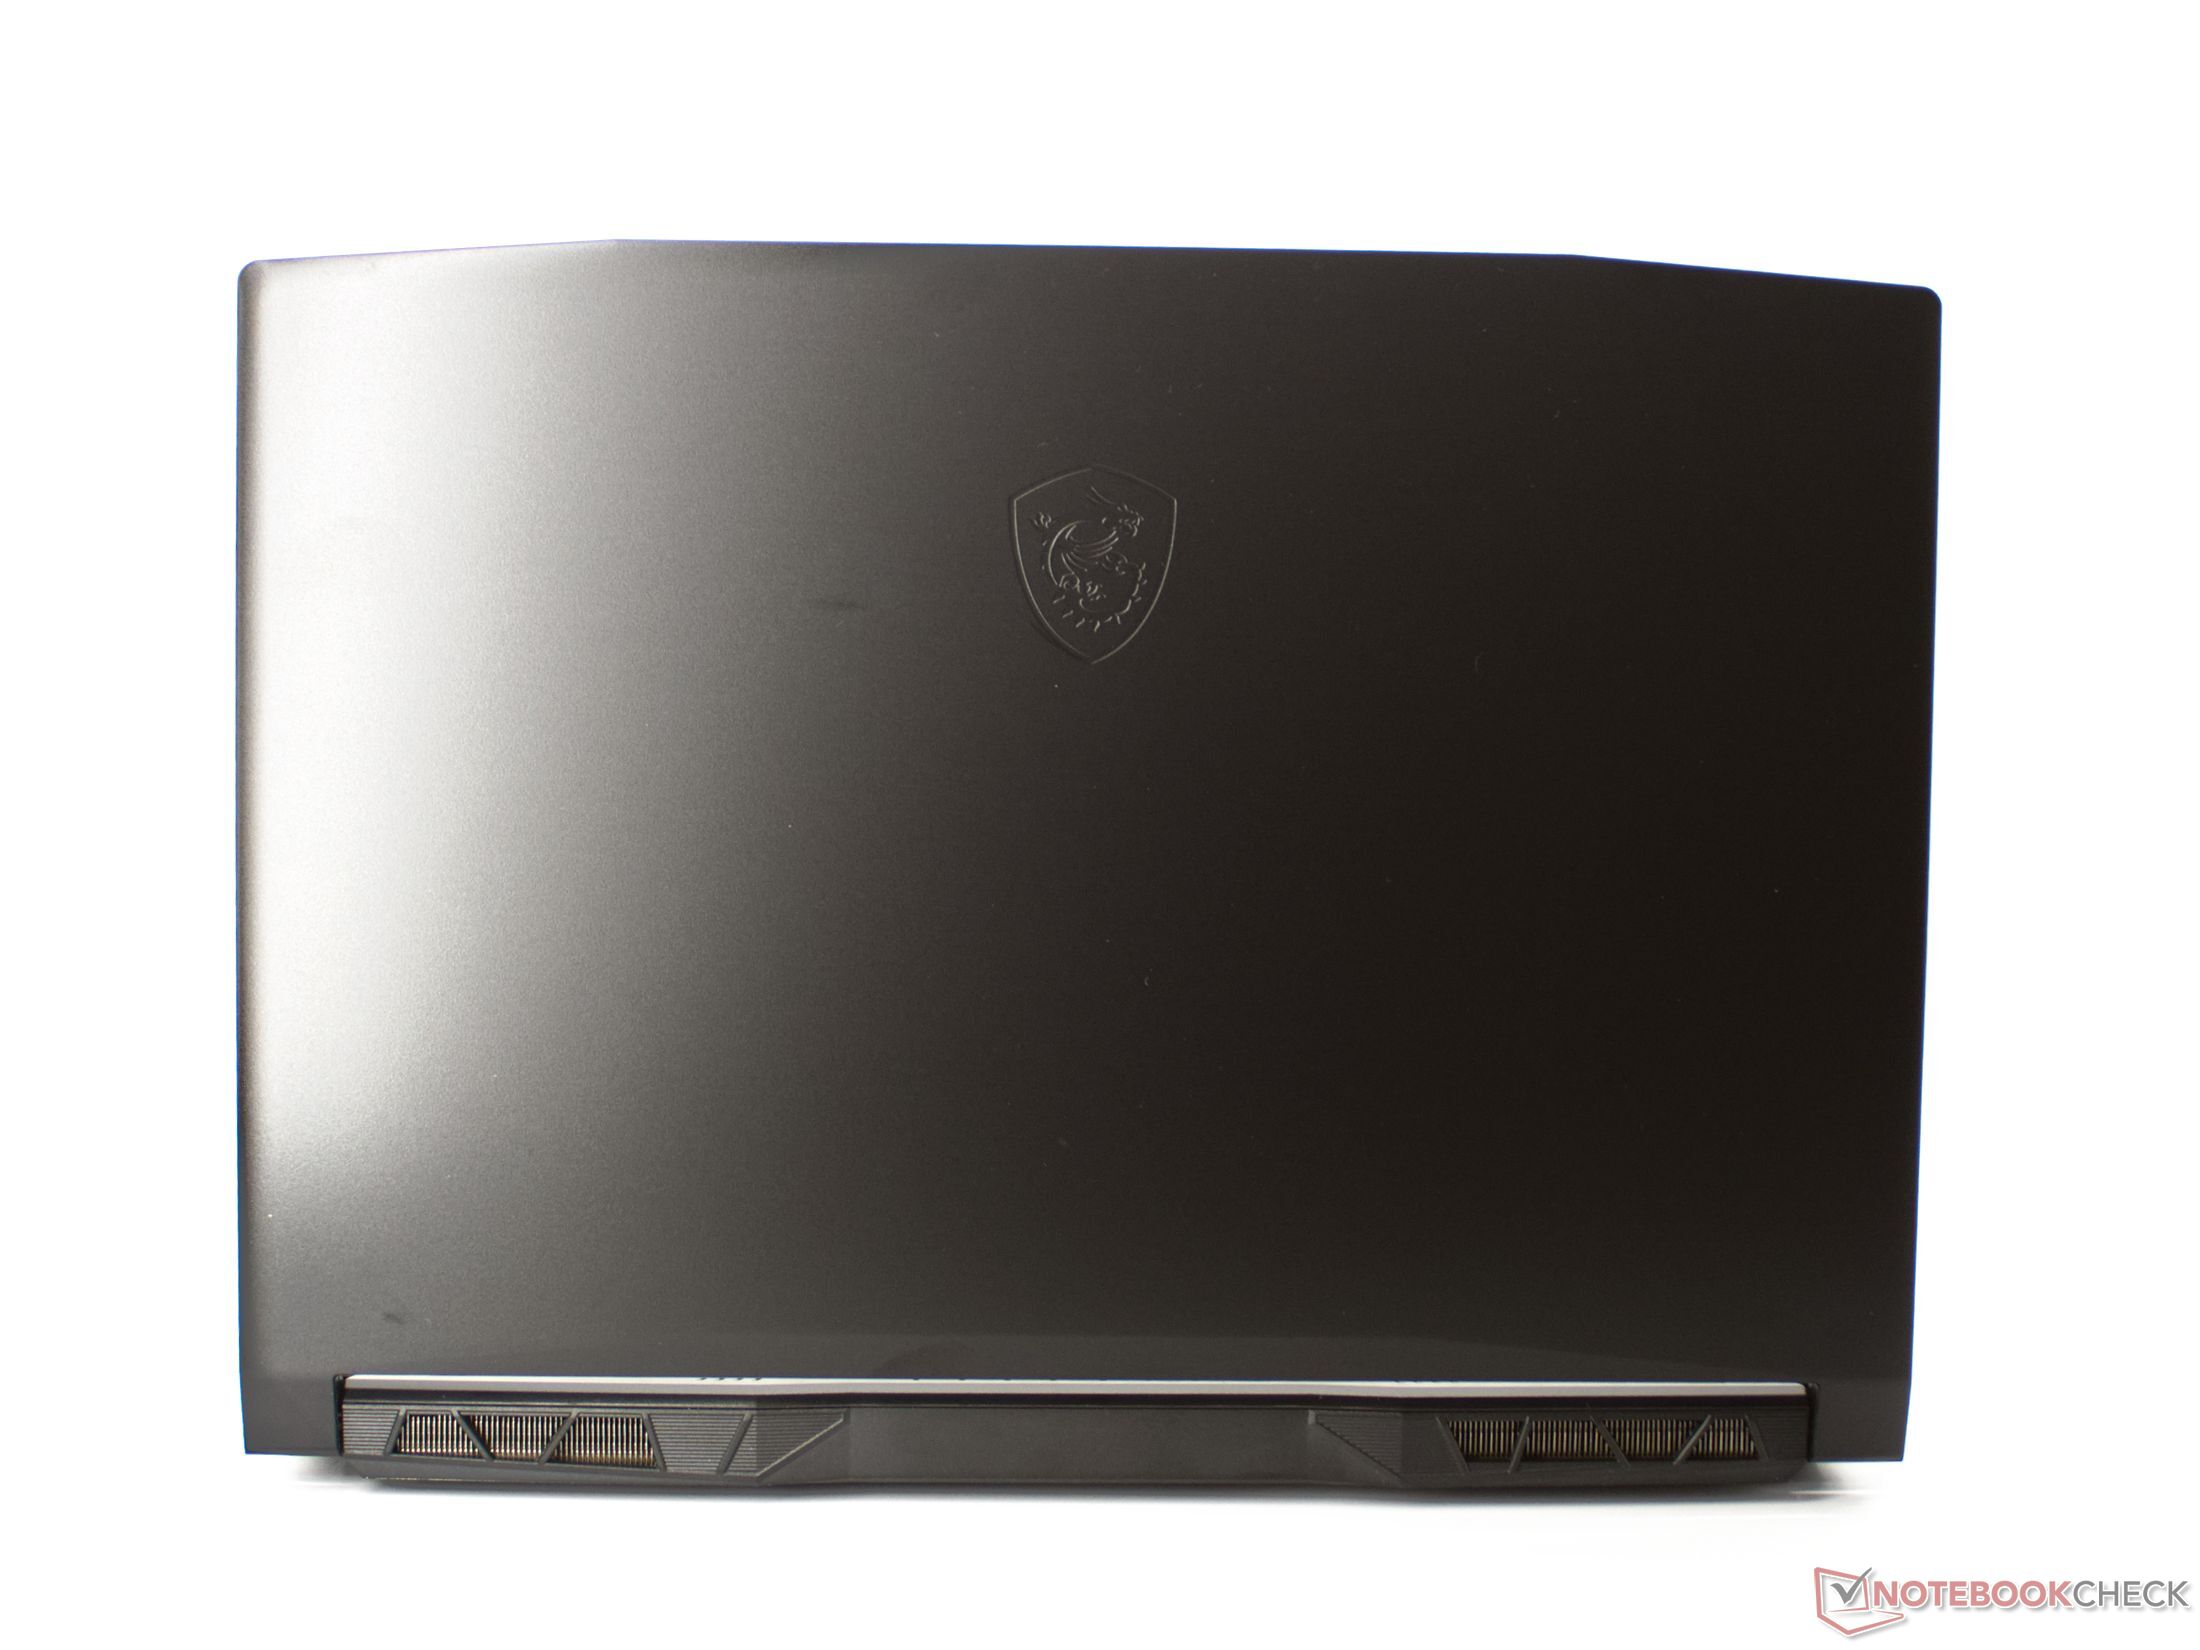
在游戏笔记本中,微星Katana GF66的外壳因其不显眼而特别突出。笔记本电脑的外壳完全由黑色塑料制成。在设计方面,微星也只使用了很少的点缀。然而,这几个元素确保了独特的设计。侧面的拉丝表面,显示屏上方的小角度,盖子上的龙形标志,以及有角度的铰链,当你再看这台游戏笔记本时,会有一种咄咄逼人的外观。
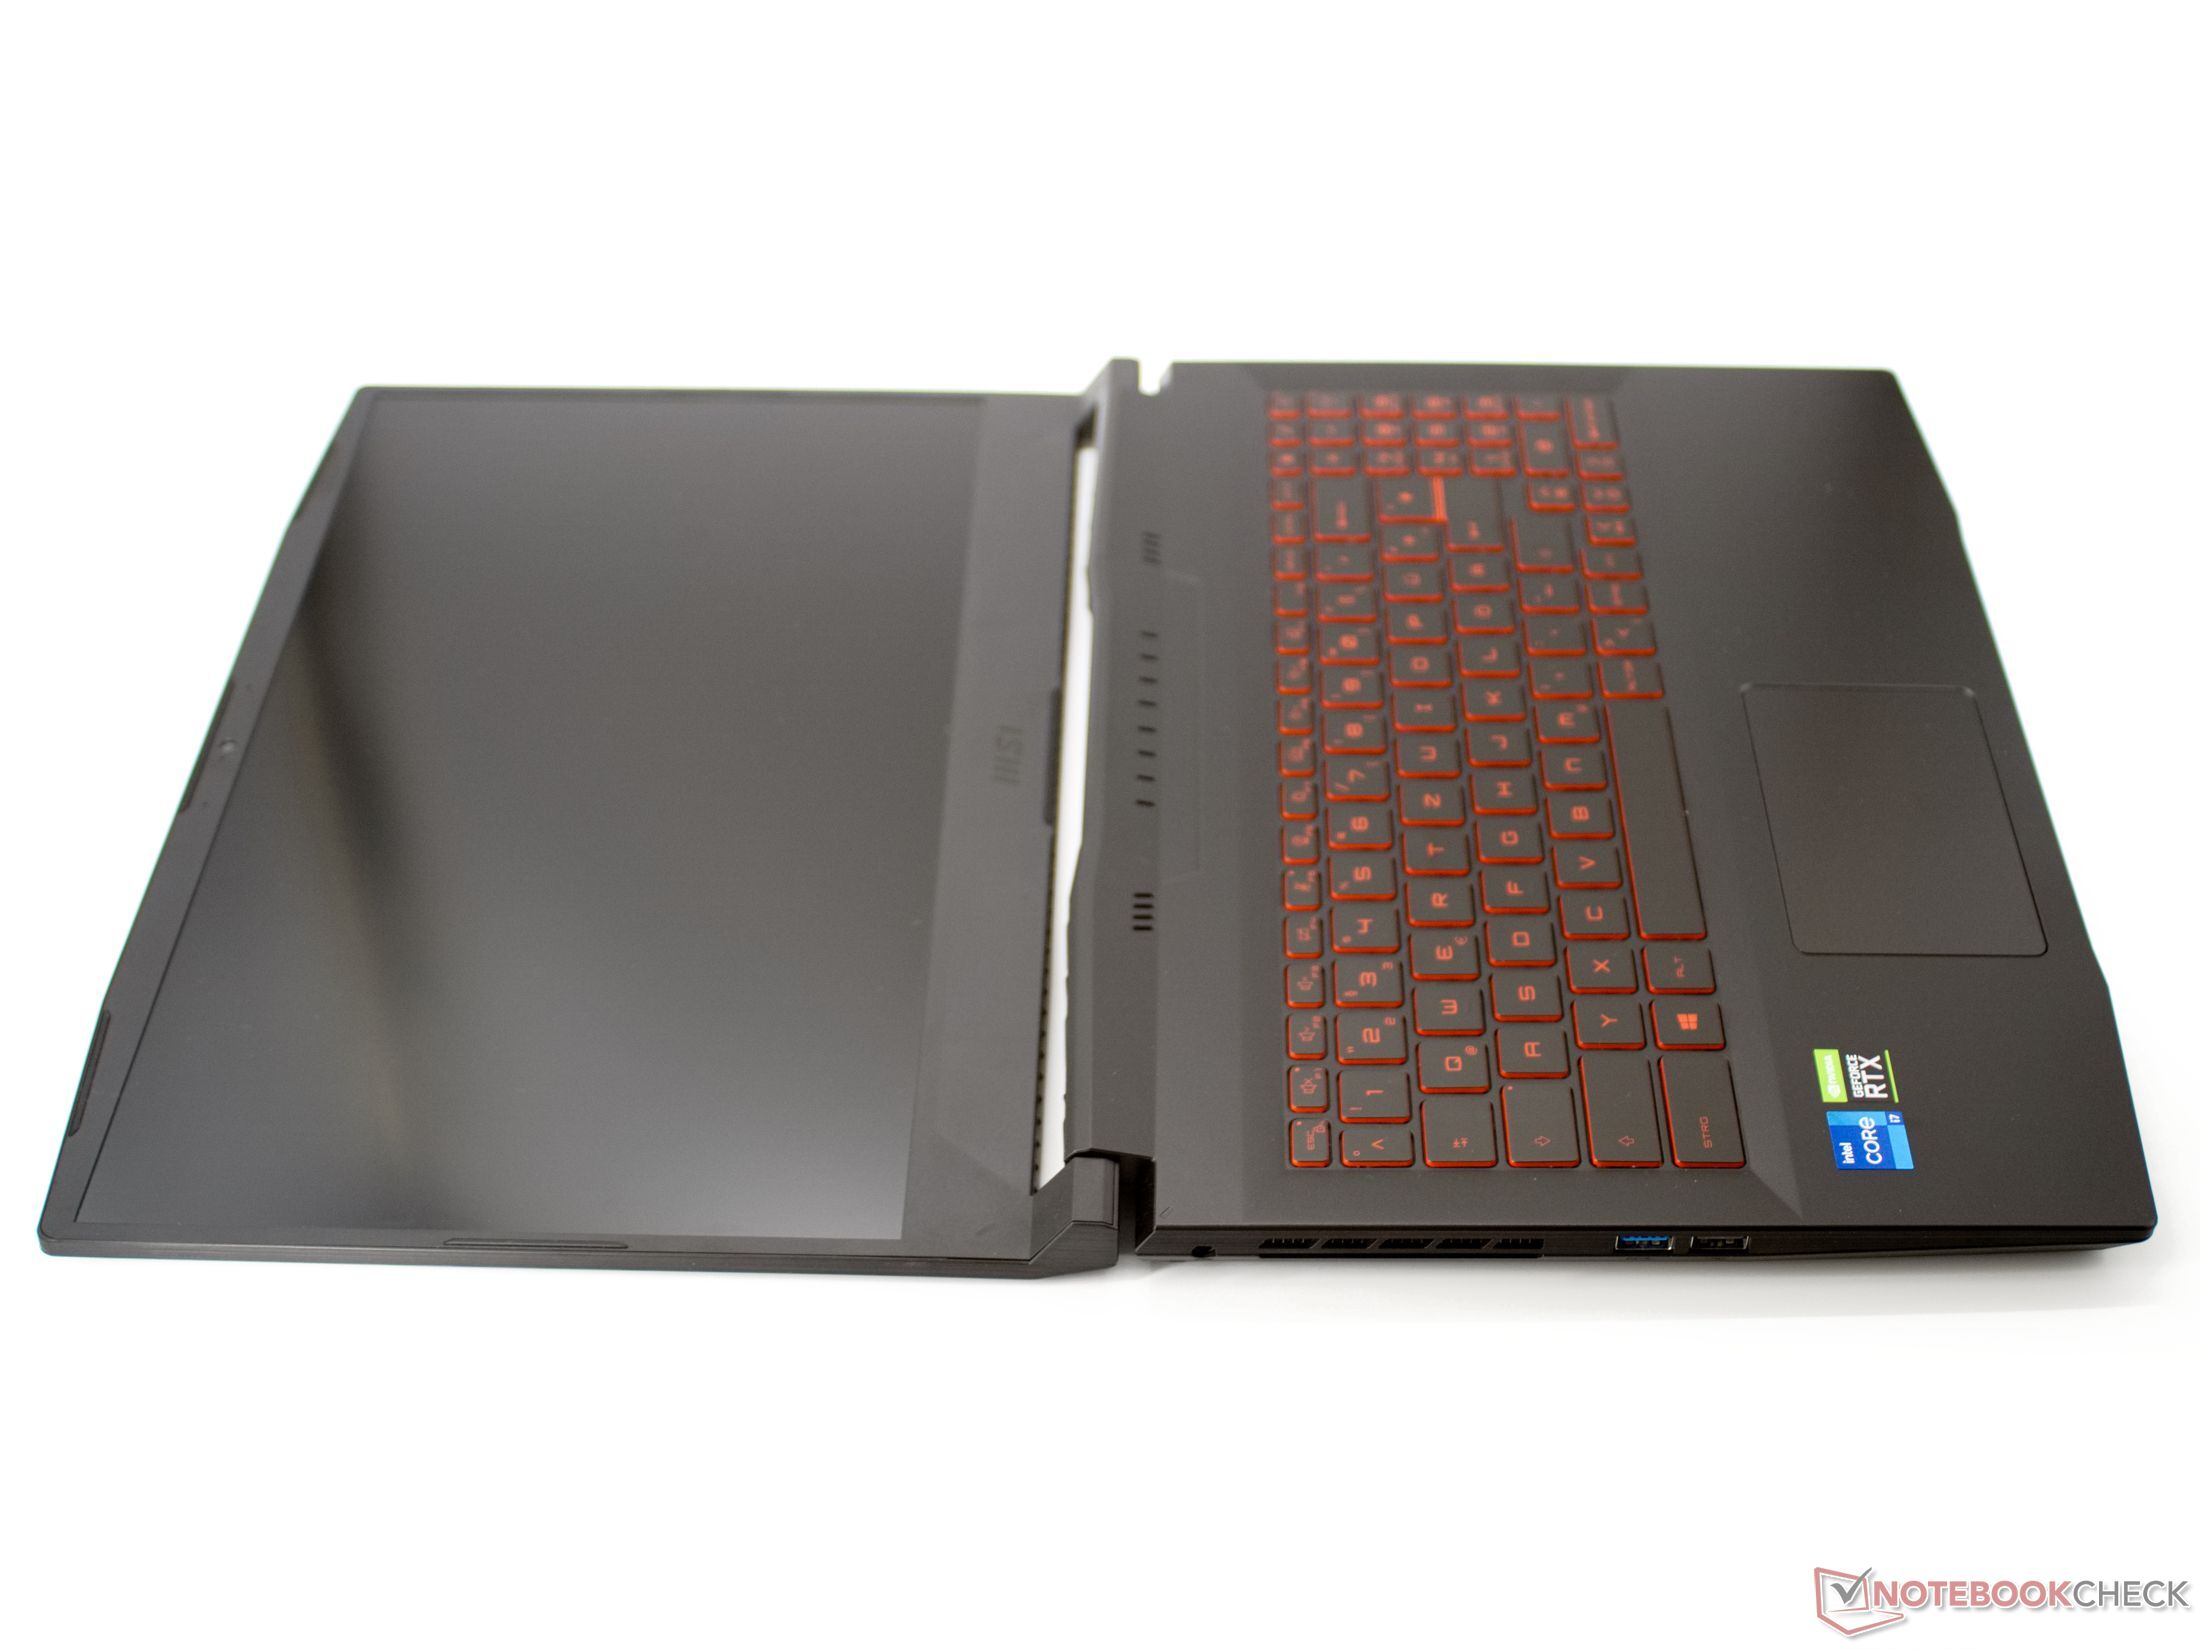
在做工方面,微星笔记本电脑只显示了一个弱点。虽然所有的缝隙都很紧密,机箱的稳定性也相当高,但显示屏的铰链往往有点太容易晃动了。显示屏也可以用一只手打开到180°角,在只有一些轻微振动的情况下,显示屏甚至会降得更低。
就其尺寸和重量而言,15至16英寸的游戏笔记本电脑是相似的。至少2公斤(约4.4磅)加上电源,是一个需要拖动的重量。
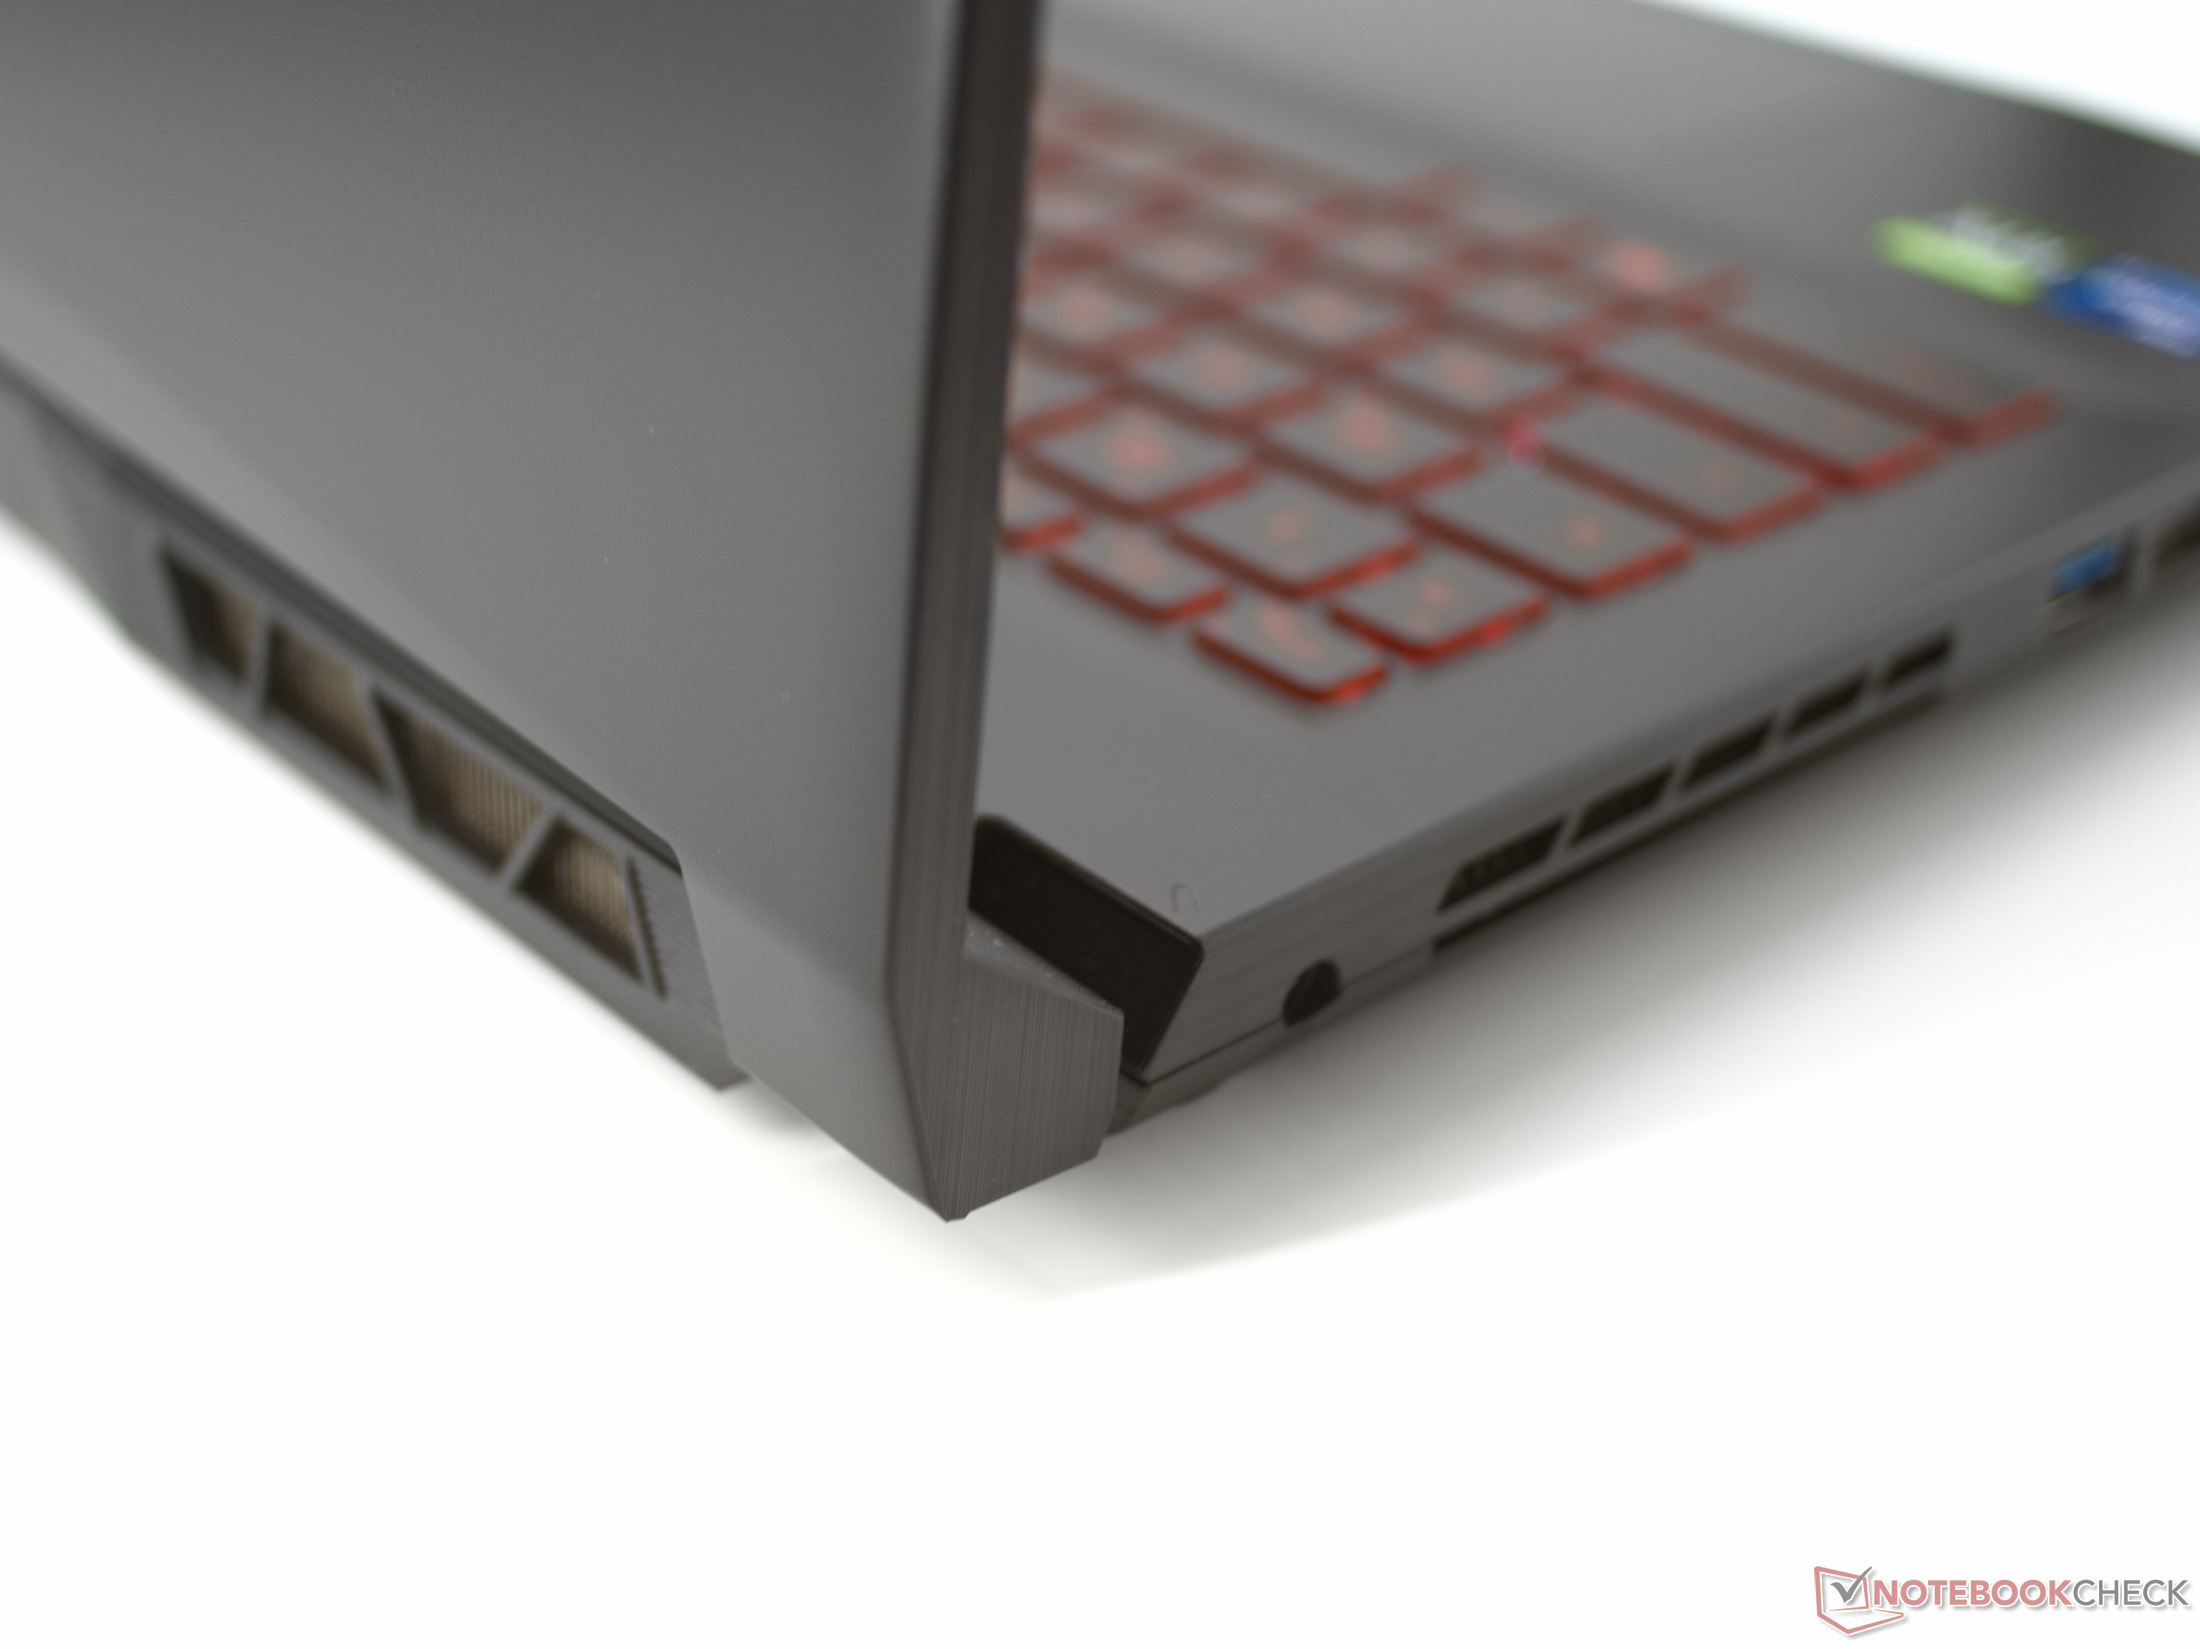
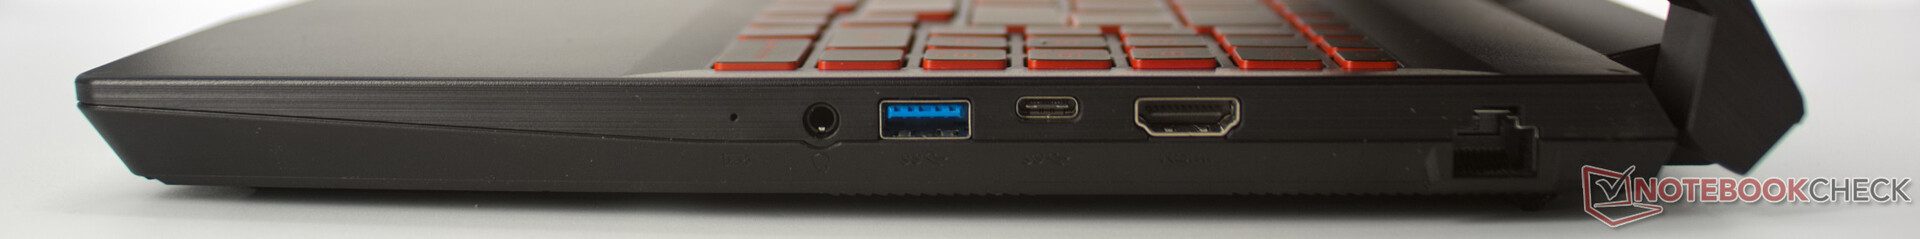
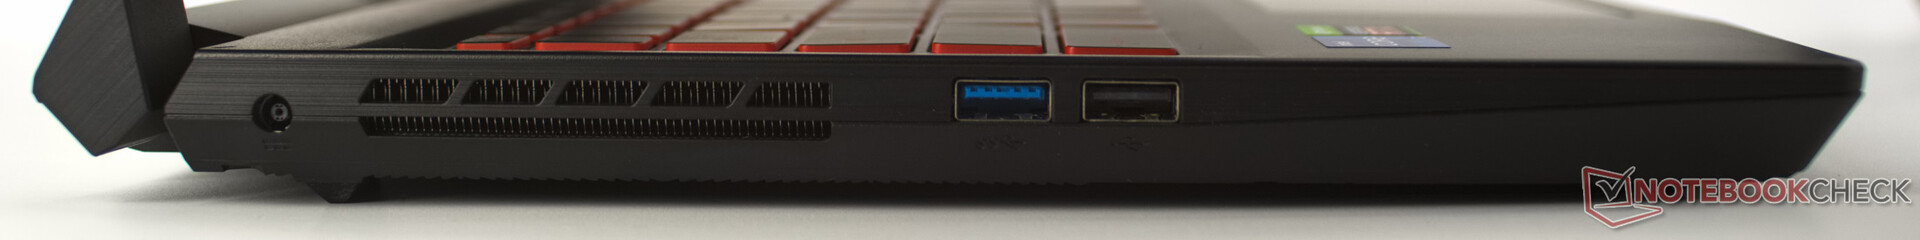
设备 - 没有Thunderbolt或DisplayPort,连接就不再是最新的了
KatanaGF66只有3个USB Type-A端口和一个USB Type-C端口,其连接方式相当有限,尤其是USB-C连接不提供任何Thunderbolt或PowerDelivery功能。这意味着,右侧的HDMI连接是连接外部显示器的唯一选择。在微星游戏笔记本中,你还必须做的是没有SD卡插槽。
此外,一些连接的位置也是令人遗憾的。由于有角度的电源插头,可能会发生暖风直接吹到电缆上的情况,而所有的USB连接都在机箱的中心。
沟通
在微星Katana GF66中,一个英特尔AX201适配器正在处理WLAN轴和蓝牙5.2。在天线的选择和位置方面,微星做得很好,所以使用WLAN卡的传输速率高于平均水平。
| Networking | |
| iperf3 transmit AX12 | |
| Schenker XMG Neo 15 Tiger Lake | |
| MSI Katana GF66 11UG-220 | |
| Gigabyte Aero 15 OLED XD | |
| Average Intel Wi-Fi 6 AX201 (49.8 - 1775, n=324) | |
| Razer Blade 15 Advanced (Mid 2021) | |
| Asus TUF Dash F15 FX516PR | |
| Lenovo Legion 5 Pro 16ACH6H (82JQ001PGE) | |
| iperf3 receive AX12 | |
| Schenker XMG Neo 15 Tiger Lake | |
| Razer Blade 15 Advanced (Mid 2021) | |
| MSI Katana GF66 11UG-220 | |
| Asus TUF Dash F15 FX516PR | |
| Average Intel Wi-Fi 6 AX201 (136 - 1743, n=324) | |
| Gigabyte Aero 15 OLED XD | |
| Lenovo Legion 5 Pro 16ACH6H (82JQ001PGE) | |
网络摄像头
720p的网络摄像头显示了当前笔记本电脑典型的糟糕图像质量。模糊的对比度和高色彩偏差也是这个镜头的特点。


安全问题
目前的英特尔处理器,如我们测试单元中的处理器,支持Windows 11的必要安全功能,如TPM 2.0和SecureBoot。微星没有在游戏笔记本中整合任何额外的安全功能。
辅料
笔记本电脑的盒子里只包括180瓦的电源和一小批写有一些重要信息的文件。
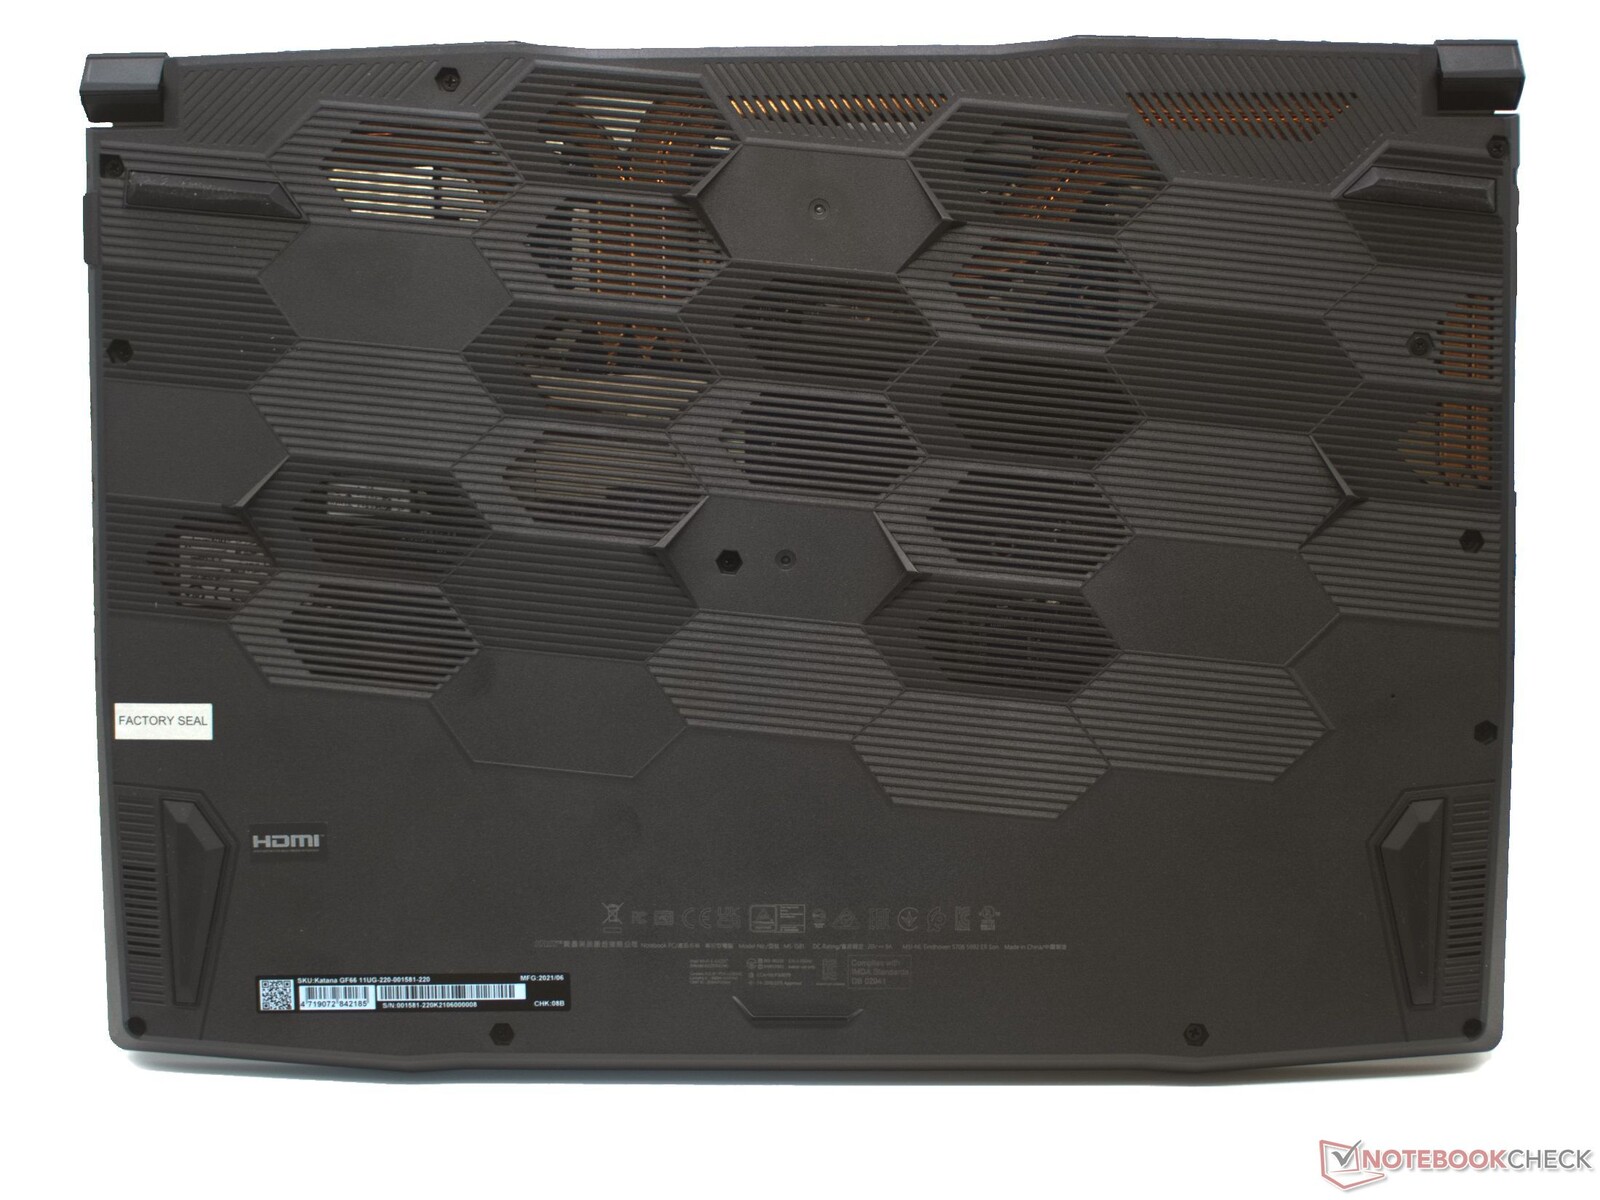
维护
原则上,微星Katana GF66可以相当容易地打开。有12颗PH1螺丝将底盖固定在底座上。卸下这些螺丝后,你可以用一个塑料撬具绕过盖子周围的缝隙,进入内部。然而,我们的测试装置借出的提供者要求我们不要破坏制造商的密封。但是,通过大的风扇通风口偷看,我们还是可以做出一些猜测。
工作内存和固态硬盘以及WLAN模块可以被替换,而且设备中还有一个额外存储模块的连接。大风扇应该也很容易清洗。
担保
微星为GF66提供了24个月的制造商保修。有缺陷的设备会在一个中心地点被取走和修理,然后也会从那里寄回给客户。
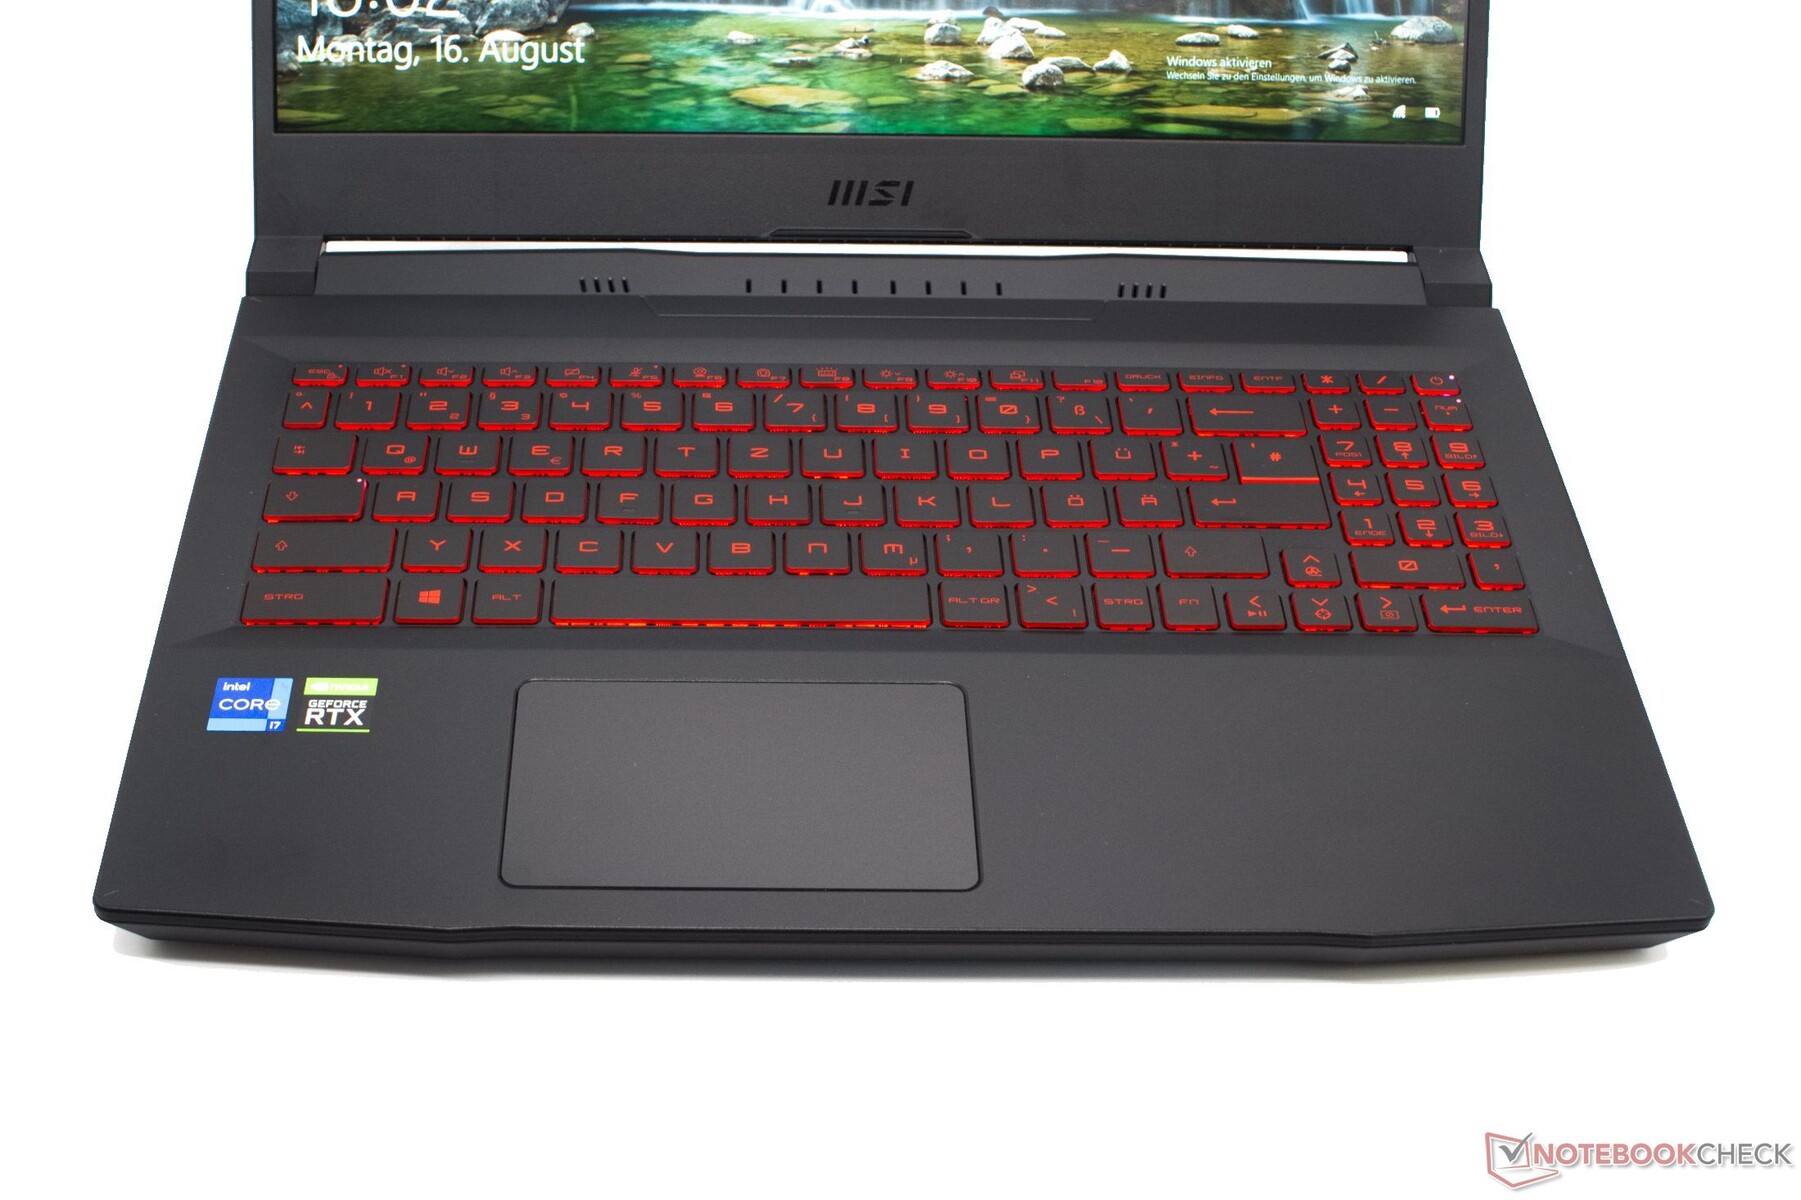
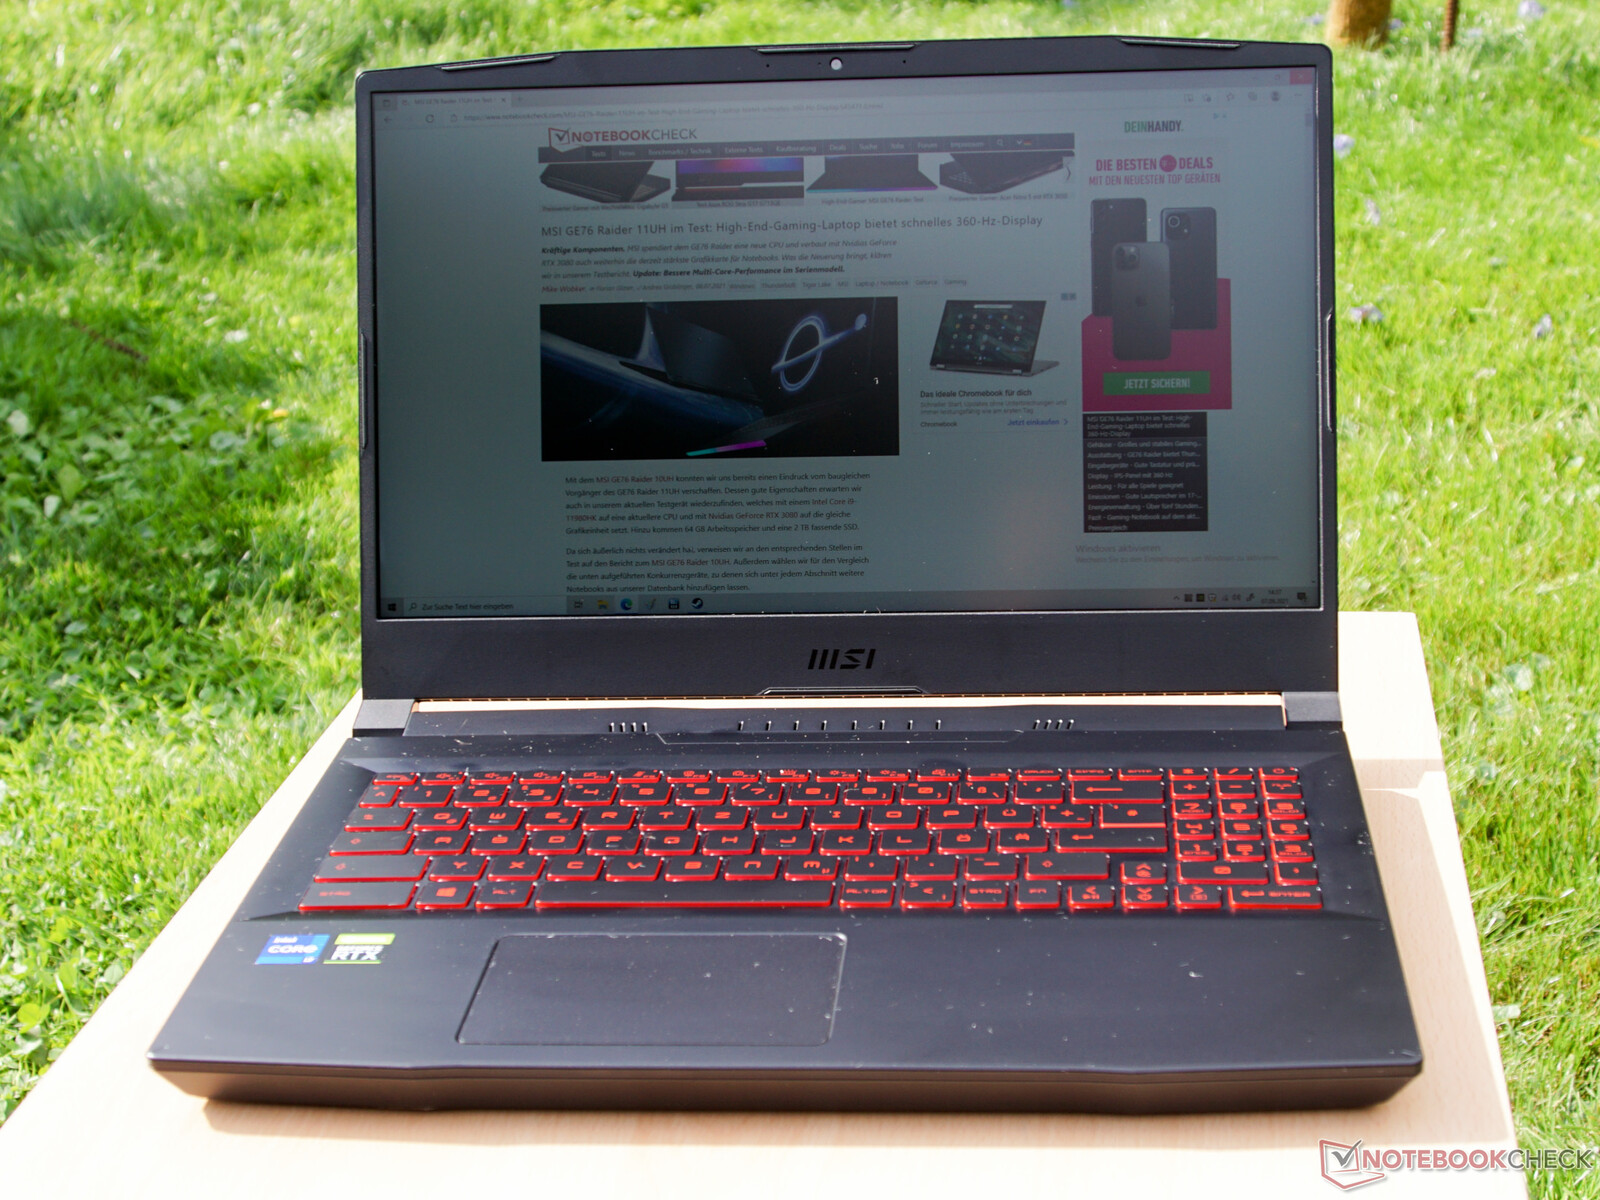
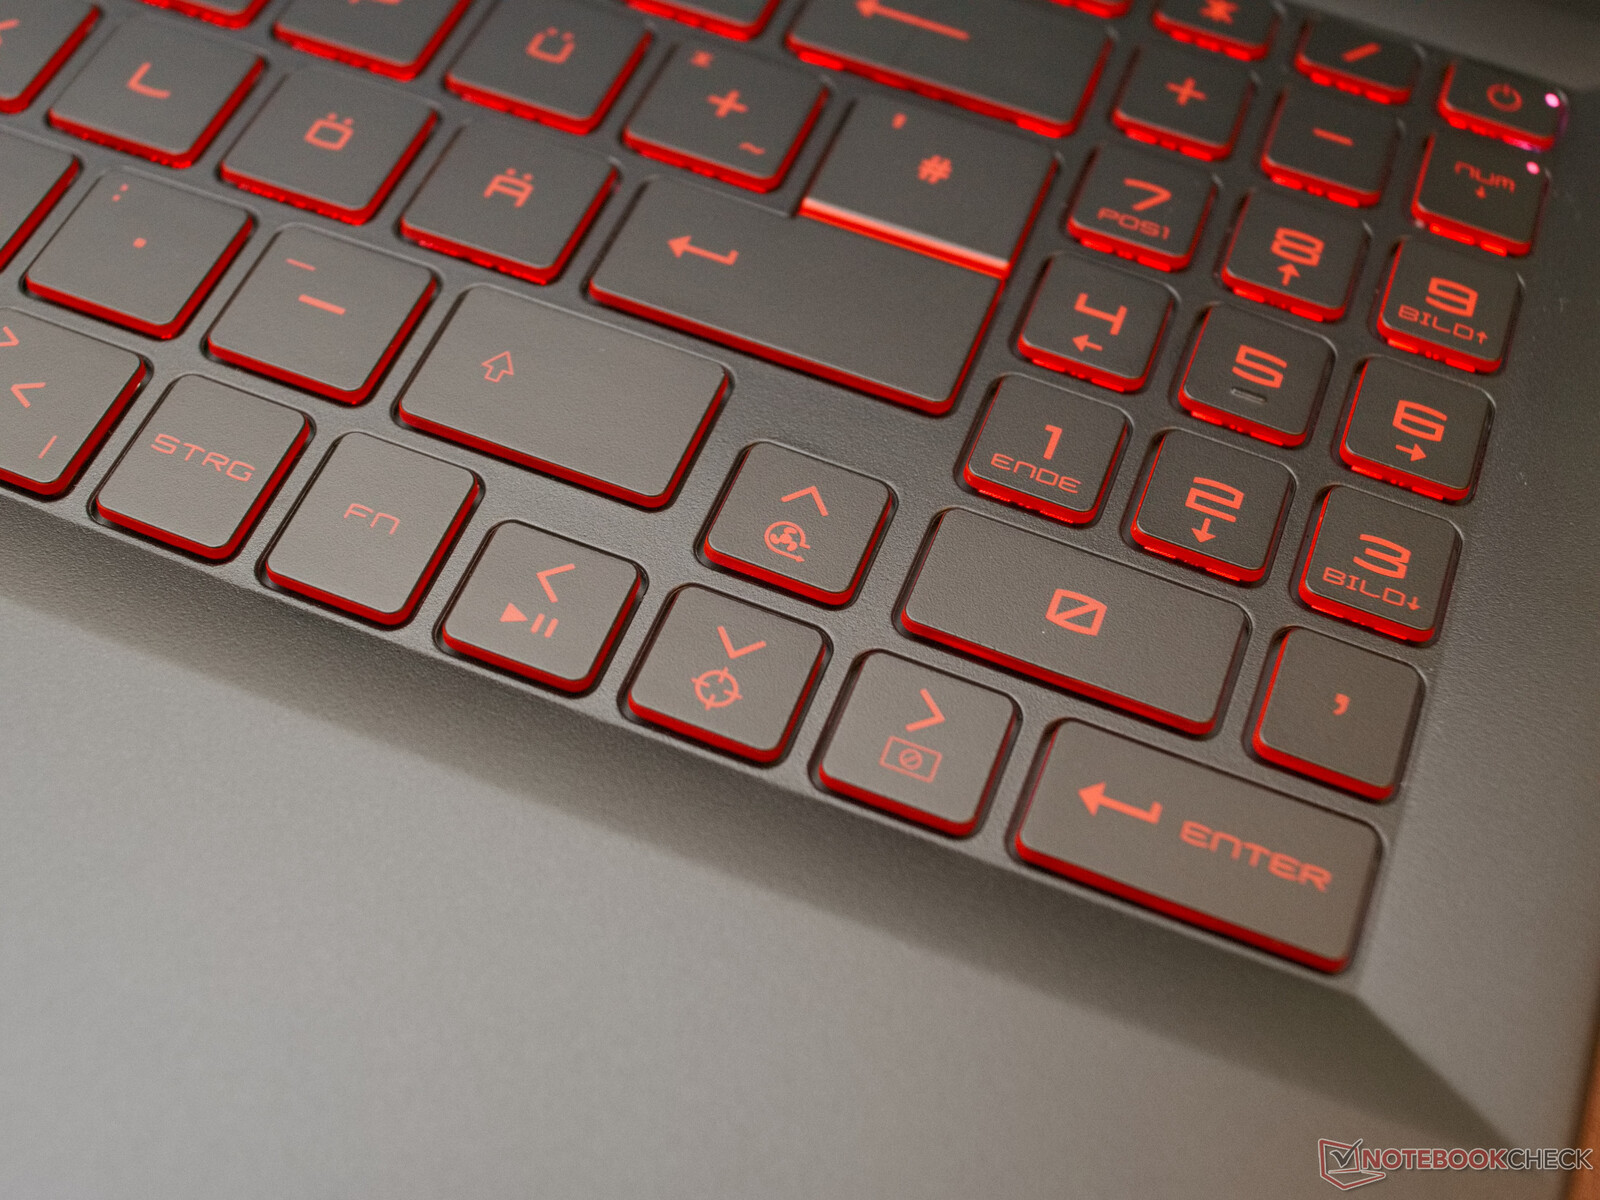
输入设备 - 一个红色的完整键盘
键盘
键盘采用红色照明,提供了一个完整的布局,包括一个数字块,尽管这个数字块原来略小。使用大键的打字体验感觉很舒服。对于一个笔记本键盘来说,按键提供了令人惊讶的高打字阻力,压力点明确。即使这个键盘也可以用一些强大的压力压下去,然而你必须使用相当大的力量才能做到这一点。这款键盘的一个小瑕疵是,光滑的表面会立即出现指纹。
红色背景照明可以分三步调整。无论调整到什么程度,红光都不会在眼睛里产生任何眩光。
不幸的是,在我们测试的时候,我们无法找到能够启用所有按键的功能键的驱动程序。与F5、F6和F7键的三个组合键没有提供任何功能。
触摸板
触摸板的尺寸为6.5厘米×10.5厘米(约2.6×4.1英寸),变成了相当小。另一方面,它的反应非常灵敏,在输入时没有显示任何弱点。
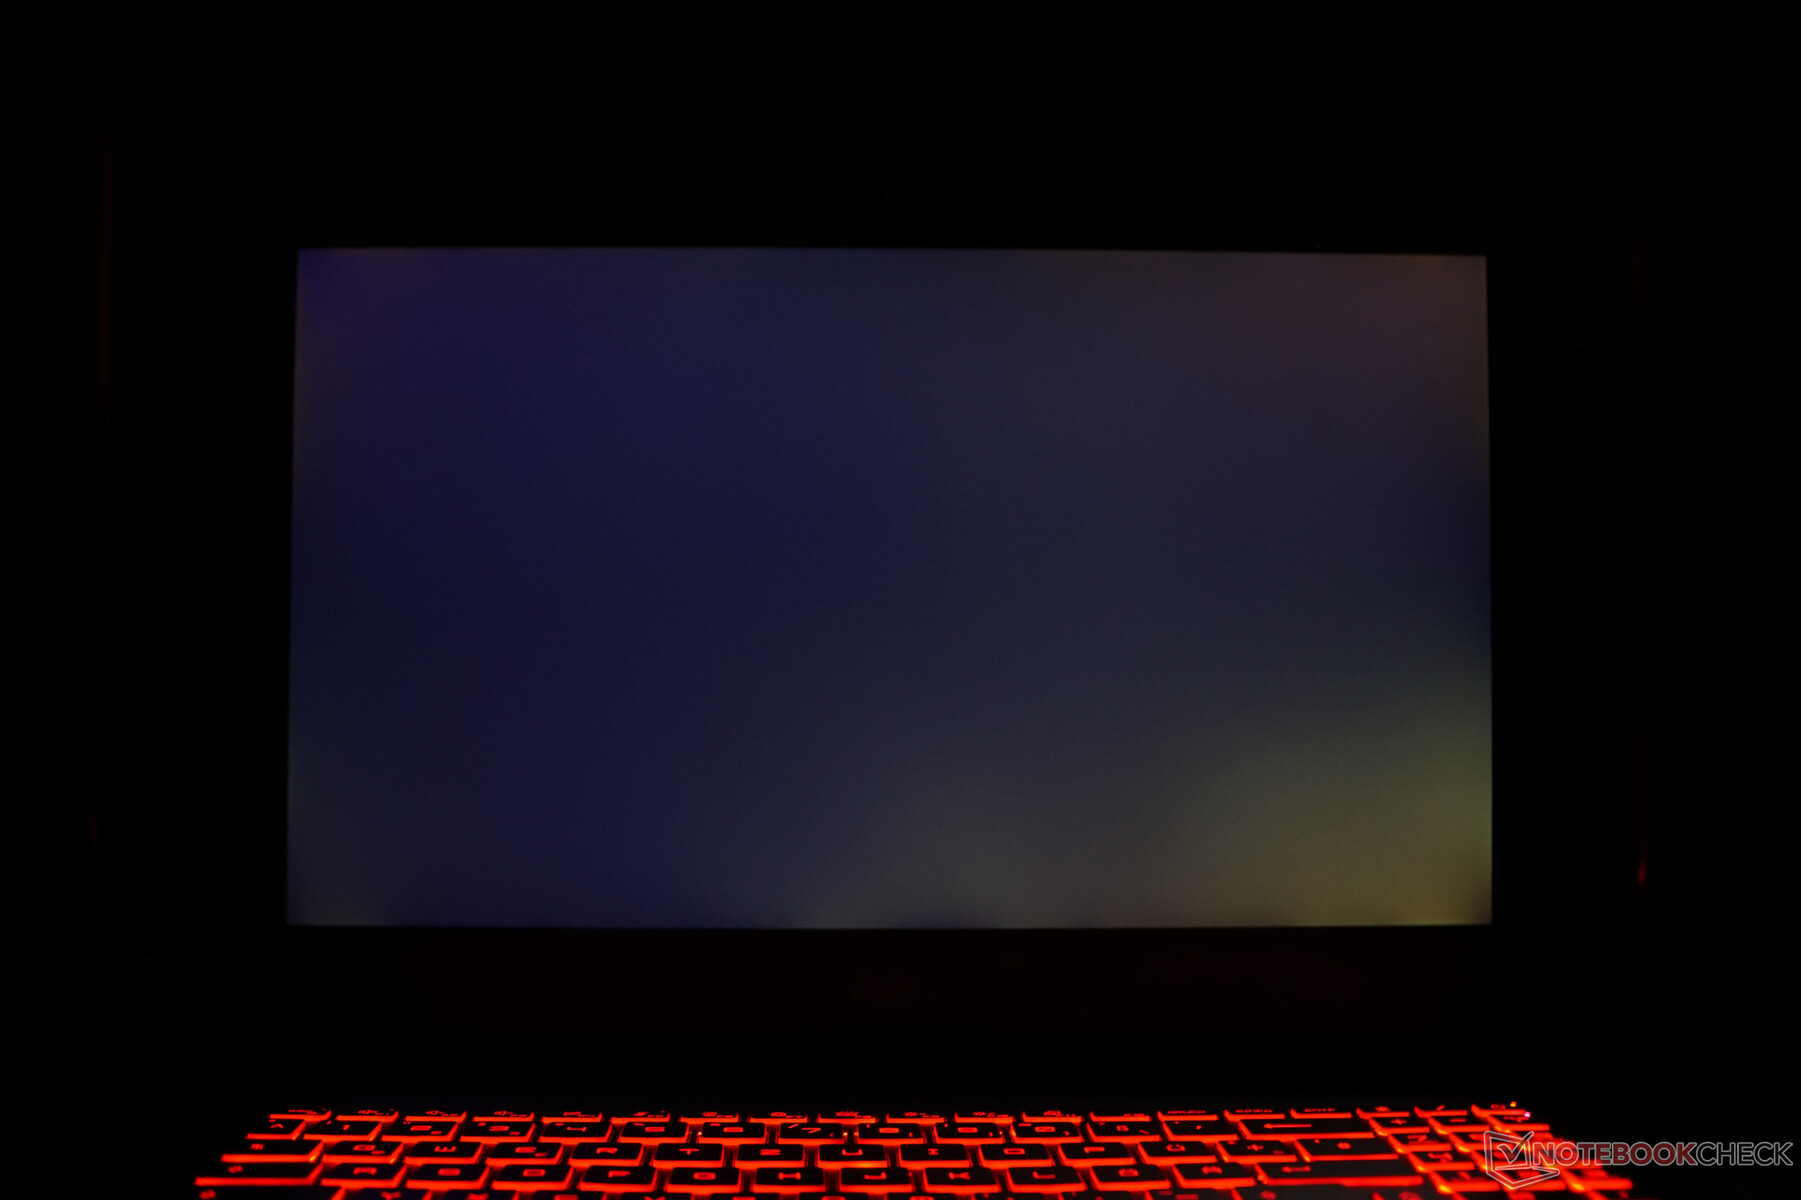
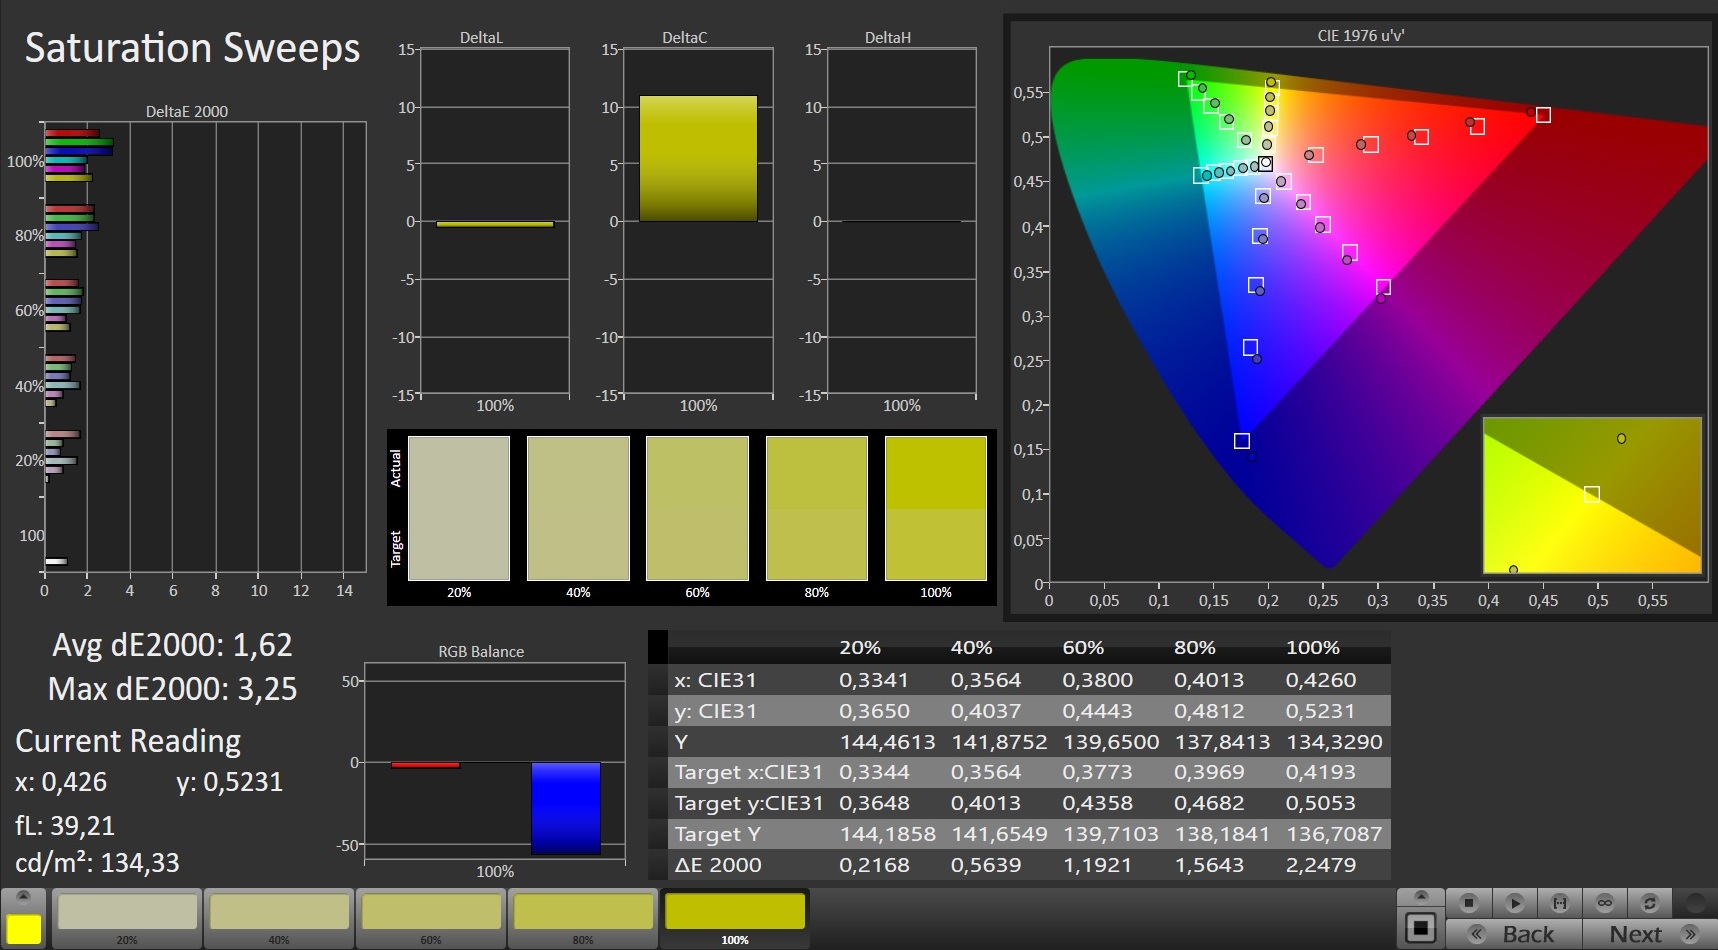
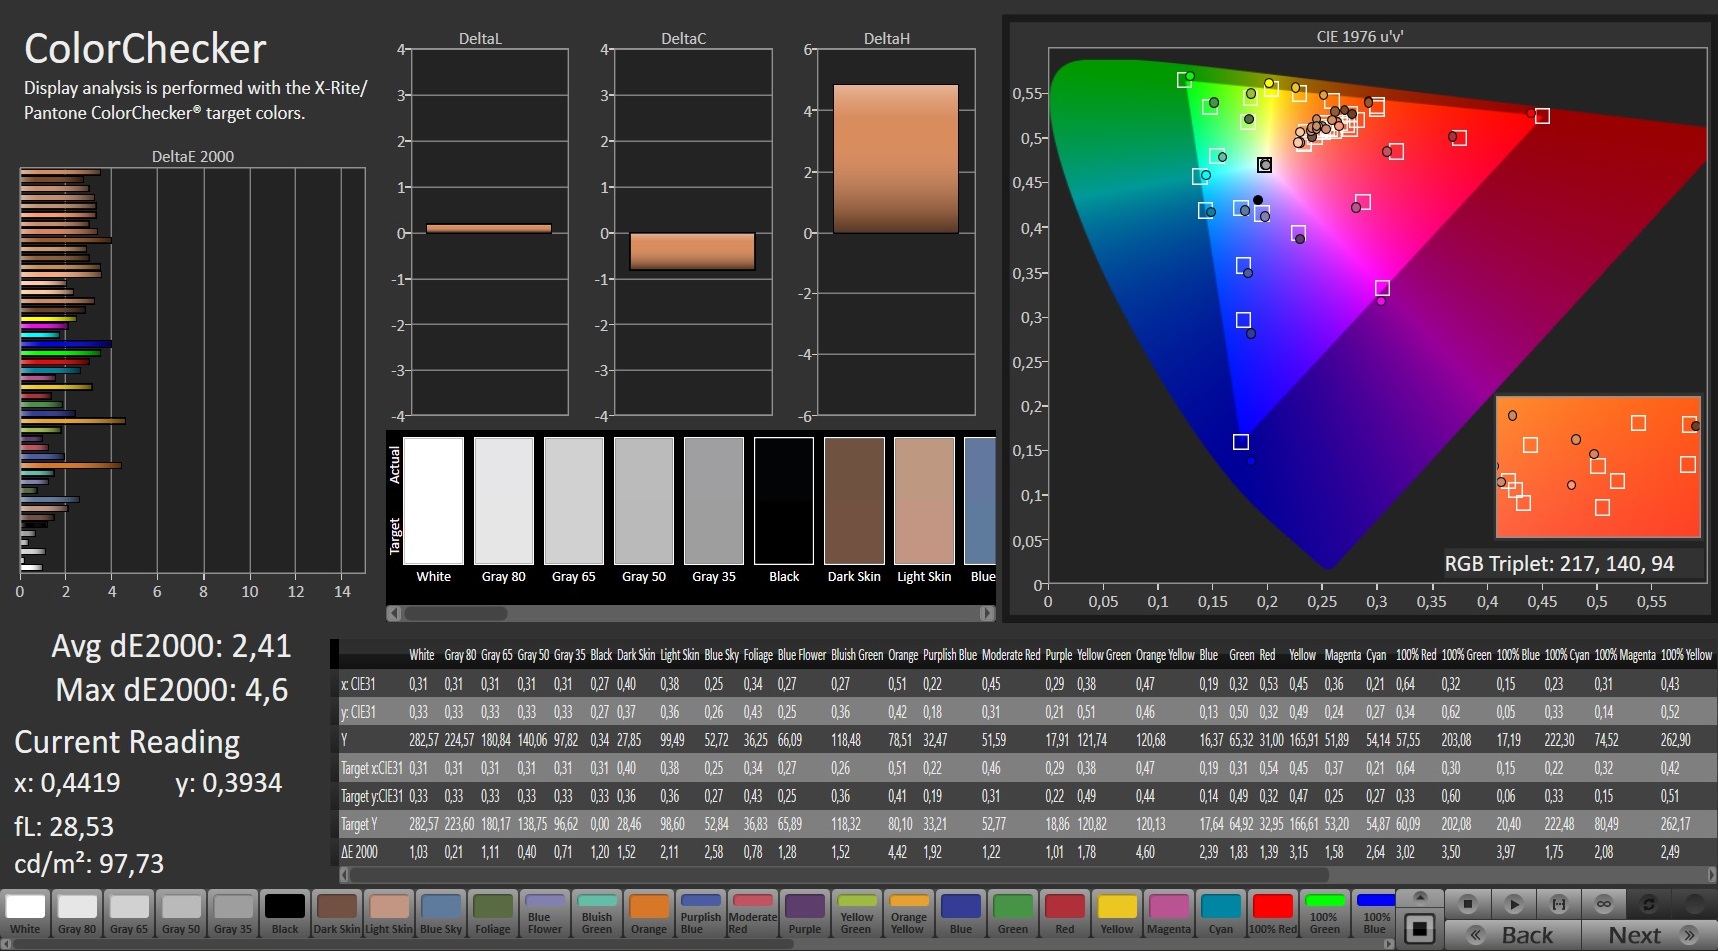
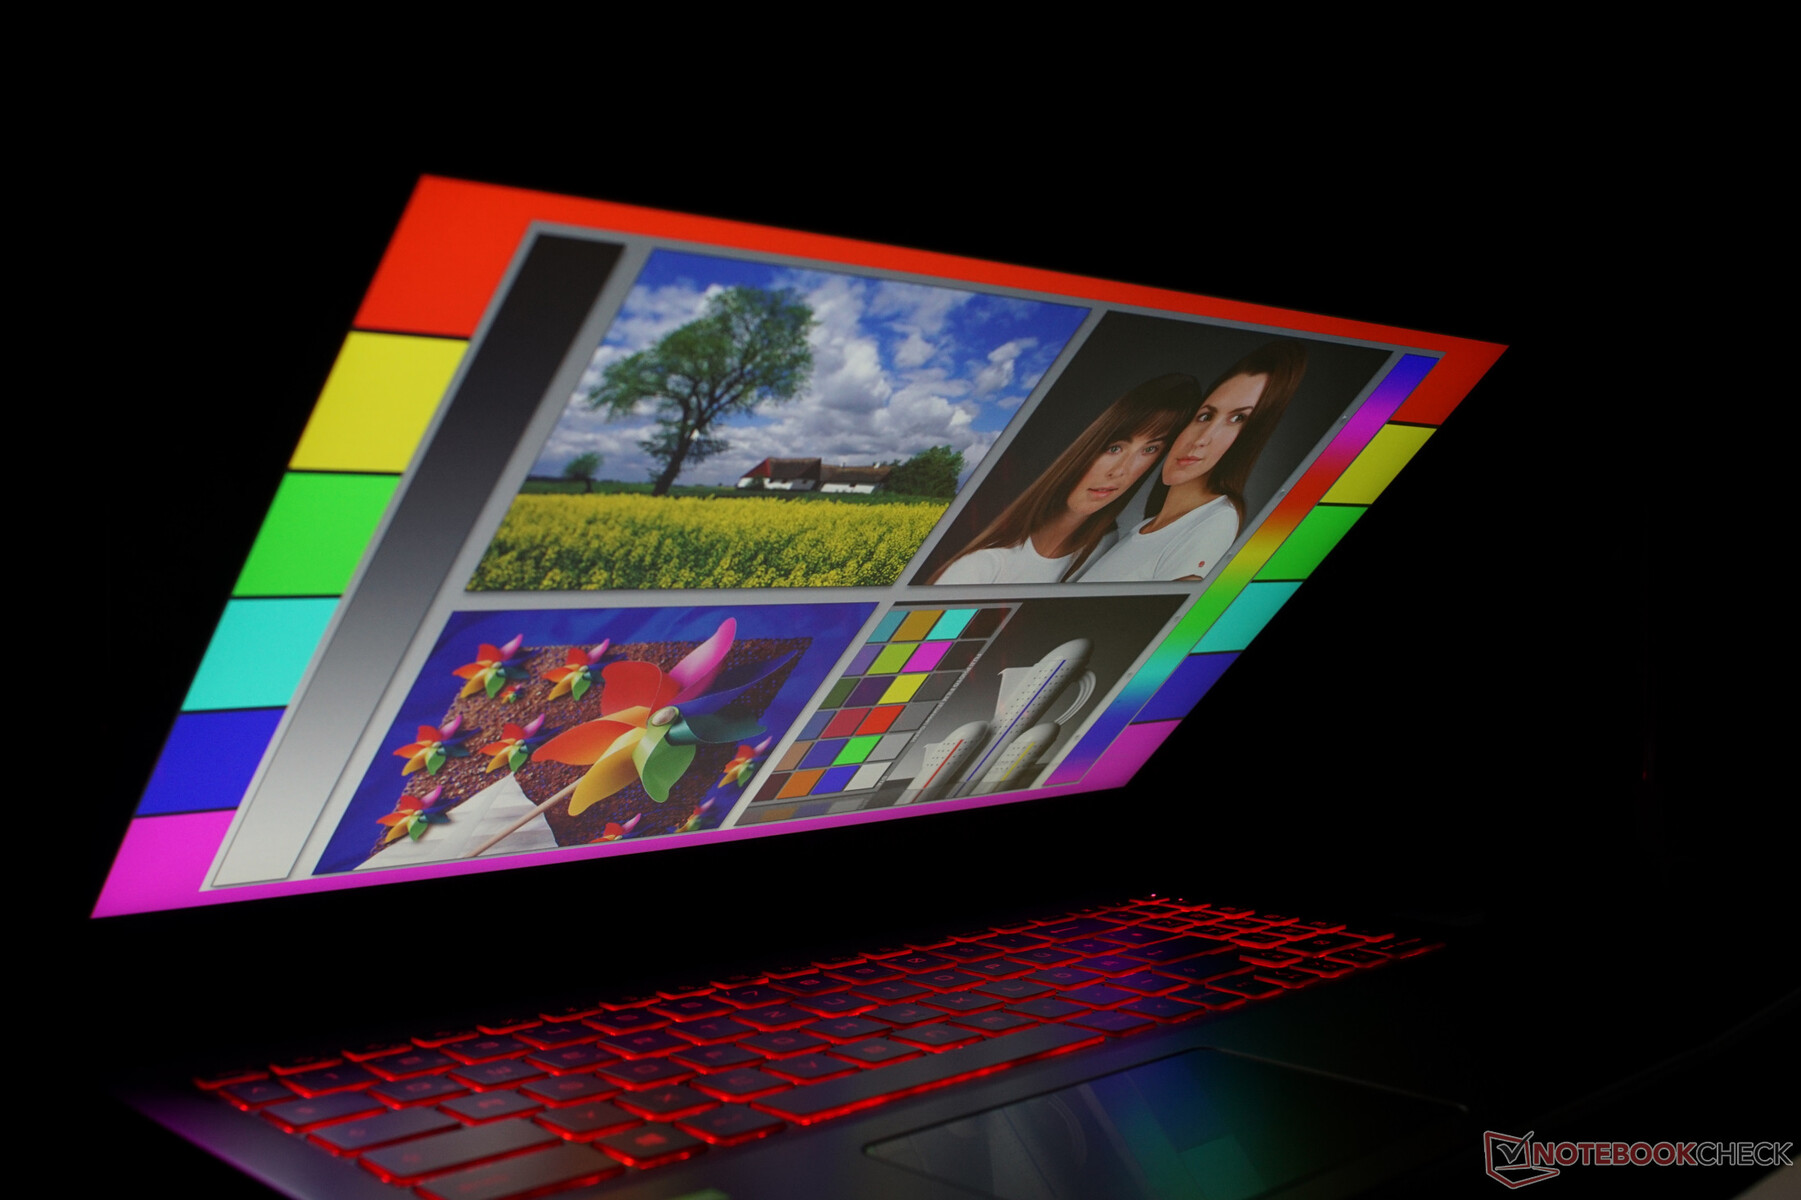
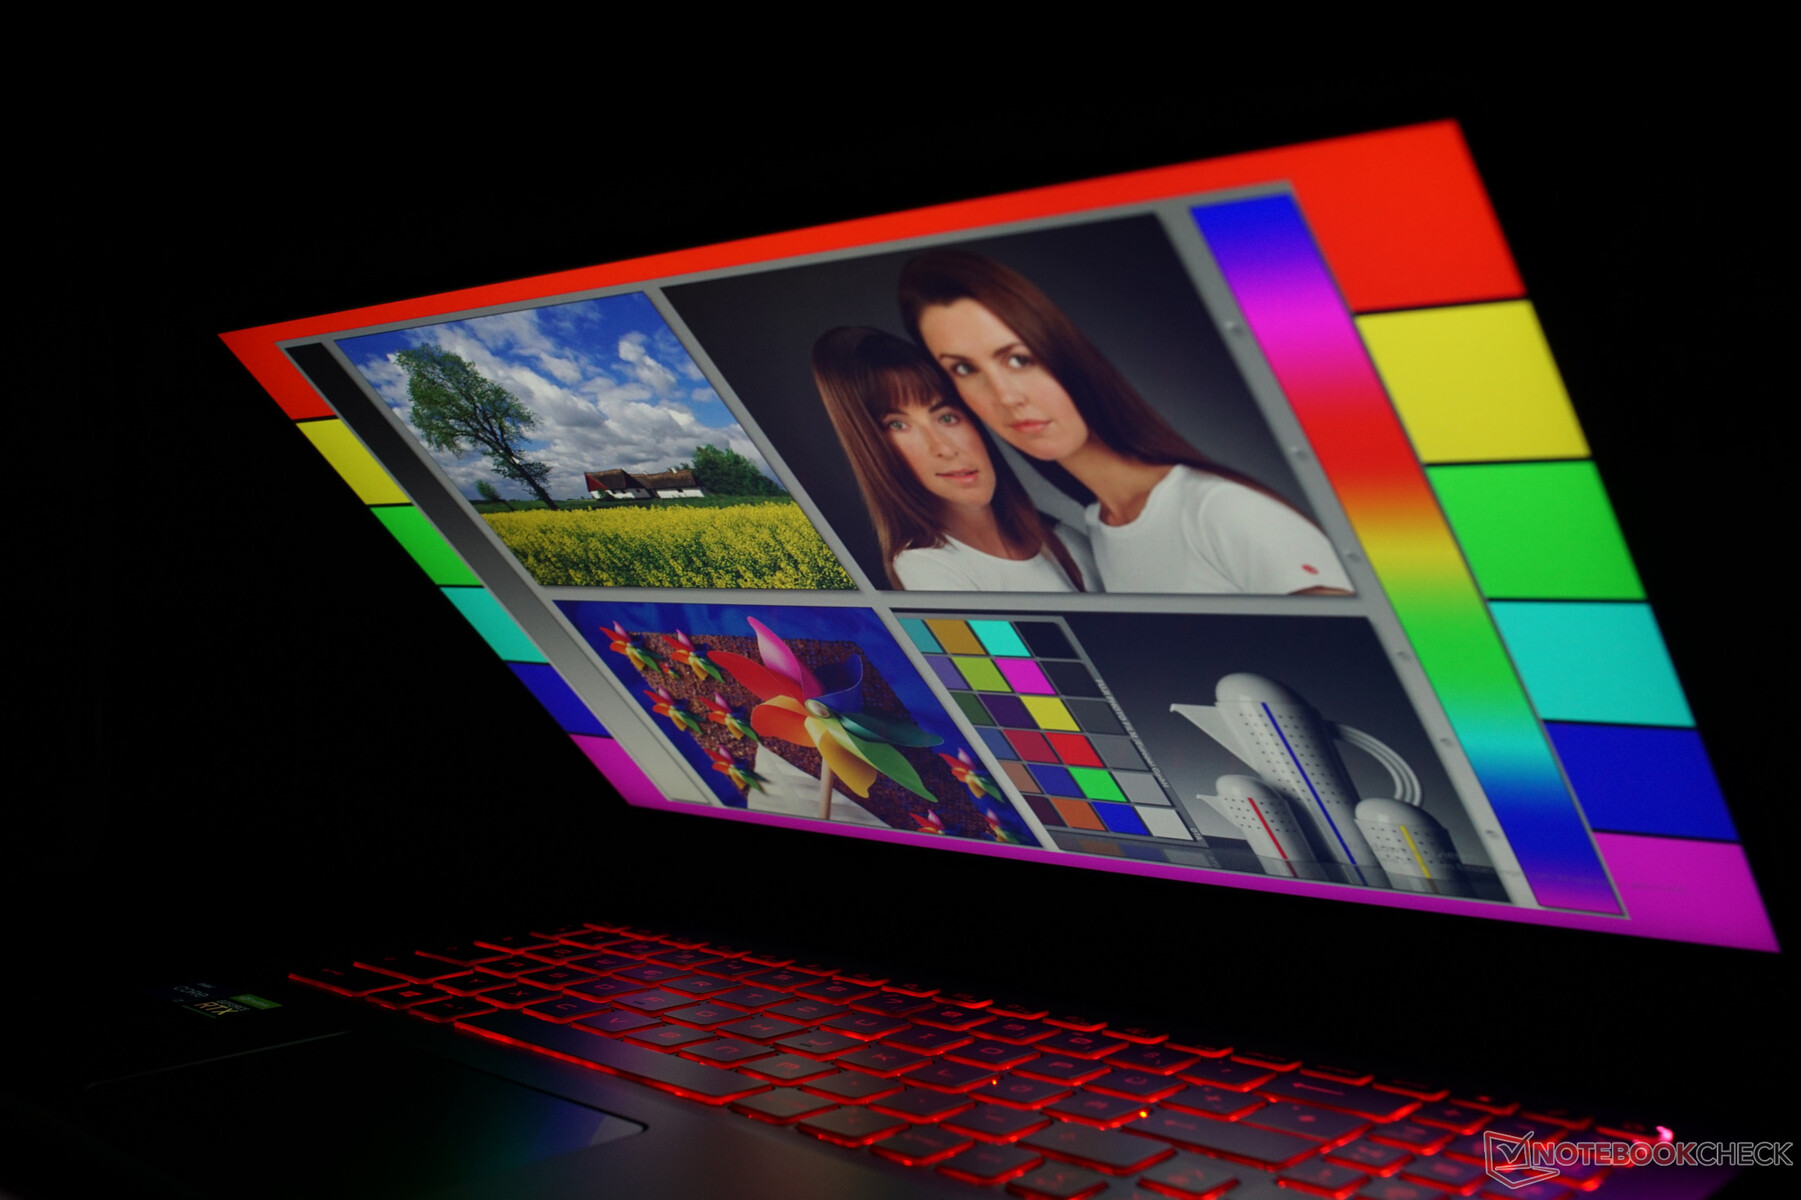
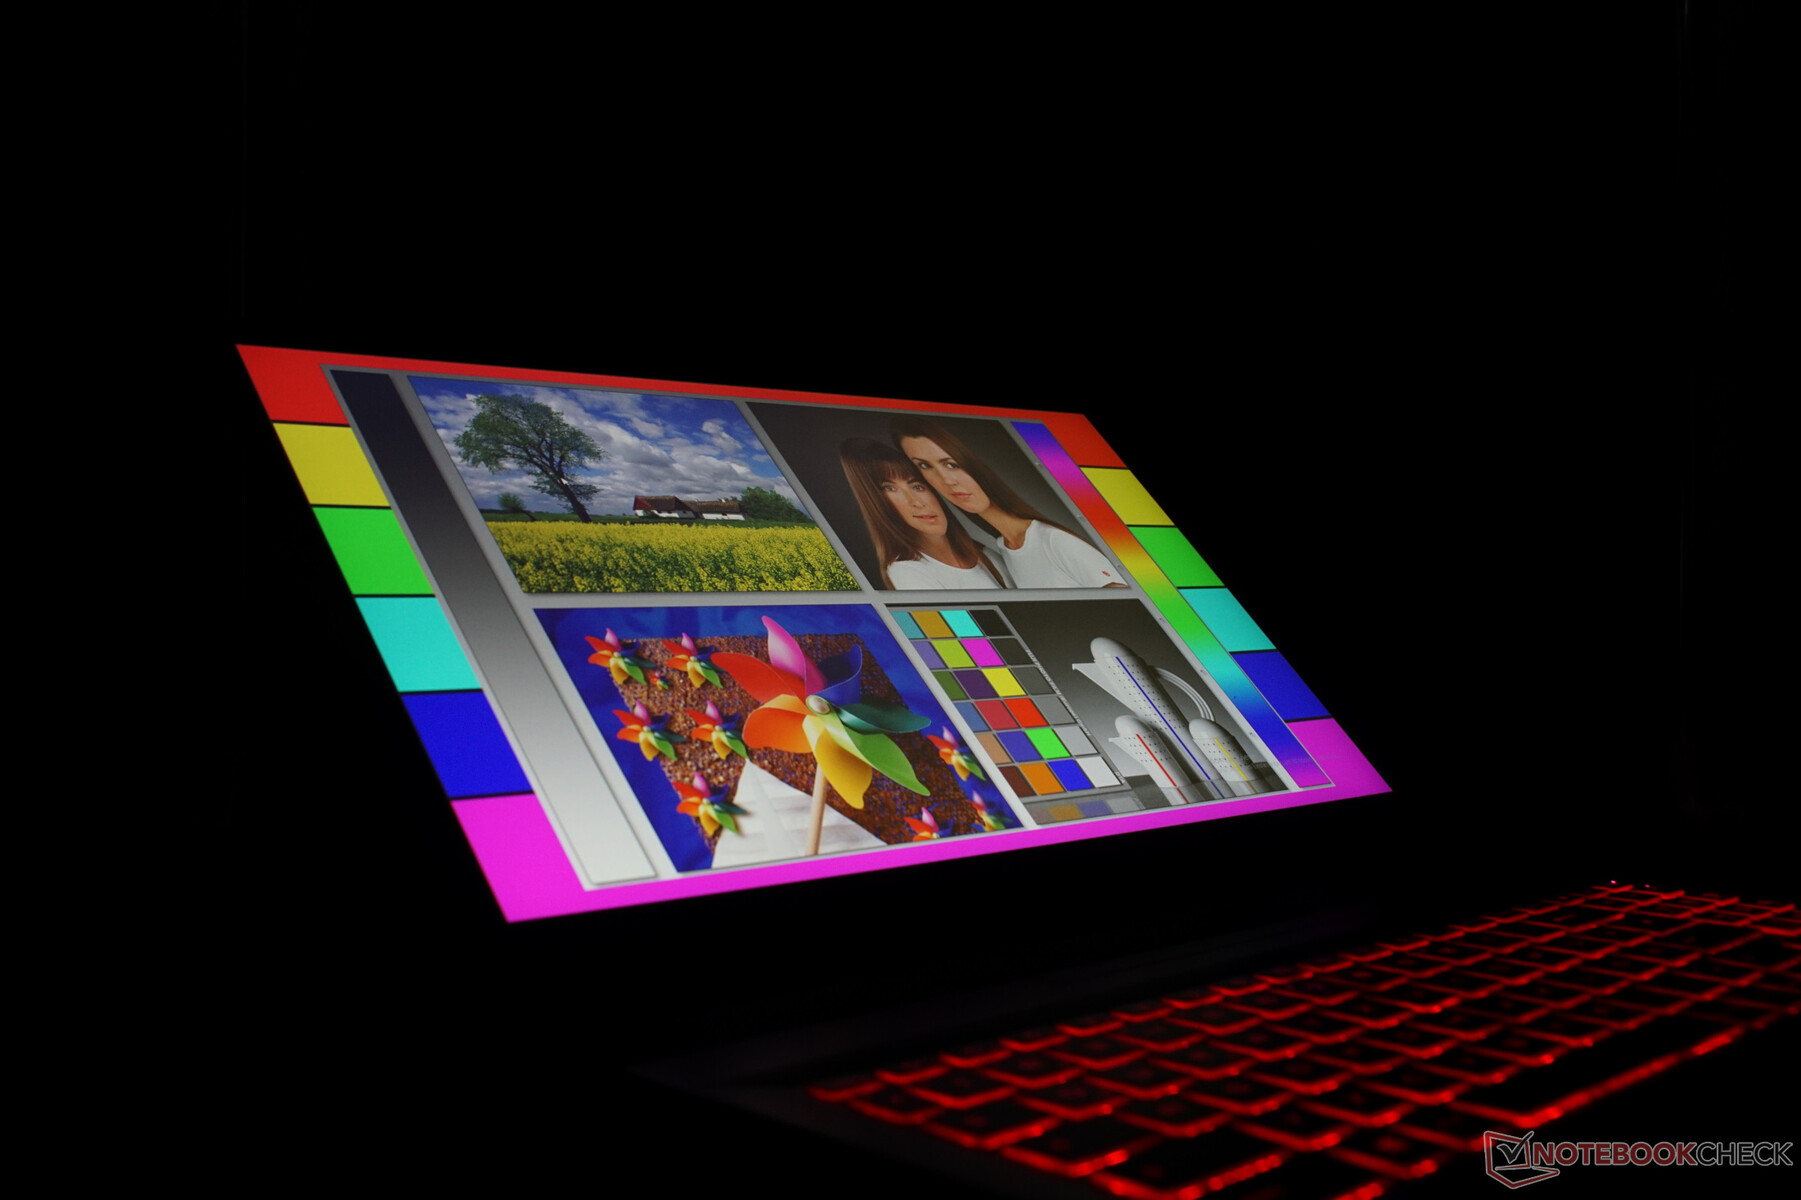
显示 - 144赫兹并不能确保良好的显示效果
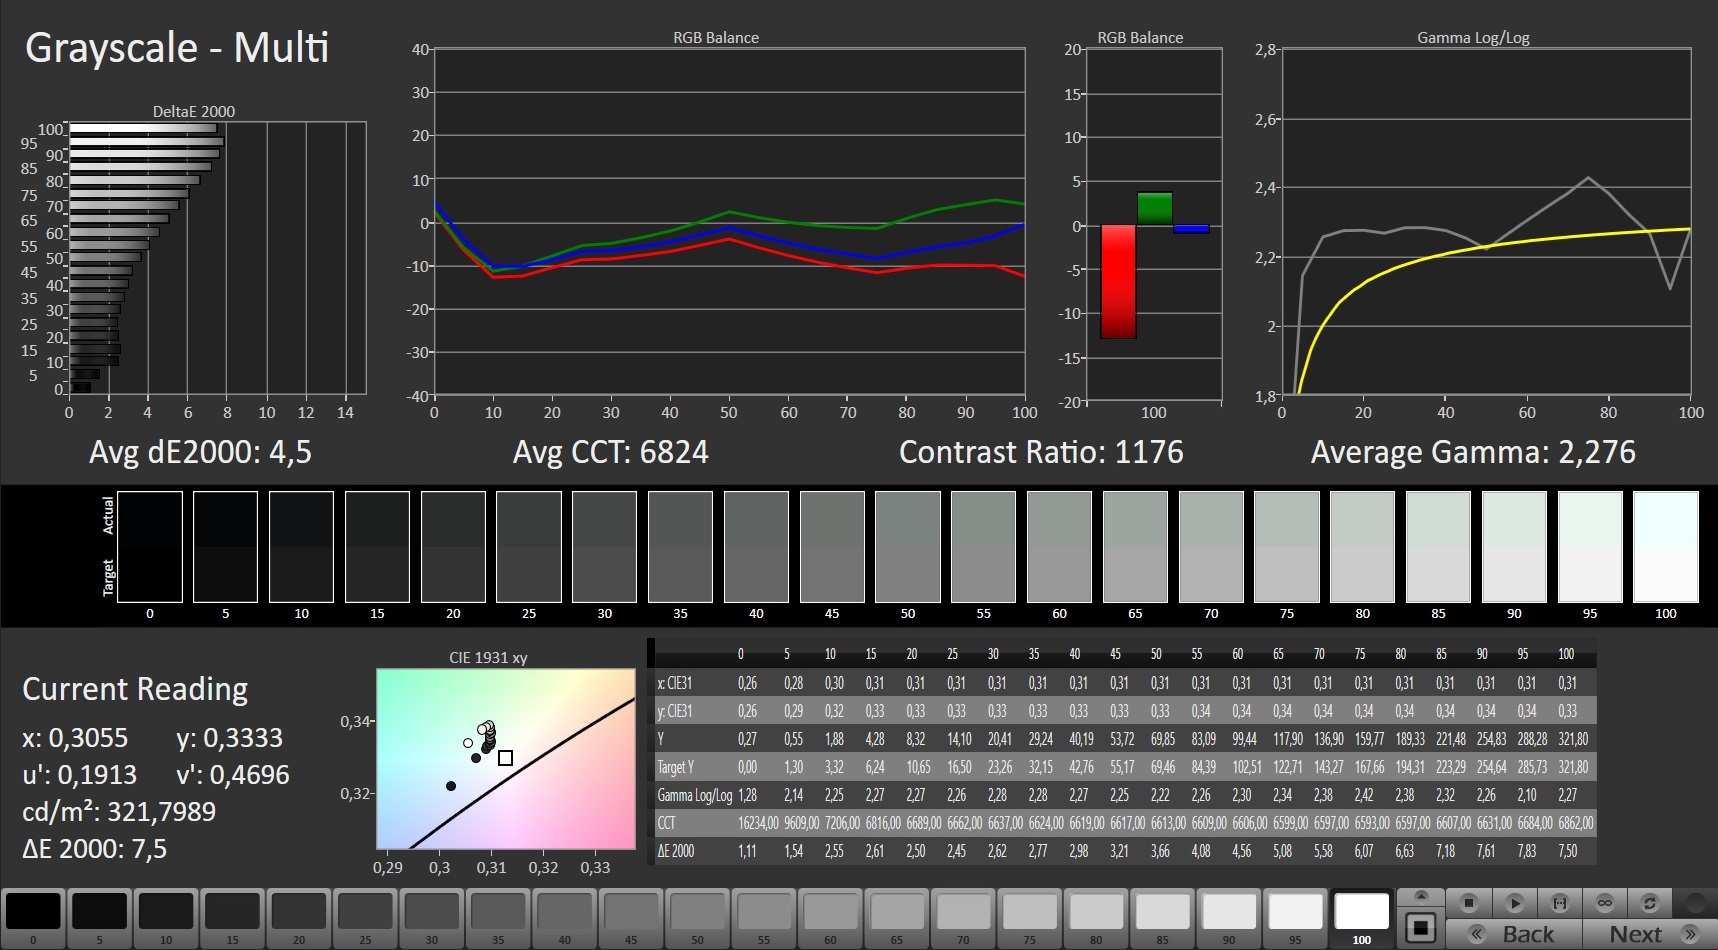
具有全高清分辨率的哑光144-Hz显示面板显示出相当好的响应时间。而在321cd/m²的情况下,显示屏也相当明亮。然而,在一些图像区域会形成较大的光晕,在一些黑暗的图像序列中也能明显感觉到。在我们的测试装置中,这些亮点集中在显示屏的右侧。
在使用的显示技术方面,微星指定为 "宽视角(IPS级)"。
| |||||||||||||||||||||||||
Brightness Distribution: 83 %
Center on Battery: 307 cd/m²
Contrast: 1137:1 (Black: 0.27 cd/m²)
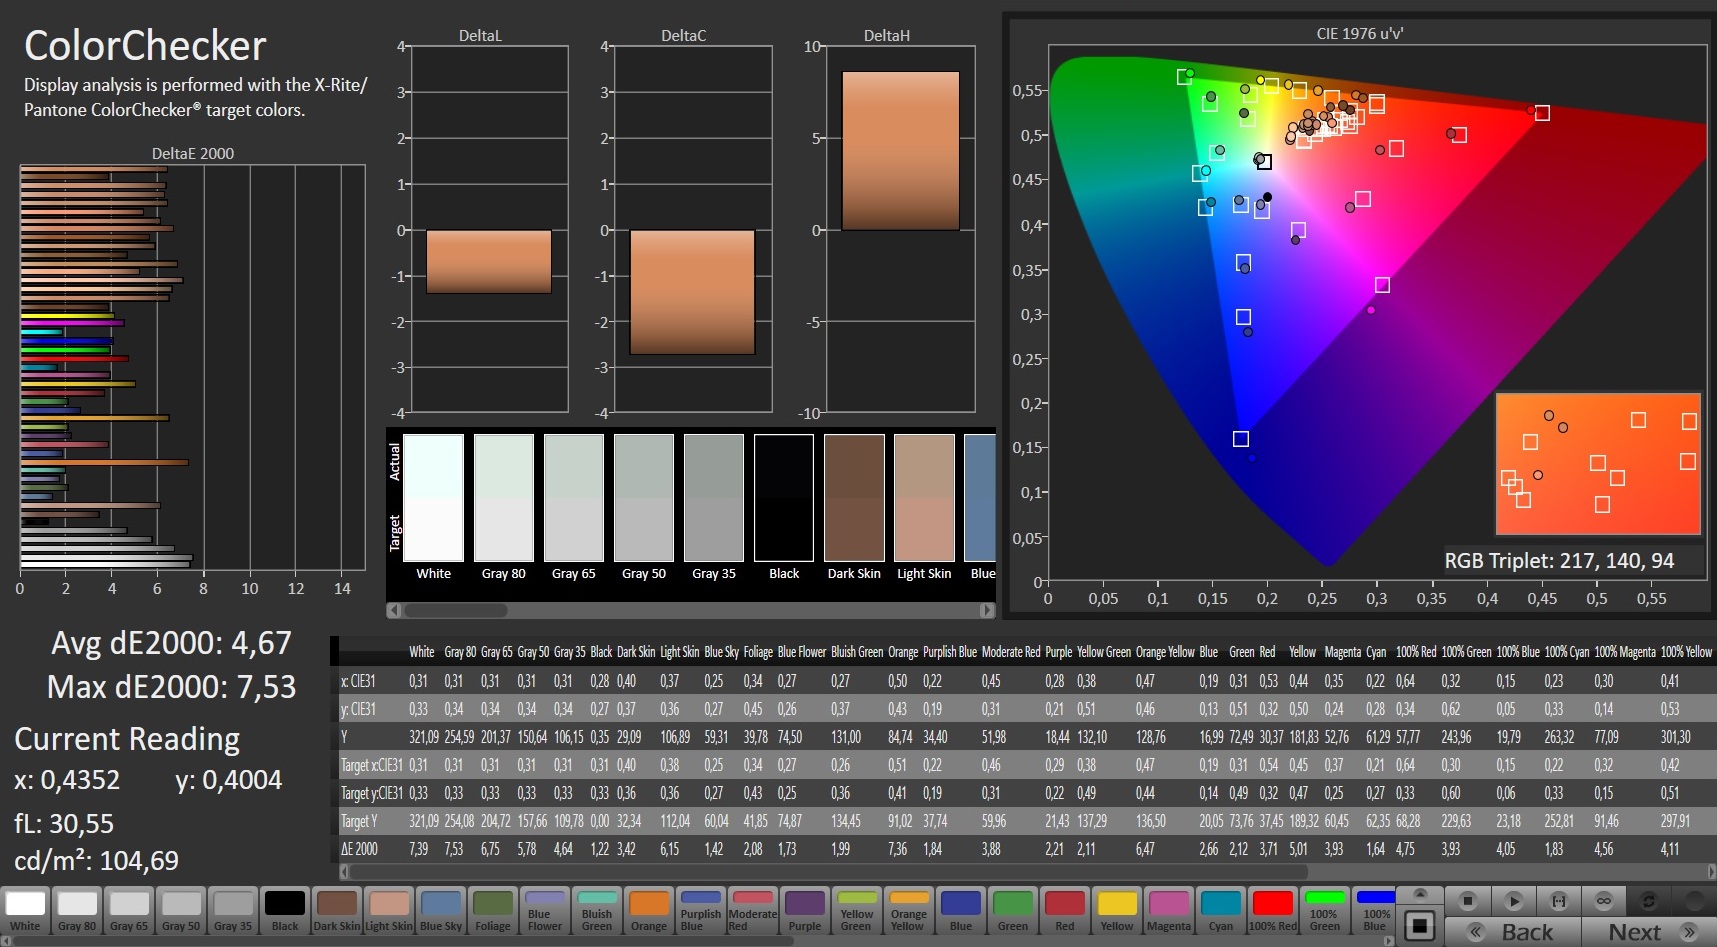
ΔE ColorChecker Calman: 4.67 | ∀{0.5-29.43 Ø4.72}
calibrated: 2.41
ΔE Greyscale Calman: 4.5 | ∀{0.09-98 Ø4.97}
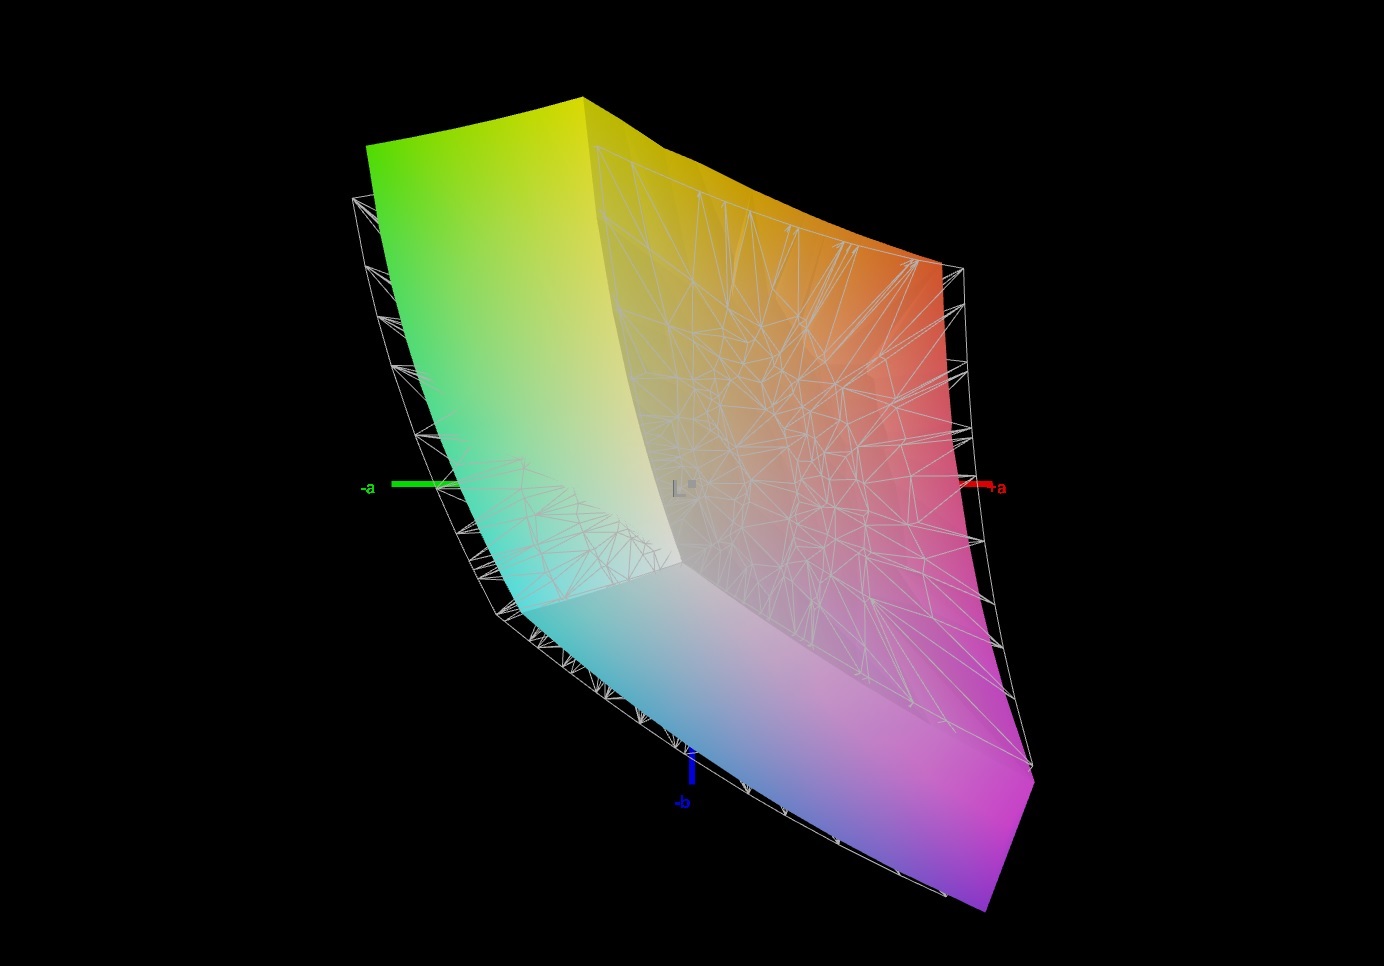
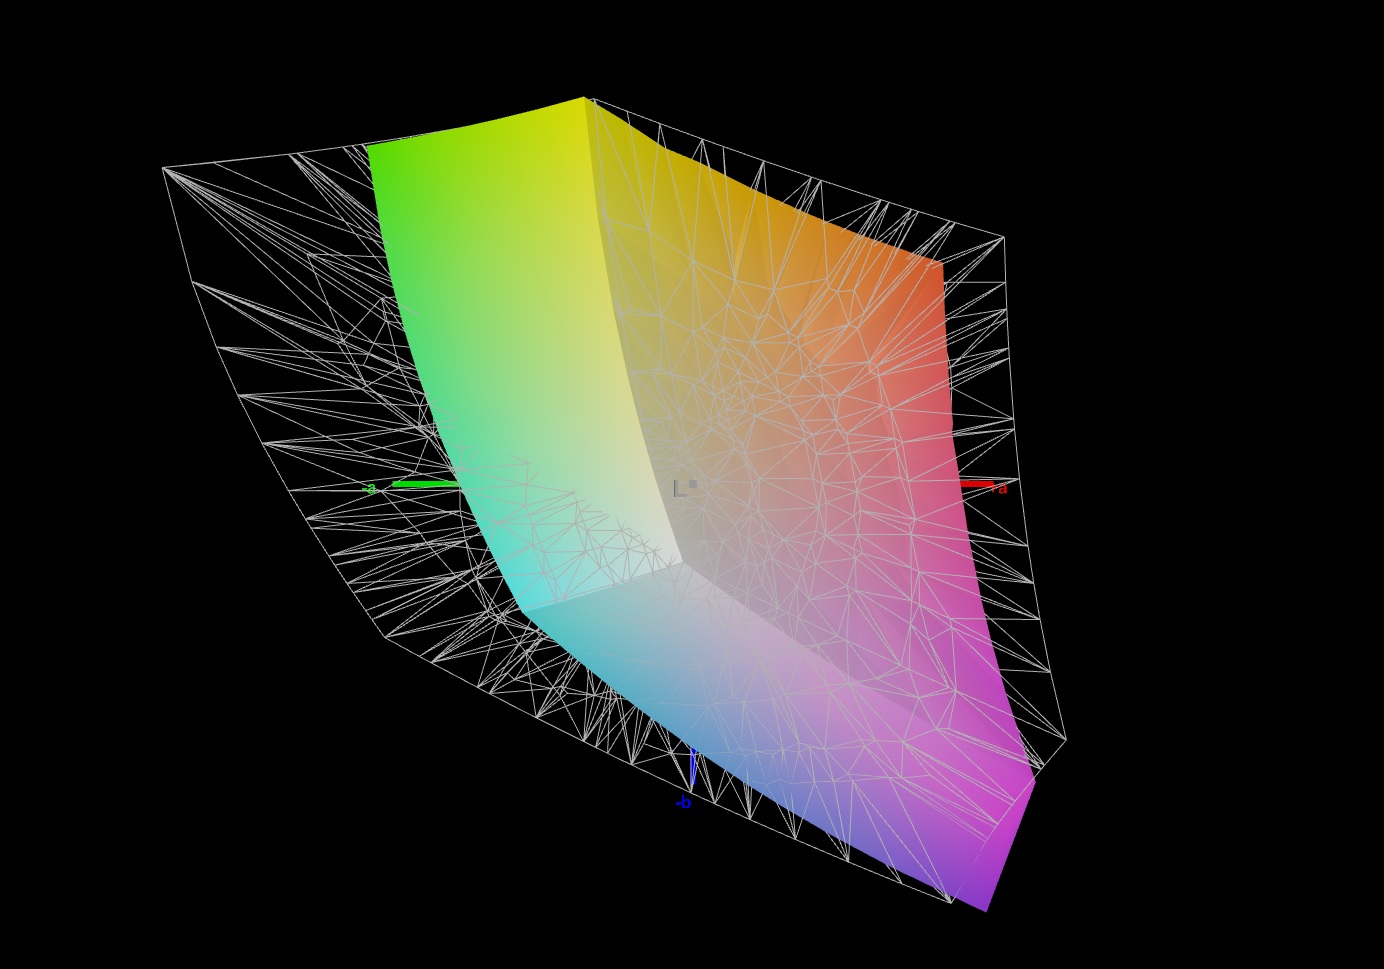
66.7% AdobeRGB 1998 (Argyll 3D)
91.3% sRGB (Argyll 3D)
65.4% Display P3 (Argyll 3D)
Gamma: 2.276
CCT: 6824 K
| MSI Katana GF66 11UG-220 AU Optronics B156HAN08.0, IPS, 1920x1080, 15.6" | Lenovo Legion 5 Pro 16ACH6H (82JQ001PGE) CSOT T3 MNG007DA1-1, IPS, 2560x1600, 16" | Gigabyte Aero 15 OLED XD Samsung SDC4143, OLED, 3840x2160, 15.6" | Asus TUF Dash F15 FX516PR LQ156M1JW26 (SHP1532), IPS, 1920x1080, 15.6" | Razer Blade 15 Advanced (Mid 2021) TL156VDXP02-0, IPS, 1920x1080, 15.6" | Schenker XMG Neo 15 Tiger Lake BOE CQ NE156QHM-NY2, IPS, 2560x1440, 15.6" | |
|---|---|---|---|---|---|---|
| Display | 9% | 37% | 4% | 4% | 6% | |
| Display P3 Coverage (%) | 65.4 | 99.9 53% | 66.9 2% | 66.9 2% | 68.6 5% | |
| sRGB Coverage (%) | 91.3 | 99 8% | 100 10% | 98.1 7% | 97.1 6% | 98.6 8% |
| AdobeRGB 1998 Coverage (%) | 66.7 | 73 9% | 99.5 49% | 67.9 2% | 69 3% | 69.3 4% |
| Response Times | 17% | 72% | -26% | 27% | -62% | |
| Response Time Grey 50% / Grey 80% * (ms) | 7.4 ? | 9.2 ? -24% | 2.8 ? 62% | 12 ? -62% | 4.2 ? 43% | 16 ? -116% |
| Response Time Black / White * (ms) | 11.2 ? | 4.8 57% | 2 ? 82% | 10 ? 11% | 10 ? 11% | 12 ? -7% |
| PWM Frequency (Hz) | 240 ? | 23580 ? | ||||
| Screen | 28% | 128% | 17% | 19% | 4% | |
| Brightness middle (cd/m²) | 307 | 551 79% | 440 43% | 286 -7% | 353.4 15% | 324 6% |
| Brightness (cd/m²) | 321 | 523 63% | 446 39% | 275 -14% | 340 6% | 307 -4% |
| Brightness Distribution (%) | 83 | 88 6% | 92 11% | 91 10% | 92 11% | 91 10% |
| Black Level * (cd/m²) | 0.27 | 0.54 -100% | 0.04 85% | 0.25 7% | 0.31 -15% | 0.27 -0% |
| Contrast (:1) | 1137 | 1020 -10% | 11000 867% | 1144 1% | 1140 0% | 1200 6% |
| Colorchecker dE 2000 * | 4.67 | 1.8 61% | 2.53 46% | 2.43 48% | 2.17 54% | 3.36 28% |
| Colorchecker dE 2000 max. * | 7.53 | 2.53 66% | 7.82 -4% | 6.33 16% | 5.69 24% | 9.87 -31% |
| Colorchecker dE 2000 calibrated * | 2.41 | 1.66 31% | 2.57 -7% | 0.83 66% | 1.05 56% | 1.23 49% |
| Greyscale dE 2000 * | 4.5 | 1.85 59% | 1.2 73% | 3.5 22% | 3.4 24% | 5.8 -29% |
| Gamma | 2.276 97% | 2.3 96% | 2.206 100% | 2.32 95% | 2.2 100% | 2.311 95% |
| CCT | 6824 95% | 6338 103% | 6371 102% | 7145 91% | 6830 95% | 7087 92% |
| Color Space (Percent of AdobeRGB 1998) (%) | 72.81 | 68 | 69 | |||
| Color Space (Percent of sRGB) (%) | 99.41 | 91 | 93 | |||
| Total Average (Program / Settings) | 18% /
23% | 79% /
101% | -2% /
8% | 17% /
17% | -17% /
-5% |
* ... smaller is better
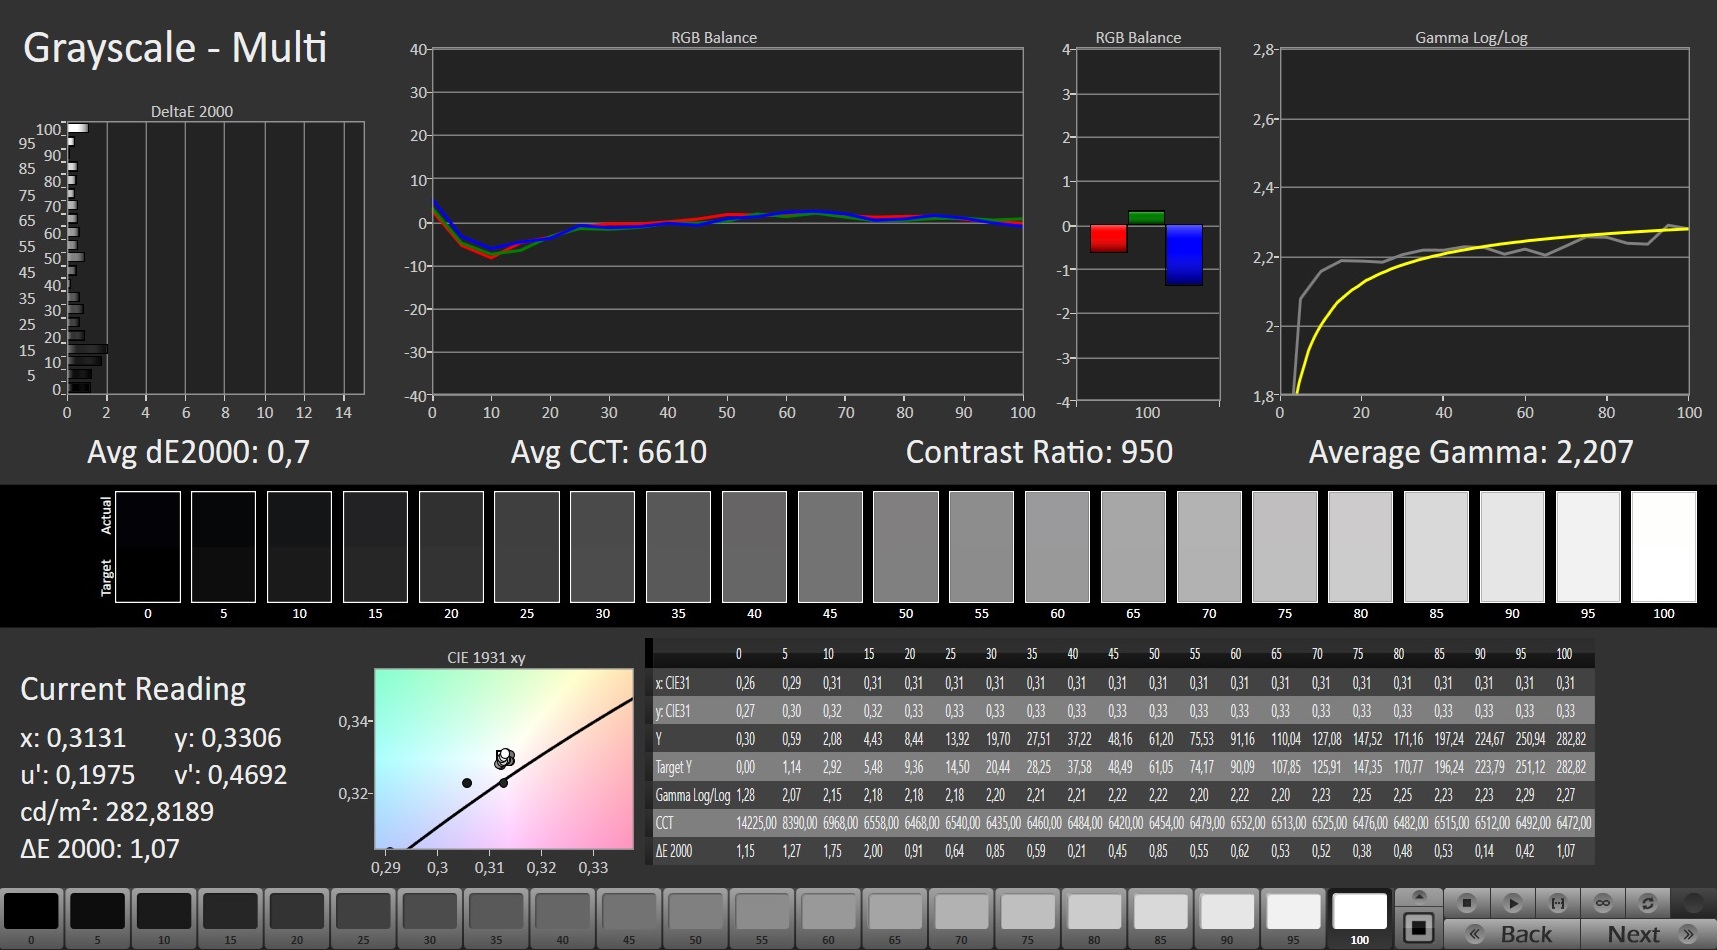
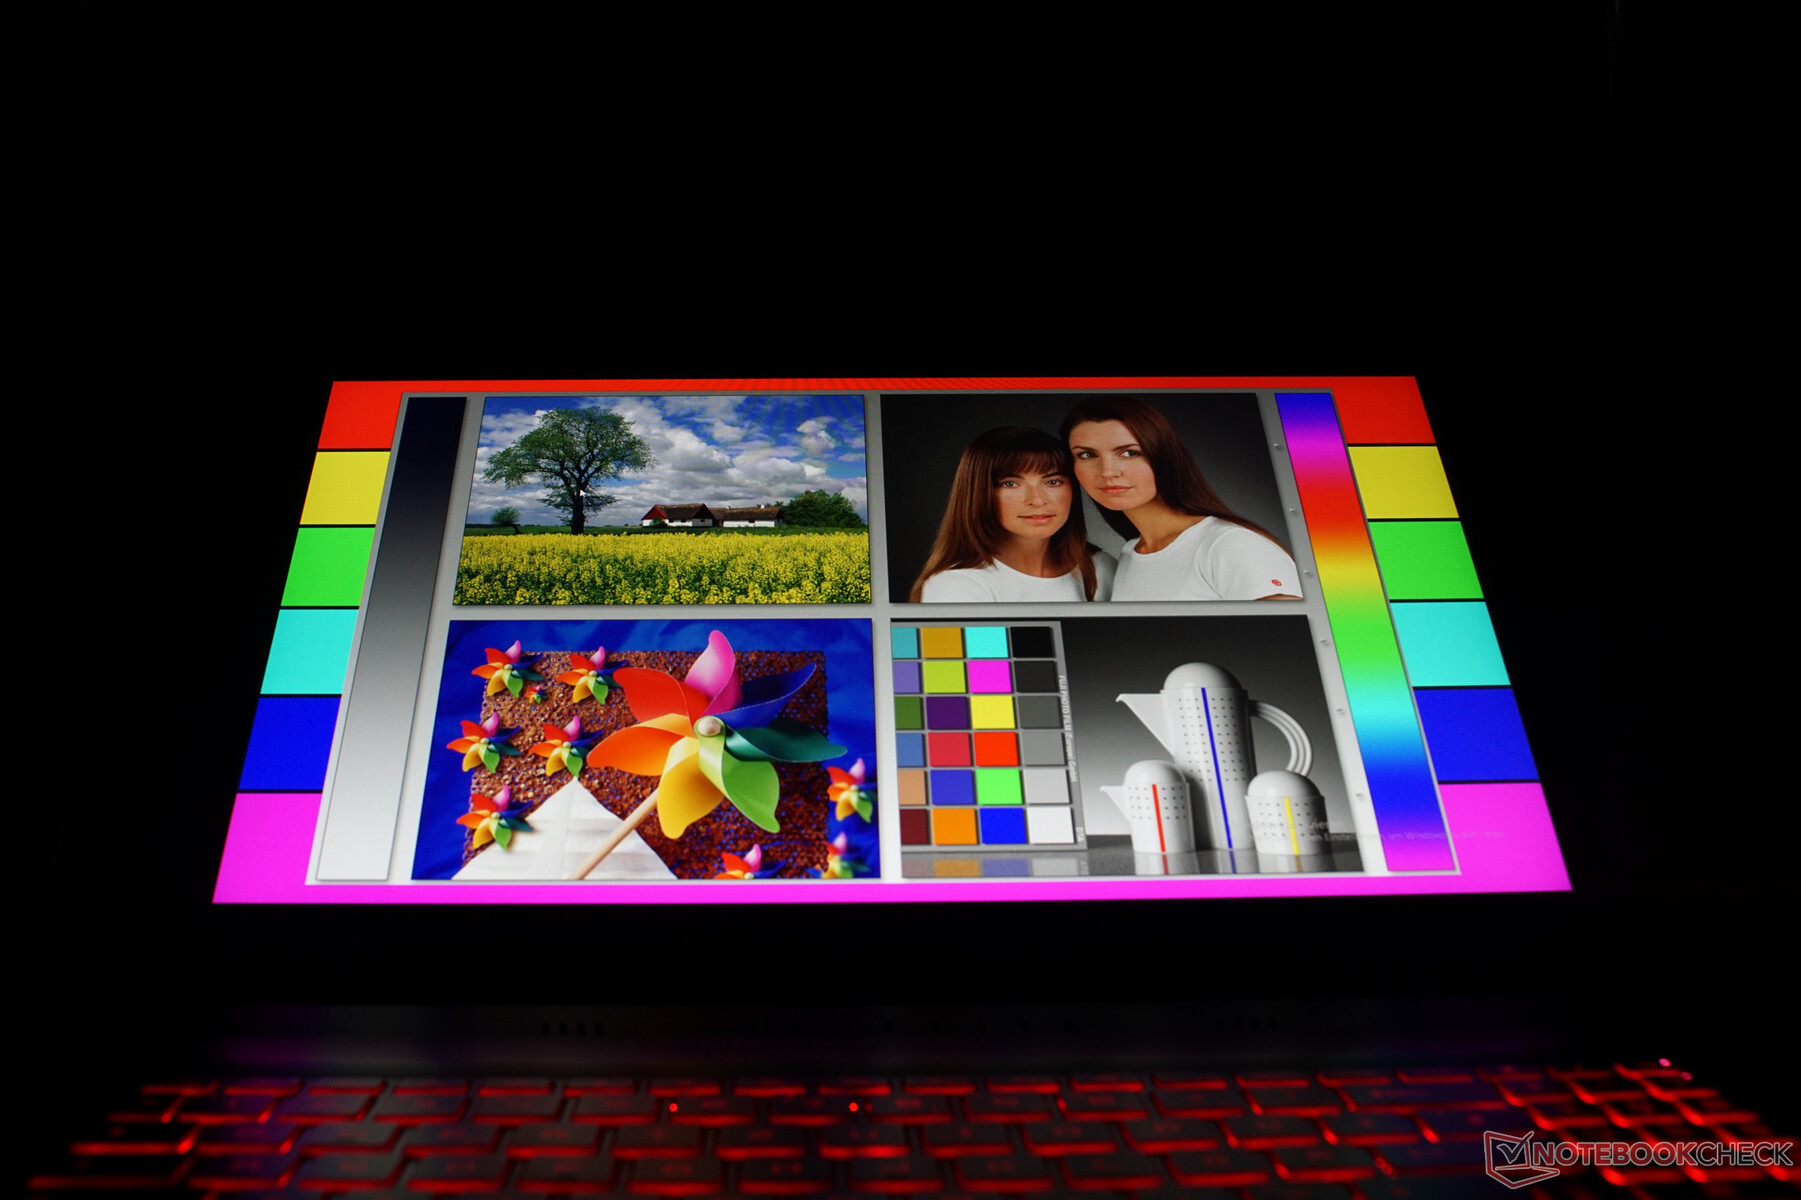
微星笔记本电脑的对比度相当高,但在某些场景中一些光晕是很明显的。只有将显示器的亮度降低20%左右,这些较亮的区域在黑暗的序列中就不会再那么明显了。然后,显示器就能以饱和的黑色来说服人。虽然91.3%的sRGB色彩空间覆盖率并不差,但考虑到这是一台游戏笔记本电脑,它可以更多一点。你还应该在Windows下使用颜色配置文件。通过使用我们的ICC文件,显示器的平均色彩偏差可以大大减少,你可以从信息框中的链接下载。一旦经过校准,该显示器就能产生相当好的图像。

户外使用
KatanaGF66的哑光显示屏在户外也能轻松阅读。表面上几乎没有任何反射。明亮的显示屏只有在阳光直射下才会被淹没。
Display Response Times
| ↔ Response Time Black to White | ||
|---|---|---|
| 11.2 ms ... rise ↗ and fall ↘ combined | ↗ 6 ms rise | 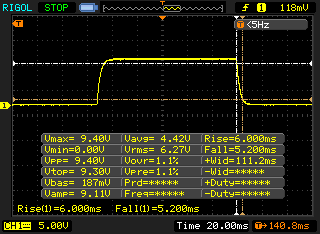 |
| ↘ 5.2 ms fall | ||
| The screen shows good response rates in our tests, but may be too slow for competitive gamers. In comparison, all tested devices range from 0.1 (minimum) to 240 (maximum) ms. » 30 % of all devices are better. This means that the measured response time is better than the average of all tested devices (19.8 ms). | ||
| ↔ Response Time 50% Grey to 80% Grey | ||
| 7.4 ms ... rise ↗ and fall ↘ combined | ↗ 3.8 ms rise | 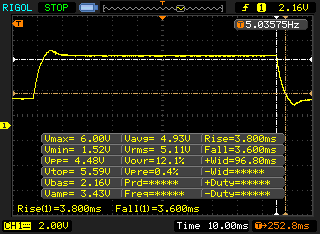 |
| ↘ 3.6 ms fall | ||
| The screen shows very fast response rates in our tests and should be very well suited for fast-paced gaming. In comparison, all tested devices range from 0.165 (minimum) to 636 (maximum) ms. » 20 % of all devices are better. This means that the measured response time is better than the average of all tested devices (31 ms). | ||
Screen Flickering / PWM (Pulse-Width Modulation)
| Screen flickering / PWM not detected | 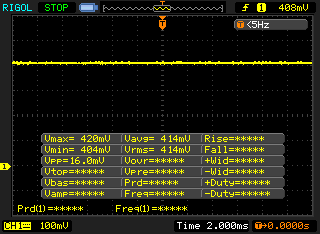 | ||
In comparison: 52 % of all tested devices do not use PWM to dim the display. If PWM was detected, an average of 7769 (minimum: 5 - maximum: 343500) Hz was measured. | |||
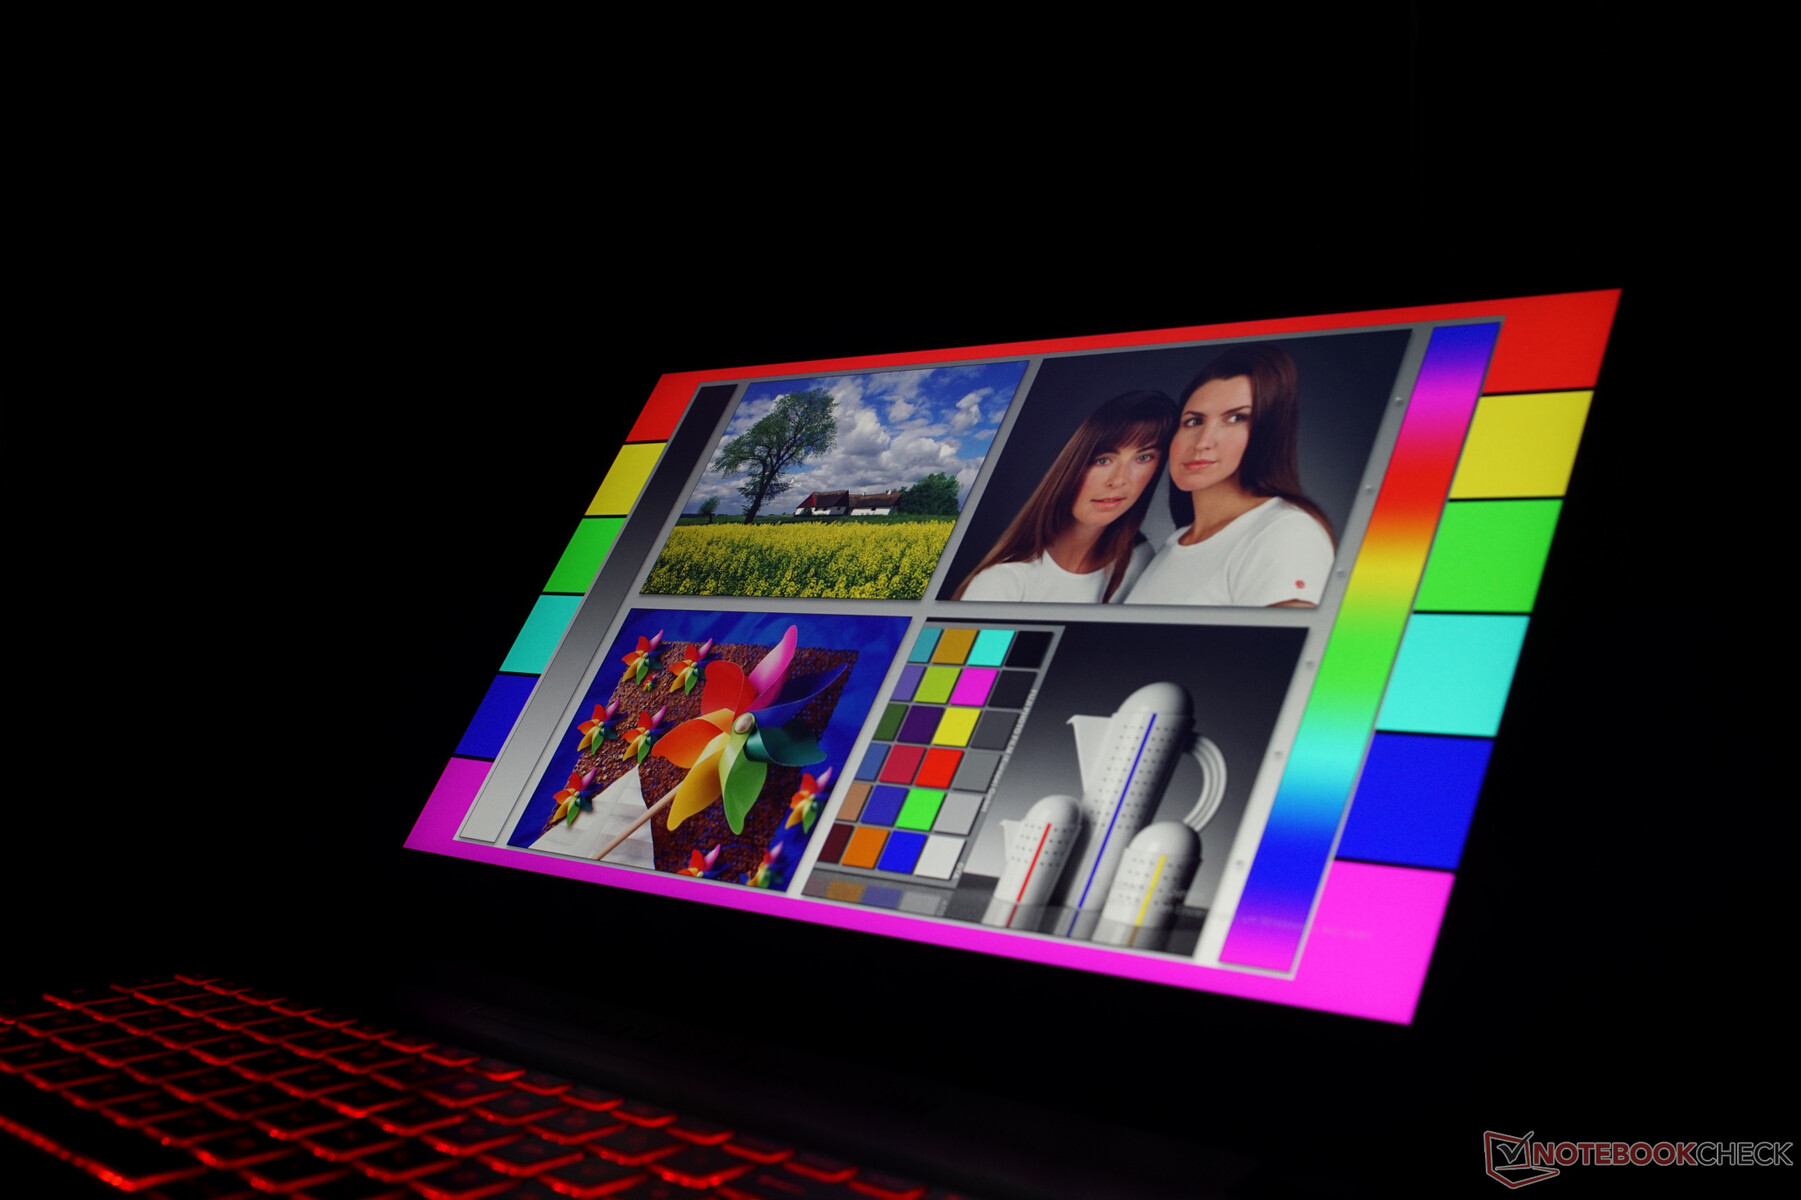
从所有视角看,显示屏的色彩再现都很稳定,唯一明显的差异是在亮度上。

性能--英特尔与AMD相差无几
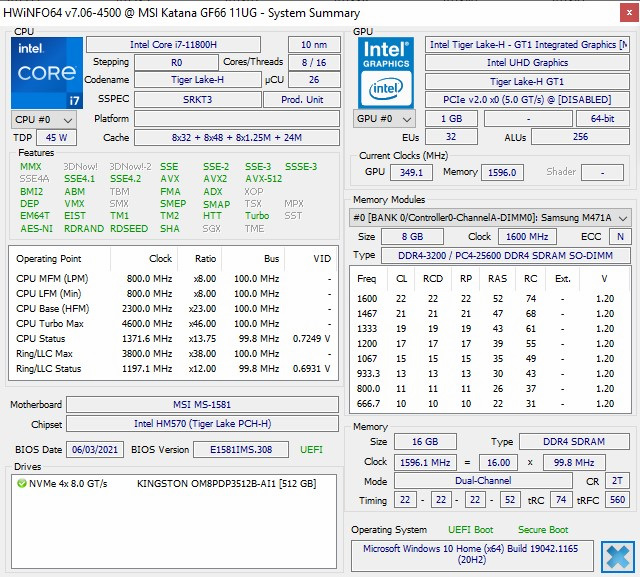
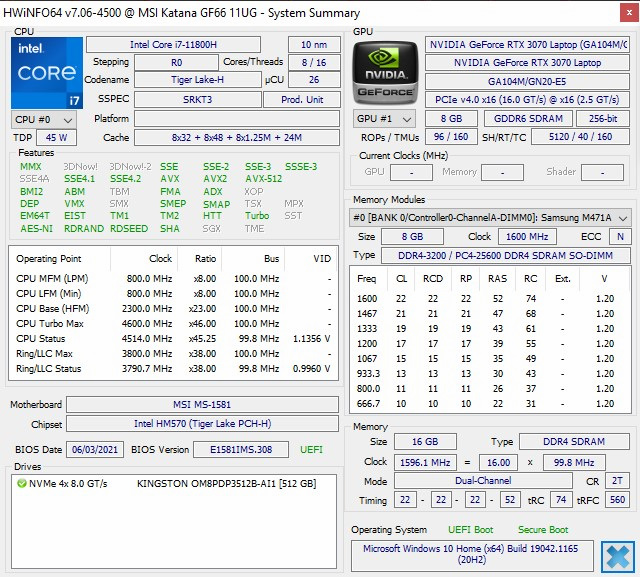
微星公司为KatanaGF66提供了大量的配置选项。我们的测试装置配备了英特尔酷睿i7-11800H处理器,NVIDIA®GeForce RTX 3070笔记本GPU,16GB DDR4-3200内存,以及512GB NVMe SSD。此外,我们的笔记本电脑还提供了扩展存储的选项。制造商的网站还显示了许多其他配置,包括RTX 3050、3060和3070显卡,以及i5和i7处理器和8或16GB的工作内存。配置选项还包括一个可用的M.2插槽。此外,这款游戏笔记本电脑可以选择是否配备微软Windows 10系统。
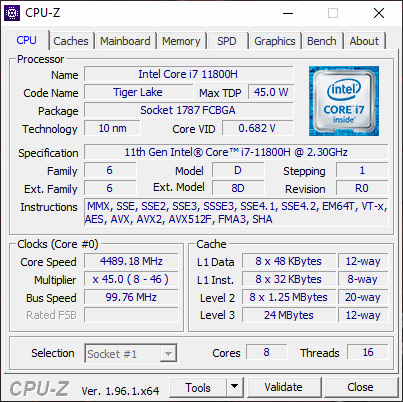

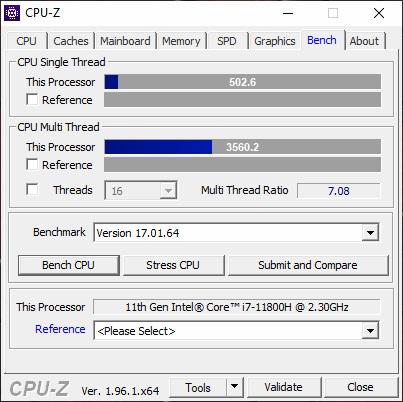
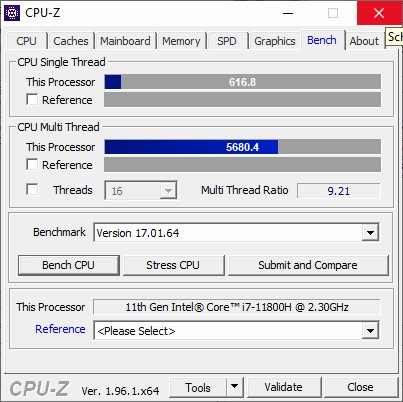
处理器
的英特尔酷睿i7-11800H是一款功能强大的SoC处理器,适用于功耗高的设备,基于Tiger Lake 架构。在GF66中,该处理器的时钟速度短暂地达到了4.6GHz。TDP是解锁的,因此,英特尔酷睿i7只受到当前温度的限制。然而,从长远来看,可用的散热选项限制了笔记本电脑的性能,即使通过[FN]+[↑]组合键 将风扇调整为以最高速度持续运行。风扇不会自己以全速运行。在30分钟的Cinebench循环中,单次运行的耗电量在74瓦左右。我们在这里也可以看到一个相当大的差异,如果我们不把风扇固定在全速上,因为平均分就会从1900降到1316。英特尔第11代笔记本处理器可以明显接近目前AMD笔记本处理器的性能。在 Legion Cinebench R15的多核模式 下,英特尔酷睿i7-11800H至少在几次运行中能够击败联想Ryzen 7 5800H。
Cinebench R15 Multi Constant Load Test
| HWBOT x265 Benchmark v2.2 - 4k Preset | |
| Average of class Gaming (11.5 - 44.3, n=108, last 2 years) | |
| Schenker XMG Neo 15 Tiger Lake | |
| Lenovo Legion 5 Pro 16ACH6H (82JQ001PGE) | |
| Lenovo Legion 5 Pro 16ACH6H (82JQ001PGE) | |
| Razer Blade 15 Advanced (Mid 2021) | |
| Average Intel Core i7-11800H (7.38 - 17.4, n=46) | |
| Gigabyte Aero 15 OLED XD | |
| MSI Katana GF66 11UG-220 | |
| Asus TUF Dash F15 FX516PR | |
* ... smaller is better
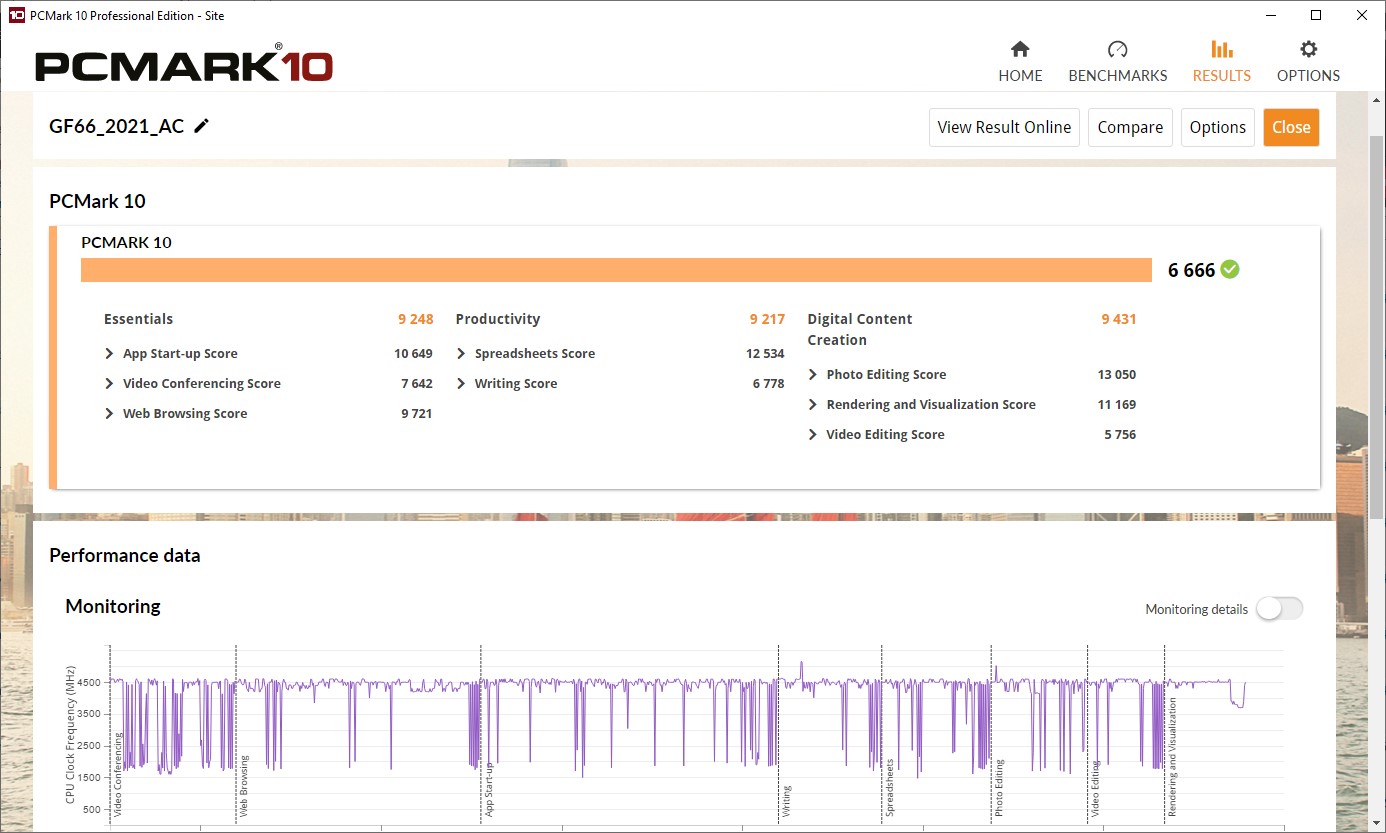
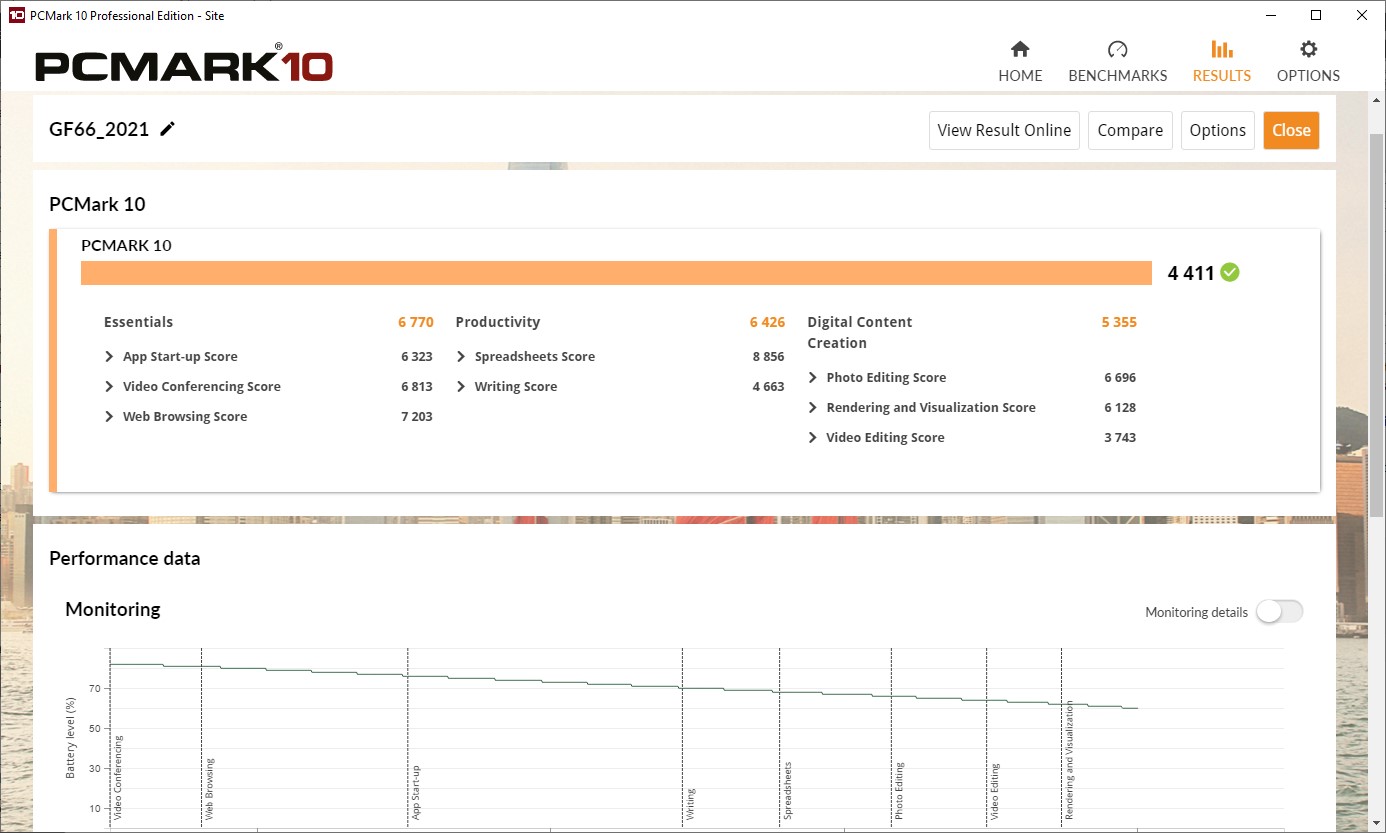
系统性能
系统性能处于一个良好的水平。这款笔记本电脑为办公任务、冲浪、游戏以及图像和视频处理提供了足够的可用资源。然而,在PCMark 10中得到6666分,微星笔记本电脑的表现没有达到其他游戏笔记本电脑的高水平。这方面的原因之一可以追溯到电源。只有180瓦,电源的尺寸非常小。 根据HWinfo的数据,CPU在测试中使用了超过74瓦的功率。由于Nvidia芯片也需要高达100瓦的功率,如果所有组件都要发挥其最高水平,那么所提供的功率对整个系统来说是不够的。此外,笔记本电脑的系统性能取决于在UEFI中调整的值和风扇模式。在运行以下基准测试之前,我们进行了几次优化系统性能的尝试。然而,事实上,微星没有提供任何Windows软件来做这件事(至少在他们的德国主页上进行测试的时候),这个过程相当麻烦,需要多次重启和测试运行。
在主电源操作中,这台笔记本电脑主观上表现出很高的水平。所有的应用程序都能快速启动,笔记本电脑对输入的反应也很迅速。另一方面,微星GF66在电池运行时显得有些迟钝。使用PCMark 10的基准测试证实了这一点。与电源操作相比,超过2000分的差异在部分地区是明显的。
| PCMark 10 / Score | |
| Average of class Gaming (5828 - 11574, n=95, last 2 years) | |
| Razer Blade 15 Advanced (Mid 2021) | |
| Schenker XMG Neo 15 Tiger Lake | |
| Gigabyte Aero 15 OLED XD | |
| Average Intel Core i7-11800H, NVIDIA GeForce RTX 3070 Laptop GPU (6126 - 7311, n=11) | |
| Lenovo Legion 5 Pro 16ACH6H (82JQ001PGE) | |
| MSI Katana GF66 11UG-220 | |
| Asus TUF Dash F15 FX516PR | |
| PCMark 10 / Essentials | |
| Razer Blade 15 Advanced (Mid 2021) | |
| Average of class Gaming (8810 - 12600, n=99, last 2 years) | |
| Schenker XMG Neo 15 Tiger Lake | |
| Average Intel Core i7-11800H, NVIDIA GeForce RTX 3070 Laptop GPU (9248 - 10832, n=11) | |
| Gigabyte Aero 15 OLED XD | |
| Lenovo Legion 5 Pro 16ACH6H (82JQ001PGE) | |
| Asus TUF Dash F15 FX516PR | |
| MSI Katana GF66 11UG-220 | |
| PCMark 10 / Productivity | |
| Average of class Gaming (6845 - 21327, n=97, last 2 years) | |
| Gigabyte Aero 15 OLED XD | |
| Asus TUF Dash F15 FX516PR | |
| MSI Katana GF66 11UG-220 | |
| Average Intel Core i7-11800H, NVIDIA GeForce RTX 3070 Laptop GPU (8571 - 9669, n=11) | |
| Razer Blade 15 Advanced (Mid 2021) | |
| Schenker XMG Neo 15 Tiger Lake | |
| Lenovo Legion 5 Pro 16ACH6H (82JQ001PGE) | |
| PCMark 10 / Digital Content Creation | |
| Average of class Gaming (7602 - 19657, n=97, last 2 years) | |
| Schenker XMG Neo 15 Tiger Lake | |
| Razer Blade 15 Advanced (Mid 2021) | |
| Gigabyte Aero 15 OLED XD | |
| Average Intel Core i7-11800H, NVIDIA GeForce RTX 3070 Laptop GPU (7627 - 10851, n=11) | |
| Lenovo Legion 5 Pro 16ACH6H (82JQ001PGE) | |
| MSI Katana GF66 11UG-220 | |
| Asus TUF Dash F15 FX516PR | |
| PCMark 10 Score | 6666 points | |
Help | ||
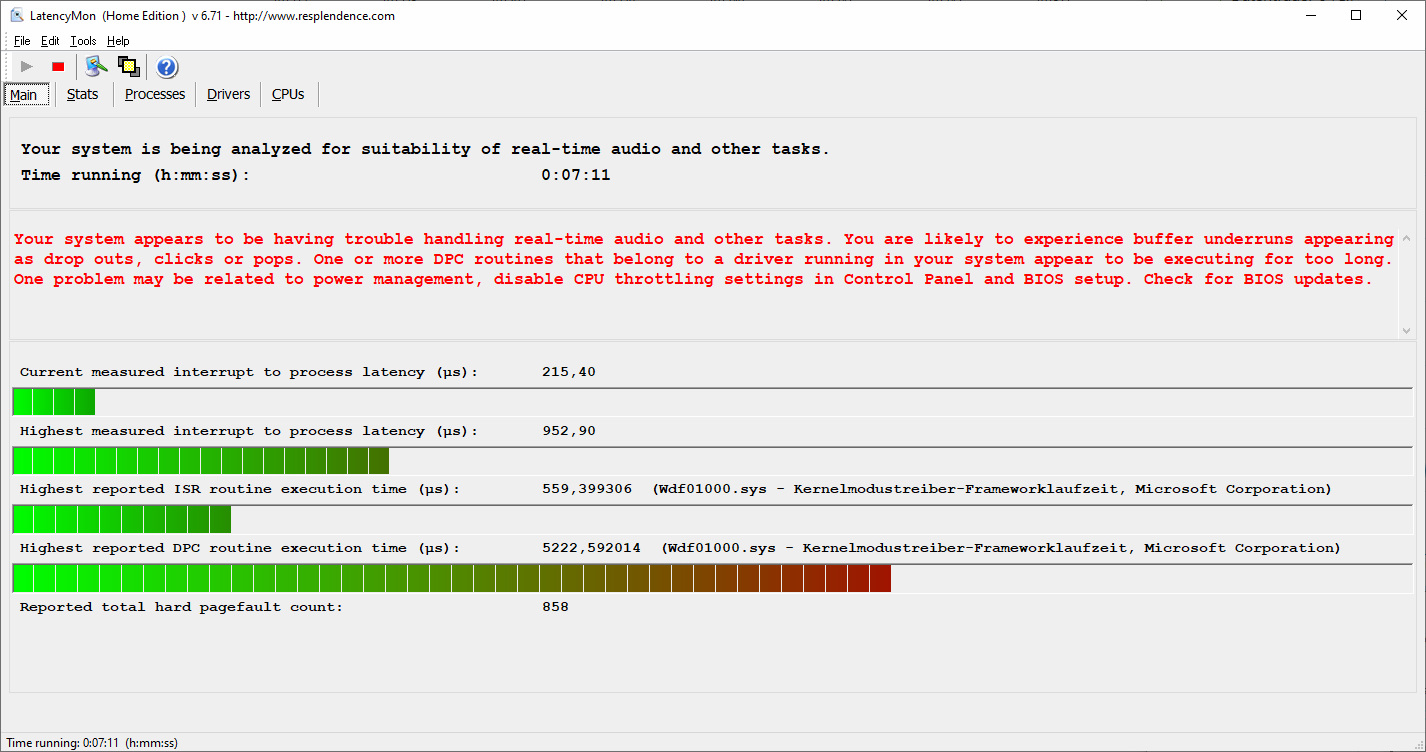
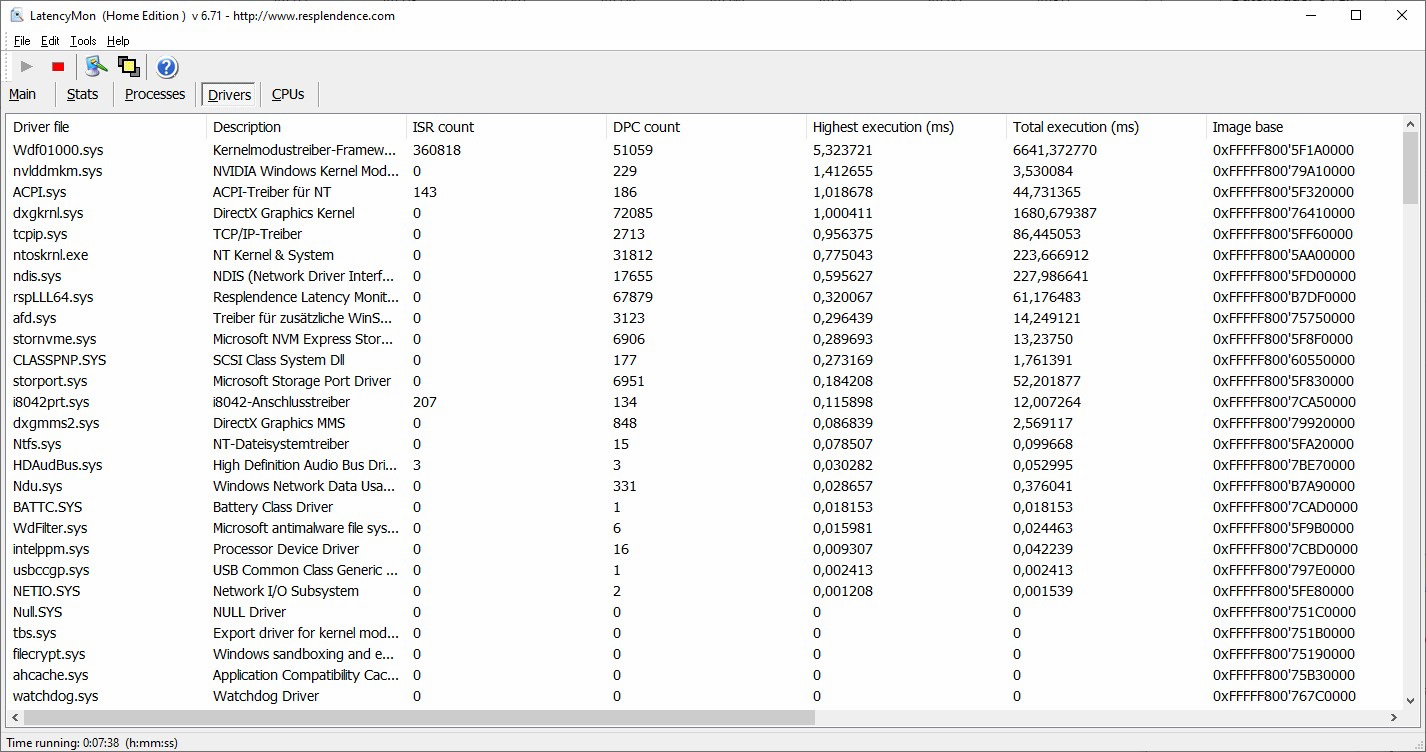
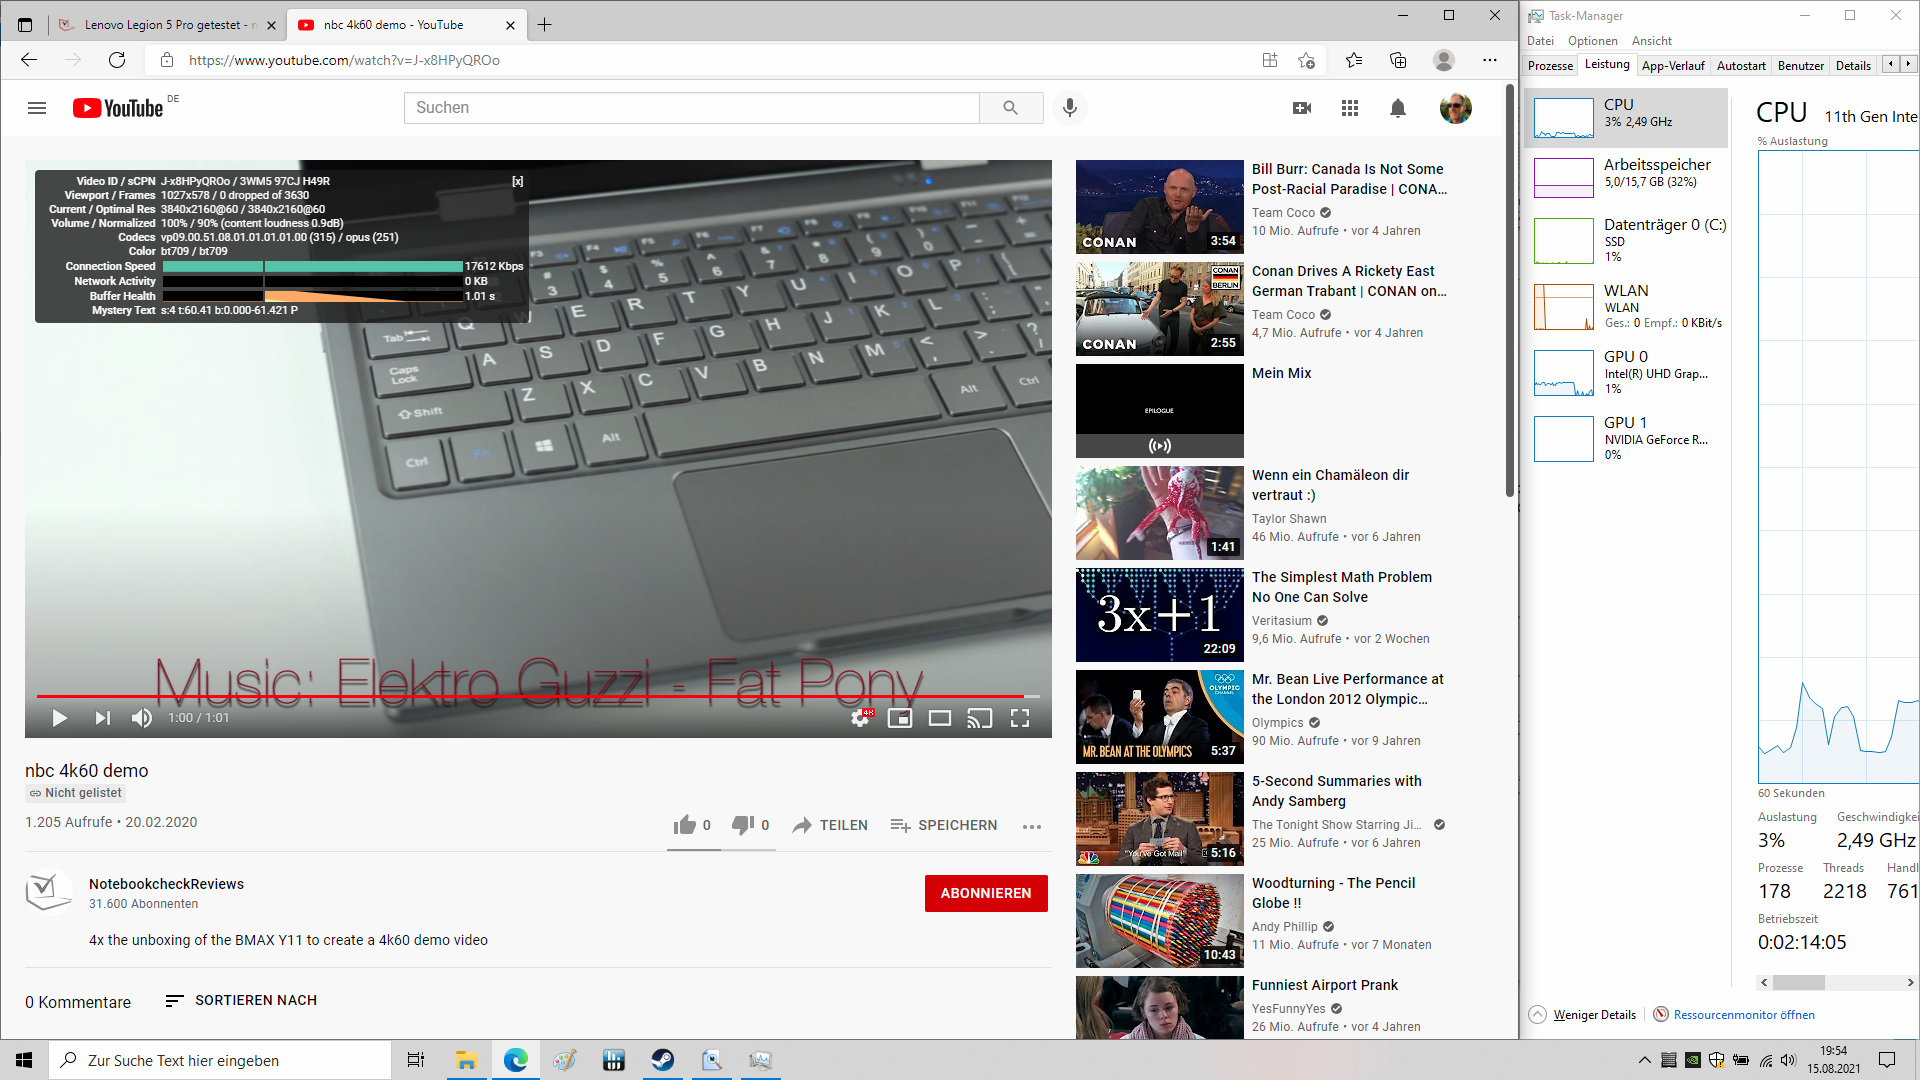
DPC延迟
DPC延迟为952微秒,微星游戏笔记本属于测试设备的平均水平。这是微软的内核模式驱动程序(WDF01000.sys)导致问题的另一个例子。根据升级的情况,这里可能会有一些改进。GF66掌握了我们的4k 60-Hz YouTube测试视频的重现,零掉帧。
| DPC Latencies / LatencyMon - interrupt to process latency (max), Web, Youtube, Prime95 | |
| Razer Blade 15 Advanced (Mid 2021) | |
| Lenovo Legion 5 Pro 16ACH6H (82JQ001PGE) | |
| Asus TUF Dash F15 FX516PR | |
| MSI Katana GF66 11UG-220 | |
| Gigabyte Aero 15 OLED XD | |
| Schenker XMG Neo 15 Tiger Lake | |
* ... smaller is better
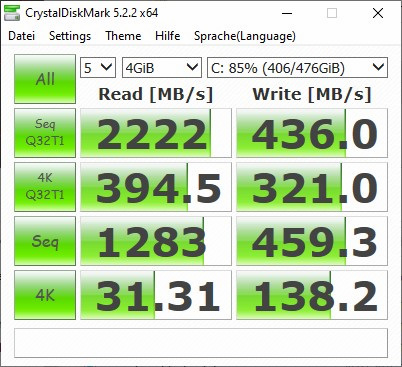
存储解决方案
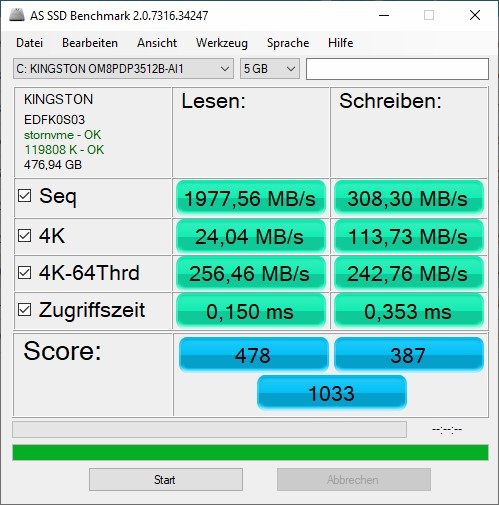
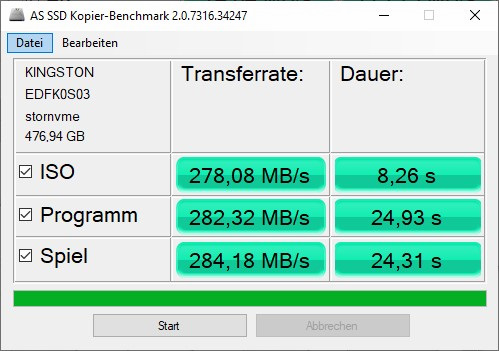
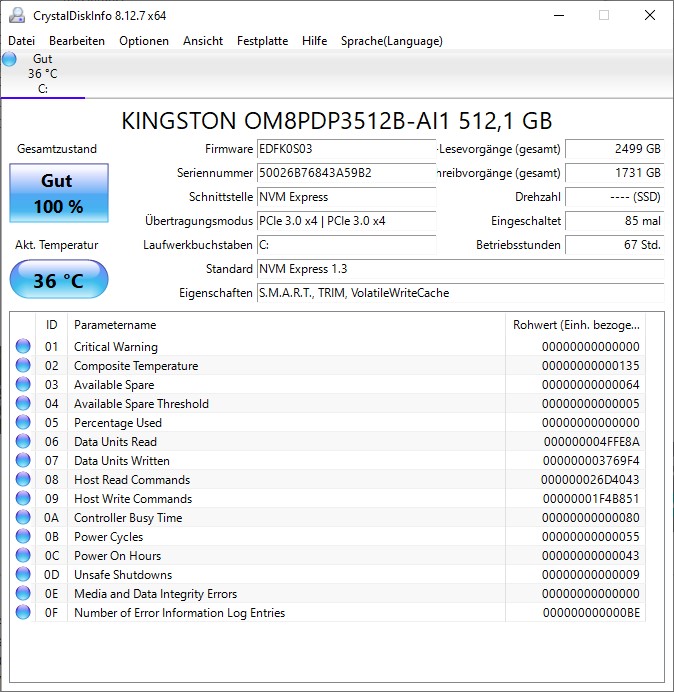
金士顿的512GB固态硬盘在CrystalDiskMark和AS SSD的基准测试中提供了可接受的数值。预装的存储空间很难满足大量游戏库的需要。然而,GF66的存储空间是可以扩展的。
| MSI Katana GF66 11UG-220 Kingston OM8PDP3512B-AI1 | Lenovo Legion 5 Pro 16ACH6H (82JQ001PGE) WDC PC SN730 SDBPNTY-1T00 | Gigabyte Aero 15 OLED XD Samsung PM9A1 MZVL21T0HCLR | Asus TUF Dash F15 FX516PR SK Hynix HFM001TD3JX013N | Razer Blade 15 Advanced (Mid 2021) SSSTC CA6-8D1024 | Schenker XMG Neo 15 Tiger Lake Samsung SSD 980 Pro 1TB MZ-V8P1T0BW | |
|---|---|---|---|---|---|---|
| CrystalDiskMark 5.2 / 6 | 109% | 348% | 92% | 338% | 271% | |
| Write 4K (MB/s) | 138.2 | 89.9 -35% | 231.4 67% | 129.6 -6% | 295.6 114% | 162.7 18% |
| Read 4K (MB/s) | 31.31 | 30.98 -1% | 89.5 186% | 44.71 43% | 85.7 174% | 79 152% |
| Write Seq (MB/s) | 459.3 | 4208 816% | 1929 320% | 4149 803% | 2865 524% | |
| Read Seq (MB/s) | 1283 | 4512 252% | 2035 59% | 4203 228% | 3411 166% | |
| Write 4K Q32T1 (MB/s) | 321 | 371.6 16% | 648 102% | 425.9 33% | 715 123% | 522 63% |
| Read 4K Q32T1 (MB/s) | 394.5 | 470.6 19% | 691 75% | 433.4 10% | 709 80% | 508 29% |
| Write Seq Q32T1 (MB/s) | 436 | 3065 603% | 5111 1072% | 1390 219% | 4681 974% | 4765 993% |
| Read Seq Q32T1 (MB/s) | 2222 | 3370 52% | 7002 215% | 3505 58% | 6905 211% | 7083 219% |
| AS SSD | 173% | 542% | 220% | 523% | 437% | |
| Seq Read (MB/s) | 1978 | 2695 36% | 5357 171% | 2671 35% | 5739 190% | 4830 144% |
| Seq Write (MB/s) | 308.3 | 2384 673% | 3978 1190% | 1501 387% | 4201 1263% | 2032 559% |
| 4K Read (MB/s) | 24.04 | 29.75 24% | 50.6 110% | 39.65 65% | 53.8 124% | 62.3 159% |
| 4K Write (MB/s) | 113.7 | 52 -54% | 156.2 37% | 69 -39% | 179.2 58% | 146.4 29% |
| 4K-64 Read (MB/s) | 256.5 | 1193 365% | 2465 861% | 1209 371% | 2959 1054% | 1305 409% |
| 4K-64 Write (MB/s) | 242.8 | 1107 356% | 3360 1284% | 1650 580% | 1891 679% | 3708 1427% |
| Access Time Read * (ms) | 0.15 | 0.136 9% | 0.08 47% | 0.093 38% | 0.027 82% | 0.029 81% |
| Access Time Write * (ms) | 0.353 | 0.36 -2% | 0.027 92% | 0.055 84% | 0.154 56% | 0.027 92% |
| Score Read (Points) | 478 | 1493 212% | 3052 538% | 1516 217% | 3587 650% | 1850 287% |
| Score Write (Points) | 387 | 1397 261% | 3914 911% | 1869 383% | 2490 543% | 4058 949% |
| Score Total (Points) | 1033 | 3636 252% | 8449 718% | 4105 297% | 7821 657% | 6724 551% |
| Copy ISO MB/s (MB/s) | 278.1 | 1007 262% | 3027 988% | 1709 515% | ||
| Copy Program MB/s (MB/s) | 282.3 | 43.11 -85% | 1177 317% | 1250 343% | ||
| Copy Game MB/s (MB/s) | 284.2 | 621 119% | 2170 664% | 1909 572% | ||
| Total Average (Program / Settings) | 141% /
154% | 445% /
460% | 156% /
166% | 431% /
456% | 354% /
376% |
* ... smaller is better

Constant Performance Reading: DiskSpd Read Loop, Queue Depth 8
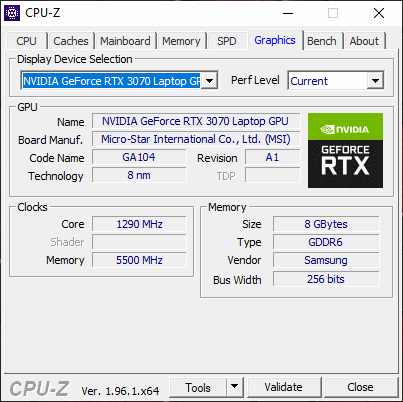
图形卡
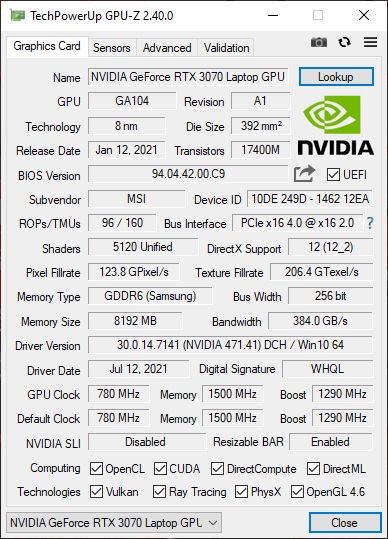
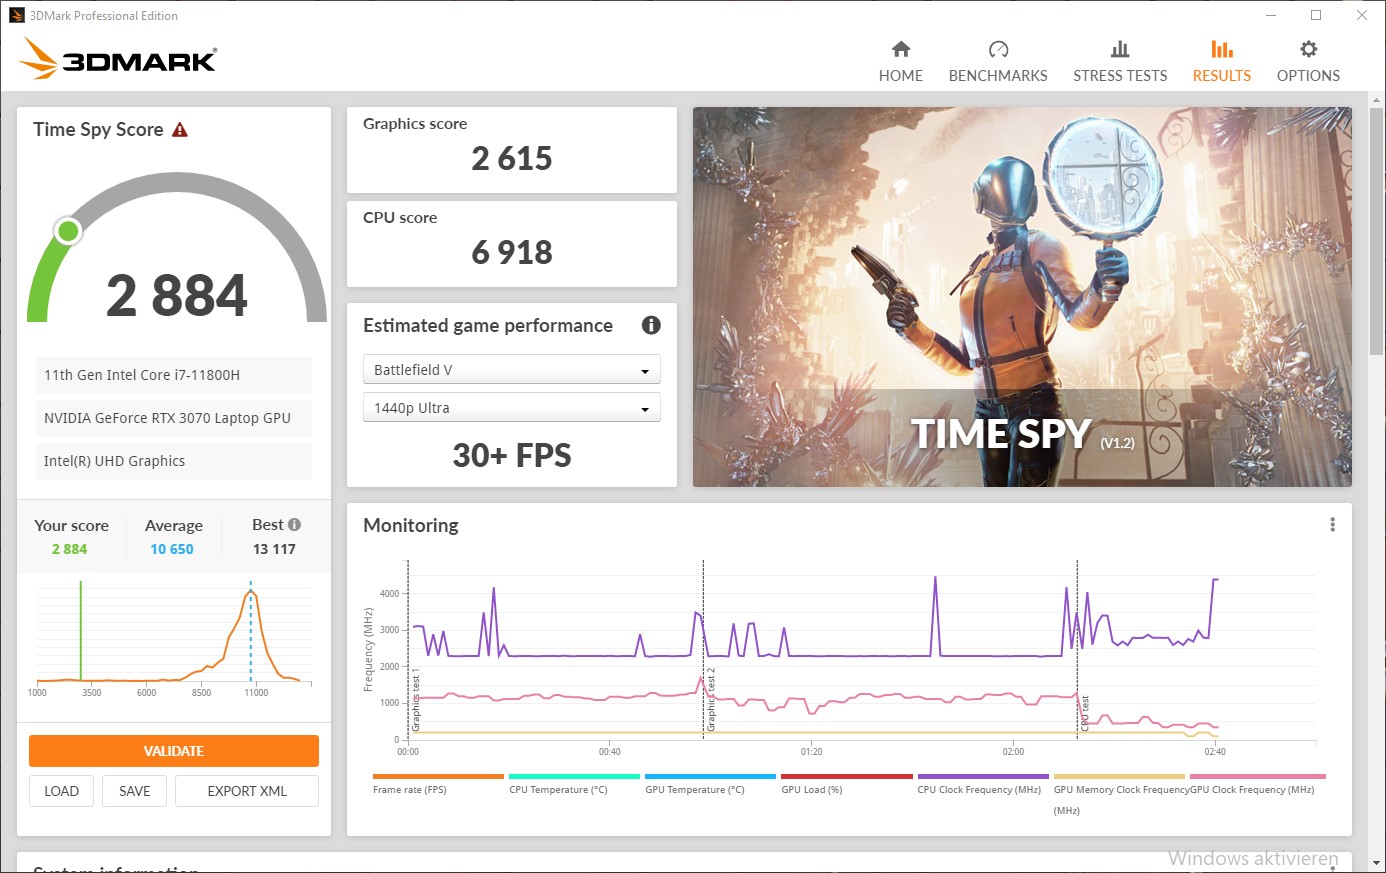
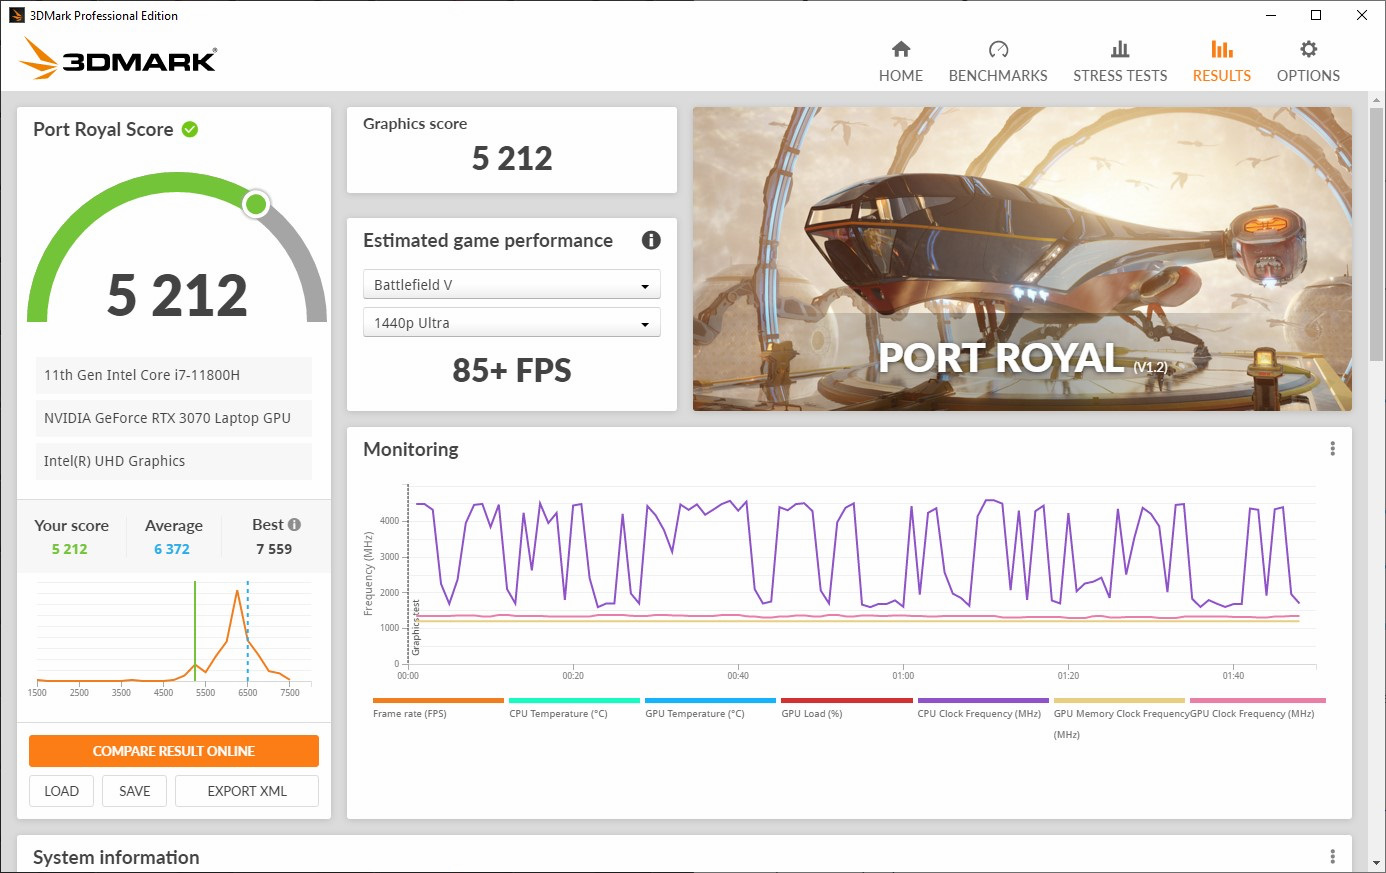
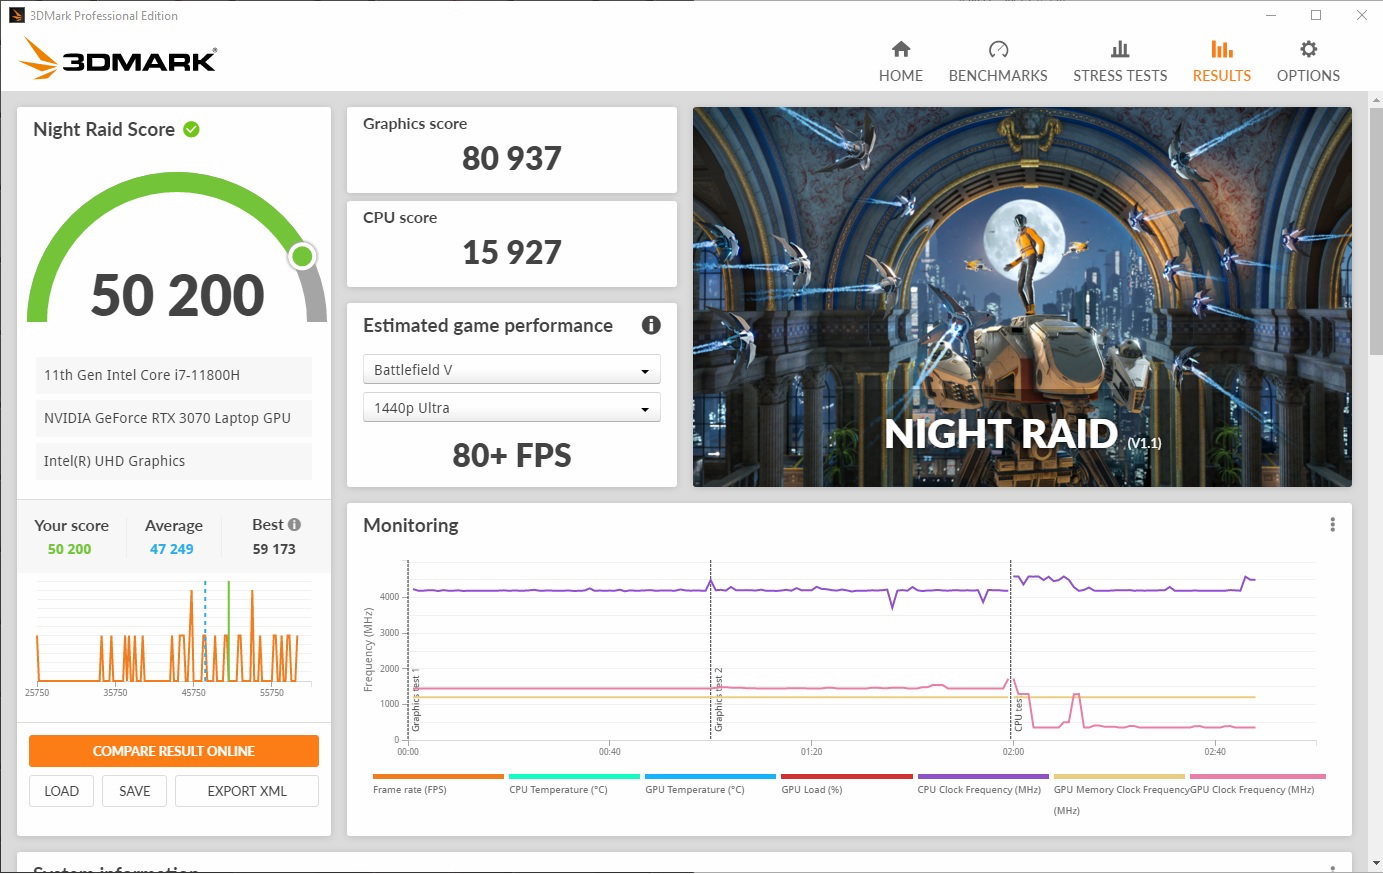
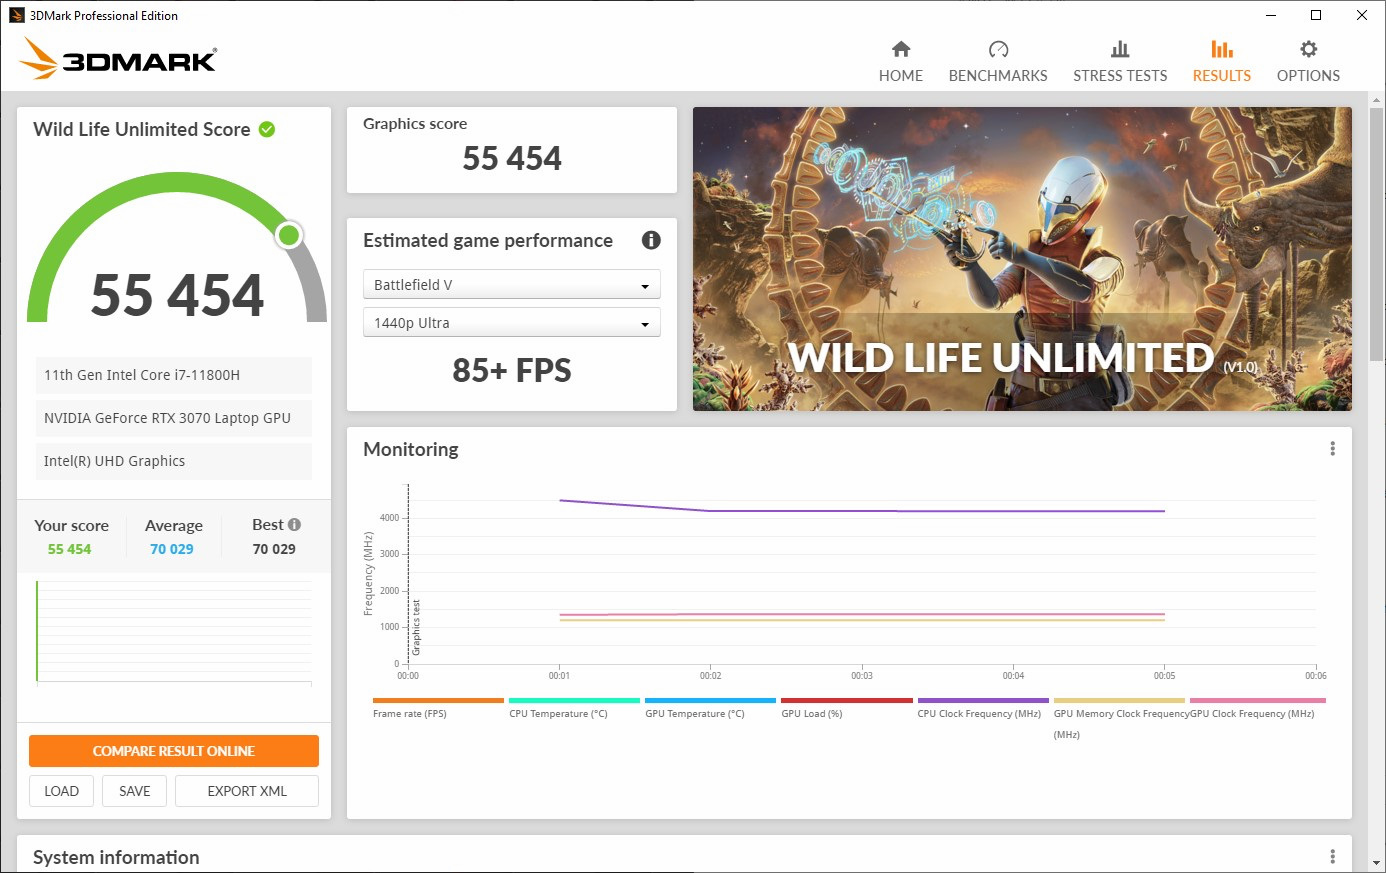
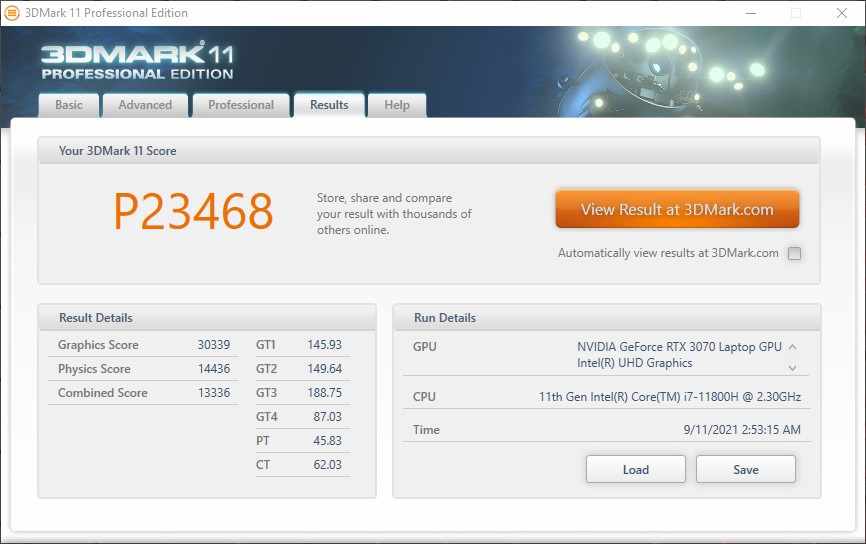
笔记本版的NvidiaGeForce RTX 3070是笔记本电脑的最快显卡之一。这款拥有5120个着色器单元的专用显卡有8GB的GDDR6工作内存供其使用。虽然工作内存可以被目前的游戏完全用完,但对于微星GF66的全高清分辨率来说是足够的。然而,3DMark基准测试的结果表明,该显卡无法开发其全部潜力。其他采用Nvidia芯片的游戏笔记本电脑取得的分数明显更高。
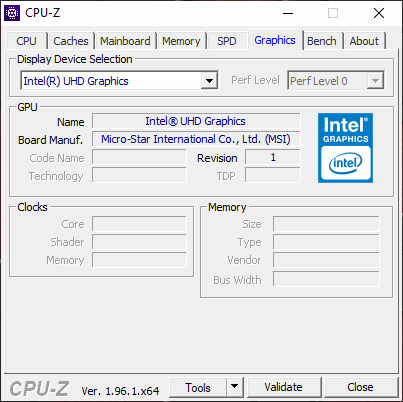
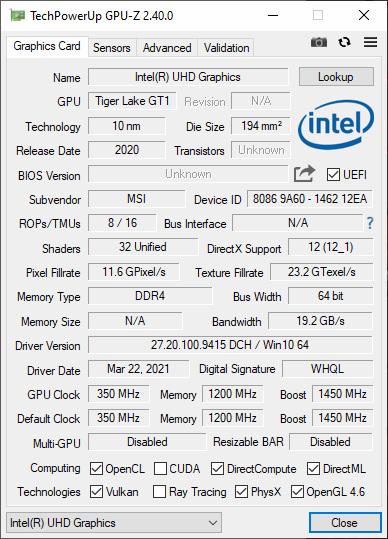
对于要求不高的图形任务,该笔记本电脑还可以使用英特尔i7的集成UHD图形,这使得它在空闲运行时可以大大降低功耗。
在不插电的情况下,笔记本电脑不能从电池中获得足够的电力,以全速运行Nvidia芯片。在游戏和基准测试中的性能明显下降,约为在主电源运行时的三分之一。


| 3DMark 11 - 1280x720 Performance GPU | |
| Average of class Gaming (21841 - 80022, n=106, last 2 years) | |
| Schenker XMG Neo 15 Tiger Lake | |
| Lenovo Legion 5 Pro 16ACH6H (82JQ001PGE) | |
| Razer Blade 15 Advanced (Mid 2021) | |
| Average NVIDIA GeForce RTX 3070 Laptop GPU (12535 - 38275, n=54) | |
| Gigabyte Aero 15 OLED XD | |
| MSI Katana GF66 11UG-220 | |
| 3DMark | |
| 1920x1080 Fire Strike Graphics | |
| Average of class Gaming (12242 - 62849, n=118, last 2 years) | |
| Schenker XMG Neo 15 Tiger Lake | |
| Razer Blade 15 Advanced (Mid 2021) | |
| Average NVIDIA GeForce RTX 3070 Laptop GPU (7178 - 29128, n=52) | |
| Gigabyte Aero 15 OLED XD | |
| Asus TUF Dash F15 FX516PR | |
| 2560x1440 Time Spy Graphics | |
| Average of class Gaming (5012 - 26212, n=117, last 2 years) | |
| Schenker XMG Neo 15 Tiger Lake | |
| Razer Blade 15 Advanced (Mid 2021) | |
| Average NVIDIA GeForce RTX 3070 Laptop GPU (2644 - 11019, n=53) | |
| Gigabyte Aero 15 OLED XD | |
| MSI Katana GF66 11UG-220 | |
| Asus TUF Dash F15 FX516PR | |
| 2560x1440 Time Spy Score | |
| Average of class Gaming (5339 - 24432, n=117, last 2 years) | |
| Schenker XMG Neo 15 Tiger Lake | |
| Lenovo Legion 5 Pro 16ACH6H (82JQ001PGE) | |
| Razer Blade 15 Advanced (Mid 2021) | |
| Average NVIDIA GeForce RTX 3070 Laptop GPU (2952 - 10872, n=54) | |
| MSI Katana GF66 11UG-220 | |
| Gigabyte Aero 15 OLED XD | |
| Asus TUF Dash F15 FX516PR | |
| 3DMark 11 Performance | 10127 points | |
| 3DMark Ice Storm Standard Score | 100884 points | |
| 3DMark Fire Strike Score | 18594 points | |
| 3DMark Fire Strike Extreme Score | 10194 points | |
| 3DMark Time Spy Score | 8715 points | |
Help | ||
游戏性能
微星笔记本电脑在我们测试的所有游戏中都提供了良好的结果。即使在最高质量设置下,全显示分辨率下的帧率也是可以接受的。
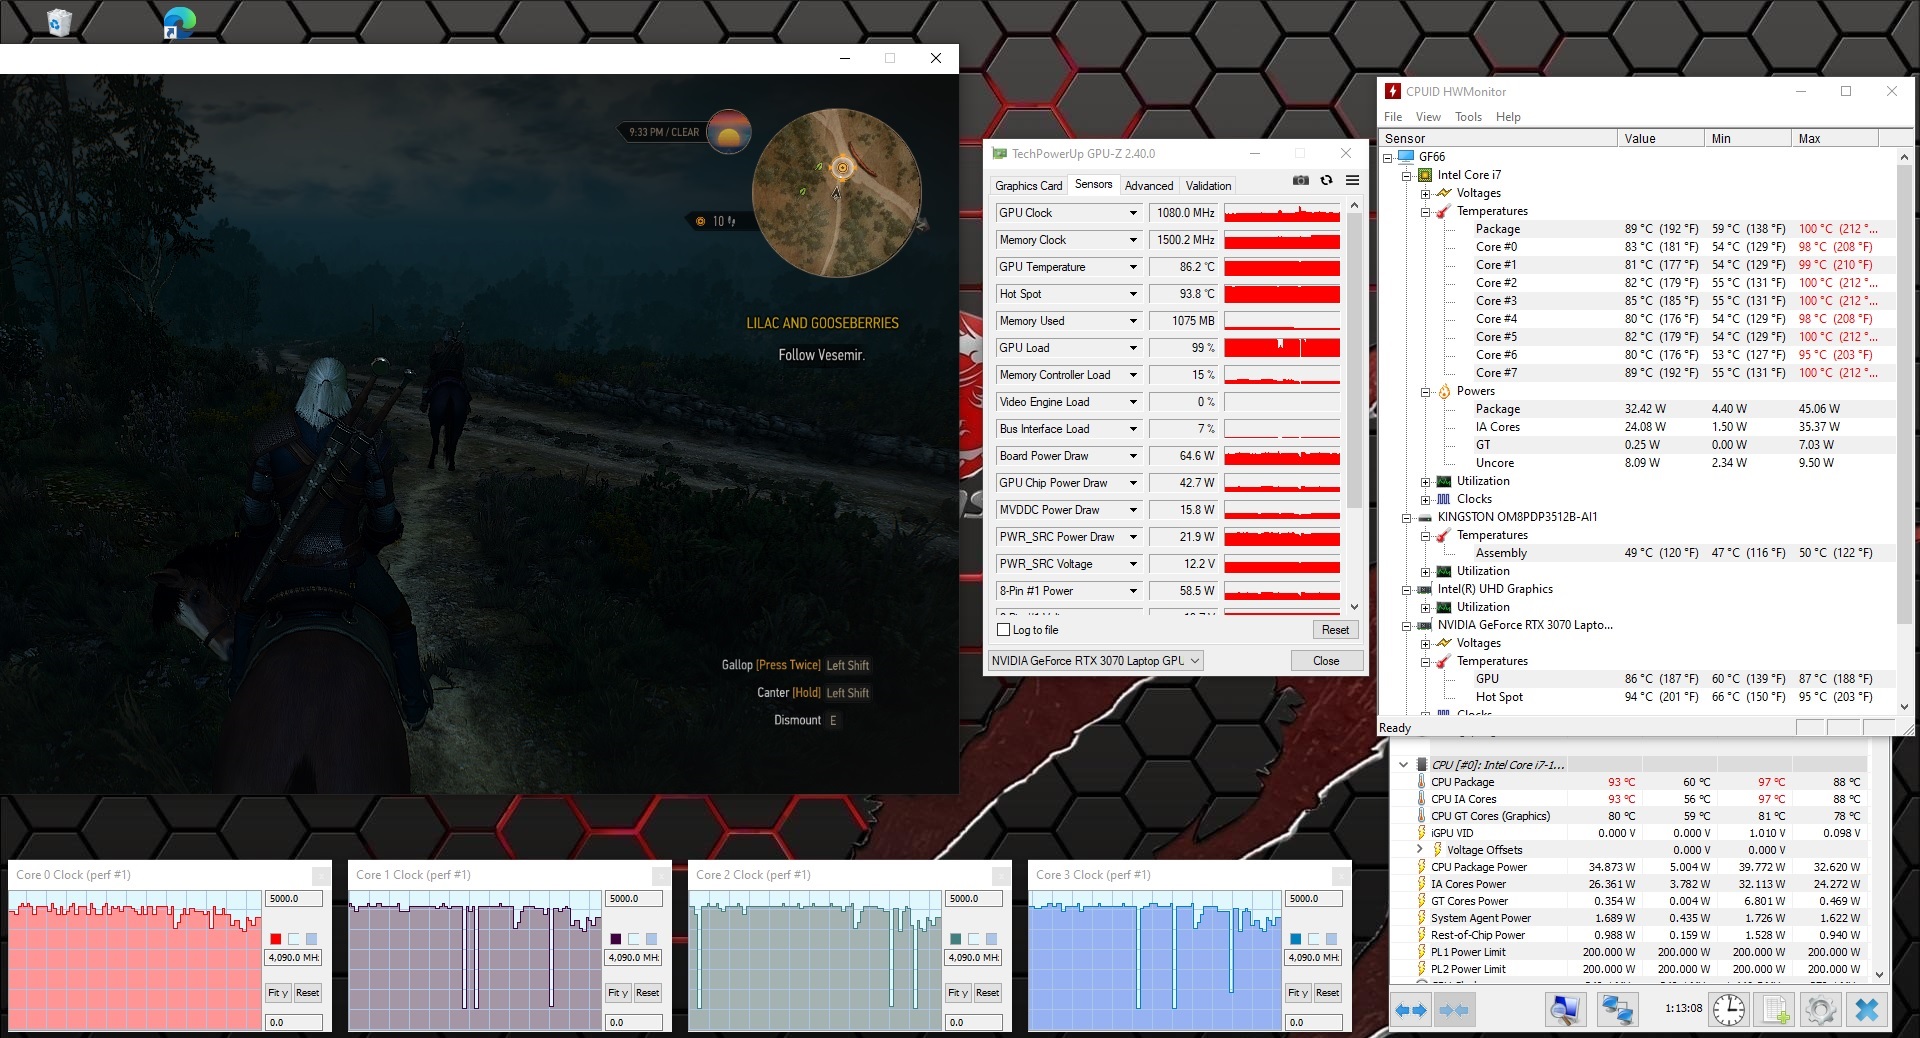
然而,在电池运行的游戏中,你必须期待一个明显的质量下降。在"TheWitcher 3"中,帧率下降了50多FPS(FHD/Ultra),在我们拔掉笔记本后。
| The Witcher 3 | |
| 1920x1080 High Graphics & Postprocessing (Nvidia HairWorks Off) | |
| Average of class Gaming (181 - 341, n=3, last 2 years) | |
| Schenker XMG Neo 15 Tiger Lake | |
| Razer Blade 15 Advanced (Mid 2021) | |
| Gigabyte Aero 15 OLED XD | |
| Average NVIDIA GeForce RTX 3070 Laptop GPU (122.1 - 207, n=34) | |
| Lenovo Legion 5 Pro 16ACH6H (82JQ001PGE) | |
| Asus TUF Dash F15 FX516PR | |
| MSI Katana GF66 11UG-220 | |
| 1920x1080 Ultra Graphics & Postprocessing (HBAO+) | |
| Average of class Gaming (95 - 240, n=8, last 2 years) | |
| Schenker XMG Neo 15 Tiger Lake | |
| Razer Blade 15 Advanced (Mid 2021) | |
| Average NVIDIA GeForce RTX 3070 Laptop GPU (34.9 - 109, n=52) | |
| Gigabyte Aero 15 OLED XD | |
| Lenovo Legion 5 Pro 16ACH6H (82JQ001PGE) | |
| MSI Katana GF66 11UG-220 | |
| Asus TUF Dash F15 FX516PR | |
| GTA V | |
| 1920x1080 High/On (Advanced Graphics Off) AA:2xMSAA + FX AF:8x | |
| Razer Blade 15 Advanced (Mid 2021) | |
| Schenker XMG Neo 15 Tiger Lake | |
| Average of class Gaming (110.7 - 189, n=69, last 2 years) | |
| MSI Katana GF66 11UG-220 | |
| Gigabyte Aero 15 OLED XD | |
| Lenovo Legion 5 Pro 16ACH6H (82JQ001PGE) | |
| Average NVIDIA GeForce RTX 3070 Laptop GPU (58.2 - 181.4, n=38) | |
| Asus TUF Dash F15 FX516PR | |
| 1920x1080 Highest AA:4xMSAA + FX AF:16x | |
| Average of class Gaming (48.3 - 186.9, n=98, last 2 years) | |
| Razer Blade 15 Advanced (Mid 2021) | |
| Schenker XMG Neo 15 Tiger Lake | |
| Lenovo Legion 5 Pro 16ACH6H (82JQ001PGE) | |
| Gigabyte Aero 15 OLED XD | |
| MSI Katana GF66 11UG-220 | |
| Average NVIDIA GeForce RTX 3070 Laptop GPU (21.7 - 125.8, n=50) | |
| Asus TUF Dash F15 FX516PR | |
| Final Fantasy XV Benchmark | |
| 1920x1080 High Quality | |
| Average of class Gaming (41 - 215, n=99, last 2 years) | |
| Schenker XMG Neo 15 Tiger Lake | |
| Lenovo Legion 5 Pro 16ACH6H (82JQ001PGE) | |
| Razer Blade 15 Advanced (Mid 2021) | |
| Gigabyte Aero 15 OLED XD | |
| Average NVIDIA GeForce RTX 3070 Laptop GPU (27.9 - 107, n=49) | |
| MSI Katana GF66 11UG-220 | |
| 2560x1440 High Quality | |
| Average of class Gaming (32.5 - 184.3, n=88, last 2 years) | |
| Schenker XMG Neo 15 Tiger Lake | |
| Lenovo Legion 5 Pro 16ACH6H (82JQ001PGE) | |
| Average NVIDIA GeForce RTX 3070 Laptop GPU (19.8 - 79.9, n=25) | |
| Gigabyte Aero 15 OLED XD | |
| MSI Katana GF66 11UG-220 | |
| Far Cry 5 | |
| 1920x1080 High Preset AA:T | |
| Schenker XMG Neo 15 Tiger Lake | |
| Average of class Gaming (82 - 163, n=9, last 2 years) | |
| Average NVIDIA GeForce RTX 3070 Laptop GPU (93 - 137, n=26) | |
| MSI Katana GF66 11UG-220 | |
| Lenovo Legion 5 Pro 16ACH6H (82JQ001PGE) | |
| Gigabyte Aero 15 OLED XD | |
| 1920x1080 Ultra Preset AA:T | |
| Schenker XMG Neo 15 Tiger Lake | |
| Average of class Gaming (70 - 151, n=9, last 2 years) | |
| Average NVIDIA GeForce RTX 3070 Laptop GPU (89 - 140, n=36) | |
| Lenovo Legion 5 Pro 16ACH6H (82JQ001PGE) | |
| MSI Katana GF66 11UG-220 | |
| Gigabyte Aero 15 OLED XD | |
| Far Cry New Dawn - 1920x1080 High Preset | |
| MSI Katana GF66 11UG-220 | |
| Average NVIDIA GeForce RTX 3070 Laptop GPU (80 - 112, n=6) | |
| Lenovo Legion 5 Pro 16ACH6H (82JQ001PGE) | |
| Asus TUF Dash F15 FX516PR | |
| Strange Brigade | |
| 1920x1080 high AA:high AF:8 | |
| Average of class Gaming (129.5 - 485, n=77, last 2 years) | |
| Schenker XMG Neo 15 Tiger Lake | |
| Lenovo Legion 5 Pro 16ACH6H (82JQ001PGE) | |
| Razer Blade 15 Advanced (Mid 2021) | |
| Average NVIDIA GeForce RTX 3070 Laptop GPU (39.6 - 225, n=35) | |
| Gigabyte Aero 15 OLED XD | |
| MSI Katana GF66 11UG-220 | |
| 1920x1080 ultra AA:ultra AF:16 | |
| Average of class Gaming (76.3 - 456, n=89, last 2 years) | |
| Schenker XMG Neo 15 Tiger Lake | |
| Lenovo Legion 5 Pro 16ACH6H (82JQ001PGE) | |
| Razer Blade 15 Advanced (Mid 2021) | |
| Average NVIDIA GeForce RTX 3070 Laptop GPU (36.2 - 194, n=46) | |
| Gigabyte Aero 15 OLED XD | |
| MSI Katana GF66 11UG-220 | |
| F1 2021 | |
| 1920x1080 High Preset AA:T AF:16x | |
| Lenovo Legion 5 Pro 16ACH6H (82JQ001PGE) | |
| Average NVIDIA GeForce RTX 3070 Laptop GPU (66.1 - 256, n=16) | |
| MSI Katana GF66 11UG-220 | |
| 1920x1080 Ultra High Preset + Raytracing AA:T AF:16x | |
| Lenovo Legion 5 Pro 16ACH6H (82JQ001PGE) | |
| Average NVIDIA GeForce RTX 3070 Laptop GPU (33.1 - 123.1, n=23) | |
| MSI Katana GF66 11UG-220 | |
| 2560x1440 Ultra High Preset + Raytracing AA:T AF:16x | |
| Lenovo Legion 5 Pro 16ACH6H (82JQ001PGE) | |
| Average NVIDIA GeForce RTX 3070 Laptop GPU (67.1 - 90.2, n=11) | |
| MSI Katana GF66 11UG-220 | |
| 3840x2160 Ultra High Preset + Raytracing AA:T AF:16x | |
| Average NVIDIA GeForce RTX 3070 Laptop GPU (37.1 - 51.1, n=3) | |
| MSI Katana GF66 11UG-220 | |
| F1 2020 | |
| 1920x1080 High Preset AA:T AF:16x | |
| Lenovo Legion 5 Pro 16ACH6H (82JQ001PGE) | |
| Average NVIDIA GeForce RTX 3070 Laptop GPU (118 - 238, n=7) | |
| Gigabyte Aero 15 OLED XD | |
| MSI Katana GF66 11UG-220 | |
| Asus TUF Dash F15 FX516PR | |
| 1920x1080 Ultra High Preset AA:T AF:16x | |
| Lenovo Legion 5 Pro 16ACH6H (82JQ001PGE) | |
| Average NVIDIA GeForce RTX 3070 Laptop GPU (97 - 173, n=7) | |
| Gigabyte Aero 15 OLED XD | |
| MSI Katana GF66 11UG-220 | |
| Asus TUF Dash F15 FX516PR | |
在"TheWitcher 3"的恒定负载测试中,帧率在最初的几分钟内下降得相当明显,然后在70 FPS左右趋于平稳。
The Witcher 3 FPS Chart
| low | med. | high | ultra | QHD | 4K | |
|---|---|---|---|---|---|---|
| GTA V (2015) | 184 | 177 | 164 | 93.5 | ||
| The Witcher 3 (2015) | 381.1 | 263.4 | 122.1 | 80.9 | ||
| Dota 2 Reborn (2015) | 164 | 140 | 131 | 122 | 109 | |
| Final Fantasy XV Benchmark (2018) | 161 | 105 | 75.7 | 56.2 | ||
| X-Plane 11.11 (2018) | 115 | 98.9 | 79.7 | 80.2 | ||
| Far Cry 5 (2018) | 158 | 122 | 113 | 107 | ||
| Strange Brigade (2018) | 405 | 199 | 163 | 143 | ||
| Far Cry New Dawn (2019) | 133 | 108 | 103 | 91 | ||
| F1 2020 (2020) | 266 | 178 | 158 | 125 | ||
| Cyberpunk 2077 1.0 (2020) | 112.1 | 75.4 | 62 | 53.7 | ||
| F1 2021 (2021) | 276 | 179 | 161 | 91.2 | 67.1 | 37.1 |
排放物--微星笔记本电脑变得又吵又热
噪声排放
在 "正常 "风扇模式下,风扇不会变得非常响亮,但它们也不会自行转到全速。这意味着,在某些情况下,笔记本电脑会过热得相当快。另一方面,如果你使用组合键将风扇设置为全速运行,从长远来看,游戏笔记本的巨大噪音会变得相当恼人。因此,好的耳机是长时间游戏的必备品。
Noise level
| Idle |
| 34 / 35 / 36 dB(A) |
| Load |
| 48 / 49 dB(A) |
 | ||
30 dB silent 40 dB(A) audible 50 dB(A) loud |
||
min: | ||
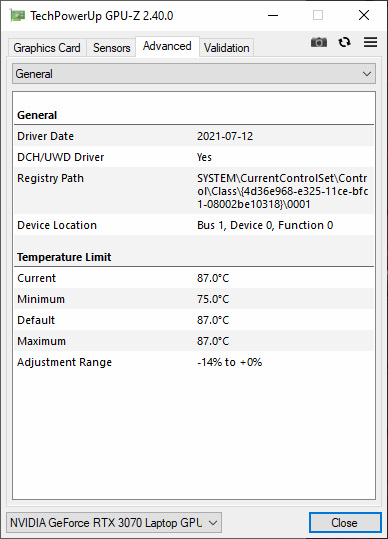
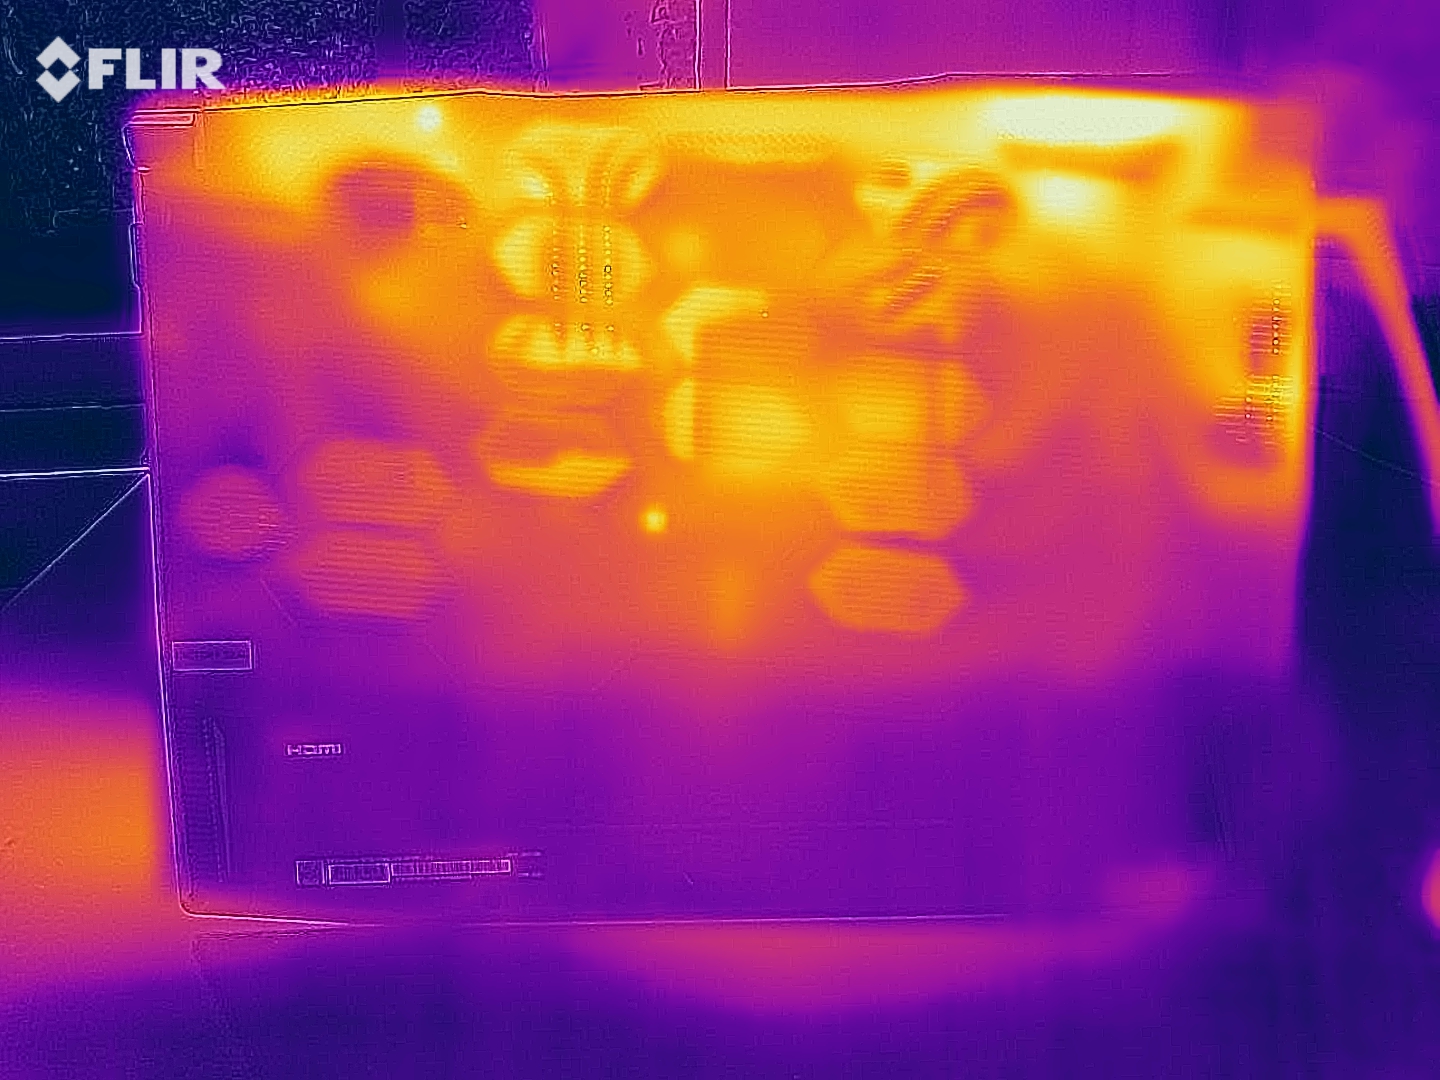
温度
在压力测试中,笔记本电脑的表面变得相当热。在游戏时,键盘的温度会在长时间内变得不舒服。然而,如果你休息一下,表面温度也会迅速下降,10分钟后表面已经感觉凉爽。笔记本电脑的掌托和ClickPad在任何情况下都不会变热。
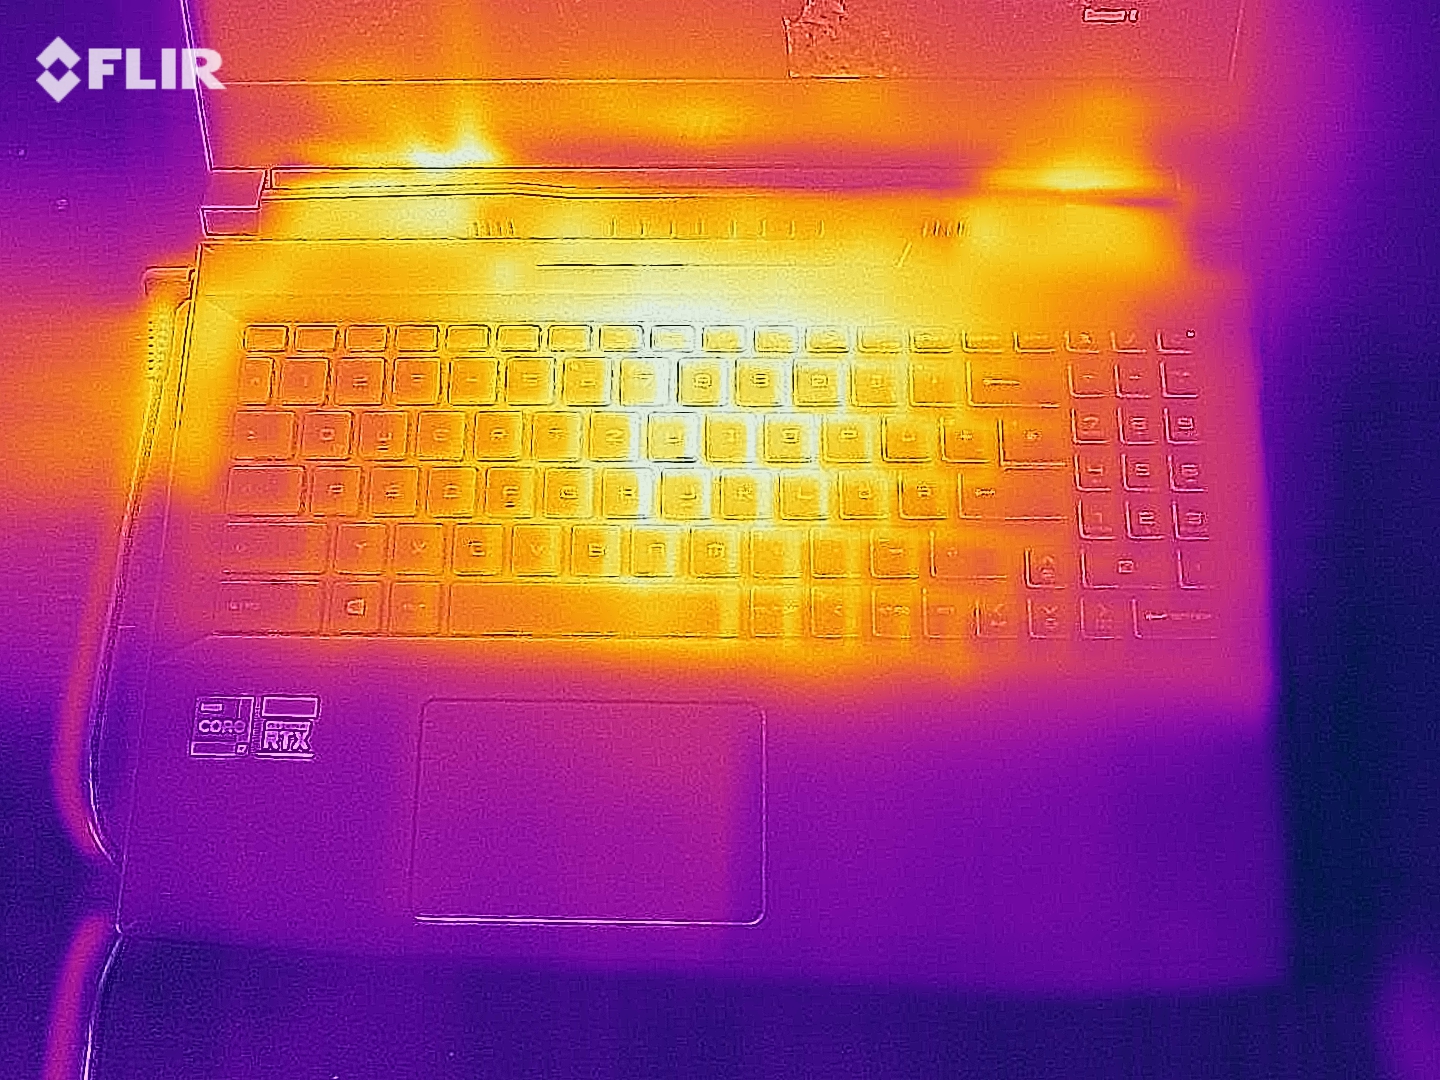
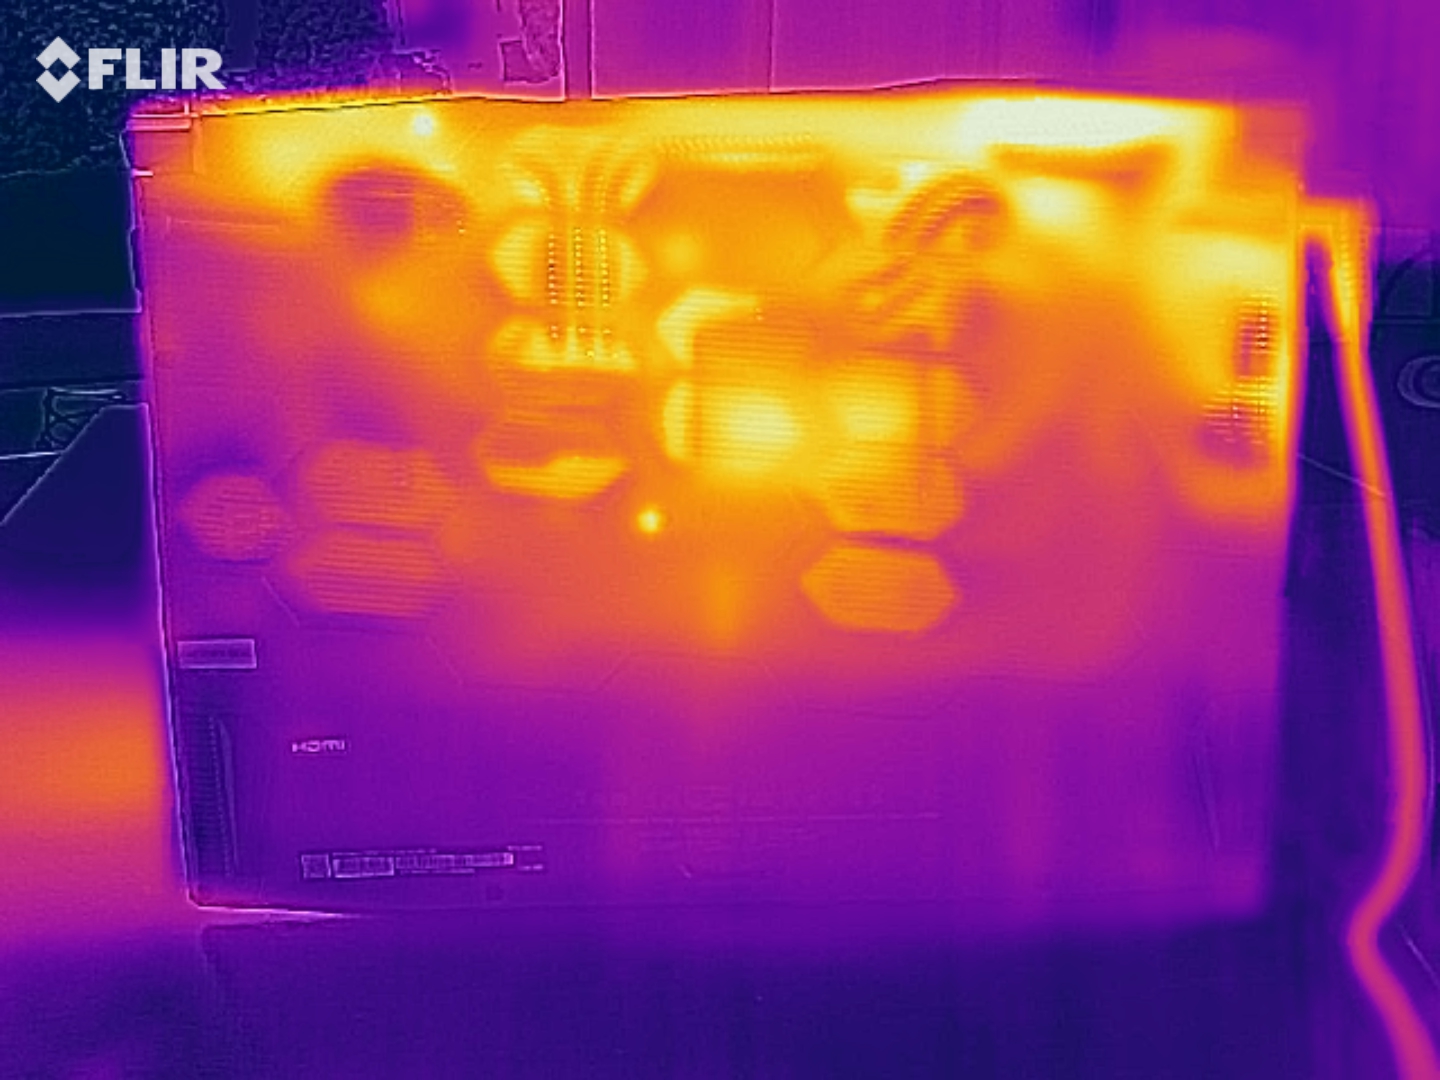
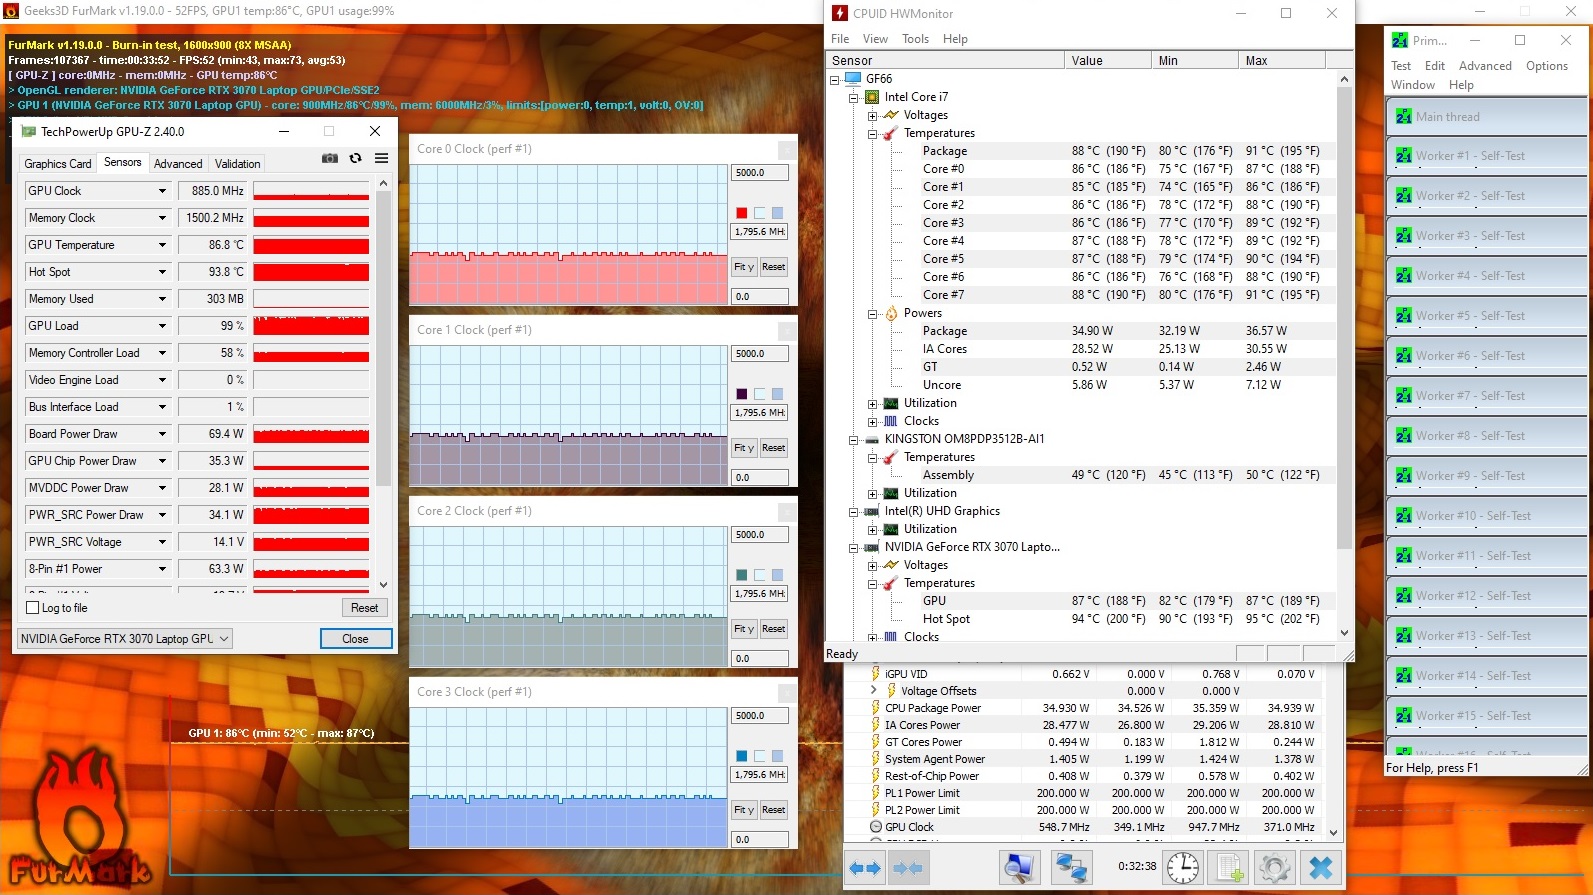
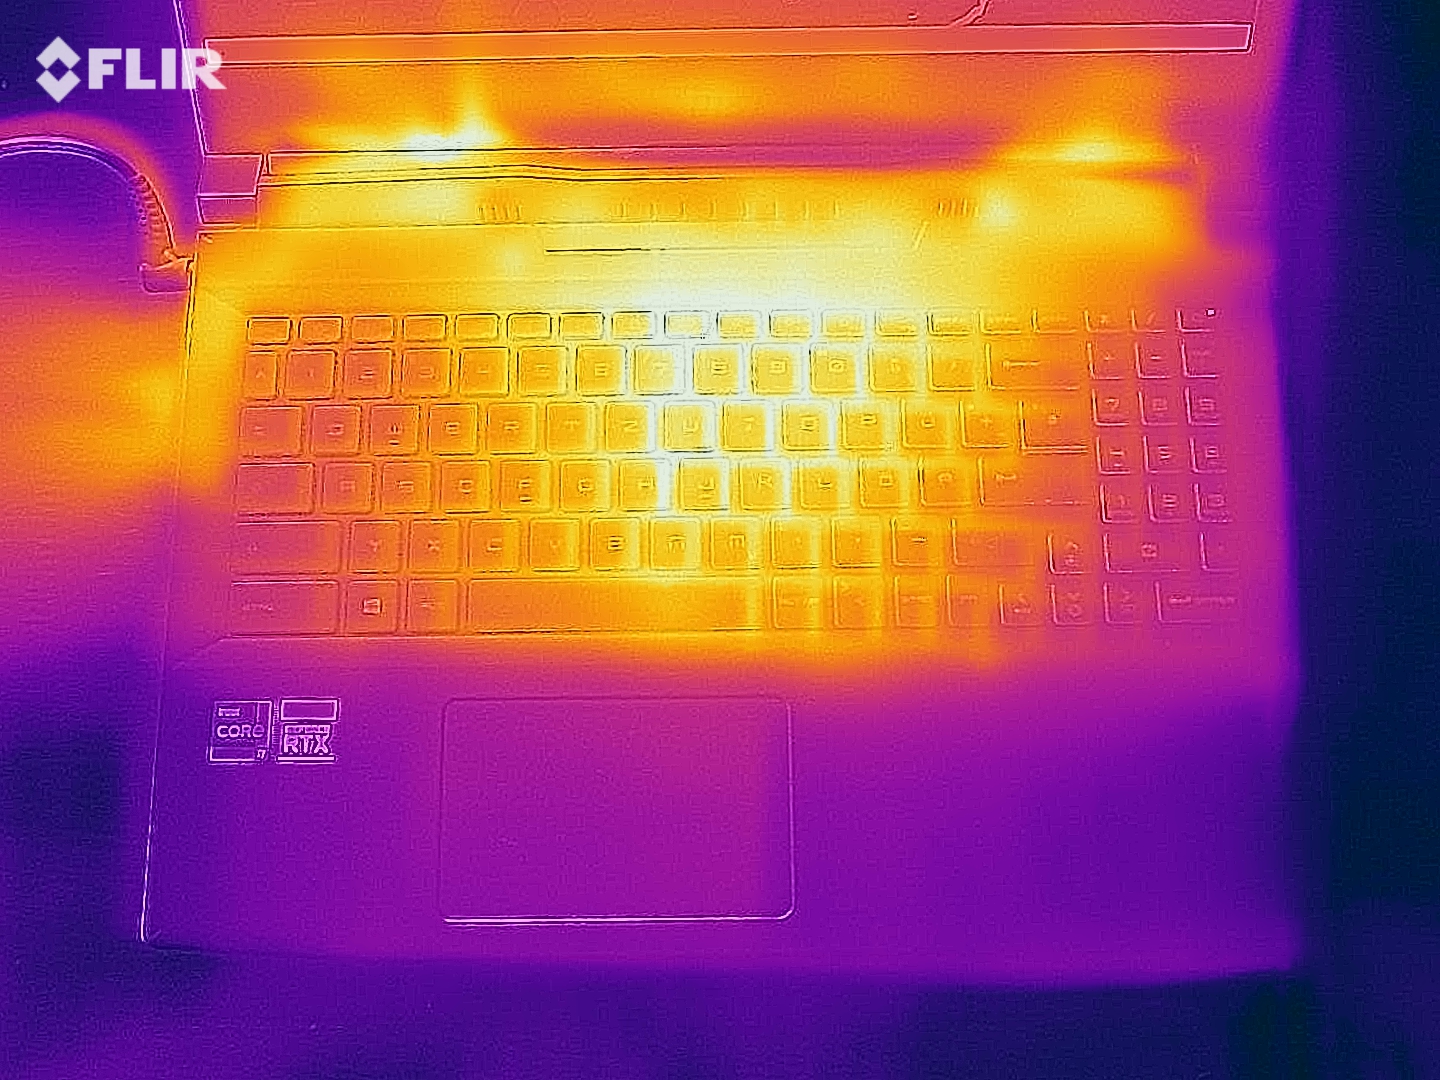
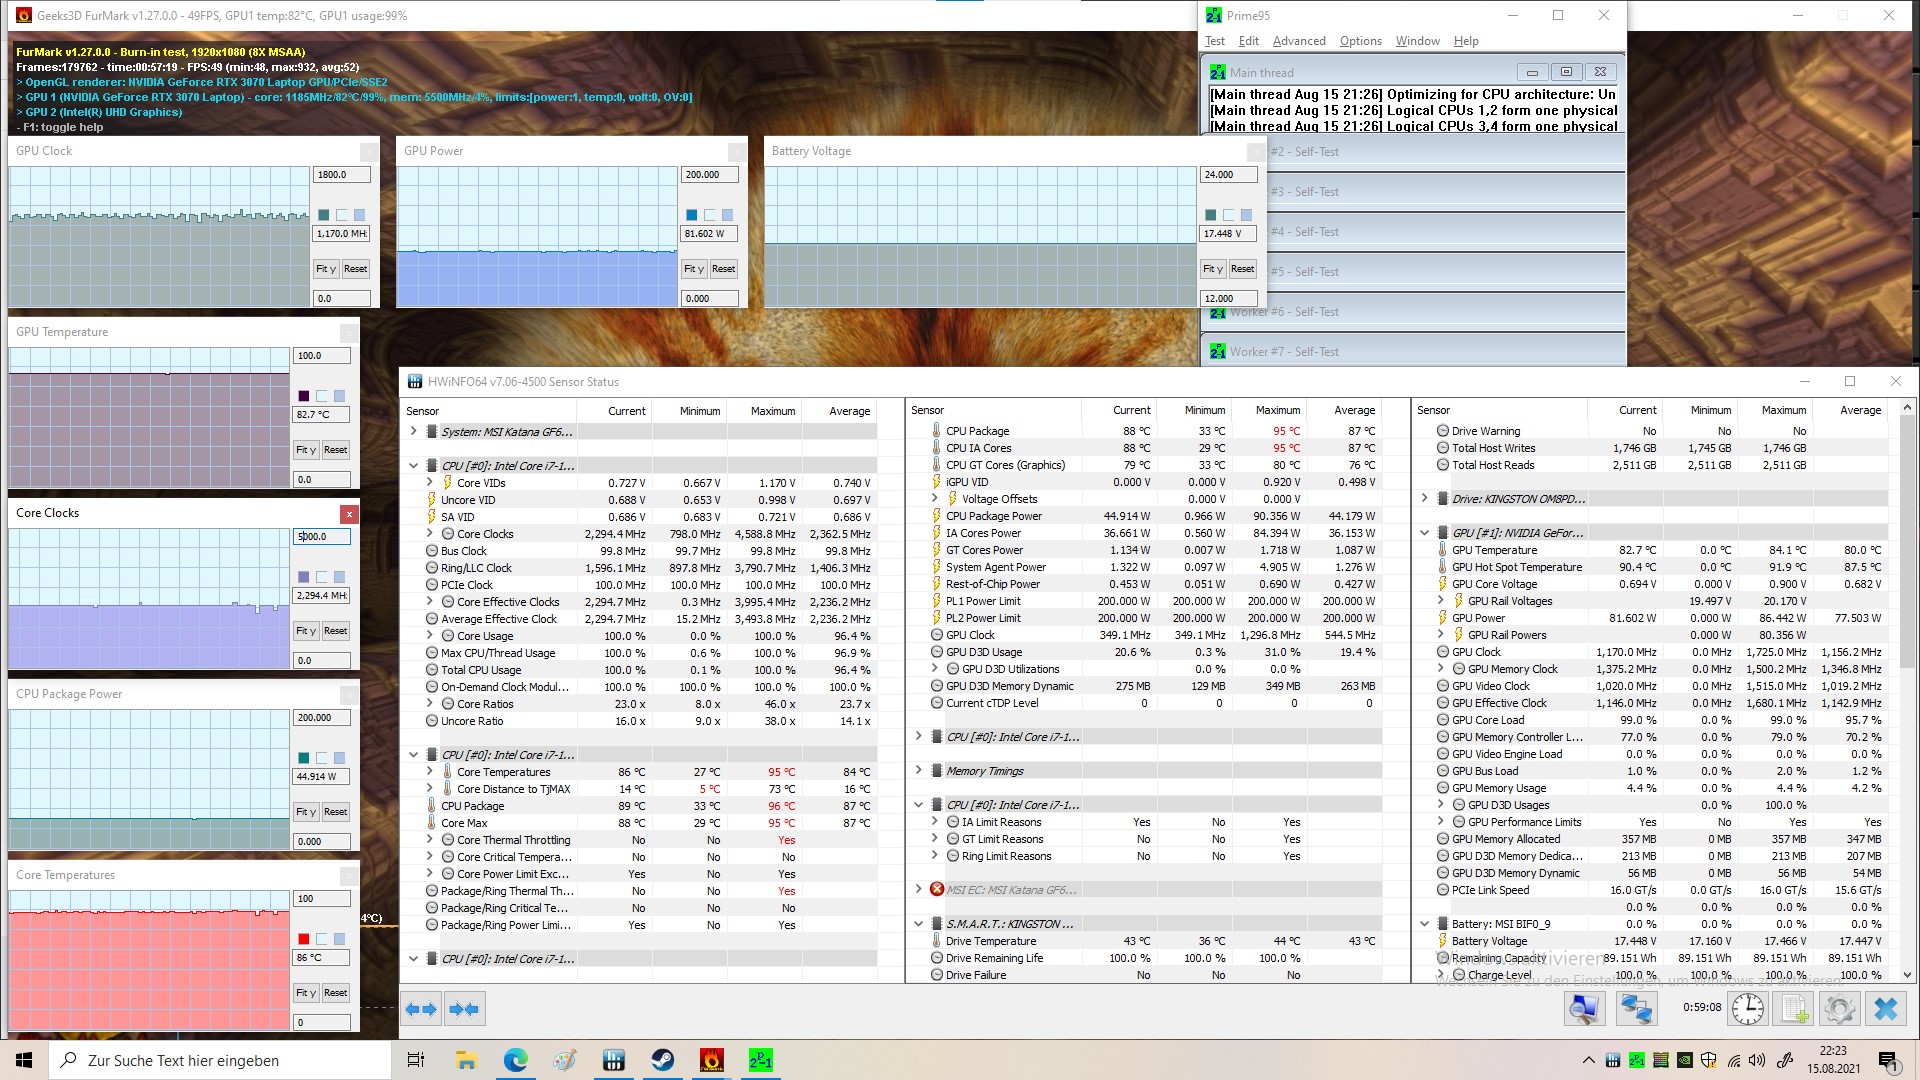
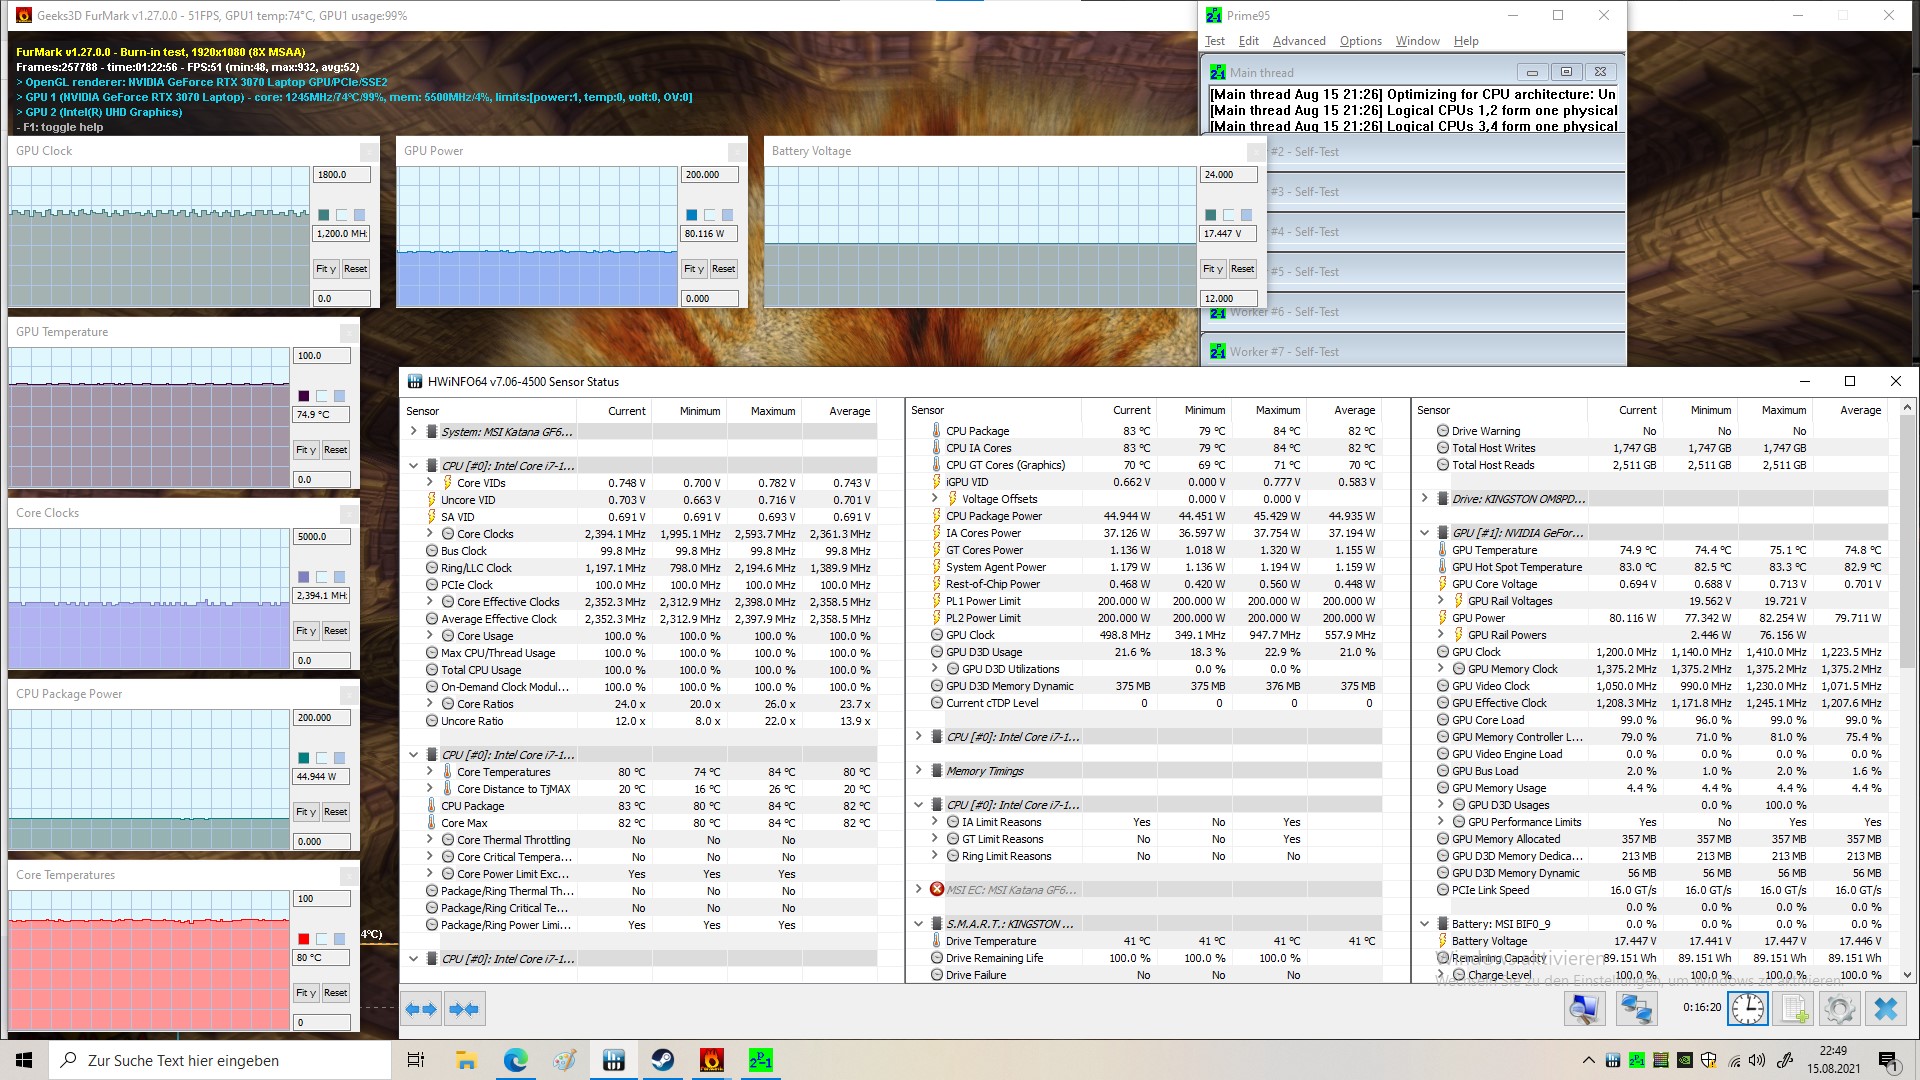
在不把风扇转速提高到全速的情况下,CPU和GPU在压力测试中过热相当快,然后被节流。在第一次压力测试中,我们创建了笔记本电脑的热图。当时,UEFI中的性能计划被设置为平衡模式。在第二次压力测试中,我们使用了UEFI中的性能模式。总的来说,我们确定图形和处理器温度几乎没有受到影响。
在第二次压力测试之后,我们在风扇以最大速度运行的情况下,将笔记本电脑又运行了20分钟。在此期间,CPU和GPU的平均温度分别下降了约5℃(9°F)。
(-) The maximum temperature on the upper side is 56 °C / 133 F, compared to the average of 40.4 °C / 105 F, ranging from 21.2 to 68.8 °C for the class Gaming.
(-) The bottom heats up to a maximum of 49 °C / 120 F, compared to the average of 43.2 °C / 110 F
(+) In idle usage, the average temperature for the upper side is 28.9 °C / 84 F, compared to the device average of 33.9 °C / 93 F.
(-) Playing The Witcher 3, the average temperature for the upper side is 45.8 °C / 114 F, compared to the device average of 33.9 °C / 93 F.
(-) The palmrests and touchpad can get very hot to the touch with a maximum of 40 °C / 104 F.
(-) The average temperature of the palmrest area of similar devices was 28.8 °C / 83.8 F (-11.2 °C / -20.2 F).
发言人
微星GF66的扬声器听起来相当尖锐,而且声音不是特别大。如果风扇全速运转,扬声器的音量就很难满足。幸运的是,你也可以通过音频端口或蓝牙连接外部扬声器。
MSI Katana GF66 11UG-220 audio analysis
(±) | speaker loudness is average but good (78 dB)
Bass 100 - 315 Hz
(-) | nearly no bass - on average 21.2% lower than median
(±) | linearity of bass is average (8.6% delta to prev. frequency)
Mids 400 - 2000 Hz
(±) | higher mids - on average 5.4% higher than median
(±) | linearity of mids is average (8.9% delta to prev. frequency)
Highs 2 - 16 kHz
(+) | balanced highs - only 0.8% away from median
(+) | highs are linear (2.1% delta to prev. frequency)
Overall 100 - 16.000 Hz
(±) | linearity of overall sound is average (18.1% difference to median)
Compared to same class
» 57% of all tested devices in this class were better, 8% similar, 35% worse
» The best had a delta of 6%, average was 18%, worst was 132%
Compared to all devices tested
» 38% of all tested devices were better, 8% similar, 54% worse
» The best had a delta of 4%, average was 24%, worst was 134%
Apple MacBook 12 (Early 2016) 1.1 GHz audio analysis
(+) | speakers can play relatively loud (83.6 dB)
Bass 100 - 315 Hz
(±) | reduced bass - on average 11.3% lower than median
(±) | linearity of bass is average (14.2% delta to prev. frequency)
Mids 400 - 2000 Hz
(+) | balanced mids - only 2.4% away from median
(+) | mids are linear (5.5% delta to prev. frequency)
Highs 2 - 16 kHz
(+) | balanced highs - only 2% away from median
(+) | highs are linear (4.5% delta to prev. frequency)
Overall 100 - 16.000 Hz
(+) | overall sound is linear (10.2% difference to median)
Compared to same class
» 7% of all tested devices in this class were better, 2% similar, 91% worse
» The best had a delta of 5%, average was 18%, worst was 53%
Compared to all devices tested
» 5% of all tested devices were better, 1% similar, 94% worse
» The best had a delta of 4%, average was 24%, worst was 134%
Lenovo Legion 5 Pro 16ACH6H (82JQ001PGE) audio analysis
(±) | speaker loudness is average but good (76.1 dB)
Bass 100 - 315 Hz
(±) | reduced bass - on average 10.8% lower than median
(±) | linearity of bass is average (14.7% delta to prev. frequency)
Mids 400 - 2000 Hz
(±) | higher mids - on average 6.7% higher than median
(±) | linearity of mids is average (7.8% delta to prev. frequency)
Highs 2 - 16 kHz
(±) | reduced highs - on average 5.2% lower than median
(±) | linearity of highs is average (8.6% delta to prev. frequency)
Overall 100 - 16.000 Hz
(±) | linearity of overall sound is average (17.4% difference to median)
Compared to same class
» 48% of all tested devices in this class were better, 12% similar, 40% worse
» The best had a delta of 6%, average was 18%, worst was 132%
Compared to all devices tested
» 33% of all tested devices were better, 8% similar, 59% worse
» The best had a delta of 4%, average was 24%, worst was 134%
电源管理 - 强大的90Wh电池最多可以持续9小时
消耗功率
微星GF66游戏笔记本的功耗明显低于平均水平,该笔记本在这里显然比大多数竞争对手更有效率。
| Off / Standby | |
| Idle | |
| Load |
|
Key:
min: | |
| MSI Katana GF66 11UG-220 i7-11800H, GeForce RTX 3070 Laptop GPU | Lenovo Legion 5 Pro 16ACH6H (82JQ001PGE) R7 5800H, GeForce RTX 3070 Laptop GPU | Gigabyte Aero 15 OLED XD i7-11800H, GeForce RTX 3070 Laptop GPU | Asus TUF Dash F15 FX516PR i7-11370H, GeForce RTX 3070 Laptop GPU | Razer Blade 15 Advanced (Mid 2021) i7-11800H, GeForce RTX 3080 Laptop GPU | Schenker XMG Neo 15 Tiger Lake i7-11800H, GeForce RTX 3080 Laptop GPU | Average of class Gaming | |
|---|---|---|---|---|---|---|---|
| Power Consumption | -14% | -64% | 6% | -61% | -34% | -40% | |
| Idle Minimum * (Watt) | 8 | 10.45 -31% | 23 -188% | 9 -13% | 19.5 -144% | 15 -88% | 13.2 ? -65% |
| Idle Average * (Watt) | 12 | 14.92 -24% | 26 -117% | 11 8% | 23.3 -94% | 17 -42% | 18.9 ? -58% |
| Idle Maximum * (Watt) | 22 | 16.02 27% | 34 -55% | 16 27% | 40.1 -82% | 22 -0% | 24.5 ? -11% |
| Load Average * (Watt) | 98 | 119.65 -22% | 99 -1% | 107 -9% | 98.9 -1% | 101 -3% | 108.8 ? -11% |
| Witcher 3 ultra * (Watt) | 152 | 174.9 -15% | 163 -7% | 121 20% | 174 -14% | 195 -28% | |
| Load Maximum * (Watt) | 162 | 187.26 -16% | 190 -17% | 162 -0% | 214 -32% | 230 -42% | 254 ? -57% |
* ... smaller is better
Power Consumption The Witcher 3
电池寿命
冲浪时超过5小时,空闲时超过9小时,微星笔记本电脑的电池提供了相当体面的运行时间。在满负荷的情况下,如果考虑到高系统性能,70分钟的电池寿命也是不错的。总的来说,目前的游戏笔记本电脑已经获得了一些耐力。有了这些数值,GF66笔记本电脑在去年仍会取得相当好的成绩,但目前这只能让它处于该领域的中间位置。
| MSI Katana GF66 11UG-220 i7-11800H, GeForce RTX 3070 Laptop GPU, 90 Wh | Lenovo Legion 5 Pro 16ACH6H (82JQ001PGE) R7 5800H, GeForce RTX 3070 Laptop GPU, 80 Wh | Gigabyte Aero 15 OLED XD i7-11800H, GeForce RTX 3070 Laptop GPU, 99 Wh | Asus TUF Dash F15 FX516PR i7-11370H, GeForce RTX 3070 Laptop GPU, 76 Wh | Razer Blade 15 Advanced (Mid 2021) i7-11800H, GeForce RTX 3080 Laptop GPU, 80 Wh | Schenker XMG Neo 15 Tiger Lake i7-11800H, GeForce RTX 3080 Laptop GPU, 93 Wh | Average of class Gaming | |
|---|---|---|---|---|---|---|---|
| Battery runtime | -3% | 60% | 74% | 11% | 66% | 17% | |
| Reader / Idle (h) | 9.1 | 9.1 0% | 16 76% | 8.71 ? -4% | |||
| WiFi v1.3 (h) | 5.3 | 7 32% | 8.5 60% | 9.1 72% | 5.9 11% | 5.6 6% | 6.96 ? 31% |
| Load (h) | 1.2 | 0.7 -42% | 2.7 125% | 1.47 ? 23% | |||
| Witcher 3 ultra (h) | 2.2 | ||||||
| H.264 (h) | 5.9 | 8.28 ? |
Pros
Cons
结论 - 有待改进

微星Katana GF6611UG-220是一个坚实的游戏设备。然而,你会在这台笔记本电脑中徒劳地寻找任何特殊的性能或设备特性。另一方面,它的性能也不必隐藏。至少在移动PC领域,目前英特尔处理器的性能接近强大的AMD处理器。有了NvidiaGeForce RTX 3070,你至少可以获得一个体面的游戏体验。
不幸的是,微星Katana GF66并没有充分开发其潜力。
这款游戏笔记本的可用软件(至少在测试时的德国微星主页上)还有待改进。我们至少希望有一个工具来控制性能,而不必重新启动笔记本电脑。键盘的驱动程序也可以有一些改进。
特别是在Nvidia芯片的性能方面,我们还可以想到通过使用更大的电源来进行一些改进。显卡的性能明显受到85瓦的微薄TGP的阻碍。
然而,我们也得出总体结论,这款游戏笔记本电脑运行得很干净。那些不看每一帧帧率的人将能够在没有任何问题的情况下用这台笔记本电脑玩目前的游戏,获得一些乐趣。
尽管这款笔记本电脑的价格水平仍处于入门级领域,但目前约1600欧元(约1891美元)的购买价格对于没有Windows系统的笔记本电脑来说相当高。
价格和可用性
微星Katana GF66 11UG-600配备英特尔Core i7和Nvidia RTX 3050,目前可从亚马逊售价1699美元在美国。
MSI Katana GF66 11UG-220
- 09/13/2021 v7 (old)
Marc Herter
Price comparison

