惠普Omen 16笔记本电脑回顾。强大的RTX 3070游戏笔记本有不必要的缺点
惠普Omen 16是今年新推出的。旧的Omen 15仍然没有看到直接的继承者。相反,惠普为一个15.6英寸的机箱安装了一个16.1英寸的显示屏。因此,现在的边框更小,而且机箱的结构也有小的差别。与去年的机型相比,当然也有CPU (Tiger Lake)和GPU ( RTX 3000 )的升级。
当然,我们将把我们的测试设备与它的前辈,即 HP Omen 15 (Ryzen 4000和RTX 2060)和它的新兄弟姐妹,即 惠普Victus 16(Ryzen 5000和RTX 3060)。.此外,我们还选择了装备类似的 联想Legion 5 Pro 16以及更昂贵的 Alienware x15 R1和 MSI Katana GF66 11UG作为我们比较的设备。
Potential competitors in comparison
Rating | Date | Model | Weight | Height | Size | Resolution | Price |
|---|---|---|---|---|---|---|---|
| 86.6 % v7 (old) | 10 / 2021 | HP Omen 16-b0085ng i7-11800H, GeForce RTX 3070 Laptop GPU | 2.4 kg | 23 mm | 16.10" | 1920x1080 | |
| 82.8 % v7 (old) | HP Omen 15-en0375ng R7 4800H, GeForce RTX 2060 Mobile | 2.2 kg | 23 mm | 15.60" | 1920x1080 | ||
| 84.3 % v7 (old) | 10 / 2021 | HP Victus 16-e0179ng R7 5800H, GeForce RTX 3060 Laptop GPU | 2.5 kg | 23.5 mm | 16.10" | 1920x1080 | |
| 87.4 % v7 (old) | 08 / 2021 | Lenovo Legion 5 Pro 16ACH6H (82JQ001PGE) R7 5800H, GeForce RTX 3070 Laptop GPU | 2.6 kg | 26.85 mm | 16.00" | 2560x1600 | |
| 87.2 % v7 (old) | 10 / 2021 | Alienware x15 RTX 3070 P111F i7-11800H, GeForce RTX 3070 Laptop GPU | 2.4 kg | 15.9 mm | 15.60" | 2560x1440 | |
| 79.2 % v7 (old) | 09 / 2021 | MSI Katana GF66 11UG-220 i7-11800H, GeForce RTX 3070 Laptop GPU | 2.3 kg | 25 mm | 15.60" | 1920x1080 |
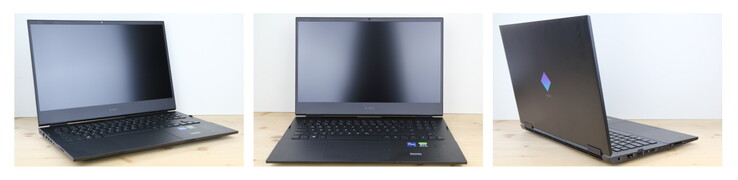
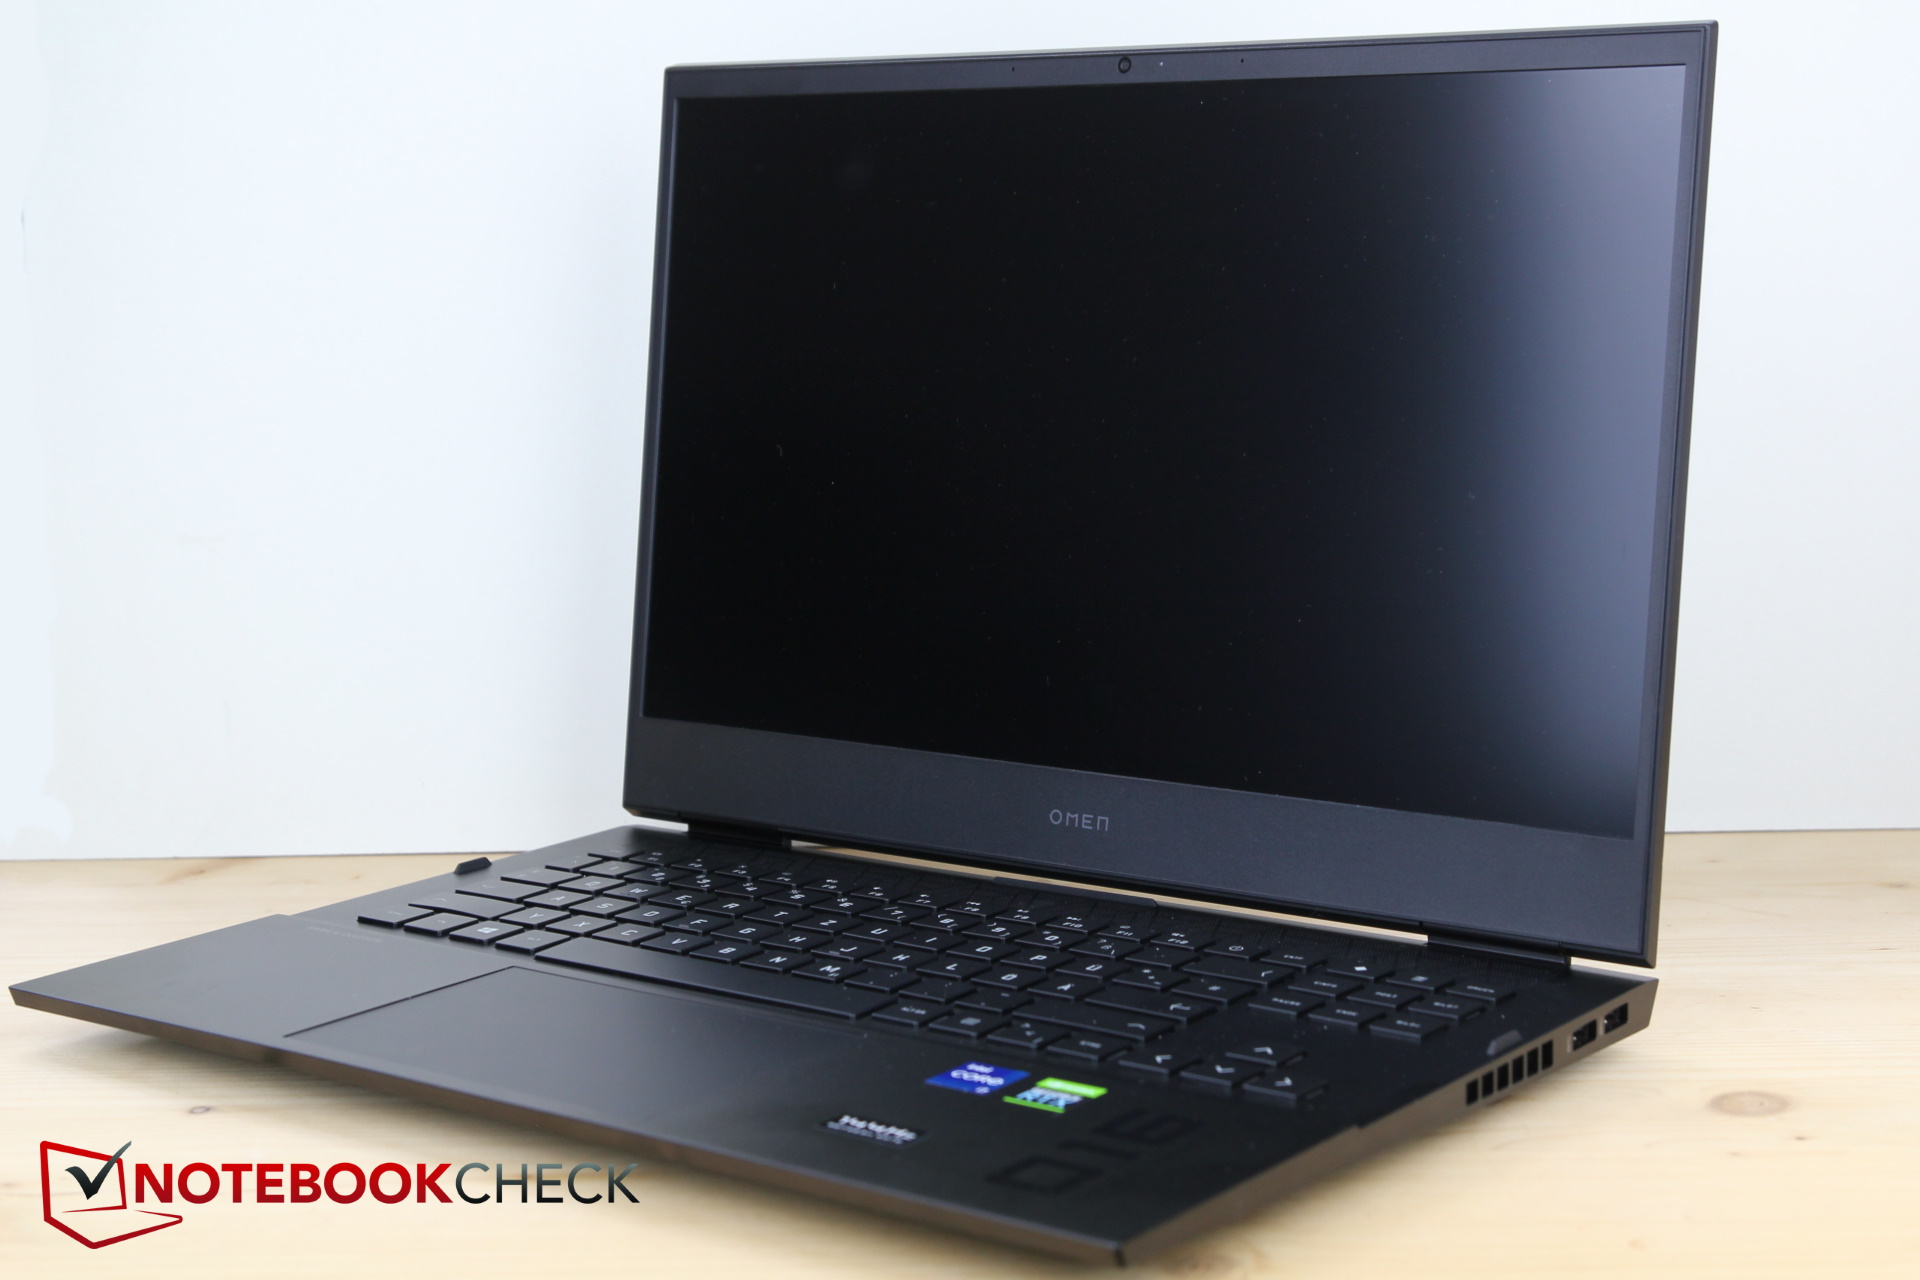
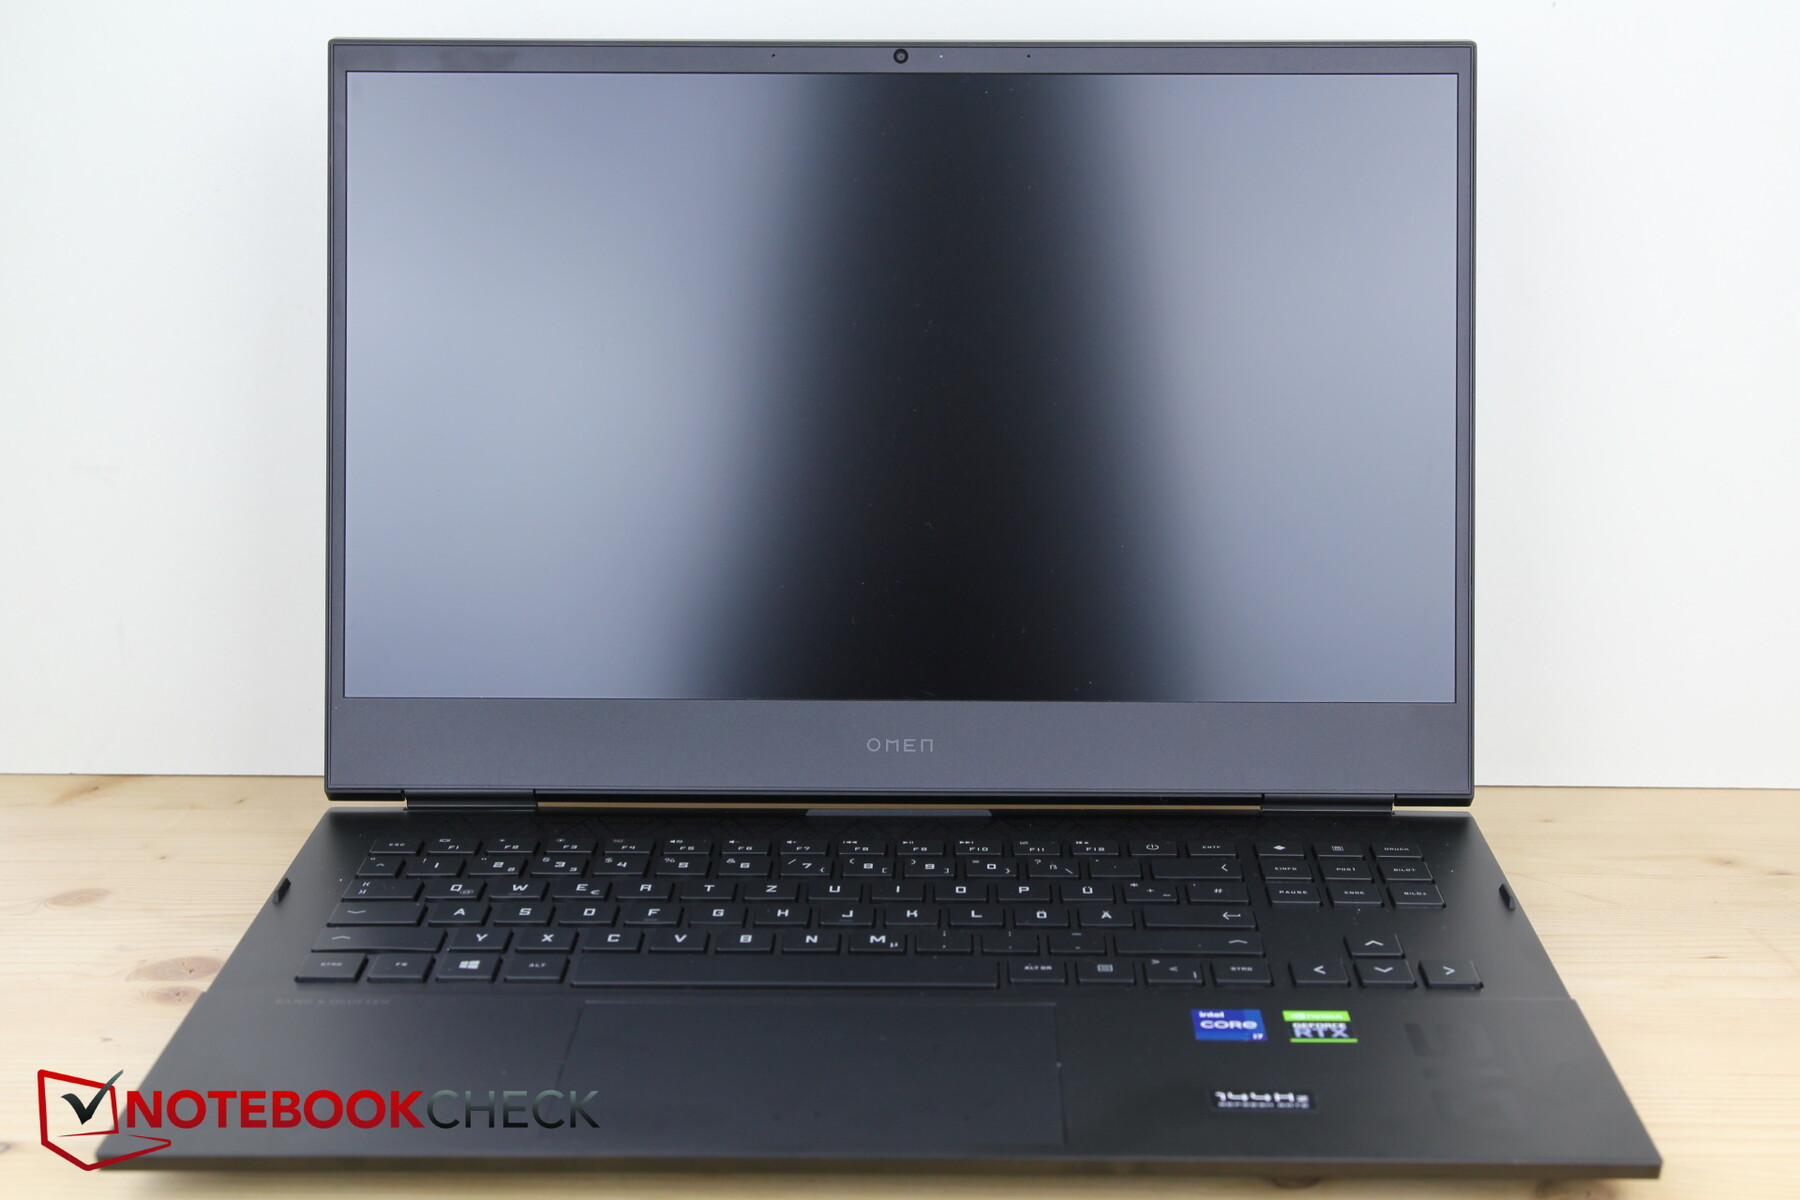
底座 - 惠普Omen的小更新
底盘与去年的模型几乎没有什么不同。例如,材料、端口布局或设计变化方面的差异只有在仔细检查后才会发现。
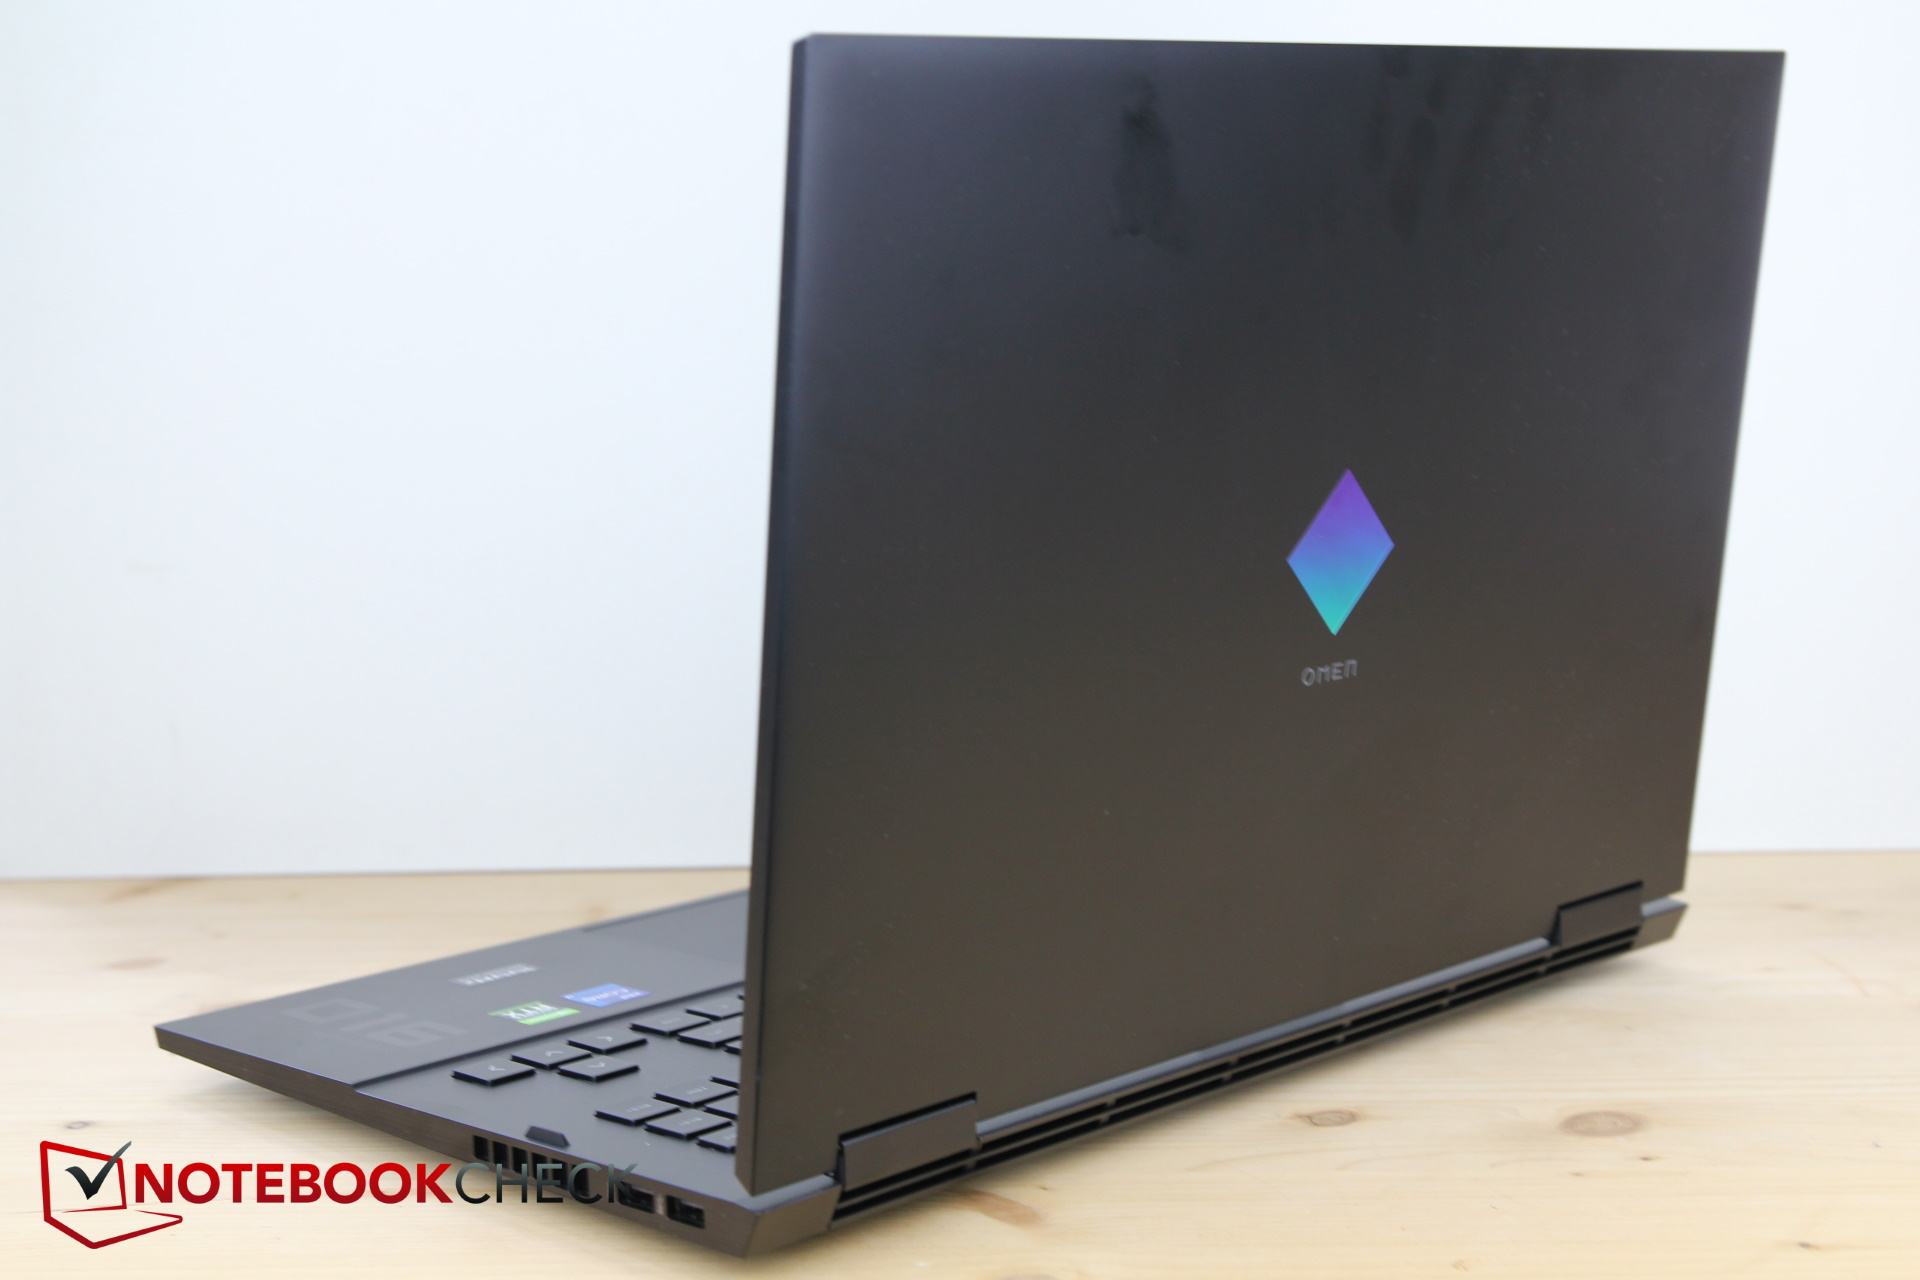
底座现在几乎完全由发黑的金属组成,显示屏框架由硬塑料制成,而边框则由较软的塑料制成,是一块真正的指纹磁铁。虽然金属底座在少量的压力下会略微弯曲,而且显示屏相当容易扭曲,然后导致IPS屏幕上出现严重的出血现象,但它总体上给人一种非常坚实的印象。
虽然盖子可以单手打开,但两个铰链可以更牢固以更好地防止摇晃。
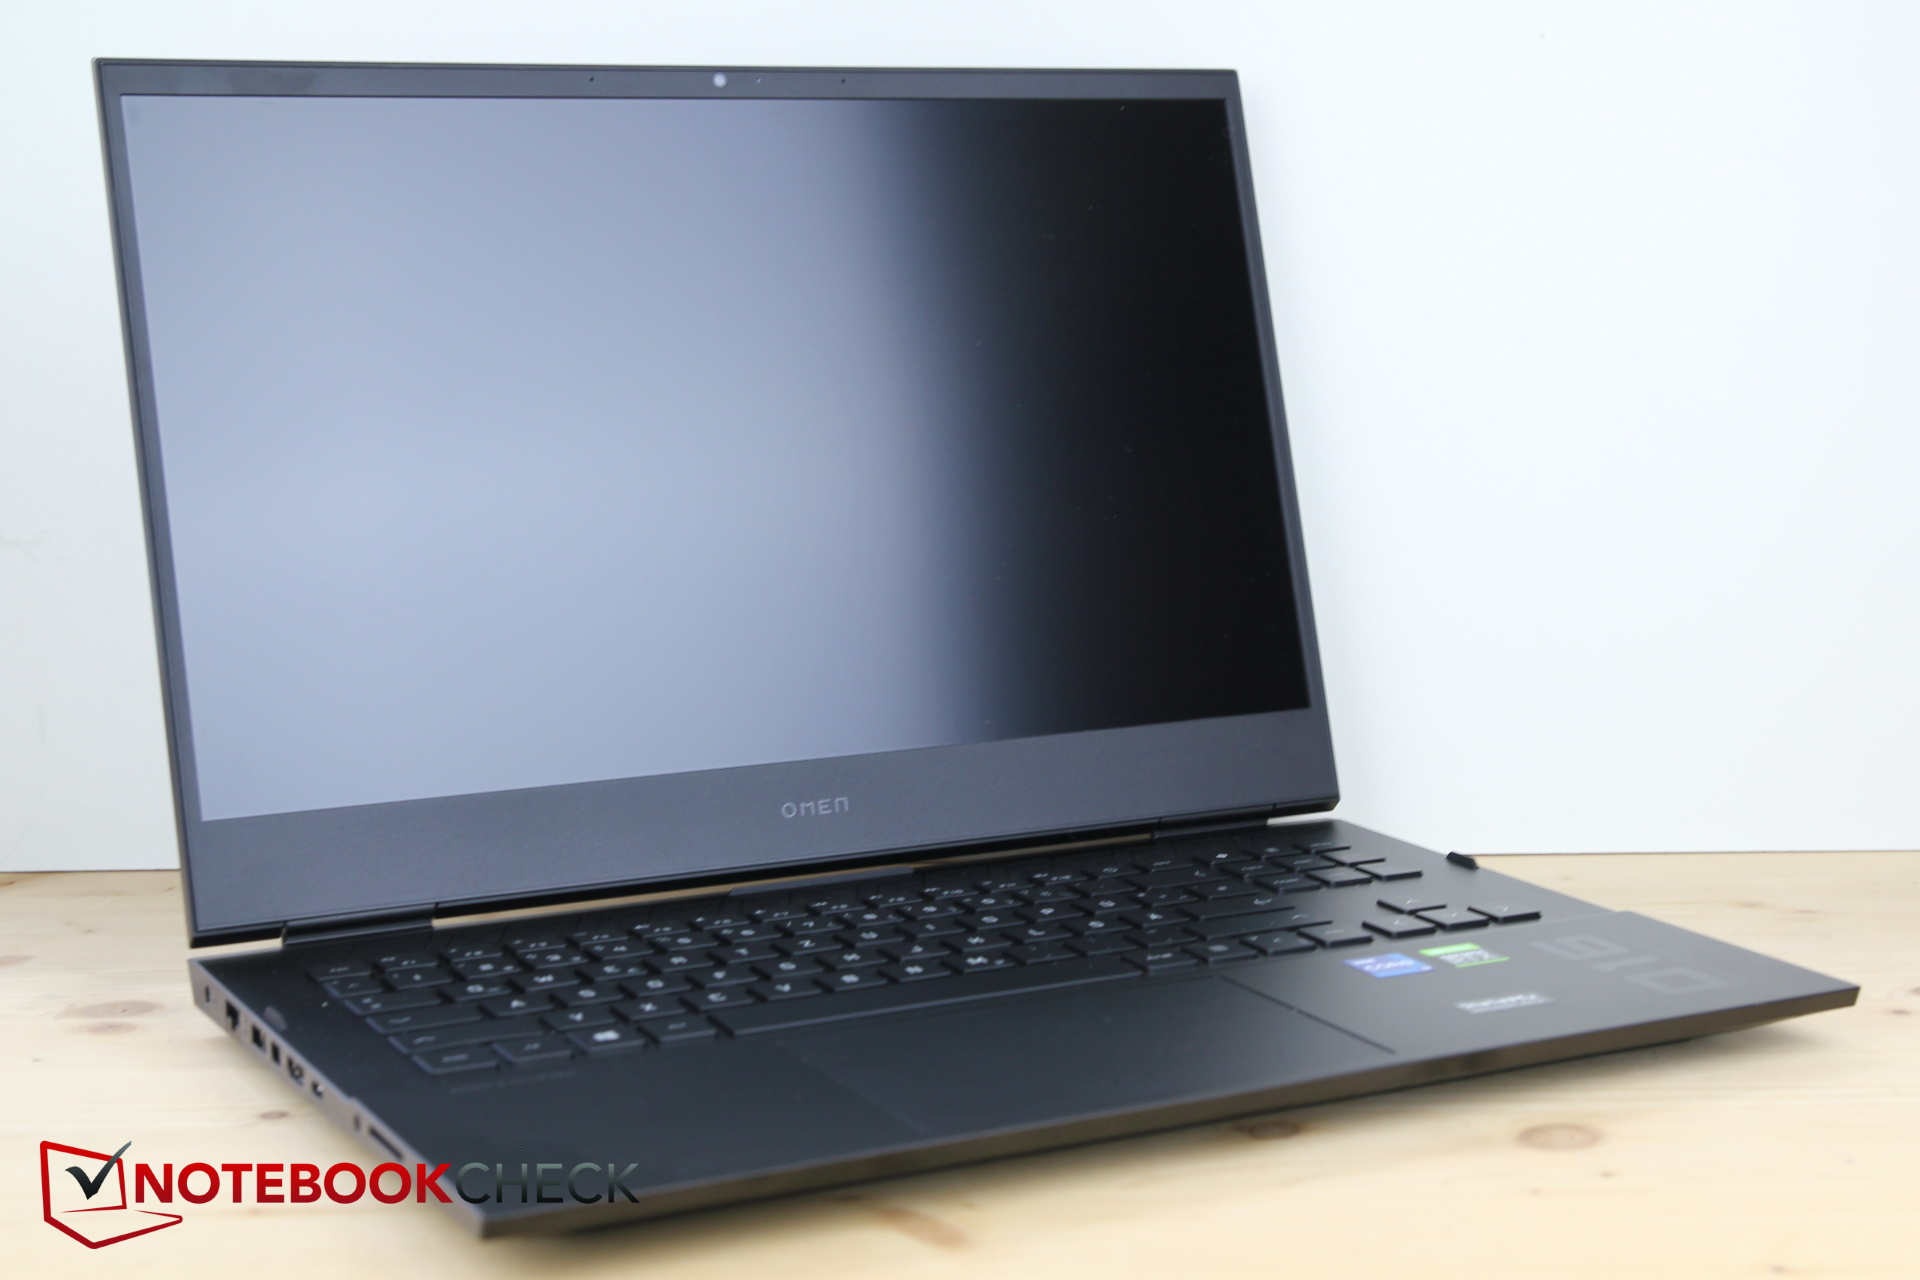
与Omen 15相比,Omen 16的宽度和深度略大。虽然宽度差不多,但惠普Victus的深度要长1厘米左右。然而,其他15英寸的竞争对手并不一定更紧凑。虽然Omen 16和Victus 16比15英寸机型更宽,但Legion 5 Pro和Alienware在深度上都更长。
最后,与Omen 15相比,Omen 16增加了200克,这仍然使它比大多数竞争对手更轻。
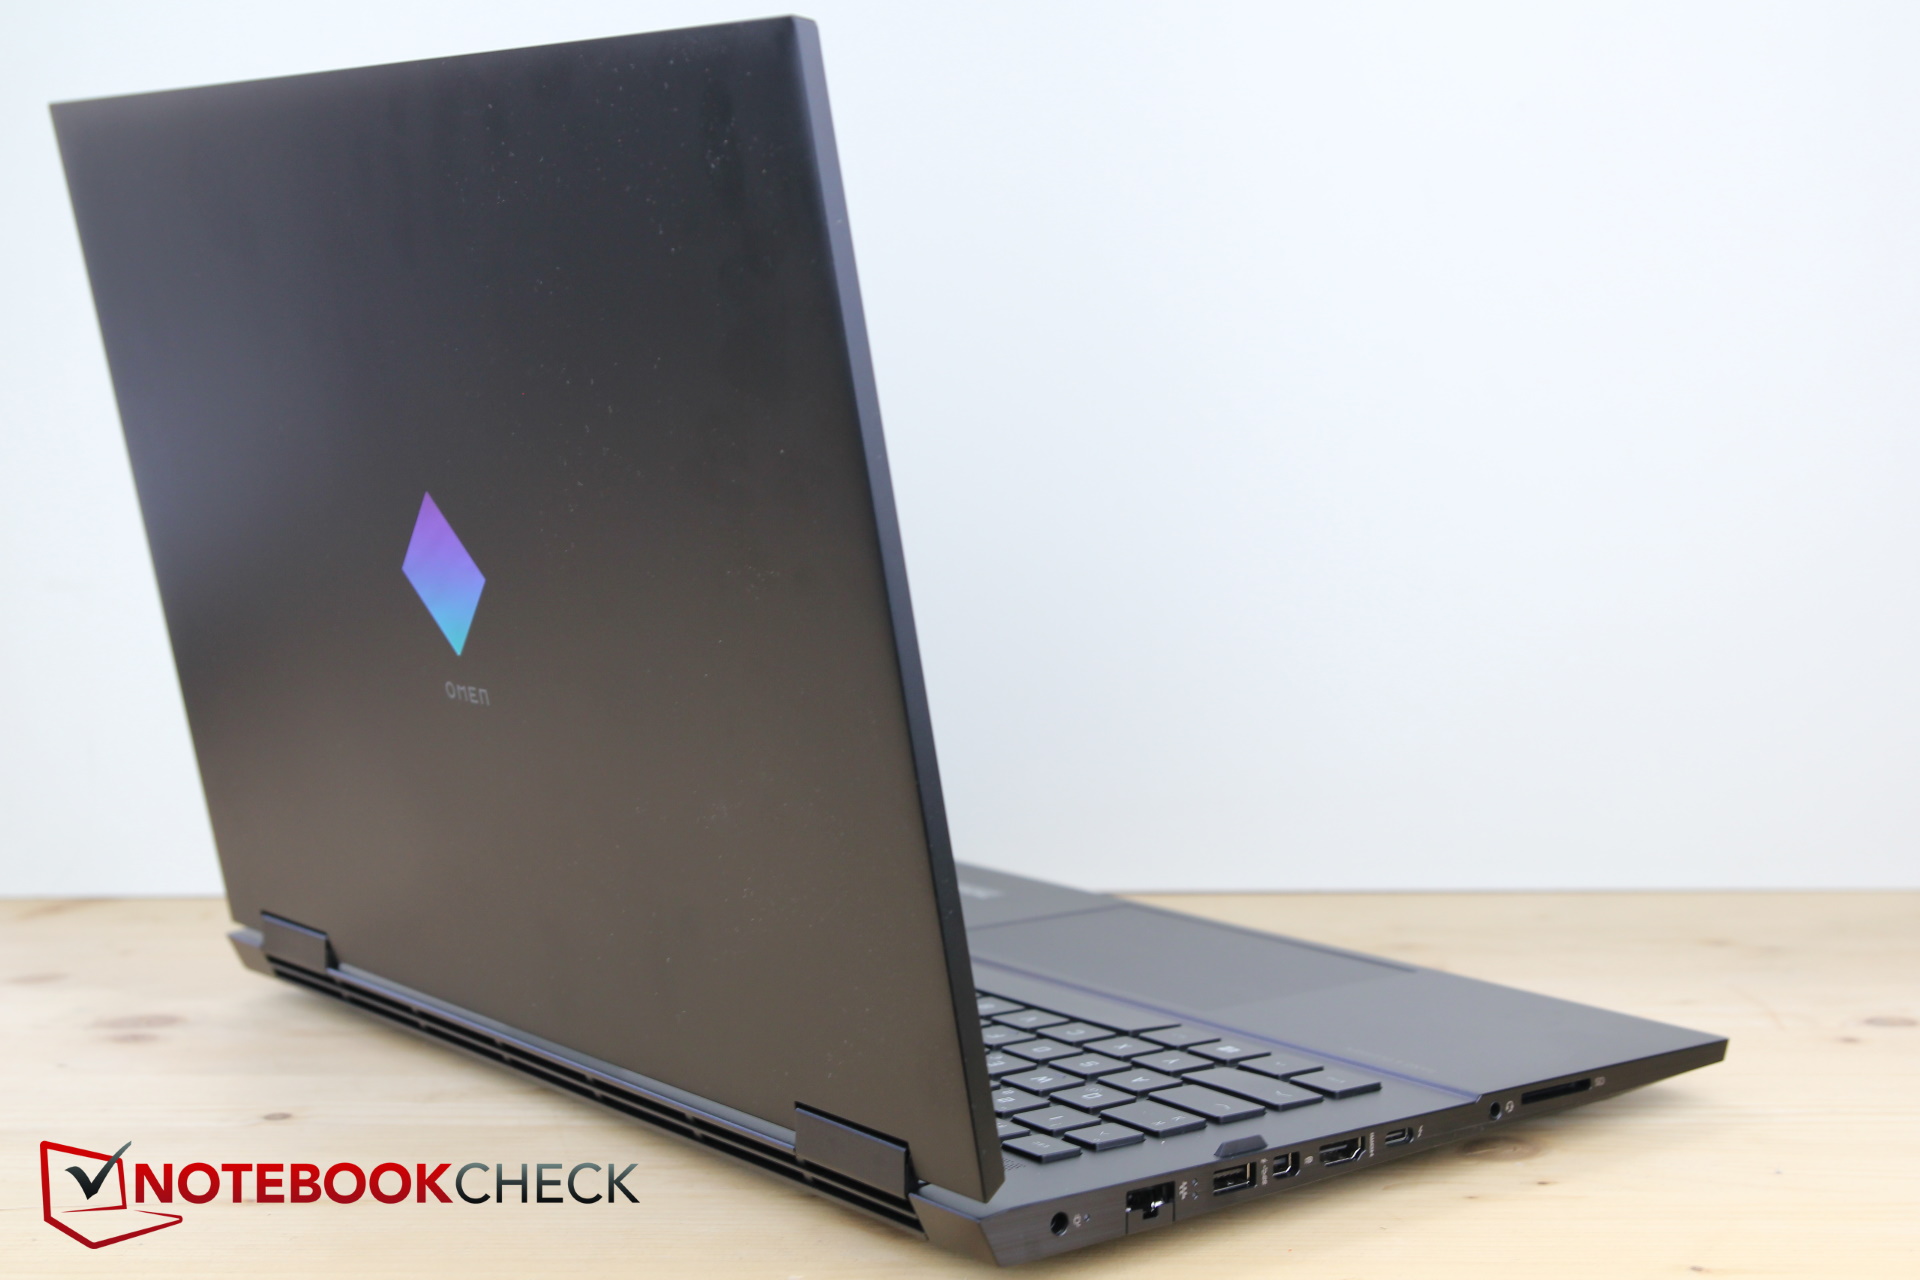
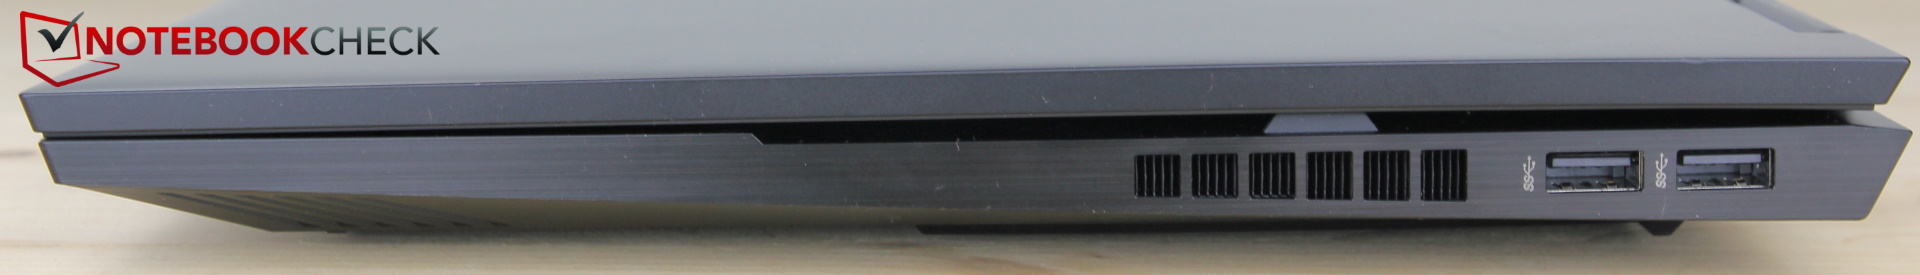
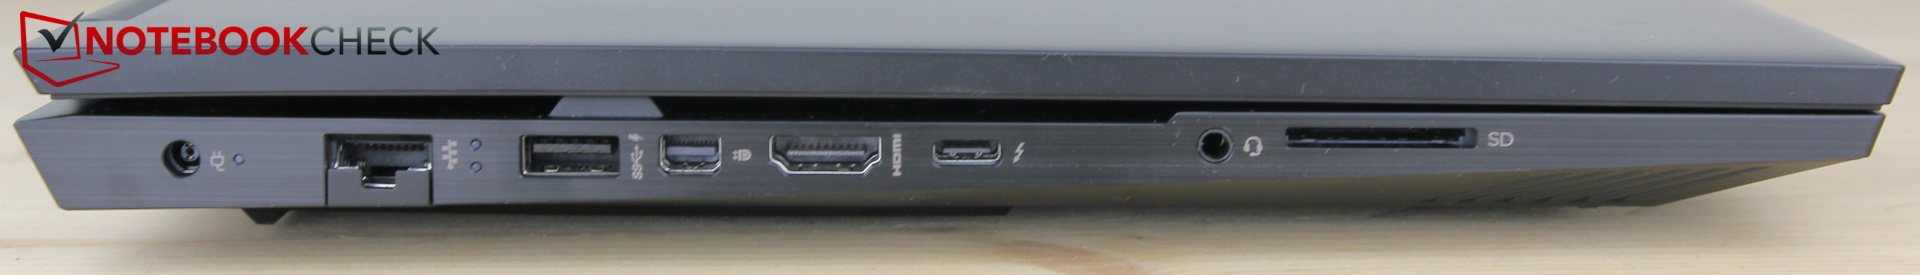
连接性 - Thunderbolt 4,否则只有USB 3.0
尽管右撇子用户会很高兴听到在机箱右侧的最顶端只有两个USB-A接口,但它们之间的空间太小了,甚至只是一个小的滑盖式U盘都无法放在更小的USB鼠标线旁边。
其余的端口位于左侧,间距也非常紧凑,这可能会导致电缆阻碍附近的接口。值得庆幸的是,这种分布方式(如USB-A旁边的miniDP)应该能大部分解决这个问题。前面和后面都没有端口。
带有Thunderbolt 4和type-C外形尺寸的USB 4端口是一个优点。尽管剩下的三个USB-A端口被惠普标记为 "超高速",但只支持3.0标准。
弹簧式读卡器可以接受全尺寸的SD卡。它们几乎完全消失在机箱内,没有不必要地突出它。
SD卡阅读器
SD卡阅读器的传输往往低于平均水平。从我们的参考存储卡AV PRO microSD 128 GB V60复制1GB的图片到桌面需要将近18秒。平均来说,我们数据库中的游戏笔记本都配备了明显更快的型号,更昂贵的Alienware显示了在速度方面的可能性。在光谱的另一端,有联想和微星,两者都没有SD卡读卡器。
| SD Card Reader | |
| average JPG Copy Test (av. of 3 runs) | |
| Alienware x15 RTX 3070 P111F (AV Pro V60) | |
| Average of class Gaming (20.9 - 210, n=54, last 2 years) | |
| HP Victus 16-e0179ng (AV PRO microSD 128 GB V60) | |
| HP Omen 15-en0375ng (Toshiba Exceria Pro SDXC 64 GB UHS-II) | |
| HP Omen 16-b0085ng (AV PRO microSD 128 GB V60) | |
| maximum AS SSD Seq Read Test (1GB) | |
| Alienware x15 RTX 3070 P111F (AV Pro V60) | |
| Average of class Gaming (25.5 - 261, n=51, last 2 years) | |
| HP Omen 15-en0375ng (Toshiba Exceria Pro SDXC 64 GB UHS-II) | |
| HP Omen 16-b0085ng (AV PRO microSD 128 GB V60) | |
| HP Victus 16-e0179ng (AV PRO microSD 128 GB V60) | |
沟通
除了1-Gbps的LAN,Omen 16还通过其英特尔AX210模块支持Wi-Fi 6E。后者能够达到千兆的速度,只是与我们的期望相差甚远。
网络摄像头
惠普已经解决了一个720p的网络摄像头。有了惠普宽视角,摄像头可以捕捉到88度的角度,导致很多环境都可以看到,而不是一个人占满屏幕。这对于视频通话来说可能是可取的,也可能是不可取的。
其他方面的质量与市场上的低标准相匹配,图像比较有颗粒感,颜色也很模糊。自动亮度表现得很奇怪,最初对人脸过度曝光,但片刻之后又严厉地调整亮度曲线,这使得背景看起来特别暗。

")
")
安全问题
Omen 16缺少Kensington锁和指纹传感器。由于采用了CPU,当然支持TPM 2.0。
配件和保修
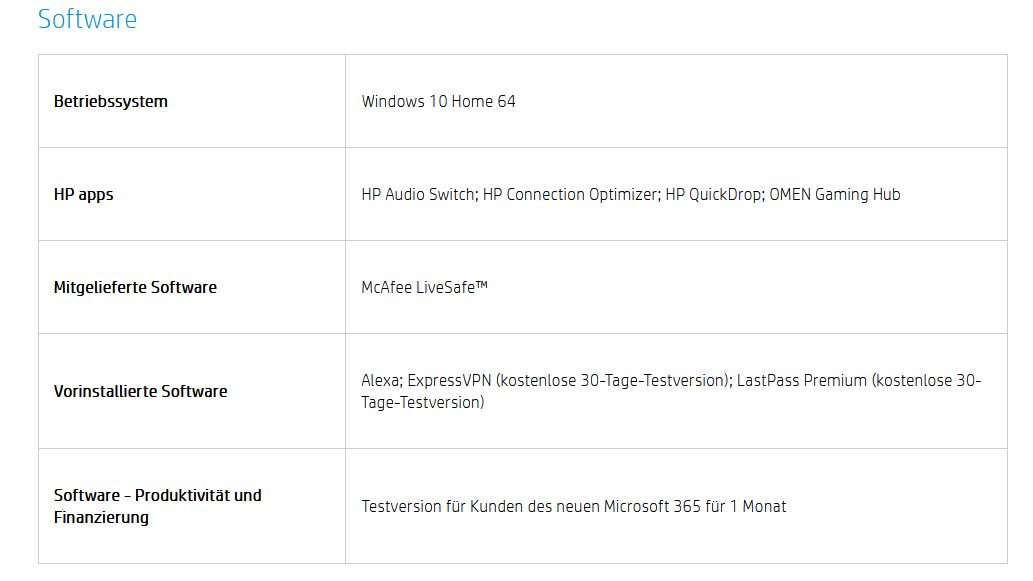
包装中没有任何额外的配件。Omen 16默认包括预装的软件试用版,如ExpressVPN(30天免费试用版)、LastPass Premium(30天免费试用版)和微软365的1个月许可证。对此感到恼火的用户将不得不手动安装这些应用程序。
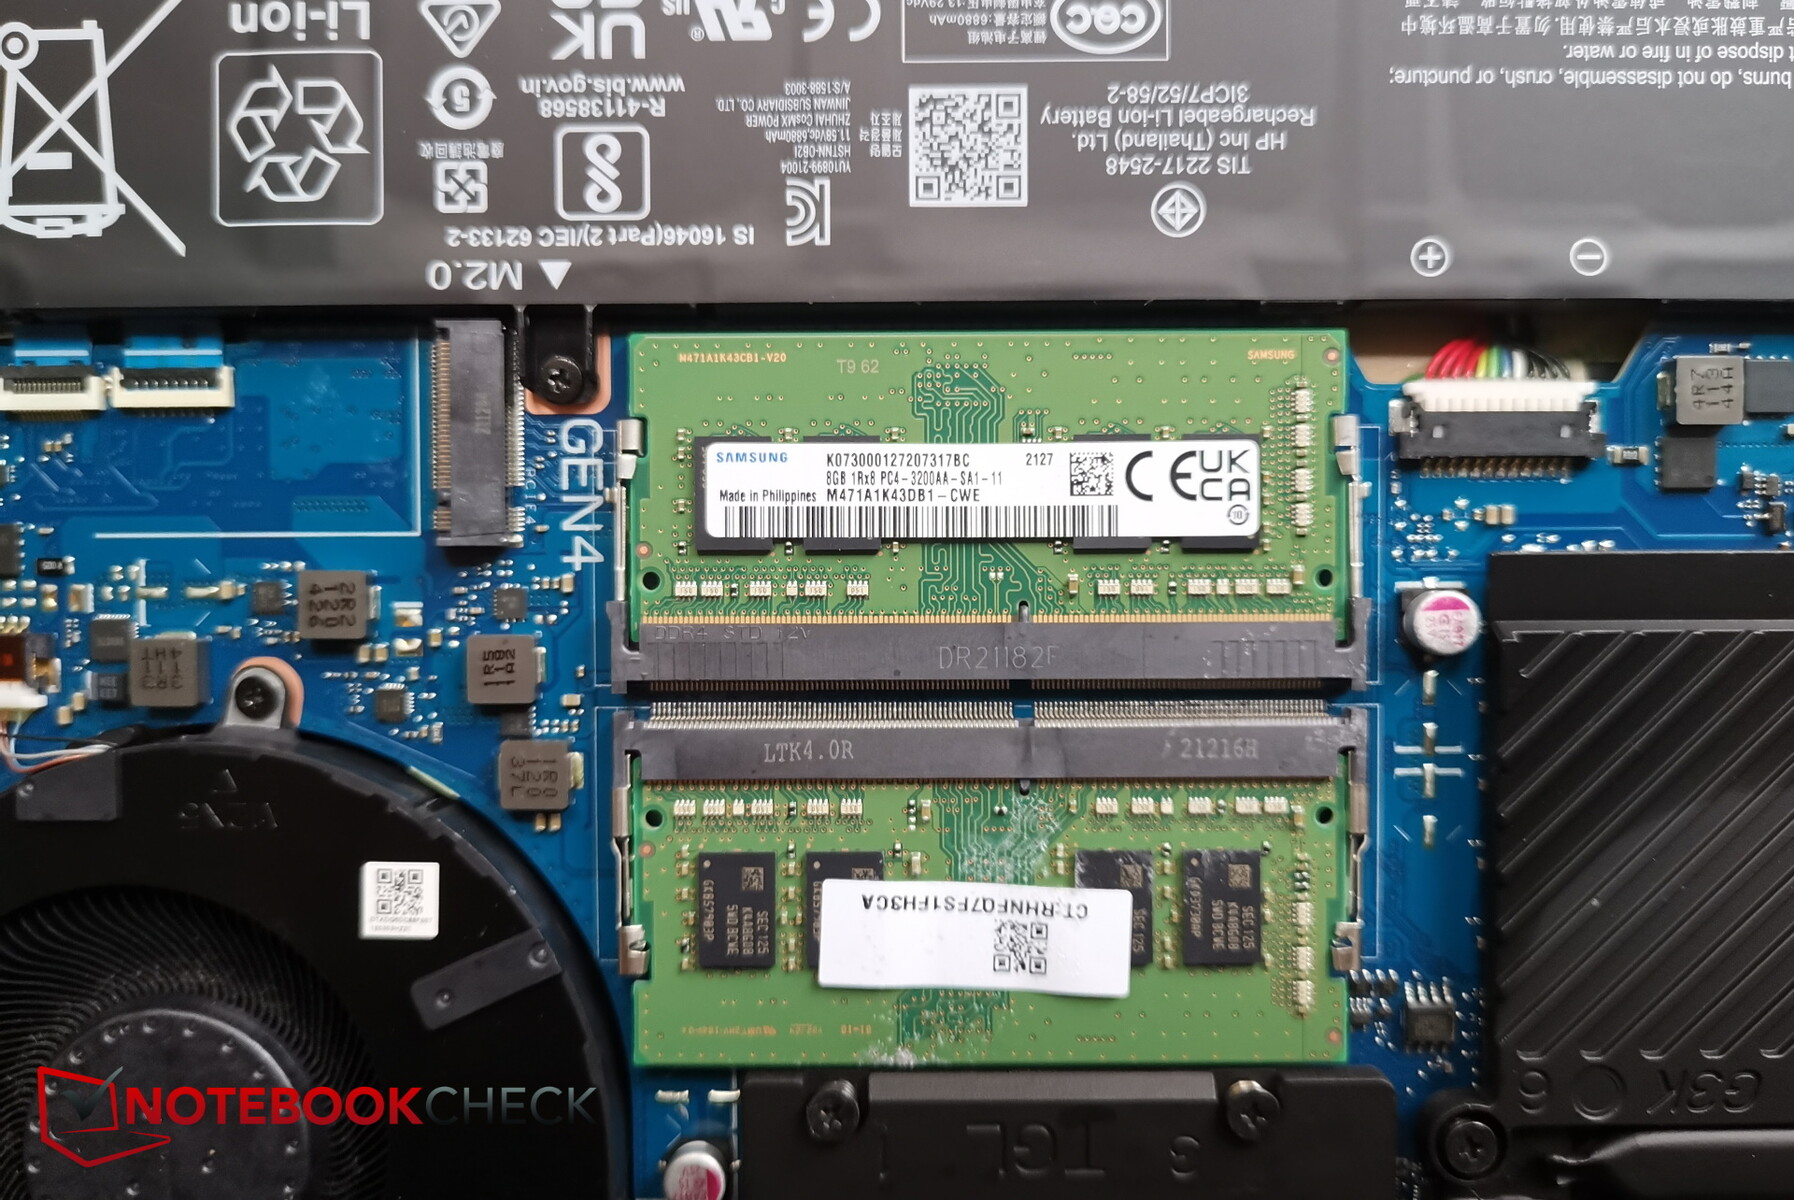
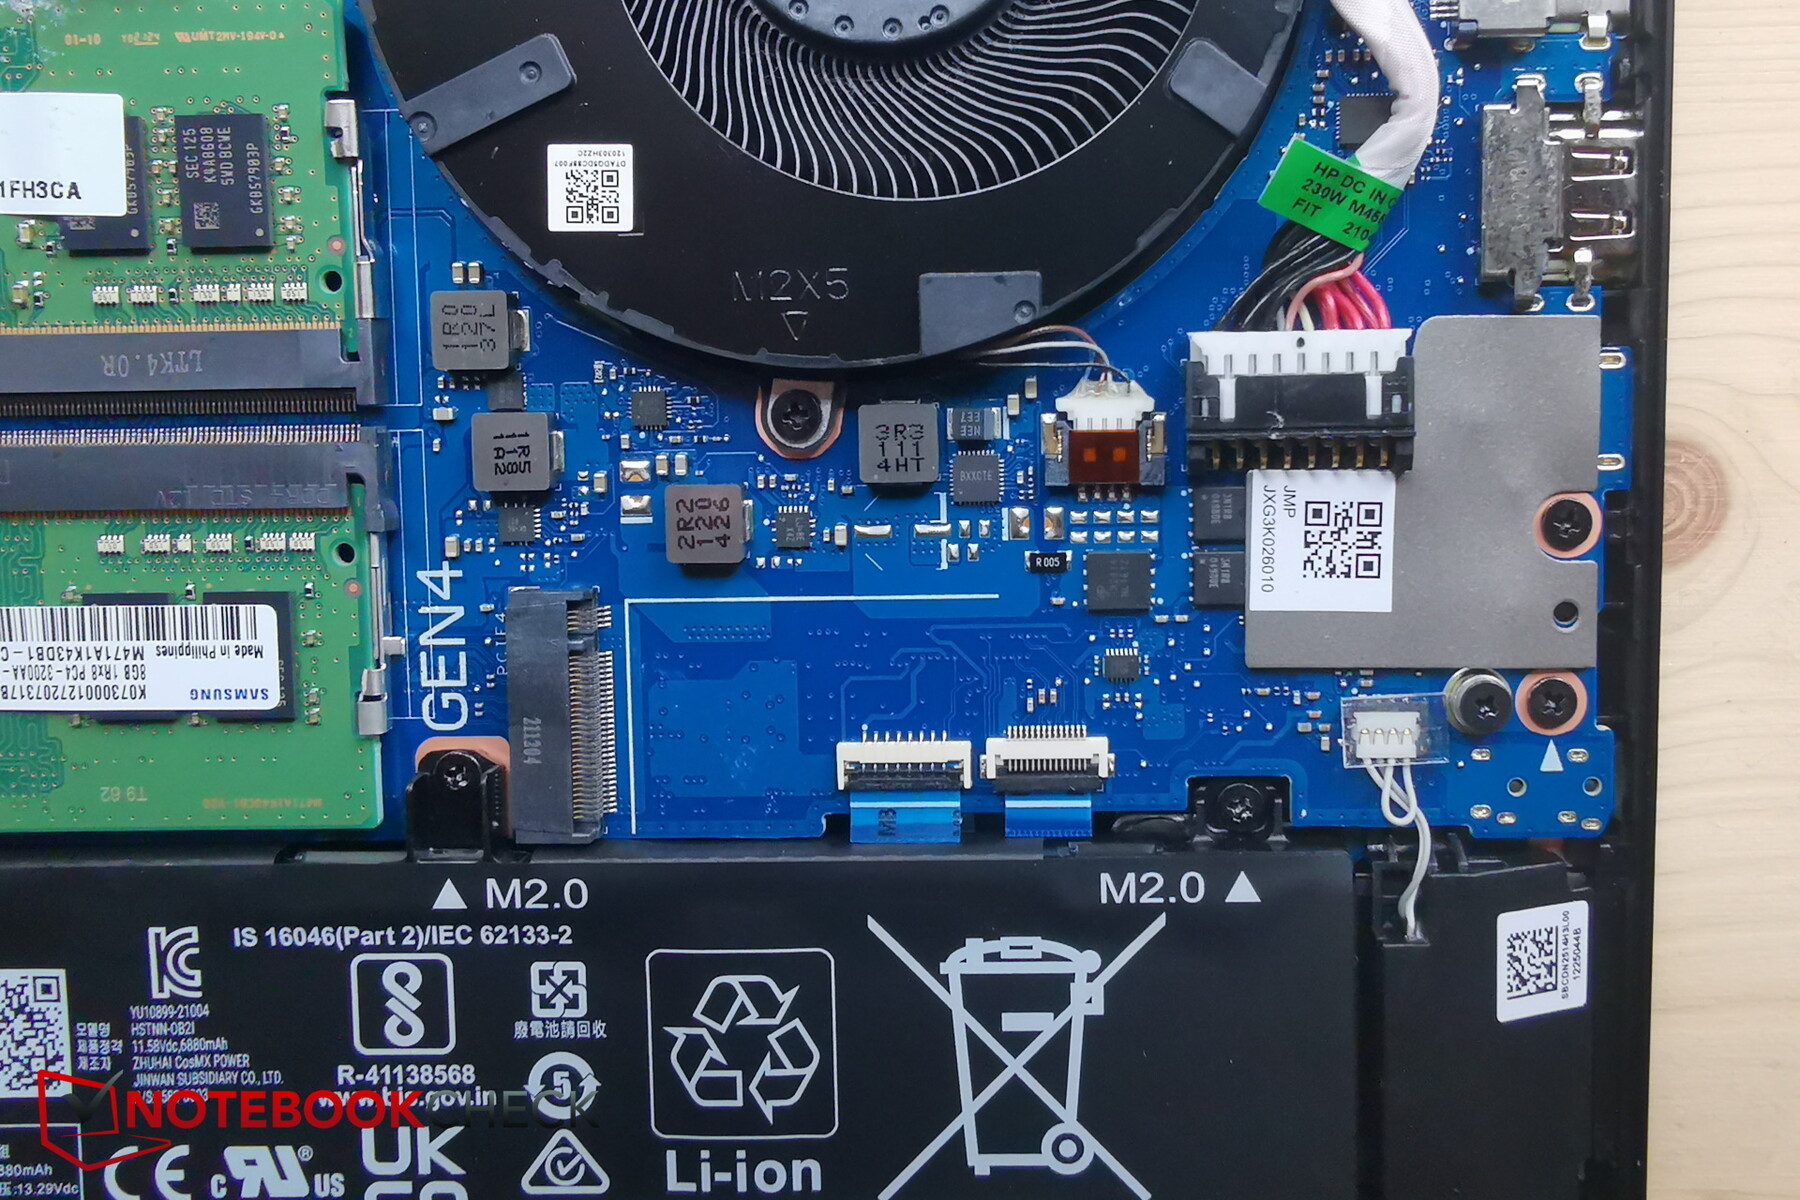
维护
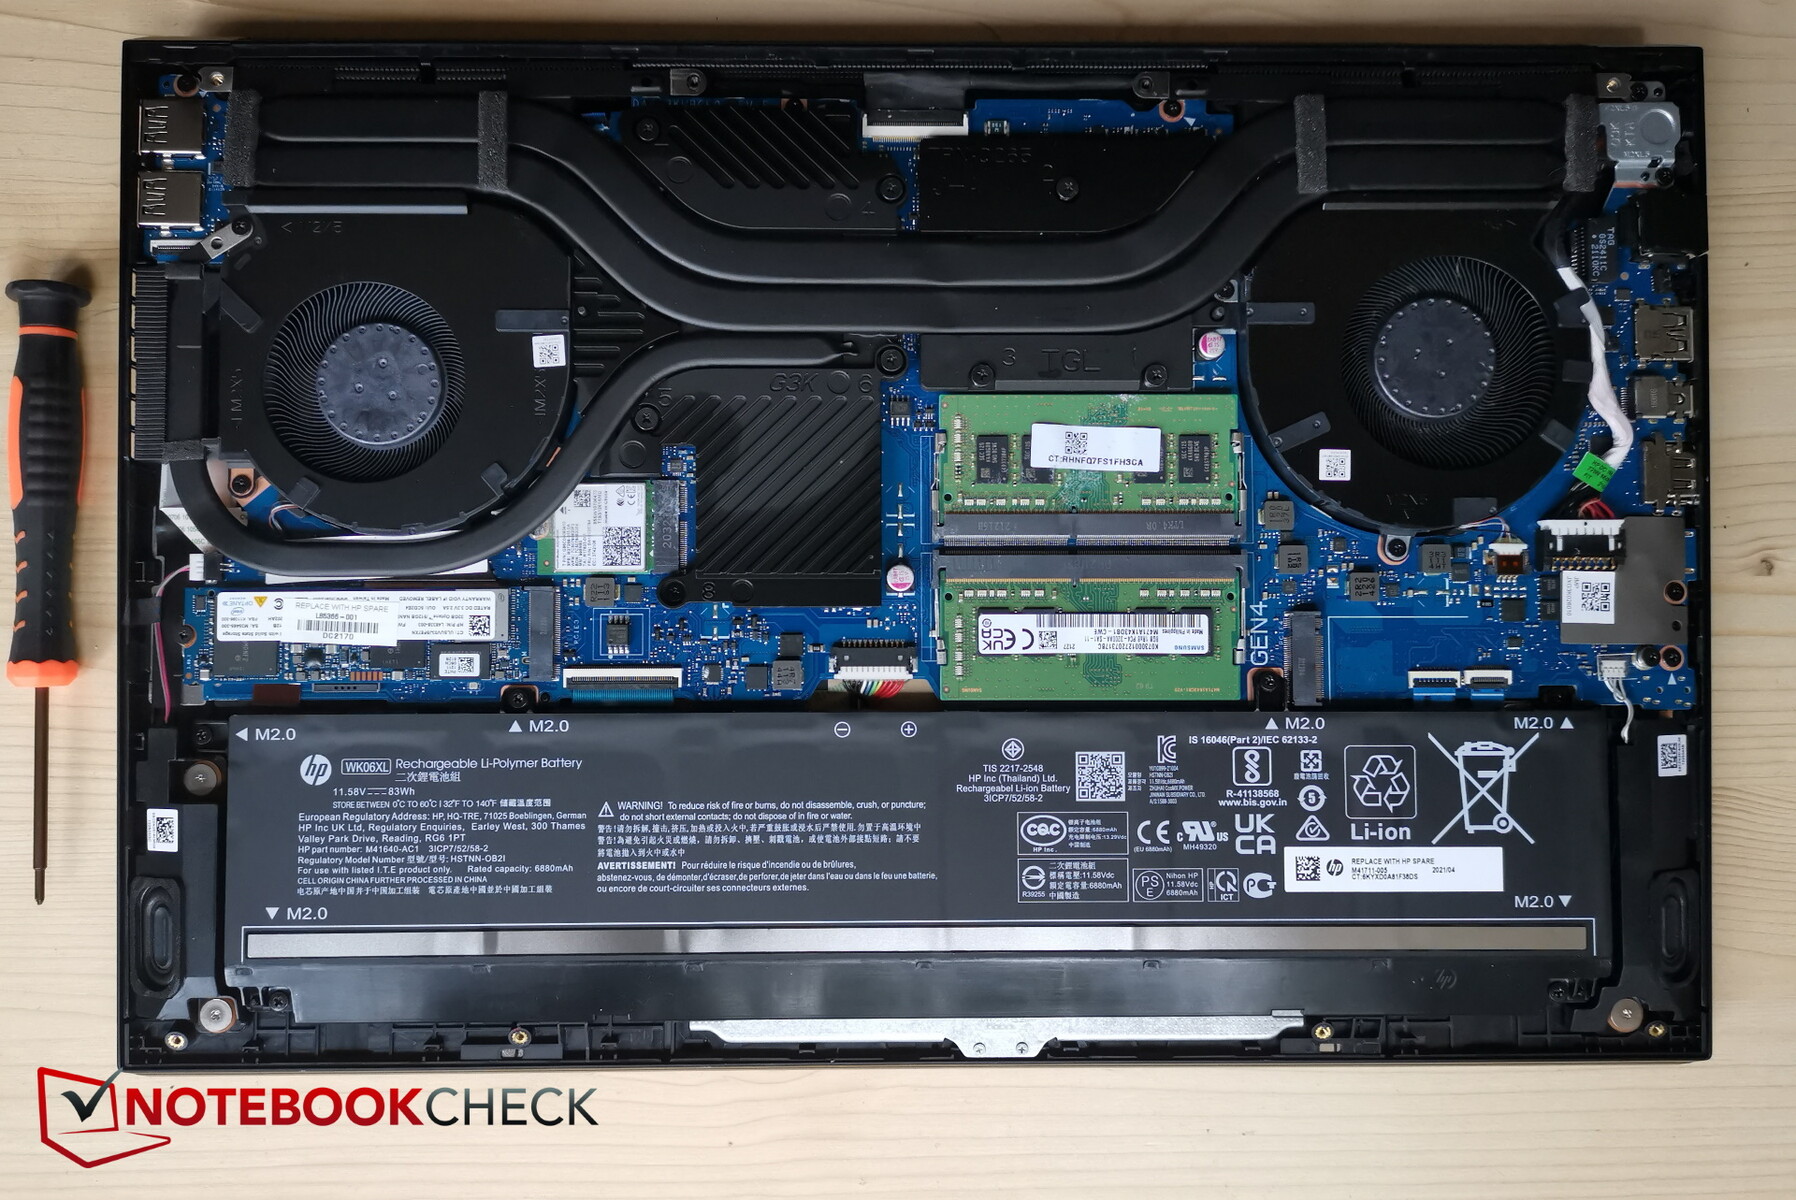
底板是用8个不同尺寸的十字螺丝和各种夹子固定的。尽管有塑料夹子,但底板可以在没有任何工具的情况下被移除--太好了随后,用户可以接触到两个风扇、内存插槽、Wi-Fi模块(部分被热管覆盖)、电池、SSD和一个额外的、未被占用的SSD插槽。
担保金
惠普提供标准的12个月有限硬件保修,以及1年的软件和初始设置有限技术支持。如果需要的话,可以通过现场硬件支持等选项来延长保修期。
输入设备--用户对触摸板,请回复!
键盘
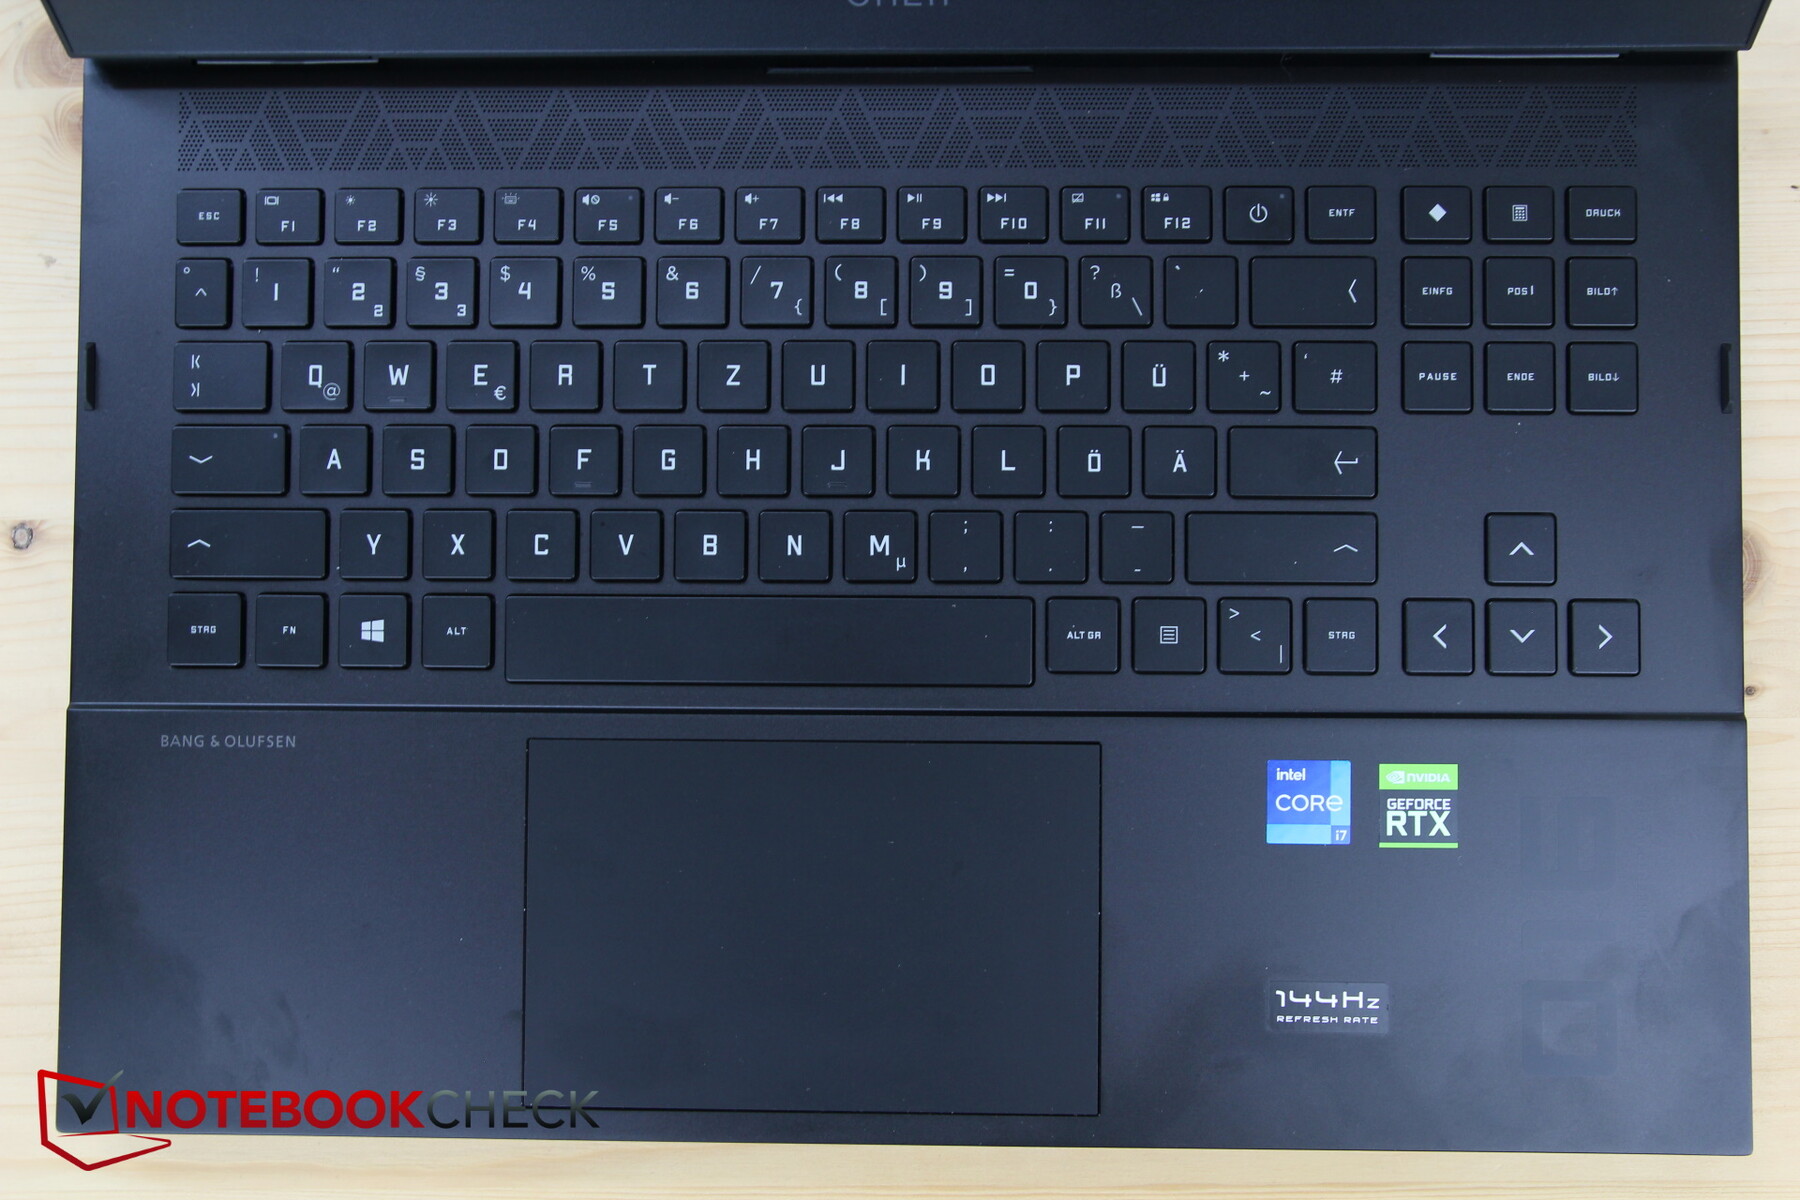
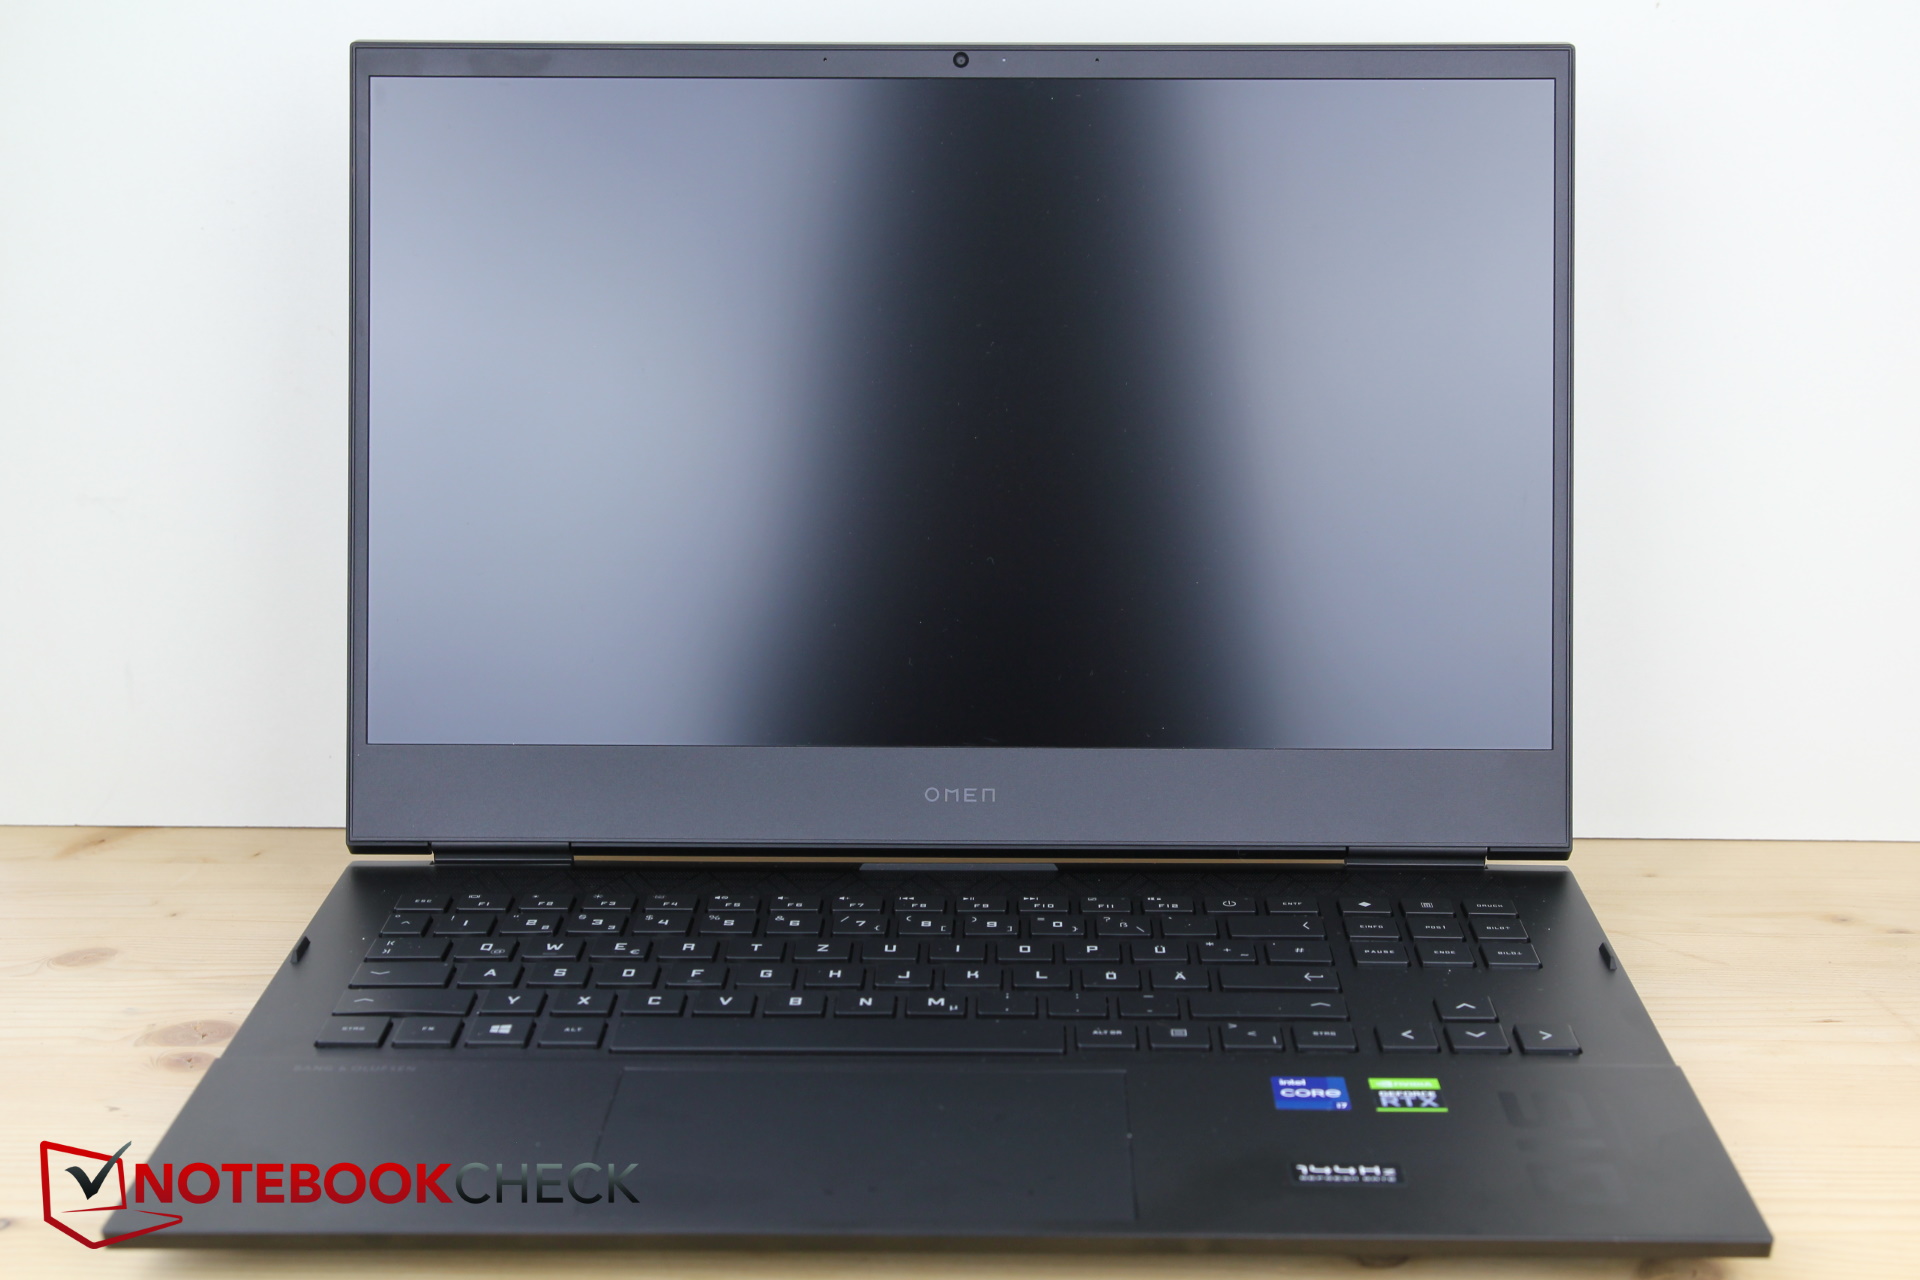
与惠普Victus 16不同的是,Omen 16没有配备数字键盘,这意味着有更多的空间给箭头、pos1、结束等键以及右上方的专用打印屏幕键,这对于截图非常方便。键盘布局看起来非常有条理,这可能是可用空间的结果,而且按键符号很容易阅读。有一个特殊的键用于启动Omen Gaming Hub,在那里可以调整性能设置(风扇、性能配置文件)。
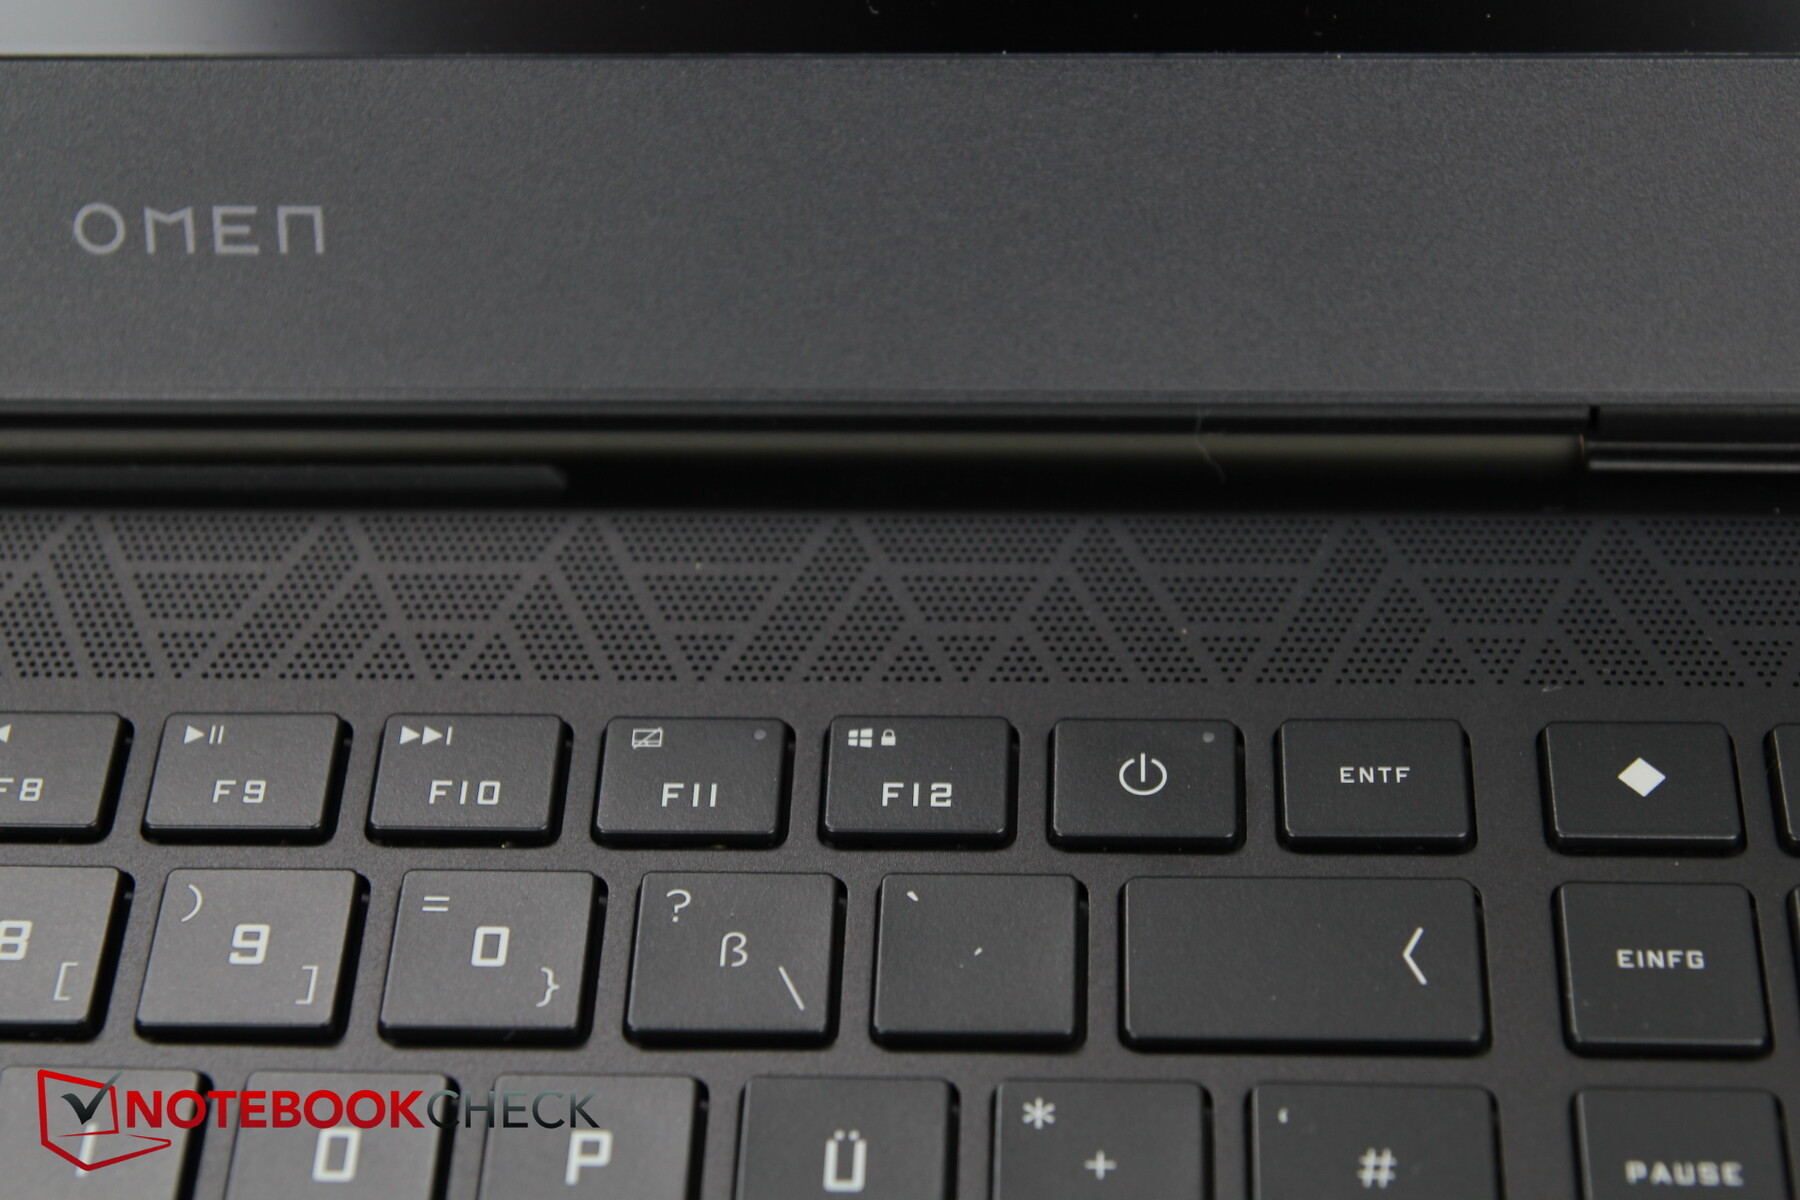
电源键在F12和Del键之间的特殊按键行的位置似乎不是最佳的,但在我们的测试中并没有造成任何问题。
该键提供了平庸的行程和坚实的反馈。很快就能达到明显的启动点,剩下的按键感觉很柔和,可以舒适而快速地打字。按键的咔哒声是适度的。
惠普安装了四区的RGB背光灯。在实践中,有三个大的区域,第四个区域是游戏时经常使用的WASD键。颜色可以通过游戏中心定制。
触摸板
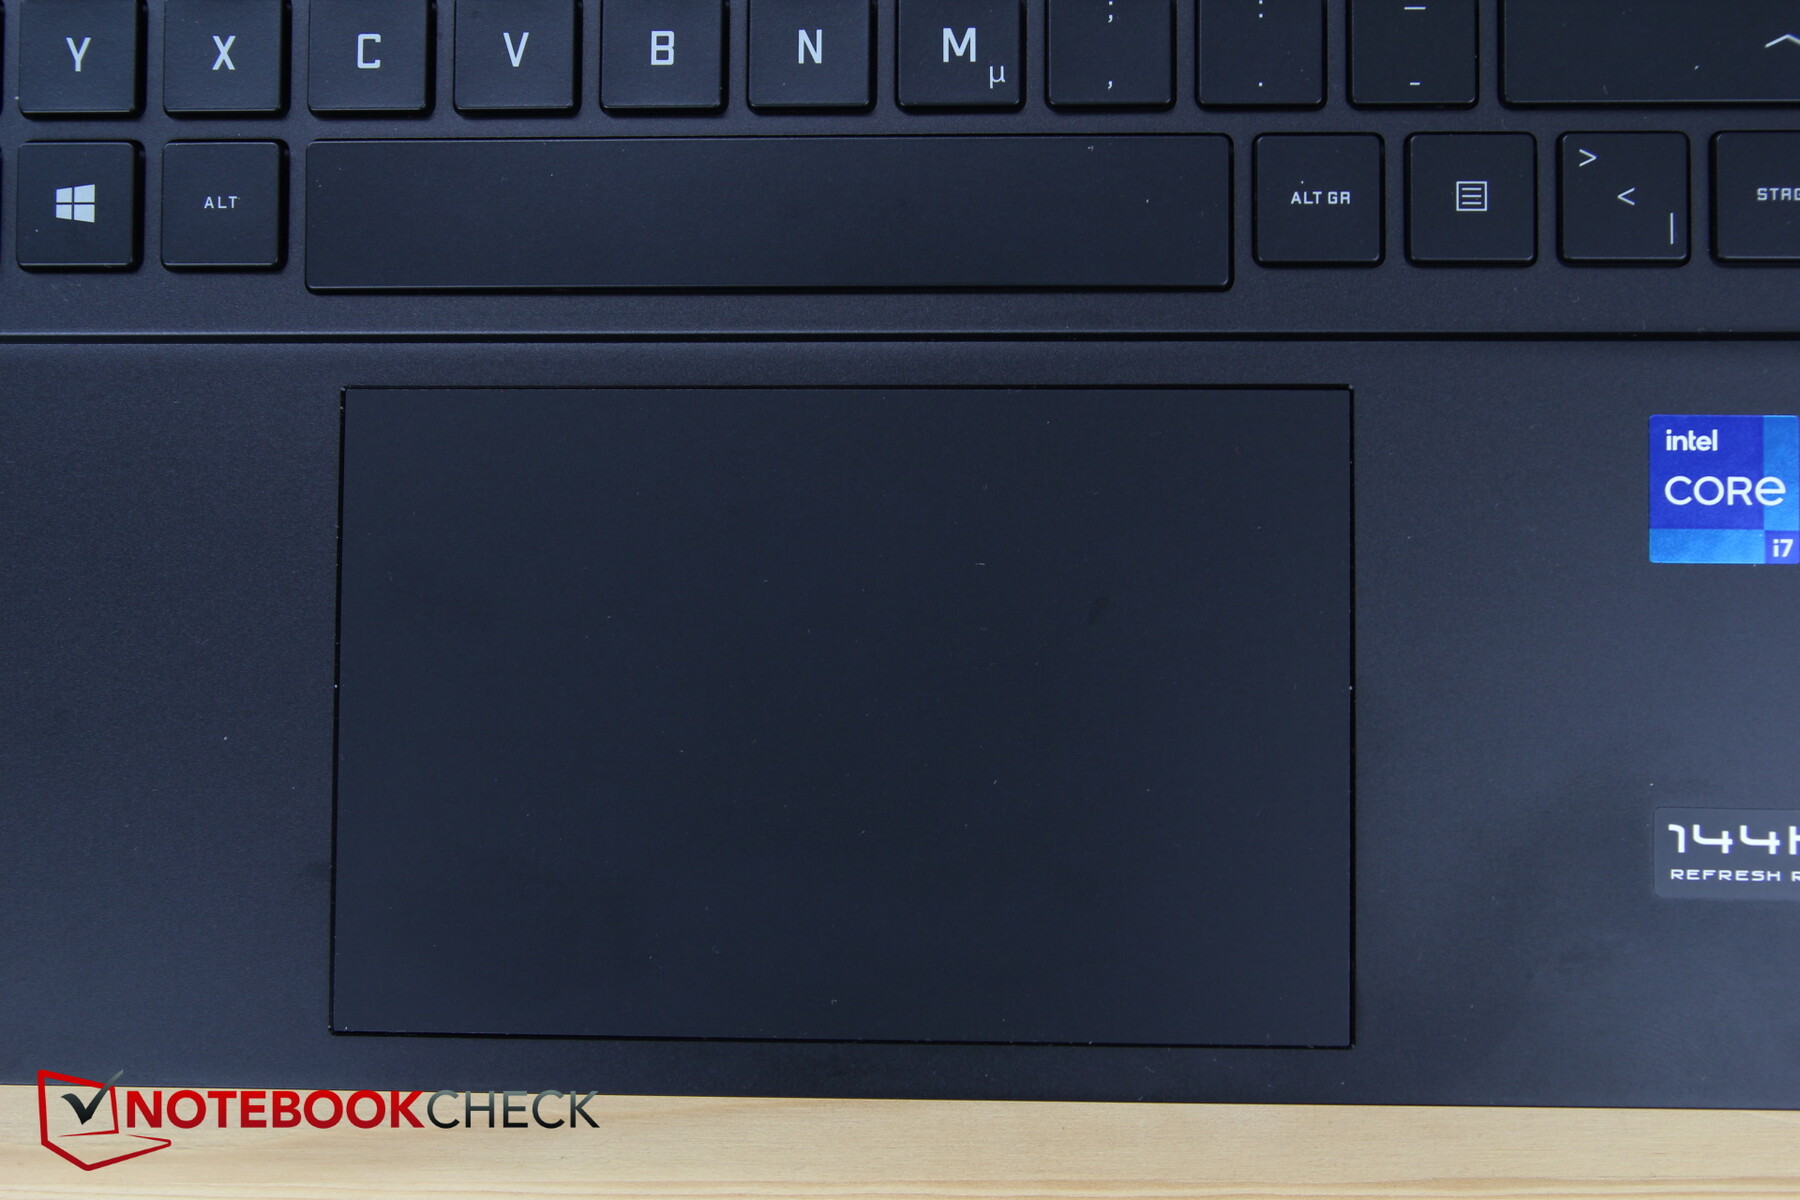
我们在触摸板上遇到了几个问题,事实上,这可能是有问题的,在这一点上使评级变得复杂。即使在卸载和重新安装驱动后,仍有各种掉线现象。点击和移动有时根本无法识别。
相比之下,我们对触摸板的尺寸或质地没有任何批评意见,因为即使在慢速情况下,滑行性能也非常好,而且点击会产生适度的声音反馈。
显示屏 - 良好的全高清模式,144赫兹
Omen 16使用与Victus 16相同的16.1英寸、哑光FHD 144-Hz BOE IPS面板。因此,结果是相似的。该显示器的亮度水平达到了近400尼特,照度为87%--这是一个不错的结果。与较早的Omen 15相比,这是一个重大改进。
尽管该面板确实存在一些沿边缘的背光渗漏,但只有在非常暗的环境照明条件下才会变得明显。
非常短的响应时间符合这个级别的预期,而且该显示器没有使用PWM进行亮度调节。

| |||||||||||||||||||||||||
Brightness Distribution: 87 %
Center on Battery: 407 cd/m²
Contrast: 1191:1 (Black: 0.34 cd/m²)
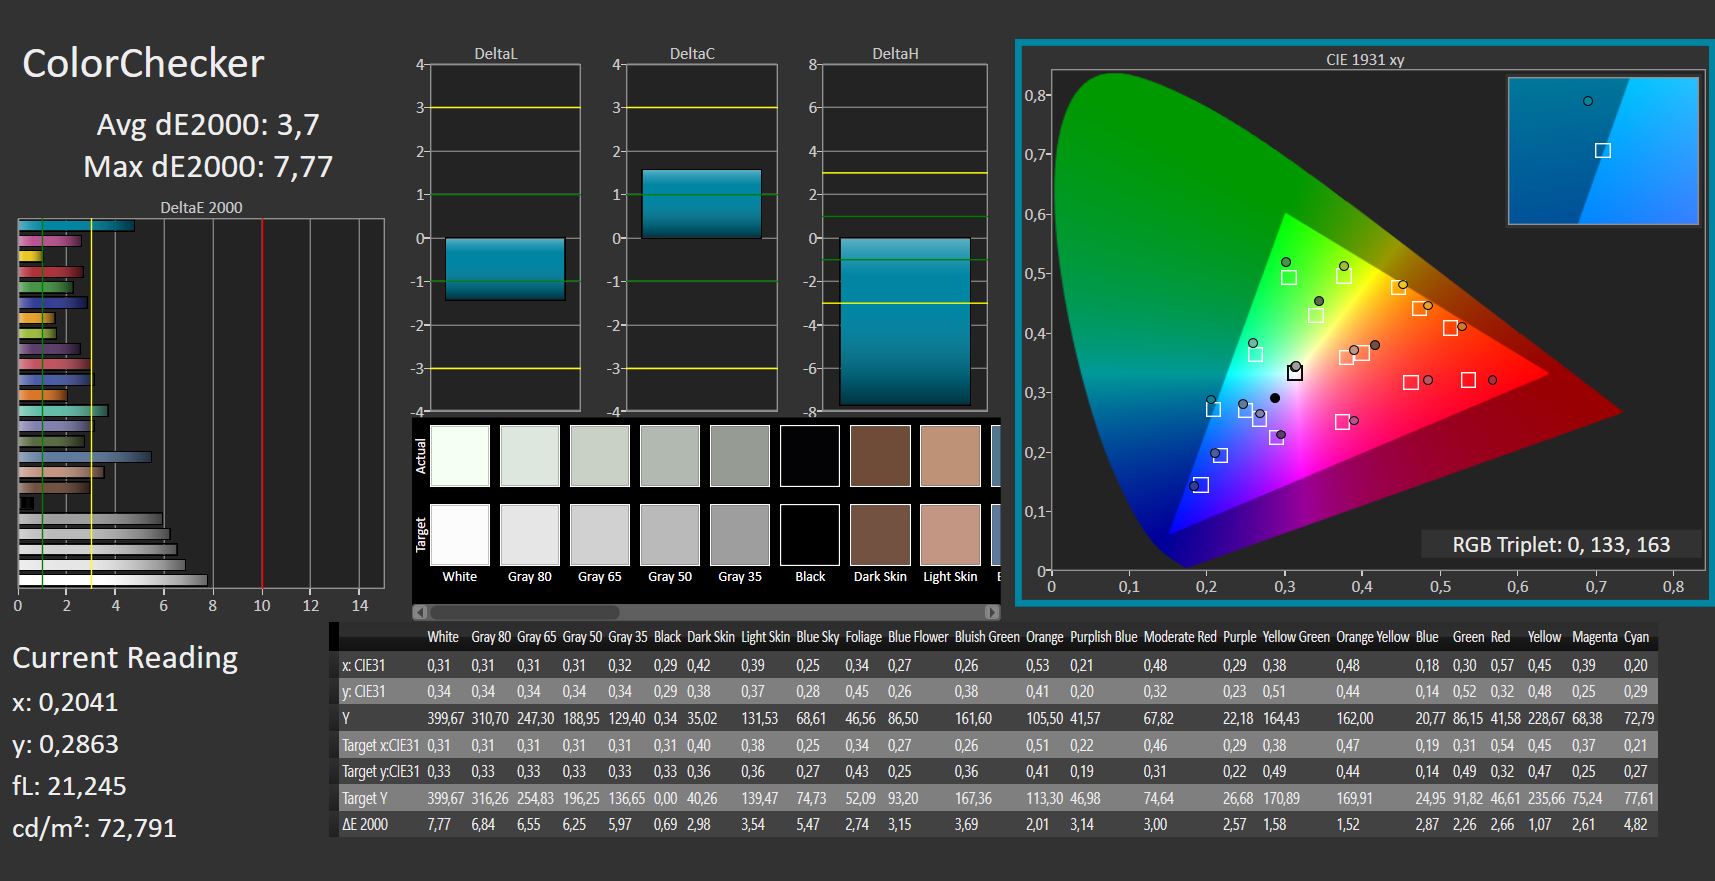
ΔE ColorChecker Calman: 3.7 | ∀{0.5-29.43 Ø4.72}
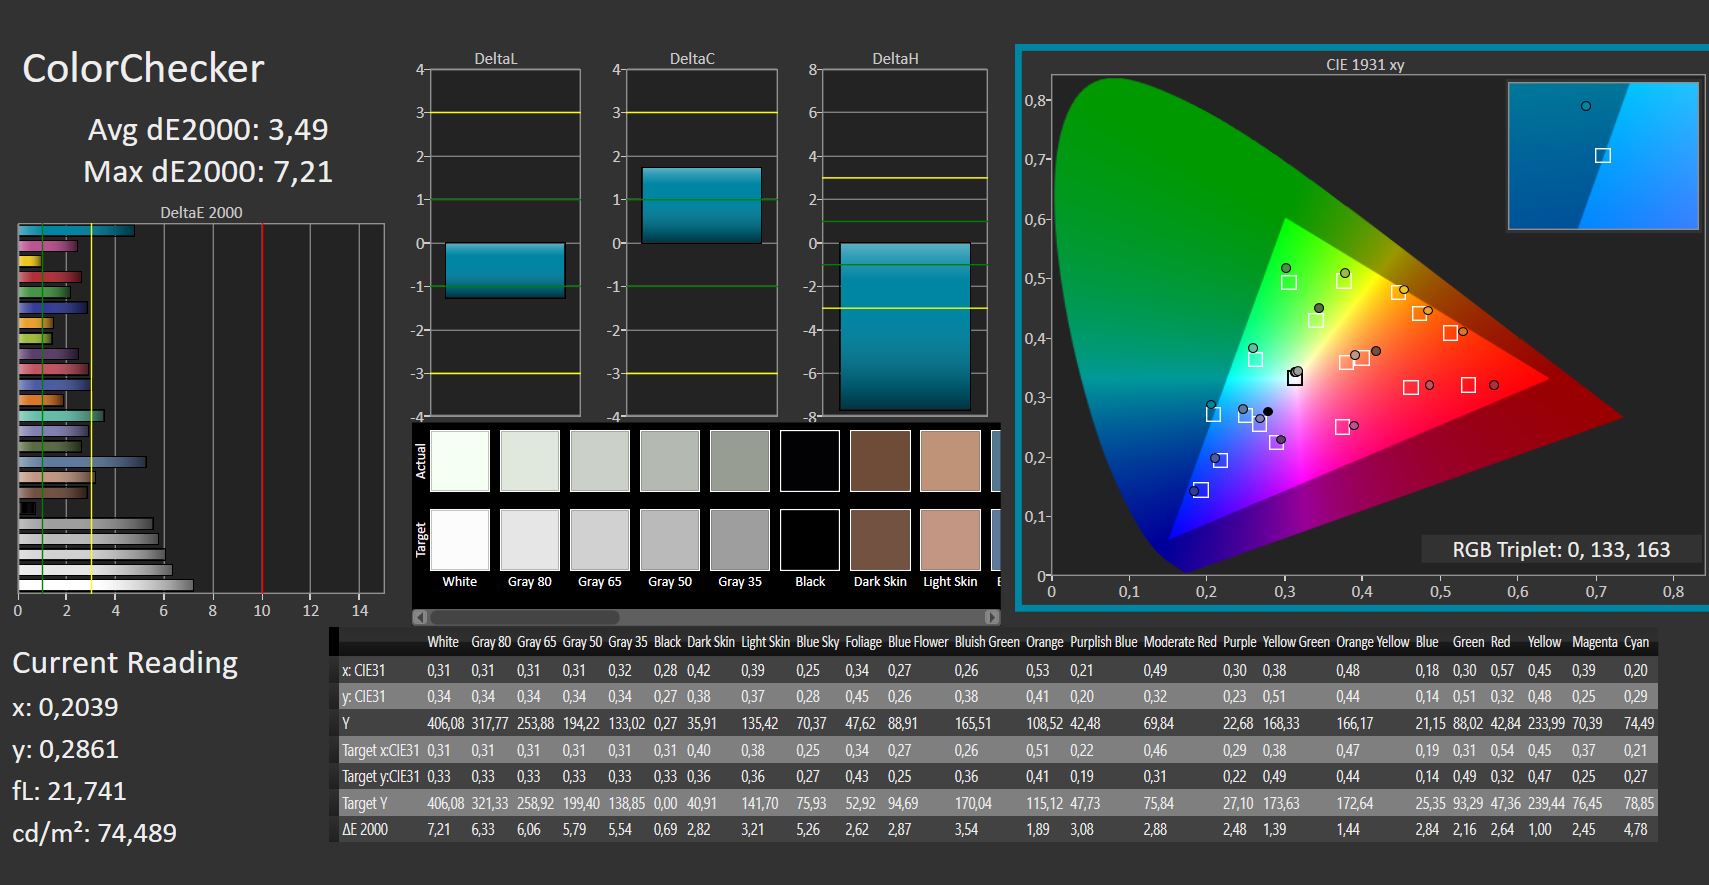
calibrated: 3.49
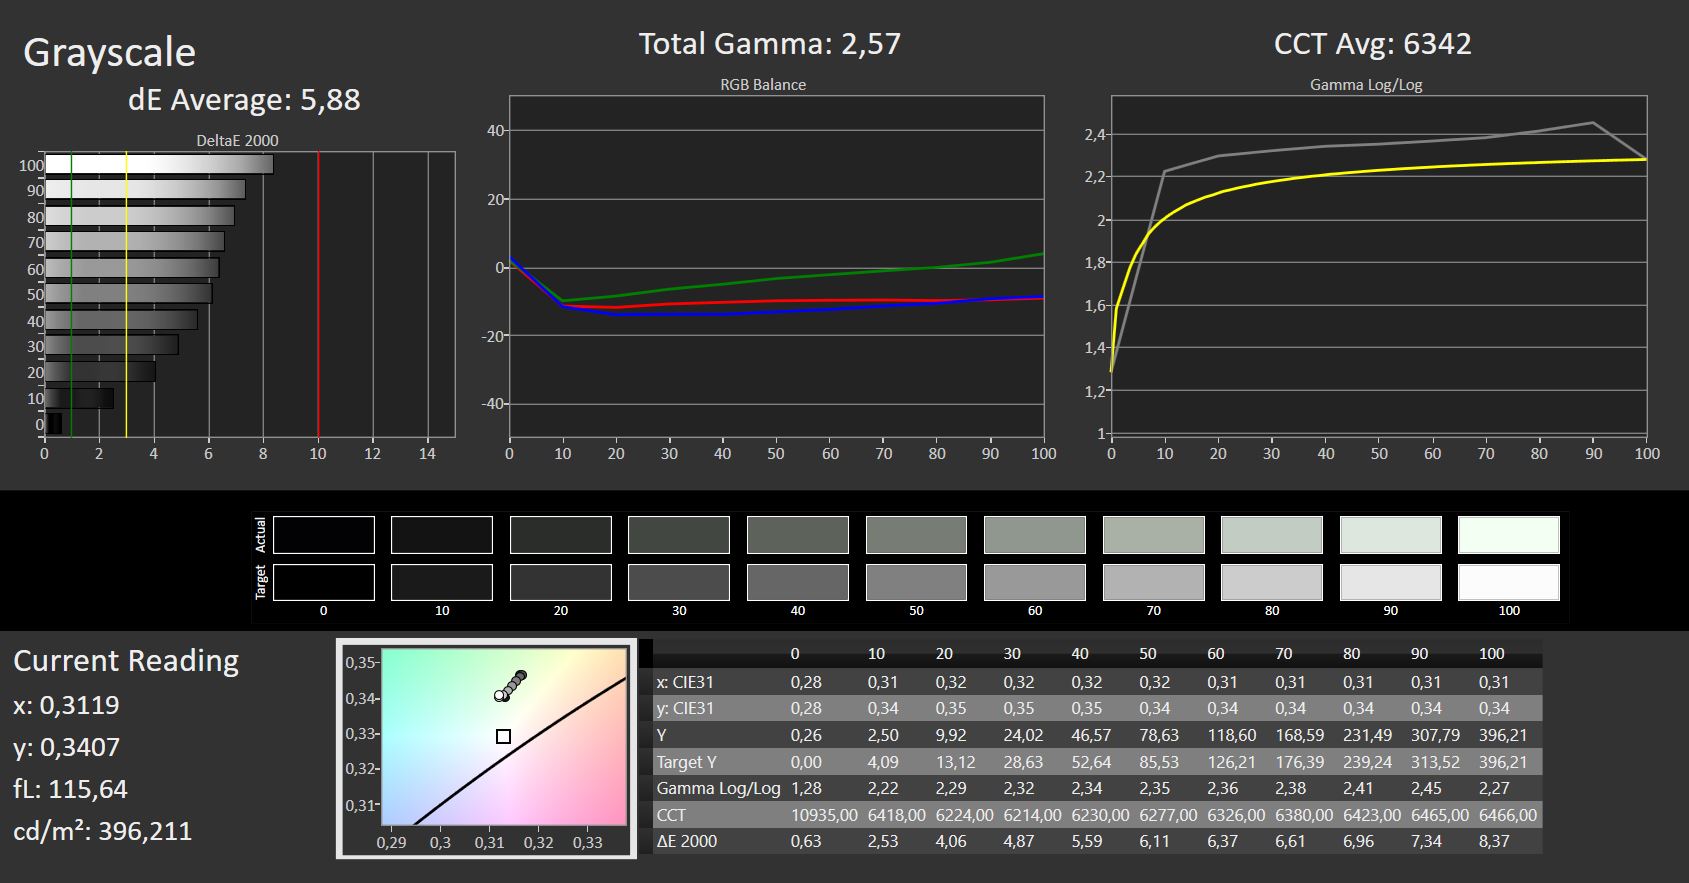
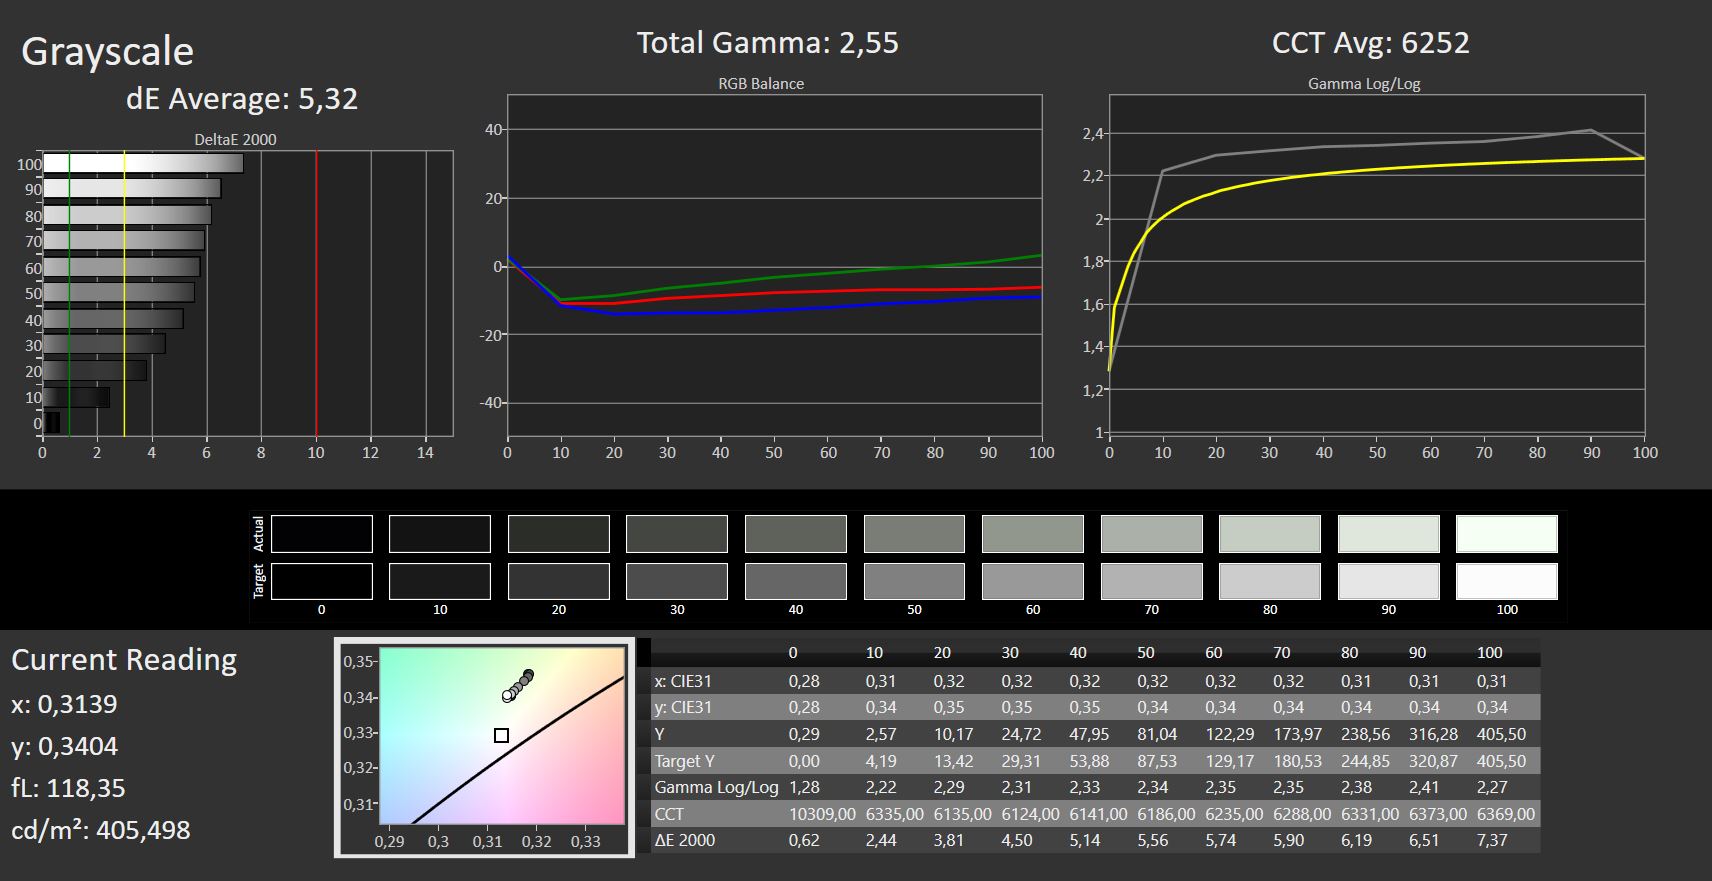
ΔE Greyscale Calman: 5.88 | ∀{0.09-98 Ø4.97}
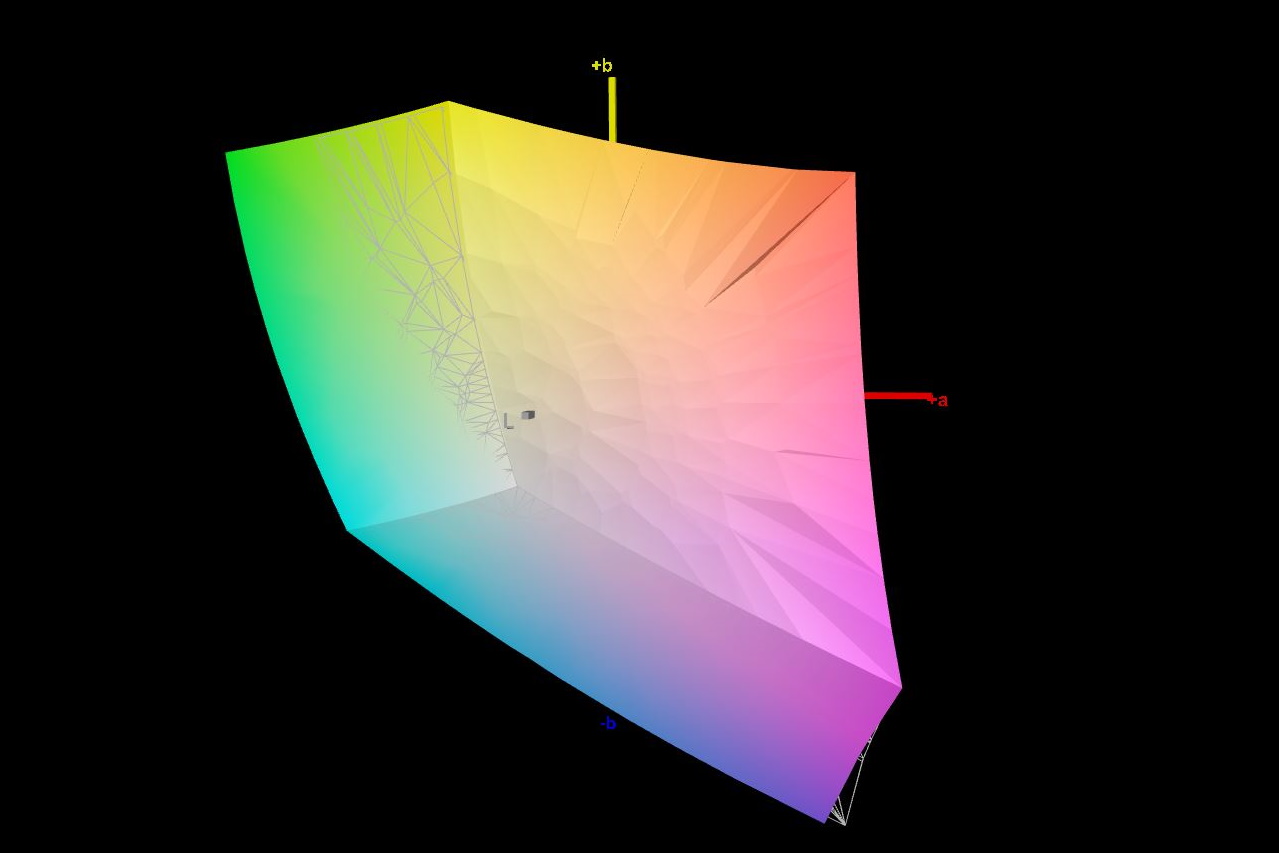
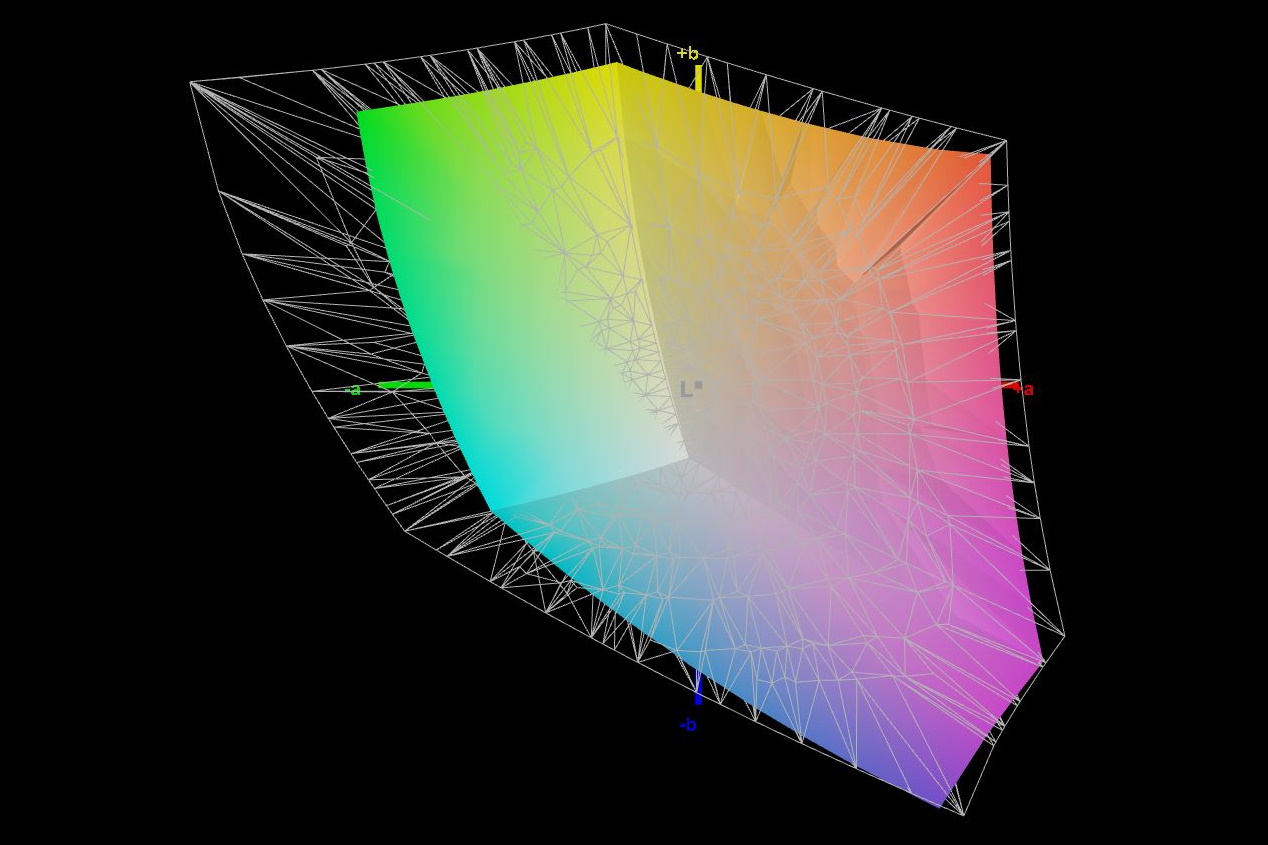
99.47% sRGB (Calman 2D)
99.47% sRGB (Argyll 1.6.3 3D)
73.76% AdobeRGB 1998 (Argyll 1.6.3 3D)
73.8% AdobeRGB 1998 (Argyll 3D)
99.5% sRGB (Argyll 3D)
72.3% Display P3 (Argyll 3D)
Gamma: 2.57
CCT: 6342 K
| HP Omen 16-b0085ng BOE09BE, IPS, 1920x1080, 16.1" | HP Omen 15-en0375ng BOE0852, IPS, 1920x1080, 15.6" | HP Victus 16-e0179ng BOE09BE, IPS, 1920x1080, 16.1" | Lenovo Legion 5 Pro 16ACH6H (82JQ001PGE) CSOT T3 MNG007DA1-1, IPS, 2560x1600, 16" | Alienware x15 RTX 3070 P111F LG Philips 156QHG, IPS, 2560x1440, 15.6" | MSI Katana GF66 11UG-220 AU Optronics B156HAN08.0, IPS, 1920x1080, 15.6" | |
|---|---|---|---|---|---|---|
| Display | -44% | 0% | -1% | 18% | -9% | |
| Display P3 Coverage (%) | 72.3 | 39.12 -46% | 72.6 0% | 97.8 35% | 65.4 -10% | |
| sRGB Coverage (%) | 99.5 | 57.6 -42% | 100 1% | 99 -1% | 99.9 0% | 91.3 -8% |
| AdobeRGB 1998 Coverage (%) | 73.8 | 40.42 -45% | 73.5 0% | 73 -1% | 66.7 -10% | |
| Response Times | -174% | -18% | 23% | -17% | 9% | |
| Response Time Grey 50% / Grey 80% * (ms) | 8 ? | 30.4 ? -280% | 9.6 ? -20% | 9.2 ? -15% | 12 ? -50% | 7.4 ? 7% |
| Response Time Black / White * (ms) | 12.4 ? | 20.8 ? -68% | 14.4 ? -16% | 4.8 61% | 10.4 ? 16% | 11.2 ? 10% |
| PWM Frequency (Hz) | 200 ? | |||||
| Screen | -27% | 15% | 22% | 6% | 0% | |
| Brightness middle (cd/m²) | 405 | 297 -27% | 361 -11% | 551 36% | 409.5 1% | 307 -24% |
| Brightness (cd/m²) | 378 | 275 -27% | 341 -10% | 523 38% | 390 3% | 321 -15% |
| Brightness Distribution (%) | 87 | 88 1% | 88 1% | 88 1% | 88 1% | 83 -5% |
| Black Level * (cd/m²) | 0.34 | 0.33 3% | 0.3 12% | 0.54 -59% | 0.47 -38% | 0.27 21% |
| Contrast (:1) | 1191 | 900 -24% | 1203 1% | 1020 -14% | 871 -27% | 1137 -5% |
| Colorchecker dE 2000 * | 3.7 | 4.54 -23% | 2.44 34% | 1.8 51% | 3.48 6% | 4.67 -26% |
| Colorchecker dE 2000 max. * | 7.77 | 18.92 -144% | 6.37 18% | 2.53 67% | 6.31 19% | 7.53 3% |
| Colorchecker dE 2000 calibrated * | 3.49 | 4.66 -34% | 1.26 64% | 1.66 52% | 0.89 74% | 2.41 31% |
| Greyscale dE 2000 * | 5.88 | 2.1 64% | 4.6 22% | 1.85 69% | 5 15% | 4.5 23% |
| Gamma | 2.57 86% | 2.066 106% | 2.268 97% | 2.3 96% | 2.16 102% | 2.276 97% |
| CCT | 6342 102% | 6291 103% | 6609 98% | 6338 103% | 6591 99% | 6824 95% |
| Color Space (Percent of AdobeRGB 1998) (%) | 73.76 | 40 -46% | 72.81 -1% | |||
| Color Space (Percent of sRGB) (%) | 99.47 | 58 -42% | 99.41 0% | |||
| Total Average (Program / Settings) | -82% /
-49% | -1% /
7% | 15% /
19% | 2% /
4% | 0% /
-1% |
* ... smaller is better
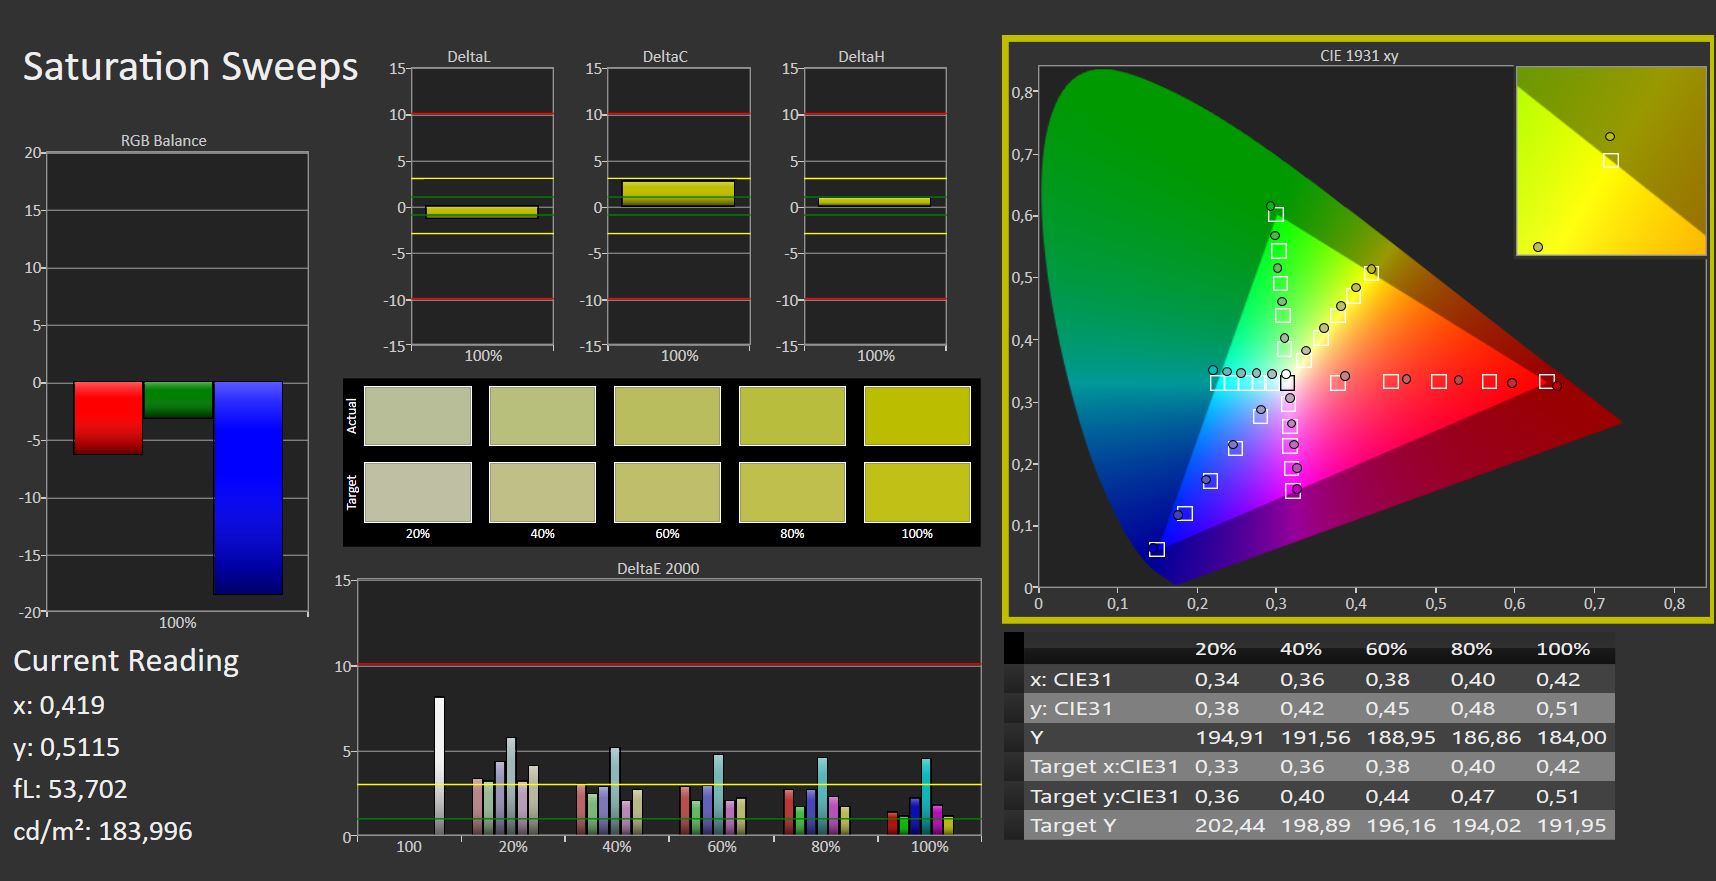
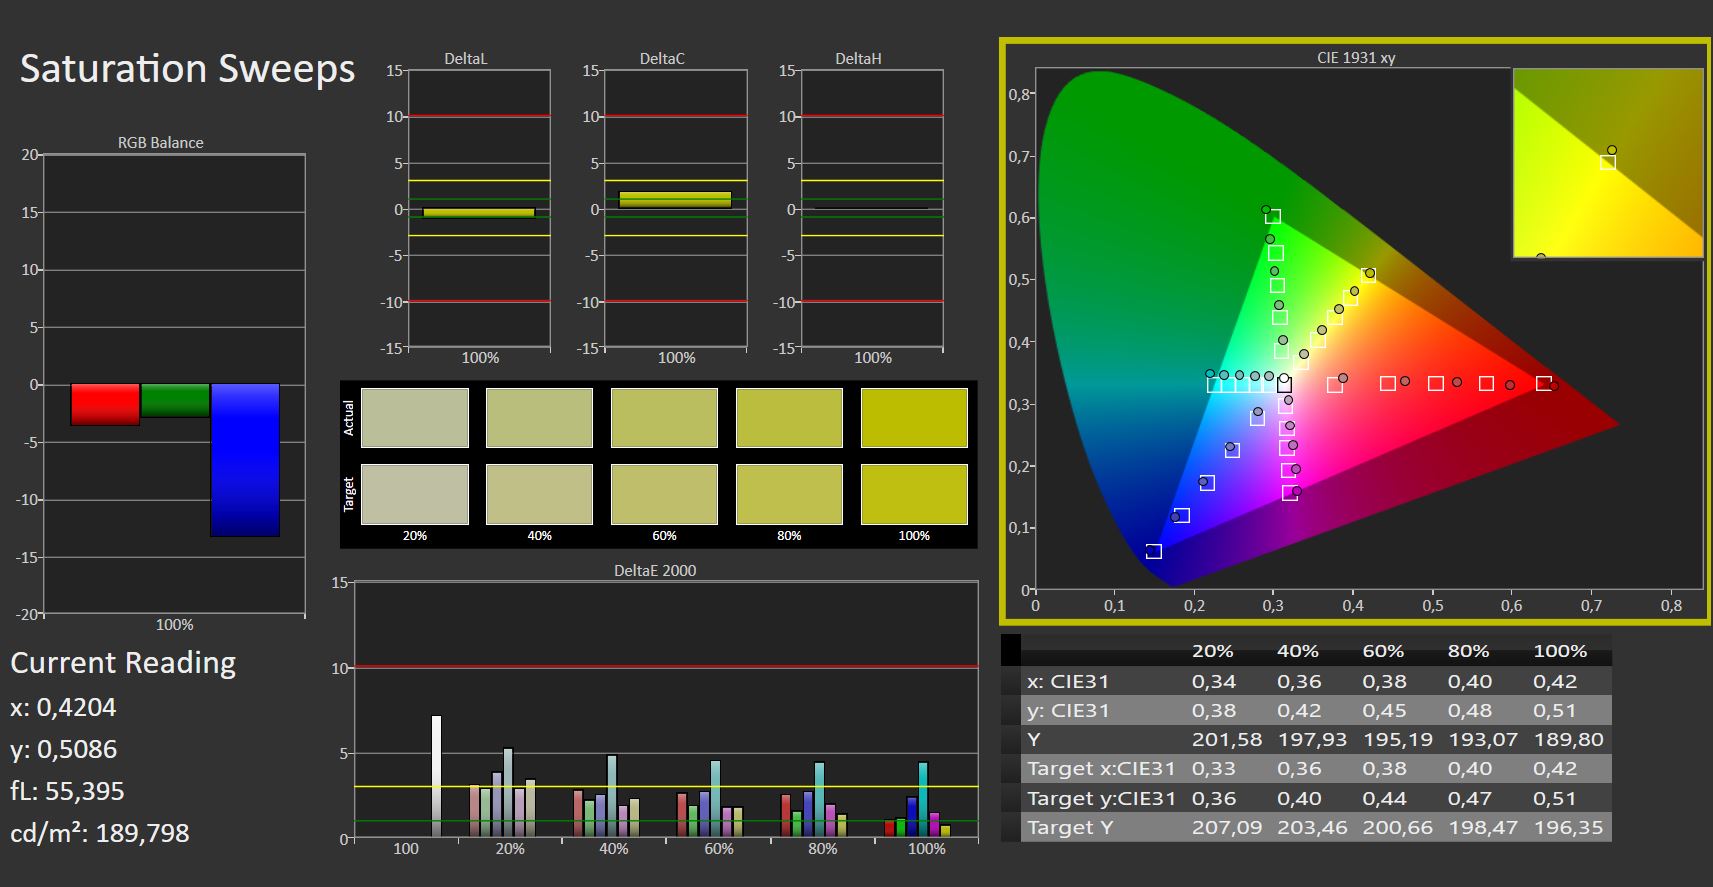
与同类平均水平相比,对比度和黑值很有竞争力,sRGB色彩空间基本上被完全覆盖。同时,该显示器仍然覆盖了73%的AdobeRGB和DCI-P3色彩空间。
尽管该显示器在出厂时已被很好地校准,但我们还是能够通过对显示器进行手动校准来进一步改善色彩。
哑光覆盖层防止了大部分的眩光和反射,亮度足以满足户外使用。像往常一样,从某个角度看显示器时,反射会变得很麻烦。


Display Response Times
| ↔ Response Time Black to White | ||
|---|---|---|
| 12.4 ms ... rise ↗ and fall ↘ combined | ↗ 6.6 ms rise | 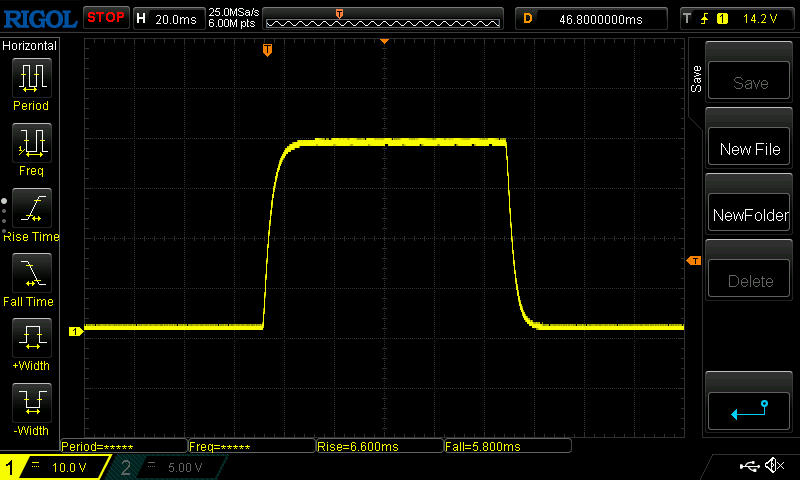 |
| ↘ 5.8 ms fall | ||
| The screen shows good response rates in our tests, but may be too slow for competitive gamers. In comparison, all tested devices range from 0.1 (minimum) to 240 (maximum) ms. » 33 % of all devices are better. This means that the measured response time is better than the average of all tested devices (19.8 ms). | ||
| ↔ Response Time 50% Grey to 80% Grey | ||
| 8 ms ... rise ↗ and fall ↘ combined | ↗ 4.2 ms rise | 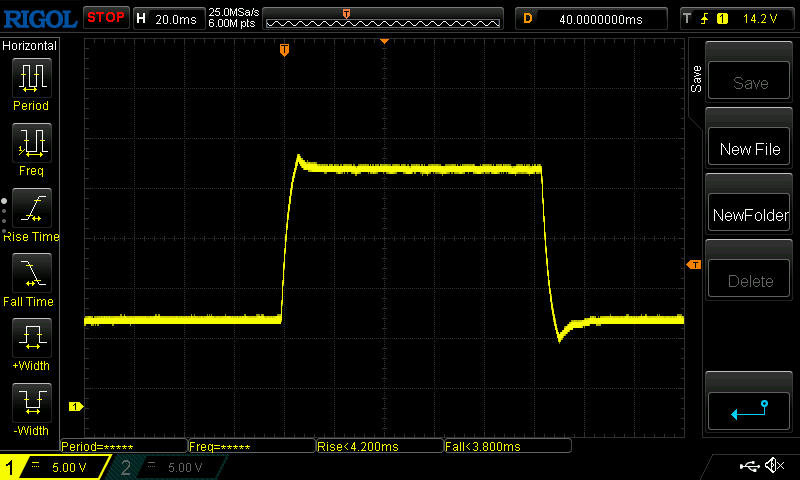 |
| ↘ 3.8 ms fall | ||
| The screen shows fast response rates in our tests and should be suited for gaming. In comparison, all tested devices range from 0.165 (minimum) to 636 (maximum) ms. » 21 % of all devices are better. This means that the measured response time is better than the average of all tested devices (31 ms). | ||
Screen Flickering / PWM (Pulse-Width Modulation)
| Screen flickering / PWM not detected | ||
In comparison: 52 % of all tested devices do not use PWM to dim the display. If PWM was detected, an average of 7769 (minimum: 5 - maximum: 343500) Hz was measured. | ||
考虑到这是一块IPS显示屏,从极端角度观看时,感知到的亮度水平下降得相当厉害,甚至可能比平时更厉害。然而,在正常情况下,这几乎是不明显的。

性能 - 快速!
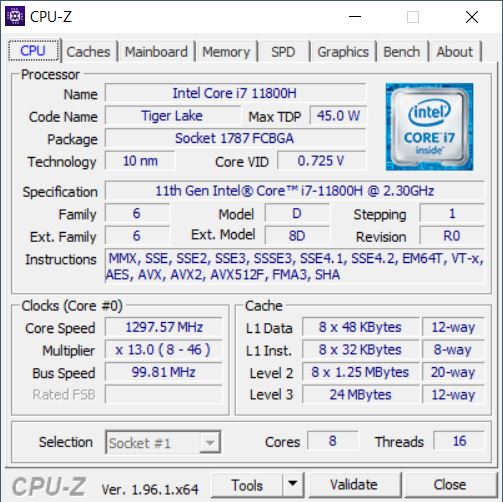
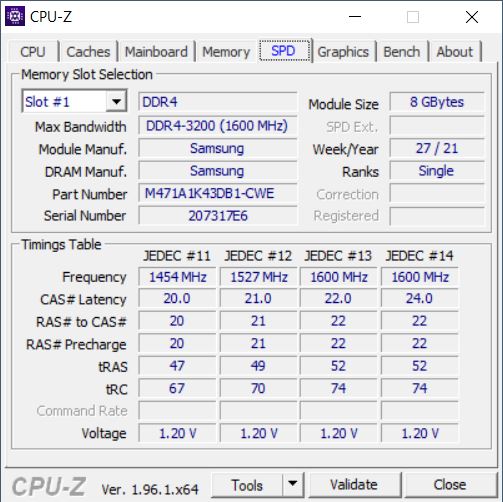
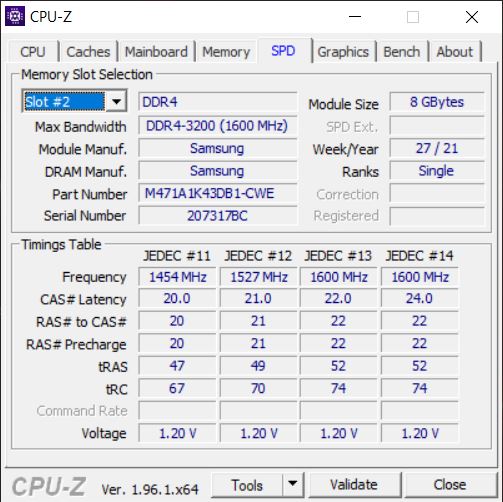
Omen 16是一个游戏系统。八核的 英特尔酷睿i7-11800H而且,更重要的是,其 NVIDIAGeForce RTX 3070笔记本GPU以及144-Hz显示屏是这方面相当明显的线索。16GB的内存容量也应该是足够的。Omen的设计时尚而微妙,主要是为那些喜欢更悠闲的设计而不是更常见的、俗气的外观的游戏玩家制作的。
在Omen游戏中心,用户可以在几个默认的性能配置文件中进行选择。对于原始性能基准测试,我们选择了性能配置文件 "性能",并将图形切换器设置为专用,以确保专用GPU始终处于启用状态。然后我们切换回混合模式(Optimus)进行电池测试。
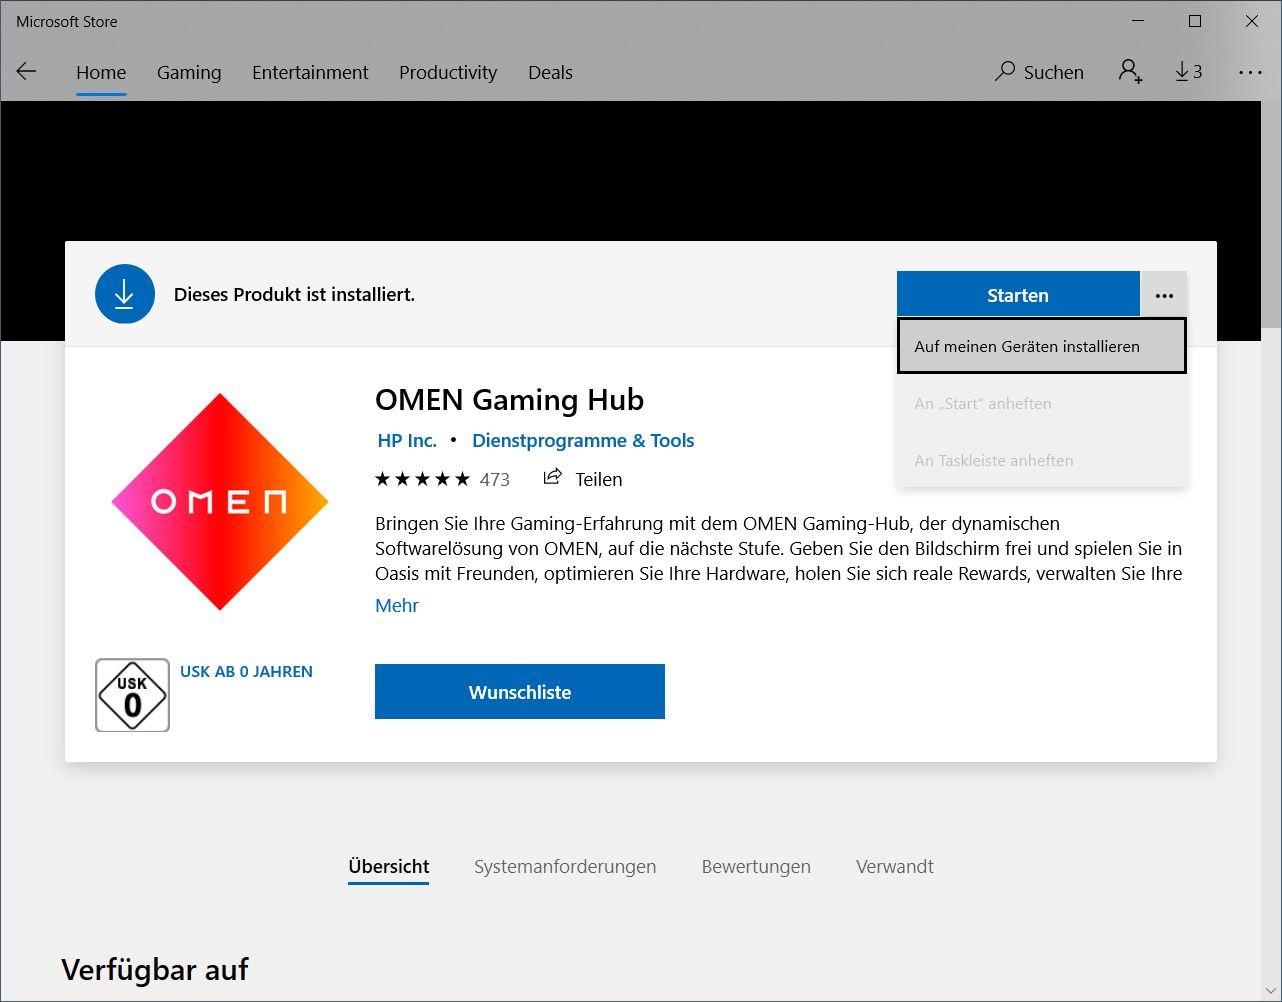
我们在Gaming Hub软件上遇到了一个令人沮丧的问题,它在每次启动时都提醒我们正在使用一个旧版本。然而,试图更新会将我们重定向到Windows商店。在这里,软件显示为 "已经安装",没有任何更新的选项。


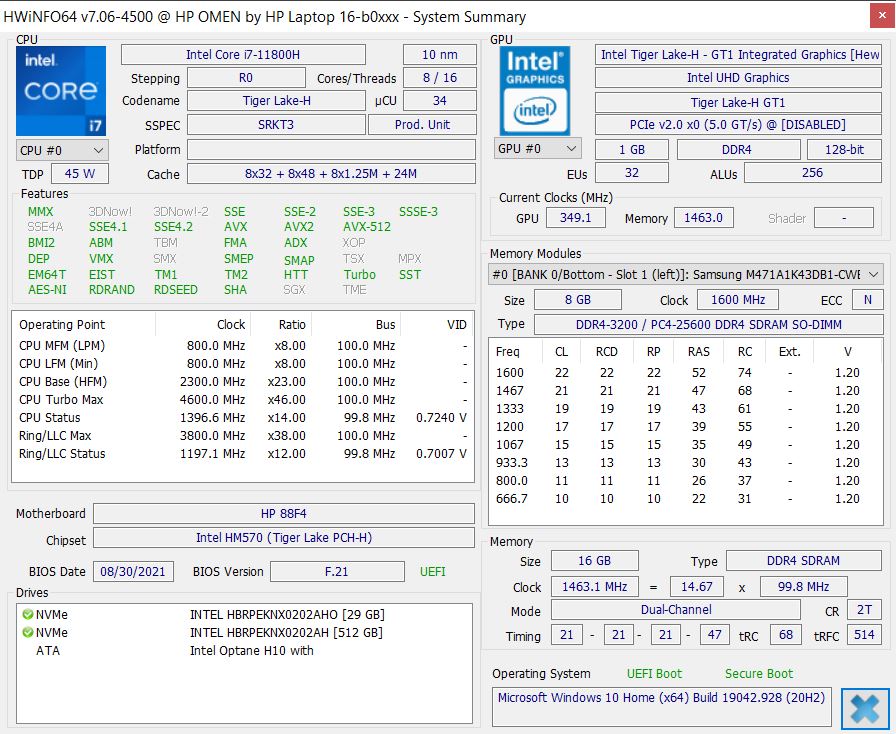
处理器
奥曼配备了一个 英特尔酷睿i7-11800H八核处理器,理论时钟速度为2.3至4.6GHz。它具有Thunderbolt 4功能,值得注意的是,AMD的竞争平台上仍然没有这个功能。
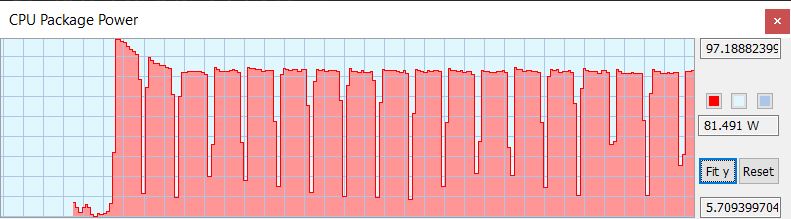
在我们的Cinebench R15循环中,性能保持非常一致,没有最初的下降。虽然TDP开始时高于95W,但在第二次循环后有所下降,并保持在80W左右的相对稳定。性能与Legion 5 Pro和Alienware x15相似,符合我们的预期。在Cinebench基准测试中,更便宜的Victus要慢15%左右。
在所有的基准测试中,CPU的性能都很快,与Legion 5 Pro相似,Alienware在一些基准测试中稍快。相比之下,Omen在Geekbench和其他一些基准测试中排名第一。
在电池模式下,CPU性能下降了整整40%。
Cinebench R15 Multi Dauertest
Cinebench R20: CPU (Multi Core) | CPU (Single Core)
Cinebench R15: CPU Multi 64Bit | CPU Single 64Bit
Blender: v2.79 BMW27 CPU
7-Zip 18.03: 7z b 4 | 7z b 4 -mmt1
Geekbench 5.5: Multi-Core | Single-Core
HWBOT x265 Benchmark v2.2: 4k Preset
LibreOffice : 20 Documents To PDF
R Benchmark 2.5: Overall mean
| Cinebench R23 / Multi Core | |
| Average of class Gaming (10488 - 40970, n=110, last 2 years) | |
| Alienware x15 RTX 3070 P111F | |
| Lenovo Legion 5 Pro 16ACH6H (82JQ001PGE) | |
| Lenovo Legion 5 Pro 16ACH6H (82JQ001PGE) | |
| HP Omen 16-b0085ng | |
| Average Intel Core i7-11800H (6508 - 14088, n=48) | |
| HP Omen 15-en0375ng | |
| HP Victus 16-e0179ng | |
| MSI Katana GF66 11UG-220 | |
| Cinebench R23 / Single Core | |
| Average of class Gaming (1166 - 2356, n=110, last 2 years) | |
| MSI Katana GF66 11UG-220 | |
| HP Omen 16-b0085ng | |
| Alienware x15 RTX 3070 P111F | |
| Average Intel Core i7-11800H (1386 - 1522, n=45) | |
| HP Victus 16-e0179ng | |
| Lenovo Legion 5 Pro 16ACH6H (82JQ001PGE) | |
| Lenovo Legion 5 Pro 16ACH6H (82JQ001PGE) | |
| HP Omen 15-en0375ng | |
| Cinebench R20 / CPU (Multi Core) | |
| Average of class Gaming (4029 - 16108, n=109, last 2 years) | |
| Alienware x15 RTX 3070 P111F | |
| Lenovo Legion 5 Pro 16ACH6H (82JQ001PGE) | |
| Lenovo Legion 5 Pro 16ACH6H (82JQ001PGE) | |
| HP Omen 16-b0085ng | |
| Average Intel Core i7-11800H (2498 - 5408, n=50) | |
| HP Omen 15-en0375ng | |
| HP Victus 16-e0179ng | |
| MSI Katana GF66 11UG-220 | |
| Cinebench R20 / CPU (Single Core) | |
| Average of class Gaming (442 - 895, n=109, last 2 years) | |
| HP Omen 16-b0085ng | |
| MSI Katana GF66 11UG-220 | |
| Alienware x15 RTX 3070 P111F | |
| Average Intel Core i7-11800H (520 - 586, n=47) | |
| HP Victus 16-e0179ng | |
| Lenovo Legion 5 Pro 16ACH6H (82JQ001PGE) | |
| Lenovo Legion 5 Pro 16ACH6H (82JQ001PGE) | |
| HP Omen 15-en0375ng | |
| Cinebench R15 / CPU Multi 64Bit | |
| Average of class Gaming (1578 - 6271, n=108, last 2 years) | |
| Alienware x15 RTX 3070 P111F | |
| HP Omen 16-b0085ng | |
| MSI Katana GF66 11UG-220 | |
| MSI Katana GF66 11UG-220 | |
| Lenovo Legion 5 Pro 16ACH6H (82JQ001PGE) | |
| HP Victus 16-e0179ng | |
| HP Omen 15-en0375ng | |
| Average Intel Core i7-11800H (1342 - 2173, n=50) | |
| Cinebench R15 / CPU Single 64Bit | |
| Average of class Gaming (188.8 - 343, n=109, last 2 years) | |
| HP Victus 16-e0179ng | |
| Lenovo Legion 5 Pro 16ACH6H (82JQ001PGE) | |
| Lenovo Legion 5 Pro 16ACH6H (82JQ001PGE) | |
| MSI Katana GF66 11UG-220 | |
| MSI Katana GF66 11UG-220 | |
| HP Omen 16-b0085ng | |
| Alienware x15 RTX 3070 P111F | |
| Average Intel Core i7-11800H (201 - 231, n=46) | |
| HP Omen 15-en0375ng | |
| Blender / v2.79 BMW27 CPU | |
| MSI Katana GF66 11UG-220 | |
| Average Intel Core i7-11800H (217 - 454, n=46) | |
| HP Omen 15-en0375ng | |
| HP Victus 16-e0179ng | |
| Lenovo Legion 5 Pro 16ACH6H (82JQ001PGE) | |
| Lenovo Legion 5 Pro 16ACH6H (82JQ001PGE) | |
| HP Omen 16-b0085ng | |
| Alienware x15 RTX 3070 P111F | |
| Average of class Gaming (80 - 330, n=107, last 2 years) | |
| 7-Zip 18.03 / 7z b 4 | |
| Average of class Gaming (33491 - 148086, n=108, last 2 years) | |
| HP Victus 16-e0179ng | |
| Lenovo Legion 5 Pro 16ACH6H (82JQ001PGE) | |
| Lenovo Legion 5 Pro 16ACH6H (82JQ001PGE) | |
| HP Omen 16-b0085ng | |
| Alienware x15 RTX 3070 P111F | |
| HP Omen 15-en0375ng | |
| Average Intel Core i7-11800H (33718 - 56758, n=46) | |
| MSI Katana GF66 11UG-220 | |
| 7-Zip 18.03 / 7z b 4 -mmt1 | |
| Average of class Gaming (4199 - 7436, n=108, last 2 years) | |
| HP Omen 16-b0085ng | |
| HP Victus 16-e0179ng | |
| MSI Katana GF66 11UG-220 | |
| Lenovo Legion 5 Pro 16ACH6H (82JQ001PGE) | |
| Lenovo Legion 5 Pro 16ACH6H (82JQ001PGE) | |
| Average Intel Core i7-11800H (5138 - 5732, n=46) | |
| Alienware x15 RTX 3070 P111F | |
| HP Omen 15-en0375ng | |
| Geekbench 5.5 / Multi-Core | |
| Average of class Gaming (6460 - 27010, n=108, last 2 years) | |
| HP Omen 16-b0085ng | |
| Average Intel Core i7-11800H (4655 - 9851, n=40) | |
| Lenovo Legion 5 Pro 16ACH6H (82JQ001PGE) | |
| Lenovo Legion 5 Pro 16ACH6H (82JQ001PGE) | |
| HP Omen 15-en0375ng | |
| HP Victus 16-e0179ng | |
| MSI Katana GF66 11UG-220 | |
| Geekbench 5.5 / Single-Core | |
| Average of class Gaming (986 - 2474, n=108, last 2 years) | |
| HP Omen 16-b0085ng | |
| MSI Katana GF66 11UG-220 | |
| Average Intel Core i7-11800H (1429 - 1625, n=40) | |
| HP Victus 16-e0179ng | |
| Lenovo Legion 5 Pro 16ACH6H (82JQ001PGE) | |
| Lenovo Legion 5 Pro 16ACH6H (82JQ001PGE) | |
| HP Omen 15-en0375ng | |
| HWBOT x265 Benchmark v2.2 / 4k Preset | |
| Average of class Gaming (11.5 - 44.3, n=108, last 2 years) | |
| HP Omen 16-b0085ng | |
| Alienware x15 RTX 3070 P111F | |
| Lenovo Legion 5 Pro 16ACH6H (82JQ001PGE) | |
| Lenovo Legion 5 Pro 16ACH6H (82JQ001PGE) | |
| HP Victus 16-e0179ng | |
| Average Intel Core i7-11800H (7.38 - 17.4, n=46) | |
| HP Omen 15-en0375ng | |
| MSI Katana GF66 11UG-220 | |
| LibreOffice / 20 Documents To PDF | |
| Lenovo Legion 5 Pro 16ACH6H (82JQ001PGE) | |
| Lenovo Legion 5 Pro 16ACH6H (82JQ001PGE) | |
| HP Omen 15-en0375ng | |
| HP Victus 16-e0179ng | |
| MSI Katana GF66 11UG-220 | |
| Alienware x15 RTX 3070 P111F | |
| Average of class Gaming (19 - 88.8, n=108, last 2 years) | |
| Average Intel Core i7-11800H (38.6 - 59.9, n=45) | |
| HP Omen 16-b0085ng | |
| R Benchmark 2.5 / Overall mean | |
| HP Omen 15-en0375ng | |
| Alienware x15 RTX 3070 P111F | |
| Average Intel Core i7-11800H (0.548 - 0.615, n=46) | |
| Lenovo Legion 5 Pro 16ACH6H (82JQ001PGE) | |
| Lenovo Legion 5 Pro 16ACH6H (82JQ001PGE) | |
| HP Omen 16-b0085ng | |
| MSI Katana GF66 11UG-220 | |
| HP Victus 16-e0179ng | |
| Average of class Gaming (0.3439 - 0.759, n=109, last 2 years) | |
* ... smaller is better
系统性能

Omen 16取得了良好的系统性能(PCMark 10)结果,并成功地在总体和基本要素类别中排名第一。
也就是说,这些差异相对较小。
| PCMark 10 / Score | |
| Average of class Gaming (5828 - 11574, n=95, last 2 years) | |
| HP Omen 16-b0085ng | |
| Alienware x15 RTX 3070 P111F | |
| Average Intel Core i7-11800H, NVIDIA GeForce RTX 3070 Laptop GPU (6126 - 7311, n=11) | |
| Lenovo Legion 5 Pro 16ACH6H (82JQ001PGE) | |
| MSI Katana GF66 11UG-220 | |
| HP Victus 16-e0179ng | |
| HP Omen 15-en0375ng | |
| PCMark 10 / Essentials | |
| HP Omen 16-b0085ng | |
| Average of class Gaming (8810 - 12600, n=99, last 2 years) | |
| Alienware x15 RTX 3070 P111F | |
| Average Intel Core i7-11800H, NVIDIA GeForce RTX 3070 Laptop GPU (9248 - 10832, n=11) | |
| HP Victus 16-e0179ng | |
| Lenovo Legion 5 Pro 16ACH6H (82JQ001PGE) | |
| MSI Katana GF66 11UG-220 | |
| HP Omen 15-en0375ng | |
| PCMark 10 / Productivity | |
| Average of class Gaming (6845 - 21327, n=97, last 2 years) | |
| MSI Katana GF66 11UG-220 | |
| Average Intel Core i7-11800H, NVIDIA GeForce RTX 3070 Laptop GPU (8571 - 9669, n=11) | |
| Alienware x15 RTX 3070 P111F | |
| HP Omen 16-b0085ng | |
| HP Victus 16-e0179ng | |
| Lenovo Legion 5 Pro 16ACH6H (82JQ001PGE) | |
| HP Omen 15-en0375ng | |
| PCMark 10 / Digital Content Creation | |
| Average of class Gaming (7602 - 19657, n=97, last 2 years) | |
| Alienware x15 RTX 3070 P111F | |
| HP Omen 16-b0085ng | |
| Average Intel Core i7-11800H, NVIDIA GeForce RTX 3070 Laptop GPU (7627 - 10851, n=11) | |
| Lenovo Legion 5 Pro 16ACH6H (82JQ001PGE) | |
| MSI Katana GF66 11UG-220 | |
| HP Victus 16-e0179ng | |
| HP Omen 15-en0375ng | |
| PCMark 10 Score | 7231 points | |
Help | ||
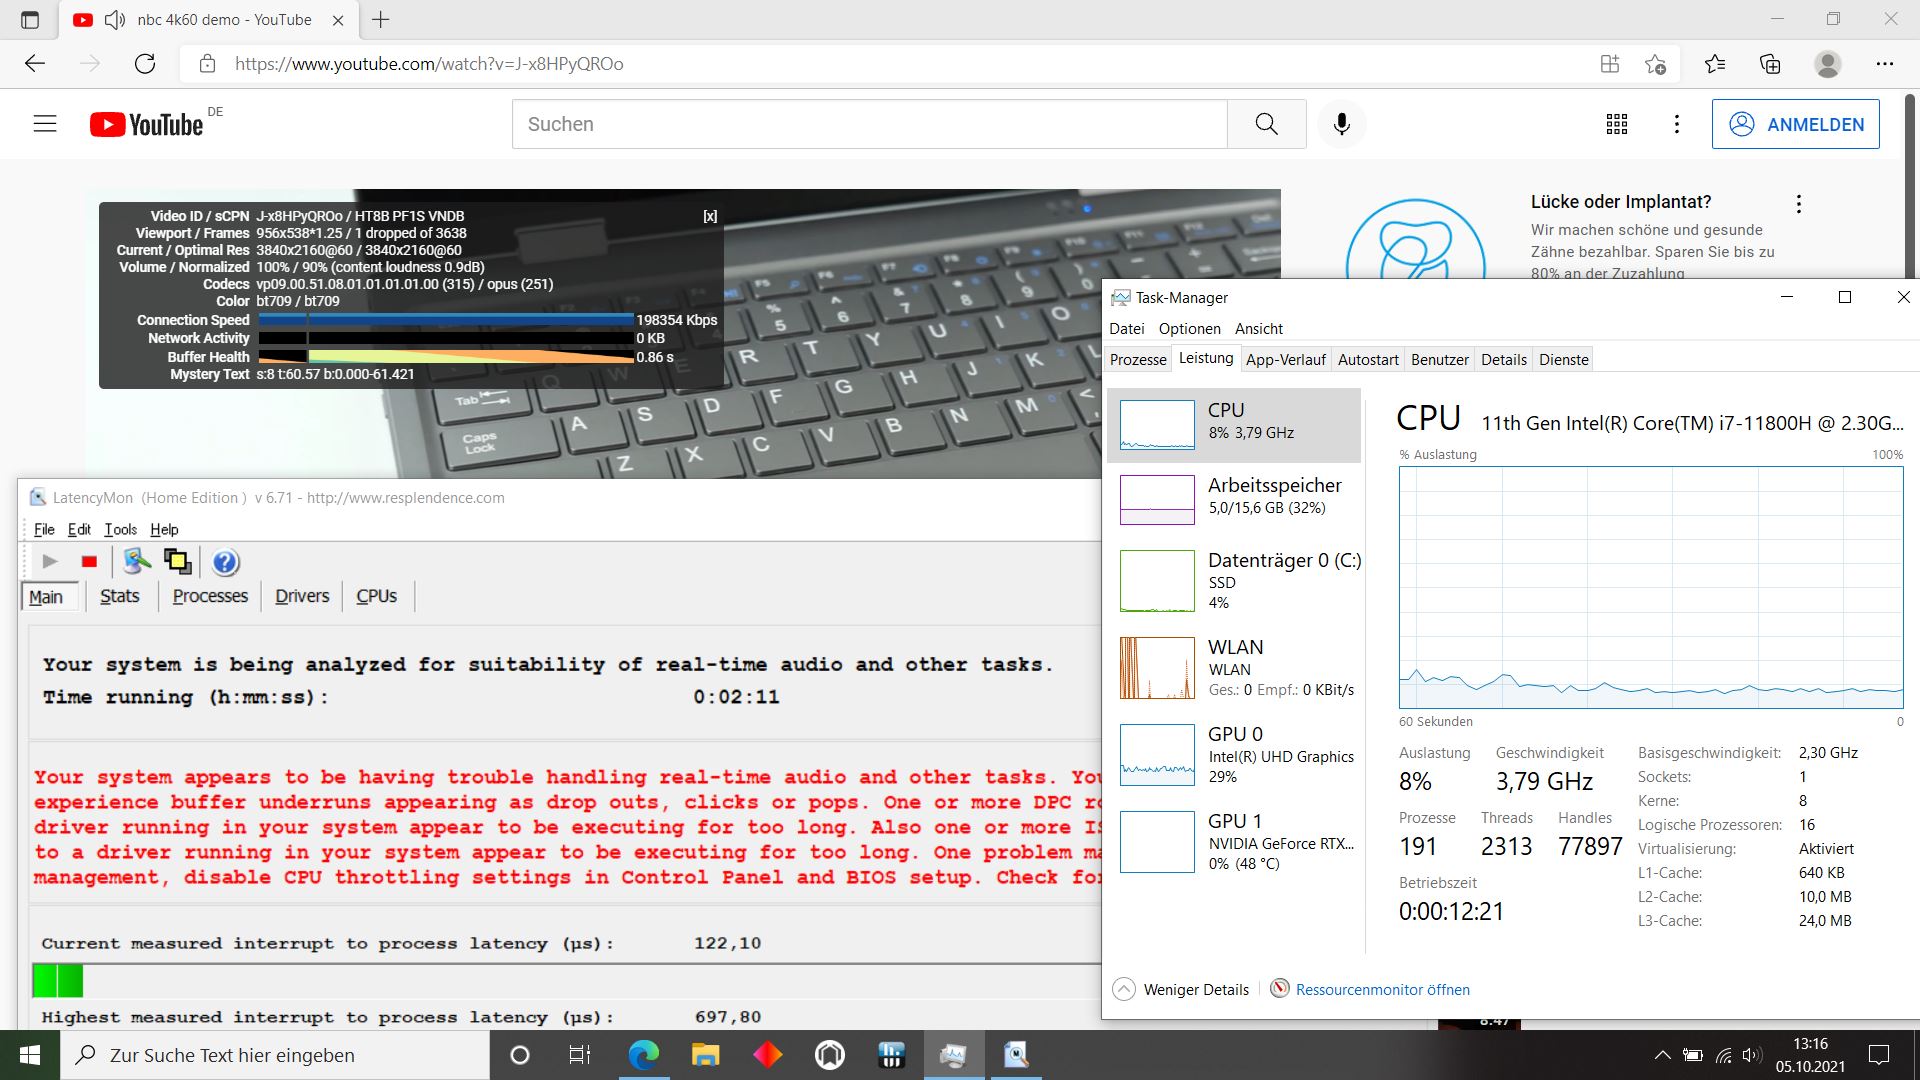
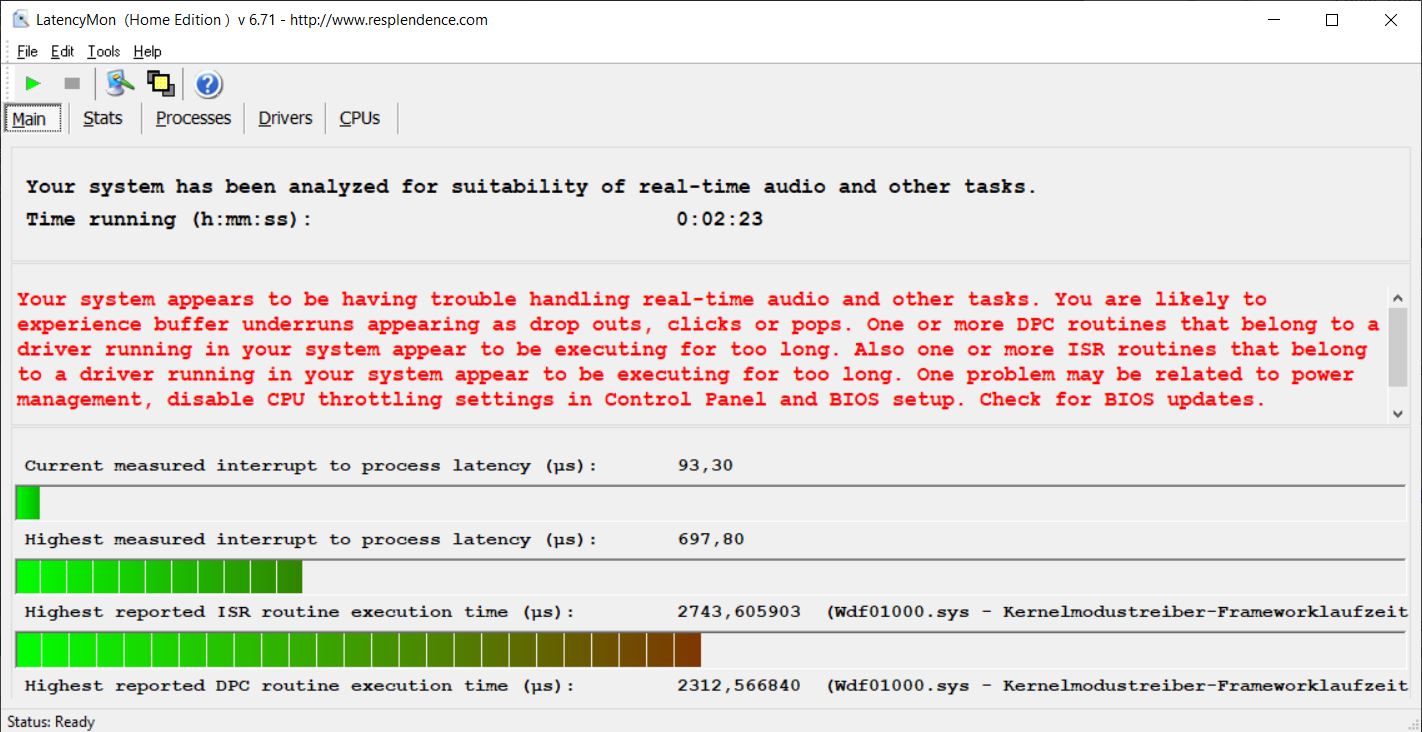
DPC延迟
根据LatencyMon,即使只是在Edge浏览器中打开我们的主页,也会导致有问题的DPC延迟。在播放我们的4K60FPS YouTube视频时,至少只有1帧被丢弃。我们希望惠普能够重新审视他们的驱动程序,并发布更新版本。

| DPC Latencies / LatencyMon - interrupt to process latency (max), Web, Youtube, Prime95 | |
| HP Omen 16-b0085ng | |
* ... smaller is better
存储解决方案
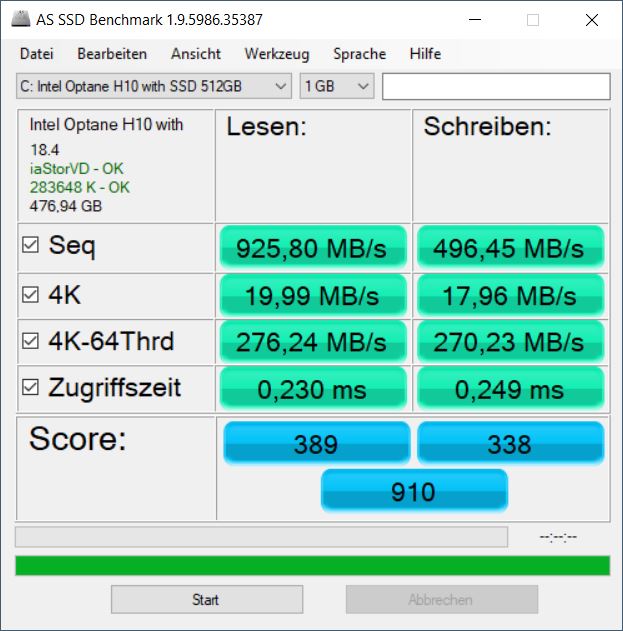
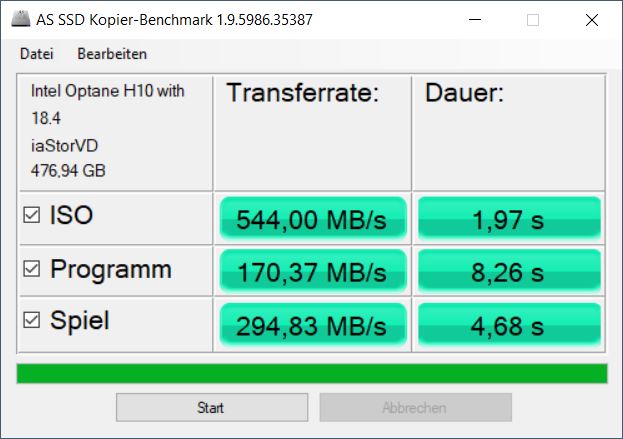
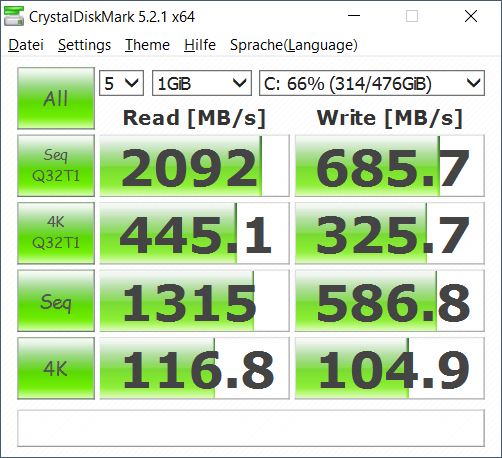
说到存储解决方案,我们的测试设备采用了由英特尔Optane内存H10 32GB + 512GB组成的组合解决方案。32GB的Optane缓存只有在重复执行相同的工作负载后才有优势,而且英特尔固态硬盘在其他方面的表现也不尽如人意--一些竞争对手的速度高达两倍以上。
考虑到这一点,出色的系统性能结果有些令人惊讶。也许,超快的Optane内存能够抵消所安装的主固态硬盘的性能劣势。在我们的 硬盘/SSD表中,固态硬盘糟糕的合成测量结果将其排在第262位。
| HP Omen 16-b0085ng Intel Optane Memory H10 with Solid State Storage 32GB + 512GB HBRPEKNX0202A(L/H) | HP Omen 15-en0375ng WDC PC SN730 SDBPNTY-512G | HP Victus 16-e0179ng WDC PC SN730 SDBPNTY-1T00 | Lenovo Legion 5 Pro 16ACH6H (82JQ001PGE) WDC PC SN730 SDBPNTY-1T00 | Alienware x15 RTX 3070 P111F WDC PC SN730 SDBPNTY-512G | MSI Katana GF66 11UG-220 Kingston OM8PDP3512B-AI1 | Average Intel Optane Memory H10 with Solid State Storage 32GB + 512GB HBRPEKNX0202A(L/H) | |
|---|---|---|---|---|---|---|---|
| CrystalDiskMark 5.2 / 6 | 96% | 113% | 57% | 89% | -14% | 13% | |
| Write 4K (MB/s) | 104.9 | 119.6 14% | 157.3 50% | 89.9 -14% | 179.6 71% | 138.2 32% | 110.3 ? 5% |
| Read 4K (MB/s) | 116.8 | 47.4 -59% | 49 -58% | 30.98 -73% | 49.21 -58% | 31.31 -73% | 131.9 ? 13% |
| Write Seq (MB/s) | 587 | 2677 356% | 2983 408% | 2062 251% | 459.3 -22% | 569 ? -3% | |
| Read Seq (MB/s) | 1316 | 2220 69% | 2247 71% | 1849 41% | 1283 -3% | 1372 ? 4% | |
| Write 4K Q32T1 (MB/s) | 325.7 | 427.4 31% | 395 21% | 371.6 14% | 462.9 42% | 321 -1% | 387 ? 19% |
| Read 4K Q32T1 (MB/s) | 445.1 | 549 23% | 557 25% | 470.6 6% | 470.2 6% | 394.5 -11% | 375 ? -16% |
| Write Seq Q32T1 (MB/s) | 686 | 2706 294% | 3094 351% | 3065 347% | 2702 294% | 436 -36% | 1141 ? 66% |
| Read Seq Q32T1 (MB/s) | 2092 | 2869 37% | 2871 37% | 3370 61% | 3371 61% | 2222 6% | 2439 ? 17% |
| Write 4K Q8T8 (MB/s) | 1619 | ||||||
| Read 4K Q8T8 (MB/s) | 1670 | ||||||
| AS SSD | 377% | 377% | 176% | 249% | 48% | 119% | |
| Seq Read (MB/s) | 925 | 2255 144% | 2383 158% | 2695 191% | 2871 210% | 1978 114% | 1056 ? 14% |
| Seq Write (MB/s) | 496 | 2129 329% | 2466 397% | 2384 381% | 1511 205% | 308.3 -38% | 429 ? -14% |
| 4K Read (MB/s) | 19.99 | 49.5 148% | 44.14 121% | 29.75 49% | 44.3 122% | 24.04 20% | 61.9 ? 210% |
| 4K Write (MB/s) | 17.96 | 175.1 875% | 117.5 554% | 52 190% | 162 802% | 113.7 533% | 105 ? 485% |
| 4K-64 Read (MB/s) | 276.2 | 1463 430% | 1734 528% | 1193 332% | 1038 276% | 256.5 -7% | 459 ? 66% |
| 4K-64 Write (MB/s) | 270.2 | 2061 663% | 2088 673% | 1107 310% | 966 258% | 242.8 -10% | 644 ? 138% |
| Access Time Read * (ms) | 0.23 | 0.138 40% | 0.049 79% | 0.136 41% | 0.077 67% | 0.15 35% | 0.1019 ? 56% |
| Access Time Write * (ms) | 0.249 | 0.022 91% | 0.032 87% | 0.36 -45% | 0.066 73% | 0.353 -42% | 0.09417 ? 62% |
| Score Read (Points) | 389 | 1738 347% | 2017 419% | 1493 284% | 1370 252% | 478 23% | 627 ? 61% |
| Score Write (Points) | 338 | 2449 625% | 2452 625% | 1397 313% | 1279 278% | 387 14% | 792 ? 134% |
| Score Total (Points) | 910 | 5075 458% | 5503 505% | 3636 300% | 3288 261% | 1033 14% | 1732 ? 90% |
| Copy ISO MB/s (MB/s) | 544 | 1007 85% | 1962 261% | 278.1 -49% | 782 ? 44% | ||
| Copy Program MB/s (MB/s) | 170.4 | 43.11 -75% | 407.9 139% | 282.3 66% | 464 ? 172% | ||
| Copy Game MB/s (MB/s) | 294.8 | 621 111% | 1105 275% | 284.2 -4% | 722 ? 145% | ||
| Total Average (Program / Settings) | 237% /
259% | 245% /
266% | 117% /
140% | 169% /
190% | 17% /
26% | 66% /
80% |
* ... smaller is better

Dauerleistung Lesen: DiskSpd Read Loop, Queue Depth 8
GPU性能
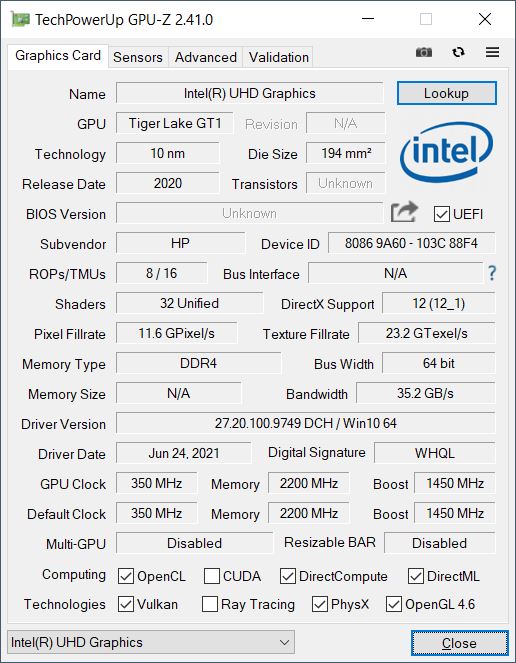
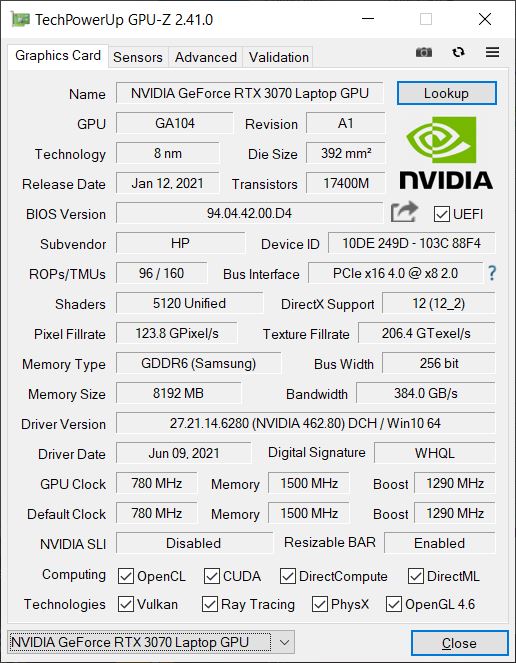
在混合模式下,集成的UHD Graphics 和专用的 NVIDIAGeForce RTX 3070笔记本GPU拥有8GB的VRAM,根据负载情况轮流使用。后者的TGP被设定为115瓦。它的可能光谱为80瓦至125瓦,属于高性能类别。另外,也可以选择配备RTX 3060的Omen 16。
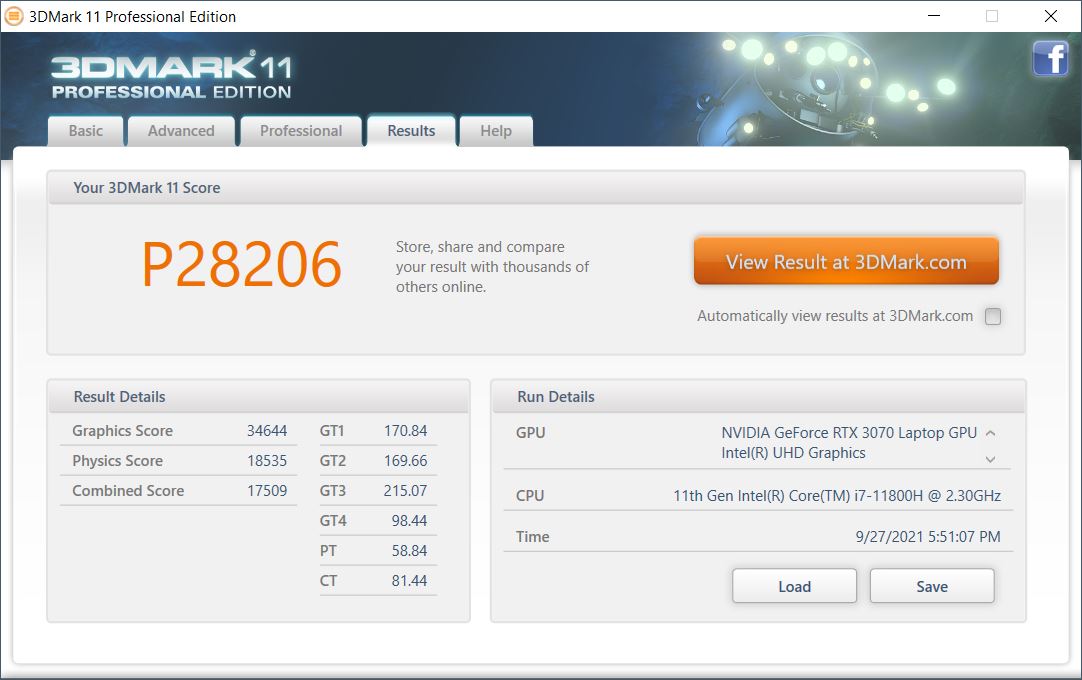
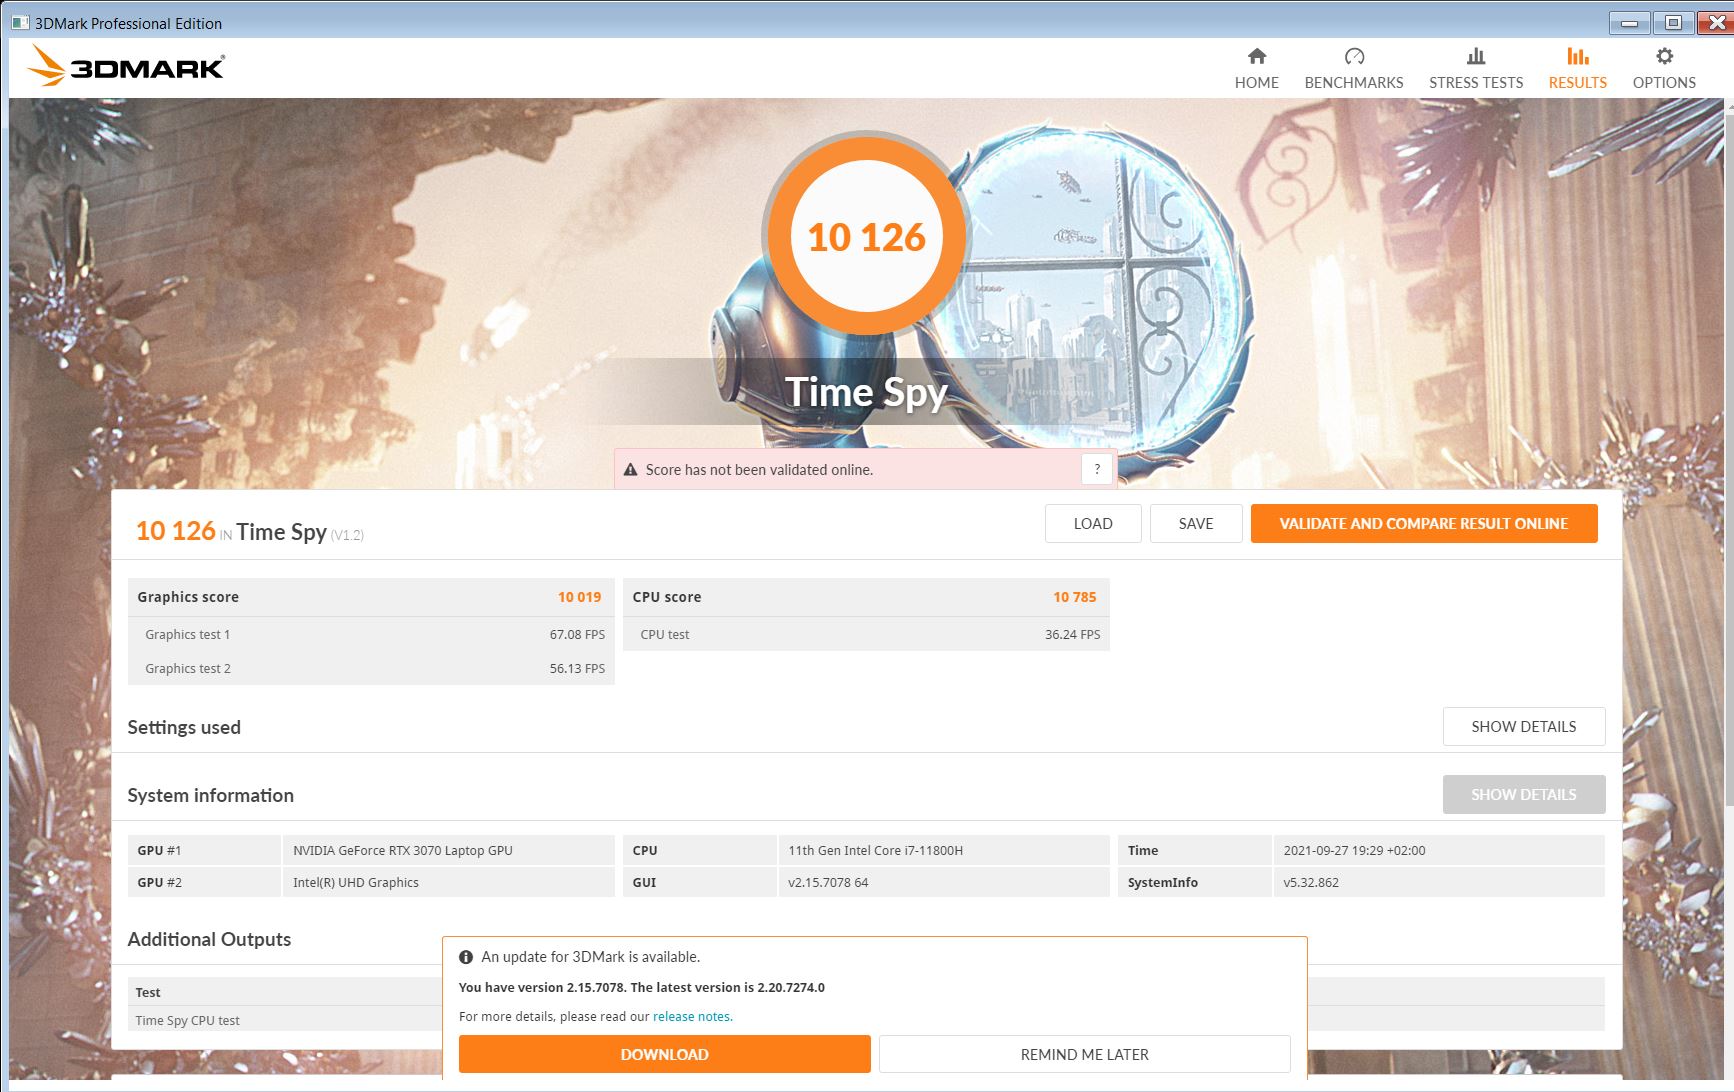
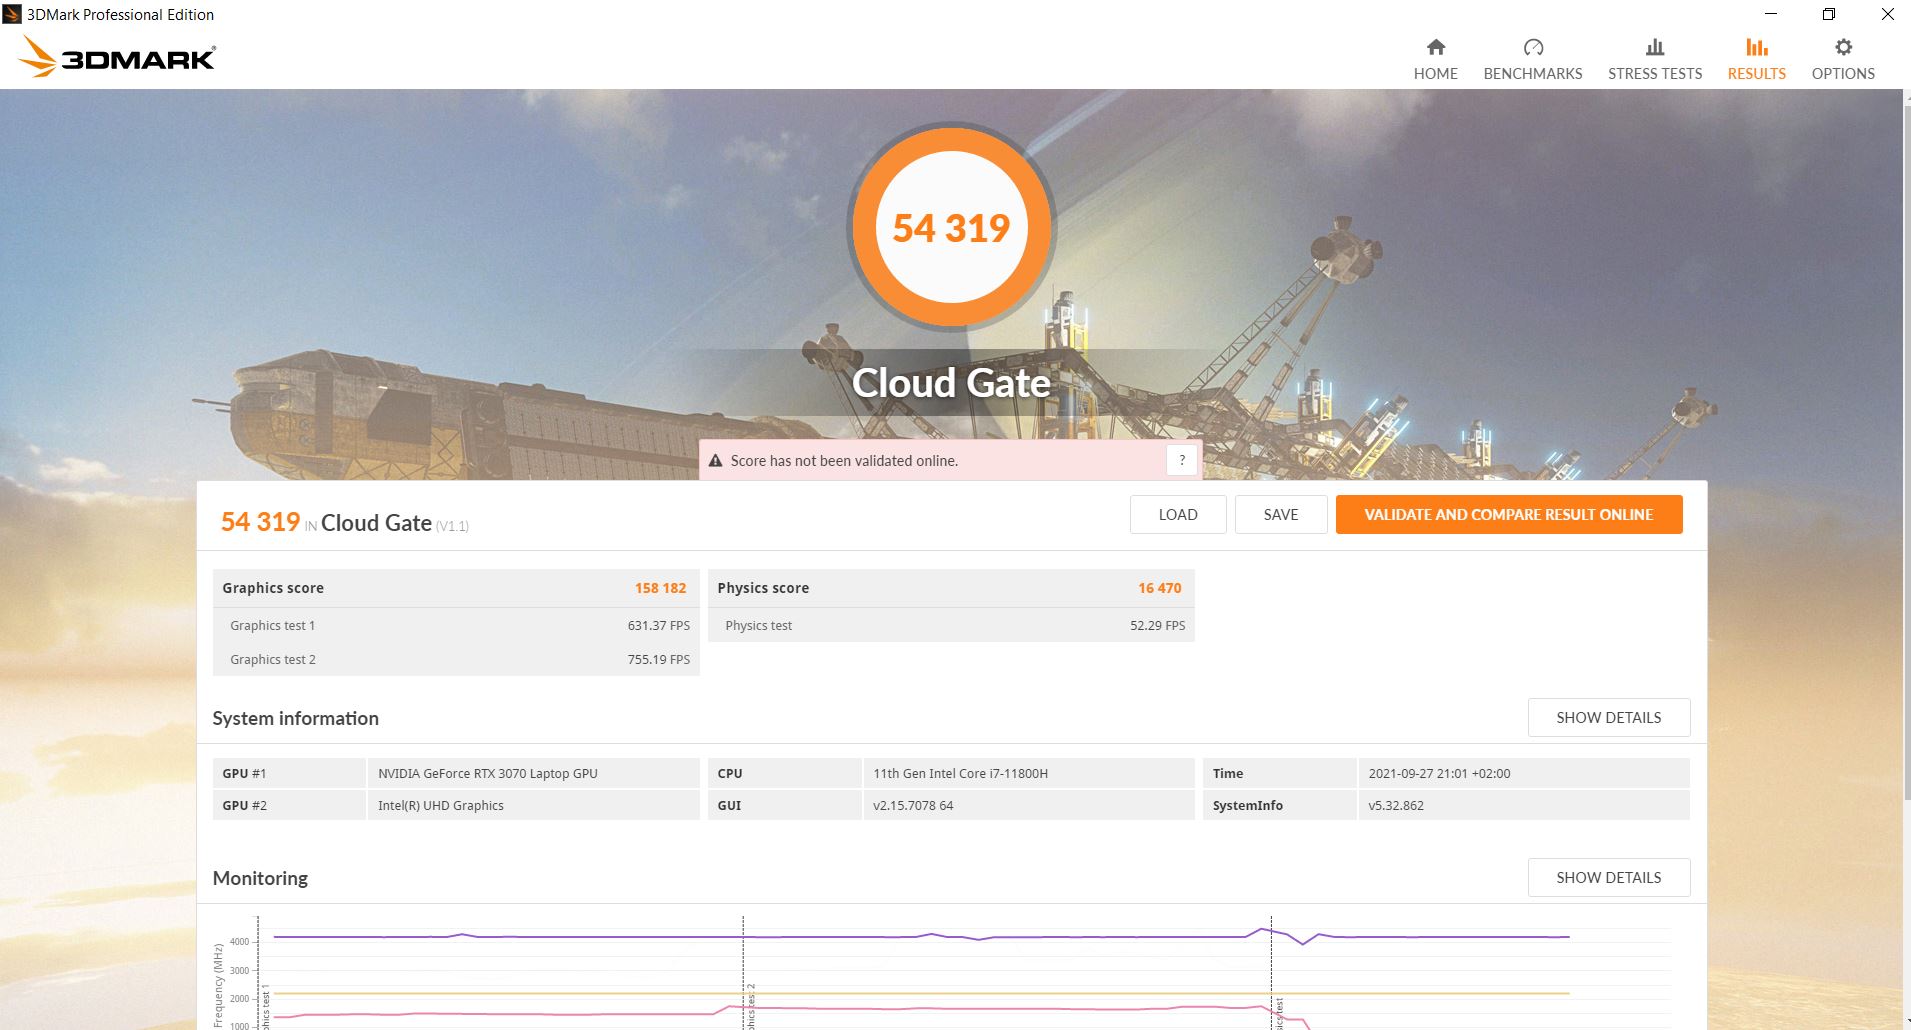
Omen 16的3DMark结果不错,与Alienware和Legion 5 Pro的结果非常相似。同时,惠普Victus内部的RTX 3060慢了约30%。
在电池模式下,该系统的图形性能下降了整整64%。

| 3DMark 11 - 1280x720 Performance GPU | |
| Average of class Gaming (21841 - 80022, n=106, last 2 years) | |
| Lenovo Legion 5 Pro 16ACH6H (82JQ001PGE) | |
| HP Omen 16-b0085ng | |
| Alienware x15 RTX 3070 P111F | |
| Average NVIDIA GeForce RTX 3070 Laptop GPU (12535 - 38275, n=54) | |
| MSI Katana GF66 11UG-220 | |
| HP Victus 16-e0179ng | |
| HP Omen 15-en0375ng | |
| 3DMark | |
| 1280x720 Cloud Gate Standard Graphics | |
| HP Omen 16-b0085ng | |
| Alienware x15 RTX 3070 P111F | |
| Average of class Gaming (86886 - 223650, n=62, last 2 years) | |
| Average NVIDIA GeForce RTX 3070 Laptop GPU (45531 - 179716, n=33) | |
| HP Victus 16-e0179ng | |
| HP Omen 15-en0375ng | |
| 1920x1080 Fire Strike Graphics | |
| Average of class Gaming (12242 - 62849, n=118, last 2 years) | |
| Alienware x15 RTX 3070 P111F | |
| HP Omen 16-b0085ng | |
| Average NVIDIA GeForce RTX 3070 Laptop GPU (7178 - 29128, n=52) | |
| HP Victus 16-e0179ng | |
| HP Omen 15-en0375ng | |
| 2560x1440 Time Spy Graphics | |
| Average of class Gaming (5012 - 26212, n=117, last 2 years) | |
| HP Omen 16-b0085ng | |
| Alienware x15 RTX 3070 P111F | |
| Average NVIDIA GeForce RTX 3070 Laptop GPU (2644 - 11019, n=53) | |
| MSI Katana GF66 11UG-220 | |
| HP Victus 16-e0179ng | |
| HP Omen 15-en0375ng | |
| 3DMark 11 Performance | 28206 points | |
| 3DMark Cloud Gate Standard Score | 54319 points | |
| 3DMark Fire Strike Score | 20835 points | |
| 3DMark Time Spy Score | 10126 points | |
Help | ||
游戏性能
在我们的游戏基准测试中,Omen 16是一个重量级产品,与Alienware争夺第一名。然而,后者的表现往往比我们的Omen 16略胜一筹,特别是在更高的分辨率和质量设置下。
| New World | |
| 1920x1080 Low Video Quality | |
| HP Omen 16-b0085ng | |
| Average NVIDIA GeForce RTX 3070 Laptop GPU (99.8 - 120.5, n=3) | |
| 1920x1080 Medium Video Quality | |
| HP Omen 16-b0085ng | |
| Average NVIDIA GeForce RTX 3070 Laptop GPU (84.6 - 96.8, n=4) | |
| 1920x1080 High Video Quality | |
| HP Omen 16-b0085ng | |
| Average NVIDIA GeForce RTX 3070 Laptop GPU (81.7 - 94.8, n=4) | |
| 1920x1080 Very High Video Quality | |
| Average NVIDIA GeForce RTX 3070 Laptop GPU (79.4 - 86.8, n=4) | |
| HP Omen 16-b0085ng | |
在我们60分钟的 Witcher 3闲置测试中,帧率并不完全稳定。在这里,性能略有波动,尽管图中没有显示出性能的长期大幅下降。
Witcher 3 FPS-Diagramm
| low | med. | high | ultra | |
|---|---|---|---|---|
| GTA V (2015) | 185 | 181 | 172 | 103 |
| The Witcher 3 (2015) | 416 | 304.5 | 184.4 | 98.6 |
| Dota 2 Reborn (2015) | 171 | 151 | 145 | 137 |
| X-Plane 11.11 (2018) | 136 | 121 | 96.7 | |
| Far Cry 5 (2018) | 156 | 129 | 123 | 115 |
| Strange Brigade (2018) | 482 | 254 | 205 | 178 |
| Shadow of the Tomb Raider (2018) | 159 | 140 | 135 | 126 |
| New World (2021) | 128 | 96.8 | 94.8 | 81.8 |
排放--不能忽视的强烈预兆
系统噪音
在混合模式下,风扇在系统空闲时往往不会打开。从Gaming Hub软件中选择性能模式后,风扇大多--但不总是--安静地旋转。在负载情况下,两个风扇变得非常响亮,噪音水平超过竞争对手。然而,从主观上讲,这台笔记本电脑并没有明显地比其竞争对手的声音大。
也就是说,有一些零星的线圈啸叫。这似乎与高负荷的情况有关,如在高分辨率和质量设置下发射 Witcher 3高分辨率和质量设置下的发射。值得庆幸的是,这些相对安静的电子噪音是暂时的,只是有时会被注意到。
Noise level
| Idle |
| 23 / 23 / 34.81 dB(A) |
| Load |
| 35.02 / 56 dB(A) |
 | ||
30 dB silent 40 dB(A) audible 50 dB(A) loud |
||
min: | ||
| HP Omen 16-b0085ng GeForce RTX 3070 Laptop GPU, i7-11800H, Intel Optane Memory H10 with Solid State Storage 32GB + 512GB HBRPEKNX0202A(L/H) | HP Omen 15-en0375ng GeForce RTX 2060 Mobile, R7 4800H, WDC PC SN730 SDBPNTY-512G | HP Victus 16-e0179ng GeForce RTX 3060 Laptop GPU, R7 5800H, WDC PC SN730 SDBPNTY-1T00 | Lenovo Legion 5 Pro 16ACH6H (82JQ001PGE) GeForce RTX 3070 Laptop GPU, R7 5800H, WDC PC SN730 SDBPNTY-1T00 | Alienware x15 RTX 3070 P111F GeForce RTX 3070 Laptop GPU, i7-11800H, WDC PC SN730 SDBPNTY-512G | MSI Katana GF66 11UG-220 GeForce RTX 3070 Laptop GPU, i7-11800H, Kingston OM8PDP3512B-AI1 | |
|---|---|---|---|---|---|---|
| Noise | -5% | -4% | 4% | 1% | -18% | |
| off / environment * (dB) | 23 | 24 -4% | 24 -4% | 23 -0% | 24.1 -5% | 25 -9% |
| Idle Minimum * (dB) | 23 | 24 -4% | 24 -4% | 25 -9% | 26.6 -16% | 34 -48% |
| Idle Average * (dB) | 23 | 25 -9% | 25 -9% | 25 -9% | 26.6 -16% | 35 -52% |
| Idle Maximum * (dB) | 34.81 | 37 -6% | 34 2% | 25 28% | 26.6 24% | 36 -3% |
| Load Average * (dB) | 35.02 | 45 -28% | 44 -26% | 35.5 -1% | 30.9 12% | 48 -37% |
| Witcher 3 ultra * (dB) | 52 | 48 8% | 50 4% | 46.67 10% | 49.9 4% | 46 12% |
| Load Maximum * (dB) | 56 | 51 9% | 52 7% | 50.35 10% | 53.5 4% | 49 12% |
* ... smaller is better
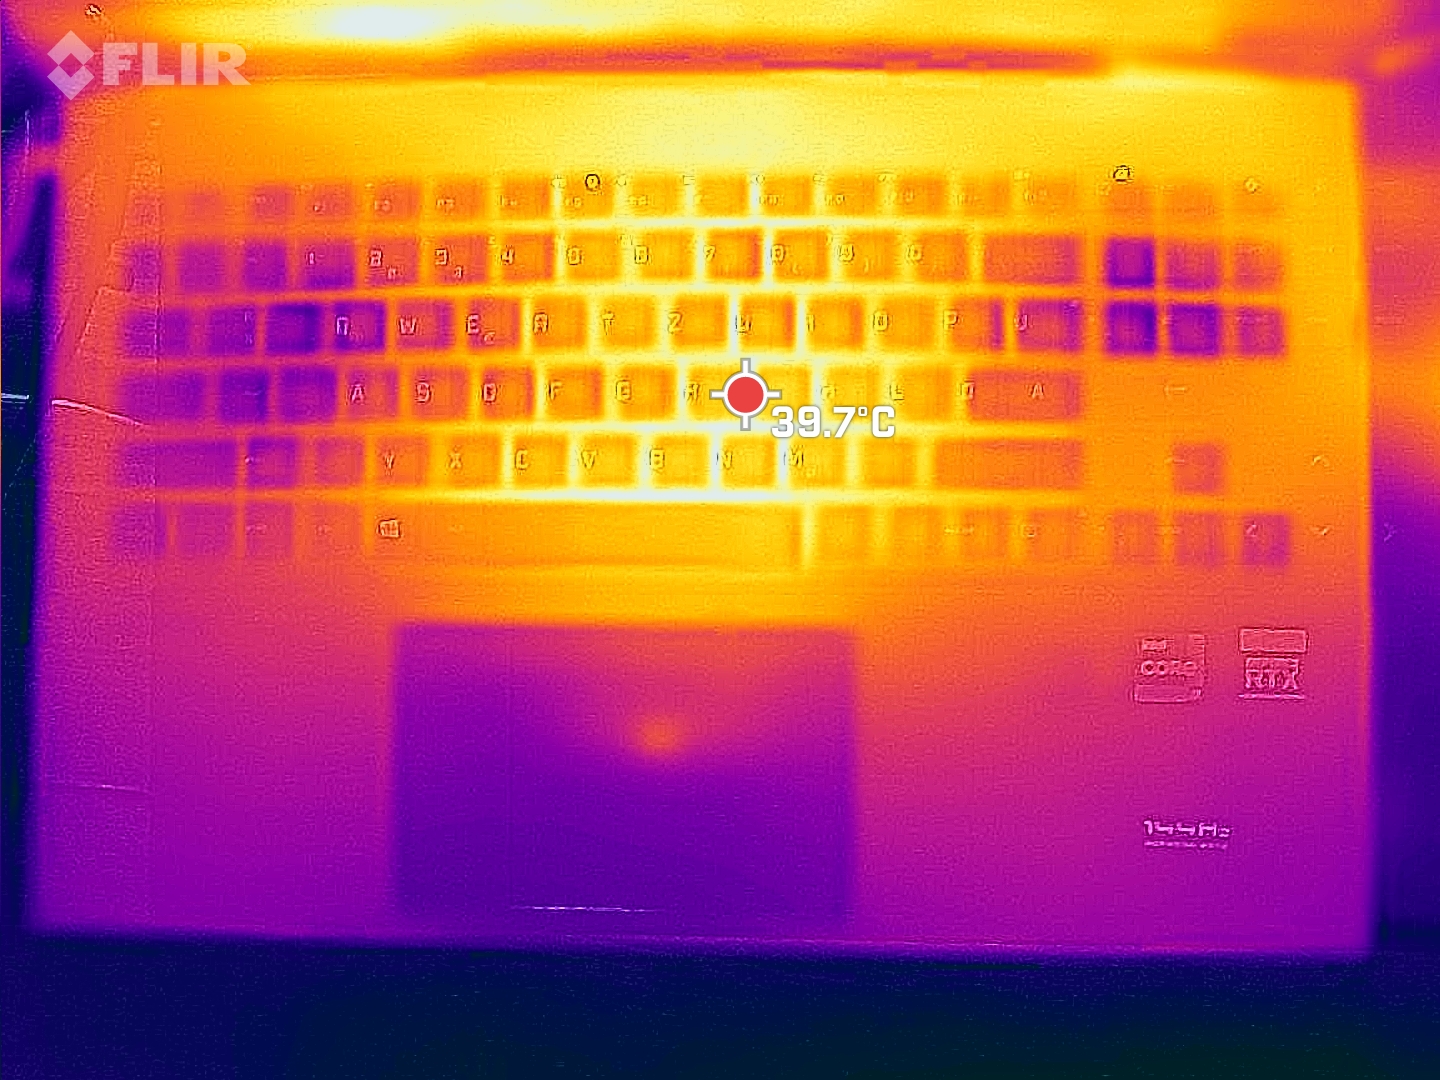
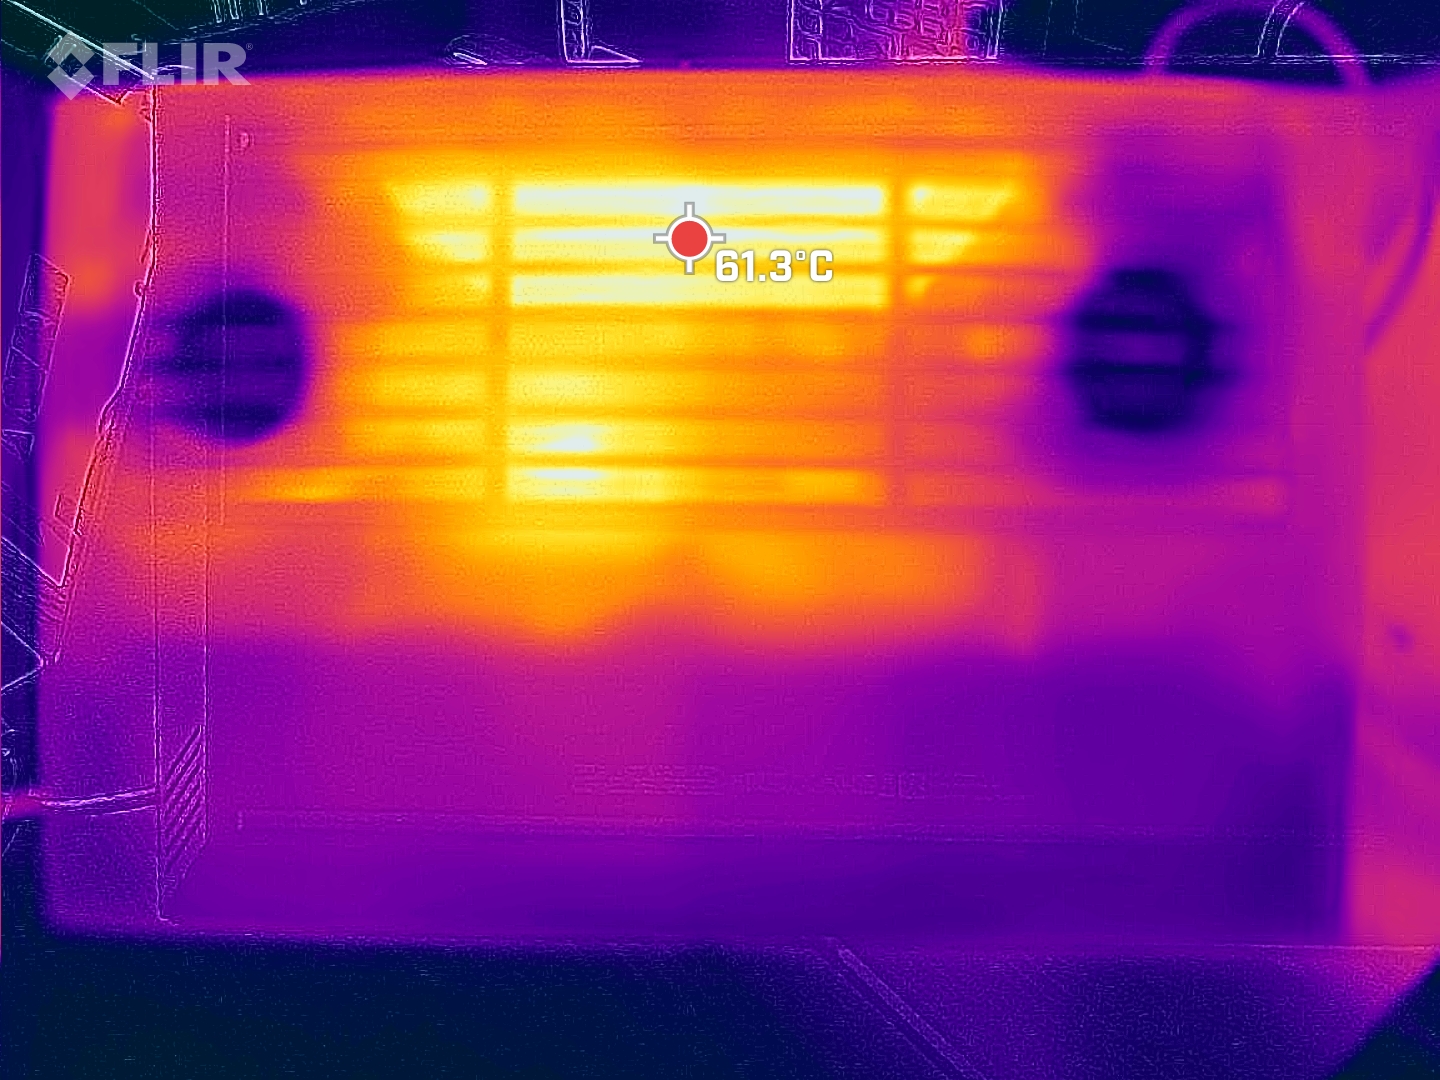
温度
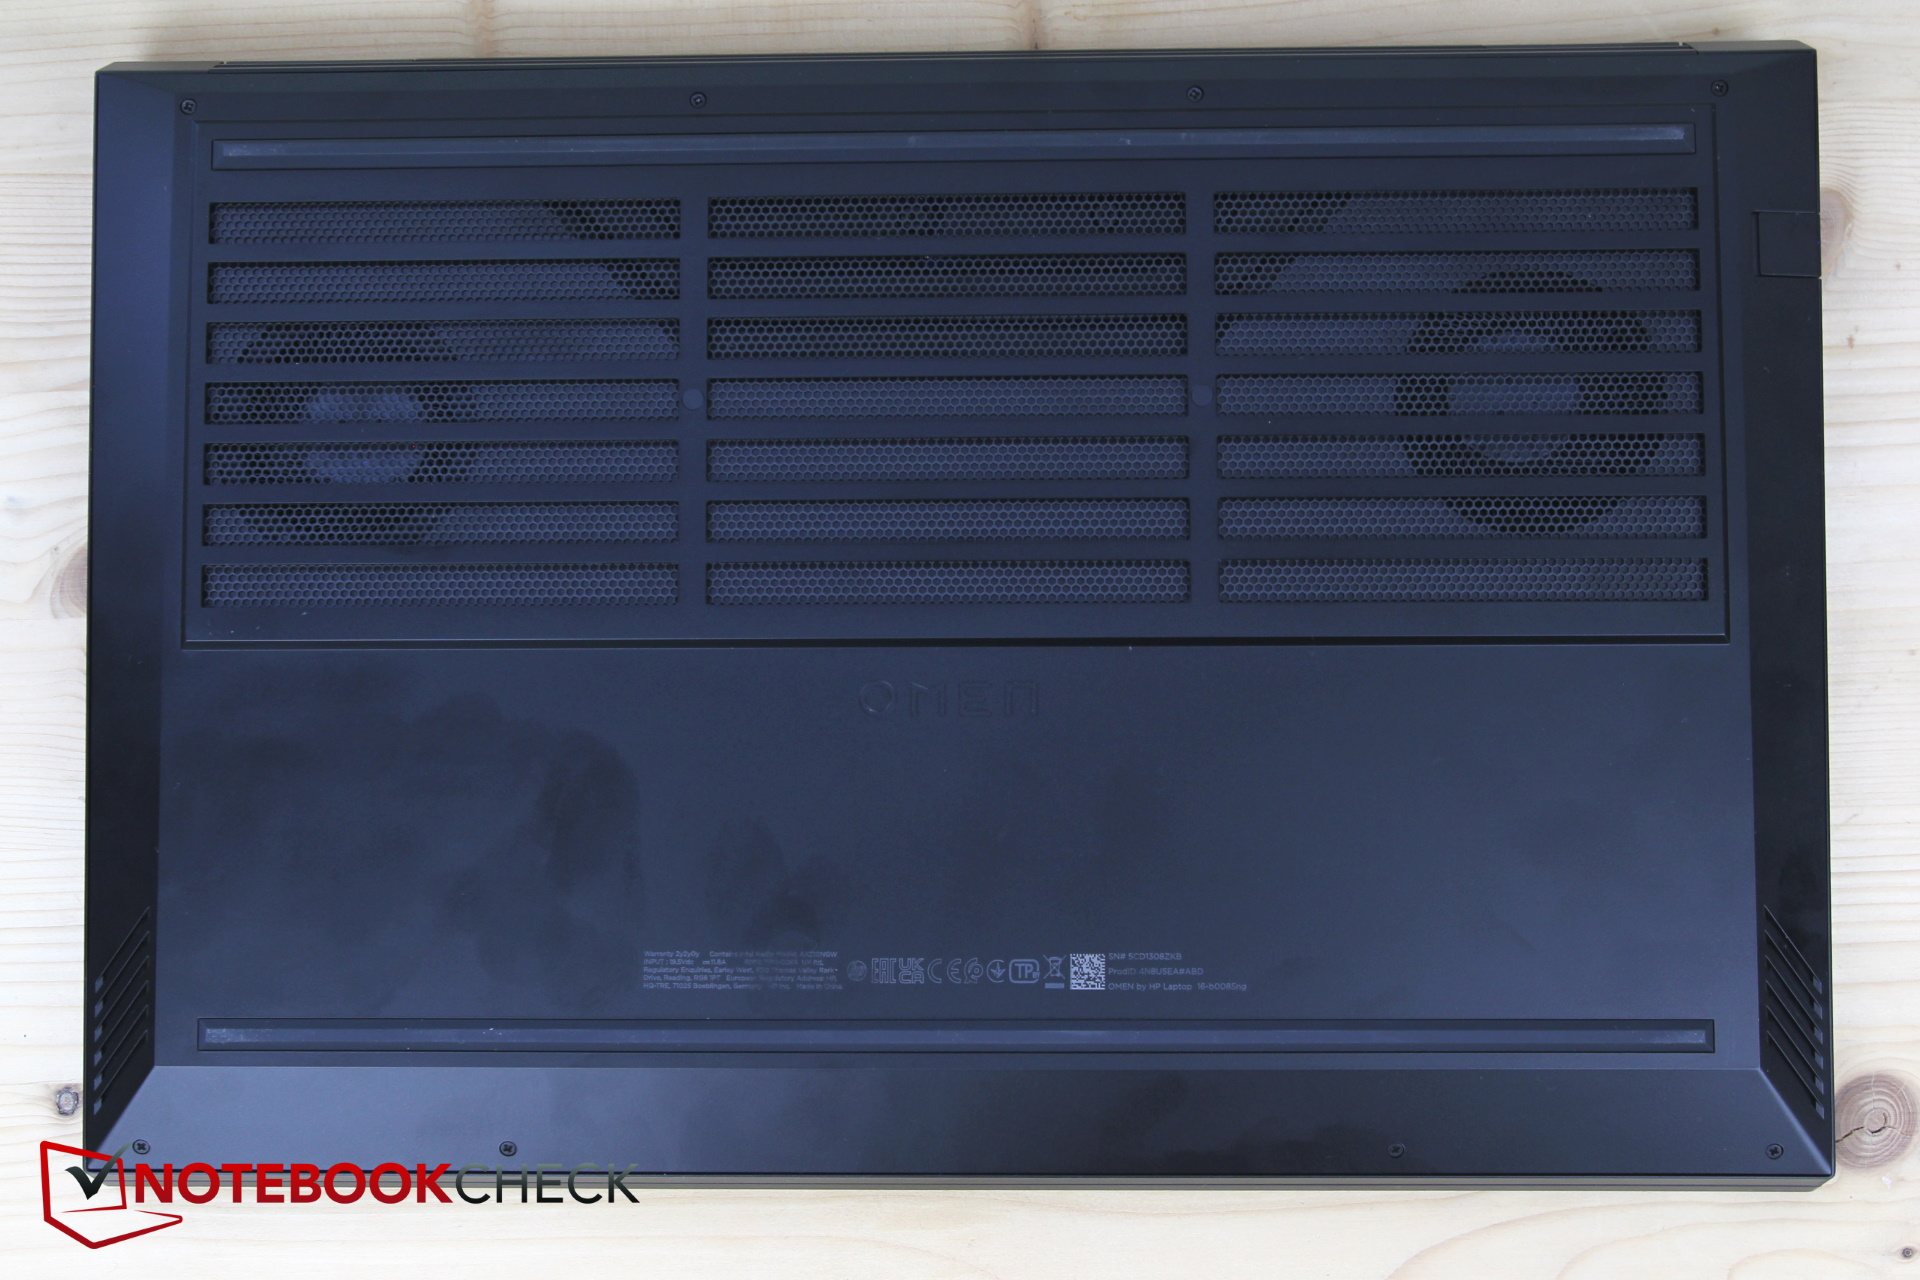
Omen 16主要在底部发热,那里有大量的栅栏作为进气口和散热口。
在顶部,Omen仍然相对凉爽。底部的热点高达55摄氏度,相对而言,这是很温和的。在这里,高度动态的冷却解决方案在全负荷下的高噪音水平展示了它的能力。尽管配备了更加宽敞的冷却解决方案,Alienware达到了更高的温度,同时只实现了略微更快的性能。
掌托保持舒适的温度,甚至WASD键的温度也出奇的低。在这方面,惠普已经成功地平衡了热量分布,应该让玩家感到满意。
(-) The maximum temperature on the upper side is 48 °C / 118 F, compared to the average of 40.4 °C / 105 F, ranging from 21.2 to 68.8 °C for the class Gaming.
(-) The bottom heats up to a maximum of 55 °C / 131 F, compared to the average of 43.2 °C / 110 F
(+) In idle usage, the average temperature for the upper side is 30.9 °C / 88 F, compared to the device average of 33.9 °C / 93 F.
(±) Playing The Witcher 3, the average temperature for the upper side is 36.2 °C / 97 F, compared to the device average of 33.9 °C / 93 F.
(+) The palmrests and touchpad are reaching skin temperature as a maximum (33 °C / 91.4 F) and are therefore not hot.
(-) The average temperature of the palmrest area of similar devices was 28.8 °C / 83.8 F (-4.2 °C / -7.6 F).
| HP Omen 16-b0085ng GeForce RTX 3070 Laptop GPU, i7-11800H, Intel Optane Memory H10 with Solid State Storage 32GB + 512GB HBRPEKNX0202A(L/H) | HP Omen 15-en0375ng GeForce RTX 2060 Mobile, R7 4800H, WDC PC SN730 SDBPNTY-512G | HP Victus 16-e0179ng GeForce RTX 3060 Laptop GPU, R7 5800H, WDC PC SN730 SDBPNTY-1T00 | Lenovo Legion 5 Pro 16ACH6H (82JQ001PGE) GeForce RTX 3070 Laptop GPU, R7 5800H, WDC PC SN730 SDBPNTY-1T00 | Alienware x15 RTX 3070 P111F GeForce RTX 3070 Laptop GPU, i7-11800H, WDC PC SN730 SDBPNTY-512G | MSI Katana GF66 11UG-220 GeForce RTX 3070 Laptop GPU, i7-11800H, Kingston OM8PDP3512B-AI1 | |
|---|---|---|---|---|---|---|
| Heat | 14% | -11% | -1% | 3% | 3% | |
| Maximum Upper Side * (°C) | 48 | 42 12% | 51 -6% | 50 -4% | 59.2 -23% | 56 -17% |
| Maximum Bottom * (°C) | 55 | 54 2% | 52 5% | 55 -0% | 58 -5% | 49 11% |
| Idle Upper Side * (°C) | 33 | 28 15% | 46 -39% | 34 -3% | 28.4 14% | 36 -9% |
| Idle Bottom * (°C) | 39 | 29 26% | 41 -5% | 37 5% | 29 26% | 28 28% |
* ... smaller is better
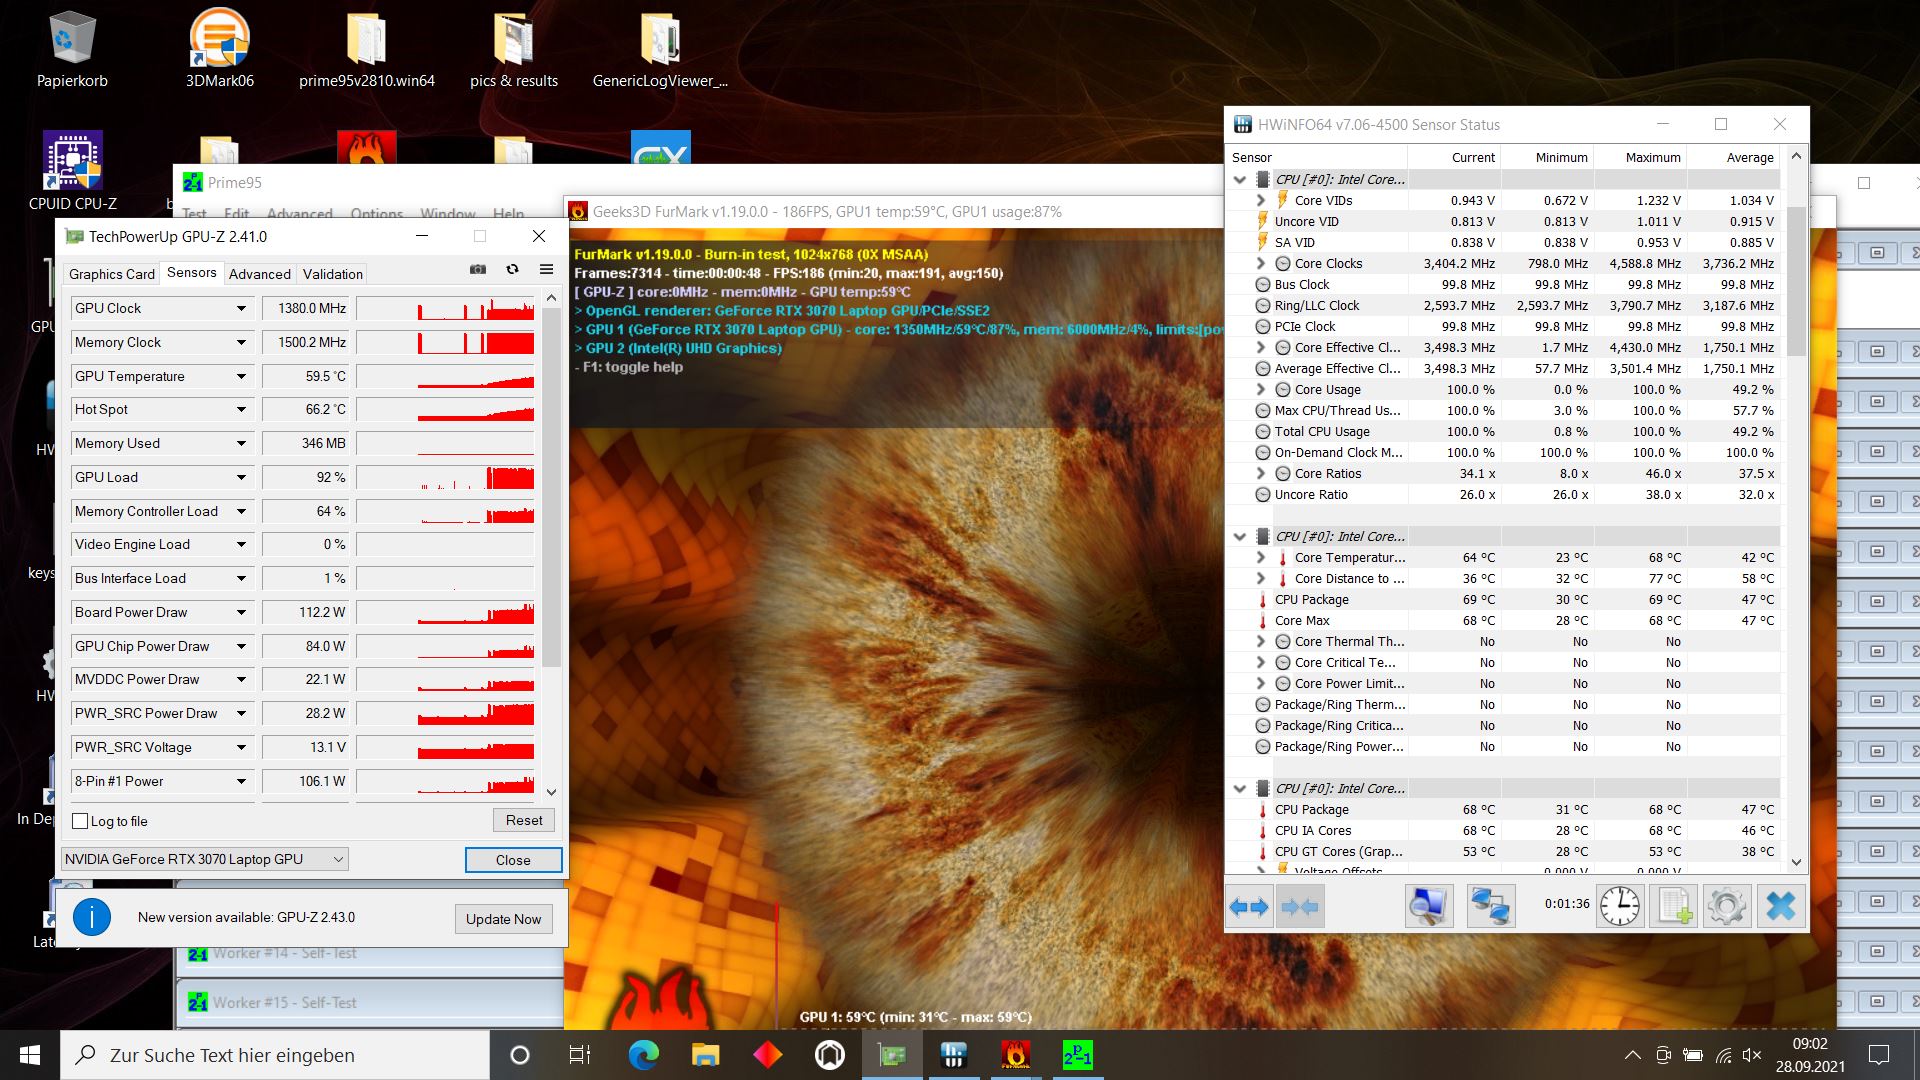
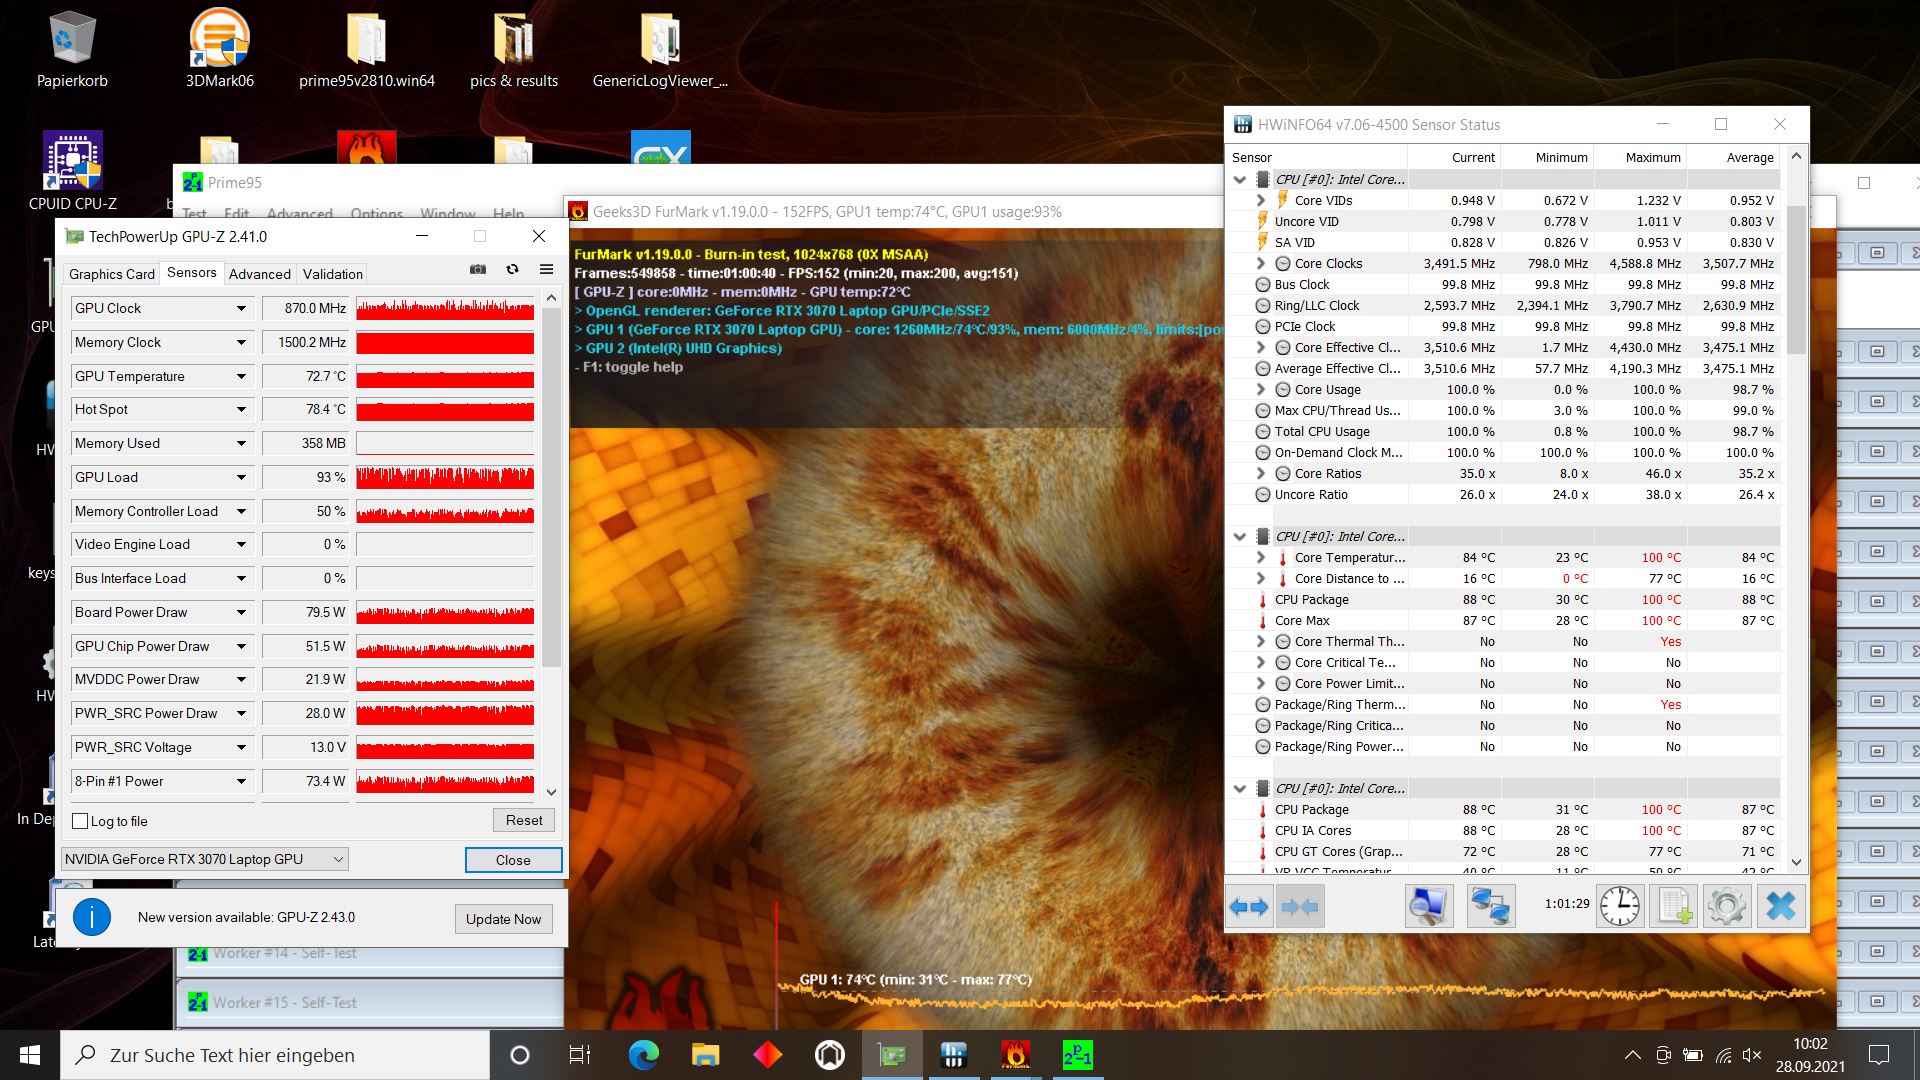
CPU以大约4.2GHz的速度开始我们的压力测试。不到一分钟后,时钟速度下降到3.5GHz。在压力测试的剩余时间里,尽管温度不断波动,但这一性能水平一直保持着。它们的平均温度为84摄氏度,短期内暂时达到100摄氏度,可能导致时钟速度略微下降,(更有可能)冷却解决方案上升。
相比之下,在整个压力测试期间,GPU循环严重,记录的时钟速度从690到1425 MHz不等,甚至在一个小时后也是如此。显然,当达到75摄氏度时,GPU的温度会暂时节流。
发言人
立体声扬声器可以变得相当响亮,并提供平衡的中音和高音。当然,它们在低音方面有所欠缺。笔记本电脑上唯一的模拟输出是一个组合式耳机插孔。
HP Omen 16-b0085ng audio analysis
(+) | speakers can play relatively loud (84.4 dB)
Bass 100 - 315 Hz
(-) | nearly no bass - on average 17.4% lower than median
(±) | linearity of bass is average (13.9% delta to prev. frequency)
Mids 400 - 2000 Hz
(+) | balanced mids - only 3.2% away from median
(+) | mids are linear (2.9% delta to prev. frequency)
Highs 2 - 16 kHz
(+) | balanced highs - only 1.5% away from median
(+) | highs are linear (3.9% delta to prev. frequency)
Overall 100 - 16.000 Hz
(+) | overall sound is linear (12.1% difference to median)
Compared to same class
» 12% of all tested devices in this class were better, 4% similar, 84% worse
» The best had a delta of 6%, average was 18%, worst was 132%
Compared to all devices tested
» 9% of all tested devices were better, 2% similar, 88% worse
» The best had a delta of 4%, average was 24%, worst was 134%
Lenovo Legion 5 Pro 16ACH6H (82JQ001PGE) audio analysis
(±) | speaker loudness is average but good (76.1 dB)
Bass 100 - 315 Hz
(±) | reduced bass - on average 10.8% lower than median
(±) | linearity of bass is average (14.7% delta to prev. frequency)
Mids 400 - 2000 Hz
(±) | higher mids - on average 6.7% higher than median
(±) | linearity of mids is average (7.8% delta to prev. frequency)
Highs 2 - 16 kHz
(±) | reduced highs - on average 5.2% lower than median
(±) | linearity of highs is average (8.6% delta to prev. frequency)
Overall 100 - 16.000 Hz
(±) | linearity of overall sound is average (17.4% difference to median)
Compared to same class
» 48% of all tested devices in this class were better, 12% similar, 40% worse
» The best had a delta of 6%, average was 18%, worst was 132%
Compared to all devices tested
» 33% of all tested devices were better, 8% similar, 59% worse
» The best had a delta of 4%, average was 24%, worst was 134%
能源管理--良好的电池寿命
能源消耗
在空闲状态下,装备相似的竞争对手显示出类似的消耗值,Alienware的耗电量略大,而联想Legion Pro的耗电量略小。在玩Witcher 3 ,Omen的功耗较低,在压力测试期间,与竞争对手相比,功耗略高。消耗值总体上符合我们的预期。
| Idle | |
| Load |
|
Key:
min: | |
| HP Omen 16-b0085ng i7-11800H, GeForce RTX 3070 Laptop GPU, Intel Optane Memory H10 with Solid State Storage 32GB + 512GB HBRPEKNX0202A(L/H), IPS, 1920x1080, 16.1" | HP Omen 15-en0375ng R7 4800H, GeForce RTX 2060 Mobile, WDC PC SN730 SDBPNTY-512G, IPS, 1920x1080, 15.6" | HP Victus 16-e0179ng R7 5800H, GeForce RTX 3060 Laptop GPU, WDC PC SN730 SDBPNTY-1T00, IPS, 1920x1080, 16.1" | Lenovo Legion 5 Pro 16ACH6H (82JQ001PGE) R7 5800H, GeForce RTX 3070 Laptop GPU, WDC PC SN730 SDBPNTY-1T00, IPS, 2560x1600, 16" | Alienware x15 RTX 3070 P111F i7-11800H, GeForce RTX 3070 Laptop GPU, WDC PC SN730 SDBPNTY-512G, IPS, 2560x1440, 15.6" | MSI Katana GF66 11UG-220 i7-11800H, GeForce RTX 3070 Laptop GPU, Kingston OM8PDP3512B-AI1, IPS, 1920x1080, 15.6" | Average NVIDIA GeForce RTX 3070 Laptop GPU | Average of class Gaming | |
|---|---|---|---|---|---|---|---|---|
| Power Consumption | 22% | 16% | 2% | -26% | 12% | -22% | -15% | |
| Idle Minimum * (Watt) | 12 | 4 67% | 5 58% | 10.45 13% | 15.7 -31% | 8 33% | 15.6 ? -30% | 13.2 ? -10% |
| Idle Average * (Watt) | 18 | 9 50% | 10 44% | 14.92 17% | 20.3 -13% | 12 33% | 20.1 ? -12% | 18.9 ? -5% |
| Idle Maximum * (Watt) | 21 | 22 -5% | 20 5% | 16.02 24% | 43 -105% | 22 -5% | 29.4 ? -40% | 24.5 ? -17% |
| Load Average * (Watt) | 94 | 102 -9% | 108 -15% | 119.65 -27% | 94.4 -0% | 98 -4% | 110.8 ? -18% | 108.8 ? -16% |
| Witcher 3 ultra * (Watt) | 147 | 119 19% | 145 1% | 174.9 -19% | 167 -14% | 152 -3% | ||
| Load Maximum * (Watt) | 199 | 182 9% | 189 5% | 187.26 6% | 183.4 8% | 162 19% | 214 ? -8% | 254 ? -28% |
* ... smaller is better
Energy Consumption Witcher 3 / Stress Test
电池寿命
惠普安装了一个83瓦时的电池。为了进行电池测试,我们切换到混合模式,启用了Optimus。尽管在某些情况下配备了稍大的电池,但无论是Alienware,还是Legion ,还是微星Katana,都不如我们的Omen持续时间长。Victus配备了较小的70瓦时电池,尽管其硬件较弱,但电池寿命明显缩短。
我们的测试设备允许在降低亮度的情况下进行约7.5小时的Wi-Fi浏览,在5.5小时内,电影之夜也不是问题。对于一个游戏设备来说,电池运行时间是不错的,几乎与同级别的平均水平相匹配,正如直接竞争对手所显示的那样,这个价格类别的笔记本电脑通常不符合这些要求。
| HP Omen 16-b0085ng i7-11800H, GeForce RTX 3070 Laptop GPU, 83 Wh | HP Omen 15-en0375ng R7 4800H, GeForce RTX 2060 Mobile, 70.9 Wh | HP Victus 16-e0179ng R7 5800H, GeForce RTX 3060 Laptop GPU, 70 Wh | Lenovo Legion 5 Pro 16ACH6H (82JQ001PGE) R7 5800H, GeForce RTX 3070 Laptop GPU, 80 Wh | Alienware x15 RTX 3070 P111F i7-11800H, GeForce RTX 3070 Laptop GPU, 87 Wh | MSI Katana GF66 11UG-220 i7-11800H, GeForce RTX 3070 Laptop GPU, 90 Wh | Average of class Gaming | |
|---|---|---|---|---|---|---|---|
| Battery runtime | 34% | -15% | -29% | -28% | -22% | 17% | |
| H.264 (h) | 5.4 | 8.28 ? 53% | |||||
| WiFi v1.3 (h) | 7.6 | 10.5 38% | 5.9 -22% | 7 -8% | 6.1 -20% | 5.3 -30% | 6.96 ? -8% |
| Load (h) | 1.4 | 1.8 29% | 1.3 -7% | 0.7 -50% | 0.9 -36% | 1.2 -14% | 1.47 ? 5% |
| Reader / Idle (h) | 20 | 8.5 | 9.1 | 9.7 | 9.1 | 8.71 ? |
Pros
Cons
结论 - 表现强劲,但有小错误
事实证明,Omen 16是一款相当不错的中端游戏笔记本电脑,与Omen 15相比有全面的改进。所有使用情况下的整体性能水平高,电池寿命长,以及良好的FHD显示屏,构成了这款惠普笔记本电脑的主要优势。主要缺点是有问题的触摸板(其中之一)和高延迟,甚至在刚打开浏览器时就可以观察到。此外,无用的、预装的各种软件的30天试用版也属于 "不必要 "的范畴。
Omen 16总体上是一款不错的游戏笔记本电脑,并达到了非常高的性能水平。然而,当涉及到驱动程序和触摸板时,仍有工作要做。
与惠普自己的更便宜的Victus 16相比,Omen 16的价格溢价可能是合理的,因为它的金属底座,更好的连接(USB 4与Thunderbolt 4),大约30%的GPU性能,更好的键盘布局(尽管没有小键盘),尽管有更强大的硬件,但稍微更轻的结构。同时,两款机型都拥有良好的显示屏和类似的CPU性能。
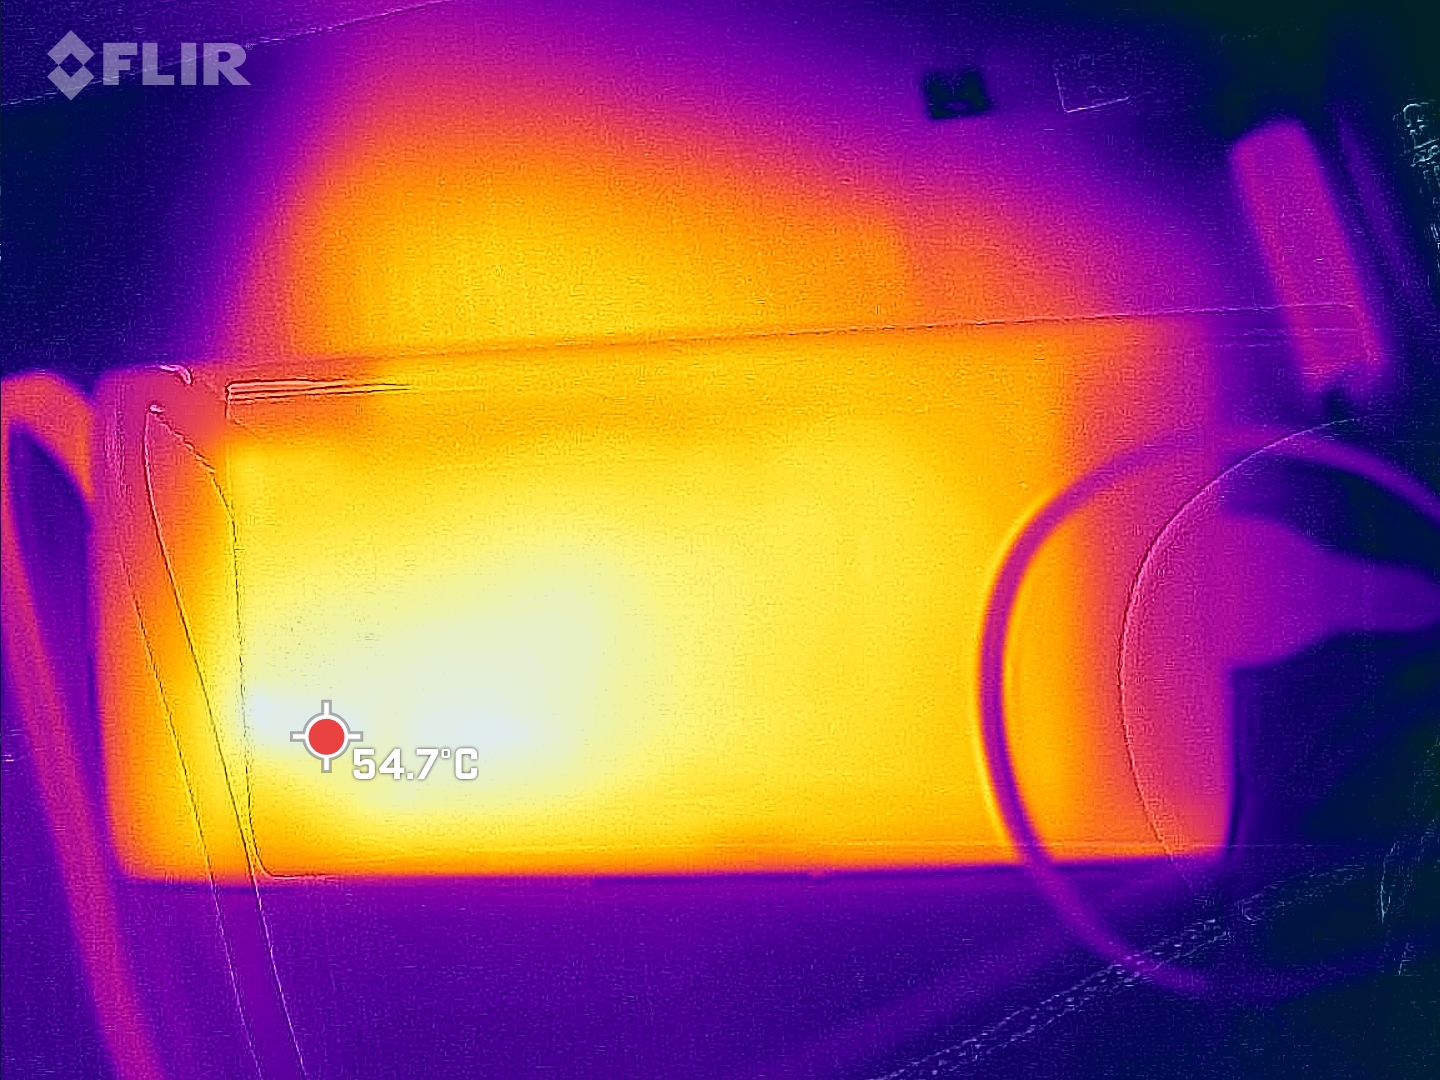
价格和可用性
与我们的配置类似的惠普Omen 16,配备RTX 3070,在BestBuy网站。价格约为1800美元,预计在未来几周内上市。
HP Omen 16-b0085ng
- 10/06/2021 v7 (old)
Christian Hintze
Price comparison

