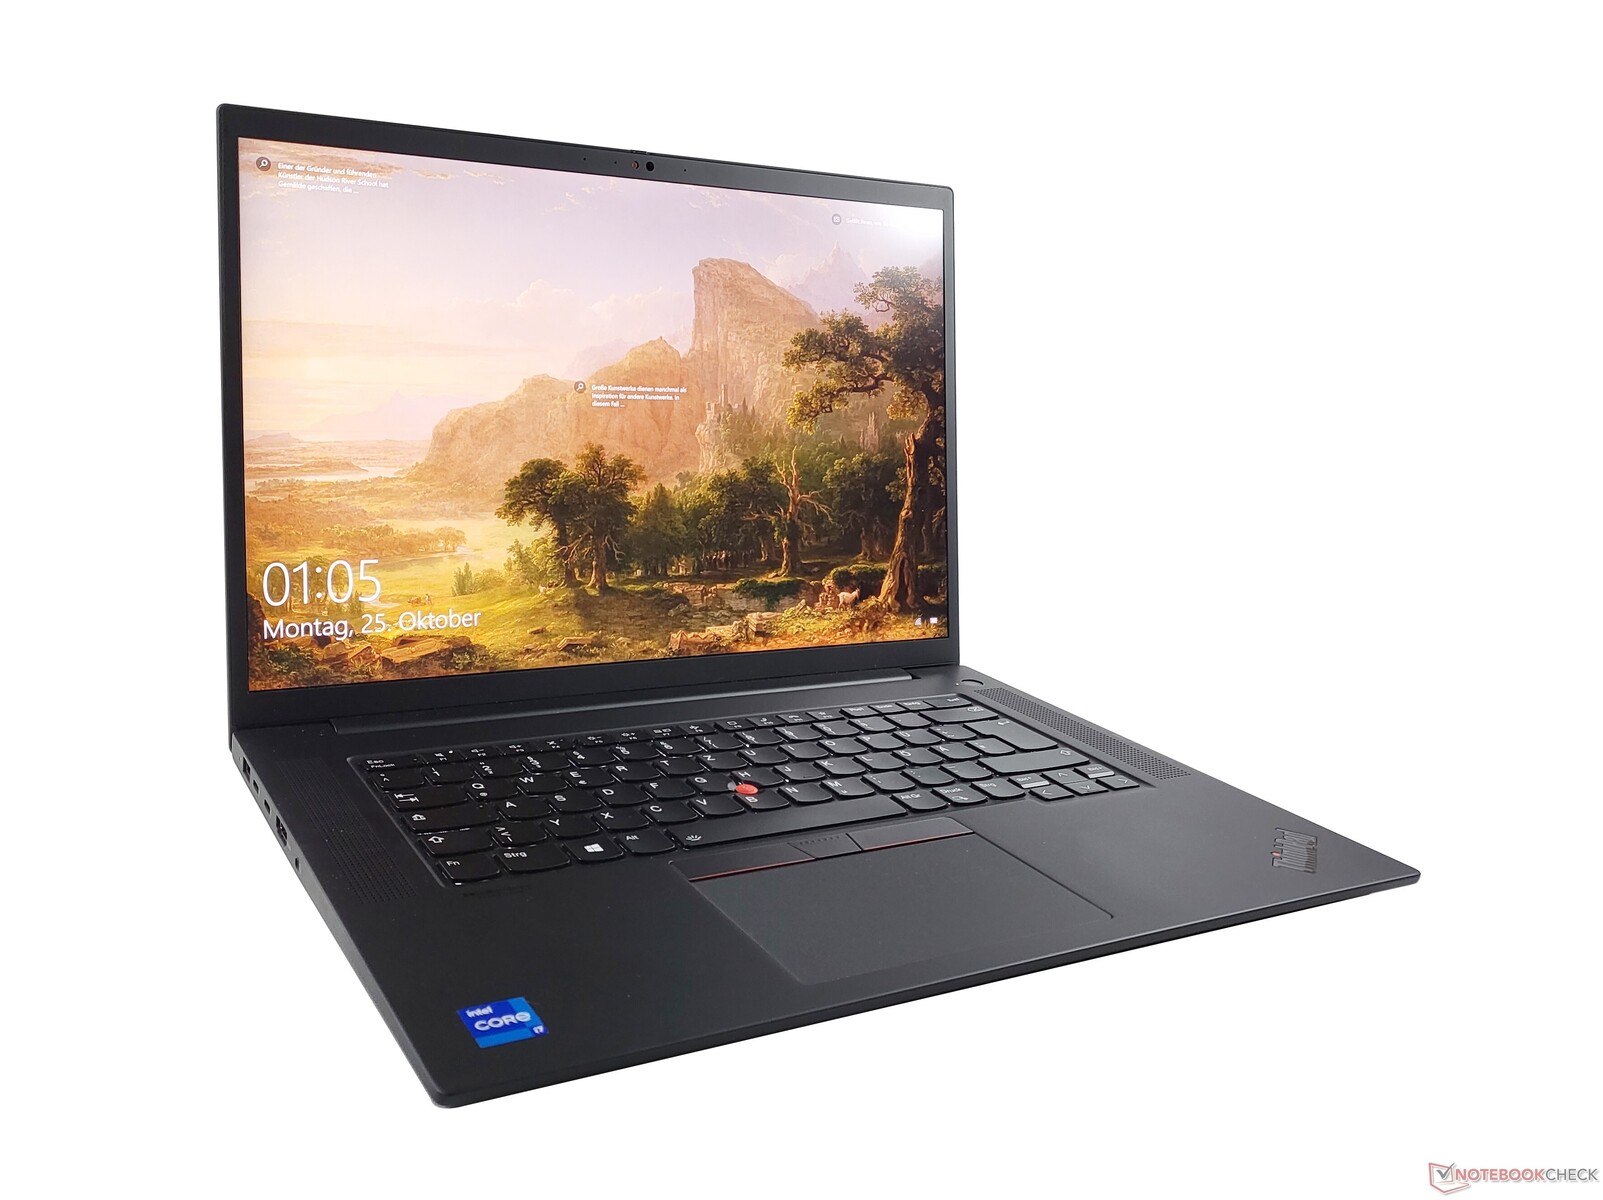
联想ThinkPad P1 G4笔记本电脑评测。成功使用Vapor-Chamber和GeForce RTX 3070
当联想推出 笔记本电脑时,联想在2018年推出了ThinkPad P1时,工作站阵容中的角色分配很明确:新的高端型号应该是为了接替那些需要特别轻薄的移动工作站,并能为此牺牲一些性能的买家。经典的工作站型号 联想ThinkPad P52另一方面,它提供了更多的性能,但移动性较差。
相比之下,新的联想ThinkPad P1 G4仍然具有移动性优势 ThinkPad P15 G2,即目前的全脂ThinkPad工作站。然而,客户不一定要再牺牲性能--至少在纸面上。联想对ThinkPad P1进行了大幅升级,为我们的测试机型配备了一台 NvidiaGeForce RTX 3070和4K UHD+分辨率,相当于最强的配置版本之一。由于我们最近在低端配置中测试了ThinkPad P1 2021,关于配置、输入设备和设计的细节,我们参考了ThinkPad P1 Gen 4 with Nvidia T1200的评论。
Possible competitors in comparison
Rating | Date | Model | Weight | Height | Size | Resolution | Price |
|---|---|---|---|---|---|---|---|
| 89.8 % v7 (old) | 11 / 2021 | Lenovo ThinkPad P1 G4-20Y4S0KS00 i7-11850H, GeForce RTX 3070 Laptop GPU | 2 kg | 17.7 mm | 16.00" | 3840x2400 | |
| 89.4 % v7 (old) | 10 / 2021 | Lenovo ThinkPad P1 G4-20Y30017GE i7-11800H, T1200 Laptop GPU | 1.8 kg | 17.7 mm | 16.00" | 2560x1600 | |
| 88.3 % v7 (old) | 10 / 2021 | Dell Precision 5000 5560 i7-11850H, RTX A2000 Laptop GPU | 2 kg | 18 mm | 15.60" | 3840x2400 | |
| 89.7 % v7 (old) | 11 / 2019 | Apple MacBook Pro 16 2019 i9 5500M i9-9880H, Radeon Pro 5500M | 2 kg | 16.2 mm | 16.00" | 3072x1920 | |
| 87.8 % v7 (old) | 08 / 2021 | HP ZBook Studio 15 G8 i9-11950H, GeForce RTX 3070 Laptop GPU | 1.9 kg | 18 mm | 15.60" | 3840x2160 | |
| 90.1 % v7 (old) | Lenovo ThinkPad X1 Extreme Gen3-20TLS0UV00 i7-10750H, GeForce GTX 1650 Ti Max-Q | 1.7 kg | 18.7 mm | 15.60" | 1920x1080 |
| SD Card Reader | |
| average JPG Copy Test (av. of 3 runs) | |
| Lenovo ThinkPad P1 G4-20Y30017GE (AV PRO V60) | |
| Dell Precision 5000 5560 (AV Pro V60) | |
| Average of class Workstation (49.6 - 681, n=14, last 2 years) | |
| Lenovo ThinkPad X1 Extreme Gen3-20TLS0UV00 (Toshiba Exceria Pro SDXC 64 GB UHS-II) | |
| HP ZBook Studio 15 G8 (AV Pro V60) | |
| maximum AS SSD Seq Read Test (1GB) | |
| Average of class Workstation (87.6 - 1455, n=14, last 2 years) | |
| Lenovo ThinkPad X1 Extreme Gen3-20TLS0UV00 (Toshiba Exceria Pro SDXC 64 GB UHS-II) | |
| Dell Precision 5000 5560 (AV Pro V60) | |
| Lenovo ThinkPad P1 G4-20Y30017GE (AV PRO V60) | |
| HP ZBook Studio 15 G8 (AV Pro V60) | |
| Networking | |
| iperf3 transmit AX12 | |
| HP ZBook Studio 15 G8 | |
| Lenovo ThinkPad P1 G4-20Y30017GE | |
| Lenovo ThinkPad X1 Extreme Gen3-20TLS0UV00 | |
| Average Intel Wi-Fi 6E AX210 (675 - 1602, n=27) | |
| Dell Precision 5000 5560 | |
| Apple MacBook Pro 16 2019 i9 5500M | |
| iperf3 receive AX12 | |
| Lenovo ThinkPad P1 G4-20Y30017GE | |
| Lenovo ThinkPad X1 Extreme Gen3-20TLS0UV00 | |
| Dell Precision 5000 5560 | |
| HP ZBook Studio 15 G8 | |
| Average Intel Wi-Fi 6E AX210 (914 - 1716, n=27) | |
| Apple MacBook Pro 16 2019 i9 5500M | |


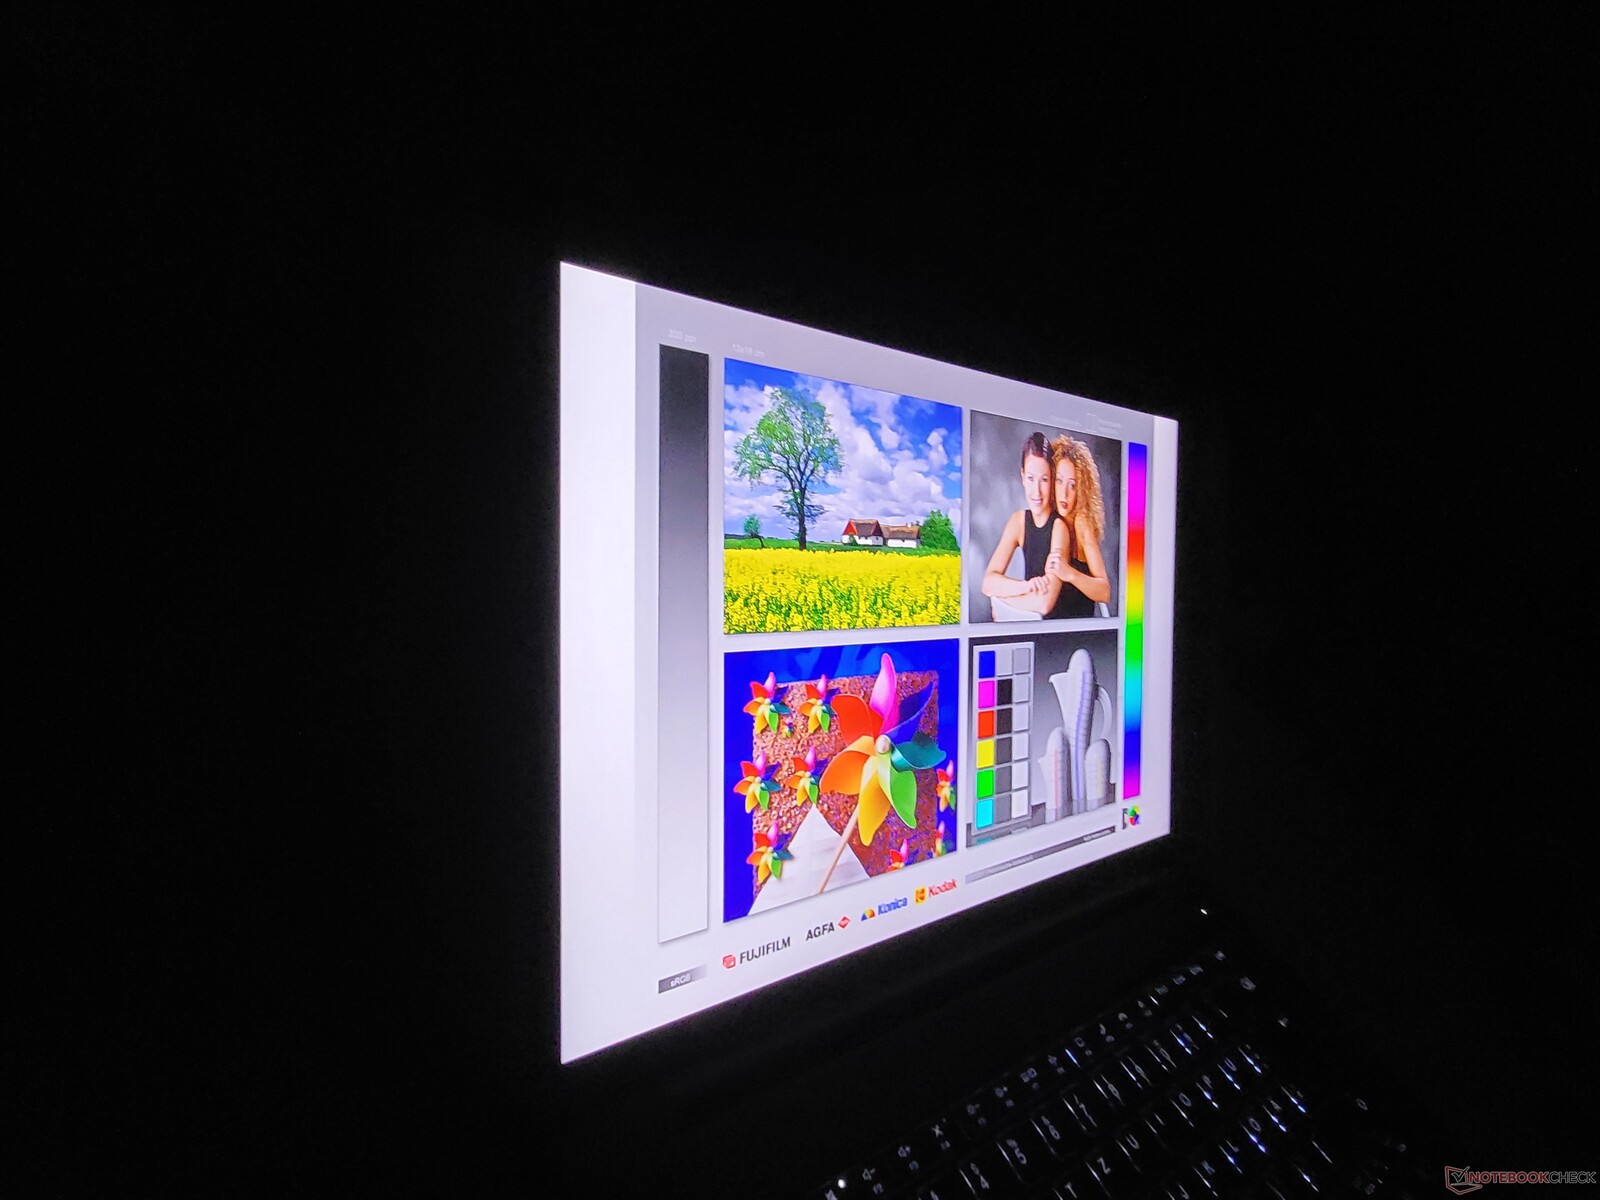
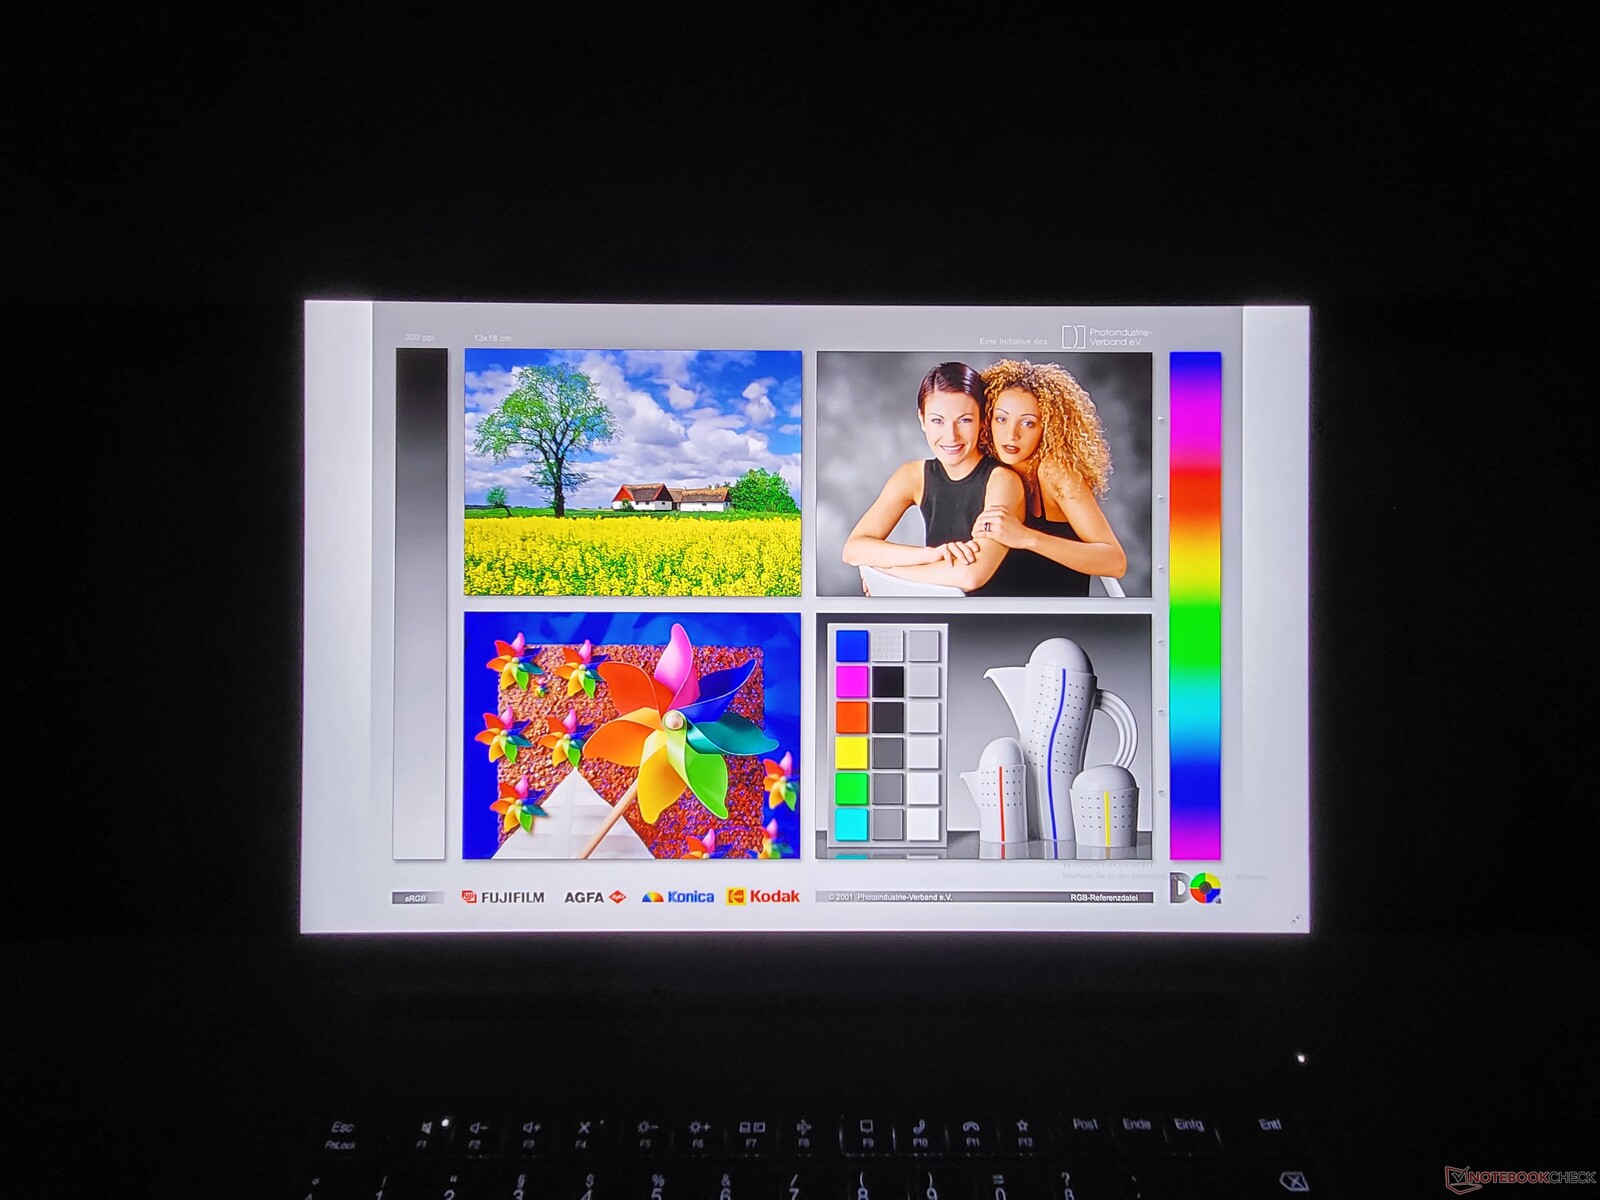
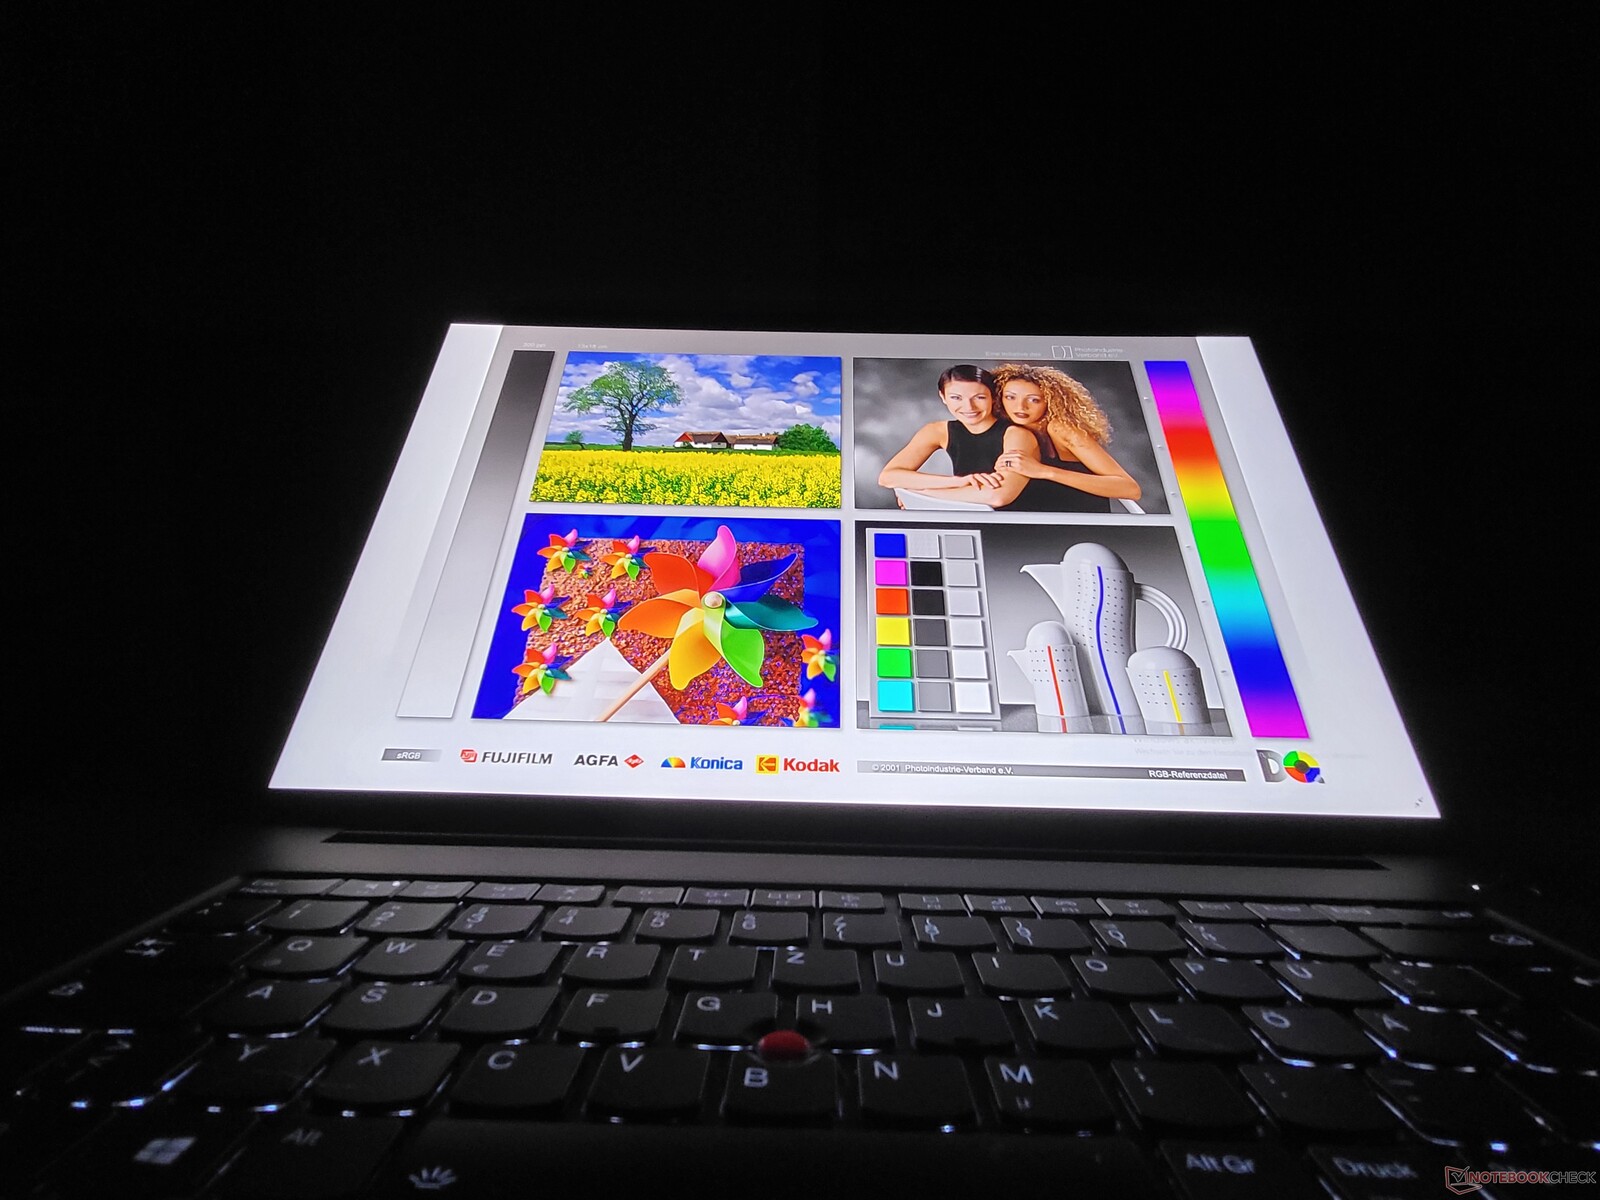
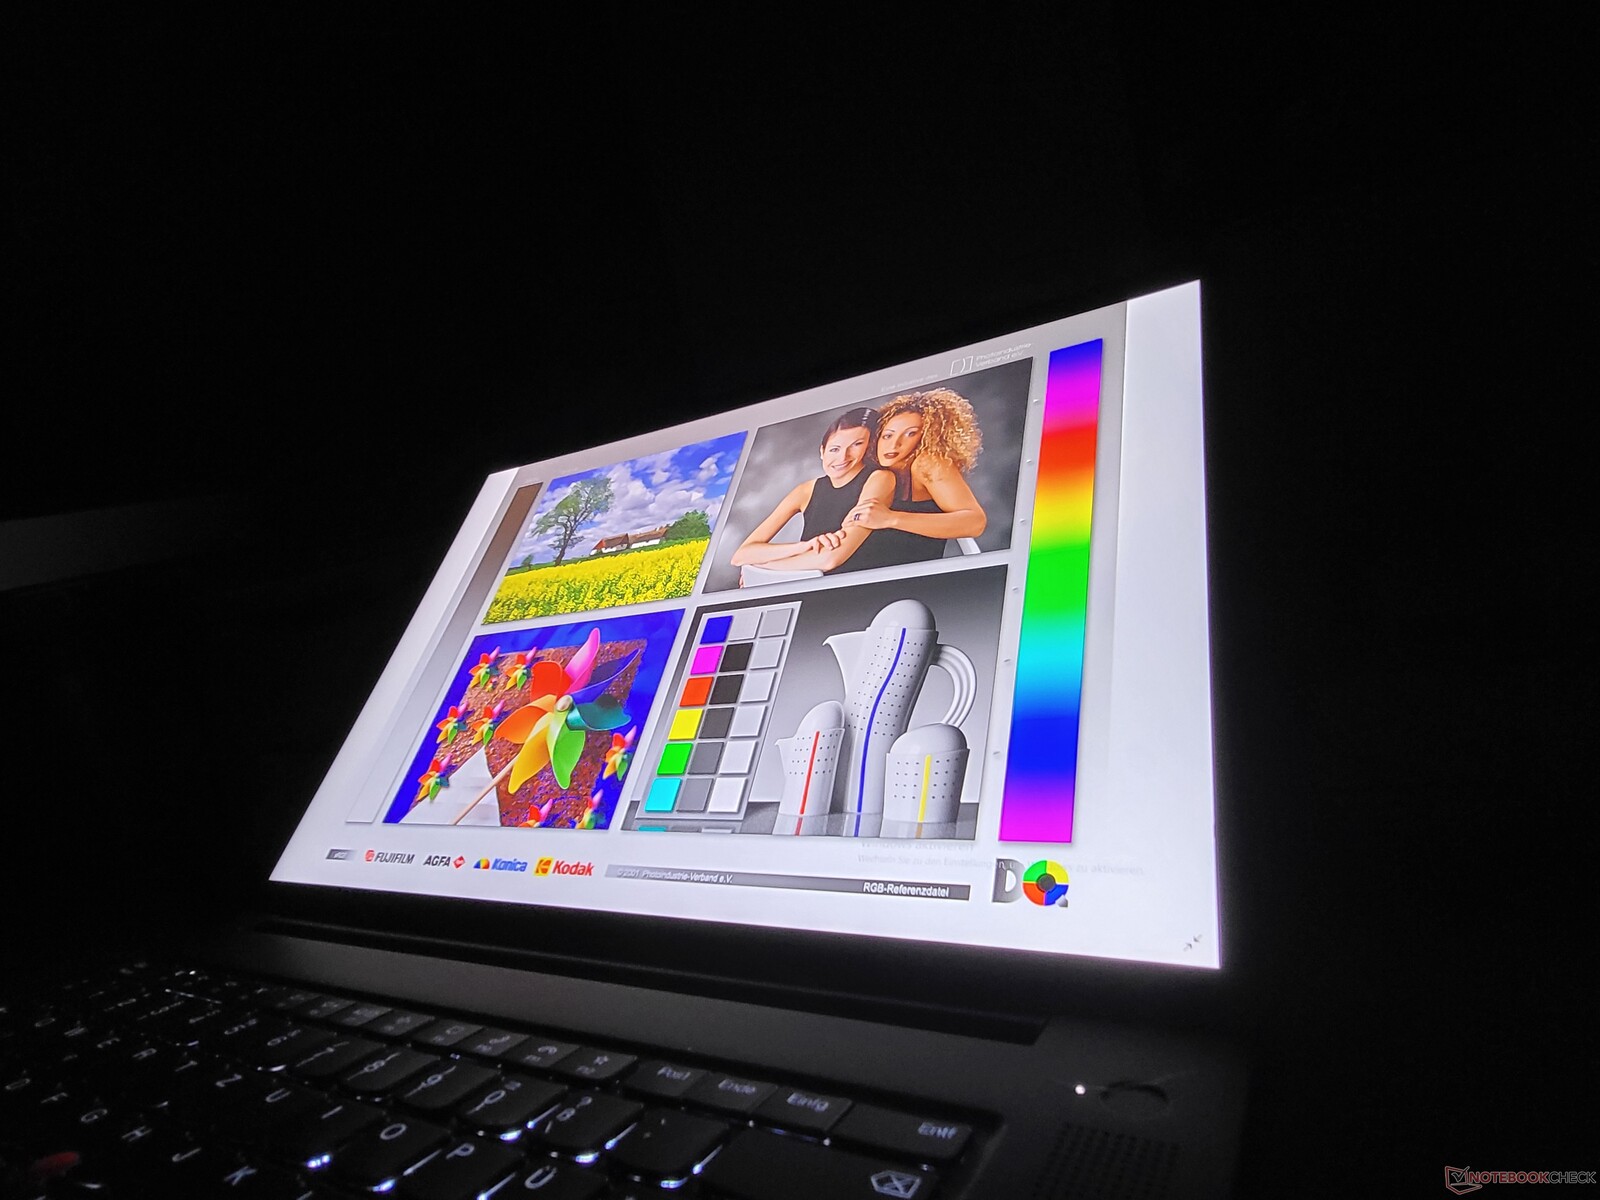
联想ThinkPad P1 G4的哑光4K UHD+显示屏很出色

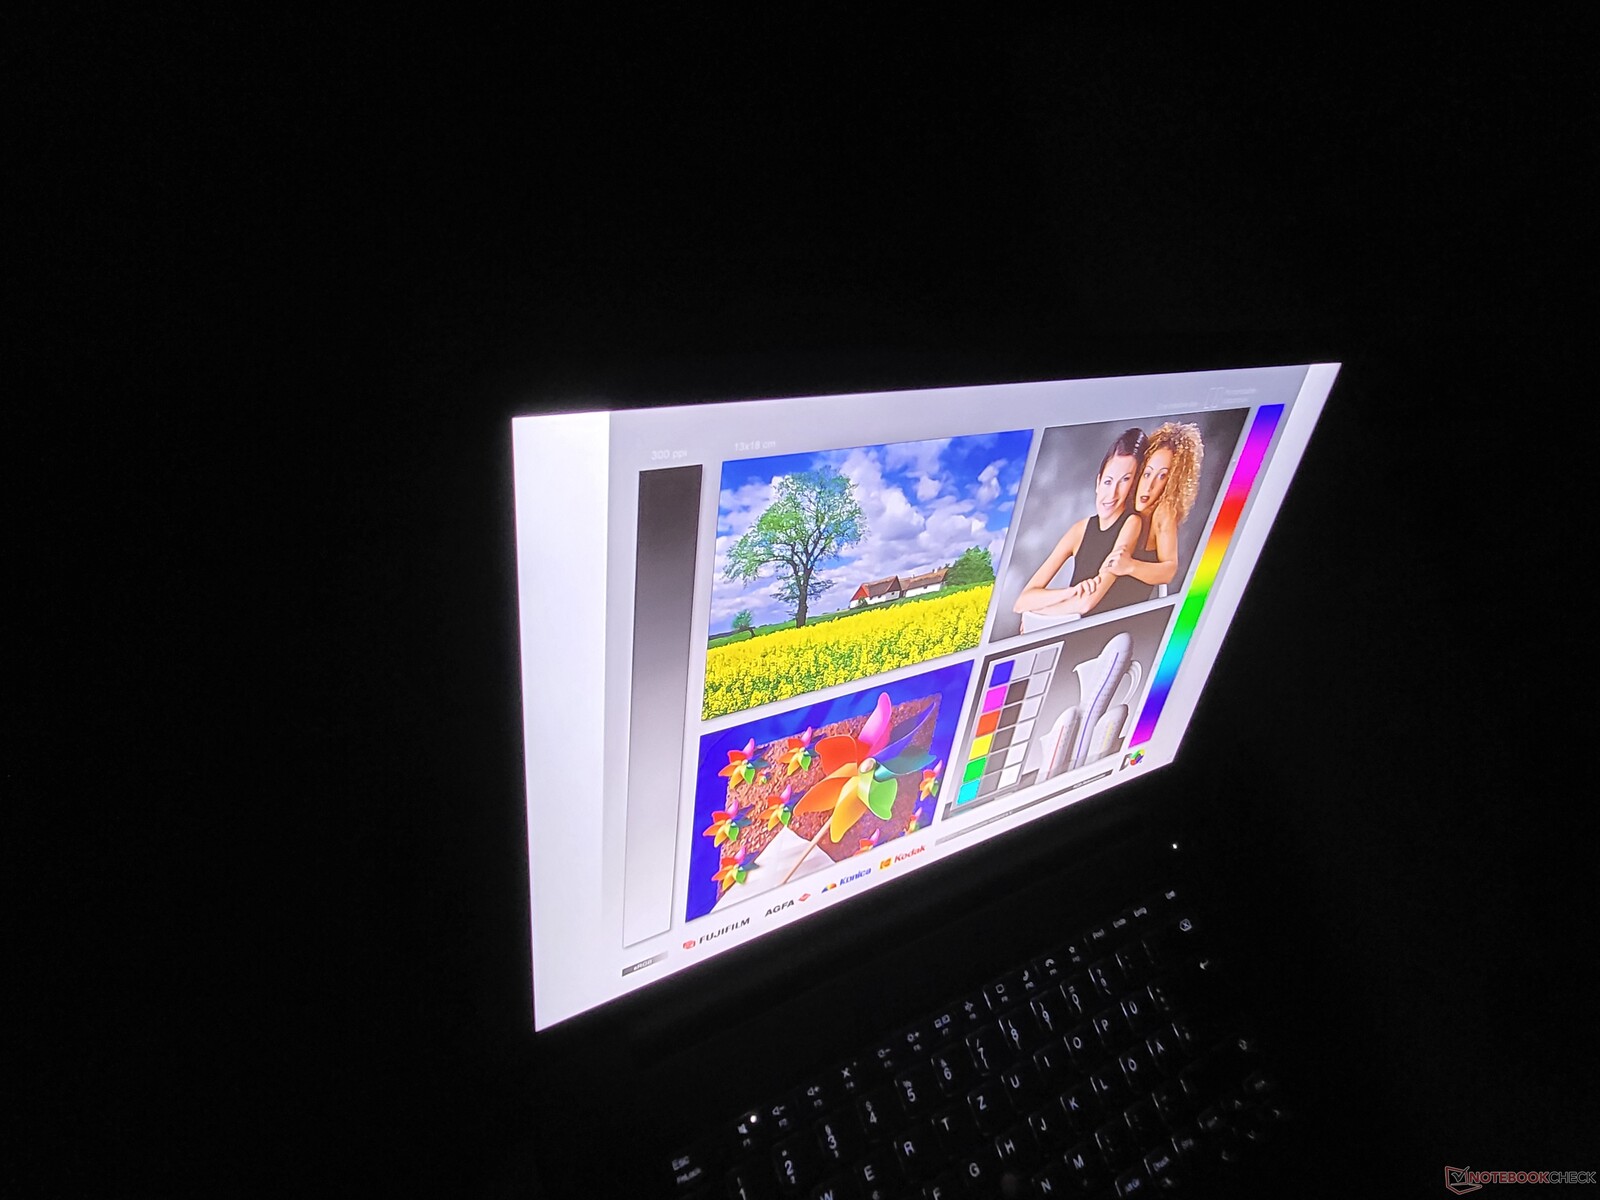
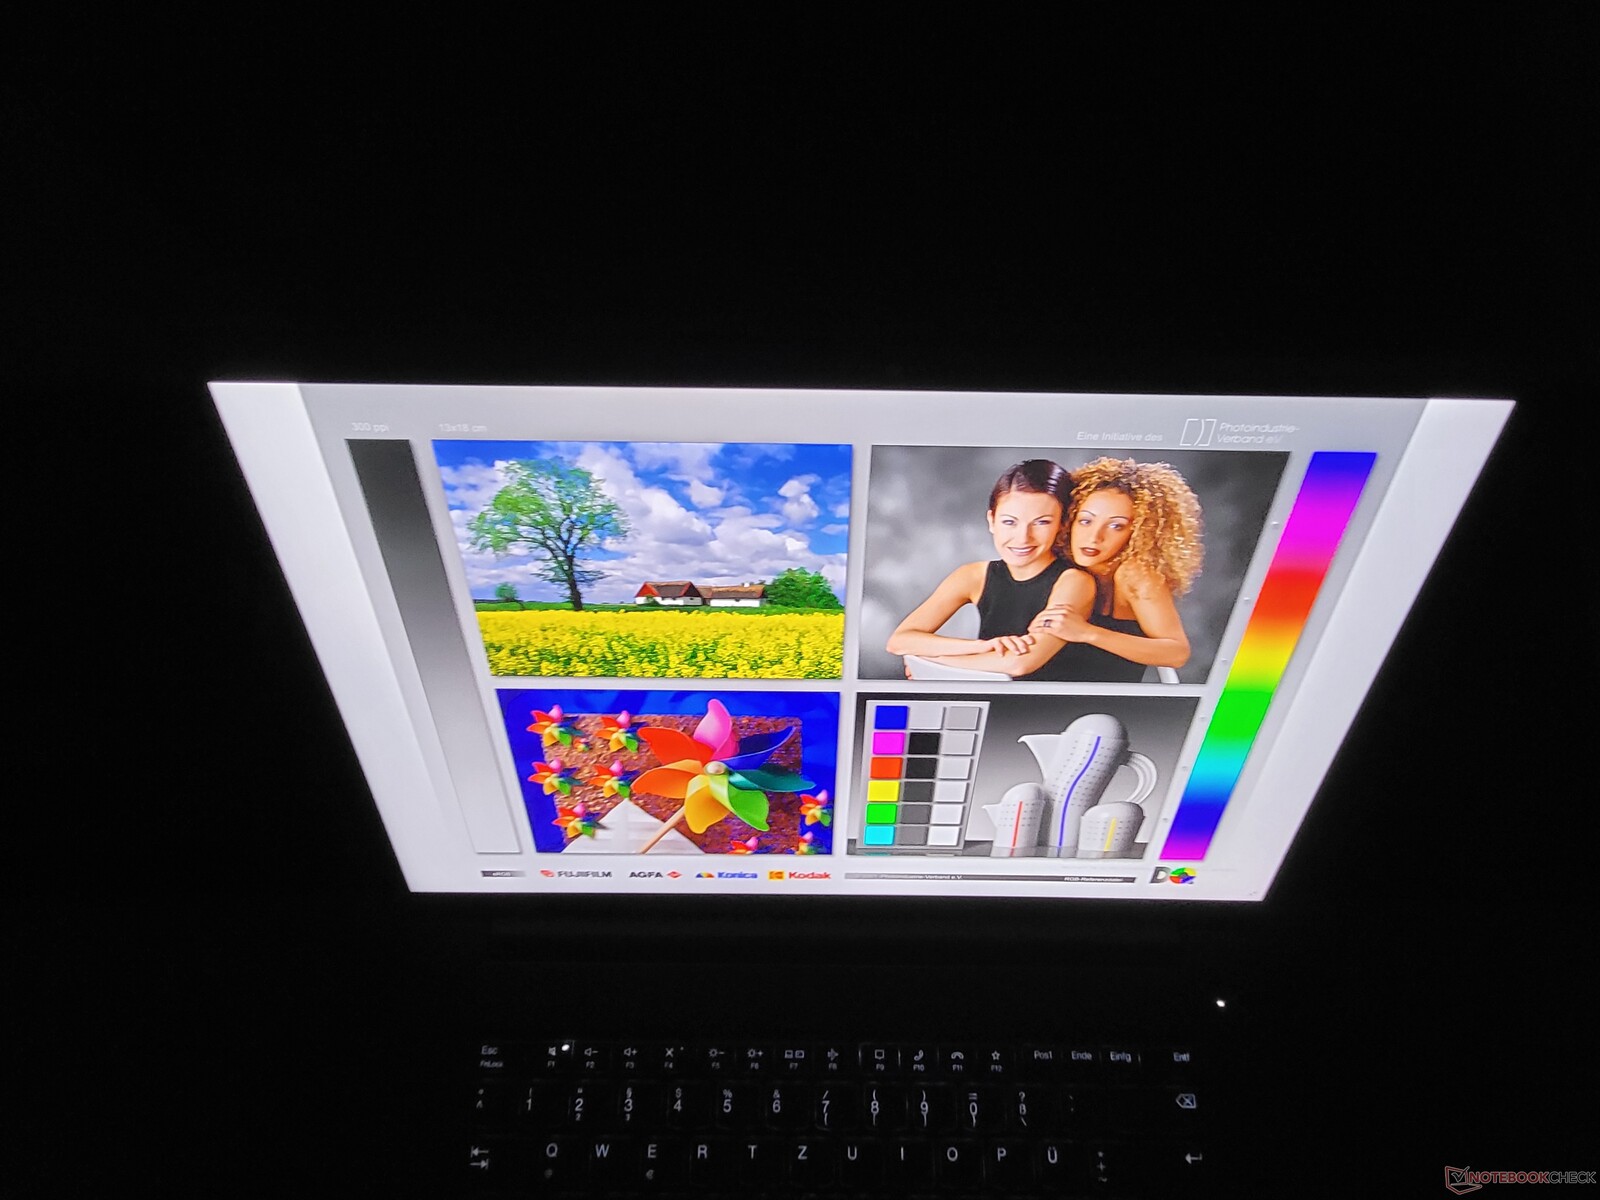
联想ThinkPad P1第4代有三种不同的16:10格式的16英寸显示屏。基本选项,是WQXGA液晶显示器(2,560 x 1,600)。我们已经测试过了.我们的评测单位包括无触摸的哑光4K UHD+/WQUXGA屏幕--第三个选项是相同的显示屏,为光面,带有触摸和Wacom数字转换器。
联想所说的600cd/m²的亮度值被LG面板超过,其平均亮度为610cd/m²。在15至16英寸规格的高端笔记本电脑测试领域,联想ThinkPad P1 G4的屏幕显然是最亮的。
响应时间不是特别好--在这方面,WQXGA选项更好。相比之下,惠普ZBook Studio 15 G8的OLED显示屏的差异就显得尤为明显了。 惠普ZBook Studio 15 G8;ThinkPad P1 G3的OLED变体很遗憾不再有ThinkPad P1 2021。
| |||||||||||||||||||||||||
Brightness Distribution: 90 %
Center on Battery: 629 cd/m²
Contrast: 1537:1 (Black: 0.41 cd/m²)
ΔE ColorChecker Calman: 2.2 | ∀{0.5-29.43 Ø4.73}
calibrated: 1
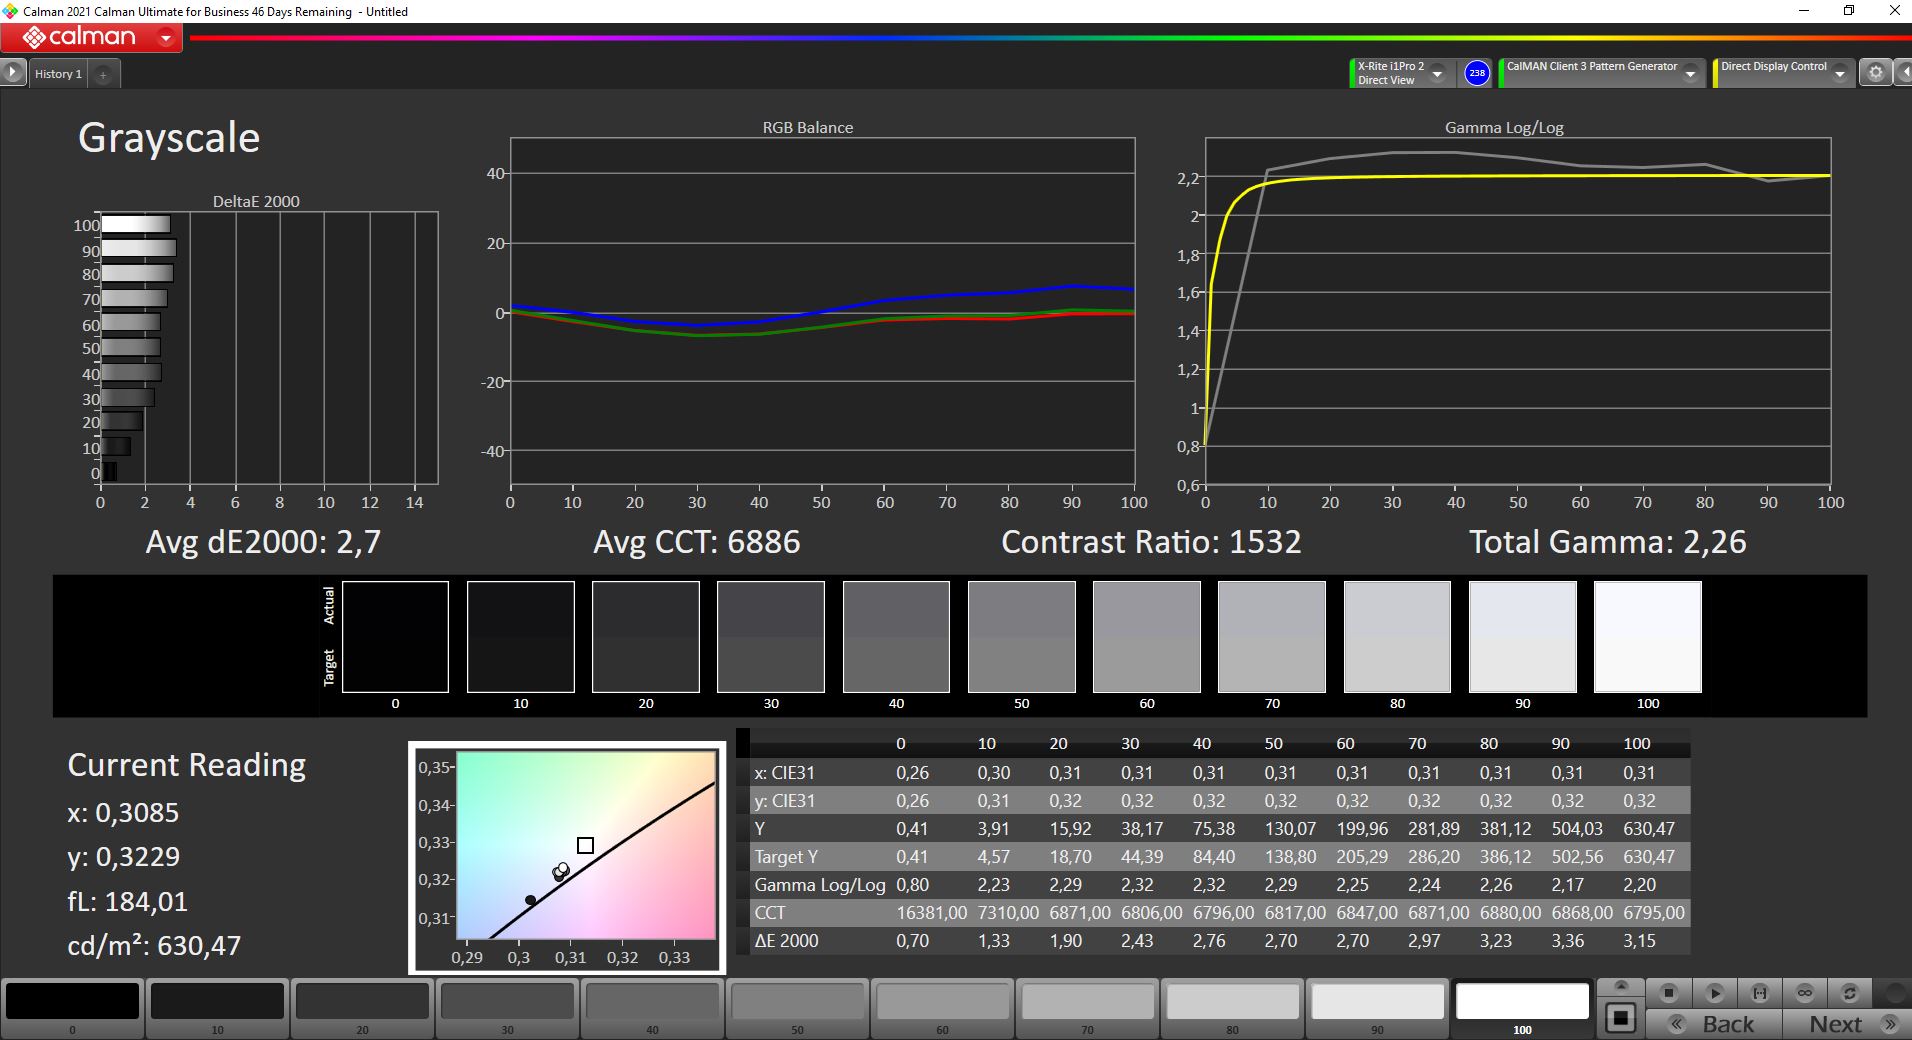
ΔE Greyscale Calman: 2.7 | ∀{0.09-98 Ø4.97}
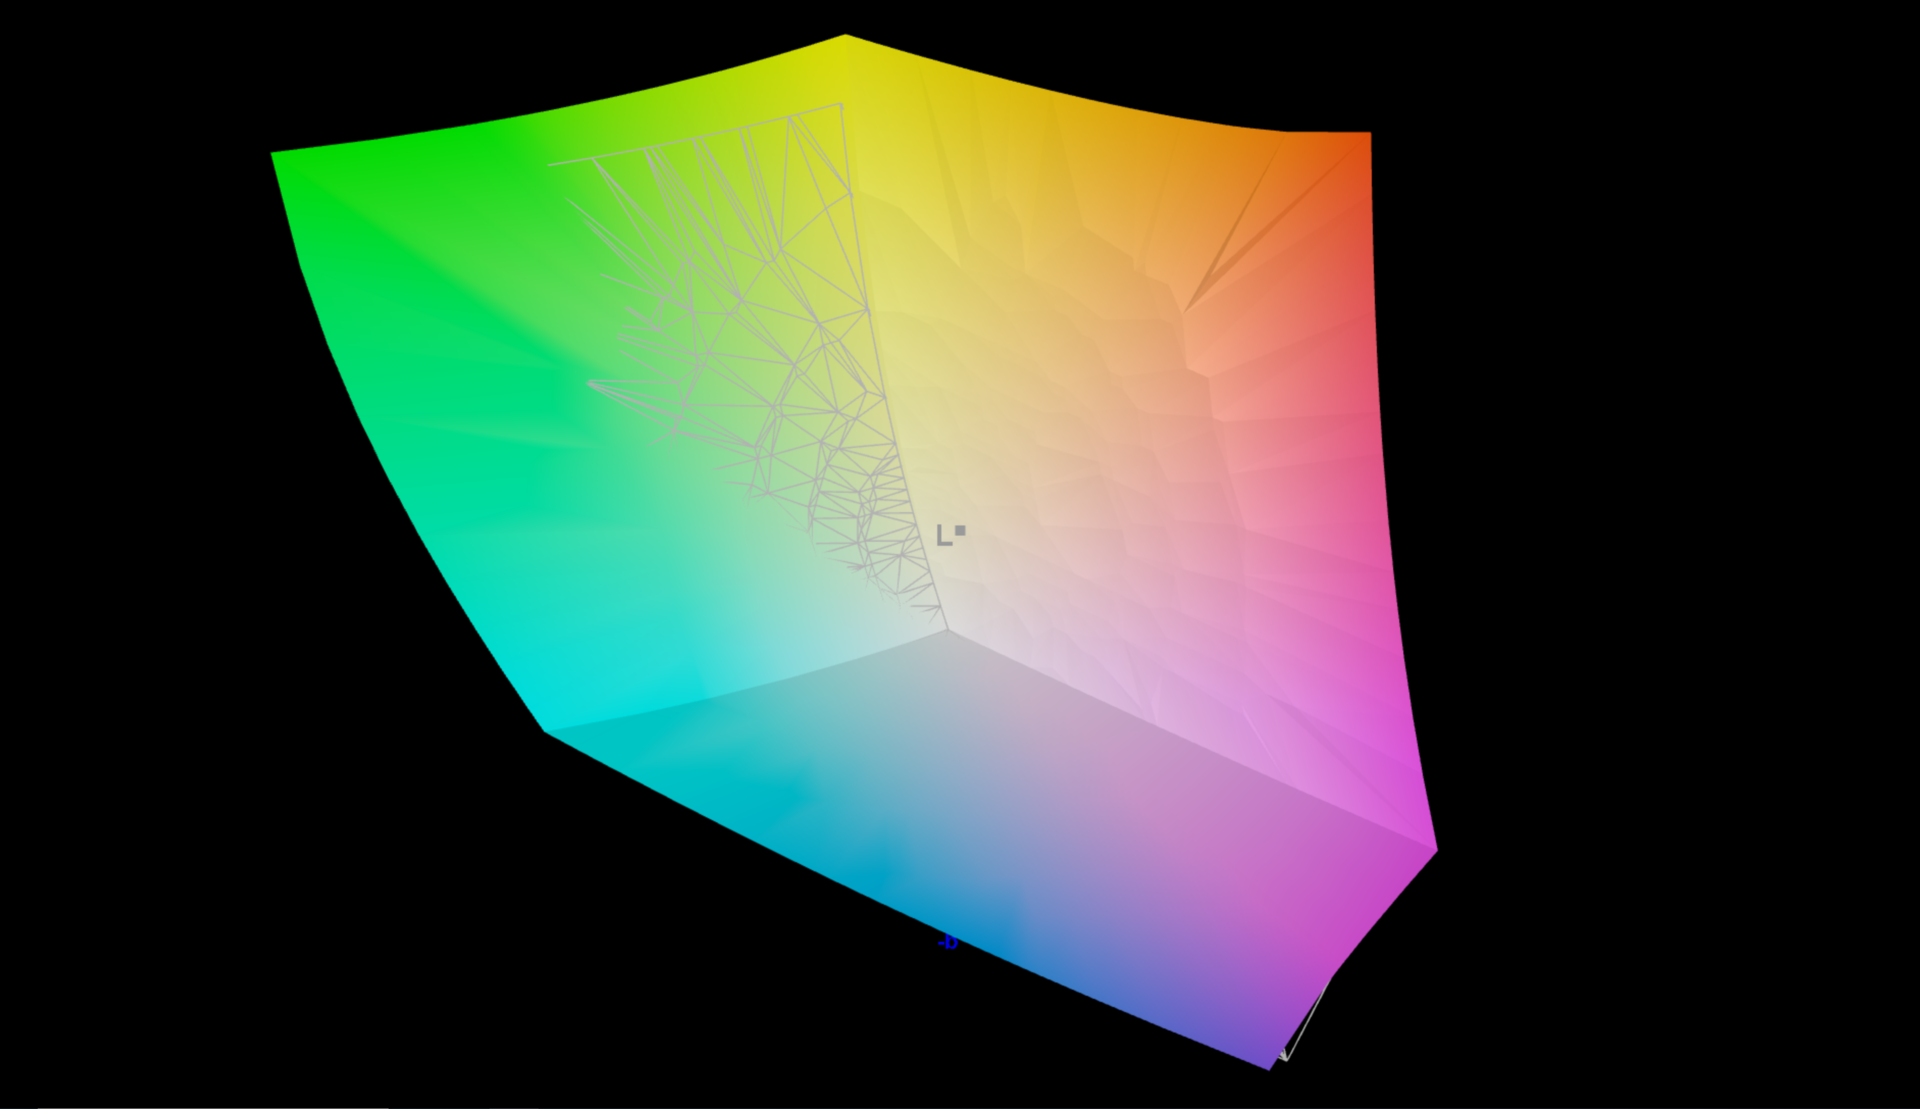
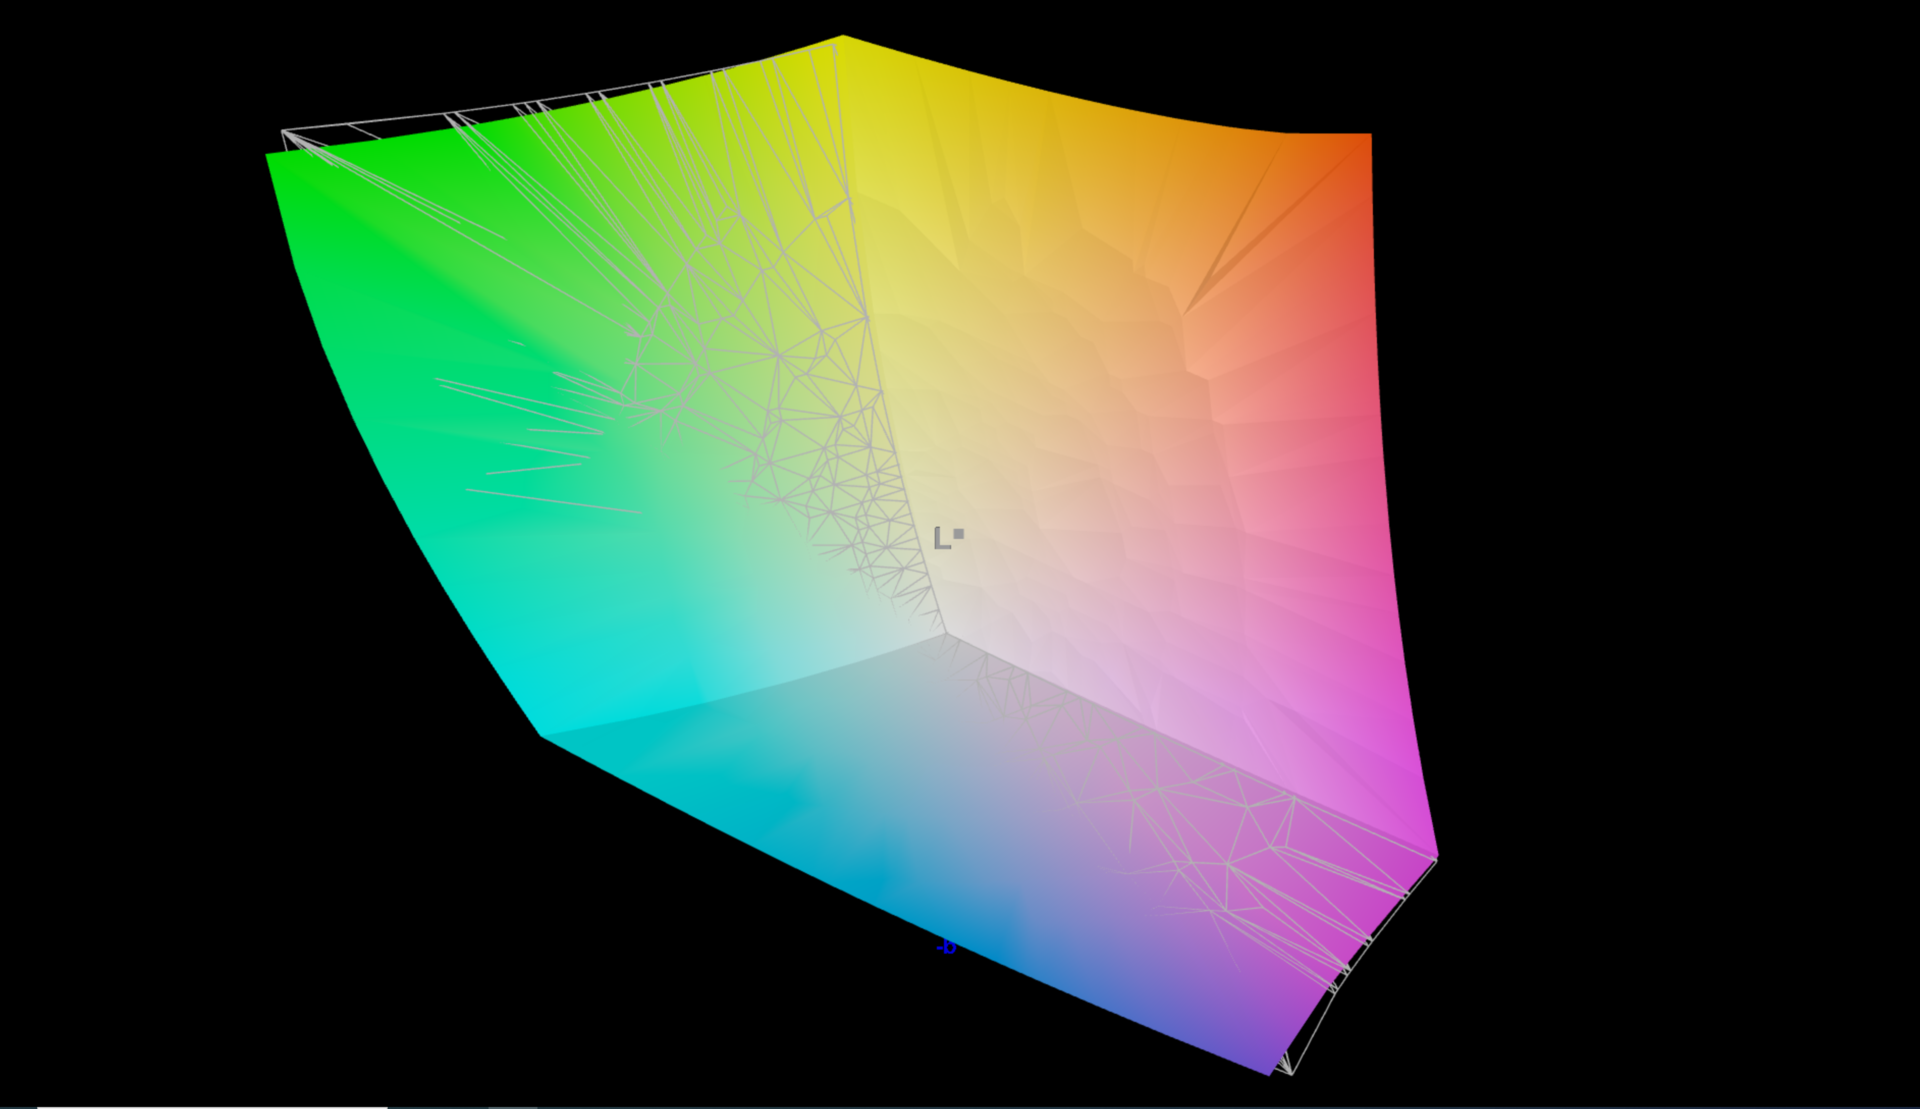
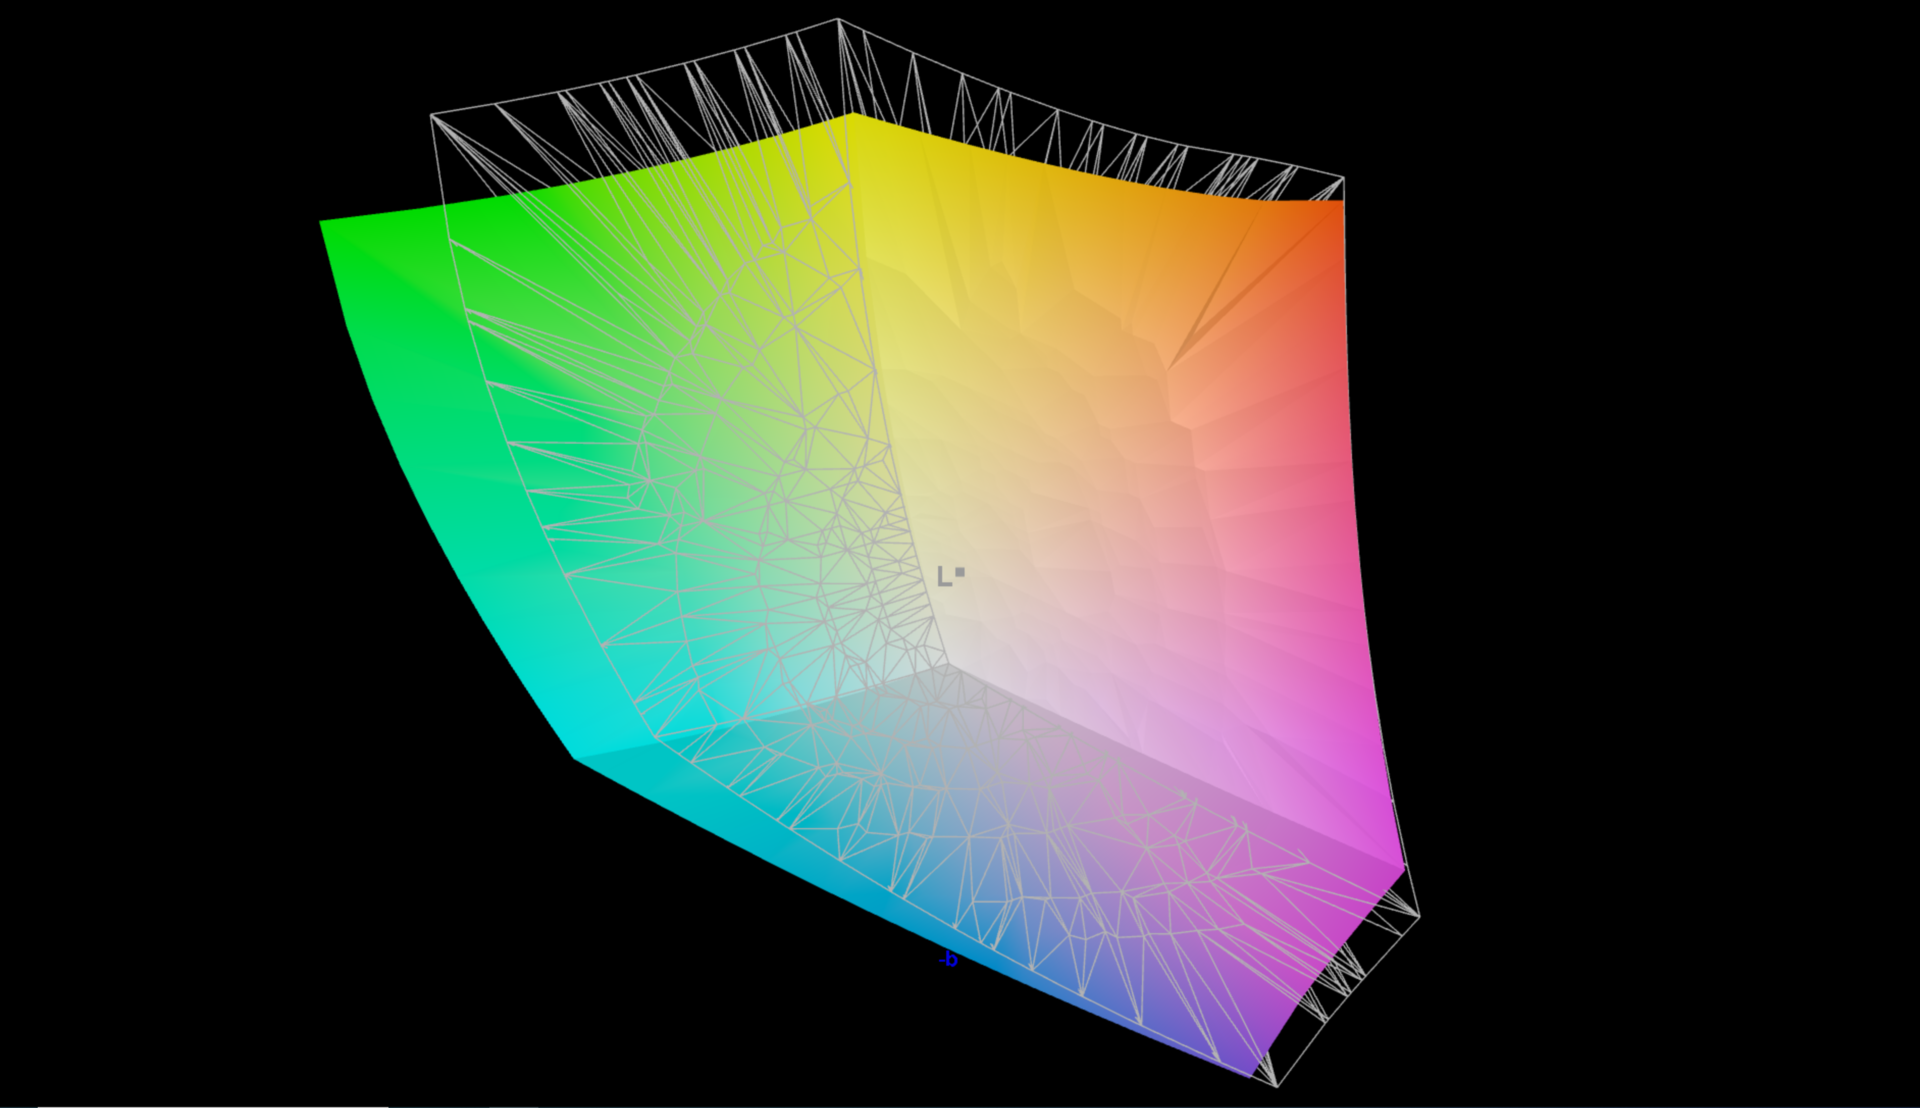
98.9% AdobeRGB 1998 (Argyll 3D)
99.4% sRGB (Argyll 3D)
85.7% Display P3 (Argyll 3D)
Gamma: 2.26
CCT: 6886 K
| Lenovo ThinkPad P1 G4-20Y4S0KS00 LP160UQ1-SPB1, IPS LED, 3840x2400, 16" | Lenovo ThinkPad P1 G4-20Y30017GE B160QAN02.M, IPS, 2560x1600, 16" | Dell Precision 5000 5560 Sharp LQ156R1, IPS, 3840x2400, 15.6" | Apple MacBook Pro 16 2019 i9 5500M APPA044, IPS, 3072x1920, 16" | HP ZBook Studio 15 G8 SDC4145, OLED, 3840x2160, 15.6" | Lenovo ThinkPad X1 Extreme Gen3-20TLS0UV00 N156HCE-GN1, IPS, 1920x1080, 15.6" | |
|---|---|---|---|---|---|---|
| Display | -10% | 4% | 5% | -25% | ||
| Display P3 Coverage (%) | 85.7 | 77.3 -10% | 94.9 11% | 99.9 17% | 61 -29% | |
| sRGB Coverage (%) | 99.4 | 99.9 1% | 100 1% | 100 1% | 89.9 -10% | |
| AdobeRGB 1998 Coverage (%) | 98.9 | 78.1 -21% | 100 1% | 95.3 -4% | 62.2 -37% | |
| Response Times | 21% | 9% | -4% | 94% | 34% | |
| Response Time Grey 50% / Grey 80% * (ms) | 55.2 ? | 40.8 ? 26% | 47.2 ? 14% | 52.4 ? 5% | 2.4 ? 96% | 33.6 ? 39% |
| Response Time Black / White * (ms) | 31.2 ? | 26.4 ? 15% | 30.4 ? 3% | 34.9 ? -12% | 2.4 ? 92% | 22.4 ? 28% |
| PWM Frequency (Hz) | 131700 | 240.4 ? | 26040 ? | |||
| Screen | -17% | -28% | -1% | -67% | -6% | |
| Brightness middle (cd/m²) | 630 | 420 -33% | 501.5 -20% | 519 -18% | 379.6 -40% | 518 -18% |
| Brightness (cd/m²) | 622 | 401 -36% | 467 -25% | 477 -23% | 380 -39% | 513 -18% |
| Brightness Distribution (%) | 90 | 90 0% | 83 -8% | 86 -4% | 95 6% | 88 -2% |
| Black Level * (cd/m²) | 0.41 | 0.3 27% | 0.44 -7% | 0.39 5% | 0.38 7% | |
| Contrast (:1) | 1537 | 1400 -9% | 1140 -26% | 1331 -13% | 1363 -11% | |
| Colorchecker dE 2000 * | 2.2 | 2.5 -14% | 4.73 -115% | 2.28 -4% | 5.15 -134% | 2.1 5% |
| Colorchecker dE 2000 max. * | 5 | 4.9 2% | 8.45 -69% | 6.54 -31% | 7.79 -56% | 4.5 10% |
| Colorchecker dE 2000 calibrated * | 1 | 1.6 -60% | 0.51 49% | 0.86 14% | 3.1 -210% | 1.3 -30% |
| Greyscale dE 2000 * | 2.7 | 3.4 -26% | 3.6 -33% | 0.9 67% | 2.6 4% | 2.7 -0% |
| Gamma | 2.26 97% | 2.24 98% | 2.08 106% | 2145 0% | 1.99 111% | 2.35 94% |
| CCT | 6886 94% | 6479 100% | 6447 101% | 6572 99% | 6166 105% | 7042 92% |
| Color Space (Percent of AdobeRGB 1998) (%) | 78 | 57.7 | ||||
| Color Space (Percent of sRGB) (%) | 90.4 | |||||
| Total Average (Program / Settings) | -2% /
-10% | -5% /
-16% | -3% /
-1% | 11% /
-22% | 1% /
-5% |
* ... smaller is better
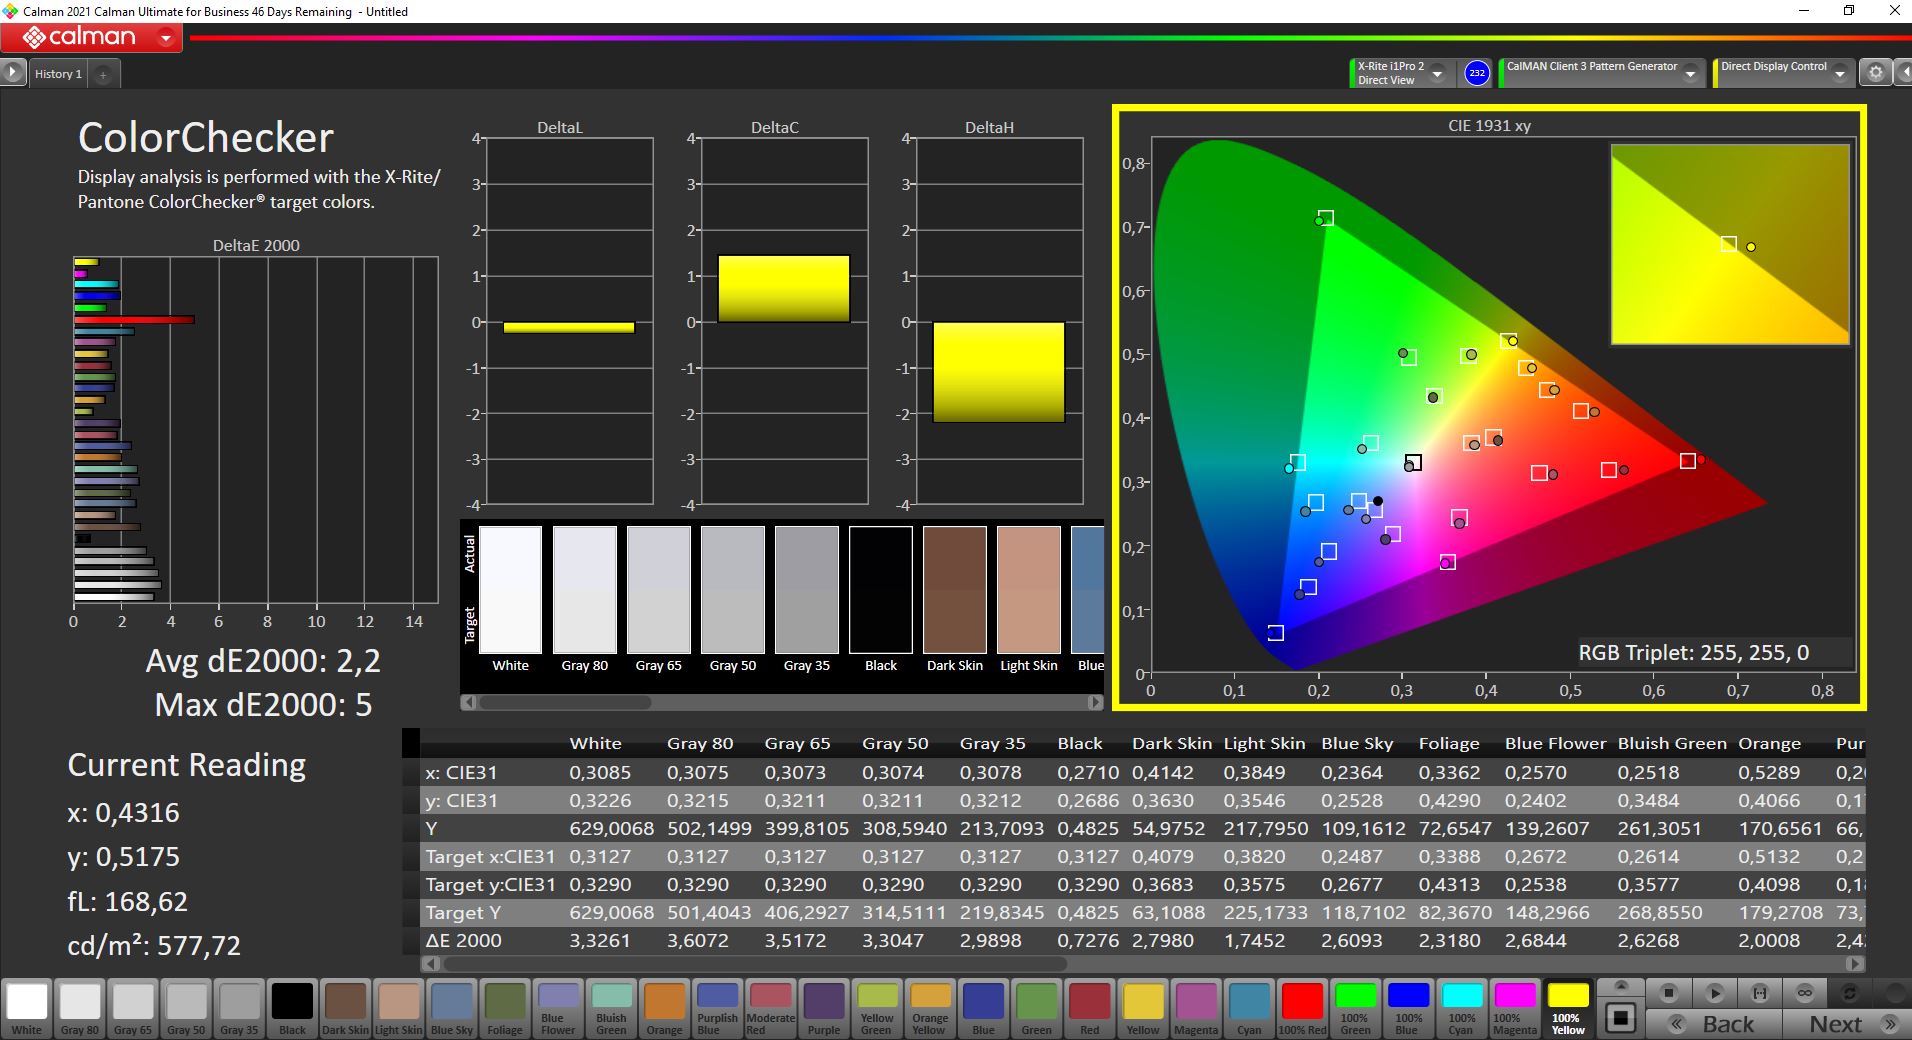

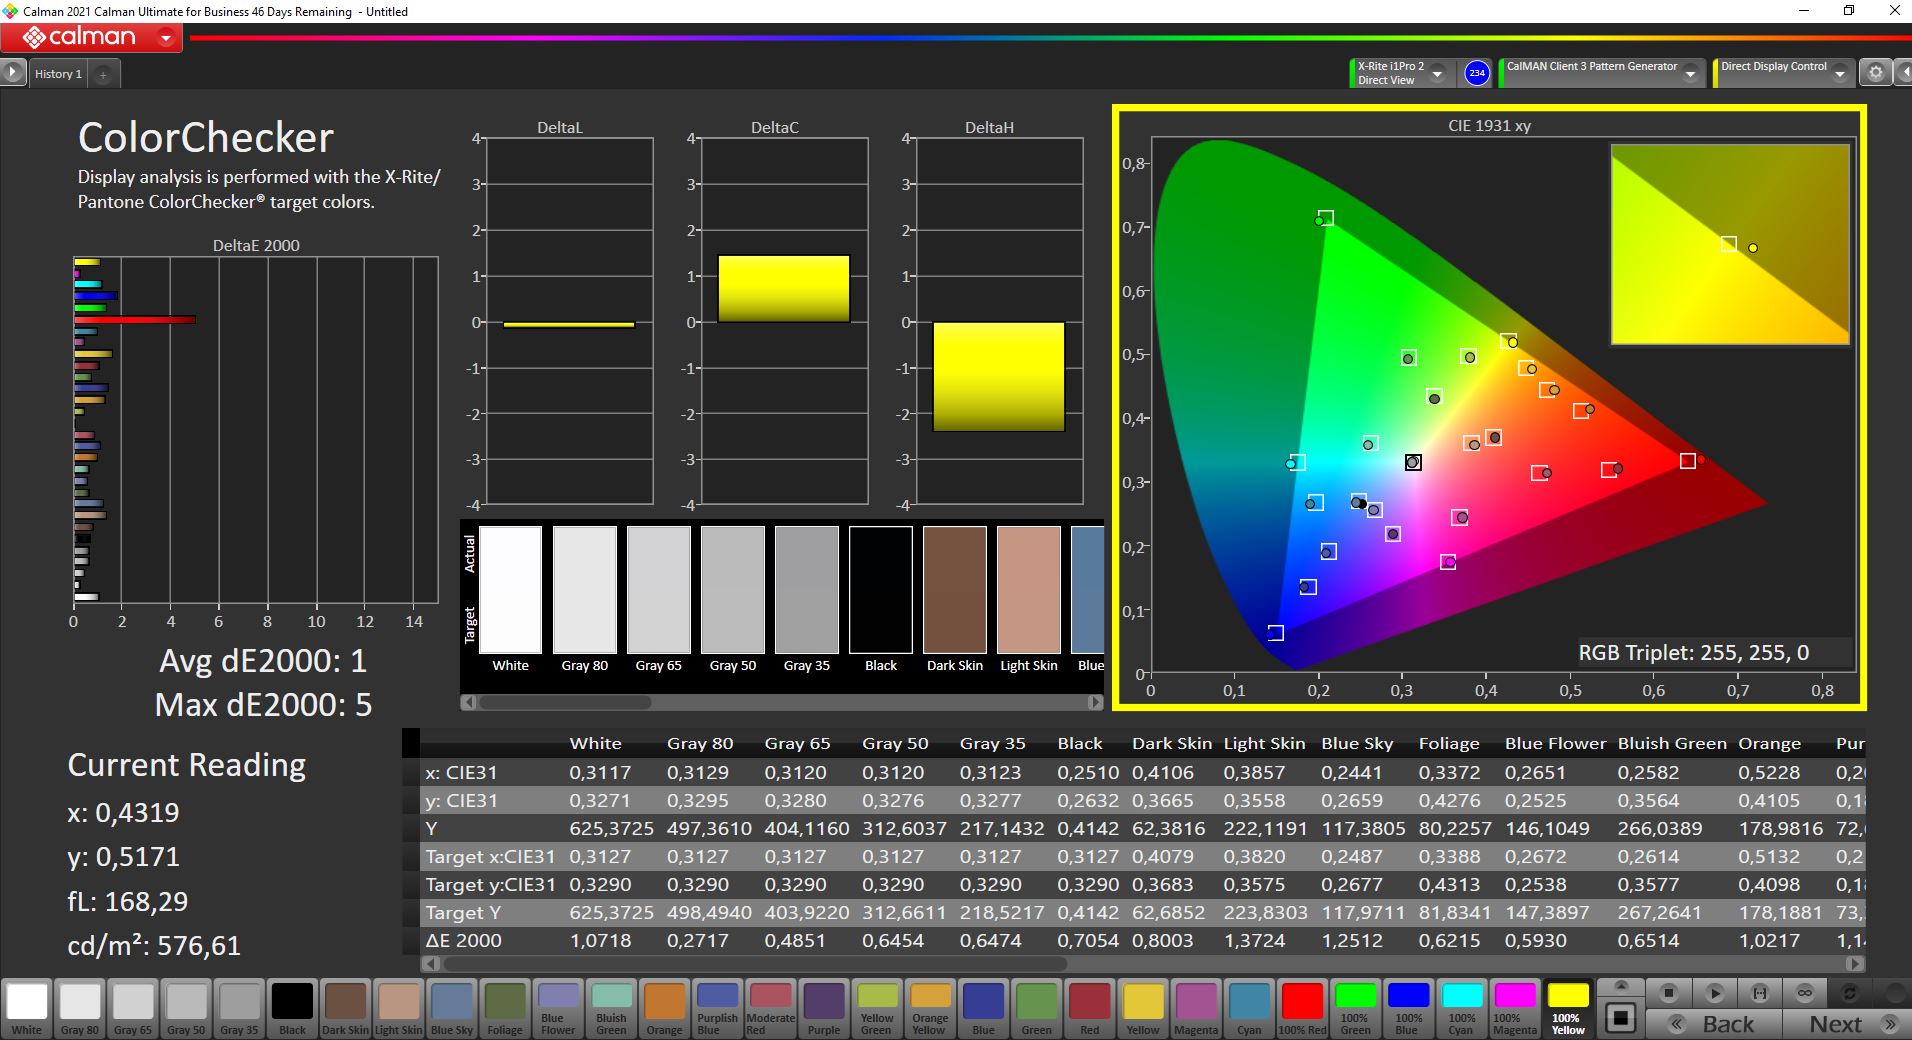
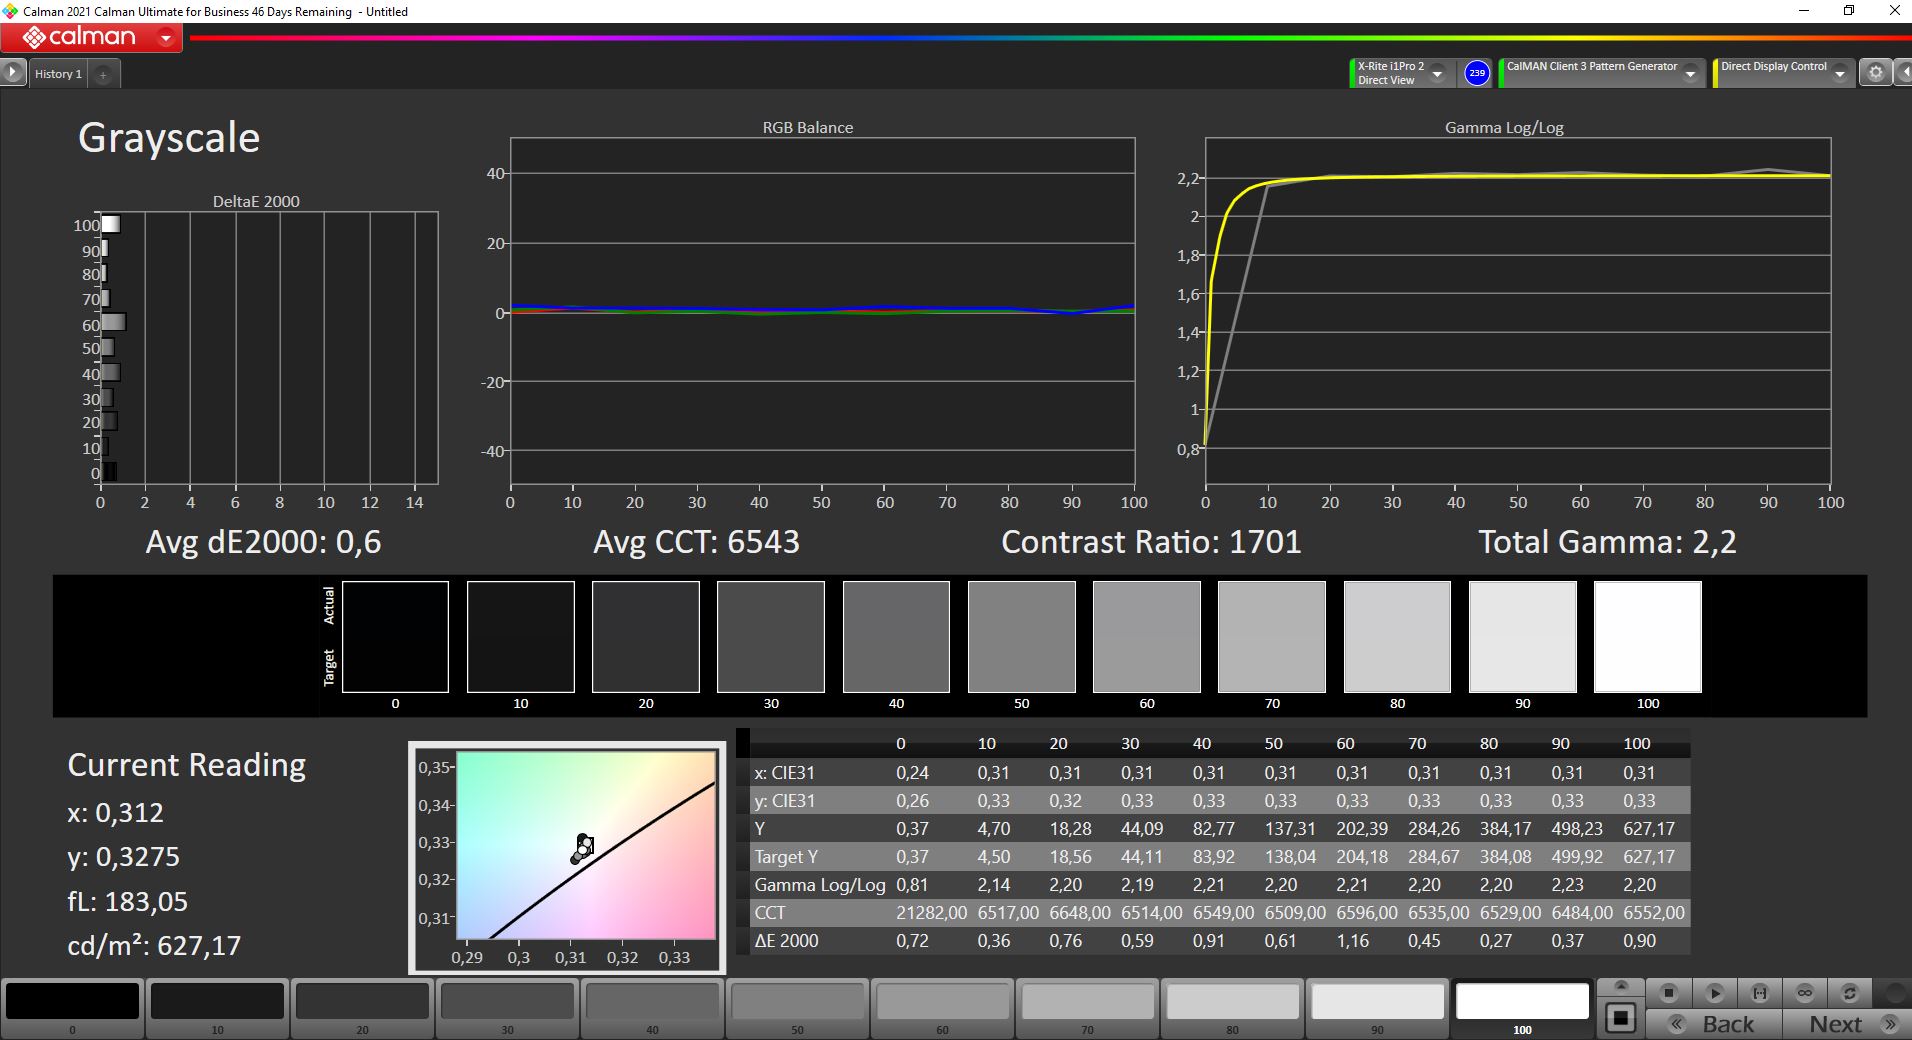
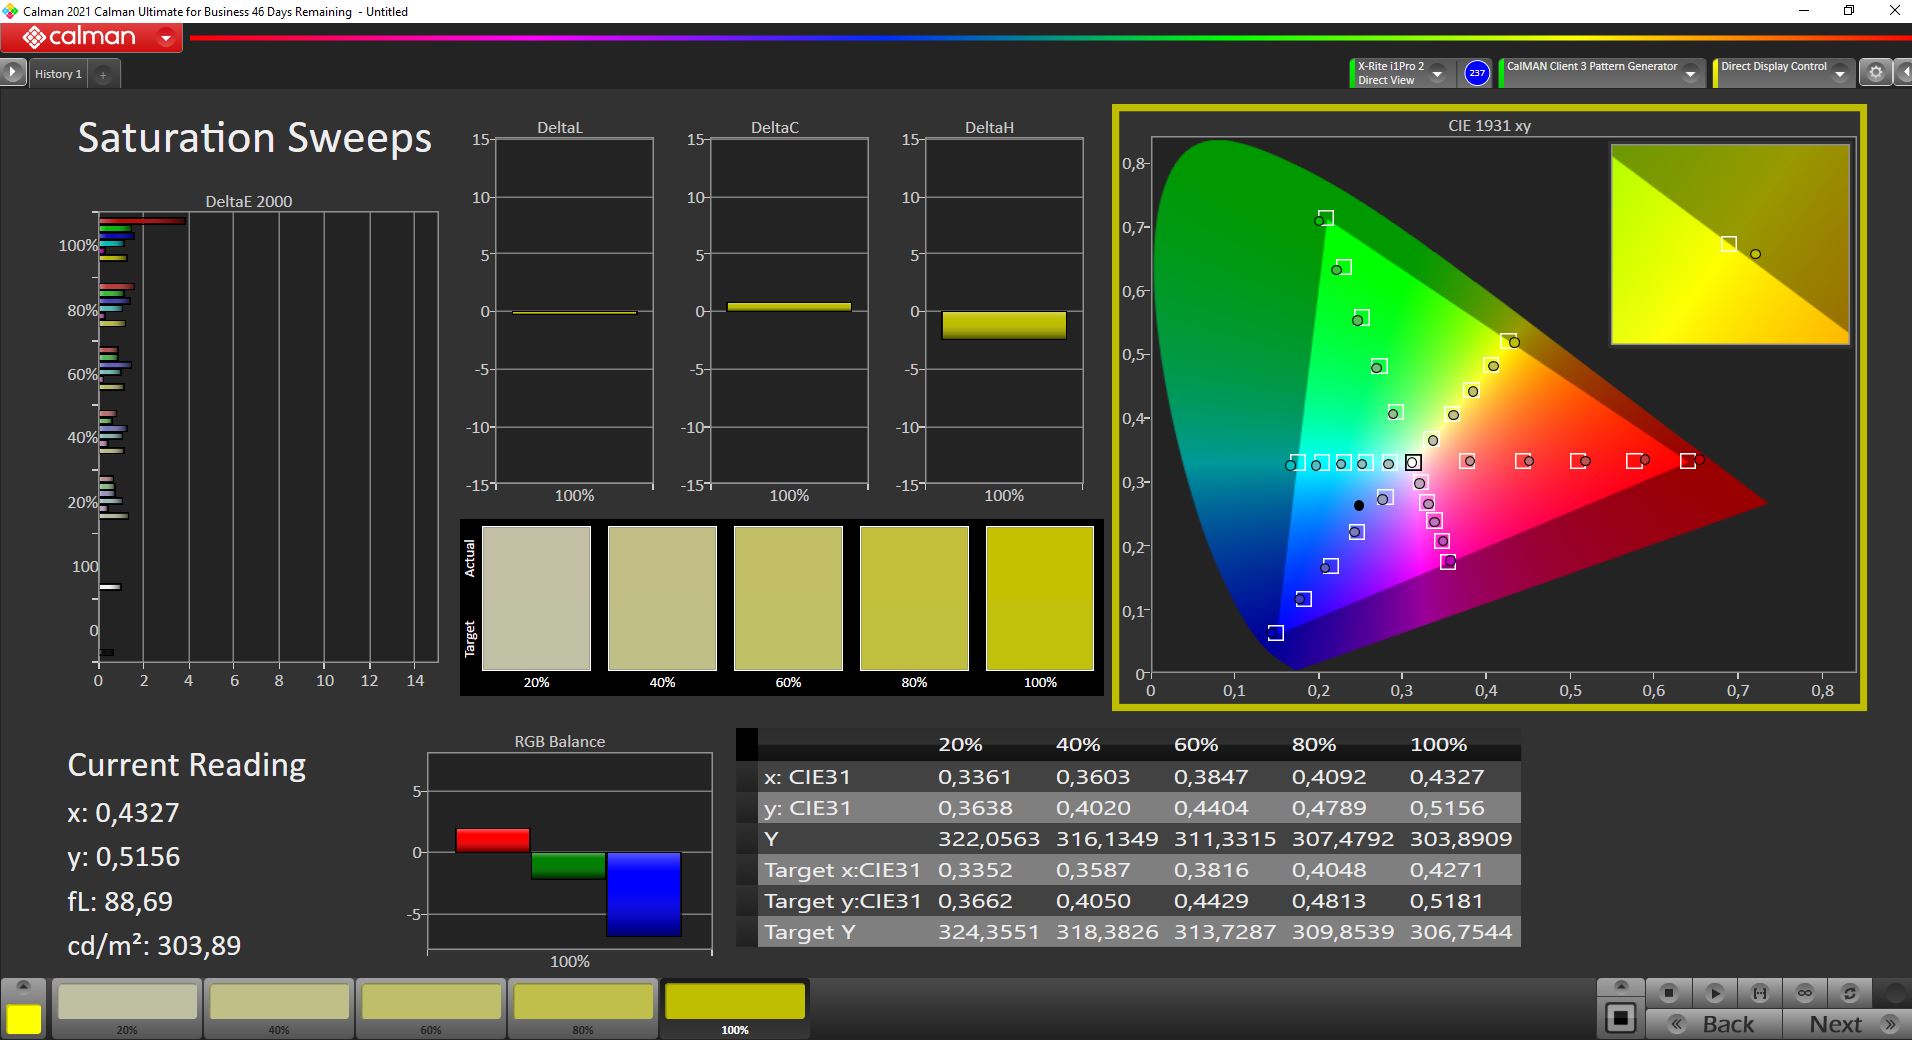
联想宣传这里安装的WQUXGA屏幕有工厂校准。事实上,我们用Calman和X-Rite i1Pro 2测量了相当好的出厂值。色彩值的DeltaE值为2.2,意味着偏差很小。然而,仍有改进的余地。用X-Rite i1Profiler校准后,DeltaE降至1.0。像往常一样,我们提供相应的颜色配置文件供免费下载。
0.41cd/m²的黑值对于IPS LED显示屏来说并不特别突出,但高亮度仍然确保了1537:1的良好对比度。再加上广义的AdobeRGB色彩空间98.9%的高色彩空间覆盖率(联想宣传的是100% AdobeRGB),联想ThinkPad P1第四代的画质非常好,8位面板很适合图像编辑。
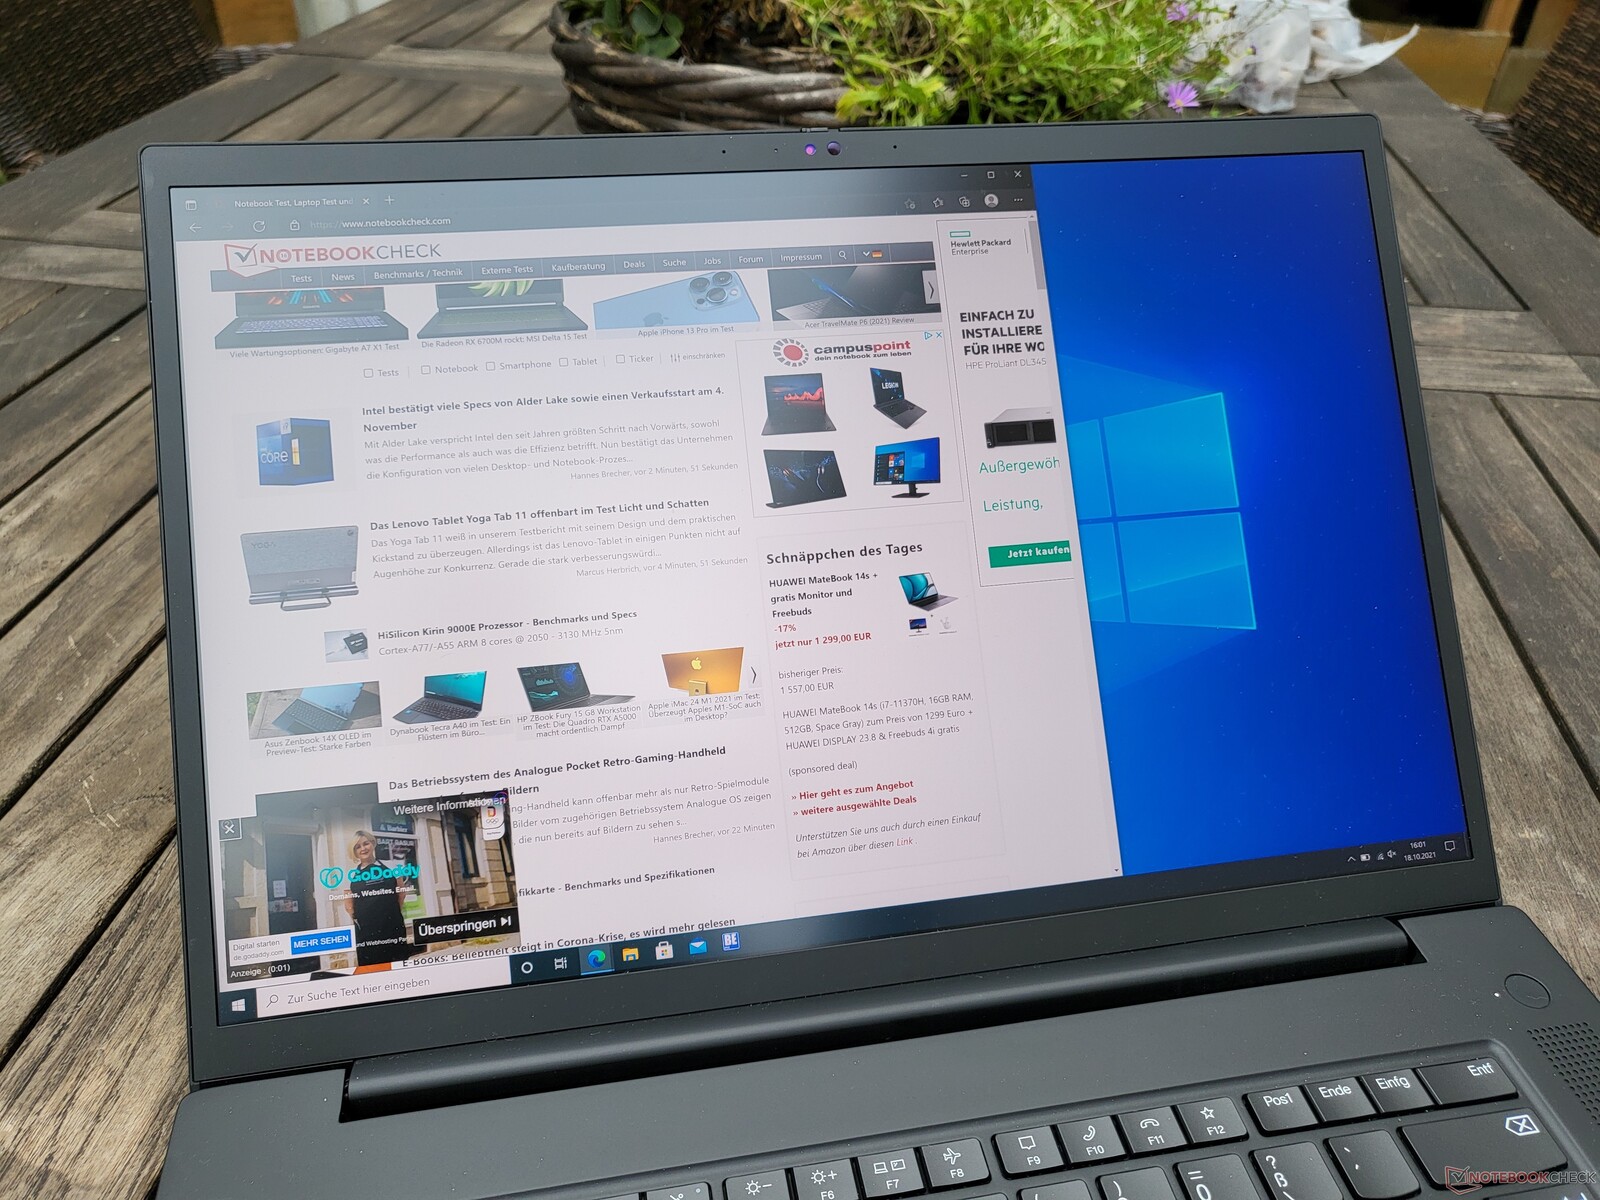
联想ThinkPad P1 2021轻松掌握了户外使用。哑光表面有助于明亮的4K UHD+显示屏在阴天轻松胜过日光。然而,即使在600cd/m²的情况下,阳光直射仍然是一种挑战。
Display Response Times
| ↔ Response Time Black to White | ||
|---|---|---|
| 31.2 ms ... rise ↗ and fall ↘ combined | ↗ 16.4 ms rise | 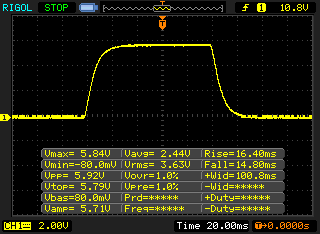 |
| ↘ 14.8 ms fall | ||
| The screen shows slow response rates in our tests and will be unsatisfactory for gamers. In comparison, all tested devices range from 0.1 (minimum) to 240 (maximum) ms. » 84 % of all devices are better. This means that the measured response time is worse than the average of all tested devices (19.9 ms). | ||
| ↔ Response Time 50% Grey to 80% Grey | ||
| 55.2 ms ... rise ↗ and fall ↘ combined | ↗ 26.8 ms rise | 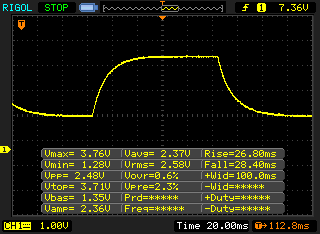 |
| ↘ 28.4 ms fall | ||
| The screen shows slow response rates in our tests and will be unsatisfactory for gamers. In comparison, all tested devices range from 0.165 (minimum) to 636 (maximum) ms. » 92 % of all devices are better. This means that the measured response time is worse than the average of all tested devices (31.1 ms). | ||
Screen Flickering / PWM (Pulse-Width Modulation)
| Screen flickering / PWM not detected |  | ||
In comparison: 52 % of all tested devices do not use PWM to dim the display. If PWM was detected, an average of 7798 (minimum: 5 - maximum: 343500) Hz was measured. | |||
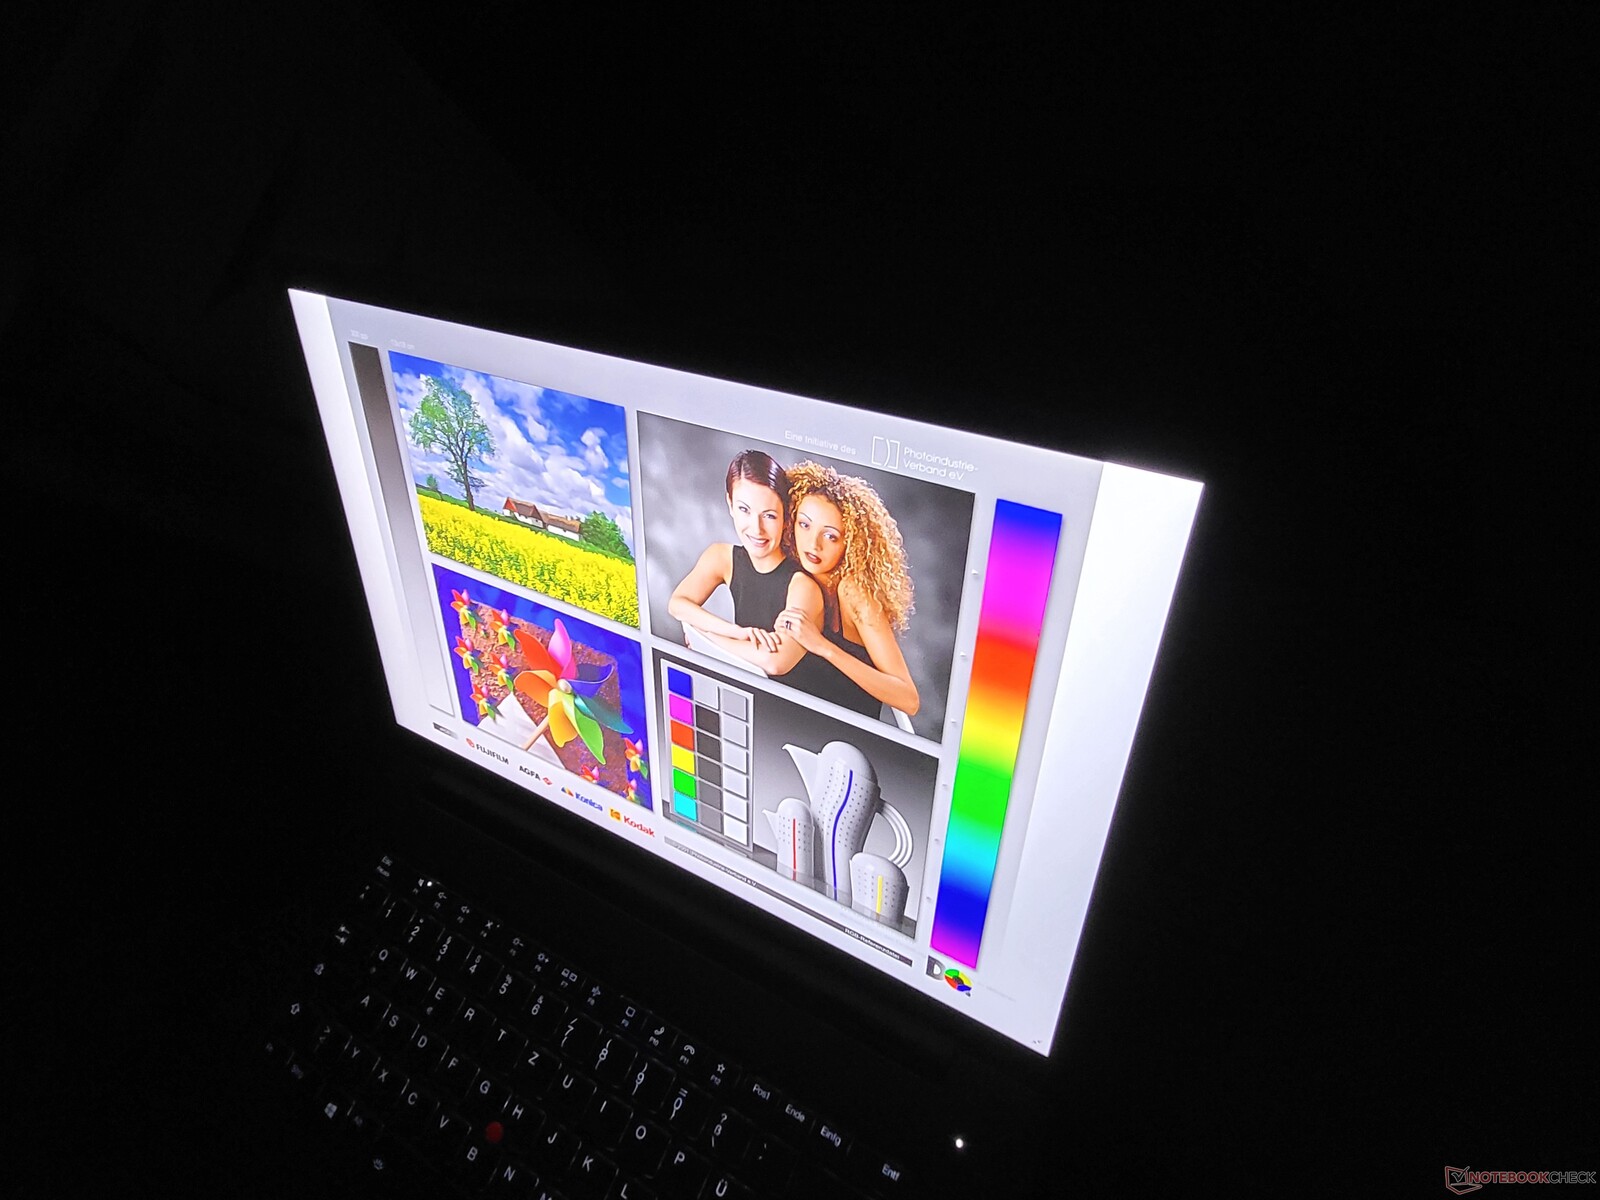
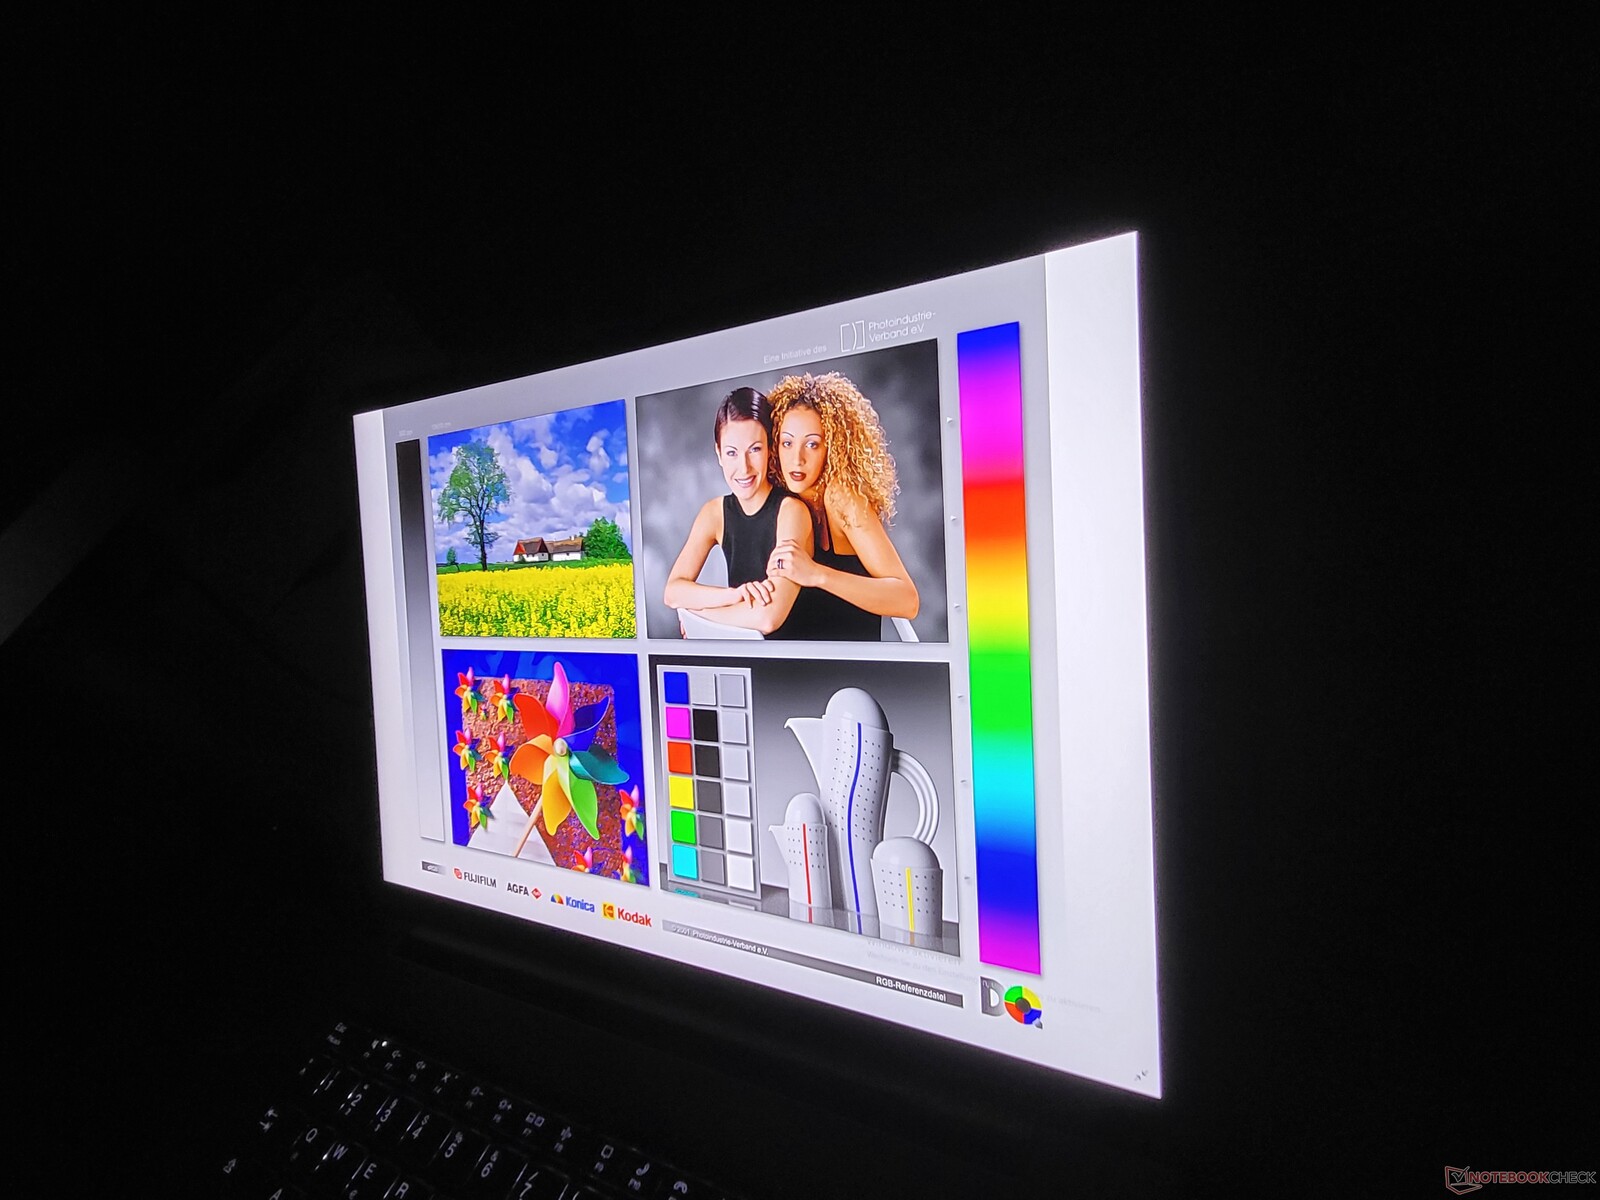
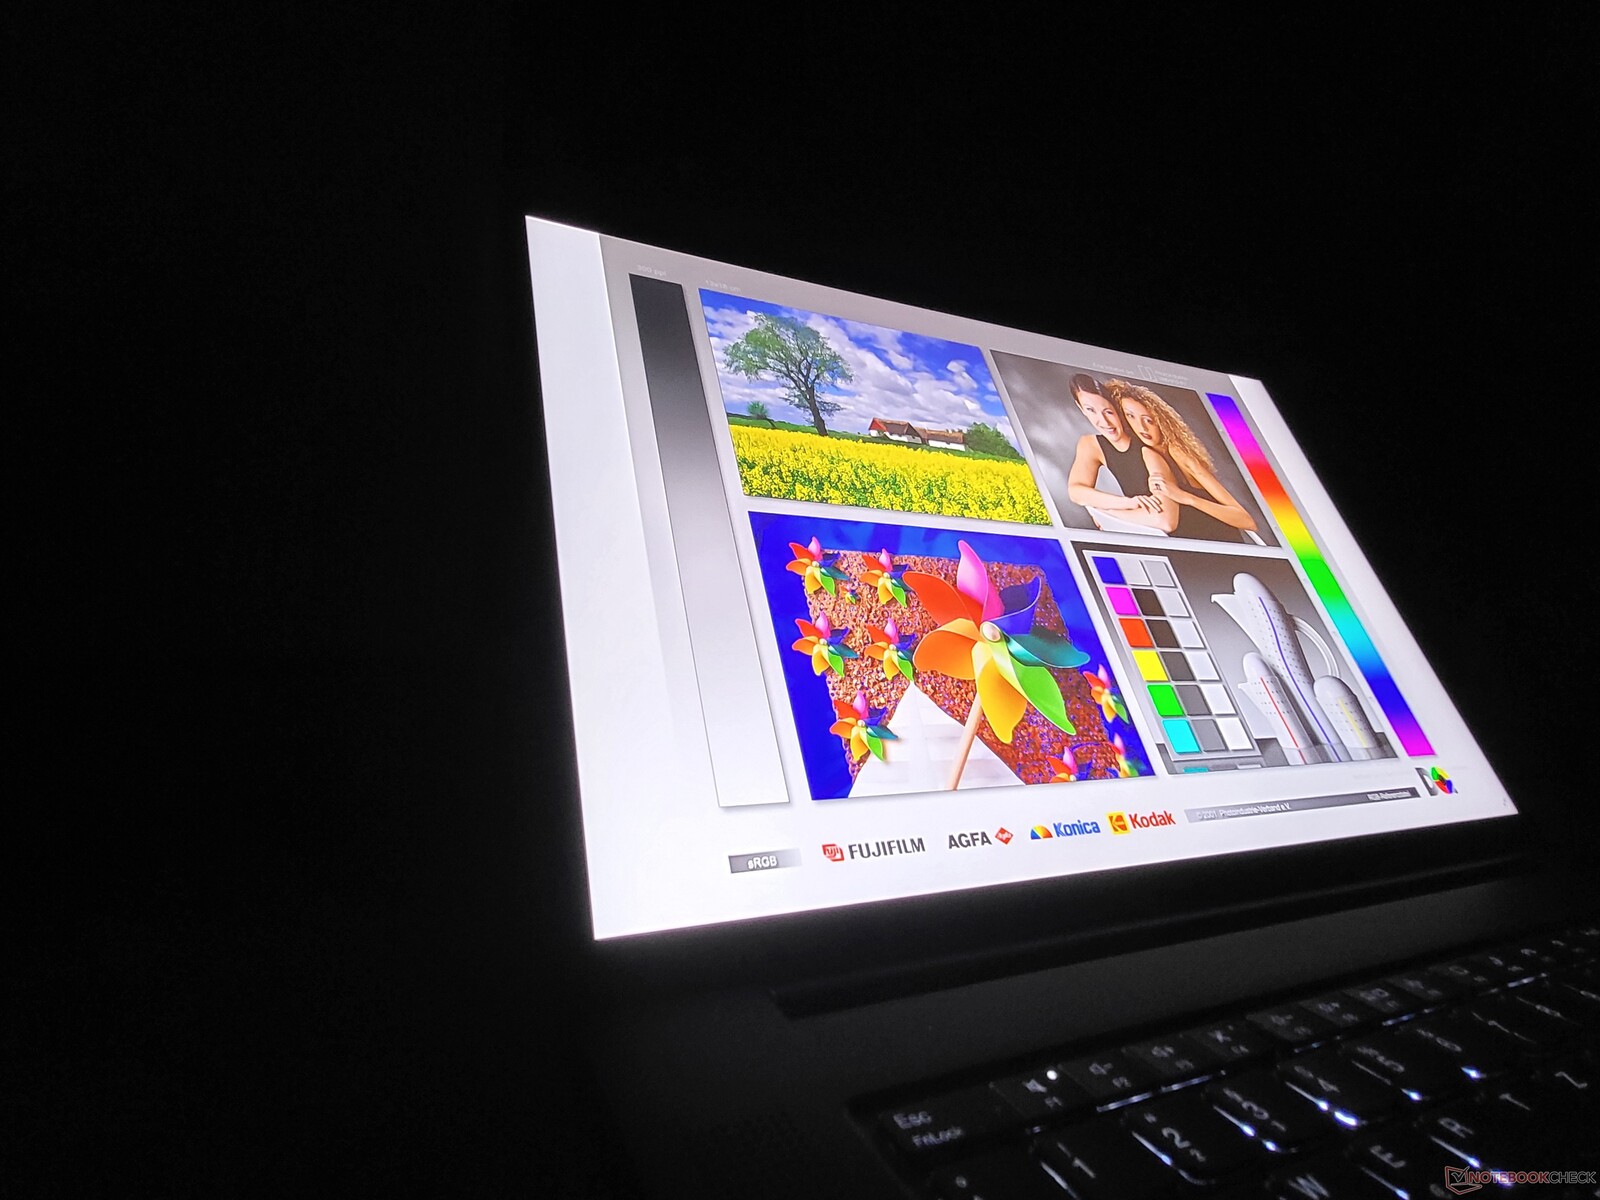
IPS技术的质量体现在其出色的视角稳定性上,这在联想的ThinkPad P1 2021中也是没有错的。
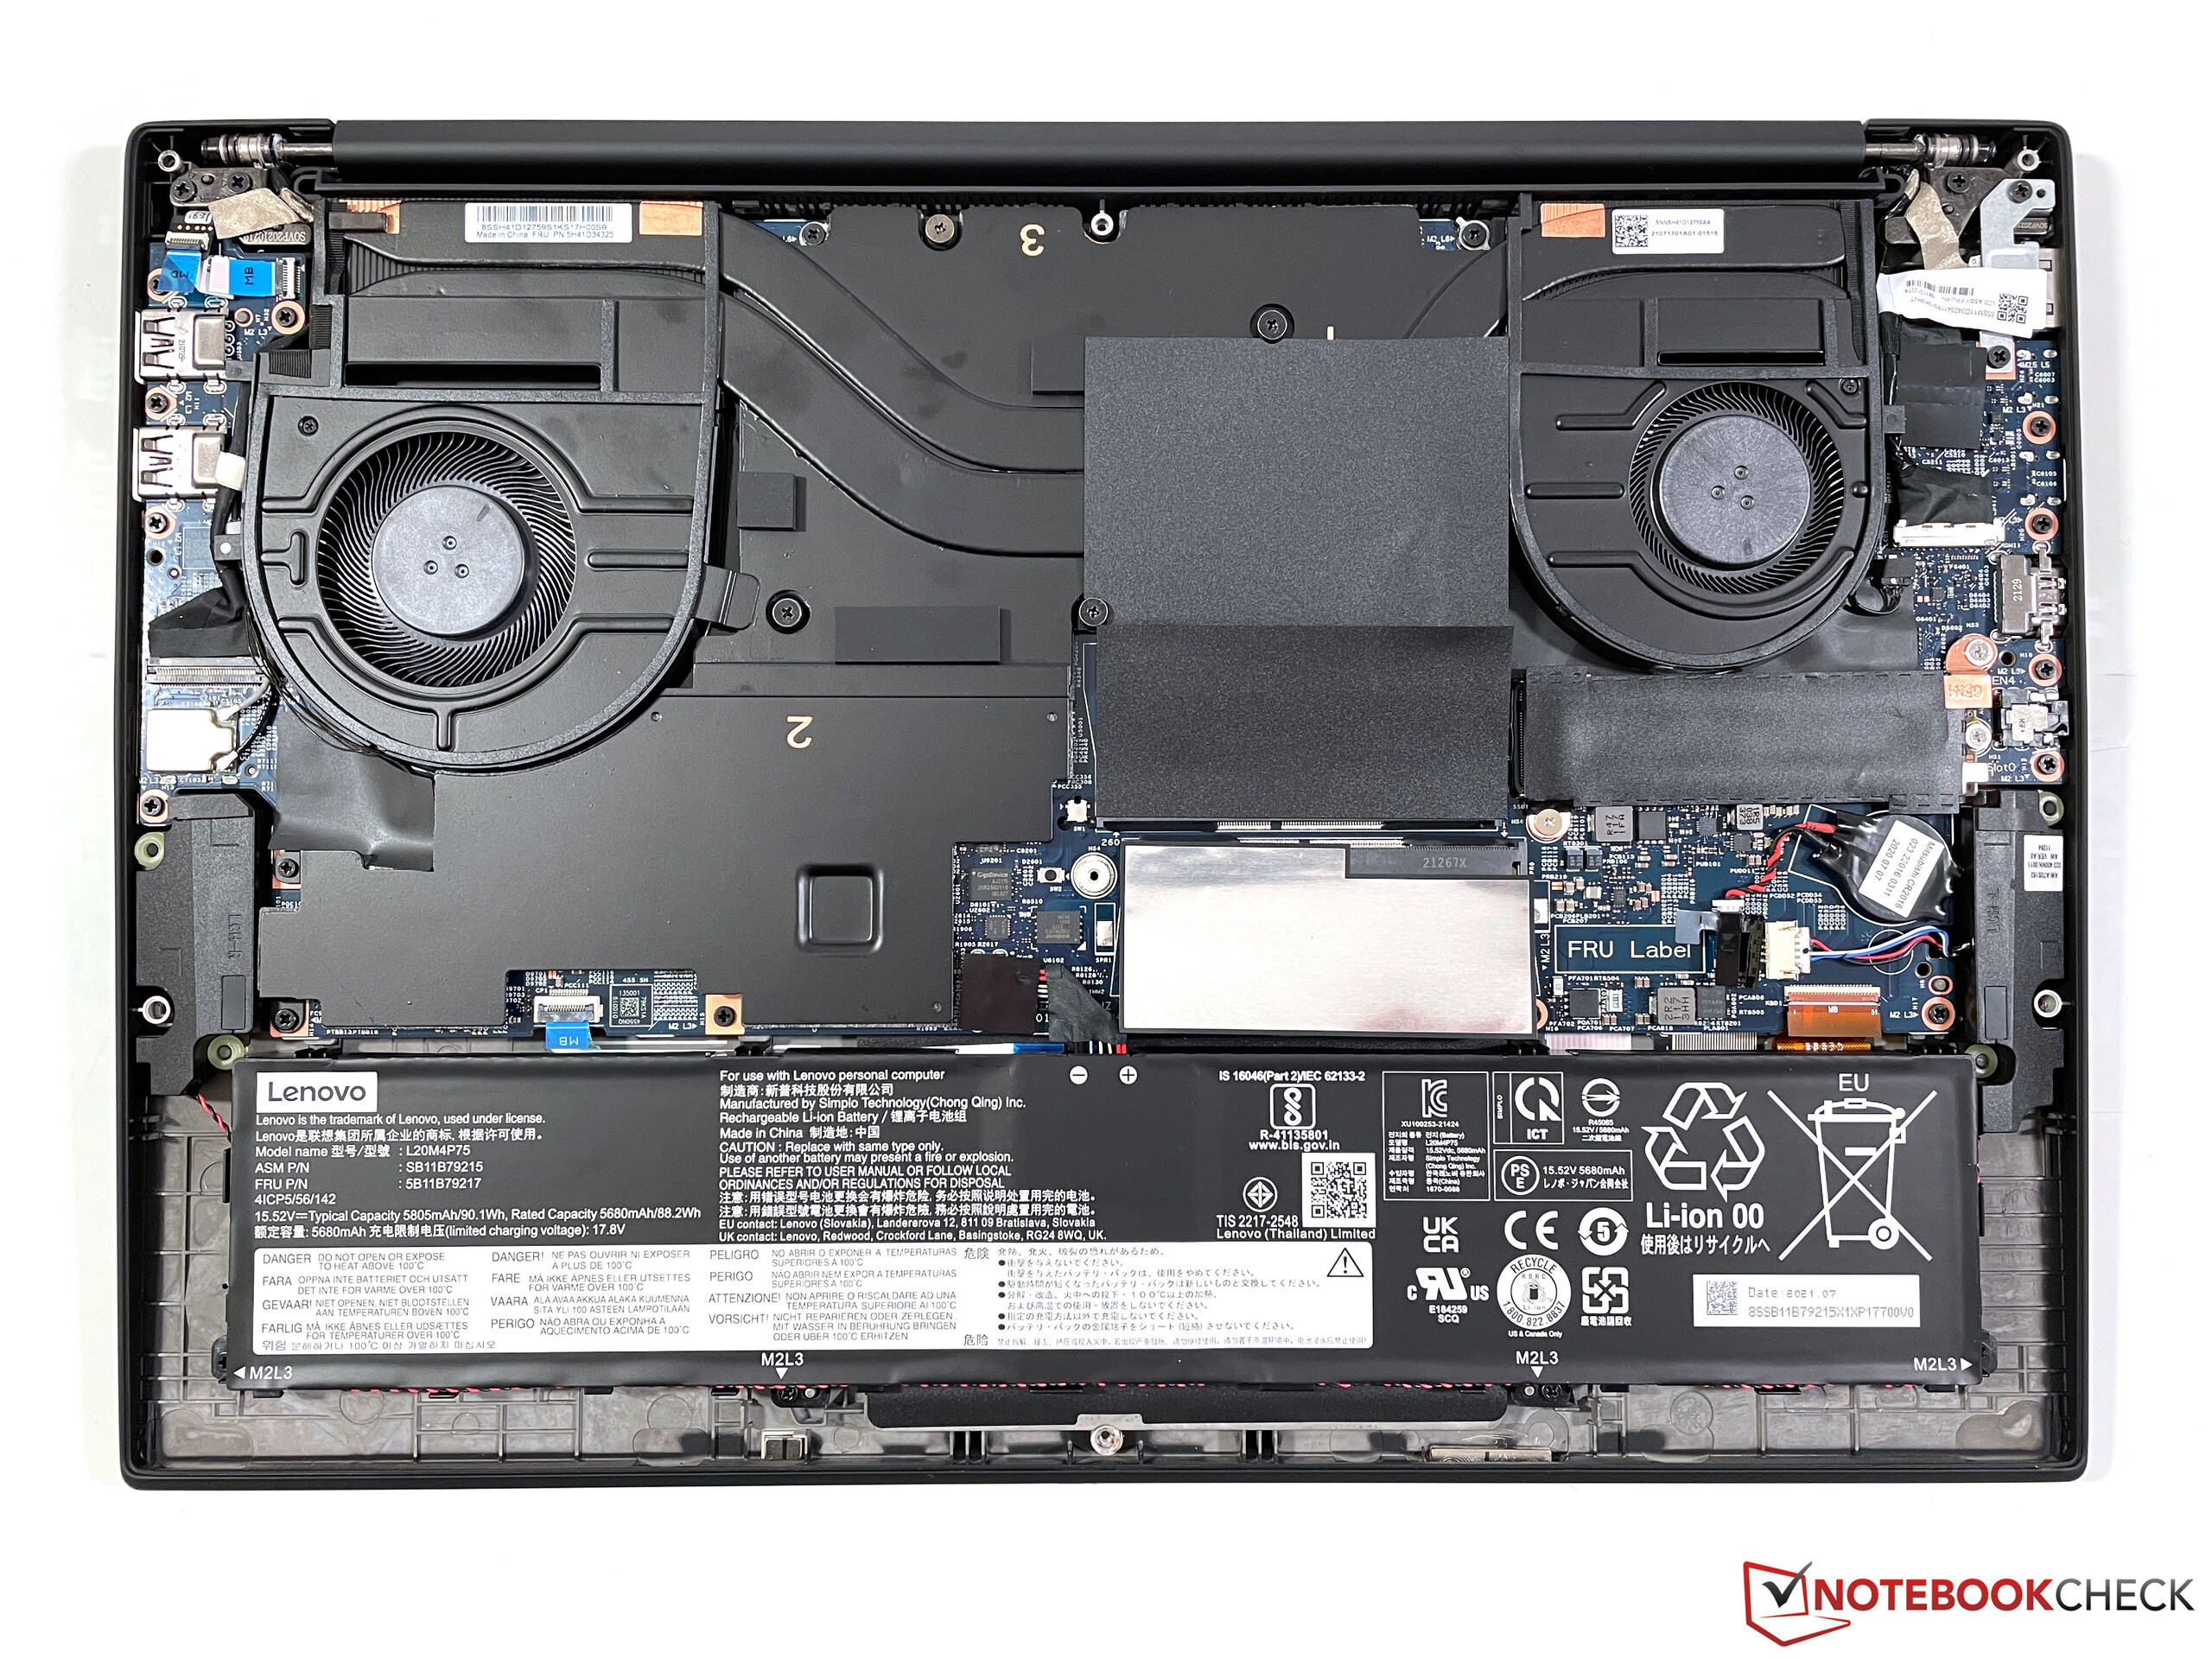
使用VaporChamber的联想工作站性能明显提高
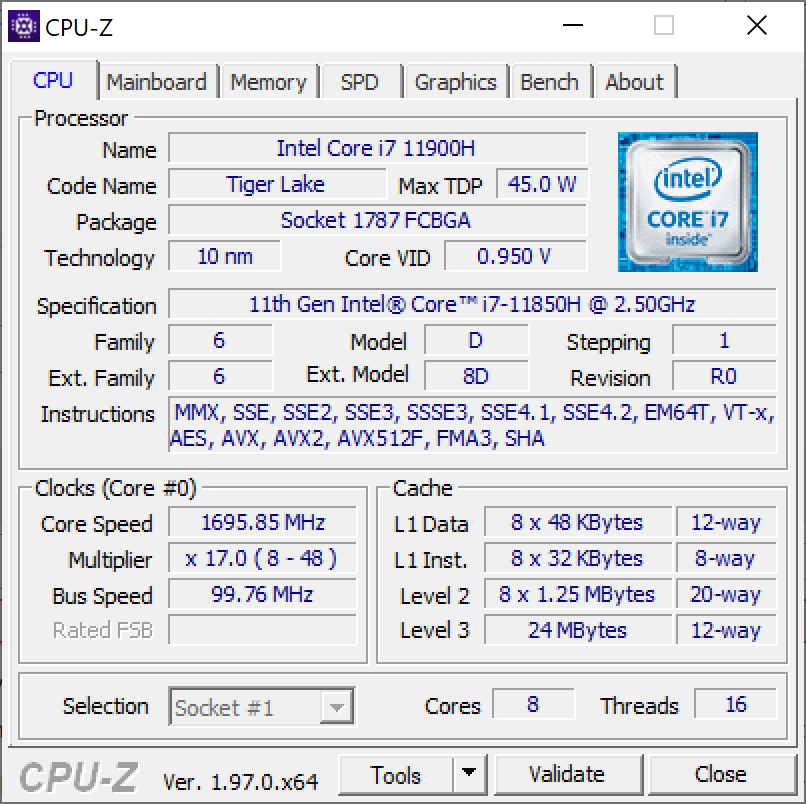
联想依靠英特尔和Nvidia目前提供的最新和最强大的组件。在英特尔的情况下,这意味着来自Tiger-Lake H系列的处理器。这三个核心CPU (i7-11800H, i7-11850H, i9-11950H)有八个核心,同时提供的Xeon W-11855M是一个六核。
可用的图形芯片的选择要大得多。作为一个绝对的基本选择,P1 G4没有专用的GPU,也就是说,只有集成的英特尔图形。有七个专用图形芯片。Nvidia T1200, RTX A2000, RTX A3000, RTX A4000, RTX 5000以及首次出现在P1 GeForce RTX 3070和 RTX 3080.
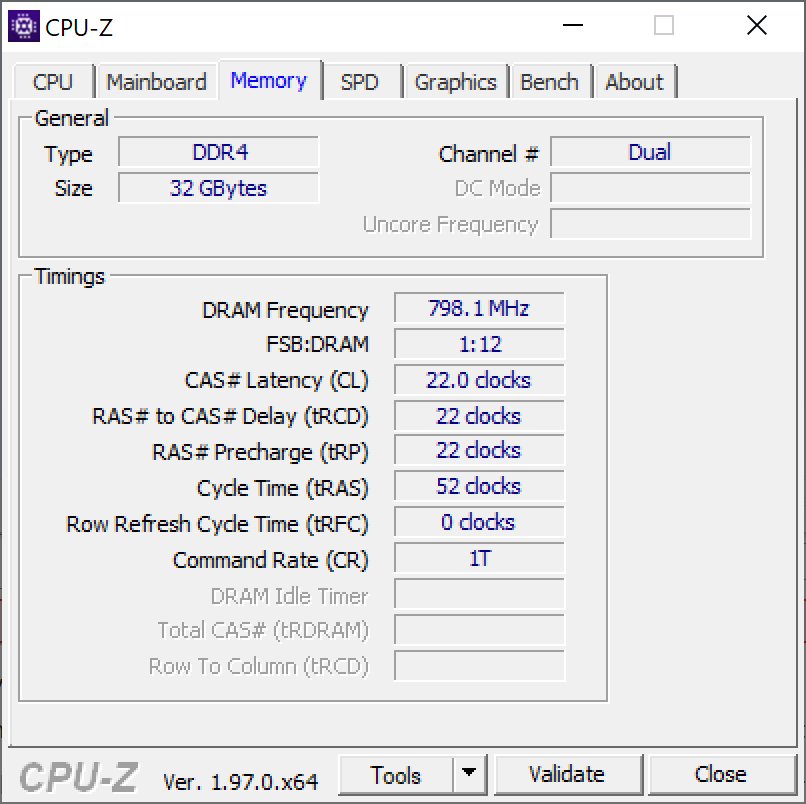
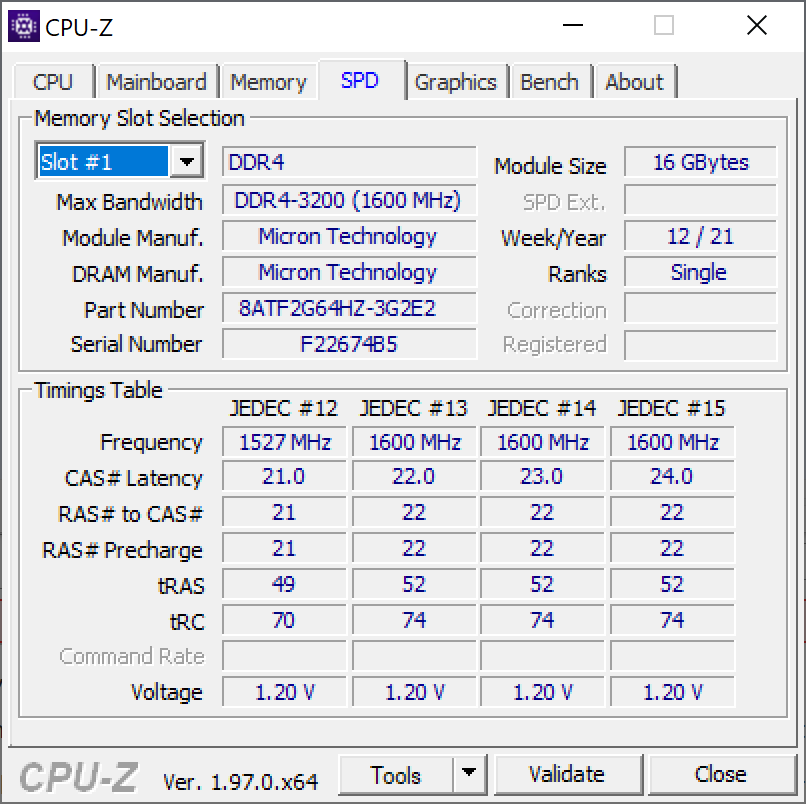
在任何情况下,联想ThinkPad P1 Gen 4有两个SO-DIMM插槽,最多可容纳64GB的内存。当ThinkPad笔记本电脑配置有Xeon时,这也可以是ECC内存。根据型号的不同,联想笔记本电脑有一个或两个M.2 2280端口 - 带有英特尔GPU、T1200或RTX A2000的型号有两个,所有其他型号只有一个大容量存储插槽。
处理器
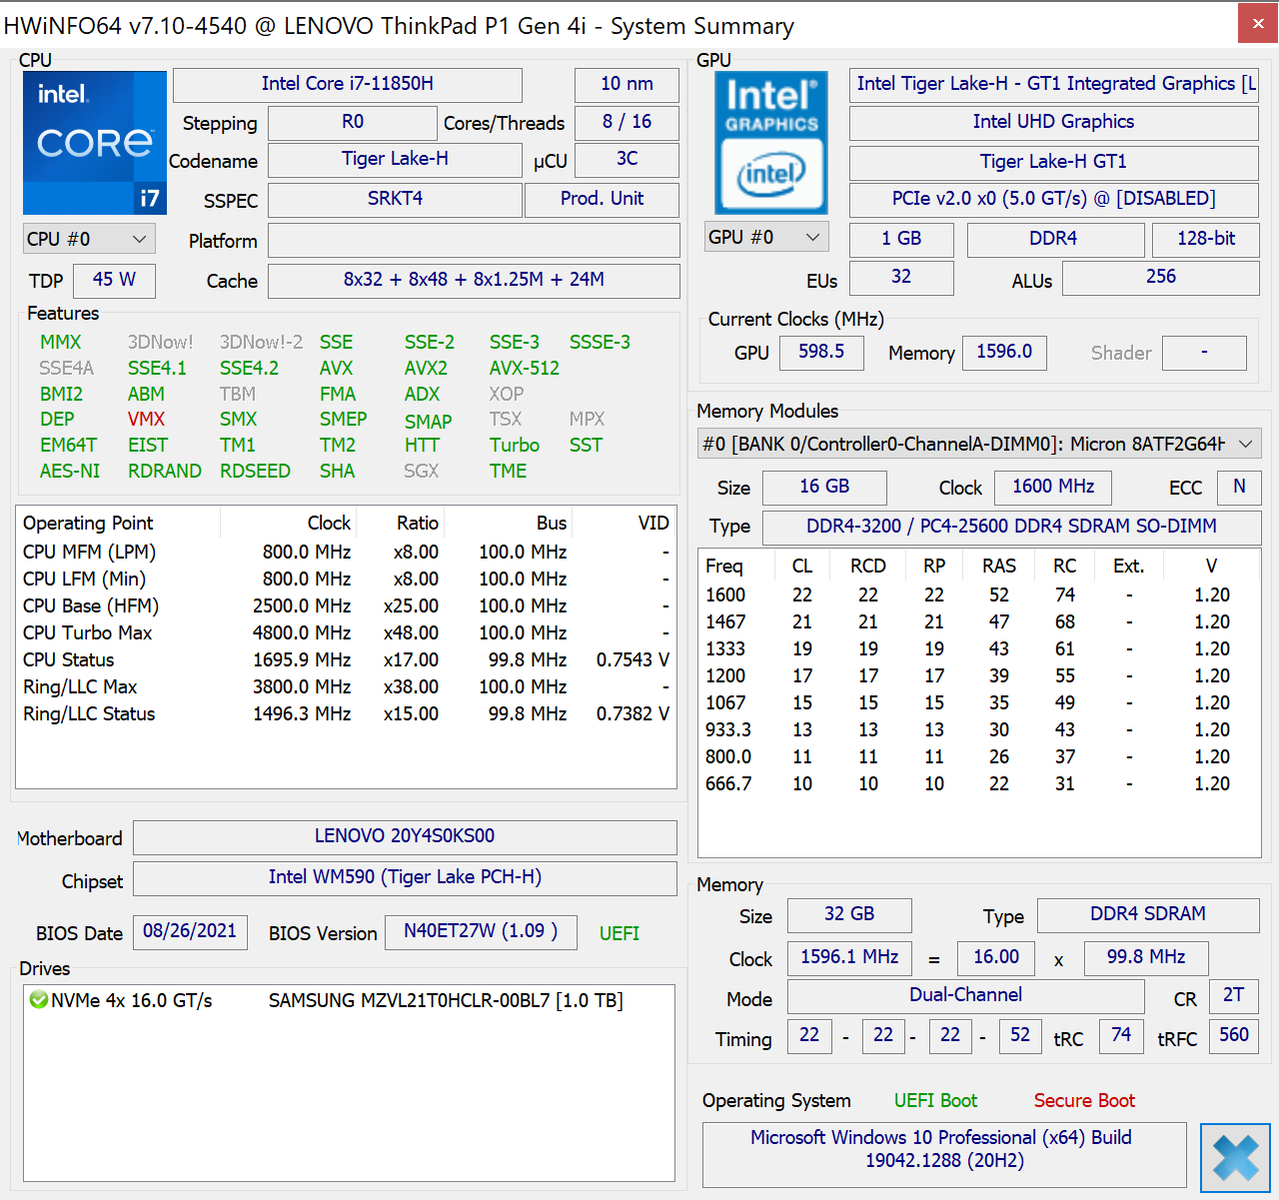
ǞǞǞ 英特尔酷睿i7-11850H是目前 "老虎湖 "系列的一个处理器,有八个核心和16个线程。名义上,该CPU的TDP为45瓦;然而,这一消耗不足以使所有核心达到4.8GHz的最大时钟速率。通过我们的 CPU列表英特尔处理器可以与其他CPU进行比较。
实际上,i7-11850H实际上和i7-11800H一样快,区别主要在于11850H的vPro支持--但在ThinkPad P1 G4中,两者之间的区别很大。原因不是处理器,而是冷却系统。这里测试的配备GeForce RTX 3070的型号包含蒸气室冷却。因此,在这里,处理器在纯粹的CPU负载下可以永久消耗约60瓦,而装备较少的型号的CPU 配备Nvidia T1200的ThinkPad P1第四代的CPU则被限制在40瓦左右。在Cinebench R23多核测试中,Vapor-Chamber P1比便宜的型号快27%,它大致上与 惠普ZBook Studio 15 G8.
我们无法确定电池模式下的CPU性能限制。
Cinebench R15 Multi Endurance test
Cinebench R23: Multi Core | Single Core
Cinebench R20: CPU (Multi Core) | CPU (Single Core)
Cinebench R15: CPU Multi 64Bit | CPU Single 64Bit
Blender: v2.79 BMW27 CPU
7-Zip 18.03: 7z b 4 | 7z b 4 -mmt1
Geekbench 5.5: Multi-Core | Single-Core
HWBOT x265 Benchmark v2.2: 4k Preset
LibreOffice : 20 Documents To PDF
R Benchmark 2.5: Overall mean
| CPU Performance rating | |
| Average of class Workstation | |
| Lenovo ThinkPad P1 G4-20Y4S0KS00 | |
| HP ZBook Studio 15 G8 | |
| Average Intel Core i7-11850H | |
| Huawei MateBook 16 R7 5800H | |
| Apple MacBook Pro 13 Late 2020 M1 Entry (8 / 256 GB) -6! | |
| Dell Precision 5000 5560 -2! | |
| Lenovo ThinkPad P1 G4-20Y30017GE | |
| Apple MacBook Pro 16 2019 i9 5500M | |
| Lenovo ThinkPad X1 Extreme Gen3-20TLS0UV00 | |
| Cinebench R23 / Multi Core | |
| Average of class Workstation (14055 - 38520, n=25, last 2 years) | |
| HP ZBook Studio 15 G8 | |
| Lenovo ThinkPad P1 G4-20Y4S0KS00 | |
| Average Intel Core i7-11850H (9779 - 11935, n=2) | |
| Huawei MateBook 16 R7 5800H | |
| Dell Precision 5000 5560 | |
| Lenovo ThinkPad P1 G4-20Y30017GE | |
| Apple MacBook Pro 16 2019 i9 5500M | |
| Apple MacBook Pro 16 2019 i9 5500M | |
| Apple MacBook Pro 13 Late 2020 M1 Entry (8 / 256 GB) | |
| Lenovo ThinkPad X1 Extreme Gen3-20TLS0UV00 | |
| Cinebench R23 / Single Core | |
| Average of class Workstation (1712 - 2228, n=25, last 2 years) | |
| HP ZBook Studio 15 G8 | |
| Lenovo ThinkPad P1 G4-20Y4S0KS00 | |
| Average Intel Core i7-11850H (1513 - 1552, n=2) | |
| Apple MacBook Pro 13 Late 2020 M1 Entry (8 / 256 GB) | |
| Dell Precision 5000 5560 | |
| Lenovo ThinkPad P1 G4-20Y30017GE | |
| Huawei MateBook 16 R7 5800H | |
| Lenovo ThinkPad X1 Extreme Gen3-20TLS0UV00 | |
| Apple MacBook Pro 16 2019 i9 5500M | |
| Cinebench R20 / CPU (Multi Core) | |
| Average of class Workstation (5471 - 15043, n=25, last 2 years) | |
| Lenovo ThinkPad P1 G4-20Y4S0KS00 | |
| HP ZBook Studio 15 G8 | |
| Average Intel Core i7-11850H (3826 - 4663, n=2) | |
| Huawei MateBook 16 R7 5800H | |
| Dell Precision 5000 5560 | |
| Lenovo ThinkPad P1 G4-20Y30017GE | |
| Apple MacBook Pro 16 2019 i9 5500M | |
| Apple MacBook Pro 16 2019 i9 5500M | |
| Lenovo ThinkPad X1 Extreme Gen3-20TLS0UV00 | |
| Apple MacBook Pro 13 Late 2020 M1 Entry (8 / 256 GB) | |
| Cinebench R20 / CPU (Single Core) | |
| Average of class Workstation (671 - 857, n=25, last 2 years) | |
| HP ZBook Studio 15 G8 | |
| Lenovo ThinkPad P1 G4-20Y4S0KS00 | |
| Average Intel Core i7-11850H (583 - 607, n=2) | |
| Dell Precision 5000 5560 | |
| Lenovo ThinkPad P1 G4-20Y30017GE | |
| Huawei MateBook 16 R7 5800H | |
| Lenovo ThinkPad X1 Extreme Gen3-20TLS0UV00 | |
| Apple MacBook Pro 16 2019 i9 5500M | |
| Apple MacBook Pro 16 2019 i9 5500M | |
| Apple MacBook Pro 13 Late 2020 M1 Entry (8 / 256 GB) | |
| Cinebench R15 / CPU Multi 64Bit | |
| Average of class Workstation (2489 - 5810, n=25, last 2 years) | |
| Huawei MateBook 16 R7 5800H | |
| Lenovo ThinkPad P1 G4-20Y4S0KS00 | |
| HP ZBook Studio 15 G8 | |
| Average Intel Core i7-11850H (1547 - 1988, n=2) | |
| Lenovo ThinkPad P1 G4-20Y30017GE | |
| Dell Precision 5000 5560 | |
| Apple MacBook Pro 16 2019 i9 5500M | |
| Apple MacBook Pro 16 2019 i9 5500M | |
| Lenovo ThinkPad X1 Extreme Gen3-20TLS0UV00 | |
| Apple MacBook Pro 13 Late 2020 M1 Entry (8 / 256 GB) | |
| Cinebench R15 / CPU Single 64Bit | |
| Average of class Workstation (191.4 - 328, n=25, last 2 years) | |
| HP ZBook Studio 15 G8 | |
| Lenovo ThinkPad P1 G4-20Y4S0KS00 | |
| Average Intel Core i7-11850H (232 - 233, n=2) | |
| Huawei MateBook 16 R7 5800H | |
| Dell Precision 5000 5560 | |
| Lenovo ThinkPad P1 G4-20Y30017GE | |
| Apple MacBook Pro 13 Late 2020 M1 Entry (8 / 256 GB) | |
| Lenovo ThinkPad X1 Extreme Gen3-20TLS0UV00 | |
| Apple MacBook Pro 16 2019 i9 5500M | |
| Apple MacBook Pro 16 2019 i9 5500M | |
| Blender / v2.79 BMW27 CPU | |
| Lenovo ThinkPad X1 Extreme Gen3-20TLS0UV00 | |
| Apple MacBook Pro 16 2019 i9 5500M | |
| Lenovo ThinkPad P1 G4-20Y30017GE | |
| Dell Precision 5000 5560 | |
| Average Intel Core i7-11850H (257 - 313, n=2) | |
| Lenovo ThinkPad P1 G4-20Y4S0KS00 | |
| HP ZBook Studio 15 G8 | |
| Huawei MateBook 16 R7 5800H | |
| Average of class Workstation (91 - 261, n=25, last 2 years) | |
| 7-Zip 18.03 / 7z b 4 | |
| Average of class Workstation (54741 - 116969, n=25, last 2 years) | |
| Huawei MateBook 16 R7 5800H | |
| Lenovo ThinkPad P1 G4-20Y4S0KS00 | |
| HP ZBook Studio 15 G8 | |
| Average Intel Core i7-11850H (44890 - 50552, n=2) | |
| Dell Precision 5000 5560 | |
| Apple MacBook Pro 16 2019 i9 5500M | |
| Lenovo ThinkPad P1 G4-20Y30017GE | |
| Lenovo ThinkPad X1 Extreme Gen3-20TLS0UV00 | |
| 7-Zip 18.03 / 7z b 4 -mmt1 | |
| Average of class Workstation (5126 - 6960, n=25, last 2 years) | |
| HP ZBook Studio 15 G8 | |
| Lenovo ThinkPad P1 G4-20Y4S0KS00 | |
| Average Intel Core i7-11850H (5727 - 5762, n=2) | |
| Dell Precision 5000 5560 | |
| Huawei MateBook 16 R7 5800H | |
| Lenovo ThinkPad P1 G4-20Y30017GE | |
| Lenovo ThinkPad X1 Extreme Gen3-20TLS0UV00 | |
| Apple MacBook Pro 16 2019 i9 5500M | |
| Geekbench 5.5 / Multi-Core | |
| Average of class Workstation (11542 - 25554, n=25, last 2 years) | |
| Lenovo ThinkPad P1 G4-20Y4S0KS00 | |
| Average Intel Core i7-11850H (9049 - 9451, n=2) | |
| Huawei MateBook 16 R7 5800H | |
| Apple MacBook Pro 13 Late 2020 M1 Entry (8 / 256 GB) | |
| HP ZBook Studio 15 G8 | |
| Apple MacBook Pro 16 2019 i9 5500M | |
| Lenovo ThinkPad P1 G4-20Y30017GE | |
| Lenovo ThinkPad X1 Extreme Gen3-20TLS0UV00 | |
| Geekbench 5.5 / Single-Core | |
| Average of class Workstation (1781 - 2183, n=25, last 2 years) | |
| Apple MacBook Pro 13 Late 2020 M1 Entry (8 / 256 GB) | |
| HP ZBook Studio 15 G8 | |
| Average Intel Core i7-11850H (1659 - 1686, n=2) | |
| Lenovo ThinkPad P1 G4-20Y4S0KS00 | |
| Lenovo ThinkPad P1 G4-20Y30017GE | |
| Huawei MateBook 16 R7 5800H | |
| Lenovo ThinkPad X1 Extreme Gen3-20TLS0UV00 | |
| Apple MacBook Pro 16 2019 i9 5500M | |
| HWBOT x265 Benchmark v2.2 / 4k Preset | |
| Average of class Workstation (14.4 - 40.5, n=25, last 2 years) | |
| HP ZBook Studio 15 G8 | |
| Huawei MateBook 16 R7 5800H | |
| Lenovo ThinkPad P1 G4-20Y4S0KS00 | |
| Average Intel Core i7-11850H (12.6 - 14.4, n=2) | |
| Dell Precision 5000 5560 | |
| Lenovo ThinkPad P1 G4-20Y30017GE | |
| Apple MacBook Pro 16 2019 i9 5500M | |
| Lenovo ThinkPad X1 Extreme Gen3-20TLS0UV00 | |
| LibreOffice / 20 Documents To PDF | |
| Apple MacBook Pro 16 2019 i9 5500M | |
| Apple MacBook Pro 16 2019 i9 5500M | |
| Huawei MateBook 16 R7 5800H | |
| Lenovo ThinkPad X1 Extreme Gen3-20TLS0UV00 | |
| Lenovo ThinkPad P1 G4-20Y30017GE | |
| HP ZBook Studio 15 G8 | |
| Dell Precision 5000 5560 | |
| Average of class Workstation (37.1 - 74.7, n=25, last 2 years) | |
| Average Intel Core i7-11850H (45.8 - 48, n=2) | |
| Lenovo ThinkPad P1 G4-20Y4S0KS00 | |
| R Benchmark 2.5 / Overall mean | |
| Apple MacBook Pro 16 2019 i9 5500M | |
| Apple MacBook Pro 16 2019 i9 5500M | |
| Lenovo ThinkPad X1 Extreme Gen3-20TLS0UV00 | |
| Lenovo ThinkPad P1 G4-20Y30017GE | |
| HP ZBook Studio 15 G8 | |
| Dell Precision 5000 5560 | |
| Average Intel Core i7-11850H (0.541 - 0.543, n=2) | |
| Lenovo ThinkPad P1 G4-20Y4S0KS00 | |
| Huawei MateBook 16 R7 5800H | |
| Average of class Workstation (0.3825 - 0.603, n=25, last 2 years) | |
* ... smaller is better
系统性能
联想ThinkPad P1 G4在日常使用中的速度非常快。在PCMark10中,它总体上处于比较领域的顶端位置,这也说明了它的系统性能非常好。
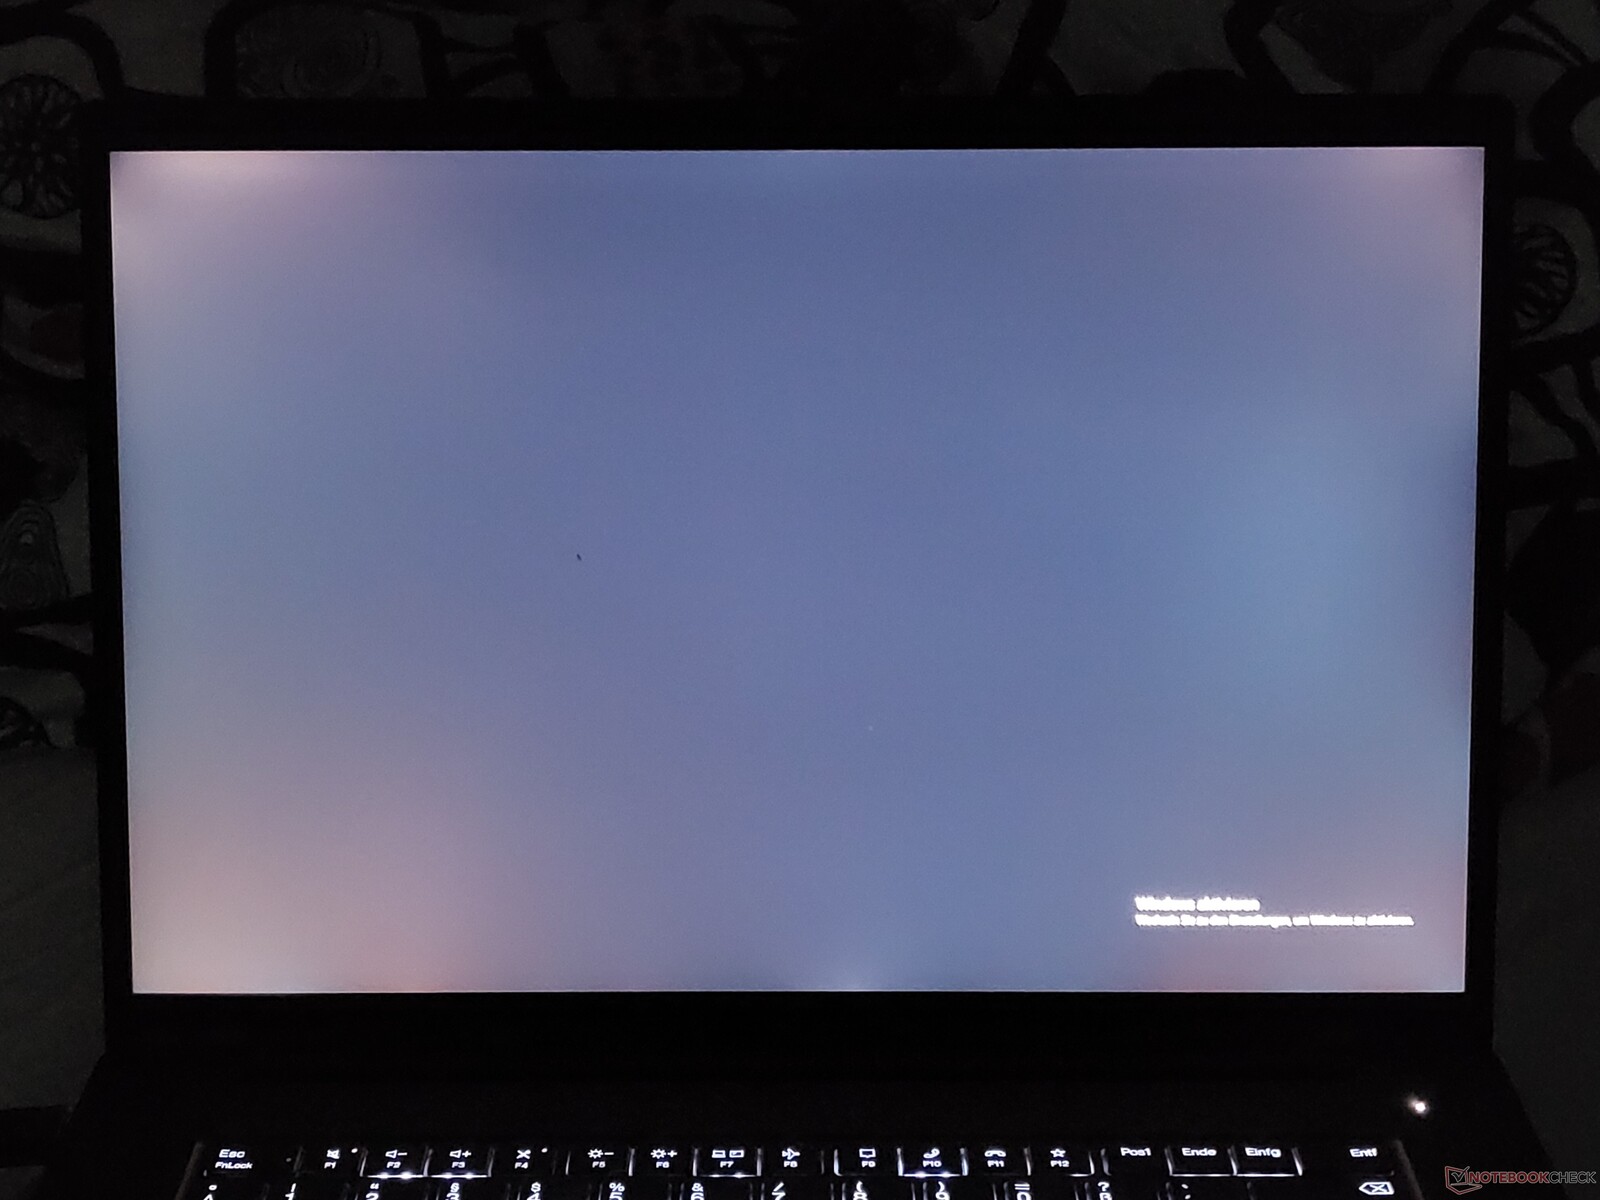
性能有多好,就有多好。我们不得不经常重新启动ThinkPad笔记本电脑。原因是待机后有时会出现图形错误;然后整个画面被黑白条纹覆盖。由于这种错误在第一个测试模型中没有出现,我们认为这是这个测试设备的一个单一问题。
| PCMark 10 / Score | |
| Average of class Workstation (6436 - 10409, n=21, last 2 years) | |
| Lenovo ThinkPad P1 G4-20Y4S0KS00 | |
| Average Intel Core i7-11850H, NVIDIA GeForce RTX 3070 Laptop GPU (n=1) | |
| HP ZBook Studio 15 G8 | |
| Dell Precision 5000 5560 | |
| Lenovo ThinkPad P1 G4-20Y30017GE | |
| Apple MacBook Pro 16 2019 i9 5500M | |
| Lenovo ThinkPad X1 Extreme Gen3-20TLS0UV00 | |
| PCMark 10 / Essentials | |
| Lenovo ThinkPad P1 G4-20Y4S0KS00 | |
| Average Intel Core i7-11850H, NVIDIA GeForce RTX 3070 Laptop GPU (n=1) | |
| Dell Precision 5000 5560 | |
| Average of class Workstation (9622 - 11157, n=21, last 2 years) | |
| HP ZBook Studio 15 G8 | |
| Lenovo ThinkPad P1 G4-20Y30017GE | |
| Lenovo ThinkPad X1 Extreme Gen3-20TLS0UV00 | |
| PCMark 10 / Productivity | |
| Average of class Workstation (8789 - 20616, n=21, last 2 years) | |
| Dell Precision 5000 5560 | |
| Lenovo ThinkPad P1 G4-20Y4S0KS00 | |
| Average Intel Core i7-11850H, NVIDIA GeForce RTX 3070 Laptop GPU (n=1) | |
| HP ZBook Studio 15 G8 | |
| Lenovo ThinkPad P1 G4-20Y30017GE | |
| Lenovo ThinkPad X1 Extreme Gen3-20TLS0UV00 | |
| PCMark 10 / Digital Content Creation | |
| Average of class Workstation (7744 - 15631, n=21, last 2 years) | |
| Lenovo ThinkPad P1 G4-20Y4S0KS00 | |
| Average Intel Core i7-11850H, NVIDIA GeForce RTX 3070 Laptop GPU (n=1) | |
| HP ZBook Studio 15 G8 | |
| Dell Precision 5000 5560 | |
| Lenovo ThinkPad P1 G4-20Y30017GE | |
| Lenovo ThinkPad X1 Extreme Gen3-20TLS0UV00 | |
| PCMark 10 Score | 7156 points | |
Help | ||
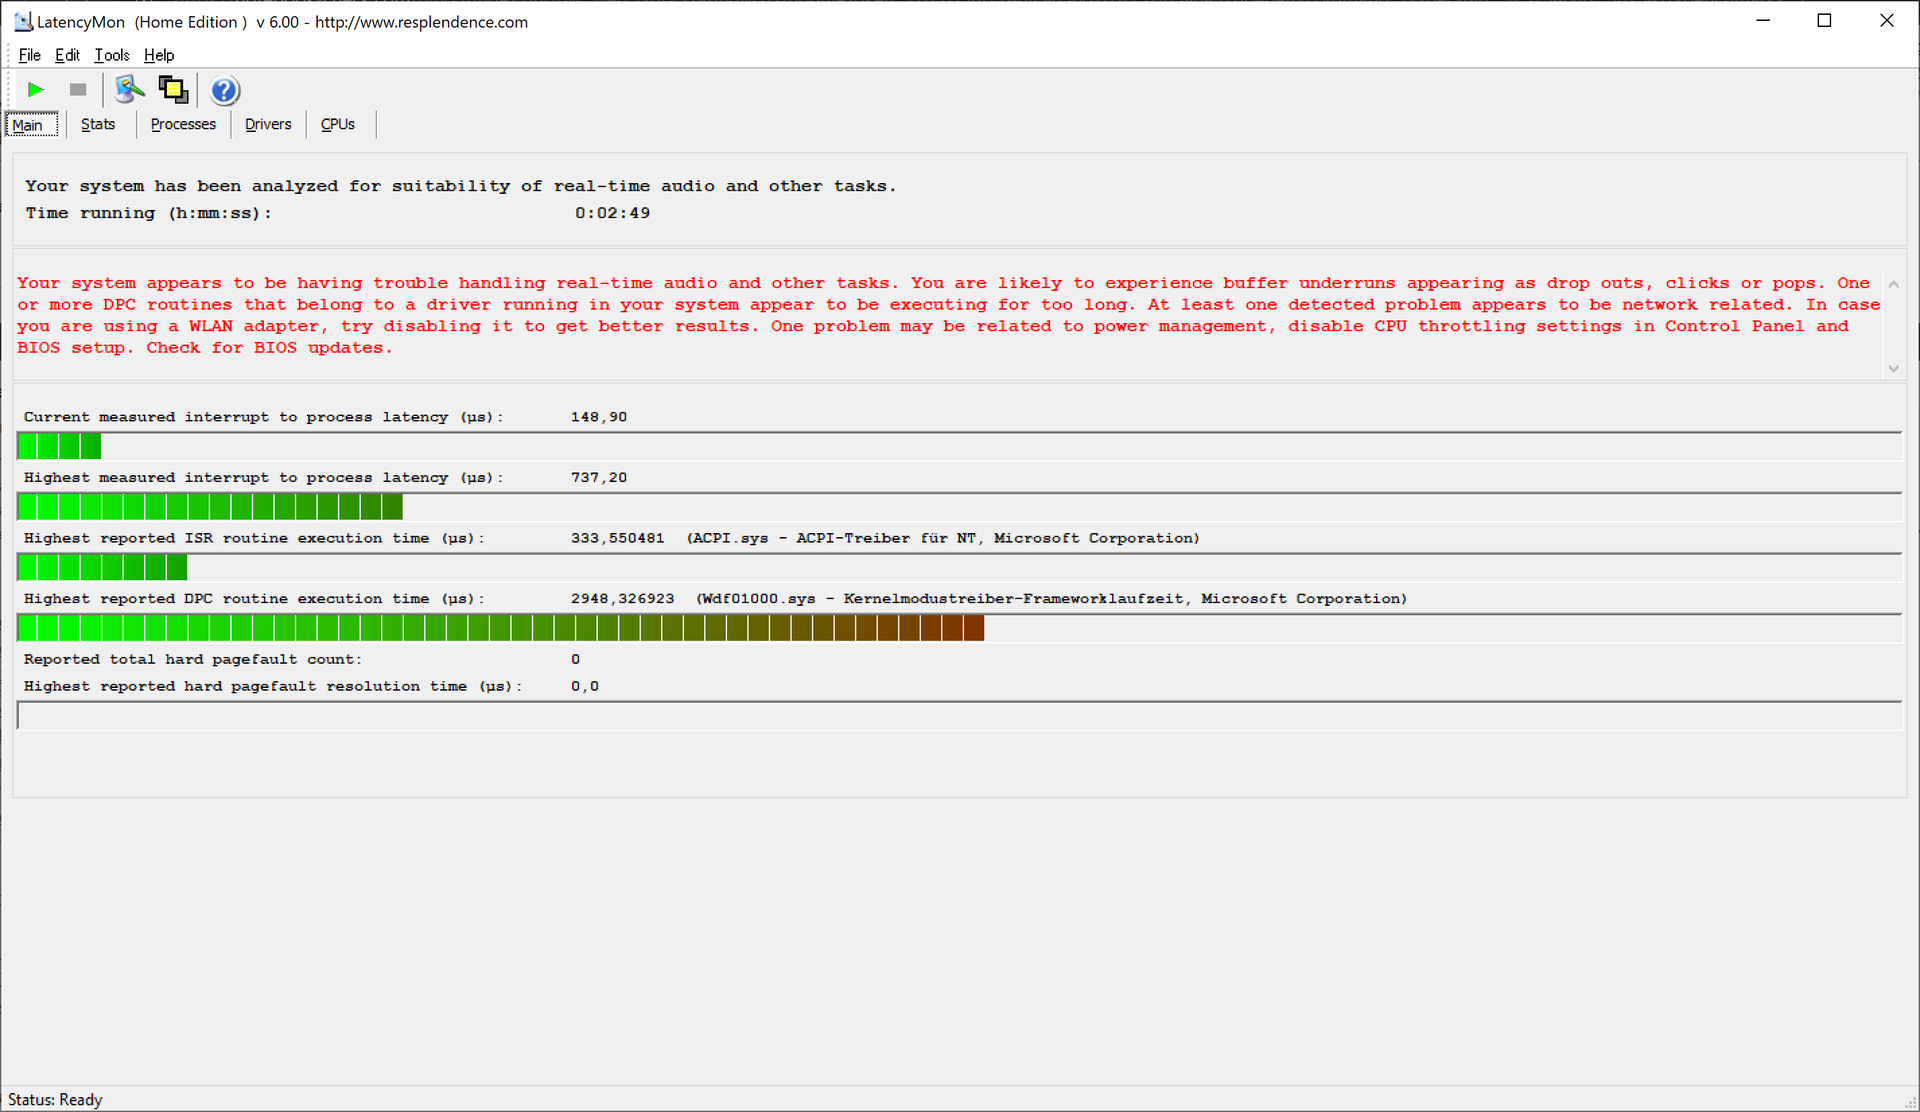
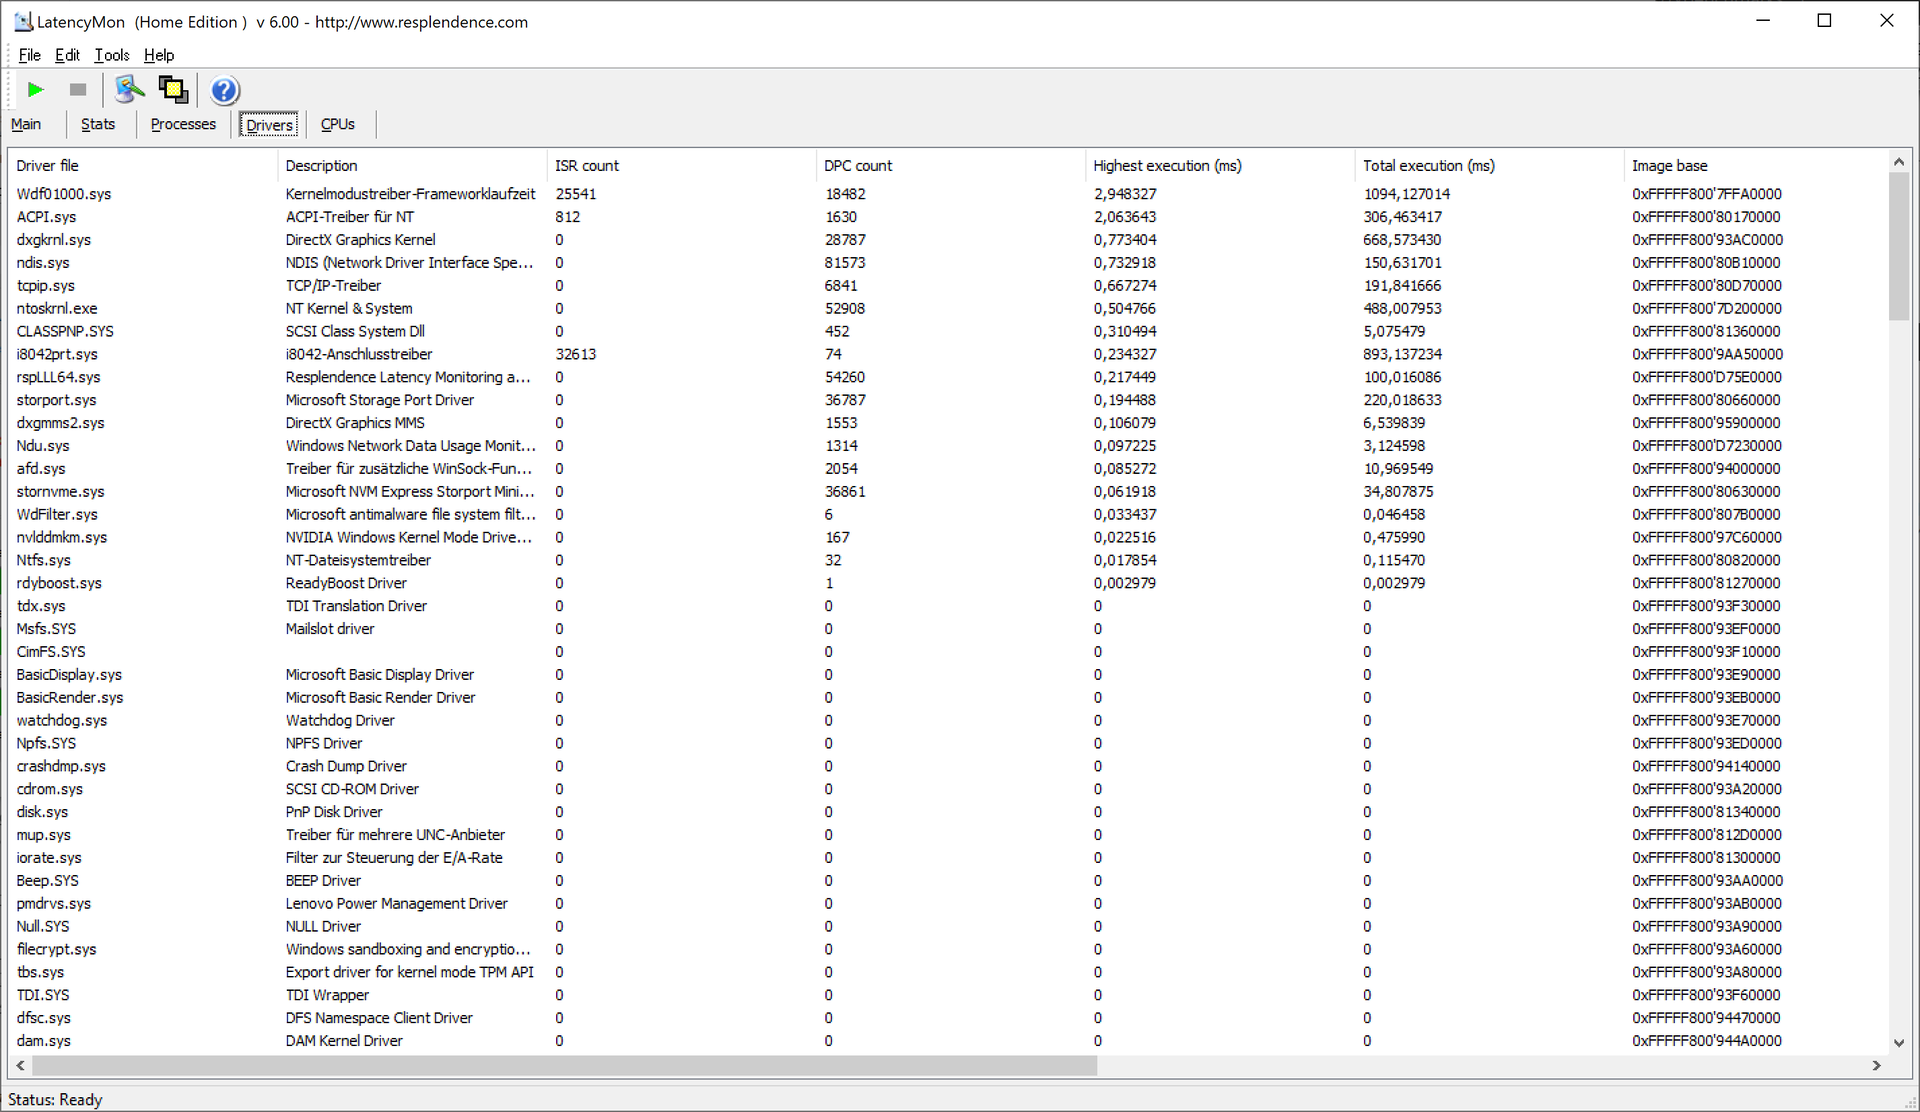
DPC延迟
处理音频和视频文件是ThinkPad P1第四代这样的笔记本电脑的可能用途之一。在这里,DPC延迟可能会导致问题,因为在我们的YouTube视频测试中,高速率也导致了掉线。
| DPC Latencies / LatencyMon - interrupt to process latency (max), Web, Youtube, Prime95 | |
| Lenovo ThinkPad P1 G4-20Y30017GE | |
| HP ZBook Studio 15 G8 | |
| Dell Precision 5000 5560 | |
| Lenovo ThinkPad P1 G4-20Y4S0KS00 | |
| Lenovo ThinkPad X1 Extreme Gen3-20TLS0UV00 | |
* ... smaller is better
大容量存储
在这种配置下,联想ThinkPad P1 G4只有一个M.2-2280插槽。至少这一个配备了1TB的三星PM9A1,非常好。这种NMVe PCIe 4.0固态硬盘在我们的基准测试中表现得非常好。
| Drive Performance rating - Percent | |
| Lenovo ThinkPad P1 G4-20Y4S0KS00 | |
| Lenovo ThinkPad P1 G4-20Y30017GE | |
| Average of class Workstation | |
| Average Samsung PM9A1 MZVL21T0HCLR | |
| Dell Precision 5000 5560 | |
| Lenovo ThinkPad X1 Extreme Gen3-20TLS0UV00 | |
| HP ZBook Studio 15 G8 | |
| Apple MacBook Pro 16 2019 i9 5500M | |
* ... smaller is better

Continuous load read: DiskSpd Read Loop, Queue Depth 8
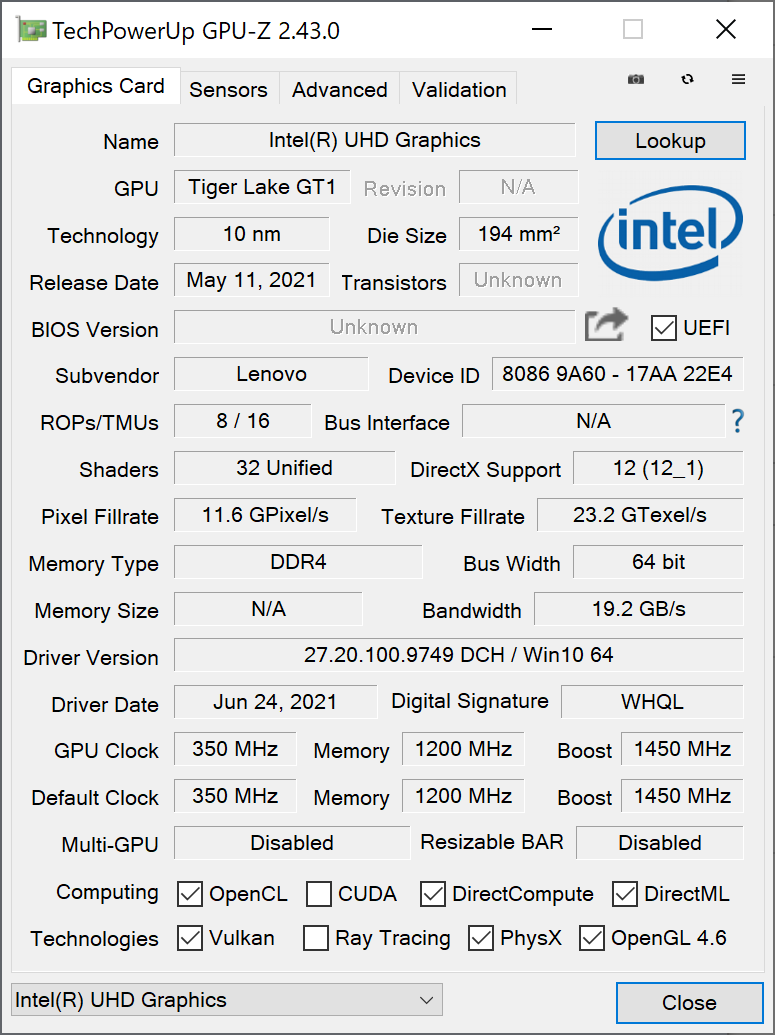
GPU性能
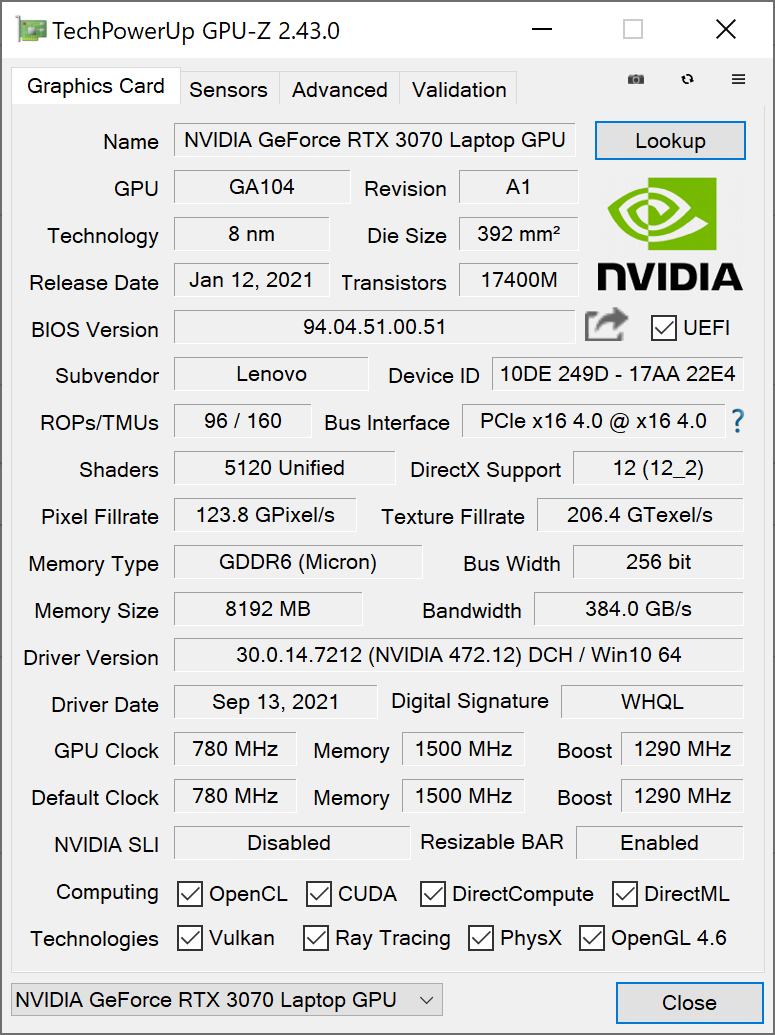
该 NvidiaGeForce RTX 3070是Nvidia目前 "安培 "一代中最强大的移动GPU之一。然而,在联想的ThinkPad P1 G4的情况下,5120个着色器单元远未达到其最大性能,因为联想将GPU设定为80瓦的TGP--在过去,这个变体会被称为 "Max-Q"。
因此,难怪RTX 3070在所有笔记本电脑中平均比这里的联想ThinkPad P1 2021快10%左右。尽管如此,与配备GeForce GTX 1650 Ti Max-Q的ThinkPad X1 Extreme G3的差距是巨大的(+148%),甚至与P1的Nvidia T1200变体相比,GeForce RTX 3070在3DMark基准测试中的速度是其两倍以上(+118%)。在这种情况下,GeForce ,当然是值得的。专业基准测试套件SPECviewperf的结论更加复杂:在这里,GeForce-P1取得了部分良好的结果,但也有部分糟糕的结果。应该选择带有ISV认证的Nvidia GPU的ThinkPad P1用于CAD。
在电池模式下,GPU的性能显然是有限的。在没有电源的情况下,3DMark 11的结果要低56%左右(3DMark 11 GPU得分13,508分)。
| 3DMark Performance rating - Percent | |
| Average of class Workstation -1! | |
| Average NVIDIA GeForce RTX 3070 Laptop GPU | |
| Lenovo ThinkPad P1 G4-20Y4S0KS00 | |
| HP ZBook Studio 15 G8 -16! | |
| Dell Precision 5000 5560 | |
| Lenovo ThinkPad P1 G4-20Y30017GE -8! | |
| Apple MacBook Pro 16 2019 i9 5500M -16! | |
| Lenovo ThinkPad X1 Extreme Gen3-20TLS0UV00 -25! | |
| 3DMark 11 - 1280x720 Performance GPU | |
| Average of class Workstation (10888 - 69594, n=25, last 2 years) | |
| Average NVIDIA GeForce RTX 3070 Laptop GPU (12535 - 38275, n=54) | |
| Lenovo ThinkPad P1 G4-20Y4S0KS00 | |
| HP ZBook Studio 15 G8 | |
| Dell Precision 5000 5560 | |
| Apple MacBook Pro 16 2019 i9 5500M | |
| Lenovo ThinkPad P1 G4-20Y30017GE | |
| Lenovo ThinkPad X1 Extreme Gen3-20TLS0UV00 | |
| 3DMark | |
| 1920x1080 Fire Strike Graphics | |
| Average of class Workstation (7578 - 52560, n=25, last 2 years) | |
| Average NVIDIA GeForce RTX 3070 Laptop GPU (7178 - 29128, n=52) | |
| Lenovo ThinkPad P1 G4-20Y4S0KS00 | |
| HP ZBook Studio 15 G8 | |
| Dell Precision 5000 5560 | |
| Apple MacBook Pro 16 2019 i9 5500M | |
| Lenovo ThinkPad P1 G4-20Y30017GE | |
| Lenovo ThinkPad X1 Extreme Gen3-20TLS0UV00 | |
| 2560x1440 Time Spy Graphics | |
| Average of class Workstation (2725 - 24806, n=25, last 2 years) | |
| Average NVIDIA GeForce RTX 3070 Laptop GPU (2644 - 11019, n=53) | |
| Lenovo ThinkPad P1 G4-20Y4S0KS00 | |
| HP ZBook Studio 15 G8 | |
| Dell Precision 5000 5560 | |
| Lenovo ThinkPad P1 G4-20Y30017GE | |
| Apple MacBook Pro 16 2019 i9 5500M | |
| Lenovo ThinkPad X1 Extreme Gen3-20TLS0UV00 | |
| 3DMark 11 Performance | 24753 points | |
| 3DMark Fire Strike Score | 17860 points | |
| 3DMark Time Spy Score | 8430 points | |
Help | ||
游戏性能
联想ThinkPad P1 G4明确不是一款游戏笔记本电脑。同时,NvidiaGeForce 3070使联想笔记本电脑可以用于游戏。即使是4K的游戏,该GPU也可以有足够的速度,这取决于标题。在我们的 Witcher 3 测试中,ThinkPad P1 2021也能持续调用其性能--只有轻微的波动。
| The Witcher 3 - 1920x1080 Ultra Graphics & Postprocessing (HBAO+) | |
| Average NVIDIA GeForce RTX 3070 Laptop GPU (34.9 - 109, n=52) | |
| Lenovo ThinkPad P1 G4-20Y4S0KS00 | |
| HP ZBook Studio 15 G8 | |
| Average of class Workstation (26.3 - 91.7, n=3, last 2 years) | |
| Dell Precision 5000 5560 | |
| Apple MacBook Pro 16 2019 i9 5500M | |
| Lenovo ThinkPad P1 G4-20Y30017GE | |
| Lenovo ThinkPad X1 Extreme Gen3-20TLS0UV00 | |
Witcher 3 FPS-Diagram
| low | med. | high | ultra | QHD | 4K | |
|---|---|---|---|---|---|---|
| GTA V (2015) | 185 | 179 | 164 | 88.1 | 74.5 | 74.3 |
| The Witcher 3 (2015) | 345 | 243 | 158 | 86.8 | 56.5 | |
| Dota 2 Reborn (2015) | 171 | 148 | 124 | 106 | 109 | |
| X-Plane 11.11 (2018) | 105 | 102 | 76.8 | 52.4 | ||
| Strange Brigade (2018) | 408 | 206 | 171 | 151 | 113 | 61.1 |
排放。强大的组件使ThinkPad P1 G4大热
风扇噪音
当涉及到ThinkPad的风扇音量时,联想传统上会有所克制。然而,这并不适用于ThinkPad P1工作站模型。两个风扇的最大运行音量为47.4dB(a),这显然是可以听到的。至少情况并非总是如此,还有一个较低的水平,即38.6 dB(a),而且主动冷却功能经常在空闲时保持关闭。
不幸的是,线圈啸叫仍然是一个太常见的问题,但联想ThinkPad P1第四代并没有受到影响。
| Lenovo ThinkPad P1 G4-20Y4S0KS00 GeForce RTX 3070 Laptop GPU, i7-11850H, Samsung PM9A1 MZVL21T0HCLR | Lenovo ThinkPad P1 G4-20Y30017GE T1200 Laptop GPU, i7-11800H, Samsung PM9A1 MZVL2512HCJQ | Dell Precision 5000 5560 RTX A2000 Laptop GPU, i7-11850H, Samsung PM9A1 MZVL22T0HBLB | Apple MacBook Pro 16 2019 i9 5500M Radeon Pro 5500M, i9-9880H, Apple SSD AP1024 7171 | HP ZBook Studio 15 G8 GeForce RTX 3070 Laptop GPU, i9-11950H, Samsung PM981a MZVLB2T0HALB | Lenovo ThinkPad X1 Extreme Gen3-20TLS0UV00 GeForce GTX 1650 Ti Max-Q, i7-10750H, Toshiba XG6 KXG6AZNV1T02 | |
|---|---|---|---|---|---|---|
| Noise | -3% | 12% | -12% | -2% | -9% | |
| off / environment * (dB) | 23.8 | 24.3 -2% | 23.4 2% | 29.8 -25% | 23.5 1% | 29.5 -24% |
| Idle Minimum * (dB) | 23.8 | 24.3 -2% | 23.6 1% | 29.9 -26% | 25.3 -6% | 29.5 -24% |
| Idle Average * (dB) | 23.8 | 24.3 -2% | 23.6 1% | 29.9 -26% | 25.3 -6% | 29.5 -24% |
| Idle Maximum * (dB) | 28.3 | 26.6 6% | 23.6 17% | 29.9 -6% | 25.3 11% | 29.9 -6% |
| Load Average * (dB) | 38.6 | 46.8 -21% | 25.8 33% | 43 -11% | 41.2 -7% | 44.2 -15% |
| Witcher 3 ultra * (dB) | 47.4 | 46.8 1% | 40.1 15% | 45.4 4% | 49.4 -4% | 36.1 24% |
| Load Maximum * (dB) | 47.4 | 46.8 1% | 41.4 13% | 46.1 3% | 49.4 -4% | 44.2 7% |
* ... smaller is better
Noise level
| Idle |
| 23.8 / 23.8 / 28.3 dB(A) |
| Load |
| 38.6 / 47.4 dB(A) |
 | ||
30 dB silent 40 dB(A) audible 50 dB(A) loud |
||
min: | ||
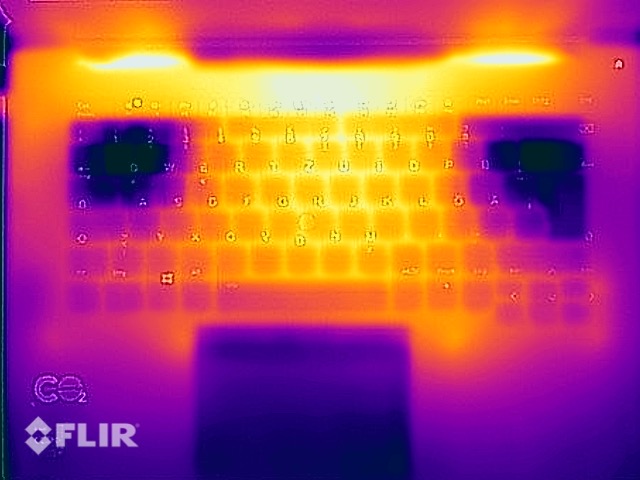
温度
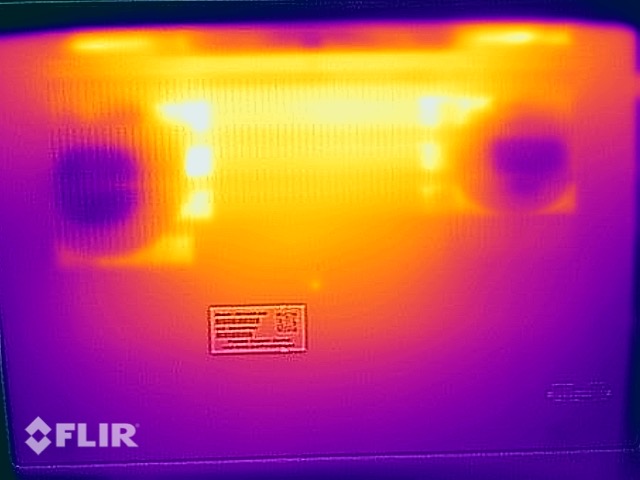
联想将ThinkPad P1第四代设计在散热极限。正如预期的那样,联想笔记本在空闲模式下保持凉爽,但在负载下的发热情况明显显现。目前英特尔CPU和Nvidia GPU所能达到的极限已经用尽。底部的温度为53.8摄氏度(约129华氏度),与其说是最高温度,不如说是机箱的均匀发热显示了这一点。甚至掌托也明显地加热到40摄氏度(104华氏度),而在测试中温度也只是略低。 Witcher 3测试。
(-) The maximum temperature on the upper side is 51 °C / 124 F, compared to the average of 38.2 °C / 101 F, ranging from 22.2 to 69.8 °C for the class Workstation.
(-) The bottom heats up to a maximum of 53.5 °C / 128 F, compared to the average of 41.1 °C / 106 F
(+) In idle usage, the average temperature for the upper side is 26.7 °C / 80 F, compared to the device average of 32 °C / 90 F.
(-) Playing The Witcher 3, the average temperature for the upper side is 43 °C / 109 F, compared to the device average of 32 °C / 90 F.
(-) The palmrests and touchpad can get very hot to the touch with a maximum of 40 °C / 104 F.
(-) The average temperature of the palmrest area of similar devices was 27.8 °C / 82 F (-12.2 °C / -22 F).
压力测试
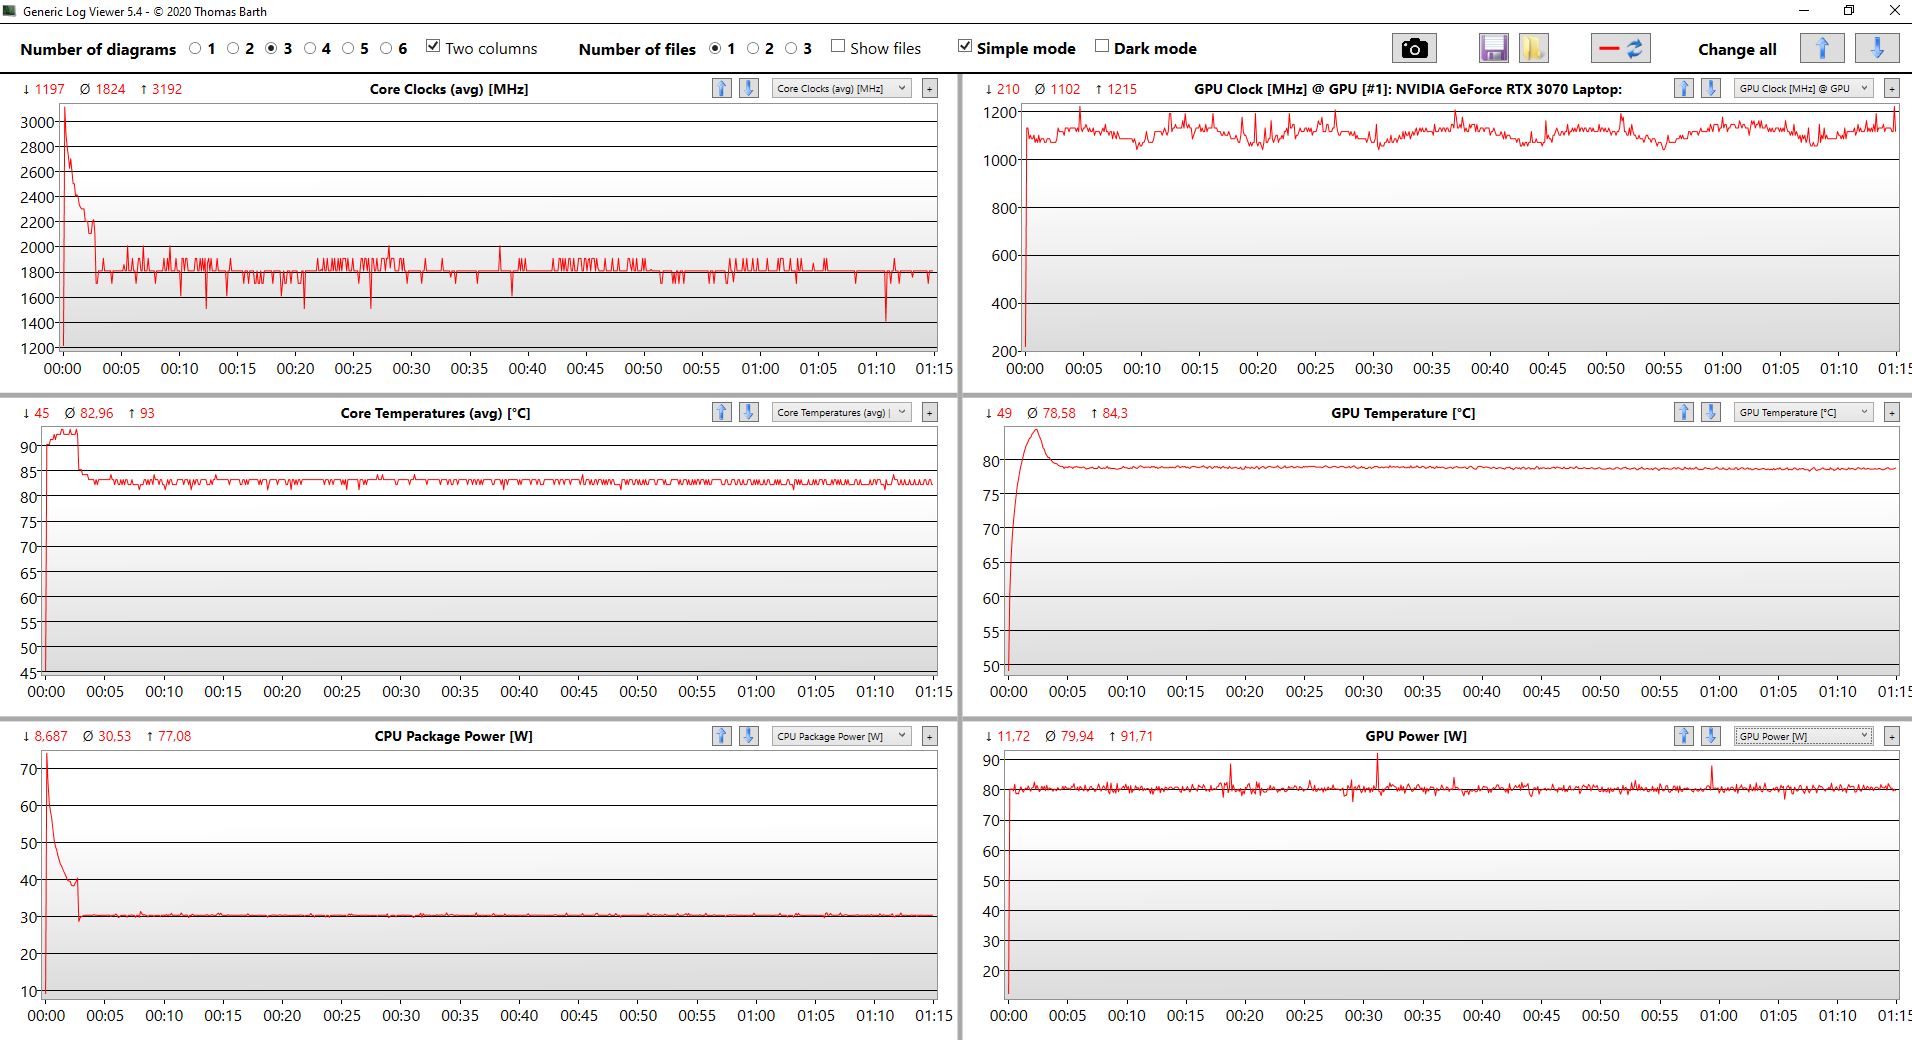
通过温度测量,已经可以看出,联想不能在压力测试中以无限制的性能运行其ThinkPad。事实上,当GPU和CPU同时满载时,处理器很快就被限制在30瓦,而GPU的性能仍然稳定在80瓦。
不过,极端场景压力测试中的明显节流现象不应该反映在日常使用中,因为压力测试后的3DMark 11产生了正常的结果。
演讲者
对扬声器质量的分析可以在对QHD型号的评论中找到。 联想ThinkPad P1第四代.
Lenovo ThinkPad P1 G4-20Y30017GE audio analysis
(+) | speakers can play relatively loud (84.3 dB)
Bass 100 - 315 Hz
(±) | reduced bass - on average 12.2% lower than median
(±) | linearity of bass is average (9.8% delta to prev. frequency)
Mids 400 - 2000 Hz
(+) | balanced mids - only 3.4% away from median
(+) | mids are linear (3.4% delta to prev. frequency)
Highs 2 - 16 kHz
(+) | balanced highs - only 2.9% away from median
(+) | highs are linear (5% delta to prev. frequency)
Overall 100 - 16.000 Hz
(+) | overall sound is linear (11.8% difference to median)
Compared to same class
» 16% of all tested devices in this class were better, 3% similar, 81% worse
» The best had a delta of 7%, average was 17%, worst was 35%
Compared to all devices tested
» 8% of all tested devices were better, 3% similar, 89% worse
» The best had a delta of 4%, average was 24%, worst was 134%
Apple MacBook Pro 16 2019 i9 5500M audio analysis
(+) | speakers can play relatively loud (82.3 dB)
Bass 100 - 315 Hz
(+) | good bass - only 2.3% away from median
(+) | bass is linear (5% delta to prev. frequency)
Mids 400 - 2000 Hz
(+) | balanced mids - only 2.7% away from median
(+) | mids are linear (3.4% delta to prev. frequency)
Highs 2 - 16 kHz
(+) | balanced highs - only 2.1% away from median
(+) | highs are linear (2.6% delta to prev. frequency)
Overall 100 - 16.000 Hz
(+) | overall sound is linear (6.9% difference to median)
Compared to same class
» 5% of all tested devices in this class were better, 1% similar, 94% worse
» The best had a delta of 5%, average was 17%, worst was 45%
Compared to all devices tested
» 1% of all tested devices were better, 0% similar, 99% worse
» The best had a delta of 4%, average was 24%, worst was 134%
能源消耗。WQUXGA液晶显示器吞噬了联想笔记本电脑的电池
有趣的是,这个版本的ThinkPad P1第四代的最低消耗量几乎没有明显高于已经测试过的配备QHD LCD的版本。在LCD亮度最大化的空闲中值中,差异非常明显。20.2瓦的消耗量在这里是非常高的。其他工作站或多媒体笔记本电脑都没有这个比率的可比性消费。
联想的ThinkPad P1 2021的这个变种在发货时配备了230瓦的电源。这甚至没有必要;170瓦的电源也足以满足最大消耗。
| Off / Standby | |
| Idle | |
| Load |
|
Key:
min: | |
| Lenovo ThinkPad P1 G4-20Y4S0KS00 i7-11850H, GeForce RTX 3070 Laptop GPU, Samsung PM9A1 MZVL21T0HCLR, IPS LED, 3840x2400, 16" | Lenovo ThinkPad P1 G4-20Y30017GE i7-11800H, T1200 Laptop GPU, Samsung PM9A1 MZVL2512HCJQ, IPS, 2560x1600, 16" | Dell Precision 5000 5560 i7-11850H, RTX A2000 Laptop GPU, Samsung PM9A1 MZVL22T0HBLB, IPS, 3840x2400, 15.6" | Apple MacBook Pro 16 2019 i9 5500M i9-9880H, Radeon Pro 5500M, Apple SSD AP1024 7171, IPS, 3072x1920, 16" | HP ZBook Studio 15 G8 i9-11950H, GeForce RTX 3070 Laptop GPU, Samsung PM981a MZVLB2T0HALB, OLED, 3840x2160, 15.6" | Lenovo ThinkPad X1 Extreme Gen3-20TLS0UV00 i7-10750H, GeForce GTX 1650 Ti Max-Q, Toshiba XG6 KXG6AZNV1T02, IPS, 1920x1080, 15.6" | Average NVIDIA GeForce RTX 3070 Laptop GPU | Average of class Workstation | |
|---|---|---|---|---|---|---|---|---|
| Power Consumption | 23% | 17% | 31% | -16% | 32% | -36% | 6% | |
| Idle Minimum * (Watt) | 8.1 | 7.7 5% | 6.2 23% | 3.7 54% | 11 -36% | 5 38% | 15.6 ? -93% | 8.94 ? -10% |
| Idle Average * (Watt) | 20.2 | 11.8 42% | 13.9 31% | 12.1 40% | 18.8 7% | 9 55% | 20.1 ? -0% | 13.8 ? 32% |
| Idle Maximum * (Watt) | 21.9 | 12.4 43% | 23.8 -9% | 17 22% | 31.7 -45% | 12.2 44% | 29.4 ? -34% | 17.5 ? 20% |
| Load Average * (Watt) | 88.2 | 94.6 -7% | 95.7 -9% | 91.5 -4% | 105.2 -19% | 94.4 -7% | 110.8 ? -26% | 95 ? -8% |
| Witcher 3 ultra * (Watt) | 149 | 99.6 33% | 87 42% | 103 31% | 148 1% | 89 40% | ||
| Load Maximum * (Watt) | 170.6 | 134 21% | 132.6 22% | 102.3 40% | 171.8 -1% | 133.9 22% | 214 ? -25% | 175.2 ? -3% |
* ... smaller is better
Energy consumption Witcher 3 / Stress test
电池寿命
与上一代产品相比,容量为90瓦时的更大的电池被4K屏幕的消耗很快耗尽。在Wi-Fi测试中,当显示屏设置为150cd/m²时,联想ThinkPad P1 G4可持续使用约7小时。在最大亮度下,电池寿命减少到4小时。带有QHD显示器的型号显然更适合移动使用--毕竟,4K ThinkPad设法击败了直接的工作站对手 戴尔Precision 5560和 惠普ZBook Studio 15 G8.
| Lenovo ThinkPad P1 G4-20Y4S0KS00 i7-11850H, GeForce RTX 3070 Laptop GPU, 90 Wh | Lenovo ThinkPad P1 G4-20Y30017GE i7-11800H, T1200 Laptop GPU, 90 Wh | Dell Precision 5000 5560 i7-11850H, RTX A2000 Laptop GPU, 86 Wh | Apple MacBook Pro 16 2019 i9 5500M i9-9880H, Radeon Pro 5500M, 99.8 Wh | HP ZBook Studio 15 G8 i9-11950H, GeForce RTX 3070 Laptop GPU, 83 Wh | Lenovo ThinkPad X1 Extreme Gen3-20TLS0UV00 i7-10750H, GeForce GTX 1650 Ti Max-Q, 80 Wh | Average of class Workstation | |
|---|---|---|---|---|---|---|---|
| Battery runtime | 26% | 20% | 30% | 20% | 51% | 24% | |
| H.264 (h) | 7.2 | 9 25% | 9.7 35% | 12.2 69% | 9.51 ? 32% | ||
| WiFi v1.3 (h) | 7 | 9 29% | 6.3 -10% | 12 71% | 6.2 -11% | 11.6 66% | 8.53 ? 22% |
| Load (h) | 1.2 | 1.5 25% | 1.8 50% | 1 -17% | 1.8 50% | 1.4 17% | 1.429 ? 19% |
| Witcher 3 ultra (h) | 0.9 |
Pros
Cons
结论:ThinkPad P1第四代有更强的冷却系统,效果更好

一次有Vapor-Chamber,一次没有(这里是带T1200的ThinkPad P1的评论):联想ThinkPad P1 G4经历了我们两次测试过程。很快就能看出两个版本中哪个更好:带Vapor-Chamber的版本。
如今,良好的散热可能是配备英特尔H系列处理器的笔记本电脑最重要的特征。这里测试的带Vapor-Chamber的型号,其CPU的消耗量明显高于带传统冷却的姐妹型号。性能差异很大,这就是为什么结论必须仅仅基于这一个差异。如果联想ThinkPad P1第四代,那么就使用Vapor-Chamber - 即使失去了第二个M.2-2280 SSD或WWAN调制解调器的选择。只有配备GeForce RTX 3070、RTX 3080以及Nvidia RTX A3000、A4000和A5000的变体包括更好的冷却系统。
我们的结论在测试设备的第二个主要区别方面不太清楚。WQUXGA液晶显示器在质量方面实现了它的承诺;它是目前所有笔记本电脑中最好的液晶显示器之一--但要牺牲电池寿命。根据用户的优先考虑,如果希望在没有连接电源的情况下长期运行,QHD显示屏可能是更好的选择。
蒸汽室,是的,请。这款联想ThinkPad P1 G4的冷却系统要比热管变体好得多。
总的来说,联想ThinkPad P1 G4显然赢得了我们的推荐,成为一款顶级的16英寸笔记本电脑。价格也相应较高,如果买家愿意花这么多钱,肯定应该是Vapor-Chamber型号。
工作站的直接竞争对手首先是 戴尔Precision 5560和 惠普ZBook Studio 15 G8两者都有弱点--更紧凑的Precision ,端口更少,性能更差,而16:9和焊接的内存不一定代表ZBook。在Windows领域之外, Apple MacBook Pro 16应该提到的是,与带有M1 Max的新机型的比较在这里将是特别有意义的。
价格和可用性
经测试,联想ThinkPad P1 2021在Campuspoint的价格为2850欧元(约3266美元)https://www.campuspoint.de/20y4s0ks00-lenovocampus-thinkpad-p1-g4.html.这是联想校园计划中专门为学生、受训者和其他符合条件的人提供的特殊型号。同样的配置在联想商店的价格为3,982欧元(约合4,564美元)。
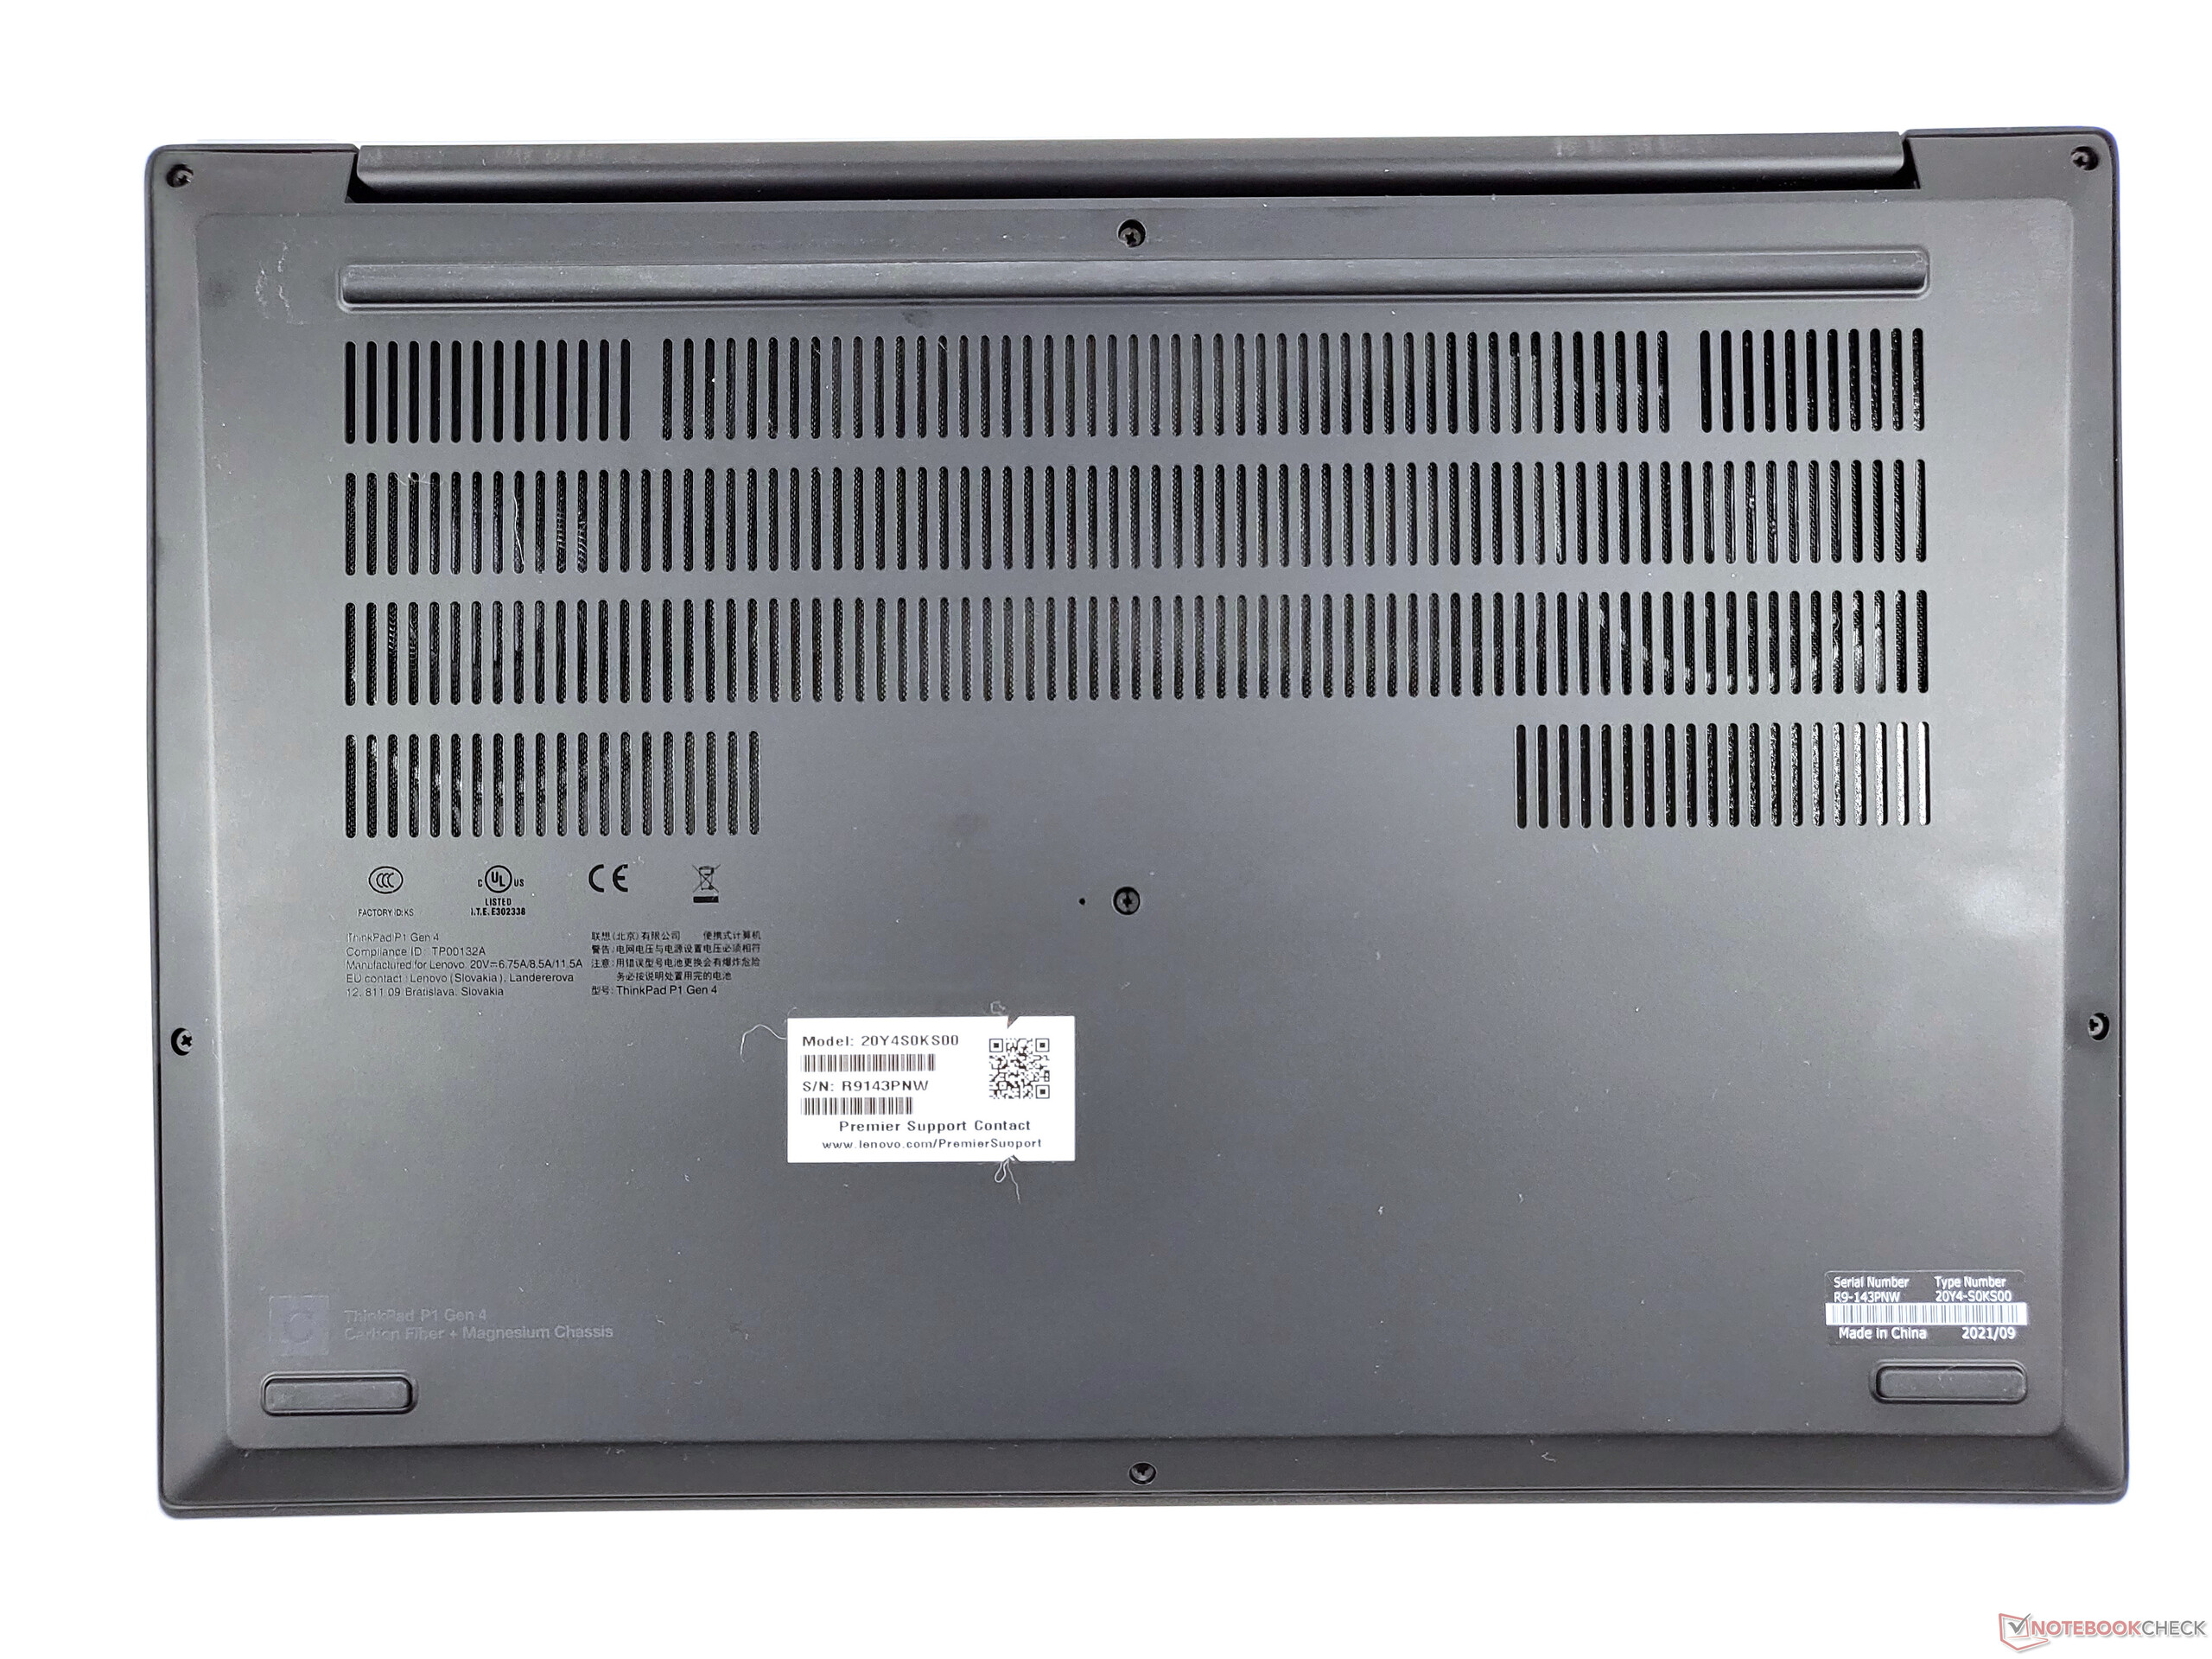
Lenovo ThinkPad P1 G4-20Y4S0KS00
- 10/25/2021 v7 (old)
Benjamin Herzig
Price comparison
