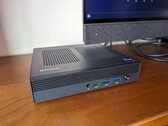
Notebookcheck Logo

Intel Core i9-11900H

Intel i9-11900H

英特尔酷睿i9-11900H是游戏笔记本电脑和移动工作站的高端八核SoC。 以Tiger Lake H45一代为基础,2021年中期发表。 内置8个Willow Cove处理器核心(Hyper 16线程)线程化)。 基本时钟速度因TDP设定而异,45瓦特为2.5GHz。 单核升压速度最高可达4.9GHz,所有核心最高可达4.5GHz。 CPU提供24MB级3高速缓存,支持DDR4-3200内存。

新的Tiger Lake体系结构使i9-11900H与以前的英特尔酷睿i9-10885H(Comet Lake-H,2.4~5.3GHz,16MBL3)在单线程和多线程性能上与Ryzen 95800H(Zen 3,4.4-4)相同或更快。 因此,i9是2021年最快的笔记本电脑CPU之一,非常适合苛刻的工作。

此外,SoC还配备了改进的Xe显卡,称为UHD显卡,适用于所有32个EUHD显卡。

此外,Tiger Lake SoCs还增加了PCIe 4支持(H45系列20通道)、AI硬件加速、Thunderbolt 4/USB 4和Wi-Fi 6E部分集成到芯片中。

芯片在英特尔改进的 10nm 工艺(称为 10nm SuperFin)中生产,与 TSMC 的 7nm 工艺(例如,Ryzen 4000 系列)相同。 默认 TDP 额定值为 45W,基本速度为 2.5GHz,基本时钟速度为 35W,降至 2.1GHz(cTDP 下降)。

SeriesIntel Tiger Lake
CodenameTiger Lake-H

Series: Tiger Lake Tiger Lake-H

Intel Core i9-11900KB3.3 - 5.3 GHz8 / 16 cores24 MB L3
Intel Core i9-11900H « 2.5 - 4.9 GHz8 / 16 cores24 MB L3
Intel Core i9-11950H2.6 - 5 GHz8 / 16 cores24 MB L3
Intel Xeon W-11955M2.6 - 5 GHz8 / 16 cores24 MB L3
Intel Core i7-11850H2.5 - 4.8 GHz8 / 16 cores24 MB L3
Intel Core i7-11800H2.3 - 4.6 GHz8 / 16 cores24 MB L3
Intel Xeon W-11855M3.2 - 4.9 GHz6 / 12 cores18 MB L3
Intel Core i5-11400H2.7 - 4.5 GHz6 / 12 cores12 MB L3
Intel Core i5-11260H2.6 - 4.4 GHz6 / 12 cores12 MB L3
Clock Rate2500 - 4900 MHz
Level 1 Cache640 KB
Level 2 Cache10 MB
Level 3 Cache24 MB
Number of Cores / Threads8 / 16
Power Consumption (TDP = Thermal Design Power)45 Watt
Manufacturing Technology10 nm
Max. Temperature100 °C
SocketBGA1787
FeaturesDDR4-3200 RAM, PCIe 4, 8 GT/s bus, DL Boost, GNA, RPE, MMX, SSE, SSE2, SSE3, SSSE3, SSE4.1, SSE4.2, AVX, AVX2, AVX-512, BMI2, ABM, FMA, ADX, VMX, SMEP, SMAP, EIST, TM1, TM2, HT, Turbo, SST, AES-NI, RDRAND, RDSEED, SHA
GPUIntel UHD Graphics Xe 32EUs (Tiger Lake-H) (350 - 1450 MHz)
64 Bit64 Bit support
Architecturex86
Announcement Date05/11/2021
Product Link (external)ark.intel.com

Benchmarks

Performance Rating - CB R15 + R20 + 7-Zip + X265 + Blender + 3DM11 CPU
40.3 pt (56%)
AMD E1-2100
2.47 -94%
...
39.3 -2%
39.6 -2%
39.7 -1%
39.9 -1%
AMD Ryzen 7 7735H
39.9 -1%
AMD Ryzen 9 5900HS
39.9 -1%
40.2 0%
40.3 0%
40.3 0%
Intel Core i9-11900H
40.3
AMD Ryzen 5 PRO 7640HS
40.4 0%
AMD Ryzen 9 5980HS
40.4 0%
40.8 1%
Intel Core i7-1365U
41 2%
Intel Core i7-12650H
41.1 2%
41.3 2%
Intel Core i7-1360P
41.3 2%
41.3 2%
41.5 3%
...
AMD Ryzen 9 7945HX3D
57 41%
max:
AMD Ryzen Threadripper PRO 7995WX
72.1 79%
0%
100%
Cinebench R23 - Cinebench R23 Multi Core
min: 11567     avg: 12433     median: 12720 (12%)     max: 13012 Points
AMD E1-2100
202 -98%
...
Apple M2 Pro 10-Core
11811 -5%
11822 -5%
AMD Ryzen 7 PRO 6860Z
11822 -5%
11992 -4%
12294 -1%
12370 -1%
12389 0%
AMD Ryzen 7 PRO 6850H
12393 0%
12394 0%
Intel Core i9-11900H
12433
Intel Core i7-12650H
12503 1%
AMD Ryzen 9 5900HS
12533 1%
AMD Ryzen 9 5980HS
12629 2%
12733 2%
AMD Ryzen 7 7736U
12768 3%
12941 4%
Intel Core i7-1370P
12969 4%
AMD Ryzen 5 7640HS
13029 5%
13286 7%
...
AMD Ryzen 9 7945HX3D
32782 164%
max:
AMD Ryzen Threadripper PRO 7995WX
107681 766%
0%
100%
Cinebench R23 - Cinebench R23 Single Core
min: 1574     avg: 1578     median: 1575 (67%)     max: 1586 Points
AMD E1-2100
114 -93%
...
Intel Core i7-11390H
1537 -3%
Intel Core i7-1260U
1538 -3%
AMD Ryzen 7 7736U
1548 -2%
1553 -2%
Intel Core i5-1240U
1559 -1%
1559 -1%
1565 -1%
AMD Ryzen 9 PRO 7940HS
1568 -1%
Intel Core i7-1250U
1568 -1%
Intel Core i9-11900H
1578
AMD Ryzen 5 PRO 7640HS
1581 0%
Intel Core i3-1215U
1581 0%
1588 1%
Intel Core i7-1265U
1595 1%
Apple M2
1595 1%
1596 1%
Intel Core i7-1270P
1620 3%
Apple M2 Pro 10-Core
1643 4%
1644 4%
...
Apple M3 Pro 12-Core
1977 25%
max:
Intel Core i9-14900K
2351 49%
0%
100%
Cinebench R20 - Cinebench R20 CPU (Single Core)
min: 600     avg: 605     median: 605.5 (67%)     max: 610 Points
Cinebench R20 - Cinebench R20 CPU (Multi Core)
min: 4403     avg: 4866     median: 4950.5 (12%)     max: 5160 Points
Cinebench R15 - Cinebench R15 CPU Multi 64 Bit
min: 2029     avg: 2143     median: 2166 (14%)     max: 2211 Points
AMD A4-1200
31 -99%
...
Apple M2 Pro
2069 -3%
AMD Ryzen 5 7640HS
2079 -3%
AMD Ryzen 9 5980HS
2083 -3%
2084 -3%
2085 -3%
2086 -3%
AMD Ryzen 7 PRO 6850H
2086 -3%
2120 -1%
2124 -1%
Intel Core i9-11900H
2143
2163 1%
Apple M3 Pro 12-Core
2163 1%
2191 2%
2205 3%
2224 4%
Intel Core i7-12800H
2236 4%
Intel Core i7-1370P
2272 6%
AMD Ryzen 5 7645HX
2276 6%
Intel Core i5-13500H
2336 9%
...
AMD Ryzen 9 7945HX3D
5600 161%
max:
AMD Ryzen Threadripper PRO 7995WX
15842 639%
0%
100%
011523034546057569080592010351150126513801495161017251840195520702185Tooltip
Cinebench R15 - Cinebench R15 CPU Single 64 Bit
min: 236     avg: 239     median: 239.5 (72%)     max: 241 Points
AMD A4-1200
19 -92%
...
AMD Ryzen 7 7735U
234 -2%
AMD Ryzen 5 6600HS
235 -2%
236 -1%
AMD Ryzen 7 PRO 6850U
236.2 -1%
Intel Core i5-1335U
236.3 -1%
236.8 -1%
237.3 -1%
237.8 -1%
238.3 0%
Intel Core i9-11900H
239
Intel Core i5-1345U
240.3 1%
Intel Core i5-1340P
240.5 1%
AMD Ryzen 5 7535HS
241 1%
241.6 1%
242 1%
Intel Core i5-1245U
242 1%
242.5 1%
AMD Ryzen 9 5980HS
243 2%
244.7 2%
...
AMD Ryzen 9 7945HX3D
311 30%
max:
Intel Core i9-14900K
332 39%
0%
100%
7-Zip 18.03 - 7-Zip 18.03 Multli Thread 4 runs
min: 50441     avg: 53766     median: 53680.5 (31%)     max: 57263 MIPS
7-Zip 18.03 - 7-Zip 18.03 Single Thread 4 runs
min: 5582     avg: 5722     median: 5717.5 (68%)     max: 5870 MIPS
HWBOT x265 Benchmark v2.2 - HWBOT x265 4k Preset
min: 14.9     avg: 15.4     median: 15 (26%)     max: 16.7 fps
0510152025Tooltip
Blender - Blender 2.79 BMW27 CPU *
min: 231     avg: 241.3     median: 242.5 (2%)     max: 249 Seconds
R Benchmark 2.5 - R Benchmark 2.5 *
min: 0.529     avg: 0.5     median: 0.5 (11%)     max: 0.544 sec
3DMark 11 - 3DM11 Performance Physics
min: 16514     avg: 18413     median: 18952.5 (51%)     max: 19231 Points
3DMark - 3DMark Cloud Gate Physics
min: 13550     avg: 16101     median: 16602 (42%)     max: 17649 Points
3DMark - 3DMark Fire Strike Standard Physics
min: 24151     avg: 25164     median: 25001.5 (45%)     max: 26502 Points
3DMark - 3DMark Time Spy CPU
min: 9050     avg: 9865     median: 9631.5 (41%)     max: 11145 Points
Geekbench 5.5 - Geekbench 5.1 - 5.4 64 Bit Single-Core
min: 1576     avg: 1620     median: 1628 (69%)     max: 1648 points
Geekbench 5.5 - Geekbench 5.1 - 5.4 64 Bit Multi-Core
min: 7725     avg: 9218     median: 9645.5 (17%)     max: 9856 points
Mozilla Kraken 1.1 - Kraken 1.1 Total Score *
min: 603     avg: 605     median: 605 (1%)     max: 608 ms
WebXPRT 3 - WebXPRT 3 Score
min: 272     avg: 272.5     median: 272.5 (57%)     max: 273 Points
Power Consumption - Prime95 Power Consumption - external Monitor *
min: 107     avg: 115.8     median: 117 (20%)     max: 122 Watt
0102030405060708090100110120130140150160170Tooltip
Power Consumption - Cinebench R15 Multi Power Consumption - external Monitor *
min: 134     avg: 149.8     median: 153 (28%)     max: 159 Watt
0102030405060708090100110120130140150160170Tooltip
Power Consumption - Cinebench R15 Multi Power Efficiency - external Monitor
min: 13.3     avg: 14.4     median: 14.1 (10%)     max: 16 Points per Watt
- Range of benchmark values for this graphics card
- Average benchmark values for this graphics card
* Smaller numbers mean a higher performance

v1.26
log 26. 16:42:02

#0 no ids found in url (should be separated by "_") +0s ... 0s

#1 not redirecting to Ajax server +0s ... 0s

#2 did not recreate cache, as it is less than 5 days old! Created at Sun, 26 Nov 2023 08:27:42 +0100 +0.001s ... 0.001s

#3 no comparison url found in template nbc.compare_page_2 needed +0.008s ... 0.009s

#4 no comparison url found in template nbc.compare_page_2 needed +0s ... 0.009s

#5 no comparison url found in template nbc.compare_page_2 needed +0s ... 0.009s

#6 no comparison url found in template nbc.compare_page_2 needed +0s ... 0.01s

#7 no comparison url found in template nbc.compare_page_2 needed +0s ... 0.01s

#8 no comparison url found in template nbc.compare_page_2 needed +0s ... 0.01s

#9 no comparison url found in template nbc.compare_page_2 needed +0s ... 0.01s

#10 no comparison url found in template nbc.compare_page_2 needed +0s ... 0.011s

#11 composed specs +0s ... 0.011s

#12 did output specs +0s ... 0.011s

#13 getting avg benchmarks for device 13143 +0.015s ... 0.026s

#14 got single benchmarks 13143 +0.034s ... 0.059s

#15 got avg benchmarks for devices +0s ... 0.059s

#16 min, max, avg, median took s +0.361s ... 0.42s

#17 no comparison url found in template nbc.compare_page_2 needed +0s ... 0.42s

#18 return log +0s ... 0.42s

Reviews for the Intel Core i9-11900H processor

微星GS76 Stealth 11UH游戏笔记本回顾。纤细的结构牺牲了GPU的性能

微星GS76 Stealth 11UH游戏笔记本回顾。纤细的结构牺牲了GPU的性能

微星GS76 Stealth是市场上最轻薄的游戏笔记本电脑之一。尽管结构很薄,但微星在我们测试的11UH-074高级型号的引擎盖下装了一个GeForce RTX 3080。在此了解这一策略是否成功。...
Intel Core i9-11900H | NVIDIA GeForce RTX 3080 Laptop GPU | 17.30" | 2.4 kg

Asus Vivobook Pro 15 K6502, i9-11900H RTX 3050: NVIDIA GeForce RTX 3050 4GB Laptop GPU, 15.60", 1.8 kg
  External Review » Asus Vivobook Pro 15 K6502, i9-11900H RTX 3050

Asus Vivobook Pro 16 K6602HC, i9-11900H RTX 3050: NVIDIA GeForce RTX 3050 4GB Laptop GPU, 16.00", 1.9 kg
  External Review » Asus Vivobook Pro 16 K6602HC, i9-11900H RTX 3050

HP Omen 17-ck0196ng: NVIDIA GeForce RTX 3080 Laptop GPU, 17.30", 2.8 kg
  External Review » HP Omen 17-ck0196ng

Alienware x15 R1, i9-11900H RTX 3070: NVIDIA GeForce RTX 3070 Laptop GPU, 15.60", 2.4 kg
  External Review » Alienware x15 R1, i9-11900H RTX 3070

Acer Predator Helios 300 PH315-54-94U7: NVIDIA GeForce RTX 3070 Laptop GPU, 15.60", 2.3 kg
  External Review » Acer Predator Helios 300 PH315-54-94U7

Acer Predator Helios 300 PH315-54-NH.QC1SN.003: NVIDIA GeForce RTX 3070 Laptop GPU, 15.60", 2.2 kg
  External Review » Acer Predator Helios 300 PH315-54-NH.QC1SN.003

Asus ROG Zephyrus S17 GX703HS-KF004R: NVIDIA GeForce RTX 3080 Laptop GPU, 17.30", 2.6 kg
  External Review » Asus ROG Zephyrus S17 GX703HS-KF004R

Alienware m15 R6 9GYW5: NVIDIA GeForce RTX 3070 Laptop GPU, 15.60", 2.7 kg
  External Review » Alienware m15 R6 9GYW5

MSI WS66 11UMT-220US: NVIDIA RTX A5000 Laptop GPU, 15.60", 2.1 kg
  External Review » MSI WS66 11UMT-220US

MSI GS76 Stealth 11UG-232: NVIDIA GeForce RTX 3070 Laptop GPU, 17.30", 2.5 kg
  External Review » MSI GS76 Stealth 11UG-232

Razer Blade 17 RZ09-0406CG63-R3G1: NVIDIA GeForce RTX 3080 Laptop GPU, 17.30", 2.8 kg
  External Review » Razer Blade 17 RZ09-0406CG63-R3G1

MSI GS66 Stealth 11UH-045: NVIDIA GeForce RTX 3080 Laptop GPU, 15.60", 2.1 kg
  External Review » MSI GS66 Stealth 11UH-045

Dell XPS 15 9510, 11900H RTX 3050 Ti OLED: NVIDIA GeForce RTX 3050 Ti Laptop GPU, 15.60", 2 kg
  External Review » Dell XPS 15 9510, 11900H RTX 3050 Ti OLED

Razer Blade 15 Advanced RZ09-0409CG53-R3G1: NVIDIA GeForce RTX 3080 Laptop GPU, 15.60", 2 kg
  External Review » Razer Blade 15 Advanced RZ09-0409CG53-R3G1

Dell XPS 17 9710, i9-11900H RTX 3060 4K: NVIDIA GeForce RTX 3060 Laptop GPU, 17.30", 2.5 kg
  External Review » Dell XPS 17 9710, i9-11900H RTX 3060 4K

Asus TUF Gaming F17 FX706HM: NVIDIA GeForce RTX 3060 Laptop GPU, 17.30", 2.7 kg
  External Review » Asus TUF Gaming F17 FX706HM

MSI GS76 Stealth 11UH: NVIDIA GeForce RTX 3080 Laptop GPU, 17.30", 2.4 kg
  External Review » MSI GS76 Stealth 11UH

MSI Creator Z16 A11UET-076NEU: NVIDIA GeForce RTX 3060 Laptop GPU, 15.60", 2.2 kg
  External Review » MSI Creator Z16 A11UET-076NEU

Asus TUF Gaming F15 FX566HM-HN097TS: NVIDIA GeForce RTX 3060 Laptop GPU, 15.60", 2.3 kg
  External Review » Asus TUF Gaming F15 FX566HM-HN097TS

Asus ROG Zephyrus M16 GU603HM-211.ZM16: NVIDIA GeForce RTX 3060 Laptop GPU, 16.00", 1.9 kg
  External Review » Asus ROG Zephyrus M16 GU603HM-211.ZM16

Acer Predator Triton 500 PT516-51s-9914: NVIDIA GeForce RTX 3080 Laptop GPU, 16.10", 2.5 kg
  External Review » Acer Predator Triton 500 PT516-51s-9914

Alienware x15 R1, i9-11900H RTX 3080 FHD: NVIDIA GeForce RTX 3080, 15.60", 2.3 kg
  External Review » Alienware x15 R1, i9-11900H RTX 3080 FHD

Asus ROG Zephyrus S17 GX703HSD: NVIDIA GeForce RTX 3080 Laptop GPU, 17.30", 2.8 kg
  External Review » Asus ROG Zephyrus S17 GX703HSD

Asus ROG Zephyrus M16 GU603H: NVIDIA GeForce RTX 3070 Laptop GPU, 16.00", 2 kg
  External Review » Asus ROG Zephyrus M16 GU603H

Please share our article, every link counts!

»移动处理器 对比
所有移动处理器的对比


»移动处理器 基准测试
所有已有笔记本电脑中使用的处理器的基准测试成绩 (桌面处理器或移动处理器)

Other CPUs of the series Tiger Lake

» Intel Core i9-11900KB
   8x 3.3 GHz - 5.3 GHz
» Intel Core i9-11980HK
   8x 3.3 GHz - 5 GHz
» Intel Core i9-11900H
   8x 2.5 GHz - 4.9 GHz
» Intel Core i9-11950H
   8x 2.6 GHz - 5 GHz
» Intel Xeon W-11955M
   8x 2.6 GHz - 5 GHz
» Intel Core i7-11850H
   8x 2.5 GHz - 4.8 GHz
» Intel Core i7-11800H
   8x 2.3 GHz - 4.6 GHz
» Intel Core i7-11600H
   6x 2.9 GHz - 4.6 GHz
» Intel Xeon W-11855M
   6x 3.2 GHz - 4.9 GHz
» Intel Core i5-11500H
   6x 2.9 GHz - 4.6 GHz
» Intel Core i5-11400H
   6x 2.7 GHz - 4.5 GHz
» Intel Core i5-11260H
   6x 2.6 GHz - 4.4 GHz
» Intel Core i7-11390H
   4x 3.4 GHz - 5 GHz
» Intel Core i7-11375H
   4x 3.3 GHz - 5 GHz
» Intel Core i7-1195G7
   4x 2.9 GHz - 5 GHz
» Intel Core i7-11370H
   4x 3.3 GHz - 4.8 GHz
» Intel Core i7-1185G7
   4x 3 GHz - 4.8 GHz
» Intel Core i7-1165G7
   4x 2.8 GHz - 4.7 GHz
» Intel Core i5-1155G7
   4x 2.5 GHz - 4.5 GHz
» Intel Core i5-11320H
   4x 3.2 GHz - 4.5 GHz
» Intel Core i5-11300H
   4x 3.1 GHz - 4.4 GHz
» Intel Core i5-1145G7
   4x 2.6 GHz - 4.4 GHz
» Intel Core i5-1135G7
   4x 2.4 GHz - 4.2 GHz
» Intel Core i7-1180G7
   4x 2.2 GHz - 4.6 GHz
» Intel Core i7-1160G7
   4x 2.1 GHz - 4.4 GHz
» Intel Core i5-1140G7
   4x 1.8 GHz - 4.2 GHz
» Intel Core i5-1130G7
   4x 1.8 GHz - 4 GHz
» Intel Core i3-1125G4
   4x 2 GHz - 3.7 GHz
» Intel Core i3-1115G4
   2x 3 GHz - 4.1 GHz
» Intel Core i3-1120G4
   4x 1.5 GHz - 3.5 GHz
» Intel Core i3-1110G4
   2x 2.5 GHz - 3.9 GHz
» Intel Celeron 6305
   2x 1.8 GHz
» Intel Celeron 6205
   2x
» Intel Pentium Gold 7505
   2x 2 GHz - 3.5 GHz

Surrounding CPUs

+ AMD Ryzen 9 PRO 6950HS
   8x 3.3 GHz - 4.9 GHz
+ AMD Ryzen 7 6800H
   8x 3.2 GHz - 4.7 GHz
+ AMD Ryzen 7 PRO 6850H
   8x 3.2 GHz - 4.7 GHz
+ Intel Core i9-11980HK
   8x 3.3 GHz - 5 GHz
+ AMD Ryzen 9 5980HX
   8x 3.3 GHz - 4.8 GHz
» Intel Core i9-11900H
   8x 2.5 GHz - 4.9 GHz
- Intel Core i5-12600HX
   12x 1.8 GHz - 4.6 GHz
- AMD Ryzen 9 5900HX
   8x 3.3 GHz - 4.6 GHz
- Intel Core i5-12600H
   12x 2 GHz - 4.5 GHz
- Intel Core i5-13600H
   12x 2.1 GHz - 4.8 GHz
- Intel Core i5-13505H
   12x 1.9 GHz - 4.7 GHz
> Notebookcheck中文版(NBC中国) > FAQ / 小提示/ 技术参数 > 移动处理器 —— 基准测试成绩列表 > Intel Tiger Lake i9-11900H 笔记本处理器
Klaus Hinum (Update: 2021-08-13)