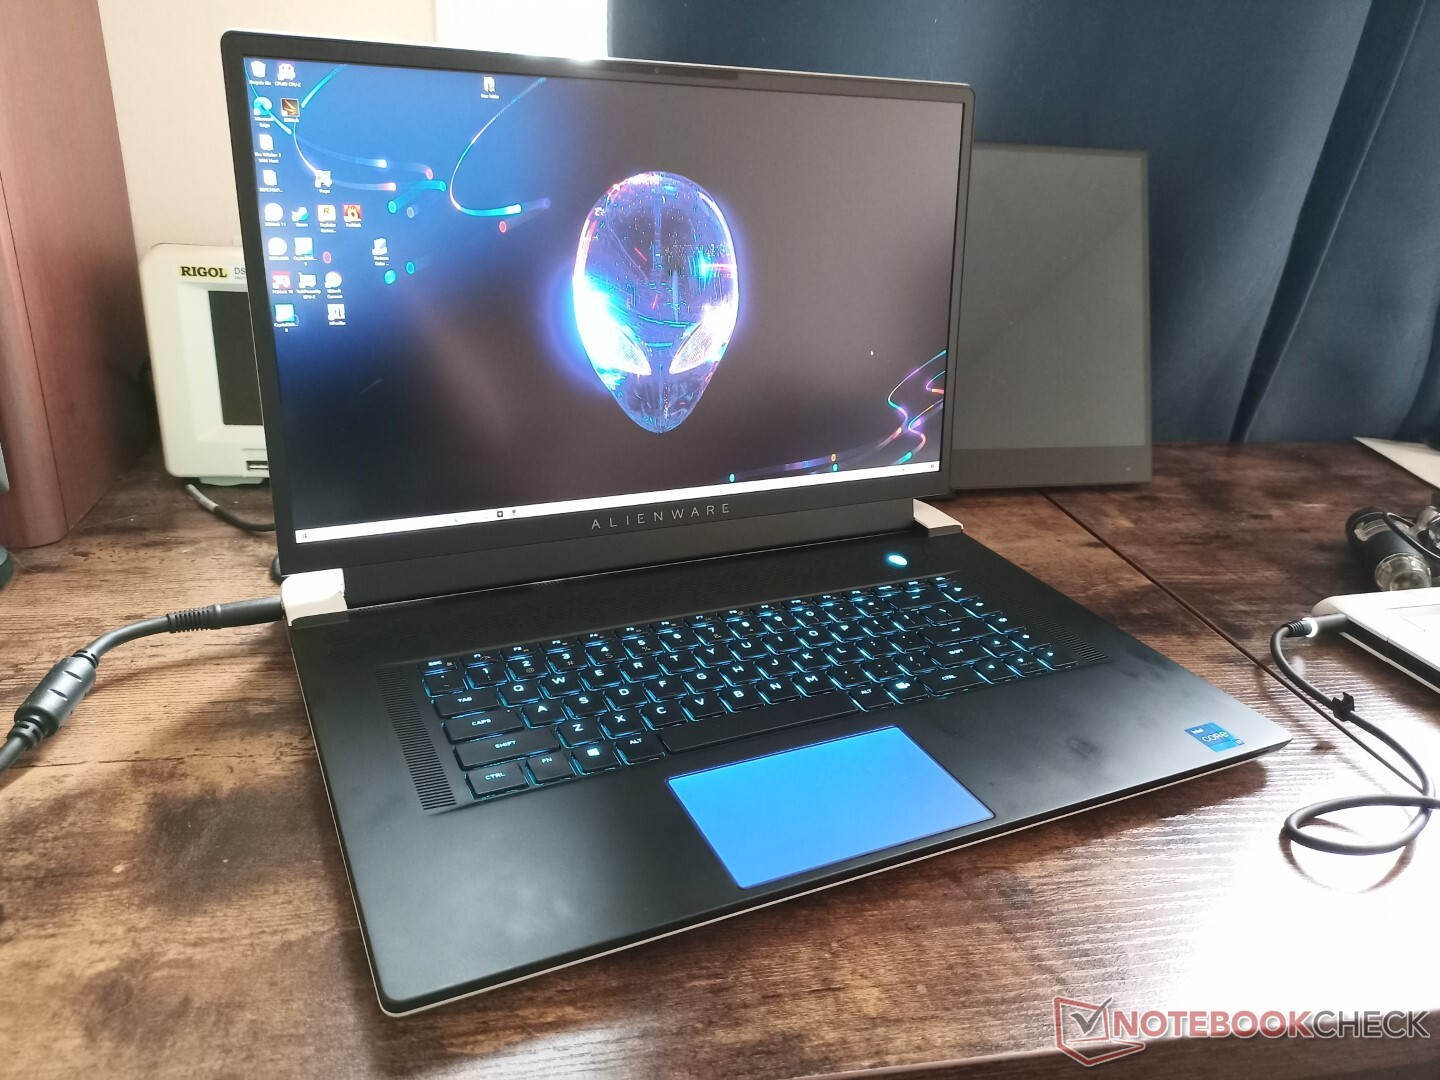
Alienware x17 R1 RTX 3080笔记本电脑评论。一个新的开始

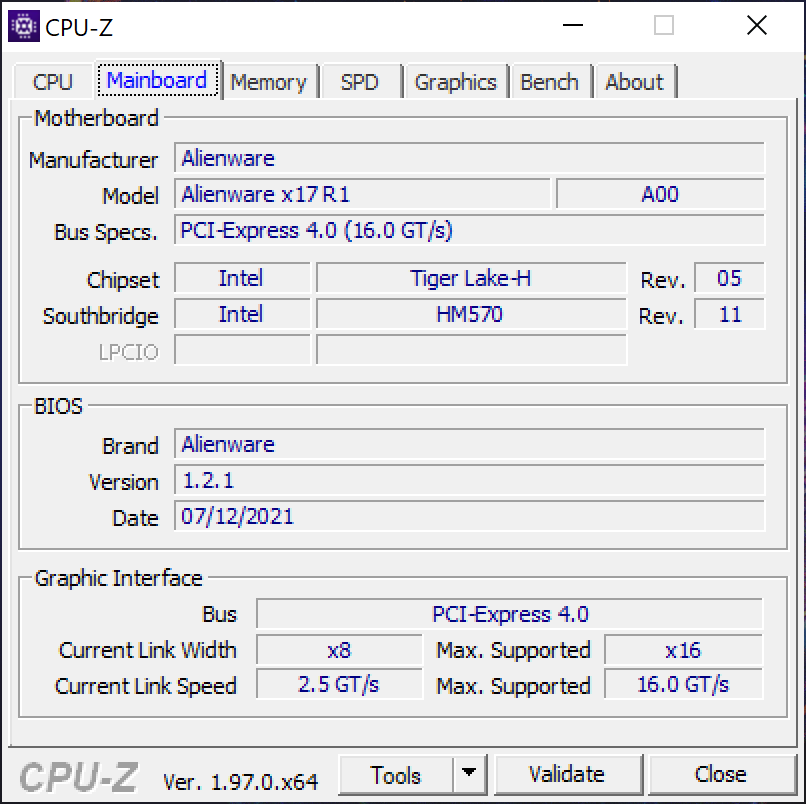
17.3英寸的Alienware笔记本电脑系列在过去几年里发生了雪崩式的变化。戴尔在2019年推出了全新的Alienware m17 R1机箱,只是在一年后的2020年才用完全重新设计的m17 R2机箱取代它。2021年,制造商又推出了另一款全面重新设计的机箱,以完全取代m17系列,称为Alienware x17。
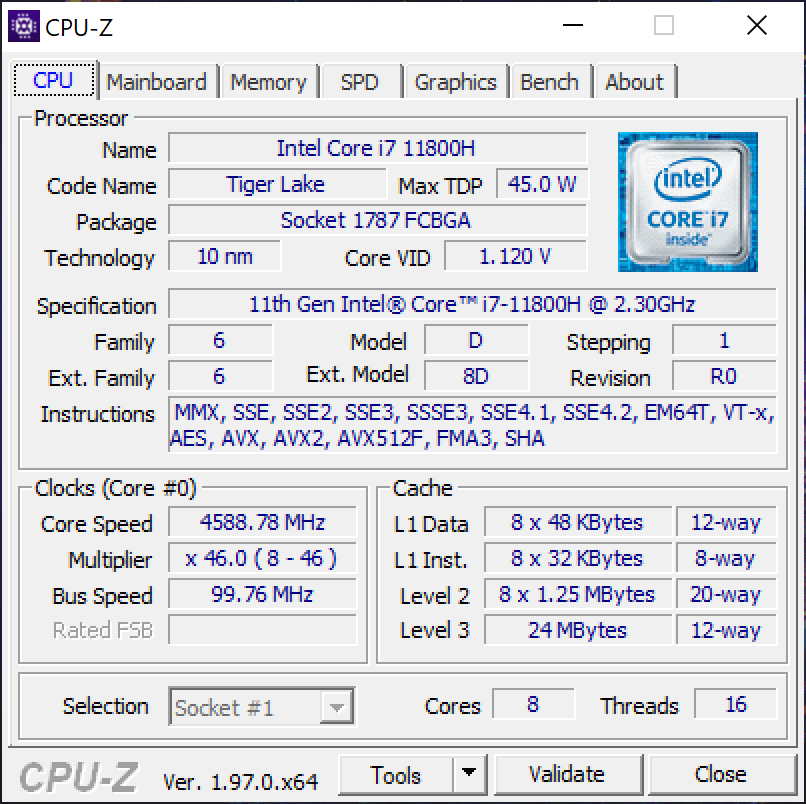
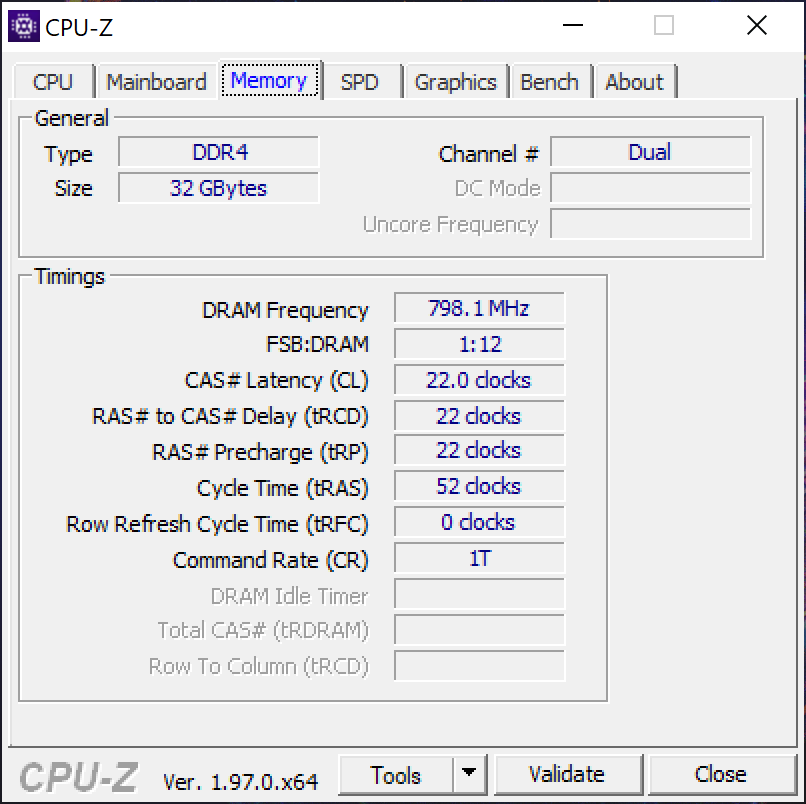
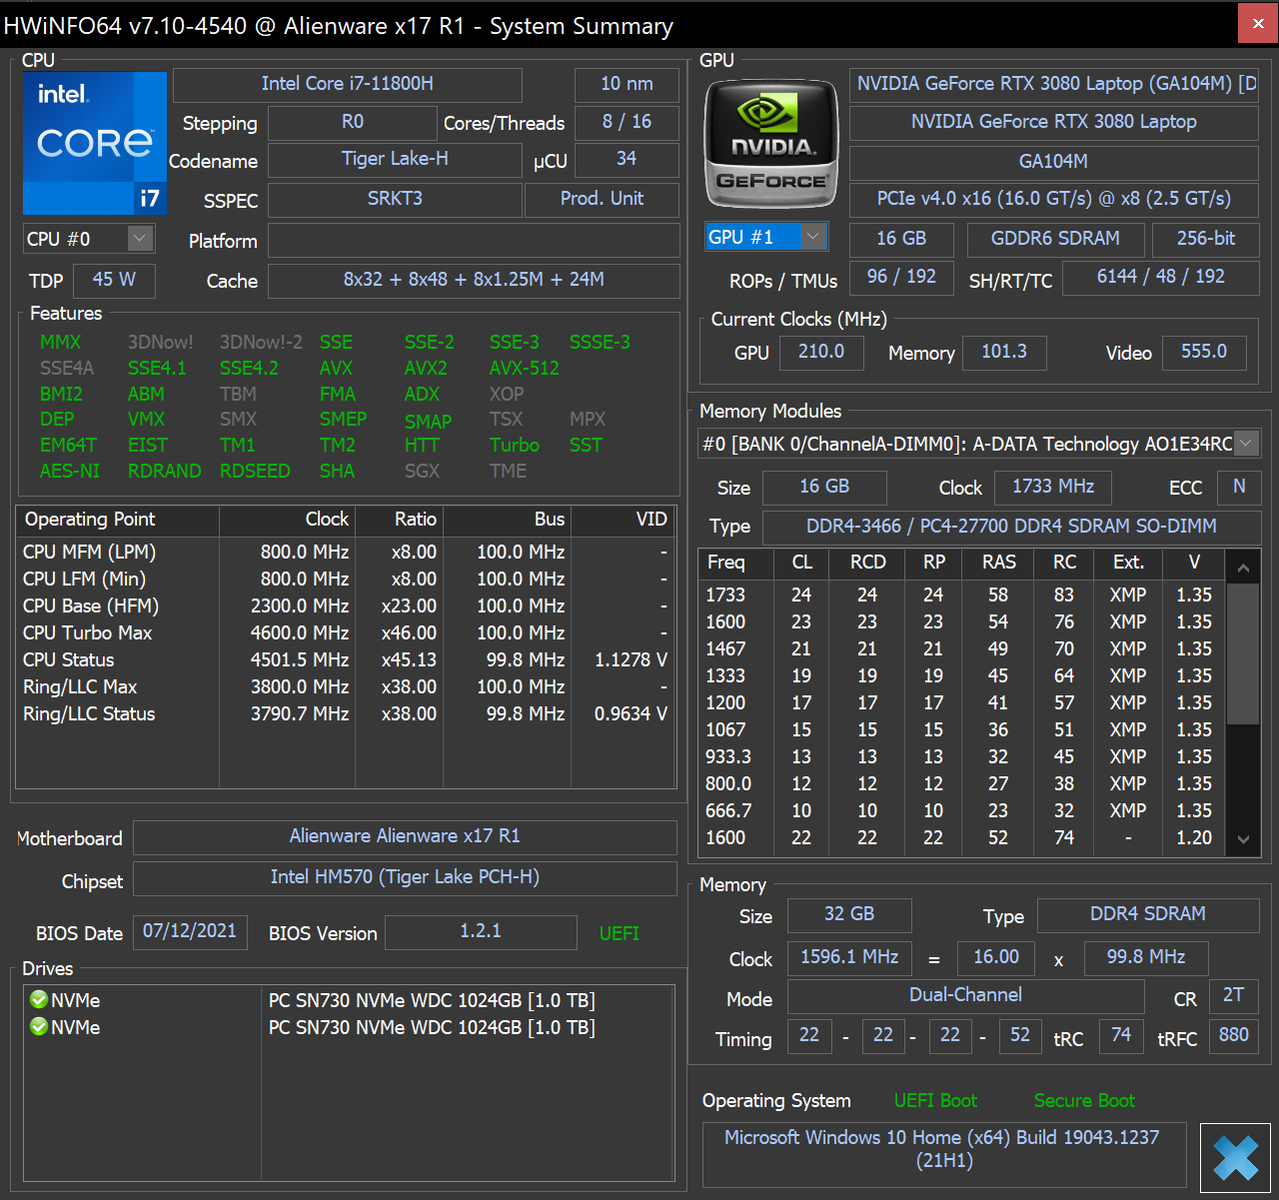
我们的测试装置是一个更高端的配置,配备了Core i7-11800H CPU、GeForce RTX 3080 GPU、120 Hz 4K UHD显示屏、CherryMX机械按键和32GB内存,价格约为3200美元。更少和更高的选项有 RTX 3060或 酷睿i9-11980HK分别。也许新机箱最重要的特点是其重新设计的冷却解决方案,包括比以前更多的风扇和CPU上方的新镓硅基散热膏。另外还有一个15.6英寸的版本,叫做Alienware x15 R1。
Alienware x17 R1的竞争对手包括其他17.3英寸的超薄游戏笔记本,如 微星GS76, Razer Blade 17,华硕ROG Zephyrus S17,以及基于同方的旗舰机Vector Pro.
更多戴尔评论。
potential competitors in comparison
Rating | Date | Model | Weight | Height | Size | Resolution | Price |
|---|---|---|---|---|---|---|---|
| 89 % v7 (old) | 09 / 2021 | Alienware x17 RTX 3080 P48E i7-11800H, GeForce RTX 3080 Laptop GPU | 3.2 kg | 21.4 mm | 17.30" | 3840x2160 | |
| 85.3 % v7 (old) | 04 / 2021 | Alienware m17 R4 i9-10980HK, GeForce RTX 3080 Laptop GPU | 3 kg | 22 mm | 17.30" | 1920x1080 | |
| 89.4 % v7 (old) | 09 / 2021 | Razer Blade 17 RTX 3070 i7-11800H, GeForce RTX 3070 Laptop GPU | 2.8 kg | 19.9 mm | 17.30" | 1920x1080 | |
| 90.1 % v7 (old) | 08 / 2021 | Asus ROG Zephyrus S17 GX703HSD i9-11900H, GeForce RTX 3080 Laptop GPU | 2.8 kg | 19.9 mm | 17.30" | 2560x1440 | |
| 86.2 % v7 (old) | 09 / 2021 | MSI GS76 Stealth 11UH i9-11900H, GeForce RTX 3080 Laptop GPU | 2.4 kg | 20 mm | 17.30" | 3840x2160 | |
| 88 % v7 (old) | 09 / 2021 | Gigabyte Aero 17 HDR YD i9-11980HK, GeForce RTX 3080 Laptop GPU | 2.8 kg | 22 mm | 17.30" | 3840x2160 |
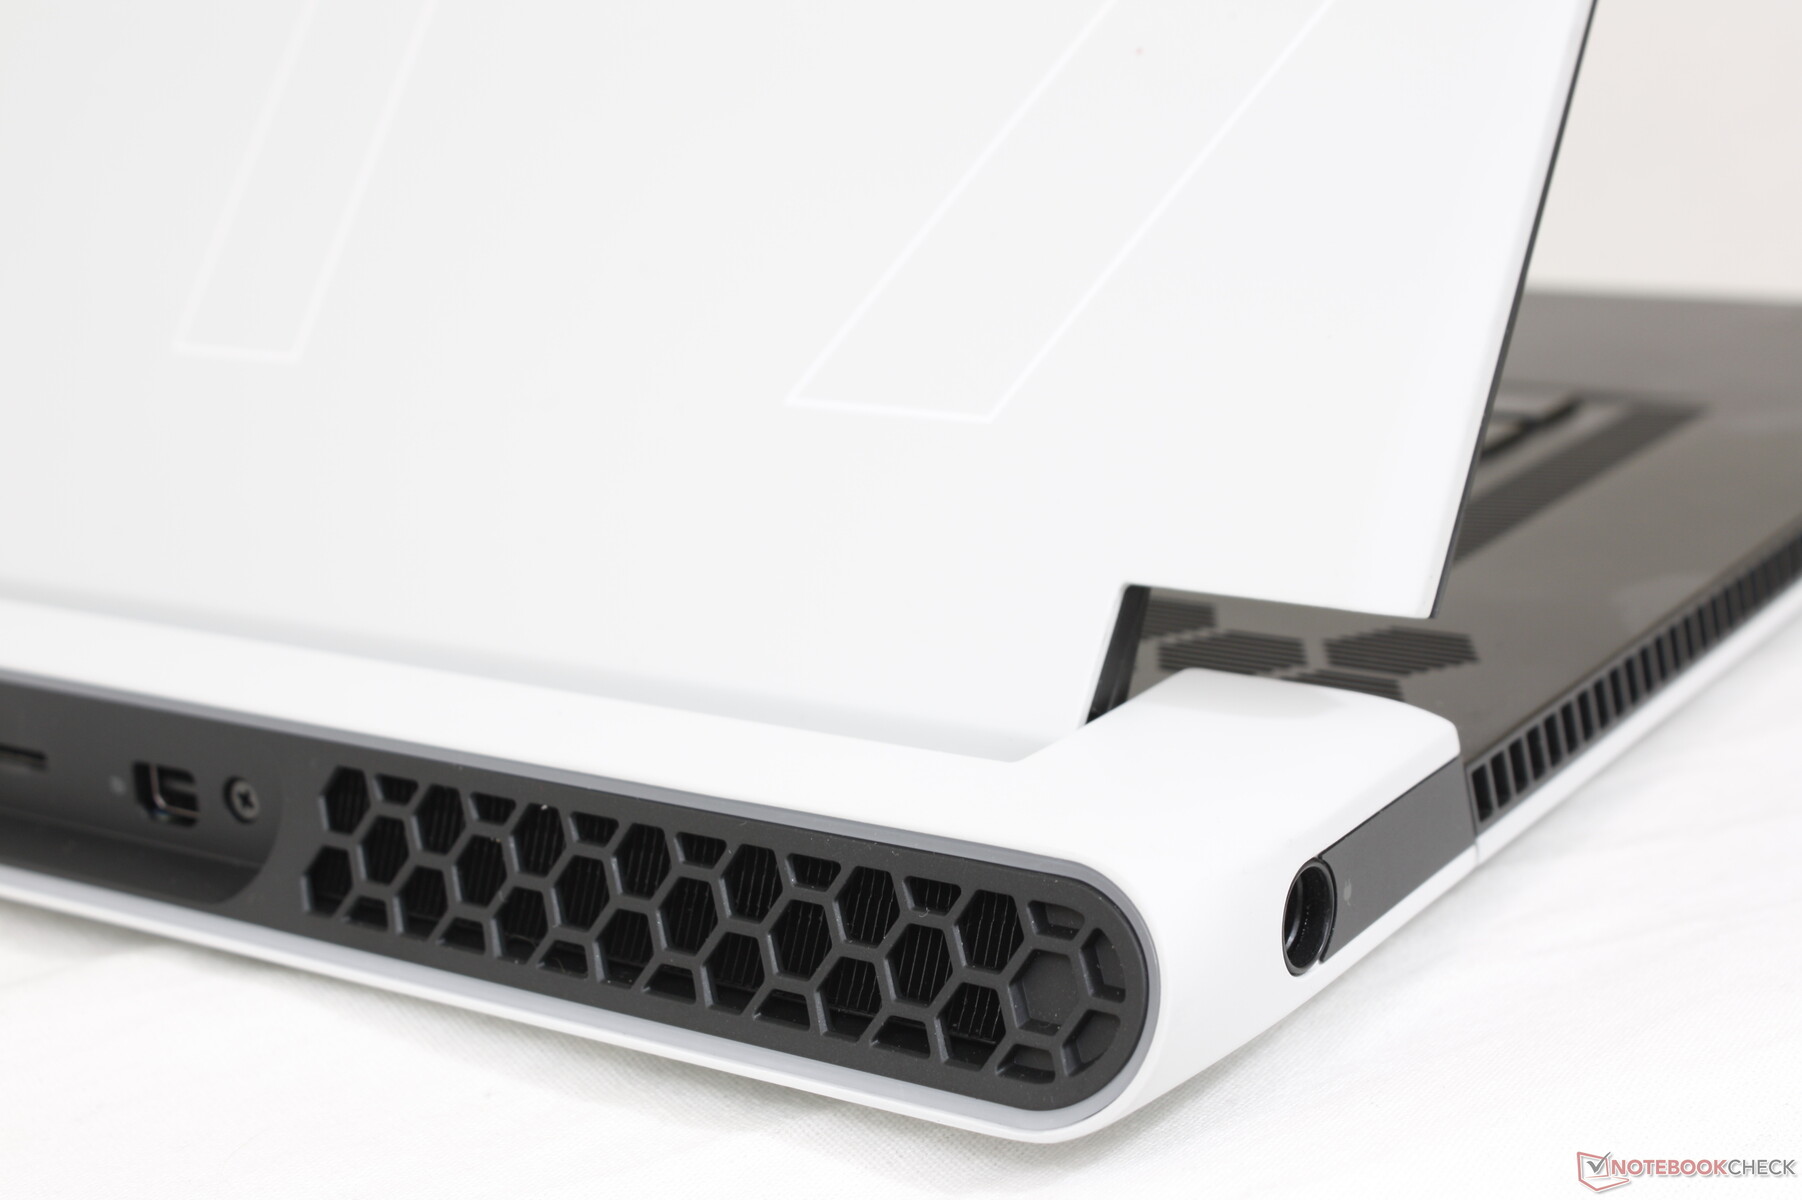
案例 - 传奇重生
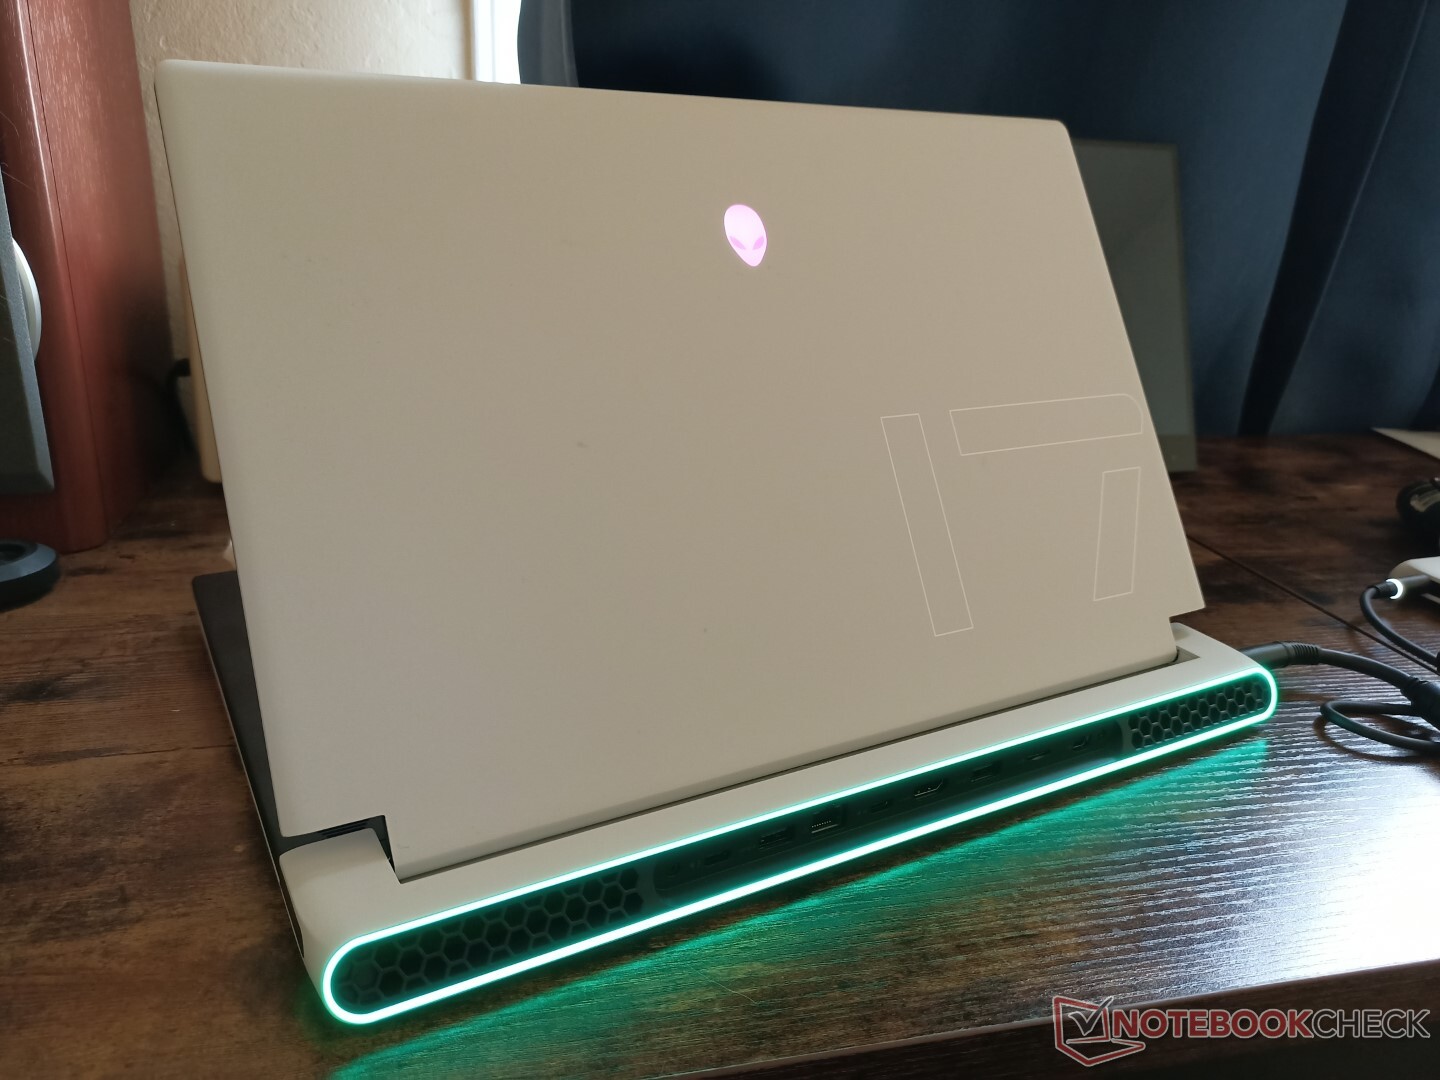
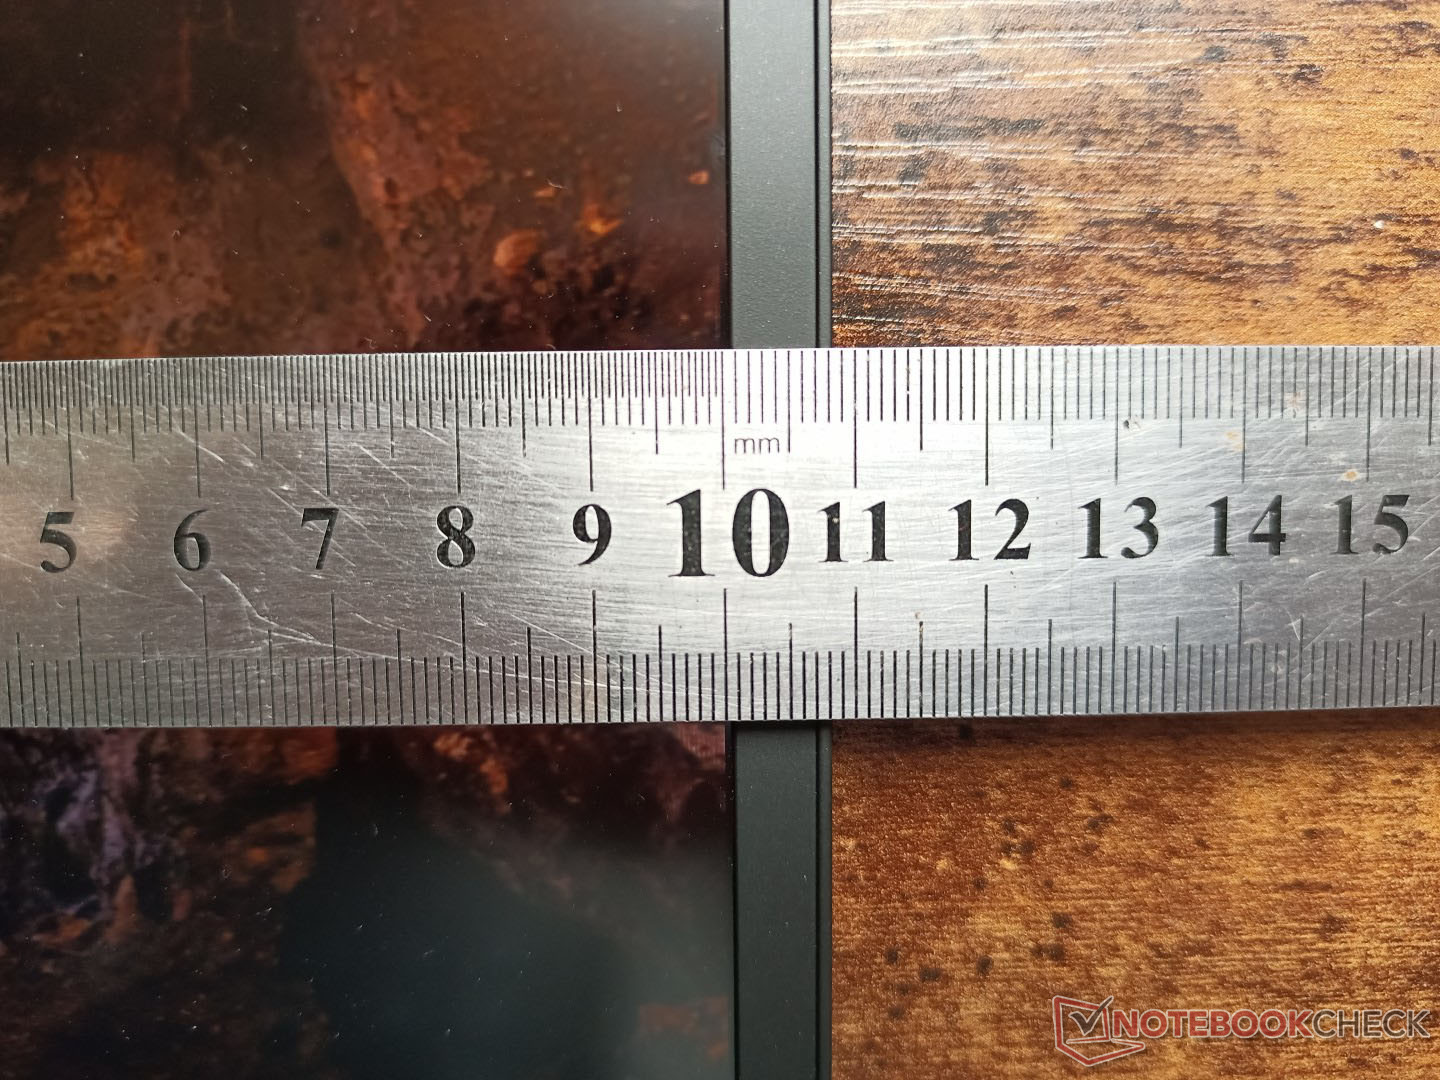
Alienware笔记本电脑不怕大,不管戴尔喜欢如何 "瘦",x17 R1仍然是一个大系统。事实是,该系统明显比大多数竞争机型如微星GS76、Blade 17或Zephyrus S17更大更重。甚至老款的 Alienware m17 R4也比x17 R1轻了约200克,尽管它们的体积几乎相同。然而,增加的重量有助于建立一个更强大和更坚硬的基础。
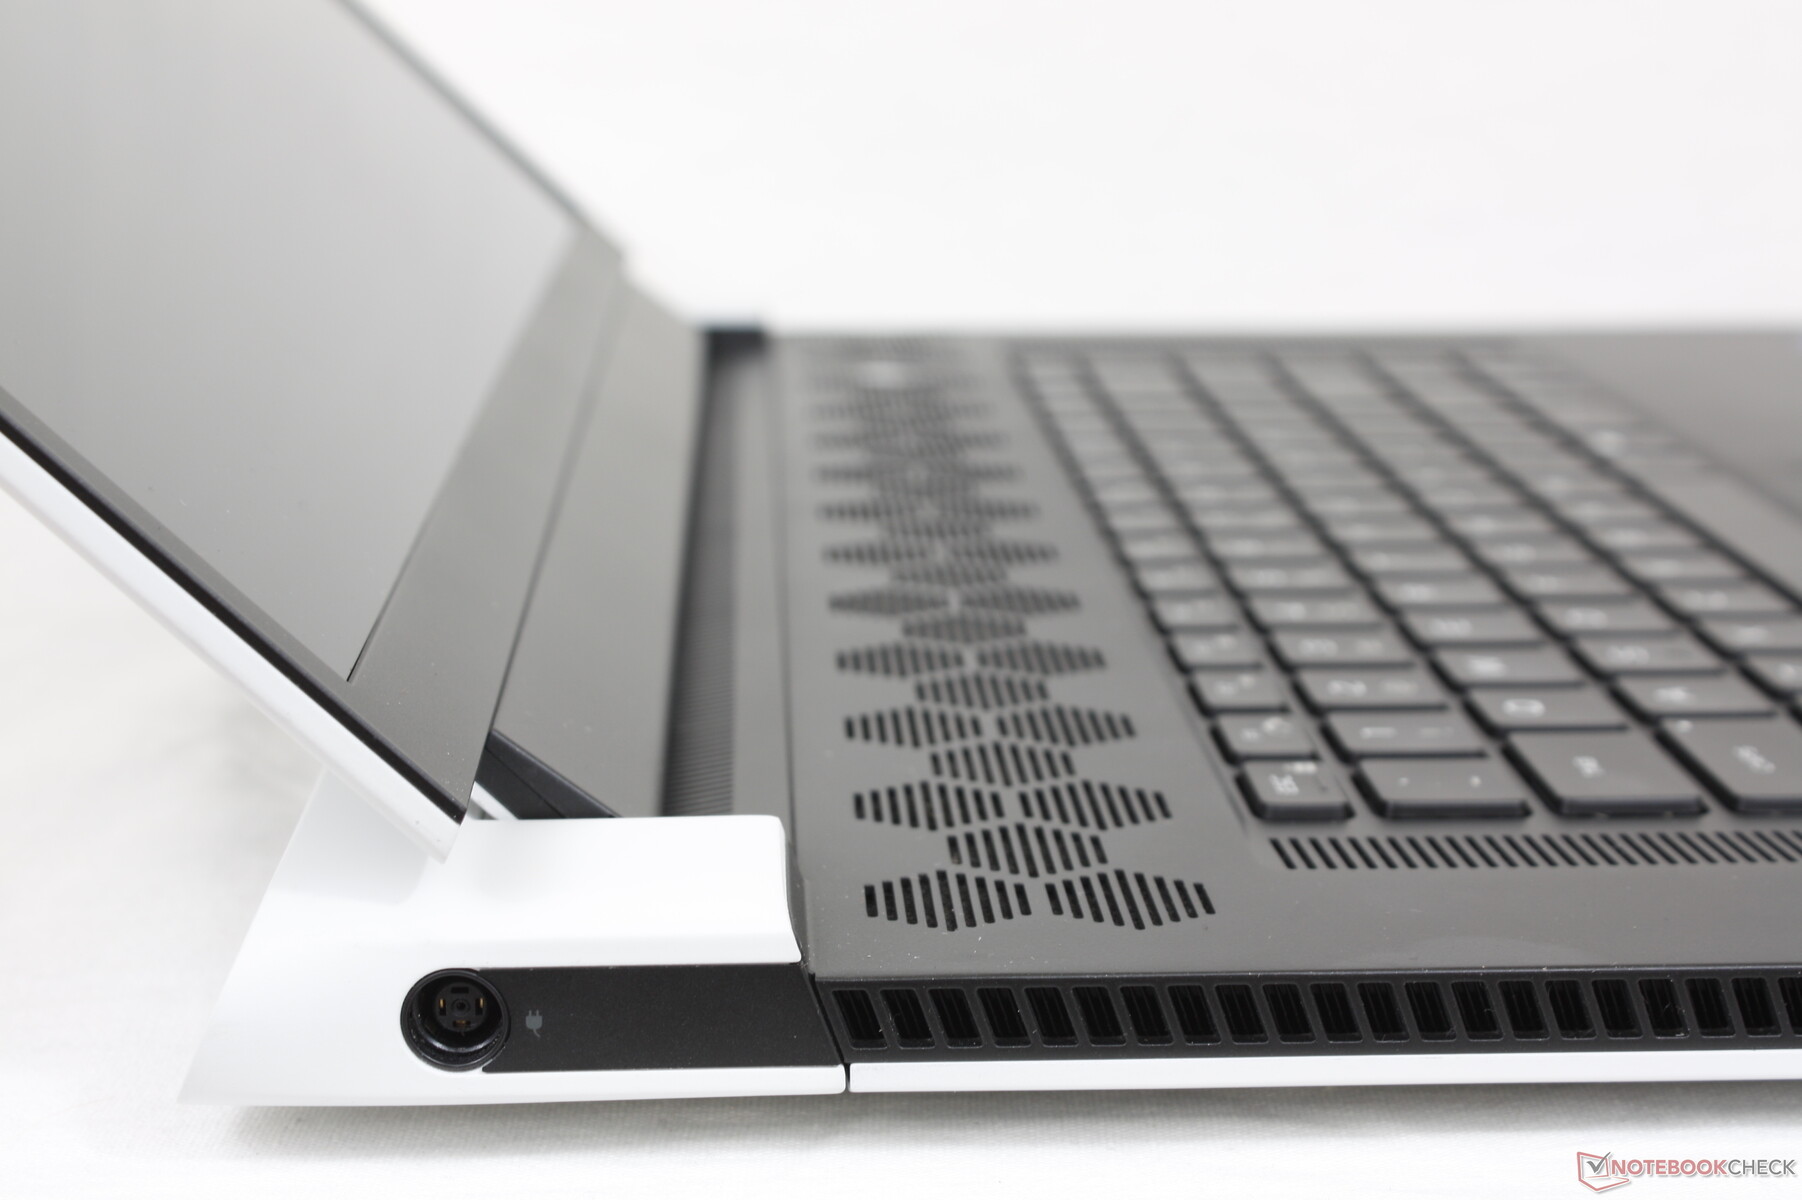
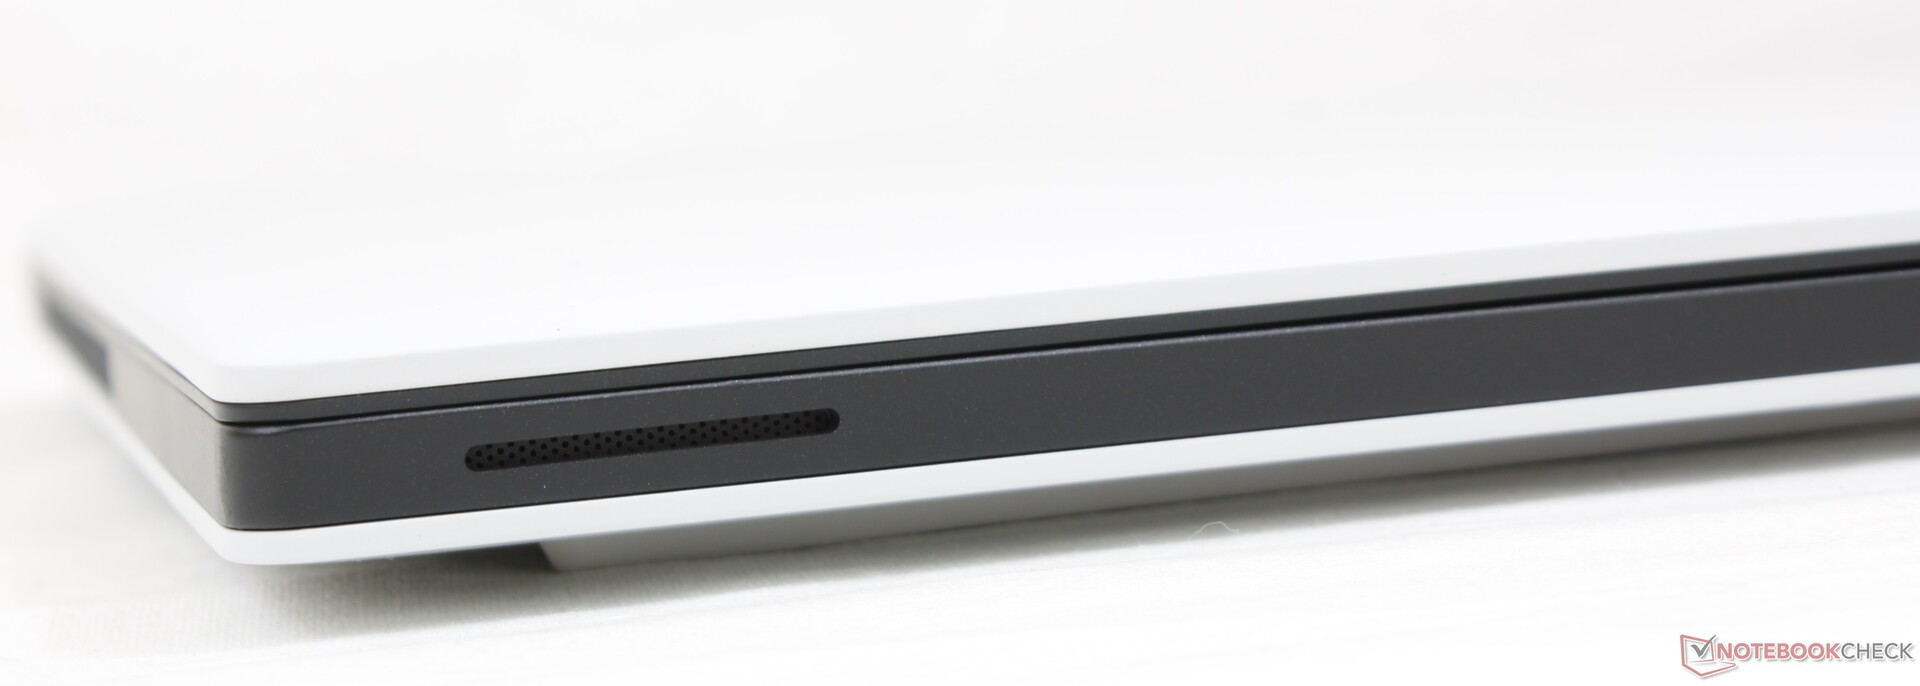
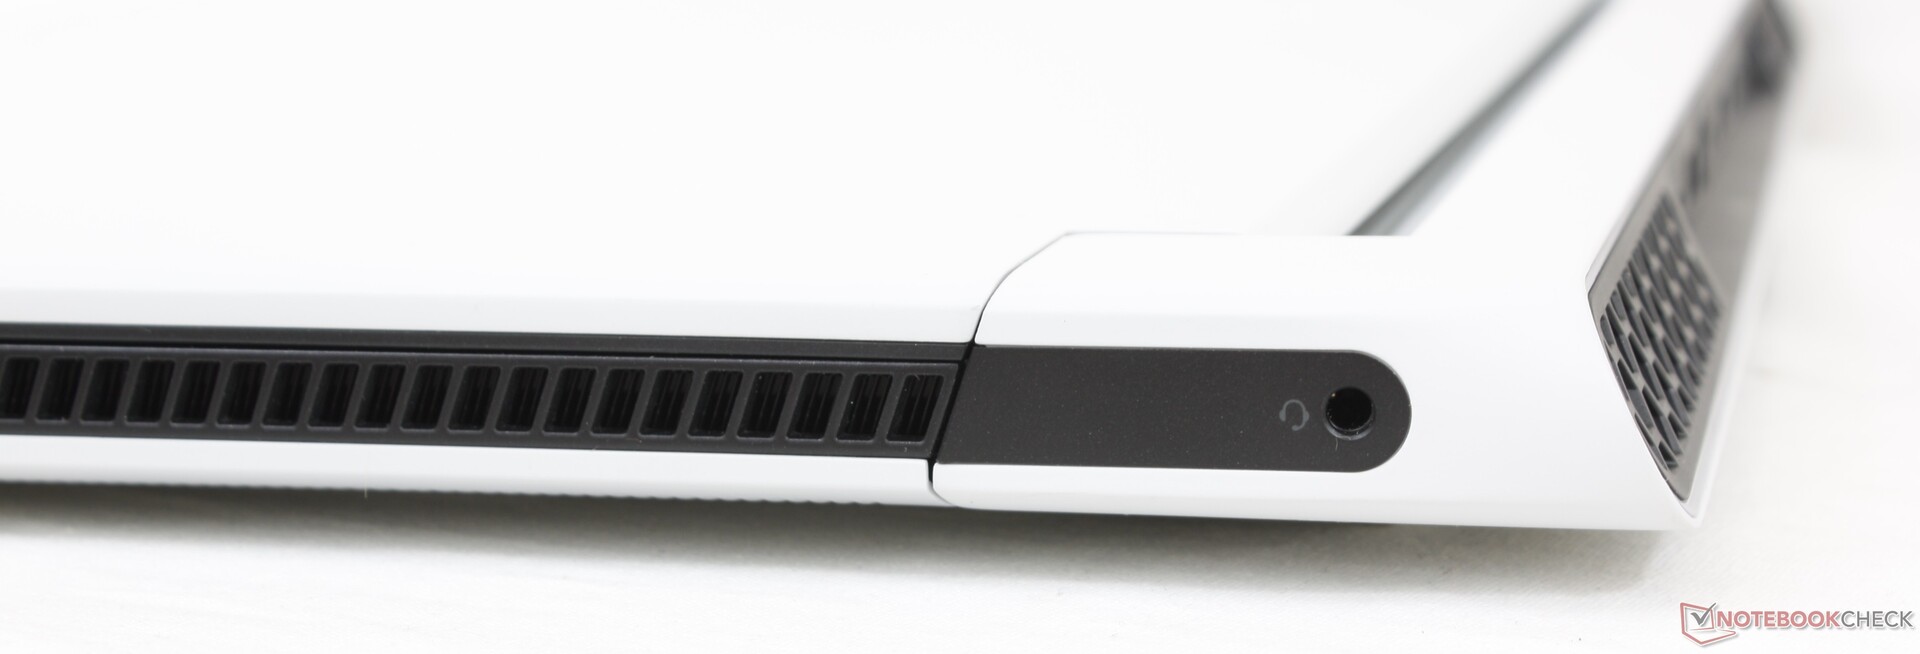
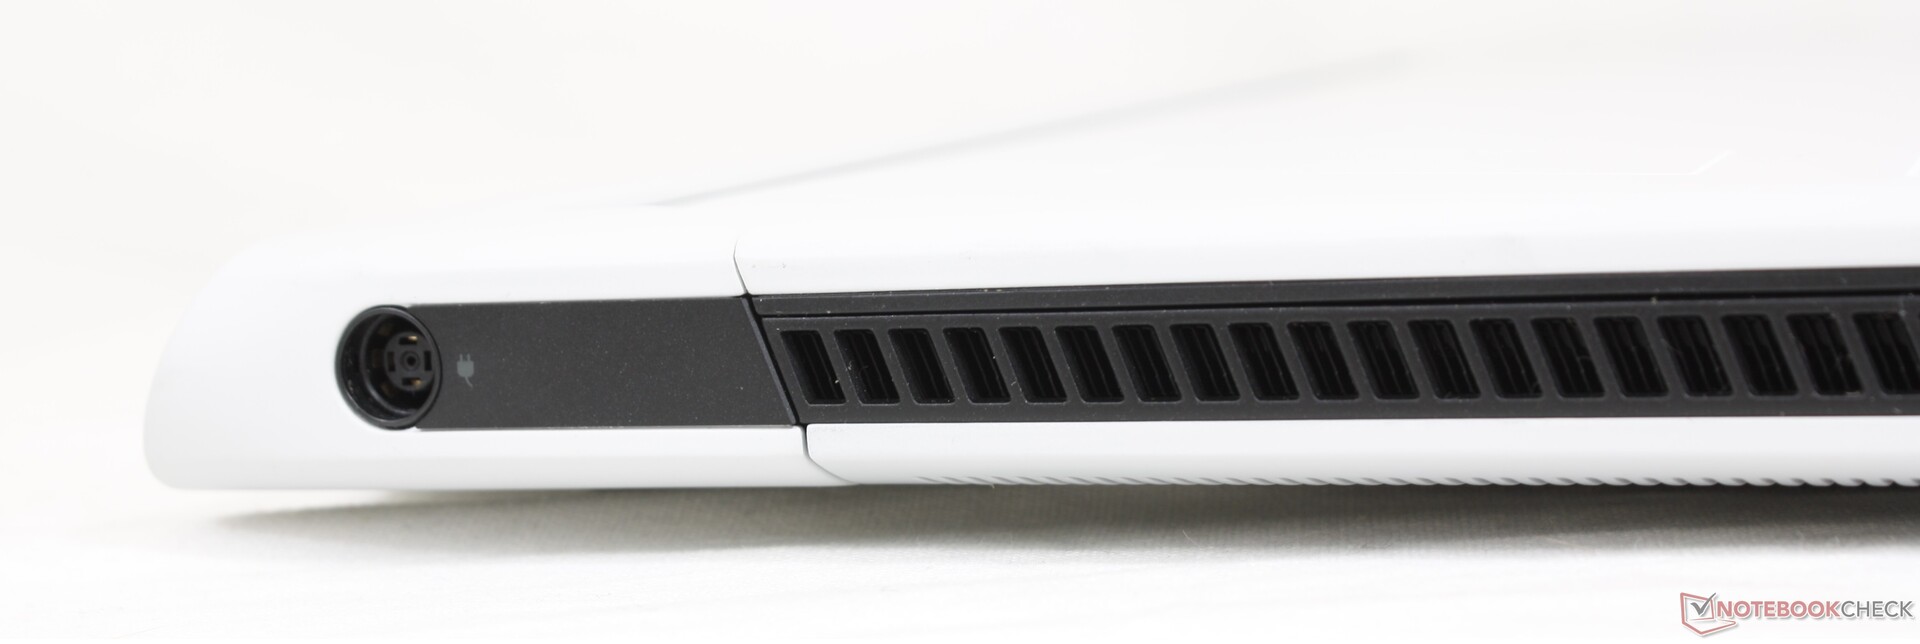
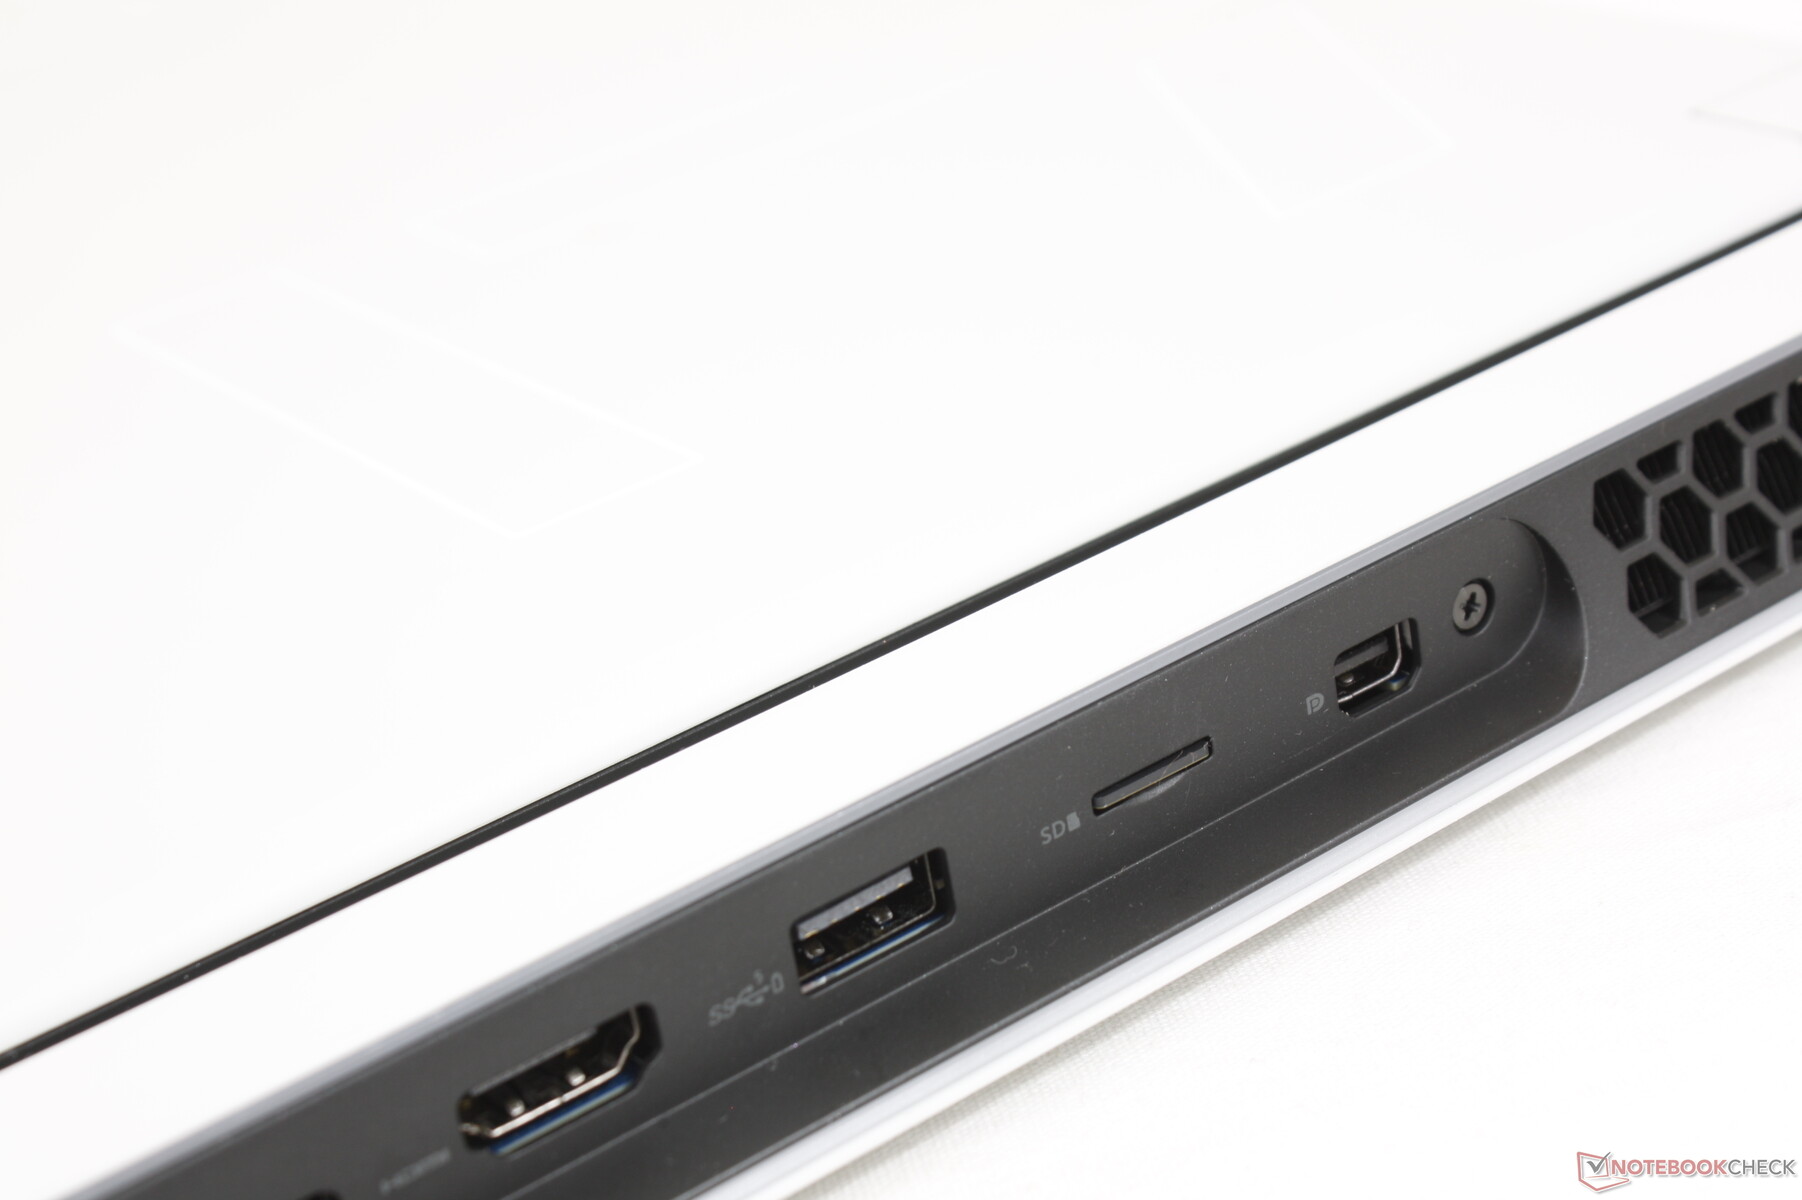
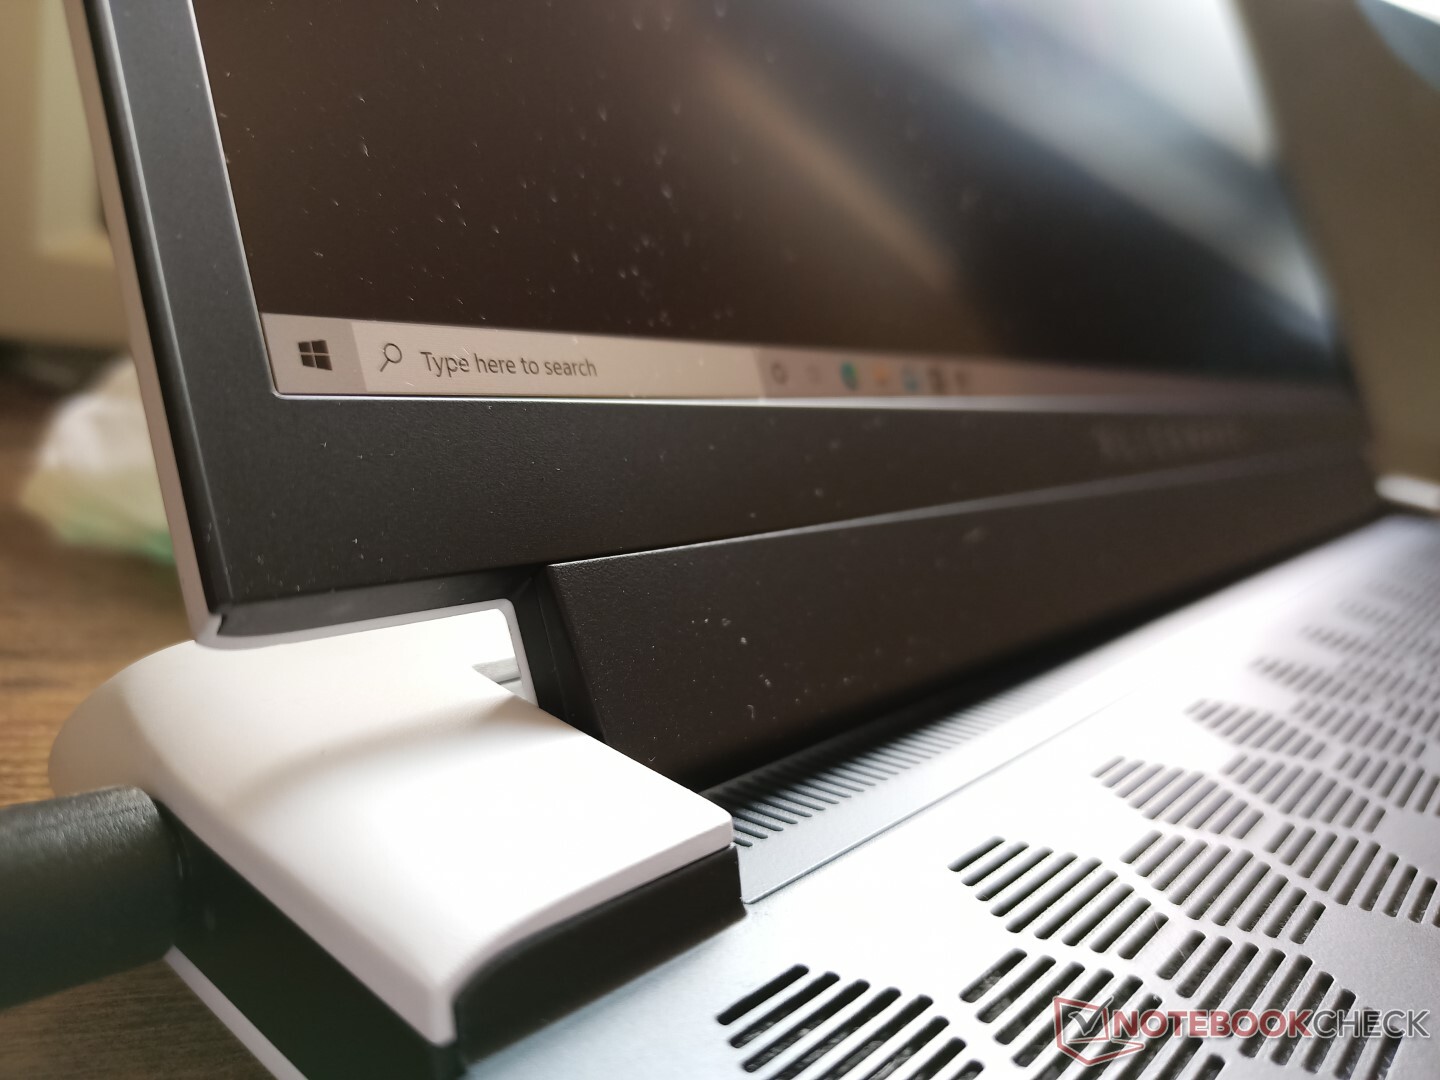
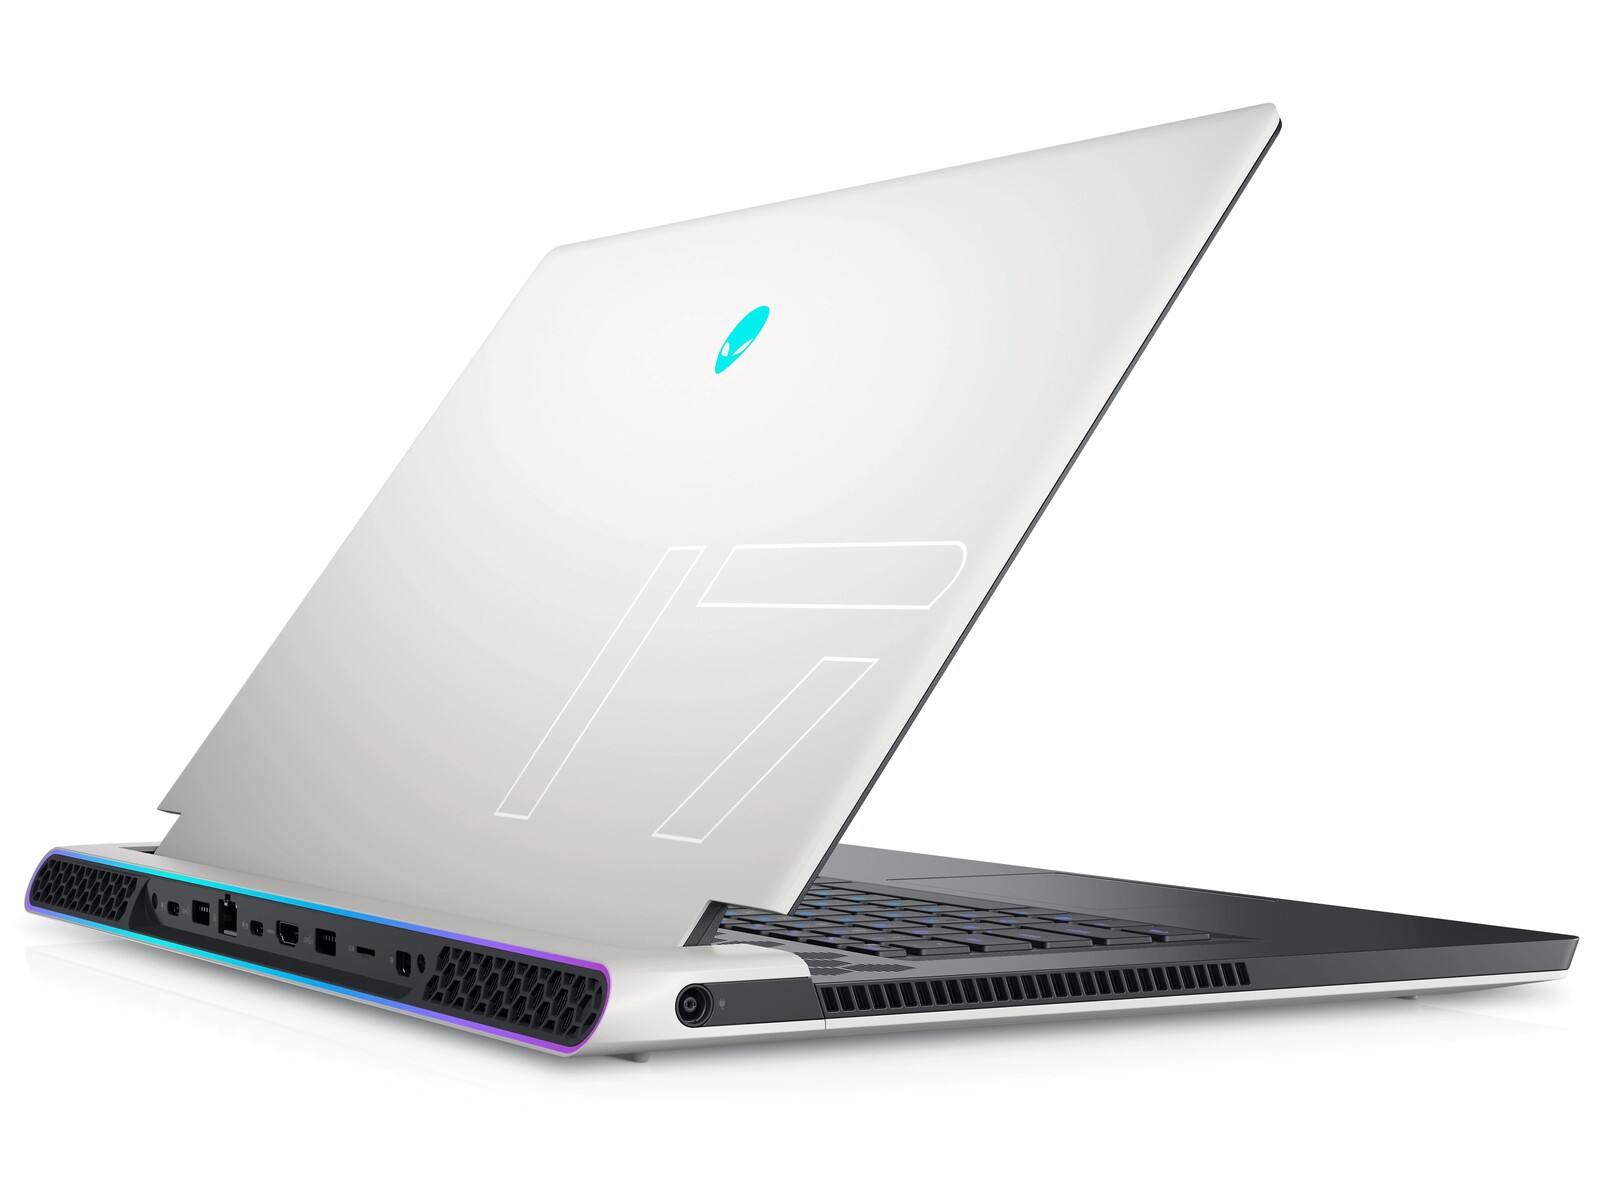
连接性--沿着背部
端口选项大多与去年的Alienware m17 R4相同,但有一些重要变化。例如,很少使用的专有图形放大器端口已被放弃,转而使用更方便的第二个USB-C端口。这次还少了一个USB-A端口。除此之外,所有其他端口都已回归,尽管沿着机身后部重新排列,通常比其他大多数笔记本电脑更难接触和看到。
请注意,两个USB-C端口都支持DisplayPort和Power Delivery,但实际上只有一个与Thunderbolt 4兼容。

SD卡阅读器
使用我们的UHS-II测试卡,集成的MicroSD读卡器的传输速度非常快,接近250MB/s。由于插槽在后面,所以有点难以进入,但这绝对胜过没有插槽。
| SD Card Reader | |
| average JPG Copy Test (av. of 3 runs) | |
| Razer Blade 17 RTX 3070 (AV Pro V60) | |
| MSI GS76 Stealth 11UH (AV PRO microSD 128 GB V60) | |
| Alienware m17 R4 (AV PRO microSD 128 GB V60) | |
| Gigabyte Aero 17 HDR YD (AV PRO microSD 128 GB V60) | |
| Asus ROG Zephyrus S17 GX703HSD | |
| Alienware x17 RTX 3080 P48E (AV Pro V60) | |
| maximum AS SSD Seq Read Test (1GB) | |
| Asus ROG Zephyrus S17 GX703HSD | |
| Alienware x17 RTX 3080 P48E (AV Pro V60) | |
| Alienware m17 R4 (AV PRO microSD 128 GB V60) | |
| MSI GS76 Stealth 11UH (AV PRO microSD 128 GB V60) | |
| Razer Blade 17 RTX 3070 (AV Pro V60) | |
| Gigabyte Aero 17 HDR YD (AV PRO microSD 128 GB V60) | |
沟通
支持Wi-Fi 6的杀手AX1675x模块是焊接的,就像它在上一代m17设计上的情况一样。有趣的是,Alienware x15的WLAN模块是可拆卸的,尽管它是一个较小的15.6英寸外形尺寸。
网络摄像头 - 红外线,但没有快门
由于该系统只配备了一个720p的传感器,因此相机质量并没有真正地逐代提高。其他一些笔记本电脑,如 Razer Blade 17已经升级到了1080p。还缺少一个网络摄像头快门。

")
")
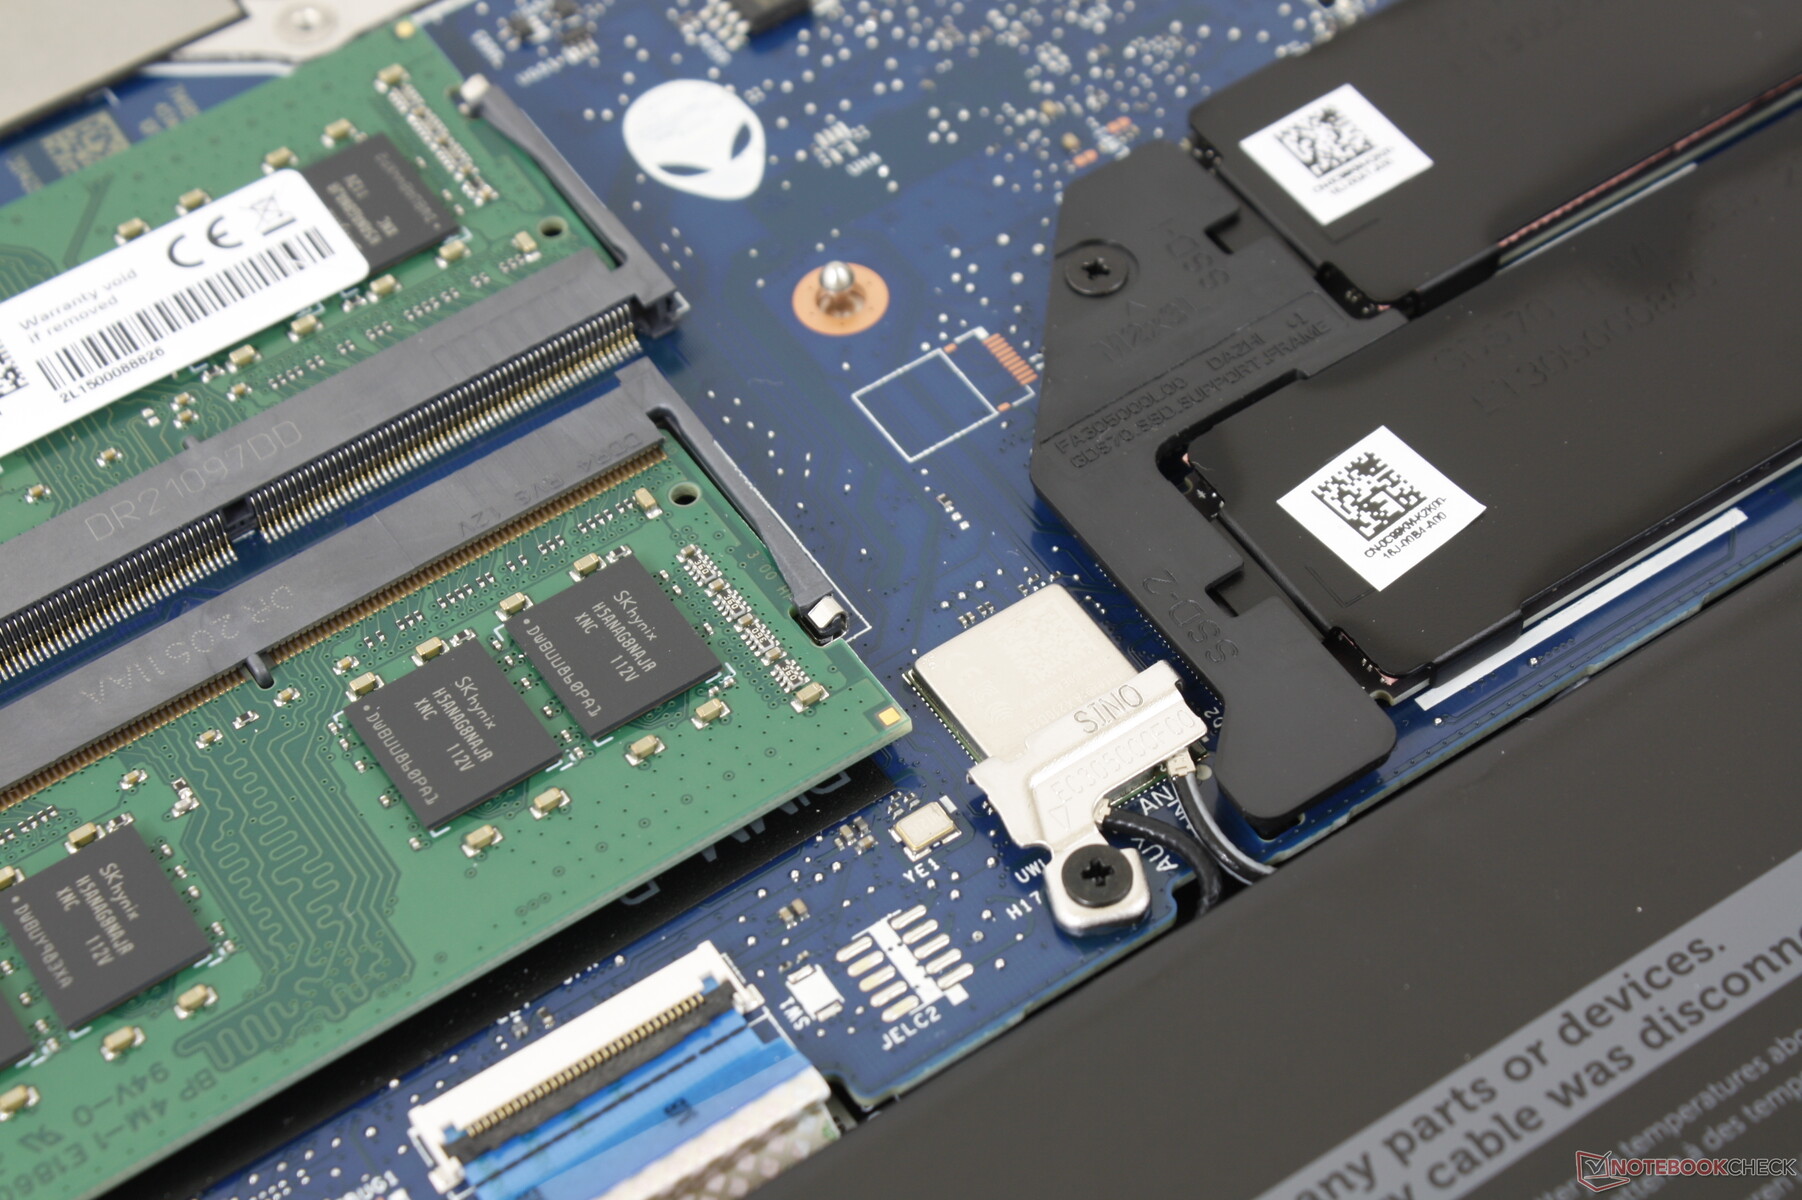
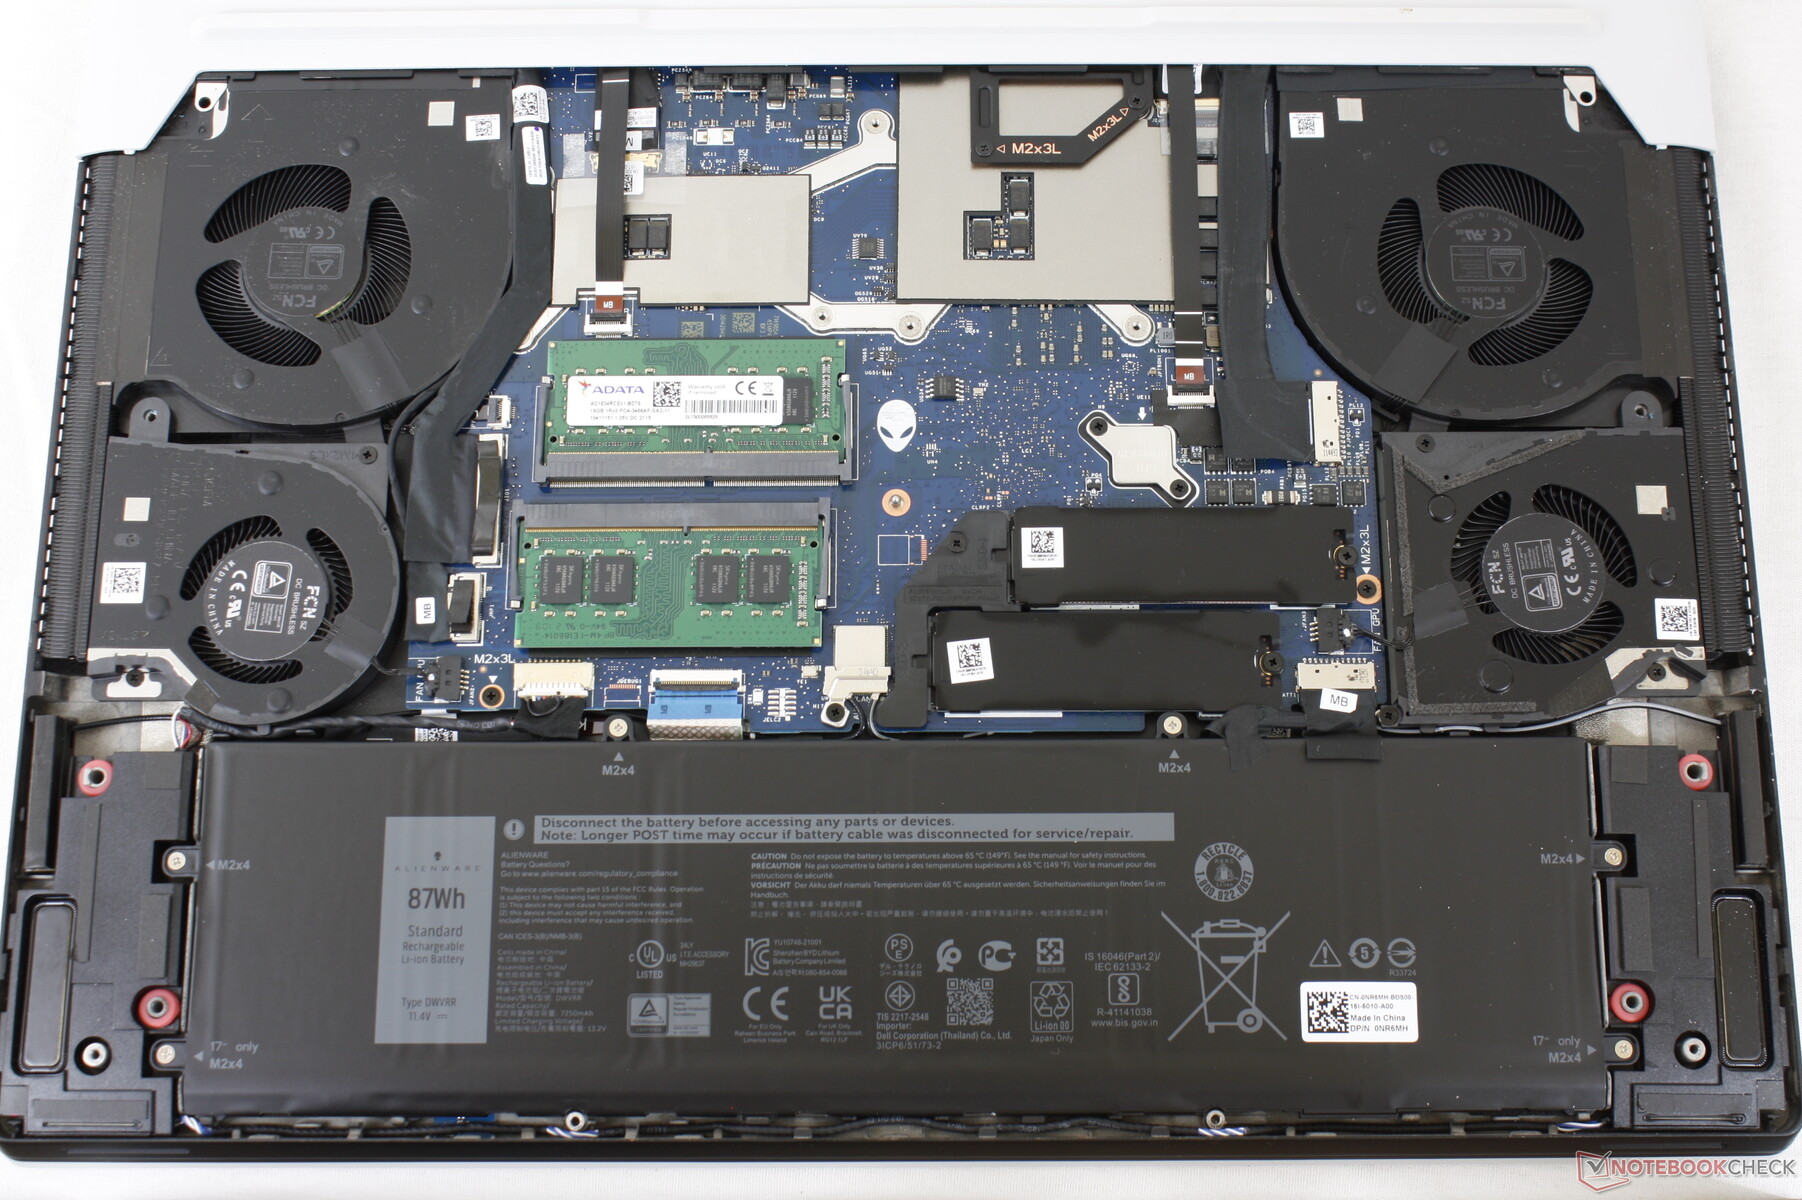
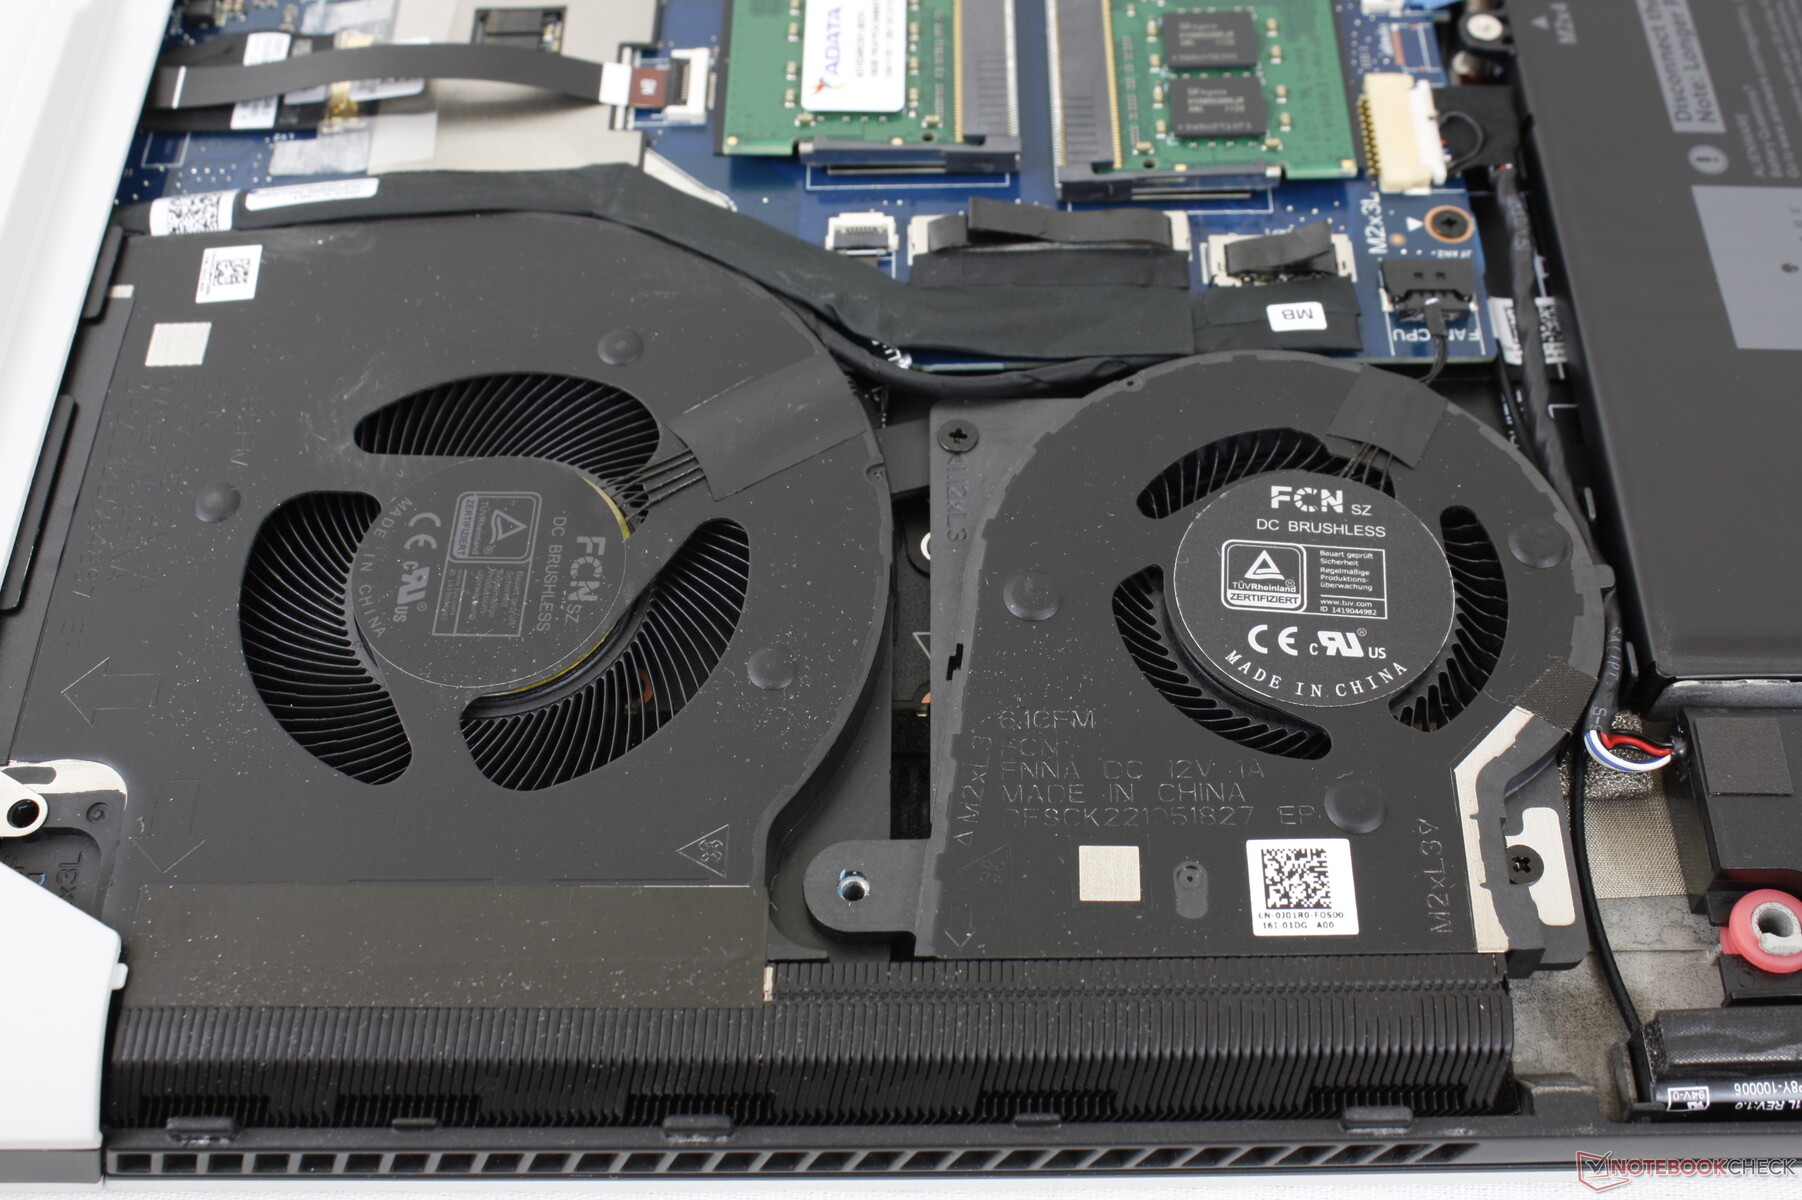
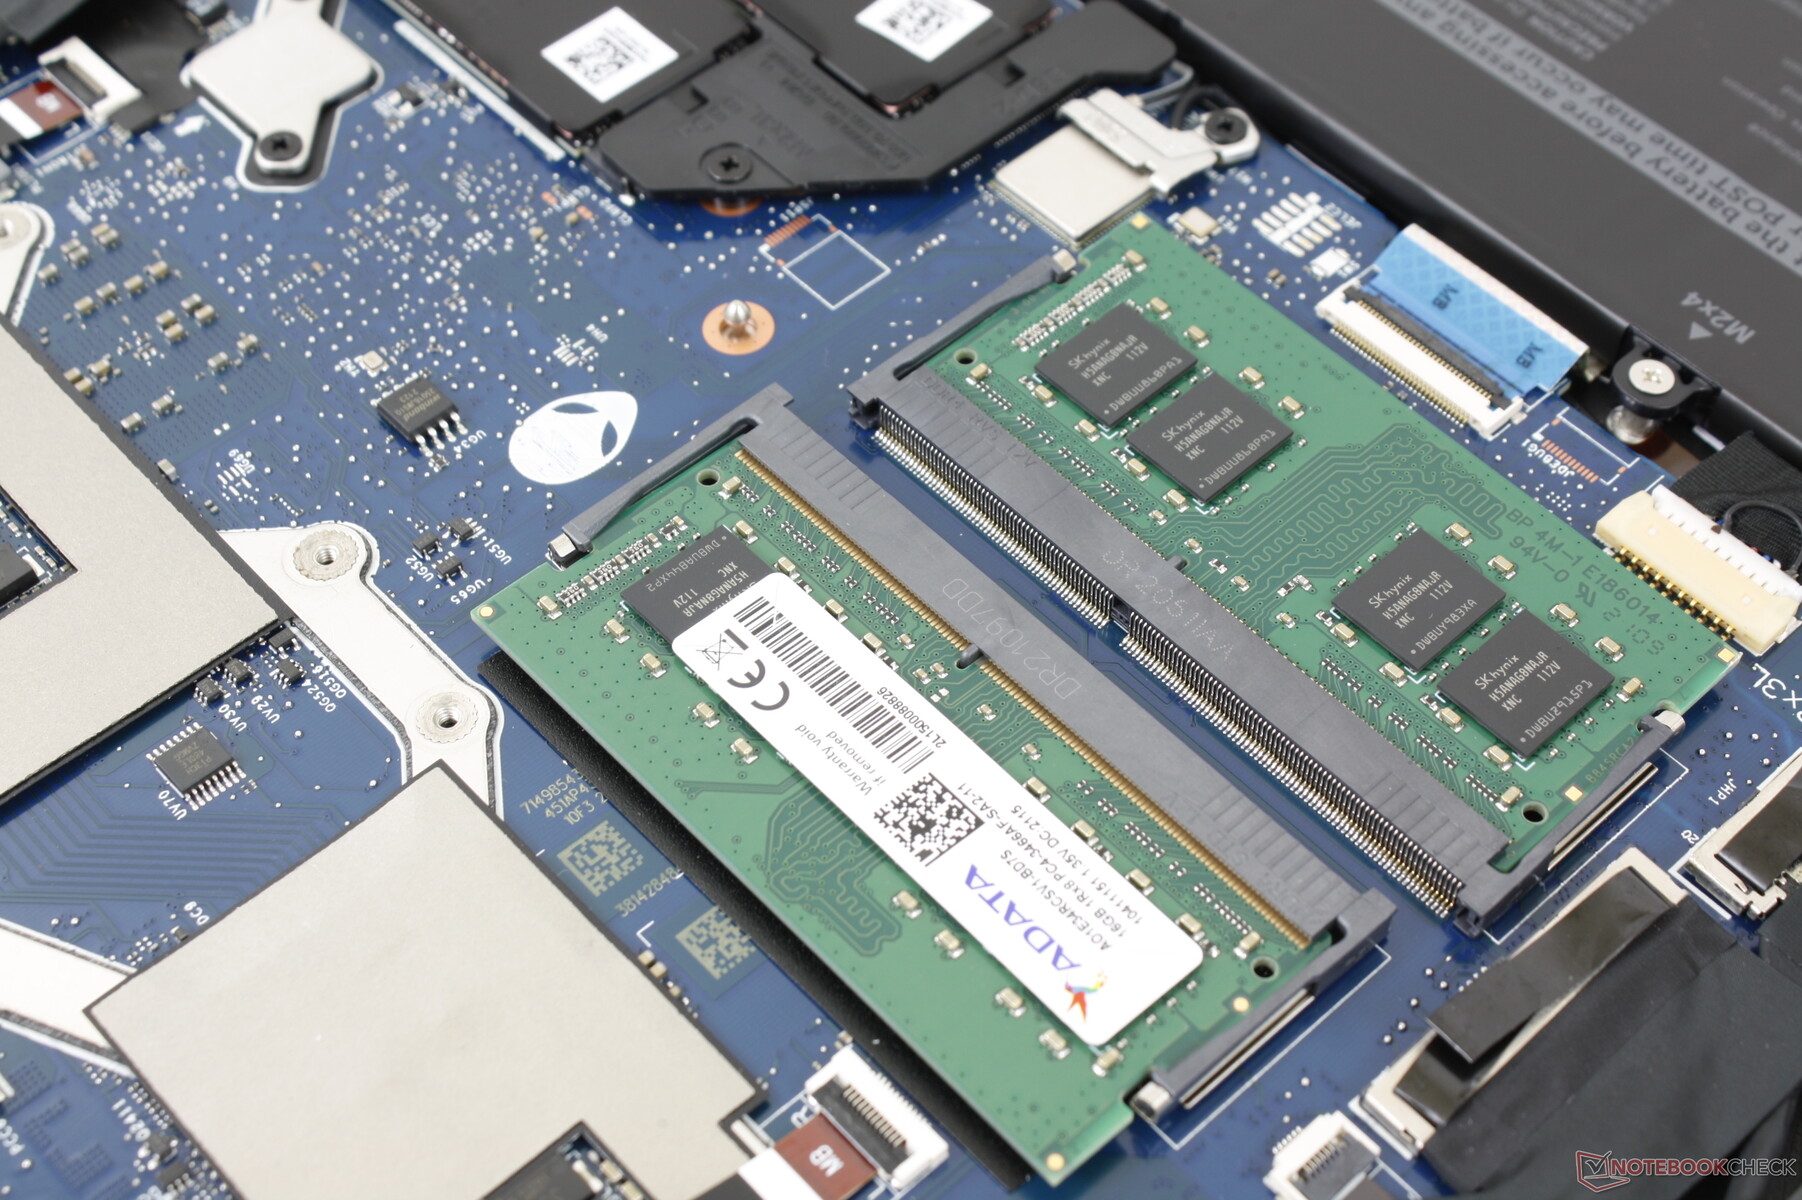
维护
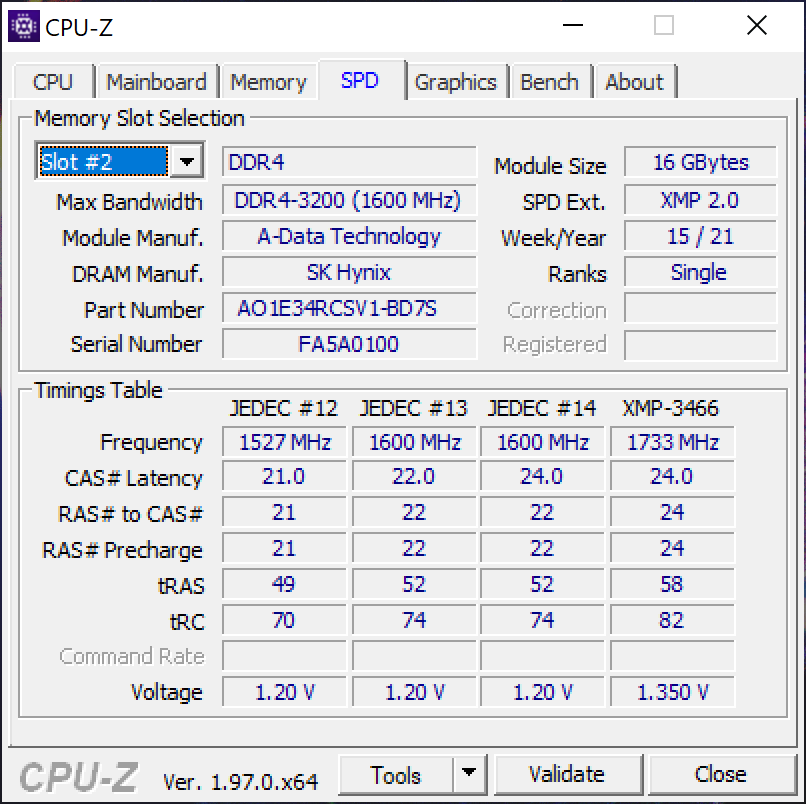
只需一把飞利浦螺丝刀和锋利的边缘,底板就能轻松弹出。内存现在可以通过2个SODIMM插槽进行扩展,而在旧的m17 R2设计上,它们是焊接的。
配件和保修
盒子里除了交流电适配器和文件外,没有任何额外的东西。如果直接从戴尔购买,标准的一年有限保修期适用于延长保修期的选项。
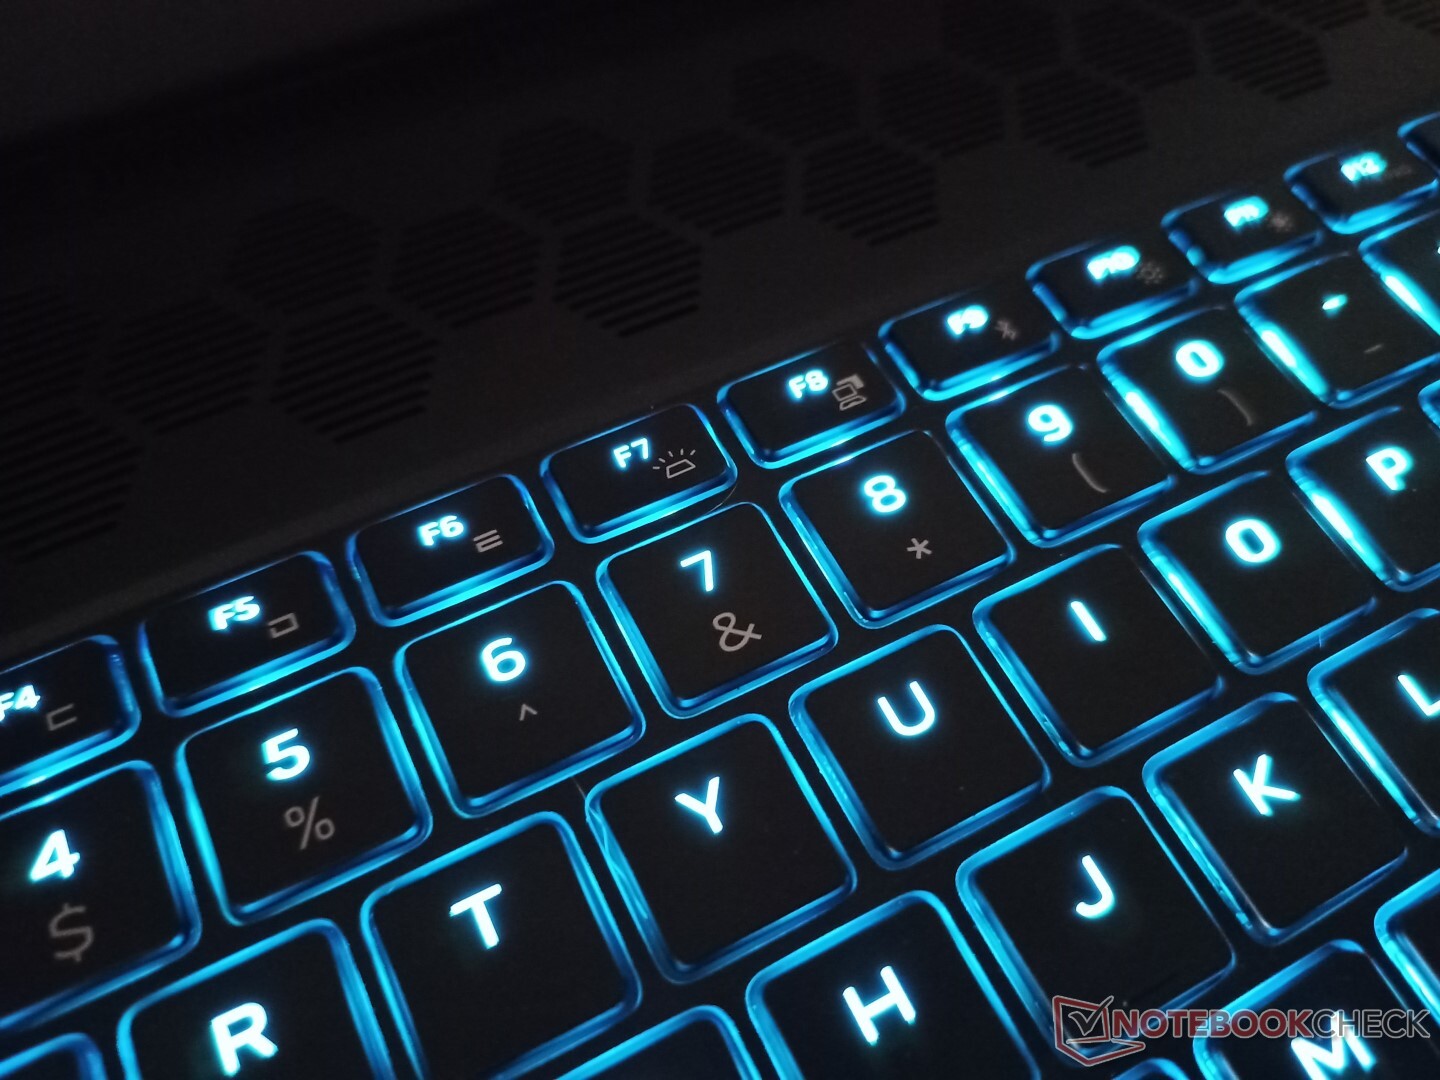
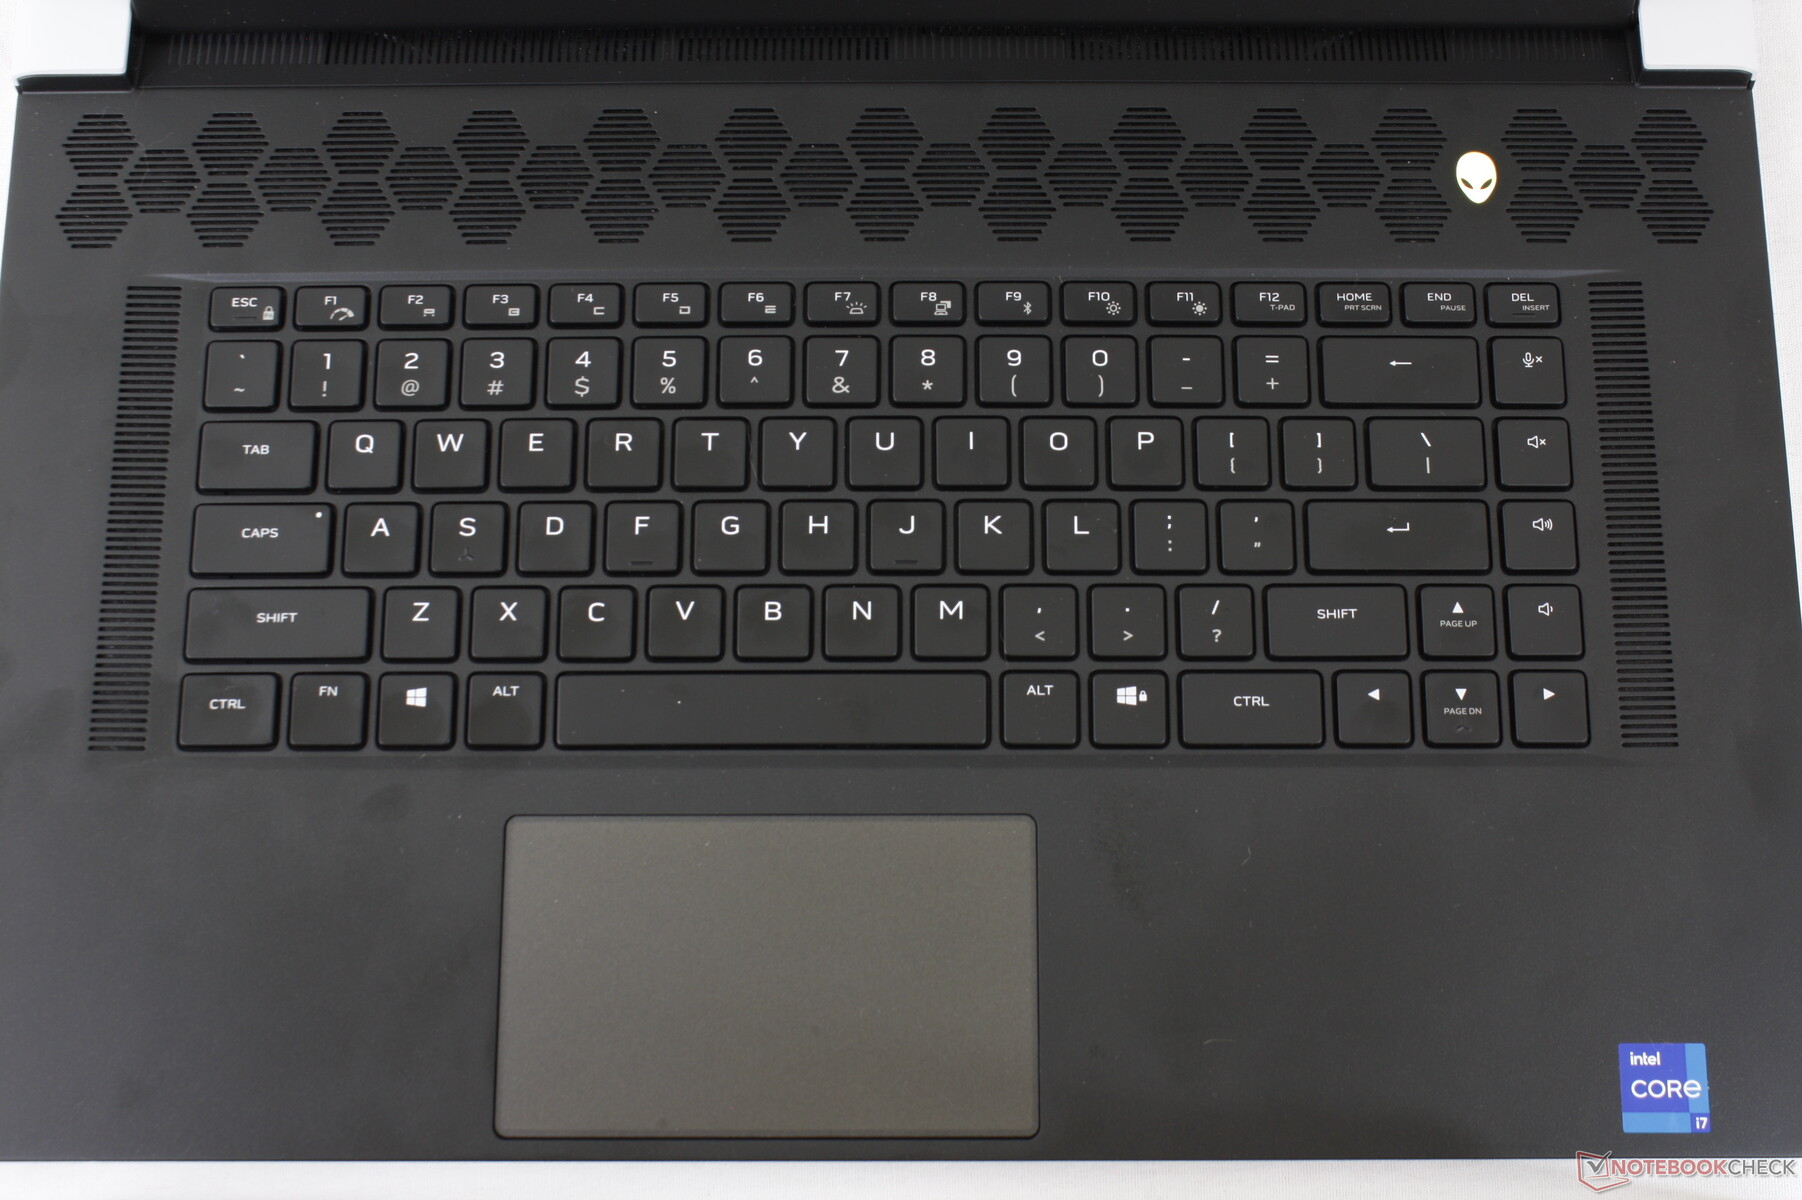
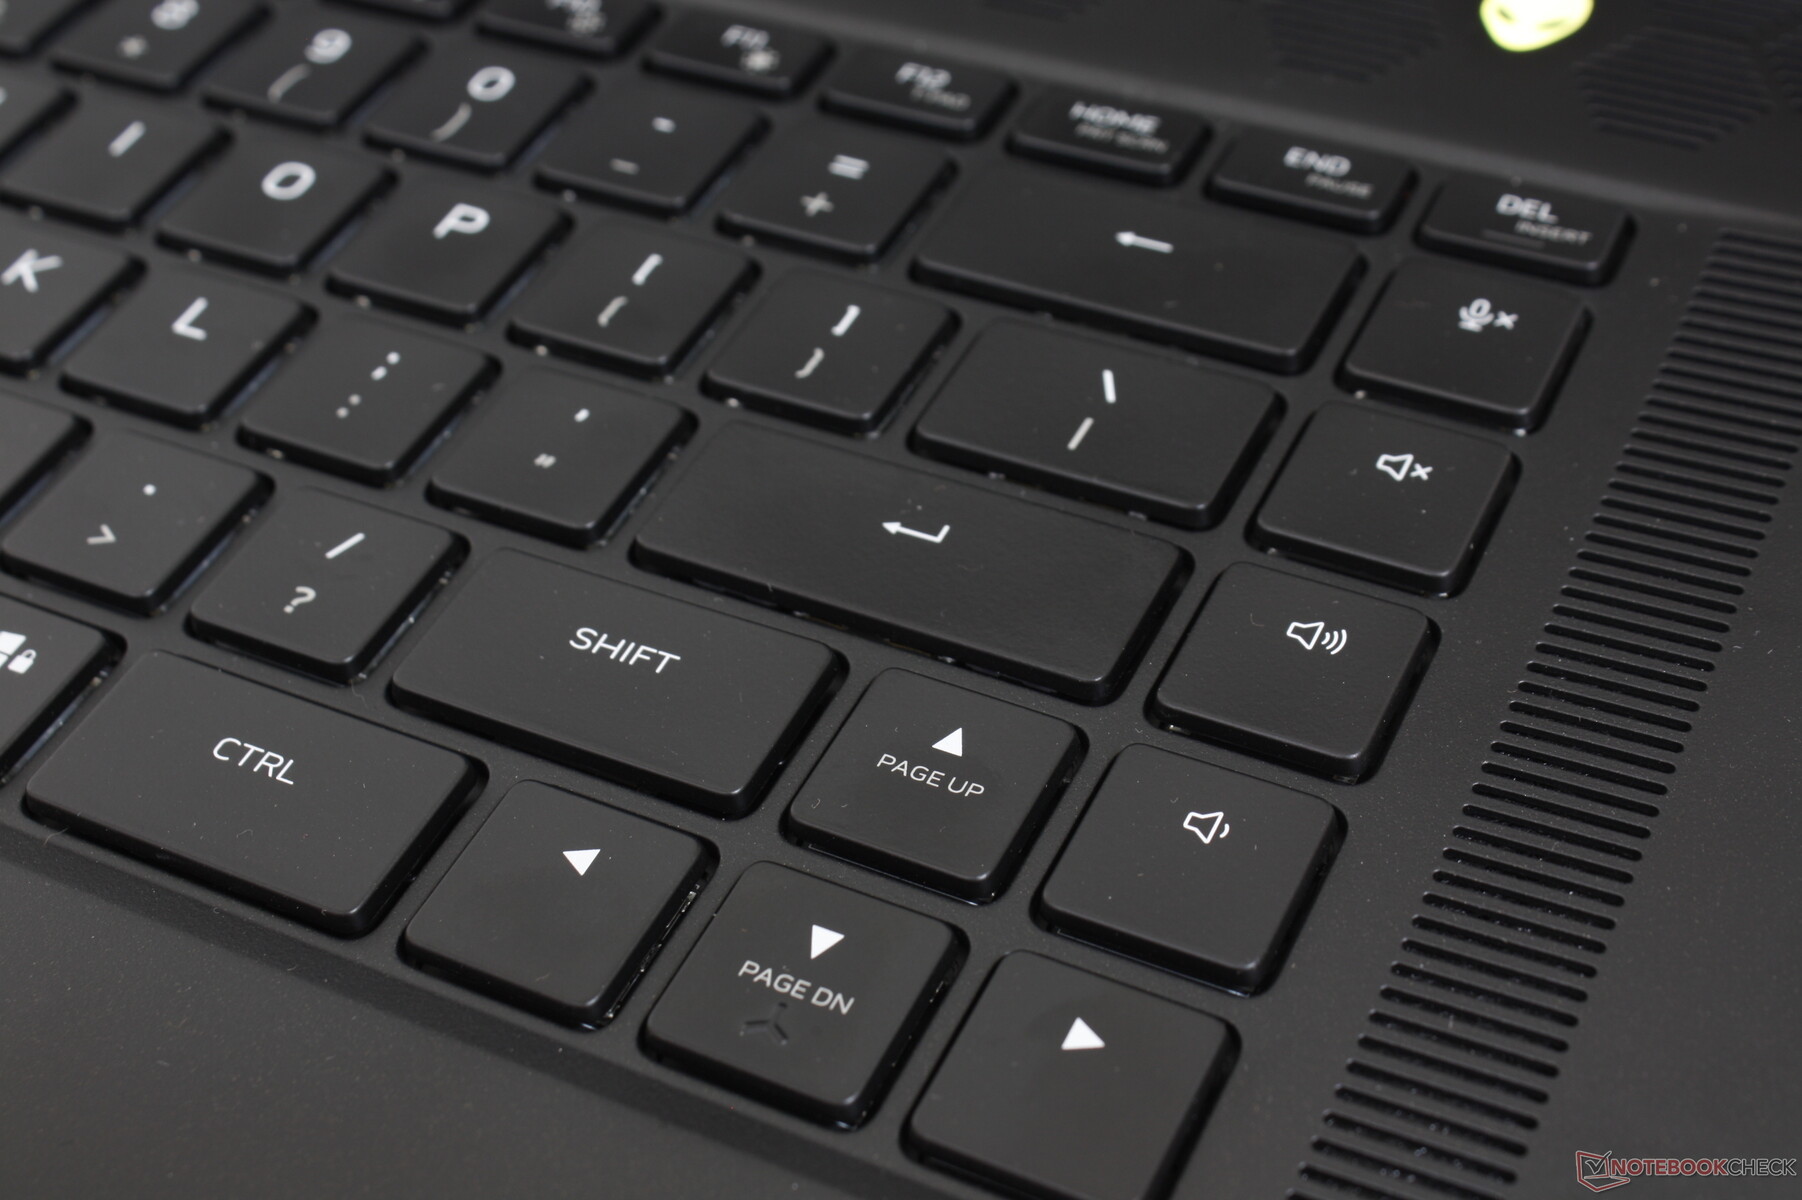
输入设备 - CherryMX的救援
键盘
去年在Alienware m17 R4上推出的 在去年的Alienware m17 R4上,超低调的CherryMX机械键作为一项可选功能回到了x17 R1上。我们最初对这些按键感到犹豫不决,因为机械或光学开关在笔记本电脑上大多是缺失的,如 微星GT80 Titan,2019年的Razer Blade 15,或 联想Legion Y920.然而,这些新的CherryMX键,很快就成为我们在任何游戏笔记本电脑上的最爱。与Razer Blade 17或MSI GS76等笔记本电脑相比,反馈均匀、更清晰,而且有更深的行程和更令人满意的点击。每个键的RGB键在文字处理和游戏方面都很好用,尽管代价是室友或同学可能不喜欢的高亢的咔哒声。在这些情况下,我们建议选择带有传统膜基开关的SKU来代替。
也许我们对键盘最大的不满是,大多数按键上的次要符号都没有背光。因此,如果在昏暗的环境中工作或游戏,几乎不可能看到亮度控制、打印屏幕、暂停、插入等按键。所有按键和符号在 刀锋17的所有按键和符号都被点亮。请注意,第一排的功能键也不是机械的。
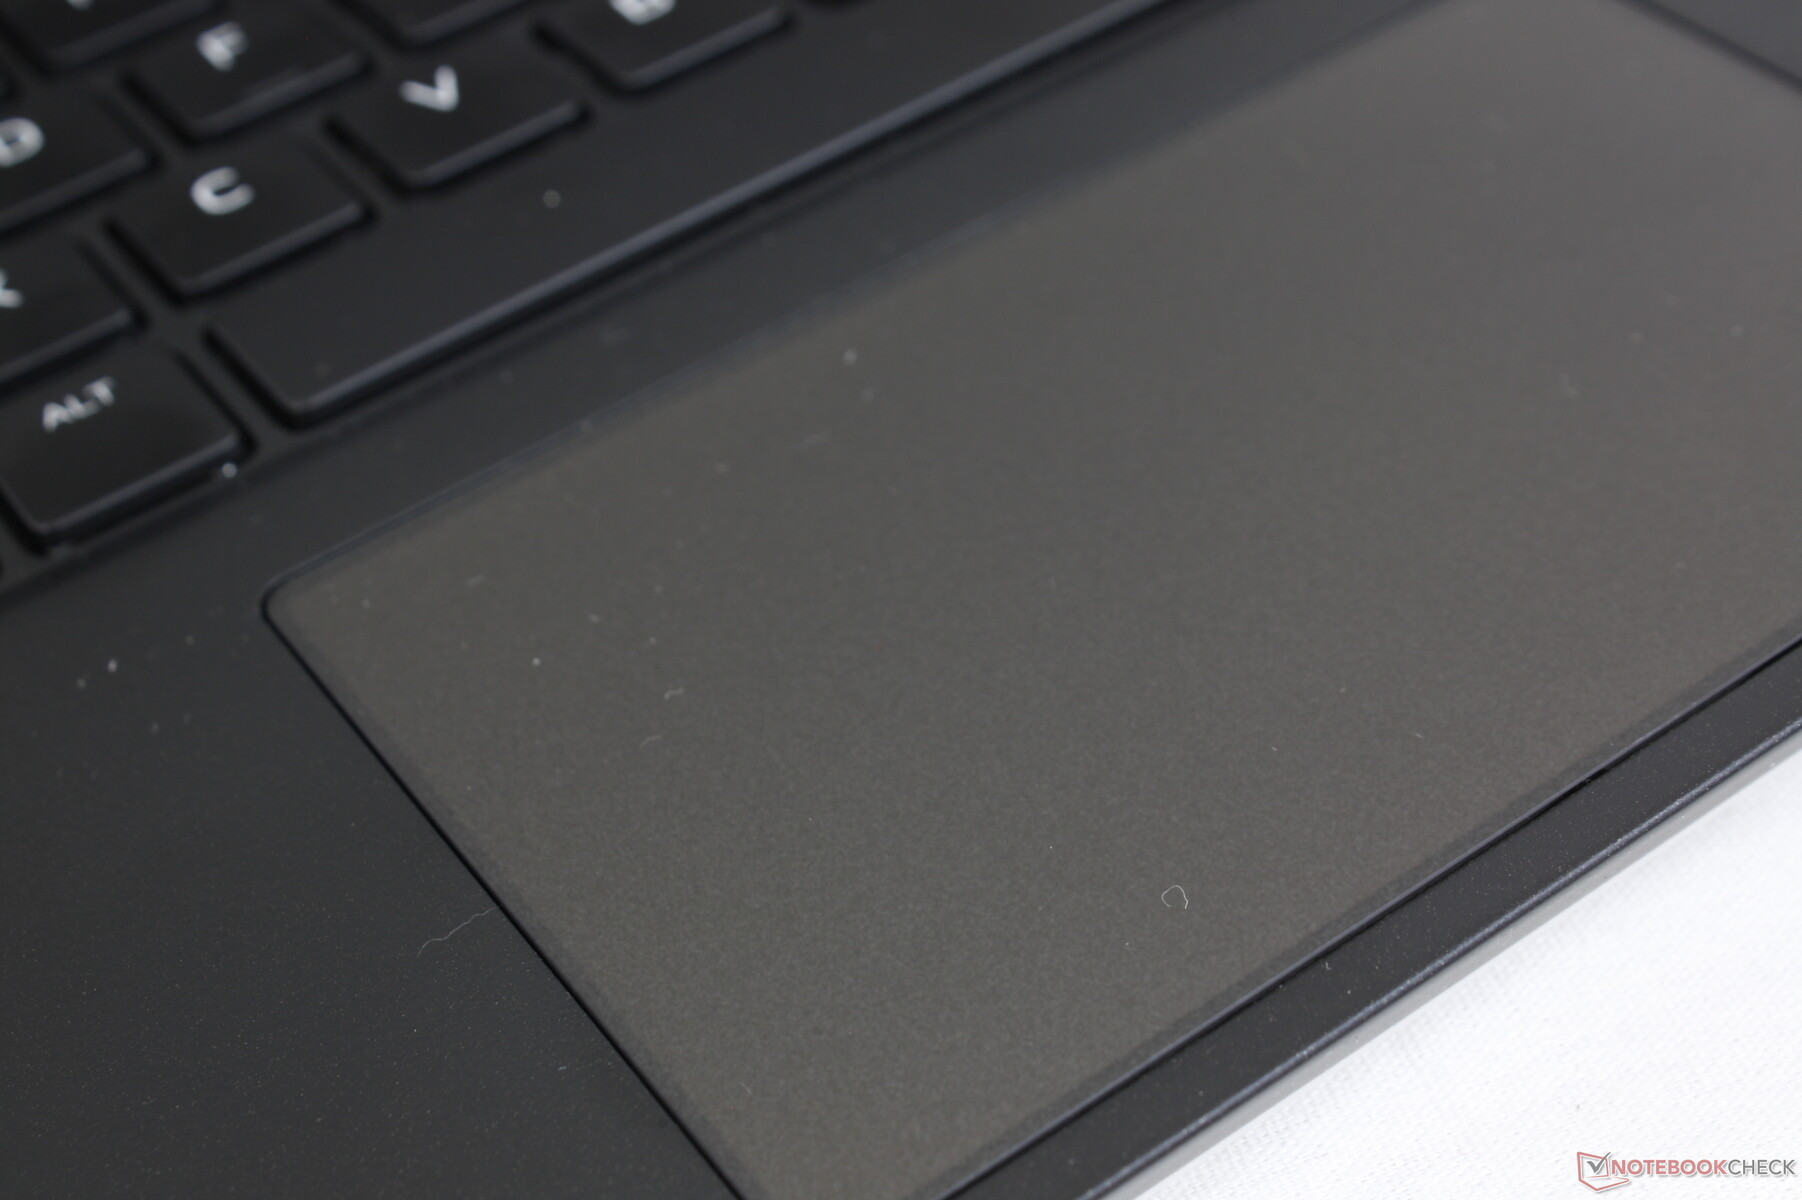
触摸板
Precision 点击板相对较小,为11.3 x 6.8厘米,而微星GS75为14 x 6.5厘米。它的表面在以中等速度滑行时是光滑的,只有在较慢的速度下才会有一点粘性,以便更准确地点击。行程很浅,按下去的时候反馈也比较柔和。虽然更大的表面积会使多点触控输入更容易,但至少点击板不像Razer Blade系列的那样海绵状。
戴尔在某些SKU上为点击板提供了RGB背光,这是一个从旧的Alienware笔记本电脑返回的表面选项。较小的15.6英寸Alienware x15 R1不具备这一功能。

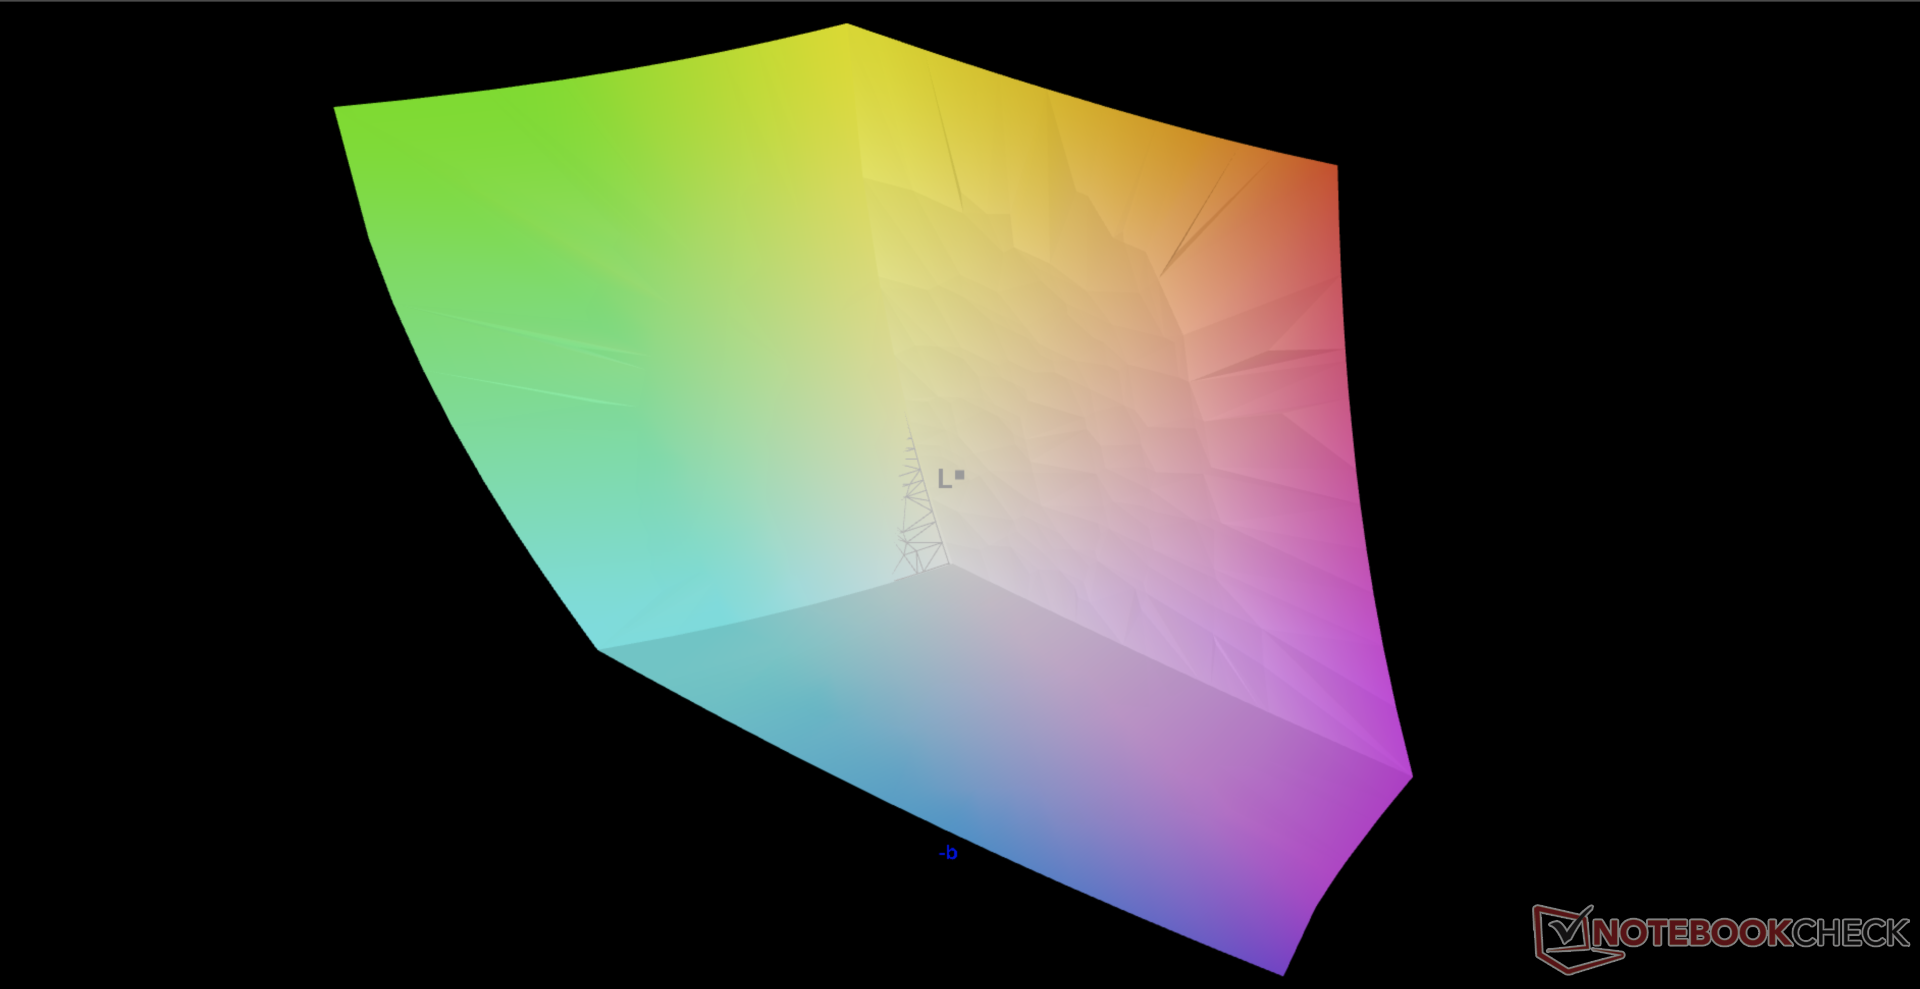
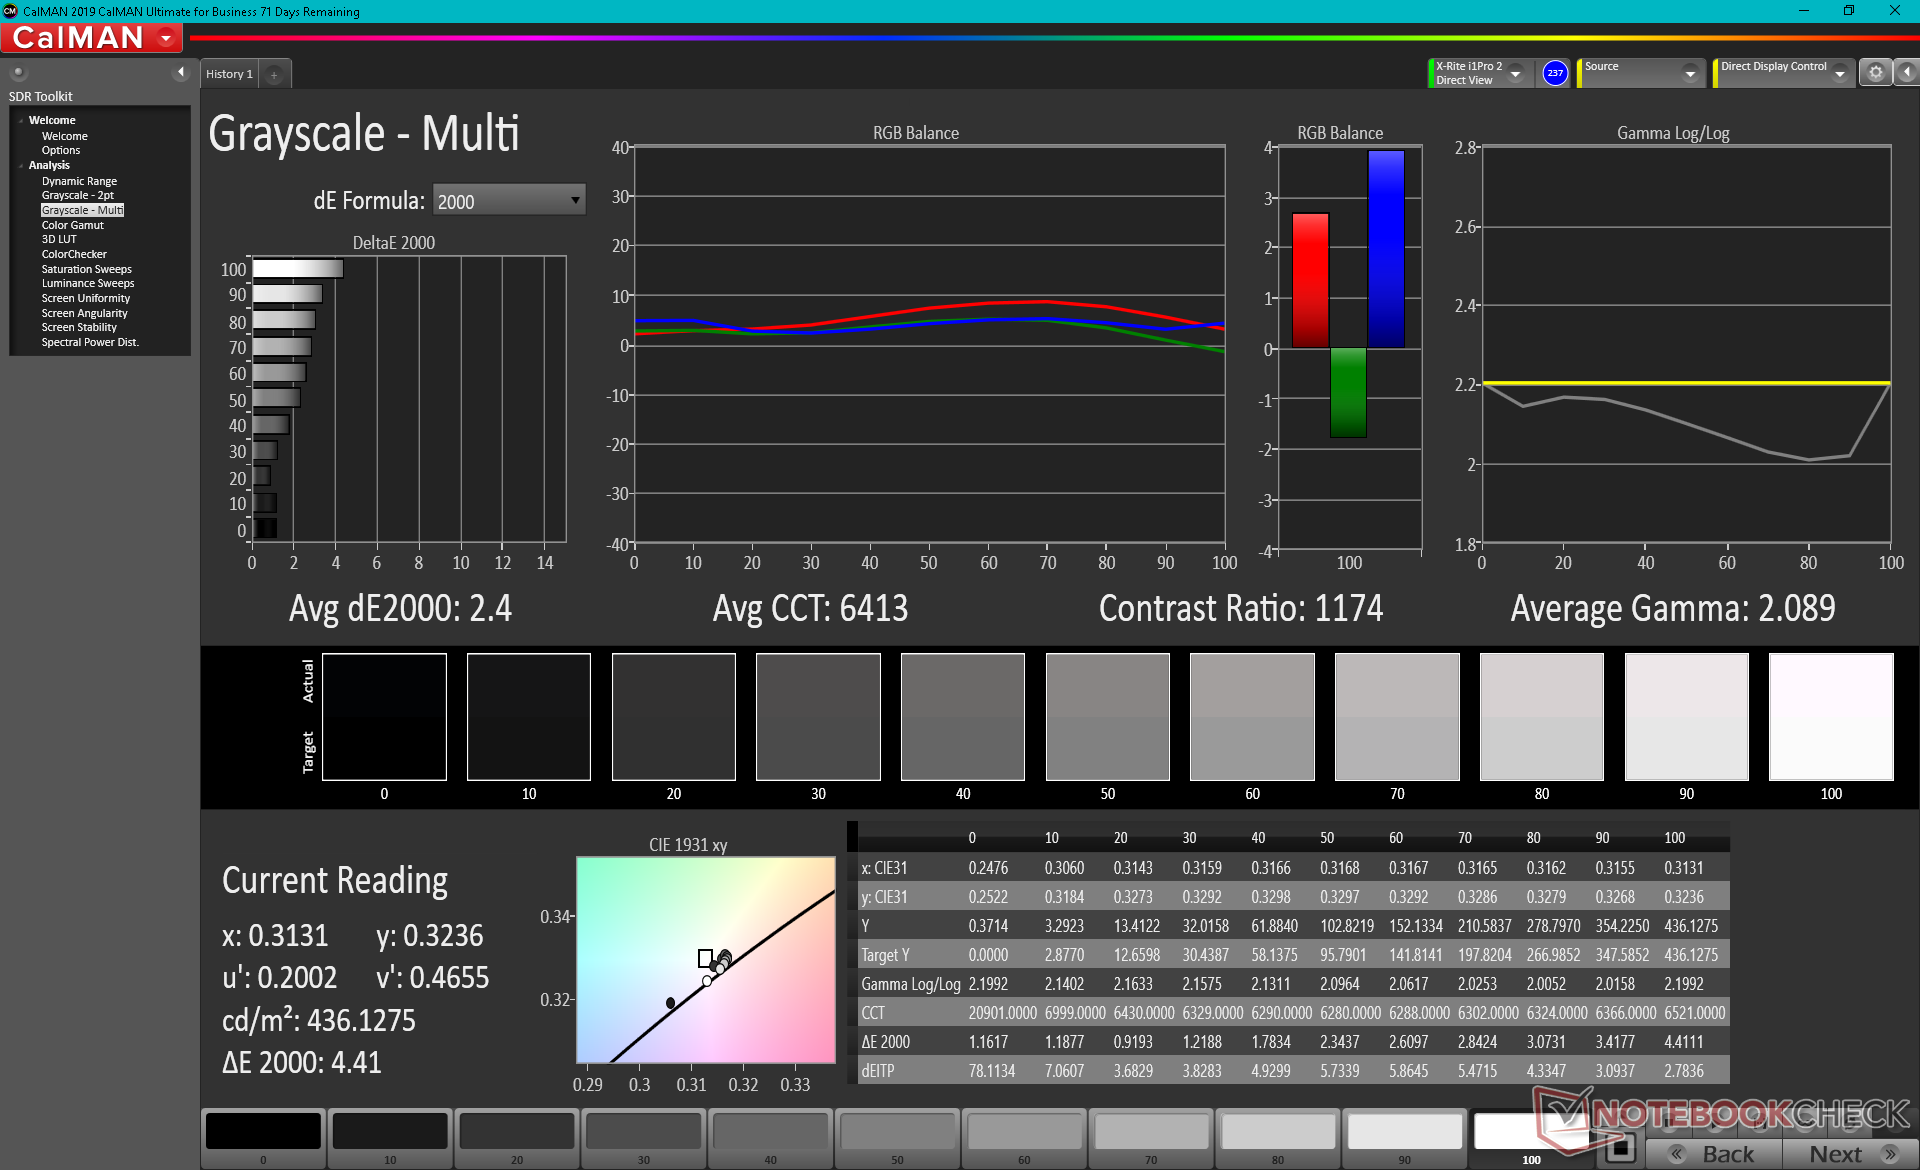
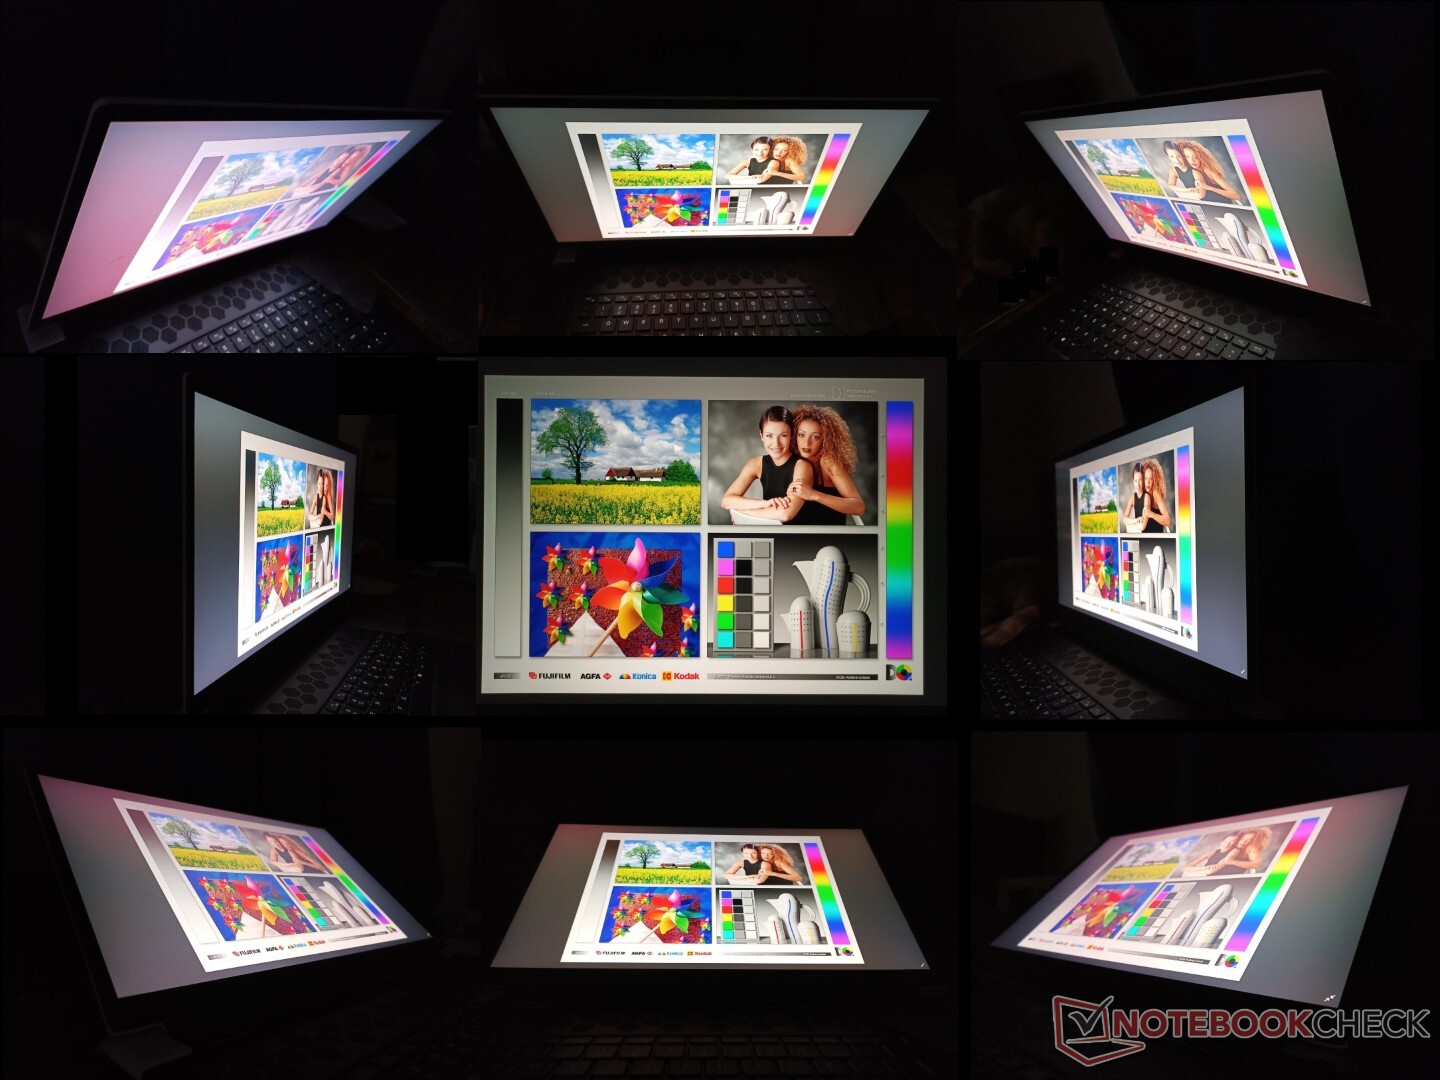
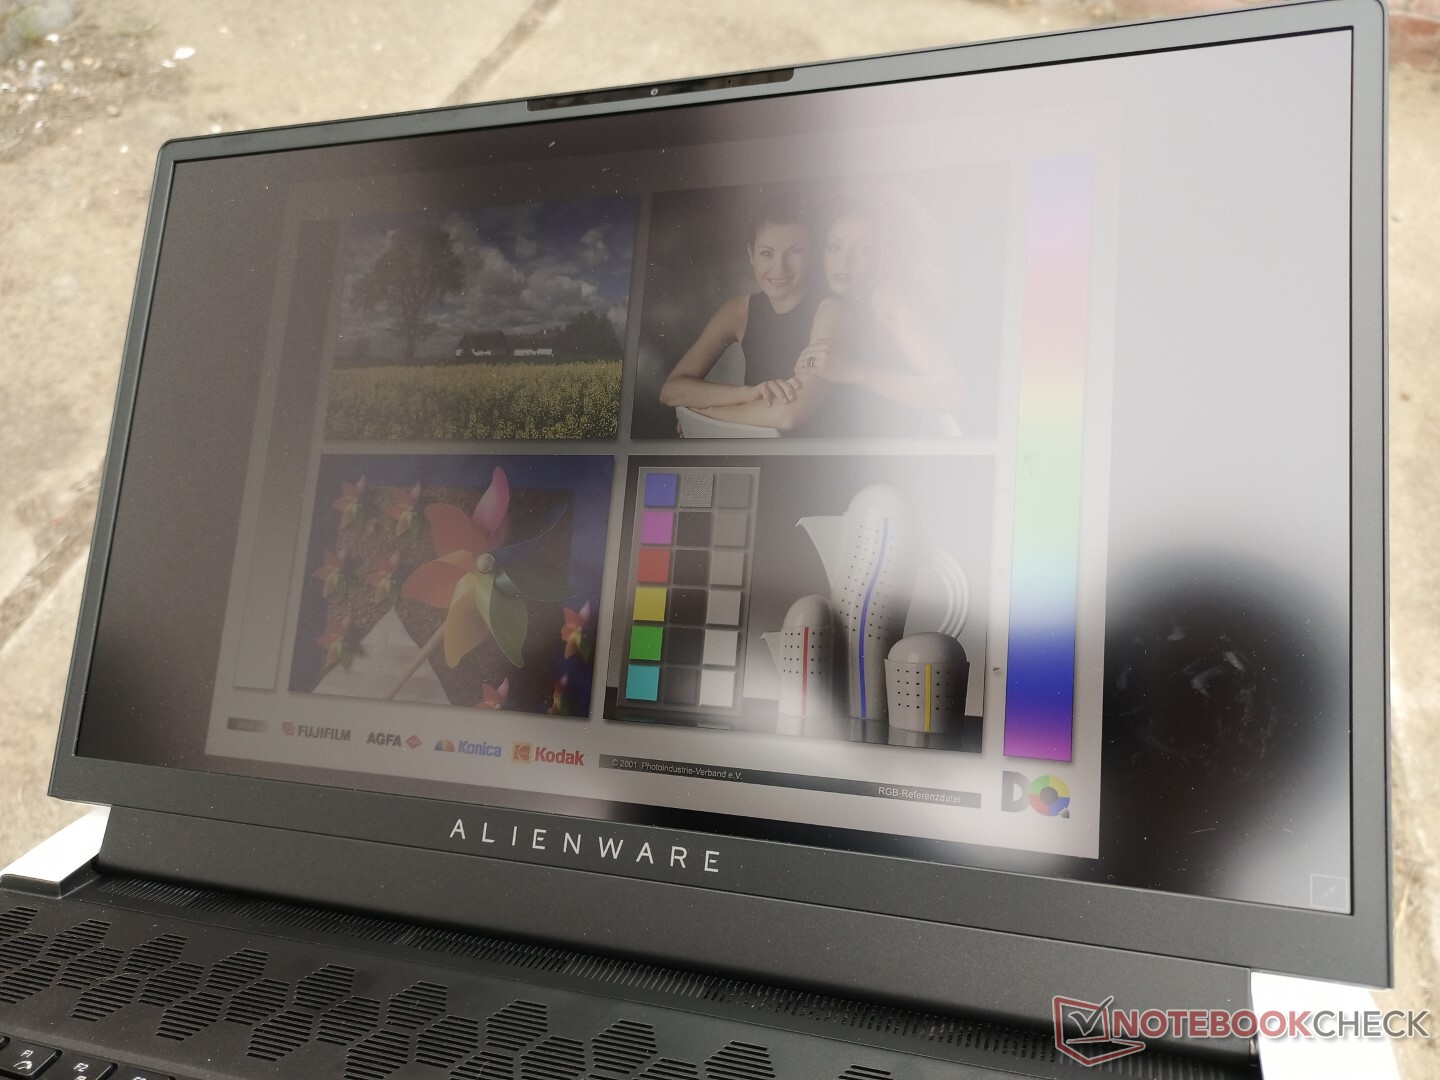
显示 - 4K, 120 Hz, 100% AdobeRGB, 5 ms
虽然AU Optronics B173ZAN面板可以在其他笔记本电脑上找到,如申科XMG Ultra 17而我们的Alienware上的面板的原始刷新率为120赫兹,而不是60赫兹。此外,黑白和灰白的响应时间在1位数范围内非常快,最大亮度也明显比其他大多数游戏笔记本更亮。微星 微星GS76采用了类似的4K面板,响应时间甚至比我们的Alienware更快,尽管代价是色域更窄。这使得Alienware显示器成为我们所见过的极少数在刷新率、分辨率、响应时间、色彩覆盖率和亮度方面似乎都能满足要求的显示器之一。
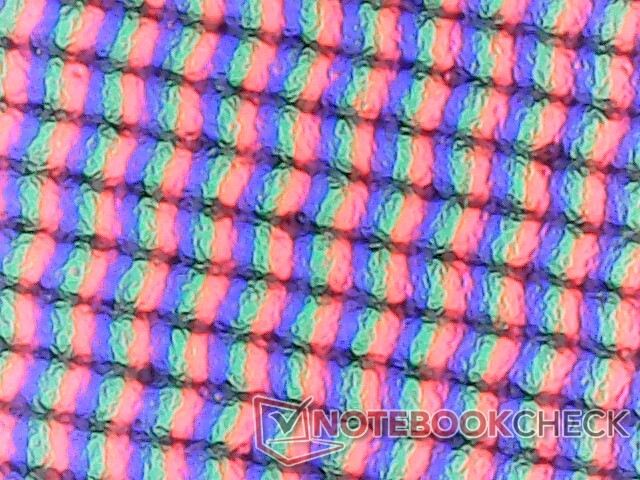
哑光的覆盖层比光面的替代物稍有颗粒感,在我们的特定设备上,背光渗漏情况可能会更好。我们下面的测量结果只反映了4K 120 Hz面板,而不是Alienware x17的任何其他显示器选项,这些选项预计会有不同的属性。
请注意,Advanced Optimus仅适用于FHD 360 Hz SKU。像我们这样的其他SKU有Optimus 1.0,在BIOS中有一个手动的独立GPU选项。

| |||||||||||||||||||||||||
Brightness Distribution: 91 %
Center on Battery: 438.7 cd/m²
Contrast: 914:1 (Black: 0.48 cd/m²)
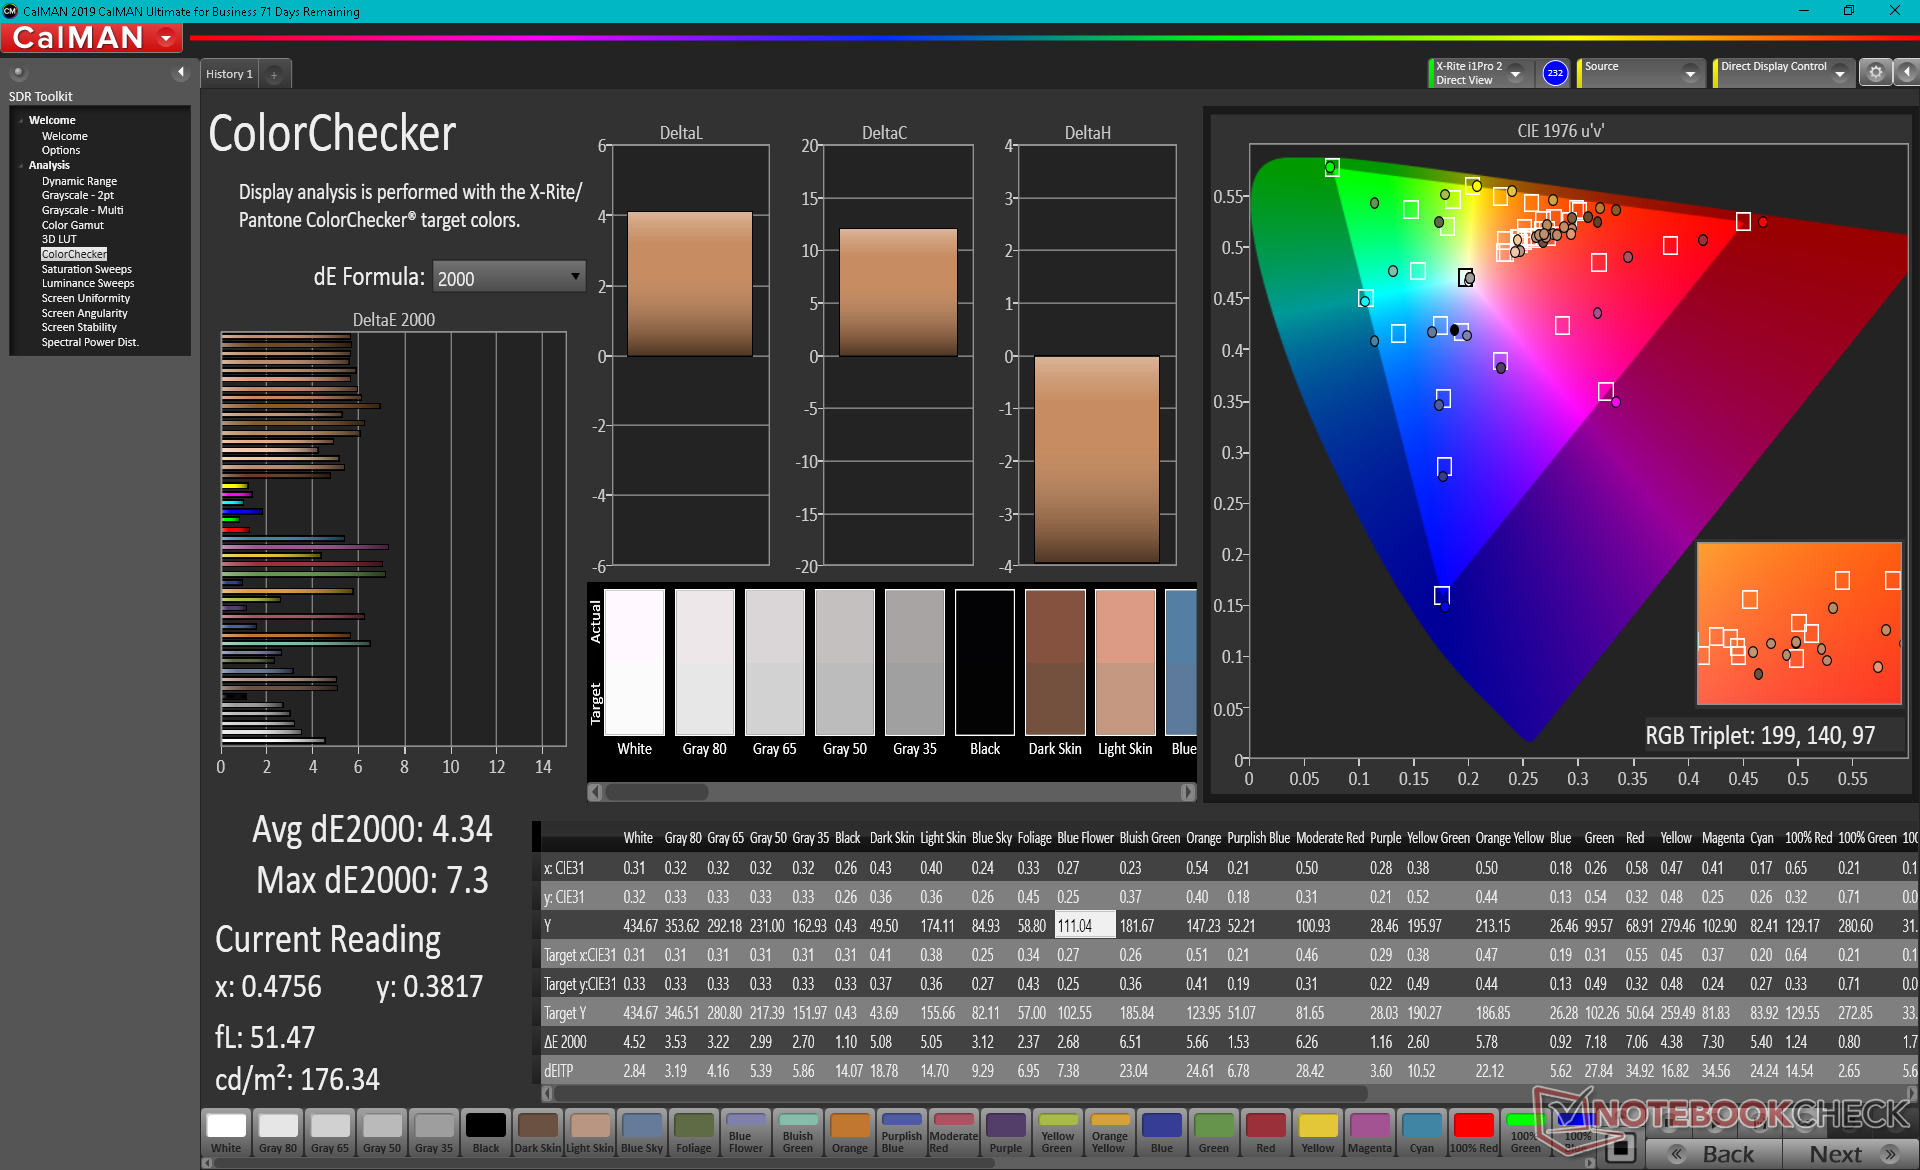
ΔE ColorChecker Calman: 4.34 | ∀{0.5-29.43 Ø4.72}
calibrated: 0.72
ΔE Greyscale Calman: 2.4 | ∀{0.09-98 Ø4.97}
100% AdobeRGB 1998 (Argyll 3D)
100% sRGB (Argyll 3D)
88.3% Display P3 (Argyll 3D)
Gamma: 2.09
CCT: 6413 K
| Alienware x17 RTX 3080 P48E AU Optronics B173ZAN, IPS, 17.3", 3840x2160 | Alienware m17 R4 AU Optronics AUOEC91, IPS, 17.3", 1920x1080 | Razer Blade 17 RTX 3070 AU Optronics B173HAN05.4, IPS, 17.3", 1920x1080 | Asus ROG Zephyrus S17 GX703HSD BOE099D (BOE CQ NE173QHM-NY3), IPS, 17.3", 2560x1440 | MSI GS76 Stealth 11UH AUO B173ZAN06.1 (AUODE95), IPS, 17.3", 3840x2160 | Gigabyte Aero 17 HDR YD AU Optronics AUO329B, IPS, 17.3", 3840x2160 | |
|---|---|---|---|---|---|---|
| Display | -16% | -15% | -3% | -23% | -1% | |
| Display P3 Coverage (%) | 88.3 | 69.8 -21% | 71.7 -19% | 94.2 7% | 63 -29% | 86.9 -2% |
| sRGB Coverage (%) | 100 | 99.7 0% | 98.8 -1% | 98.7 -1% | 94.8 -5% | 100 0% |
| AdobeRGB 1998 Coverage (%) | 100 | 71.6 -28% | 73.6 -26% | 84.4 -16% | 65 -35% | 99.6 0% |
| Response Times | 10% | 43% | 45% | 39% | -206% | |
| Response Time Grey 50% / Grey 80% * (ms) | 14.4 ? | 13.2 ? 8% | 4.2 ? 71% | 4.8 67% | 8.8 ? 39% | 52 ? -261% |
| Response Time Black / White * (ms) | 10.4 ? | 9.2 ? 12% | 8.8 ? 15% | 8 23% | 6.4 ? 38% | 26 ? -150% |
| PWM Frequency (Hz) | ||||||
| Screen | 21% | -44% | -19% | 9% | 30% | |
| Brightness middle (cd/m²) | 438.7 | 305 -30% | 323.3 -26% | 322 -27% | 474 8% | 488 11% |
| Brightness (cd/m²) | 435 | 301 -31% | 315 -28% | 288 -34% | 454 4% | 467 7% |
| Brightness Distribution (%) | 91 | 93 2% | 91 0% | 72 -21% | 88 -3% | 86 -5% |
| Black Level * (cd/m²) | 0.48 | 0.19 60% | 0.33 31% | 0.3 37% | 0.46 4% | 0.33 31% |
| Contrast (:1) | 914 | 1605 76% | 980 7% | 1073 17% | 1030 13% | 1479 62% |
| Colorchecker dE 2000 * | 4.34 | 1.31 70% | 4.59 -6% | 3.05 30% | 1.5 65% | 1.23 72% |
| Colorchecker dE 2000 max. * | 7.3 | 2.32 68% | 10.82 -48% | 5.23 28% | 5.59 23% | 2.94 60% |
| Colorchecker dE 2000 calibrated * | 0.72 | 0.91 -26% | 1.4 -94% | 1.92 -167% | 0.86 -19% | 0.77 -7% |
| Greyscale dE 2000 * | 2.4 | 2.3 4% | 7.9 -229% | 3.11 -30% | 2.8 -17% | 1.5 37% |
| Gamma | 2.09 105% | 2.281 96% | 2.28 96% | 2.13 103% | 2.158 102% | 2.169 101% |
| CCT | 6413 101% | 6449 101% | 5941 109% | 6553 99% | 6597 99% | 6614 98% |
| Color Space (Percent of AdobeRGB 1998) (%) | 72 | 84 | 99 | |||
| Color Space (Percent of sRGB) (%) | 94 | 99 | 99 | |||
| Total Average (Program / Settings) | 5% /
12% | -5% /
-25% | 8% /
-6% | 8% /
6% | -59% /
-10% |
* ... smaller is better
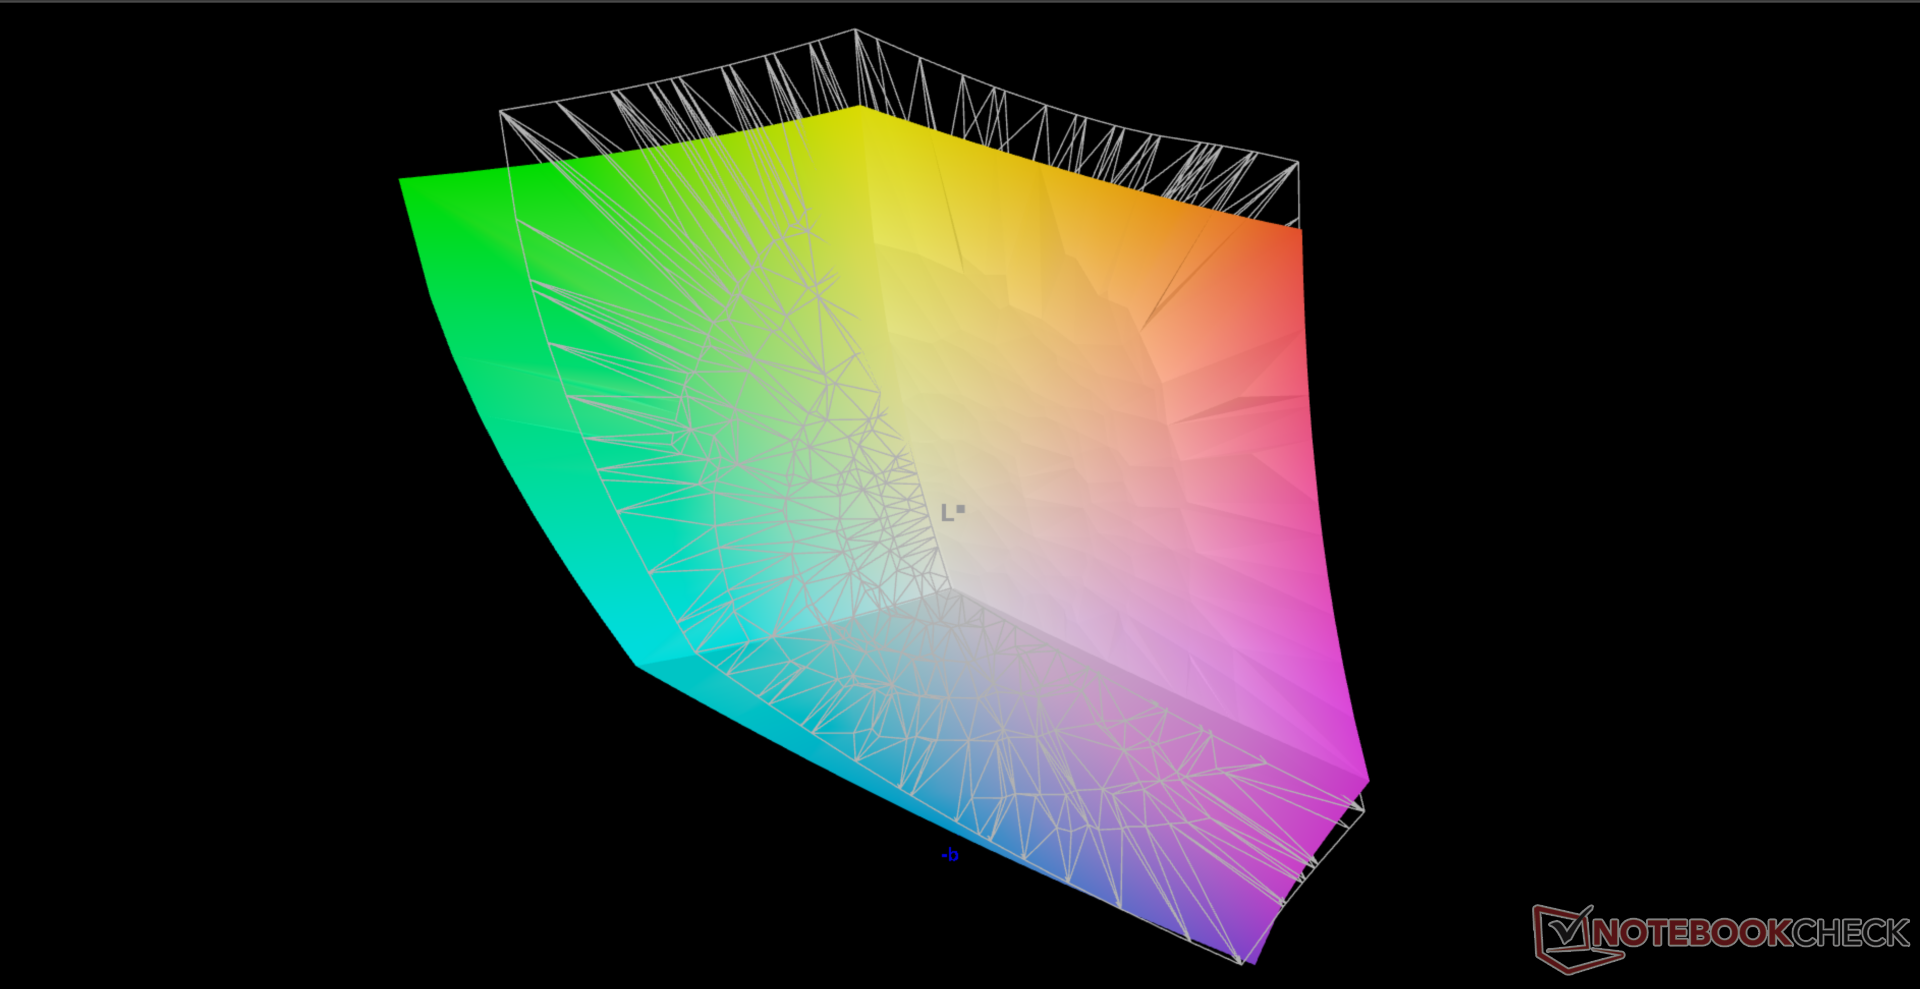
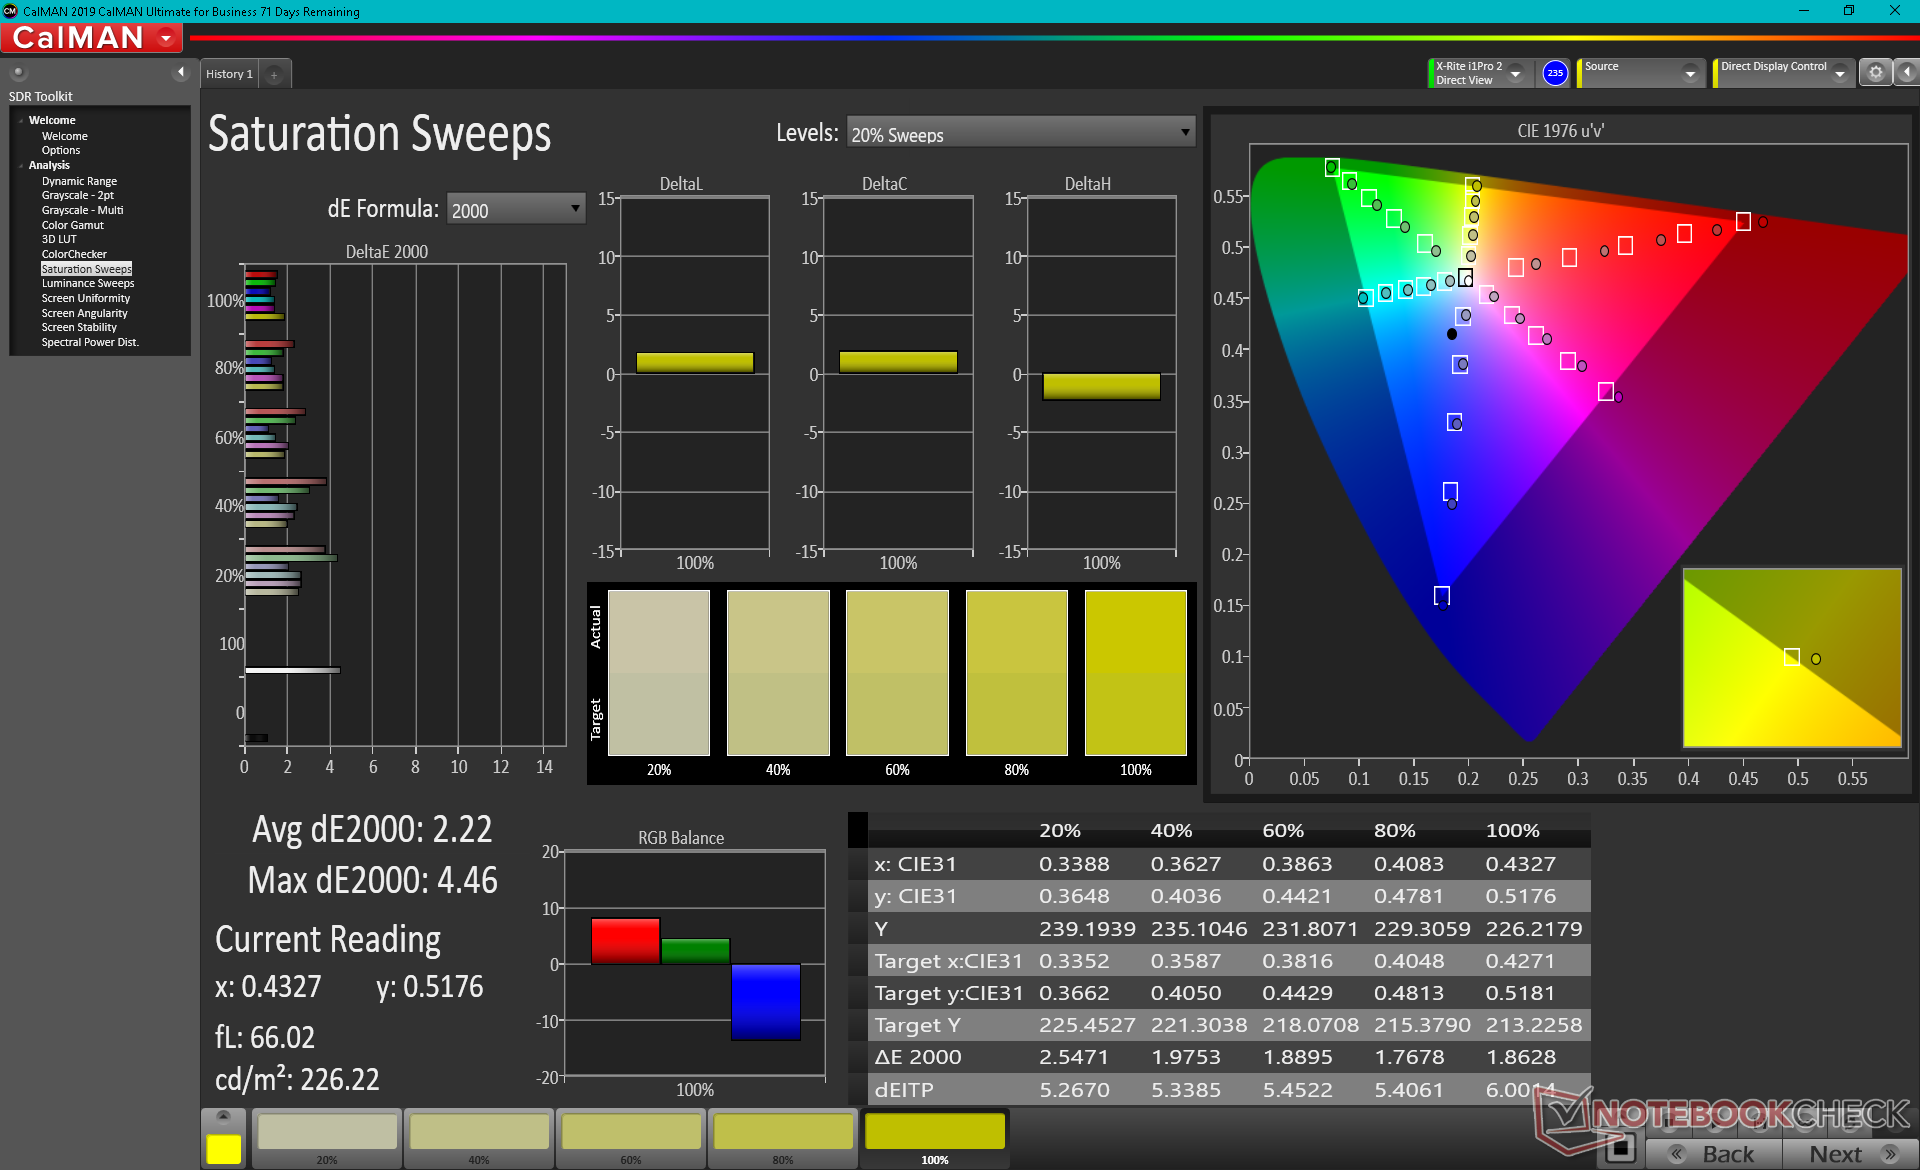
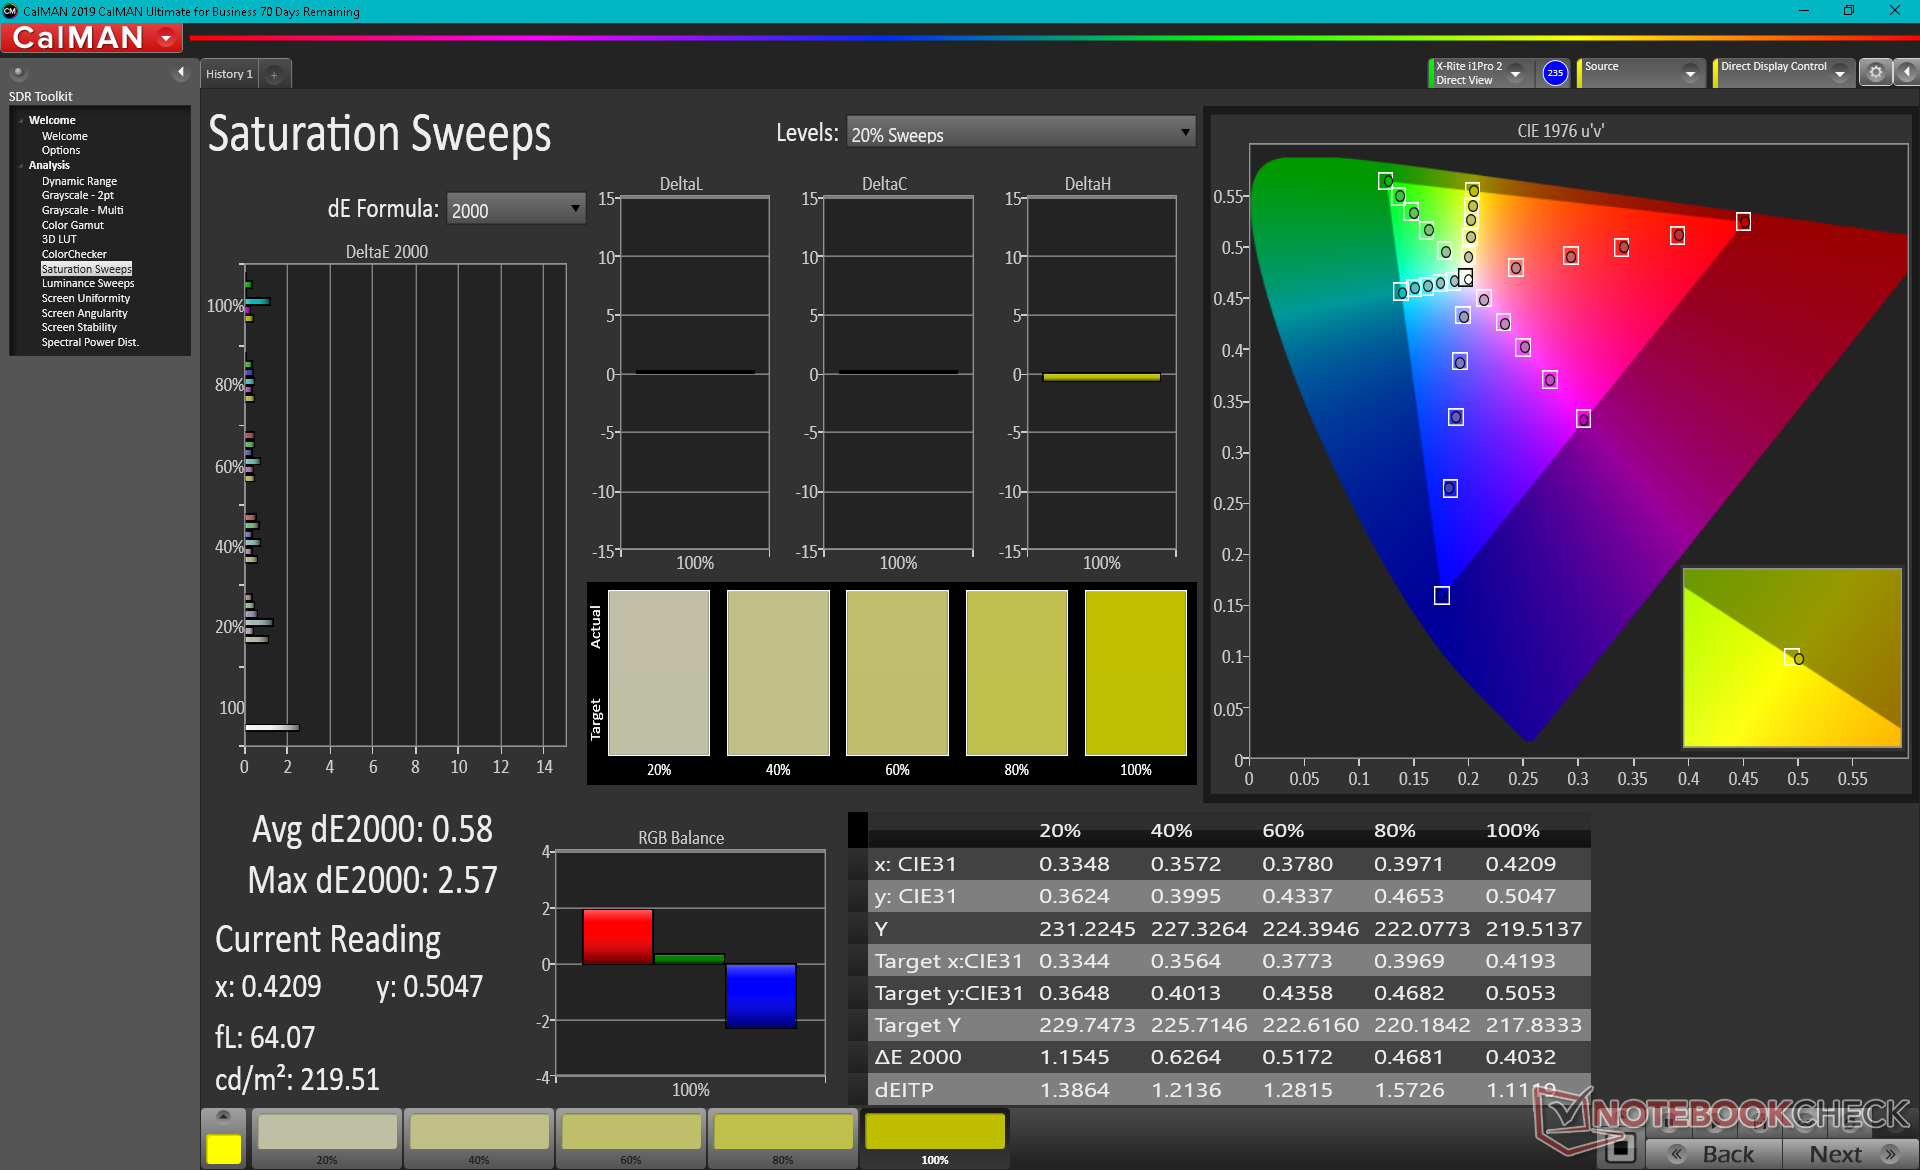
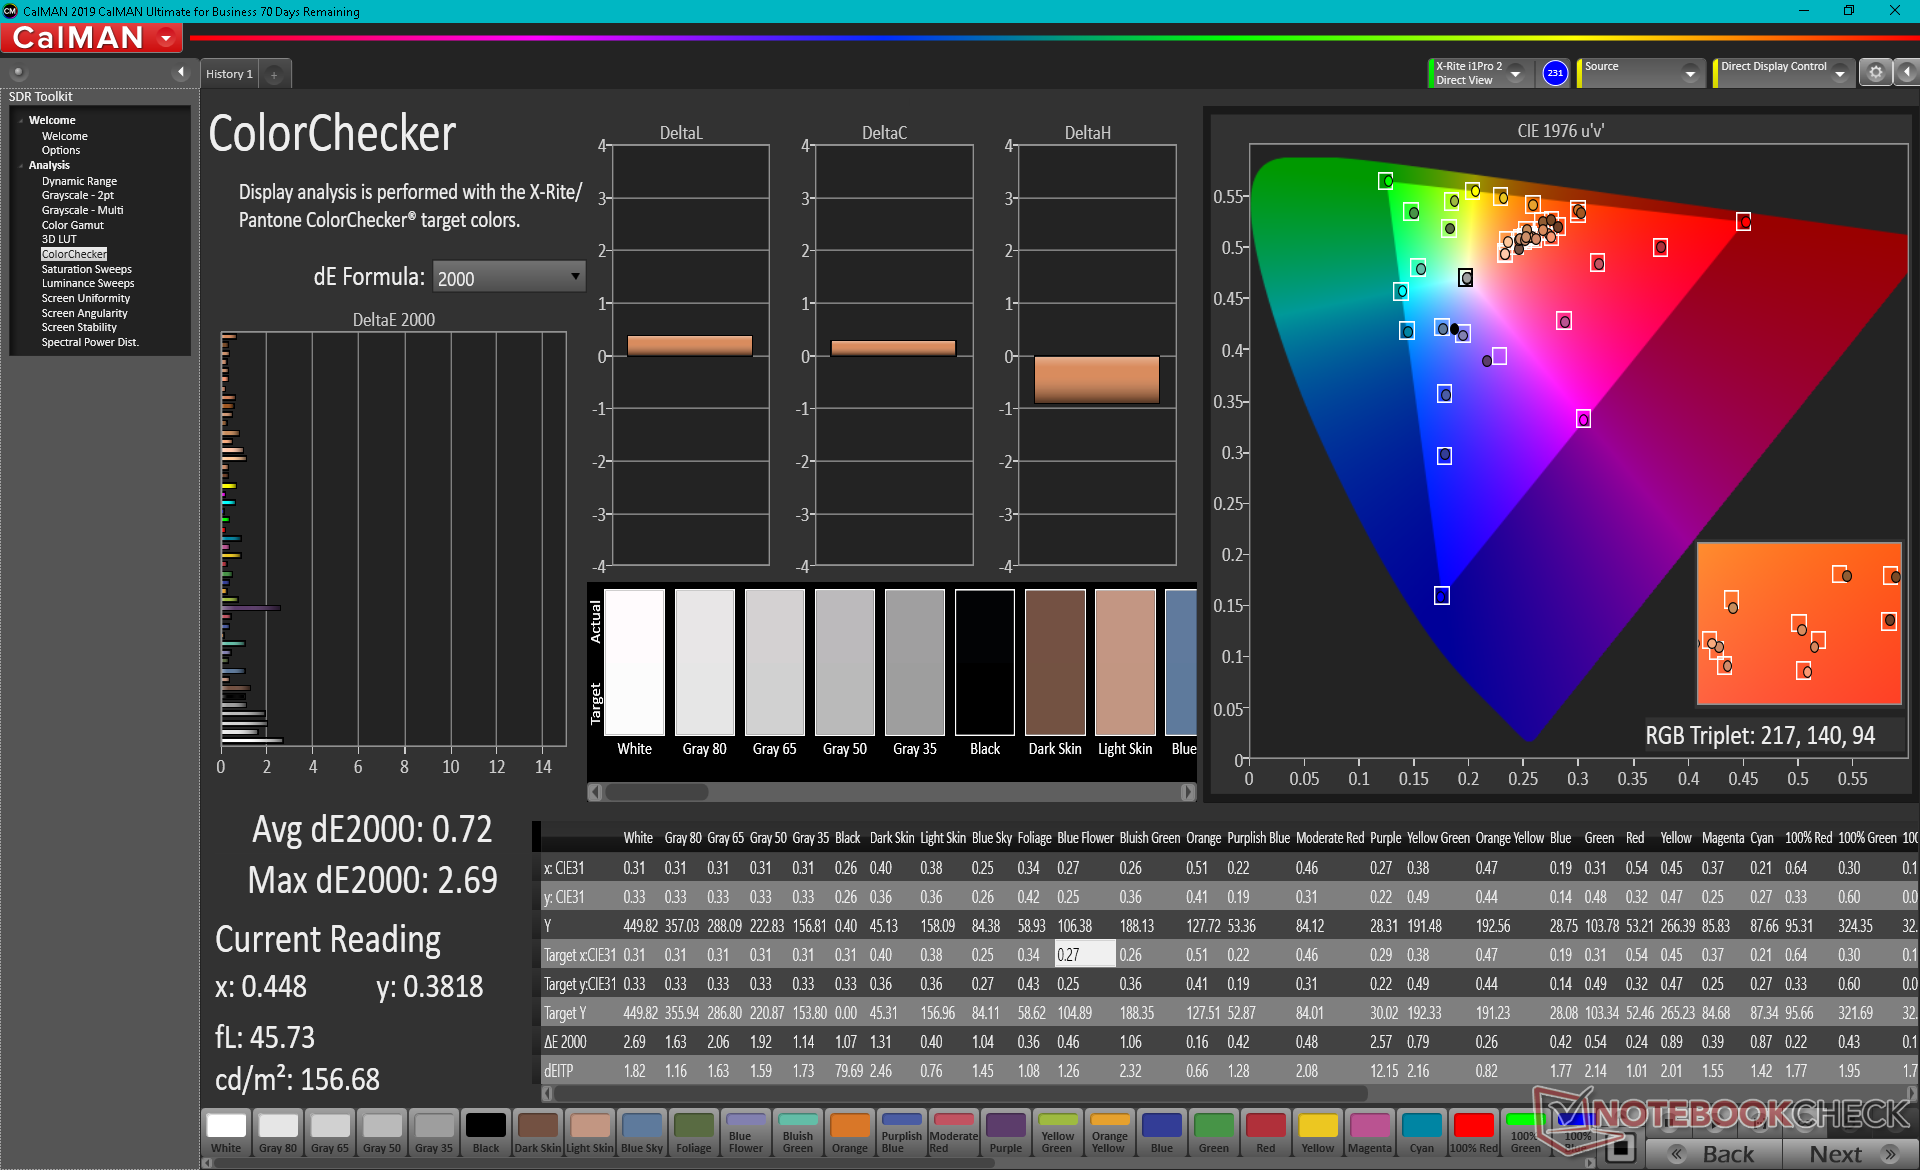
色彩空间包括制造商宣传的所有sRGB和AdobeRGB,而DCI-P3覆盖率约为88%。深邃的色彩、快速的响应时间和快速的刷新率都使这款4K面板适合游戏和图形编辑。
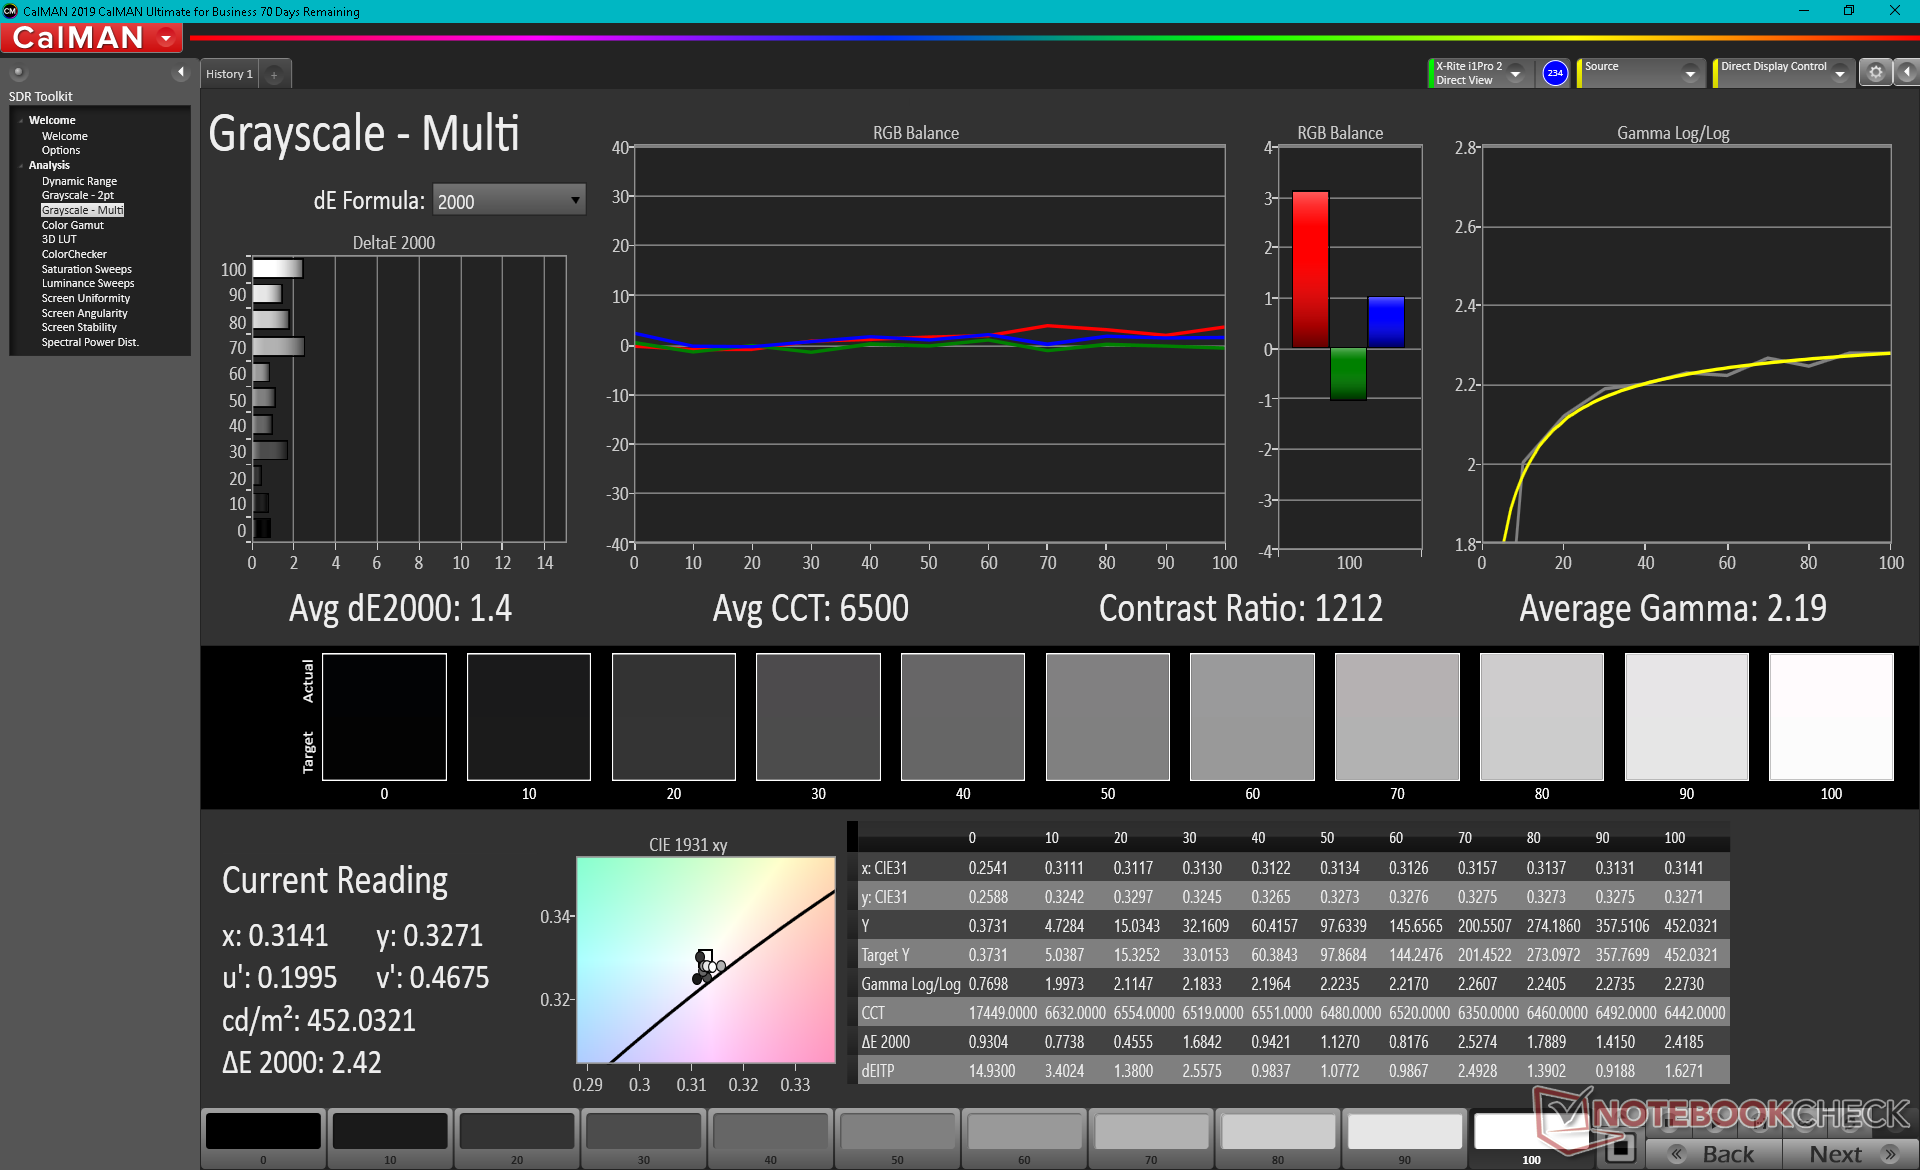
X-Rite色度计的测量结果显示,该显示器开箱即被校准,与AdobeRGB标准相比,其平均灰度和色彩DeltaE值分别仅为2.4和4.34。将显示器设置为sRGB,然后校准它的颜色,将导致全面的DeltaE值小于2。
Display Response Times
| ↔ Response Time Black to White | ||
|---|---|---|
| 10.4 ms ... rise ↗ and fall ↘ combined | ↗ 5.2 ms rise | 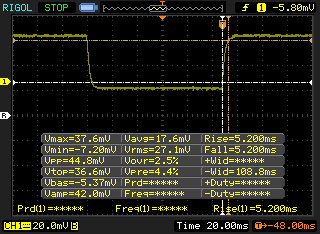 |
| ↘ 5.2 ms fall | ||
| The screen shows good response rates in our tests, but may be too slow for competitive gamers. In comparison, all tested devices range from 0.1 (minimum) to 240 (maximum) ms. » 28 % of all devices are better. This means that the measured response time is better than the average of all tested devices (19.8 ms). | ||
| ↔ Response Time 50% Grey to 80% Grey | ||
| 14.4 ms ... rise ↗ and fall ↘ combined | ↗ 7.6 ms rise | 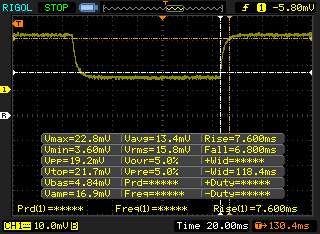 |
| ↘ 6.8 ms fall | ||
| The screen shows good response rates in our tests, but may be too slow for competitive gamers. In comparison, all tested devices range from 0.165 (minimum) to 636 (maximum) ms. » 28 % of all devices are better. This means that the measured response time is better than the average of all tested devices (31 ms). | ||
Screen Flickering / PWM (Pulse-Width Modulation)
| Screen flickering / PWM not detected | 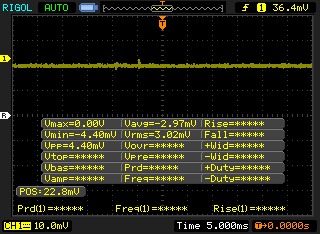 | ||
In comparison: 52 % of all tested devices do not use PWM to dim the display. If PWM was detected, an average of 7763 (minimum: 5 - maximum: 343500) Hz was measured. | |||
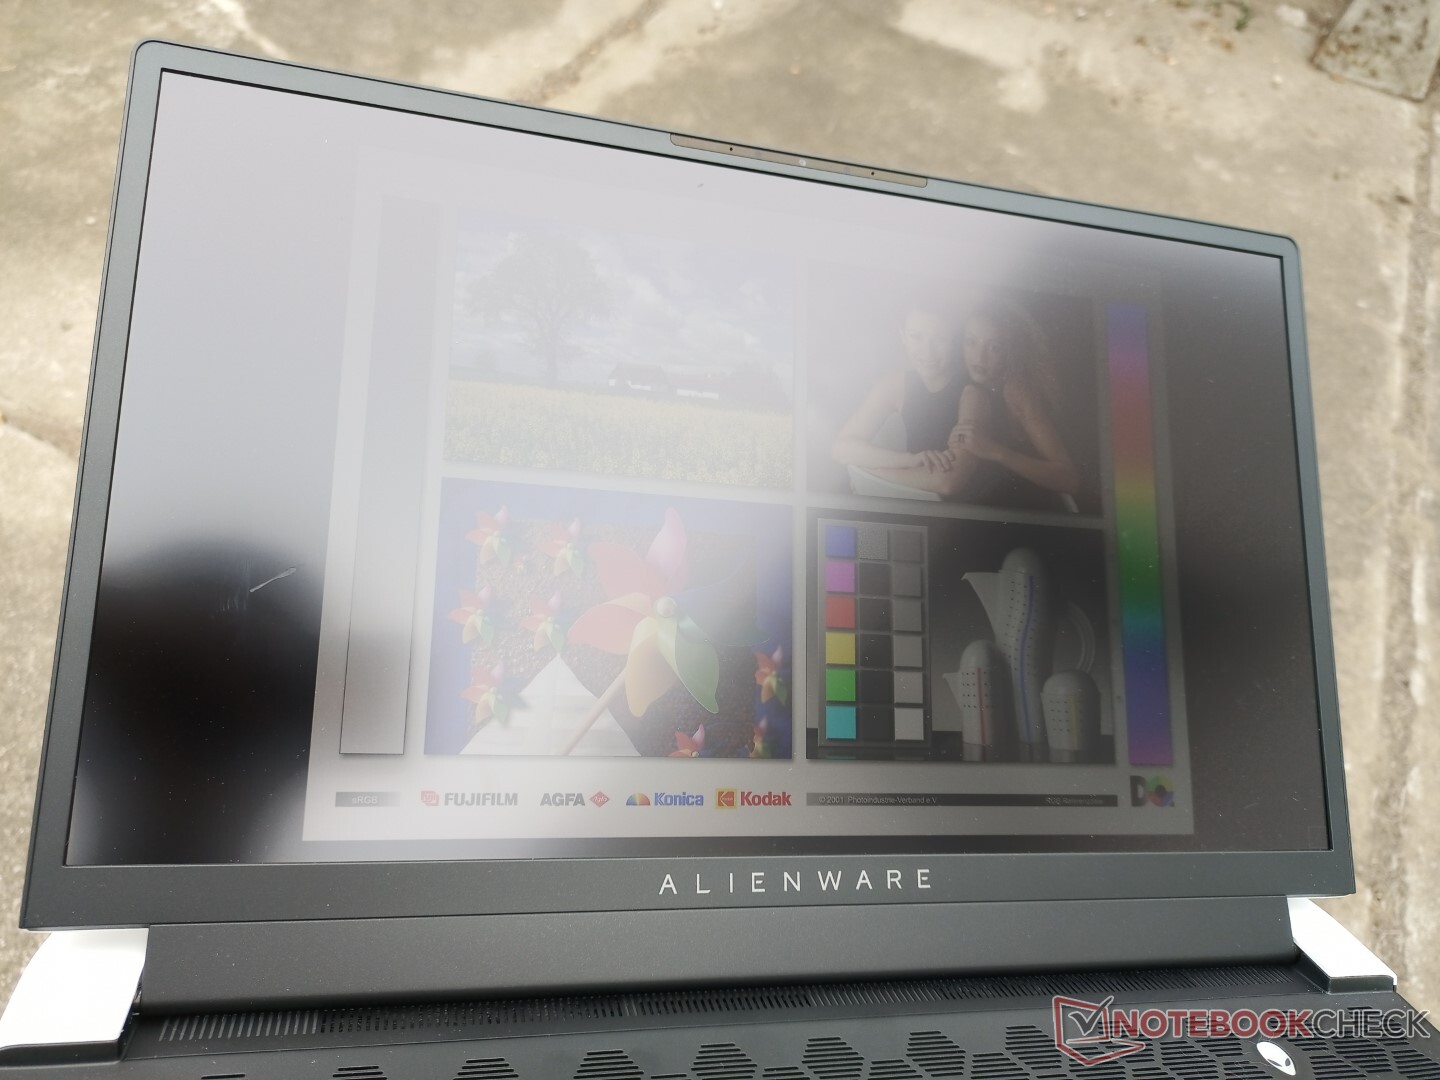
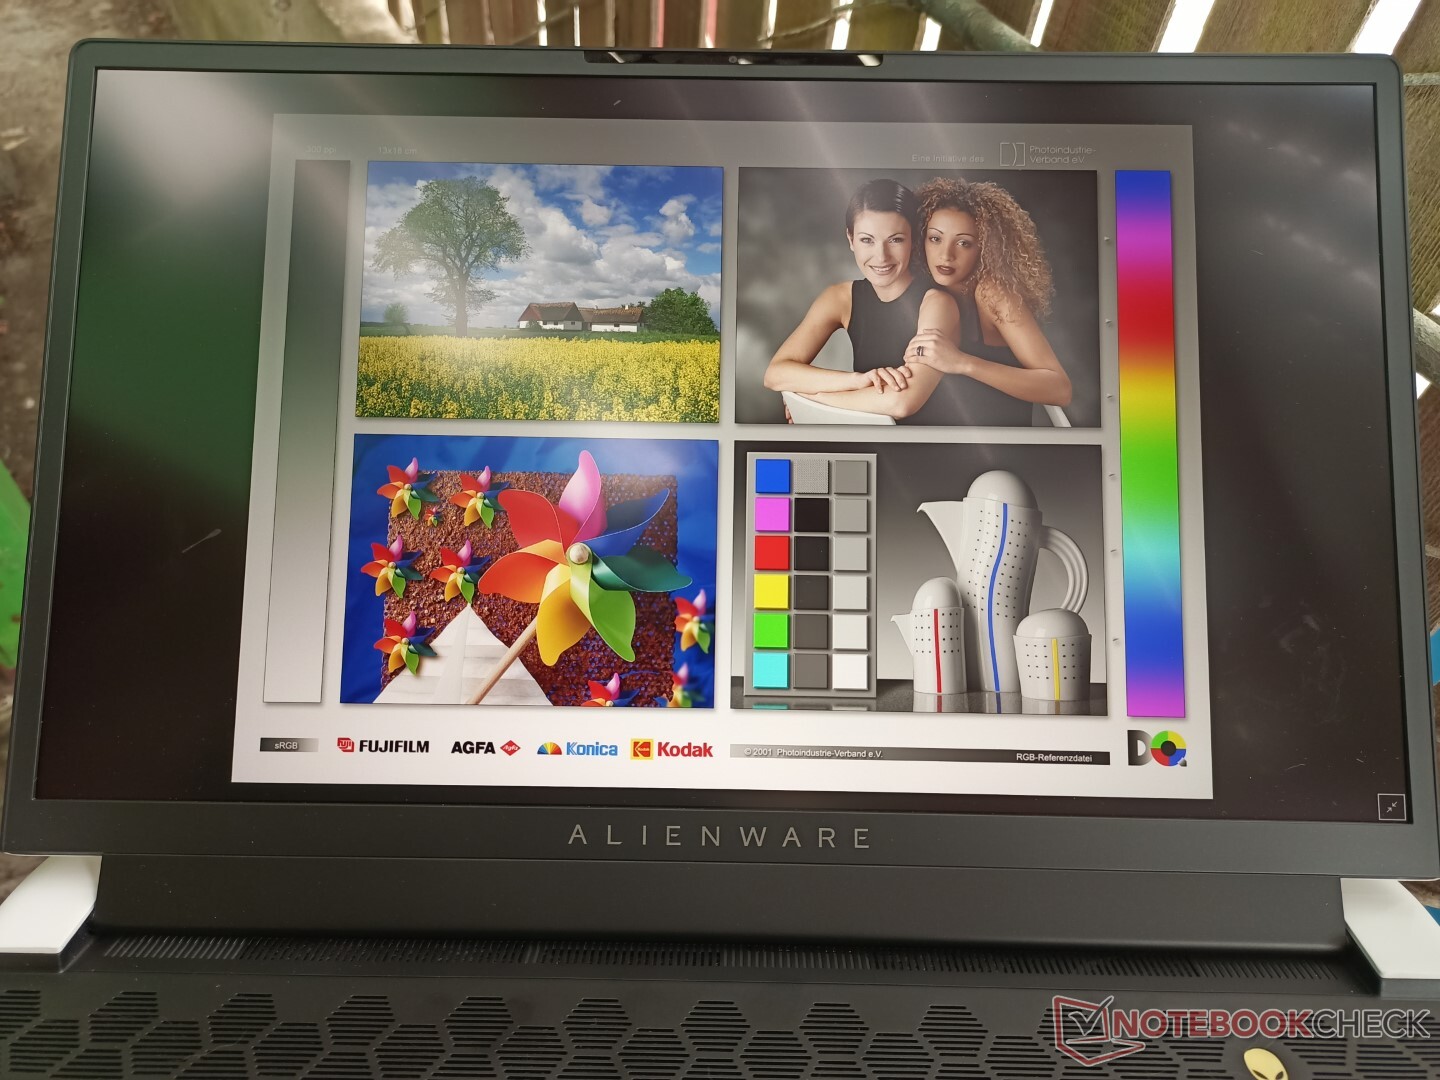
户外能见度比许多其他17.3英寸游戏笔记本电脑略好,因为400尼特的哑光显示屏比典型的300尼特目标更亮。然而,沉重的重量和尺寸是难以忽视的,因此,无论在什么环境下,你都可能想在一个平坦的桌子上工作。
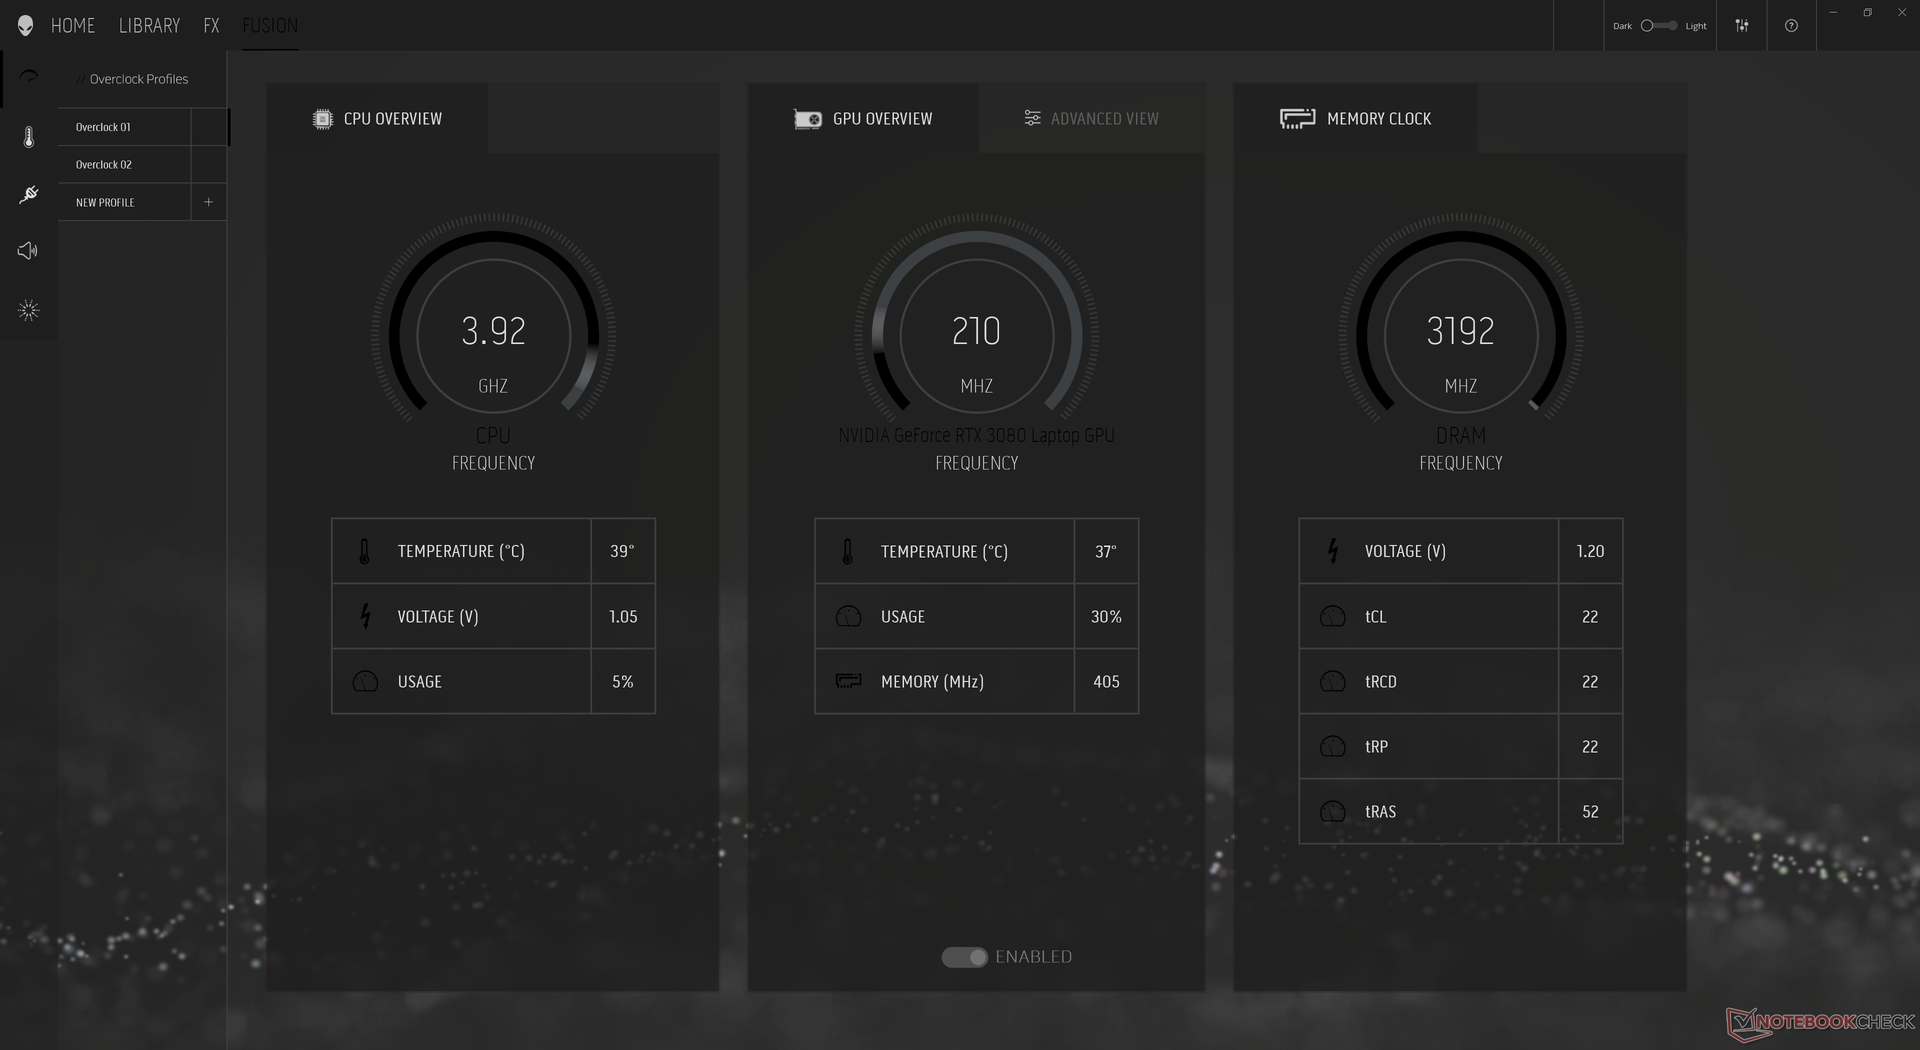
性能 - 令人印象深刻的处理器时钟速率
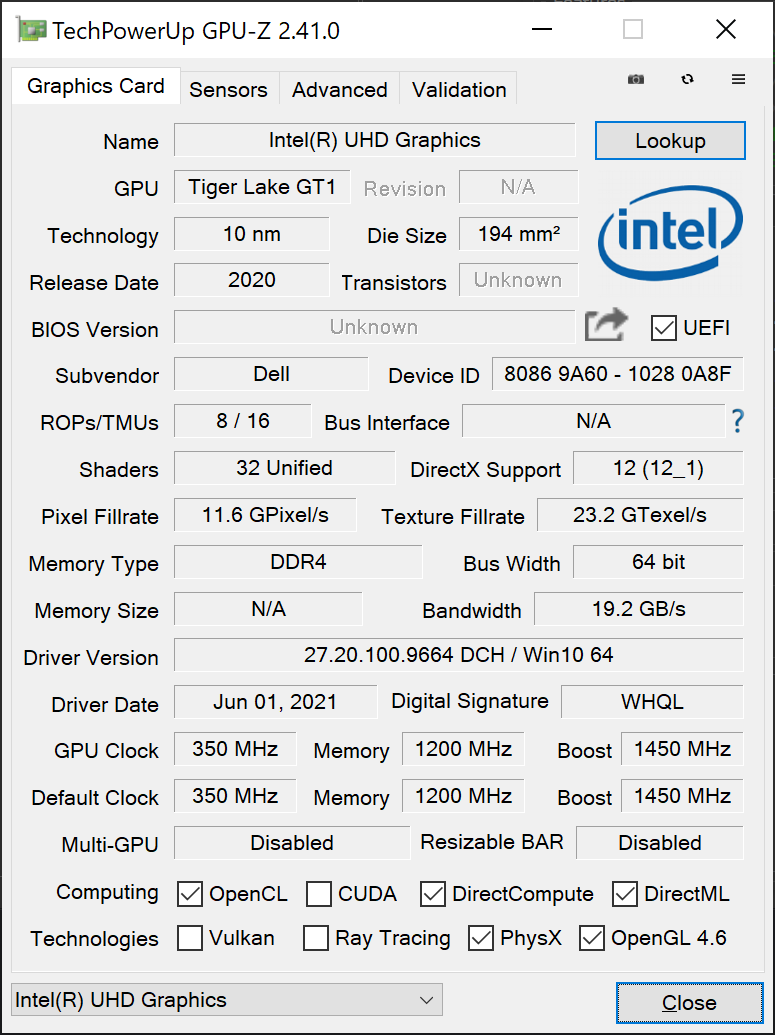
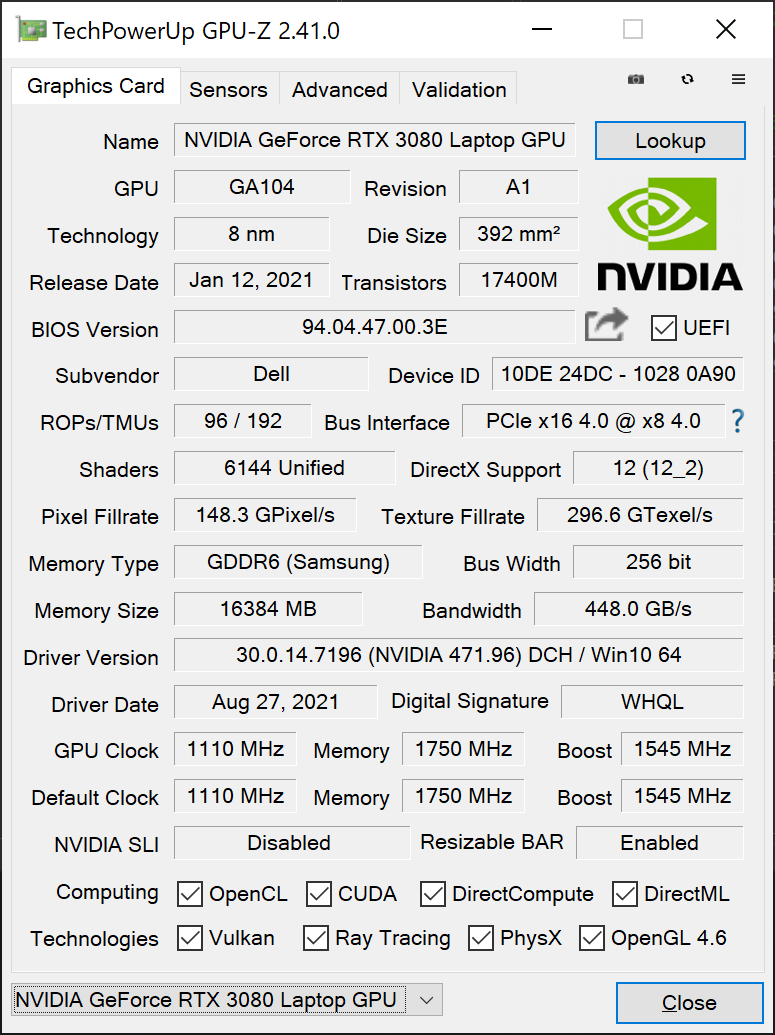
两个CPU选项(Core i7-11800H,Core i9-11980HK)和三个GeForce 图形选项(RTX 3060。 RTX 3070, RTX 3080)可供选择。我们不指望两个CPU之间有大的差异,因为我们的i7-11800H在负载下运行时已经远远超过90 C,但三个GPU分别在130 W、140 W和165 W的不同TGP目标下运行。相比之下,Razer Blade 17中的RTX 3080的目标 "只有 "130 W。
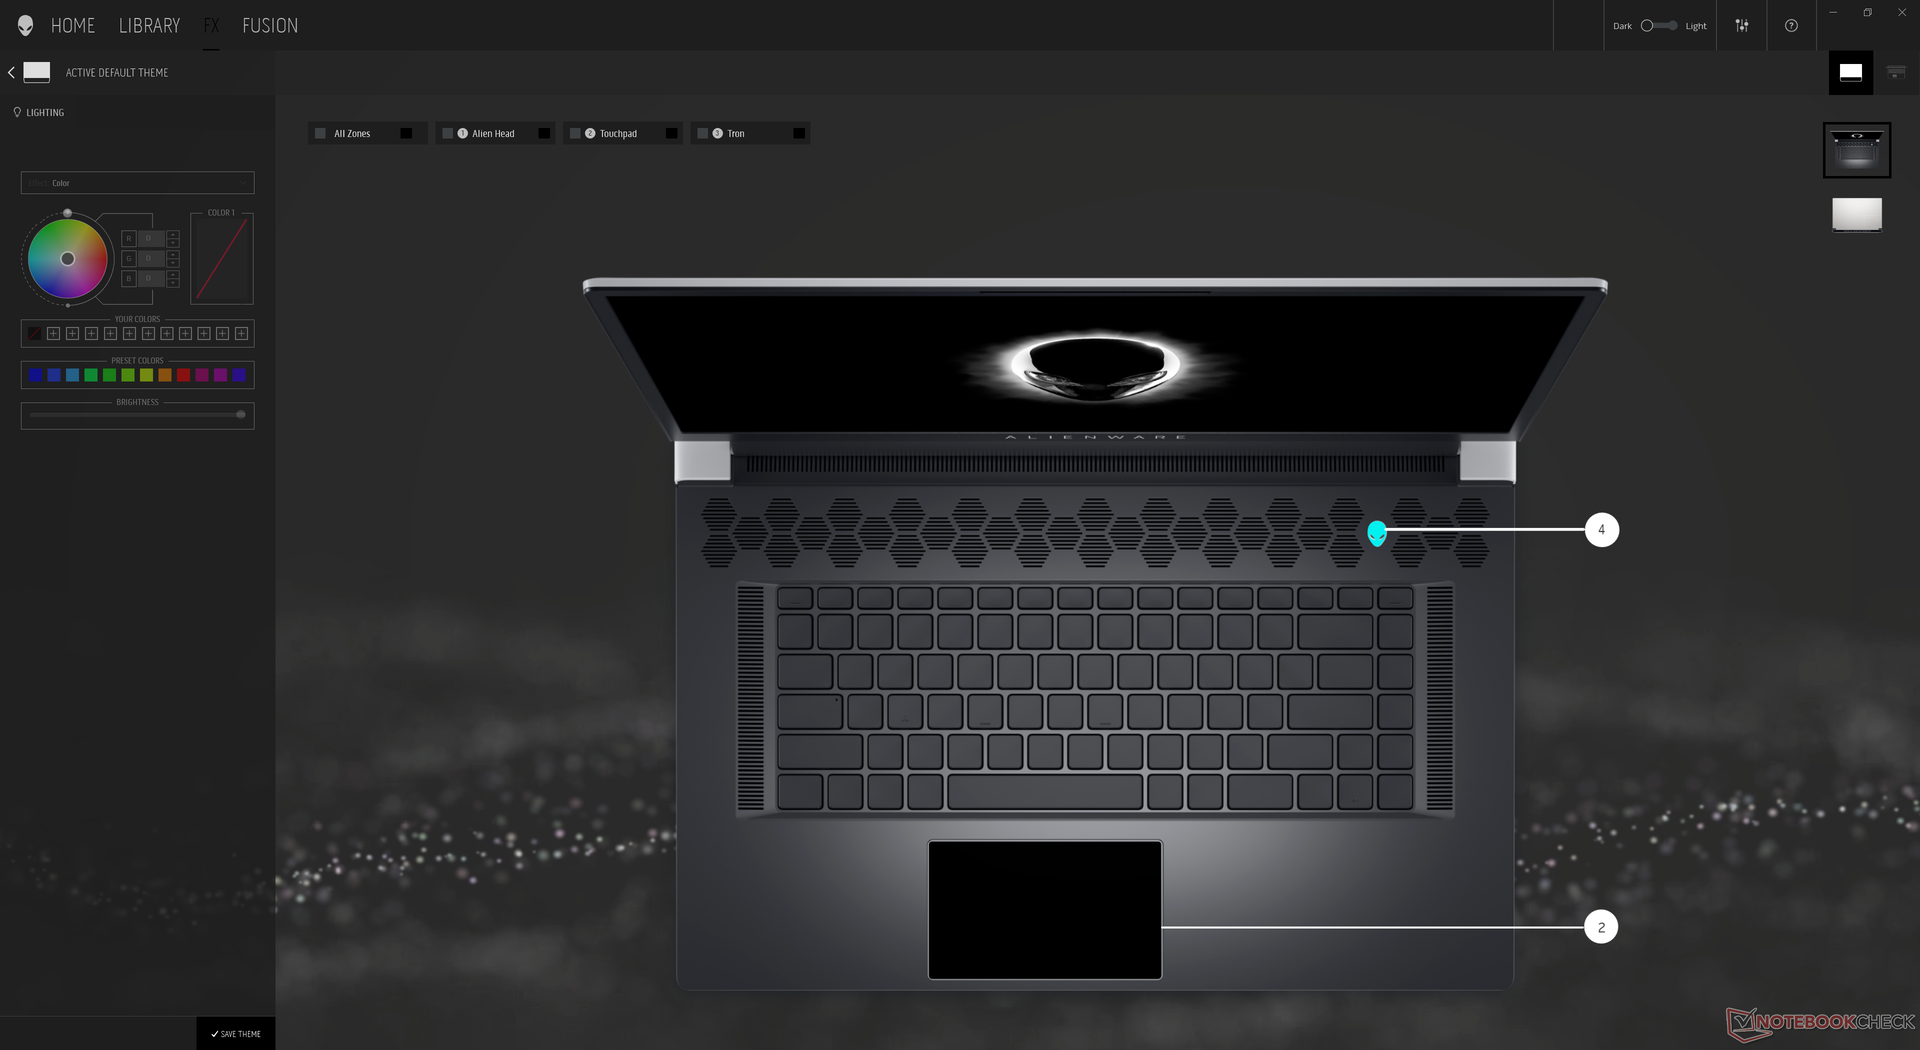
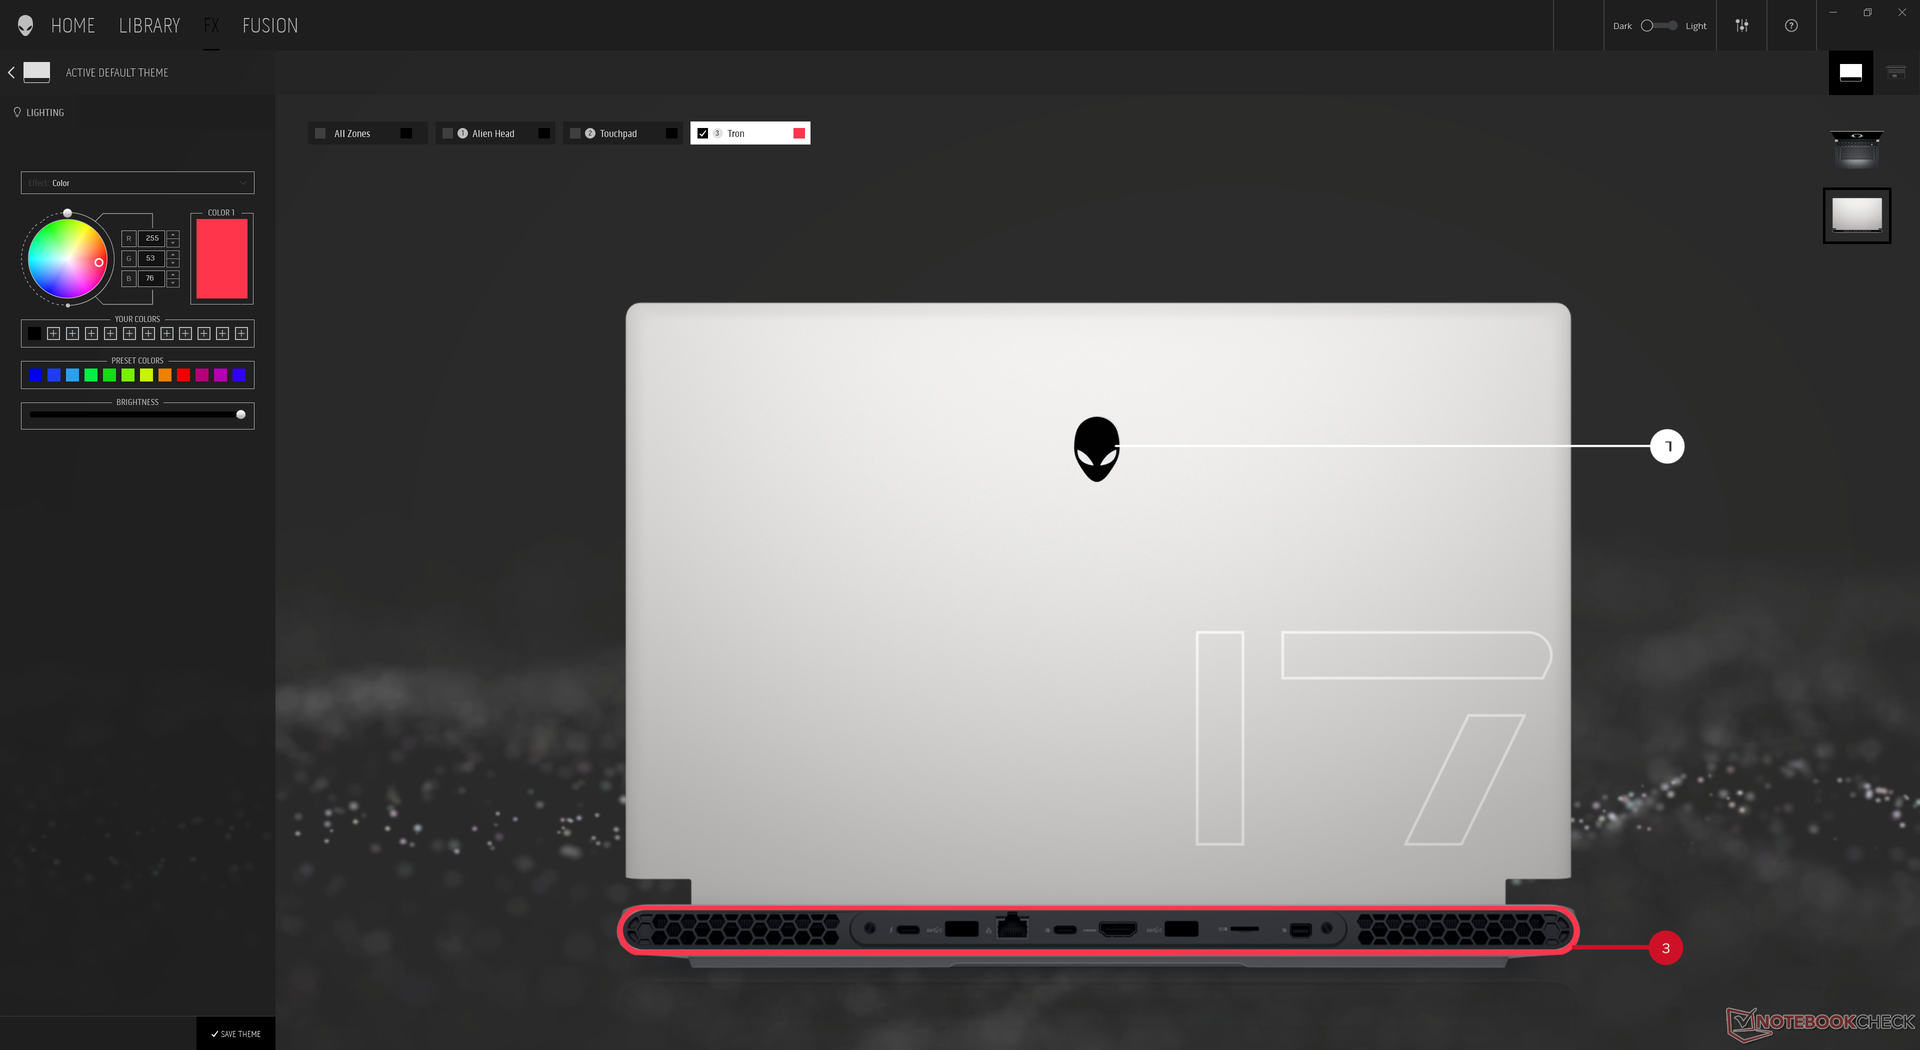
在运行下面的基准测试之前,我们的系统通过Alienware指挥中心软件设置为高性能模式,以获得尽可能高的分数。我们建议用户熟悉这个软件,因为所有的照明和性能功能都在这里找到。此外,用户可以通过BIOS将系统设置为Optimus或独立GPU模式。
高级Optimus和G-Sync只支持360赫兹FHD SKU。
处理器
CPU性能出色,CineBench xT得分比我们数据库中相同的笔记本平均速度快20%。 Core i7-11800HCPU。事实上,Alienware x17是市场上使用这种特定处理器的最快笔记本电脑之一。我们的系统比预期的性能更快,实际上使它稍微领先于 Ryzen 9 5900HX或 酷睿i9-11900K在多线程负载方面,尽管i7-11800H在大多数其他笔记本电脑上普遍落后。
Alienware的高CPU性能可以归功于非常高的PL1和PL2目标,每个目标为165W,而其他笔记本电脑如Razer Blade 17的目标分别为65W和90W。正如我们在下面的CineBench R15 xT循环测试中所显示的那样,该系统在长时间内保持高Turbo Boost时钟速率方面也很出色。然而,如此高的性能结果并不是免费的,正如我们下面的压力测试和功耗部分所示。
Cinebench R15 Multi Loop
Cinebench R23: Multi Core | Single Core
Cinebench R15: CPU Multi 64Bit | CPU Single 64Bit
Blender: v2.79 BMW27 CPU
7-Zip 18.03: 7z b 4 -mmt1 | 7z b 4
Geekbench 5.5: Single-Core | Multi-Core
HWBOT x265 Benchmark v2.2: 4k Preset
LibreOffice : 20 Documents To PDF
R Benchmark 2.5: Overall mean
| Cinebench R20 / CPU (Multi Core) | |
| Alienware x17 RTX 3080 P48E | |
| Asus Strix Scar 17 G733QSA-XS99 | |
| Schenker XMG Ultra 17 Rocket Lake | |
| Asus ROG Strix G17 G713QE-RB74 | |
| MSI GS76 Stealth 11UH | |
| Eluktronics RP-17 | |
| Average Intel Core i7-11800H (2498 - 5408, n=50) | |
| Alienware m17 R4 | |
| MSI GS75 10SF-609US | |
| Medion Erazer Beast X20 | |
| Schenker XMG Pro 17 PB71RD-G | |
| Lenovo Legion 5 17IMH05 | |
| Cinebench R20 / CPU (Single Core) | |
| Schenker XMG Ultra 17 Rocket Lake | |
| MSI GS76 Stealth 11UH | |
| Alienware x17 RTX 3080 P48E | |
| Average Intel Core i7-11800H (520 - 586, n=47) | |
| Asus Strix Scar 17 G733QSA-XS99 | |
| Asus ROG Strix G17 G713QE-RB74 | |
| Alienware m17 R4 | |
| Eluktronics RP-17 | |
| MSI GS75 10SF-609US | |
| Medion Erazer Beast X20 | |
| Schenker XMG Pro 17 PB71RD-G | |
| Lenovo Legion 5 17IMH05 | |
| Cinebench R23 / Multi Core | |
| Schenker XMG Ultra 17 Rocket Lake | |
| Alienware x17 RTX 3080 P48E | |
| Asus Strix Scar 17 G733QSA-XS99 | |
| MSI GS76 Stealth 11UH | |
| Asus ROG Strix G17 G713QE-RB74 | |
| Average Intel Core i7-11800H (6508 - 14088, n=48) | |
| Alienware m17 R4 | |
| Medion Erazer Beast X20 | |
| Cinebench R23 / Single Core | |
| Schenker XMG Ultra 17 Rocket Lake | |
| MSI GS76 Stealth 11UH | |
| Alienware x17 RTX 3080 P48E | |
| Asus Strix Scar 17 G733QSA-XS99 | |
| Average Intel Core i7-11800H (1386 - 1522, n=45) | |
| Asus ROG Strix G17 G713QE-RB74 | |
| Alienware m17 R4 | |
| Medion Erazer Beast X20 | |
| Cinebench R15 / CPU Multi 64Bit | |
| Schenker XMG Ultra 17 Rocket Lake | |
| Asus Strix Scar 17 G733QSA-XS99 | |
| Alienware x17 RTX 3080 P48E | |
| MSI GS76 Stealth 11UH | |
| Asus ROG Strix G17 G713QE-RB74 | |
| Eluktronics RP-17 | |
| Average Intel Core i7-11800H (1342 - 2173, n=50) | |
| Alienware m17 R4 | |
| MSI GS75 10SF-609US | |
| Medion Erazer Beast X20 | |
| Schenker XMG Pro 17 PB71RD-G | |
| Lenovo Legion 5 17IMH05 | |
| Cinebench R15 / CPU Single 64Bit | |
| Schenker XMG Ultra 17 Rocket Lake | |
| Asus Strix Scar 17 G733QSA-XS99 | |
| MSI GS76 Stealth 11UH | |
| Asus ROG Strix G17 G713QE-RB74 | |
| Alienware x17 RTX 3080 P48E | |
| Average Intel Core i7-11800H (201 - 231, n=46) | |
| Alienware m17 R4 | |
| Medion Erazer Beast X20 | |
| MSI GS75 10SF-609US | |
| Eluktronics RP-17 | |
| Schenker XMG Pro 17 PB71RD-G | |
| Lenovo Legion 5 17IMH05 | |
| Blender / v2.79 BMW27 CPU | |
| Lenovo Legion 5 17IMH05 | |
| Schenker XMG Pro 17 PB71RD-G | |
| Medion Erazer Beast X20 | |
| MSI GS75 10SF-609US | |
| Average Intel Core i7-11800H (217 - 454, n=46) | |
| MSI GS76 Stealth 11UH | |
| Eluktronics RP-17 | |
| Alienware m17 R4 | |
| Asus ROG Strix G17 G713QE-RB74 | |
| Asus Strix Scar 17 G733QSA-XS99 | |
| Schenker XMG Ultra 17 Rocket Lake | |
| Alienware x17 RTX 3080 P48E | |
| 7-Zip 18.03 / 7z b 4 -mmt1 | |
| Schenker XMG Ultra 17 Rocket Lake | |
| Asus Strix Scar 17 G733QSA-XS99 | |
| MSI GS76 Stealth 11UH | |
| Asus ROG Strix G17 G713QE-RB74 | |
| Average Intel Core i7-11800H (5138 - 5732, n=46) | |
| Alienware m17 R4 | |
| Alienware x17 RTX 3080 P48E | |
| Medion Erazer Beast X20 | |
| MSI GS75 10SF-609US | |
| Eluktronics RP-17 | |
| Schenker XMG Pro 17 PB71RD-G | |
| Lenovo Legion 5 17IMH05 | |
| 7-Zip 18.03 / 7z b 4 | |
| Asus Strix Scar 17 G733QSA-XS99 | |
| Schenker XMG Ultra 17 Rocket Lake | |
| Asus ROG Strix G17 G713QE-RB74 | |
| Alienware x17 RTX 3080 P48E | |
| MSI GS76 Stealth 11UH | |
| Eluktronics RP-17 | |
| Alienware m17 R4 | |
| MSI GS75 10SF-609US | |
| Average Intel Core i7-11800H (33718 - 56758, n=46) | |
| Medion Erazer Beast X20 | |
| Schenker XMG Pro 17 PB71RD-G | |
| Lenovo Legion 5 17IMH05 | |
| Geekbench 5.5 / Single-Core | |
| Schenker XMG Ultra 17 Rocket Lake | |
| MSI GS76 Stealth 11UH | |
| Average Intel Core i7-11800H (1429 - 1625, n=40) | |
| Asus Strix Scar 17 G733QSA-XS99 | |
| Alienware m17 R4 | |
| MSI GS75 10SF-609US | |
| Medion Erazer Beast X20 | |
| Eluktronics RP-17 | |
| Schenker XMG Pro 17 PB71RD-G | |
| Lenovo Legion 5 17IMH05 | |
| Geekbench 5.5 / Multi-Core | |
| Schenker XMG Ultra 17 Rocket Lake | |
| MSI GS76 Stealth 11UH | |
| Asus Strix Scar 17 G733QSA-XS99 | |
| Average Intel Core i7-11800H (4655 - 9851, n=40) | |
| MSI GS75 10SF-609US | |
| Alienware m17 R4 | |
| Eluktronics RP-17 | |
| Medion Erazer Beast X20 | |
| Schenker XMG Pro 17 PB71RD-G | |
| Lenovo Legion 5 17IMH05 | |
| HWBOT x265 Benchmark v2.2 / 4k Preset | |
| Alienware x17 RTX 3080 P48E | |
| Schenker XMG Ultra 17 Rocket Lake | |
| Asus Strix Scar 17 G733QSA-XS99 | |
| MSI GS76 Stealth 11UH | |
| Asus ROG Strix G17 G713QE-RB74 | |
| Alienware m17 R4 | |
| Average Intel Core i7-11800H (7.38 - 17.4, n=46) | |
| Eluktronics RP-17 | |
| MSI GS75 10SF-609US | |
| Medion Erazer Beast X20 | |
| Schenker XMG Pro 17 PB71RD-G | |
| Lenovo Legion 5 17IMH05 | |
| LibreOffice / 20 Documents To PDF | |
| Lenovo Legion 5 17IMH05 | |
| Eluktronics RP-17 | |
| Asus ROG Strix G17 G713QE-RB74 | |
| Medion Erazer Beast X20 | |
| Alienware m17 R4 | |
| MSI GS75 10SF-609US | |
| MSI GS76 Stealth 11UH | |
| Alienware x17 RTX 3080 P48E | |
| Average Intel Core i7-11800H (38.6 - 59.9, n=45) | |
| Asus Strix Scar 17 G733QSA-XS99 | |
| Schenker XMG Ultra 17 Rocket Lake | |
| R Benchmark 2.5 / Overall mean | |
| Lenovo Legion 5 17IMH05 | |
| Schenker XMG Pro 17 PB71RD-G | |
| Medion Erazer Beast X20 | |
| MSI GS75 10SF-609US | |
| Eluktronics RP-17 | |
| Alienware m17 R4 | |
| Average Intel Core i7-11800H (0.548 - 0.615, n=46) | |
| Alienware x17 RTX 3080 P48E | |
| MSI GS76 Stealth 11UH | |
| Asus ROG Strix G17 G713QE-RB74 | |
| Schenker XMG Ultra 17 Rocket Lake | |
| Asus Strix Scar 17 G733QSA-XS99 | |
* ... smaller is better
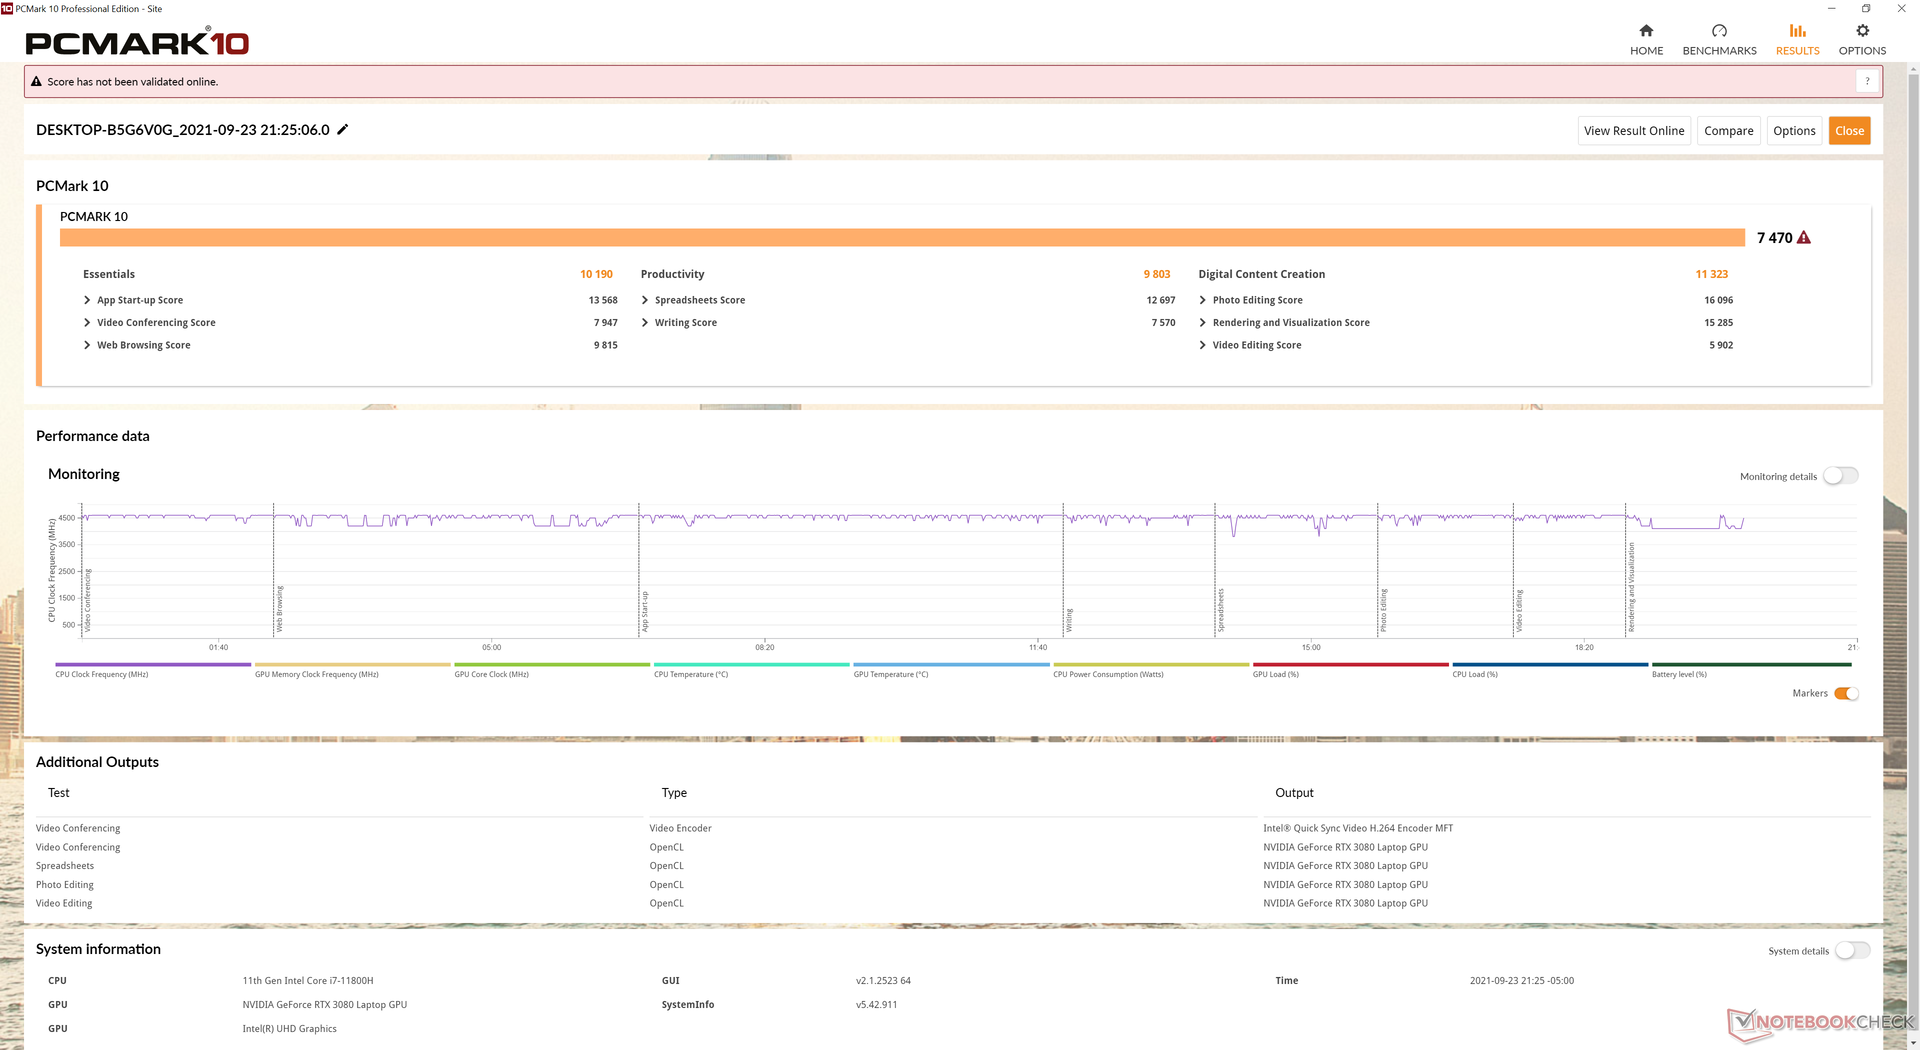
系统性能
PCMark分数是我们期望的相对于其他高性能游戏笔记本电脑的分数。总体结果只是略微领先于配备相同CPU和GPU的Razer Blade 17。
| PCMark 10 / Score | |
| Alienware x17 RTX 3080 P48E | |
| Razer Blade 17 RTX 3070 | |
| Asus ROG Zephyrus S17 GX703HSD | |
| Average Intel Core i7-11800H, NVIDIA GeForce RTX 3080 Laptop GPU (6673 - 7470, n=11) | |
| Gigabyte Aero 17 HDR YD | |
| MSI GS76 Stealth 11UH | |
| Alienware m17 R4 | |
| PCMark 10 / Essentials | |
| Razer Blade 17 RTX 3070 | |
| Asus ROG Zephyrus S17 GX703HSD | |
| Average Intel Core i7-11800H, NVIDIA GeForce RTX 3080 Laptop GPU (9862 - 11064, n=11) | |
| Gigabyte Aero 17 HDR YD | |
| Alienware x17 RTX 3080 P48E | |
| MSI GS76 Stealth 11UH | |
| Alienware m17 R4 | |
| PCMark 10 / Productivity | |
| Alienware x17 RTX 3080 P48E | |
| Asus ROG Zephyrus S17 GX703HSD | |
| Razer Blade 17 RTX 3070 | |
| Average Intel Core i7-11800H, NVIDIA GeForce RTX 3080 Laptop GPU (8278 - 9803, n=11) | |
| Gigabyte Aero 17 HDR YD | |
| MSI GS76 Stealth 11UH | |
| Alienware m17 R4 | |
| PCMark 10 / Digital Content Creation | |
| Alienware x17 RTX 3080 P48E | |
| Razer Blade 17 RTX 3070 | |
| Asus ROG Zephyrus S17 GX703HSD | |
| Average Intel Core i7-11800H, NVIDIA GeForce RTX 3080 Laptop GPU (9881 - 11323, n=11) | |
| Gigabyte Aero 17 HDR YD | |
| MSI GS76 Stealth 11UH | |
| Alienware m17 R4 | |
| PCMark 10 Score | 7470 points | |
Help | ||
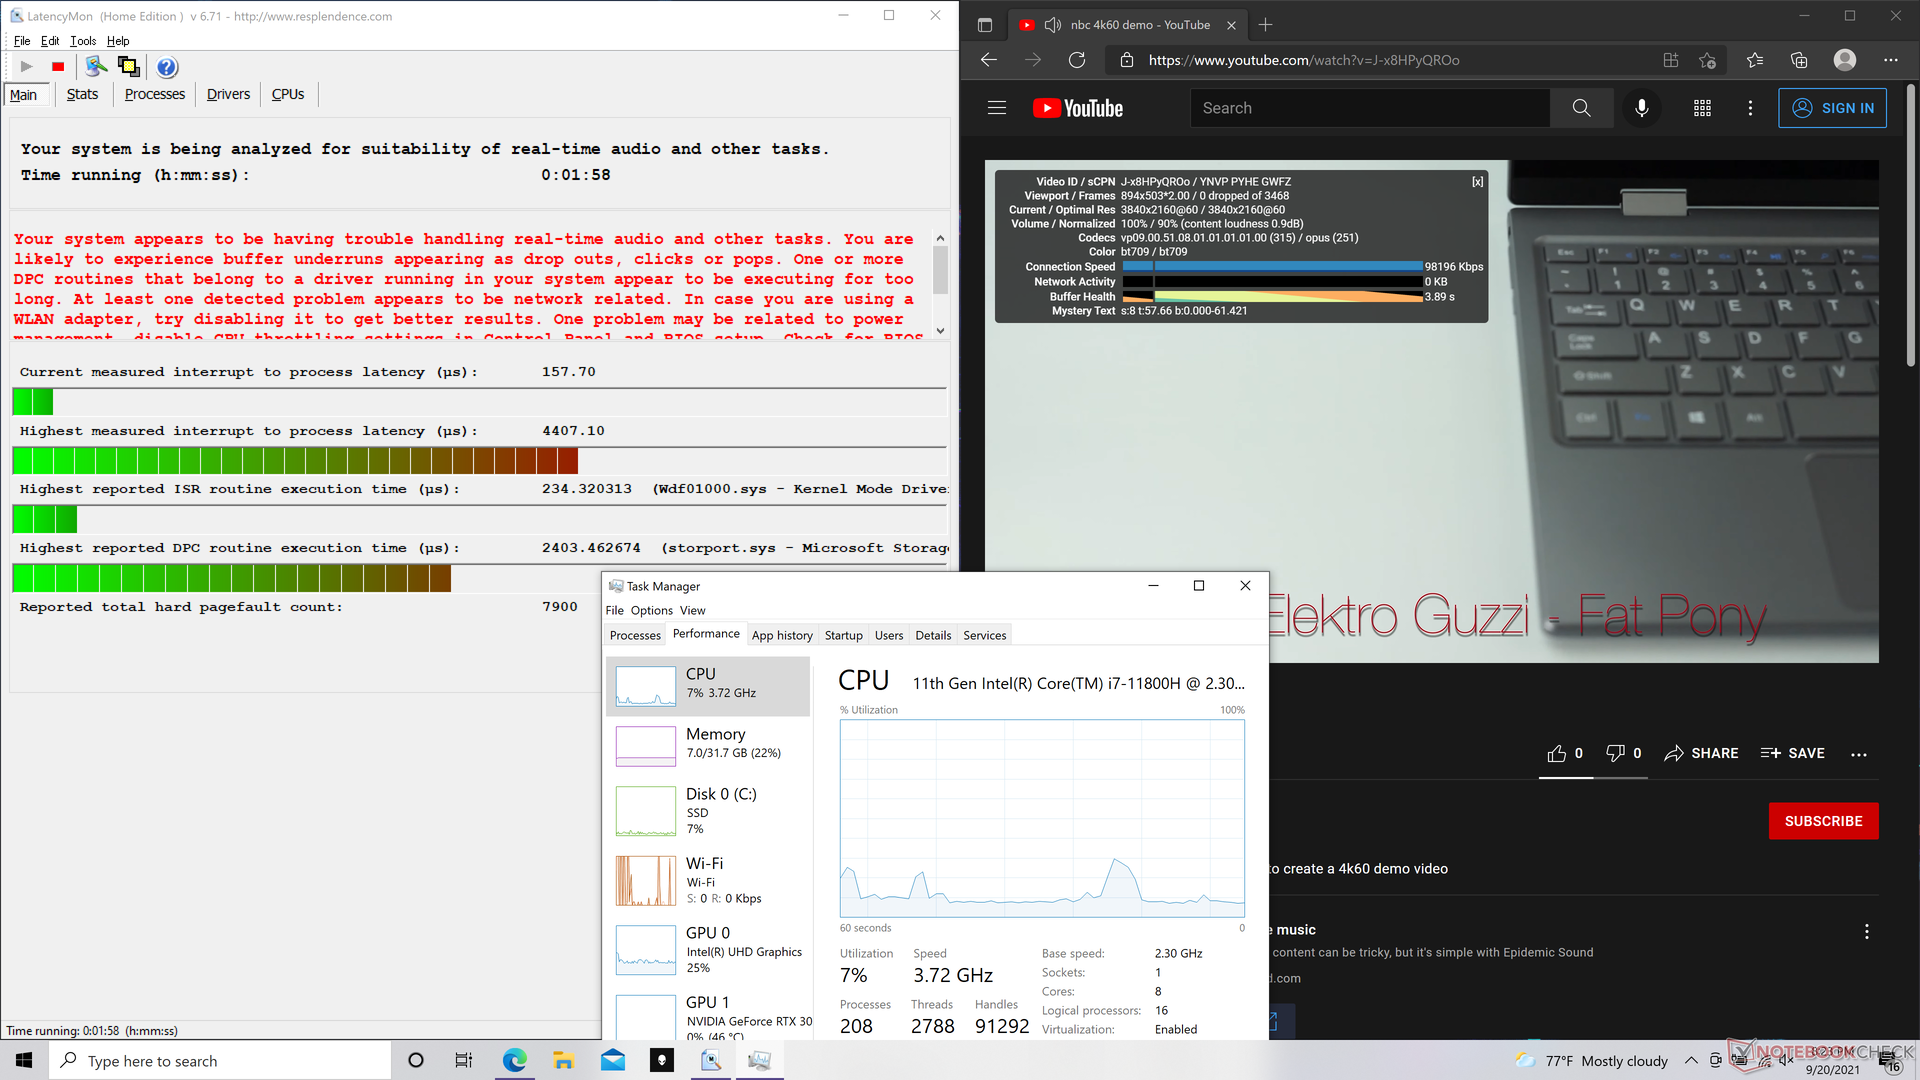
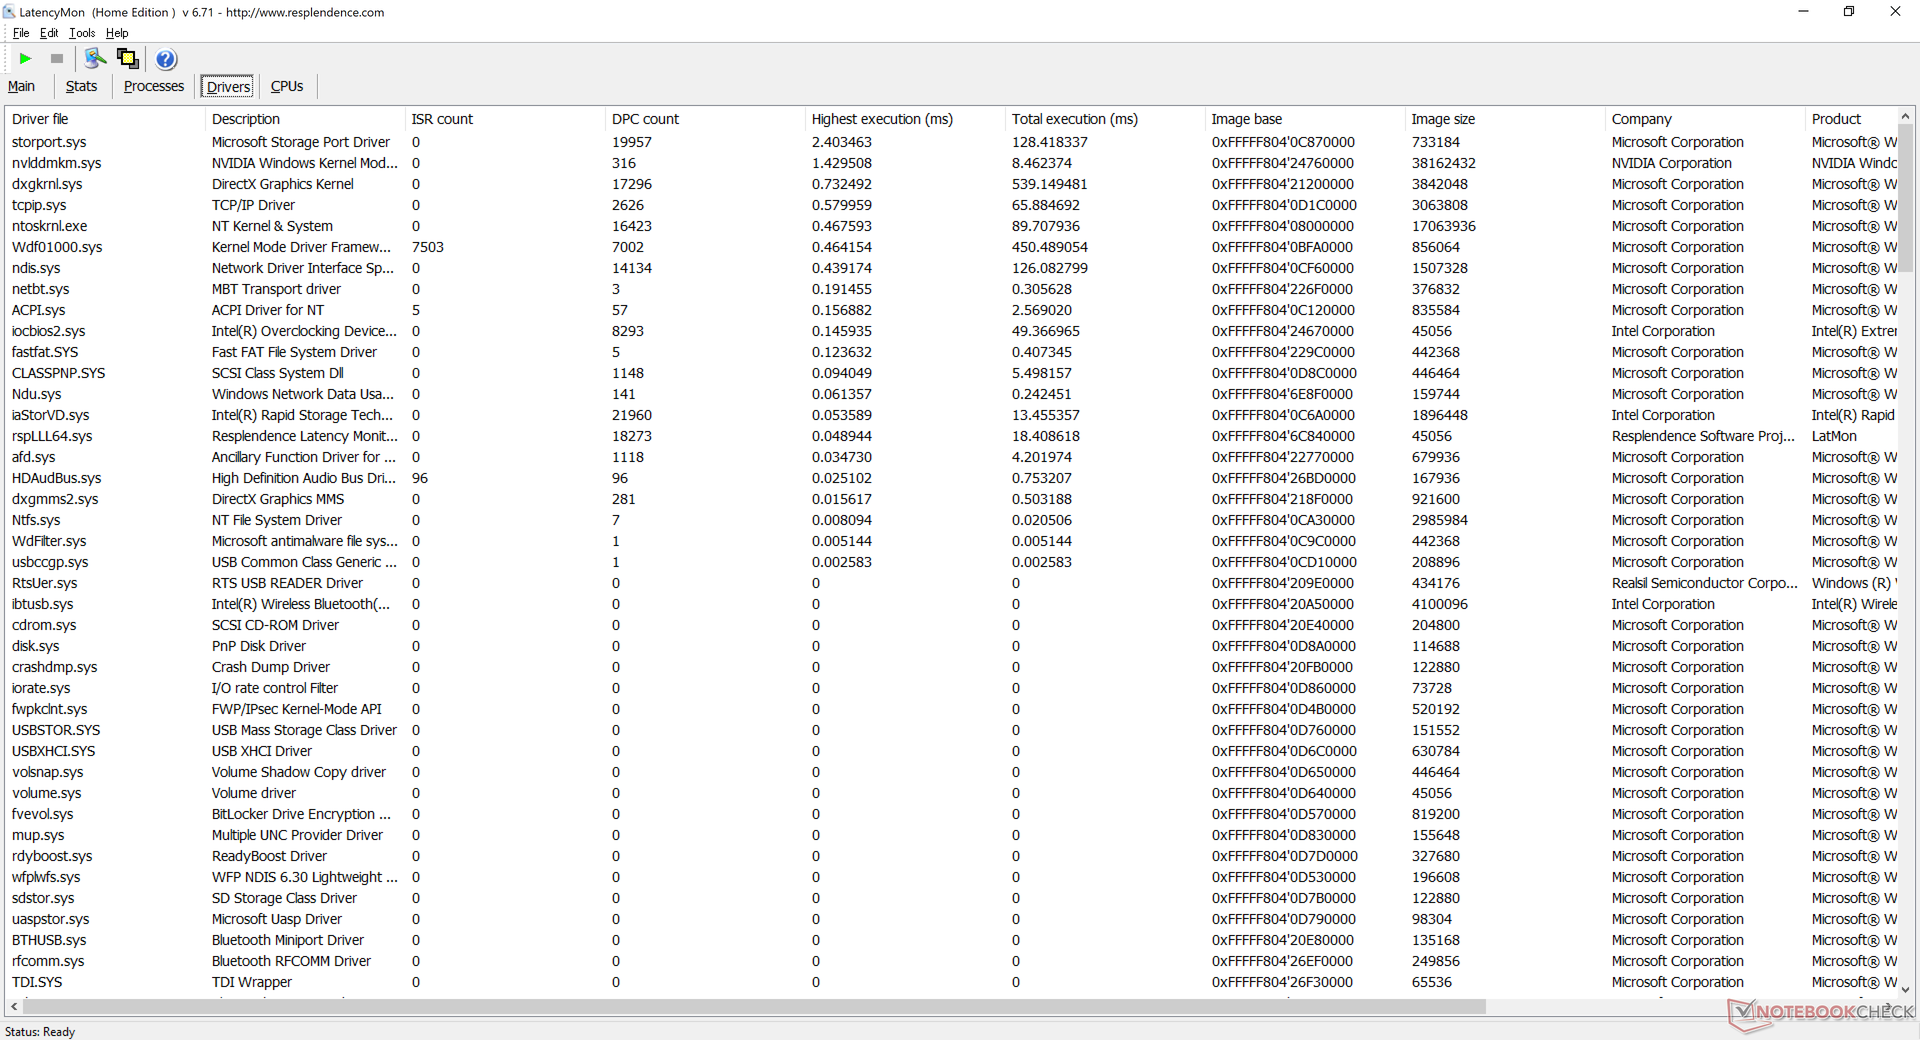
DPC延时
LatencyMon显示了在我们的主页上打开多个浏览器标签和运行Prime95压力时的DPC延迟问题。在60 FPS的情况下,4K视频播放是完美的,没有丢帧。
| DPC Latencies / LatencyMon - interrupt to process latency (max), Web, Youtube, Prime95 | |
| Alienware x17 RTX 3080 P48E | |
| Gigabyte Aero 17 HDR YD | |
| Asus ROG Zephyrus S17 GX703HSD | |
| MSI GS76 Stealth 11UH | |
| Alienware m17 R4 | |
| Razer Blade 17 RTX 3070 | |
* ... smaller is better
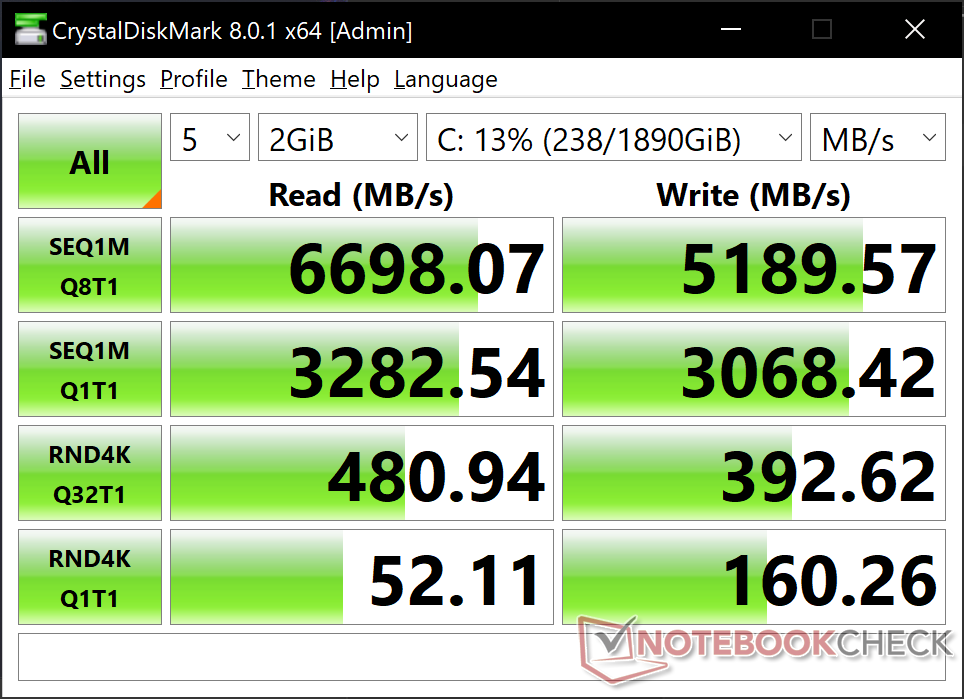
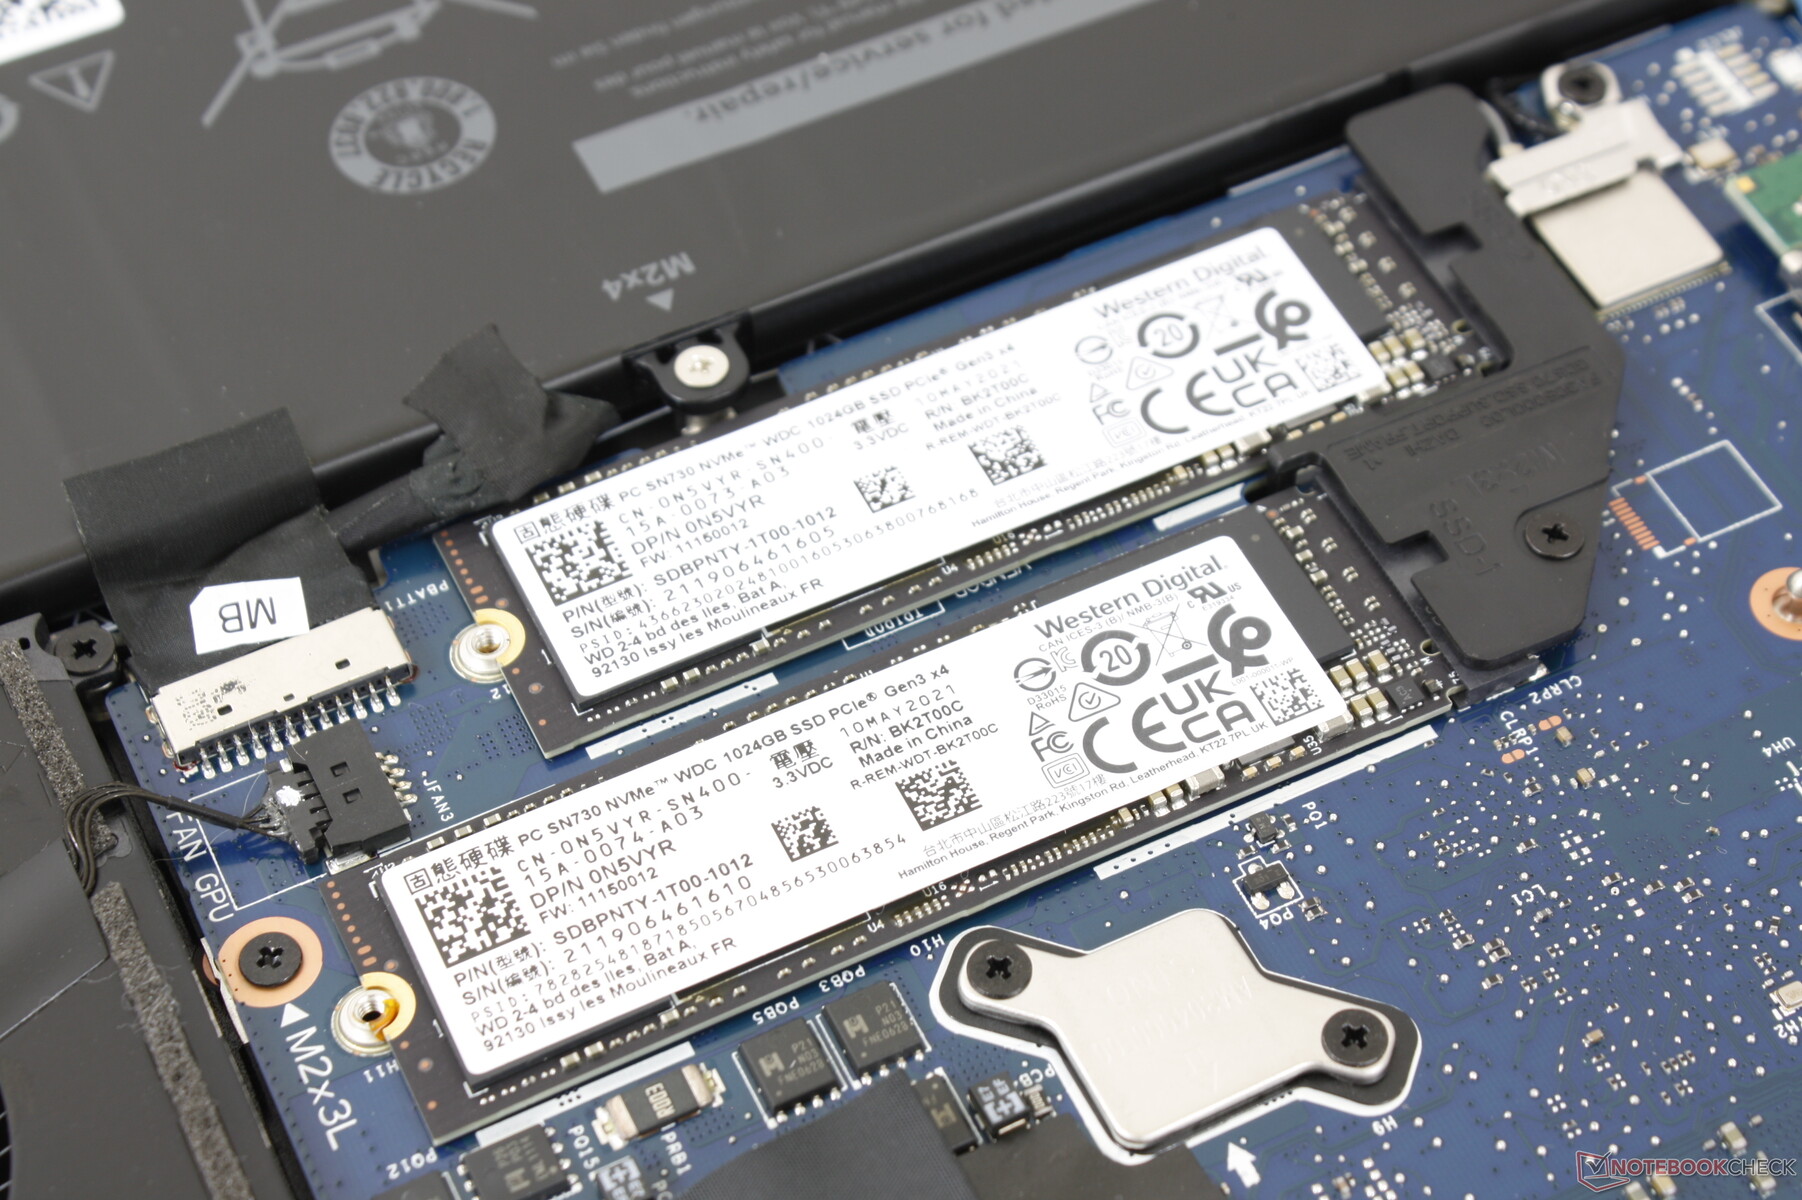
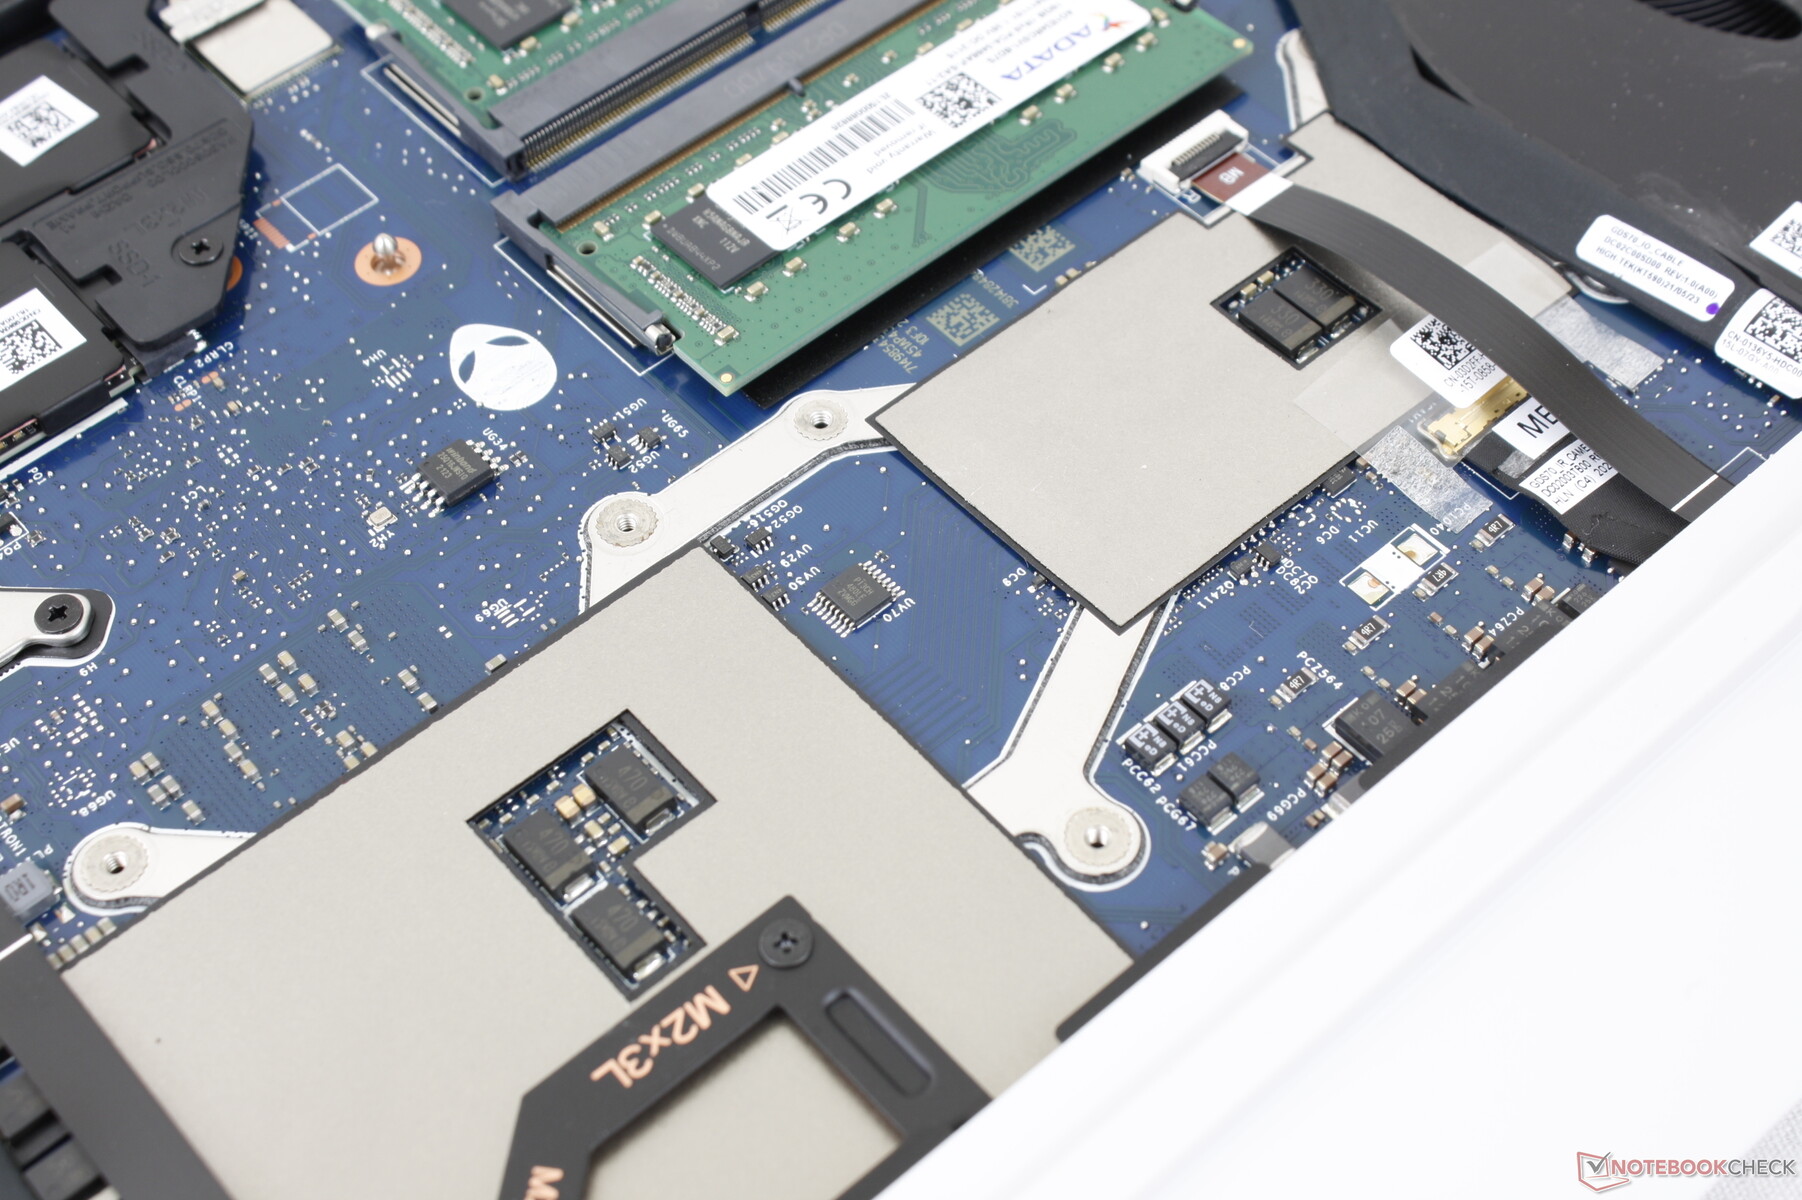
存储设备 - 一个PCIe4和一个PCIe3
我们的测试装置配备了两个1TB的WD SN730 NVMe SSD,在RAID 0中的连续读取和写入速度分别高达6700 MB/s和4300 MB/s,要比现有的任何单一PCIe3 SSD快。尽管如此,单三星PM9A1PCIe4固态硬盘的性能仍将超过我们的PCIe3 RAID 0设置。戴尔表示,如果用户想自己安装一个PCIe4固态硬盘,该系统最多可以支持一个。
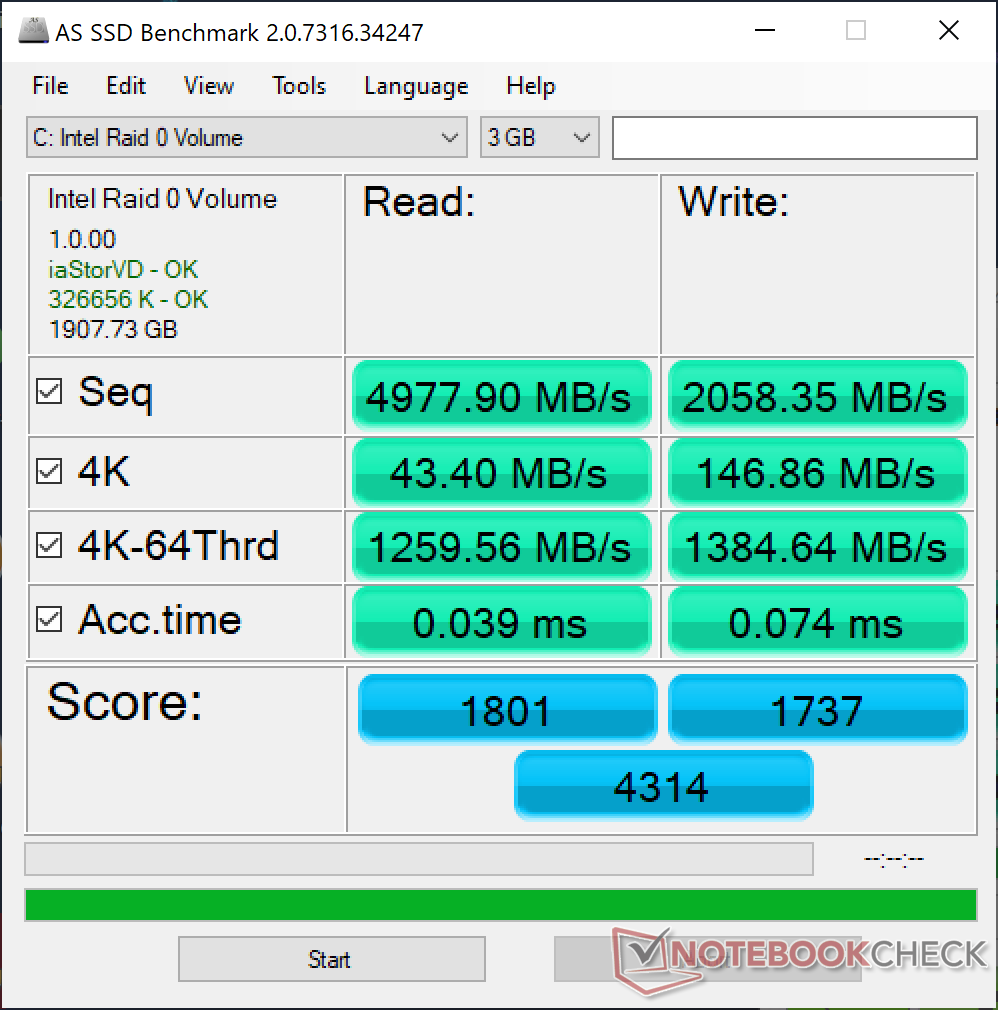
| Alienware x17 RTX 3080 P48E 2x WDC PC SN730 SDBPNTY-1T00 (RAID 0) | Alienware m17 R4 2x Micron 2300 512 GB (RAID 0) | Razer Blade 17 RTX 3070 Samsung PM9A1 MZVL21T0HCLR | Asus ROG Zephyrus S17 GX703HSD Samsung PM9A1 MZVL22T0HBLB | MSI GS76 Stealth 11UH Samsung PM9A1 MZVL22T0HBLB | Gigabyte Aero 17 HDR YD Samsung PM9A1 MZVL2512HCJQ | |
|---|---|---|---|---|---|---|
| AS SSD | -12% | 52% | 67% | 68% | 66% | |
| Seq Read (MB/s) | 4978 | 2733 -45% | 5302 7% | 5085 2% | 5408 9% | 5438 9% |
| Seq Write (MB/s) | 2058 | 2822 37% | 3977 93% | 4434 115% | 3863 88% | 3904 90% |
| 4K Read (MB/s) | 43.4 | 45.04 4% | 55 27% | 80.3 85% | 52.7 21% | 56.2 29% |
| 4K Write (MB/s) | 146.9 | 88.4 -40% | 148.7 1% | 214.7 46% | 153.1 4% | 165.8 13% |
| 4K-64 Read (MB/s) | 1260 | 1388 10% | 2715 115% | 2573 104% | 2692 114% | 2489 98% |
| 4K-64 Write (MB/s) | 1385 | 1227 -11% | 3416 147% | 2972 115% | 3414 146% | 3480 151% |
| Access Time Read * (ms) | 0.039 | 0.079 -103% | 0.044 -13% | 0.018 54% | 0.046 -18% | 0.054 -38% |
| Access Time Write * (ms) | 0.074 | 0.095 -28% | 0.085 -15% | 0.02 73% | 0.027 64% | 0.026 65% |
| Score Read (Points) | 1801 | 1706 -5% | 3300 83% | 3161 76% | 3285 82% | 3089 72% |
| Score Write (Points) | 1737 | 1598 -8% | 3963 128% | 3631 109% | 3953 128% | 4036 132% |
| Score Total (Points) | 4314 | 4184 -3% | 8874 106% | 8380 94% | 8830 105% | 8620 100% |
| Copy ISO MB/s (MB/s) | 2009 | 2414 20% | 2710 35% | 3239 61% | ||
| Copy Program MB/s (MB/s) | 1099 | 1030 -6% | 1114 1% | 899 -18% | ||
| Copy Game MB/s (MB/s) | 1881 | 1991 6% | 2095 11% | 2171 15% | ||
| CrystalDiskMark 5.2 / 6 | -16% | 38% | 41% | 39% | 42% | |
| Write 4K (MB/s) | 159.2 | 93.1 -42% | 233.5 47% | 244.2 53% | 230.7 45% | 230.4 45% |
| Read 4K (MB/s) | 51.9 | 46.79 -10% | 90.1 74% | 89.8 73% | 87.9 69% | 91.6 76% |
| Write Seq (MB/s) | 3115 | 2853 -8% | 4263 37% | 4300 38% | 4216 35% | |
| Read Seq (MB/s) | 3298 | 2556 -22% | 4468 35% | 4392 33% | 4543 38% | |
| Write 4K Q32T1 (MB/s) | 392.6 | 475 21% | 538 37% | 607 55% | 582 48% | 667 70% |
| Read 4K Q32T1 (MB/s) | 474.7 | 529 11% | 703 48% | 658 39% | 730 54% | 728 53% |
| Write Seq Q32T1 (MB/s) | 4331 | 3331 -23% | 5097 18% | 5270 22% | 5152 19% | 5043 16% |
| Read Seq Q32T1 (MB/s) | 6746 | 3319 -51% | 7065 5% | 7091 5% | 7094 5% | 6821 1% |
| Write 4K Q8T8 (MB/s) | 2270 | |||||
| Read 4K Q8T8 (MB/s) | 2490 | |||||
| Total Average (Program / Settings) | -14% /
-13% | 45% /
47% | 54% /
59% | 54% /
55% | 54% /
56% |
* ... smaller is better

Disk Throttling: DiskSpd Read Loop, Queue Depth 8
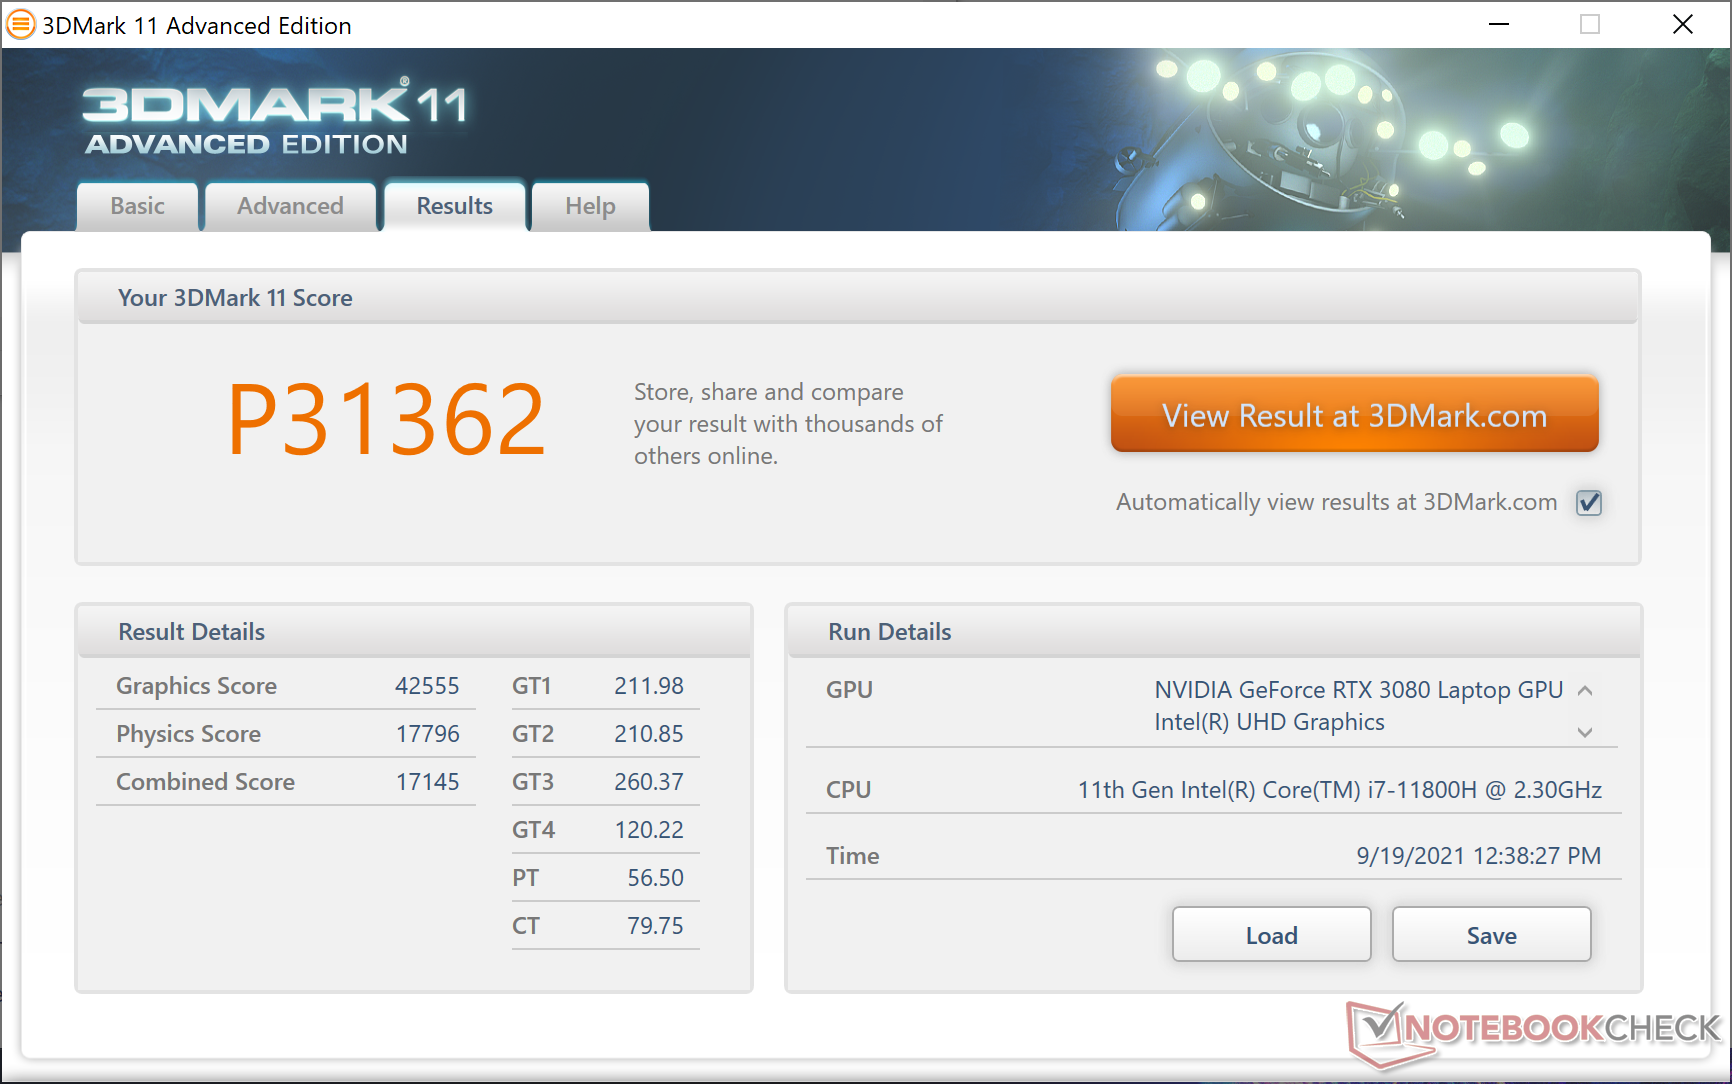
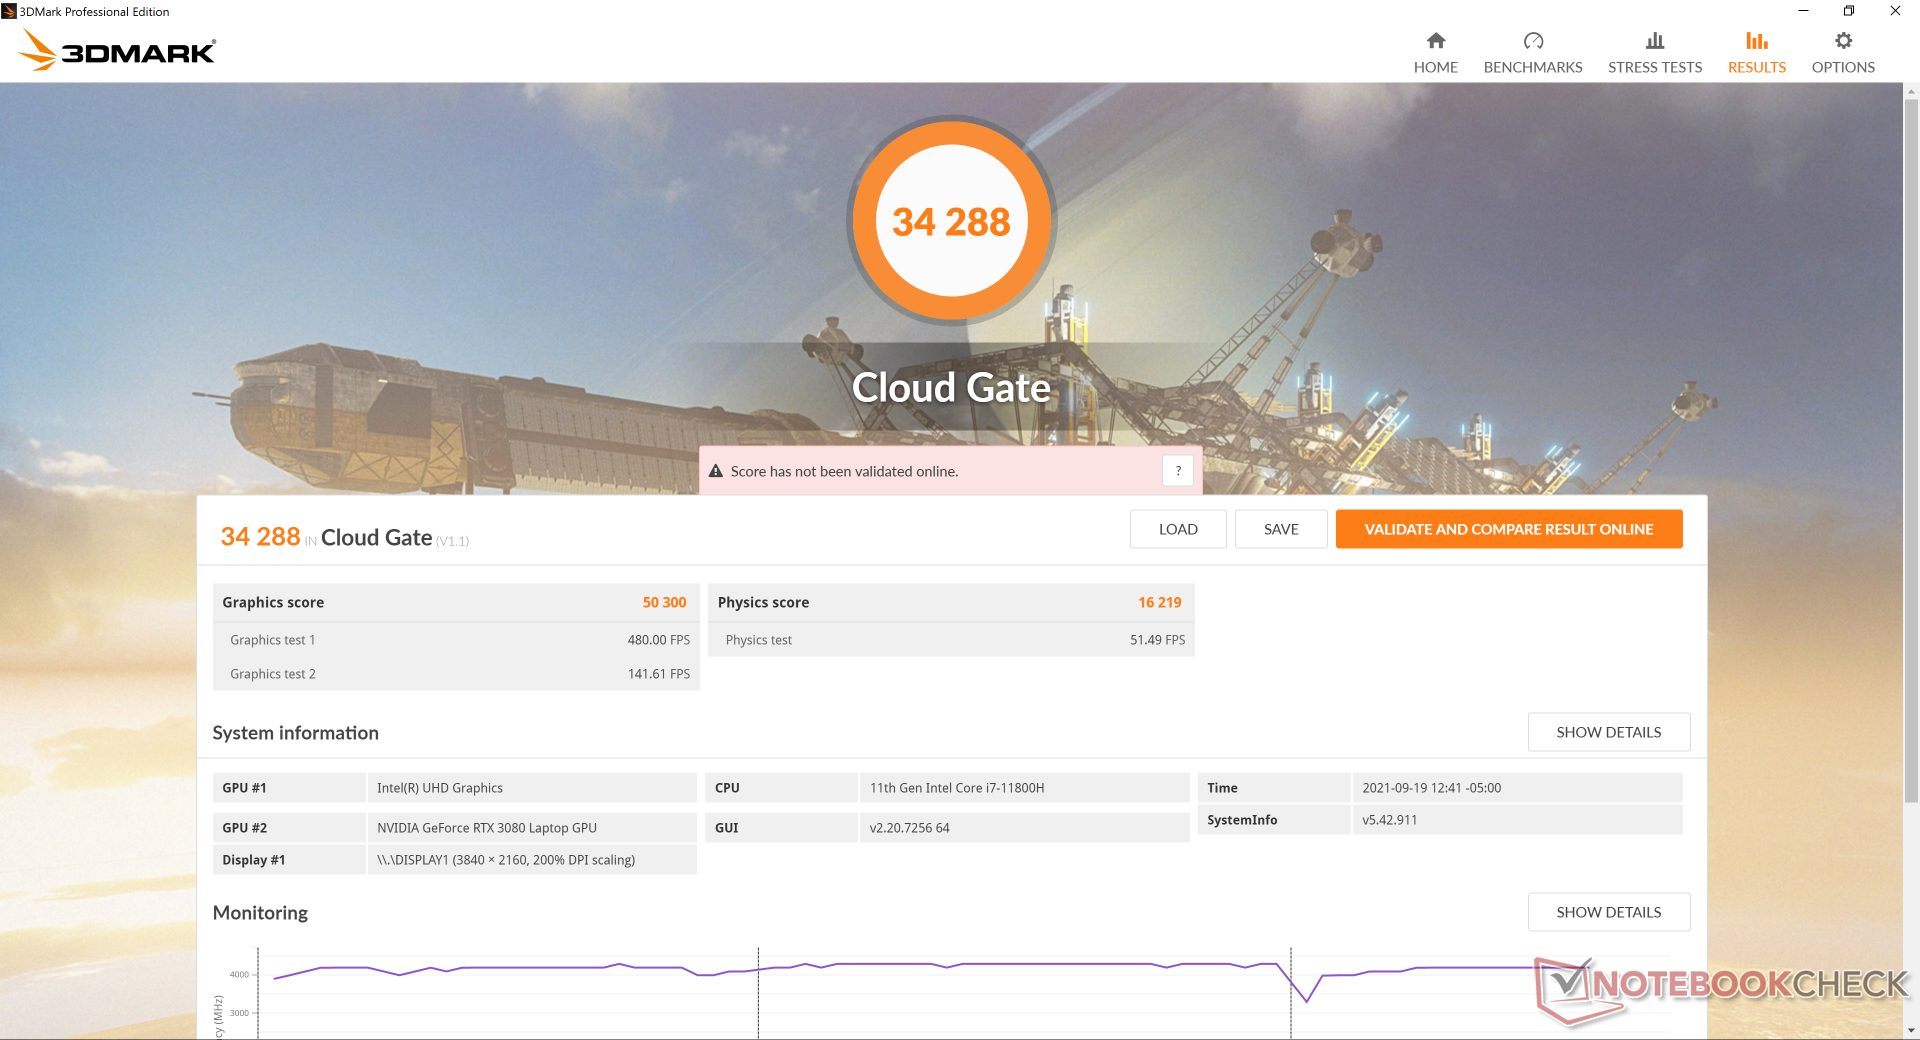
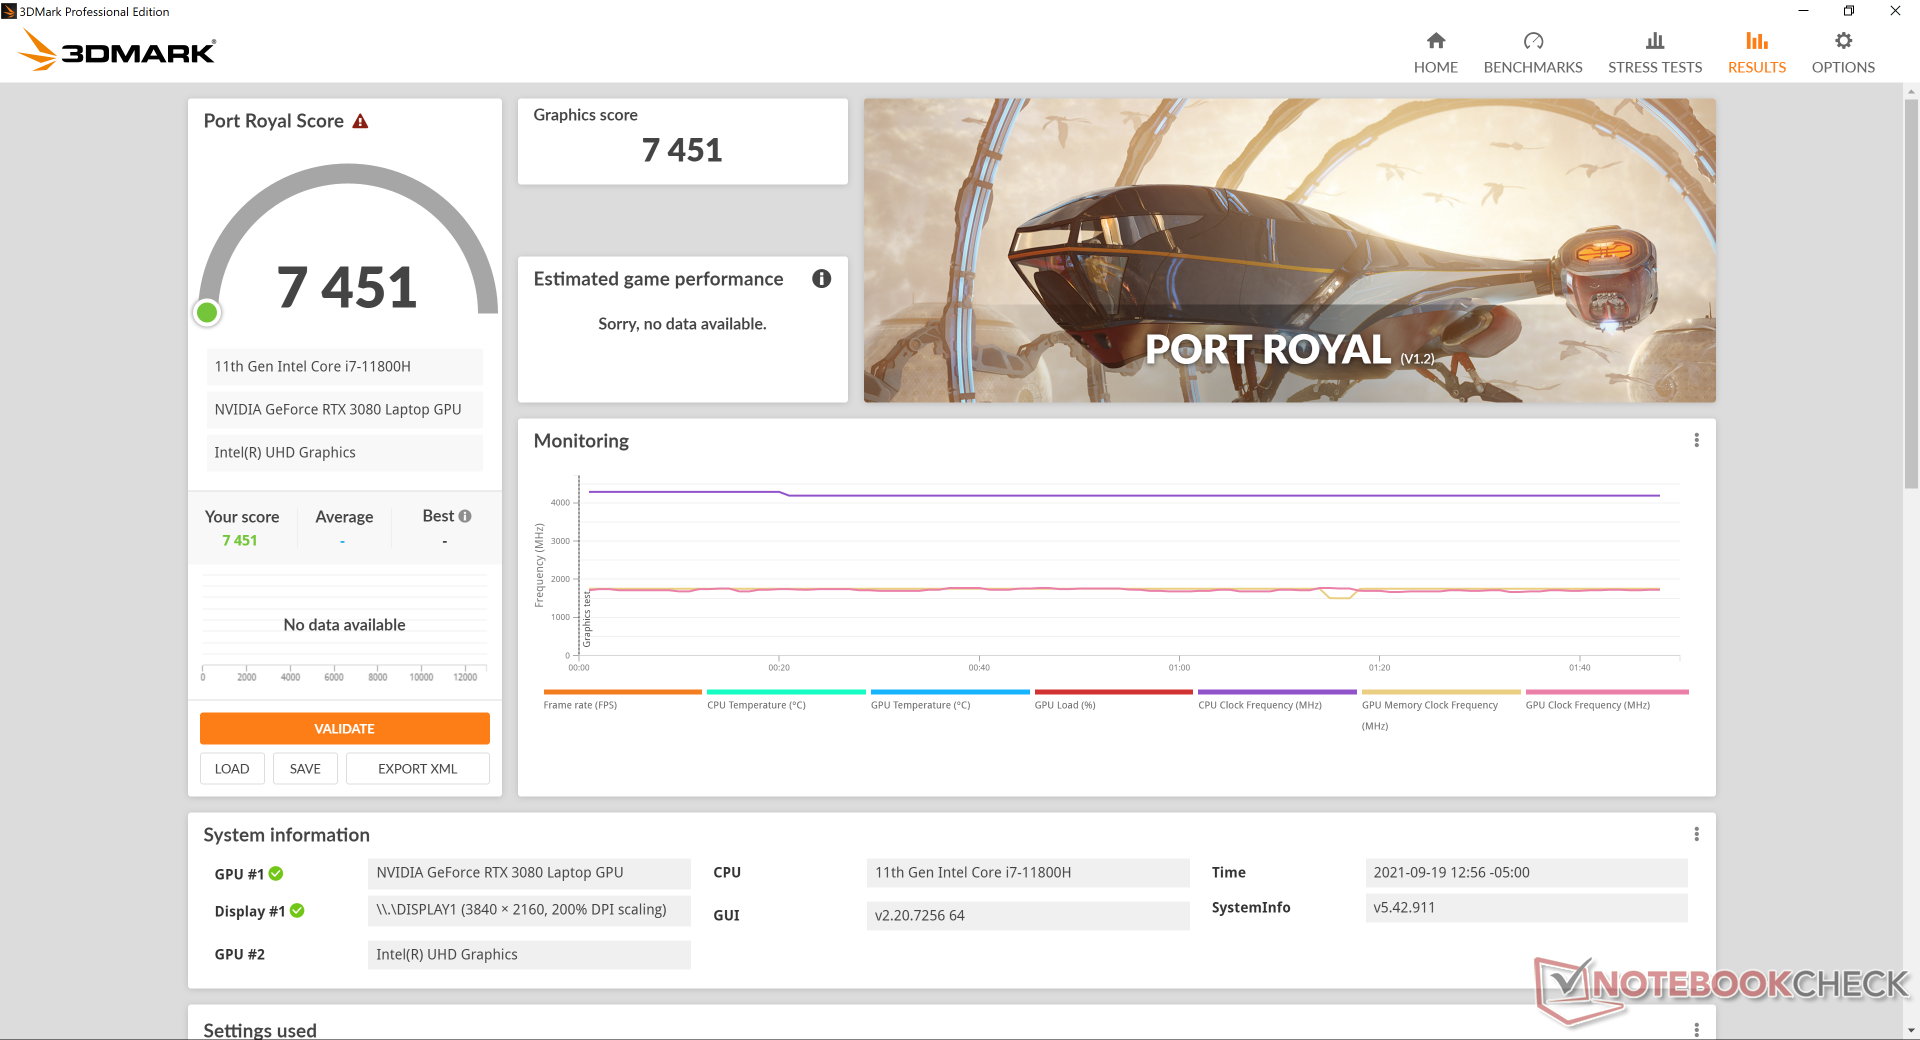
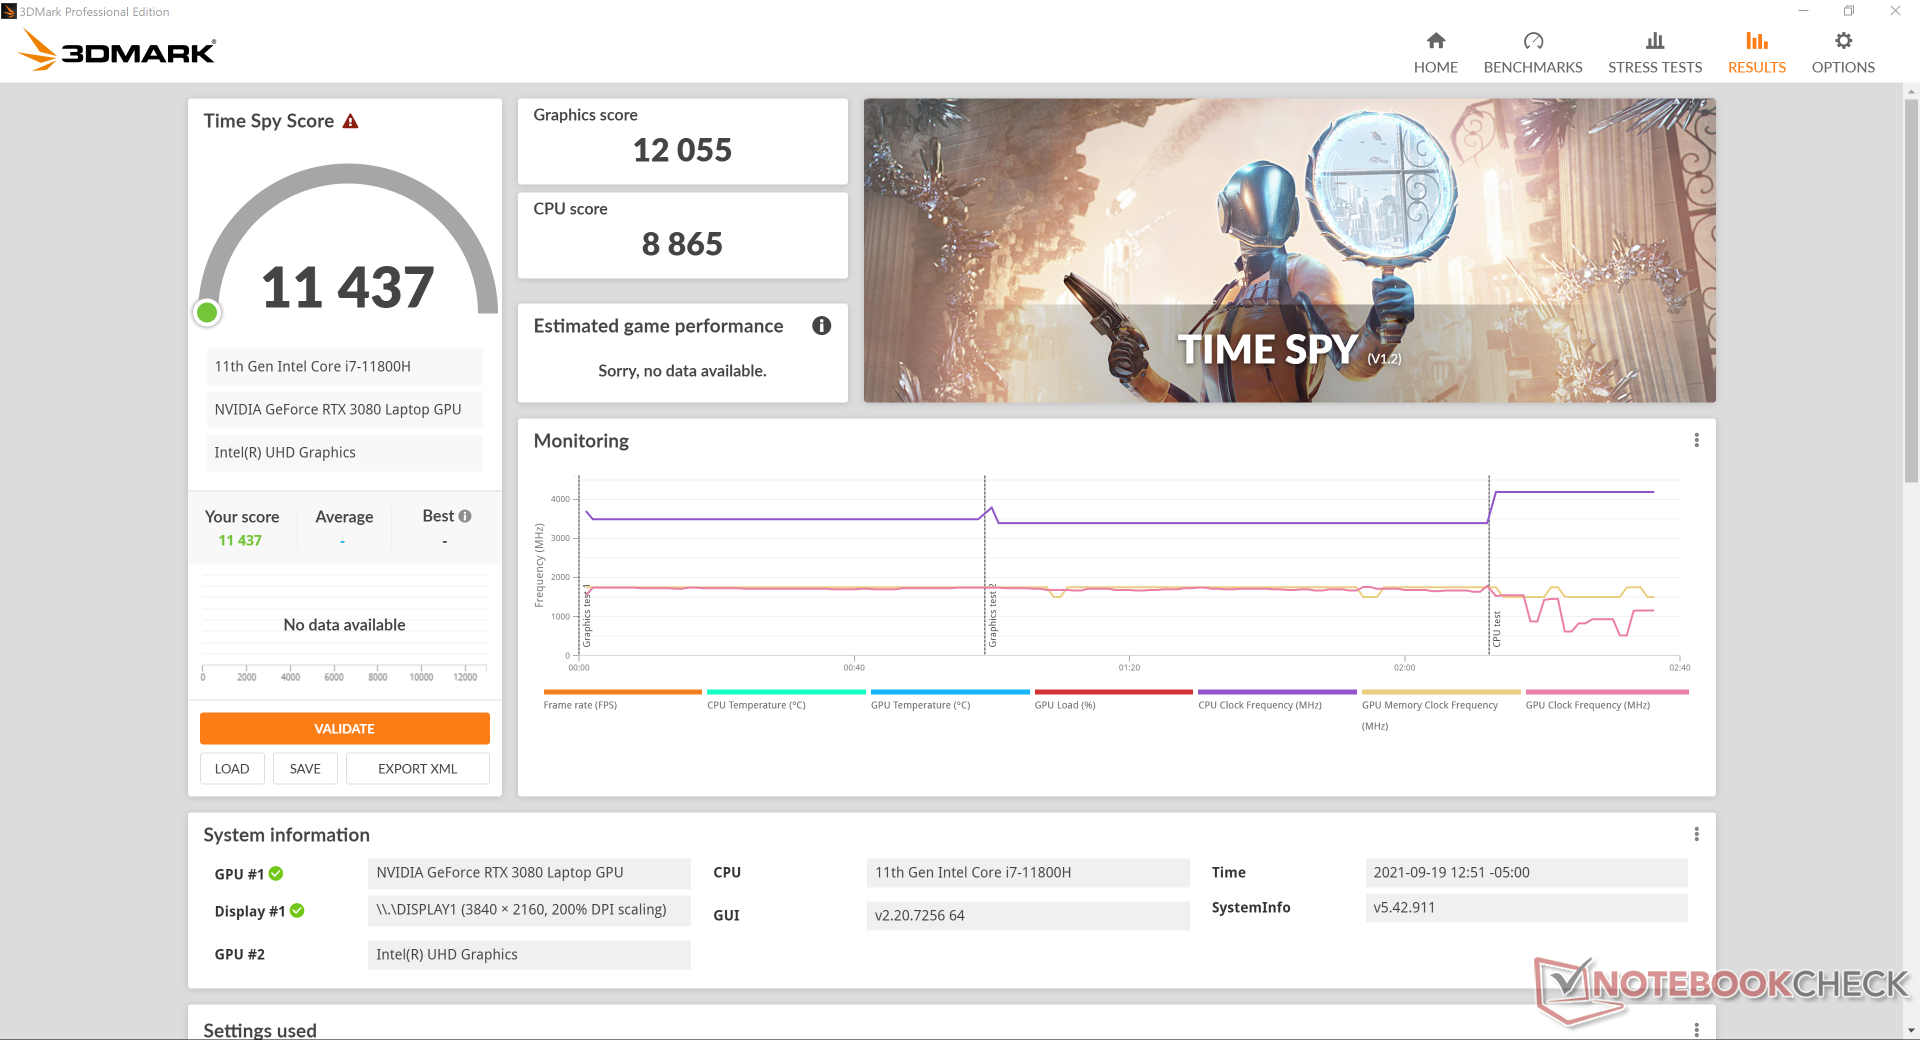
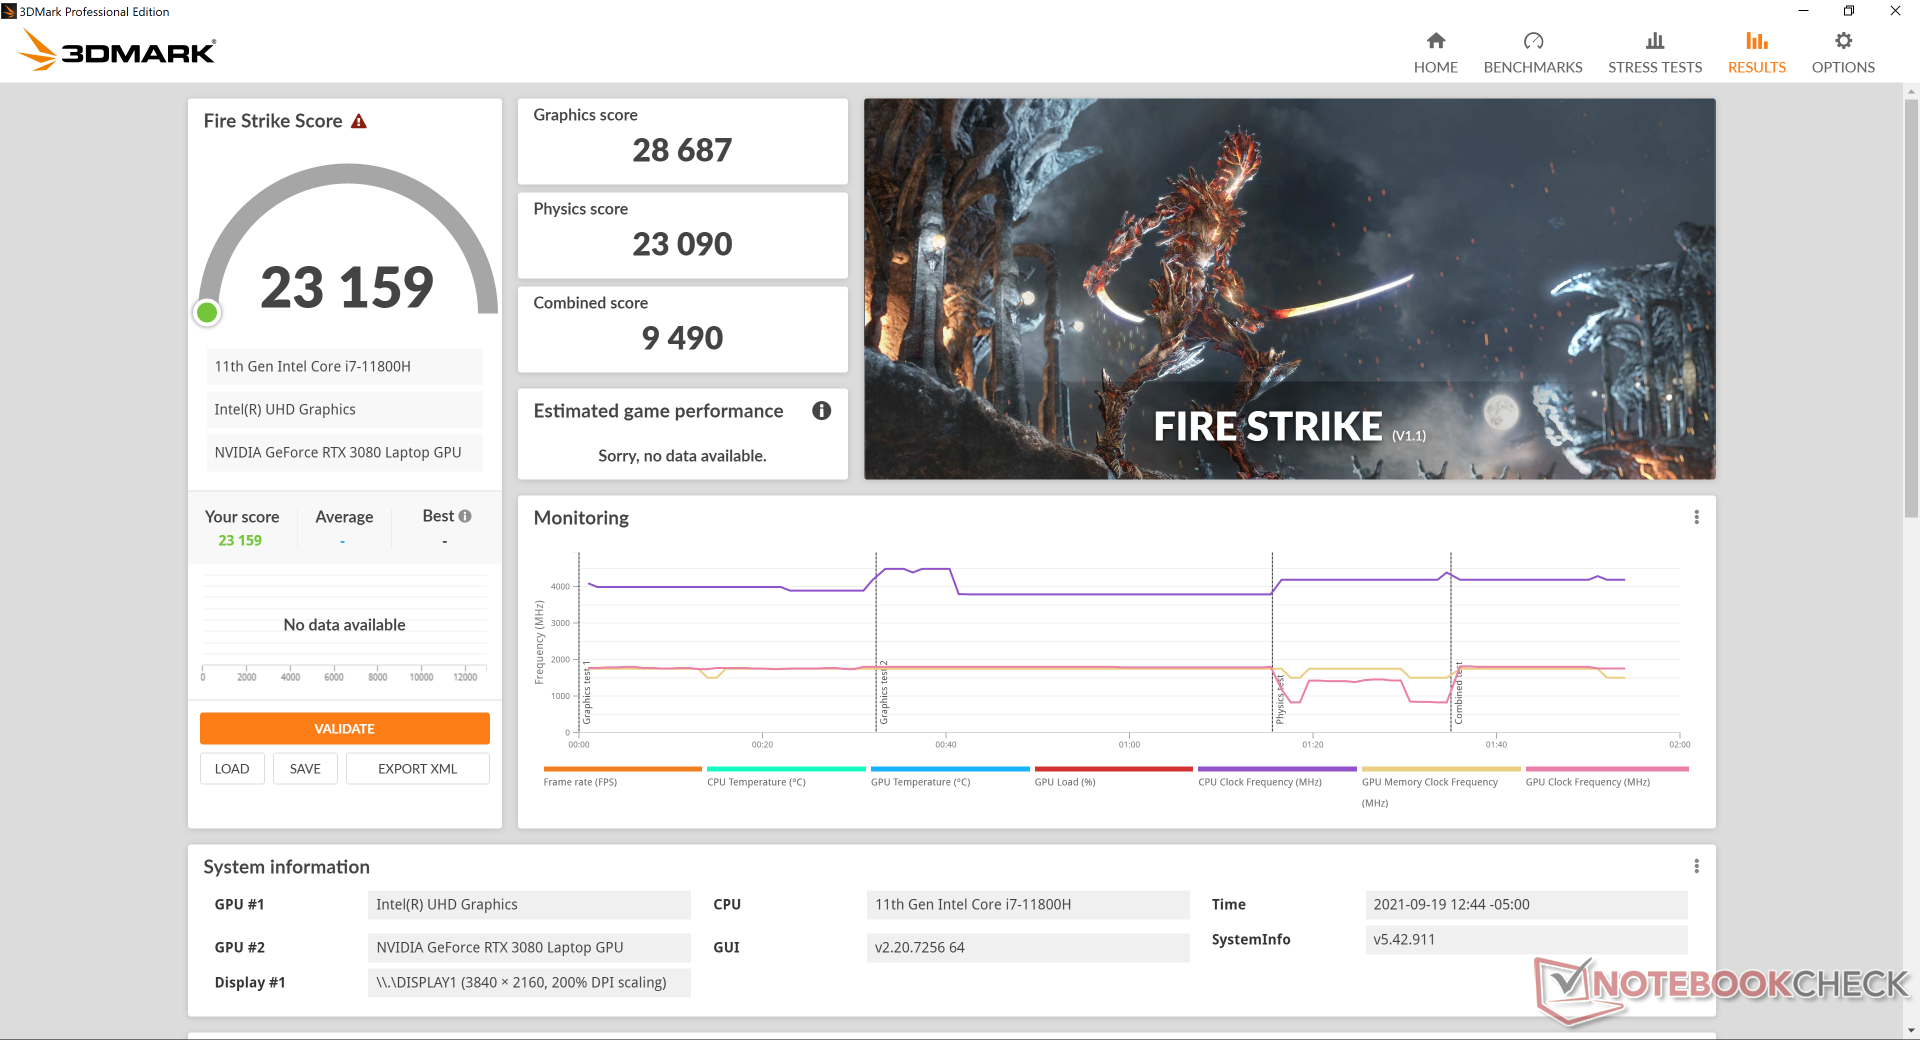
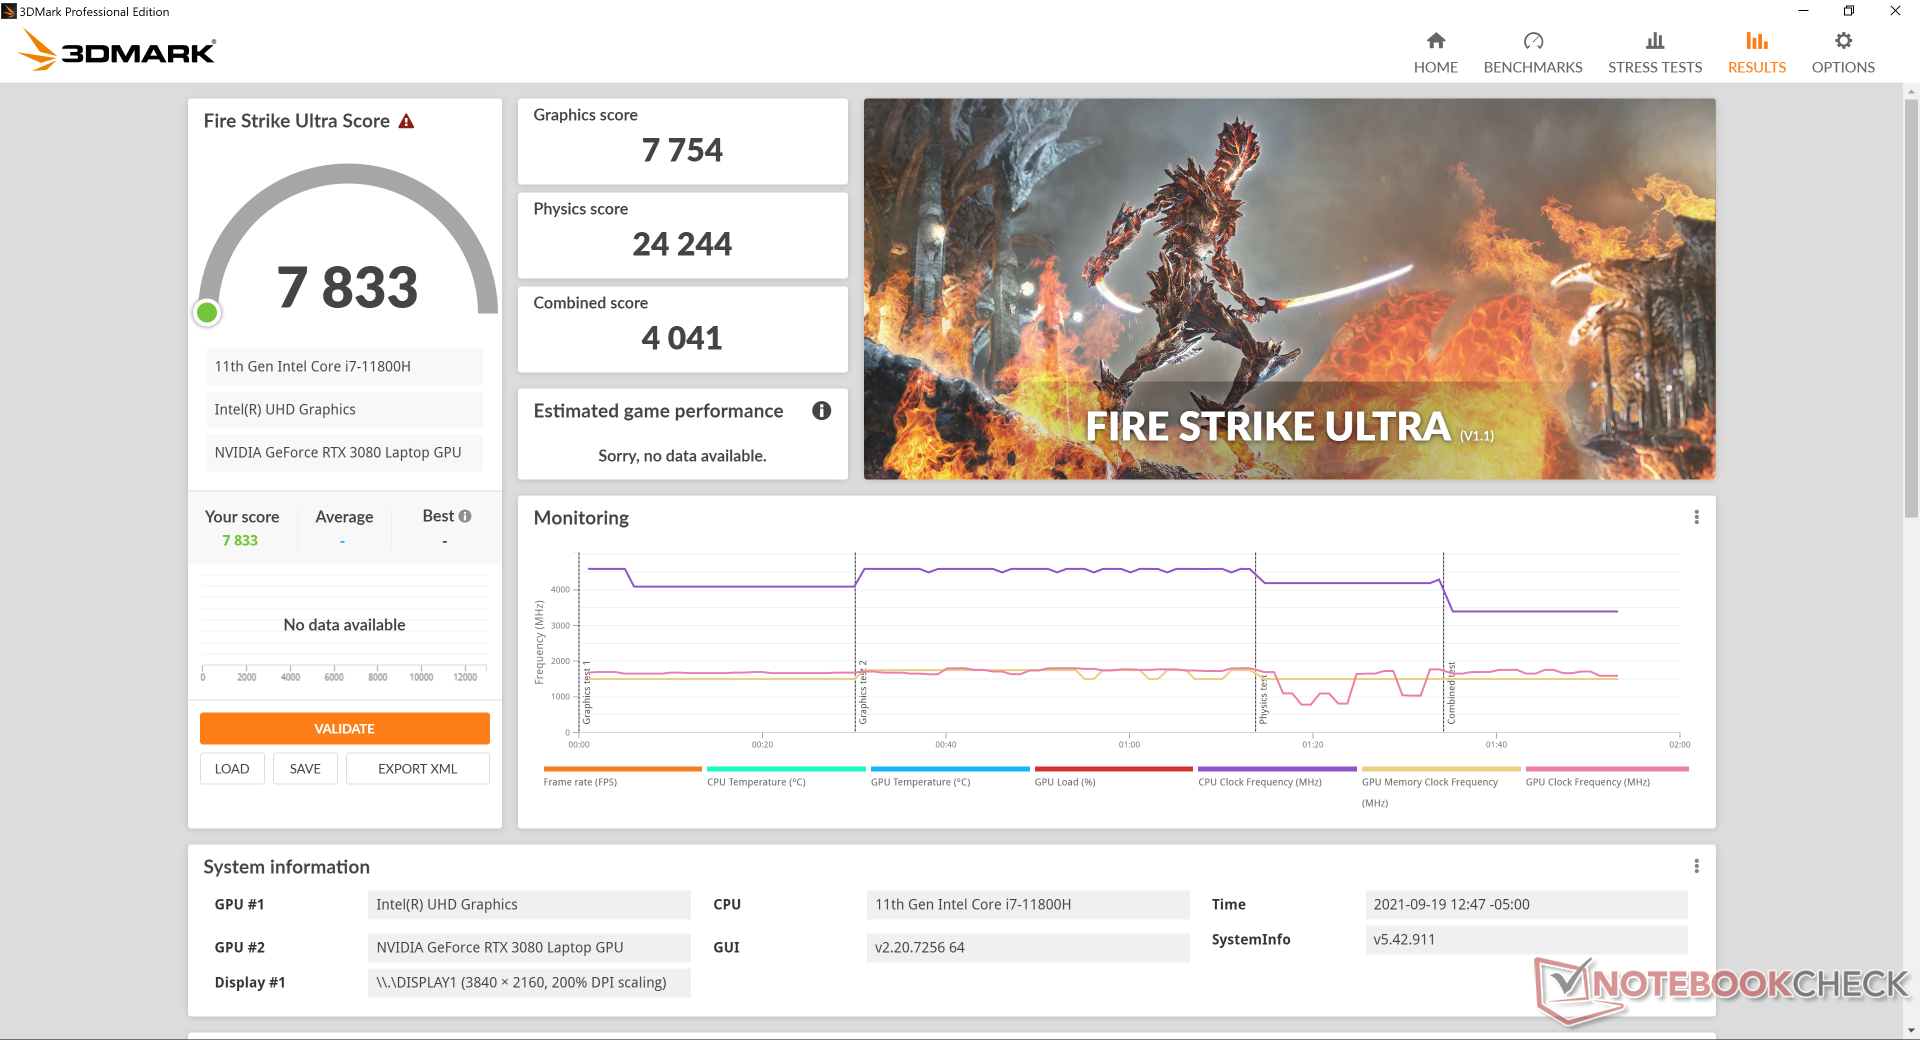
GPU性能--仅比平均水平高一点
尽管有165瓦的RTX 3080显卡,但原始性能只比一般的RTX 3080笔记本电脑快2%到9%。 平均RTX 3080笔记本电脑在我们的数据库中,可能是由于在更高的TGP目标下收益递减。在运行游戏时,也可以看到这种小的优势,因为帧率平均也只高出几个百分点。然而,与微星GS76中的90W RTX 3080相比,性能差异变得更加明显,我们的Alienware在某些游戏中的速度大约为15%至30%。A 配备RTX 3080图形的台式电脑仍将比任何RTX 3080笔记本电脑的性能高出约40%至45%。
闲置的 Witcher 3一个多小时,显示出稳定的帧率,没有随机下降,表明游戏时没有中断背景活动,这与我们在一些旧的Alienware m15型号上观察到的情况相反。
| 3DMark 11 | |
| 1280x720 Performance GPU | |
| ASUS GeForce RTX 3080 ROG STRIX OC GAMING | |
| Alienware x17 RTX 3080 P48E | |
| Average NVIDIA GeForce RTX 3080 Laptop GPU (31288 - 43744, n=40) | |
| Maingear Vector Pro MG-VCP17 | |
| Razer Blade Pro 17 2021 (QHD Touch) | |
| Razer Blade 17 RTX 3070 | |
| Alienware m17 R3 P45E | |
| MSI GS76 Stealth 11UH | |
| Schenker Compact 17 | |
| Asus TUF Gaming F17 FX706HM | |
| MSI Alpha 17 A4DEK | |
| Aorus 7 KB | |
| Asus ROG Strix G17 G713QE-RB74 | |
| MSI GF75 Thin 10SDR | |
| 1280x720 Performance Combined | |
| MSI GS76 Stealth 11UH | |
| Razer Blade 17 RTX 3070 | |
| Razer Blade Pro 17 2021 (QHD Touch) | |
| Alienware x17 RTX 3080 P48E | |
| ASUS GeForce RTX 3080 ROG STRIX OC GAMING | |
| Maingear Vector Pro MG-VCP17 | |
| Average NVIDIA GeForce RTX 3080 Laptop GPU (10637 - 20233, n=39) | |
| Alienware m17 R3 P45E | |
| Schenker Compact 17 | |
| Asus TUF Gaming F17 FX706HM | |
| Asus ROG Strix G17 G713QE-RB74 | |
| MSI Alpha 17 A4DEK | |
| MSI GF75 Thin 10SDR | |
| Aorus 7 KB | |
| 3DMark 11 Performance | 31362 points | |
| 3DMark Cloud Gate Standard Score | 34288 points | |
| 3DMark Fire Strike Score | 23159 points | |
| 3DMark Time Spy Score | 11437 points | |
Help | ||
Witcher 3 FPS Chart
| low | med. | high | ultra | QHD | 4K | |
|---|---|---|---|---|---|---|
| GTA V (2015) | 183 | 176 | 163 | 98.1 | 89.2 | 98.1 |
| The Witcher 3 (2015) | 370.2 | 294 | 192 | 105.2 | 80.2 | |
| Dota 2 Reborn (2015) | 164 | 148 | 143 | 135 | 111 | |
| Final Fantasy XV Benchmark (2018) | 181 | 134 | 106 | 81.8 | 50.8 | |
| X-Plane 11.11 (2018) | 118 | 99.3 | 79.7 | 56.9 | ||
| Far Cry 5 (2018) | 144 | 125 | 120 | 112 | 98 | 63 |
| Strange Brigade (2018) | 456 | 269 | 225 | 199 | 152 | 91.6 |
Emissions
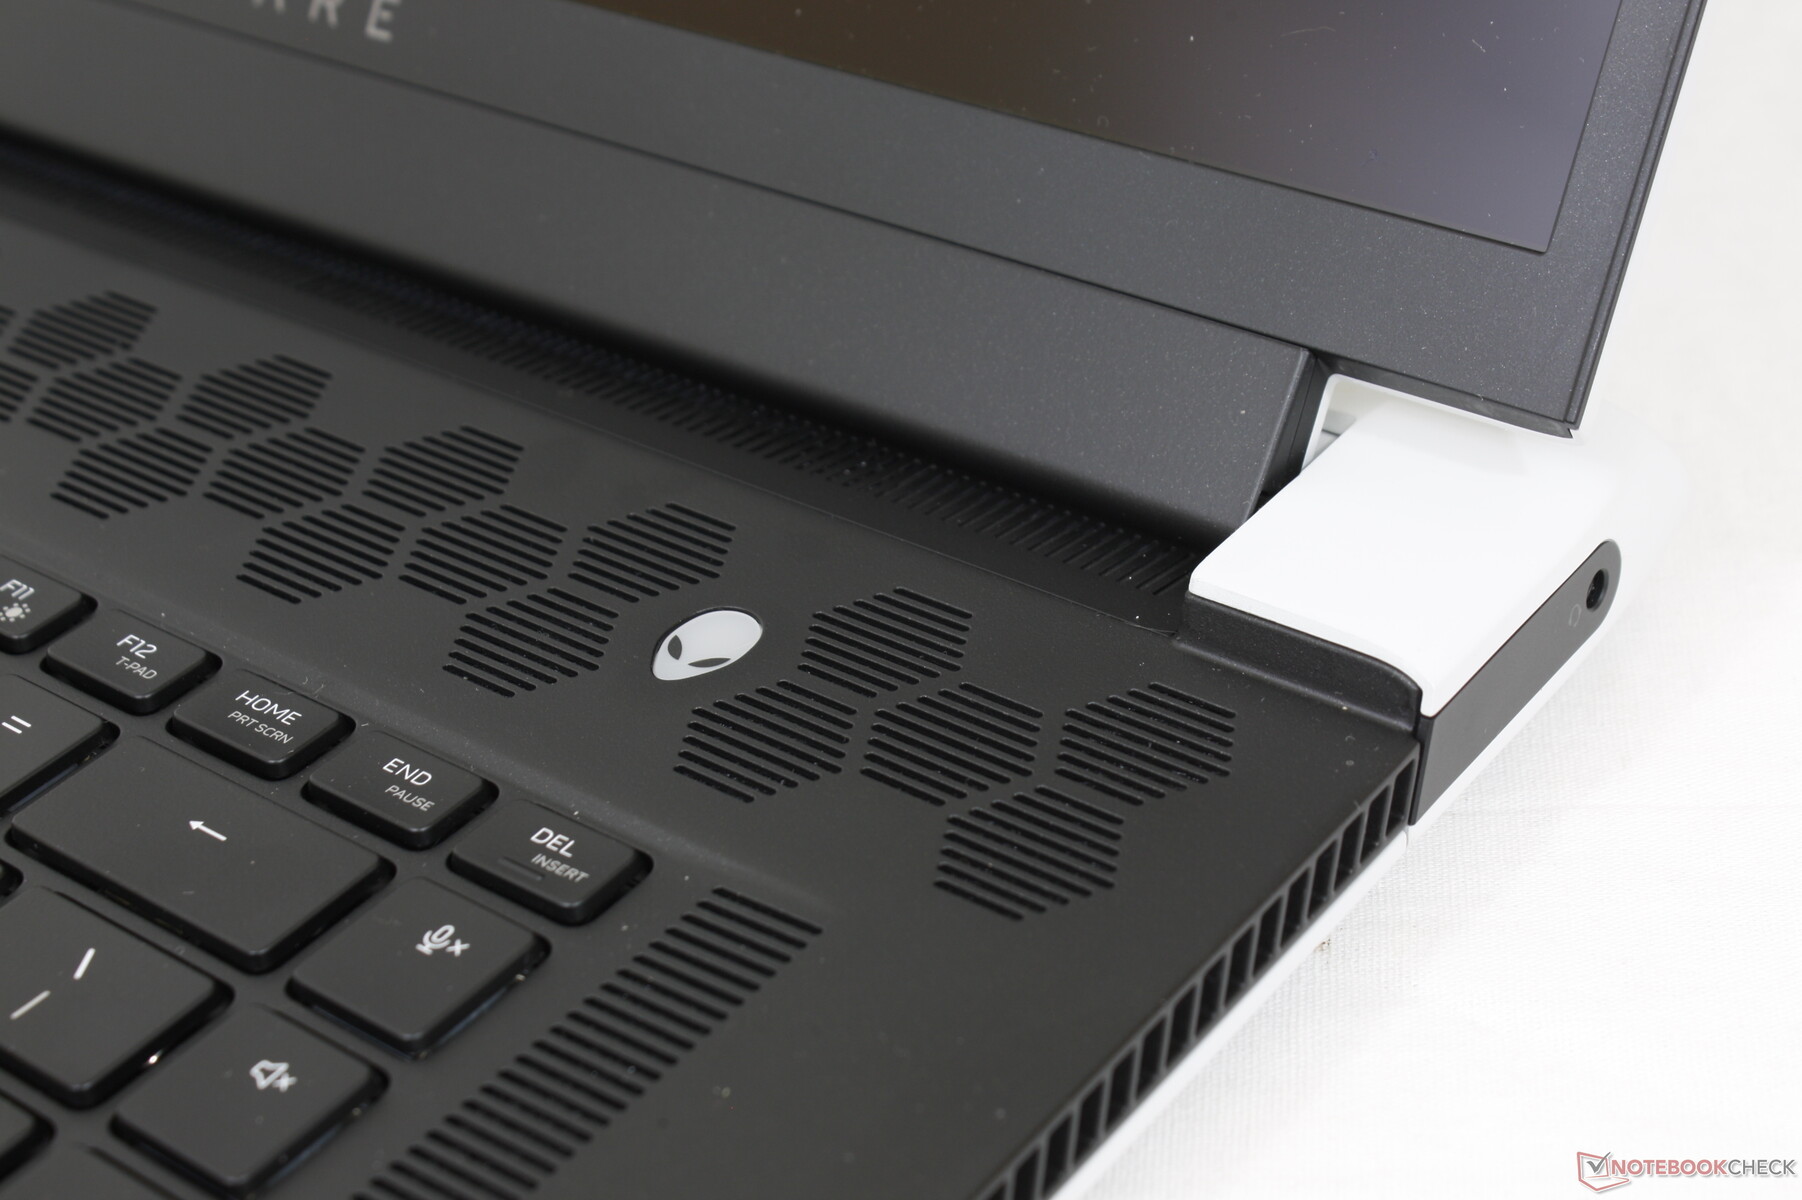
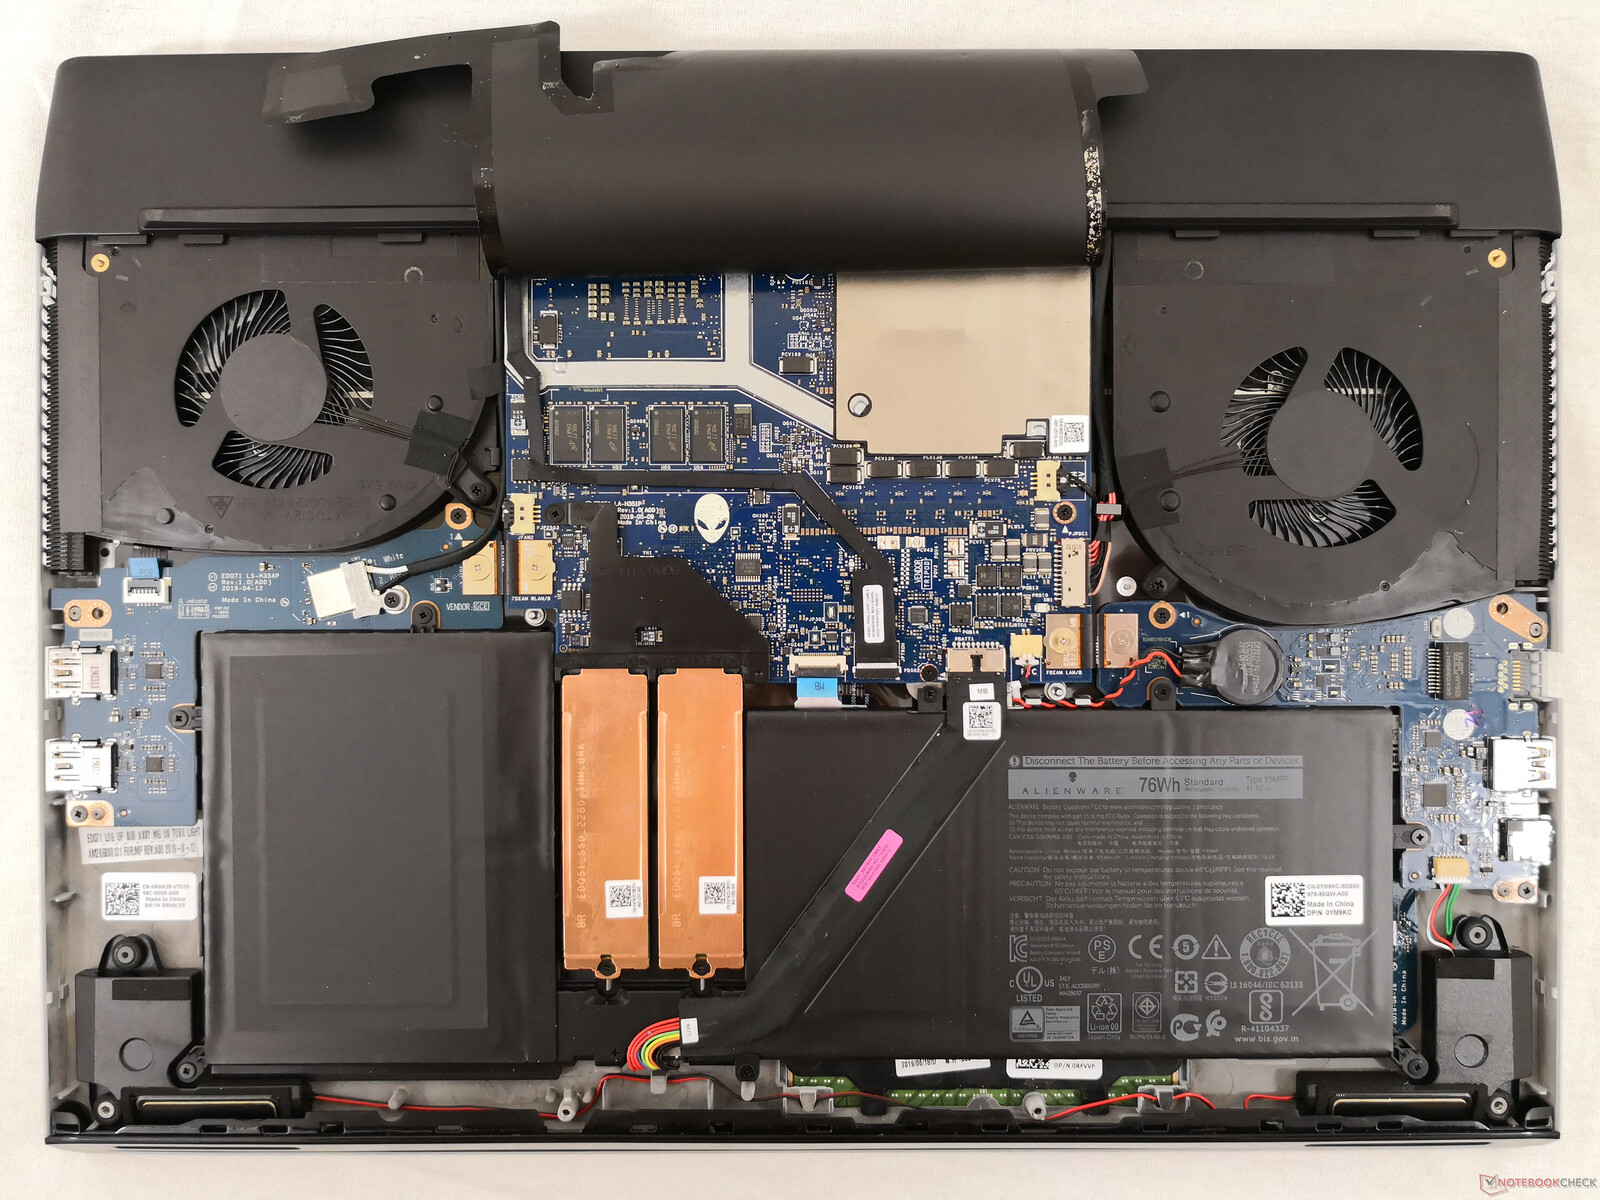
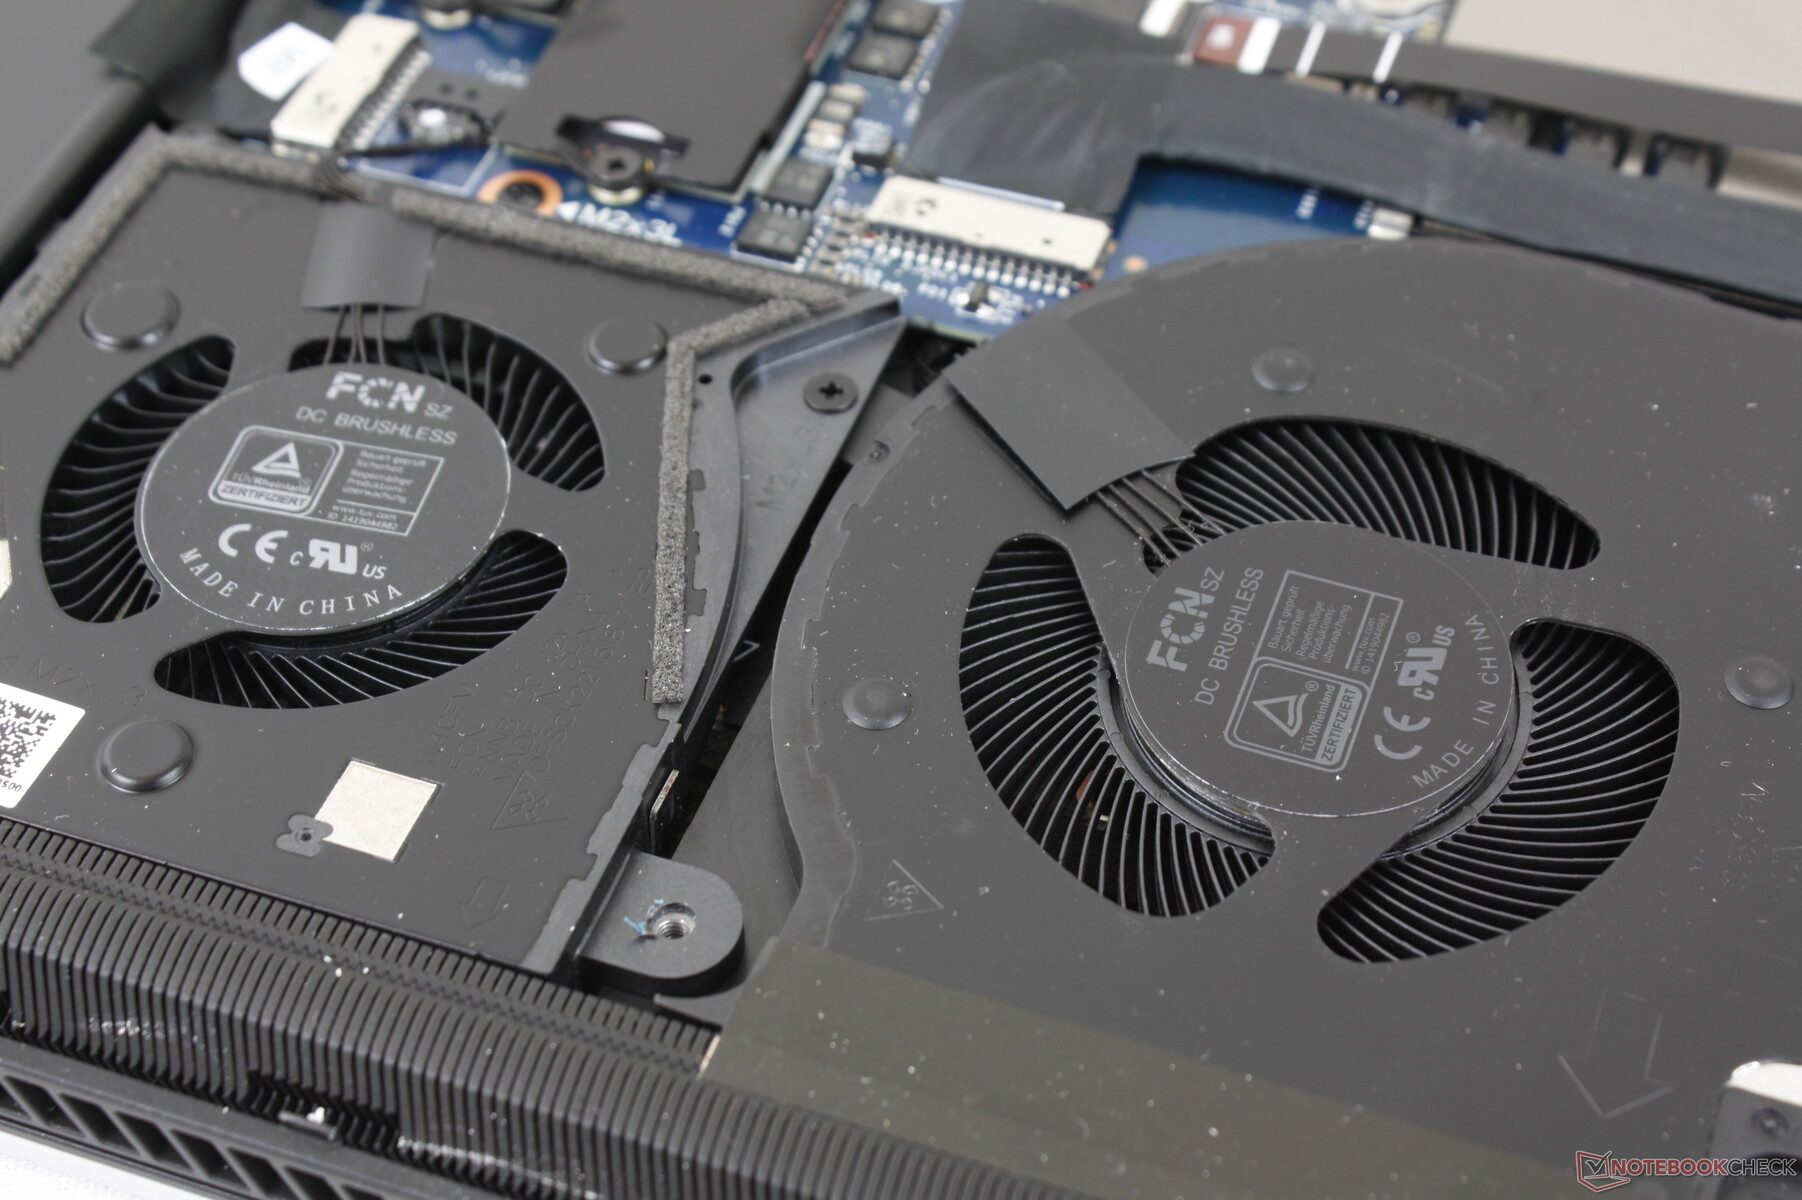
系统噪音--蒸气室+镓硅导热膏
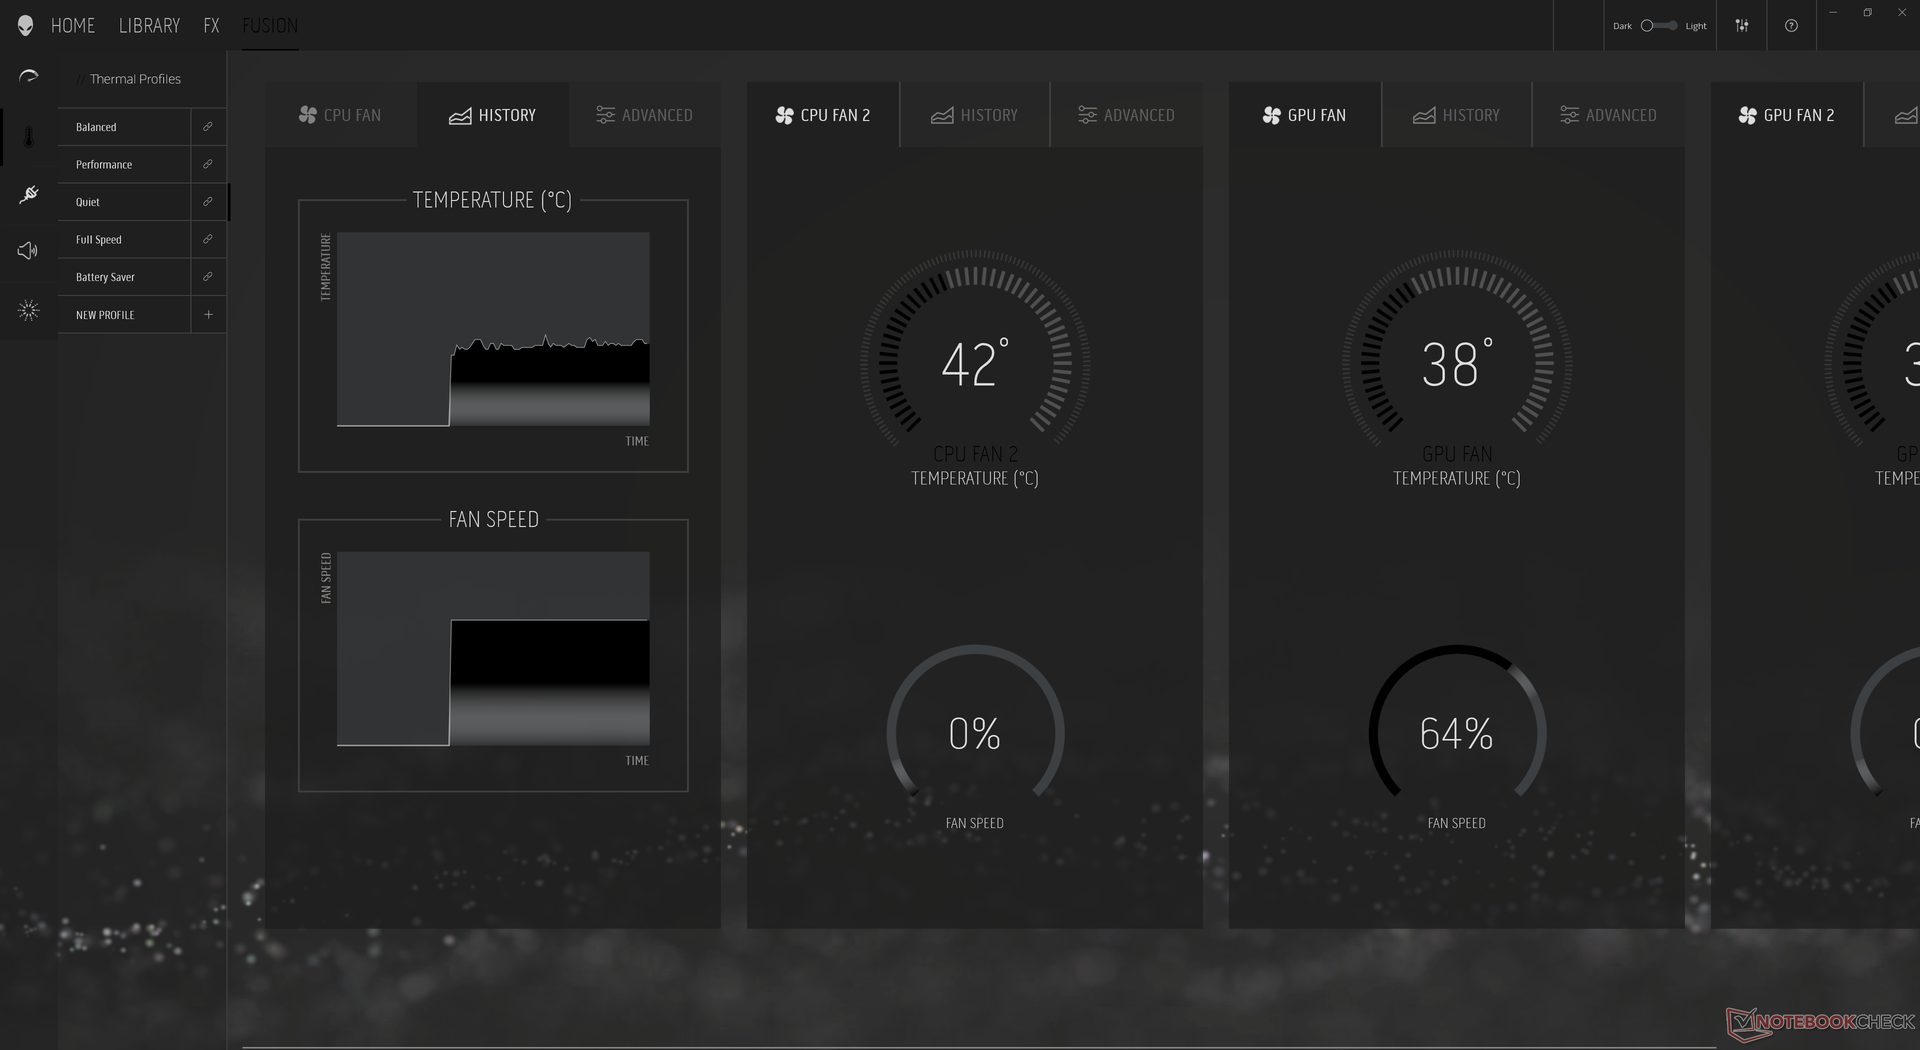
风扇噪音在很大程度上取决于Alienware指挥中心的设置(安静、性能和全速)。尽管Alienware x17的风扇数量是大多数其他游戏笔记本的2倍,但在浏览或视频流等低负载情况下,即使设置为性能模式,一般也非常安静。在运行3DMark 06 90秒时,我们能够记录到的风扇噪音仅为31.3 dB(A),而背景是24.9 dB(A)。然而,再长的时间,风扇噪音最终会上升到43.8 dB(A),这与我们在其他游戏笔记本上记录到的情况相似。
在性能模式下运行Witcher 3 ,将导致风扇噪音稳定在49.7 dB(A)。有趣的是,即使在平衡模式下,这一水平也会保持不变,因此玩家应该尽可能地将系统设置为性能模式。将风扇设置为全速模式,无论屏幕上的负载如何,风扇噪音都会增加到55分贝(A)。Alienware x17在低负载时通常比技嘉Aero 17或上一代m17 R4更安静,但一旦引入高负载,它们几乎是一样的。
| Alienware x17 RTX 3080 P48E GeForce RTX 3080 Laptop GPU, i7-11800H, 2x WDC PC SN730 SDBPNTY-1T00 (RAID 0) | Alienware m17 R4 GeForce RTX 3080 Laptop GPU, i9-10980HK, 2x Micron 2300 512 GB (RAID 0) | Razer Blade 17 RTX 3070 GeForce RTX 3070 Laptop GPU, i7-11800H, Samsung PM9A1 MZVL21T0HCLR | Asus ROG Zephyrus S17 GX703HSD GeForce RTX 3080 Laptop GPU, i9-11900H, Samsung PM9A1 MZVL22T0HBLB | MSI GS76 Stealth 11UH GeForce RTX 3080 Laptop GPU, i9-11900H, Samsung PM9A1 MZVL22T0HBLB | Gigabyte Aero 17 HDR YD GeForce RTX 3080 Laptop GPU, i9-11980HK, Samsung PM9A1 MZVL2512HCJQ | |
|---|---|---|---|---|---|---|
| Noise | -6% | -3% | 4% | -10% | -20% | |
| off / environment * (dB) | 24.9 | 24 4% | 24.2 3% | 23 8% | 24 4% | 25 -0% |
| Idle Minimum * (dB) | 24.9 | 24 4% | 24.7 1% | 23 8% | 24 4% | 30 -20% |
| Idle Average * (dB) | 24.9 | 25 -0% | 24.7 1% | 23 8% | 25 -0% | 32 -29% |
| Idle Maximum * (dB) | 29.6 | 36 -22% | 24.7 17% | 23 22% | 42 -42% | 41 -39% |
| Load Average * (dB) | 31.1 | 45 -45% | 44.3 -42% | 41 -32% | 46 -48% | 43 -38% |
| Witcher 3 ultra * (dB) | 49.7 | 47 5% | 56.3 -13% | 45 9% | 48 3% | 51 -3% |
| Load Maximum * (dB) | 54.8 | 50 9% | 47.7 13% | 52 5% | 48 12% | 59 -8% |
* ... smaller is better
Noise level
| Idle |
| 24.9 / 24.9 / 29.6 dB(A) |
| Load |
| 31.1 / 54.8 dB(A) |
 | ||
30 dB silent 40 dB(A) audible 50 dB(A) loud |
||
min: | ||
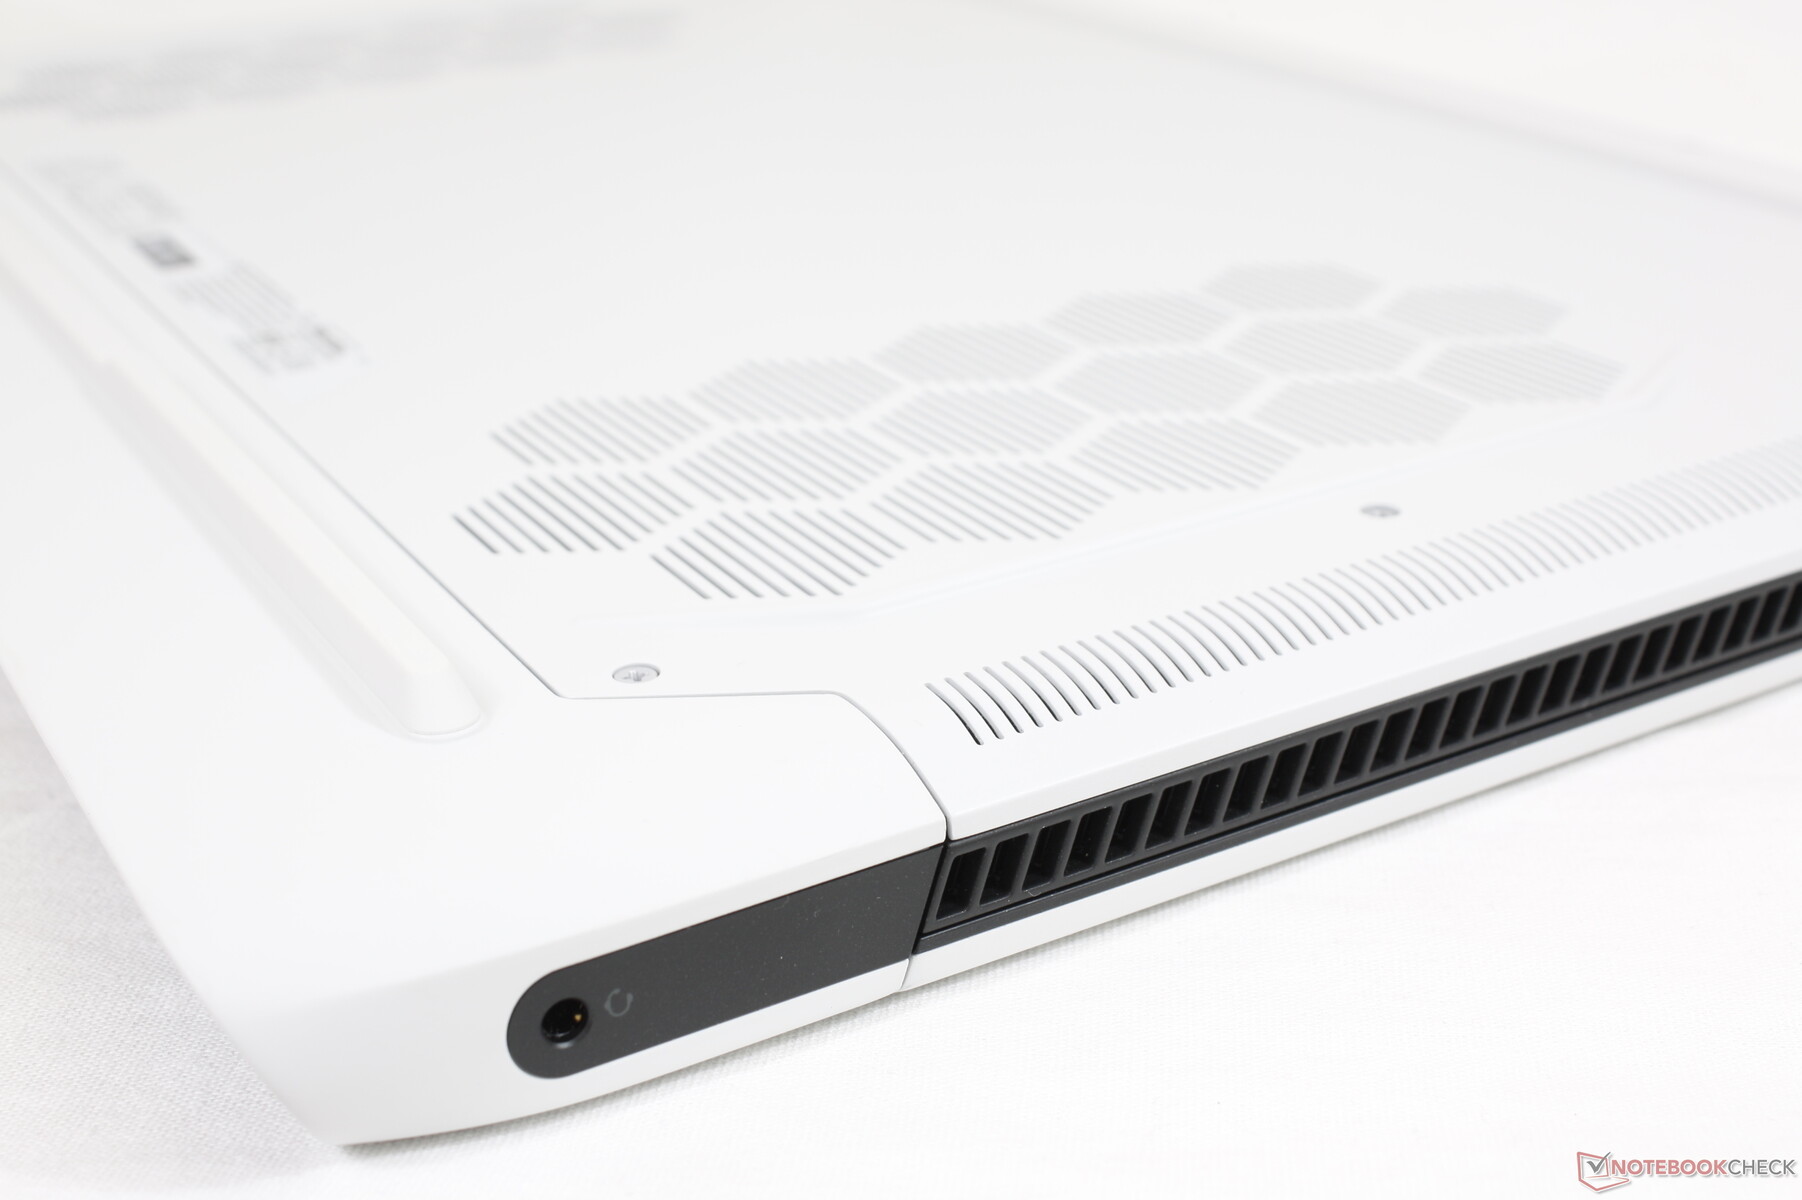
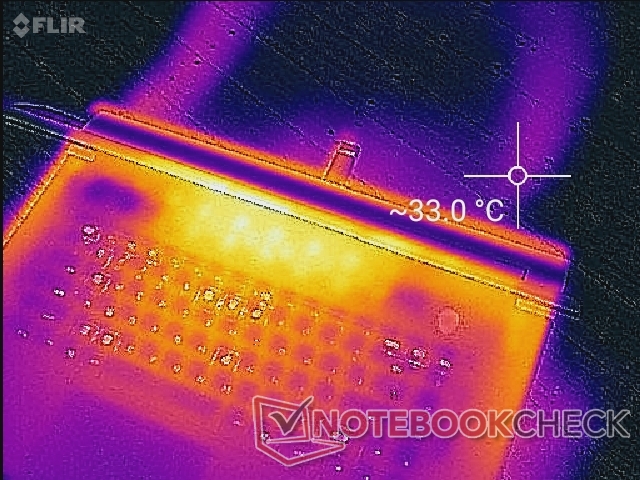
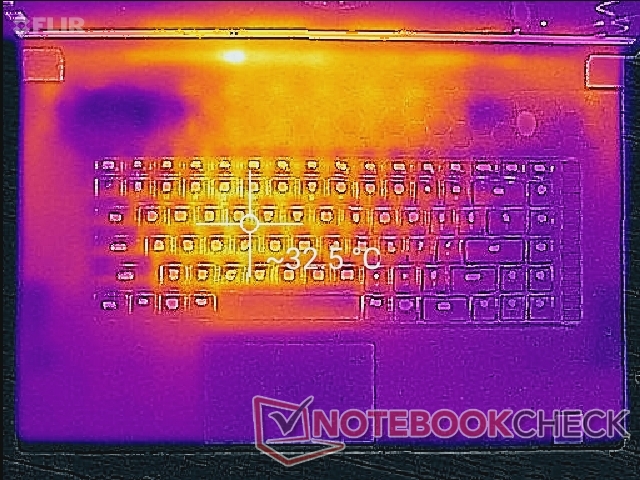
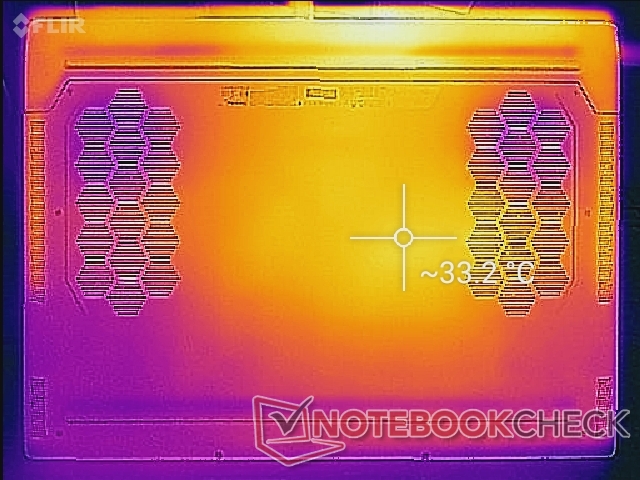
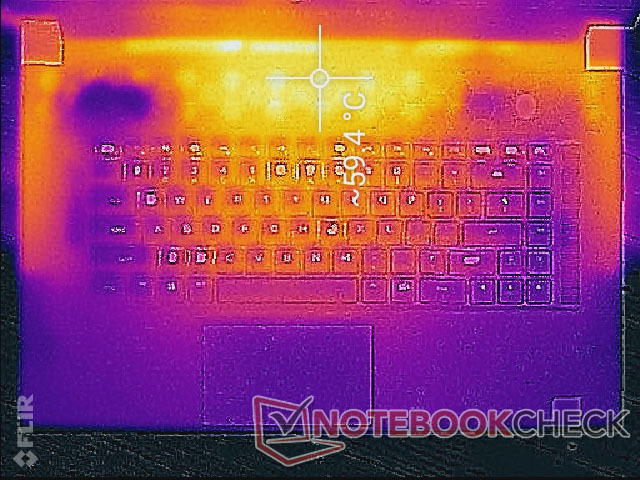
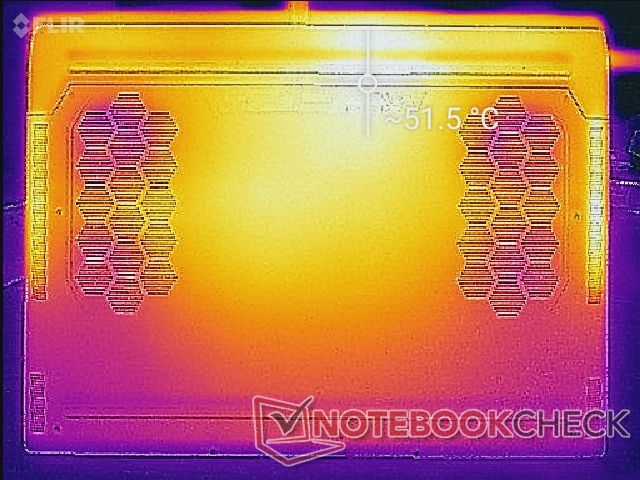
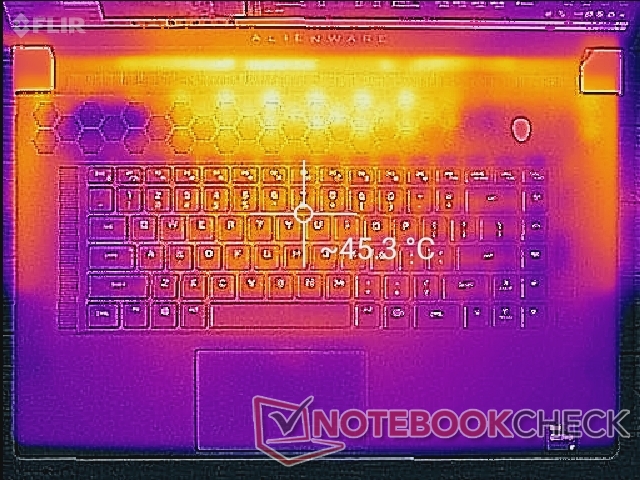
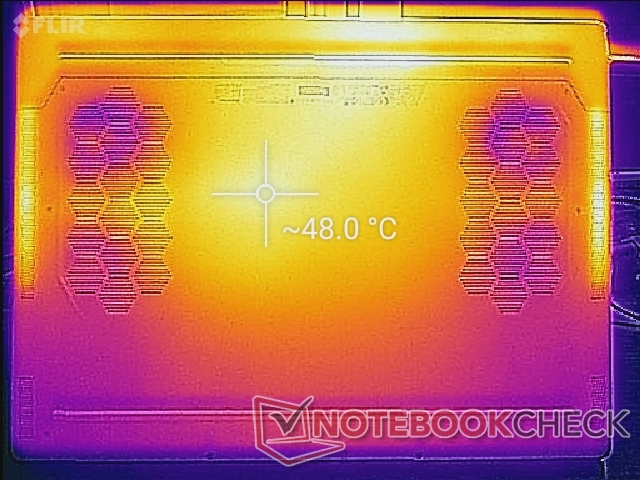
温度
闲置时,掌托上的表面温度相对较低,而键盘中央和底部的温度明显较高,约为33℃,因为风扇处于低速状态。当游戏时,顶部和底部的热点温度可分别达到59摄氏度和52摄氏度,甚至沿着键盘的侧边也可达到39摄氏度。这些热点通常远离用户的手掌和手指,以便在游戏过程中不至于分心,但绝对建议不要挡住系统周围的几个通风格栅中的任何一个。
整体温度实际上比我们在华硕Zephyrus S17上观察到的要冷一些。 华硕Zephyrus S17这可能是由于我们的Alienware机箱更厚、更大。
(-) The maximum temperature on the upper side is 58.4 °C / 137 F, compared to the average of 40.4 °C / 105 F, ranging from 21.2 to 68.8 °C for the class Gaming.
(-) The bottom heats up to a maximum of 49 °C / 120 F, compared to the average of 43.2 °C / 110 F
(+) In idle usage, the average temperature for the upper side is 29.5 °C / 85 F, compared to the device average of 33.9 °C / 93 F.
(-) Playing The Witcher 3, the average temperature for the upper side is 41.4 °C / 107 F, compared to the device average of 33.9 °C / 93 F.
(+) The palmrests and touchpad are reaching skin temperature as a maximum (32.4 °C / 90.3 F) and are therefore not hot.
(-) The average temperature of the palmrest area of similar devices was 28.8 °C / 83.8 F (-3.6 °C / -6.5 F).
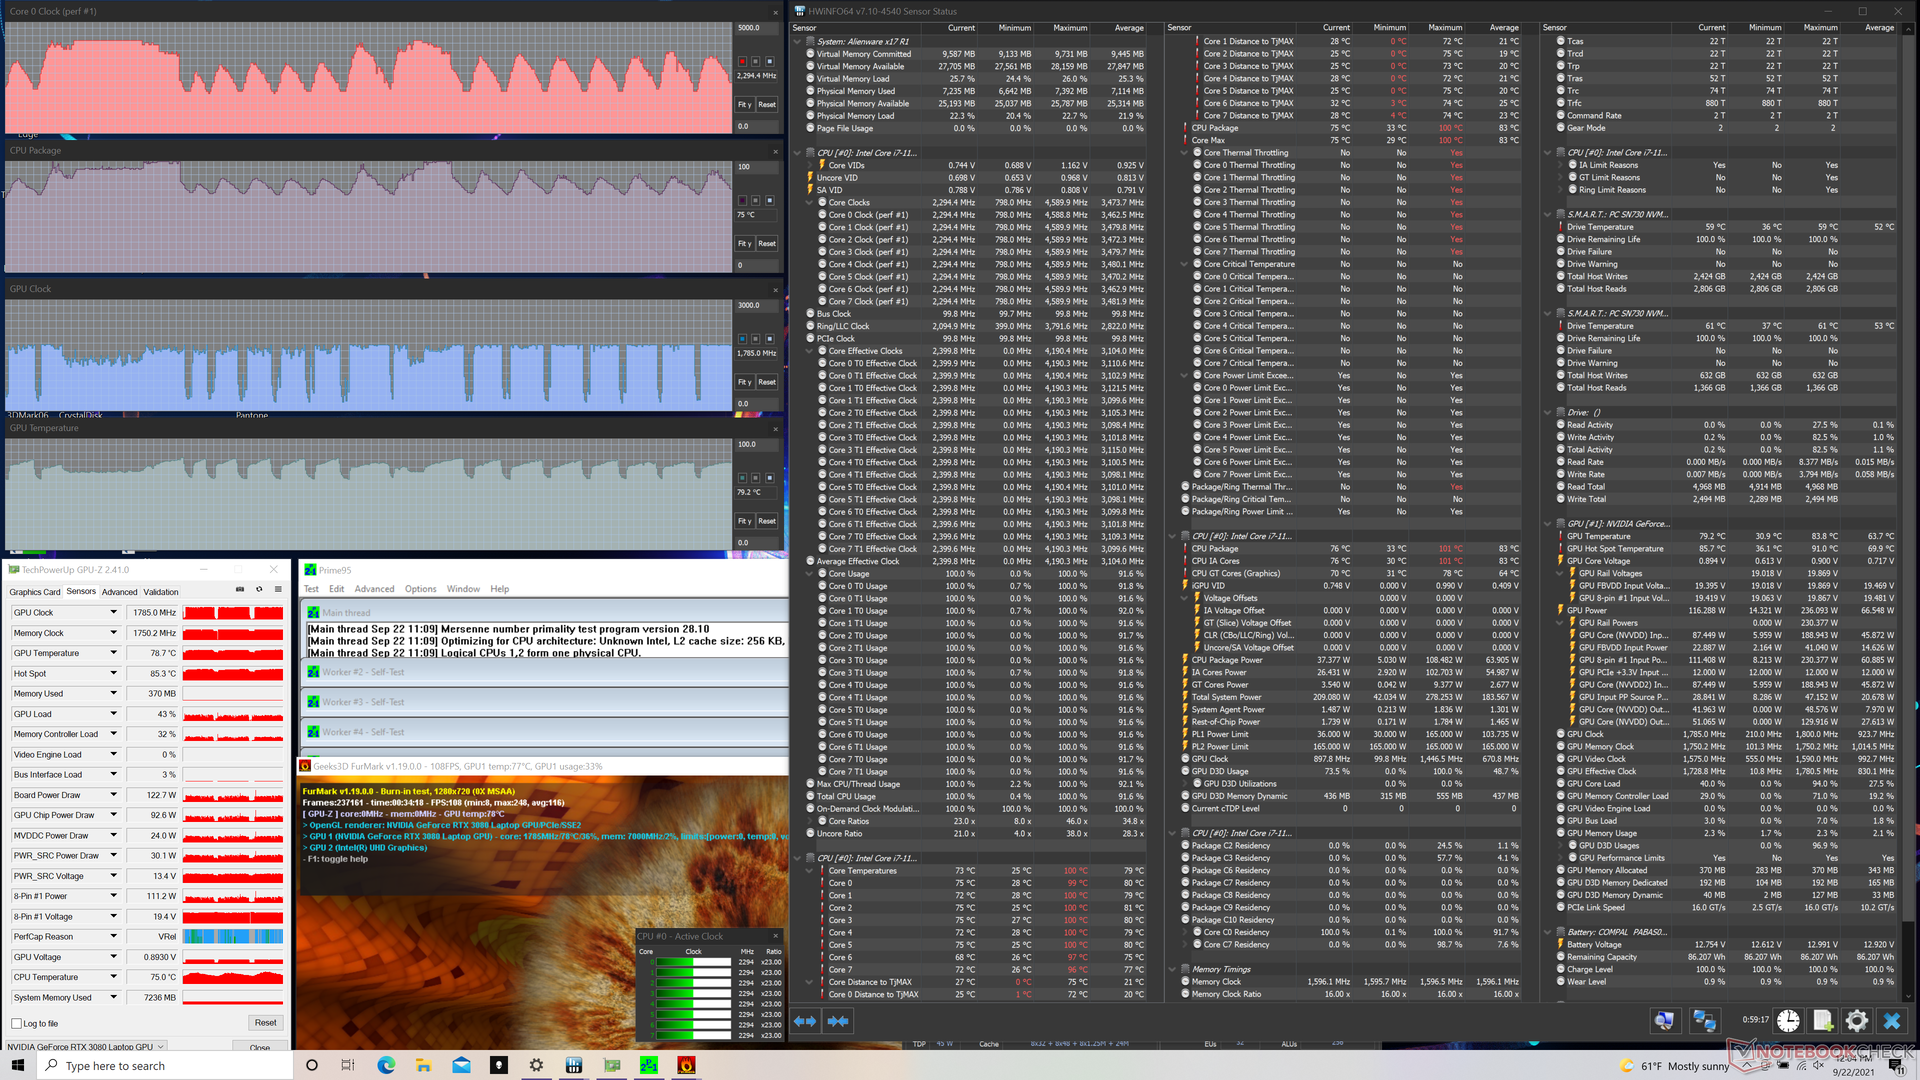
压力测试
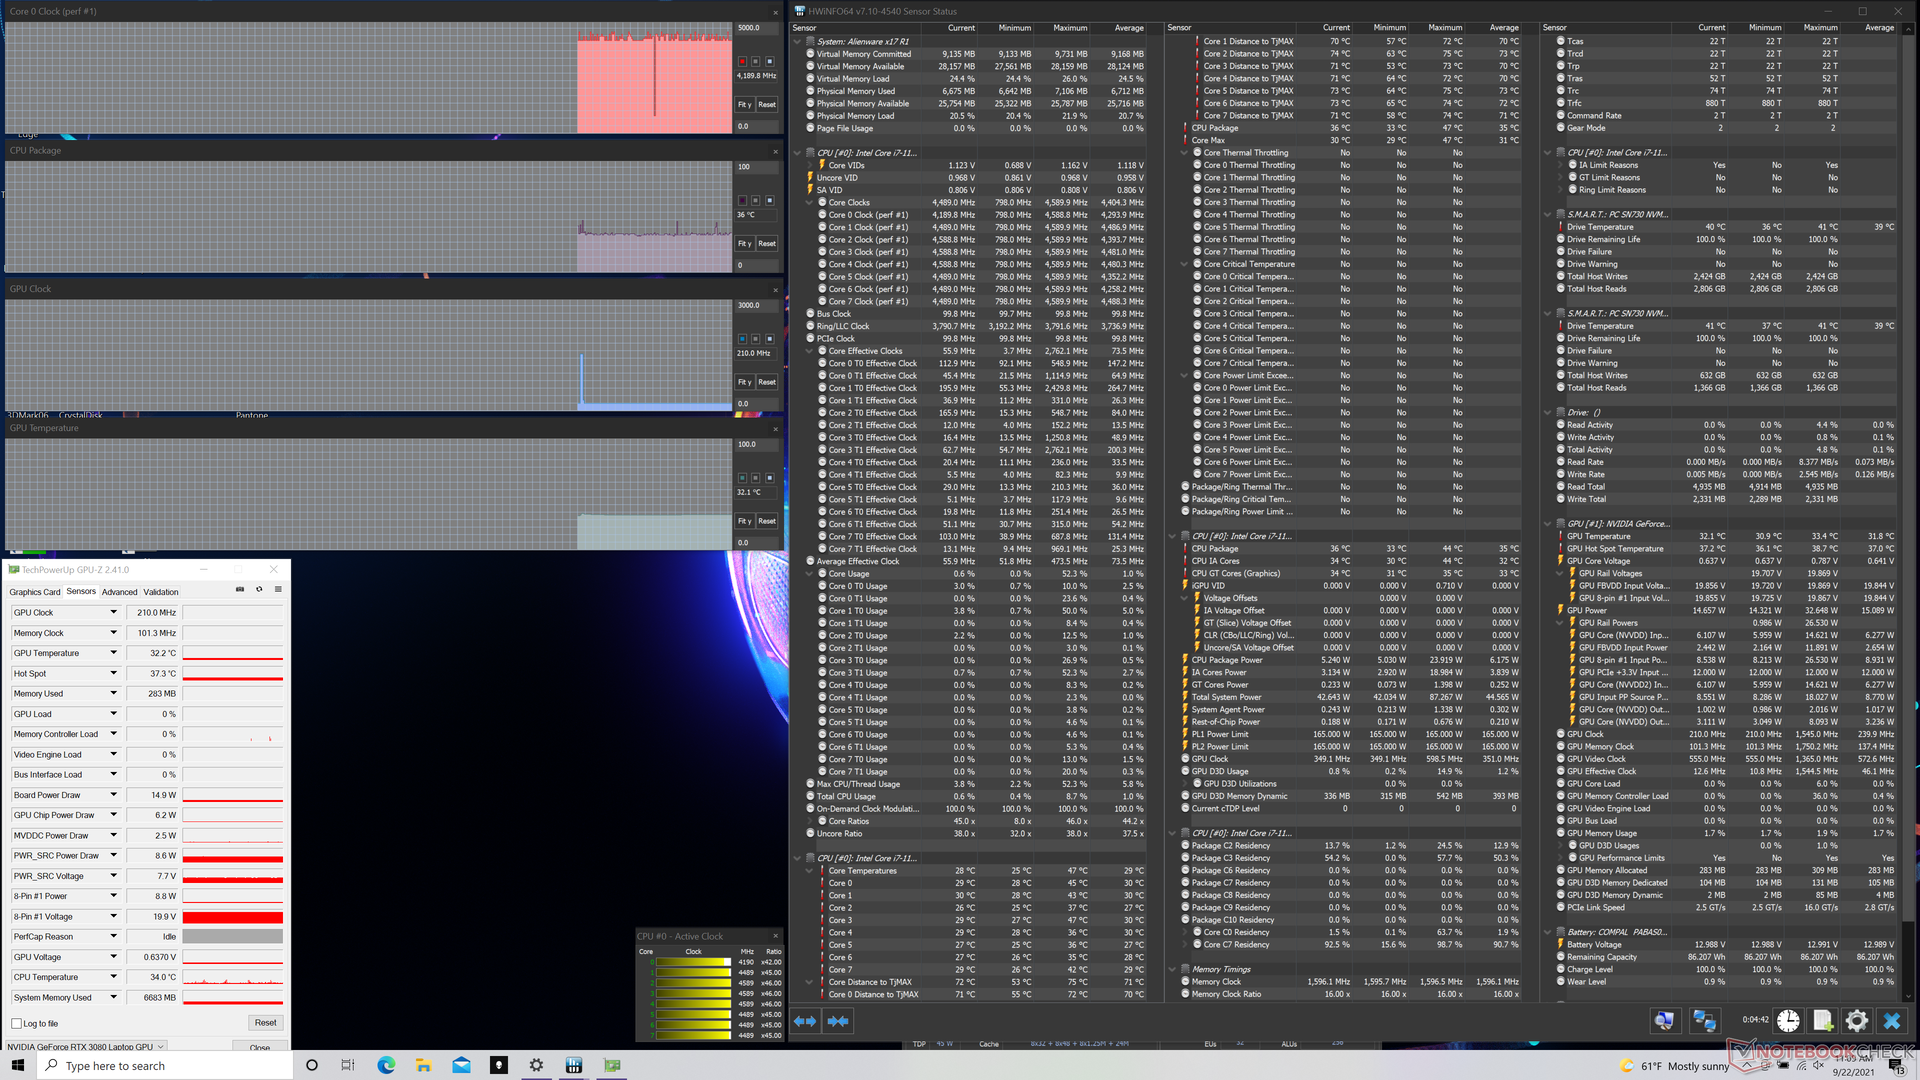
当用Prime95强调时,CPU时钟速率和温度会在3.8GHz到4.2GHz之间循环,每隔几分钟就会有85C到100C的温度,这些都是非常高的数值。作为比较,Razer Blade 17配备了完全相同的Core i7-11800H处理器,但它在遭受相同条件时仅稳定在2.8 GHz和78 C。通过Prime95和FurMark,当CPU和GPU的利用率达到100%时,CPU和GPU的时钟速率都会被扼杀。
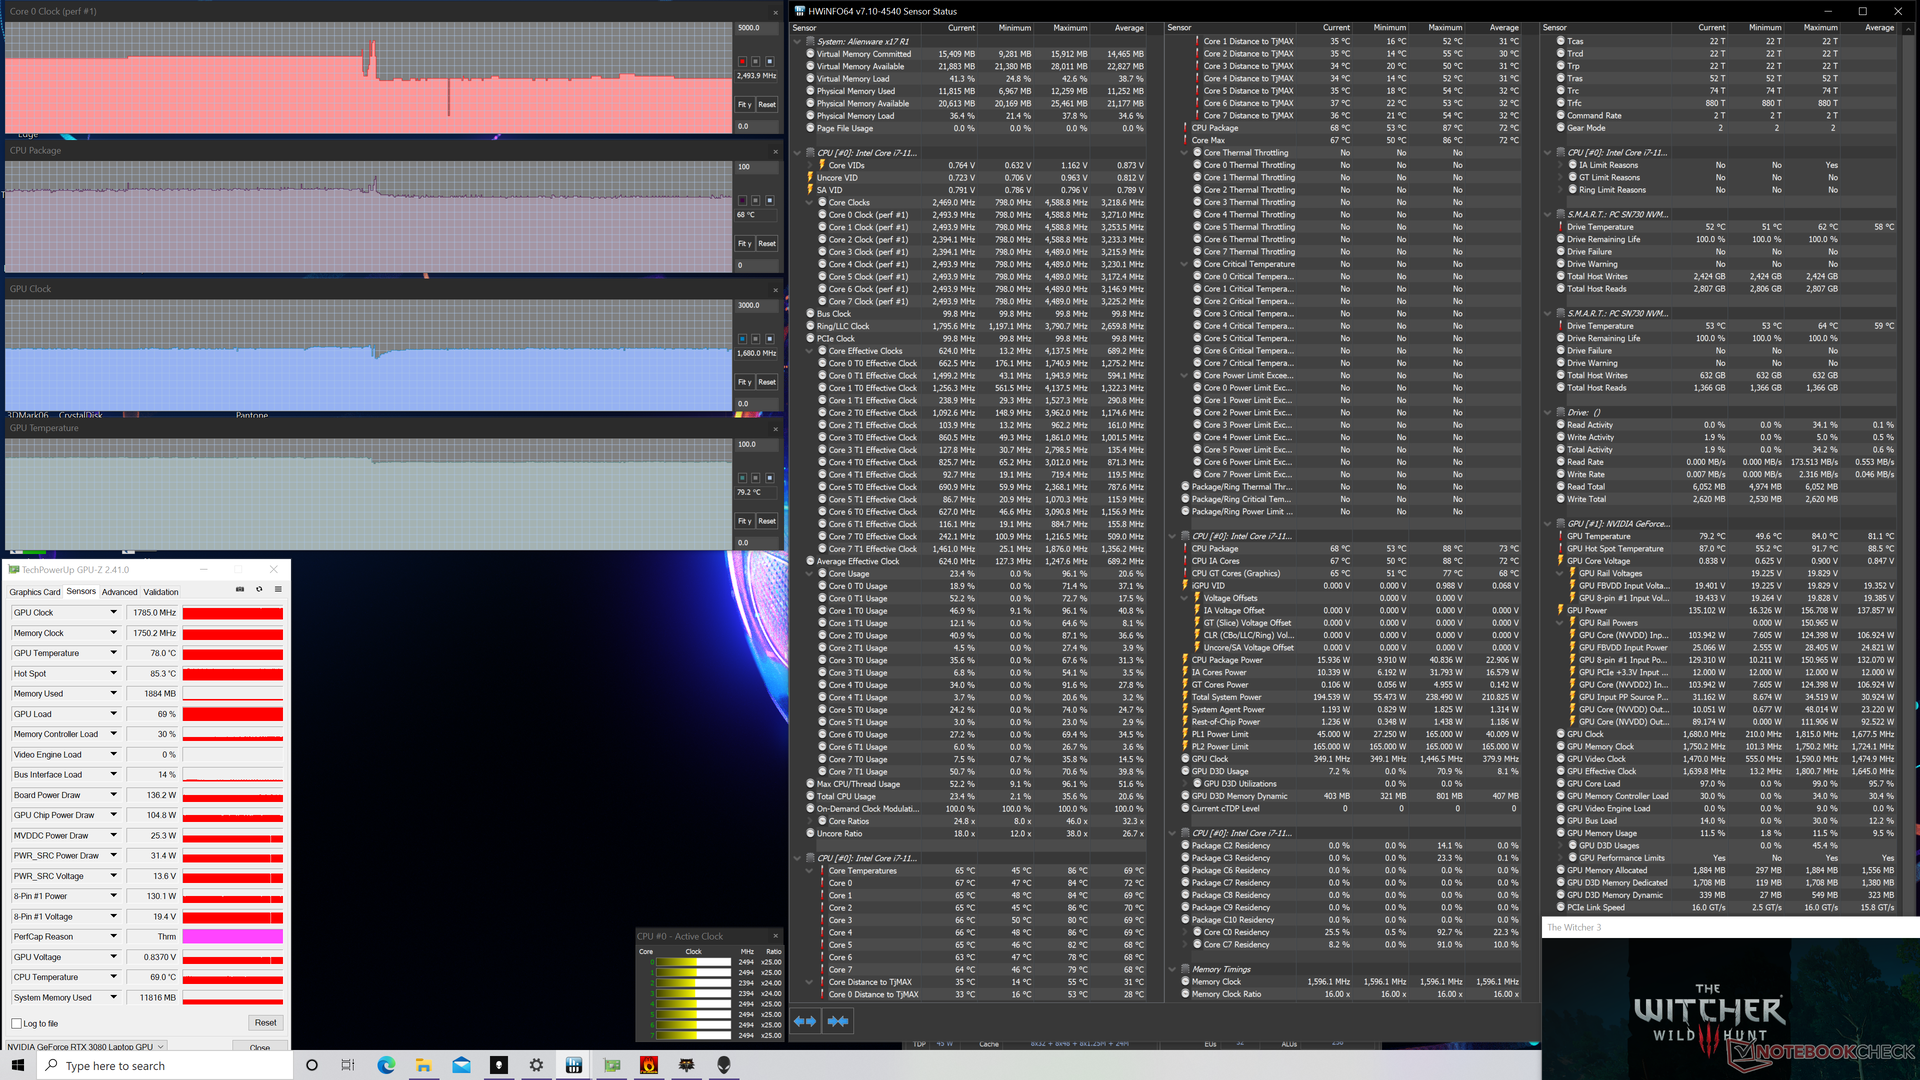
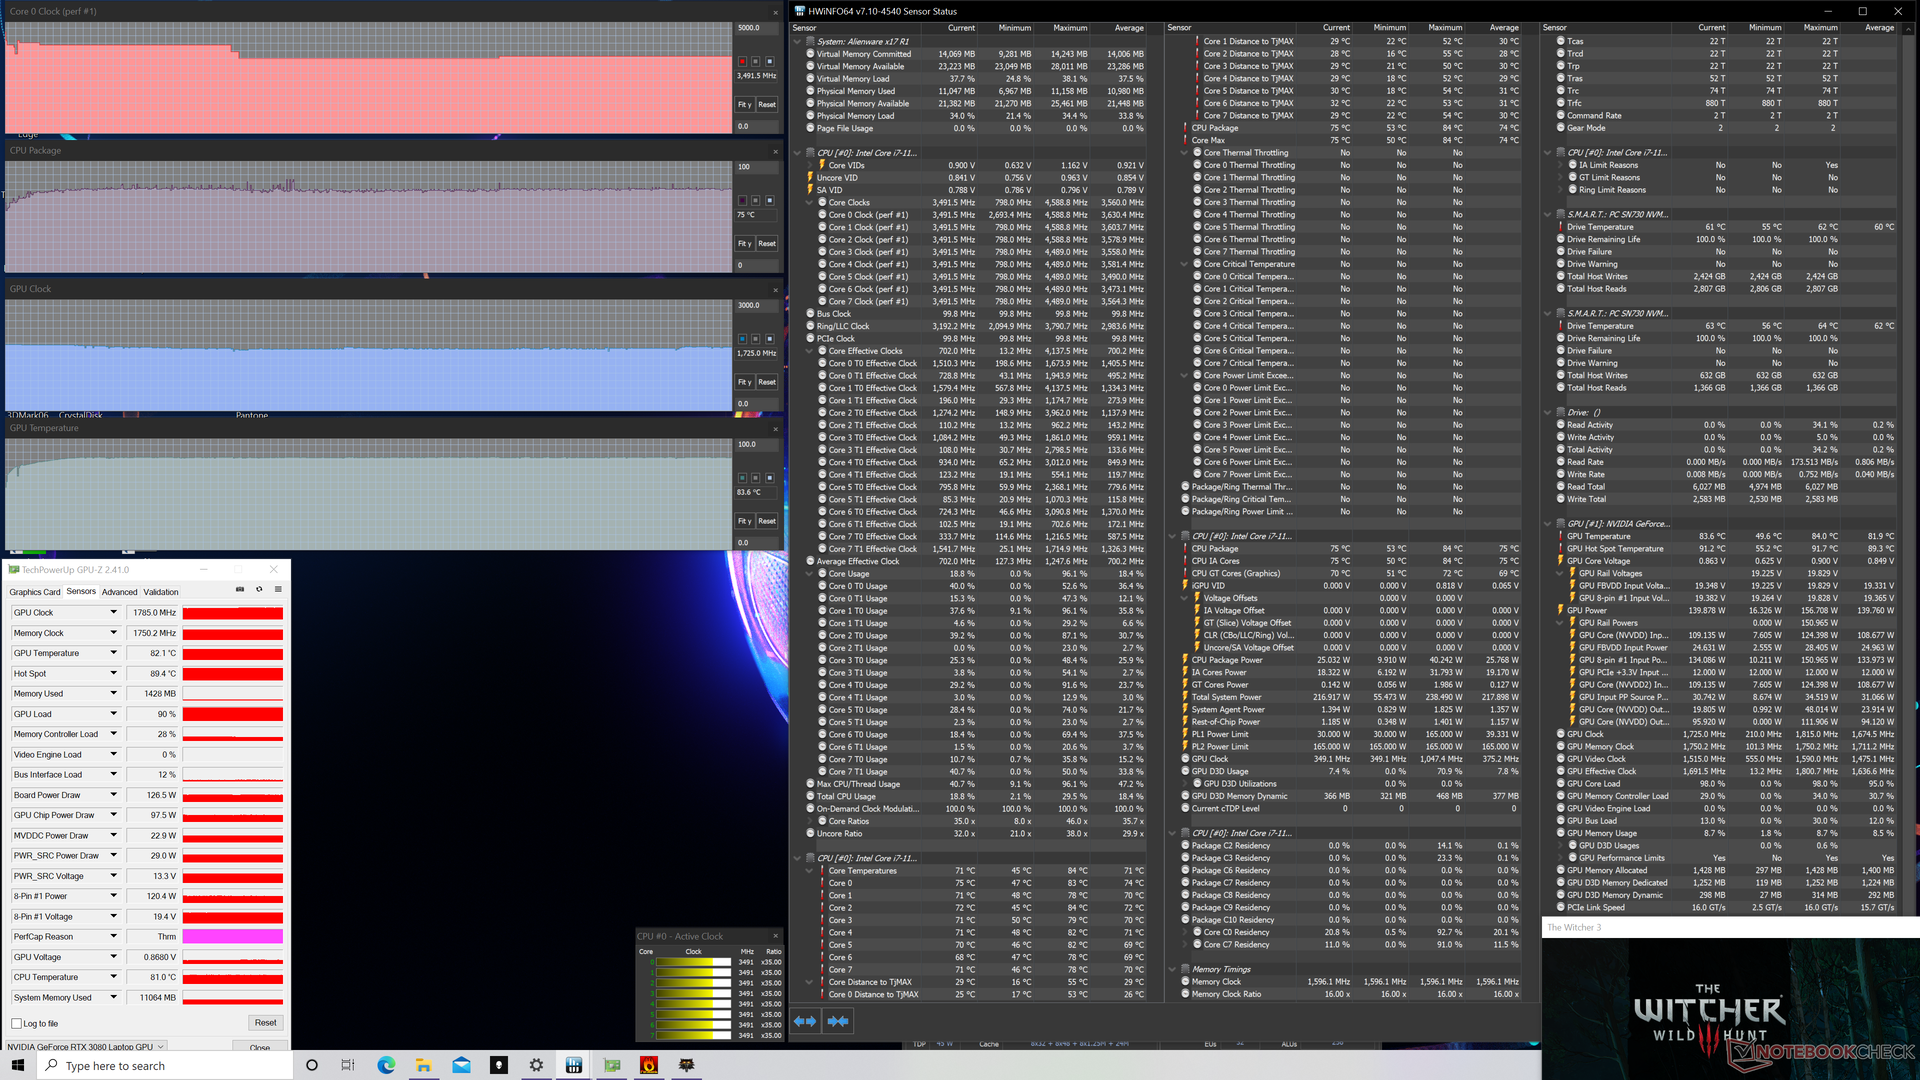
在高性能模式下运行 Witcher 3在高性能模式下,CPU和GPU分别稳定在3.5 GHz和1785 MHz,GPU板的功耗稳定在145 W左右。如果在平衡模式下,CPU时钟速率将下降到2.5 GHz,而GPU时钟速率可能略微下降到1680 MHz,功耗约为135 W。与其他大多数具有相同GPU的笔记本电脑相比,GPU时钟速率比预期的要快,如 主设备Vector Pro.
用电池供电运行将限制图形性能。在电池上进行的Fire Strike 测试将返回物理和图形分数,分别为24602和13281分,而在主电源上则为22907和29194分。
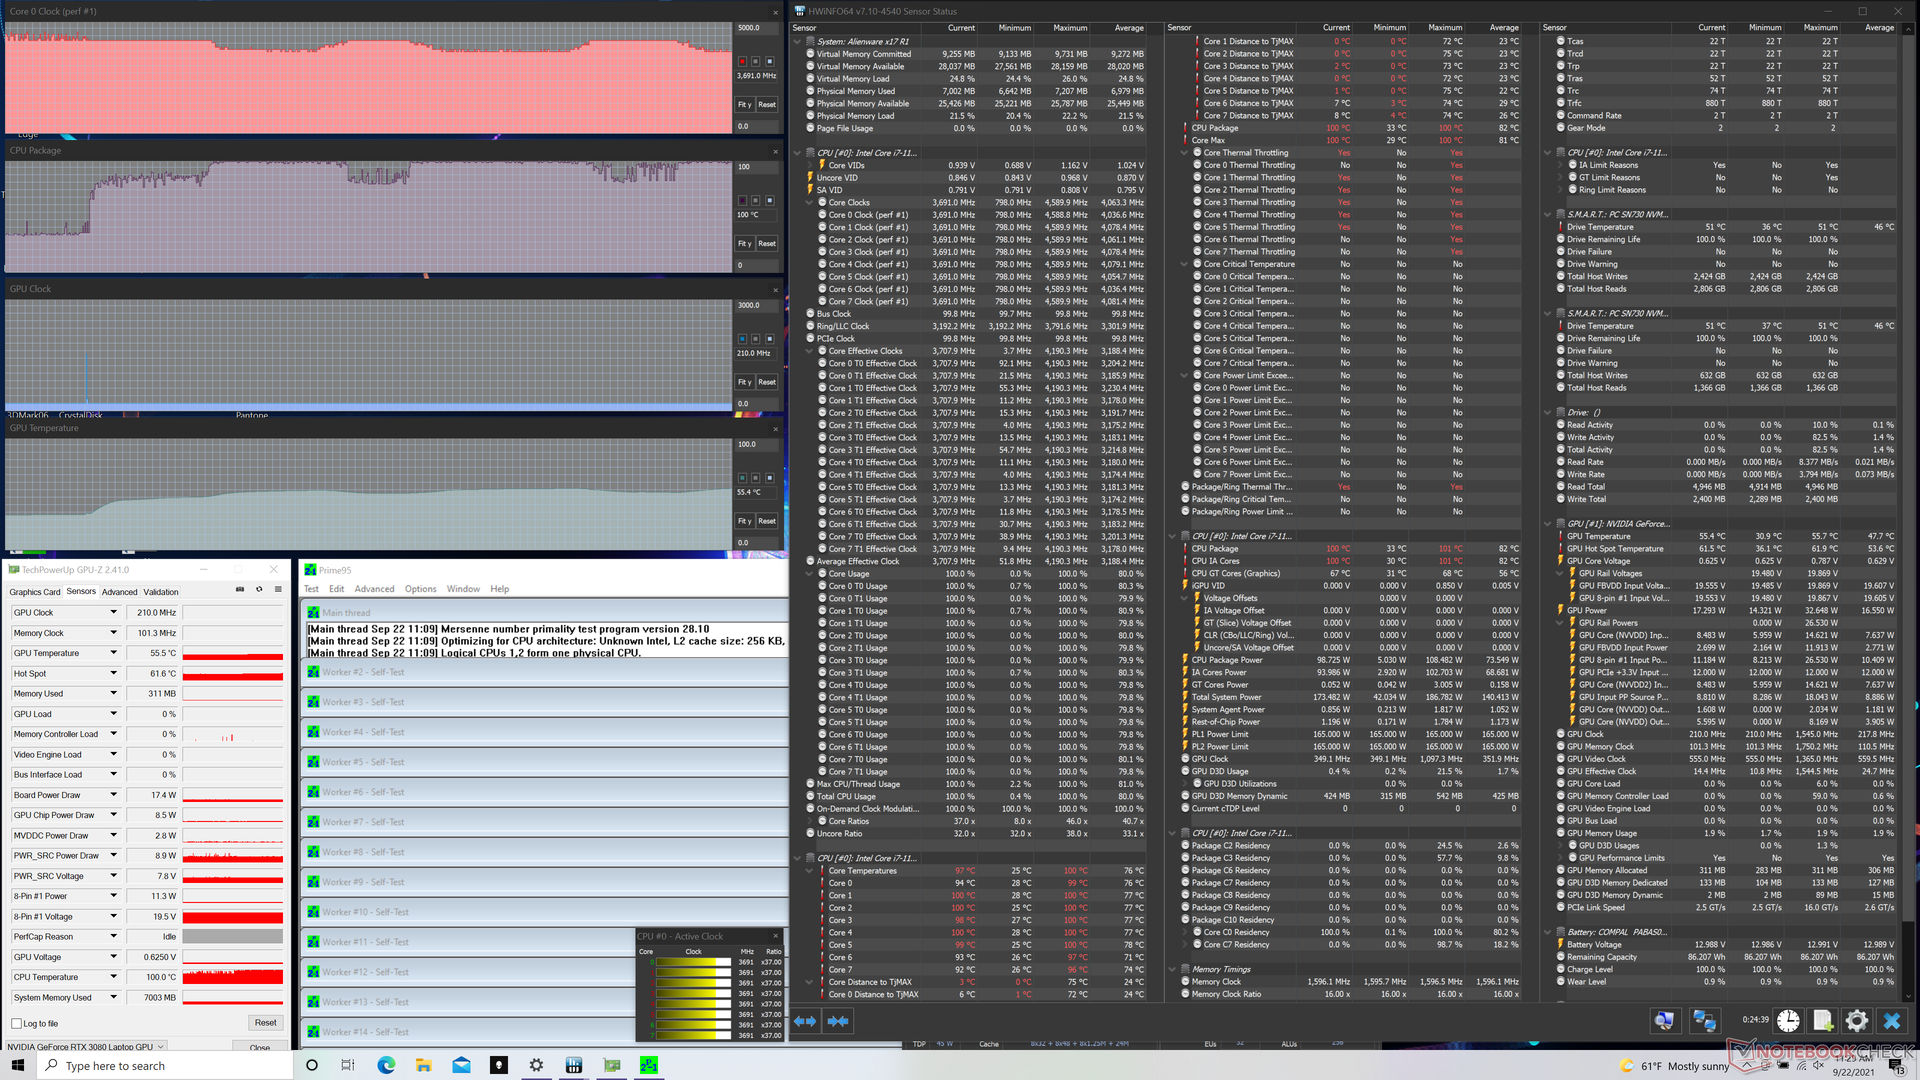
| CPU时钟(GHz) | GPU时钟(MHz) | CPU平均温度(℃) | GPU平均温度(℃) | |
| 系统空闲时 | -- | -- | 36 | 32 |
| Prime95压力(高性能模式) | 3.8 - 4.2 | -- | 85 - 100 | 55 |
| Prime95 + FurMark压力(高性能模式) | 1.9 - 3.4 | 300 - 1785 | 71 - 86 | 65 - 79 |
| Witcher 3 压力(平衡模式) | 2.5 | 1785 | 68 | 79 |
| Witcher 3 Stress (High Performance mode) | 3.5 | 1785 | 75 | 84 |
发言人


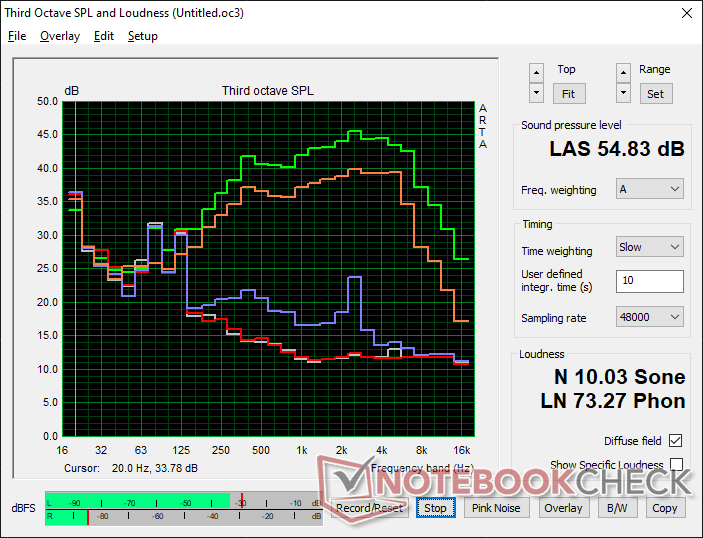
Alienware x17 RTX 3080 P48E audio analysis
(+) | speakers can play relatively loud (88 dB)
Bass 100 - 315 Hz
(-) | nearly no bass - on average 23% lower than median
(±) | linearity of bass is average (9.8% delta to prev. frequency)
Mids 400 - 2000 Hz
(+) | balanced mids - only 2.7% away from median
(+) | mids are linear (4% delta to prev. frequency)
Highs 2 - 16 kHz
(+) | balanced highs - only 4.4% away from median
(±) | linearity of highs is average (7% delta to prev. frequency)
Overall 100 - 16.000 Hz
(±) | linearity of overall sound is average (17.3% difference to median)
Compared to same class
» 47% of all tested devices in this class were better, 12% similar, 41% worse
» The best had a delta of 6%, average was 18%, worst was 132%
Compared to all devices tested
» 32% of all tested devices were better, 8% similar, 59% worse
» The best had a delta of 4%, average was 24%, worst was 134%
Apple MacBook 12 (Early 2016) 1.1 GHz audio analysis
(+) | speakers can play relatively loud (83.6 dB)
Bass 100 - 315 Hz
(±) | reduced bass - on average 11.3% lower than median
(±) | linearity of bass is average (14.2% delta to prev. frequency)
Mids 400 - 2000 Hz
(+) | balanced mids - only 2.4% away from median
(+) | mids are linear (5.5% delta to prev. frequency)
Highs 2 - 16 kHz
(+) | balanced highs - only 2% away from median
(+) | highs are linear (4.5% delta to prev. frequency)
Overall 100 - 16.000 Hz
(+) | overall sound is linear (10.2% difference to median)
Compared to same class
» 7% of all tested devices in this class were better, 2% similar, 91% worse
» The best had a delta of 5%, average was 18%, worst was 53%
Compared to all devices tested
» 5% of all tested devices were better, 1% similar, 94% worse
» The best had a delta of 4%, average was 24%, worst was 134%
Energy Management
电力消耗--高额的能源账单
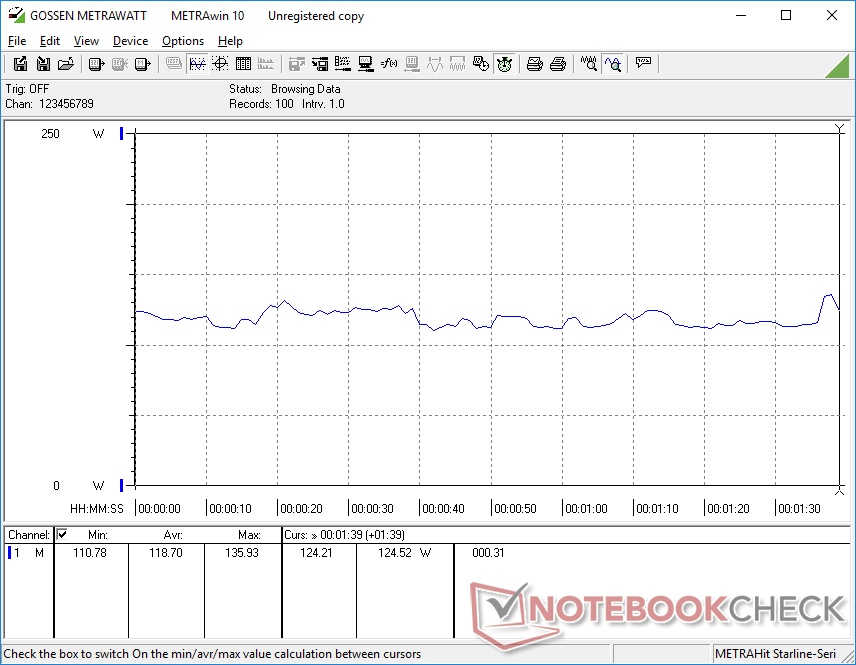
与m17 R4相比,戴尔已经改善了系统在低负载时的功耗,这可能解释了我们下一节中的整体电池寿命更长。我们的系统在最低亮度设置下,在桌面上空转时的耗电量低至10W,比去年的m17 R4的记录效率高4倍。
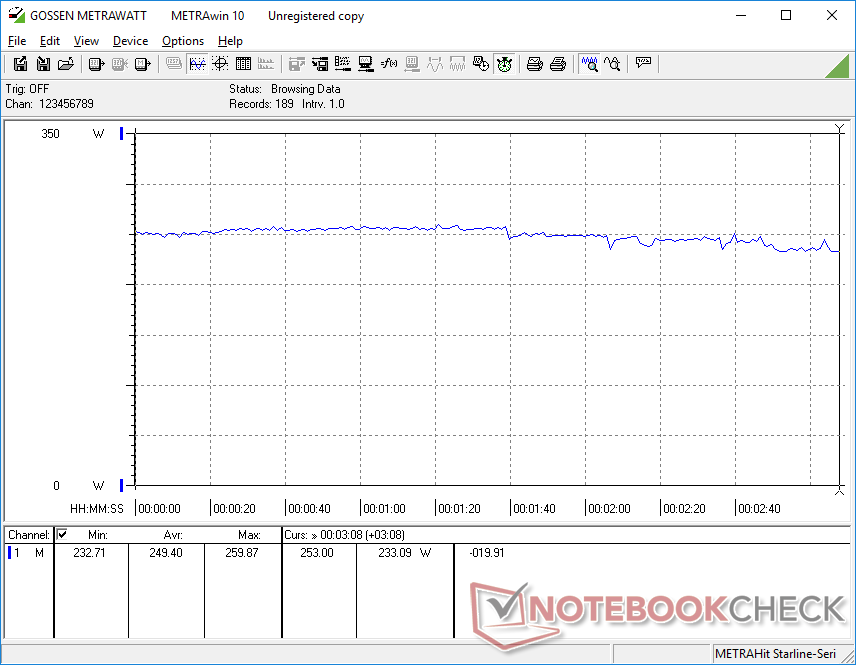
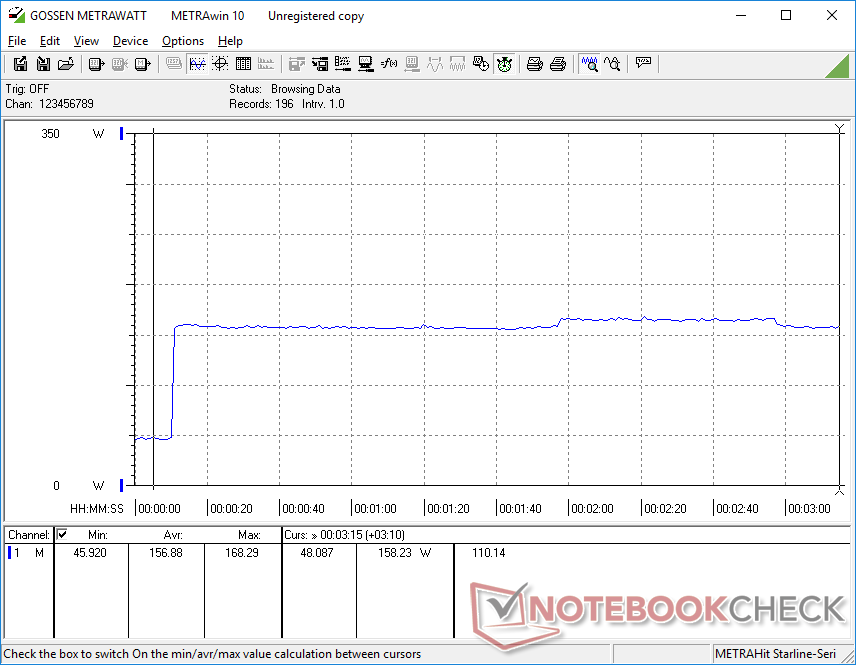
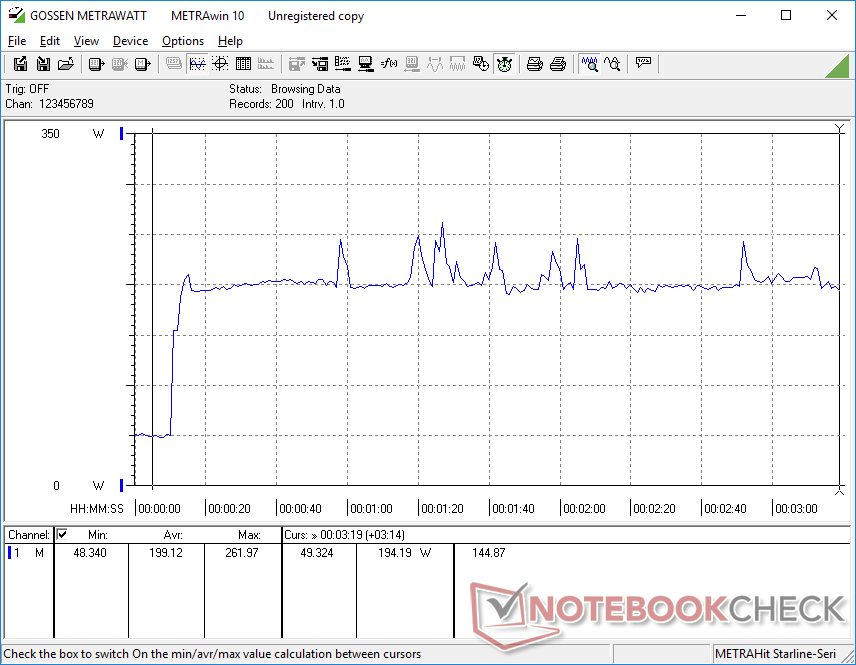
游戏时的耗电量仍然比平时高,就像我们在m17系列上发现的那样。运行时 Witcher 3将平均消耗249瓦,而华硕ROG Zephyrus S17或微星GS76则分别只有195瓦或156瓦。Alienware系统更高的CPU TDP和GPU TGP目标可能是其更高的电力需求的原因。
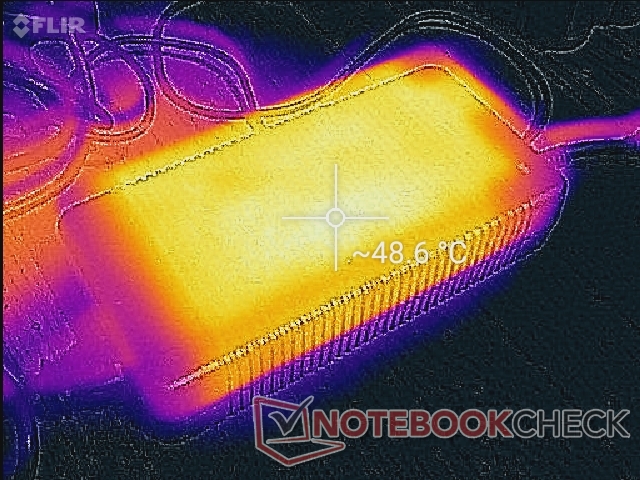
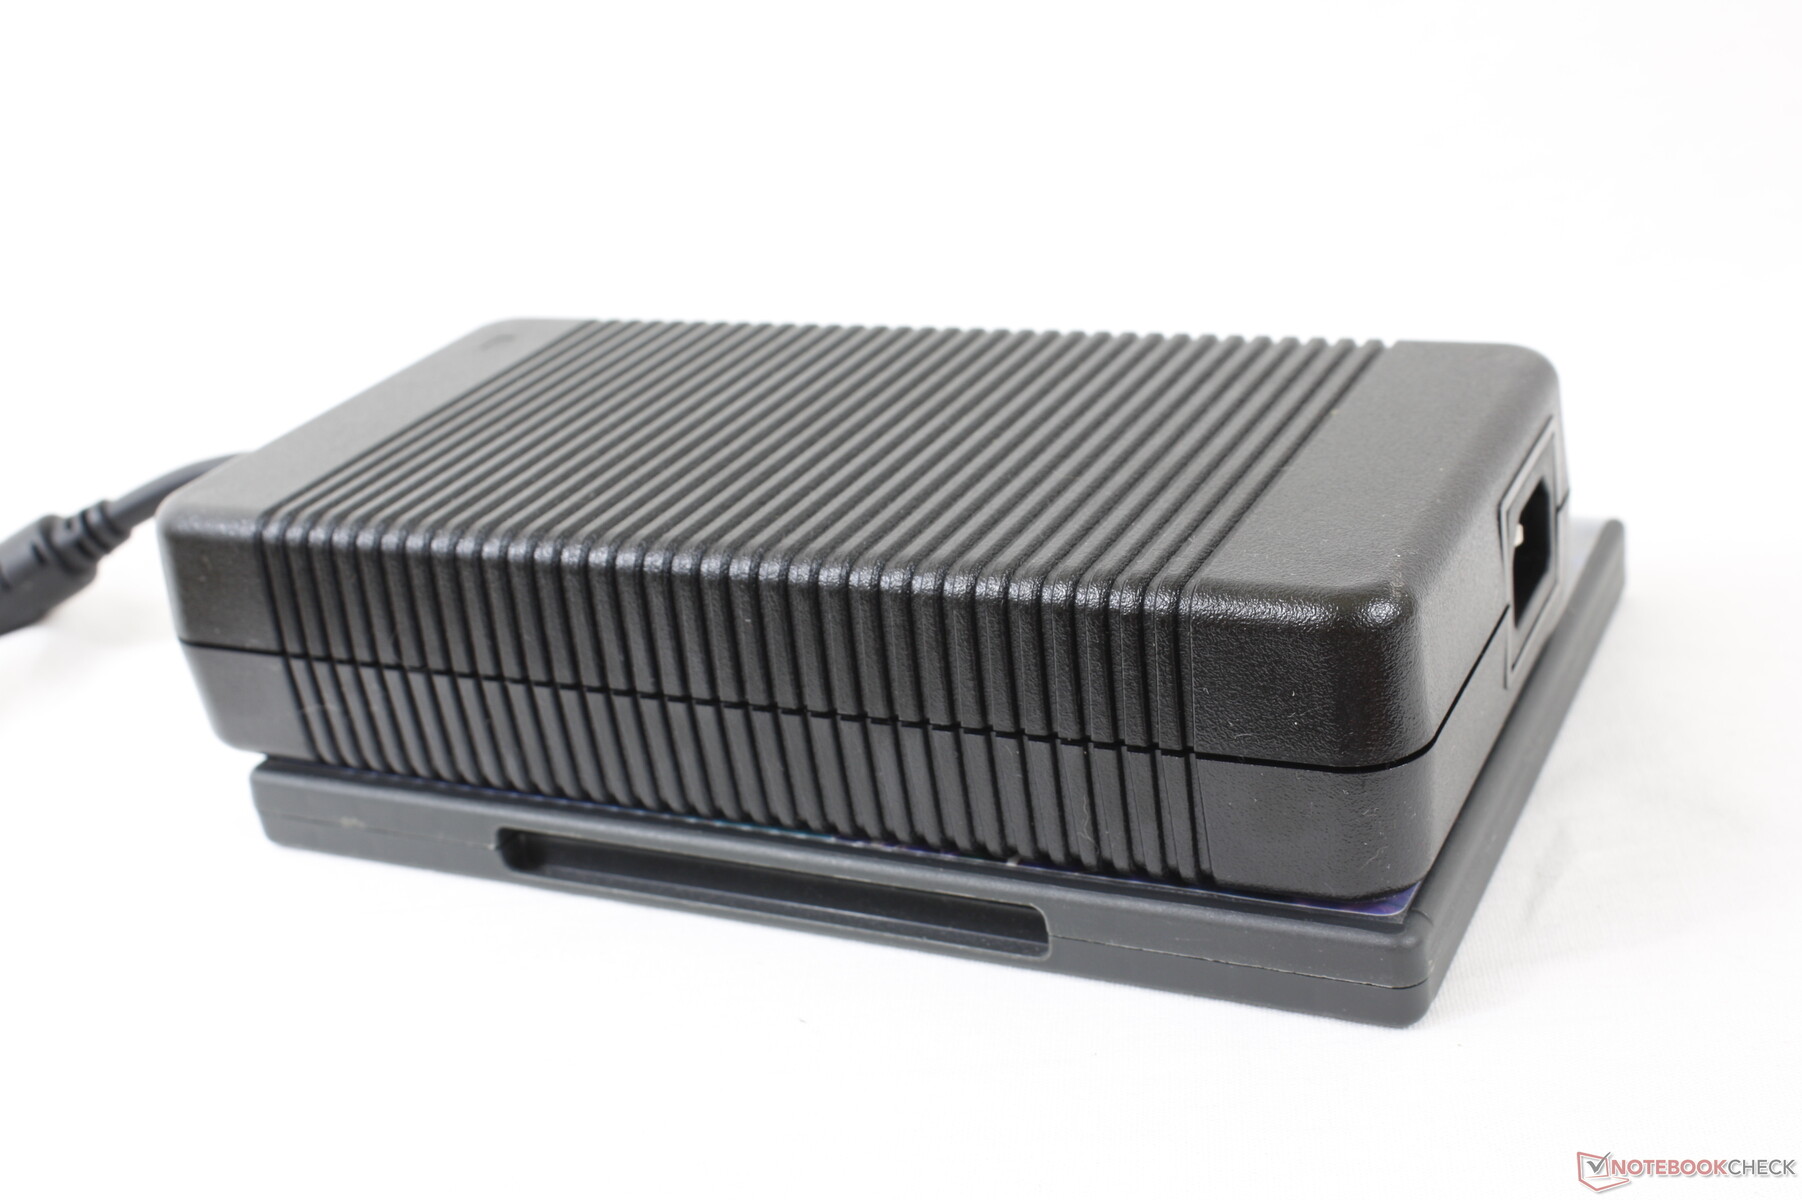
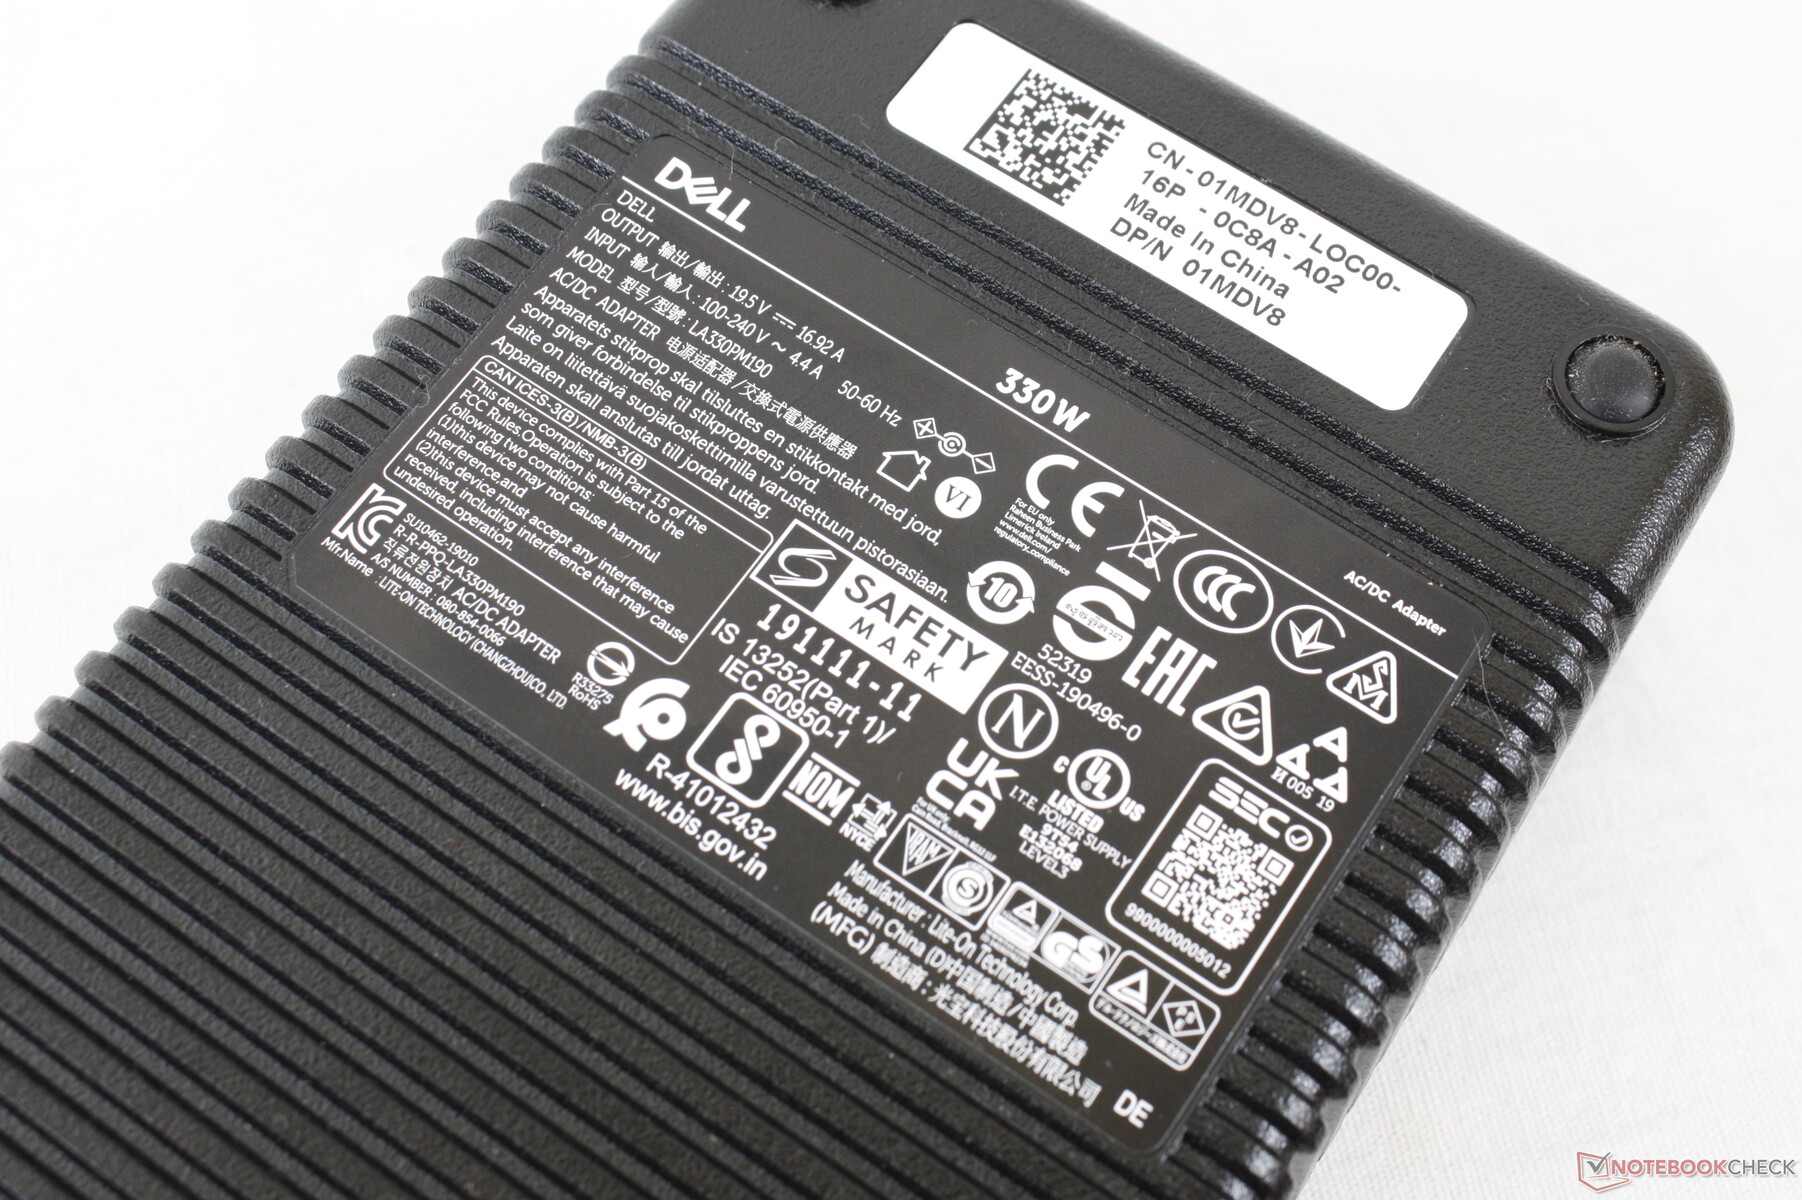
我们的测试设备配备了一个大而重(约20 x 9.9 x 4.3厘米,1.5公斤)的330 W交流适配器,而ROG Zephyrus S17或Razer Blade 17的交流适配器则较小,分别为280 W或230 W。我们怀疑超大的交流适配器是为了更好地支持上述更高的系统TDP和TGP目标,以及游戏时的电池充电速度。戴尔为较小的RTX 3060 SKU提供一个较小的240 W交流适配器。
| Off / Standby | |
| Idle | |
| Load |
|
Key:
min: | |
| Alienware x17 RTX 3080 P48E i7-11800H, GeForce RTX 3080 Laptop GPU, 2x WDC PC SN730 SDBPNTY-1T00 (RAID 0), IPS, 3840x2160, 17.3" | Alienware m17 R4 i9-10980HK, GeForce RTX 3080 Laptop GPU, 2x Micron 2300 512 GB (RAID 0), IPS, 1920x1080, 17.3" | Razer Blade 17 RTX 3070 i7-11800H, GeForce RTX 3070 Laptop GPU, Samsung PM9A1 MZVL21T0HCLR, IPS, 1920x1080, 17.3" | Asus ROG Zephyrus S17 GX703HSD i9-11900H, GeForce RTX 3080 Laptop GPU, Samsung PM9A1 MZVL22T0HBLB, IPS, 2560x1440, 17.3" | MSI GS76 Stealth 11UH i9-11900H, GeForce RTX 3080 Laptop GPU, Samsung PM9A1 MZVL22T0HBLB, IPS, 3840x2160, 17.3" | Gigabyte Aero 17 HDR YD i9-11980HK, GeForce RTX 3080 Laptop GPU, Samsung PM9A1 MZVL2512HCJQ, IPS, 3840x2160, 17.3" | |
|---|---|---|---|---|---|---|
| Power Consumption | -80% | -11% | -10% | 13% | -20% | |
| Idle Minimum * (Watt) | 10.2 | 42 -312% | 20.9 -105% | 21.7 -113% | 14 -37% | 25 -145% |
| Idle Average * (Watt) | 21.2 | 48 -126% | 25.1 -18% | 27 -27% | 19 10% | 28 -32% |
| Idle Maximum * (Watt) | 48.4 | 58 -20% | 45 7% | 33 32% | 31 36% | 40 17% |
| Load Average * (Watt) | 118.7 | 124 -4% | 102 14% | 108 9% | 97 18% | 114 4% |
| Witcher 3 ultra * (Watt) | 249 | 219 12% | 189 24% | 195 22% | 156 37% | 176 29% |
| Load Maximum * (Watt) | 262 | 337 -29% | 234.8 10% | 210 20% | 231 12% | 236 10% |
* ... smaller is better
Power Consumption Witcher 3 / Stresstest
电池寿命--对尺寸来说还不错
上一代m17系列的运行时间很糟糕,即使所有性能设置都设置为最低。值得庆幸的是,x17的电池寿命有了明显改善,而不需要提高电池容量。用户现在可以期待实际的WLAN使用时间低于6小时,而m17 R4为2.5小时,这对高性能游戏笔记本来说是很好的。结果一般与微星GS76或 技嘉Aero 17这两款产品配备了较大的99Wh电池。
使用随附的AC桶式适配器,从空电到满电的充电速度非常快,大约为75分钟。
| Alienware x17 RTX 3080 P48E i7-11800H, GeForce RTX 3080 Laptop GPU, 87 Wh | Alienware m17 R4 i9-10980HK, GeForce RTX 3080 Laptop GPU, 86 Wh | Razer Blade 17 RTX 3070 i7-11800H, GeForce RTX 3070 Laptop GPU, 70 Wh | Asus ROG Zephyrus S17 GX703HSD i9-11900H, GeForce RTX 3080 Laptop GPU, 90 Wh | MSI GS76 Stealth 11UH i9-11900H, GeForce RTX 3080 Laptop GPU, 99.9 Wh | Gigabyte Aero 17 HDR YD i9-11980HK, GeForce RTX 3080 Laptop GPU, 99 Wh | |
|---|---|---|---|---|---|---|
| Battery runtime | -5% | 24% | 133% | 37% | 23% | |
| Reader / Idle (h) | 7 | 6.7 -4% | 9.9 41% | |||
| WiFi v1.3 (h) | 5.9 | 2.4 -59% | 5.2 -12% | 7.5 27% | 6.4 8% | 5.6 -5% |
| Load (h) | 0.8 | 1.2 50% | 1.5 88% | 2.7 238% | 1.3 63% | 1.2 50% |
| Witcher 3 ultra (h) | 1 |
Pros
Cons
结论--更大、更重的原因是正确的
Alienware x17最引人注目的特点是其处理器性能和CherryMX机械按键。这里的酷睿i7-11800H处理器的运行速度明显快于其他配备相同芯片的笔记本电脑,而点击式机械按键是我们在任何游戏笔记本电脑上使用过的最舒适的一些按键。
戴尔的Alienware x17并不害怕最大限度地提高性能,即使这意味着比其他产品略大和略重。
所有这些性能都是以核心温度、功耗、尺寸和重量为代价的,而其他型号如Razer Blade 17,微星GS76 Stealth, 或 华硕ROG Zephyrus S17都更小、更轻、更省电,同时提供类似的英特尔和Nvidia选项。然而,这些系统往往运行速度较慢,因此将由用户来平衡性能和他们的个人便携性偏好。如果你满足于RTX 3060级别的性能,那么更轻的Razer或MSI可能是更好的选择,而RTX 3080性能的猎人可以从Alienware x17和其相对较大的冷却系统中榨取更多。
Alienware x17 RTX 3080 P48E
- 09/24/2021 v7 (old)
Allen Ngo
Price comparison

