廉价的MSI GP66 Leopard 11UH在审查中。具备RTX 3080的玩家,价格低于2000欧元
早在4月,我们审查了前辈 微星GP66 Leopard 10UG配备彗星湖CPU,并对其重新设计的外壳表示赞赏。较新的GP66 Leopard 11UH现在配备了Tiger Lake CPU,外壳也有变化。但最重要的是,在配置RTX 3080的情况下,已经可以用不到2000欧元的价格购买到这款强大的游戏机了
GP66 11UH还配备了QHD显示屏或RTX 3070作为替代;我们的测试模型配备了快速全高清显示屏。
微星显然是配备RTX 3080的最便宜的游戏笔记本电脑之一,所以在这个价格范围内不容易找到合适的竞争对手。这就是为什么我们在这里也使用更昂贵的(高达+500欧元)模型进行比较。Aorus 15P YD,以及 华硕ROG Strix Scar 15、华硕ROG Strix Scar 15 申克XMG Neo 15以及贵得多的 兴发xf187在线娱乐Alienware m15 R6.
Possible competitors in comparison
Rating | Date | Model | Weight | Height | Size | Resolution | Price |
|---|---|---|---|---|---|---|---|
| 85.4 % v7 (old) | 12 / 2021 | MSI GP66 Leopard 11UH-028 i7-11800H, GeForce RTX 3080 Laptop GPU | 2.3 kg | 23.4 mm | 15.60" | 1920x1080 | |
| 84.2 % v7 (old) | 03 / 2021 | MSI GP66 Leopard 10UG i7-10870H, GeForce RTX 3070 Laptop GPU | 2.3 kg | 23.4 mm | 15.60" | 1920x1080 | |
| 86.4 % v7 (old) | 09 / 2021 | Aorus 15P YD i7-11800H, GeForce RTX 3080 Laptop GPU | 2.2 kg | 27 mm | 15.60" | 1920x1080 | |
| 86.3 % v7 (old) | 09 / 2021 | Asus ROG Strix Scar 15 G533QS R9 5900HX, GeForce RTX 3080 Laptop GPU | 2.3 kg | 27.2 mm | 15.60" | 2560x1440 | |
| 87 % v7 (old) | Schenker XMG Neo 15 Tiger Lake i7-11800H, GeForce RTX 3080 Laptop GPU | 2.2 kg | 26 mm | 15.60" | 2560x1440 | ||
| 86.1 % v7 (old) | 11 / 2021 | Alienware m15 R6, i7-11800H RTX 3080 i7-11800H, GeForce RTX 3080 Laptop GPU | 2.5 kg | 22.85 mm | 15.60" | 1920x1080 |
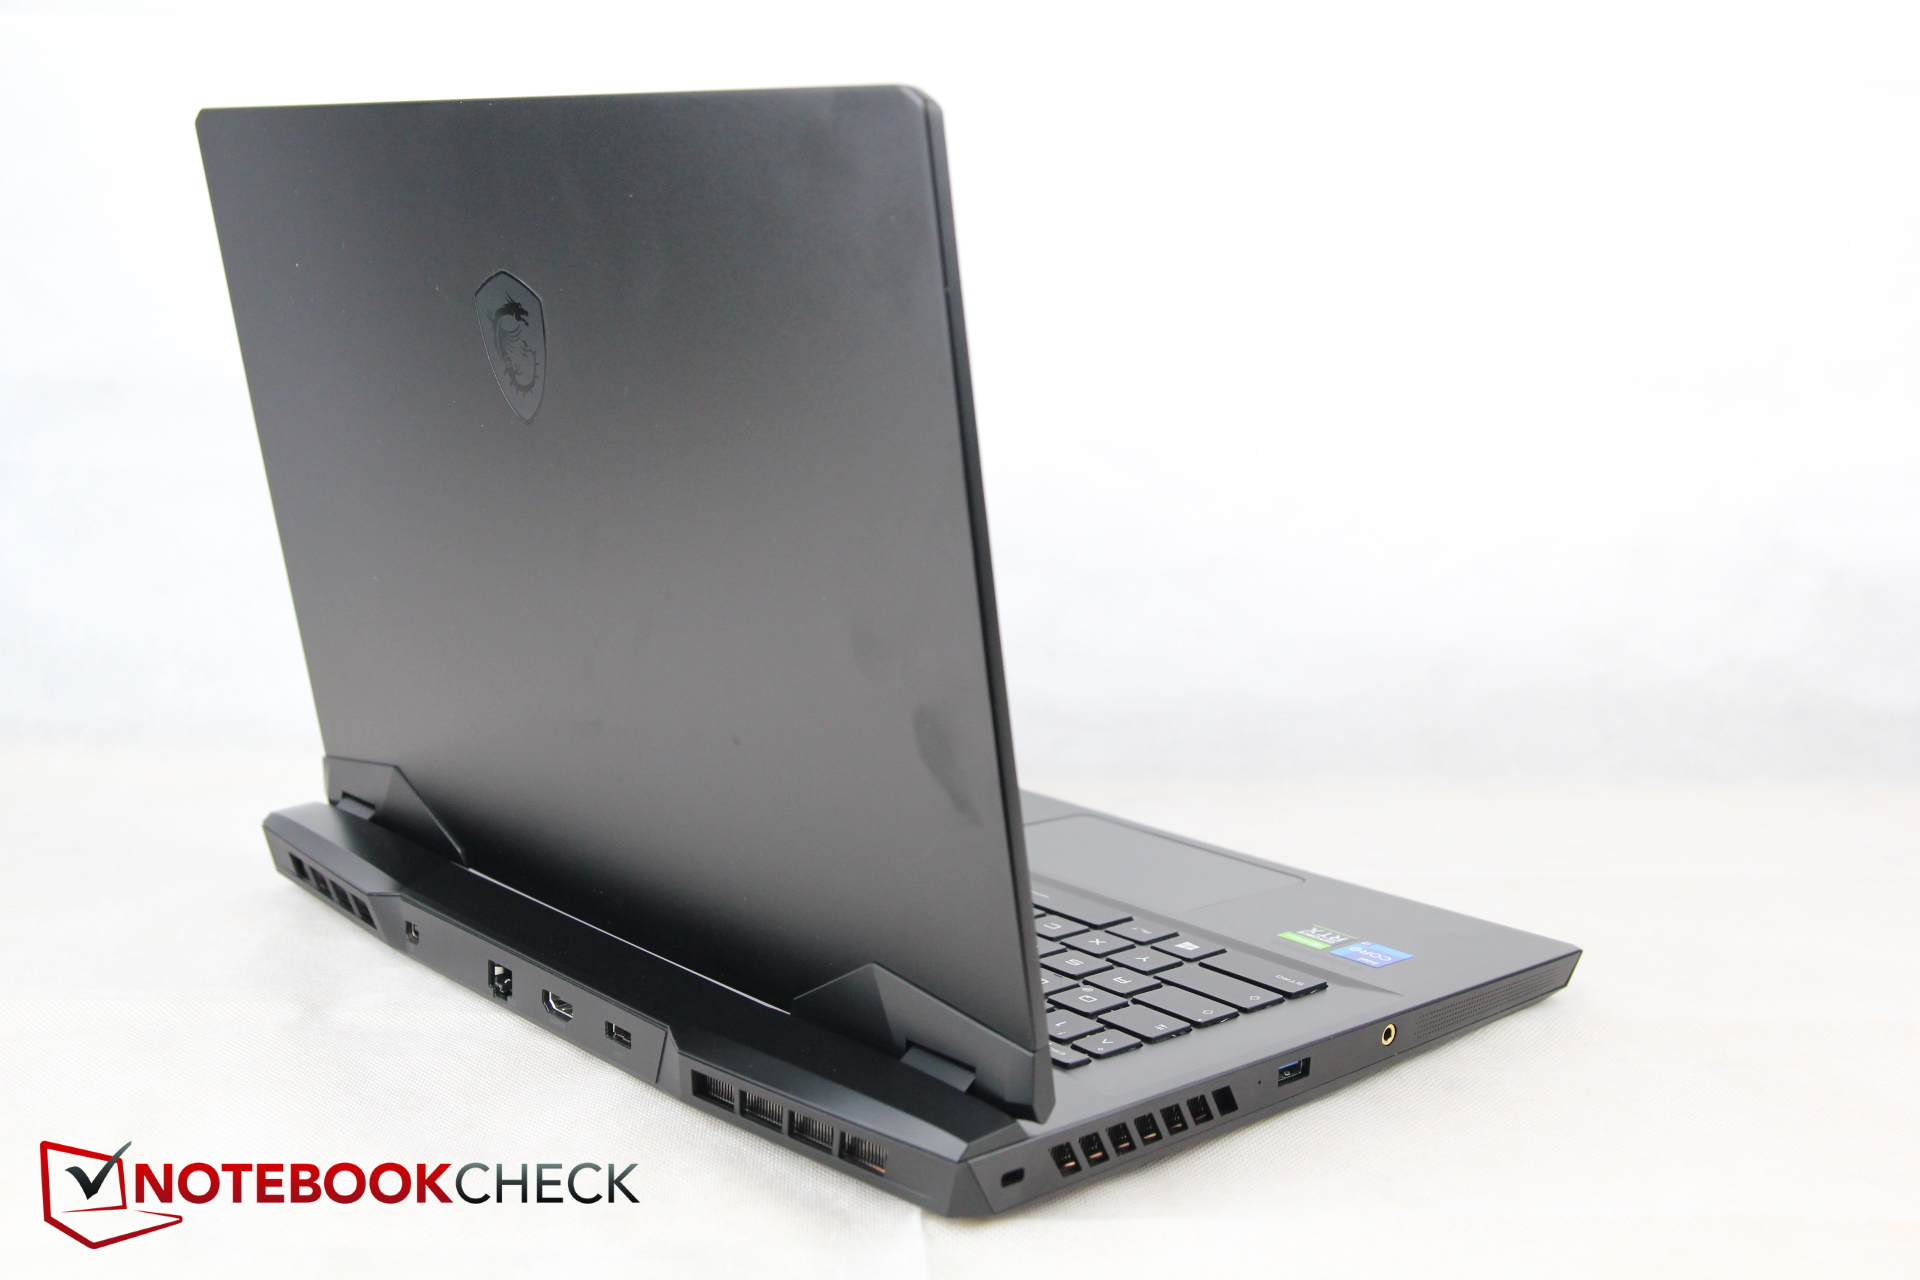
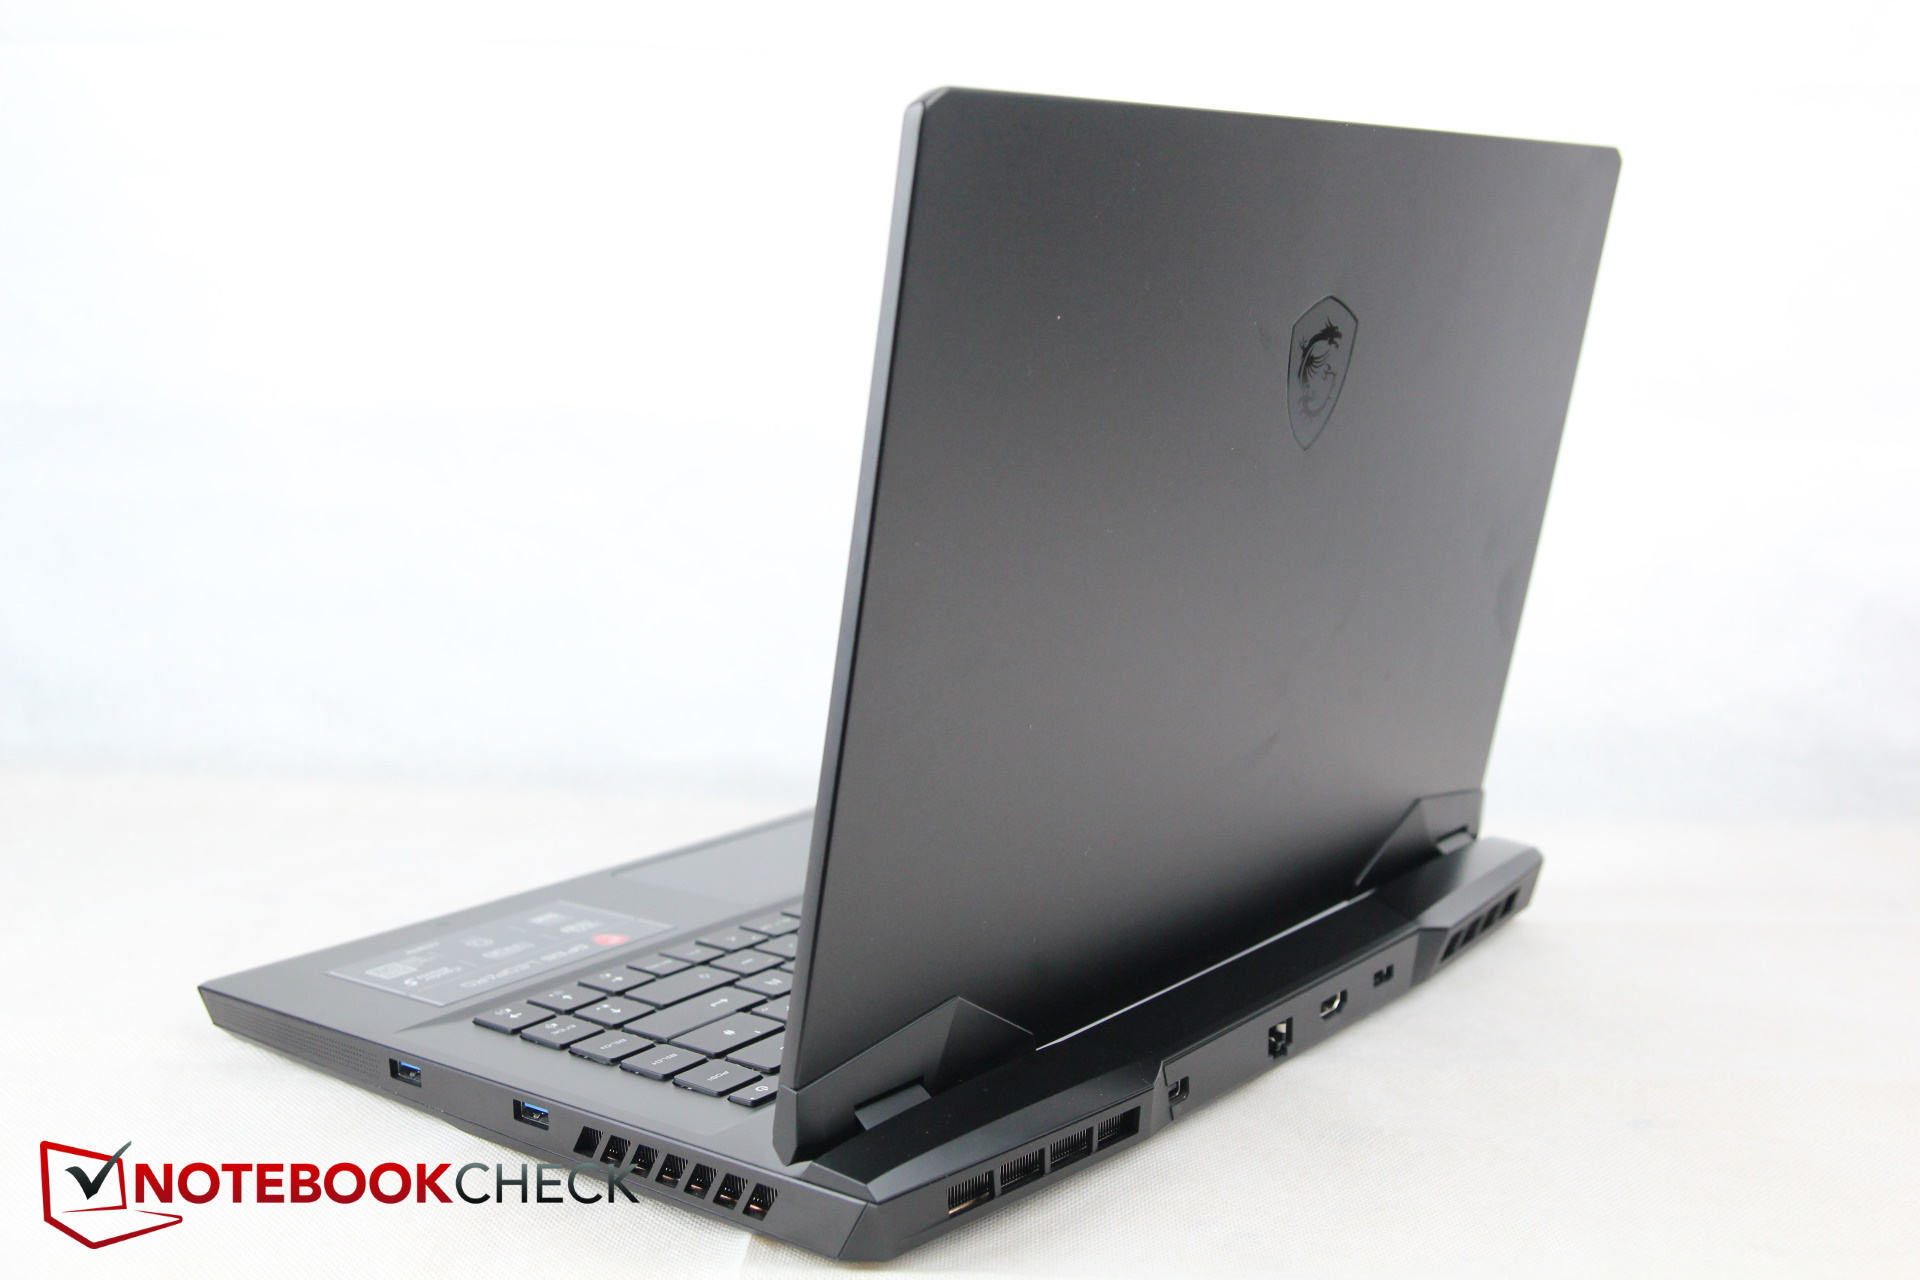
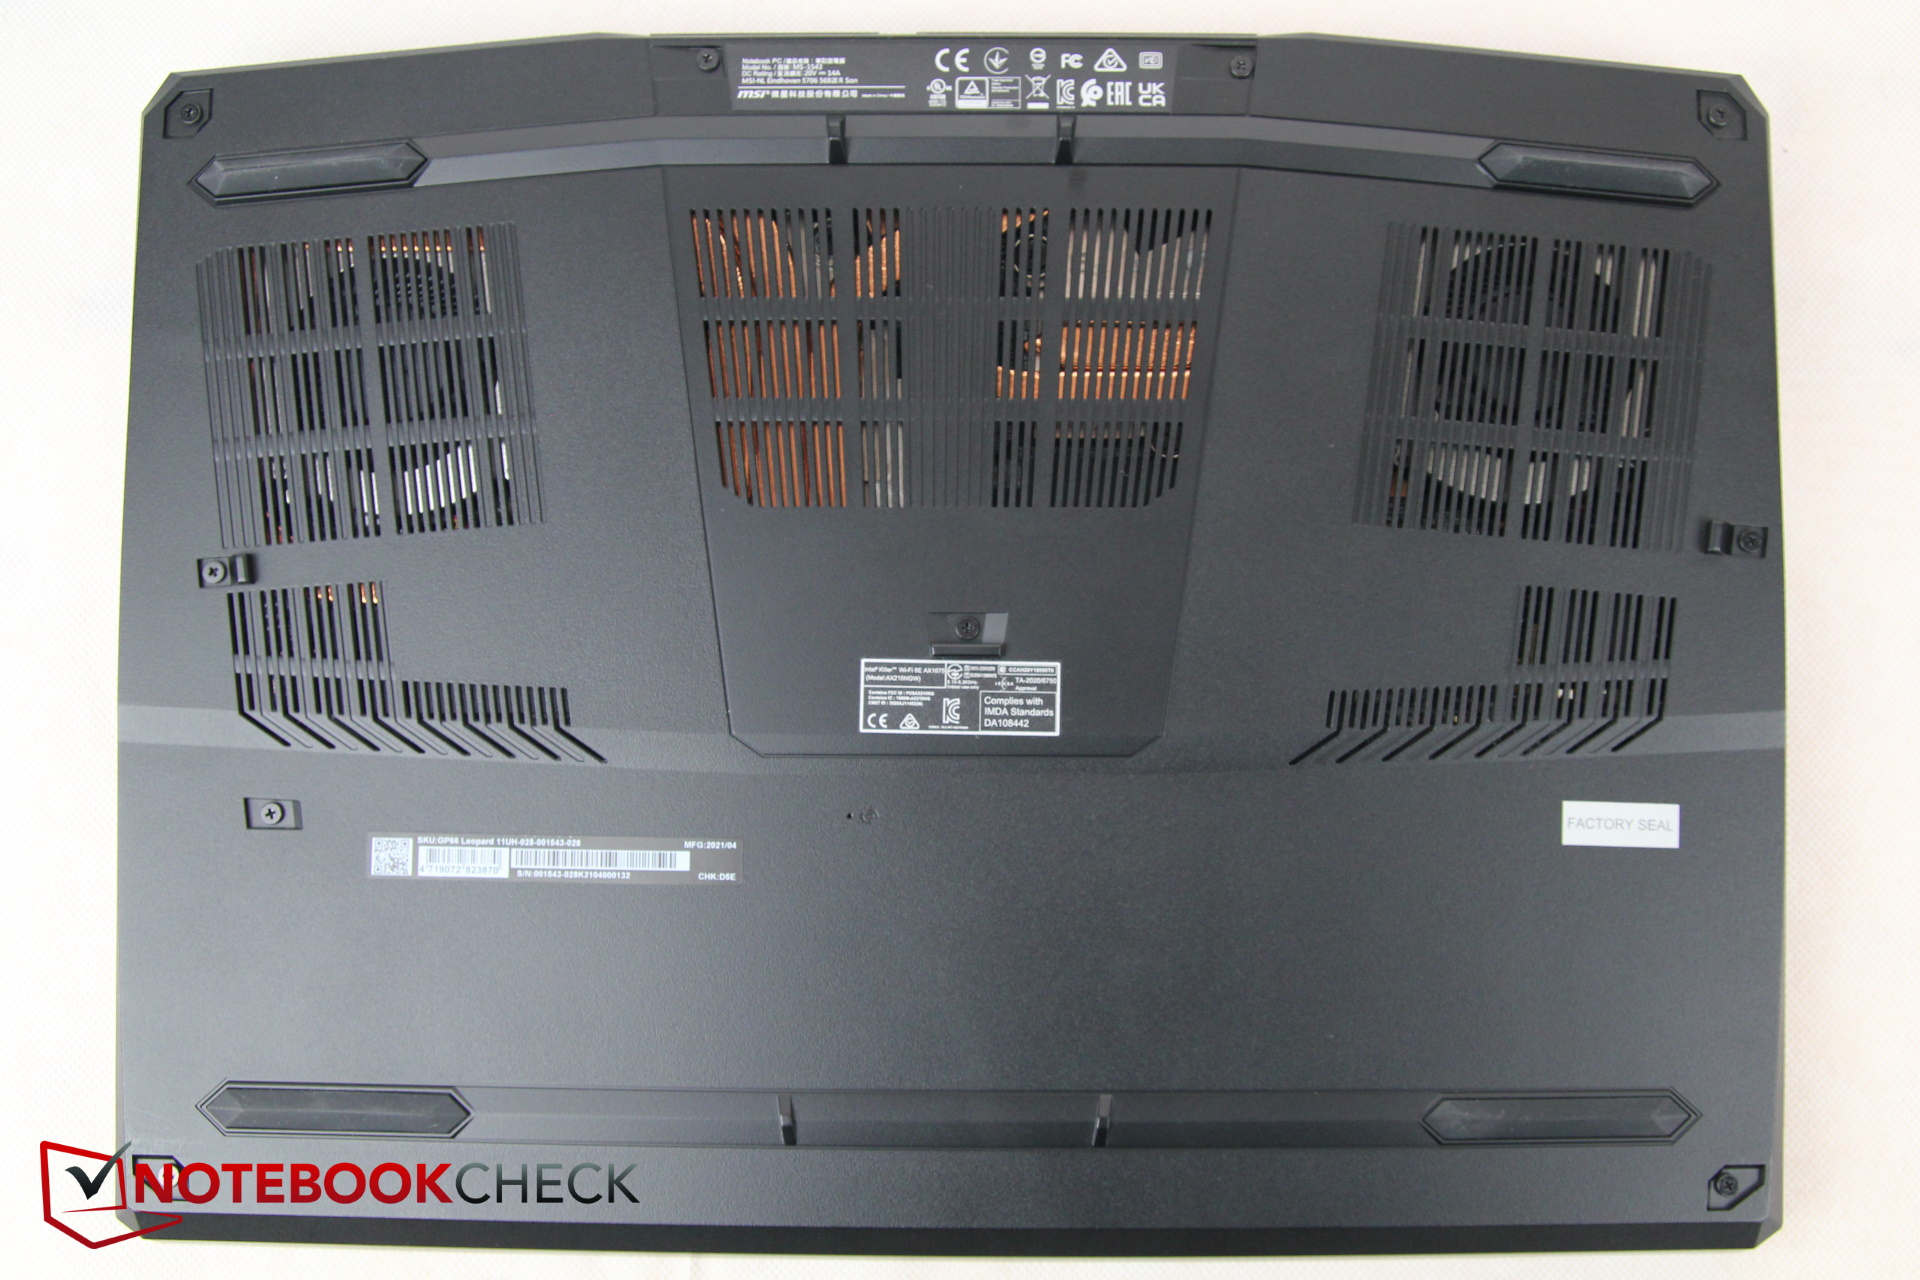
案例 - 微星的轻微制造缺陷
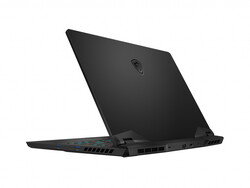
外壳本身仍然很相似,但在端口方面有一些关键的变化(见下文)。显示屏盖和底座由深色光滑金属制成,而底部仍由塑料制成。在背面,冷却系统延伸,增加了笔记本电脑的深度,与Alienware类似。
盖子出奇的结实,理论上底座也是如此。然而,我们的测试样品有一些问题:当我们把底座按到触摸板的左边时,后者从触摸板上抬起,出现了很大的缝隙--这可能是触摸板响的原因。
总的来说,底座似乎只是很松散地连接到表面,而且前面的边缘也很快脱落,你在照片中也可以看到。这应该有利于维护,但另一方面,它在建造质量方面并没有真正给人留下好印象。不过,建筑本身看起来非常坚固,所以在没有缺陷的单位上应该是可以的。
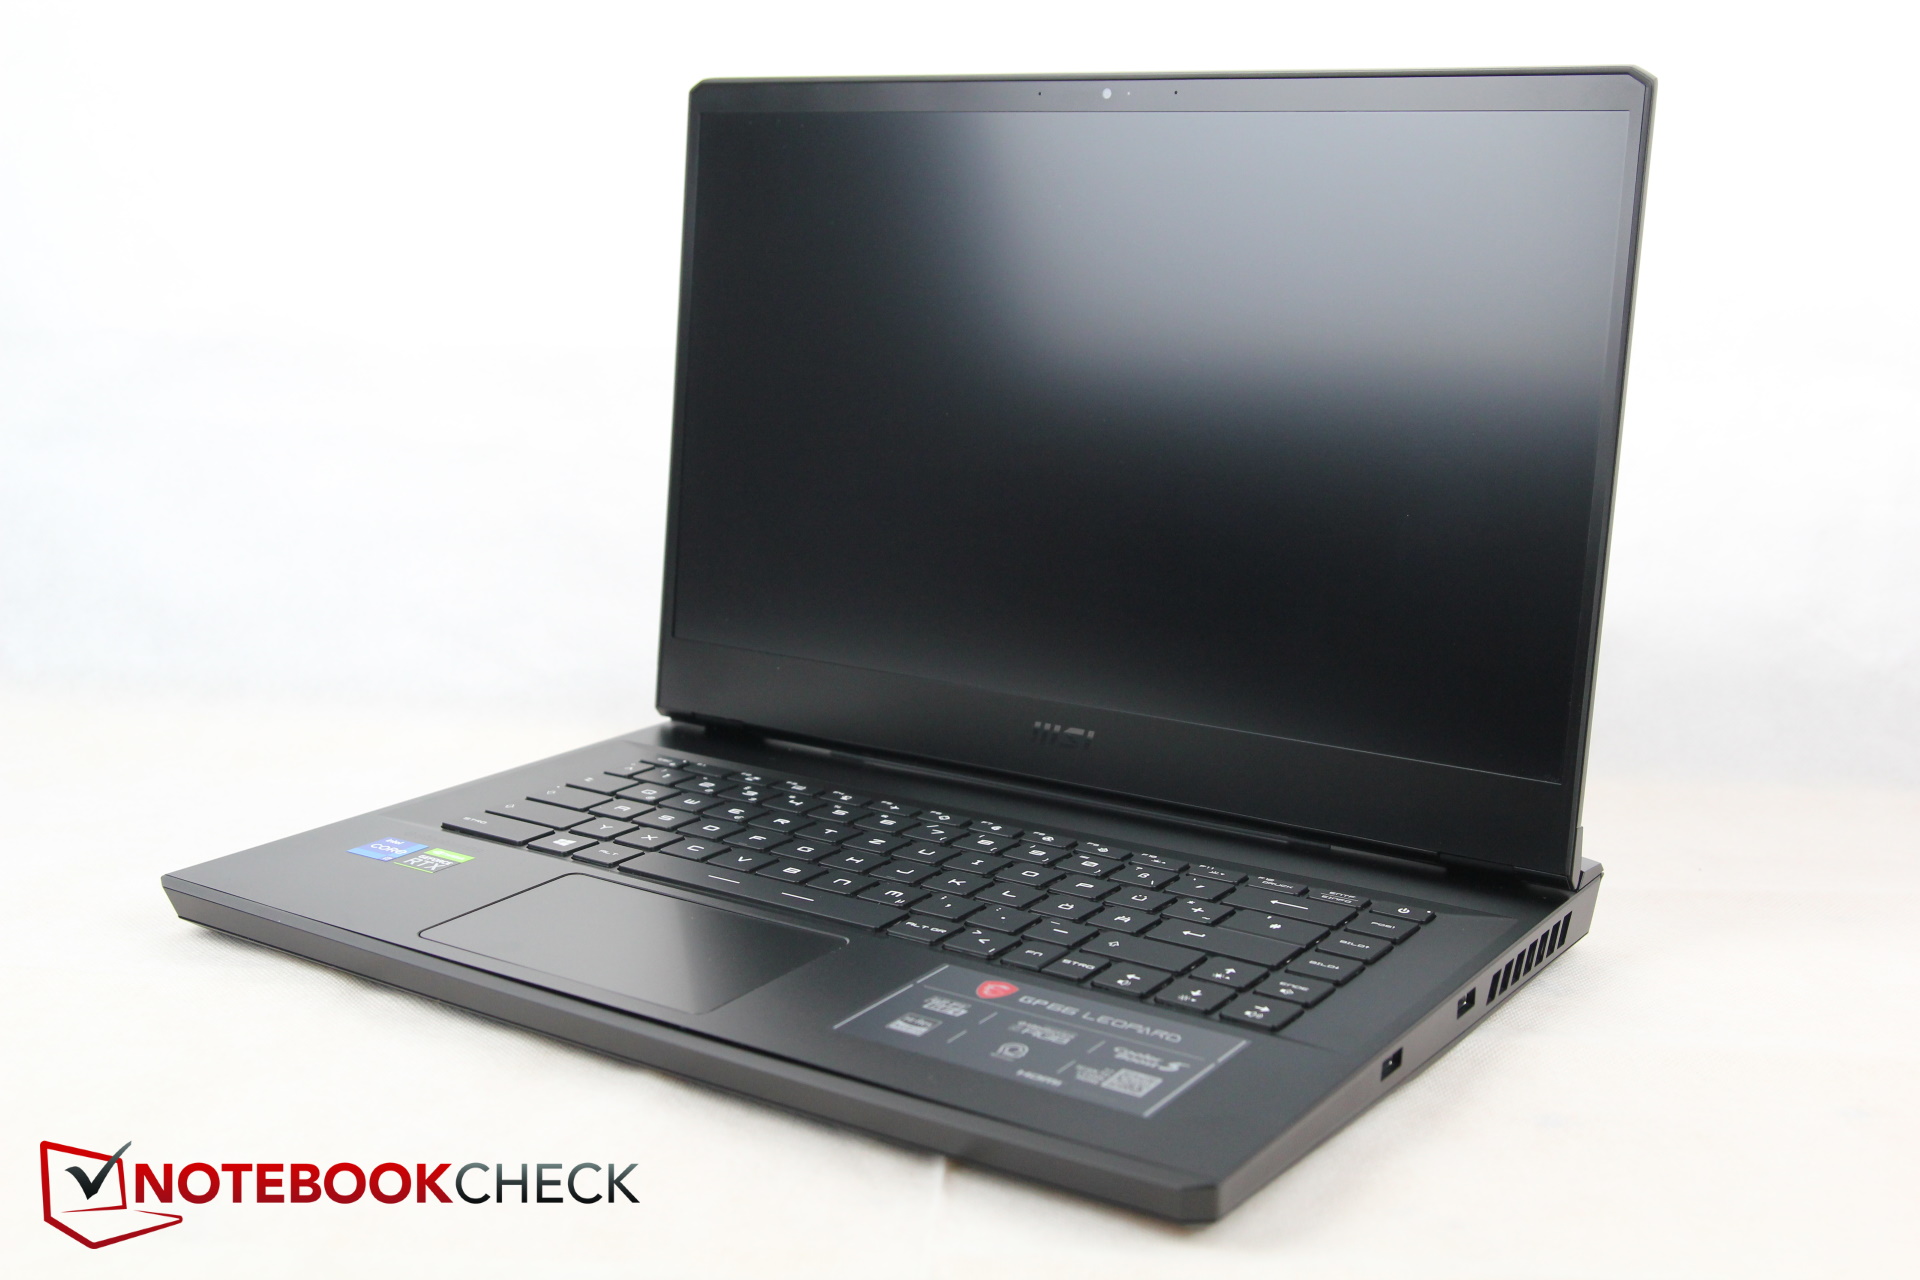
由于其突出的冷却系统,GP66比其大多数对手更深。因此,它与Alienware非常相似,后者又深了5毫米。幸运的是,它不像后者那么重,而是与其他竞争者相当。除此以外,它是比较中最薄的设备之一。同样,只有新的Alienware更薄一点。
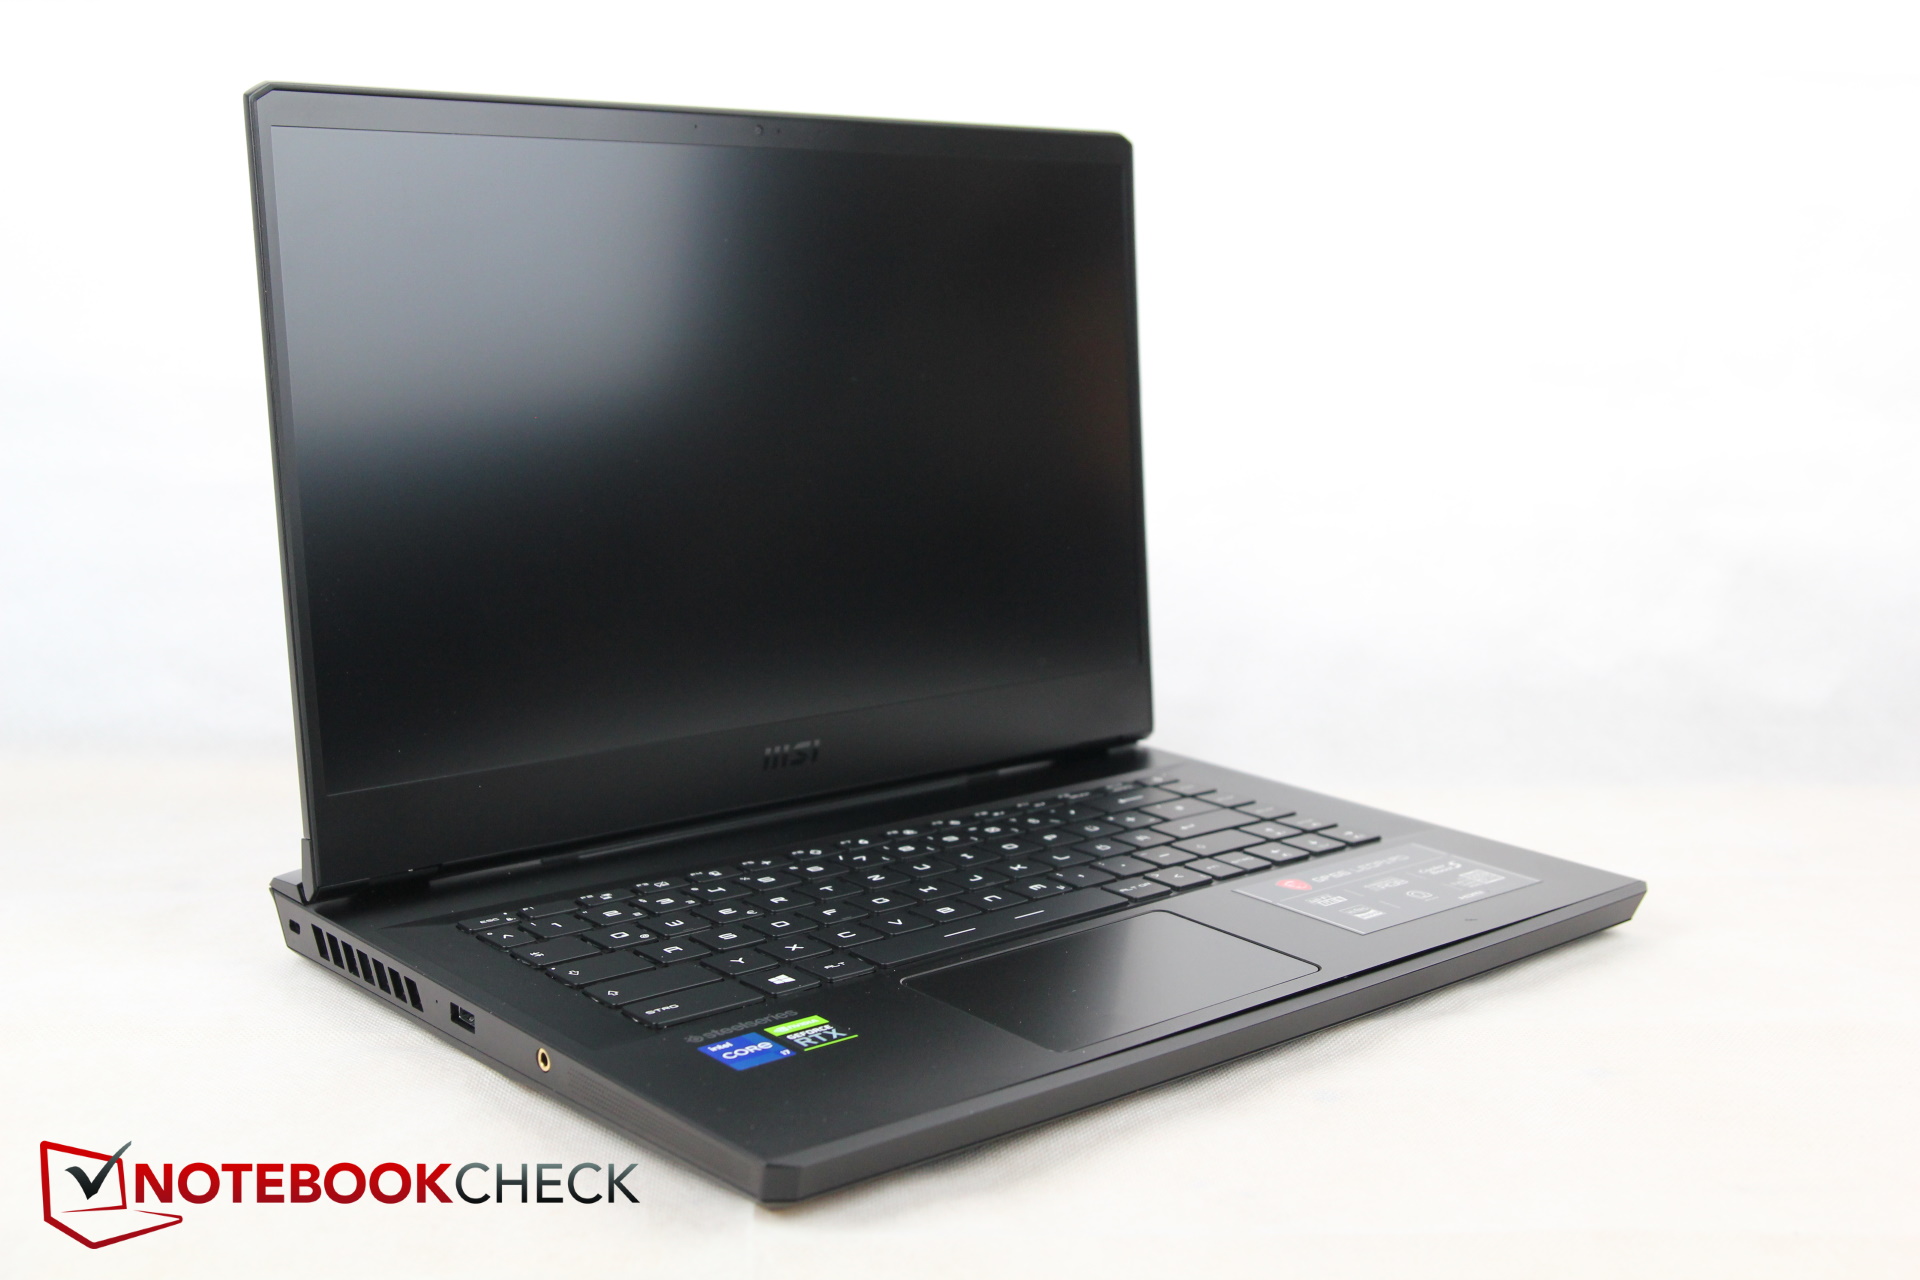
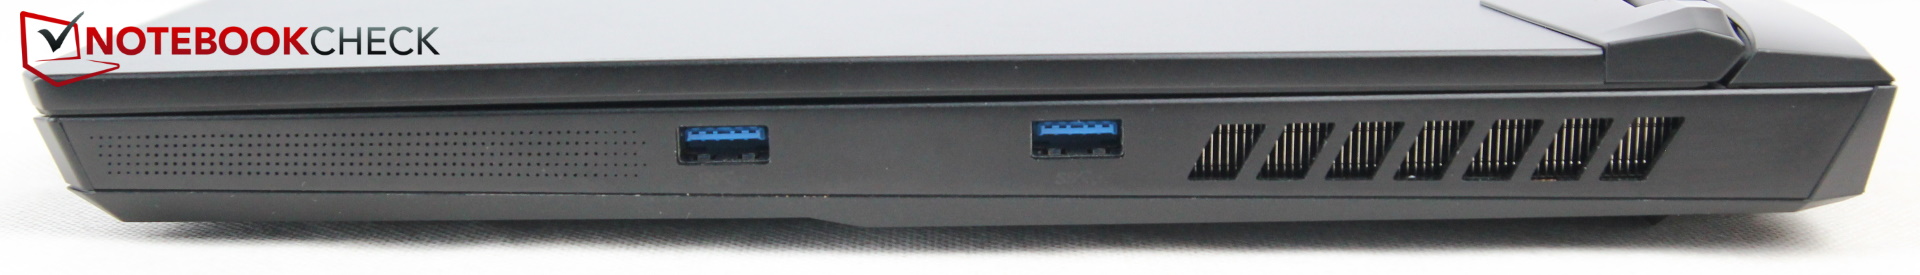
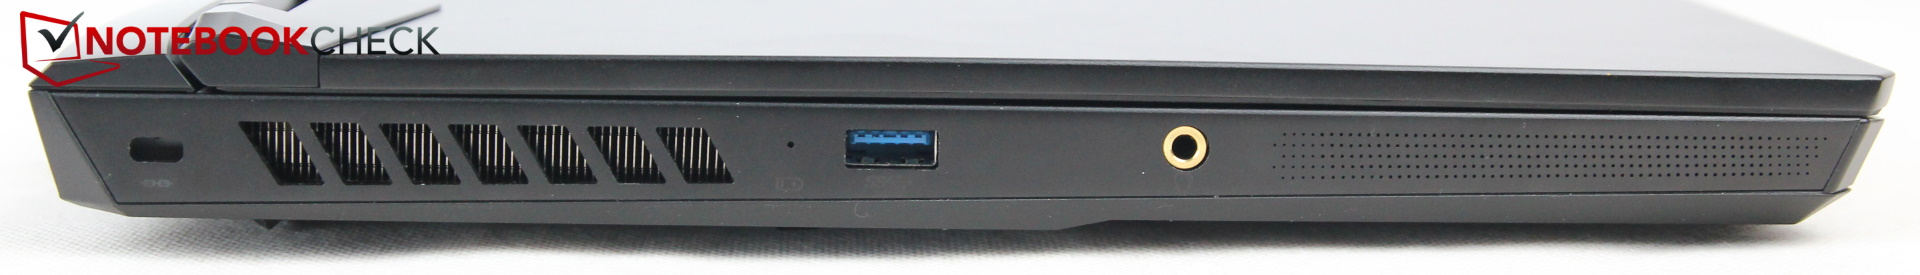
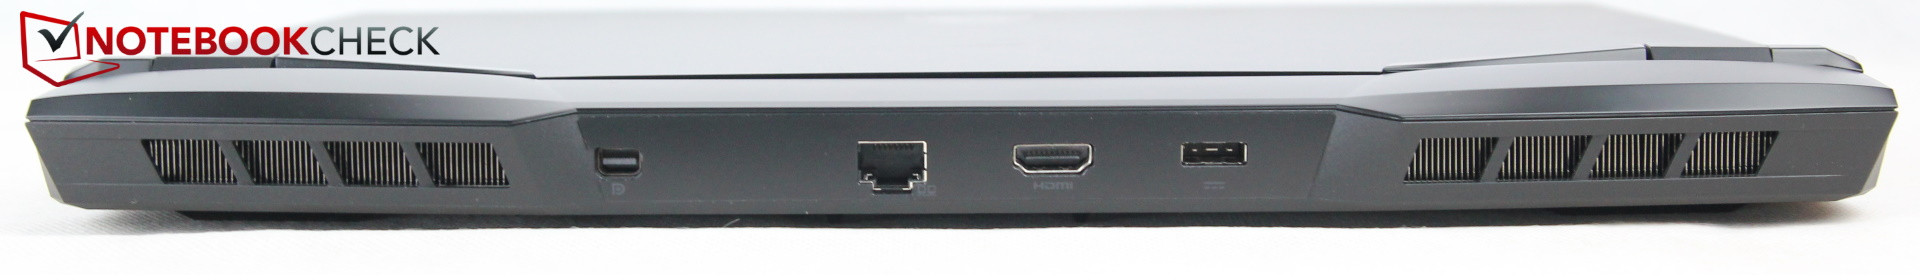
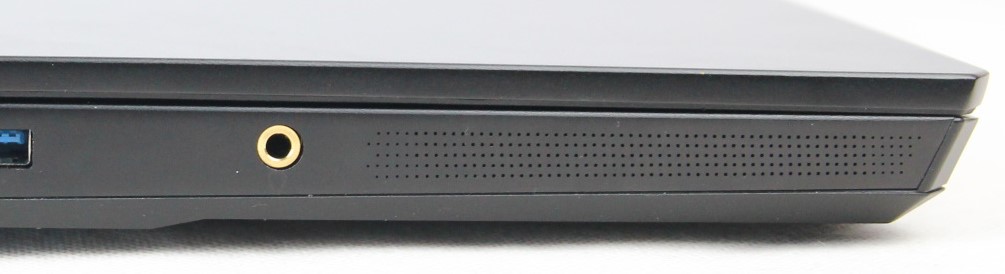
功能 - 老实说,微星,没有USB-C?
与它的前辈GP66 10UG相比,微星放弃了MiniDP端口,转而使用USB-C端口。在目前的GP66 11UH中,微星退了一步,带回了Mini DisplayPort,这是一个值得欢迎的举措。但是,制造商也取消了USB-C端口因此,GP66 Leopard是唯一没有USB-C端口的现代笔记本电脑!我们不知道微星为什么这样做,因为USB-C端口已经成为当今的绝对标准。因此,作为一个副作用,该笔记本电脑只有三个USB端口。也没有SD读卡器。
剩下的几个端口都很好地分布在三个侧面,即机箱的左、右和背面。微星公司在这里真的值得称赞,因为各种端口之间有很大的空间,这至少使人们对微薄的各种选择有了一定的认识。所有潜在的粗线(HDMI、DP、LAN、电源)都被放置在后面,而侧面只有USB-A和耳机接口--非常好。
沟通
微星用支持蓝牙5.2的杀手级Wi-Fi 6E AX1675取代了英特尔AX201。这并没有使Wi-Fi的速度提高很多。虽然它在千兆范围内,但它没有达到模块的潜力。特别是接收曲线有一个下降的斜率,但传输功率相当稳定。
| Networking | |
| iperf3 transmit AX12 | |
| Schenker XMG Neo 15 Tiger Lake | |
| Average Intel Killer Wi-Fi 6E AX1675x (210NGW) (1066 - 1499, n=8) | |
| Aorus 15P YD | |
| MSI GP66 Leopard 10UG | |
| MSI GP66 Leopard 11UH-028 | |
| Alienware m15 R6, i7-11800H RTX 3080 | |
| Asus ROG Strix Scar 15 G533QS | |
| iperf3 receive AX12 | |
| Schenker XMG Neo 15 Tiger Lake | |
| Average Intel Killer Wi-Fi 6E AX1675x (210NGW) (1037 - 1469, n=8) | |
| MSI GP66 Leopard 10UG | |
| MSI GP66 Leopard 11UH-028 | |
| Alienware m15 R6, i7-11800H RTX 3080 | |
| Aorus 15P YD | |
| Asus ROG Strix Scar 15 G533QS | |
网络摄像头
一个标准的高清网络摄像头在Zoom、Teams和其他会议应用程序中最多只能提供可接受的图片。即使在光线良好的情况下,画面看起来也很模糊,而且颜色偏差相当明显,特别是在红色和绿色的颜色范围。


安全问题
一个Kensington端口和TPM都在板上。然而,没有指纹扫描仪或其他安全技术--这对游戏笔记本来说是可以接受的。
维护
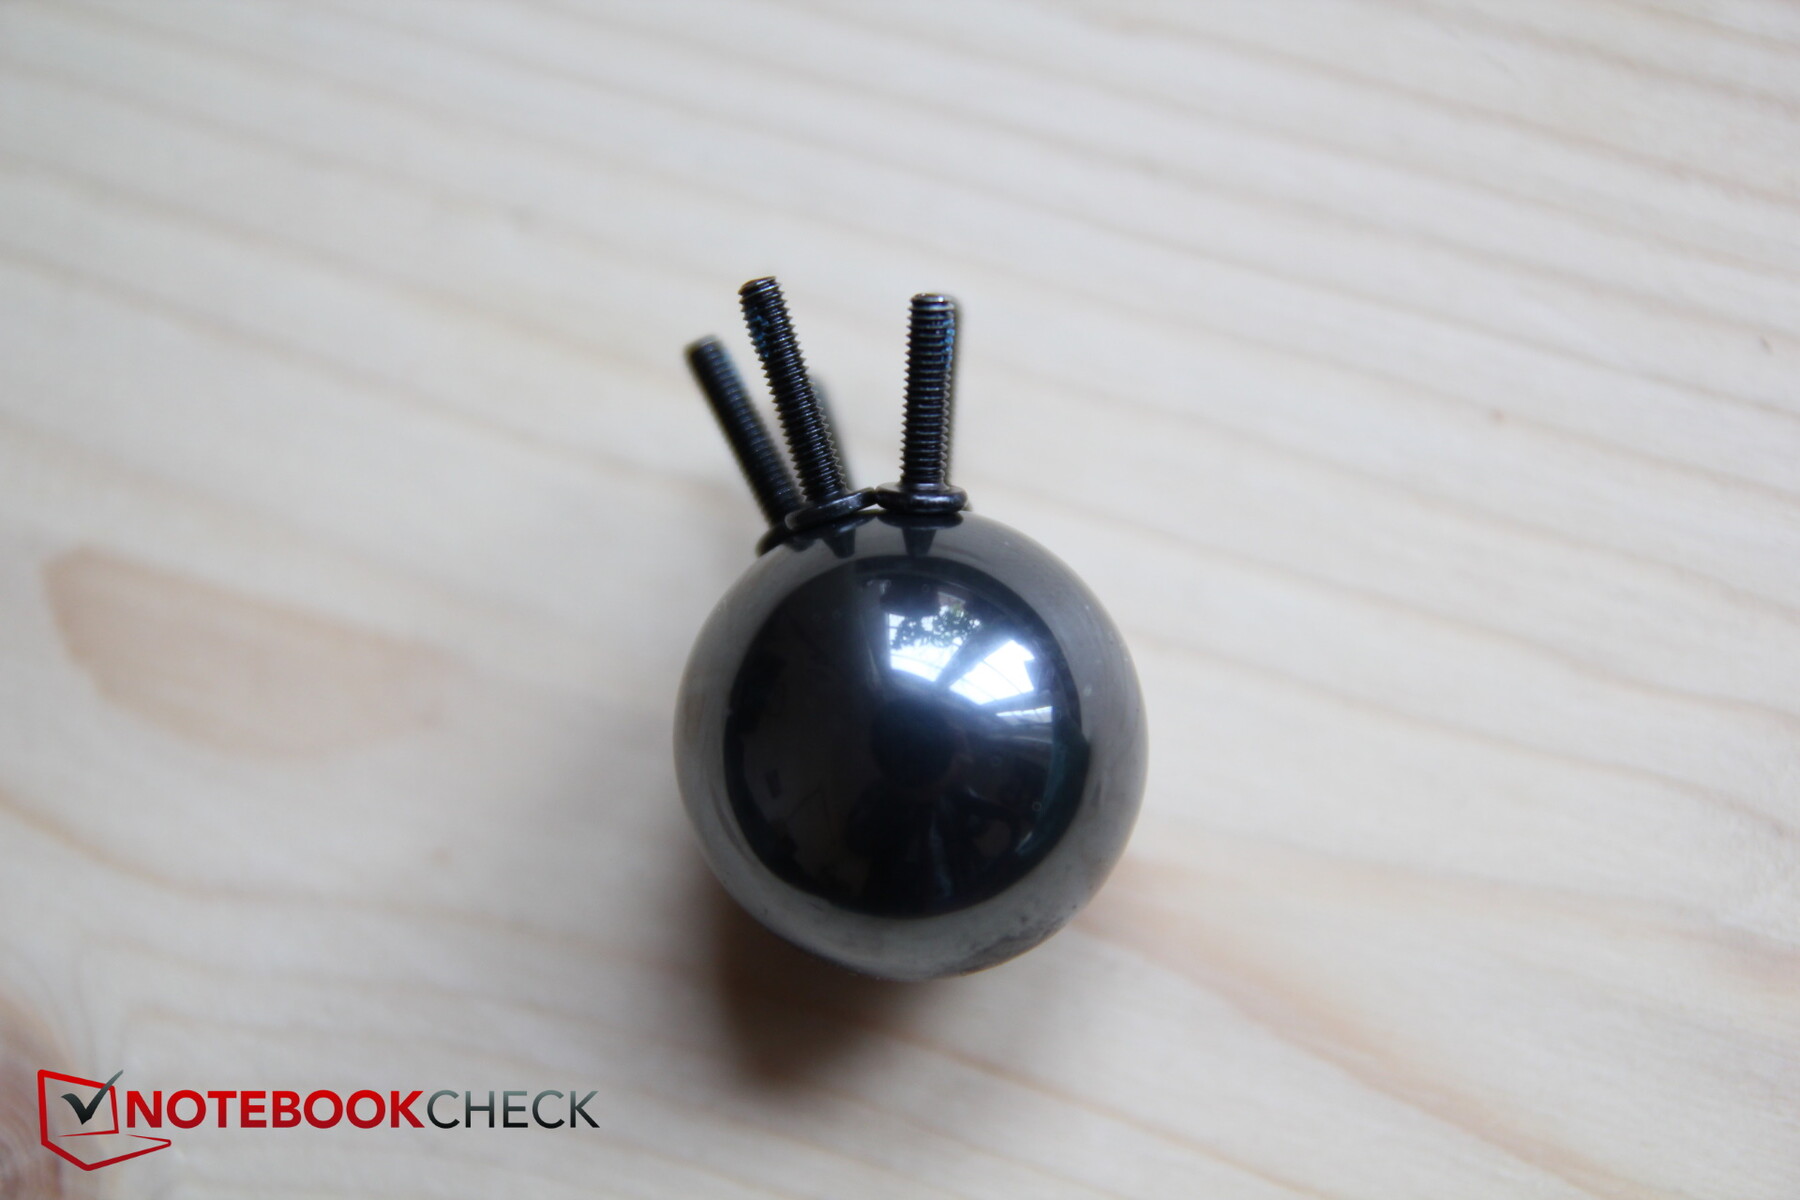
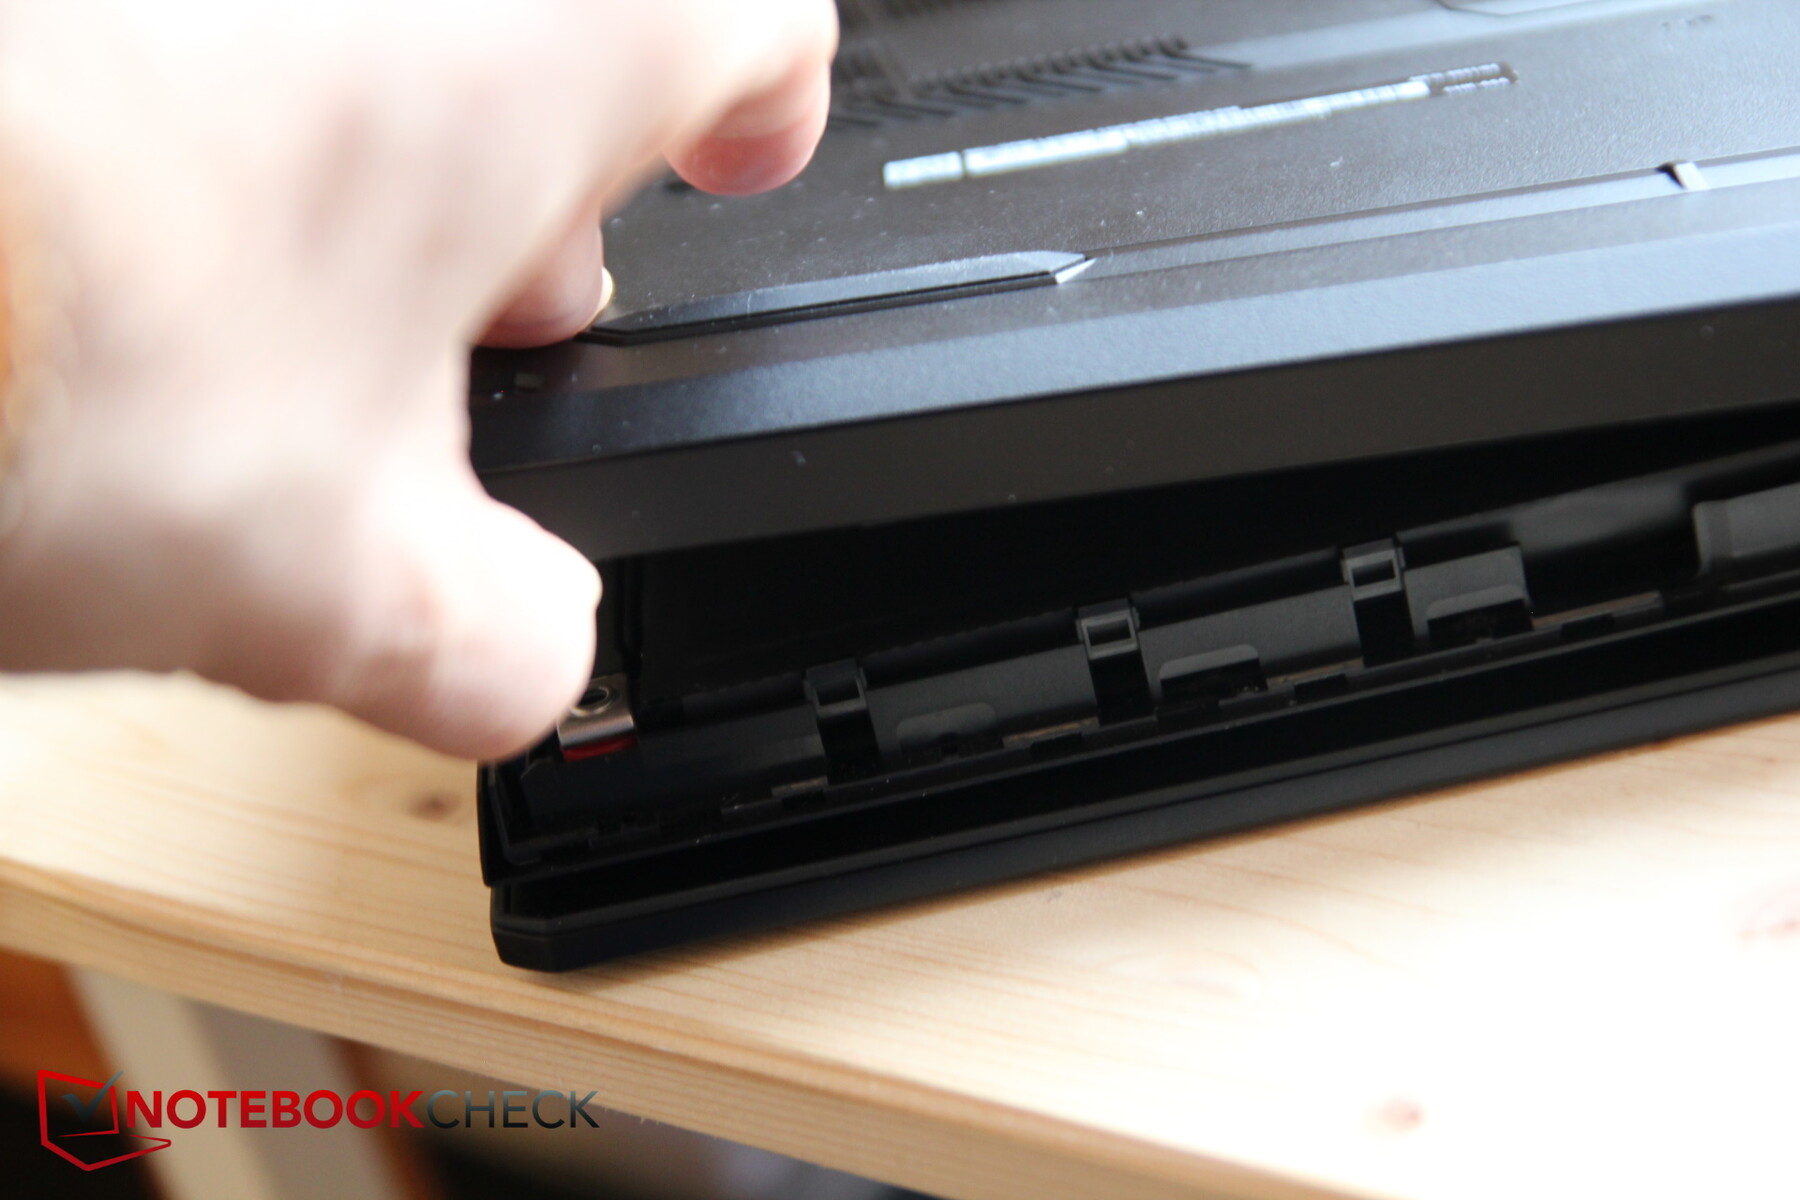
底板由至少10个十字螺丝(其中一个比其他所有螺丝都短)和各种锁扣固定。虽然我们的模型的前缘之前已经部分拆开,但事实证明维修比预期的要复杂。
前部边缘脱落得很好,但两侧和后部边缘却完全没有。特别是在耳机插座的地方,底板仍然被紧紧地锁住(不是直接在边缘,而是在里面),尽管有杠杆工具,我们还是不得不放弃打开的尝试,因为担心会损坏薄的塑料板。后边缘也没有屈服。隐藏的螺丝不应该是问题,至少在侧面是这样。
其内部结构应该类似于 MSI GP66 Leopard 10UG(见维修部分),但打开它也是有问题的。
配件和保修
除了电源之外,盒子里没有其他附件。注意:微星在运送GP66 Leopard时没有操作系统,但各种商店应该包括一个Windows许可证。
微星提供为期2年的保修,并提供提货和退货服务。
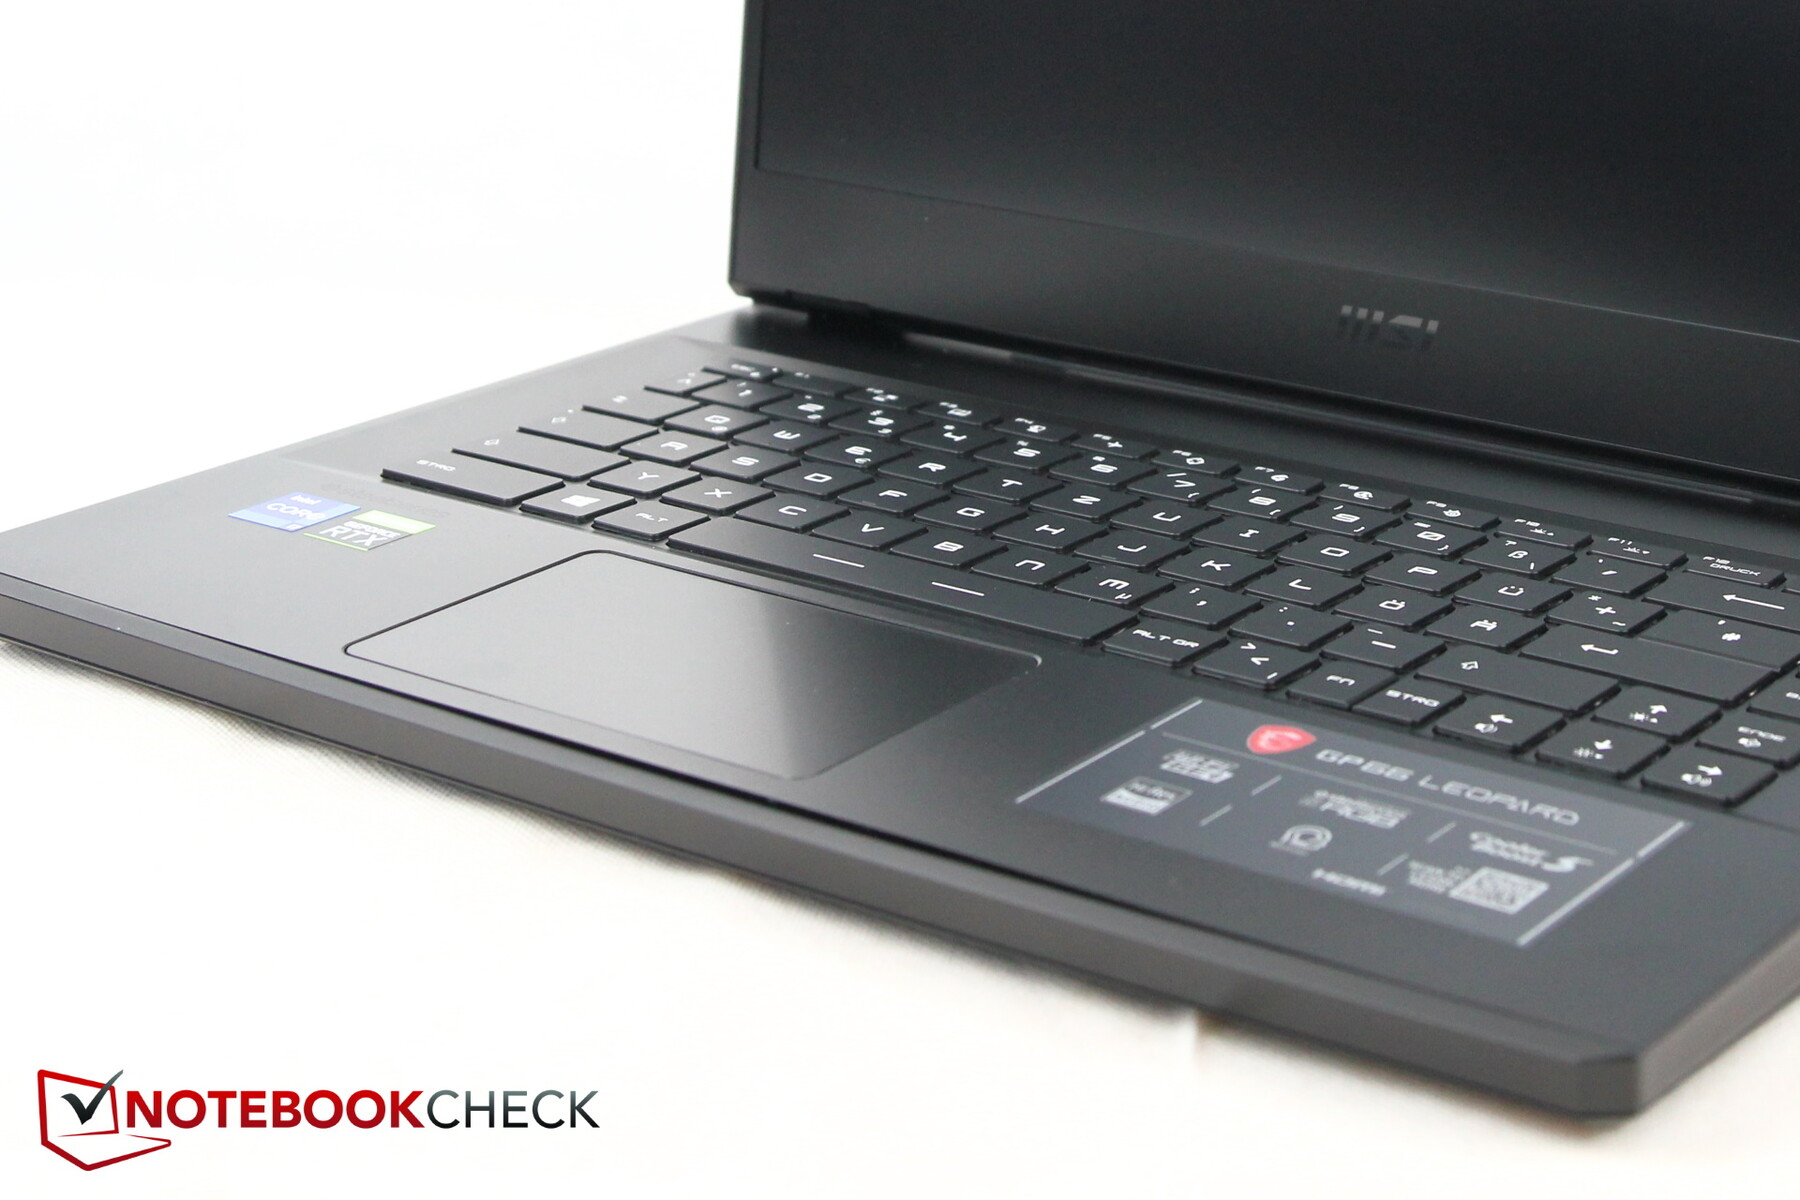
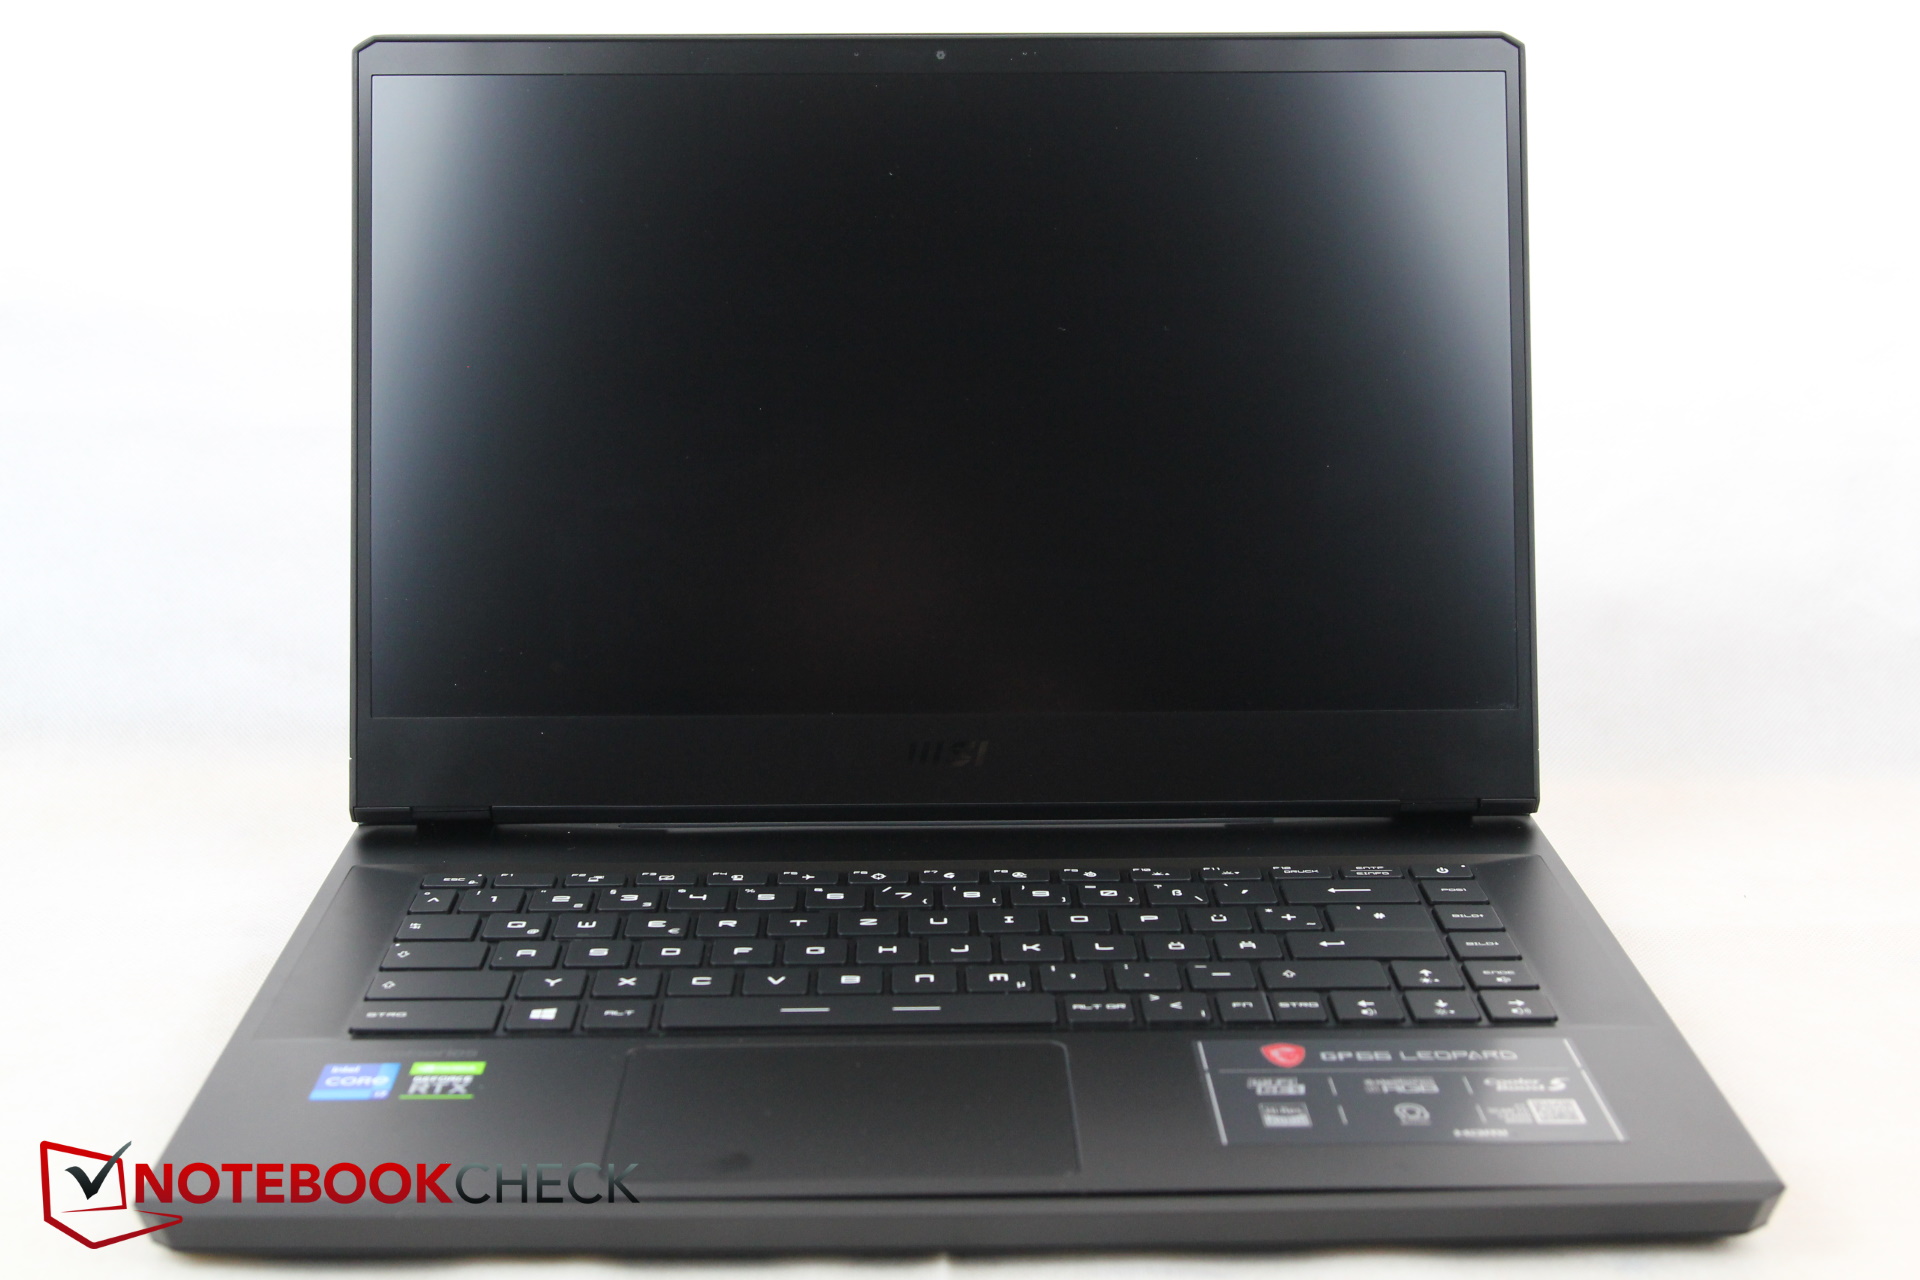
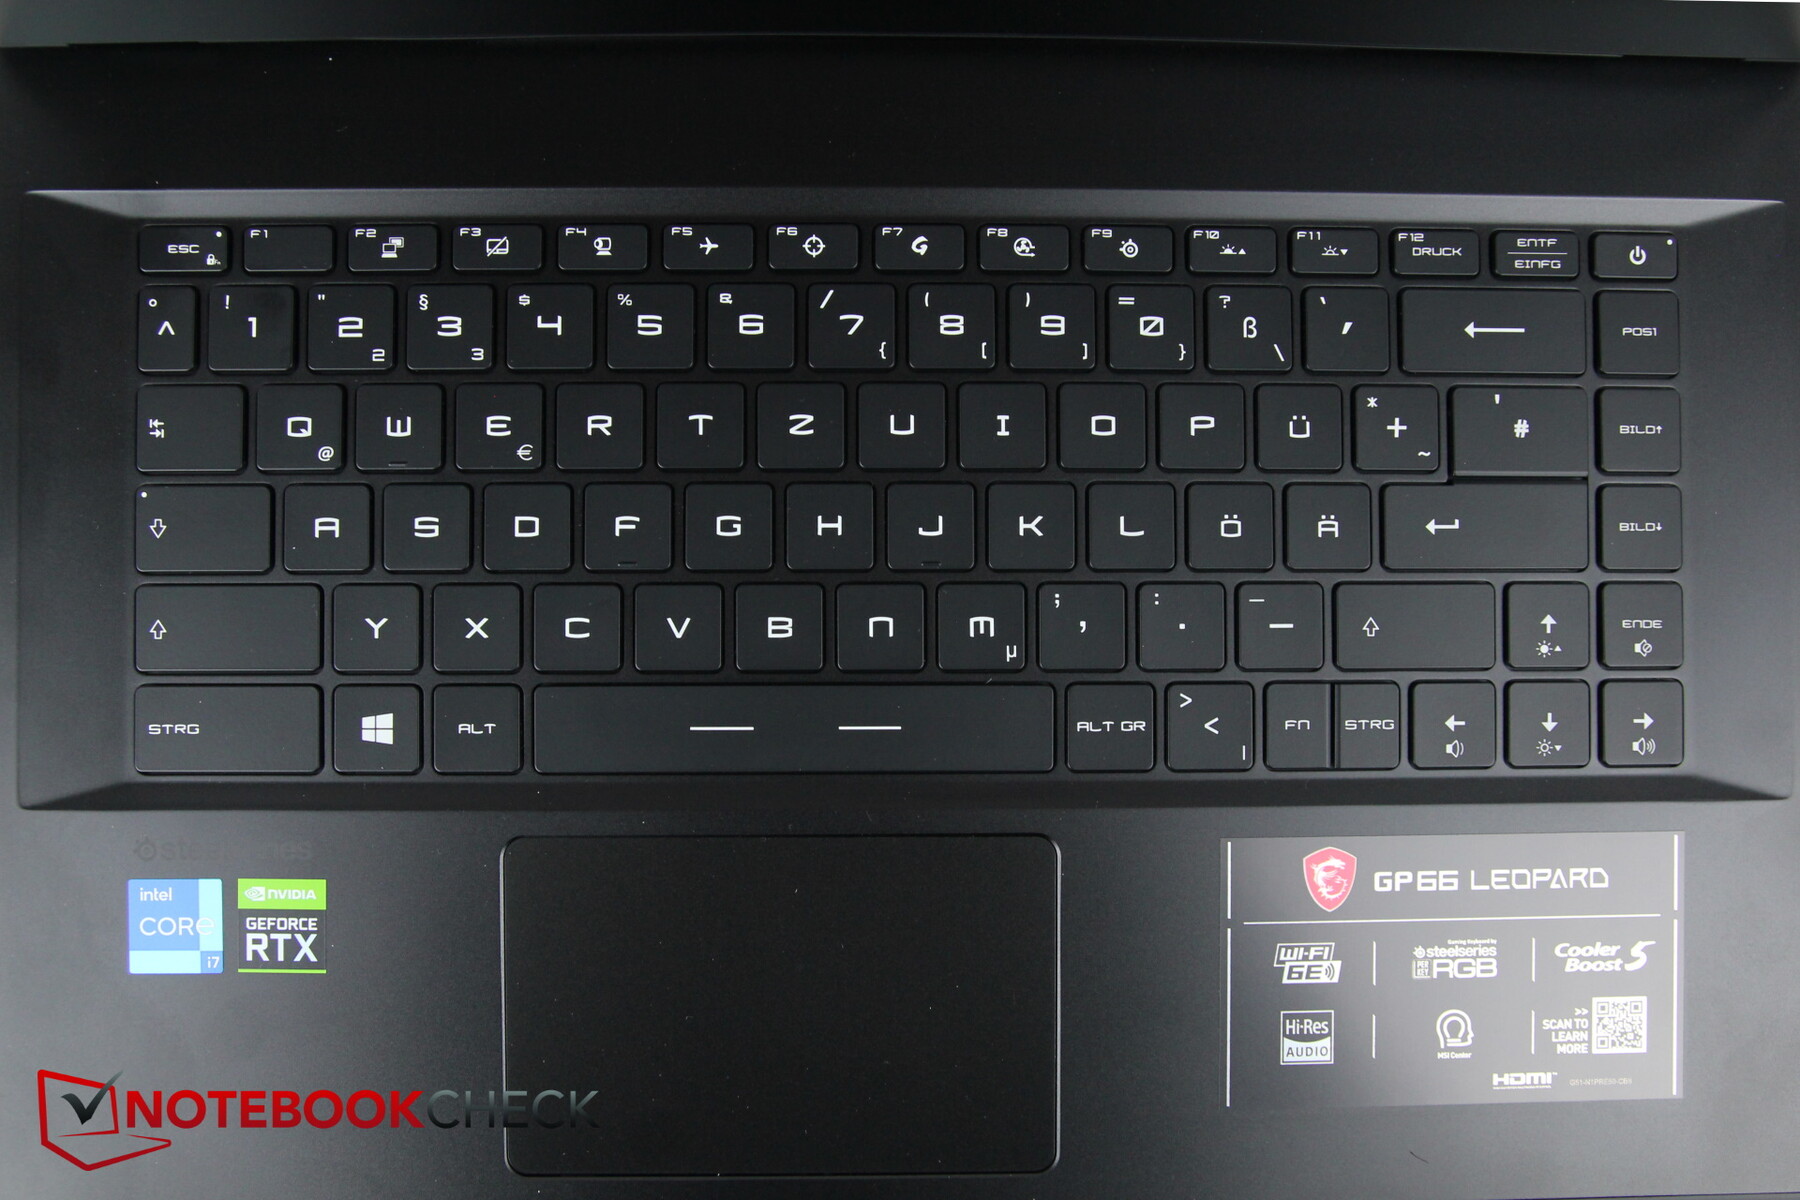
输入设备 - 良好的键盘,触摸板发出响声
键盘
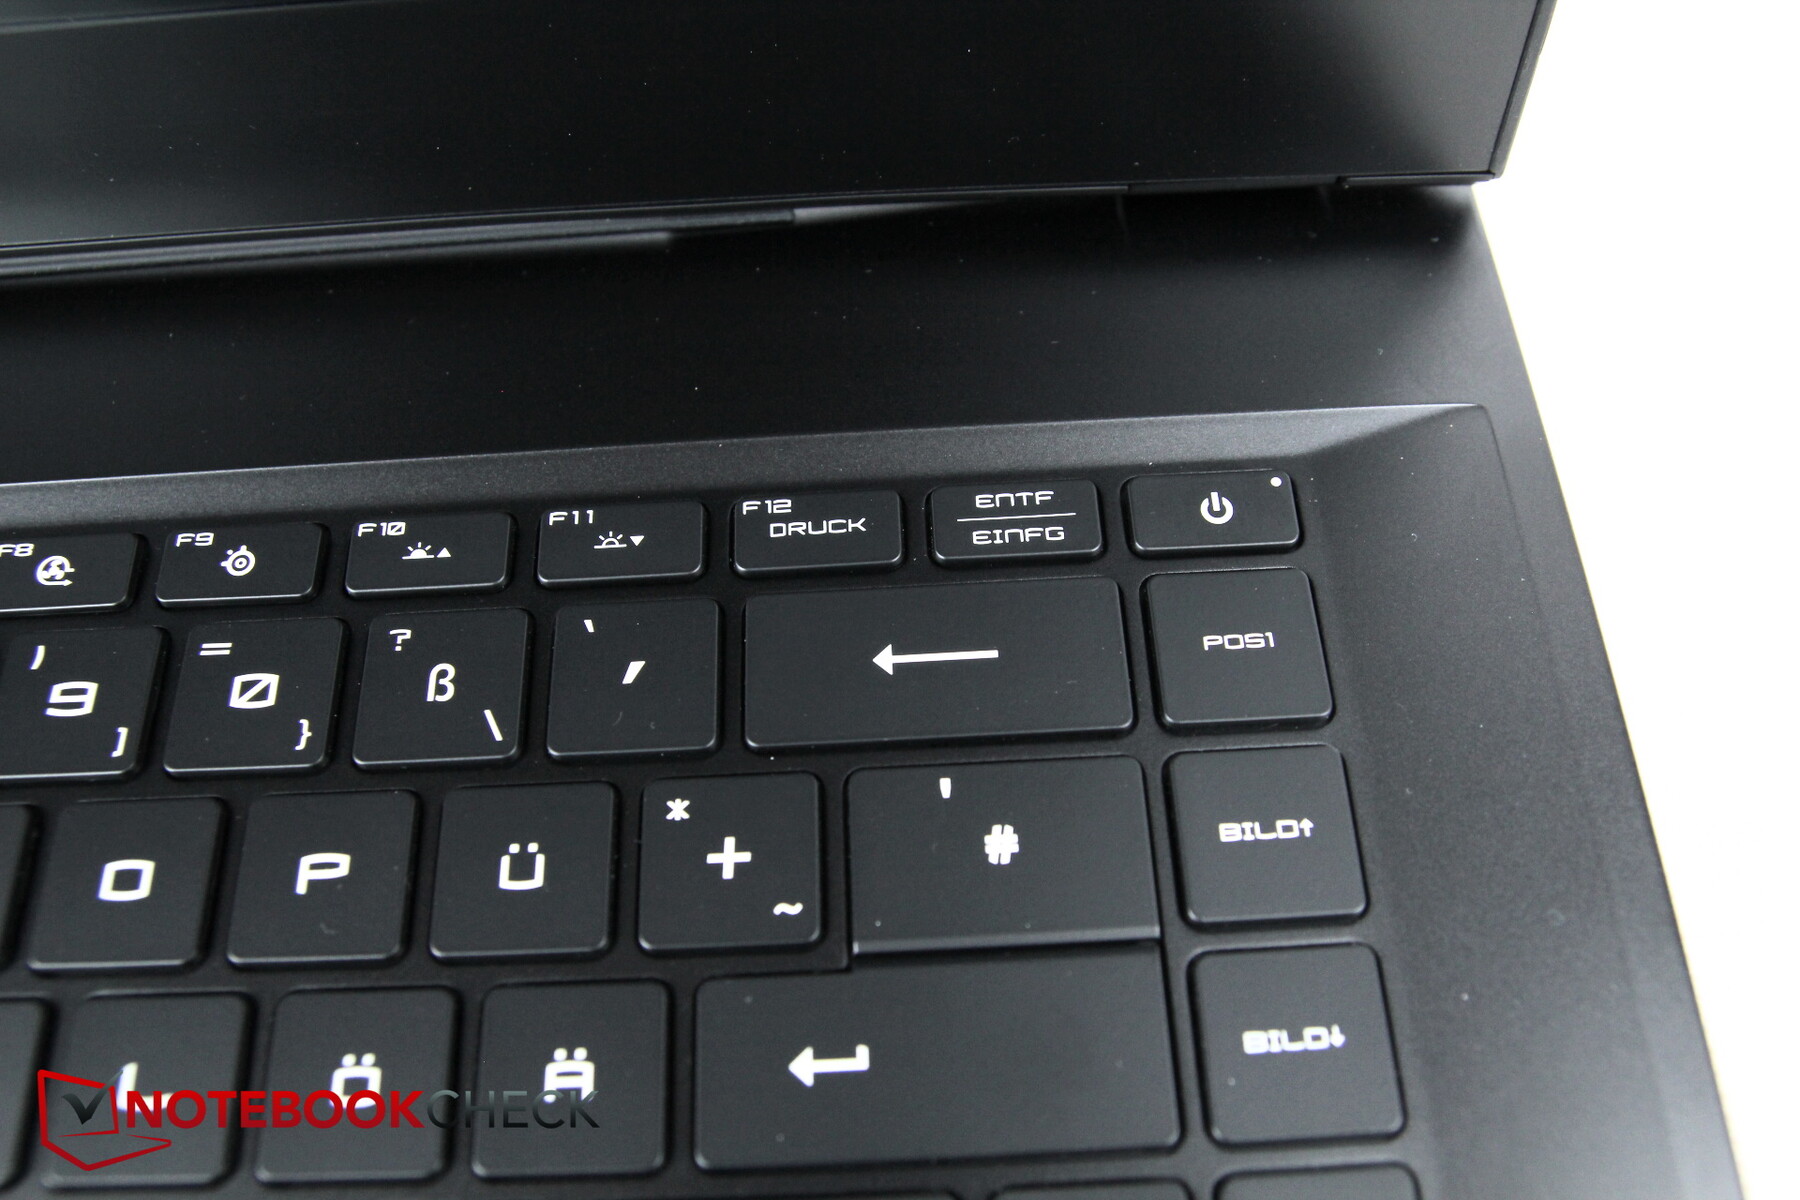
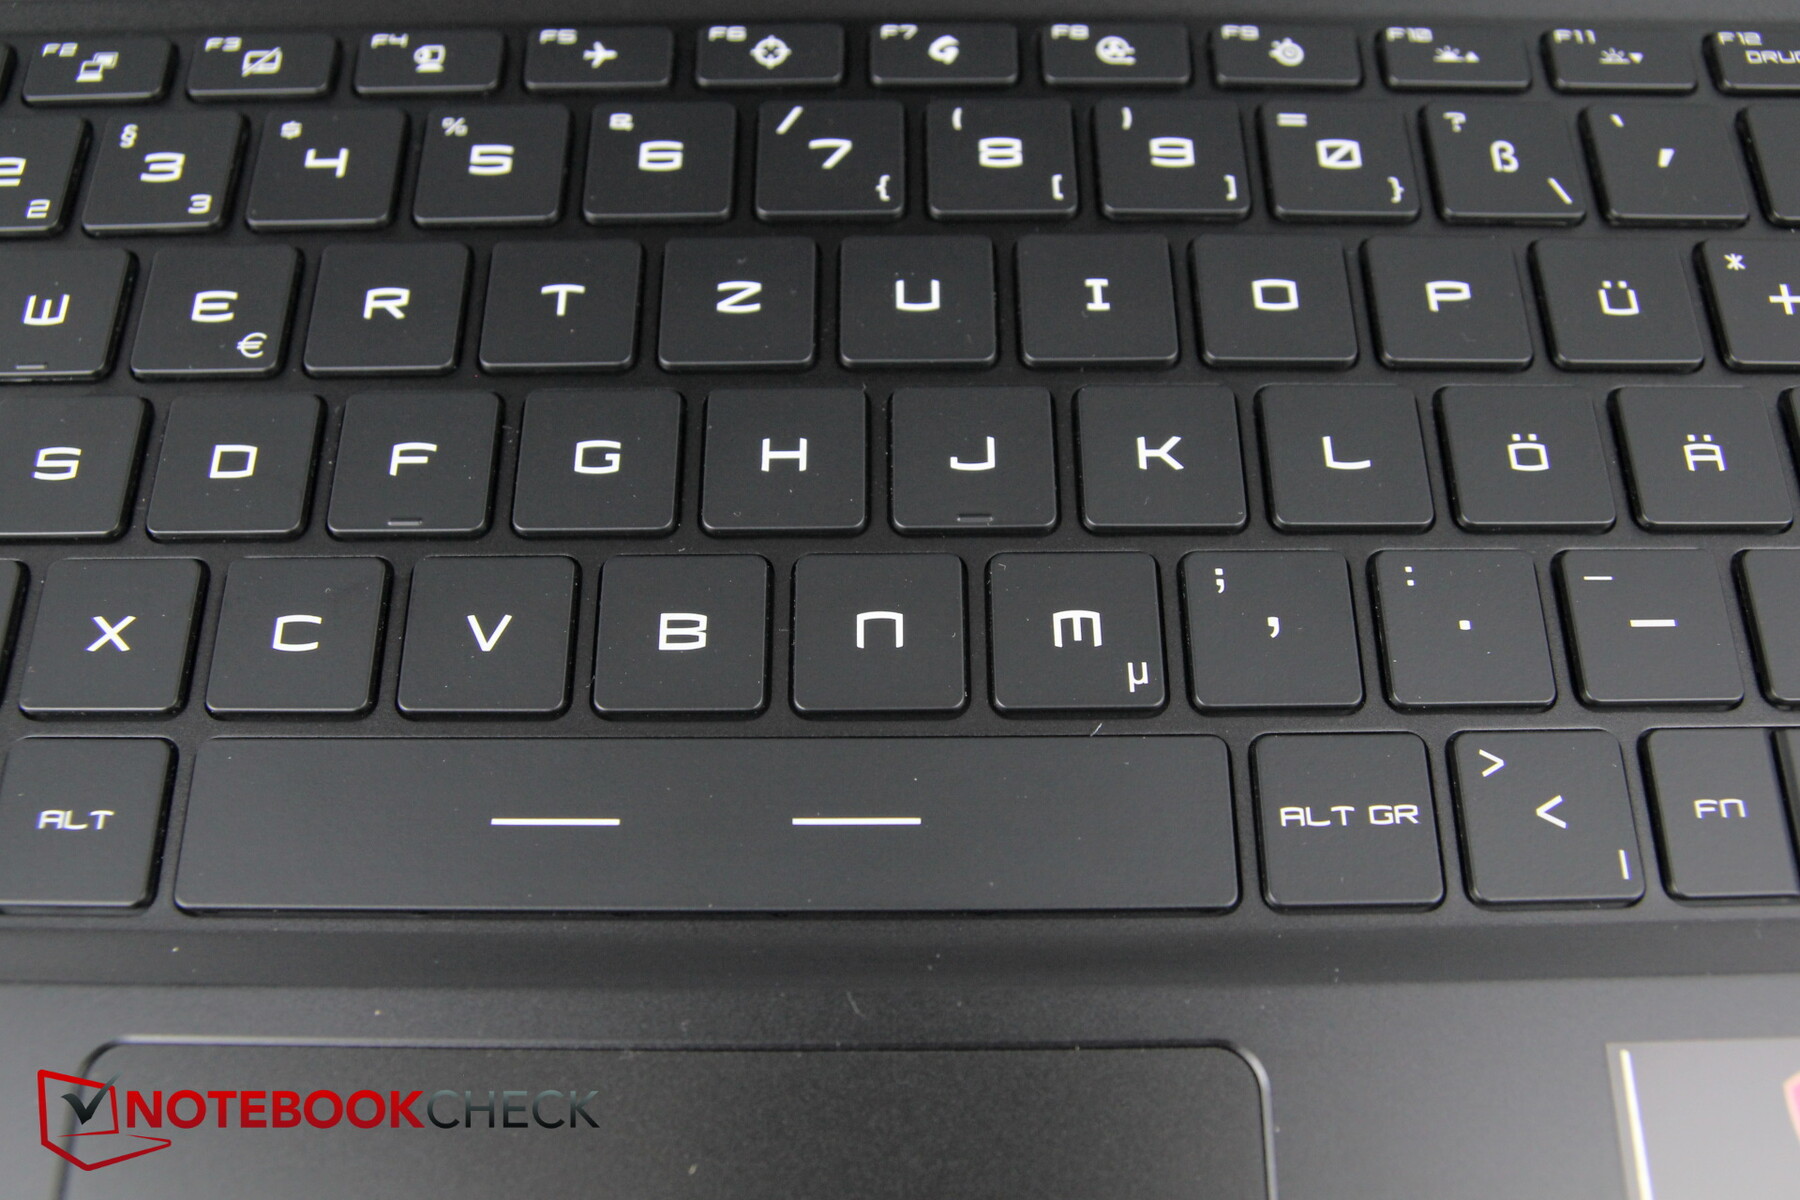
尽管有15.6英寸的尺寸,Leopard并没有配备NumPad。另一方面,这确保了所有的按键都相当大,也有良好的间距。字母很大,易于阅读,即使选择的字体有点不寻常,这应该明确地吸引游戏玩家。电源键是键盘的一部分,位于右上角的位置。由于 "insert "和 "pos1 "的距离很近,它可能在文本处理过程中被无意地触发。
敲击的时间相当短,但反馈仍然很清晰。打字的噪音非常适中,只有空格键的声音最小。总的来说,在GP66上打字既有趣又快速。
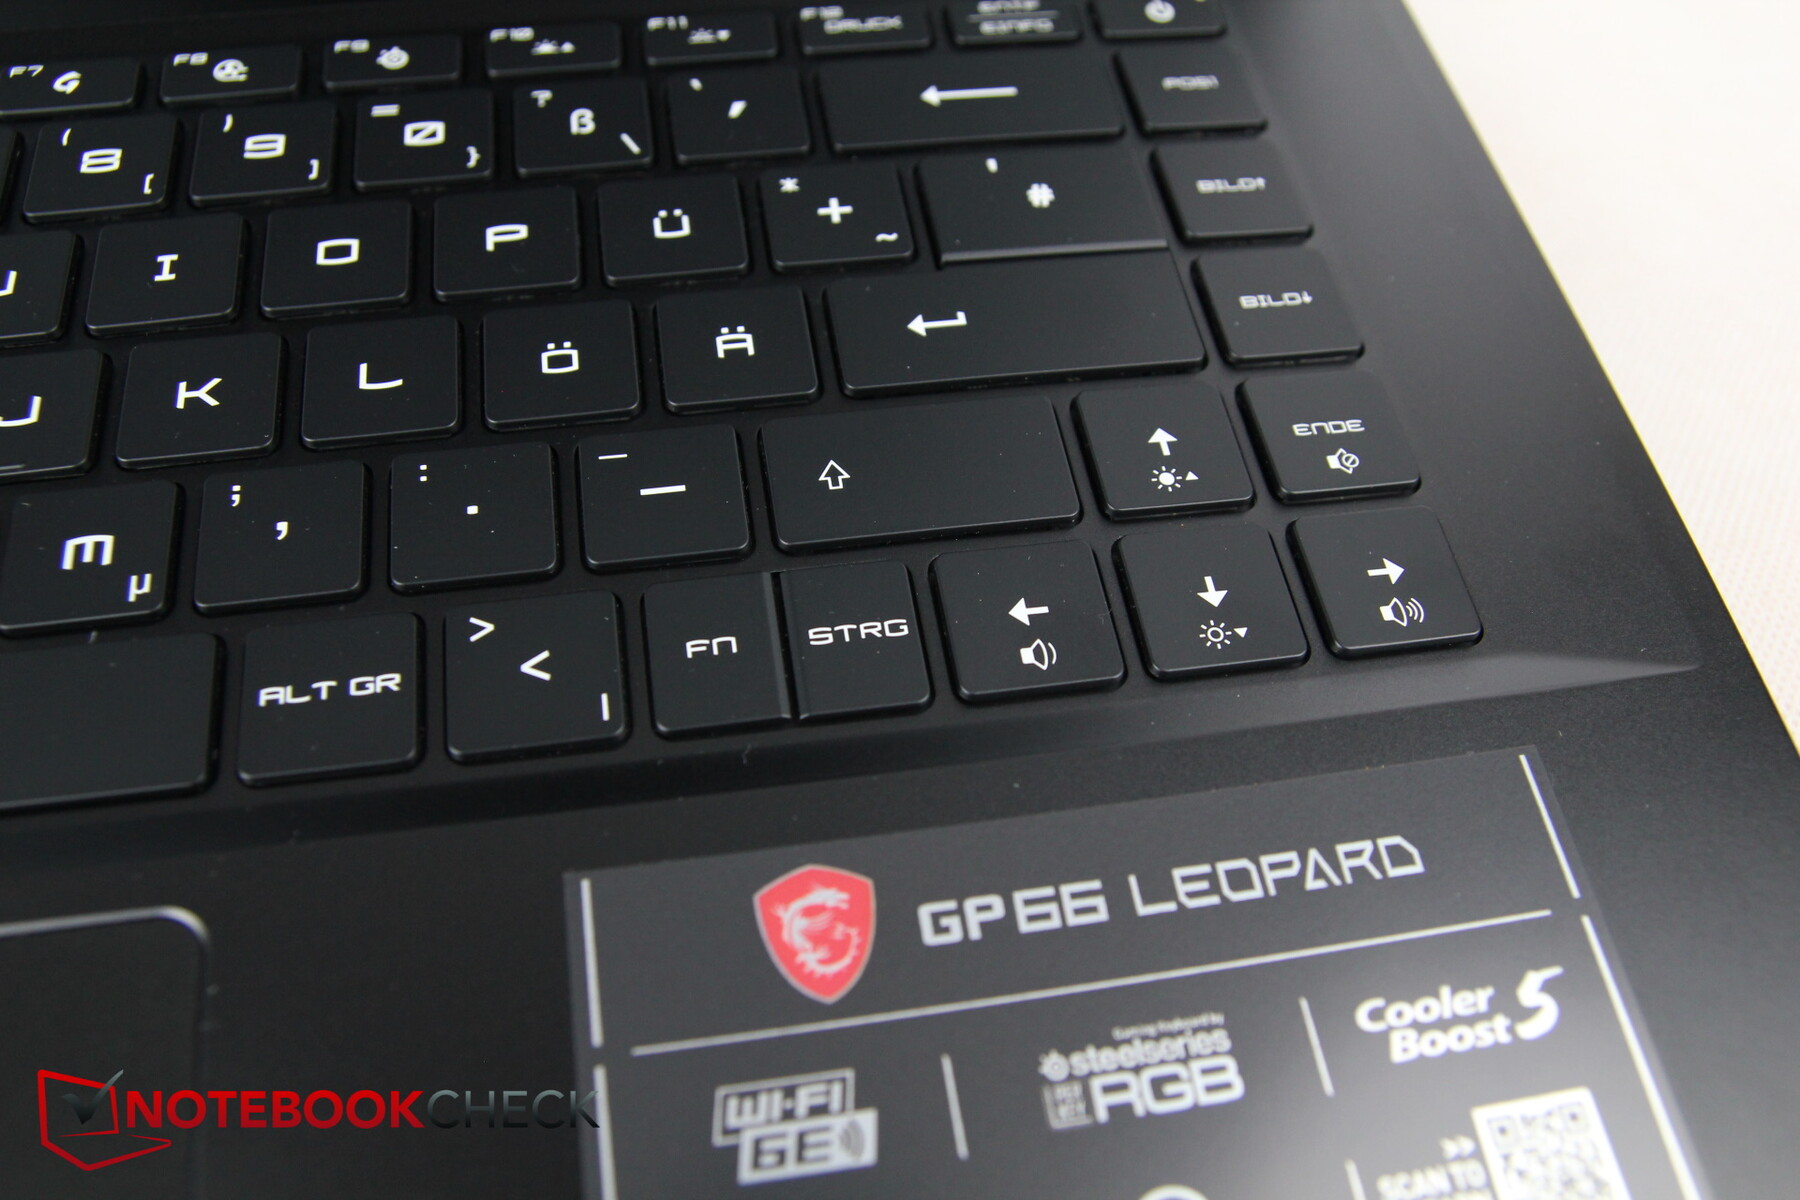
微星很不常规地解决了一个问题:如此重要的 "fn "键不在左边,而是在右边,与右边的Ctrl键共享位置。一方面,这意味着你必须三思而后行,组合键有时会很别扭,因为你要么不能用双手来进行大范围的组合键,要么你必须用左手按第二个键。这个键也很窄,这特别不利,因为通常是用右手拇指按的。至少你还可以将fn键的功能与MSI中心的Windows键进行交换。
在这种情况下,有一个很酷的功能,但也有一个弱点:键盘有一个3段式背光。当按下fn键时,所有其他按键的照明会暂时关闭,只有F键的特殊功能,即现在可以与fn键组合的按键会亮起红色。然而,这个功能有一个缺点,因为如果我们改变背光的照明水平,我们不会立即看到这种变化的效果,因为亮起红色的特殊按键不会改变照明水平,这与其他按键不同。
触摸板
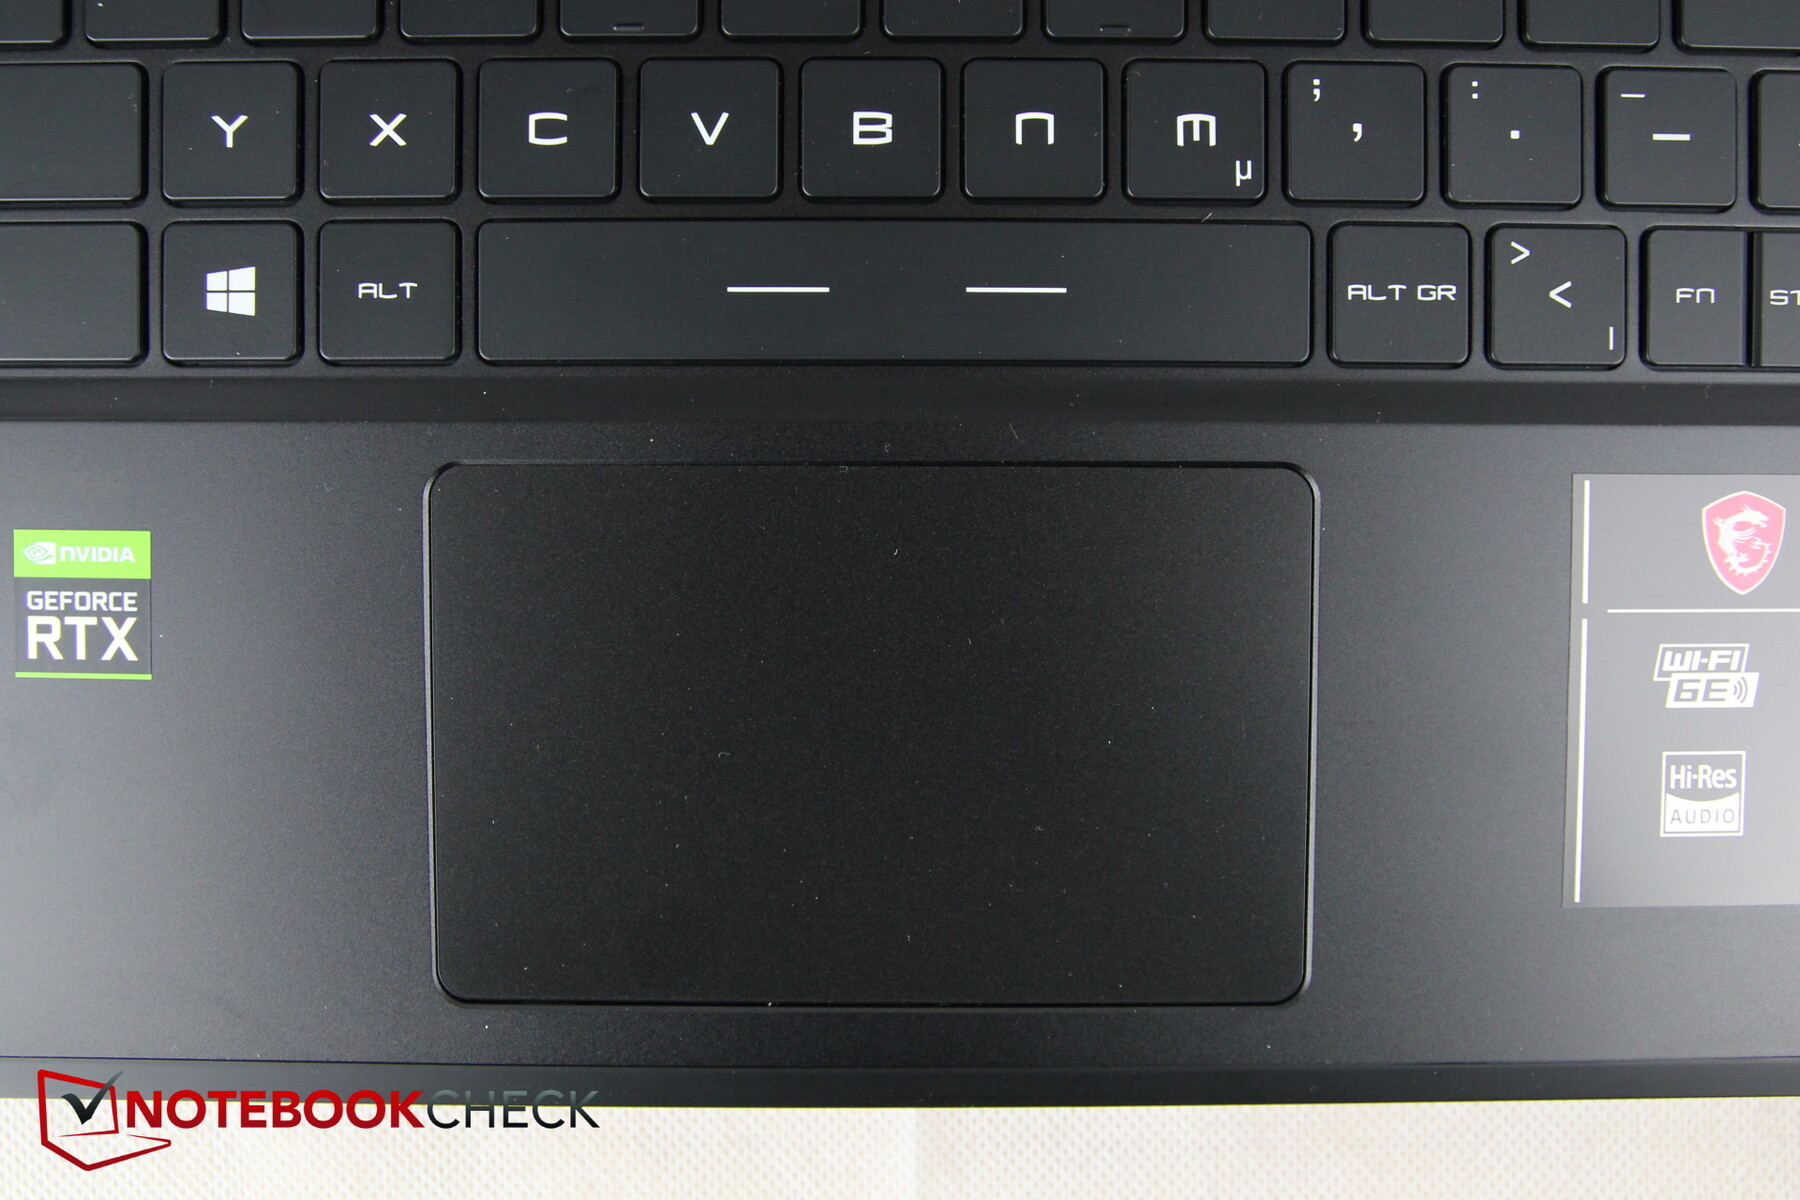
触摸板的尺寸约为10.5×6.5厘米,有内部点击按钮。表面的滑行能力很好,但在缓慢移动或潮湿的手指时,它显然会动摇。触摸板的下角也相当不精确。
正如一开始提到的,当你用手指轻轻敲击触摸板时,我们的测试模型的触摸板会发出响声。这很烦人,而且当你想用手指敲击来触发点击时也很响。
集成键的点击相当迟缓,特别是双击感觉不必要的费力,你宁愿用手指敲击来触发,这时嘎嘎声又出现了。总的来说,触摸板与键盘不同,并不是最好的数字。
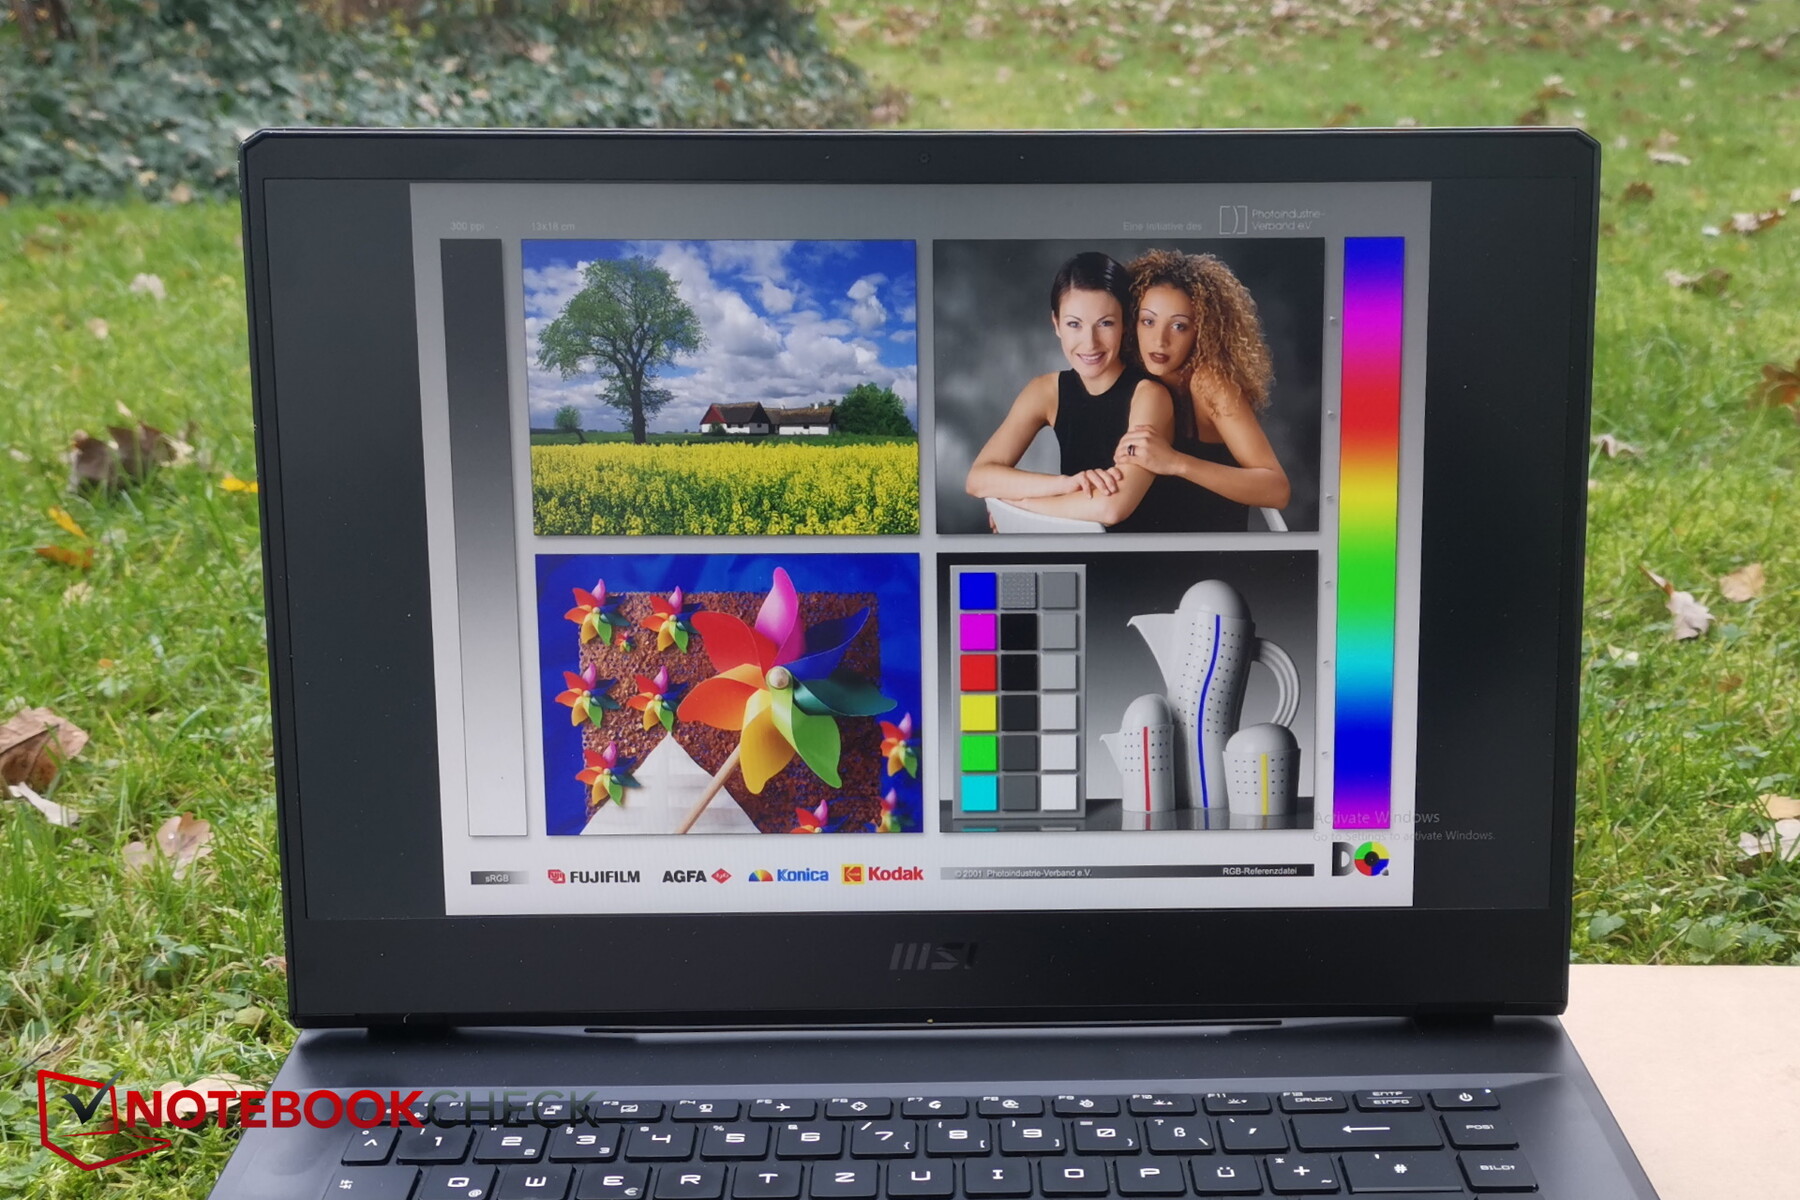
显示
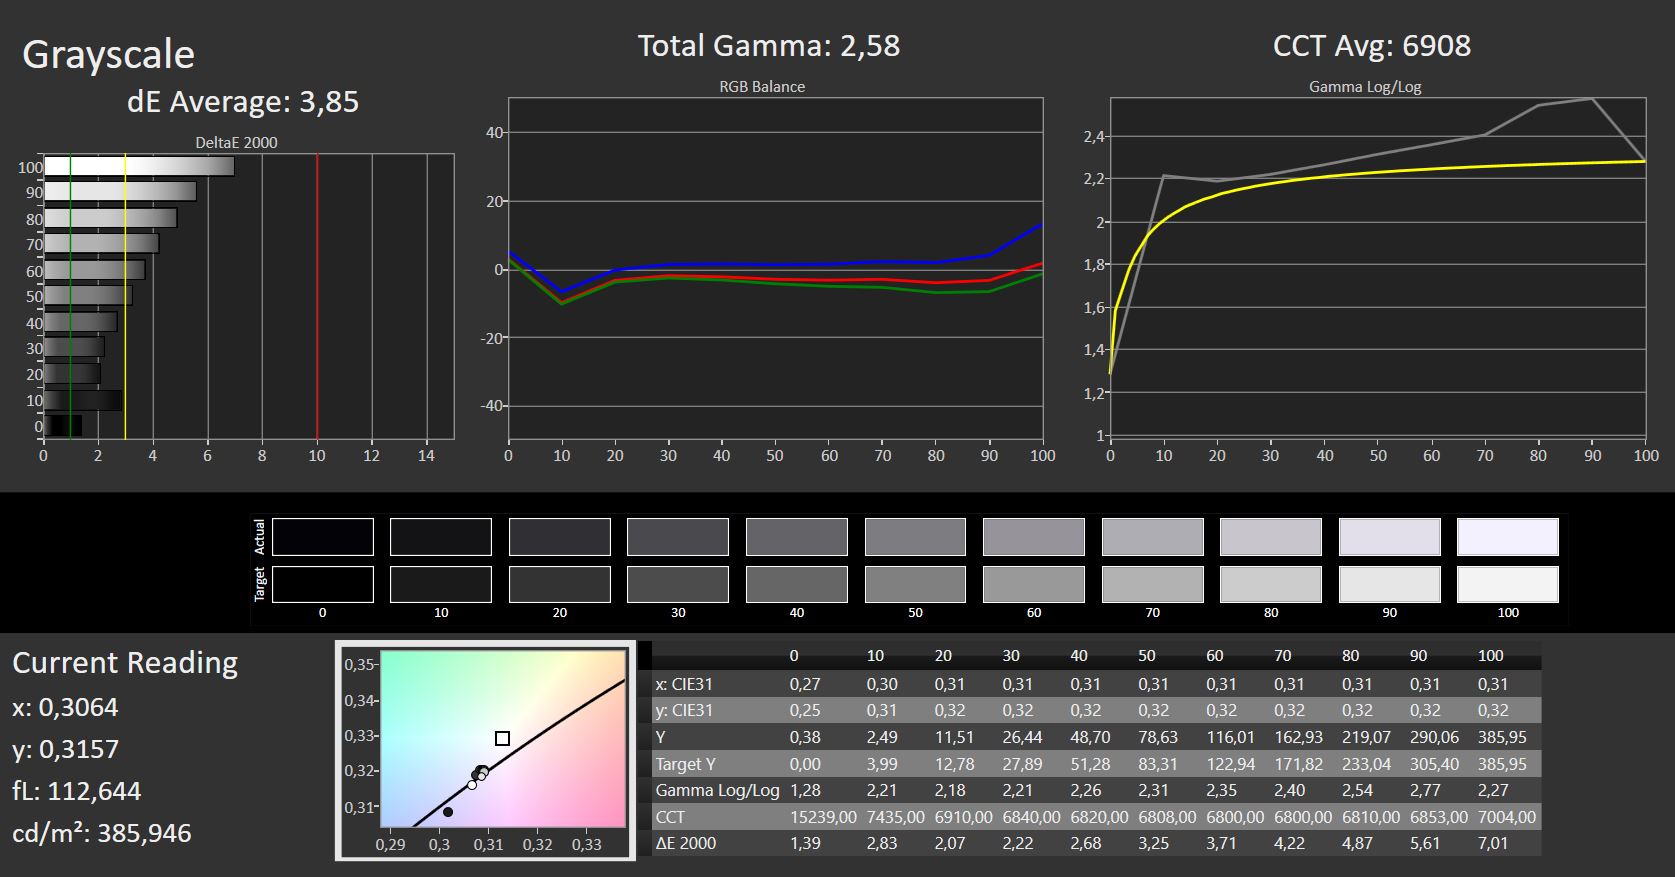
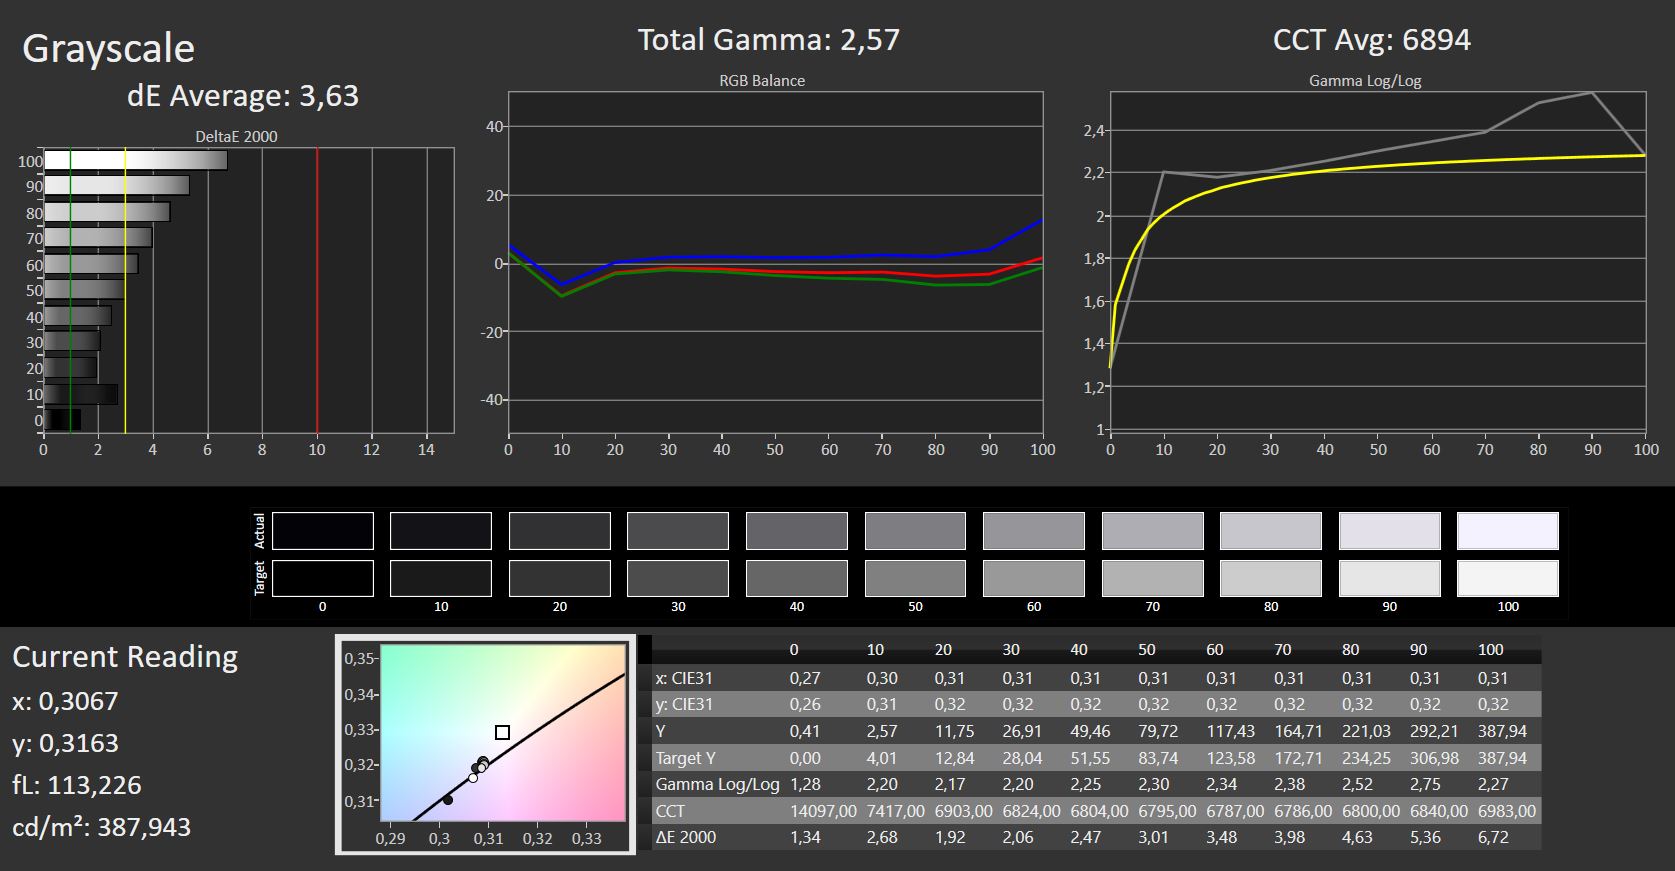
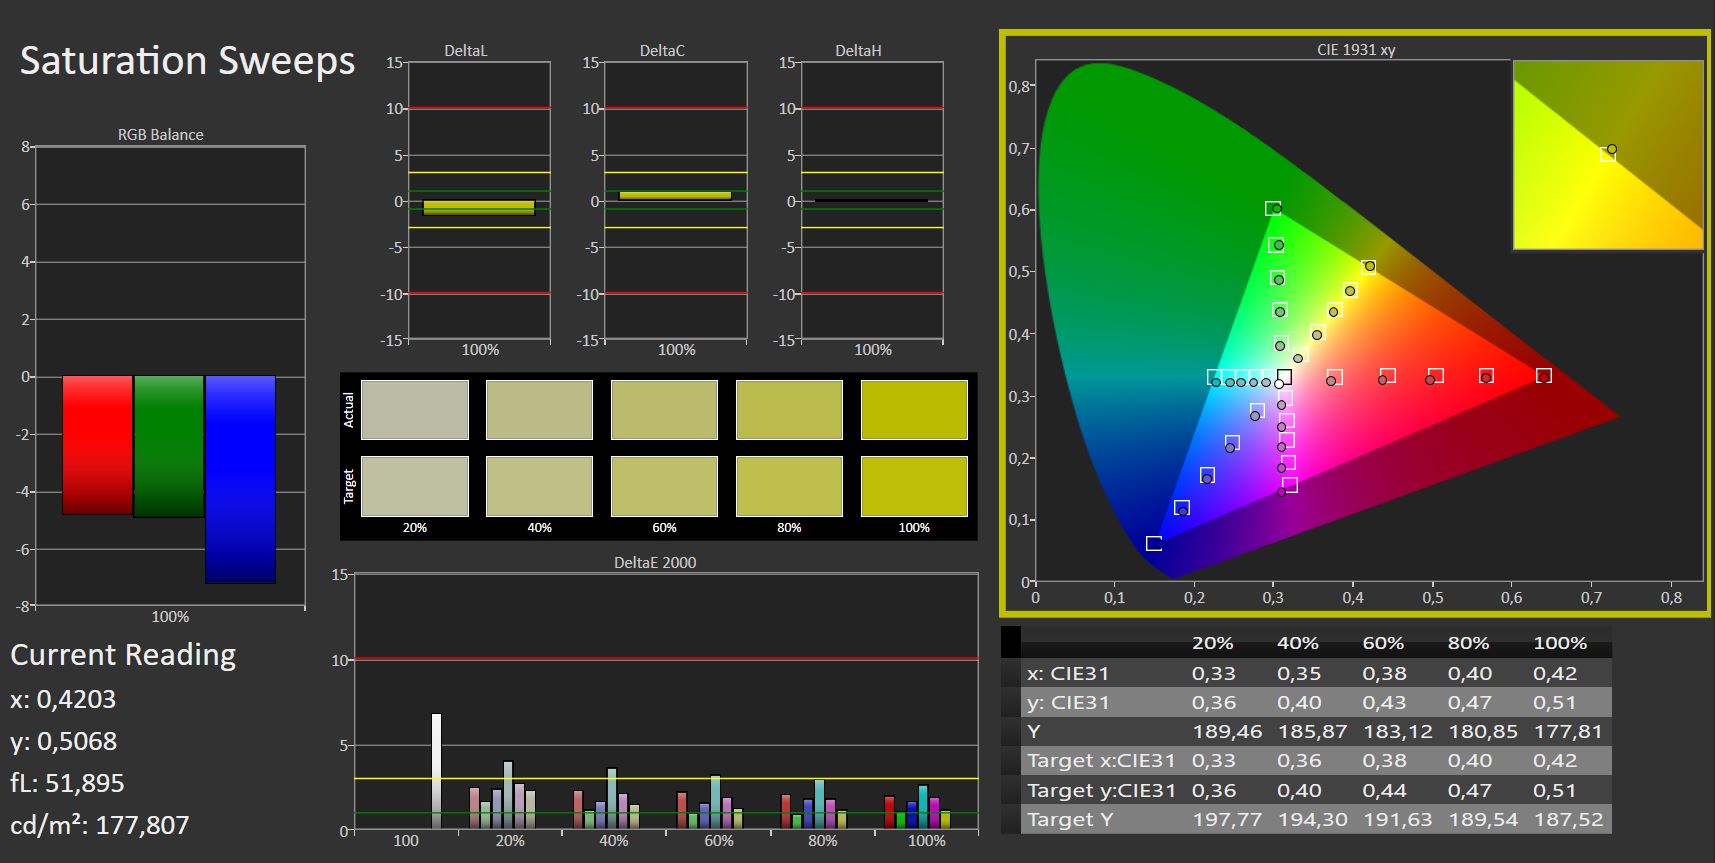
微星使用了LG Display的哑光全高清IPS面板,频率为144Hz。它与Schenker XMG Apex 15 NH57E 中的面板相同。它的平均亮度约为360尼特,是同类产品中最高的,而且其87%的分布率也很不错。另外,GP66也有配备QHD面板(2560 x 1440像素)。
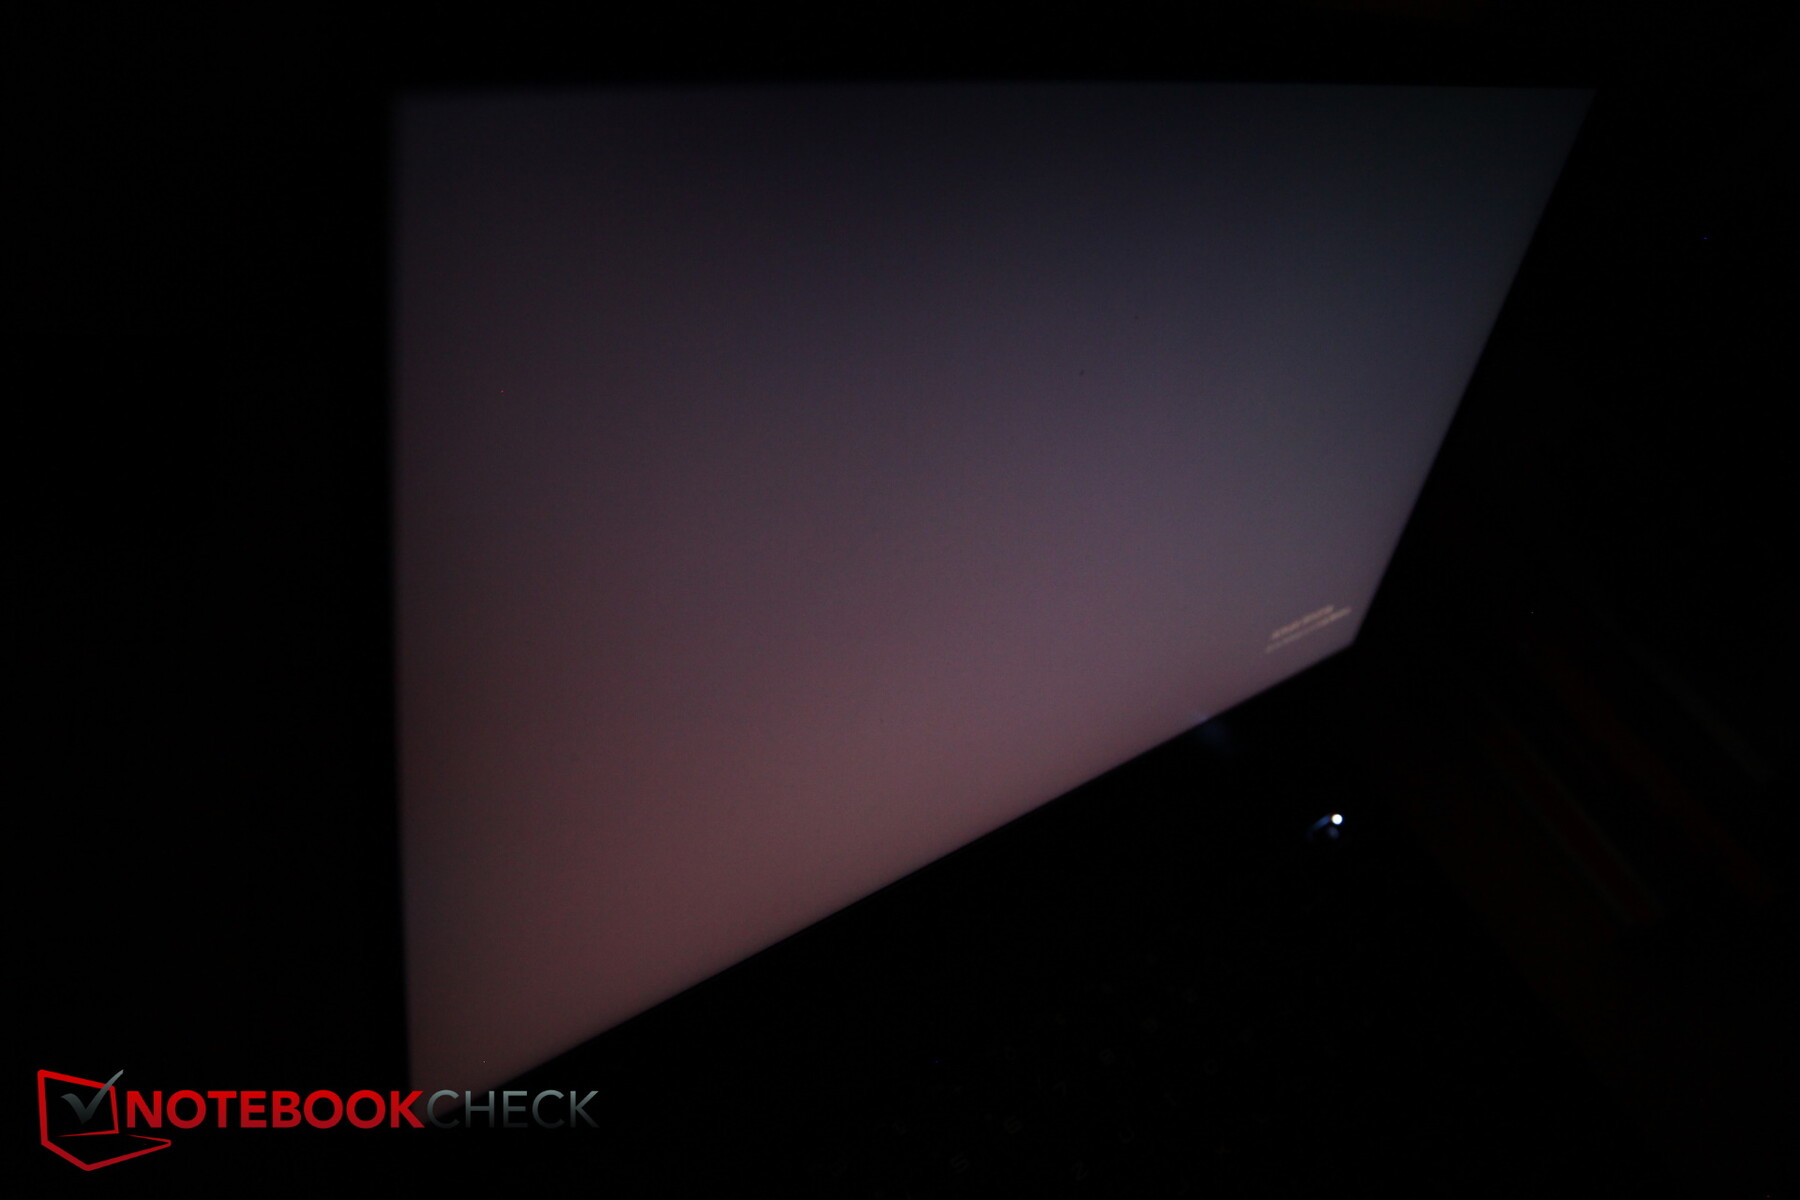
黑值太高,这就是为什么对比度不能产生顶级速率的原因,但它仍然可以与竞争对手相媲美。只有Schenker XMG Neo在这里明显更好。当从侧面看带有黑色图像的显示器时,你可以清楚地看到强烈的背景光亮。随着亮度的降低,黑值自然会提高。
在我们的测试模型中,屏幕出血现象几乎不明显,由于磨砂表面的原因,像素网格有点颗粒感。面板的响应时间还可以,没有使用PWM。
| |||||||||||||||||||||||||
Brightness Distribution: 87 %
Center on Battery: 390 cd/m²
Contrast: 951:1 (Black: 0.41 cd/m²)
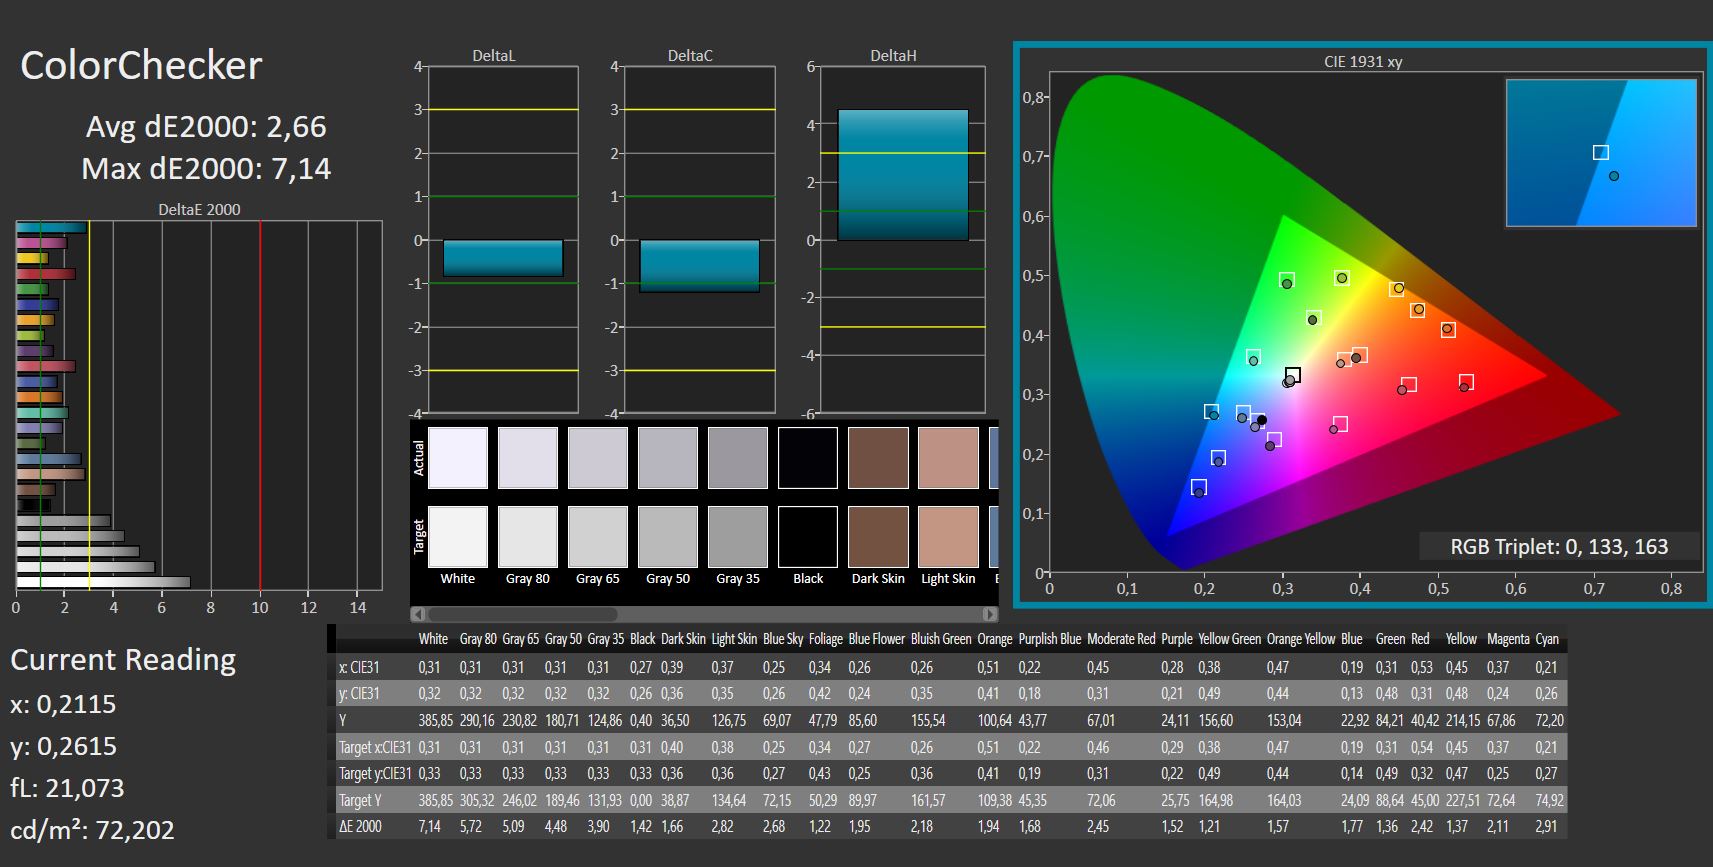
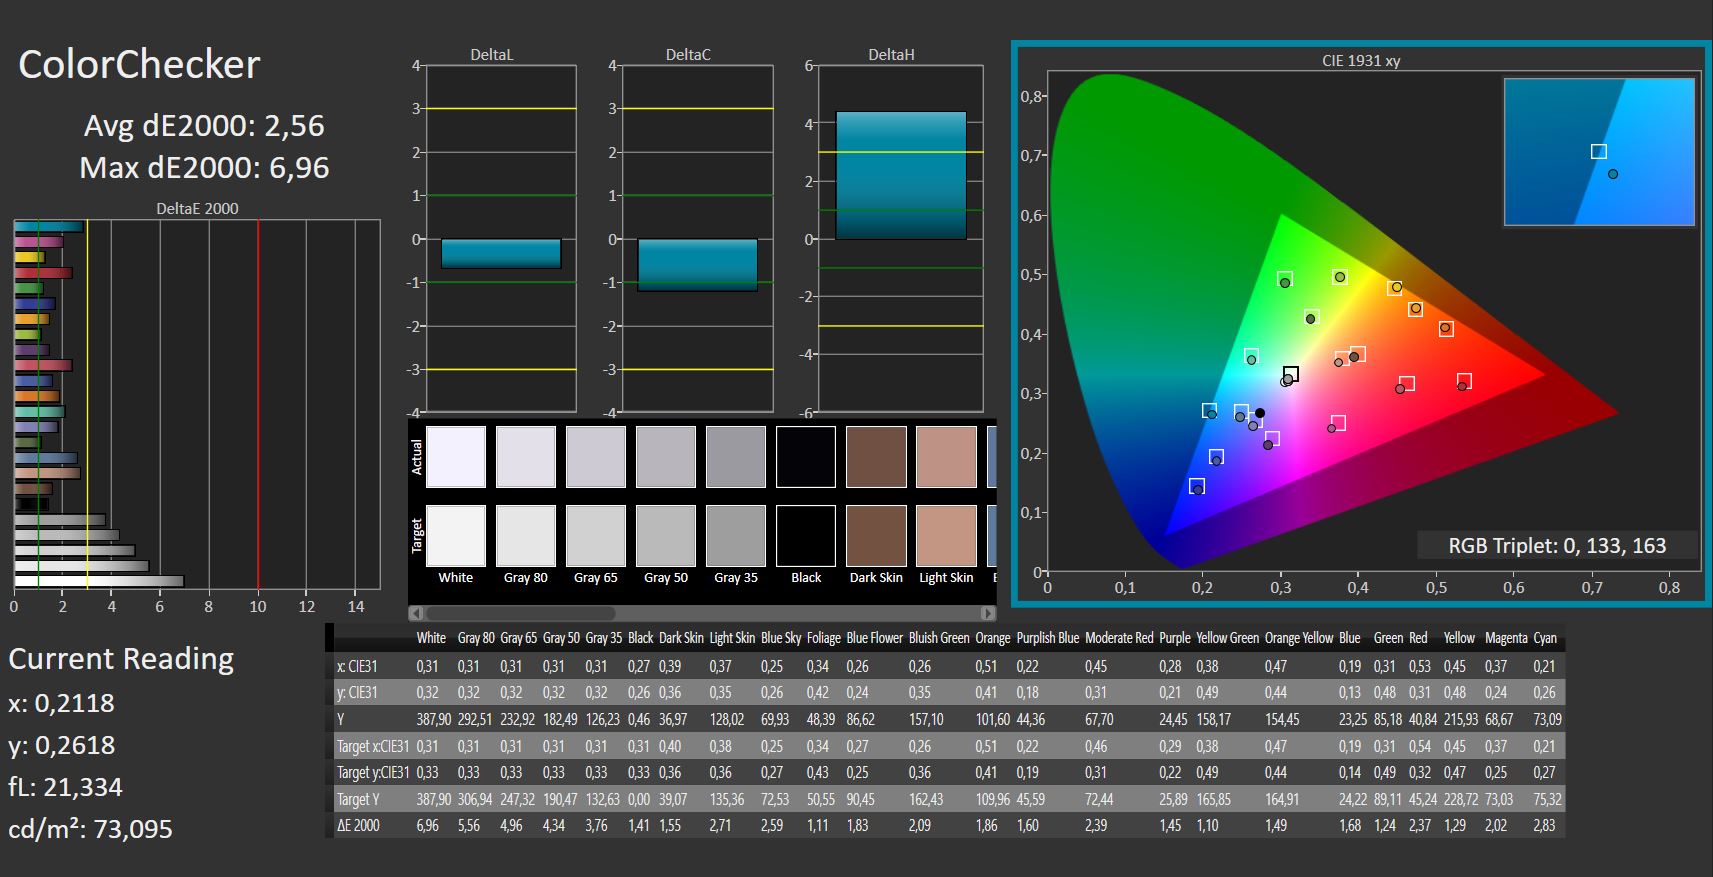
ΔE ColorChecker Calman: 2.66 | ∀{0.5-29.43 Ø4.73}
calibrated: 2.56
ΔE Greyscale Calman: 3.63 | ∀{0.09-98 Ø4.97}
66% AdobeRGB 1998 (Argyll 3D)
95.8% sRGB (Argyll 3D)
65.2% Display P3 (Argyll 3D)
Gamma: 2.57
CCT: 6894 K
| MSI GP66 Leopard 11UH-028 LGD0625 (LP156WFG-SPB3), IPS, 1920x1080, 15.6" | MSI GP66 Leopard 10UG Sharp LQ156M1JW03, IPS, 1920x1080, 15.6" | Aorus 15P YD BOE09B9, IPS, 1920x1080, 15.6" | Asus ROG Strix Scar 15 G533QS BOE CQ NE156QHM-NY1, IPS, 2560x1440, 15.6" | Schenker XMG Neo 15 Tiger Lake BOE CQ NE156QHM-NY2, IPS, 2560x1440, 15.6" | Alienware m15 R6, i7-11800H RTX 3080 AU Optronics AUO9092 (B156HAN), IPS, 1920x1080, 15.6" | |
|---|---|---|---|---|---|---|
| Display | 5% | 7% | 28% | 4% | 11% | |
| Display P3 Coverage (%) | 65.2 | 68.3 5% | 70.2 8% | 97.6 50% | 68.6 5% | 74.1 14% |
| sRGB Coverage (%) | 95.8 | 99.2 4% | 98.5 3% | 99.9 4% | 98.6 3% | 99.5 4% |
| AdobeRGB 1998 Coverage (%) | 66 | 70.4 7% | 72.4 10% | 85.3 29% | 69.3 5% | 75.7 15% |
| Response Times | 7% | 6% | -8% | -13% | 64% | |
| Response Time Grey 50% / Grey 80% * (ms) | 14 ? | 13.6 ? 3% | 14 ? -0% | 14 ? -0% | 16 ? -14% | 2.8 80% |
| Response Time Black / White * (ms) | 10.8 ? | 9.6 ? 11% | 9.6 ? 11% | 12.4 ? -15% | 12 ? -11% | 5.6 48% |
| PWM Frequency (Hz) | 23580 ? | |||||
| Screen | -15% | -7% | -3% | -4% | -1% | |
| Brightness middle (cd/m²) | 390 | 225.9 -42% | 337 -14% | 304.3 -22% | 324 -17% | 359 -8% |
| Brightness (cd/m²) | 362 | 211 -42% | 316 -13% | 286 -21% | 307 -15% | 344 -5% |
| Brightness Distribution (%) | 87 | 83 -5% | 85 -2% | 76 -13% | 91 5% | 85 -2% |
| Black Level * (cd/m²) | 0.41 | 0.23 44% | 0.31 24% | 0.33 20% | 0.27 34% | 0.35 15% |
| Contrast (:1) | 951 | 982 3% | 1087 14% | 922 -3% | 1200 26% | 1026 8% |
| Colorchecker dE 2000 * | 2.66 | 3.98 -50% | 3.87 -45% | 2.76 -4% | 3.36 -26% | 3.3 -24% |
| Colorchecker dE 2000 max. * | 7.14 | 8.95 -25% | 8.09 -13% | 5.57 22% | 9.87 -38% | 4.84 32% |
| Colorchecker dE 2000 calibrated * | 2.56 | 1.15 55% | 1.15 55% | 2.38 7% | 1.23 52% | 3.28 -28% |
| Greyscale dE 2000 * | 3.63 | 6.4 -76% | 6.1 -68% | 4 -10% | 5.8 -60% | 3.66 -1% |
| Gamma | 2.57 86% | 2.25 98% | 2.132 103% | 2.14 103% | 2.311 95% | 2.43 91% |
| CCT | 6894 94% | 6991 93% | 6891 94% | 6844 95% | 7087 92% | 5896 110% |
| Color Space (Percent of AdobeRGB 1998) (%) | 64.5 | 72 | 69 | |||
| Color Space (Percent of sRGB) (%) | 99.3 | 94 | 93 | |||
| Total Average (Program / Settings) | -1% /
-8% | 2% /
-2% | 6% /
3% | -4% /
-4% | 25% /
11% |
* ... smaller is better
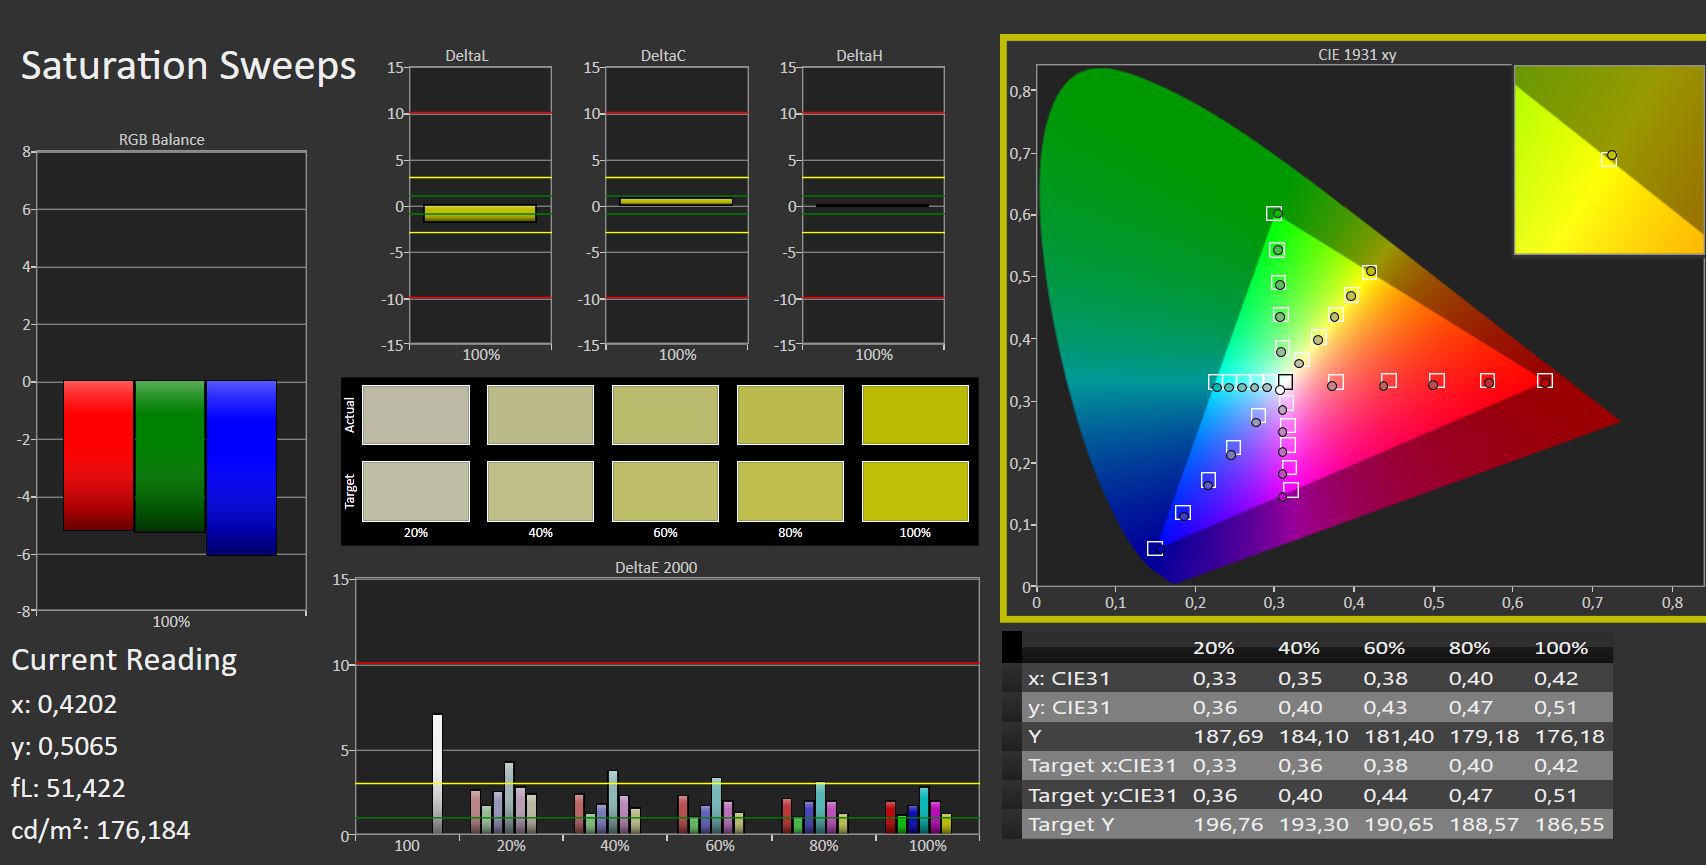
在色彩空间覆盖方面,竞争对手只是略胜一筹。只有华硕ROG在这里明显领先,因为它也几乎完全覆盖了AdobeRGB,而我们的MSI只覆盖了66%。因此,华硕更适合用于图像编辑。
显示屏在出厂前的配置很好,手动校准并不能改善它。
Display Response Times
| ↔ Response Time Black to White | ||
|---|---|---|
| 10.8 ms ... rise ↗ and fall ↘ combined | ↗ 6.2 ms rise | 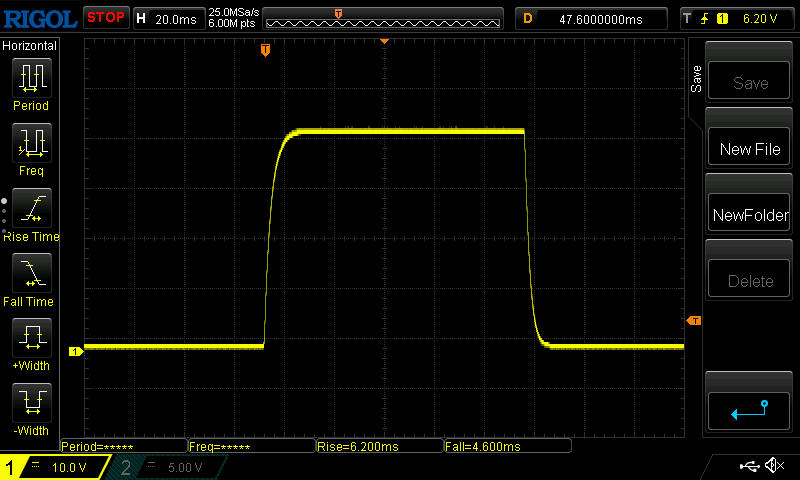 |
| ↘ 4.6 ms fall | ||
| The screen shows good response rates in our tests, but may be too slow for competitive gamers. In comparison, all tested devices range from 0.1 (minimum) to 240 (maximum) ms. » 29 % of all devices are better. This means that the measured response time is better than the average of all tested devices (19.9 ms). | ||
| ↔ Response Time 50% Grey to 80% Grey | ||
| 14 ms ... rise ↗ and fall ↘ combined | ↗ 7 ms rise | 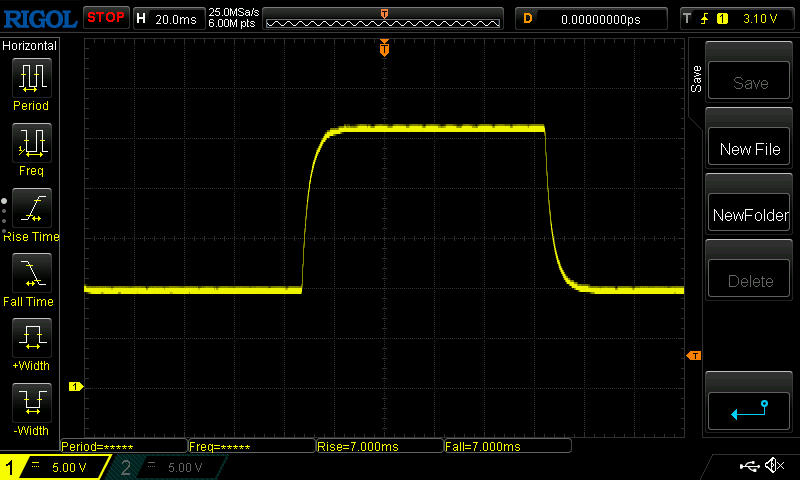 |
| ↘ 7 ms fall | ||
| The screen shows good response rates in our tests, but may be too slow for competitive gamers. In comparison, all tested devices range from 0.165 (minimum) to 636 (maximum) ms. » 28 % of all devices are better. This means that the measured response time is better than the average of all tested devices (31.1 ms). | ||
Screen Flickering / PWM (Pulse-Width Modulation)
| Screen flickering / PWM not detected | 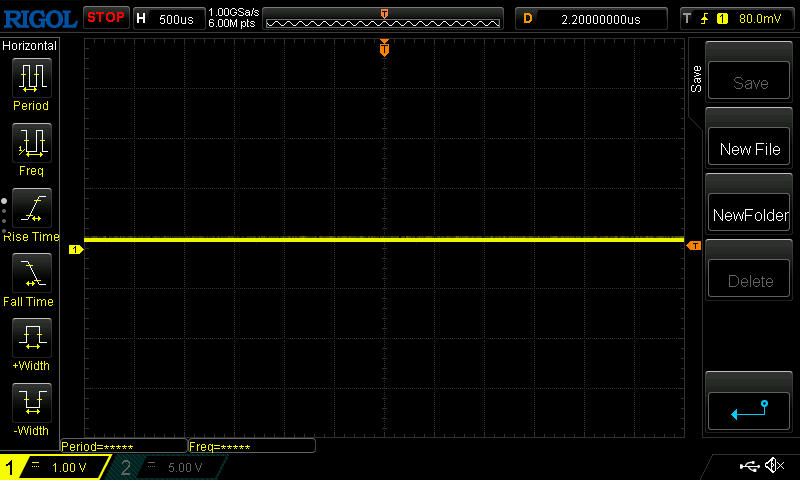 | ||
In comparison: 52 % of all tested devices do not use PWM to dim the display. If PWM was detected, an average of 7791 (minimum: 5 - maximum: 343500) Hz was measured. | |||
由于良好的亮度和哑光表面,在户外的能见度很好--至少在阴凉处和直接俯视时是如此。应避免阳光直射以及斜视角度。
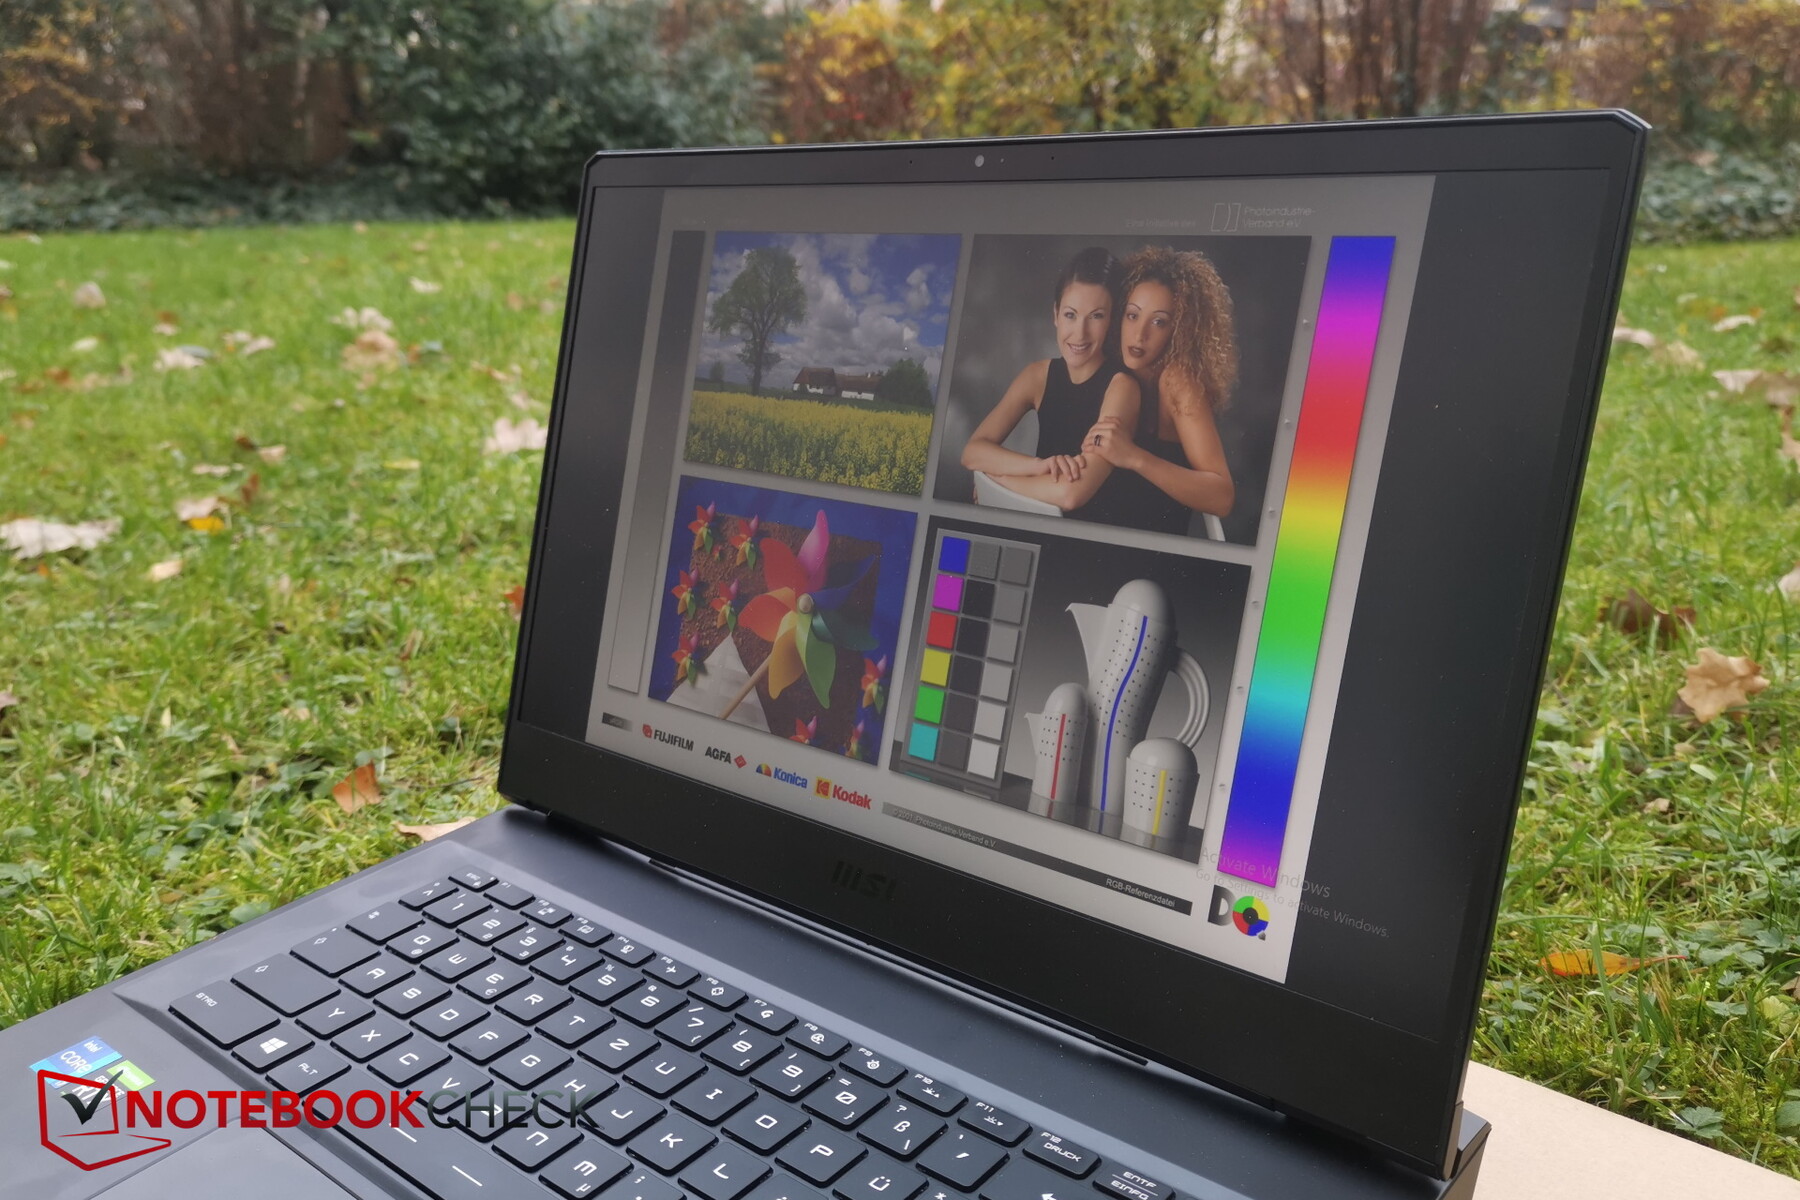
当从极端角度观看时,特别是失去了一些亮度,但只是非常少,因为这是典型的IPS,而且内容仍然可以很好地被识别。

性能 - 只有CPU受益于MSI中心
微星的Leopard是一款游戏笔记本电脑,这一点由RTX 3080表示。理论上,这款笔记本电脑应该能够在原生分辨率下流畅地渲染所有当前的游戏,也有足够的储备用于4K分辨率。
测试条件
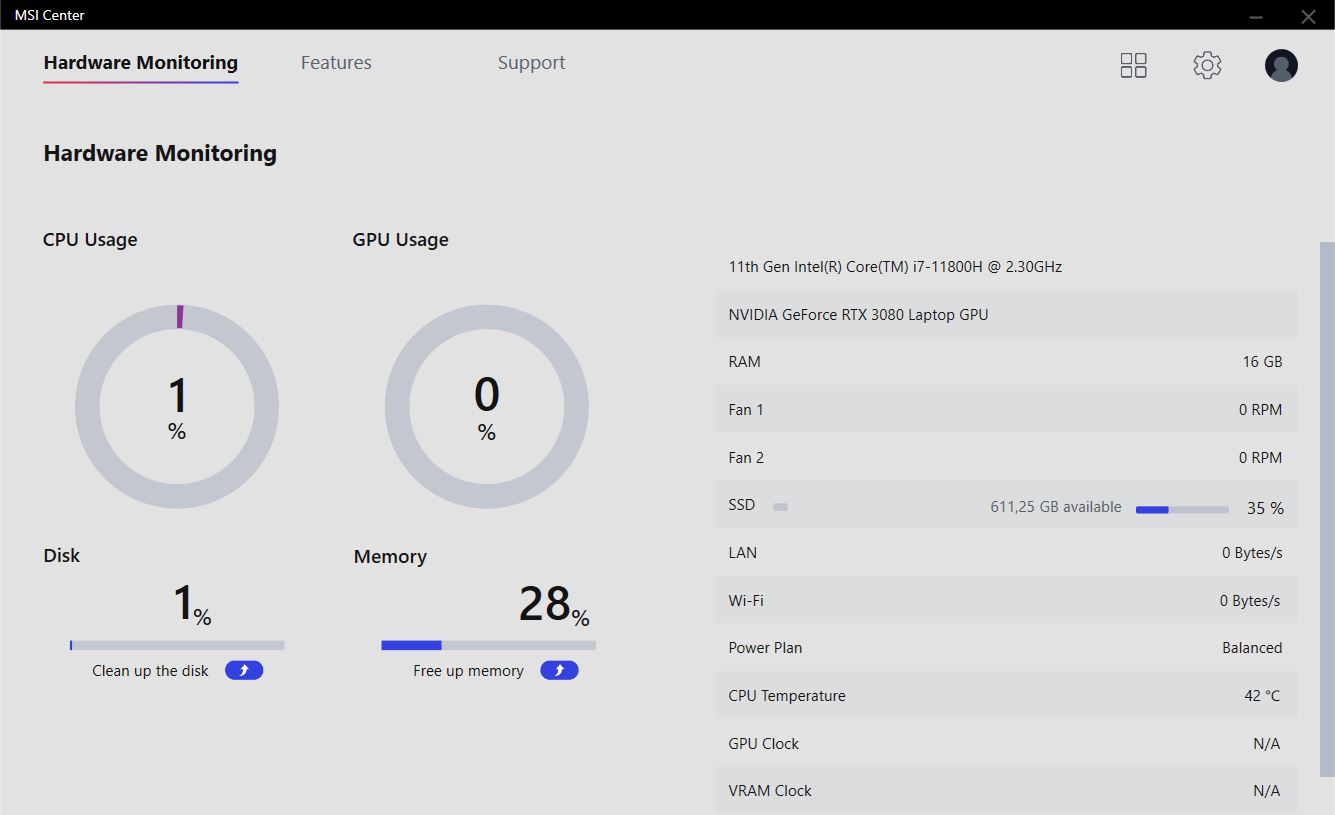
我们在还没有安装MSI中心的时候进行了所有的基准测试。毕竟,GP66只在官方出货时装有FreeDOS,没有Windows许可证。我们的测试装置的Windows性能滑块总是被设置为 "最佳性能 "来进行性能基准测试。
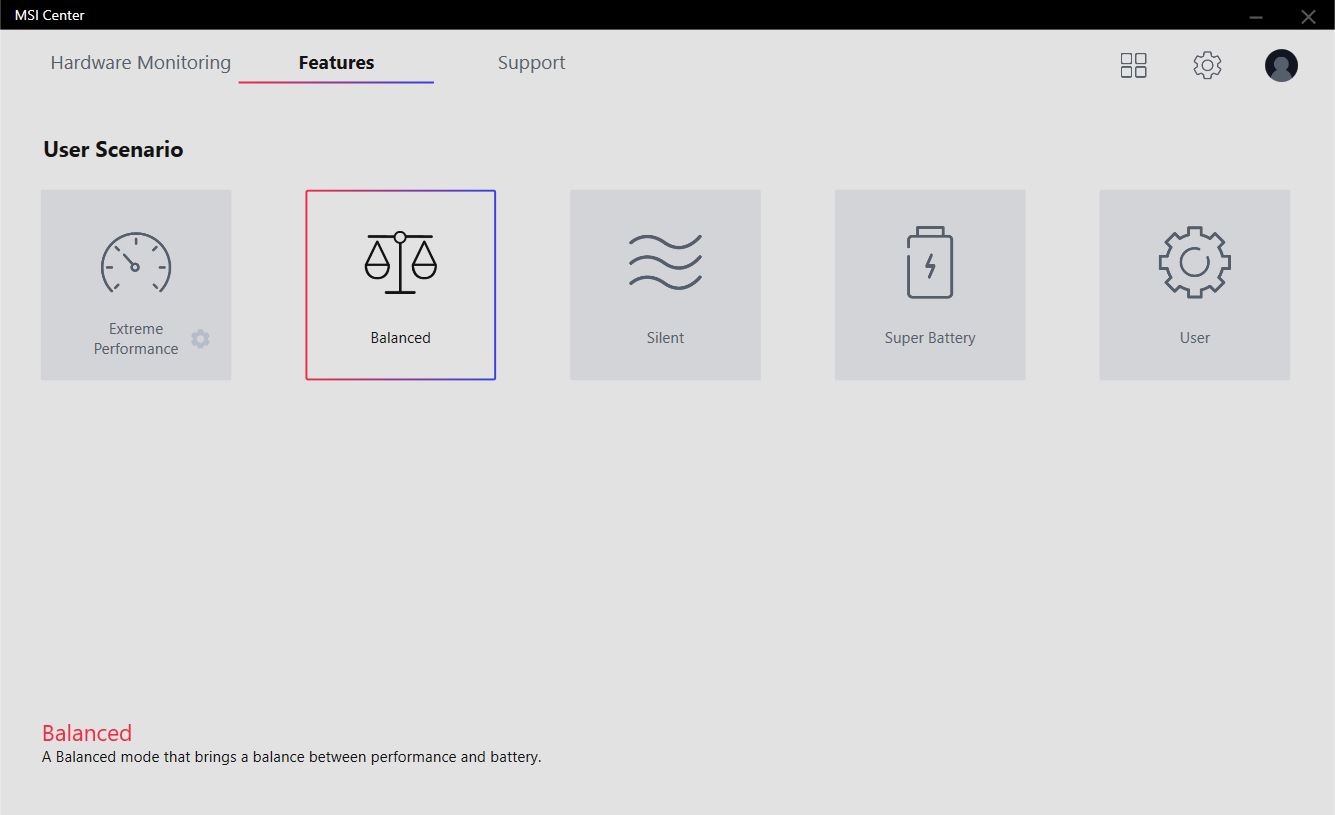
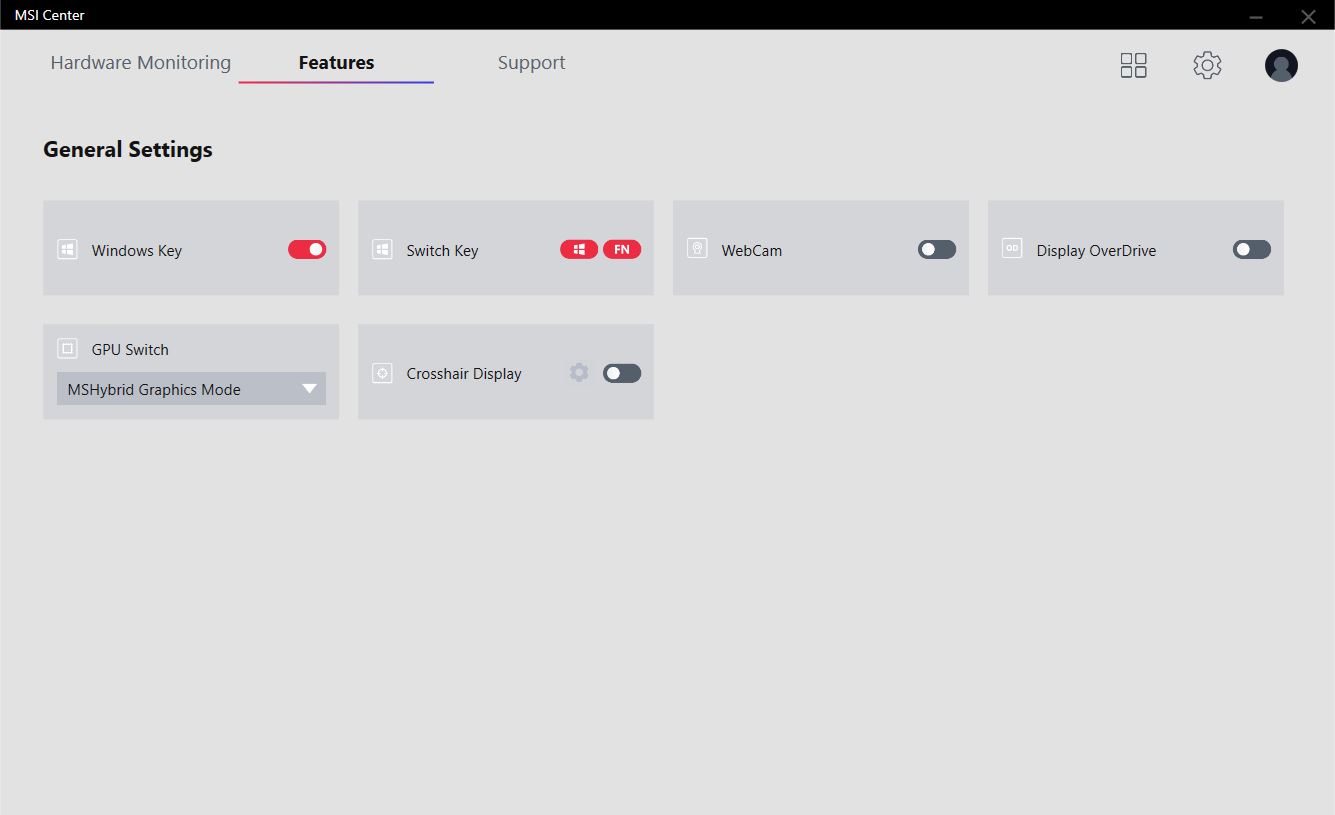
另一方面,MSI中心使用其他性能模式,这些模式隐藏在 "用户场景 "下。我们将在性能部分探讨与Windows模式的区别。在微星的设置中,你也可以选择混合图形模式或仅有独立GPU。
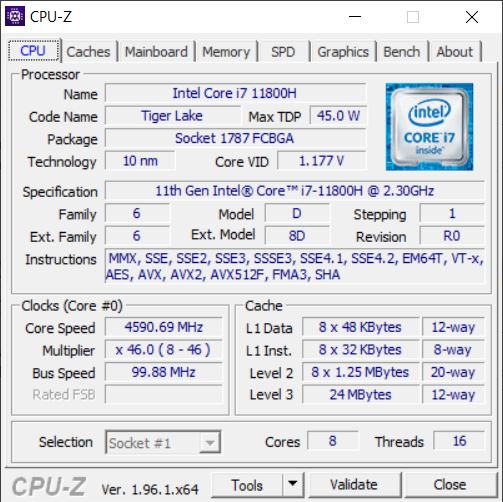
处理器
与目前许多英特尔游戏笔记本电脑一样,微星Leopard配备了一个 英特尔酷睿i7-11800H处理器。它有八个核心,每个核心的时钟从2.3到4.6GHz。当所有核心都处于负载状态时,最高时钟可以达到4.2GHz。
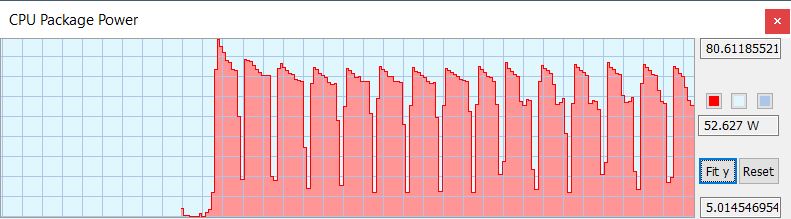
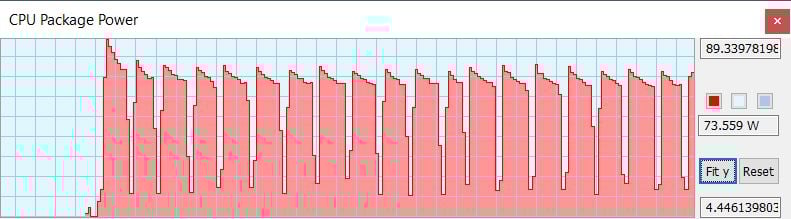
在我们的Cinebench循环中,性能只下降了很少,总的来说,GP 66 11UH比它的前辈快了大约25%。通过HWinfo,我们可以看到CPU在开始时允许自己使用80W,但接下来的运行反而以75W开始,最后以53W结束。
极限性能 "模式特别有利于CPU的功率。CPU甚至可以在短时间内允许自己使用90W,而不是之前的75W,在一次运行中迅速恢复到74W而不是53W。然而,即使在极限模式下,GP66也不能完全达到无节制的XMG Neo或华硕ROG的AMD CPU的性能。
电池电量的表现明显下降:从以前的2000分左右,只剩下1178分。
Cinebench R15 Multi endurance test
Cinebench R23: Multi Core | Single Core
Cinebench R20: CPU (Multi Core) | CPU (Single Core)
Cinebench R15: CPU Multi 64Bit | CPU Single 64Bit
Blender: v2.79 BMW27 CPU
7-Zip 18.03: 7z b 4 | 7z b 4 -mmt1
Geekbench 5.5: Multi-Core | Single-Core
HWBOT x265 Benchmark v2.2: 4k Preset
LibreOffice : 20 Documents To PDF
R Benchmark 2.5: Overall mean
| CPU Performance rating | |
| Average of class Gaming | |
| Schenker XMG Neo 15 Tiger Lake | |
| MSI GP66 Leopard 11UH-028 | |
| Asus ROG Strix Scar 15 G533QS -2! | |
| Alienware m15 R6, i7-11800H RTX 3080 | |
| Average Intel Core i7-11800H | |
| Aorus 15P YD -2! | |
| MSI GP66 Leopard 10UG | |
| Cinebench R23 / Multi Core | |
| Average of class Gaming (10488 - 40970, n=110, last 2 years) | |
| Schenker XMG Neo 15 Tiger Lake | |
| Asus ROG Strix Scar 15 G533QS | |
| Alienware m15 R6, i7-11800H RTX 3080 | |
| MSI GP66 Leopard 11UH-028 | |
| Average Intel Core i7-11800H (6508 - 14088, n=48) | |
| MSI GP66 Leopard 10UG | |
| Cinebench R23 / Single Core | |
| Average of class Gaming (1166 - 2356, n=110, last 2 years) | |
| MSI GP66 Leopard 11UH-028 | |
| Schenker XMG Neo 15 Tiger Lake | |
| Average Intel Core i7-11800H (1386 - 1522, n=45) | |
| Alienware m15 R6, i7-11800H RTX 3080 | |
| Asus ROG Strix Scar 15 G533QS | |
| MSI GP66 Leopard 10UG | |
| Cinebench R20 / CPU (Multi Core) | |
| Average of class Gaming (4029 - 16108, n=109, last 2 years) | |
| Schenker XMG Neo 15 Tiger Lake | |
| Asus ROG Strix Scar 15 G533QS | |
| Aorus 15P YD | |
| MSI GP66 Leopard 11UH-028 | |
| Alienware m15 R6, i7-11800H RTX 3080 | |
| Average Intel Core i7-11800H (2498 - 5408, n=50) | |
| MSI GP66 Leopard 10UG | |
| Cinebench R20 / CPU (Single Core) | |
| Average of class Gaming (442 - 895, n=109, last 2 years) | |
| Aorus 15P YD | |
| MSI GP66 Leopard 11UH-028 | |
| Schenker XMG Neo 15 Tiger Lake | |
| Alienware m15 R6, i7-11800H RTX 3080 | |
| Average Intel Core i7-11800H (520 - 586, n=47) | |
| Asus ROG Strix Scar 15 G533QS | |
| MSI GP66 Leopard 10UG | |
| Cinebench R15 / CPU Multi 64Bit | |
| Average of class Gaming (1578 - 6271, n=109, last 2 years) | |
| Asus ROG Strix Scar 15 G533QS | |
| Schenker XMG Neo 15 Tiger Lake | |
| Alienware m15 R6, i7-11800H RTX 3080 | |
| MSI GP66 Leopard 11UH-028 | |
| Aorus 15P YD | |
| Average Intel Core i7-11800H (1342 - 2173, n=50) | |
| MSI GP66 Leopard 10UG | |
| Cinebench R15 / CPU Single 64Bit | |
| Average of class Gaming (188.8 - 343, n=109, last 2 years) | |
| Asus ROG Strix Scar 15 G533QS | |
| Aorus 15P YD | |
| Schenker XMG Neo 15 Tiger Lake | |
| MSI GP66 Leopard 11UH-028 | |
| Alienware m15 R6, i7-11800H RTX 3080 | |
| Average Intel Core i7-11800H (201 - 231, n=46) | |
| MSI GP66 Leopard 10UG | |
| Blender / v2.79 BMW27 CPU | |
| Aorus 15P YD | |
| MSI GP66 Leopard 10UG | |
| Average Intel Core i7-11800H (217 - 454, n=46) | |
| Alienware m15 R6, i7-11800H RTX 3080 | |
| MSI GP66 Leopard 11UH-028 | |
| Asus ROG Strix Scar 15 G533QS | |
| Schenker XMG Neo 15 Tiger Lake | |
| Average of class Gaming (80 - 330, n=107, last 2 years) | |
| 7-Zip 18.03 / 7z b 4 | |
| Average of class Gaming (33491 - 148086, n=108, last 2 years) | |
| Asus ROG Strix Scar 15 G533QS | |
| Schenker XMG Neo 15 Tiger Lake | |
| MSI GP66 Leopard 11UH-028 | |
| Alienware m15 R6, i7-11800H RTX 3080 | |
| Average Intel Core i7-11800H (33718 - 56758, n=46) | |
| Aorus 15P YD | |
| MSI GP66 Leopard 10UG | |
| 7-Zip 18.03 / 7z b 4 -mmt1 | |
| Average of class Gaming (4199 - 7436, n=108, last 2 years) | |
| Schenker XMG Neo 15 Tiger Lake | |
| Aorus 15P YD | |
| MSI GP66 Leopard 11UH-028 | |
| Asus ROG Strix Scar 15 G533QS | |
| Average Intel Core i7-11800H (5138 - 5732, n=46) | |
| Alienware m15 R6, i7-11800H RTX 3080 | |
| MSI GP66 Leopard 10UG | |
| Geekbench 5.5 / Multi-Core | |
| Average of class Gaming (6460 - 27010, n=108, last 2 years) | |
| Schenker XMG Neo 15 Tiger Lake | |
| Alienware m15 R6, i7-11800H RTX 3080 | |
| MSI GP66 Leopard 11UH-028 | |
| Aorus 15P YD | |
| Average Intel Core i7-11800H (4655 - 9851, n=40) | |
| MSI GP66 Leopard 10UG | |
| Geekbench 5.5 / Single-Core | |
| Average of class Gaming (986 - 2474, n=108, last 2 years) | |
| Schenker XMG Neo 15 Tiger Lake | |
| Aorus 15P YD | |
| MSI GP66 Leopard 11UH-028 | |
| Alienware m15 R6, i7-11800H RTX 3080 | |
| Average Intel Core i7-11800H (1429 - 1625, n=40) | |
| MSI GP66 Leopard 10UG | |
| HWBOT x265 Benchmark v2.2 / 4k Preset | |
| Average of class Gaming (11.5 - 44.3, n=108, last 2 years) | |
| Schenker XMG Neo 15 Tiger Lake | |
| Asus ROG Strix Scar 15 G533QS | |
| MSI GP66 Leopard 11UH-028 | |
| Average Intel Core i7-11800H (7.38 - 17.4, n=46) | |
| Alienware m15 R6, i7-11800H RTX 3080 | |
| MSI GP66 Leopard 10UG | |
| Aorus 15P YD | |
| LibreOffice / 20 Documents To PDF | |
| Asus ROG Strix Scar 15 G533QS | |
| MSI GP66 Leopard 10UG | |
| Average of class Gaming (19 - 88.8, n=108, last 2 years) | |
| MSI GP66 Leopard 11UH-028 | |
| Schenker XMG Neo 15 Tiger Lake | |
| Average Intel Core i7-11800H (38.6 - 59.9, n=45) | |
| Alienware m15 R6, i7-11800H RTX 3080 | |
| Aorus 15P YD | |
| R Benchmark 2.5 / Overall mean | |
| MSI GP66 Leopard 10UG | |
| MSI GP66 Leopard 11UH-028 | |
| Average Intel Core i7-11800H (0.548 - 0.615, n=46) | |
| Aorus 15P YD | |
| Alienware m15 R6, i7-11800H RTX 3080 | |
| Schenker XMG Neo 15 Tiger Lake | |
| Asus ROG Strix Scar 15 G533QS | |
| Average of class Gaming (0.3439 - 0.759, n=109, last 2 years) | |
* ... smaller is better
AIDA64: FP32 Ray-Trace | FPU Julia | CPU SHA3 | CPU Queen | FPU SinJulia | FPU Mandel | CPU AES | CPU ZLib | FP64 Ray-Trace | CPU PhotoWorxx
| Performance rating | |
| Average of class Gaming | |
| Asus ROG Strix Scar 15 G533QS | |
| Alienware m15 R6, i7-11800H RTX 3080 | |
| MSI GP66 Leopard 11UH-028 | |
| Average Intel Core i7-11800H | |
| MSI GP66 Leopard 10UG | |
| AIDA64 / FP32 Ray-Trace | |
| Average of class Gaming (10227 - 85542, n=107, last 2 years) | |
| Alienware m15 R6, i7-11800H RTX 3080 | |
| Asus ROG Strix Scar 15 G533QS | |
| MSI GP66 Leopard 11UH-028 | |
| Average Intel Core i7-11800H (8772 - 15961, n=20) | |
| MSI GP66 Leopard 10UG | |
| AIDA64 / FPU Julia | |
| Average of class Gaming (51376 - 238426, n=107, last 2 years) | |
| Asus ROG Strix Scar 15 G533QS | |
| Alienware m15 R6, i7-11800H RTX 3080 | |
| MSI GP66 Leopard 11UH-028 | |
| MSI GP66 Leopard 10UG | |
| Average Intel Core i7-11800H (39404 - 65636, n=20) | |
| AIDA64 / CPU SHA3 | |
| Average of class Gaming (2180 - 9817, n=107, last 2 years) | |
| Alienware m15 R6, i7-11800H RTX 3080 | |
| MSI GP66 Leopard 11UH-028 | |
| Average Intel Core i7-11800H (2599 - 4439, n=20) | |
| Asus ROG Strix Scar 15 G533QS | |
| MSI GP66 Leopard 10UG | |
| AIDA64 / CPU Queen | |
| Average of class Gaming (49785 - 173351, n=98, last 2 years) | |
| Asus ROG Strix Scar 15 G533QS | |
| MSI GP66 Leopard 11UH-028 | |
| Alienware m15 R6, i7-11800H RTX 3080 | |
| Average Intel Core i7-11800H (85233 - 91941, n=20) | |
| MSI GP66 Leopard 10UG | |
| AIDA64 / FPU SinJulia | |
| Average of class Gaming (4424 - 33636, n=107, last 2 years) | |
| Asus ROG Strix Scar 15 G533QS | |
| MSI GP66 Leopard 11UH-028 | |
| Alienware m15 R6, i7-11800H RTX 3080 | |
| MSI GP66 Leopard 10UG | |
| Average Intel Core i7-11800H (6420 - 9792, n=20) | |
| AIDA64 / FPU Mandel | |
| Average of class Gaming (25115 - 128721, n=107, last 2 years) | |
| Asus ROG Strix Scar 15 G533QS | |
| Alienware m15 R6, i7-11800H RTX 3080 | |
| MSI GP66 Leopard 11UH-028 | |
| Average Intel Core i7-11800H (23365 - 39464, n=20) | |
| MSI GP66 Leopard 10UG | |
| AIDA64 / CPU AES | |
| Alienware m15 R6, i7-11800H RTX 3080 | |
| MSI GP66 Leopard 11UH-028 | |
| Asus ROG Strix Scar 15 G533QS | |
| Average Intel Core i7-11800H (74617 - 149388, n=20) | |
| Average of class Gaming (39258 - 247074, n=107, last 2 years) | |
| MSI GP66 Leopard 10UG | |
| AIDA64 / CPU ZLib | |
| Average of class Gaming (574 - 2531, n=107, last 2 years) | |
| Asus ROG Strix Scar 15 G533QS | |
| Alienware m15 R6, i7-11800H RTX 3080 | |
| MSI GP66 Leopard 11UH-028 | |
| MSI GP66 Leopard 10UG | |
| Average Intel Core i7-11800H (461 - 830, n=43) | |
| AIDA64 / FP64 Ray-Trace | |
| Average of class Gaming (5509 - 45446, n=107, last 2 years) | |
| Alienware m15 R6, i7-11800H RTX 3080 | |
| Asus ROG Strix Scar 15 G533QS | |
| MSI GP66 Leopard 11UH-028 | |
| Average Intel Core i7-11800H (4545 - 8717, n=21) | |
| MSI GP66 Leopard 10UG | |
| AIDA64 / CPU PhotoWorxx | |
| Average of class Gaming (12271 - 89891, n=107, last 2 years) | |
| Asus ROG Strix Scar 15 G533QS | |
| Alienware m15 R6, i7-11800H RTX 3080 | |
| MSI GP66 Leopard 11UH-028 | |
| MSI GP66 Leopard 10UG | |
| Average Intel Core i7-11800H (11898 - 26757, n=21) | |
系统性能
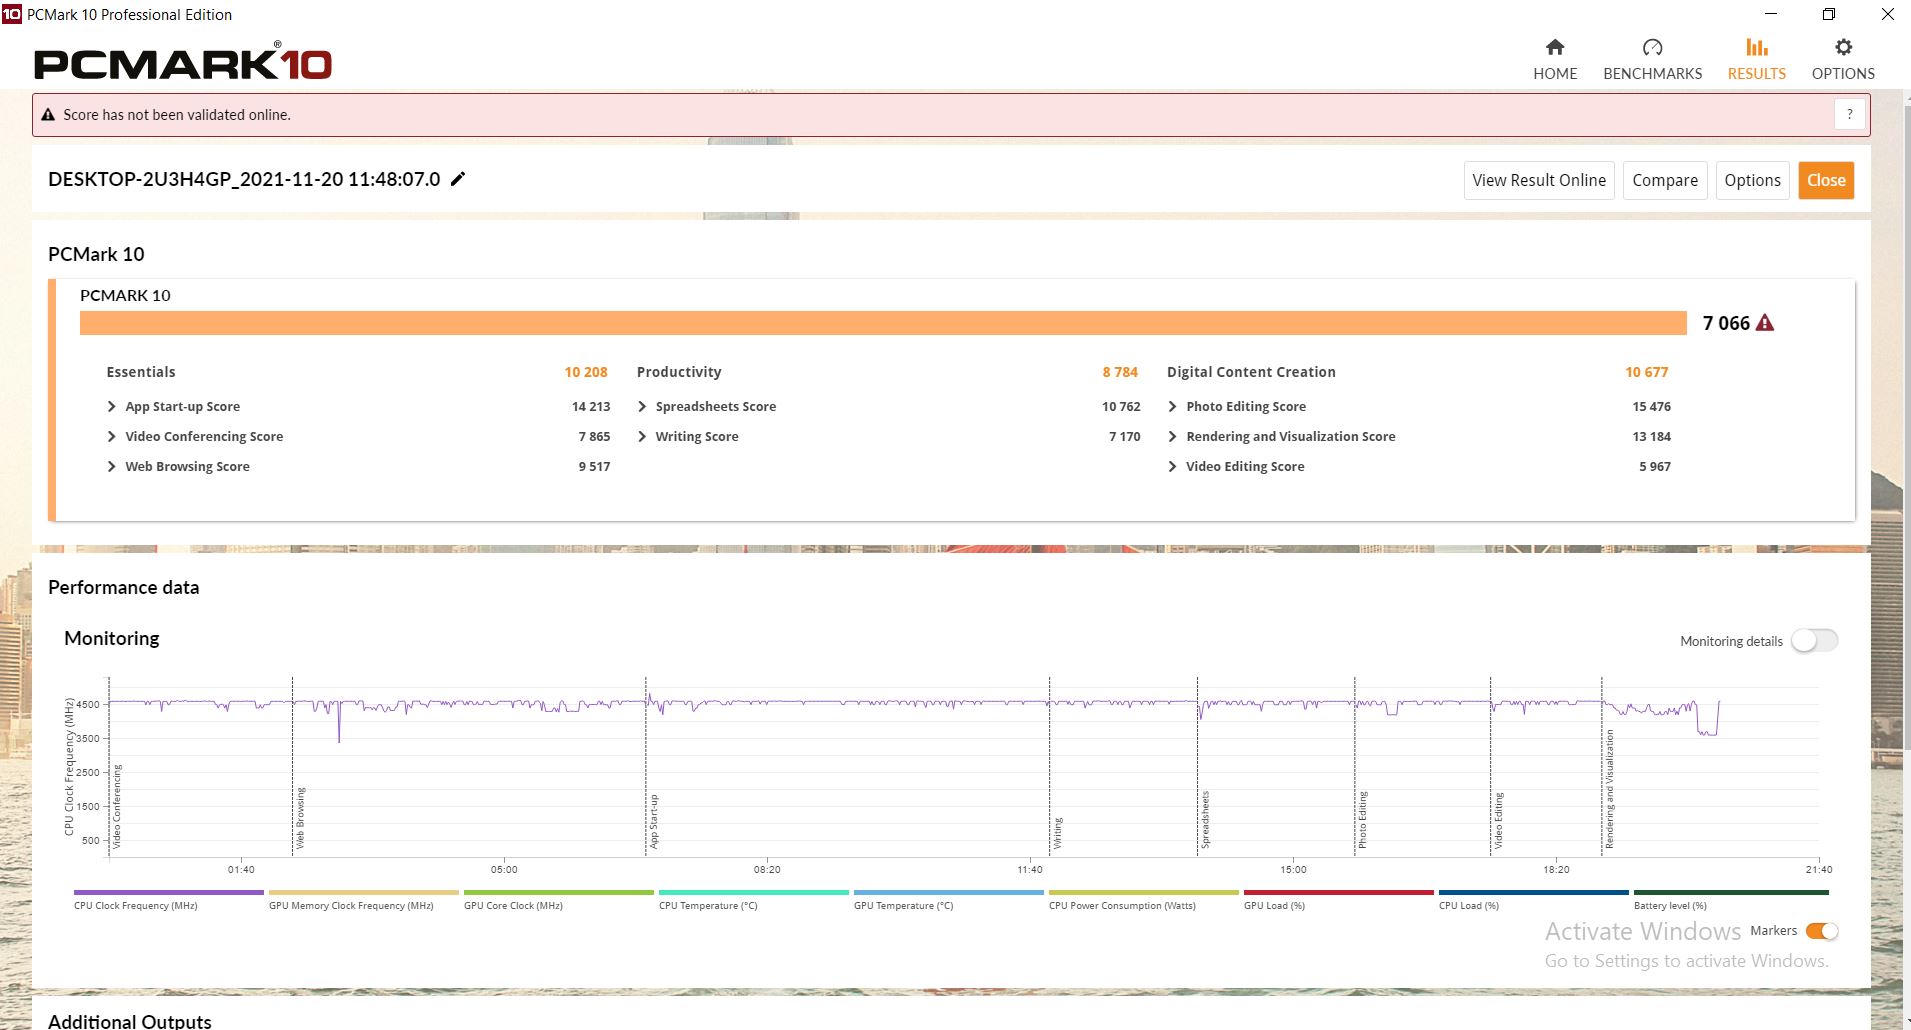
Leopard在PCMark 10中的表现大致符合预期水平。尽管如此,对手往往略胜一筹,但这更可能是由于测量的准确性造成的。
| PCMark 10 / Score | |
| Average of class Gaming (5828 - 11574, n=94, last 2 years) | |
| Asus ROG Strix Scar 15 G533QS | |
| Aorus 15P YD | |
| Schenker XMG Neo 15 Tiger Lake | |
| Alienware m15 R6, i7-11800H RTX 3080 | |
| Average Intel Core i7-11800H, NVIDIA GeForce RTX 3080 Laptop GPU (6673 - 7470, n=11) | |
| MSI GP66 Leopard 11UH-028 | |
| MSI GP66 Leopard 10UG | |
| PCMark 10 / Essentials | |
| Average of class Gaming (8810 - 12600, n=98, last 2 years) | |
| Aorus 15P YD | |
| Average Intel Core i7-11800H, NVIDIA GeForce RTX 3080 Laptop GPU (9862 - 11064, n=11) | |
| Schenker XMG Neo 15 Tiger Lake | |
| Asus ROG Strix Scar 15 G533QS | |
| MSI GP66 Leopard 11UH-028 | |
| Alienware m15 R6, i7-11800H RTX 3080 | |
| MSI GP66 Leopard 10UG | |
| PCMark 10 / Productivity | |
| Average of class Gaming (6845 - 18766, n=96, last 2 years) | |
| Asus ROG Strix Scar 15 G533QS | |
| Alienware m15 R6, i7-11800H RTX 3080 | |
| Aorus 15P YD | |
| Average Intel Core i7-11800H, NVIDIA GeForce RTX 3080 Laptop GPU (8278 - 9803, n=11) | |
| Schenker XMG Neo 15 Tiger Lake | |
| MSI GP66 Leopard 11UH-028 | |
| MSI GP66 Leopard 10UG | |
| PCMark 10 / Digital Content Creation | |
| Average of class Gaming (7602 - 19657, n=96, last 2 years) | |
| Schenker XMG Neo 15 Tiger Lake | |
| Alienware m15 R6, i7-11800H RTX 3080 | |
| MSI GP66 Leopard 11UH-028 | |
| Average Intel Core i7-11800H, NVIDIA GeForce RTX 3080 Laptop GPU (9881 - 11323, n=11) | |
| Aorus 15P YD | |
| MSI GP66 Leopard 10UG | |
| Asus ROG Strix Scar 15 G533QS | |
| PCMark 10 Score | 7066 points | |
Help | ||
| AIDA64 / Memory Copy | |
| Average of class Gaming (21750 - 129946, n=107, last 2 years) | |
| MSI GP66 Leopard 11UH-028 | |
| Alienware m15 R6, i7-11800H RTX 3080 | |
| Asus ROG Strix Scar 15 G533QS | |
| Average Intel Core i7-11800H (24508 - 48144, n=21) | |
| MSI GP66 Leopard 10UG | |
| AIDA64 / Memory Read | |
| Average of class Gaming (22956 - 118858, n=107, last 2 years) | |
| MSI GP66 Leopard 11UH-028 | |
| Alienware m15 R6, i7-11800H RTX 3080 | |
| Asus ROG Strix Scar 15 G533QS | |
| Average Intel Core i7-11800H (25882 - 50365, n=20) | |
| MSI GP66 Leopard 10UG | |
| AIDA64 / Memory Write | |
| Average of class Gaming (22297 - 135096, n=107, last 2 years) | |
| MSI GP66 Leopard 10UG | |
| Asus ROG Strix Scar 15 G533QS | |
| MSI GP66 Leopard 11UH-028 | |
| Alienware m15 R6, i7-11800H RTX 3080 | |
| Average Intel Core i7-11800H (22240 - 46214, n=20) | |
| AIDA64 / Memory Latency | |
| Average of class Gaming (75.3 - 259, n=107, last 2 years) | |
| Alienware m15 R6, i7-11800H RTX 3080 | |
| MSI GP66 Leopard 11UH-028 | |
| Asus ROG Strix Scar 15 G533QS | |
| MSI GP66 Leopard 10UG | |
| Average Intel Core i7-11800H (71.9 - 104.1, n=44) | |
| Aorus 15P YD | |
| Schenker XMG Neo 15 Tiger Lake | |
* ... smaller is better
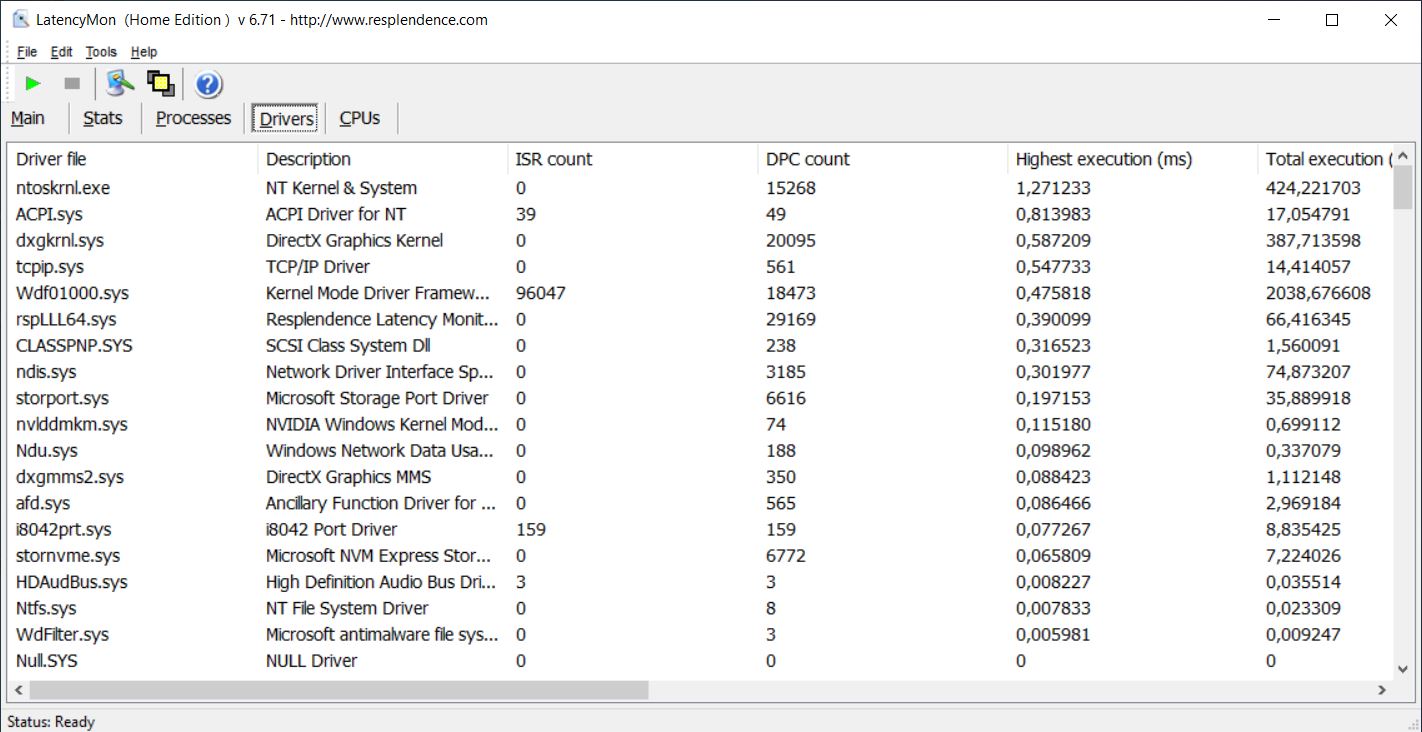
DPC延迟
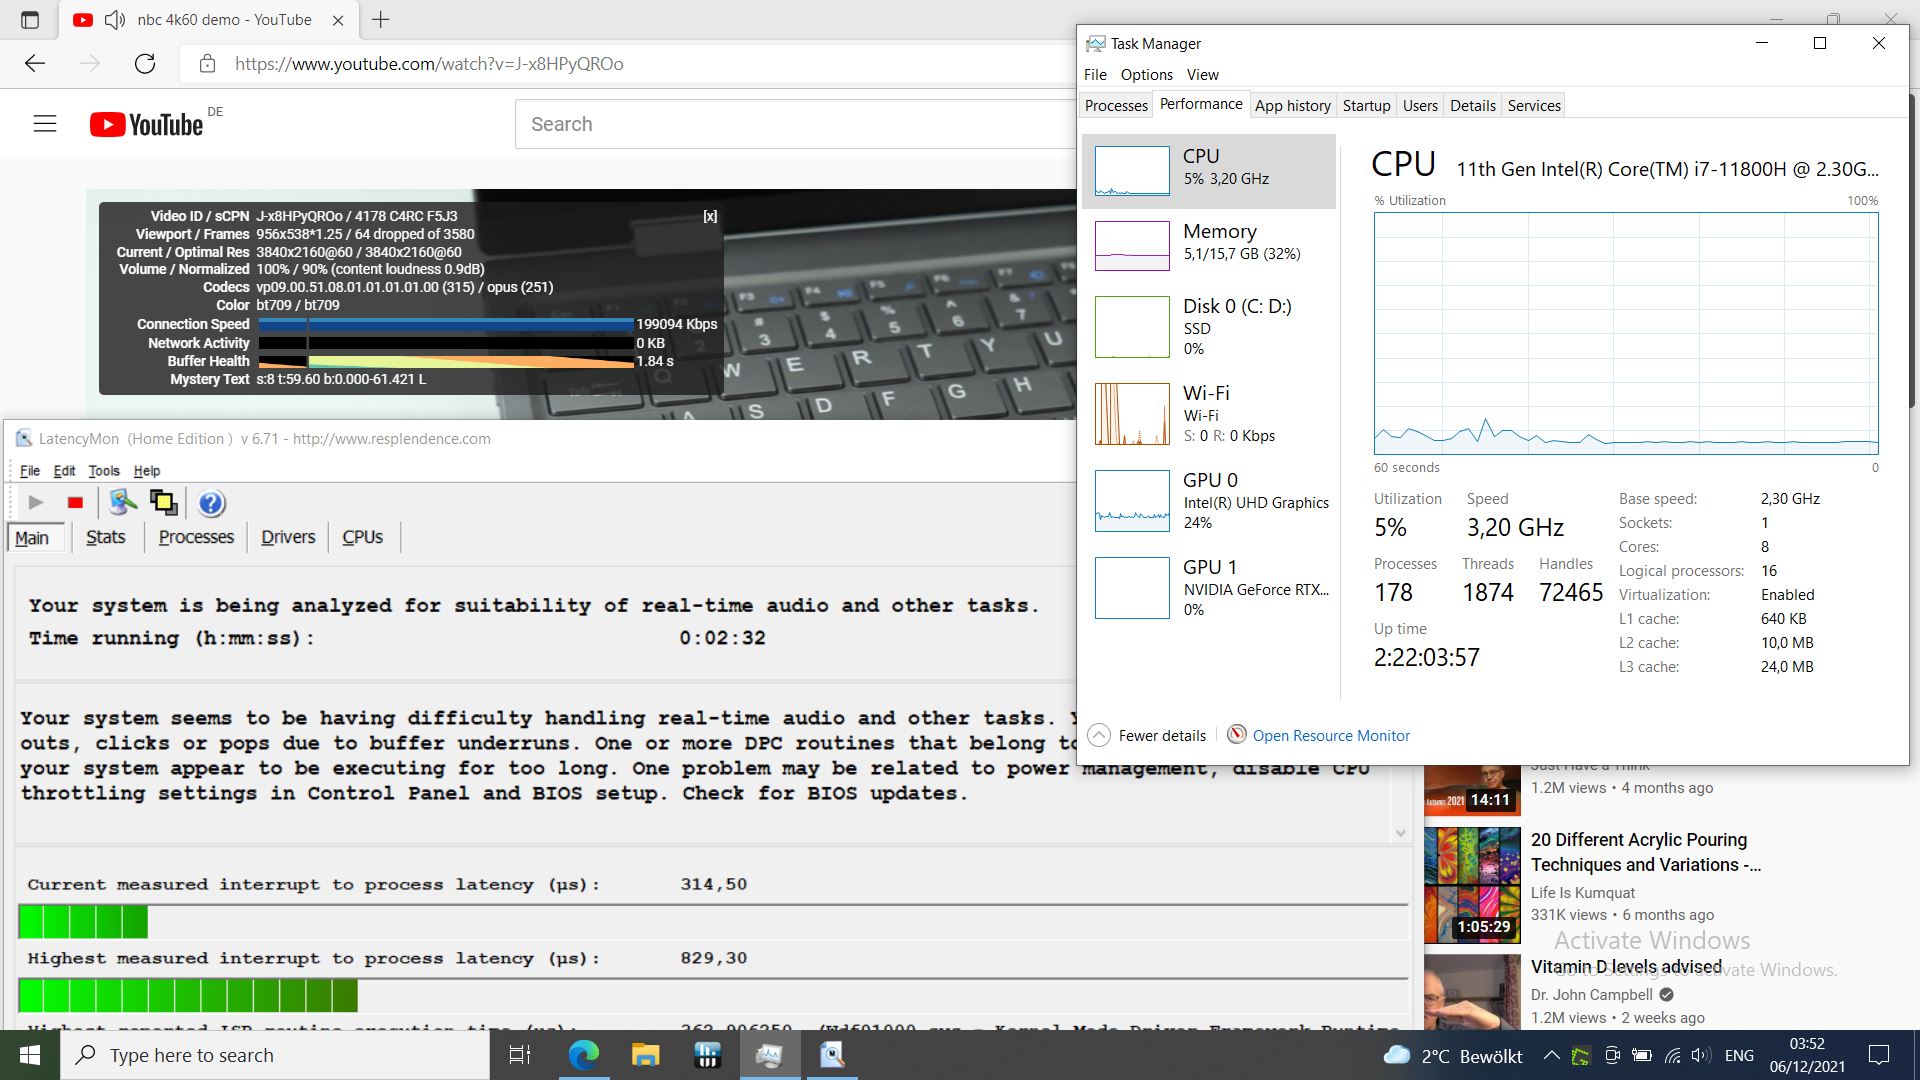
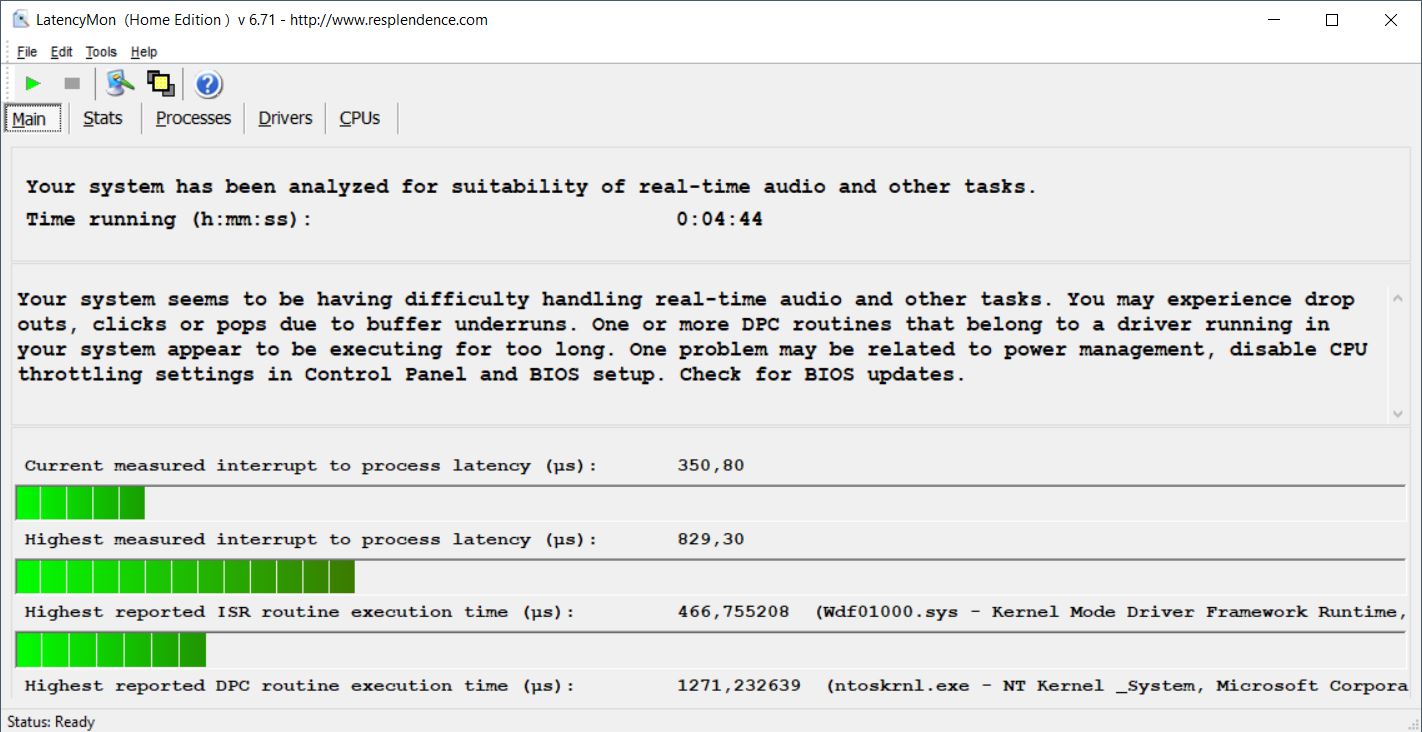
GP66在处理几个打开的浏览器标签或我们的4K/60 fps YouTube视频时有延迟问题。Leopard在测试视频中每秒钟都会收集掉帧,最后是64帧。在其他方面,NT内核和系统驱动是有问题的。竞争对手也有类似的高延迟率,但除了Alienware之外,在视频播放方面管理得更好。
| DPC Latencies / LatencyMon - interrupt to process latency (max), Web, Youtube, Prime95 | |
| Asus ROG Strix Scar 15 G533QS | |
| Alienware m15 R6, i7-11800H RTX 3080 | |
| MSI GP66 Leopard 11UH-028 | |
| Aorus 15P YD | |
| Schenker XMG Neo 15 Tiger Lake | |
| MSI GP66 Leopard 10UG | |
* ... smaller is better
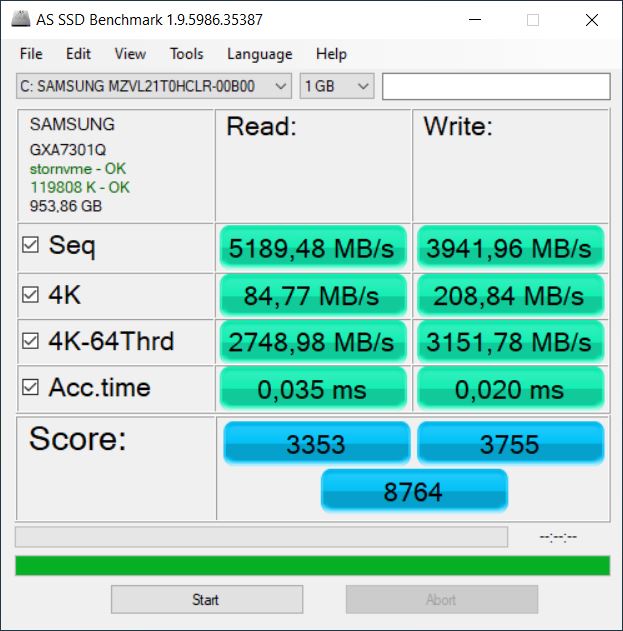
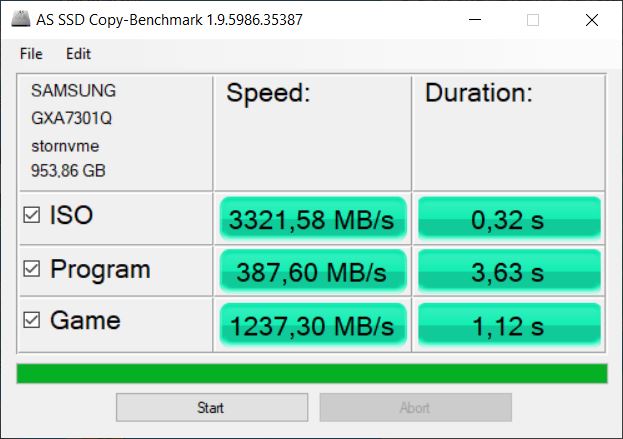
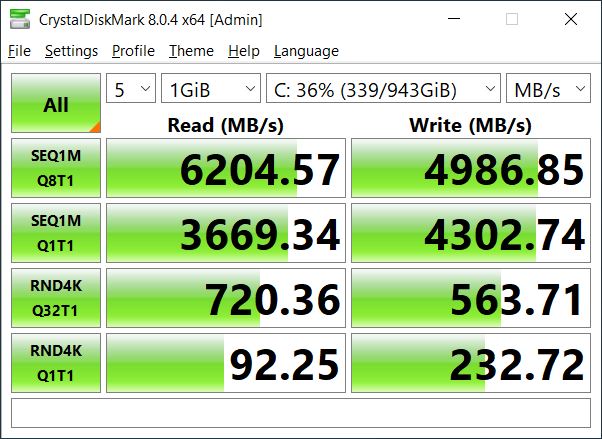
储存
三星公司安装的具有1TB存储空间的NVMe固态硬盘非常快(SSD/HDD最佳列表然而,其最高性能在耐力测试中下降了一半以上。这在日常使用中应该很难注意到,其余的耐力性能仍然比较高。

| Drive Performance rating - Percent | |
| MSI GP66 Leopard 11UH-028 | |
| Aorus 15P YD | |
| Average of class Gaming | |
| Average Samsung PM9A1 MZVL21T0HCLR | |
| Schenker XMG Neo 15 Tiger Lake | |
| Alienware m15 R6, i7-11800H RTX 3080 | |
| MSI GP66 Leopard 10UG | |
| Asus ROG Strix Scar 15 G533QS | |
* ... smaller is better
Continuous load read: DiskSpd Read Loop, Queue Depth 8
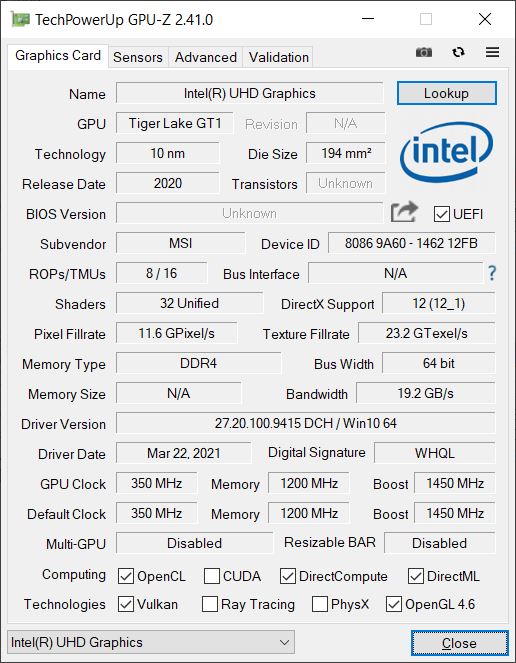
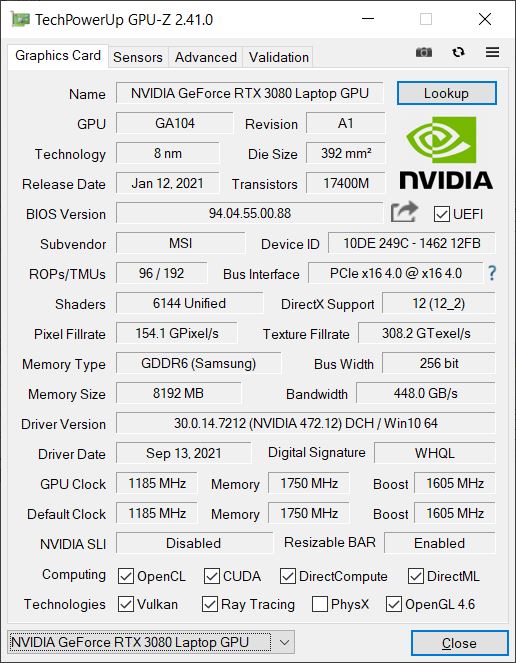
图形卡
除了集成了CPU的英特尔UHD Graphics Xe (32EUs)笔记本电脑有独立的 英伟达GeForce RTX 3080笔记本电脑GPU以确保流畅的帧速率。该GPU被允许消耗140瓦,包括动态提升,而Schenker XMG Neo中的相同卡允许自己使用完整的165瓦。 RTX 3070配备。
因此,Schenker在3DMarks中经常领先几个百分点,但Leopard可以在其他竞争中领先。
在3DMark 11中,图形性能因电池电量而大幅下降,整整下降了65%。在TheWitcher 3(Ultra)中,帧率从良好的120帧自发下降到只有无法播放的11帧!因此,移动游戏只有在做出非常大的牺牲后才有可能。
| 3DMark Performance rating - Percent | |
| Average of class Gaming | |
| MSI GP66 Leopard 10UG | |
| MSI GP66 Leopard 11UH-028 | |
| Aorus 15P YD | |
| Schenker XMG Neo 15 Tiger Lake | |
| Alienware m15 R6, i7-11800H RTX 3080 | |
| Average NVIDIA GeForce RTX 3080 Laptop GPU | |
| Asus ROG Strix Scar 15 G533QS | |
| 3DMark 11 - 1280x720 Performance GPU | |
| Average of class Gaming (21841 - 80022, n=106, last 2 years) | |
| Schenker XMG Neo 15 Tiger Lake | |
| MSI GP66 Leopard 11UH-028 | |
| Asus ROG Strix Scar 15 G533QS | |
| Alienware m15 R6, i7-11800H RTX 3080 | |
| Aorus 15P YD | |
| Average NVIDIA GeForce RTX 3080 Laptop GPU (31288 - 43744, n=40) | |
| MSI GP66 Leopard 10UG | |
| 3DMark | |
| 1280x720 Cloud Gate Standard Graphics | |
| MSI GP66 Leopard 10UG | |
| Average of class Gaming (86886 - 223650, n=61, last 2 years) | |
| MSI GP66 Leopard 11UH-028 | |
| Aorus 15P YD | |
| Alienware m15 R6, i7-11800H RTX 3080 | |
| Average NVIDIA GeForce RTX 3080 Laptop GPU (38816 - 192950, n=35) | |
| Schenker XMG Neo 15 Tiger Lake | |
| Asus ROG Strix Scar 15 G533QS | |
| 1920x1080 Fire Strike Graphics | |
| Average of class Gaming (12242 - 62849, n=118, last 2 years) | |
| Schenker XMG Neo 15 Tiger Lake | |
| MSI GP66 Leopard 11UH-028 | |
| Aorus 15P YD | |
| Alienware m15 R6, i7-11800H RTX 3080 | |
| MSI GP66 Leopard 10UG | |
| Average NVIDIA GeForce RTX 3080 Laptop GPU (16455 - 32366, n=46) | |
| Asus ROG Strix Scar 15 G533QS | |
| 2560x1440 Time Spy Graphics | |
| Average of class Gaming (5012 - 26212, n=117, last 2 years) | |
| Schenker XMG Neo 15 Tiger Lake | |
| Asus ROG Strix Scar 15 G533QS | |
| MSI GP66 Leopard 11UH-028 | |
| Aorus 15P YD | |
| Alienware m15 R6, i7-11800H RTX 3080 | |
| MSI GP66 Leopard 10UG | |
| Average NVIDIA GeForce RTX 3080 Laptop GPU (6407 - 13210, n=45) | |
| 3DMark 11 Performance | 30689 points | |
| 3DMark Cloud Gate Standard Score | 51452 points | |
| 3DMark Fire Strike Score | 24909 points | |
| 3DMark Time Spy Score | 11030 points | |
Help | ||
游戏性能
微星以全高清显示所有测试的游戏,即使是在100帧左右的超级设置下。因此,仍有足够的空间来显示4K内容。
相比之下,Leopard的表现相当不错,但配备RTX 3080的竞争对手之间的差异相当小。只有配备165W RTX的XMG Neo可以稍微超过微星,这取决于游戏。
在极限性能模式下,我们在《Witcher 3》(Ultra)中取得了略低于5%的收益。GPU显然比CPU从该模式中受益更具有决定性。
| Far Cry 5 | |
| 1920x1080 Medium Preset AA:T | |
| Average of class Gaming (84 - 173, n=10, last 2 years) | |
| Schenker XMG Neo 15 Tiger Lake | |
| Aorus 15P YD | |
| Average NVIDIA GeForce RTX 3080 Laptop GPU (84 - 162, n=26) | |
| Alienware m15 R6, i7-11800H RTX 3080 | |
| MSI GP66 Leopard 11UH-028 | |
| 1920x1080 High Preset AA:T | |
| Schenker XMG Neo 15 Tiger Lake | |
| Average of class Gaming (82 - 163, n=10, last 2 years) | |
| Aorus 15P YD | |
| Average NVIDIA GeForce RTX 3080 Laptop GPU (79 - 155, n=28) | |
| Alienware m15 R6, i7-11800H RTX 3080 | |
| MSI GP66 Leopard 11UH-028 | |
| 1920x1080 Ultra Preset AA:T | |
| Aorus 15P YD | |
| Schenker XMG Neo 15 Tiger Lake | |
| Average of class Gaming (70 - 151, n=10, last 2 years) | |
| Average NVIDIA GeForce RTX 3080 Laptop GPU (75 - 146, n=33) | |
| Alienware m15 R6, i7-11800H RTX 3080 | |
| MSI GP66 Leopard 11UH-028 | |
| New World | |
| 1920x1080 Medium Video Quality | |
| MSI GP66 Leopard 11UH-028 | |
| Alienware m15 R6, i7-11800H RTX 3080 | |
| Average NVIDIA GeForce RTX 3080 Laptop GPU (80.8 - 105.4, n=4) | |
| 1920x1080 High Video Quality | |
| MSI GP66 Leopard 11UH-028 | |
| Alienware m15 R6, i7-11800H RTX 3080 | |
| Average NVIDIA GeForce RTX 3080 Laptop GPU (75.1 - 96.7, n=4) | |
| 1920x1080 Very High Video Quality | |
| MSI GP66 Leopard 11UH-028 | |
| Alienware m15 R6, i7-11800H RTX 3080 | |
| Average NVIDIA GeForce RTX 3080 Laptop GPU (71.5 - 90.4, n=4) | |
| GTA V | |
| 1920x1080 Normal/Off AF:4x | |
| Average of class Gaming (121.4 - 191.2, n=35, last 2 years) | |
| MSI GP66 Leopard 10UG | |
| Schenker XMG Neo 15 Tiger Lake | |
| MSI GP66 Leopard 11UH-028 | |
| Alienware m15 R6, i7-11800H RTX 3080 | |
| Average NVIDIA GeForce RTX 3080 Laptop GPU (160 - 182, n=29) | |
| Aorus 15P YD | |
| Asus ROG Strix Scar 15 G533QS | |
| 1920x1080 High/On (Advanced Graphics Off) AA:2xMSAA + FX AF:8x | |
| Schenker XMG Neo 15 Tiger Lake | |
| Average of class Gaming (110.7 - 189, n=70, last 2 years) | |
| MSI GP66 Leopard 10UG | |
| Alienware m15 R6, i7-11800H RTX 3080 | |
| MSI GP66 Leopard 11UH-028 | |
| Average NVIDIA GeForce RTX 3080 Laptop GPU (137 - 176, n=30) | |
| Aorus 15P YD | |
| Asus ROG Strix Scar 15 G533QS | |
| 1920x1080 Highest AA:4xMSAA + FX AF:16x | |
| Average of class Gaming (48.3 - 186.9, n=100, last 2 years) | |
| Schenker XMG Neo 15 Tiger Lake | |
| MSI GP66 Leopard 11UH-028 | |
| Alienware m15 R6, i7-11800H RTX 3080 | |
| Average NVIDIA GeForce RTX 3080 Laptop GPU (68.6 - 114.6, n=34) | |
| Aorus 15P YD | |
| MSI GP66 Leopard 10UG | |
| Asus ROG Strix Scar 15 G533QS | |
| Dota 2 Reborn | |
| 1920x1080 high (2/3) | |
| Average of class Gaming (82.8 - 275, n=109, last 2 years) | |
| Schenker XMG Neo 15 Tiger Lake | |
| Alienware m15 R6, i7-11800H RTX 3080 | |
| MSI GP66 Leopard 11UH-028 | |
| MSI GP66 Leopard 10UG | |
| Aorus 15P YD | |
| Average NVIDIA GeForce RTX 3080 Laptop GPU (108.1 - 161, n=45) | |
| Asus ROG Strix Scar 15 G533QS | |
| 1920x1080 ultra (3/3) best looking | |
| Average of class Gaming (84.8 - 248, n=110, last 2 years) | |
| Schenker XMG Neo 15 Tiger Lake | |
| MSI GP66 Leopard 10UG | |
| Alienware m15 R6, i7-11800H RTX 3080 | |
| MSI GP66 Leopard 11UH-028 | |
| Aorus 15P YD | |
| Average NVIDIA GeForce RTX 3080 Laptop GPU (98 - 156, n=45) | |
| Asus ROG Strix Scar 15 G533QS | |
| Strange Brigade | |
| 1920x1080 medium AA:medium AF:4 | |
| Average of class Gaming (160.9 - 509, n=76, last 2 years) | |
| MSI GP66 Leopard 10UG | |
| Schenker XMG Neo 15 Tiger Lake | |
| MSI GP66 Leopard 11UH-028 | |
| Alienware m15 R6, i7-11800H RTX 3080 | |
| Aorus 15P YD | |
| Average NVIDIA GeForce RTX 3080 Laptop GPU (186 - 306, n=29) | |
| Asus ROG Strix Scar 15 G533QS | |
| 1920x1080 high AA:high AF:8 | |
| Average of class Gaming (129.5 - 485, n=78, last 2 years) | |
| MSI GP66 Leopard 10UG | |
| MSI GP66 Leopard 11UH-028 | |
| Schenker XMG Neo 15 Tiger Lake | |
| Alienware m15 R6, i7-11800H RTX 3080 | |
| Aorus 15P YD | |
| Average NVIDIA GeForce RTX 3080 Laptop GPU (165 - 248, n=30) | |
| Asus ROG Strix Scar 15 G533QS | |
| 1920x1080 ultra AA:ultra AF:16 | |
| Average of class Gaming (76.3 - 456, n=91, last 2 years) | |
| Schenker XMG Neo 15 Tiger Lake | |
| MSI GP66 Leopard 11UH-028 | |
| MSI GP66 Leopard 10UG | |
| Alienware m15 R6, i7-11800H RTX 3080 | |
| Aorus 15P YD | |
| Average NVIDIA GeForce RTX 3080 Laptop GPU (117 - 219, n=34) | |
| Asus ROG Strix Scar 15 G533QS | |
| Final Fantasy XV Benchmark | |
| 1280x720 Lite Quality | |
| Average of class Gaming (117.4 - 235, n=69, last 2 years) | |
| Schenker XMG Neo 15 Tiger Lake | |
| Asus ROG Strix Scar 15 G533QS | |
| Average NVIDIA GeForce RTX 3080 Laptop GPU (123 - 199, n=27) | |
| Aorus 15P YD | |
| MSI GP66 Leopard 10UG | |
| 1920x1080 Standard Quality | |
| Average of class Gaming (85.7 - 236, n=88, last 2 years) | |
| MSI GP66 Leopard 10UG | |
| Schenker XMG Neo 15 Tiger Lake | |
| Asus ROG Strix Scar 15 G533QS | |
| MSI GP66 Leopard 11UH-028 | |
| Average NVIDIA GeForce RTX 3080 Laptop GPU (97 - 154, n=29) | |
| Aorus 15P YD | |
| 1920x1080 High Quality | |
| Average of class Gaming (41 - 215, n=101, last 2 years) | |
| Aorus 15P YD | |
| Schenker XMG Neo 15 Tiger Lake | |
| Asus ROG Strix Scar 15 G533QS | |
| MSI GP66 Leopard 10UG | |
| Average NVIDIA GeForce RTX 3080 Laptop GPU (55.5 - 115, n=34) | |
Witcher 3,在GP66上以大约120 fps的速度开始。在最初的几分钟后,这一数值下降,并在相当稳定的110 fps的水平,这一数值在一小时后仍然保持。在这方面,笔记本电脑随着时间的推移只损失了微不足道的一部分性能。
Witcher 3 FPS Diagramm
| low | med. | high | ultra | |
|---|---|---|---|---|
| GTA V (2015) | 184 | 177 | 166 | 103 |
| The Witcher 3 (2015) | 344.8 | 300 | 196.5 | 110.2 |
| Dota 2 Reborn (2015) | 168 | 151 | 143 | 135 |
| Final Fantasy XV Benchmark (2018) | 136 | |||
| X-Plane 11.11 (2018) | 121 | 107 | 85.7 | |
| Far Cry 5 (2018) | 152 | 123 | 119 | 111 |
| Strange Brigade (2018) | 492 | 267 | 223 | 197 |
| New World (2021) | 132.7 | 105.4 | 96.7 | 90.4 |
排放 - 模范的风扇行为
噪声排放
风扇在空转时通常很安静,我们通常喜欢自适应的风扇行为,因为即使在重载后风扇也会很快平静下来。即使在 Witcher 3
,整整一个小时之后,风扇在大约30秒之后就大大地安静下来,并且在空转时发出相当安静的呼噜声。在极限性能模式下,风扇在怠速时大部分时间也保持关闭状态,即使在重载后也能很快平静下来。然而,如果你另外激活 "冷却器提升",风扇会突然跳到最大速度,噪音达到58分贝。
平衡、极致性能和极致性能加冷却器提升之间的性能差异很有趣--它几乎不存在或几乎不存在!另一方面,它们之间有明显的差异。另一方面,噪音水平也有很大差异。我们在平衡状态下测得约47分贝,在极限性能下测得约53分贝(在此作为最大值输入),而上述的58分贝则是在冷却器提升的情况下测得的。
因此,GP66是平衡模式下最安静的笔记本电脑之一,也是使用Cooler Boost时最吵的笔记本电脑之一。我们没有发现任何电子噪音。
Noise level
| Idle |
| 23 / 23 / 30.11 dB(A) |
| Load |
| 41.86 / 53 dB(A) |
 | ||
30 dB silent 40 dB(A) audible 50 dB(A) loud |
||
min: | ||
| MSI GP66 Leopard 11UH-028 GeForce RTX 3080 Laptop GPU, i7-11800H, Samsung PM9A1 MZVL21T0HCLR | MSI GP66 Leopard 10UG GeForce RTX 3070 Laptop GPU, i7-10870H, Kingston OM8PCP31024F | Aorus 15P YD GeForce RTX 3080 Laptop GPU, i7-11800H, Samsung PM9A1 MZVL21T0HCLR | Asus ROG Strix Scar 15 G533QS GeForce RTX 3080 Laptop GPU, R9 5900HX, ADATA Swordfish 2 TB | Schenker XMG Neo 15 Tiger Lake GeForce RTX 3080 Laptop GPU, i7-11800H, Samsung SSD 980 Pro 1TB MZ-V8P1T0BW | Alienware m15 R6, i7-11800H RTX 3080 GeForce RTX 3080 Laptop GPU, i7-11800H, Samsung PM9A1 MZVL21T0HCLR | |
|---|---|---|---|---|---|---|
| Noise | -5% | -12% | -8% | -12% | -2% | |
| off / environment * (dB) | 23 | 24.7 -7% | 25 -9% | 25.5 -11% | 25 -9% | 23 -0% |
| Idle Minimum * (dB) | 23 | 26.8 -17% | 26 -13% | 25.5 -11% | 27 -17% | 23 -0% |
| Idle Average * (dB) | 23 | 26.8 -17% | 30 -30% | 25.5 -11% | 30 -30% | 23 -0% |
| Idle Maximum * (dB) | 30.11 | 26.8 11% | 34 -13% | 37.1 -23% | 32 -6% | 30 -0% |
| Load Average * (dB) | 41.86 | 40.4 3% | 43 -3% | 39.2 6% | 46 -10% | 41.26 1% |
| Witcher 3 ultra * (dB) | 47.79 | 48.8 -2% | 50 -5% | 50.5 -6% | 52 -9% | 53.4 -12% |
| Load Maximum * (dB) | 53 | 57.2 -8% | 57 -8% | 51.8 2% | 55 -4% | 53.37 -1% |
* ... smaller is better
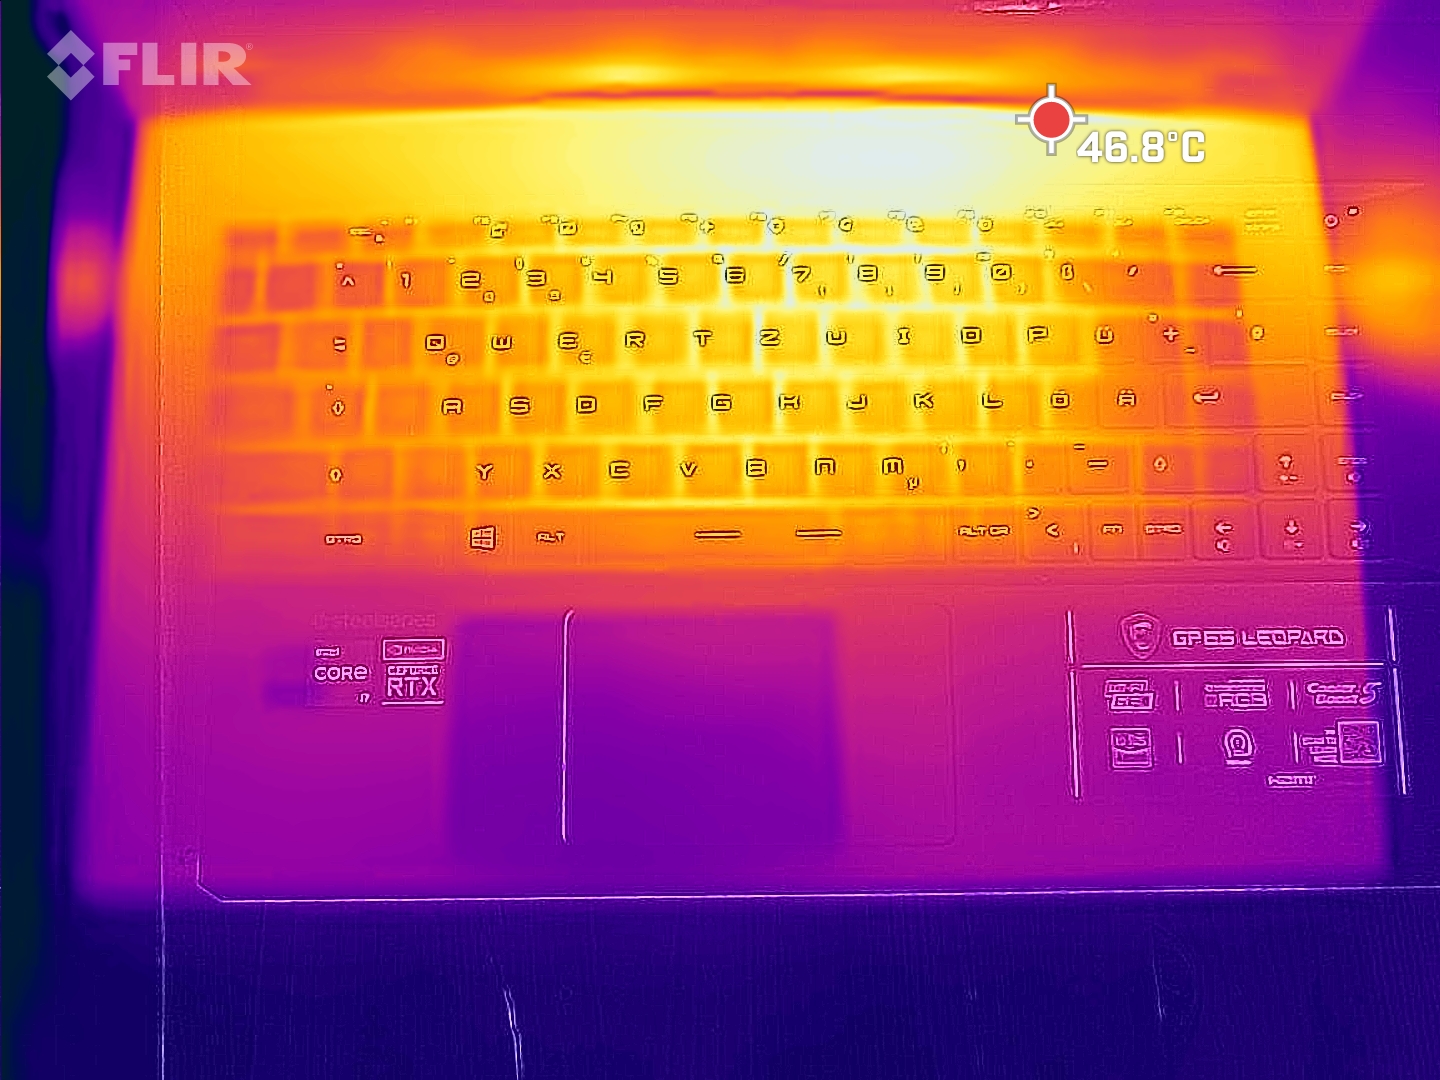
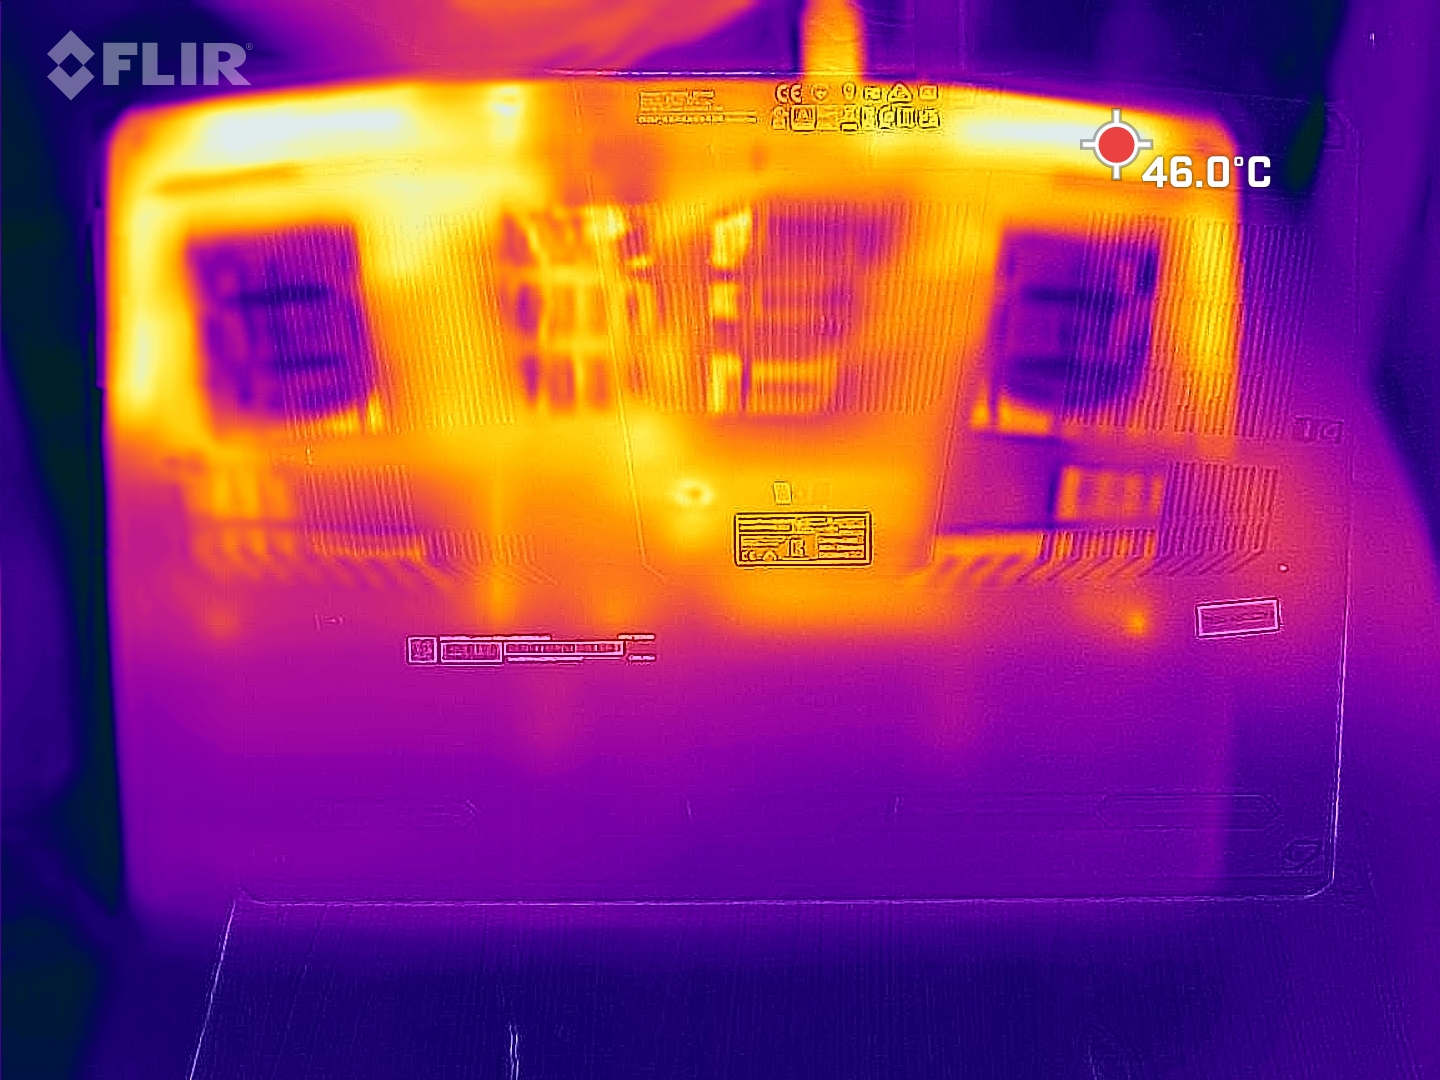
温度
在游戏过程中,顶部和底部的热点高达54℃,这使玩家在竞争中处于中间位置。Alienware和Aorus的温度更高,而华硕和XMG的温度更低,但冷却系统的声音更大。
所有上述的测量都是在平衡模式下进行的。由于在更高的模式下,性能不会增加很多,至少在游戏中不会,由于风扇旋转得更快,温度可能会下降更多。
(-) The maximum temperature on the upper side is 49 °C / 120 F, compared to the average of 40.4 °C / 105 F, ranging from 21.2 to 68.8 °C for the class Gaming.
(-) The bottom heats up to a maximum of 47 °C / 117 F, compared to the average of 43.2 °C / 110 F
(+) In idle usage, the average temperature for the upper side is 26.7 °C / 80 F, compared to the device average of 33.9 °C / 93 F.
(-) Playing The Witcher 3, the average temperature for the upper side is 43.9 °C / 111 F, compared to the device average of 33.9 °C / 93 F.
(+) The palmrests and touchpad are reaching skin temperature as a maximum (32 °C / 89.6 F) and are therefore not hot.
(-) The average temperature of the palmrest area of similar devices was 28.8 °C / 83.8 F (-3.2 °C / -5.8 F).
| MSI GP66 Leopard 11UH-028 Intel Core i7-11800H, NVIDIA GeForce RTX 3080 Laptop GPU | MSI GP66 Leopard 10UG Intel Core i7-10870H, NVIDIA GeForce RTX 3070 Laptop GPU | Aorus 15P YD Intel Core i7-11800H, NVIDIA GeForce RTX 3080 Laptop GPU | Asus ROG Strix Scar 15 G533QS AMD Ryzen 9 5900HX, NVIDIA GeForce RTX 3080 Laptop GPU | Schenker XMG Neo 15 Tiger Lake Intel Core i7-11800H, NVIDIA GeForce RTX 3080 Laptop GPU | Alienware m15 R6, i7-11800H RTX 3080 Intel Core i7-11800H, NVIDIA GeForce RTX 3080 Laptop GPU | |
|---|---|---|---|---|---|---|
| Heat | 3% | -9% | -5% | -2% | -20% | |
| Maximum Upper Side * (°C) | 49 | 42.8 13% | 49 -0% | 43.4 11% | 39 20% | 61 -24% |
| Maximum Bottom * (°C) | 47 | 50 -6% | 57 -21% | 48.2 -3% | 50 -6% | 58 -23% |
| Idle Upper Side * (°C) | 31 | 33 -6% | 33 -6% | 35.2 -14% | 34 -10% | 38 -23% |
| Idle Bottom * (°C) | 33 | 29 12% | 36 -9% | 37 -12% | 37 -12% | 36 -9% |
* ... smaller is better
压力测试
CPU的8个核心以4.2GHz左右的频率开始我们的压力测试。然而,在核心温度在大约一分钟内达到96℃后,时钟速率被节制。它短暂地降到3GHz以下,但后来又超过了这个极限。我们在一小时后测量了大约3.3GHz,温度在82至86℃之间,取决于时钟速率。
在整个测试期间,GPU时钟在1.3和1.7GHz之间波动。GPU核心的温度最高达到76℃。
在压力测试之后,系统很快又平静了下来。在压力测试结束后直接运行另一个3DMark 11,得到的分数与之前大致相同。
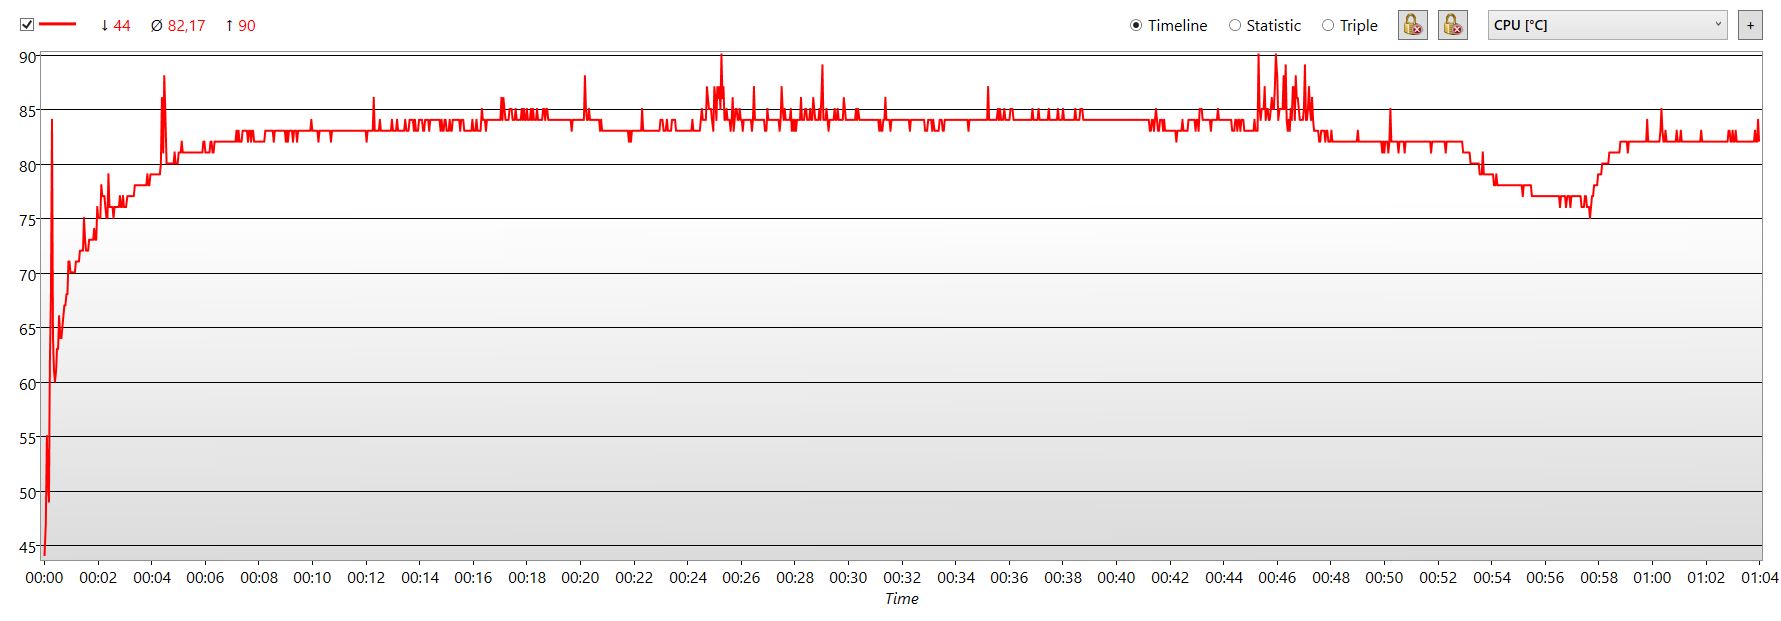
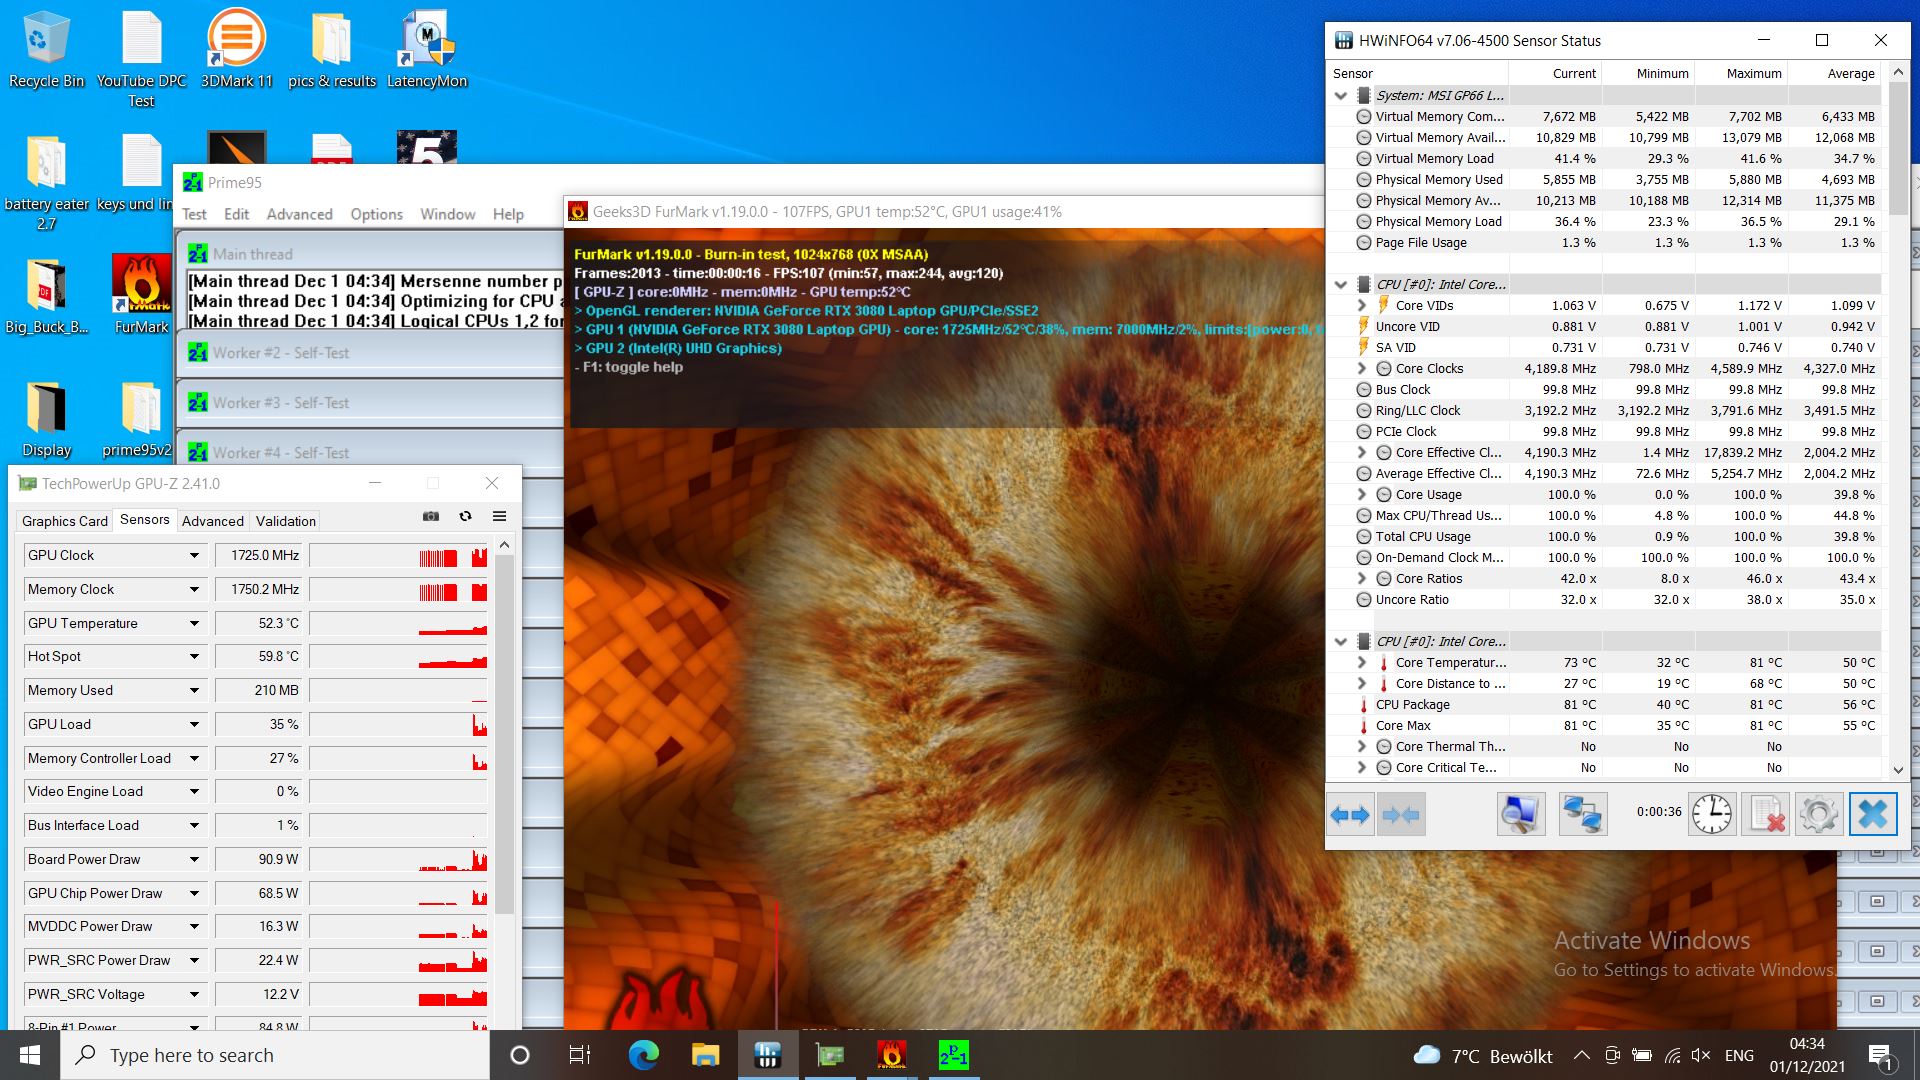
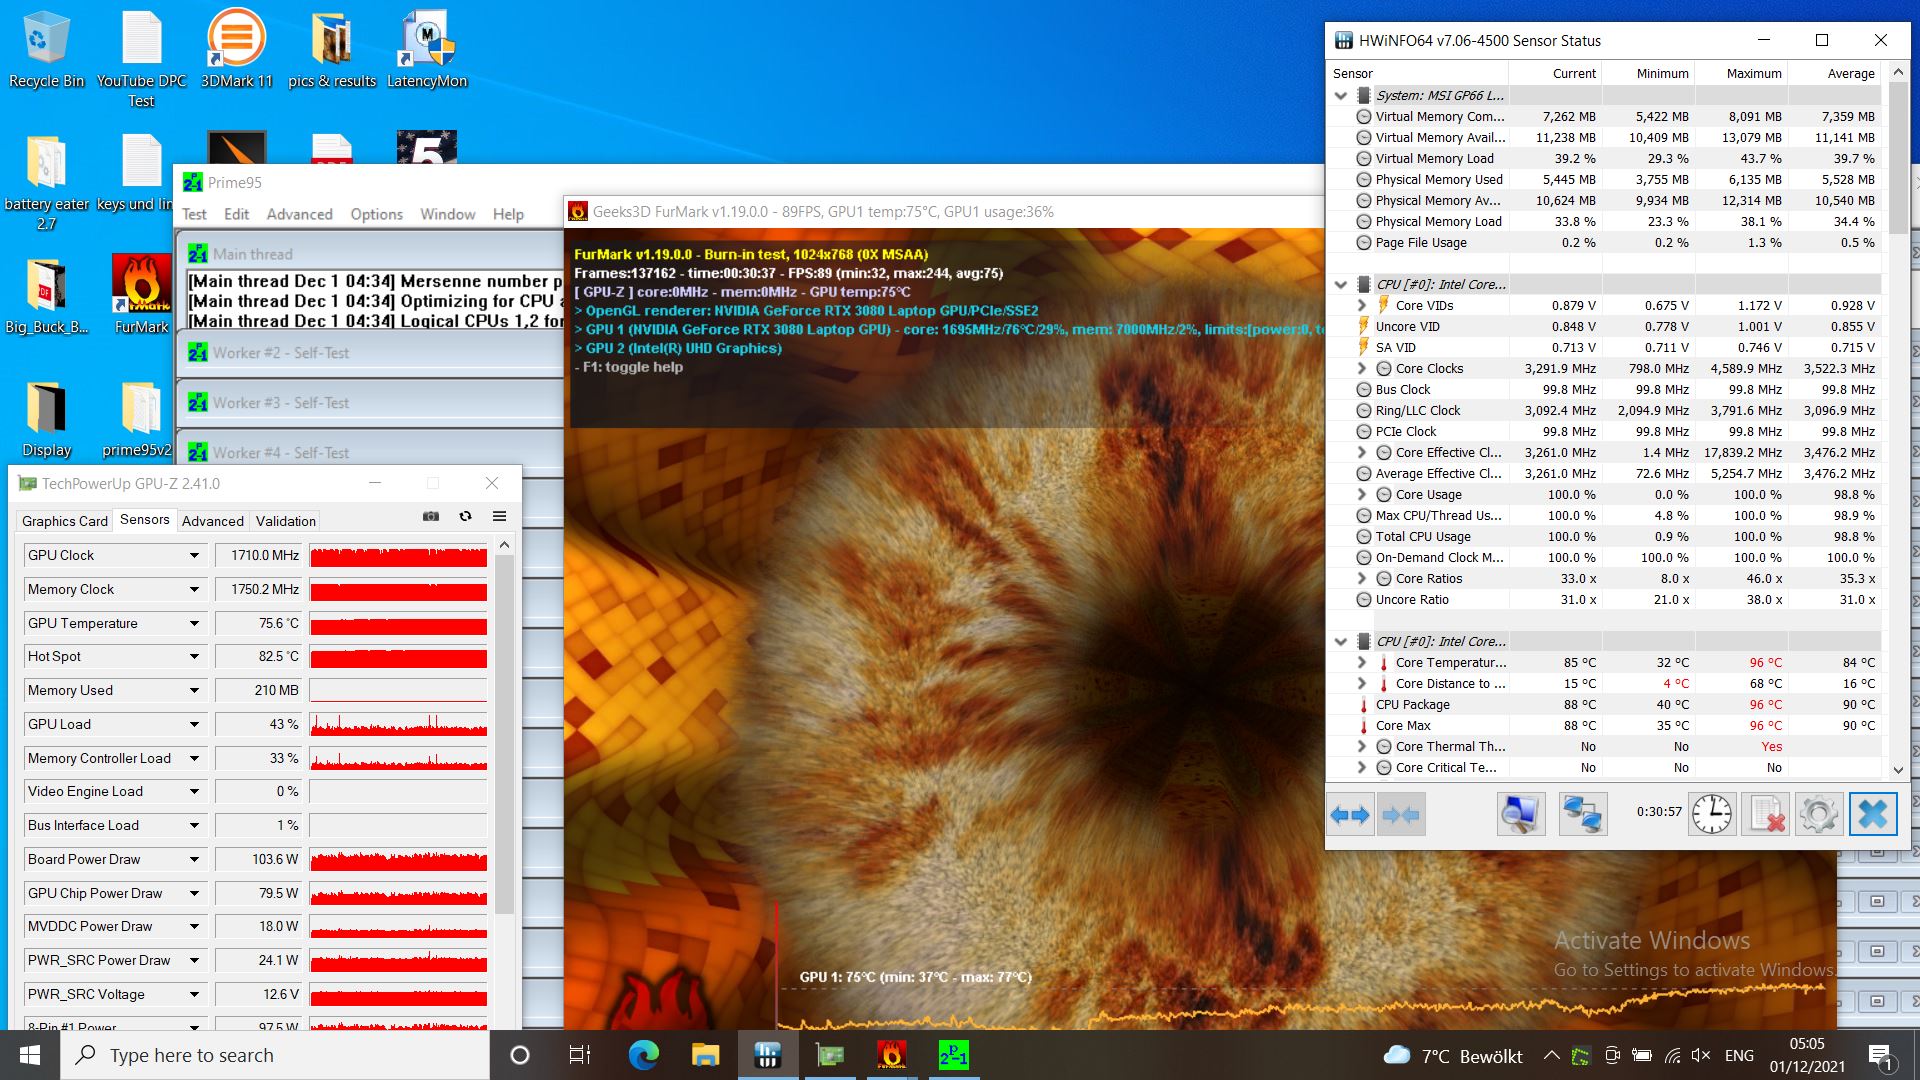
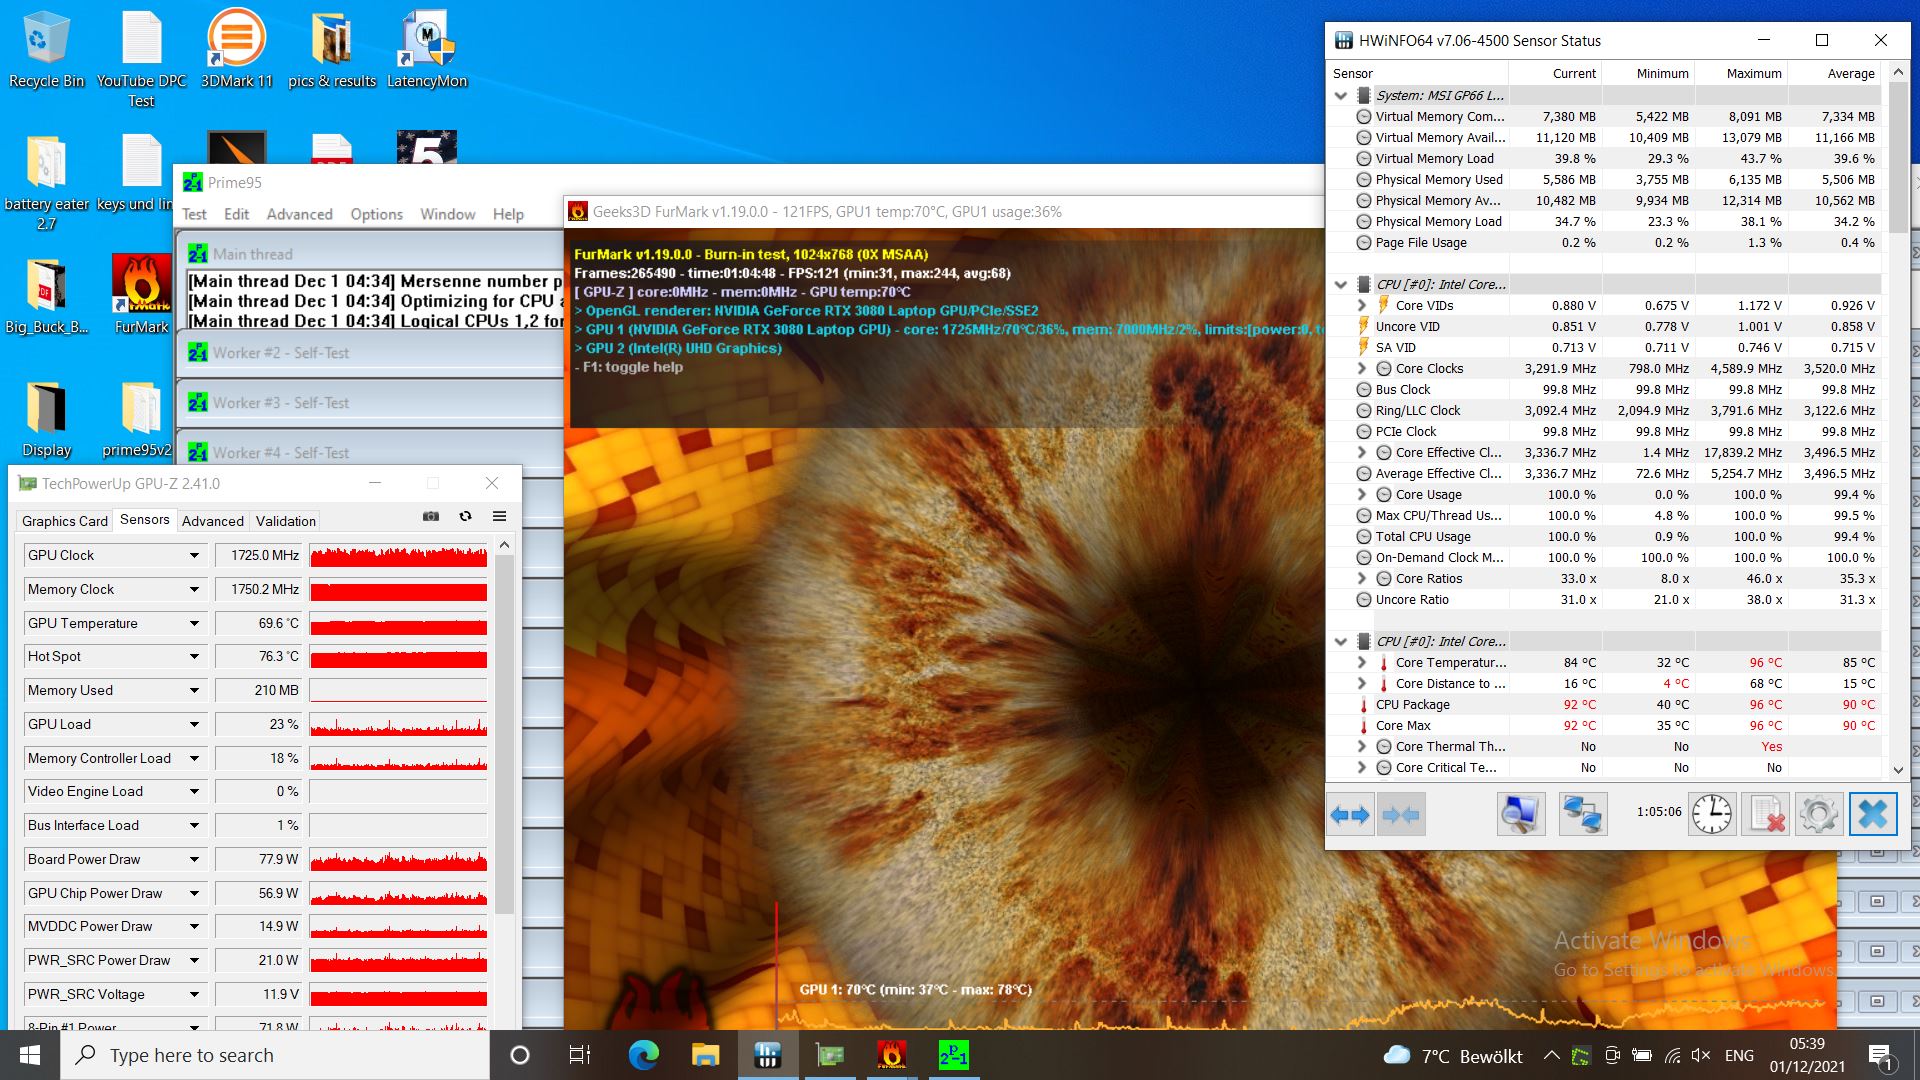
| CPU时钟(GHz) | GPU时钟 | 平均CPU温度(℃) | 平均GPU温度(℃) | |
| 系统空闲 | 4.5 GHz | 350 MHz | 35 | 32 |
| Prime95 + FurMark压力 | 2.8 - 3.3 GHz | 1.3 - 1.7 GHz | 85 | 76 |
| Witcher 3 Stress | 4.2 GHz | 1.3 - 1.7 GHz | 85 | 76 |
扬声器
从积极的方面看,这些扬声器可以播放得相当响亮,而且中音和高音似乎相当平衡。然而,它们自然会受到所有传统笔记本电脑扬声器的共同抱怨--缺乏低音。外部音频设备,如耳机,可以通过模拟镀金的迷你插孔耳机端口连接。
MSI GP66 Leopard 11UH-028 audio analysis
(+) | speakers can play relatively loud (85.6 dB)
Bass 100 - 315 Hz
(-) | nearly no bass - on average 22.9% lower than median
(±) | linearity of bass is average (8.9% delta to prev. frequency)
Mids 400 - 2000 Hz
(+) | balanced mids - only 2.8% away from median
(+) | mids are linear (3.9% delta to prev. frequency)
Highs 2 - 16 kHz
(+) | balanced highs - only 4.6% away from median
(+) | highs are linear (6.6% delta to prev. frequency)
Overall 100 - 16.000 Hz
(±) | linearity of overall sound is average (16.9% difference to median)
Compared to same class
» 44% of all tested devices in this class were better, 11% similar, 45% worse
» The best had a delta of 6%, average was 18%, worst was 132%
Compared to all devices tested
» 30% of all tested devices were better, 8% similar, 62% worse
» The best had a delta of 4%, average was 24%, worst was 134%
Schenker XMG Neo 15 Tiger Lake audio analysis
(±) | speaker loudness is average but good (79 dB)
Bass 100 - 315 Hz
(-) | nearly no bass - on average 22.6% lower than median
(±) | linearity of bass is average (9.5% delta to prev. frequency)
Mids 400 - 2000 Hz
(+) | balanced mids - only 4.7% away from median
(±) | linearity of mids is average (9.1% delta to prev. frequency)
Highs 2 - 16 kHz
(+) | balanced highs - only 4.1% away from median
(+) | highs are linear (5.3% delta to prev. frequency)
Overall 100 - 16.000 Hz
(±) | linearity of overall sound is average (19.4% difference to median)
Compared to same class
» 67% of all tested devices in this class were better, 7% similar, 26% worse
» The best had a delta of 6%, average was 18%, worst was 132%
Compared to all devices tested
» 48% of all tested devices were better, 7% similar, 45% worse
» The best had a delta of 4%, average was 24%, worst was 134%
电源管理--带迷你电池的Leopard
能量吸收
我们在玩《Witcher 3》时测得的平均消耗为207瓦,这比竞争对手需要的要多一些。最大功率为223瓦,介于顶级消费者Aorus和Alienware以及更节俭的其他竞争对手之间。
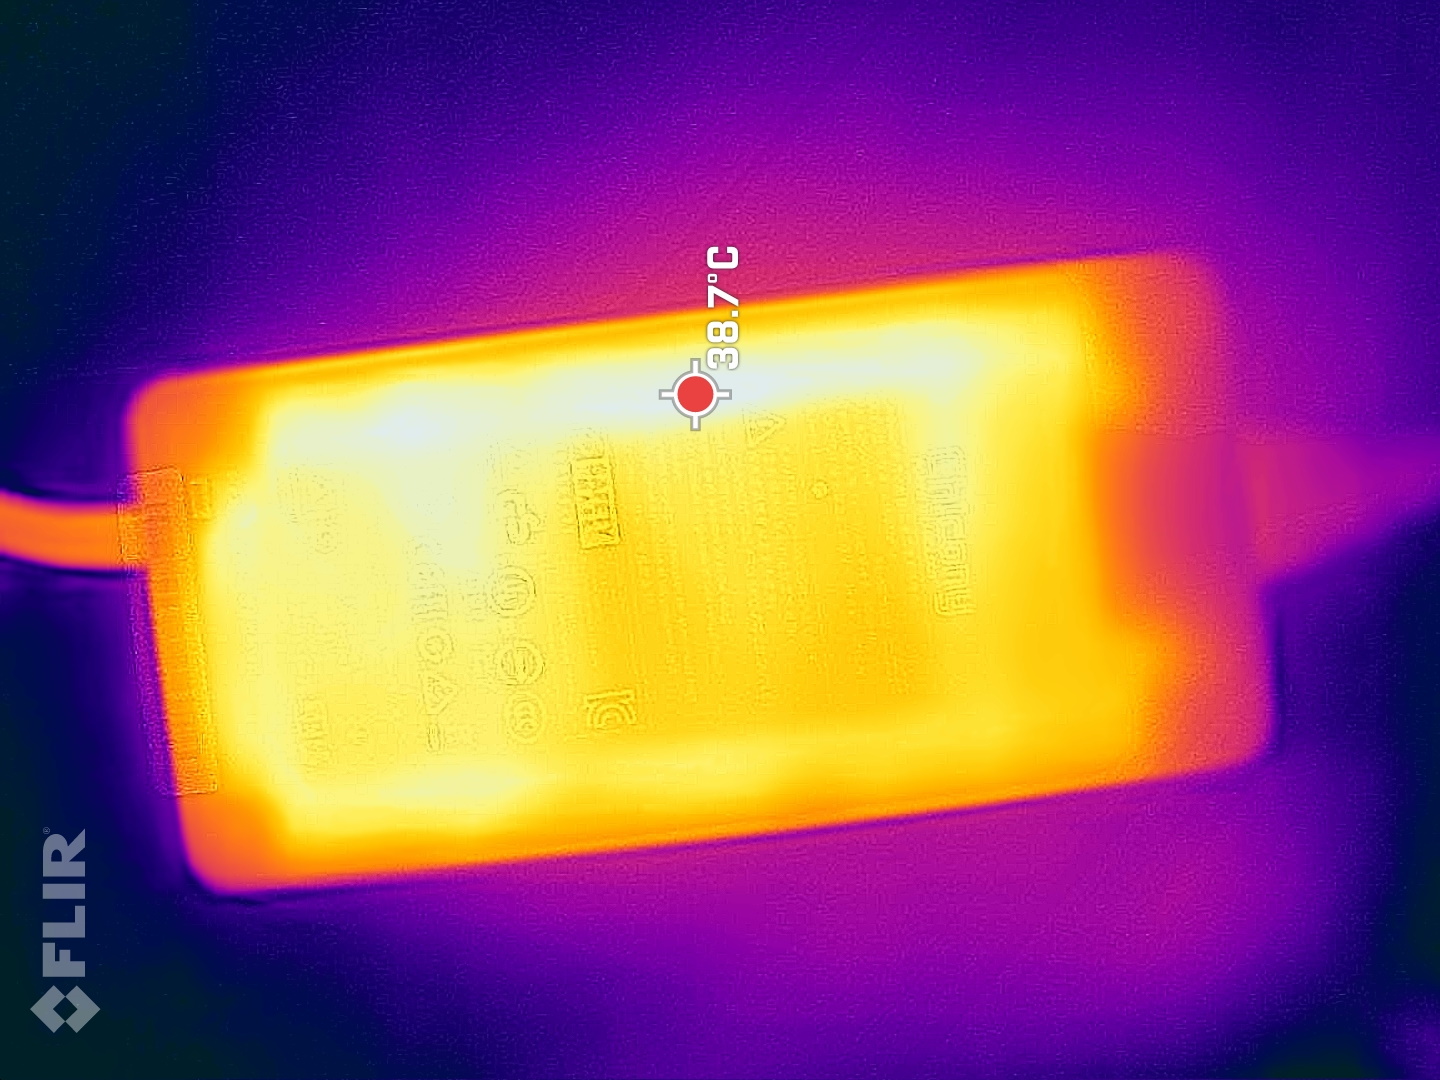
电源的尺寸很大,有280瓦,充电时应该不会有任何问题。
| Idle | |
| Load |
|
Key:
min: | |
| MSI GP66 Leopard 11UH-028 i7-11800H, GeForce RTX 3080 Laptop GPU, Samsung PM9A1 MZVL21T0HCLR, IPS, 1920x1080, 15.6" | MSI GP66 Leopard 10UG i7-10870H, GeForce RTX 3070 Laptop GPU, Kingston OM8PCP31024F, IPS, 1920x1080, 15.6" | Aorus 15P YD i7-11800H, GeForce RTX 3080 Laptop GPU, Samsung PM9A1 MZVL21T0HCLR, IPS, 1920x1080, 15.6" | Asus ROG Strix Scar 15 G533QS R9 5900HX, GeForce RTX 3080 Laptop GPU, ADATA Swordfish 2 TB, IPS, 2560x1440, 15.6" | Schenker XMG Neo 15 Tiger Lake i7-11800H, GeForce RTX 3080 Laptop GPU, Samsung SSD 980 Pro 1TB MZ-V8P1T0BW, IPS, 2560x1440, 15.6" | Alienware m15 R6, i7-11800H RTX 3080 i7-11800H, GeForce RTX 3080 Laptop GPU, Samsung PM9A1 MZVL21T0HCLR, IPS, 1920x1080, 15.6" | Average NVIDIA GeForce RTX 3080 Laptop GPU | Average of class Gaming | |
|---|---|---|---|---|---|---|---|---|
| Power Consumption | -7% | -40% | -7% | -7% | -9% | -39% | -15% | |
| Idle Minimum * (Watt) | 13 | 15.3 -18% | 23 -77% | 11.2 14% | 15 -15% | 14 -8% | 19.8 ? -52% | 13.2 ? -2% |
| Idle Average * (Watt) | 17 | 21.2 -25% | 25 -47% | 16.4 4% | 17 -0% | 18 -6% | 24.3 ? -43% | 18.9 ? -11% |
| Idle Maximum * (Watt) | 18 | 22.3 -24% | 35 -94% | 29.4 -63% | 22 -22% | 29 -61% | 33.3 ? -85% | 24.3 ? -35% |
| Load Average * (Watt) | 96 | 82.3 14% | 101 -5% | 106.2 -11% | 101 -5% | 93 3% | 108.1 ? -13% | 108.3 ? -13% |
| Witcher 3 ultra * (Watt) | 207 | 191.2 8% | 190 8% | 189 9% | 195 6% | 190 8% | ||
| Load Maximum * (Watt) | 223 | 216.6 3% | 280 -26% | 213.6 4% | 230 -3% | 203 9% | 230 ? -3% | 254 ? -14% |
* ... smaller is better
Power consumption Witcher 3 / Stress test
电池寿命
微星使用65Wh的电池,这对于配备RTX 3080的游戏笔记本来说是非常小的。竞争对手的电池有84或90Wh,甚至更多!因此,离开插座的运行时间很差。
相应地,离开插座的运行时间很差,Leopard的预算价格在这里被注意到。只有3.5小时的冲浪或看视频的时间是令人失望的低,竞争对手的持续时间要长40%到100%(华硕ROG)。笔记本电脑只能提供四分之三小时的游戏时间(TheWitcher 3 )。
| MSI GP66 Leopard 11UH-028 i7-11800H, GeForce RTX 3080 Laptop GPU, 65 Wh | MSI GP66 Leopard 10UG i7-10870H, GeForce RTX 3070 Laptop GPU, 65 Wh | Aorus 15P YD i7-11800H, GeForce RTX 3080 Laptop GPU, 99 Wh | Asus ROG Strix Scar 15 G533QS R9 5900HX, GeForce RTX 3080 Laptop GPU, 90 Wh | Schenker XMG Neo 15 Tiger Lake i7-11800H, GeForce RTX 3080 Laptop GPU, 93 Wh | Alienware m15 R6, i7-11800H RTX 3080 i7-11800H, GeForce RTX 3080 Laptop GPU, 84 Wh | Average of class Gaming | |
|---|---|---|---|---|---|---|---|
| Battery runtime | 13% | 61% | 60% | 83% | 44% | 85% | |
| H.264 (h) | 3.5 | 5.9 69% | 5.6 60% | 8.26 ? 136% | |||
| WiFi v1.3 (h) | 3.6 | 5.1 42% | 5.3 47% | 7.3 103% | 5.6 56% | 5 39% | 7.04 ? 96% |
| Witcher 3 ultra (h) | 0.8 | ||||||
| Load (h) | 1.2 | 1 -17% | 2.1 75% | 1.4 17% | 2.7 125% | 1.6 33% | 1.47 ? 23% |
| Reader / Idle (h) | 6.6 | 7.5 | 11.1 | 8.71 ? |
Pros
Cons
结论 - 良好的预算高性能游戏机
一台现代游戏笔记本电脑,配备Nvidia RTX 3080和相应的高、有竞争力的性能,价格低于2000欧元,这在现在可能是很罕见的。尽管价格低廉,微星在纯粹的性能之外也做了很多事情。例如,自适应冷却系统确实给我们带来了积极的惊喜,即使是在极限性能模式下--像Alienwares这样更昂贵的竞争对手可以从这本书中吸取经验。显示屏也不是预算面板,但至少在亮度方面超过了竞争对手。
当然,你也必须接受这个价格类别中的一些妥协。这包括Leopard的电池运行时间不长,而且制造质量不尽如人意,这在比较复杂的维护中也很明显。我们几乎感到震惊的是,新的GP66型号不再有USB-C端口,这在2021年底就不再是最新的了!这也是我们的一个遗憾。如果你能克服这一点,目前你很难得到一个更便宜的RTX 3080游戏机,同时还能做得这么好。
Leopard GP66 11UH是一款经济型游戏笔记本,在某些地方甚至让高端机型显得很苍白。当然,也有缺点,如缺乏USB-C或电池运行时间低,但性能、冷却和显示也符合更高的类别。
在这个价格范围内,具有这些规格的竞争是罕见的。而且即使是更昂贵的对手也不是什么都做得更好,请看冷却系统。测试中的对比设备都比较昂贵,但它们在性能、显示效果,特别是冷却系统方面都没有什么优势。然而,你必须为USB-C或更长的电池运行时间付出更多。另外,我们建议看一下我们的 廉价游戏笔记本电脑排行榜.
价格和可用性
我们的测试模型是目前最便宜的,在Computeruniverse,该笔记本电脑目前的价格为1,899欧元(约2,140美元)。.但我们的配置也可以在Cyberport买到,价格略低于欧元2,000 (~2,253美元)来获取。
MSI GP66 Leopard 11UH-028
- 12/08/2021 v7 (old)
Christian Hintze
Price comparison
