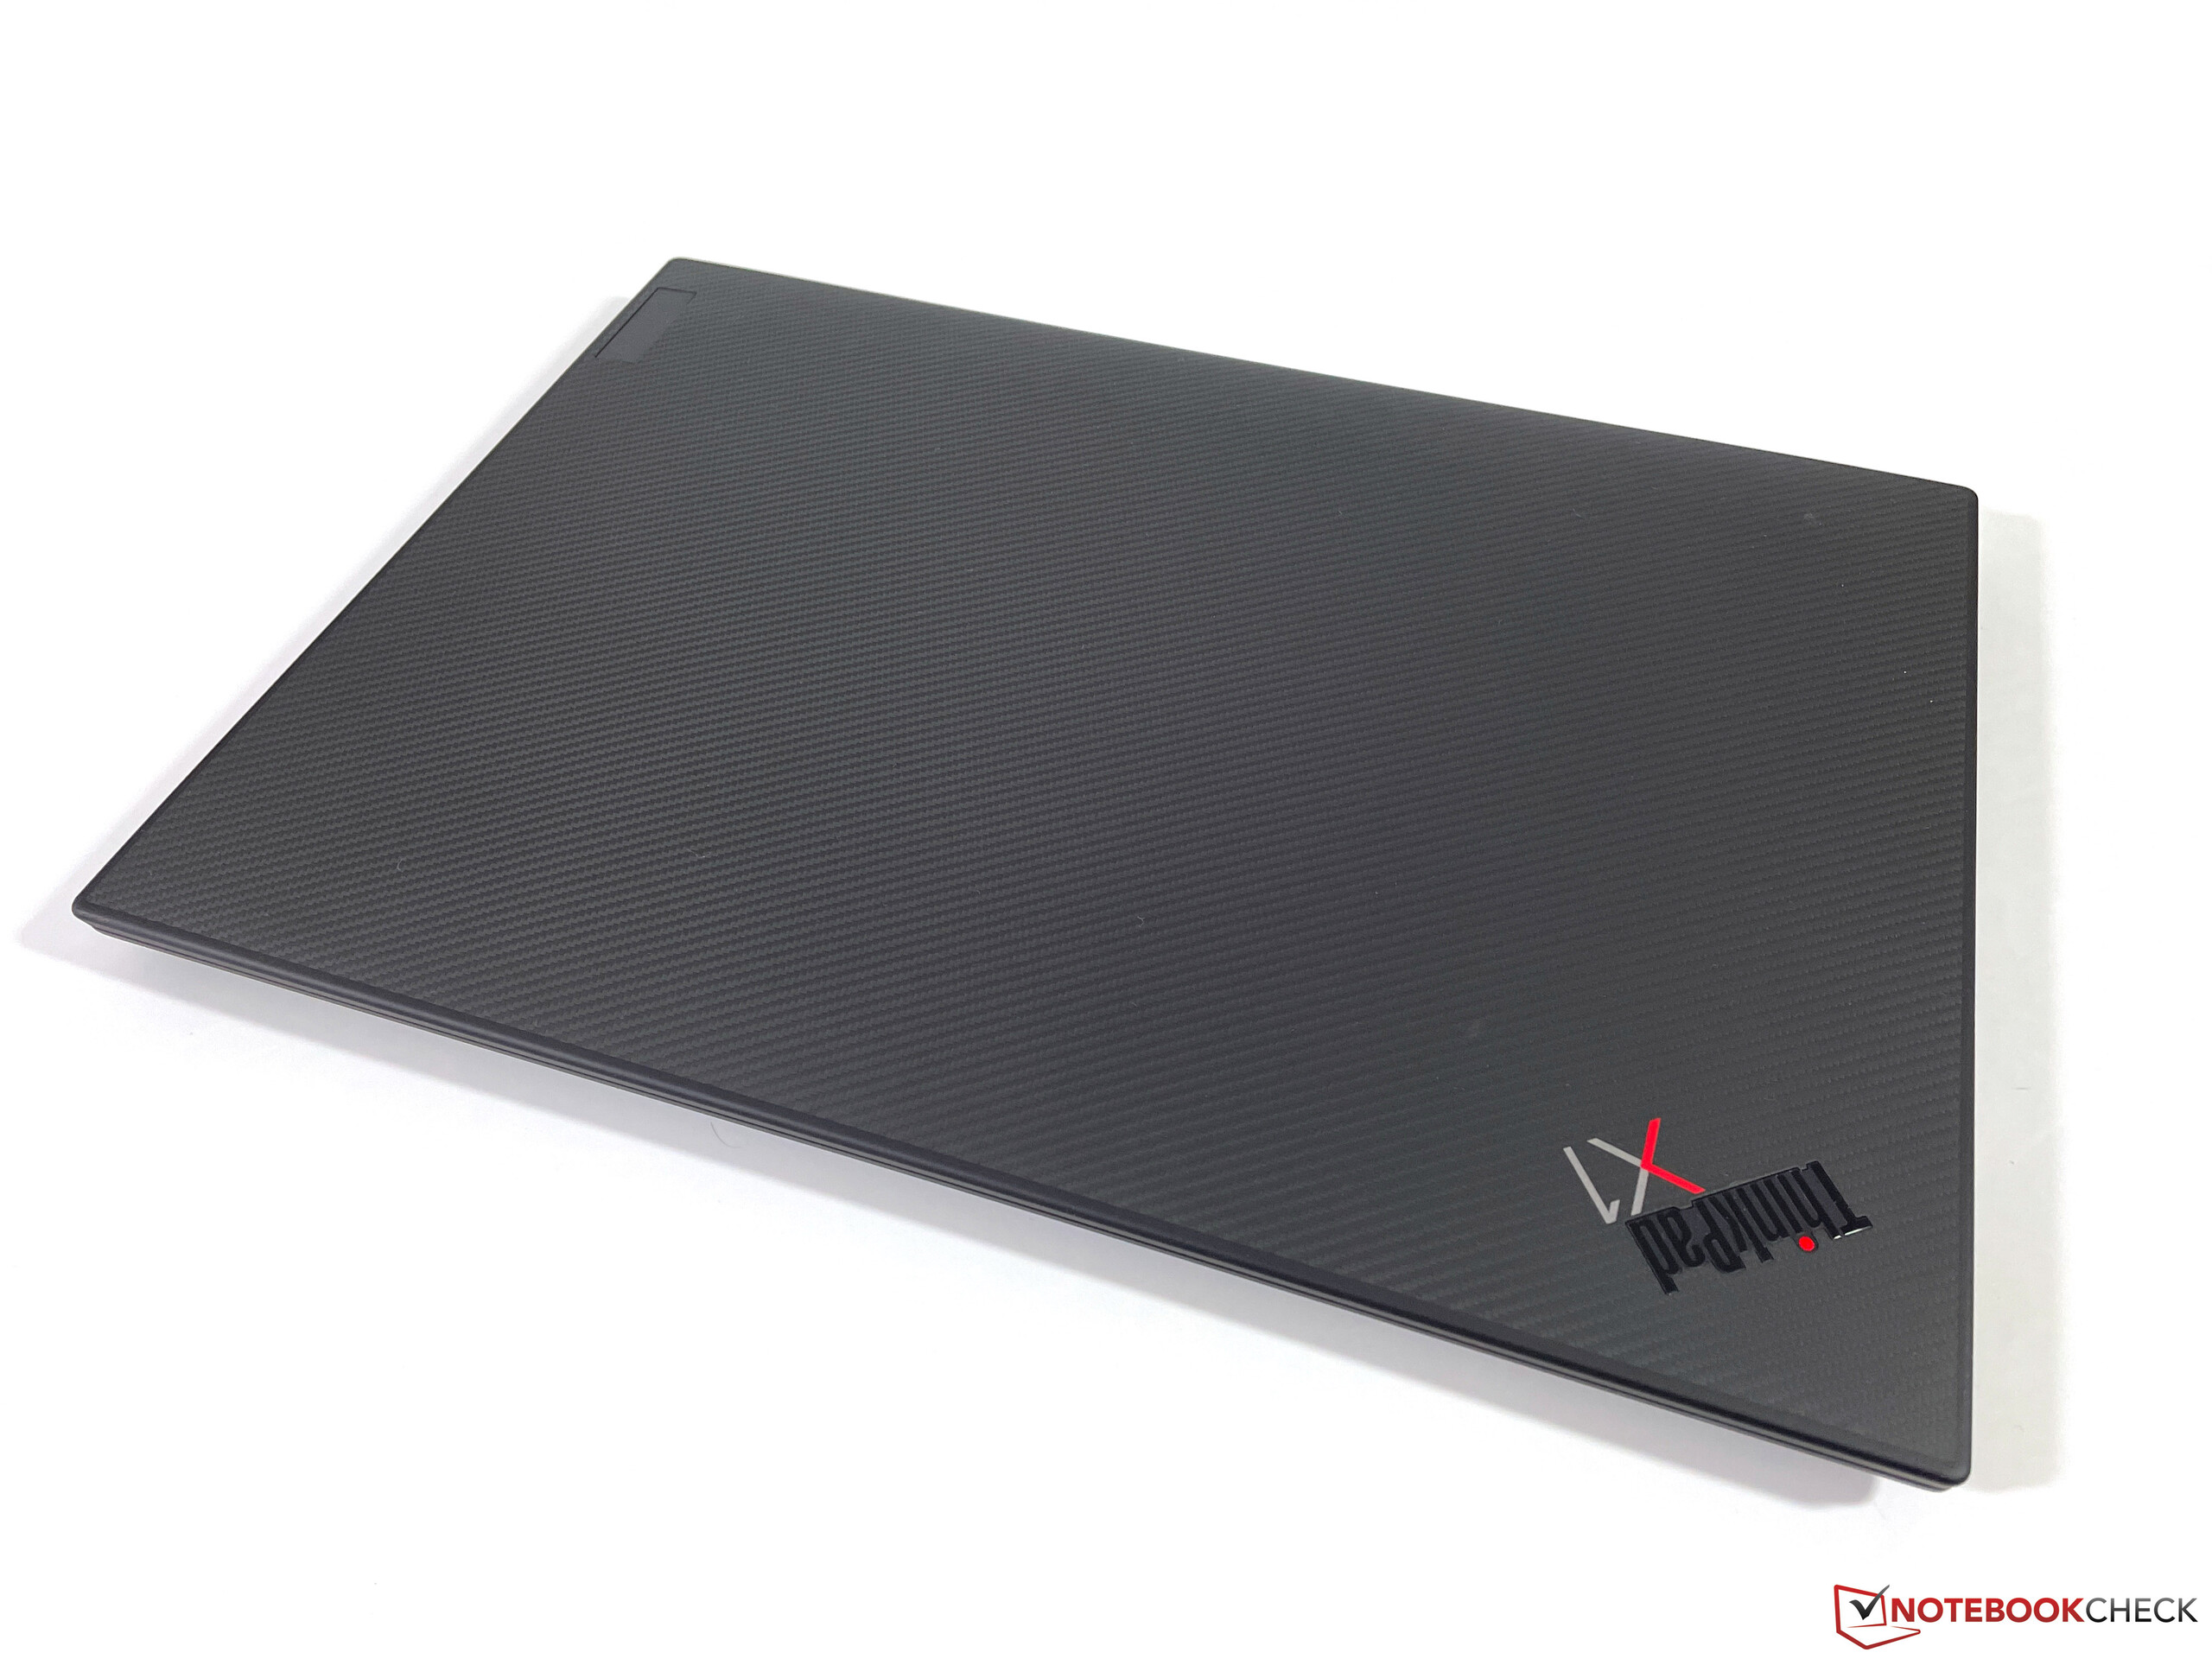
联想ThinkPad X1 Extreme G4评论。酷睿i9和RTX3080带来的最佳Mutlimedia笔记本电脑?

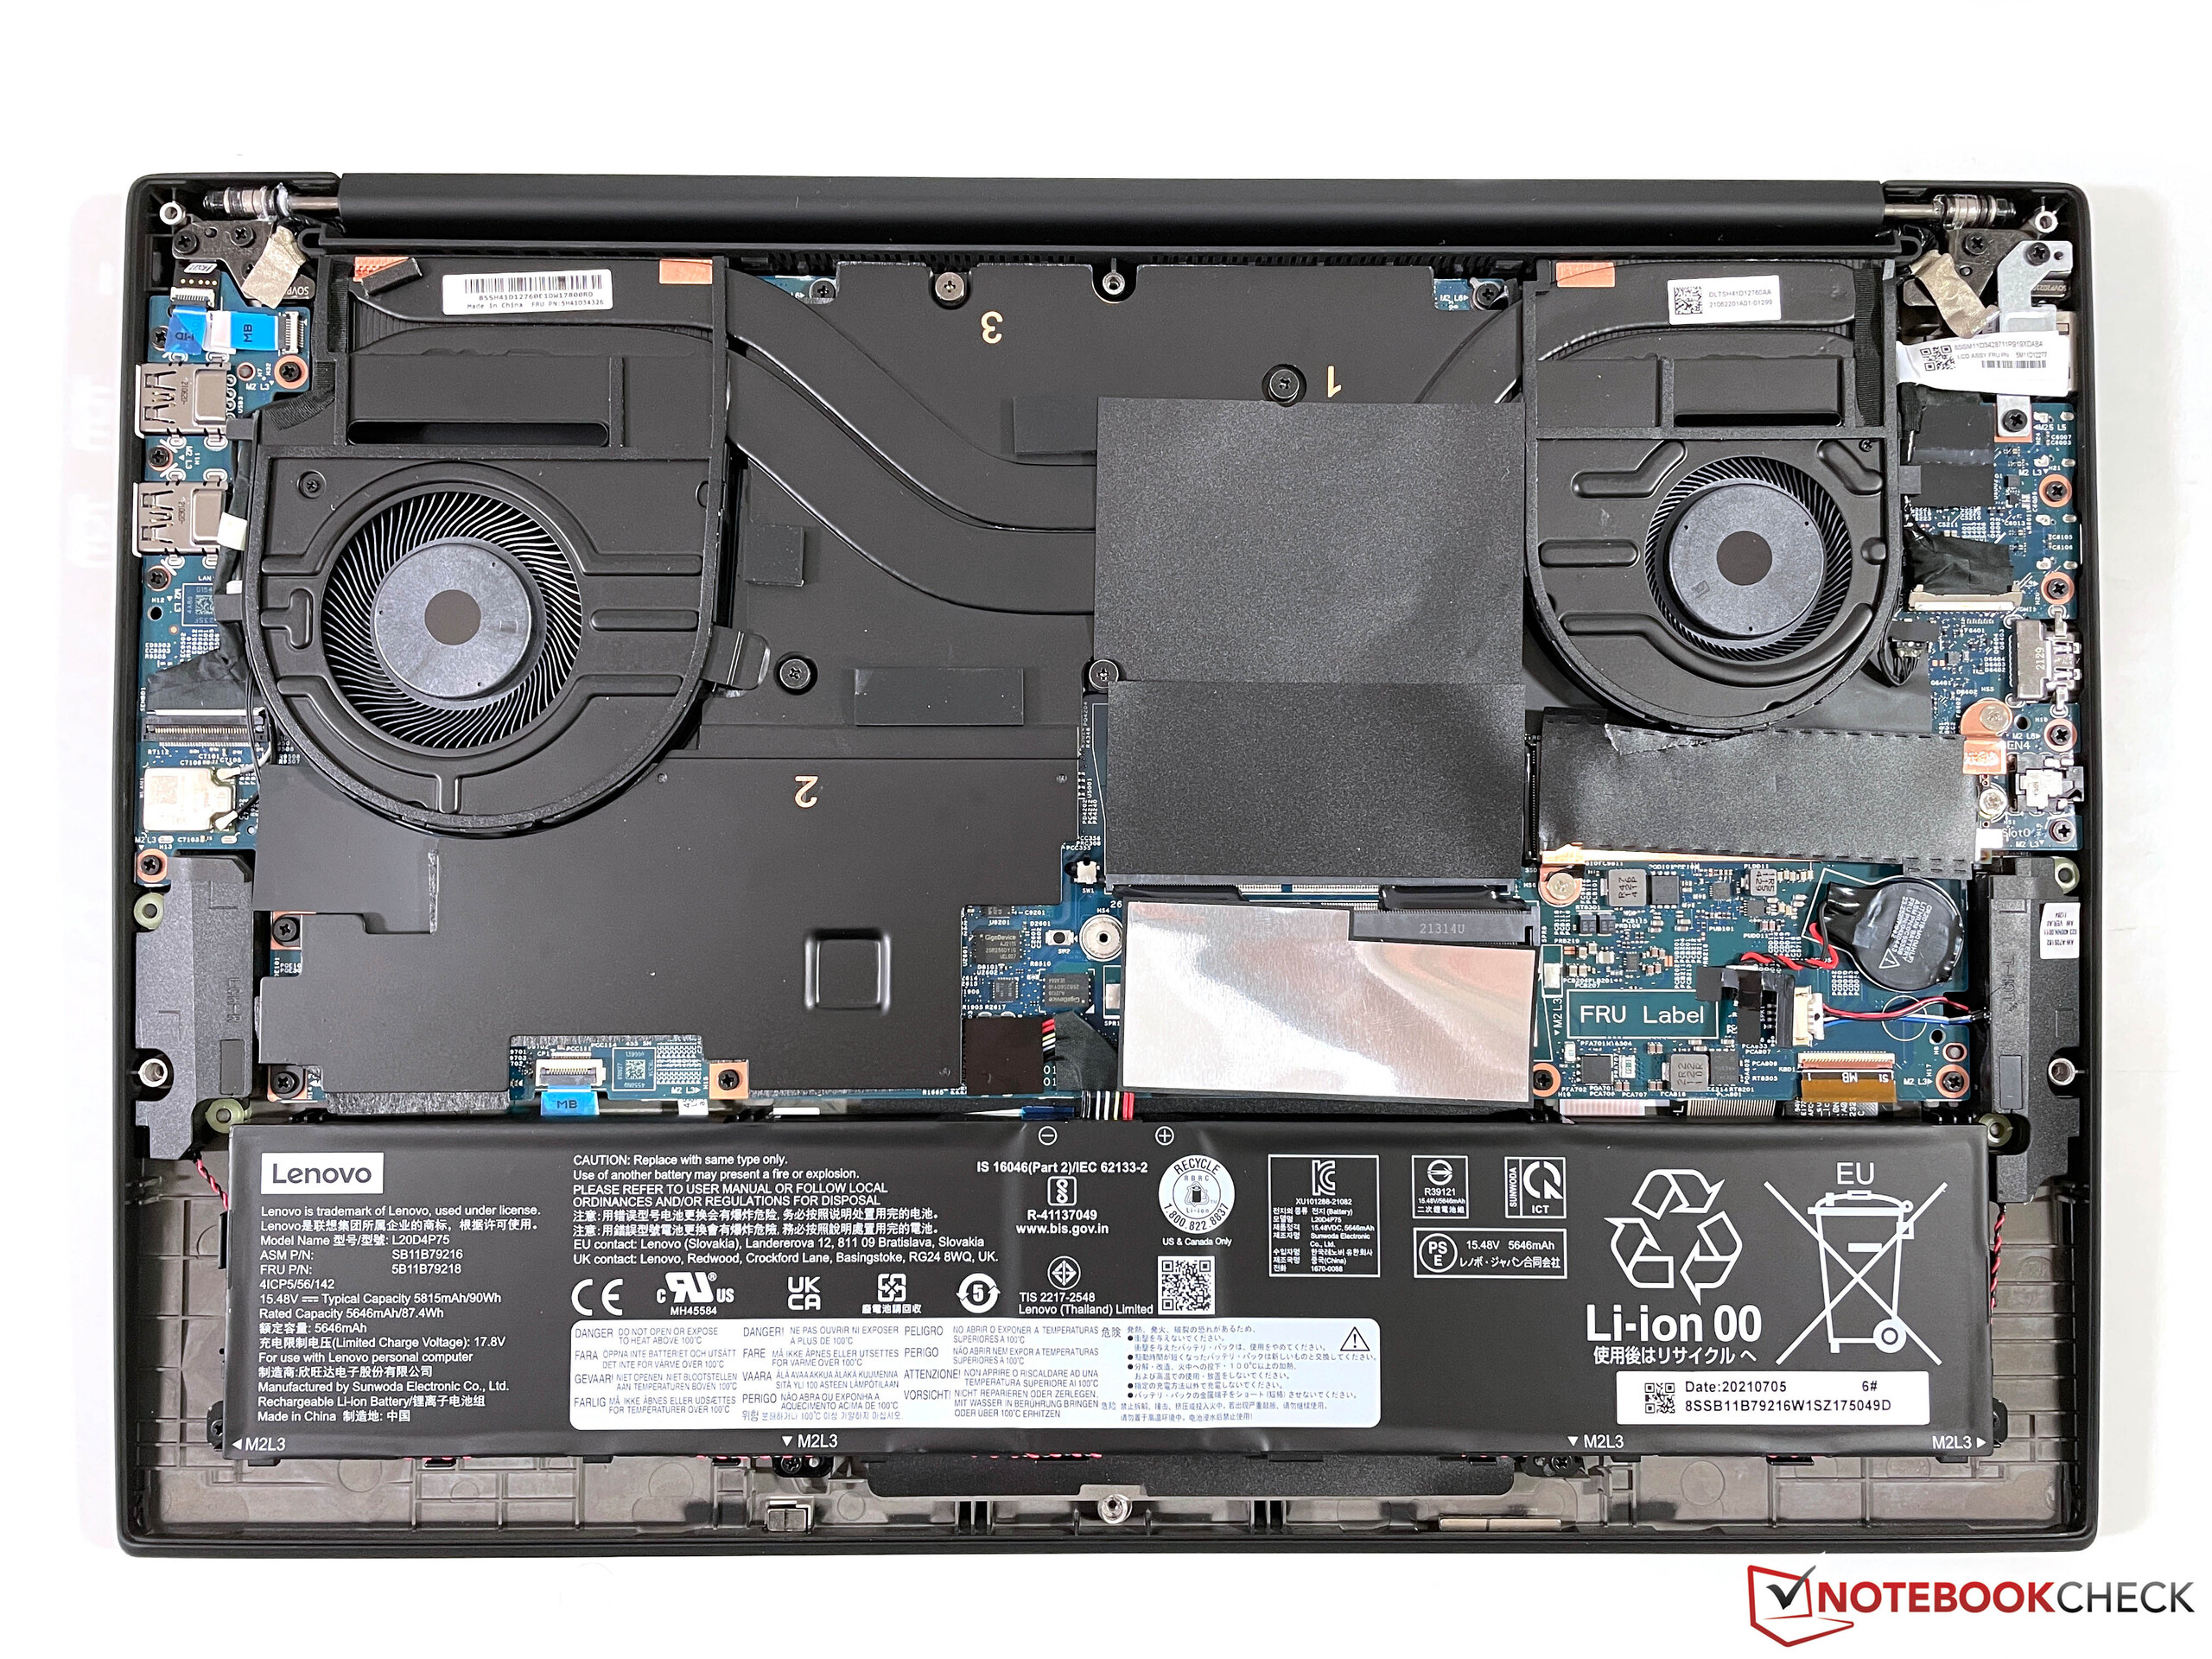
联想的第四代高端多媒体笔记本电脑也可以使用更强大的蒸汽室冷却解决方案,这允许实施更强大的图形卡。然而,由于冷却的尺寸增加,这些型号缺乏二级M.2-SSD插槽以及可选的WWAN模块;它们只适用于具有常规冷却的型号和GeForce RTX 3050 Ti.
我们已经评测过类似结构的工作站对应产品ThinkPad P1 G4配备酷睿i7处理器和Nvidia的GeForce RTX 3070现在我们来看看配备英特尔酷睿i9和GeForce RTX 3080的新X1 Extreme G4的高端规格。与RTX 3070一样,这也是90W版本的RTX 3080,所以它是市场上最慢的型号之一。我们想知道升级到Core i9和RTX 3080是否有意义。
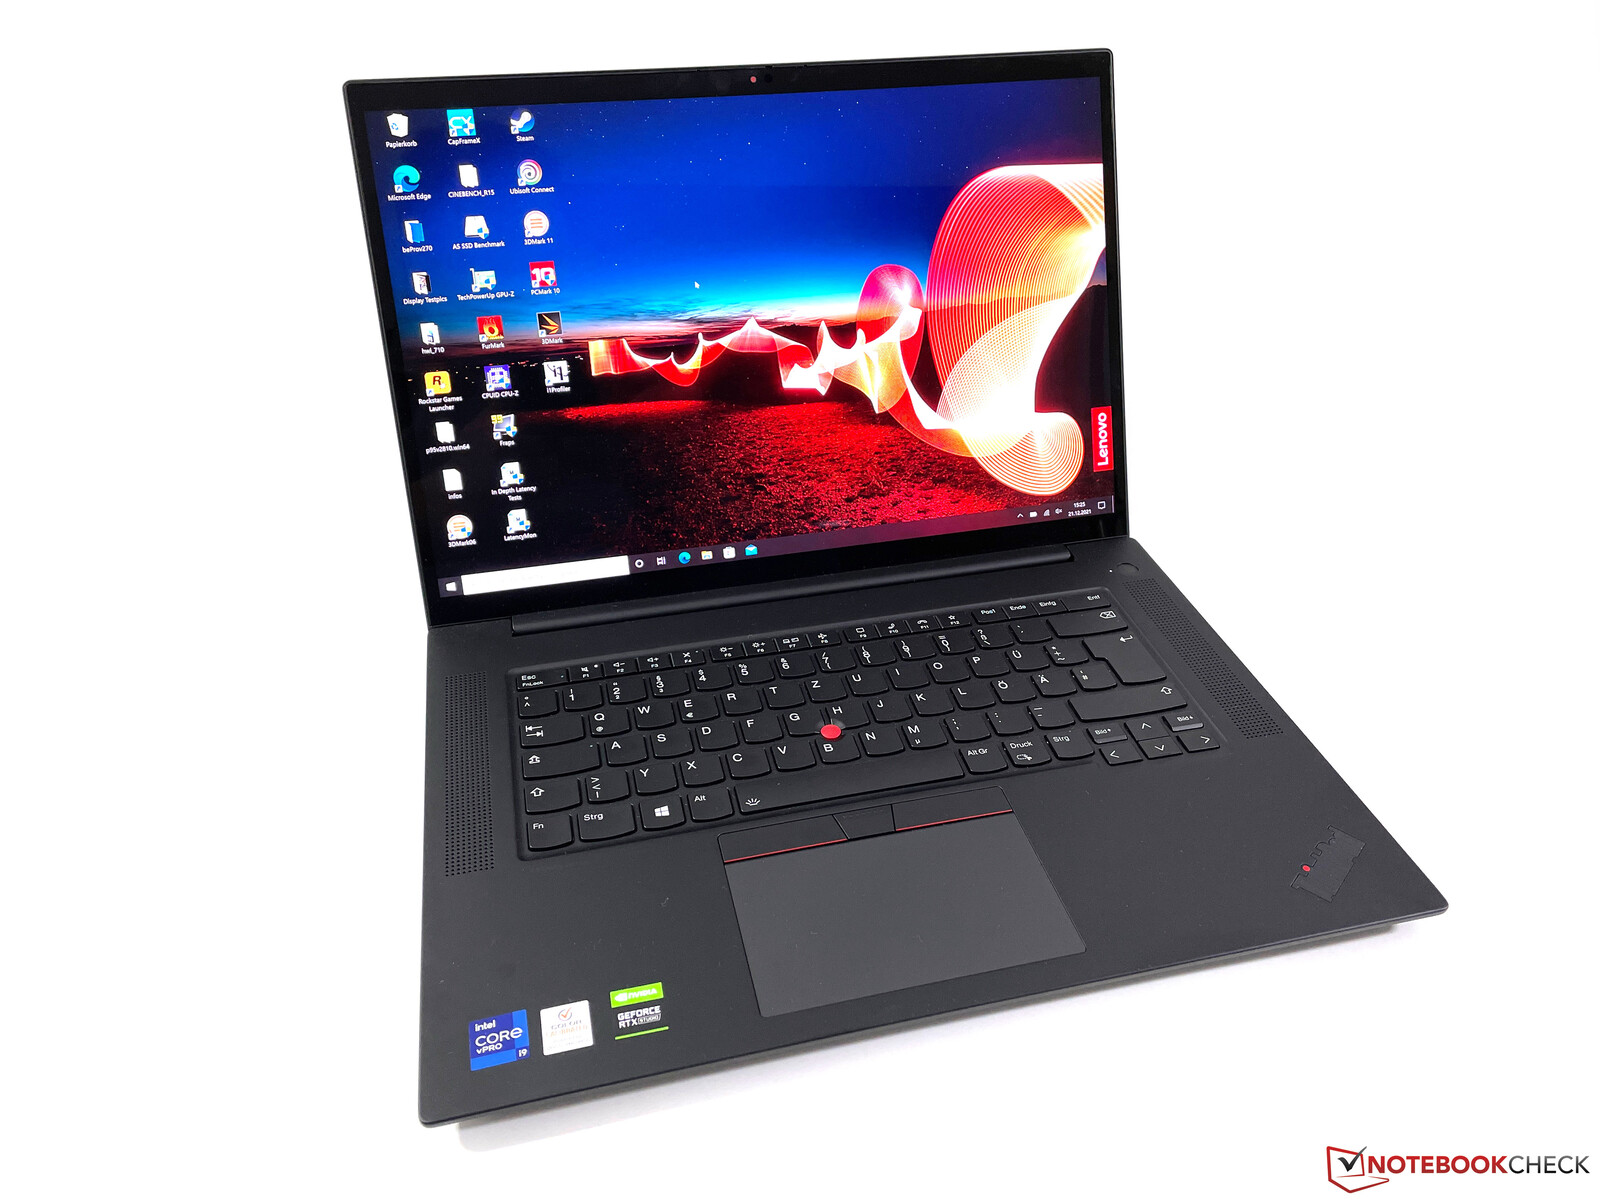
我们的测试装置配备了高分辨率的4K触摸屏,我们已经在较慢型号的X1 Extreme G4中进行了测试,所以我们将在这次审查中重点关注性能以及排放。请参阅我们对当前X1 Extreme以及ThinkPad P1型号的全面评论,以了解有关机箱、连接和输入设备的更多信息。
Possible Competitors
Rating | Date | Model | Weight | Height | Size | Resolution | Price |
|---|---|---|---|---|---|---|---|
| 88.3 % v7 (old) | 12 / 2021 | Lenovo ThinkPad X1 Extreme G4-20Y50040GE i9-11950H, GeForce RTX 3080 Laptop GPU | 1.9 kg | 18.2 mm | 16.00" | 3840x2400 | |
| 89.8 % v7 (old) | 11 / 2021 | Lenovo ThinkPad P1 G4-20Y4S0KS00 i7-11850H, GeForce RTX 3070 Laptop GPU | 2 kg | 17.7 mm | 16.00" | 3840x2400 | |
| 92.5 % v7 (old) | 11 / 2021 | Apple MacBook Pro 16 2021 M1 Max M1 Max, M1 Max 32-Core GPU | 2.2 kg | 16.8 mm | 16.20" | 3456x2234 | |
| 87.8 % v7 (old) | 08 / 2021 | HP ZBook Studio 15 G8 i9-11950H, GeForce RTX 3070 Laptop GPU | 1.9 kg | 18 mm | 15.60" | 3840x2160 | |
| 88.9 % v7 (old) | 10 / 2021 | Razer Blade 15 Advanced (Mid 2021) i7-11800H, GeForce RTX 3080 Laptop GPU | 2 kg | 16.99 mm | 15.60" | 1920x1080 | |
| 86.6 % v7 (old) | 02 / 2021 | Asus ROG Zephyrus Duo 15 SE GX551QS R9 5900HX, GeForce RTX 3080 Laptop GPU | 2.5 kg | 20.9 mm | 15.60" | 3840x2160 |

显示屏 - 带有HDR的4K触摸屏幕
我们已经分别测试了新的ThinkPad X1 Extreme G4或ThinkPad P1 G4的所有三种可用屏幕。我们的测试设备配备的是光面4K触摸屏(面板ID相同),我们已经在对 较慢的X1 Extreme G4配置.
| Lenovo ThinkPad X1 Extreme G4-20Y50040GE LP160UQ1-SPB1, IPS, 3840x2400, 16" | Lenovo ThinkPad X1 Extreme G4-20Y5CTO1WW (3050 Ti) LP160UQ1-SPB1, IPS LED, 3840x2400, 16" | Lenovo ThinkPad P1 G4-20Y4S0KS00 LP160UQ1-SPB1, IPS LED, 3840x2400, 16" | Lenovo ThinkPad P1 G4-20Y30017GE B160QAN02.M, IPS, 2560x1600, 16" | |
|---|---|---|---|---|
| Display | ||||
| Display P3 Coverage (%) | 84.3 | 85.7 | 77.3 | |
| sRGB Coverage (%) | 98.3 | 99.4 | 99.9 | |
| AdobeRGB 1998 Coverage (%) | 97.8 | 98.9 | 78.1 | |
| Response Times | ||||
| Response Time Grey 50% / Grey 80% * (ms) | 60 ? | 55.2 ? | 40.8 ? | |
| Response Time Black / White * (ms) | 42 ? | 31.2 ? | 26.4 ? | |
| PWM Frequency (Hz) | ||||
| Screen | ||||
| Brightness middle (cd/m²) | 639 | 630 | 420 | |
| Black Level * (cd/m²) | 0.47 | 0.41 | 0.3 | |
| Brightness (cd/m²) | 612 | 622 | 401 | |
| Brightness Distribution (%) | 84 | 90 | 90 | |
| Contrast (:1) | 1360 | 1537 | 1400 | |
| Colorchecker dE 2000 * | 2.2 | 2.2 | 2.5 | |
| Colorchecker dE 2000 max. * | 5.3 | 5 | 4.9 | |
| Colorchecker dE 2000 calibrated * | 1.4 | 1 | 1.6 | |
| Greyscale dE 2000 * | 1.7 | 2.7 | 3.4 | |
| Gamma | 2.31 95% | 2.26 97% | 2.24 98% | |
| CCT | 6390 102% | 6886 94% | 6479 100% | |
| Total Average (Program / Settings) |
* ... smaller is better
性能--配备Core i9和RTX 3080的X1 Extreme
审查设置
联想曾经提供额外的性能设置,这些设置可以通过Vantage应用程序获得。然而,现在有一段时间,它们被实施到常规的Windows电源设置中,这让人非常舒服。在本评论发布前不久,联想提供了一个新的BIOS版本(1.13),更新了散热设置。我们注意到在一些测试中性能略有提高,所以我们决定用新的BIOS版本重复所有的测试和测量。
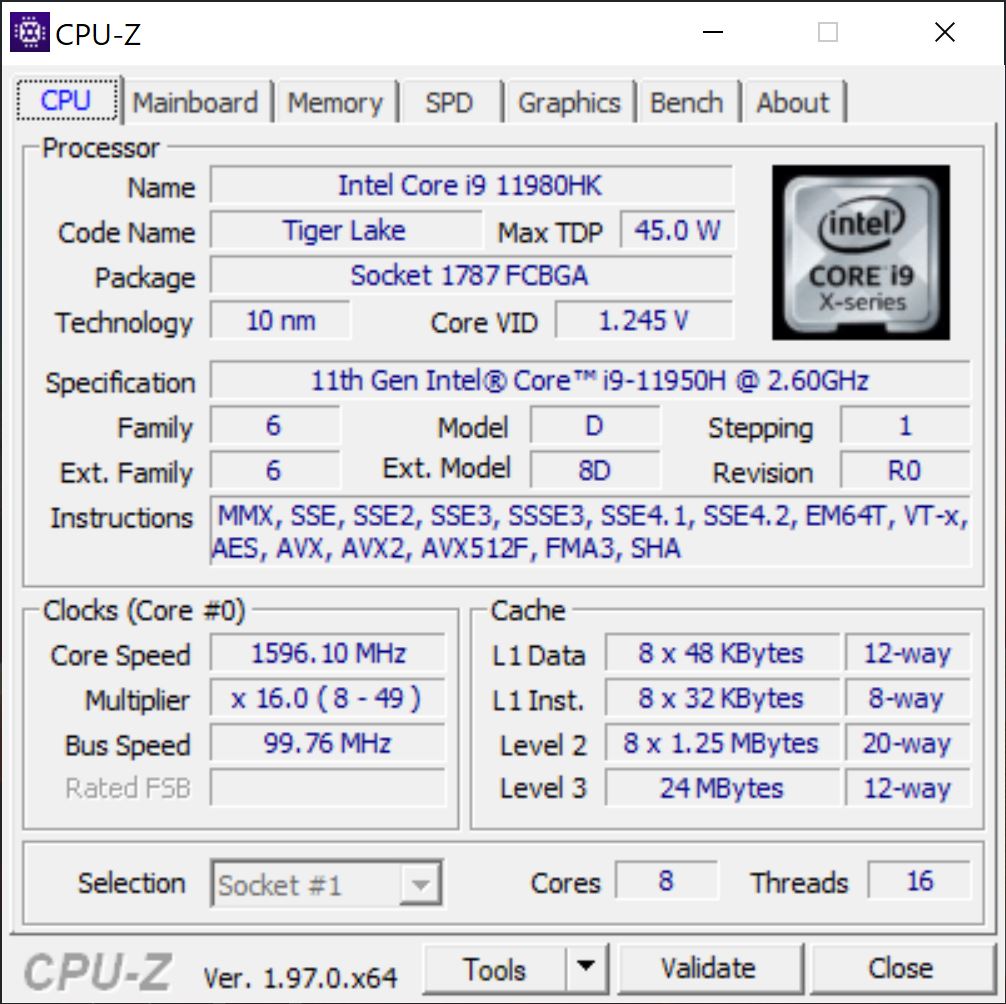
处理器
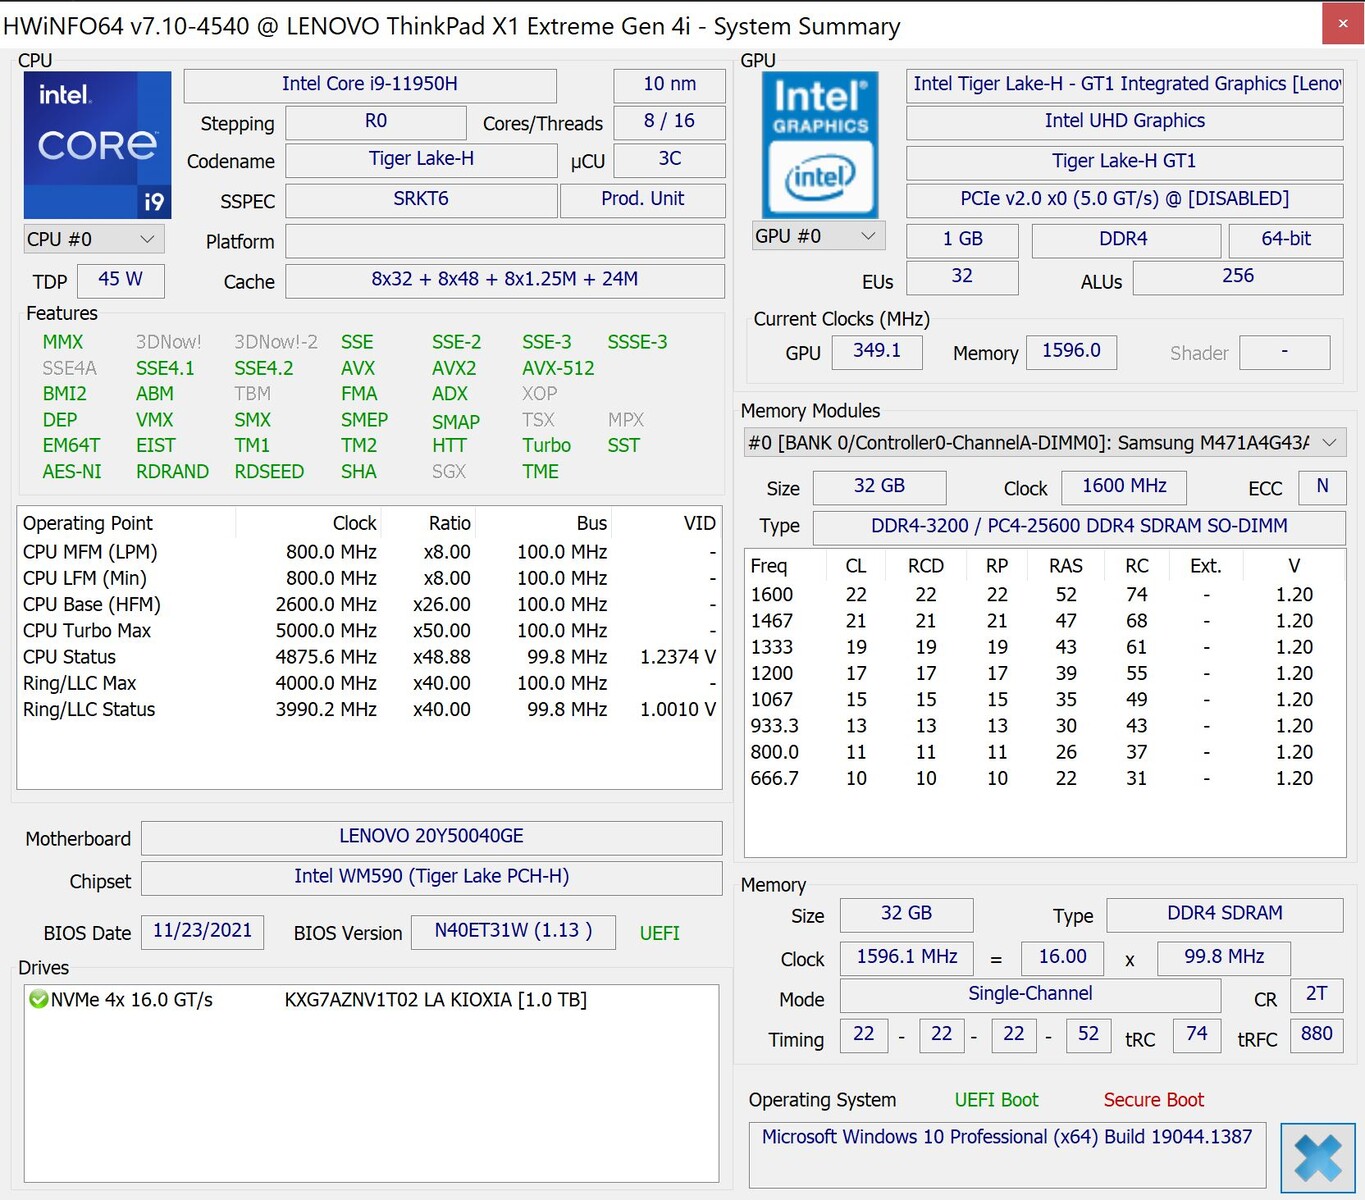
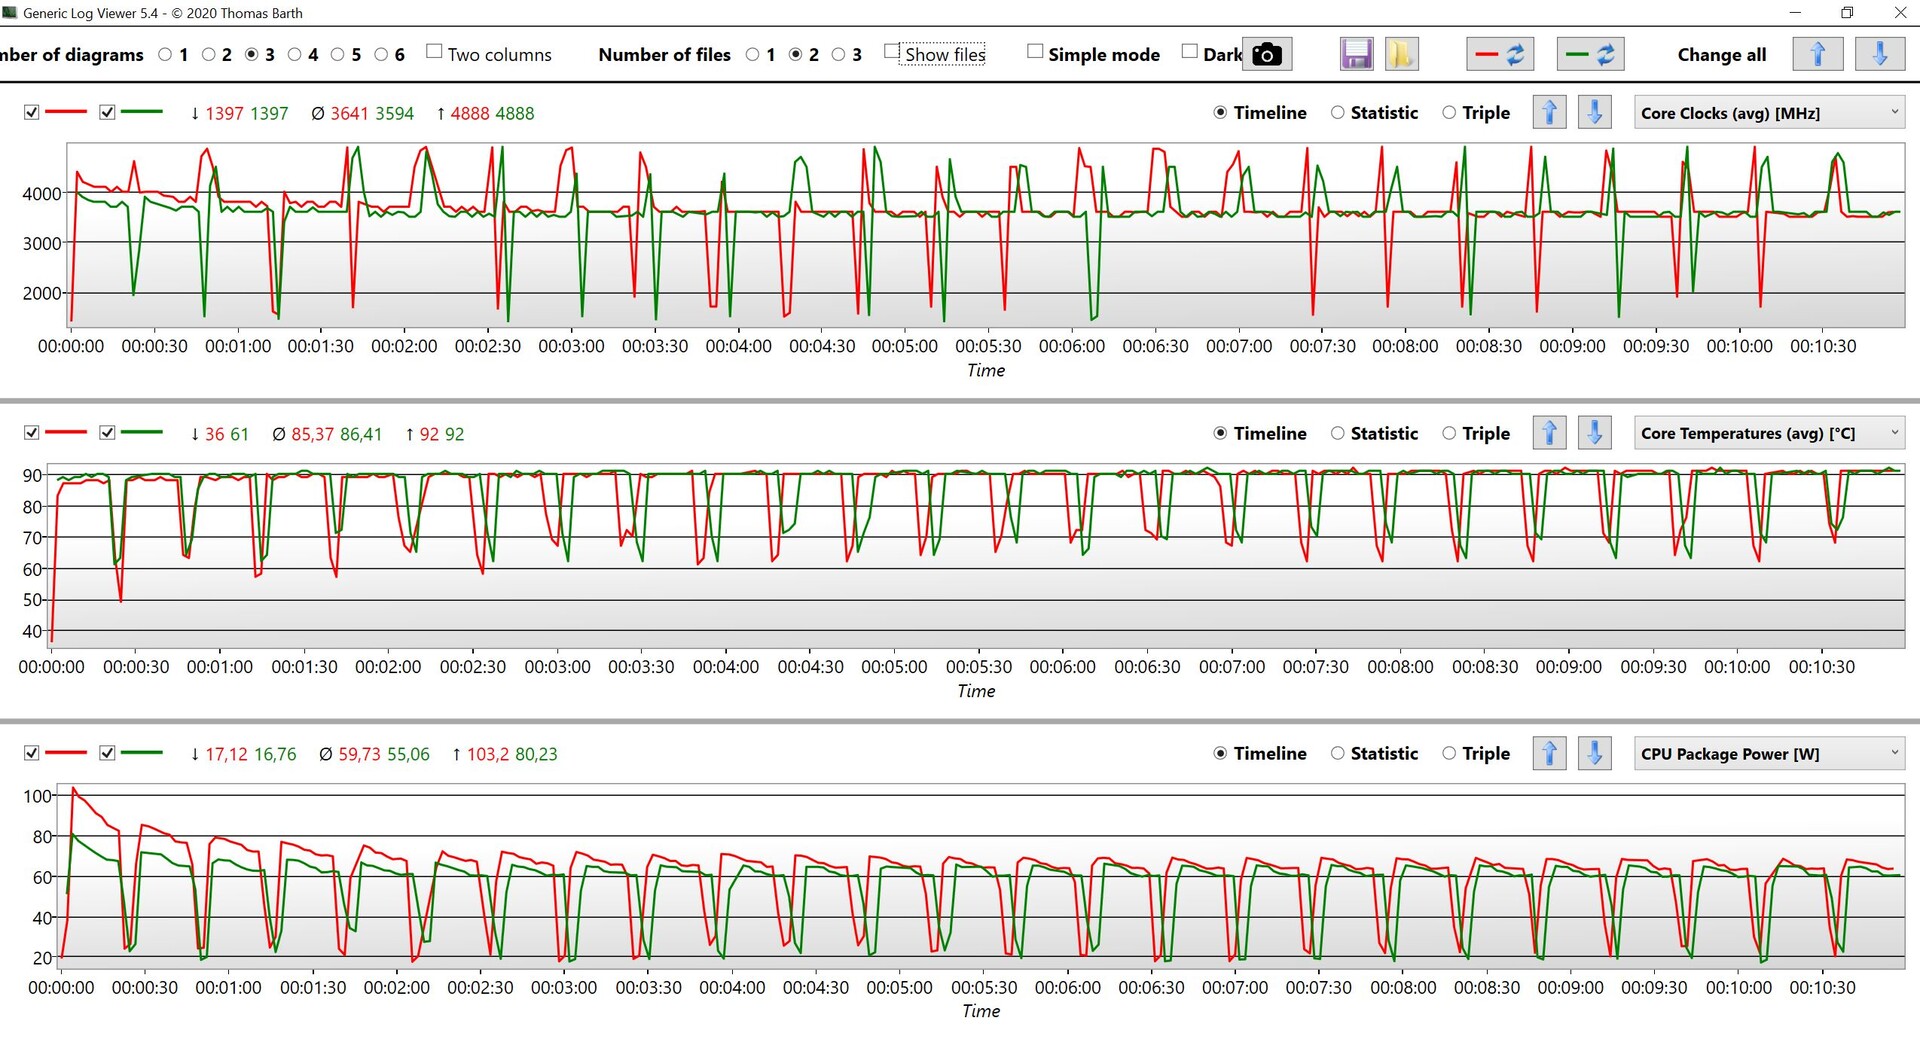
我们的测试装置配备了酷睿i9-11950H,它支持英特尔的vPro技术。该处理器在一个核心上的最高时钟可以达到5.0GHz,当你给所有核心施加压力时,最高时钟可以达到4.5GHz。在基准测试期间,我们看到一个核心的最高时钟为4.9GHz,所有8个核心的最高时钟为4.4GHz,这导致功耗为100瓦。这个数值只能维持短暂的时间,设备必须是 "冷 "的,否则最大TDP被限制在80瓦。在持续的工作负荷下,这两个数值都会迅速下降,处理器会在60W多一点的时候趋于平稳。BIOS更新到1.13版后,情况有了一些改善,之前的性能比较低。总而言之,结果还不错,但这意味着酷睿i9只在非常短的峰值负载情况下或当你给一个核心施加压力时有优势,但在持续工作负载中,它并不比所谓的慢速酷睿i7芯片快多少。
AMD的对应产品AMD Ryzen 9 5900HX中的华硕Zephyrus Duo 15在多核测试中明显更快,而且性能也没有下降(TDP @ 70W)。Apple'sM1 Pro或M1 MaxCPU在Cinebench R23等原生应用程序中也稍快,但在效率方面却遥遥领先,功耗仅为30W。
总而言之,可选的Core i9-11950H在ThinkPad X1 Extreme G4上也没有多大意义。在电池供电的情况下,TDP在35W和70W之间波动很大,所以基准测试结果也不尽相同(在1500-1670分之间@CBR15 Multi),所以如果你不在主电源上运行,你将不得不期待20-30%的性能下降。更多的CPU基准测试可在我们的 技术部分.
Cinebench R15 Multi Loop
Cinebench R23: Multi Core | Single Core
Cinebench R20: CPU (Multi Core) | CPU (Single Core)
Cinebench R15: CPU Multi 64Bit | CPU Single 64Bit
Blender: v2.79 BMW27 CPU
7-Zip 18.03: 7z b 4 | 7z b 4 -mmt1
Geekbench 5.5: Multi-Core | Single-Core
HWBOT x265 Benchmark v2.2: 4k Preset
LibreOffice : 20 Documents To PDF
R Benchmark 2.5: Overall mean
| CPU Performance rating | |
| Average of class Multimedia | |
| Asus ROG Zephyrus Duo 15 SE GX551QS | |
| Apple MacBook Pro 16 2021 M1 Max -5! | |
| Lenovo ThinkPad X1 Extreme G4-20Y50040GE -3! | |
| Lenovo ThinkPad P1 G4-20Y4S0KS00 | |
| Average Intel Core i9-11950H | |
| HP ZBook Studio 15 G8 | |
| Razer Blade 15 Advanced (Mid 2021) -2! | |
| Cinebench R23 / Multi Core | |
| Average of class Multimedia (4861 - 33362, n=74, last 2 years) | |
| Asus ROG Zephyrus Duo 15 SE GX551QS | |
| Average Intel Core i9-11950H (12048 - 13113, n=4) | |
| Apple MacBook Pro 16 2021 M1 Max | |
| Razer Blade 15 Advanced (Mid 2021) | |
| HP ZBook Studio 15 G8 | |
| Lenovo ThinkPad X1 Extreme G4-20Y50040GE | |
| Lenovo ThinkPad P1 G4-20Y4S0KS00 | |
| Cinebench R23 / Single Core | |
| Average of class Multimedia (1128 - 2459, n=66, last 2 years) | |
| Average Intel Core i9-11950H (1569 - 1633, n=4) | |
| Lenovo ThinkPad X1 Extreme G4-20Y50040GE | |
| HP ZBook Studio 15 G8 | |
| Lenovo ThinkPad P1 G4-20Y4S0KS00 | |
| Apple MacBook Pro 16 2021 M1 Max | |
| Razer Blade 15 Advanced (Mid 2021) | |
| Asus ROG Zephyrus Duo 15 SE GX551QS | |
| Cinebench R20 / CPU (Multi Core) | |
| Average of class Multimedia (1887 - 12912, n=57, last 2 years) | |
| Asus ROG Zephyrus Duo 15 SE GX551QS | |
| Razer Blade 15 Advanced (Mid 2021) | |
| Average Intel Core i9-11950H (4471 - 5000, n=4) | |
| Lenovo ThinkPad P1 G4-20Y4S0KS00 | |
| HP ZBook Studio 15 G8 | |
| Lenovo ThinkPad X1 Extreme G4-20Y50040GE | |
| Apple MacBook Pro 16 2021 M1 Max | |
| Cinebench R20 / CPU (Single Core) | |
| Average of class Multimedia (425 - 853, n=57, last 2 years) | |
| Lenovo ThinkPad X1 Extreme G4-20Y50040GE | |
| Average Intel Core i9-11950H (610 - 632, n=4) | |
| HP ZBook Studio 15 G8 | |
| Lenovo ThinkPad P1 G4-20Y4S0KS00 | |
| Razer Blade 15 Advanced (Mid 2021) | |
| Asus ROG Zephyrus Duo 15 SE GX551QS | |
| Apple MacBook Pro 16 2021 M1 Max | |
| Cinebench R15 / CPU Multi 64Bit | |
| Average of class Multimedia (856 - 5224, n=61, last 2 years) | |
| Asus ROG Zephyrus Duo 15 SE GX551QS | |
| Lenovo ThinkPad X1 Extreme G4-20Y50040GE | |
| Lenovo ThinkPad X1 Extreme G4-20Y50040GE | |
| Lenovo ThinkPad P1 G4-20Y4S0KS00 | |
| Average Intel Core i9-11950H (1827 - 2130, n=5) | |
| Razer Blade 15 Advanced (Mid 2021) | |
| HP ZBook Studio 15 G8 | |
| Apple MacBook Pro 16 2021 M1 Max | |
| Cinebench R15 / CPU Single 64Bit | |
| Average of class Multimedia (184.8 - 326, n=59, last 2 years) | |
| Lenovo ThinkPad X1 Extreme G4-20Y50040GE | |
| Average Intel Core i9-11950H (236 - 249, n=4) | |
| HP ZBook Studio 15 G8 | |
| Asus ROG Zephyrus Duo 15 SE GX551QS | |
| Lenovo ThinkPad P1 G4-20Y4S0KS00 | |
| Razer Blade 15 Advanced (Mid 2021) | |
| Apple MacBook Pro 16 2021 M1 Max | |
| Blender / v2.79 BMW27 CPU | |
| Razer Blade 15 Advanced (Mid 2021) | |
| Lenovo ThinkPad P1 G4-20Y4S0KS00 | |
| HP ZBook Studio 15 G8 | |
| Average Intel Core i9-11950H (244 - 261, n=3) | |
| Average of class Multimedia (100 - 557, n=58, last 2 years) | |
| Asus ROG Zephyrus Duo 15 SE GX551QS | |
| Apple MacBook Pro 16 2021 M1 Max | |
| 7-Zip 18.03 / 7z b 4 | |
| Asus ROG Zephyrus Duo 15 SE GX551QS | |
| Average of class Multimedia (26062 - 130368, n=55, last 2 years) | |
| Razer Blade 15 Advanced (Mid 2021) | |
| Lenovo ThinkPad P1 G4-20Y4S0KS00 | |
| Average Intel Core i9-11950H (50050 - 51402, n=3) | |
| HP ZBook Studio 15 G8 | |
| 7-Zip 18.03 / 7z b 4 -mmt1 | |
| Average of class Multimedia (3666 - 7545, n=56, last 2 years) | |
| Average Intel Core i9-11950H (5755 - 5919, n=3) | |
| HP ZBook Studio 15 G8 | |
| Lenovo ThinkPad P1 G4-20Y4S0KS00 | |
| Asus ROG Zephyrus Duo 15 SE GX551QS | |
| Razer Blade 15 Advanced (Mid 2021) | |
| Geekbench 5.5 / Multi-Core | |
| Average of class Multimedia (4652 - 20422, n=56, last 2 years) | |
| Apple MacBook Pro 16 2021 M1 Max | |
| Lenovo ThinkPad P1 G4-20Y4S0KS00 | |
| Asus ROG Zephyrus Duo 15 SE GX551QS | |
| Lenovo ThinkPad X1 Extreme G4-20Y50040GE | |
| Average Intel Core i9-11950H (7286 - 8152, n=3) | |
| HP ZBook Studio 15 G8 | |
| Geekbench 5.5 / Single-Core | |
| Average of class Multimedia (805 - 2974, n=56, last 2 years) | |
| Apple MacBook Pro 16 2021 M1 Max | |
| HP ZBook Studio 15 G8 | |
| Lenovo ThinkPad P1 G4-20Y4S0KS00 | |
| Average Intel Core i9-11950H (1623 - 1702, n=3) | |
| Lenovo ThinkPad X1 Extreme G4-20Y50040GE | |
| Asus ROG Zephyrus Duo 15 SE GX551QS | |
| HWBOT x265 Benchmark v2.2 / 4k Preset | |
| Average of class Multimedia (5.26 - 36.1, n=56, last 2 years) | |
| Asus ROG Zephyrus Duo 15 SE GX551QS | |
| Razer Blade 15 Advanced (Mid 2021) | |
| HP ZBook Studio 15 G8 | |
| Lenovo ThinkPad P1 G4-20Y4S0KS00 | |
| Average Intel Core i9-11950H (13.8 - 14.5, n=4) | |
| Lenovo ThinkPad X1 Extreme G4-20Y50040GE | |
| LibreOffice / 20 Documents To PDF | |
| Average of class Multimedia (23.9 - 146.7, n=57, last 2 years) | |
| HP ZBook Studio 15 G8 | |
| Average Intel Core i9-11950H (38.6 - 53.2, n=4) | |
| Razer Blade 15 Advanced (Mid 2021) | |
| Lenovo ThinkPad P1 G4-20Y4S0KS00 | |
| Asus ROG Zephyrus Duo 15 SE GX551QS | |
| Lenovo ThinkPad X1 Extreme G4-20Y50040GE | |
| R Benchmark 2.5 / Overall mean | |
| HP ZBook Studio 15 G8 | |
| Razer Blade 15 Advanced (Mid 2021) | |
| Lenovo ThinkPad X1 Extreme G4-20Y50040GE | |
| Lenovo ThinkPad P1 G4-20Y4S0KS00 | |
| Average Intel Core i9-11950H (0.521 - 0.551, n=4) | |
| Asus ROG Zephyrus Duo 15 SE GX551QS | |
| Average of class Multimedia (0.3604 - 0.947, n=56, last 2 years) | |
* ... smaller is better
AIDA64: FP32 Ray-Trace | FPU Julia | CPU SHA3 | CPU Queen | FPU SinJulia | FPU Mandel | CPU AES | CPU ZLib | FP64 Ray-Trace | CPU PhotoWorxx
| Performance rating | |
| Average of class Multimedia | |
| Lenovo ThinkPad X1 Extreme G4-20Y50040GE | |
| Average Intel Core i9-11950H | |
| HP ZBook Studio 15 G8 | |
| Lenovo ThinkPad P1 G4-20Y4S0KS00 -9! | |
| Razer Blade 15 Advanced (Mid 2021) -9! | |
| AIDA64 / FP32 Ray-Trace | |
| Average of class Multimedia (2214 - 50388, n=53, last 2 years) | |
| Lenovo ThinkPad X1 Extreme G4-20Y50040GE | |
| Average Intel Core i9-11950H (14407 - 15655, n=4) | |
| HP ZBook Studio 15 G8 | |
| AIDA64 / FPU Julia | |
| Average of class Multimedia (12867 - 201874, n=54, last 2 years) | |
| Lenovo ThinkPad X1 Extreme G4-20Y50040GE | |
| Average Intel Core i9-11950H (60286 - 63537, n=4) | |
| HP ZBook Studio 15 G8 | |
| AIDA64 / CPU SHA3 | |
| Lenovo ThinkPad X1 Extreme G4-20Y50040GE | |
| Average Intel Core i9-11950H (4003 - 4254, n=4) | |
| HP ZBook Studio 15 G8 | |
| Average of class Multimedia (626 - 8623, n=54, last 2 years) | |
| AIDA64 / CPU Queen | |
| HP ZBook Studio 15 G8 | |
| Average Intel Core i9-11950H (97840 - 98772, n=4) | |
| Lenovo ThinkPad X1 Extreme G4-20Y50040GE | |
| Average of class Multimedia (13483 - 181505, n=41, last 2 years) | |
| AIDA64 / FPU SinJulia | |
| Lenovo ThinkPad X1 Extreme G4-20Y50040GE | |
| Average Intel Core i9-11950H (9828 - 10462, n=4) | |
| HP ZBook Studio 15 G8 | |
| Average of class Multimedia (886 - 28794, n=54, last 2 years) | |
| AIDA64 / FPU Mandel | |
| Average of class Multimedia (6395 - 105740, n=53, last 2 years) | |
| Lenovo ThinkPad X1 Extreme G4-20Y50040GE | |
| Average Intel Core i9-11950H (35735 - 38450, n=4) | |
| HP ZBook Studio 15 G8 | |
| AIDA64 / CPU AES | |
| Lenovo ThinkPad X1 Extreme G4-20Y50040GE | |
| Average Intel Core i9-11950H (83095 - 147249, n=4) | |
| HP ZBook Studio 15 G8 | |
| Average of class Multimedia (8171 - 126790, n=54, last 2 years) | |
| AIDA64 / CPU ZLib | |
| Average of class Multimedia (143.8 - 2022, n=54, last 2 years) | |
| Lenovo ThinkPad X1 Extreme G4-20Y50040GE | |
| Average Intel Core i9-11950H (756 - 820, n=4) | |
| HP ZBook Studio 15 G8 | |
| Razer Blade 15 Advanced (Mid 2021) | |
| Lenovo ThinkPad P1 G4-20Y4S0KS00 | |
| AIDA64 / FP64 Ray-Trace | |
| Average of class Multimedia (1014 - 26875, n=54, last 2 years) | |
| Lenovo ThinkPad X1 Extreme G4-20Y50040GE | |
| Average Intel Core i9-11950H (7871 - 8549, n=4) | |
| HP ZBook Studio 15 G8 | |
| AIDA64 / CPU PhotoWorxx | |
| Average of class Multimedia (8187 - 88154, n=54, last 2 years) | |
| HP ZBook Studio 15 G8 | |
| Average Intel Core i9-11950H (12933 - 26370, n=4) | |
| Lenovo ThinkPad X1 Extreme G4-20Y50040GE | |
系统性能
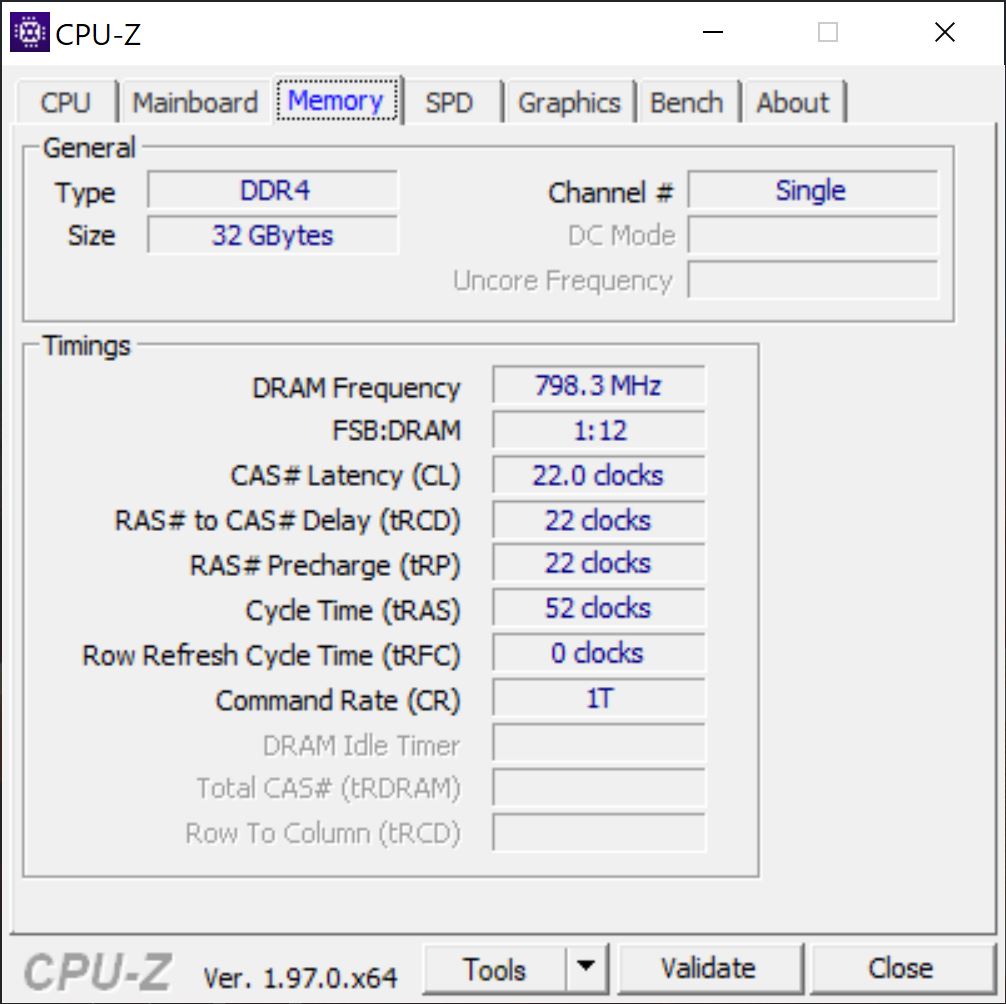
总的来说,系统性能非常好;从主观上看,该系统反应非常灵敏,并能管理高基准分数。然而,它与ThinkPad P1 G4我们测试了使用常规Core i7和RTX 3070的ThinkPad P1 G4。内存性能应该也有影响,因为你确实得到了32GB,但只有一个单通道配置的模块。这也解释了在AIDA的内存基准测试中的相对较低性能。
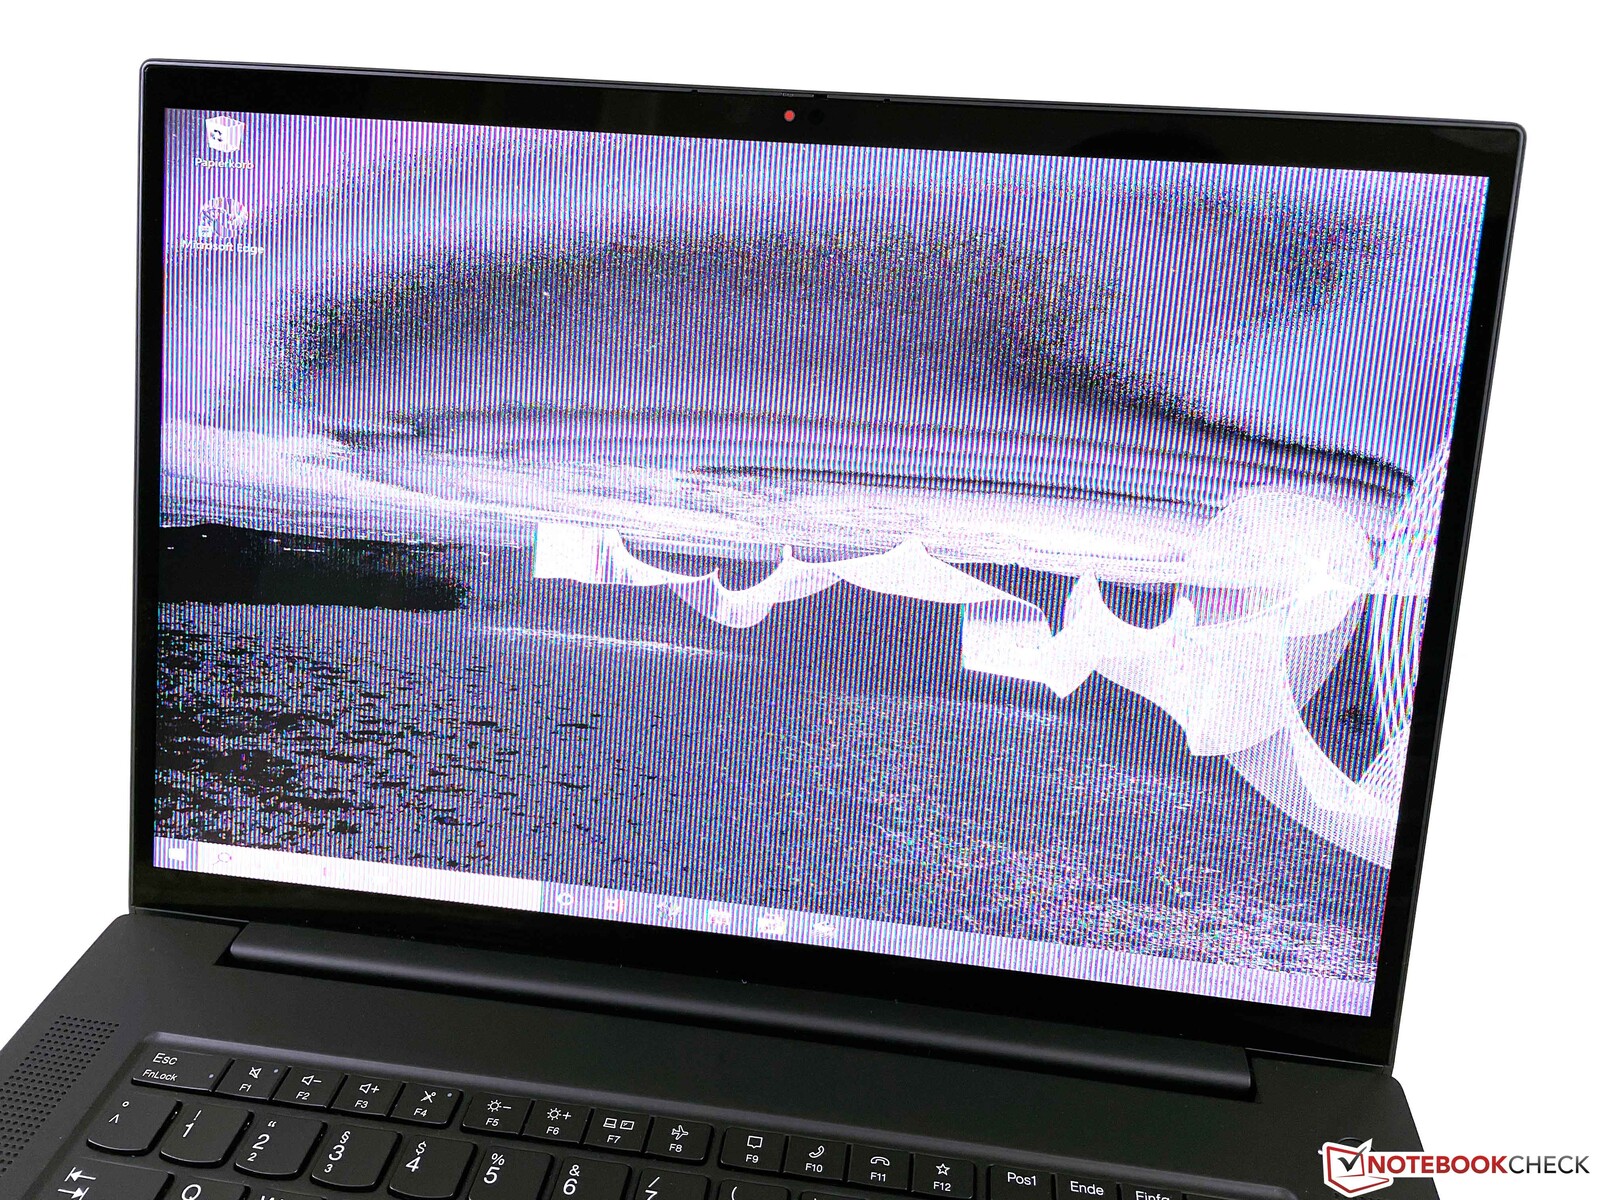
与我们之前测试的X1 Extreme G4/P1 G4型号类似,当设备从待机状态唤醒时,会出现严重的图形问题,有时甚至在你启动3D应用程序或连接外部显示器时也会出现这种问题。这将需要重新启动设备,而且似乎与iGPU驱动程序有关。现在摆脱这个问题的唯一方法是在BIOS中停用混合图形。联想应该尽快提供这个问题的解决方案,因为有了这个问题,你就不能真正可靠地使用笔记本电脑。
CrossMark: Overall | Productivity | Creativity | Responsiveness
| PCMark 10 / Score | |
| Average of class Multimedia (4325 - 10386, n=52, last 2 years) | |
| Razer Blade 15 Advanced (Mid 2021) | |
| Lenovo ThinkPad P1 G4-20Y4S0KS00 | |
| Lenovo ThinkPad X1 Extreme G4-20Y50040GE | |
| Average Intel Core i9-11950H, NVIDIA GeForce RTX 3080 Laptop GPU (n=1) | |
| Asus ROG Zephyrus Duo 15 SE GX551QS | |
| HP ZBook Studio 15 G8 | |
| PCMark 10 / Essentials | |
| Razer Blade 15 Advanced (Mid 2021) | |
| Lenovo ThinkPad P1 G4-20Y4S0KS00 | |
| Lenovo ThinkPad X1 Extreme G4-20Y50040GE | |
| Average Intel Core i9-11950H, NVIDIA GeForce RTX 3080 Laptop GPU (n=1) | |
| Average of class Multimedia (8025 - 11664, n=51, last 2 years) | |
| Asus ROG Zephyrus Duo 15 SE GX551QS | |
| HP ZBook Studio 15 G8 | |
| PCMark 10 / Productivity | |
| Average of class Multimedia (7323 - 18233, n=51, last 2 years) | |
| Razer Blade 15 Advanced (Mid 2021) | |
| Lenovo ThinkPad P1 G4-20Y4S0KS00 | |
| Lenovo ThinkPad X1 Extreme G4-20Y50040GE | |
| Average Intel Core i9-11950H, NVIDIA GeForce RTX 3080 Laptop GPU (n=1) | |
| Asus ROG Zephyrus Duo 15 SE GX551QS | |
| HP ZBook Studio 15 G8 | |
| PCMark 10 / Digital Content Creation | |
| Razer Blade 15 Advanced (Mid 2021) | |
| Average of class Multimedia (3651 - 16240, n=51, last 2 years) | |
| Lenovo ThinkPad P1 G4-20Y4S0KS00 | |
| HP ZBook Studio 15 G8 | |
| Asus ROG Zephyrus Duo 15 SE GX551QS | |
| Lenovo ThinkPad X1 Extreme G4-20Y50040GE | |
| Average Intel Core i9-11950H, NVIDIA GeForce RTX 3080 Laptop GPU (n=1) | |
| CrossMark / Overall | |
| Average of class Multimedia (866 - 2728, n=60, last 2 years) | |
| Lenovo ThinkPad X1 Extreme G4-20Y50040GE | |
| Average Intel Core i9-11950H, NVIDIA GeForce RTX 3080 Laptop GPU (n=1) | |
| Lenovo ThinkPad P1 G4-20Y4S0KS00 | |
| Apple MacBook Pro 16 2021 M1 Max | |
| CrossMark / Productivity | |
| Average of class Multimedia (931 - 2489, n=60, last 2 years) | |
| Lenovo ThinkPad X1 Extreme G4-20Y50040GE | |
| Average Intel Core i9-11950H, NVIDIA GeForce RTX 3080 Laptop GPU (n=1) | |
| Lenovo ThinkPad P1 G4-20Y4S0KS00 | |
| Apple MacBook Pro 16 2021 M1 Max | |
| CrossMark / Creativity | |
| Average of class Multimedia (907 - 3465, n=60, last 2 years) | |
| Apple MacBook Pro 16 2021 M1 Max | |
| Lenovo ThinkPad P1 G4-20Y4S0KS00 | |
| Lenovo ThinkPad X1 Extreme G4-20Y50040GE | |
| Average Intel Core i9-11950H, NVIDIA GeForce RTX 3080 Laptop GPU (n=1) | |
| CrossMark / Responsiveness | |
| Lenovo ThinkPad X1 Extreme G4-20Y50040GE | |
| Average Intel Core i9-11950H, NVIDIA GeForce RTX 3080 Laptop GPU (n=1) | |
| Average of class Multimedia (605 - 2024, n=60, last 2 years) | |
| Lenovo ThinkPad P1 G4-20Y4S0KS00 | |
| Apple MacBook Pro 16 2021 M1 Max | |
| PCMark 10 Score | 6919 points | |
Help | ||
| AIDA64 / Memory Copy | |
| Average of class Multimedia (11299 - 132135, n=54, last 2 years) | |
| HP ZBook Studio 15 G8 | |
| Average Intel Core i9-11950H (25952 - 48565, n=4) | |
| Lenovo ThinkPad X1 Extreme G4-20Y50040GE | |
| AIDA64 / Memory Read | |
| Average of class Multimedia (11624 - 174586, n=54, last 2 years) | |
| HP ZBook Studio 15 G8 | |
| Average Intel Core i9-11950H (26064 - 47921, n=4) | |
| Lenovo ThinkPad X1 Extreme G4-20Y50040GE | |
| AIDA64 / Memory Write | |
| Average of class Multimedia (11755 - 134998, n=54, last 2 years) | |
| HP ZBook Studio 15 G8 | |
| Average Intel Core i9-11950H (22302 - 46818, n=4) | |
| Lenovo ThinkPad X1 Extreme G4-20Y50040GE | |
| AIDA64 / Memory Latency | |
| Average of class Multimedia (7 - 535, n=53, last 2 years) | |
| Lenovo ThinkPad X1 Extreme G4-20Y50040GE | |
| Average Intel Core i9-11950H (82.6 - 88.6, n=4) | |
| HP ZBook Studio 15 G8 | |
| Razer Blade 15 Advanced (Mid 2021) | |
| Lenovo ThinkPad P1 G4-20Y4S0KS00 | |
* ... smaller is better
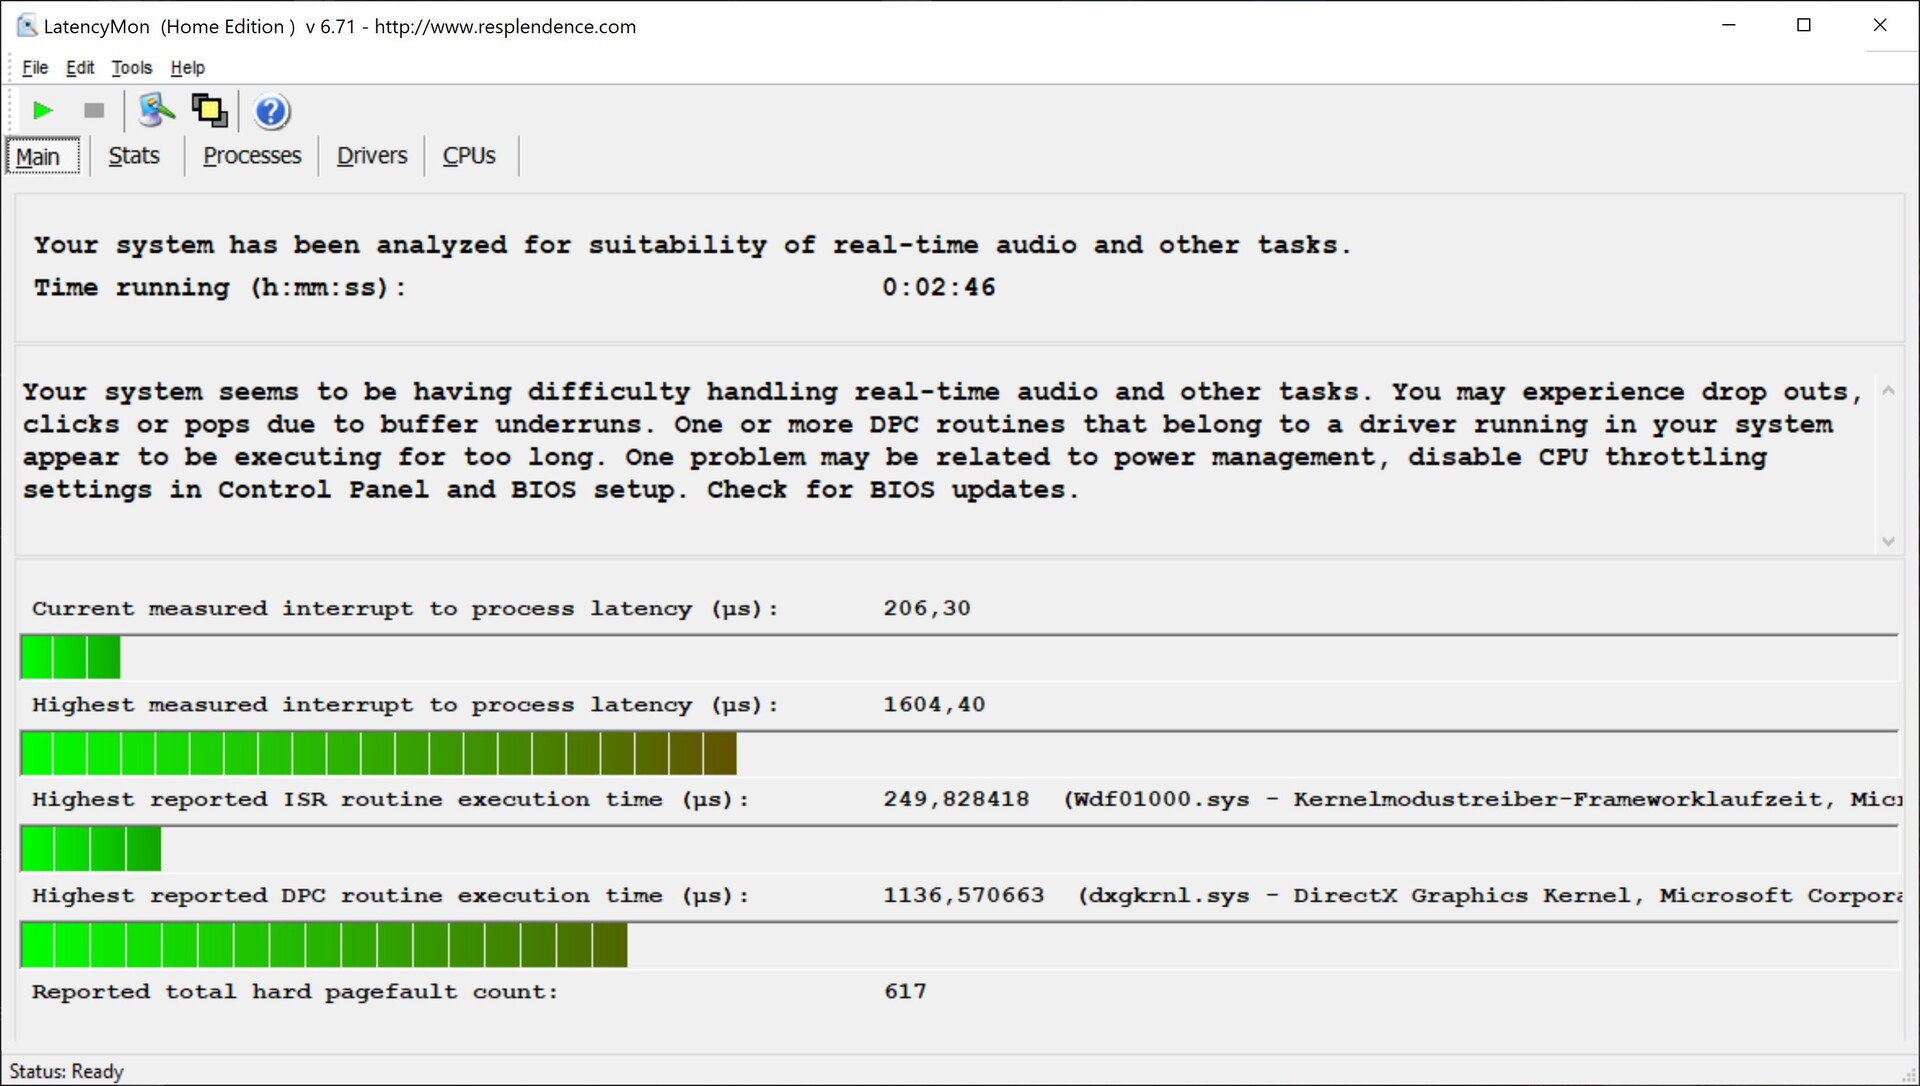
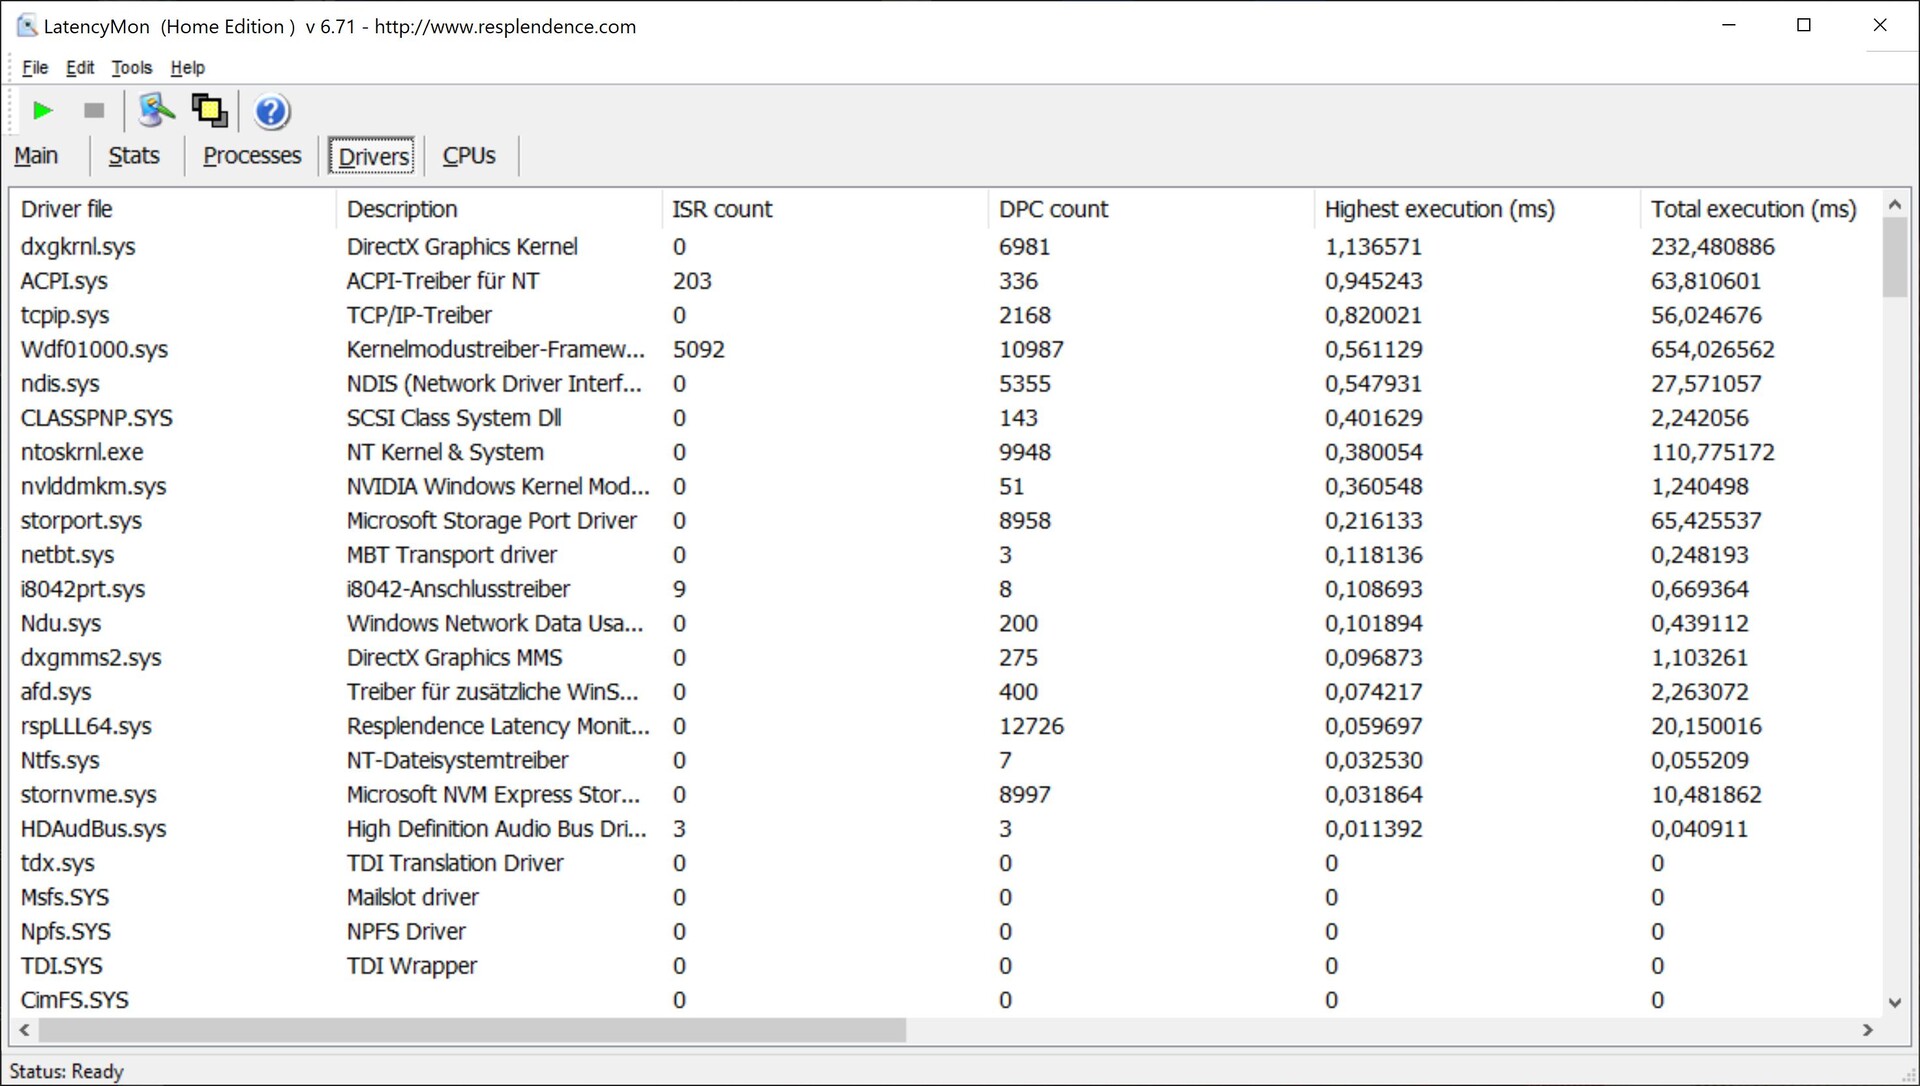
DPC延时
我们的BIOS 1.13版本的测试装置在我们的标准化测试中存在延迟增加的问题,这意味着它不适合实时音频应用。
| DPC Latencies / LatencyMon - interrupt to process latency (max), Web, Youtube, Prime95 | |
| Razer Blade 15 Advanced (Mid 2021) | |
| Lenovo ThinkPad X1 Extreme G4-20Y50040GE | |
| HP ZBook Studio 15 G8 | |
| Asus ROG Zephyrus Duo 15 SE GX551QS | |
| Lenovo ThinkPad P1 G4-20Y4S0KS00 | |
* ... smaller is better
存储设备
采用更强大的蒸汽室冷却解决方案的型号只有一个M.2-2280插槽,用于SSD,但它至少支持快速的PCIe 4.0接口,我们设备中的Kioxia XG7可以利用新标准。它提供了1TB的存储容量(初始设置后有895GB),并能管理超过6GB/s的非常高的传输速率。更多的SSD基准测试可在 这里.

* ... smaller is better
Disk Throttling: DiskSpd Read Loop, Queue Depth 8
GPU性能
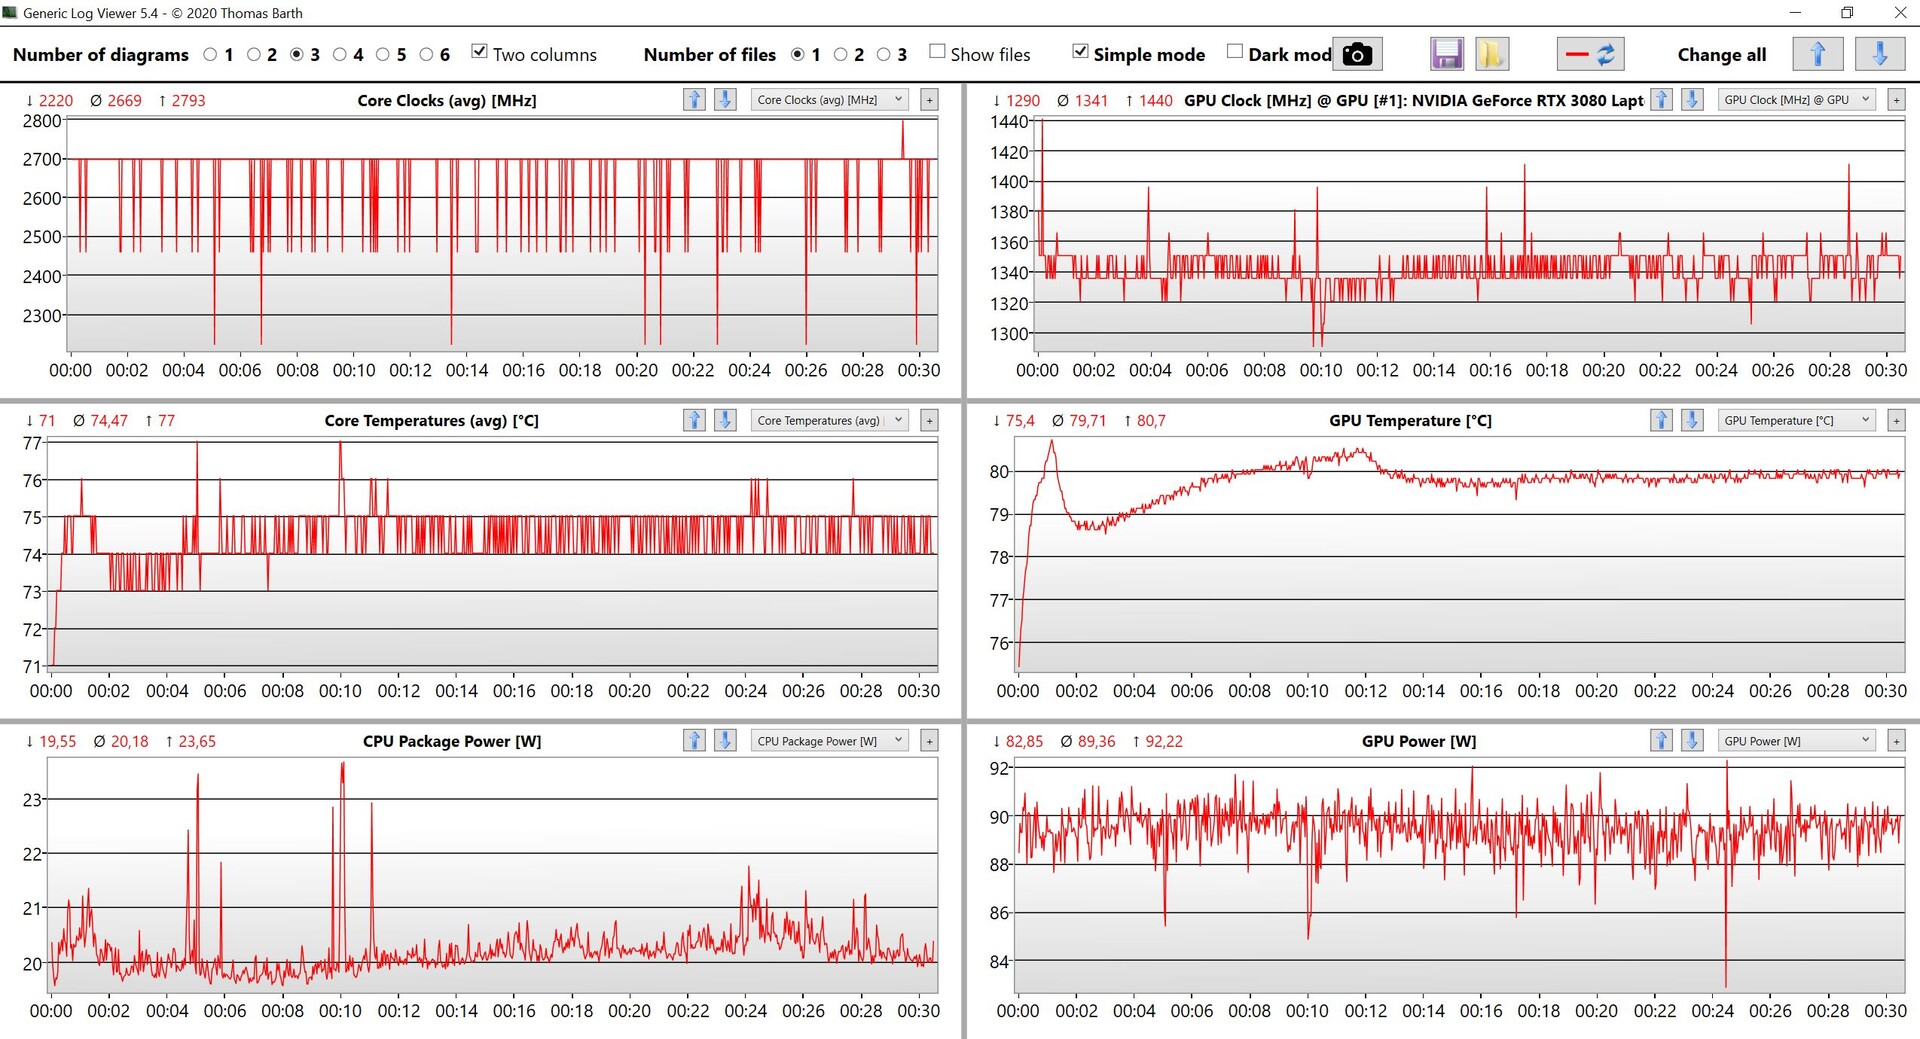
虽然第三代ThinkPad X1 Extreme只能使用中端GPU,但由于采用了蒸气室冷却,联想现在能够实现更强大的Nvidia RTX GPU。最快的选择是RTX 3080,这也是我们的评测单元里面的。然而,它是90W模型,因此是最慢的RTX 3080版本之一。我们在基准测试中看到最大核心时钟为1425 MHz。这比我们在工作站对应产品ThinkPad P1 G4中测试的RTX 3070快不了多少,但RTX 3080有16GB VRAM的优势。
基准测试显示,X1 Extreme中的RTX 3080比该GPU的平均结果慢约15%-20%,它实际上只比ThinkPad P1 G4中的RTX 3070略快。这意味着RTX 3080只有在你能利用更大的VRAM时才有意义。
在持续的工作负荷下,GPU的性能是稳定的,该设备很容易通过Time Spy 压力测试。在电池供电的情况下,GPU被限制在55W,这导致了约45%的性能赤字。RTX 3080的更多基准测试列在我们的 技术部分.
| 3DMark 11 Performance | 24326 points | |
| 3DMark Fire Strike Score | 15666 points | |
| 3DMark Time Spy Score | 8195 points | |
Help | ||
游戏性能
在X1 Extreme G4上进行游戏显然是可能的,但其性能再次没有真正达到人们对RTX 3080而整体性能与RTX 3070在ThinkPad P1 G4上的表现非常相似。ThinkPad P1 G4.在大多数游戏中,其性能仍可轻松满足最大设置。尽管有4K屏幕,但我们经常无法在许多游戏中选择4K分辨率(16:9),所以这些结果都没有。在较长的时间里,游戏性能是稳定的,但在电池电量上下降了~40%(50 vs. 85 fps @Witcher 3 Ultra)。你可以找到更多的游戏基准测试 这里.
| Cyberpunk 2077 1.0 - 1920x1080 Ultra Preset | |
| Average NVIDIA GeForce RTX 3080 Laptop GPU (52.9 - 84.3, n=9) | |
| Lenovo ThinkPad X1 Extreme G4-20Y50040GE | |
| Lenovo ThinkPad P1 G4-20Y30017GE | |
Witcher 3 FPS Diagram
| low | med. | high | ultra | QHD | 4K | |
|---|---|---|---|---|---|---|
| The Witcher 3 (2015) | 371 | 261 | 177 | 85.1 | ||
| Dota 2 Reborn (2015) | 133.5 | 111 | 108.1 | 98 | 55.2 | |
| Final Fantasy XV Benchmark (2018) | 123 | 97 | 78.2 | 61.6 | 37.5 | |
| X-Plane 11.11 (2018) | 112 | 90.8 | 74 | 39.9 | ||
| Far Cry 5 (2018) | 129 | 108 | 104 | 93 | 86 | |
| Cyberpunk 2077 1.0 (2020) | 105 | 86 | 72 | 61 | 40 | |
| Far Cry 6 (2021) | 101 | 73 | 65 | 55 |
排放--ThinkPad的冷却功能已达到极限
系统噪音
主观地讲,在BIOS更新后,X1 Extreme G4的风扇会更快地启动,你几乎总是能在空转时听到安静的杂音,至少在你使用Windows的最佳性能设置时是这样。我们建议你在执行日常任务时将性能滑块向左移动一个设置(更好的性能),此时设备明显更安静。在游戏和负载情况下,风扇的声音非常大,分别为47和52 dB(A),但风扇的噪音并不高。因此,x1 Extreme G4是我们比较组中最吵的设备之一,与Razer Blade 15以及华硕Zephyrus Duo 15,尽管它们配备了更快版本的RTX 3080。
我们注意到RTX 3080偶尔发出的线圈啸叫,而当iGPU处于激活状态时则没有这种情况。
Noise level
| Idle |
| 24.7 / 24.7 / 28.1 dB(A) |
| Load |
| 42.5 / 52.1 dB(A) |
 | ||
30 dB silent 40 dB(A) audible 50 dB(A) loud |
||
min: | ||
| Lenovo ThinkPad X1 Extreme G4-20Y50040GE GeForce RTX 3080 Laptop GPU, i9-11950H, Kioxia XG7 KXG7AZNV1T02 | Lenovo ThinkPad P1 G4-20Y4S0KS00 GeForce RTX 3070 Laptop GPU, i7-11850H, Samsung PM9A1 MZVL21T0HCLR | Apple MacBook Pro 16 2021 M1 Max M1 Max 32-Core GPU, M1 Max, Apple SSD AP2048R | HP ZBook Studio 15 G8 GeForce RTX 3070 Laptop GPU, i9-11950H, Samsung PM981a MZVLB2T0HALB | Razer Blade 15 Advanced (Mid 2021) GeForce RTX 3080 Laptop GPU, i7-11800H, SSSTC CA6-8D1024 | Asus ROG Zephyrus Duo 15 SE GX551QS GeForce RTX 3080 Laptop GPU, R9 5900HX, 2x Samsung PM981a MZVLB1T0HBLR (RAID 0) | |
|---|---|---|---|---|---|---|
| Noise | 4% | 7% | 2% | 1% | 1% | |
| off / environment * (dB) | 24.7 | 23.8 4% | 24.2 2% | 23.5 5% | 25.1 -2% | 27 -9% |
| Idle Minimum * (dB) | 24.7 | 23.8 4% | 24.2 2% | 25.3 -2% | 25.3 -2% | 27 -9% |
| Idle Average * (dB) | 24.7 | 23.8 4% | 24.2 2% | 25.3 -2% | 25.3 -2% | 27 -9% |
| Idle Maximum * (dB) | 28.1 | 28.3 -1% | 24.2 14% | 25.3 10% | 25.3 10% | 27 4% |
| Load Average * (dB) | 42.5 | 38.6 9% | 42.9 -1% | 41.2 3% | 42 1% | 31.2 27% |
| Witcher 3 ultra * (dB) | 46.4 | 47.4 -2% | 39.5 15% | 49.4 -6% | 45.6 2% | 44.5 4% |
| Load Maximum * (dB) | 52.1 | 47.4 9% | 42.9 18% | 49.4 5% | 51.6 1% | 53.5 -3% |
* ... smaller is better
温度
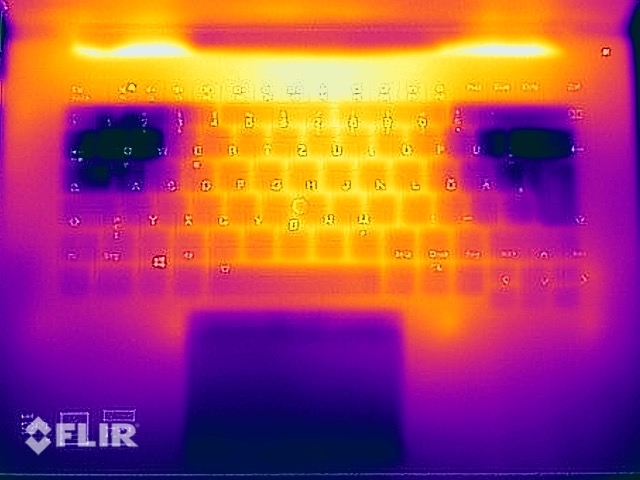
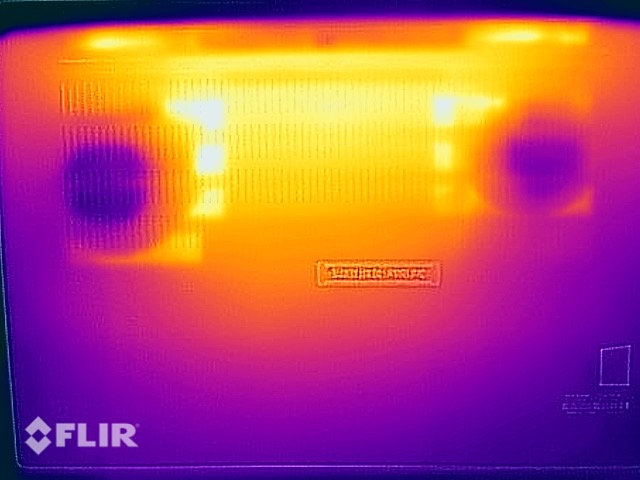
X1 Extreme G4在日常工作和轻度工作负荷中没有任何温度问题,但在游戏时或真正给机器施加压力时,不应该把它放在腿上。我们可以在底部的热点处测量到超过50℃的温度,在游戏过程中温度甚至更高一些,在游戏过程中,风扇速度稍低一些。
在压力测试中,该系统偏向于专用显卡。它的工作功率为80W,而处理器几乎立即下降到只有30W,并保持在这个水平。
(-) The maximum temperature on the upper side is 51.4 °C / 125 F, compared to the average of 36.8 °C / 98 F, ranging from 21 to 71 °C for the class Multimedia.
(-) The bottom heats up to a maximum of 55.9 °C / 133 F, compared to the average of 39.1 °C / 102 F
(+) In idle usage, the average temperature for the upper side is 26.4 °C / 80 F, compared to the device average of 31.3 °C / 88 F.
(-) Playing The Witcher 3, the average temperature for the upper side is 43.6 °C / 110 F, compared to the device average of 31.3 °C / 88 F.
(-) The palmrests and touchpad can get very hot to the touch with a maximum of 41.3 °C / 106.3 F.
(-) The average temperature of the palmrest area of similar devices was 28.7 °C / 83.7 F (-12.6 °C / -22.6 F).
| Lenovo ThinkPad X1 Extreme G4-20Y50040GE Intel Core i9-11950H, NVIDIA GeForce RTX 3080 Laptop GPU | Lenovo ThinkPad P1 G4-20Y4S0KS00 Intel Core i7-11850H, NVIDIA GeForce RTX 3070 Laptop GPU | Apple MacBook Pro 16 2021 M1 Max Apple M1 Max, Apple M1 Max 32-Core GPU | HP ZBook Studio 15 G8 Intel Core i9-11950H, NVIDIA GeForce RTX 3070 Laptop GPU | Razer Blade 15 Advanced (Mid 2021) Intel Core i7-11800H, NVIDIA GeForce RTX 3080 Laptop GPU | Asus ROG Zephyrus Duo 15 SE GX551QS AMD Ryzen 9 5900HX, NVIDIA GeForce RTX 3080 Laptop GPU | |
|---|---|---|---|---|---|---|
| Heat | -1% | 18% | 2% | -13% | 5% | |
| Maximum Upper Side * (°C) | 51.4 | 51 1% | 42.3 18% | 49 5% | 51 1% | 33.4 35% |
| Maximum Bottom * (°C) | 55.9 | 53.5 4% | 41.7 25% | 54.2 3% | 52 7% | 45 19% |
| Idle Upper Side * (°C) | 27.2 | 28.8 -6% | 23.9 12% | 26.2 4% | 35.2 -29% | 30.8 -13% |
| Idle Bottom * (°C) | 28.8 | 29.3 -2% | 23.9 17% | 30.2 -5% | 37.8 -31% | 35.4 -23% |
* ... smaller is better
能源管理--4K面板成本电池运行时间
消耗功率
我们的消耗量测量值与评测单位的ThinkPad P1 G4相比略高。ThinkPad P1 G4但总的来说,基本上处于同一水平,这再次表明组件的功率限制相同。最大消耗为170瓦,在压力测试期间达到约155瓦,因此附带的230瓦电源适配器是完全足够的,甚至有足够的空间为电池充电。然而,它也是一块相当大的砖头,将近900克。我们注意到,待机消耗超过3瓦特,这太多了,你可能应该把笔记本关上一晚上。
| Off / Standby | |
| Idle | |
| Load |
|
Key:
min: | |
| Lenovo ThinkPad X1 Extreme G4-20Y50040GE i9-11950H, GeForce RTX 3080 Laptop GPU, Kioxia XG7 KXG7AZNV1T02, IPS, 3840x2400, 16" | Lenovo ThinkPad P1 G4-20Y4S0KS00 i7-11850H, GeForce RTX 3070 Laptop GPU, Samsung PM9A1 MZVL21T0HCLR, IPS LED, 3840x2400, 16" | Apple MacBook Pro 16 2021 M1 Max M1 Max, M1 Max 32-Core GPU, Apple SSD AP2048R, Mini-LED, 3456x2234, 16.2" | HP ZBook Studio 15 G8 i9-11950H, GeForce RTX 3070 Laptop GPU, Samsung PM981a MZVLB2T0HALB, OLED, 3840x2160, 15.6" | Razer Blade 15 Advanced (Mid 2021) i7-11800H, GeForce RTX 3080 Laptop GPU, SSSTC CA6-8D1024, IPS, 1920x1080, 15.6" | Asus ROG Zephyrus Duo 15 SE GX551QS R9 5900HX, GeForce RTX 3080 Laptop GPU, 2x Samsung PM981a MZVLB1T0HBLR (RAID 0), IPS, 3840x2160, 15.6" | Average NVIDIA GeForce RTX 3080 Laptop GPU | Average of class Multimedia | |
|---|---|---|---|---|---|---|---|---|
| Power Consumption | -0% | 20% | -18% | -49% | -46% | -51% | 37% | |
| Idle Minimum * (Watt) | 12.3 | 8.1 34% | 5.4 56% | 11 11% | 19.5 -59% | 16.3 -33% | 19.8 ? -61% | 5.66 ? 54% |
| Idle Average * (Watt) | 22.8 | 20.2 11% | 16.4 28% | 18.8 18% | 23.3 -2% | 22.5 1% | 24.3 ? -7% | 10.2 ? 55% |
| Idle Maximum * (Watt) | 13.9 | 21.9 -58% | 16.7 -20% | 31.7 -128% | 40.1 -188% | 39.9 -187% | 33.3 ? -140% | 12.5 ? 10% |
| Load Average * (Watt) | 95.4 | 88.2 8% | 94 1% | 105.2 -10% | 98.9 -4% | 116.1 -22% | 108.1 ? -13% | 65.2 ? 32% |
| Witcher 3 ultra * (Watt) | 154 | 149 3% | 104 32% | 148 4% | 174 -13% | 181.2 -18% | ||
| Load Maximum * (Watt) | 170.7 | 170.6 -0% | 135 21% | 171.8 -1% | 214 -25% | 196.7 -15% | 230 ? -35% | 113.5 ? 34% |
* ... smaller is better
Energieaufnahme Witcher 3 / Stresstest
Power Consumption external monitor
电池运行时间
电池运行时间明显受到4K面板高耗电的影响,其结果再次与ThinkPad P1 G4相当。即使将亮度调整到150尼特,你也很难获得超过7小时的时间。最大面板亮度下的Wi-Fi运行时间甚至下降到只有4小时。然而,竞争对手并没有好多少,只有Apple MacBook Pro 16在电池上持续的时间明显更长。
如果你由于前面提到的问题而停用混合图形,只使用Nvidia GPU,你将得到更短的电池运行时间。在150尼特的Wi-Fi测试中,使用dGPU只能运行2.5小时。
| Lenovo ThinkPad X1 Extreme G4-20Y50040GE i9-11950H, GeForce RTX 3080 Laptop GPU, 90 Wh | Lenovo ThinkPad P1 G4-20Y4S0KS00 i7-11850H, GeForce RTX 3070 Laptop GPU, 90 Wh | Apple MacBook Pro 16 2021 M1 Max M1 Max, M1 Max 32-Core GPU, 99.6 Wh | HP ZBook Studio 15 G8 i9-11950H, GeForce RTX 3070 Laptop GPU, 83 Wh | Razer Blade 15 Advanced (Mid 2021) i7-11800H, GeForce RTX 3080 Laptop GPU, 80 Wh | Asus ROG Zephyrus Duo 15 SE GX551QS R9 5900HX, GeForce RTX 3080 Laptop GPU, 90 Wh | Lenovo ThinkPad P1 G4-20Y30017GE i7-11800H, T1200 Laptop GPU, 90 Wh | Average of class Multimedia | |
|---|---|---|---|---|---|---|---|---|
| Battery runtime | 5% | 88% | 28% | -13% | -7% | 33% | 93% | |
| H.264 (h) | 6.9 | 7.2 4% | 17 146% | 9 30% | 17.1 ? 148% | |||
| WiFi v1.3 (h) | 6.8 | 7 3% | 14.9 119% | 6.2 -9% | 5.9 -13% | 5.3 -22% | 9 32% | 12.2 ? 79% |
| Load (h) | 1.1 | 1.2 9% | 1.1 0% | 1.8 64% | 1.2 9% | 1.5 36% | 1.664 ? 51% | |
| Reader / Idle (h) | 12.9 | 6.8 | 24.9 ? |
Pros
Cons
结论 - ThinkPad X1 Extreme G4仍有问题
我们不得不以这样一个事实开始我们的评判:我们非常惊讶联想在我们对工作站对应产品进行评测近两个月后还没有修复图形错误的问题。ThinkPad P1 G4当你想使用这台笔记本电脑时,这实在是非常令人讨厌。你被迫在设备处于待机状态后重新启动,而且当你使用3D应用程序时可能会出现问题。现在唯一的解决办法是在BIOS中停用iGPU,但这显然会影响功耗和电池运行时间。联想应该尽快解决这个问题。
两款产品都不是酷睿i9-11950H,也没有GeForce RTX 3080在X1 Extreme G4的情况下,真正令人信服。性能还不错,但与Core i7-11850H相比,其结果几乎没有好转。酷睿i7-11850H和GeForce RTX 3070(具有相同的功率限制)相比,ThinkPad P1 G4的性能并不差。冷却方案绝对是这里的限制因素。
无论是酷睿i9 CPU,还是RTX 3080 GPU都没有留下好印象,因为与酷睿i7和RTX 3070相比,性能优势只是微不足道。然而,更大的问题是图形问题,即使在两个月后,联想也没有解决这个问题。
4K触摸屏,我们已经在ThinkPad X1 Extreme G4的不太强大的配置中进行了审查,它消耗了大量的电力,影响了电池运行时间。我们没有从90瓦时的电池中获得超过7小时的时间,当你使用全面板亮度时,甚至更少。如果你需要更长的电池运行时间,你应该选择默认的WQHD屏幕。
得益于快速的显卡,这一代的ThinkPad X1 Extreme G4明显地将自己提升到了一个新的高度。戴尔XPS 15,后者只提供了GeForce RTX 3050 Ti(RTX 3060在更大的XPS 17).内容创作者绝对应该看一下新的AppleMacBook Pro 16,它在某些方面比X1 Extreme G4有优势。我们将在另一篇文章中仔细研究这两款高端多媒体笔记本电脑的差异。这款Razer Blade 15也是一个很好的对手,它有一个稍快的RTX 3080GPU,但在专业环境中,它绝对是一个比较明显的例子。
由于严重的图形问题,经常迫使用户重启机器(这很烦人,也很费时间),我们目前不能推荐ThinkPad x1 Extreme G4。如果你对该设备感兴趣,你应该等到联想提供解决方案,否则你将不会对该设备感到满意。这个问题没有体现在最后的评分中。
价格和可用性
新款ThinkPad X1 Extreme G4的供应量仍然有限。你可以在联想的网上商店建立自己的模型我们的测试设备售价约为6100美元,但目前自动折扣后的售价约为3500美元。
Lenovo ThinkPad X1 Extreme G4-20Y50040GE
- 12/22/2021 v7 (old)
Andreas Osthoff
Price comparison

