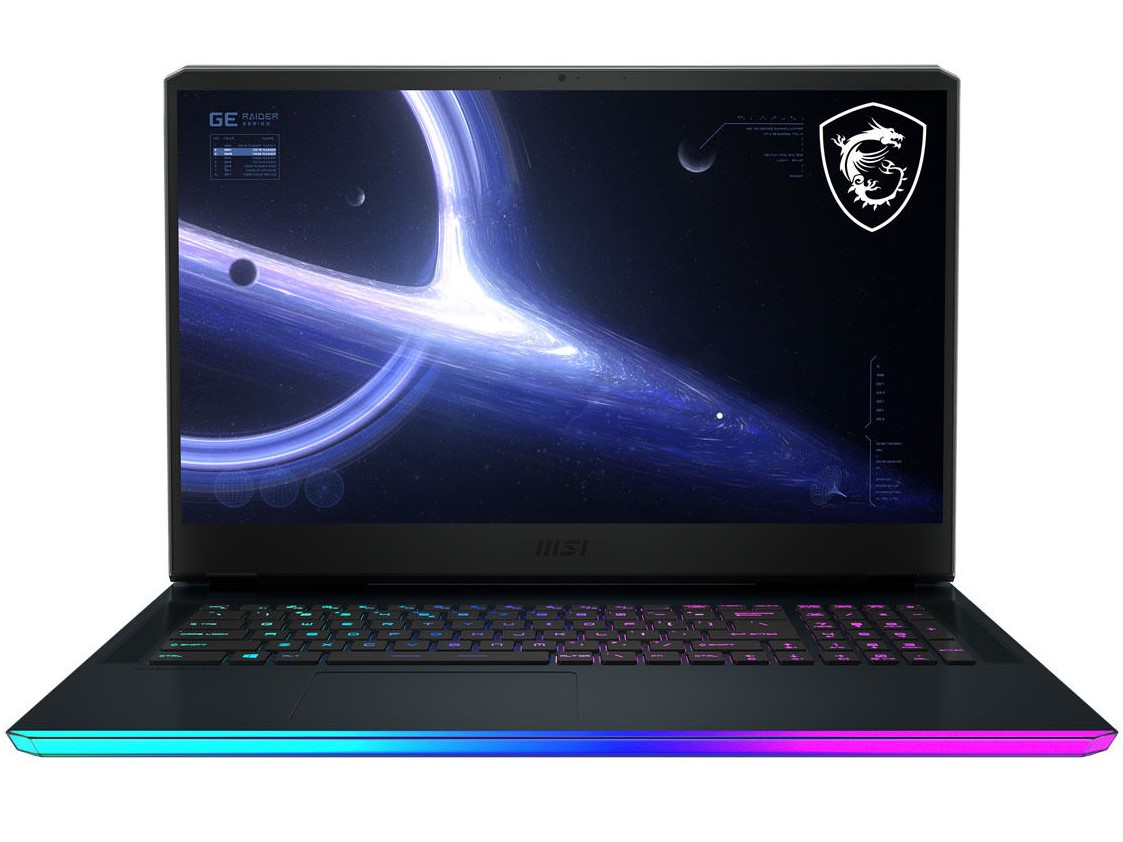
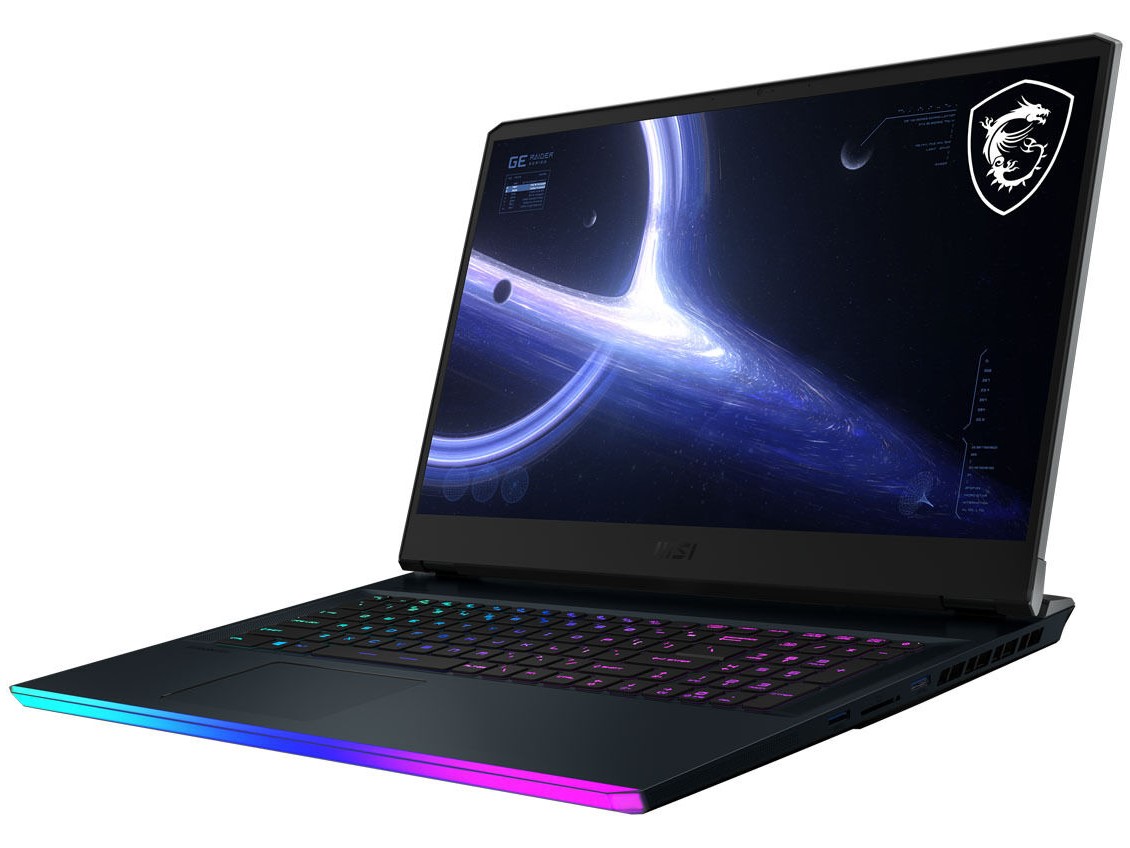
MSI GE76 Raider 11UH在审查中。高端游戏笔记本提供快速的360赫兹显示

我们已经能够通过微星GE76 Raider 10UH ,对GE76 Raider 11UH的相同的前辈有了印象。我们希望在我们目前的审查样本中也能找到它的良好特性,它配备了更多最新的CPU,形式为Intel Core i9-11980HK,同样的图形单元,形式为NvidiaGeForce RTX 3080 。此外,还有64GB的内存,以及2TB的SSD。
由于外部没有任何变化,我们在评论的相应部分指出了对微星GE76 Raider 10UH。此外,我们选择下面列出的竞争设备进行比较,在每个部分下可以添加我们数据库中的其他笔记本电脑。
2021年8月16日更新。在 "性能 "部分对生产型号的CPU性能进行评估。
Possible contenders in comparison
Rating | Date | Model | Weight | Height | Size | Resolution | Price |
|---|---|---|---|---|---|---|---|
| 86.2 % v7 (old) | 09 / 2021 | MSI GE76 Raider 11UH-472US i9-11980HK, GeForce RTX 3080 Laptop GPU | 3 kg | 27.4 mm | 17.30" | 1920x1080 | |
| 87.1 % v7 (old) | 02 / 2021 | MSI GE76 Raider 10UH i7-10870H, GeForce RTX 3080 Laptop GPU | 3 kg | 27.4 mm | 17.30" | 1920x1080 | |
| 88 % v7 (old) | 09 / 2021 | Gigabyte Aero 17 HDR YD i9-11980HK, GeForce RTX 3080 Laptop GPU | 2.8 kg | 22 mm | 17.30" | 3840x2160 | |
| 85.3 % v7 (old) | 04 / 2021 | Alienware m17 R4 i9-10980HK, GeForce RTX 3080 Laptop GPU | 3 kg | 22 mm | 17.30" | 1920x1080 |

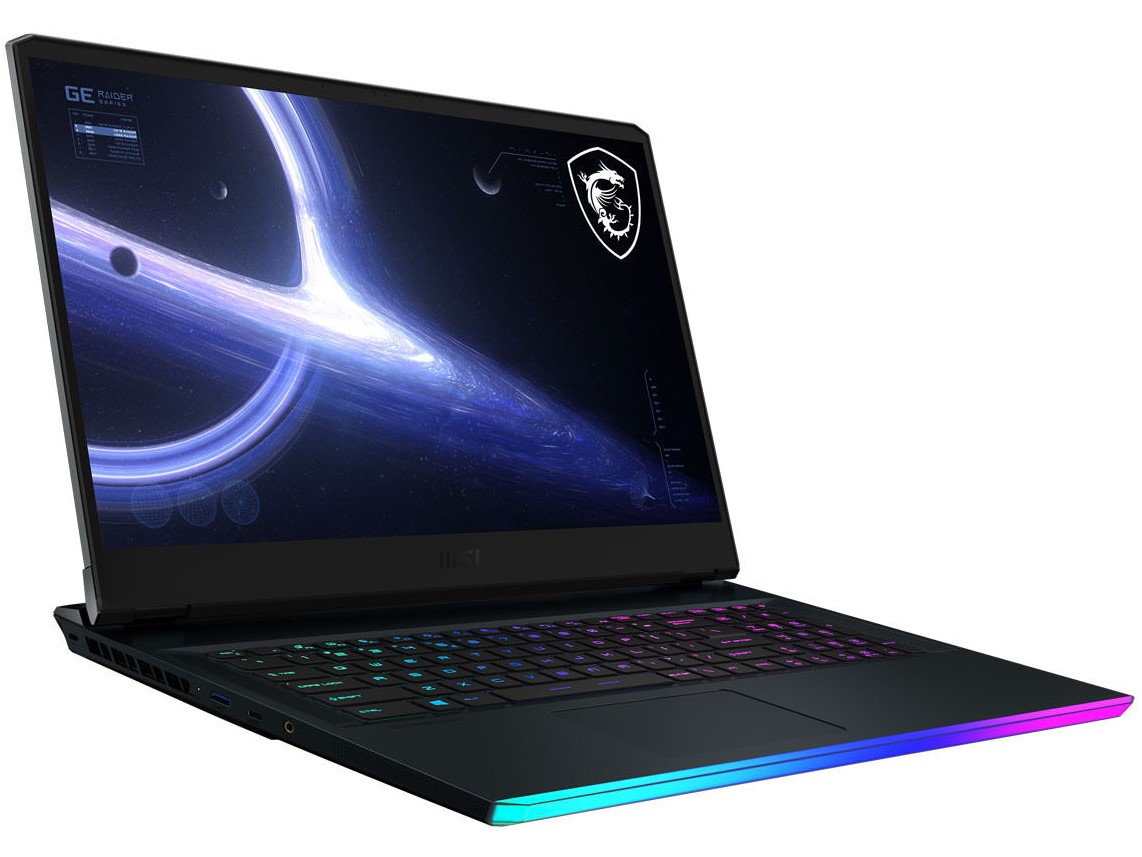
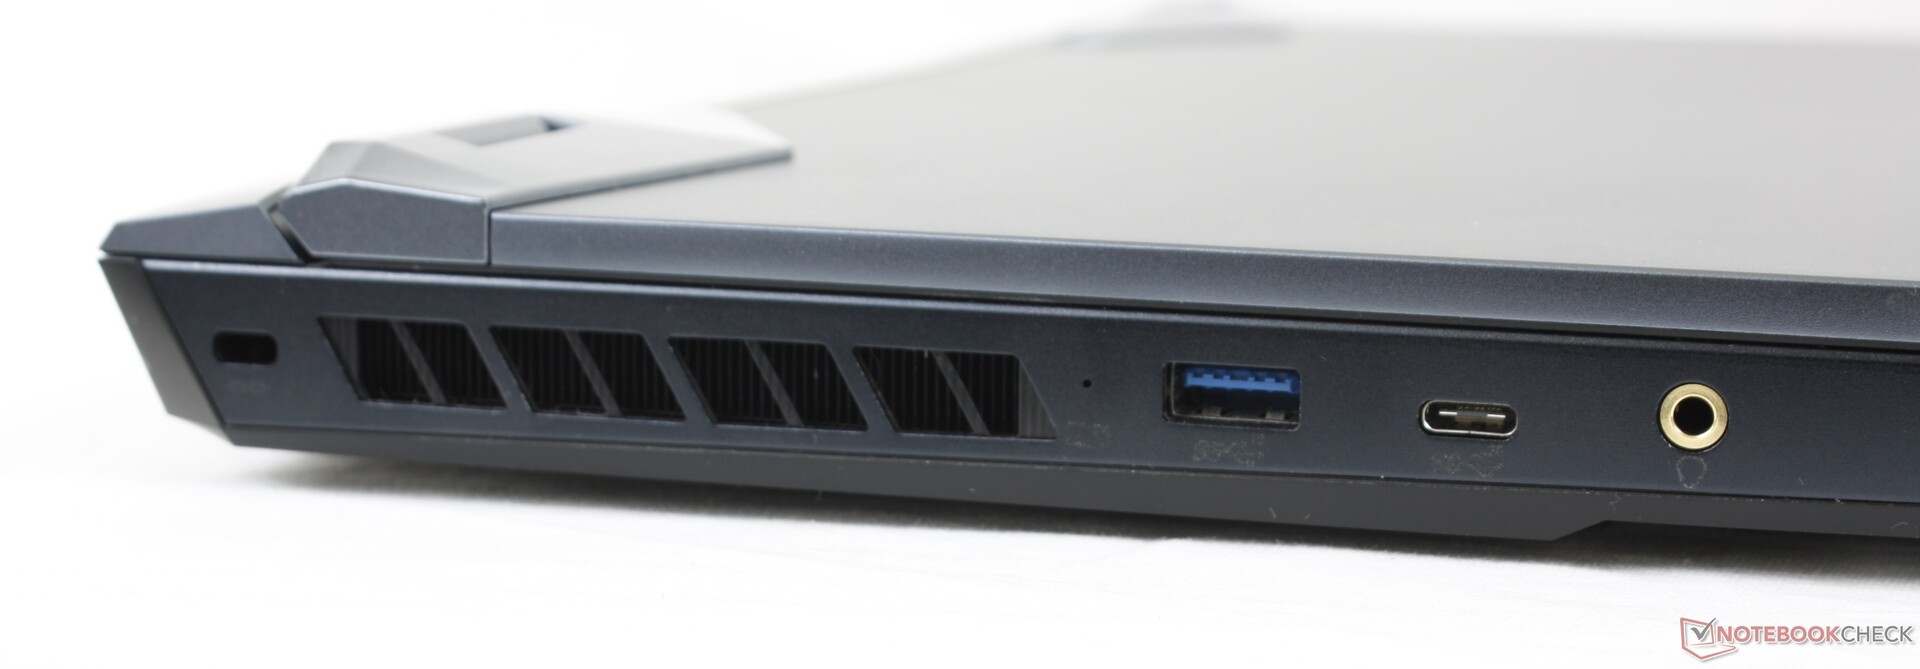
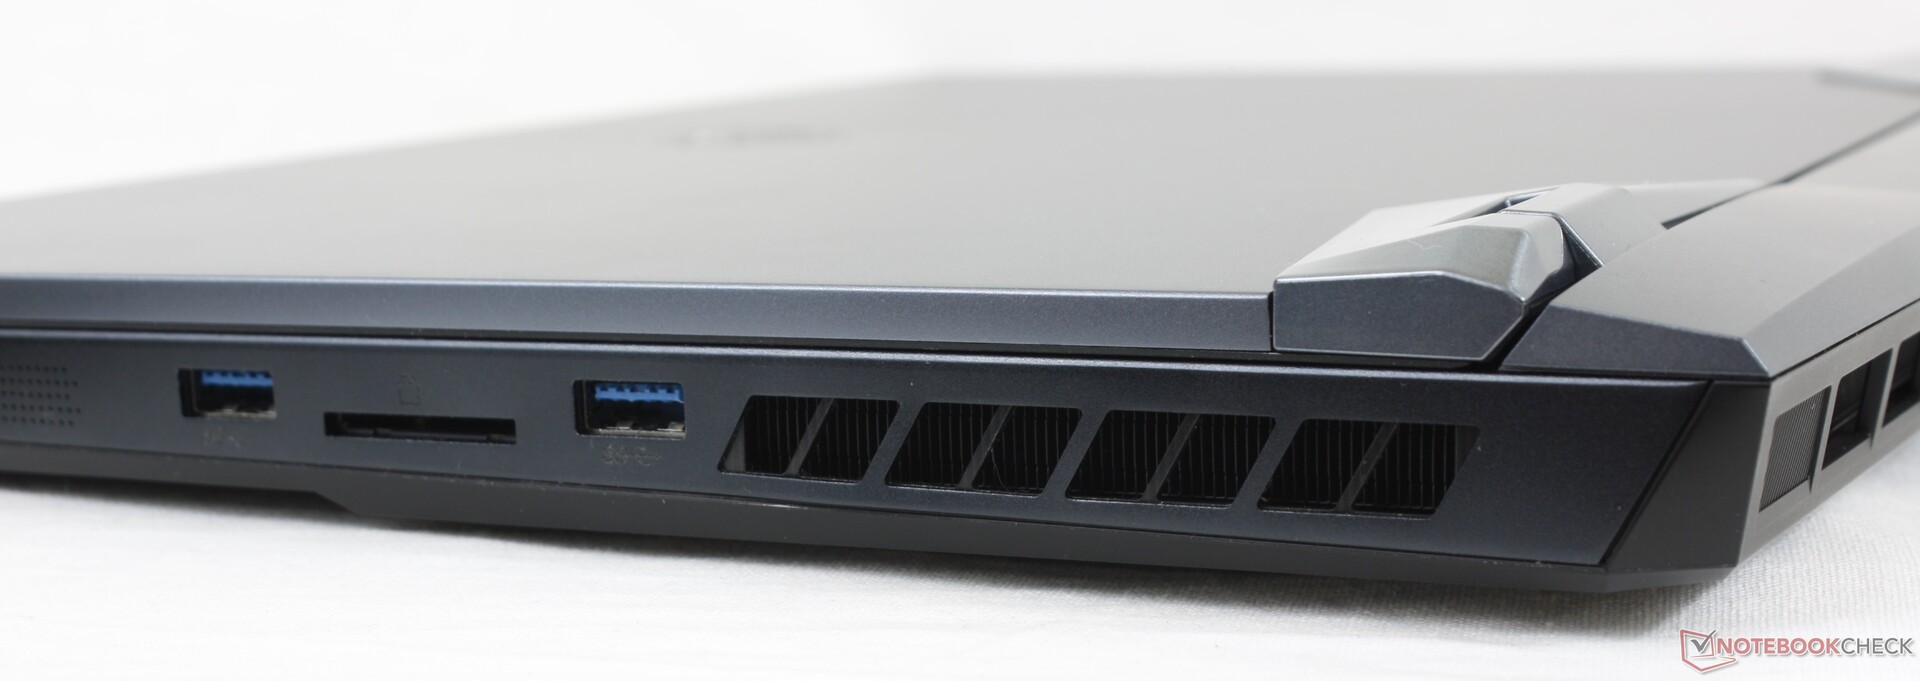
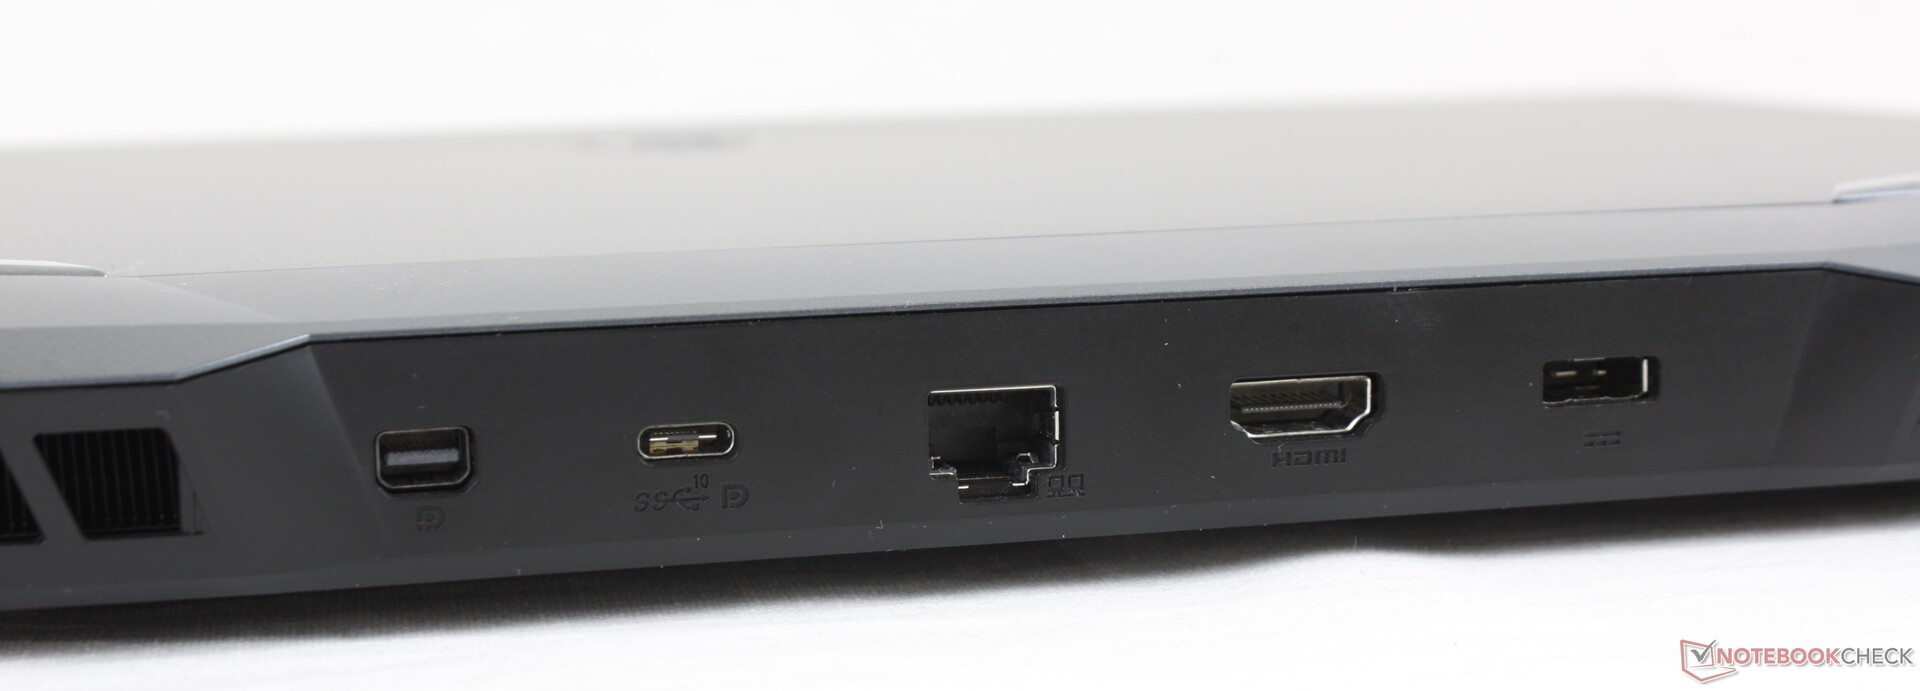
连接性 - GE76 Raider提供Thunderbolt 4和Wi-Fi 6E
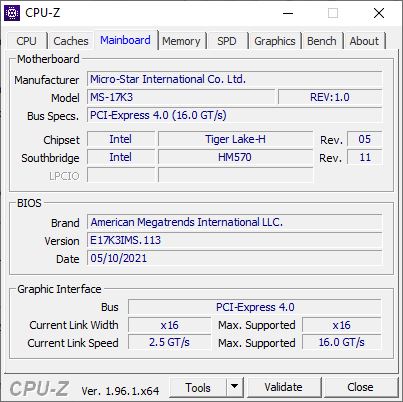
虽然与GE76 Raider 10UH相比,端口选择保持不变,但后面的USB-C端口现在采用了雷电4标准。
SD卡阅读器
GE76 Raider 11UH中的SD读卡器在使用我们的参考存储卡--128GB AV Pro V60 microSD时,实现了77MB/s的复制和88MB/s的读取数据。虽然这些速率是合格的,但它们明显低于前代产品。
| SD Card Reader | |
| average JPG Copy Test (av. of 3 runs) | |
| MSI GE76 Raider 10UH (Toshiba Exceria Pro SDXC 64 GB UHS-II) | |
| Alienware m17 R4 (AV PRO microSD 128 GB V60) | |
| Gigabyte Aero 17 HDR YD (AV PRO microSD 128 GB V60) | |
| Average of class Gaming (20.9 - 210, n=54, last 2 years) | |
| MSI GE76 Raider 11UH-472US (AV PRO microSD 128 GB V60) | |
| maximum AS SSD Seq Read Test (1GB) | |
| Alienware m17 R4 (AV PRO microSD 128 GB V60) | |
| MSI GE76 Raider 10UH (Toshiba Exceria Pro SDXC 64 GB UHS-II) | |
| Gigabyte Aero 17 HDR YD (AV PRO microSD 128 GB V60) | |
| Average of class Gaming (25.5 - 261, n=51, last 2 years) | |
| MSI GE76 Raider 11UH-472US (AV PRO microSD 128 GB V60) | |
沟通
微星GE76 Raider 11UH可以通过蓝牙5.2和Wi-Fi 6E建立无线连接。通过我们的Netgear Nighthawk AX12参考路由器,传输数据的速度达到非常好的1,396 Mb/s,接收数据的速度达到1,343 Mb/s。这使得微星游戏笔记本的速度略高于前代产品。
网络摄像头
凭借210万像素的分辨率,微星安装了一个比大多数笔记本电脑制造商稍强的网络摄像头,但即使在良好的照明条件下,图像质量也相当平庸。


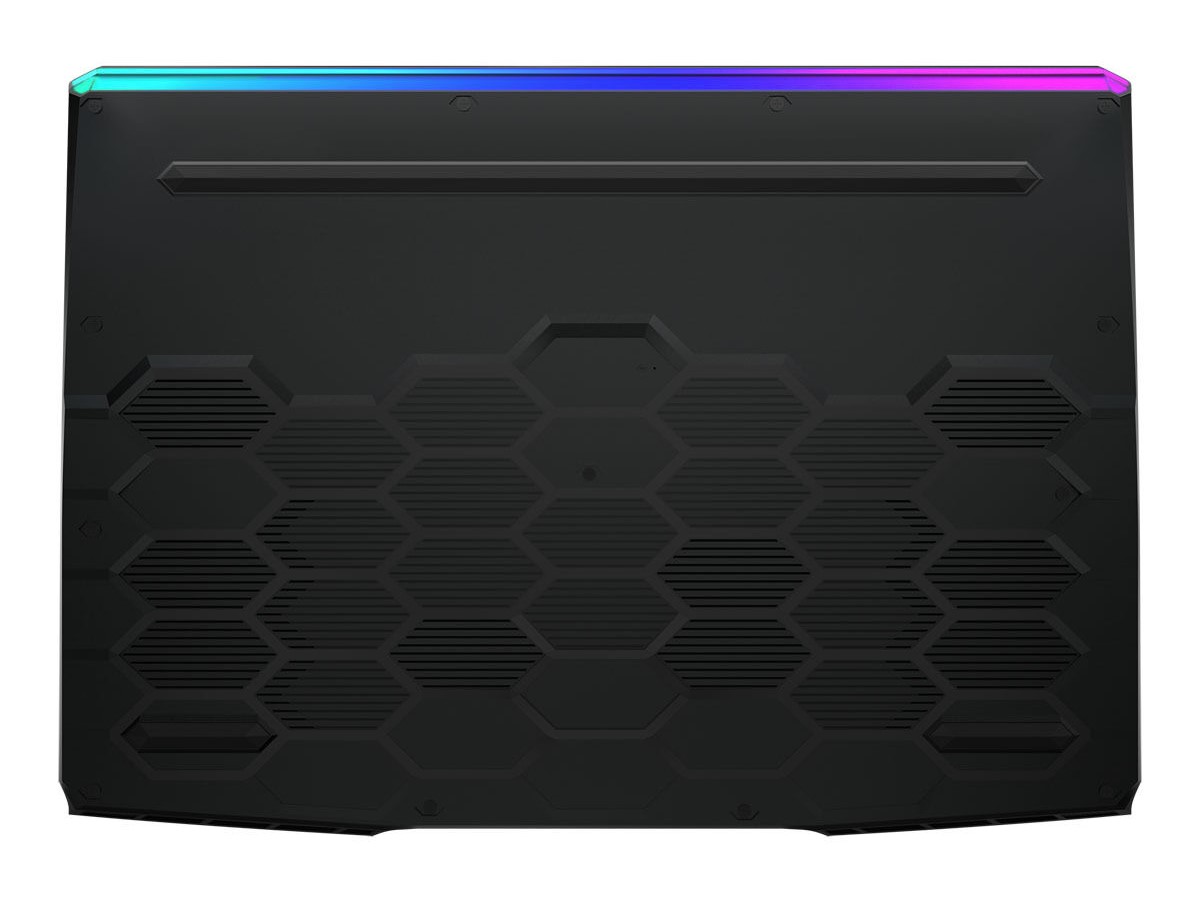
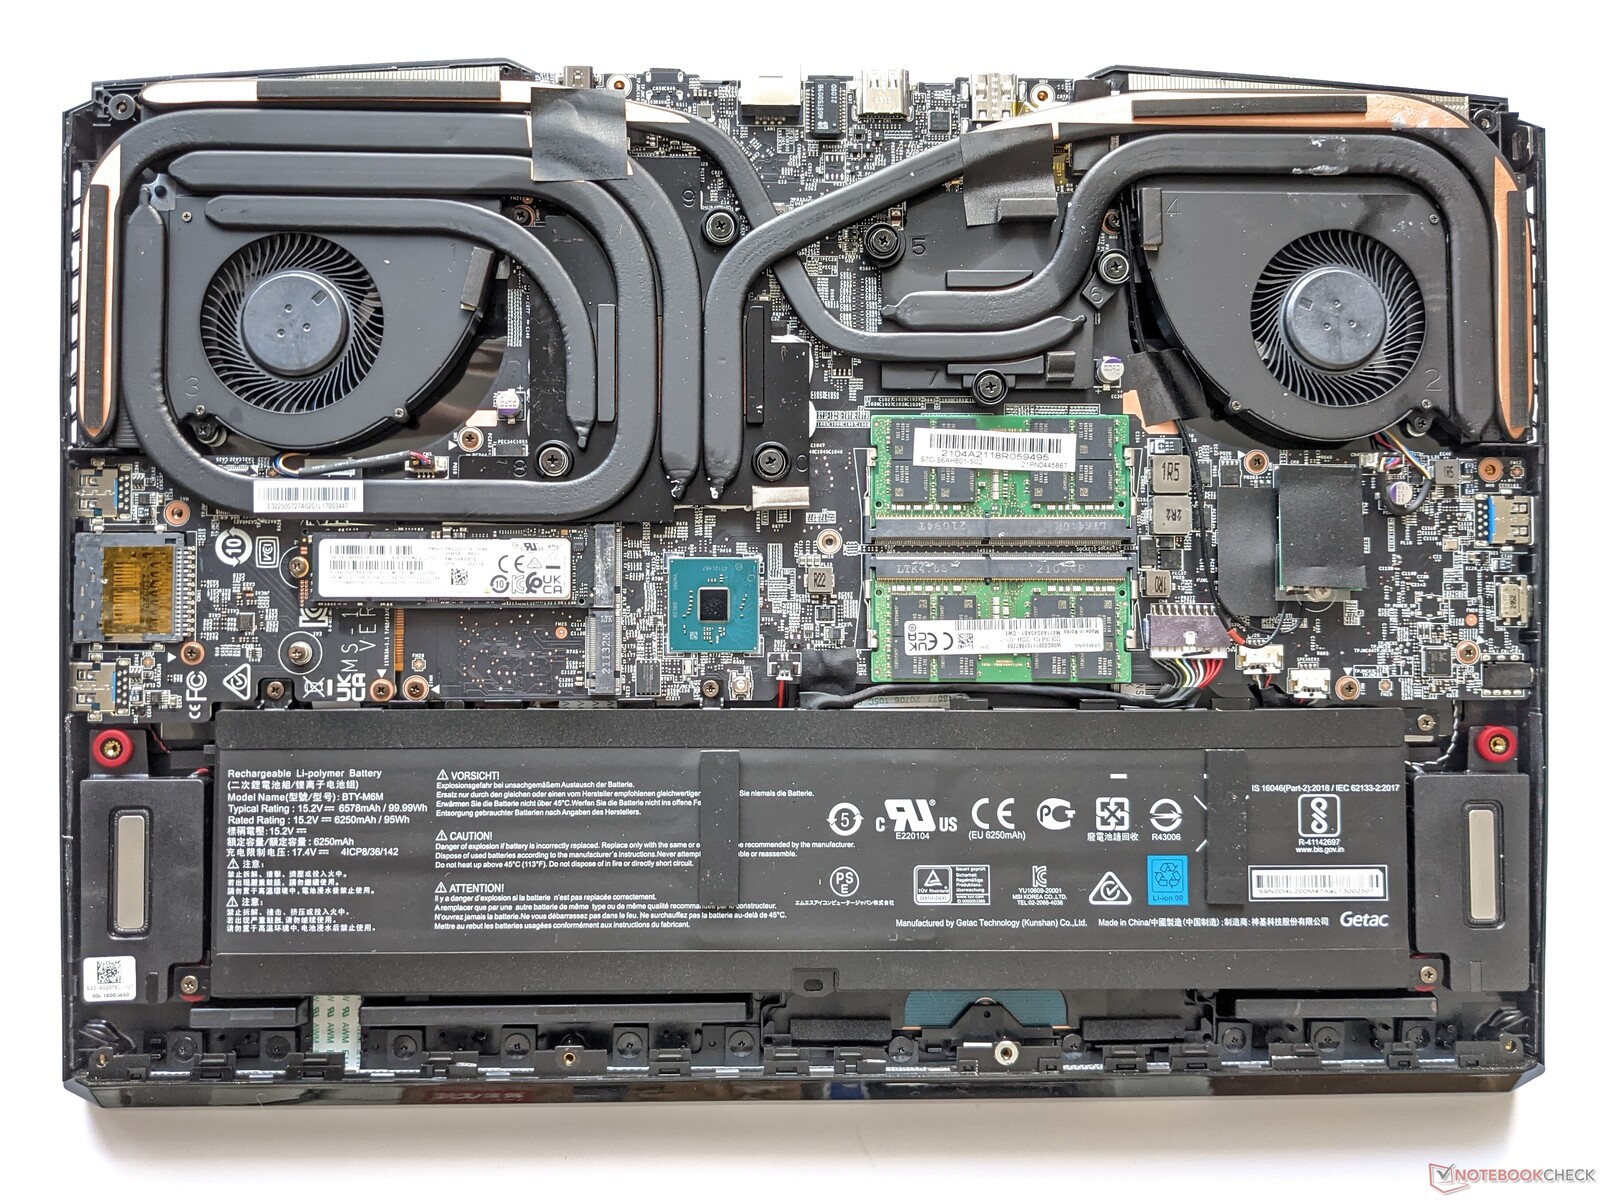
维护
微星GE76 Raider 11UH可以在卸下底部的所有螺丝后打开。这样就可以接触到两个固态硬盘和两个内存插槽。
担保
除了笔记本电脑本身,GE76 Raider 11UH还配有相应的电源适配器。制造商还提供了24个月的保修期。
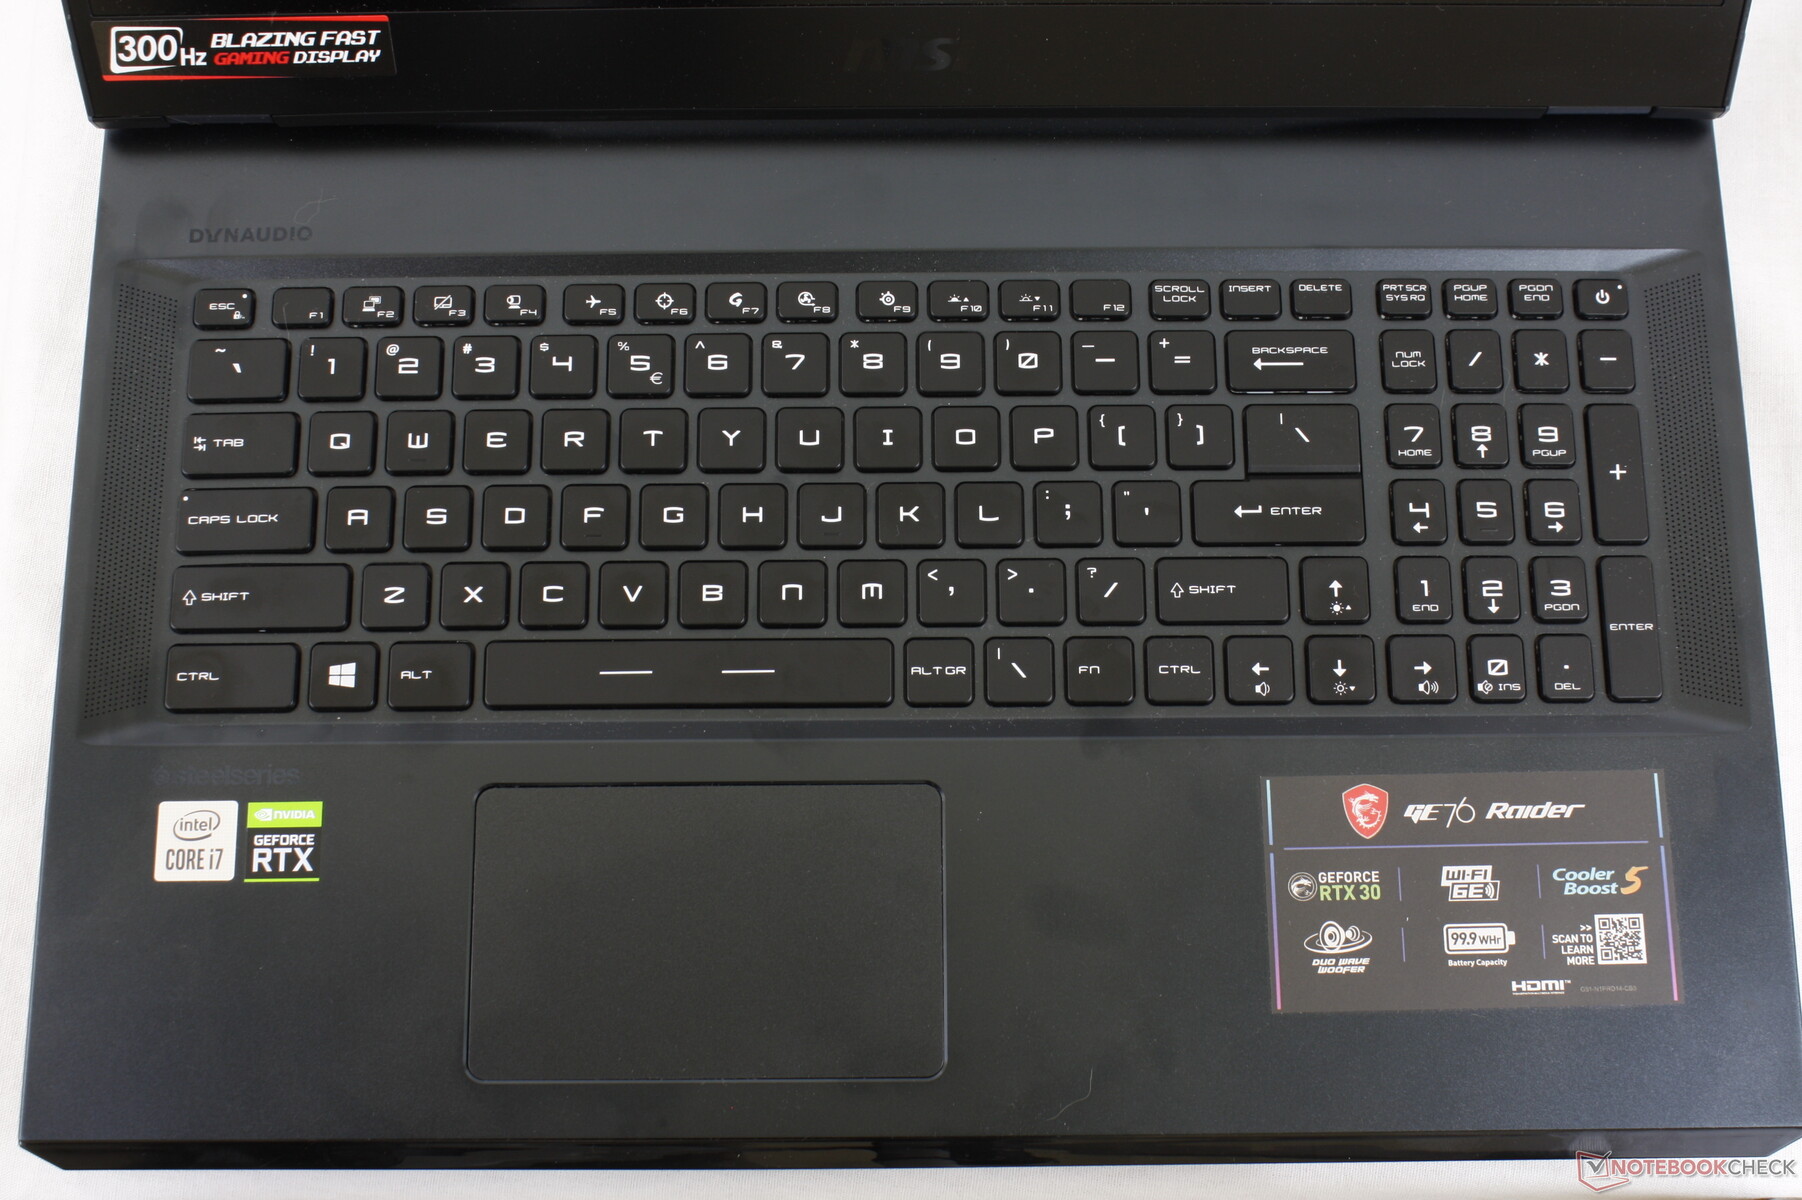
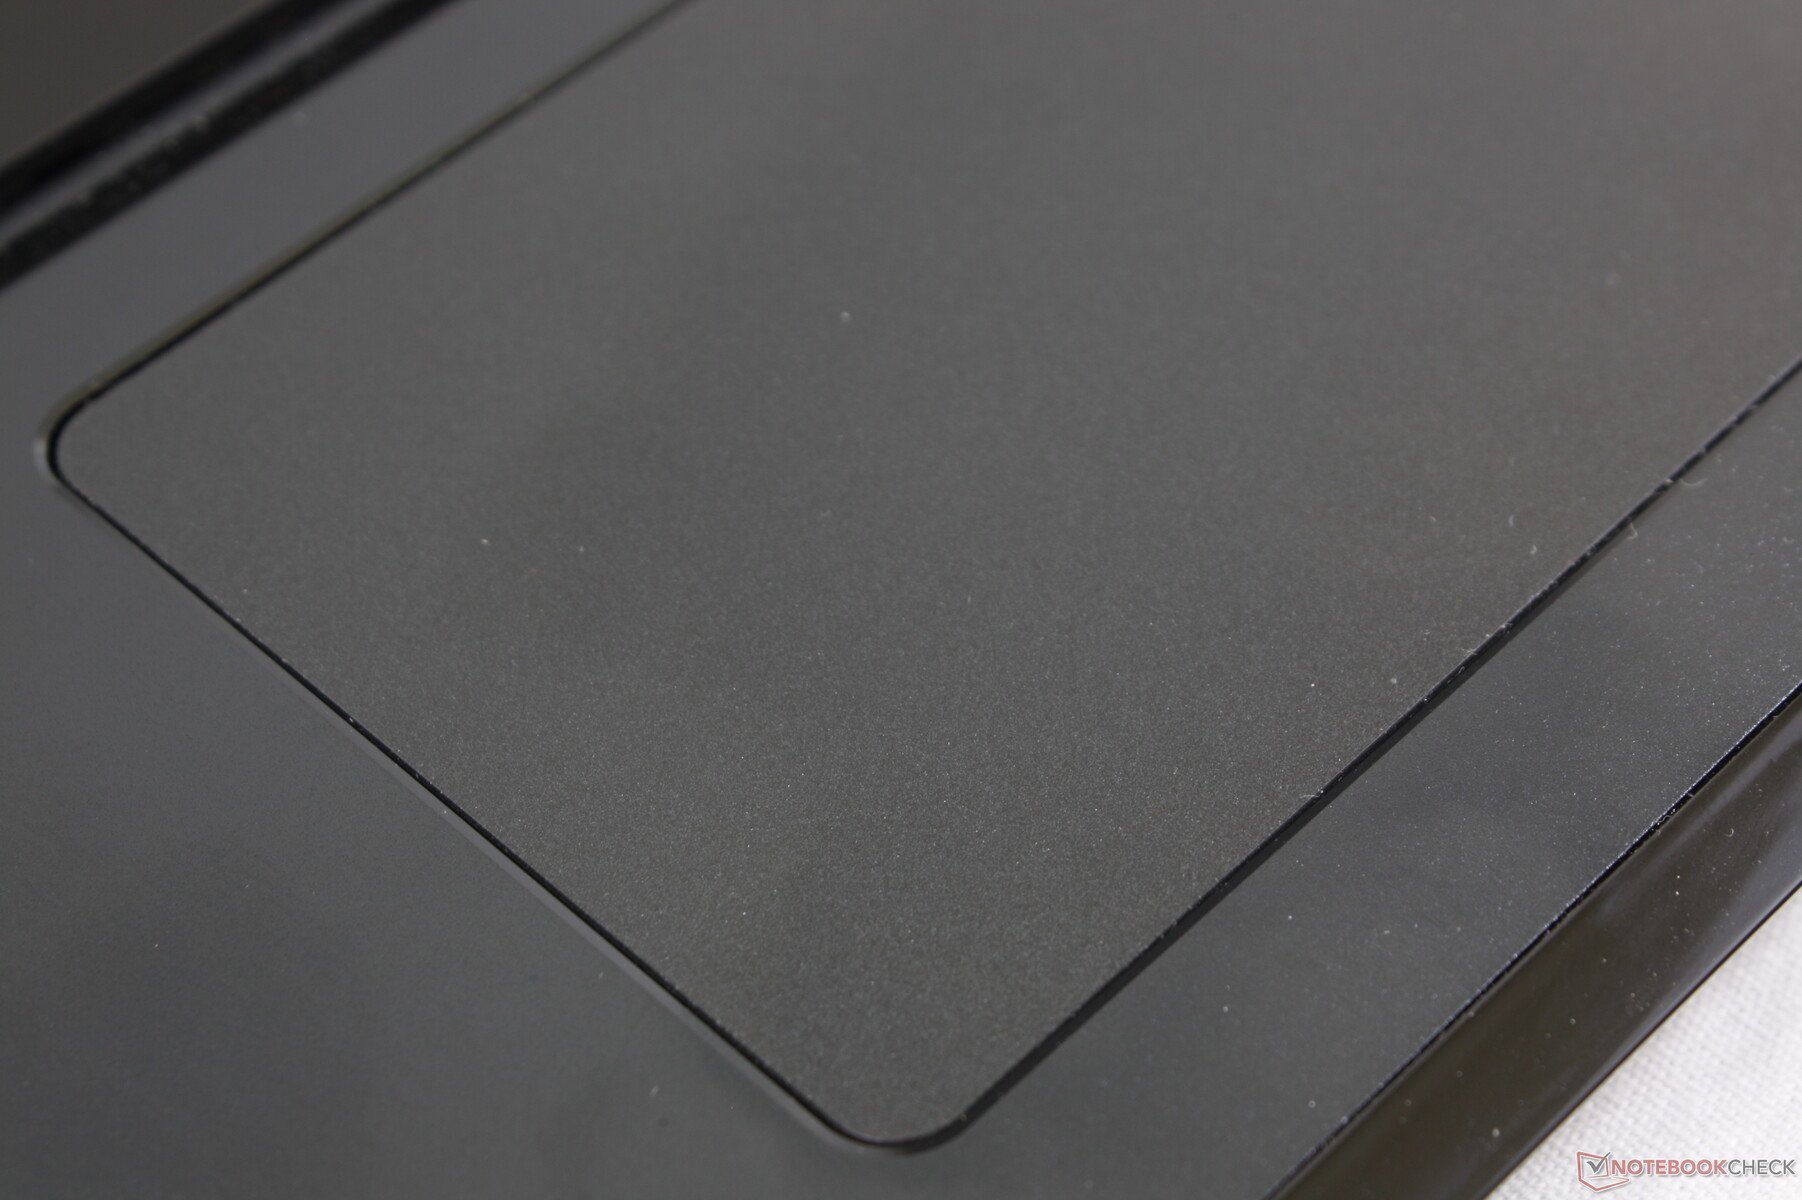
输入设备 - 良好的键盘和准确的ClickPad
关于输入设备的详细描述可以在MSI GE76 Raider 10UH 的评论中找到。
显示器 - IPS面板,360赫兹
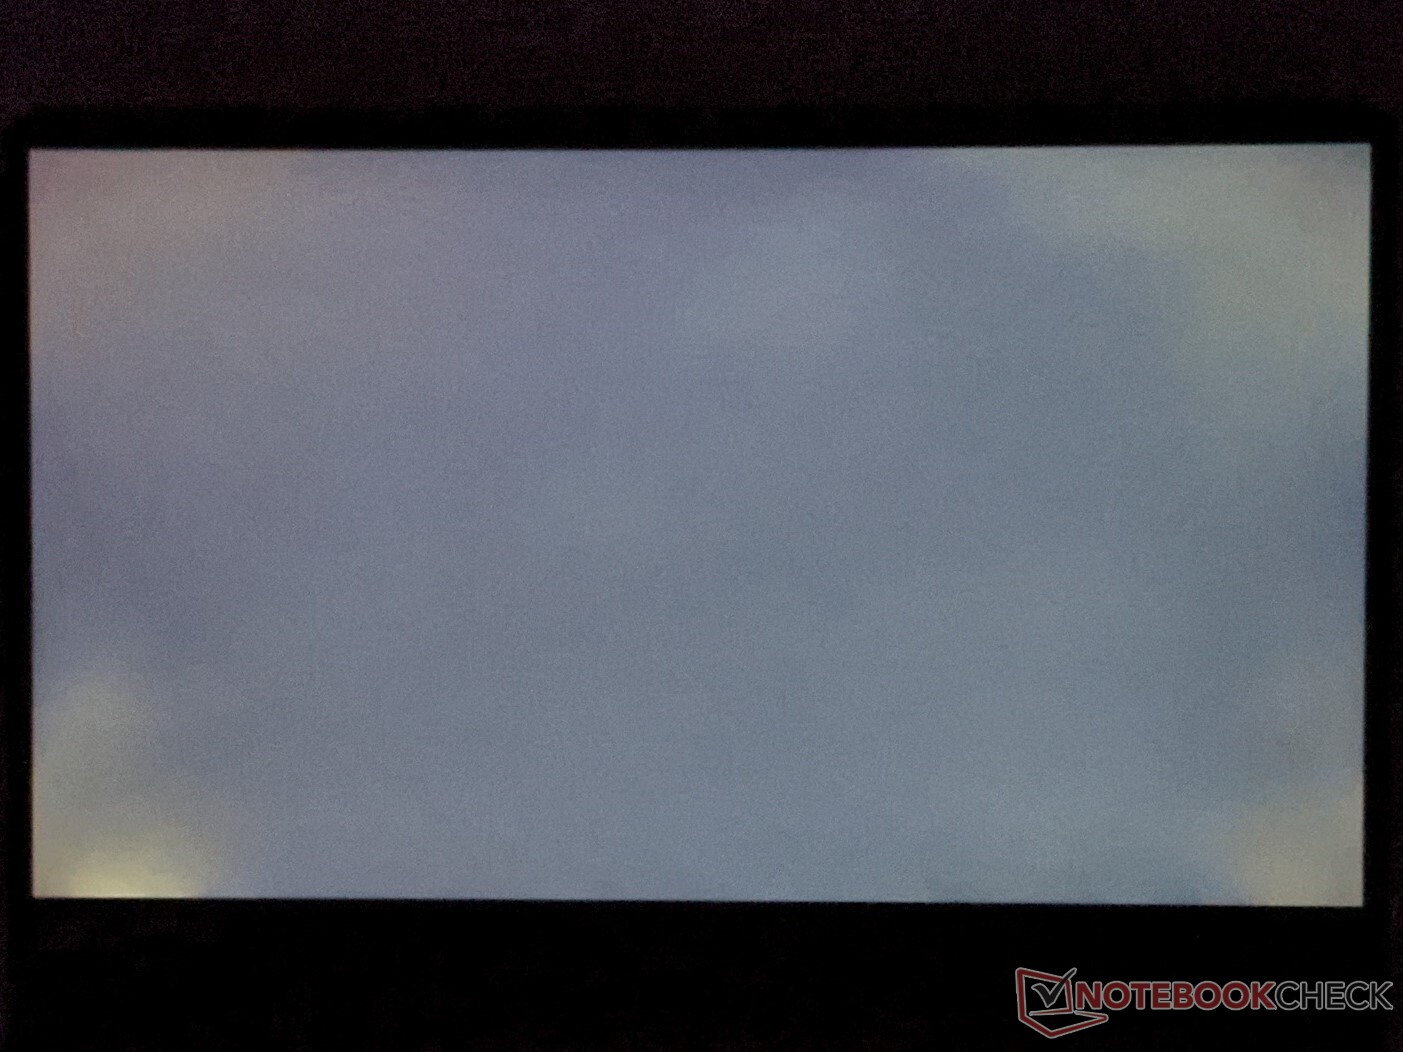
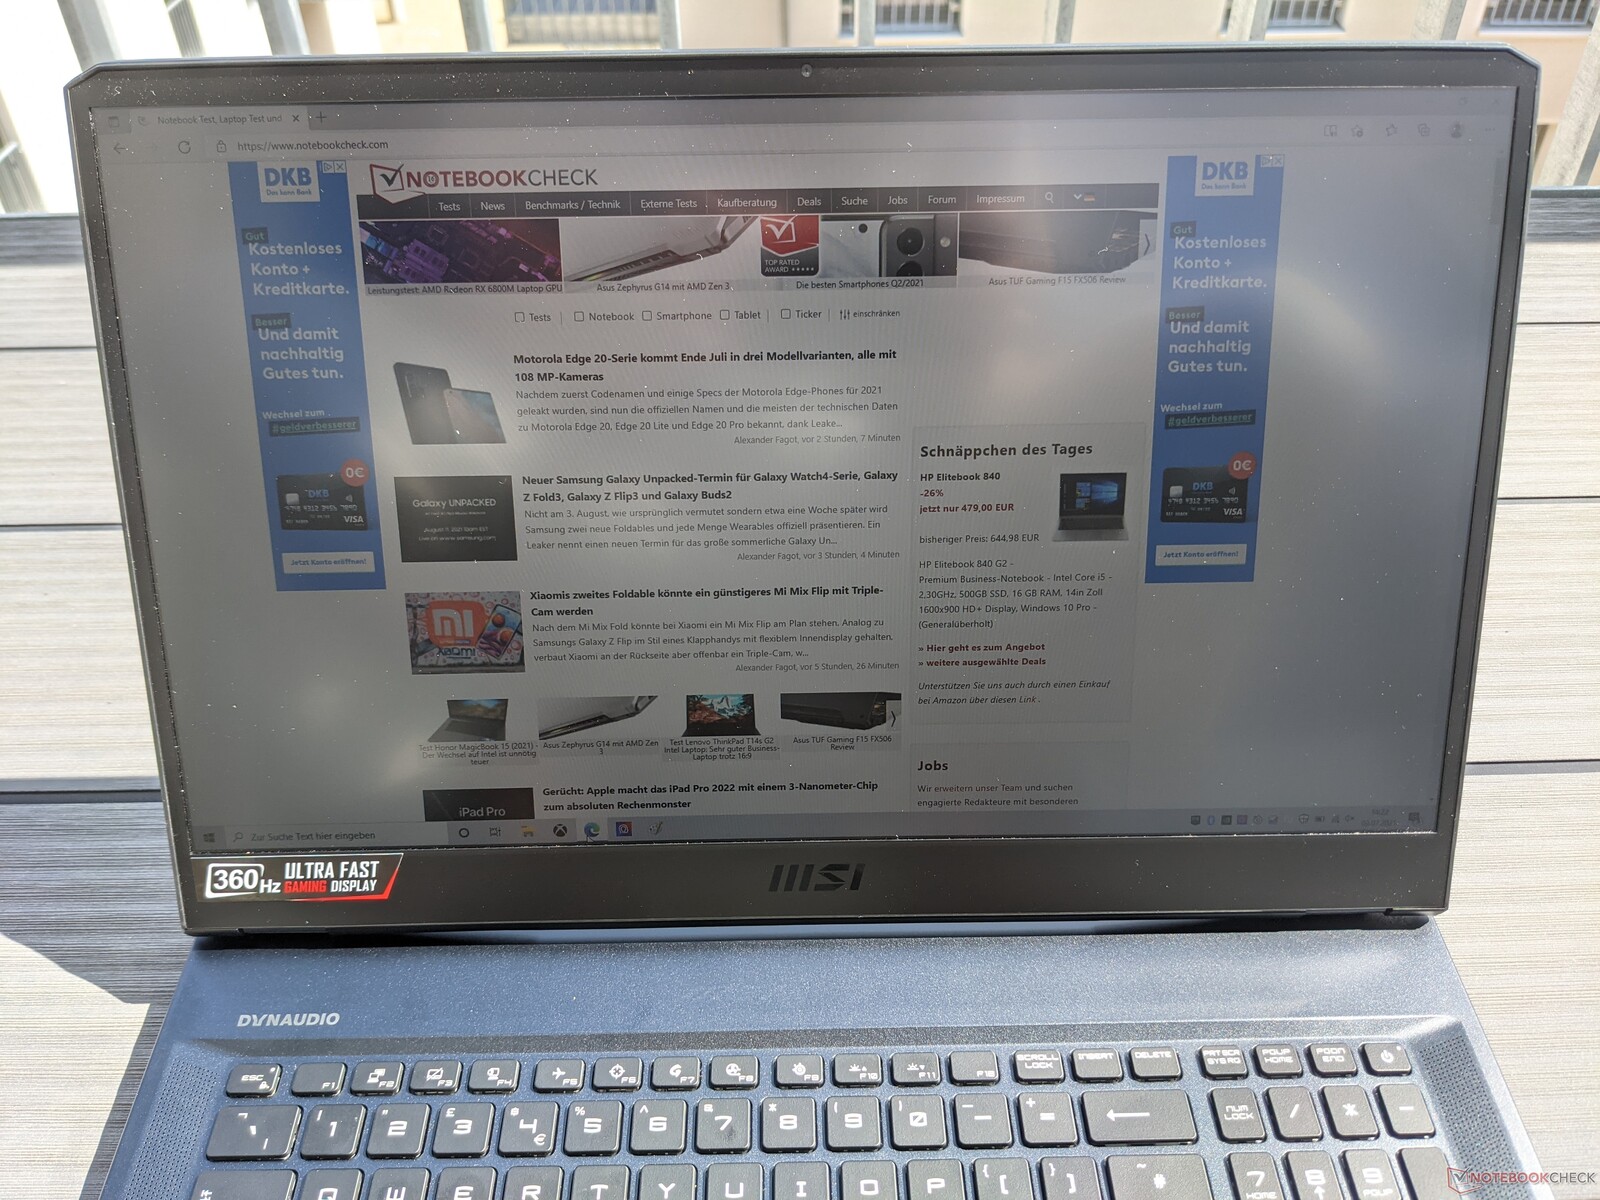
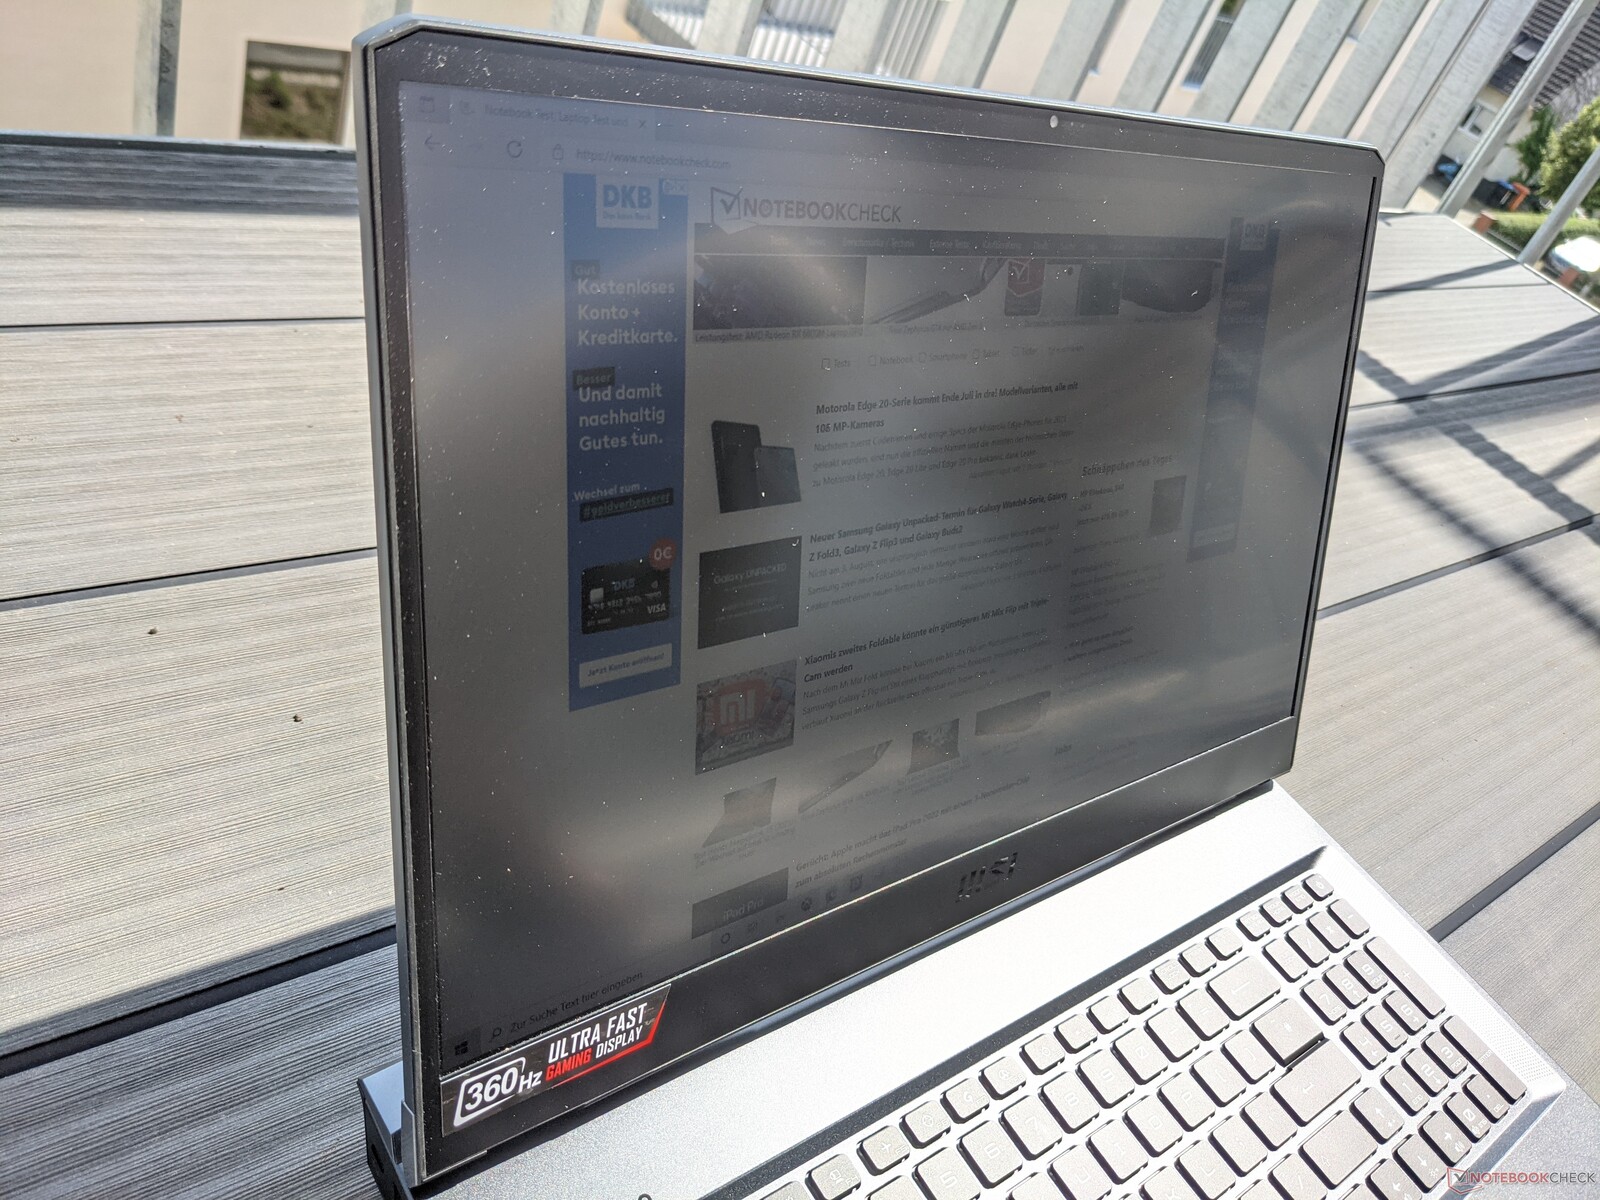
微星GE76 Raider 11UH的屏幕包括一个17.3英寸的IPS面板,分辨率为1920x1080像素,刷新率为360赫兹。虽然295cd/m²的最大亮度还算不错,但它仍然是我们测试领域中最低的。96%的亮度分布是非常好的。此外,微星避免使用PWM进行亮度控制。
除了这里安装的面板,GE76 Raider 11UH还提供UHD分辨率(3840x2160像素)和120 Hz,以及QHD分辨率(2560x1440像素)和165 Hz或240 Hz。
| |||||||||||||||||||||||||
Brightness Distribution: 96 %
Center on Battery: 301 cd/m²
Contrast: 1204:1 (Black: 0.25 cd/m²)
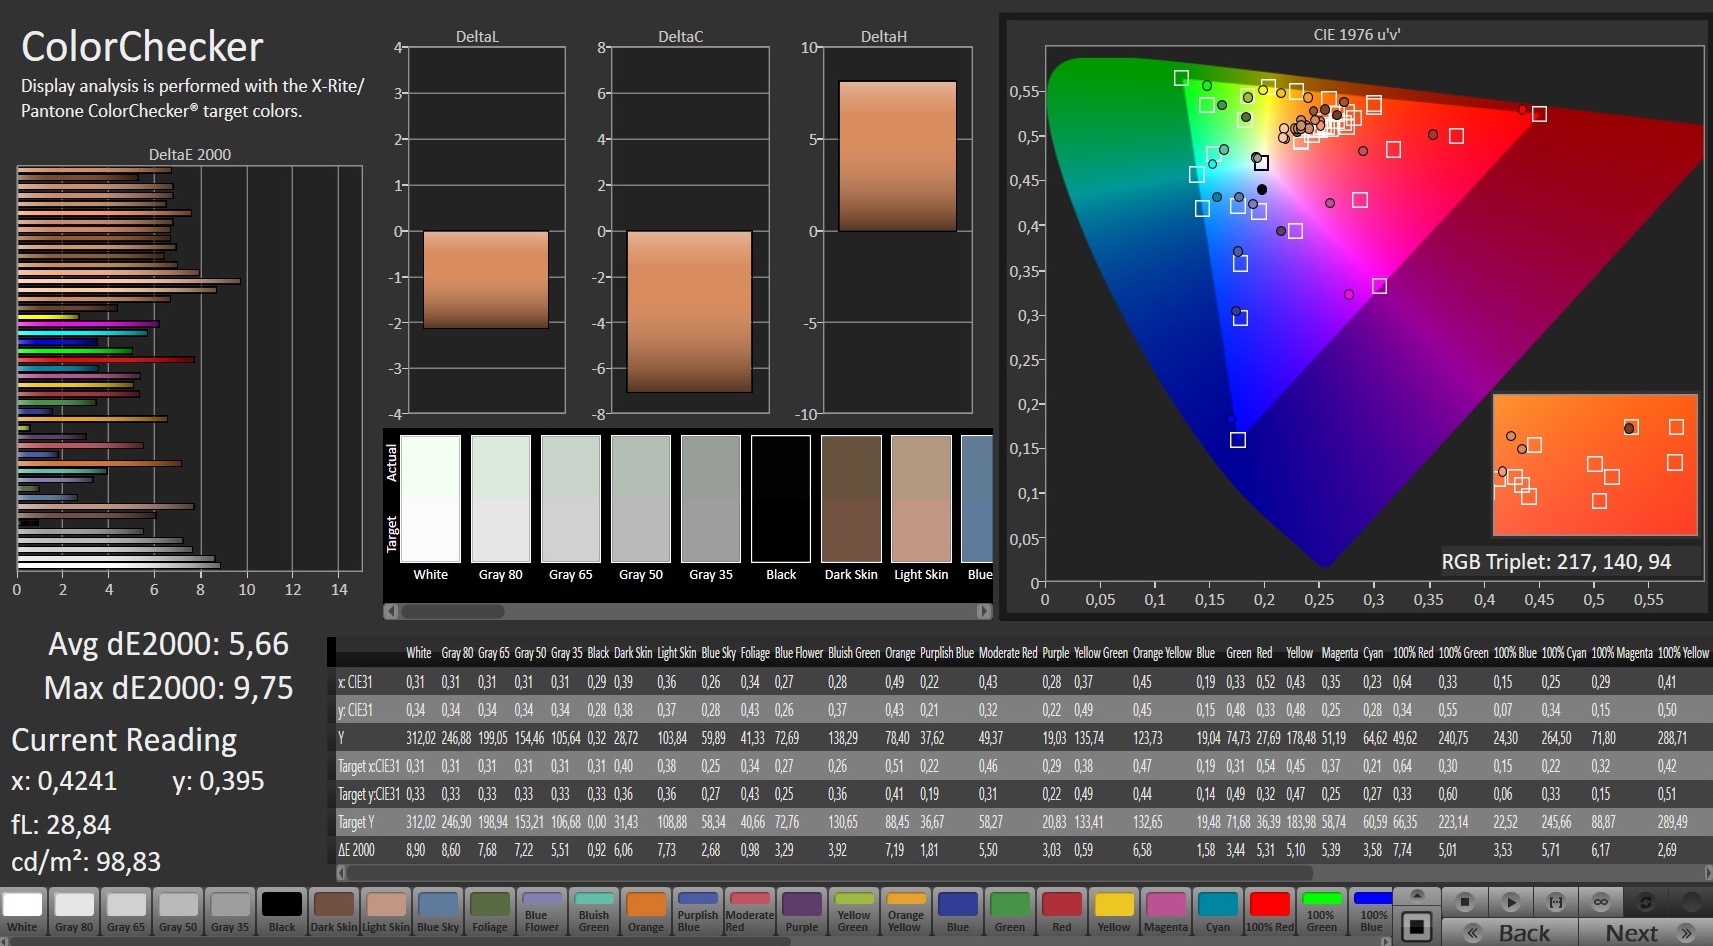
ΔE ColorChecker Calman: 5.66 | ∀{0.5-29.43 Ø4.72}
calibrated: 2.7
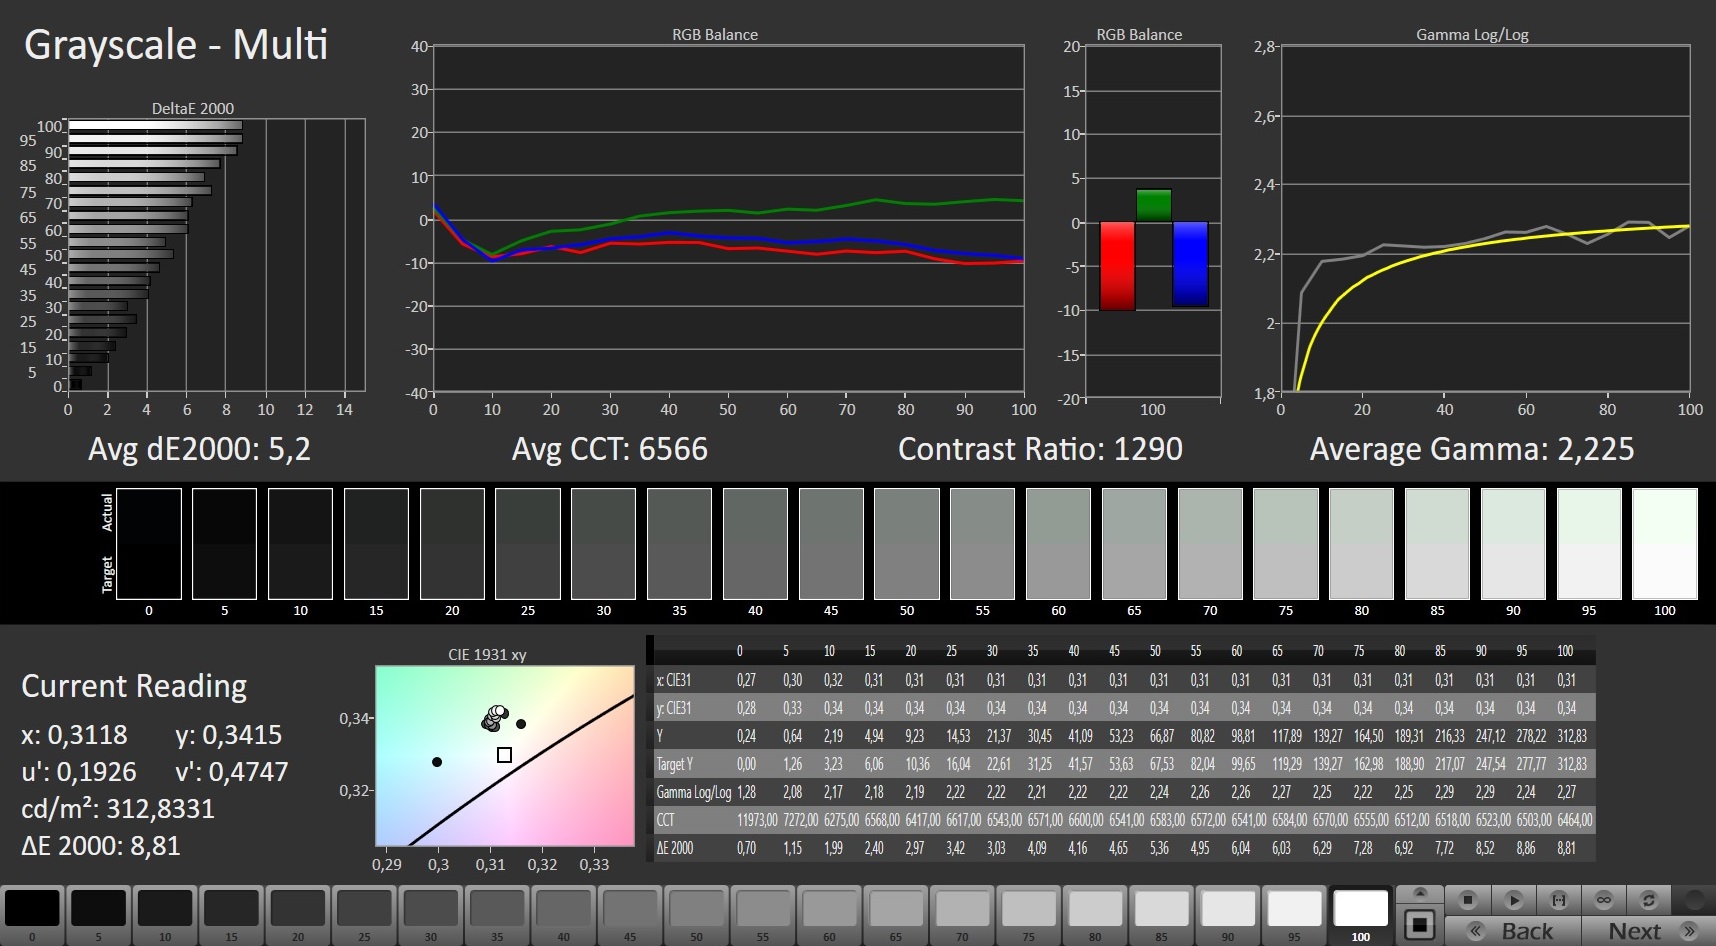
ΔE Greyscale Calman: 5.2 | ∀{0.09-98 Ø4.97}
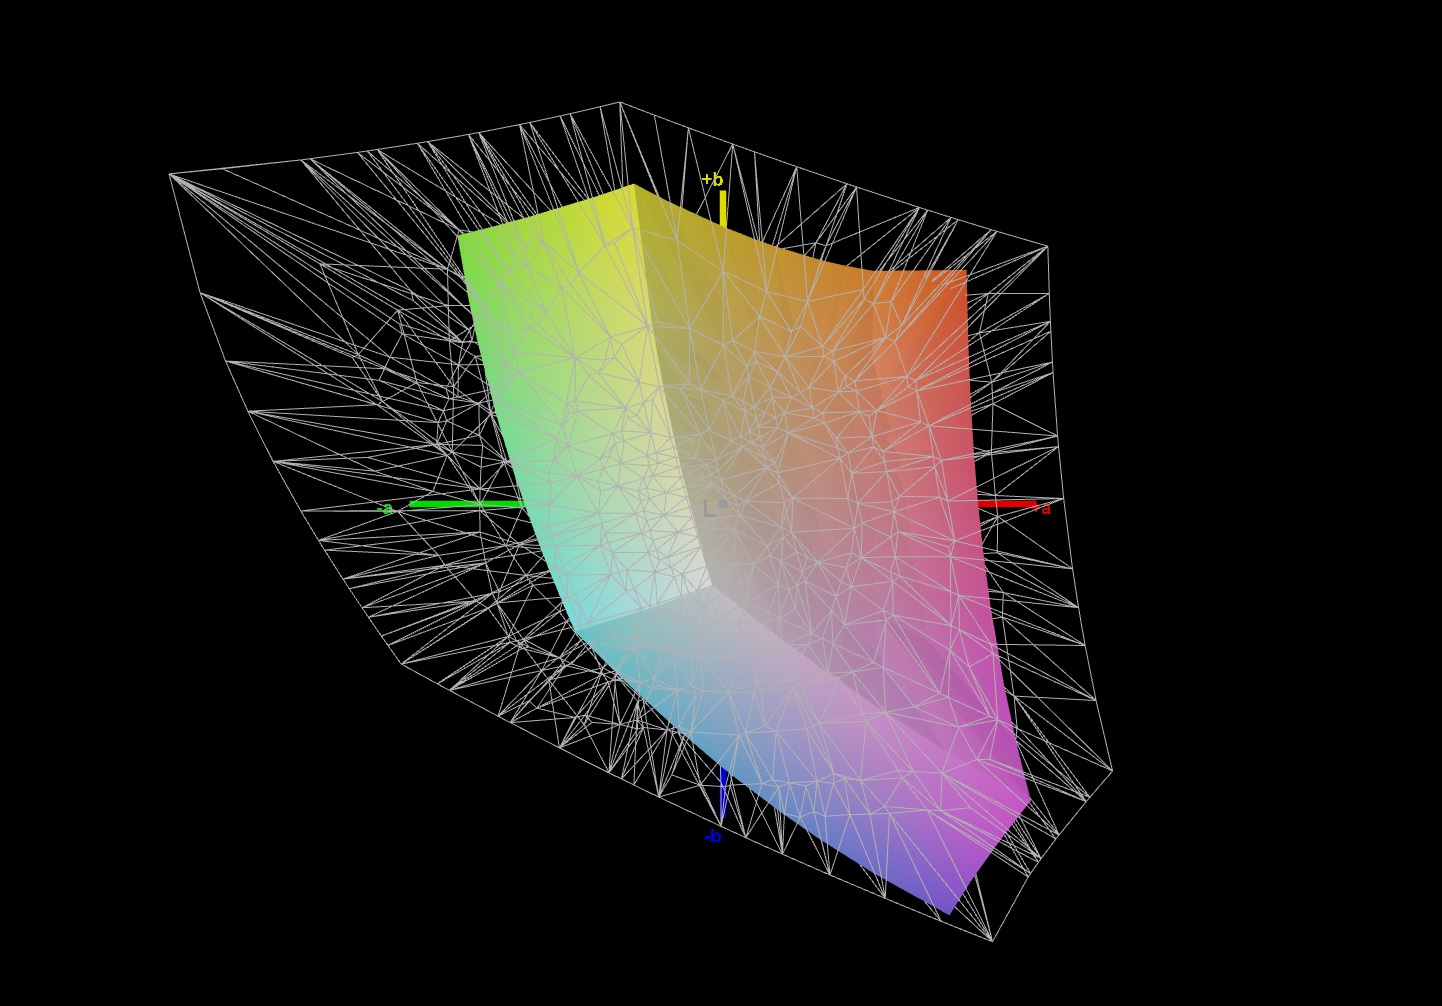
51.2% AdobeRGB 1998 (Argyll 3D)
74.4% sRGB (Argyll 3D)
49.6% Display P3 (Argyll 3D)
Gamma: 2.225
CCT: 6566 K
| MSI GE76 Raider 11UH-472US AU Optronics AUOE295, IPS, 1920x1080, 17.3" | MSI GE76 Raider 10UH AU Optronics B173HAN05.1, IPS, 1920x1080, 17.3" | Gigabyte Aero 17 HDR YD AU Optronics AUO329B, IPS, 3840x2160, 17.3" | Alienware m17 R4 AU Optronics AUOEC91, IPS, 1920x1080, 17.3" | |
|---|---|---|---|---|
| Display | 40% | 68% | 38% | |
| Display P3 Coverage (%) | 49.6 | 71.8 45% | 86.9 75% | 69.8 41% |
| sRGB Coverage (%) | 74.4 | 98.1 32% | 100 34% | 99.7 34% |
| AdobeRGB 1998 Coverage (%) | 51.2 | 73.9 44% | 99.6 95% | 71.6 40% |
| Response Times | -108% | -432% | -47% | |
| Response Time Grey 50% / Grey 80% * (ms) | 6.4 ? | 20.4 ? -219% | 52 ? -713% | 13.2 ? -106% |
| Response Time Black / White * (ms) | 10.4 ? | 10 ? 4% | 26 ? -150% | 9.2 ? 12% |
| PWM Frequency (Hz) | 151500 | |||
| Screen | 5% | 43% | 37% | |
| Brightness middle (cd/m²) | 301 | 324.6 8% | 488 62% | 305 1% |
| Brightness (cd/m²) | 295 | 312 6% | 467 58% | 301 2% |
| Brightness Distribution (%) | 96 | 87 -9% | 86 -10% | 93 -3% |
| Black Level * (cd/m²) | 0.25 | 0.28 -12% | 0.33 -32% | 0.19 24% |
| Contrast (:1) | 1204 | 1159 -4% | 1479 23% | 1605 33% |
| Colorchecker dE 2000 * | 5.66 | 3.87 32% | 1.23 78% | 1.31 77% |
| Colorchecker dE 2000 max. * | 9.75 | 9.35 4% | 2.94 70% | 2.32 76% |
| Colorchecker dE 2000 calibrated * | 2.7 | 1.42 47% | 0.77 71% | 0.91 66% |
| Greyscale dE 2000 * | 5.2 | 6.5 -25% | 1.5 71% | 2.3 56% |
| Gamma | 2.225 99% | 2.23 99% | 2.169 101% | 2.281 96% |
| CCT | 6566 99% | 5702 114% | 6614 98% | 6449 101% |
| Color Space (Percent of AdobeRGB 1998) (%) | 66.3 | 99 | 72 | |
| Color Space (Percent of sRGB) (%) | 98 | 99 | 94 | |
| Total Average (Program / Settings) | -21% /
-3% | -107% /
-19% | 9% /
25% |
* ... smaller is better
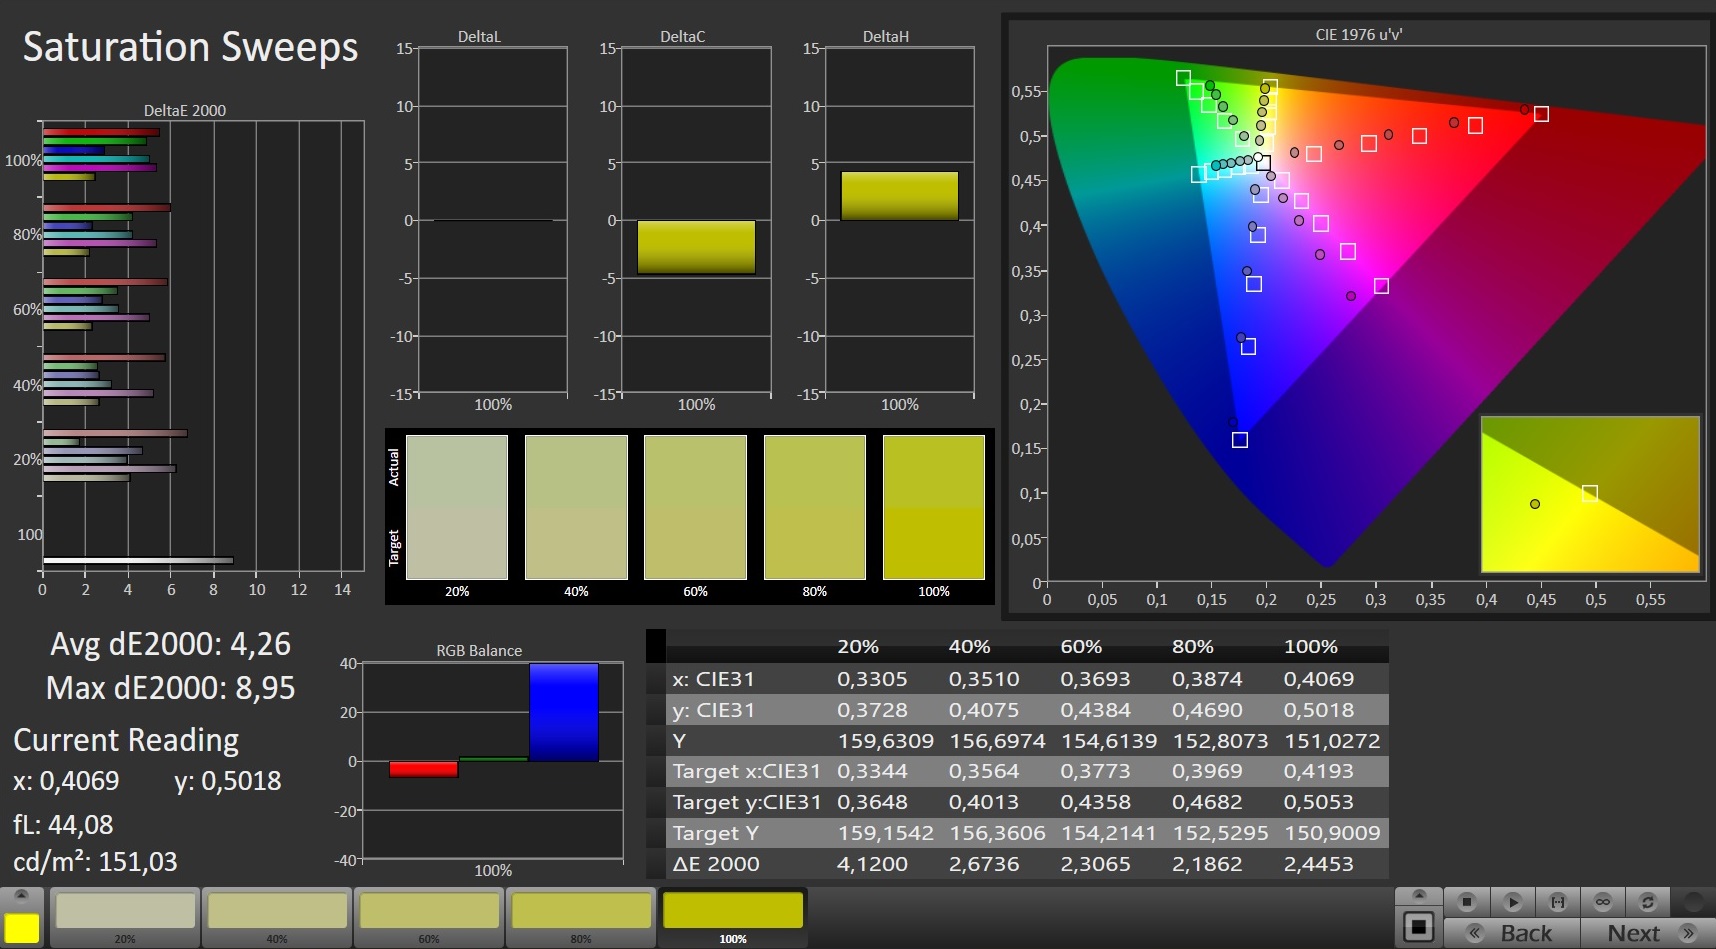
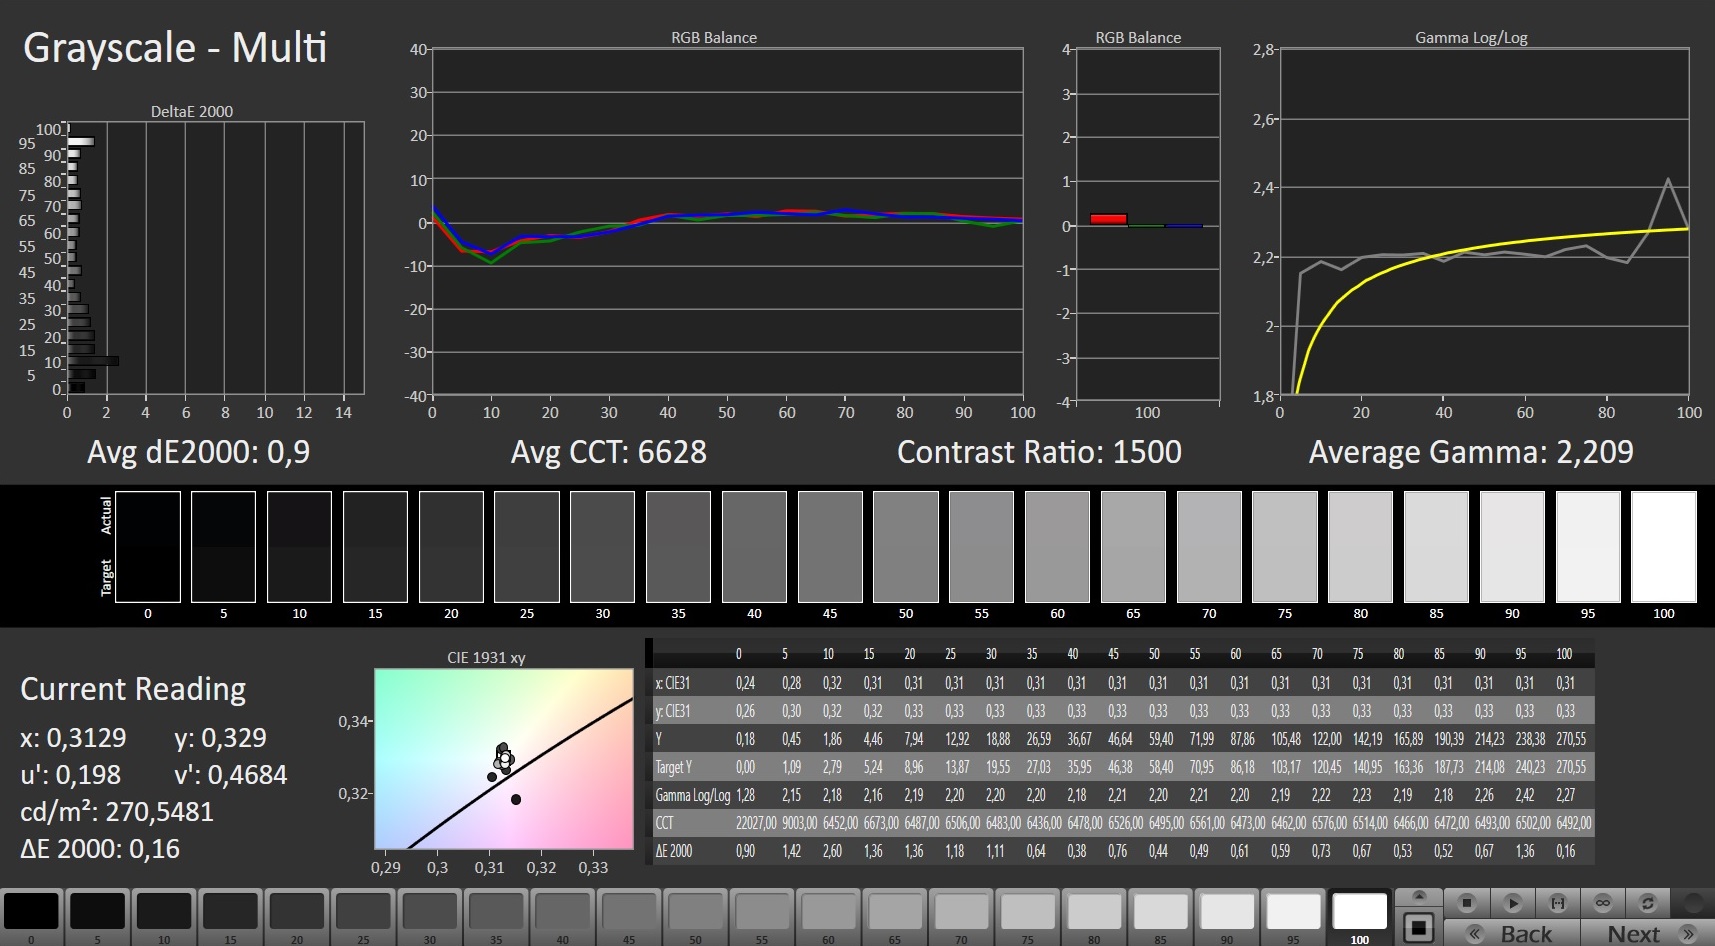
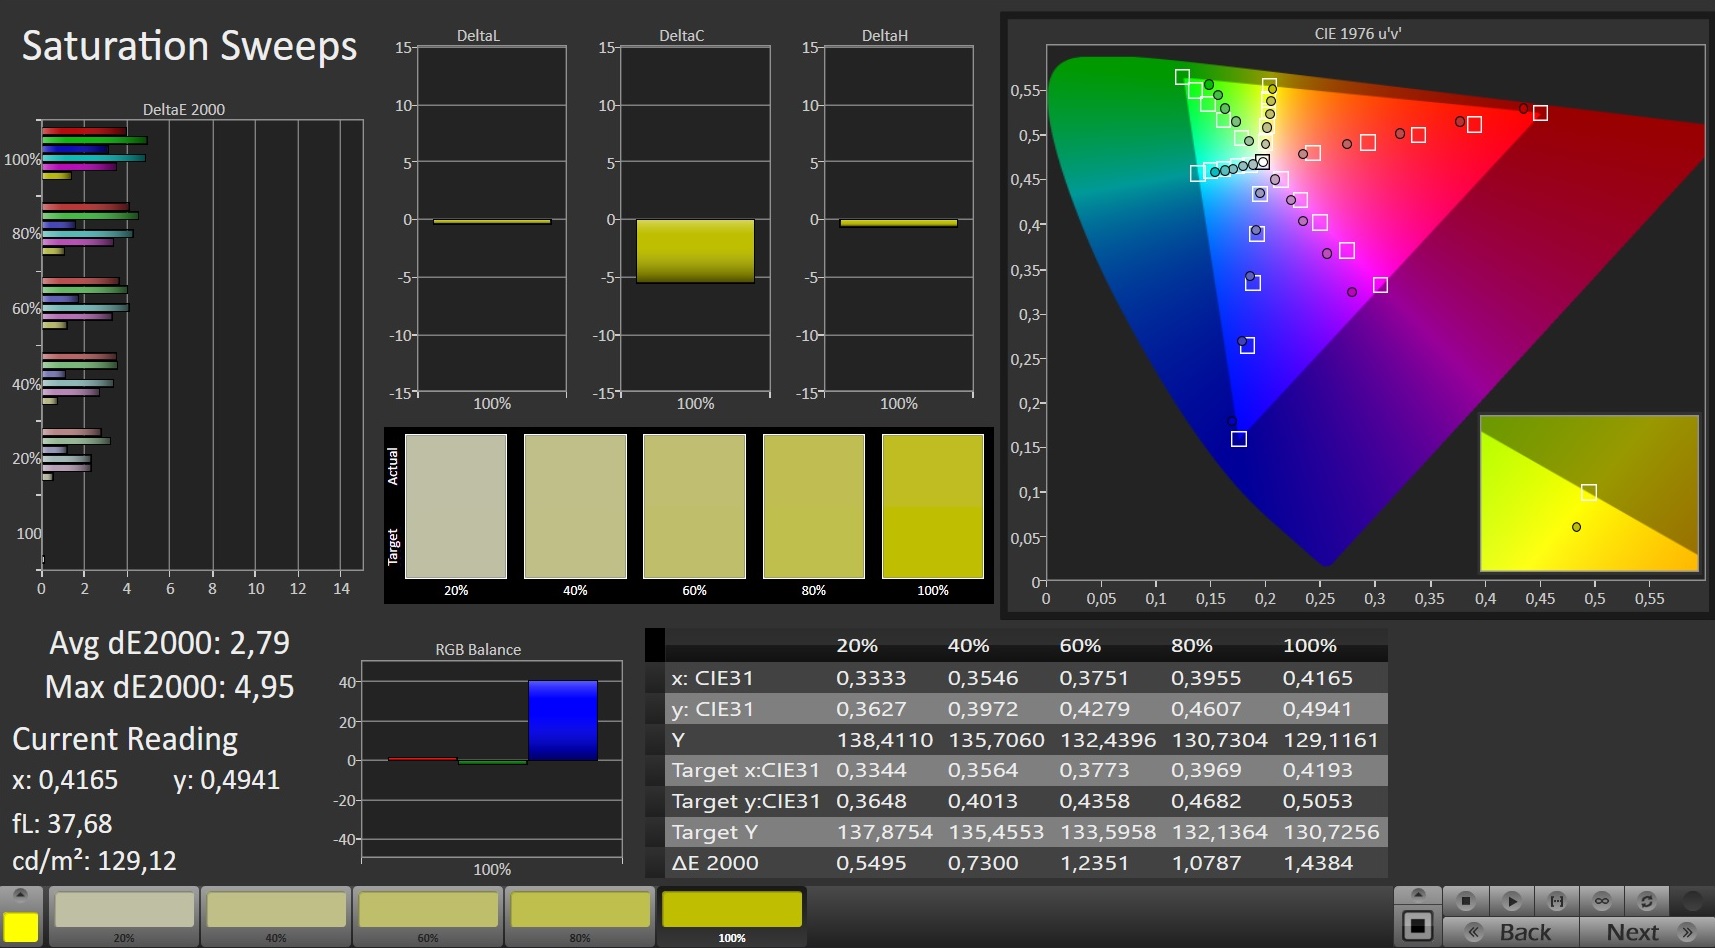
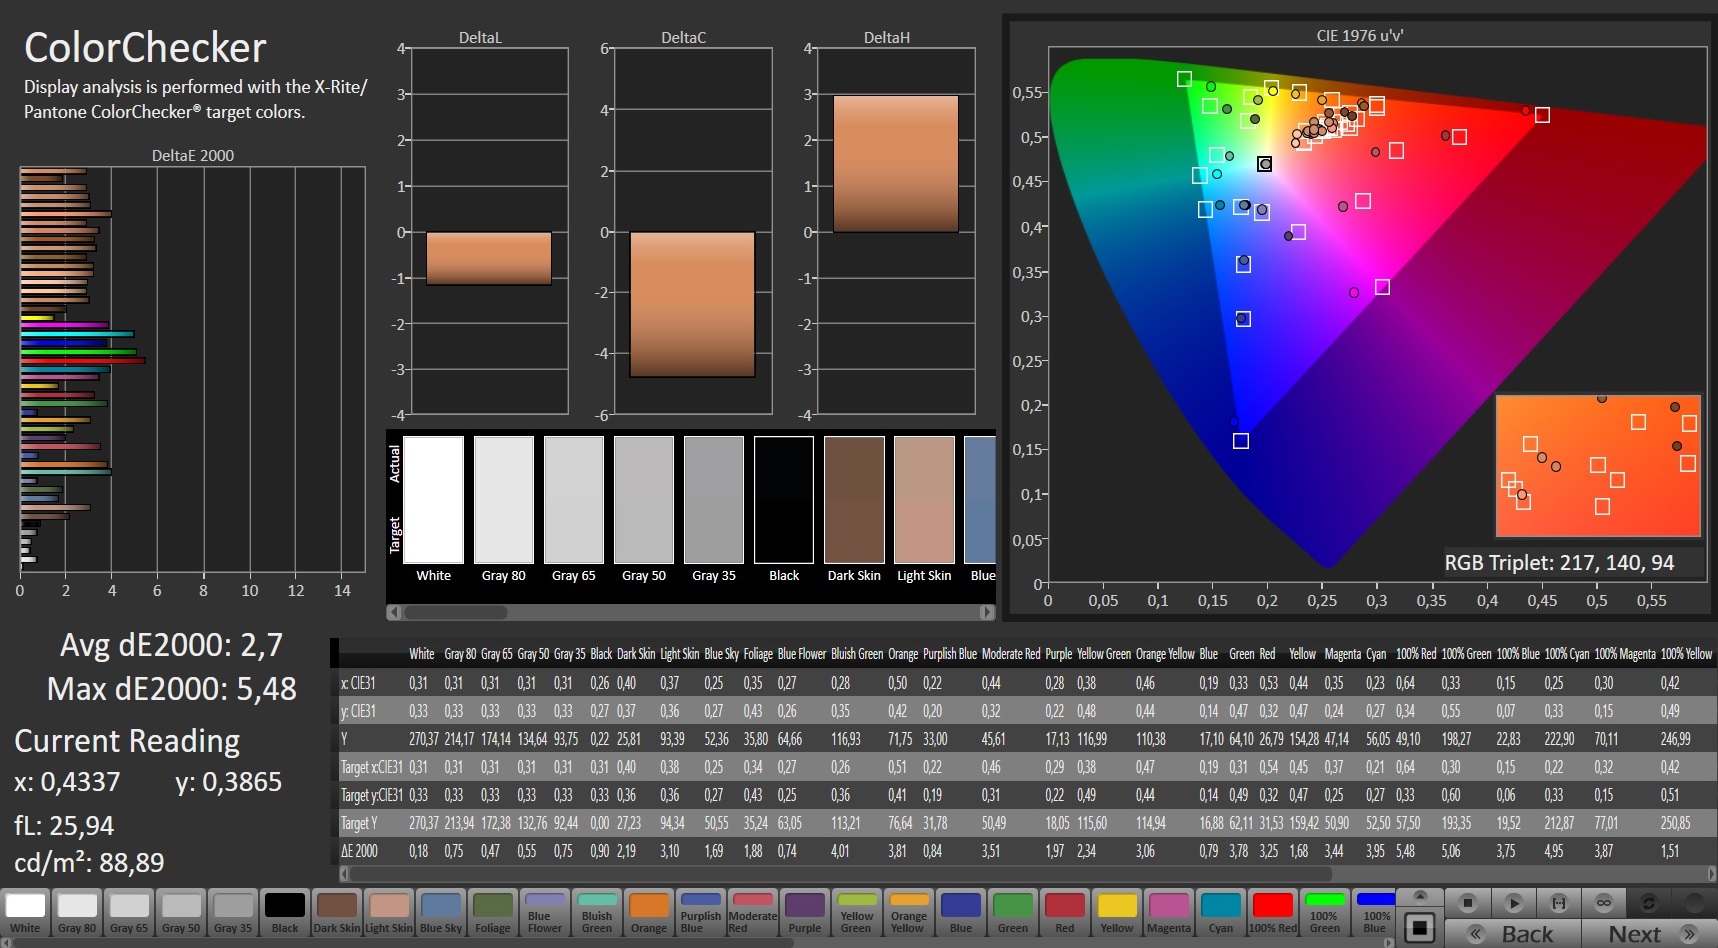
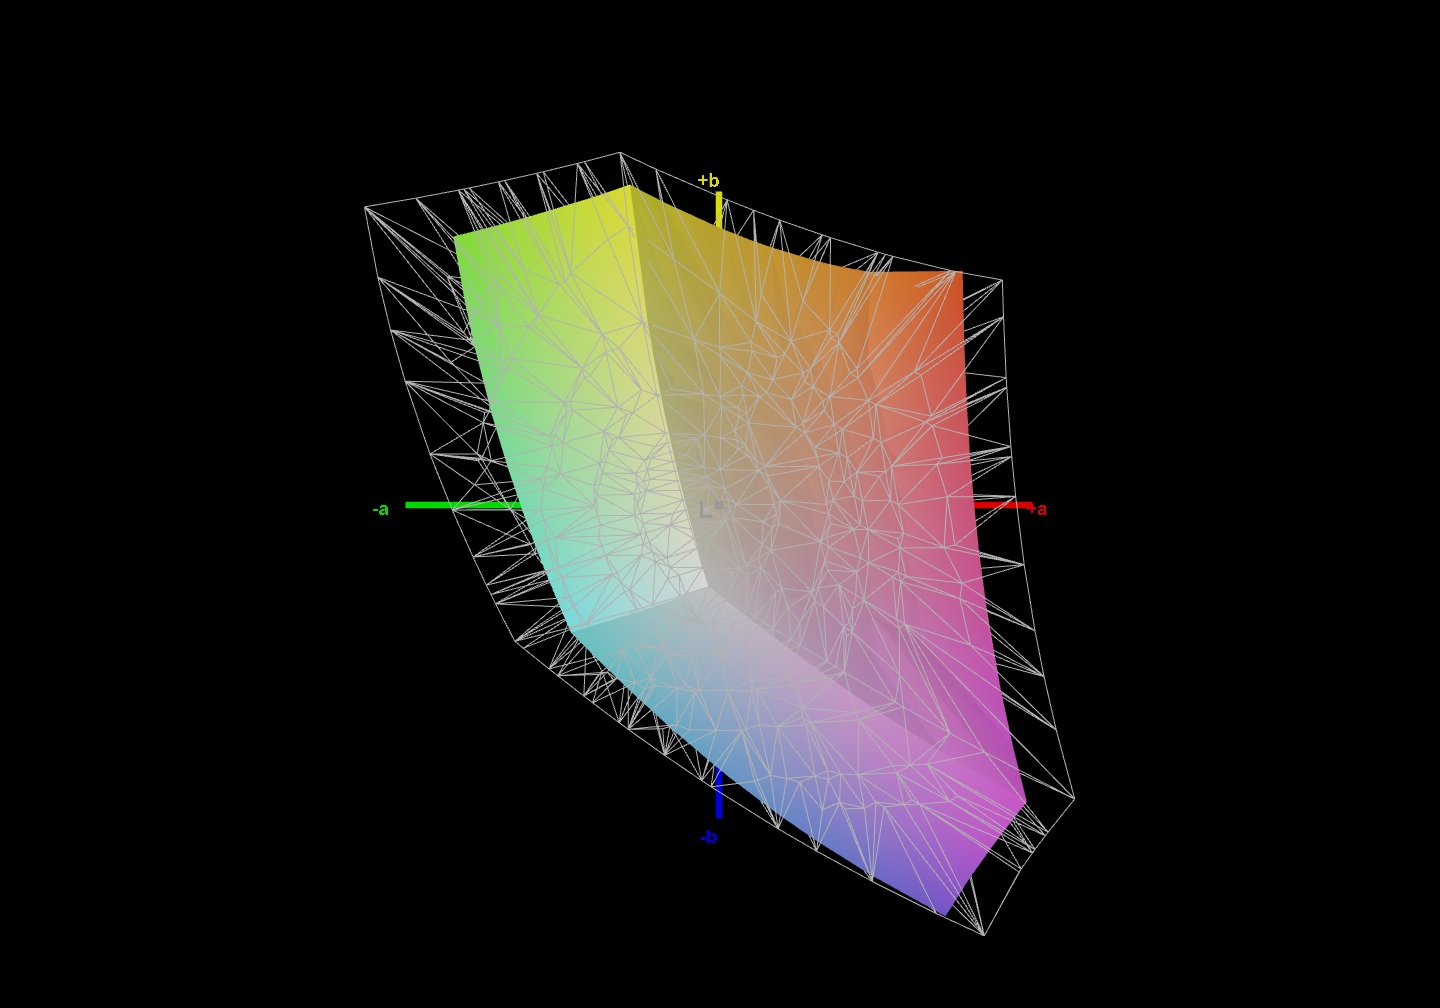
我们的测量结果显示,GE76 Raider 11UH的显示屏具有1,204:1的良好对比度和0.25cd/m²的同样良好的黑色水平。74.4%(sRGB)和51.2%(AdobeRGB)的色彩空间覆盖率相当令人失望,低于我们测试领域中其他设备的覆盖率。
CalMAN分析还显示,色彩显示的DeltaE 2000偏差为5.66。通过校准,这个值可以减少到2.7。相应的ICC文件可以在屏幕照度图形旁边的右上方窗口中下载。
微星GE76 Raider 11UH可以在户外使用,只要在阴凉处的地方是首选。屏幕上的内容仍然可以刚刚阅读,但亮度不够高,不适合长时间的户外游戏。
Display Response Times
| ↔ Response Time Black to White | ||
|---|---|---|
| 10.4 ms ... rise ↗ and fall ↘ combined | ↗ 6 ms rise | 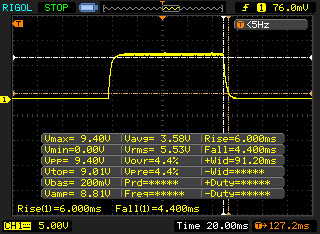 |
| ↘ 4.4 ms fall | ||
| The screen shows good response rates in our tests, but may be too slow for competitive gamers. In comparison, all tested devices range from 0.1 (minimum) to 240 (maximum) ms. » 28 % of all devices are better. This means that the measured response time is better than the average of all tested devices (19.8 ms). | ||
| ↔ Response Time 50% Grey to 80% Grey | ||
| 6.4 ms ... rise ↗ and fall ↘ combined | ↗ 2.8 ms rise | 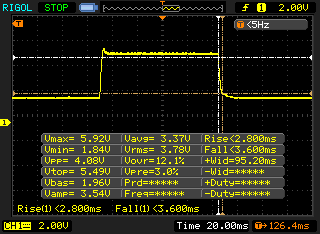 |
| ↘ 3.6 ms fall | ||
| The screen shows very fast response rates in our tests and should be very well suited for fast-paced gaming. In comparison, all tested devices range from 0.165 (minimum) to 636 (maximum) ms. » 19 % of all devices are better. This means that the measured response time is better than the average of all tested devices (31 ms). | ||
Screen Flickering / PWM (Pulse-Width Modulation)
| Screen flickering / PWM not detected | 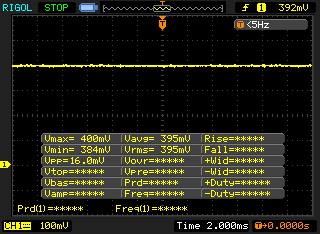 | ||
In comparison: 52 % of all tested devices do not use PWM to dim the display. If PWM was detected, an average of 7769 (minimum: 5 - maximum: 343500) Hz was measured. | |||
微星GE76 Raider的IPS面板在视角上非常稳定。图像内容几乎可以从每个角度阅读,而不会变形或显示不准确的颜色。

性能 - 为所有游戏配备
通过GE76 Raider 11UH,微星的目标是雄心勃勃的游戏玩家,他们正在寻找一个强大的游戏笔记本电脑,并配备了目前可能的最佳硬件。然而,除了我们的测试配置外,Raider 11UH也可使用NvidiaGeForce RTX 3070和不同的内存配置。
下面的基准测试是使用性能级别设置 "高 "和风扇配置文件 "自动 "执行的。此外,我们的测试设备是一个预生产模型,所以我们可能会看到生产版本的性能增加。
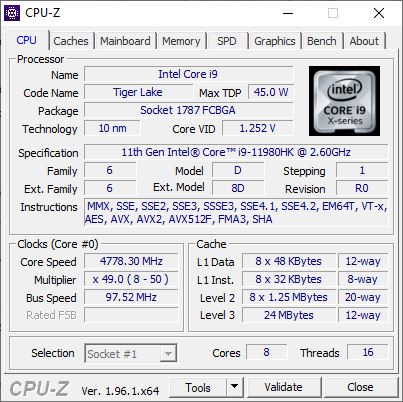
处理器
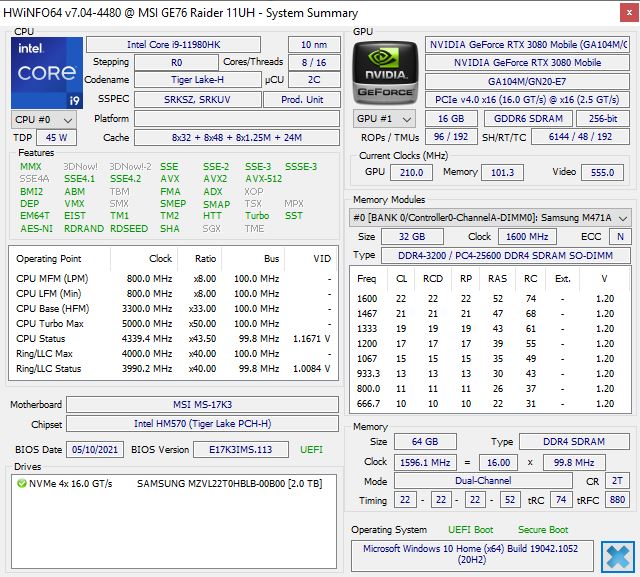
这里使用的英特尔酷睿i9-11980HK,是一个有八个核心的处理器,可以同时处理16个任务。时钟频率在2.6到5GHz之间,实际性能取决于冷却系统和预定义的TDP。微星配置后者的短期值(PL2)为200瓦,长期值(PL1)为91.75瓦。
使用这些参数,Cinebench R15的长期性能与GE76 Raider 10UH ,性能没有下降,可以观察到。然而,应该注意的是,在我们的审查中,前辈是使用 "极端 "性能设置进行测试的,而11UH仍然是一个预生产的设备。因此,生产版本的性能仍然可以更好一些。
在个别测试中,GE76 Raider 11UH的CPU实现了非常好的单核速率,这导致该设备在测试领域的排名处于上游。另一方面,多核结果低于平均水平。
更新:微星能够在GE76 Raider 11UH的生产模型中的某些方面大大增加游戏笔记本电脑的多核性能。在Cinebench R15、Cinebench R20、7zip、x265和Blender的单个基准测试中,结果提高了约20%。在Geekbench 5.3中,有12%的增长。相比之下,单核性能只在通常的公差范围内变化。正如我们的Cinebench R15连续负载图所显示的那样,现在长时间负载下的性能也明显提高。
因此,微星GE76 Raider 11UH中的Intel Core i9-11980HK的性能现在处于平均水平以上,可以跟上或超过竞争对手,如Gigabyte Aero 17 HDR YD 。
| Cinebench R20 | |
| CPU (Single Core) | |
| Average of class Gaming (442 - 895, n=109, last 2 years) | |
| MSI GE76 Raider 11UH-472US (Vorserie) | |
| MSI GE76 Raider 11UH-472US (Serienmodell) | |
| Average Intel Core i9-11980HK (572 - 622, n=7) | |
| Gigabyte Aero 17 HDR YD | |
| Alienware m17 R4 | |
| MSI GE76 Raider 10UH | |
| CPU (Multi Core) | |
| Average of class Gaming (4029 - 16108, n=109, last 2 years) | |
| Gigabyte Aero 17 HDR YD | |
| MSI GE76 Raider 11UH-472US (Serienmodell) | |
| MSI GE76 Raider 11UH-472US (Vorserie) | |
| Average Intel Core i9-11980HK (3779 - 5256, n=8) | |
| Alienware m17 R4 | |
| MSI GE76 Raider 10UH | |
| Cinebench R15 | |
| CPU Single 64Bit | |
| Average of class Gaming (188.8 - 343, n=109, last 2 years) | |
| Average Intel Core i9-11980HK (224 - 244, n=6) | |
| Gigabyte Aero 17 HDR YD | |
| MSI GE76 Raider 11UH-472US (Vorserie) | |
| MSI GE76 Raider 11UH-472US (Serienmodell) | |
| Alienware m17 R4 | |
| MSI GE76 Raider 10UH | |
| CPU Multi 64Bit | |
| Average of class Gaming (1578 - 6271, n=108, last 2 years) | |
| MSI GE76 Raider 11UH-472US (Serienmodell) | |
| MSI GE76 Raider 11UH-472US (Vorserie) | |
| Gigabyte Aero 17 HDR YD | |
| Average Intel Core i9-11980HK (1696 - 2287, n=7) | |
| Alienware m17 R4 | |
| MSI GE76 Raider 10UH | |
| Blender - v2.79 BMW27 CPU | |
| MSI GE76 Raider 11UH-472US (Vorserie) | |
| MSI GE76 Raider 11UH-472US (Serienmodell) | |
| MSI GE76 Raider 10UH | |
| Average Intel Core i9-11980HK (231 - 284, n=4) | |
| Alienware m17 R4 | |
| Gigabyte Aero 17 HDR YD | |
| Average of class Gaming (80 - 330, n=107, last 2 years) | |
| HWBOT x265 Benchmark v2.2 - 4k Preset | |
| Average of class Gaming (11.5 - 44.3, n=108, last 2 years) | |
| MSI GE76 Raider 11UH-472US (Serienmodell) | |
| MSI GE76 Raider 11UH-472US (Vorserie) | |
| Gigabyte Aero 17 HDR YD | |
| Average Intel Core i9-11980HK (13.1 - 16.3, n=5) | |
| Alienware m17 R4 | |
| MSI GE76 Raider 10UH | |
| LibreOffice - 20 Documents To PDF | |
| Alienware m17 R4 | |
| Average of class Gaming (19 - 88.8, n=108, last 2 years) | |
| MSI GE76 Raider 10UH | |
| Average Intel Core i9-11980HK (40.6 - 47.7, n=5) | |
| Gigabyte Aero 17 HDR YD | |
| MSI GE76 Raider 11UH-472US (Serienmodell) | |
| MSI GE76 Raider 11UH-472US (Vorserie) | |
| R Benchmark 2.5 - Overall mean | |
| MSI GE76 Raider 10UH | |
| Alienware m17 R4 | |
| MSI GE76 Raider 11UH-472US (Serienmodell) | |
| MSI GE76 Raider 11UH-472US (Vorserie) | |
| Gigabyte Aero 17 HDR YD | |
| Average Intel Core i9-11980HK (0.545 - 0.565, n=5) | |
| Average of class Gaming (0.3439 - 0.759, n=109, last 2 years) | |
* ... smaller is better
系统性能
在评估系统性能的PCMark 10测试中,微星GE76 Raider 11UH取得了良好的成绩,在我们的测试领域中排名第二。在这里,"Essentials "个人得分尤其突出。最大的竞争对手是Gigabyte Aero 17 HDR YD 。
这款游戏笔记本在日常使用中可以非常流畅地操作。程序启动很快,访问文件也没有延迟。其他笔记本电脑如何进行比较,可以在我们的 CPU基准测试文章中找到 。
| PCMark 10 / Score | |
| Average of class Gaming (5828 - 11574, n=95, last 2 years) | |
| Gigabyte Aero 17 HDR YD | |
| MSI GE76 Raider 11UH-472US (Serienmodell) | |
| MSI GE76 Raider 11UH-472US | |
| Average Intel Core i9-11980HK, NVIDIA GeForce RTX 3080 Laptop GPU (6937 - 7088, n=3) | |
| Alienware m17 R4 | |
| MSI GE76 Raider 10UH | |
| PCMark 10 / Essentials | |
| Average of class Gaming (8810 - 12600, n=99, last 2 years) | |
| MSI GE76 Raider 11UH-472US | |
| MSI GE76 Raider 11UH-472US (Serienmodell) | |
| Gigabyte Aero 17 HDR YD | |
| Average Intel Core i9-11980HK, NVIDIA GeForce RTX 3080 Laptop GPU (9665 - 10291, n=3) | |
| MSI GE76 Raider 10UH | |
| Alienware m17 R4 | |
| PCMark 10 / Productivity | |
| Average of class Gaming (6845 - 21327, n=97, last 2 years) | |
| MSI GE76 Raider 11UH-472US (Serienmodell) | |
| MSI GE76 Raider 11UH-472US | |
| Gigabyte Aero 17 HDR YD | |
| Average Intel Core i9-11980HK, NVIDIA GeForce RTX 3080 Laptop GPU (8934 - 9107, n=3) | |
| Alienware m17 R4 | |
| MSI GE76 Raider 10UH | |
| PCMark 10 / Digital Content Creation | |
| Average of class Gaming (7602 - 19657, n=97, last 2 years) | |
| MSI GE76 Raider 11UH-472US (Serienmodell) | |
| MSI GE76 Raider 11UH-472US | |
| Gigabyte Aero 17 HDR YD | |
| Average Intel Core i9-11980HK, NVIDIA GeForce RTX 3080 Laptop GPU (9855 - 10823, n=3) | |
| MSI GE76 Raider 10UH | |
| Alienware m17 R4 | |
| PCMark 10 Score | 7054 points | |
Help | ||
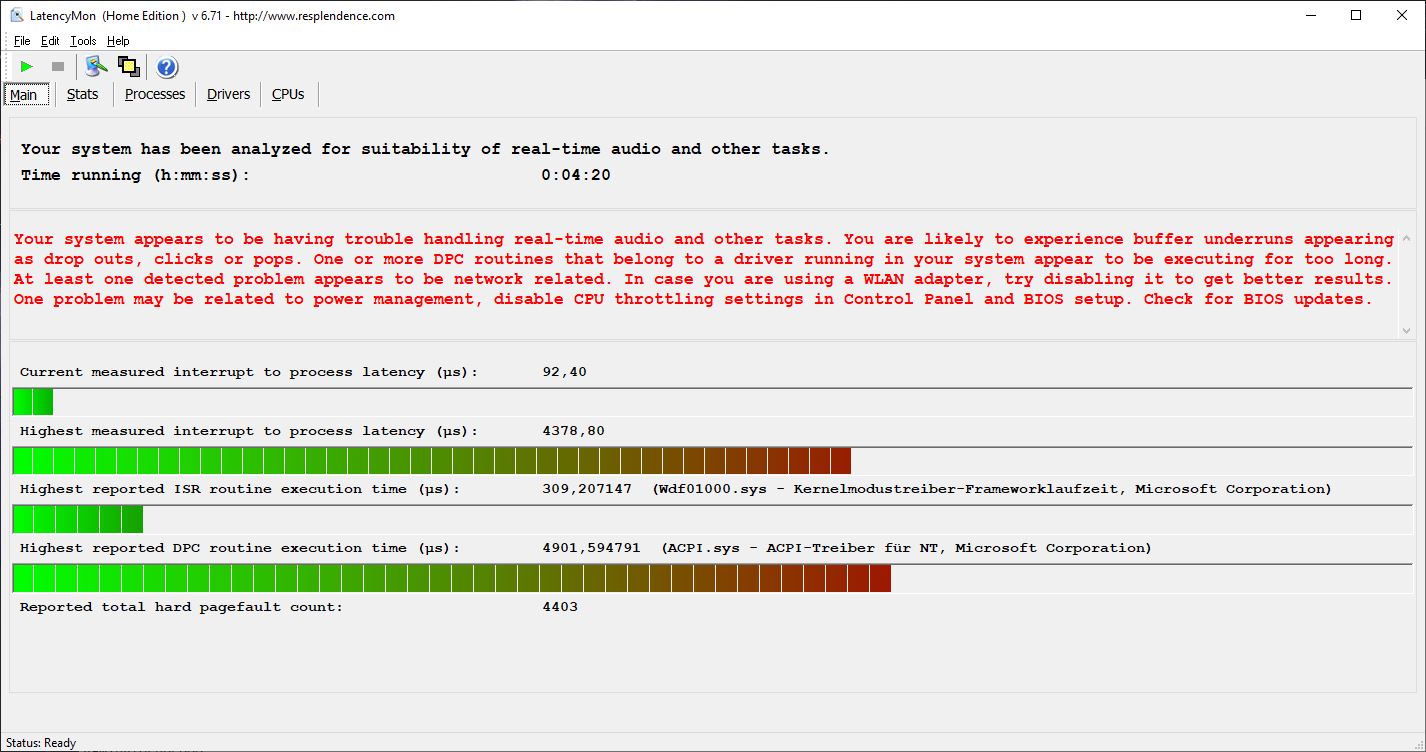
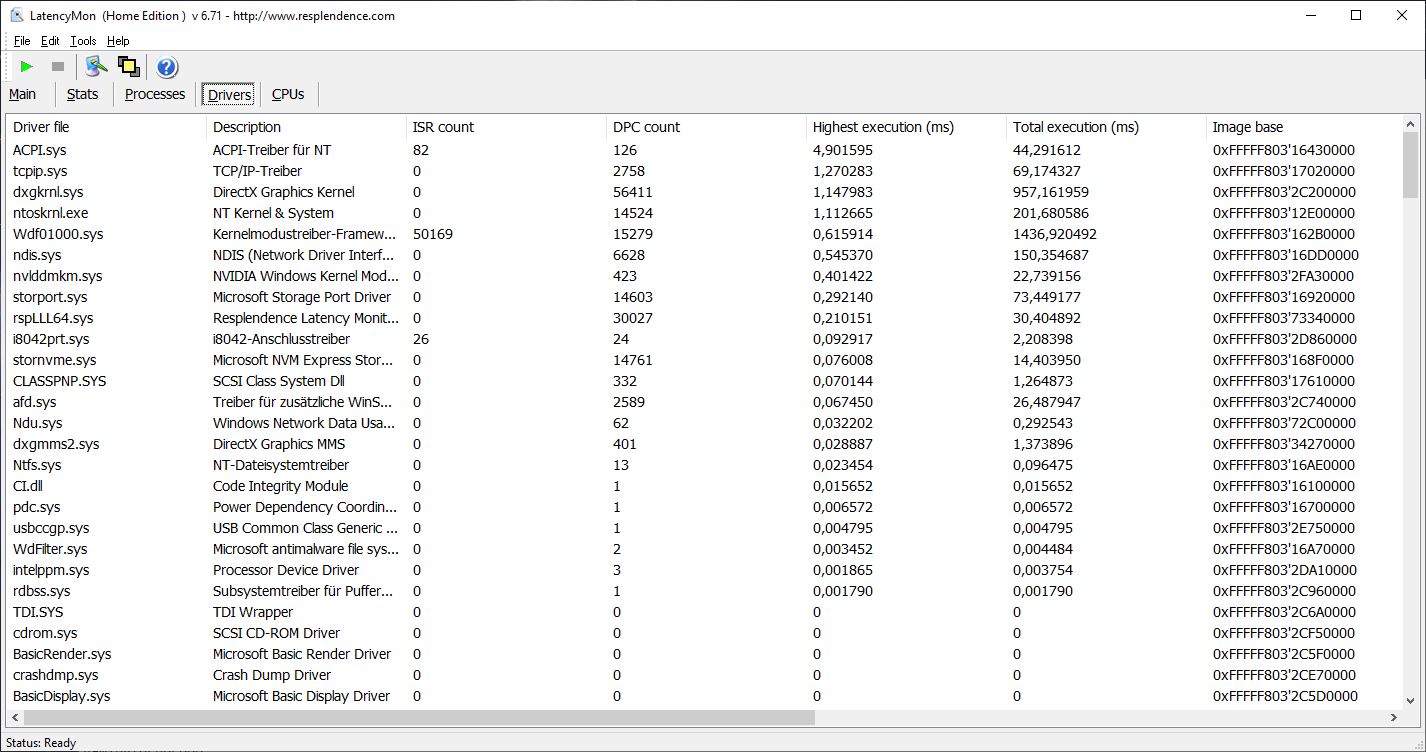
DPC延迟
在LatencyMon的测试中,微星GE76 Raider 11UH显示了高中断时间。这意味着,它不适合实时音频应用或类似的应用。
| DPC Latencies / LatencyMon - interrupt to process latency (max), Web, Youtube, Prime95 | |
| MSI GE76 Raider 10UH | |
| MSI GE76 Raider 11UH-472US | |
| Gigabyte Aero 17 HDR YD | |
| Alienware m17 R4 | |
* ... smaller is better
储存
| MSI GE76 Raider 11UH-472US Samsung PM9A1 MZVL21T0HCLR | MSI GE76 Raider 10UH WDC PC SN730 SDBPNTY-1T00 | Gigabyte Aero 17 HDR YD Samsung PM9A1 MZVL2512HCJQ | Alienware m17 R4 2x Micron 2300 512 GB (RAID 0) | Average Samsung PM9A1 MZVL21T0HCLR | |
|---|---|---|---|---|---|
| CrystalDiskMark 5.2 / 6 | -42% | -2% | -42% | -14% | |
| Write 4K (MB/s) | 238.8 | 157.1 -34% | 230.4 -4% | 93.1 -61% | 194.2 ? -19% |
| Read 4K (MB/s) | 88 | 46.3 -47% | 91.6 4% | 46.79 -47% | 80.6 ? -8% |
| Write Seq (MB/s) | 4306 | 2396 -44% | 4216 -2% | 2853 -34% | 3638 ? -16% |
| Read Seq (MB/s) | 4549 | 2245 -51% | 4543 0% | 2556 -44% | 3838 ? -16% |
| Write 4K Q32T1 (MB/s) | 699 | 436.1 -38% | 667 -5% | 475 -32% | 500 ? -28% |
| Read 4K Q32T1 (MB/s) | 752 | 524 -30% | 728 -3% | 529 -30% | 605 ? -20% |
| Write Seq Q32T1 (MB/s) | 5119 | 3086 -40% | 5043 -1% | 3331 -35% | 4898 ? -4% |
| Read Seq Q32T1 (MB/s) | 7086 | 3363 -53% | 6821 -4% | 3319 -53% | 6775 ? -4% |
| AS SSD | -70% | 0% | -68% | -7% | |
| Seq Read (MB/s) | 5435 | 2967 -45% | 5438 0% | 2733 -50% | 4901 ? -10% |
| Seq Write (MB/s) | 3954 | 2604 -34% | 3904 -1% | 2822 -29% | 3334 ? -16% |
| 4K Read (MB/s) | 52.9 | 42.97 -19% | 56.2 6% | 45.04 -15% | 72.4 ? 37% |
| 4K Write (MB/s) | 158.8 | 107.8 -32% | 165.8 4% | 88.4 -44% | 186 ? 17% |
| 4K-64 Read (MB/s) | 2551 | 1684 -34% | 2489 -2% | 1388 -46% | 1871 ? -27% |
| 4K-64 Write (MB/s) | 3155 | 2164 -31% | 3480 10% | 1227 -61% | 2764 ? -12% |
| Access Time Read * (ms) | 0.044 | 0.116 -164% | 0.054 -23% | 0.079 -80% | 0.0377 ? 14% |
| Access Time Write * (ms) | 0.026 | 0.106 -308% | 0.026 -0% | 0.095 -265% | 0.03431 ? -32% |
| Score Read (Points) | 3148 | 2023 -36% | 3089 -2% | 1706 -46% | 2433 ? -23% |
| Score Write (Points) | 3709 | 2532 -32% | 4036 9% | 1598 -57% | 3284 ? -11% |
| Score Total (Points) | 8383 | 5571 -34% | 8620 3% | 4184 -50% | 6892 ? -18% |
| Total Average (Program / Settings) | -56% /
-58% | -1% /
-1% | -55% /
-57% | -11% /
-10% |
* ... smaller is better

Continuous load read: DiskSpd Read Loop, Queue Depth 8
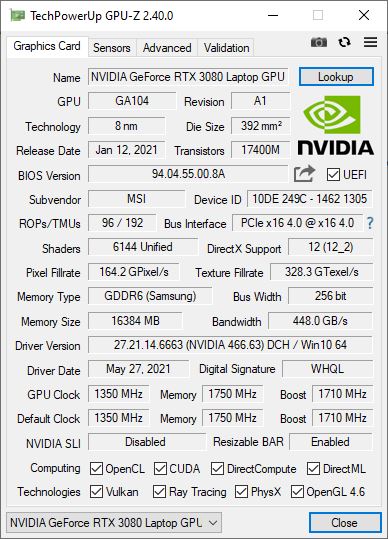
图形卡
这里使用的NvidiaGeForce RTX 3080是目前最强的移动显卡。然而,其性能取决于TGP设置,微星将其设置为165瓦的最大可能值。基准测试中的性能结果也相应不错。应该再次指出的是,GE76 Raider 10UH是在 "极端 "设置下测试的,GE76 Raider 11UH是在 "高性能 "设置下测试的。
我们的GPU基准测试文章,显示了其他显卡的对比表现。
| 3DMark 11 Performance | 30194 points | |
| 3DMark Cloud Gate Standard Score | 47525 points | |
| 3DMark Fire Strike Score | 21608 points | |
Help | ||
游戏性能
微星GE76 Raider 11UH出色地适用于游戏。内置的NvidiaGeForce RTX 3080
,提供非常高的帧率,甚至可以在高分辨率和最大细节水平下流畅地显示要求很高的标题。与我们选择的竞争对手相比,微星的游戏笔记本表现出类似的水平。NvidiaGeForce RTX 3080在其他游戏中可以预期的性能,在我们的 GPU游戏文章中列出 。
| The Witcher 3 - 1920x1080 Ultra Graphics & Postprocessing (HBAO+) | |
| Average of class Gaming (95 - 240, n=8, last 2 years) | |
| MSI GE76 Raider 10UH | |
| Alienware m17 R4 | |
| MSI GE76 Raider 11UH-472US | |
| Average NVIDIA GeForce RTX 3080 Laptop GPU (85.1 - 123, n=40) | |
| Gigabyte Aero 17 HDR YD | |
| Cyberpunk 2077 1.0 - 1920x1080 Ultra Preset | |
| Alienware m17 R4 | |
| MSI GE76 Raider 11UH-472US | |
| Average NVIDIA GeForce RTX 3080 Laptop GPU (52.9 - 84.3, n=9) | |
| Gigabyte Aero 17 HDR YD | |
| X-Plane 11.11 - 1920x1080 high (fps_test=3) | |
| Average of class Gaming (52.1 - 143.5, n=113, last 2 years) | |
| Gigabyte Aero 17 HDR YD | |
| Alienware m17 R4 | |
| MSI GE76 Raider 11UH-472US | |
| Average NVIDIA GeForce RTX 3080 Laptop GPU (65.6 - 113, n=44) | |
| MSI GE76 Raider 10UH | |
| GTA V - 1920x1080 High/On (Advanced Graphics Off) AA:2xMSAA + FX AF:8x | |
| Average of class Gaming (110.7 - 189, n=69, last 2 years) | |
| Gigabyte Aero 17 HDR YD | |
| MSI GE76 Raider 11UH-472US | |
| Average NVIDIA GeForce RTX 3080 Laptop GPU (137 - 176, n=30) | |
| MSI GE76 Raider 10UH | |
| Alienware m17 R4 | |
| Final Fantasy XV Benchmark - 1920x1080 High Quality | |
| Average of class Gaming (41 - 215, n=99, last 2 years) | |
| MSI GE76 Raider 10UH | |
| MSI GE76 Raider 11UH-472US | |
| Average NVIDIA GeForce RTX 3080 Laptop GPU (55.5 - 115, n=34) | |
| Gigabyte Aero 17 HDR YD | |
| Alienware m17 R4 | |
| Dota 2 Reborn - 1920x1080 ultra (3/3) best looking | |
| Average of class Gaming (84.8 - 248, n=110, last 2 years) | |
| Gigabyte Aero 17 HDR YD | |
| MSI GE76 Raider 11UH-472US | |
| Alienware m17 R4 | |
| Average NVIDIA GeForce RTX 3080 Laptop GPU (98 - 156, n=45) | |
| MSI GE76 Raider 10UH | |
我们对TheWitcher 3使用 "Ultra "图形设置进行的连续负载测试也表明,尽管有轻微的波动,但帧率即使在长时间内也保持稳定。因此,在长时间的游戏过程中,不会出现性能限制。
The Witcher 3 FPS diagram
| low | med. | high | ultra | QHD | 4K | |
|---|---|---|---|---|---|---|
| GTA V (2015) | 182 | 177 | 164 | |||
| The Witcher 3 (2015) | 112 | |||||
| Dota 2 Reborn (2015) | 173 | 159 | 148 | 138 | ||
| Final Fantasy XV Benchmark (2018) | 183 | 136 | 108 | |||
| X-Plane 11.11 (2018) | 122 | 104 | 84.2 | |||
| Far Cry 5 (2018) | 136 | 115 | 113 | 110 | ||
| Strange Brigade (2018) | 446 | 265 | 219 | 196 | ||
| Cyberpunk 2077 1.0 (2020) | 105 | 99.2 | 90.6 | 80.1 | ||
| Diablo 4 (2023) | 184.6 | 124 | 65.5 |
排放 - 17英寸笔记本电脑中的良好扬声器
噪声排放
微星GE76 Raider 11UH的风扇在负载下可以变得相当响亮,最高可达55 dB(A)。在 "自动 "风扇配置文件中,只有在要求非常高的游戏中才会达到这个噪音水平,但即使在较低的负载下,均匀的风扇噪音也是清晰可闻的。与其他游戏笔记本电脑相比,GE76 Raider的噪音水平中等。
在我们的测试设备中,我们无法检测到其他背景噪音,如线圈啸叫之类的。
Noise level
| Idle |
| 25 / 27 / 35 dB(A) |
| Load |
| 54 / 55 dB(A) |
 | ||
30 dB silent 40 dB(A) audible 50 dB(A) loud |
||
min: | ||
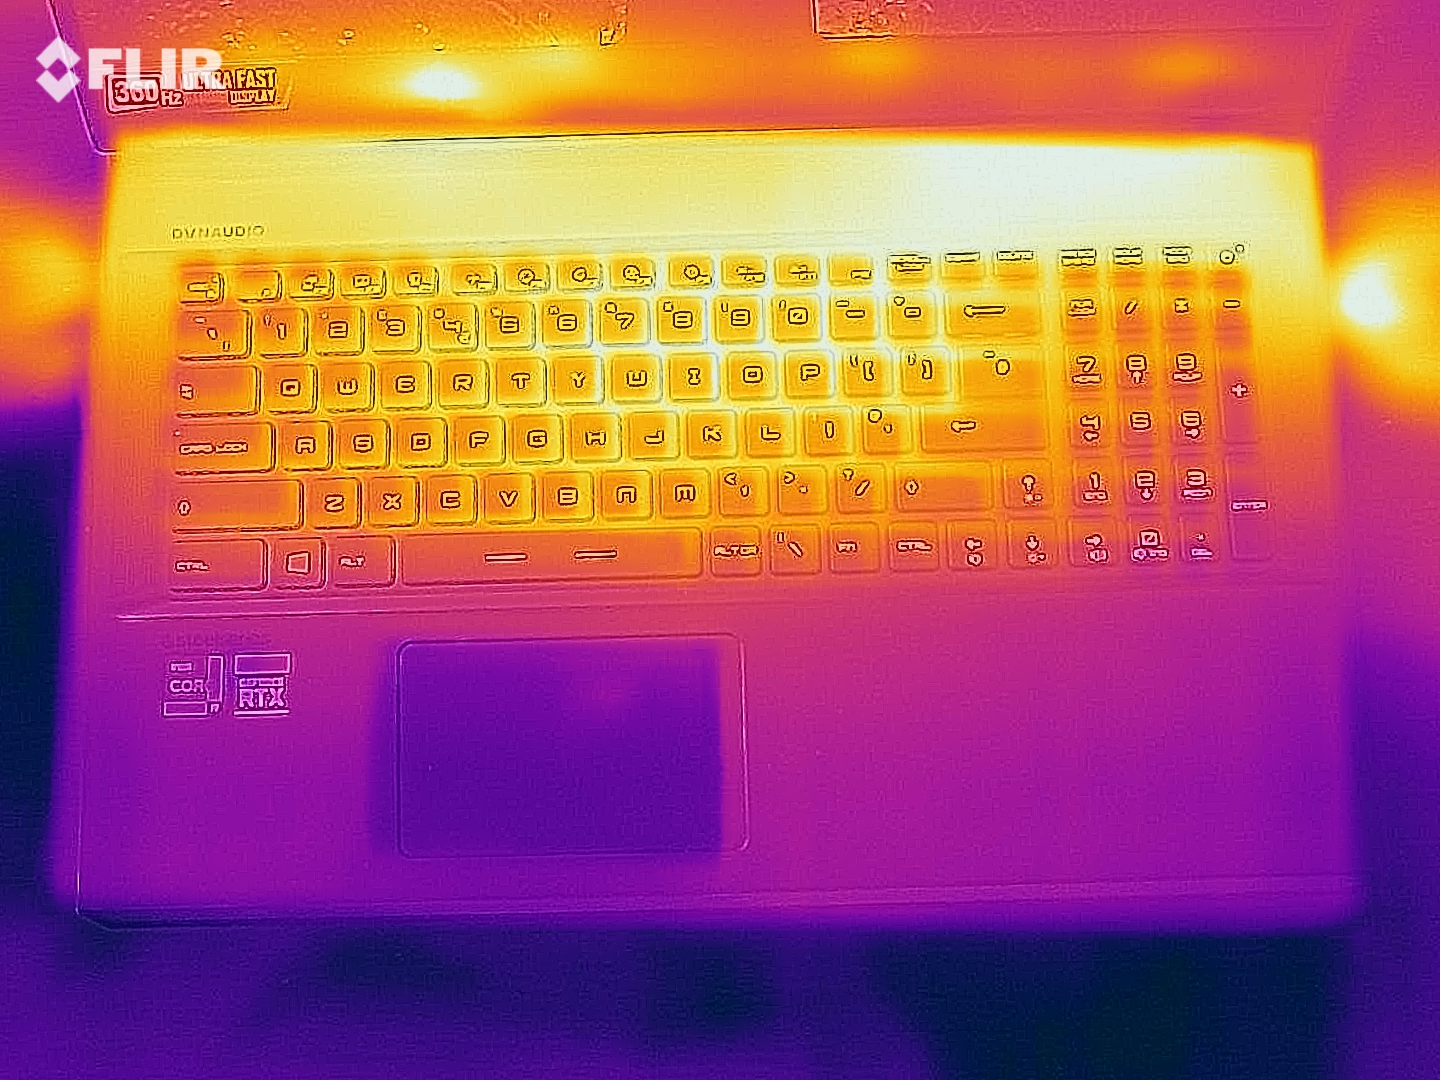
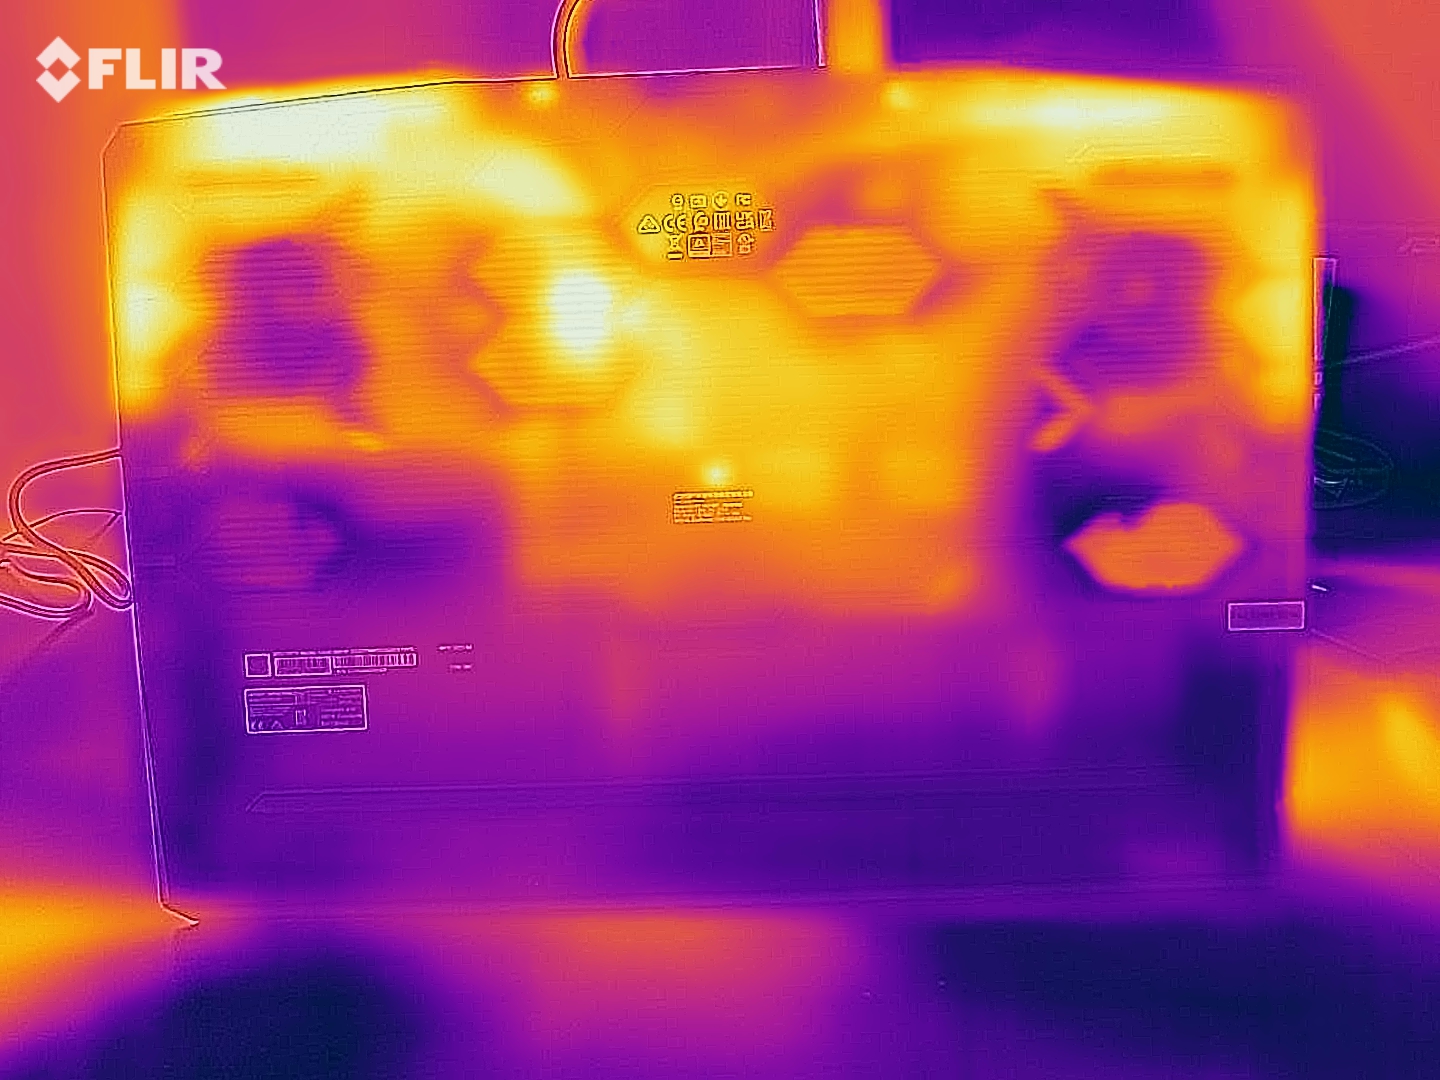
温度
根据我们的测量,微星笔记本电脑的表面在负载下发热高达50℃(约122°F)。最热的地方是底面的左后角。掌托的温度在任何时候都保持适中,最高为34 °C(~93 °F)。
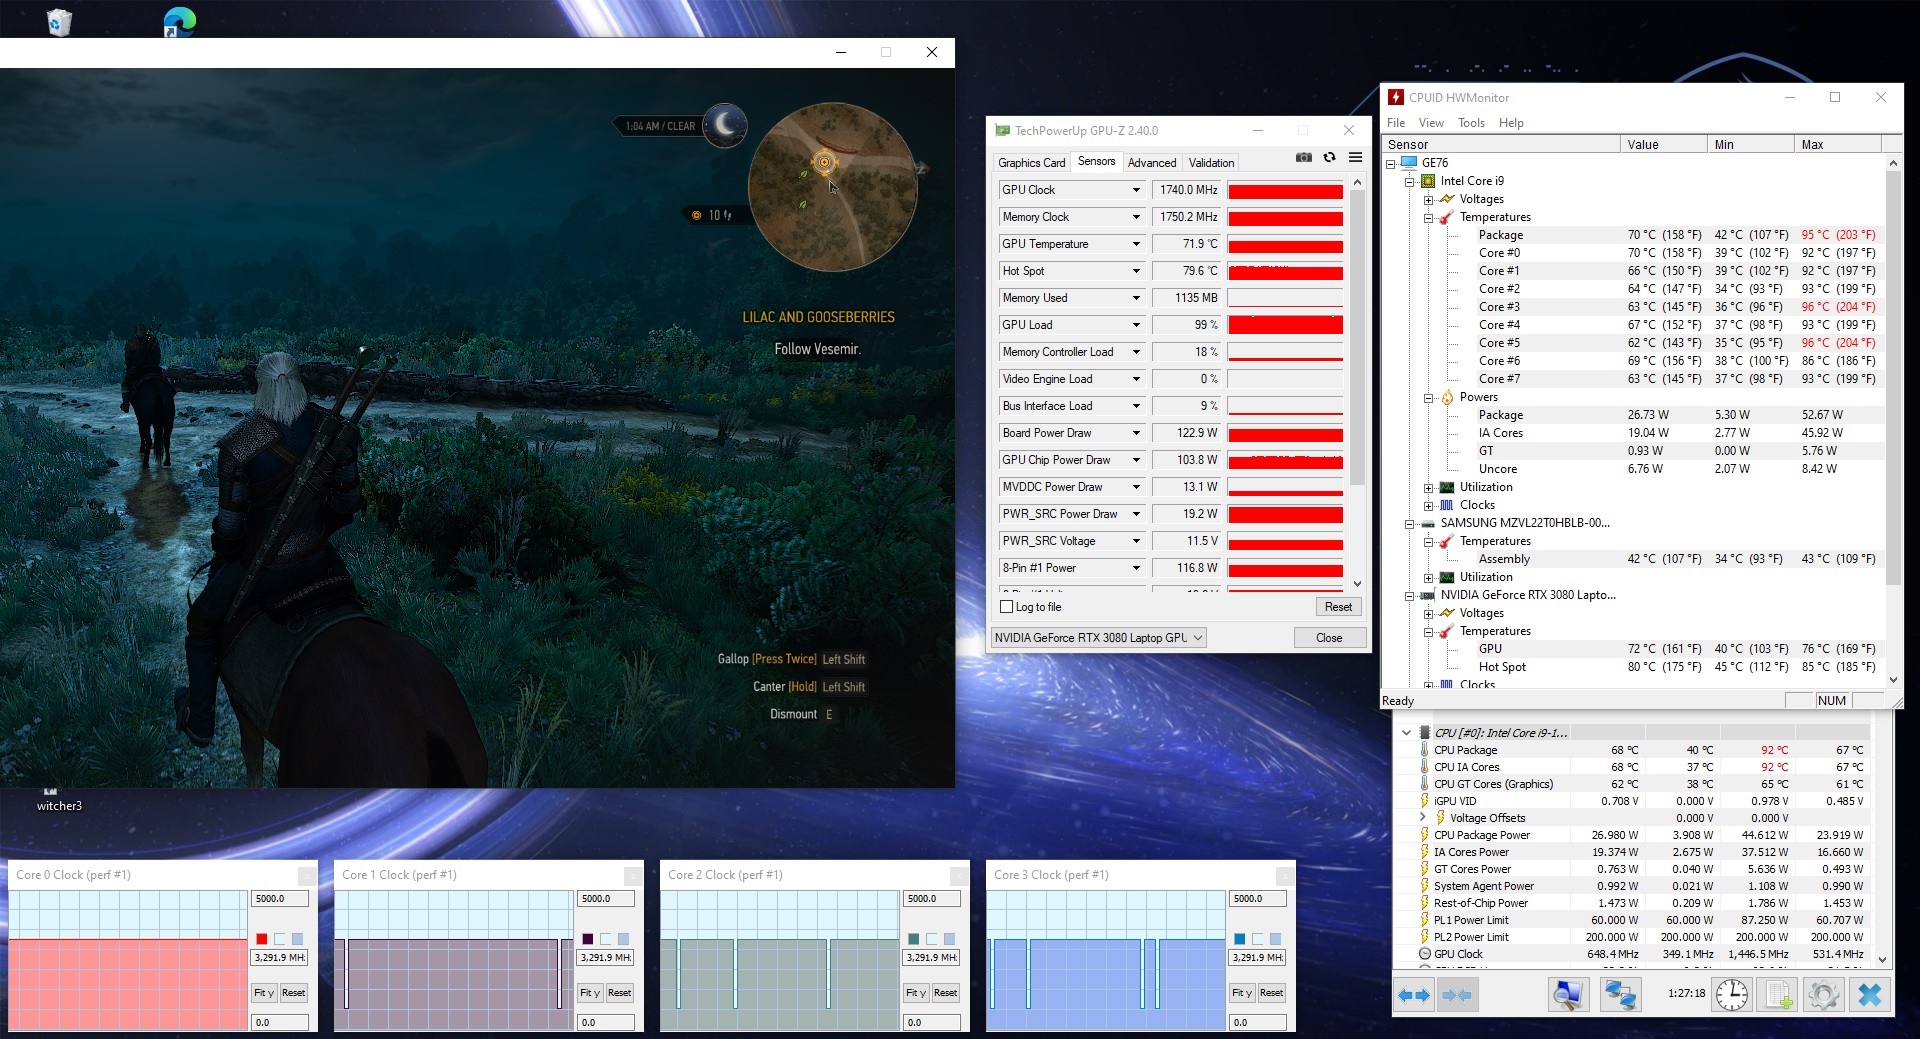
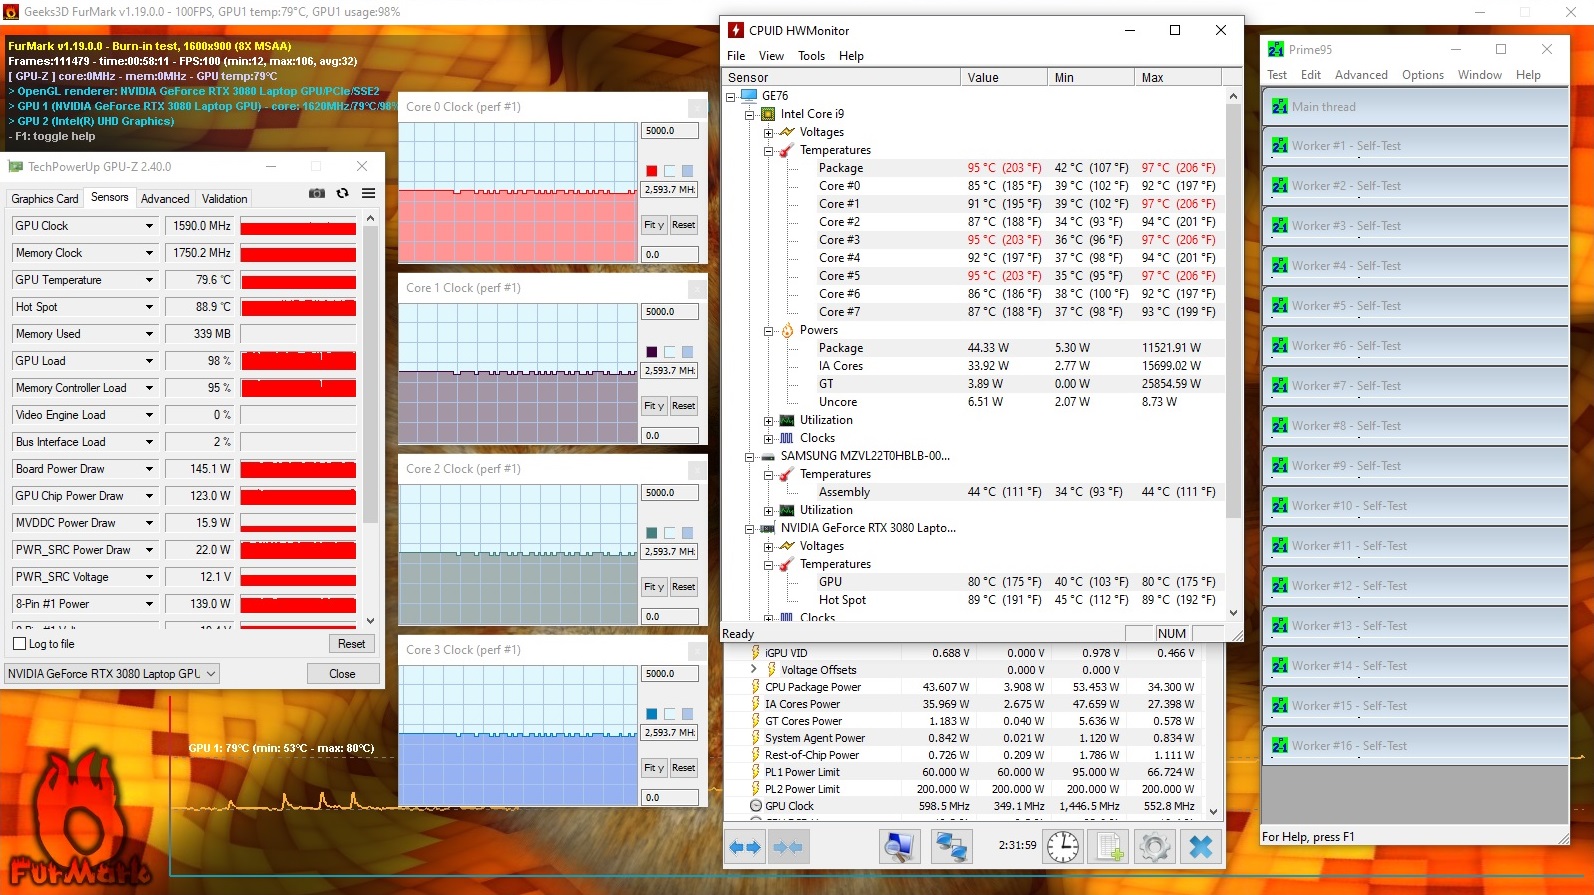
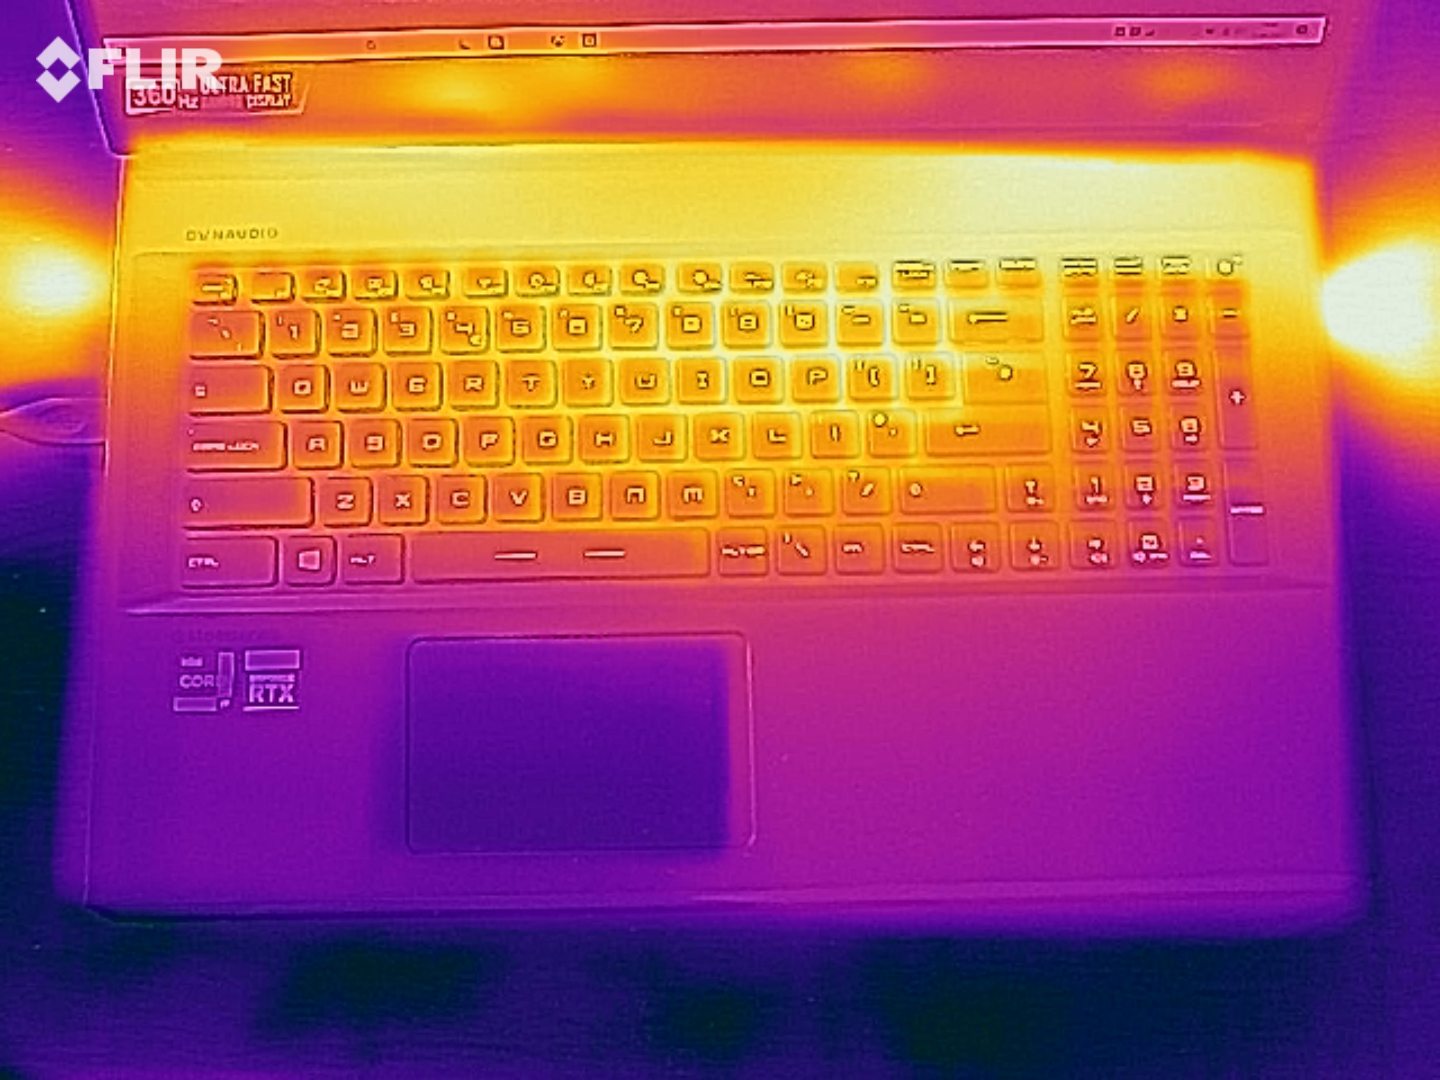
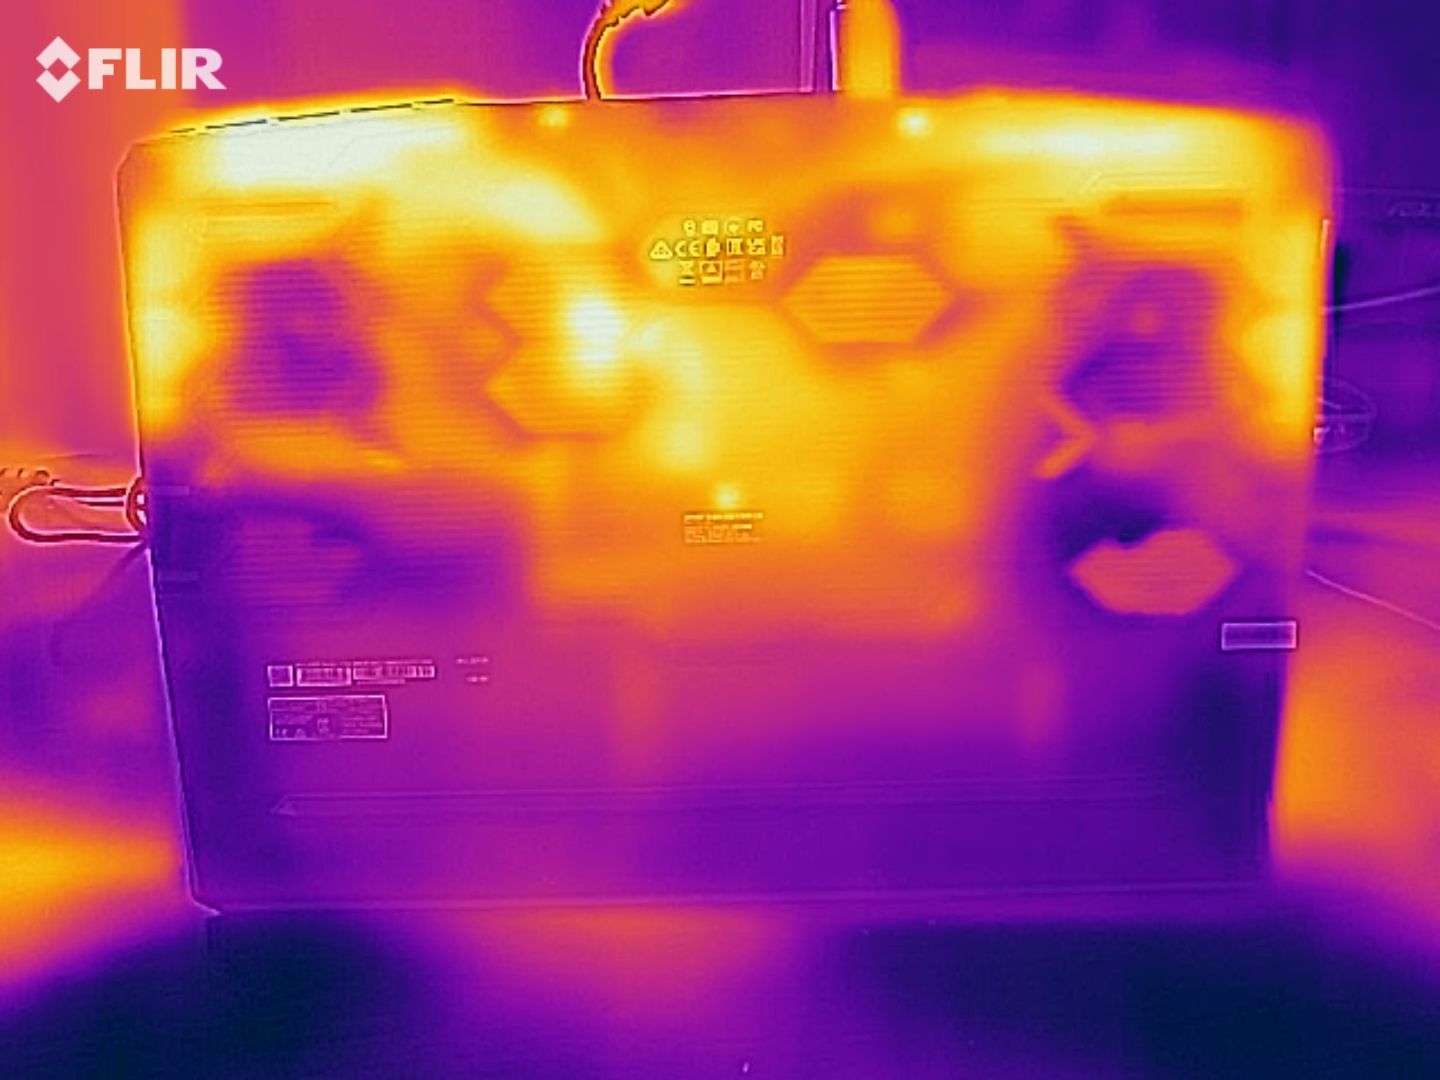
在我们的耐久压力测试中,内部温度攀升至97°C(约207°F),但在2.6GHz左右,CPU时钟速率没有下降到基本时钟速度以下。在我们的TheWitcher 3耐力测试中,温度高达96°C(约205°F),但时钟速率没有低于3.3GHz。因此,即使在长时间的负载下,也不必期待性能限制或节流。
(-) The maximum temperature on the upper side is 46 °C / 115 F, compared to the average of 40.4 °C / 105 F, ranging from 21.2 to 68.8 °C for the class Gaming.
(-) The bottom heats up to a maximum of 48 °C / 118 F, compared to the average of 43.2 °C / 110 F
(+) In idle usage, the average temperature for the upper side is 29.3 °C / 85 F, compared to the device average of 33.9 °C / 93 F.
(-) Playing The Witcher 3, the average temperature for the upper side is 40.7 °C / 105 F, compared to the device average of 33.9 °C / 93 F.
(+) The palmrests and touchpad are reaching skin temperature as a maximum (34 °C / 93.2 F) and are therefore not hot.
(-) The average temperature of the palmrest area of similar devices was 28.8 °C / 83.8 F (-5.2 °C / -9.4 F).
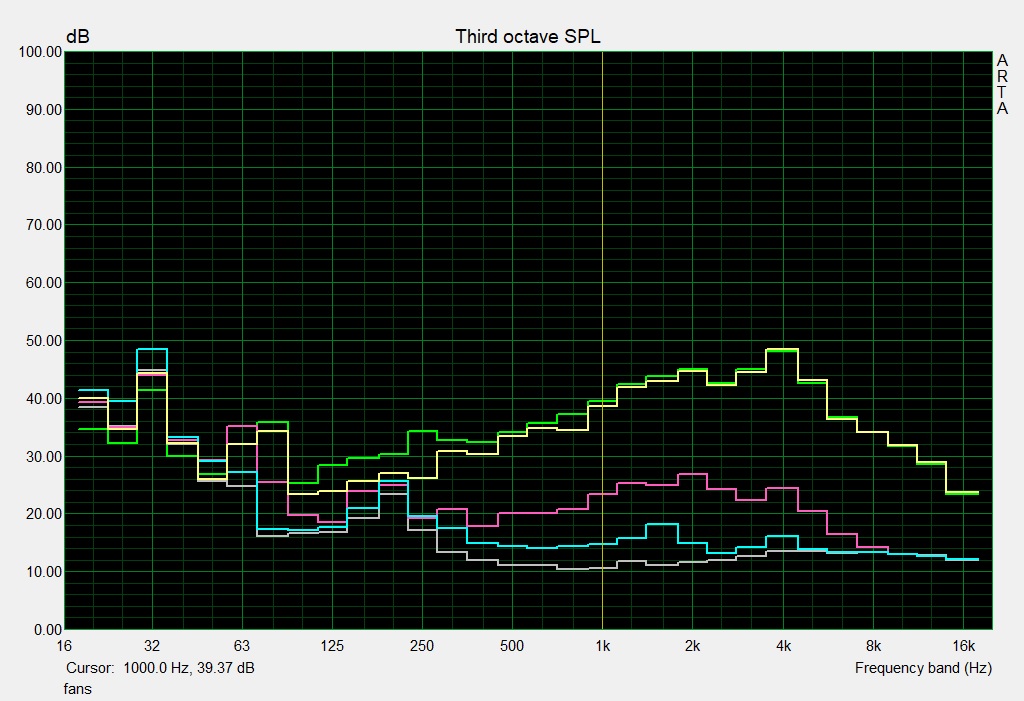
发言人
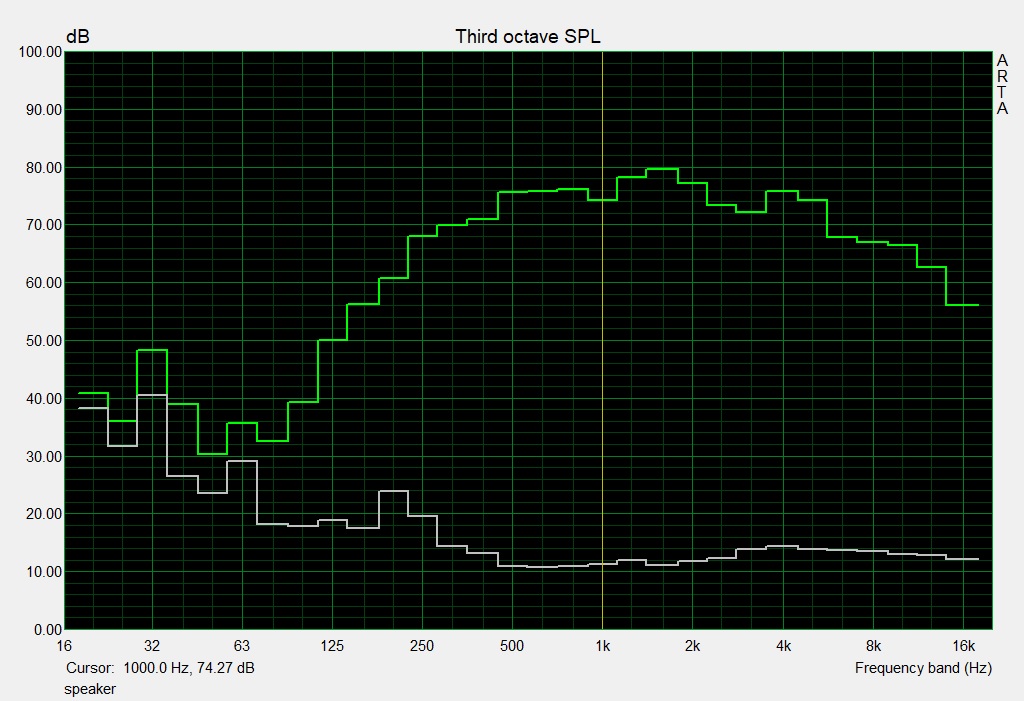
微星GE76 Raider UH11的扬声器提供相对较高的音量和相当广泛的声谱。这使得它们非常适合播放媒体内容。然而,由于风扇的噪音水平有点强,在游戏时仍然建议使用外部扬声器或耳机。
MSI GE76 Raider 11UH-472US audio analysis
(+) | speakers can play relatively loud (87 dB)
Bass 100 - 315 Hz
(±) | reduced bass - on average 14.8% lower than median
(±) | linearity of bass is average (10.5% delta to prev. frequency)
Mids 400 - 2000 Hz
(+) | balanced mids - only 4.1% away from median
(+) | mids are linear (3.3% delta to prev. frequency)
Highs 2 - 16 kHz
(+) | balanced highs - only 3.2% away from median
(+) | highs are linear (4.3% delta to prev. frequency)
Overall 100 - 16.000 Hz
(+) | overall sound is linear (12.6% difference to median)
Compared to same class
» 16% of all tested devices in this class were better, 4% similar, 81% worse
» The best had a delta of 6%, average was 18%, worst was 132%
Compared to all devices tested
» 11% of all tested devices were better, 3% similar, 86% worse
» The best had a delta of 4%, average was 24%, worst was 134%
Gigabyte Aero 17 HDR YD audio analysis
(+) | speakers can play relatively loud (88 dB)
Bass 100 - 315 Hz
(-) | nearly no bass - on average 33.9% lower than median
(±) | linearity of bass is average (9.6% delta to prev. frequency)
Mids 400 - 2000 Hz
(+) | balanced mids - only 2.9% away from median
(+) | mids are linear (6.5% delta to prev. frequency)
Highs 2 - 16 kHz
(±) | higher highs - on average 5.1% higher than median
(+) | highs are linear (4.7% delta to prev. frequency)
Overall 100 - 16.000 Hz
(±) | linearity of overall sound is average (19.8% difference to median)
Compared to same class
» 70% of all tested devices in this class were better, 6% similar, 24% worse
» The best had a delta of 6%, average was 18%, worst was 132%
Compared to all devices tested
» 50% of all tested devices were better, 7% similar, 42% worse
» The best had a delta of 4%, average was 24%, worst was 134%
能源管理 - 超过5小时的电池寿命
能源消耗
微星GE76 Raider UH11在空闲状态下的平均功耗为16瓦,证明它比我们选择的竞争对手更节俭。在负载情况下,消耗量在103至266瓦之间。
附带的电源适配器提供280瓦的输出能力;因此,它有一个足够高的评级。
| Off / Standby | |
| Idle | |
| Load |
|
Key:
min: | |
| MSI GE76 Raider 11UH-472US i9-11980HK, GeForce RTX 3080 Laptop GPU | MSI GE76 Raider 10UH i7-10870H, GeForce RTX 3080 Laptop GPU | Gigabyte Aero 17 HDR YD i9-11980HK, GeForce RTX 3080 Laptop GPU | Alienware m17 R4 i9-10980HK, GeForce RTX 3080 Laptop GPU | Average of class Gaming | |
|---|---|---|---|---|---|
| Power Consumption | -29% | -44% | -116% | -9% | |
| Idle Minimum * (Watt) | 10 | 15.5 -55% | 25 -150% | 42 -320% | 13.2 ? -32% |
| Idle Average * (Watt) | 16 | 31.3 -96% | 28 -75% | 48 -200% | 18.9 ? -18% |
| Idle Maximum * (Watt) | 26 | 31.7 -22% | 40 -54% | 58 -123% | 24.5 ? 6% |
| Load Average * (Watt) | 103 | 93.6 9% | 114 -11% | 124 -20% | 108.8 ? -6% |
| Witcher 3 ultra * (Watt) | 204 | 233 -14% | 176 14% | 219 -7% | |
| Load Maximum * (Watt) | 266 | 260.3 2% | 236 11% | 337 -27% | 254 ? 5% |
* ... smaller is better
Energy consumption during The Witcher 3 / Stress test
电池寿命
微星GE76 Raider UH11在我们的真实世界Wi-Fi测试中实现了5:30小时的运行时间。这意味着它的99.9Wh电池的使用情况与同类设备相似。
| MSI GE76 Raider 11UH-472US i9-11980HK, GeForce RTX 3080 Laptop GPU, 99.9 Wh | MSI GE76 Raider 10UH i7-10870H, GeForce RTX 3080 Laptop GPU, 99.9 Wh | Gigabyte Aero 17 HDR YD i9-11980HK, GeForce RTX 3080 Laptop GPU, 99 Wh | Alienware m17 R4 i9-10980HK, GeForce RTX 3080 Laptop GPU, 86 Wh | Average of class Gaming | |
|---|---|---|---|---|---|
| Battery runtime | 11% | -9% | -38% | 12% | |
| Reader / Idle (h) | 7.8 | 8.2 5% | 8.71 ? 12% | ||
| WiFi v1.3 (h) | 5.5 | 6.3 15% | 5.6 2% | 2.4 -56% | 6.96 ? 27% |
| Load (h) | 1.5 | 1.7 13% | 1.2 -20% | 1.2 -20% | 1.47 ? -2% |
Pros
Cons
结论 - 最先进的游戏笔记本电脑
微星GE76 Raider 11UH几乎提供了其前辈的所有功能。凭借新的CPU和相同的NvidiaGeForce RTX 3080,性能至少与GE76 Raider 10UH相当,因此很适合所有最新的游戏。端口的选择也保持不变,但其中一个USB-C端口现在也支持雷电4。由于有良好的维护选项,内存和存储设备都可以在以后进行升级。
通过GE76 Raider UH11,微星提供了一个强大的笔记本电脑,最适合所有现代游戏。
与GE76 Raider 10UH相比,11UH现在还提供更高分辨率的显示器。我们的测试配置具有360赫兹的最高刷新率,只有全高清才有。该面板有限的色彩空间值得批评,因为从价格上看,它是不能接受的。总体而言,GE76是配备RTX 3080的最佳游戏笔记本电脑之一。
遗憾的是,210万像素的网络摄像头以稍高的分辨率捕捉图像,在日常使用中几乎看不出来。然而,微星GE76 Raider UH11与Gigabyte Aero 17 HDR YD 和 Alienware m17 R4 等设备相比,在尺寸方面也有不同。如果你正在寻找一个超薄的箱子,竞争对手是一个更好的选择。
更新:现在生产型的CPU性能明显高于GE76 Raider 10UH的前辈。
价格和可用性
在写这篇文章的时候,微星GE76 Raider 11UH与 Core i9-11980HK ,似乎大部分已经缺货了。尽管如此,你可以在亚马逊 ,和新蛋 ,例如,或者微星的在线商店 ,那里的设备显示价格为3399.99美元,配置为32GB内存和1TB的SSD存储。如果你可以接受性能较差的处理器,配备Core i7-11800H 的版本在亚马逊上的库存为3099美元 。
MSI GE76 Raider 11UH-472US
- 08/16/2021 v7 (old)
Mike Wobker
Price comparison

