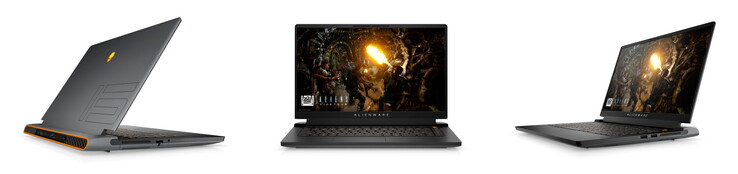
Alienware m15 R6笔记本电脑评论。效率更高,但RTX 3080比前代更慢
令人惊讶的是,戴尔在这么短的时间内推出了这么多型号的m15。我们已经测试了m15 R4、m15 R5和现在的m15 R6--它们都是在今年推出的。
令人困惑的是,由于R6现在包含一个Tiger Lake CPU,它确实是采用Comet Lake CPU的R4的继任者,更像是采用AMD处理器的R5的兄弟姐妹。机箱和许多其他特征与m15 R5相对应,这就是我们不讨论机箱、输入设备、连接设备等特征的原因,除非有一些变化。你可以在我们对Alienware m15 R5的评论中找到这些方面的信息。 对Alienware m15 R5的评论.
当然,我们也将英特尔m15 R6与 AMD m15 R5和 m15 R4 Comet Lake的前身,此外还与 Aorus 15P YD的Razer Blade 15 pro模型,以及 申克XMG Neo 15.
Possible competitors in Comparison
Rating | Date | Model | Weight | Height | Size | Resolution | Price |
|---|---|---|---|---|---|---|---|
| 86.1 % v7 (old) | 11 / 2021 | Alienware m15 R6, i7-11800H RTX 3080 i7-11800H, GeForce RTX 3080 Laptop GPU | 2.5 kg | 22.85 mm | 15.60" | 1920x1080 | |
| 84.7 % v7 (old) | 08 / 2025 | Alienware m15 R5 Ryzen Edition R7 5800H, GeForce RTX 3060 Laptop GPU | 2.5 kg | 22.85 mm | 15.60" | 1920x1080 | |
| 86.1 % v7 (old) | 09 / 2021 | Alienware m15 R4 RTX 3080 i9-10980HK, GeForce RTX 3080 Laptop GPU | 2.4 kg | 20 mm | 15.60" | 1920x1080 | |
| 86.4 % v7 (old) | 09 / 2021 | Aorus 15P YD i7-11800H, GeForce RTX 3080 Laptop GPU | 2.2 kg | 27 mm | 15.60" | 1920x1080 | |
| 87 % v7 (old) | Schenker XMG Neo 15 Tiger Lake i7-11800H, GeForce RTX 3080 Laptop GPU | 2.2 kg | 26 mm | 15.60" | 2560x1440 | ||
| 88.9 % v7 (old) | 10 / 2021 | Razer Blade 15 Advanced (Mid 2021) i7-11800H, GeForce RTX 3080 Laptop GPU | 2 kg | 16.99 mm | 15.60" | 1920x1080 |
案例 - 知名设计
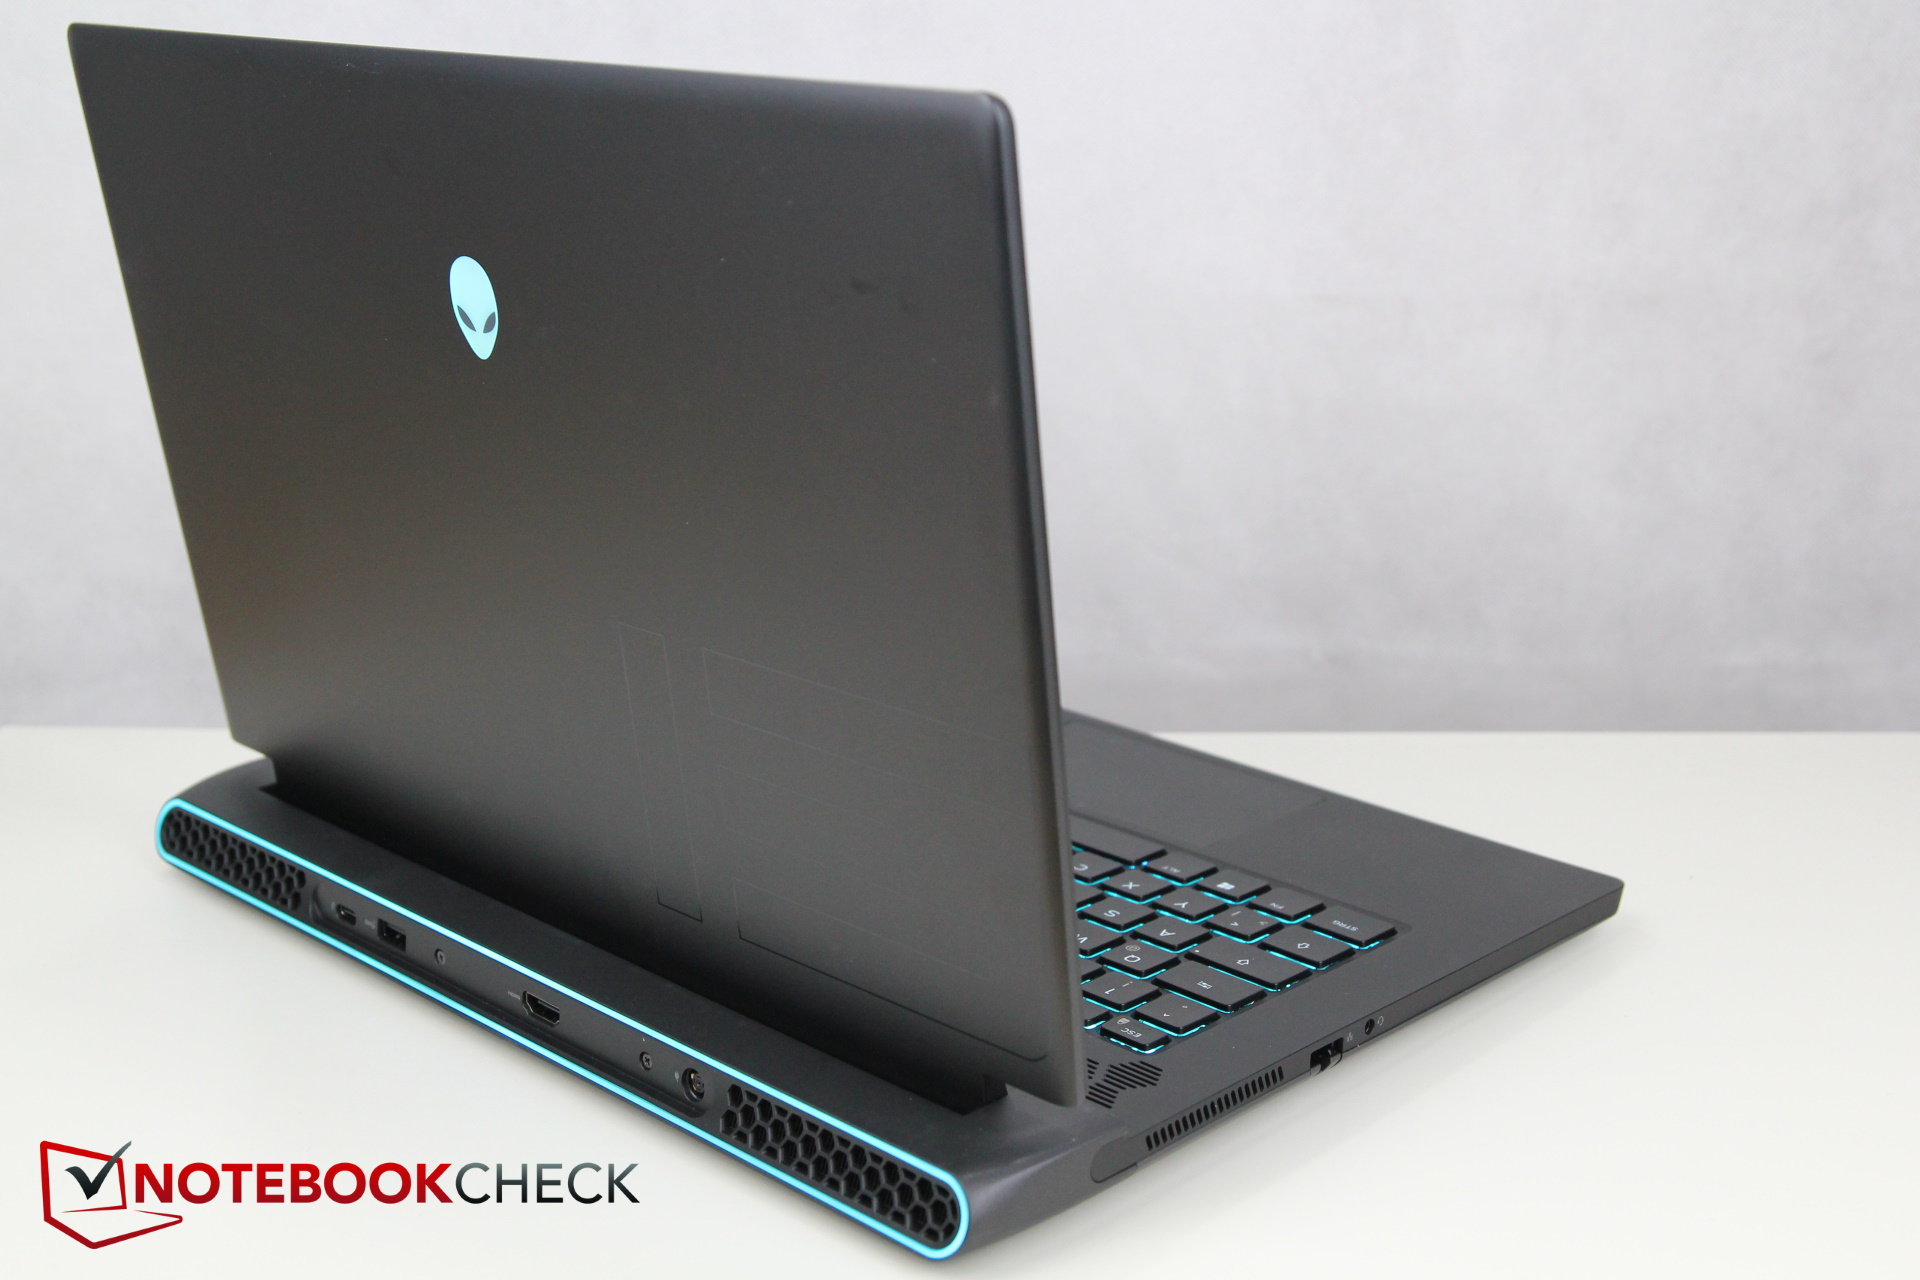
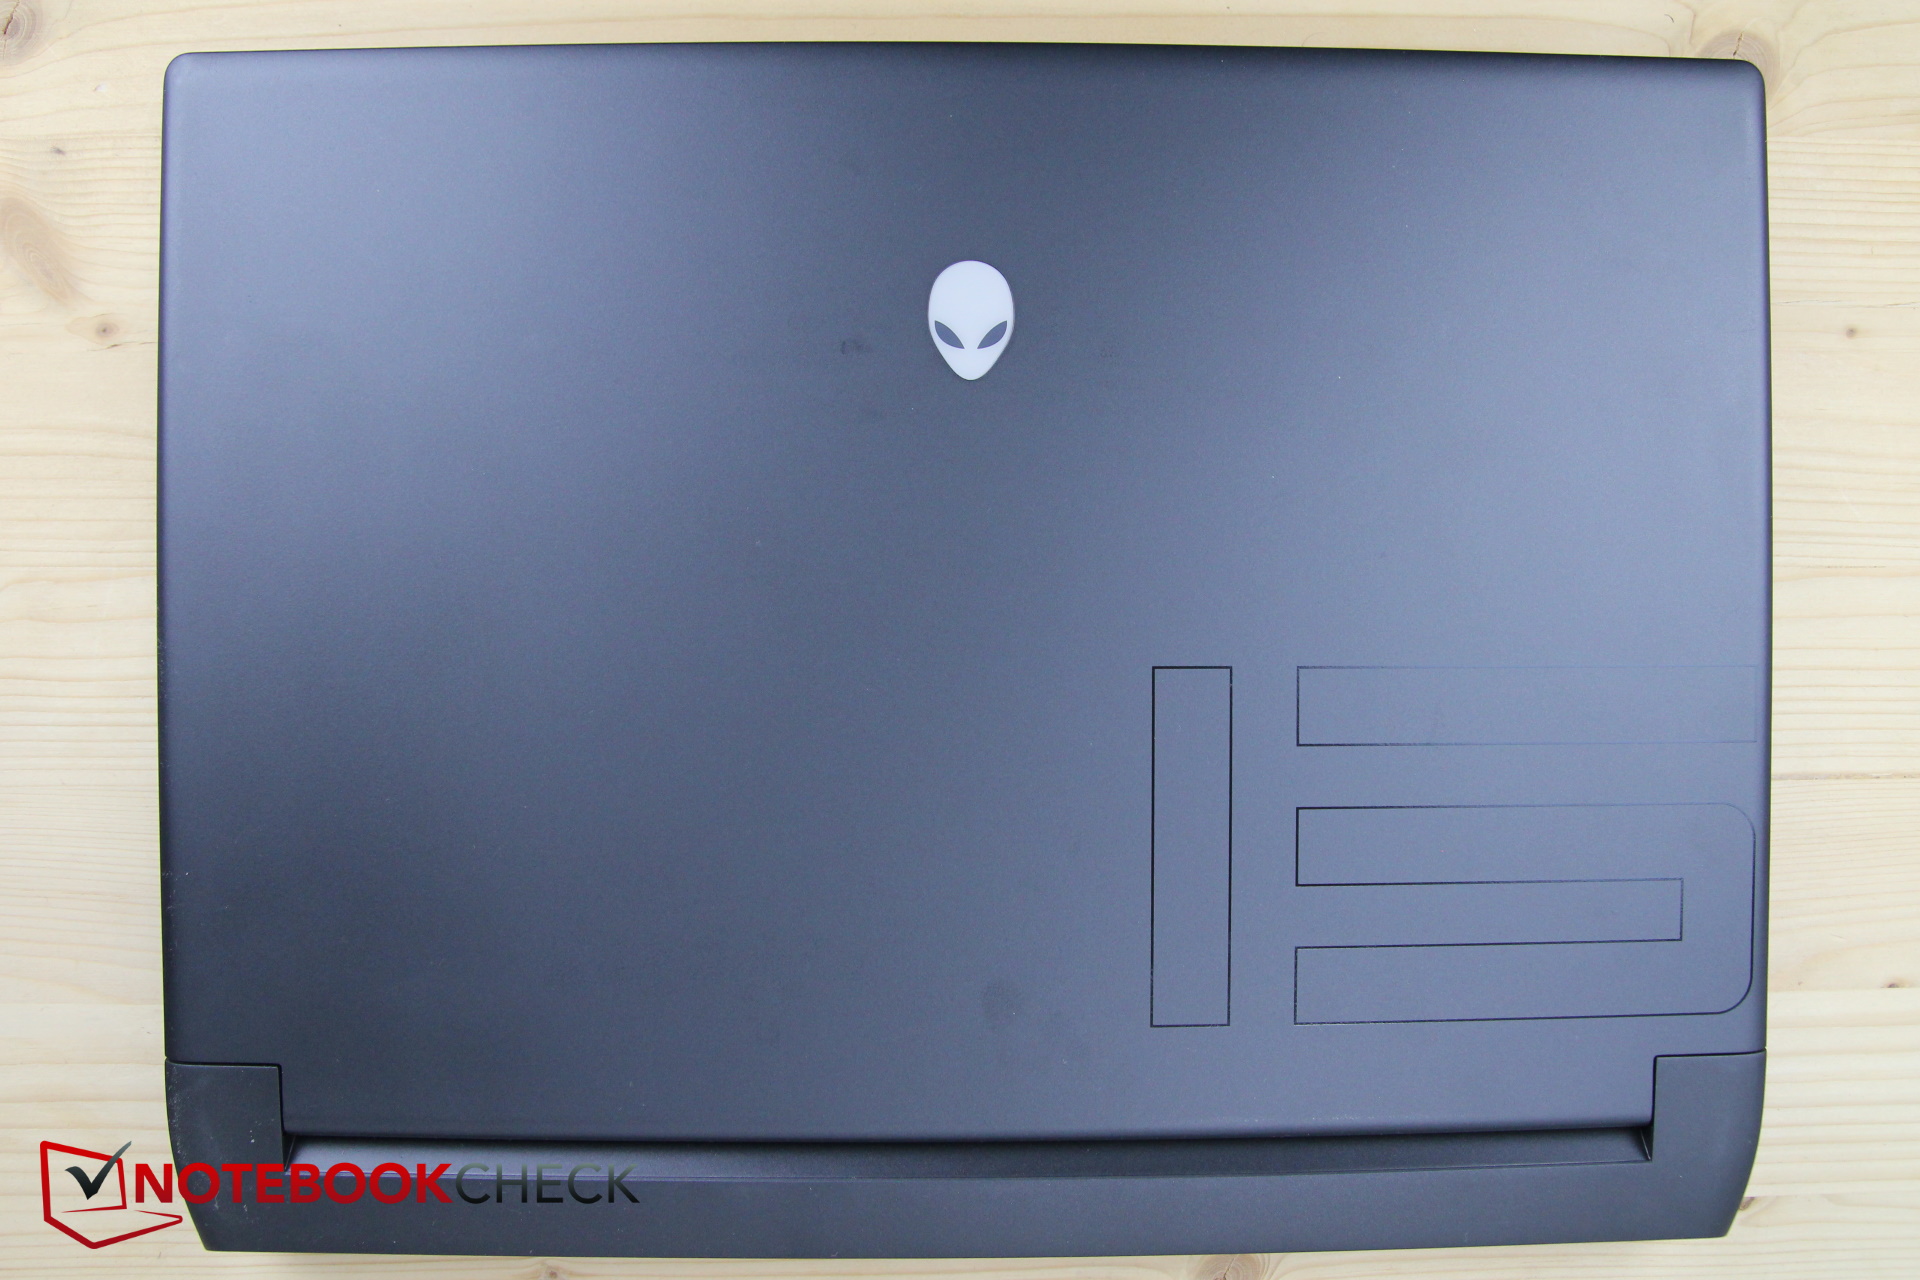
Alienware笔记本电脑以其背后的大型冷却系统而闻名,因此,目前的模型也明显比其他制造商的竞争对手更深,这并不令人惊讶。但至少它比Schenker或Aorus略微轻薄,尽管在这方面没有一个型号能够击败Razer Blade。
Alienware笔记本电脑的重量为2.5公斤(约5.5磅),也比对比设备重200-500克(约7-18盎司)。
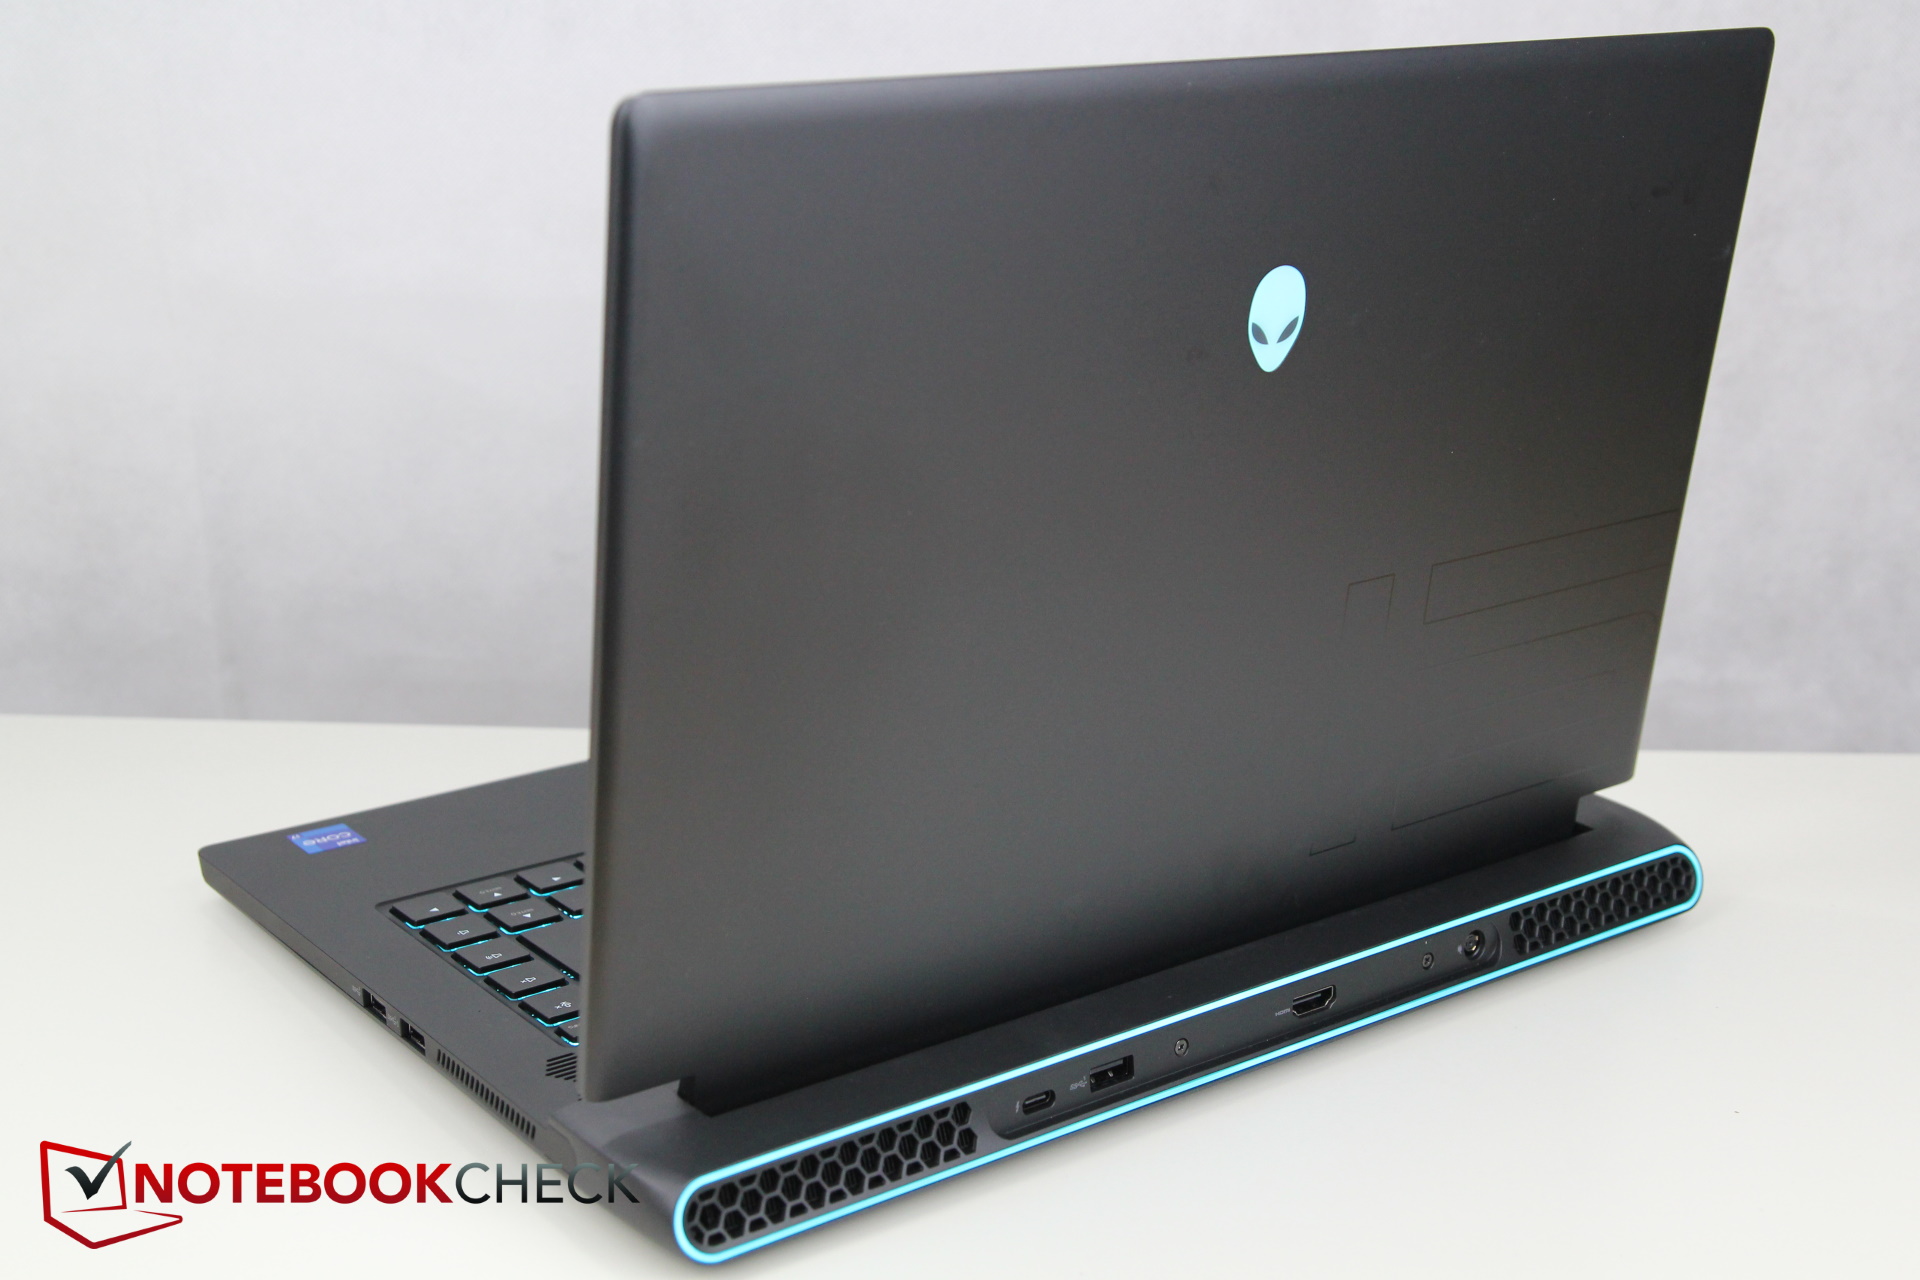
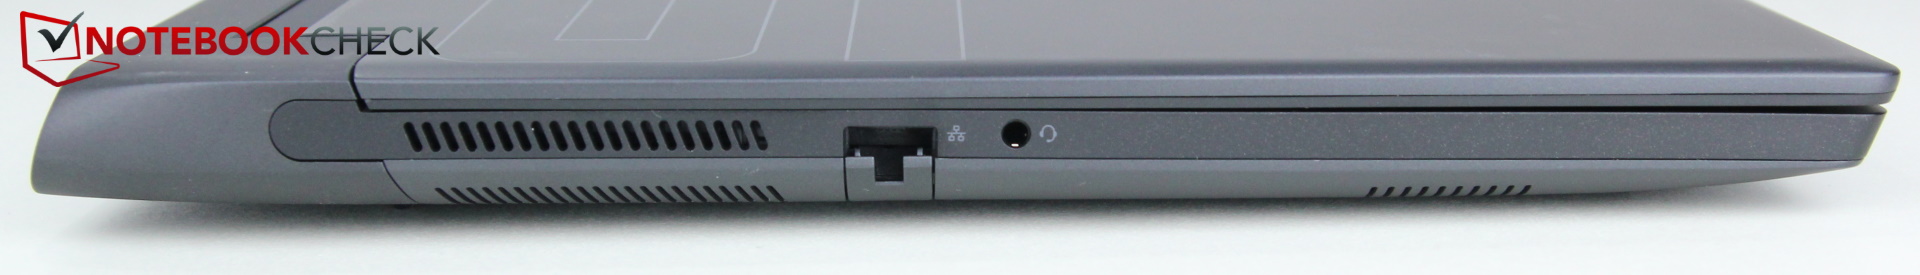
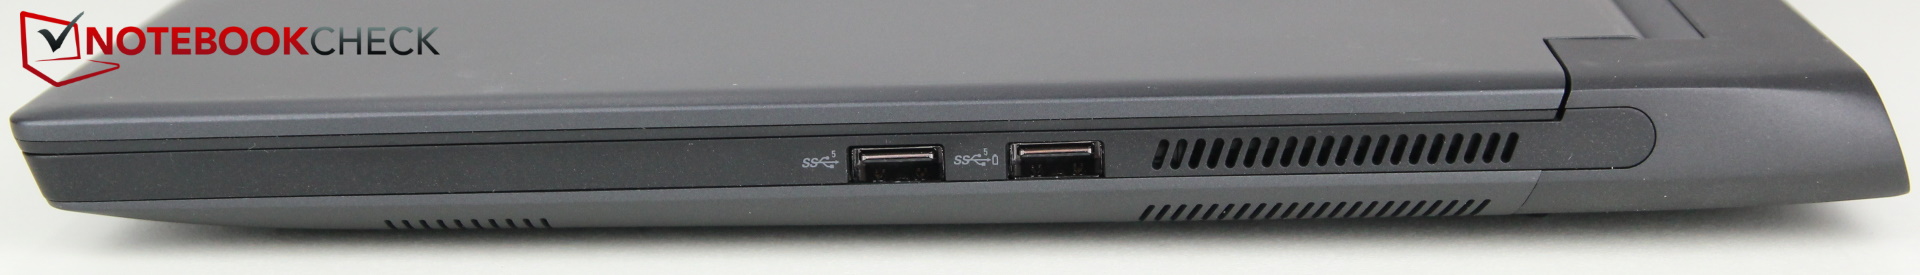
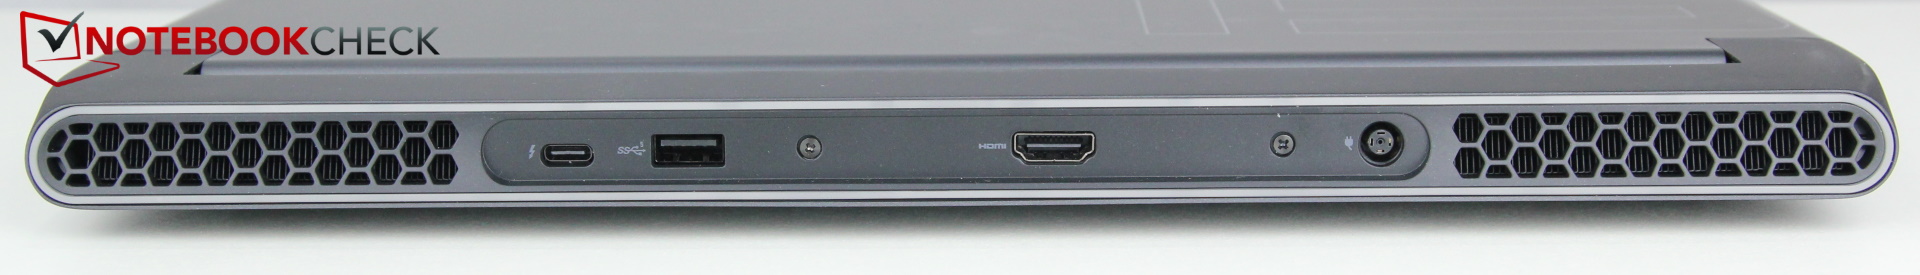
连接设备 - 带有Thunderbolt的Intel Alienware
与m15 R5 AMD版本相比,由于采用了英特尔CPU,m15 R6现在支持Thunderbolt 4,相应的USB-C端口也支持USB 3.2 Gen 2而不是Gen 1。此外,USB-C端口现在还支持Power Delivery,这意味着它可以用于充电,但最多只能使用15瓦。除此之外,连接方式保持不变。
沟通
| Networking | |
| iperf3 transmit AX12 | |
| Schenker XMG Neo 15 Tiger Lake | |
| Alienware m15 R5 Ryzen Edition | |
| Aorus 15P YD | |
| Average Killer Wi-Fi 6 AX1650i 160MHz Wireless Network Adapter (201NGW) (758 - 1514, n=10) | |
| Alienware m15 R4 RTX 3080 | |
| Razer Blade 15 Advanced (Mid 2021) | |
| Alienware m15 R6, i7-11800H RTX 3080 | |
| iperf3 receive AX12 | |
| Schenker XMG Neo 15 Tiger Lake | |
| Razer Blade 15 Advanced (Mid 2021) | |
| Alienware m15 R5 Ryzen Edition | |
| Average Killer Wi-Fi 6 AX1650i 160MHz Wireless Network Adapter (201NGW) (887 - 1670, n=10) | |
| Alienware m15 R6, i7-11800H RTX 3080 | |
| Aorus 15P YD | |
| Alienware m15 R4 RTX 3080 | |
网络摄像头


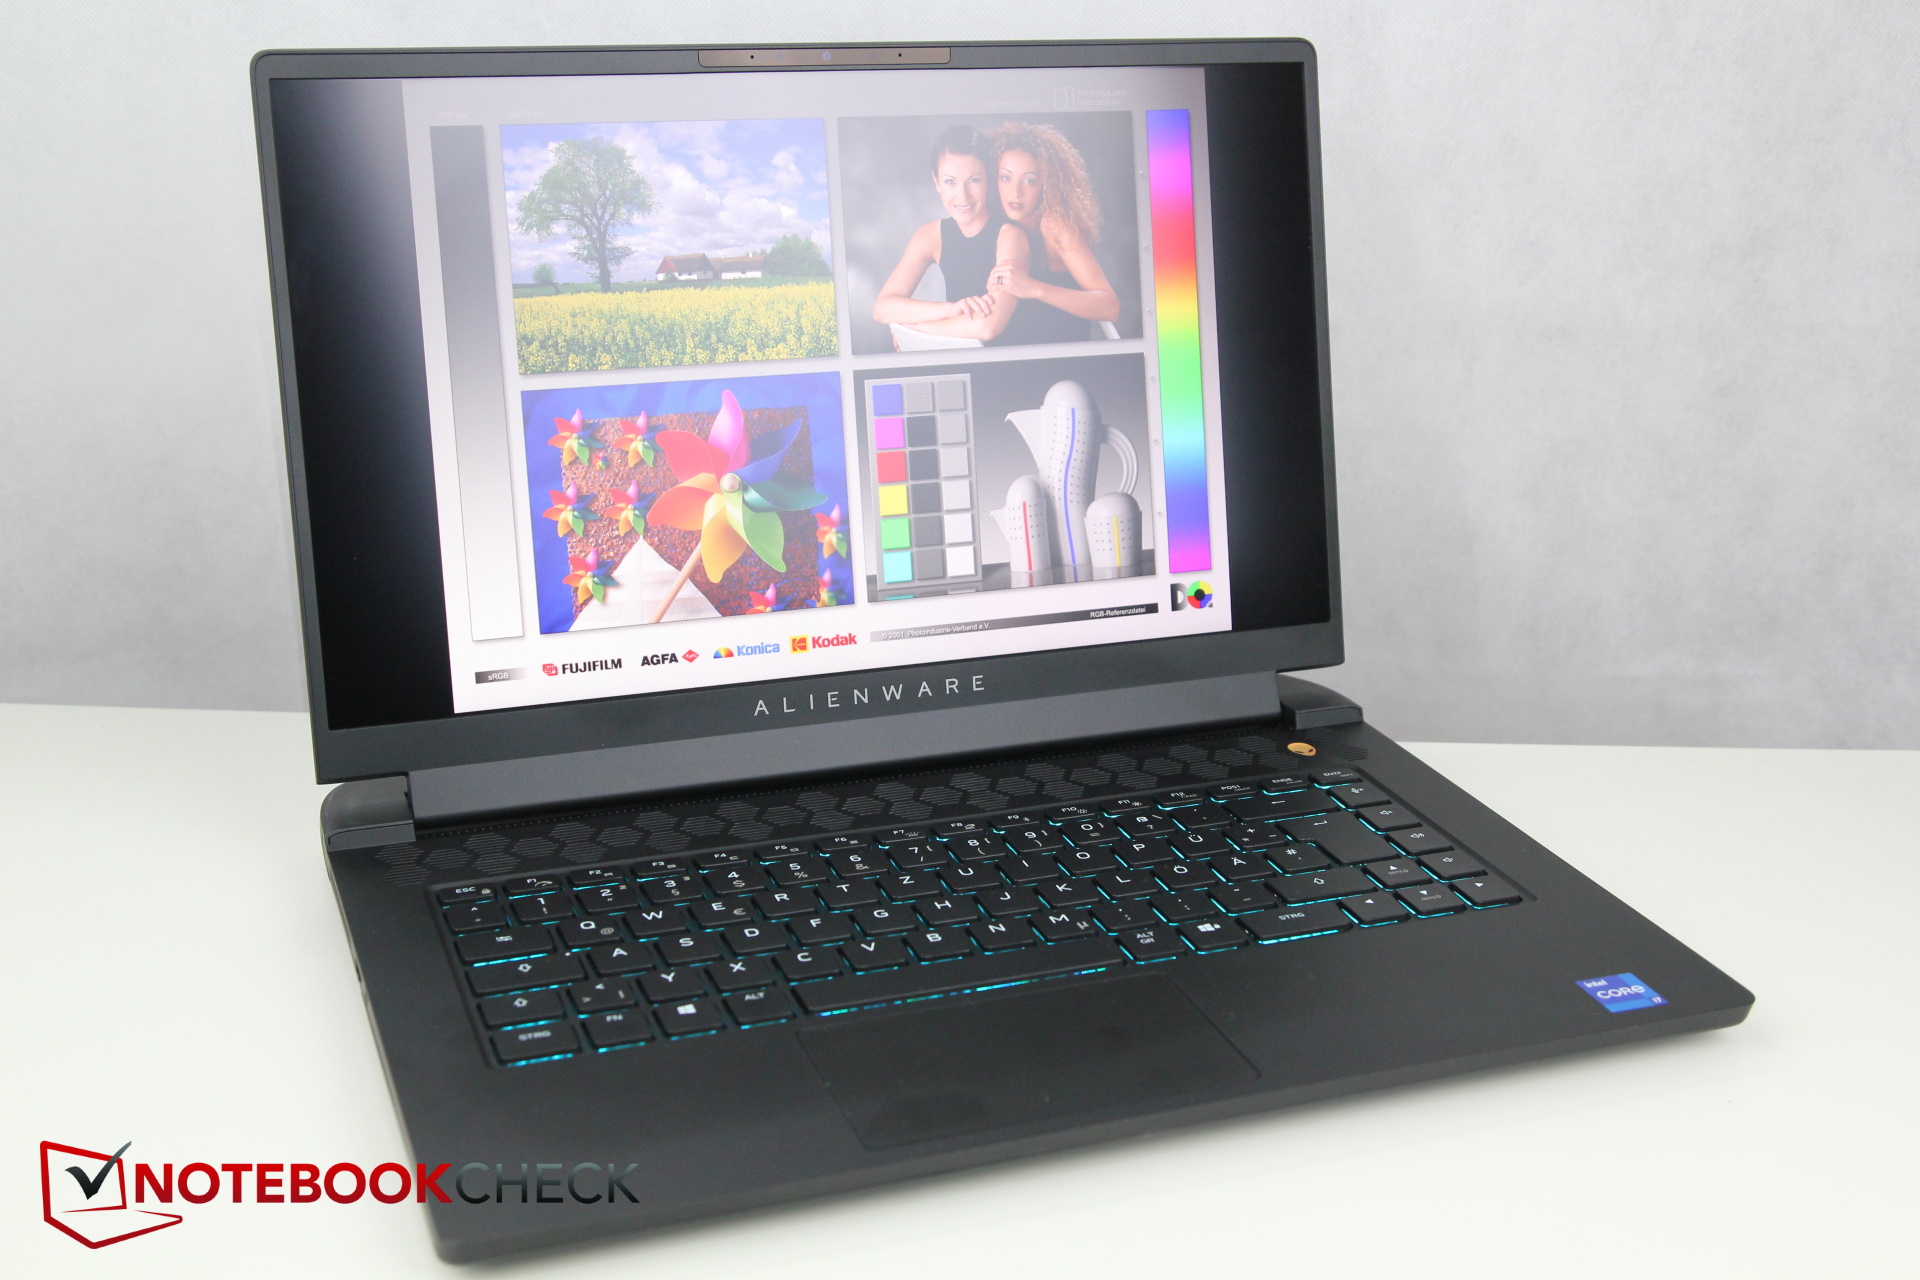
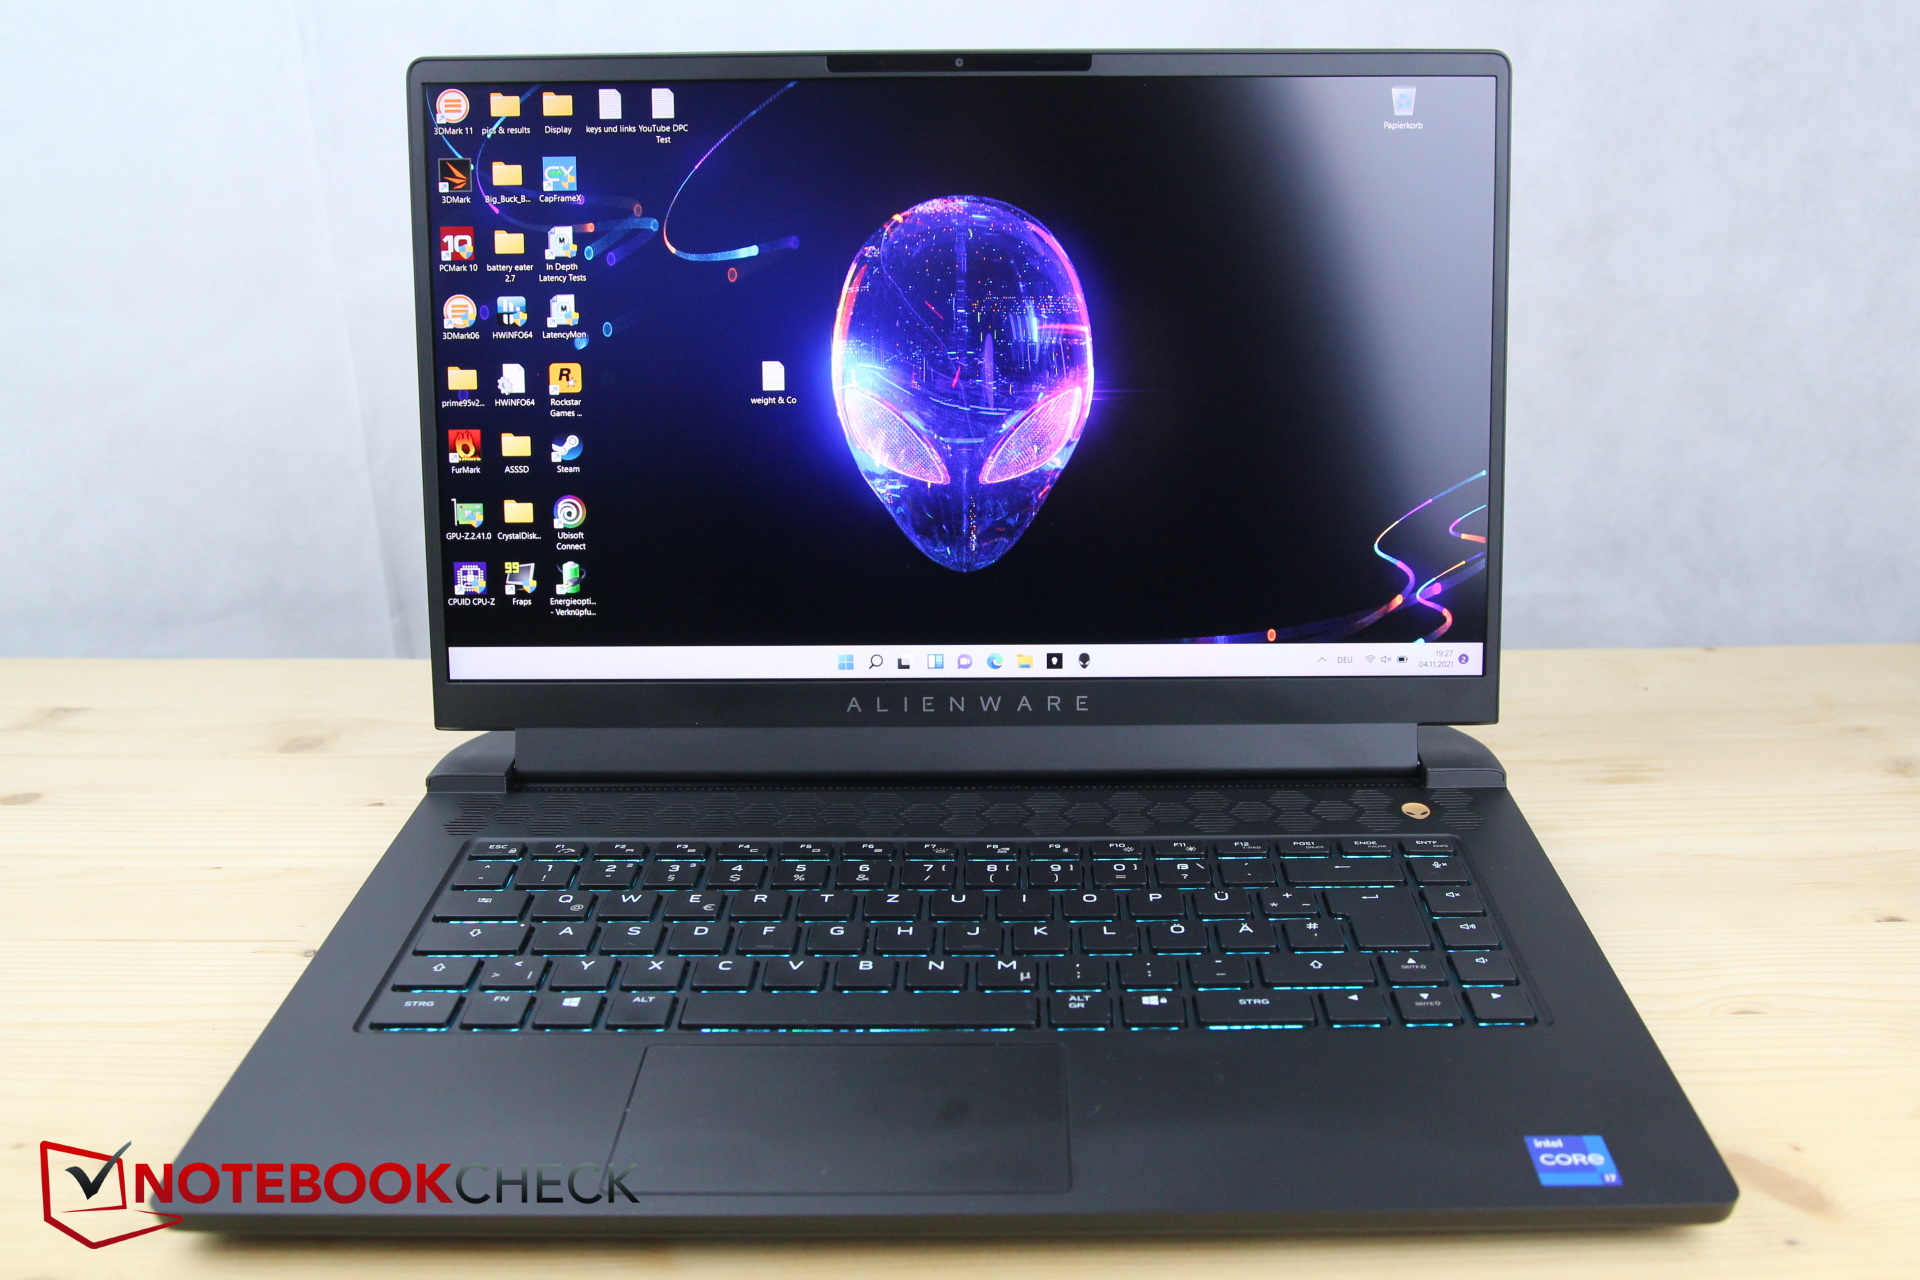
显示 - 速度增加到360赫兹
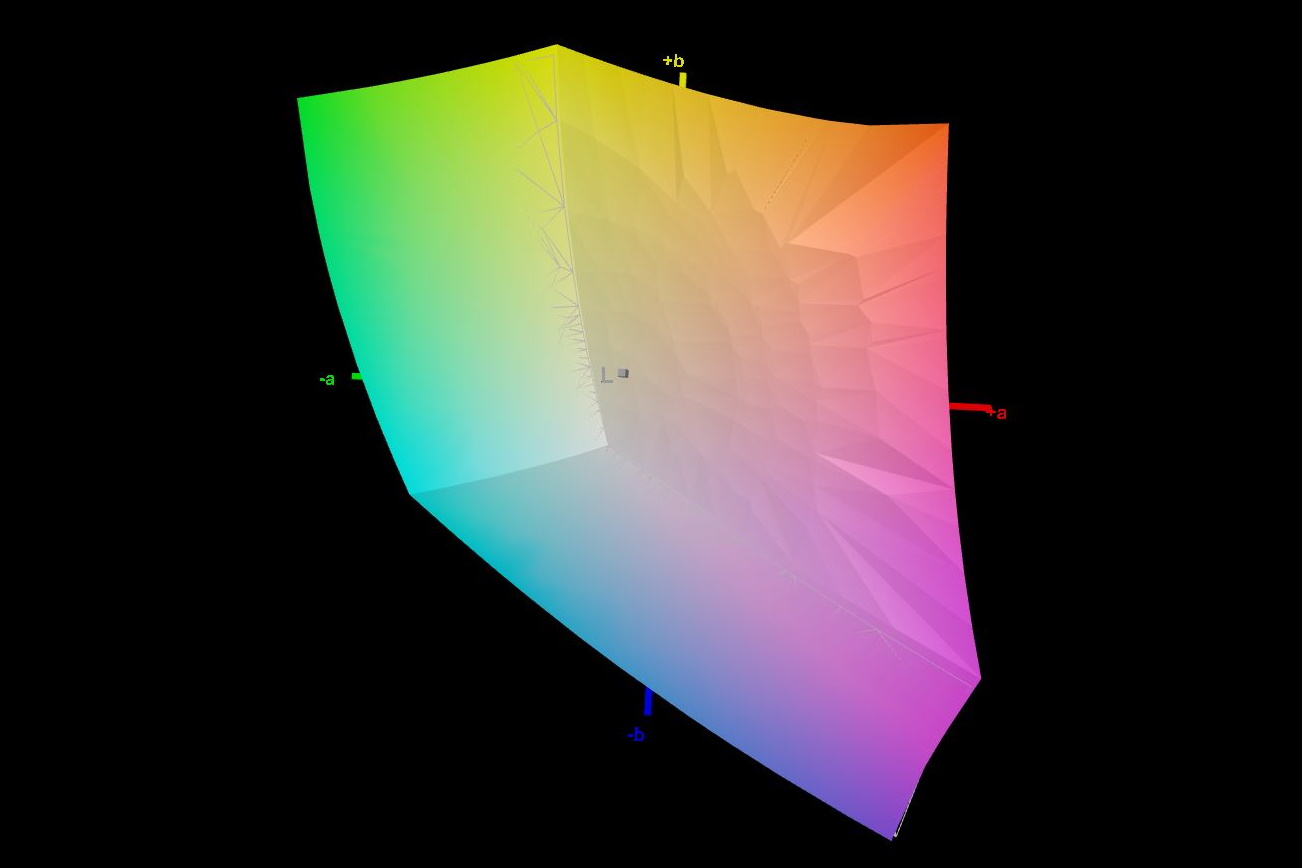
据HWinfo报道,该显示器与m15 R5一样,采用了友达光电的哑光FHD面板。然而,目前的模型提供了一个快速的360赫兹的刷新率,而AMD m15的刷新率 "只有 "165赫兹。另外,你也可以购买带有相同的165赫兹面板的R6,此外,还有240赫兹的QHD面板可供选择。但为什么没有配备RTX 3080的游戏笔记本的4K选项?
尽管共享相同的标签,但两个面板的数值也不同。虽然亮度稍好,但其分布更差。黑值和对比度也比兄弟姐妹的型号略差。
这两块面板的反应时间非常短,因此也很出色,这是积极的。
| |||||||||||||||||||||||||
Brightness Distribution: 85 %
Center on Battery: 360 cd/m²
Contrast: 1026:1 (Black: 0.35 cd/m²)
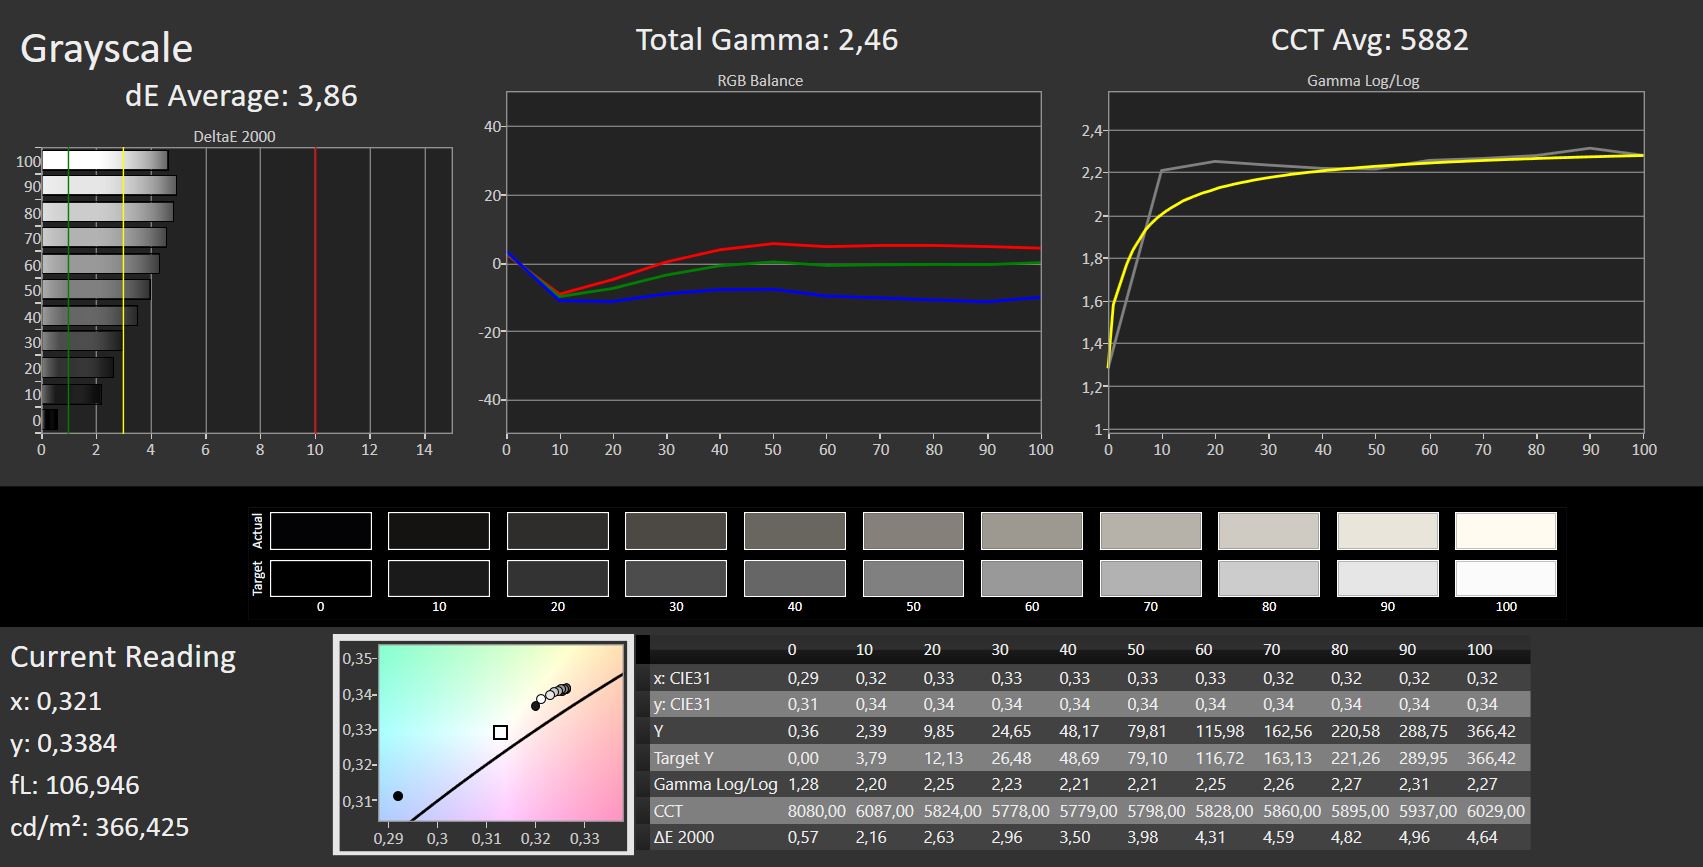
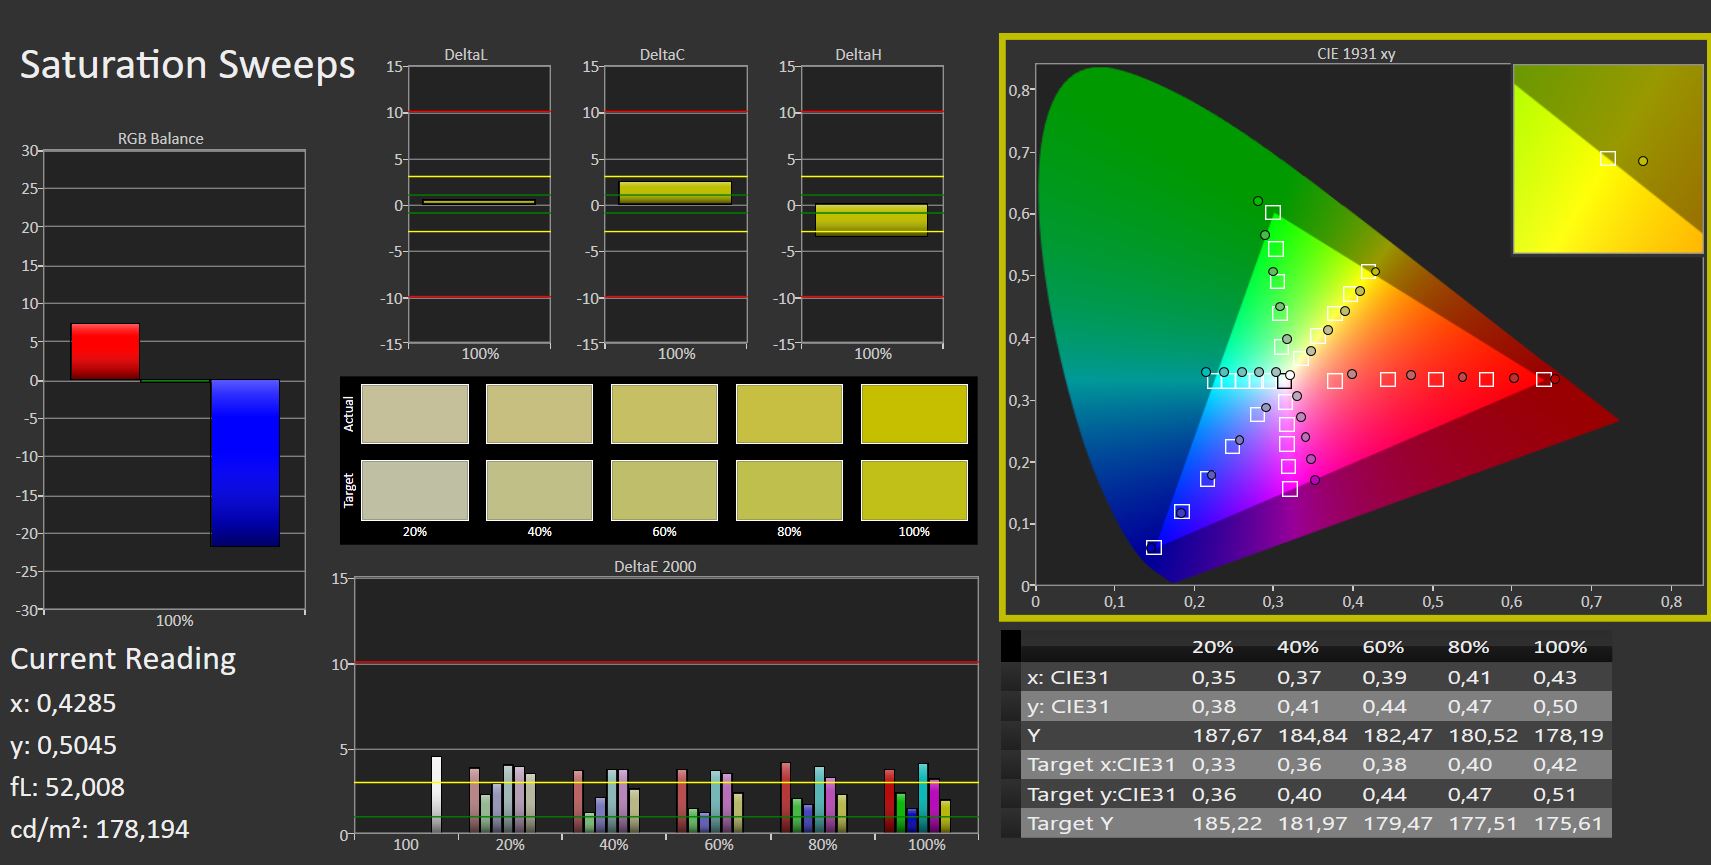
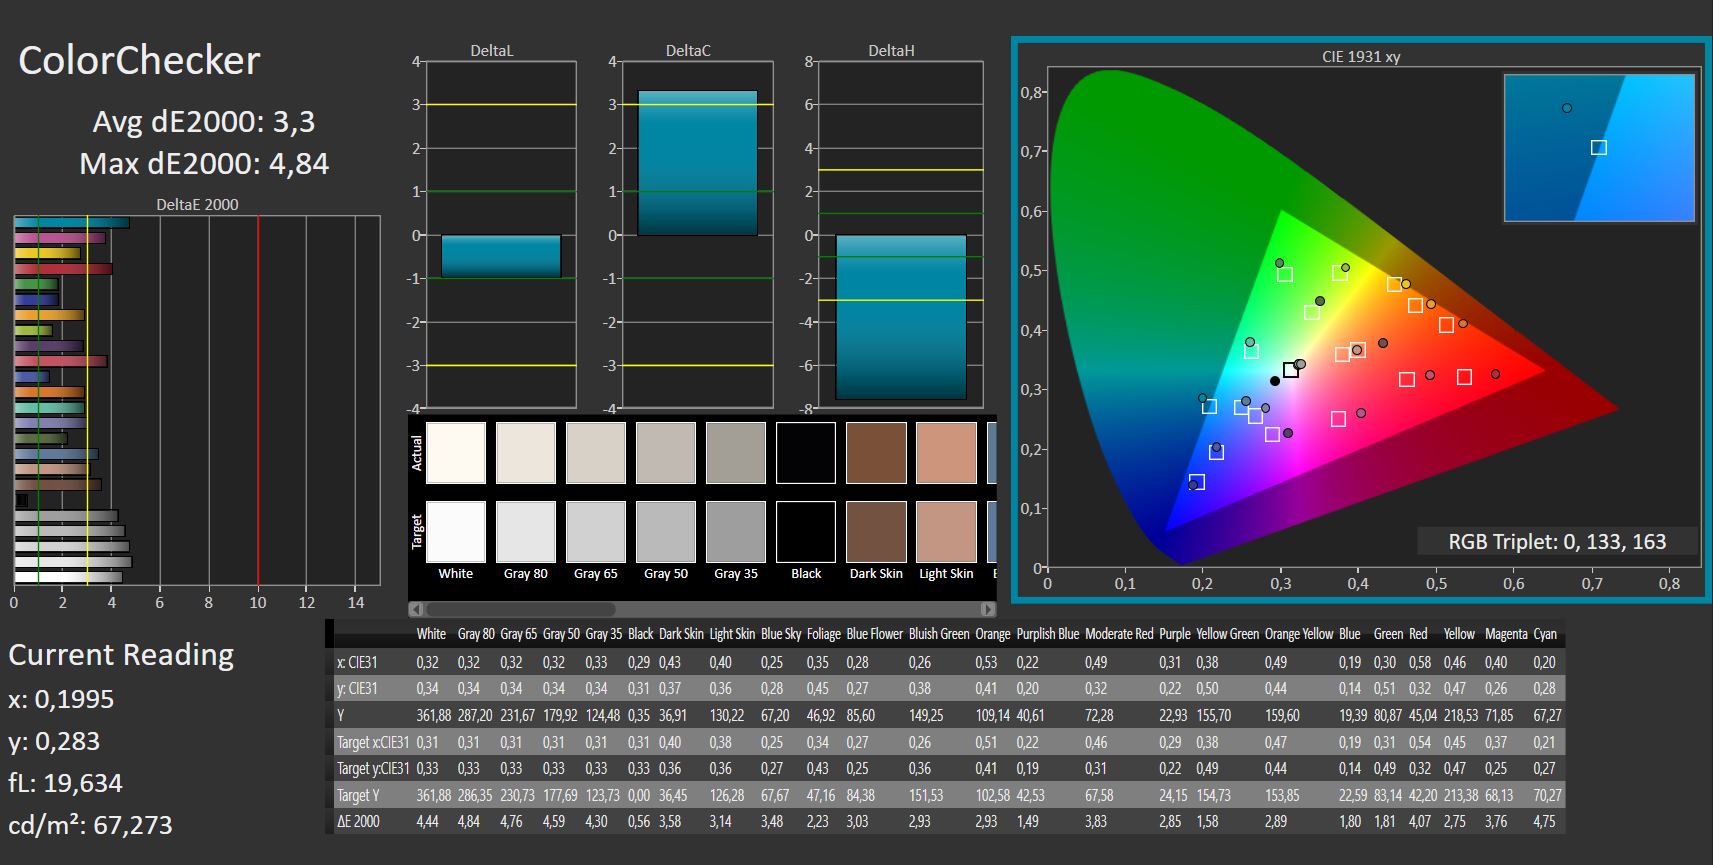
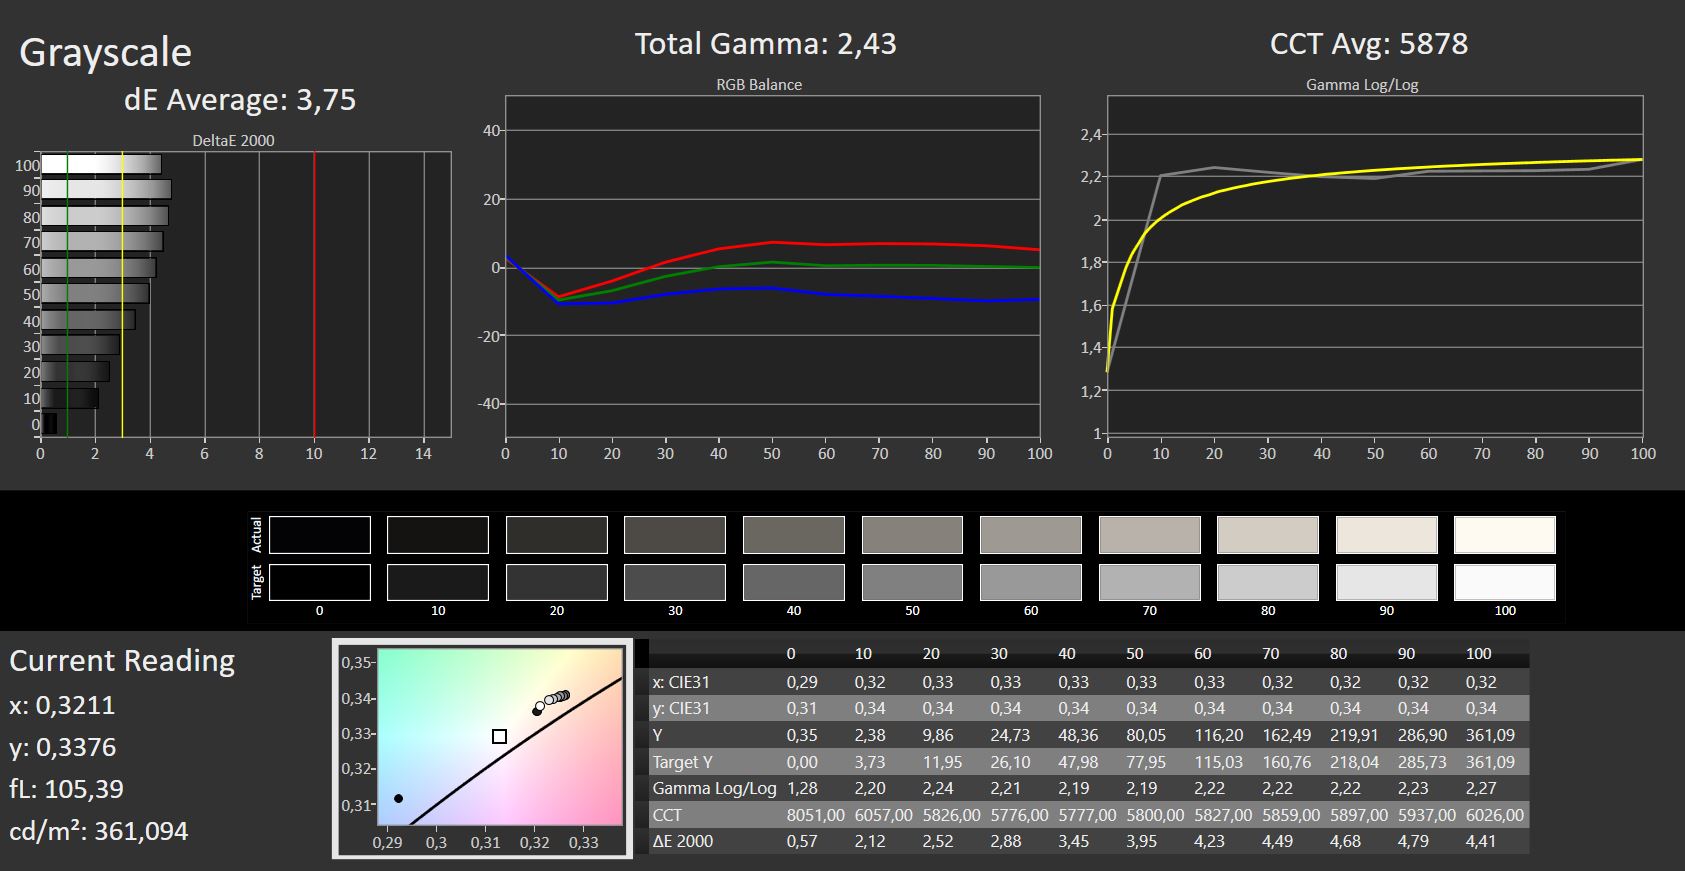
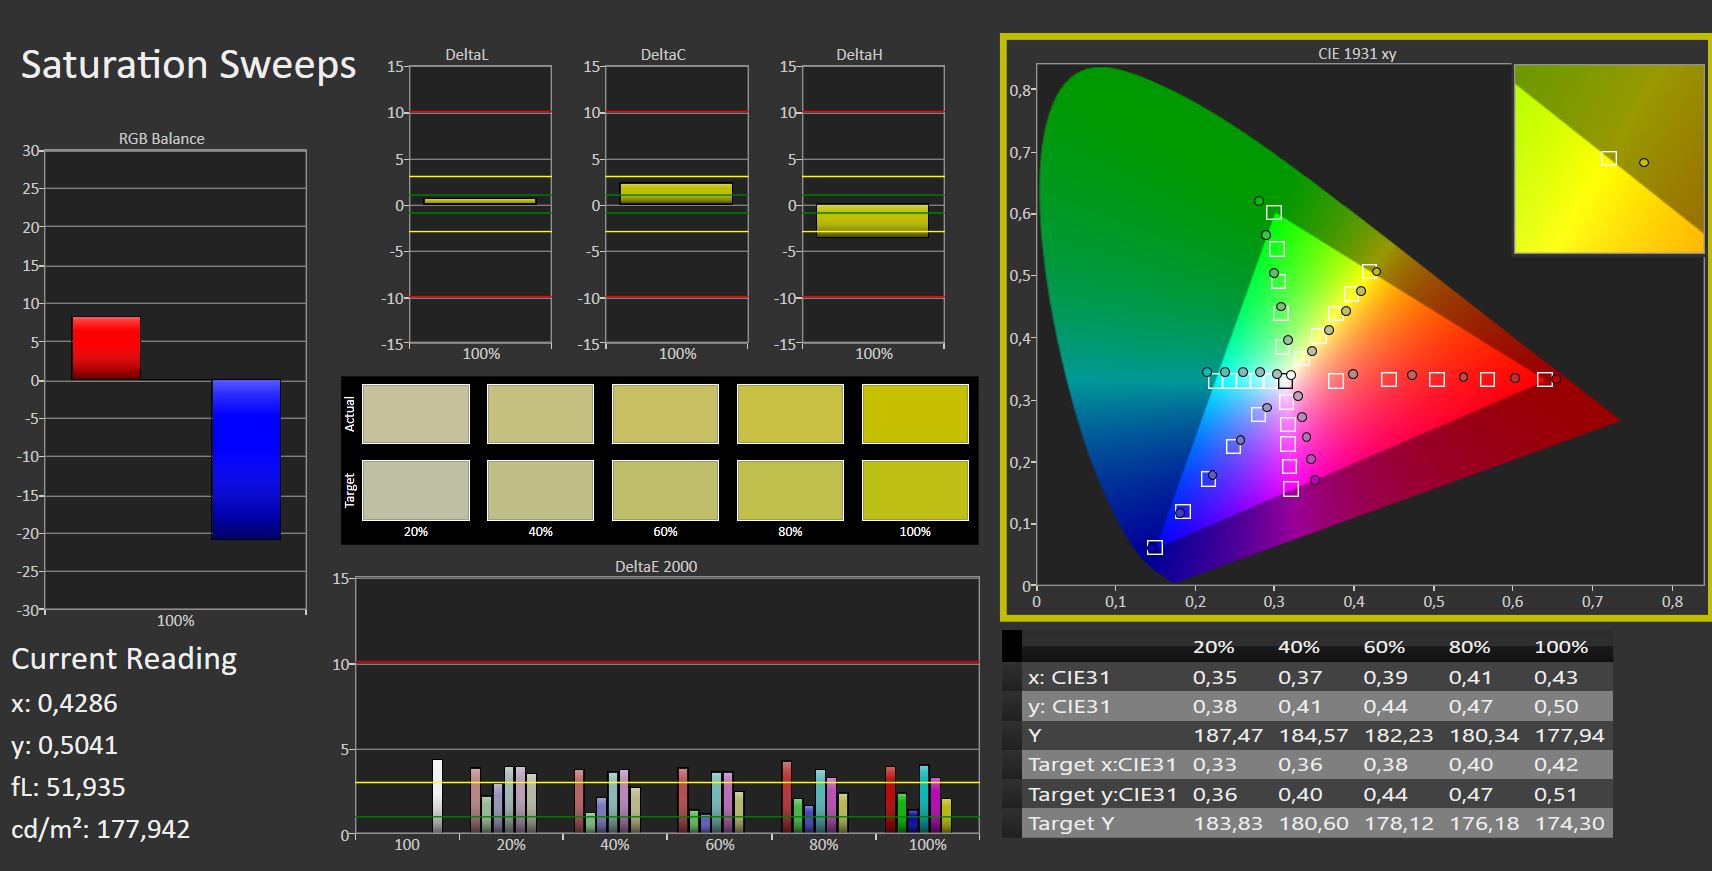
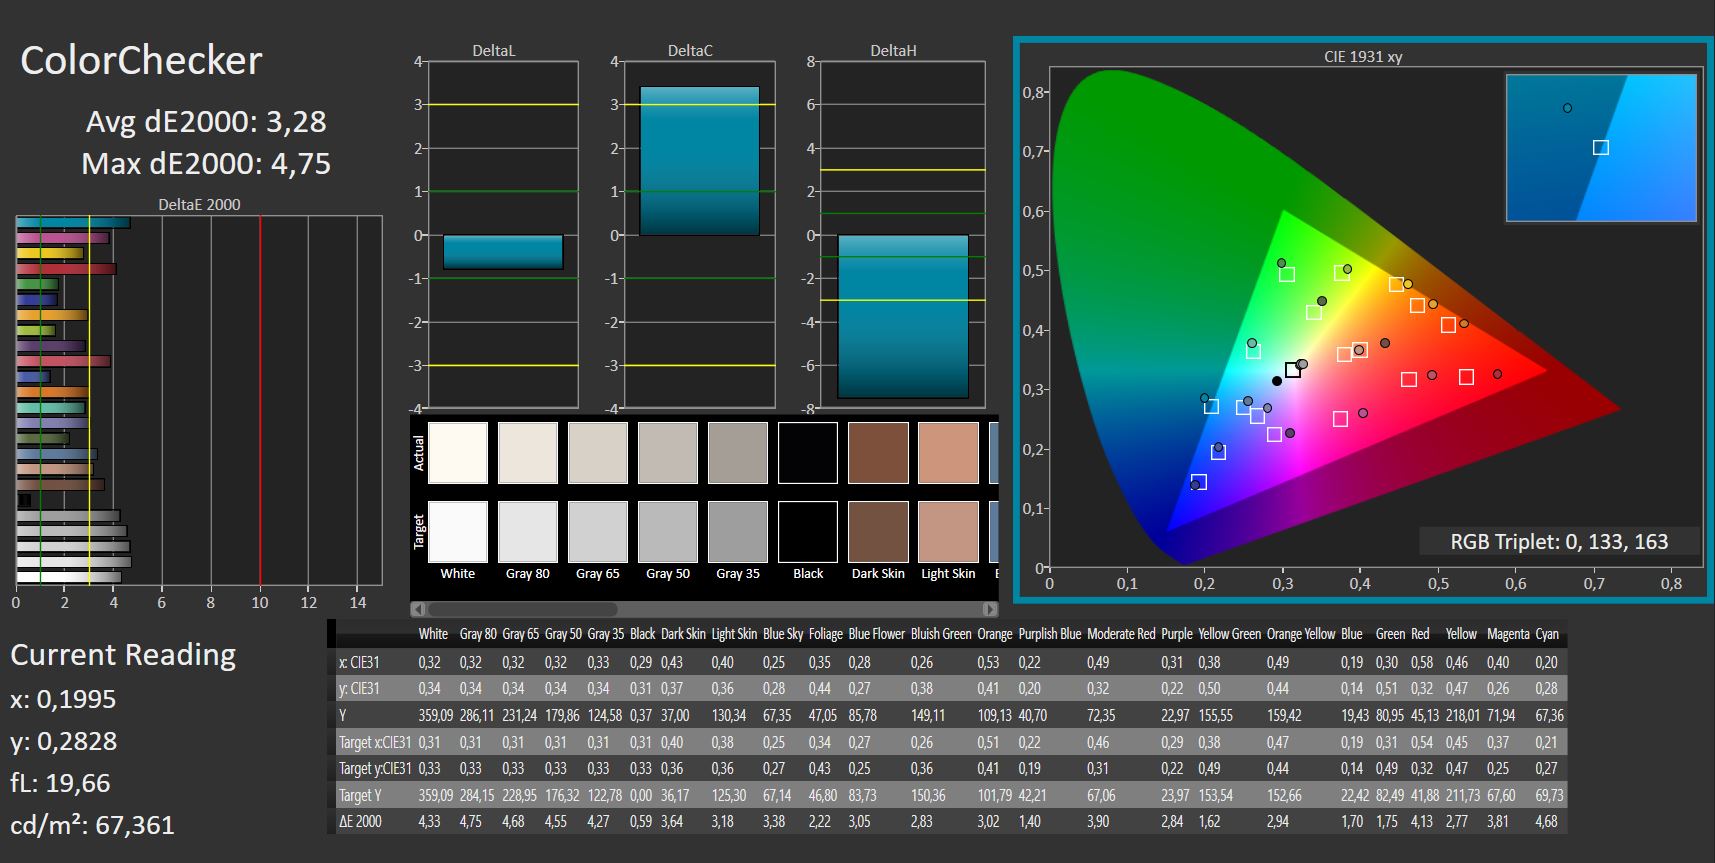
ΔE ColorChecker Calman: 3.3 | ∀{0.5-29.43 Ø4.71}
calibrated: 3.28
ΔE Greyscale Calman: 3.66 | ∀{0.09-98 Ø4.96}
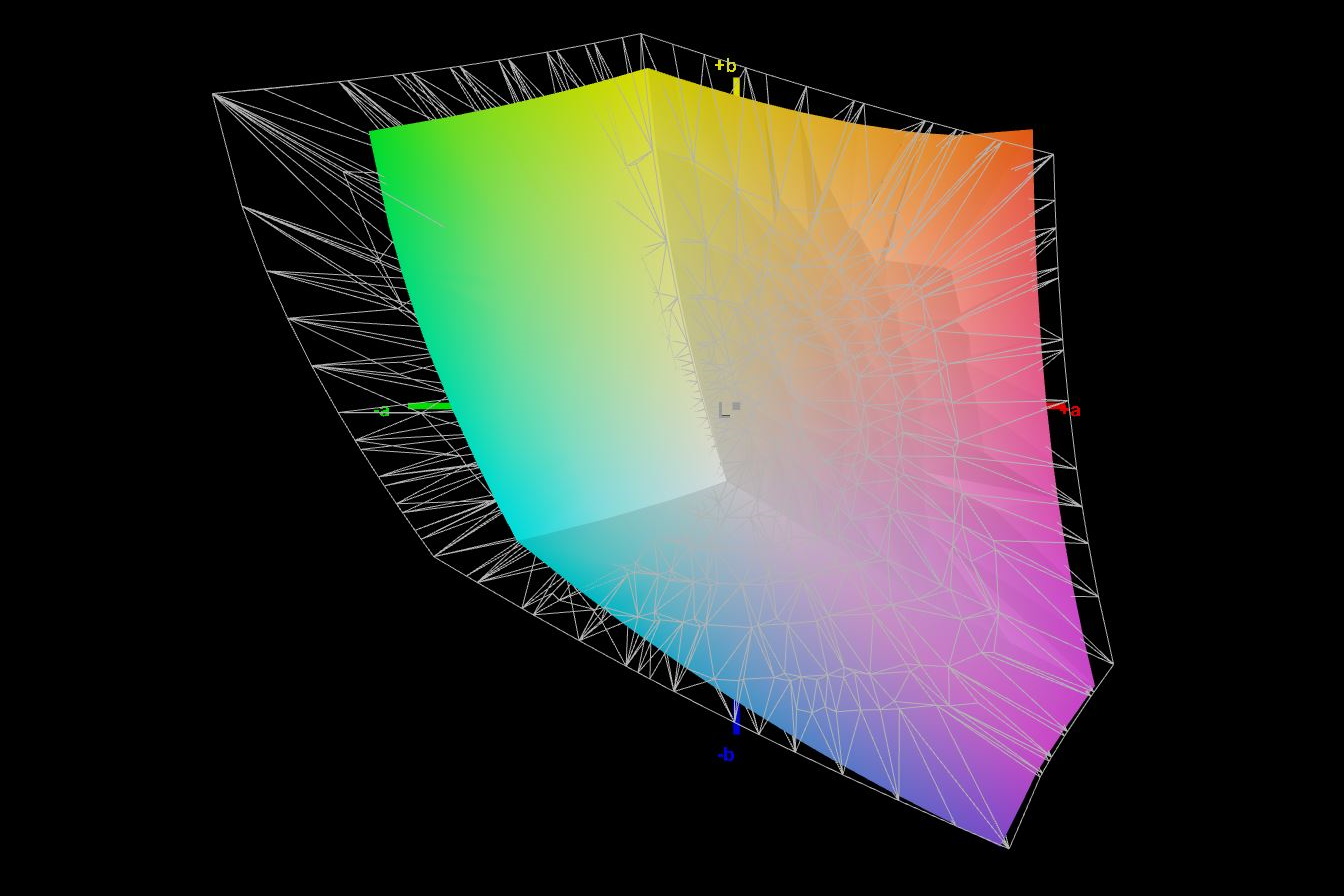
75.7% AdobeRGB 1998 (Argyll 3D)
99.5% sRGB (Argyll 3D)
74.1% Display P3 (Argyll 3D)
Gamma: 2.43
CCT: 5896 K
| Alienware m15 R6, i7-11800H RTX 3080 AU Optronics AUO9092 (B156HAN), IPS, 1920x1080, 15.6" | Alienware m15 R5 Ryzen Edition B156HAN, IPS, 1920x1080, 15.6" | Alienware m15 R4 RTX 3080 LG Philips LGD066E (156WFG), IPS, 1920x1080, 15.6" | Aorus 15P YD BOE09B9, IPS, 1920x1080, 15.6" | Schenker XMG Neo 15 Tiger Lake BOE CQ NE156QHM-NY2, IPS, 2560x1440, 15.6" | Razer Blade 15 Advanced (Mid 2021) TL156VDXP02-0, IPS, 1920x1080, 15.6" | |
|---|---|---|---|---|---|---|
| Display | -4% | -3% | -5% | -7% | ||
| Display P3 Coverage (%) | 74.1 | 70.1 -5% | 70.2 -5% | 68.6 -7% | 66.9 -10% | |
| sRGB Coverage (%) | 99.5 | 99.8 0% | 98.5 -1% | 98.6 -1% | 97.1 -2% | |
| AdobeRGB 1998 Coverage (%) | 75.7 | 71.5 -6% | 72.4 -4% | 69.3 -8% | 69 -9% | |
| Response Times | -47% | -121% | -236% | -293% | -65% | |
| Response Time Grey 50% / Grey 80% * (ms) | 2.8 | 4 ? -43% | 7.6 ? -171% | 14 ? -400% | 16 ? -471% | 4.2 ? -50% |
| Response Time Black / White * (ms) | 5.6 | 8.4 ? -50% | 9.6 ? -71% | 9.6 ? -71% | 12 ? -114% | 10 ? -79% |
| PWM Frequency (Hz) | ||||||
| Screen | 15% | 24% | -9% | -8% | 13% | |
| Brightness middle (cd/m²) | 359 | 329 -8% | 347 -3% | 337 -6% | 324 -10% | 353.4 -2% |
| Brightness (cd/m²) | 344 | 321 -7% | 318 -8% | 316 -8% | 307 -11% | 340 -1% |
| Brightness Distribution (%) | 85 | 92 8% | 86 1% | 85 0% | 91 7% | 92 8% |
| Black Level * (cd/m²) | 0.35 | 0.27 23% | 0.31 11% | 0.31 11% | 0.27 23% | 0.31 11% |
| Contrast (:1) | 1026 | 1219 19% | 1119 9% | 1087 6% | 1200 17% | 1140 11% |
| Colorchecker dE 2000 * | 3.3 | 2.78 16% | 1.68 49% | 3.87 -17% | 3.36 -2% | 2.17 34% |
| Colorchecker dE 2000 max. * | 4.84 | 4.88 -1% | 3.03 37% | 8.09 -67% | 9.87 -104% | 5.69 -18% |
| Colorchecker dE 2000 calibrated * | 3.28 | 1.63 50% | 1.08 67% | 1.15 65% | 1.23 62% | 1.05 68% |
| Greyscale dE 2000 * | 3.66 | 2.5 32% | 1.8 51% | 6.1 -67% | 5.8 -58% | 3.4 7% |
| Gamma | 2.43 91% | 2.106 104% | 2.262 97% | 2.132 103% | 2.311 95% | 2.2 100% |
| CCT | 5896 110% | 6201 105% | 6592 99% | 6891 94% | 7087 92% | 6830 95% |
| Color Space (Percent of AdobeRGB 1998) (%) | 76 | 71 | 72 | 69 | ||
| Color Space (Percent of sRGB) (%) | 99 | 94 | 94 | 93 | ||
| Total Average (Program / Settings) | -16% /
4% | -34% /
-3% | -83% /
-40% | -102% /
-48% | -20% /
-2% |
* ... smaller is better
几乎100%的sRGB和大约76%的AdobeRGB,色彩空间的覆盖率非常好,而许多竞争对手却没有完全达到这些数值。
显示屏在交付状态下已经被校准得相当好,手动校准在色彩偏差方面几乎没有明显的改善。
Display Response Times
| ↔ Response Time Black to White | ||
|---|---|---|
| 5.6 ms ... rise ↗ and fall ↘ combined | ↗ ms rise | 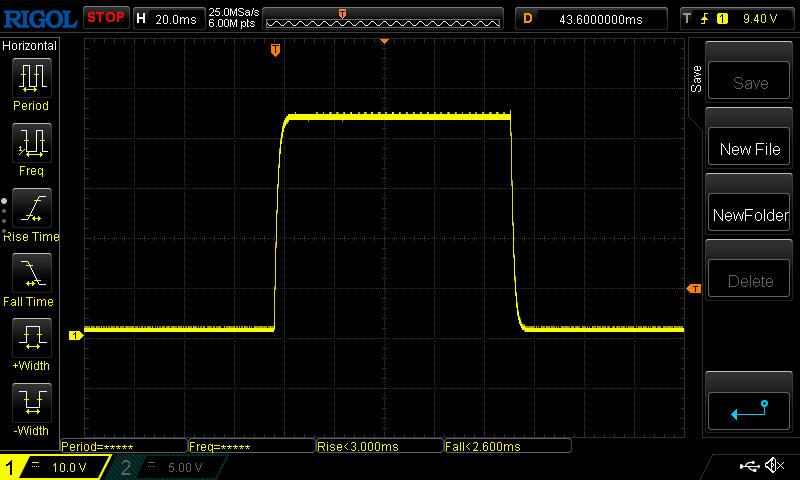 |
| ↘ ms fall | ||
| The screen shows very fast response rates in our tests and should be very well suited for fast-paced gaming. In comparison, all tested devices range from 0.1 (minimum) to 240 (maximum) ms. » 18 % of all devices are better. This means that the measured response time is better than the average of all tested devices (19.8 ms). | ||
| ↔ Response Time 50% Grey to 80% Grey | ||
| 2.8 ms ... rise ↗ and fall ↘ combined | ↗ ms rise | 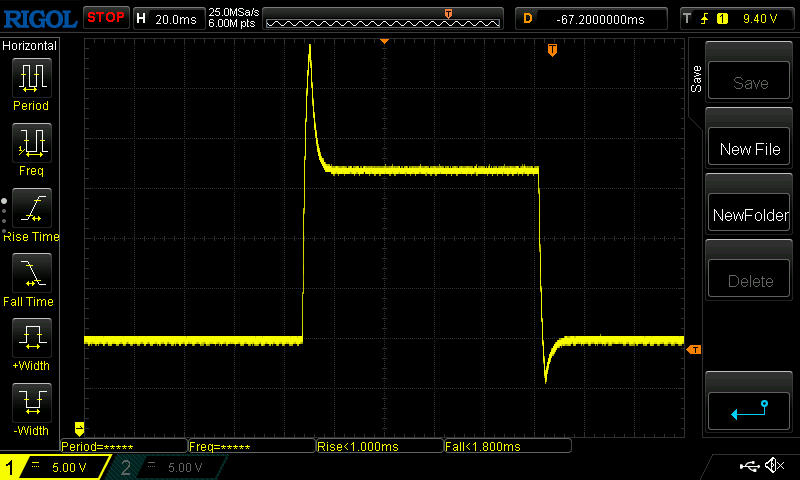 |
| ↘ ms fall | ||
| The screen shows very fast response rates in our tests and should be very well suited for fast-paced gaming. In comparison, all tested devices range from 0.165 (minimum) to 636 (maximum) ms. » 12 % of all devices are better. This means that the measured response time is better than the average of all tested devices (31 ms). | ||
Screen Flickering / PWM (Pulse-Width Modulation)
| Screen flickering / PWM not detected | 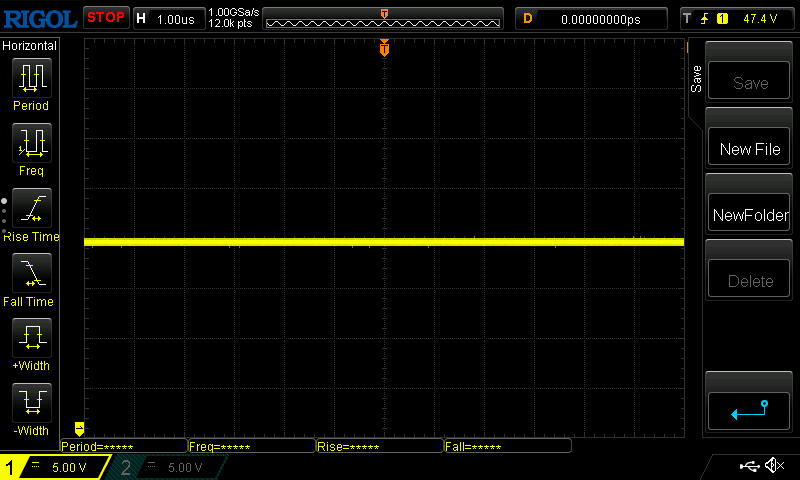 | ||
In comparison: 52 % of all tested devices do not use PWM to dim the display. If PWM was detected, an average of 7754 (minimum: 5 - maximum: 343500) Hz was measured. | |||
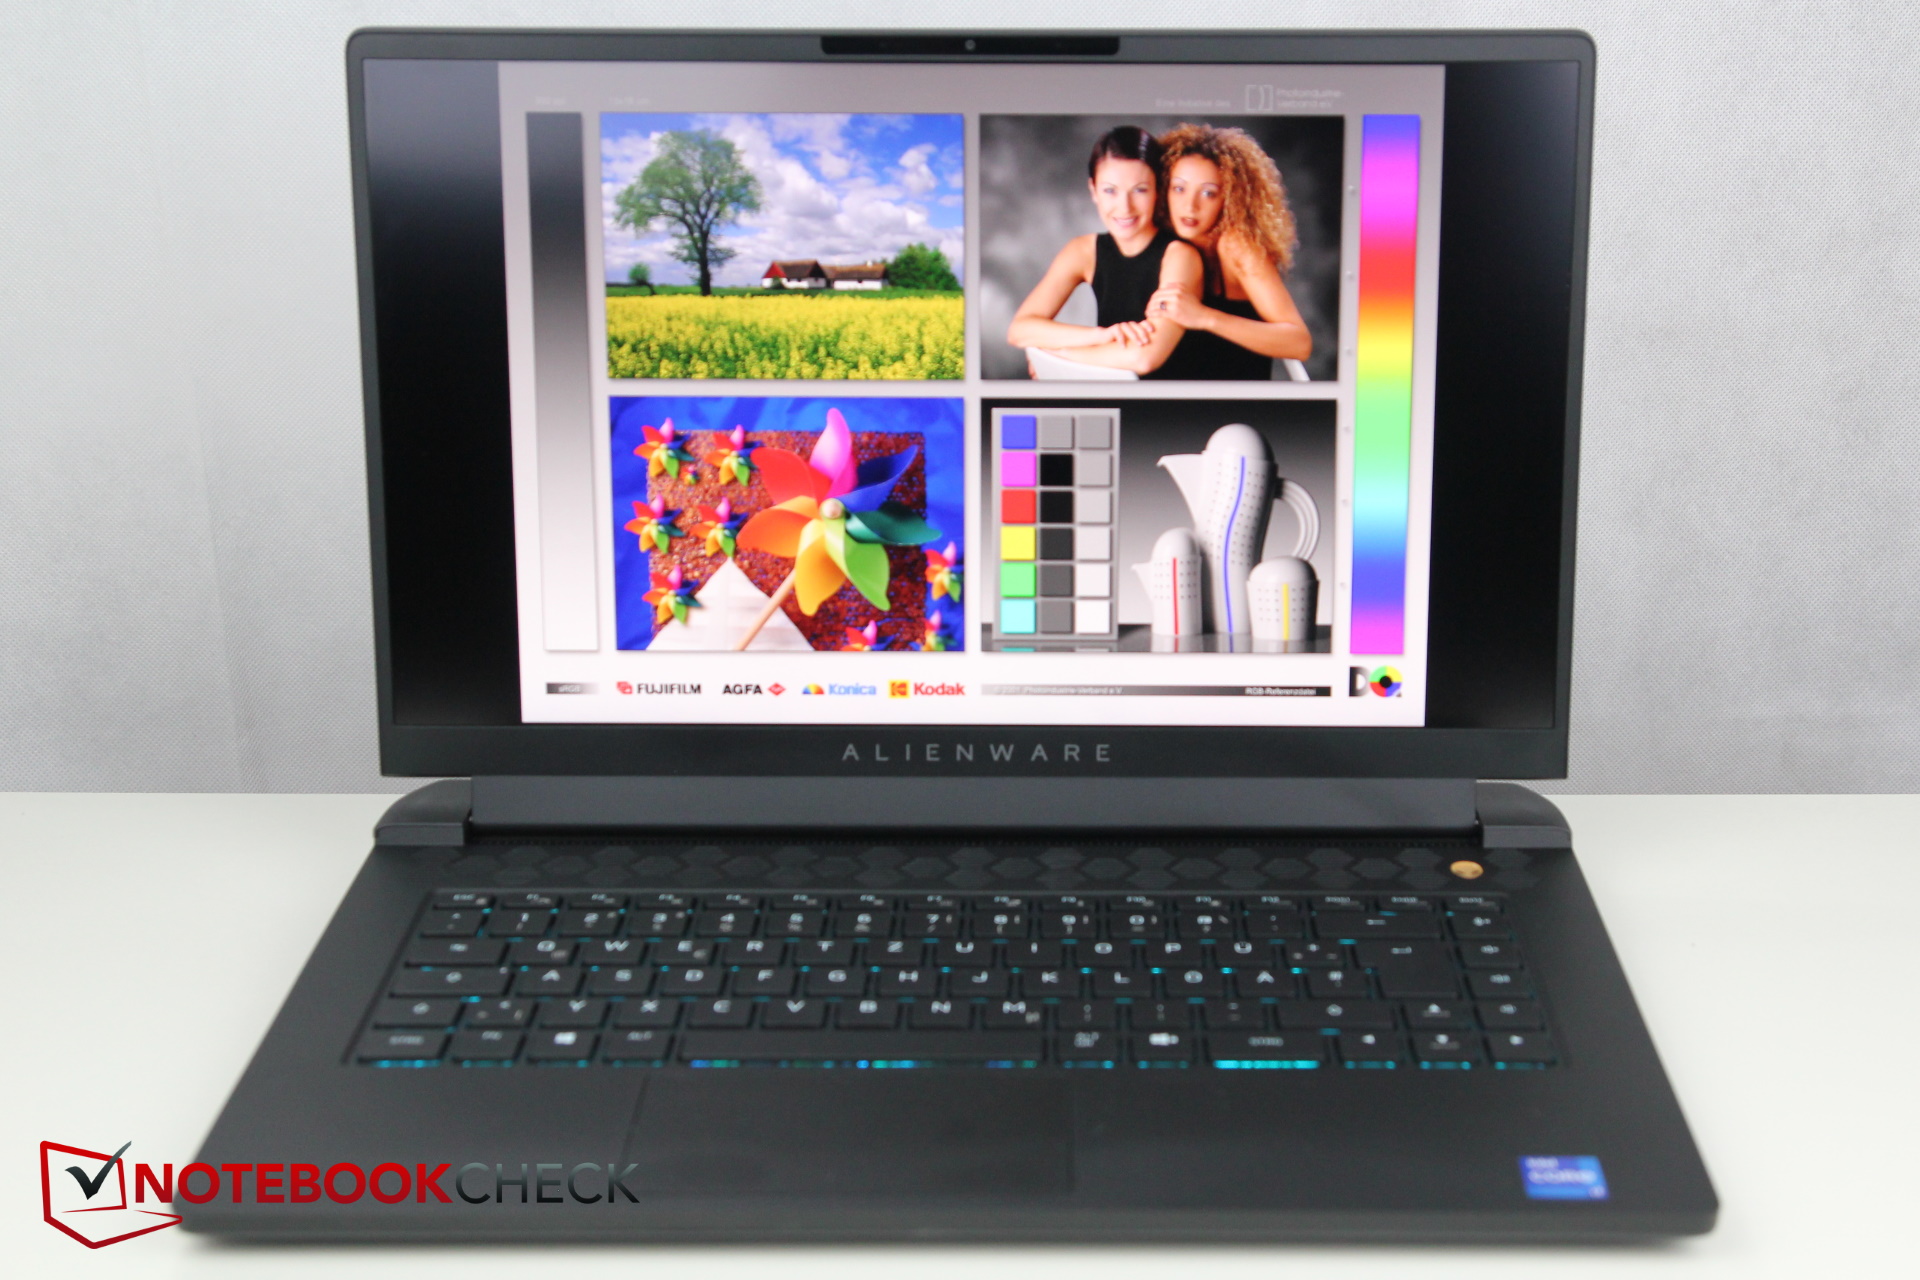
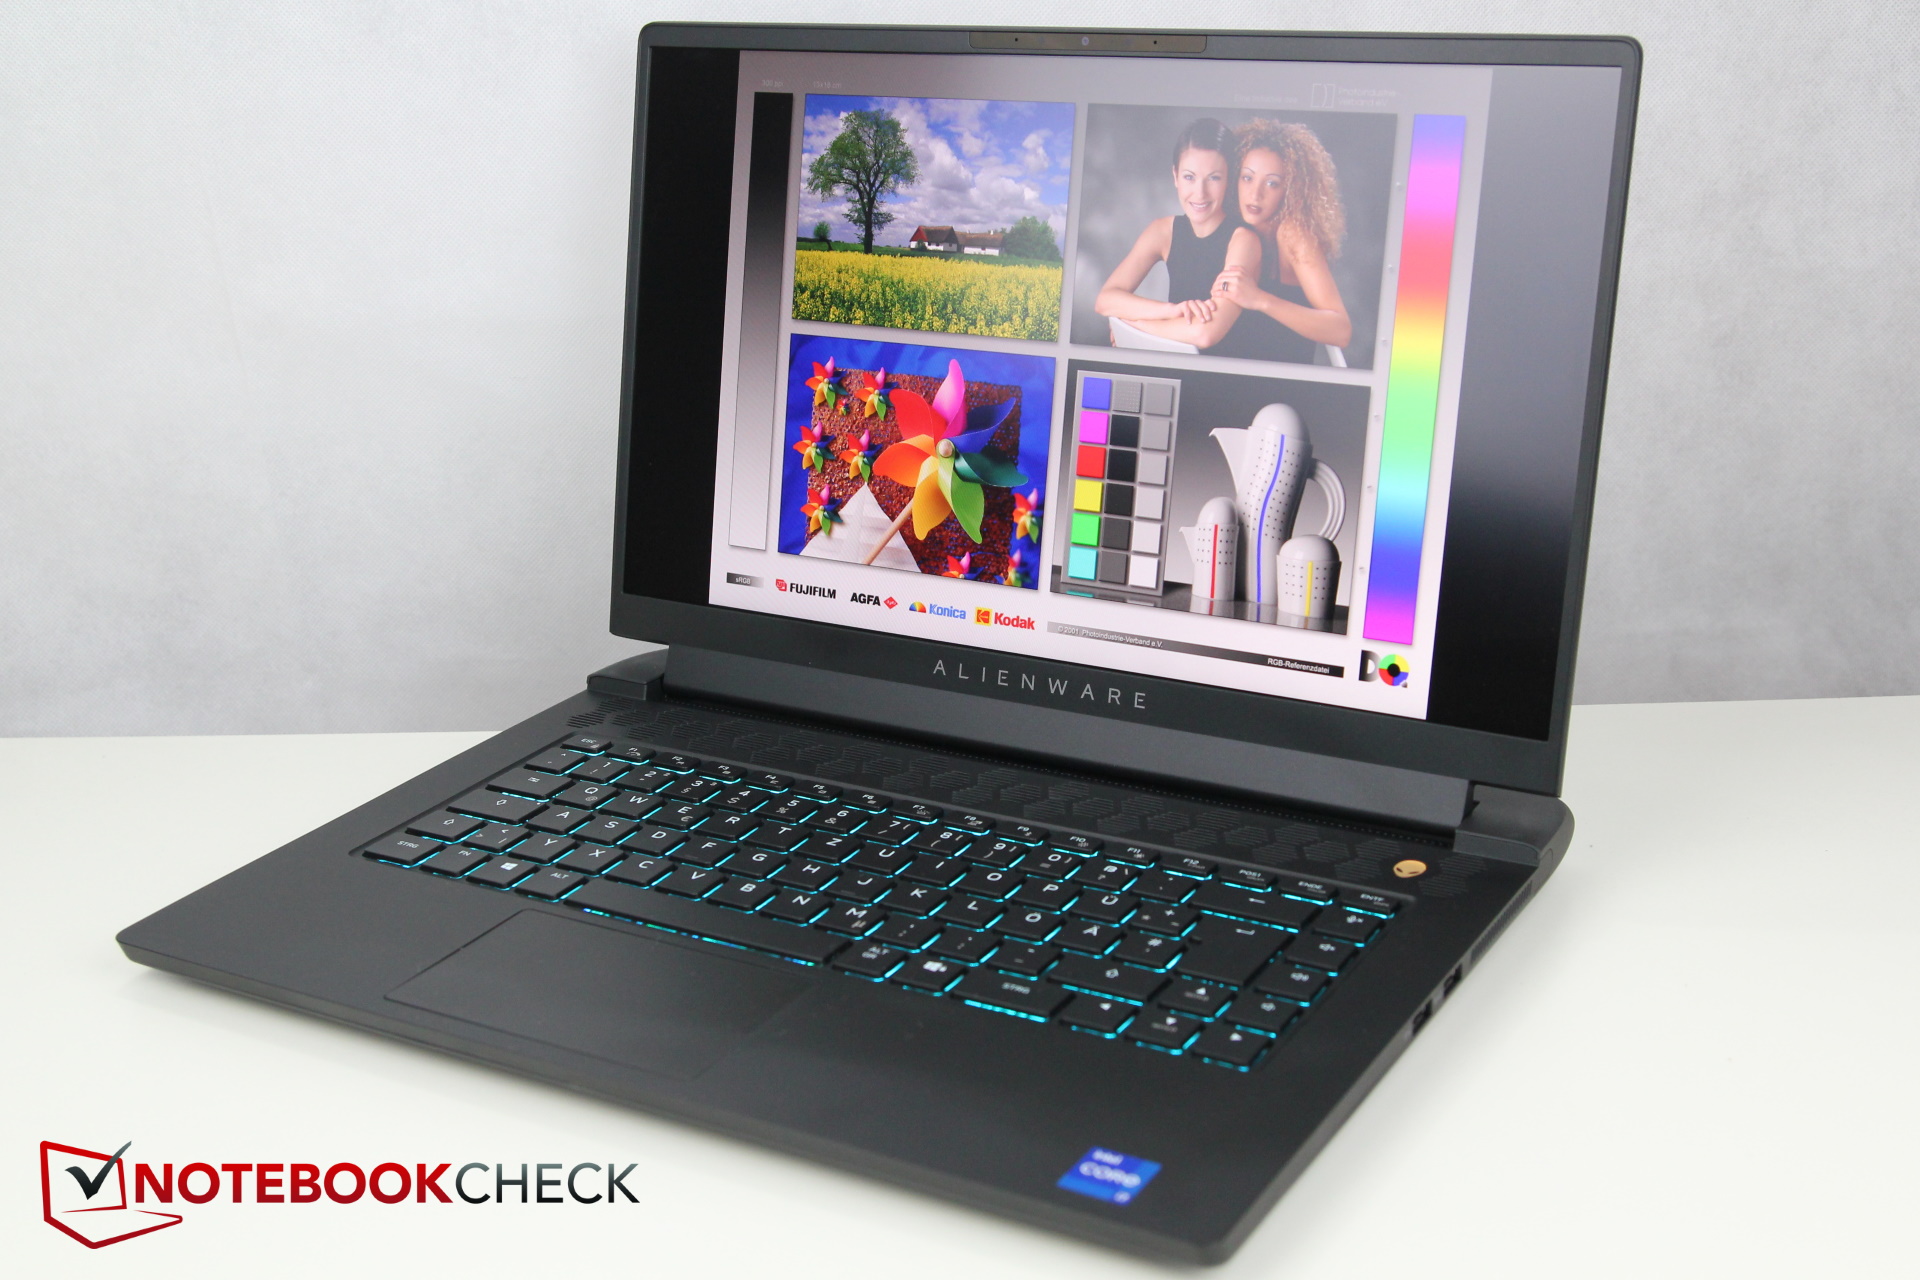
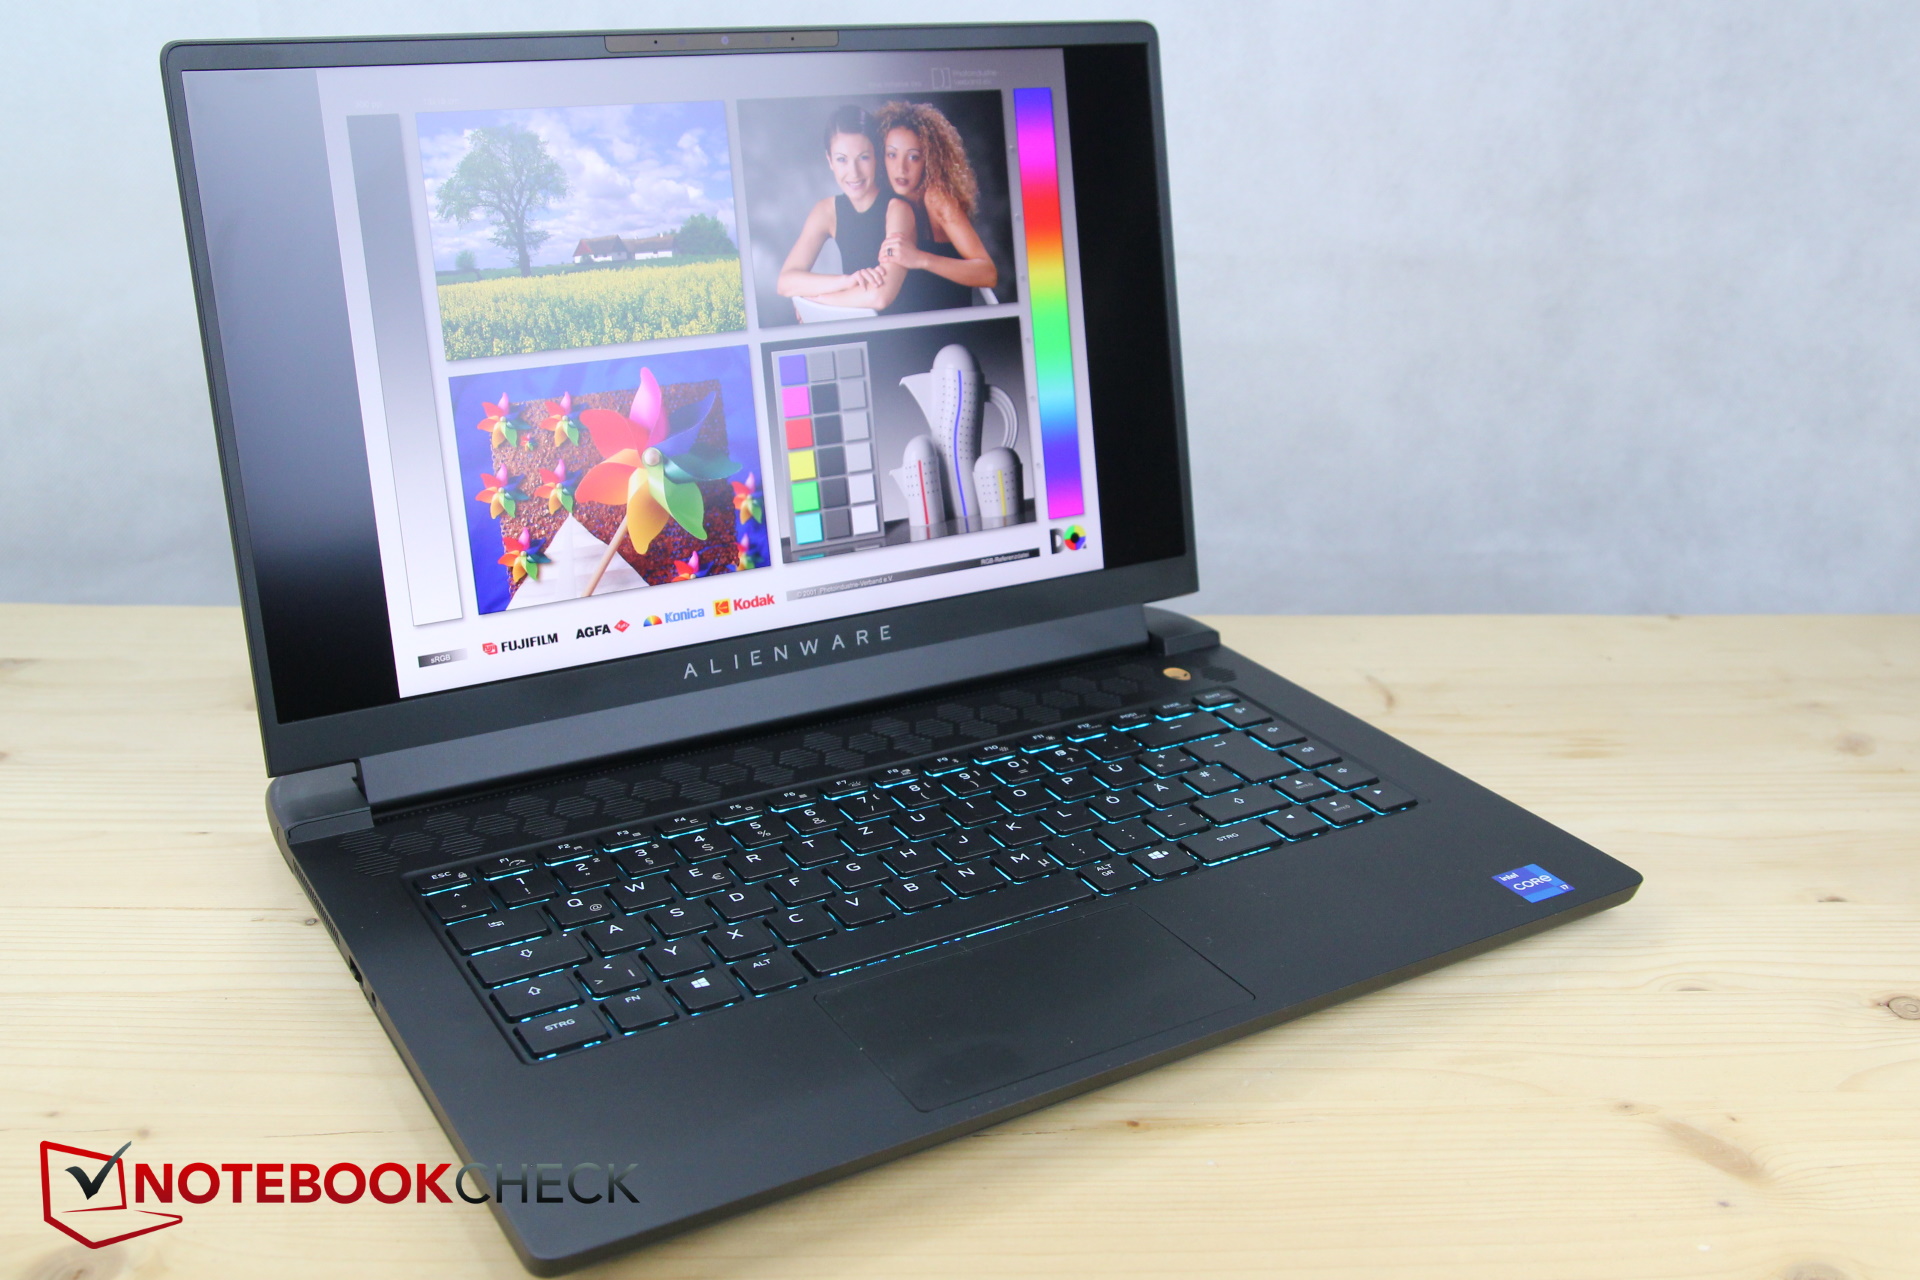
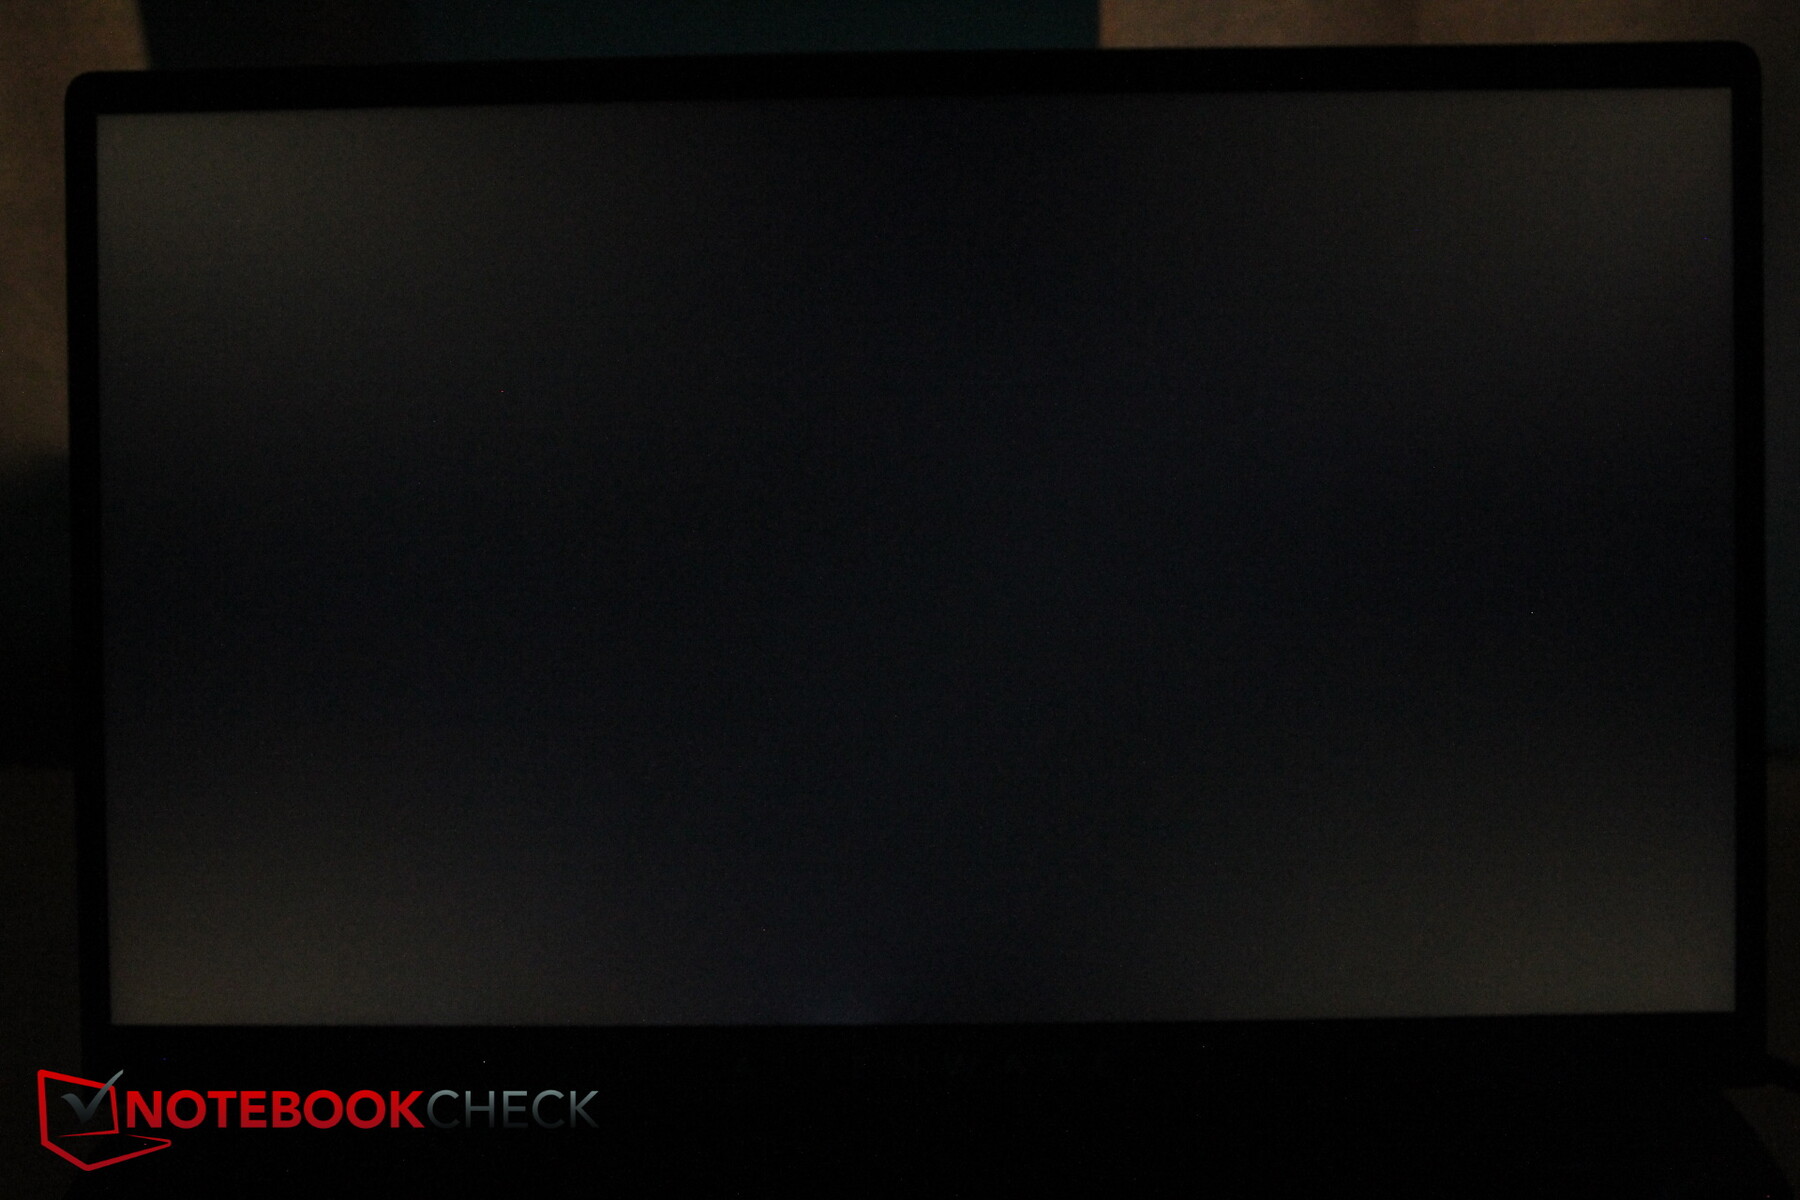
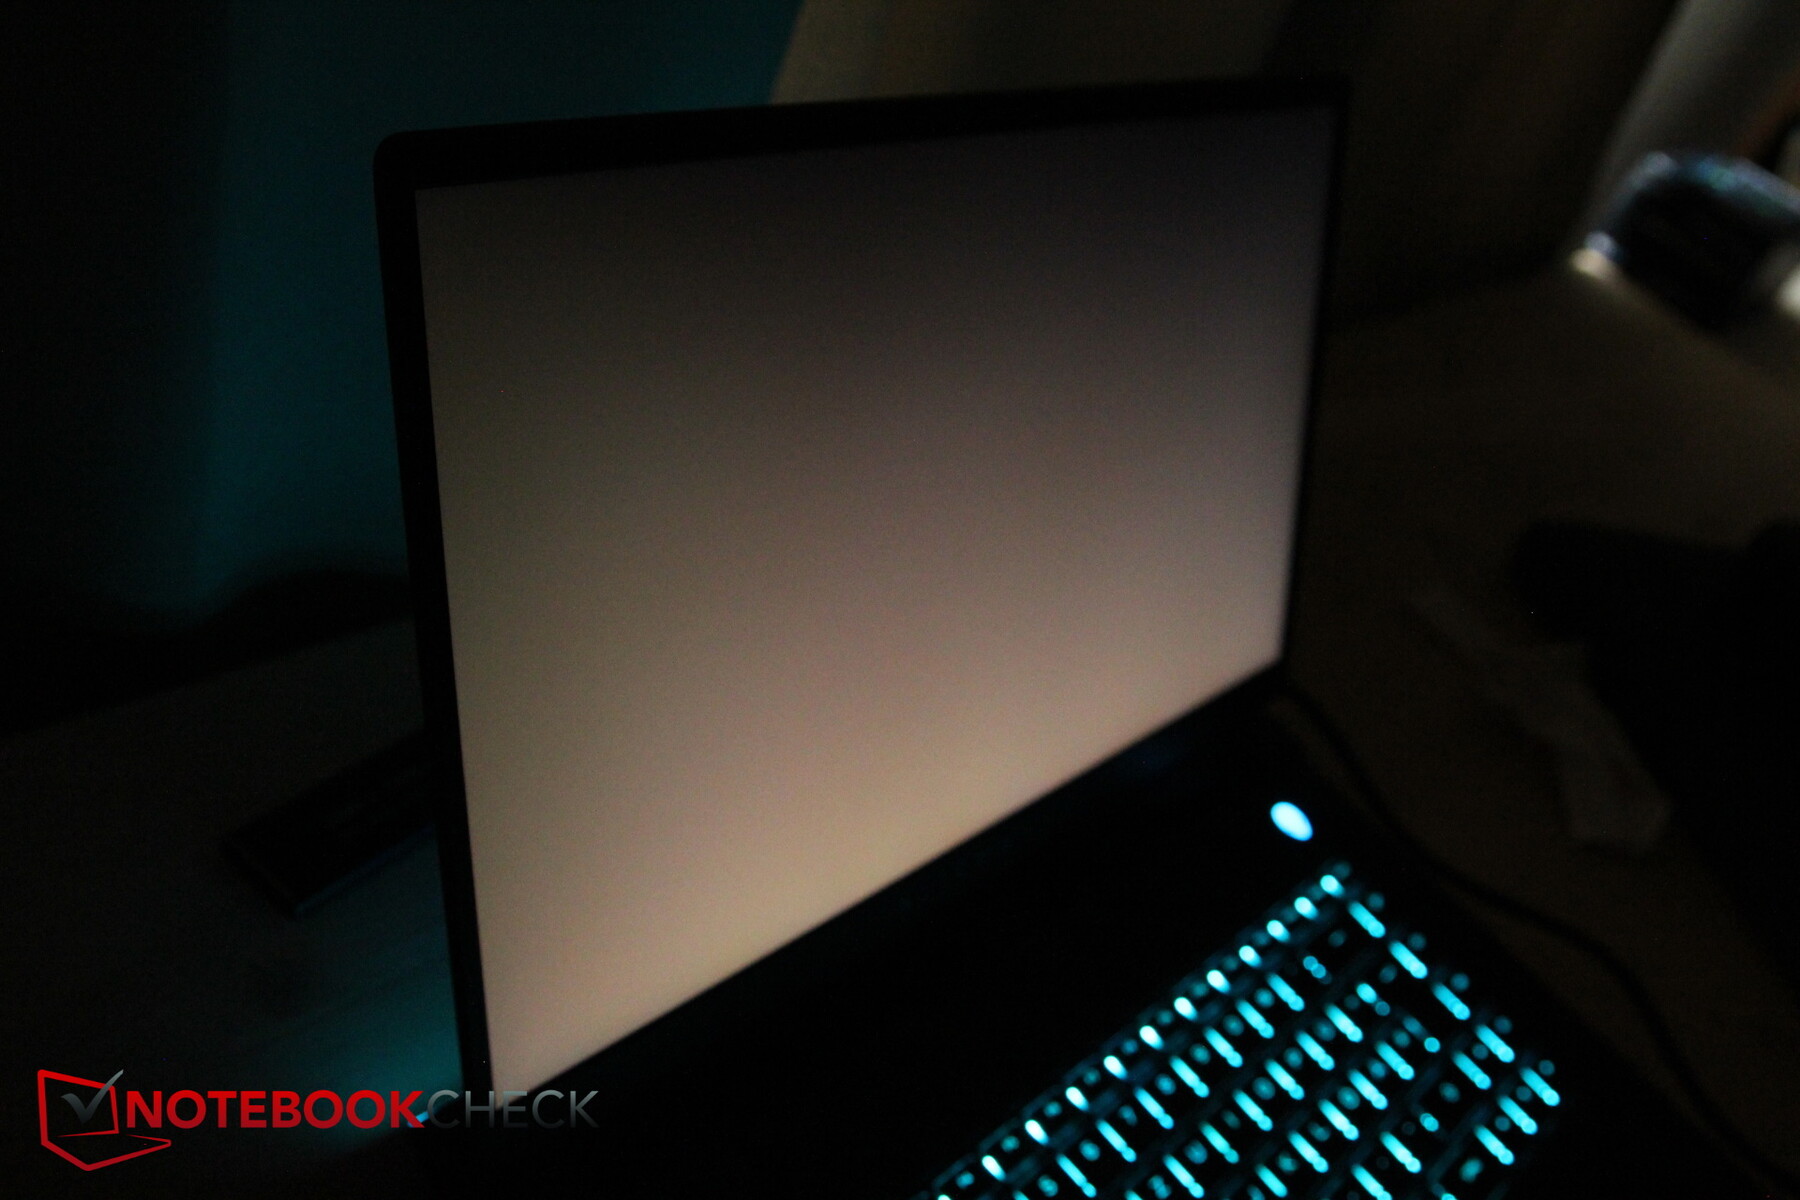
在这次测试中,没有太多的阳光,这有助于Alienware的显示内容更容易阅读。即使在陡峭的视角下,哑光和相当明亮的显示屏也能确保良好的可读性,至少在阴天和阴暗处是如此。
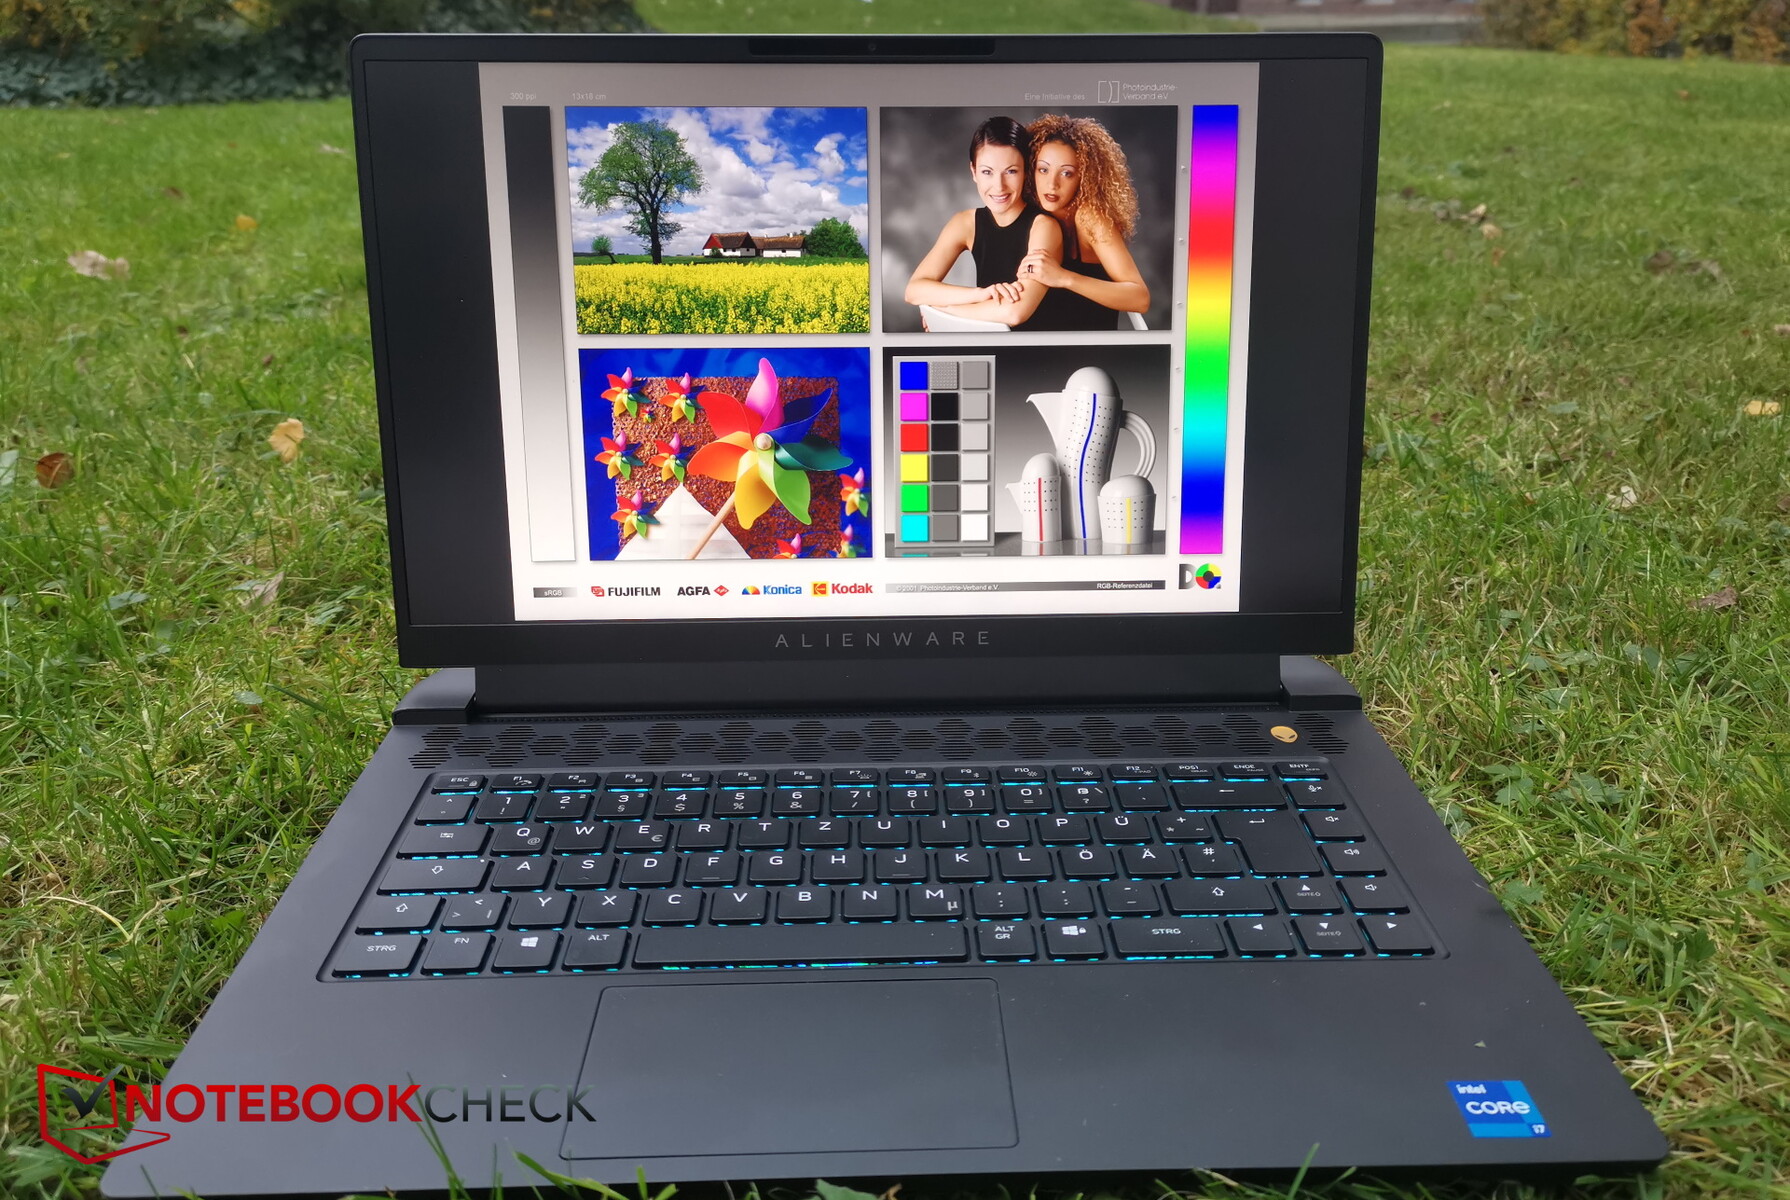
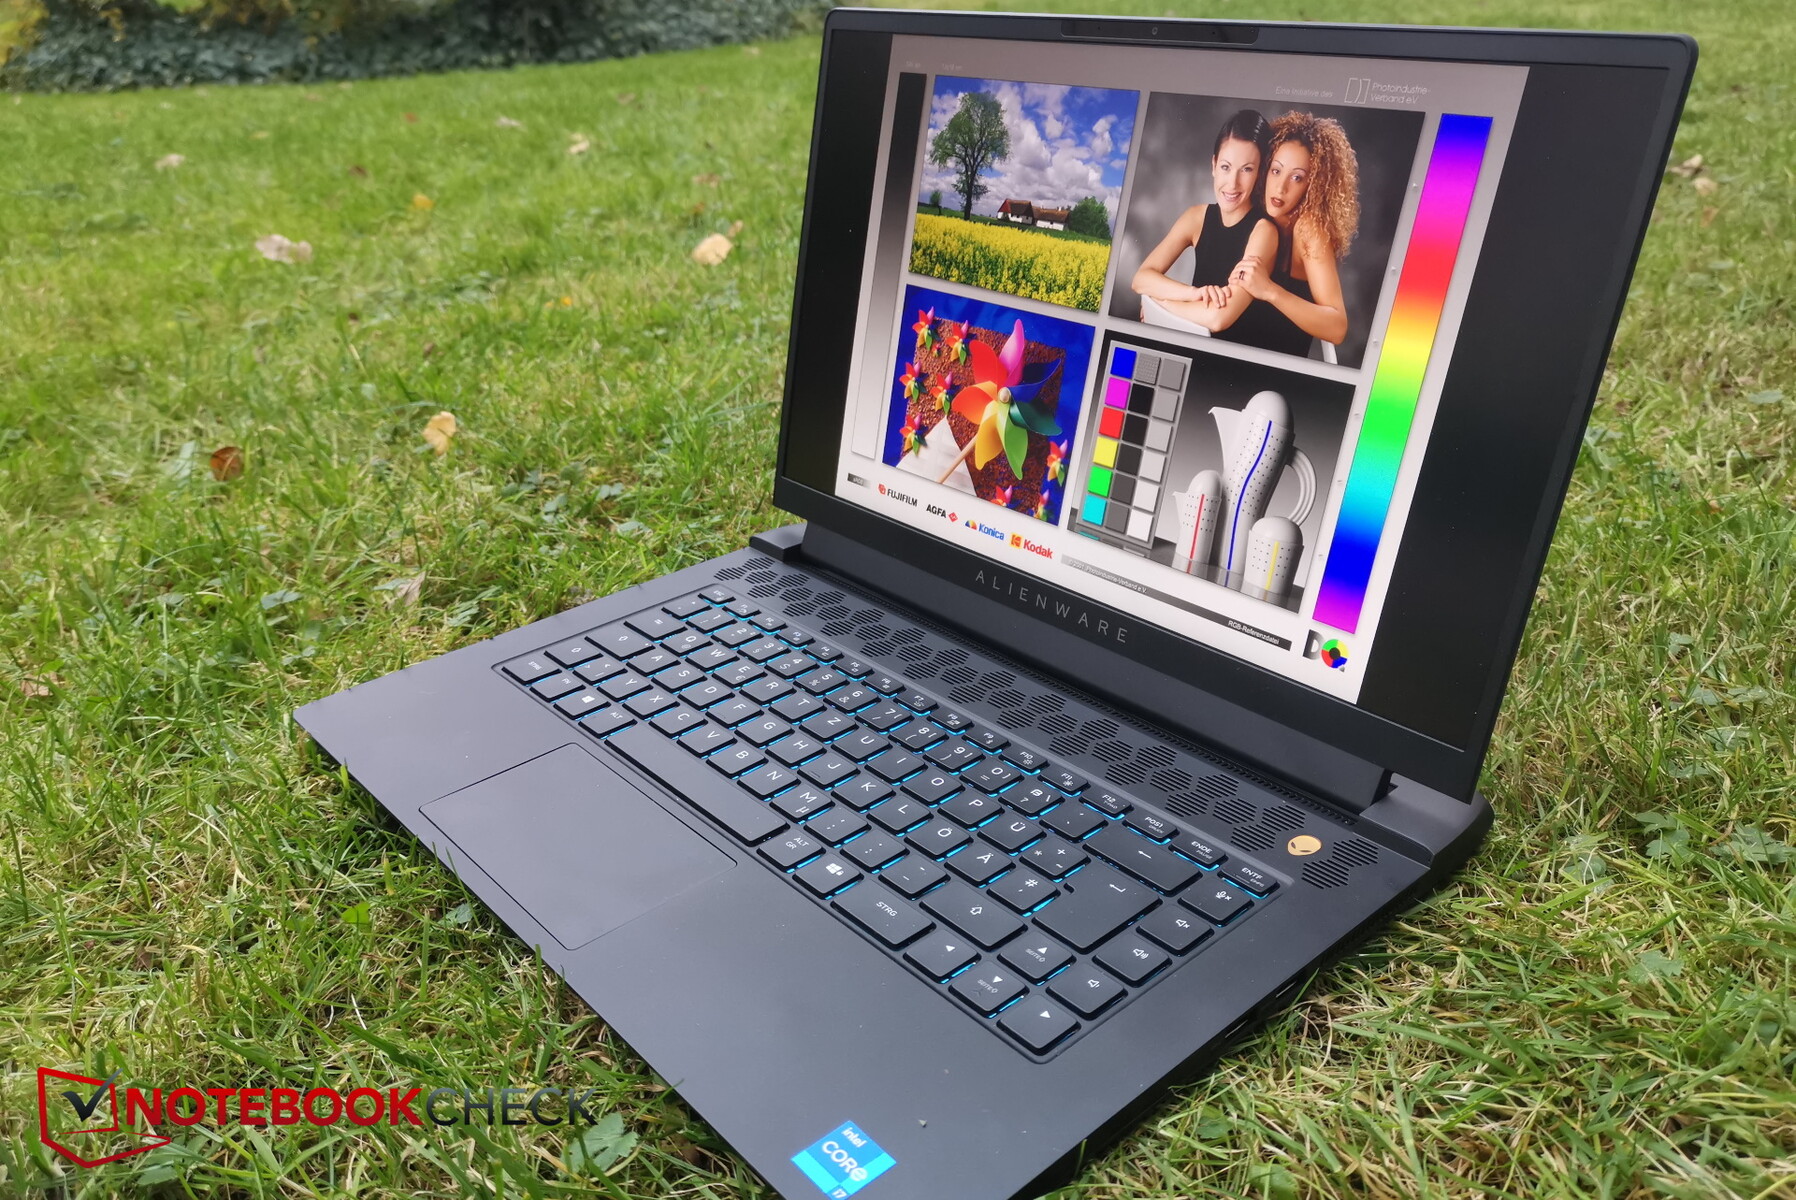
作为IPS屏幕的典型,可视角度的稳定性是一个较小的课题。然而,仍然可以注意到,直视屏幕时的亮度比从陡峭的视角看要好,但这种轻微的下降仍然可以接受。

性能 - RTX 3080的功率只有125W
凭借其英特尔酷睿i7-11800H和 NVIDIAGeForce RTX 3080移动GPU我们的测试单元代表了配置的最高端。另外,你也可以配置Alienware,它显然可以被认为是一个游戏笔记本电脑,与RTX 3070或RTX 3060,甚至与一个较弱的 英特尔酷睿i5 11400HCPU。
测试条件
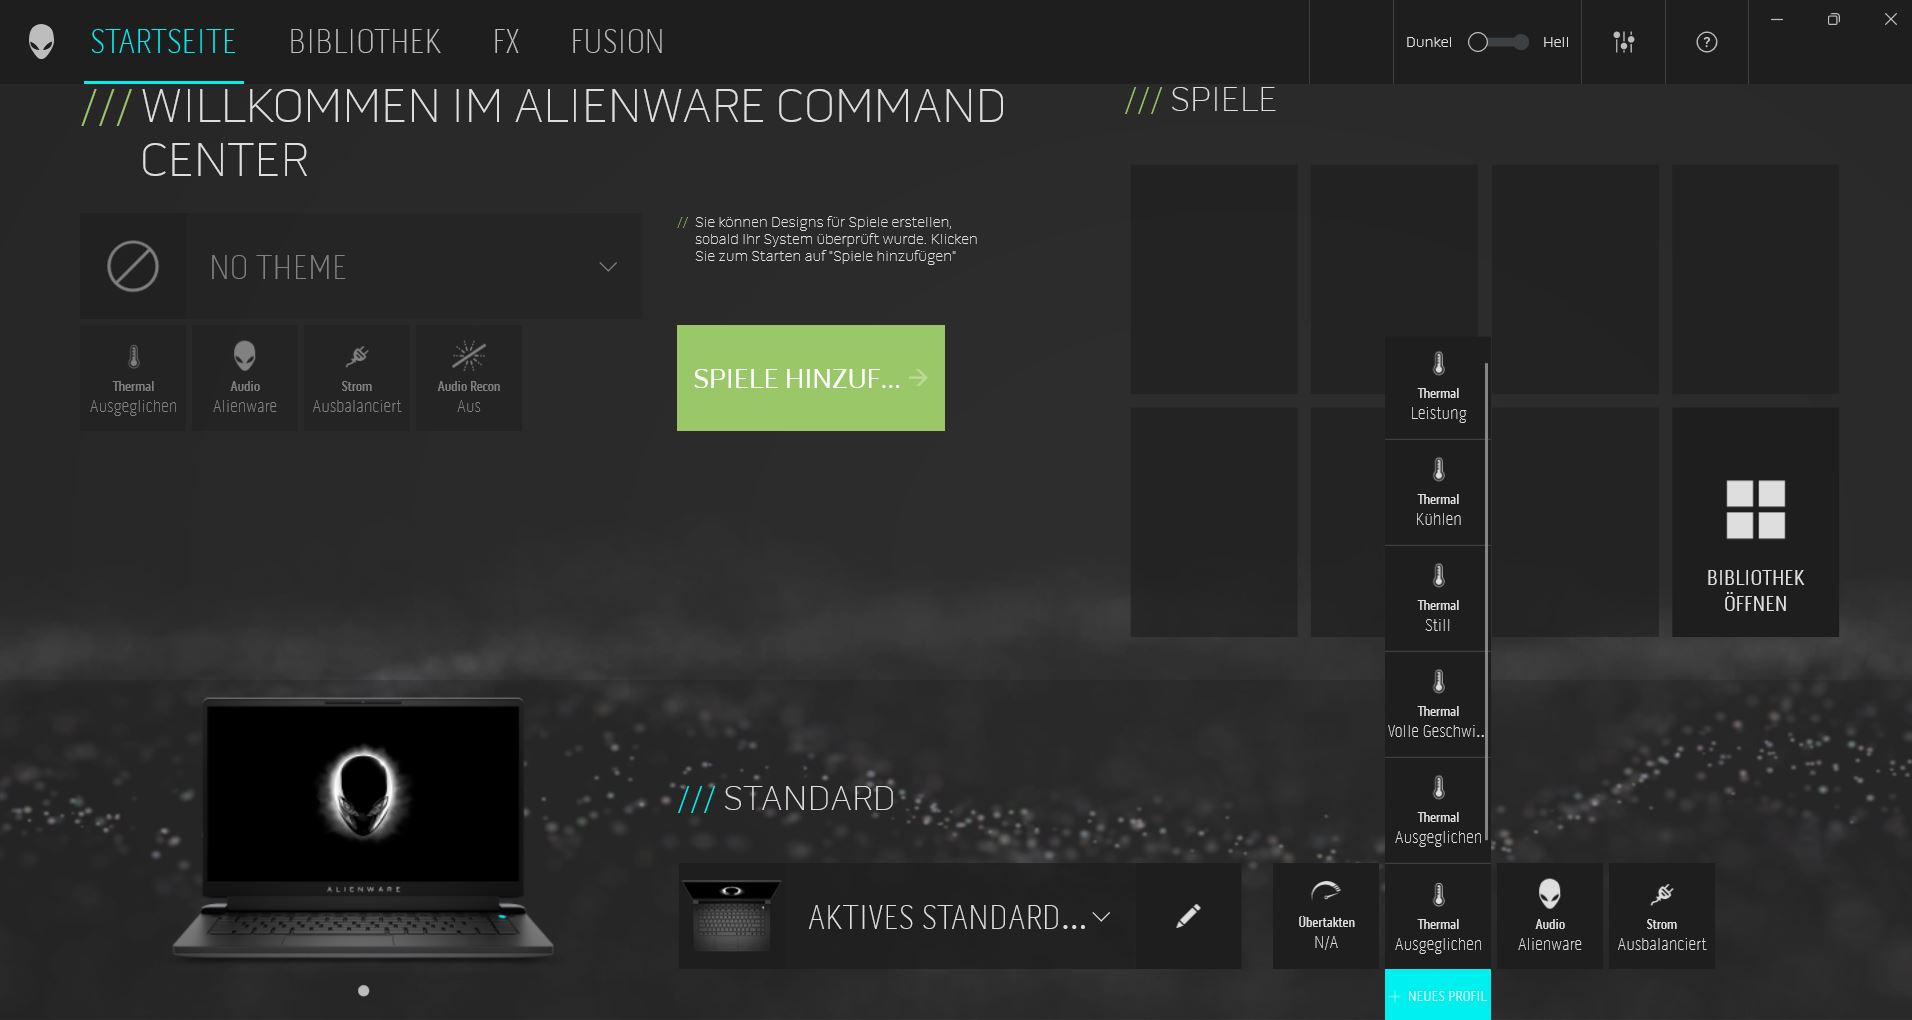
Alienware指挥中心提供了许多名称不太直观的风扇配置文件,而模式描述也只是通过一个小星星的系统来实现。性能"、"完全性能 "和 "冷却 "之间可能有什么区别?由于在这三种模式下,即使在空闲运行时,风扇也总是发出噪音("全性能 "甚至比 "性能 "模式下的噪音还要大),我们在 "平衡 "模式下运行基准测试和噪音测量。尽管这与我们使用最高性能模式测试游戏笔记本的方法相矛盾,但至少这样的噪音测量会有意义。
在每次系统启动时,Alienware指挥中心(ACC)也需要特别长的时间来完成加载。即使在主观上所有其他Windows进程都完成了加载,ACC仍然需要更多的时间。虽然你已经可以启动它了,但在相当长的一段时间内,你仍然无法在概览中选择风扇模式。
Alienware开机时的行为也很奇怪。当你按下电源按钮时,它会亮起几秒钟的蓝灯,但随后就没有其他事情发生了。只有当你第二次按下该按钮时,笔记本电脑才会真正启动--非常令人讨厌
安装了Windows 11作为操作系统,这可能仍然会导致一些基准测试的问题。
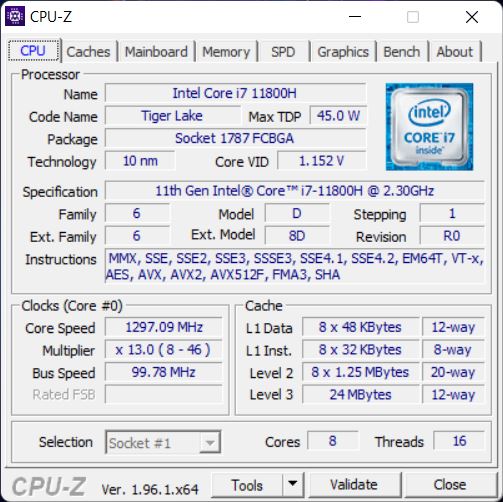
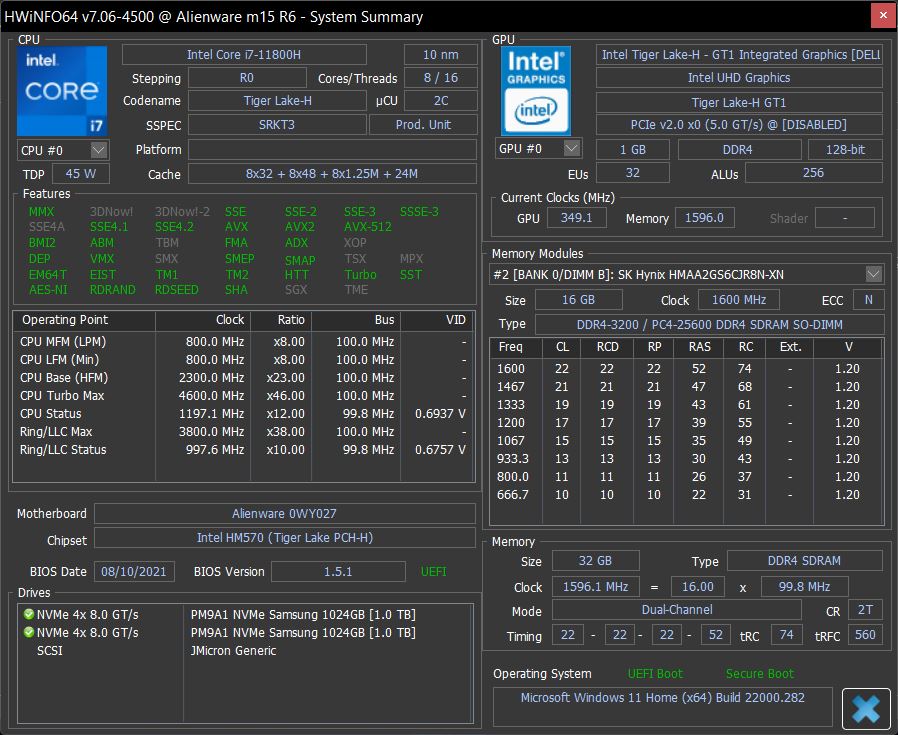
处理器
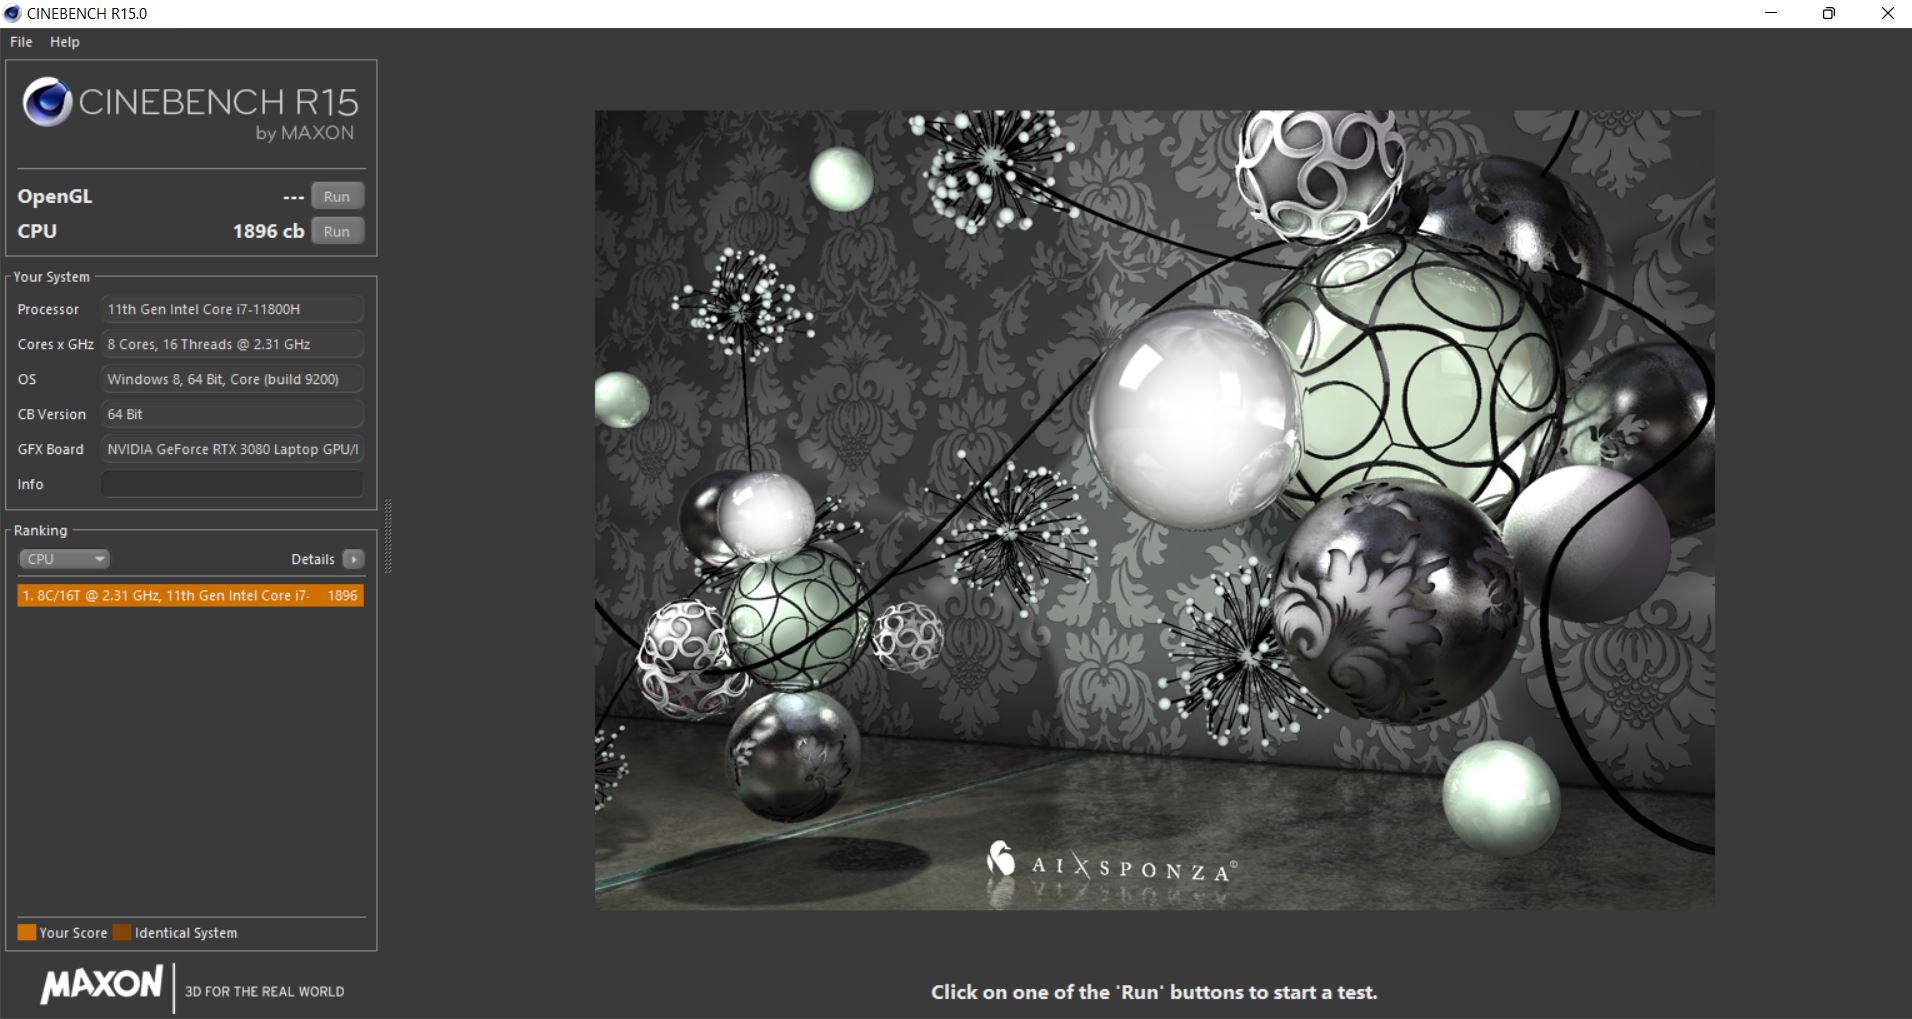
的英特尔酷睿i7-11800H来自Tiger Lake 系列,其8个核心的时钟速度可以达到2.3和4.6 GHz之间(单核涡轮增压)。
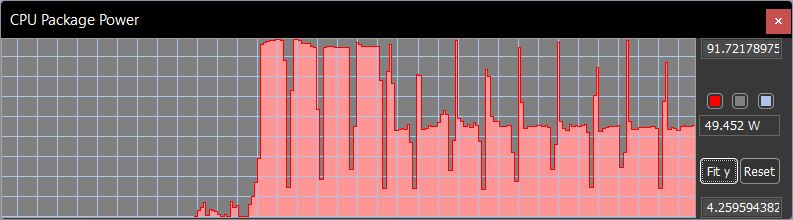
在Cinebench循环中,我们测量到前四次运行后,性能略有下降。之后,其性能与Aorus中的英特尔酷睿i7-11800H相当。在前四次运行中,TDP约为90瓦。之后,它开始变得有限,在每一次新的运行中,TDP只会短暂地达到最大值,然后下降到大约50瓦。
在直接比较中,Schenker的Core i7-11800H提供了最好的性能,但在大多数情况下,Alienware落后5%左右。
在电池模式下,Cinebench R15的CPU性能与开始时的性能相比只下降了约10%。
Cinebench R15 Multi Constant Load Test
Cinebench R23: Multi Core | Single Core
Cinebench R20: CPU (Multi Core) | CPU (Single Core)
Cinebench R15: CPU Multi 64Bit | CPU Single 64Bit
Blender: v2.79 BMW27 CPU
7-Zip 18.03: 7z b 4 | 7z b 4 -mmt1
Geekbench 5.5: Multi-Core | Single-Core
HWBOT x265 Benchmark v2.2: 4k Preset
LibreOffice : 20 Documents To PDF
R Benchmark 2.5: Overall mean
| CPU Performance rating | |
| Average of class Gaming | |
| Schenker XMG Neo 15 Tiger Lake | |
| Alienware m15 R6, i7-11800H RTX 3080 | |
| Alienware m15 R5 Ryzen Edition | |
| Razer Blade 15 Advanced (Mid 2021) -2! | |
| Average Intel Core i7-11800H | |
| Aorus 15P YD -2! | |
| Alienware m15 R4 RTX 3080 | |
| Cinebench R23 / Multi Core | |
| Average of class Gaming (10488 - 42661, n=107, last 2 years) | |
| Schenker XMG Neo 15 Tiger Lake | |
| Alienware m15 R6, i7-11800H RTX 3080 | |
| Razer Blade 15 Advanced (Mid 2021) | |
| Alienware m15 R5 Ryzen Edition | |
| Average Intel Core i7-11800H (6508 - 14088, n=48) | |
| Alienware m15 R4 RTX 3080 | |
| Cinebench R23 / Single Core | |
| Average of class Gaming (1166 - 2415, n=107, last 2 years) | |
| Schenker XMG Neo 15 Tiger Lake | |
| Razer Blade 15 Advanced (Mid 2021) | |
| Average Intel Core i7-11800H (1386 - 1522, n=45) | |
| Alienware m15 R6, i7-11800H RTX 3080 | |
| Alienware m15 R5 Ryzen Edition | |
| Alienware m15 R4 RTX 3080 | |
| Cinebench R20 / CPU (Multi Core) | |
| Average of class Gaming (4029 - 16433, n=106, last 2 years) | |
| Schenker XMG Neo 15 Tiger Lake | |
| Aorus 15P YD | |
| Alienware m15 R5 Ryzen Edition | |
| Razer Blade 15 Advanced (Mid 2021) | |
| Alienware m15 R6, i7-11800H RTX 3080 | |
| Average Intel Core i7-11800H (2498 - 5408, n=50) | |
| Alienware m15 R4 RTX 3080 | |
| Cinebench R20 / CPU (Single Core) | |
| Average of class Gaming (442 - 913, n=106, last 2 years) | |
| Aorus 15P YD | |
| Razer Blade 15 Advanced (Mid 2021) | |
| Schenker XMG Neo 15 Tiger Lake | |
| Alienware m15 R6, i7-11800H RTX 3080 | |
| Average Intel Core i7-11800H (520 - 586, n=47) | |
| Alienware m15 R5 Ryzen Edition | |
| Alienware m15 R4 RTX 3080 | |
| Cinebench R15 / CPU Multi 64Bit | |
| Average of class Gaming (1578 - 6330, n=105, last 2 years) | |
| Schenker XMG Neo 15 Tiger Lake | |
| Alienware m15 R6, i7-11800H RTX 3080 | |
| Alienware m15 R5 Ryzen Edition | |
| Aorus 15P YD | |
| Average Intel Core i7-11800H (1342 - 2173, n=50) | |
| Razer Blade 15 Advanced (Mid 2021) | |
| Alienware m15 R4 RTX 3080 | |
| Cinebench R15 / CPU Single 64Bit | |
| Average of class Gaming (188.8 - 350, n=106, last 2 years) | |
| Alienware m15 R5 Ryzen Edition | |
| Aorus 15P YD | |
| Schenker XMG Neo 15 Tiger Lake | |
| Razer Blade 15 Advanced (Mid 2021) | |
| Alienware m15 R6, i7-11800H RTX 3080 | |
| Average Intel Core i7-11800H (201 - 231, n=46) | |
| Alienware m15 R4 RTX 3080 | |
| Blender / v2.79 BMW27 CPU | |
| Aorus 15P YD | |
| Alienware m15 R4 RTX 3080 | |
| Average Intel Core i7-11800H (217 - 454, n=46) | |
| Alienware m15 R6, i7-11800H RTX 3080 | |
| Razer Blade 15 Advanced (Mid 2021) | |
| Alienware m15 R5 Ryzen Edition | |
| Schenker XMG Neo 15 Tiger Lake | |
| Average of class Gaming (79 - 330, n=104, last 2 years) | |
| 7-Zip 18.03 / 7z b 4 | |
| Average of class Gaming (33491 - 148086, n=105, last 2 years) | |
| Schenker XMG Neo 15 Tiger Lake | |
| Alienware m15 R5 Ryzen Edition | |
| Razer Blade 15 Advanced (Mid 2021) | |
| Alienware m15 R6, i7-11800H RTX 3080 | |
| Alienware m15 R4 RTX 3080 | |
| Average Intel Core i7-11800H (33718 - 56758, n=46) | |
| Aorus 15P YD | |
| 7-Zip 18.03 / 7z b 4 -mmt1 | |
| Average of class Gaming (4199 - 7436, n=105, last 2 years) | |
| Schenker XMG Neo 15 Tiger Lake | |
| Alienware m15 R5 Ryzen Edition | |
| Aorus 15P YD | |
| Average Intel Core i7-11800H (5138 - 5732, n=46) | |
| Razer Blade 15 Advanced (Mid 2021) | |
| Alienware m15 R6, i7-11800H RTX 3080 | |
| Alienware m15 R4 RTX 3080 | |
| Geekbench 5.5 / Multi-Core | |
| Average of class Gaming (6460 - 28263, n=105, last 2 years) | |
| Schenker XMG Neo 15 Tiger Lake | |
| Alienware m15 R6, i7-11800H RTX 3080 | |
| Aorus 15P YD | |
| Average Intel Core i7-11800H (4655 - 9851, n=40) | |
| Alienware m15 R4 RTX 3080 | |
| Alienware m15 R5 Ryzen Edition | |
| Geekbench 5.5 / Single-Core | |
| Average of class Gaming (986 - 2474, n=105, last 2 years) | |
| Schenker XMG Neo 15 Tiger Lake | |
| Aorus 15P YD | |
| Alienware m15 R6, i7-11800H RTX 3080 | |
| Average Intel Core i7-11800H (1429 - 1625, n=40) | |
| Alienware m15 R5 Ryzen Edition | |
| Alienware m15 R4 RTX 3080 | |
| HWBOT x265 Benchmark v2.2 / 4k Preset | |
| Average of class Gaming (11.5 - 44.4, n=105, last 2 years) | |
| Schenker XMG Neo 15 Tiger Lake | |
| Razer Blade 15 Advanced (Mid 2021) | |
| Alienware m15 R5 Ryzen Edition | |
| Average Intel Core i7-11800H (7.38 - 17.4, n=46) | |
| Alienware m15 R6, i7-11800H RTX 3080 | |
| Alienware m15 R4 RTX 3080 | |
| Aorus 15P YD | |
| LibreOffice / 20 Documents To PDF | |
| Alienware m15 R4 RTX 3080 | |
| Alienware m15 R5 Ryzen Edition | |
| Average of class Gaming (33.2 - 88.8, n=105, last 2 years) | |
| Schenker XMG Neo 15 Tiger Lake | |
| Average Intel Core i7-11800H (38.6 - 59.9, n=45) | |
| Razer Blade 15 Advanced (Mid 2021) | |
| Alienware m15 R6, i7-11800H RTX 3080 | |
| Aorus 15P YD | |
| R Benchmark 2.5 / Overall mean | |
| Alienware m15 R4 RTX 3080 | |
| Average Intel Core i7-11800H (0.548 - 0.615, n=46) | |
| Aorus 15P YD | |
| Alienware m15 R6, i7-11800H RTX 3080 | |
| Schenker XMG Neo 15 Tiger Lake | |
| Razer Blade 15 Advanced (Mid 2021) | |
| Alienware m15 R5 Ryzen Edition | |
| Average of class Gaming (0.3439 - 0.759, n=106, last 2 years) | |
* ... smaller is better
AIDA64: FP32 Ray-Trace | FPU Julia | CPU SHA3 | CPU Queen | FPU SinJulia | FPU Mandel | CPU AES | CPU ZLib | FP64 Ray-Trace | CPU PhotoWorxx
| Performance rating | |
| Average of class Gaming | |
| Alienware m15 R6, i7-11800H RTX 3080 | |
| Alienware m15 R5 Ryzen Edition | |
| Average Intel Core i7-11800H | |
| Alienware m15 R4 RTX 3080 | |
| Aorus 15P YD -9! | |
| Schenker XMG Neo 15 Tiger Lake -9! | |
| Razer Blade 15 Advanced (Mid 2021) -9! | |
| AIDA64 / FP32 Ray-Trace | |
| Average of class Gaming (10227 - 85542, n=105, last 2 years) | |
| Alienware m15 R6, i7-11800H RTX 3080 | |
| Alienware m15 R5 Ryzen Edition | |
| Alienware m15 R4 RTX 3080 | |
| Average Intel Core i7-11800H (8772 - 15961, n=20) | |
| AIDA64 / FPU Julia | |
| Average of class Gaming (51376 - 238426, n=105, last 2 years) | |
| Alienware m15 R5 Ryzen Edition | |
| Alienware m15 R4 RTX 3080 | |
| Alienware m15 R6, i7-11800H RTX 3080 | |
| Average Intel Core i7-11800H (39404 - 65636, n=20) | |
| AIDA64 / CPU SHA3 | |
| Average of class Gaming (2180 - 10115, n=105, last 2 years) | |
| Alienware m15 R6, i7-11800H RTX 3080 | |
| Average Intel Core i7-11800H (2599 - 4439, n=20) | |
| Alienware m15 R4 RTX 3080 | |
| Alienware m15 R5 Ryzen Edition | |
| AIDA64 / CPU Queen | |
| Average of class Gaming (49785 - 173351, n=90, last 2 years) | |
| Alienware m15 R5 Ryzen Edition | |
| Alienware m15 R4 RTX 3080 | |
| Alienware m15 R6, i7-11800H RTX 3080 | |
| Average Intel Core i7-11800H (85233 - 91941, n=20) | |
| AIDA64 / FPU SinJulia | |
| Average of class Gaming (4424 - 33636, n=105, last 2 years) | |
| Alienware m15 R5 Ryzen Edition | |
| Alienware m15 R4 RTX 3080 | |
| Alienware m15 R6, i7-11800H RTX 3080 | |
| Average Intel Core i7-11800H (6420 - 9792, n=20) | |
| AIDA64 / FPU Mandel | |
| Average of class Gaming (25115 - 128721, n=105, last 2 years) | |
| Alienware m15 R5 Ryzen Edition | |
| Alienware m15 R6, i7-11800H RTX 3080 | |
| Average Intel Core i7-11800H (23365 - 39464, n=20) | |
| Alienware m15 R4 RTX 3080 | |
| AIDA64 / CPU AES | |
| Alienware m15 R6, i7-11800H RTX 3080 | |
| Average Intel Core i7-11800H (74617 - 149388, n=20) | |
| Alienware m15 R5 Ryzen Edition | |
| Average of class Gaming (39258 - 247074, n=105, last 2 years) | |
| Alienware m15 R4 RTX 3080 | |
| AIDA64 / CPU ZLib | |
| Average of class Gaming (574 - 2531, n=105, last 2 years) | |
| Alienware m15 R6, i7-11800H RTX 3080 | |
| Alienware m15 R5 Ryzen Edition | |
| Alienware m15 R4 RTX 3080 | |
| Average Intel Core i7-11800H (461 - 830, n=43) | |
| Aorus 15P YD | |
| Schenker XMG Neo 15 Tiger Lake | |
| Razer Blade 15 Advanced (Mid 2021) | |
| AIDA64 / FP64 Ray-Trace | |
| Average of class Gaming (5509 - 45446, n=105, last 2 years) | |
| Alienware m15 R6, i7-11800H RTX 3080 | |
| Alienware m15 R5 Ryzen Edition | |
| Alienware m15 R4 RTX 3080 | |
| Average Intel Core i7-11800H (4545 - 8717, n=21) | |
| AIDA64 / CPU PhotoWorxx | |
| Average of class Gaming (12271 - 89891, n=105, last 2 years) | |
| Alienware m15 R6, i7-11800H RTX 3080 | |
| Average Intel Core i7-11800H (11898 - 26757, n=21) | |
| Alienware m15 R4 RTX 3080 | |
| Alienware m15 R5 Ryzen Edition | |
系统性能
PCMark 10基准测试并没有很好地将竞争对手区分开来,至少在总分上没有。Razer Blade在次级测试中似乎略微领先,但Alienware正在挑战它,仅在Essentials基准测试中仍落后约5%。
| PCMark 10 / Score | |
| Average of class Gaming (5828 - 12414, n=93, last 2 years) | |
| Razer Blade 15 Advanced (Mid 2021) | |
| Aorus 15P YD | |
| Schenker XMG Neo 15 Tiger Lake | |
| Alienware m15 R6, i7-11800H RTX 3080 | |
| Average Intel Core i7-11800H, NVIDIA GeForce RTX 3080 Laptop GPU (6673 - 7470, n=11) | |
| Alienware m15 R4 RTX 3080 | |
| Alienware m15 R5 Ryzen Edition | |
| PCMark 10 / Essentials | |
| Razer Blade 15 Advanced (Mid 2021) | |
| Average of class Gaming (8810 - 11935, n=97, last 2 years) | |
| Aorus 15P YD | |
| Average Intel Core i7-11800H, NVIDIA GeForce RTX 3080 Laptop GPU (9862 - 11064, n=11) | |
| Schenker XMG Neo 15 Tiger Lake | |
| Alienware m15 R6, i7-11800H RTX 3080 | |
| Alienware m15 R4 RTX 3080 | |
| Alienware m15 R5 Ryzen Edition | |
| PCMark 10 / Productivity | |
| Average of class Gaming (6845 - 25323, n=95, last 2 years) | |
| Alienware m15 R6, i7-11800H RTX 3080 | |
| Alienware m15 R4 RTX 3080 | |
| Aorus 15P YD | |
| Average Intel Core i7-11800H, NVIDIA GeForce RTX 3080 Laptop GPU (8278 - 9803, n=11) | |
| Razer Blade 15 Advanced (Mid 2021) | |
| Schenker XMG Neo 15 Tiger Lake | |
| Alienware m15 R5 Ryzen Edition | |
| PCMark 10 / Digital Content Creation | |
| Average of class Gaming (7602 - 19954, n=95, last 2 years) | |
| Schenker XMG Neo 15 Tiger Lake | |
| Razer Blade 15 Advanced (Mid 2021) | |
| Alienware m15 R6, i7-11800H RTX 3080 | |
| Average Intel Core i7-11800H, NVIDIA GeForce RTX 3080 Laptop GPU (9881 - 11323, n=11) | |
| Aorus 15P YD | |
| Alienware m15 R4 RTX 3080 | |
| Alienware m15 R5 Ryzen Edition | |
| PCMark 10 Score | 7177 points | |
Help | ||
| AIDA64 / Memory Copy | |
| Average of class Gaming (21750 - 129946, n=105, last 2 years) | |
| Alienware m15 R6, i7-11800H RTX 3080 | |
| Average Intel Core i7-11800H (24508 - 48144, n=21) | |
| Alienware m15 R5 Ryzen Edition | |
| Alienware m15 R4 RTX 3080 | |
| AIDA64 / Memory Read | |
| Average of class Gaming (22956 - 118858, n=105, last 2 years) | |
| Alienware m15 R6, i7-11800H RTX 3080 | |
| Average Intel Core i7-11800H (25882 - 50365, n=20) | |
| Alienware m15 R5 Ryzen Edition | |
| Alienware m15 R4 RTX 3080 | |
| AIDA64 / Memory Write | |
| Average of class Gaming (22297 - 135096, n=105, last 2 years) | |
| Alienware m15 R6, i7-11800H RTX 3080 | |
| Average Intel Core i7-11800H (22240 - 46214, n=20) | |
| Alienware m15 R4 RTX 3080 | |
| Alienware m15 R5 Ryzen Edition | |
| AIDA64 / Memory Latency | |
| Average of class Gaming (75.3 - 259, n=105, last 2 years) | |
| Alienware m15 R6, i7-11800H RTX 3080 | |
| Alienware m15 R5 Ryzen Edition | |
| Alienware m15 R4 RTX 3080 | |
| Average Intel Core i7-11800H (71.9 - 104.1, n=44) | |
| Aorus 15P YD | |
| Schenker XMG Neo 15 Tiger Lake | |
| Razer Blade 15 Advanced (Mid 2021) | |
* ... smaller is better
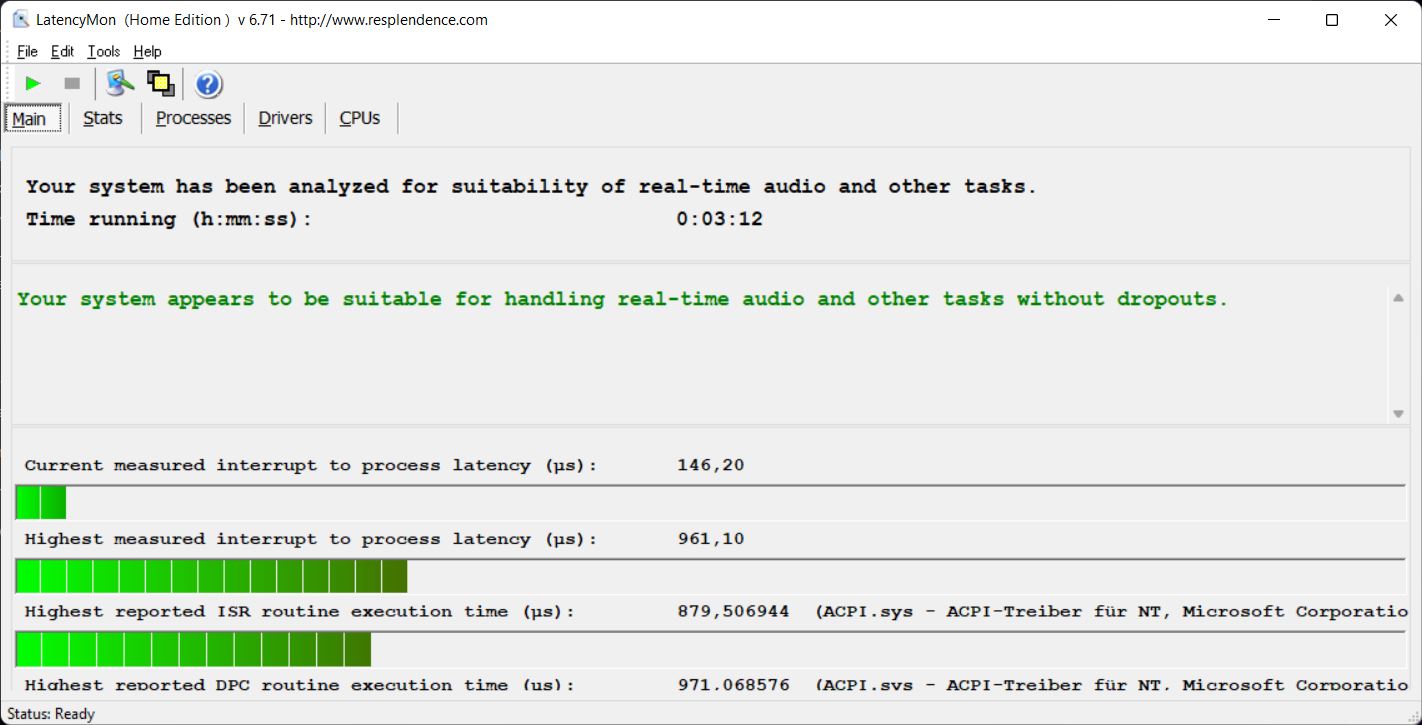
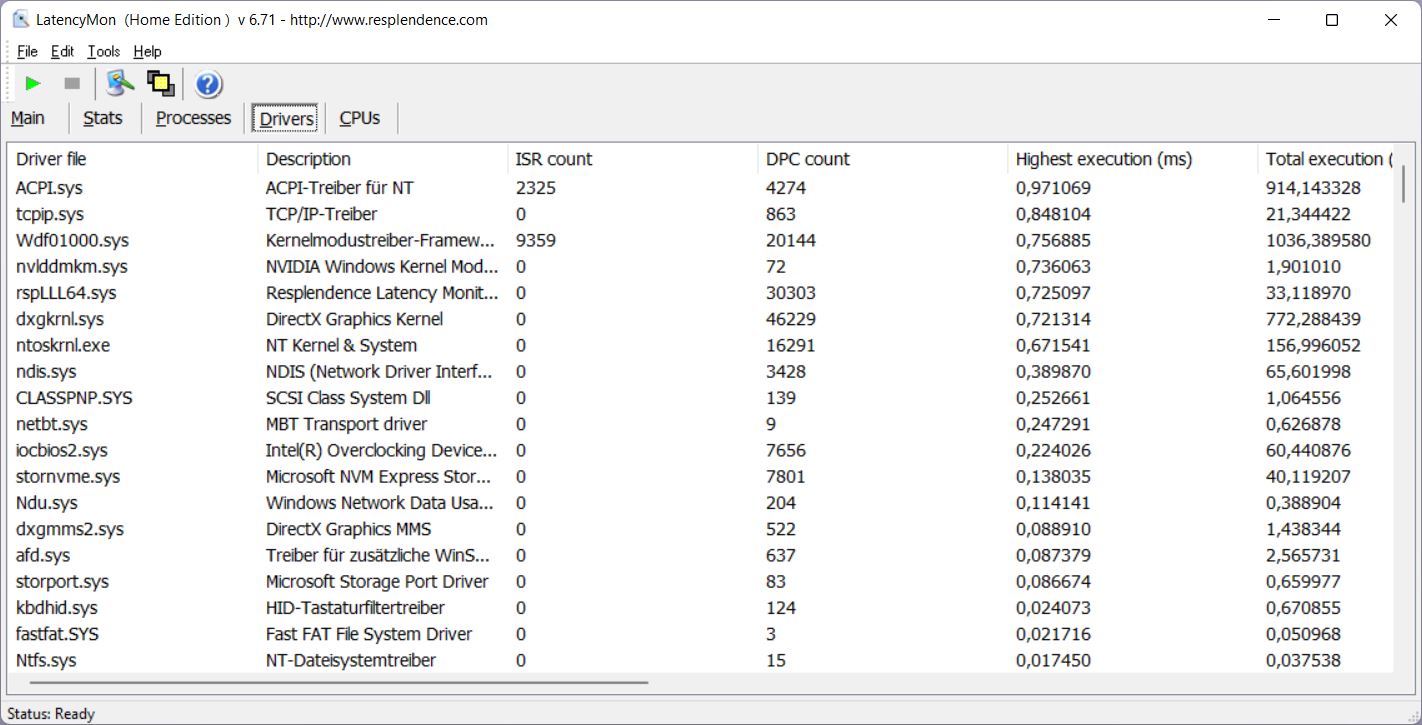
DPC延迟
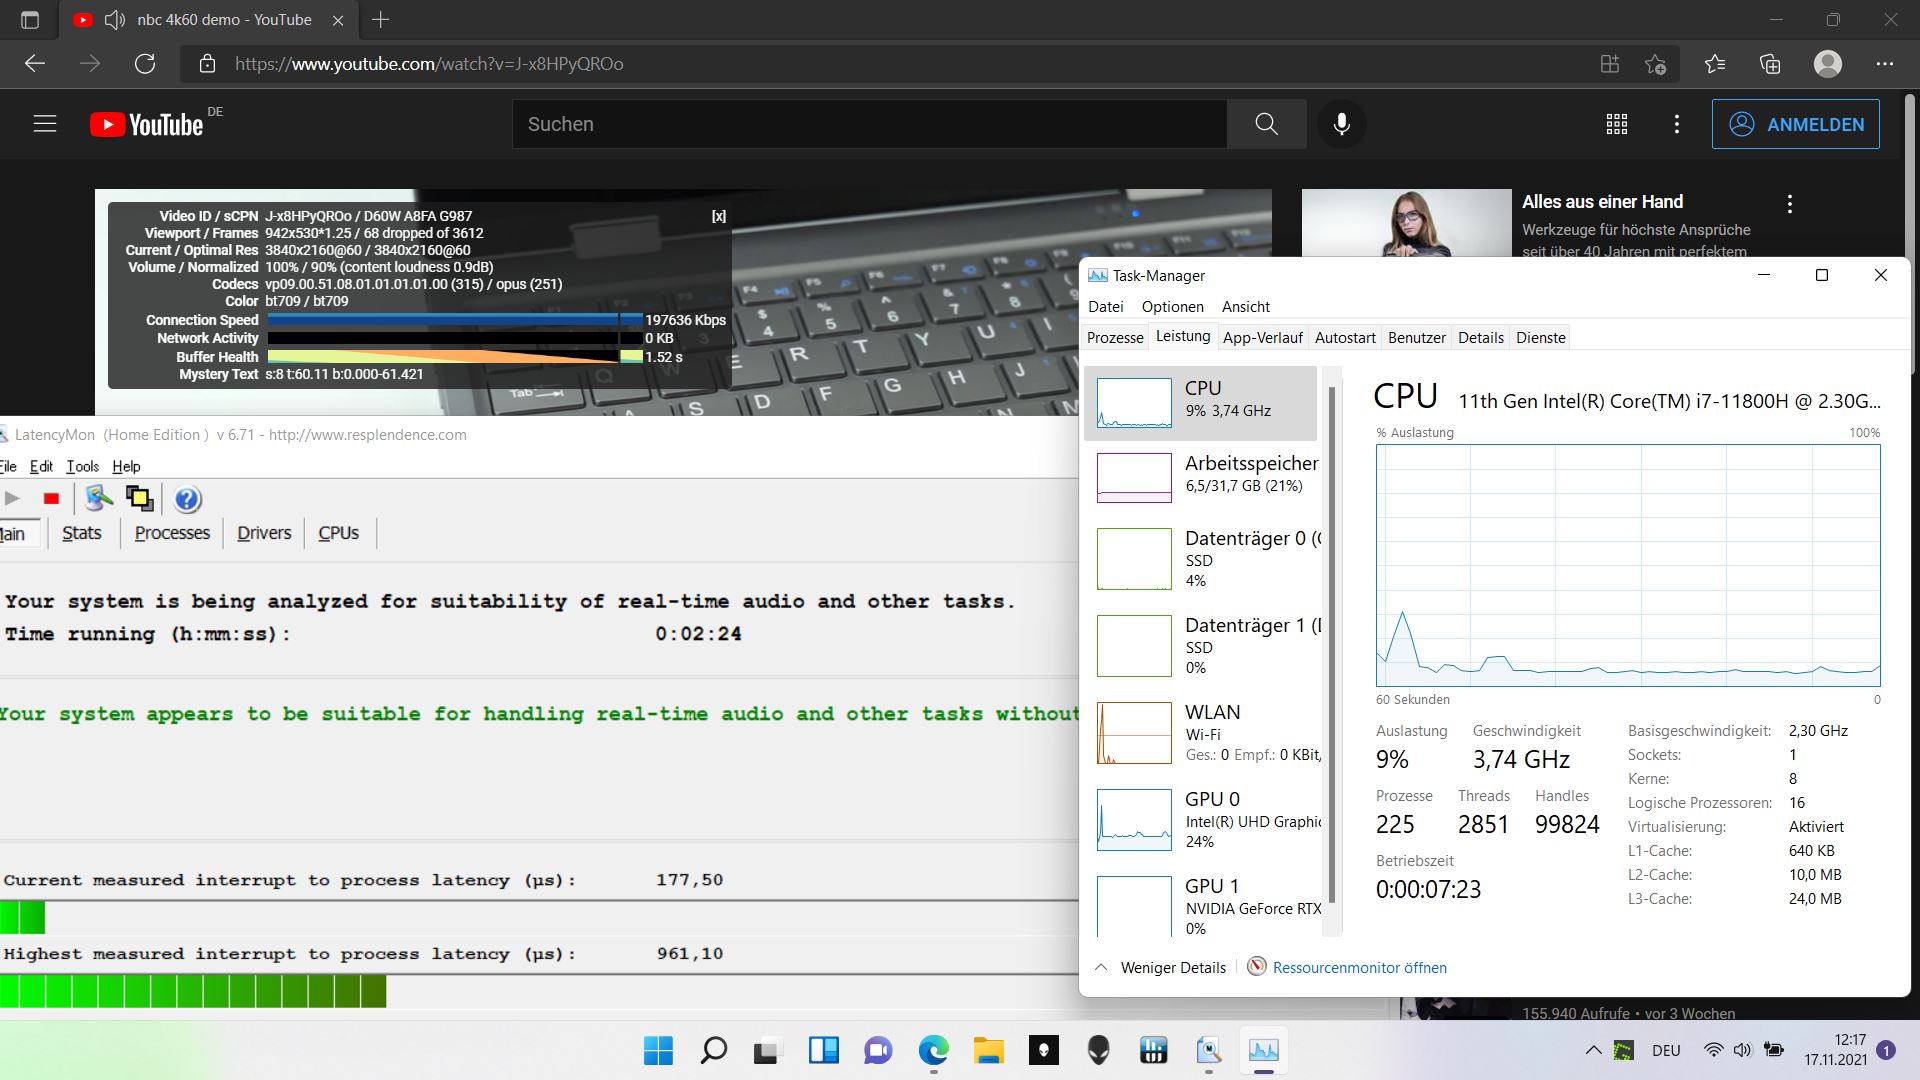
LatencyMon工具没有检测到任何明显的延迟,无论是在打开几个浏览器标签时,还是在流媒体视频或通过Prime95的CPU负载期间。另一方面,我们的4K/60-fps YouTube视频被复制,总共有68个丢帧。
| DPC Latencies / LatencyMon - interrupt to process latency (max), Web, Youtube, Prime95 | |
| Razer Blade 15 Advanced (Mid 2021) | |
| Alienware m15 R6, i7-11800H RTX 3080 | |
| Aorus 15P YD | |
| Alienware m15 R4 RTX 3080 | |
| Schenker XMG Neo 15 Tiger Lake | |
| Alienware m15 R5 Ryzen Edition | |
* ... smaller is better
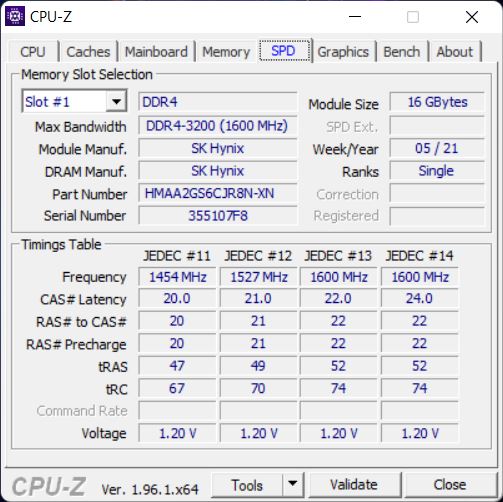
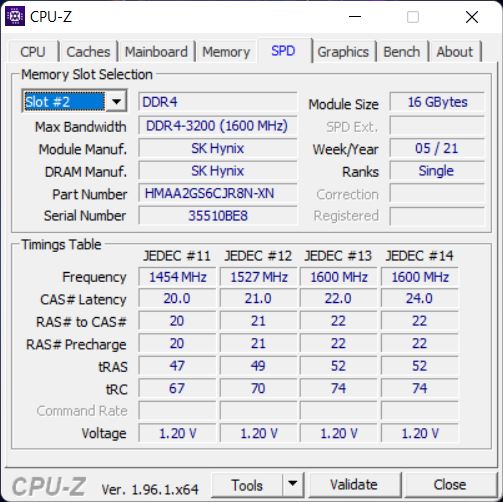
存储解决方案
戴尔为m15 R6配备了两块来自三星的1-TB NVMe固态硬盘,因此有充足的存储量,总容量为2TB。尽管三星PM9A1在我们的SSD数据库中占据了第三位 SSD数据库的第三位但在R6中,它甚至无法接近其理论上的高速度。这里有一些浪费的潜力,但速度仍然不差。

| Drive Performance rating - Percent | |
| Aorus 15P YD | |
| Average of class Gaming | |
| Average Samsung PM9A1 MZVL21T0HCLR | |
| Razer Blade 15 Advanced (Mid 2021) | |
| Schenker XMG Neo 15 Tiger Lake | |
| Alienware m15 R6, i7-11800H RTX 3080 | |
| Alienware m15 R4 RTX 3080 | |
| Alienware m15 R5 Ryzen Edition | |
* ... smaller is better
Constant Performance Reading: DiskSpd Read Loop, Queue Depth 8
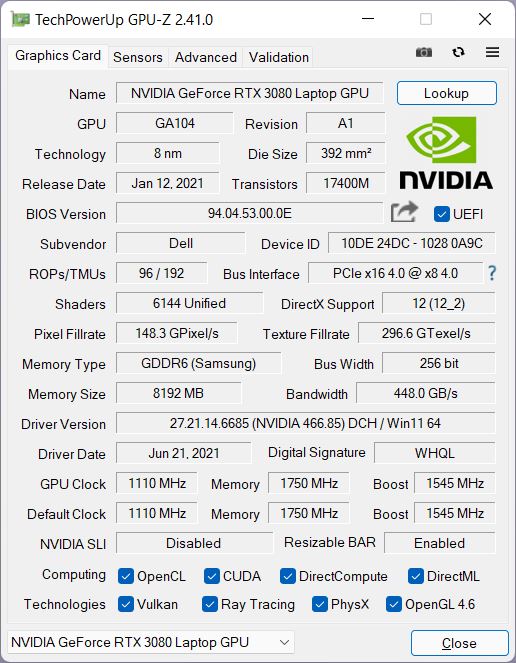
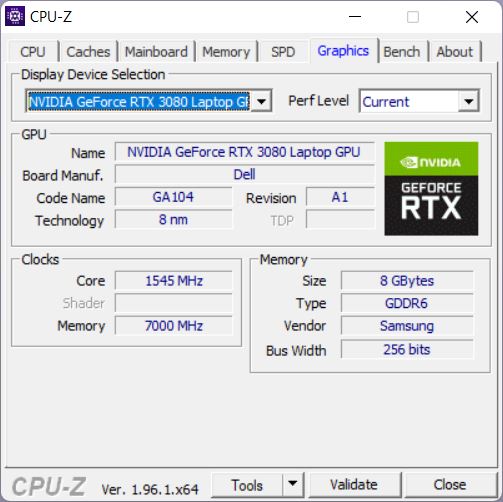
图形卡
R6包含一个 NVIDIAGeForce RTX 3080移动GPU它能够消耗125瓦,包括10瓦的动态提升。考虑到一些RTX 3080笔记本电脑的配置高达165瓦,这似乎相当低,特别是对于Alienware笔记本电脑而言。例如,即使是带有RTX 3070选项的R6也能使用130瓦的功率。
在3DMark测试中,就其RTX 3080而言,Alienware的性能与平均水平相当完全对应。然而,配备RTX 3080和Intel Core i9-10980HK的 "老 "R4彗星湖CPU在大部分时间里明显更快。这并不奇怪,因为R4的GPU能够使用140瓦。
在电池模式下,运行3DMark 11的结果只有16,083分,而不是之前的30,178分,这相当于减少了47%。
| 3DMark Performance rating - Percent | |
| Average of class Gaming | |
| Alienware m15 R4 RTX 3080 | |
| Razer Blade 15 Advanced (Mid 2021) | |
| Schenker XMG Neo 15 Tiger Lake | |
| Aorus 15P YD | |
| Alienware m15 R6, i7-11800H RTX 3080 | |
| Average NVIDIA GeForce RTX 3080 Laptop GPU | |
| Alienware m15 R5 Ryzen Edition | |
| 3DMark 11 - 1280x720 Performance GPU | |
| Average of class Gaming (21841 - 80022, n=104, last 2 years) | |
| Schenker XMG Neo 15 Tiger Lake | |
| Alienware m15 R4 RTX 3080 | |
| Alienware m15 R6, i7-11800H RTX 3080 | |
| Aorus 15P YD | |
| Average NVIDIA GeForce RTX 3080 Laptop GPU (31288 - 43744, n=40) | |
| Razer Blade 15 Advanced (Mid 2021) | |
| Alienware m15 R5 Ryzen Edition | |
| 3DMark | |
| 1280x720 Cloud Gate Standard Graphics | |
| Alienware m15 R4 RTX 3080 | |
| Razer Blade 15 Advanced (Mid 2021) | |
| Average of class Gaming (86886 - 223650, n=60, last 2 years) | |
| Aorus 15P YD | |
| Alienware m15 R6, i7-11800H RTX 3080 | |
| Average NVIDIA GeForce RTX 3080 Laptop GPU (38816 - 192950, n=35) | |
| Schenker XMG Neo 15 Tiger Lake | |
| Alienware m15 R5 Ryzen Edition | |
| 1920x1080 Fire Strike Graphics | |
| Average of class Gaming (12242 - 62849, n=115, last 2 years) | |
| Schenker XMG Neo 15 Tiger Lake | |
| Alienware m15 R4 RTX 3080 | |
| Aorus 15P YD | |
| Alienware m15 R6, i7-11800H RTX 3080 | |
| Average NVIDIA GeForce RTX 3080 Laptop GPU (16455 - 32366, n=46) | |
| Razer Blade 15 Advanced (Mid 2021) | |
| Alienware m15 R5 Ryzen Edition | |
| 2560x1440 Time Spy Graphics | |
| Average of class Gaming (5012 - 26212, n=115, last 2 years) | |
| Schenker XMG Neo 15 Tiger Lake | |
| Alienware m15 R4 RTX 3080 | |
| Aorus 15P YD | |
| Alienware m15 R6, i7-11800H RTX 3080 | |
| Average NVIDIA GeForce RTX 3080 Laptop GPU (6407 - 13210, n=45) | |
| Razer Blade 15 Advanced (Mid 2021) | |
| Alienware m15 R5 Ryzen Edition | |
| 3DMark 11 Performance | 30178 points | |
| 3DMark Cloud Gate Standard Score | 53399 points | |
| 3DMark Fire Strike Score | 24014 points | |
| 3DMark Time Spy Score | 10763 points | |
Help | ||
游戏性能
尽管RTX 3080略有节流,但Alienware能够以最大的细节和全高清分辨率显示所有现代游戏,甚至应该有足够的储备用于4K分辨率。
总体而言,R6的性能又相当接近我们数据库中其他配备RTX 3080的笔记本电脑的平均水平。然而,它的大多数直接竞争对手仍然更快,老式的m15 R4处于顶端。与前代产品相比,限制性能似乎有点奇怪,可能是为了能够为系统提供更好的冷却。
风扇模式似乎只对性能有很小的影响。在性能模式下,许多游戏几乎不会受益于理论上的额外冷却(GTA V),但在一些游戏中,我们可以看到最小的优势(Strange Brigade,+ 3-5%)。
| Far Cry 5 | |
| 1920x1080 Medium Preset AA:T | |
| Alienware m15 R4 RTX 3080 | |
| Schenker XMG Neo 15 Tiger Lake | |
| Average of class Gaming (84 - 173, n=6, last 2 years) | |
| Aorus 15P YD | |
| Average NVIDIA GeForce RTX 3080 Laptop GPU (84 - 162, n=26) | |
| Alienware m15 R6, i7-11800H RTX 3080 | |
| Alienware m15 R5 Ryzen Edition | |
| 1920x1080 High Preset AA:T | |
| Alienware m15 R4 RTX 3080 | |
| Schenker XMG Neo 15 Tiger Lake | |
| Average of class Gaming (82 - 163, n=6, last 2 years) | |
| Aorus 15P YD | |
| Average NVIDIA GeForce RTX 3080 Laptop GPU (79 - 155, n=28) | |
| Alienware m15 R6, i7-11800H RTX 3080 | |
| Alienware m15 R5 Ryzen Edition | |
| 1920x1080 Ultra Preset AA:T | |
| Aorus 15P YD | |
| Alienware m15 R4 RTX 3080 | |
| Schenker XMG Neo 15 Tiger Lake | |
| Average of class Gaming (70 - 151, n=6, last 2 years) | |
| Average NVIDIA GeForce RTX 3080 Laptop GPU (75 - 146, n=33) | |
| Alienware m15 R6, i7-11800H RTX 3080 | |
| Alienware m15 R5 Ryzen Edition | |
| New World | |
| 1920x1080 Medium Video Quality | |
| Alienware m15 R6, i7-11800H RTX 3080 | |
| Average NVIDIA GeForce RTX 3080 Laptop GPU (80.8 - 105.4, n=4) | |
| 1920x1080 High Video Quality | |
| Alienware m15 R6, i7-11800H RTX 3080 | |
| Average NVIDIA GeForce RTX 3080 Laptop GPU (75.1 - 96.7, n=4) | |
| 1920x1080 Very High Video Quality | |
| Alienware m15 R6, i7-11800H RTX 3080 | |
| Average NVIDIA GeForce RTX 3080 Laptop GPU (71.5 - 90.4, n=4) | |
| GTA V | |
| 1920x1080 Normal/Off AF:4x | |
| Razer Blade 15 Advanced (Mid 2021) | |
| Average of class Gaming (121.4 - 191.2, n=32, last 2 years) | |
| Alienware m15 R4 RTX 3080 | |
| Schenker XMG Neo 15 Tiger Lake | |
| Alienware m15 R6, i7-11800H RTX 3080 | |
| Average NVIDIA GeForce RTX 3080 Laptop GPU (160 - 182, n=29) | |
| Aorus 15P YD | |
| Alienware m15 R5 Ryzen Edition | |
| 1920x1080 High/On (Advanced Graphics Off) AA:2xMSAA + FX AF:8x | |
| Razer Blade 15 Advanced (Mid 2021) | |
| Schenker XMG Neo 15 Tiger Lake | |
| Average of class Gaming (110.7 - 189, n=64, last 2 years) | |
| Alienware m15 R6, i7-11800H RTX 3080 | |
| Alienware m15 R4 RTX 3080 | |
| Average NVIDIA GeForce RTX 3080 Laptop GPU (137 - 176, n=30) | |
| Aorus 15P YD | |
| Alienware m15 R5 Ryzen Edition | |
| 1920x1080 Highest AA:4xMSAA + FX AF:16x | |
| Average of class Gaming (48.3 - 186.9, n=94, last 2 years) | |
| Razer Blade 15 Advanced (Mid 2021) | |
| Schenker XMG Neo 15 Tiger Lake | |
| Alienware m15 R6, i7-11800H RTX 3080 | |
| Alienware m15 R4 RTX 3080 | |
| Average NVIDIA GeForce RTX 3080 Laptop GPU (68.6 - 114.6, n=34) | |
| Aorus 15P YD | |
| Alienware m15 R5 Ryzen Edition | |
| Strange Brigade | |
| 1920x1080 medium AA:medium AF:4 | |
| Average of class Gaming (160.9 - 509, n=72, last 2 years) | |
| Schenker XMG Neo 15 Tiger Lake | |
| Alienware m15 R6, i7-11800H RTX 3080 | |
| Aorus 15P YD | |
| Average NVIDIA GeForce RTX 3080 Laptop GPU (186 - 306, n=29) | |
| Razer Blade 15 Advanced (Mid 2021) | |
| Alienware m15 R5 Ryzen Edition | |
| 1920x1080 high AA:high AF:8 | |
| Average of class Gaming (129.5 - 494, n=75, last 2 years) | |
| Schenker XMG Neo 15 Tiger Lake | |
| Alienware m15 R6, i7-11800H RTX 3080 | |
| Aorus 15P YD | |
| Average NVIDIA GeForce RTX 3080 Laptop GPU (165 - 248, n=30) | |
| Razer Blade 15 Advanced (Mid 2021) | |
| Alienware m15 R5 Ryzen Edition | |
| 1920x1080 ultra AA:ultra AF:16 | |
| Average of class Gaming (76.3 - 458, n=87, last 2 years) | |
| Schenker XMG Neo 15 Tiger Lake | |
| Alienware m15 R6, i7-11800H RTX 3080 | |
| Aorus 15P YD | |
| Average NVIDIA GeForce RTX 3080 Laptop GPU (117 - 219, n=34) | |
| Razer Blade 15 Advanced (Mid 2021) | |
| Alienware m15 R5 Ryzen Edition | |
| Dota 2 Reborn | |
| 1920x1080 high (2/3) | |
| Average of class Gaming (82.8 - 275, n=106, last 2 years) | |
| Schenker XMG Neo 15 Tiger Lake | |
| Razer Blade 15 Advanced (Mid 2021) | |
| Alienware m15 R6, i7-11800H RTX 3080 | |
| Aorus 15P YD | |
| Average NVIDIA GeForce RTX 3080 Laptop GPU (108.1 - 161, n=45) | |
| Alienware m15 R4 RTX 3080 | |
| Alienware m15 R5 Ryzen Edition | |
| 1920x1080 ultra (3/3) best looking | |
| Average of class Gaming (84.8 - 248, n=107, last 2 years) | |
| Schenker XMG Neo 15 Tiger Lake | |
| Razer Blade 15 Advanced (Mid 2021) | |
| Alienware m15 R6, i7-11800H RTX 3080 | |
| Aorus 15P YD | |
| Alienware m15 R4 RTX 3080 | |
| Average NVIDIA GeForce RTX 3080 Laptop GPU (98 - 156, n=45) | |
| Alienware m15 R5 Ryzen Edition | |
| X-Plane 11.11 | |
| 1920x1080 med (fps_test=2) | |
| Razer Blade 15 Advanced (Mid 2021) | |
| Average of class Gaming (63.8 - 181.2, n=103, last 2 years) | |
| Alienware m15 R6, i7-11800H RTX 3080 | |
| Aorus 15P YD | |
| Schenker XMG Neo 15 Tiger Lake | |
| Average NVIDIA GeForce RTX 3080 Laptop GPU (80.6 - 139, n=44) | |
| Alienware m15 R4 RTX 3080 | |
| Alienware m15 R5 Ryzen Edition | |
| 1920x1080 high (fps_test=3) | |
| Average of class Gaming (55.5 - 143.5, n=109, last 2 years) | |
| Razer Blade 15 Advanced (Mid 2021) | |
| Alienware m15 R6, i7-11800H RTX 3080 | |
| Alienware m15 R4 RTX 3080 | |
| Aorus 15P YD | |
| Average NVIDIA GeForce RTX 3080 Laptop GPU (65.6 - 113, n=44) | |
| Schenker XMG Neo 15 Tiger Lake | |
| Alienware m15 R5 Ryzen Edition | |
在运行《Witcher 3 》的一个小时内,帧率只略微下降,因此性能相当稳定,异常值或下降仍然是例外。
The Witcher 3 FPS Chart
| low | med. | high | ultra | |
|---|---|---|---|---|
| GTA V (2015) | 183 | 177 | 166 | 99.5 |
| The Witcher 3 (2015) | 312 | 276 | 149 | 108.4 |
| Dota 2 Reborn (2015) | 168 | 151 | 144 | 135 |
| X-Plane 11.11 (2018) | 127 | 110 | 87.9 | |
| Far Cry 5 (2018) | 132 | 126 | 119 | 113 |
| Strange Brigade (2018) | 424 | 261 | 216 | 190 |
| New World (2021) | 115.5 | 95.7 | 91.3 | 84 |
排放 - 比大多数竞争对手更热
噪声排放
在空闲运行期间,6号机的风扇经常保持关闭状态,至少在平衡或安静模式下是如此。在性能模式下,它们在怠速运行时也很响亮,同样在 "冷却 "模式下也是如此。在完全性能模式下,它们变得更加响亮。
在平衡模式下,风扇甚至可以在最大空闲运行时不时地转动起来,噪音水平大约为30dB。在平均负荷下(3DMark06,第一个基准),R6现在仍然比它的一些竞争对手更安静。
另一方面,在重载情况下,风扇的转速相当高。但至少它们在这里也不比Aorus或Schenker的声音大。然而,当你使用全性能模式时,情况就不是这样了。因此,每个用户都必须自己决定,多做几帧是否也值得增加噪音水平。
在某些类型的负载下(3DMark06),我们可以听到以嗡嗡声为形式的电子噪音。可能只有在中等负荷水平下才能注意到,之后它就会被风扇的噪音所淹没。
Noise level
| Idle |
| 23 / 23 / 30 dB(A) |
| Load |
| 41.26 / 53.37 dB(A) |
 | ||
30 dB silent 40 dB(A) audible 50 dB(A) loud |
||
min: | ||
| Alienware m15 R6, i7-11800H RTX 3080 GeForce RTX 3080 Laptop GPU, i7-11800H, Samsung PM9A1 MZVL21T0HCLR | Alienware m15 R5 Ryzen Edition GeForce RTX 3060 Laptop GPU, R7 5800H, Toshiba KBG40ZNS512G NVMe | Alienware m15 R4 RTX 3080 GeForce RTX 3080 Laptop GPU, i9-10980HK, 2x WDC PC SN730 SDBPNTY-512G (RAID 0) | Aorus 15P YD GeForce RTX 3080 Laptop GPU, i7-11800H, Samsung PM9A1 MZVL21T0HCLR | Schenker XMG Neo 15 Tiger Lake GeForce RTX 3080 Laptop GPU, i7-11800H, Samsung SSD 980 Pro 1TB MZ-V8P1T0BW | Razer Blade 15 Advanced (Mid 2021) GeForce RTX 3080 Laptop GPU, i7-11800H, SSSTC CA6-8D1024 | |
|---|---|---|---|---|---|---|
| Noise | -4% | -7% | -10% | -11% | 0% | |
| off / environment * (dB) | 23 | 24 -4% | 25 -9% | 25 -9% | 25 -9% | 25.1 -9% |
| Idle Minimum * (dB) | 23 | 24 -4% | 25 -9% | 26 -13% | 27 -17% | 25.3 -10% |
| Idle Average * (dB) | 23 | 25 -9% | 29 -26% | 30 -30% | 30 -30% | 25.3 -10% |
| Idle Maximum * (dB) | 30 | 35 -17% | 33 -10% | 34 -13% | 32 -7% | 25.3 16% |
| Load Average * (dB) | 41.26 | 44 -7% | 48 -16% | 43 -4% | 46 -11% | 42 -2% |
| Witcher 3 ultra * (dB) | 53.4 | 48 10% | 46 14% | 50 6% | 52 3% | 45.6 15% |
| Load Maximum * (dB) | 53.37 | 50 6% | 49 8% | 57 -7% | 55 -3% | 51.6 3% |
* ... smaller is better
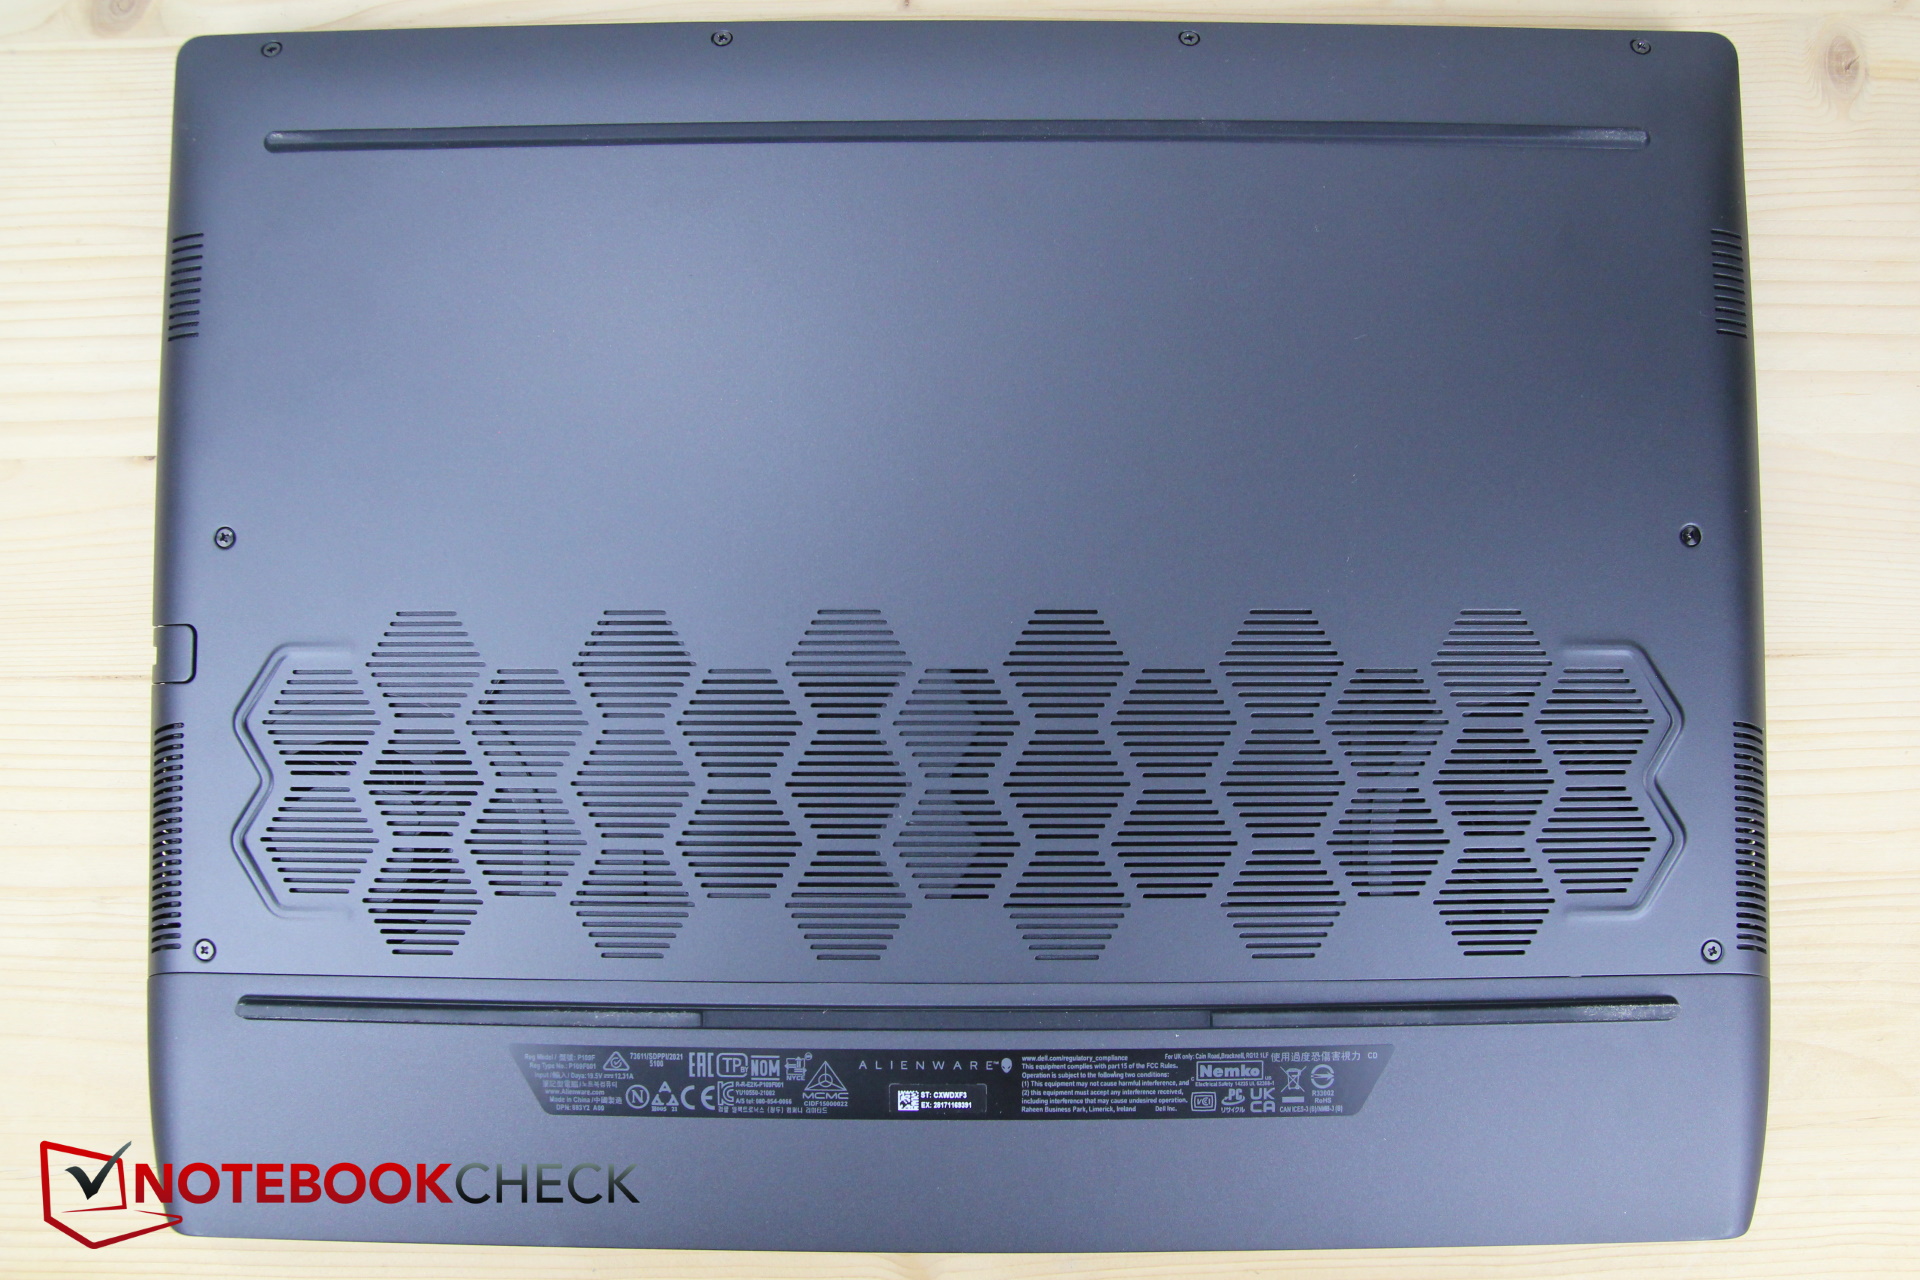
温度
在怠速运行时,R6现在仍然比R4冷。然而,在负载情况下,它又变得同样热,虽然至少3D性能略低。
在重压下,顶部和底部的表面可以达到约60°C(140°F)的温度,这绝对不适合在人的腿上操作。另一方面,那些住在寒冷的花园小屋里的人可以从R6的一些其他方面获益。在游戏时,WASD键周围的温度仍然达到舒适的40-45°C(104-113°F),但至少掌托仍然相对凉爽。
有趣的是,配备较弱的RTX 3060和Ryzen 7 5800H的R5也变得同样热。然而,其余的竞争对手仍然明显较冷。
(-) The maximum temperature on the upper side is 61 °C / 142 F, compared to the average of 40.4 °C / 105 F, ranging from 21.2 to 68.8 °C for the class Gaming.
(-) The bottom heats up to a maximum of 58 °C / 136 F, compared to the average of 43.2 °C / 110 F
(+) In idle usage, the average temperature for the upper side is 29.6 °C / 85 F, compared to the device average of 33.9 °C / 93 F.
(-) Playing The Witcher 3, the average temperature for the upper side is 40.7 °C / 105 F, compared to the device average of 33.9 °C / 93 F.
(±) The palmrests and touchpad can get very hot to the touch with a maximum of 39 °C / 102.2 F.
(-) The average temperature of the palmrest area of similar devices was 28.8 °C / 83.8 F (-10.2 °C / -18.4 F).
| Alienware m15 R6, i7-11800H RTX 3080 Intel Core i7-11800H, NVIDIA GeForce RTX 3080 Laptop GPU | Alienware m15 R5 Ryzen Edition AMD Ryzen 7 5800H, NVIDIA GeForce RTX 3060 Laptop GPU | Alienware m15 R4 RTX 3080 Intel Core i9-10980HK, NVIDIA GeForce RTX 3080 Laptop GPU | Aorus 15P YD Intel Core i7-11800H, NVIDIA GeForce RTX 3080 Laptop GPU | Schenker XMG Neo 15 Tiger Lake Intel Core i7-11800H, NVIDIA GeForce RTX 3080 Laptop GPU | Razer Blade 15 Advanced (Mid 2021) Intel Core i7-11800H, NVIDIA GeForce RTX 3080 Laptop GPU | |
|---|---|---|---|---|---|---|
| Heat | 2% | -7% | 9% | 15% | 7% | |
| Maximum Upper Side * (°C) | 61 | 62 -2% | 59 3% | 49 20% | 39 36% | 51 16% |
| Maximum Bottom * (°C) | 58 | 61 -5% | 61 -5% | 57 2% | 50 14% | 52 10% |
| Idle Upper Side * (°C) | 38 | 36 5% | 43 -13% | 33 13% | 34 11% | 35.2 7% |
| Idle Bottom * (°C) | 36 | 33 8% | 41 -14% | 36 -0% | 37 -3% | 37.8 -5% |
* ... smaller is better
压力测试
在长达一小时的压力测试中,核心开始时的频率约为4.2GHz。不到半小时后,时钟速度只有2.7GHz。直到最后,它在2.7和2.9GHz之间略有变化。
在此期间,核心温度保持在完全不临界的80°C(176°F),即使它们可以暂时上升到98°C(208°F),这将触发热节流。
同时,在整个测试过程中,GPU的时钟速度在1.3和1.7GHz之间变化。它的温度在77℃(171°F)左右,热点达到85℃(185°F)左右。
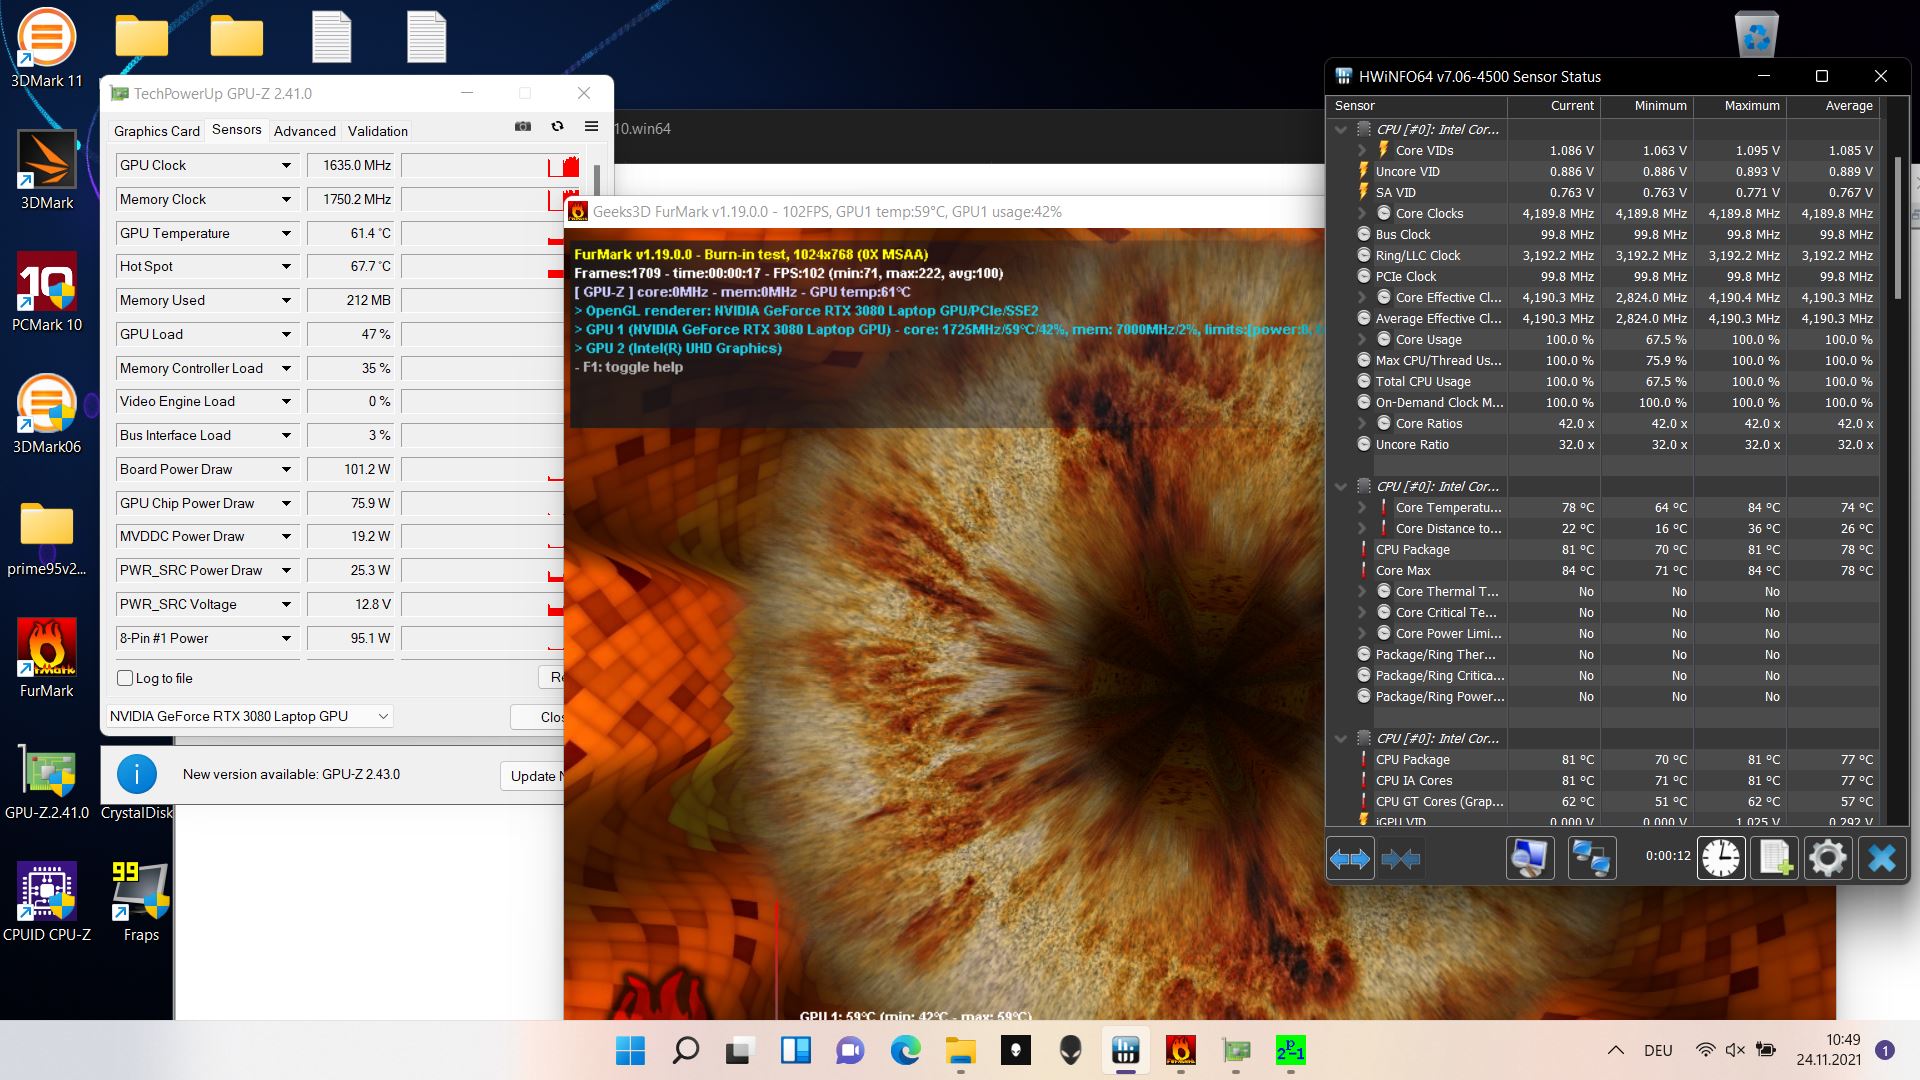
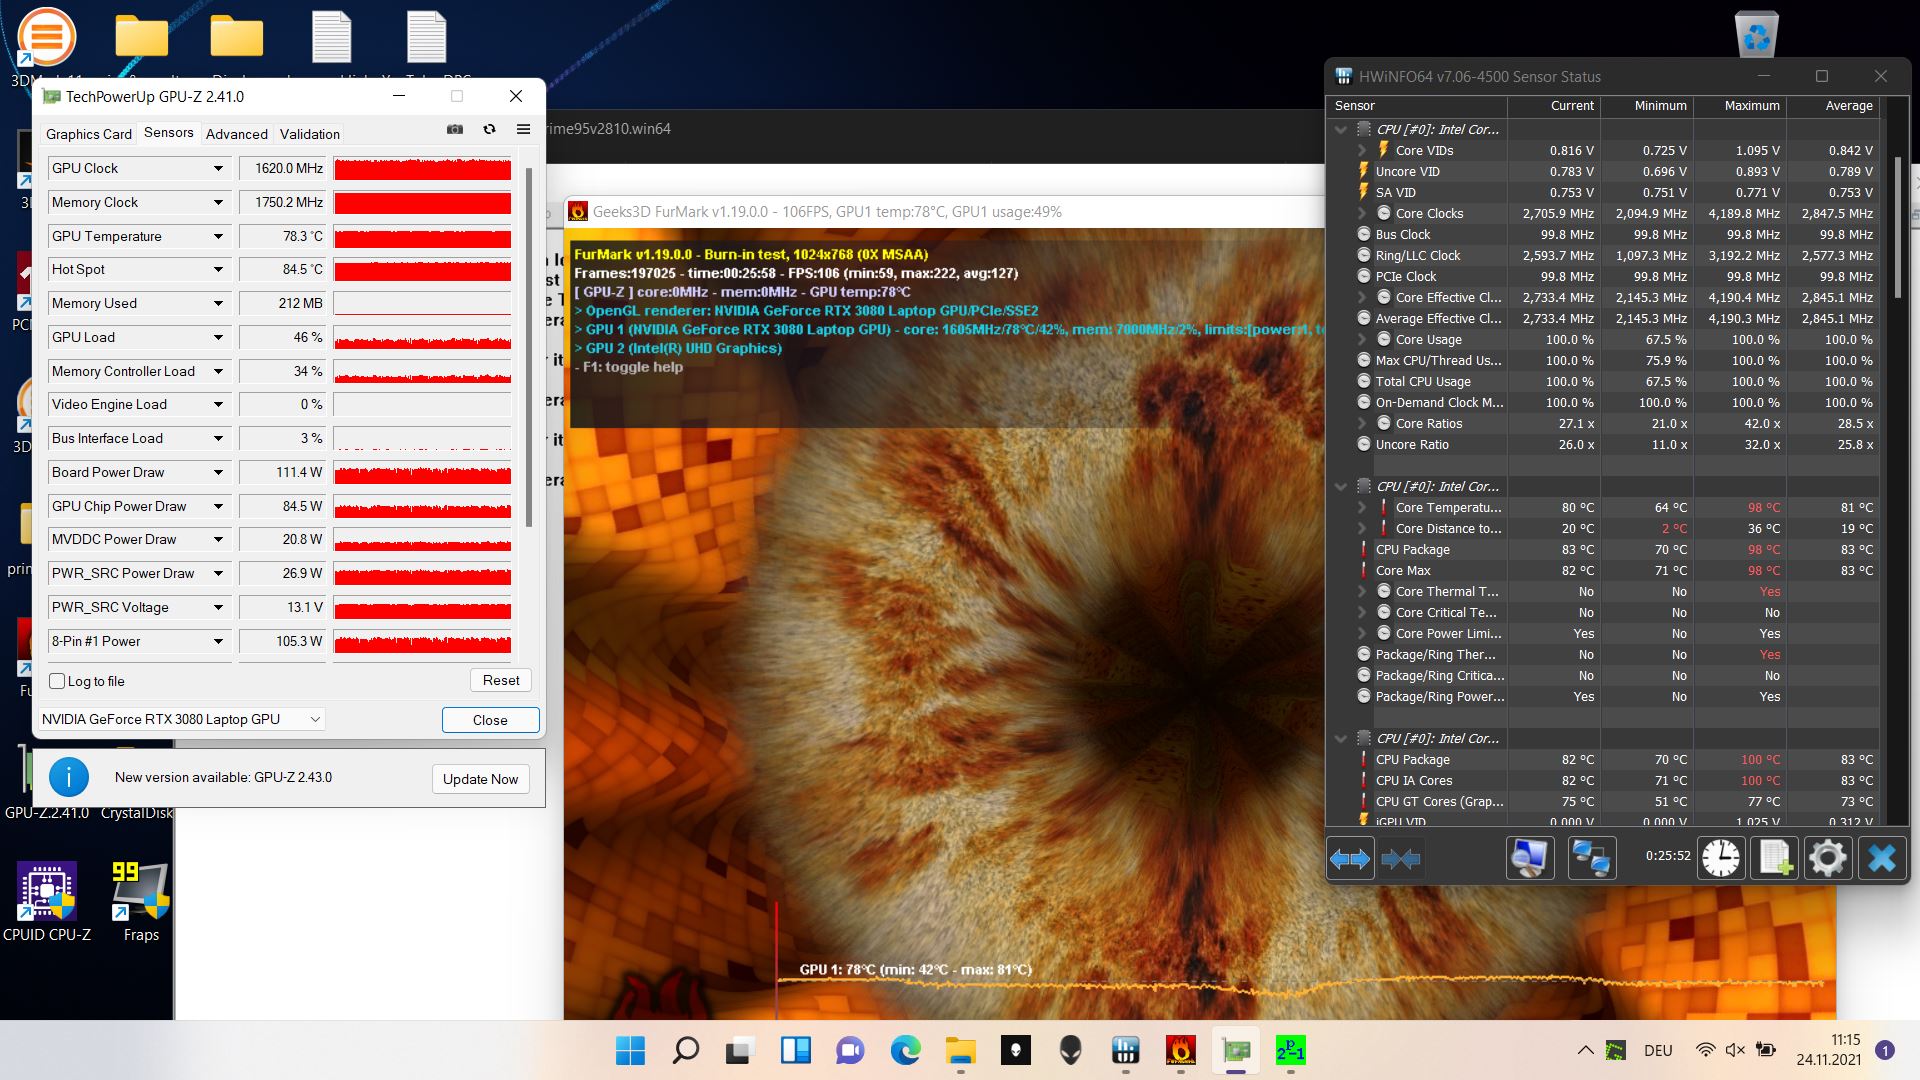
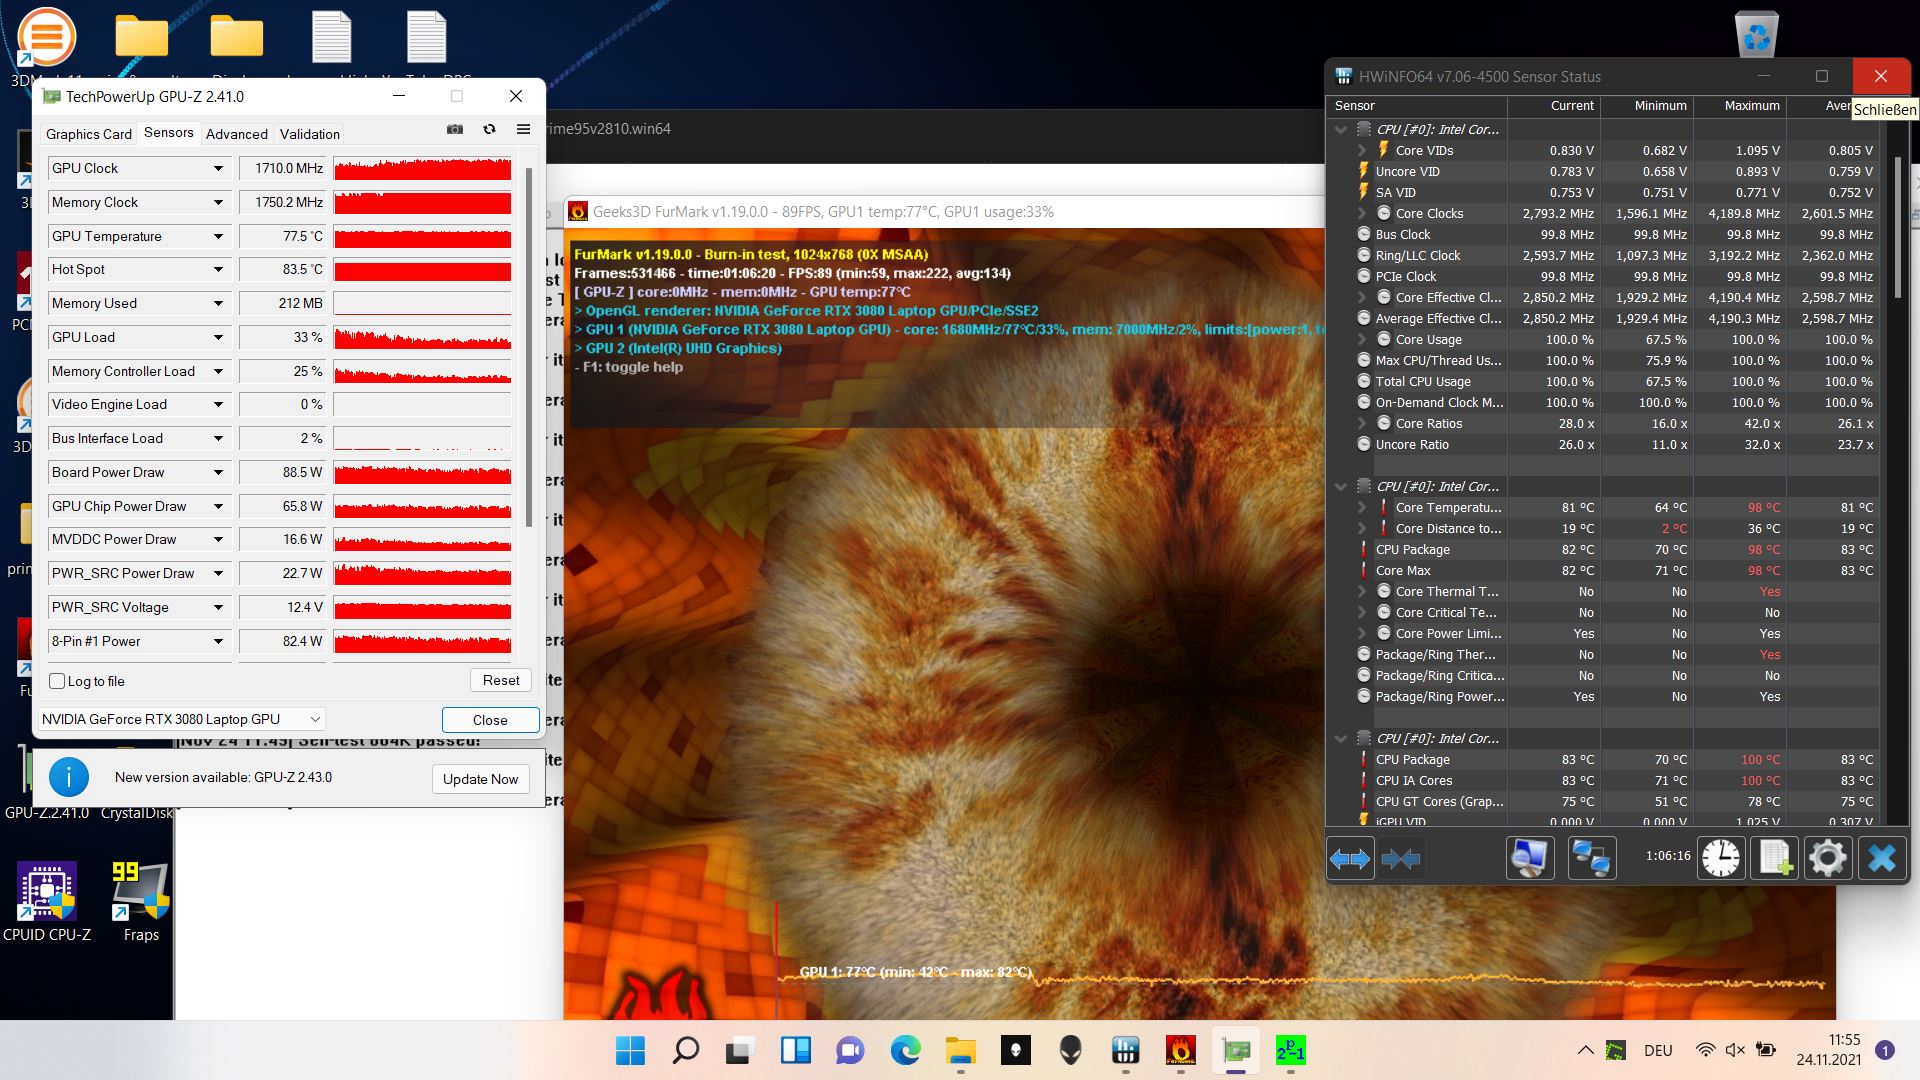
| CPU时钟(GHz) | GPU时钟(MHz) | CPU平均温度(℃) | GPU平均温度(℃) | |
| Prime95 + FurMark Stress | 2.7 - 2.9 | 1,395 - 1,710 | 80 | 77 |
发言人
积极的方面是,该扬声器可以变得相当响亮。但不幸的是,它们缺乏低音,而且我们还听到了在中音方面更好的型号。由于风扇的声音很大,建议无论如何都要使用耳机,而且有一个音频端口。
Alienware m15 R6, i7-11800H RTX 3080 audio analysis
(+) | speakers can play relatively loud (85.2 dB)
Bass 100 - 315 Hz
(-) | nearly no bass - on average 23.8% lower than median
(±) | linearity of bass is average (12% delta to prev. frequency)
Mids 400 - 2000 Hz
(±) | higher mids - on average 8.3% higher than median
(+) | mids are linear (6.9% delta to prev. frequency)
Highs 2 - 16 kHz
(+) | balanced highs - only 3.3% away from median
(+) | highs are linear (5.7% delta to prev. frequency)
Overall 100 - 16.000 Hz
(±) | linearity of overall sound is average (21.8% difference to median)
Compared to same class
» 78% of all tested devices in this class were better, 6% similar, 16% worse
» The best had a delta of 6%, average was 18%, worst was 132%
Compared to all devices tested
» 62% of all tested devices were better, 7% similar, 31% worse
» The best had a delta of 4%, average was 23%, worst was 134%
Apple MacBook 12 (Early 2016) 1.1 GHz audio analysis
(+) | speakers can play relatively loud (83.6 dB)
Bass 100 - 315 Hz
(±) | reduced bass - on average 11.3% lower than median
(±) | linearity of bass is average (14.2% delta to prev. frequency)
Mids 400 - 2000 Hz
(+) | balanced mids - only 2.4% away from median
(+) | mids are linear (5.5% delta to prev. frequency)
Highs 2 - 16 kHz
(+) | balanced highs - only 2% away from median
(+) | highs are linear (4.5% delta to prev. frequency)
Overall 100 - 16.000 Hz
(+) | overall sound is linear (10.2% difference to median)
Compared to same class
» 7% of all tested devices in this class were better, 2% similar, 90% worse
» The best had a delta of 5%, average was 18%, worst was 53%
Compared to all devices tested
» 5% of all tested devices were better, 1% similar, 94% worse
» The best had a delta of 4%, average was 23%, worst was 134%
电源管理 - 比上一代产品更有效
消耗功率
由于采用了Optimus开关,R6现在的耗电量明显低于R4,至少在空闲运行时是这样。在负载情况下,消耗也略低于竞争对手,但这也可能是由于较低的3D性能。
我们测量的最大消耗量略高于200瓦,这意味着240瓦的电源应该足以在任何情况下能够为设备可靠地充电。
| Idle | |
| Load |
|
Key:
min: | |
| Alienware m15 R6, i7-11800H RTX 3080 i7-11800H, GeForce RTX 3080 Laptop GPU, Samsung PM9A1 MZVL21T0HCLR, IPS, 1920x1080, 15.6" | Alienware m15 R5 Ryzen Edition R7 5800H, GeForce RTX 3060 Laptop GPU, Toshiba KBG40ZNS512G NVMe, IPS, 1920x1080, 15.6" | Alienware m15 R4 RTX 3080 i9-10980HK, GeForce RTX 3080 Laptop GPU, 2x WDC PC SN730 SDBPNTY-512G (RAID 0), IPS, 1920x1080, 15.6" | Aorus 15P YD i7-11800H, GeForce RTX 3080 Laptop GPU, Samsung PM9A1 MZVL21T0HCLR, IPS, 1920x1080, 15.6" | Schenker XMG Neo 15 Tiger Lake i7-11800H, GeForce RTX 3080 Laptop GPU, Samsung SSD 980 Pro 1TB MZ-V8P1T0BW, IPS, 2560x1440, 15.6" | Razer Blade 15 Advanced (Mid 2021) i7-11800H, GeForce RTX 3080 Laptop GPU, SSSTC CA6-8D1024, IPS, 1920x1080, 15.6" | Average NVIDIA GeForce RTX 3080 Laptop GPU | Average of class Gaming | |
|---|---|---|---|---|---|---|---|---|
| Power Consumption | 4% | -70% | -29% | -0% | -18% | -24% | -6% | |
| Idle Minimum * (Watt) | 14 | 11 21% | 37 -164% | 23 -64% | 15 -7% | 19.5 -39% | 19.8 ? -41% | 13 ? 7% |
| Idle Average * (Watt) | 18 | 14 22% | 40 -122% | 25 -39% | 17 6% | 23.3 -29% | 24.3 ? -35% | 19 ? -6% |
| Idle Maximum * (Watt) | 29 | 25 14% | 53 -83% | 35 -21% | 22 24% | 40.1 -38% | 33.3 ? -15% | 24.6 ? 15% |
| Load Average * (Watt) | 93 | 123 -32% | 121 -30% | 101 -9% | 101 -9% | 98.9 -6% | 108.1 ? -16% | 110.7 ? -19% |
| Witcher 3 ultra * (Watt) | 190 | 176 7% | 193 -2% | 190 -0% | 195 -3% | 174 8% | ||
| Load Maximum * (Watt) | 203 | 226 -11% | 246 -21% | 280 -38% | 230 -13% | 214 -5% | 230 ? -13% | 259 ? -28% |
* ... smaller is better
Power Consumption The Witcher 3 / Stress Test
Power Consumption with an External Monitor
电池寿命
尽管有更强大的GPU,R6并没有配备比R5的RTX 3060更大的电池。然而,这似乎不一定对电池寿命有负面影响,因为在我们的电池测试中,集成的GPU大部分时间都在活动。WLAN测试结果是在眼睛的位置,只有在播放视频时,R6的持续时间明显比R5的8小时少,只有5.5小时。
| Alienware m15 R6, i7-11800H RTX 3080 i7-11800H, GeForce RTX 3080 Laptop GPU, 84 Wh | Alienware m15 R5 Ryzen Edition R7 5800H, GeForce RTX 3060 Laptop GPU, 86 Wh | Alienware m15 R4 RTX 3080 i9-10980HK, GeForce RTX 3080 Laptop GPU, 86 Wh | Aorus 15P YD i7-11800H, GeForce RTX 3080 Laptop GPU, 99 Wh | Schenker XMG Neo 15 Tiger Lake i7-11800H, GeForce RTX 3080 Laptop GPU, 93 Wh | Razer Blade 15 Advanced (Mid 2021) i7-11800H, GeForce RTX 3080 Laptop GPU, 80 Wh | Average of class Gaming | |
|---|---|---|---|---|---|---|---|
| Battery runtime | 5% | -60% | 19% | 29% | 18% | 28% | |
| H.264 (h) | 5.6 | 8.8 57% | 1.9 -66% | 5.9 5% | 8.32 ? 49% | ||
| WiFi v1.3 (h) | 5 | 5.1 2% | 1.8 -64% | 5.3 6% | 5.6 12% | 5.9 18% | 7.11 ? 42% |
| Load (h) | 1.6 | 0.9 -44% | 0.8 -50% | 2.1 31% | 2.7 69% | 1.502 ? -6% | |
| Reader / Idle (h) | 14.7 | 7.5 | 8.27 ? | ||||
| Witcher 3 ultra (h) | 1.6 | 0.8 |
Pros
Cons
结论 - 为什么这么热?
与R4相比,Tiger Lake ,更新后的R6主要是更加高效和节俭,但不一定更快。即使CPU性能提高了,但由于TGP的降低,3D性能也下降了。这也降低了消耗。冷却模式似乎只对性能有很小的影响,RTX 3080仍然没有得到更高的功率分配。
CPU的性能与Ryzen m15 R5相当。此外,还有支持Thunderbolt的优势。但除此之外,R5和R6极为相似。所以你应该根据价格和Thunderbolt对你的重要性来选择。
冷却系统仍然显示出需要进一步优化。尽管RTX 3080的功耗很低,但Alienware的表面比大多数竞争对手的表面更热,其中一些竞争对手的3D性能更高。
m15 R6比它的前辈R4更加高效和节俭。然而,RTX 3080在这里被扼杀了,Alienware的表面仍然变得非常热。
这款Aorus 15P YD产生了最低限度的更高的性能,同时仍然保持更低的温度,但它也有更高的消耗。这款申克XMG Neo 15也提供了明显更高的3D性能,而且还能保持更低的温度。此外,它还提供更长的电池寿命,但另一方面,它的声音也更大。
价格和可用性
m15 R6的各种配置目前可从戴尔公司,起价约1200美元。.亚马逊提供一个更高端的 配置,价格为1783美元.
Alienware m15 R6, i7-11800H RTX 3080
- 11/25/2021 v7 (old)
Christian Hintze
Price comparison

