申克XMG Pro 15 (Clevo PC50HS-D)回顾。薄而轻的4K游戏笔记本电脑

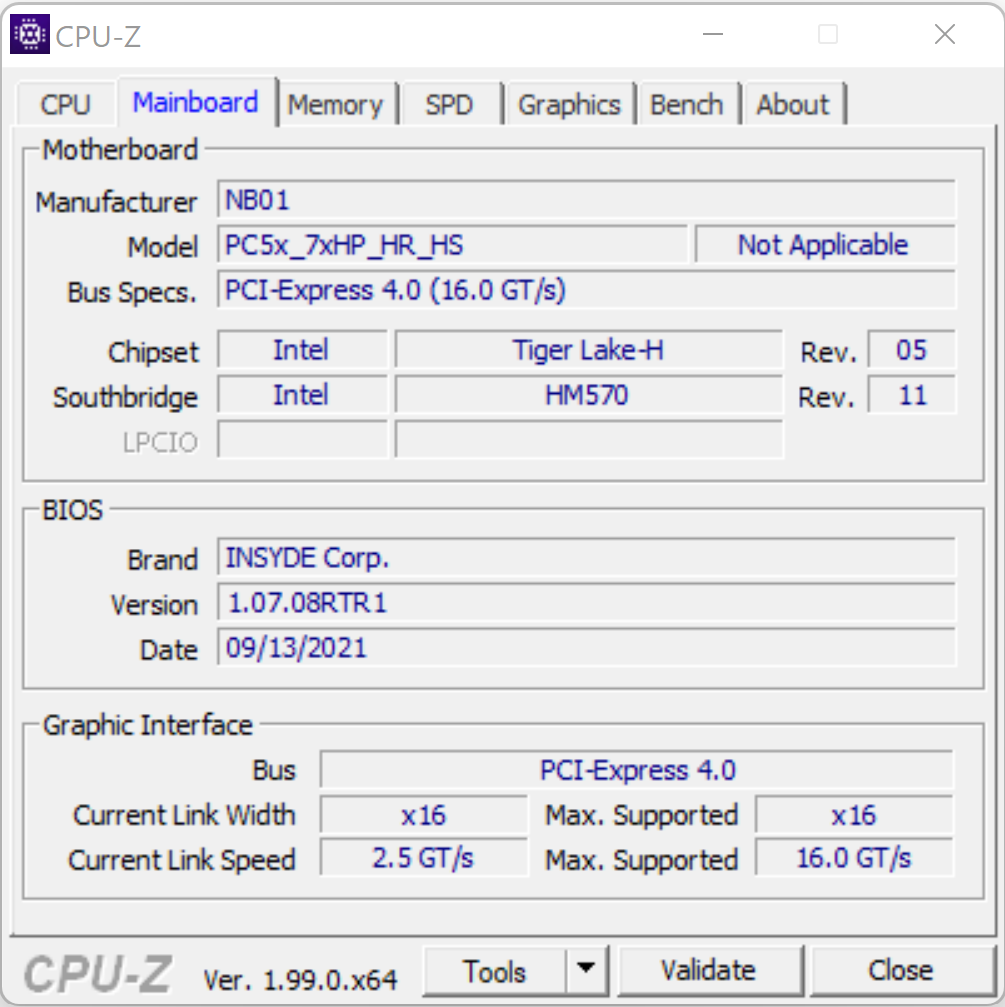
2021年底的Schenker XMG Pro 15是一款轻巧的15.6英寸游戏笔记本电脑。它基于Clevo裸机(PC50HS-D),由一台Core-i7-11800HCPU和一个移动GeForce RTX 3080GPU。它直接与以下设备竞争,如联想Legion S7 15ACH6, MSI Delta 15, Alienware x15和Razer Blade 15 Advanced (2021年中期).
Potential competitors in comparison
Rating | Date | Model | Weight | Height | Size | Resolution | Price |
|---|---|---|---|---|---|---|---|
| 84.6 % v7 (old) | 01 / 2022 | Schenker XMG Pro 15 (Late 2021) i7-11800H, GeForce RTX 3080 Laptop GPU | 2 kg | 19.8 mm | 15.60" | 3840x2160 | |
| 87.9 % v7 (old) | 11 / 2021 | Lenovo Legion S7 15ACH6 82K80030GE R9 5900HX, GeForce RTX 3060 Laptop GPU | 2 kg | 18.9 mm | 15.60" | 3840x2160 | |
| 87.2 % v7 (old) | 10 / 2021 | Alienware x15 RTX 3070 P111F i7-11800H, GeForce RTX 3070 Laptop GPU | 2.4 kg | 15.9 mm | 15.60" | 2560x1440 | |
| 88.9 % v7 (old) | 10 / 2021 | Razer Blade 15 Advanced (Mid 2021) i7-11800H, GeForce RTX 3080 Laptop GPU | 2 kg | 16.99 mm | 15.60" | 1920x1080 |
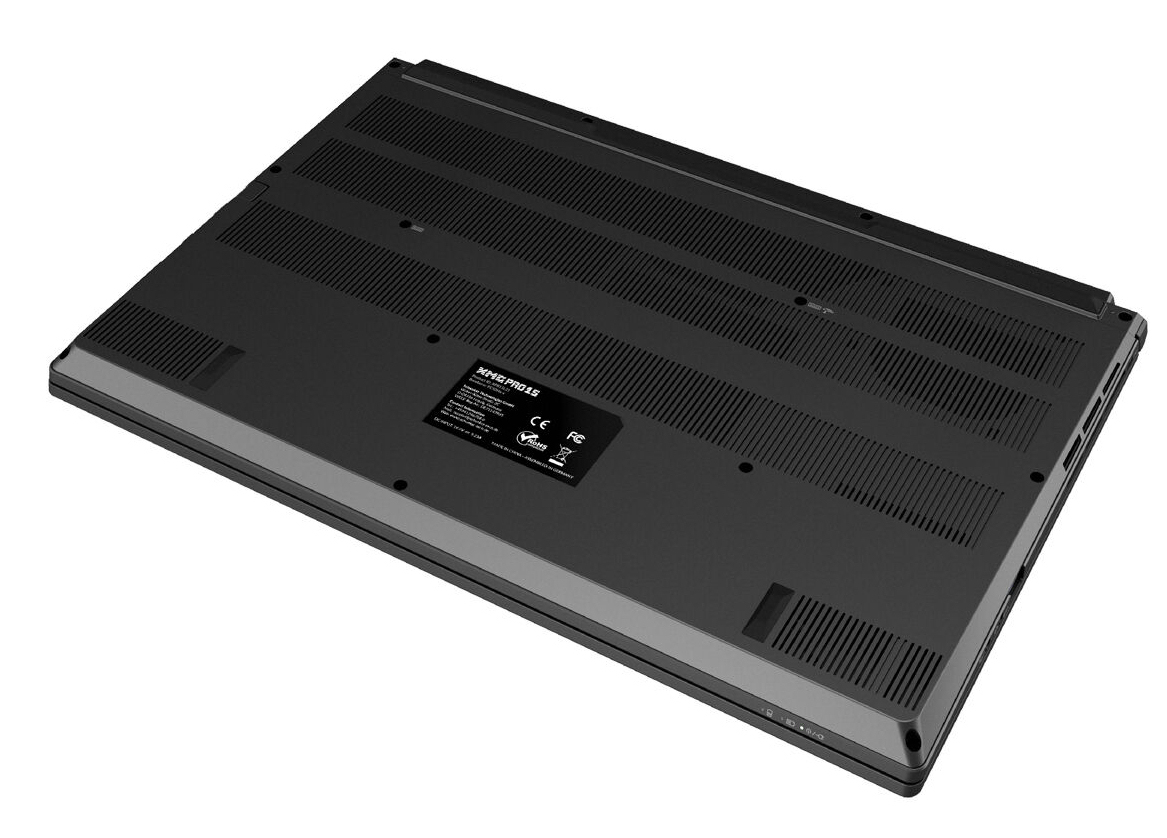
外壳 - 带有金属底盘的申克笔记本电脑
对于XMG Pro,Schenker使用了一个亚光黑色的纤细金属底盘。由于简单而优雅的机箱没有任何醒目的视觉效果,它适合于专业场合。相较于2021年初的XMG Pro 15型号,只有一些小的区别。没有维护舱口,电池是固定的。
结构不值得批评。间隙均匀,没有不必要的材料突起。虽然盖子和底座在转角处略微弯曲,但总体上仍有很强的刚性。铰链将盖子牢牢地固定住,尽管它们允许有一些摇晃。显示器可以打开到130度。只用一只手就可以打开笔记本电脑。

在我们的比较中,XMG Pro是最紧凑的设备之一,而且只比 刀片15.在大多数情况下,在我们的比较中,所有的笔记本电脑在重量上是均匀的。只有Alienware x15偏离了这一点,重量多了约400克。
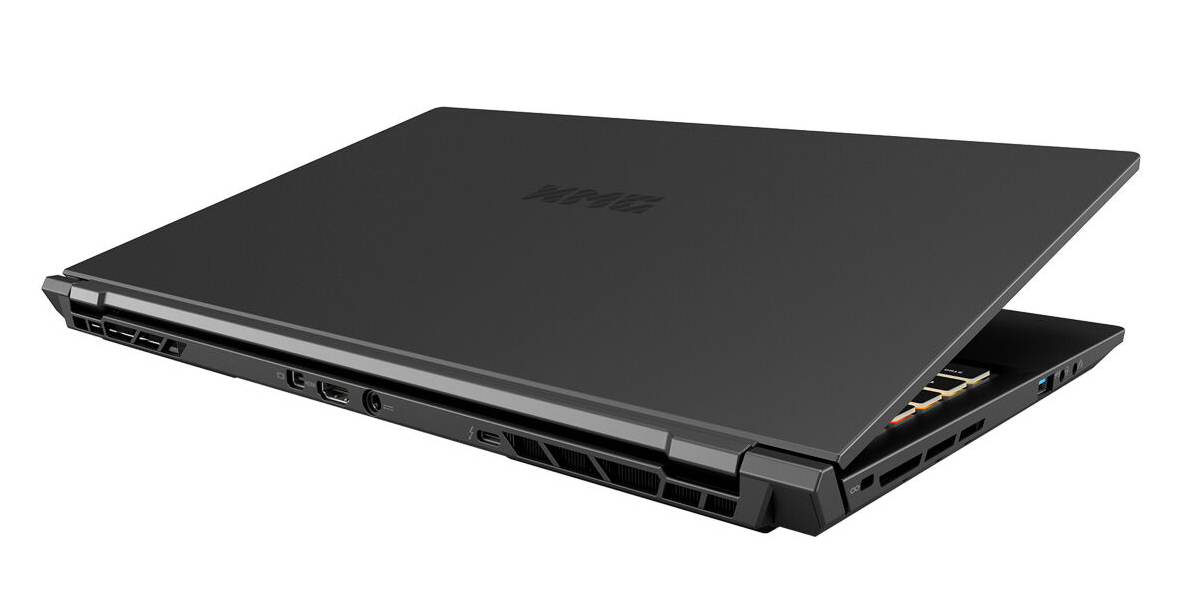
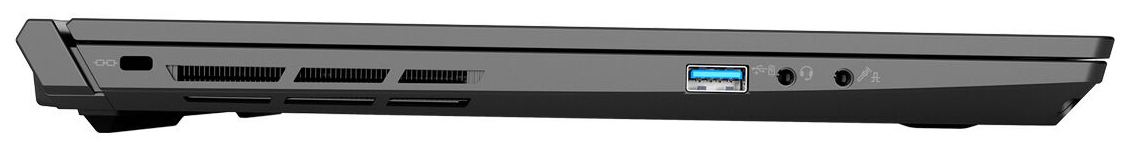
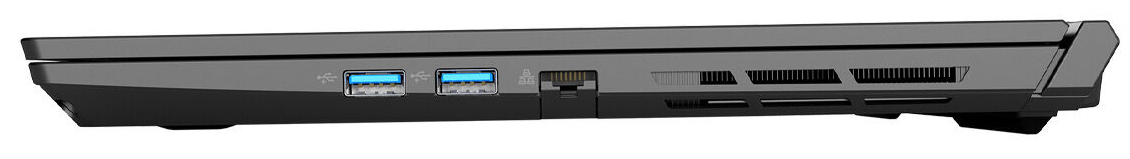
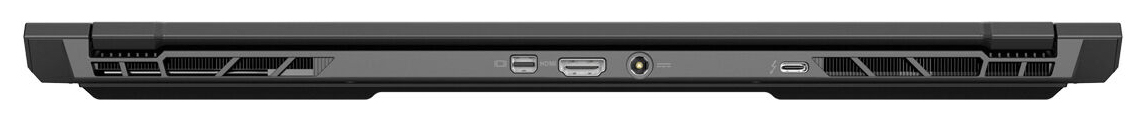
连接性 - 带有Thunderbolt 4的Schenker XMG
XMG Pro集成了三个USB type-A端口(USB 3.2 Gen 1)和一个USB type-C端口(Thunderbolt 4)。后者可以连接到一个功能丰富的扩展坞或外部GPU。此外,该端口通过USB-C支持DisplayPort。结合Mini DisplayPort和HDMI端口,总共有三个视频输出。所有三个视频输出都支持G-Sync。对于USB Type-C端口,必须从BIOS中手动启用。没有集成读卡器。
这些端口分布在笔记本的三个侧面。所有三个视频输出都位于设备的背面。因此,连接的电缆是沿着背部走的,不会碍事。
沟通
Wi-Fi模块是基于英特尔芯片(AX201),支持802.11a/b/g/n/ac/ax标准。在最佳条件下(附近没有其他Wi-Fi设备,笔记本和服务器离得很近),我们观察到出色的传输速率。一个Realtek千兆位以太网控制器处理有线网络。在我们的测试中,我们没有遇到任何问题。
| Networking | |
| iperf3 transmit AX12 | |
| Schenker XMG Pro 15 (Late 2021) | |
| Lenovo Legion S7 15ACH6 82K80030GE | |
| Average Intel Wi-Fi 6 AX201 (49.8 - 1775, n=324) | |
| Alienware x15 RTX 3070 P111F | |
| Razer Blade 15 Advanced (Mid 2021) | |
| MSI Delta 15 A5EFK | |
| Schenker XMG Pro 15 (Early 2021, RTX 3080) | |
| iperf3 receive AX12 | |
| Schenker XMG Pro 15 (Early 2021, RTX 3080) | |
| Alienware x15 RTX 3070 P111F | |
| Razer Blade 15 Advanced (Mid 2021) | |
| Schenker XMG Pro 15 (Late 2021) | |
| Average Intel Wi-Fi 6 AX201 (136 - 1743, n=324) | |
| MSI Delta 15 A5EFK | |
| Lenovo Legion S7 15ACH6 82K80030GE | |
网络摄像头
网络摄像头(0.9MP)捕获的图像最大分辨率为1280 x 720像素。色彩准确性不高。颜色明显偏离其理想值。

 GeForce RTX 3080 Laptop GPU, i7-11800H, Samsung SSD 980 Pro 1TB MZ-V8P1T0BW")
 GeForce RTX 3080 Laptop GPU, i7-11800H, Samsung SSD 980 Pro 1TB MZ-V8P1T0BW")
辅料
除了保修信息和手册外,包装中还包括一张恢复DVD、一块清洁布、USB拇指驱动器和一个M.2螺丝。
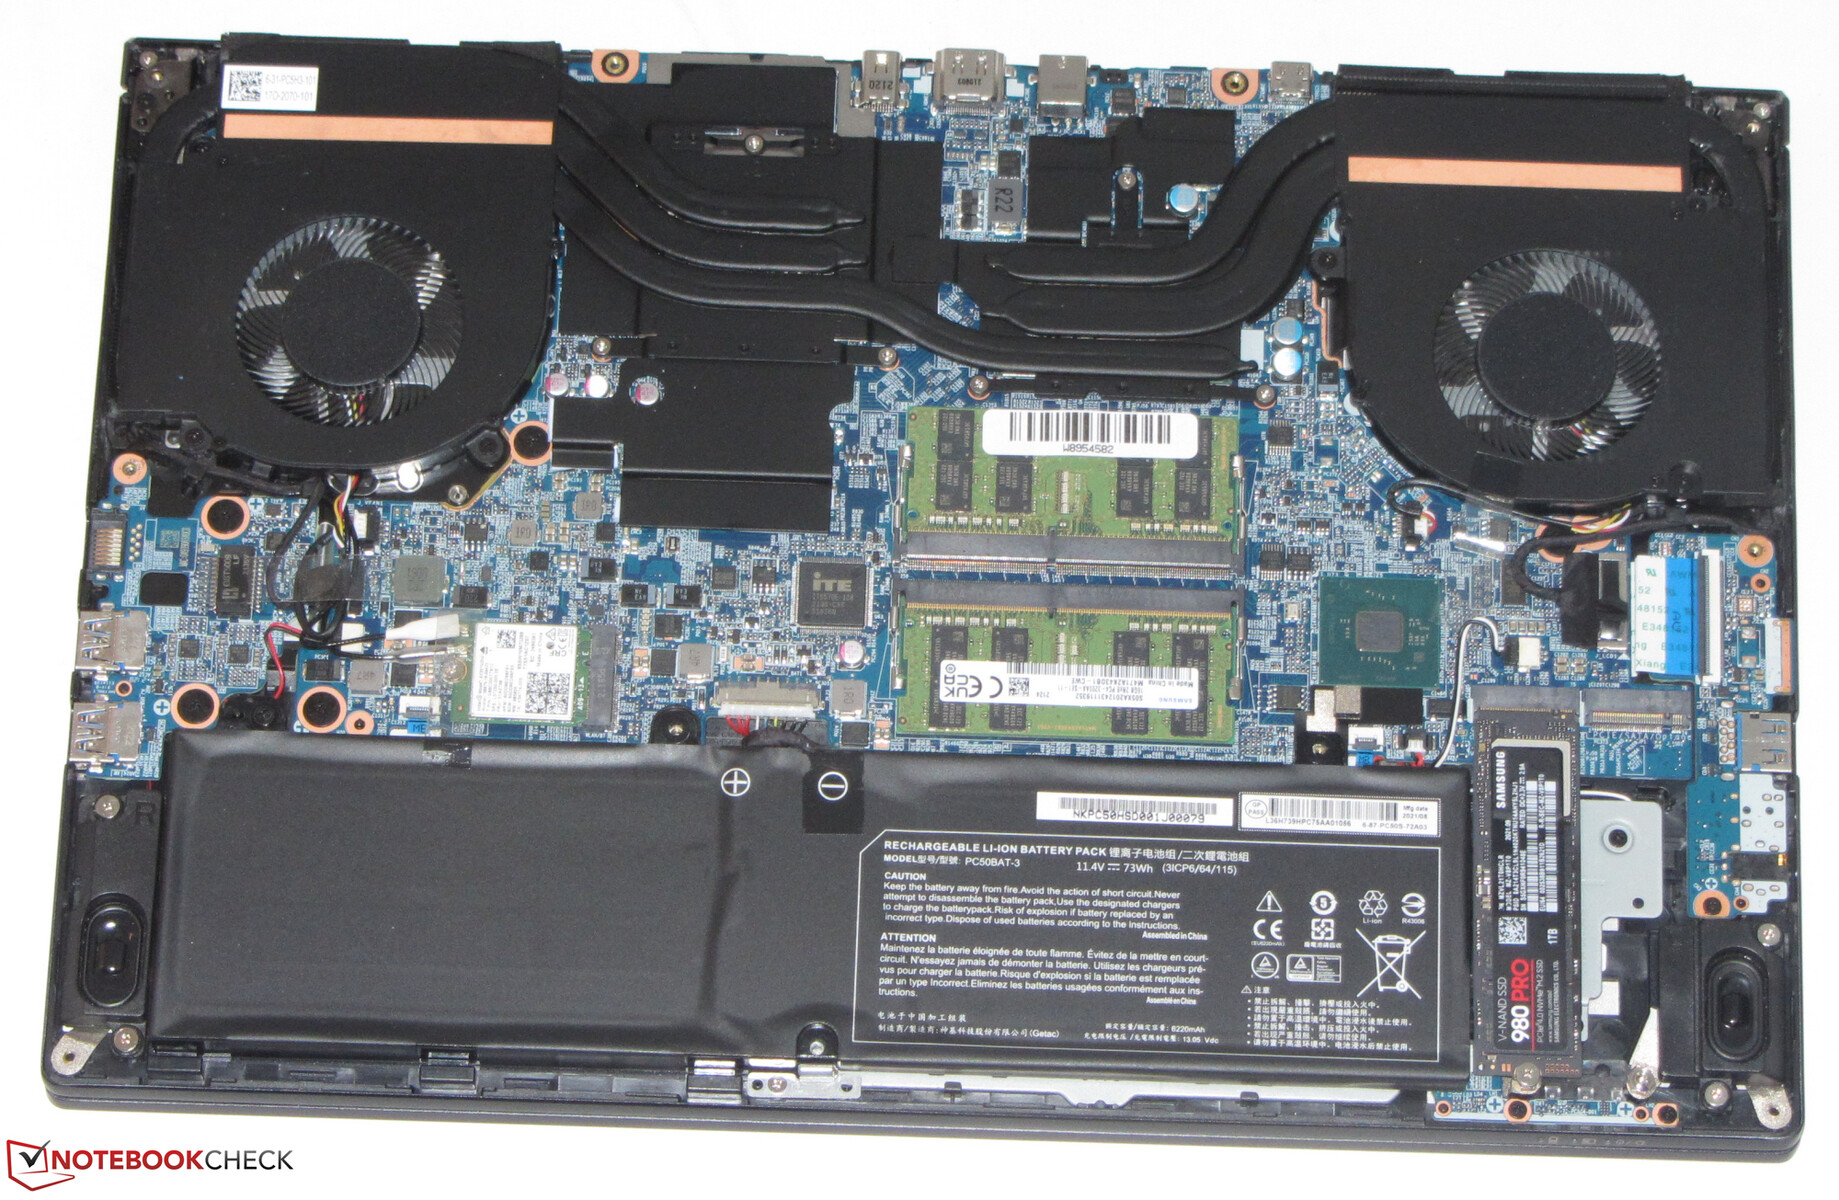
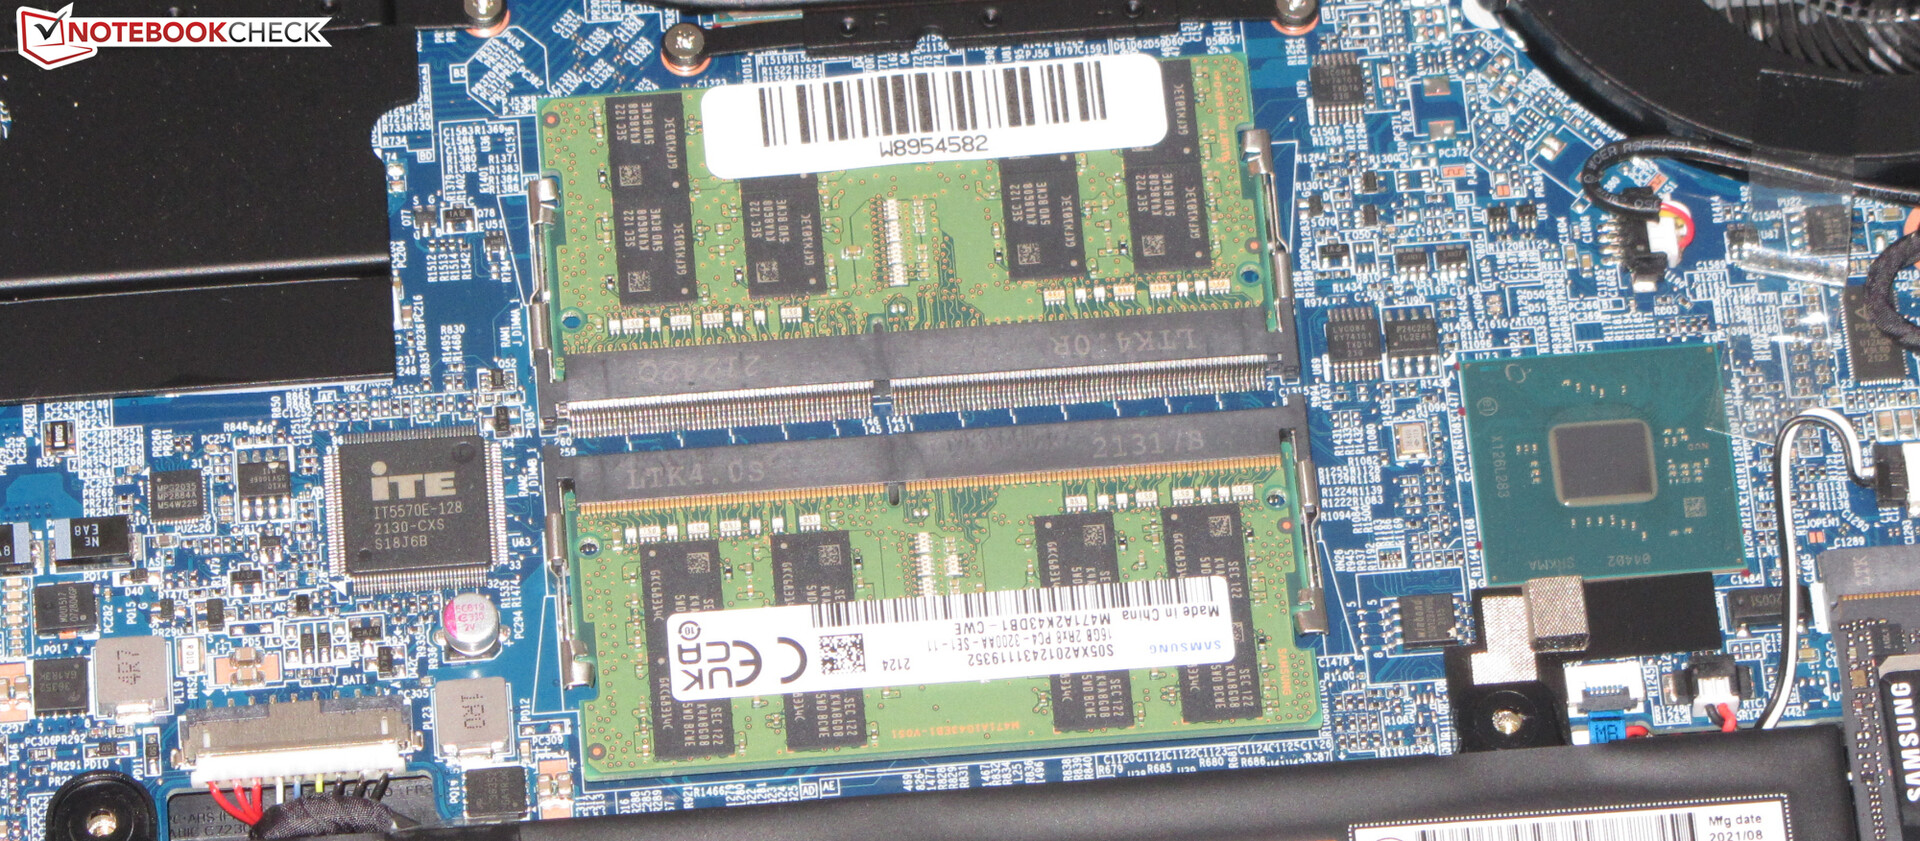
维护
进行维护和升级系统很简单。松开设备底部的所有螺丝后,可以借助于有尖锐边缘的物体将底板取下。随后,用户可以访问固态硬盘、二级M.2插槽、Wi-Fi模块、电池、内存和风扇。
担保
制造商提供两年的基本保修,在某些欧洲国家提供取货和退货服务,以及6个月的快速维修服务(48小时内修复)。保修期延长至36个月,费用为100-149欧元(约110-170美元)--取决于快速维修期。
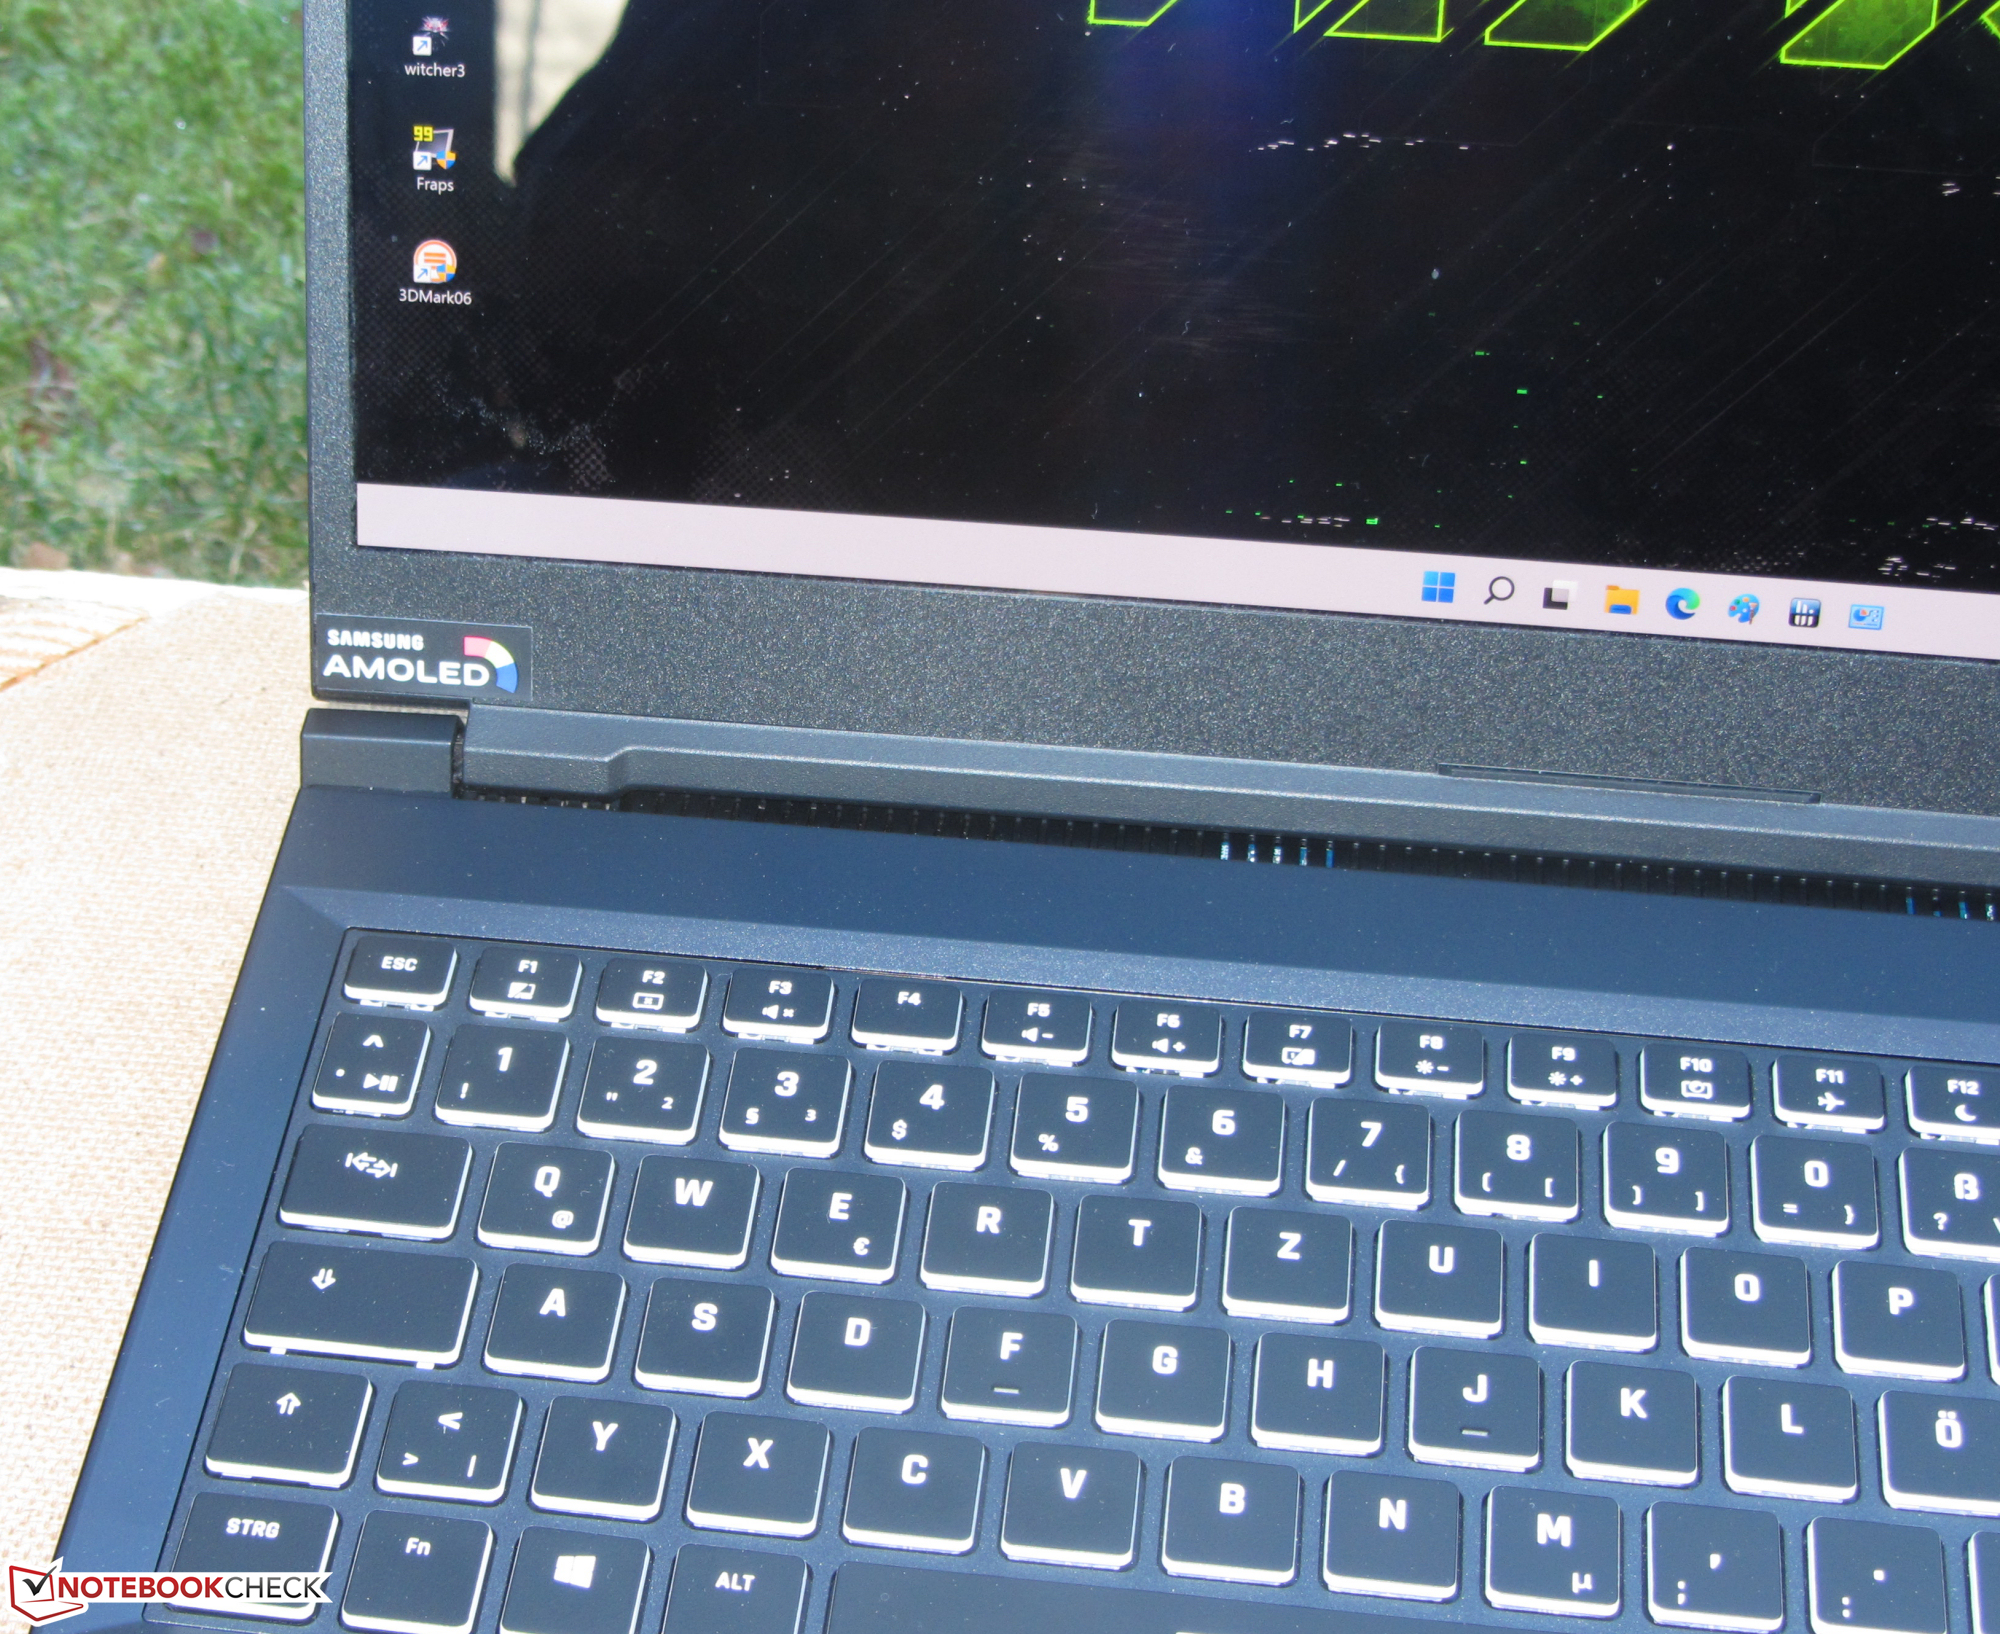
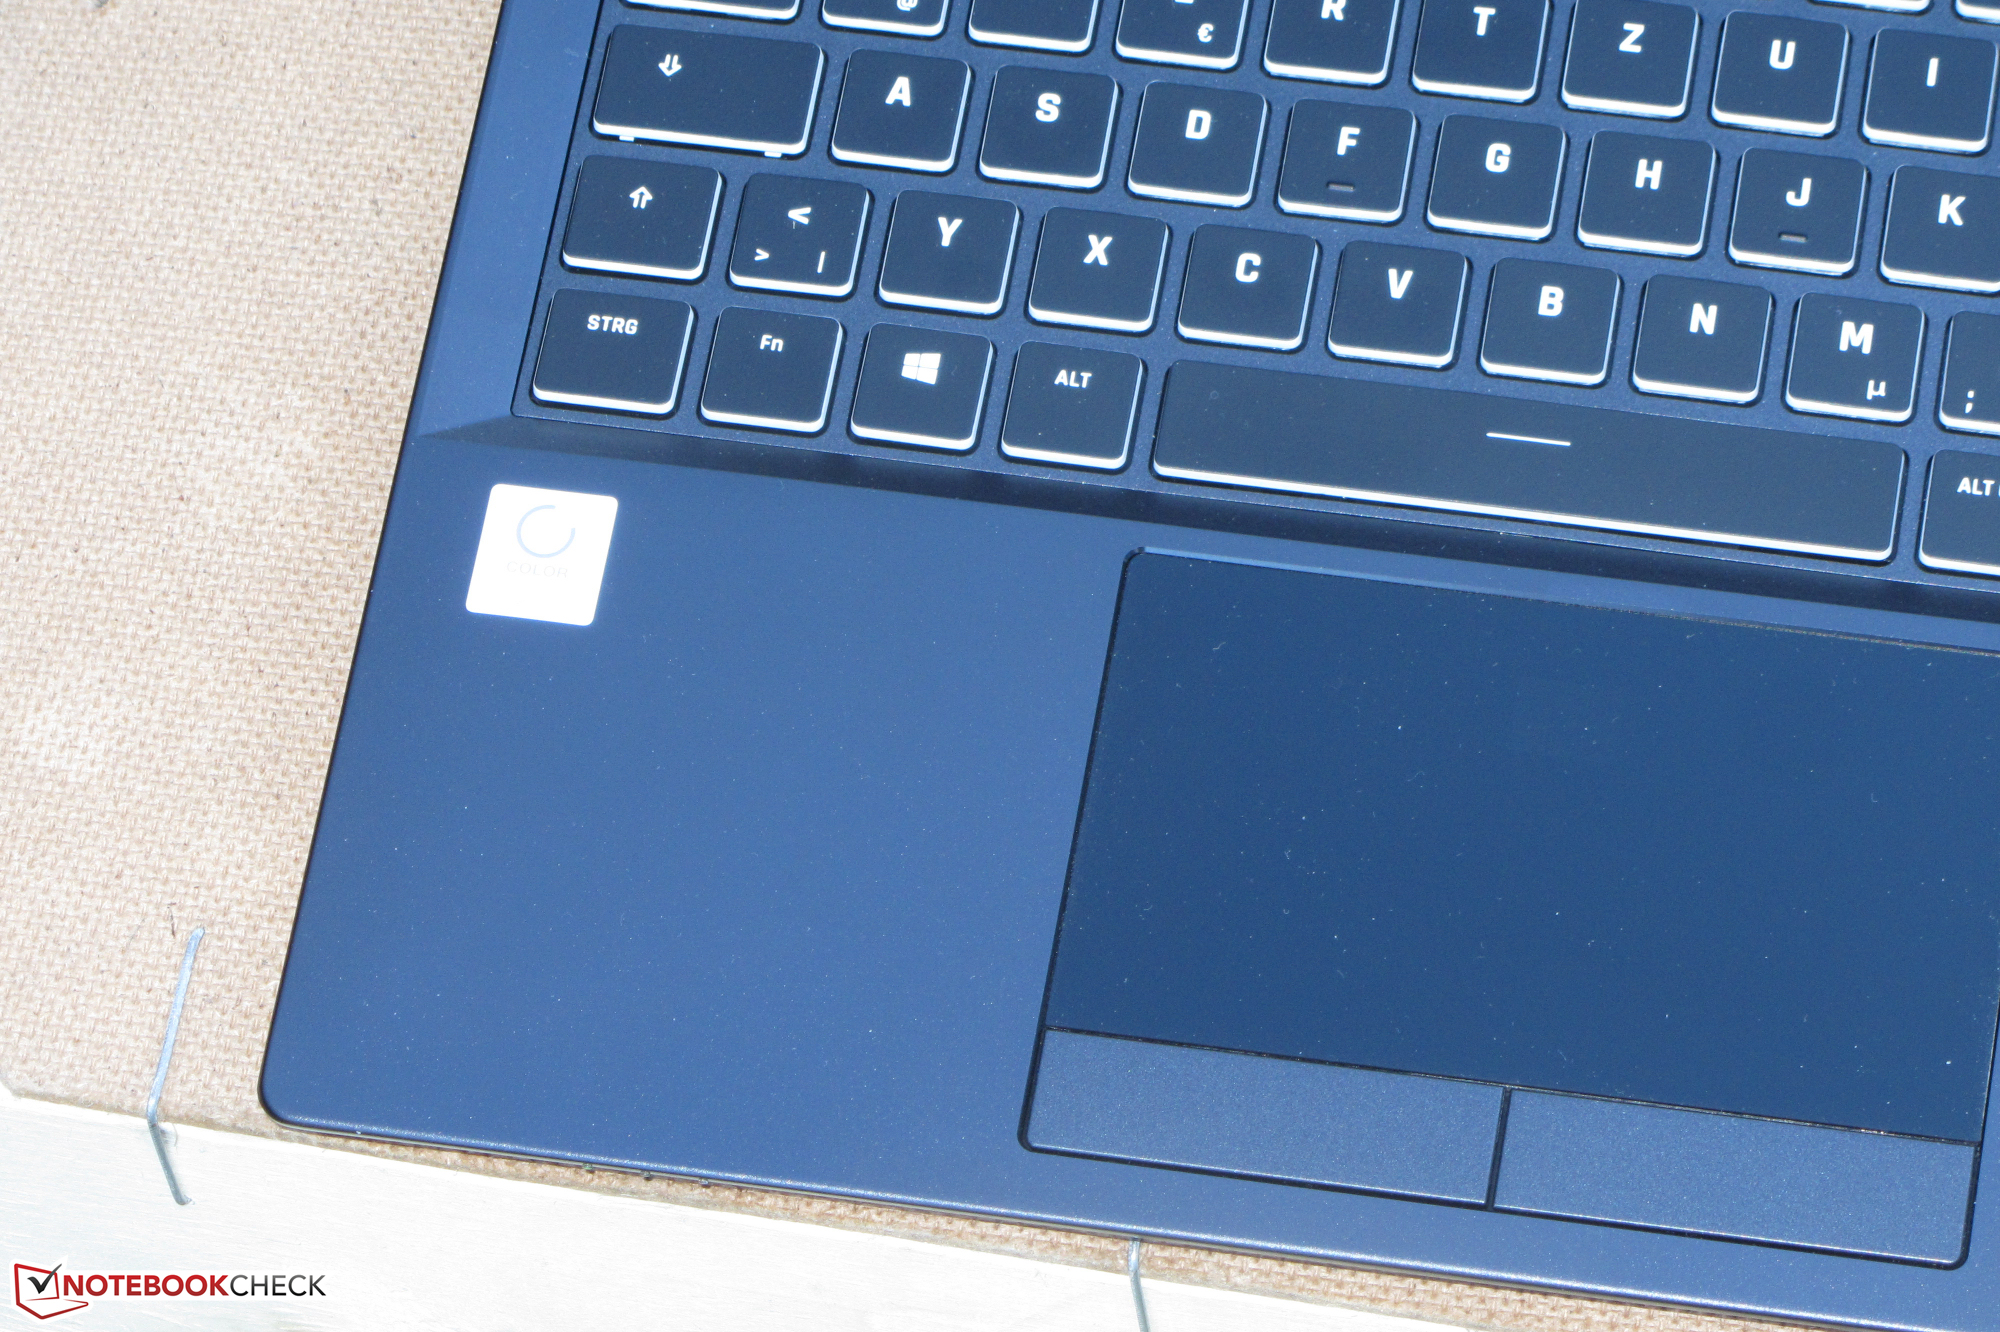
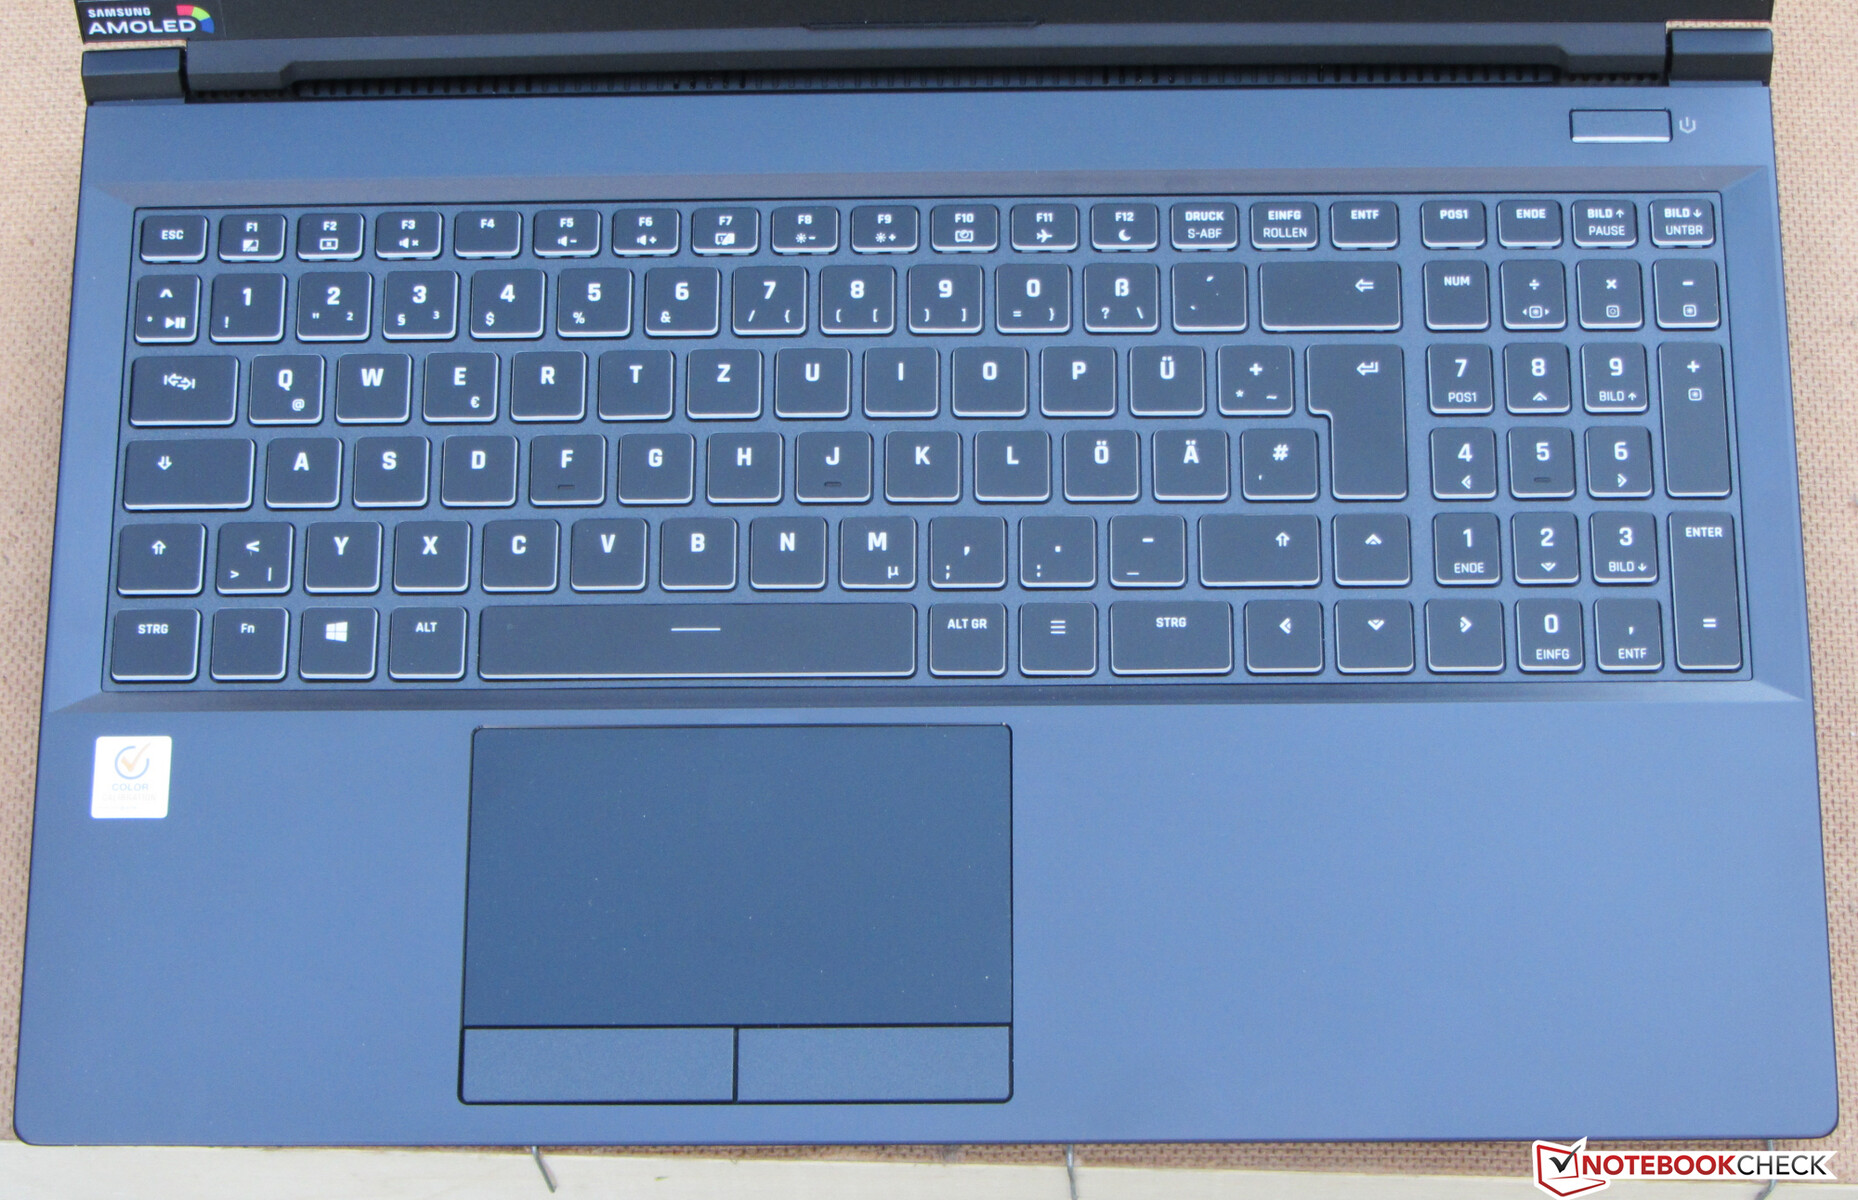
输入设备 - 带RGB背光的键盘
键盘
Schenker笔记本电脑配备了一个背光的RGB Chiclet键盘,包括一个小键盘。平坦、光滑的按键具有中等行程和明显的启动点。我们对按键的反馈感到满意。键盘区域在打字时略微有些松动。在我们的测试中,这并没有成为一个问题。键盘背光灯有三个亮度设置,可以通过两个功能键控制。总的来说,该键盘很适合日常使用。
触摸板
触摸板的光滑表面(约10.8x6.1厘米)支持多点触摸手势,具有良好的滑行特性。它对一直到角落的输入反应良好。两个专用的鼠标按钮提供了中等的行程和一个明显的启动点。
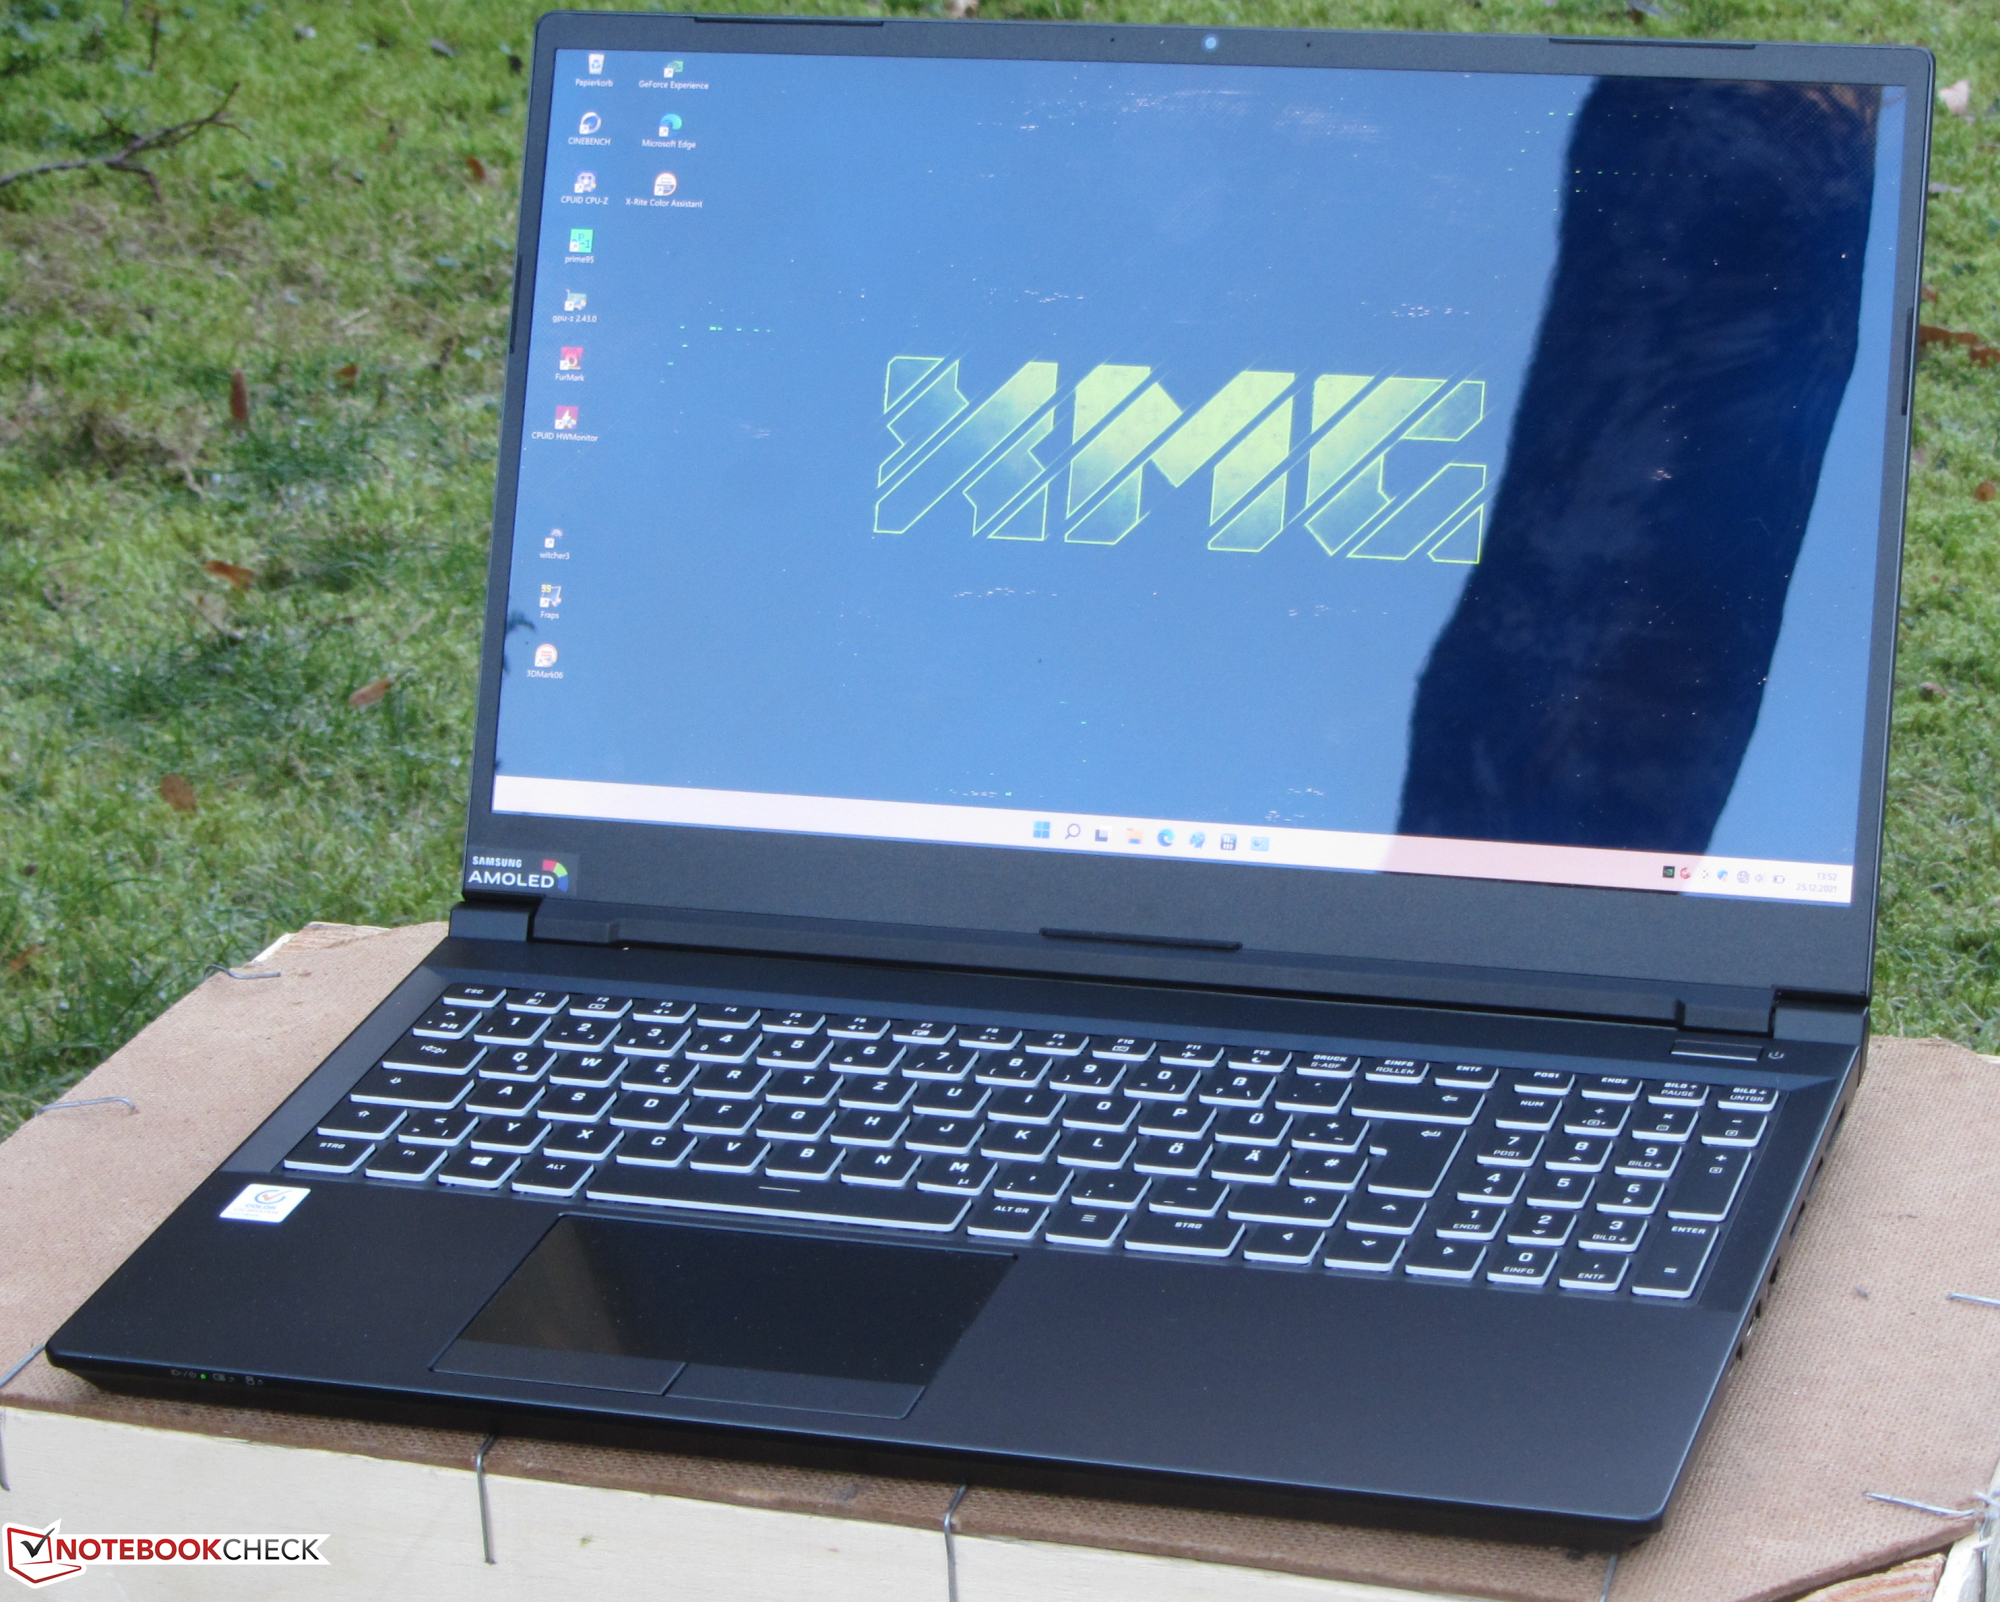
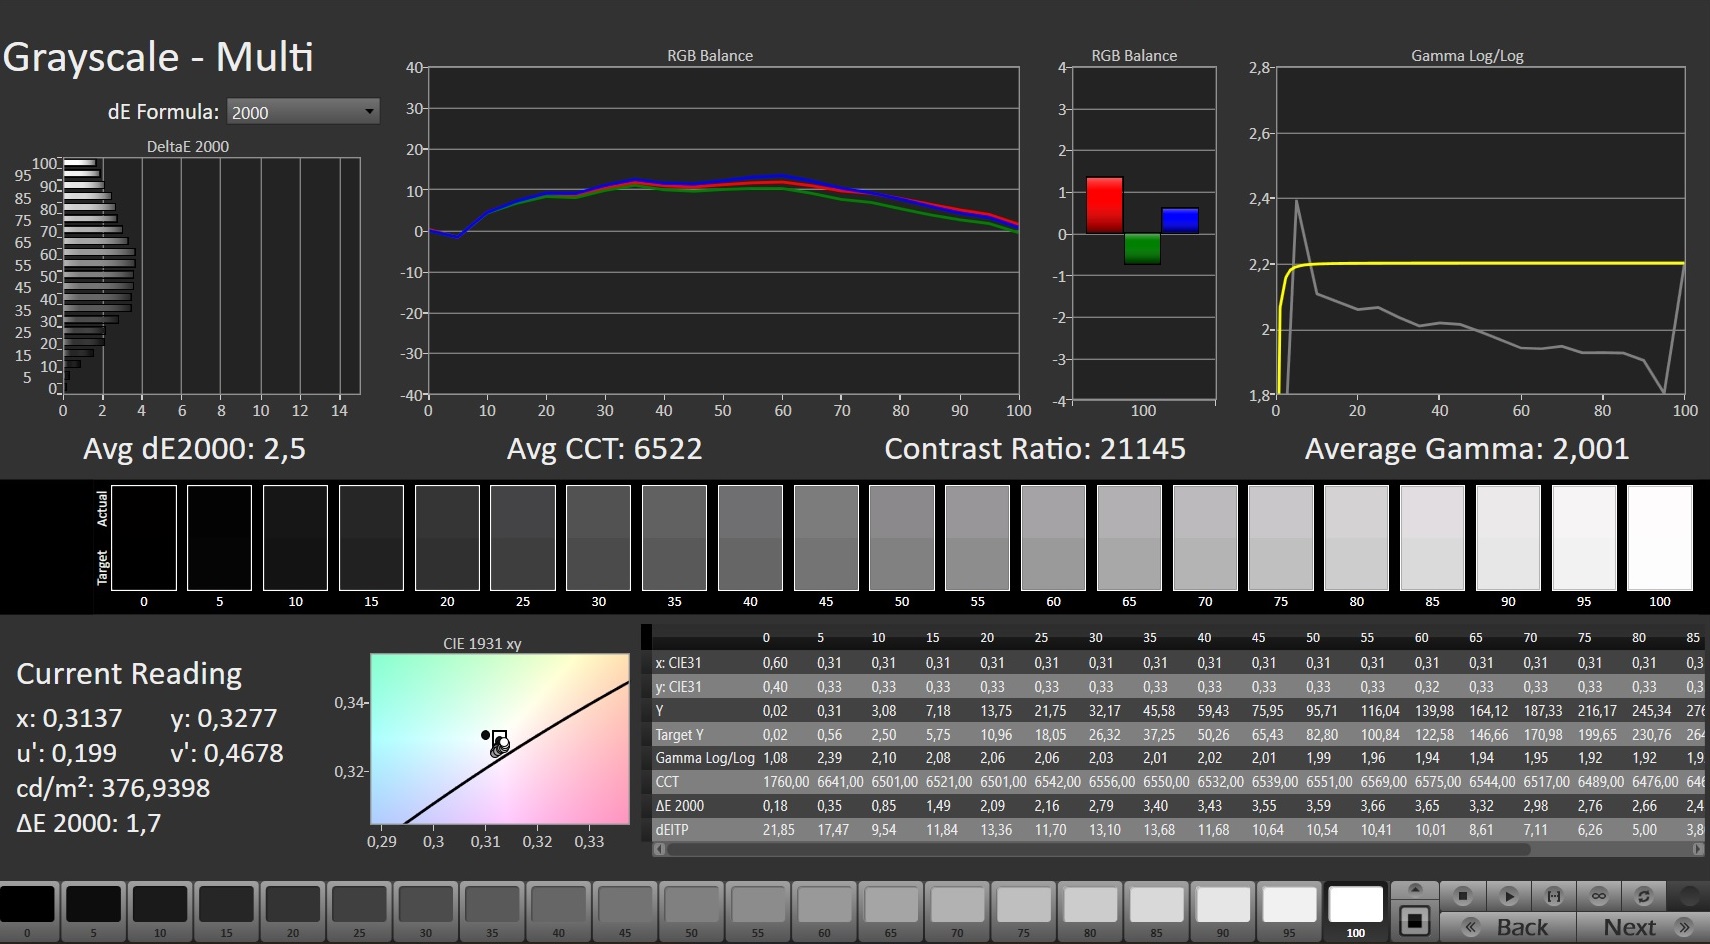
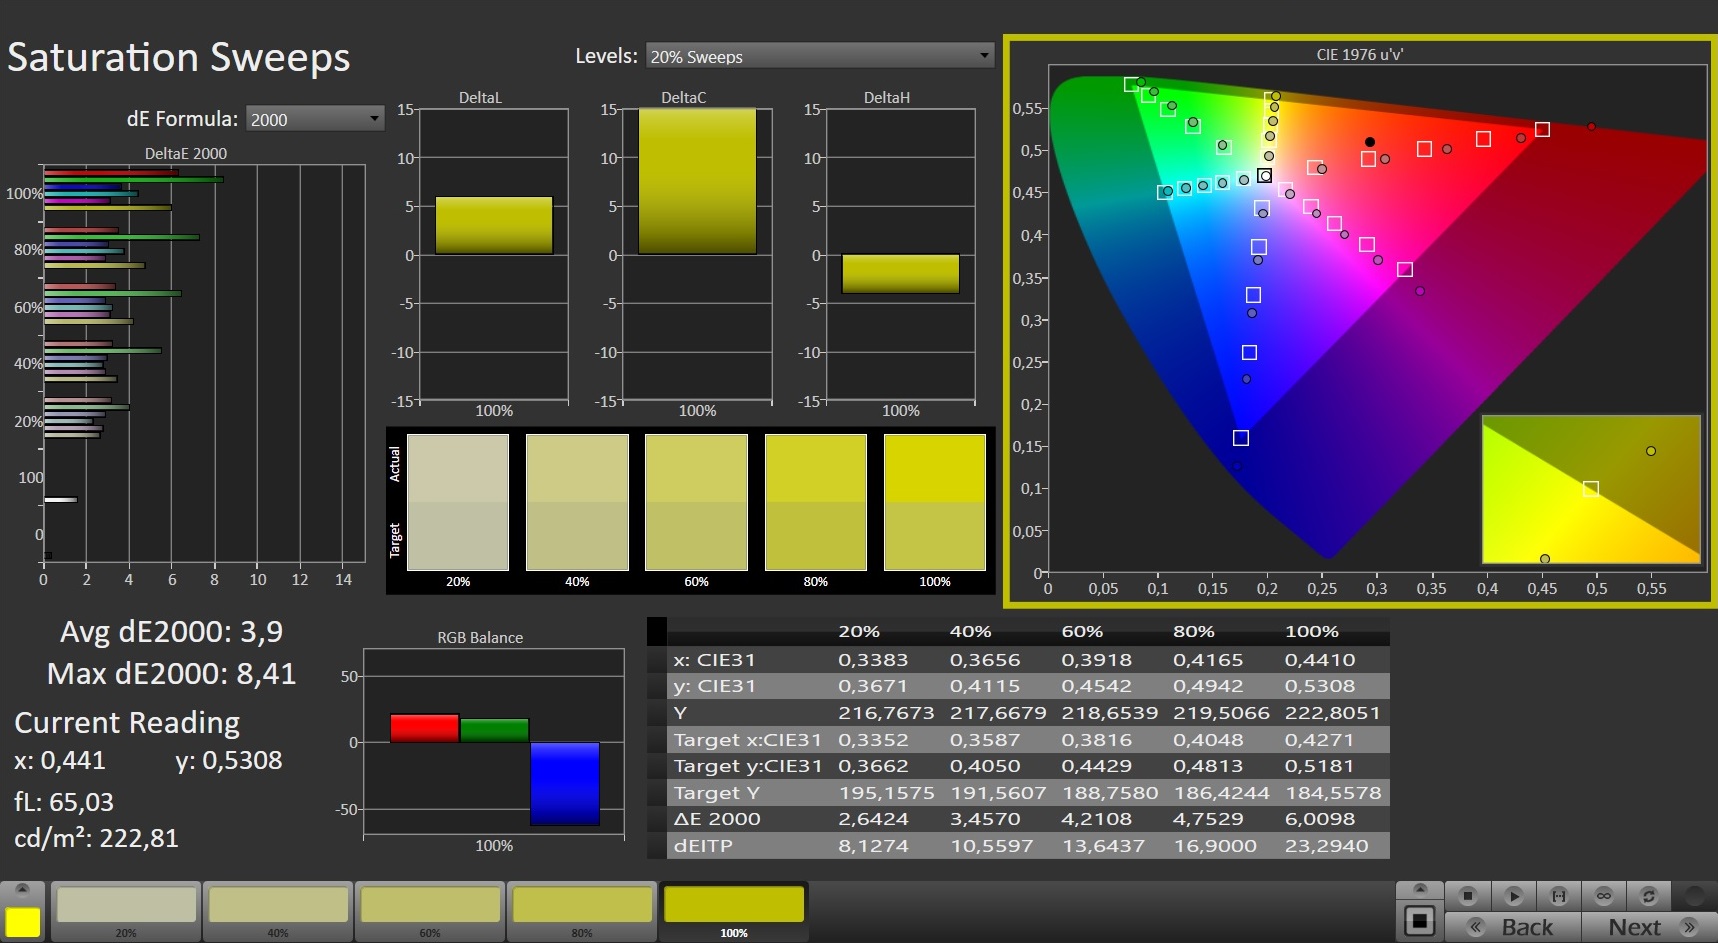
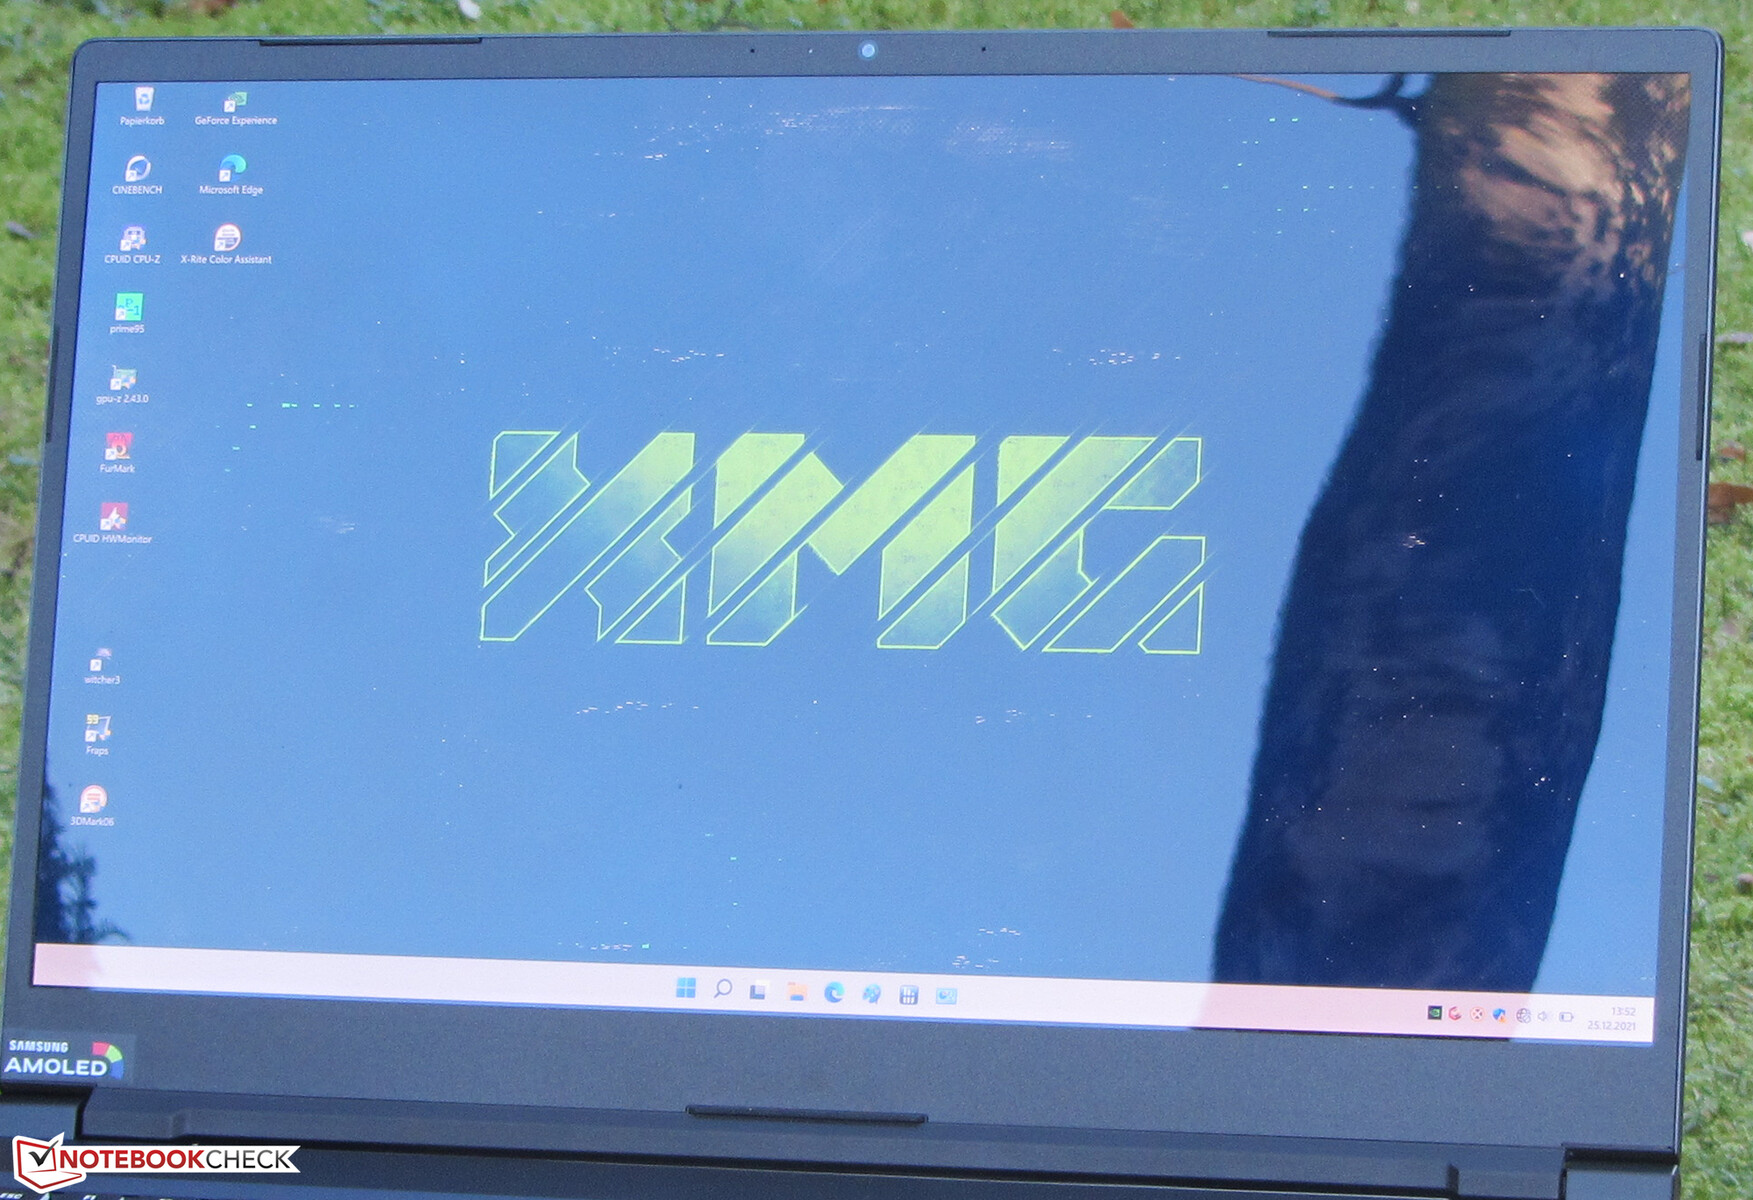
显示屏 - 带有4K OLED面板的游戏笔记本
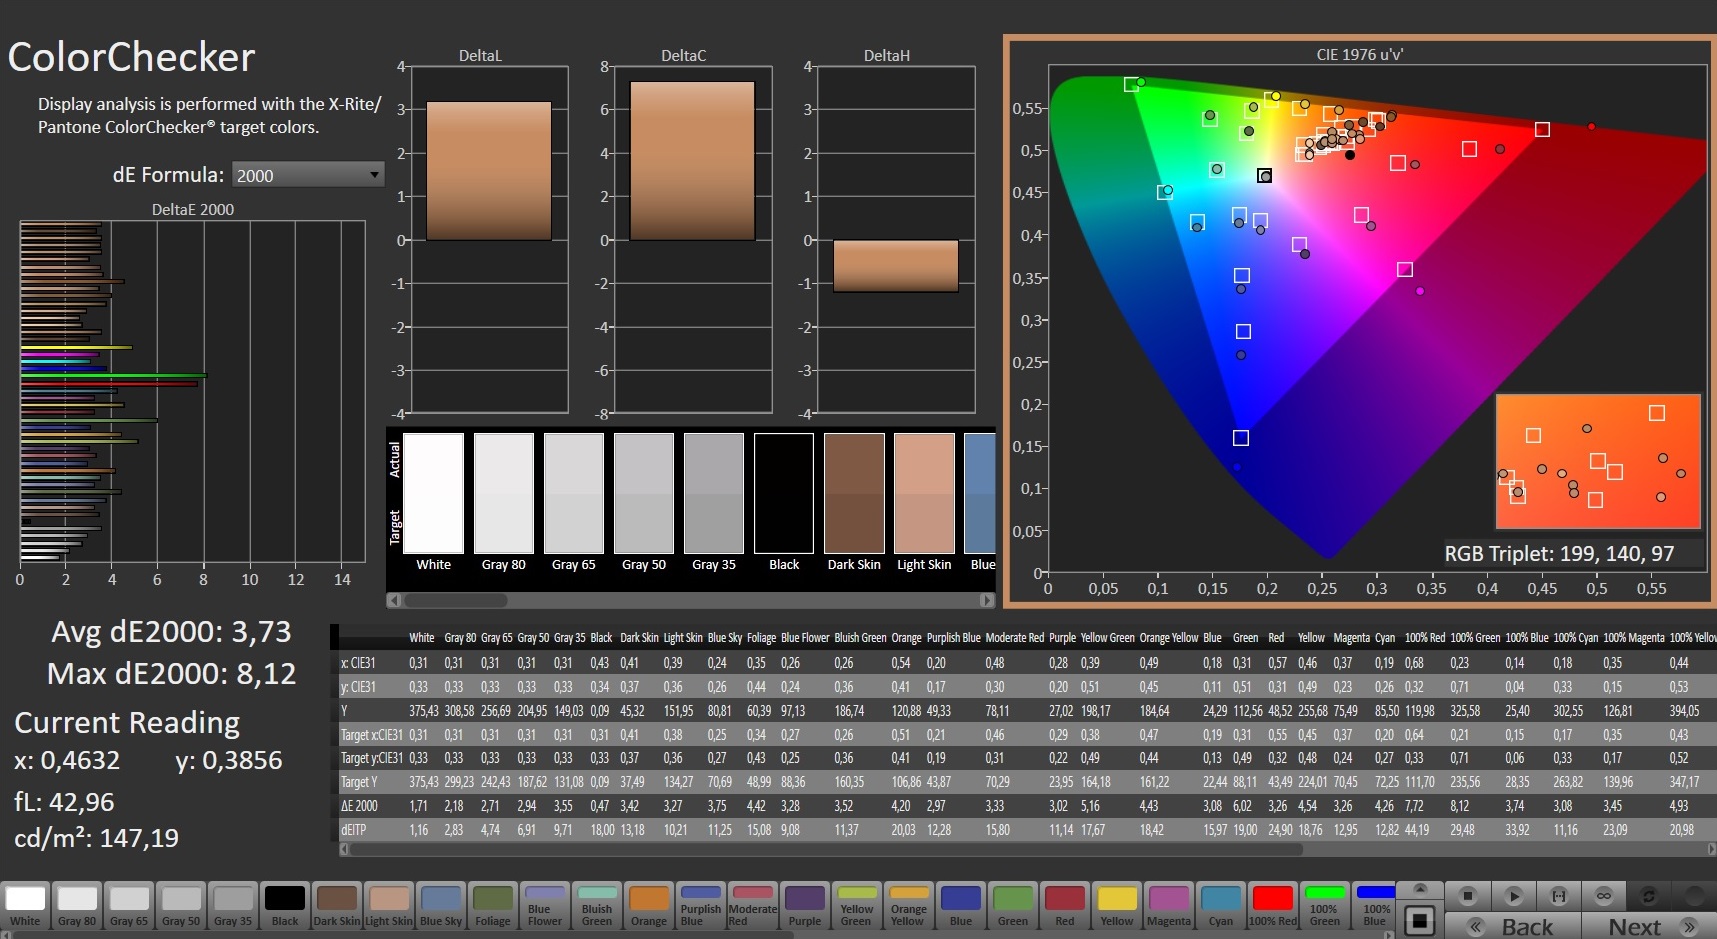
反射式OLED屏幕(3840 x 2160像素)提供了出色的对比度(22150:1)以及黑值(0.02)和短响应时间。亮度(433.7尼特)也是令人愉快的高。在81%和更低的亮度水平上,我们的测量设备检测到频率为60至240赫兹的闪烁。由于频率低,敏感的用户可能会出现头痛或眼疲劳。作为OLED面板的替代品,申克公司还提供了一个哑光FHD显示屏(IPS,300 Hz)。同样的面板可以在 早期的2021-Modell des XMG Pro,我们也对其进行了评测。
| |||||||||||||||||||||||||
Brightness Distribution: 94 %
Center on Battery: 443 cd/m²
Contrast: 22150:1 (Black: 0.02 cd/m²)
ΔE ColorChecker Calman: 3.73 | ∀{0.5-29.43 Ø4.71}
ΔE Greyscale Calman: 2.5 | ∀{0.09-98 Ø4.96}
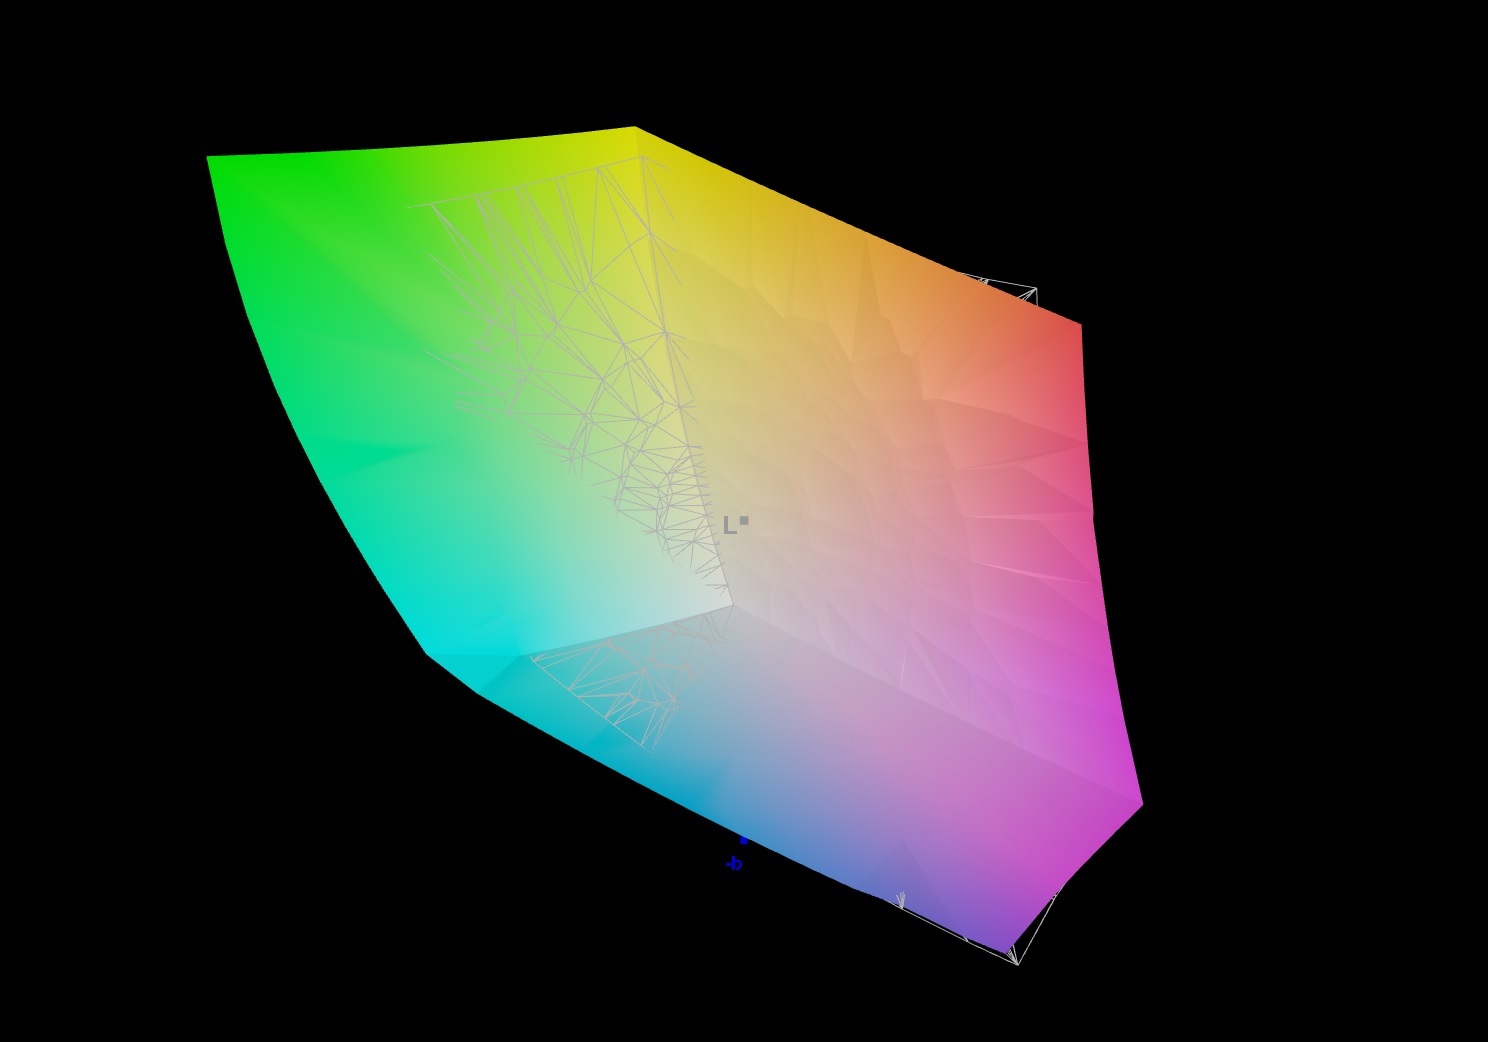
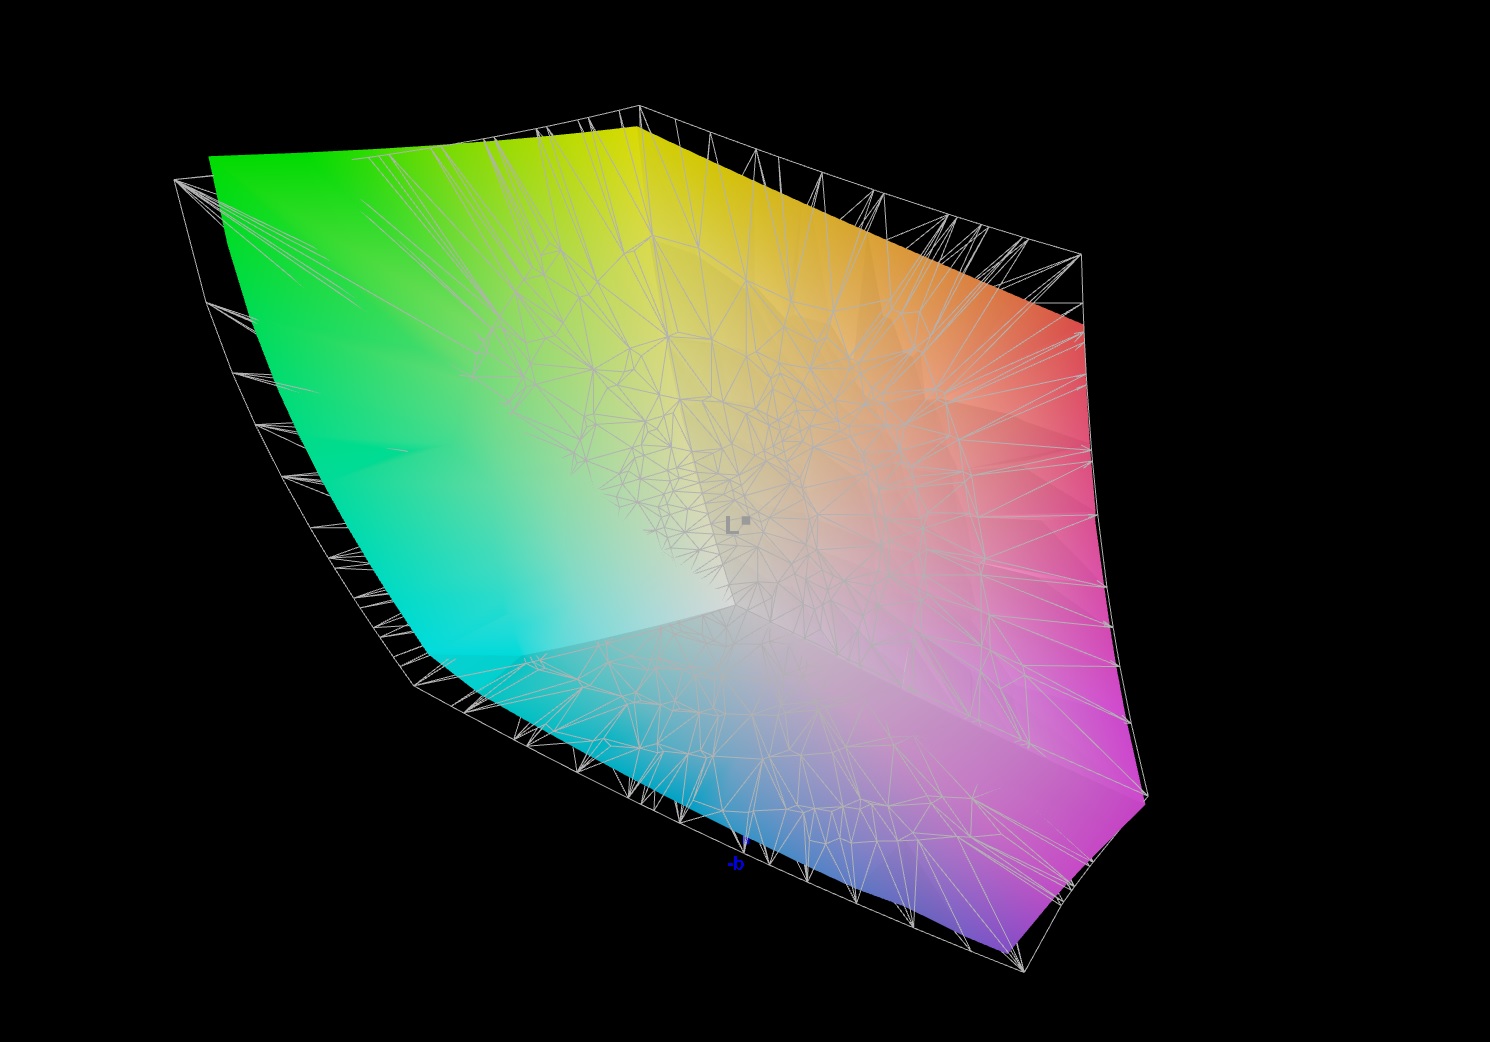
89.1% AdobeRGB 1998 (Argyll 3D)
97.7% sRGB (Argyll 3D)
81.2% Display P3 (Argyll 3D)
Gamma: 2.001
CCT: 6522 K
| Schenker XMG Pro 15 (Late 2021) Samsung ATNA56WR14-0, OLED, 3840x2160, 15.6" | Lenovo Legion S7 15ACH6 82K80030GE CSOT T3 MNF601EA1-6, IPS, 3840x2160, 15.6" | Alienware x15 RTX 3070 P111F LG Philips 156QHG, IPS, 2560x1440, 15.6" | Razer Blade 15 Advanced (Mid 2021) TL156VDXP02-0, IPS, 1920x1080, 15.6" | Schenker XMG Pro 15 (Early 2021, RTX 3080) AU Optronics AUO7A8C (B156HAN12.0), IPS, 1920x1080, 15.6" | MSI Delta 15 A5EFK LQ156M1JW03 (SHP155D), IPS-Level, 1920x1080, 15.6" | |
|---|---|---|---|---|---|---|
| Display | 5% | 11% | -14% | -11% | -14% | |
| Display P3 Coverage (%) | 81.2 | 85.2 5% | 97.8 20% | 66.9 -18% | 69.2 -15% | 66.5 -18% |
| sRGB Coverage (%) | 97.7 | 98.8 1% | 99.9 2% | 97.1 -1% | 99.7 2% | 97.8 0% |
| AdobeRGB 1998 Coverage (%) | 89.1 | 98.2 10% | 69 -23% | 70.8 -21% | 67.6 -24% | |
| Response Times | -894% | -413% | -278% | -269% | -425% | |
| Response Time Grey 50% / Grey 80% * (ms) | 3.2 ? | 31.6 ? -888% | 12 ? -275% | 4.2 ? -31% | 3.6 ? -13% | 12.8 ? -300% |
| Response Time Black / White * (ms) | 1.6 ? | 16 ? -900% | 10.4 ? -550% | 10 ? -525% | 10 ? -525% | 10.4 ? -550% |
| PWM Frequency (Hz) | 60 ? | 23580 ? | ||||
| Screen | -222% | -305% | -194% | -133% | -240% | |
| Brightness middle (cd/m²) | 443 | 607 37% | 409.5 -8% | 353.4 -20% | 327 -26% | 291 -34% |
| Brightness (cd/m²) | 434 | 605 39% | 390 -10% | 340 -22% | 335 -23% | 266 -39% |
| Brightness Distribution (%) | 94 | 93 -1% | 88 -6% | 92 -2% | 89 -5% | 88 -6% |
| Black Level * (cd/m²) | 0.02 | 0.41 -1950% | 0.47 -2250% | 0.31 -1450% | 0.22 -1000% | 0.36 -1700% |
| Contrast (:1) | 22150 | 1480 -93% | 871 -96% | 1140 -95% | 1486 -93% | 808 -96% |
| Colorchecker dE 2000 * | 3.73 | 0.84 77% | 3.48 7% | 2.17 42% | 2.18 42% | 2.98 20% |
| Colorchecker dE 2000 max. * | 8.12 | 3.02 63% | 6.31 22% | 5.69 30% | 4.24 48% | 7.59 7% |
| Greyscale dE 2000 * | 2.5 | 1.1 56% | 5 -100% | 3.4 -36% | 2.6 -4% | 4.2 -68% |
| Gamma | 2.001 110% | 2.131 103% | 2.16 102% | 2.2 100% | 2.123 104% | 2.293 96% |
| CCT | 6522 100% | 6648 98% | 6591 99% | 6830 95% | 6815 95% | 7624 85% |
| Colorchecker dE 2000 calibrated * | 0.69 | 0.89 | 1.05 | 1 | 0.91 | |
| Color Space (Percent of AdobeRGB 1998) (%) | 71 | |||||
| Color Space (Percent of sRGB) (%) | 93 | |||||
| Total Average (Program / Settings) | -370% /
-273% | -236% /
-270% | -162% /
-165% | -138% /
-126% | -226% /
-216% |
* ... smaller is better
屏幕的X-Rite认证确保了自然的色彩表现。即使在出厂时,颜色偏差也非常小,用肉眼无法察觉。显示屏不会出现蓝色的色调。色彩空间覆盖面很广。屏幕可以分别显示98%和89%的sRGB和AdobeRGB色彩空间(我们可以重新测试,因为Schenker在他们自己的测试中达到了100%)。
Display Response Times
| ↔ Response Time Black to White | ||
|---|---|---|
| 1.6 ms ... rise ↗ and fall ↘ combined | ↗ 1 ms rise | 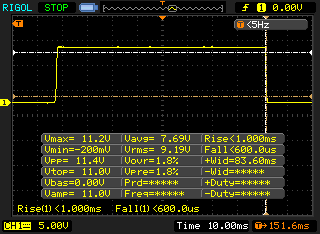 |
| ↘ 0.6 ms fall | ||
| The screen shows very fast response rates in our tests and should be very well suited for fast-paced gaming. In comparison, all tested devices range from 0.1 (minimum) to 240 (maximum) ms. » 10 % of all devices are better. This means that the measured response time is better than the average of all tested devices (19.8 ms). | ||
| ↔ Response Time 50% Grey to 80% Grey | ||
| 3.2 ms ... rise ↗ and fall ↘ combined | ↗ 1.2 ms rise | 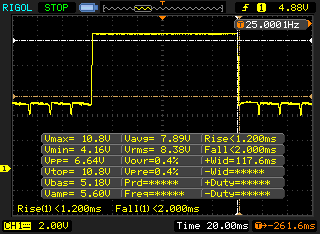 |
| ↘ 2 ms fall | ||
| The screen shows very fast response rates in our tests and should be very well suited for fast-paced gaming. In comparison, all tested devices range from 0.165 (minimum) to 636 (maximum) ms. » 13 % of all devices are better. This means that the measured response time is better than the average of all tested devices (30.9 ms). | ||
Screen Flickering / PWM (Pulse-Width Modulation)
| Screen flickering / PWM detected | 60 Hz | ≤ 81 % brightness setting | 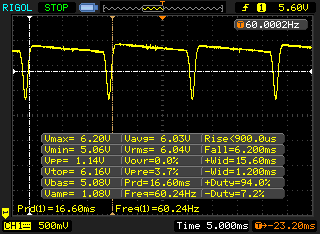 |
The display backlight flickers at 60 Hz (worst case, e.g., utilizing PWM) Flickering detected at a brightness setting of 81 % and below. There should be no flickering or PWM above this brightness setting. The frequency of 60 Hz is very low, so the flickering may cause eyestrain and headaches after extended use. In comparison: 52 % of all tested devices do not use PWM to dim the display. If PWM was detected, an average of 7741 (minimum: 5 - maximum: 343500) Hz was measured. | |||
由于该面板具有良好的视角,因此可以从任何位置阅读。在户外,由于显示屏的反射特性,阅读其内容可能会很棘手。

性能 - 足以应付未来几年的需要
通过XMG Pro 15,Schenker创造了一款纤细、紧凑的15.6英寸游戏笔记本,其性能储备足以流畅地运行当前所有的游戏。

测试条件
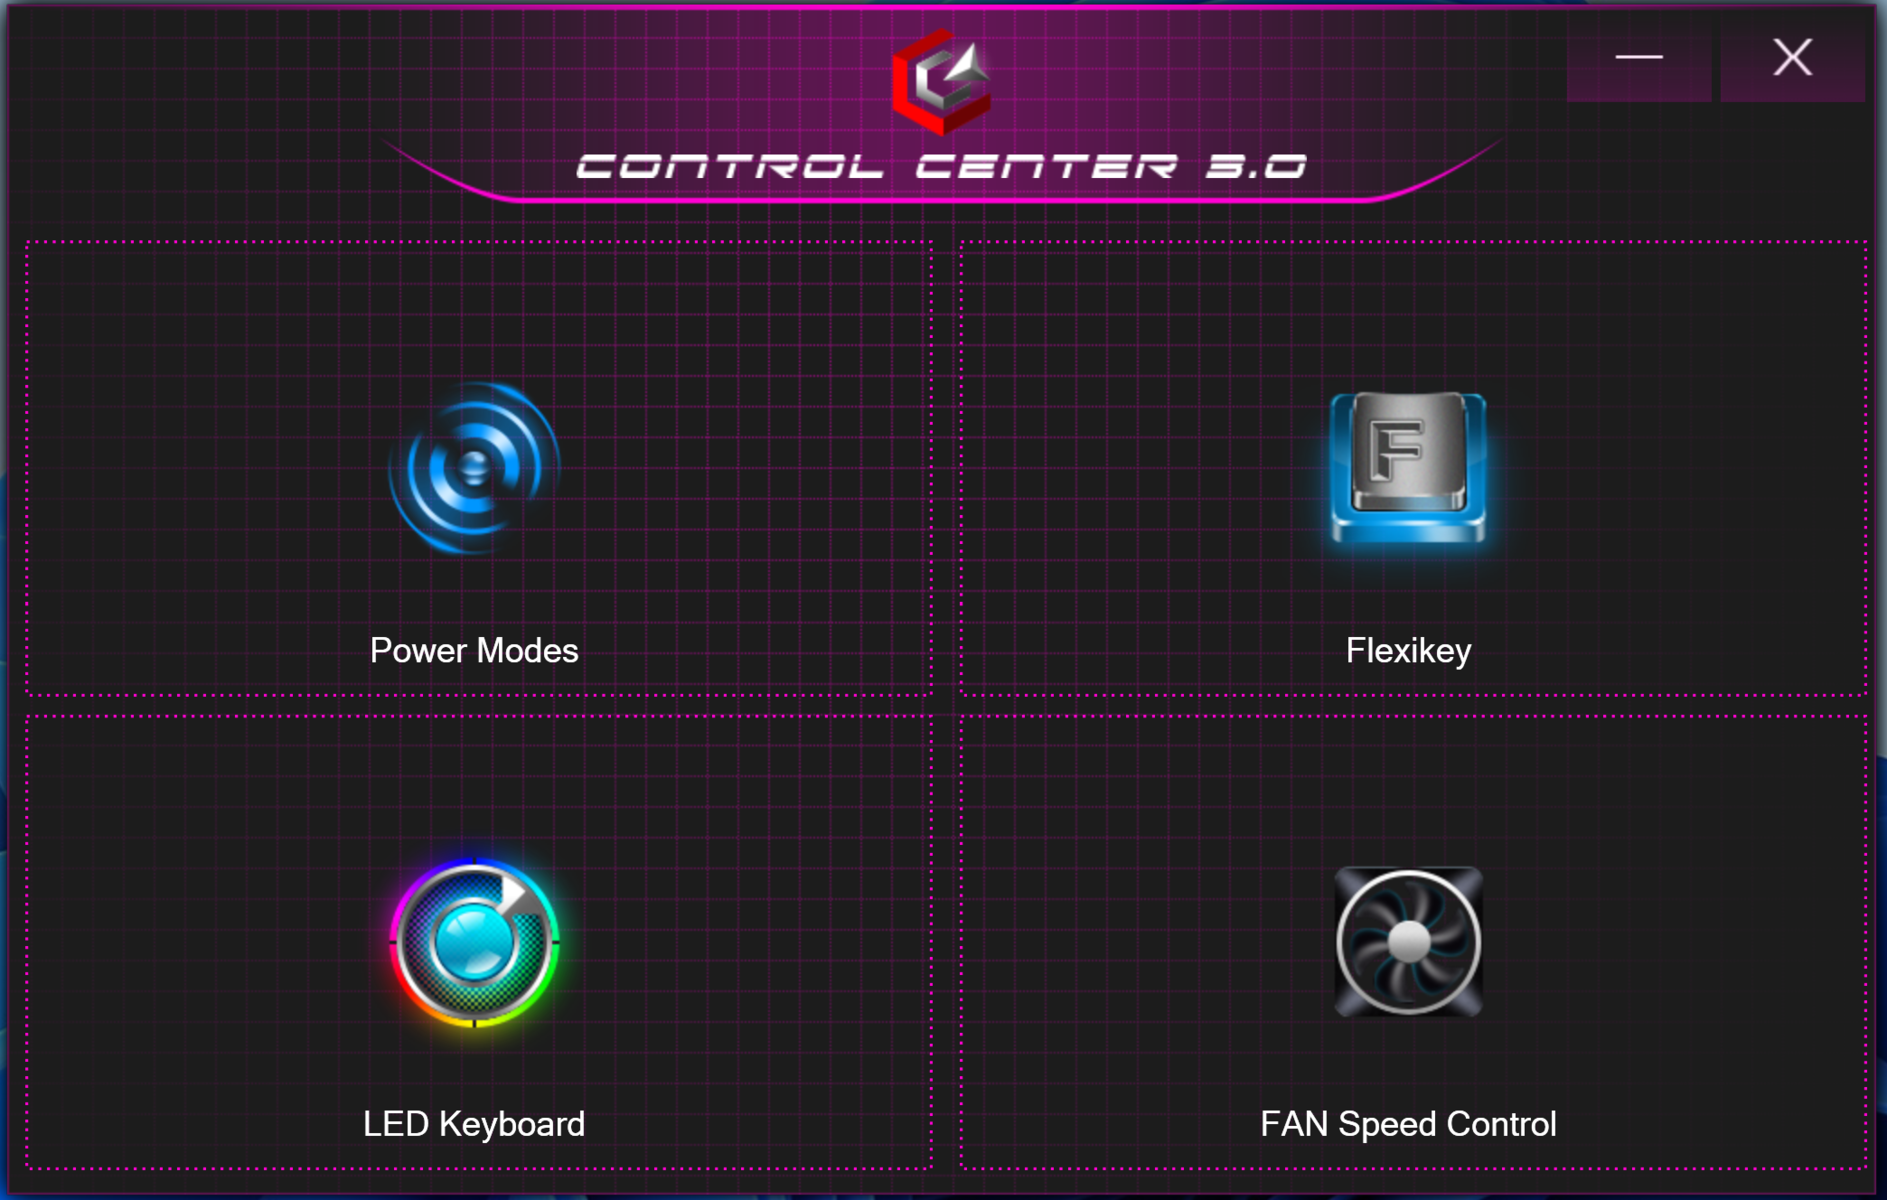
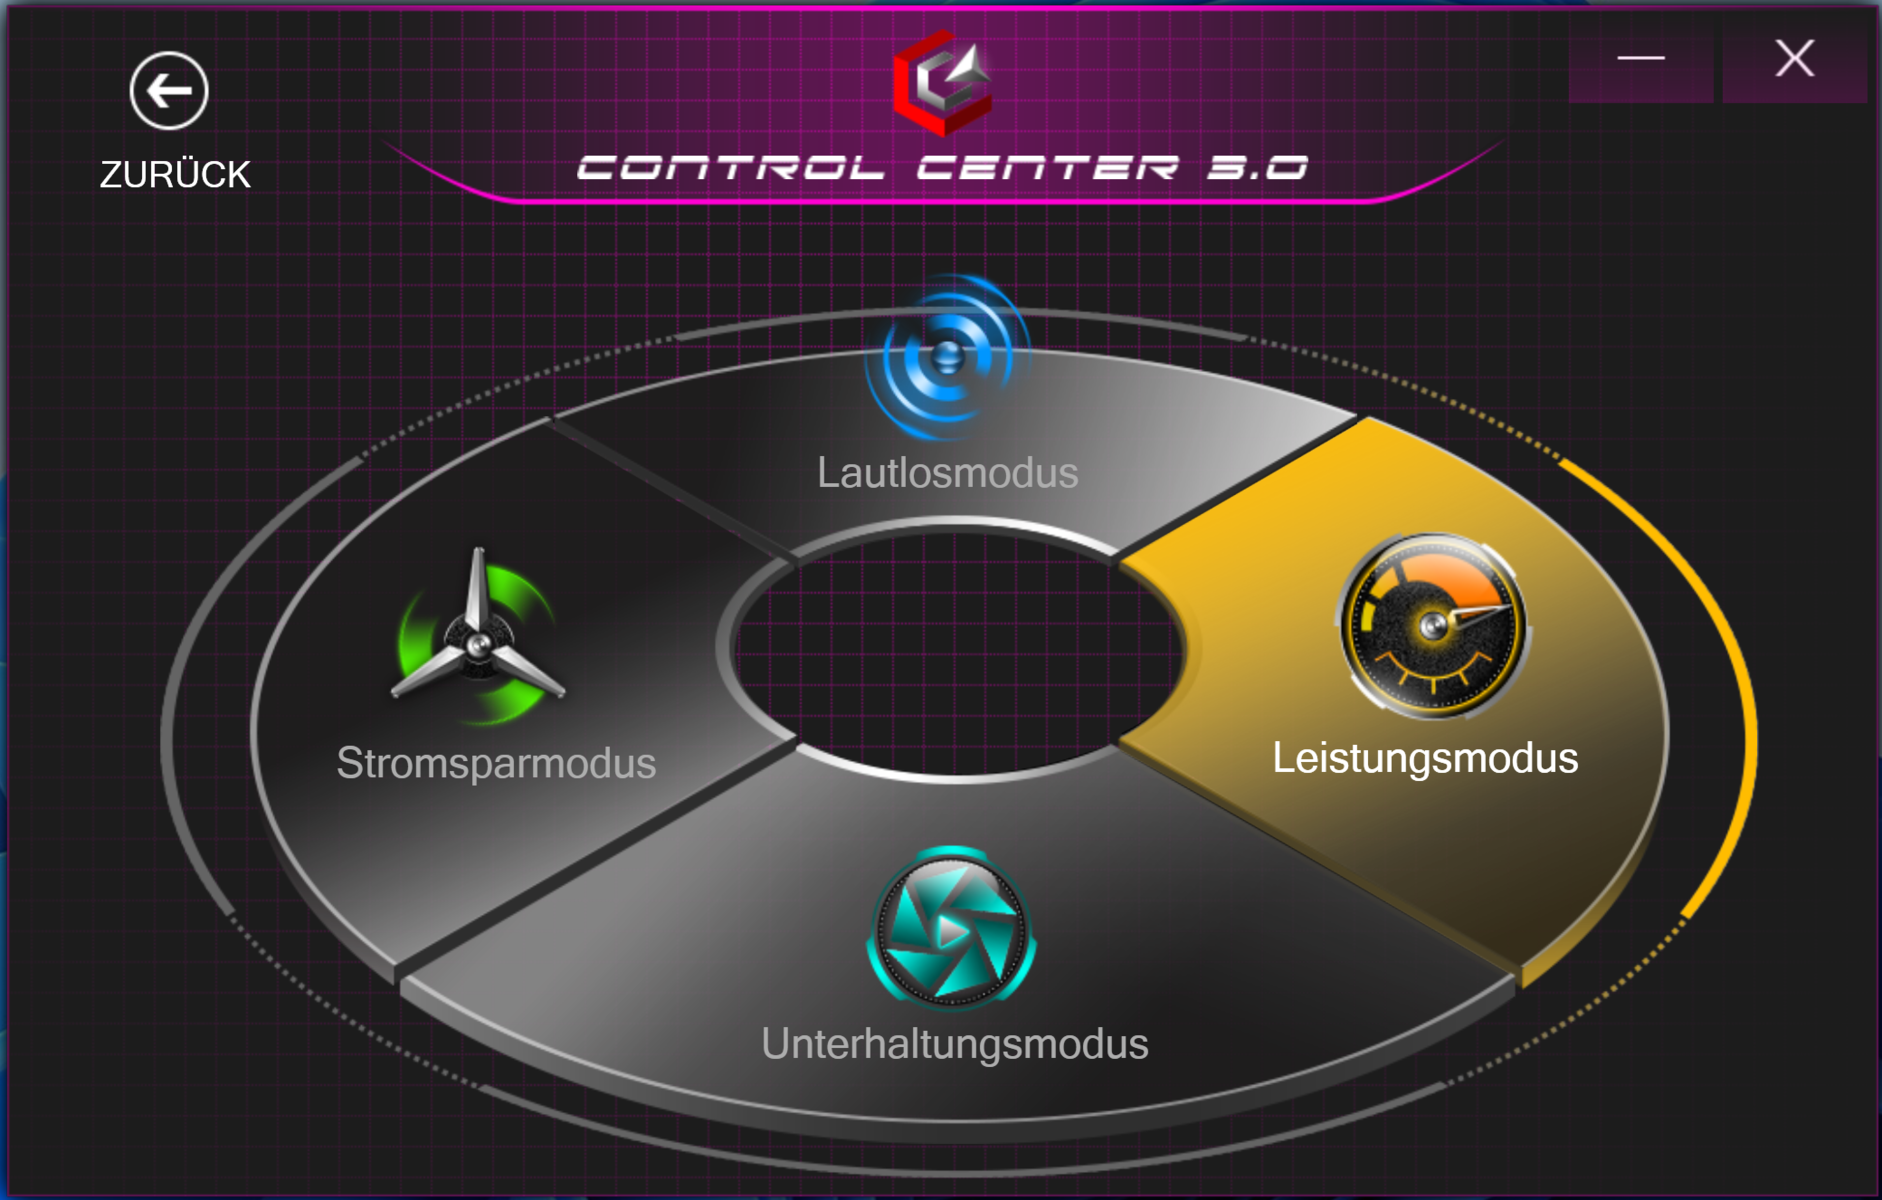
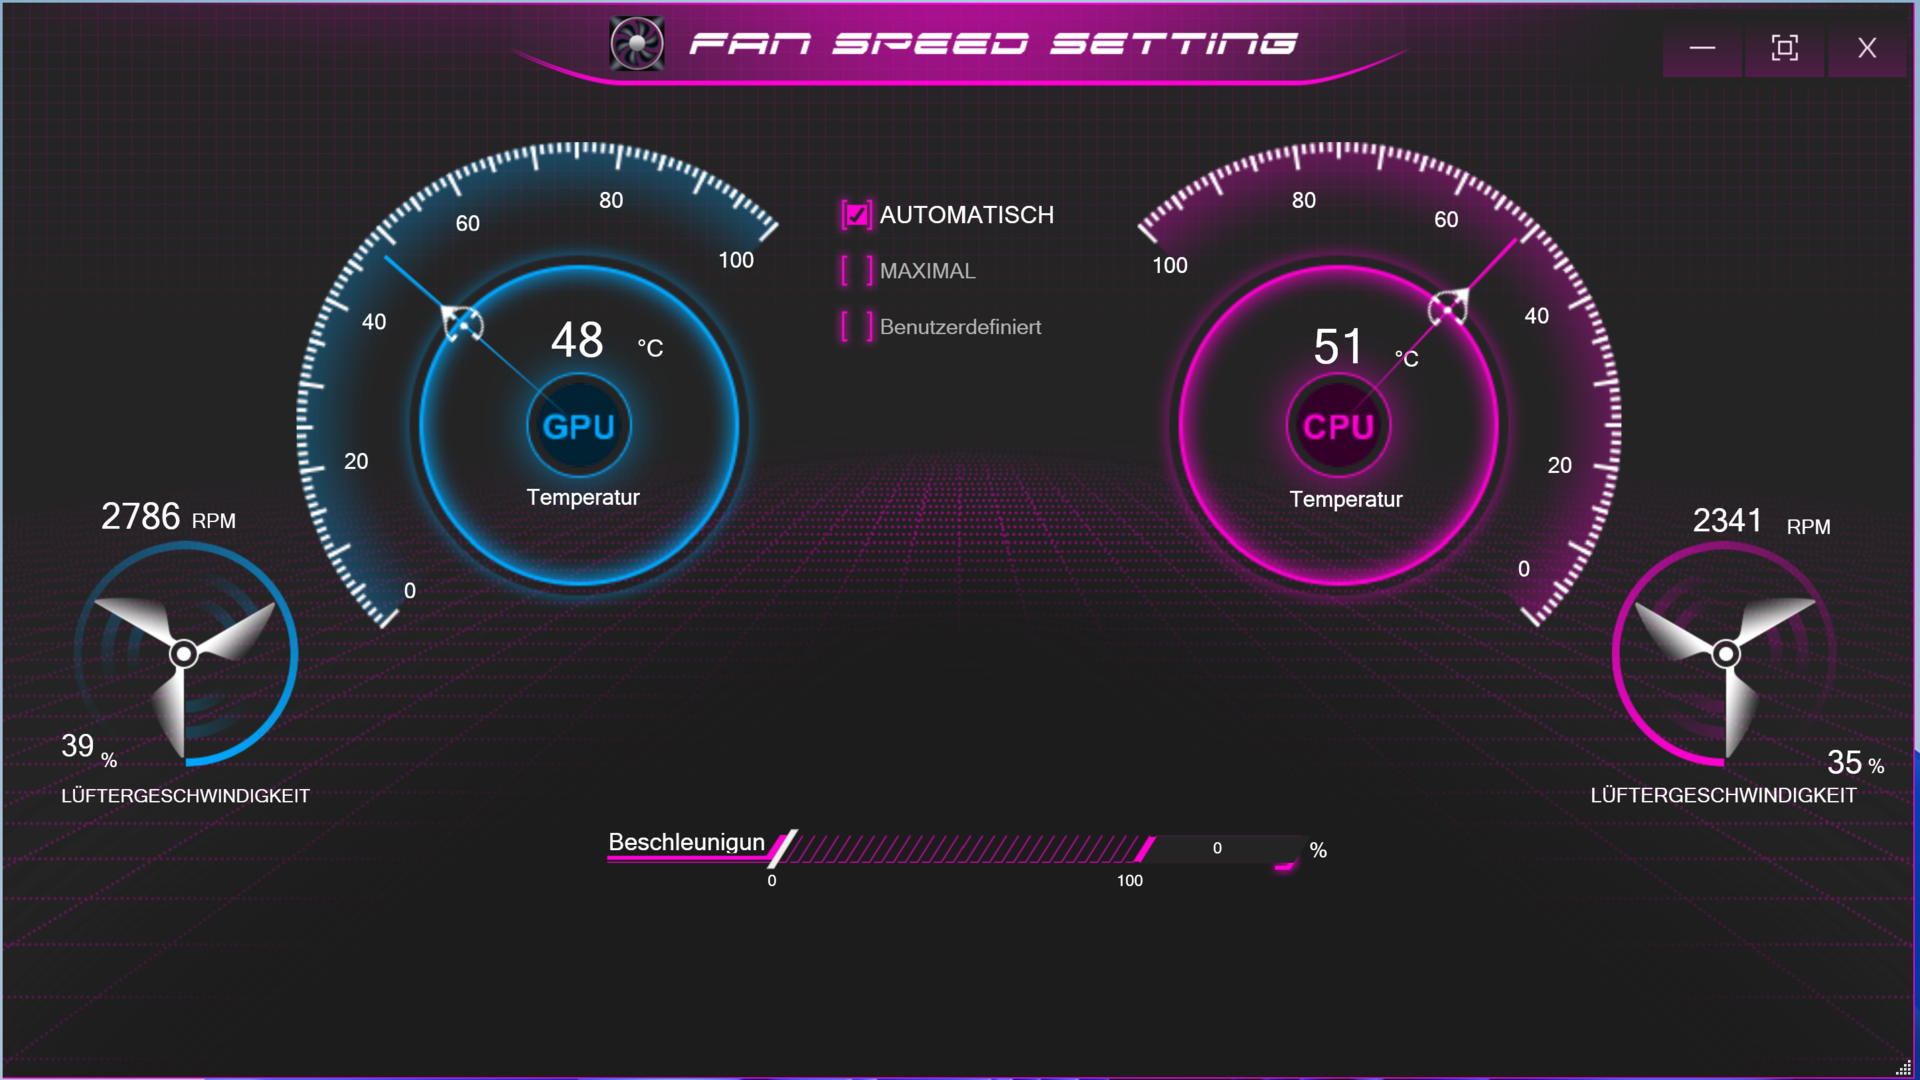
预装的控制中心软件允许用户选择一个电源配置文件(见表),以及其他事项。在运行任何基准测试之前,选择了带有自动风扇控制的性能配置。还使用其他三个配置文件运行了一些基准测试。结果可以在比较表中找到。电池寿命测试是使用 "娱乐模式 "进行的。
| 性能模式 | 娱乐模式 | 省电模式 | 静音模式 | |
|---|---|---|---|---|
| 功率限制1 | 55瓦 | 45瓦 | 20瓦 | 15瓦 |
| 功率限制2 | 135瓦 | 90瓦 | 90瓦 | 90瓦 |
| 最大。TGP | 105 瓦特 | 90 瓦特 | 80 瓦特 | 80 瓦特 |
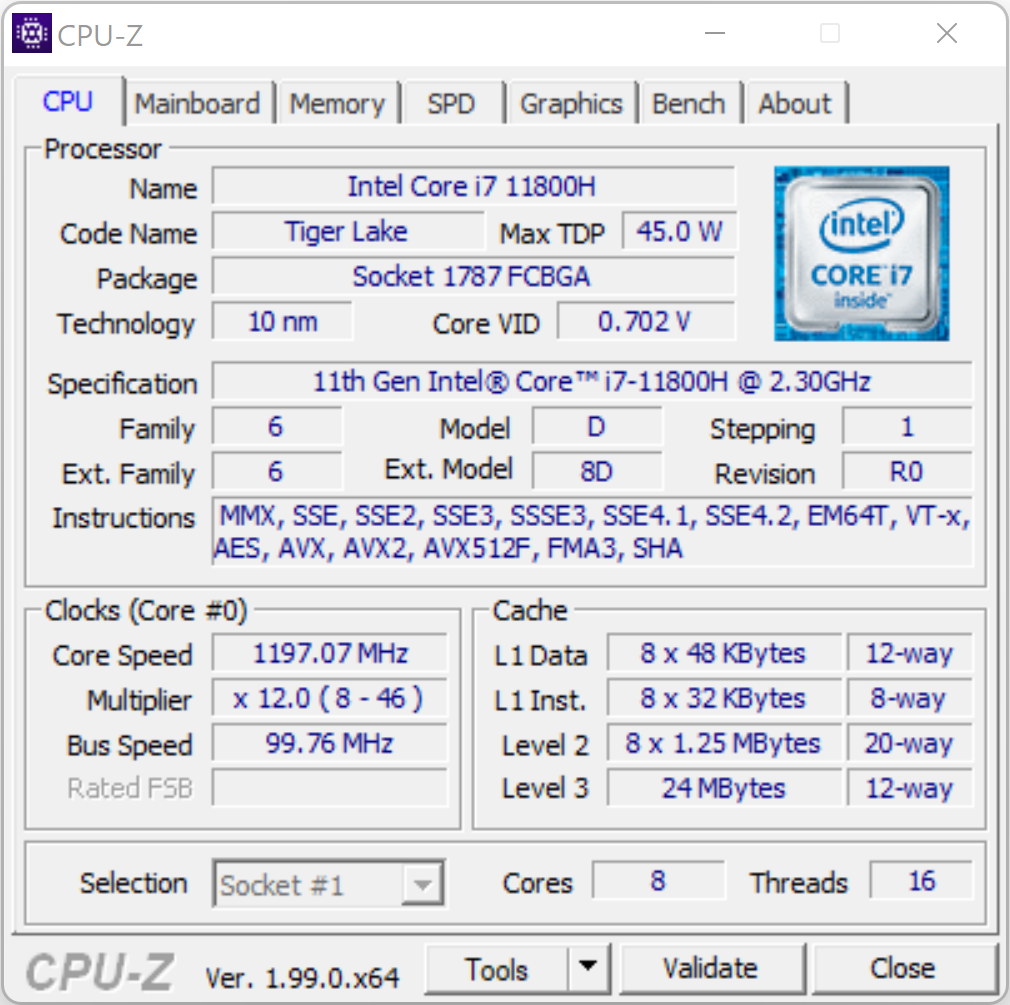
处理器
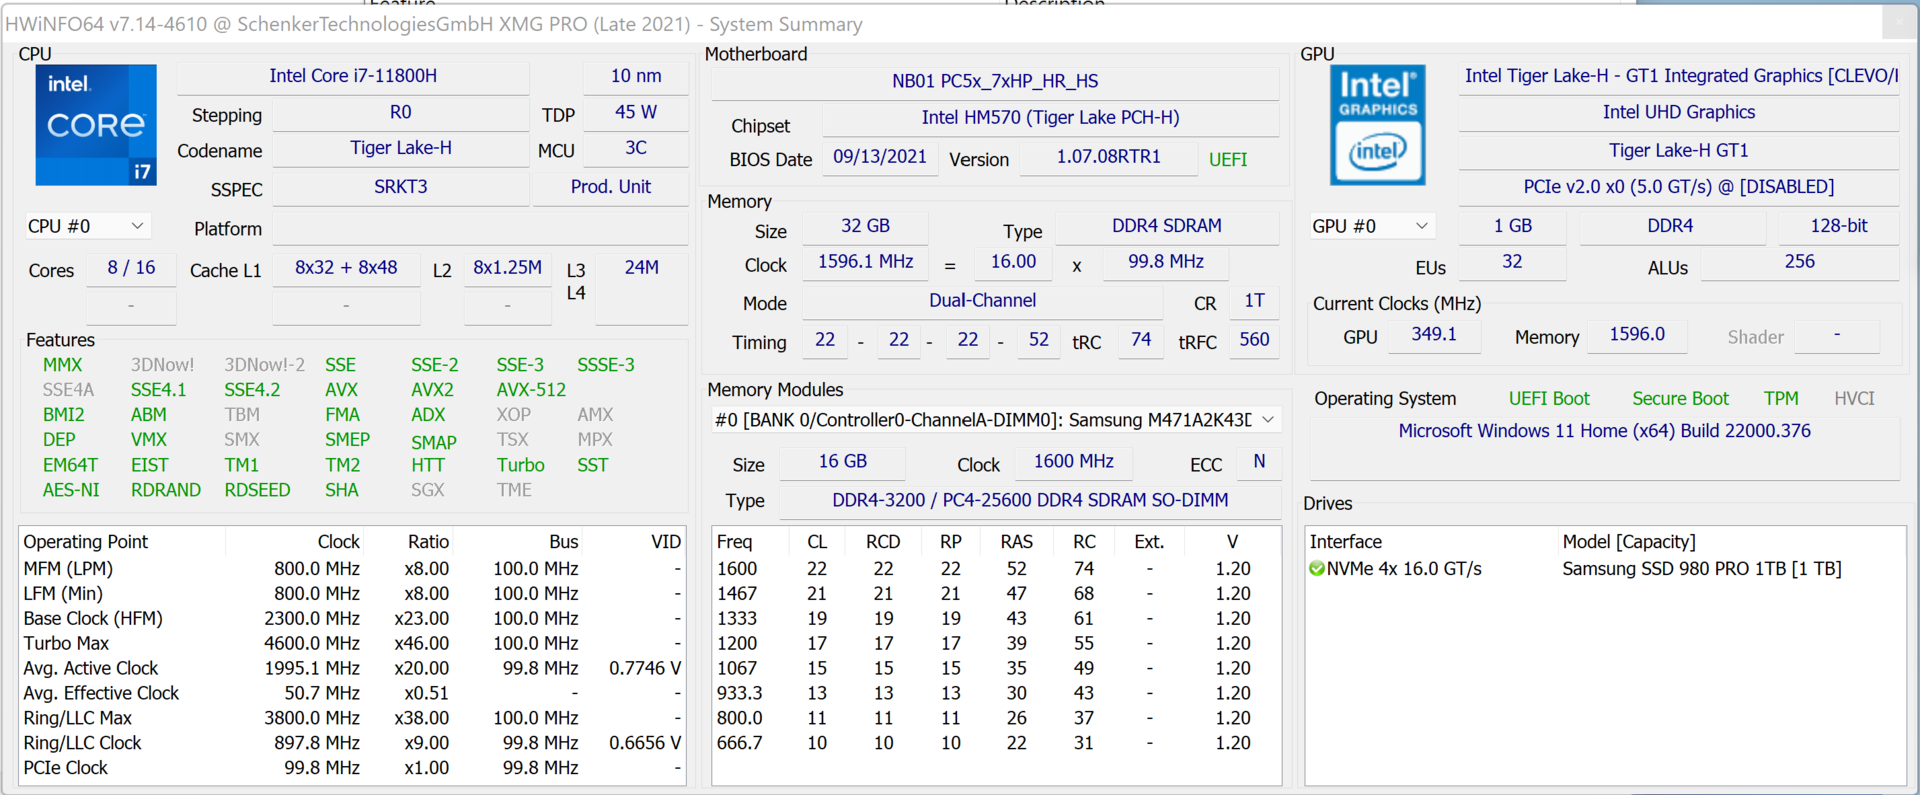
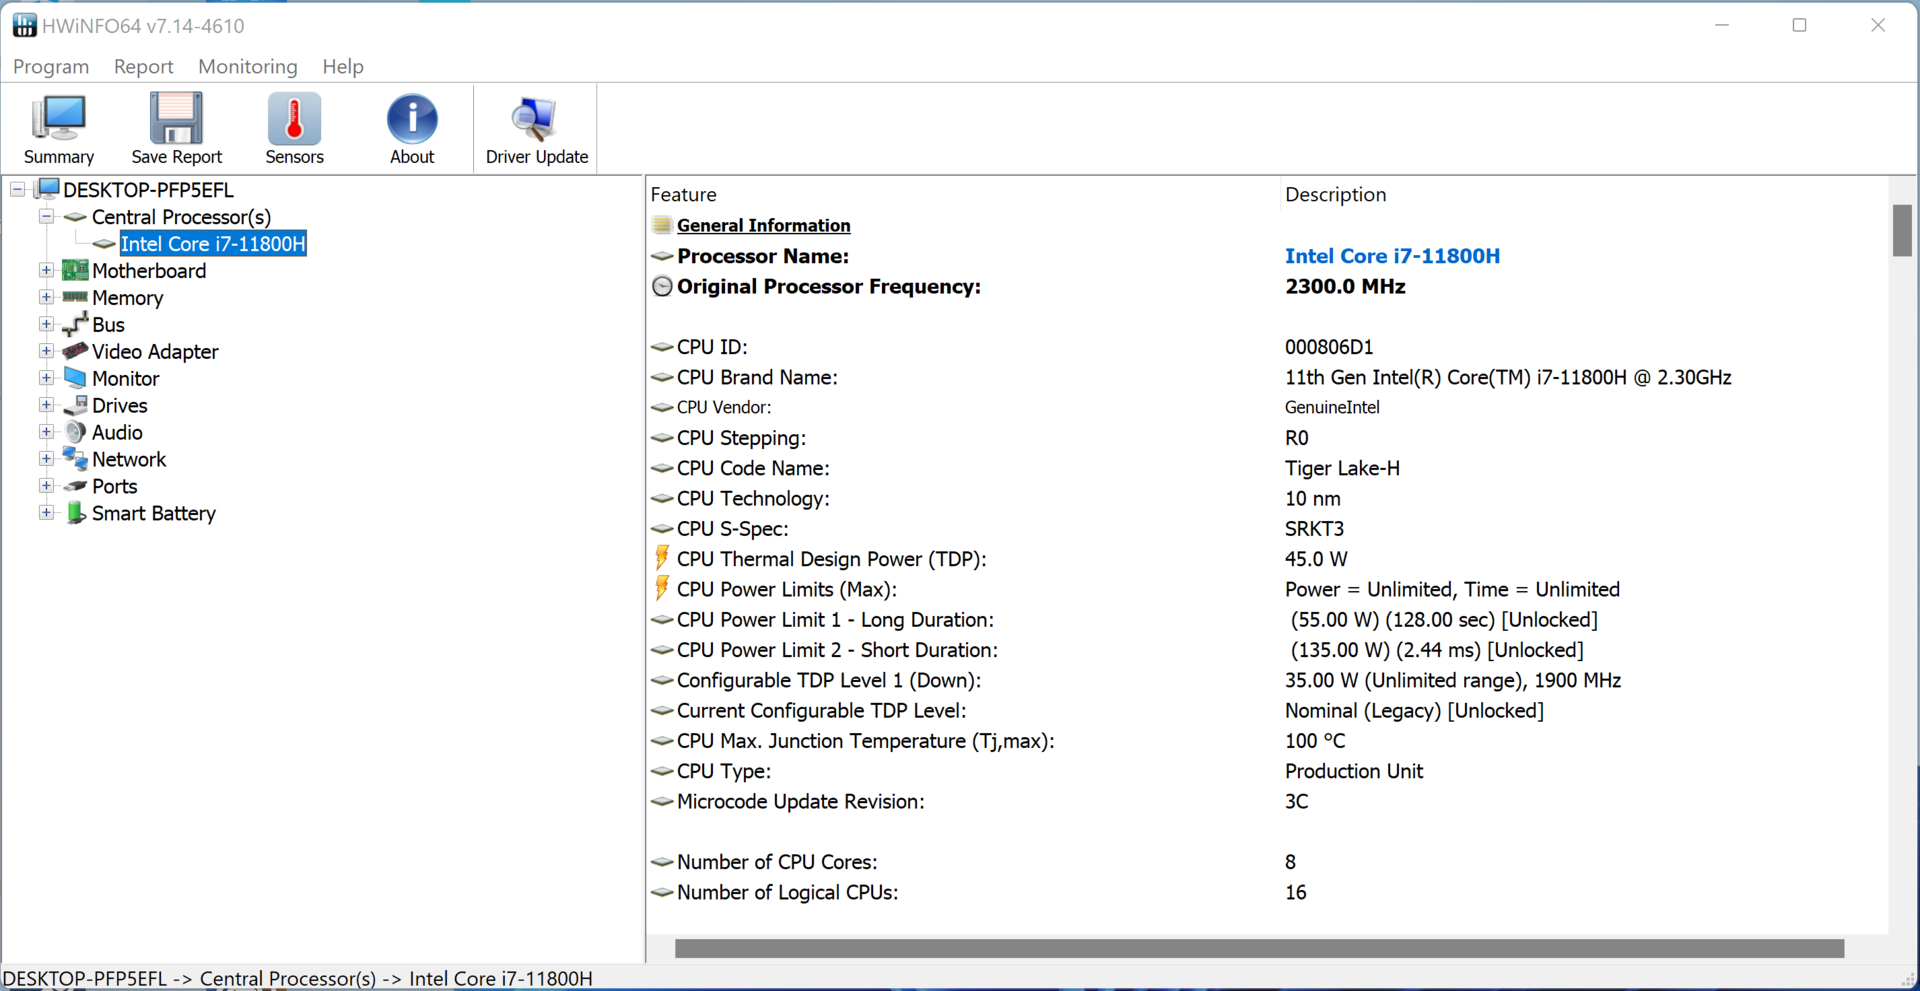
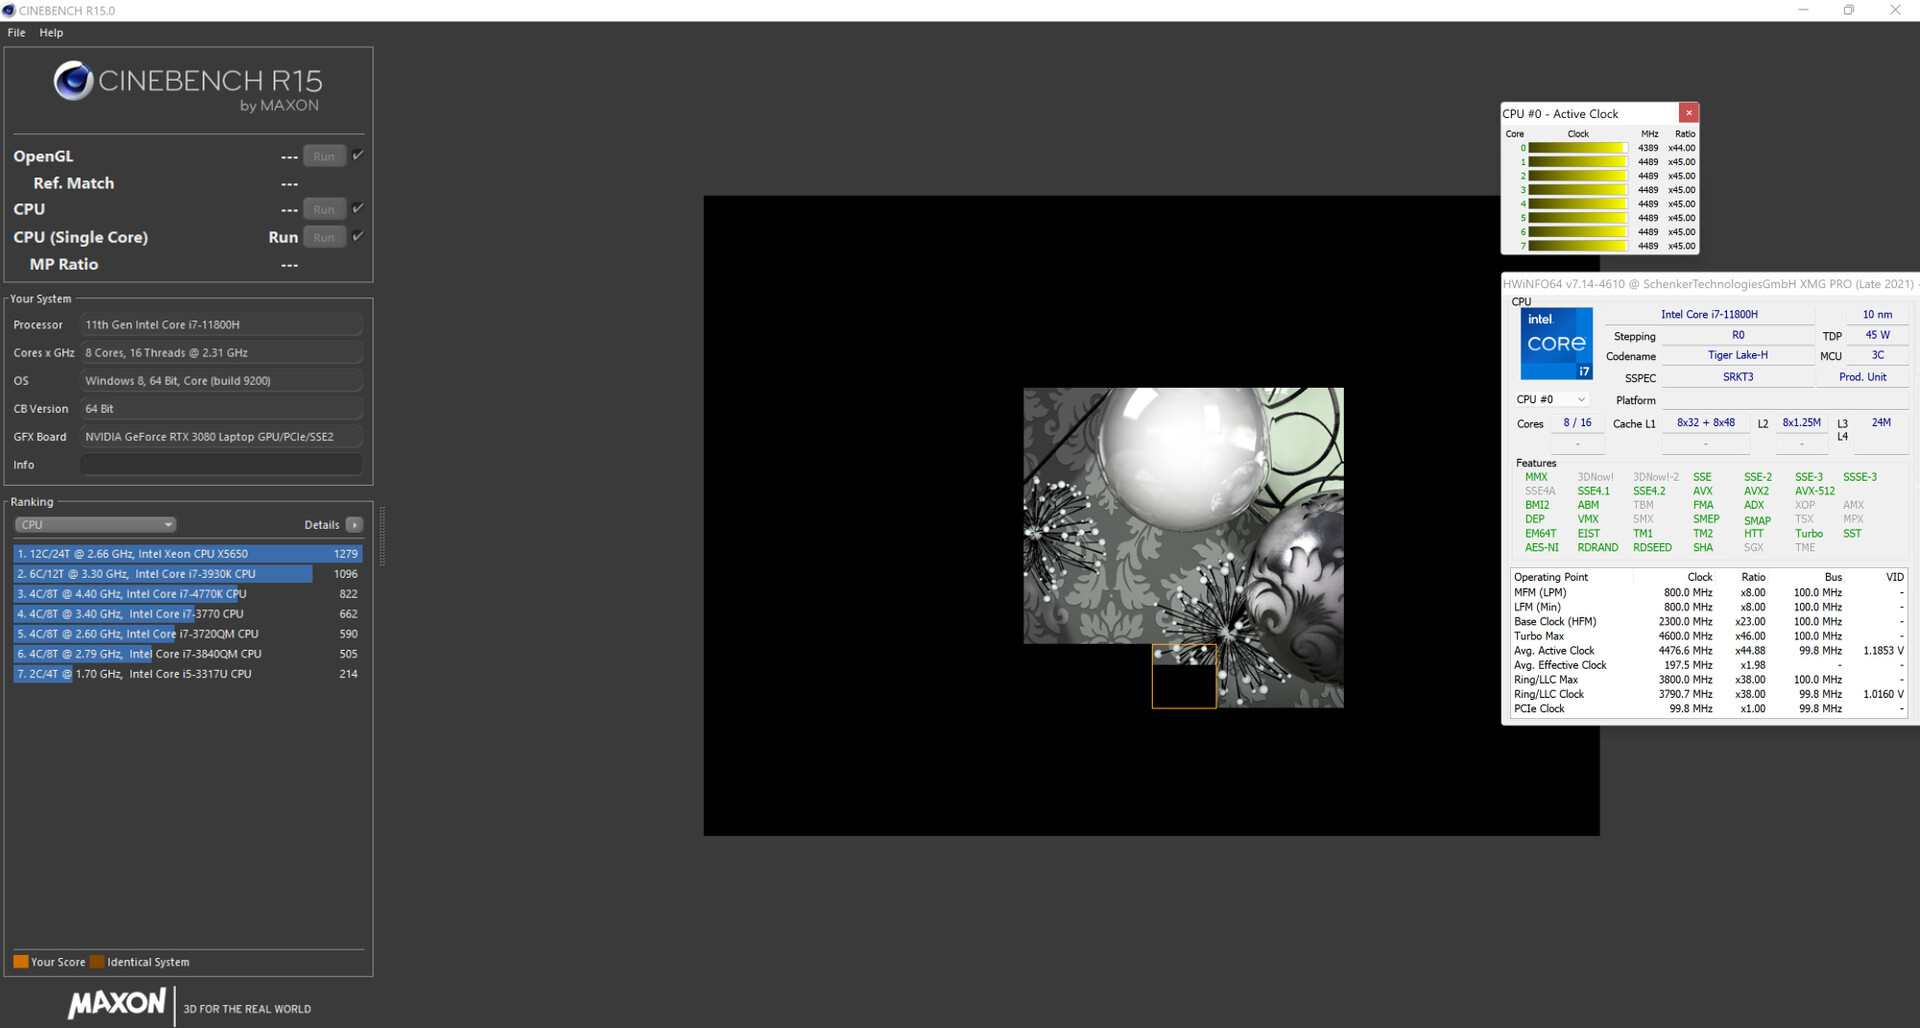
八核处理器 酷睿i7-11800H(Tiger Lake)以2.3 GHz的基本时钟运行。通过涡轮增压,它可提升至4.2 GHz(八个核心)或4.6 GHz(单核心)。支持超线程(每个核心两个线程)。
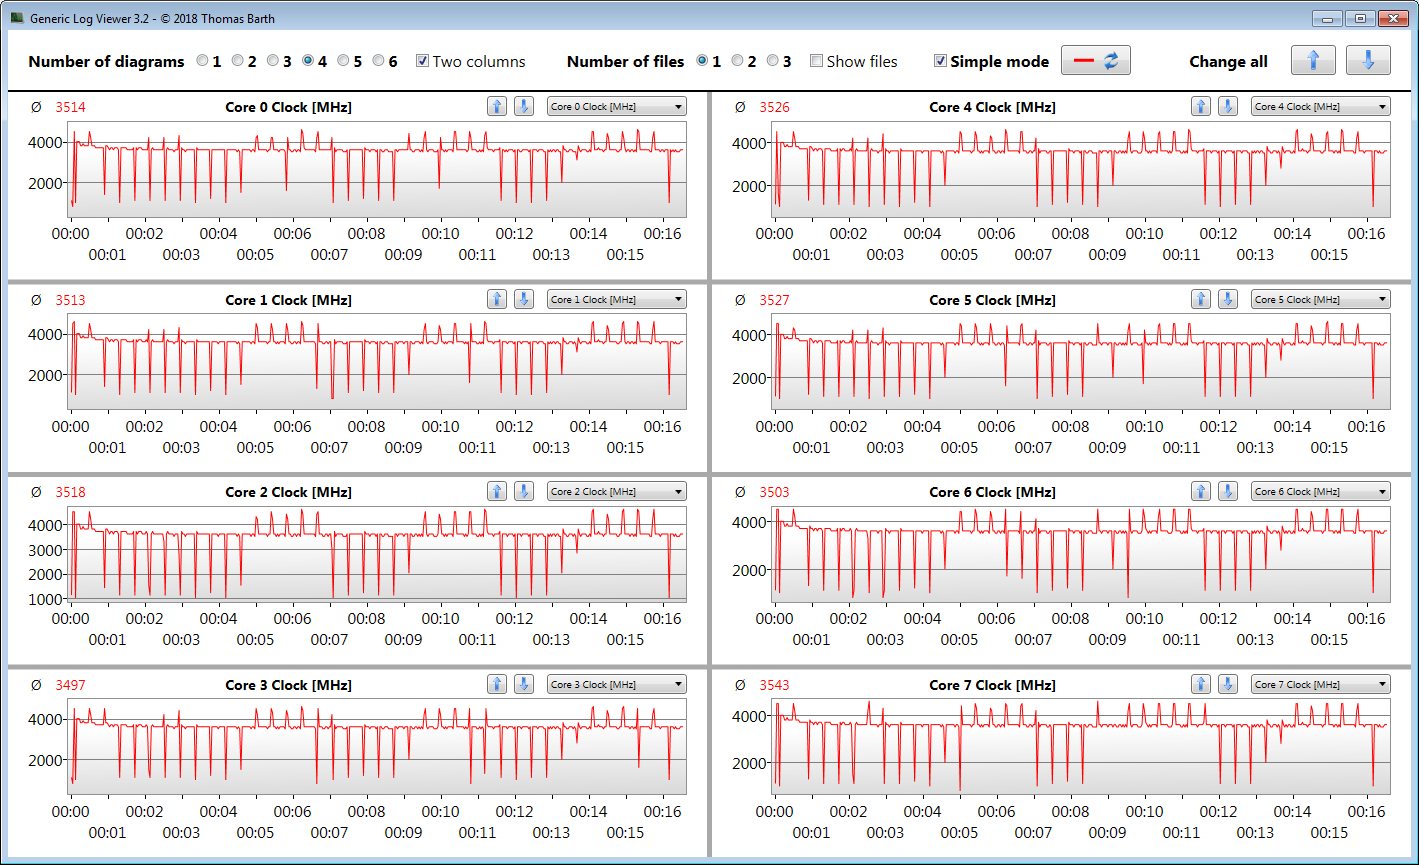
在Cinebench R15 Multi基准测试期间,CPU运行在4至4.1 GHz(主电源)或1至4.1 GHz(电池模式)。在单线程基准测试期间,CPU在两种情况下都以1.6至4.6 GHz的速度运行。
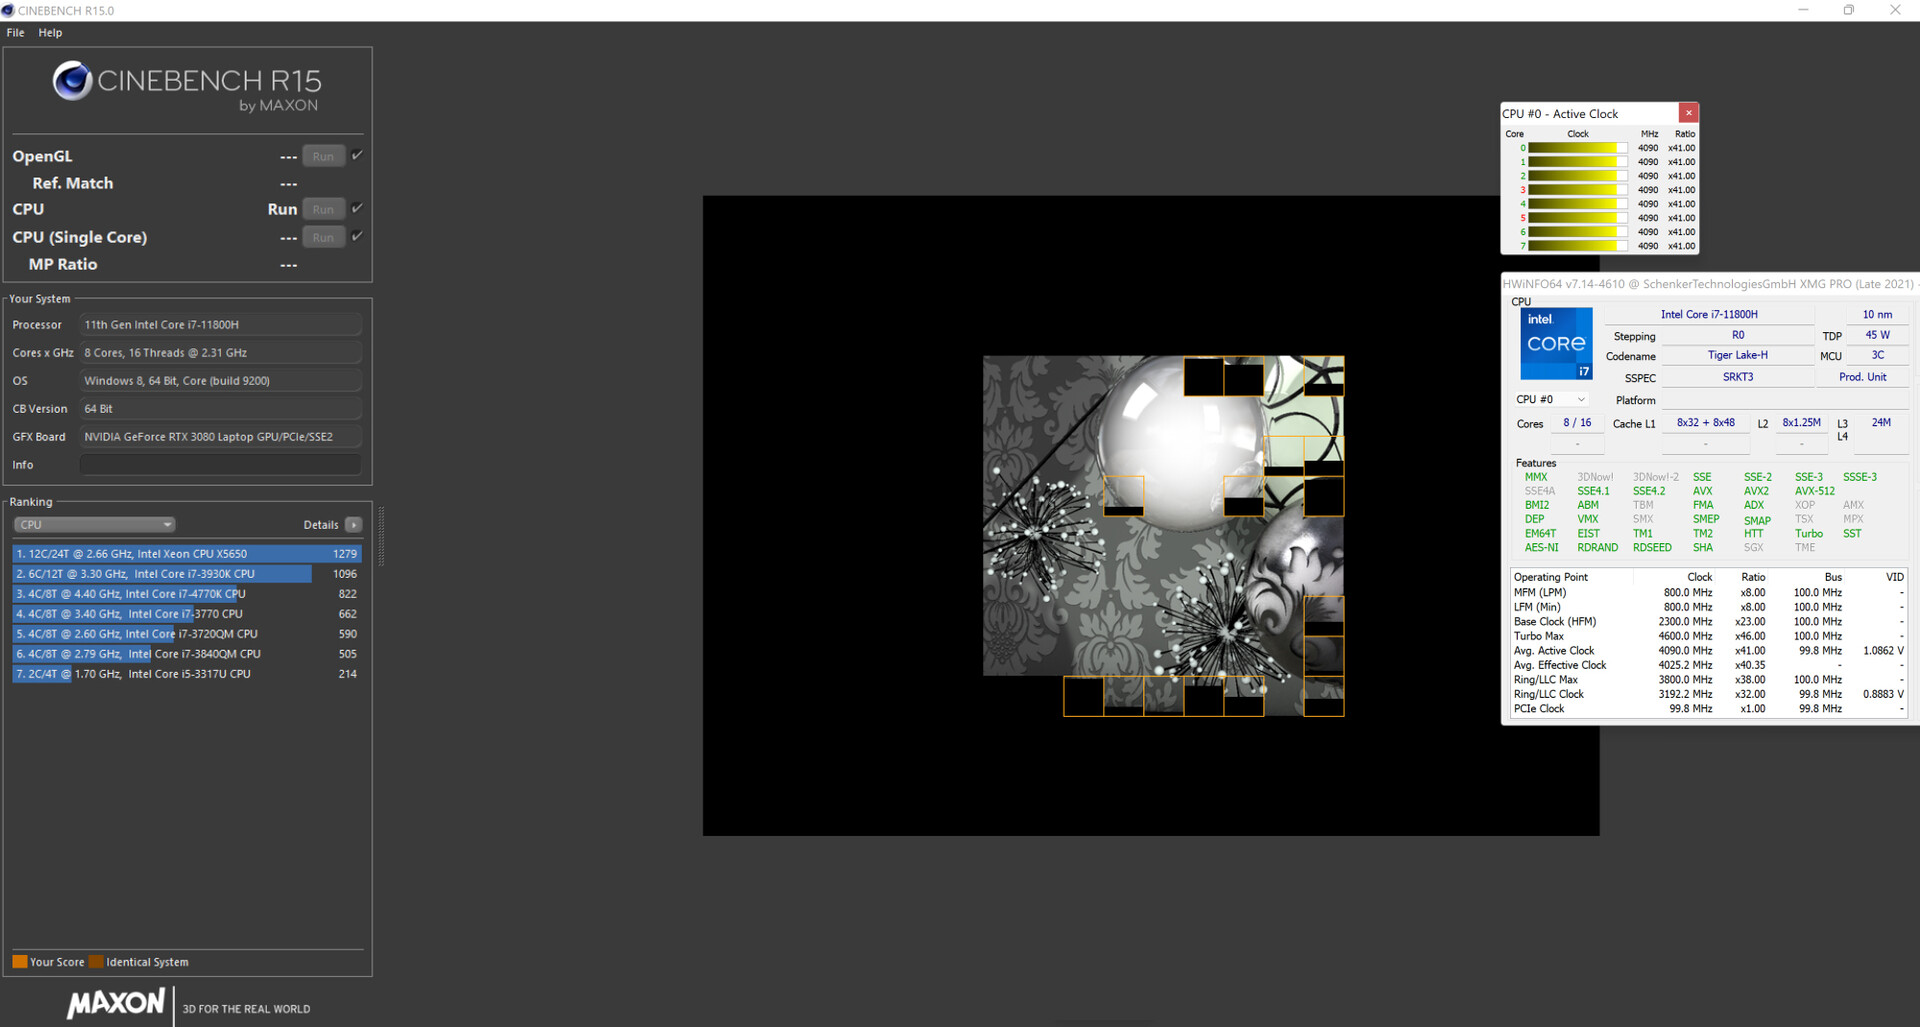
通过循环运行Cinebench R15多线程基准测试至少30分钟,我们确定CPU Turbo Boost是否持续活动。事实证明是这样的,Turbo以高时钟速度运行。
在静音电源配置文件中,性能明显下降。然后,高Turbo Boost频率只是间歇性地实现。不管怎么说,降低的性能对于办公和网络浏览的工作负荷,甚至是轻度游戏来说都是绰绰有余的。
Cinebench R15 Multi Loop


| CPU Performance rating - Percent | |
| Average of class Gaming | |
| MSI Delta 15 A5EFK | |
| Schenker XMG Pro 15 (Late 2021) | |
| Alienware x15 RTX 3070 P111F -2! | |
| Lenovo Legion S7 15ACH6 82K80030GE | |
| Schenker XMG Pro 15 (Late 2021) | |
| Razer Blade 15 Advanced (Mid 2021) -2! | |
| Average Intel Core i7-11800H | |
| Schenker XMG Pro 15 (Late 2021) | |
| Schenker XMG Pro 15 (Early 2021, RTX 3080) | |
| Schenker XMG Pro 15 (Late 2021) | |
| Cinebench R23 | |
| Multi Core | |
| Average of class Gaming (10488 - 42661, n=104, last 2 years) | |
| Alienware x15 RTX 3070 P111F | |
| Lenovo Legion S7 15ACH6 82K80030GE | |
| Schenker XMG Pro 15 (Late 2021) | |
| Schenker XMG Pro 15 (Late 2021) (Unterhaltungsmodus) | |
| Razer Blade 15 Advanced (Mid 2021) | |
| MSI Delta 15 A5EFK | |
| Average Intel Core i7-11800H (6508 - 14088, n=48) | |
| Schenker XMG Pro 15 (Early 2021, RTX 3080) | |
| Schenker XMG Pro 15 (Late 2021) (Stromsparmodus) | |
| Schenker XMG Pro 15 (Late 2021) (Lautlosmodus) | |
| Single Core | |
| Average of class Gaming (1601 - 2415, n=104, last 2 years) | |
| Razer Blade 15 Advanced (Mid 2021) | |
| Schenker XMG Pro 15 (Late 2021) | |
| Alienware x15 RTX 3070 P111F | |
| Schenker XMG Pro 15 (Late 2021) (Unterhaltungsmodus) | |
| Schenker XMG Pro 15 (Late 2021) (Stromsparmodus) | |
| Schenker XMG Pro 15 (Late 2021) (Lautlosmodus) | |
| Average Intel Core i7-11800H (1386 - 1522, n=45) | |
| Lenovo Legion S7 15ACH6 82K80030GE | |
| MSI Delta 15 A5EFK | |
| Schenker XMG Pro 15 (Early 2021, RTX 3080) | |
| Cinebench R20 | |
| CPU (Multi Core) | |
| Average of class Gaming (4029 - 16433, n=103, last 2 years) | |
| Alienware x15 RTX 3070 P111F | |
| Lenovo Legion S7 15ACH6 82K80030GE | |
| Schenker XMG Pro 15 (Late 2021) | |
| Razer Blade 15 Advanced (Mid 2021) | |
| Schenker XMG Pro 15 (Late 2021) (Unterhaltungsmodus) | |
| MSI Delta 15 A5EFK | |
| Average Intel Core i7-11800H (2498 - 5408, n=50) | |
| Schenker XMG Pro 15 (Early 2021, RTX 3080) | |
| Schenker XMG Pro 15 (Late 2021) (Stromsparmodus) | |
| Schenker XMG Pro 15 (Late 2021) (Lautlosmodus) | |
| CPU (Single Core) | |
| Average of class Gaming (622 - 913, n=103, last 2 years) | |
| Schenker XMG Pro 15 (Late 2021) | |
| Razer Blade 15 Advanced (Mid 2021) | |
| Schenker XMG Pro 15 (Late 2021) (Unterhaltungsmodus) | |
| Schenker XMG Pro 15 (Late 2021) (Stromsparmodus) | |
| Alienware x15 RTX 3070 P111F | |
| Schenker XMG Pro 15 (Late 2021) (Lautlosmodus) | |
| Lenovo Legion S7 15ACH6 82K80030GE | |
| MSI Delta 15 A5EFK | |
| Average Intel Core i7-11800H (520 - 586, n=47) | |
| Schenker XMG Pro 15 (Early 2021, RTX 3080) | |
| Cinebench R15 | |
| CPU Multi 64Bit | |
| Average of class Gaming (1578 - 6330, n=102, last 2 years) | |
| Lenovo Legion S7 15ACH6 82K80030GE | |
| Alienware x15 RTX 3070 P111F | |
| MSI Delta 15 A5EFK | |
| Schenker XMG Pro 15 (Late 2021) | |
| Schenker XMG Pro 15 (Late 2021) (Unterhaltungsmodus) | |
| Average Intel Core i7-11800H (1342 - 2173, n=50) | |
| Razer Blade 15 Advanced (Mid 2021) | |
| Schenker XMG Pro 15 (Early 2021, RTX 3080) | |
| Schenker XMG Pro 15 (Late 2021) (Stromsparmodus) | |
| Schenker XMG Pro 15 (Late 2021) (Lautlosmodus) | |
| CPU Single 64Bit | |
| Average of class Gaming (188.8 - 350, n=103, last 2 years) | |
| MSI Delta 15 A5EFK | |
| Lenovo Legion S7 15ACH6 82K80030GE | |
| Schenker XMG Pro 15 (Late 2021) (Stromsparmodus) | |
| Schenker XMG Pro 15 (Late 2021) (Lautlosmodus) | |
| Schenker XMG Pro 15 (Late 2021) (Unterhaltungsmodus) | |
| Razer Blade 15 Advanced (Mid 2021) | |
| Alienware x15 RTX 3070 P111F | |
| Schenker XMG Pro 15 (Late 2021) | |
| Average Intel Core i7-11800H (201 - 231, n=46) | |
| Schenker XMG Pro 15 (Early 2021, RTX 3080) | |
| Blender - v2.79 BMW27 CPU | |
| Schenker XMG Pro 15 (Late 2021) (Lautlosmodus) | |
| Schenker XMG Pro 15 (Late 2021) (Stromsparmodus) | |
| Schenker XMG Pro 15 (Early 2021, RTX 3080) | |
| Average Intel Core i7-11800H (217 - 454, n=46) | |
| Razer Blade 15 Advanced (Mid 2021) | |
| Schenker XMG Pro 15 (Late 2021) (Unterhaltungsmodus) | |
| Schenker XMG Pro 15 (Late 2021) | |
| MSI Delta 15 A5EFK | |
| Lenovo Legion S7 15ACH6 82K80030GE | |
| Alienware x15 RTX 3070 P111F | |
| Average of class Gaming (79 - 330, n=101, last 2 years) | |
| 7-Zip 18.03 | |
| 7z b 4 | |
| Average of class Gaming (33491 - 148086, n=102, last 2 years) | |
| Lenovo Legion S7 15ACH6 82K80030GE | |
| MSI Delta 15 A5EFK | |
| Schenker XMG Pro 15 (Late 2021) | |
| Razer Blade 15 Advanced (Mid 2021) | |
| Schenker XMG Pro 15 (Late 2021) (Unterhaltungsmodus) | |
| Alienware x15 RTX 3070 P111F | |
| Average Intel Core i7-11800H (33718 - 56758, n=46) | |
| Schenker XMG Pro 15 (Early 2021, RTX 3080) | |
| Schenker XMG Pro 15 (Late 2021) (Stromsparmodus) | |
| Schenker XMG Pro 15 (Late 2021) (Lautlosmodus) | |
| 7z b 4 -mmt1 | |
| Average of class Gaming (4824 - 7436, n=102, last 2 years) | |
| Lenovo Legion S7 15ACH6 82K80030GE | |
| MSI Delta 15 A5EFK | |
| Schenker XMG Pro 15 (Late 2021) (Lautlosmodus) | |
| Schenker XMG Pro 15 (Late 2021) | |
| Schenker XMG Pro 15 (Late 2021) (Stromsparmodus) | |
| Average Intel Core i7-11800H (5138 - 5732, n=46) | |
| Schenker XMG Pro 15 (Late 2021) (Unterhaltungsmodus) | |
| Razer Blade 15 Advanced (Mid 2021) | |
| Alienware x15 RTX 3070 P111F | |
| Schenker XMG Pro 15 (Early 2021, RTX 3080) | |
| Geekbench 5.5 | |
| Multi-Core | |
| Average of class Gaming (6460 - 28263, n=102, last 2 years) | |
| Schenker XMG Pro 15 (Late 2021) | |
| Schenker XMG Pro 15 (Late 2021) (Unterhaltungsmodus) | |
| Schenker XMG Pro 15 (Late 2021) (Stromsparmodus) | |
| MSI Delta 15 A5EFK | |
| Lenovo Legion S7 15ACH6 82K80030GE | |
| Average Intel Core i7-11800H (4655 - 9851, n=40) | |
| Schenker XMG Pro 15 (Early 2021, RTX 3080) | |
| Schenker XMG Pro 15 (Late 2021) (Lautlosmodus) | |
| Single-Core | |
| Average of class Gaming (1403 - 2474, n=102, last 2 years) | |
| Schenker XMG Pro 15 (Late 2021) | |
| Schenker XMG Pro 15 (Late 2021) (Stromsparmodus) | |
| MSI Delta 15 A5EFK | |
| Average Intel Core i7-11800H (1429 - 1625, n=40) | |
| Schenker XMG Pro 15 (Late 2021) (Unterhaltungsmodus) | |
| Lenovo Legion S7 15ACH6 82K80030GE | |
| Schenker XMG Pro 15 (Late 2021) (Lautlosmodus) | |
| Schenker XMG Pro 15 (Early 2021, RTX 3080) | |
| HWBOT x265 Benchmark v2.2 - 4k Preset | |
| Average of class Gaming (11.5 - 44.4, n=102, last 2 years) | |
| Alienware x15 RTX 3070 P111F | |
| Lenovo Legion S7 15ACH6 82K80030GE | |
| Schenker XMG Pro 15 (Late 2021) | |
| MSI Delta 15 A5EFK | |
| Razer Blade 15 Advanced (Mid 2021) | |
| Schenker XMG Pro 15 (Late 2021) (Unterhaltungsmodus) | |
| Average Intel Core i7-11800H (7.38 - 17.4, n=46) | |
| Schenker XMG Pro 15 (Early 2021, RTX 3080) | |
| Schenker XMG Pro 15 (Late 2021) (Stromsparmodus) | |
| Schenker XMG Pro 15 (Late 2021) (Lautlosmodus) | |
| LibreOffice - 20 Documents To PDF | |
| Lenovo Legion S7 15ACH6 82K80030GE | |
| Schenker XMG Pro 15 (Early 2021, RTX 3080) | |
| Schenker XMG Pro 15 (Late 2021) (Unterhaltungsmodus) | |
| MSI Delta 15 A5EFK | |
| Average of class Gaming (33.2 - 88.8, n=102, last 2 years) | |
| Alienware x15 RTX 3070 P111F | |
| Schenker XMG Pro 15 (Late 2021) | |
| Average Intel Core i7-11800H (38.6 - 59.9, n=45) | |
| Razer Blade 15 Advanced (Mid 2021) | |
| Schenker XMG Pro 15 (Late 2021) (Lautlosmodus) | |
| Schenker XMG Pro 15 (Late 2021) (Stromsparmodus) | |
| R Benchmark 2.5 - Overall mean | |
| Schenker XMG Pro 15 (Early 2021, RTX 3080) | |
| Schenker XMG Pro 15 (Late 2021) (Lautlosmodus) | |
| Schenker XMG Pro 15 (Late 2021) (Stromsparmodus) | |
| Alienware x15 RTX 3070 P111F | |
| Average Intel Core i7-11800H (0.548 - 0.615, n=46) | |
| Schenker XMG Pro 15 (Late 2021) (Unterhaltungsmodus) | |
| Razer Blade 15 Advanced (Mid 2021) | |
| Schenker XMG Pro 15 (Late 2021) | |
| MSI Delta 15 A5EFK | |
| Lenovo Legion S7 15ACH6 82K80030GE | |
| Average of class Gaming (0.3439 - 0.59, n=102, last 2 years) | |
* ... smaller is better
AIDA64: FP32 Ray-Trace | FPU Julia | CPU SHA3 | CPU Queen | FPU SinJulia | FPU Mandel | CPU AES | CPU ZLib | FP64 Ray-Trace | CPU PhotoWorxx
| Performance rating | |
| Average of class Gaming | |
| Lenovo Legion S7 15ACH6 82K80030GE | |
| MSI Delta 15 A5EFK | |
| Schenker XMG Pro 15 (Late 2021) | |
| Average Intel Core i7-11800H | |
| Schenker XMG Pro 15 (Late 2021) | |
| Schenker XMG Pro 15 (Early 2021, RTX 3080) | |
| Schenker XMG Pro 15 (Late 2021) | |
| Alienware x15 RTX 3070 P111F -9! | |
| Razer Blade 15 Advanced (Mid 2021) -9! | |
| AIDA64 / FP32 Ray-Trace | |
| Average of class Gaming (10227 - 85542, n=102, last 2 years) | |
| Lenovo Legion S7 15ACH6 82K80030GE (v6.33.5700) | |
| Schenker XMG Pro 15 (Late 2021) (v6.50.5800) | |
| MSI Delta 15 A5EFK (v6.33.5700) | |
| Average Intel Core i7-11800H (8772 - 15961, n=20) | |
| Schenker XMG Pro 15 (Early 2021, RTX 3080) (v6.32.5600) | |
| Schenker XMG Pro 15 (Late 2021) (v6.50.5800, Stromsparmodus) | |
| Schenker XMG Pro 15 (Late 2021) (v6.50.5800, Lautlosmodus) | |
| AIDA64 / FPU Julia | |
| Average of class Gaming (51376 - 372155, n=102, last 2 years) | |
| Lenovo Legion S7 15ACH6 82K80030GE (v6.33.5700) | |
| MSI Delta 15 A5EFK (v6.33.5700) | |
| Schenker XMG Pro 15 (Late 2021) (v6.50.5800) | |
| Schenker XMG Pro 15 (Early 2021, RTX 3080) (v6.32.5600) | |
| Average Intel Core i7-11800H (39404 - 65636, n=20) | |
| Schenker XMG Pro 15 (Late 2021) (v6.50.5800, Stromsparmodus) | |
| Schenker XMG Pro 15 (Late 2021) (v6.50.5800, Lautlosmodus) | |
| AIDA64 / CPU SHA3 | |
| Average of class Gaming (2180 - 10115, n=102, last 2 years) | |
| Schenker XMG Pro 15 (Late 2021) (v6.50.5800) | |
| Average Intel Core i7-11800H (2599 - 4439, n=20) | |
| Lenovo Legion S7 15ACH6 82K80030GE (v6.33.5700) | |
| Schenker XMG Pro 15 (Early 2021, RTX 3080) (v6.32.5600) | |
| MSI Delta 15 A5EFK (v6.33.5700) | |
| Schenker XMG Pro 15 (Late 2021) (v6.50.5800, Stromsparmodus) | |
| Schenker XMG Pro 15 (Late 2021) (v6.50.5800, Lautlosmodus) | |
| AIDA64 / CPU Queen | |
| Average of class Gaming (49785 - 173351, n=86, last 2 years) | |
| MSI Delta 15 A5EFK (v6.33.5700) | |
| Lenovo Legion S7 15ACH6 82K80030GE (v6.33.5700) | |
| Schenker XMG Pro 15 (Late 2021) (v6.50.5800) | |
| Schenker XMG Pro 15 (Late 2021) (v6.50.5800, Lautlosmodus) | |
| Schenker XMG Pro 15 (Late 2021) (v6.50.5800, Stromsparmodus) | |
| Average Intel Core i7-11800H (85233 - 91941, n=20) | |
| Schenker XMG Pro 15 (Early 2021, RTX 3080) (v6.32.5600) | |
| AIDA64 / FPU SinJulia | |
| Average of class Gaming (4424 - 33636, n=102, last 2 years) | |
| MSI Delta 15 A5EFK (v6.33.5700) | |
| Lenovo Legion S7 15ACH6 82K80030GE (v6.33.5700) | |
| Schenker XMG Pro 15 (Late 2021) (v6.50.5800) | |
| Schenker XMG Pro 15 (Early 2021, RTX 3080) (v6.32.5600) | |
| Average Intel Core i7-11800H (6420 - 9792, n=20) | |
| Schenker XMG Pro 15 (Late 2021) (v6.50.5800, Stromsparmodus) | |
| Schenker XMG Pro 15 (Late 2021) (v6.50.5800, Lautlosmodus) | |
| AIDA64 / FPU Mandel | |
| Average of class Gaming (25115 - 196829, n=102, last 2 years) | |
| Lenovo Legion S7 15ACH6 82K80030GE (v6.33.5700) | |
| MSI Delta 15 A5EFK (v6.33.5700) | |
| Schenker XMG Pro 15 (Late 2021) (v6.50.5800) | |
| Average Intel Core i7-11800H (23365 - 39464, n=20) | |
| Schenker XMG Pro 15 (Early 2021, RTX 3080) (v6.32.5600) | |
| Schenker XMG Pro 15 (Late 2021) (v6.50.5800, Stromsparmodus) | |
| Schenker XMG Pro 15 (Late 2021) (v6.50.5800, Lautlosmodus) | |
| AIDA64 / CPU AES | |
| Schenker XMG Pro 15 (Late 2021) (v6.50.5800) | |
| Lenovo Legion S7 15ACH6 82K80030GE (v6.33.5700) | |
| MSI Delta 15 A5EFK (v6.33.5700) | |
| Average Intel Core i7-11800H (74617 - 149388, n=20) | |
| Average of class Gaming (39258 - 247074, n=102, last 2 years) | |
| Schenker XMG Pro 15 (Late 2021) (v6.50.5800, Stromsparmodus) | |
| Schenker XMG Pro 15 (Late 2021) (v6.50.5800, Lautlosmodus) | |
| Schenker XMG Pro 15 (Early 2021, RTX 3080) (v6.32.5600) | |
| AIDA64 / CPU ZLib | |
| Average of class Gaming (574 - 2531, n=102, last 2 years) | |
| Lenovo Legion S7 15ACH6 82K80030GE (v6.33.5700) | |
| MSI Delta 15 A5EFK (v6.33.5700) | |
| Schenker XMG Pro 15 (Late 2021) (v6.50.5800) | |
| Schenker XMG Pro 15 (Early 2021, RTX 3080) (v6.32.5600) | |
| Schenker XMG Pro 15 (Late 2021) (v6.50.5800, Stromsparmodus) | |
| Schenker XMG Pro 15 (Late 2021) (v6.50.5800, Lautlosmodus) | |
| Average Intel Core i7-11800H (461 - 830, n=43) | |
| Razer Blade 15 Advanced (Mid 2021) (v6.33.5700) | |
| Alienware x15 RTX 3070 P111F (v6.33.5700) | |
| AIDA64 / FP64 Ray-Trace | |
| Average of class Gaming (5509 - 45446, n=102, last 2 years) | |
| Schenker XMG Pro 15 (Late 2021) (v6.50.5800) | |
| Lenovo Legion S7 15ACH6 82K80030GE (v6.33.5700) | |
| MSI Delta 15 A5EFK (v6.33.5700) | |
| Average Intel Core i7-11800H (4545 - 8717, n=21) | |
| Schenker XMG Pro 15 (Early 2021, RTX 3080) (v6.32.5600) | |
| Schenker XMG Pro 15 (Late 2021) (v6.50.5800, Stromsparmodus) | |
| Schenker XMG Pro 15 (Late 2021) (v6.50.5800, Lautlosmodus) | |
| AIDA64 / CPU PhotoWorxx | |
| Average of class Gaming (12271 - 89891, n=102, last 2 years) | |
| Schenker XMG Pro 15 (Late 2021) (v6.50.5800) | |
| Schenker XMG Pro 15 (Late 2021) (v6.50.5800, Stromsparmodus) | |
| Schenker XMG Pro 15 (Late 2021) (v6.50.5800, Lautlosmodus) | |
| Average Intel Core i7-11800H (11898 - 26757, n=21) | |
| MSI Delta 15 A5EFK (v6.33.5700) | |
| Schenker XMG Pro 15 (Early 2021, RTX 3080) (v6.32.5600) | |
| Lenovo Legion S7 15ACH6 82K80030GE (v6.33.5700) | |
系统性能
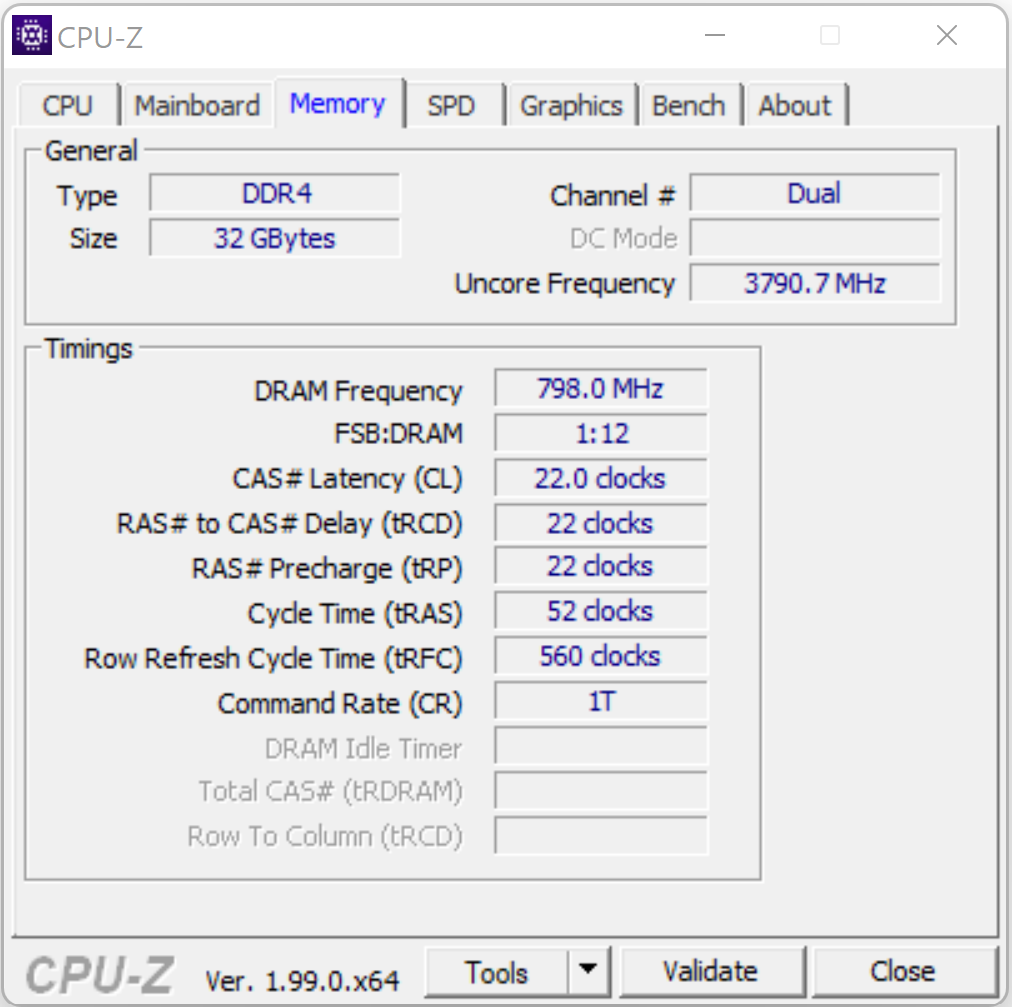
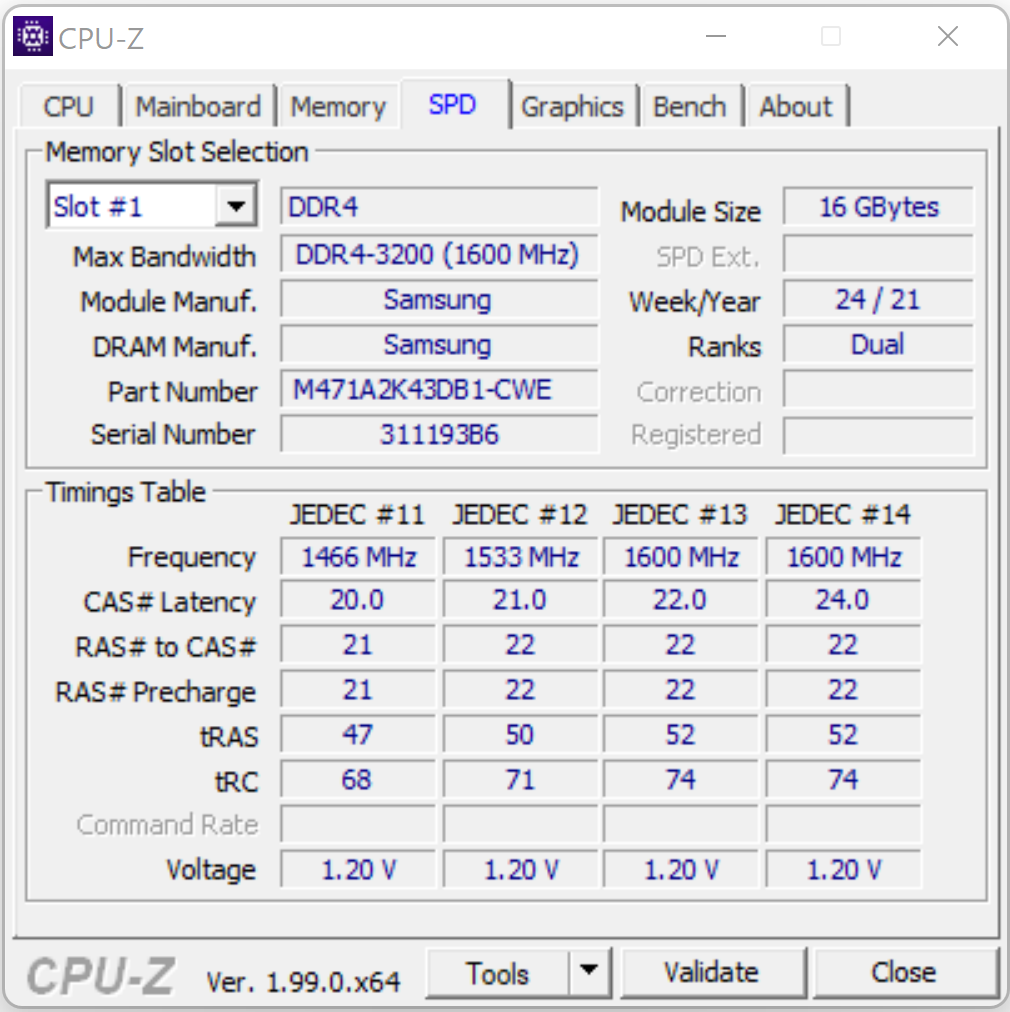
该系统感觉很流畅,反应迅速。这些组件对于游戏以及视频和照片编辑等苛刻的工作负荷来说是绰绰有余的。内存的传输率符合我们对DDR4-3200内存的期望。最后,PCMark的结果很好。
| PCMark 8 Home Score Accelerated v2 | 3941 points | |
| PCMark 8 Creative Score Accelerated v2 | 6411 points | |
| PCMark 8 Work Score Accelerated v2 | 4756 points | |
| PCMark 10 Score | 6673 points | |
Help | ||
| PCMark 10 / Score | |
| Average of class Gaming (5828 - 12414, n=93, last 2 years) | |
| Razer Blade 15 Advanced (Mid 2021) | |
| MSI Delta 15 A5EFK | |
| Alienware x15 RTX 3070 P111F | |
| Average Intel Core i7-11800H, NVIDIA GeForce RTX 3080 Laptop GPU (6673 - 7470, n=11) | |
| Schenker XMG Pro 15 (Late 2021) | |
| Lenovo Legion S7 15ACH6 82K80030GE | |
| Schenker XMG Pro 15 (Early 2021, RTX 3080) | |
| PCMark 10 / Essentials | |
| Razer Blade 15 Advanced (Mid 2021) | |
| Average of class Gaming (8810 - 11935, n=97, last 2 years) | |
| MSI Delta 15 A5EFK | |
| Alienware x15 RTX 3070 P111F | |
| Average Intel Core i7-11800H, NVIDIA GeForce RTX 3080 Laptop GPU (9862 - 11064, n=11) | |
| Schenker XMG Pro 15 (Late 2021) | |
| Lenovo Legion S7 15ACH6 82K80030GE | |
| Schenker XMG Pro 15 (Early 2021, RTX 3080) | |
| PCMark 10 / Productivity | |
| Average of class Gaming (6845 - 25323, n=95, last 2 years) | |
| MSI Delta 15 A5EFK | |
| Average Intel Core i7-11800H, NVIDIA GeForce RTX 3080 Laptop GPU (8278 - 9803, n=11) | |
| Alienware x15 RTX 3070 P111F | |
| Razer Blade 15 Advanced (Mid 2021) | |
| Lenovo Legion S7 15ACH6 82K80030GE | |
| Schenker XMG Pro 15 (Early 2021, RTX 3080) | |
| Schenker XMG Pro 15 (Late 2021) | |
| PCMark 10 / Digital Content Creation | |
| Average of class Gaming (7602 - 19954, n=95, last 2 years) | |
| Alienware x15 RTX 3070 P111F | |
| Razer Blade 15 Advanced (Mid 2021) | |
| MSI Delta 15 A5EFK | |
| Average Intel Core i7-11800H, NVIDIA GeForce RTX 3080 Laptop GPU (9881 - 11323, n=11) | |
| Schenker XMG Pro 15 (Late 2021) | |
| Schenker XMG Pro 15 (Early 2021, RTX 3080) | |
| Lenovo Legion S7 15ACH6 82K80030GE | |
| AIDA64 / Memory Copy | |
| Average of class Gaming (21750 - 129946, n=102, last 2 years) | |
| Schenker XMG Pro 15 (Late 2021) | |
| Average Intel Core i7-11800H (24508 - 48144, n=21) | |
| MSI Delta 15 A5EFK | |
| Lenovo Legion S7 15ACH6 82K80030GE | |
| Schenker XMG Pro 15 (Early 2021, RTX 3080) | |
| AIDA64 / Memory Read | |
| Average of class Gaming (22956 - 118858, n=102, last 2 years) | |
| Schenker XMG Pro 15 (Late 2021) | |
| MSI Delta 15 A5EFK | |
| Lenovo Legion S7 15ACH6 82K80030GE | |
| Average Intel Core i7-11800H (25882 - 50365, n=20) | |
| Schenker XMG Pro 15 (Early 2021, RTX 3080) | |
| AIDA64 / Memory Write | |
| Average of class Gaming (22297 - 135096, n=102, last 2 years) | |
| Schenker XMG Pro 15 (Late 2021) | |
| MSI Delta 15 A5EFK | |
| Average Intel Core i7-11800H (22240 - 46214, n=20) | |
| Lenovo Legion S7 15ACH6 82K80030GE | |
| Schenker XMG Pro 15 (Early 2021, RTX 3080) | |
| AIDA64 / Memory Latency | |
| Average of class Gaming (75.3 - 165.4, n=102, last 2 years) | |
| Schenker XMG Pro 15 (Late 2021) | |
| Lenovo Legion S7 15ACH6 82K80030GE | |
| MSI Delta 15 A5EFK | |
| Schenker XMG Pro 15 (Early 2021, RTX 3080) | |
| Average Intel Core i7-11800H (71.9 - 104.1, n=44) | |
| Razer Blade 15 Advanced (Mid 2021) | |
| Alienware x15 RTX 3070 P111F | |
* ... smaller is better
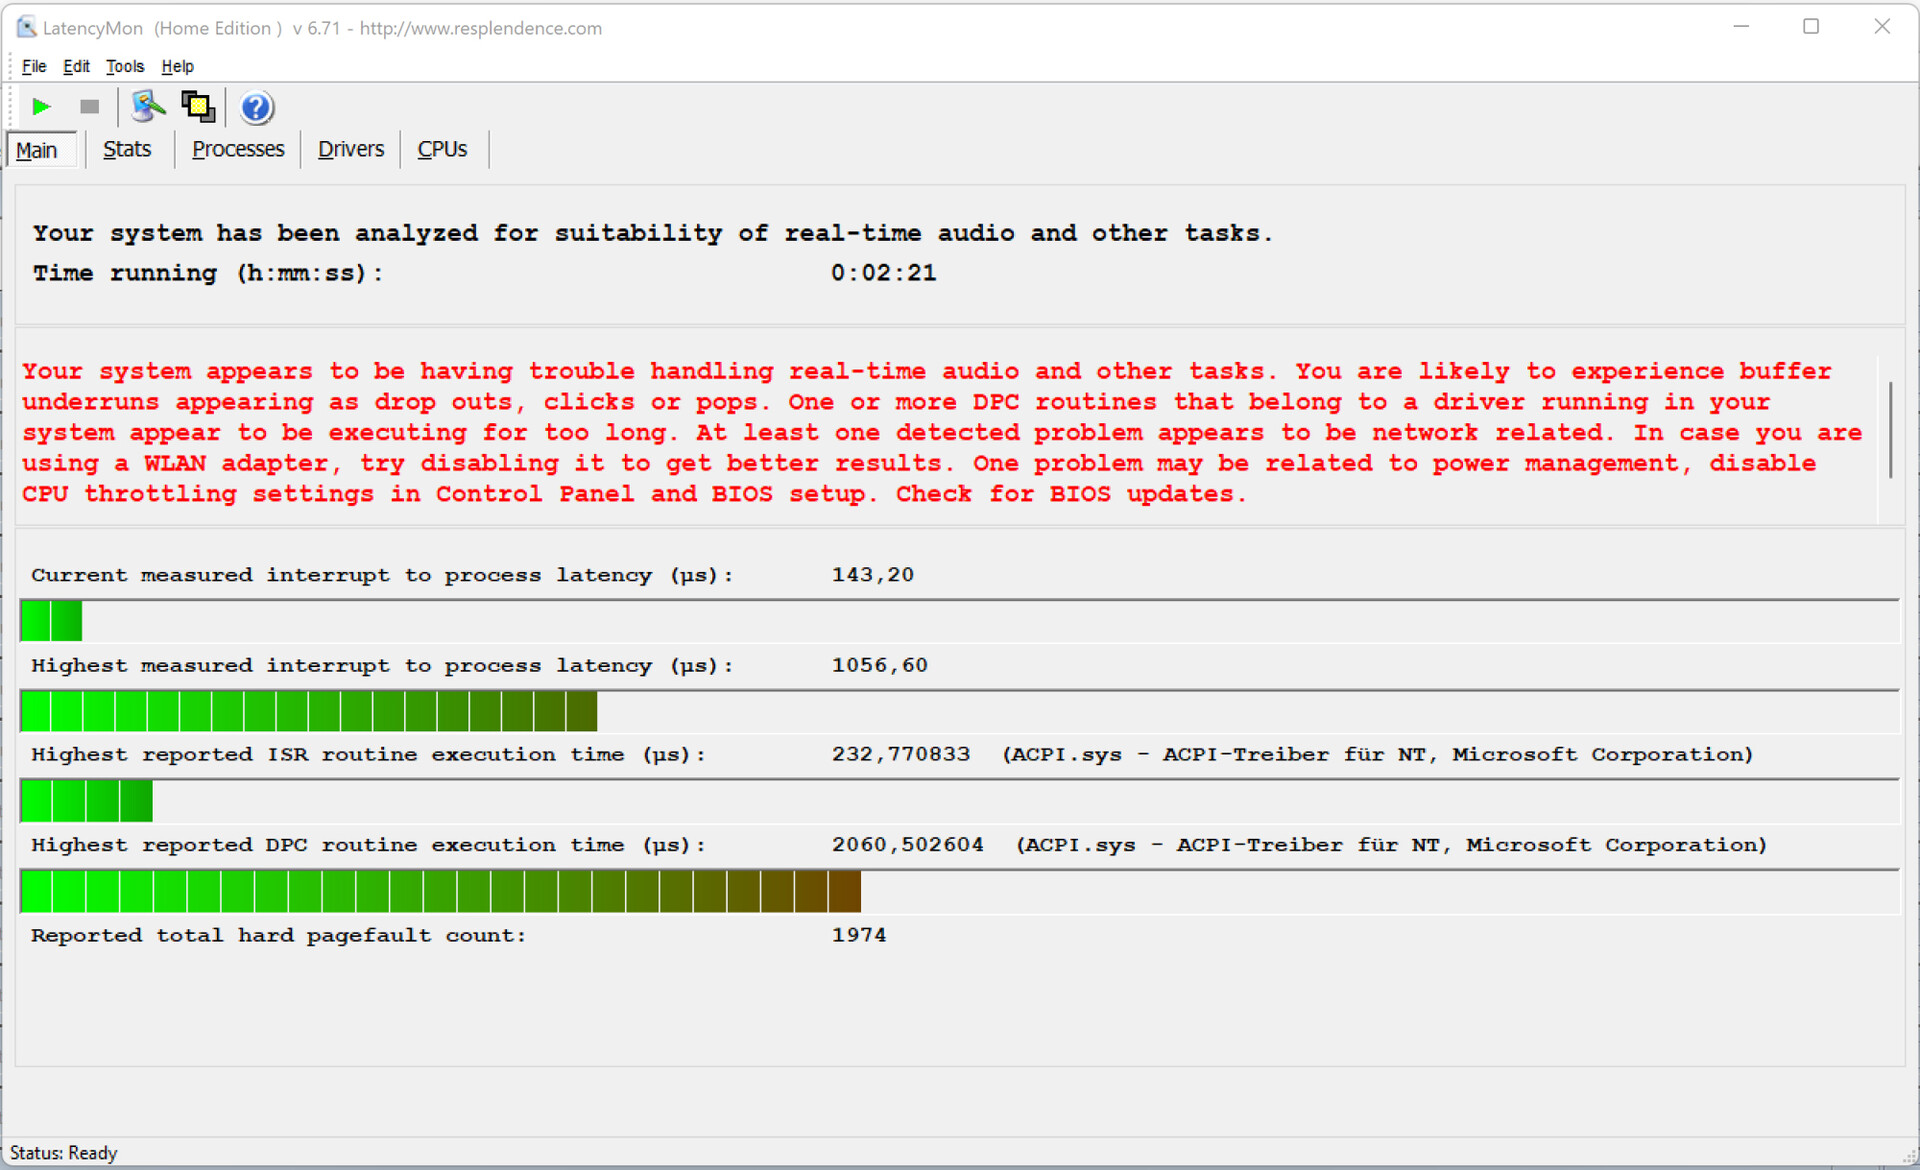
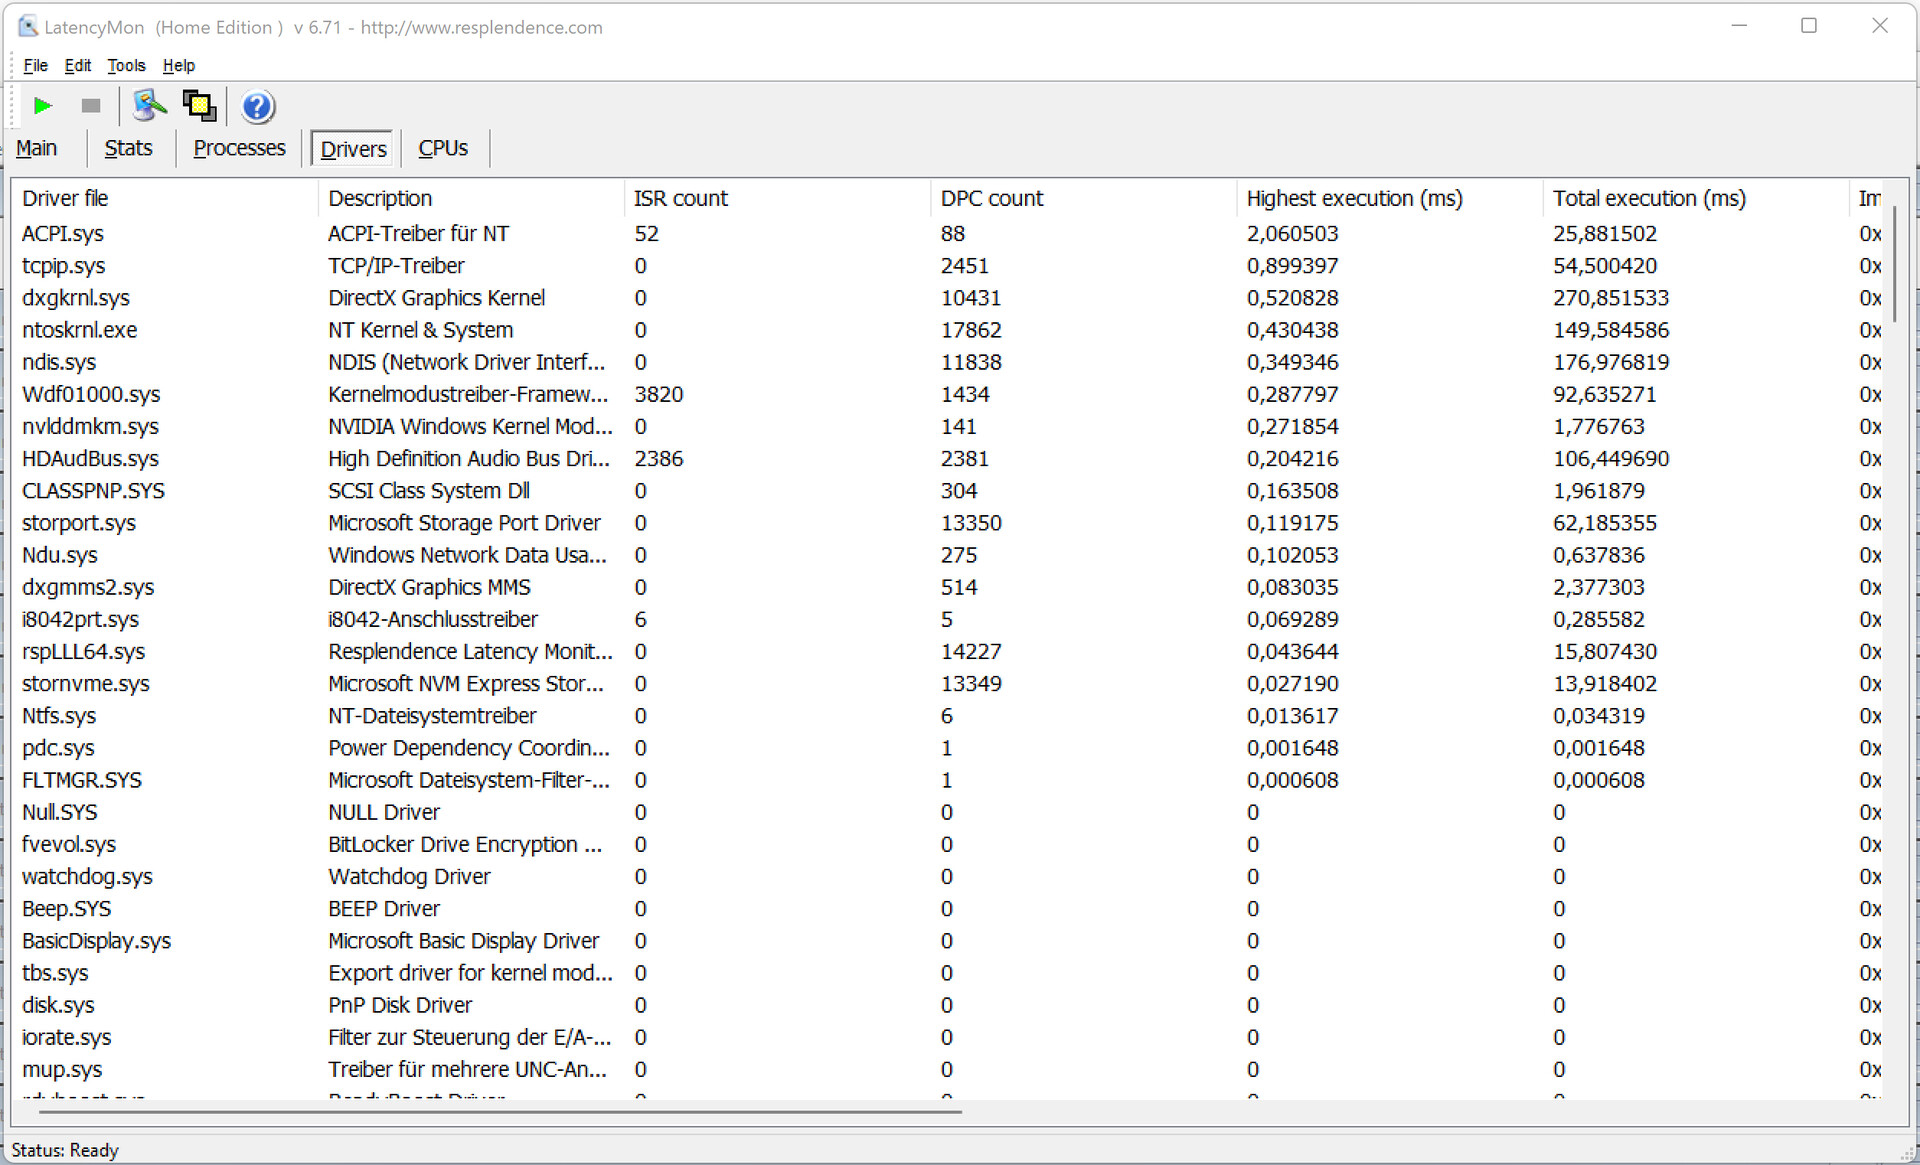
DPC延迟
我们的标准化LatencyMon测试(网页浏览、播放4K视频、Prime95高负载)显示了潜在的DPC延迟问题。该系统似乎并不适合实时视频和音频编辑。未来的软件更新可能会改善或加剧这个问题。
| DPC Latencies / LatencyMon - interrupt to process latency (max), Web, Youtube, Prime95 | |
| Razer Blade 15 Advanced (Mid 2021) | |
| MSI Delta 15 A5EFK | |
| Alienware x15 RTX 3070 P111F | |
| Schenker XMG Pro 15 (Late 2021) | |
| Schenker XMG Pro 15 (Early 2021, RTX 3080) | |
| Lenovo Legion S7 15ACH6 82K80030GE | |
* ... smaller is better
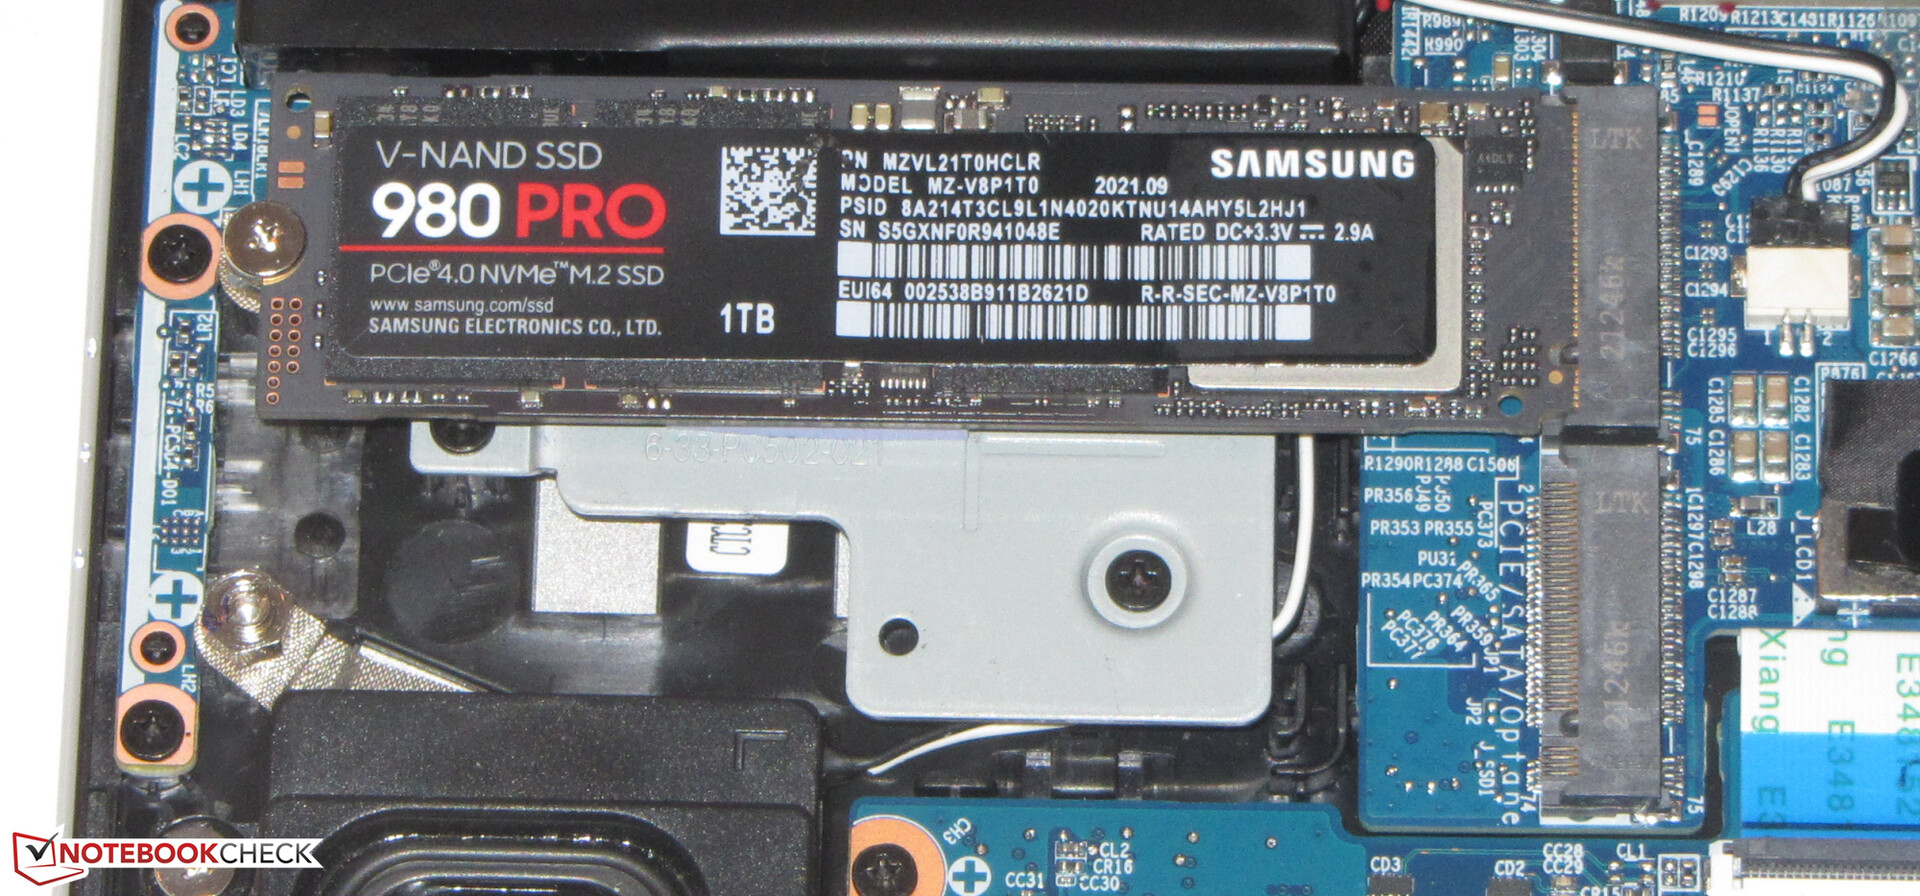
存储解决方案
三星1TB固态硬盘(NVMe,M.2-2280)作为系统驱动器,由于其PCIe 4接口,实现了出色的传输速率。这台笔记本电脑总共支持两个M.2-2280固态硬盘(1个PCIe 4.0,1个PCIe 3.0/SATA)。还支持RAID 0/1。

| Drive Performance rating - Percent | |
| Average Samsung SSD 980 Pro 1TB MZ-V8P1T0BW | |
| Average of class Gaming | |
| Razer Blade 15 Advanced (Mid 2021) | |
| Schenker XMG Pro 15 (Late 2021) | |
| Schenker XMG Pro 15 (Early 2021, RTX 3080) | |
| Lenovo Legion S7 15ACH6 82K80030GE | |
| MSI Delta 15 A5EFK | |
| Alienware x15 RTX 3070 P111F | |
* ... smaller is better
Disk Throttling: DiskSpd Read Loop, Queue Depth 8
GPU性能
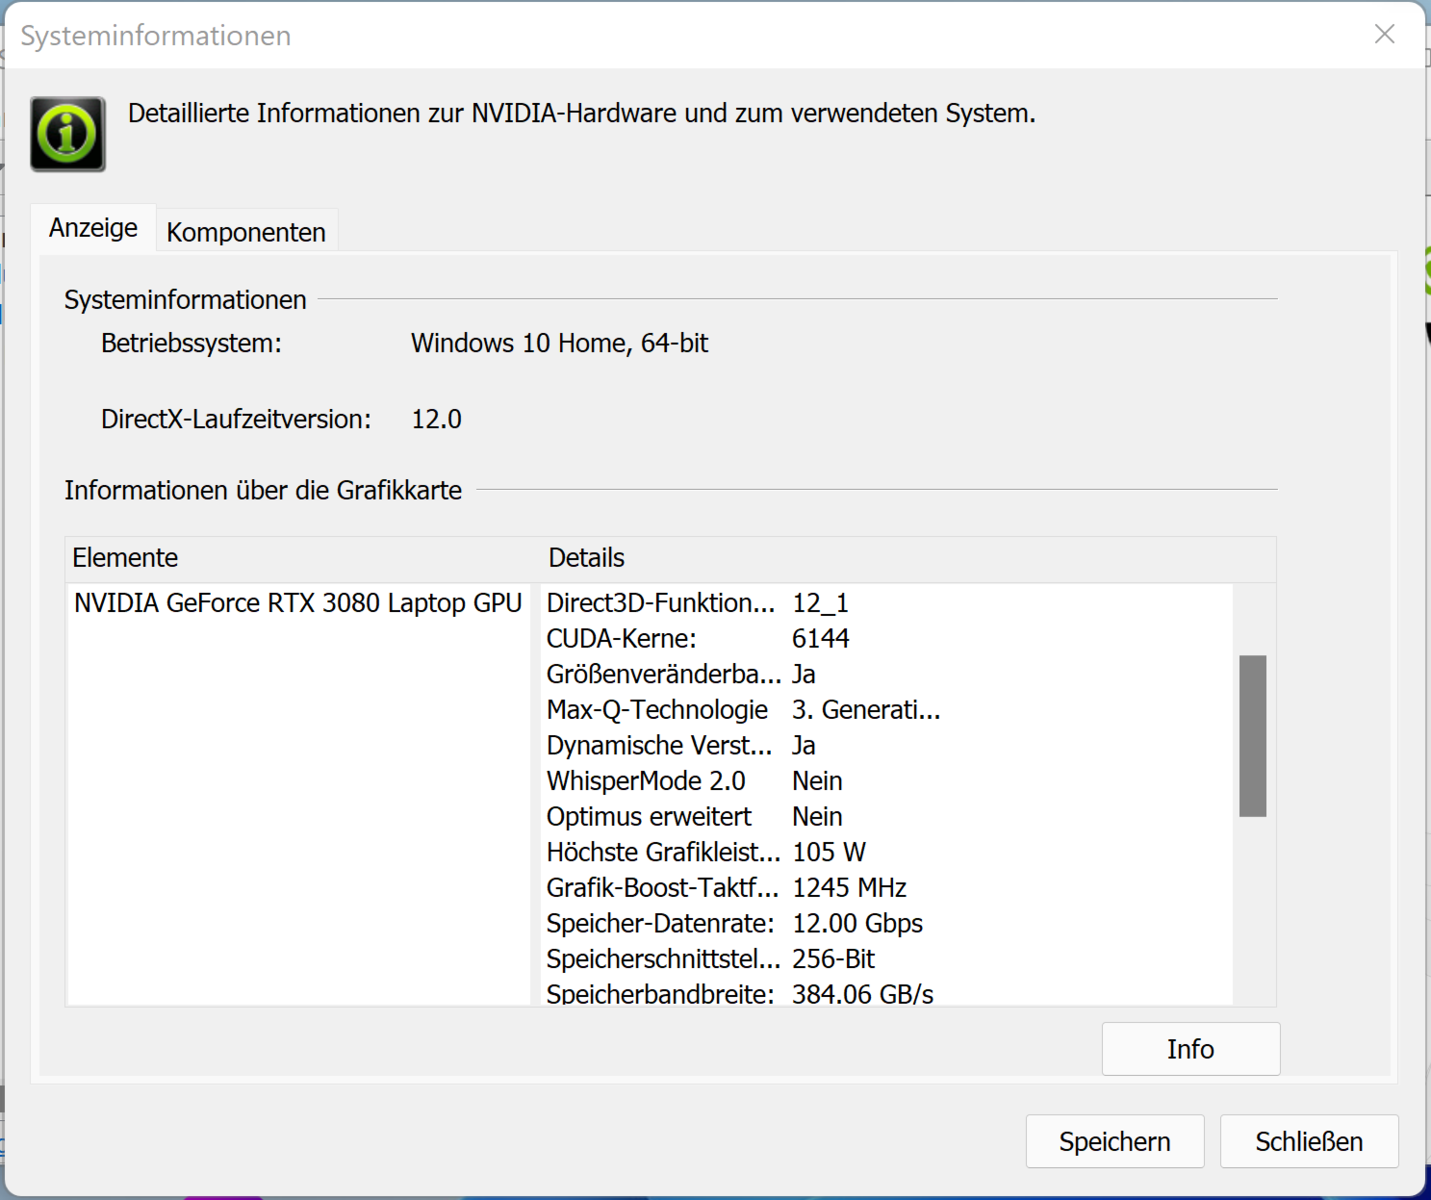
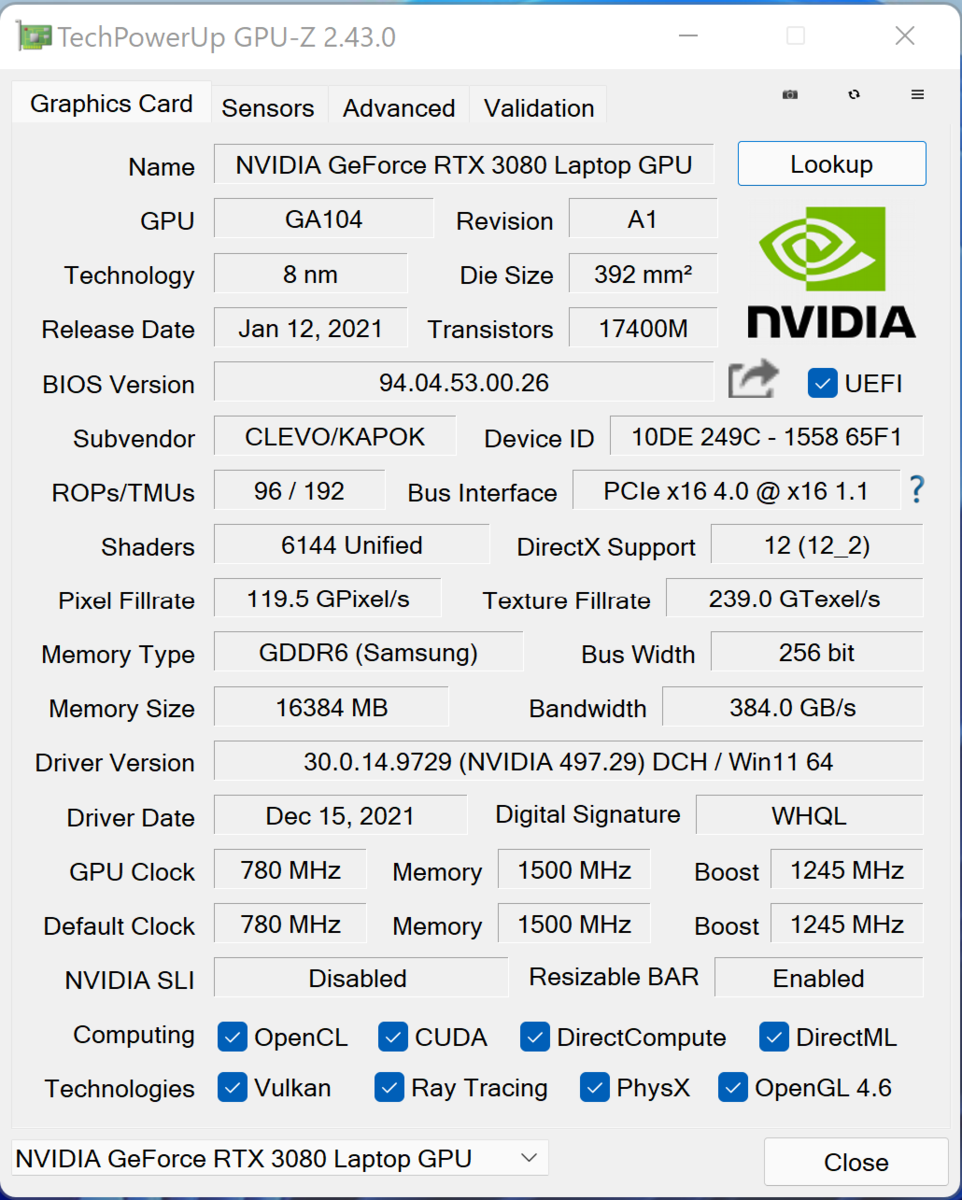
RTX 3000 GPU的实际性能取决于众多因素。冷却方案、内存配置和最大TGP,制造商可以将其设置为Nvidia预先定义的范围内的数值。申克公司将所安装的最大TGP设定为移动式的。 GeForce RTX 3080 GPU(所有RTX 3080笔记本电脑及其TGP的概述)为105瓦(90瓦+15瓦动态提升)。
与我们之前的RTX 3080的平均值相比,3DMark的结果较低。这里,相对较低的TGP变得很明显。Razer Blade 15 Advanced的得分是 Razer Blade 15 Advanced是我们测试设备的直接竞争者,具有可比性。我们的 Witcher 3基准测试表明,最大的TGP可以在很长一段时间内保持。
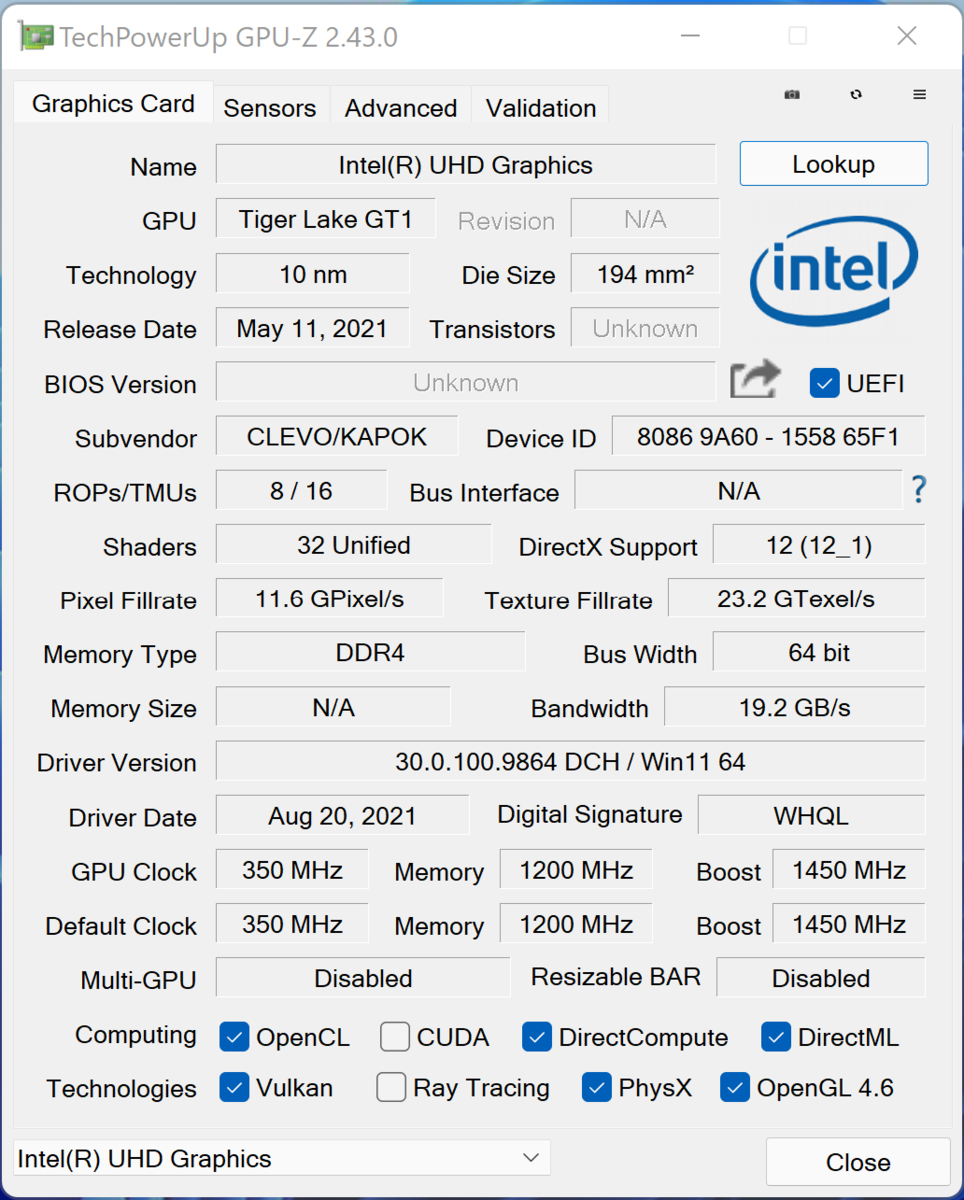
GPU配备了快速的GDDR6显存(16384MB)。集成的 UHD Graphics XeGPU被启用,笔记本电脑使用Nvidia的图形切换技术Optimus。


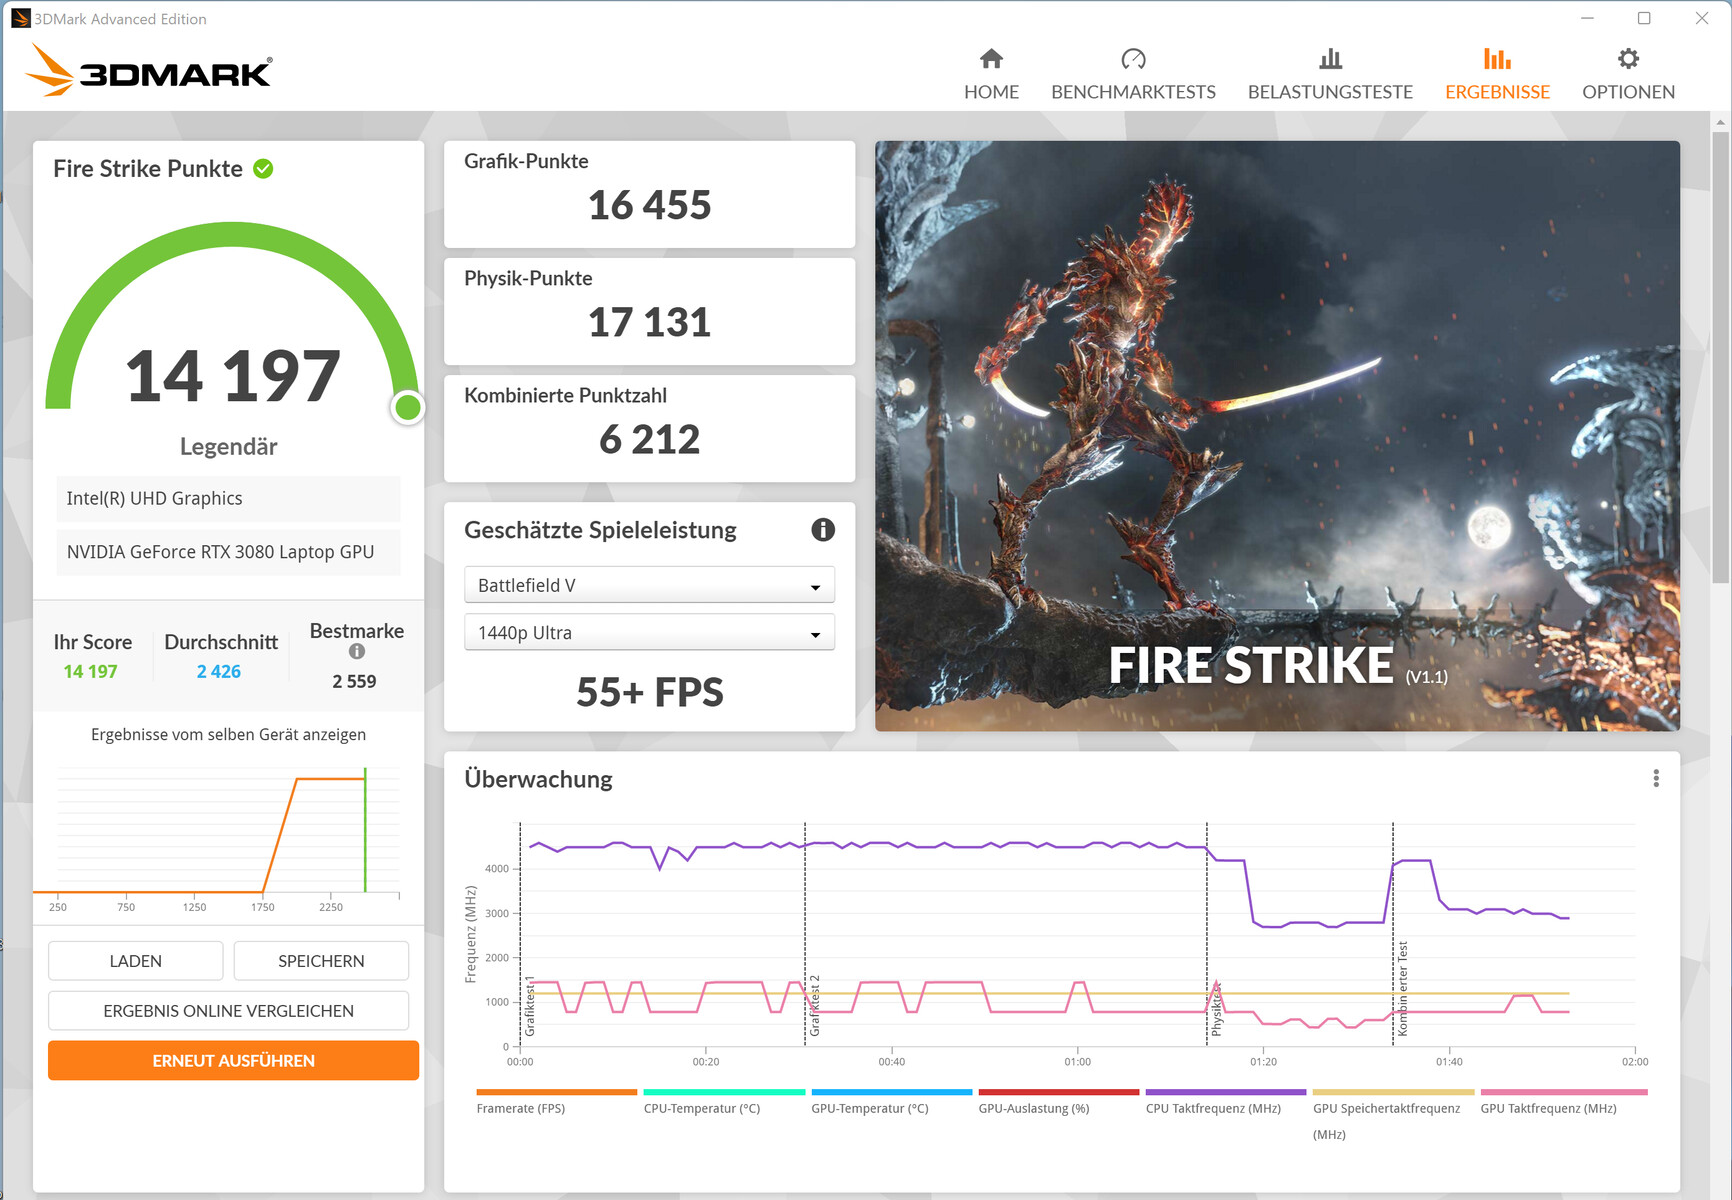

| 3DMark 11 Performance | 29001 points | |
| 3DMark Fire Strike Score | 19449 points | |
| 3DMark Time Spy Score | 9882 points | |
Help | ||
| 3DMark Performance rating - Percent | |
| Average of class Gaming | |
| Average NVIDIA GeForce RTX 3080 Laptop GPU | |
| Razer Blade 15 Advanced (Mid 2021) | |
| Schenker XMG Pro 15 (Late 2021) | |
| Schenker XMG Pro 15 (Early 2021, RTX 3080) | |
| MSI Delta 15 A5EFK | |
| Alienware x15 RTX 3070 P111F | |
| Schenker XMG Pro 15 (Late 2021) -1! | |
| Schenker XMG Pro 15 (Late 2021) -1! | |
| Lenovo Legion S7 15ACH6 82K80030GE | |
| Schenker XMG Pro 15 (Late 2021) -1! | |
| 3DMark 11 - 1280x720 Performance GPU | |
| Average of class Gaming (21841 - 80022, n=103, last 2 years) | |
| Average NVIDIA GeForce RTX 3080 Laptop GPU (31288 - 43744, n=40) | |
| Schenker XMG Pro 15 (Late 2021) | |
| Razer Blade 15 Advanced (Mid 2021) | |
| Schenker XMG Pro 15 (Early 2021, RTX 3080) | |
| Alienware x15 RTX 3070 P111F | |
| MSI Delta 15 A5EFK | |
| Lenovo Legion S7 15ACH6 82K80030GE | |
| 3DMark | |
| 1920x1080 Fire Strike Graphics | |
| Average of class Gaming (18629 - 62849, n=112, last 2 years) | |
| MSI Delta 15 A5EFK | |
| Average NVIDIA GeForce RTX 3080 Laptop GPU (16455 - 32366, n=46) | |
| Razer Blade 15 Advanced (Mid 2021) | |
| Schenker XMG Pro 15 (Early 2021, RTX 3080) | |
| Schenker XMG Pro 15 (Late 2021) | |
| Schenker XMG Pro 15 (Late 2021) (Unterhaltungsmodus) | |
| Alienware x15 RTX 3070 P111F | |
| Schenker XMG Pro 15 (Late 2021) (Lautlosmodus) | |
| Lenovo Legion S7 15ACH6 82K80030GE | |
| Schenker XMG Pro 15 (Late 2021) (Stromsparmodus) | |
| 2560x1440 Time Spy Graphics | |
| Average of class Gaming (6387 - 26212, n=112, last 2 years) | |
| Average NVIDIA GeForce RTX 3080 Laptop GPU (6407 - 13210, n=45) | |
| Razer Blade 15 Advanced (Mid 2021) | |
| Schenker XMG Pro 15 (Early 2021, RTX 3080) | |
| Schenker XMG Pro 15 (Late 2021) | |
| Alienware x15 RTX 3070 P111F | |
| Schenker XMG Pro 15 (Late 2021) (Unterhaltungsmodus) | |
| MSI Delta 15 A5EFK | |
| Schenker XMG Pro 15 (Late 2021) (Lautlosmodus) | |
| Lenovo Legion S7 15ACH6 82K80030GE | |
| Schenker XMG Pro 15 (Late 2021) (Stromsparmodus) | |
游戏性能
在FHD分辨率和最大质量设置下,该硬件毫不费力地顺利显示所有当前游戏。选择更高的分辨率也是可能的,尽管是在降低的细节设置下。帧率在RTX 3080的平均水平附近徘徊--有时Pro 15超过了它,其他时候它略微落后。
| The Witcher 3 - 1920x1080 Ultra Graphics & Postprocessing (HBAO+) | |
| Average of class Gaming (104.7 - 240, n=7, last 2 years) | |
| Average NVIDIA GeForce RTX 3080 Laptop GPU (85.1 - 123, n=40) | |
| Razer Blade 15 Advanced (Mid 2021) | |
| Alienware x15 RTX 3070 P111F | |
| Schenker XMG Pro 15 (Late 2021) | |
| Schenker XMG Pro 15 (Early 2021, RTX 3080) | |
| MSI Delta 15 A5EFK | |
| Schenker XMG Pro 15 (Late 2021) (Lautlosmodus) | |
| Lenovo Legion S7 15ACH6 82K80030GE | |
| Dota 2 Reborn | |
| 1920x1080 ultra (3/3) best looking | |
| Average of class Gaming (84.8 - 252, n=104, last 2 years) | |
| Razer Blade 15 Advanced (Mid 2021) | |
| Schenker XMG Pro 15 (Late 2021) | |
| Alienware x15 RTX 3070 P111F | |
| Average NVIDIA GeForce RTX 3080 Laptop GPU (98 - 156, n=45) | |
| Schenker XMG Pro 15 (Late 2021) (Unterhaltungsmodus) | |
| Lenovo Legion S7 15ACH6 82K80030GE | |
| Schenker XMG Pro 15 (Early 2021, RTX 3080) | |
| Schenker XMG Pro 15 (Late 2021) (Stromsparmodus) | |
| MSI Delta 15 A5EFK | |
| Schenker XMG Pro 15 (Late 2021) (Lautlosmodus) | |
| 3840x2160 ultra (3/3) best looking | |
| Average of class Gaming (114.9 - 199.2, n=32, last 2 years) | |
| Schenker XMG Pro 15 (Late 2021) | |
| Schenker XMG Pro 15 (Late 2021) (Unterhaltungsmodus) | |
| Average NVIDIA GeForce RTX 3080 Laptop GPU (55.2 - 128, n=17) | |
| Lenovo Legion S7 15ACH6 82K80030GE | |
| Schenker XMG Pro 15 (Late 2021) (Lautlosmodus) | |
| Schenker XMG Pro 15 (Late 2021) (Stromsparmodus) | |
| X-Plane 11.11 | |
| 1920x1080 high (fps_test=3) | |
| Average of class Gaming (55.5 - 148.5, n=106, last 2 years) | |
| Razer Blade 15 Advanced (Mid 2021) | |
| Alienware x15 RTX 3070 P111F | |
| Schenker XMG Pro 15 (Late 2021) | |
| Schenker XMG Pro 15 (Late 2021) (Unterhaltungsmodus) | |
| Average NVIDIA GeForce RTX 3080 Laptop GPU (65.6 - 113, n=44) | |
| Schenker XMG Pro 15 (Early 2021, RTX 3080) | |
| Schenker XMG Pro 15 (Late 2021) (Stromsparmodus) | |
| Lenovo Legion S7 15ACH6 82K80030GE | |
| Schenker XMG Pro 15 (Late 2021) (Lautlosmodus) | |
| 3840x2160 high (fps_test=3) | |
| Average of class Gaming (60 - 124.1, n=32, last 2 years) | |
| Schenker XMG Pro 15 (Late 2021) | |
| Average NVIDIA GeForce RTX 3080 Laptop GPU (39.9 - 88.6, n=17) | |
| Schenker XMG Pro 15 (Late 2021) (Unterhaltungsmodus) | |
| Schenker XMG Pro 15 (Late 2021) (Stromsparmodus) | |
| Lenovo Legion S7 15ACH6 82K80030GE | |
| Schenker XMG Pro 15 (Late 2021) (Lautlosmodus) | |
| GTA V | |
| 1920x1080 Highest AA:4xMSAA + FX AF:16x | |
| Average of class Gaming (67.1 - 186.9, n=90, last 2 years) | |
| Razer Blade 15 Advanced (Mid 2021) | |
| Schenker XMG Pro 15 (Late 2021) | |
| Schenker XMG Pro 15 (Late 2021) (Unterhaltungsmodus) | |
| Average NVIDIA GeForce RTX 3080 Laptop GPU (68.6 - 114.6, n=34) | |
| Alienware x15 RTX 3070 P111F | |
| Lenovo Legion S7 15ACH6 82K80030GE | |
| MSI Delta 15 A5EFK | |
| Schenker XMG Pro 15 (Late 2021) (Stromsparmodus) | |
| Schenker XMG Pro 15 (Late 2021) (Lautlosmodus) | |
| 2560x1440 Highest AA:4xMSAA + FX AF:16x | |
| Average of class Gaming (62.7 - 183.9, n=68, last 2 years) | |
| Average NVIDIA GeForce RTX 3080 Laptop GPU (82.2 - 99.1, n=12) | |
| Schenker XMG Pro 15 (Late 2021) | |
| Alienware x15 RTX 3070 P111F | |
| Lenovo Legion S7 15ACH6 82K80030GE | |
| 3840x2160 Highest AA:4xMSAA + FX AF:16x | |
| Average of class Gaming (53.9 - 123.2, n=25, last 2 years) | |
| Average NVIDIA GeForce RTX 3080 Laptop GPU (32.4 - 57.8, n=9) | |
| Schenker XMG Pro 15 (Late 2021) | |
| Schenker XMG Pro 15 (Late 2021) (Unterhaltungsmodus) | |
| Schenker XMG Pro 15 (Late 2021) (Stromsparmodus) | |
| Strange Brigade | |
| 1920x1080 ultra AA:ultra AF:16 | |
| Average of class Gaming (113.6 - 458, n=83, last 2 years) | |
| Average NVIDIA GeForce RTX 3080 Laptop GPU (117 - 219, n=34) | |
| Razer Blade 15 Advanced (Mid 2021) (1.47.22.14 D3D12) | |
| Alienware x15 RTX 3070 P111F (1.47.22.14 D3D12) | |
| Schenker XMG Pro 15 (Late 2021) (1.47.22.14 D3D12) | |
| MSI Delta 15 A5EFK (1.47.22.14 D3D12) | |
| Schenker XMG Pro 15 (Late 2021) (1.47.22.14 D3D12, Unterhaltungsmodus) | |
| Schenker XMG Pro 15 (Late 2021) (1.47.22.14 D3D12, Lautlosmodus) | |
| Lenovo Legion S7 15ACH6 82K80030GE (1.47.22.14 D3D12) | |
| Schenker XMG Pro 15 (Late 2021) (1.47.22.14 D3D12, Stromsparmodus) | |
| 2560x1440 ultra AA:ultra AF:16 | |
| Average of class Gaming (103.8 - 354, n=72, last 2 years) | |
| Average NVIDIA GeForce RTX 3080 Laptop GPU (123 - 165, n=14) | |
| Alienware x15 RTX 3070 P111F (1.47.22.14 D3D12) | |
| Schenker XMG Pro 15 (Late 2021) (1.47.22.14 D3D12) | |
| Lenovo Legion S7 15ACH6 82K80030GE (1.47.22.14 D3D12) | |
| 3840x2160 ultra AA:ultra AF:16 | |
| Average of class Gaming (83 - 187.2, n=34, last 2 years) | |
| Average NVIDIA GeForce RTX 3080 Laptop GPU (55.9 - 91.7, n=12) | |
| Schenker XMG Pro 15 (Late 2021) (1.47.22.14 D3D12) | |
| Schenker XMG Pro 15 (Late 2021) (1.47.22.14 D3D12, Unterhaltungsmodus) | |
| Schenker XMG Pro 15 (Late 2021) (1.47.22.14 D3D12, Lautlosmodus) | |
| Lenovo Legion S7 15ACH6 82K80030GE (1.47.22.14 D3D12) | |
| Schenker XMG Pro 15 (Late 2021) (1.47.22.14 D3D12, Stromsparmodus) | |
| F1 2021 | |
| 1920x1080 Ultra High Preset + Raytracing AA:T AF:16x | |
| Schenker XMG Pro 15 (Late 2021) (831795) | |
| Schenker XMG Pro 15 (Late 2021) (831795, Unterhaltungsmodus) | |
| Average NVIDIA GeForce RTX 3080 Laptop GPU (74.9 - 123.7, n=9) | |
| MSI Delta 15 A5EFK | |
| Schenker XMG Pro 15 (Late 2021) (831795, Lautlosmodus) | |
| Lenovo Legion S7 15ACH6 82K80030GE (815237) | |
| Schenker XMG Pro 15 (Late 2021) (831795, Stromsparmodus) | |
| 2560x1440 Ultra High Preset + Raytracing AA:T AF:16x | |
| Average NVIDIA GeForce RTX 3080 Laptop GPU (84 - 90.4, n=4) | |
| Schenker XMG Pro 15 (Late 2021) (831795) | |
| Lenovo Legion S7 15ACH6 82K80030GE (815237) | |
| 3840x2160 Ultra High Preset + Raytracing AA:T AF:16x | |
| Schenker XMG Pro 15 (Late 2021) (831795) | |
| Schenker XMG Pro 15 (Late 2021) (831795, Unterhaltungsmodus) | |
| Average NVIDIA GeForce RTX 3080 Laptop GPU (32.5 - 51.5, n=7) | |
| Schenker XMG Pro 15 (Late 2021) (831795, Lautlosmodus) | |
| Lenovo Legion S7 15ACH6 82K80030GE (815237) | |
| Schenker XMG Pro 15 (Late 2021) (831795, Stromsparmodus) | |
| Far Cry 6 | |
| 1920x1080 Ultra Graphics Quality + HD Textures AA:T | |
| Average of class Gaming (n=1last 2 years) | |
| Lenovo Legion S7 15ACH6 82K80030GE | |
| Average NVIDIA GeForce RTX 3080 Laptop GPU (55 - 104.4, n=5) | |
| MSI Delta 15 A5EFK | |
| Schenker XMG Pro 15 (Late 2021) | |
| 3840x2160 Ultra Graphics Quality + HD Textures AA:T | |
| Average NVIDIA GeForce RTX 3080 Laptop GPU (40 - 50, n=4) | |
| Schenker XMG Pro 15 (Late 2021) | |
| 1920x1080 Ultra Graphics Quality + HD Textures + DXR AA:T | |
| Average of class Gaming (n=1last 2 years) | |
| Average NVIDIA GeForce RTX 3080 Laptop GPU (59 - 84.7, n=4) | |
| Lenovo Legion S7 15ACH6 82K80030GE | |
| Schenker XMG Pro 15 (Late 2021) | |
| MSI Delta 15 A5EFK | |
| Guardians of the Galaxy | |
| 1920x1080 Ultra Preset | |
| Average NVIDIA GeForce RTX 3080 Laptop GPU (122 - 145, n=4) | |
| Schenker XMG Pro 15 (Late 2021) | |
| Lenovo Legion S7 15ACH6 82K80030GE | |
| 3840x2160 Ultra Preset | |
| Average NVIDIA GeForce RTX 3080 Laptop GPU (55 - 60, n=4) | |
| Schenker XMG Pro 15 (Late 2021) | |
| Lenovo Legion S7 15ACH6 82K80030GE | |
| 1920x1080 Ultra Preset + Ultra Ray-Tracing | |
| Average NVIDIA GeForce RTX 3080 Laptop GPU (75 - 85, n=4) | |
| Schenker XMG Pro 15 (Late 2021) | |
| Lenovo Legion S7 15ACH6 82K80030GE | |
| Riders Republic | |
| 1920x1080 Ultra Preset | |
| Average NVIDIA GeForce RTX 3080 Laptop GPU (104 - 115, n=2) | |
| Schenker XMG Pro 15 (Late 2021) | |
| Lenovo Legion S7 15ACH6 82K80030GE | |
| 3840x2160 Ultra Preset | |
| Average NVIDIA GeForce RTX 3080 Laptop GPU (41 - 47, n=2) | |
| Schenker XMG Pro 15 (Late 2021) | |
| Lenovo Legion S7 15ACH6 82K80030GE | |
| Forza Horizon 5 | |
| 1920x1080 Extreme Preset | |
| Average NVIDIA GeForce RTX 3080 Laptop GPU (81 - 84, n=4) | |
| Schenker XMG Pro 15 (Late 2021) | |
| 3840x2160 Extreme Preset | |
| Average NVIDIA GeForce RTX 3080 Laptop GPU (48 - 55, n=4) | |
| Schenker XMG Pro 15 (Late 2021) | |
| Battlefield 2042 | |
| 1920x1080 Ultra Preset | |
| Average NVIDIA GeForce RTX 3080 Laptop GPU (88.7 - 104, n=2) | |
| Schenker XMG Pro 15 (Late 2021) | |
| 3840x2160 Ultra Preset | |
| Average NVIDIA GeForce RTX 3080 Laptop GPU (43 - 50.2, n=2) | |
| Schenker XMG Pro 15 (Late 2021) | |
| 1920x1080 Ultra Preset + Ray Tracing | |
| Average NVIDIA GeForce RTX 3080 Laptop GPU (68 - 84.2, n=2) | |
| Schenker XMG Pro 15 (Late 2021) | |
| Halo Infinite | |
| 1920x1080 Ultra Preset | |
| Average NVIDIA GeForce RTX 3080 Laptop GPU (96.1 - 106, n=2) | |
| Schenker XMG Pro 15 (Late 2021) | |
| 3840x2160 Ultra Preset | |
| Average NVIDIA GeForce RTX 3080 Laptop GPU (40.2 - 46.2, n=2) | |
| Schenker XMG Pro 15 (Late 2021) | |
| Alan Wake Remastered | |
| 1920x1080 High Preset | |
| Schenker XMG Pro 15 (Late 2021) | |
| Average NVIDIA GeForce RTX 3080 Laptop GPU (95 - 111, n=2) | |
| Lenovo Legion S7 15ACH6 82K80030GE | |
| 3840x2160 High Preset | |
| Average NVIDIA GeForce RTX 3080 Laptop GPU (64.6 - 73.9, n=2) | |
| Schenker XMG Pro 15 (Late 2021) | |
| Lenovo Legion S7 15ACH6 82K80030GE | |
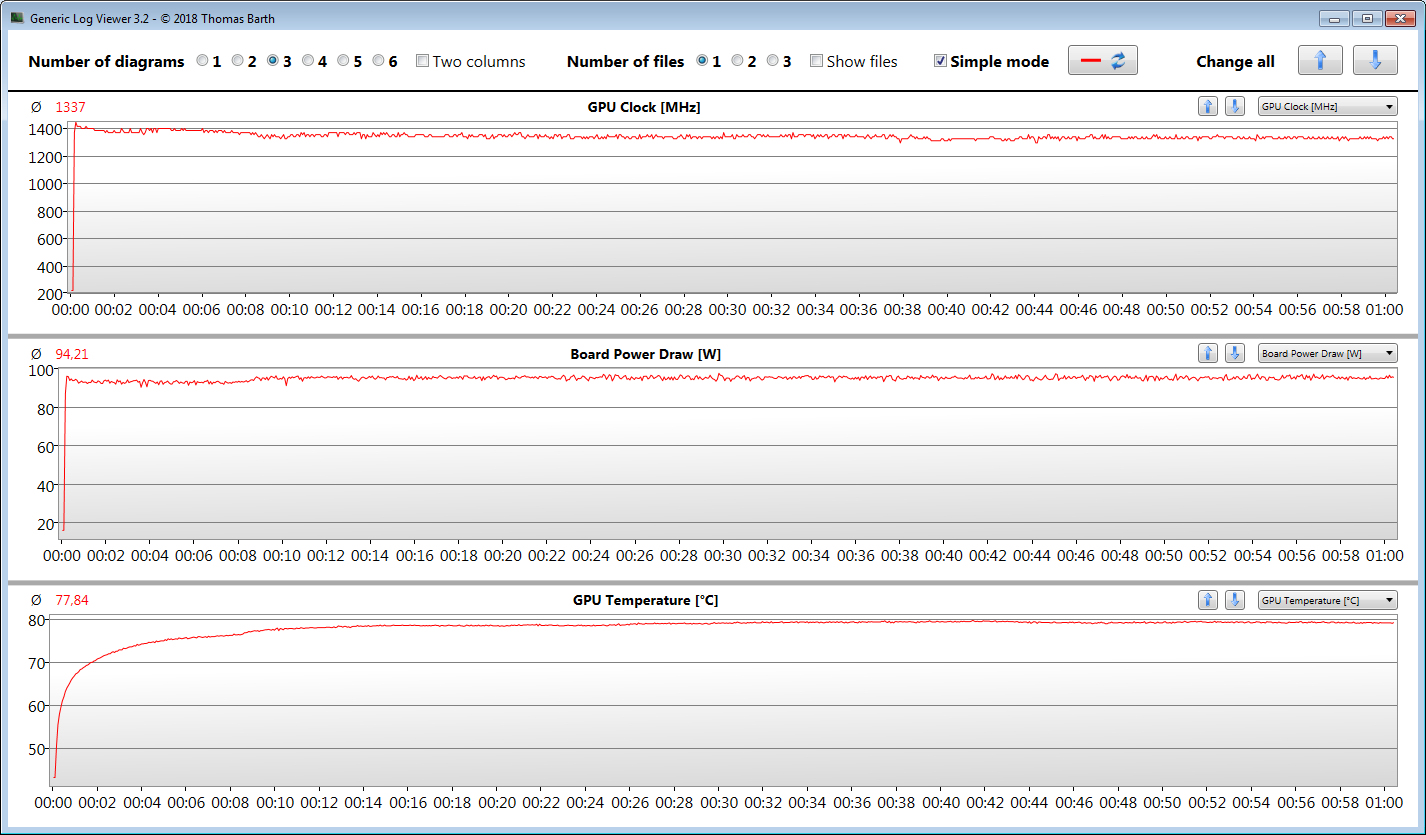
为了确定帧率是否在很长一段时间内保持恒定,我们在FHD分辨率和最大细节条件下,在TheWitcher 3中空转了大约60分钟。在整个时间范围内,角色没有被移动。在选择性能模式时,我们没有观察到任何帧数下降。
Witcher 3 FPS Diagram

| low | med. | high | ultra | QHD | 4K | |
|---|---|---|---|---|---|---|
| GTA V (2015) | 184 | 180 | 166 | 102 | 85.7 | 93 |
| The Witcher 3 (2015) | 399 | 285 | 176 | 100 | 69.6 | |
| Dota 2 Reborn (2015) | 164 | 146 | 137 | 132 | 116 | |
| Final Fantasy XV Benchmark (2018) | 187 | 129 | 97.5 | 74.6 | 44.1 | |
| X-Plane 11.11 (2018) | 128 | 109 | 88.5 | 67.9 | ||
| Far Cry 5 (2018) | 163 | 130 | 123 | 115 | 95 | 54 |
| Strange Brigade (2018) | 465 | 244 | 201 | 176 | 130 | 76 |
| F1 2021 (2021) | 314 | 219 | 190 | 117 | 87.4 | 49.6 |
| Alan Wake Remastered (2021) | 121 | 111 | 108 | 64.6 | ||
| Far Cry 6 (2021) | 101 | 82 | 75 | 70 | 62 | 40 |
| Guardians of the Galaxy (2021) | 130 | 122 | 124 | 122 | 95 | 55 |
| Riders Republic (2021) | 155 | 137 | 113 | 104 | 74 | 41 |
| Forza Horizon 5 (2021) | 214 | 131 | 122 | 81 | 67 | 48 |
| Battlefield 2042 (2021) | 133 | 110 | 99.8 | 88.7 | 69.9 | 43 |
| Halo Infinite (2021) | 118 | 101 | 96.1 | 70.4 | 40.2 |
排放物 - 申克笔记本电脑发出很大的噪音
系统噪音
在日常使用中(办公、浏览网页),这两个风扇倾向于保留和安静。然而,我们确实注意到风扇偶尔会不必要地升温--这使噪音水平上升到41 dB(A)。在负载情况下,事情会变得非常嘈杂,最高值为58 dB(A)(压力测试)和53 dB(A)(测试)。Witcher 3测试)。这款 Razer Blade 15无论系统负载如何,都会产生较少的噪音。
负载下的噪音水平可以通过选择静音电源配置文件来降低。风扇会非常安静地旋转。同时,CPU和GPU的时钟速率受到严重限制。尽管在这种模式下仍然可以进行游戏,但质量设置或分辨率可能需要降低。
Noise level
| Idle |
| 31 / 37 / 41 dB(A) |
| Load |
| 56 / 58 dB(A) |
 | ||
30 dB silent 40 dB(A) audible 50 dB(A) loud |
||
min: | ||
| Schenker XMG Pro 15 (Late 2021) i7-11800H, GeForce RTX 3080 Laptop GPU | Lenovo Legion S7 15ACH6 82K80030GE R9 5900HX, GeForce RTX 3060 Laptop GPU | Alienware x15 RTX 3070 P111F i7-11800H, GeForce RTX 3070 Laptop GPU | Razer Blade 15 Advanced (Mid 2021) i7-11800H, GeForce RTX 3080 Laptop GPU | Schenker XMG Pro 15 (Early 2021, RTX 3080) i7-10870H, GeForce RTX 3080 Laptop GPU | MSI Delta 15 A5EFK R9 5900HX, Radeon RX 6700M | |
|---|---|---|---|---|---|---|
| Noise | 11% | 19% | 19% | 4% | 10% | |
| off / environment * (dB) | 24 | 25 -4% | 24.1 -0% | 25.1 -5% | 25 -4% | 25 -4% |
| Idle Minimum * (dB) | 31 | 25 19% | 26.6 14% | 25.3 18% | 33 -6% | 25 19% |
| Idle Average * (dB) | 37 | 30 19% | 26.6 28% | 25.3 32% | 34 8% | 30 19% |
| Idle Maximum * (dB) | 41 | 36 12% | 26.6 35% | 25.3 38% | 35 15% | 40 2% |
| Load Average * (dB) | 56 | 42 25% | 30.9 45% | 42 25% | 51 9% | 47 16% |
| Witcher 3 ultra * (dB) | 53 | 53 -0% | 49.9 6% | 45.6 14% | 52 2% | 48 9% |
| Load Maximum * (dB) | 58 | 54 7% | 53.5 8% | 51.6 11% | 57 2% | 51 12% |
* ... smaller is better
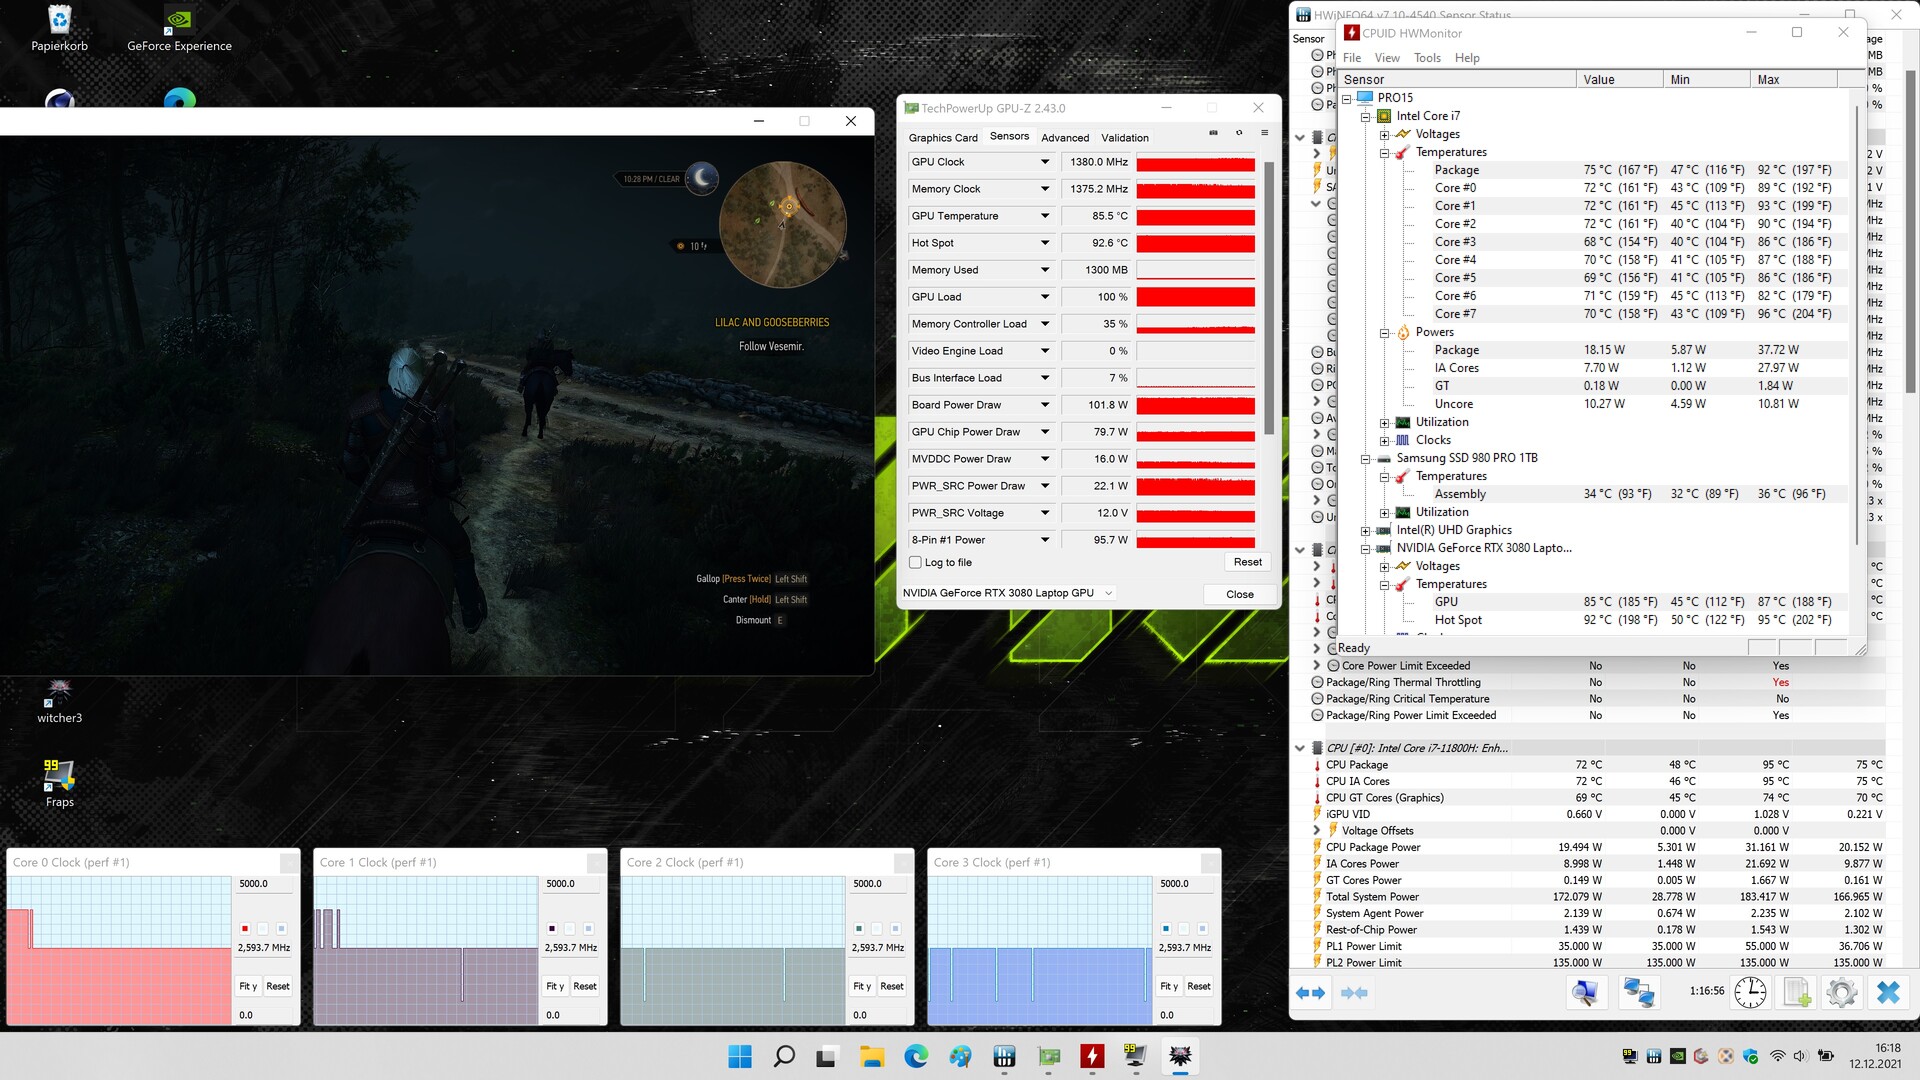
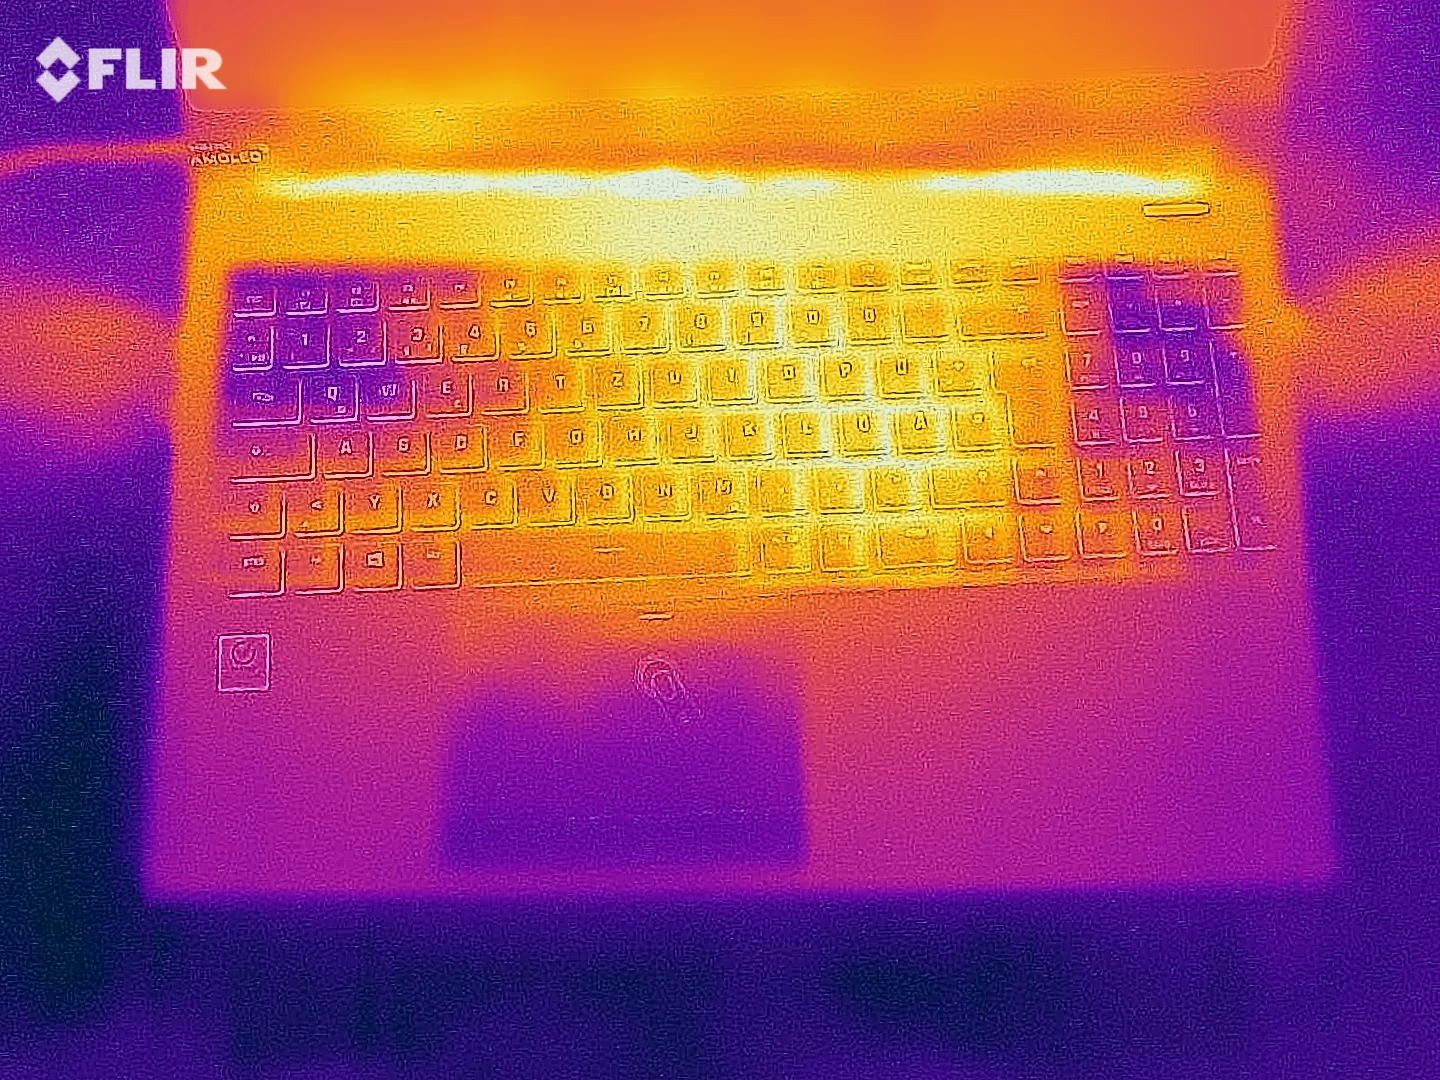
温度
在日常使用中(办公、浏览网页),表面温度保持较低。在负载(压力测试。 Witcher 3),笔记本电脑变得非常热。在某些地方,我们测量到的温度超过了60℃(140°F)。在测试开始时,CPU的温度达到了100 °C(212 °F),因此是英特尔规定的最大值。随后,温度稳定在90至100°C(194-212°F)之间。
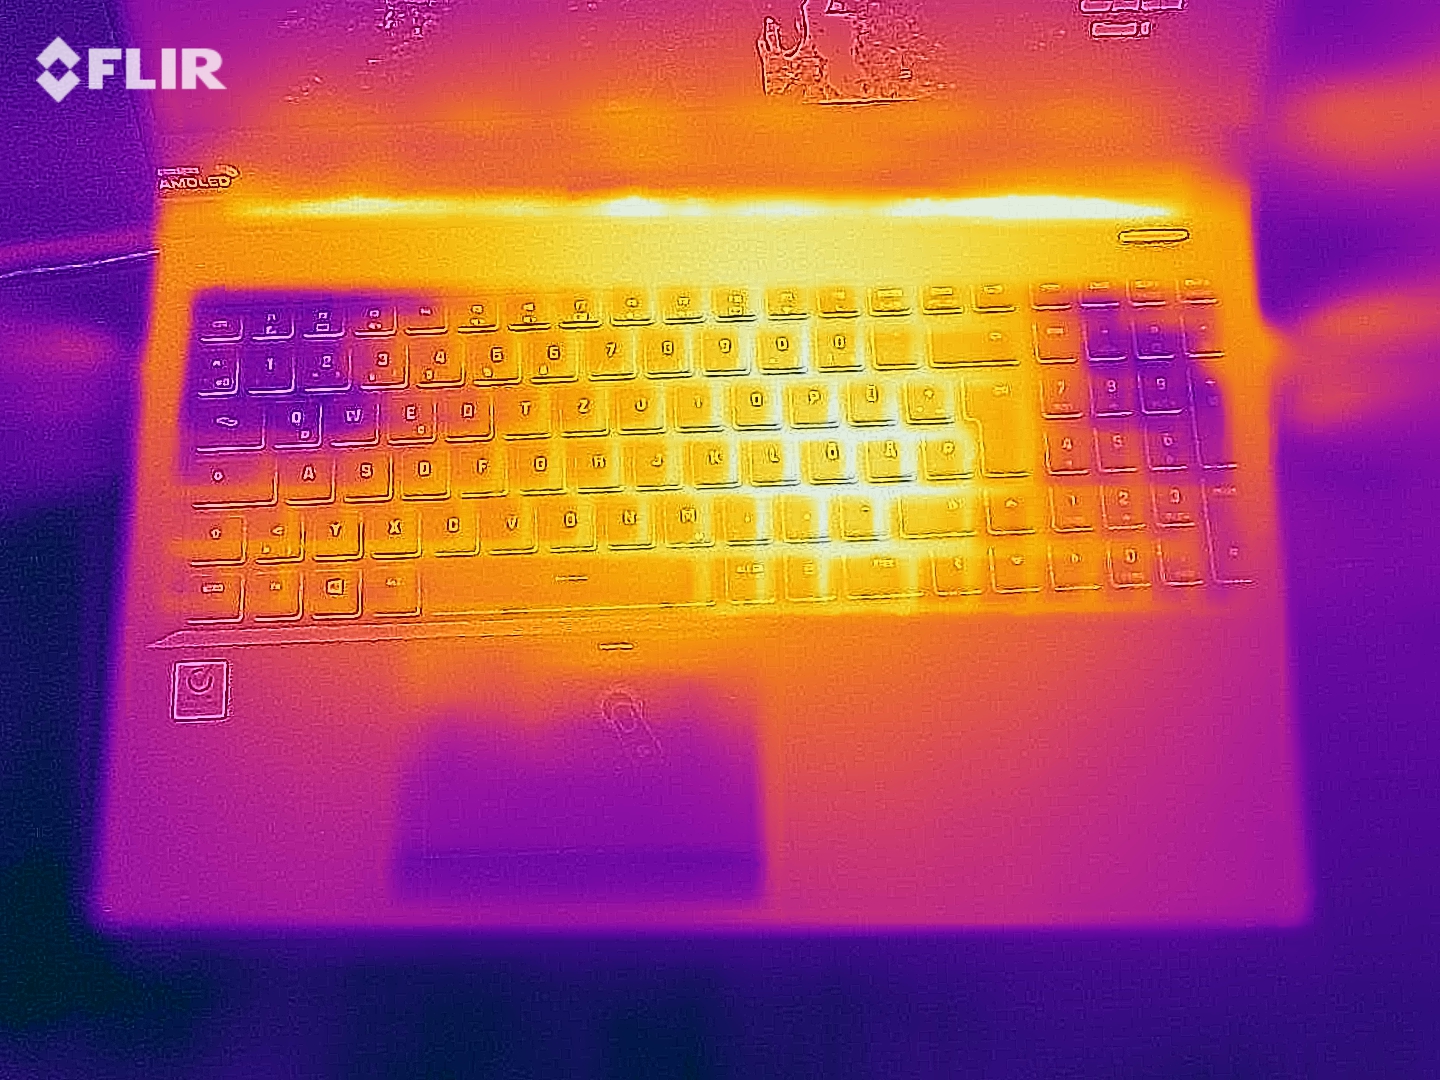
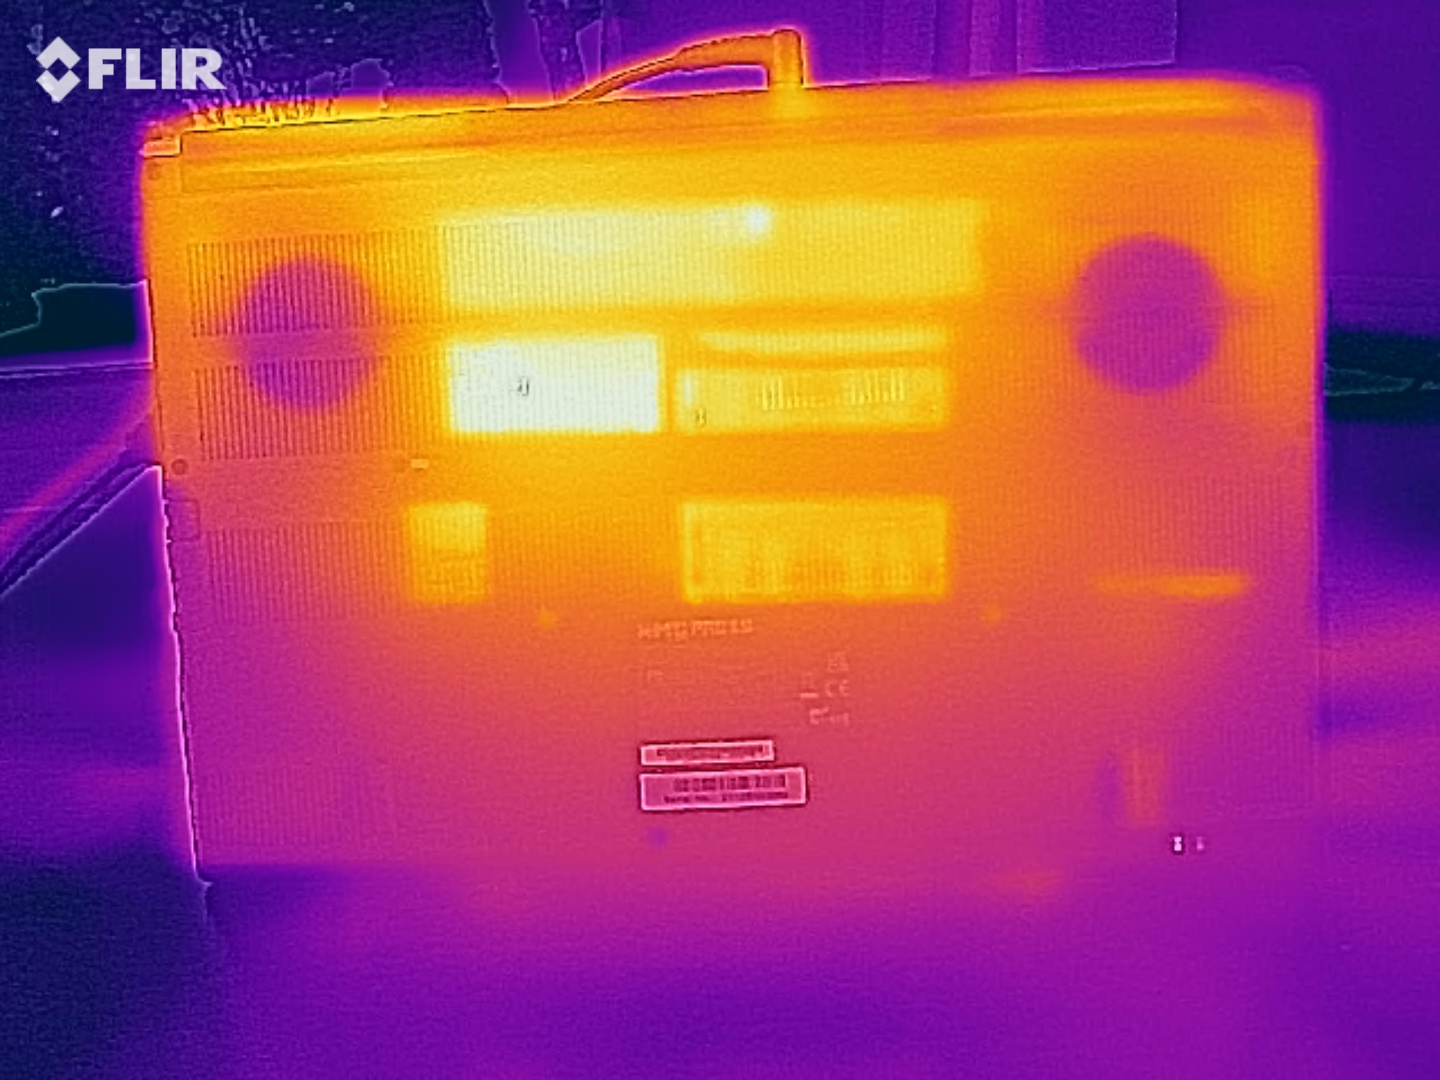
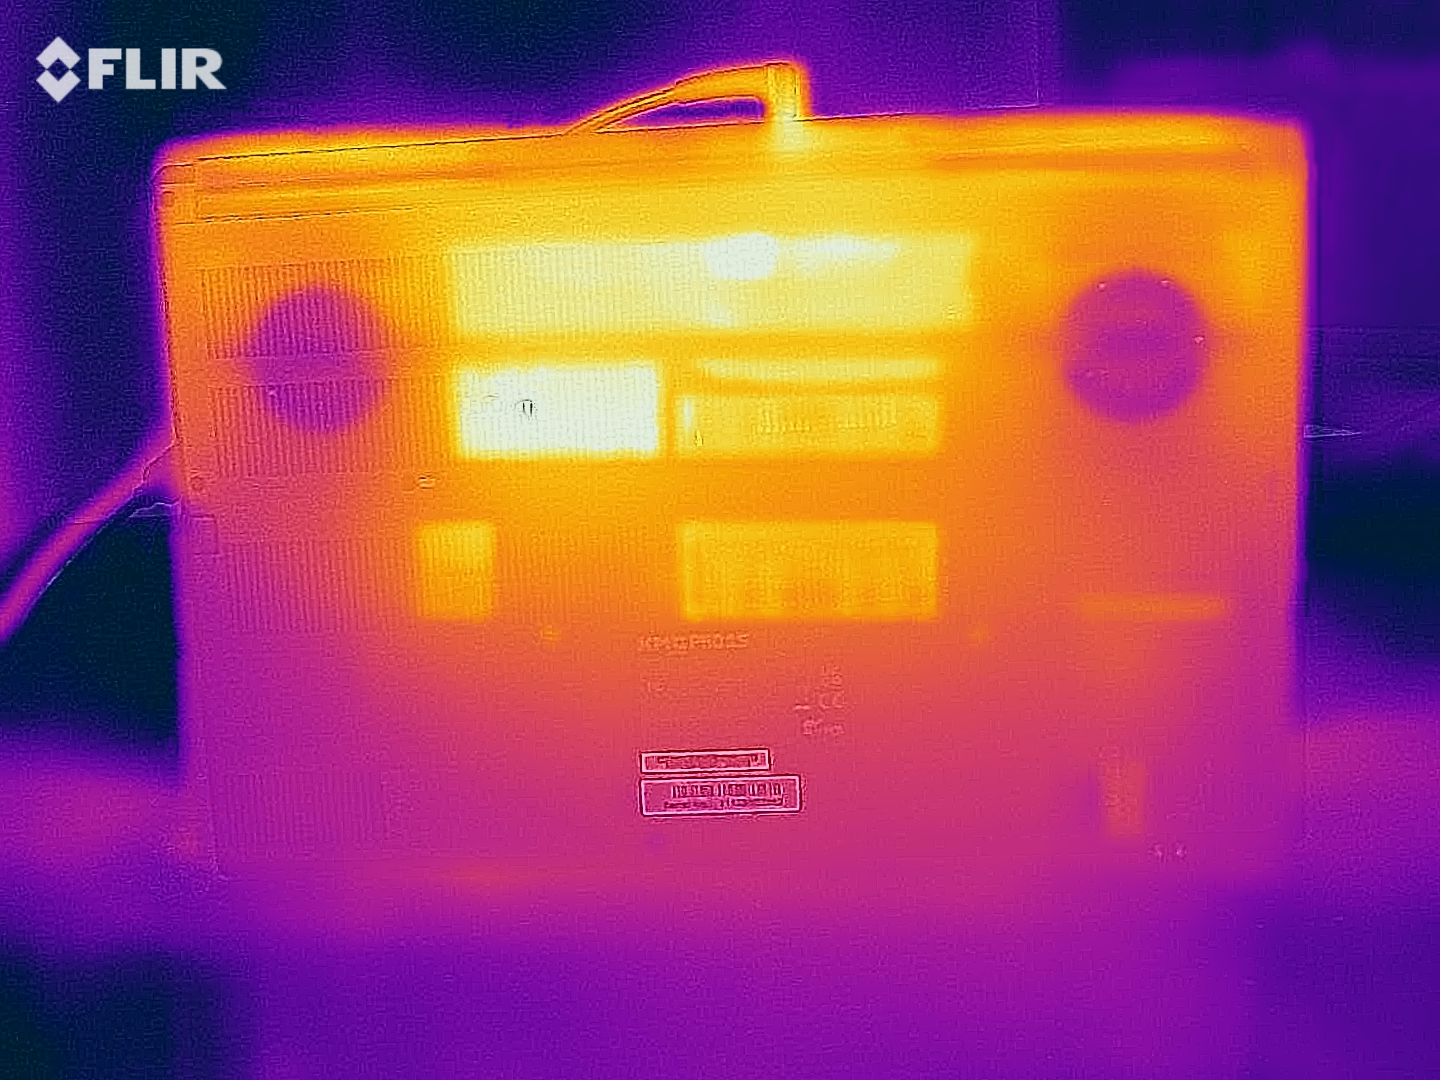
(±) The maximum temperature on the upper side is 44 °C / 111 F, compared to the average of 40.4 °C / 105 F, ranging from 21.2 to 68.8 °C for the class Gaming.
(-) The bottom heats up to a maximum of 60 °C / 140 F, compared to the average of 43.2 °C / 110 F
(+) In idle usage, the average temperature for the upper side is 27.8 °C / 82 F, compared to the device average of 33.9 °C / 93 F.
(-) Playing The Witcher 3, the average temperature for the upper side is 44.2 °C / 112 F, compared to the device average of 33.9 °C / 93 F.
(±) The palmrests and touchpad can get very hot to the touch with a maximum of 38 °C / 100.4 F.
(-) The average temperature of the palmrest area of similar devices was 28.8 °C / 83.8 F (-9.2 °C / -16.6 F).
| Schenker XMG Pro 15 (Late 2021) Intel Core i7-11800H, NVIDIA GeForce RTX 3080 Laptop GPU | Lenovo Legion S7 15ACH6 82K80030GE AMD Ryzen 9 5900HX, NVIDIA GeForce RTX 3060 Laptop GPU | Alienware x15 RTX 3070 P111F Intel Core i7-11800H, NVIDIA GeForce RTX 3070 Laptop GPU | Razer Blade 15 Advanced (Mid 2021) Intel Core i7-11800H, NVIDIA GeForce RTX 3080 Laptop GPU | Schenker XMG Pro 15 (Early 2021, RTX 3080) Intel Core i7-10870H, NVIDIA GeForce RTX 3080 Laptop GPU | MSI Delta 15 A5EFK AMD Ryzen 9 5900HX, AMD Radeon RX 6700M | |
|---|---|---|---|---|---|---|
| Heat | 5% | -3% | -8% | -7% | 1% | |
| Maximum Upper Side * (°C) | 44 | 49 -11% | 59.2 -35% | 51 -16% | 51 -16% | 50 -14% |
| Maximum Bottom * (°C) | 60 | 50 17% | 58 3% | 52 13% | 66 -10% | 55 8% |
| Idle Upper Side * (°C) | 30 | 29 3% | 28.4 5% | 35.2 -17% | 32 -7% | 31 -3% |
| Idle Bottom * (°C) | 34 | 30 12% | 29 15% | 37.8 -11% | 32 6% | 30 12% |
* ... smaller is better
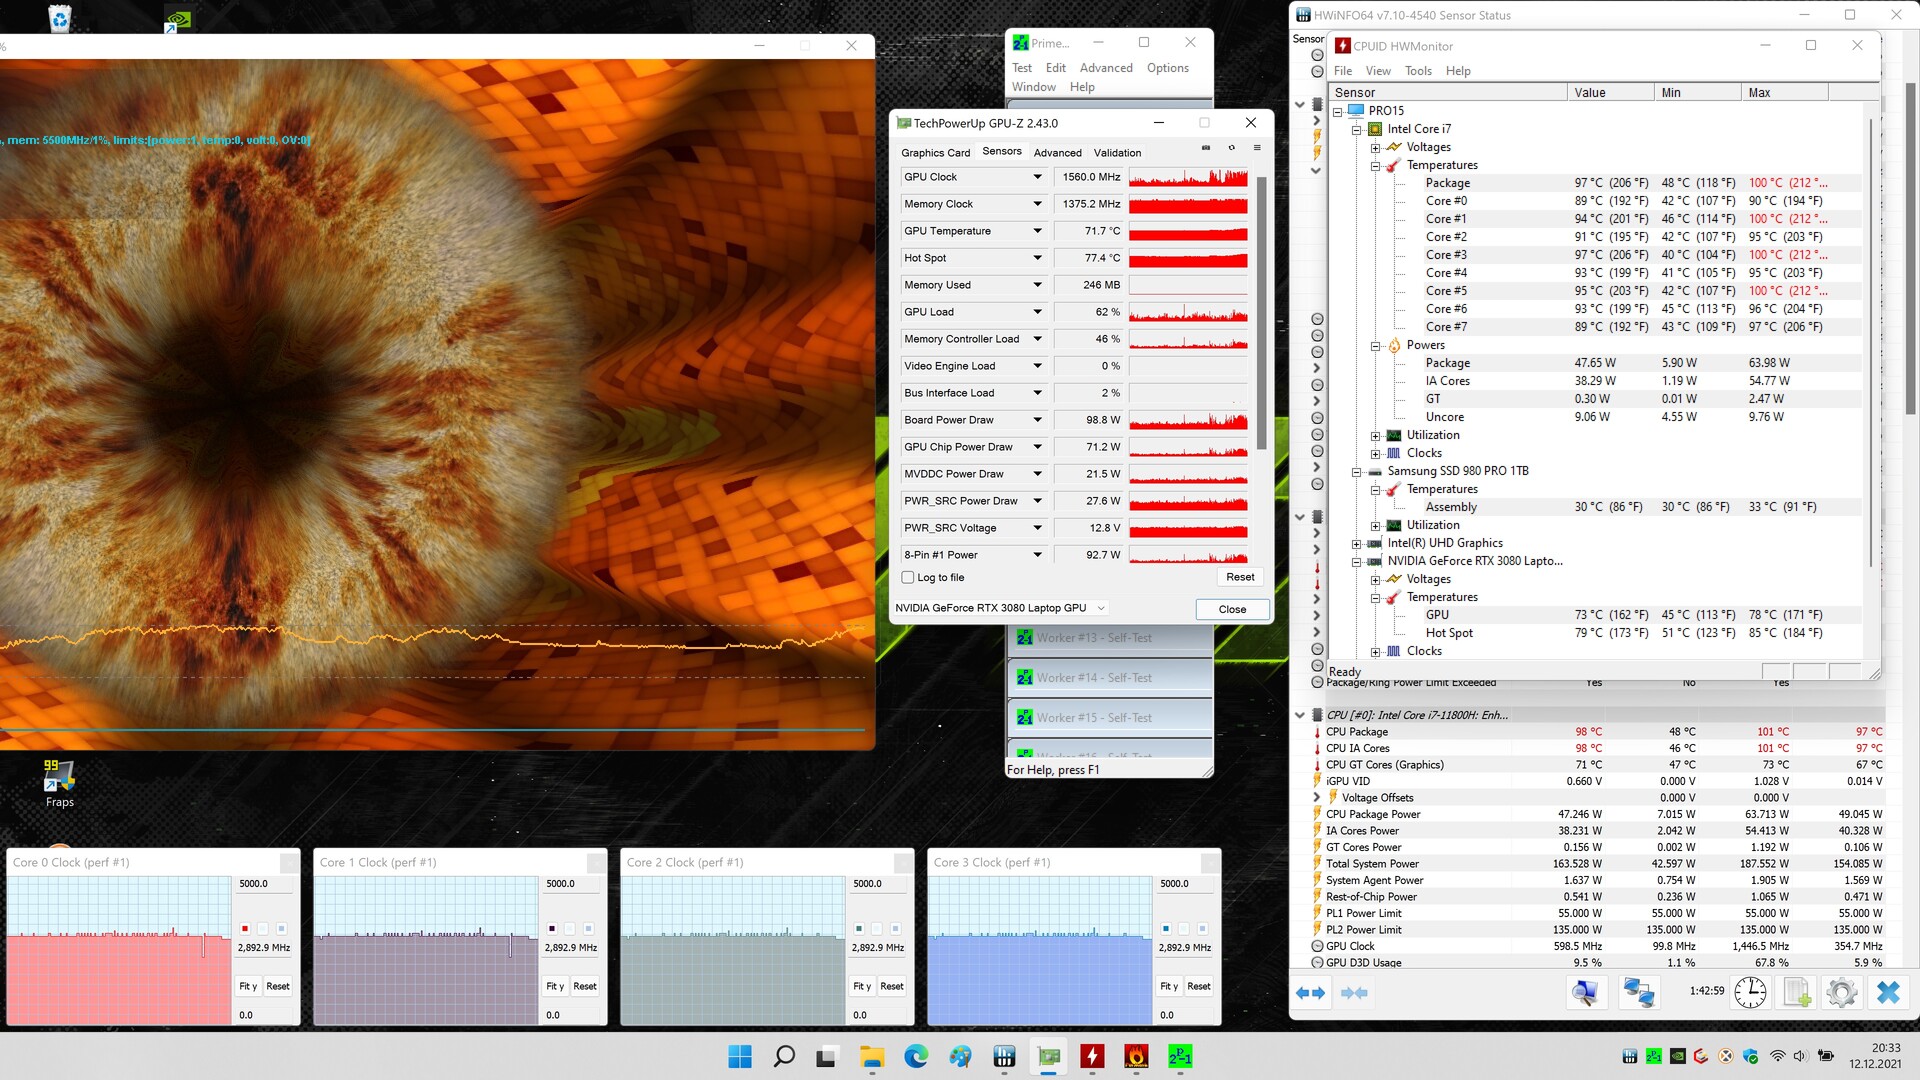
压力测试
在我们的压力测试开始时(运行Prime95和FurMark至少一个小时),CPU(3.8至4.1 GHz)和GPU(1300至1600 MHz)以相当高的时钟速度运行。仅仅几分钟后,时钟速率就分别下降到2.9 GHz和500至1600 MHz,并保持在这一水平。这个压力测试代表了一种极端情况。我们用这个测试来确定系统是否在最大负荷下仍然保持稳定。
发言人
立体声扬声器产生的声音很一般,缺乏低音。最大音量相对较高。我们建议使用耳机或外部扬声器以获得更好的声音体验。
Schenker XMG Pro 15 (Late 2021) audio analysis
(+) | speakers can play relatively loud (89 dB)
Bass 100 - 315 Hz
(-) | nearly no bass - on average 26% lower than median
(±) | linearity of bass is average (10.4% delta to prev. frequency)
Mids 400 - 2000 Hz
(±) | higher mids - on average 10.2% higher than median
(±) | linearity of mids is average (8% delta to prev. frequency)
Highs 2 - 16 kHz
(±) | higher highs - on average 5.1% higher than median
(+) | highs are linear (5.5% delta to prev. frequency)
Overall 100 - 16.000 Hz
(±) | linearity of overall sound is average (22.5% difference to median)
Compared to same class
» 81% of all tested devices in this class were better, 5% similar, 14% worse
» The best had a delta of 6%, average was 18%, worst was 132%
Compared to all devices tested
» 66% of all tested devices were better, 6% similar, 28% worse
» The best had a delta of 4%, average was 23%, worst was 134%
Razer Blade 15 Advanced (Mid 2021) audio analysis
(+) | speakers can play relatively loud (84.6 dB)
Bass 100 - 315 Hz
(-) | nearly no bass - on average 20.1% lower than median
(±) | linearity of bass is average (12.8% delta to prev. frequency)
Mids 400 - 2000 Hz
(+) | balanced mids - only 3.6% away from median
(+) | mids are linear (4.1% delta to prev. frequency)
Highs 2 - 16 kHz
(+) | balanced highs - only 4.9% away from median
(±) | linearity of highs is average (8.3% delta to prev. frequency)
Overall 100 - 16.000 Hz
(±) | linearity of overall sound is average (15.8% difference to median)
Compared to same class
» 37% of all tested devices in this class were better, 7% similar, 56% worse
» The best had a delta of 6%, average was 18%, worst was 132%
Compared to all devices tested
» 24% of all tested devices were better, 5% similar, 70% worse
» The best had a delta of 4%, average was 23%, worst was 134%
能源管理--申克15,电池寿命尚可
能源消耗
Schenker模型的功耗没有什么特别之处。它符合我们对所安装硬件的预期。在我们的压力测试开始时,耗电量激增到218瓦,然后迅速下降到165瓦左右。在我们的 Witcher 3测试期间,我们观察到的平均耗电量为186瓦。由于我们在这期间没有遇到电池耗尽的情况,附带的充电器似乎是足够的(额定功率为180瓦)。
| Off / Standby | |
| Idle | |
| Load |
|
Key:
min: | |
| Schenker XMG Pro 15 (Late 2021) i7-11800H, GeForce RTX 3080 Laptop GPU | Lenovo Legion S7 15ACH6 82K80030GE R9 5900HX, GeForce RTX 3060 Laptop GPU | Alienware x15 RTX 3070 P111F i7-11800H, GeForce RTX 3070 Laptop GPU | Razer Blade 15 Advanced (Mid 2021) i7-11800H, GeForce RTX 3080 Laptop GPU | Schenker XMG Pro 15 (Early 2021, RTX 3080) i7-10870H, GeForce RTX 3080 Laptop GPU | MSI Delta 15 A5EFK R9 5900HX, Radeon RX 6700M | Average NVIDIA GeForce RTX 3080 Laptop GPU | Average of class Gaming | |
|---|---|---|---|---|---|---|---|---|
| Power Consumption | 18% | -0% | -8% | 21% | 12% | -10% | 5% | |
| Idle Minimum * (Watt) | 20 | 13 35% | 15.7 22% | 19.5 2% | 8 60% | 10 50% | 19.8 ? 1% | 13.1 ? 34% |
| Idle Average * (Watt) | 22 | 16 27% | 20.3 8% | 23.3 -6% | 13 41% | 18 18% | 24.3 ? -10% | 19 ? 14% |
| Idle Maximum * (Watt) | 26 | 23 12% | 43 -65% | 40.1 -54% | 22 15% | 25 4% | 33.3 ? -28% | 24.6 ? 5% |
| Load Average * (Watt) | 103 | 95 8% | 94.4 8% | 98.9 4% | 97 6% | 101 2% | 108.1 ? -5% | 111.3 ? -8% |
| Witcher 3 ultra * (Watt) | 186 | 156 16% | 167 10% | 174 6% | 179 4% | 187 -1% | ||
| Load Maximum * (Watt) | 218 | 191 12% | 183.4 16% | 214 2% | 225 -3% | 217 -0% | 230 ? -6% | 260 ? -19% |
* ... smaller is better
Energy Consumption Witcher 3 / Stress Test
Energy Consumption external Monitor
电池寿命
在我们的Wi-Fi(通过脚本定期访问网页)和视频(短片Big Buck Bunny循环播放,H.264编解码器,FHD)测试中,这台15.6英寸笔记本电脑的运行时间分别达到5:14小时和6:32小时。在这两项测试中,我们禁用了笔记本的所有节能机制,并将显示器的亮度设置为大约150cd/m²。在视频测试中,我们还禁用了无线模块。

Pros
Cons
| Schenker XMG Pro 15 (Late 2021) i7-11800H, GeForce RTX 3080 Laptop GPU, 73 Wh | Lenovo Legion S7 15ACH6 82K80030GE R9 5900HX, GeForce RTX 3060 Laptop GPU, 71 Wh | Alienware x15 RTX 3070 P111F i7-11800H, GeForce RTX 3070 Laptop GPU, 87 Wh | Razer Blade 15 Advanced (Mid 2021) i7-11800H, GeForce RTX 3080 Laptop GPU, 80 Wh | Schenker XMG Pro 15 (Early 2021, RTX 3080) i7-10870H, GeForce RTX 3080 Laptop GPU, 73 Wh | MSI Delta 15 A5EFK R9 5900HX, Radeon RX 6700M, 82 Wh | Average of class Gaming | |
|---|---|---|---|---|---|---|---|
| Battery runtime | 19% | -7% | 13% | 6% | 27% | 13% | |
| Reader / Idle (h) | 10.6 | 14 32% | 9.7 -8% | 8.4 -21% | 11.1 5% | 7.84 ? -26% | |
| H.264 (h) | 6.5 | 7.5 15% | 5.5 -15% | 8.27 ? 27% | |||
| WiFi v1.3 (h) | 5.2 | 7 35% | 6.1 17% | 5.9 13% | 7.2 38% | 7.9 52% | 7.08 ? 36% |
| Load (h) | 1.3 | 1.2 -8% | 0.9 -31% | 1.6 23% | 1.6 23% | 1.496 ? 15% |
结论--Schenker XMG Pro 15是一款结构良好、结构紧凑的游戏笔记本。
这款超薄笔记本电脑的游戏性能符合RTX 3080设备的平均水平。在这里,105瓦的相对较低的TGP变得很明显。虽然在FHD下,大多数游戏可以在最大质量设置下进行,但在原生显示分辨率(4K)下运行,往往需要降低质量设置。
PCIe 4、Thunderbolt 4、OLED--Schenker XMG Pro 15(2021年底)配备了最新技术。
芯片 酷睿i7-11800HCPU和GeForce RTX 3080移动GPU始终表现良好。在负载情况下,笔记本电脑会大幅升温,并产生大量噪音。静音电源配置文件以牺牲一些性能为代价降低了噪音水平。
有两个M.2-2280固态硬盘的空间(1个PCIe 4.0,1个PCIe 3.0/SATA)和RAID 0/1支持。我们的测试设备配备了一个极快的PCIe-4 SSD(1TB)。虽然它的实际Wi-Fi运行时间约为5至7小时,没有什么可写的,但对一台拥有4K屏幕的游戏笔记本电脑有更多期待是不合理的。不幸的是,电池不能通过集成的Thunderbolt 4端口进行充电。
OLED屏幕(3840 x 2160像素)是Pro 15的突出特点。它提供了较高的最大亮度、出色的对比度、良好的可视角度、较短的响应时间、良好的色彩准确性和宽广的色域。不幸的是,该屏幕是反光的。此外,我们观察到PWM闪烁。
XMG Pro的一个替代品是 Razer Blade 15 Advanced.它甚至更紧凑,并提供两个雷电4端口。虽然它的电池容量更大,而且 "只 "配备了FHD面板,但它的电池寿命并没有超过我们的申克笔记本电脑的意义。同时, 联想Legion S7 15ACH6(2000欧元或约2250美元)。虽然它的3D性能明显较慢,但它以更明亮的哑光4K IPS屏幕、更好的电池运行时间和三年的保修期而大放异彩。最大的弱点是其单一的、焊接的内存模块。
价格和可用性
Schenker XMG Pro 15(2021年底)可以通过Schenker在线商店进行配置。.我们的配置可以以大约3000欧元(约3400美元)的价格购买。基本型号的起价约为2200欧元(约2500美元)。
Schenker XMG Pro 15 (Late 2021)
- 01/19/2022 v7 (old)
Sascha Mölck
Price comparison

