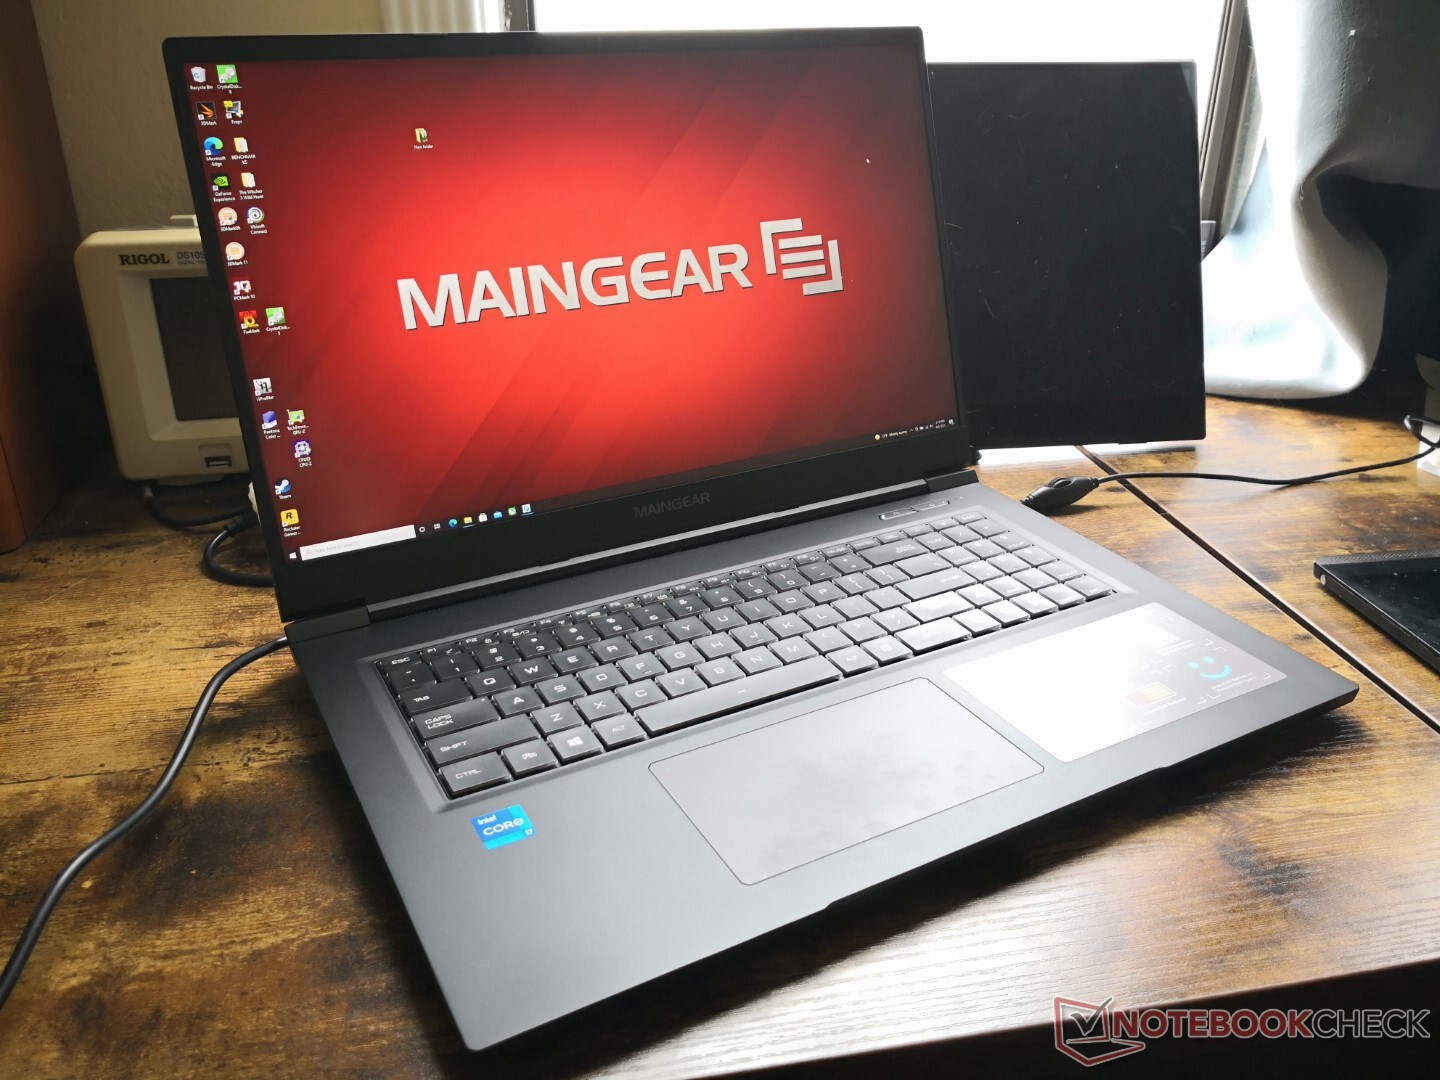
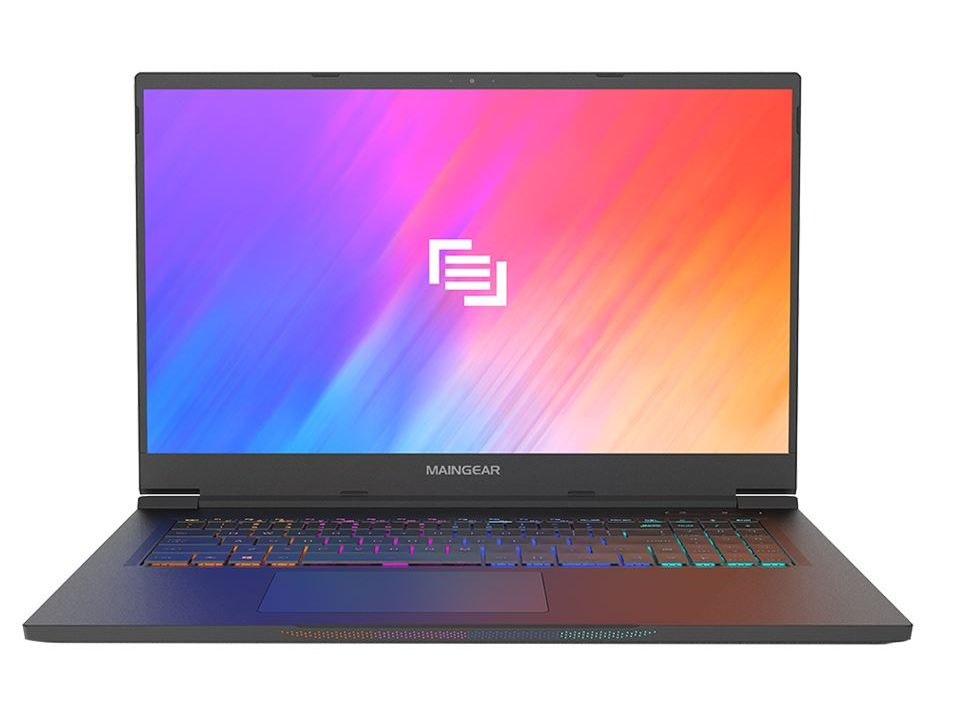
Maingear Vector Pro MG-VCP17笔记本电脑评论。165 WGeForce RTX 3080的超薄尺寸
Vector Pro是定制PC制造商Maingear的一款17.3英寸超薄游戏笔记本电脑。它是一个超薄的高性能系统,与微星GS75相同。 MSI GS75, 雷蛇Blade Pro, 华硕Zephyrus S17,或戴尔Alienware x17系列。
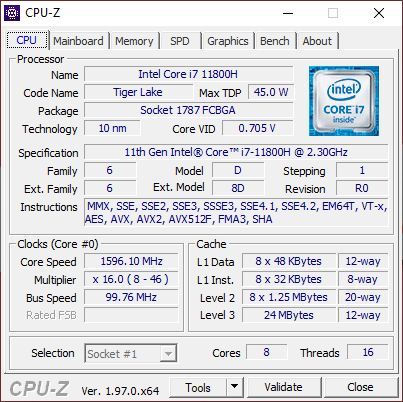
我们的测试装置已经完全配置了第11代酷睿i7-11800H CPU,165瓦GeForce RTX 3080 GPU,以及165赫兹1440p IPS显示屏,零售价约为2500美元。更少的SKU将提供RTX 3070,起步价更低。
值得一提的是,Vector Pro采用了白色标签的同方机箱。因此,用户可以从其他经销商那里找到非常类似的设计和功能,如 申克XMG Neo 17或XMG Core 17.
potential competitors in comparison
Rating | Date | Model | Weight | Height | Size | Resolution | Price |
|---|---|---|---|---|---|---|---|
| 87.8 % v7 (old) | 09 / 2021 | Maingear Vector Pro MG-VCP17 i7-11800H, GeForce RTX 3080 Laptop GPU | 2.3 kg | 19.81 mm | 17.30" | 2560x1440 | |
| 90.1 % v7 (old) | 08 / 2021 | Asus ROG Zephyrus S17 GX703HSD i9-11900H, GeForce RTX 3080 Laptop GPU | 2.8 kg | 19.9 mm | 17.30" | 2560x1440 | |
| 83.9 % v7 (old) | Schenker XMG Core 17 (Early 2021) i7-10870H, GeForce RTX 3060 Laptop GPU | 2.5 kg | 30.05 mm | 17.30" | 2560x1440 | ||
| 85.1 % v7 (old) | Schenker XMG Neo 17 (Early 2021, RTX 3070, 5800H) R7 5800H, GeForce RTX 3070 Laptop GPU | 2.5 kg | 27 mm | 17.30" | 2560x1440 | ||
| 84 % v7 (old) | Schenker Compact 17 i7-10875H, GeForce RTX 2070 Super Mobile | 2.9 kg | 29.9 mm | 17.30" | 3840x2160 | ||
| 83.7 % v7 (old) | MSI GS75 10SF-609US i7-10875H, GeForce RTX 2070 Max-Q | 2.3 kg | 18.9 mm | 17.30" | 1920x1080 |
案例
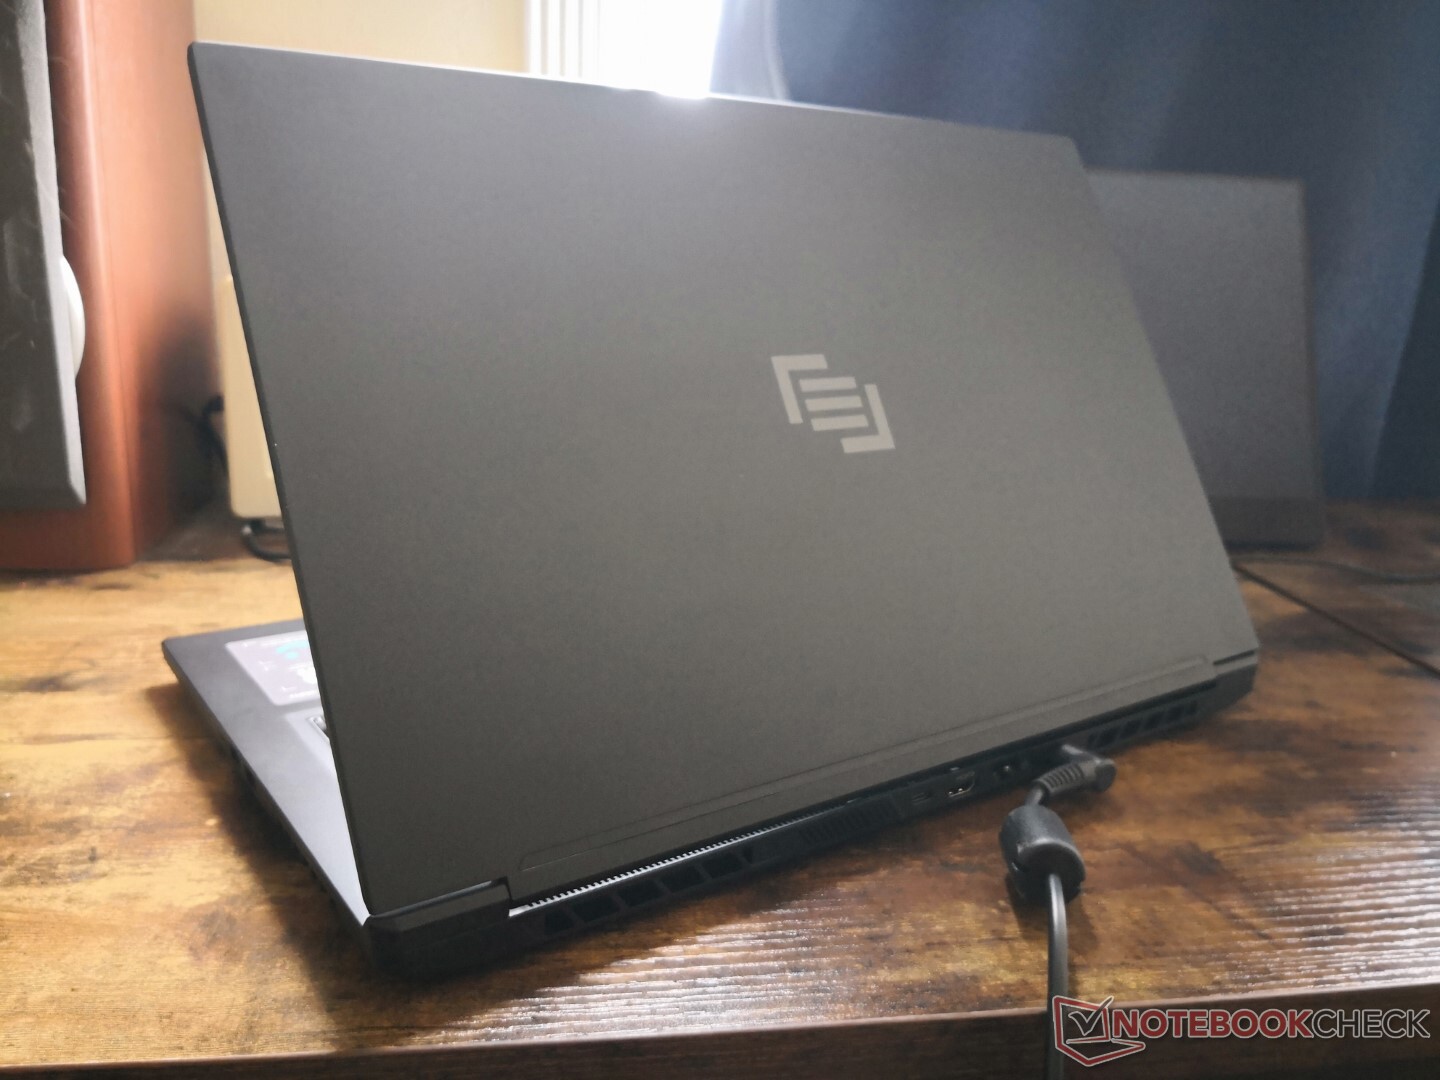
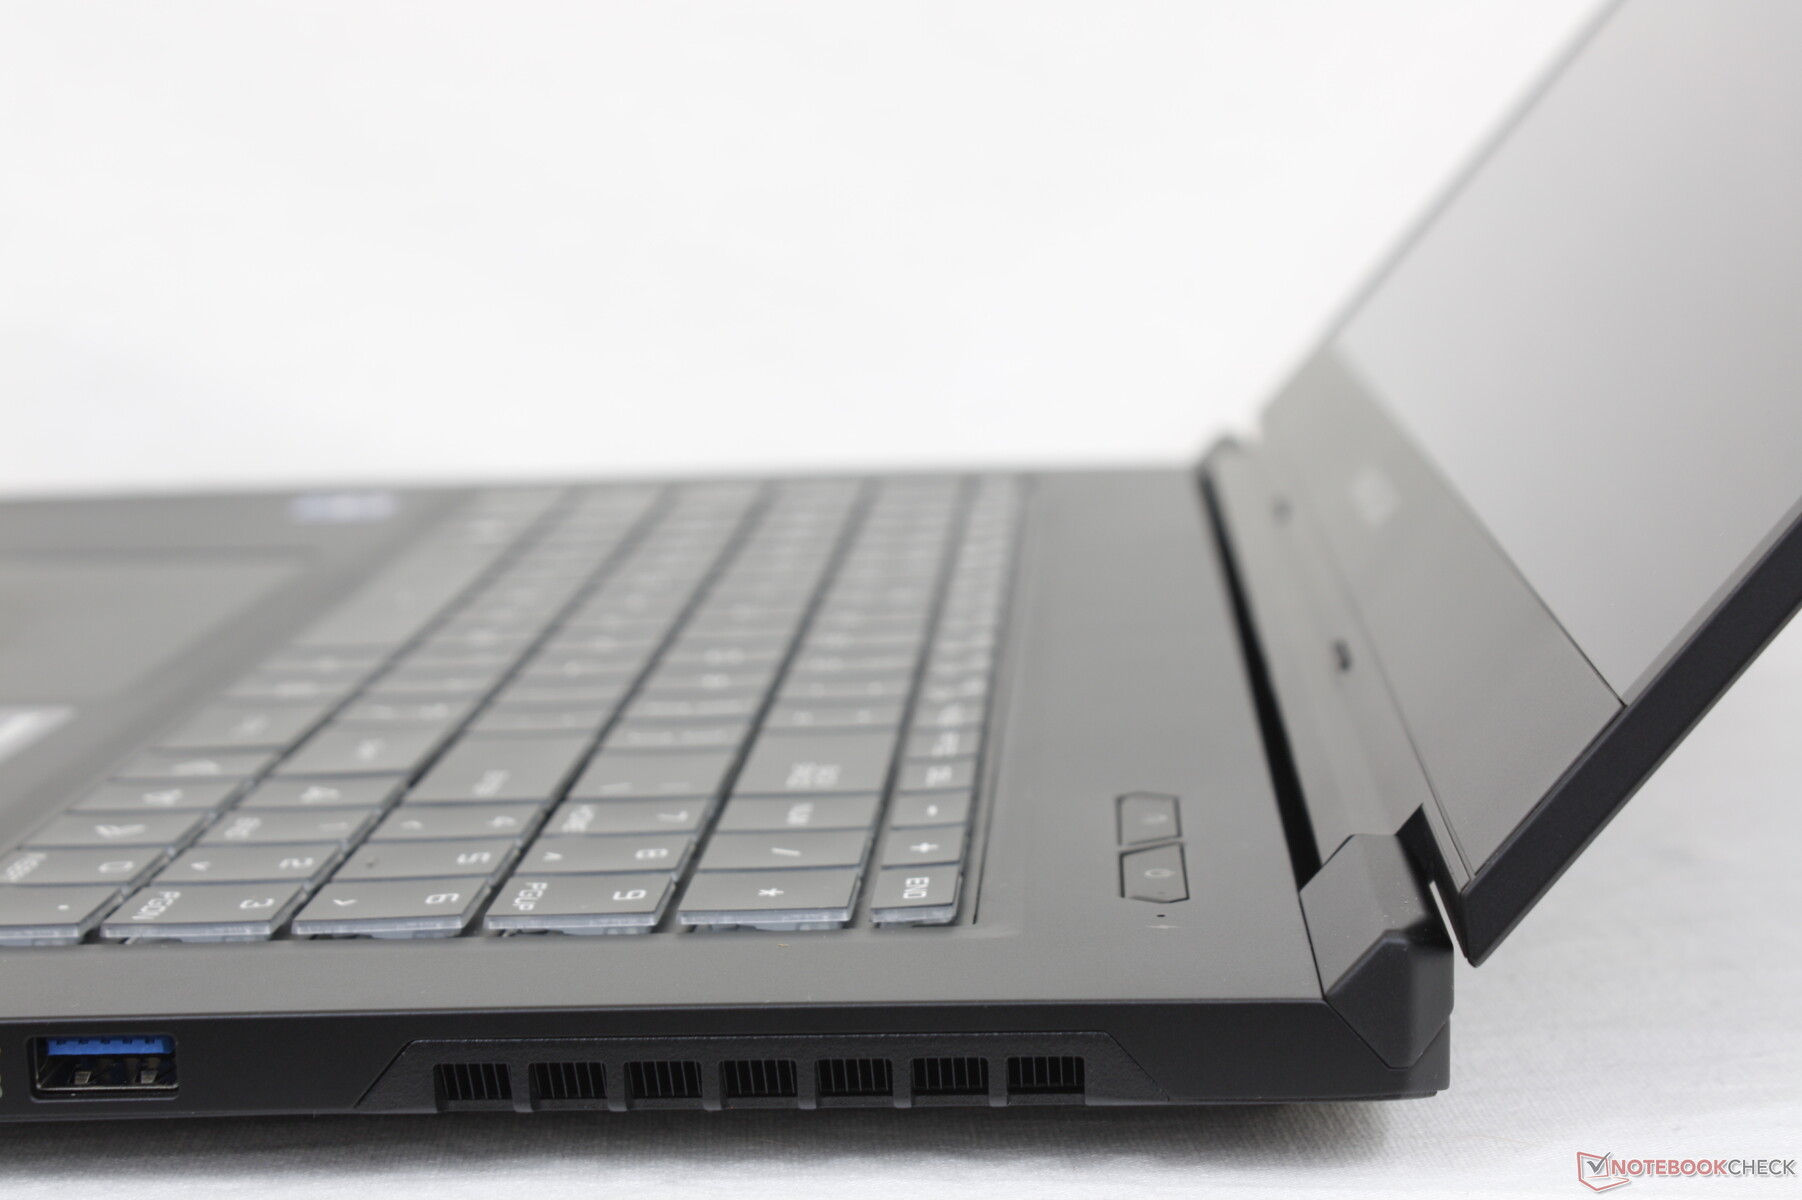
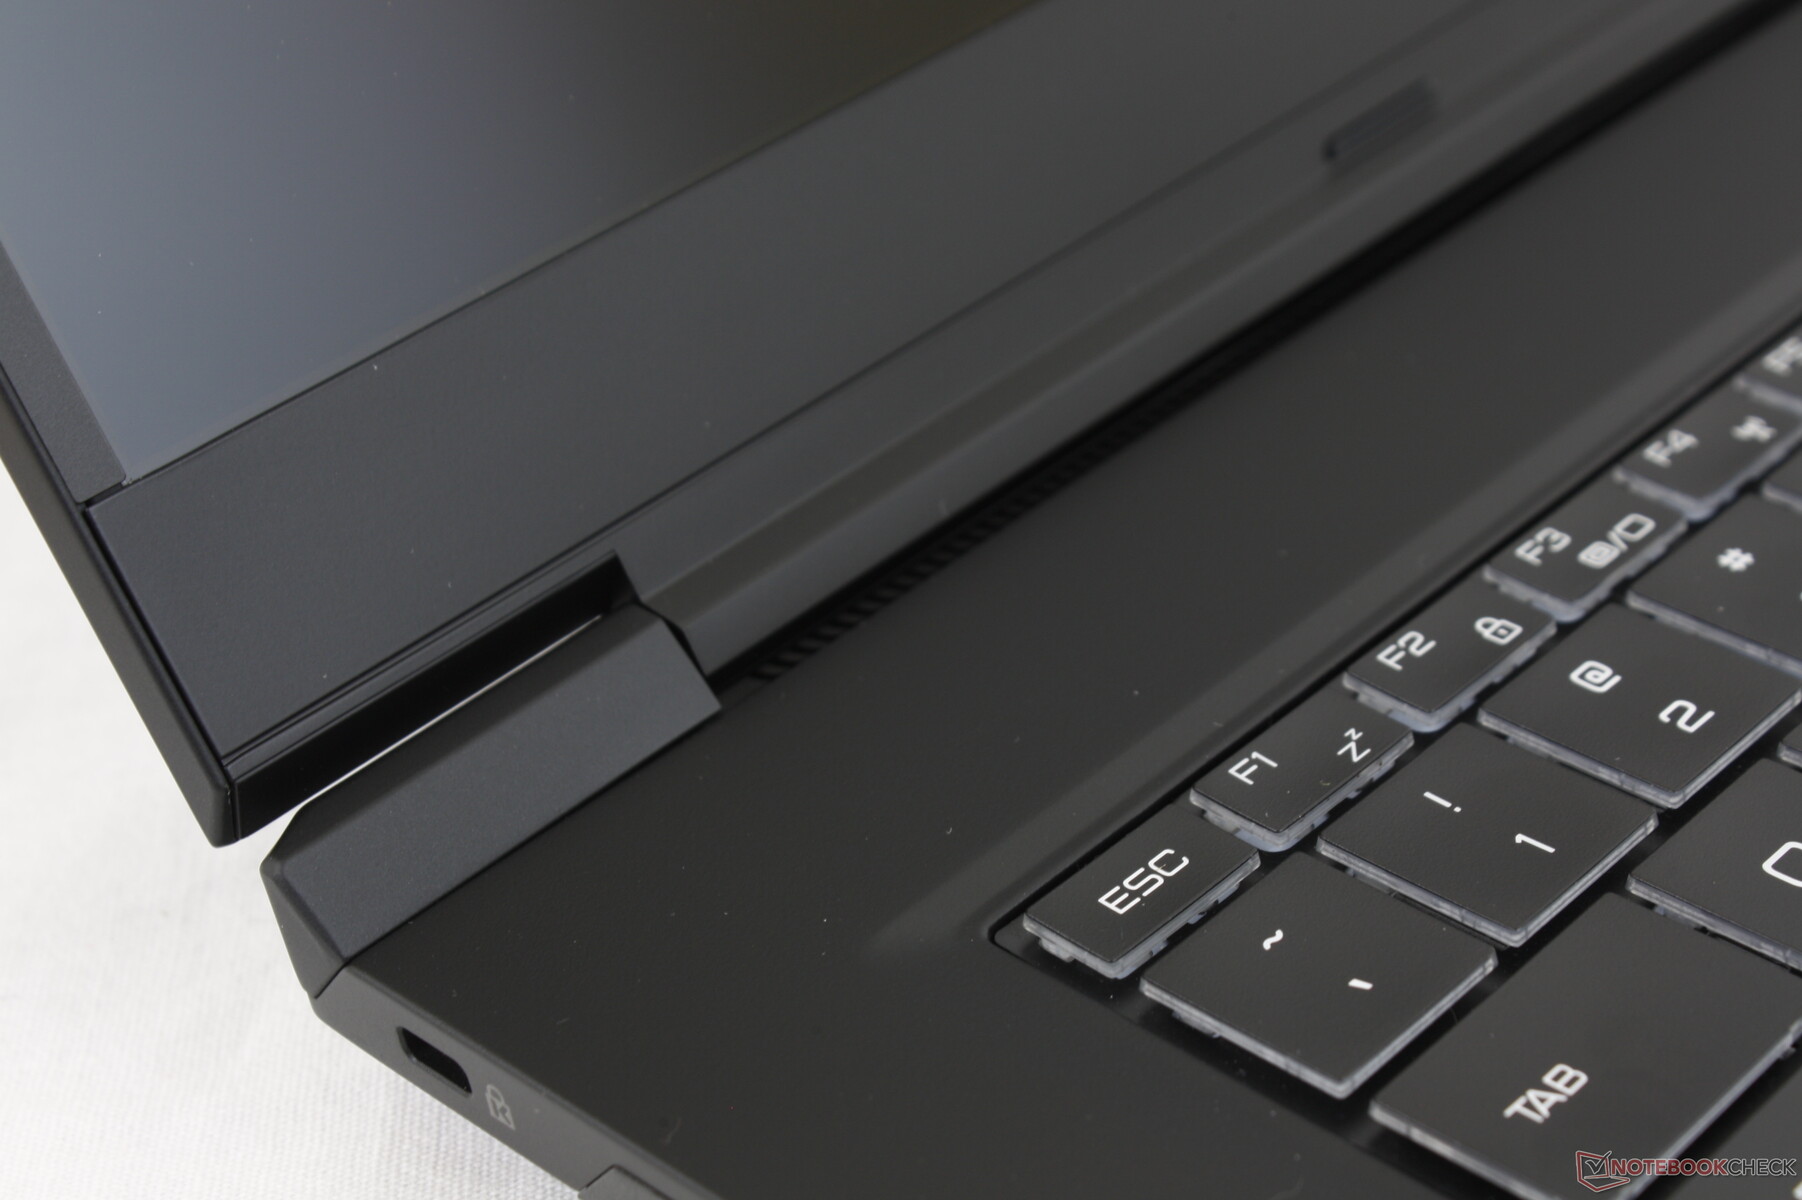
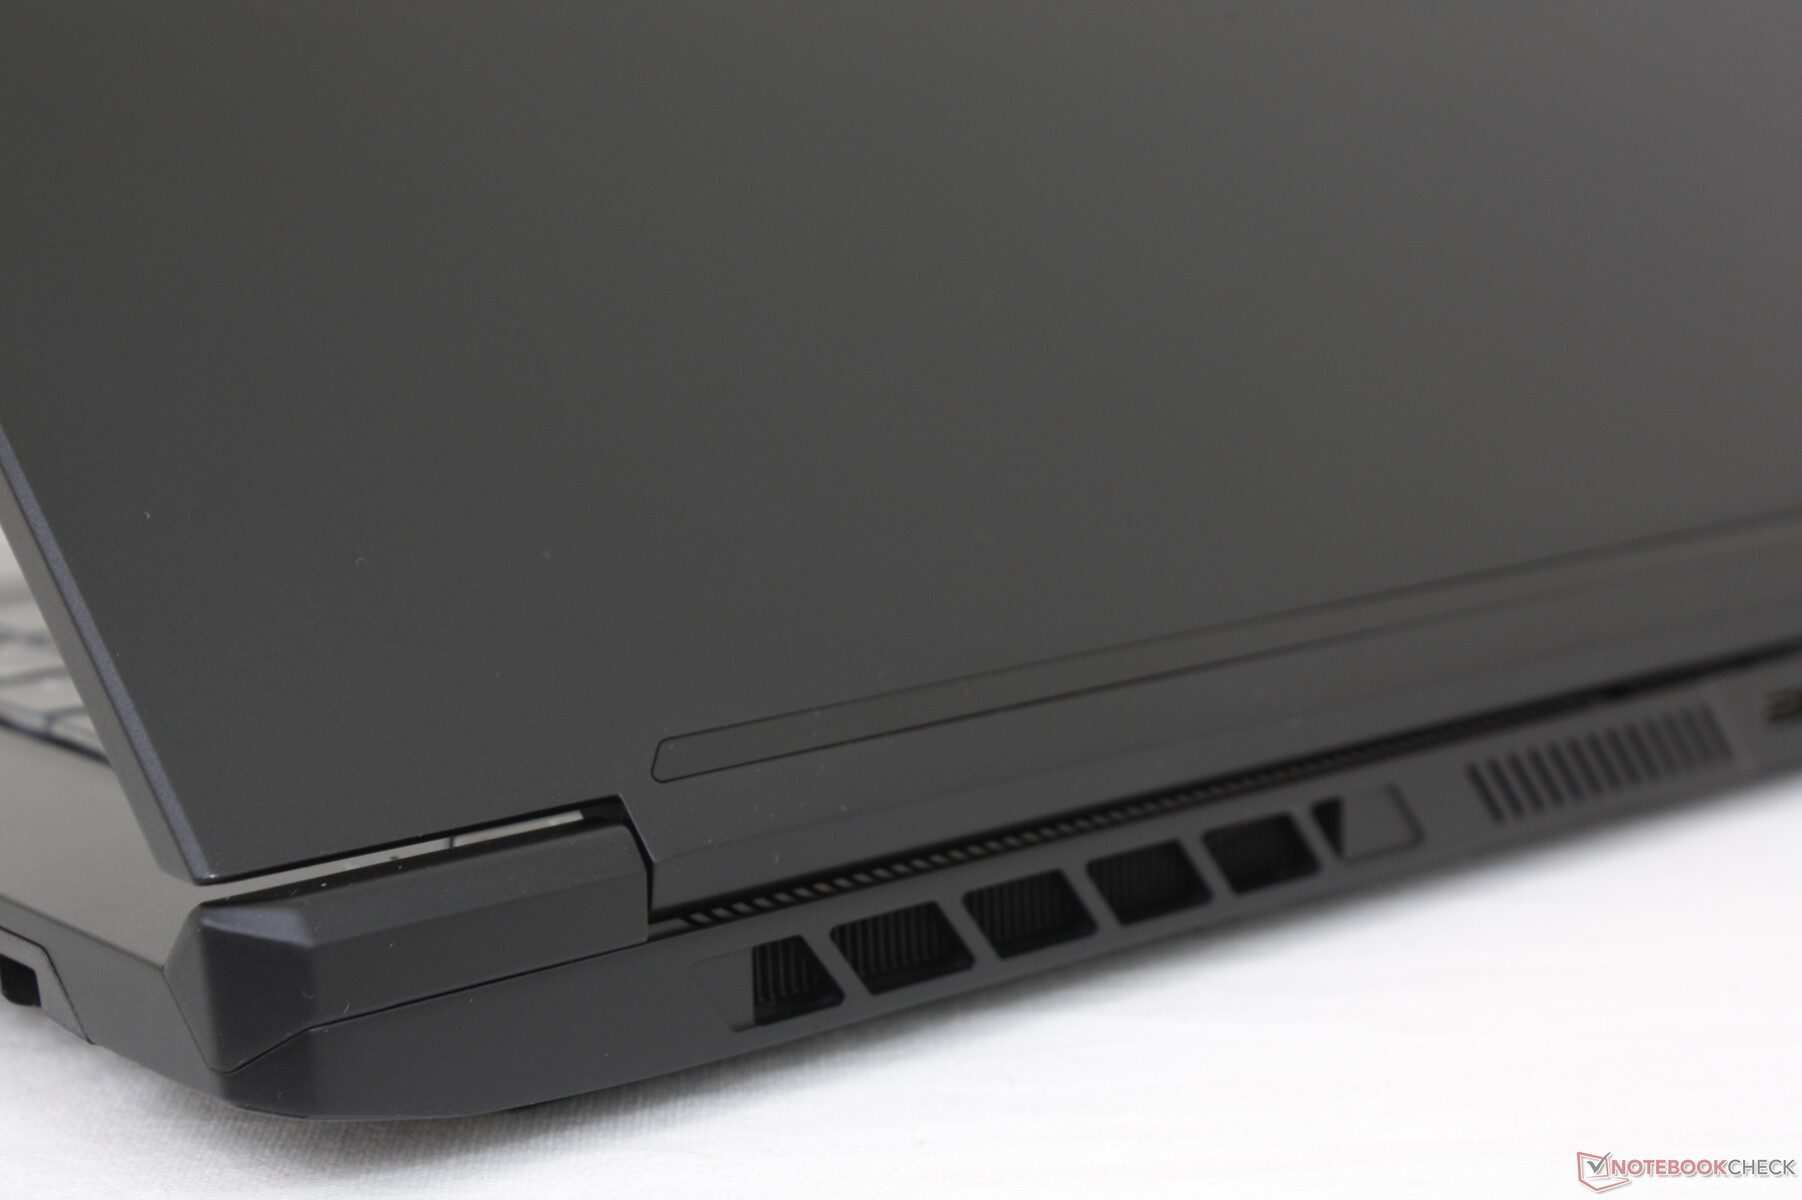
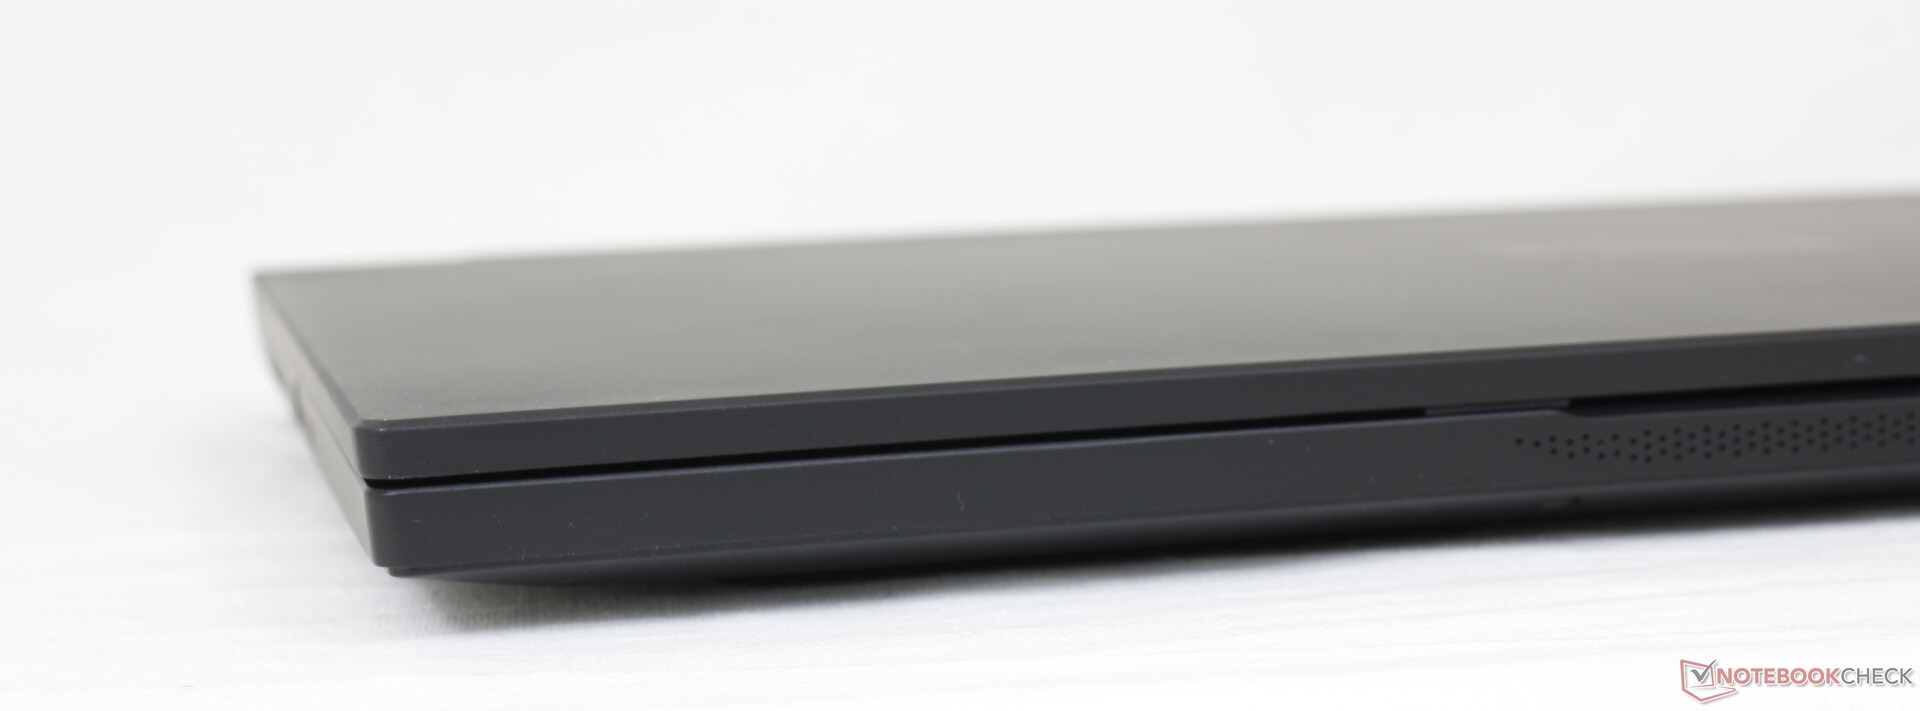
机箱可能不像华硕Zephyrus S或微星GS75那样华而不实,但它肯定感觉更强大、更坚硬。当试图扭转其角落时,底座不会屈服或吱吱作响,给人以强烈的第一印象。然而,盖子和铰链可以更硬,以减少调整角度时的摇晃。更厚的 华硕ROG Strix笔记本电脑有更大的铰链,以获得更好的寿命感。
尺寸几乎与Razer Blade Pro相同。然而,重量方面,Maingear几乎轻了半公斤。在Maingear中缺少一个蒸汽室冷却器,这可能是重量较轻的原因。
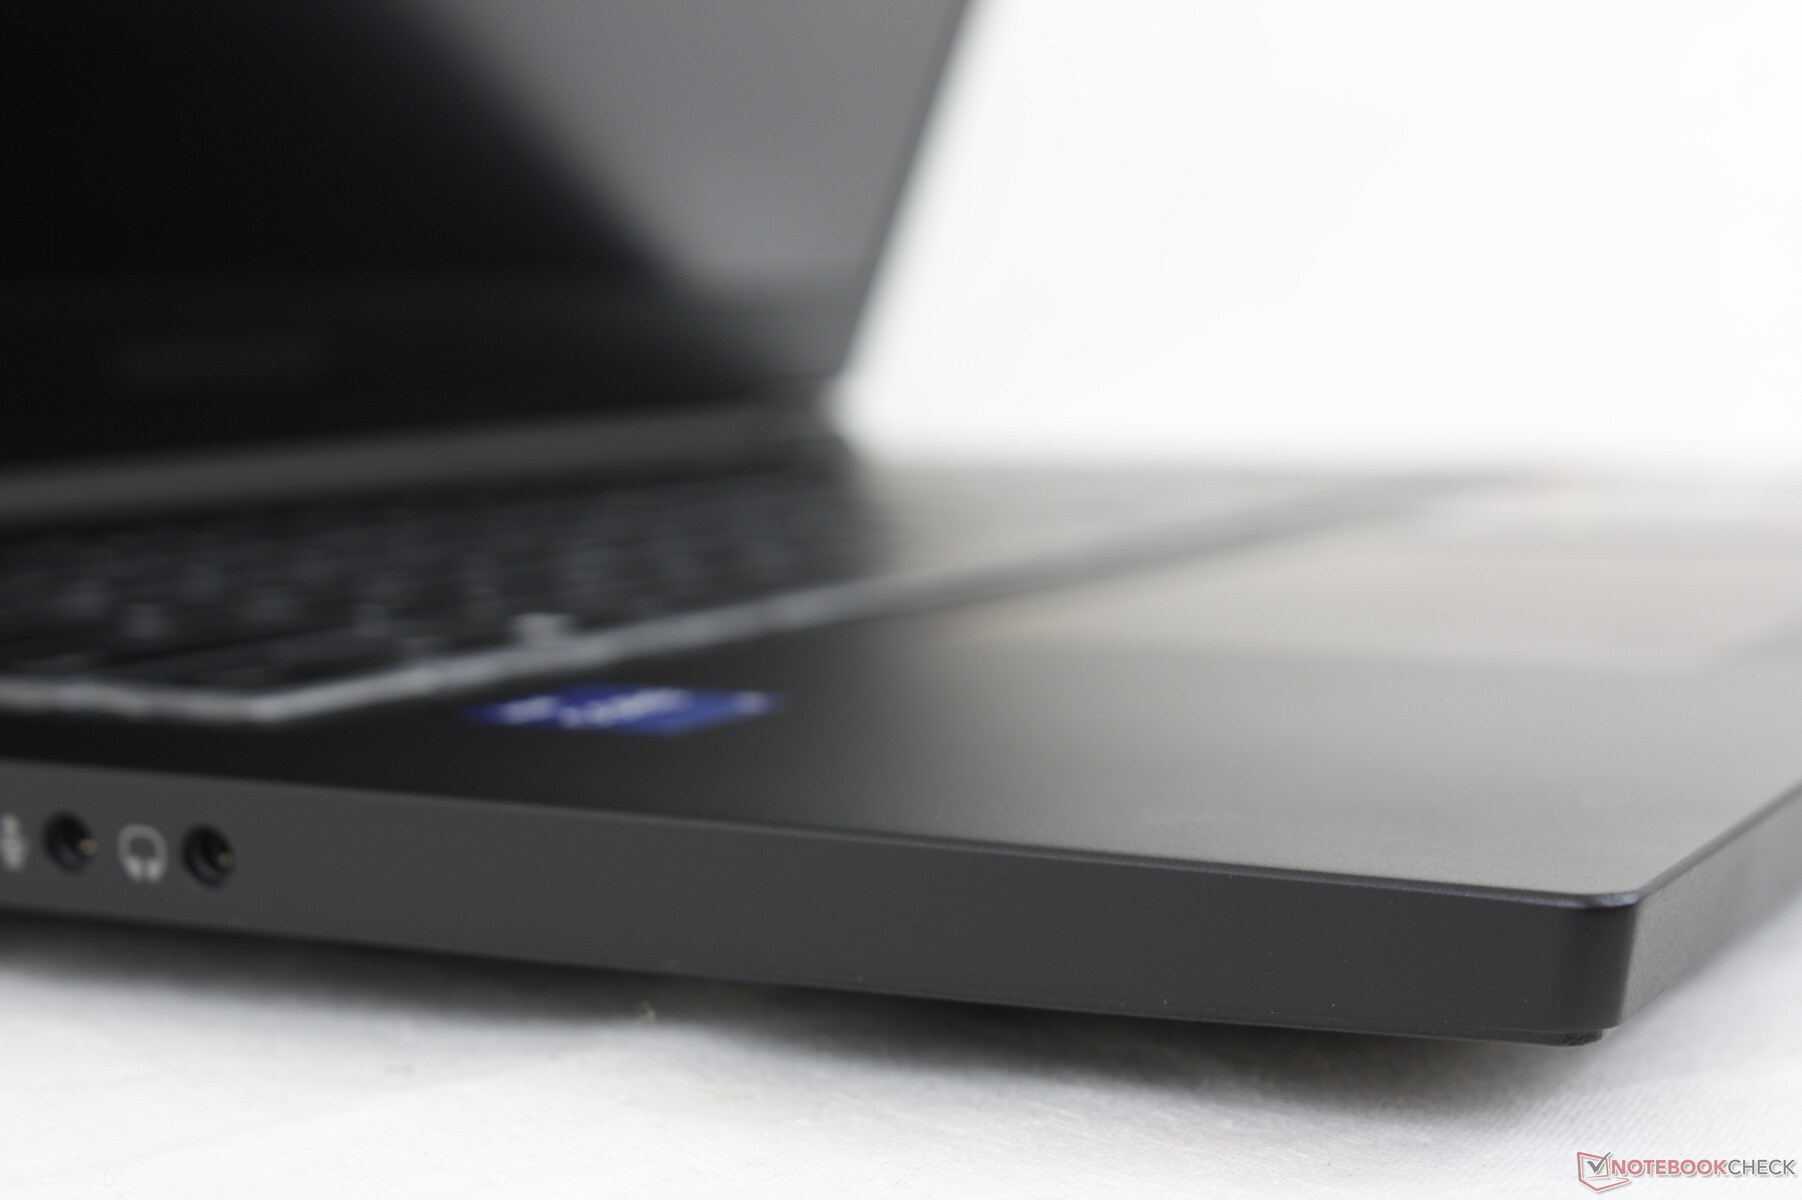
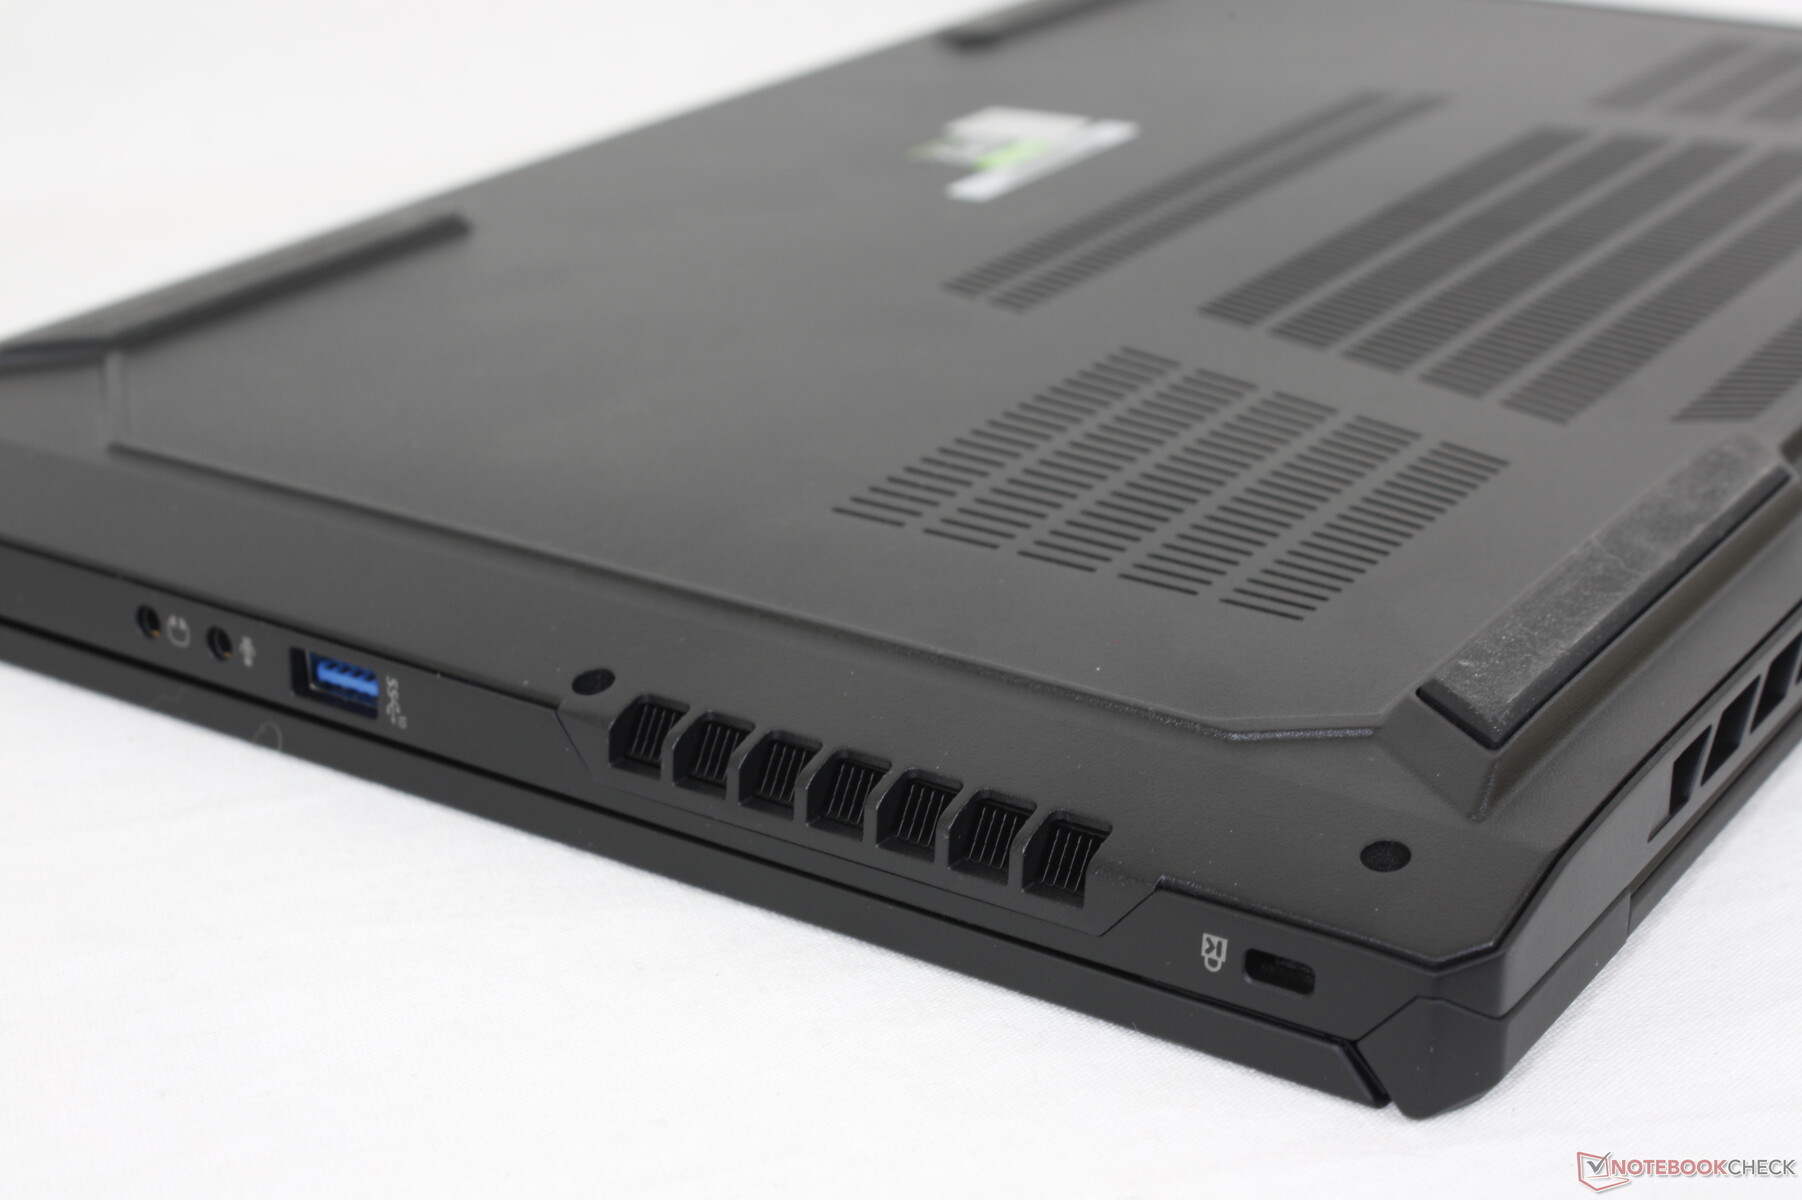
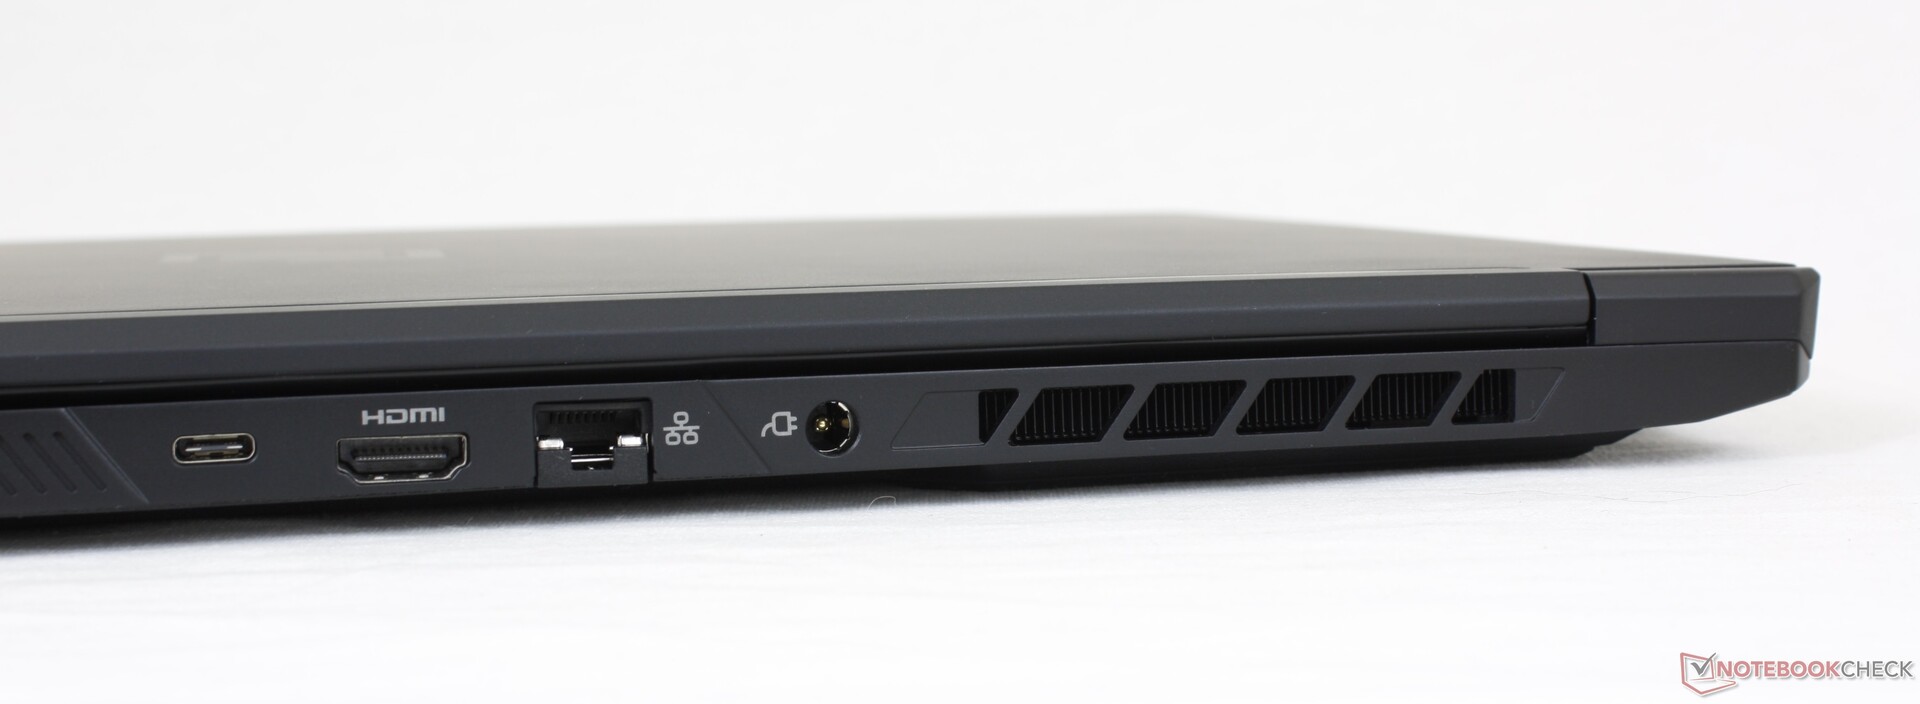
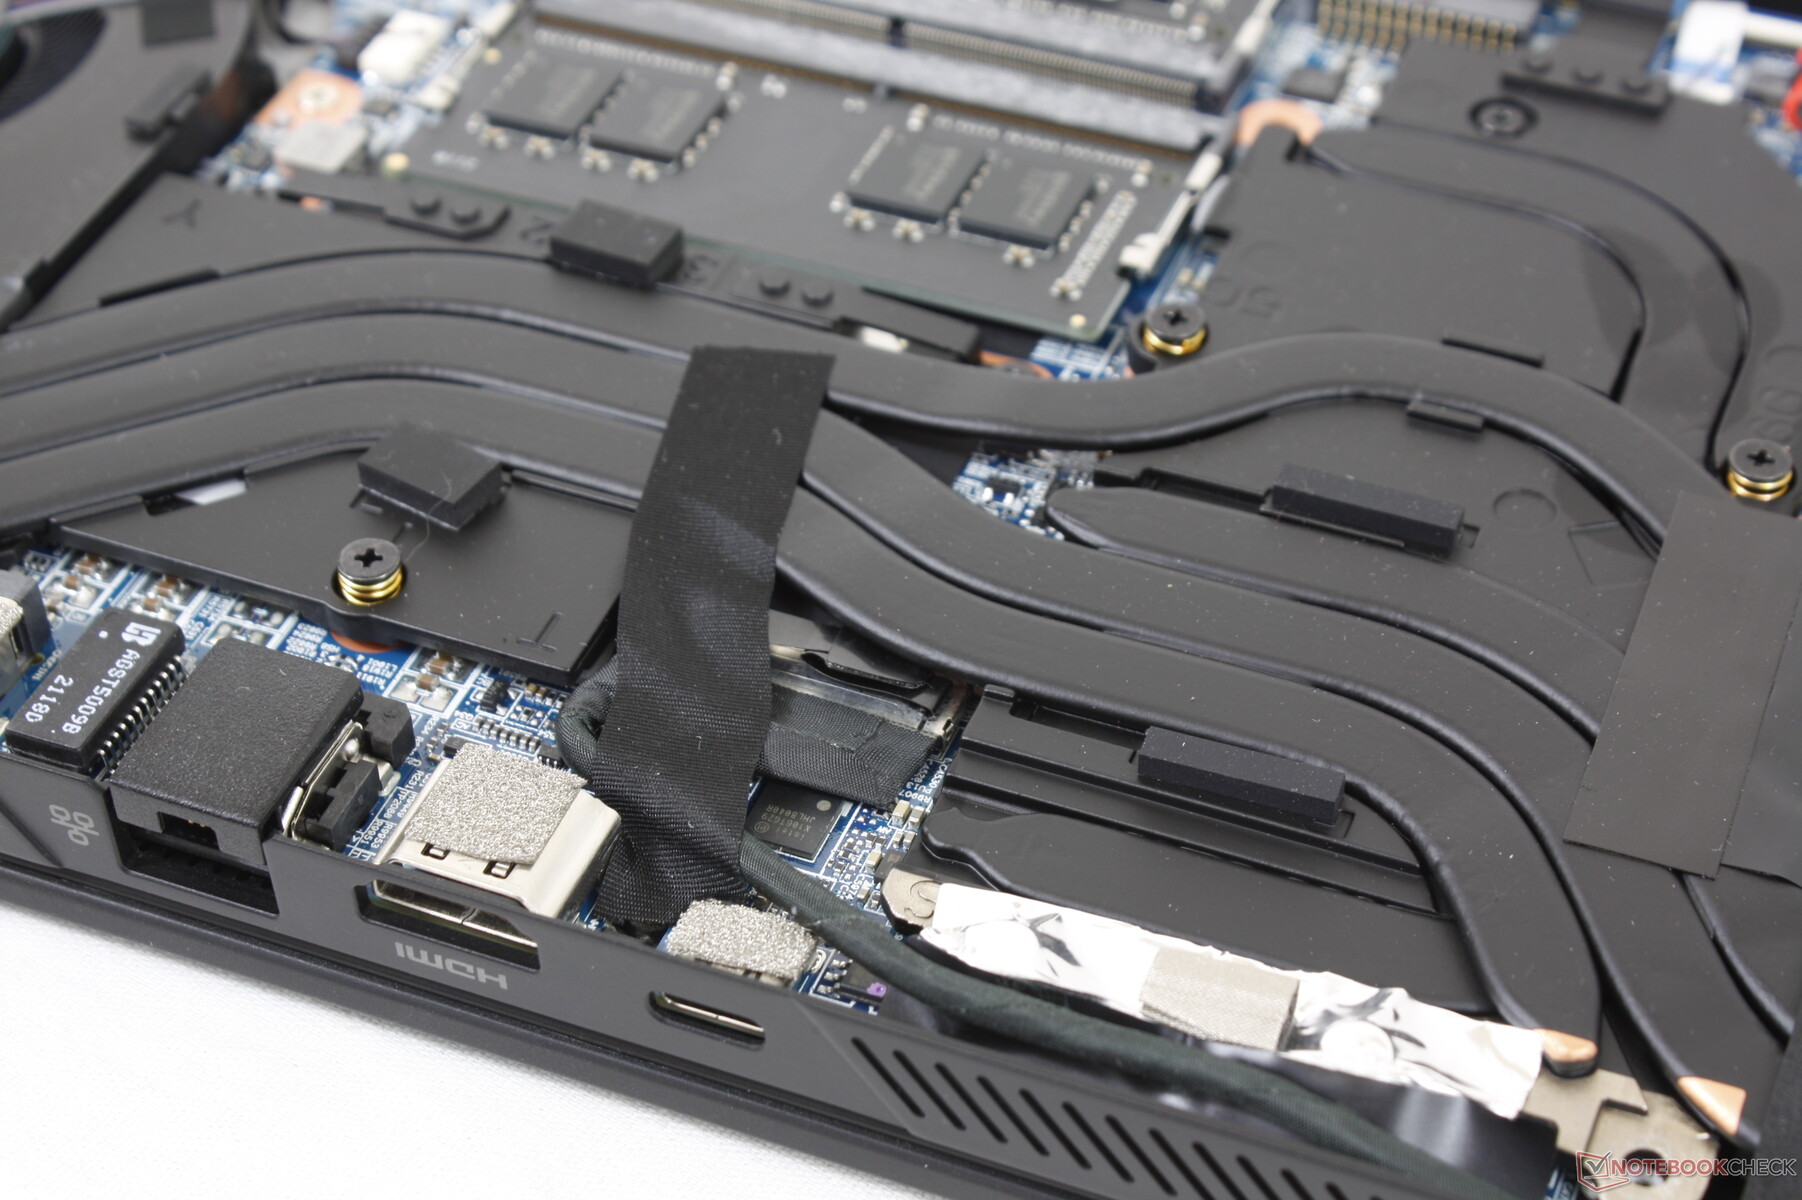
连接性
端口选项几乎与同方GM7ZG7S或GM7MG0R相同,但有一个明显的例外:我们的Maingear机箱集成了一个MicroSD读卡器,而不是一个全尺寸的。通过英特尔芯片组原生支持Thunderbolt 4,与AMD驱动的笔记本电脑不同。
不幸的是,即使在测试了多个USB-C适配器后,该笔记本电脑也不能通过USB-C充电。
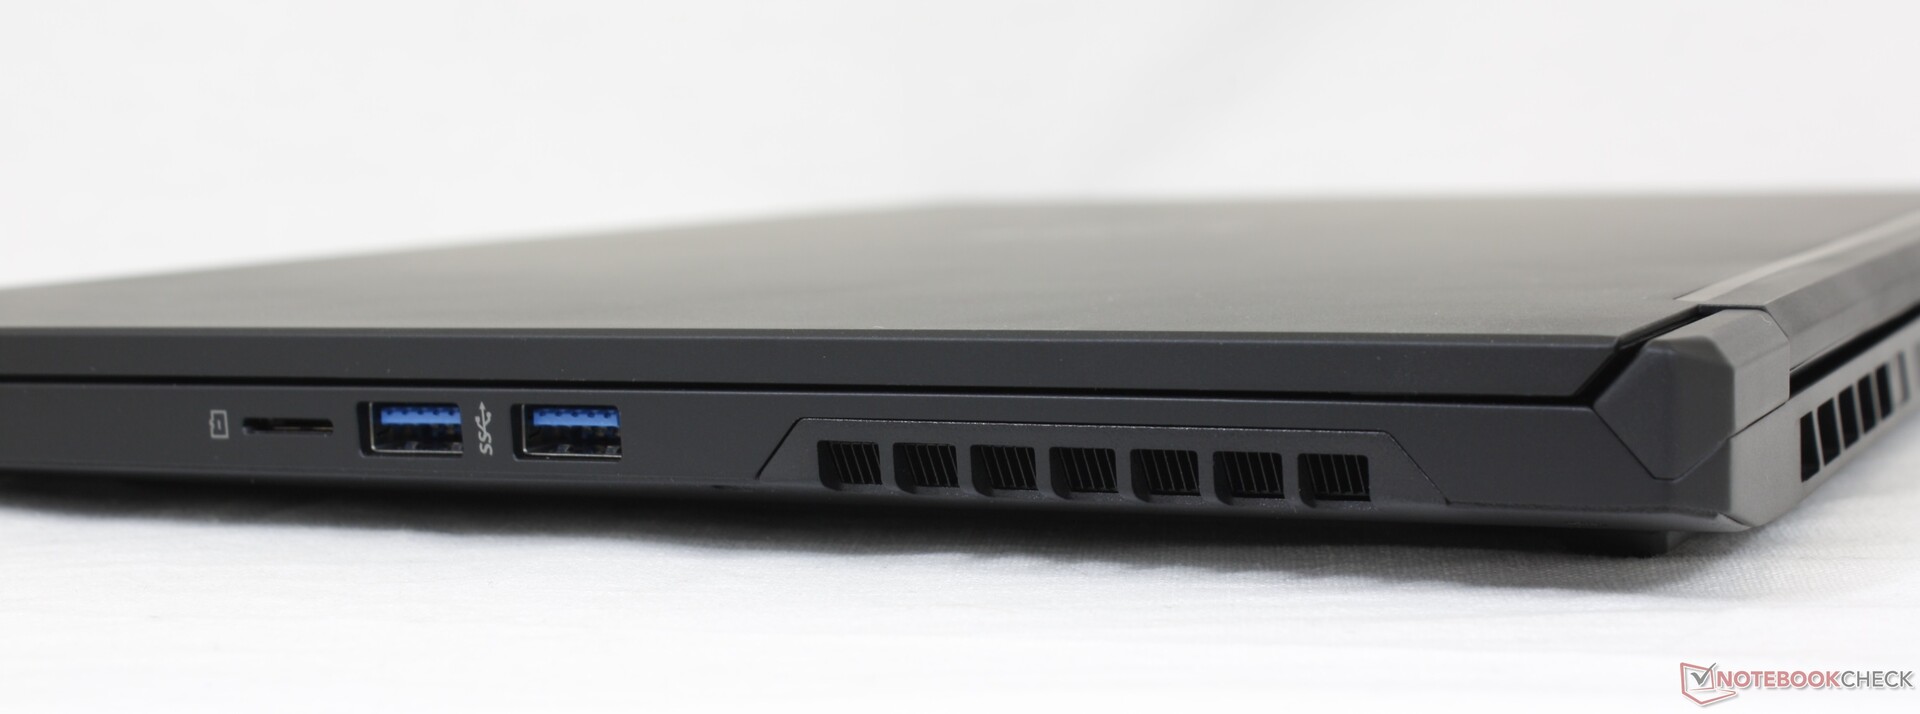
SD卡阅读器
集成的MicroSD读卡器的传输速率是平均的。将1GB的图片从我们的UHS-II测试卡移动到桌面上需要大约14秒,而微星GS75的时间还不到一半。
| SD Card Reader | |
| average JPG Copy Test (av. of 3 runs) | |
| MSI GS75 10SF-609US (Toshiba Exceria Pro M501 UHS-II) | |
| Asus ROG Zephyrus S17 GX703HSD | |
| Schenker Compact 17 (Toshiba Exceria Pro SDXC 64 GB UHS-II) | |
| Schenker XMG Neo 17 (Early 2021, RTX 3070, 5800H) (Toshiba Exceria Pro SDXC 64 GB UHS-II) | |
| Maingear Vector Pro MG-VCP17 (AV Pro V60) | |
| Schenker XMG Core 17 (Early 2021) (AV PRO microSD 128 GB V60) | |
| maximum AS SSD Seq Read Test (1GB) | |
| Asus ROG Zephyrus S17 GX703HSD | |
| MSI GS75 10SF-609US (Toshiba Exceria Pro M501 UHS-II) | |
| Schenker Compact 17 (Toshiba Exceria Pro SDXC 64 GB UHS-II) | |
| Schenker XMG Neo 17 (Early 2021, RTX 3070, 5800H) (Toshiba Exceria Pro SDXC 64 GB UHS-II) | |
| Maingear Vector Pro MG-VCP17 (AV Pro V60) | |
| Schenker XMG Core 17 (Early 2021) (AV PRO microSD 128 GB V60) | |
沟通
| Networking | |
| iperf3 transmit AX12 | |
| Schenker XMG Core 17 (Early 2021) | |
| Schenker XMG Neo 17 (Early 2021, RTX 3070, 5800H) | |
| Schenker Compact 17 | |
| MSI GS75 10SF-609US | |
| Maingear Vector Pro MG-VCP17 | |
| Asus ROG Zephyrus S17 GX703HSD | |
| iperf3 receive AX12 | |
| Schenker XMG Core 17 (Early 2021) | |
| Maingear Vector Pro MG-VCP17 | |
| Schenker XMG Neo 17 (Early 2021, RTX 3070, 5800H) | |
| MSI GS75 10SF-609US | |
| Schenker Compact 17 | |
| Asus ROG Zephyrus S17 GX703HSD | |
网络摄像头
虽然有兼容Windows Hello的红外线,但720p的网络摄像头没有集成隐私快门。


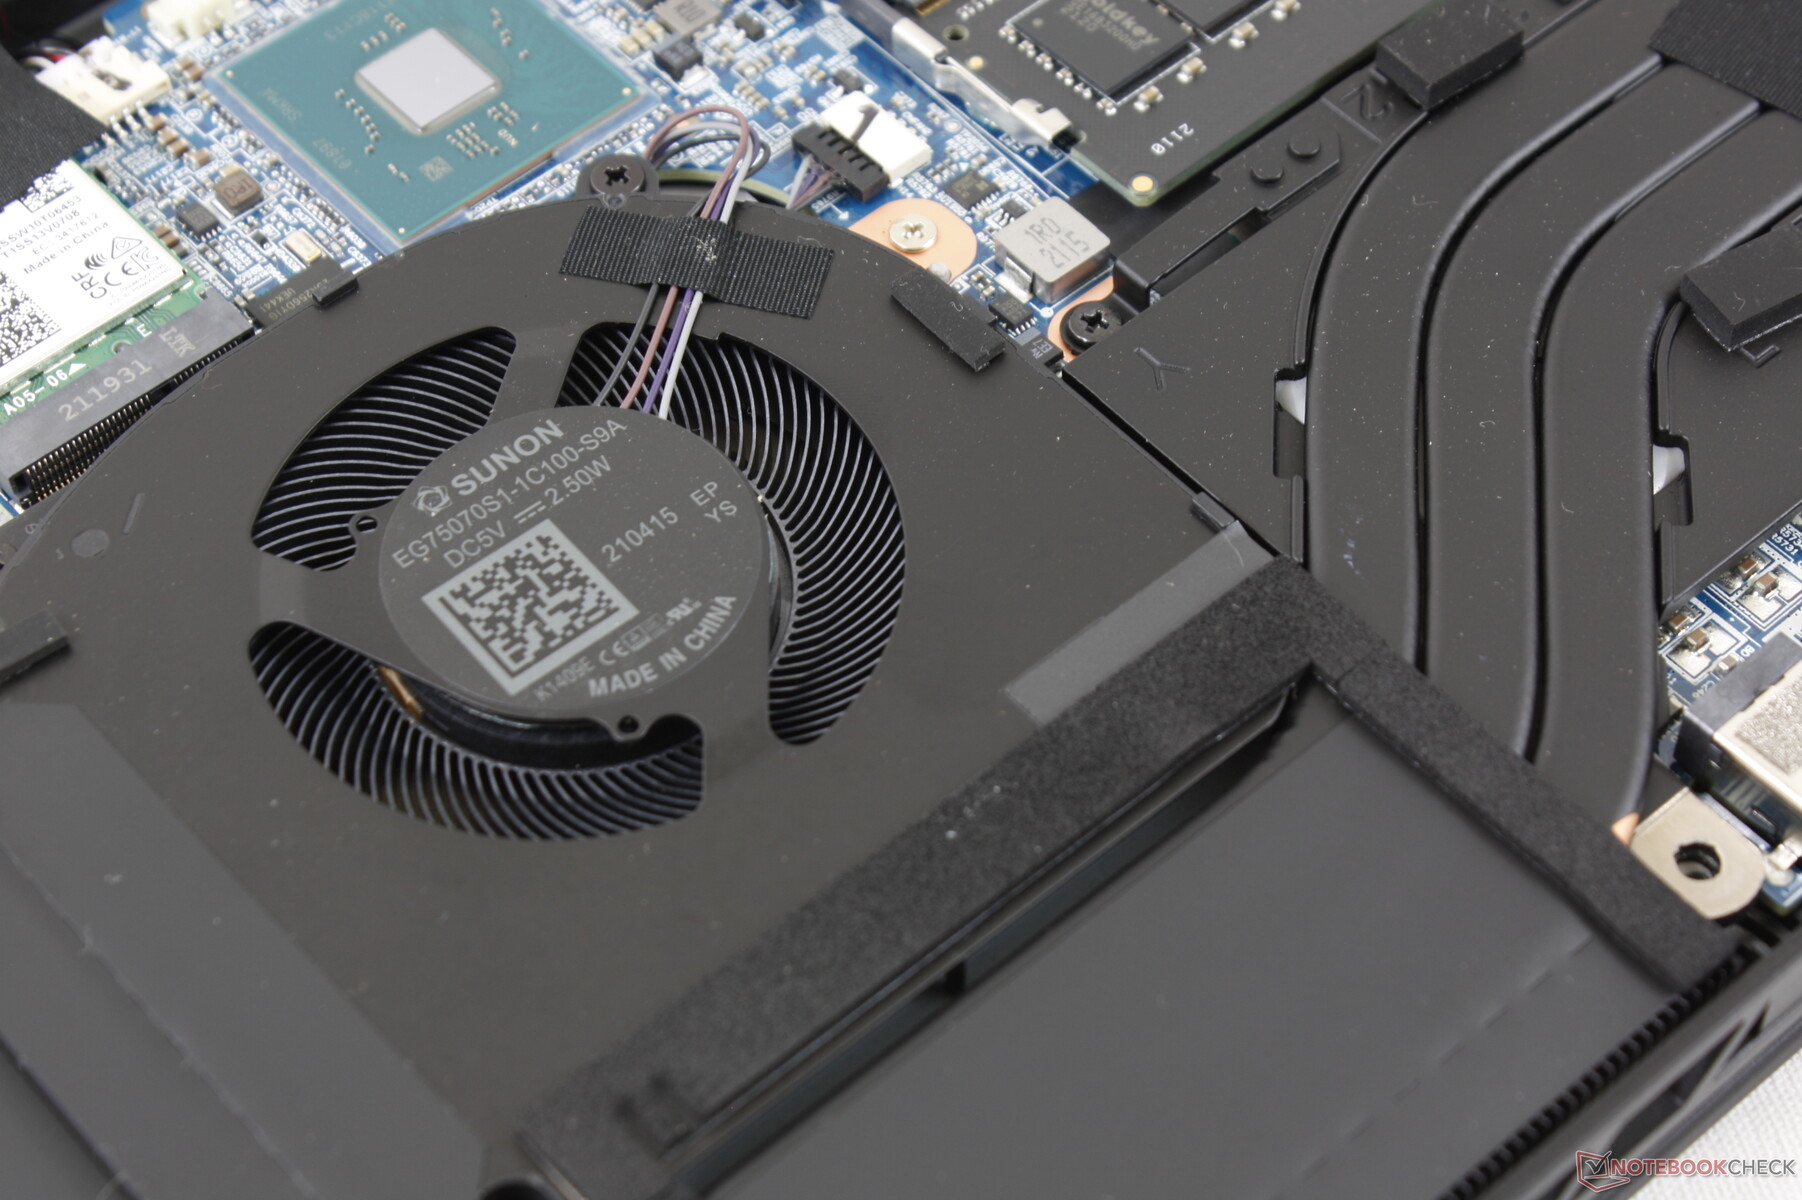
维护
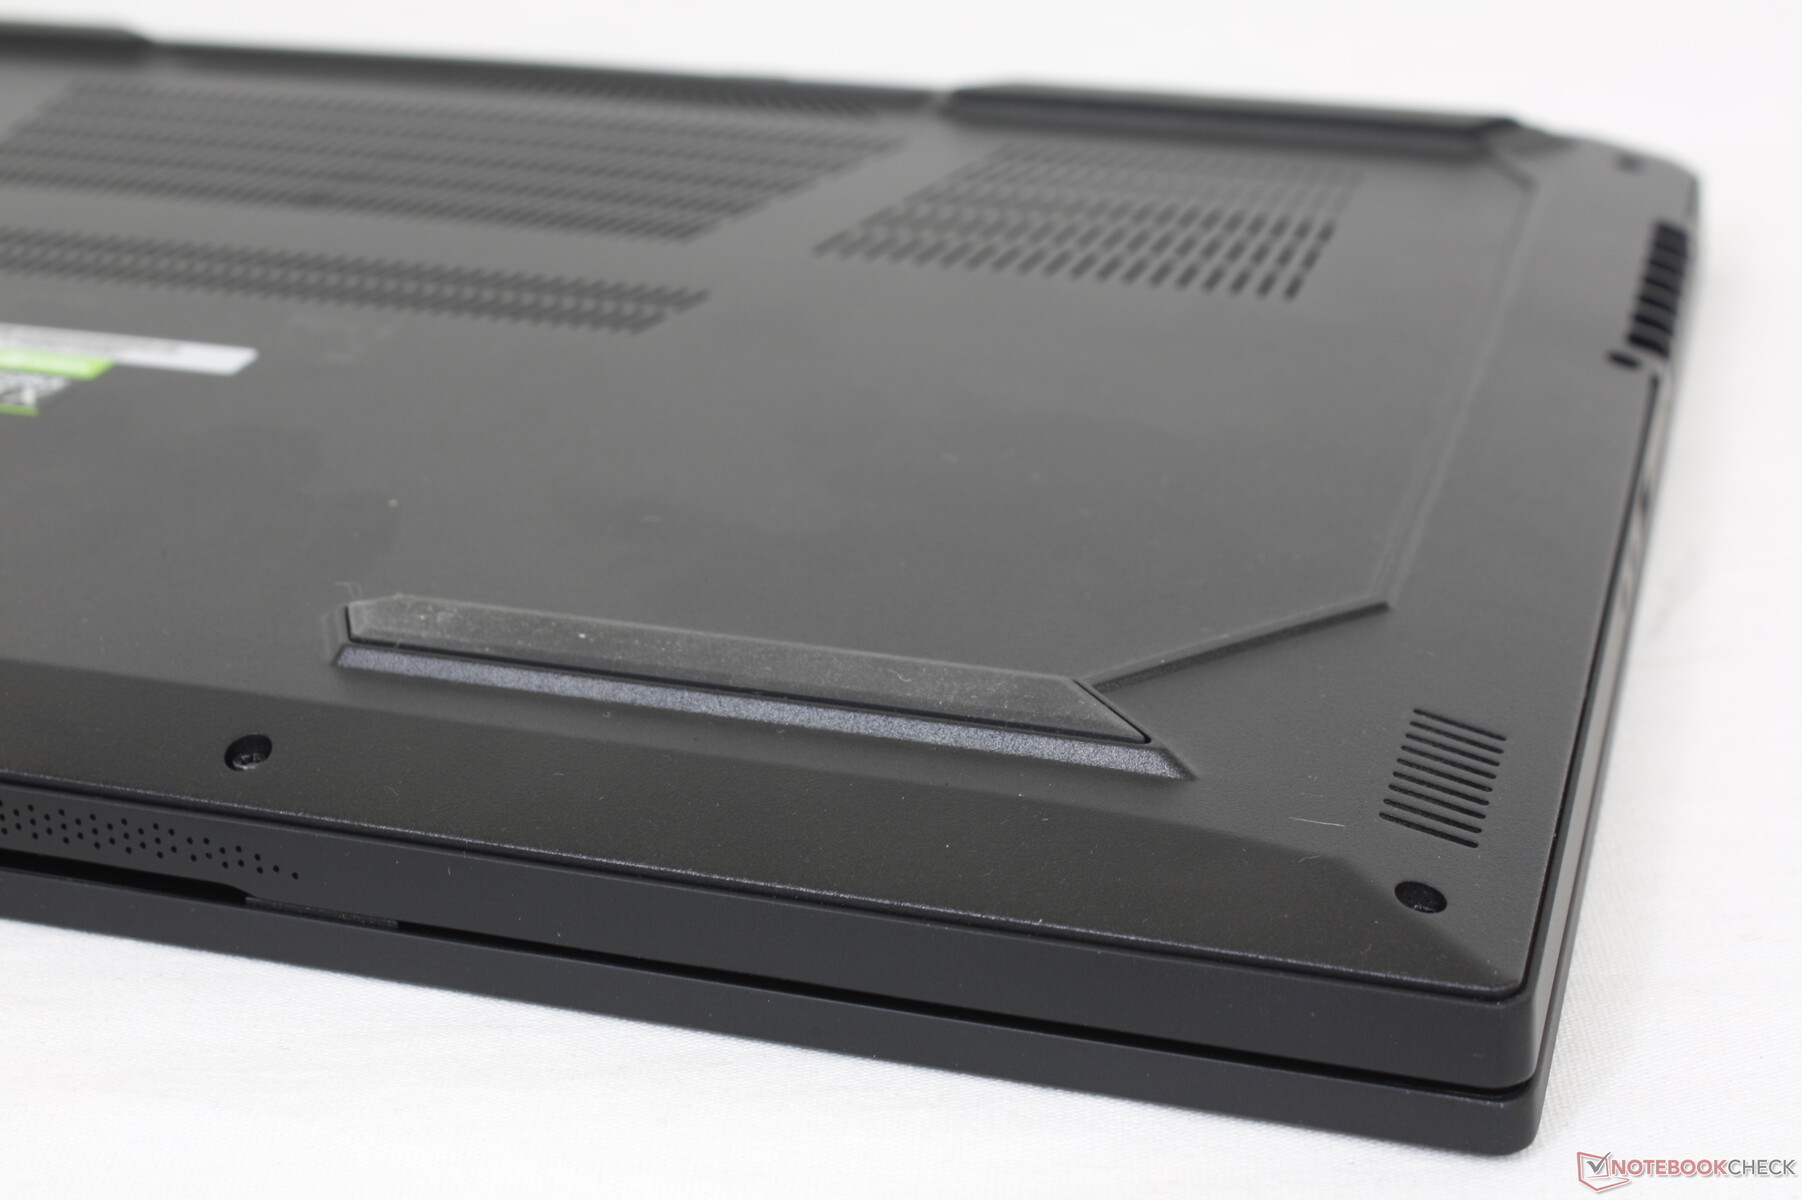
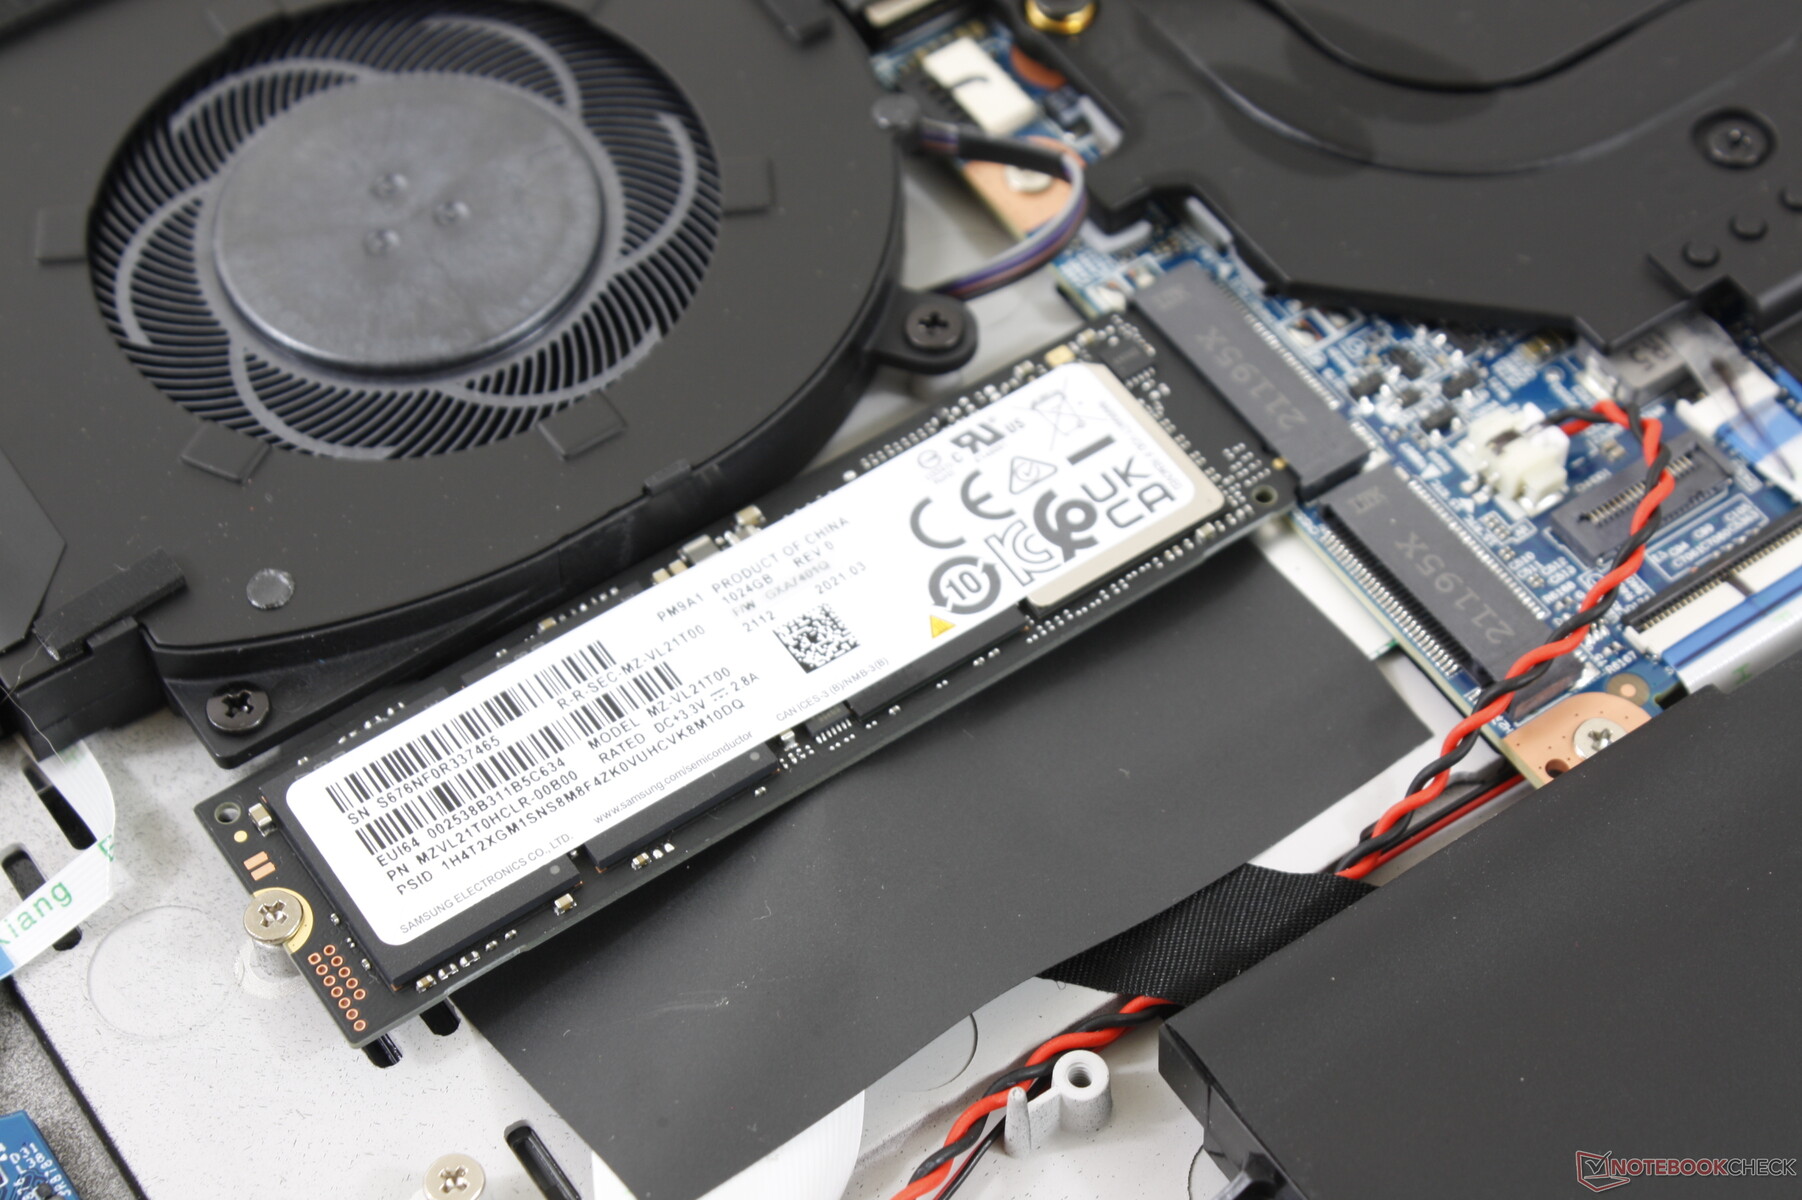
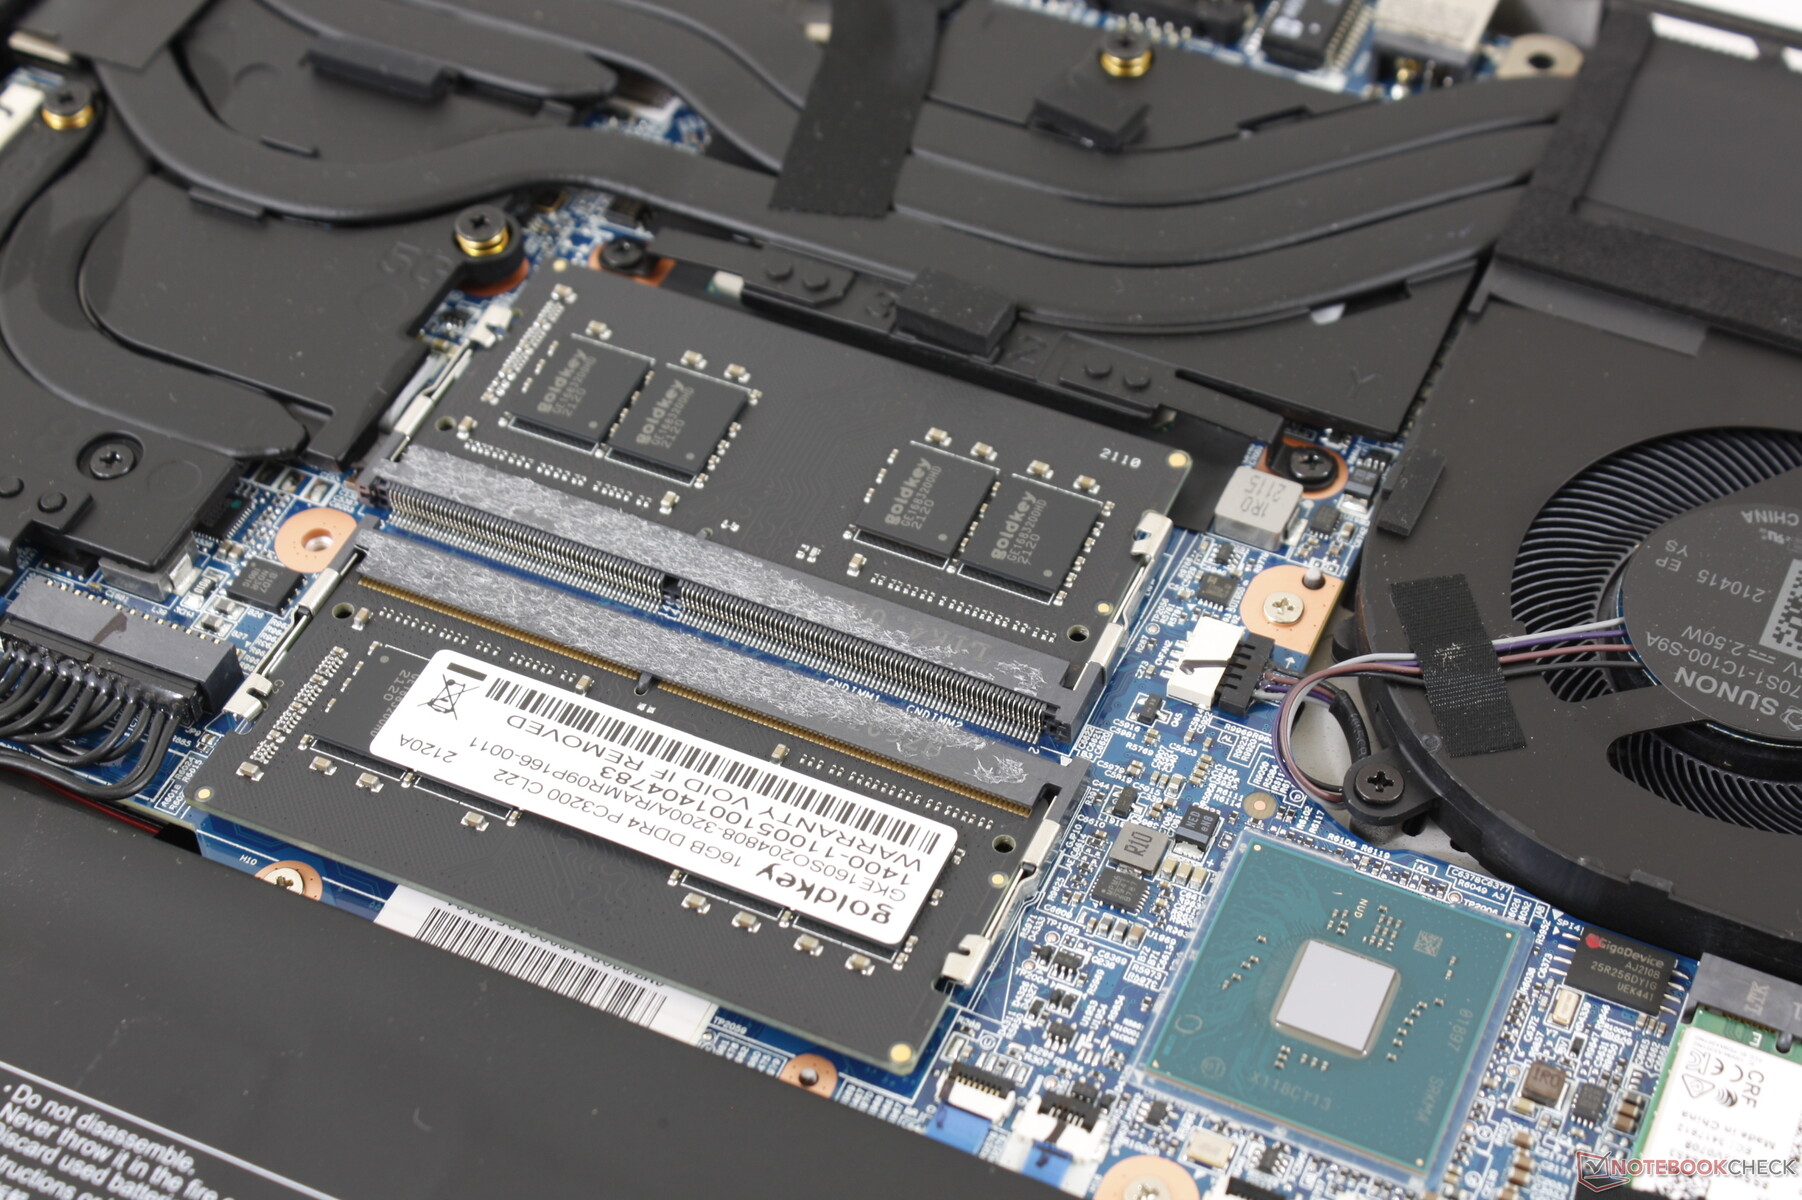
卸下下面的十颗飞利浦螺丝后,底板很容易弹开。用户可以直接接触到电池、两个M.2 2280插槽、两个内存插槽和WLAN模块。
配件和保修
除了交流电适配器、文件和几张Maingear的标志贴纸外,零售盒中没有任何额外的东西。标准的一年有限保修期适用于Maingear的扩展选项。
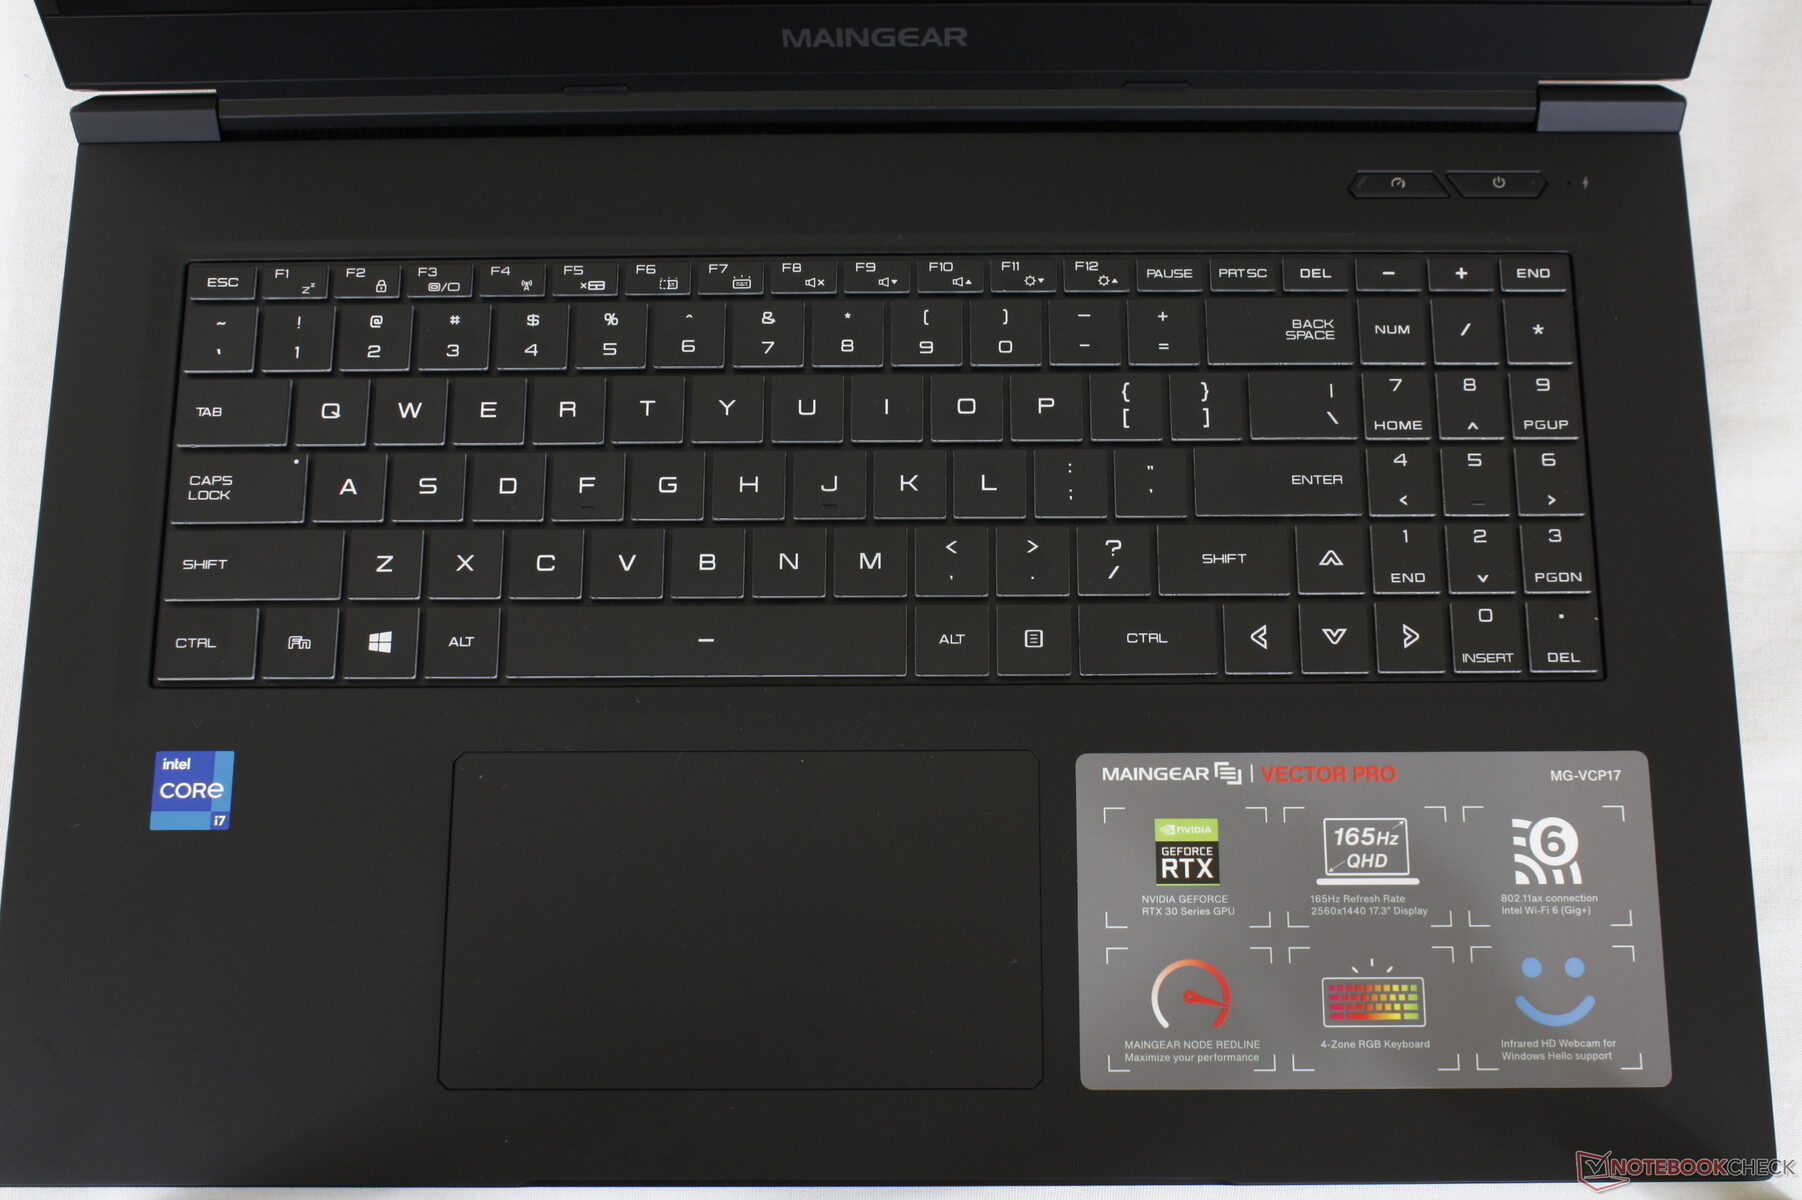
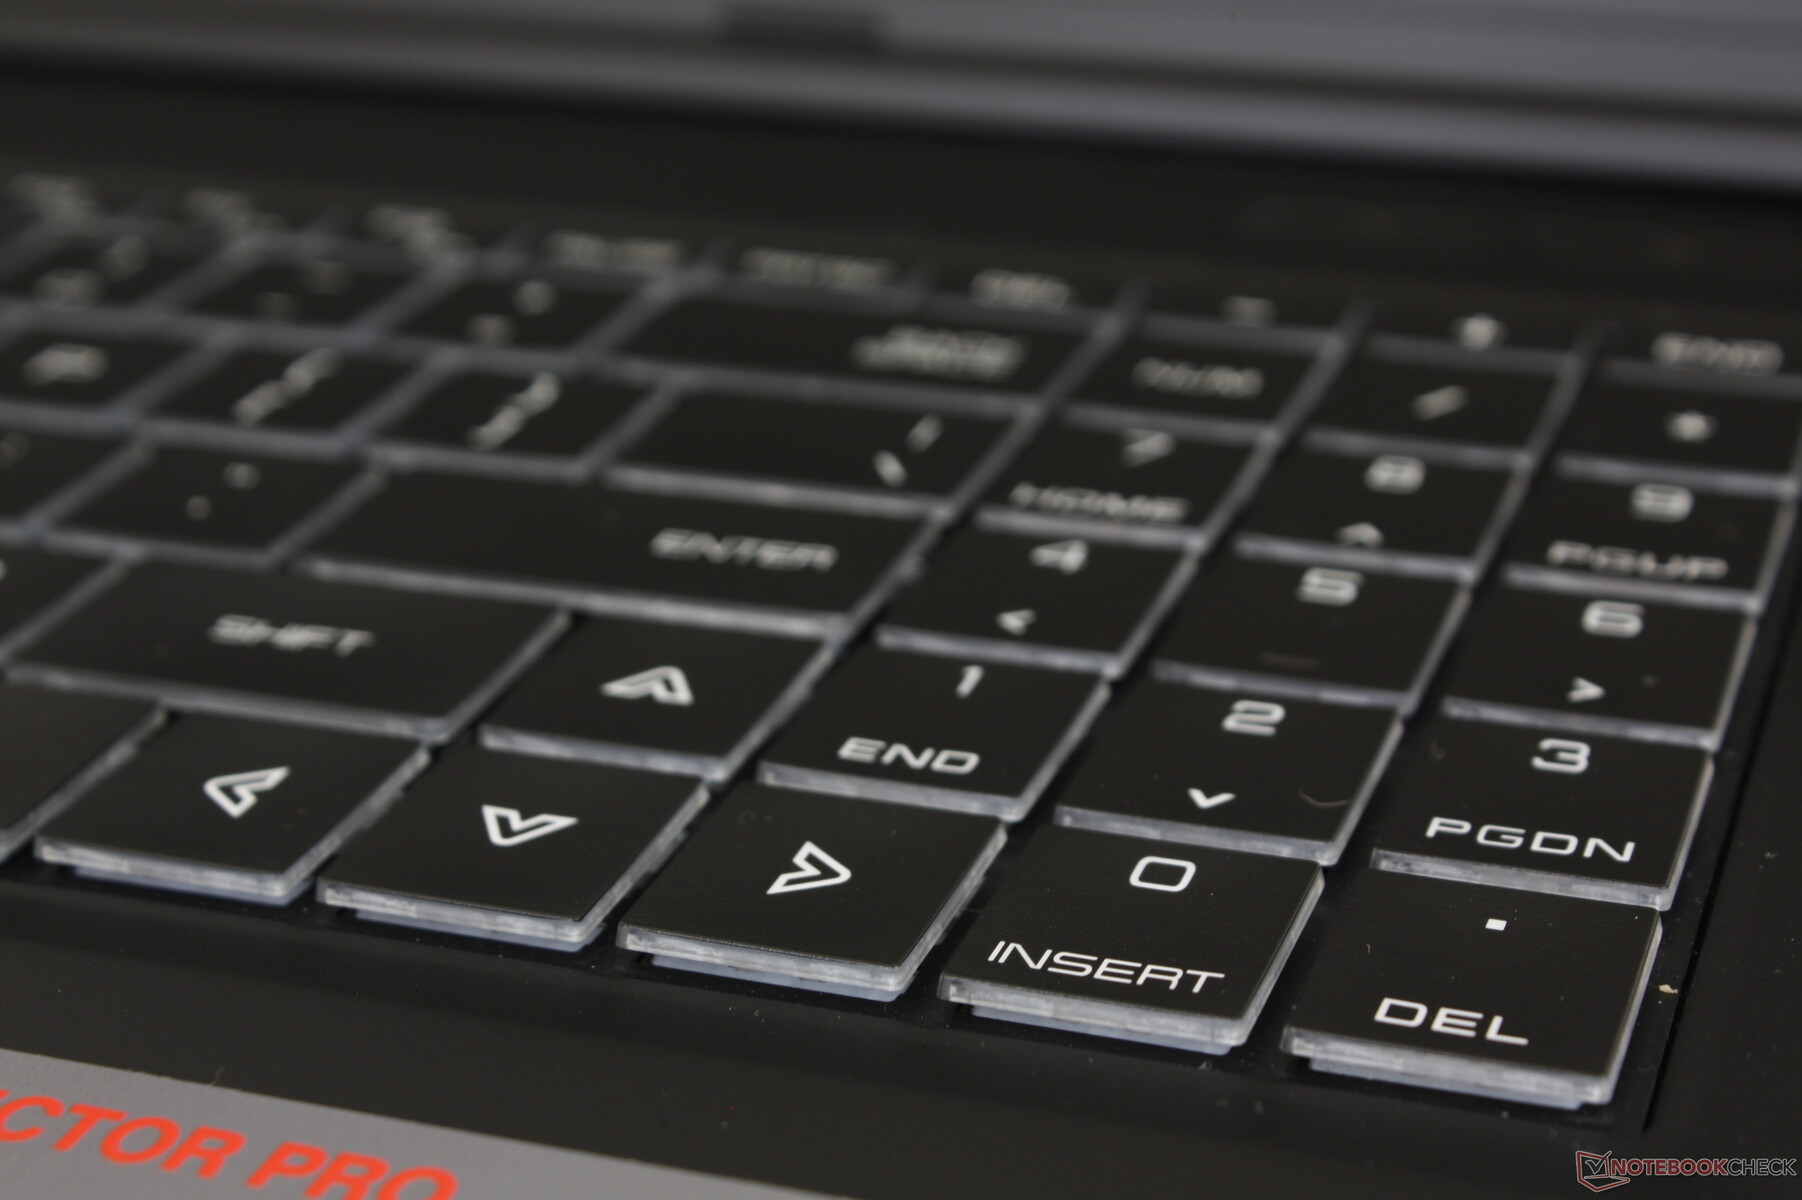
输入设备
键盘
键盘的反馈和行程本可以更牢固和更深入,特别是对于一个游戏笔记本来说。虽然不像廉价的华硕VivoBook那样轻巧或浅薄,但更多的键位可以改善游戏和打字体验。与微星GT或GS型号相比,华硕Zephyrus的反馈更具有可比性。
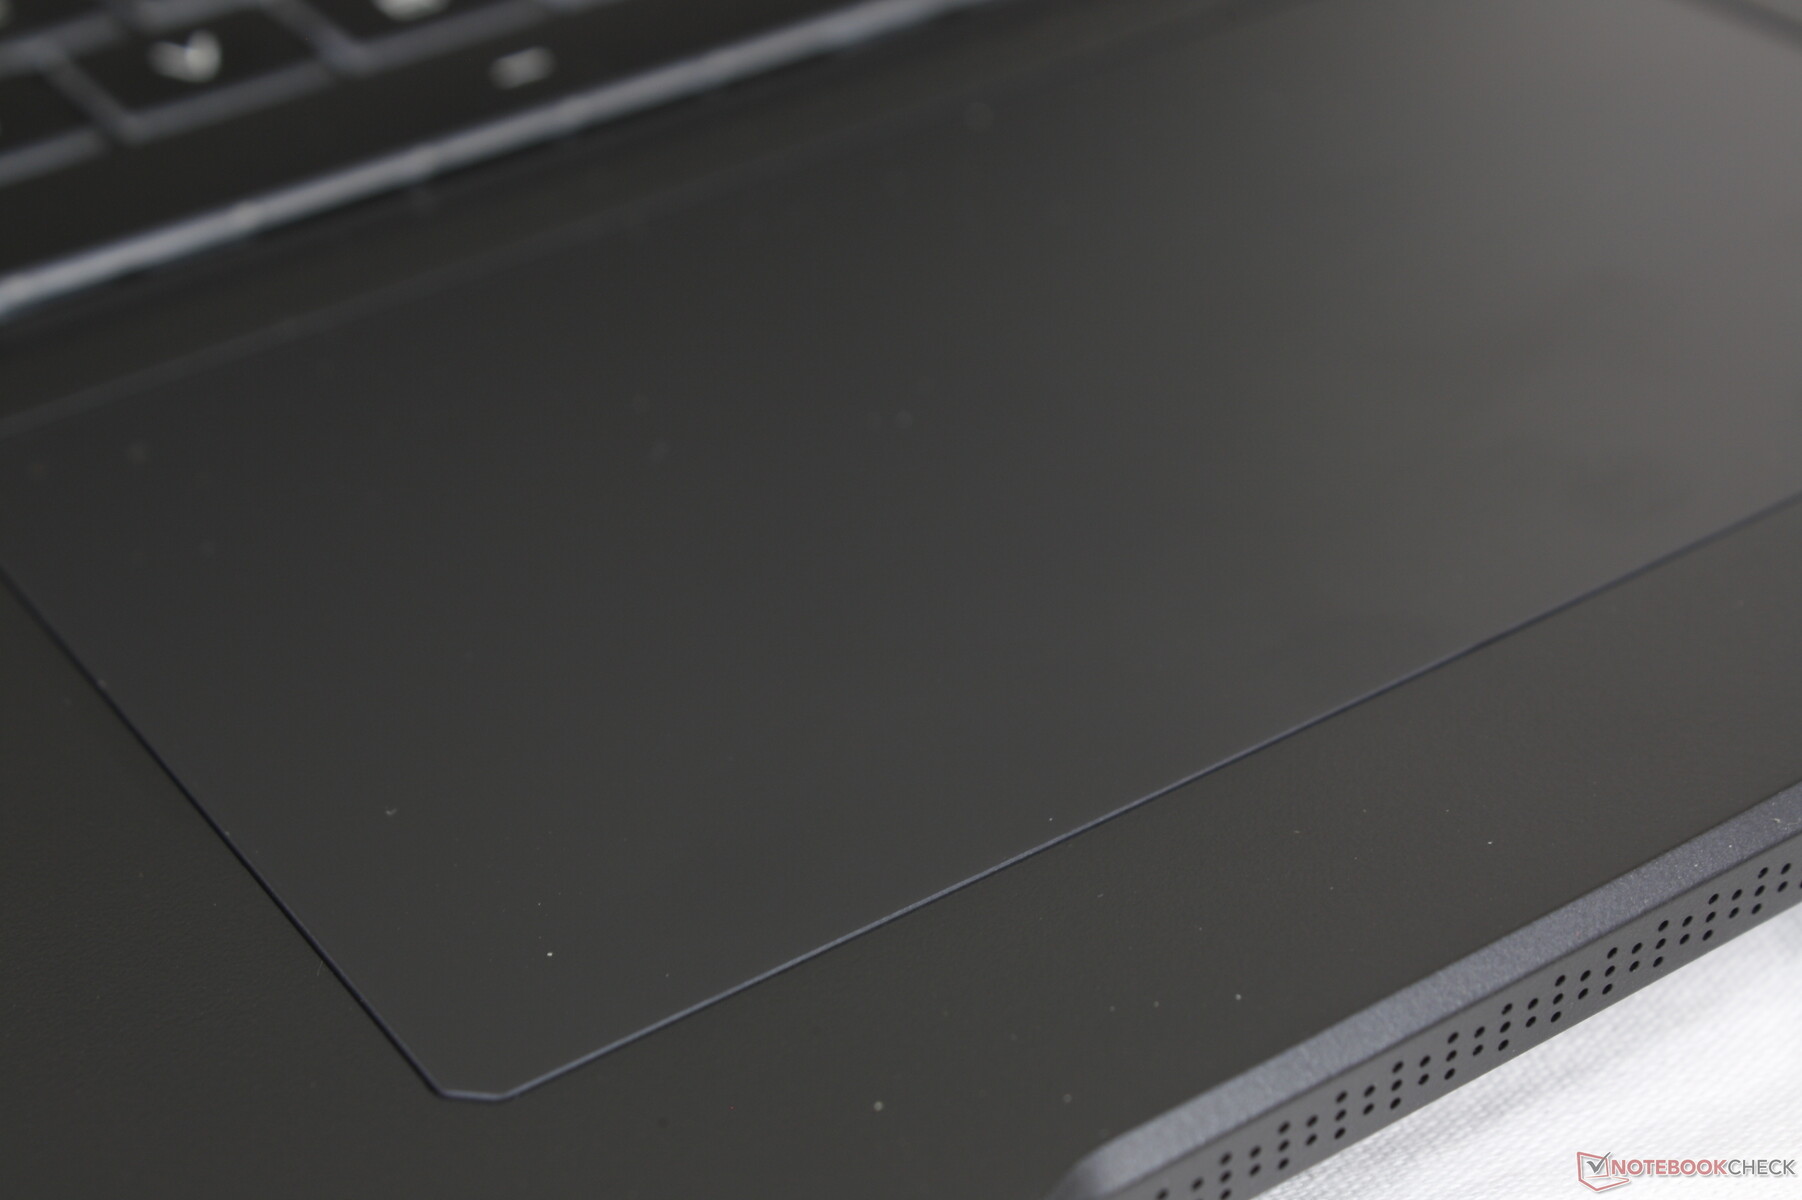
触摸板
点击板比Razer Blade Pro上的小一点(13.3 x 7.5厘米对13 x 8厘米)。然而,在Maingear上的反馈更强,而且没有海绵状的感觉。

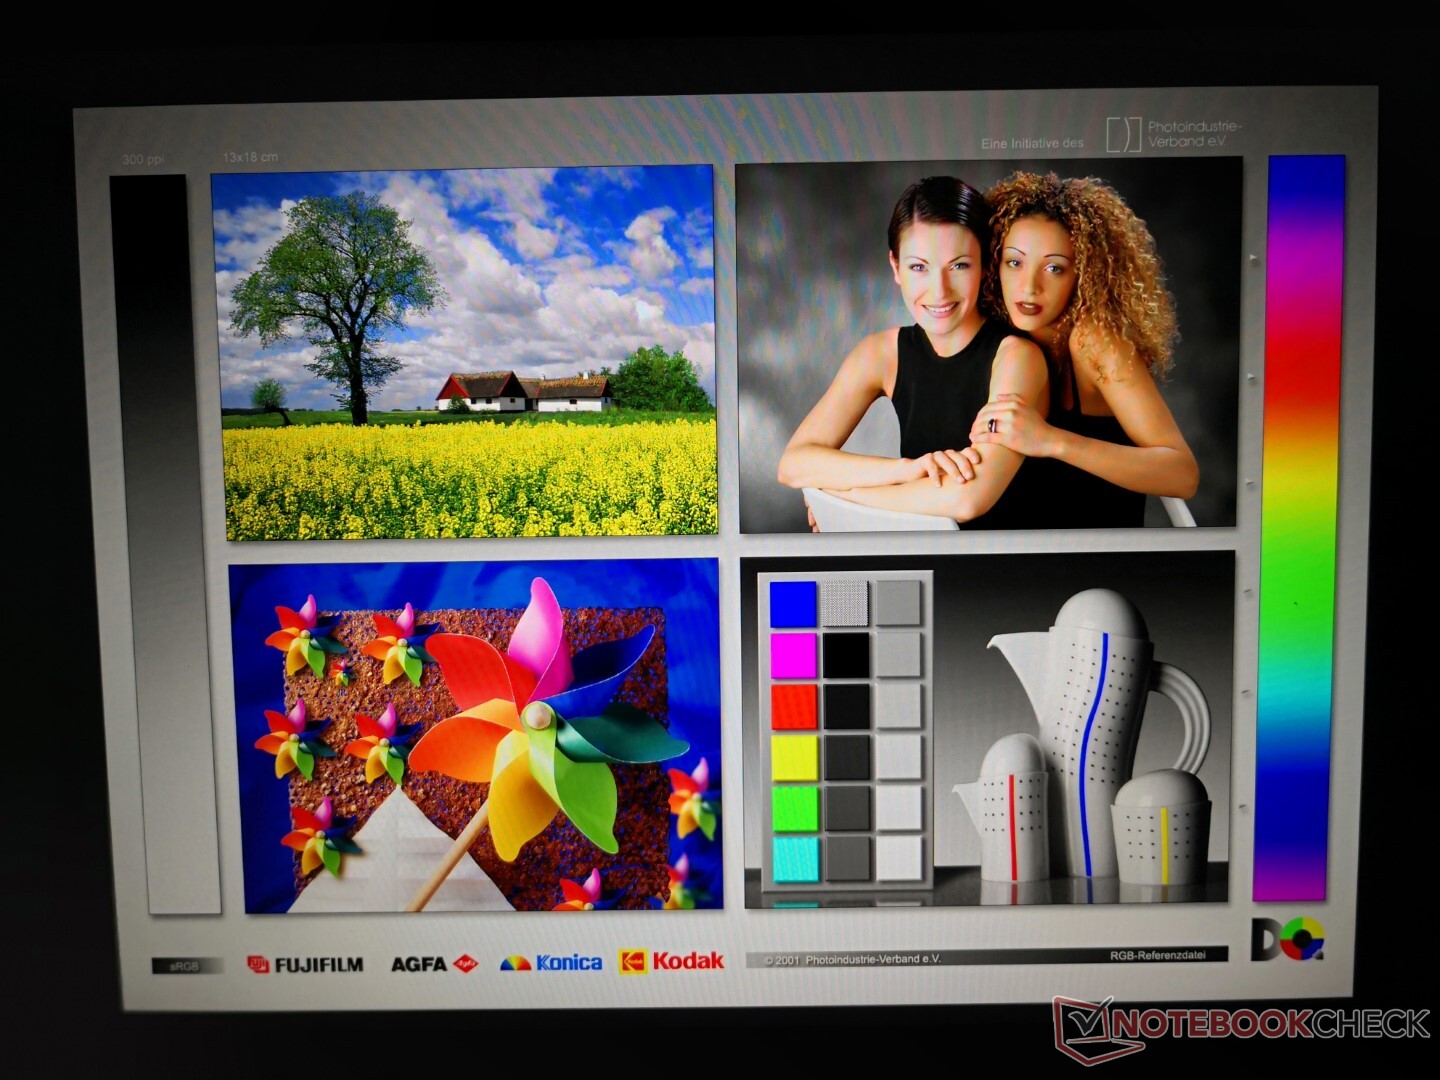
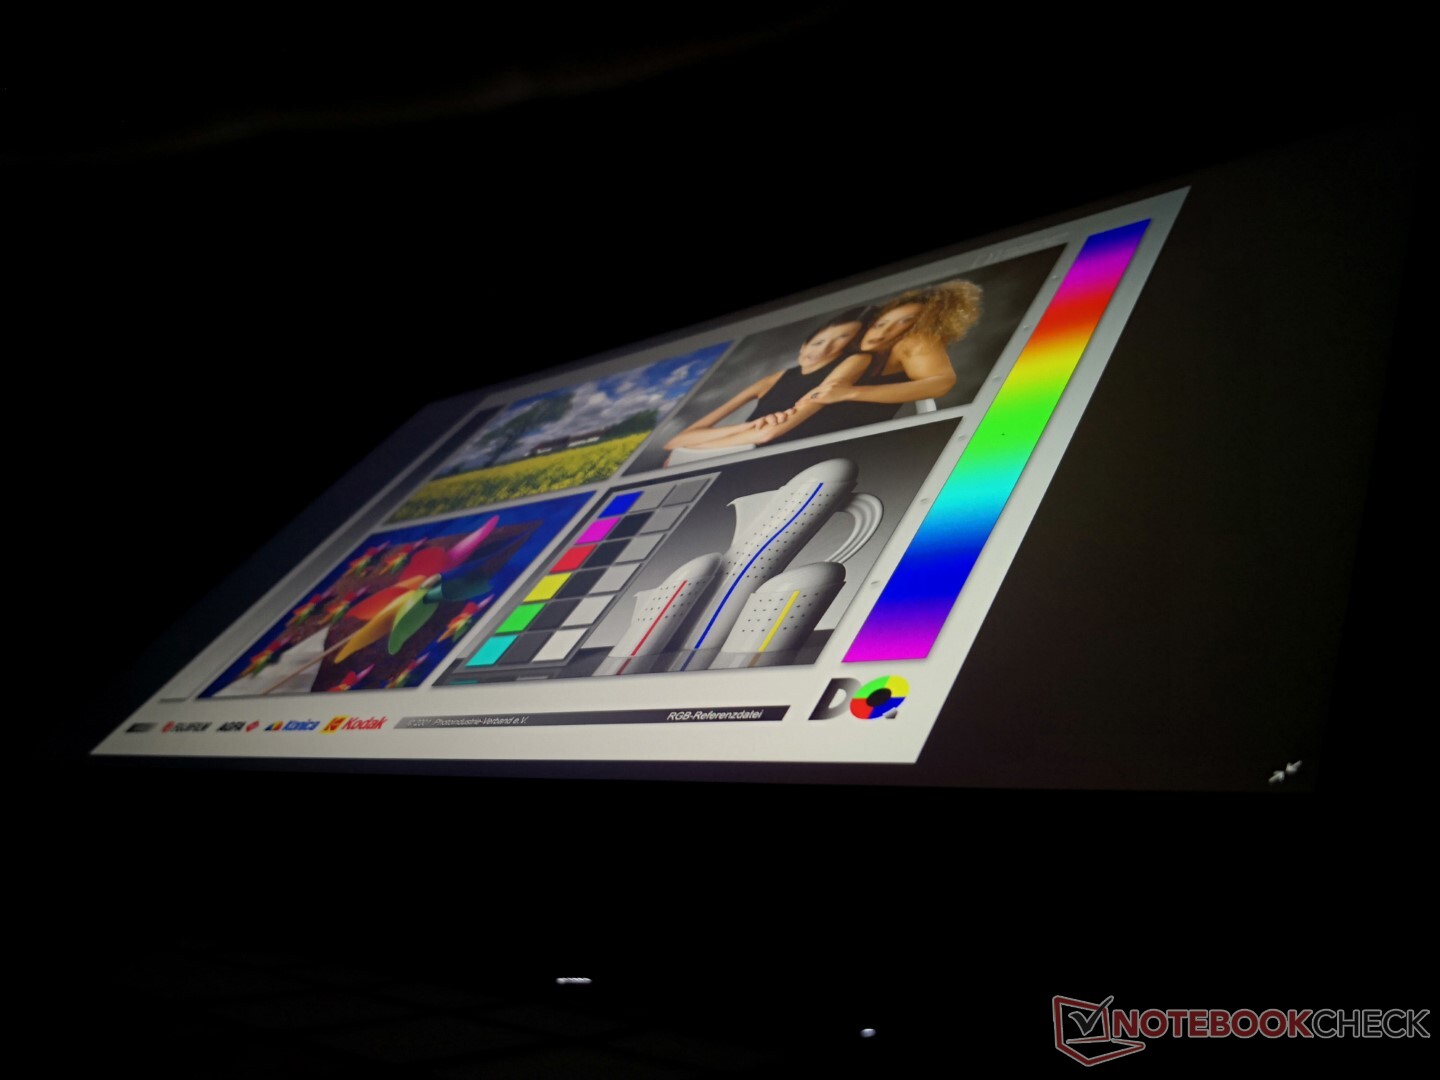
显示
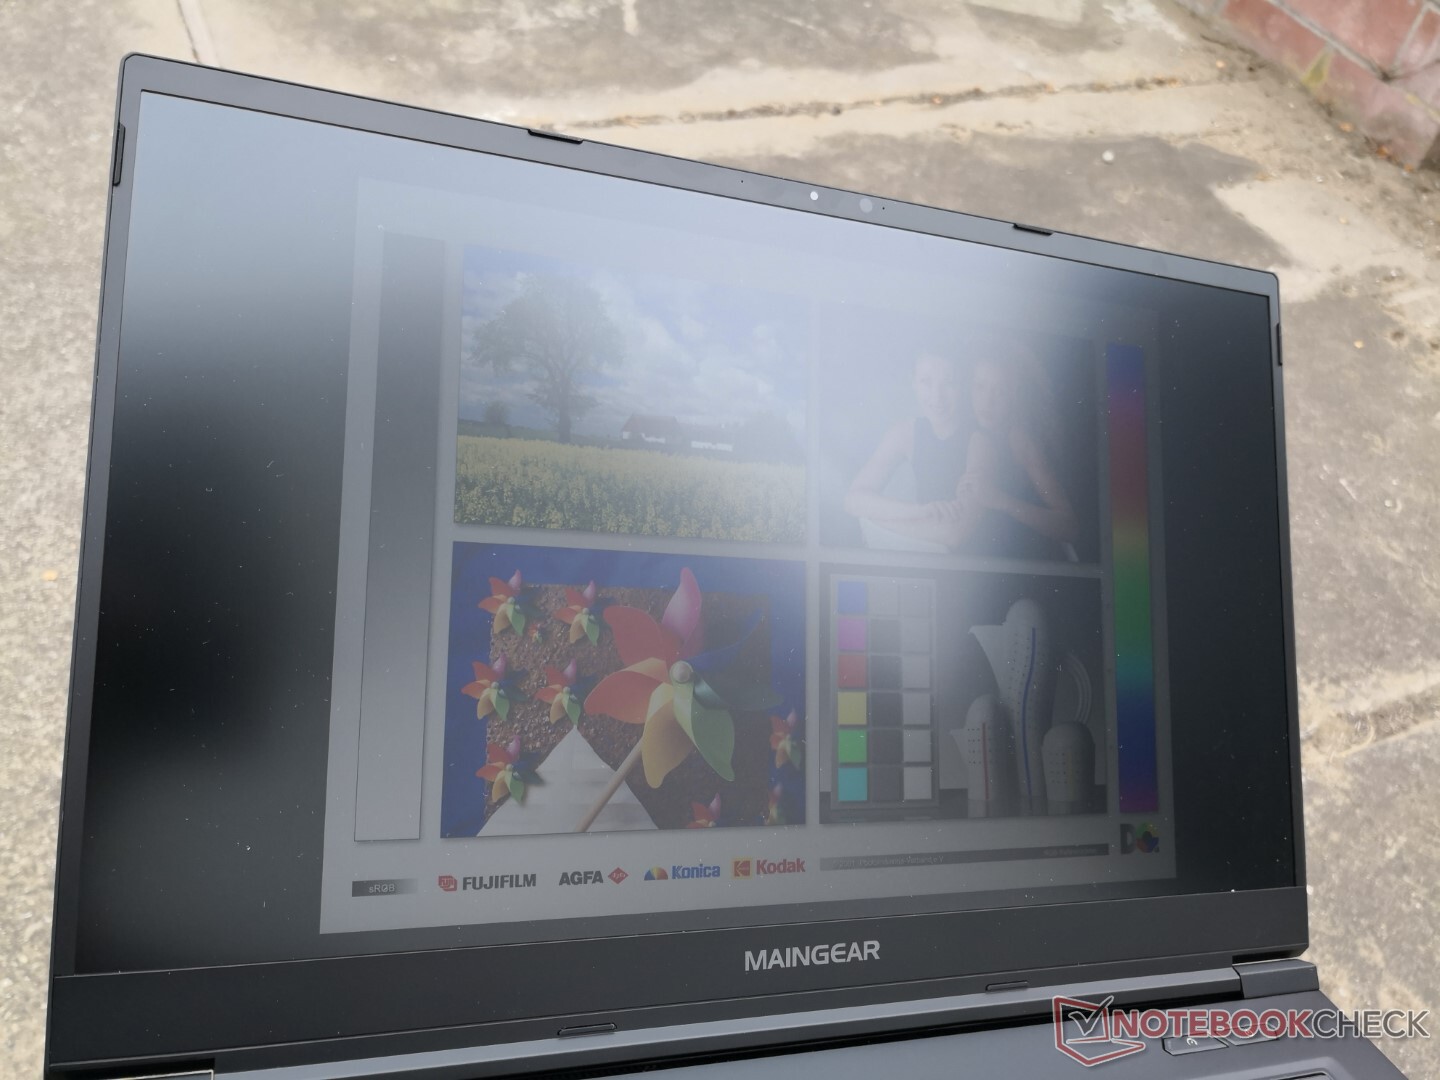
我们的Vector Pro使用的是京东方的NE173QHM-NY2 IPS面板,与申科XMG Core 17上的面板相同,这意味着这两台笔记本都有类似的显示属性。响应时间很快,具有良好的亮度、对比度和刷新率,代表了专为游戏设计的高端1440p面板。京东方有一个较新的NE173QHM-NY3面板,具有更快的响应时间和更好的颜色,因为发现在华硕ROG Zephyrus S17 GX703因此,我们的Maingear使用的是一个旧版本,这有点令人失望。
| |||||||||||||||||||||||||
Brightness Distribution: 84 %
Center on Battery: 389.7 cd/m²
Contrast: 829:1 (Black: 0.47 cd/m²)
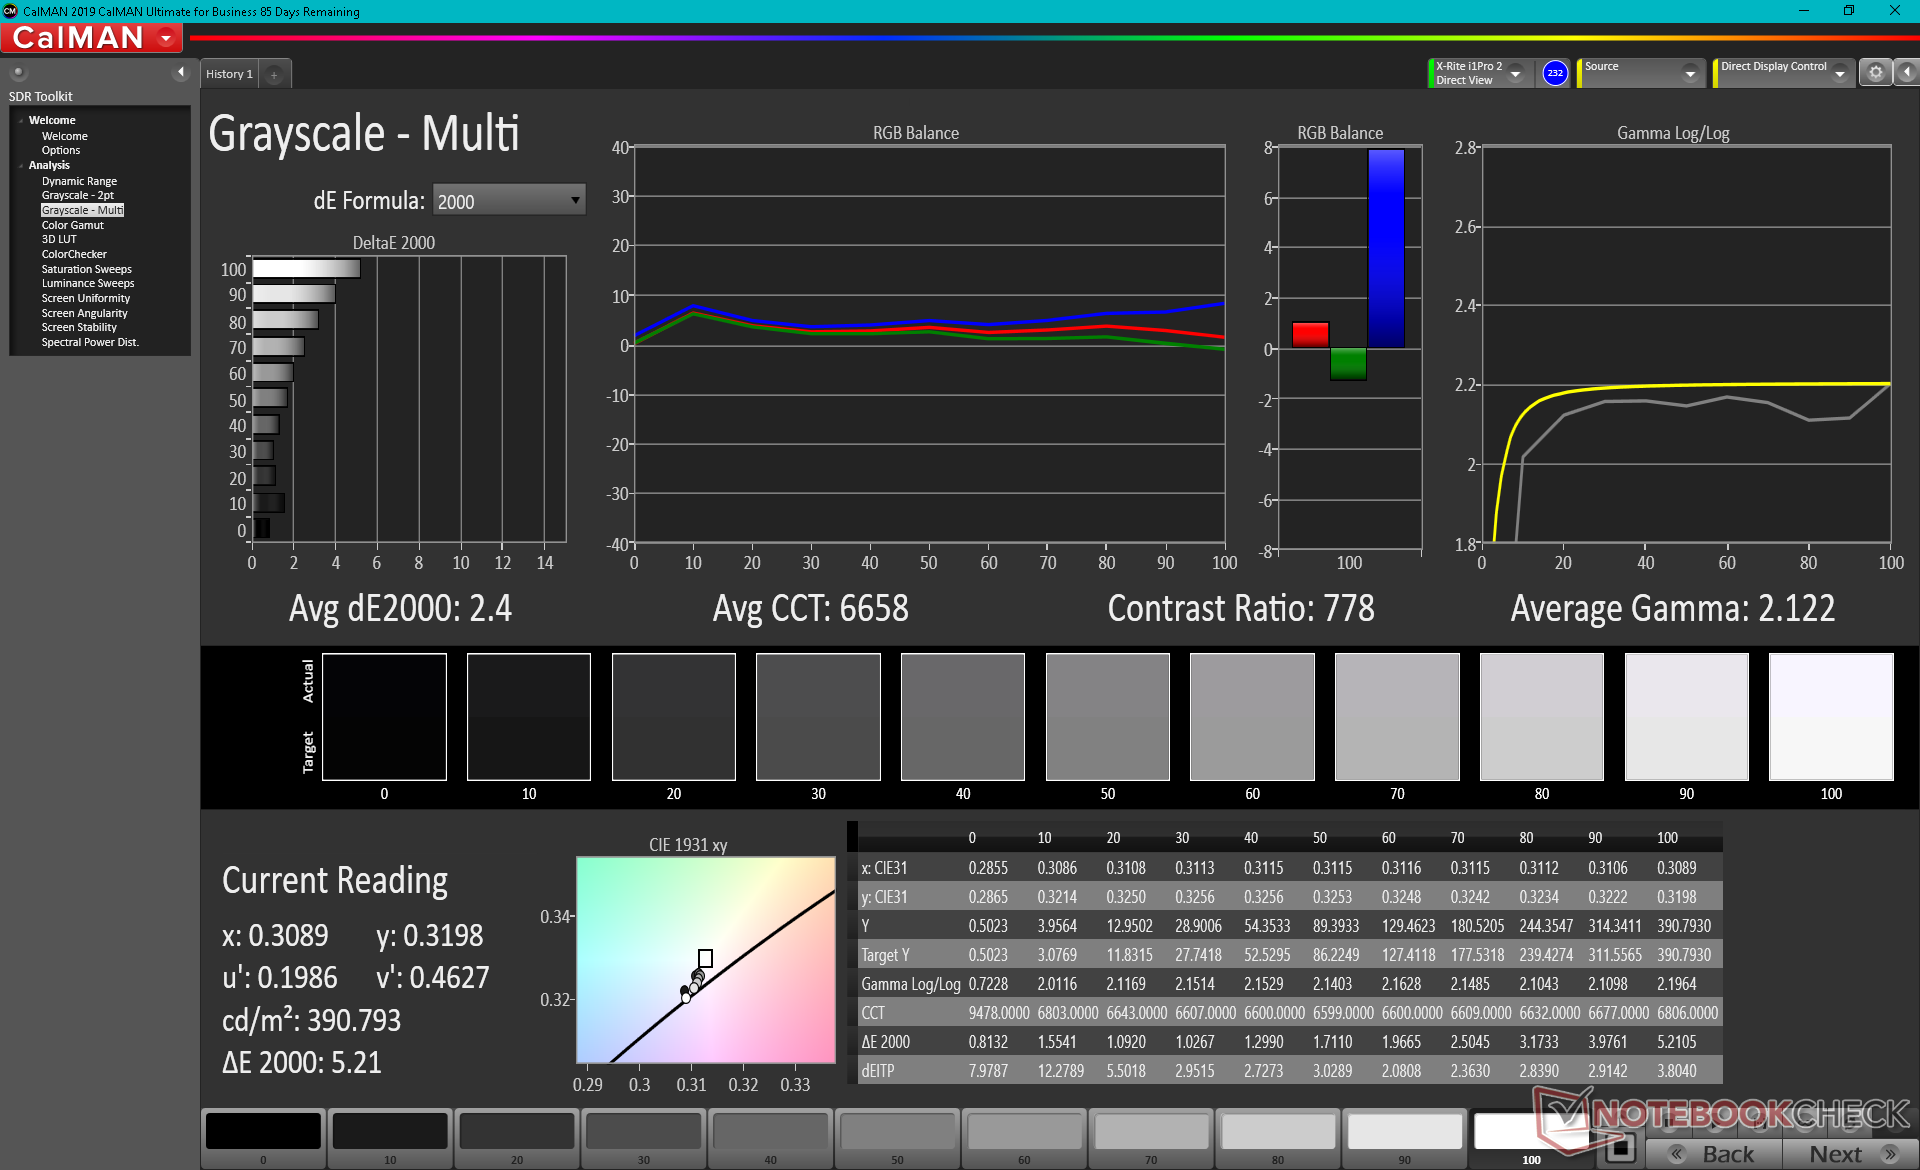
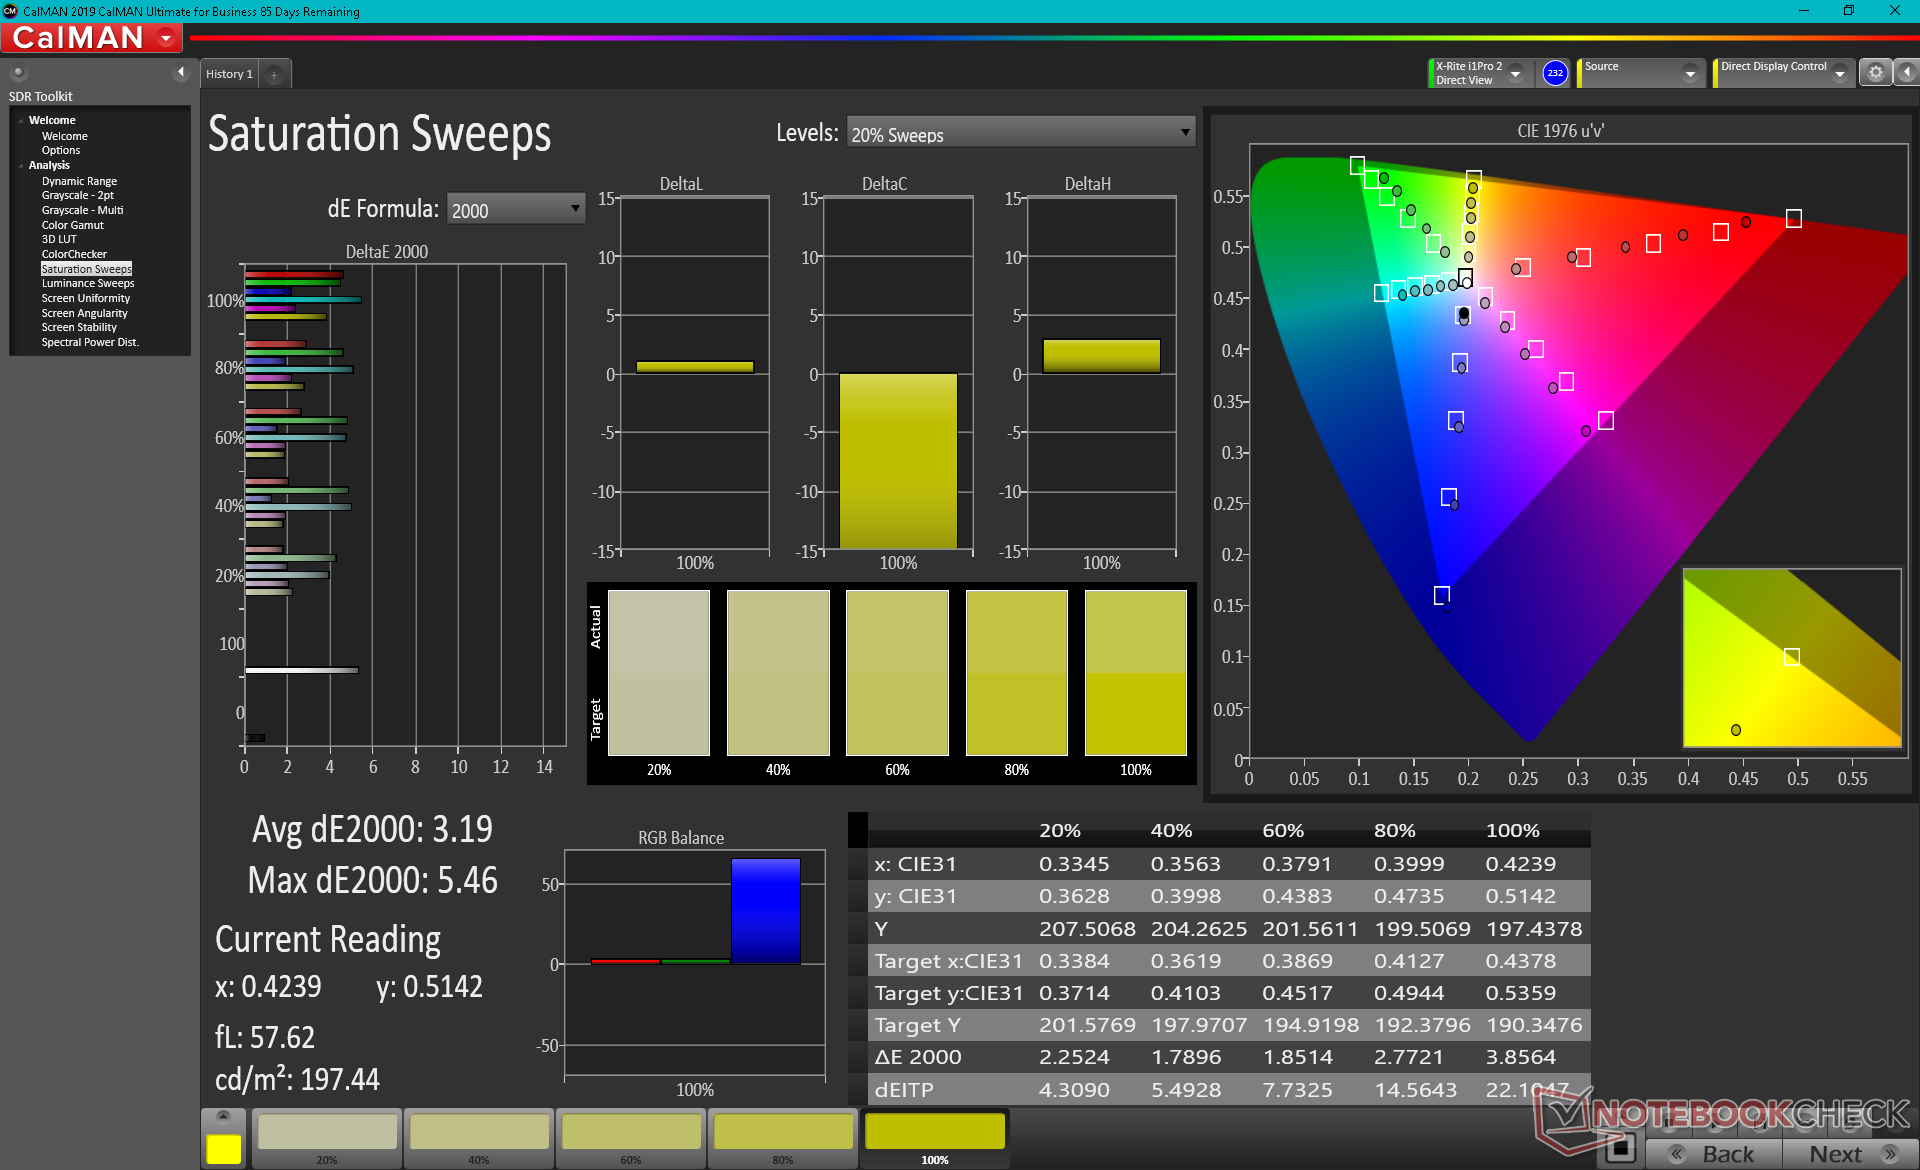
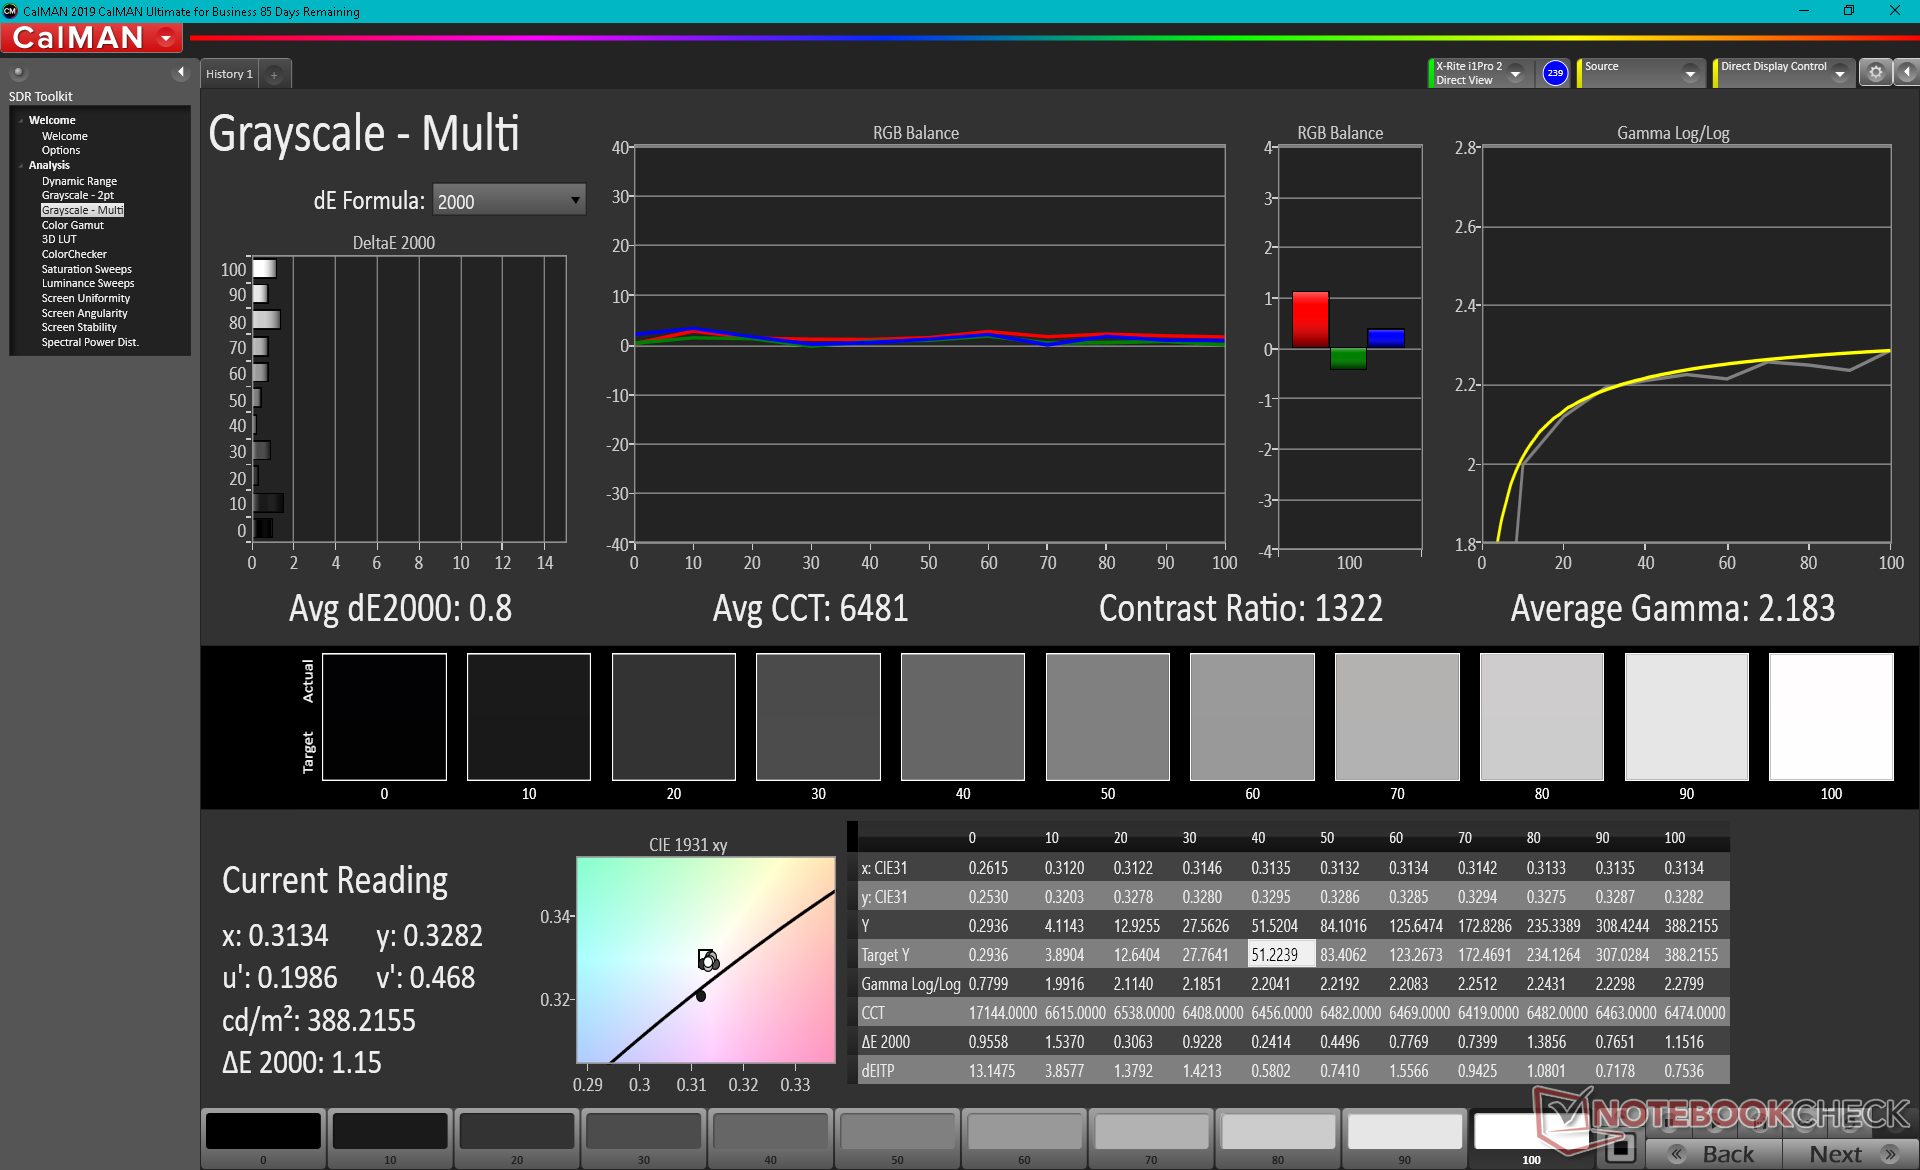
ΔE ColorChecker Calman: 1.93 | ∀{0.5-29.43 Ø4.72}
calibrated: 1.31
ΔE Greyscale Calman: 2.4 | ∀{0.09-98 Ø4.97}
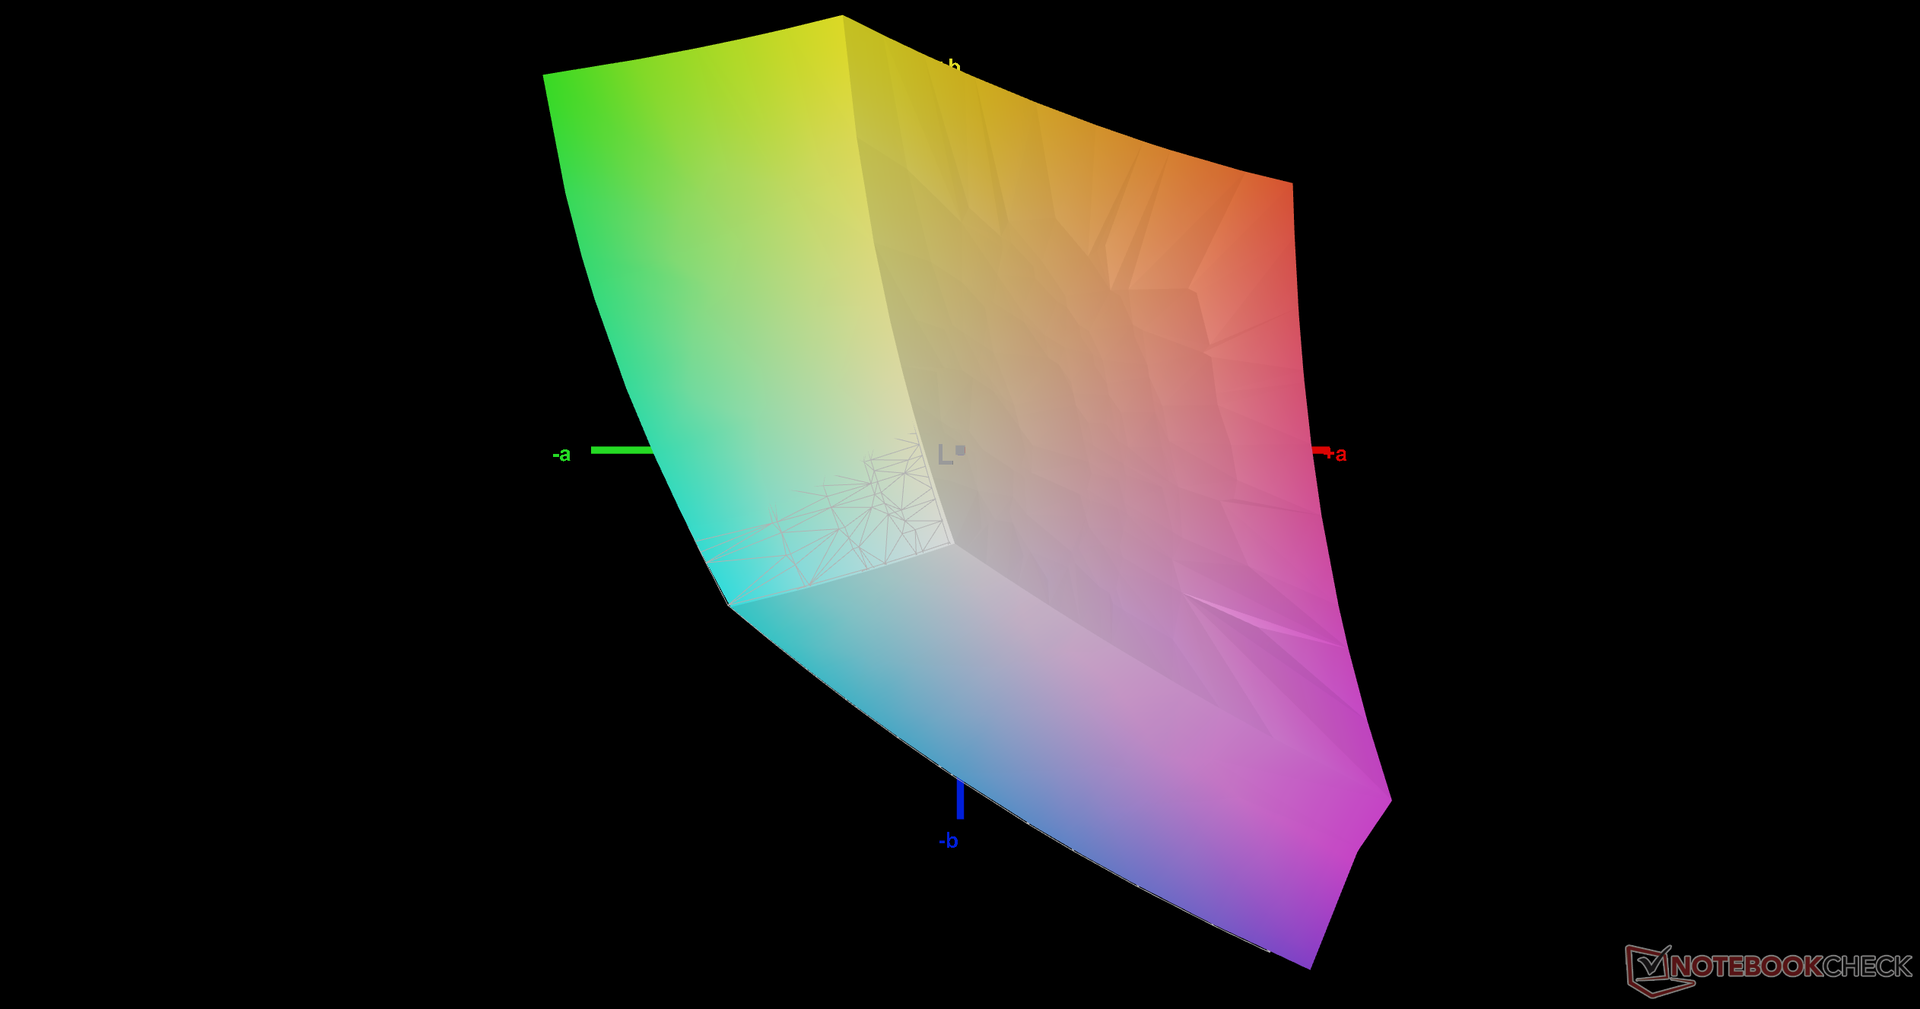
71.7% AdobeRGB 1998 (Argyll 3D)
99.4% sRGB (Argyll 3D)
70.7% Display P3 (Argyll 3D)
Gamma: 2.12
CCT: 6658 K
| Maingear Vector Pro MG-VCP17 BOE NE173QHM-NY2, IPS, 17.3", 2560x1440 | Asus ROG Zephyrus S17 GX703HSD BOE099D (BOE CQ NE173QHM-NY3), IPS, 17.3", 2560x1440 | Schenker XMG Core 17 (Early 2021) BOE CQ NE173QHM-NY2, IPS, 17.3", 2560x1440 | Schenker XMG Neo 17 (Early 2021, RTX 3070, 5800H) BOE NE173QHM-NY2 (BOE0977), IPS, 17.3", 2560x1440 | Schenker Compact 17 AU Optronics B173ZAN03.0, IPS, 17.3", 3840x2160 | MSI GS75 10SF-609US Sharp LQ173M1JW05, IPS, 17.3", 1920x1080 | |
|---|---|---|---|---|---|---|
| Display | 17% | -3% | 0% | 19% | 4% | |
| Display P3 Coverage (%) | 70.7 | 94.2 33% | 68.1 -4% | 70.5 0% | 84.4 19% | 75.6 7% |
| sRGB Coverage (%) | 99.4 | 98.7 -1% | 98.5 -1% | 99.5 0% | 99.9 1% | 99.8 0% |
| AdobeRGB 1998 Coverage (%) | 71.7 | 84.4 18% | 69.3 -3% | 71.8 0% | 98 37% | 75.1 5% |
| Response Times | 51% | 5% | 5% | -197% | 57% | |
| Response Time Grey 50% / Grey 80% * (ms) | 15.6 ? | 4.8 69% | 16.8 ? -8% | 16.8 ? -8% | 51 ? -227% | 5 ? 68% |
| Response Time Black / White * (ms) | 12 ? | 8 33% | 10 ? 17% | 10 ? 17% | 32 ? -167% | 6.6 ? 45% |
| PWM Frequency (Hz) | ||||||
| Screen | -11% | -7% | 4% | -40% | 3% | |
| Brightness middle (cd/m²) | 389.7 | 322 -17% | 370 -5% | 410 5% | 437 12% | 299.4 -23% |
| Brightness (cd/m²) | 363 | 288 -21% | 333 -8% | 381 5% | 413 14% | 299 -18% |
| Brightness Distribution (%) | 84 | 72 -14% | 84 0% | 88 5% | 88 5% | 84 0% |
| Black Level * (cd/m²) | 0.47 | 0.3 36% | 0.38 19% | 0.37 21% | 0.6 -28% | 0.31 34% |
| Contrast (:1) | 829 | 1073 29% | 974 17% | 1108 34% | 728 -12% | 966 17% |
| Colorchecker dE 2000 * | 1.93 | 3.05 -58% | 2.41 -25% | 2.55 -32% | 4.28 -122% | 1.82 6% |
| Colorchecker dE 2000 max. * | 6.84 | 5.23 24% | 7.32 -7% | 4.33 37% | 7.65 -12% | 3.91 43% |
| Colorchecker dE 2000 calibrated * | 1.31 | 1.92 -47% | 1.19 9% | 1.28 2% | 3.41 -160% | 1.59 -21% |
| Greyscale dE 2000 * | 2.4 | 3.11 -30% | 3.9 -63% | 3.4 -42% | 3.8 -58% | 2.7 -13% |
| Gamma | 2.12 104% | 2.13 103% | 2.287 96% | 2.275 97% | 2.49 88% | 2.18 101% |
| CCT | 6658 98% | 6553 99% | 7302 89% | 6637 98% | 7363 88% | 6837 95% |
| Color Space (Percent of AdobeRGB 1998) (%) | 84 | 69 | 72 | 87 | 67.1 | |
| Color Space (Percent of sRGB) (%) | 99 | 93 | 95 | 100 | 99.8 | |
| Total Average (Program / Settings) | 19% /
4% | -2% /
-4% | 3% /
3% | -73% /
-50% | 21% /
11% |
* ... smaller is better
色彩空间完全涵盖了sRGB和大约72%的AdobeRGB。更高分辨率的4K IPS面板往往能提供更深的色彩,尽管其代价是刷新率和响应时间更慢。
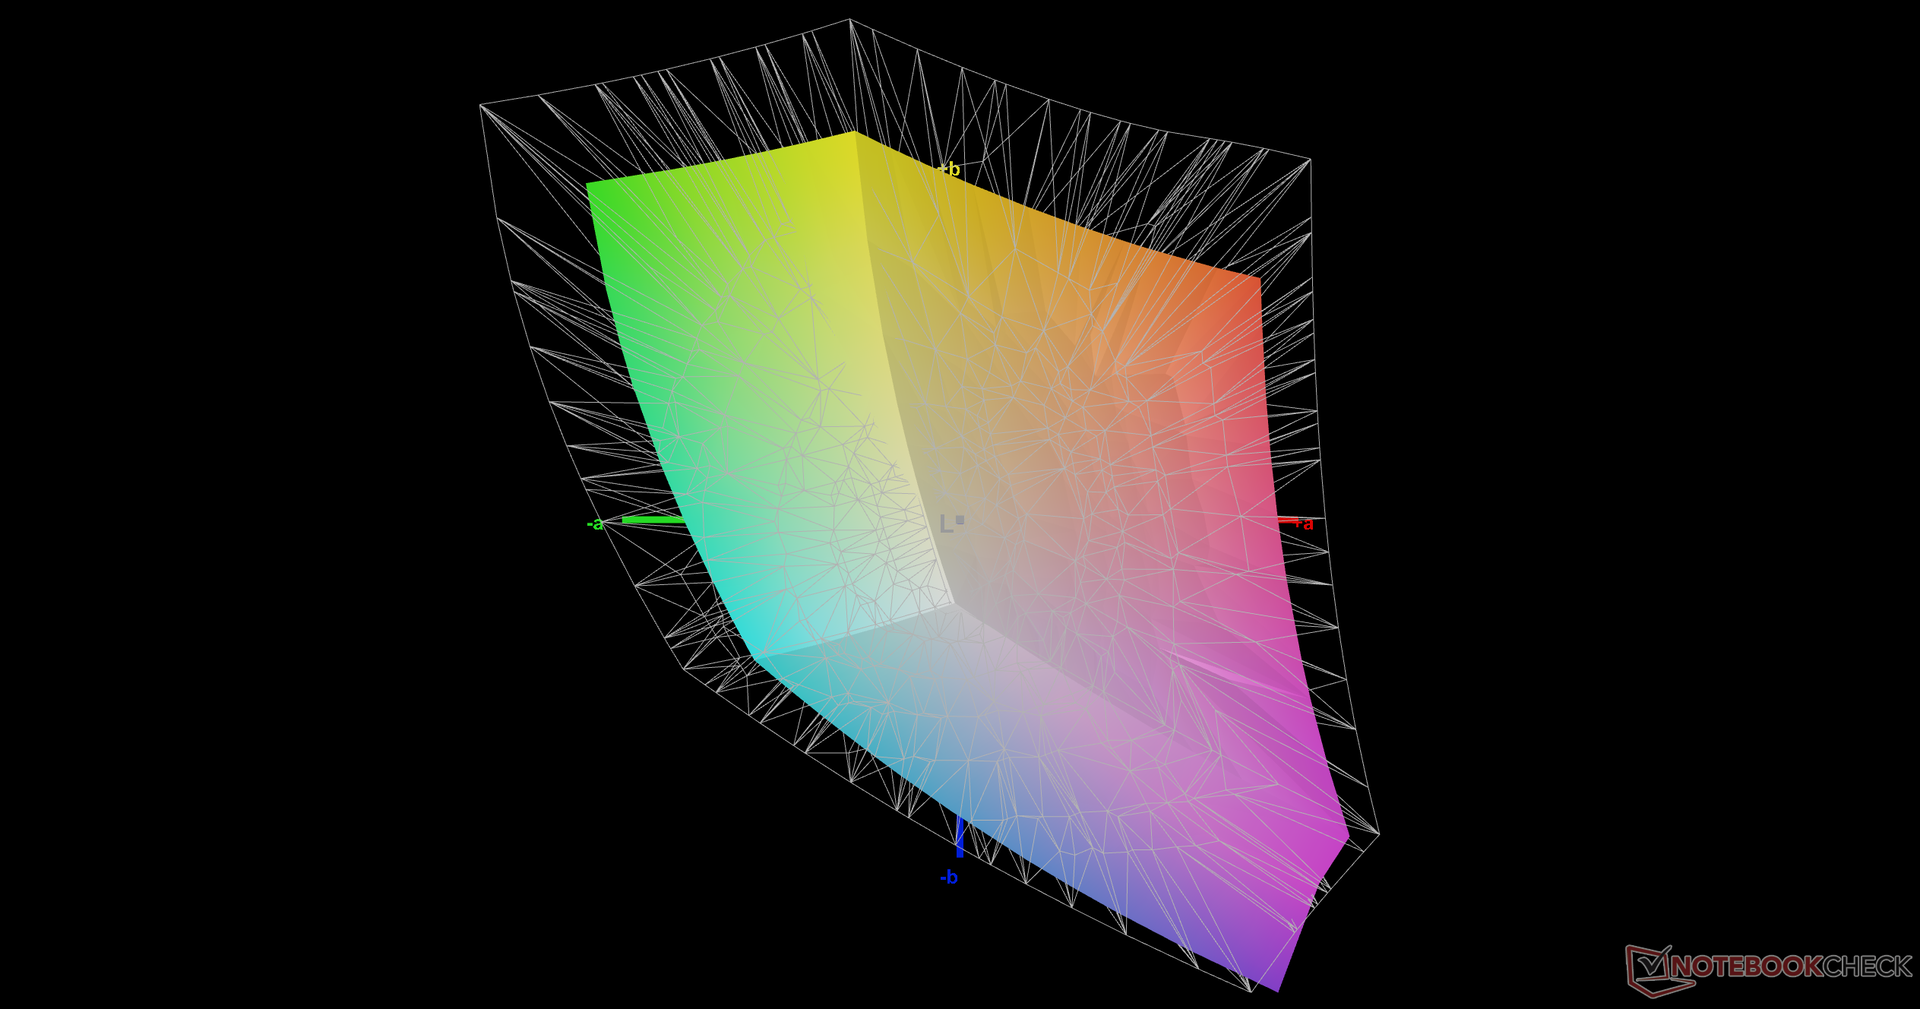
颜色和灰度在开箱后相当准确,表明没有必要对终端用户进行修补。尽管如此,我们自己用X-Rite色度计进行的校准会使平均灰度值在全局范围内略有改善。

Display Response Times
| ↔ Response Time Black to White | ||
|---|---|---|
| 12 ms ... rise ↗ and fall ↘ combined | ↗ 6.8 ms rise |  |
| ↘ 5.2 ms fall | ||
| The screen shows good response rates in our tests, but may be too slow for competitive gamers. In comparison, all tested devices range from 0.1 (minimum) to 240 (maximum) ms. » 32 % of all devices are better. This means that the measured response time is better than the average of all tested devices (19.8 ms). | ||
| ↔ Response Time 50% Grey to 80% Grey | ||
| 15.6 ms ... rise ↗ and fall ↘ combined | ↗ 8.4 ms rise |  |
| ↘ 7.2 ms fall | ||
| The screen shows good response rates in our tests, but may be too slow for competitive gamers. In comparison, all tested devices range from 0.165 (minimum) to 636 (maximum) ms. » 30 % of all devices are better. This means that the measured response time is better than the average of all tested devices (31 ms). | ||
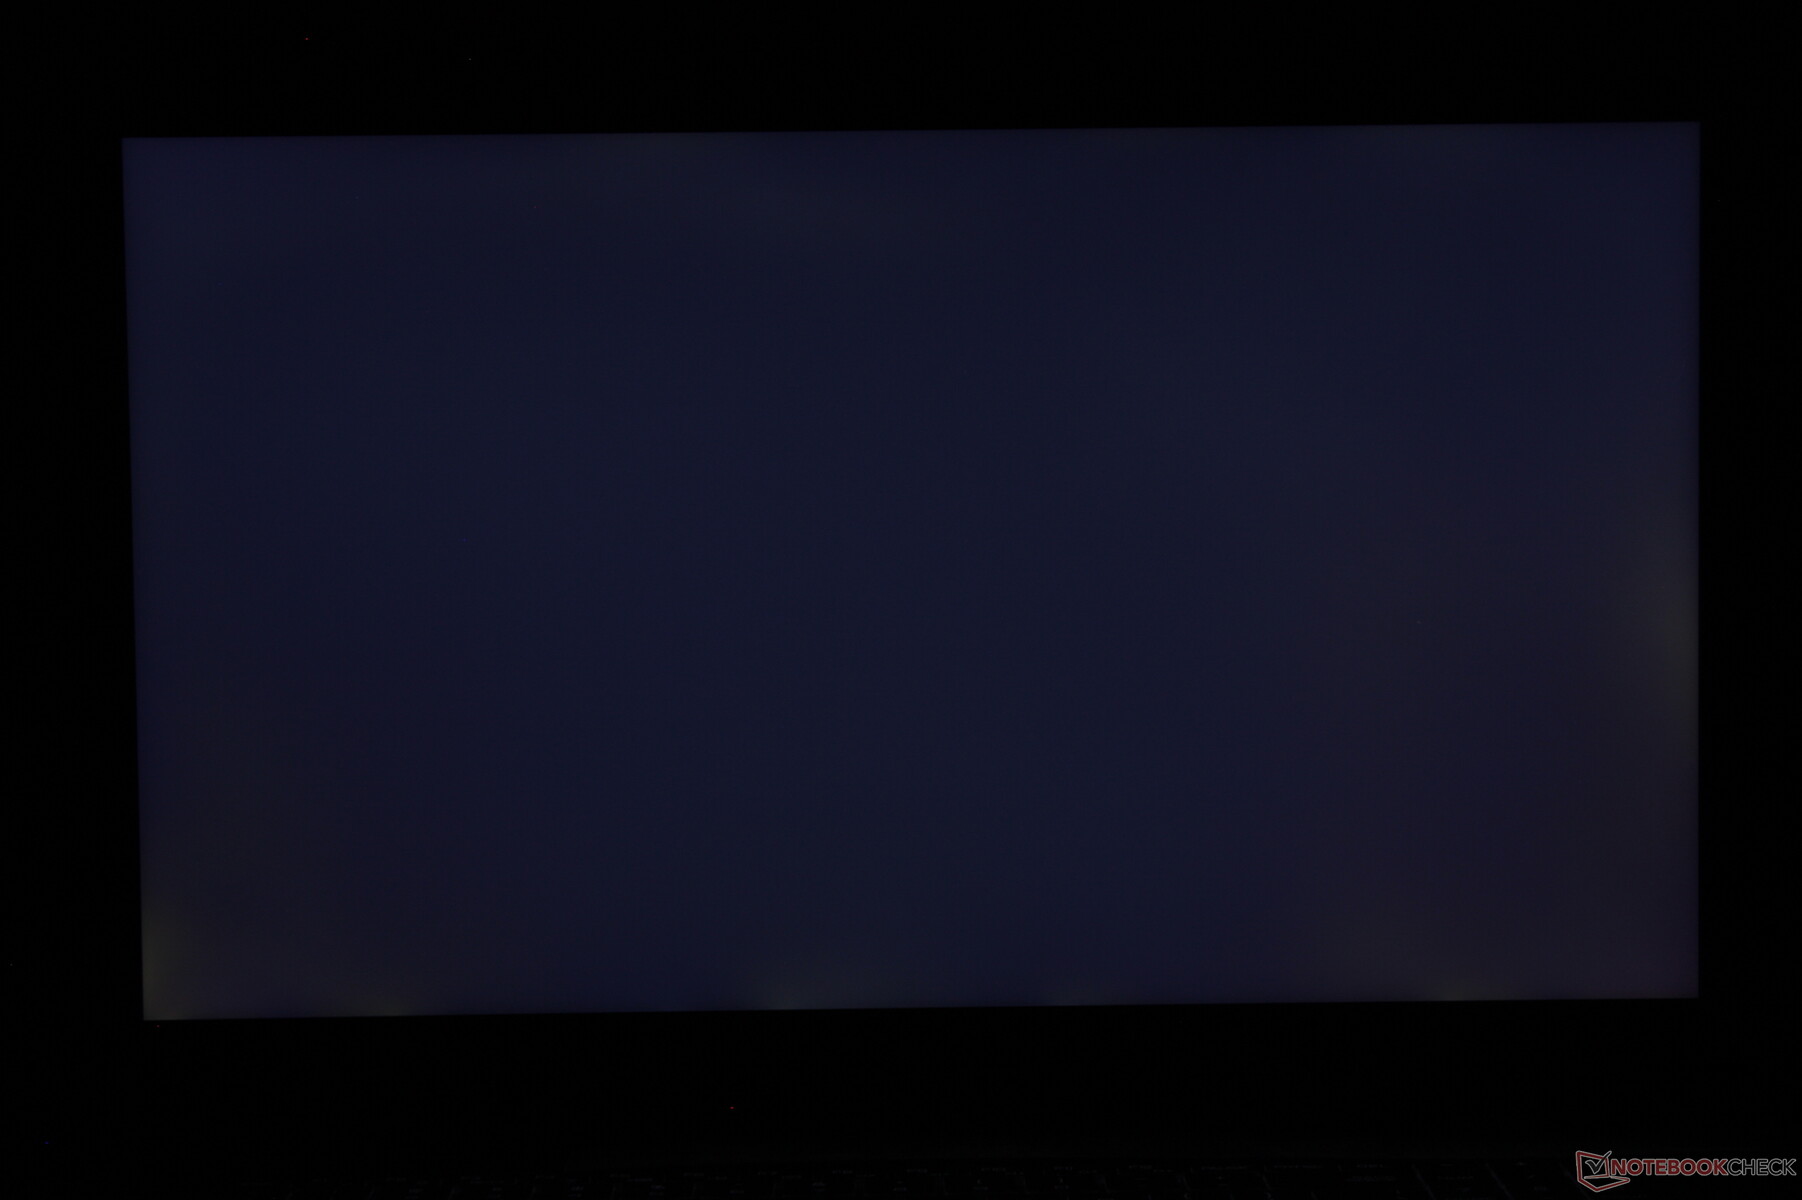
Screen Flickering / PWM (Pulse-Width Modulation)
| Screen flickering / PWM not detected | 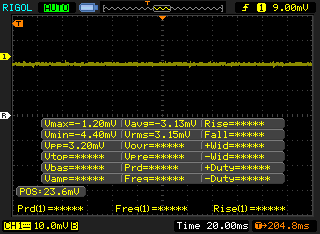 | ||
In comparison: 52 % of all tested devices do not use PWM to dim the display. If PWM was detected, an average of 7772 (minimum: 5 - maximum: 343500) Hz was measured. | |||
由于最大亮度接近400尼特,而不是通常的300尼特,因此户外能见度比大多数17.3英寸游戏笔记本要好。然而,你还是要避免阳光直射,否则屏幕会被洗掉。
业绩
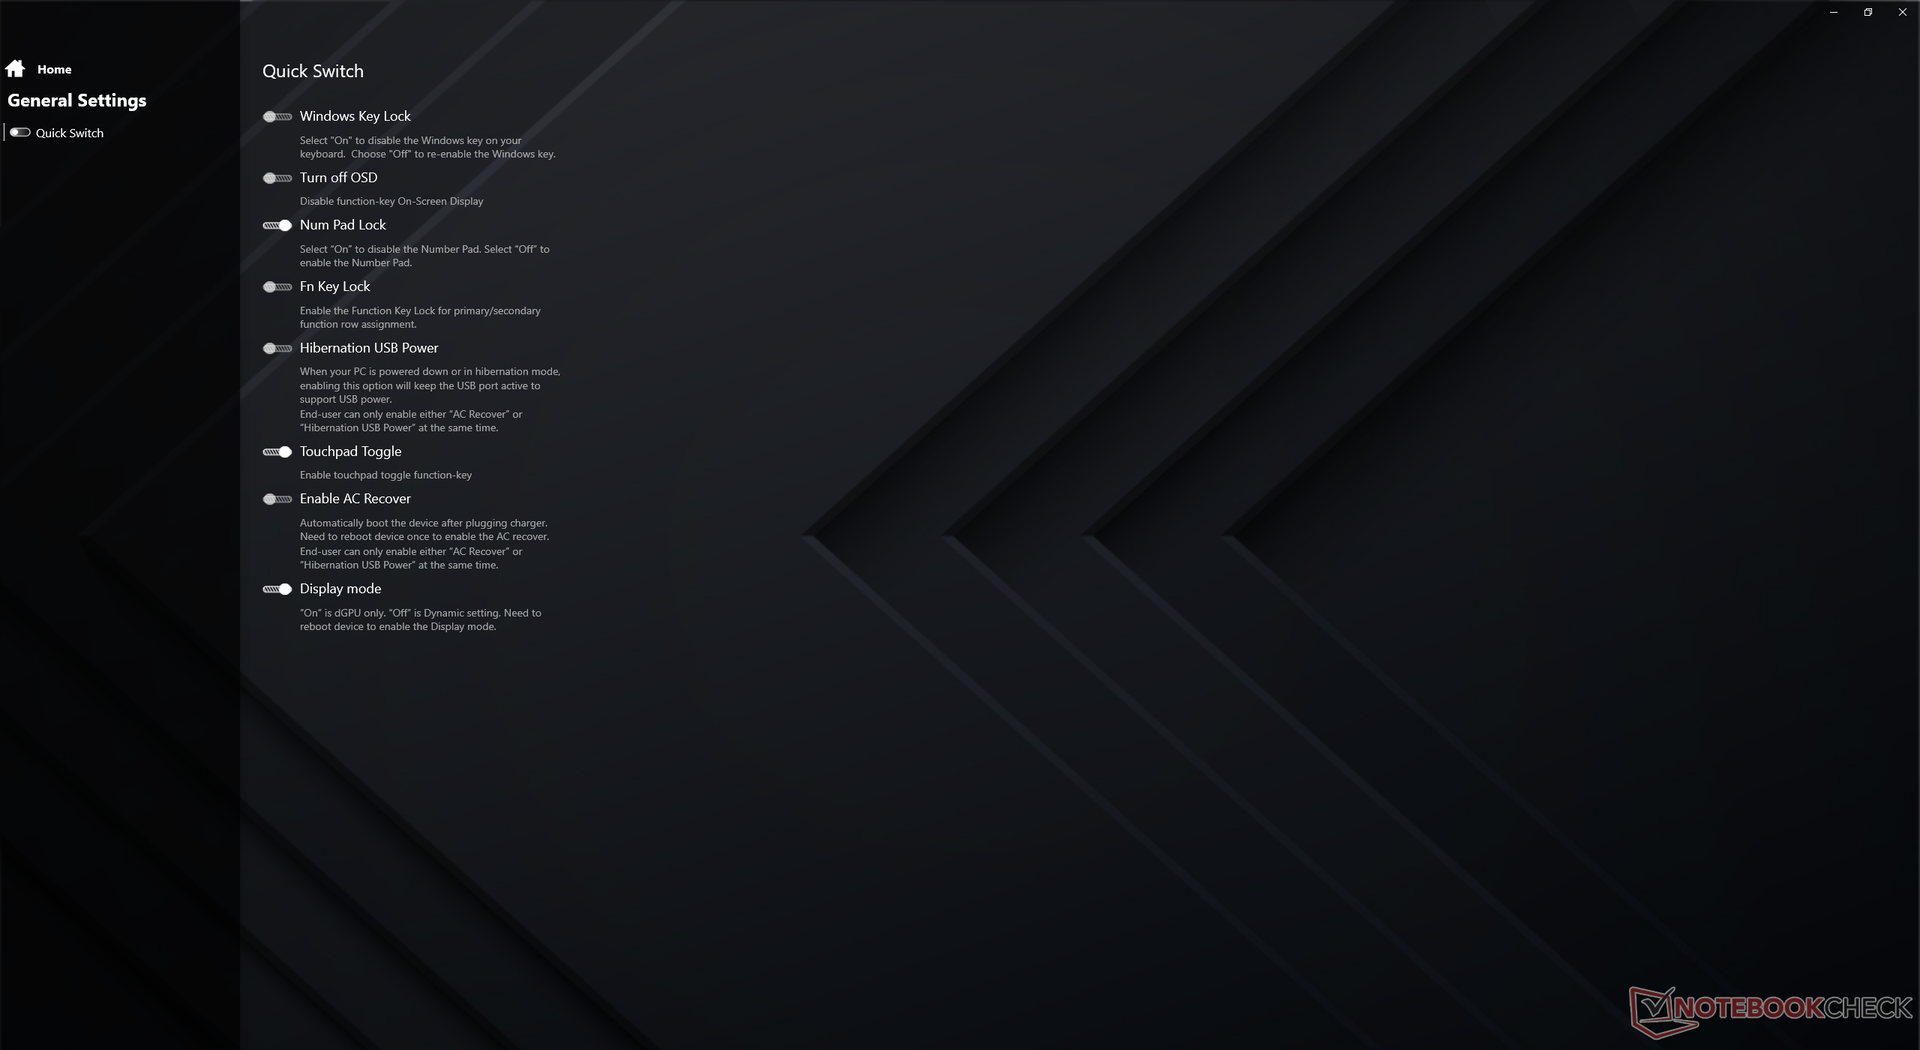
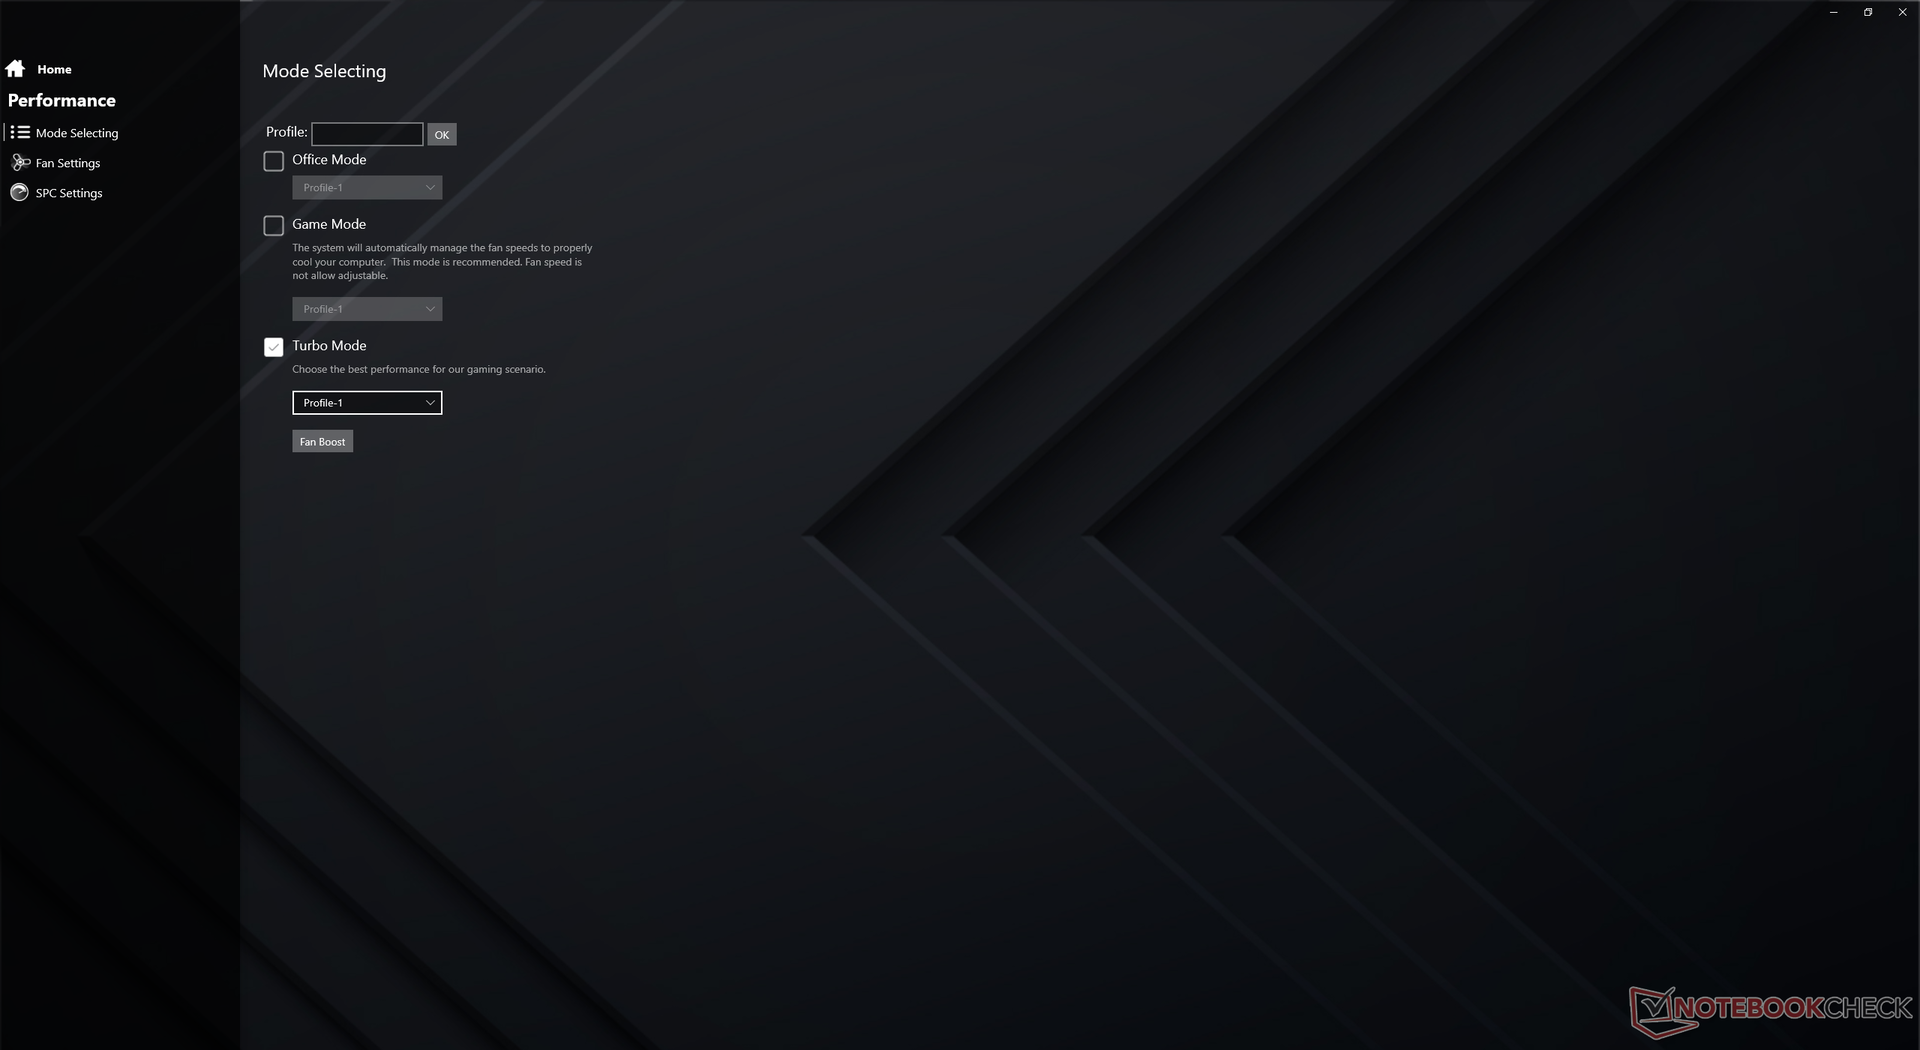
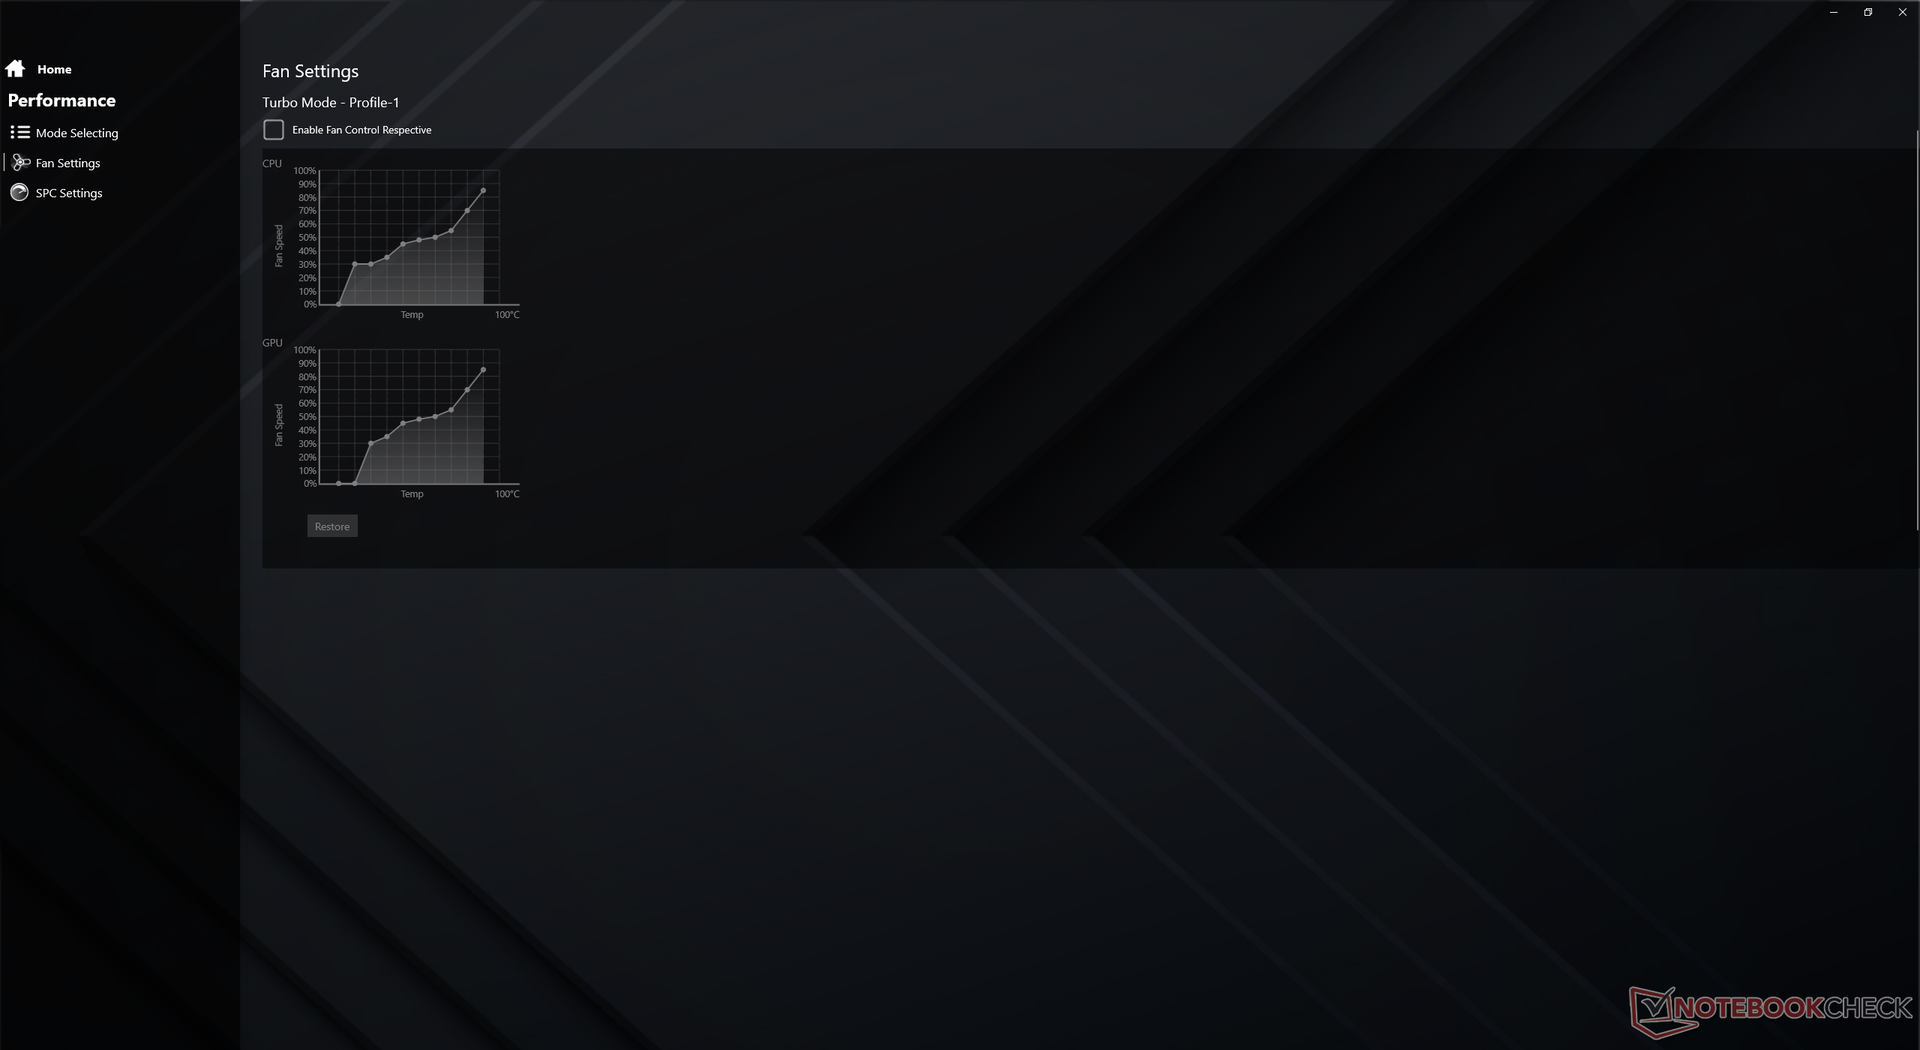
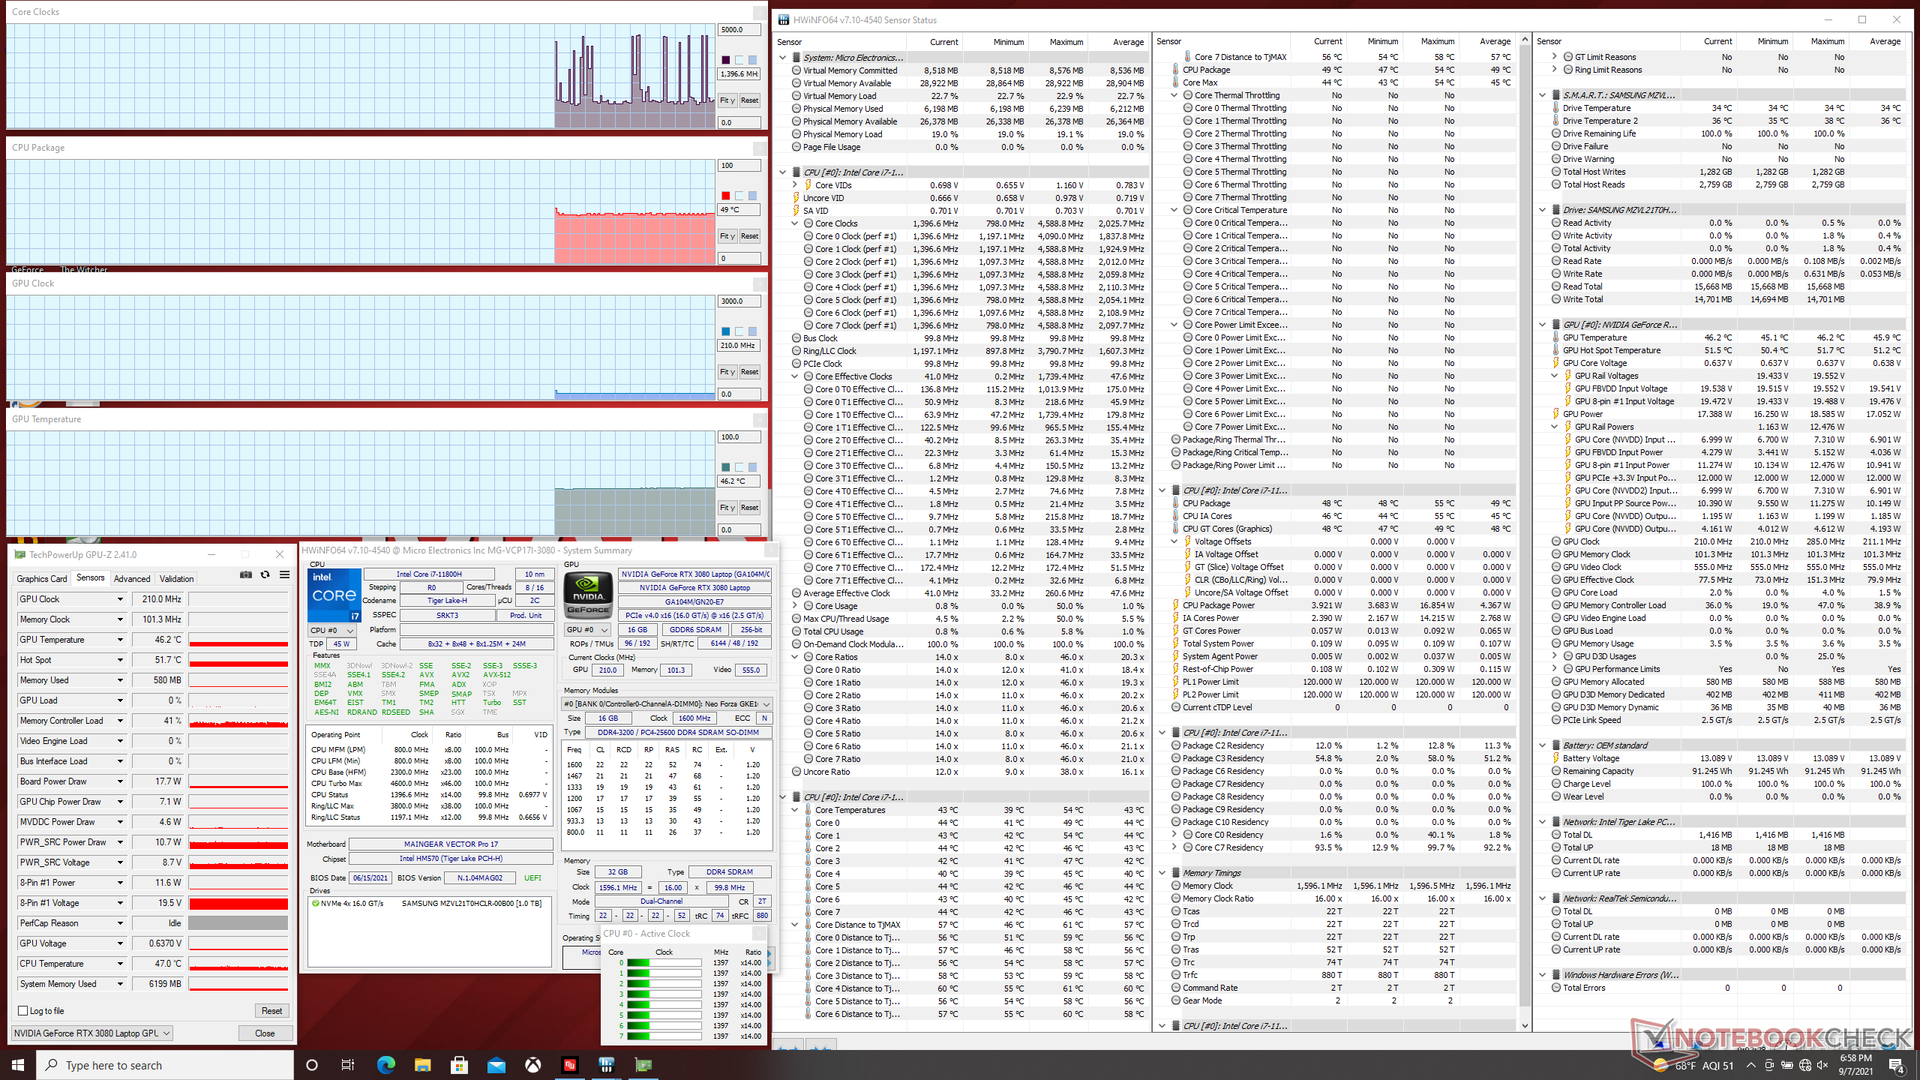
Maingear挤进了一个165瓦的GeForce RTX 3080 GPU,尽管它的设计很紧凑,在目标TGP方面与更厚的Schenker XMG Ultra 17 上的GPU相似。可调整栏、动态提升2.0和WhisperMode 2.0都支持,而高级优化和内部G-Sync则不支持。因此,可以通过Maingear NODE控制中心软件进行手动切换,在dGPU模式(即全GPU性能模式)或Optimus模式之间切换。我们建议用户熟悉这个软件,因为许多系统特定的设置和LED功能都是在这里切换的。
在运行以下任何性能基准测试之前,我们的系统被设置为涡轮模式和dGPU模式,以获得尽可能高的分数。
处理器
CPU的性能非常好,与其他配备相同处理器的笔记本电脑相比,我们期望它能达到这个水平。用户从旧的酷睿i7-10750H或 酷睿i7-10875H笔记本电脑的用户将分别看到大约40%和20%的性能提升。竞争性的 Ryzen 7 5800H在多线程负载中稍快,而在单线程负载中则比我们的 酷睿i7-11800H.
Cinebench R15 Multi Loop
Cinebench R23: Multi Core | Single Core
Cinebench R15: CPU Multi 64Bit | CPU Single 64Bit
Blender: v2.79 BMW27 CPU
7-Zip 18.03: 7z b 4 -mmt1 | 7z b 4
Geekbench 5.5: Single-Core | Multi-Core
HWBOT x265 Benchmark v2.2: 4k Preset
LibreOffice : 20 Documents To PDF
R Benchmark 2.5: Overall mean
| Cinebench R20 / CPU (Multi Core) | |
| Schenker XMG Ultra 17 Rocket Lake | |
| Asus ROG Zephyrus S17 GX703HSD | |
| Asus ROG Strix G17 G713QE-RB74 | |
| Medion Erazer Beast X25 | |
| Eluktronics RP-17 | |
| Average Intel Core i7-11800H (2498 - 5408, n=50) | |
| Maingear Vector Pro MG-VCP17 | |
| Razer Blade Pro 17 2021 (QHD Touch) | |
| Medion Erazer Beast X20 | |
| Schenker XMG Core 17 Comet Lake | |
| Schenker XMG Pro 17 PB71RD-G | |
| Lenovo Legion 5 17IMH05 | |
| Cinebench R20 / CPU (Single Core) | |
| Schenker XMG Ultra 17 Rocket Lake | |
| Asus ROG Zephyrus S17 GX703HSD | |
| Medion Erazer Beast X25 | |
| Maingear Vector Pro MG-VCP17 | |
| Average Intel Core i7-11800H (520 - 586, n=47) | |
| Asus ROG Strix G17 G713QE-RB74 | |
| Schenker XMG Core 17 Comet Lake | |
| Razer Blade Pro 17 2021 (QHD Touch) | |
| Eluktronics RP-17 | |
| Medion Erazer Beast X20 | |
| Schenker XMG Pro 17 PB71RD-G | |
| Lenovo Legion 5 17IMH05 | |
| Cinebench R23 / Multi Core | |
| Schenker XMG Ultra 17 Rocket Lake | |
| Asus ROG Strix G17 G713QE-RB74 | |
| Asus ROG Zephyrus S17 GX703HSD | |
| Medion Erazer Beast X25 | |
| Maingear Vector Pro MG-VCP17 | |
| Average Intel Core i7-11800H (6508 - 14088, n=48) | |
| Razer Blade Pro 17 2021 (QHD Touch) | |
| Medion Erazer Beast X20 | |
| Schenker XMG Core 17 Comet Lake | |
| Cinebench R23 / Single Core | |
| Schenker XMG Ultra 17 Rocket Lake | |
| Asus ROG Zephyrus S17 GX703HSD | |
| Maingear Vector Pro MG-VCP17 | |
| Average Intel Core i7-11800H (1386 - 1522, n=45) | |
| Medion Erazer Beast X25 | |
| Asus ROG Strix G17 G713QE-RB74 | |
| Razer Blade Pro 17 2021 (QHD Touch) | |
| Schenker XMG Core 17 Comet Lake | |
| Medion Erazer Beast X20 | |
| Cinebench R15 / CPU Multi 64Bit | |
| Schenker XMG Ultra 17 Rocket Lake | |
| Asus ROG Zephyrus S17 GX703HSD | |
| Asus ROG Strix G17 G713QE-RB74 | |
| Medion Erazer Beast X25 | |
| Eluktronics RP-17 | |
| Average Intel Core i7-11800H (1342 - 2173, n=50) | |
| Maingear Vector Pro MG-VCP17 | |
| Razer Blade Pro 17 2021 (QHD Touch) | |
| Medion Erazer Beast X20 | |
| Schenker XMG Core 17 Comet Lake | |
| Schenker XMG Pro 17 PB71RD-G | |
| Lenovo Legion 5 17IMH05 | |
| Cinebench R15 / CPU Single 64Bit | |
| Schenker XMG Ultra 17 Rocket Lake | |
| Asus ROG Zephyrus S17 GX703HSD | |
| Medion Erazer Beast X25 | |
| Asus ROG Strix G17 G713QE-RB74 | |
| Maingear Vector Pro MG-VCP17 | |
| Average Intel Core i7-11800H (201 - 231, n=46) | |
| Schenker XMG Core 17 Comet Lake | |
| Razer Blade Pro 17 2021 (QHD Touch) | |
| Medion Erazer Beast X20 | |
| Eluktronics RP-17 | |
| Schenker XMG Pro 17 PB71RD-G | |
| Lenovo Legion 5 17IMH05 | |
| Blender / v2.79 BMW27 CPU | |
| Lenovo Legion 5 17IMH05 | |
| Schenker XMG Pro 17 PB71RD-G | |
| Schenker XMG Core 17 Comet Lake | |
| Medion Erazer Beast X20 | |
| Razer Blade Pro 17 2021 (QHD Touch) | |
| Average Intel Core i7-11800H (217 - 454, n=46) | |
| Maingear Vector Pro MG-VCP17 | |
| Medion Erazer Beast X25 | |
| Eluktronics RP-17 | |
| Asus ROG Strix G17 G713QE-RB74 | |
| Asus ROG Zephyrus S17 GX703HSD | |
| Schenker XMG Ultra 17 Rocket Lake | |
| 7-Zip 18.03 / 7z b 4 -mmt1 | |
| Schenker XMG Ultra 17 Rocket Lake | |
| Asus ROG Zephyrus S17 GX703HSD | |
| Medion Erazer Beast X25 | |
| Asus ROG Strix G17 G713QE-RB74 | |
| Average Intel Core i7-11800H (5138 - 5732, n=46) | |
| Schenker XMG Core 17 Comet Lake | |
| Maingear Vector Pro MG-VCP17 | |
| Razer Blade Pro 17 2021 (QHD Touch) | |
| Medion Erazer Beast X20 | |
| Eluktronics RP-17 | |
| Schenker XMG Pro 17 PB71RD-G | |
| Lenovo Legion 5 17IMH05 | |
| 7-Zip 18.03 / 7z b 4 | |
| Medion Erazer Beast X25 | |
| Schenker XMG Ultra 17 Rocket Lake | |
| Asus ROG Zephyrus S17 GX703HSD | |
| Asus ROG Strix G17 G713QE-RB74 | |
| Maingear Vector Pro MG-VCP17 | |
| Eluktronics RP-17 | |
| Average Intel Core i7-11800H (33718 - 56758, n=46) | |
| Razer Blade Pro 17 2021 (QHD Touch) | |
| Medion Erazer Beast X20 | |
| Schenker XMG Core 17 Comet Lake | |
| Schenker XMG Pro 17 PB71RD-G | |
| Lenovo Legion 5 17IMH05 | |
| Geekbench 5.5 / Single-Core | |
| Schenker XMG Ultra 17 Rocket Lake | |
| Asus ROG Zephyrus S17 GX703HSD | |
| Average Intel Core i7-11800H (1429 - 1625, n=40) | |
| Medion Erazer Beast X25 | |
| Schenker XMG Core 17 Comet Lake | |
| Razer Blade Pro 17 2021 (QHD Touch) | |
| Medion Erazer Beast X20 | |
| Eluktronics RP-17 | |
| Schenker XMG Pro 17 PB71RD-G | |
| Lenovo Legion 5 17IMH05 | |
| Geekbench 5.5 / Multi-Core | |
| Schenker XMG Ultra 17 Rocket Lake | |
| Asus ROG Zephyrus S17 GX703HSD | |
| Medion Erazer Beast X25 | |
| Average Intel Core i7-11800H (4655 - 9851, n=40) | |
| Razer Blade Pro 17 2021 (QHD Touch) | |
| Eluktronics RP-17 | |
| Medion Erazer Beast X20 | |
| Schenker XMG Core 17 Comet Lake | |
| Schenker XMG Pro 17 PB71RD-G | |
| Lenovo Legion 5 17IMH05 | |
| HWBOT x265 Benchmark v2.2 / 4k Preset | |
| Schenker XMG Ultra 17 Rocket Lake | |
| Asus ROG Zephyrus S17 GX703HSD | |
| Medion Erazer Beast X25 | |
| Asus ROG Strix G17 G713QE-RB74 | |
| Average Intel Core i7-11800H (7.38 - 17.4, n=46) | |
| Maingear Vector Pro MG-VCP17 | |
| Eluktronics RP-17 | |
| Razer Blade Pro 17 2021 (QHD Touch) | |
| Medion Erazer Beast X20 | |
| Schenker XMG Core 17 Comet Lake | |
| Schenker XMG Pro 17 PB71RD-G | |
| Lenovo Legion 5 17IMH05 | |
| LibreOffice / 20 Documents To PDF | |
| Lenovo Legion 5 17IMH05 | |
| Eluktronics RP-17 | |
| Schenker XMG Core 17 Comet Lake | |
| Asus ROG Strix G17 G713QE-RB74 | |
| Medion Erazer Beast X20 | |
| Medion Erazer Beast X25 | |
| Average Intel Core i7-11800H (38.6 - 59.9, n=45) | |
| Maingear Vector Pro MG-VCP17 | |
| Razer Blade Pro 17 2021 (QHD Touch) | |
| Asus ROG Zephyrus S17 GX703HSD | |
| Schenker XMG Ultra 17 Rocket Lake | |
| R Benchmark 2.5 / Overall mean | |
| Lenovo Legion 5 17IMH05 | |
| Schenker XMG Pro 17 PB71RD-G | |
| Medion Erazer Beast X20 | |
| Razer Blade Pro 17 2021 (QHD Touch) | |
| Eluktronics RP-17 | |
| Schenker XMG Core 17 Comet Lake | |
| Maingear Vector Pro MG-VCP17 | |
| Average Intel Core i7-11800H (0.548 - 0.615, n=46) | |
| Asus ROG Zephyrus S17 GX703HSD | |
| Asus ROG Strix G17 G713QE-RB74 | |
| Schenker XMG Ultra 17 Rocket Lake | |
| Medion Erazer Beast X25 | |
* ... smaller is better
系统性能
| PCMark 10 / Score | |
| Maingear Vector Pro MG-VCP17 | |
| Asus ROG Zephyrus S17 GX703HSD | |
| Average Intel Core i7-11800H, NVIDIA GeForce RTX 3080 Laptop GPU (6673 - 7470, n=11) | |
| Schenker XMG Neo 17 (Early 2021, RTX 3070, 5800H) | |
| MSI GS75 10SF-609US | |
| Schenker Compact 17 | |
| Schenker XMG Core 17 (Early 2021) | |
| PCMark 10 / Essentials | |
| Maingear Vector Pro MG-VCP17 | |
| Asus ROG Zephyrus S17 GX703HSD | |
| Average Intel Core i7-11800H, NVIDIA GeForce RTX 3080 Laptop GPU (9862 - 11064, n=11) | |
| MSI GS75 10SF-609US | |
| Schenker XMG Neo 17 (Early 2021, RTX 3070, 5800H) | |
| Schenker Compact 17 | |
| Schenker XMG Core 17 (Early 2021) | |
| PCMark 10 / Productivity | |
| Asus ROG Zephyrus S17 GX703HSD | |
| Average Intel Core i7-11800H, NVIDIA GeForce RTX 3080 Laptop GPU (8278 - 9803, n=11) | |
| Maingear Vector Pro MG-VCP17 | |
| Schenker XMG Neo 17 (Early 2021, RTX 3070, 5800H) | |
| Schenker Compact 17 | |
| MSI GS75 10SF-609US | |
| Schenker XMG Core 17 (Early 2021) | |
| PCMark 10 / Digital Content Creation | |
| Maingear Vector Pro MG-VCP17 | |
| Asus ROG Zephyrus S17 GX703HSD | |
| Average Intel Core i7-11800H, NVIDIA GeForce RTX 3080 Laptop GPU (9881 - 11323, n=11) | |
| Schenker XMG Neo 17 (Early 2021, RTX 3070, 5800H) | |
| MSI GS75 10SF-609US | |
| Schenker Compact 17 | |
| Schenker XMG Core 17 (Early 2021) | |
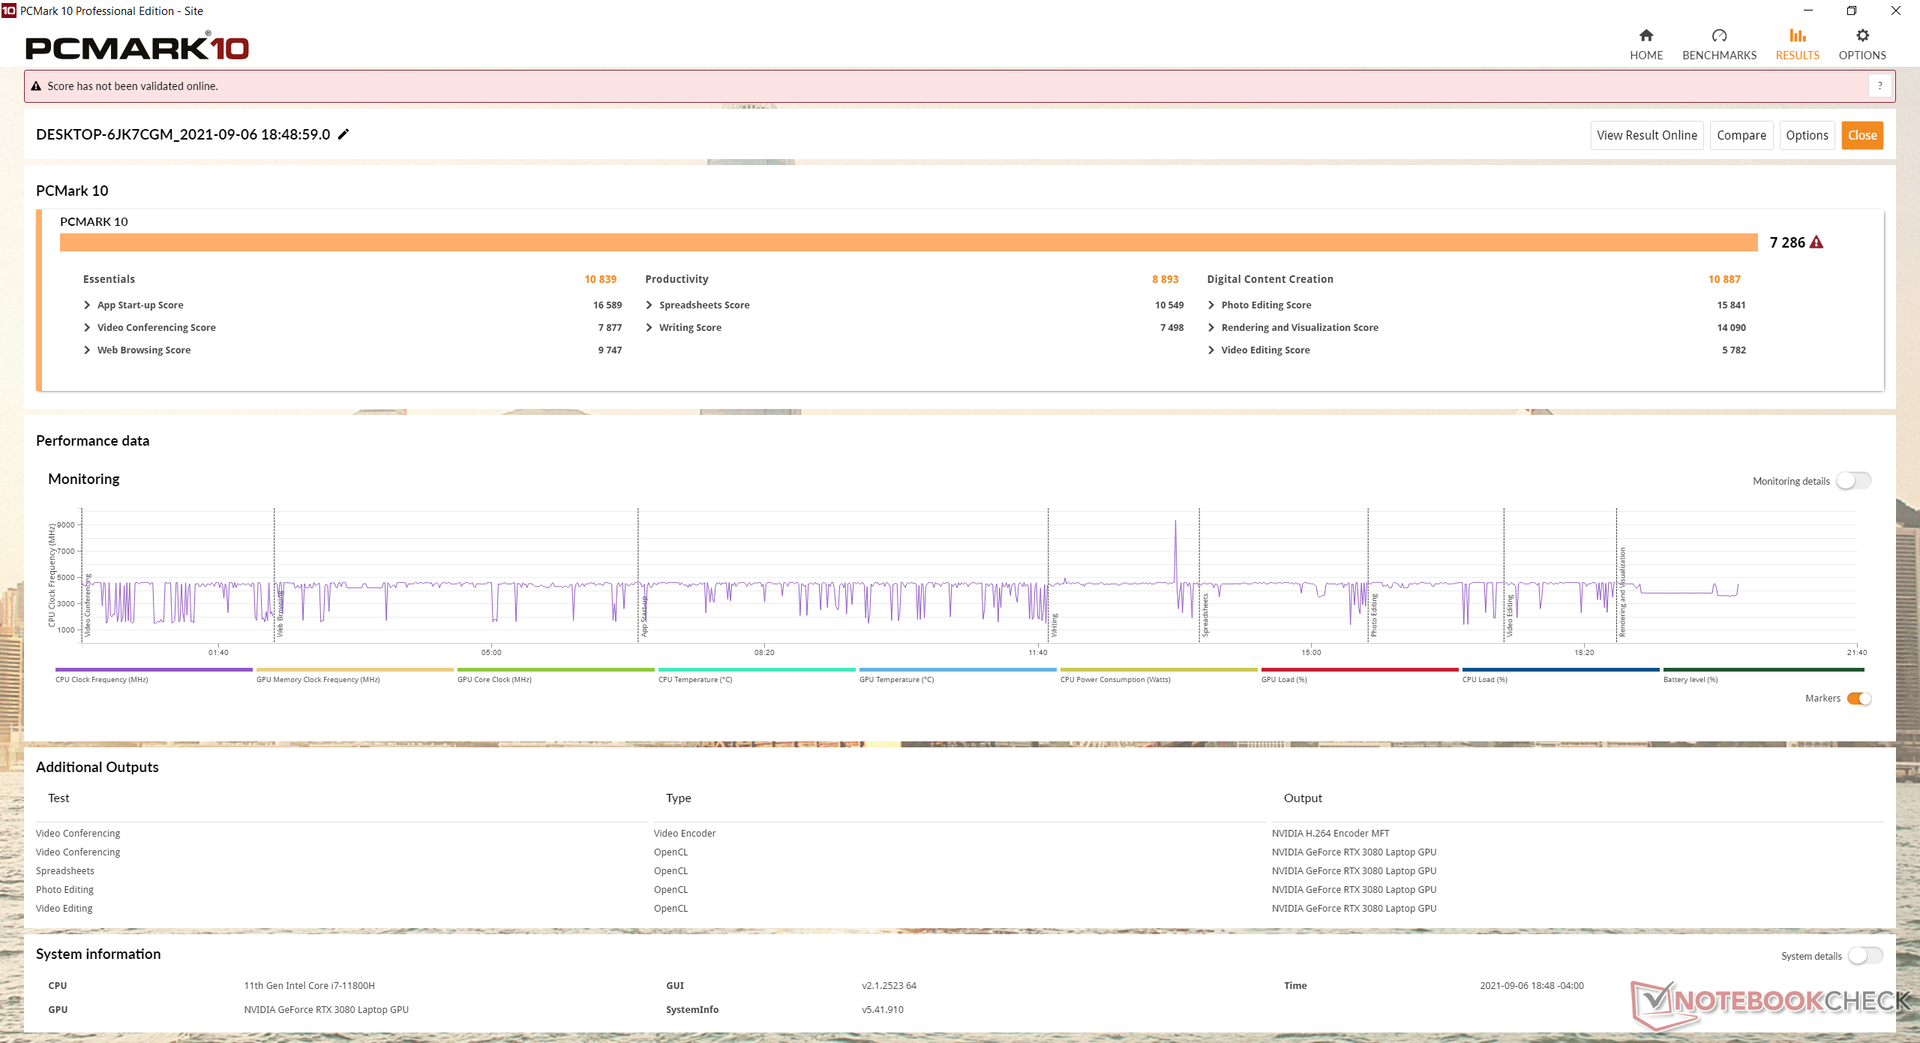
| PCMark 10 Score | 7286 points | |
Help | ||
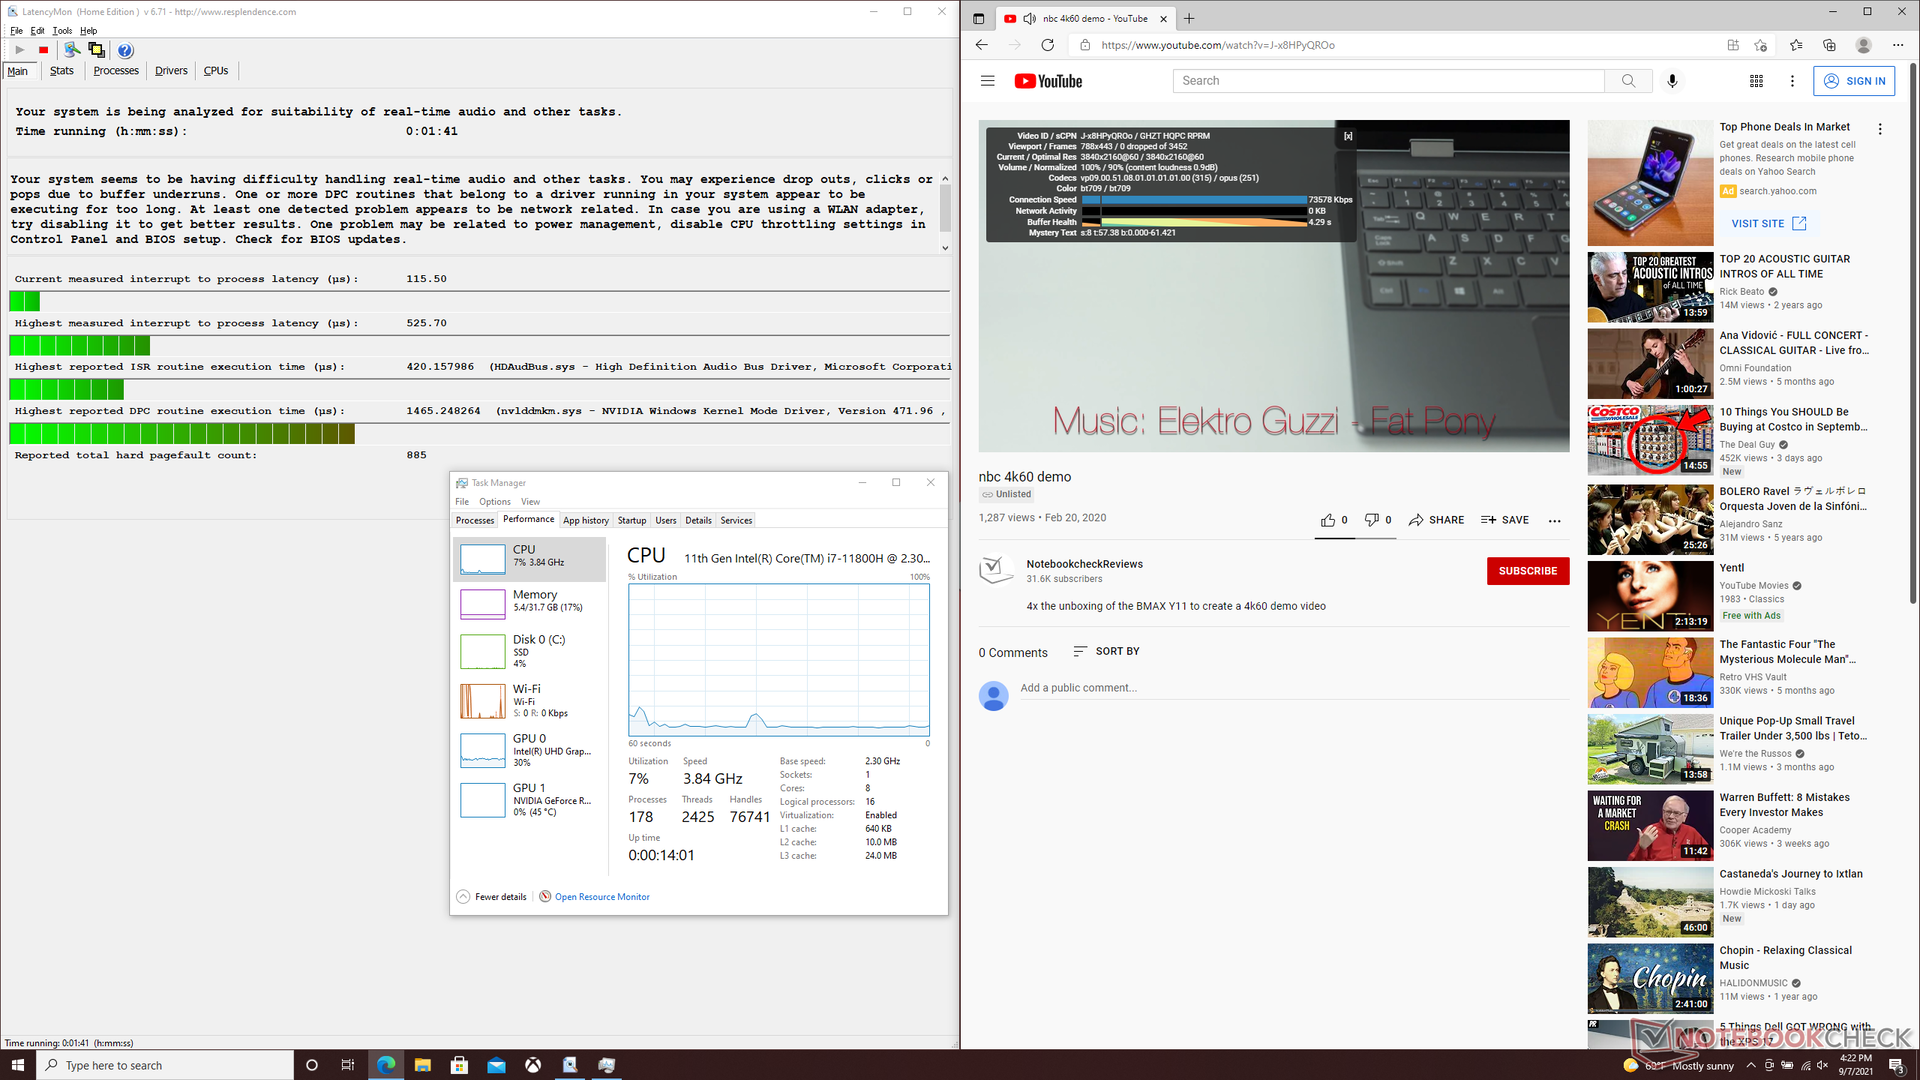
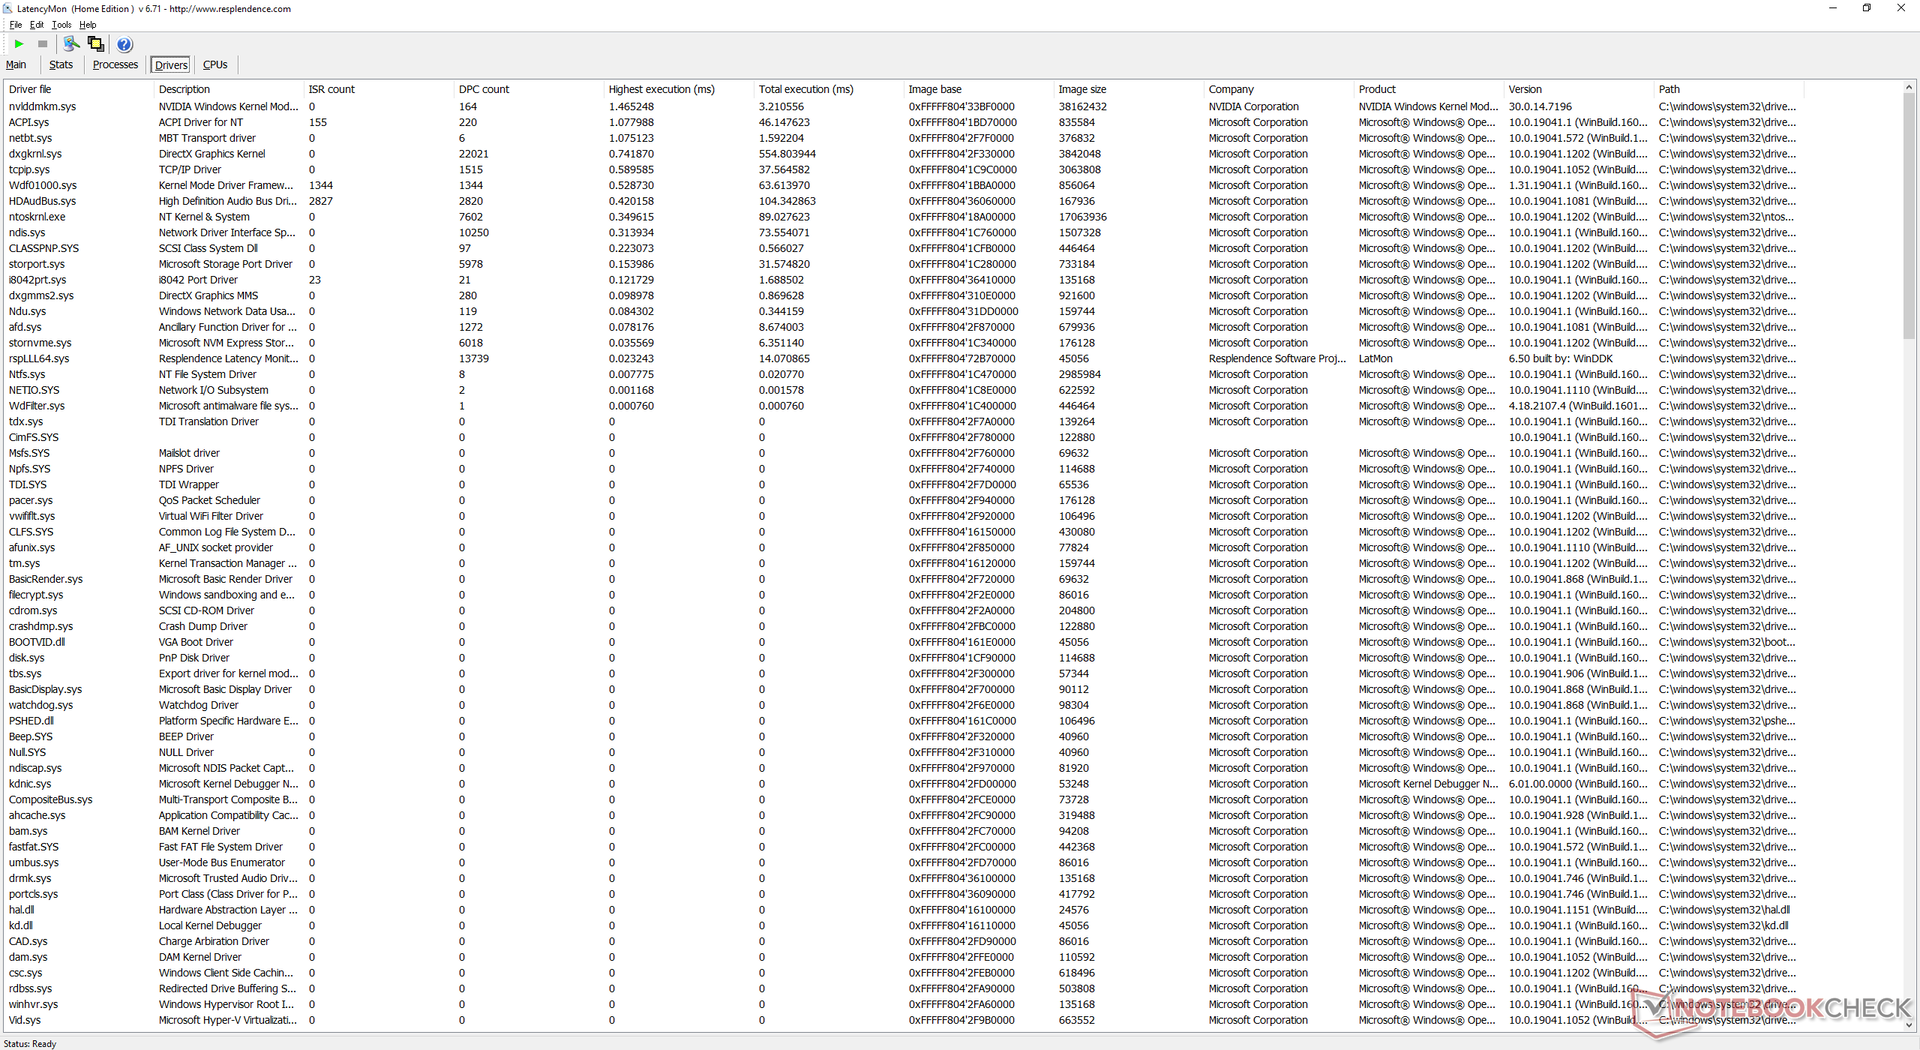
DPC延时
LatencyMon显示在我们的主页上打开多个浏览器标签时有轻微的DPC延迟问题。在60 FPS的情况下,4K视频播放很流畅,没有丢帧。
| DPC Latencies / LatencyMon - interrupt to process latency (max), Web, Youtube, Prime95 | |
| Schenker XMG Neo 17 (Early 2021, RTX 3070, 5800H) | |
| Asus ROG Zephyrus S17 GX703HSD | |
| Schenker XMG Core 17 (Early 2021) | |
| Schenker Compact 17 | |
| Maingear Vector Pro MG-VCP17 | |
| MSI GS75 10SF-609US | |
* ... smaller is better
存储设备
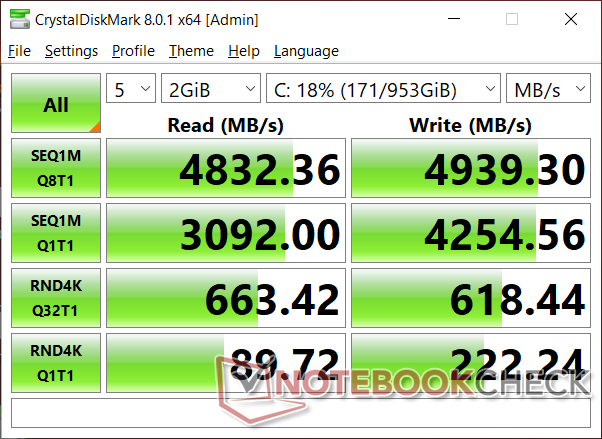
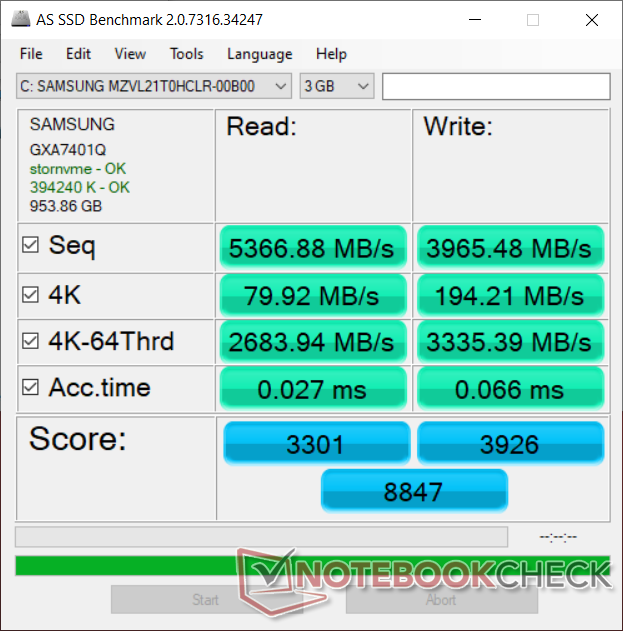
我们的测试装置配备了三星PM9A1,这是制造商为消费者提供的首要PCIe Gen4 NVMe SSD。连续读取和写入率分别接近7000 MB/s和5200 MB/s,比三星PM981a的速度快了约2倍。 三星PM981a系列的速度快约2倍,这在上一代旗舰笔记本电脑上很常见。
| Maingear Vector Pro MG-VCP17 Samsung PM9A1 MZVL21T0HCLR | Asus ROG Zephyrus S17 GX703HSD Samsung PM9A1 MZVL22T0HBLB | Schenker XMG Core 17 (Early 2021) Samsung SSD 970 EVO Plus 1TB | Schenker XMG Neo 17 (Early 2021, RTX 3070, 5800H) Samsung SSD 970 EVO Plus 500GB | Schenker Compact 17 Samsung SSD 970 EVO Plus 1TB | MSI GS75 10SF-609US WDC PC SN730 SDBPNTY-512G | |
|---|---|---|---|---|---|---|
| AS SSD | 7% | -38% | -28% | -28% | -50% | |
| Seq Read (MB/s) | 5367 | 5085 -5% | 2876 -46% | 3020 -44% | 2879 -46% | 2327 -57% |
| Seq Write (MB/s) | 3965 | 4434 12% | 2803 -29% | 2631 -34% | 2842 -28% | 2479 -37% |
| 4K Read (MB/s) | 79.9 | 80.3 1% | 55.3 -31% | 60.3 -25% | 51.6 -35% | 45.46 -43% |
| 4K Write (MB/s) | 194.2 | 214.7 11% | 106.9 -45% | 171.6 -12% | 142.5 -27% | 157.4 -19% |
| 4K-64 Read (MB/s) | 2684 | 2573 -4% | 1662 -38% | 1410 -47% | 1672 -38% | 1050 -61% |
| 4K-64 Write (MB/s) | 3335 | 2972 -11% | 2101 -37% | 2324 -30% | 2293 -31% | 938 -72% |
| Access Time Read * (ms) | 0.027 | 0.018 33% | 0.067 -148% | 0.045 -67% | 0.034 -26% | 0.076 -181% |
| Access Time Write * (ms) | 0.066 | 0.02 70% | 0.037 44% | 0.024 64% | 0.027 59% | 0.071 -8% |
| Score Read (Points) | 3301 | 3161 -4% | 2005 -39% | 1773 -46% | 2012 -39% | 1328 -60% |
| Score Write (Points) | 3926 | 3631 -8% | 2488 -37% | 2759 -30% | 2719 -31% | 1343 -66% |
| Score Total (Points) | 8847 | 8380 -5% | 5520 -38% | 5429 -39% | 5760 -35% | 3366 -62% |
| Copy ISO MB/s (MB/s) | 2579 | 3239 26% | 2029 -21% | 2383 -8% | 3092 20% | |
| Copy Program MB/s (MB/s) | 1133 | 899 -21% | 691 -39% | 603 -47% | 733 -35% | |
| Copy Game MB/s (MB/s) | 2161 | 2171 0% | 1513 -30% | 873 -60% | 1683 -22% | |
| CrystalDiskMark 5.2 / 6 | 1% | -32% | -28% | -31% | -37% | |
| Write 4K (MB/s) | 227.2 | 244.2 7% | 145.7 -36% | 206.1 -9% | 167.8 -26% | 177.9 -22% |
| Read 4K (MB/s) | 89 | 89.8 1% | 51.3 -42% | 53 -40% | 53.5 -40% | 47.42 -47% |
| Write Seq (MB/s) | 4256 | 3036 -29% | 3018 -29% | 3073 -28% | 2707 -36% | |
| Read Seq (MB/s) | 4364 | 2837 -35% | 2575 -41% | 2488 -43% | 2369 -46% | |
| Write 4K Q32T1 (MB/s) | 614 | 607 -1% | 511 -17% | 535 -13% | 524 -15% | 427.8 -30% |
| Read 4K Q32T1 (MB/s) | 659 | 658 0% | 582 -12% | 608 -8% | 595 -10% | 543 -18% |
| Write Seq Q32T1 (MB/s) | 5216 | 5270 1% | 3294 -37% | 3242 -38% | 3324 -36% | 2703 -48% |
| Read Seq Q32T1 (MB/s) | 7073 | 7091 0% | 3522 -50% | 3617 -49% | 3564 -50% | 3387 -52% |
| Write 4K Q8T8 (MB/s) | 2270 | |||||
| Read 4K Q8T8 (MB/s) | 2490 | |||||
| Total Average (Program / Settings) | 4% /
5% | -35% /
-36% | -28% /
-28% | -30% /
-29% | -44% /
-46% |
* ... smaller is better

Disk Throttling: DiskSpd Read Loop, Queue Depth 8
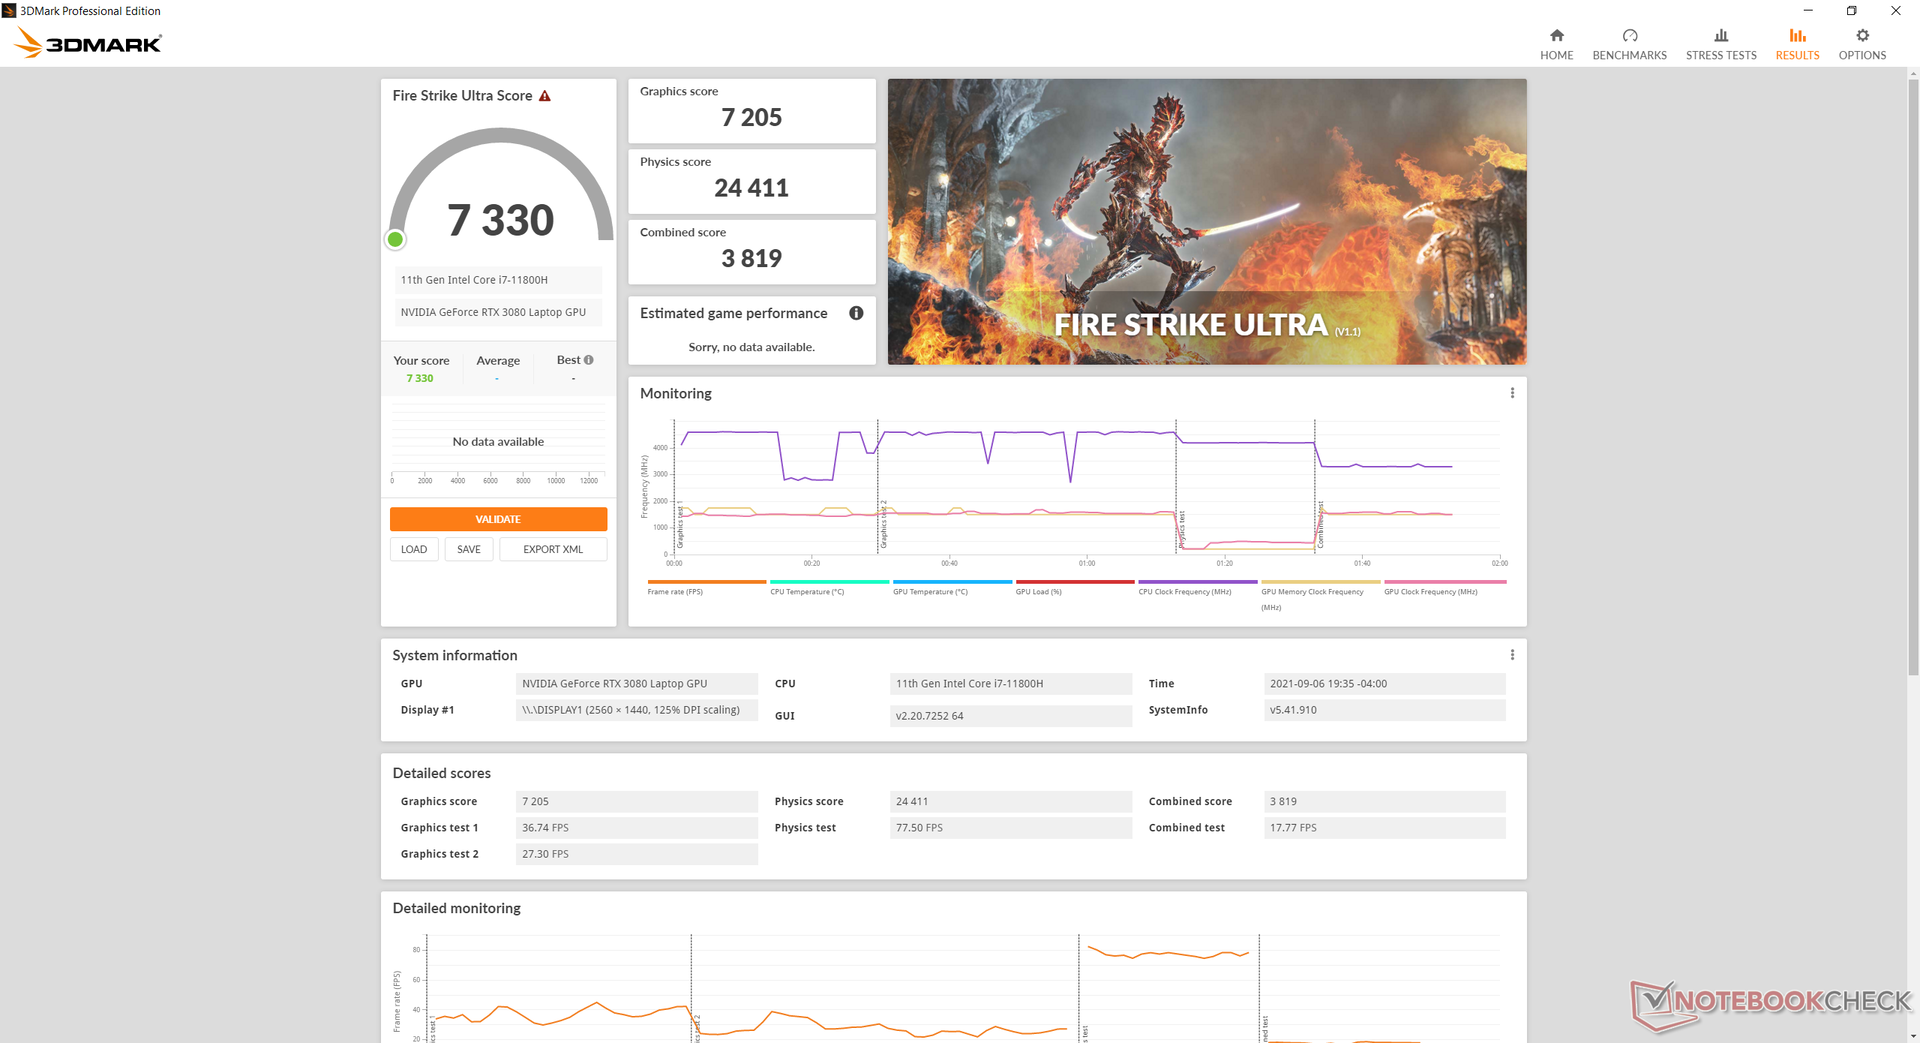
GPU性能
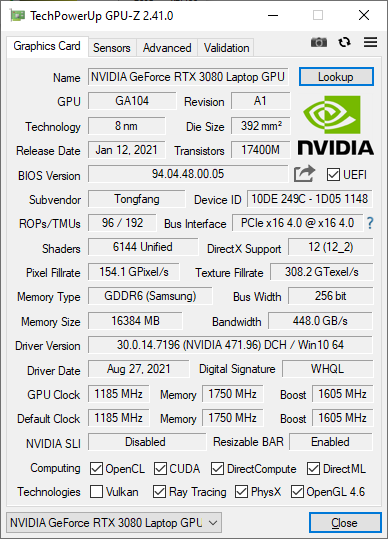
与Schenker Ultra 17相比,图形性能下降了约15%,尽管每个系统都配备了165 W TGPGeForce RTX 3080。一个 "适当的" 桌面RTX 3080可以比我们的移动版本快40%到60%。即便如此,我们的GPU在测试了超过30台RTX 3080笔记本电脑后,达到了我们预期的水平。 RTX 3080笔记本电脑到目前为止。
| 3DMark 11 | |
| 1280x720 Performance GPU | |
| ASUS GeForce RTX 3080 ROG STRIX OC GAMING | |
| Schenker XMG Ultra 17 Rocket Lake | |
| Average NVIDIA GeForce RTX 3080 Laptop GPU (31288 - 43744, n=40) | |
| Maingear Vector Pro MG-VCP17 | |
| Alienware m17 R3 P45E | |
| Asus Zephyrus S17 GX701LXS | |
| HP Omen 17-cb0020ng | |
| Asus Strix G17 G712LWS | |
| Acer Nitro 5 AN517-41-R5Z7 | |
| Lenovo Legion Y740-17IRHg-81UJ001VGE | |
| Asus TUF Gaming F17 FX706HM | |
| Eluktronics RP-17 | |
| 1280x720 Performance Combined | |
| Schenker XMG Ultra 17 Rocket Lake | |
| ASUS GeForce RTX 3080 ROG STRIX OC GAMING | |
| Maingear Vector Pro MG-VCP17 | |
| Average NVIDIA GeForce RTX 3080 Laptop GPU (10637 - 20233, n=39) | |
| Alienware m17 R3 P45E | |
| HP Omen 17-cb0020ng | |
| Asus TUF Gaming F17 FX706HM | |
| Asus Zephyrus S17 GX701LXS | |
| Acer Nitro 5 AN517-41-R5Z7 | |
| Eluktronics RP-17 | |
| Lenovo Legion Y740-17IRHg-81UJ001VGE | |
| Asus Strix G17 G712LWS | |
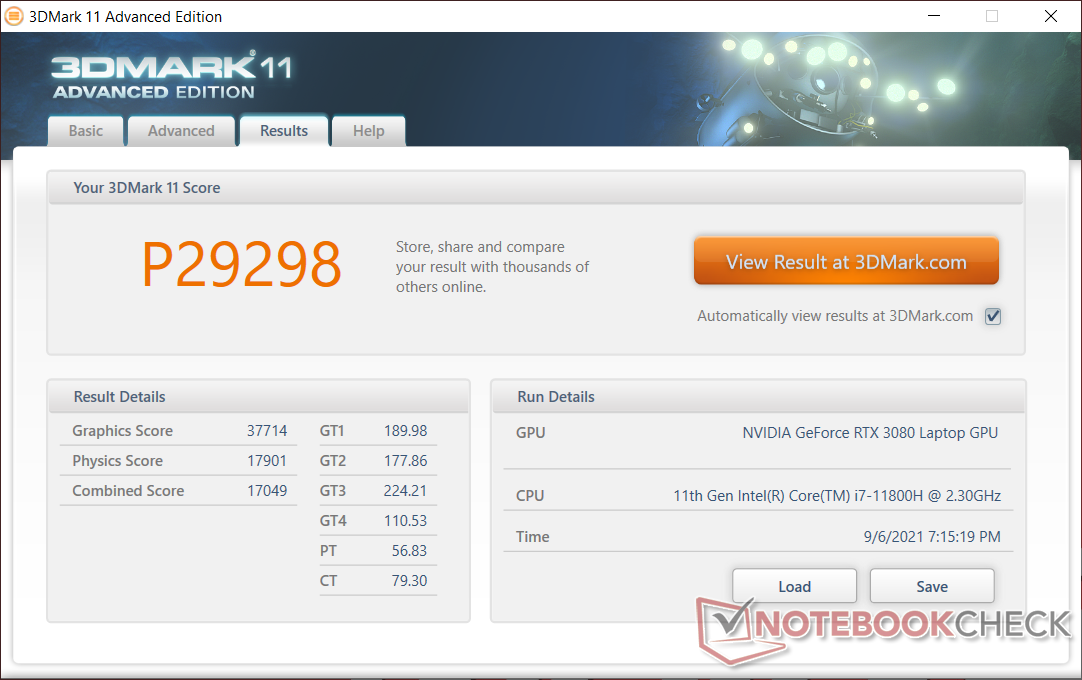
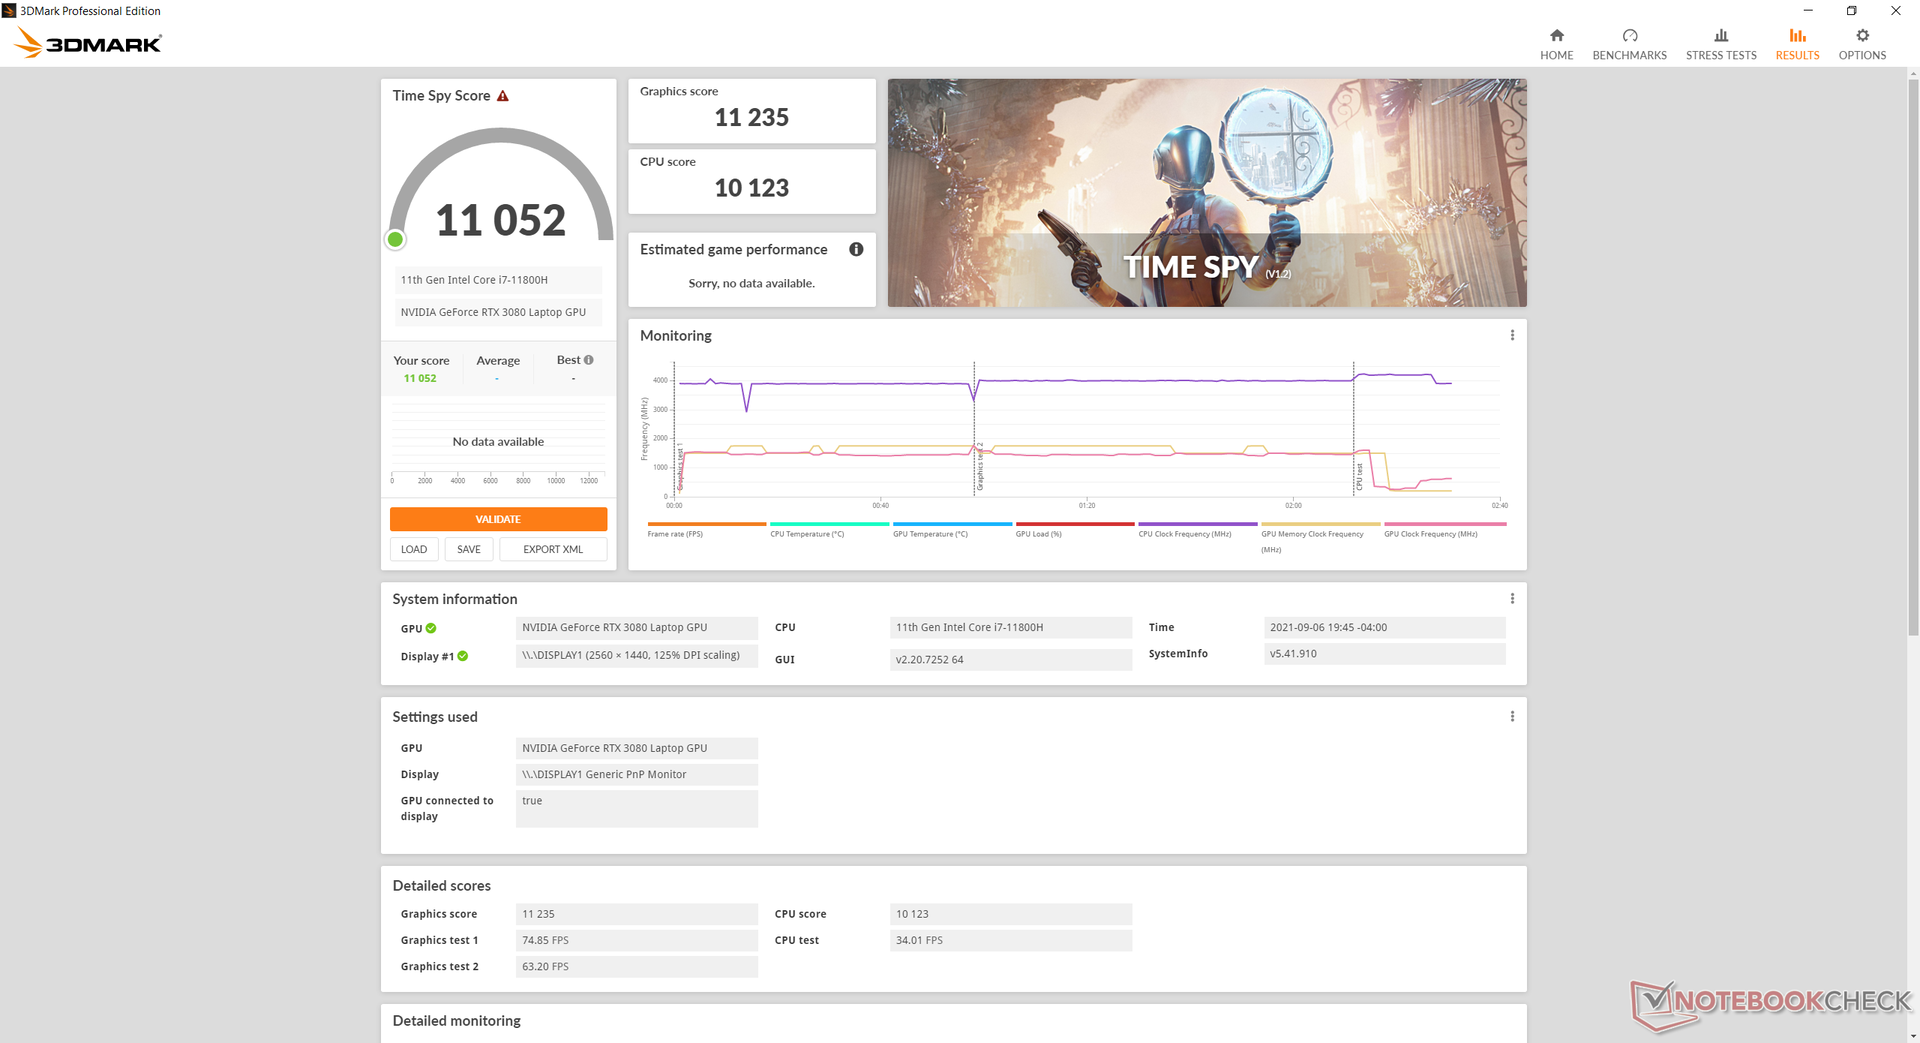
| 3DMark 11 Performance | 29298 points | |
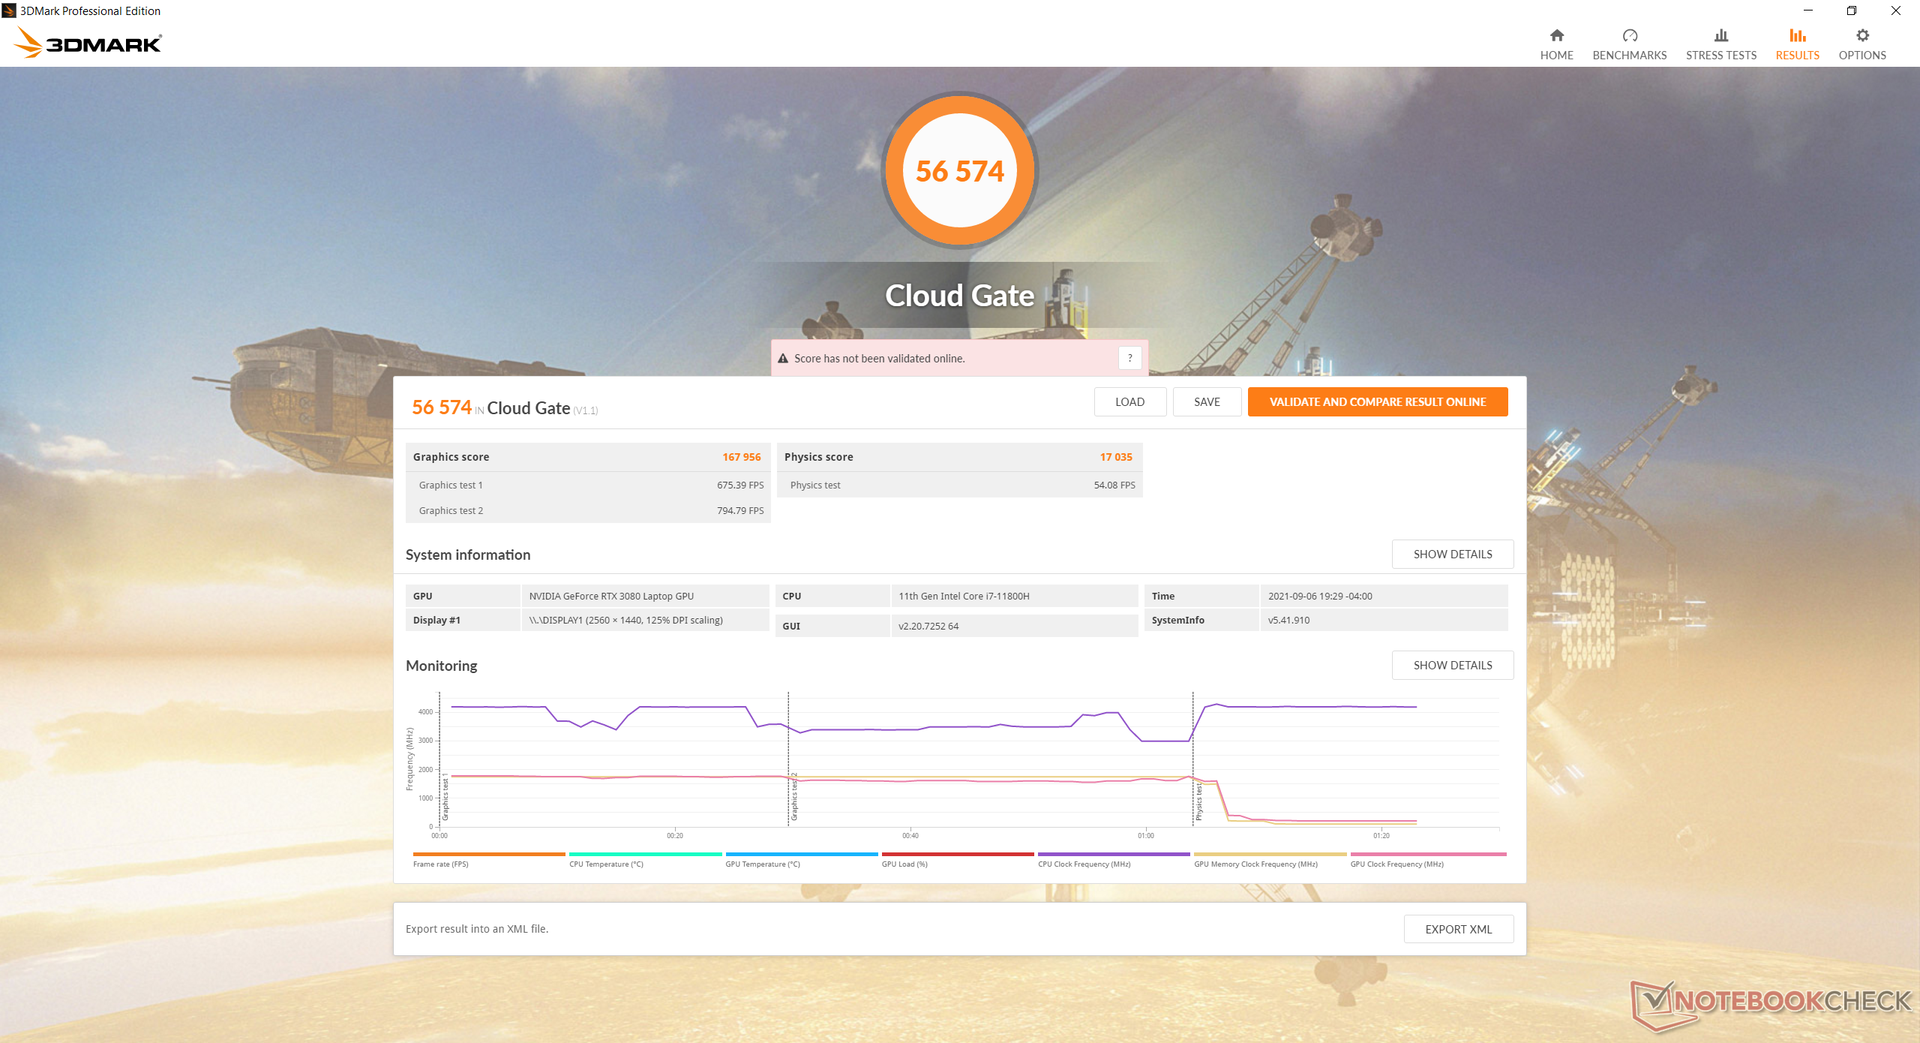
| 3DMark Cloud Gate Standard Score | 56574 points | |
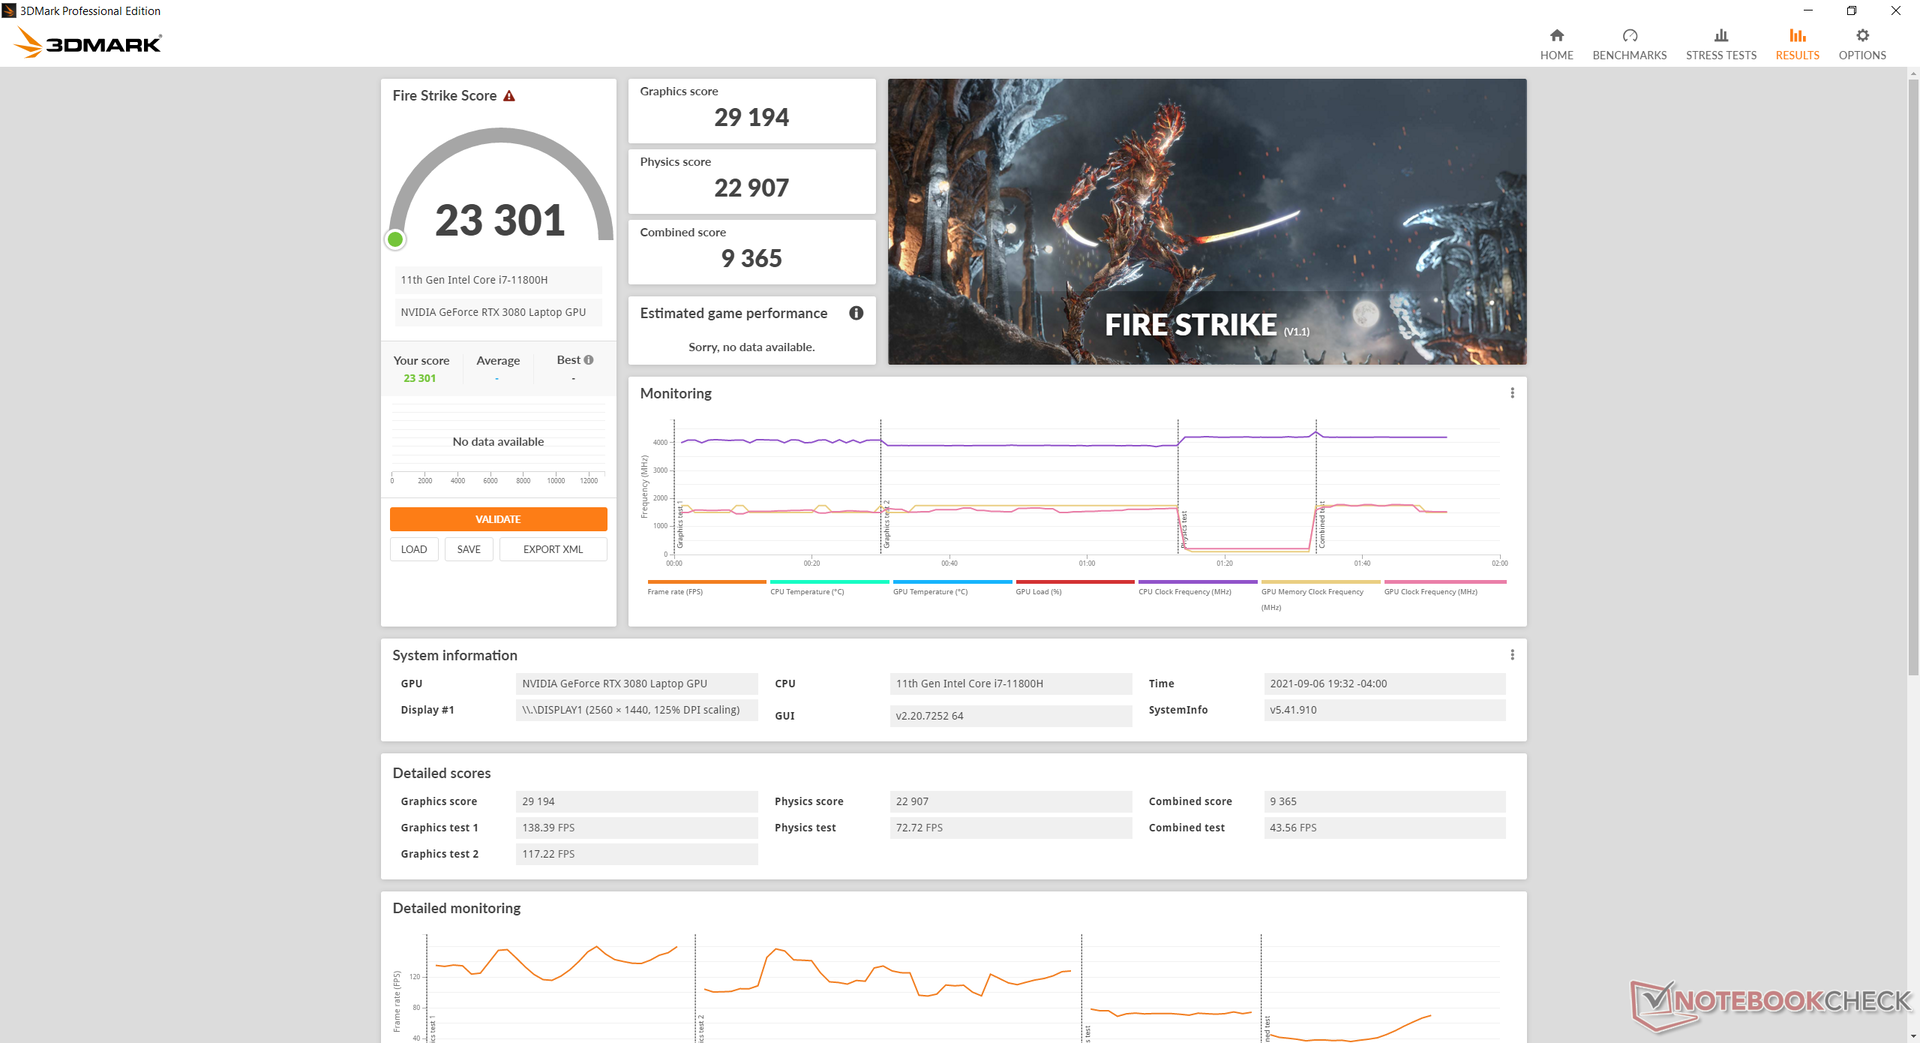
| 3DMark Fire Strike Score | 23301 points | |
| 3DMark Time Spy Score | 11052 points | |
Help | ||
Witcher 3 FPS Chart
| low | med. | high | ultra | QHD | |
|---|---|---|---|---|---|
| GTA V (2015) | 184 | 179 | 173 | 109 | 99.1 |
| The Witcher 3 (2015) | 439.6 | 321.2 | 212.9 | 108.6 | |
| Dota 2 Reborn (2015) | 164 | 145 | 142 | 127 | |
| Final Fantasy XV Benchmark (2018) | 184 | 144 | 108 | 83.5 | |
| X-Plane 11.11 (2018) | 126 | 114 | 85.7 | ||
| Far Cry 5 (2018) | 162 | 140 | 134 | 124 | 110 |
| Strange Brigade (2018) | 521 | 289 | 233 | 204 | 151 |
Emissions
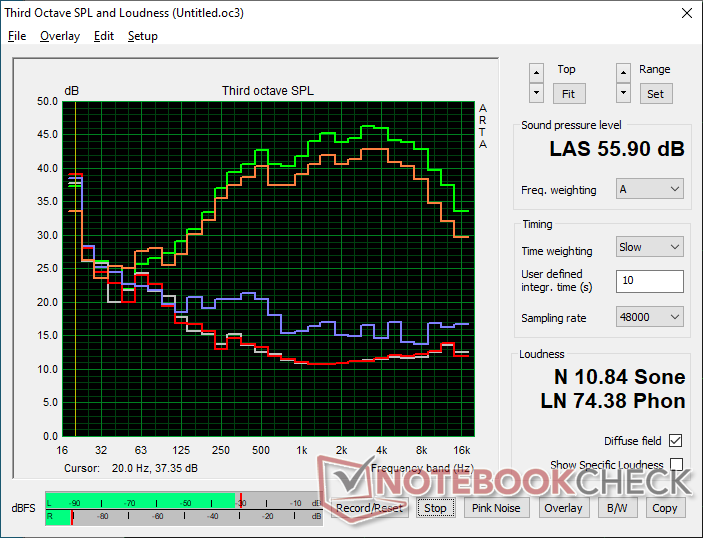
系统噪音
风扇噪音是一个混合的袋子。当在桌面上闲置或浏览网页时,风扇噪音通常很安静,最高只有28.7 dB(A),而安静的背景只有23.8 dB(A)。然而,当运行3DMark 06的第一个基准场景时,风扇噪音在场景中间会提升到38 dB(A),然后在接近结束时回落到28.7 dB(A)。建议在办公室模式下运行,而不是在涡轮模式下运行,以防止风扇频繁地跳动。
如果不戴耳机,游戏时的风扇噪音非常大,几乎达到56 dB(A),会让人分心。启用风扇增强功能将使风扇达到最大的56 dB(A),而不考虑处理负荷,但是无论风扇增强功能设置如何,用户在游戏时都会达到这个上限。

| Maingear Vector Pro MG-VCP17 GeForce RTX 3080 Laptop GPU, i7-11800H, Samsung PM9A1 MZVL21T0HCLR | Asus ROG Zephyrus S17 GX703HSD GeForce RTX 3080 Laptop GPU, i9-11900H, Samsung PM9A1 MZVL22T0HBLB | Schenker XMG Core 17 (Early 2021) GeForce RTX 3060 Laptop GPU, i7-10870H, Samsung SSD 970 EVO Plus 1TB | Schenker XMG Neo 17 (Early 2021, RTX 3070, 5800H) GeForce RTX 3070 Laptop GPU, R7 5800H, Samsung SSD 970 EVO Plus 500GB | Schenker Compact 17 GeForce RTX 2070 Super Mobile, i7-10875H, Samsung SSD 970 EVO Plus 1TB | MSI GS75 10SF-609US GeForce RTX 2070 Max-Q, i7-10875H, WDC PC SN730 SDBPNTY-512G | |
|---|---|---|---|---|---|---|
| Noise | 5% | -20% | -20% | -21% | -21% | |
| off / environment * (dB) | 23.8 | 23 3% | 25 -5% | 24 -1% | 25.4 -7% | 26.2 -10% |
| Idle Minimum * (dB) | 23.9 | 23 4% | 30 -26% | 29 -21% | 25.4 -6% | 31.2 -31% |
| Idle Average * (dB) | 23.9 | 23 4% | 32 -34% | 32 -34% | 25.4 -6% | 31.4 -31% |
| Idle Maximum * (dB) | 23.9 | 23 4% | 36 -51% | 38 -59% | 40 -67% | 34 -42% |
| Load Average * (dB) | 38 | 41 -8% | 53 -39% | 49 -29% | 54.6 -44% | 49.5 -30% |
| Witcher 3 ultra * (dB) | 55.9 | 45 19% | 51 9% | 53 5% | 50.6 9% | |
| Load Maximum * (dB) | 55.9 | 52 7% | 54 3% | 55 2% | 54.6 2% | 60.7 -9% |
* ... smaller is better
Noise level
| Idle |
| 23.9 / 23.9 / 23.9 dB(A) |
| Load |
| 38 / 55.9 dB(A) |
 | ||
30 dB silent 40 dB(A) audible 50 dB(A) loud |
||
min: | ||
温度
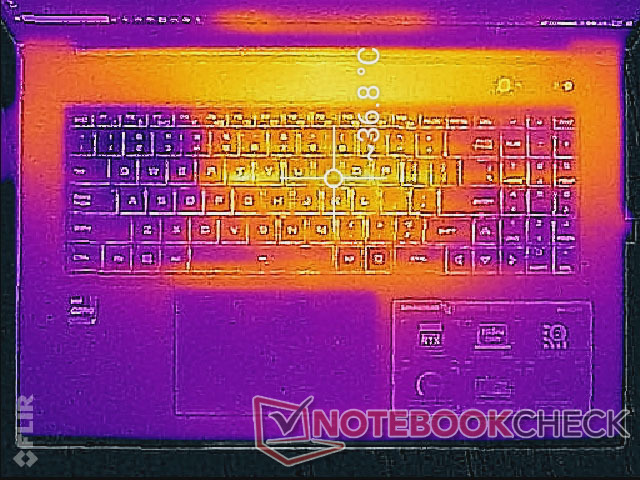
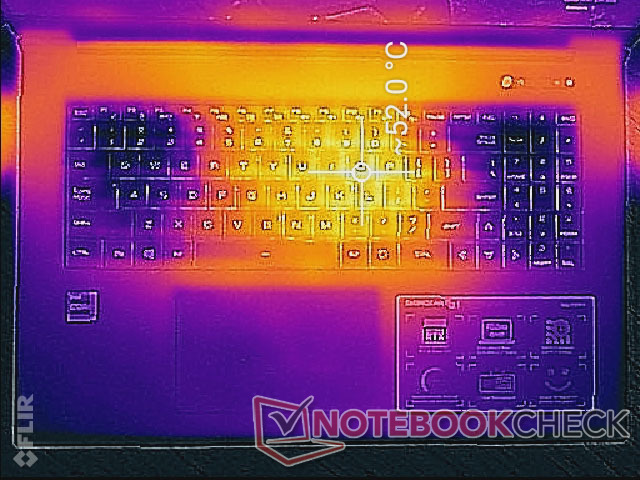
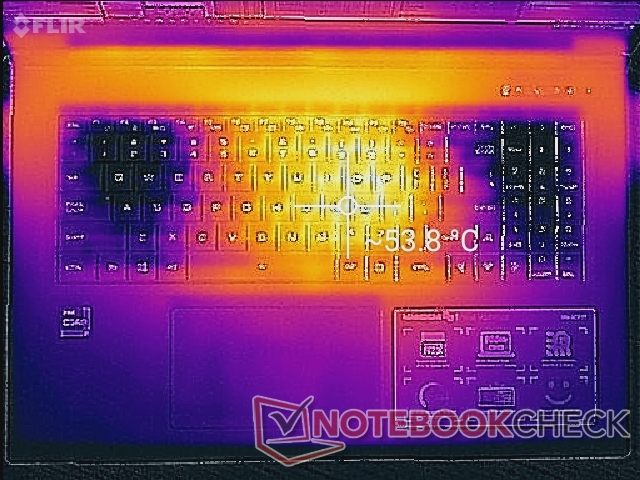
键盘中心的表面温度最高,而WASD键、数字键盘和掌托上的温度则低得多。这样的分布在游戏时是可取的,因为手指和手掌更有可能停留在这些较冷的区域,而不是在键盘中心的任何地方。在游戏时,我们能够在 "J "键上测量到超过53摄氏度的热点,而在 "W "键上只有26摄氏度,冷空气被拉入。
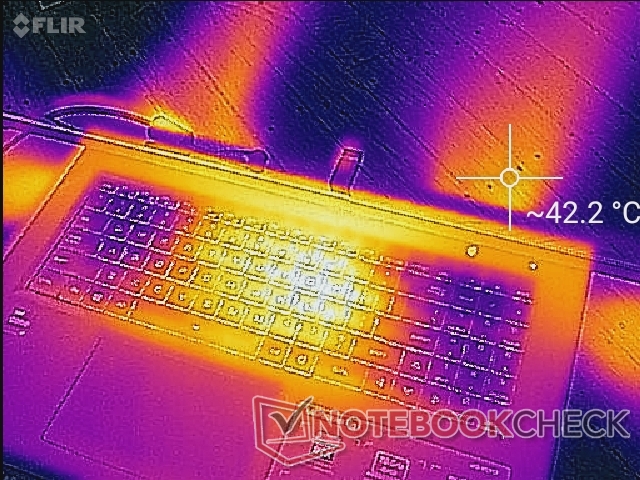
(-) The maximum temperature on the upper side is 54.2 °C / 130 F, compared to the average of 40.4 °C / 105 F, ranging from 21.2 to 68.8 °C for the class Gaming.
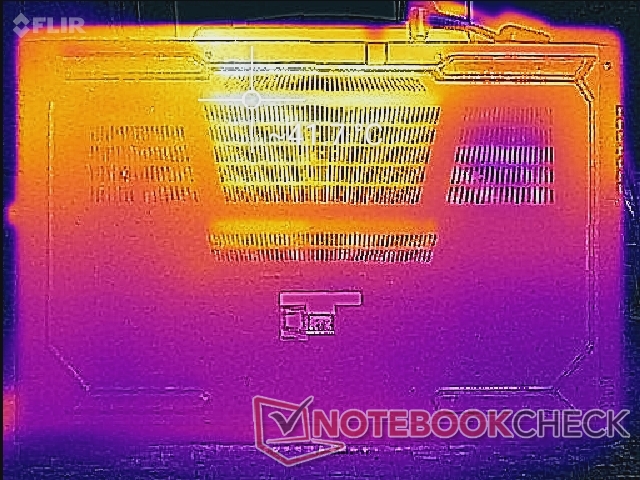
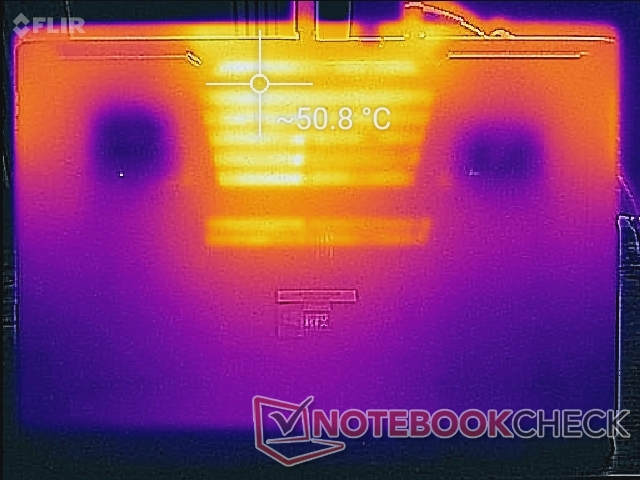
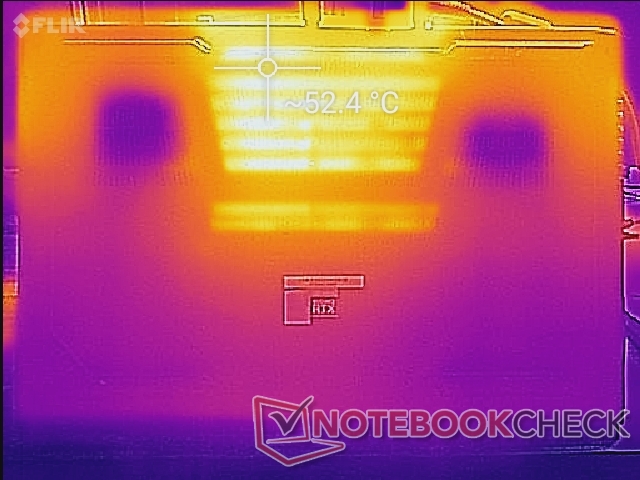
(-) The bottom heats up to a maximum of 52.2 °C / 126 F, compared to the average of 43.2 °C / 110 F
(+) In idle usage, the average temperature for the upper side is 31.5 °C / 89 F, compared to the device average of 33.9 °C / 93 F.
(±) Playing The Witcher 3, the average temperature for the upper side is 36.1 °C / 97 F, compared to the device average of 33.9 °C / 93 F.
(+) The palmrests and touchpad are reaching skin temperature as a maximum (32.6 °C / 90.7 F) and are therefore not hot.
(-) The average temperature of the palmrest area of similar devices was 28.8 °C / 83.8 F (-3.8 °C / -6.9 F).
压力测试
当使用Prime95时,CPU在最初几秒钟会提升到4.1GHz,然后下降,最终在3.2GHz至3.8GHz范围内波动。核心温度会达到90℃以上,而搭载Ryzen 7的处理器只有76℃。 华硕ROG Strix G17 G713QE在类似条件下。
运行 Witcher 3更能代表真实世界的游戏压力。我们的CPU和GPU将稳定在80 C,稳定的TGP功耗为130 W,而不是目标的165 W。这个赤字可以解释为什么我们的Maingear落后于Schenker Ultra 17,尽管两者都配备了165 W RTX 3080 GPU。启用Fan Boost模式似乎根本没有改善图形性能或温度,因为该模式只是将风扇转速设置为最高,而不考虑处理负荷。
用电池供电运行将严重限制性能,即使设置为涡轮模式。在电池上进行的Fire Strike 测试,物理学和图形学得分分别只有6513和2345分,而在主电源上则为22907和29194分。
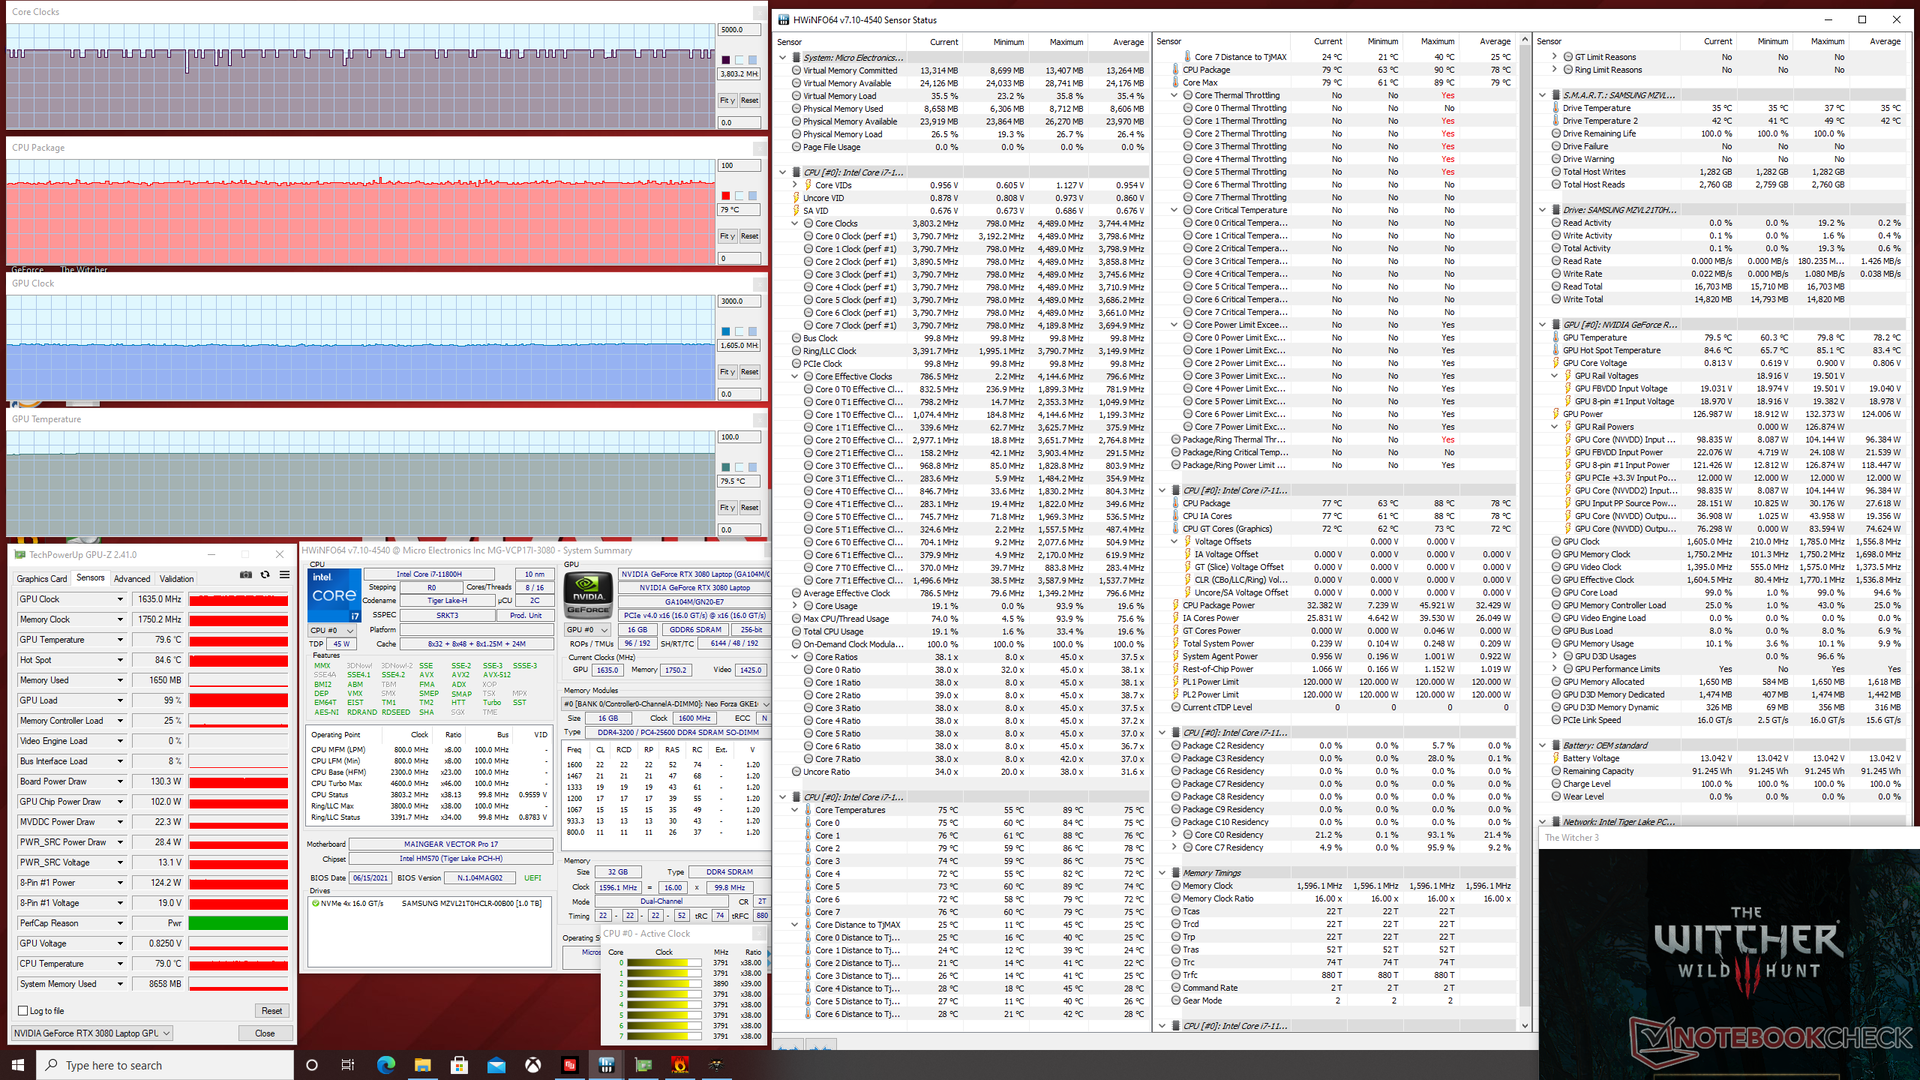
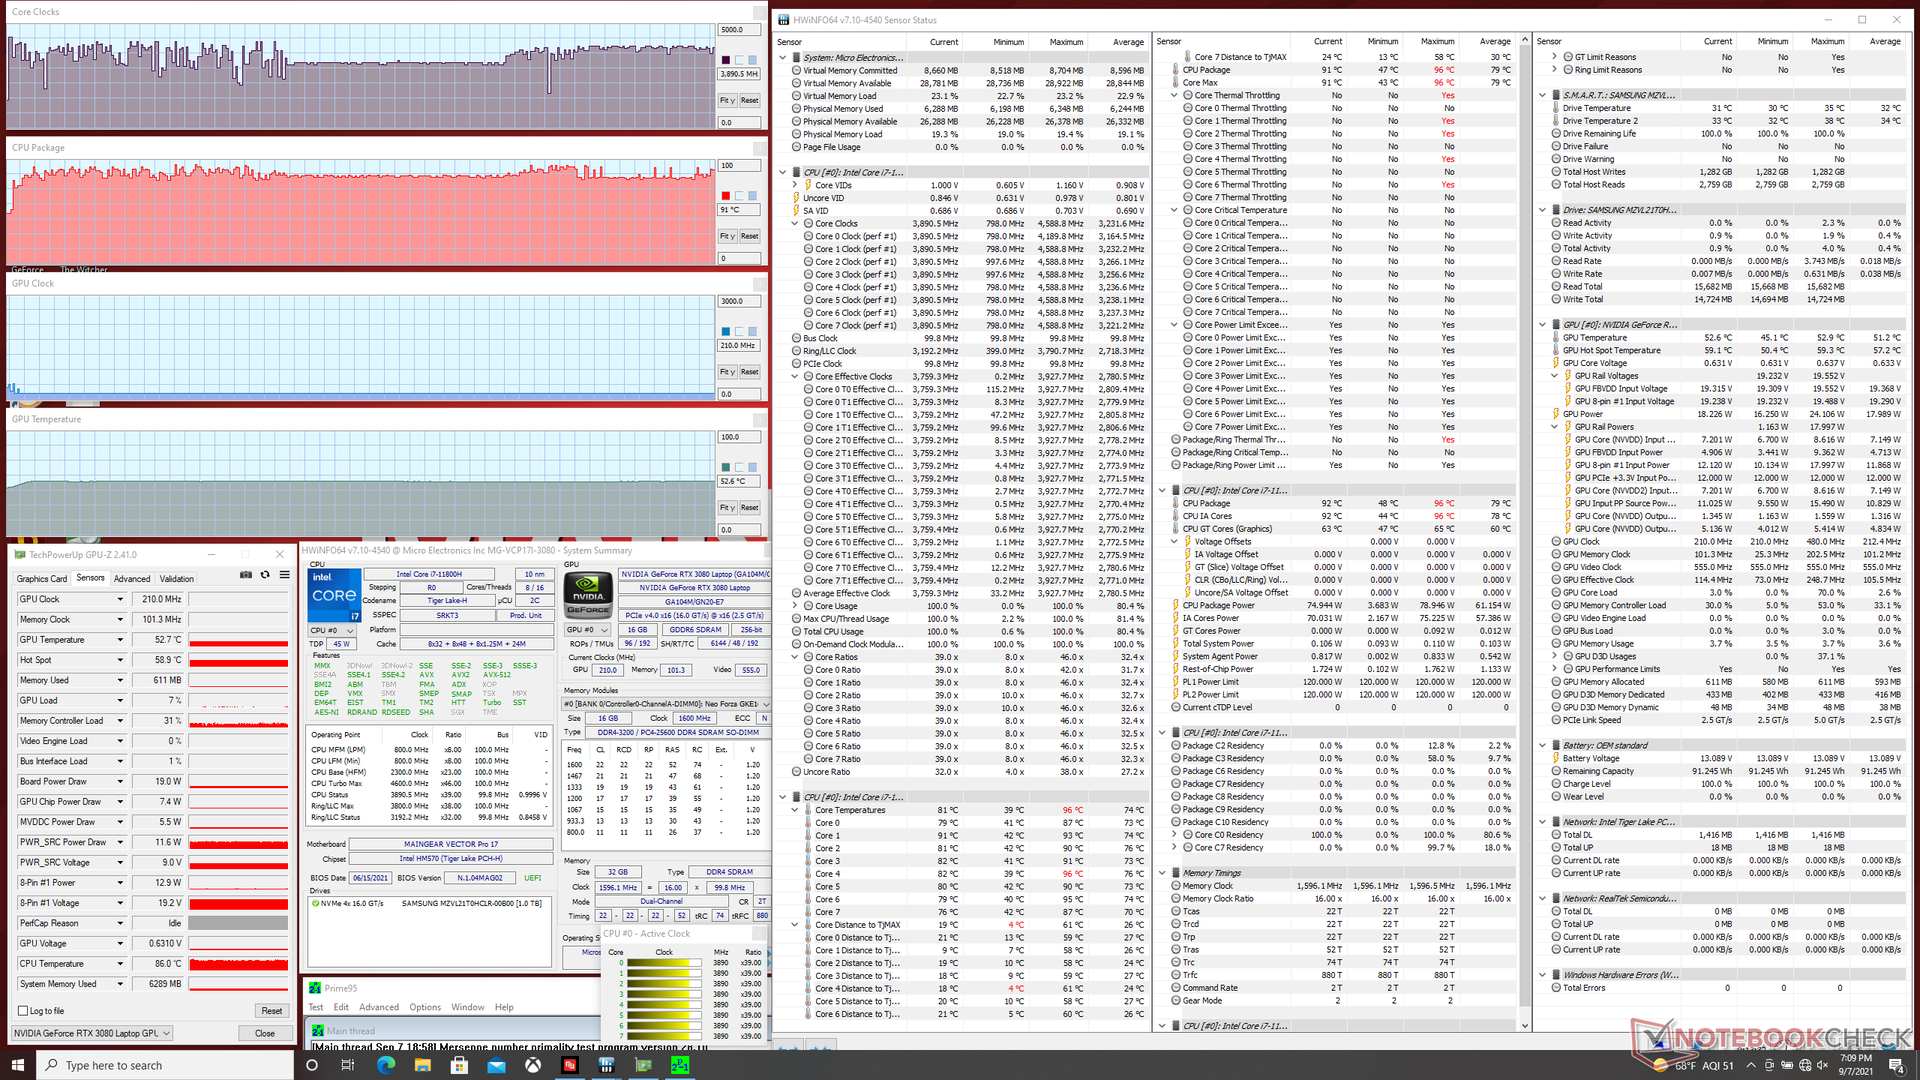
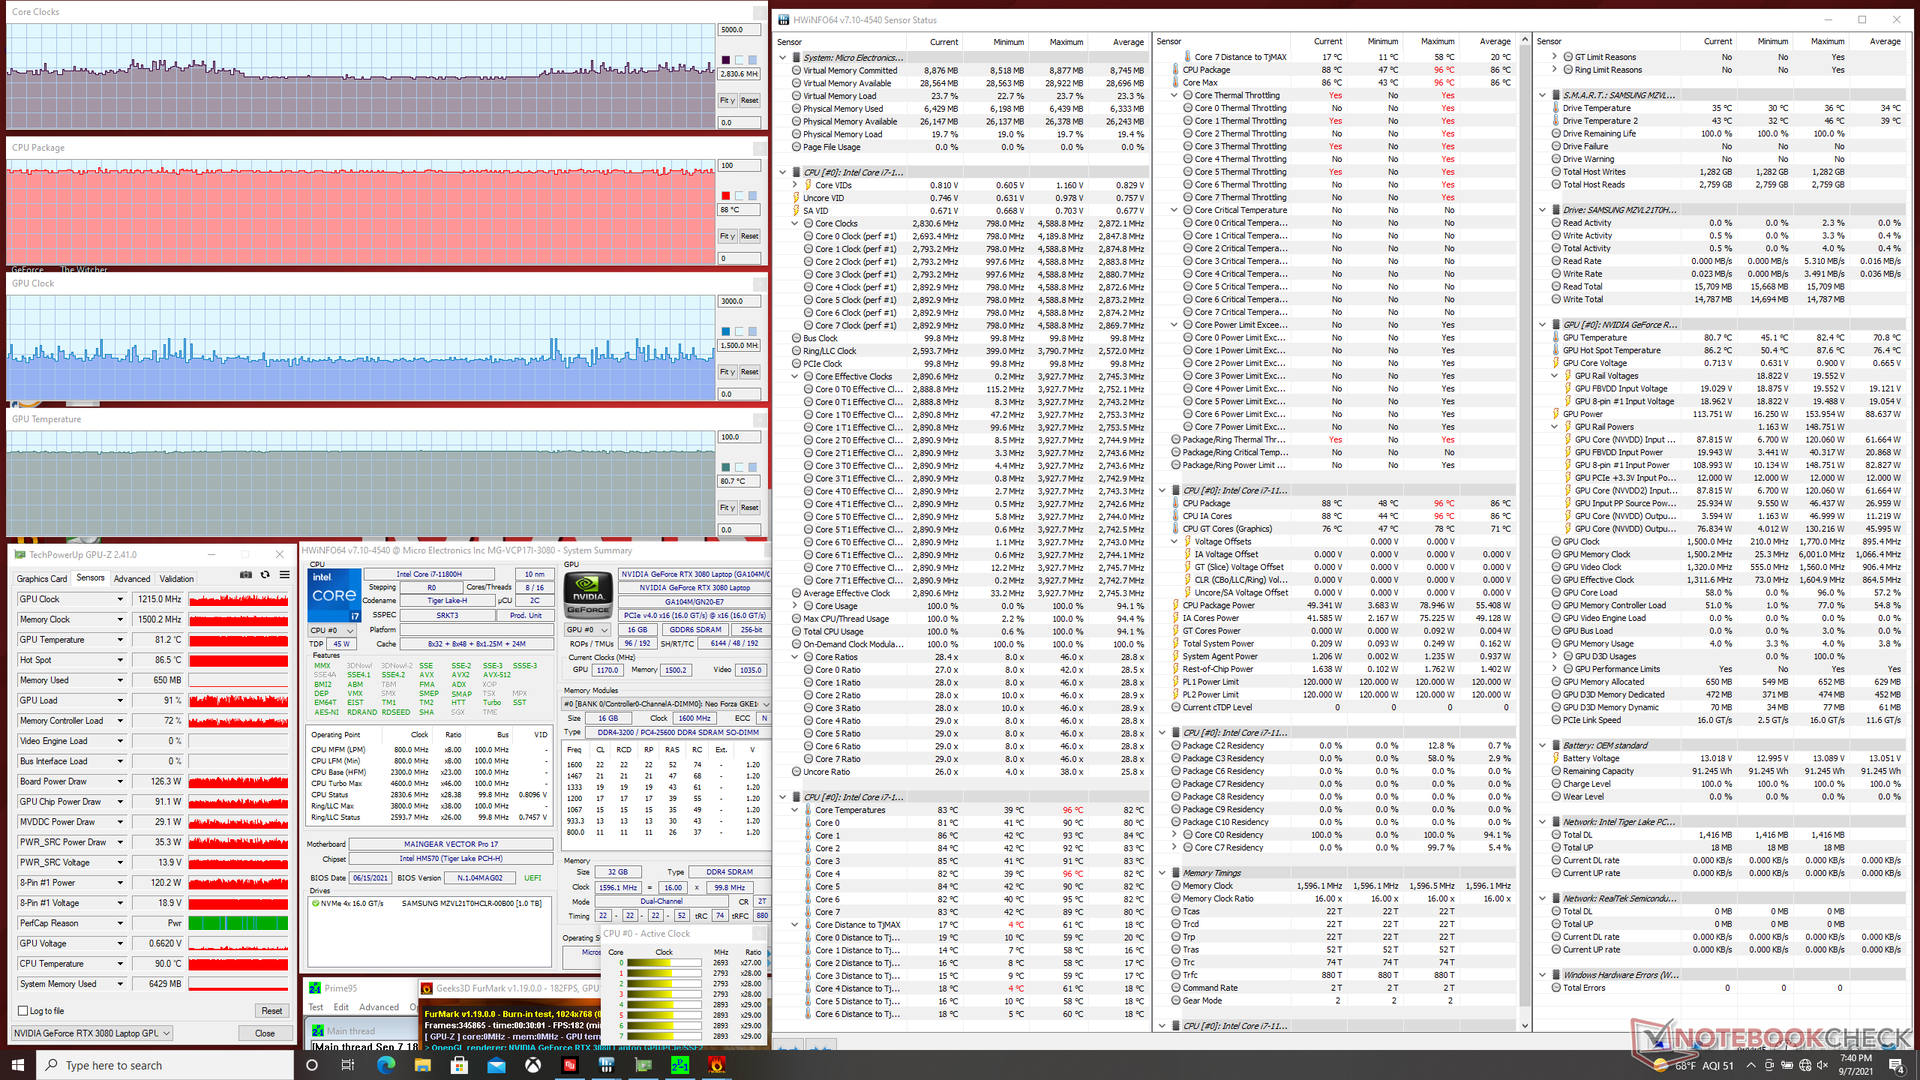
| CPU时钟(GHz) | GPU时钟(MHz) | CPU平均温度(℃) | GPU平均温度(℃) | |
| 系统空闲 | -- | -- | 49 | 46 |
| Prime95压力 | 3.2 - 3.8 | -- | 91 | 53 |
| Prime95 + FurMark压力 | 2.8 - 3.2 | 1100 - 1770 | 88 | 81 |
| Witcher 3 应力 | 3.4 - 3.8 | 1635 | 79 | 80 |
发言人


Maingear Vector Pro MG-VCP17 audio analysis
(±) | speaker loudness is average but good (75.5 dB)
Bass 100 - 315 Hz
(-) | nearly no bass - on average 19.3% lower than median
(±) | linearity of bass is average (11.7% delta to prev. frequency)
Mids 400 - 2000 Hz
(+) | balanced mids - only 2.1% away from median
(+) | mids are linear (4.5% delta to prev. frequency)
Highs 2 - 16 kHz
(+) | balanced highs - only 3.4% away from median
(+) | highs are linear (6.6% delta to prev. frequency)
Overall 100 - 16.000 Hz
(±) | linearity of overall sound is average (17.5% difference to median)
Compared to same class
» 49% of all tested devices in this class were better, 12% similar, 40% worse
» The best had a delta of 6%, average was 18%, worst was 132%
Compared to all devices tested
» 34% of all tested devices were better, 8% similar, 58% worse
» The best had a delta of 4%, average was 24%, worst was 134%
Apple MacBook 12 (Early 2016) 1.1 GHz audio analysis
(+) | speakers can play relatively loud (83.6 dB)
Bass 100 - 315 Hz
(±) | reduced bass - on average 11.3% lower than median
(±) | linearity of bass is average (14.2% delta to prev. frequency)
Mids 400 - 2000 Hz
(+) | balanced mids - only 2.4% away from median
(+) | mids are linear (5.5% delta to prev. frequency)
Highs 2 - 16 kHz
(+) | balanced highs - only 2% away from median
(+) | highs are linear (4.5% delta to prev. frequency)
Overall 100 - 16.000 Hz
(+) | overall sound is linear (10.2% difference to median)
Compared to same class
» 7% of all tested devices in this class were better, 2% similar, 91% worse
» The best had a delta of 5%, average was 18%, worst was 53%
Compared to all devices tested
» 5% of all tested devices were better, 1% similar, 94% worse
» The best had a delta of 4%, average was 24%, worst was 134%
Energy Management
消耗功率
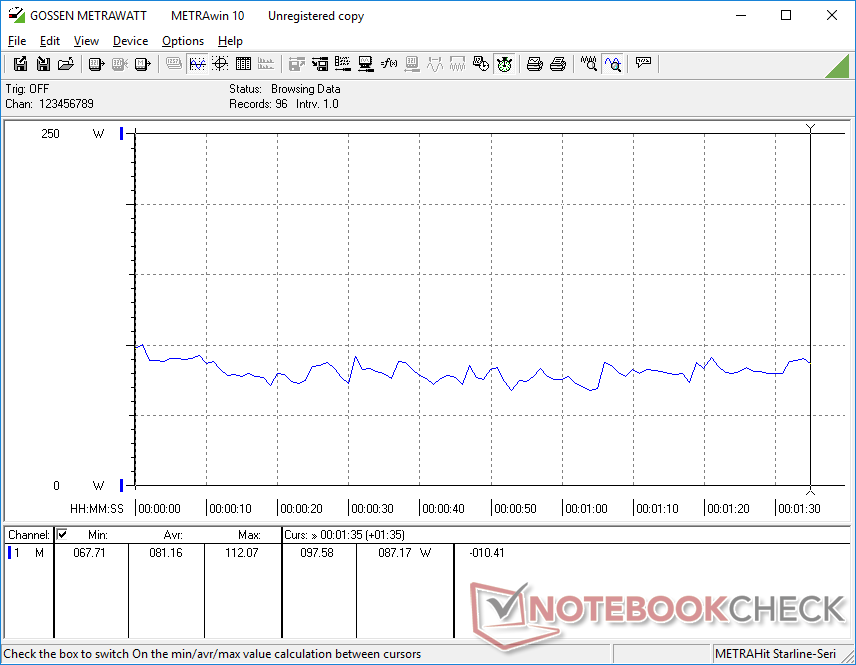
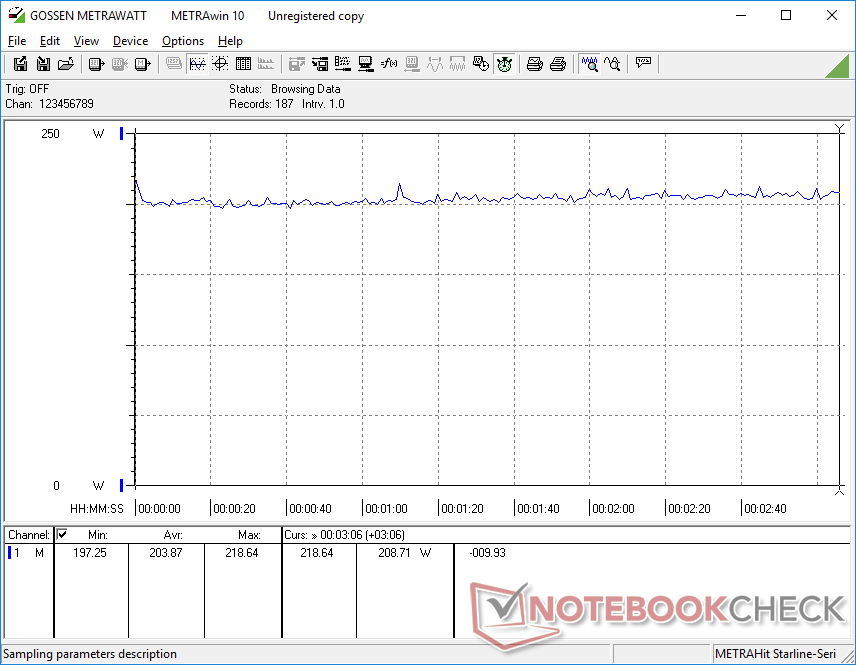
在Turbo模式和dGPU激活的情况下,桌面上的空闲时间可以消耗多达34W,而在Optimus模式下仅为16W。因此,如果不需要额外的功率,值得调低性能水平。
运行 Witcher 3消耗的功率比大多数其他17.3英寸GeForce RTX笔记本电脑略高,与我们的RTX 3080供电的Maingear更快的图形性能相关。例如,配备RTX 3060图形的Schenker XMG Core 17消耗的电力约为15%,而提供的图形性能比我们的RTX 3080慢了25%。
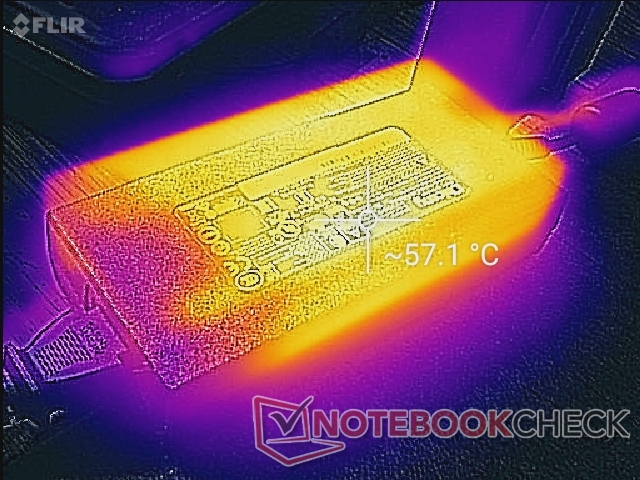
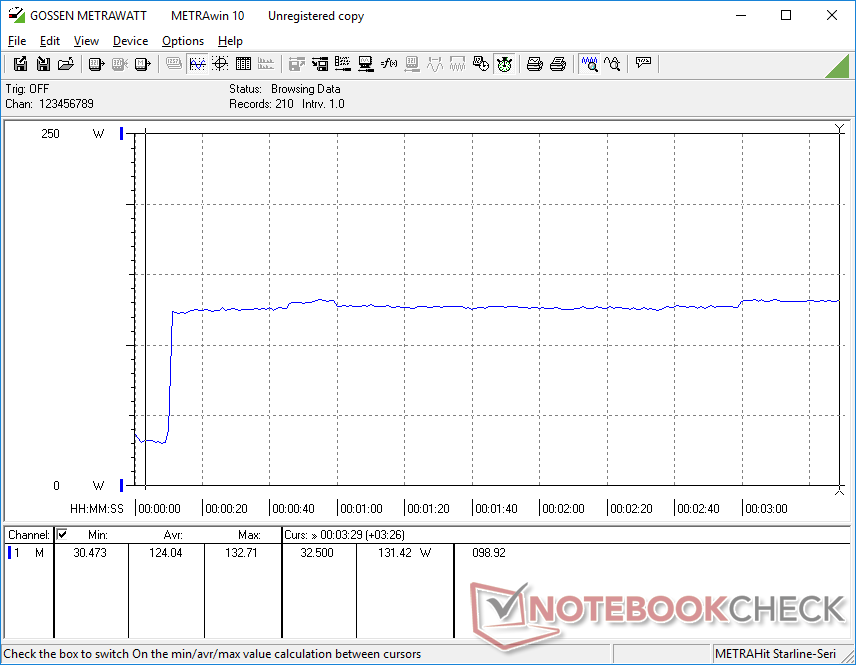
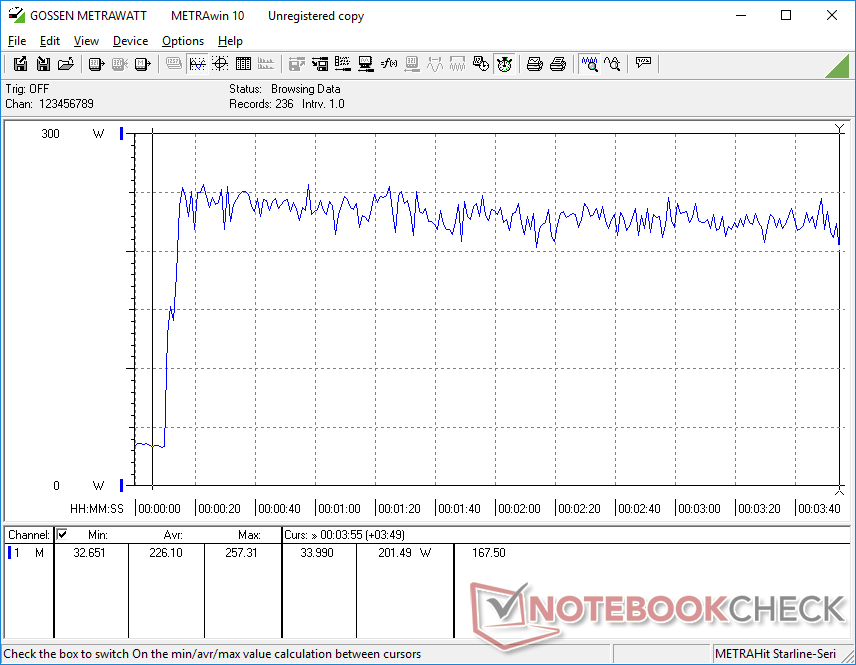
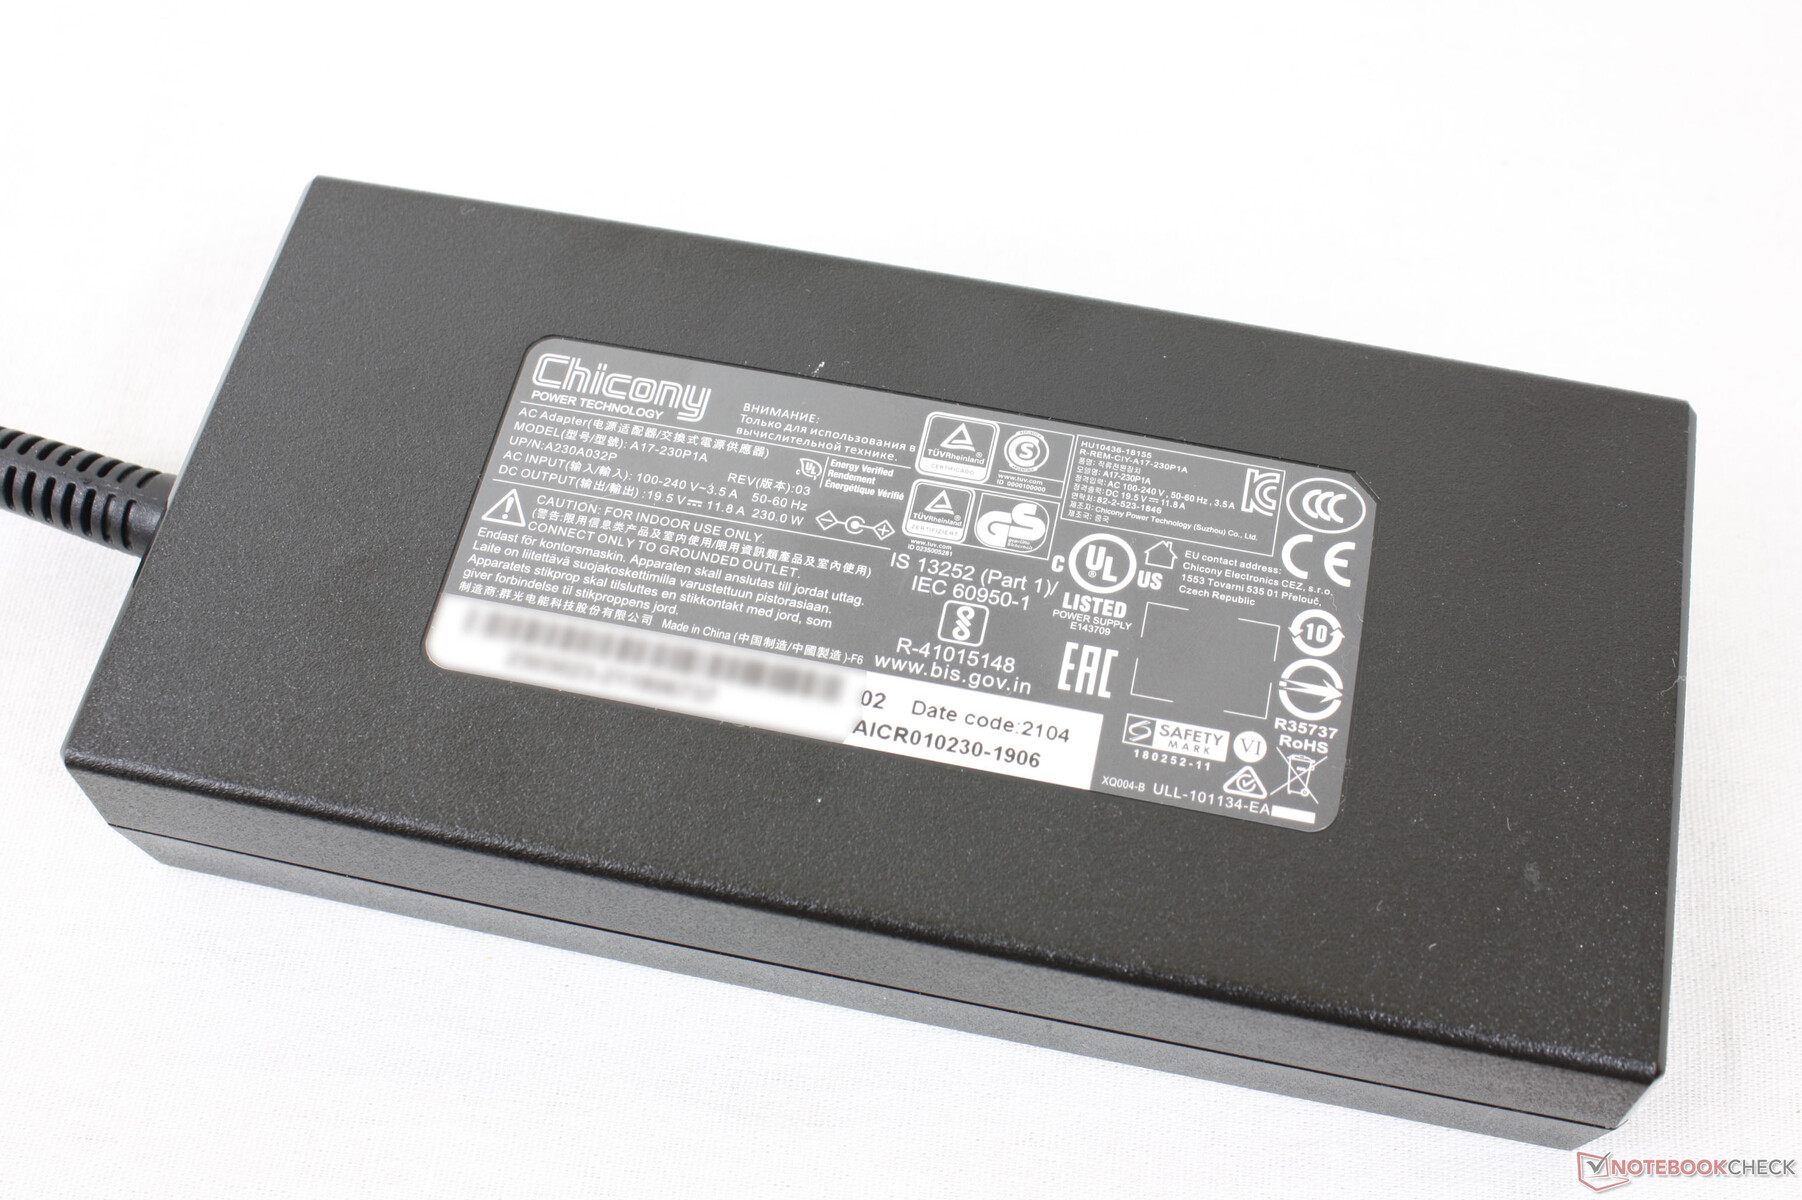
在同时运行Prime95和FurMark时,我们能够从中等尺寸(约15.3 x 7.4 x 3厘米)的240瓦交流适配器中记录到257瓦的最大功耗。因此,该系统有可能受益于更大的交流适配器,其额定功率更高。值得庆幸的是,当连接到插座时,运行游戏不会耗尽电池。 与一些早期的戴尔XPS 17型号不同.
| Off / Standby | |
| Idle | |
| Load |
|
Key:
min: | |
| Maingear Vector Pro MG-VCP17 i7-11800H, GeForce RTX 3080 Laptop GPU, Samsung PM9A1 MZVL21T0HCLR, IPS, 2560x1440, 17.3" | Asus ROG Zephyrus S17 GX703HSD i9-11900H, GeForce RTX 3080 Laptop GPU, Samsung PM9A1 MZVL22T0HBLB, IPS, 2560x1440, 17.3" | Schenker XMG Core 17 (Early 2021) i7-10870H, GeForce RTX 3060 Laptop GPU, Samsung SSD 970 EVO Plus 1TB, IPS, 2560x1440, 17.3" | Schenker XMG Neo 17 (Early 2021, RTX 3070, 5800H) R7 5800H, GeForce RTX 3070 Laptop GPU, Samsung SSD 970 EVO Plus 500GB, IPS, 2560x1440, 17.3" | Schenker Compact 17 i7-10875H, GeForce RTX 2070 Super Mobile, Samsung SSD 970 EVO Plus 1TB, IPS, 3840x2160, 17.3" | MSI GS75 10SF-609US i7-10875H, GeForce RTX 2070 Max-Q, WDC PC SN730 SDBPNTY-512G, IPS, 1920x1080, 17.3" | |
|---|---|---|---|---|---|---|
| Power Consumption | -30% | 1% | -7% | -9% | -21% | |
| Idle Minimum * (Watt) | 11 | 21.7 -97% | 13 -18% | 13 -18% | 13.6 -24% | 19.2 -75% |
| Idle Average * (Watt) | 15.6 | 27 -73% | 16 -3% | 16 -3% | 19.8 -27% | 22.4 -44% |
| Idle Maximum * (Watt) | 34 | 33 3% | 29 15% | 26 24% | 23.5 31% | 34.7 -2% |
| Load Average * (Watt) | 81.2 | 108 -33% | 100 -23% | 125 -54% | 105 -29% | 106.7 -31% |
| Witcher 3 ultra * (Watt) | 204 | 195 4% | 173 15% | 187 8% | 160.5 21% | |
| Load Maximum * (Watt) | 257.3 | 210 18% | 213 17% | 259 -1% | 243 6% | 248.7 3% |
* ... smaller is better
Power Consumption Witcher 3 / Stresstest
电池寿命
尽管机箱设计很薄,但电池容量却很大,为91Wh。当系统设置为iGPU模式时,我们能够在充满电的情况下挤出近7小时的实际WLAN使用时间。
从空电到满电只需要不到2小时。
| Maingear Vector Pro MG-VCP17 i7-11800H, GeForce RTX 3080 Laptop GPU, 91 Wh | Asus ROG Zephyrus S17 GX703HSD i9-11900H, GeForce RTX 3080 Laptop GPU, 90 Wh | Schenker XMG Core 17 (Early 2021) i7-10870H, GeForce RTX 3060 Laptop GPU, 62 Wh | Schenker XMG Neo 17 (Early 2021, RTX 3070, 5800H) R7 5800H, GeForce RTX 3070 Laptop GPU, 62 Wh | Schenker Compact 17 i7-10875H, GeForce RTX 2070 Super Mobile, 62 Wh | MSI GS75 10SF-609US i7-10875H, GeForce RTX 2070 Max-Q, 80.25 Wh | |
|---|---|---|---|---|---|---|
| Battery runtime | 9% | -29% | -49% | -32% | -29% | |
| WiFi v1.3 (h) | 6.9 | 7.5 9% | 4.9 -29% | 3.5 -49% | 4.7 -32% | 4.9 -29% |
| Witcher 3 ultra (h) | 1 | |||||
| Load (h) | 2.7 | 1.3 | 0.7 | 4.1 | ||
| Reader / Idle (h) | 7.7 | 4.7 | 8.6 |
Pros
Cons
结论 - 重量和性能的出色平衡
你真的能在一个只有Razer Blade Pro那么大的机箱里运行165瓦的TGP GPU,而重量却少了500克吗?我们的测试表明,Maingear的GPU在游戏时反而会在130W左右徘徊,考虑到目前市场上的其他RTX 3080笔记本电脑,这大约是平均水平。如果你想最大限度地提高RTX 3080的性能,那么你仍然要考虑更庞大的笔记本电脑,如 申科XMG Ultra 17.
在铰链硬度方面,Maingear系统也可以使用一些改进。虽然它的底座感觉比华硕Zephyrus S更结实,但它的铰链可以更硬,以获得更好的寿命和质量感。风扇在游戏时也非常响亮,但这是其他超薄游戏笔记本的共同特征,因此我们不能因为Vector Pro的噪音而对其进行独特的批评。
功能强大,而且就其尺寸而言出乎意料地轻。一些小功能被省略了,但核心系统、显示、性能和可扩展性都很稳固。
对于一台超薄的游戏笔记本电脑来说,长的电池寿命和容易升级是值得一提的。对于未来的型号,我们希望看到每键RGB照明、USB-C PD、更大的扬声器和网络摄像头快门,所有这些都成为高端型号的标准。
价格和可用性
我们的确切配置目前可以在 在亚马逊上找到2499美元,而较小的RTX 3070 SKU则是 零售价为2099美元.
Maingear Vector Pro MG-VCP17
- 09/10/2021 v7 (old)
Allen Ngo
Price comparison

