MSI GS76 Stealth 11UH gaming laptop review: GPU performance sacrificed for a slimmer build ↺

虽然其他微星游戏笔记本相当笨重(例如,我们记得17英寸GT76怪物),但GS系列给人的印象非常微妙和谨慎。最新的17英寸机型采用了英特尔第11代的处理器。采用Core i7-11800H 和Core i9-11900H的型号目前已在德国主页上列出。
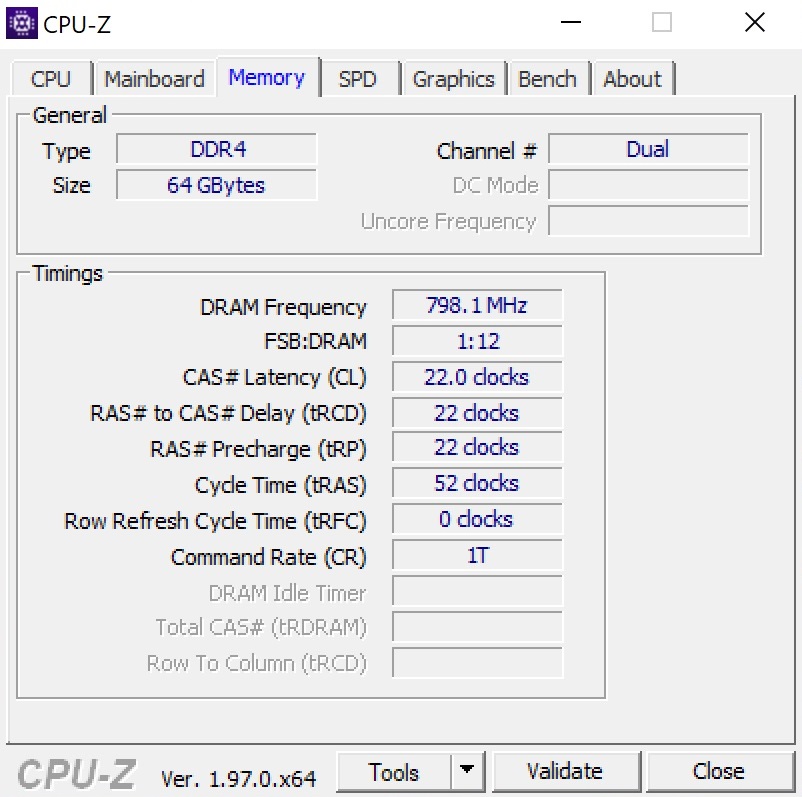
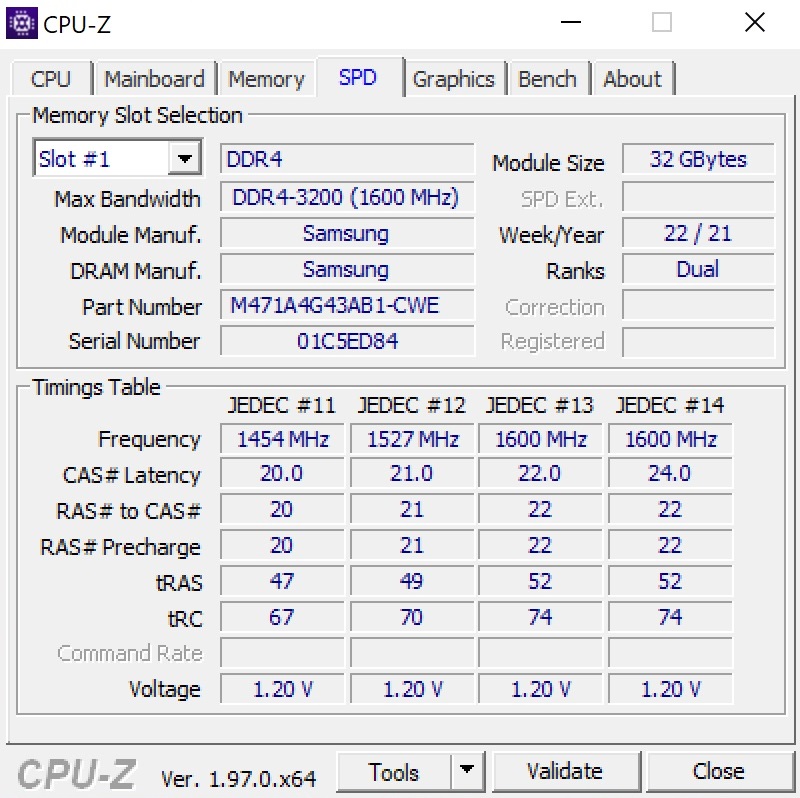
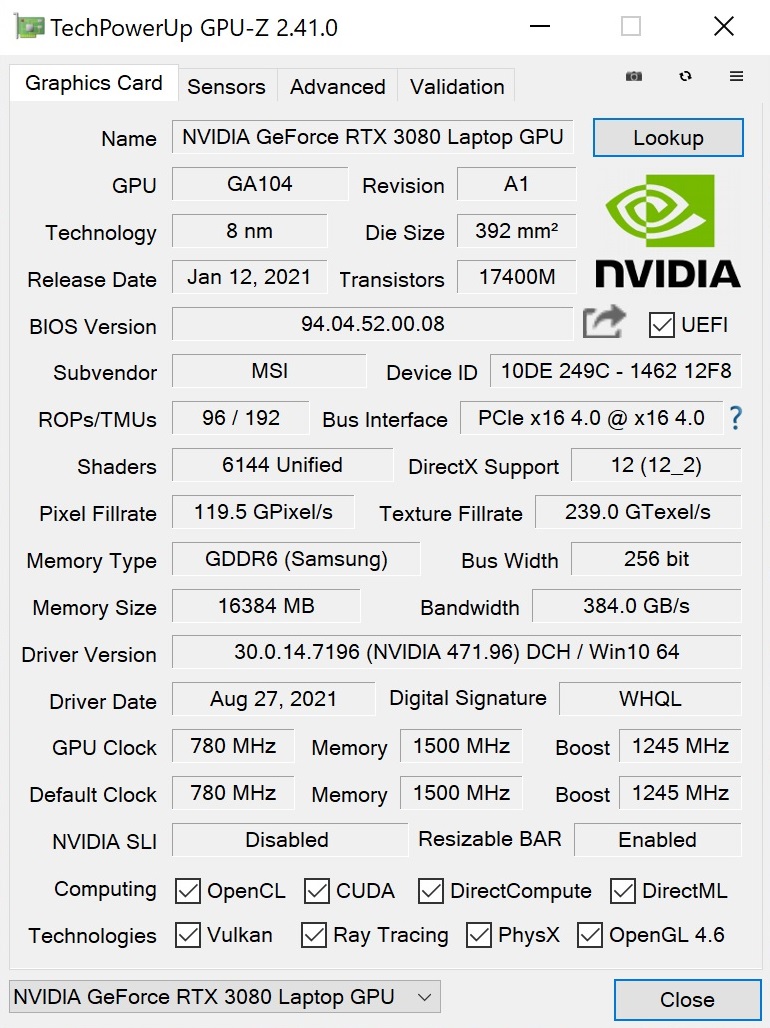
苛刻的图形计算由带有8GB VRAM的GeForce RTX 3070或带有8或16GB VRAM的GeForce RTX 3080处理。伴随着32至64GB的DDR4-3200内存,以及容量为1或2TB的NVMe SSD。对于显示器,你可以选择300或360赫兹的全高清面板,或120赫兹的4K面板。
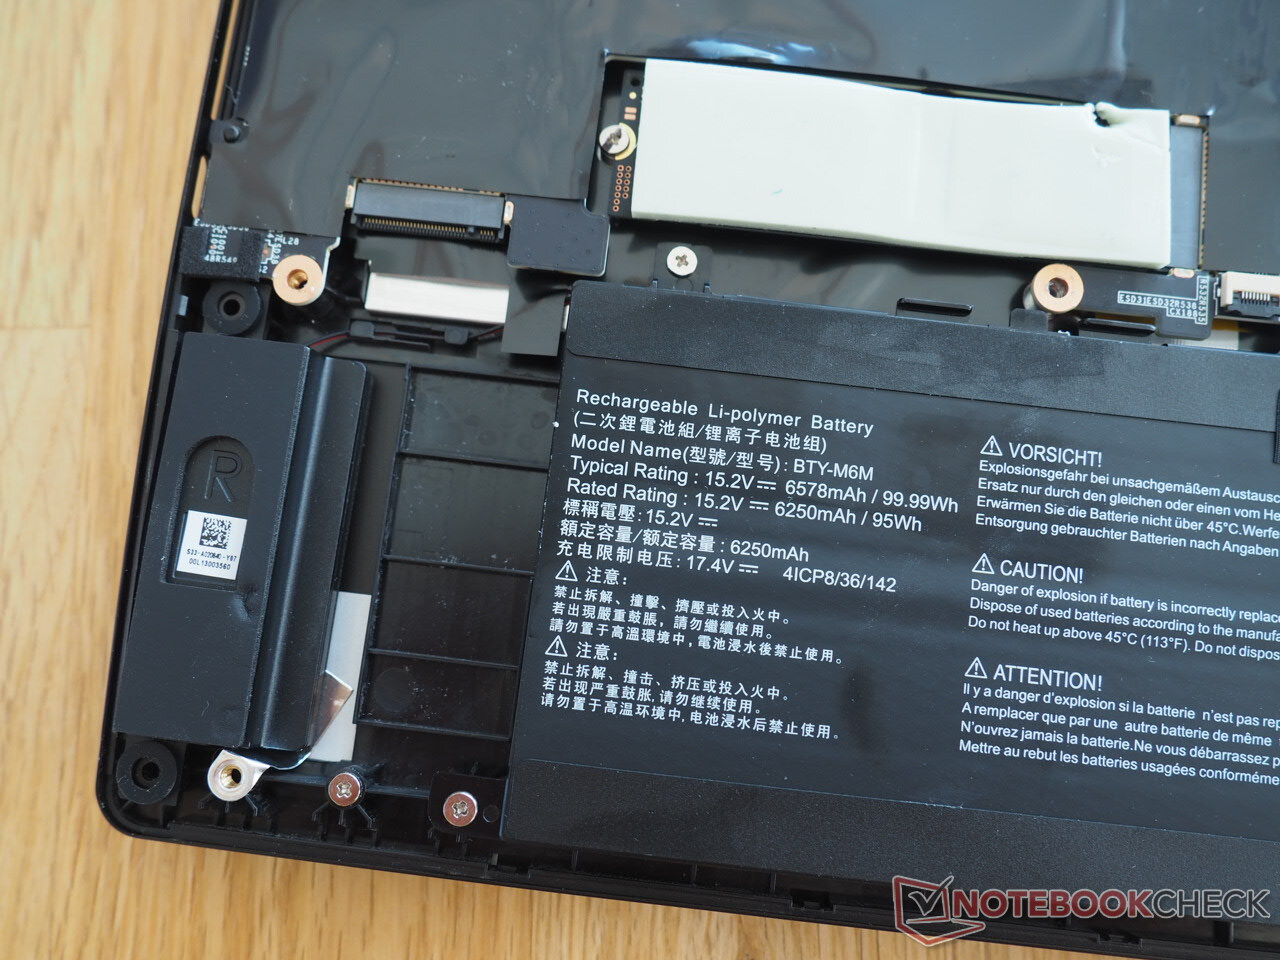
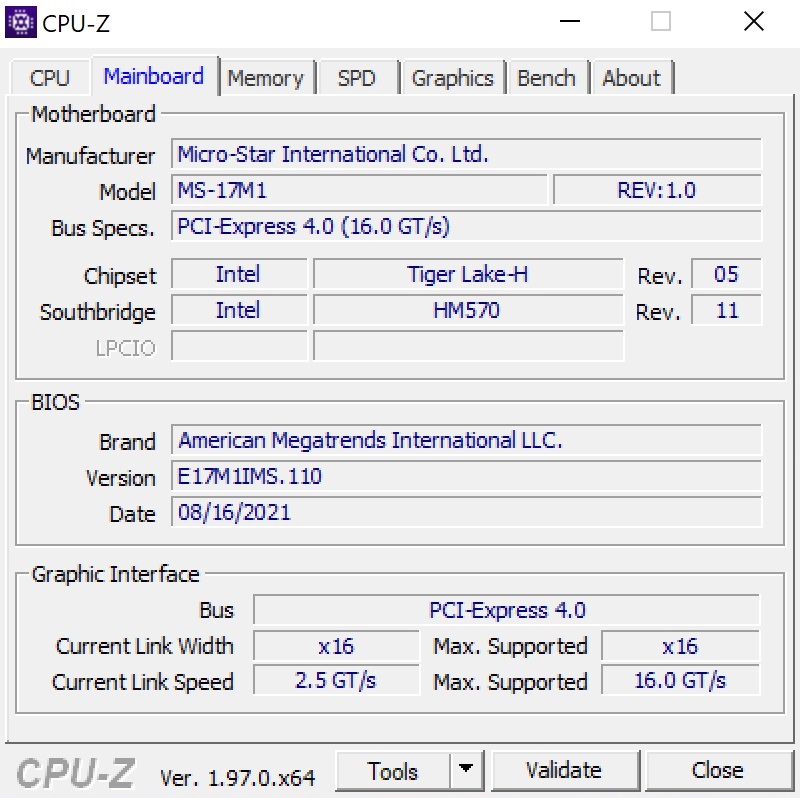
我们的审查是基于GS76 11UH-074版本,价格约为4,400欧元(约5,159美元)。它配备了64GB内存,2TB固态硬盘,Core i9-11900H,以及GeForce RTX 3080。
GS76 11UH的竞争对手包括其他配备GeForce RTX 3080的高端游戏笔记本电脑,其厚度不超过2.5厘米。除了Gigabyte Aero 17 HDR YD 和 Asus ROG Zephyrus S17 GX703HSD ,Razer Blade Pro 17 2021 和 Medion Erazer Beast X25这里也应该提到。这些笔记本电脑在表中被列为对比设备。
Possible contenders in comparison
Rating | Date | Model | Weight | Height | Size | Resolution | Price |
|---|---|---|---|---|---|---|---|
| 86.2 % v7 (old) | 09 / 2021 | MSI GS76 Stealth 11UH i9-11900H, GeForce RTX 3080 Laptop GPU | 2.4 kg | 20 mm | 17.30" | 3840x2160 | |
| 88 % v7 (old) | 09 / 2021 | Gigabyte Aero 17 HDR YD i9-11980HK, GeForce RTX 3080 Laptop GPU | 2.8 kg | 22 mm | 17.30" | 3840x2160 | |
| 90.1 % v7 (old) | 08 / 2021 | Asus ROG Zephyrus S17 GX703HSD i9-11900H, GeForce RTX 3080 Laptop GPU | 2.8 kg | 19.9 mm | 17.30" | 2560x1440 | |
| 87.8 % v7 (old) | 09 / 2021 | Razer Blade Pro 17 2021 (QHD Touch) i7-10875H, GeForce RTX 3080 Laptop GPU | 3 kg | 19.9 mm | 17.30" | 3840x2160 | |
| 85 % v7 (old) | 08 / 2021 | Medion Erazer Beast X25 R9 5900HX, GeForce RTX 3080 Laptop GPU | 2.3 kg | 23 mm | 17.30" | 1920x1080 |
案例
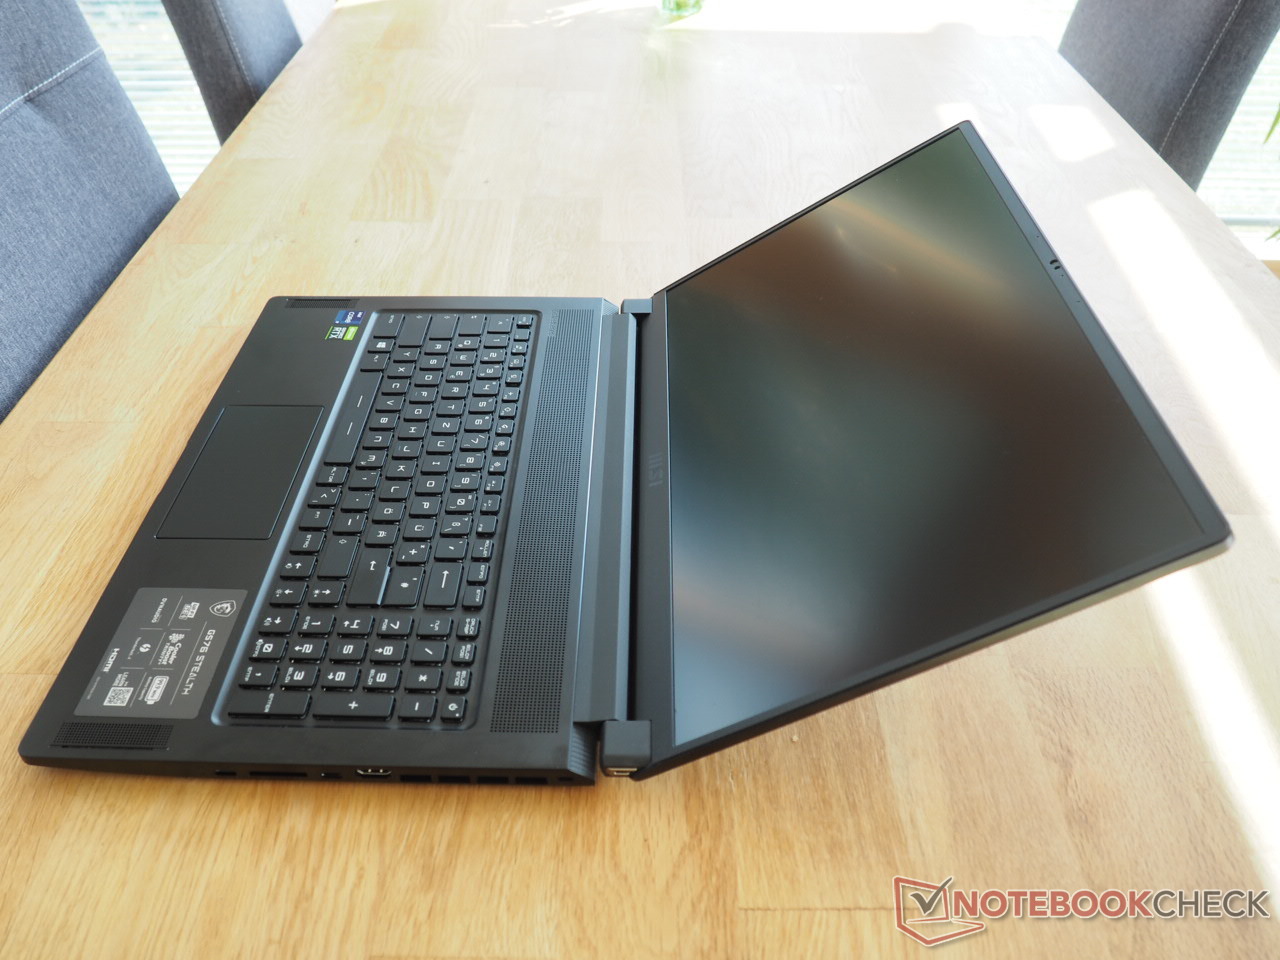
让我们直接进入最大的弱点之一。尽管GS系列经过几代人的努力已经变得更加坚固,但目前的型号仍然在稳定性和抗扭性上挣扎。当施加强大的压力时,不仅触摸板区域的基本单元明显弯曲,而且键盘的中心也是如此。尽管有类似的薄型设计,大多数制造商在这方面做得更好。
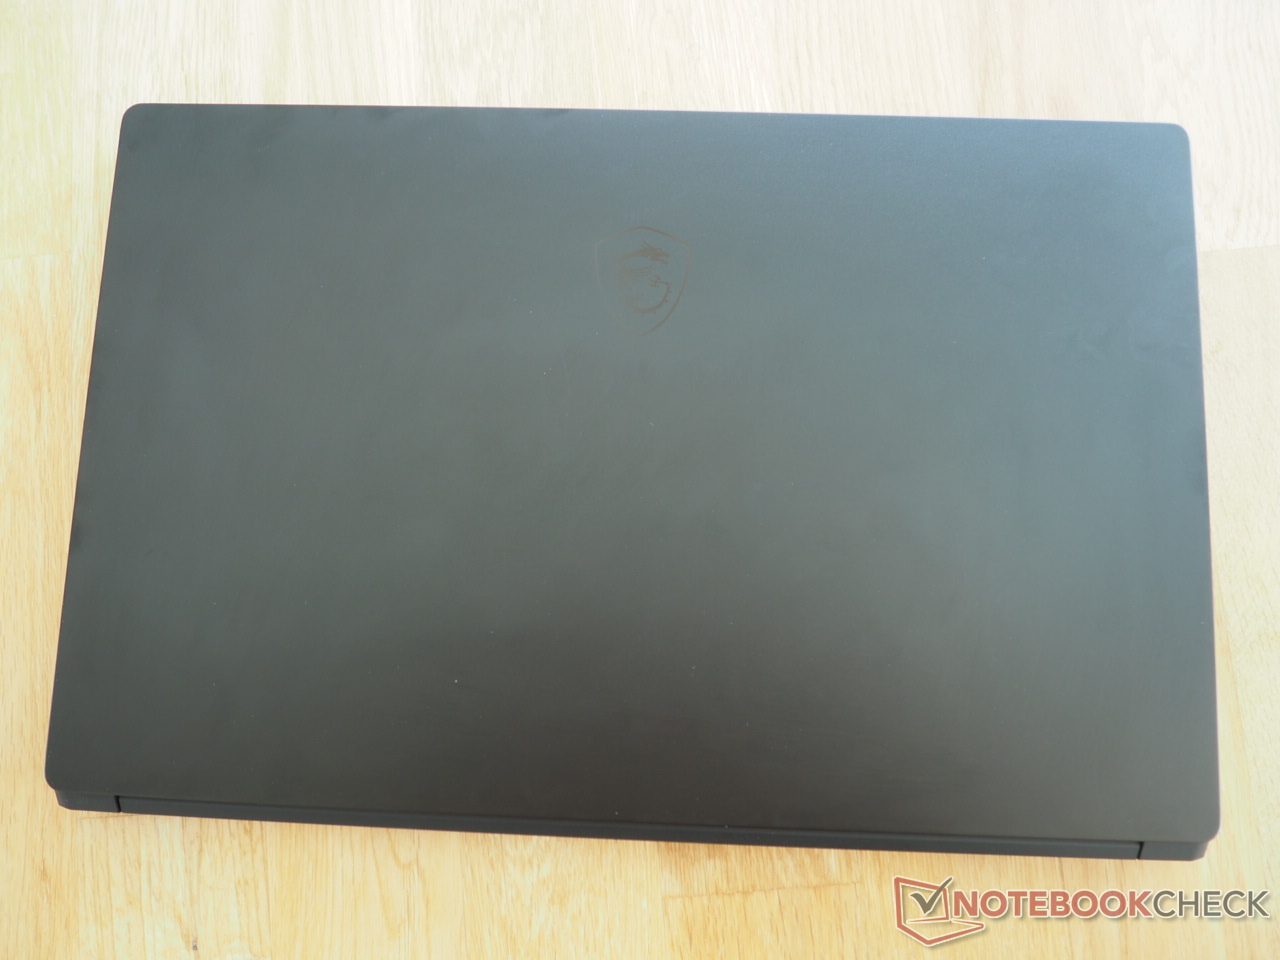
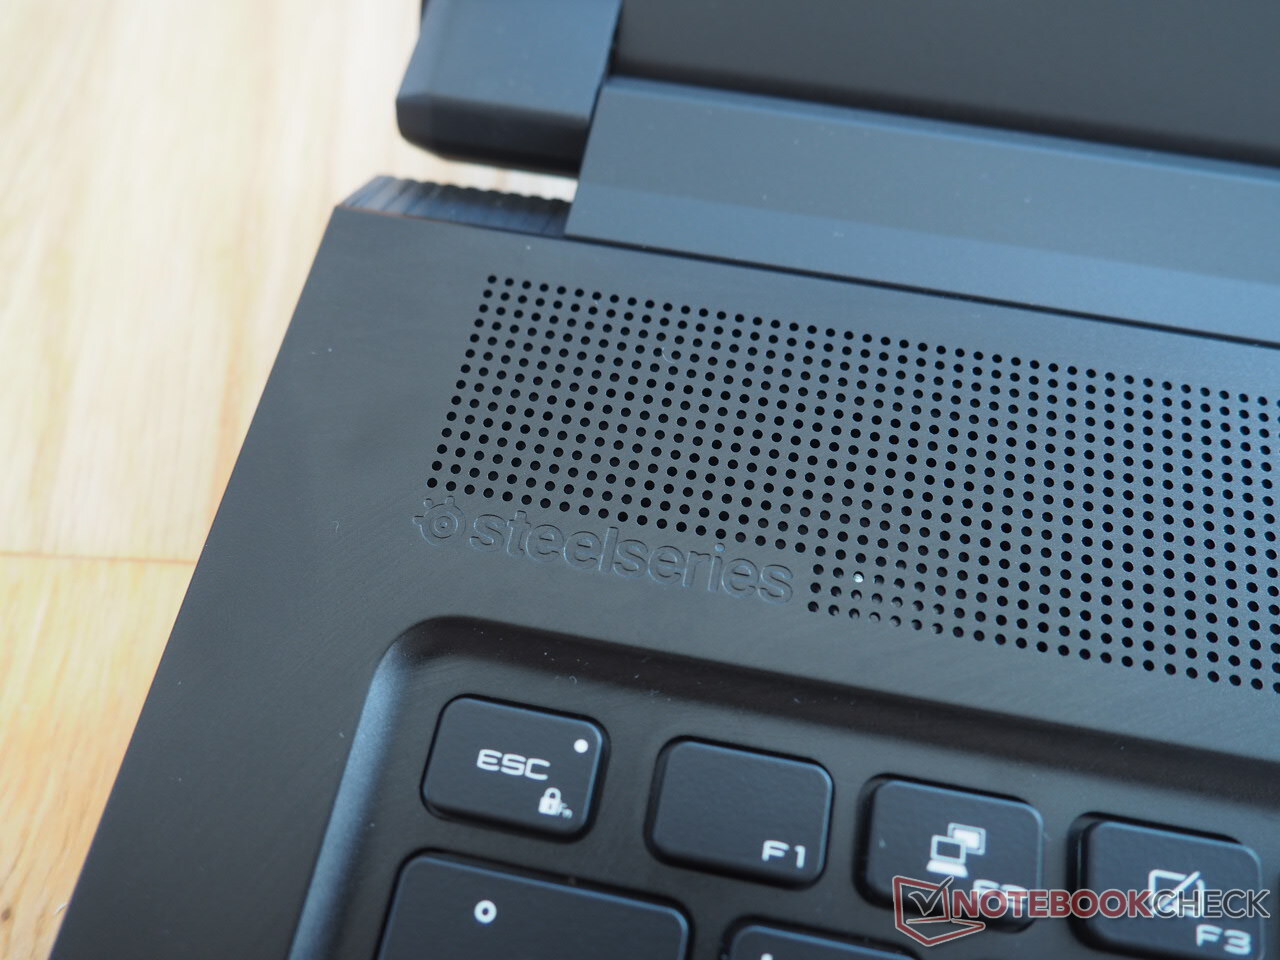
除此之外,这款机箱几乎没有什么可以批评的地方。与前辈GS75 相比,微星没有使用金色的元素,这使得17英寸机看起来更加清醒,同时也在任何情况或环境下给人留下时尚和谨慎的印象。除了C罩和D罩之间在某些方面的过渡略显粗糙之外,其制造质量也能够给人留下深刻印象。GS76在质量方面也是令人满意的。深色金属表面是指纹磁铁,但除了缺乏稳定性外,感觉非常优质。
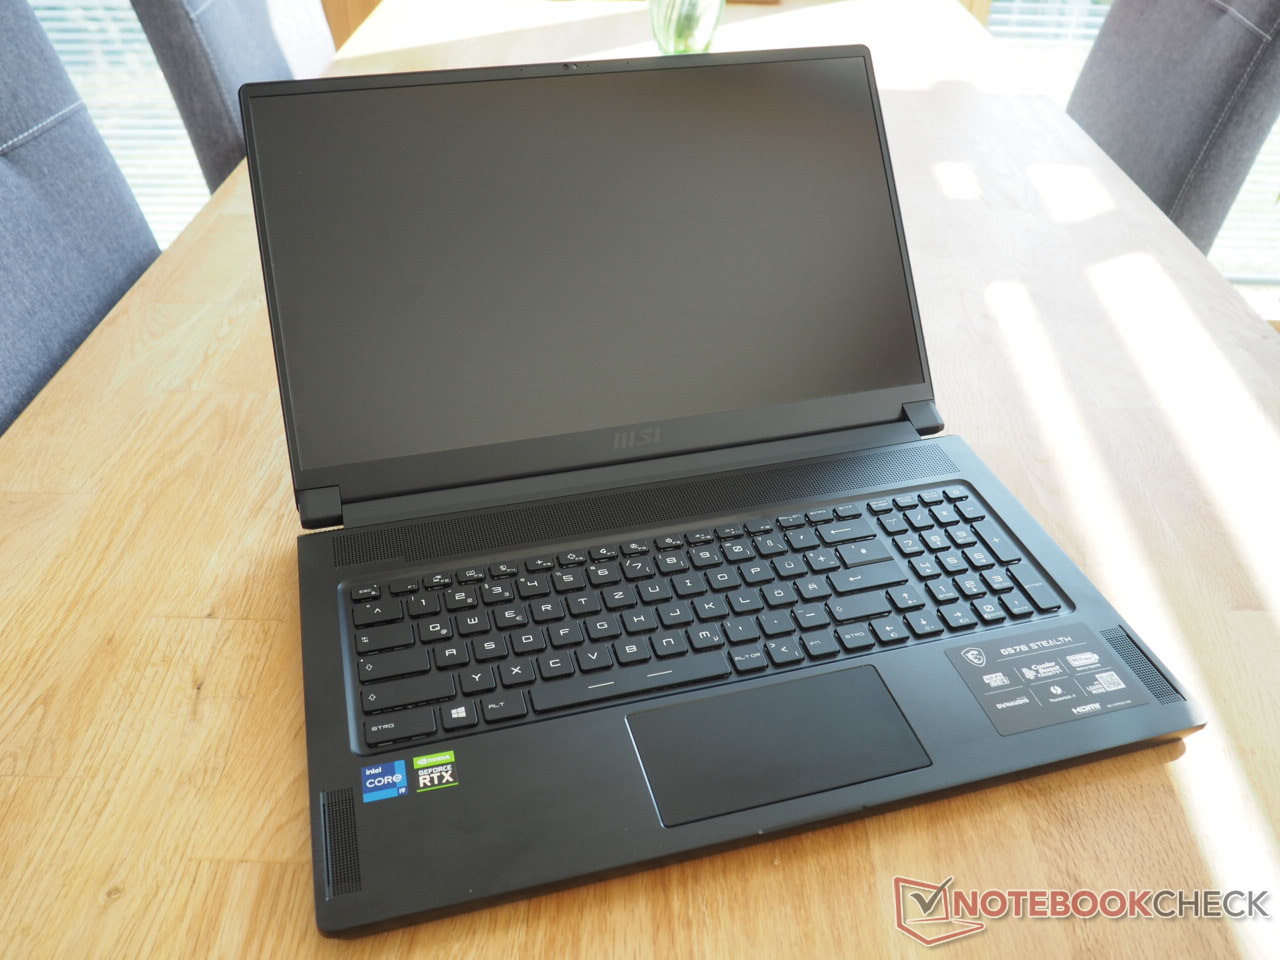
GS75的重量约为2.4公斤,也是最轻的17英寸游戏设备之一。除了Medion Beast X25,所有的竞争对手都要重几百克(2.8-3.0公斤)。结合其较低的建筑高度(不含脚垫约2厘米),微星笔记本电脑携带起来相当舒适。
连接性
端口
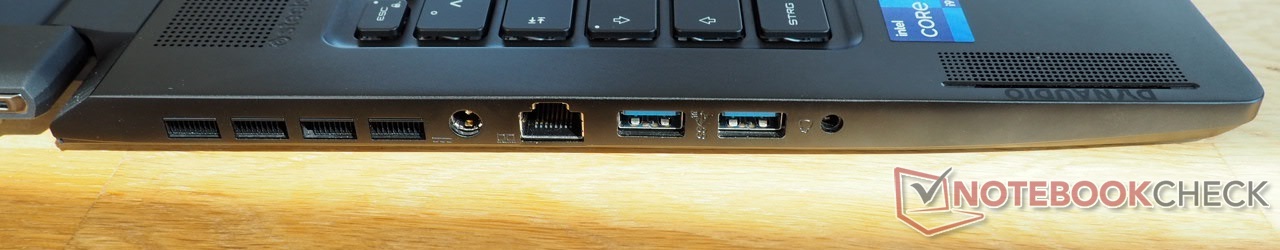
在端口方面,微星是与时俱进的。正如你所期望的那样,GS76提供了一个雷电4端口,支持DisplayPort和Power Delivery。加上第二个USB Type-C端口(也支持DisplayPort),以及HDMI 2.1输出(120 Hz @4K或60 Hz @8K),可以连接多达三个外部显示器。此外,还有两个经典的USB Type-A端口(3.2 Gen 2)、一个2.5千兆网口(Killer E3100G以太网控制器)、一个3.5毫米音频插孔、一个读卡器(UHS-III)和一个Kensington锁的插槽。
由于这些端口被挤在两个侧面的中央区域,使用鼠标时可能会出现运动限制,这取决于所涉及的电缆数量。
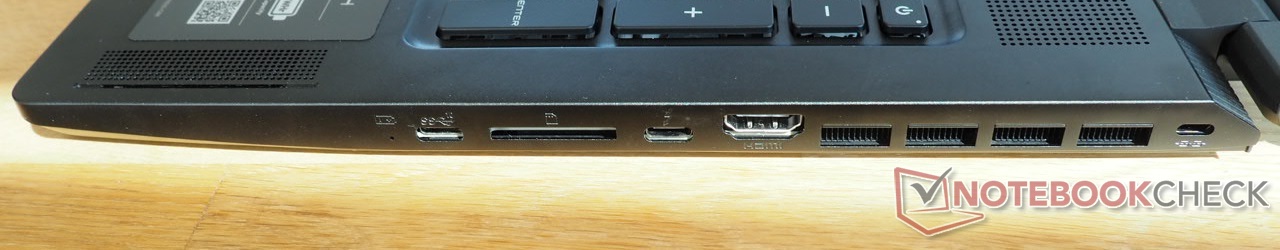
SD卡阅读器
该读卡器提供了一个非常好的性能。用我们的128GB AV Pro V60参考microSD卡连续读取时的速度为199MB/s,传输照片时的速度为196MB/s,在测试领域排名第二。只有Razer Blade 17 Pro 2021表现得更好。
| SD Card Reader | |
| average JPG Copy Test (av. of 3 runs) | |
| Razer Blade Pro 17 2021 (QHD Touch) (Toshiba Exceria Pro SDXC 64 GB UHS-II) | |
| MSI GS76 Stealth 11UH (AV PRO microSD 128 GB V60) | |
| Gigabyte Aero 17 HDR YD (AV PRO microSD 128 GB V60) | |
| Asus ROG Zephyrus S17 GX703HSD | |
| Average of class Gaming (20.9 - 210, n=54, last 2 years) | |
| Medion Erazer Beast X25 (AV PRO microSD 128 GB V60) | |
| maximum AS SSD Seq Read Test (1GB) | |
| Asus ROG Zephyrus S17 GX703HSD | |
| MSI GS76 Stealth 11UH (AV PRO microSD 128 GB V60) | |
| Razer Blade Pro 17 2021 (QHD Touch) (Toshiba Exceria Pro SDXC 64 GB UHS-II) | |
| Gigabyte Aero 17 HDR YD (AV PRO microSD 128 GB V60) | |
| Average of class Gaming (25.5 - 261, n=51, last 2 years) | |
| Medion Erazer Beast X25 (AV PRO microSD 128 GB V60) | |
沟通
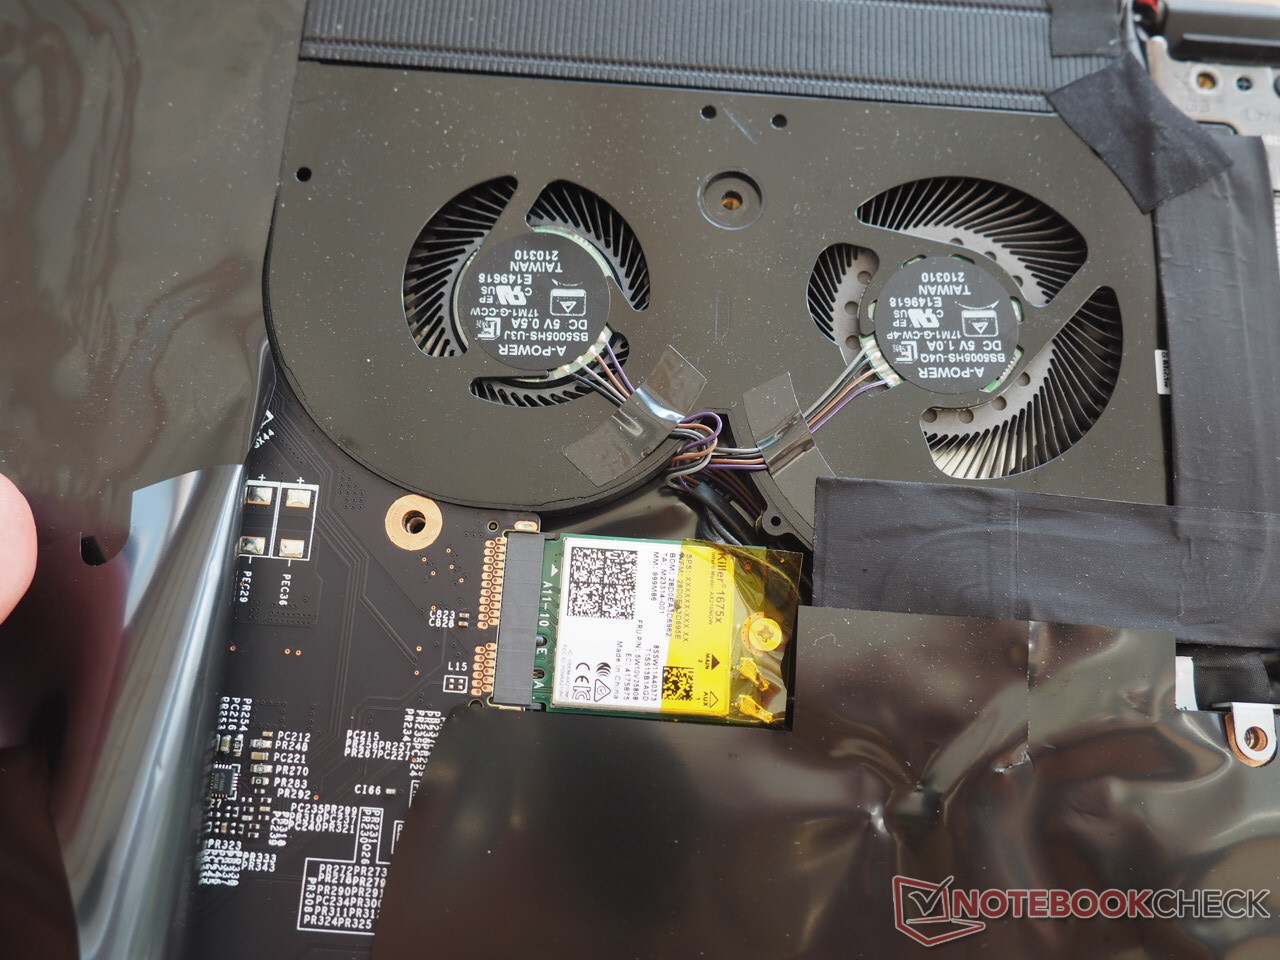
Wi-Fi 6E Killer AX1675x芯片负责无线连接。它支持蓝牙5.2和WLAN 802.11b/g/n/ac/ax标准。在与我们的Netgear Nighthawk AX12参考路由器(1米距离)的测试中,GS76没有显示出任何弱点。1,499 Mb/s(发送)和1,328 Mb/s(接收)分别是优秀的速率。
网络摄像头
事实证明,内置的720p网络摄像头不那么令人印象深刻。与大多数对手一样,它缺乏色彩准确性和图像清晰度。


辅料
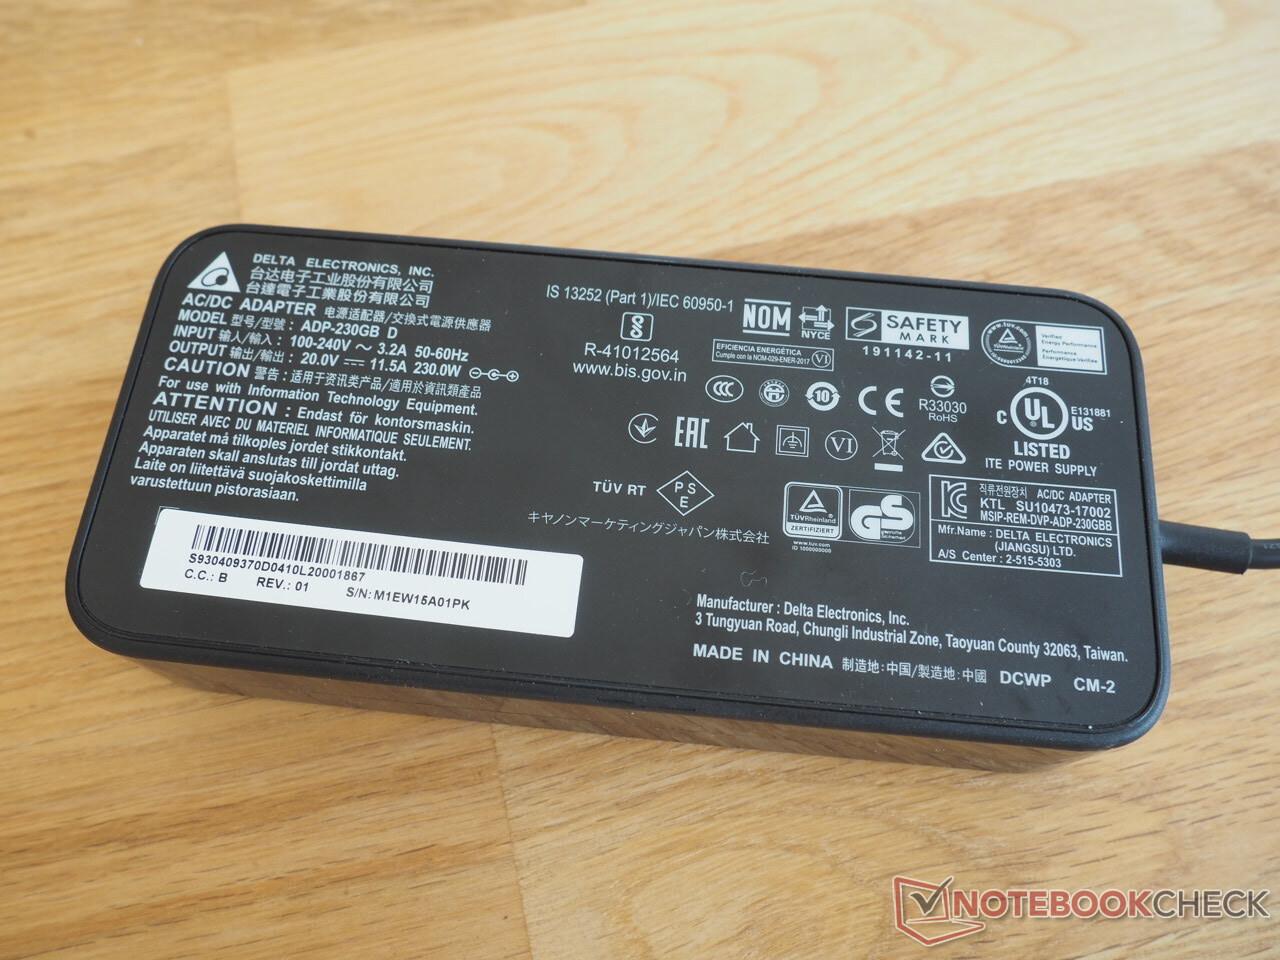
盒子里包括一个230瓦的电源适配器,它并不特别紧凑,还有一些信息手册。
维护
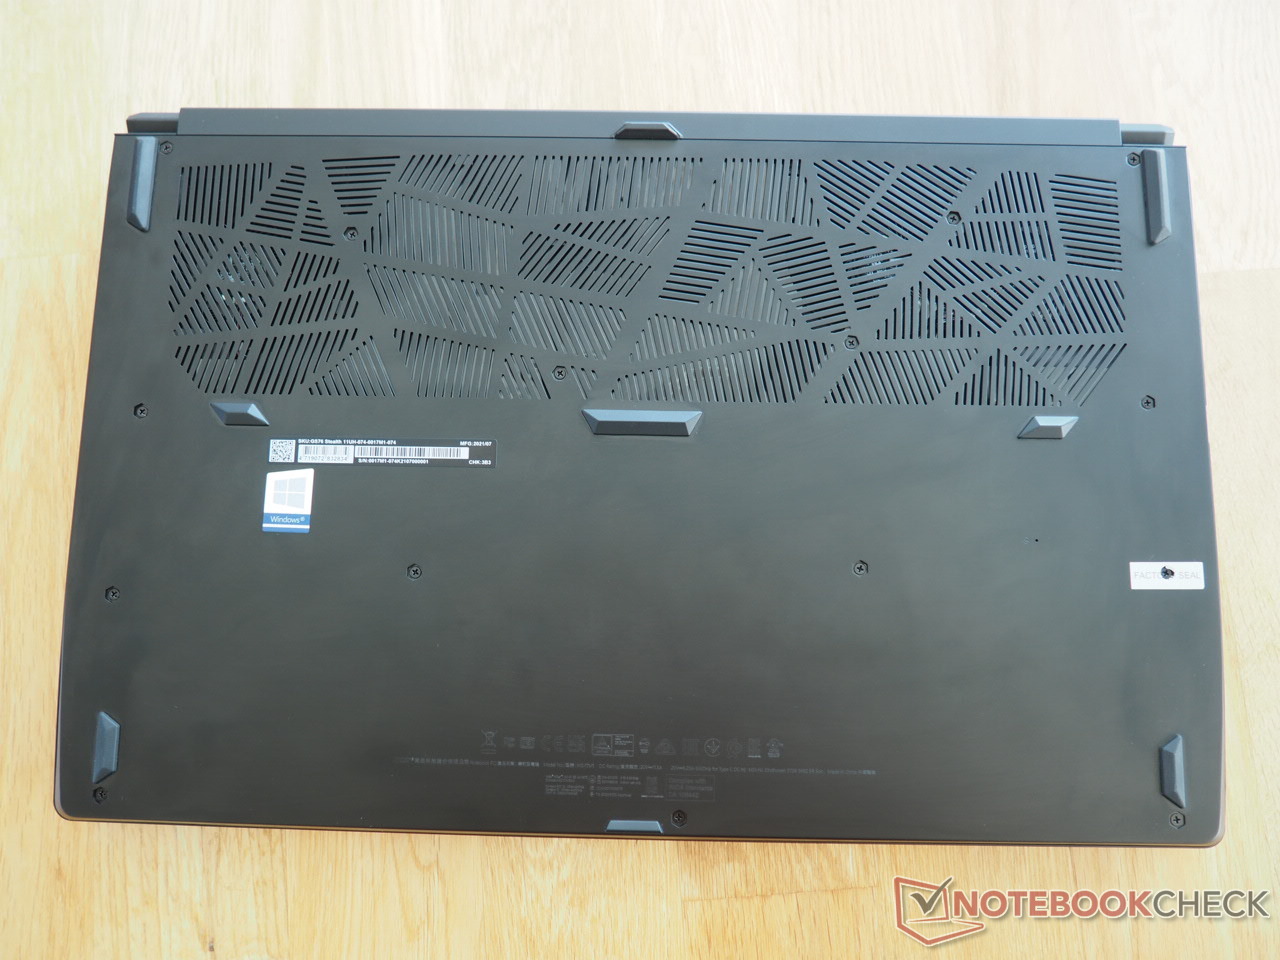
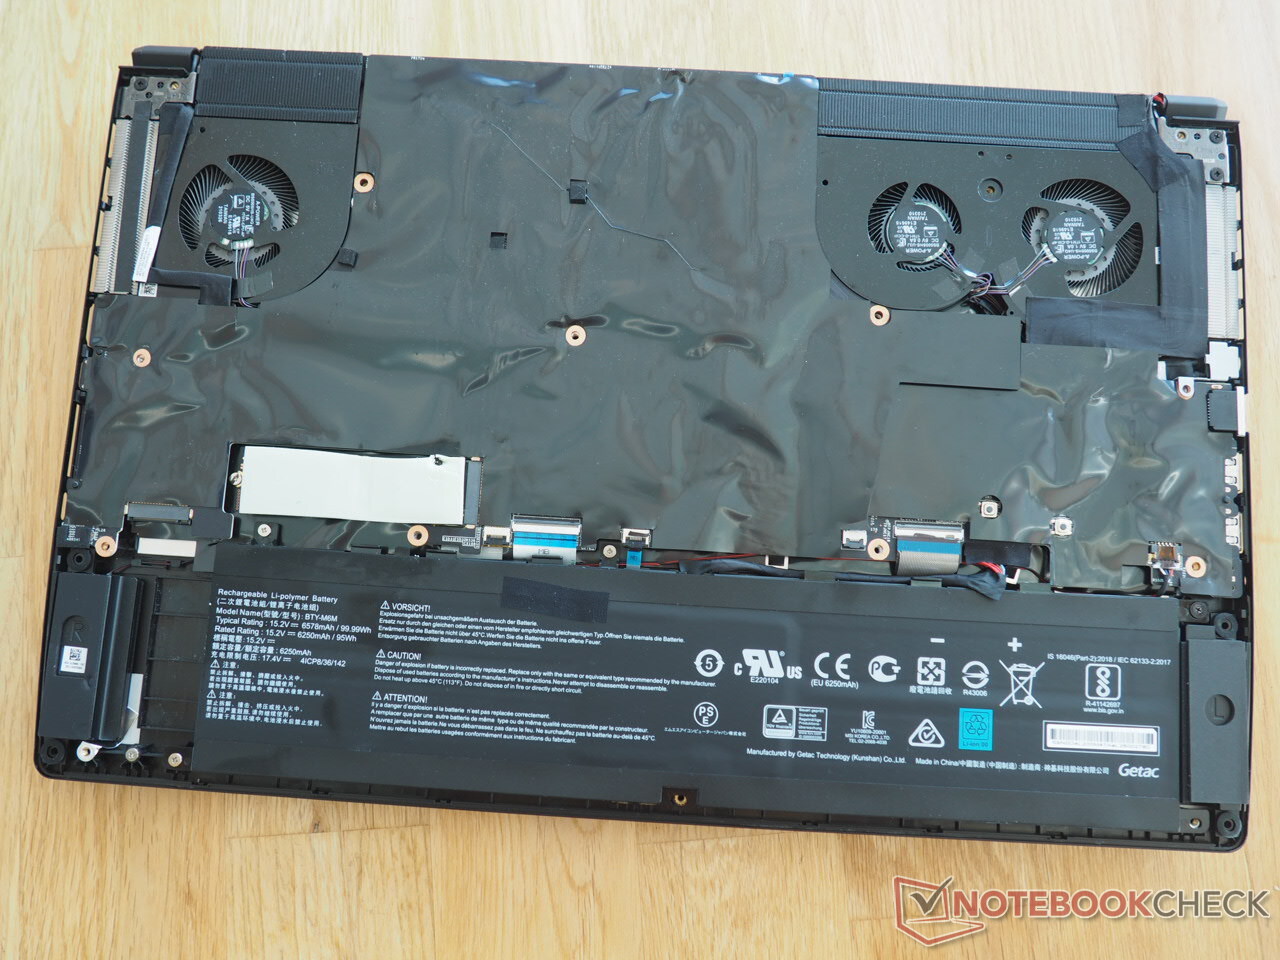
维修选项相当令人失望。那些打破机箱底部的原厂封条并卸下15颗十字头螺钉的人确实可以掀开整个底盖,但由于存在巨大的胶合铝箔表面,里面只有风扇、电池、M.2插槽和无线模块可以接触。CPU或GPU的冷却系统和内存则不容易接触到。这是不必要的,其他制造商已经用更好的方式解决了这个问题。
担保
保修期延长至24个月(提货和退货服务)。
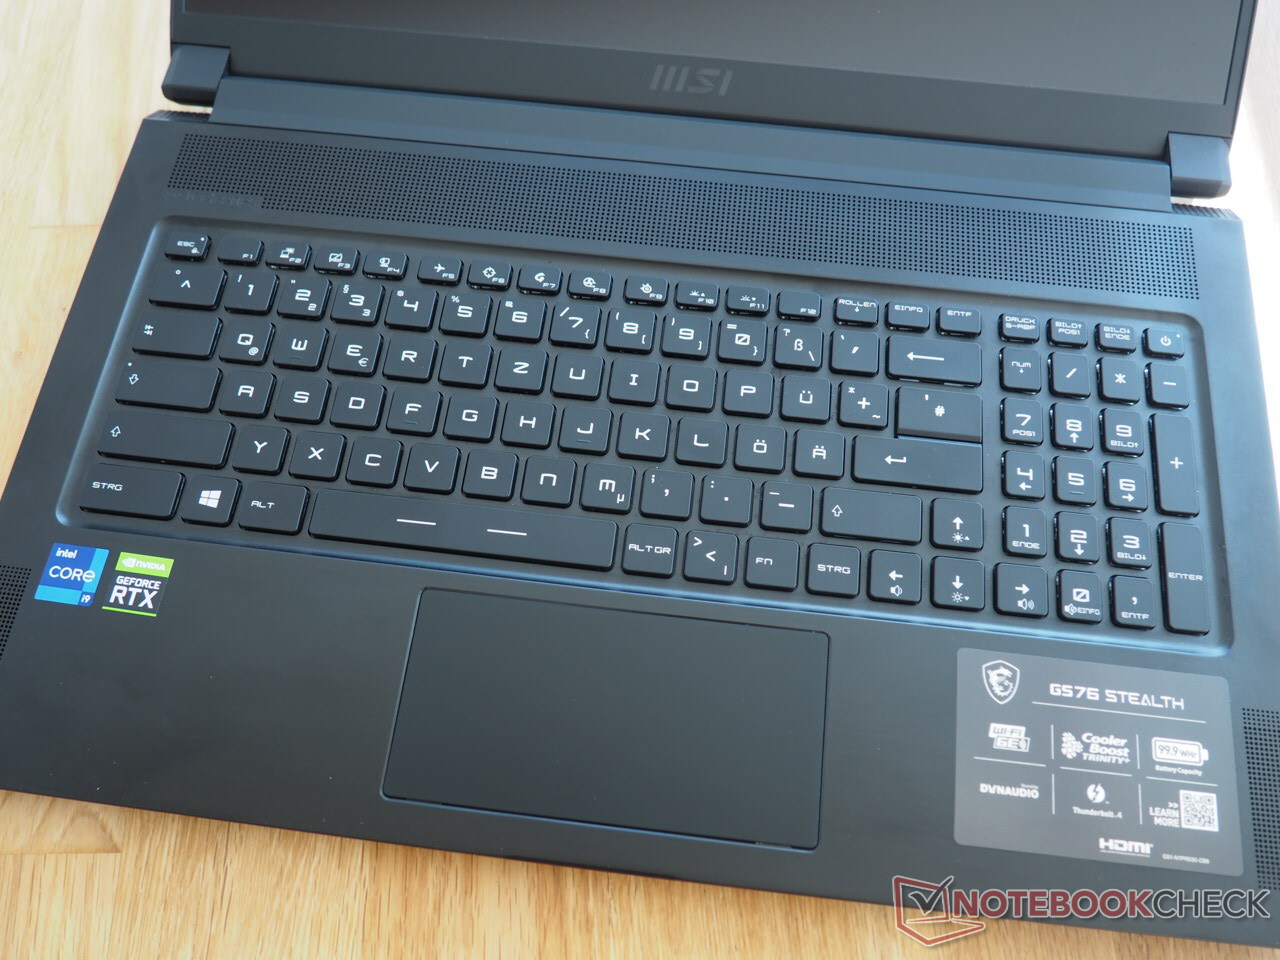
输入设备
键盘
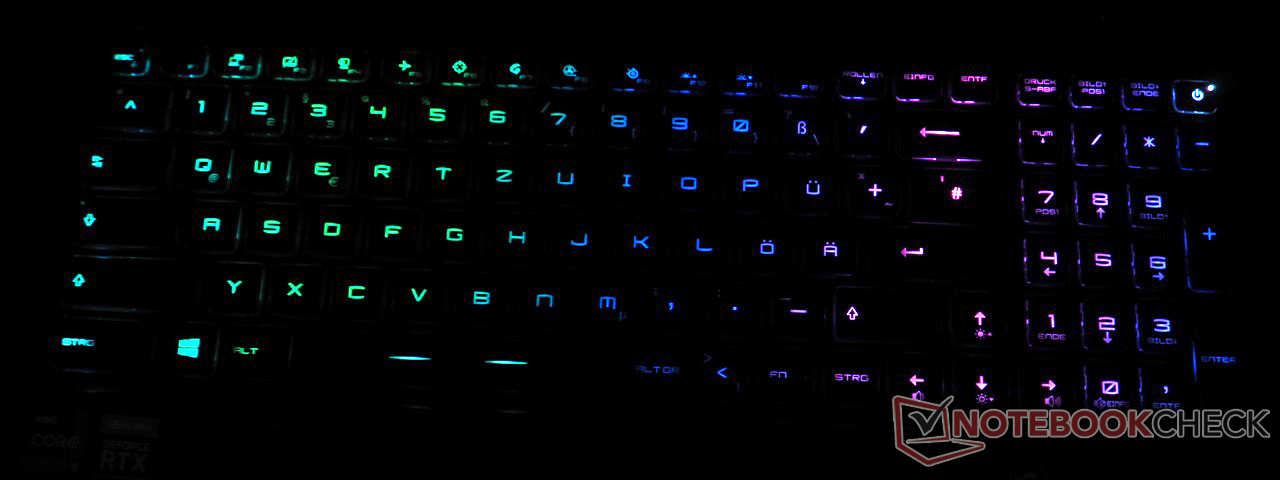
和微星笔记本电脑一样,键盘布局需要很多时间来适应,它在很多地方与标准不同(见照片),这就是为什么你首先需要花一些时间来熟悉它。尽管稳定性不理想,但该键盘以良好的打字体验而得分。特别是由于相对较高的键程和清晰的行程,产生了坚定的反馈,而且输入并不特别安静。旧的GS型号部分配备了相当模糊的键盘。因此,我们可以看到这里有了改进。
除了有点窄的数字键盘之外,其他的尺寸都很好。玩家还可以享受到可以在几个级别上调整的RGB灯光。一个小小的缺点。由于键盘的中心位置,掌托的高度是有限的。因此,较大的手会不高兴地放在机箱的边缘。
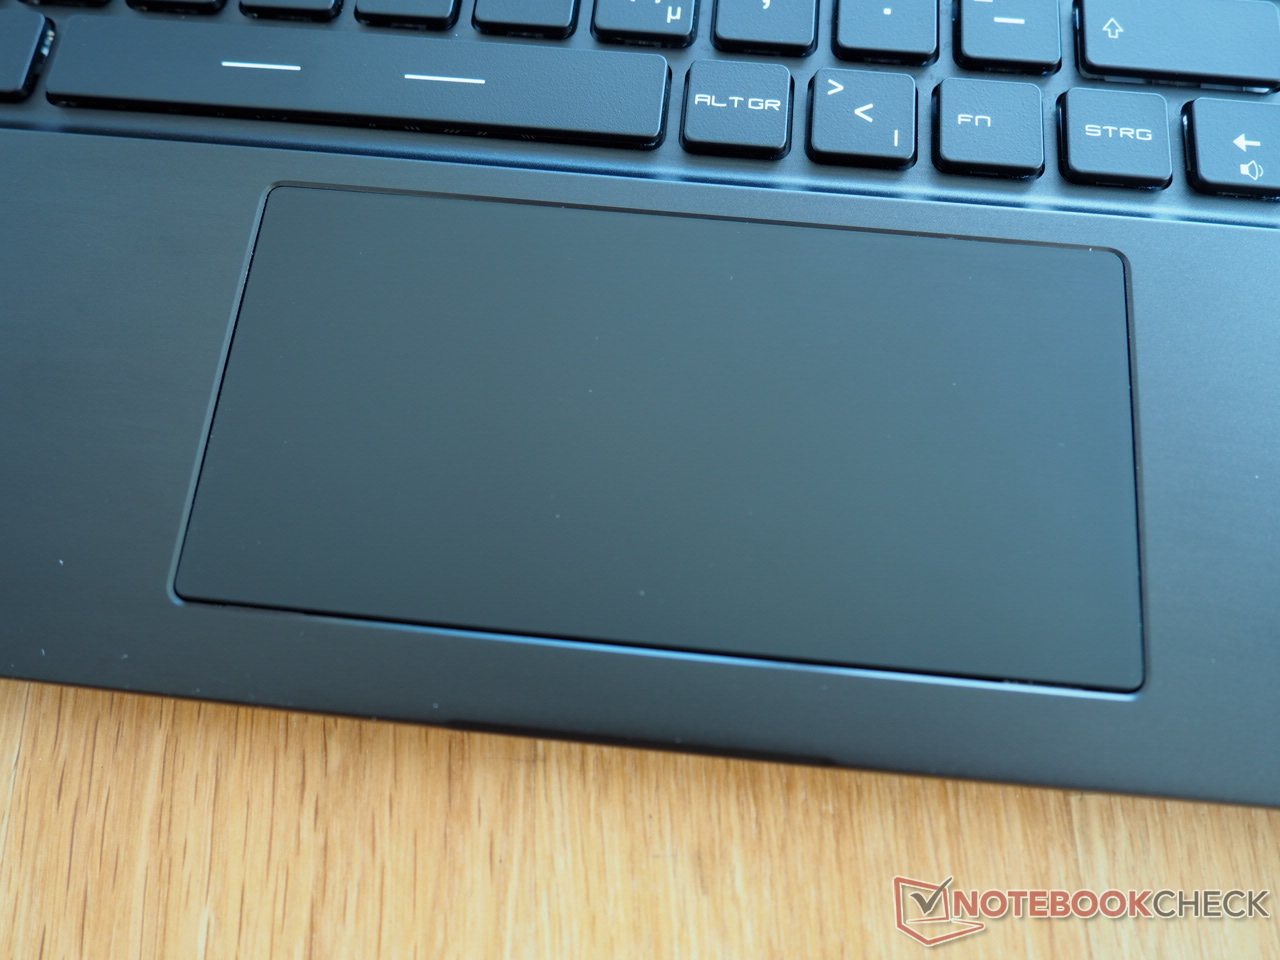
触摸板
总的来说,触摸板有一些需要补上的地方。由于稳定性适中,鼠标的替代物显然可以被推倒,而且它在输入时很快就会发出响声,这对感知的质量是不利的。准确度也可以更好一点。至少光滑的表面提供了一个愉快的滑行体验。尺寸让人喜忧参半。虽然触摸板的宽度为12厘米,令人愉快,但6厘米的高度却有点低。在手势支持方面没有问题(用两个手指缩放和滚动,等等)。
显示
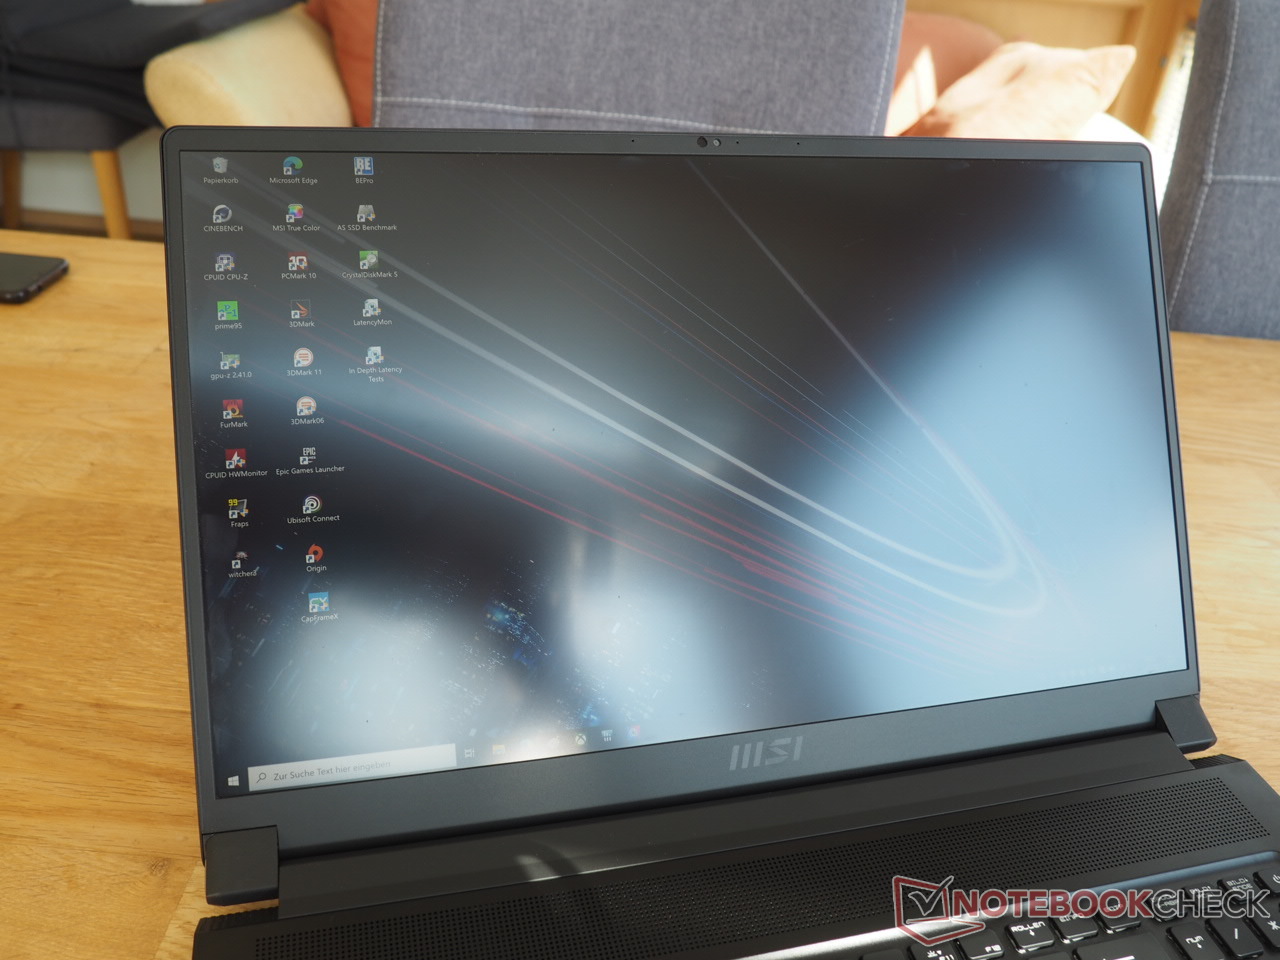
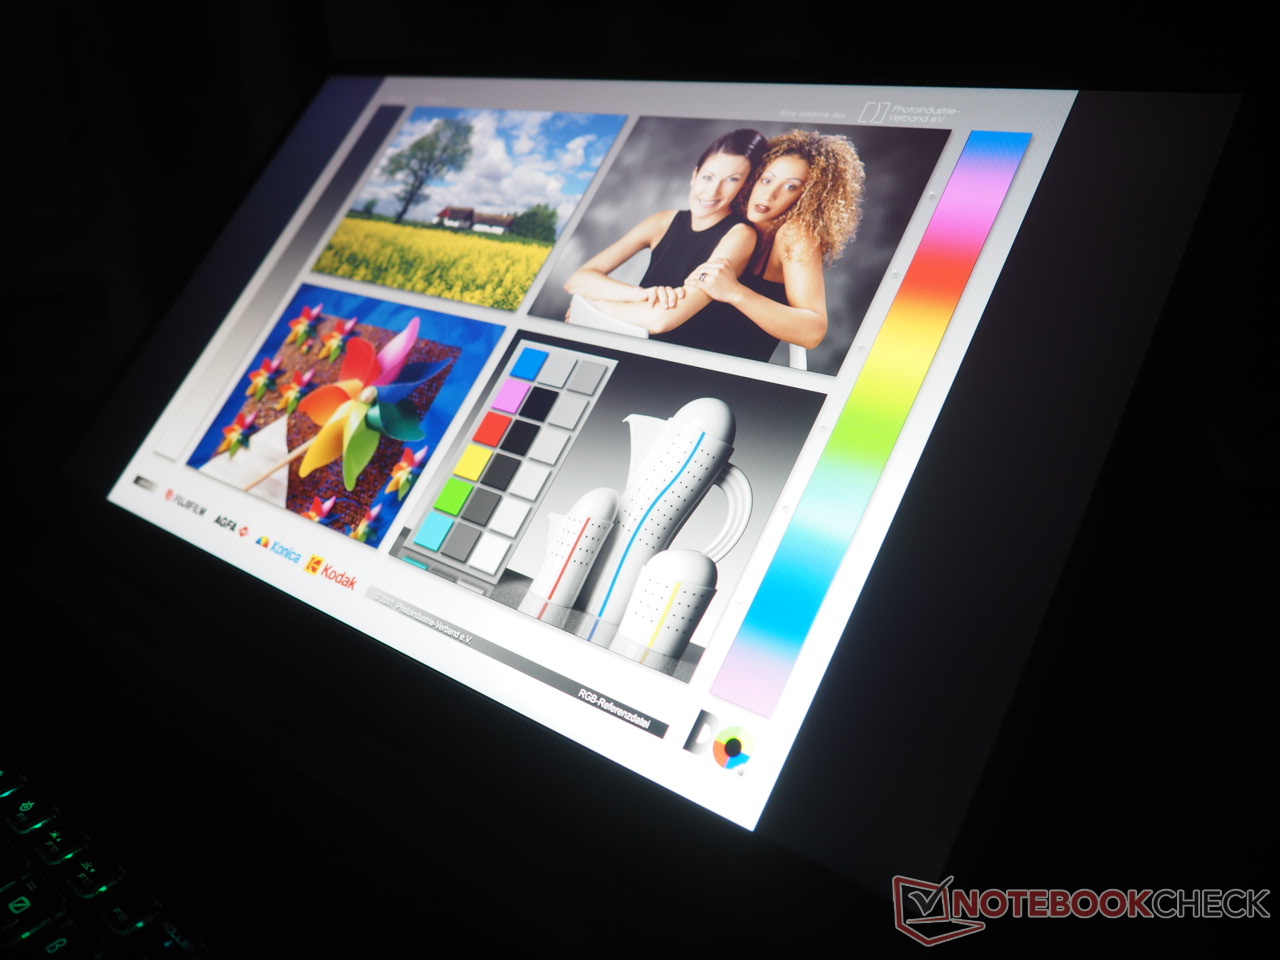
顶级型号配备了现有显示屏中最清晰的显示屏。这块4K显示屏有AUO B173ZAN06.1的称号,提供3840x2160像素的分辨率。
| |||||||||||||||||||||||||
Brightness Distribution: 88 %
Center on Battery: 474 cd/m²
Contrast: 1030:1 (Black: 0.46 cd/m²)
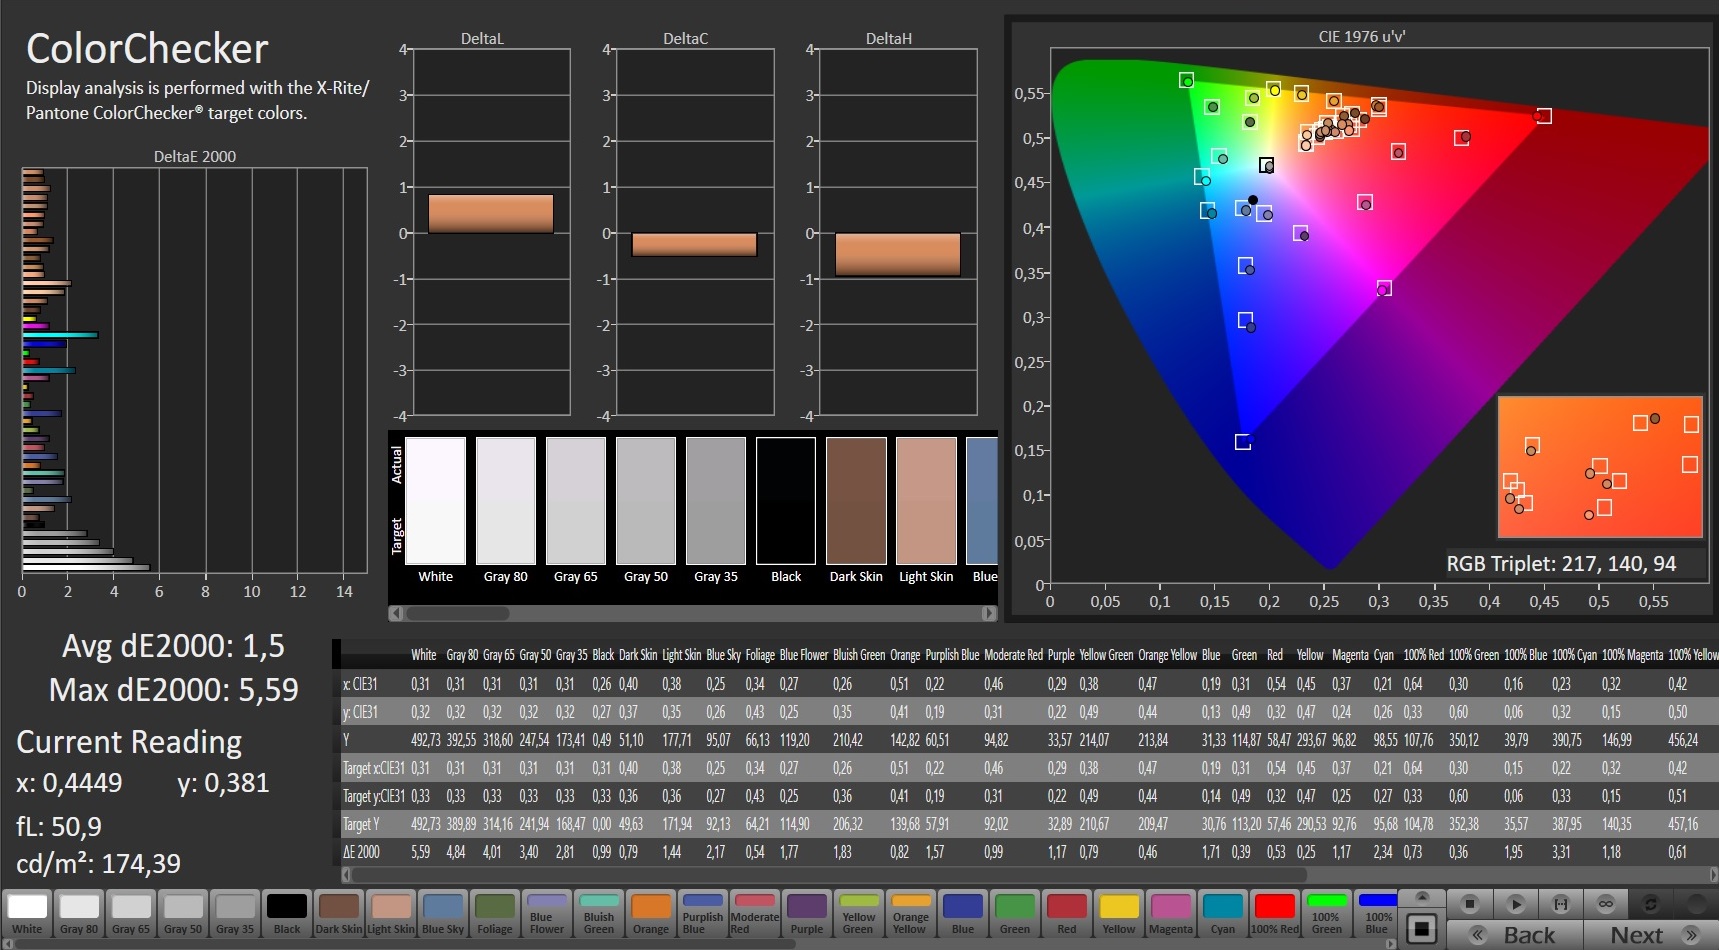
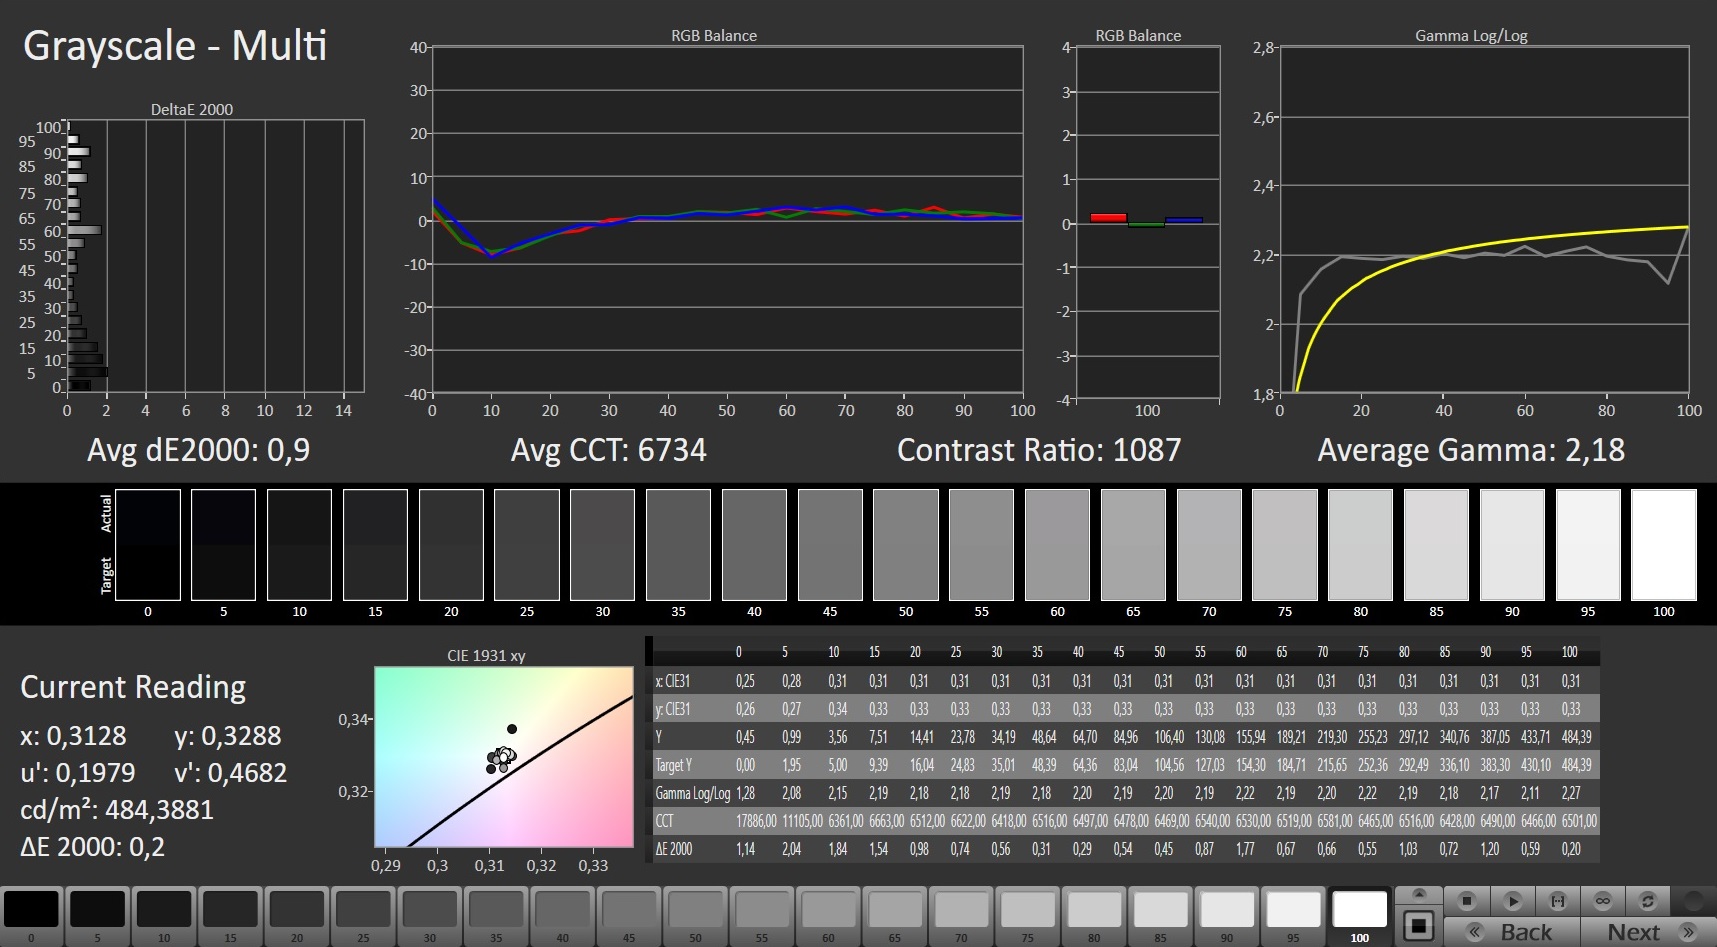
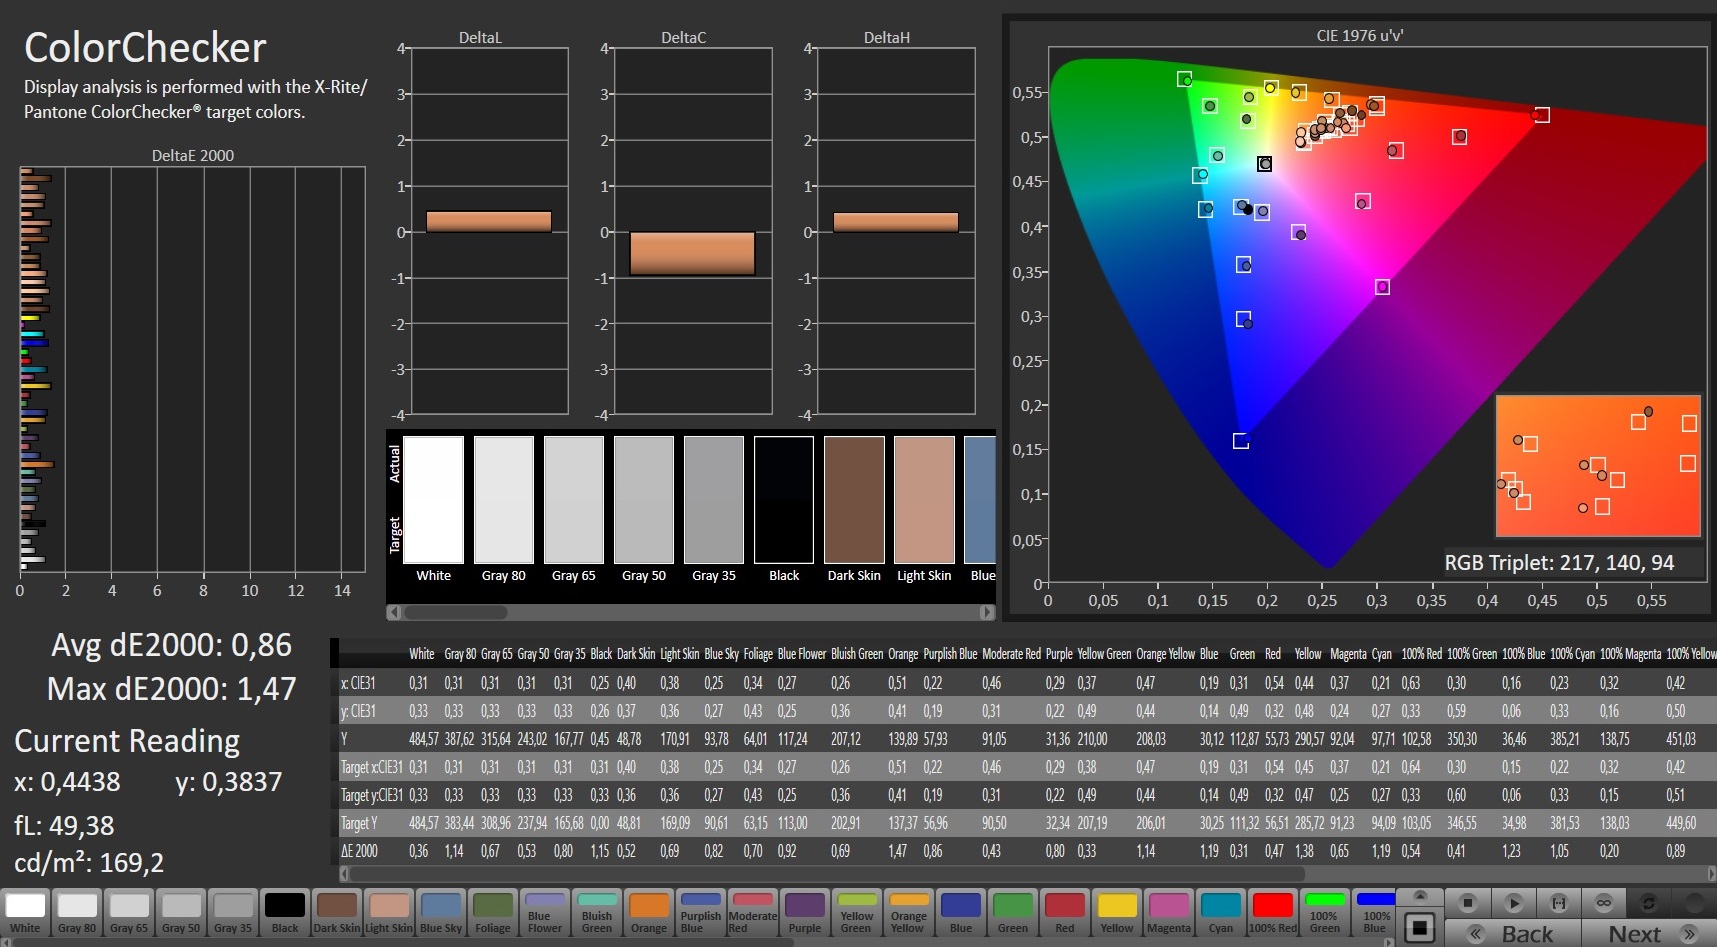
ΔE ColorChecker Calman: 1.5 | ∀{0.5-29.43 Ø4.73}
calibrated: 0.86
ΔE Greyscale Calman: 2.8 | ∀{0.09-98 Ø4.97}
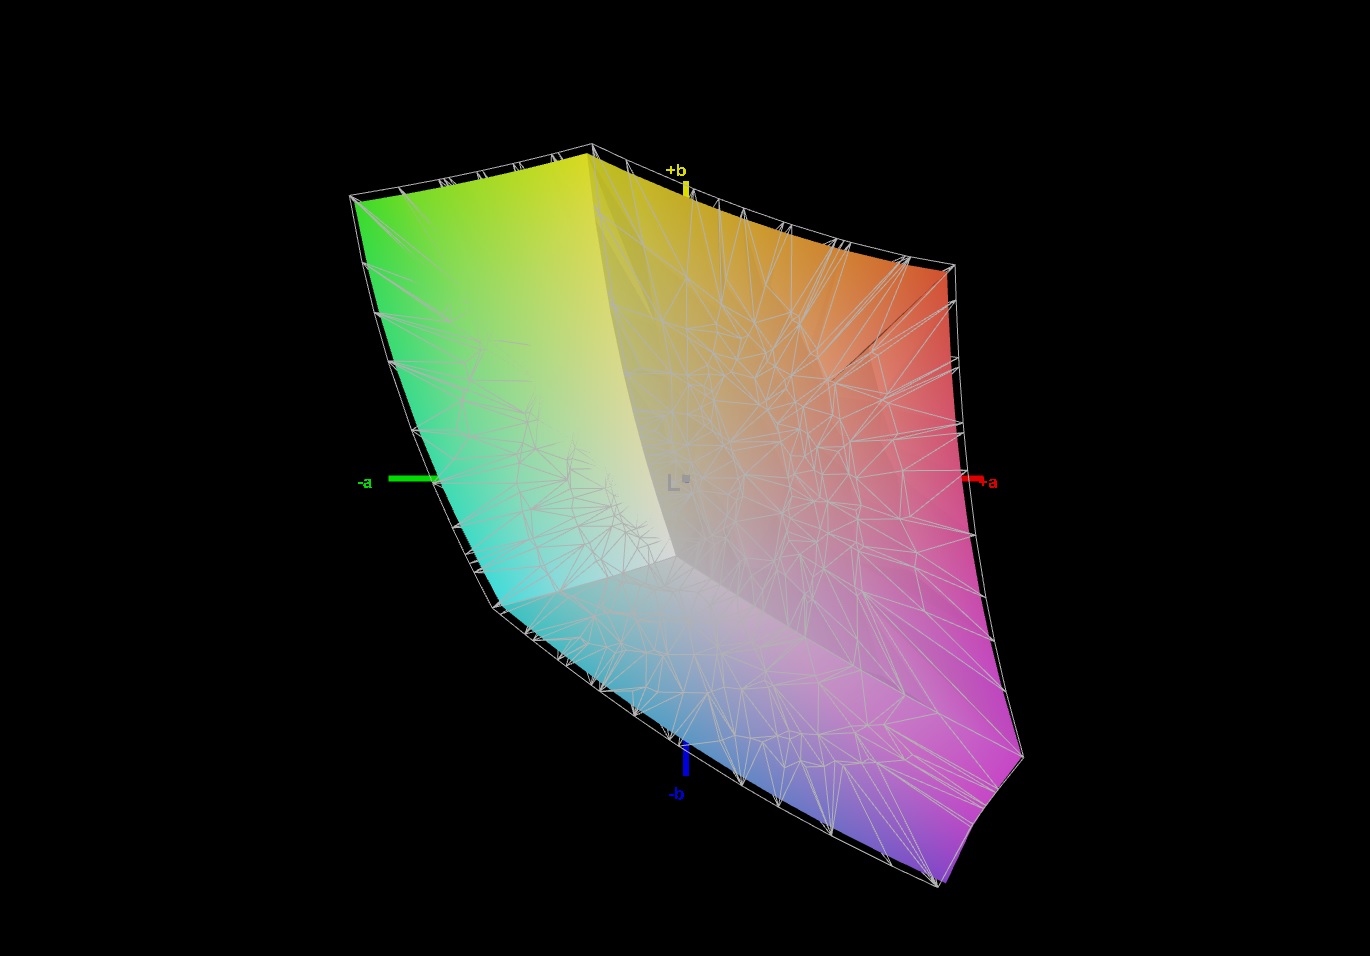
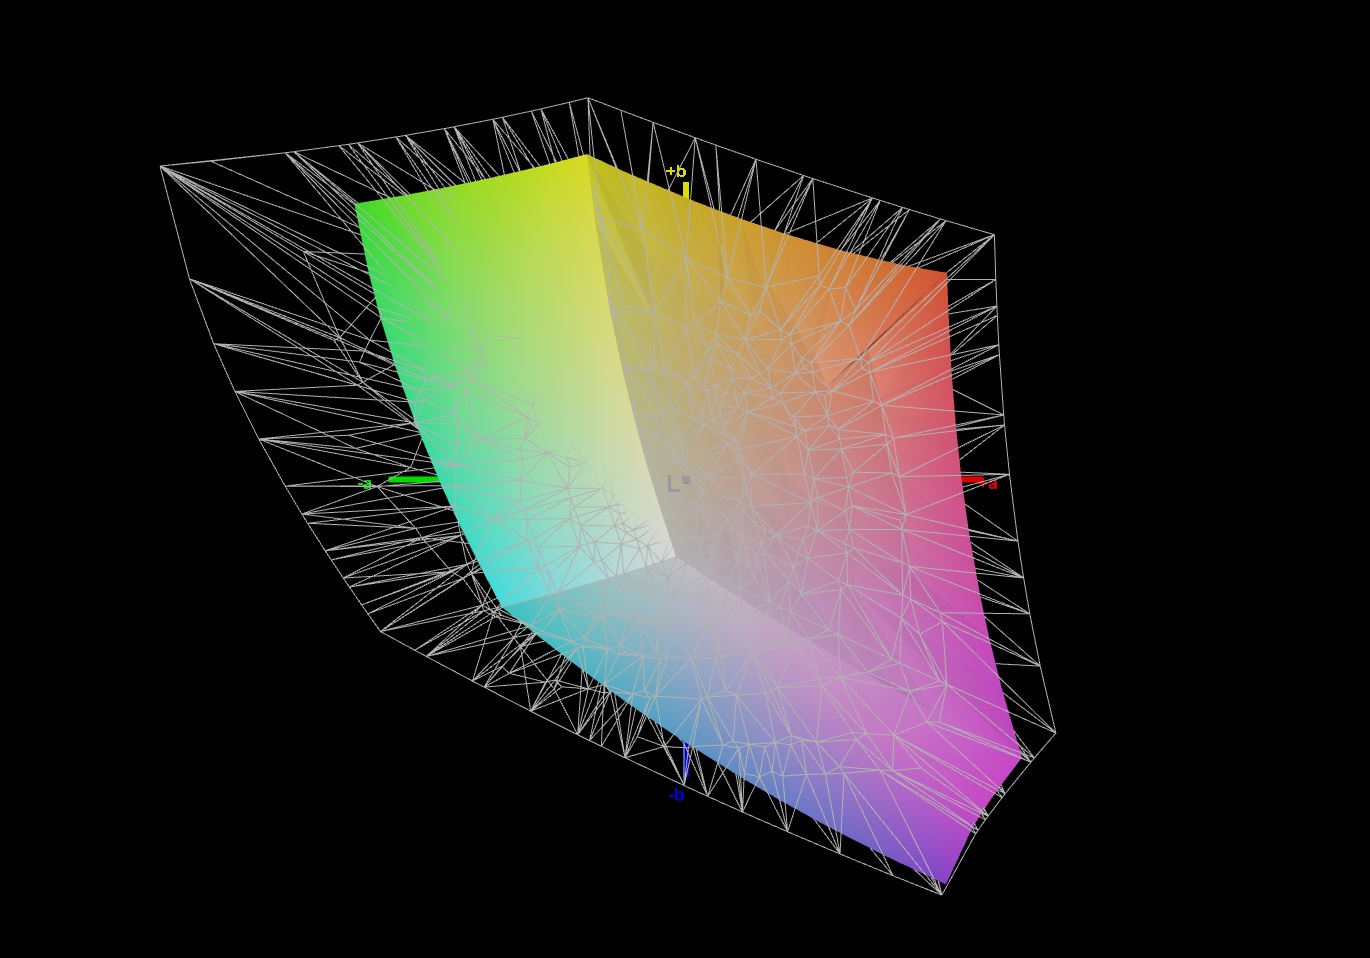
65% AdobeRGB 1998 (Argyll 3D)
94.8% sRGB (Argyll 3D)
63% Display P3 (Argyll 3D)
Gamma: 2.158
CCT: 6597 K
| MSI GS76 Stealth 11UH AUO B173ZAN06.1 (AUODE95), IPS, 3840x2160, 17.3" | Gigabyte Aero 17 HDR YD AU Optronics AUO329B, IPS, 3840x2160, 17.3" | Asus ROG Zephyrus S17 GX703HSD BOE099D (BOE CQ NE173QHM-NY3), IPS, 2560x1440, 17.3" | Razer Blade Pro 17 2021 (QHD Touch) AU Optronics B173ZAN03.3, IPS, 3840x2160, 17.3" | Medion Erazer Beast X25 BOE NE173FHM-NZ1 (BOE0884), IPS, 1920x1080, 17.3" | |
|---|---|---|---|---|---|
| Display | 32% | 28% | 33% | 9% | |
| Display P3 Coverage (%) | 63 | 86.9 38% | 94.2 50% | 88.6 41% | 70.4 12% |
| sRGB Coverage (%) | 94.8 | 100 5% | 98.7 4% | 100 5% | 99.8 5% |
| AdobeRGB 1998 Coverage (%) | 65 | 99.6 53% | 84.4 30% | 99.9 54% | 71.6 10% |
| Response Times | -399% | 10% | -81% | 4% | |
| Response Time Grey 50% / Grey 80% * (ms) | 8.8 ? | 52 ? -491% | 4.8 45% | 15.2 ? -73% | 9.2 ? -5% |
| Response Time Black / White * (ms) | 6.4 ? | 26 ? -306% | 8 -25% | 12 ? -88% | 5.6 ? 13% |
| PWM Frequency (Hz) | |||||
| Screen | 22% | -31% | -115% | -10% | |
| Brightness middle (cd/m²) | 474 | 488 3% | 322 -32% | 407.2 -14% | 329 -31% |
| Brightness (cd/m²) | 454 | 467 3% | 288 -37% | 403 -11% | 315 -31% |
| Brightness Distribution (%) | 88 | 86 -2% | 72 -18% | 90 2% | 88 0% |
| Black Level * (cd/m²) | 0.46 | 0.33 28% | 0.3 35% | 0.42 9% | 0.33 28% |
| Contrast (:1) | 1030 | 1479 44% | 1073 4% | 970 -6% | 997 -3% |
| Colorchecker dE 2000 * | 1.5 | 1.23 18% | 3.05 -103% | 7.25 -383% | 2.03 -35% |
| Colorchecker dE 2000 max. * | 5.59 | 2.94 47% | 5.23 6% | 12.51 -124% | 5.5 2% |
| Colorchecker dE 2000 calibrated * | 0.86 | 0.77 10% | 1.92 -123% | 3.62 -321% | 0.82 5% |
| Greyscale dE 2000 * | 2.8 | 1.5 46% | 3.11 -11% | 8.1 -189% | 3.5 -25% |
| Gamma | 2.158 102% | 2.169 101% | 2.13 103% | 2.24 98% | 2.223 99% |
| CCT | 6597 99% | 6614 98% | 6553 99% | 5925 110% | 6526 100% |
| Color Space (Percent of AdobeRGB 1998) (%) | 99 | 84 | 88.1 | ||
| Color Space (Percent of sRGB) (%) | 99 | 99 | 100 | ||
| Total Average (Program / Settings) | -115% /
-36% | 2% /
-13% | -54% /
-78% | 1% /
-4% |
* ... smaller is better
与其他一些4K笔记本电脑不同,刷新率不是60赫兹,而是120赫兹,这应该使GS76也适合快速游戏。这一说法得到了实测响应时间的支持。 6.黑到白4毫秒,灰到灰8.8毫秒,以笔记本电脑的标准来说是非常好的--特别是对于UHD显示器。
其余的结果也是可敬的。只有Gigabyte Aero 17 HDR YD接近454 cd/m²的平均亮度,但它的响应时间明显更差。由于这个数值和磨砂表面,即使在有些明亮的地方也可以在户外使用,只要你不把它暴露在过度的阳光下。
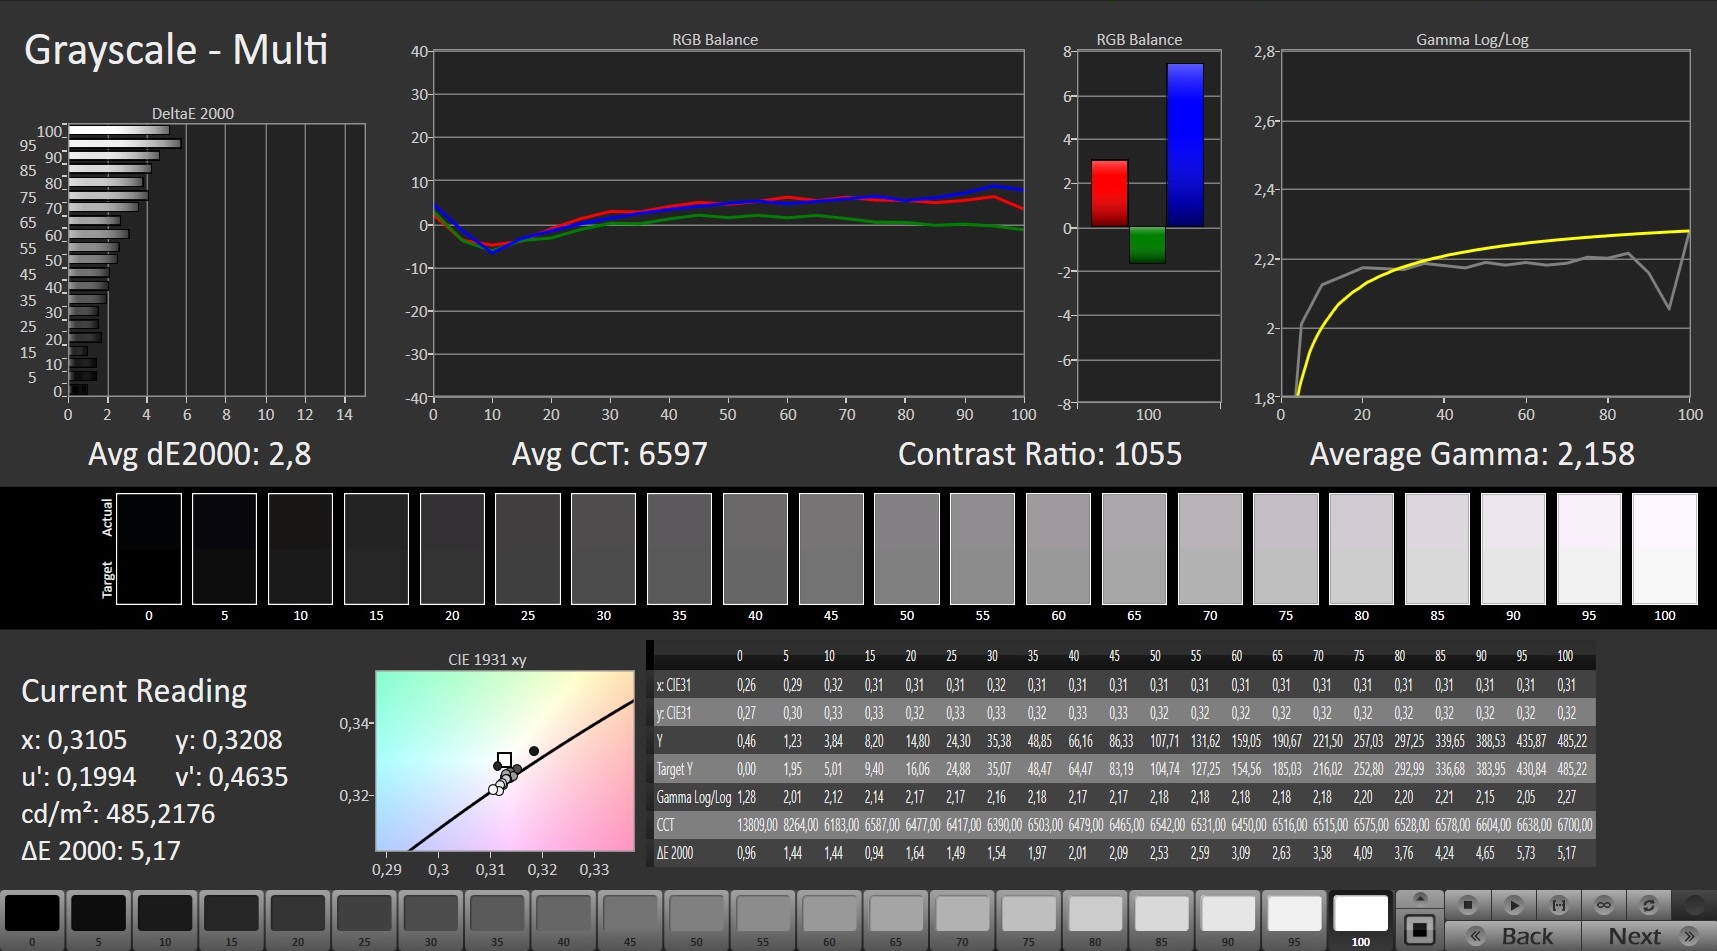

1,030:1的对比度只排在中场。其原因是0.46cd/m²的不理想的黑色水平。在可视角度方面没有什么惊喜。正如广视角面板(IPS级别)所预期的那样,只有在非常倾斜的视角下才能看到颜色和亮度的微小变化。我们没有观察到任何屏幕闪烁(例如,像PWM)或过多的屏幕渗漏。
开箱后的色彩再现已经非常好(DeltaE 2000小于2)。校准将平均DeltaE值提高到1以下(我们的ICC文件在上面有链接)。至于色彩空间,95%的sRGB被覆盖,其次是65%的AdobeRGB。所有的显示测量都是使用真彩模式 "sRGB "进行的(MSI控制图像复制的软件)。
Display Response Times
| ↔ Response Time Black to White | ||
|---|---|---|
| 6.4 ms ... rise ↗ and fall ↘ combined | ↗ 2 ms rise | 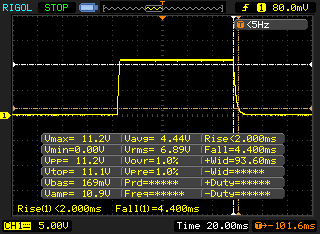 |
| ↘ 4.4 ms fall | ||
| The screen shows very fast response rates in our tests and should be very well suited for fast-paced gaming. In comparison, all tested devices range from 0.1 (minimum) to 240 (maximum) ms. » 20 % of all devices are better. This means that the measured response time is better than the average of all tested devices (19.9 ms). | ||
| ↔ Response Time 50% Grey to 80% Grey | ||
| 8.8 ms ... rise ↗ and fall ↘ combined | ↗ 2.8 ms rise | 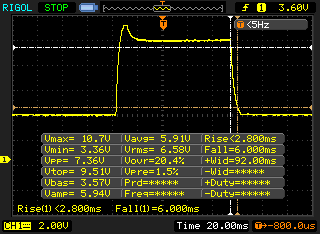 |
| ↘ 6 ms fall | ||
| The screen shows fast response rates in our tests and should be suited for gaming. In comparison, all tested devices range from 0.165 (minimum) to 636 (maximum) ms. » 22 % of all devices are better. This means that the measured response time is better than the average of all tested devices (31.1 ms). | ||
Screen Flickering / PWM (Pulse-Width Modulation)
| Screen flickering / PWM not detected | 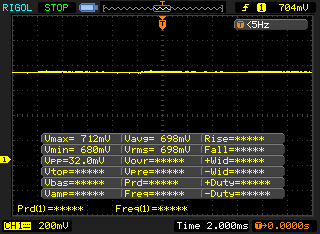 | ||
In comparison: 52 % of all tested devices do not use PWM to dim the display. If PWM was detected, an average of 7784 (minimum: 5 - maximum: 343500) Hz was measured. | |||
测试条件
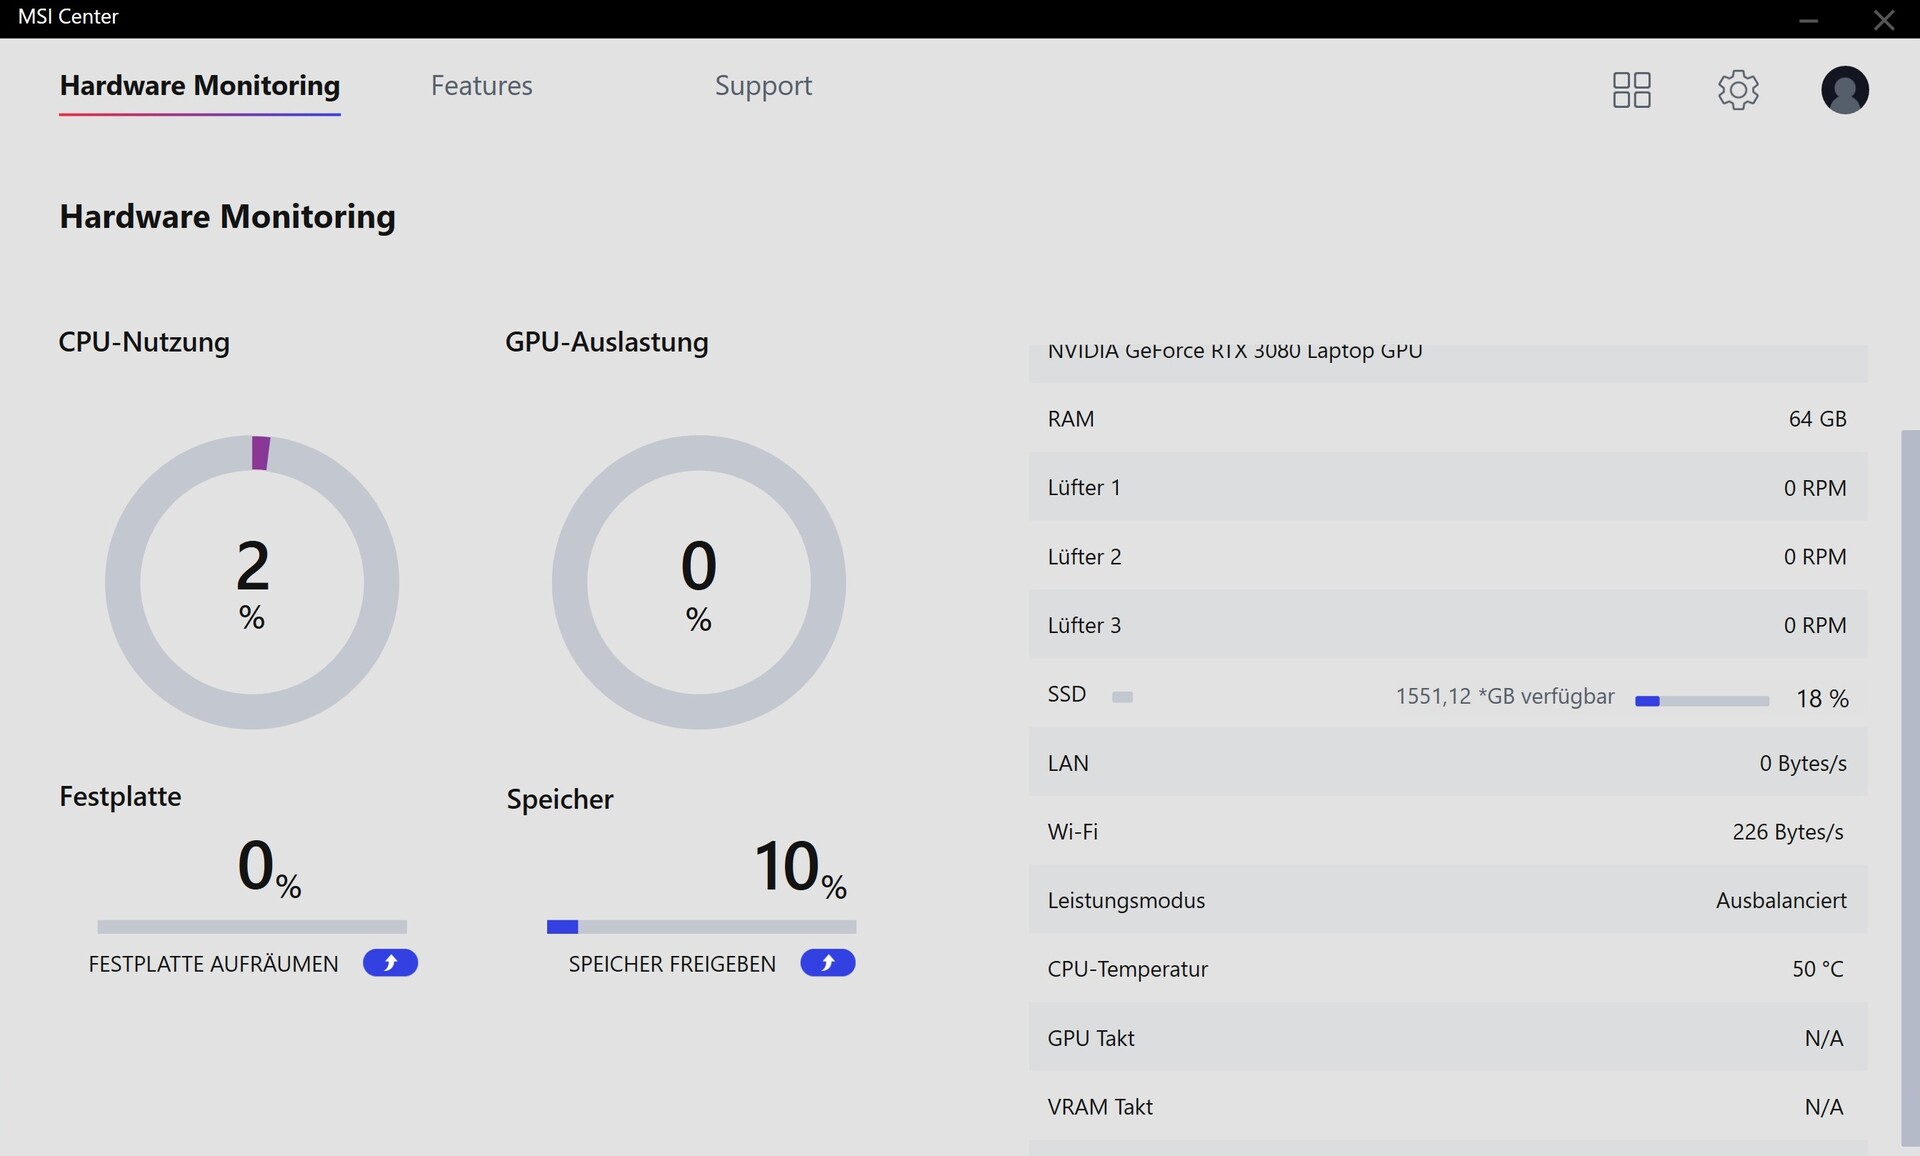
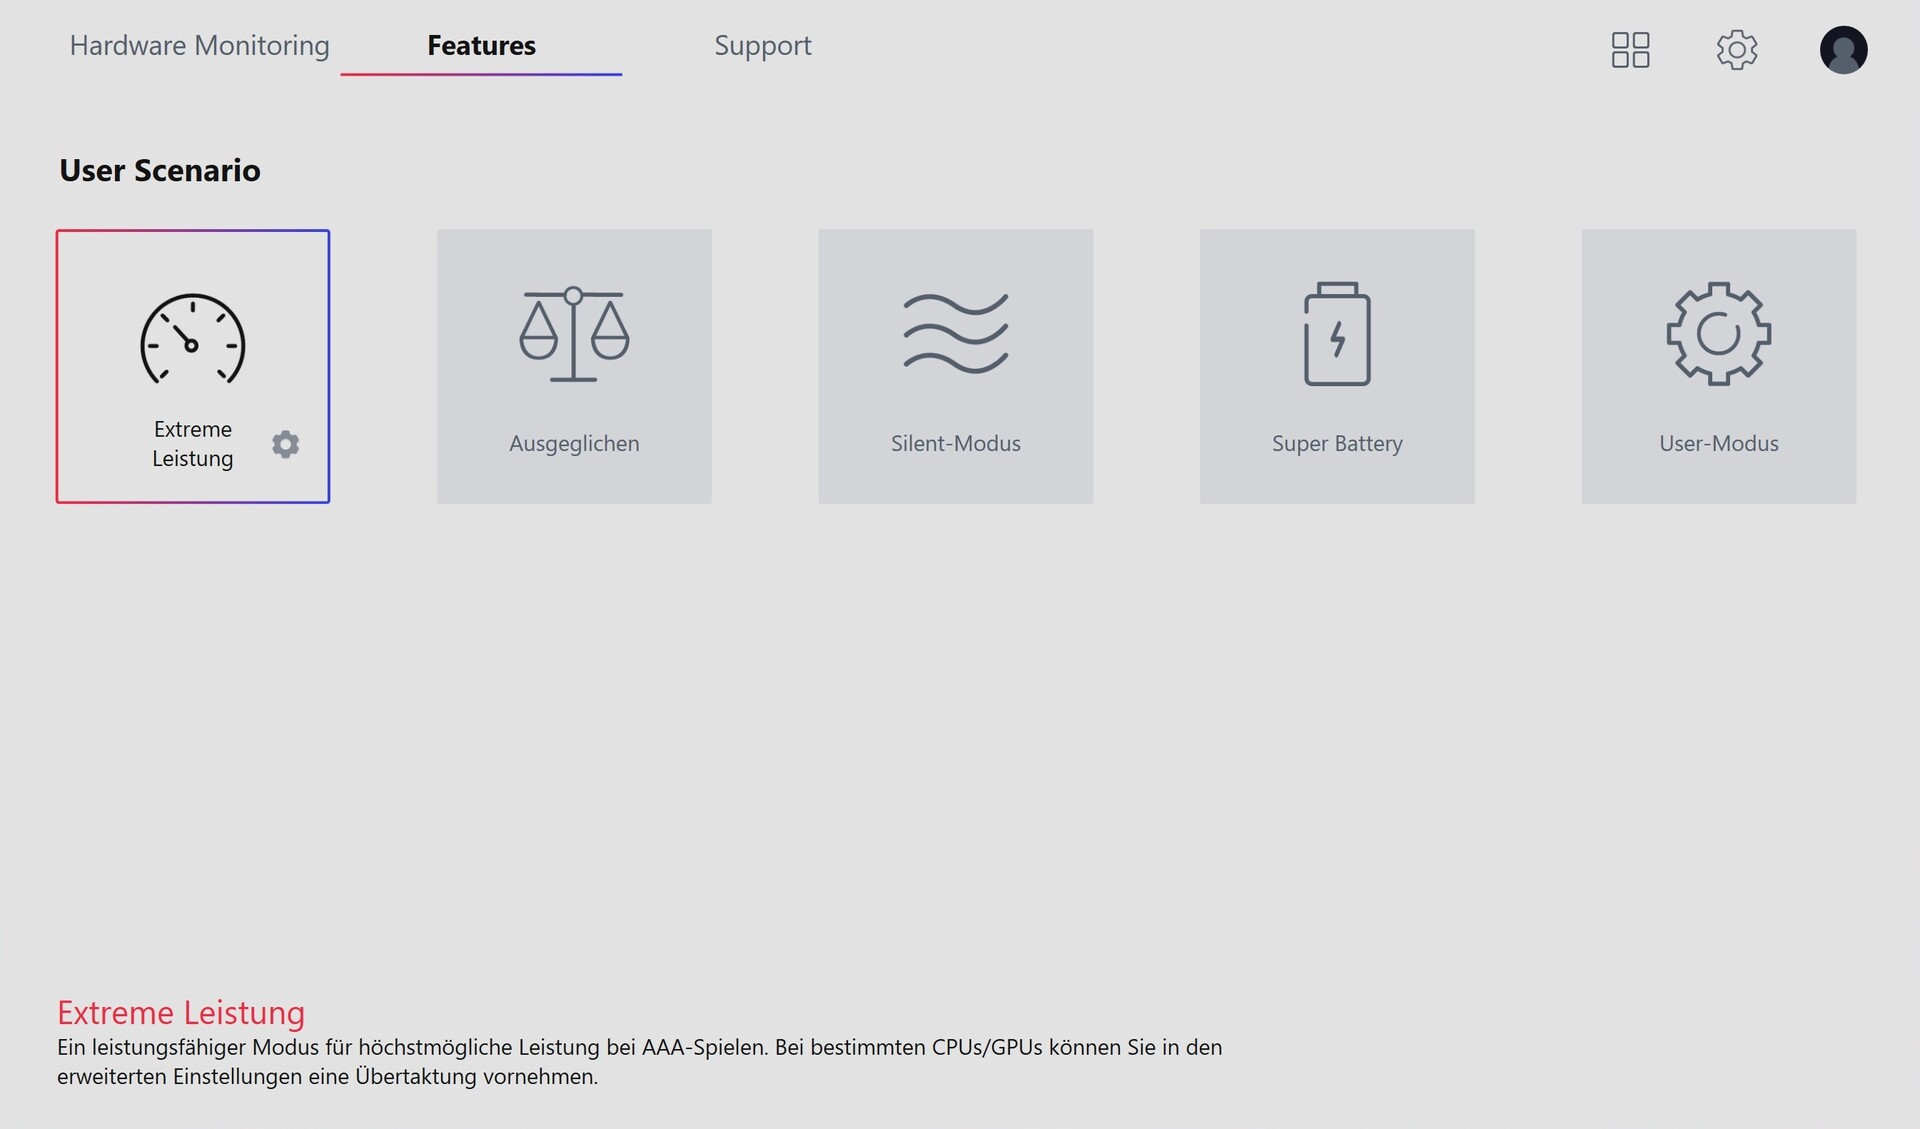
各种系统设置可以在预装的MSI中心进行调整。我们使用用户场景 "极端性能"(没有额外的风扇涡轮增压)进行测试。此外,图形切换始终处于活动状态(MSHybrid @GPU Switch)。
业绩
八核CPU,16GB的GPU,以及64GB的慷慨的RAM。GS76 11UH-074属于绝对的高端范围--考虑到4,400欧元(约5,159美元)的高价,这并不令人惊讶。
处理器
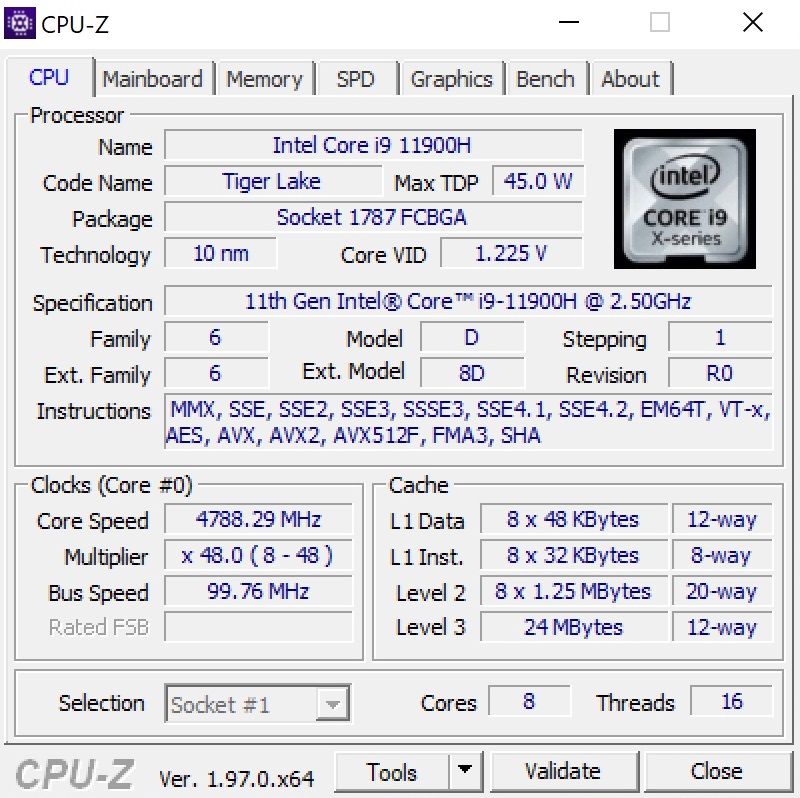
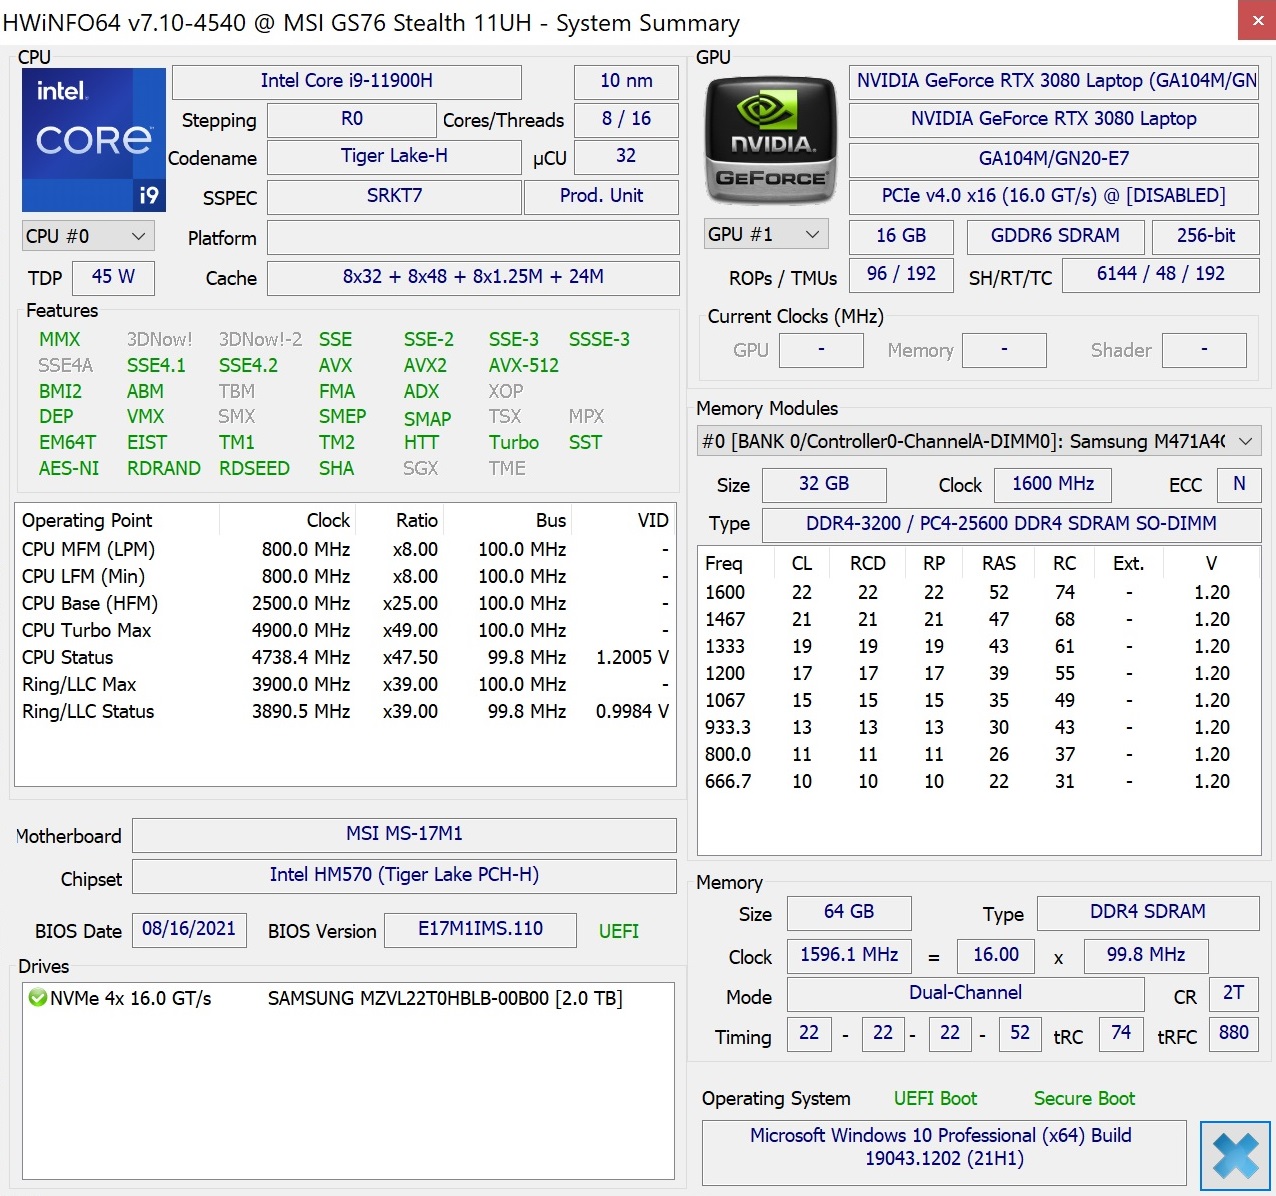
微星为其顶级型号选择了英特尔当前Tiger Lake 代中最强的处理器之一。酷睿i9-11900H提供24MB的L3缓存和八个核心,通过超线程技术可以实现多达16个并行线程。这款10纳米芯片的基本时钟速度为2.5GHz。在负载情况下--取决于应用和压力--可以达到4.9GHz。TDP为45瓦,与其他大多数具有六个或八个内核的移动CPU一致。HWiNFO工具显示PL1值为90瓦,PL2值为109瓦。
在我们的基准测试过程中,GS76以非常高的速度表现出众,但正如我们的Cinebench循环所显示的那样,其性能随着时间的推移有所下降。基于11900H/11980HK或5900HX的对比笔记本电脑从长远来看往往会获得一些优势。另一方面,较老的彗星湖对应产品(例如采用Core i7-10875H )则大大落后。
Cinebench R15 Multi endurance test
* ... smaller is better
系统性能
GS76 11UH的系统性能达到了很高的期望值,尽管它只够在PCMark 10中排名倒数第二。不过,总分的差异是很小的。
| PCMark 10 / Score | |
| Average of class Gaming (5828 - 11574, n=94, last 2 years) | |
| Asus ROG Zephyrus S17 GX703HSD | |
| Gigabyte Aero 17 HDR YD | |
| Average Intel Core i9-11900H, NVIDIA GeForce RTX 3080 Laptop GPU (6822 - 7245, n=2) | |
| Medion Erazer Beast X25 | |
| MSI GS76 Stealth 11UH | |
| Razer Blade Pro 17 2021 (QHD Touch) | |
| PCMark 10 / Essentials | |
| Average of class Gaming (8810 - 12600, n=98, last 2 years) | |
| Asus ROG Zephyrus S17 GX703HSD | |
| Gigabyte Aero 17 HDR YD | |
| Average Intel Core i9-11900H, NVIDIA GeForce RTX 3080 Laptop GPU (9690 - 10630, n=2) | |
| Medion Erazer Beast X25 | |
| Razer Blade Pro 17 2021 (QHD Touch) | |
| MSI GS76 Stealth 11UH | |
| PCMark 10 / Productivity | |
| Average of class Gaming (6845 - 18766, n=96, last 2 years) | |
| Medion Erazer Beast X25 | |
| Asus ROG Zephyrus S17 GX703HSD | |
| Gigabyte Aero 17 HDR YD | |
| Average Intel Core i9-11900H, NVIDIA GeForce RTX 3080 Laptop GPU (8882 - 9182, n=2) | |
| MSI GS76 Stealth 11UH | |
| Razer Blade Pro 17 2021 (QHD Touch) | |
| PCMark 10 / Digital Content Creation | |
| Average of class Gaming (7602 - 19657, n=96, last 2 years) | |
| Asus ROG Zephyrus S17 GX703HSD | |
| Gigabyte Aero 17 HDR YD | |
| Average Intel Core i9-11900H, NVIDIA GeForce RTX 3080 Laptop GPU (10014 - 10573, n=2) | |
| MSI GS76 Stealth 11UH | |
| Medion Erazer Beast X25 | |
| Razer Blade Pro 17 2021 (QHD Touch) | |
| PCMark 10 Score | 6822 points | |
Help | ||
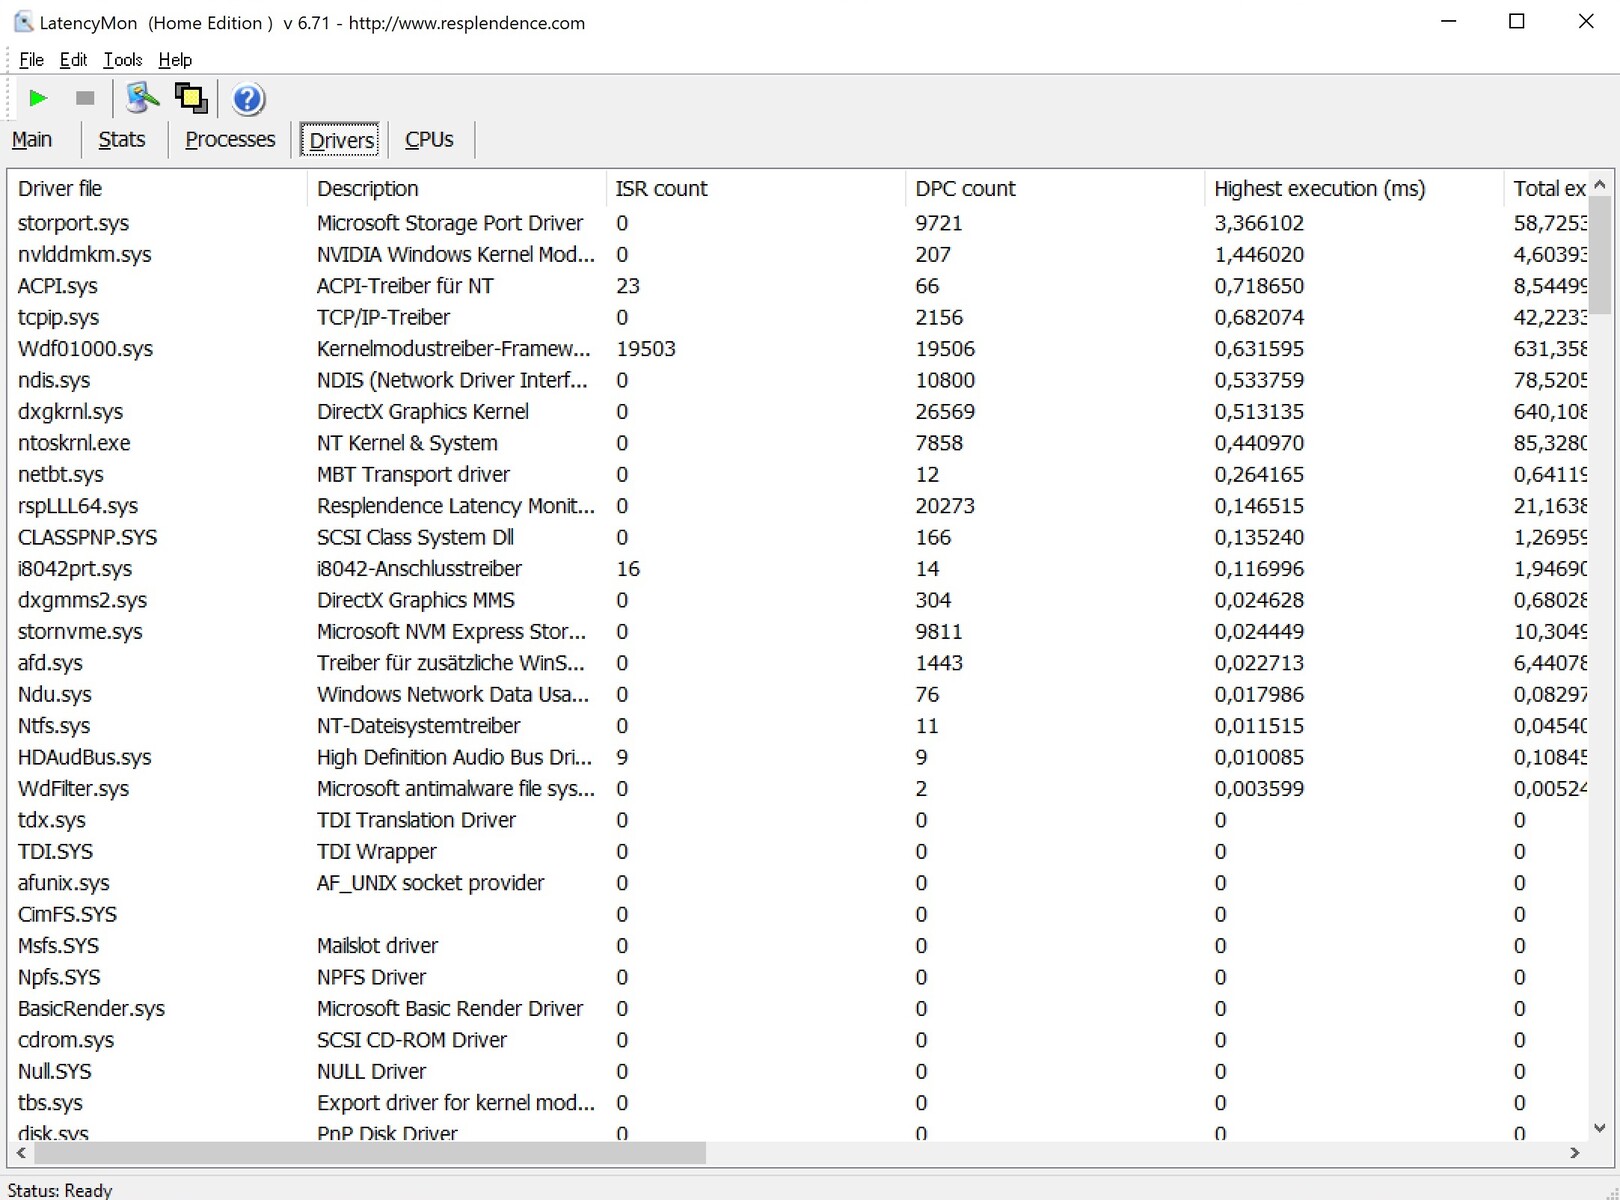
DPC延迟
虽然GS76的延迟是测试领域中最低的,但根据LatencyMon工具,它只适合在有限的范围内进行实时视频和音频编辑。
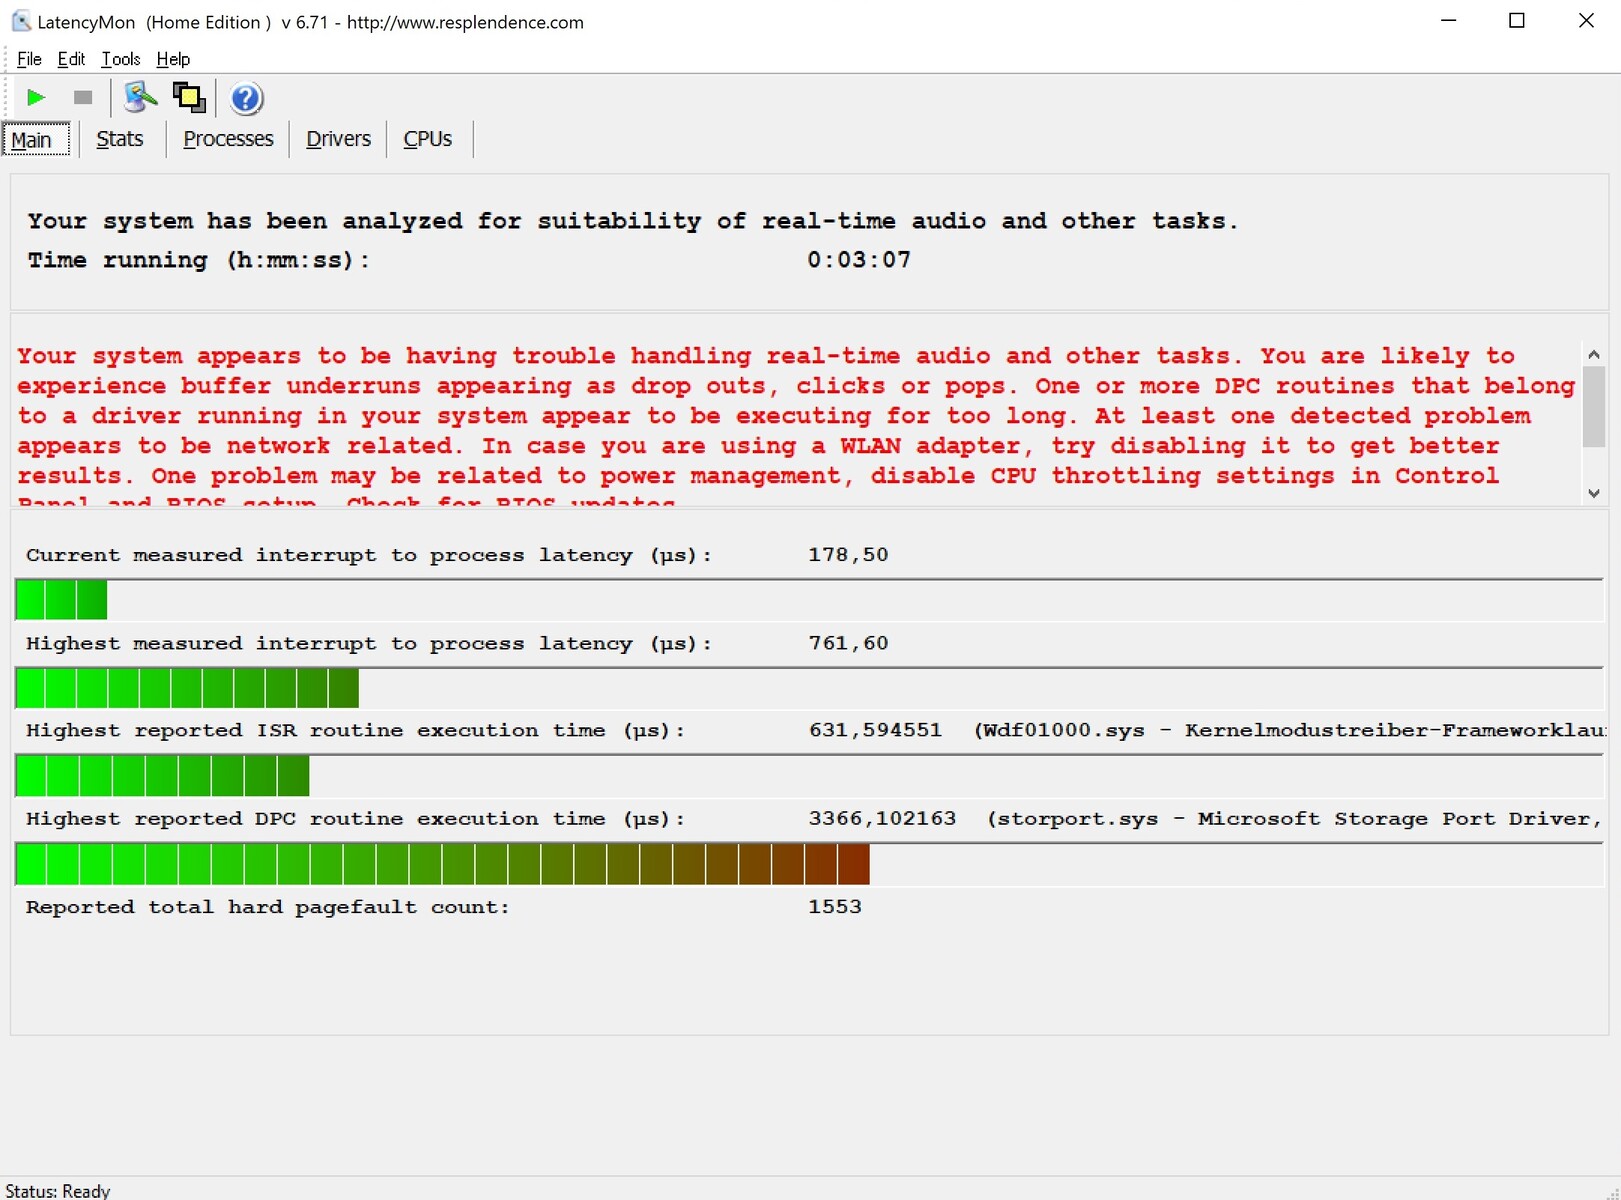
| DPC Latencies / LatencyMon - interrupt to process latency (max), Web, Youtube, Prime95 | |
| Gigabyte Aero 17 HDR YD | |
| Razer Blade Pro 17 2021 (QHD Touch) | |
| Asus ROG Zephyrus S17 GX703HSD | |
| Medion Erazer Beast X25 | |
| MSI GS76 Stealth 11UH | |
* ... smaller is better
储存
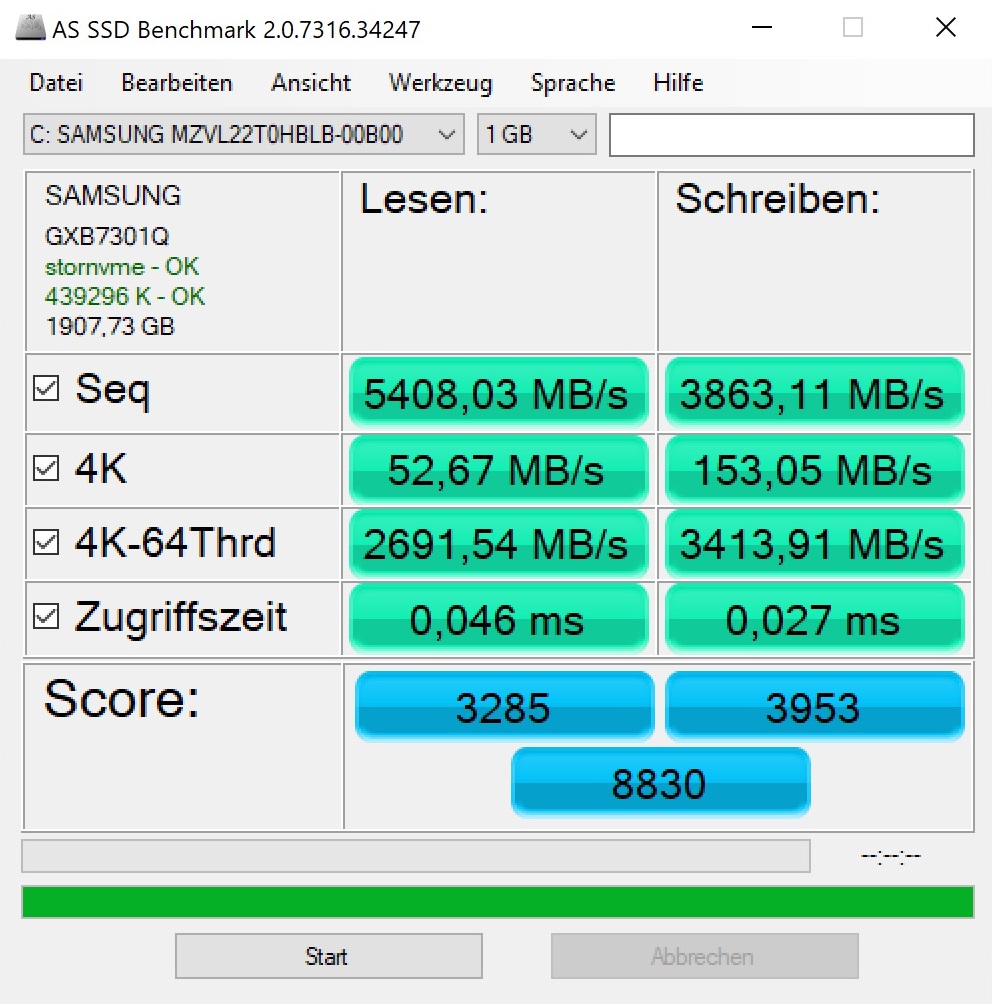
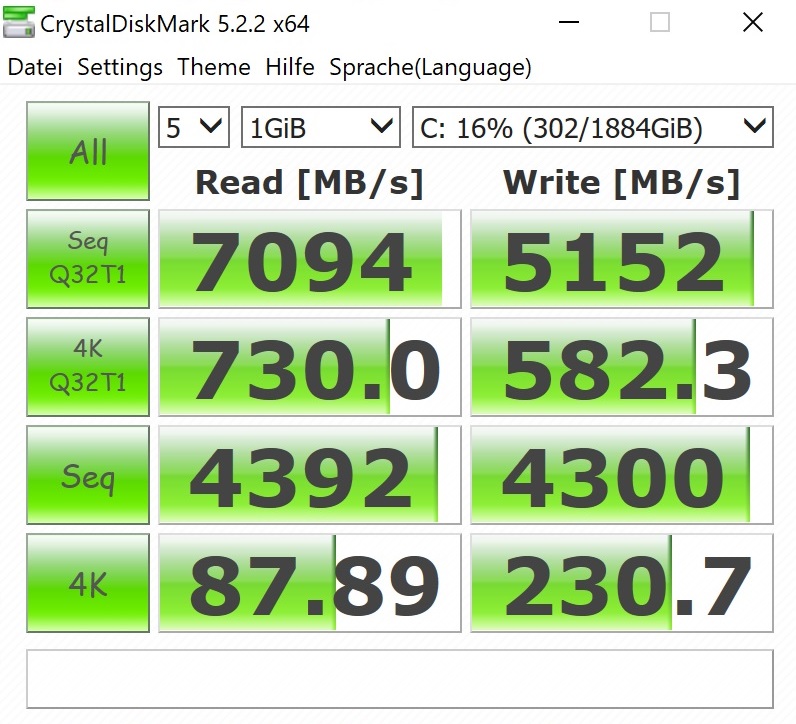
当涉及到存储时,事情才真正起飞。微星为17英寸机提供了一个极快的PCIe 4固态硬盘,大大超过了旧的PCIe 3驱动器(至少在纸上)。三星PM9A1的2TB版本也被安装在我们的测试设备华硕ROG GX703HSD中,正如预期的那样,它在那里的表现同样出色。如果你想扩大存储空间,机箱内还有一个空的M.2插槽(但只有PCIe 3.0)。
| MSI GS76 Stealth 11UH Samsung PM9A1 MZVL22T0HBLB | Gigabyte Aero 17 HDR YD Samsung PM9A1 MZVL2512HCJQ | Asus ROG Zephyrus S17 GX703HSD Samsung PM9A1 MZVL22T0HBLB | Razer Blade Pro 17 2021 (QHD Touch) Samsung PM981a MZVLB1T0HBLR | Medion Erazer Beast X25 Samsung PM9A1 MZVL22T0HBLB | |
|---|---|---|---|---|---|
| CrystalDiskMark 5.2 / 6 | 2% | 1% | -44% | -37% | |
| Write 4K (MB/s) | 230.7 | 230.4 0% | 244.2 6% | 123.5 -46% | 129.7 -44% |
| Read 4K (MB/s) | 87.9 | 91.6 4% | 89.8 2% | 45.96 -48% | 62.4 -29% |
| Write Seq (MB/s) | 4300 | 4216 -2% | 1861 -57% | 2436 -43% | |
| Read Seq (MB/s) | 4392 | 4543 3% | 1584 -64% | 2354 -46% | |
| Write 4K Q32T1 (MB/s) | 582 | 667 15% | 607 4% | 466.4 -20% | 512 -12% |
| Read 4K Q32T1 (MB/s) | 730 | 728 0% | 658 -10% | 566 -22% | 436.2 -40% |
| Write Seq Q32T1 (MB/s) | 5152 | 5043 -2% | 5270 2% | 2981 -42% | 3541 -31% |
| Read Seq Q32T1 (MB/s) | 7094 | 6821 -4% | 7091 0% | 3260 -54% | 3568 -50% |
| AS SSD | -1% | 14% | -67% | -28% | |
| Seq Read (MB/s) | 5408 | 5438 1% | 5085 -6% | 2068 -62% | 2591 -52% |
| Seq Write (MB/s) | 3863 | 3904 1% | 4434 15% | 2047 -47% | 1900 -51% |
| 4K Read (MB/s) | 52.7 | 56.2 7% | 80.3 52% | 47.85 -9% | 53.9 2% |
| 4K Write (MB/s) | 153.1 | 165.8 8% | 214.7 40% | 87.4 -43% | 112.6 -26% |
| 4K-64 Read (MB/s) | 2692 | 2489 -8% | 2573 -4% | 1932 -28% | 1335 -50% |
| 4K-64 Write (MB/s) | 3414 | 3480 2% | 2972 -13% | 2017 -41% | 2966 -13% |
| Access Time Read * (ms) | 0.046 | 0.054 -17% | 0.018 61% | 0.055 -20% | 0.038 17% |
| Access Time Write * (ms) | 0.027 | 0.026 4% | 0.02 26% | 0.128 -374% | 0.036 -33% |
| Score Read (Points) | 3285 | 3089 -6% | 3161 -4% | 2187 -33% | 1648 -50% |
| Score Write (Points) | 3953 | 4036 2% | 3631 -8% | 2309 -42% | 3269 -17% |
| Score Total (Points) | 8830 | 8620 -2% | 8380 -5% | 5612 -36% | 5733 -35% |
| Total Average (Program / Settings) | 1% /
0% | 8% /
9% | -56% /
-57% | -33% /
-32% |
* ... smaller is better

Continuous load read: DiskSpd Read Loop, Queue Depth 8
图形卡
由于TGP差异很大,估计目前Nvidia显卡的性能并不是一件容易的事。就GS76而言,GeForce RTX 3080 ,理论上可达165瓦(包括动态提升),但运行时的TGP只有95瓦;这可能导致Nvidia的Ampere系列顶级型号的性能比便宜得多的RTX 3070 。
相应地,GS76在合成图形基准测试中排在最后也就不足为奇了。尽管其高度相当,但华硕Zephyrus S17的部分速度超过20%。这也难怪,因为华硕允许RTX 3080消耗140瓦特。排放量是否至少比竞争对手低的回报,我们很快就会分析的。
| 3DMark 11 Performance | 28333 points | |
| 3DMark Cloud Gate Standard Score | 35442 points | |
| 3DMark Fire Strike Score | 21544 points | |
| 3DMark Time Spy Score | 9326 points | |
Help | ||
游戏性能
疲软的TGP对游戏基准也有不利影响。GS76在这里也经常不得不向其竞争对手认输。然而,性能足以在FHD或QHD下以最大的细节顺利运行所有最新的游戏。然而,在原生4K分辨率下和/或启用光线追踪时,情况可能会变得有点紧张,这在我们的基准测试中得到了证明。在这种情况下,Crysis Remastered,例如,下降到30 FPS大关以下。如果在必要时降低分辨率,热情的游戏玩家仍会对GS76 11UH的3D性能感到满意。
| The Witcher 3 | |
| 1920x1080 High Graphics & Postprocessing (Nvidia HairWorks Off) | |
| Average of class Gaming (181 - 341, n=3, last 2 years) | |
| Razer Blade Pro 17 2021 (QHD Touch) | |
| Asus ROG Zephyrus S17 GX703HSD | |
| Average NVIDIA GeForce RTX 3080 Laptop GPU (149 - 242, n=32) | |
| Medion Erazer Beast X25 | |
| MSI GS76 Stealth 11UH | |
| 1920x1080 Ultra Graphics & Postprocessing (HBAO+) | |
| Average of class Gaming (95 - 240, n=8, last 2 years) | |
| Asus ROG Zephyrus S17 GX703HSD | |
| Razer Blade Pro 17 2021 (QHD Touch) | |
| Average NVIDIA GeForce RTX 3080 Laptop GPU (85.1 - 123, n=40) | |
| Medion Erazer Beast X25 | |
| MSI GS76 Stealth 11UH | |
| Gigabyte Aero 17 HDR YD | |
我们用角色扮演游戏TheWitcher 3长达60分钟(FHD/Ultra),测试了图形性能在长时间内的表现。与CPU类似,GPU的性能在一段时间后也有一些下降,但我们不能说有重大的性能下降。
The Witcher 3 FPS diagram
| low | med. | high | ultra | QHD | 4K | |
|---|---|---|---|---|---|---|
| GTA V (2015) | 164 | 98.5 | 82.3 | 86.5 | ||
| The Witcher 3 (2015) | 174 | 93.8 | 66.7 | |||
| Dota 2 Reborn (2015) | 175 | 155 | 146 | 131 | 110 | |
| Final Fantasy XV Benchmark (2018) | 88 | 71.2 | 42.9 | |||
| X-Plane 11.11 (2018) | 133 | 109 | 89.2 | 63.2 | ||
| Far Cry 5 (2018) | 125 | 114 | 90 | 52 | ||
| Strange Brigade (2018) | 185 | 165 | 123 | 72.1 | ||
| Hunt Showdown (2020) | 110 | 77.9 | 37.8 | |||
| Gears Tactics (2020) | 138 | 103 | 73.2 | 39.8 | ||
| Death Stranding (2020) | 104 | 102 | 92.2 | 55.8 | ||
| Crysis Remastered (2020) | 78.8 | 54.3 | 44 | 28 | ||
| Mafia Definitive Edition (2020) | 102 | 69.3 | 37.4 | |||
| Star Wars Squadrons (2020) | 228 | 220 | 162 | 97.1 | ||
| FIFA 21 (2020) | 227 | 223 | 177 | 97.5 | ||
| Resident Evil Village (2021) | 163 | 145 | 99.4 | 51.7 | ||
| Monster Hunter Stories 2 (2021) | 144 | 143 | 118 | |||
| F1 2021 (2021) | 172 | 110 | 84 | 47 |
排放
噪声排放
根据我们的排放测量,GS76 11UH的冷却系统无法跟上Zephyrus S17。虽然微星笔记本电脑的TGP较低,图形性能也因此较低,但在3D模式下,它的声音往往比华硕的同类产品要大。在播放《Witcher 3》时,我们测得的平均音量为48 dB(A),而不是45 dB(A)--这是一个很高的水平,但(还)不是非常响。GS76仍然值得称赞,因为许多竞争对手在这里超过了50分贝的大关,因此是令人讨厌的大声。
在空闲使用时,这台17英寸的机器通常是无声的,但偶尔会不必要地提高音量。
Noise level
| Idle |
| 24 / 25 / 42 dB(A) |
| Load |
| 46 / 48 dB(A) |
 | ||
30 dB silent 40 dB(A) audible 50 dB(A) loud |
||
min: | ||
| MSI GS76 Stealth 11UH i9-11900H, GeForce RTX 3080 Laptop GPU | Gigabyte Aero 17 HDR YD i9-11980HK, GeForce RTX 3080 Laptop GPU | Asus ROG Zephyrus S17 GX703HSD i9-11900H, GeForce RTX 3080 Laptop GPU | Razer Blade Pro 17 2021 (QHD Touch) i7-10875H, GeForce RTX 3080 Laptop GPU | Medion Erazer Beast X25 R9 5900HX, GeForce RTX 3080 Laptop GPU | Average of class Gaming | |
|---|---|---|---|---|---|---|
| Noise | -11% | 10% | -3% | -11% | 1% | |
| off / environment * (dB) | 24 | 25 -4% | 23 4% | 26.1 -9% | 25 -4% | 24.1 ? -0% |
| Idle Minimum * (dB) | 24 | 30 -25% | 23 4% | 26.1 -9% | 26 -8% | 25.8 ? -8% |
| Idle Average * (dB) | 25 | 32 -28% | 23 8% | 26.5 -6% | 30 -20% | 27.4 ? -10% |
| Idle Maximum * (dB) | 42 | 41 2% | 23 45% | 30.7 27% | 43 -2% | 29.9 ? 29% |
| Load Average * (dB) | 46 | 43 7% | 41 11% | 43.5 5% | 54 -17% | 43 ? 7% |
| Witcher 3 ultra * (dB) | 48 | 51 -6% | 45 6% | 54 -13% | 52 -8% | |
| Load Maximum * (dB) | 48 | 59 -23% | 52 -8% | 55 -15% | 55 -15% | 54 ? -13% |
* ... smaller is better
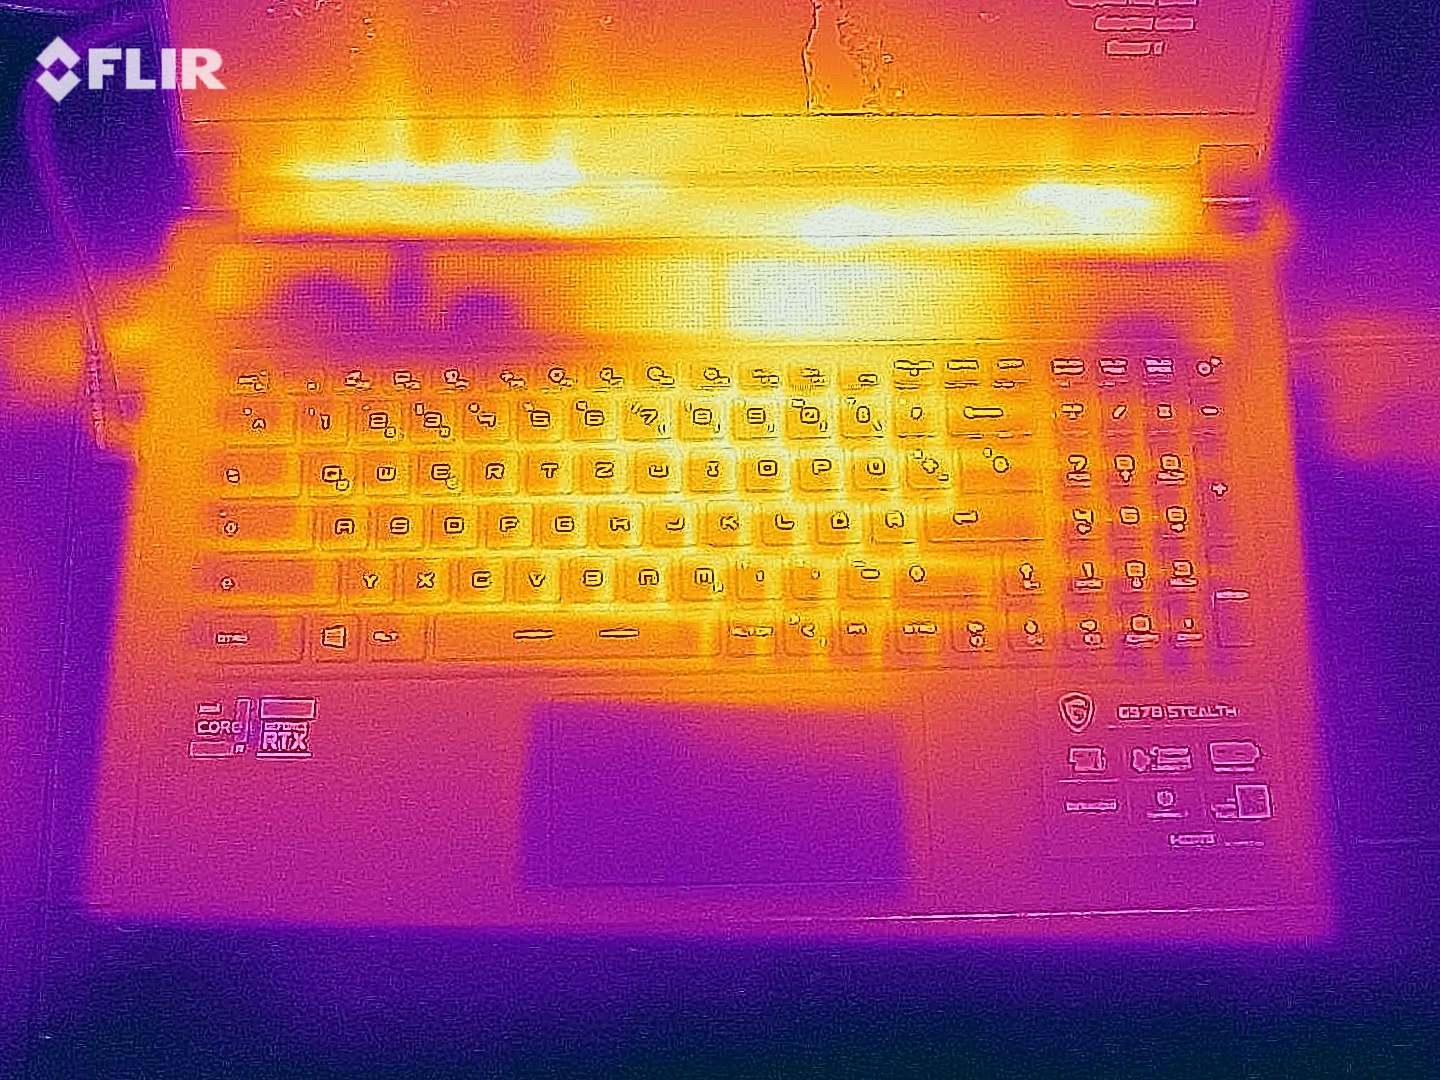
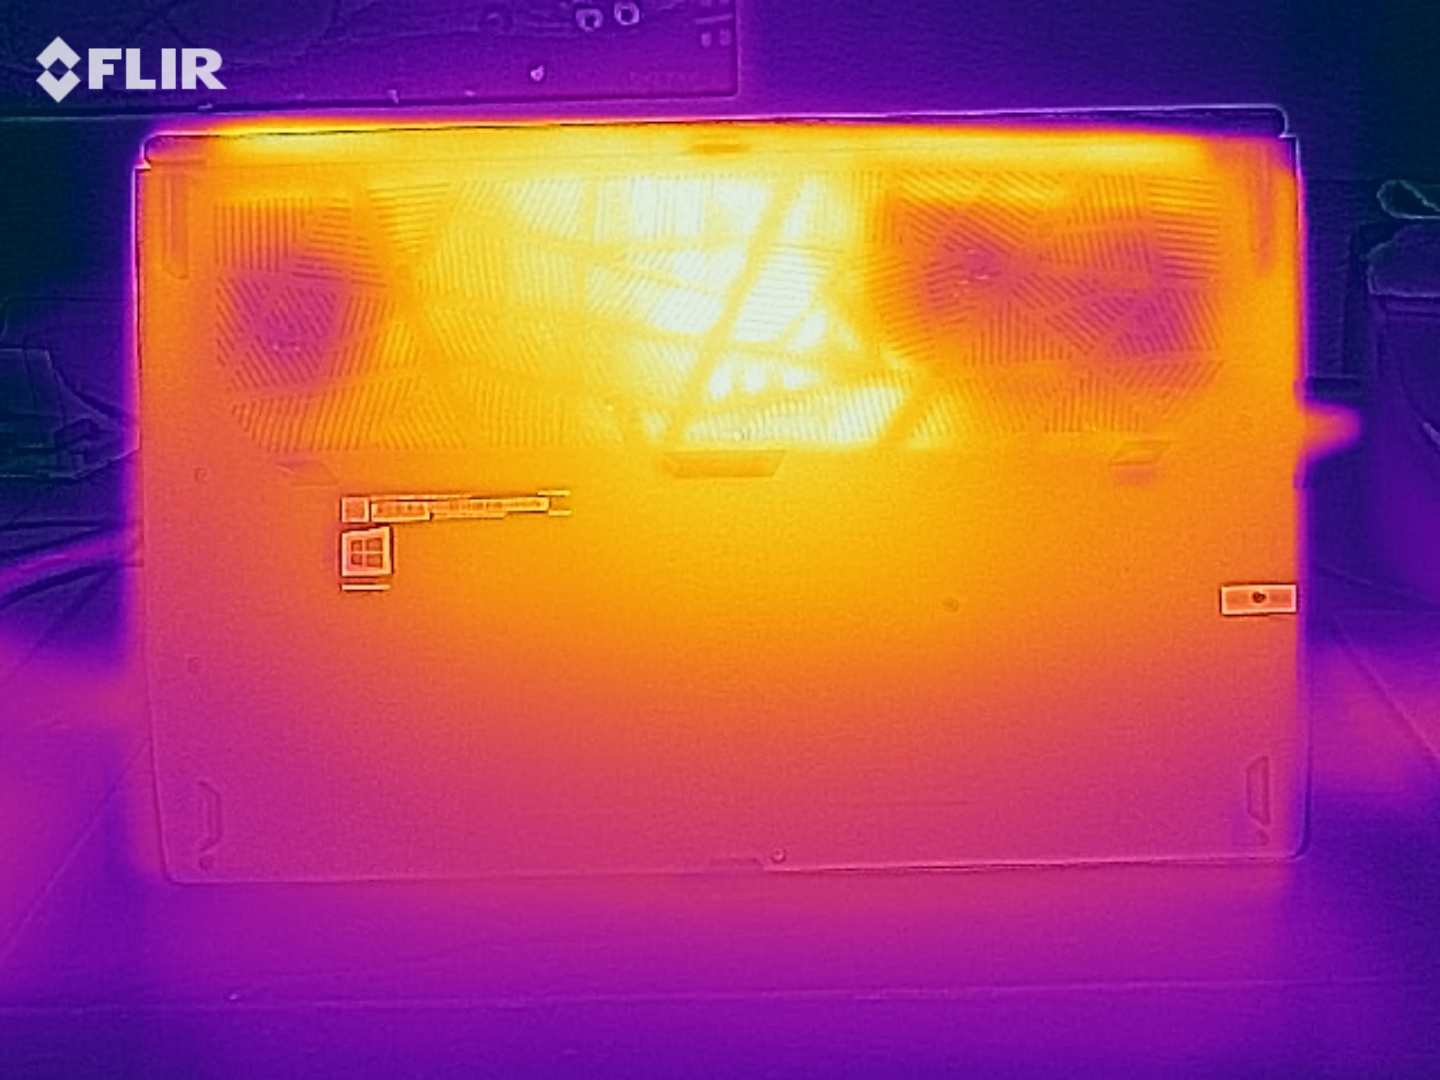
温度
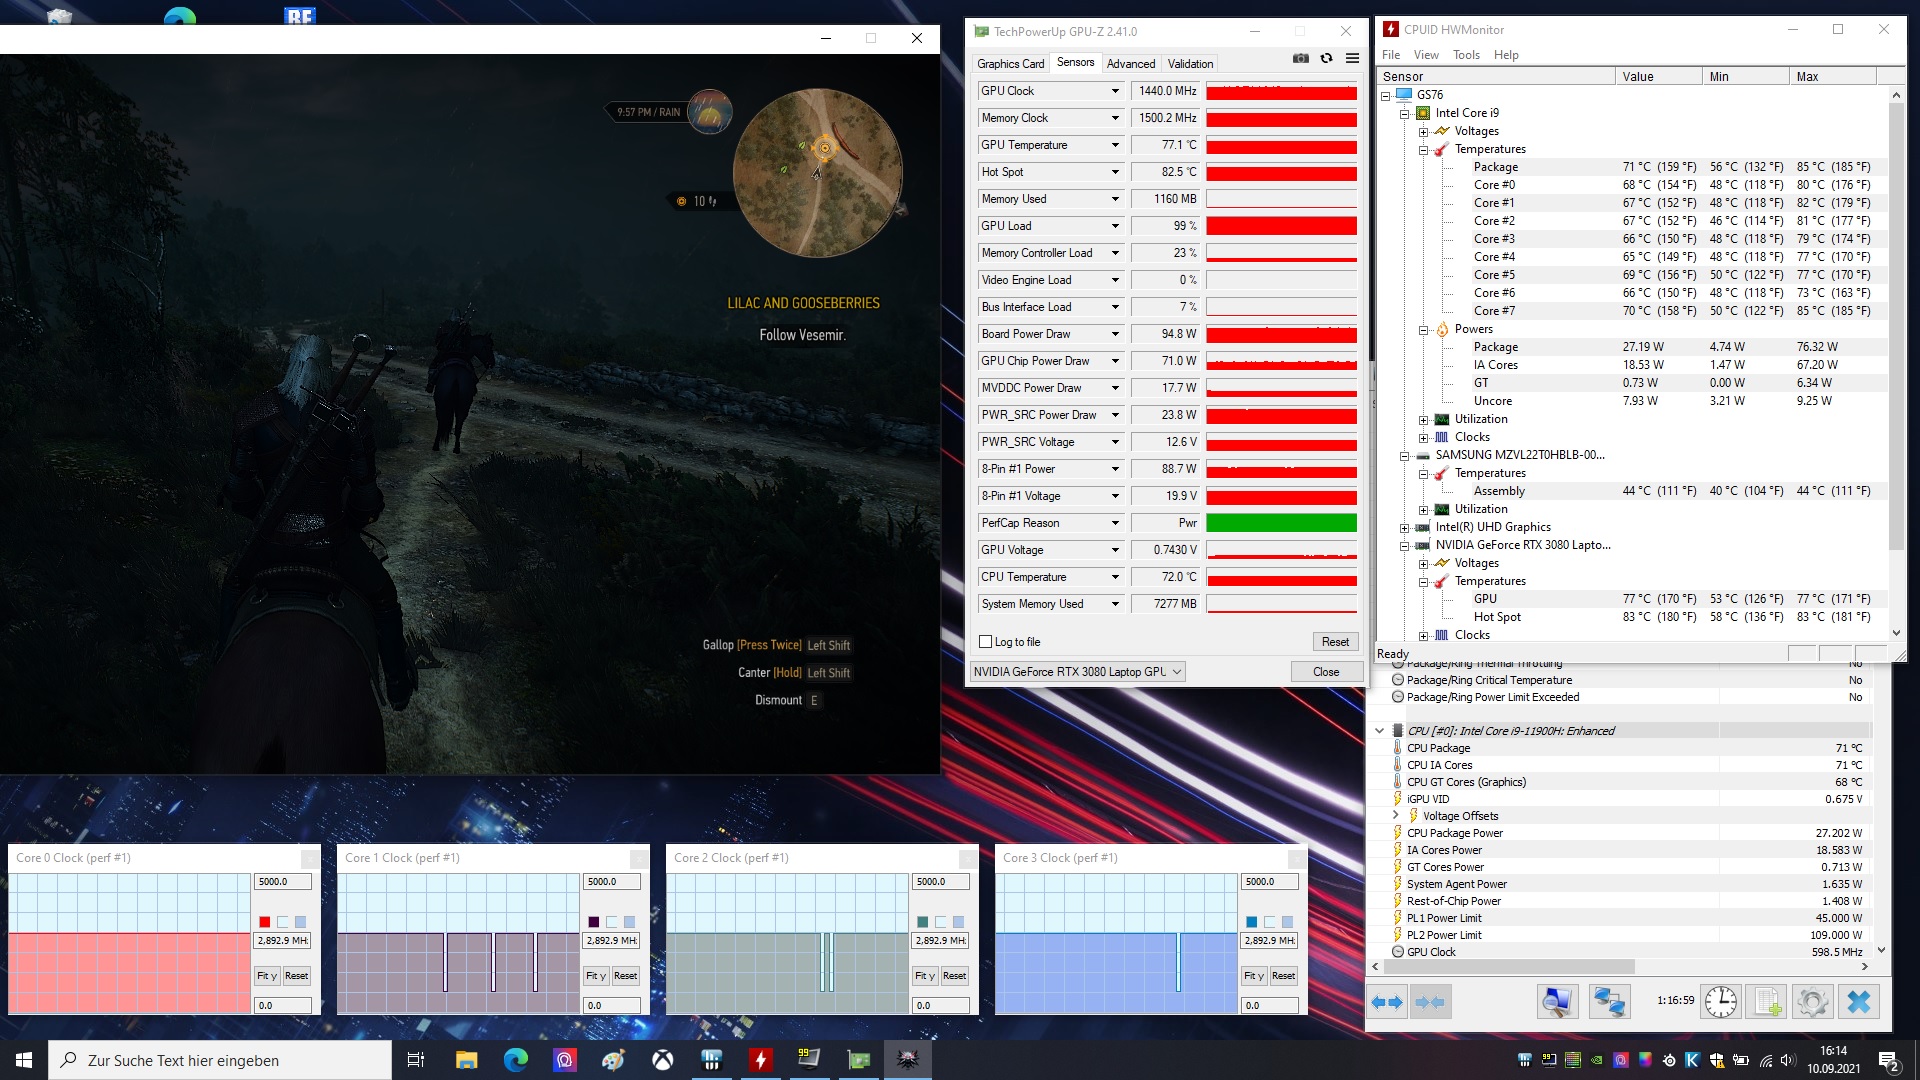
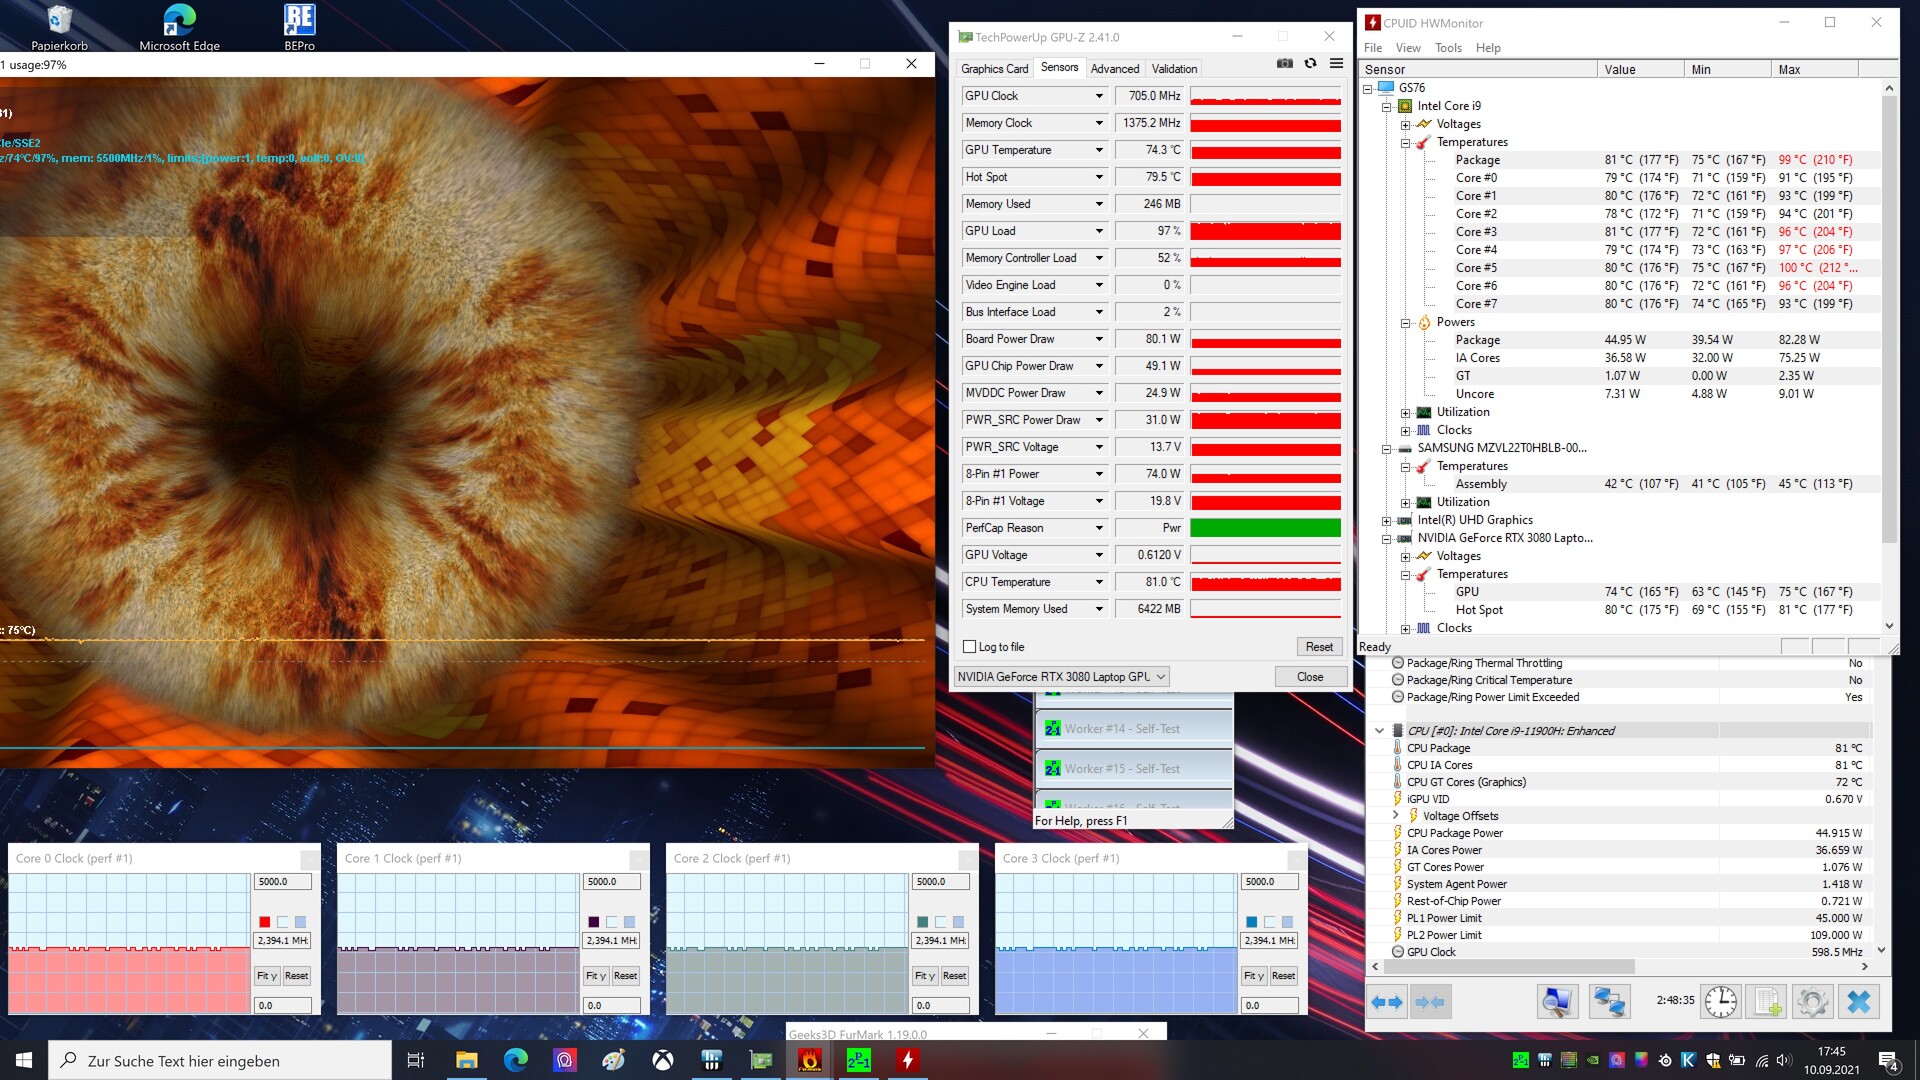
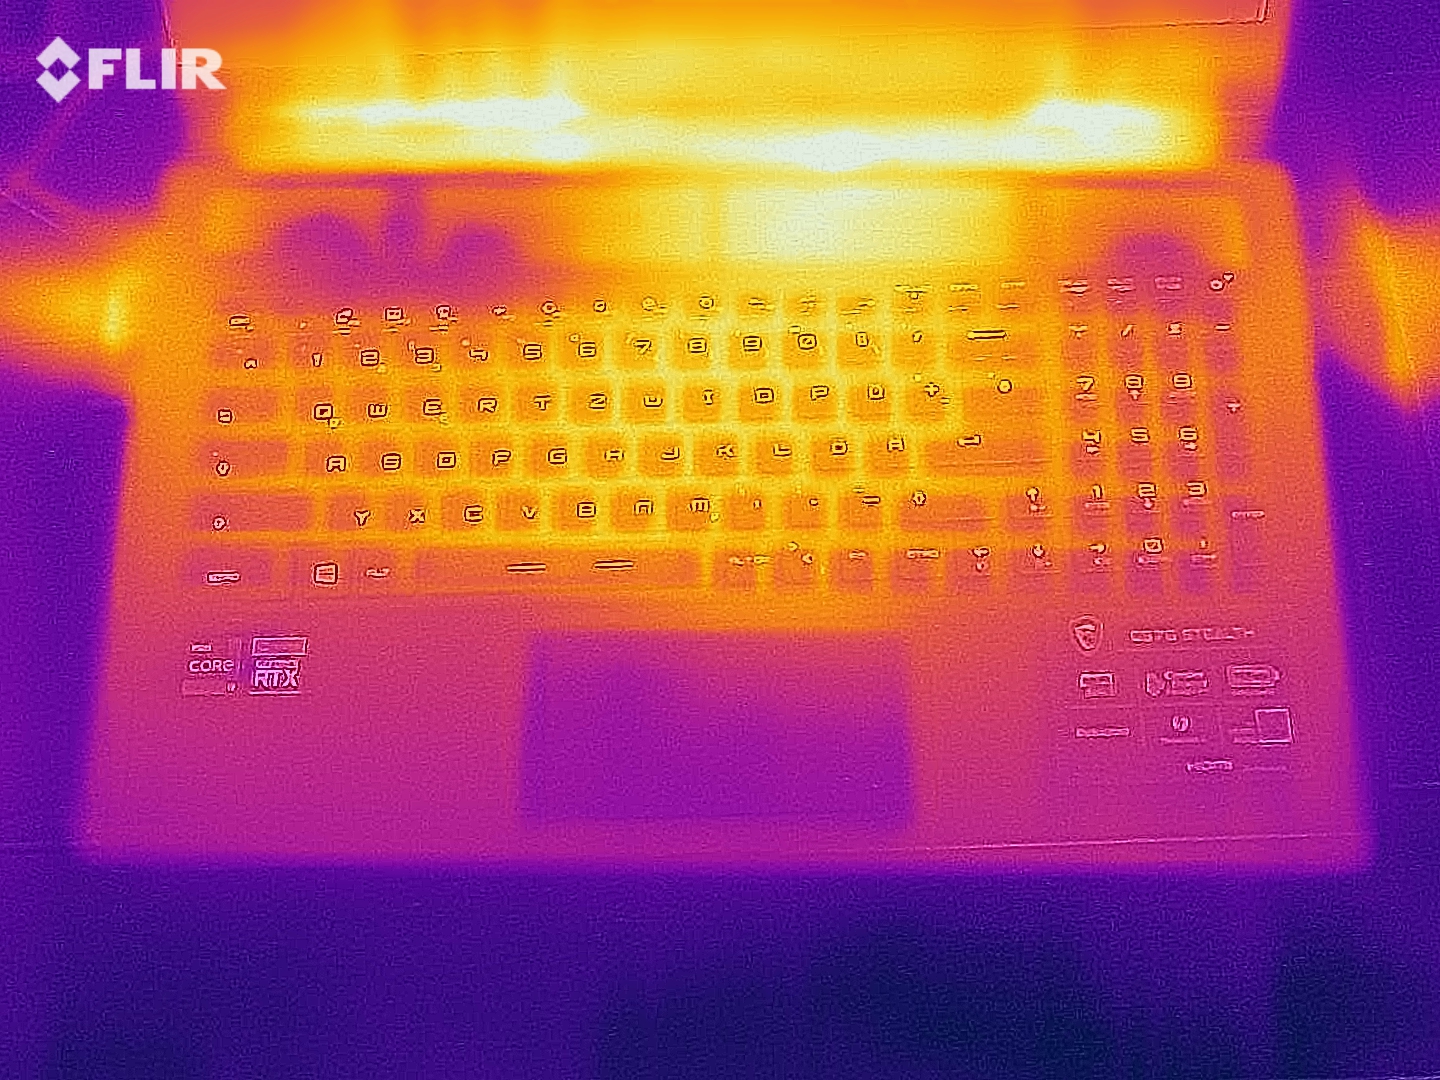
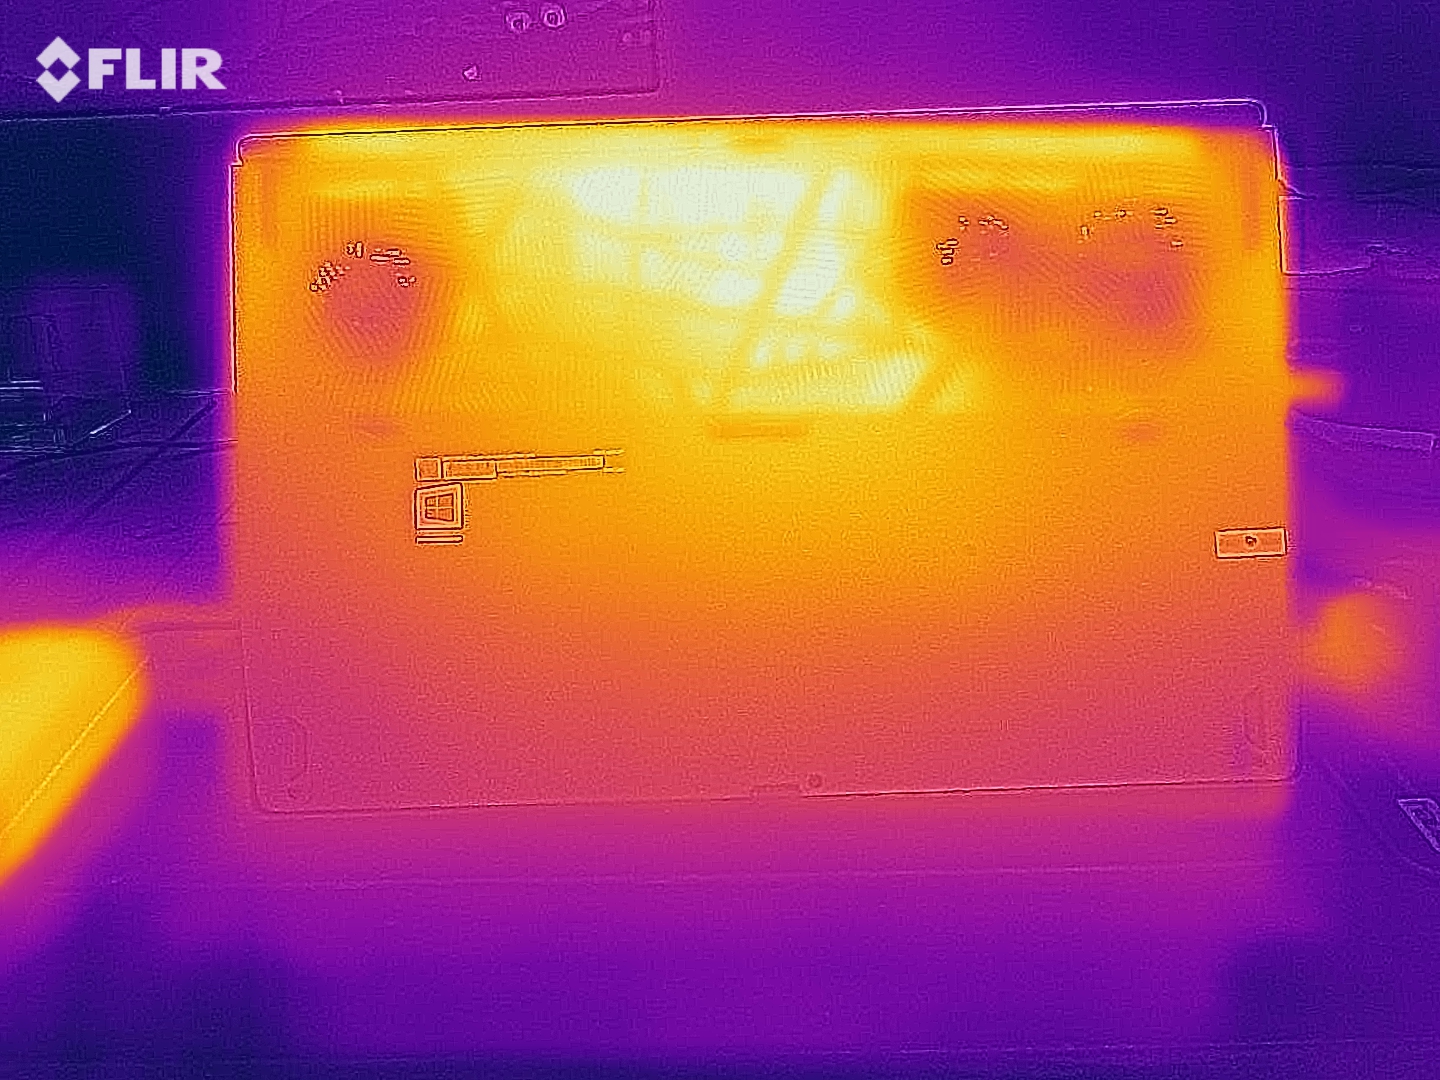
这些温度对于超薄的高端笔记本电脑来说是典型的。虽然机箱表面在空闲使用时保持在30°C(约86°F)以下,但在FurMark和Prime95的压力测试中,机箱顶部加热至49°C(约120°F),底部加热至57°C(约135°F)。因此,不建议在游戏时将设备放在腿上。
组件也很挣扎。尽管温度仍然可以接受,但CPU和GPU在全负荷下都在节流,下降到低于其基本速度的速率。另一方面,你不需要担心在日常游戏中会出现任何问题。下面的截图显示,我们的TheWitcher 3测试是在没有节流的情况下进行的。
(-) The maximum temperature on the upper side is 49 °C / 120 F, compared to the average of 40.4 °C / 105 F, ranging from 21.2 to 68.8 °C for the class Gaming.
(-) The bottom heats up to a maximum of 57 °C / 135 F, compared to the average of 43.2 °C / 110 F
(+) In idle usage, the average temperature for the upper side is 27.1 °C / 81 F, compared to the device average of 33.9 °C / 93 F.
(-) Playing The Witcher 3, the average temperature for the upper side is 44.3 °C / 112 F, compared to the device average of 33.9 °C / 93 F.
(-) The palmrests and touchpad can get very hot to the touch with a maximum of 40 °C / 104 F.
(-) The average temperature of the palmrest area of similar devices was 28.8 °C / 83.8 F (-11.2 °C / -20.2 F).
| MSI GS76 Stealth 11UH i9-11900H, GeForce RTX 3080 Laptop GPU | Gigabyte Aero 17 HDR YD i9-11980HK, GeForce RTX 3080 Laptop GPU | Asus ROG Zephyrus S17 GX703HSD i9-11900H, GeForce RTX 3080 Laptop GPU | Razer Blade Pro 17 2021 (QHD Touch) i7-10875H, GeForce RTX 3080 Laptop GPU | Medion Erazer Beast X25 R9 5900HX, GeForce RTX 3080 Laptop GPU | Average of class Gaming | |
|---|---|---|---|---|---|---|
| Heat | -5% | -14% | 2% | -12% | -0% | |
| Maximum Upper Side * (°C) | 49 | 44 10% | 59 -20% | 38.2 22% | 54 -10% | 45.2 ? 8% |
| Maximum Bottom * (°C) | 57 | 56 2% | 53 7% | 42.2 26% | 57 -0% | 47.9 ? 16% |
| Idle Upper Side * (°C) | 28 | 32 -14% | 35 -25% | 33.6 -20% | 34 -21% | 31.1 ? -11% |
| Idle Bottom * (°C) | 30 | 35 -17% | 35 -17% | 36.2 -21% | 35 -17% | 34.2 ? -14% |
* ... smaller is better
发言人
对于这么薄的笔记本电脑来说,声音质量相对较好。微星安装了一个来自Dynaudio的2.0系统,隐藏在掌托的左右边缘;在我们的音频分析中,它只在涉及到低音时显示出弱点。
MSI GS76 Stealth 11UH audio analysis
(+) | speakers can play relatively loud (89 dB)
Bass 100 - 315 Hz
(-) | nearly no bass - on average 19.8% lower than median
(±) | linearity of bass is average (10.4% delta to prev. frequency)
Mids 400 - 2000 Hz
(+) | balanced mids - only 3.4% away from median
(+) | mids are linear (3.5% delta to prev. frequency)
Highs 2 - 16 kHz
(+) | balanced highs - only 3% away from median
(+) | highs are linear (3.8% delta to prev. frequency)
Overall 100 - 16.000 Hz
(+) | overall sound is linear (14% difference to median)
Compared to same class
» 23% of all tested devices in this class were better, 7% similar, 70% worse
» The best had a delta of 6%, average was 18%, worst was 132%
Compared to all devices tested
» 16% of all tested devices were better, 4% similar, 80% worse
» The best had a delta of 4%, average was 24%, worst was 134%
Asus ROG Zephyrus S17 GX703HSD audio analysis
(±) | speaker loudness is average but good (74.2 dB)
Bass 100 - 315 Hz
(+) | good bass - only 3.6% away from median
(±) | linearity of bass is average (7.3% delta to prev. frequency)
Mids 400 - 2000 Hz
(+) | balanced mids - only 1.1% away from median
(+) | mids are linear (2.6% delta to prev. frequency)
Highs 2 - 16 kHz
(+) | balanced highs - only 3.3% away from median
(+) | highs are linear (4% delta to prev. frequency)
Overall 100 - 16.000 Hz
(+) | overall sound is linear (8.1% difference to median)
Compared to same class
» 1% of all tested devices in this class were better, 1% similar, 98% worse
» The best had a delta of 6%, average was 18%, worst was 132%
Compared to all devices tested
» 2% of all tested devices were better, 1% similar, 98% worse
» The best had a delta of 4%, average was 24%, worst was 134%
能源管理
能源消耗
由于图形切换(Nvidia Optimus),GS76在空闲时的使用相当节俭。它的平均功率为19瓦,大部分被竞争对手超越,这说明了微星的能源管理机制。即使在负载情况下,微星笔记本电脑通常也比其对手需要更少的电力,这可能主要是由于较低的TGP。
| Off / Standby | |
| Idle | |
| Load |
|
Key:
min: | |
| MSI GS76 Stealth 11UH i9-11900H, GeForce RTX 3080 Laptop GPU | Gigabyte Aero 17 HDR YD i9-11980HK, GeForce RTX 3080 Laptop GPU | Asus ROG Zephyrus S17 GX703HSD i9-11900H, GeForce RTX 3080 Laptop GPU | Razer Blade Pro 17 2021 (QHD Touch) i7-10875H, GeForce RTX 3080 Laptop GPU | Medion Erazer Beast X25 R9 5900HX, GeForce RTX 3080 Laptop GPU | Average of class Gaming | |
|---|---|---|---|---|---|---|
| Power Consumption | -31% | -22% | -9% | -25% | 1% | |
| Idle Minimum * (Watt) | 14 | 25 -79% | 21.7 -55% | 15.2 -9% | 22 -57% | 13.2 ? 6% |
| Idle Average * (Watt) | 19 | 28 -47% | 27 -42% | 20.3 -7% | 26 -37% | 18.9 ? 1% |
| Idle Maximum * (Watt) | 31 | 40 -29% | 33 -6% | 37.3 -20% | 34 -10% | 24.3 ? 22% |
| Load Average * (Watt) | 97 | 114 -18% | 108 -11% | 114.9 -18% | 120 -24% | 108.3 ? -12% |
| Witcher 3 ultra * (Watt) | 156 | 176 -13% | 195 -25% | 158.4 -2% | 189 -21% | |
| Load Maximum * (Watt) | 231 | 236 -2% | 210 9% | 223.7 3% | 231 -0% | 254 ? -10% |
* ... smaller is better
Energy consumption during The Witcher 3
电池寿命
由于插电时的功耗可能与使用电池供电的设备不同,我们目前的结果(我们总是在插入电源适配器的情况下测量)只是最终电池寿命的一个有限指标。这也应该解释了为什么华硕Zephyrus S17尽管容量较低(90而不是99.9Wh),却取得了更好的结果。然而,微星GS76能够在中等亮度下通过Wi-Fi浏览互联网的时间不到6.5小时,这对于拥有高端硬件的笔记本电脑来说仍然是比较好的。Gigabyte和Razer的竞争者在这里没有持续那么久。
| MSI GS76 Stealth 11UH i9-11900H, GeForce RTX 3080 Laptop GPU, 99.9 Wh | Gigabyte Aero 17 HDR YD i9-11980HK, GeForce RTX 3080 Laptop GPU, 99 Wh | Asus ROG Zephyrus S17 GX703HSD i9-11900H, GeForce RTX 3080 Laptop GPU, 90 Wh | Razer Blade Pro 17 2021 (QHD Touch) i7-10875H, GeForce RTX 3080 Laptop GPU, 70.5 Wh | Medion Erazer Beast X25 R9 5900HX, GeForce RTX 3080 Laptop GPU, 91 Wh | Average of class Gaming | |
|---|---|---|---|---|---|---|
| Battery runtime | -11% | 63% | 0% | 5% | 4% | |
| Reader / Idle (h) | 9.9 | 9.9 0% | 9.9 0% | 8.71 ? -12% | ||
| WiFi v1.3 (h) | 6.4 | 5.6 -13% | 7.5 17% | 5.9 -8% | 6.8 6% | 7.04 ? 10% |
| Load (h) | 1.3 | 1.2 -8% | 2.7 108% | 1.4 8% | 1.4 8% | 1.47 ? 13% |
| H.264 (h) | 7.2 | 8.26 ? | ||||
| Witcher 3 ultra (h) | 1 |
Pros
Cons
判决书
GS76 Stealth 11UH-074很好地表明,目前瘦身笔记本电脑的趋势除了优雅的外观外,还有一些缺点。
除了在负载下的操作,并不完全是安静和凉爽的,但这是即使是更厚的笔记本电脑也经常要挣扎的事情,在这一点上,不得不提到有限的GPU性能。即使使用95瓦的TGP,GeForce RTX 3080仍然提供非常好的3D和游戏性能,但显卡的潜力(包括动态提升在内高达165瓦)远未得到充分挖掘,在与其他RTX 3080笔记本电脑的基准比较中也可以看到这一点。
考虑到冷却和性价比,Core i9-11900H也似乎有点过了,这就是为什么我们一般更愿意推荐GS76型号的Core i7-11800H 和GeForce RTX 3070 。
顶级型号的最大亮点是明亮和反应灵敏的4K显示屏,它没有任何真正的缺点。这款机箱给人留下了模棱两可的印象。虽然重量和尺寸令人信服,并在一定程度上抢了竞争对手的风头,但坚固性却相当一般(键盘、触摸板......)。
总而言之,微星GS76 Stealth 11UH-074仍然是一个很好的游戏笔记本电脑,尽管华硕的主要竞争对手,ROG Zephyrus S17 GX703HSD ,在一天结束时领先。Gigabyte Aero 17 HDR YD 和 Razer Blade Pro 17 2021整体得分也略高。
价格和可用性
MSI GS76 Stealth 11UH
- 09/18/2021 v7 (old)
Florian Glaser
Price comparison

