Medion Erazer Beast X25 (Tongfang GM7ZG8P) 游戏笔记本电脑评测。轻巧而又强大

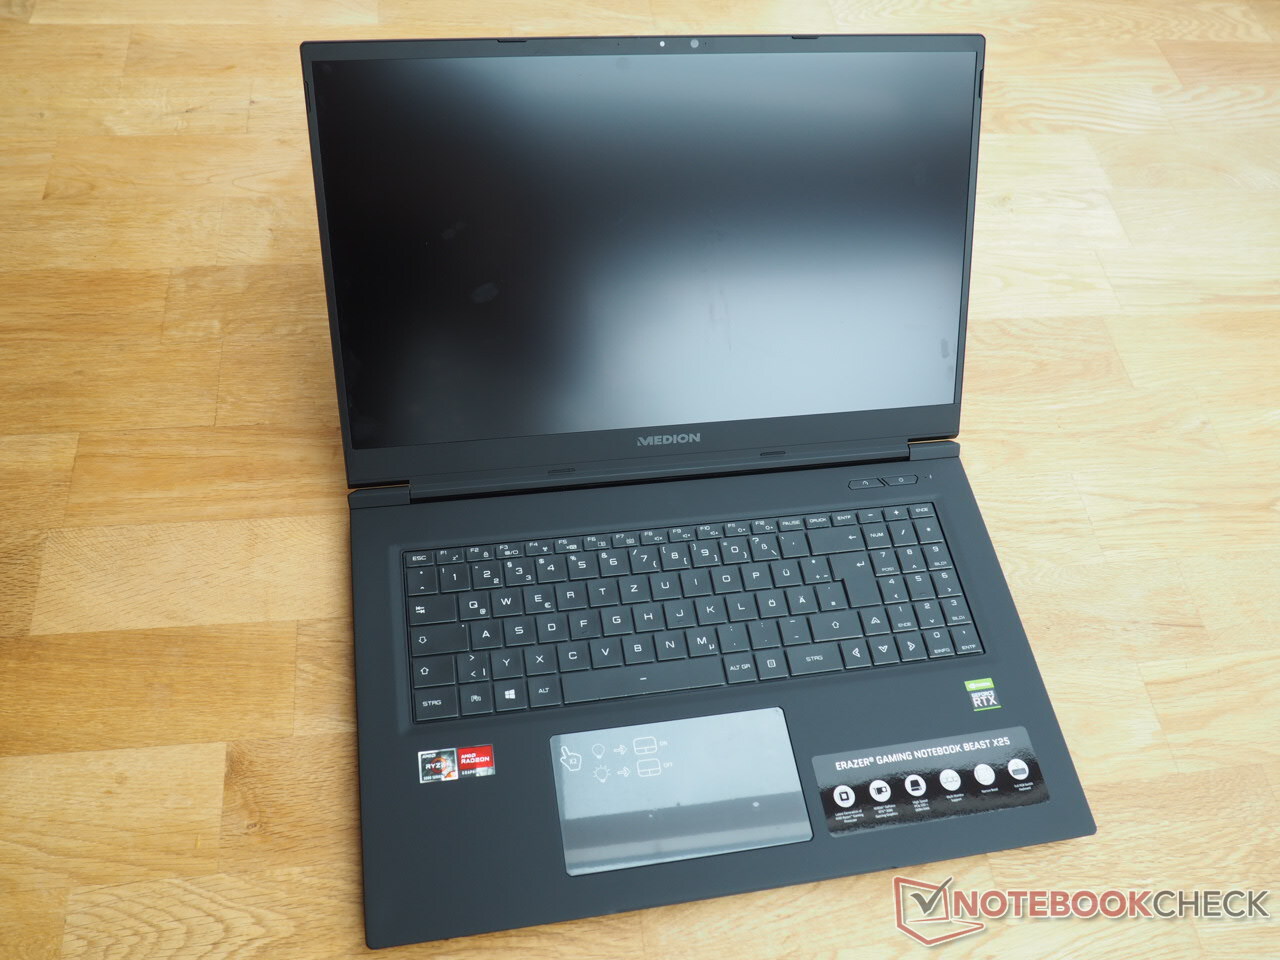
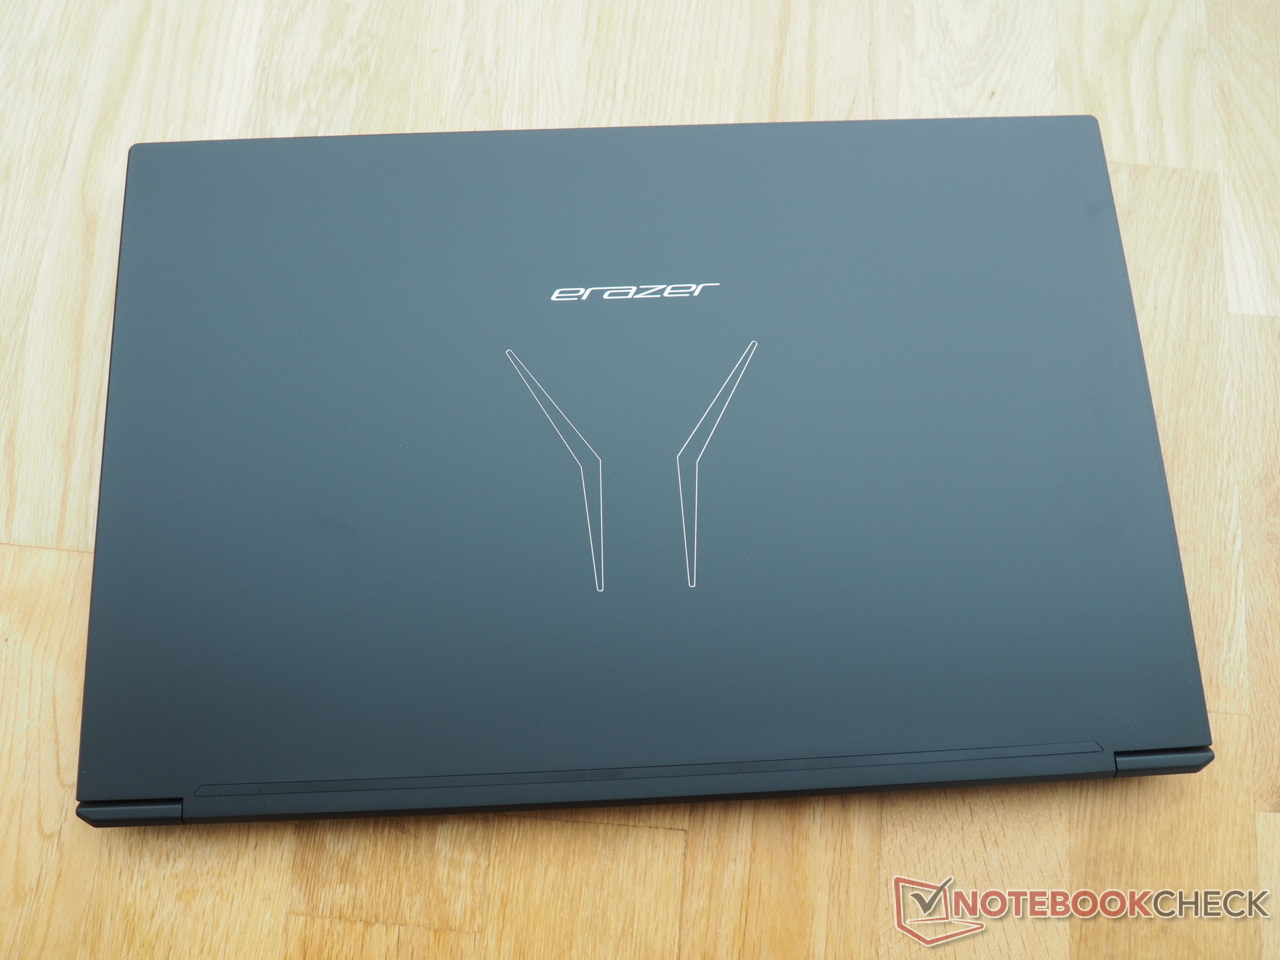
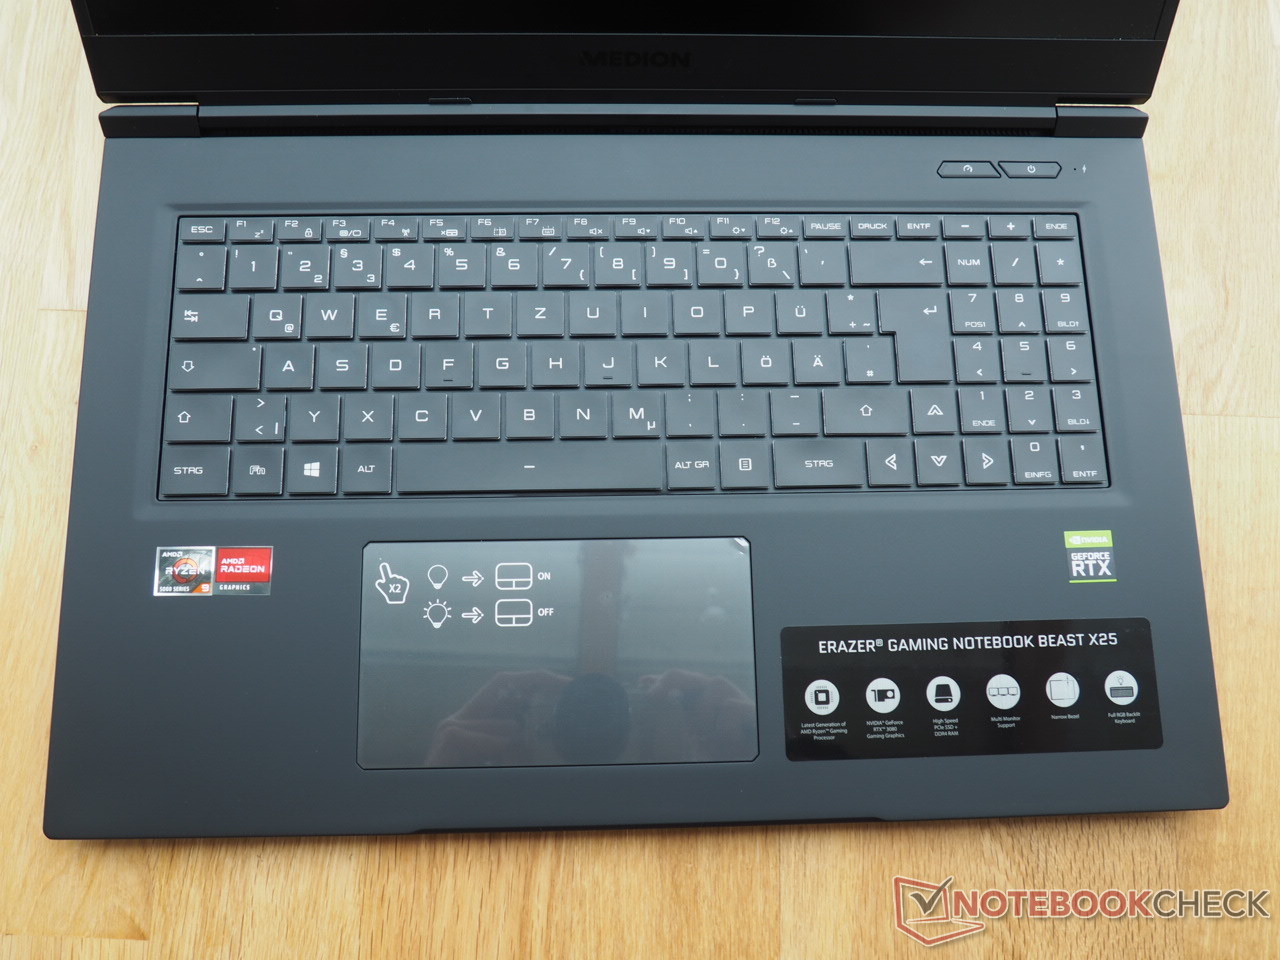
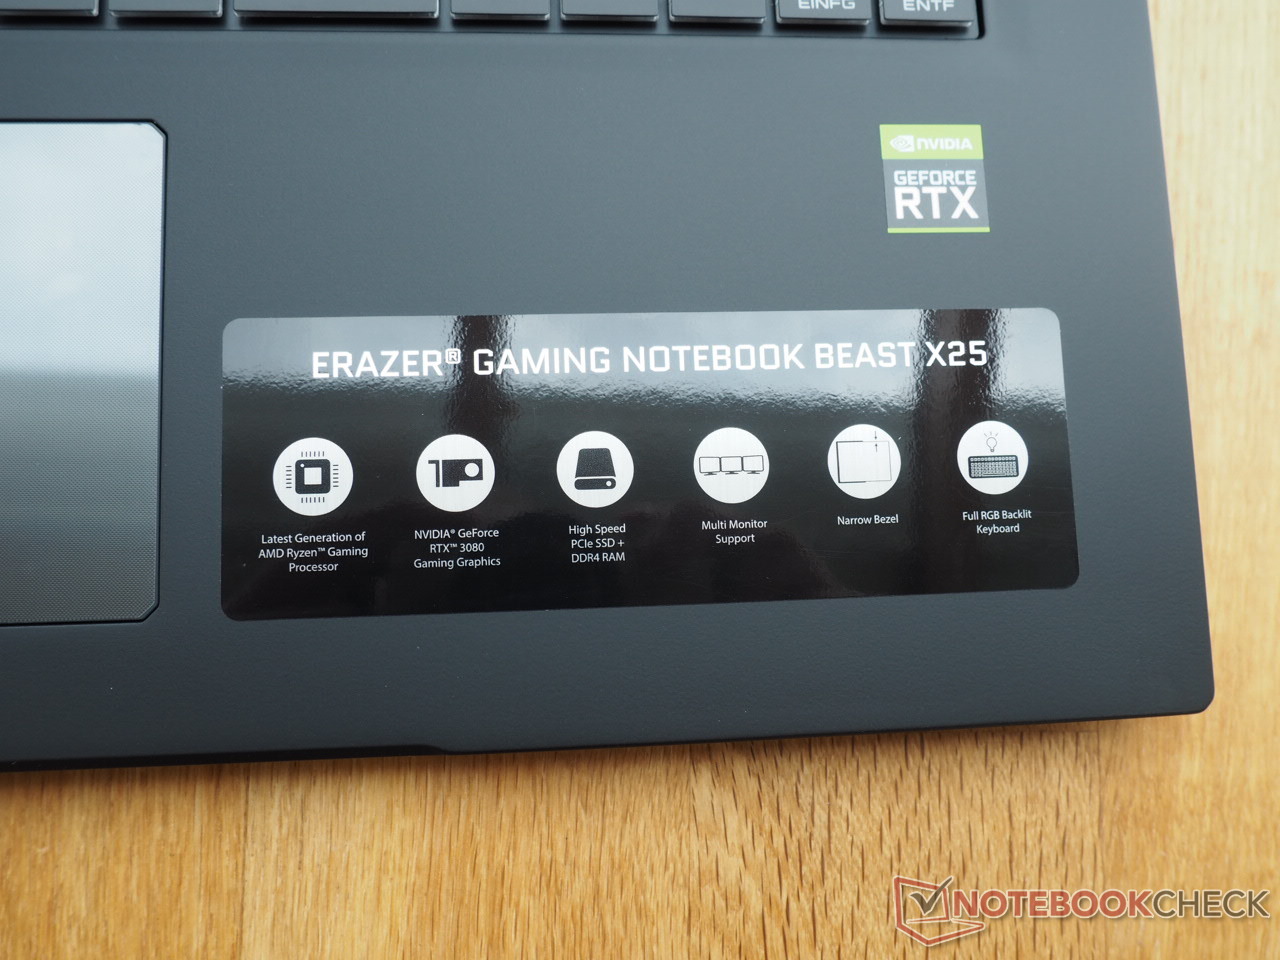
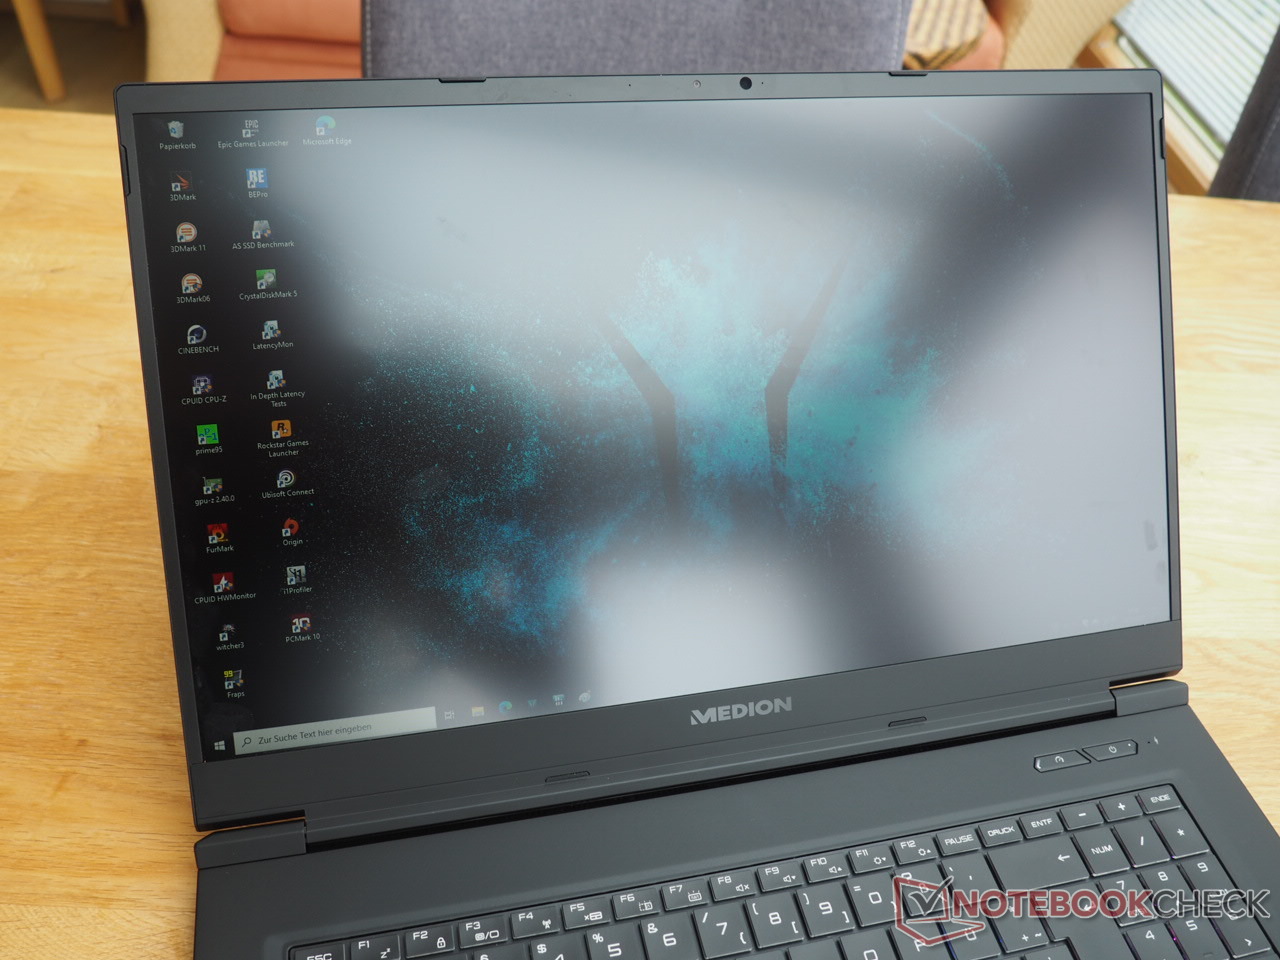
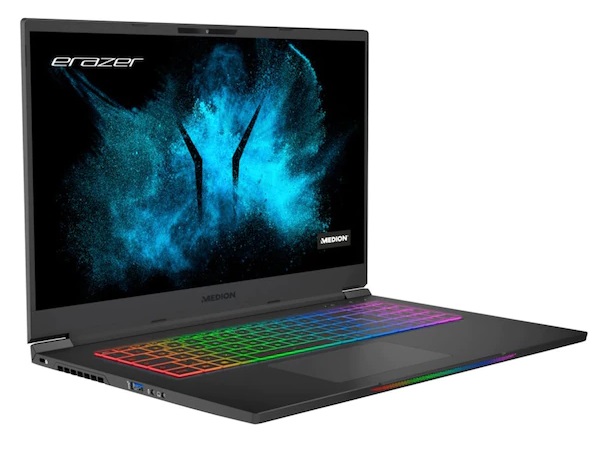
高端笔记本电脑必须非常笨重的日子已经一去不复返了。来自Medion的Erazer Beast X25是新的、相当苗条和轻盈的一代游戏笔记本电脑的最佳例子之一,尽管它的尺寸为17英寸,但仅重2.3公斤,而且也相对较薄,总高度为2.3厘米(包括机箱脚在内为2.6厘米)。这使得这款17英寸的产品在携带时有些舒适,而且不会在桌面上占用太多的空间。结合谨慎的设计,Beast X25看起来相当温和。只有当你打开它,键盘上色彩鲜艳的RGB灯光被激活时,你才能注意到它的游戏性质。
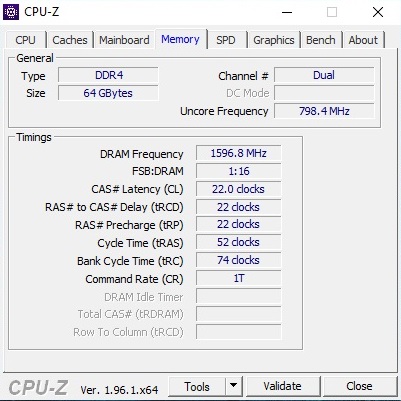
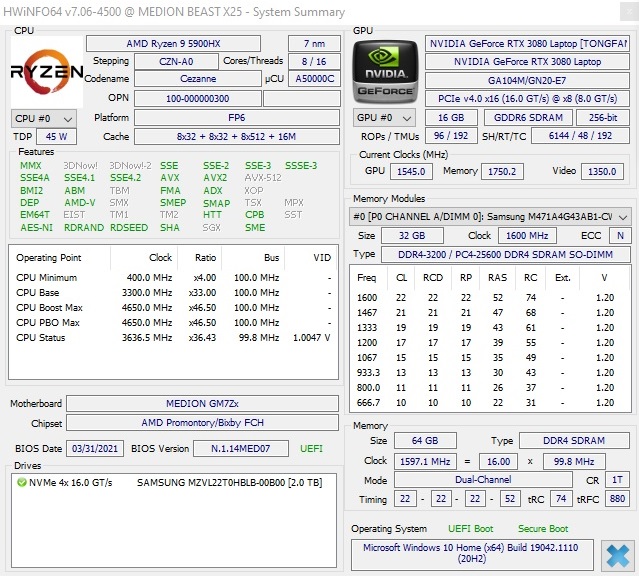
当涉及到硬件时,Medion将踏板放在金属上。AMDRyzen 9 5900HX处理器和Nvidia GeForce RTX 3080笔记本电脑显卡,配备16GB的VRAM,是目前笔记本电脑市场上最快的组件之一。此外--正如最初提到的--还有大量的内存和存储。64GB的DDR4-3200内存(双通道模式下的2x 32GB)和2TB的M.2 NVMe固态硬盘一样充足(如果需要,还有空间再装一个M.2固态硬盘)。在我们的评测样本中,MD63835的价格略低于2,700欧元(约合3,191美元),该配置由一个具有1920x1080像素的快速240赫兹面板来完成。喜欢更清晰显示的用户应该对MD62210型号感到满意,它的价格高出200欧元(约合236美元),采用QHD显示屏(165赫兹,2560x1440像素)。
Erazer Beast X25的竞争对手包括其他配备GeForce RTX 3080和现代高端CPU的17英寸游戏笔记本电脑,如华硕Strix Scar 17 G733QSA ,华硕ROG Zephyrus S17 GX703HSD,技嘉Aero 17 HDR YD, Aorus 17G YD,所有这些都作为对比设备出现在表中。
Possible contenders in comparison
Rating | Date | Model | Weight | Height | Size | Resolution | Price |
|---|---|---|---|---|---|---|---|
| 85 % v7 (old) | 08 / 2021 | Medion Erazer Beast X25 R9 5900HX, GeForce RTX 3080 Laptop GPU | 2.3 kg | 23 mm | 17.30" | 1920x1080 | |
| 86.6 % v7 (old) | 09 / 2021 | Asus Strix Scar 17 G733QSA-XS99 R9 5900HX, GeForce RTX 3080 Laptop GPU | 2.8 kg | 28.3 mm | 17.30" | 1920x1080 | |
| 88 % v7 (old) | 09 / 2021 | Gigabyte Aero 17 HDR YD i9-11980HK, GeForce RTX 3080 Laptop GPU | 2.8 kg | 22 mm | 17.30" | 3840x2160 | |
| 90.1 % v7 (old) | 08 / 2021 | Asus ROG Zephyrus S17 GX703HSD i9-11900H, GeForce RTX 3080 Laptop GPU | 2.8 kg | 19.9 mm | 17.30" | 2560x1440 | |
| 86 % v7 (old) | 06 / 2021 | Aorus 17G YD i7-11800H, GeForce RTX 3080 Laptop GPU | 2.8 kg | 26 mm | 17.30" | 1920x1080 |
SD卡阅读器
| SD Card Reader | |
| average JPG Copy Test (av. of 3 runs) | |
| Aorus 17G YD (AV PRO microSD 128 GB V60) | |
| Gigabyte Aero 17 HDR YD (AV PRO microSD 128 GB V60) | |
| Asus ROG Zephyrus S17 GX703HSD | |
| Average of class Gaming (20.9 - 210, n=55, last 2 years) | |
| Medion Erazer Beast X25 (AV PRO microSD 128 GB V60) | |
| maximum AS SSD Seq Read Test (1GB) | |
| Asus ROG Zephyrus S17 GX703HSD | |
| Aorus 17G YD (AV PRO microSD 128 GB V60) | |
| Gigabyte Aero 17 HDR YD (AV PRO microSD 128 GB V60) | |
| Average of class Gaming (25.5 - 261, n=52, last 2 years) | |
| Medion Erazer Beast X25 (AV PRO microSD 128 GB V60) | |
沟通
网络摄像头


显示--240赫兹,反应时间快
该显示屏由全高清分辨率的无光泽IPS面板组成,由于其240赫兹的高频率,在任何情况下都感觉非常流畅。响应时间也同样可观。我们能够在从黑色到白色以及从灰色到灰色的过程中测量到10毫秒以下。因此,这台17英寸显示器也完全适合于特别快的游戏,如第一人称射击游戏。
| |||||||||||||||||||||||||
Brightness Distribution: 88 %
Center on Battery: 329 cd/m²
Contrast: 997:1 (Black: 0.33 cd/m²)
ΔE ColorChecker Calman: 2.03 | ∀{0.5-29.43 Ø4.71}
calibrated: 0.82
ΔE Greyscale Calman: 3.5 | ∀{0.09-98 Ø4.96}
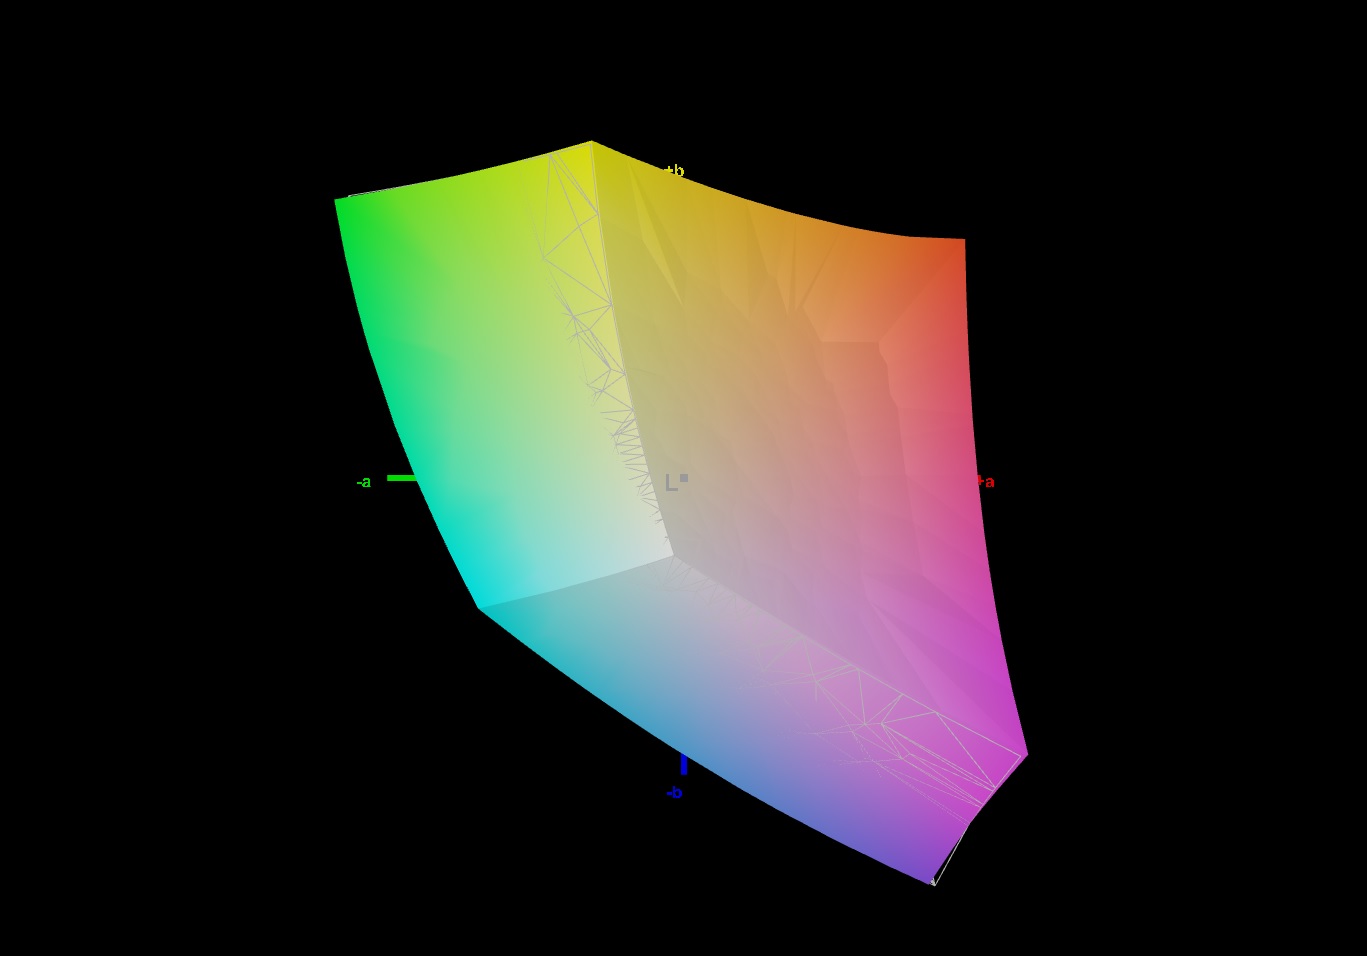
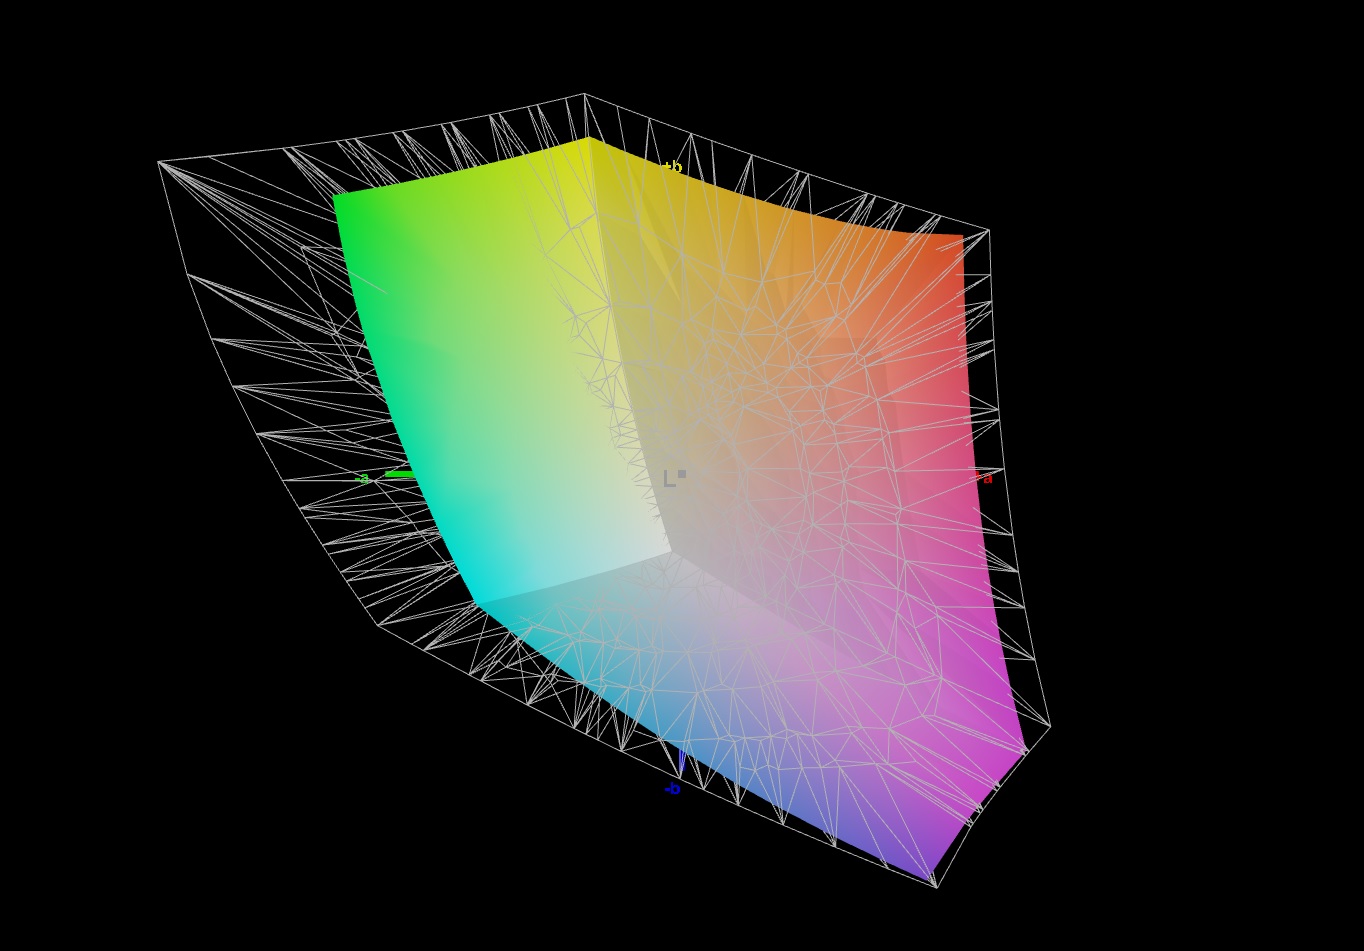
71.6% AdobeRGB 1998 (Argyll 3D)
99.8% sRGB (Argyll 3D)
70.4% Display P3 (Argyll 3D)
Gamma: 2.223
CCT: 6526 K
| Medion Erazer Beast X25 BOE NE173FHM-NZ1 (BOE0884), IPS, 1920x1080, 17.3" | Asus Strix Scar 17 G733QSA-XS99 AU Optronics B173HAN05.4, IPS, 1920x1080, 17.3" | Gigabyte Aero 17 HDR YD AU Optronics AUO329B, IPS, 3840x2160, 17.3" | Asus ROG Zephyrus S17 GX703HSD BOE099D (BOE CQ NE173QHM-NY3), IPS, 2560x1440, 17.3" | Aorus 17G YD Sharp LQ173M1JW04, IPS, 1920x1080, 17.3" | |
|---|---|---|---|---|---|
| Display | 1% | 21% | 17% | 2% | |
| Display P3 Coverage (%) | 70.4 | 71 1% | 86.9 23% | 94.2 34% | 72.3 3% |
| sRGB Coverage (%) | 99.8 | 99.4 0% | 100 0% | 98.7 -1% | 100 0% |
| AdobeRGB 1998 Coverage (%) | 71.6 | 72.2 1% | 99.6 39% | 84.4 18% | 73.7 3% |
| Response Times | -33% | -415% | 3% | -56% | |
| Response Time Grey 50% / Grey 80% * (ms) | 9.2 ? | 6.6 ? 28% | 52 ? -465% | 4.8 48% | 13.6 ? -48% |
| Response Time Black / White * (ms) | 5.6 ? | 10.8 ? -93% | 26 ? -364% | 8 -43% | 9.2 ? -64% |
| PWM Frequency (Hz) | |||||
| Screen | 4% | 32% | -20% | -5% | |
| Brightness middle (cd/m²) | 329 | 303.8 -8% | 488 48% | 322 -2% | 286 -13% |
| Brightness (cd/m²) | 315 | 292 -7% | 467 48% | 288 -9% | 282 -10% |
| Brightness Distribution (%) | 88 | 85 -3% | 86 -2% | 72 -18% | 73 -17% |
| Black Level * (cd/m²) | 0.33 | 0.23 30% | 0.33 -0% | 0.3 9% | 0.24 27% |
| Contrast (:1) | 997 | 1321 32% | 1479 48% | 1073 8% | 1192 20% |
| Colorchecker dE 2000 * | 2.03 | 1.87 8% | 1.23 39% | 3.05 -50% | 2.79 -37% |
| Colorchecker dE 2000 max. * | 5.5 | 3.26 41% | 2.94 47% | 5.23 5% | 6.23 -13% |
| Colorchecker dE 2000 calibrated * | 0.82 | 1.45 -77% | 0.77 6% | 1.92 -134% | 0.82 -0% |
| Greyscale dE 2000 * | 3.5 | 2.7 23% | 1.5 57% | 3.11 11% | 3.5 -0% |
| Gamma | 2.223 99% | 2.26 97% | 2.169 101% | 2.13 103% | 2.358 93% |
| CCT | 6526 100% | 6436 101% | 6614 98% | 6553 99% | 6147 106% |
| Color Space (Percent of AdobeRGB 1998) (%) | 65.6 | 99 | 84 | 74 | |
| Color Space (Percent of sRGB) (%) | 99.4 | 99 | 99 | 96 | |
| Total Average (Program / Settings) | -9% /
-2% | -121% /
-34% | 0% /
-9% | -20% /
-11% |
* ... smaller is better
其余的参数在积极意义上是相当不起眼的。亮度值略低于315cd/m²,应能满足大多数买家的要求,对比度约为1,000:1,即使竞争对手的对比度更高一些。同时,色彩空间覆盖率分别为99.8%(sRGB)和71.6%(AdobeRGB),与竞争对手持平。只有技嘉Aero 17 HDR YD的4K面板能够在这个类别中明显脱颖而出(99.6% AdobeRGB)。
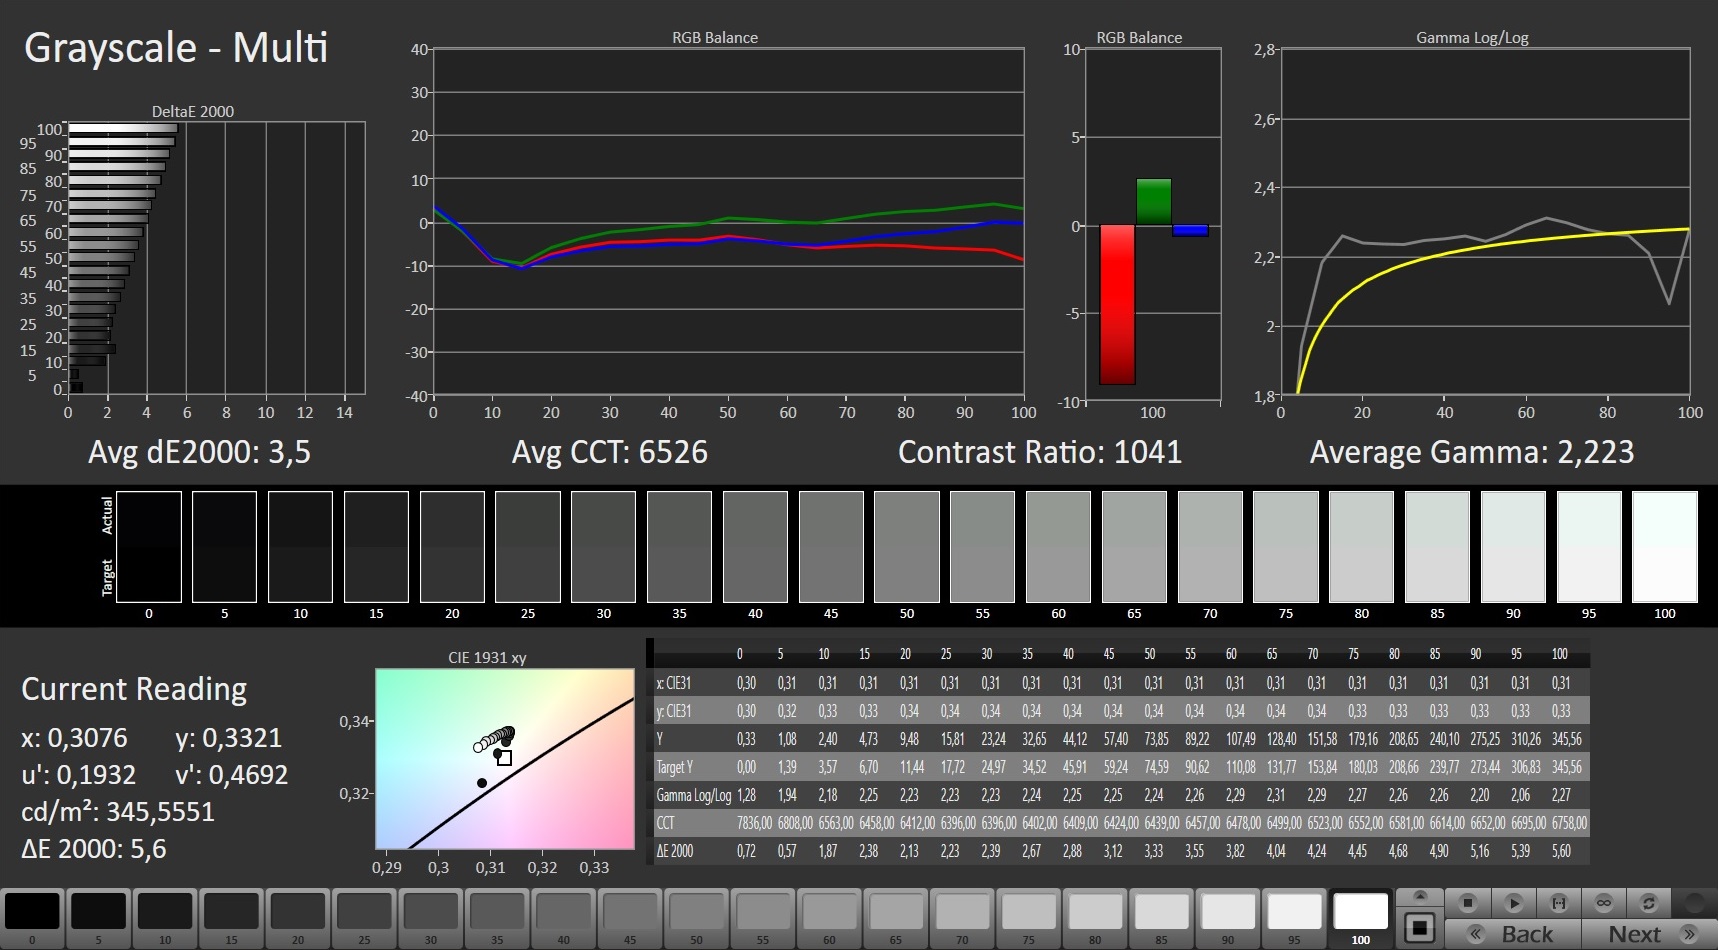
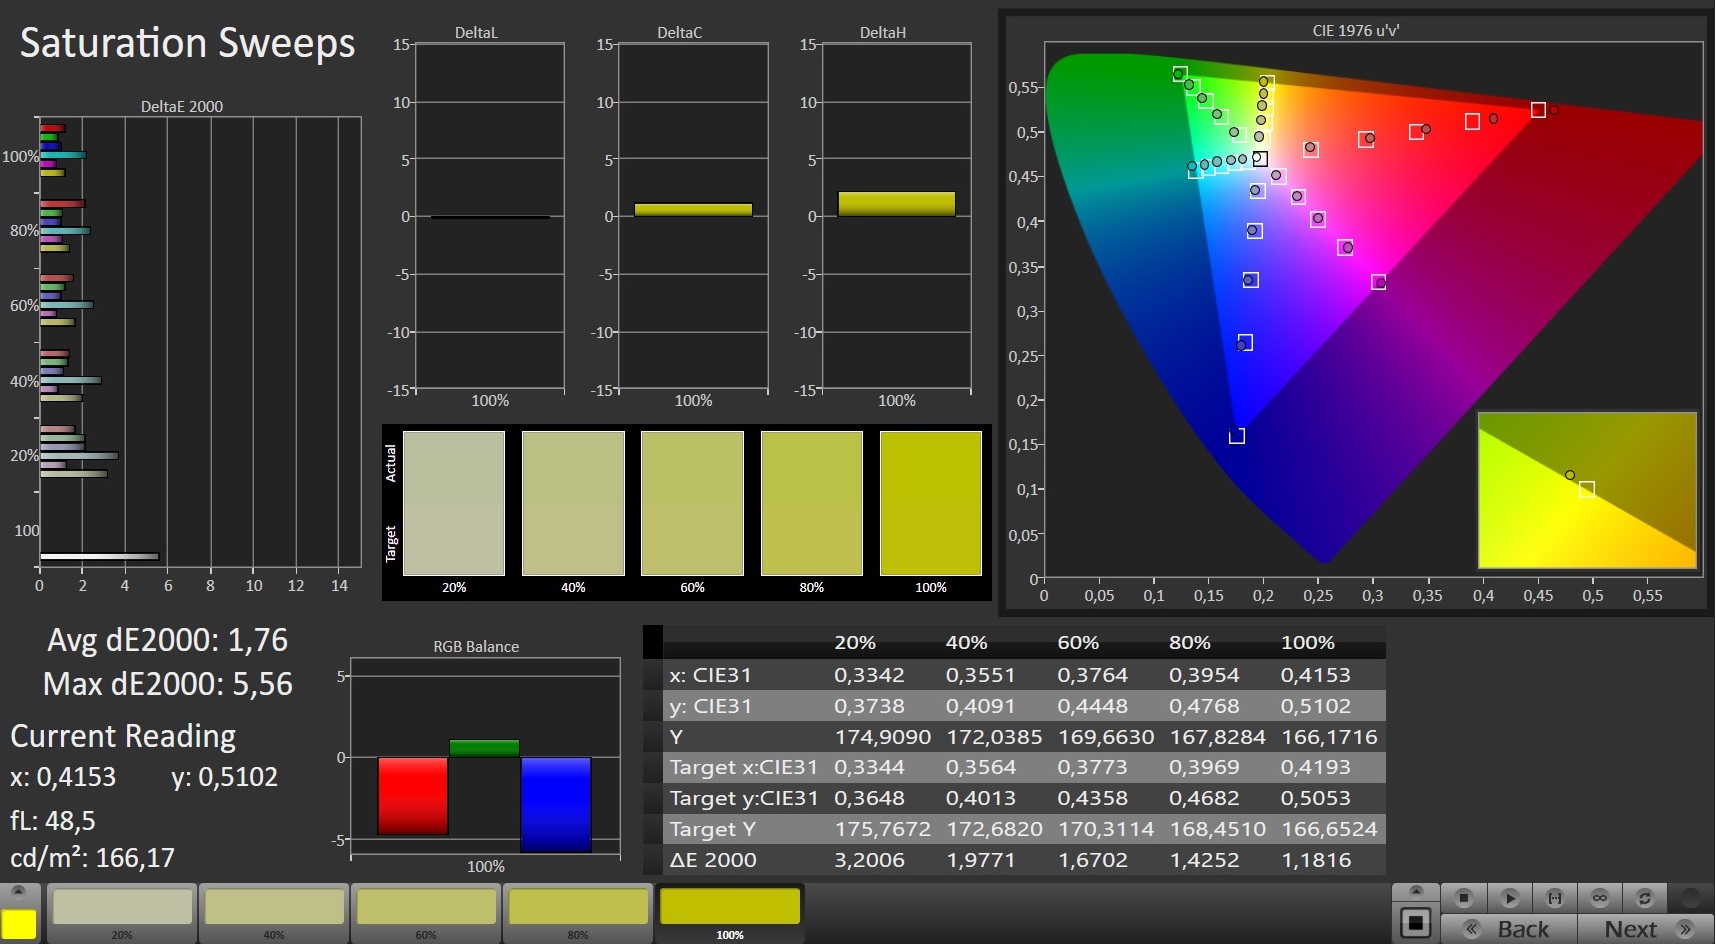
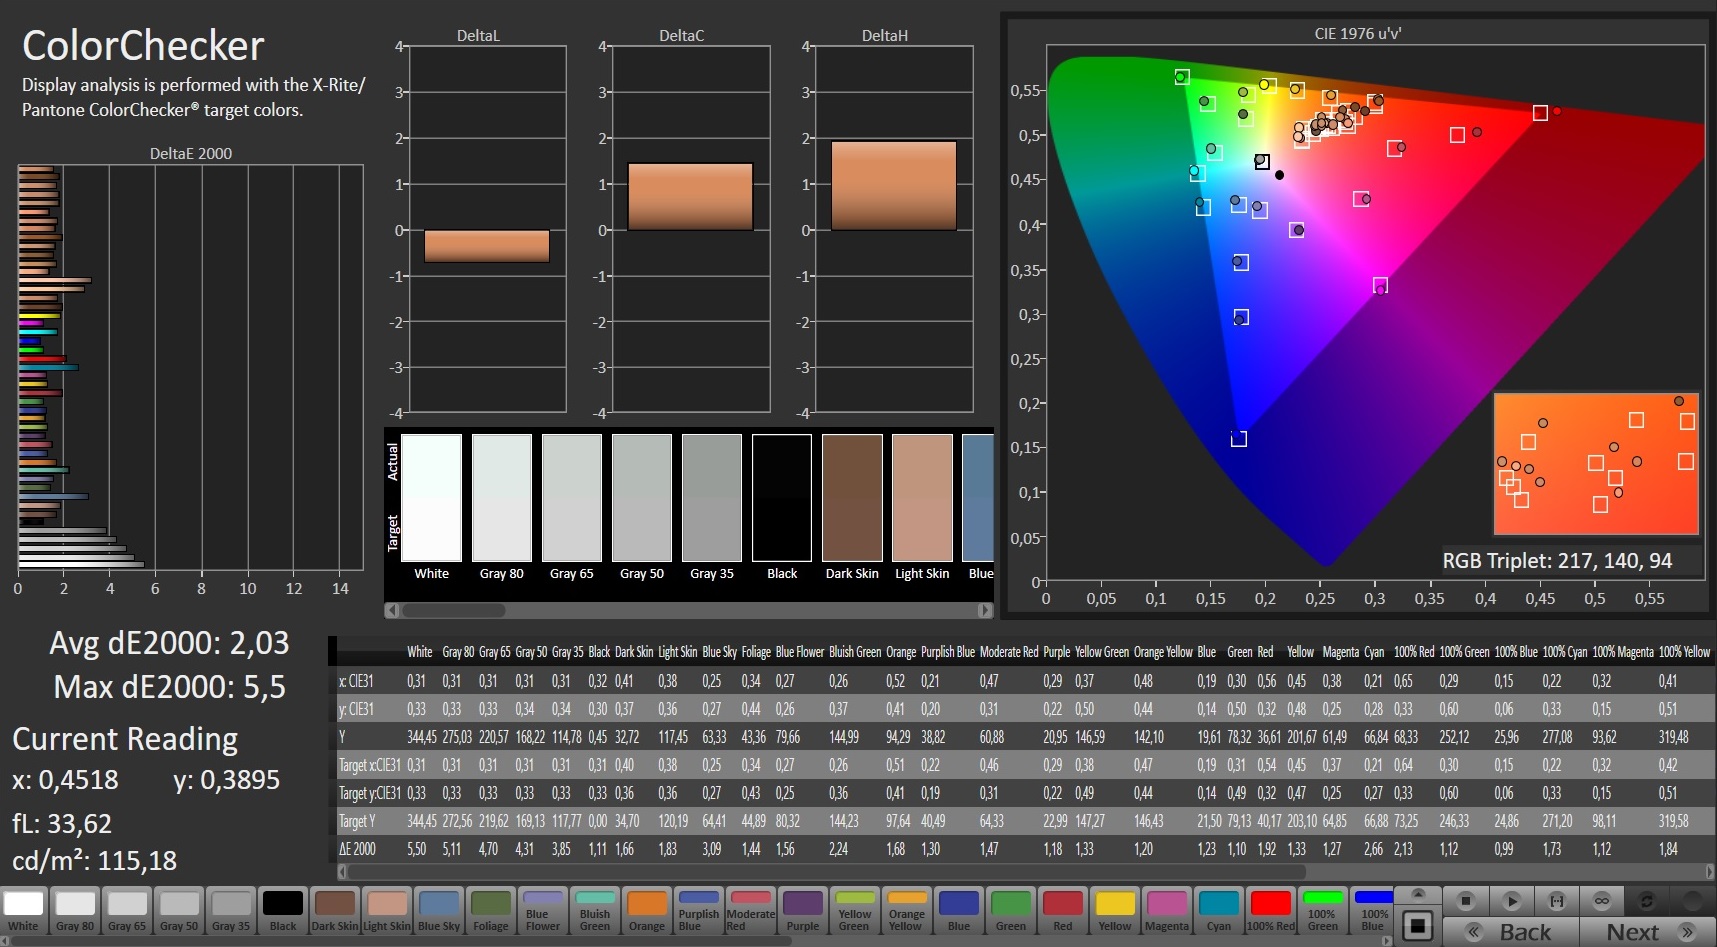
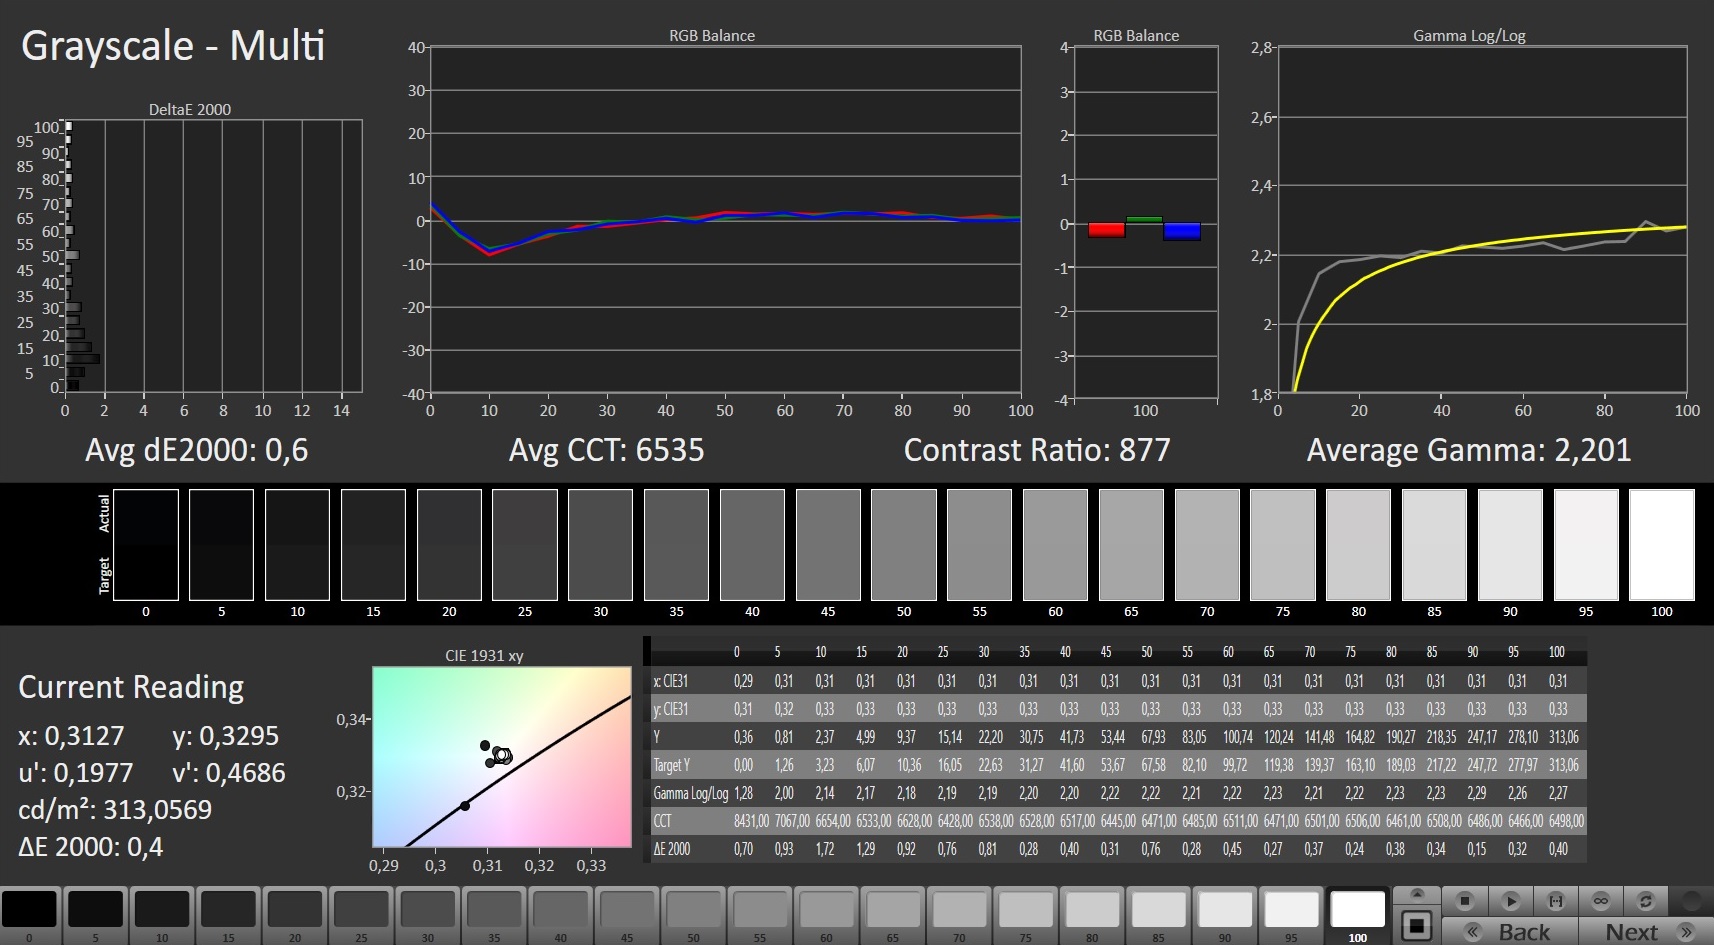

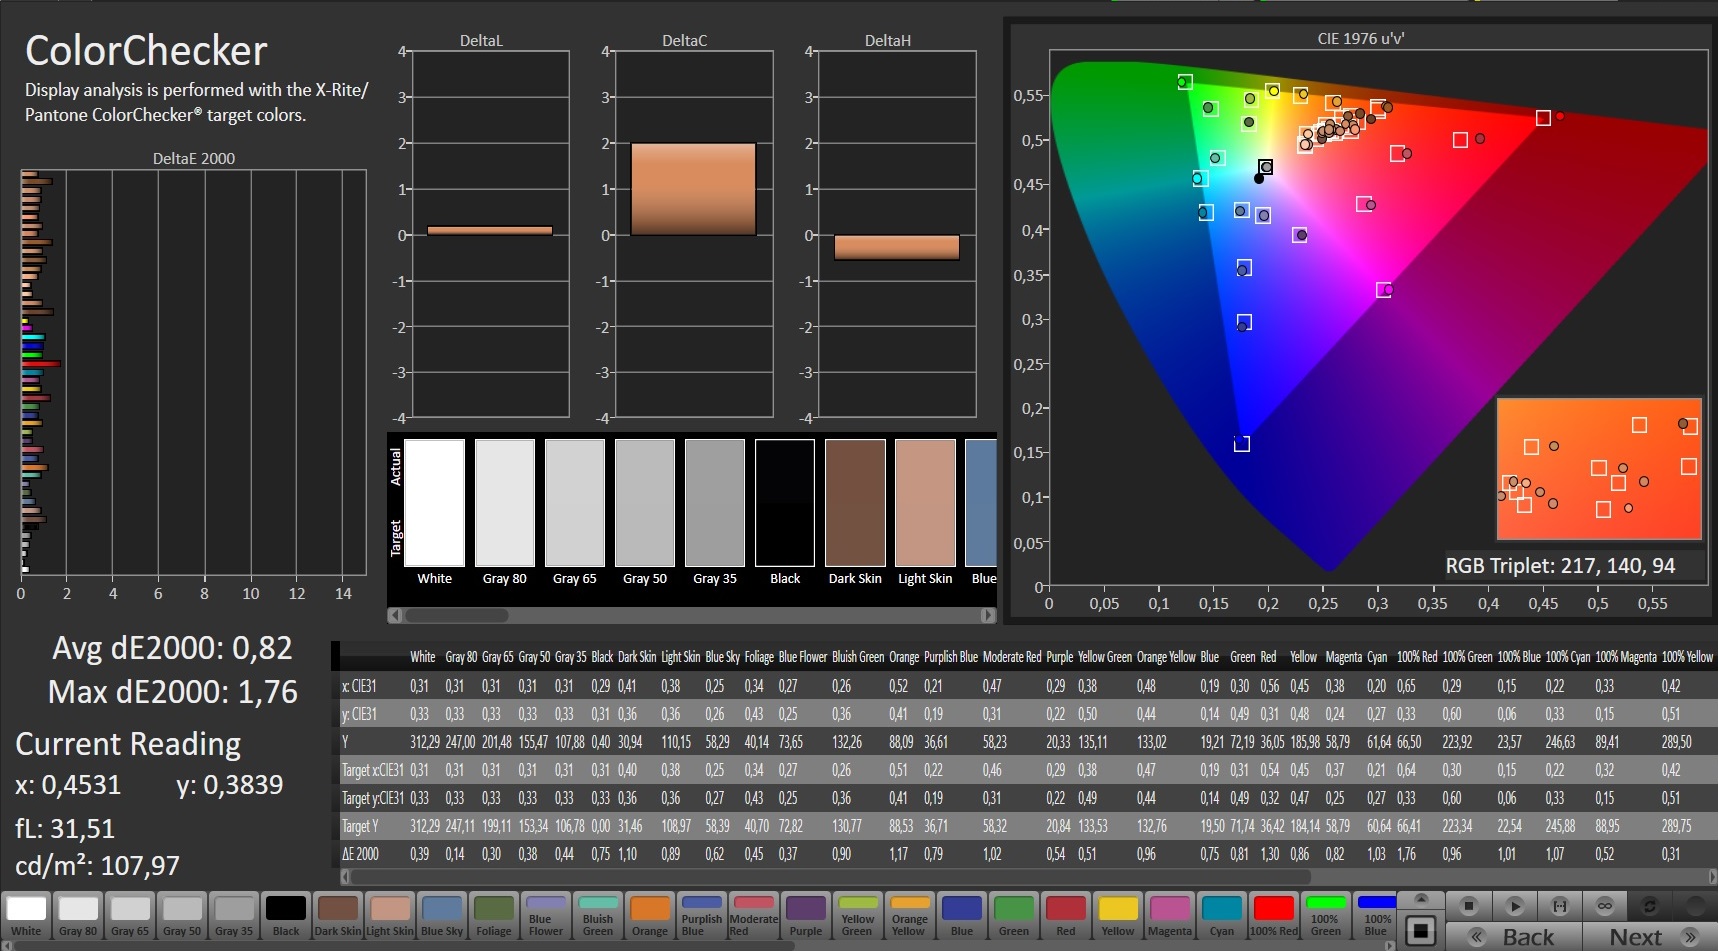
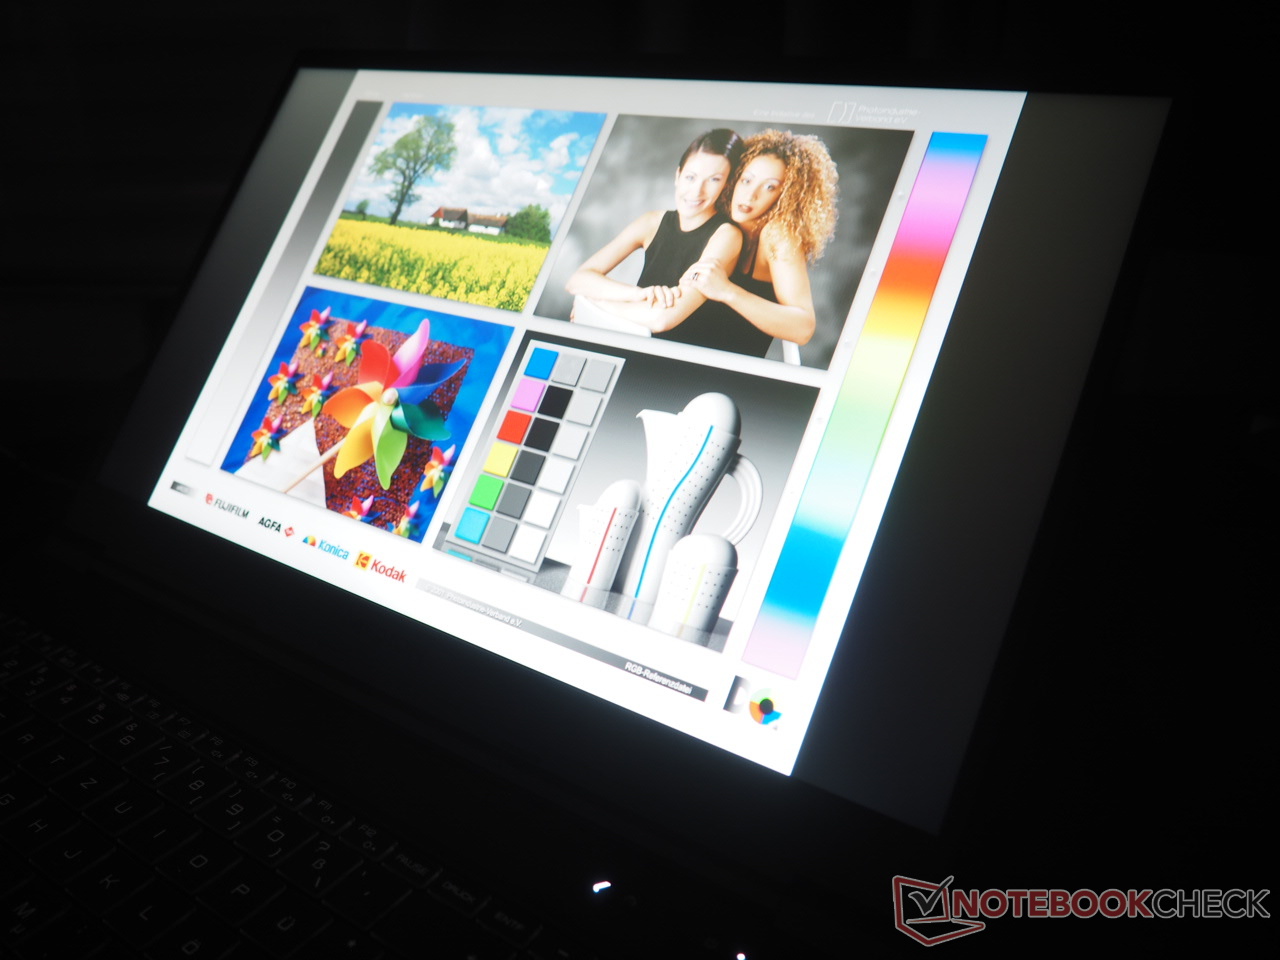
在色彩准确性方面,Beast X25的表现很好。在Calman测量软件的ColorChecker测试中,DeltaE 2000值保持在理想范围内,平均为2.03(最高为3),通过校准甚至可以获得更好的值。我们相应的ICC文件在上面的亮度分布图旁边进一步链接。作为IPS面板的典型,在视角稳定性方面也没有什么可抱怨的。
最多,在户外使用时,全高清面板会暴露出弱点。虽然在阴凉处亮度通常足够,但你会发现自己希望在阳光充足的地方有更高的亮度。
Display Response Times
| ↔ Response Time Black to White | ||
|---|---|---|
| 5.6 ms ... rise ↗ and fall ↘ combined | ↗ 2.8 ms rise | 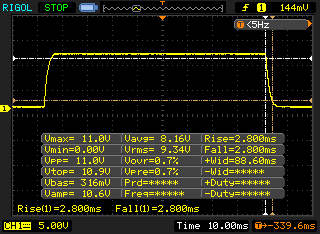 |
| ↘ 2.8 ms fall | ||
| The screen shows very fast response rates in our tests and should be very well suited for fast-paced gaming. In comparison, all tested devices range from 0.1 (minimum) to 240 (maximum) ms. » 18 % of all devices are better. This means that the measured response time is better than the average of all tested devices (19.8 ms). | ||
| ↔ Response Time 50% Grey to 80% Grey | ||
| 9.2 ms ... rise ↗ and fall ↘ combined | ↗ 4.8 ms rise | 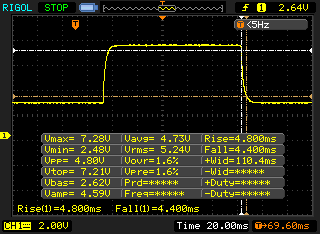 |
| ↘ 4.4 ms fall | ||
| The screen shows fast response rates in our tests and should be suited for gaming. In comparison, all tested devices range from 0.165 (minimum) to 636 (maximum) ms. » 23 % of all devices are better. This means that the measured response time is better than the average of all tested devices (30.9 ms). | ||
Screen Flickering / PWM (Pulse-Width Modulation)
| Screen flickering / PWM not detected | 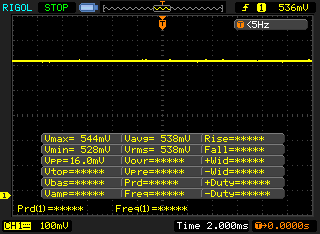 | ||
In comparison: 52 % of all tested devices do not use PWM to dim the display. If PWM was detected, an average of 7748 (minimum: 5 - maximum: 343500) Hz was measured. | |||
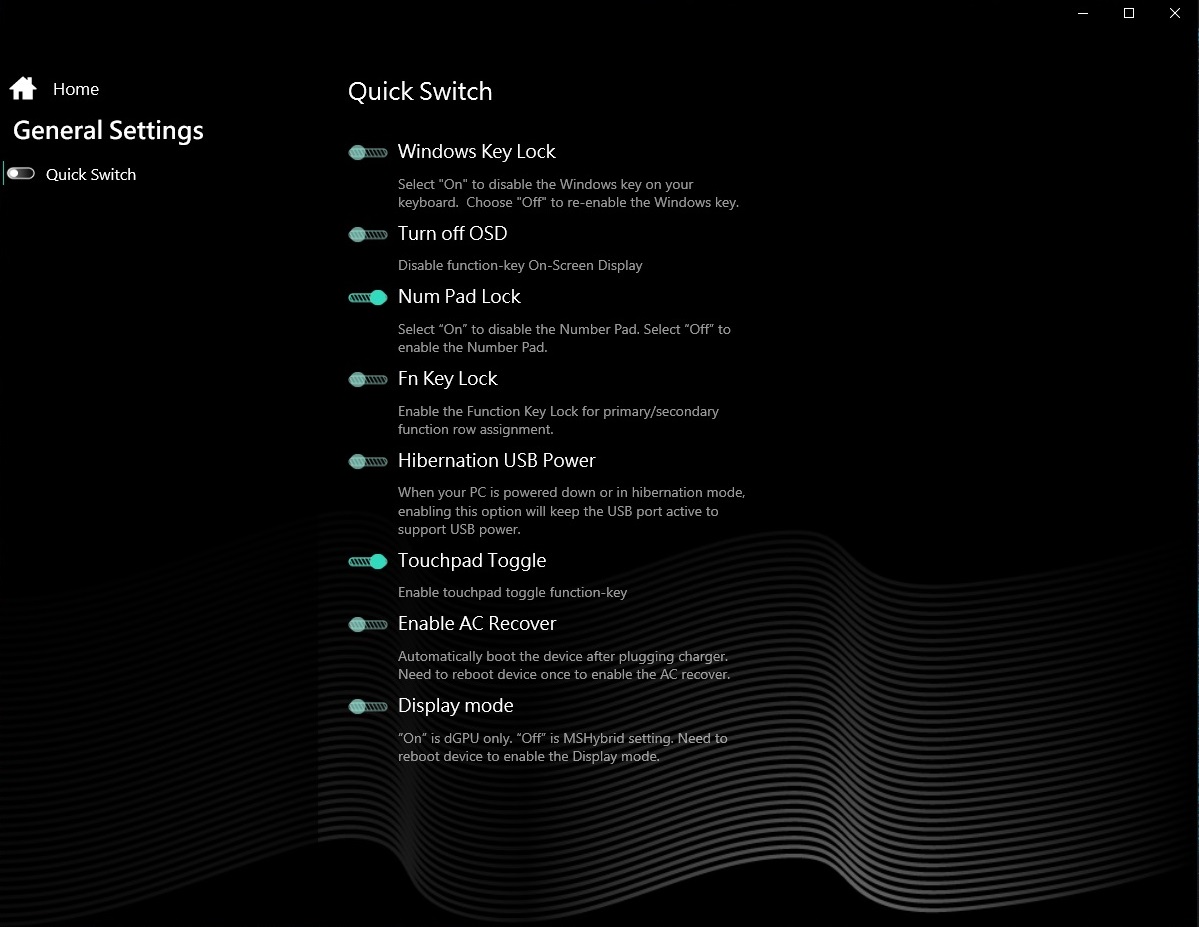
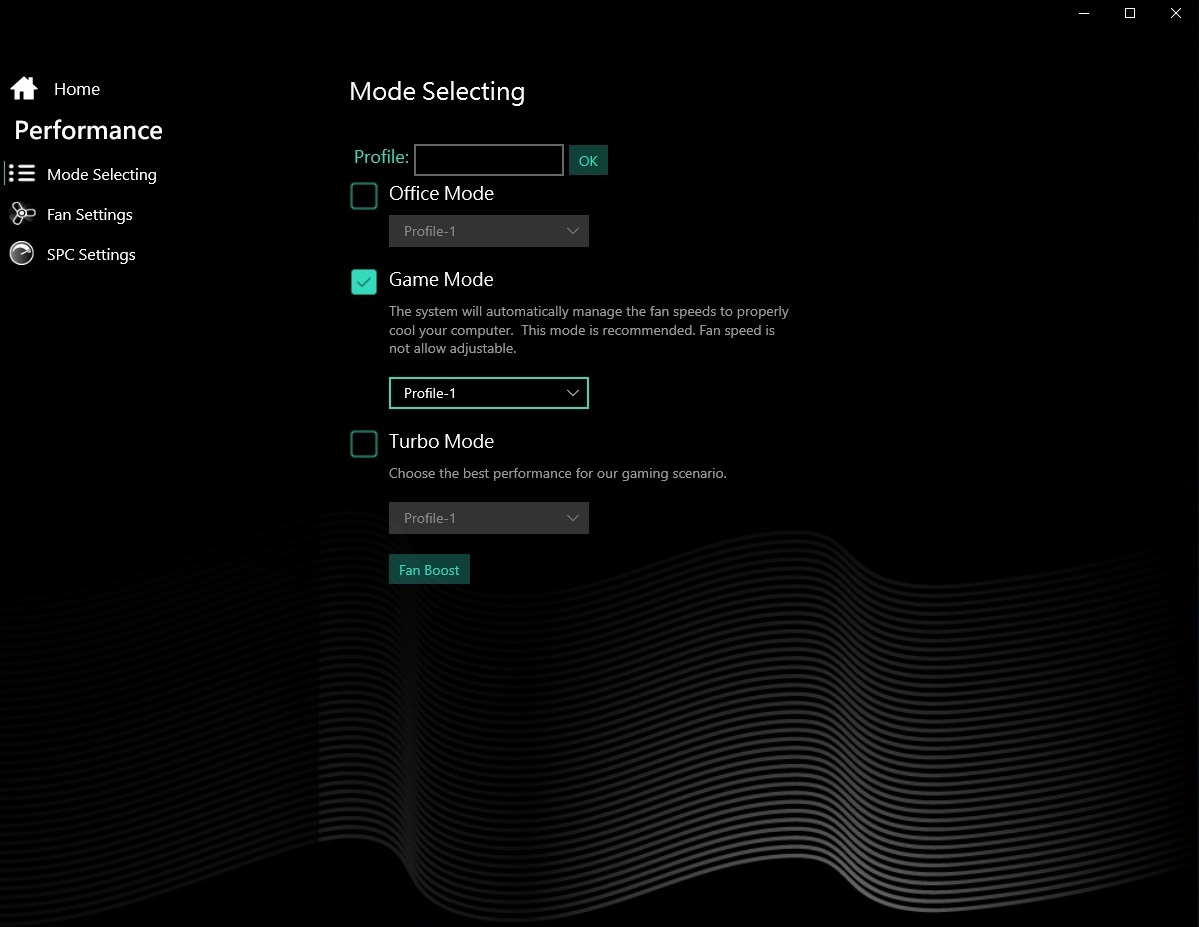
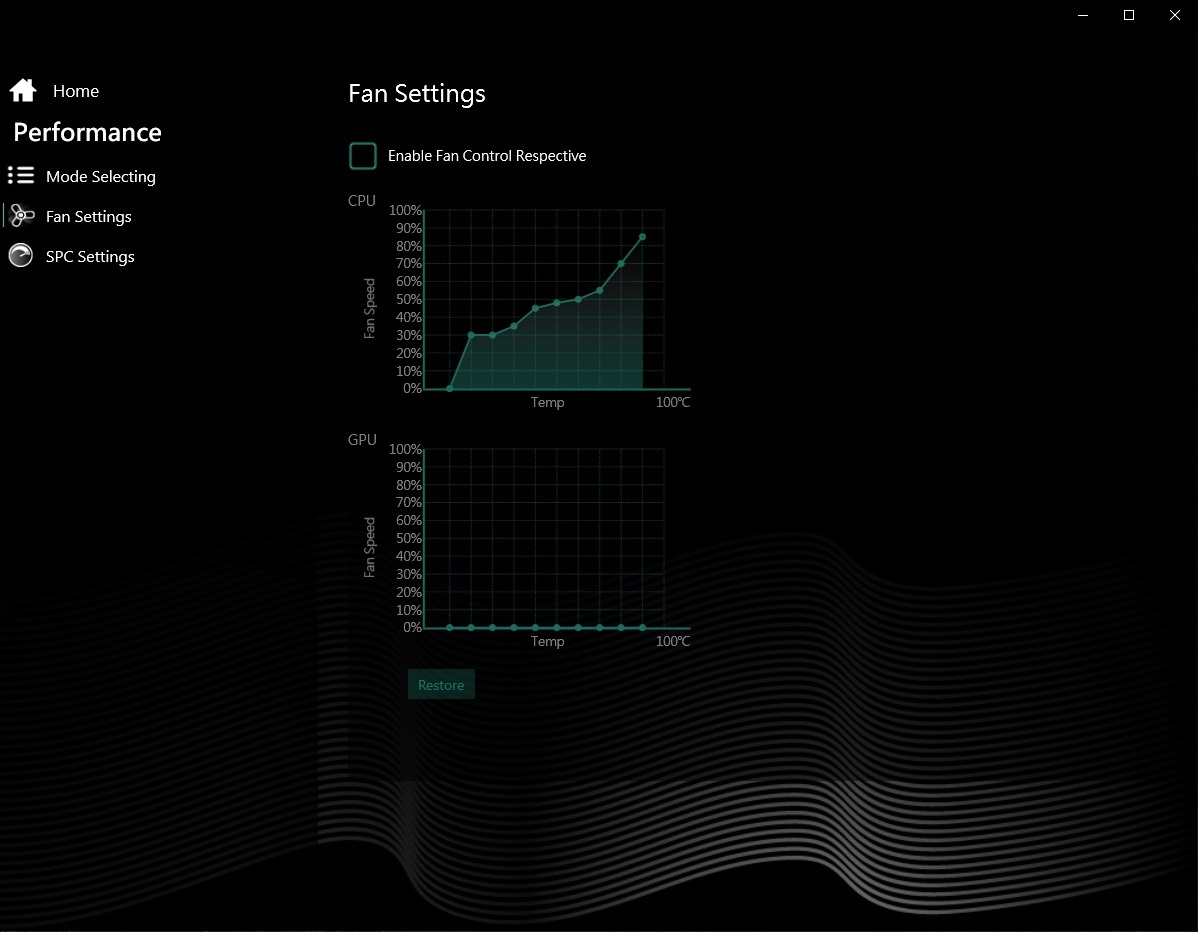
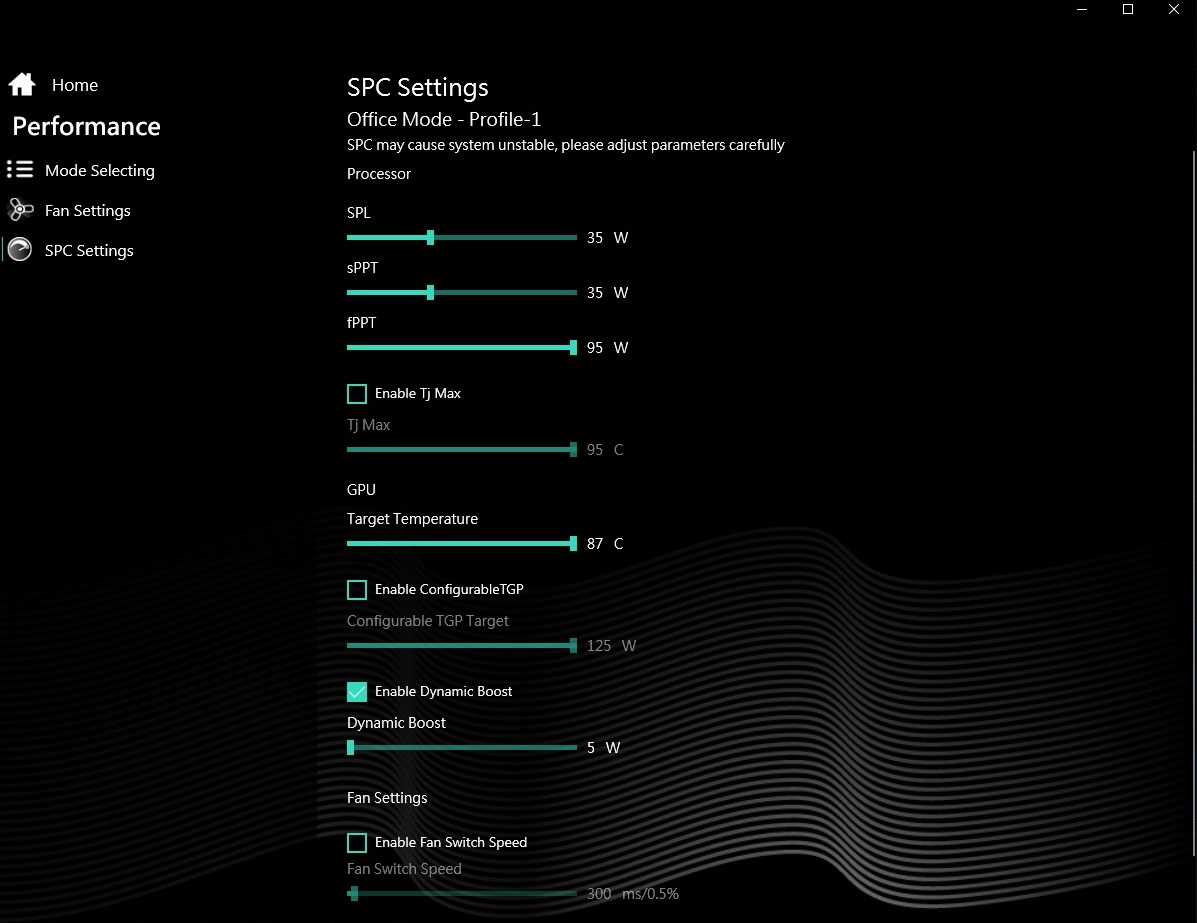
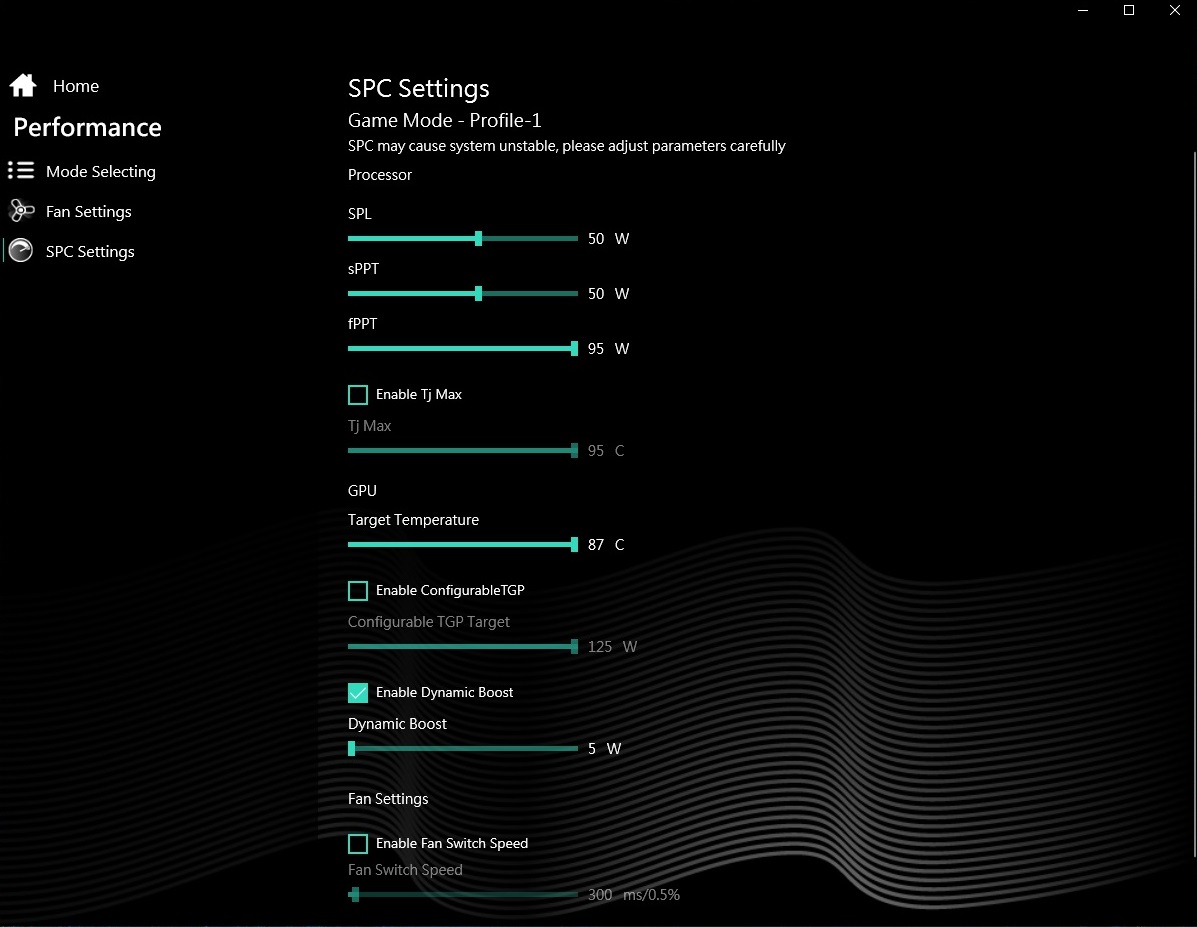
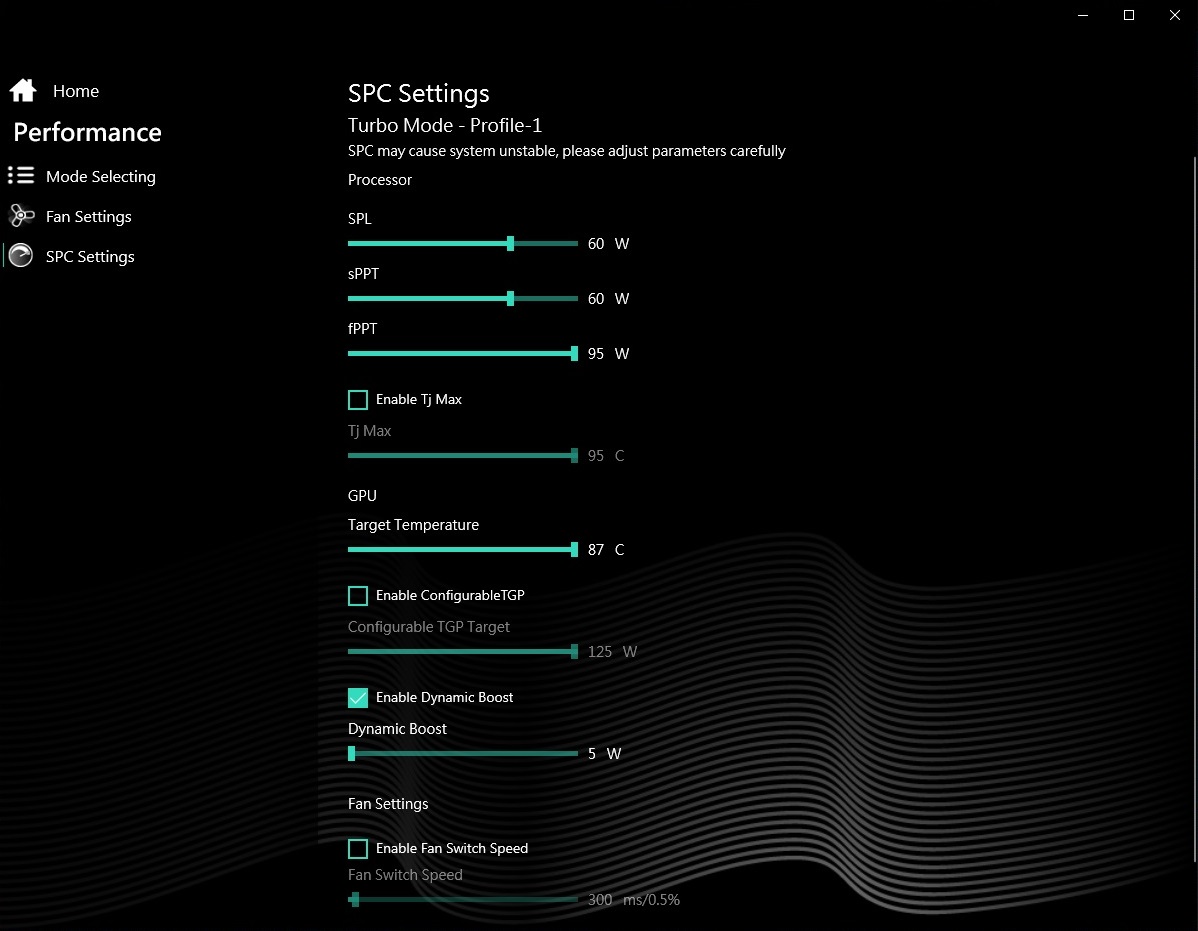
测试条件 - 控制中心的许多选项
裸机制造商同方的综合控制中心值得大加赞扬。这个预装的工具可以用来调整大量的系统设置。例如,你可以(取消)激活Optimus图形切换功能或改变性能配置文件。
我们的测试都是使用Optimus技术和 "游戏 "性能模式进行的。后者为CPU提供50瓦,并将显卡的TGP设置为130瓦(125瓦+5瓦的动态提升)。如果你想从17英寸的显示器中榨取更多的性能,你可以将动态提升增加到最大15瓦,这导致总功率为140瓦。其他两种模式的标准设置,即 "办公 "和 "涡轮",可以在下面的截图中看到。一个有趣的事实:根据Nvidia驱动程序和Medion的主页,该显卡甚至可以达到165瓦的TGP。然而,在我们的测试设备中,这个数值是无法选择的。
性能--AMD与Nvidia的结合
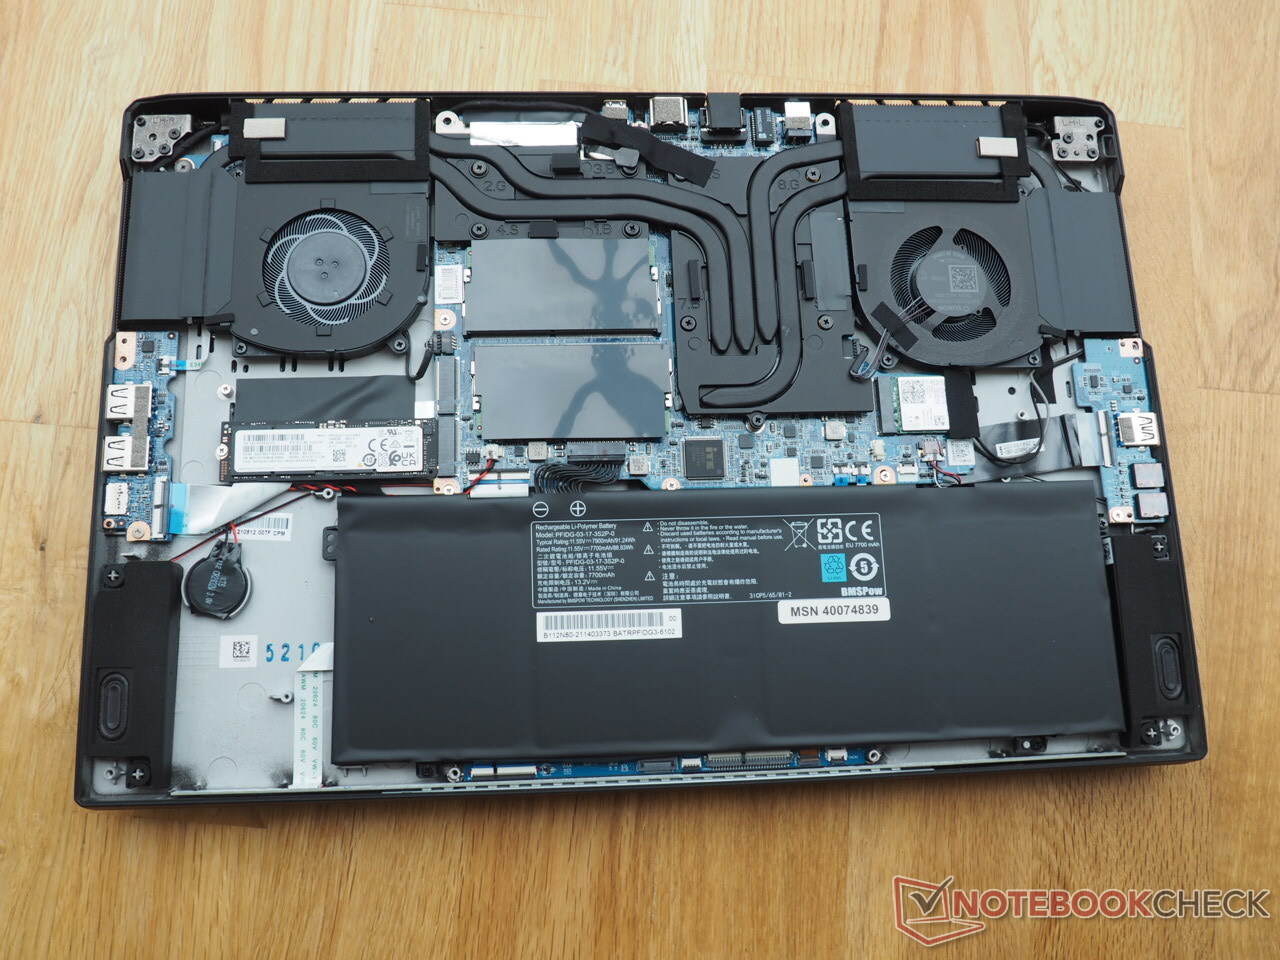
如果你非常关心未来,Medion Erazer Beast X25是一个完美的伴侣。即使在游戏领域,64GB的内存和2TB的SSD存储也不是必然的。许多竞争对手不得不用16到32GB和500到1000GB的固态硬盘来凑合。适当地,Medion安装了当时最强大的移动Nvidia GPU和最强大的移动AMD CPU之一。
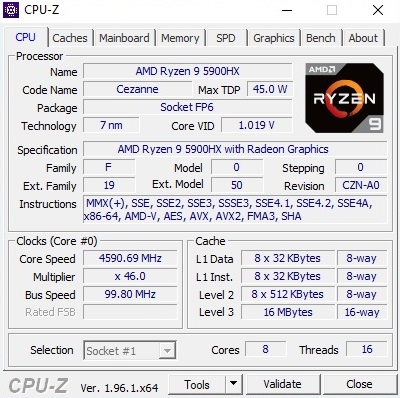
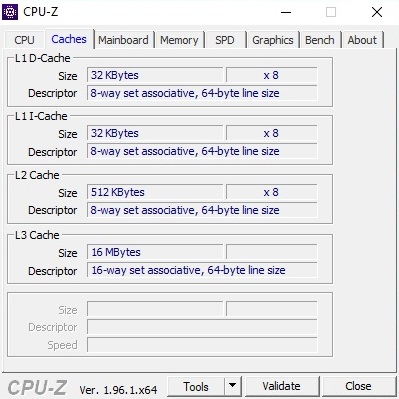
处理器
Ryzen 9 5900HX是一个极其强大的八核型号,配备了16MB的L3缓存,可以使用SMT并行处理多达16个线程。在45瓦,TDP与英特尔的竞争产品相似,但AMD使用的是略微精细的制造工艺(7纳米对10纳米 @Tiger Lake )。
* ... smaller is better
从纸面上看,时钟速率从3.3到最高4.6GHz。在我们的Cinebench R15测试中,CPU在单核负载下达到3.6至4.6 GHz,当所有核心都处于负载状态时,平均为3.7 GHz。这个数值对于Ryzen 9 5900HX来说有点差。华硕Strix Scar 17 G733QSA也配备了5900HX,在直接比较中提供了更好的基准测试结果。性能更符合基于英特尔酷睿i7-11800H或酷睿i9-11980H(K)的笔记本电脑。在使用涡轮增压模式或在控制中心程序中手动增加CPU值时,Beast X25应该能够胜过英特尔的竞争对手。
Cinebench R15 Multi endurance test
根据上图,你可以看到,即使经过几次运行,CPU的性能仍然相当稳定,并没有出现任何重大的下降。
系统性能
可能是由于固态硬盘的结果相对较弱,当涉及到系统测试时,Erazer在我们的测试领域中排名最后。尽管如此,这款笔记本电脑还是以非常高的系统速度获得了分数,在快速启动、加载和响应时间等方面表现突出。
| PCMark 10 / Score | |
| Average of class Gaming (5828 - 12414, n=94, last 2 years) | |
| Asus ROG Zephyrus S17 GX703HSD | |
| Asus Strix Scar 17 G733QSA-XS99 | |
| Average AMD Ryzen 9 5900HX, NVIDIA GeForce RTX 3080 Laptop GPU (6807 - 7416, n=6) | |
| Gigabyte Aero 17 HDR YD | |
| Aorus 17G YD | |
| Medion Erazer Beast X25 | |
| PCMark 10 / Essentials | |
| Average of class Gaming (8810 - 11935, n=98, last 2 years) | |
| Asus ROG Zephyrus S17 GX703HSD | |
| Asus Strix Scar 17 G733QSA-XS99 | |
| Aorus 17G YD | |
| Average AMD Ryzen 9 5900HX, NVIDIA GeForce RTX 3080 Laptop GPU (10018 - 10593, n=6) | |
| Gigabyte Aero 17 HDR YD | |
| Medion Erazer Beast X25 | |
| PCMark 10 / Productivity | |
| Average of class Gaming (6845 - 25323, n=96, last 2 years) | |
| Asus Strix Scar 17 G733QSA-XS99 | |
| Average AMD Ryzen 9 5900HX, NVIDIA GeForce RTX 3080 Laptop GPU (8546 - 10066, n=6) | |
| Aorus 17G YD | |
| Medion Erazer Beast X25 | |
| Asus ROG Zephyrus S17 GX703HSD | |
| Gigabyte Aero 17 HDR YD | |
| PCMark 10 / Digital Content Creation | |
| Average of class Gaming (7602 - 19954, n=96, last 2 years) | |
| Asus ROG Zephyrus S17 GX703HSD | |
| Gigabyte Aero 17 HDR YD | |
| Aorus 17G YD | |
| Average AMD Ryzen 9 5900HX, NVIDIA GeForce RTX 3080 Laptop GPU (9377 - 10582, n=6) | |
| Asus Strix Scar 17 G733QSA-XS99 | |
| Medion Erazer Beast X25 | |
| PCMark 10 Score | 6842 points | |
Help | ||
DPC延迟
在用LatencyMon工具进行的延迟测试中没有明显的问题。17英寸机似乎是实时音频和视频编辑的理想选择。
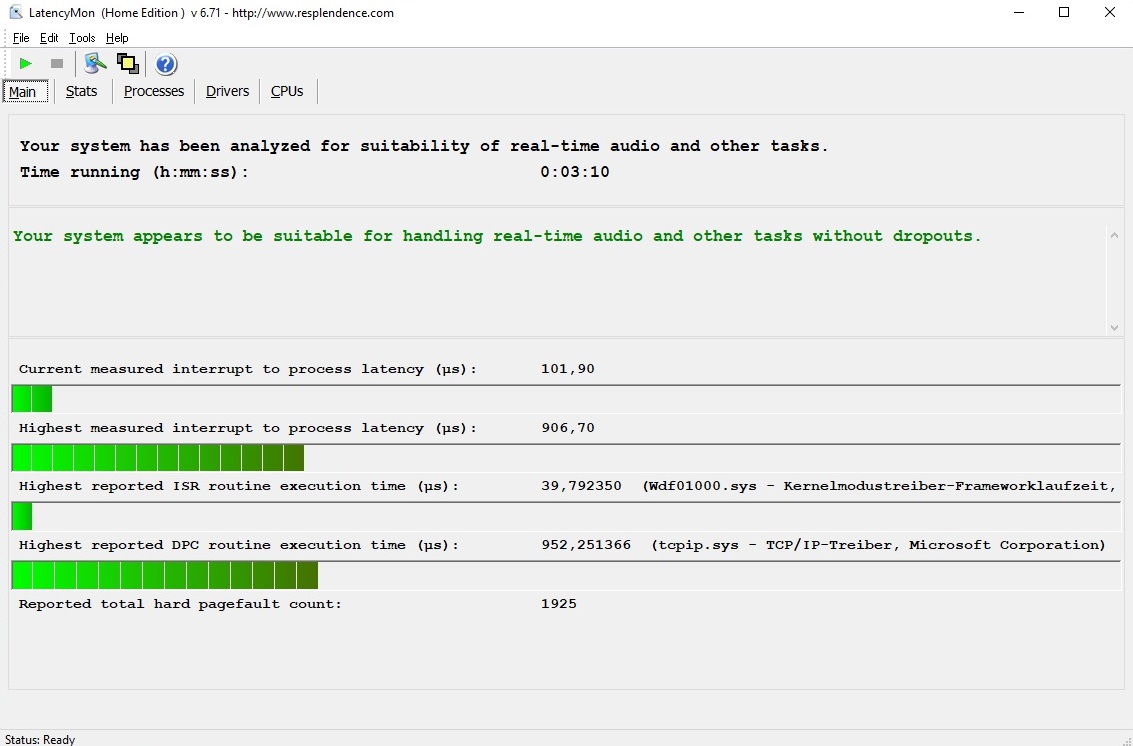
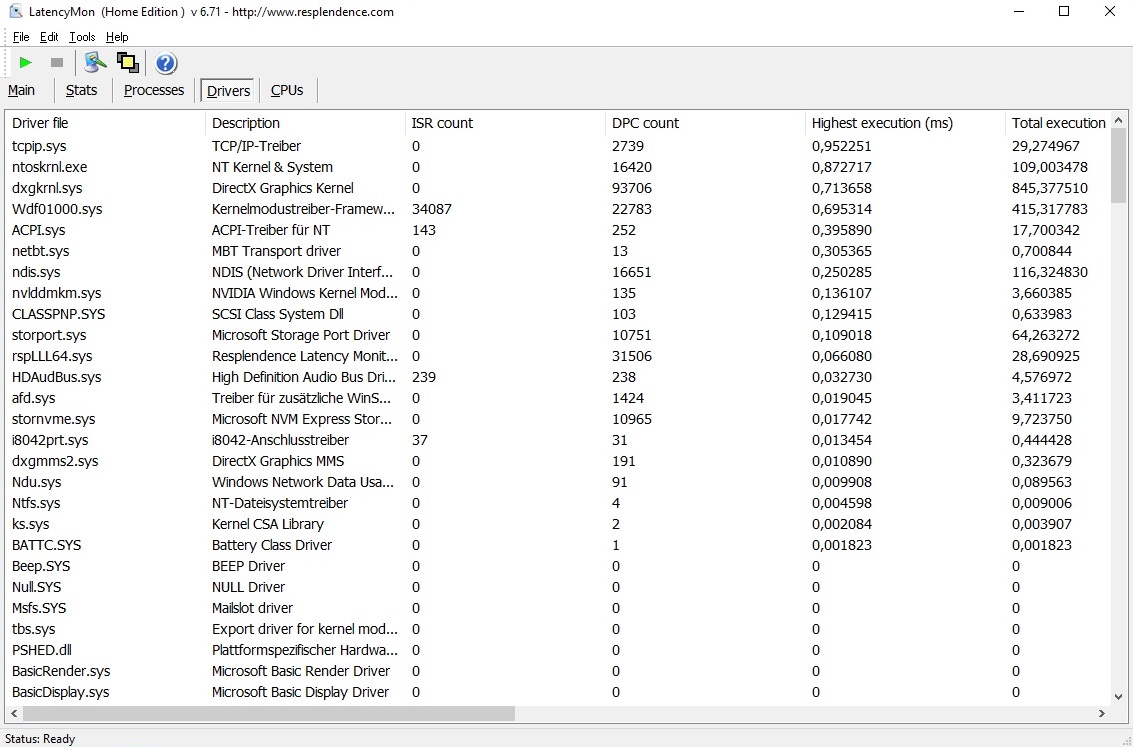
| DPC Latencies / LatencyMon - interrupt to process latency (max), Web, Youtube, Prime95 | |
| Gigabyte Aero 17 HDR YD | |
| Asus ROG Zephyrus S17 GX703HSD | |
| Aorus 17G YD | |
| Medion Erazer Beast X25 | |
| Asus Strix Scar 17 G733QSA-XS99 | |
* ... smaller is better
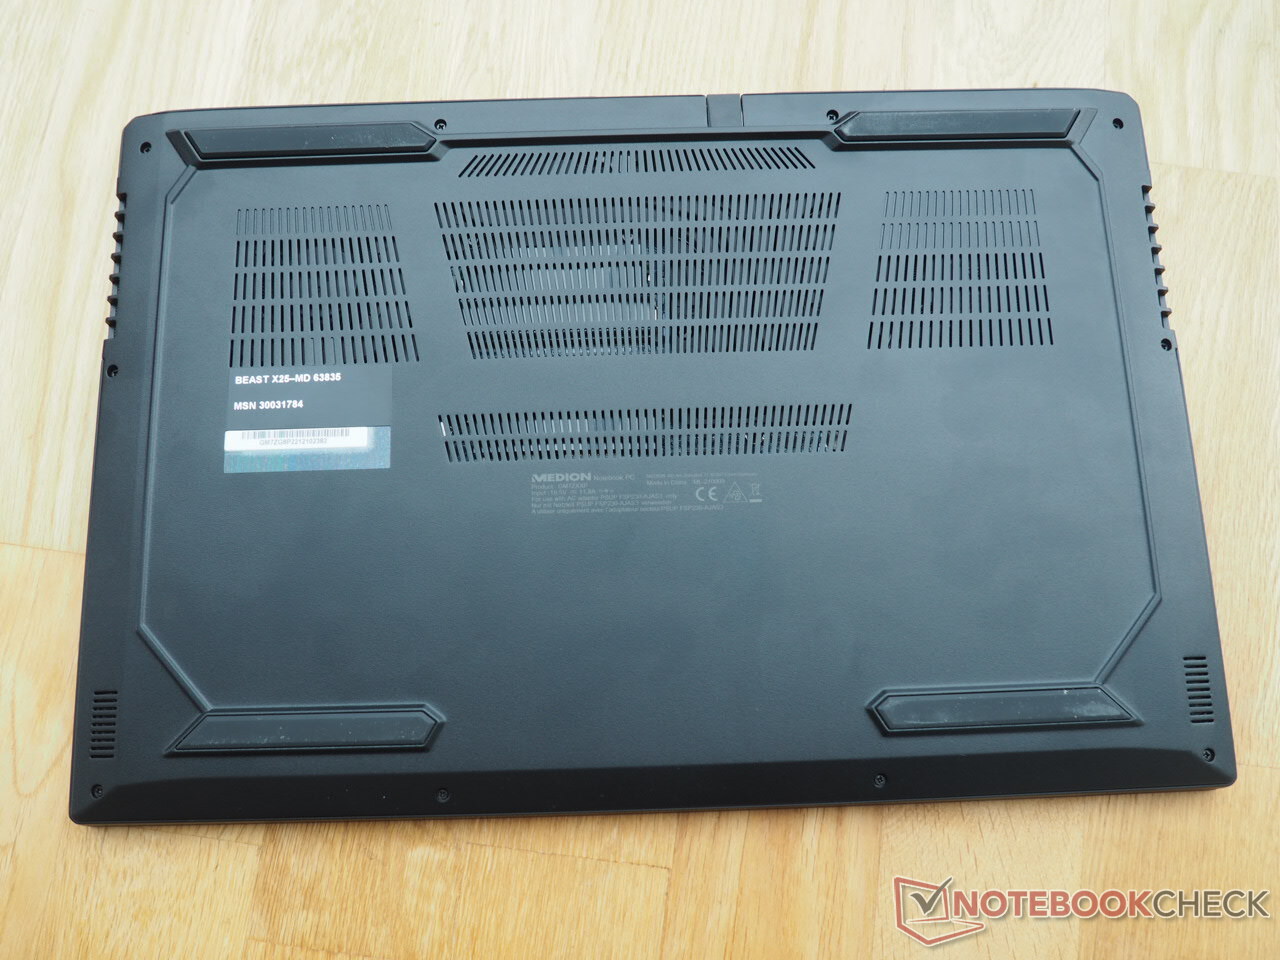
储存
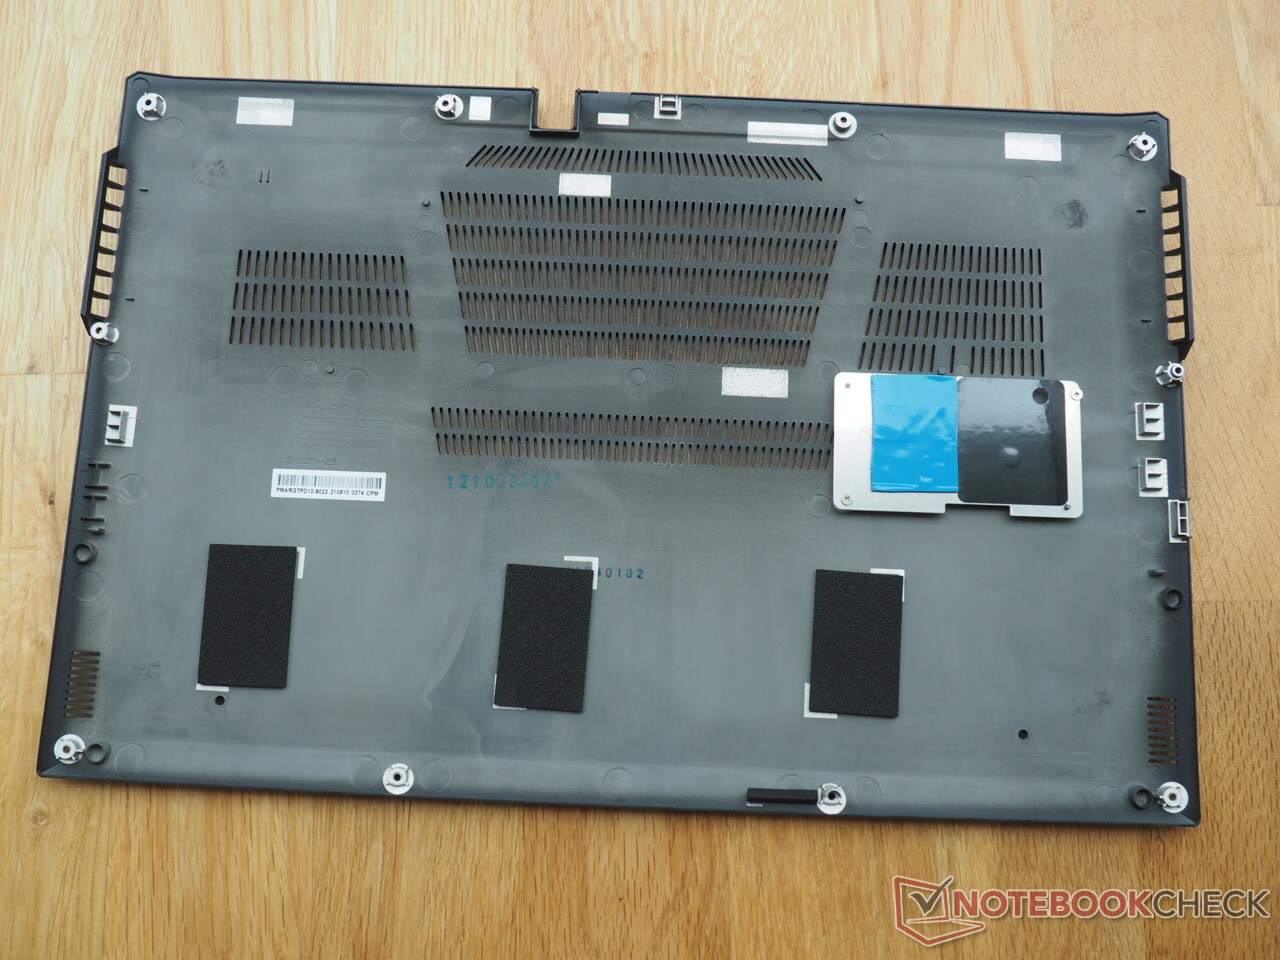
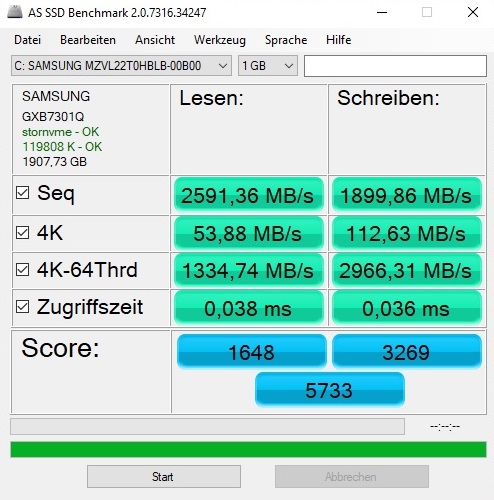
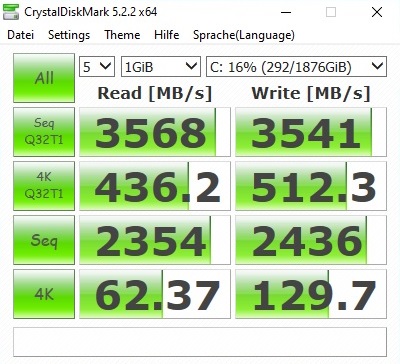
就像竞争对手一样,Medion安装了来自三星的快如闪电的PCIe 4固态硬盘,但在AS固态硬盘基准测试和CrystalDiskMark中却出人意料地落后于对比笔记本电脑,正如我们的表格所显示的。很好。由于有免费的M.2插槽,如果需要的话,存储空间可以不费吹灰之力就能扩大。
| Medion Erazer Beast X25 Samsung PM9A1 MZVL22T0HBLB | Asus Strix Scar 17 G733QSA-XS99 2x Samsung PM981a MZVLB1T0HBLR (RAID 0) | Gigabyte Aero 17 HDR YD Samsung PM9A1 MZVL2512HCJQ | Asus ROG Zephyrus S17 GX703HSD Samsung PM9A1 MZVL22T0HBLB | Aorus 17G YD Samsung PM9A1 MZVL2512HCJQ | |
|---|---|---|---|---|---|
| CrystalDiskMark 5.2 / 6 | 54% | 65% | 58% | 41% | |
| Write 4K (MB/s) | 129.7 | 235.9 82% | 230.4 78% | 244.2 88% | 227.4 75% |
| Read 4K (MB/s) | 62.4 | 48.02 -23% | 91.6 47% | 89.8 44% | 91.3 46% |
| Write Seq (MB/s) | 2436 | 4822 98% | 4216 73% | 2241 -8% | |
| Read Seq (MB/s) | 2354 | 5043 114% | 4543 93% | 4496 91% | |
| Write 4K Q32T1 (MB/s) | 512 | 625 22% | 667 30% | 607 19% | 661 29% |
| Read 4K Q32T1 (MB/s) | 436.2 | 392.3 -10% | 728 67% | 658 51% | 712 63% |
| Write Seq Q32T1 (MB/s) | 3541 | 5350 51% | 5043 42% | 5270 49% | 1540 -57% |
| Read Seq Q32T1 (MB/s) | 3568 | 7130 100% | 6821 91% | 7091 99% | 6806 91% |
| AS SSD | 14% | 47% | 64% | 25% | |
| Seq Read (MB/s) | 2591 | 4981 92% | 5438 110% | 5085 96% | 5150 99% |
| Seq Write (MB/s) | 1900 | 3050 61% | 3904 105% | 4434 133% | 3920 106% |
| 4K Read (MB/s) | 53.9 | 57 6% | 56.2 4% | 80.3 49% | 46.6 -14% |
| 4K Write (MB/s) | 112.6 | 261.3 132% | 165.8 47% | 214.7 91% | 145.8 29% |
| 4K-64 Read (MB/s) | 1335 | 1205 -10% | 2489 86% | 2573 93% | 2071 55% |
| 4K-64 Write (MB/s) | 2966 | 1290 -57% | 3480 17% | 2972 0% | 3267 10% |
| Access Time Read * (ms) | 0.038 | 0.032 16% | 0.054 -42% | 0.018 53% | 0.078 -105% |
| Access Time Write * (ms) | 0.036 | 0.044 -22% | 0.026 28% | 0.02 44% | 0.029 19% |
| Score Read (Points) | 1648 | 1760 7% | 3089 87% | 3161 92% | 2633 60% |
| Score Write (Points) | 3269 | 1857 -43% | 4036 23% | 3631 11% | 2805 -14% |
| Score Total (Points) | 5733 | 4428 -23% | 8620 50% | 8380 46% | 7716 35% |
| Total Average (Program / Settings) | 34% /
31% | 56% /
55% | 61% /
62% | 33% /
32% |
* ... smaller is better

Continuous load read: DiskSpd Read Loop, Queue Depth 8
图形卡
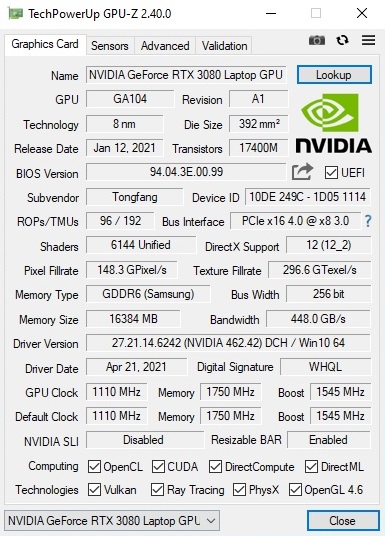
GeForce RTX 3080,这是Nvidia安培一代的绝对高端型号,具有6144个CUDA核心和16GB GDDR6 VRAM,负责Erazer中苛刻的图形计算。GPU-Z工具报告说,该芯片的时钟速度在1,110和1,545 MHz之间(基础/提升),其内存的时钟速度为1,750 MHz。
目前Nvidia GPU的性能在很大程度上取决于配置的TGP,制造商可以相对自由地选择。正如以前的报告,DirectX 12芯片在 "游戏模式 "下运行的功率为130瓦,包括动态提升,考虑到我们的RTX 3080笔记本电脑文章 ,这代表了一个合格的价值;这相应地反映在图形基准上,野兽X25通常在我们比较领域的(低)中场。
| 3DMark 11 Performance | 27989 points | |
| 3DMark Cloud Gate Standard Score | 48998 points | |
| 3DMark Fire Strike Score | 23834 points | |
| 3DMark Time Spy Score | 10580 points | |
Help | ||
游戏性能
尽管在我们的游戏测试中,Beast X25并没有排在最前面,但其3D性能非常高。所有最新的游戏都可以在1920x1080的原始分辨率和高到最大的细节下顺利进行。对于外部QHD(2560x1440像素)或UHD(3840x2160像素)显示器来说,往往会有足够的潜力。只有在极端的CPU密集型游戏中,情况才会变得困难,如赛博朋克2077和/或在没有DLSS的情况下启用光线追踪时,情况才会变得困难。
| The Witcher 3 | |
| 1920x1080 High Graphics & Postprocessing (Nvidia HairWorks Off) | |
| Average of class Gaming (341 - 404, n=2, last 2 years) | |
| Asus ROG Zephyrus S17 GX703HSD | |
| Average NVIDIA GeForce RTX 3080 Laptop GPU (149 - 242, n=32) | |
| Asus Strix Scar 17 G733QSA-XS99 | |
| Aorus 17G YD | |
| Medion Erazer Beast X25 | |
| 1920x1080 Ultra Graphics & Postprocessing (HBAO+) | |
| Average of class Gaming (104.7 - 240, n=7, last 2 years) | |
| Asus ROG Zephyrus S17 GX703HSD | |
| Aorus 17G YD | |
| Asus Strix Scar 17 G733QSA-XS99 | |
| Average NVIDIA GeForce RTX 3080 Laptop GPU (85.1 - 123, n=40) | |
| Medion Erazer Beast X25 | |
| Gigabyte Aero 17 HDR YD | |
| GTA V | |
| 1920x1080 High/On (Advanced Graphics Off) AA:2xMSAA + FX AF:8x | |
| Asus ROG Zephyrus S17 GX703HSD | |
| Average of class Gaming (110.7 - 189, n=64, last 2 years) | |
| Gigabyte Aero 17 HDR YD | |
| Average NVIDIA GeForce RTX 3080 Laptop GPU (137 - 176, n=30) | |
| Aorus 17G YD | |
| Medion Erazer Beast X25 | |
| Asus Strix Scar 17 G733QSA-XS99 | |
| 1920x1080 Highest AA:4xMSAA + FX AF:16x | |
| Average of class Gaming (48.3 - 186.9, n=94, last 2 years) | |
| Asus ROG Zephyrus S17 GX703HSD | |
| Gigabyte Aero 17 HDR YD | |
| Average NVIDIA GeForce RTX 3080 Laptop GPU (68.6 - 114.6, n=34) | |
| Aorus 17G YD | |
| Asus Strix Scar 17 G733QSA-XS99 | |
| Medion Erazer Beast X25 | |
| Final Fantasy XV Benchmark - 1920x1080 High Quality | |
| Average of class Gaming (41 - 215, n=95, last 2 years) | |
| Asus Strix Scar 17 G733QSA-XS99 | |
| Average NVIDIA GeForce RTX 3080 Laptop GPU (55.5 - 115, n=34) | |
| Gigabyte Aero 17 HDR YD | |
| Medion Erazer Beast X25 | |
| Aorus 17G YD | |
我们检查了RPG热门游戏的帧率是否在很长一段时间内保持不变。 我们检查了Witcher 3我们运行了60分钟(全高清/超清)。就像我们在CPU测试中已经看到的那样,Erazer在这里也没有受到性能下降的影响。
The Witcher 3 FPS diagram
| low | med. | high | ultra | |
|---|---|---|---|---|
| GTA V (2015) | 180 | 157 | 91.9 | |
| The Witcher 3 (2015) | 175 | 97.9 | ||
| Dota 2 Reborn (2015) | 147 | 141 | 126 | 119 |
| Final Fantasy XV Benchmark (2018) | 170 | 127 | 97 | |
| X-Plane 11.11 (2018) | 101 | 87.4 | 72.1 | |
| Far Cry 5 (2018) | 119 | 110 | ||
| Strange Brigade (2018) | 332 | 199 | 180 | 168 |
| Hunt Showdown (2020) | 122 | |||
| Death Stranding (2020) | 135 | 134 | ||
| Mafia Definitive Edition (2020) | 104 | |||
| Resident Evil Village (2021) | 155 | 144 | ||
| Mass Effect Legendary Edition (2021) | 109 | |||
| Days Gone (2021) | 130 | 100 | ||
| F1 2021 (2021) | 165 | 111 |
排放 - 喷气式飞机
噪声排放
薄型结构的一个主要缺点是噪音大,尽管大多数游戏笔记本电脑都要在这方面做斗争。Witcher 3 ,一小时后约为52 dB(A),相当响亮,不戴耳机只能部分忍受。只有华硕ROG Zephyrus S17 GX703HSD在测试中明显地更安静。
Beast X25在空闲模式下的表现也需要改进。尽管笔记本电脑有时完全无声(除了暂时的线圈啸叫),或者它只是以略低于30 dB(A)的相当微妙的水平发出嘶嘶声,但风扇偶尔会无缘无故地转速超过40 dB(A),这将使敏感的用户感到烦恼。控制中心的 "办公室模式 "提供了一个解决方案,或至少提供了一些衰减。
Noise level
| Idle |
| 26 / 30 / 43 dB(A) |
| Load |
| 54 / 55 dB(A) |
 | ||
30 dB silent 40 dB(A) audible 50 dB(A) loud |
||
min: | ||
| Medion Erazer Beast X25 R9 5900HX, GeForce RTX 3080 Laptop GPU | Asus Strix Scar 17 G733QSA-XS99 R9 5900HX, GeForce RTX 3080 Laptop GPU | Gigabyte Aero 17 HDR YD i9-11980HK, GeForce RTX 3080 Laptop GPU | Asus ROG Zephyrus S17 GX703HSD i9-11900H, GeForce RTX 3080 Laptop GPU | Aorus 17G YD i7-11800H, GeForce RTX 3080 Laptop GPU | Average of class Gaming | |
|---|---|---|---|---|---|---|
| Noise | 16% | -0% | 19% | -2% | 10% | |
| off / environment * (dB) | 25 | 25 -0% | 25 -0% | 23 8% | 25 -0% | 24.1 ? 4% |
| Idle Minimum * (dB) | 26 | 25.2 3% | 30 -15% | 23 12% | 32 -23% | 26 ? -0% |
| Idle Average * (dB) | 30 | 25.2 16% | 32 -7% | 23 23% | 33 -10% | 27.5 ? 8% |
| Idle Maximum * (dB) | 43 | 25.2 41% | 41 5% | 23 47% | 39 9% | 30.1 ? 30% |
| Load Average * (dB) | 54 | 30.7 43% | 43 20% | 41 24% | 43 20% | 43.8 ? 19% |
| Witcher 3 ultra * (dB) | 52 | 51.3 1% | 51 2% | 45 13% | 52 -0% | |
| Load Maximum * (dB) | 55 | 51.3 7% | 59 -7% | 52 5% | 61 -11% | 54.3 ? 1% |
* ... smaller is better
温度
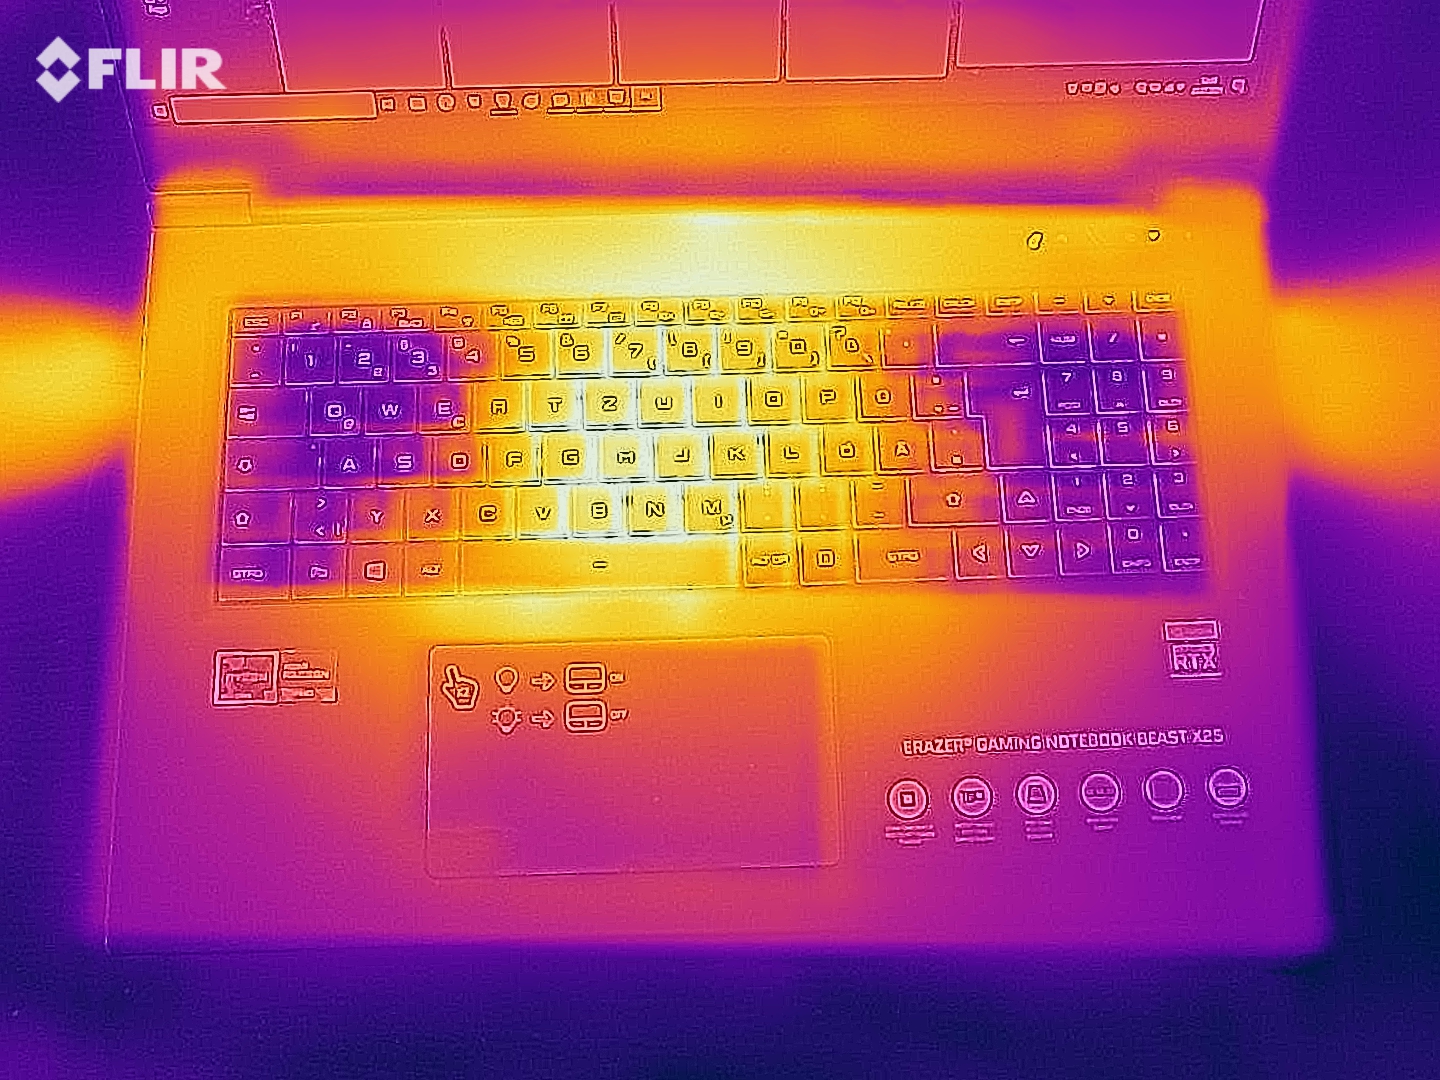
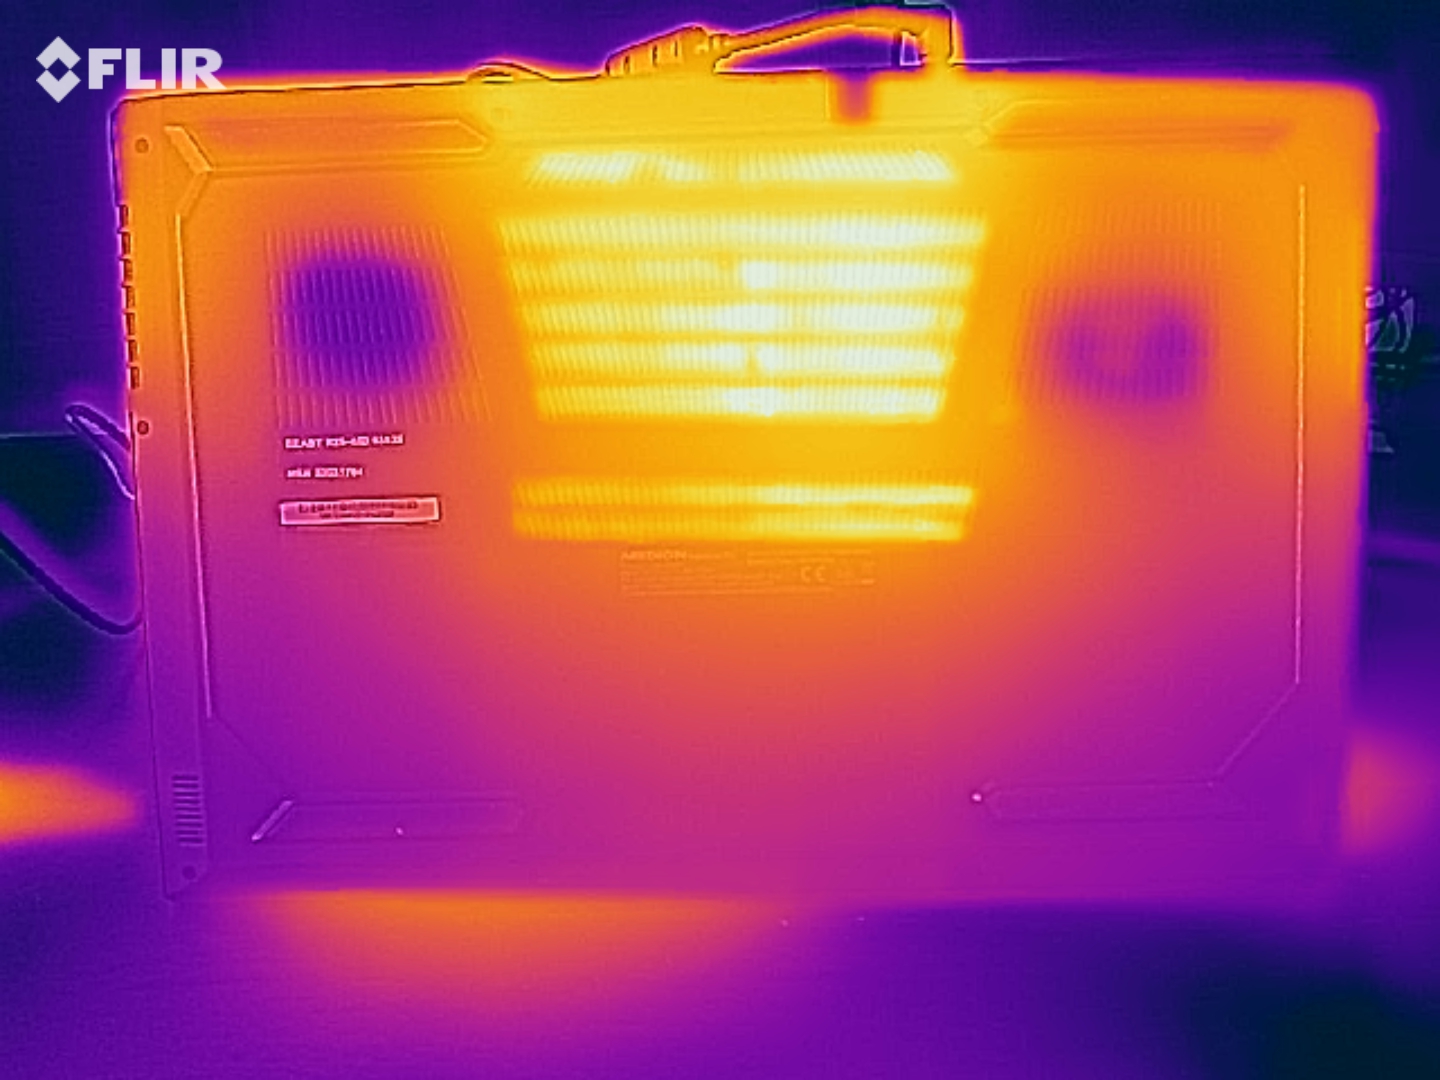
尽管噪音水平很高,但17英寸机箱在负载下会变得相对较热。在这种情况下,我们在使用FurMark和Prime95工具进行压力测试时,机箱顶部的温度高达54℃(约129°F),底部的温度高达57℃(约135°F)(最高温度分别为52℃(约126°F)和55℃(约131°F),@TheWitcher 3 )。另一方面,机箱在空闲使用时感觉相当凉爽,最高温度为35°C(约95°F)。
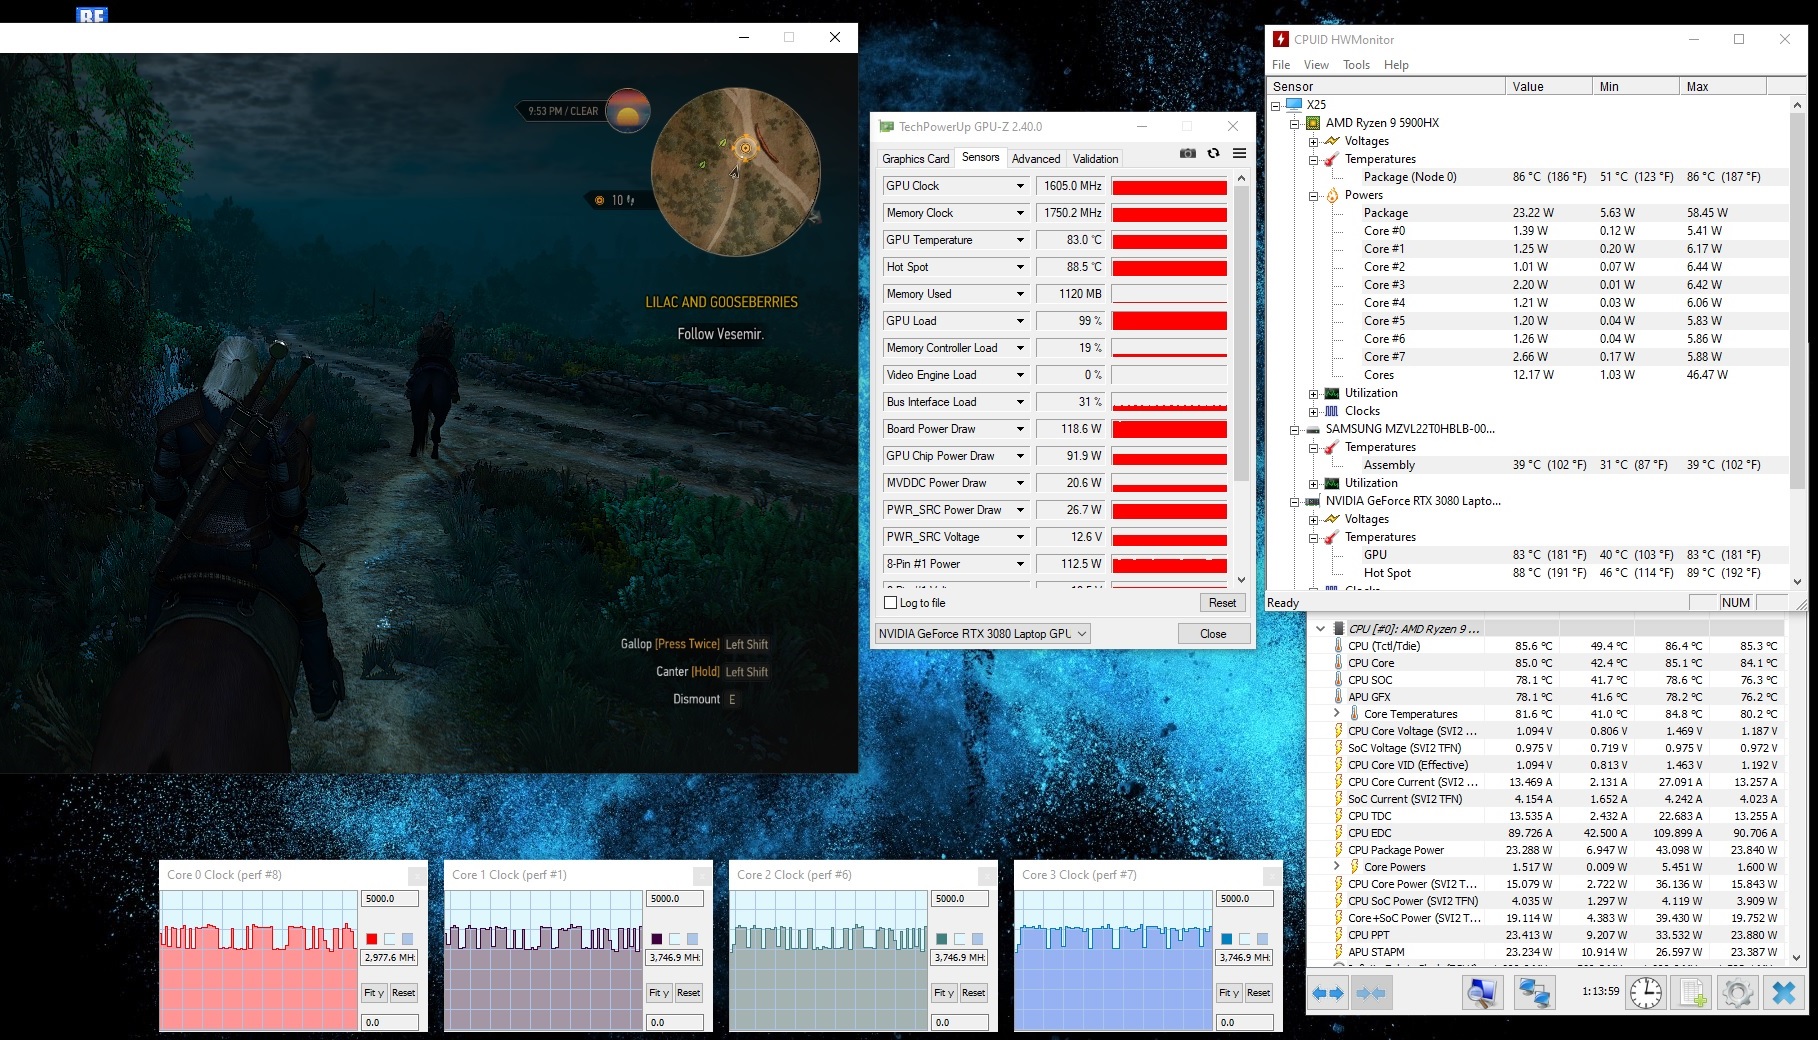
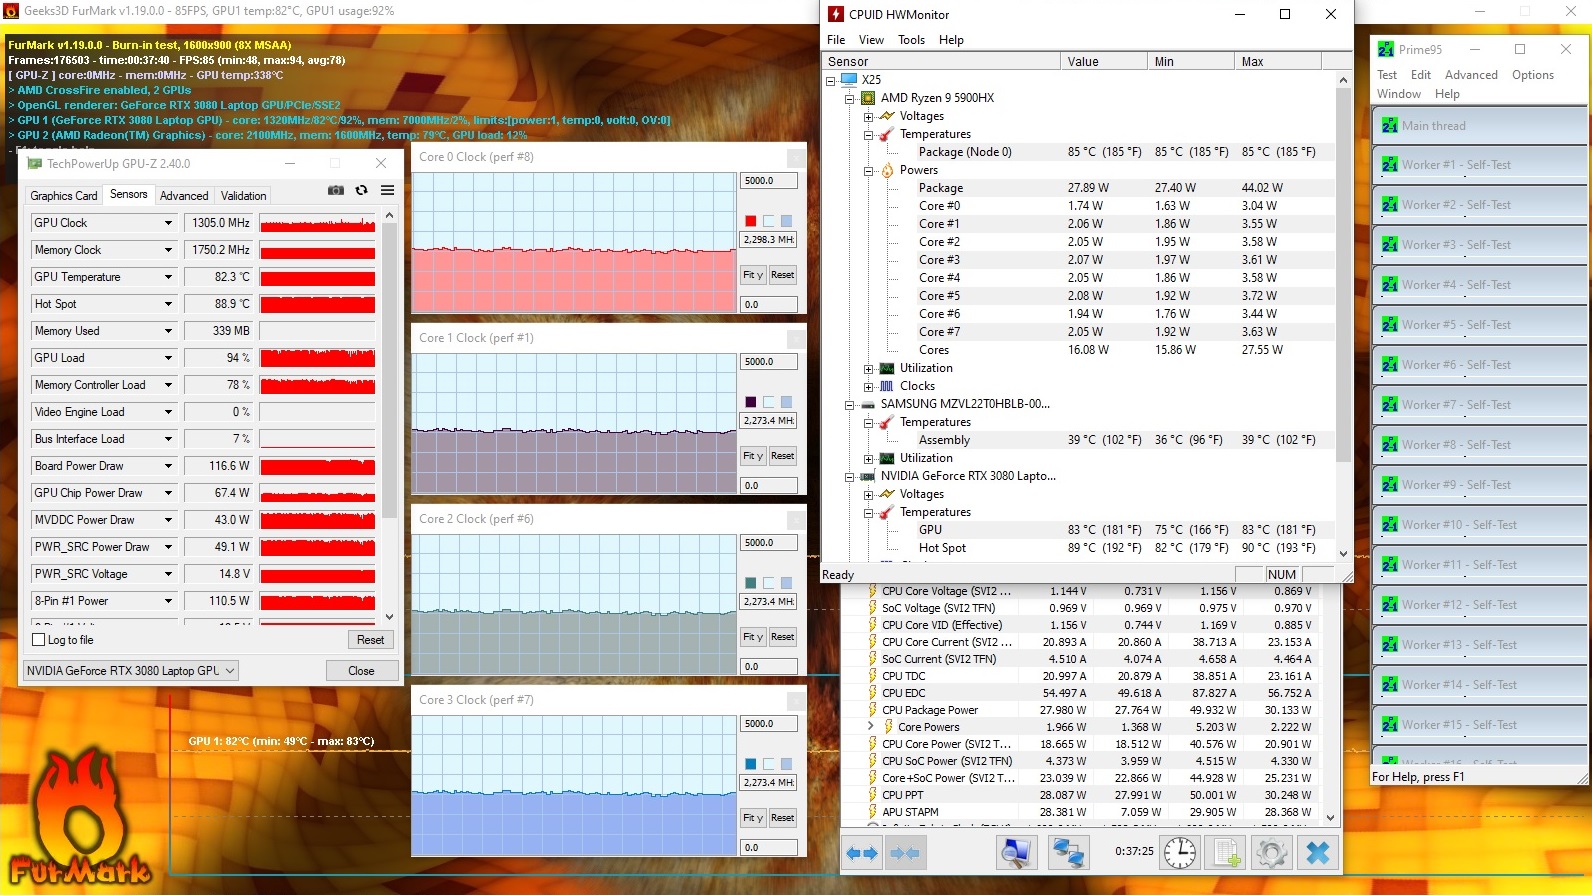
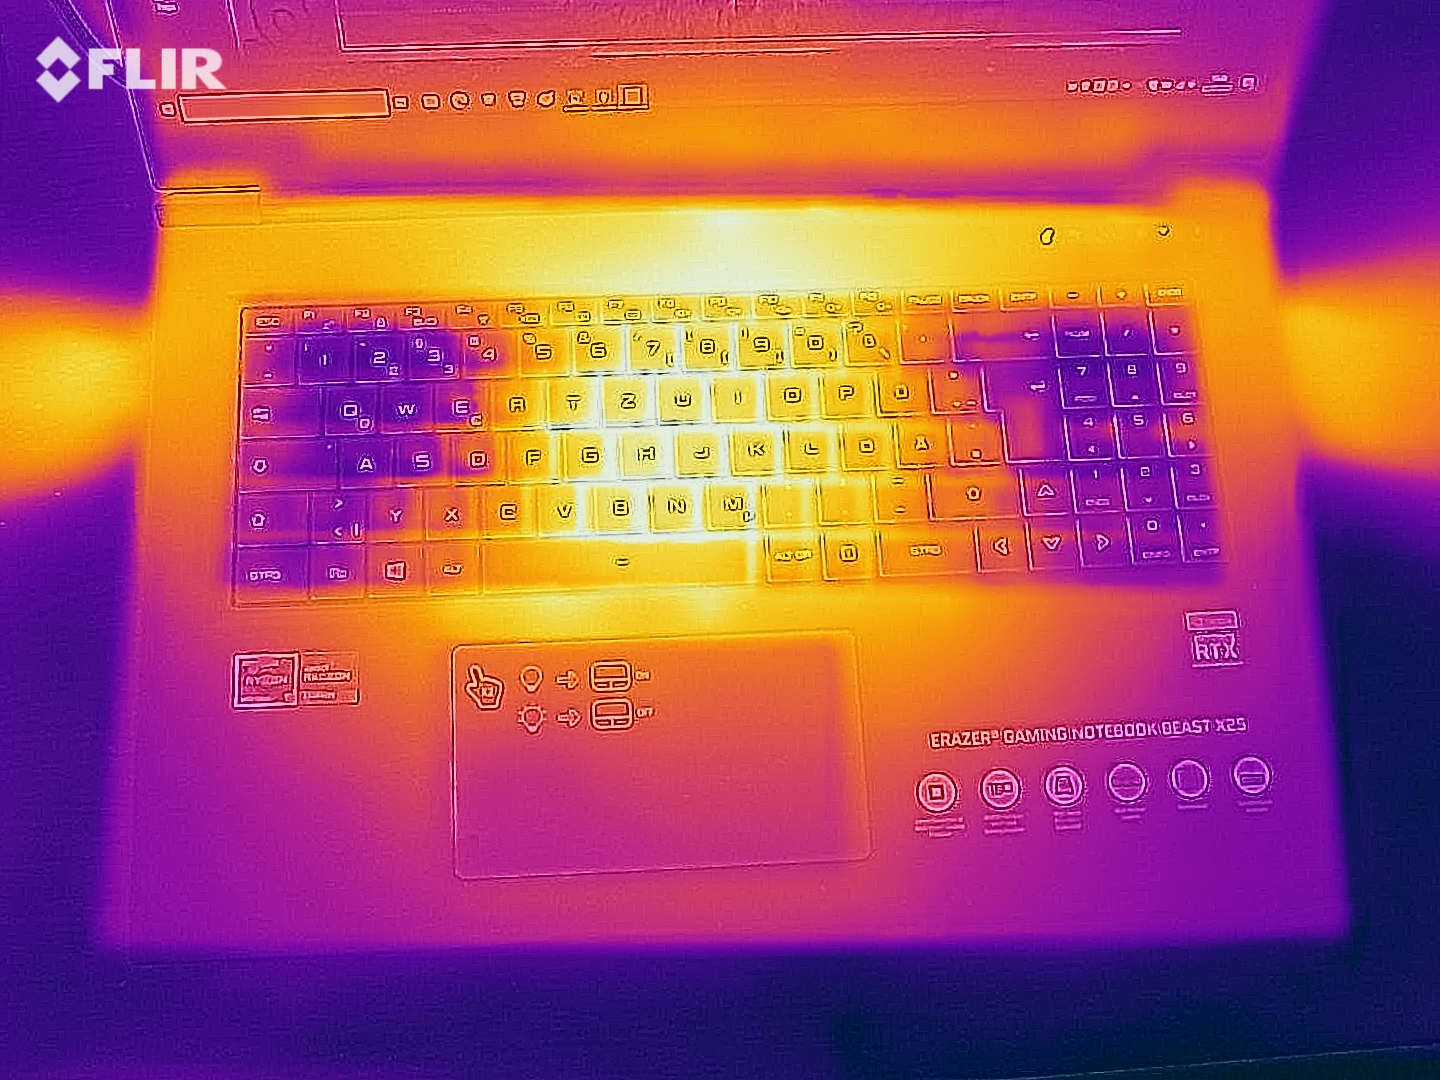
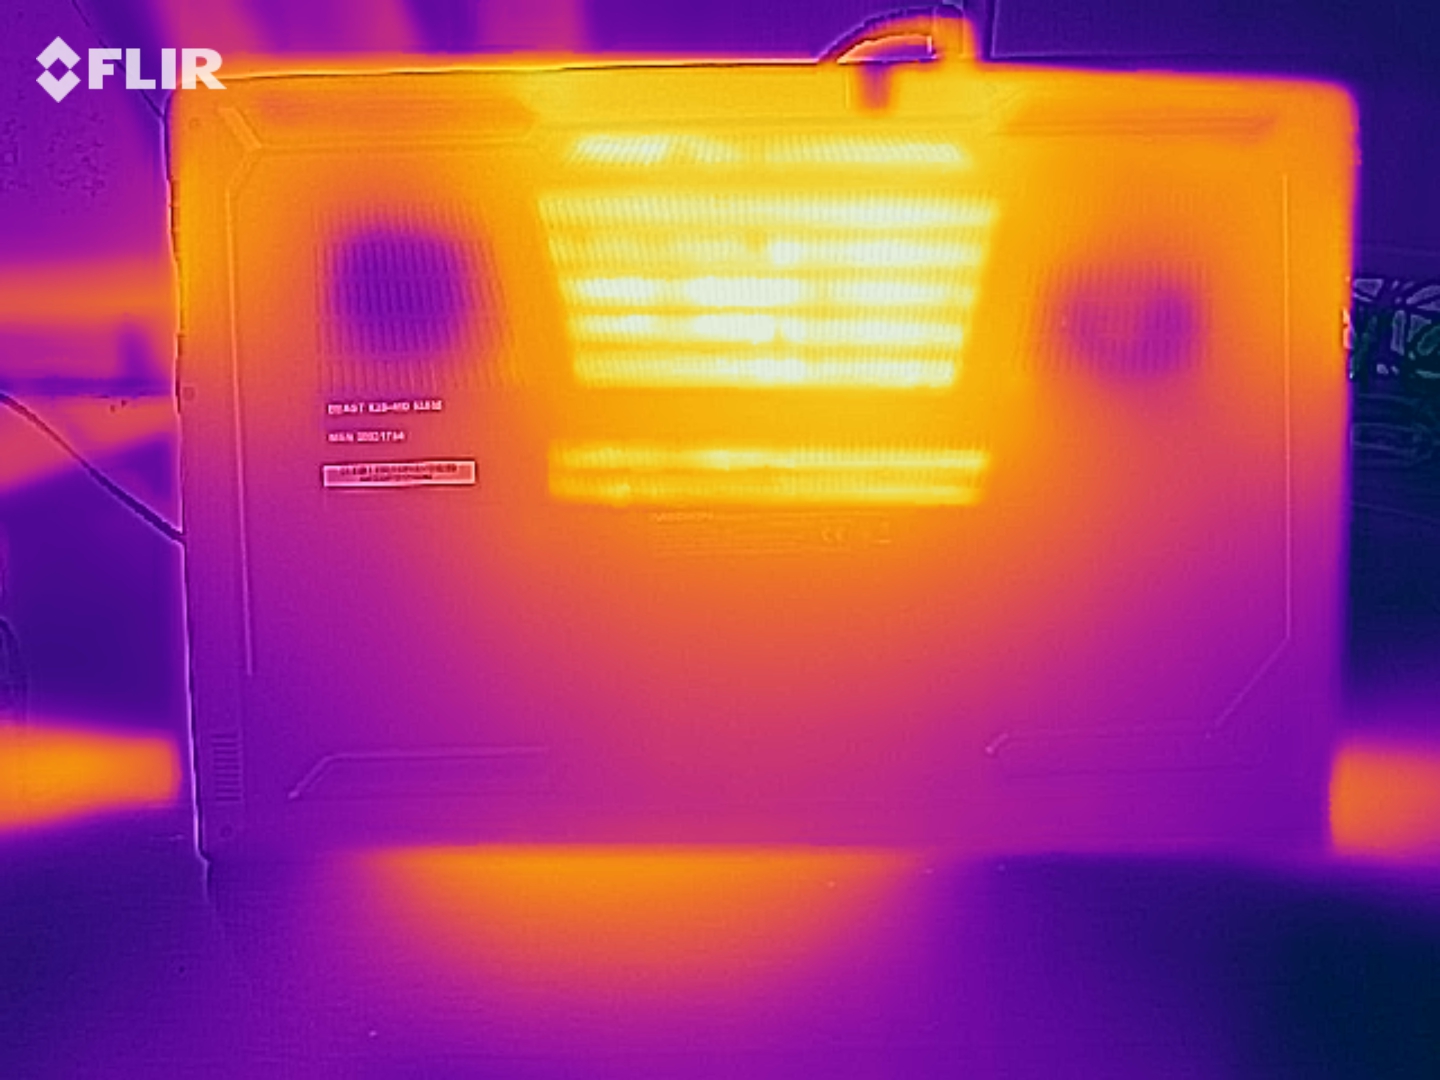
像往常一样,组件变得相当热。虽然Ryzen 9 5900HX在全负荷下节流到2.3 GHz,但HWMonitor工具报告了一个高但仍然不关键的85℃(约185°F)。GeForce RTX 3080的情况要好一些,在压力测试中(没有节流),它舒适地稳定在82°C左右(约180°F)。在我们的TheWitcher 3测试中,温度相似,但该设备能够达到更高的时钟速率(见截图)。
(-) The maximum temperature on the upper side is 54 °C / 129 F, compared to the average of 40.4 °C / 105 F, ranging from 21.2 to 68.8 °C for the class Gaming.
(-) The bottom heats up to a maximum of 57 °C / 135 F, compared to the average of 43.2 °C / 110 F
(±) In idle usage, the average temperature for the upper side is 32.1 °C / 90 F, compared to the device average of 33.9 °C / 93 F.
(-) Playing The Witcher 3, the average temperature for the upper side is 45.8 °C / 114 F, compared to the device average of 33.9 °C / 93 F.
(-) The palmrests and touchpad can get very hot to the touch with a maximum of 45 °C / 113 F.
(-) The average temperature of the palmrest area of similar devices was 28.8 °C / 83.8 F (-16.2 °C / -29.2 F).
| Medion Erazer Beast X25 R9 5900HX, GeForce RTX 3080 Laptop GPU | Asus Strix Scar 17 G733QSA-XS99 R9 5900HX, GeForce RTX 3080 Laptop GPU | Gigabyte Aero 17 HDR YD i9-11980HK, GeForce RTX 3080 Laptop GPU | Asus ROG Zephyrus S17 GX703HSD i9-11900H, GeForce RTX 3080 Laptop GPU | Aorus 17G YD i7-11800H, GeForce RTX 3080 Laptop GPU | Average of class Gaming | |
|---|---|---|---|---|---|---|
| Heat | 11% | 7% | -1% | 16% | 11% | |
| Maximum Upper Side * (°C) | 54 | 40 26% | 44 19% | 59 -9% | 36 33% | 45.2 ? 16% |
| Maximum Bottom * (°C) | 57 | 39.8 30% | 56 2% | 53 7% | 52 9% | 48.2 ? 15% |
| Idle Upper Side * (°C) | 34 | 34.6 -2% | 32 6% | 35 -3% | 29 15% | 31 ? 9% |
| Idle Bottom * (°C) | 35 | 38.4 -10% | 35 -0% | 35 -0% | 33 6% | 34.2 ? 2% |
* ... smaller is better
发言人
Medion Erazer Beast X25 audio analysis
(+) | speakers can play relatively loud (85 dB)
Bass 100 - 315 Hz
(-) | nearly no bass - on average 25% lower than median
(±) | linearity of bass is average (14.4% delta to prev. frequency)
Mids 400 - 2000 Hz
(+) | balanced mids - only 1.8% away from median
(+) | mids are linear (3.5% delta to prev. frequency)
Highs 2 - 16 kHz
(±) | higher highs - on average 5% higher than median
(±) | linearity of highs is average (8.3% delta to prev. frequency)
Overall 100 - 16.000 Hz
(±) | linearity of overall sound is average (15.5% difference to median)
Compared to same class
» 35% of all tested devices in this class were better, 7% similar, 58% worse
» The best had a delta of 6%, average was 18%, worst was 132%
Compared to all devices tested
» 23% of all tested devices were better, 4% similar, 73% worse
» The best had a delta of 4%, average was 23%, worst was 134%
Asus Strix Scar 17 G733QSA-XS99 audio analysis
(±) | speaker loudness is average but good (73.7 dB)
Bass 100 - 315 Hz
(+) | good bass - only 2.1% away from median
(±) | linearity of bass is average (7% delta to prev. frequency)
Mids 400 - 2000 Hz
(+) | balanced mids - only 1.4% away from median
(+) | mids are linear (4.8% delta to prev. frequency)
Highs 2 - 16 kHz
(±) | higher highs - on average 5.9% higher than median
(±) | linearity of highs is average (8.7% delta to prev. frequency)
Overall 100 - 16.000 Hz
(+) | overall sound is linear (10.7% difference to median)
Compared to same class
» 7% of all tested devices in this class were better, 2% similar, 91% worse
» The best had a delta of 6%, average was 18%, worst was 132%
Compared to all devices tested
» 6% of all tested devices were better, 2% similar, 93% worse
» The best had a delta of 4%, average was 23%, worst was 134%
能源管理 - 强大的91Wh电池
能源消耗
对于一个具有图形切换功能的高端笔记本电脑来说,其能量率也不是很好或特别差。闲置时的22至34瓦和负载时的120至231瓦一样,与大多数竞争对手一致。只要你不过度使用控制中心的设置,附带的230瓦电源适配器有足够的容量。
| Off / Standby | |
| Idle | |
| Load |
|
Key:
min: | |
| Medion Erazer Beast X25 R9 5900HX, GeForce RTX 3080 Laptop GPU | Asus Strix Scar 17 G733QSA-XS99 R9 5900HX, GeForce RTX 3080 Laptop GPU | Gigabyte Aero 17 HDR YD i9-11980HK, GeForce RTX 3080 Laptop GPU | Asus ROG Zephyrus S17 GX703HSD i9-11900H, GeForce RTX 3080 Laptop GPU | Aorus 17G YD i7-11800H, GeForce RTX 3080 Laptop GPU | Average of class Gaming | |
|---|---|---|---|---|---|---|
| Power Consumption | 21% | -5% | 3% | 1% | 18% | |
| Idle Minimum * (Watt) | 22 | 10.9 50% | 25 -14% | 21.7 1% | 24 -9% | 13 ? 41% |
| Idle Average * (Watt) | 26 | 14.7 43% | 28 -8% | 27 -4% | 26 -0% | 19 ? 27% |
| Idle Maximum * (Watt) | 34 | 26.8 21% | 40 -18% | 33 3% | 38 -12% | 24.5 ? 28% |
| Load Average * (Watt) | 120 | 106.7 11% | 114 5% | 108 10% | 101 16% | 111.1 ? 7% |
| Witcher 3 ultra * (Watt) | 189 | 192.4 -2% | 176 7% | 195 -3% | 164 13% | |
| Load Maximum * (Watt) | 231 | 228.4 1% | 236 -2% | 210 9% | 230 -0% | 260 ? -13% |
* ... smaller is better
Energy consumption during The Witcher 3 / stress test
电池寿命
虽然其他制造商在谈到电池寿命时喜欢讲童话故事,但Medion网站上提供的信息是非常保守的,最多3小时(视频播放)。在我们的自动Wi-Fi测试中,六芯91.2Wh的电池持续了近7个小时(在中等显示亮度下访问各种网站),这在游戏笔记本电脑领域是一个非常可敬的比率。在理想的条件下(无负载,最低亮度),17英寸的笔记本需要在10小时内再次插入电源。
| Medion Erazer Beast X25 R9 5900HX, GeForce RTX 3080 Laptop GPU, 91 Wh | Asus Strix Scar 17 G733QSA-XS99 R9 5900HX, GeForce RTX 3080 Laptop GPU, 90 Wh | Gigabyte Aero 17 HDR YD i9-11980HK, GeForce RTX 3080 Laptop GPU, 99 Wh | Asus ROG Zephyrus S17 GX703HSD i9-11900H, GeForce RTX 3080 Laptop GPU, 90 Wh | Aorus 17G YD i7-11800H, GeForce RTX 3080 Laptop GPU, 99 Wh | Average of class Gaming | |
|---|---|---|---|---|---|---|
| Battery runtime | 24% | -16% | 52% | -2% | -1% | |
| Reader / Idle (h) | 9.9 | 13.3 34% | 9 -9% | 8.27 ? -16% | ||
| WiFi v1.3 (h) | 6.8 | 9.3 37% | 5.6 -18% | 7.5 10% | 6 -12% | 7.11 ? 5% |
| Load (h) | 1.4 | 1.4 0% | 1.2 -14% | 2.7 93% | 1.6 14% | 1.502 ? 7% |
| H.264 (h) | 7.2 | 6.2 | 8.32 ? | |||
| Witcher 3 ultra (h) | 1 |
Pros
Cons
结论 - 价格昂贵,但比许多竞争对手便宜
Medion Erazer Beast X25是一款理想的笔记本电脑,适合那些正在寻找一个谨慎、苗条和相对轻巧的设备的热情玩家,同时也是高度面向未来的。
虽然由于AMD处理器的存在,该机箱没有提供Thunderbolt端口,但该设备拥有(几乎)其他一切你可以从现代高端笔记本电脑中得到的东西。除了快速的240赫兹全高清面板(Beast X25还可以选择165赫兹的QHD显示屏),这里应该提到充足的内存和存储(64GB内存,2TB NVMe SSD)。
Ryzen 9 5900HXCPU和 GeForce RTX 3080笔记本GPU的组合在运行3D应用时特别强大。与其他制造商的笔记本电脑不同的是,CPU和GPU的TDP是固定的,你可以在预装的控制中心通过选择配置文件或手动调整相应的值--这是一个很大的优点和一个很好的独特卖点。
然而,强大的硬件导致了负载下的显著噪音水平,这鼓励使用耳机。闲置时的风扇控制也是次优的(关键词:"转速")。这也是评论中提到的竞争设备(例如华硕ROG Zephyrus S17 )在总体评级中得分略高的原因之一。
相对较好的性价比说明了Erazer Beast X25的优势。许多RTX 3080笔记本电脑的价格超过3000欧元(约3545美元),甚至接近4000欧元(约4723美元)大关。
价格和可用性
在美国,一个使用同方裸机系统作为其笔记本电脑基础的知名电子供应商是Eluktronics公司。在这种情况下,你会发现他们的MAX-17模型与我们的审查样本相当。价格从1799美元开始,你可以全面定制该设备以满足你的需求。
Medion Erazer Beast X25
- 07/25/2021 v7 (old)
Florian Glaser
Price comparison

