带有RTX 3080的Schenker XMG Pro 17(Clevo PC70HS)评测。一台节流的超轻薄游戏笔记本和工作站合二为一
我们上次测试17英寸版本的XMG Pro是在2020年初,从那时起已经发生了很多事情。正如我们在 15英寸版本我们现在要问的是,这种超轻薄的设计是否能同时为游戏玩家和专业人士提供足够的动力。
前代产品配备了RTX 2060和 英特尔酷睿i7-9750H几乎不再适合进行比较。因此,对于基准测试,我们使用其他竞争对手,如 Alienware x17 R1,以及Medion Erazer Beast X25以及明显更昂贵的 华硕ROG Zephyrus S17和 MSI GS76 Stealth 11UH以及15英寸的 XMG Pro 15的同胞模型进行比较。
Possible Competitors for Comparison
Rating | Date | Model | Weight | Height | Size | Resolution | Price |
|---|---|---|---|---|---|---|---|
| 84.7 % v7 (old) | 01 / 2022 | Schenker XMG Pro 17 (Late 2021, RTX 3080) i7-11800H, GeForce RTX 3080 Laptop GPU | 2.4 kg | 19.9 mm | 17.30" | 3840x2160 | |
| 84.6 % v7 (old) | 01 / 2022 | Schenker XMG Pro 15 (Late 2021) i7-11800H, GeForce RTX 3080 Laptop GPU | 2 kg | 19.8 mm | 15.60" | 3840x2160 | |
| 89 % v7 (old) | 09 / 2021 | Alienware x17 RTX 3080 P48E i7-11800H, GeForce RTX 3080 Laptop GPU | 3.2 kg | 21.4 mm | 17.30" | 3840x2160 | |
| 85 % v7 (old) | 08 / 2021 | Medion Erazer Beast X25 R9 5900HX, GeForce RTX 3080 Laptop GPU | 2.3 kg | 23 mm | 17.30" | 1920x1080 | |
| 86.2 % v7 (old) | 09 / 2021 | MSI GS76 Stealth 11UH i9-11900H, GeForce RTX 3080 Laptop GPU | 2.4 kg | 20 mm | 17.30" | 3840x2160 | |
| 90.1 % v7 (old) | 08 / 2021 | Asus ROG Zephyrus S17 GX703HSD i9-11900H, GeForce RTX 3080 Laptop GPU | 2.8 kg | 19.9 mm | 17.30" | 2560x1440 |
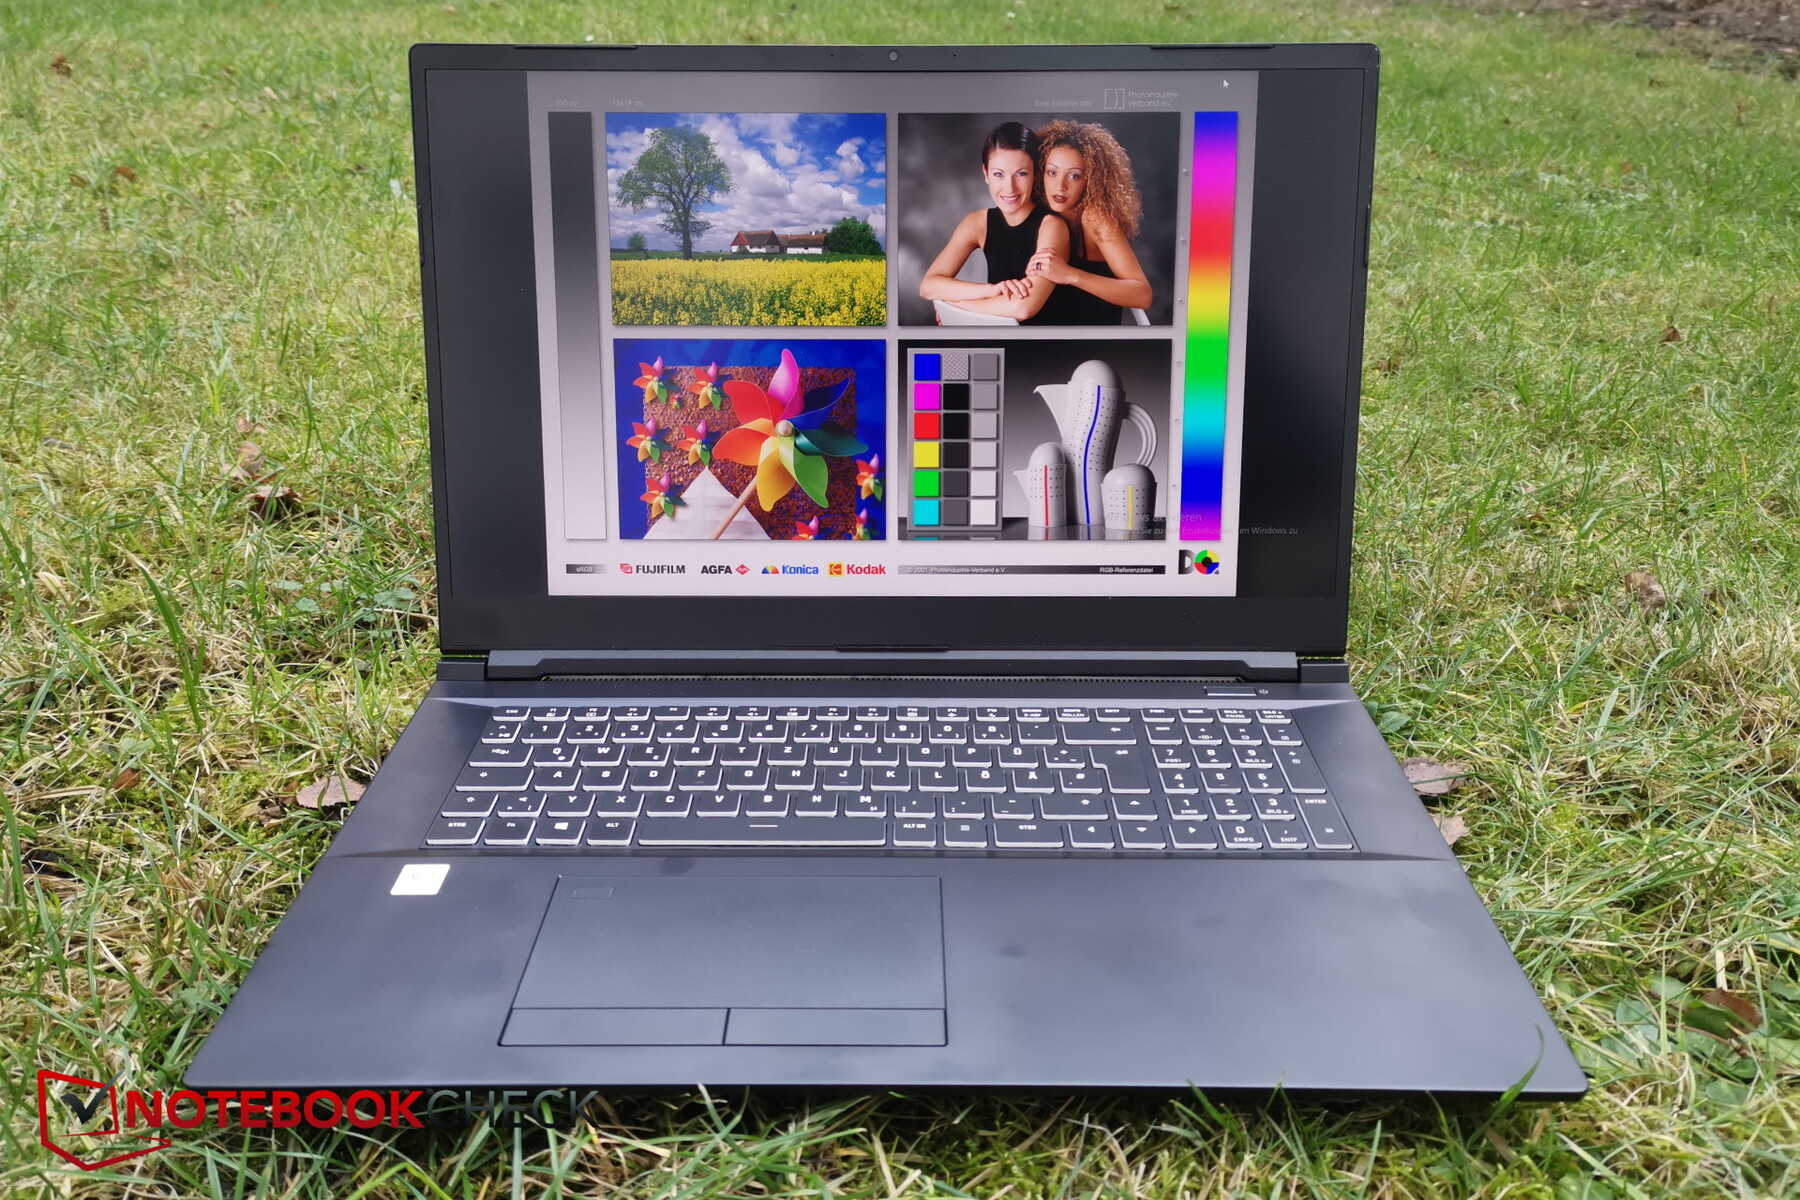
外壳 - 超薄的金属外壳和塑料键盘
纤细的黑色外壳现在几乎完全由金属制成,除了显示屏边框和镶嵌在底座上的键盘。对于一台游戏笔记本电脑来说,其设计保持了非常适度,更多地反映了其作为专业工作站的平行野心。
底座并不完全耐翘,但仍然相当坚固,尽管当我们试图弯曲它时,它仍然产生各种吱吱嘎嘎的声音,特别是在右侧。
虽然显示器盖子也可以稍微弯曲,但由于金属框架的存在,它显得很舒适坚固。铰链可以更紧,特别是在小的开放角度。
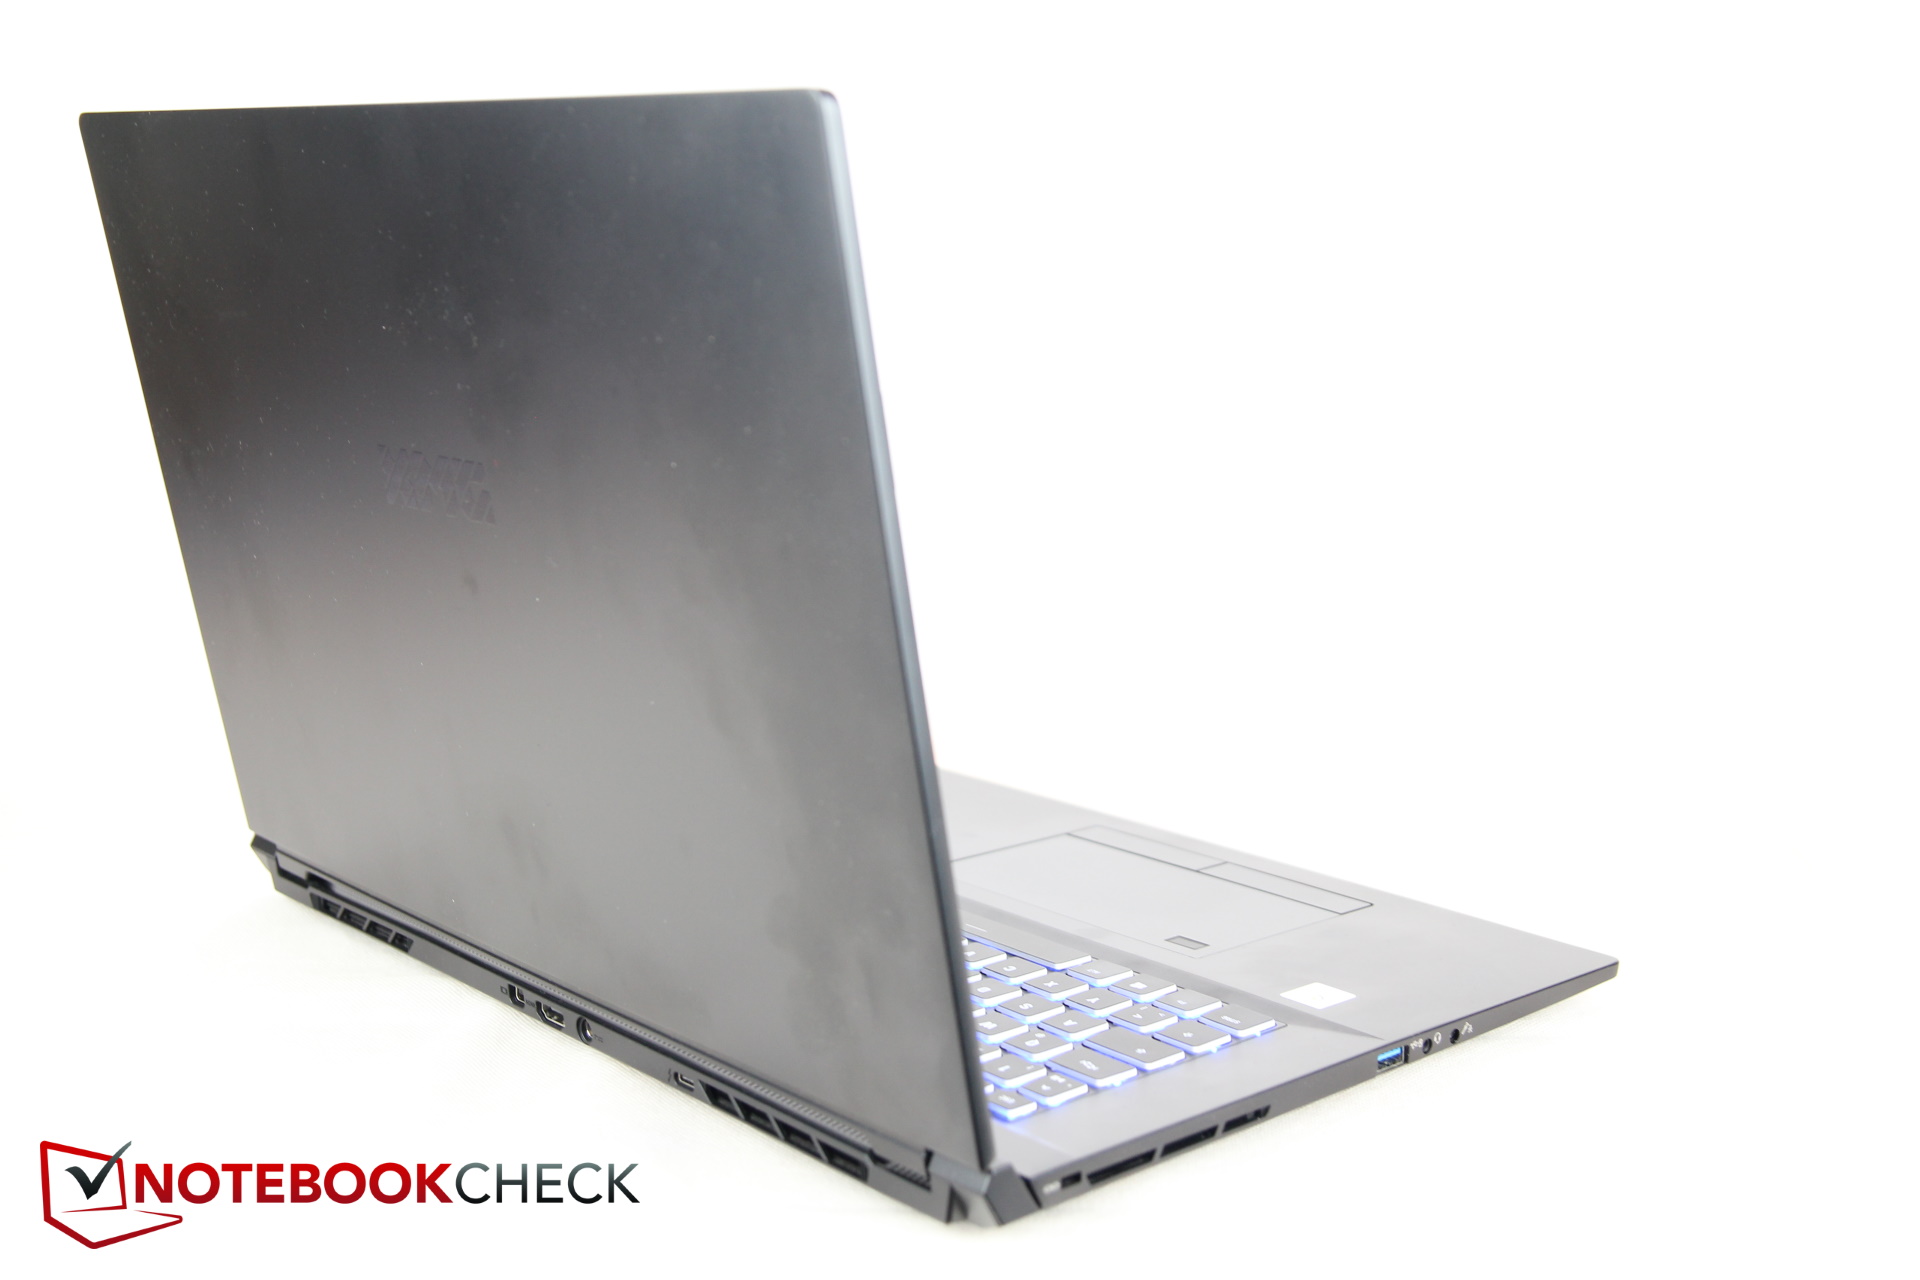
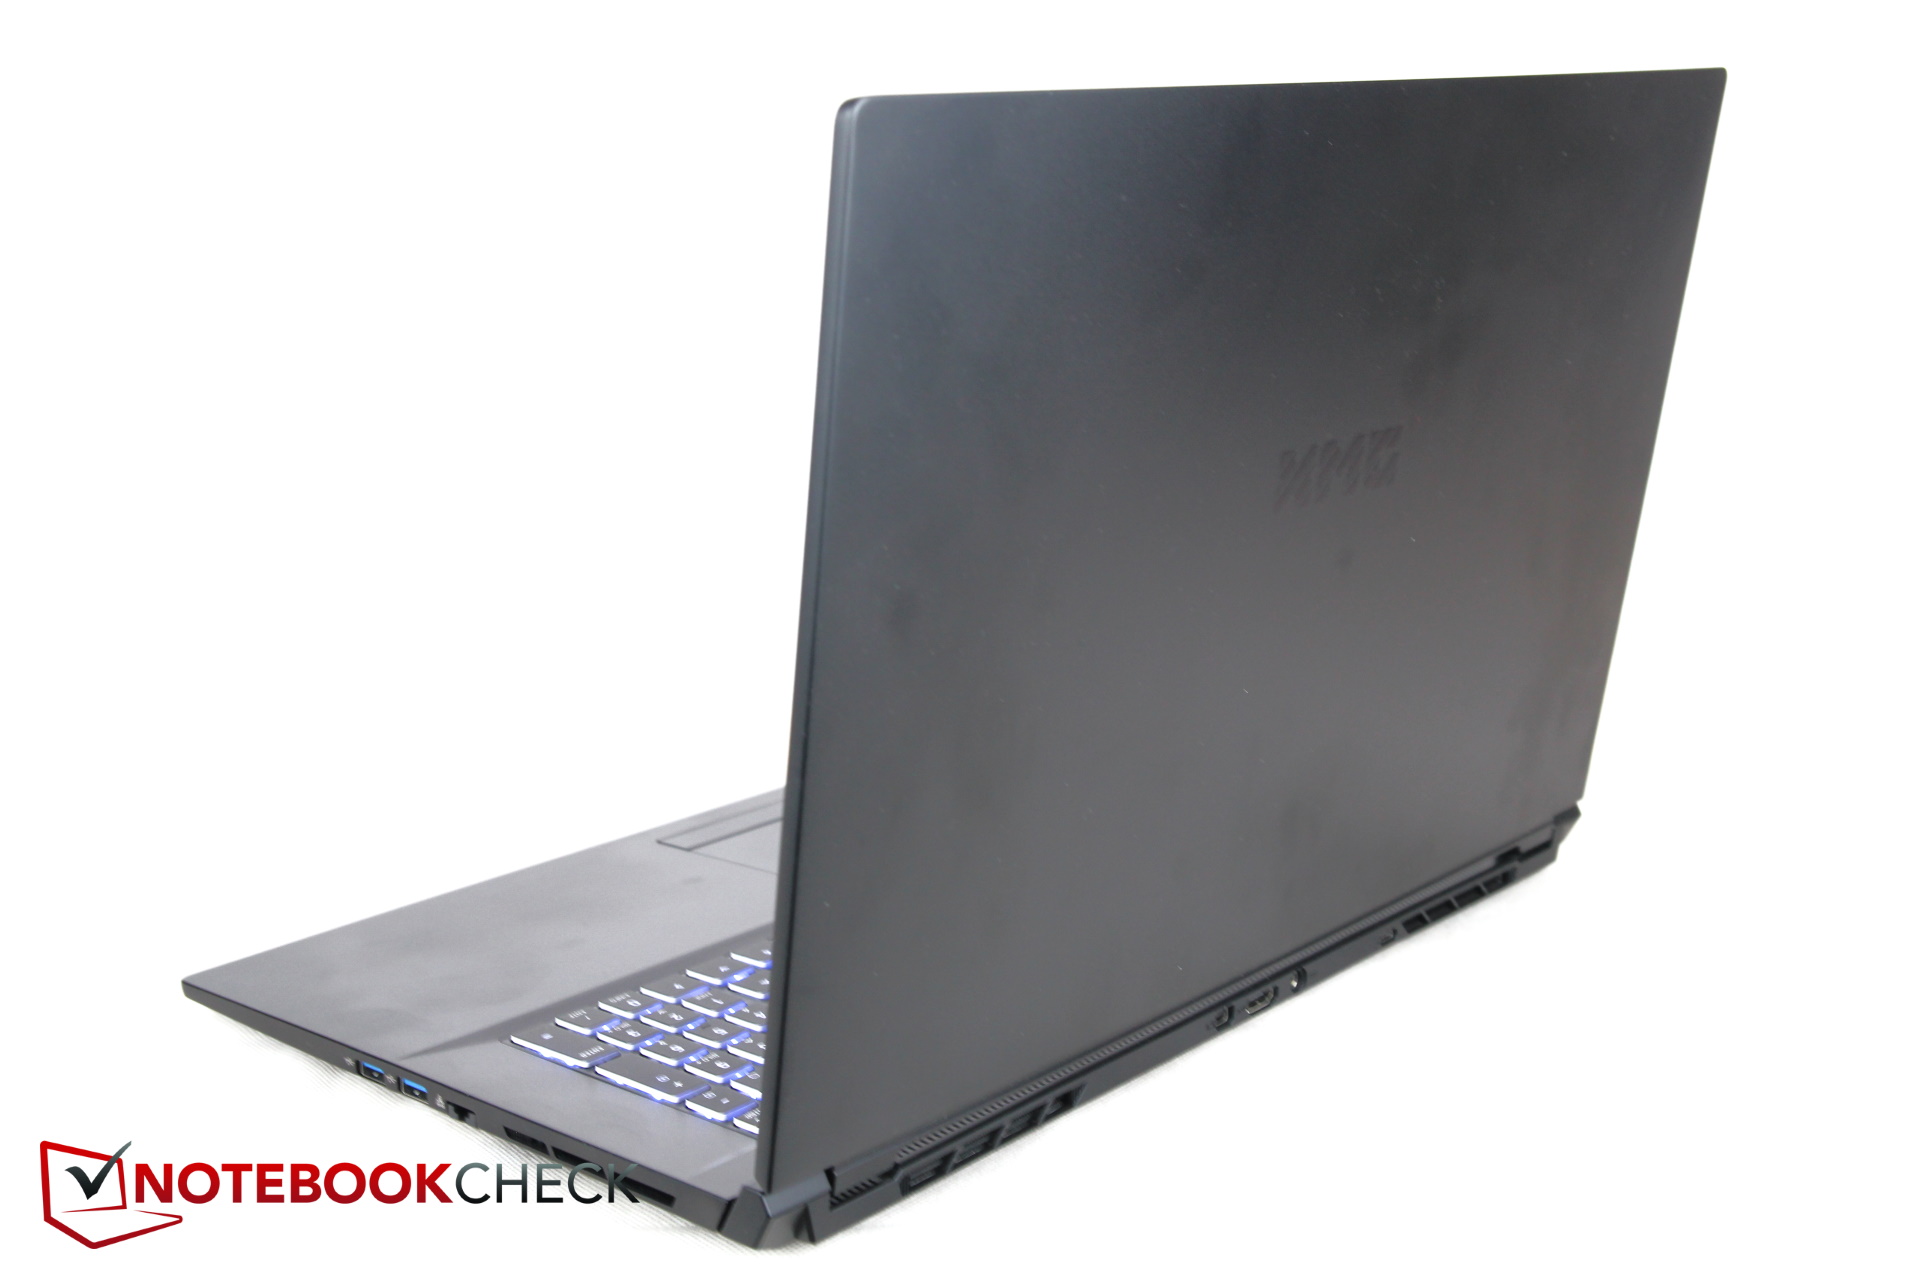
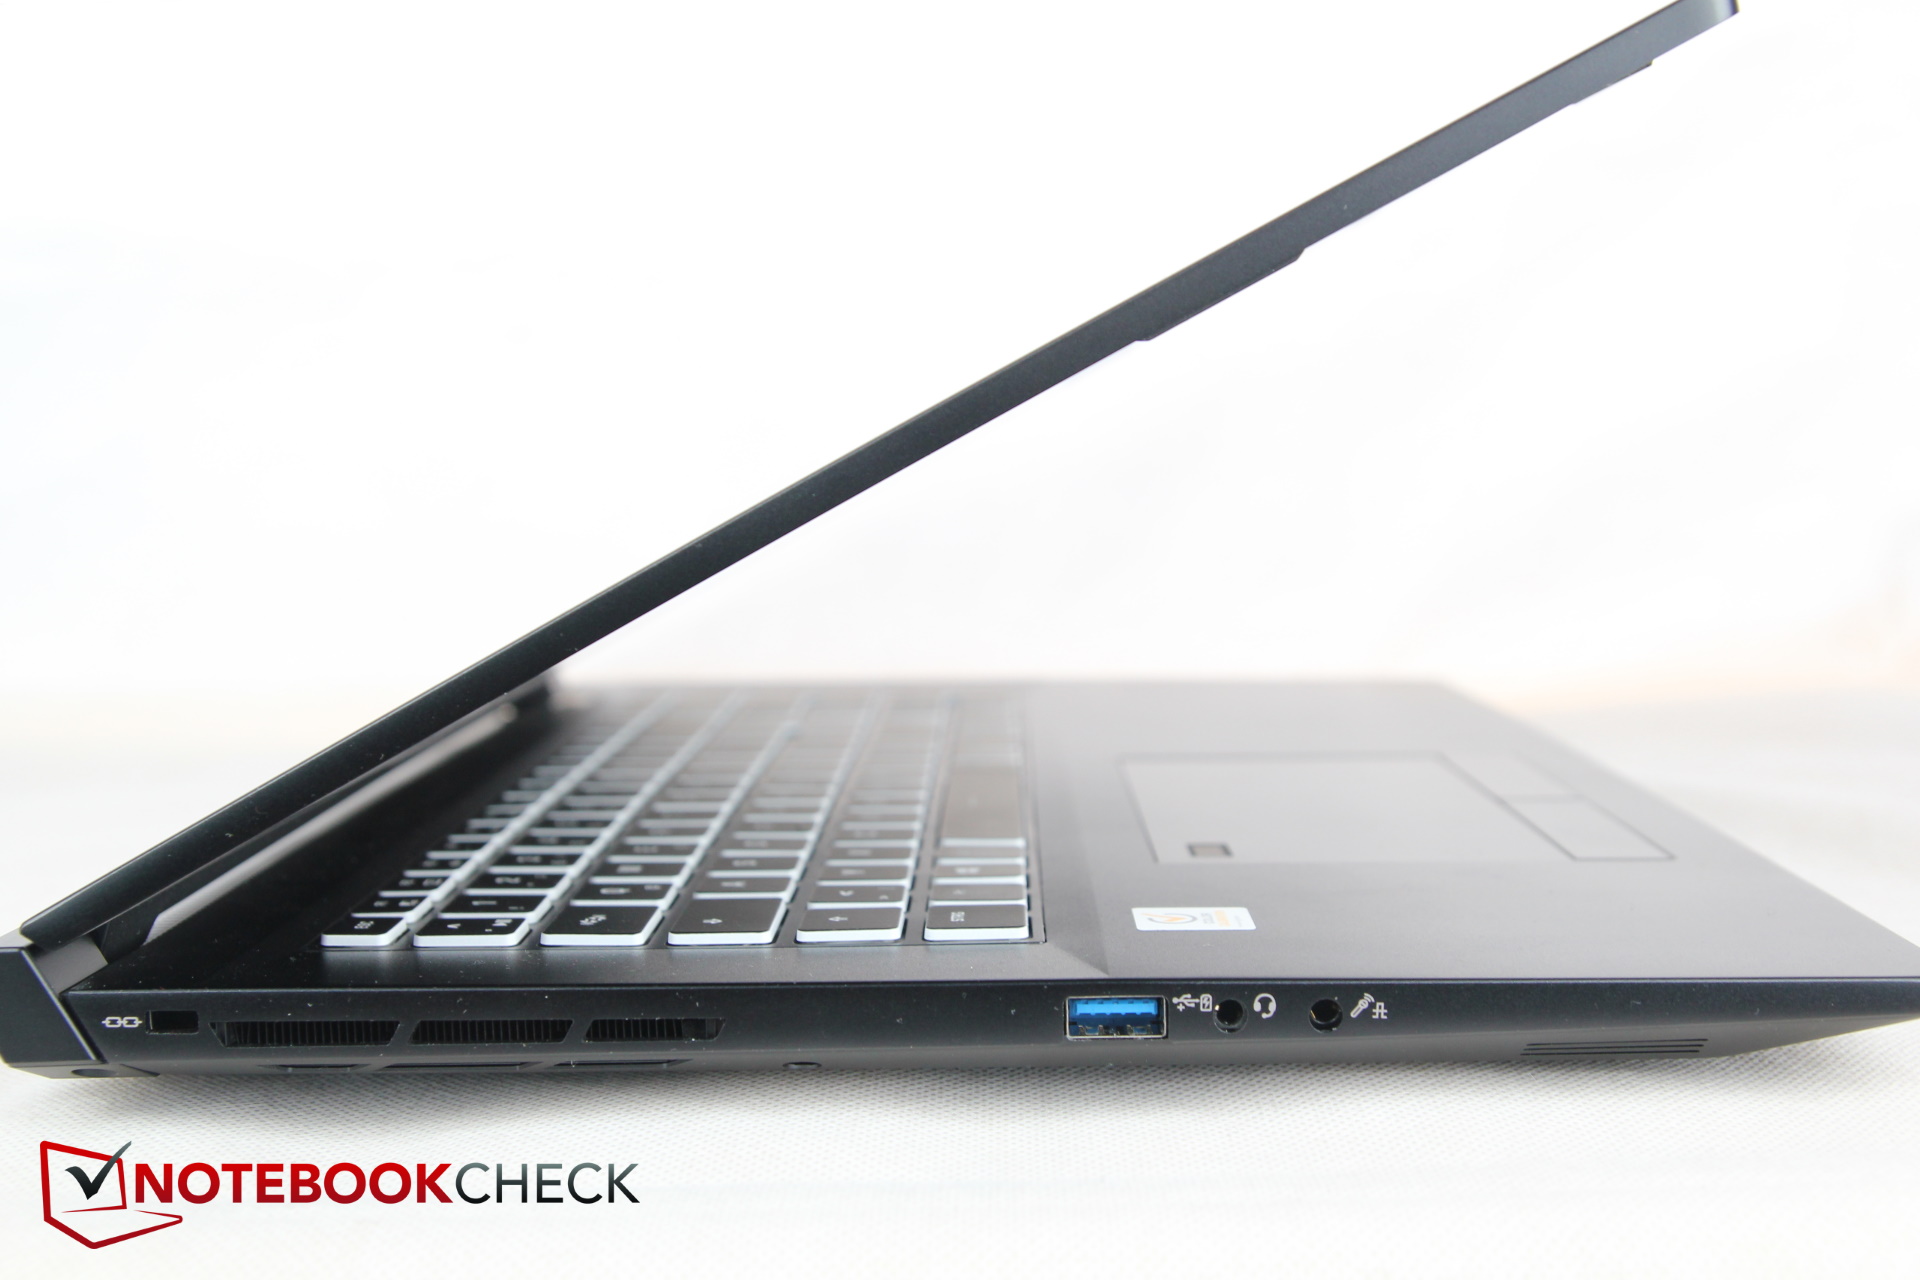
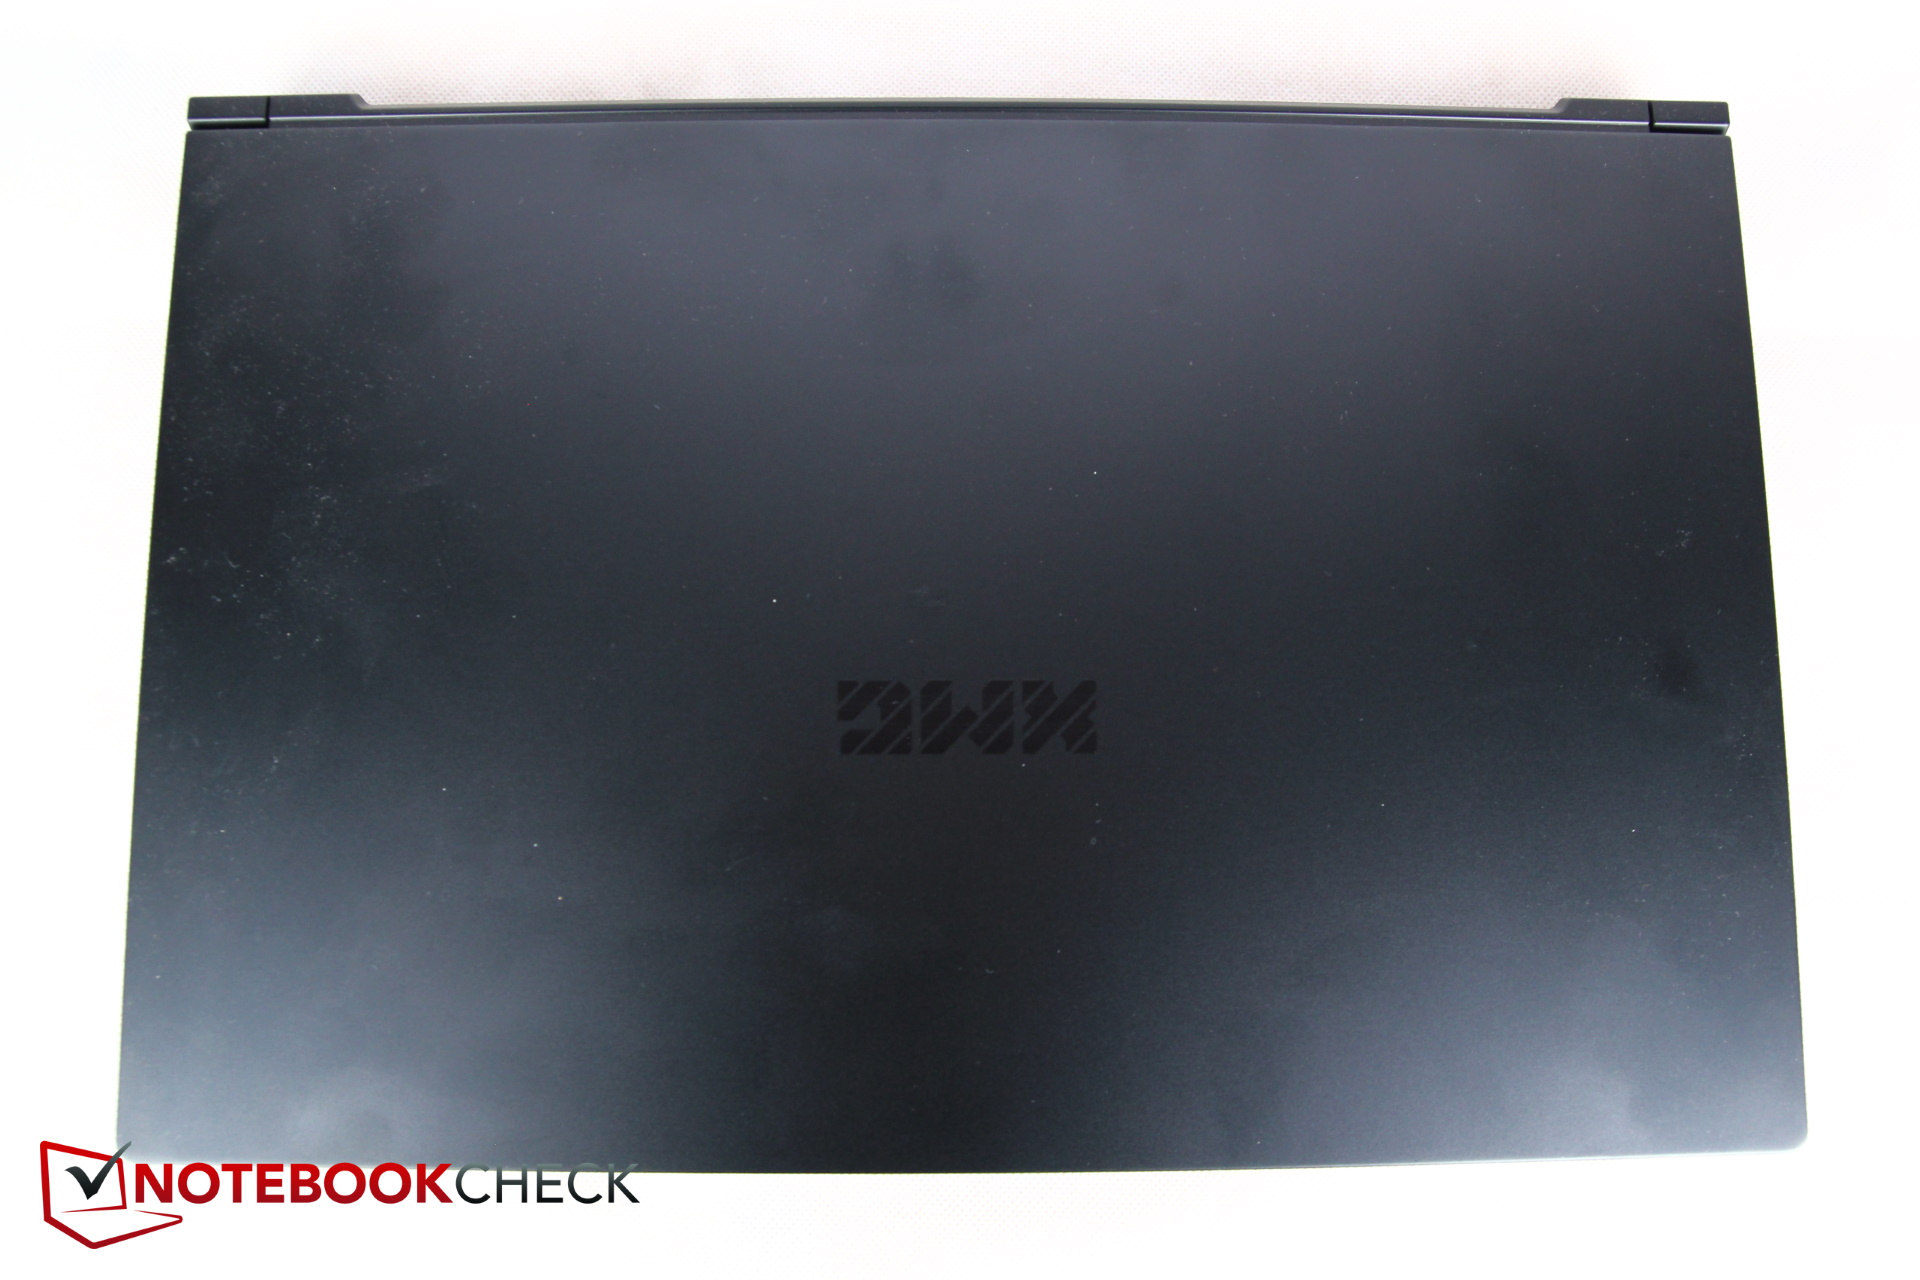
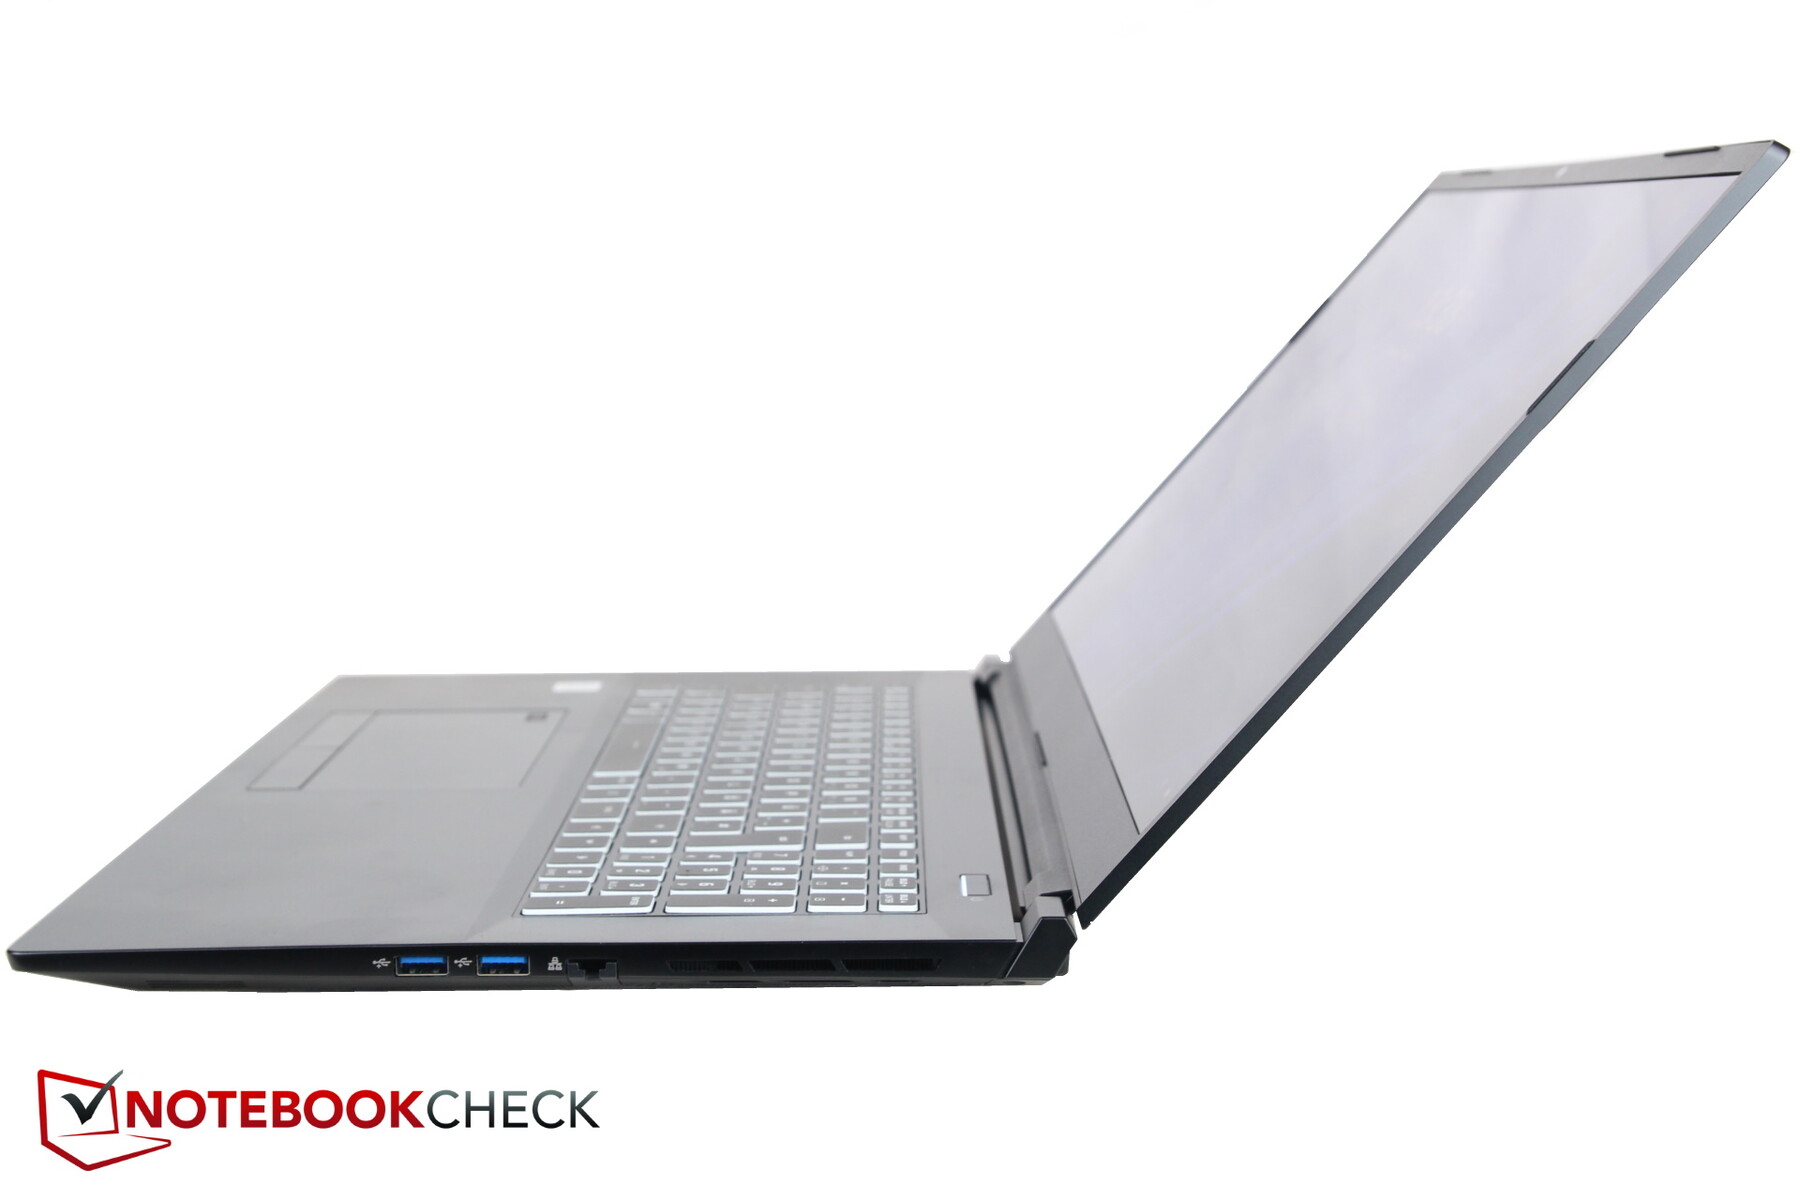
Schenker提供各种17英寸笔记本电脑,但新的XMG Pro 17在超薄设计方面可以轻松击败Key、Apex、Core、Ultra、Focus、Neo和前代产品。它整整瘦了一厘米(约0.4英寸),成为整体上最薄的17英寸申博太阳城手机版!
微星和华硕ROG也同样纤薄,但价格要高得多。Alienware和Medion在这里不能完全跟上,即使至少Alienware是什么都不厚。
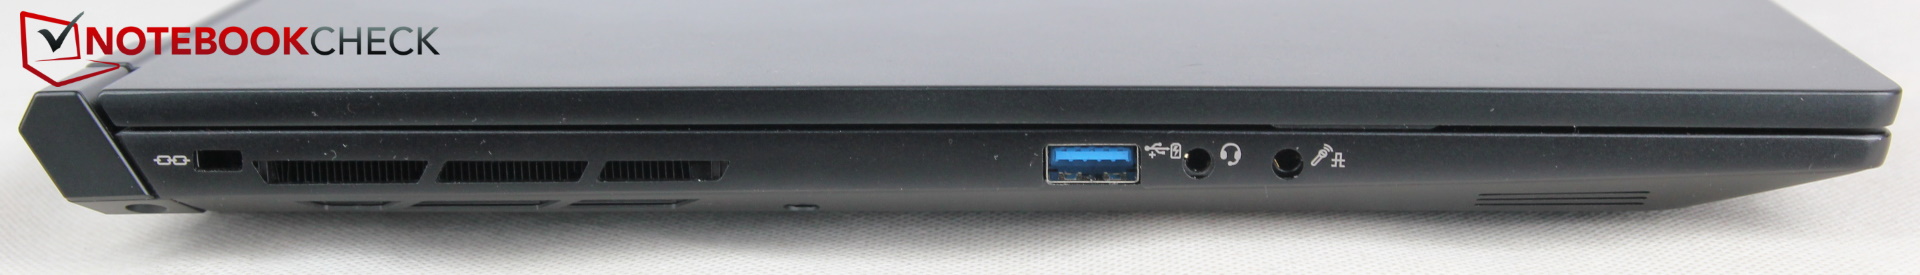
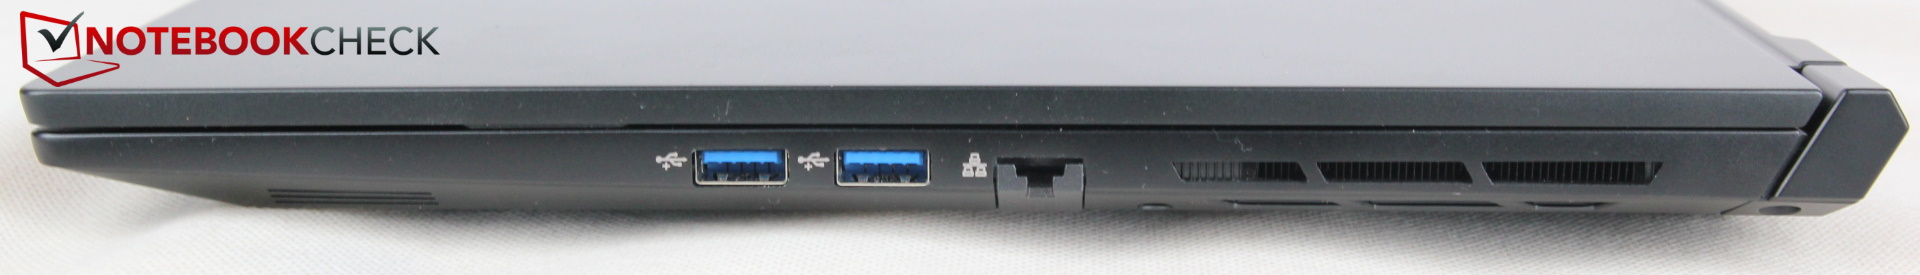
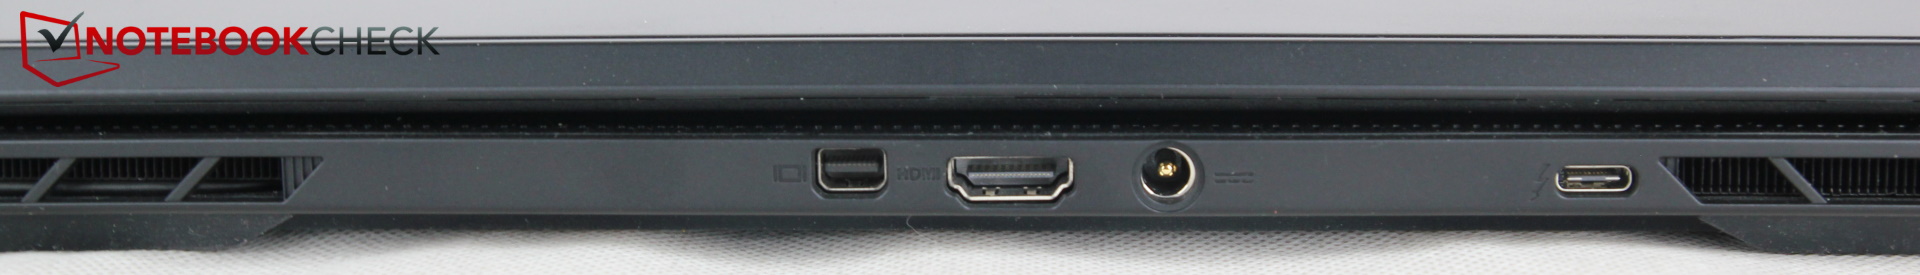
设备 - 3台外部显示器
通过Thunderbolt 4(没有充电功能的USB-C)、MiniDisplayport和HDMI,你可以将三个外部显示器连接到Pro 17。所有的显示端口都兼容G-Sync。用于麦克风和耳机的独立端口也是积极的。
另一方面,专业用户可能会错过SD读卡器,而且连接的位置也让人有一些抱怨的小理由。尽管接口分布在背面、左侧和右侧,但不幸的是,它们被放在一起非常近。在这方面,所有的制造商都应该看一看价格低廉的 MSI GP66 Leopard作为一个很好的例子。
沟通
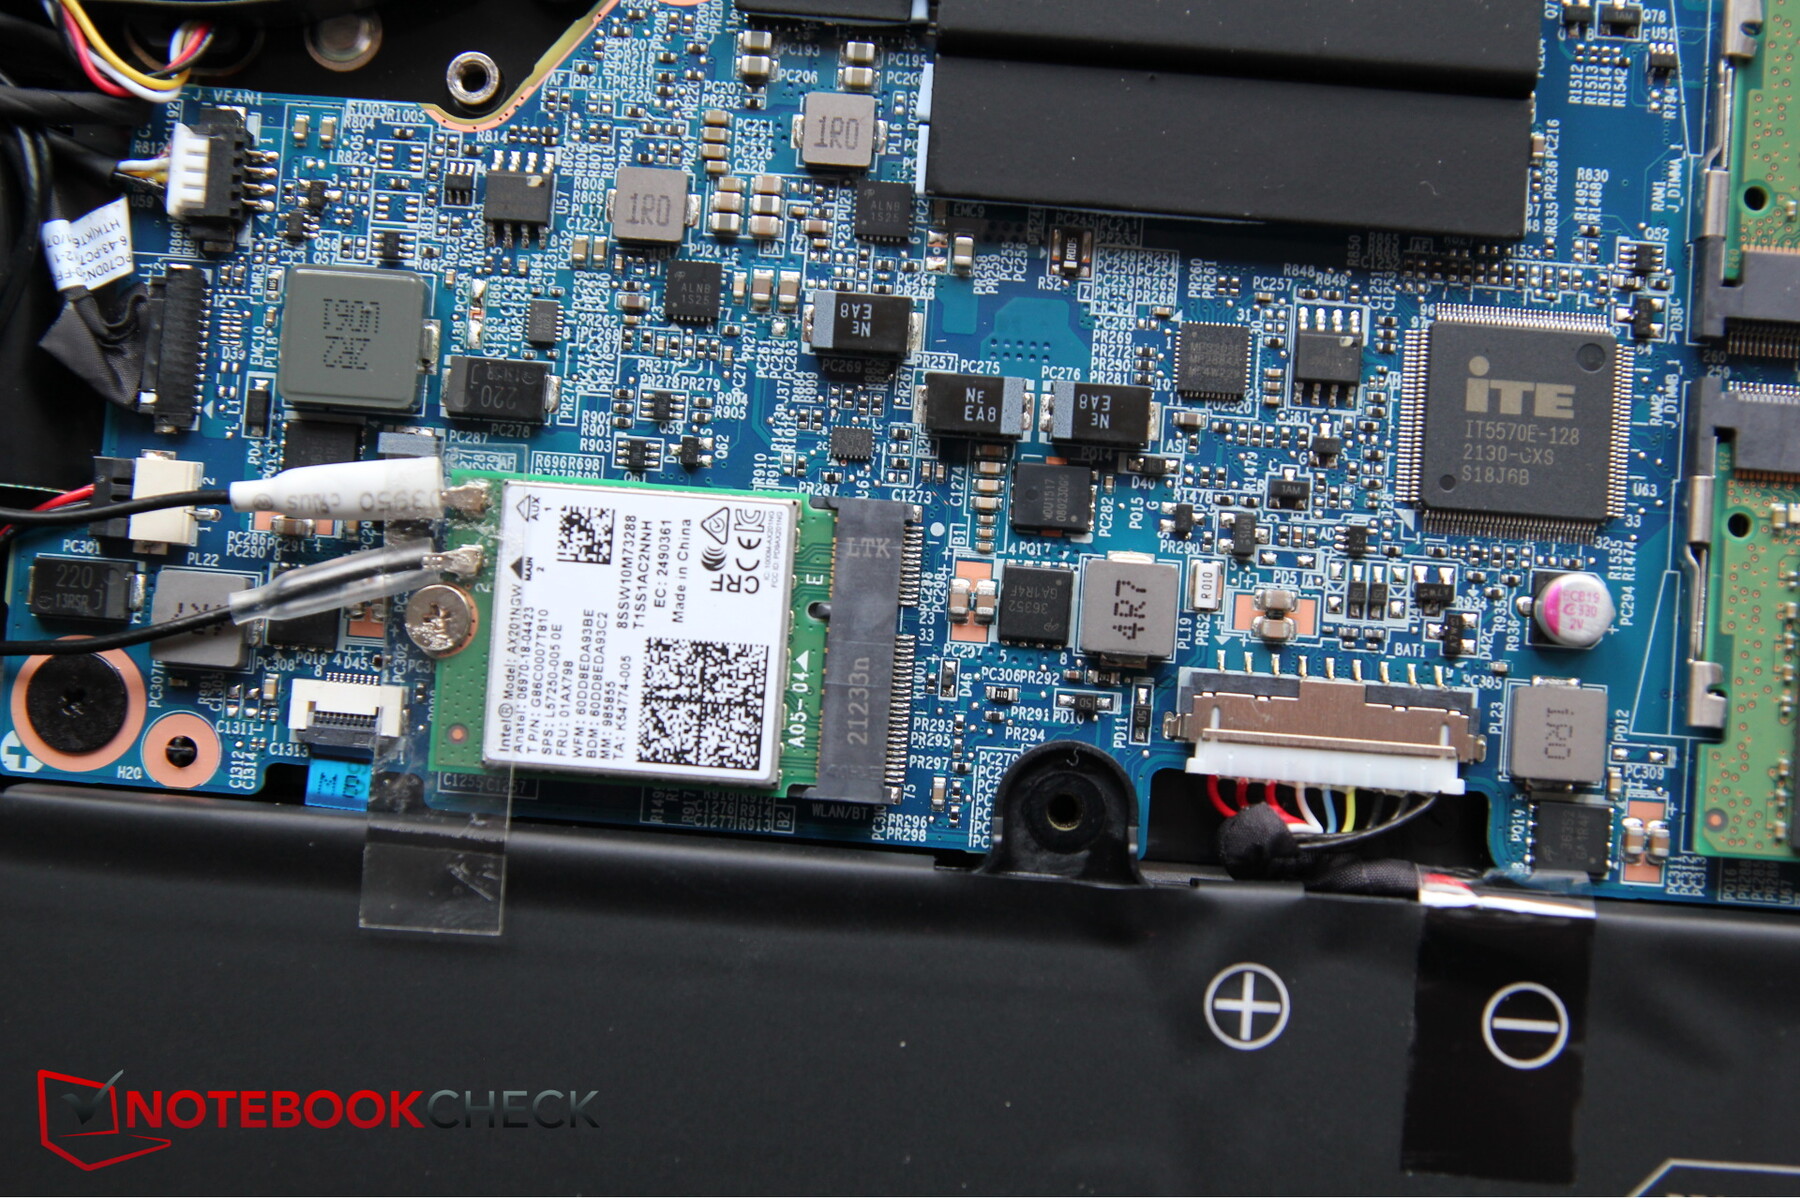
虽然这里使用的英特尔AX201 WiFi模块实现了千兆速度,但它的表现仍然略低于其全部能力,特别是在接收数据时。
网络摄像头
尽管目标群体是富有创造力的专业人士,但有一个标准的720p网络摄像头,它的色彩偏差甚至比竞争对手还要大,这已经不是很好了。


")
")
 GeForce RTX 3080 Laptop GPU, i7-11800H, Samsung SSD 980 Pro 1TB MZ-V8P1T0BW")
 GeForce RTX 3080 Laptop GPU, i7-11800H, Samsung SSD 980 Pro 1TB MZ-V8P1T0BW")
安全问题
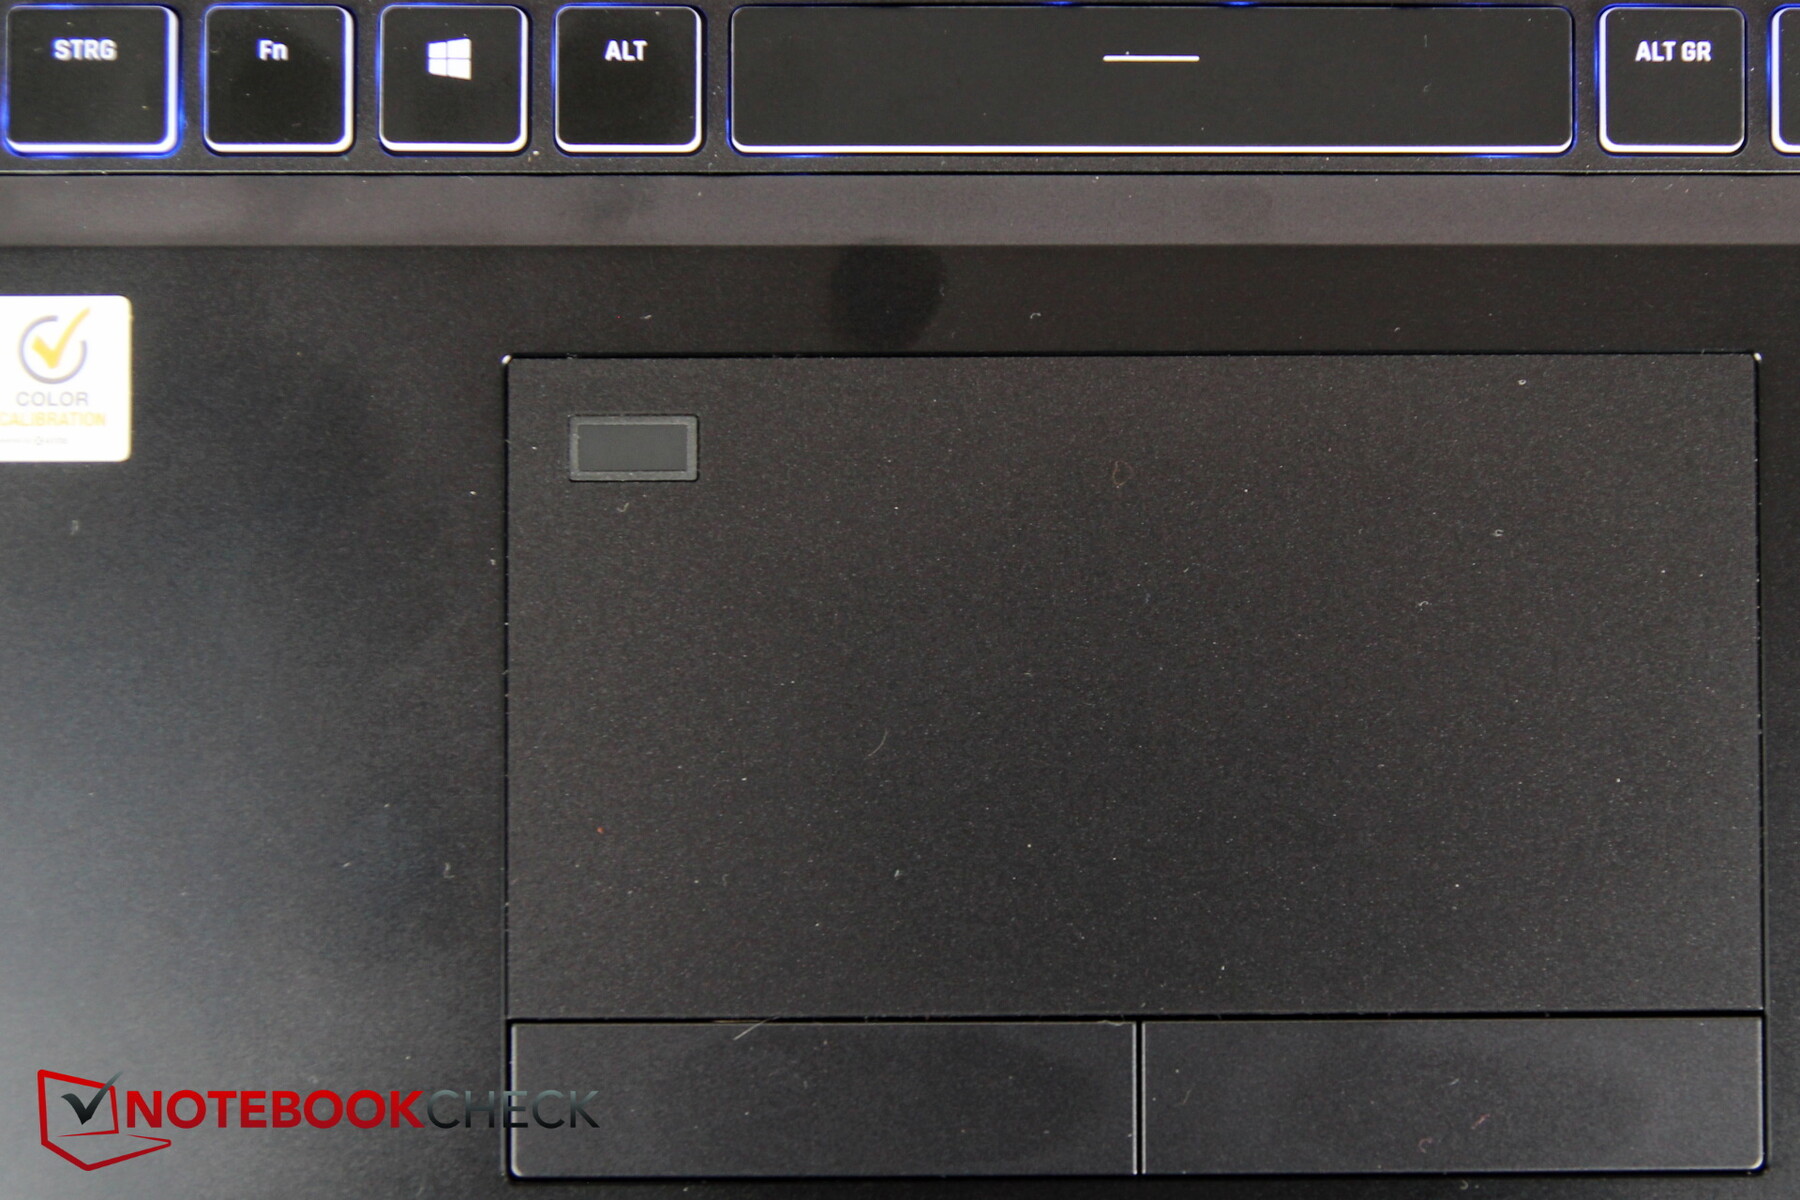
有一个Kensington锁插槽,也有TPM 2.0。此外,Pro 17提供了一个指纹传感器,它被集成到触摸板的左上角。
该传感器与Windows Hello结合使用,可以非常迅速地解锁笔记本电脑。
辅料
除了通常的文件之外,作为Schenker的典型代表,盒子里还包括一个带有驱动程序的U盘,或者还有一张驱动光盘,以及一块黑色的清洁布。 其他制造商只包括较少的附件,或者根本就没有附件。
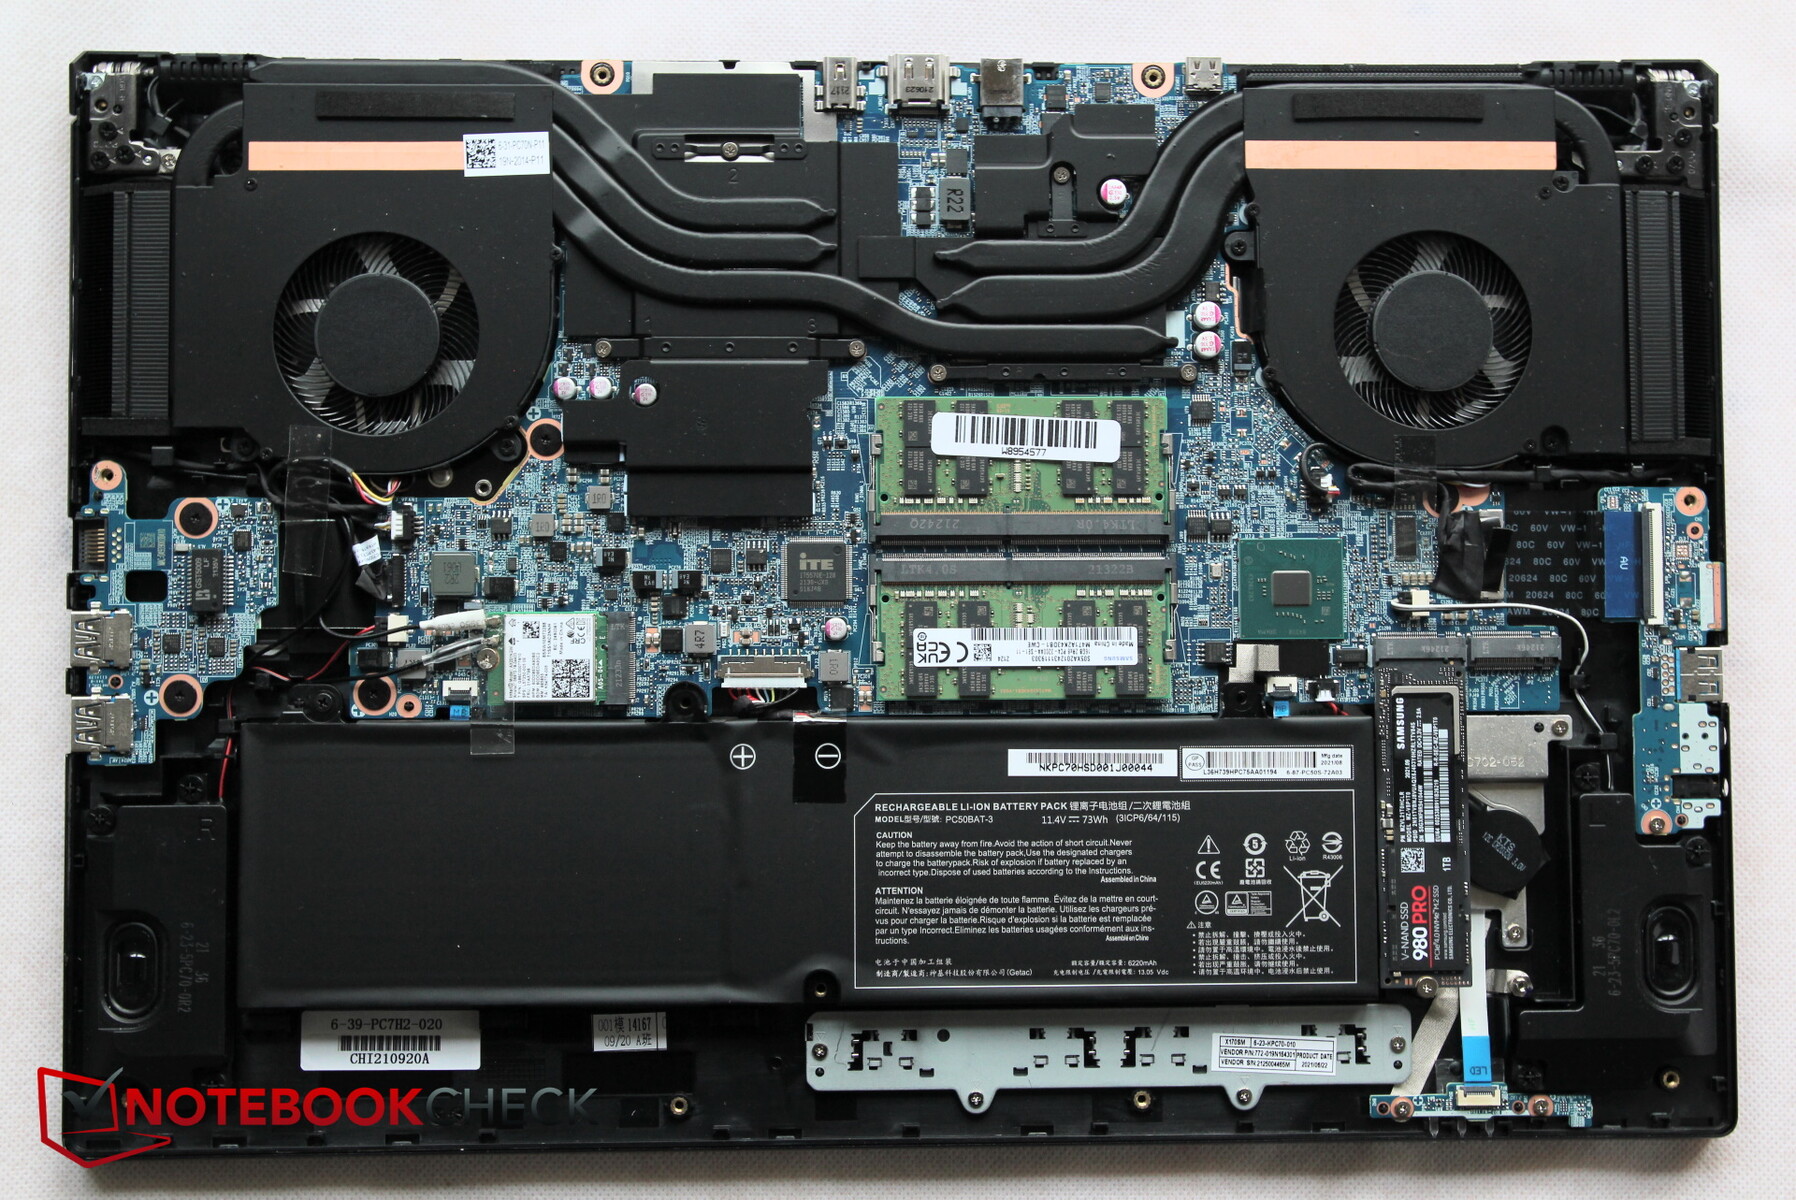
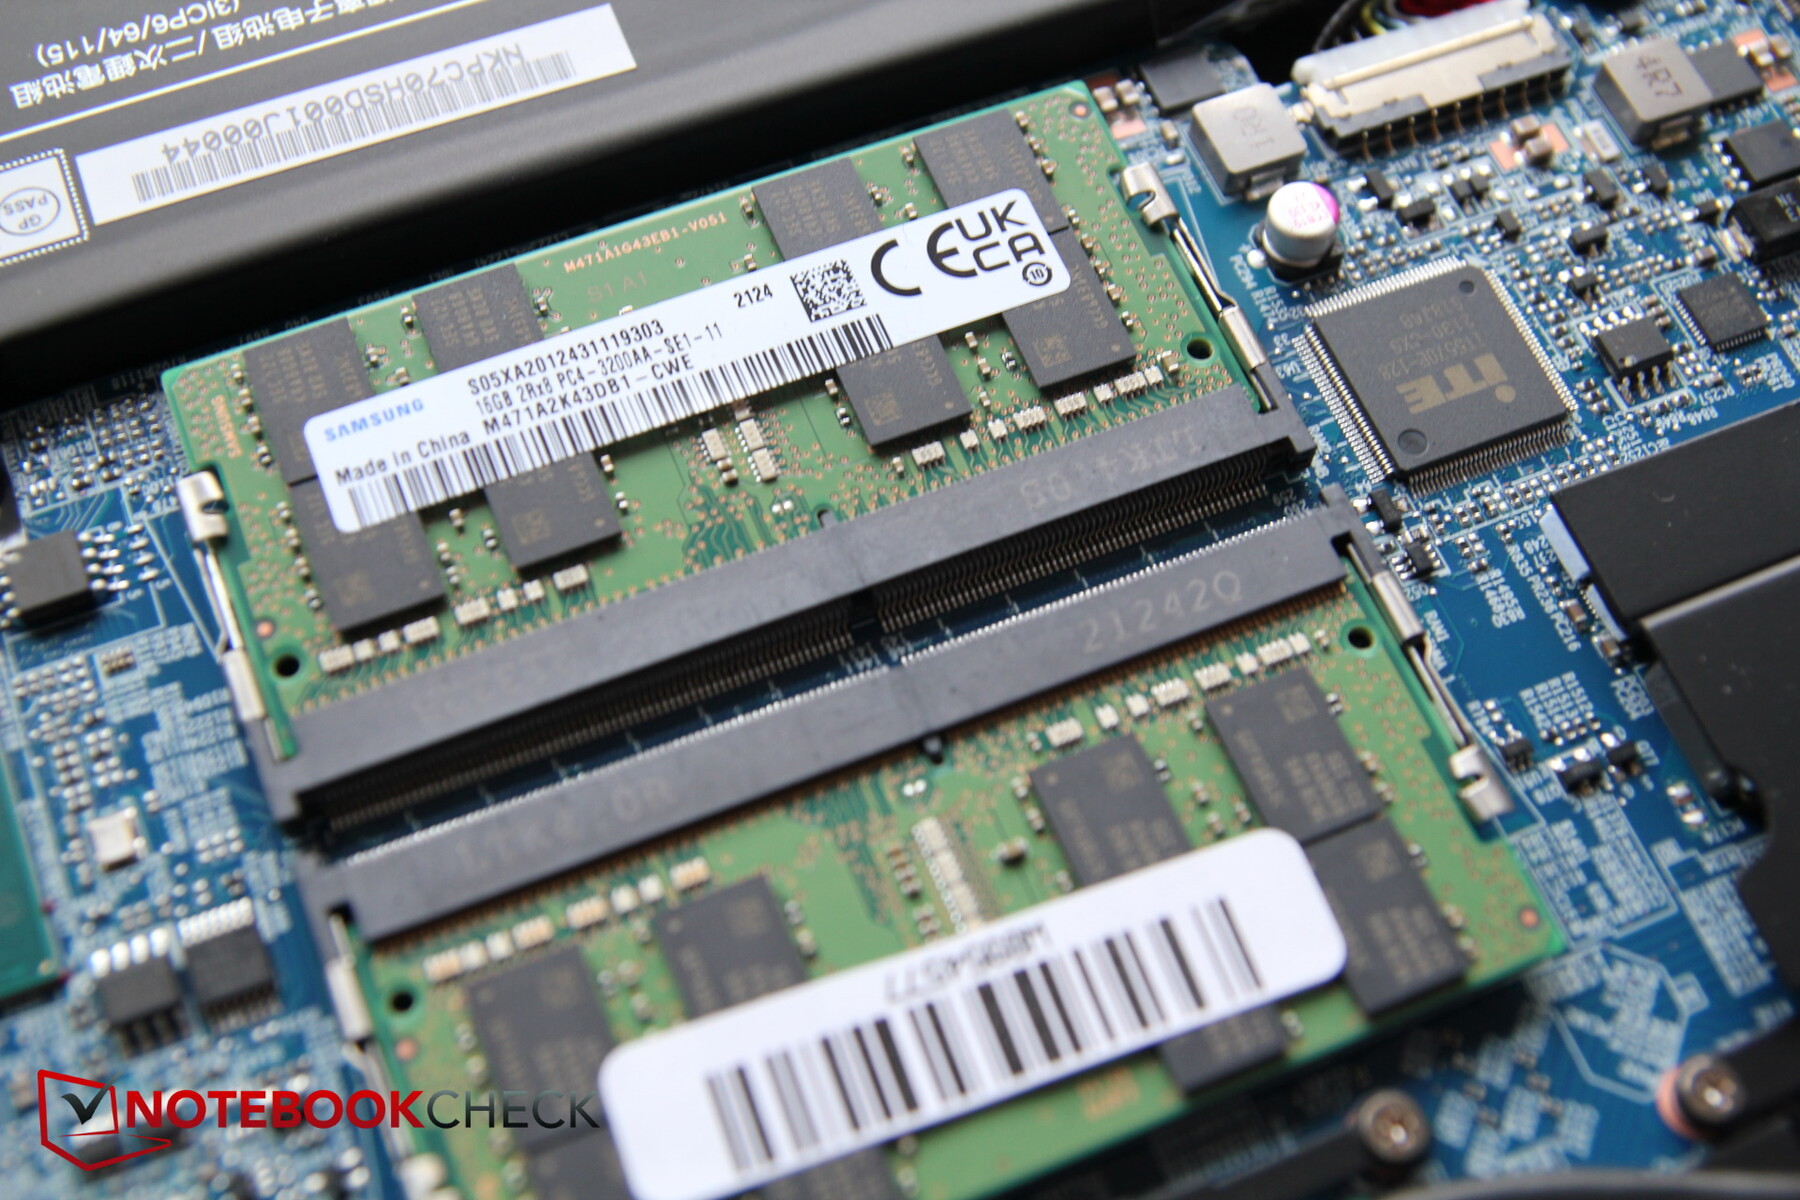
维护
箱子的底部用12颗飞利浦螺钉固定。卸下这些螺丝后,虽然底板是由坚固的金属制成,但要撬开它并不难。一旦你能进入内部,你就可以更换两个内存模块、WLAN模块和SSD,还可以清洁两个风扇。还有空间可以放置第二块固态硬盘,电池也可以拿到。
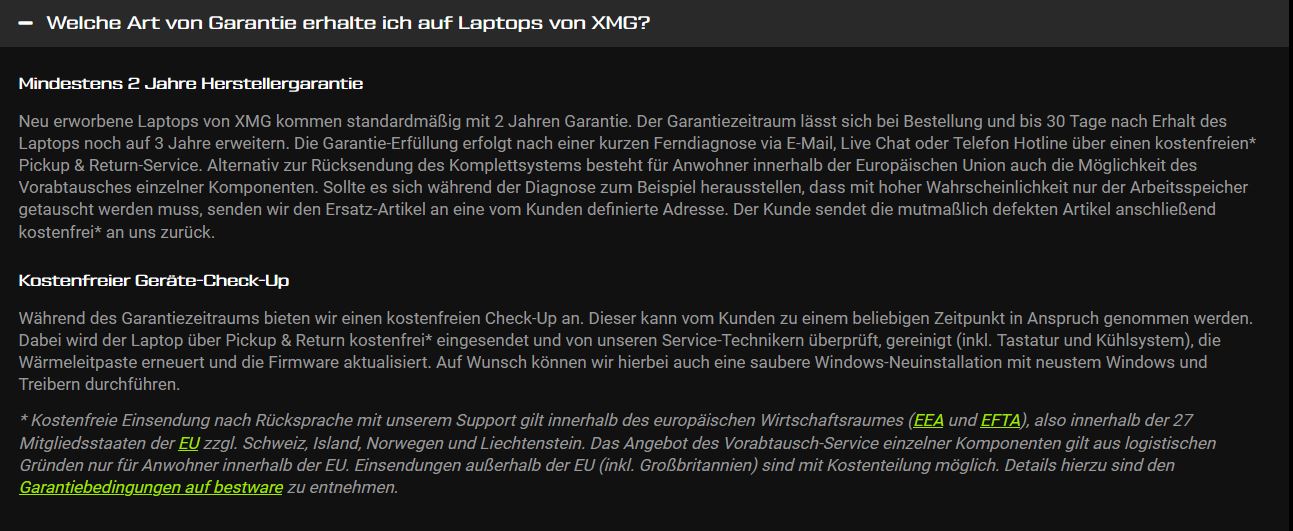
担保
XMG提供两年的制造商保修。在订购笔记本电脑时,你也可以将其扩大到三年,但需要支付额外费用。与许多其他制造商相比,保修服务还包括免费检查。在你免费送来笔记本后,会对其进行清洁,更新散热膏,并将固件更新到最新版本。如果你愿意,还可以重新安装Windows,并提供所有当前的更新。
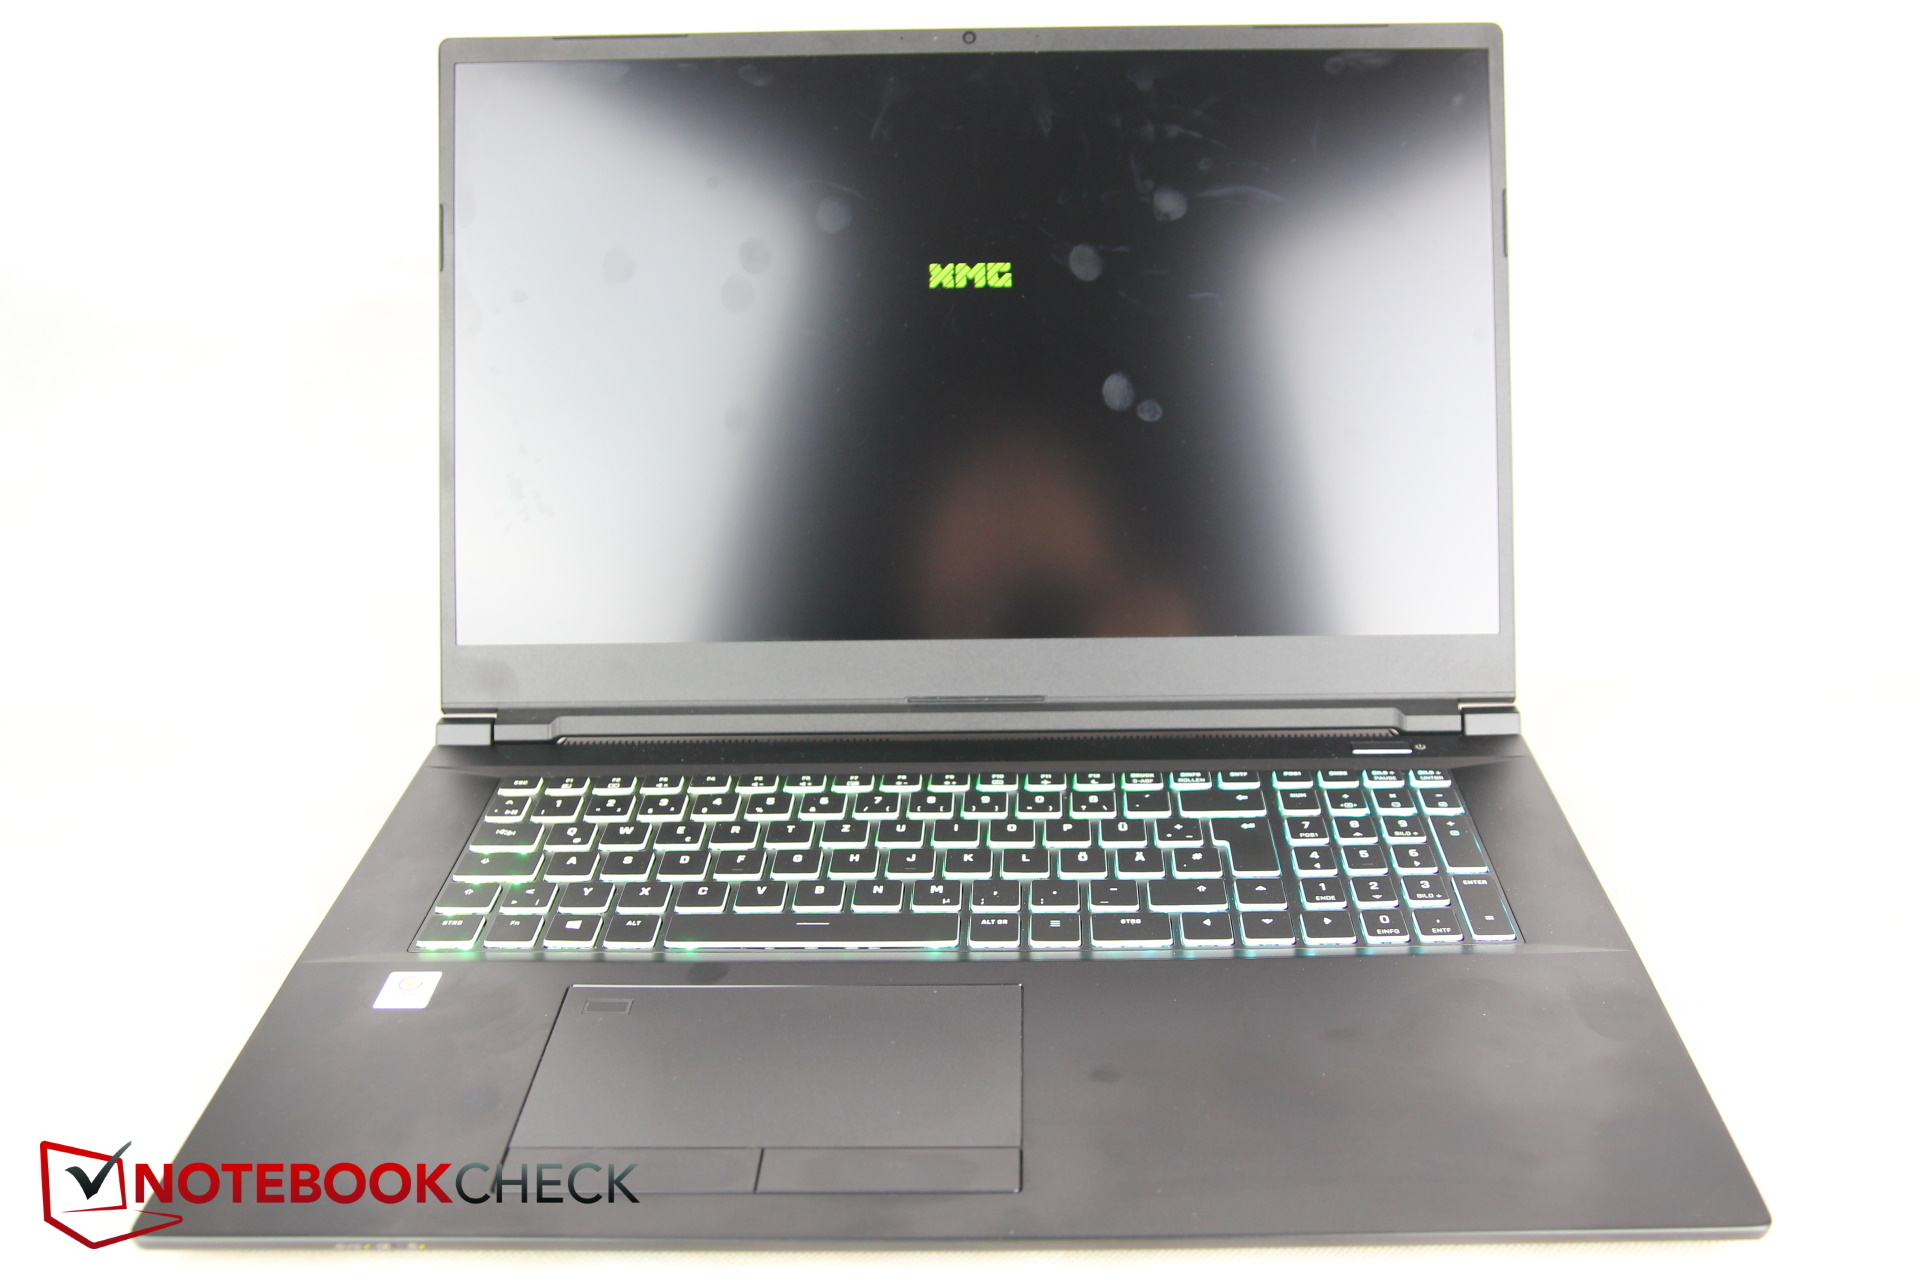
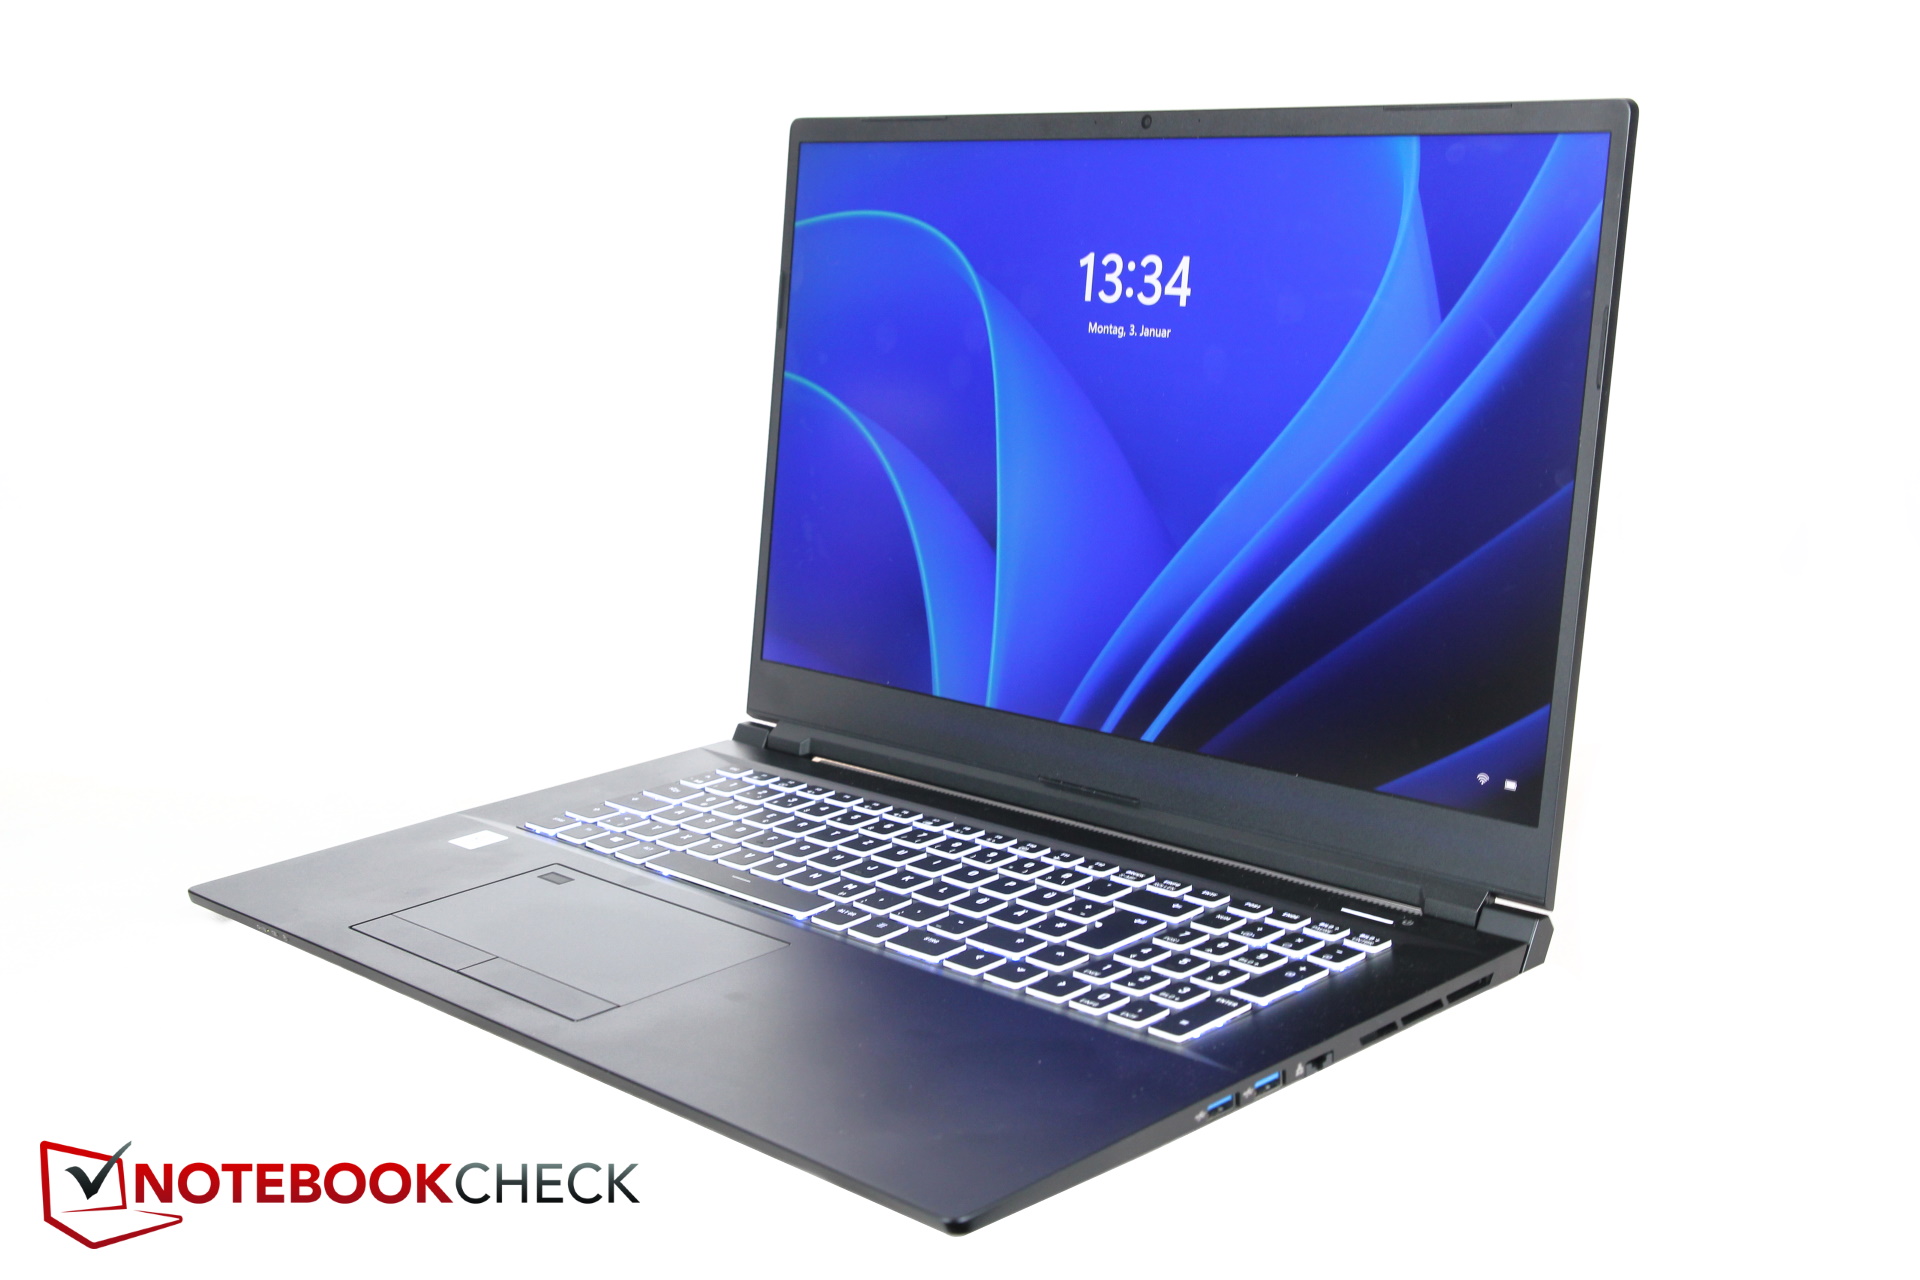
输入设备 - 键盘上的小按键弯曲太大
键盘
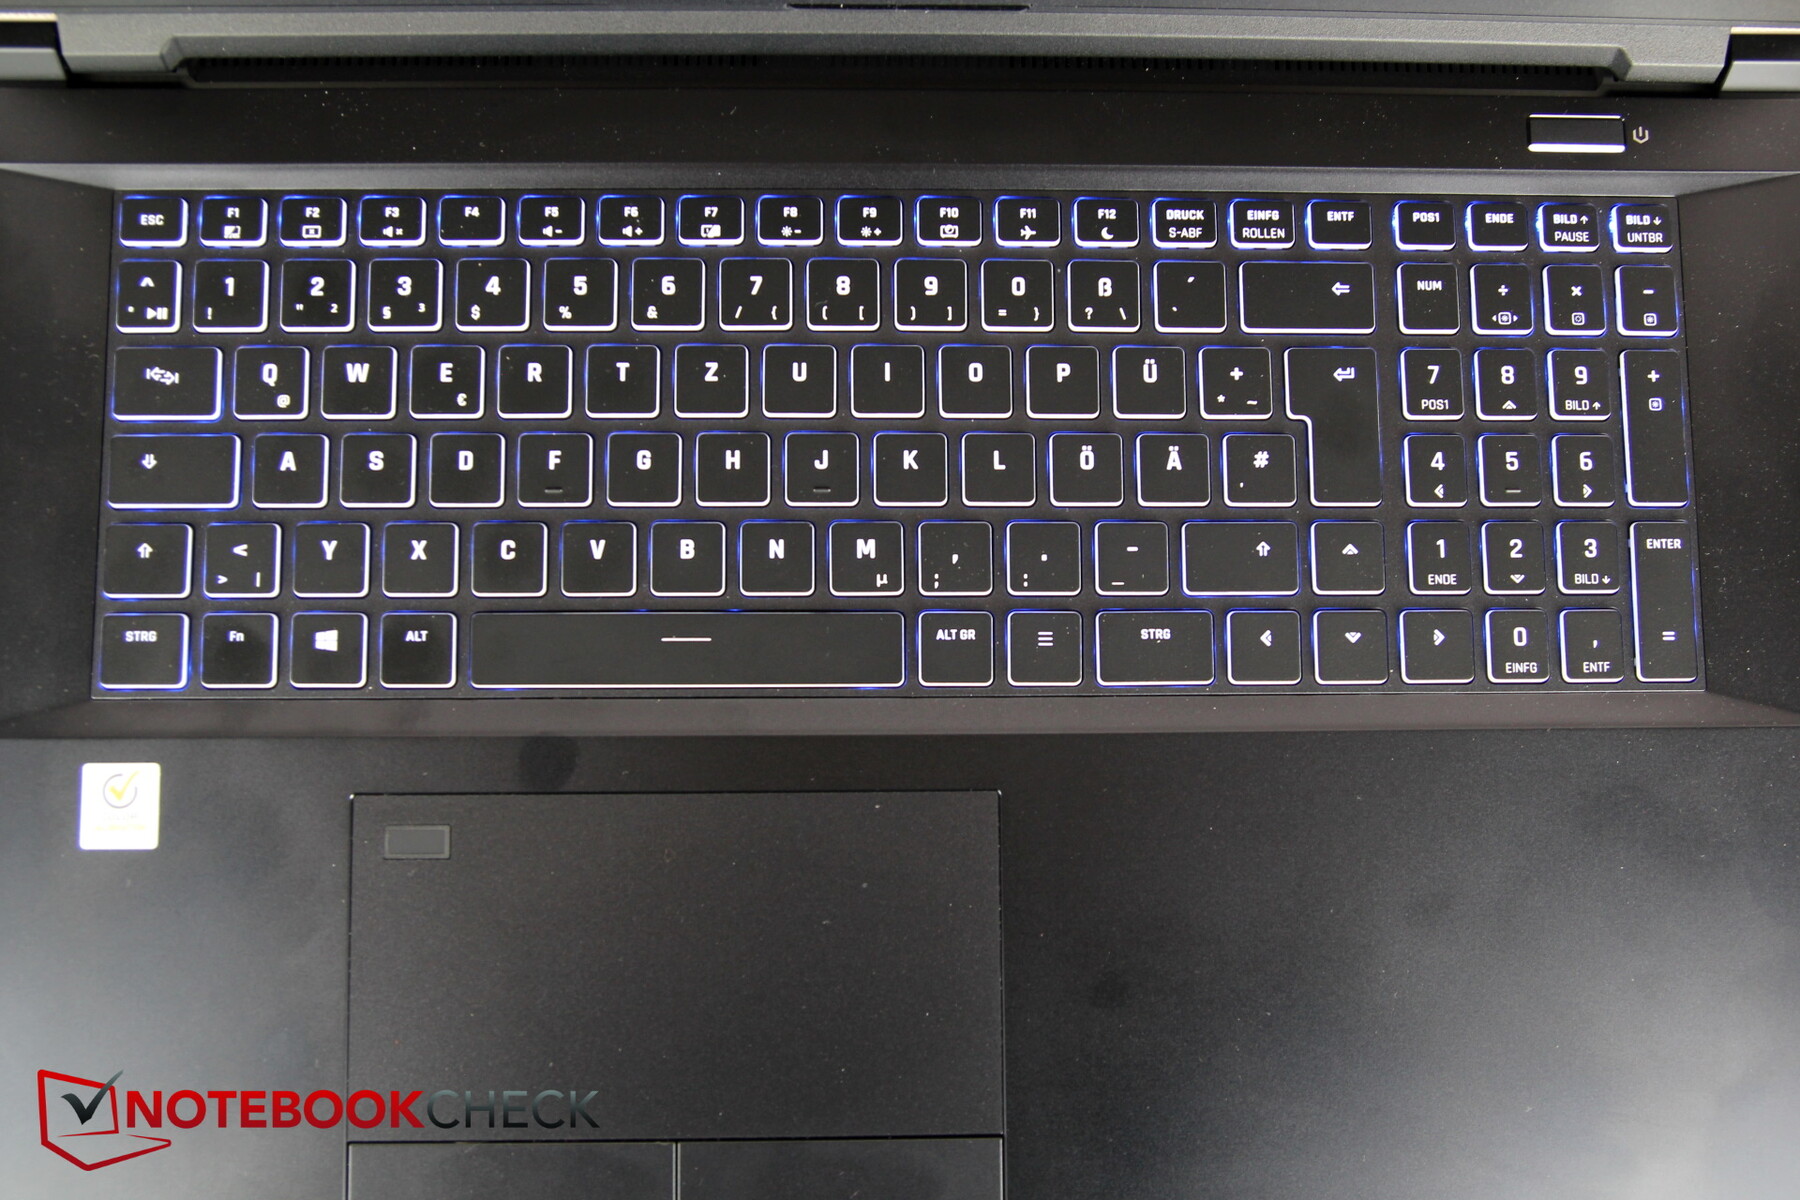
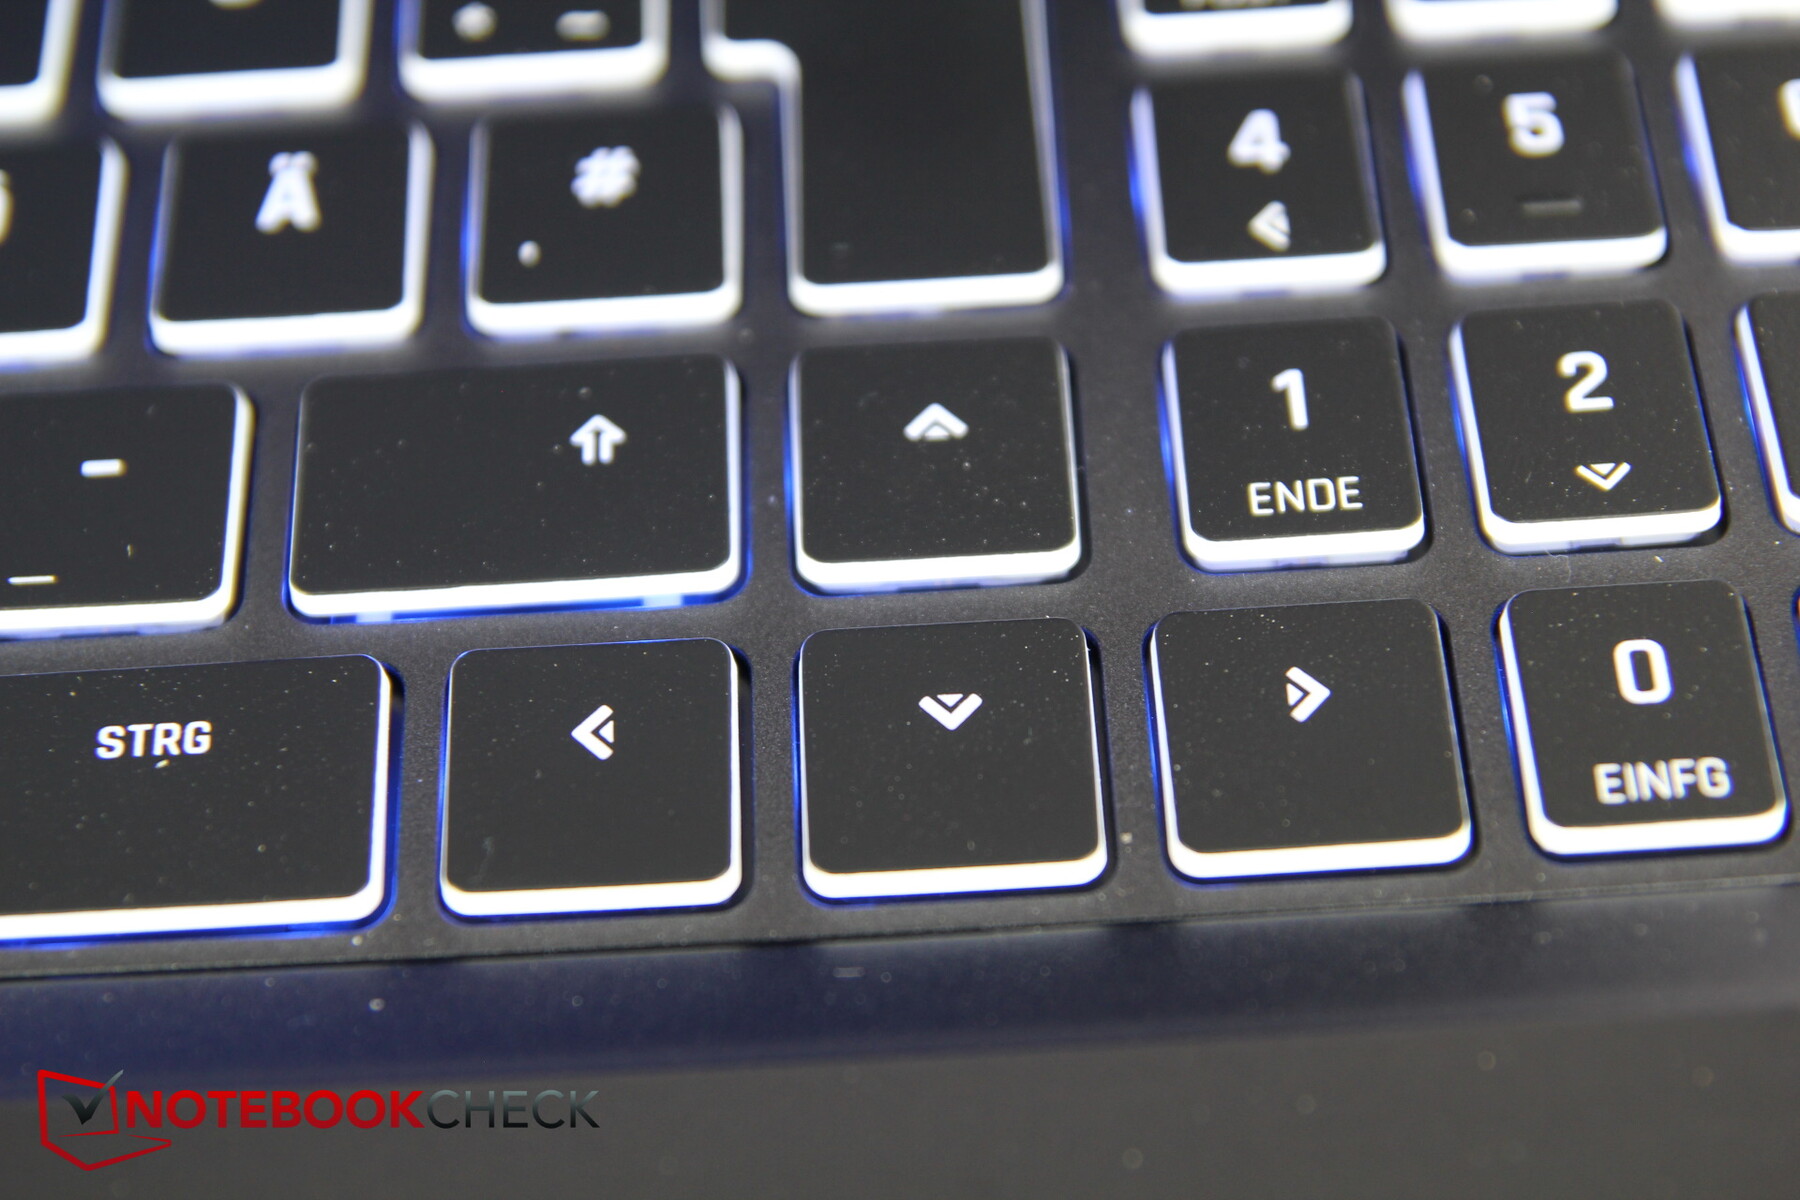
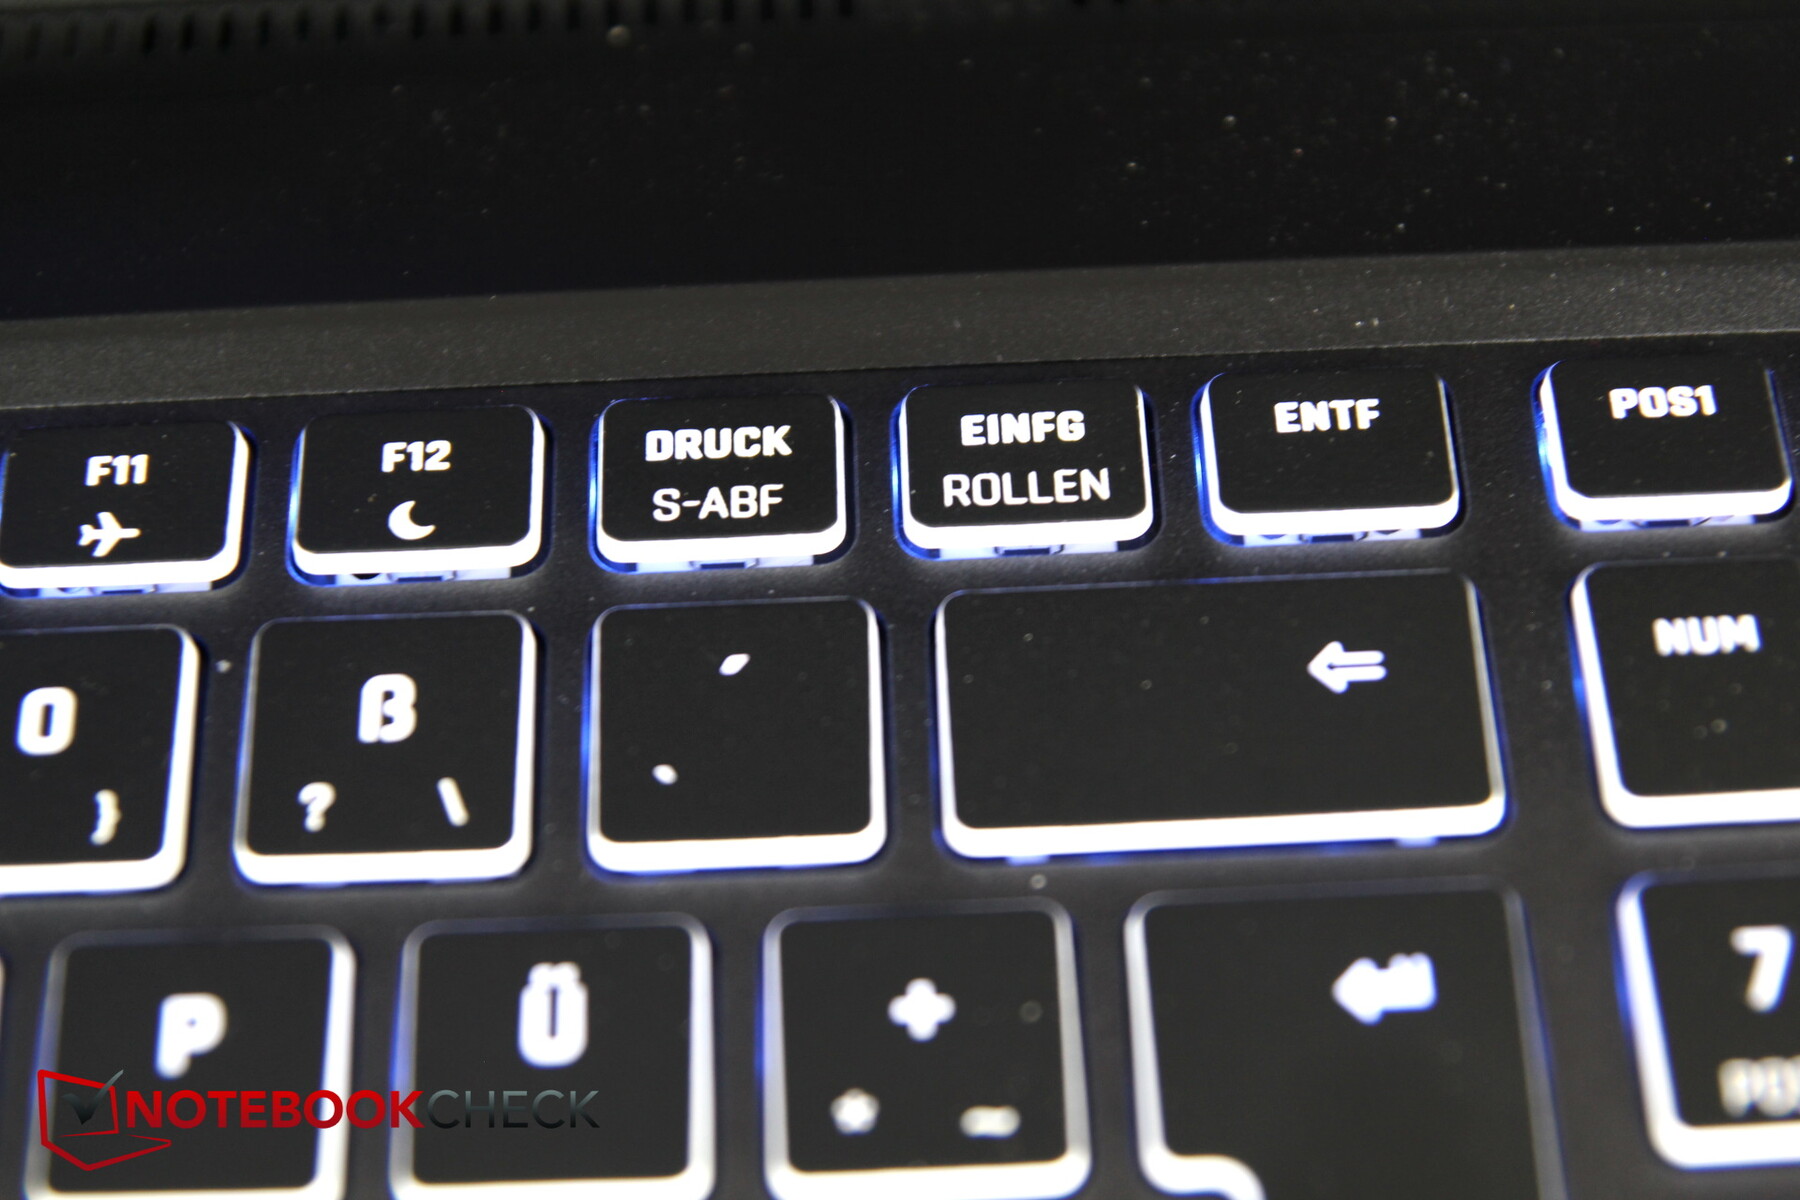
键看起来相当小,特别是对于17英寸的笔记本电脑来说。但布局看起来非常干净,而且有一个数字块。不幸的是,普通键盘和数字块之间没有缝隙,因此普通尺寸的方向键没有被单独放置,而是被放置在两块键盘之间。
乍一看并不明显,但镶嵌在金属底座上的键盘只是由薄塑料制成。这意味着按键下面的薄板会经常向下弯曲,在打字的时候会有明显的波动。这对我们来说有点过分,变得很烦人。
笔画高度一般,但反馈清晰,打字也相当舒适。只有小尺寸的按键稍微令人讨厌。打字的噪音非常适中。
键盘为每个键提供了单独的RGB照明,允许你用不同的颜色来照亮WASD键,例如,使它们从其他键中更加突出。这方面的设置包含在控制中心中。
触摸板
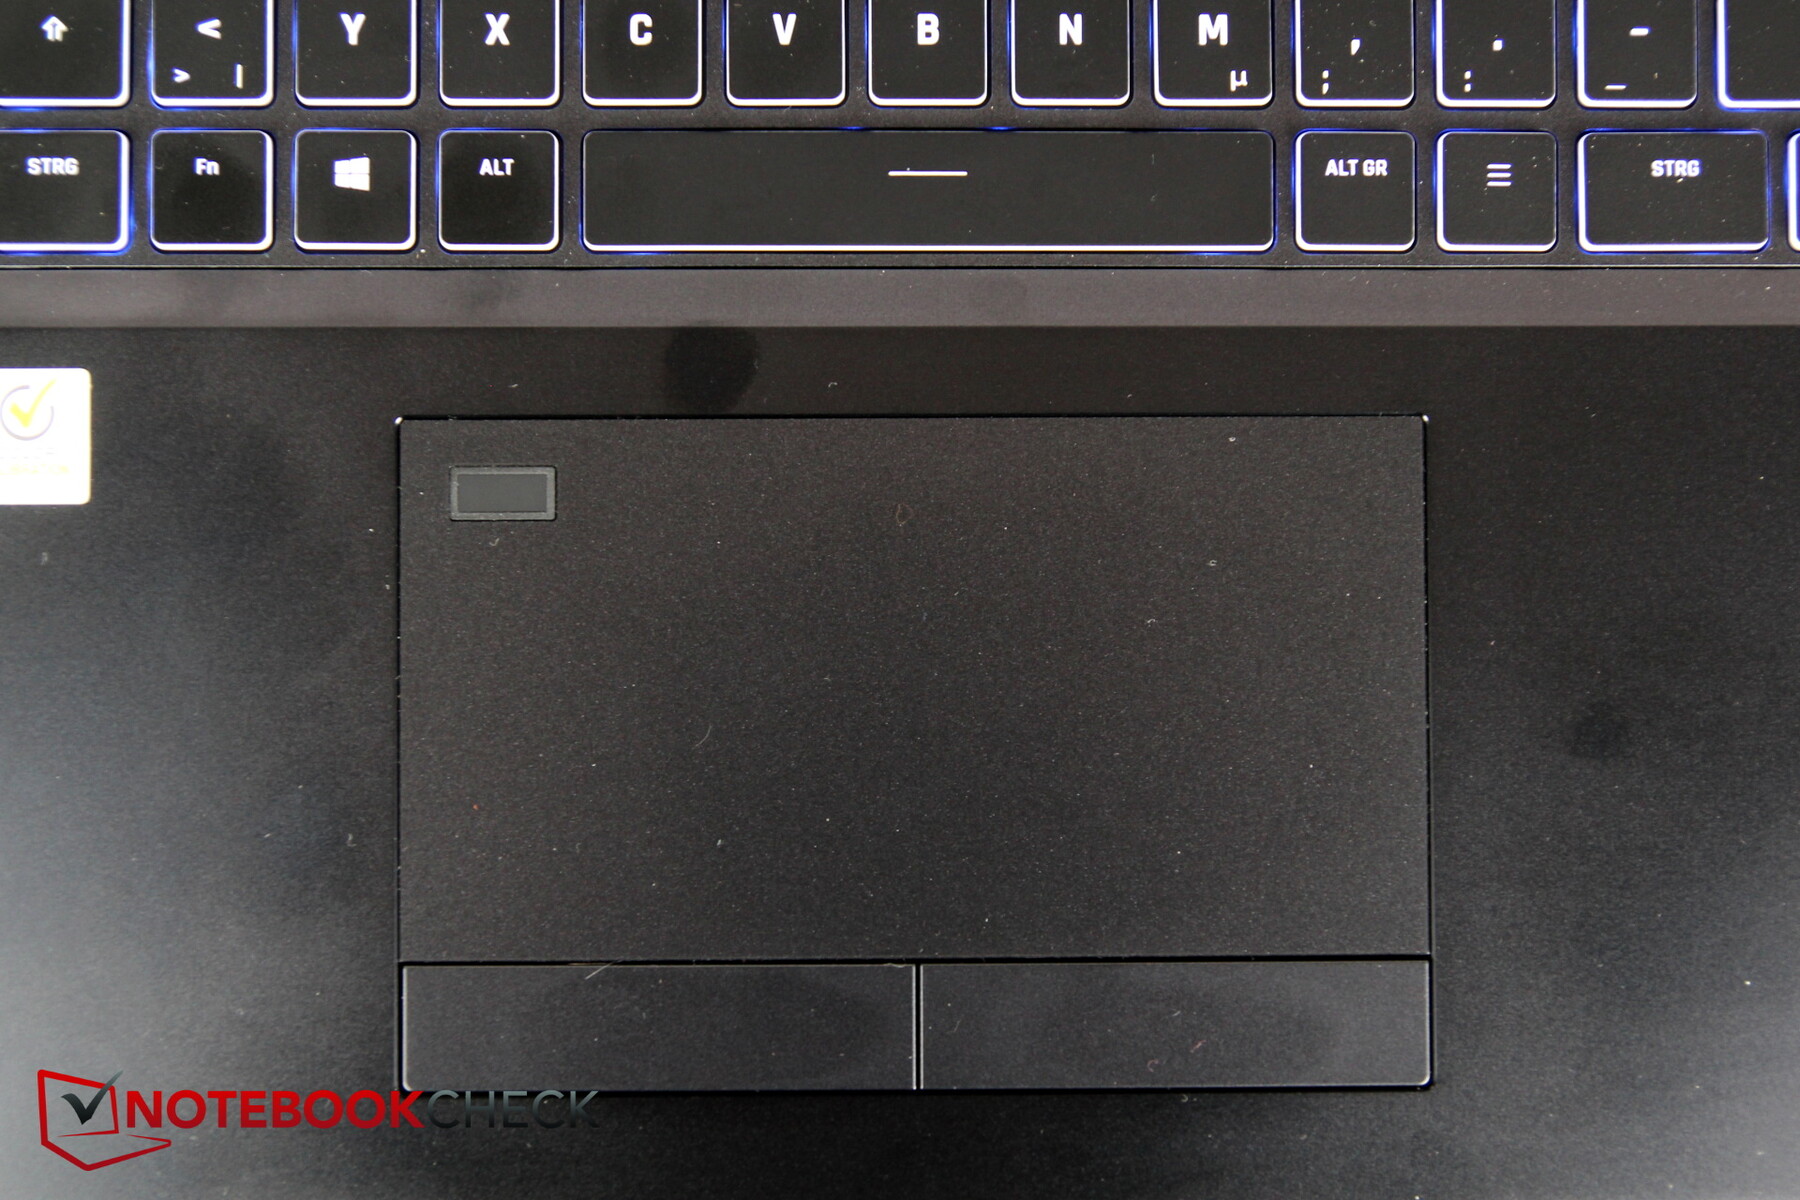
触摸板相当大(约13×6.8厘米,约5.1×2.7英寸),下面有专用的鼠标键。 指纹传感器集成在左上角。手指在上面和左边的移动不会被记录。
表面允许手指轻松滑动,即使在慢速运动中也几乎没有任何停顿。
下面的额外的鼠标键很宽,第一眼就能给人留下好印象。鼠标点击的音量也处于适中的水平。然而,当仔细聆听时,按键会产生一些轻微的吱吱声。
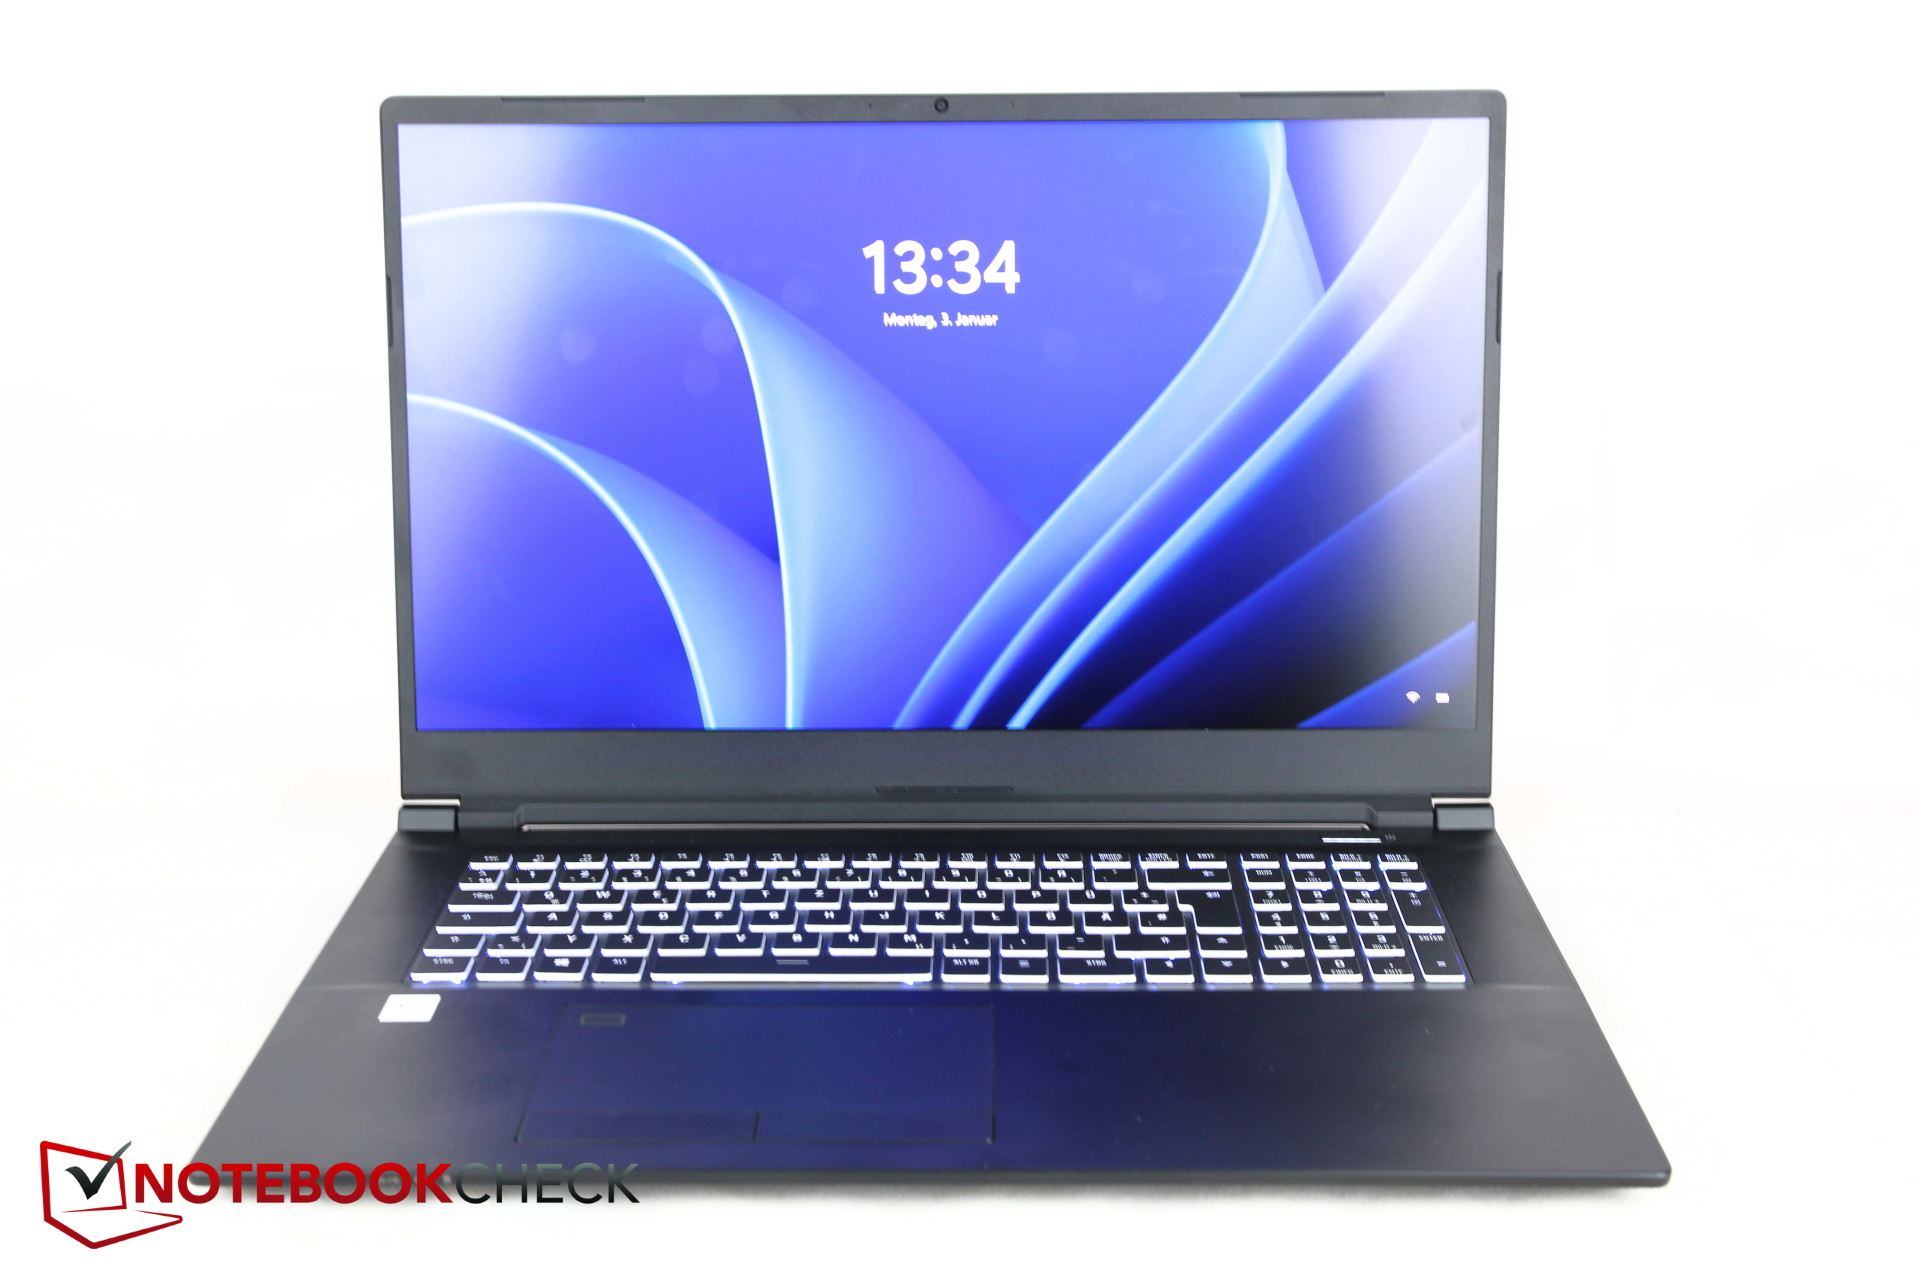
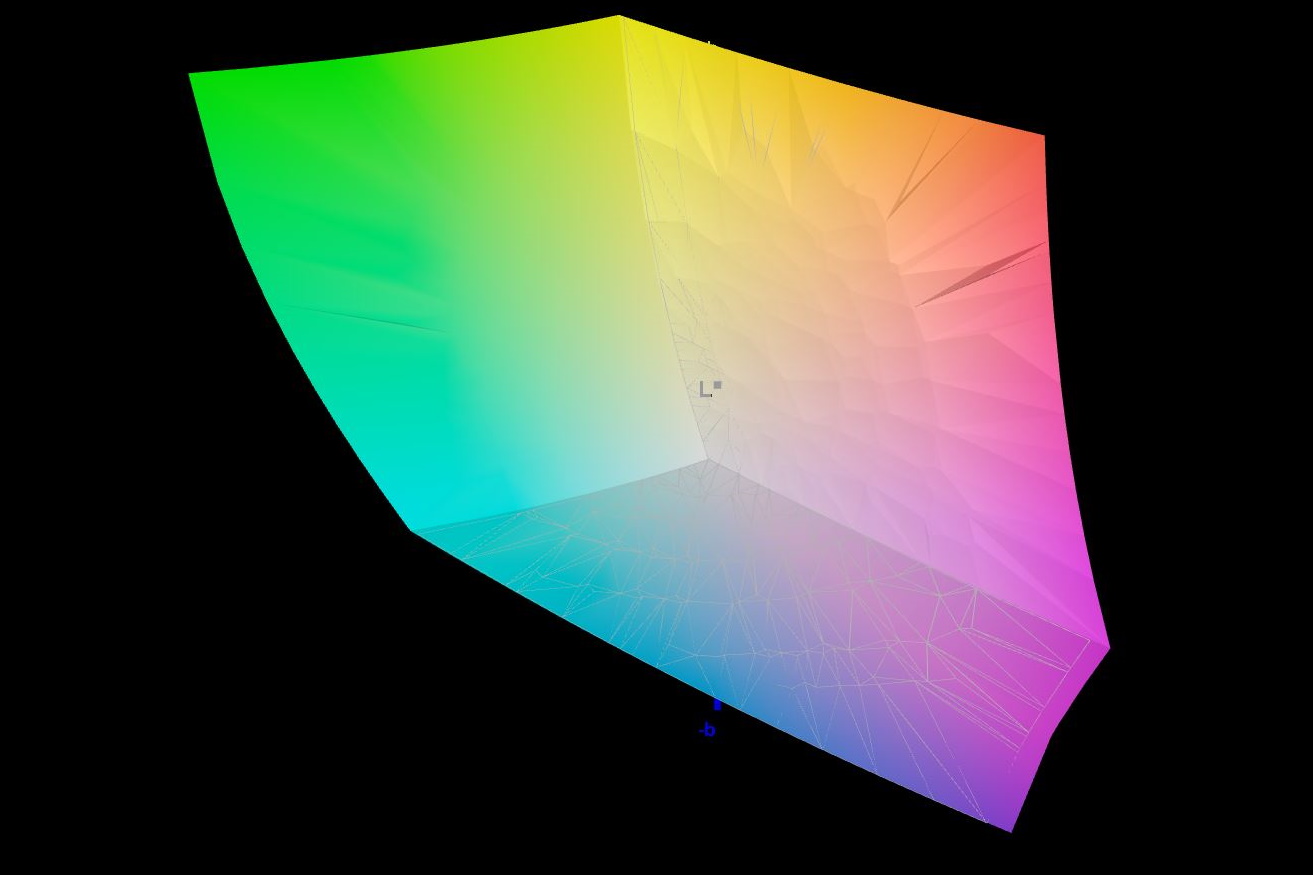
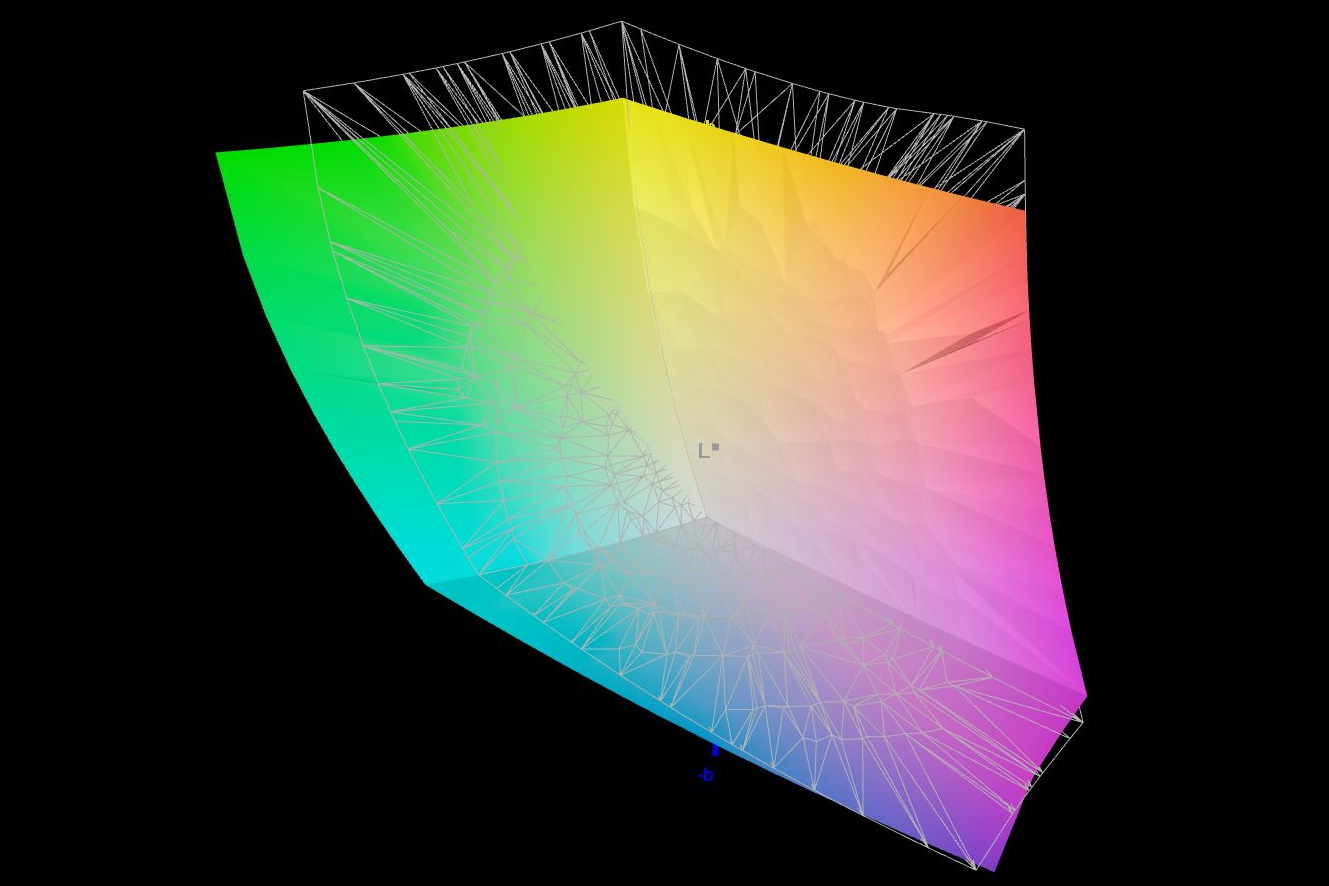
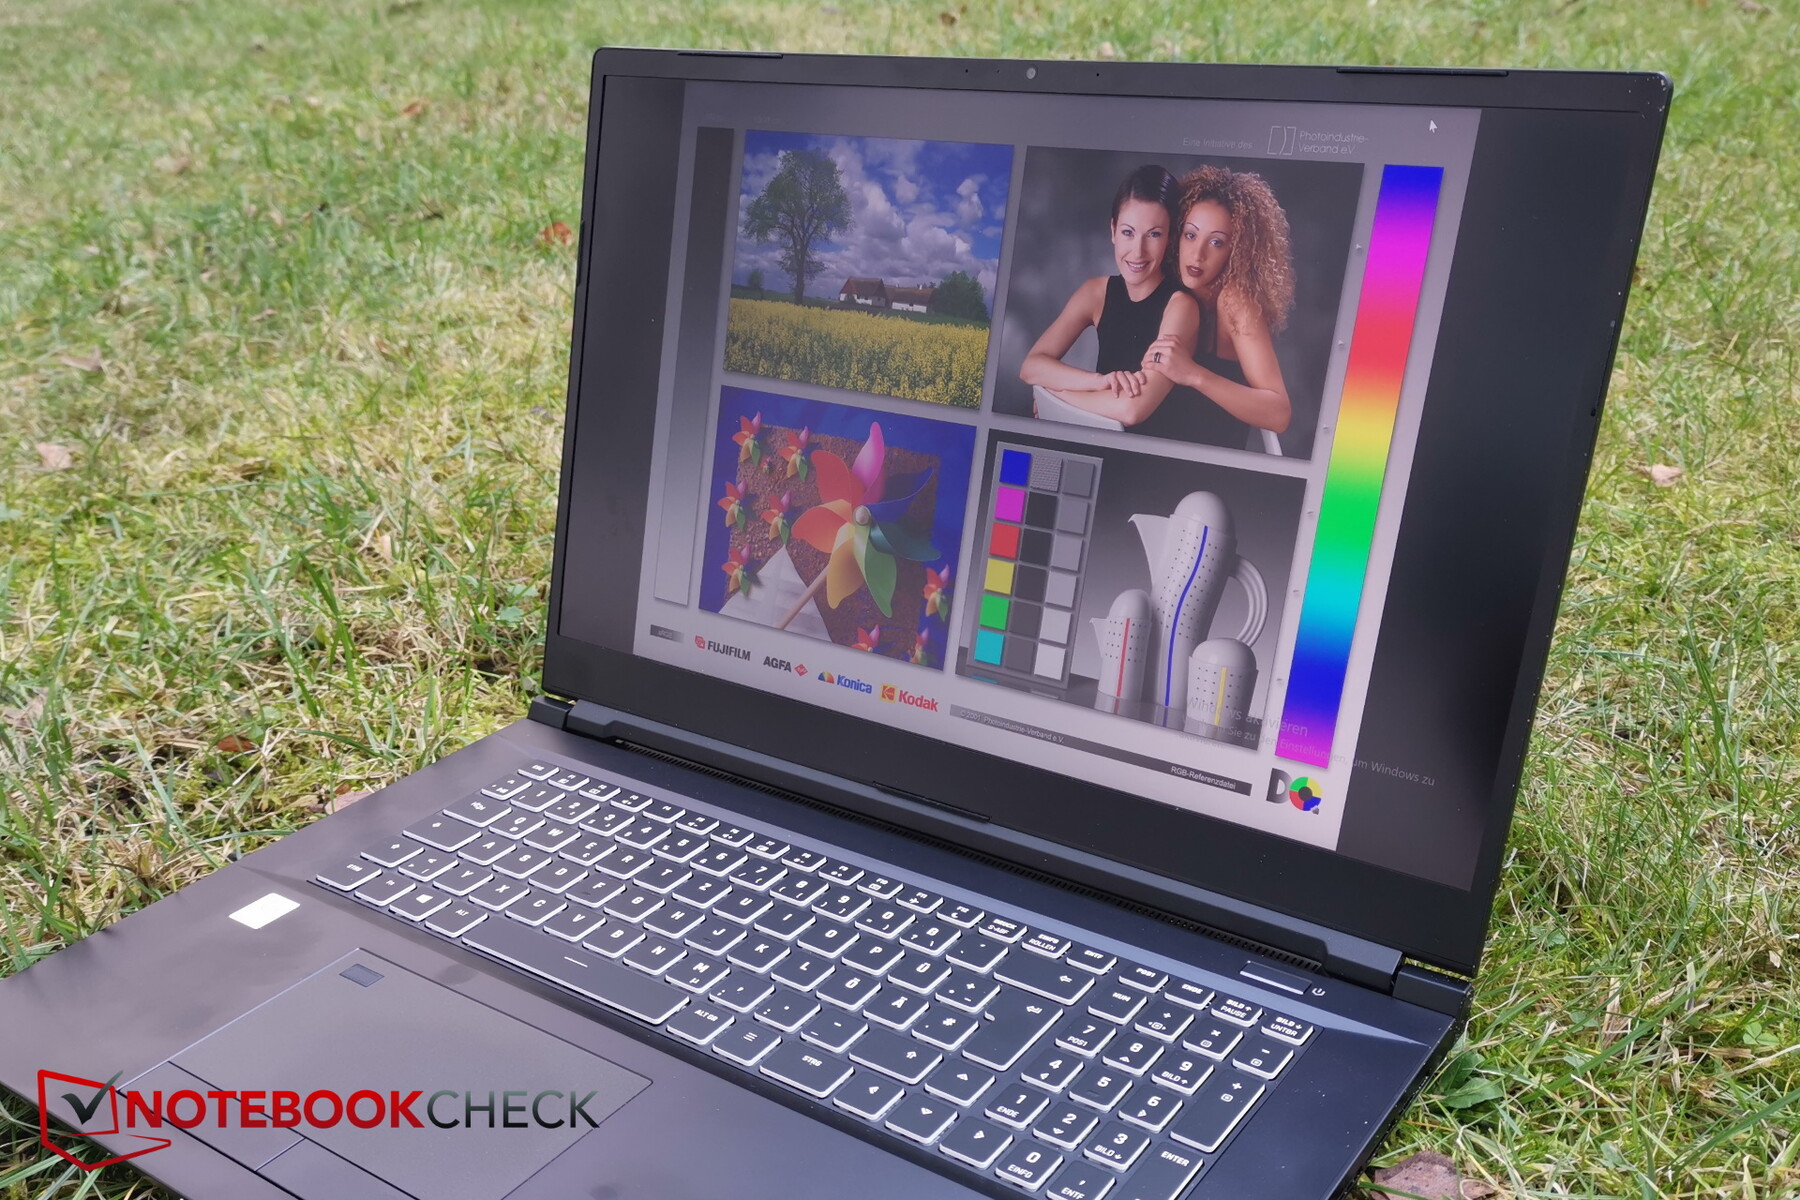
显示屏 - 4K,色彩空间覆盖率高
哑光4K IPS显示屏与去年的Schenker XMG Ultra 17所使用的相同。不幸的是,由于4K分辨率的原因,你必须做的是没有更高的刷新率。另外,这款笔记本电脑也可以选择全高清显示屏和快速的300赫兹。
此外,该面板非常明亮,亮度分布也还算不错。黑值和对比度也处于良好水平,后者甚至略高于竞争对手的水平。
不太好的是非常蹩脚的响应时间。结合较低的刷新率,这也表明配备4K显示屏的XMG Pro 17更多的是针对创意专业人士,而游戏玩家可能更愿意选择全高清型号,这取决于他们的偏好。
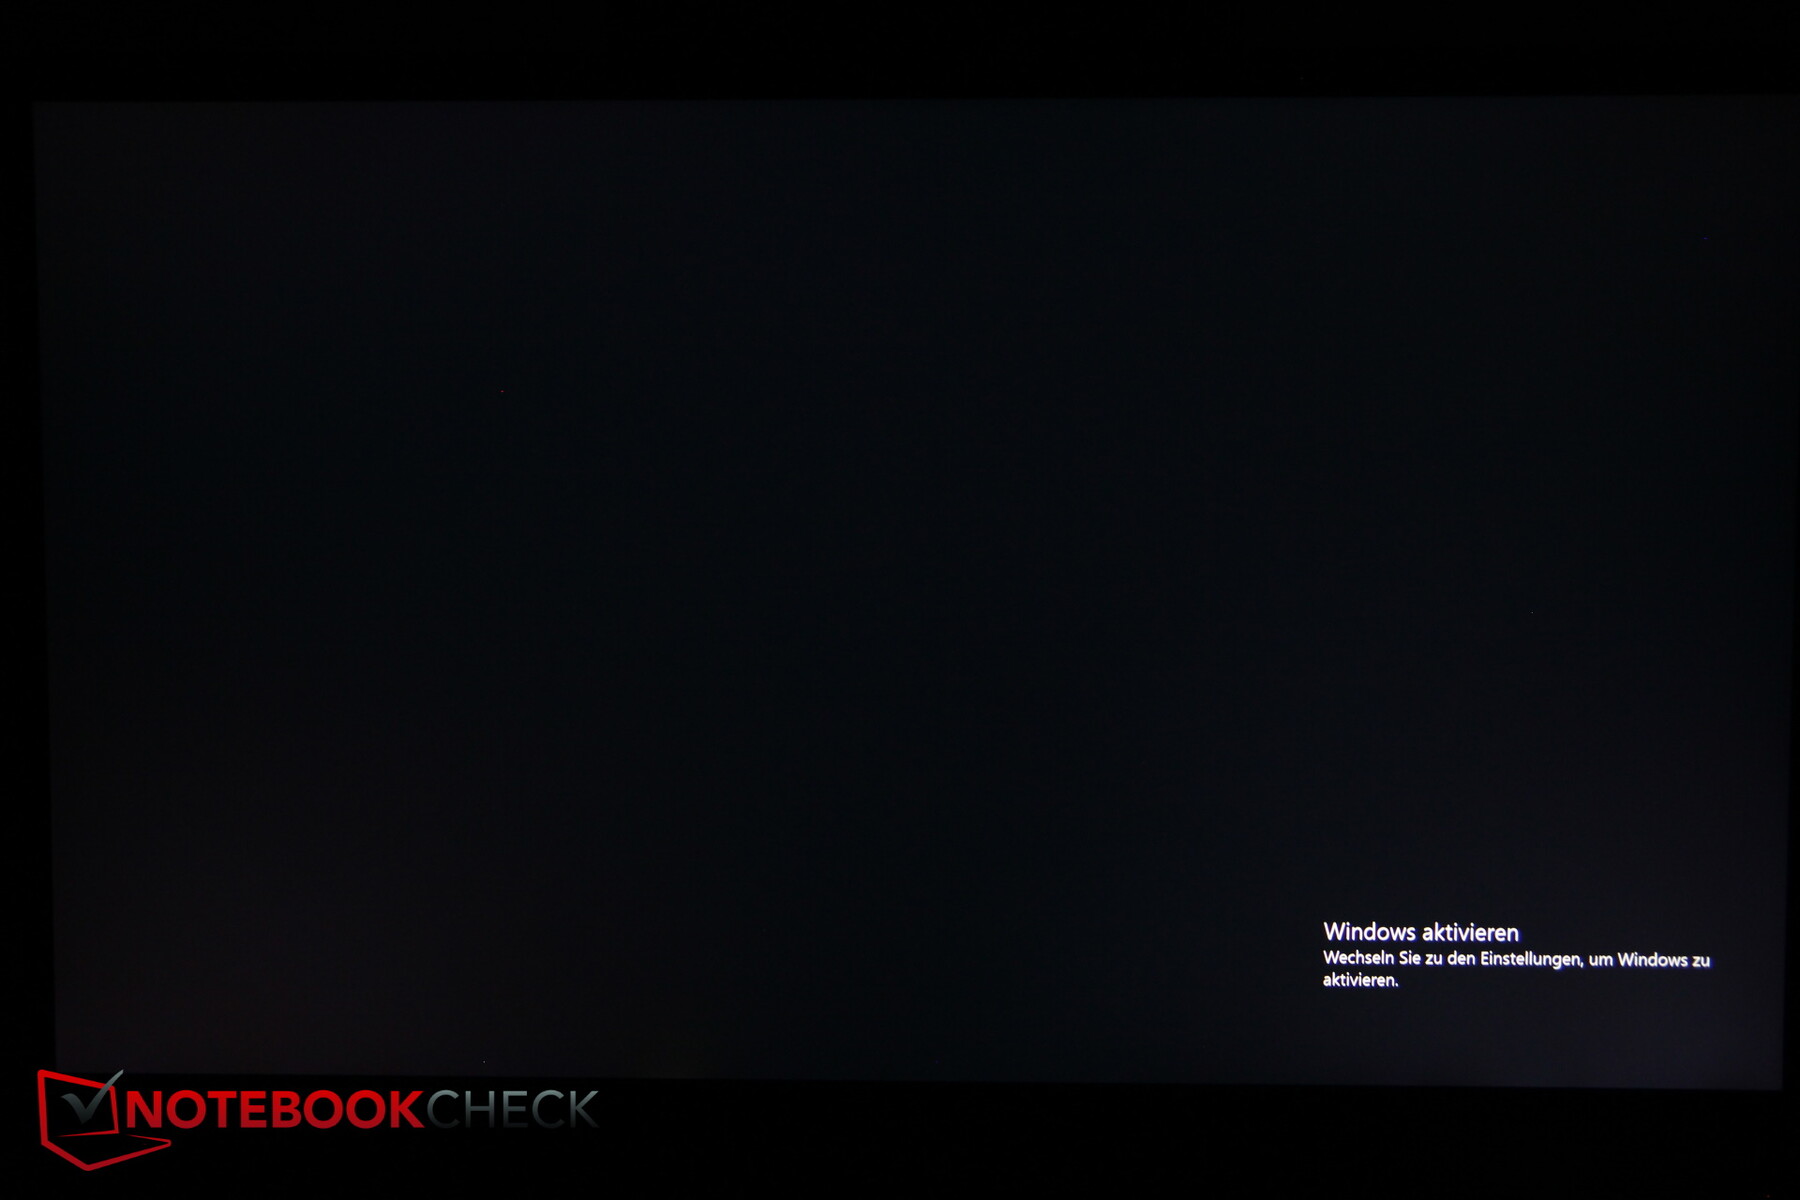
我们没有检测到任何PWM。即使在黑暗中非常仔细地观察,我们也只能在底部边缘看到一些最小的屏幕出血(但在截图中看不到),所以这并不是什么问题。
| |||||||||||||||||||||||||
Brightness Distribution: 84 %
Center on Battery: 471 cd/m²
Contrast: 1397:1 (Black: 0.34 cd/m²)
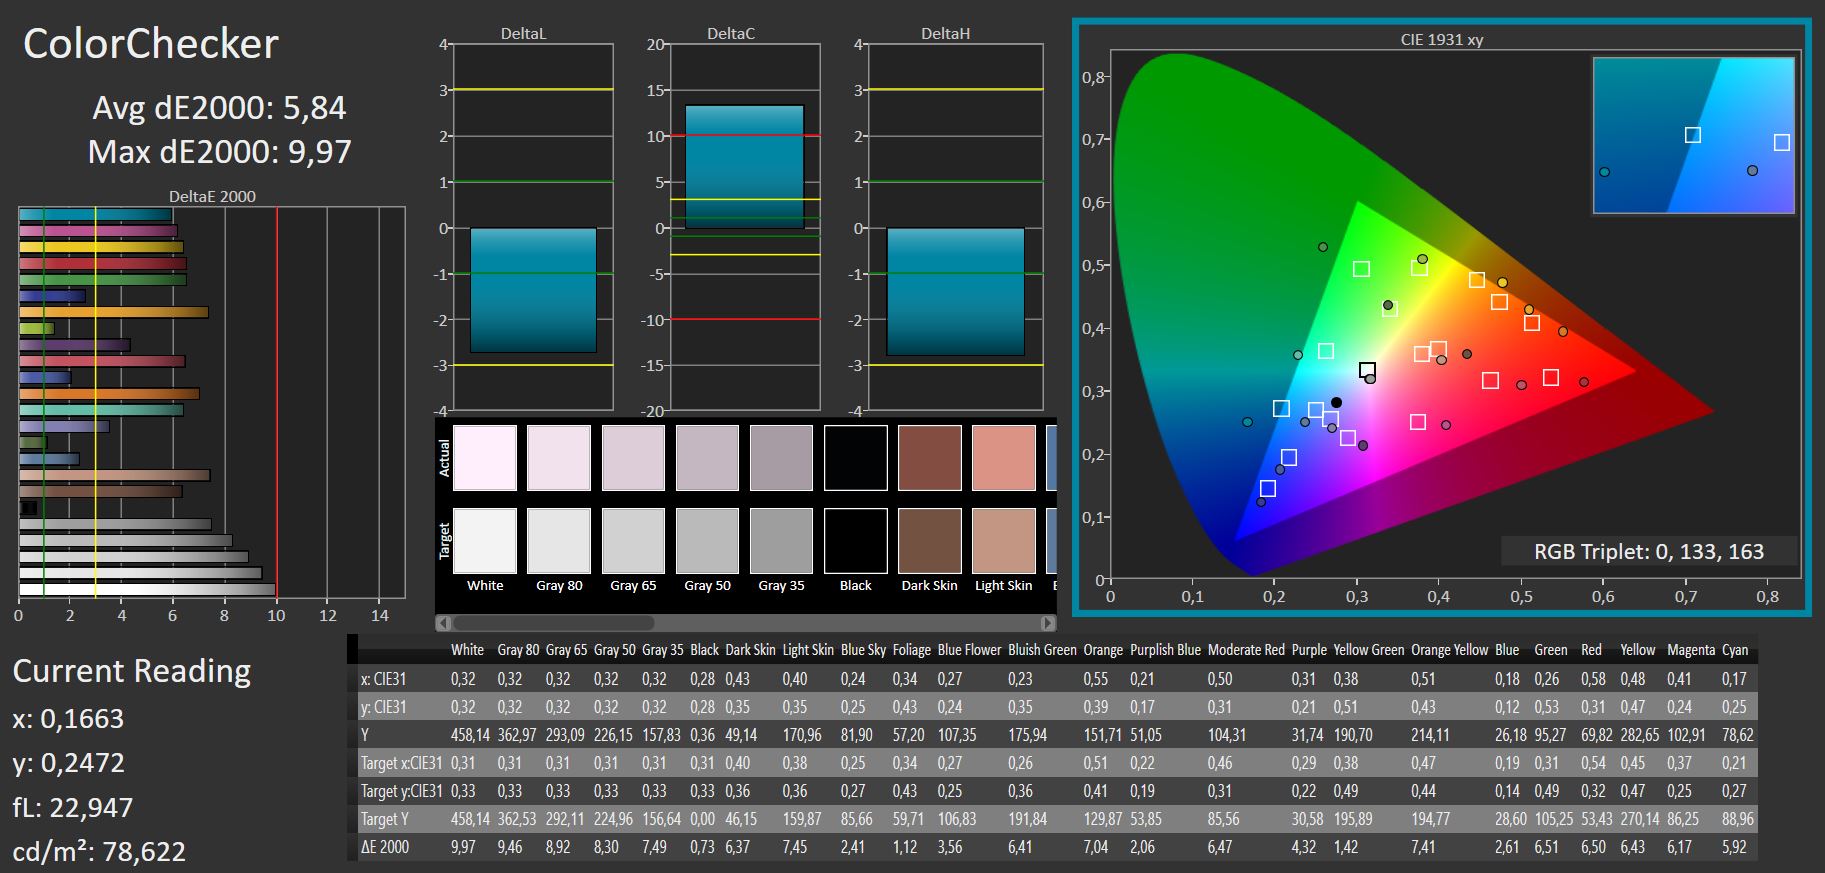
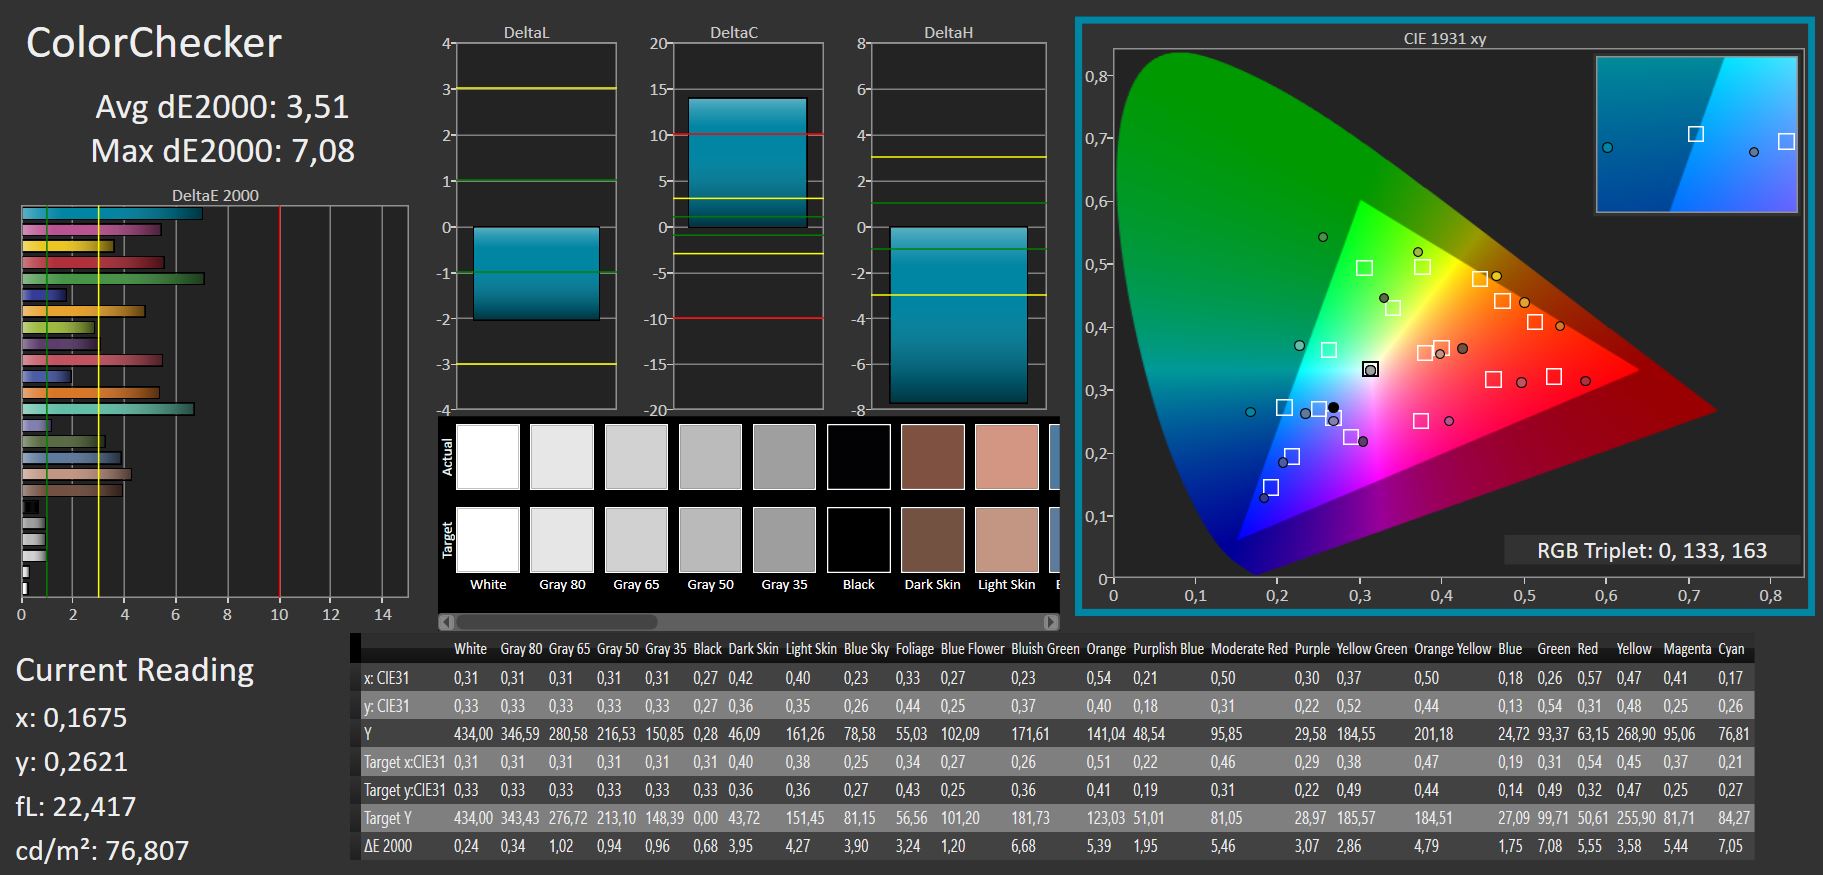
ΔE ColorChecker Calman: 5.84 | ∀{0.5-29.43 Ø4.71}
calibrated: 3.51
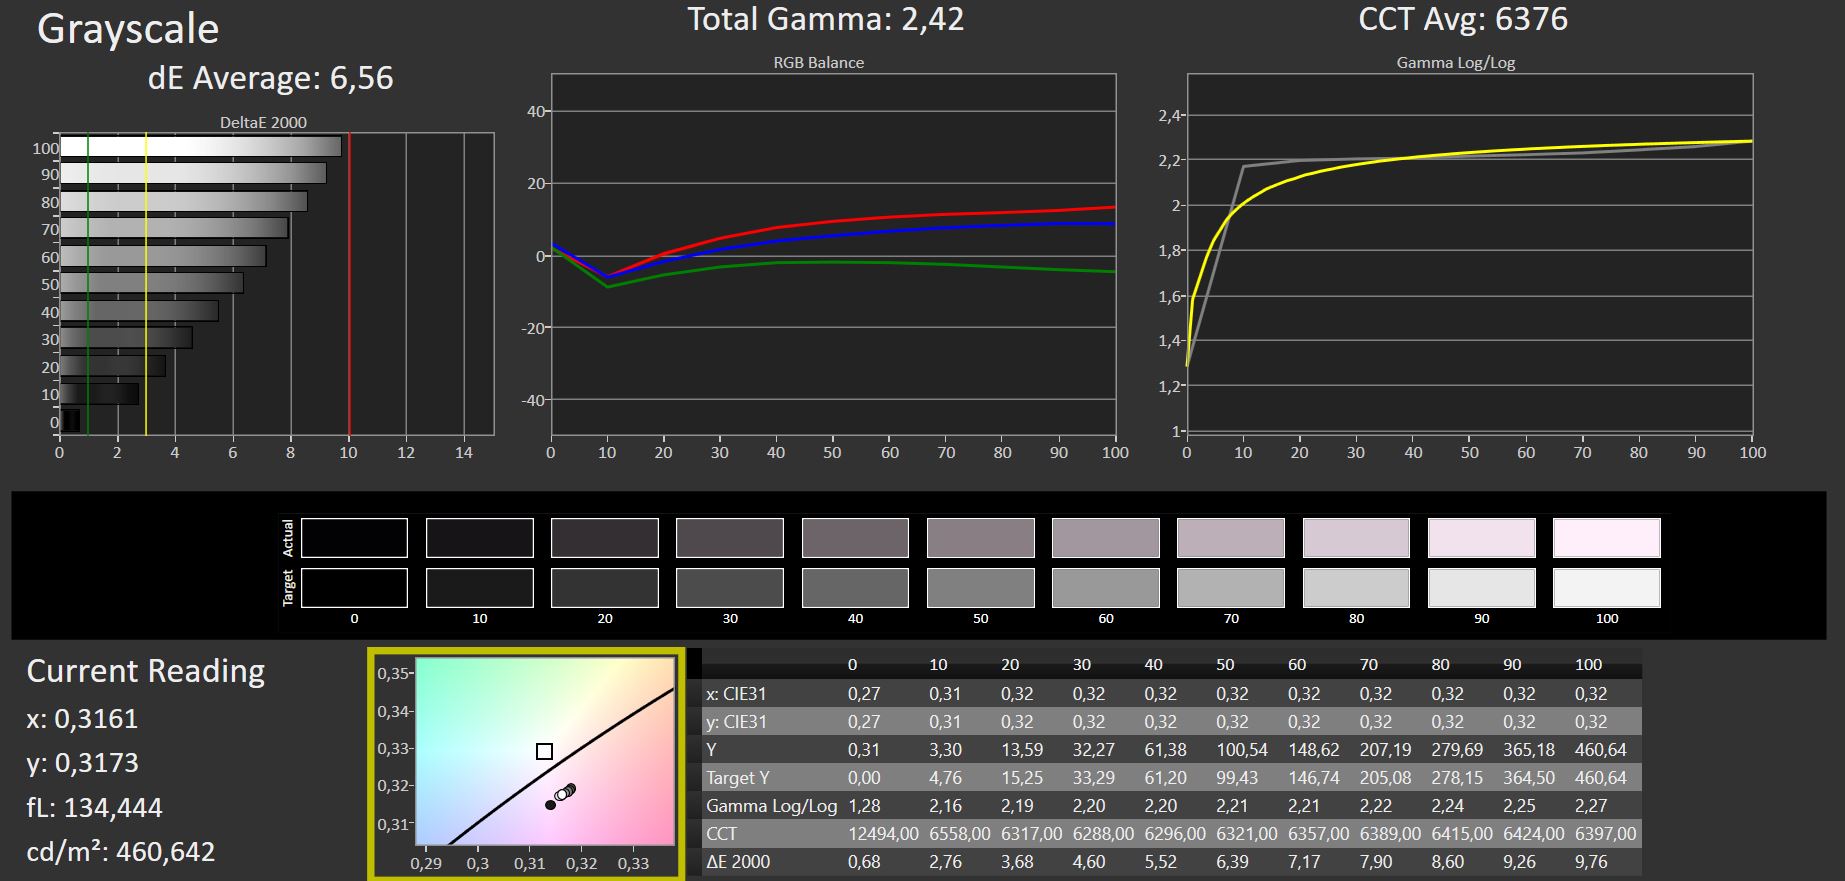
ΔE Greyscale Calman: 6.56 | ∀{0.09-98 Ø4.96}
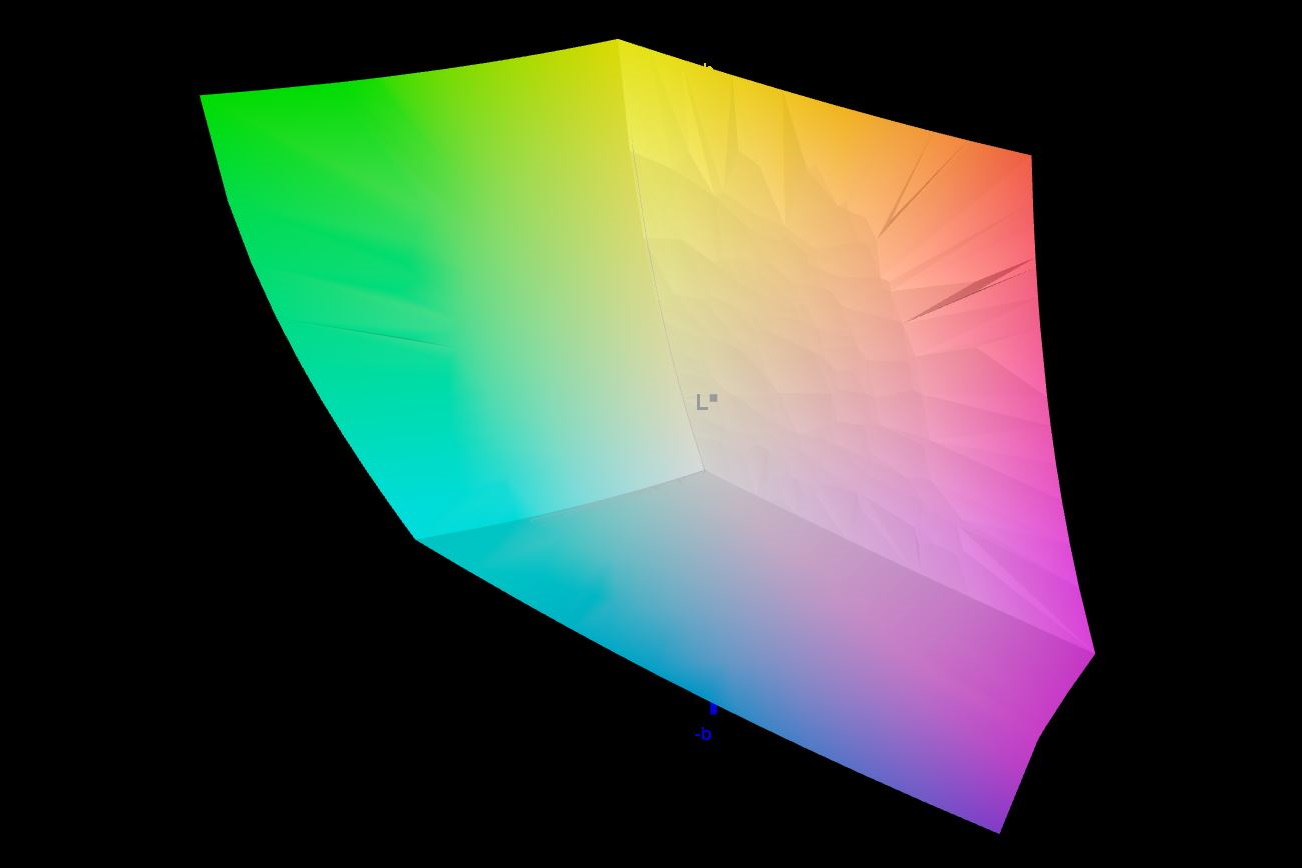
100% AdobeRGB 1998 (Argyll 3D)
100% sRGB (Argyll 3D)
87.1% Display P3 (Argyll 3D)
Gamma: 2.42
CCT: 6376 K
| Schenker XMG Pro 17 (Late 2021, RTX 3080) AUO B173ZAN3.0 (AUO309B), IPS, 3840x2160, 17.3" | Schenker XMG Pro 15 (Late 2021) Samsung ATNA56WR14-0, OLED, 3840x2160, 15.6" | Alienware x17 RTX 3080 P48E AU Optronics B173ZAN, IPS, 3840x2160, 17.3" | Medion Erazer Beast X25 BOE NE173FHM-NZ1 (BOE0884), IPS, 1920x1080, 17.3" | MSI GS76 Stealth 11UH AUO B173ZAN06.1 (AUODE95), IPS, 3840x2160, 17.3" | Asus ROG Zephyrus S17 GX703HSD BOE099D (BOE CQ NE173QHM-NY3), IPS, 2560x1440, 17.3" | |
|---|---|---|---|---|---|---|
| Display | -7% | 0% | -16% | -23% | -3% | |
| Display P3 Coverage (%) | 87.1 | 81.2 -7% | 88.3 1% | 70.4 -19% | 63 -28% | 94.2 8% |
| sRGB Coverage (%) | 100 | 97.7 -2% | 100 0% | 99.8 0% | 94.8 -5% | 98.7 -1% |
| AdobeRGB 1998 Coverage (%) | 100 | 89.1 -11% | 100 0% | 71.6 -28% | 65 -35% | 84.4 -16% |
| Response Times | 94% | 69% | 82% | 81% | 83% | |
| Response Time Grey 50% / Grey 80% * (ms) | 46.8 ? | 3.2 ? 93% | 14.4 ? 69% | 9.2 ? 80% | 8.8 ? 81% | 4.8 90% |
| Response Time Black / White * (ms) | 32.6 ? | 1.6 ? 95% | 10.4 ? 68% | 5.6 ? 83% | 6.4 ? 80% | 8 75% |
| PWM Frequency (Hz) | 60 ? | |||||
| Screen | 212% | 13% | 17% | 22% | 11% | |
| Brightness middle (cd/m²) | 475 | 443 -7% | 438.7 -8% | 329 -31% | 474 0% | 322 -32% |
| Brightness (cd/m²) | 451 | 434 -4% | 435 -4% | 315 -30% | 454 1% | 288 -36% |
| Brightness Distribution (%) | 84 | 94 12% | 91 8% | 88 5% | 88 5% | 72 -14% |
| Black Level * (cd/m²) | 0.34 | 0.02 94% | 0.48 -41% | 0.33 3% | 0.46 -35% | 0.3 12% |
| Contrast (:1) | 1397 | 22150 1486% | 914 -35% | 997 -29% | 1030 -26% | 1073 -23% |
| Colorchecker dE 2000 * | 5.84 | 3.73 36% | 4.34 26% | 2.03 65% | 1.5 74% | 3.05 48% |
| Colorchecker dE 2000 max. * | 9.97 | 8.12 19% | 7.3 27% | 5.5 45% | 5.59 44% | 5.23 48% |
| Colorchecker dE 2000 calibrated * | 3.51 | 0.72 79% | 0.82 77% | 0.86 75% | 1.92 45% | |
| Greyscale dE 2000 * | 6.56 | 2.5 62% | 2.4 63% | 3.5 47% | 2.8 57% | 3.11 53% |
| Gamma | 2.42 91% | 2.001 110% | 2.09 105% | 2.223 99% | 2.158 102% | 2.13 103% |
| CCT | 6376 102% | 6522 100% | 6413 101% | 6526 100% | 6597 99% | 6553 99% |
| Color Space (Percent of AdobeRGB 1998) (%) | 84 | |||||
| Color Space (Percent of sRGB) (%) | 99 | |||||
| Total Average (Program / Settings) | 100% /
144% | 27% /
18% | 28% /
19% | 27% /
21% | 30% /
18% |
* ... smaller is better
Schenker宣传该显示器是由X-Rite校准的颜色,但颜色偏差仍有改进的余地。暖色调、红色调占主导地位,至少在全亮度下是如此。手动校准进一步降低了Delta-E值,你可以从上面的链接中下载相应的ICC配置文件。
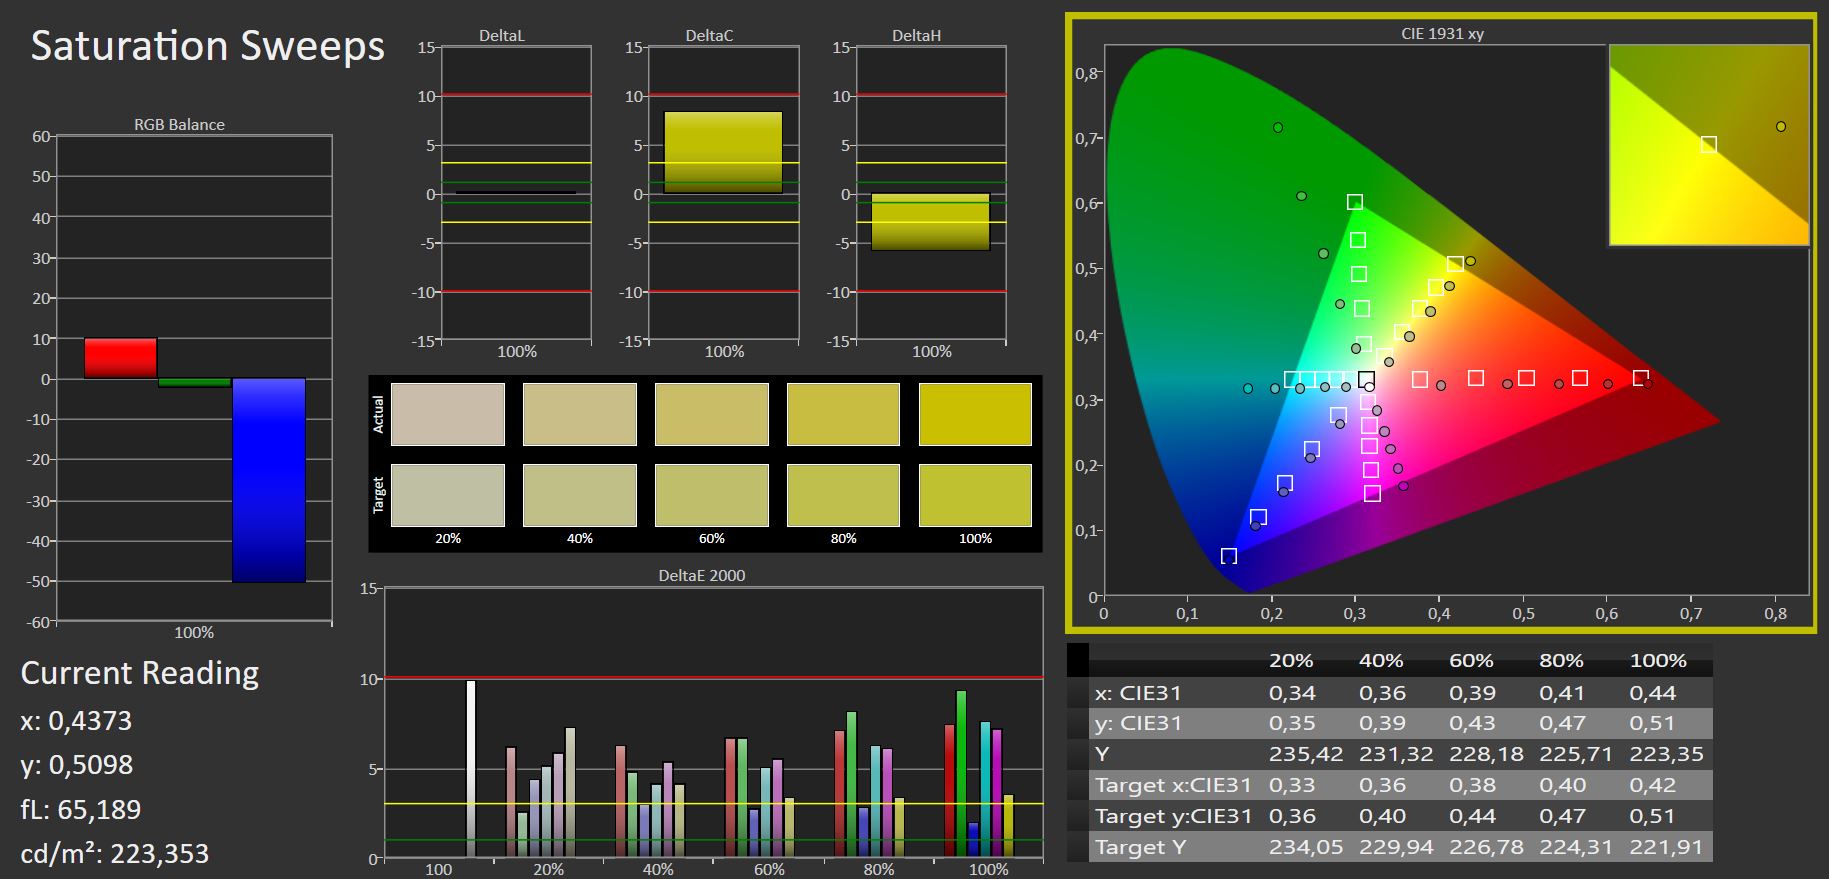
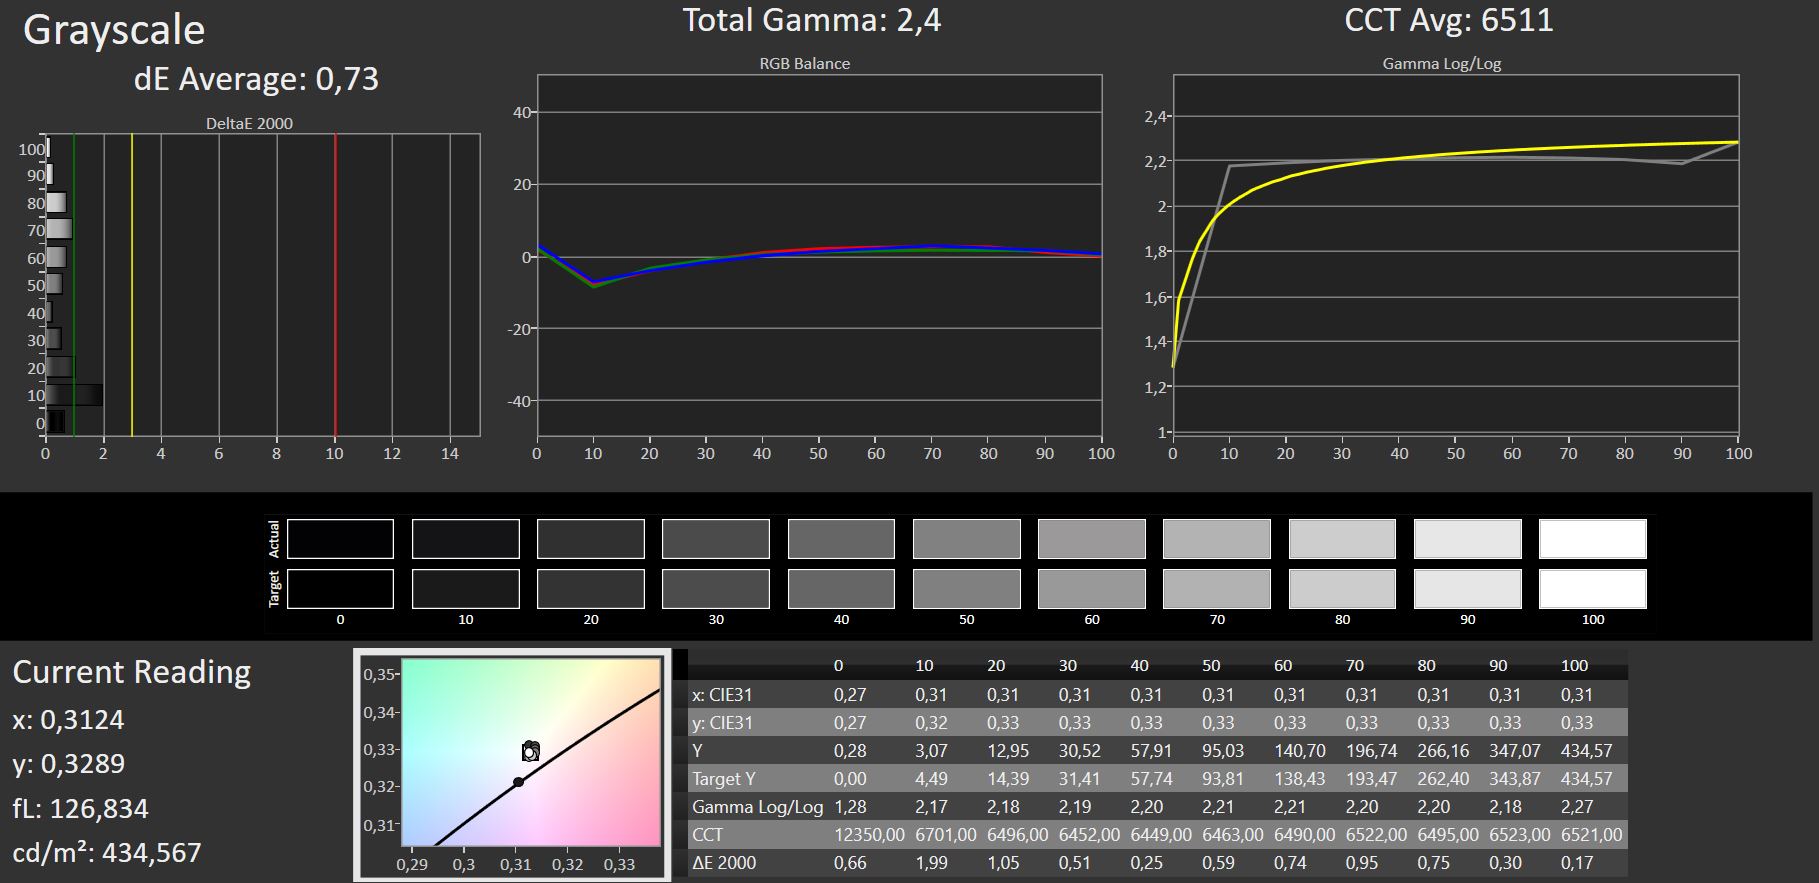
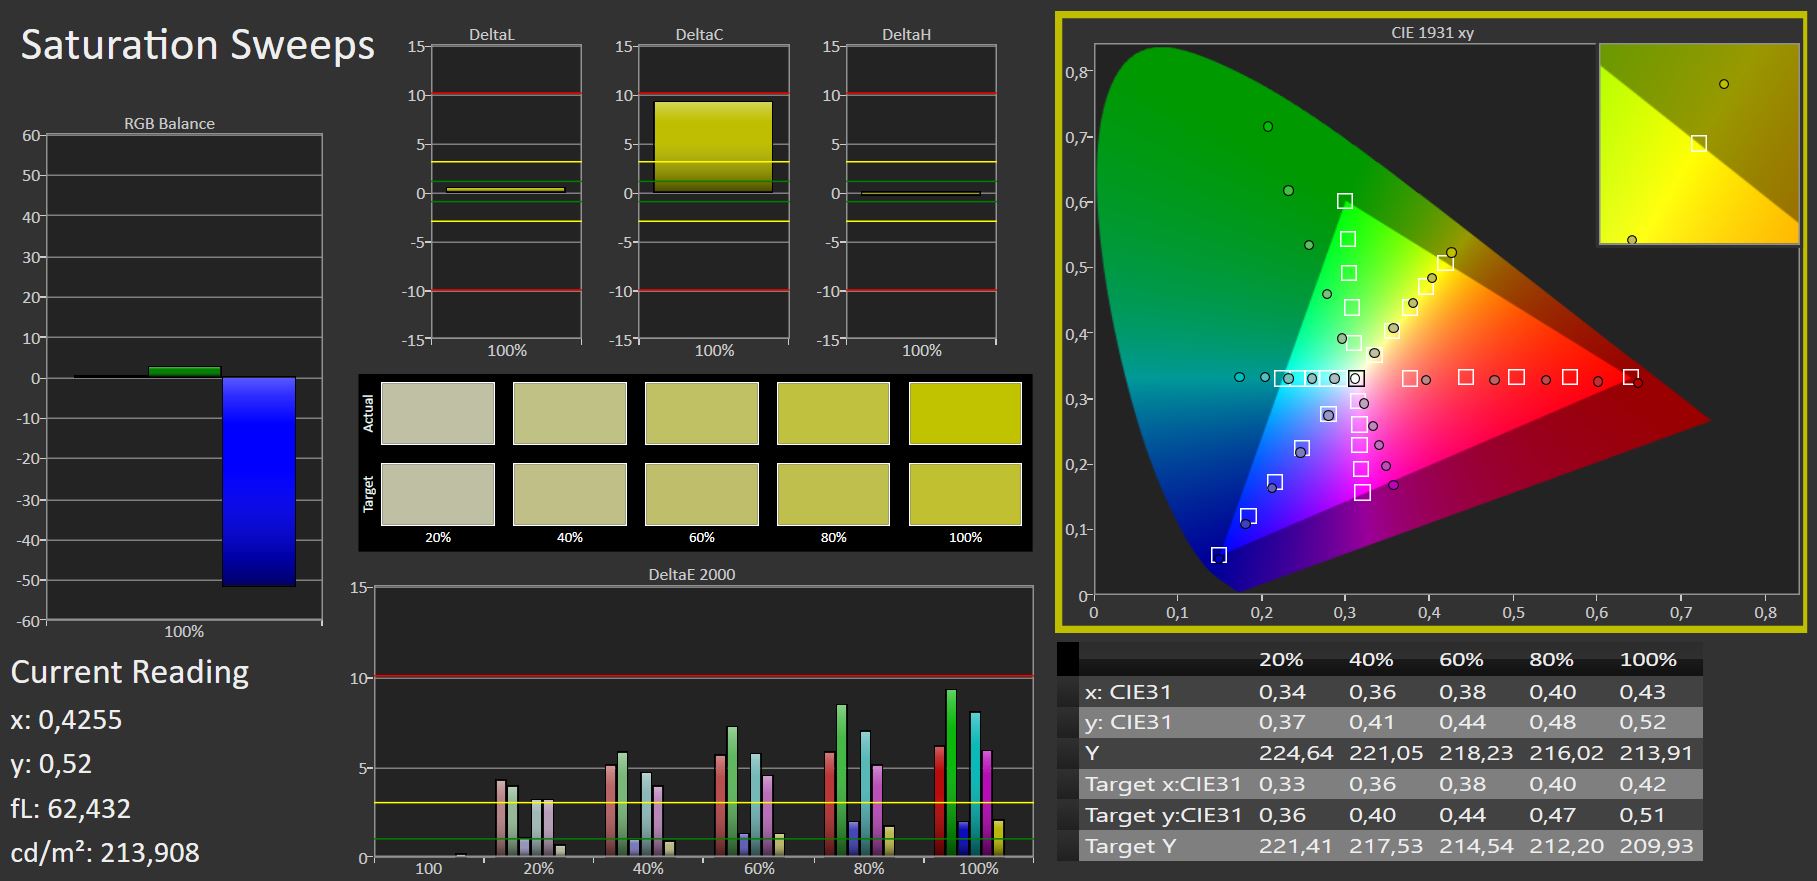
该显示器非常适用于图像处理和视频编辑,因为各种色彩空间都被很好地覆盖。虽然sRGB和AdobeRGB被完全覆盖,但DCI-P3仍被覆盖到87%。
Alienware的4K面板和华硕Zephyrus的2K面板也同样不错,Medion Erazer Beast和微星GS76 Stealth在这里的表现更差,但这也是价格的问题。
Display Response Times
| ↔ Response Time Black to White | ||
|---|---|---|
| 32.6 ms ... rise ↗ and fall ↘ combined | ↗ 16.6 ms rise | 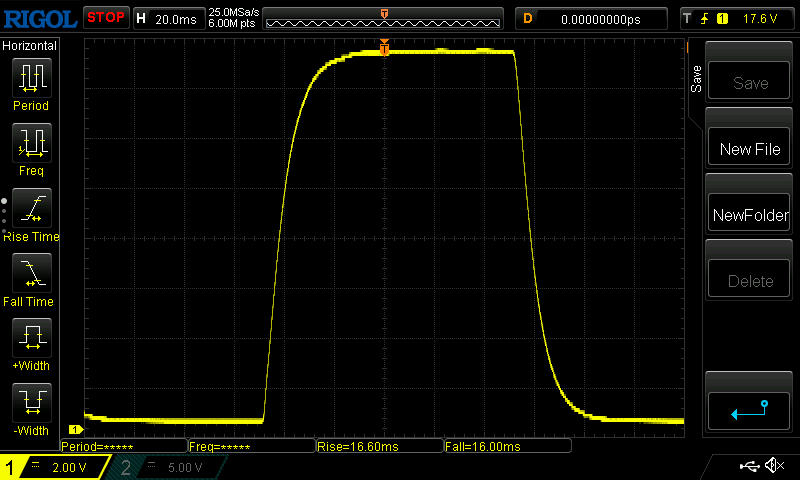 |
| ↘ 16 ms fall | ||
| The screen shows slow response rates in our tests and will be unsatisfactory for gamers. In comparison, all tested devices range from 0.1 (minimum) to 240 (maximum) ms. » 88 % of all devices are better. This means that the measured response time is worse than the average of all tested devices (19.8 ms). | ||
| ↔ Response Time 50% Grey to 80% Grey | ||
| 46.8 ms ... rise ↗ and fall ↘ combined | ↗ 23.4 ms rise | 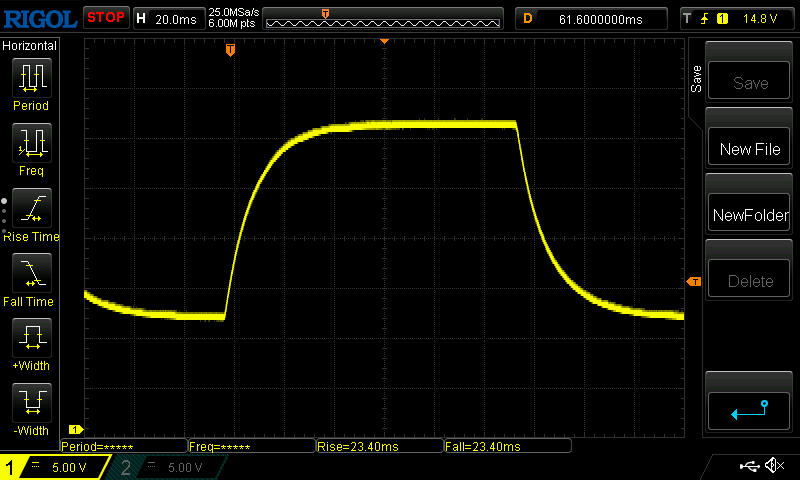 |
| ↘ 23.4 ms fall | ||
| The screen shows slow response rates in our tests and will be unsatisfactory for gamers. In comparison, all tested devices range from 0.165 (minimum) to 636 (maximum) ms. » 81 % of all devices are better. This means that the measured response time is worse than the average of all tested devices (31 ms). | ||
Screen Flickering / PWM (Pulse-Width Modulation)
| Screen flickering / PWM not detected |  | ||
In comparison: 52 % of all tested devices do not use PWM to dim the display. If PWM was detected, an average of 7757 (minimum: 5 - maximum: 343500) Hz was measured. | |||
在户外,哑光表面、超过400尼特的高亮度、良好的视角和相当高的对比度将使你受益,让你在大多数情况下阅读显示内容而不会受到太大的影响。
可视角度的稳定性还不错,尽管在极端的可视角度下亮度会明显下降。 有一些IPS面板的可视角度甚至更稳定。

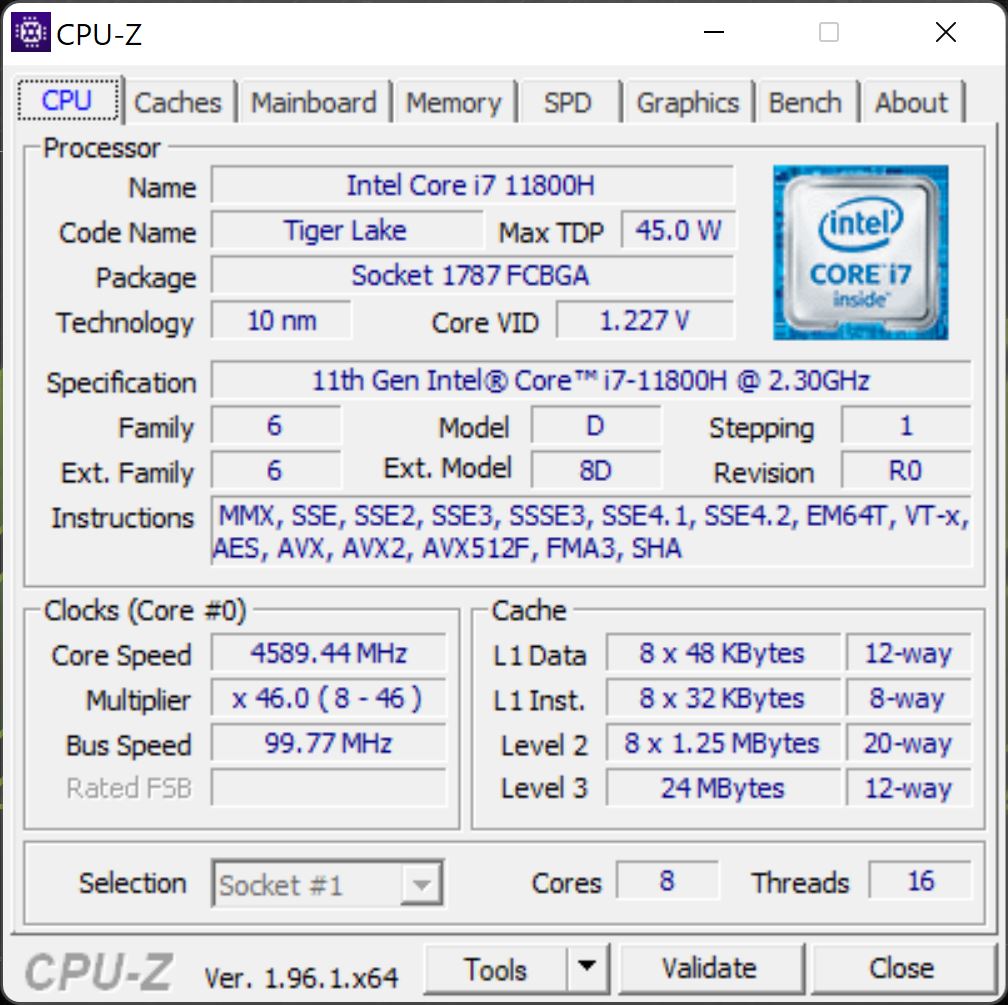
Performance - Throttled for the slim case
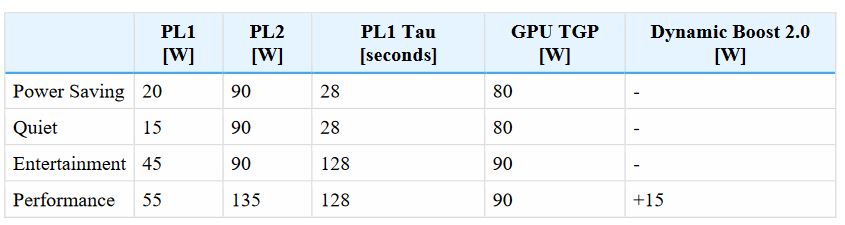
Schenker为XMG Pro 17做了广告,目标是游戏玩家以及专业用户。该 英特尔酷睿i7-11800H和特别是 NVIDIAGeForce RTX 3080笔记本GPU,以及充足的32GB内存支持这一原因。另一方面,4K显示屏只有60赫兹,但色彩空间覆盖率非常好,这表明这款笔记本电脑的目标略微偏向创意用户的需求,而不是游戏玩家。另外,你也不会真的指望从一个超薄的设计中获得最高的游戏性能。例如,显卡的TGP被限制在相对较弱的105瓦特。
测试条件
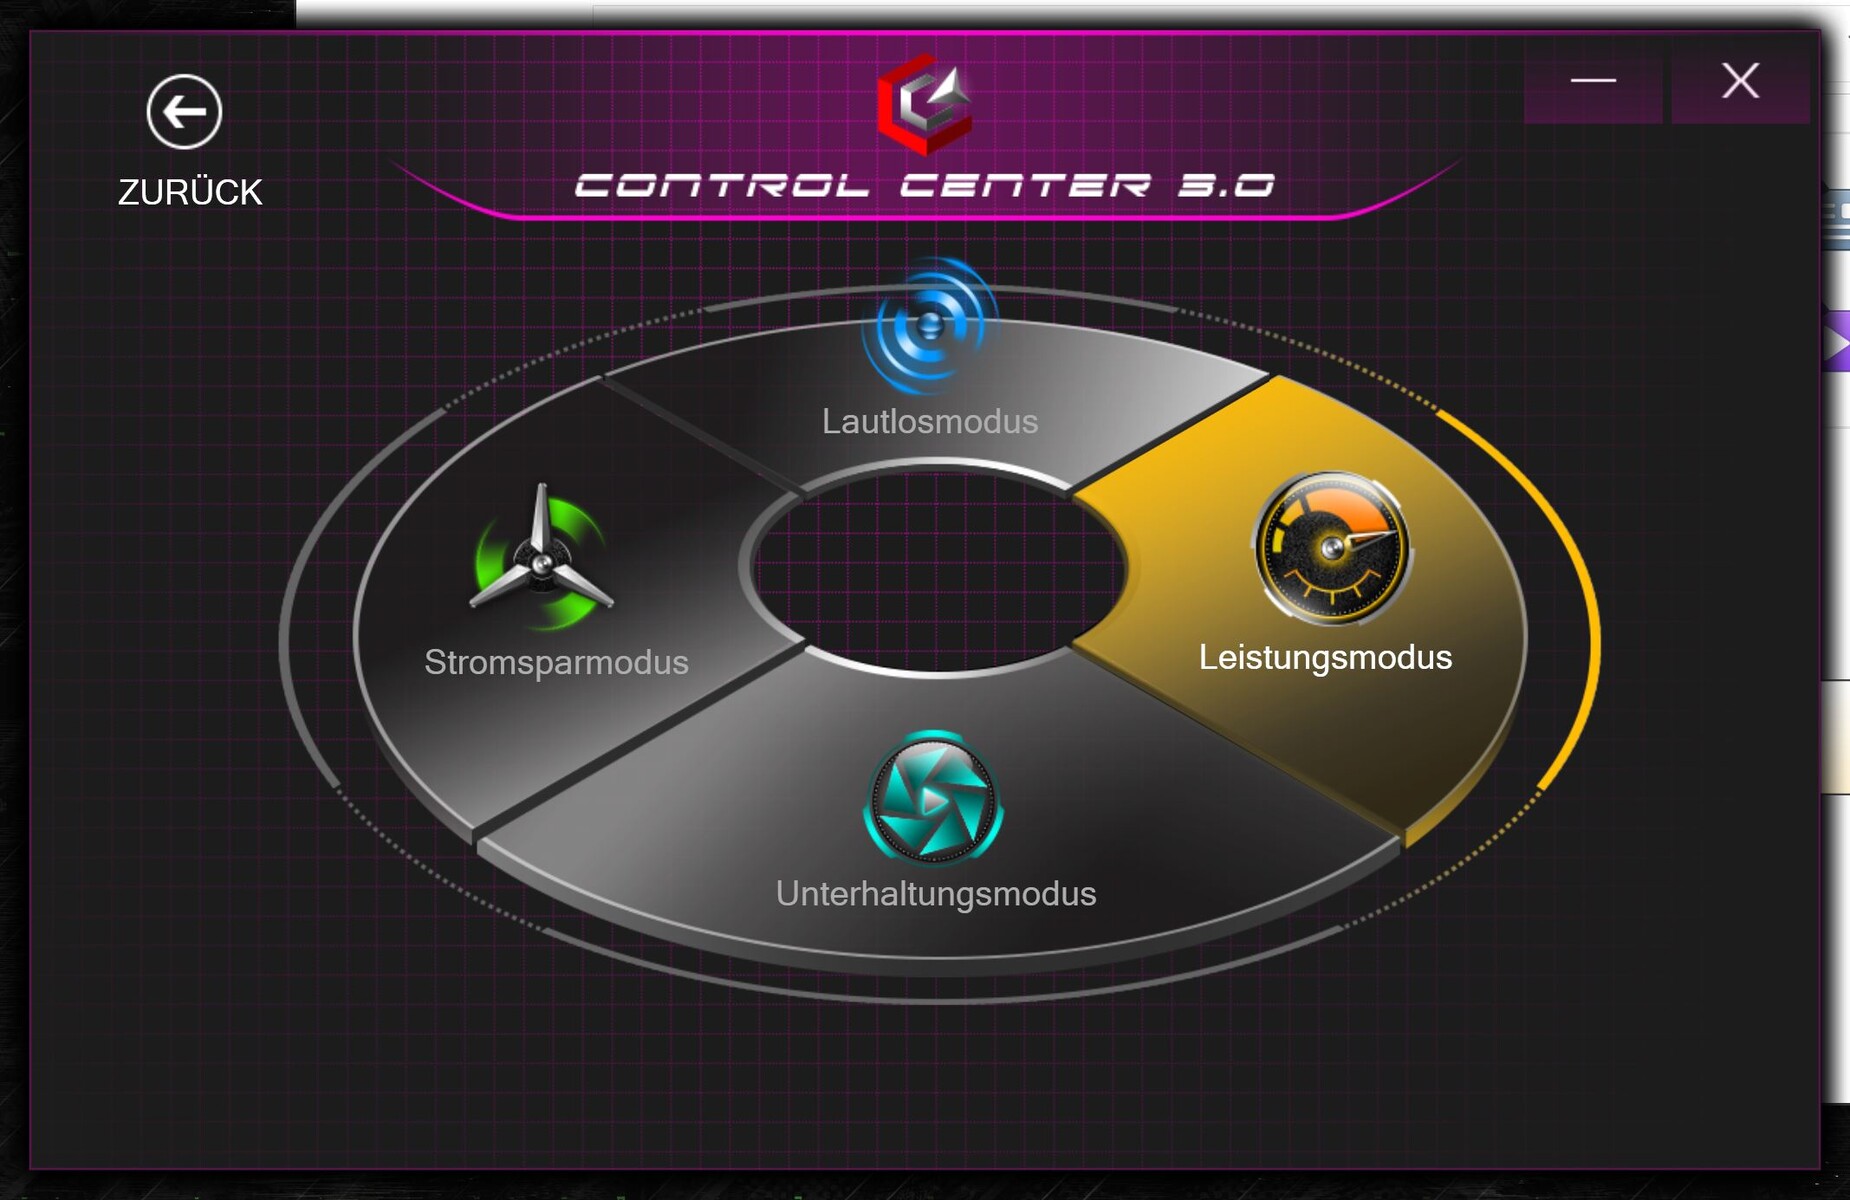
Schenker对其各种性能配置的性能值相当透明。制造商官方推荐的 "娱乐 "模式是噪音量和性能之间的最佳折衷方案。然而,由于我们在最佳性能模式(不超频)下测量所有的游戏笔记本电脑,我们在控制中心中改为 "性能 "模式。只有在这里,GPU也被允许使用动态提升,而且CPU的TDP也略高。下面的图片显示了申克公司列出的所有模式的性能值。
处理器
的英特尔酷睿i7-11800H提供了充足的八个核心,其时钟速度在2.3和4.6GHz之间。
在Cinebench循环中,数值在前四或五次循环内下降了约7%,但之后保持稳定。
尽管它们使用相同的CPU,但在多核测试中,XMG Pro无法跟上强大的、没有节流的Alienware X17,而其他竞争者则略微领先于它。然而,这些微小的差异在日常操作中并不重要,只有Alienware的速度明显快了10-15%。
在单核测试中,笔记本电脑之间的差异明显更小。
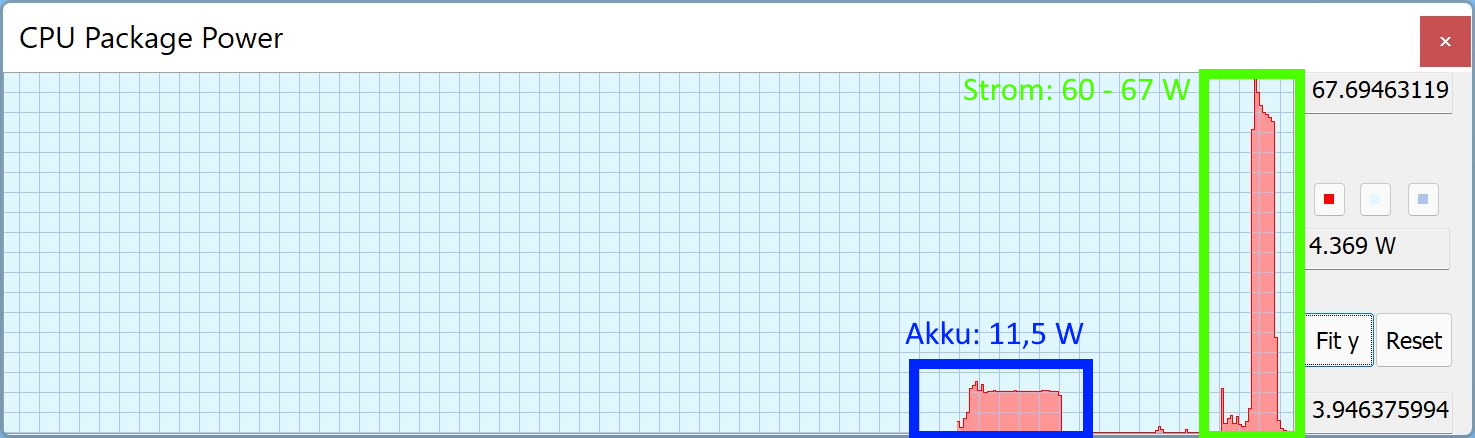
在电池模式下,CPU的性能要低得多。在13瓦的初始值之后,TDP下降到只有11.5瓦。相应地,得分从1,865-2,009降至只有534分,这至少减少了71%!这也是一个很好的例子。
Cinebench R15 Multi Constant Load Test
Cinebench R23: Multi Core | Single Core
Cinebench R20: CPU (Multi Core) | CPU (Single Core)
Cinebench R15: CPU Multi 64Bit | CPU Single 64Bit
Blender: v2.79 BMW27 CPU
7-Zip 18.03: 7z b 4 | 7z b 4 -mmt1
Geekbench 5.5: Multi-Core | Single-Core
HWBOT x265 Benchmark v2.2: 4k Preset
LibreOffice : 20 Documents To PDF
R Benchmark 2.5: Overall mean
| CPU Performance rating | |
| Average of class Gaming | |
| Asus ROG Zephyrus S17 GX703HSD | |
| MSI GS76 Stealth 11UH | |
| Medion Erazer Beast X25 | |
| Schenker XMG Pro 15 (Late 2021) | |
| Alienware x17 RTX 3080 P48E -2! | |
| Schenker XMG Pro 17 (Late 2021, RTX 3080) | |
| Average Intel Core i7-11800H | |
| Cinebench R23 / Multi Core | |
| Average of class Gaming (10488 - 42661, n=107, last 2 years) | |
| Alienware x17 RTX 3080 P48E | |
| MSI GS76 Stealth 11UH | |
| Schenker XMG Pro 15 (Late 2021) | |
| Asus ROG Zephyrus S17 GX703HSD | |
| Medion Erazer Beast X25 | |
| Schenker XMG Pro 17 (Late 2021, RTX 3080) | |
| Average Intel Core i7-11800H (6508 - 14088, n=48) | |
| Cinebench R23 / Single Core | |
| Average of class Gaming (1166 - 2415, n=107, last 2 years) | |
| Asus ROG Zephyrus S17 GX703HSD | |
| MSI GS76 Stealth 11UH | |
| Schenker XMG Pro 17 (Late 2021, RTX 3080) | |
| Schenker XMG Pro 15 (Late 2021) | |
| Alienware x17 RTX 3080 P48E | |
| Average Intel Core i7-11800H (1386 - 1522, n=45) | |
| Medion Erazer Beast X25 | |
| Cinebench R20 / CPU (Multi Core) | |
| Average of class Gaming (4029 - 16433, n=106, last 2 years) | |
| Alienware x17 RTX 3080 P48E | |
| Asus ROG Zephyrus S17 GX703HSD | |
| MSI GS76 Stealth 11UH | |
| Medion Erazer Beast X25 | |
| Schenker XMG Pro 15 (Late 2021) | |
| Schenker XMG Pro 17 (Late 2021, RTX 3080) | |
| Average Intel Core i7-11800H (2498 - 5408, n=50) | |
| Cinebench R20 / CPU (Single Core) | |
| Average of class Gaming (442 - 913, n=106, last 2 years) | |
| MSI GS76 Stealth 11UH | |
| Asus ROG Zephyrus S17 GX703HSD | |
| Schenker XMG Pro 17 (Late 2021, RTX 3080) | |
| Schenker XMG Pro 15 (Late 2021) | |
| Alienware x17 RTX 3080 P48E | |
| Medion Erazer Beast X25 | |
| Average Intel Core i7-11800H (520 - 586, n=47) | |
| Cinebench R15 / CPU Multi 64Bit | |
| Average of class Gaming (1578 - 6330, n=105, last 2 years) | |
| Asus ROG Zephyrus S17 GX703HSD | |
| Alienware x17 RTX 3080 P48E | |
| MSI GS76 Stealth 11UH | |
| Schenker XMG Pro 15 (Late 2021) | |
| Medion Erazer Beast X25 | |
| Schenker XMG Pro 17 (Late 2021, RTX 3080) | |
| Average Intel Core i7-11800H (1342 - 2173, n=50) | |
| Cinebench R15 / CPU Single 64Bit | |
| Average of class Gaming (188.8 - 350, n=106, last 2 years) | |
| Asus ROG Zephyrus S17 GX703HSD | |
| Medion Erazer Beast X25 | |
| MSI GS76 Stealth 11UH | |
| Schenker XMG Pro 17 (Late 2021, RTX 3080) | |
| Alienware x17 RTX 3080 P48E | |
| Schenker XMG Pro 15 (Late 2021) | |
| Average Intel Core i7-11800H (201 - 231, n=46) | |
| Blender / v2.79 BMW27 CPU | |
| Average Intel Core i7-11800H (217 - 454, n=46) | |
| Schenker XMG Pro 17 (Late 2021, RTX 3080) | |
| Medion Erazer Beast X25 | |
| MSI GS76 Stealth 11UH | |
| Schenker XMG Pro 15 (Late 2021) | |
| Asus ROG Zephyrus S17 GX703HSD | |
| Alienware x17 RTX 3080 P48E | |
| Average of class Gaming (79 - 330, n=104, last 2 years) | |
| 7-Zip 18.03 / 7z b 4 | |
| Average of class Gaming (33491 - 148086, n=105, last 2 years) | |
| Medion Erazer Beast X25 | |
| Asus ROG Zephyrus S17 GX703HSD | |
| Schenker XMG Pro 15 (Late 2021) | |
| Alienware x17 RTX 3080 P48E | |
| MSI GS76 Stealth 11UH | |
| Schenker XMG Pro 17 (Late 2021, RTX 3080) | |
| Average Intel Core i7-11800H (33718 - 56758, n=46) | |
| 7-Zip 18.03 / 7z b 4 -mmt1 | |
| Average of class Gaming (4199 - 7436, n=105, last 2 years) | |
| Asus ROG Zephyrus S17 GX703HSD | |
| Medion Erazer Beast X25 | |
| MSI GS76 Stealth 11UH | |
| Schenker XMG Pro 17 (Late 2021, RTX 3080) | |
| Schenker XMG Pro 15 (Late 2021) | |
| Average Intel Core i7-11800H (5138 - 5732, n=46) | |
| Alienware x17 RTX 3080 P48E | |
| Geekbench 5.5 / Multi-Core | |
| Average of class Gaming (6460 - 28263, n=105, last 2 years) | |
| MSI GS76 Stealth 11UH | |
| Asus ROG Zephyrus S17 GX703HSD | |
| Schenker XMG Pro 15 (Late 2021) | |
| Schenker XMG Pro 17 (Late 2021, RTX 3080) | |
| Medion Erazer Beast X25 | |
| Average Intel Core i7-11800H (4655 - 9851, n=40) | |
| Geekbench 5.5 / Single-Core | |
| Average of class Gaming (986 - 2474, n=105, last 2 years) | |
| Asus ROG Zephyrus S17 GX703HSD | |
| MSI GS76 Stealth 11UH | |
| Schenker XMG Pro 17 (Late 2021, RTX 3080) | |
| Schenker XMG Pro 15 (Late 2021) | |
| Average Intel Core i7-11800H (1429 - 1625, n=40) | |
| Medion Erazer Beast X25 | |
| HWBOT x265 Benchmark v2.2 / 4k Preset | |
| Average of class Gaming (11.5 - 44.4, n=105, last 2 years) | |
| Alienware x17 RTX 3080 P48E | |
| Asus ROG Zephyrus S17 GX703HSD | |
| Medion Erazer Beast X25 | |
| Schenker XMG Pro 15 (Late 2021) | |
| MSI GS76 Stealth 11UH | |
| Schenker XMG Pro 17 (Late 2021, RTX 3080) | |
| Average Intel Core i7-11800H (7.38 - 17.4, n=46) | |
| LibreOffice / 20 Documents To PDF | |
| Average of class Gaming (33.2 - 88.8, n=105, last 2 years) | |
| Medion Erazer Beast X25 | |
| MSI GS76 Stealth 11UH | |
| Schenker XMG Pro 15 (Late 2021) | |
| Schenker XMG Pro 17 (Late 2021, RTX 3080) | |
| Alienware x17 RTX 3080 P48E | |
| Average Intel Core i7-11800H (38.6 - 59.9, n=45) | |
| Asus ROG Zephyrus S17 GX703HSD | |
| R Benchmark 2.5 / Overall mean | |
| Average Intel Core i7-11800H (0.548 - 0.615, n=46) | |
| Alienware x17 RTX 3080 P48E | |
| Schenker XMG Pro 17 (Late 2021, RTX 3080) | |
| Schenker XMG Pro 15 (Late 2021) | |
| MSI GS76 Stealth 11UH | |
| Asus ROG Zephyrus S17 GX703HSD | |
| Medion Erazer Beast X25 | |
| Average of class Gaming (0.3439 - 0.759, n=106, last 2 years) | |
* ... smaller is better
AIDA64: FP32 Ray-Trace | FPU Julia | CPU SHA3 | CPU Queen | FPU SinJulia | FPU Mandel | CPU AES | CPU ZLib | FP64 Ray-Trace | CPU PhotoWorxx
| Performance rating | |
| Average of class Gaming | |
| Schenker XMG Pro 17 (Late 2021, RTX 3080) | |
| Average Intel Core i7-11800H | |
| AIDA64 / FP32 Ray-Trace | |
| Average of class Gaming (10227 - 85542, n=105, last 2 years) | |
| Schenker XMG Pro 17 (Late 2021, RTX 3080) | |
| Average Intel Core i7-11800H (8772 - 15961, n=20) | |
| AIDA64 / FPU Julia | |
| Average of class Gaming (51376 - 238426, n=105, last 2 years) | |
| Schenker XMG Pro 17 (Late 2021, RTX 3080) | |
| Average Intel Core i7-11800H (39404 - 65636, n=20) | |
| AIDA64 / CPU SHA3 | |
| Average of class Gaming (2180 - 10115, n=105, last 2 years) | |
| Schenker XMG Pro 17 (Late 2021, RTX 3080) | |
| Average Intel Core i7-11800H (2599 - 4439, n=20) | |
| AIDA64 / CPU Queen | |
| Average of class Gaming (49785 - 173351, n=90, last 2 years) | |
| Schenker XMG Pro 17 (Late 2021, RTX 3080) | |
| Average Intel Core i7-11800H (85233 - 91941, n=20) | |
| AIDA64 / FPU SinJulia | |
| Average of class Gaming (4424 - 33636, n=105, last 2 years) | |
| Schenker XMG Pro 17 (Late 2021, RTX 3080) | |
| Average Intel Core i7-11800H (6420 - 9792, n=20) | |
| AIDA64 / FPU Mandel | |
| Average of class Gaming (25115 - 128721, n=105, last 2 years) | |
| Schenker XMG Pro 17 (Late 2021, RTX 3080) | |
| Average Intel Core i7-11800H (23365 - 39464, n=20) | |
| AIDA64 / CPU AES | |
| Schenker XMG Pro 17 (Late 2021, RTX 3080) | |
| Average Intel Core i7-11800H (74617 - 149388, n=20) | |
| Average of class Gaming (39258 - 247074, n=105, last 2 years) | |
| AIDA64 / CPU ZLib | |
| Average of class Gaming (574 - 2531, n=105, last 2 years) | |
| Schenker XMG Pro 17 (Late 2021, RTX 3080) | |
| Average Intel Core i7-11800H (461 - 830, n=43) | |
| AIDA64 / FP64 Ray-Trace | |
| Average of class Gaming (5509 - 45446, n=105, last 2 years) | |
| Schenker XMG Pro 17 (Late 2021, RTX 3080) | |
| Average Intel Core i7-11800H (4545 - 8717, n=21) | |
| AIDA64 / CPU PhotoWorxx | |
| Average of class Gaming (12271 - 89891, n=105, last 2 years) | |
| Schenker XMG Pro 17 (Late 2021, RTX 3080) | |
| Average Intel Core i7-11800H (11898 - 26757, n=21) | |
系统性能
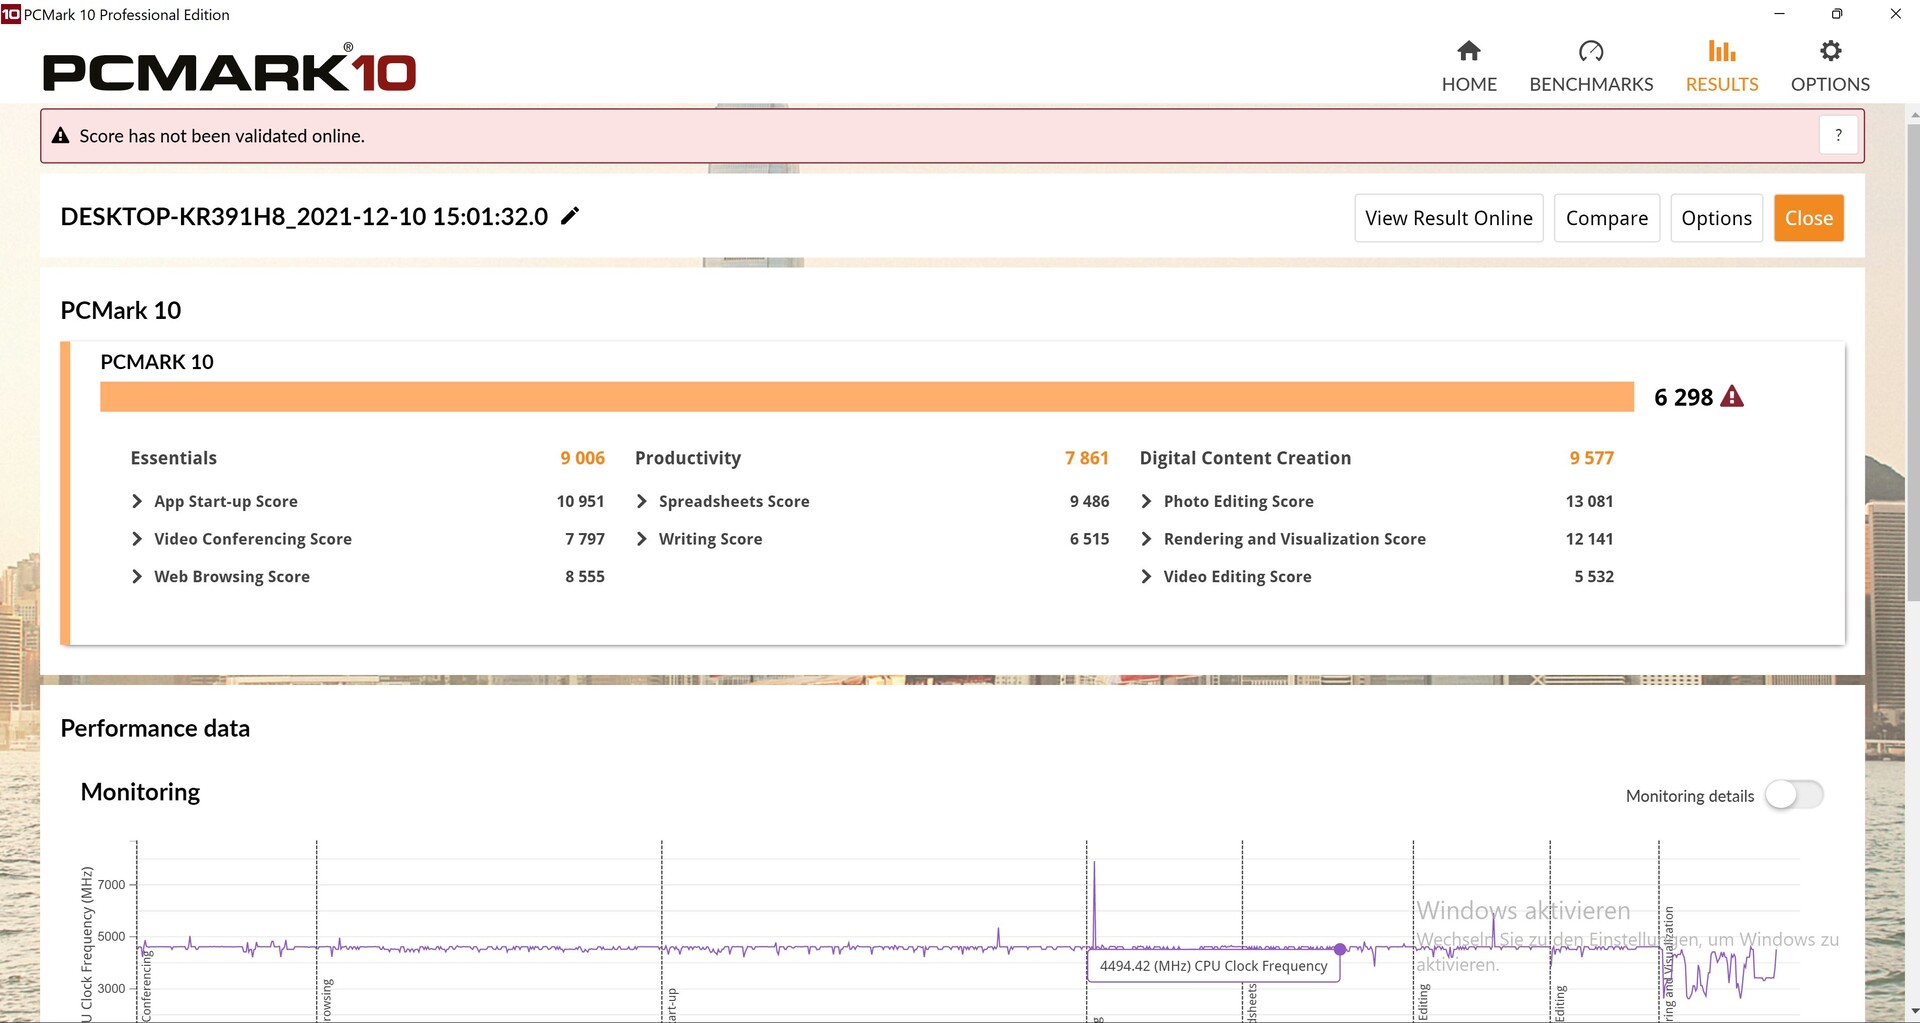
在PCMark 10中,XMG Pro不一定能提供最强大的性能,可以说很温和。通常情况下,测试中的竞争对手仍然相当接近,但我们的测试设备总是落后于竞争对手约8%(微星)至18%(Alienware)。虽然在这个性能级别中,这在日常操作中不会真的那么明显,因为一切都运行顺畅,但对于性能爱好者来说,这款超薄笔记本电脑的PCMark分数让人失望。
| PCMark 10 / Score | |
| Average of class Gaming (5828 - 12414, n=93, last 2 years) | |
| Alienware x17 RTX 3080 P48E | |
| Asus ROG Zephyrus S17 GX703HSD | |
| Average Intel Core i7-11800H, NVIDIA GeForce RTX 3080 Laptop GPU (6673 - 7470, n=11) | |
| Schenker XMG Pro 17 (Late 2021, RTX 3080) | |
| Medion Erazer Beast X25 | |
| MSI GS76 Stealth 11UH | |
| Schenker XMG Pro 15 (Late 2021) | |
| PCMark 10 / Essentials | |
| Average of class Gaming (8810 - 11935, n=97, last 2 years) | |
| Asus ROG Zephyrus S17 GX703HSD | |
| Average Intel Core i7-11800H, NVIDIA GeForce RTX 3080 Laptop GPU (9862 - 11064, n=11) | |
| Alienware x17 RTX 3080 P48E | |
| Schenker XMG Pro 17 (Late 2021, RTX 3080) | |
| Medion Erazer Beast X25 | |
| Schenker XMG Pro 15 (Late 2021) | |
| MSI GS76 Stealth 11UH | |
| PCMark 10 / Productivity | |
| Average of class Gaming (6845 - 25323, n=95, last 2 years) | |
| Alienware x17 RTX 3080 P48E | |
| Medion Erazer Beast X25 | |
| Asus ROG Zephyrus S17 GX703HSD | |
| Schenker XMG Pro 17 (Late 2021, RTX 3080) | |
| Average Intel Core i7-11800H, NVIDIA GeForce RTX 3080 Laptop GPU (8278 - 9803, n=11) | |
| MSI GS76 Stealth 11UH | |
| Schenker XMG Pro 15 (Late 2021) | |
| PCMark 10 / Digital Content Creation | |
| Average of class Gaming (7602 - 19954, n=95, last 2 years) | |
| Alienware x17 RTX 3080 P48E | |
| Asus ROG Zephyrus S17 GX703HSD | |
| Average Intel Core i7-11800H, NVIDIA GeForce RTX 3080 Laptop GPU (9881 - 11323, n=11) | |
| Schenker XMG Pro 17 (Late 2021, RTX 3080) | |
| MSI GS76 Stealth 11UH | |
| Schenker XMG Pro 15 (Late 2021) | |
| Medion Erazer Beast X25 | |
| PCMark 10 Score | 6996 points | |
Help | ||
| AIDA64 / Memory Copy | |
| Average of class Gaming (21750 - 129946, n=105, last 2 years) | |
| Schenker XMG Pro 15 (Late 2021) | |
| Schenker XMG Pro 17 (Late 2021, RTX 3080) | |
| Medion Erazer Beast X25 | |
| Average Intel Core i7-11800H (24508 - 48144, n=21) | |
| AIDA64 / Memory Read | |
| Average of class Gaming (22956 - 118858, n=105, last 2 years) | |
| Schenker XMG Pro 15 (Late 2021) | |
| Schenker XMG Pro 17 (Late 2021, RTX 3080) | |
| Average Intel Core i7-11800H (25882 - 50365, n=20) | |
| Medion Erazer Beast X25 | |
| AIDA64 / Memory Write | |
| Average of class Gaming (22297 - 135096, n=105, last 2 years) | |
| Medion Erazer Beast X25 | |
| Schenker XMG Pro 15 (Late 2021) | |
| Schenker XMG Pro 17 (Late 2021, RTX 3080) | |
| Average Intel Core i7-11800H (22240 - 46214, n=20) | |
| AIDA64 / Memory Latency | |
| Average of class Gaming (75.3 - 259, n=105, last 2 years) | |
| Schenker XMG Pro 15 (Late 2021) | |
| Schenker XMG Pro 17 (Late 2021, RTX 3080) | |
| Medion Erazer Beast X25 | |
| Average Intel Core i7-11800H (71.9 - 104.1, n=44) | |
| Asus ROG Zephyrus S17 GX703HSD | |
| Alienware x17 RTX 3080 P48E | |
* ... smaller is better
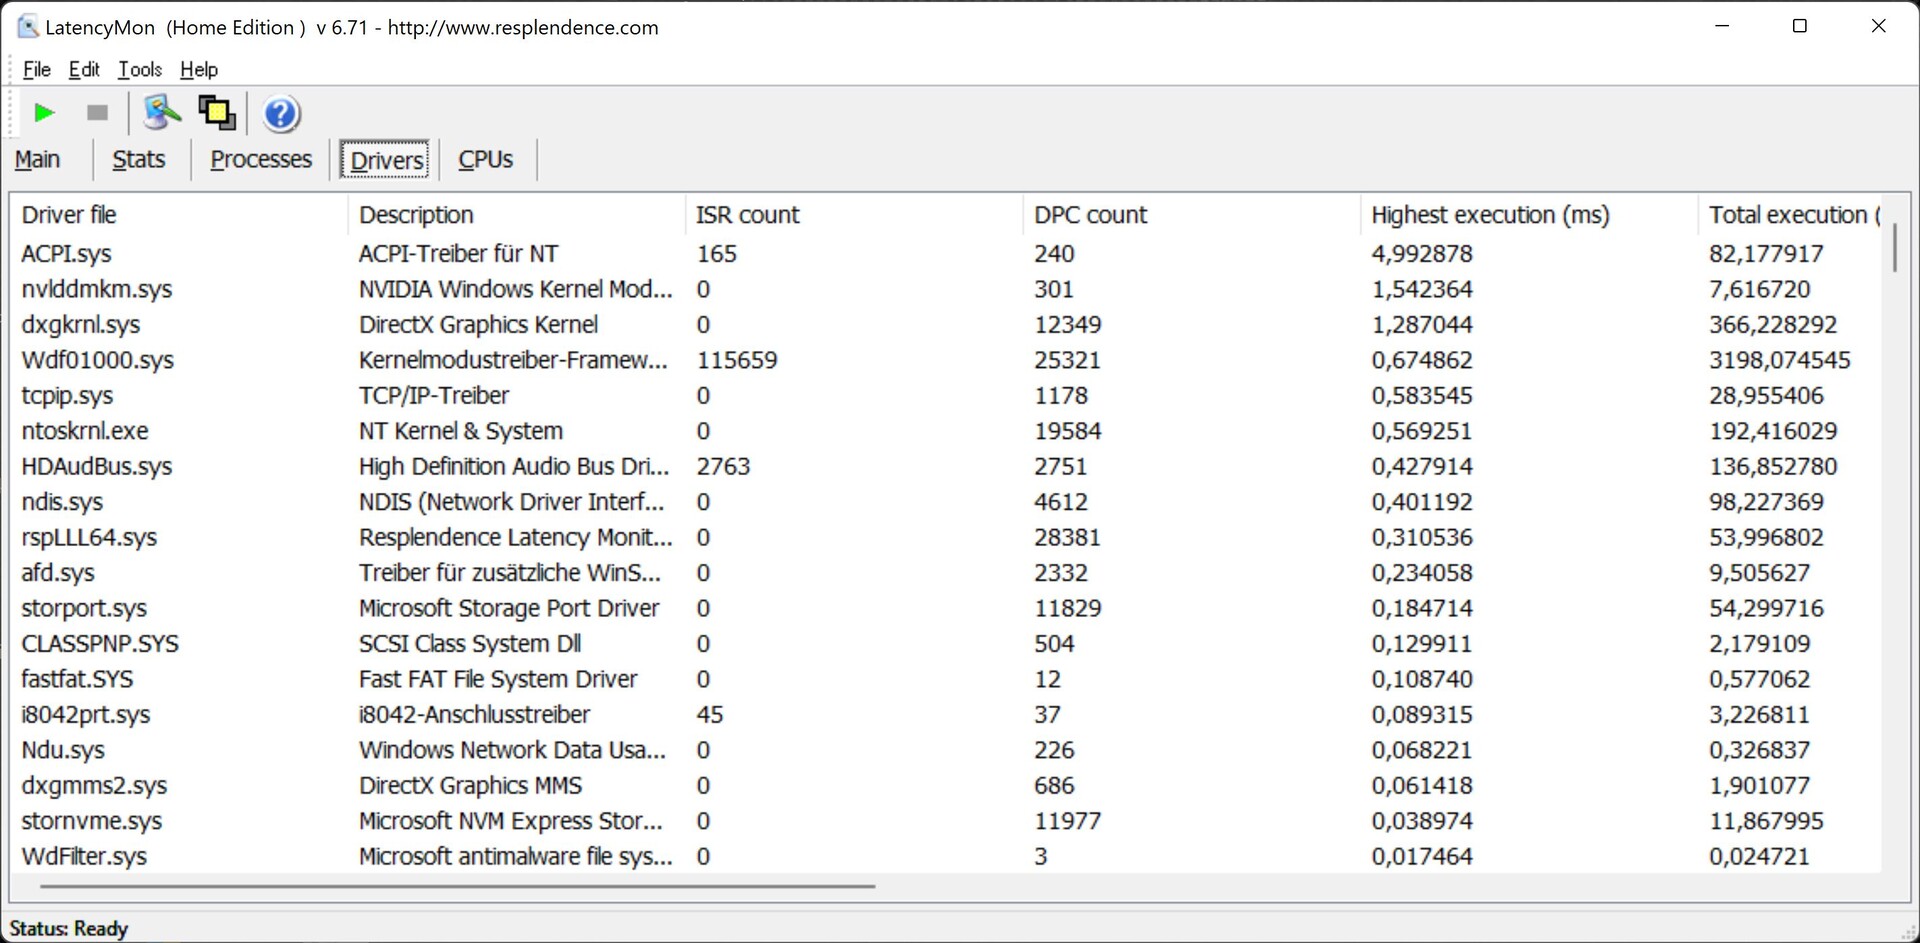
DPC延迟
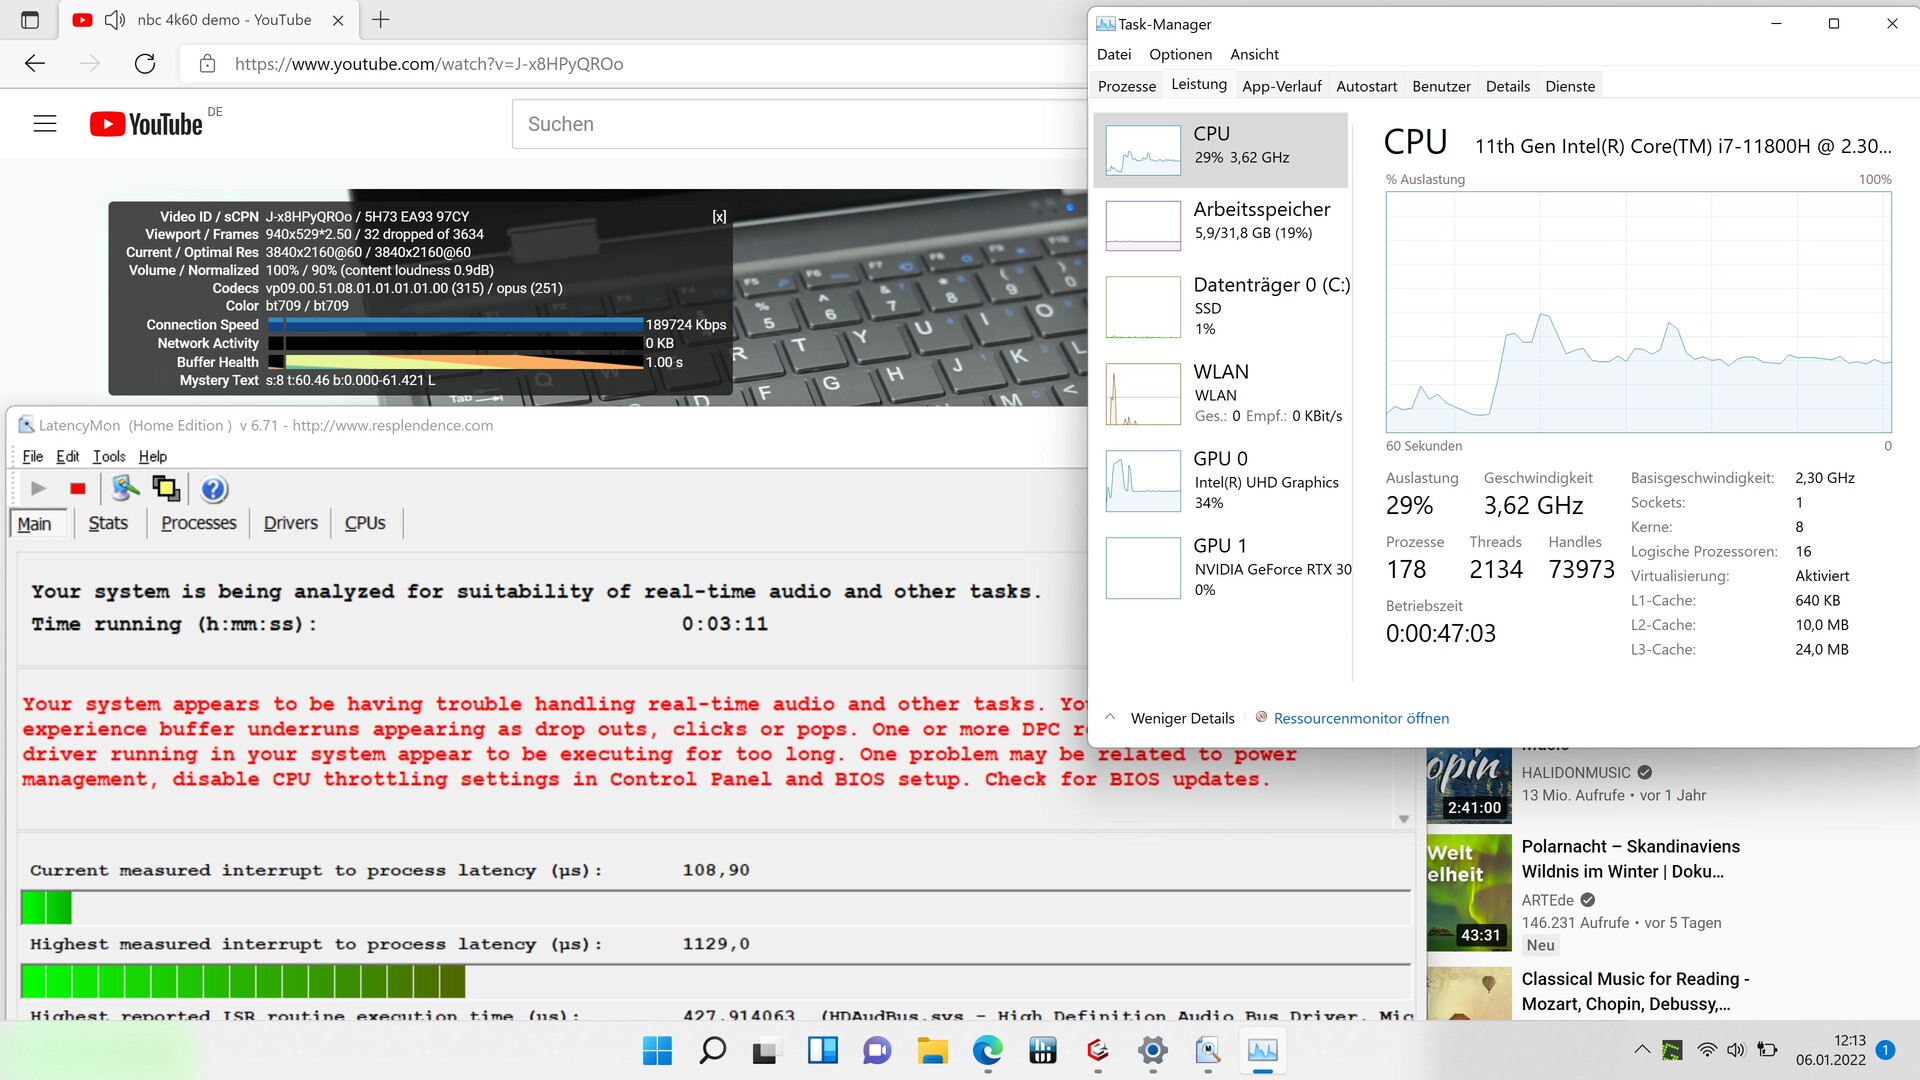
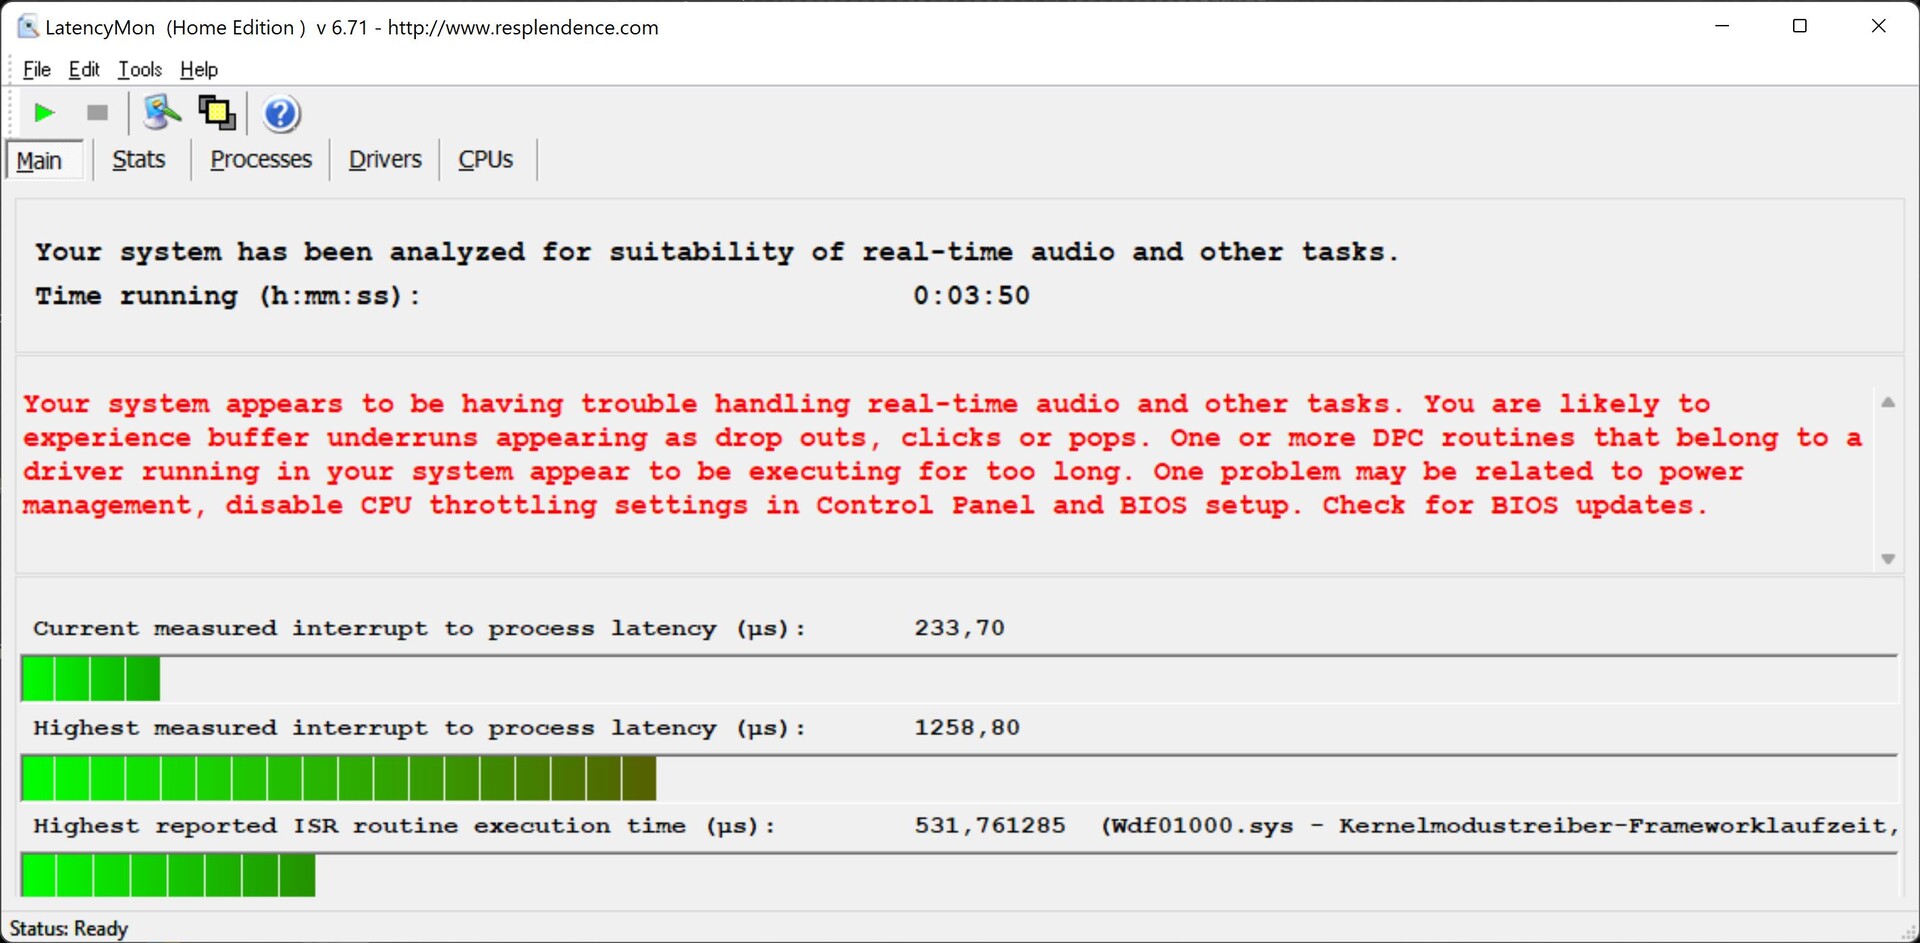
当刚打开网络浏览器(Edge)时,LatencyMon软件已经遇到了一些延迟问题。在播放我们的4K、60帧的YouTube测试视频(32个丢帧)或短暂启动Prime95测试时,这些问题会增加。
故障似乎主要在于NT的ACPI驱动,但也有一个Nvidia驱动给系统带来一些问题。
然而,在我们的比较中,延迟值的大小更多的是处于中间位置,而且比较的笔记本电脑也不是没有问题。只是他们的延迟开始得比较晚,而且绝对不是在刚开始使用浏览器的时候。
| DPC Latencies / LatencyMon - interrupt to process latency (max), Web, Youtube, Prime95 | |
| Alienware x17 RTX 3080 P48E | |
| Asus ROG Zephyrus S17 GX703HSD | |
| Schenker XMG Pro 17 (Late 2021, RTX 3080) | |
| Schenker XMG Pro 15 (Late 2021) | |
| Medion Erazer Beast X25 | |
| MSI GS76 Stealth 11UH | |
* ... smaller is better
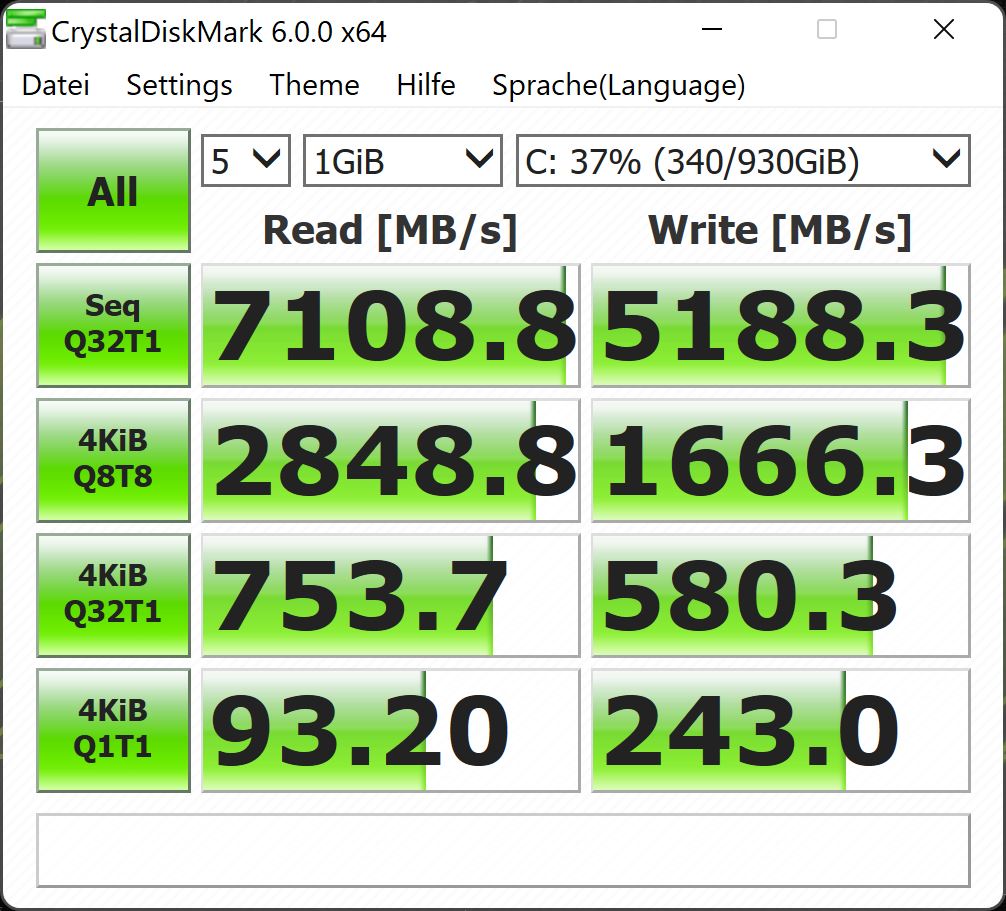
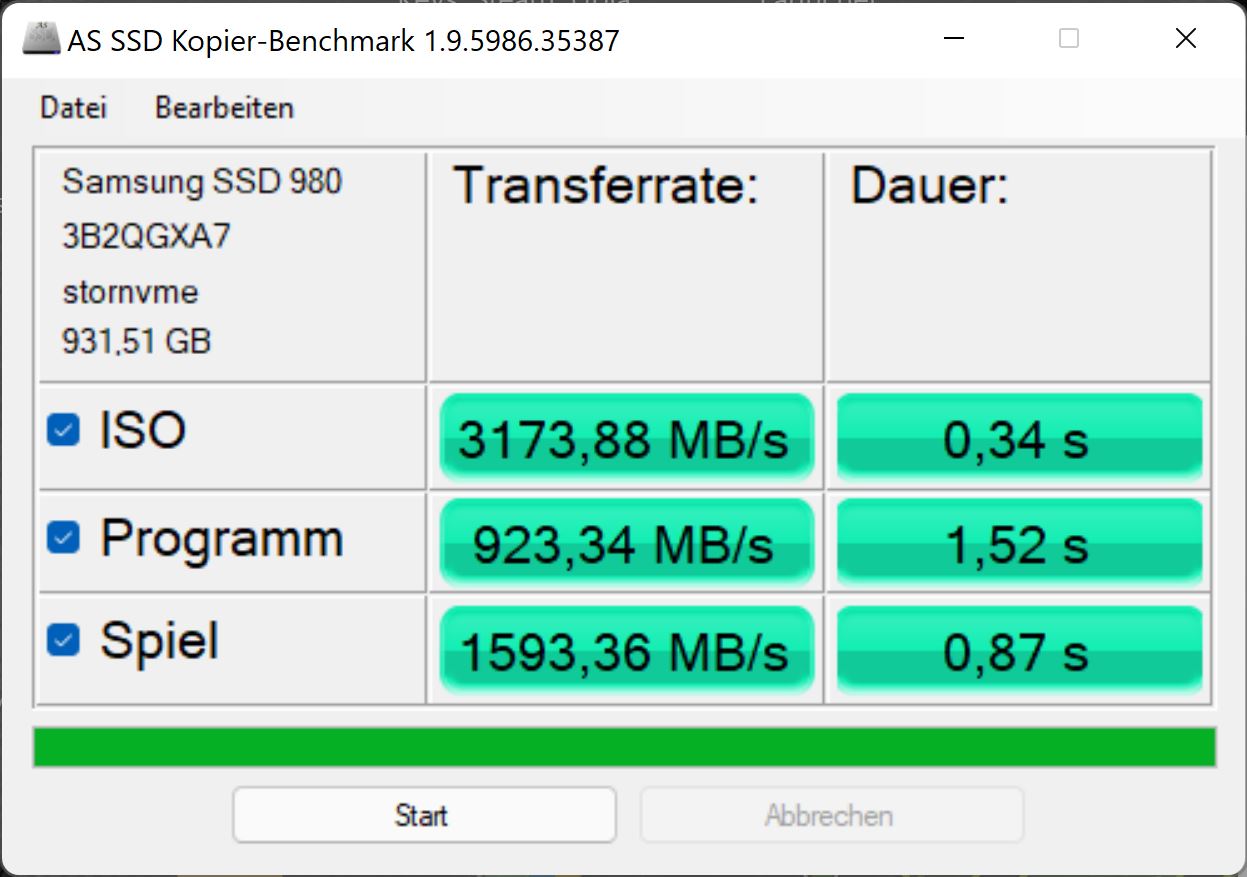
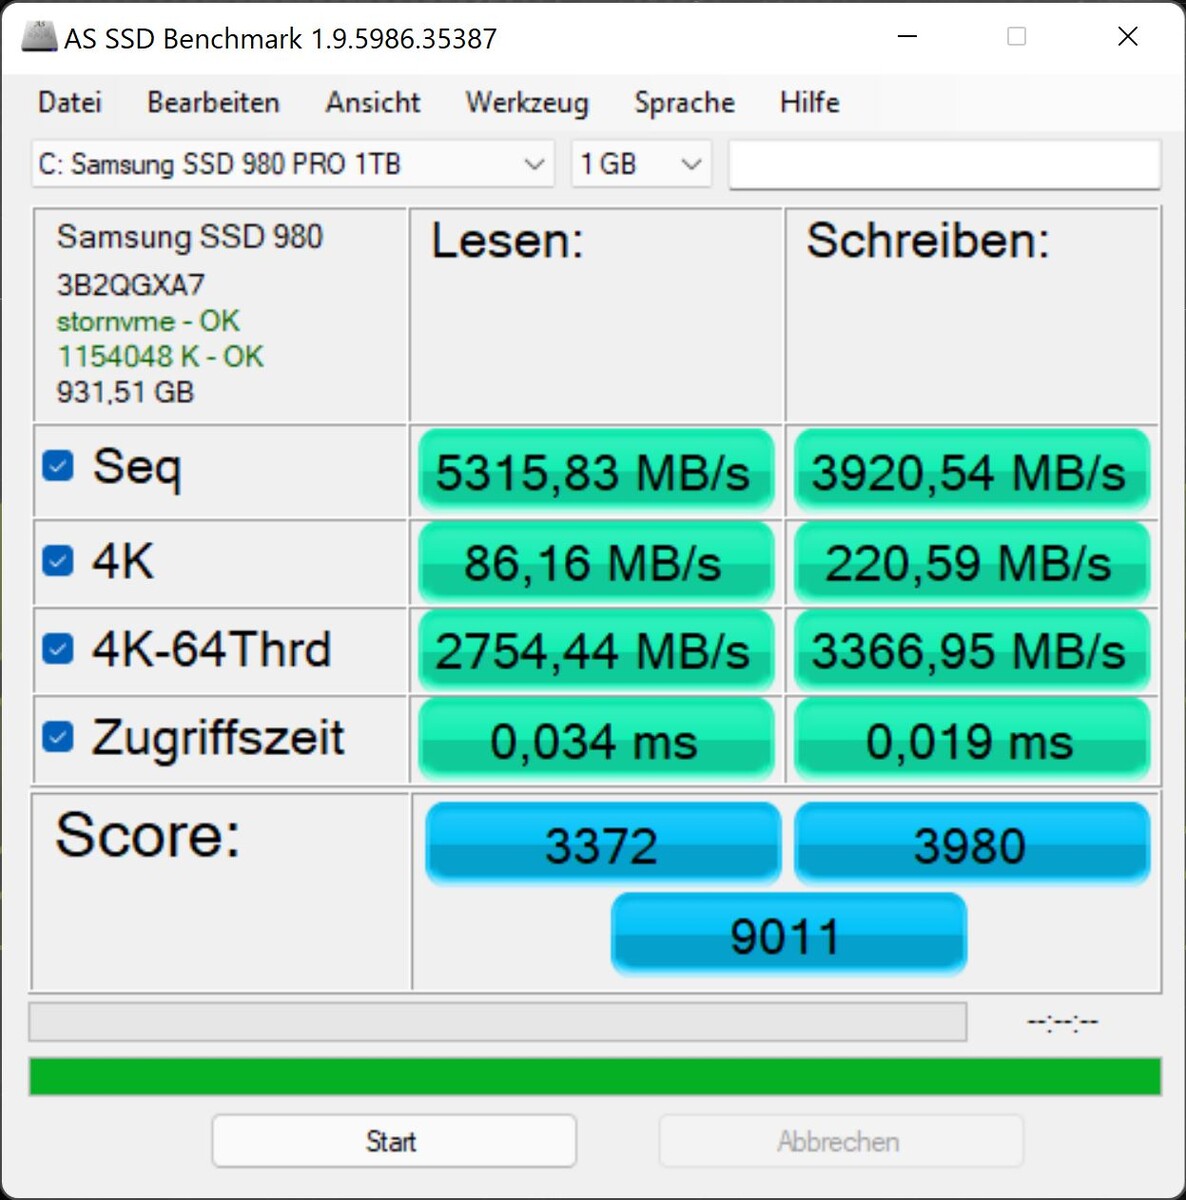
存储解决方案
Schenker使用了成熟而快速的三星SSD 980 Pro,拥有1TB的存储空间。它的性能处于最高端,只有同一制造商的PM9A1(微星,华硕Zephyrus)在某些方面稍快。
在不断的读取测试中,随着时间的推移,非常高的性能略有下降,但它应该仍然高于一些竞争对手的性能。

* ... smaller is better
Constant Performance Reading: DiskSpd Read Loop, Queue Depth 8
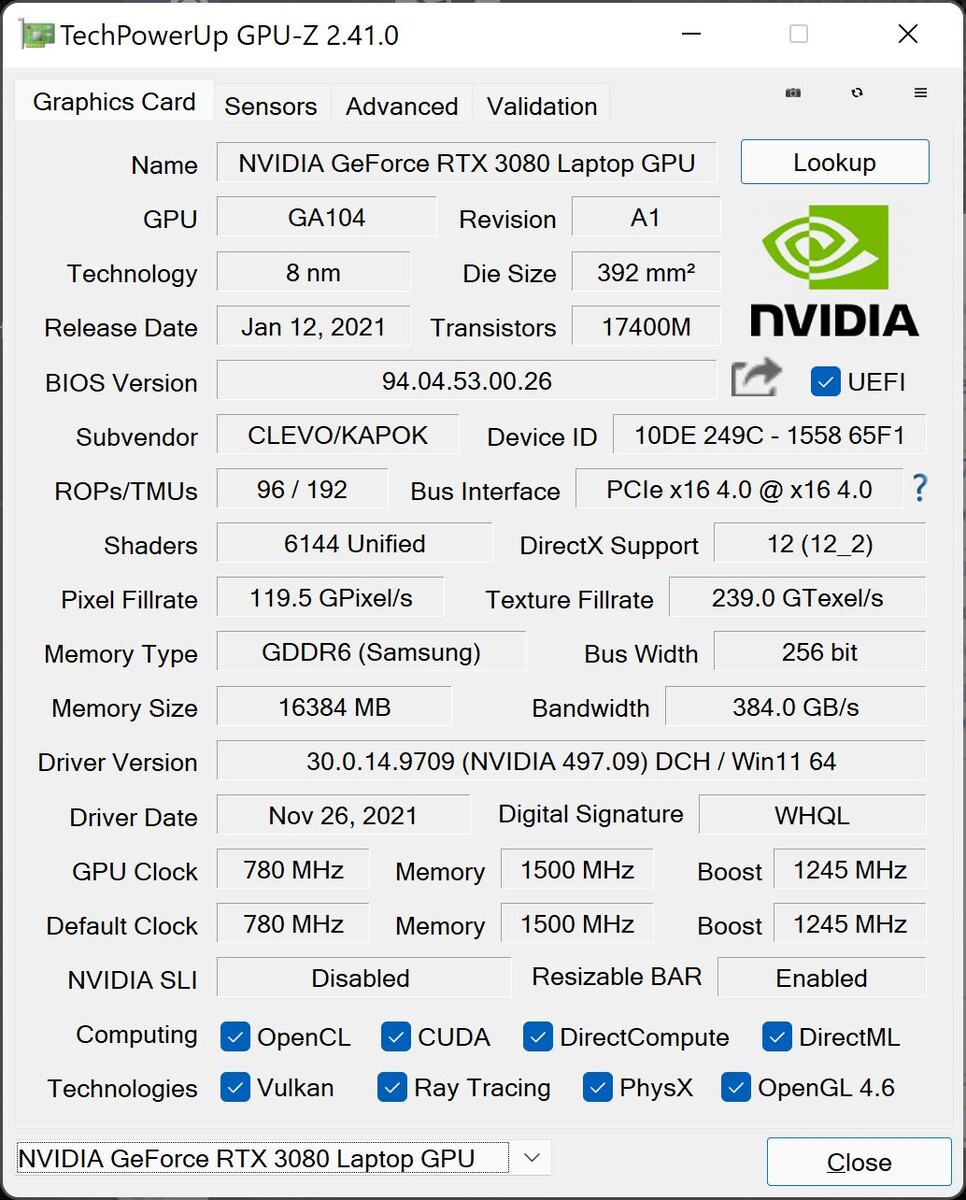
图形卡
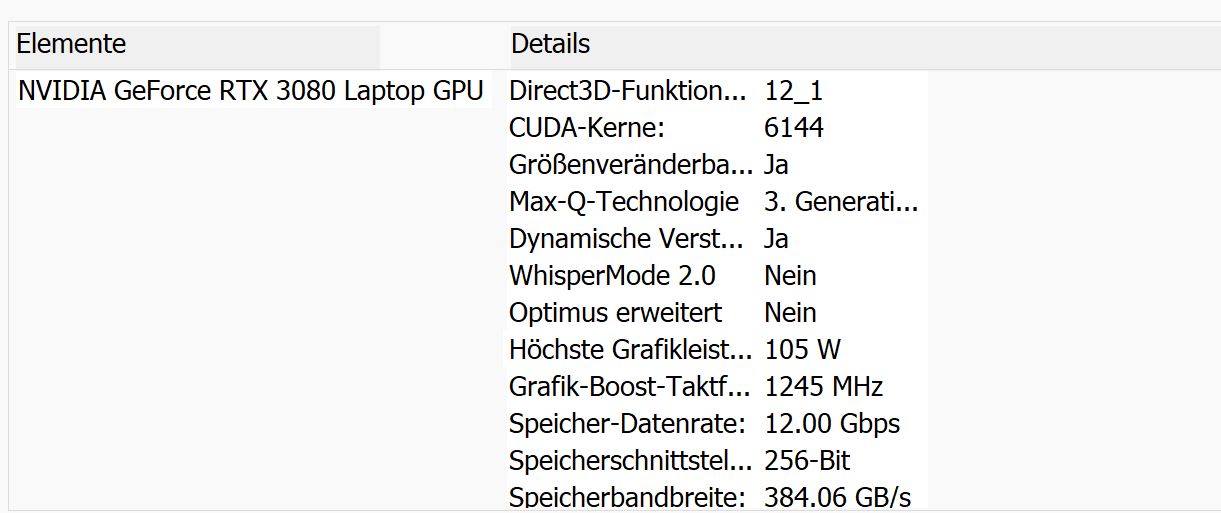
16GB版本的NVIDIAGeForce RTX 3080 笔记本电脑GPU被使用,但它只允许消耗90瓦,加上15瓦的动态提升,导致总的最大功率为105瓦。相比之下,Zephyrus S17的功率高达140瓦,Alienware X17 R1甚至达到165瓦。这表明,由于超薄的外壳,Schenker不得不做出一些妥协,更多的是为了提高效率而不是最大的性能。
虽然我们的测试装置的配置不提供先进的Optimus,但你可以在BIOS中通过MUX为USB-C端口选择是否应该通过iGPU或dGPU连接。
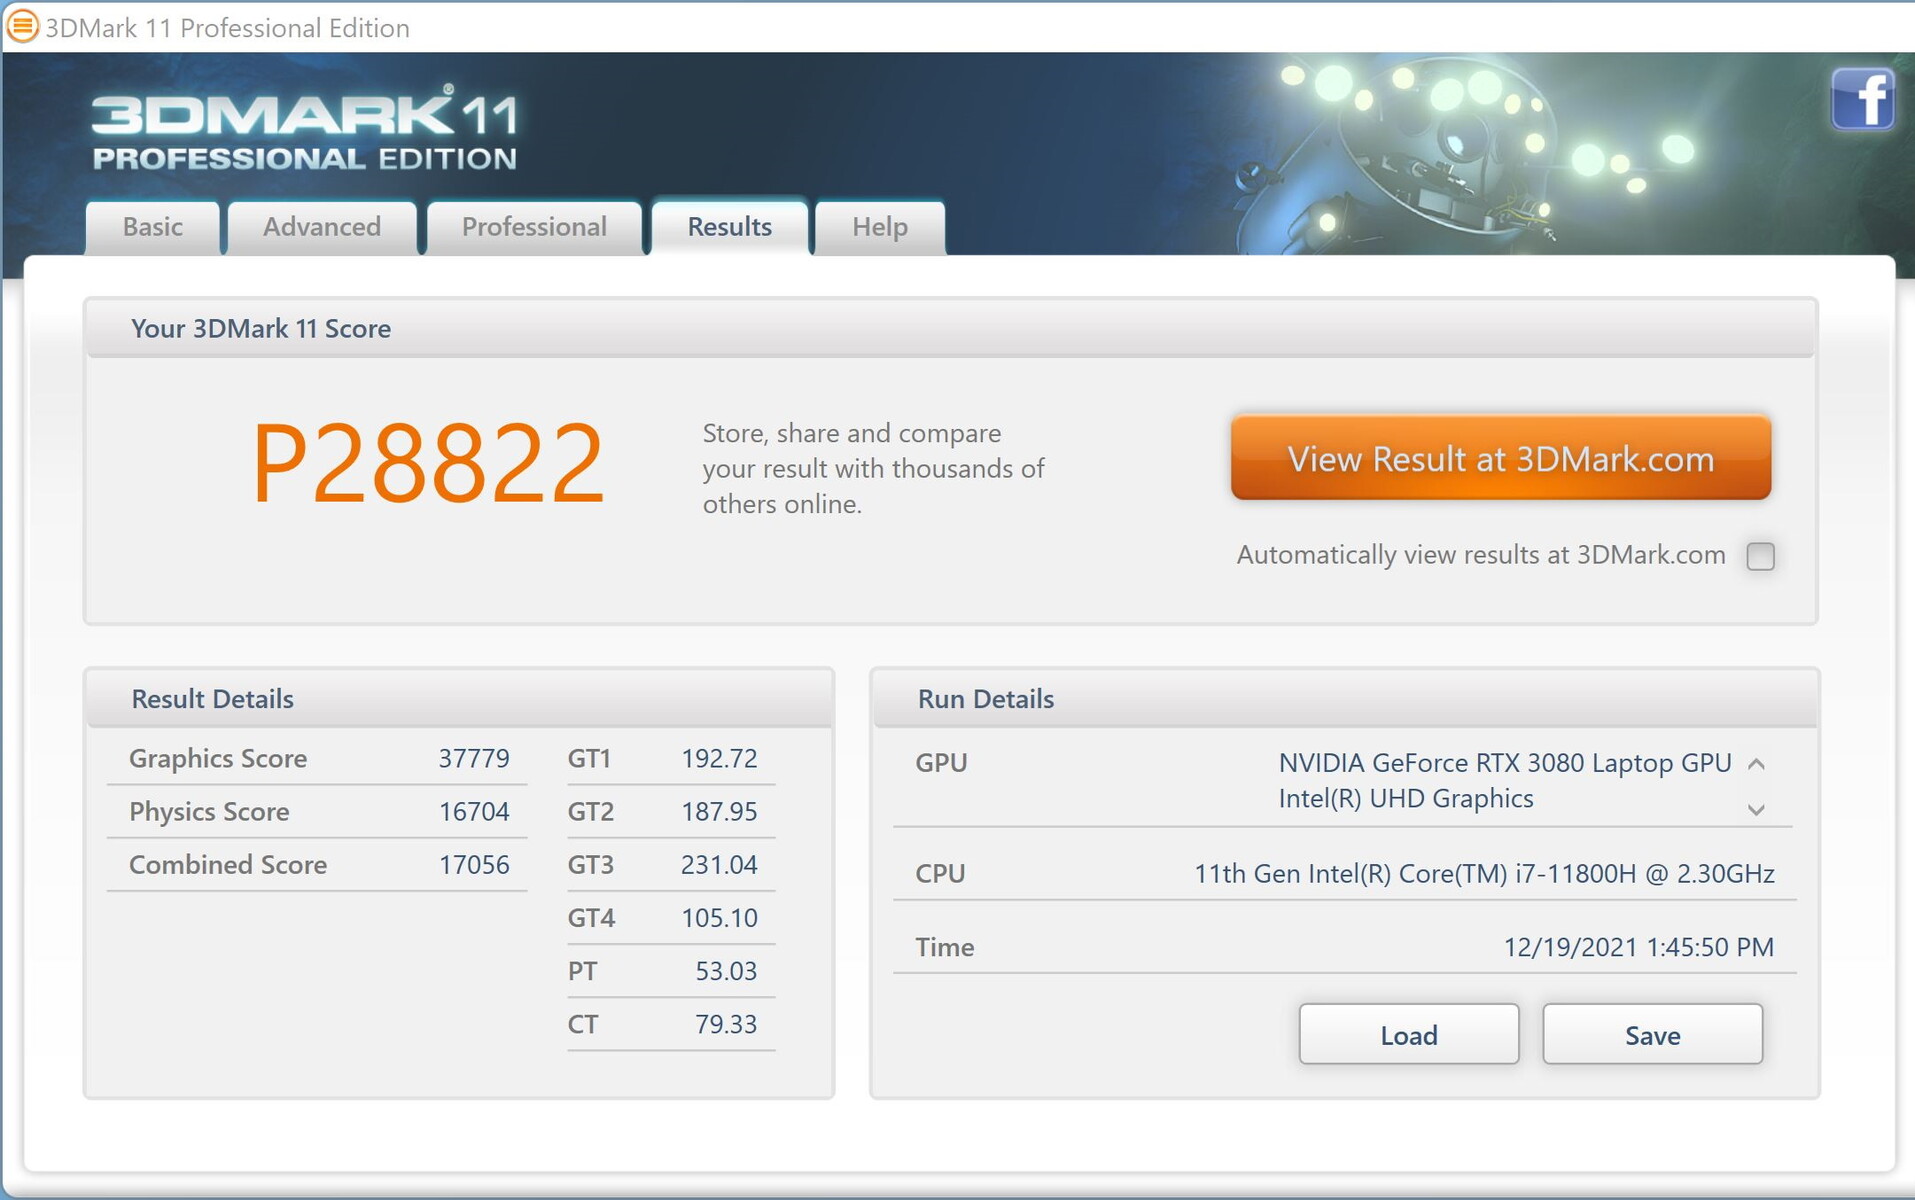
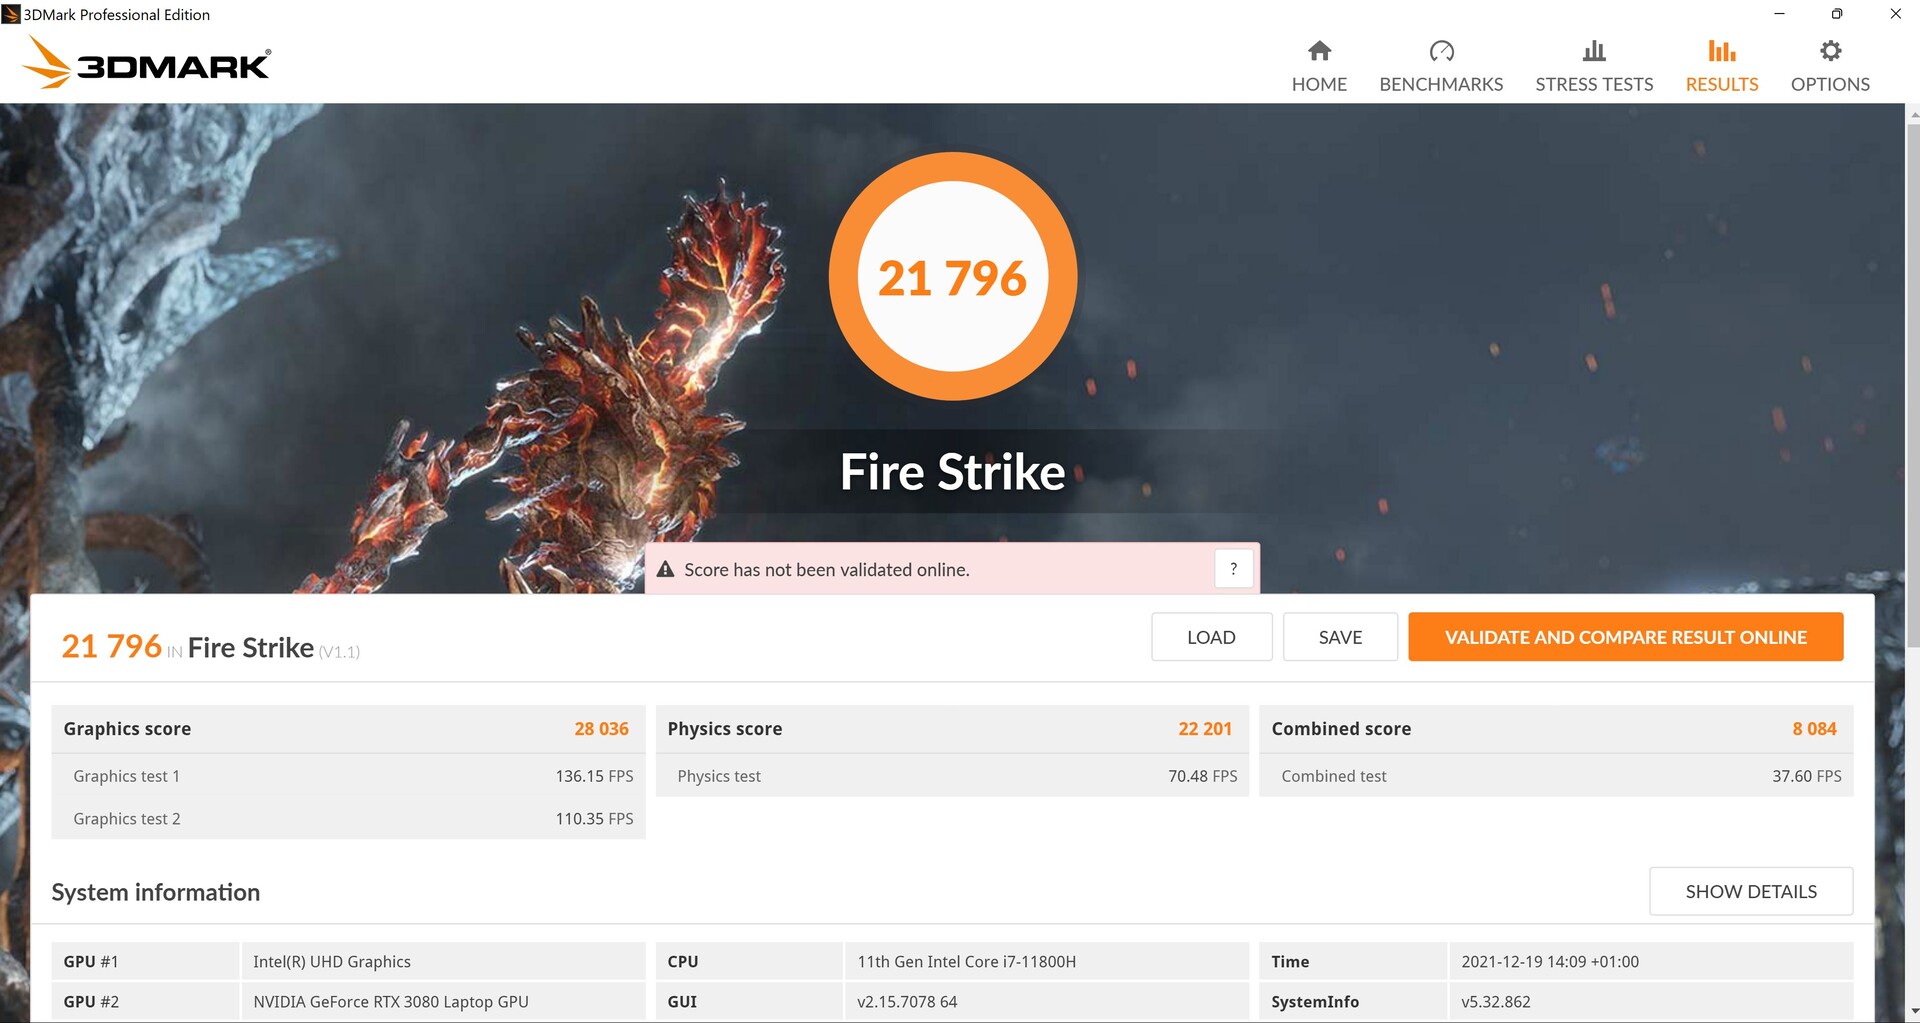
在3DMark测试中,XMG Pro的表现相应地略低于平均水平,但它在某些方面仍然比微星甚至Medion笔记本电脑表现得更好。华硕ROG Zephyrus和Alienware显然更快。
在电池模式下,大部分的3D性能都会丢失。 Witcher 3 Ultra"不是以90-107帧的速度运行,而是只能以8-10帧的速度运行,这让它无法播放。所以离开了插座,你只能玩休闲或古老的游戏。
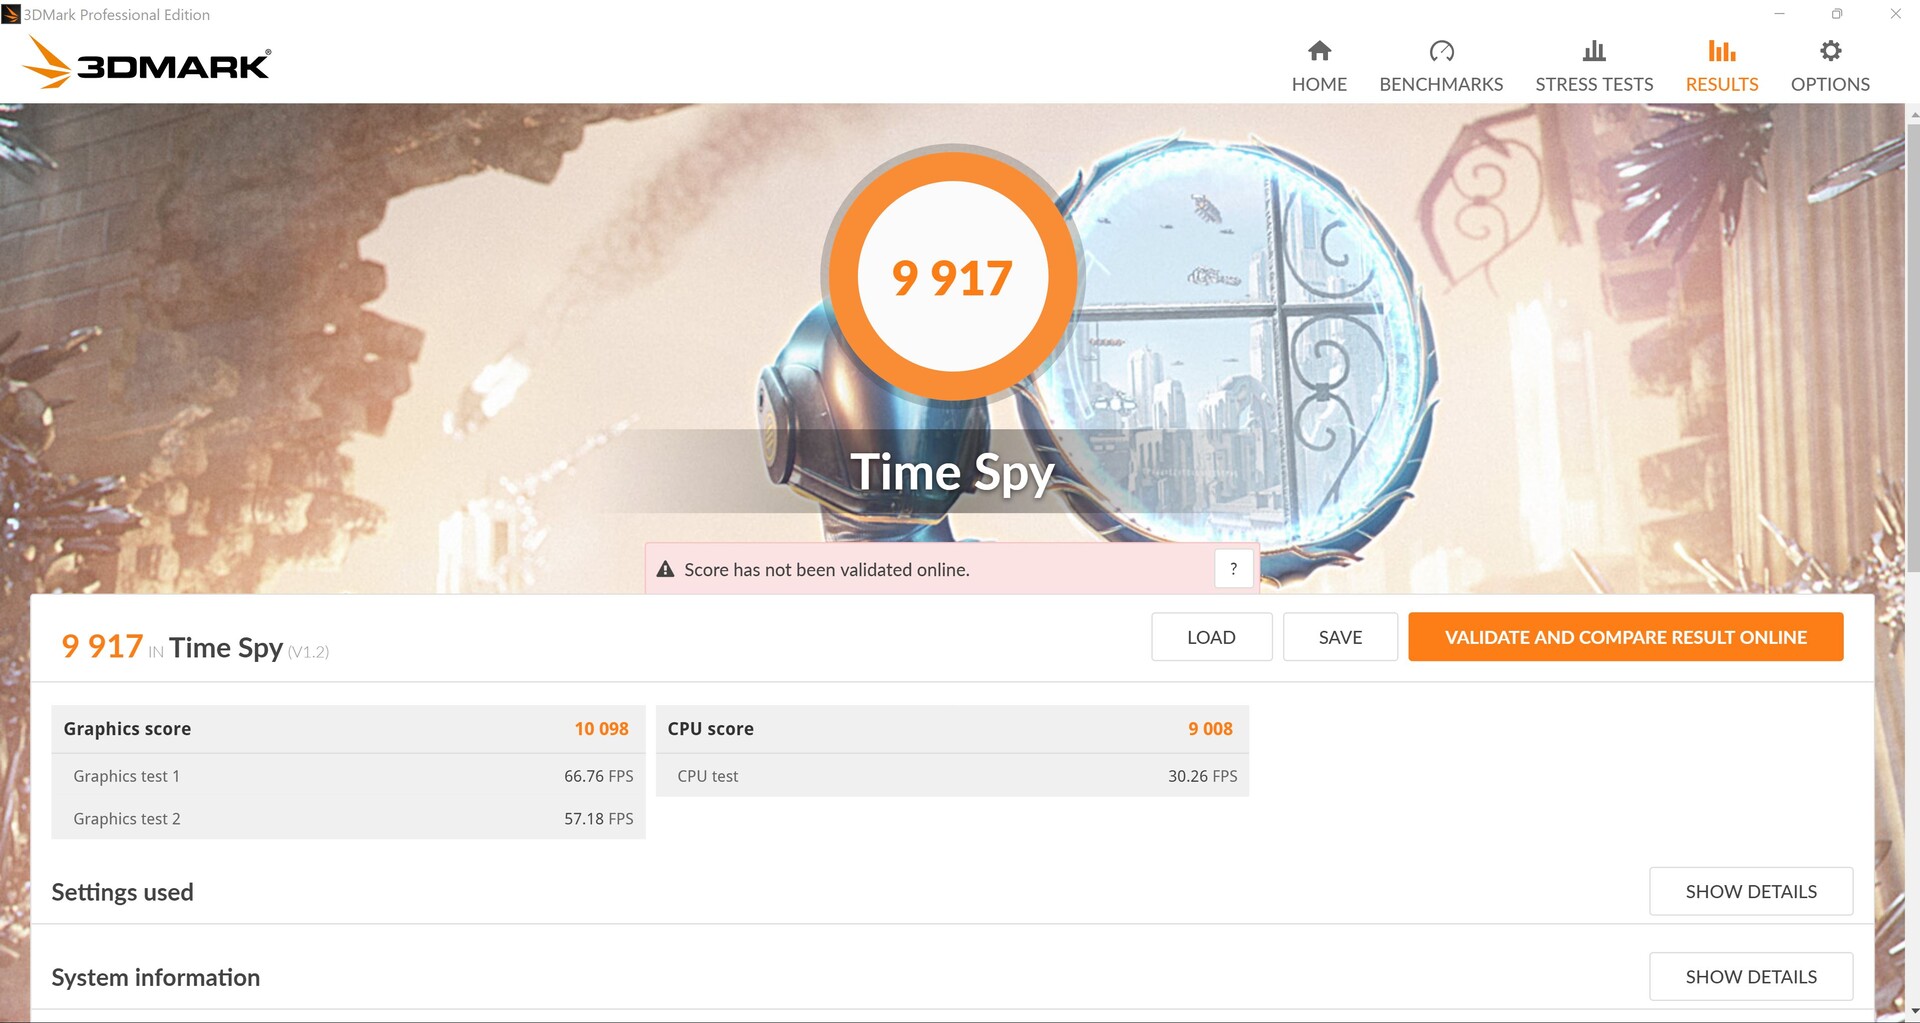
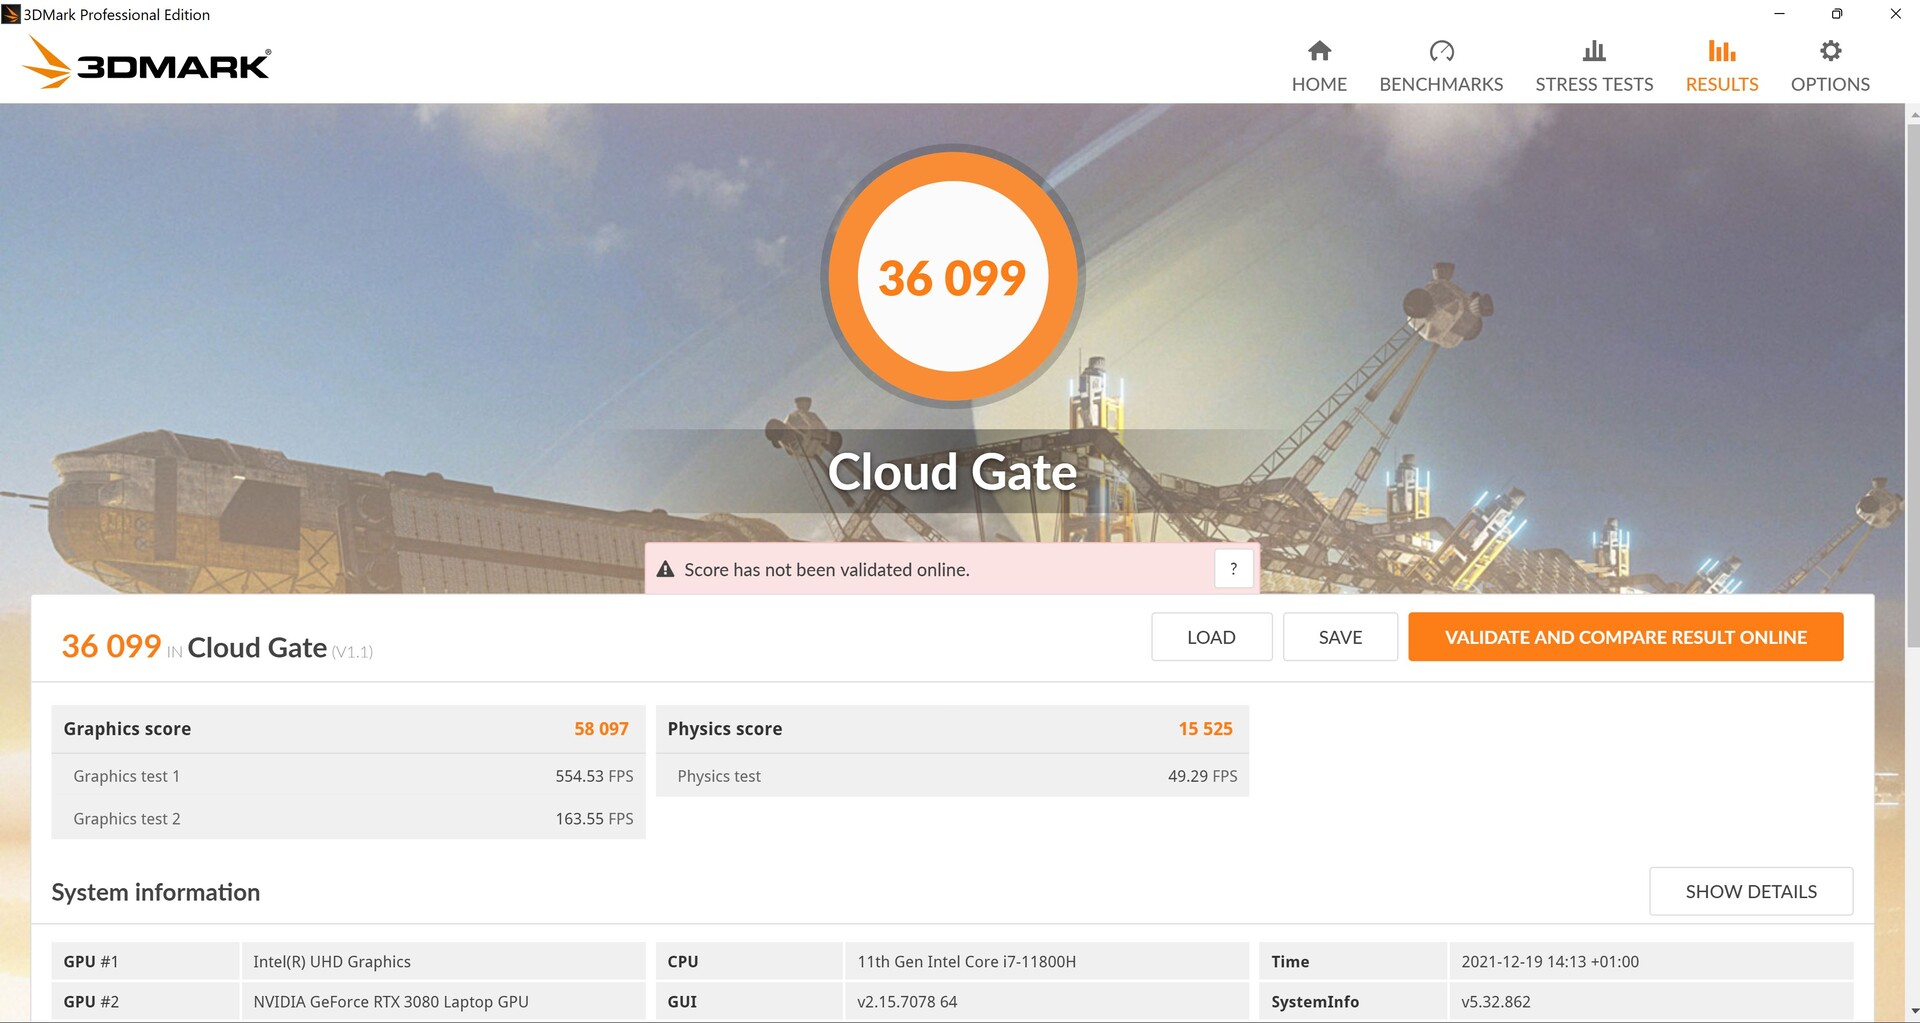
| 3DMark 11 Performance | 28822 points | |
| 3DMark Cloud Gate Standard Score | 36099 points | |
| 3DMark Fire Strike Score | 21796 points | |
| 3DMark Time Spy Score | 9917 points | |
Help | ||
游戏性能
XMG Pro能够在全高清状态下流畅地玩所有的游戏,但节流的RTX 3080在原生4K分辨率的非常现代的游戏中会出一些汗。例如,4K和最大细节的"新世界"在开始的序列中只能以37帧运行,在一些复杂的战斗中,可能已经有一些停滞。在"Far Cry 5"中,在相同的设置下,至少可以达到56帧的好成绩。
正如预期的那样,根据不同的游戏,其性能将略低于普通的RTX 3080,但在一些游戏中,TGP的劣势几乎无法察觉。相应地,该卡将再次排在中间位置,与3DMark测试中的顺序相似。
| New World | |
| 1920x1080 High Video Quality | |
| Average NVIDIA GeForce RTX 3080 Laptop GPU (75.1 - 96.7, n=4) | |
| Schenker XMG Pro 17 (Late 2021, RTX 3080) | |
| 1920x1080 Very High Video Quality | |
| Average NVIDIA GeForce RTX 3080 Laptop GPU (71.5 - 90.4, n=4) | |
| Schenker XMG Pro 17 (Late 2021, RTX 3080) | |
| 2560x1440 Very High Video Quality | |
| Average NVIDIA GeForce RTX 3080 Laptop GPU (63.3 - 67.2, n=2) | |
| Schenker XMG Pro 17 (Late 2021, RTX 3080) | |
| 3840x2160 Very High Video Quality | |
| Average NVIDIA GeForce RTX 3080 Laptop GPU (37.1 - 42.9, n=2) | |
| Schenker XMG Pro 17 (Late 2021, RTX 3080) | |
在一个小时内,《Witcher 3 》的帧率只在开始时从大约109帧下降到100帧,降幅很小。
The Witcher 3 FPS Chart
| low | med. | high | ultra | QHD | 4K | |
|---|---|---|---|---|---|---|
| The Witcher 3 (2015) | 151 | 262 | 189 | 109 | 60 | |
| Dota 2 Reborn (2015) | 178 | 151 | 134 | 136 | 119 | |
| Final Fantasy XV Benchmark (2018) | 187 | 123 | 94.2 | 73.1 | 43.6 | |
| X-Plane 11.11 (2018) | 125 | 110 | 88.8 | 67.9 | ||
| Far Cry 5 (2018) | 170 | 135 | 128 | 120 | 101 | 56 |
| Strange Brigade (2018) | 472 | 254 | 204 | 182 | ||
| New World (2021) | 97.4 | 80.8 | 75.1 | 71.5 | 63.3 | 37.1 |
排放 - 相当大的噪音和热量
噪声排放
纤细的外形因素在这里付出了代价,噪音负荷比大多数竞争对手要高一些,只有Medion的野兽才有类似的声音。在最大负荷下,XMG甚至是我们测试领域中最响亮的,尽管其RTX TGP有限。即使在空闲运行时,风扇也大部分时间是打开的。静音 "模式只有在最低性能设置下才对得起它的名字,即使在空闲运行时也是如此。
在平均负荷下(3DMark 06的第一个基准),风扇已经变得相当响亮,在"TheWitcher 3 ,"噪音水平甚至高于51分贝。我们没有注意到任何电子噪音。
Noise level
| Idle |
| 24 / 31.26 / 38.64 dB(A) |
| Load |
| 48.11 / 56.74 dB(A) |
 | ||
30 dB silent 40 dB(A) audible 50 dB(A) loud |
||
min: | ||
| Schenker XMG Pro 17 (Late 2021, RTX 3080) GeForce RTX 3080 Laptop GPU, i7-11800H, Samsung SSD 980 Pro 1TB MZ-V8P1T0BW | Schenker XMG Pro 15 (Late 2021) GeForce RTX 3080 Laptop GPU, i7-11800H, Samsung SSD 980 Pro 1TB MZ-V8P1T0BW | Alienware x17 RTX 3080 P48E GeForce RTX 3080 Laptop GPU, i7-11800H, 2x WDC PC SN730 SDBPNTY-1T00 (RAID 0) | Medion Erazer Beast X25 GeForce RTX 3080 Laptop GPU, R9 5900HX, Samsung PM9A1 MZVL22T0HBLB | MSI GS76 Stealth 11UH GeForce RTX 3080 Laptop GPU, i9-11900H, Samsung PM9A1 MZVL22T0HBLB | Asus ROG Zephyrus S17 GX703HSD GeForce RTX 3080 Laptop GPU, i9-11900H, Samsung PM9A1 MZVL22T0HBLB | |
|---|---|---|---|---|---|---|
| Noise | -11% | 11% | -4% | 5% | 16% | |
| off / environment * (dB) | 24 | 24 -0% | 24.9 -4% | 25 -4% | 24 -0% | 23 4% |
| Idle Minimum * (dB) | 24 | 31 -29% | 24.9 -4% | 26 -8% | 24 -0% | 23 4% |
| Idle Average * (dB) | 31.26 | 37 -18% | 24.9 20% | 30 4% | 25 20% | 23 26% |
| Idle Maximum * (dB) | 38.64 | 41 -6% | 29.6 23% | 43 -11% | 42 -9% | 23 40% |
| Load Average * (dB) | 48.11 | 56 -16% | 31.1 35% | 54 -12% | 46 4% | 41 15% |
| Witcher 3 ultra * (dB) | 51.5 | 53 -3% | 49.7 3% | 52 -1% | 48 7% | 45 13% |
| Load Maximum * (dB) | 56.74 | 58 -2% | 54.8 3% | 55 3% | 48 15% | 52 8% |
* ... smaller is better
温度
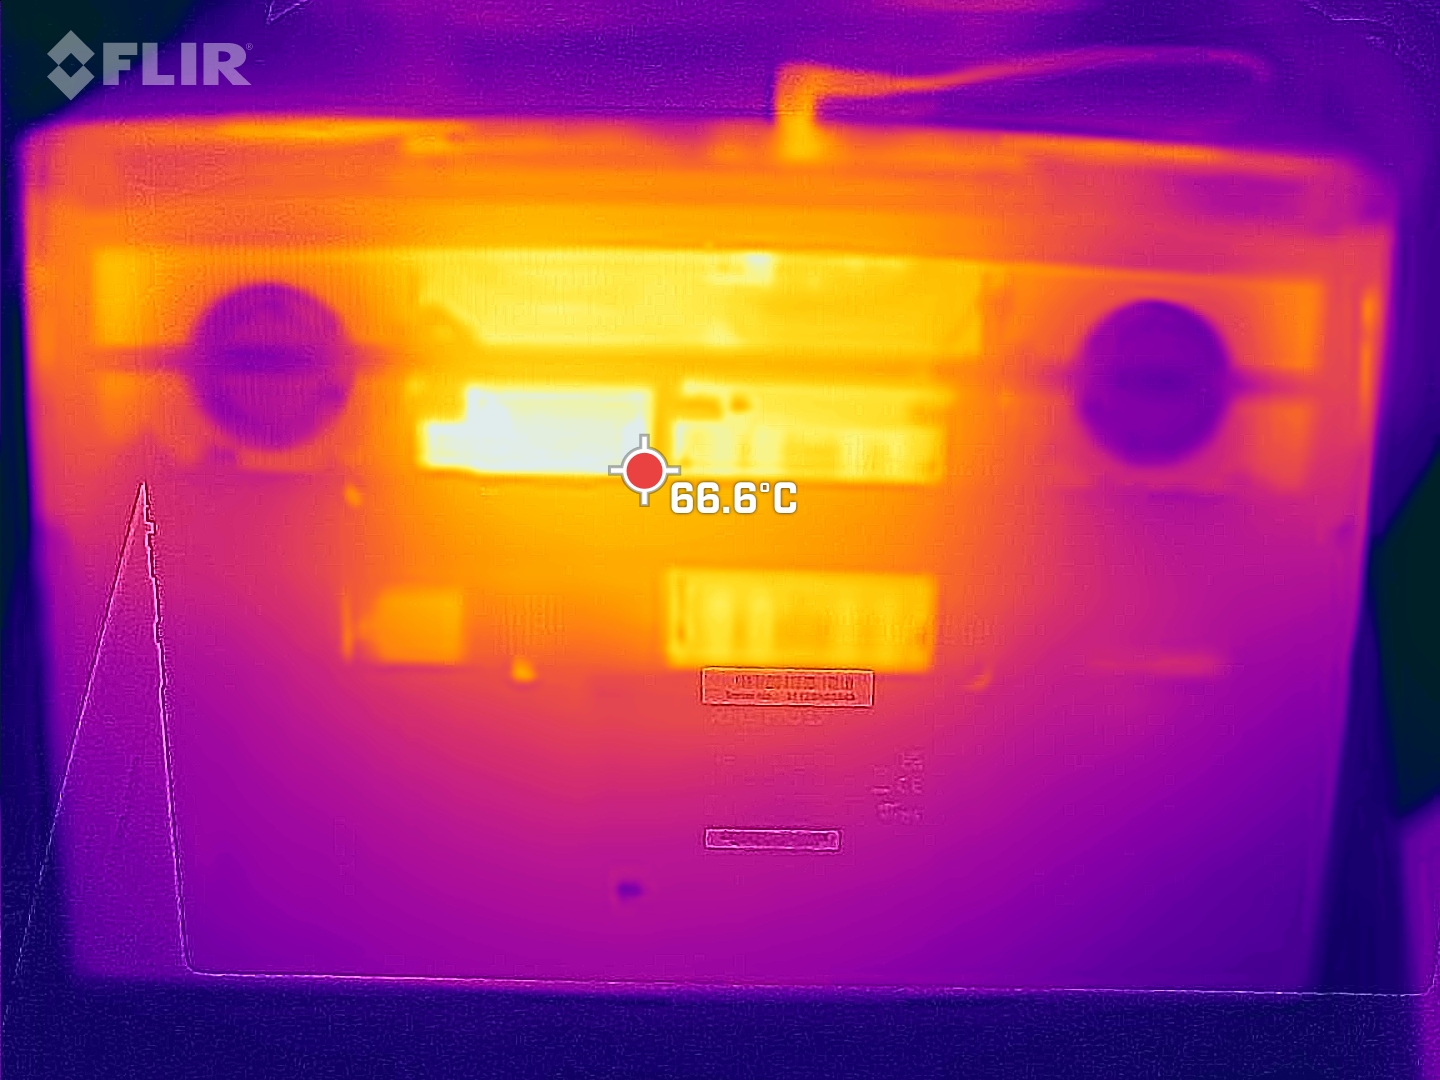
尽管风扇的声音大了一些,性能也降低了,但冷却系统很难将表面温度保持在适度范围内。虽然在最高53°C(127°F)时,顶部达到了与竞争对手相似的温度,但我们在底部测得的温度高达68°C(154°F),这对我们的口味来说绝对是太高了。15英寸机型在底部的温度也明显高于顶部。在最新的压力测试中,你应该把XMG Pro 17从你的腿上拿开。
即使在压力测试期间,掌托仍然相对凉爽,整个左侧包括WASD键受到热量发展的影响较小。至少,这台17英寸的笔记本电脑在空闲运行时保持相对凉爽。
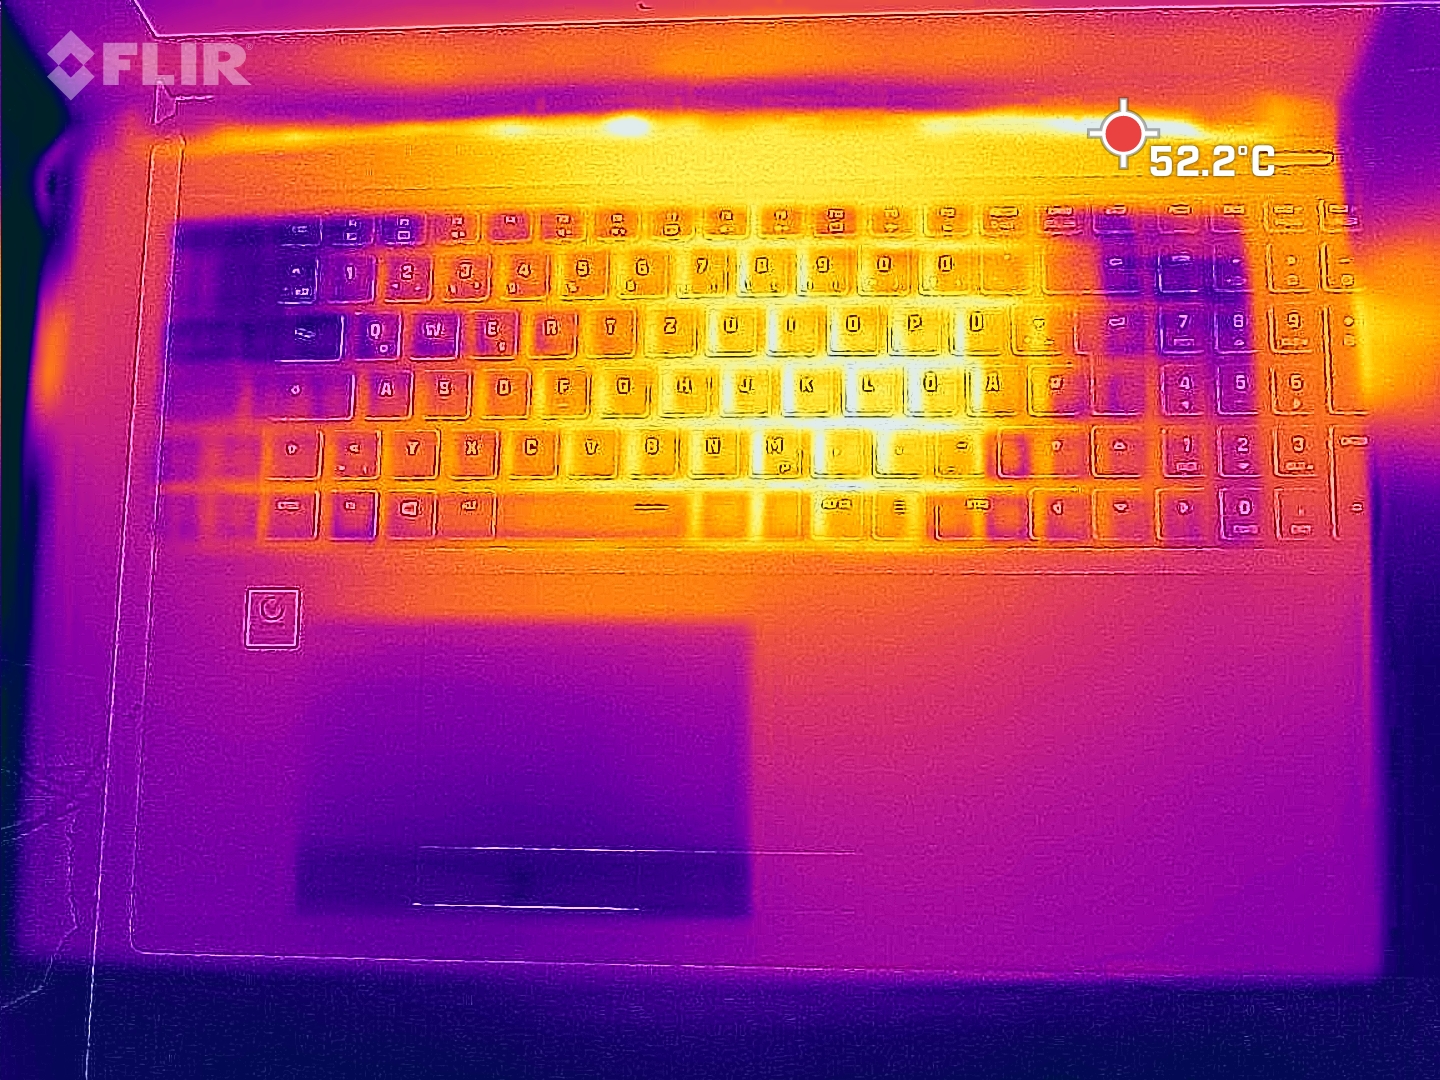
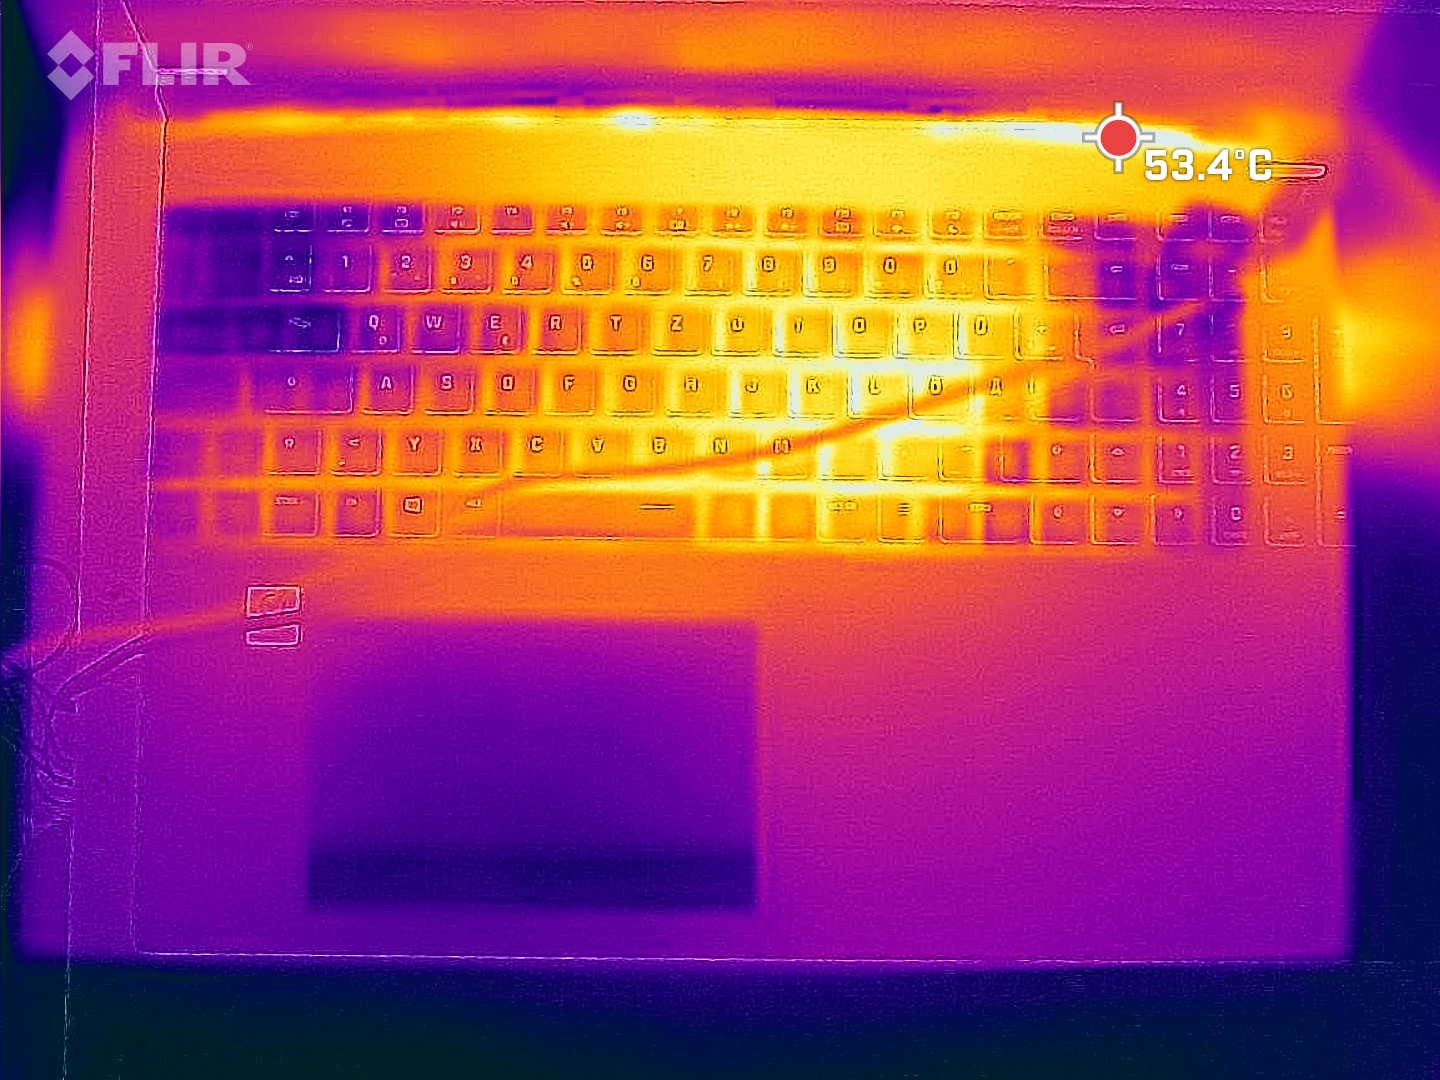
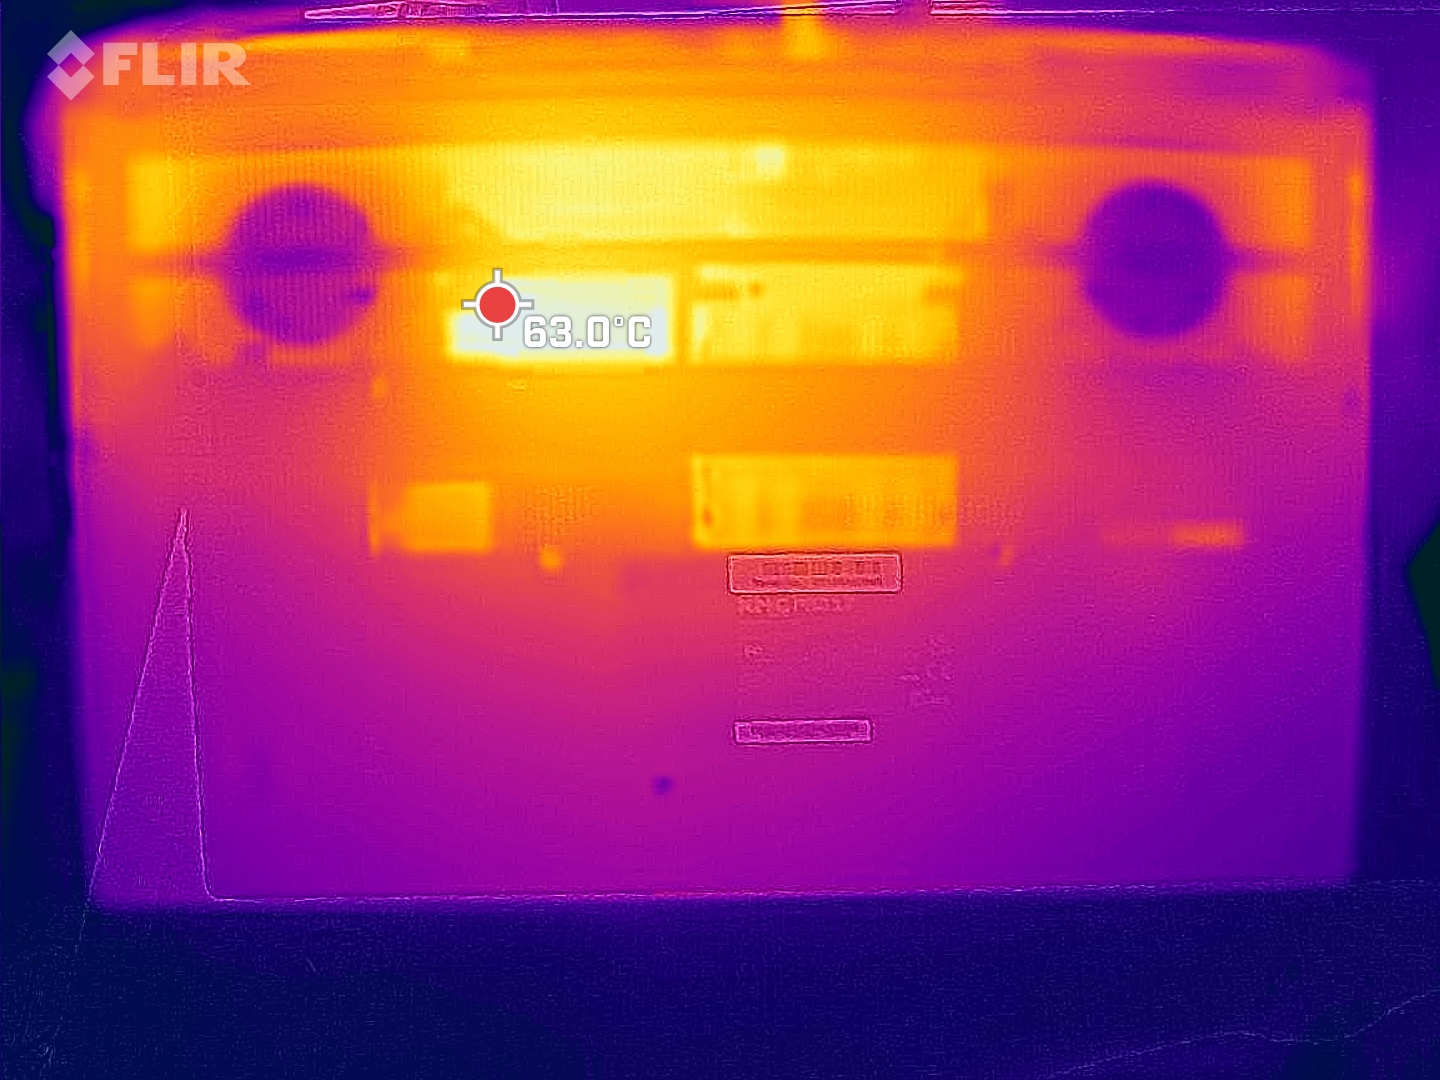
(-) The maximum temperature on the upper side is 53 °C / 127 F, compared to the average of 40.4 °C / 105 F, ranging from 21.2 to 68.8 °C for the class Gaming.
(-) The bottom heats up to a maximum of 68 °C / 154 F, compared to the average of 43.2 °C / 110 F
(+) In idle usage, the average temperature for the upper side is 24.2 °C / 76 F, compared to the device average of 33.9 °C / 93 F.
(-) Playing The Witcher 3, the average temperature for the upper side is 44.9 °C / 113 F, compared to the device average of 33.9 °C / 93 F.
(±) The palmrests and touchpad can get very hot to the touch with a maximum of 37 °C / 98.6 F.
(-) The average temperature of the palmrest area of similar devices was 28.8 °C / 83.8 F (-8.2 °C / -14.8 F).
| Schenker XMG Pro 17 (Late 2021, RTX 3080) Intel Core i7-11800H, NVIDIA GeForce RTX 3080 Laptop GPU | Schenker XMG Pro 15 (Late 2021) Intel Core i7-11800H, NVIDIA GeForce RTX 3080 Laptop GPU | Alienware x17 RTX 3080 P48E Intel Core i7-11800H, NVIDIA GeForce RTX 3080 Laptop GPU | Medion Erazer Beast X25 AMD Ryzen 9 5900HX, NVIDIA GeForce RTX 3080 Laptop GPU | MSI GS76 Stealth 11UH Intel Core i9-11900H, NVIDIA GeForce RTX 3080 Laptop GPU | Asus ROG Zephyrus S17 GX703HSD Intel Core i9-11900H, NVIDIA GeForce RTX 3080 Laptop GPU | |
|---|---|---|---|---|---|---|
| Heat | -1% | -8% | -9% | 3% | -11% | |
| Maximum Upper Side * (°C) | 53 | 44 17% | 58.4 -10% | 54 -2% | 49 8% | 59 -11% |
| Maximum Bottom * (°C) | 68 | 60 12% | 49 28% | 57 16% | 57 16% | 53 22% |
| Idle Upper Side * (°C) | 27 | 30 -11% | 33.6 -24% | 34 -26% | 28 -4% | 35 -30% |
| Idle Bottom * (°C) | 28 | 34 -21% | 34.6 -24% | 35 -25% | 30 -7% | 35 -25% |
* ... smaller is better
压力测试
核心以大约4.2 GHz的速度开始压力测试。然而,几秒钟后,CPU的温度就达到了90°C(194°F)以上,热节流功能开始发挥作用。在整个测试过程中,时钟速度继续下降。大约30分钟后,它只有3GHz,一小时后,只有2.8GHz,几分钟后,只有2.7GHz。当这种情况发生时,CPU的温度往往非常高,持续达到90℃(194°F),节流的目标温度约为85℃(185°F)。
GPU开始时的时钟速度约为1.5 GHz。根据热负荷,速度有时会下降到1.2GHz,然后再恢复到1.3GHz以上。这里的温度也达到了相当高的85℃(185°F),甚至暂时更高。
在压力测试之后,系统恢复得相当快。 紧接着进行的3DMark 11测试的结果是比平时低了大约3-4%。
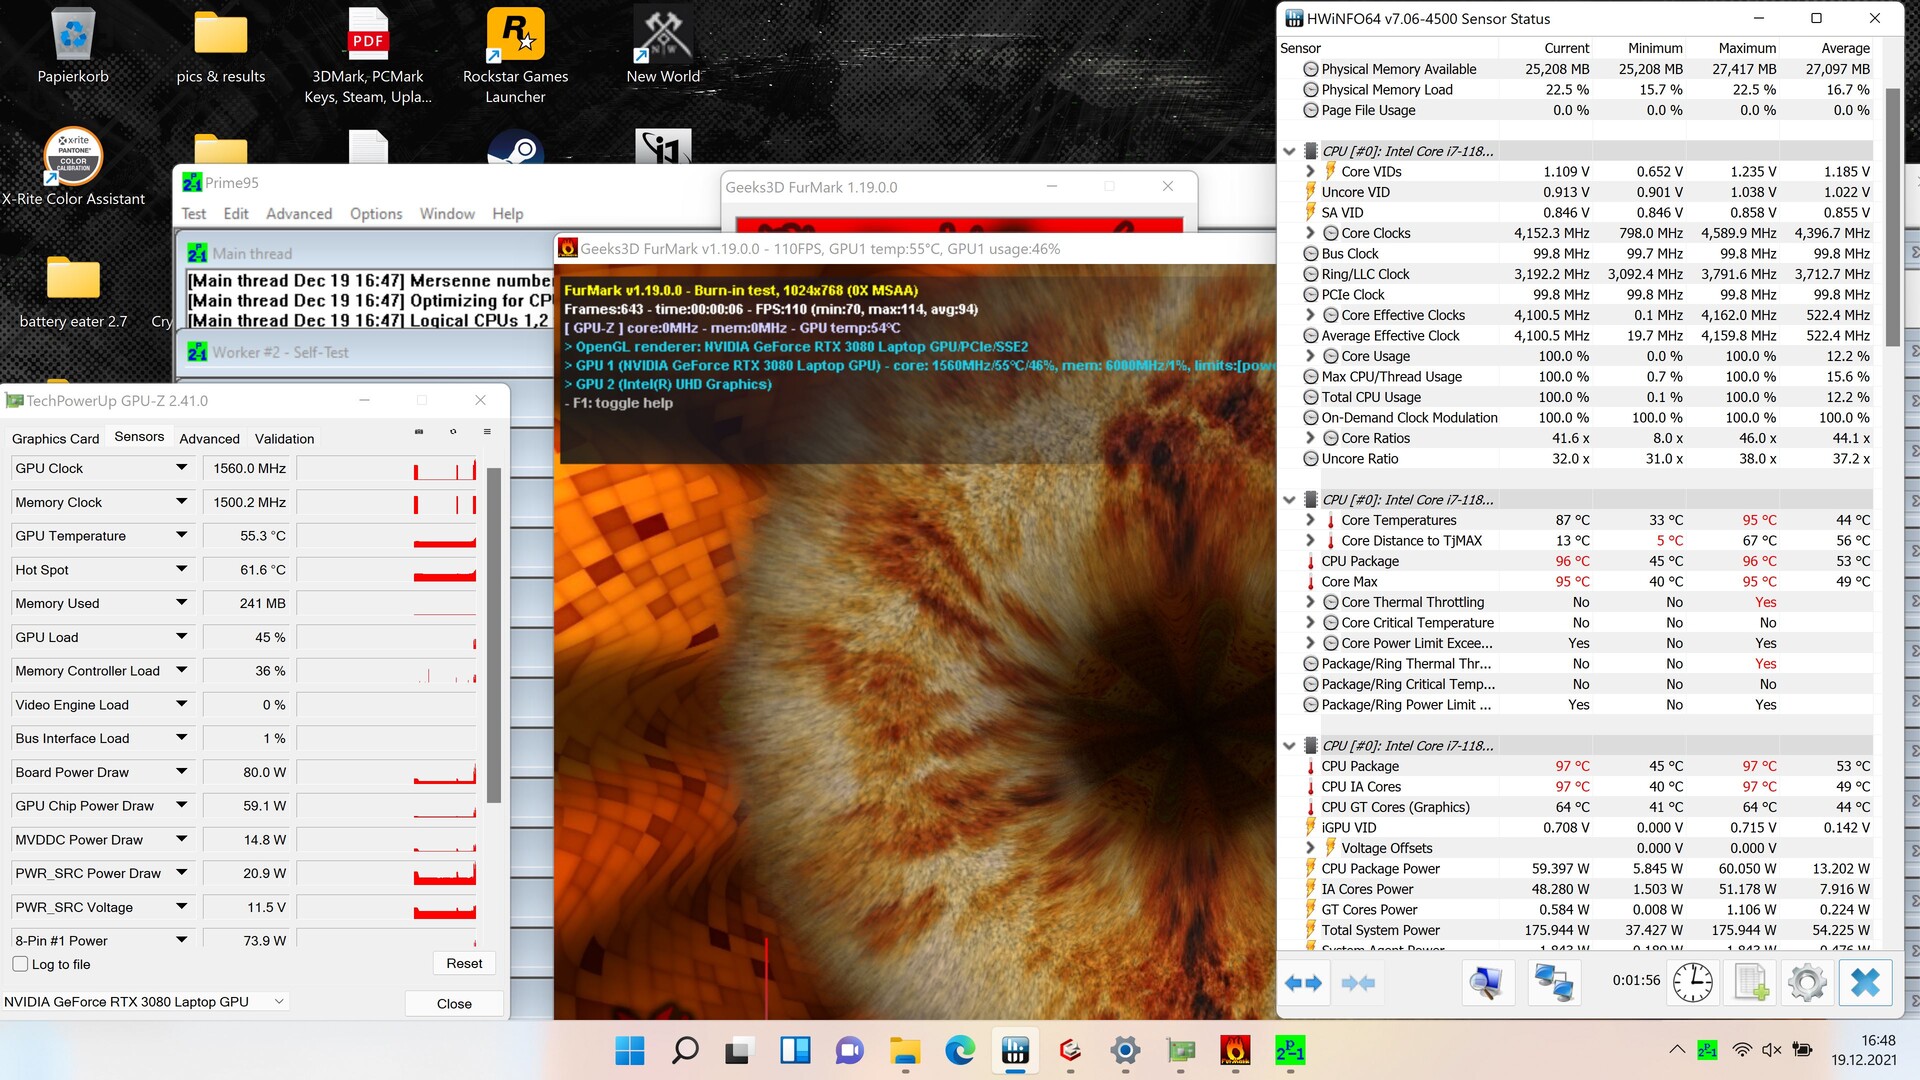
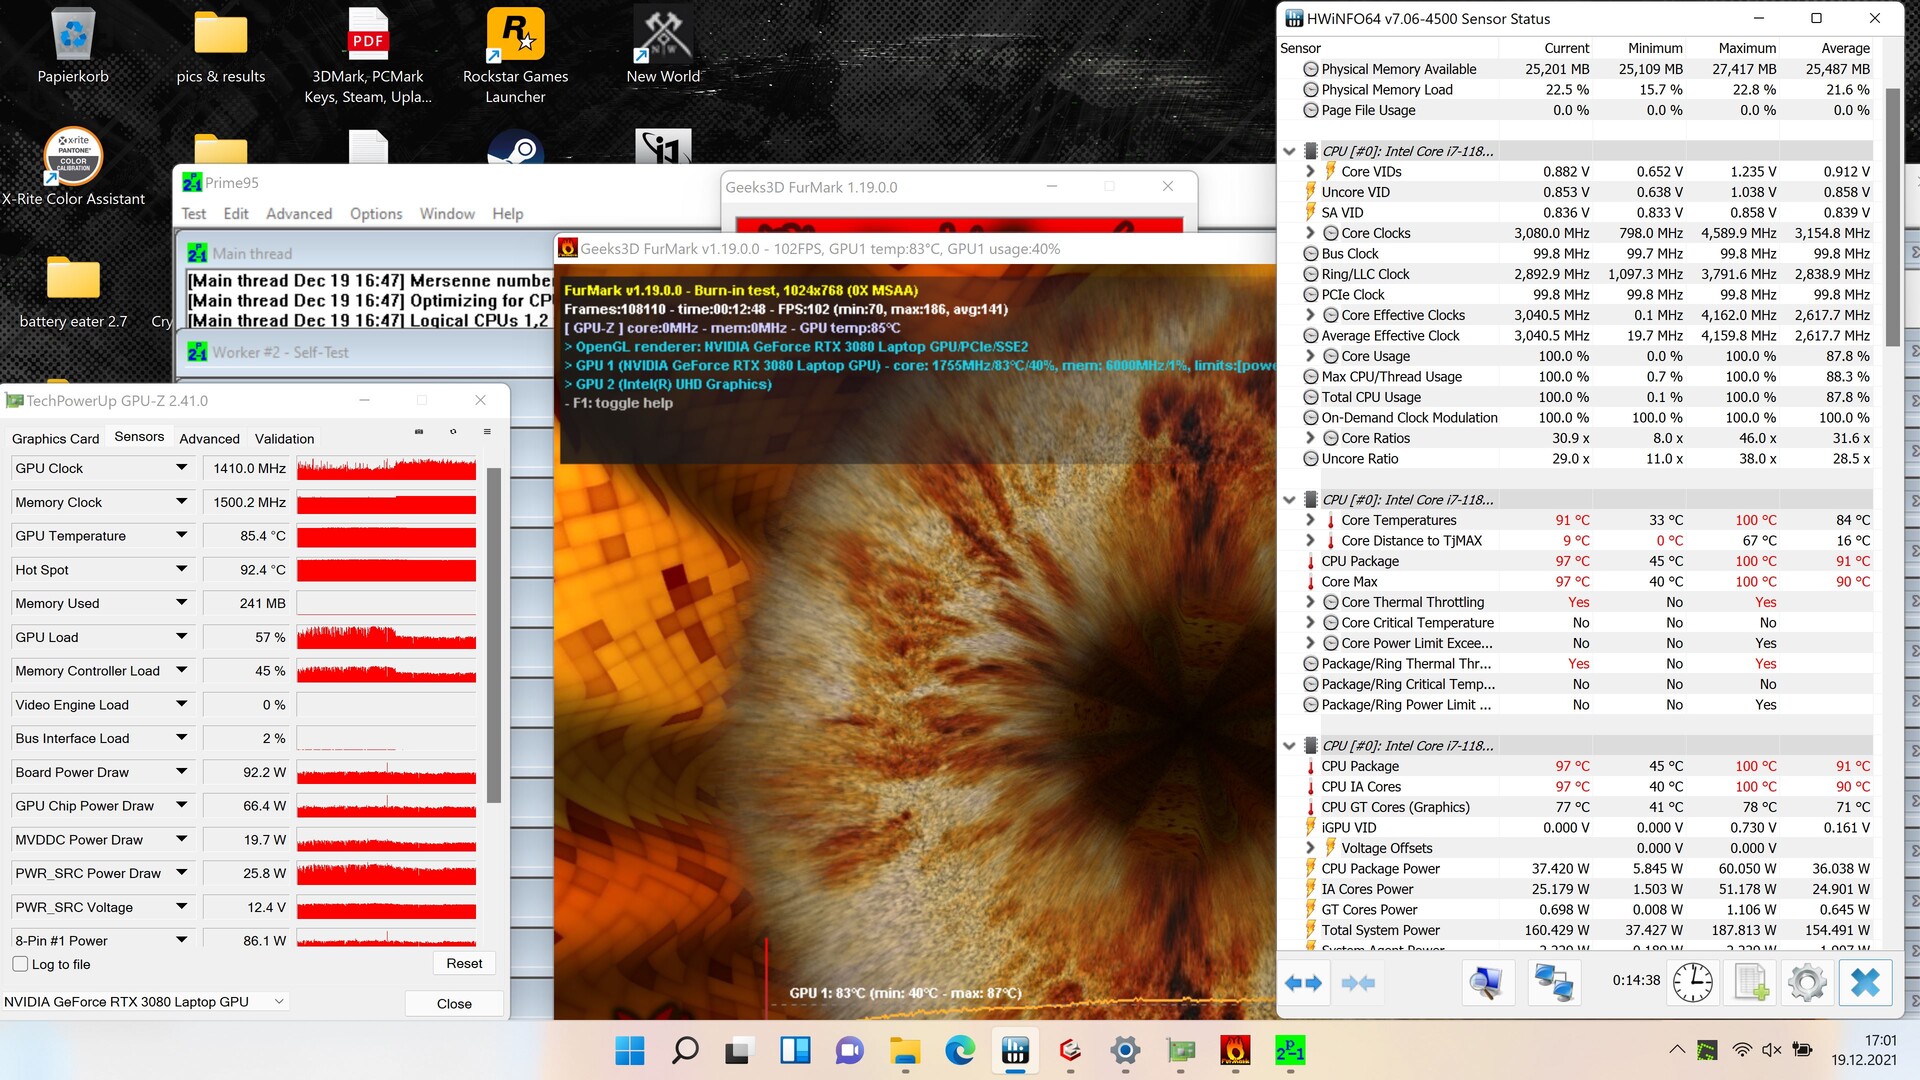
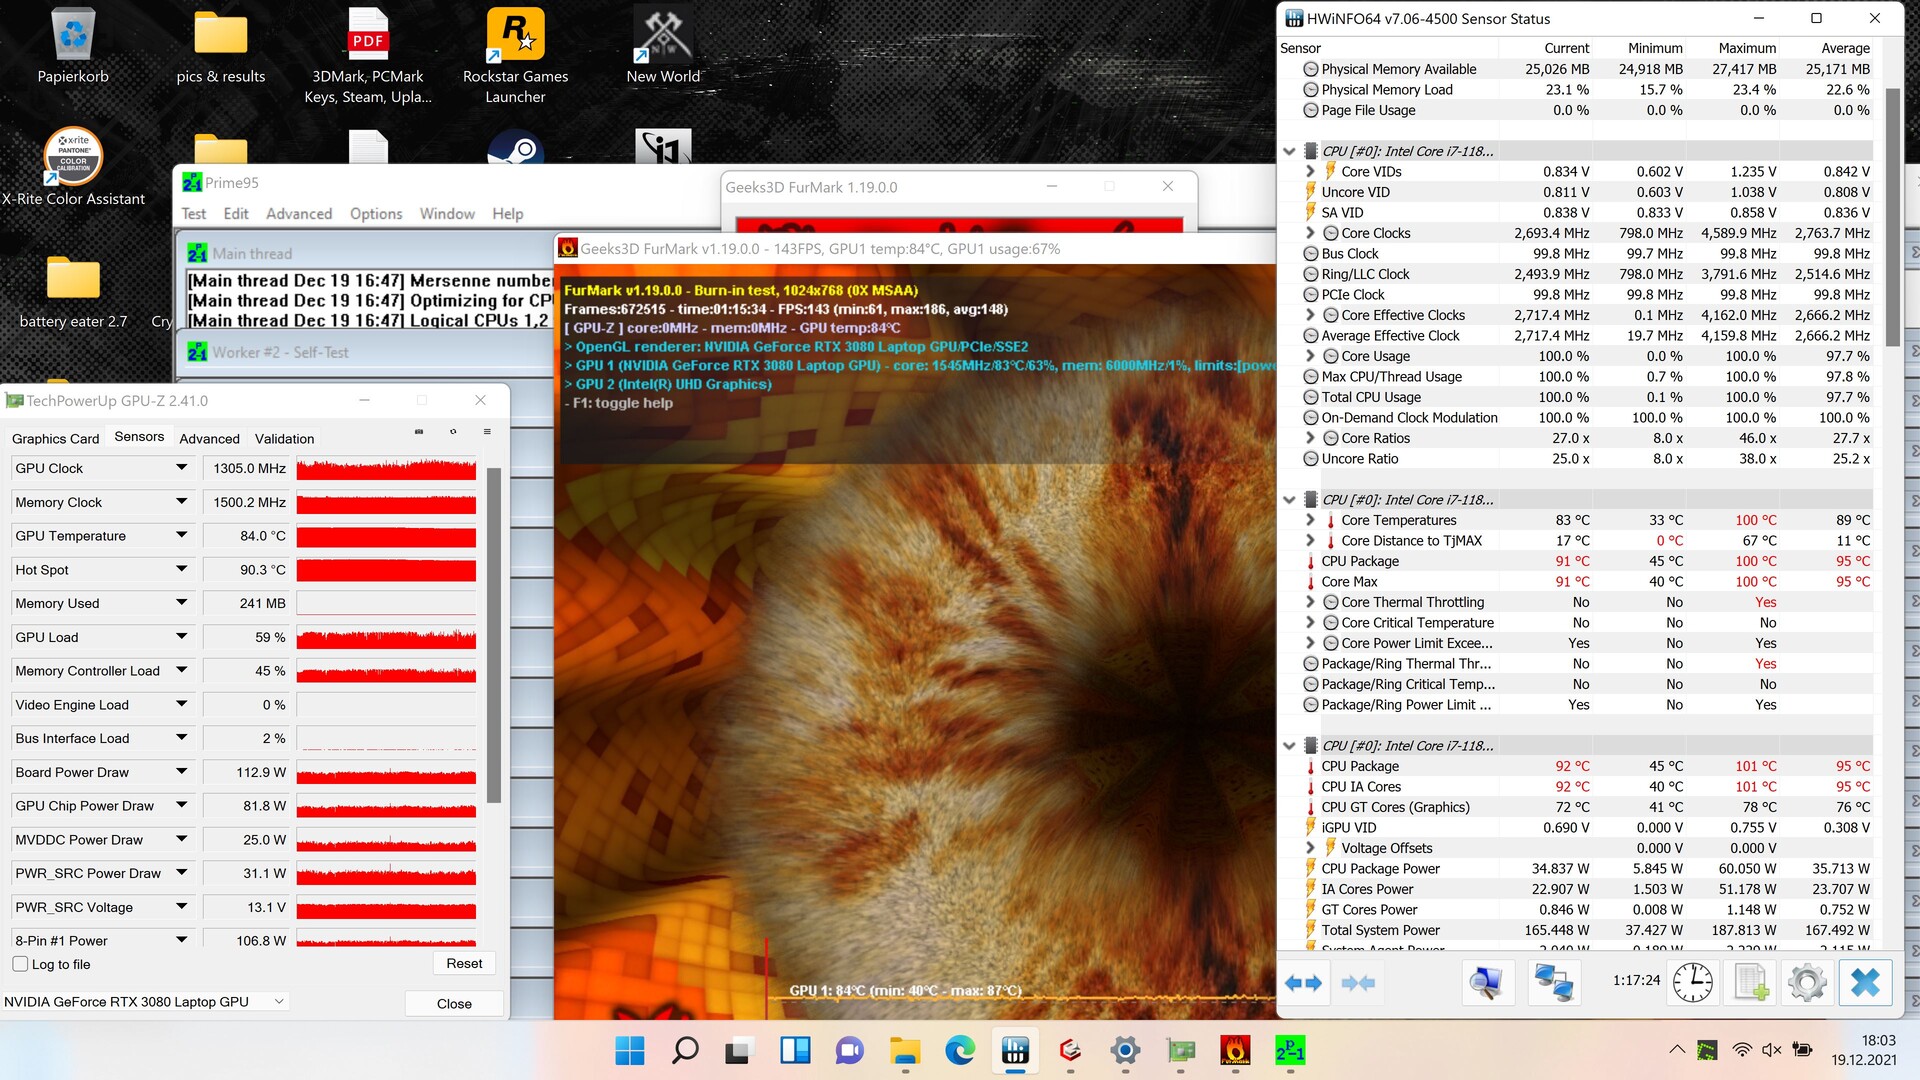
| CPU时钟(GHz) | GPU时钟(MHz) | CPU平均温度(℃) | GPU平均温度(℃) | |
| 系统空闲 | 3.6 | 350 (iGPU) | 35 | 35 |
| Prime95 + FurMark压力 | 2.6 | 1,230 - 1,375 | 88 | 85 |
发言人
扬声器产生了相当好的最大音量和平衡、线性的高频。虽然中音的表现略显不足,但低音却几乎没有,尽管是17英寸的外形尺寸。
你可以使用耳机或线路输入端口连接外部音频设备。
Schenker XMG Pro 17 (Late 2021, RTX 3080) audio analysis
(+) | speakers can play relatively loud (87.4 dB)
Bass 100 - 315 Hz
(-) | nearly no bass - on average 24% lower than median
(±) | linearity of bass is average (8.7% delta to prev. frequency)
Mids 400 - 2000 Hz
(±) | higher mids - on average 10.1% higher than median
(±) | linearity of mids is average (7.2% delta to prev. frequency)
Highs 2 - 16 kHz
(+) | balanced highs - only 2% away from median
(+) | highs are linear (2.6% delta to prev. frequency)
Overall 100 - 16.000 Hz
(±) | linearity of overall sound is average (18.8% difference to median)
Compared to same class
» 62% of all tested devices in this class were better, 8% similar, 30% worse
» The best had a delta of 6%, average was 18%, worst was 132%
Compared to all devices tested
» 43% of all tested devices were better, 8% similar, 49% worse
» The best had a delta of 4%, average was 23%, worst was 134%
Apple MacBook 12 (Early 2016) 1.1 GHz audio analysis
(+) | speakers can play relatively loud (83.6 dB)
Bass 100 - 315 Hz
(±) | reduced bass - on average 11.3% lower than median
(±) | linearity of bass is average (14.2% delta to prev. frequency)
Mids 400 - 2000 Hz
(+) | balanced mids - only 2.4% away from median
(+) | mids are linear (5.5% delta to prev. frequency)
Highs 2 - 16 kHz
(+) | balanced highs - only 2% away from median
(+) | highs are linear (4.5% delta to prev. frequency)
Overall 100 - 16.000 Hz
(+) | overall sound is linear (10.2% difference to median)
Compared to same class
» 7% of all tested devices in this class were better, 2% similar, 90% worse
» The best had a delta of 5%, average was 18%, worst was 53%
Compared to all devices tested
» 5% of all tested devices were better, 1% similar, 94% worse
» The best had a delta of 4%, average was 23%, worst was 134%
电源管理--效率高,但供电能力弱
消耗功率
在空闲运行期间,XMG Pro 17呈现出相对高效的特点。在游戏时,我们的测试设备也比Alienware或华硕ROG的耗电量略低,但这些设备的性能明显更高。总的来说,消耗水平与性能相对应。
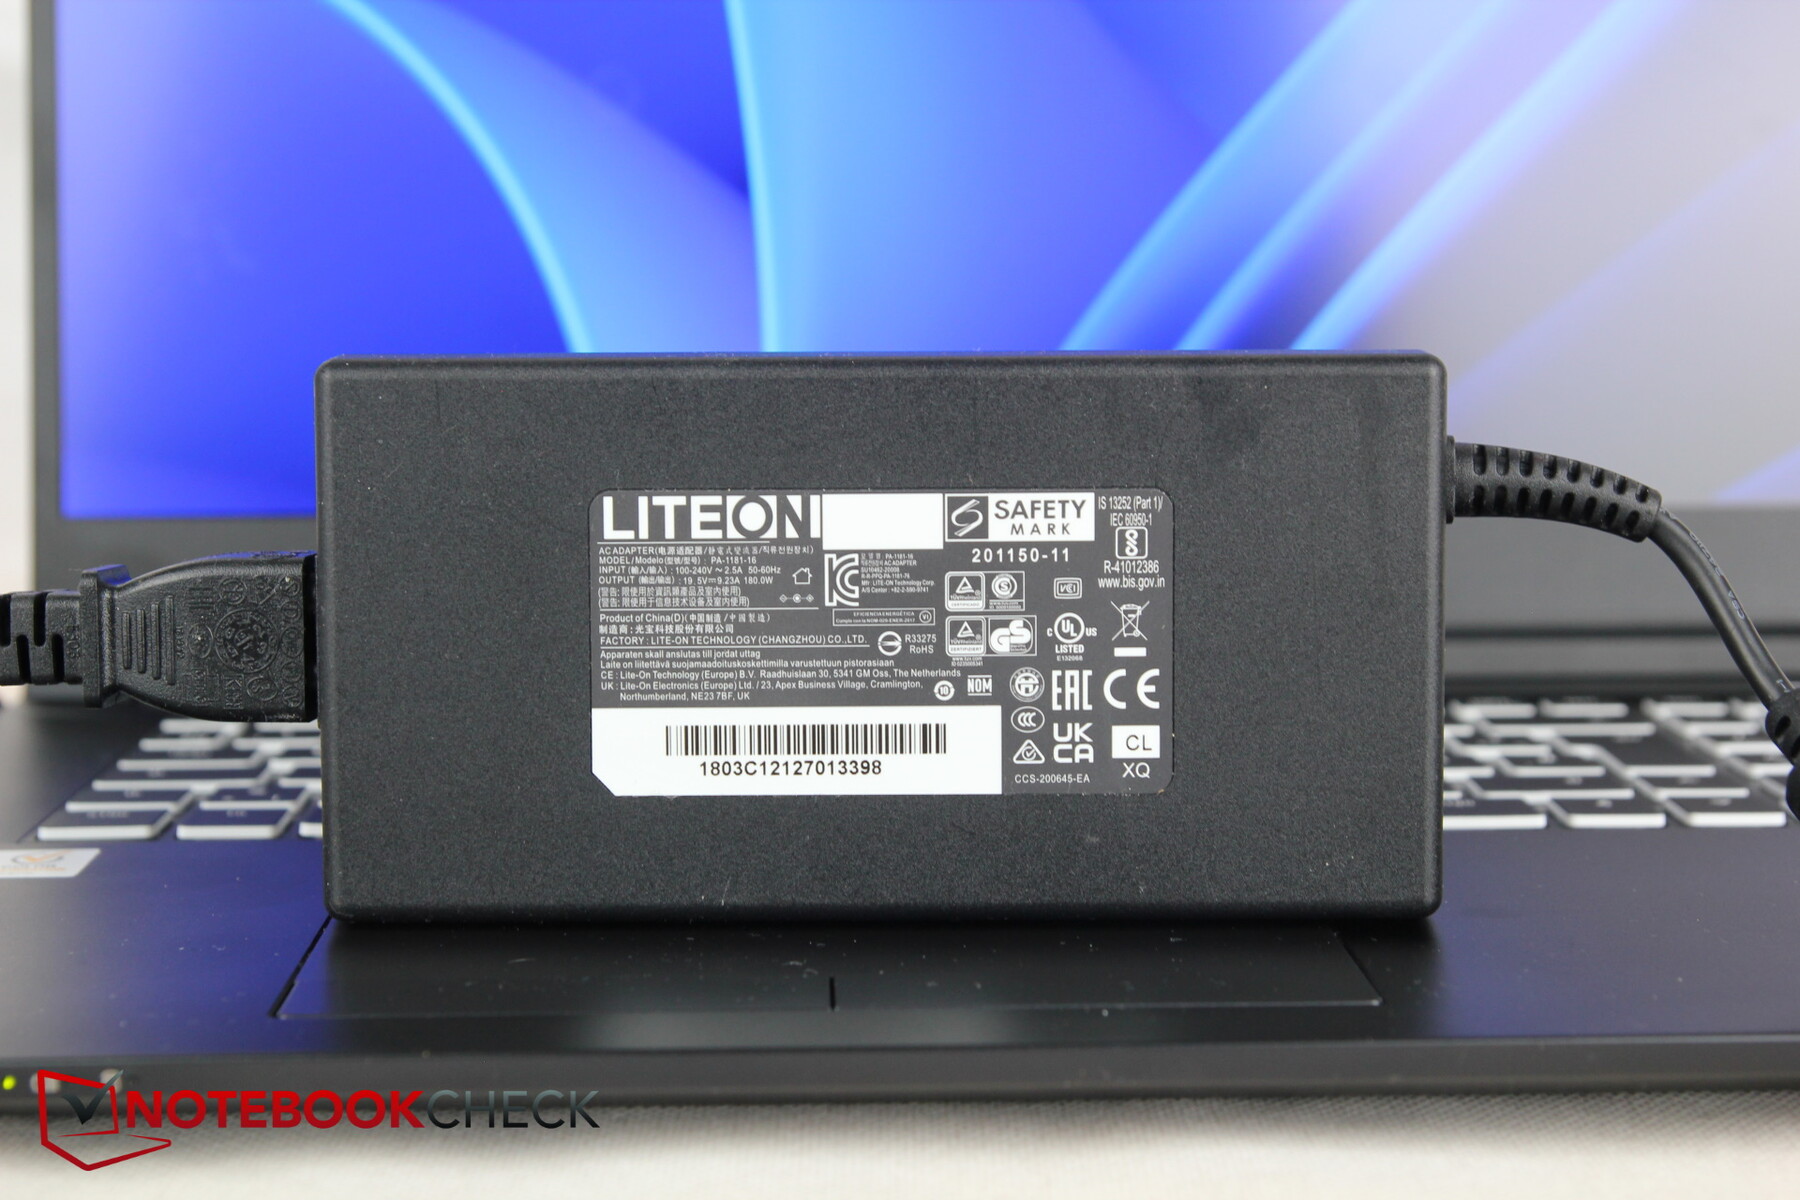
我们测量的最高消耗量为227瓦。然而,附带的LiteOn电源的额定功率只有180瓦。即使在最大消耗以外的时间,这也会成为一个问题。例如,在压力测试期间,它不断使用约200瓦。在这种极端情况下,电源无法为笔记本电脑可靠地充电。
| Idle | |
| Load |
|
Key:
min: | |
| Schenker XMG Pro 17 (Late 2021, RTX 3080) i7-11800H, GeForce RTX 3080 Laptop GPU, Samsung SSD 980 Pro 1TB MZ-V8P1T0BW, IPS, 3840x2160, 17.3" | Schenker XMG Pro 15 (Late 2021) i7-11800H, GeForce RTX 3080 Laptop GPU, Samsung SSD 980 Pro 1TB MZ-V8P1T0BW, OLED, 3840x2160, 15.6" | Alienware x17 RTX 3080 P48E i7-11800H, GeForce RTX 3080 Laptop GPU, 2x WDC PC SN730 SDBPNTY-1T00 (RAID 0), IPS, 3840x2160, 17.3" | Medion Erazer Beast X25 R9 5900HX, GeForce RTX 3080 Laptop GPU, Samsung PM9A1 MZVL22T0HBLB, IPS, 1920x1080, 17.3" | MSI GS76 Stealth 11UH i9-11900H, GeForce RTX 3080 Laptop GPU, Samsung PM9A1 MZVL22T0HBLB, IPS, 3840x2160, 17.3" | Asus ROG Zephyrus S17 GX703HSD i9-11900H, GeForce RTX 3080 Laptop GPU, Samsung PM9A1 MZVL22T0HBLB, IPS, 2560x1440, 17.3" | Average NVIDIA GeForce RTX 3080 Laptop GPU | Average of class Gaming | |
|---|---|---|---|---|---|---|---|---|
| Power Consumption | -9% | -21% | -24% | 1% | -21% | -18% | 0% | |
| Idle Minimum * (Watt) | 13.6 | 20 -47% | 10.2 25% | 22 -62% | 14 -3% | 21.7 -60% | 19.8 ? -46% | 13 ? 4% |
| Idle Average * (Watt) | 19.4 | 22 -13% | 21.2 -9% | 26 -34% | 19 2% | 27 -39% | 24.3 ? -25% | 19 ? 2% |
| Idle Maximum * (Watt) | 27.7 | 26 6% | 48.4 -75% | 34 -23% | 31 -12% | 33 -19% | 33.3 ? -20% | 24.6 ? 11% |
| Load Average * (Watt) | 110 | 103 6% | 118.7 -8% | 120 -9% | 97 12% | 108 2% | 108.1 ? 2% | 110.7 ? -1% |
| Witcher 3 ultra * (Watt) | 170 | 186 -9% | 249 -46% | 189 -11% | 156 8% | 195 -15% | ||
| Load Maximum * (Watt) | 227 | 218 4% | 262 -15% | 231 -2% | 231 -2% | 210 7% | 230 ? -1% | 259 ? -14% |
* ... smaller is better
Power Consumption The Witcher 3 / Stress Test
Power Consumption With External Monitor
电池寿命
与15英寸机型一样,申克在这里也使用了73瓦时的电池。竞争对手提供87(Alienware)到几乎100Wh(MSI),但这并不一定导致对比机型的电池寿命更好。只有华硕ROG Zephyrus的90瓦时电池明显持续时间更长,其余竞争对手的部分表现甚至更糟,包括微星。
你可以计划在降低亮度的情况下看一个大约5小时的电影之夜,而在冲浪时,XMG的持续时间大约为40分钟。
| Schenker XMG Pro 17 (Late 2021, RTX 3080) i7-11800H, GeForce RTX 3080 Laptop GPU, 73 Wh | Schenker XMG Pro 15 (Late 2021) i7-11800H, GeForce RTX 3080 Laptop GPU, 73 Wh | Alienware x17 RTX 3080 P48E i7-11800H, GeForce RTX 3080 Laptop GPU, 87 Wh | Medion Erazer Beast X25 R9 5900HX, GeForce RTX 3080 Laptop GPU, 91 Wh | MSI GS76 Stealth 11UH i9-11900H, GeForce RTX 3080 Laptop GPU, 99.9 Wh | Asus ROG Zephyrus S17 GX703HSD i9-11900H, GeForce RTX 3080 Laptop GPU, 90 Wh | Average of class Gaming | |
|---|---|---|---|---|---|---|---|
| Battery runtime | -4% | -26% | -2% | -8% | 40% | 23% | |
| H.264 (h) | 5.2 | 6.5 25% | 7.2 38% | 8.32 ? 60% | |||
| WiFi v1.3 (h) | 5.7 | 5.2 -9% | 5.9 4% | 6.8 19% | 6.4 12% | 7.5 32% | 7.11 ? 25% |
| Load (h) | 1.8 | 1.3 -28% | 0.8 -56% | 1.4 -22% | 1.3 -28% | 2.7 50% | 1.502 ? -17% |
| Reader / Idle (h) | 10.6 | 7 | 9.9 | 9.9 | 8.27 ? | ||
| Witcher 3 ultra (h) | 1 |
Pros
Cons
评语--与其说是游戏笔记本,不如说是工作站
尽管XMG Pro 17想同时吸引游戏玩家以及创意专业人士,但它不太可能吸引游戏玩家中的性能爱好者,因为由于超薄的设计,有太多的性能妥协。然而,Schenker模型可能仍然对一些游戏者感兴趣。至少,这款配备RTX 3080的超薄笔记本电脑比大多数竞争对手更具有移动性,除了尺寸和重量之外,电池寿命也很合适。 明亮的4K显示屏,其大色彩空间覆盖率也是专业人士的一大优势,使其也适合视频编辑或图像处理。
凭借其强大的硬件,超薄外壳的缺点也很明显。笔记本电脑底部会相当热,并不真正安静,而且性能也低于许多竞争对手的水平。此外,摇晃的键盘底座有点令人讨厌,Schenker也应该重新考虑其电源,它真的太弱了。
除了4K显示屏之外,XMG Pro 17的大优势在于其超薄的外壳和相对较低的重量。那些喜欢移动性而不是最大性能的游戏玩家和专业人士应该给这个模型一个机会。
其他笔记本电脑也不是什么都做得很好,也许华硕ROG Zephyrus是个例外,它同样纤薄,但也比它重400克(约14盎司)。但是那款笔记本电脑几乎在所有方面都给我们留下了深刻印象,你在购买时只需注意一些单位的任何恼人的噪音。不幸的是,华硕的价格也更高一些,尽管XMG Pro也不是一个便宜货。那些想省钱的人应该看一下 微星GP66 Leopard,价格不到2000欧元(~$2286).
价格和可用性
XMG Pro 17在Schenker商店的价格为:2249欧元,配备全高清显示屏,配备4K显示屏的价格为278欧元。全高清显示屏,4K显示屏的价格为278欧元。Clevo PC70HS具有类似的结构,在Clevo商店的起价为 2560美元。.
Schenker XMG Pro 17 (Late 2021, RTX 3080)
- 01/13/2022 v7 (old)
Christian Hintze
Price comparison

