华硕Vivobook Pro 14 OLED在审查。潘多拉验证的笔记本电脑包含了大量的处理能力
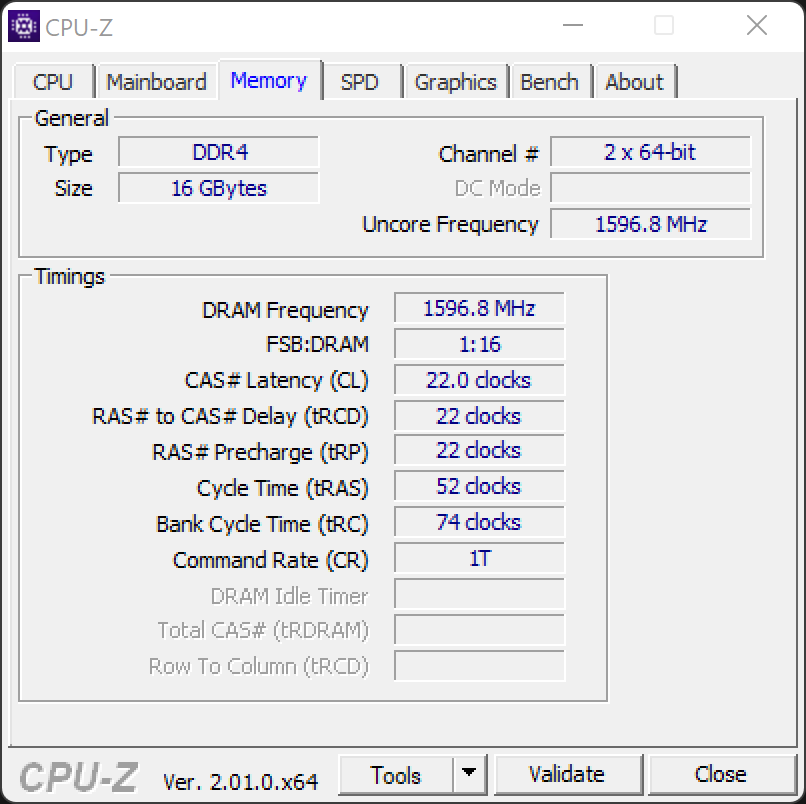
华硕的VivoBook Pro机型以相对较低的价格提供了大量的性能。这些笔记本电脑有14英寸、15英寸和16英寸规格,配备英特尔和AMD处理器,以及各种显卡选项。我们的测试设备因其高分辨率的OLED显示屏而特别令人印象深刻。它提供2800×1800像素,尺寸为14英寸。一个 AMD Ryzen 5 5600H,一个 NvidiaGeForce RTX 3050,以及16GB的内存,确保了高计算能力。一些零售商和华硕目前对此的收费低于1000欧元(约1,016美元)。
我们已经审查了15英寸版本的VivoBook Pro OLED前一阵子。几款配备dGPU的多媒体和办公笔记本电脑作为竞争者出现了问题。这些产品包括更昂贵的微软Surface Laptop Studio,更便宜的Acer Swift X SFX14配有GeForce GTX 1650,甚至还有 华硕Zenbook Pro 15.
潜在的竞争对手比较
Rating | Date | Model | Weight | Height | Size | Resolution | Price |
|---|---|---|---|---|---|---|---|
| 86.3 % v7 (old) | 07 / 2022 | Asus Vivobook Pro 14 M3401QC-KM007T R5 5600H, GeForce RTX 3050 4GB Laptop GPU | 1.5 kg | 19 mm | 14.00" | 2880x1800 | |
| 85.6 % v7 (old) | 03 / 2022 | Acer Swift X SFX14-41G-R7F3 R5 5500U, GeForce GTX 1650 Mobile | 1.4 kg | 18.89 mm | 14.00" | 1920x1080 | |
| 89 % v7 (old) | 03 / 2022 | Microsoft Surface Laptop Studio i7 RTX 3050 Ti i7-11370H, GeForce RTX 3050 Ti Laptop GPU | 1.8 kg | 19 mm | 14.40" | 2400x1600 | |
| 82.2 % v7 (old) | MSI Modern 14 B11SB-085 i7-1165G7, GeForce MX450 | 1.3 kg | 16.9 mm | 14.00" | 1920x1080 | ||
| 86.1 % v7 (old) | 12 / 2021 | Acer Swift 3X SF314-510G-70DW i7-1165G7, Xe MAX | 1.4 kg | 17.9 mm | 14.00" | 1920x1080 | |
| 87.7 % v7 (old) | 05 / 2022 | Asus Zenbook Pro 15 OLED UM535Q R9 5900HX, GeForce RTX 3050 Ti Laptop GPU | 1.9 kg | 18 mm | 15.60" | 1920x1080 | |
| 87.7 % v7 (old) | 01 / 2022 | Schenker Vision 14 i7-11370H, GeForce RTX 3050 Ti Laptop GPU | 1.1 kg | 15.6 mm | 14.00" | 2880x1800 |
外壳 - 大量的塑料和少量的铝材
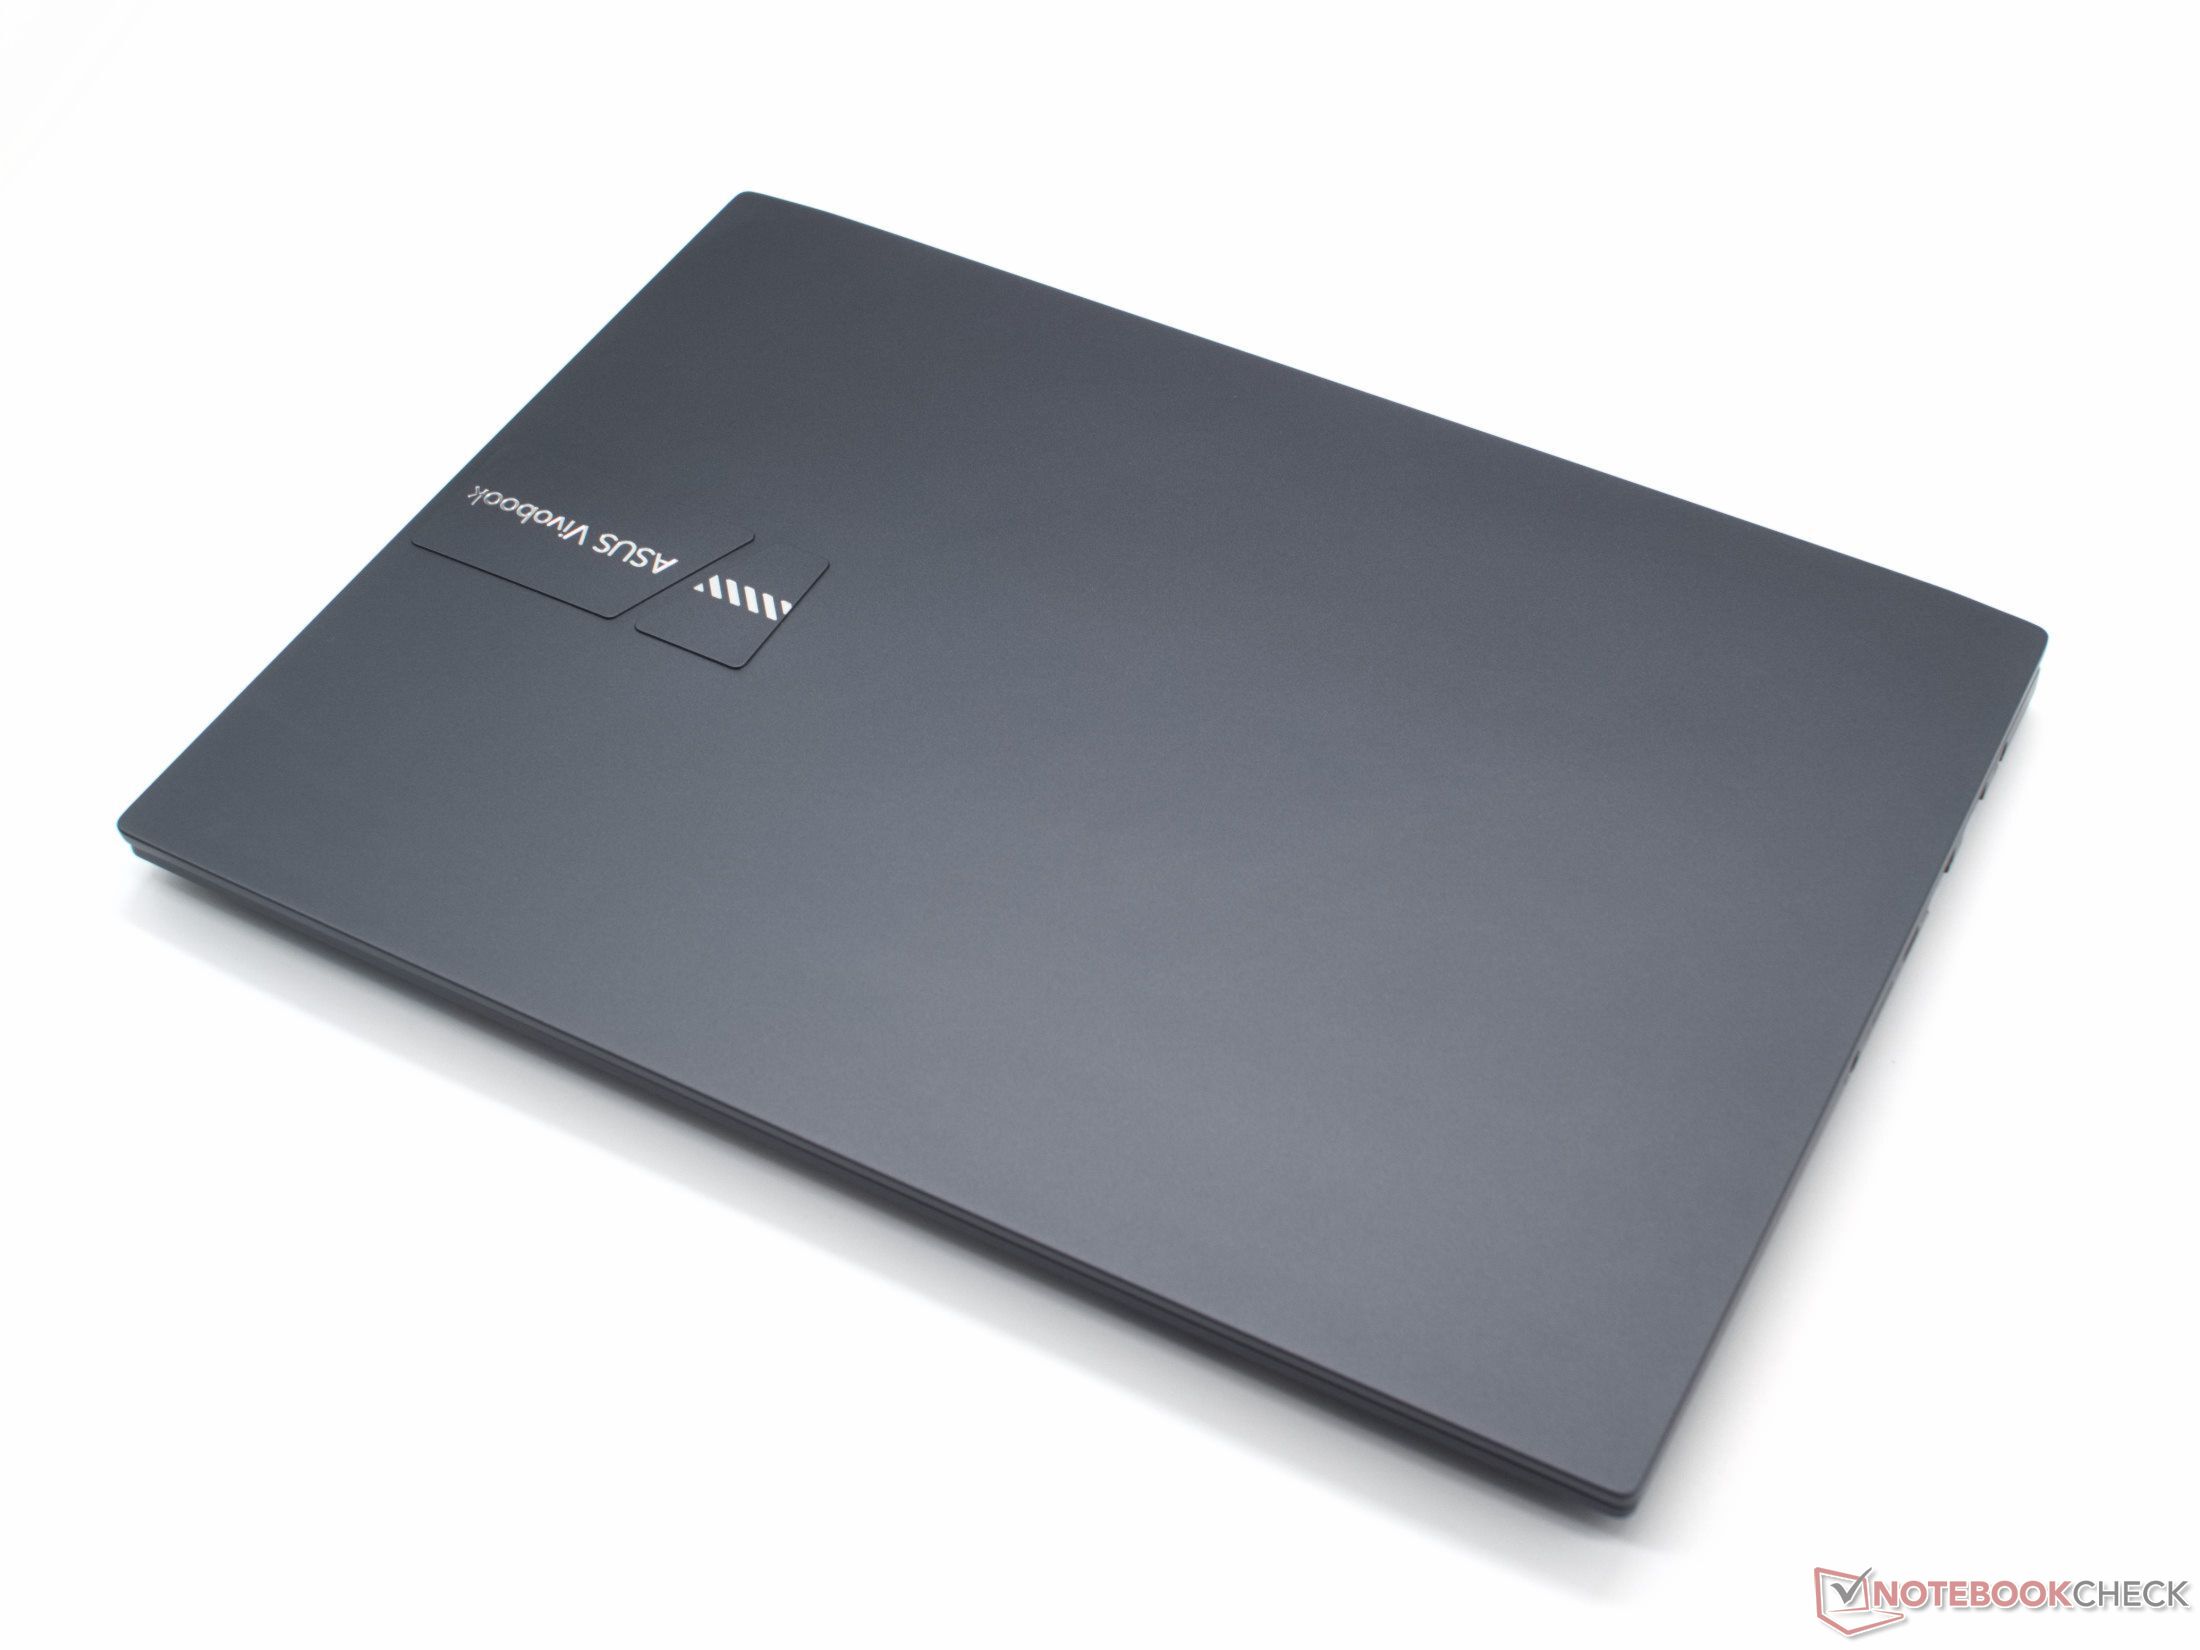
华硕VivoBook Pro 14看起来很苗条,总体上呈现出一种相当谨慎的设计。笔记本电脑的底座是由塑料制成的,而显示屏的盖子是由铝合金制成的。这两个部分看起来都非常结实。需要很大的力量才能使笔记本变形。我们的评测单元的颜色是灰蓝色的,根据光线的不同,也可以看起来是普通的灰色。
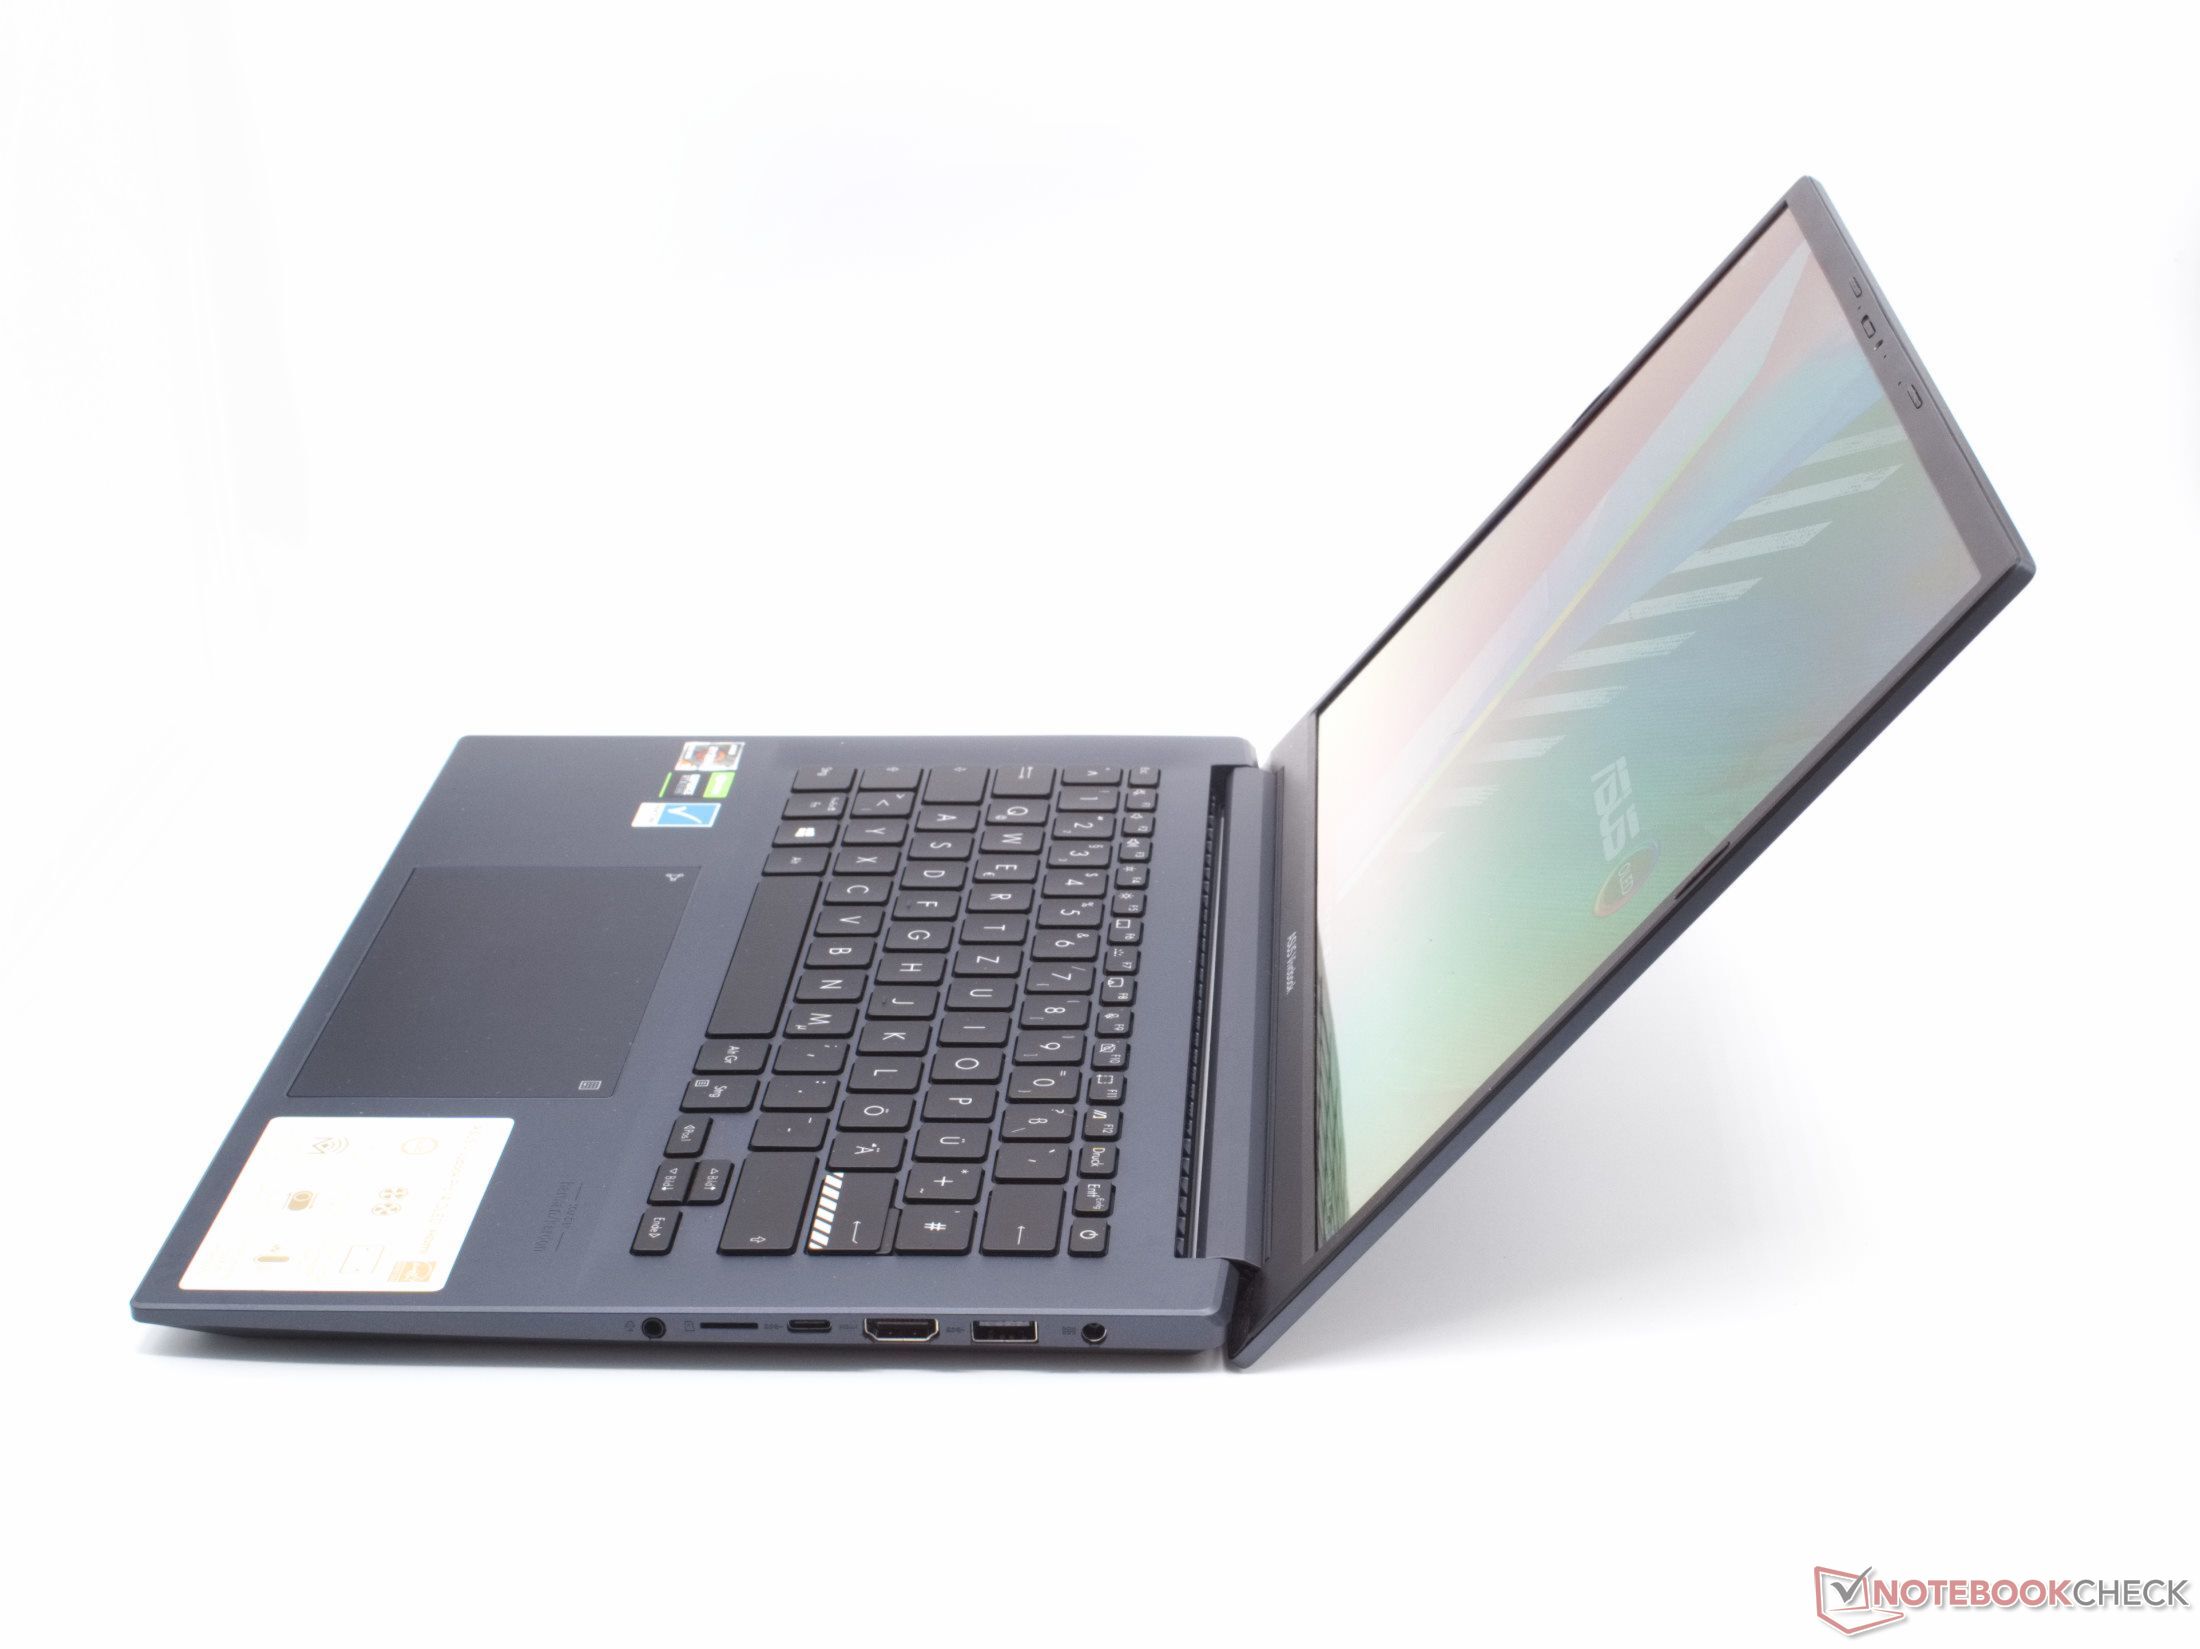
屏幕可以用一只手打开;最大打开角度为130°。这在定位时提供了很大的空间。虽然铰链很光滑,但屏幕能很好地保持其位置。屏幕周围的边框相对较窄,但该设备还不能完全被称为 "窄边框"。
小的设计元素减轻了笔记本电脑的整体外观。回车键上的条纹图案和盖子上的3D标志在其他华硕笔记本上也有。
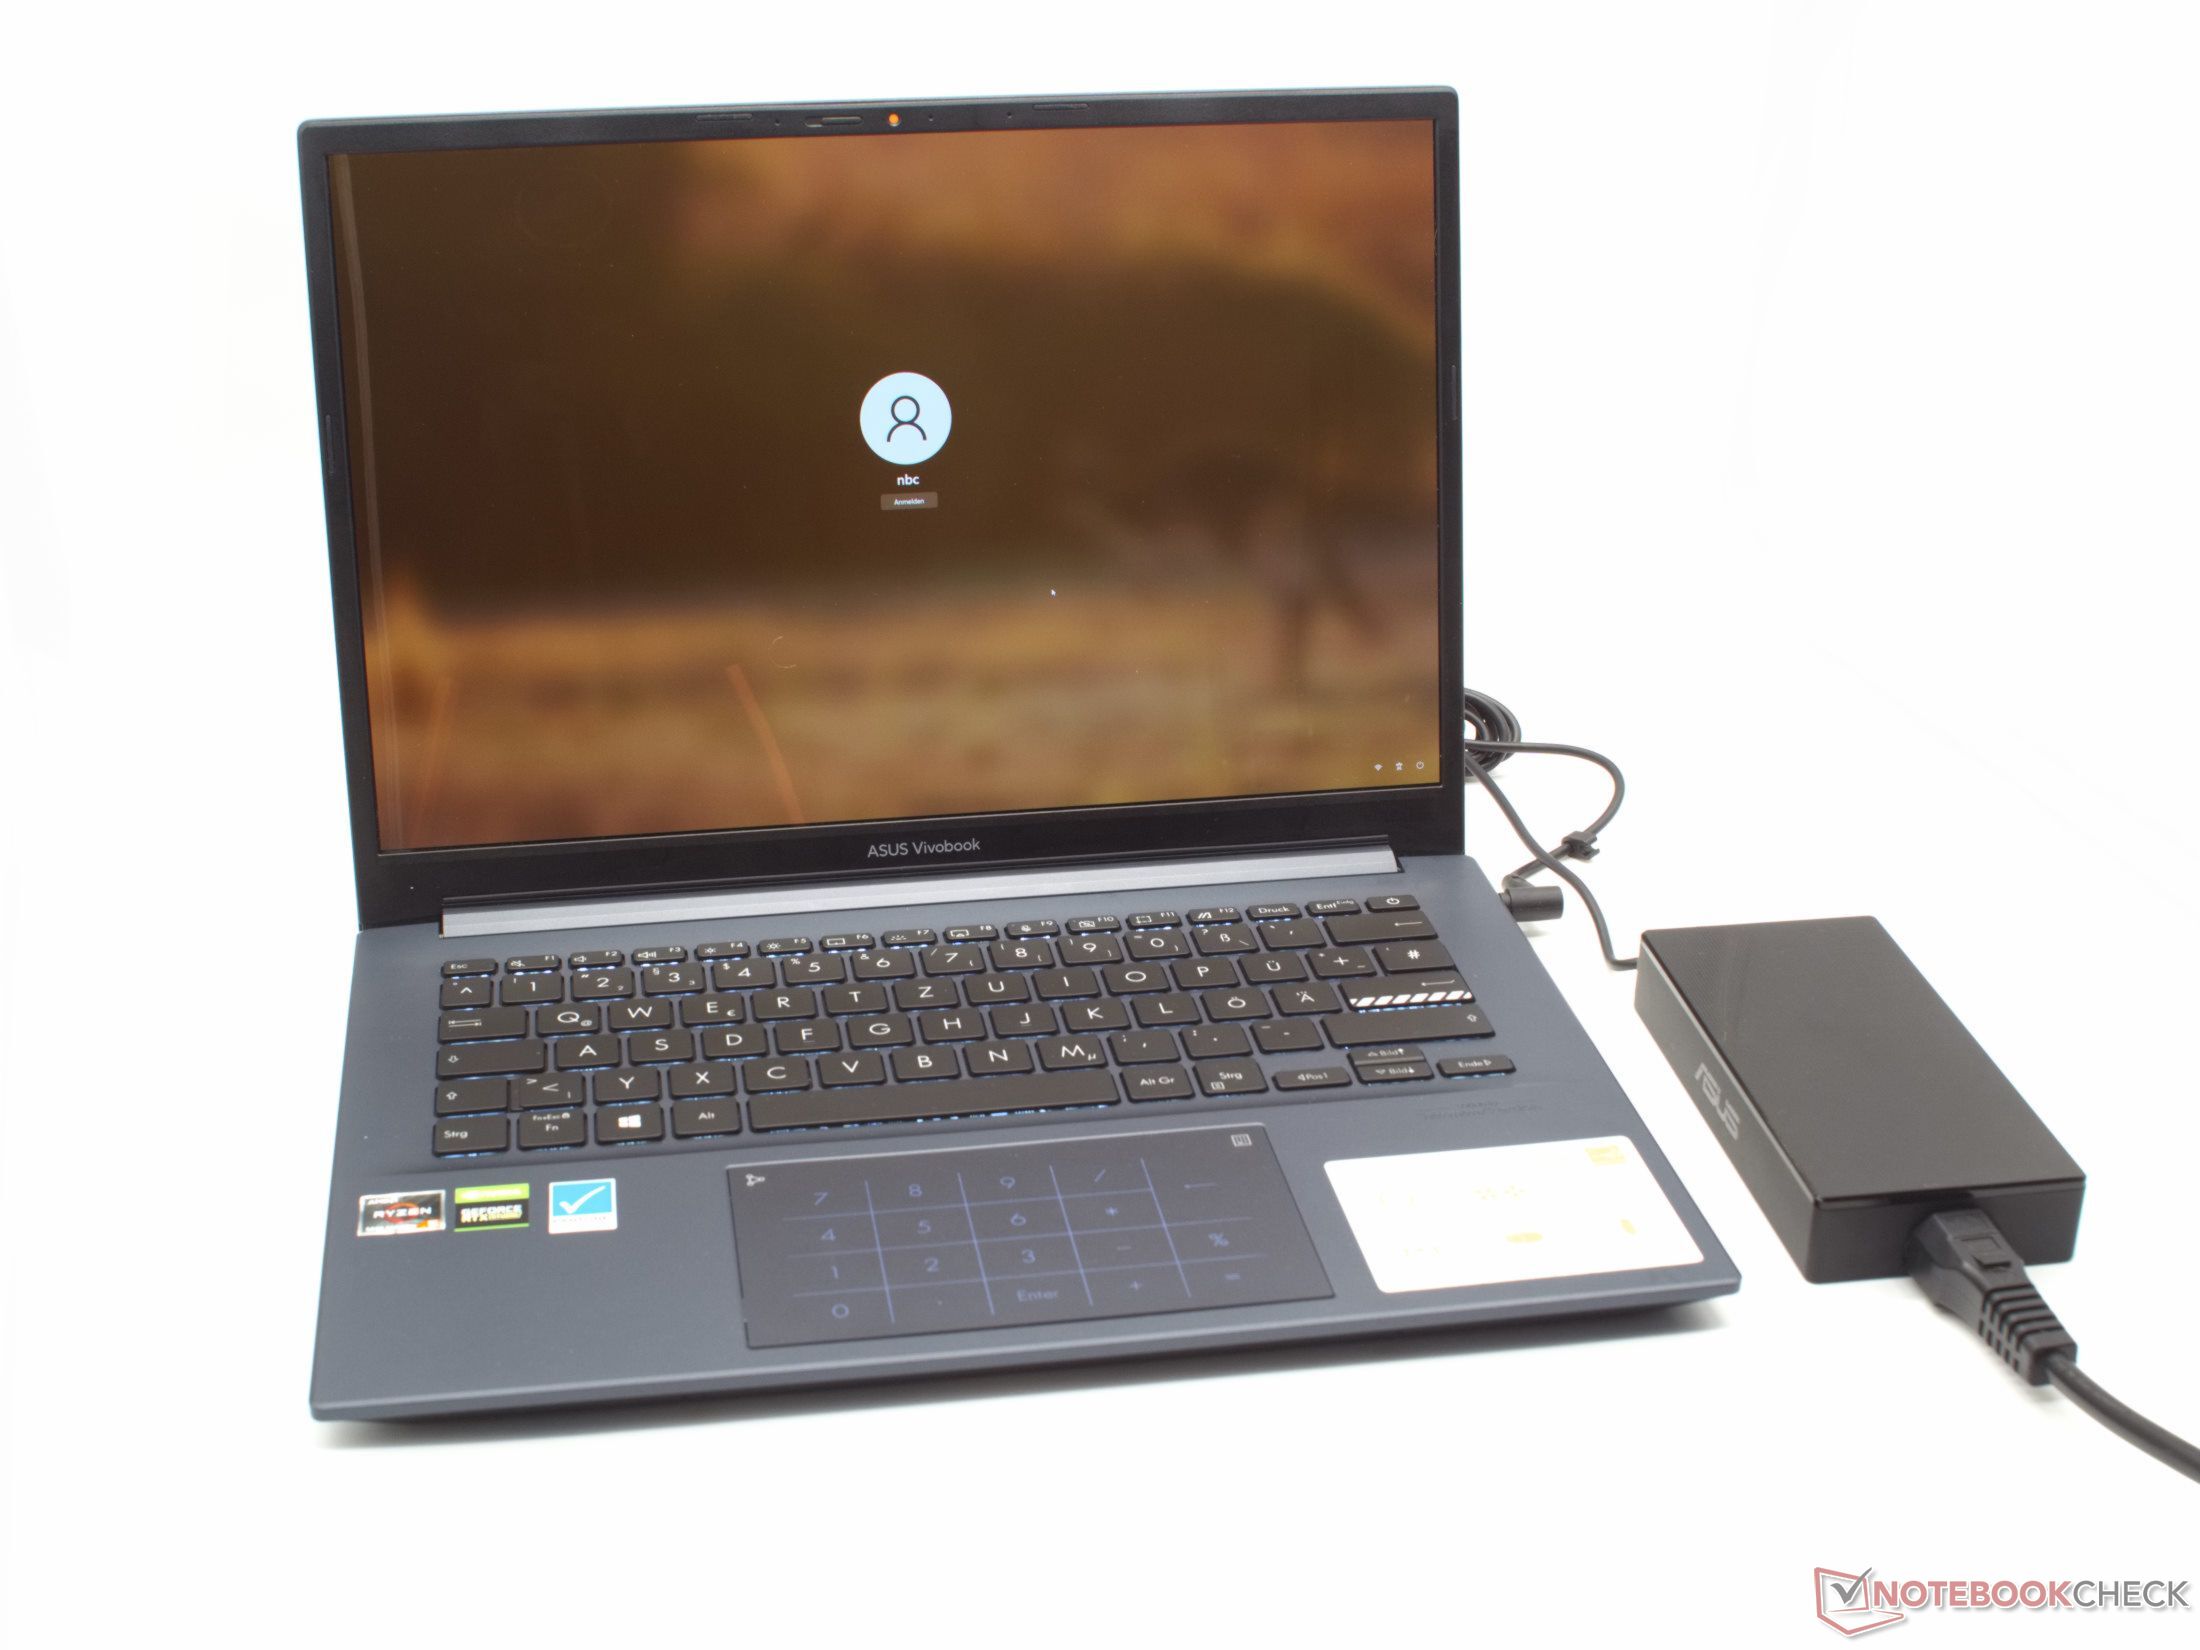
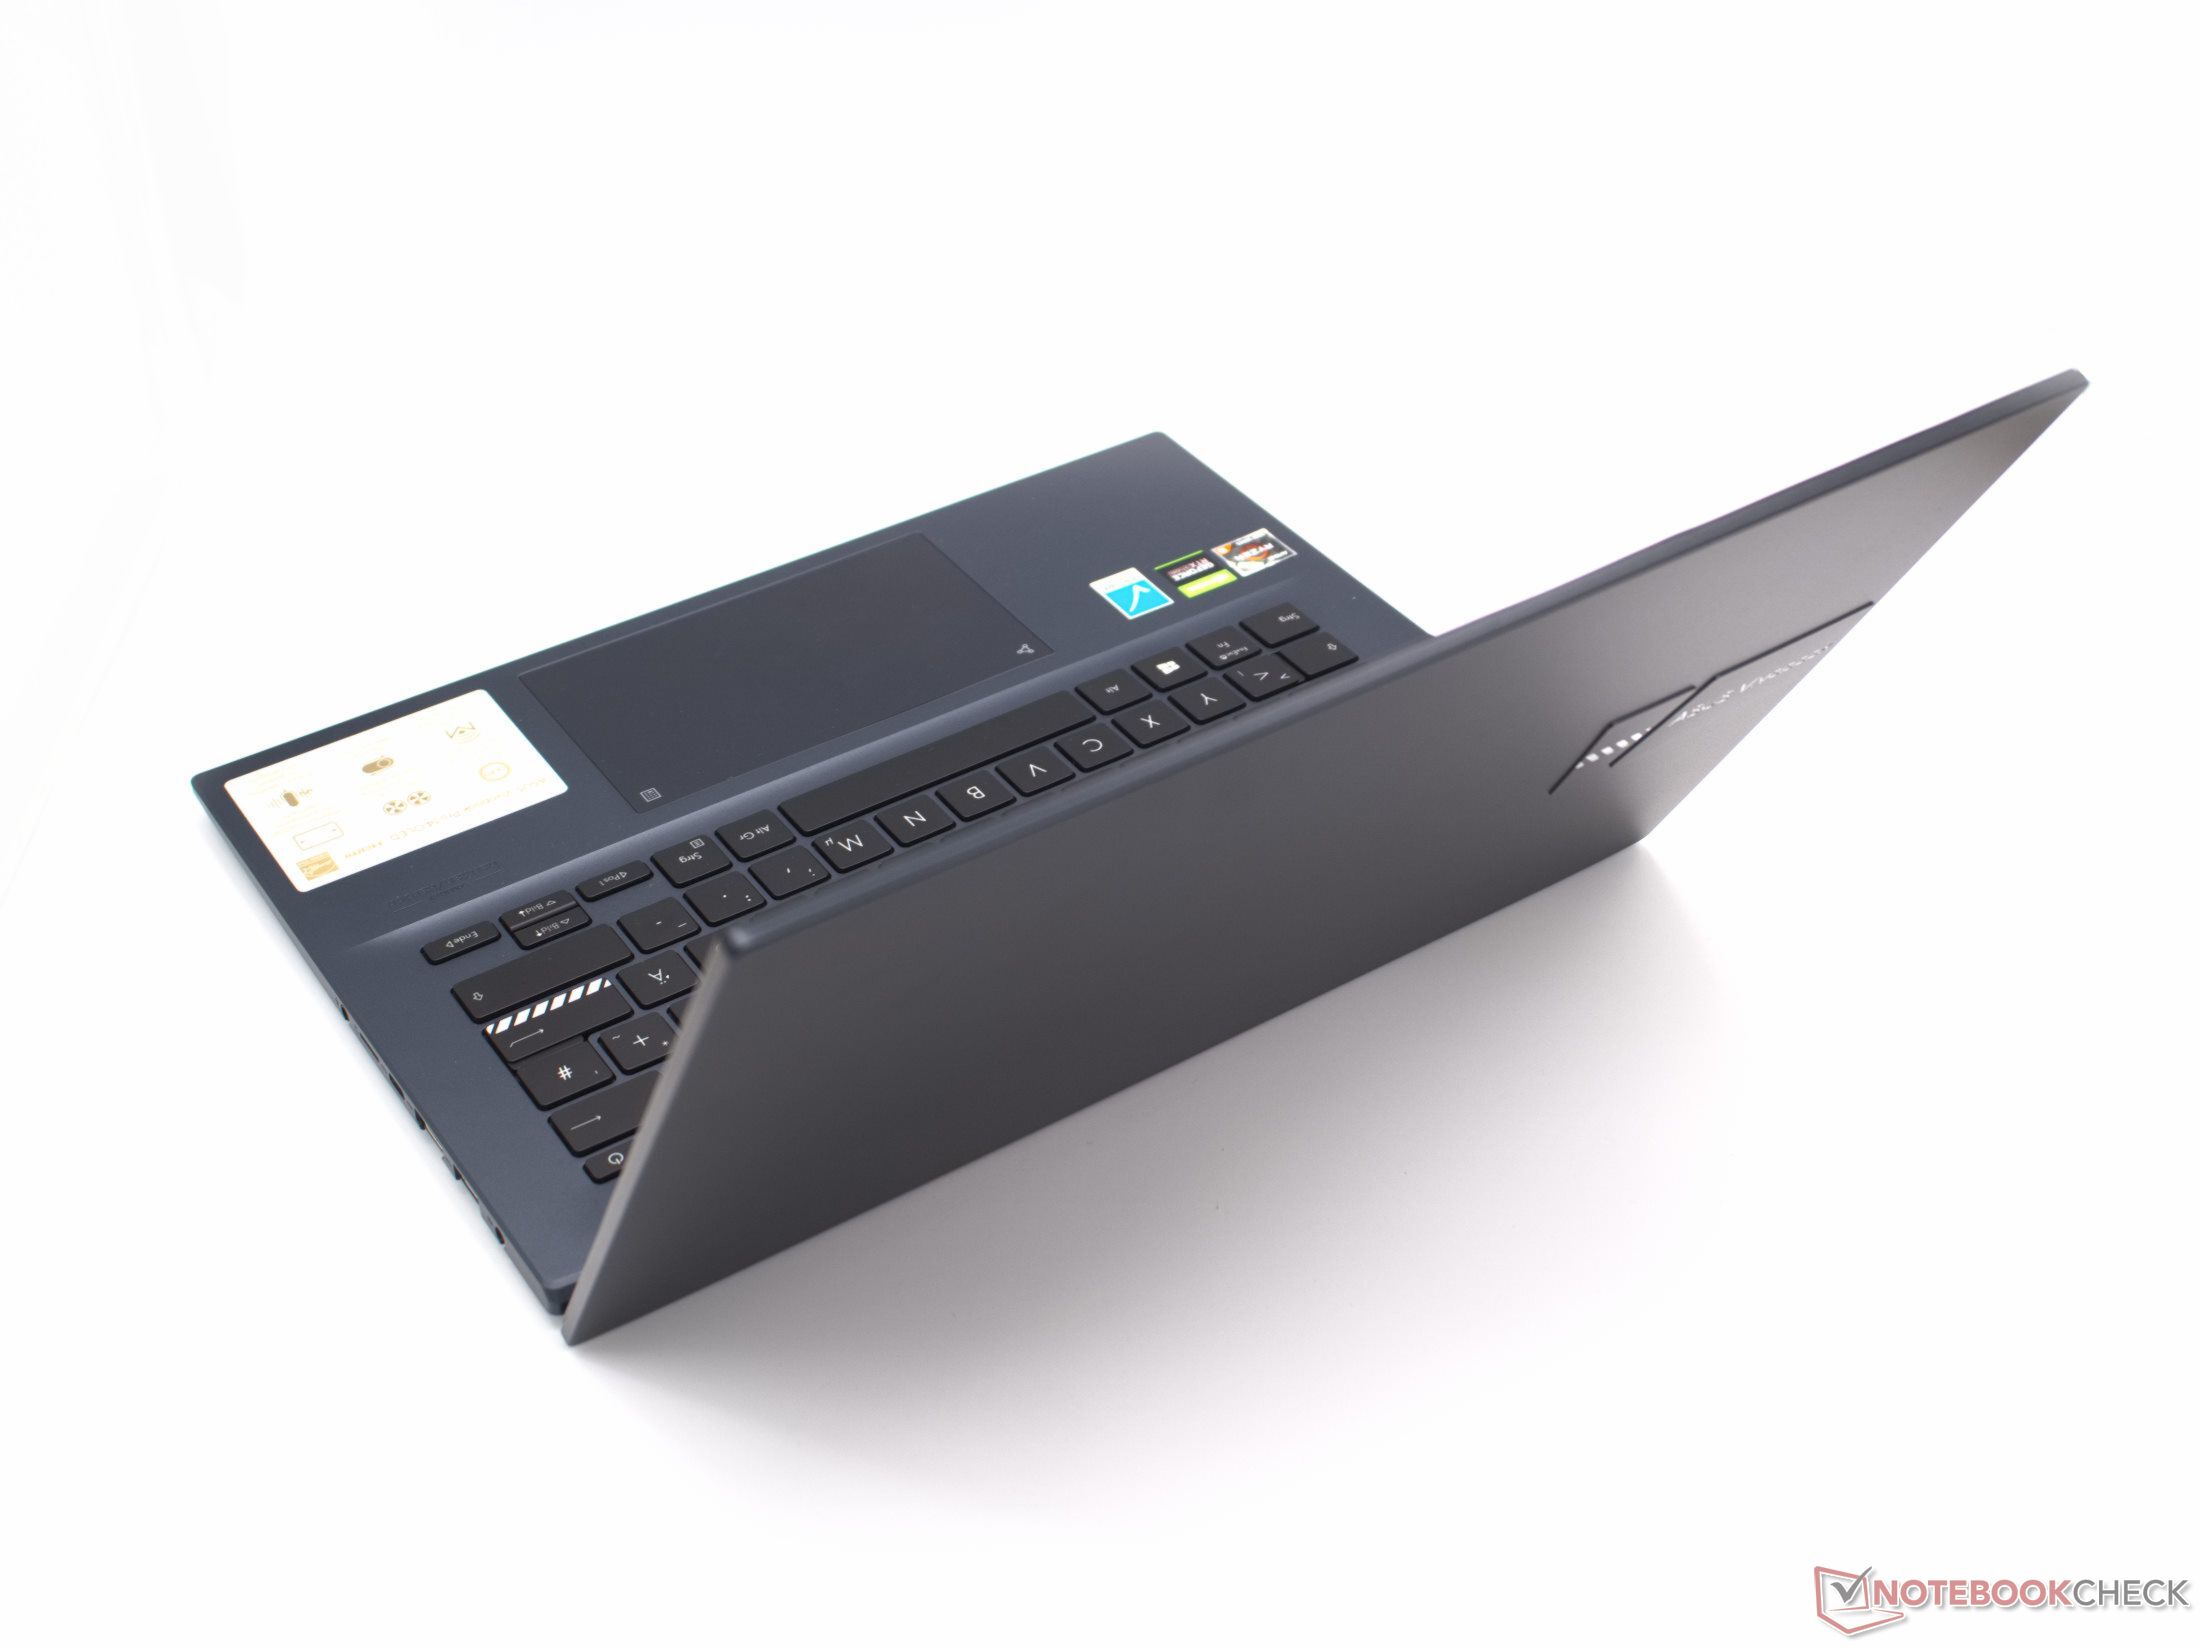
VivoBook 14的厚度为19毫米,重量为1.5公斤,对于一台多媒体笔记本电脑来说,它既不特别薄也不特别轻。但是,带有Ryzen 5和GeForce RTX 3050的强大计算硬件也需要适当的冷却。因此,与其他拥有dGPU的多媒体笔记本电脑相比,华硕的笔记本电脑处于中场位置。
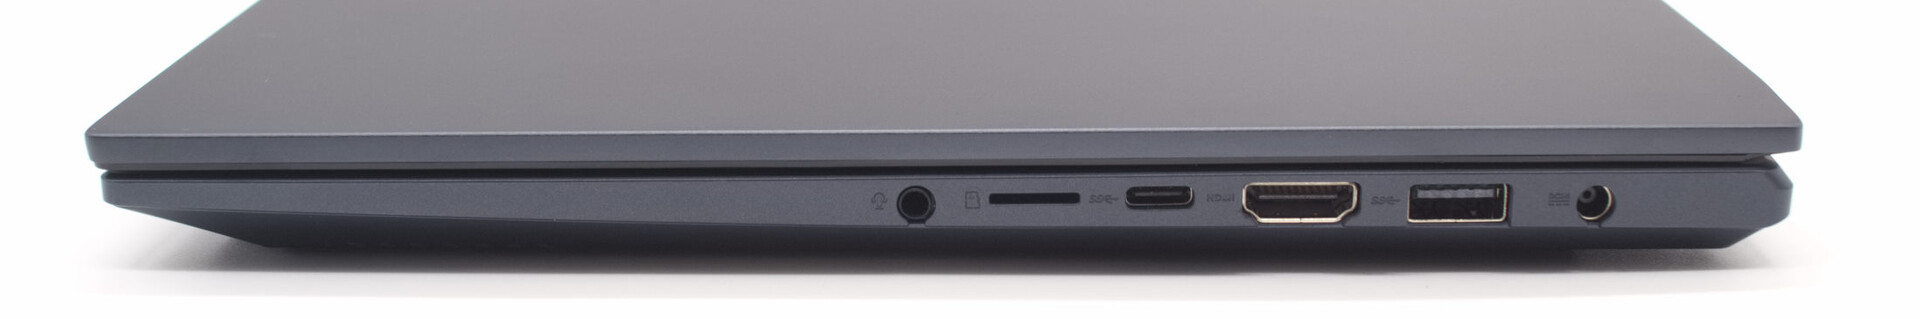
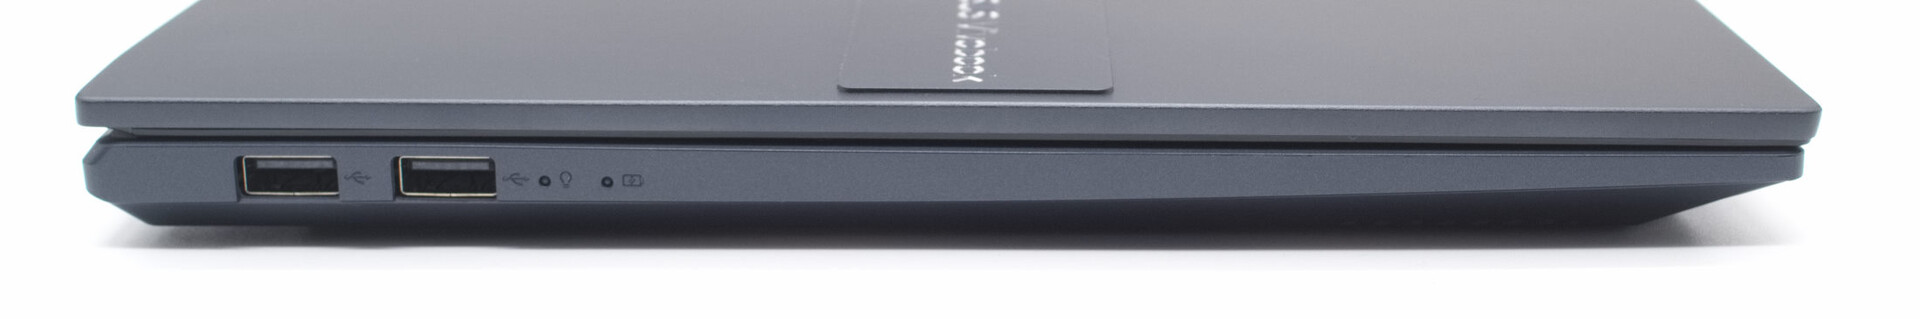
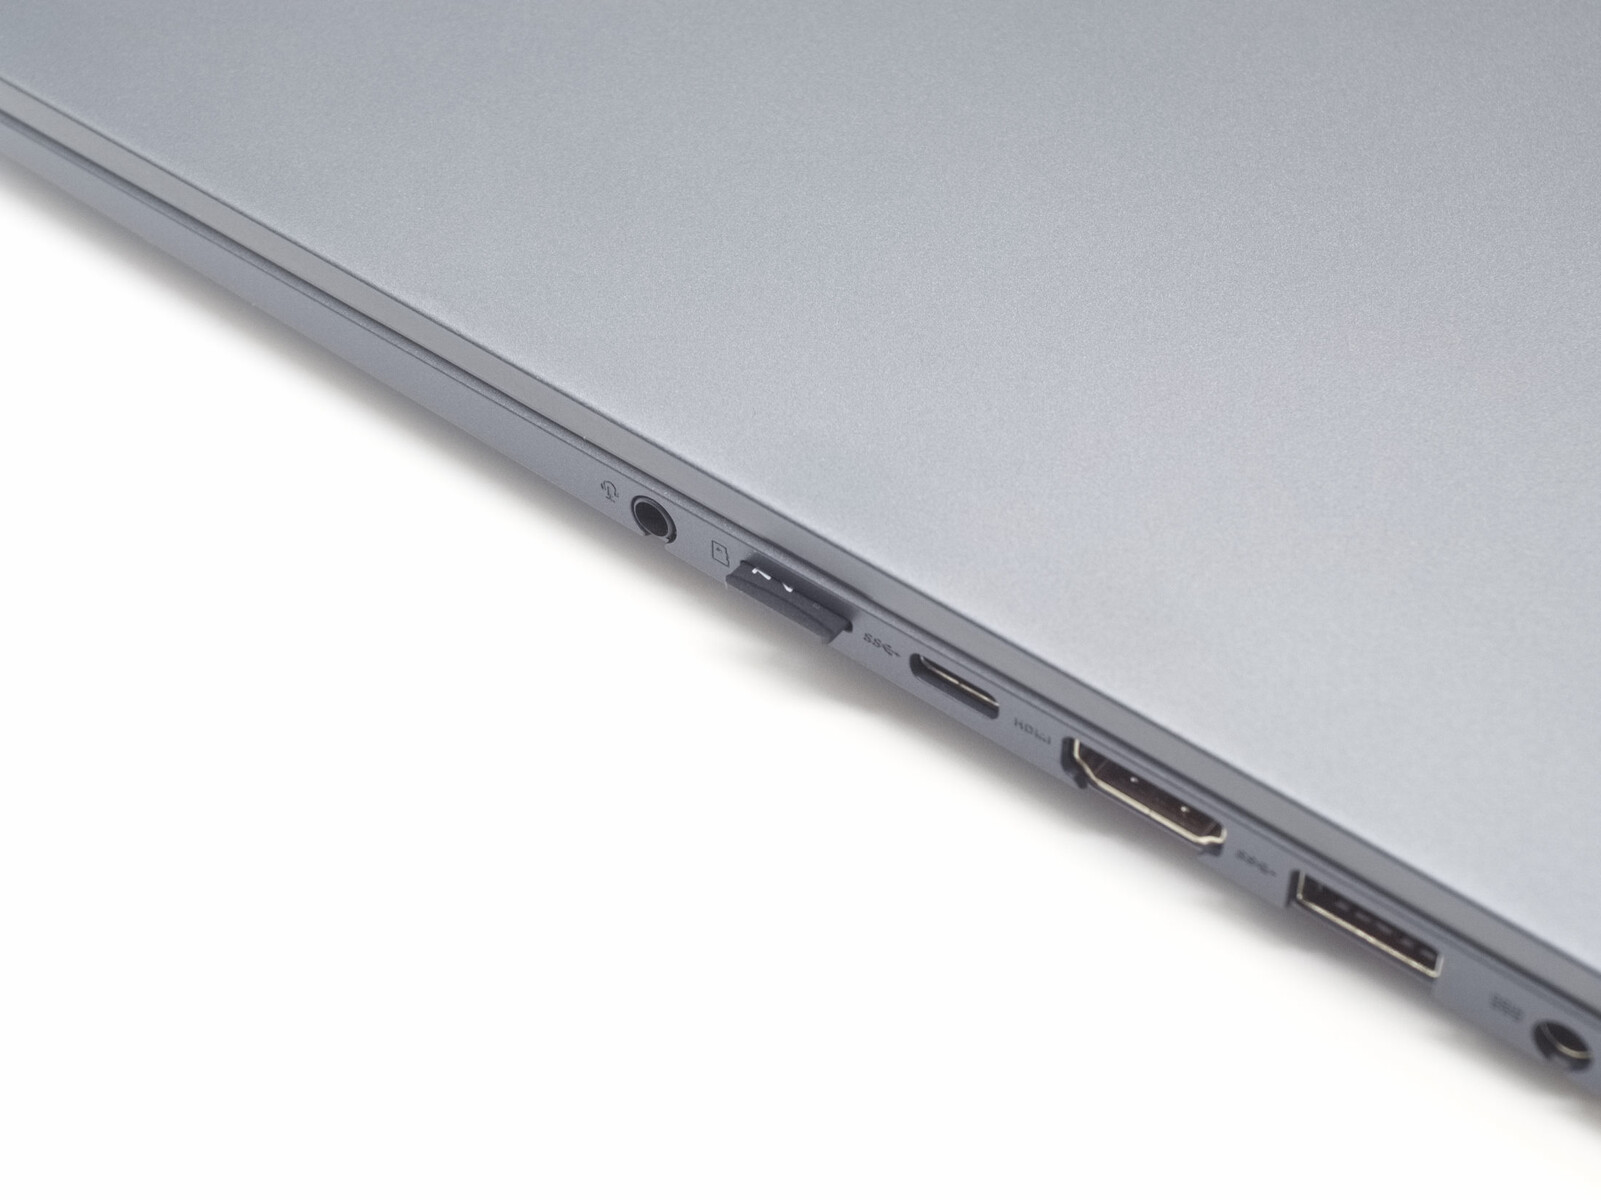
连接性--只有不可缺少的东西
对于一台同样为媒体创作者准备的多媒体笔记本电脑来说,华硕VivoBook提供的快速端口数量相当少。我们发现左侧有两个USB 2.0 Type-A端口。在右侧,至少有一个USB Type-A和一个USB 3.1(5Gb/s)的USB-C端口。AMD处理器不支持Thunderbolt 4。另一方面,microSD读卡器只能通过USB 2.0连接。归根结底,VivoBook缺乏真正快速传输数据的可能性。
微型SD卡读卡器
由于USB 2.0的连接,即使是快速的AV PRO microSD 128 GB V60参考卡也不能提供高的数据传输速度。然而,读卡器也仍然远远低于USB 2.0的最高速度(480 Mb/s),最高速度为304.8 Mb/s。MicroSD卡也不能完全插入读卡器中。
| SD Card Reader | |
| average JPG Copy Test (av. of 3 runs) | |
| Average of class Multimedia (23 - 531, n=37, last 2 years) | |
| Asus Zenbook Pro 15 OLED UM535Q (Toshiba Exceria Pro SDXC 64 GB UHS-II) | |
| Schenker Vision 14 (Angelbird AV Pro V60) | |
| Asus Vivobook Pro 14 M3401QC-KM007T (AV Pro SD microSD 128 GB V60) | |
| MSI Modern 14 B11SB-085 (Toshiba Exceria Pro M501 microSDXC 64GB) | |
| maximum AS SSD Seq Read Test (1GB) | |
| Average of class Multimedia (37.3 - 1455, n=36, last 2 years) | |
| Schenker Vision 14 (Angelbird AV Pro V60) | |
| Asus Zenbook Pro 15 OLED UM535Q (Toshiba Exceria Pro SDXC 64 GB UHS-II) | |
| Asus Vivobook Pro 14 M3401QC-KM007T (AV Pro SD microSD 128 GB V60) | |
| MSI Modern 14 B11SB-085 (Toshiba Exceria Pro M501 microSDXC 64GB) | |
沟通
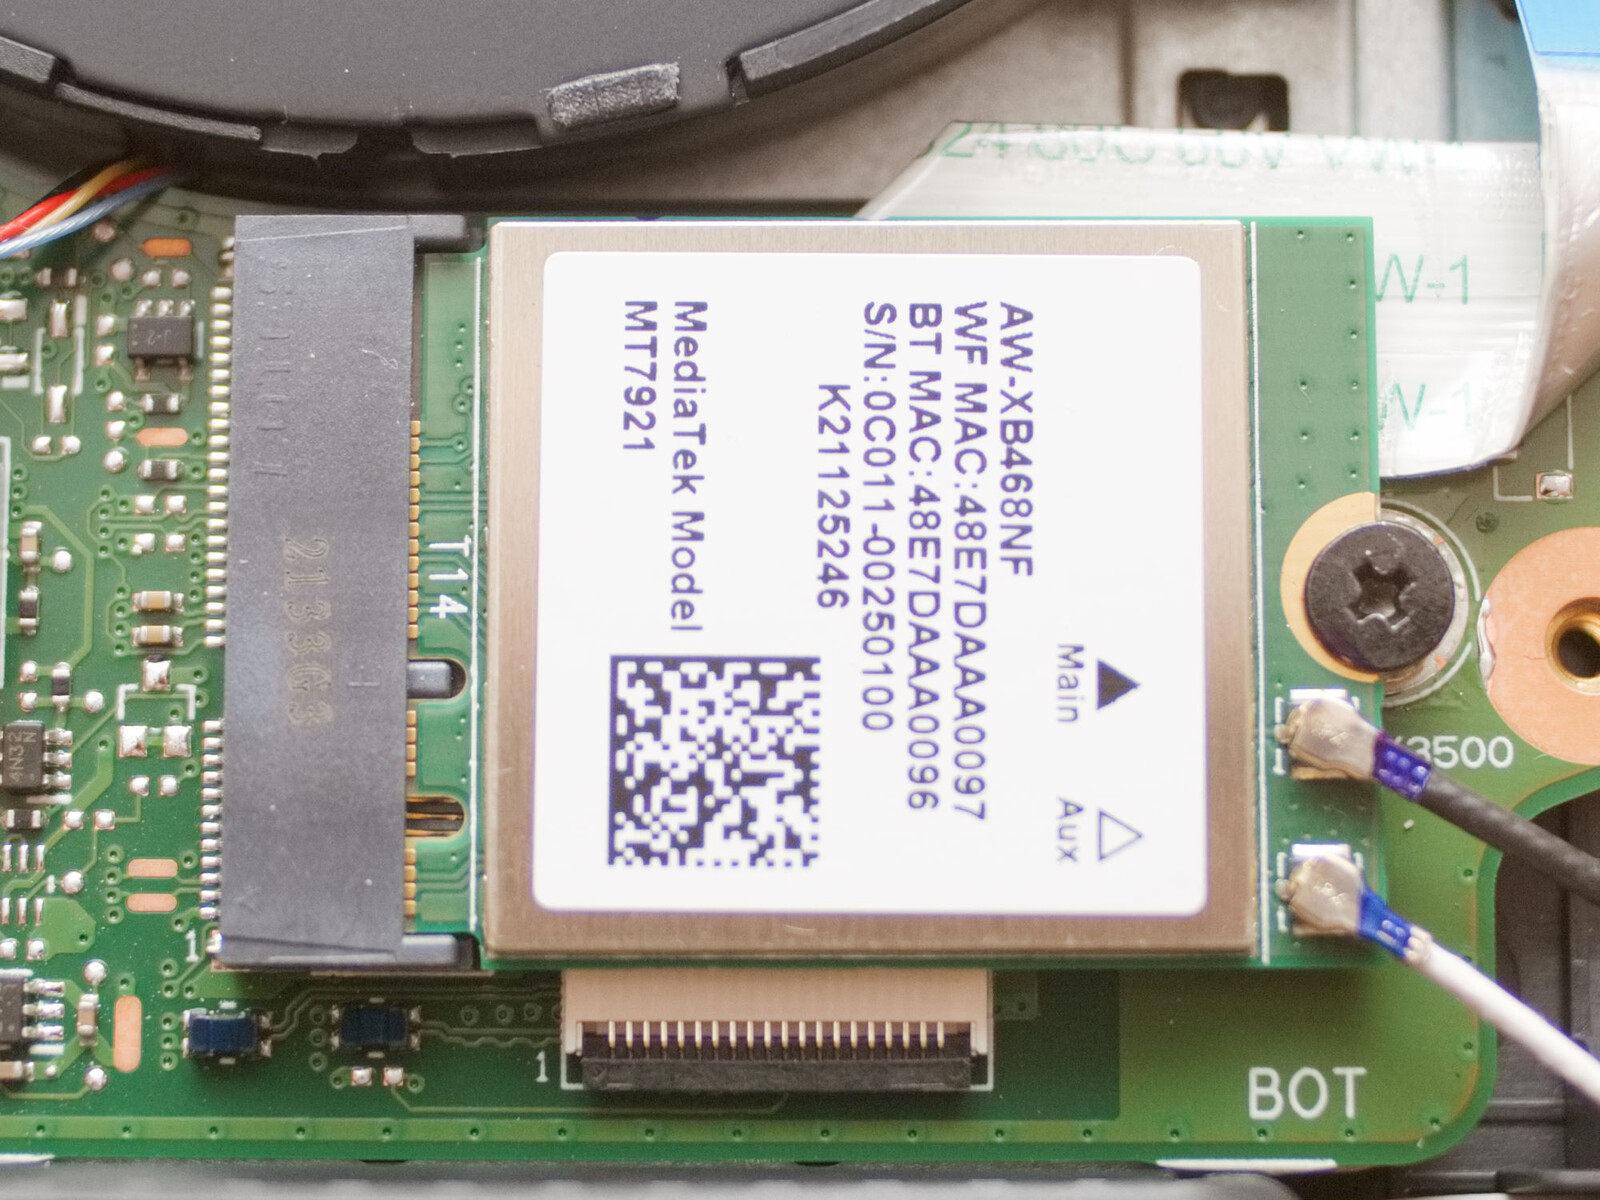
在Wi-Fi测试中,大型金属外壳部件会对笔记本电脑的传输速率产生负面影响。这也表明,华硕VivoBook不一定会有最高的Wi-Fi传输速率。然而,对于联发科MT7921 Wi-Fi模块来说,发送和接收的速率分别为950和920 Mb/s,仍然相当不错。发送和接收速度显然高于这里廉价模块的平均性能。
| Networking | |
| iperf3 transmit AX12 | |
| Microsoft Surface Laptop Studio i7 RTX 3050 Ti | |
| Schenker Vision 14 | |
| MSI Modern 14 B11SB-085 | |
| Acer Swift 3X SF314-510G-70DW | |
| Acer Swift X SFX14-41G-R7F3 | |
| Average MediaTek MT7921 (548 - 985, n=16) | |
| Asus Zenbook Pro 15 OLED UM535Q | |
| iperf3 receive AX12 | |
| Schenker Vision 14 | |
| Acer Swift 3X SF314-510G-70DW | |
| MSI Modern 14 B11SB-085 | |
| Microsoft Surface Laptop Studio i7 RTX 3050 Ti | |
| Asus Zenbook Pro 15 OLED UM535Q | |
| Average MediaTek MT7921 (90 - 972, n=16) | |
| Acer Swift X SFX14-41G-R7F3 | |
| iperf3 receive AXE11000 6GHz | |
| Average of class Multimedia (1212 - 2361, n=23, last 2 years) | |
| Asus Vivobook Pro 14 M3401QC-KM007T | |
| Average MediaTek MT7921 (609 - 1245, n=5) | |
| iperf3 transmit AXE11000 6GHz | |
| Average of class Multimedia (869 - 2373, n=23, last 2 years) | |
| Asus Vivobook Pro 14 M3401QC-KM007T | |
| Average MediaTek MT7921 (829 - 1116, n=5) | |
网络摄像头
0.9MP的网络摄像头只能在有限的范围内为你提供良好的图像。隐私快门是一个很好的功能,可以用来隐藏内置摄像头的镜头。


安全问题
根据规格表,华硕VivoBook Pro 14 OLED还拥有一个集成在电源按钮上的指纹传感器,此外,还提供了安全功能。 AMD Ryzen 5 5600H.然而,我们无法在测试中检查传感器的功能,因为Windows无法识别它。
辅料

除了通常的文件和电源适配器之外,VivoBook的交货范围中还包括一系列的贴纸。包装几乎完全没有塑料。只有一个小的密封贴纸在这里表明笔记本电脑的盒子是否已经被打开。
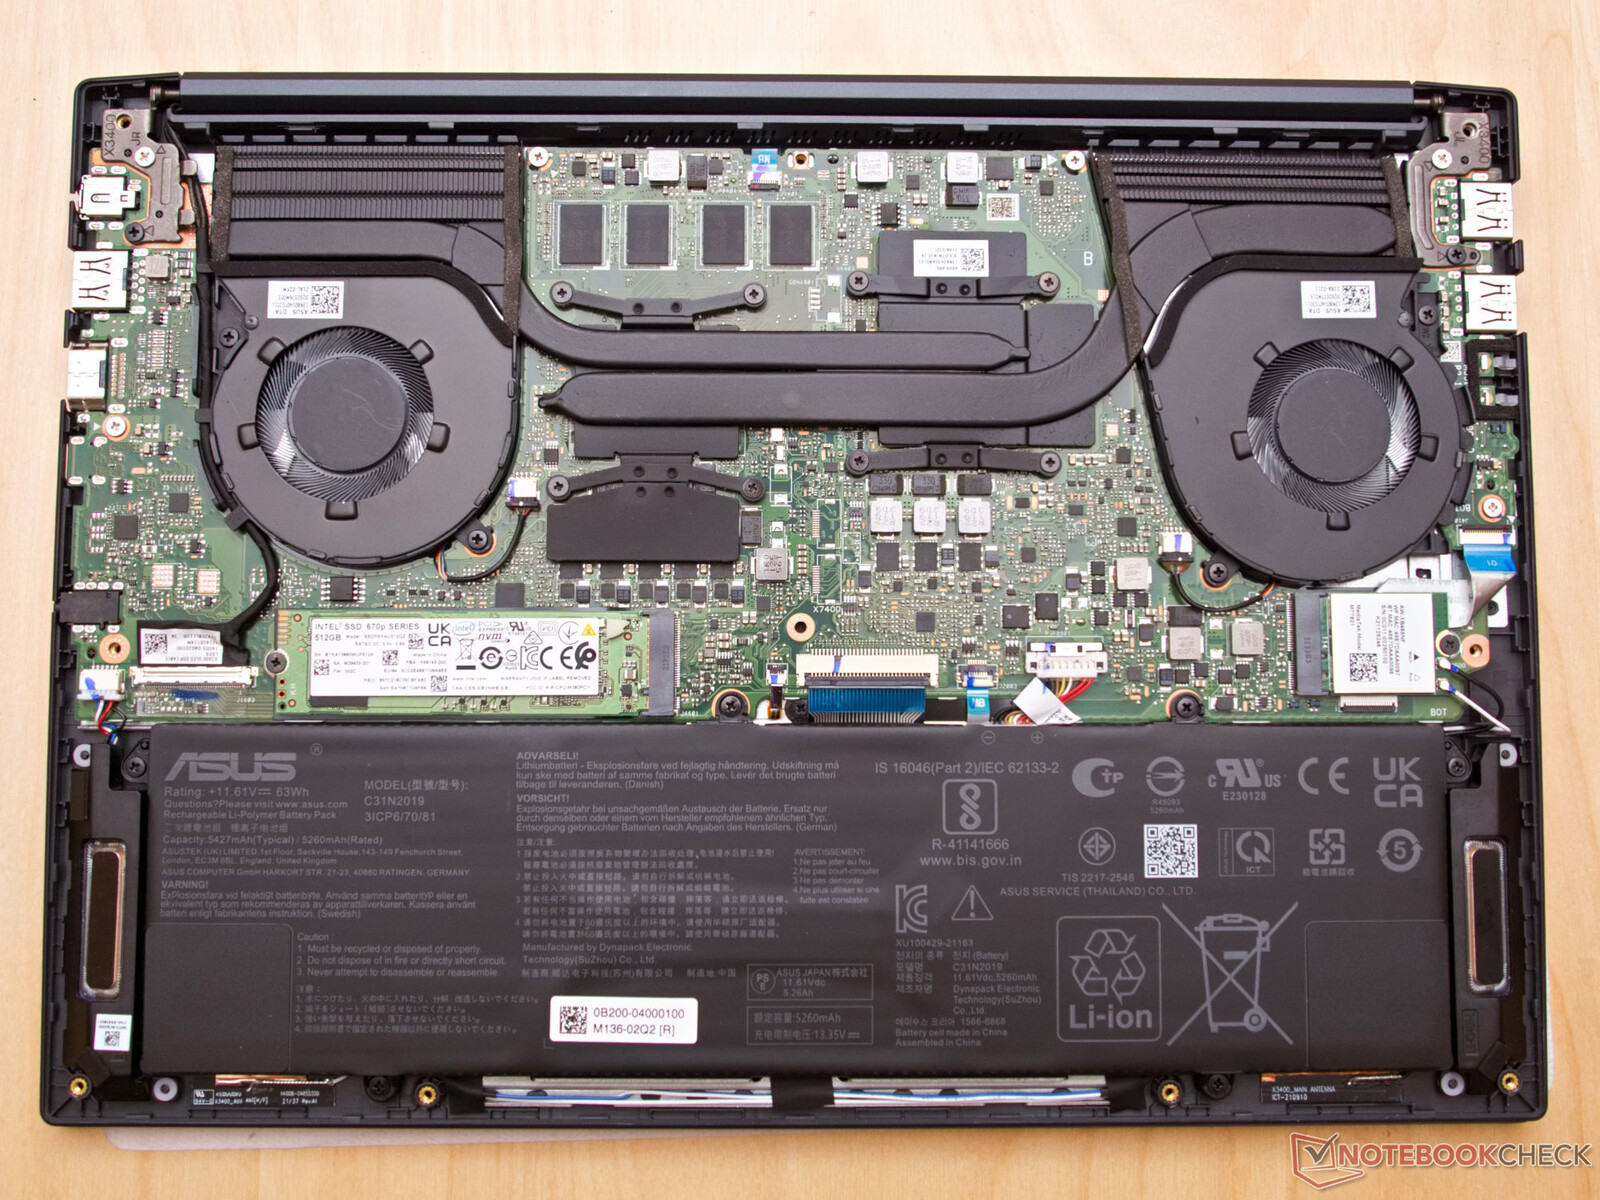
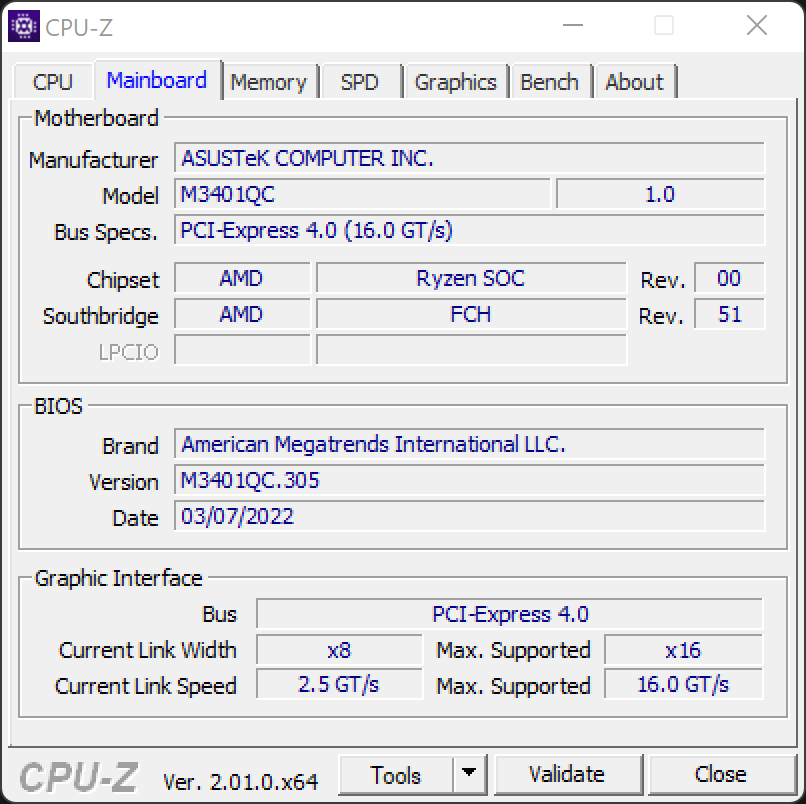
维护
九颗Torx 5螺丝将笔记本的底盖固定住。由于内存是焊接的,而且也没有第二个M.2插槽,这台笔记本电脑几乎无法升级。
担保
华硕在全球范围内为笔记本电脑提供自购买之日起36个月或24个月的保修。电池的保修期为12个月。其中一个标签显示,笔记本电脑有36个月或24个月的保修期。这样一来,我们的测试设备就有24个月的保修期。
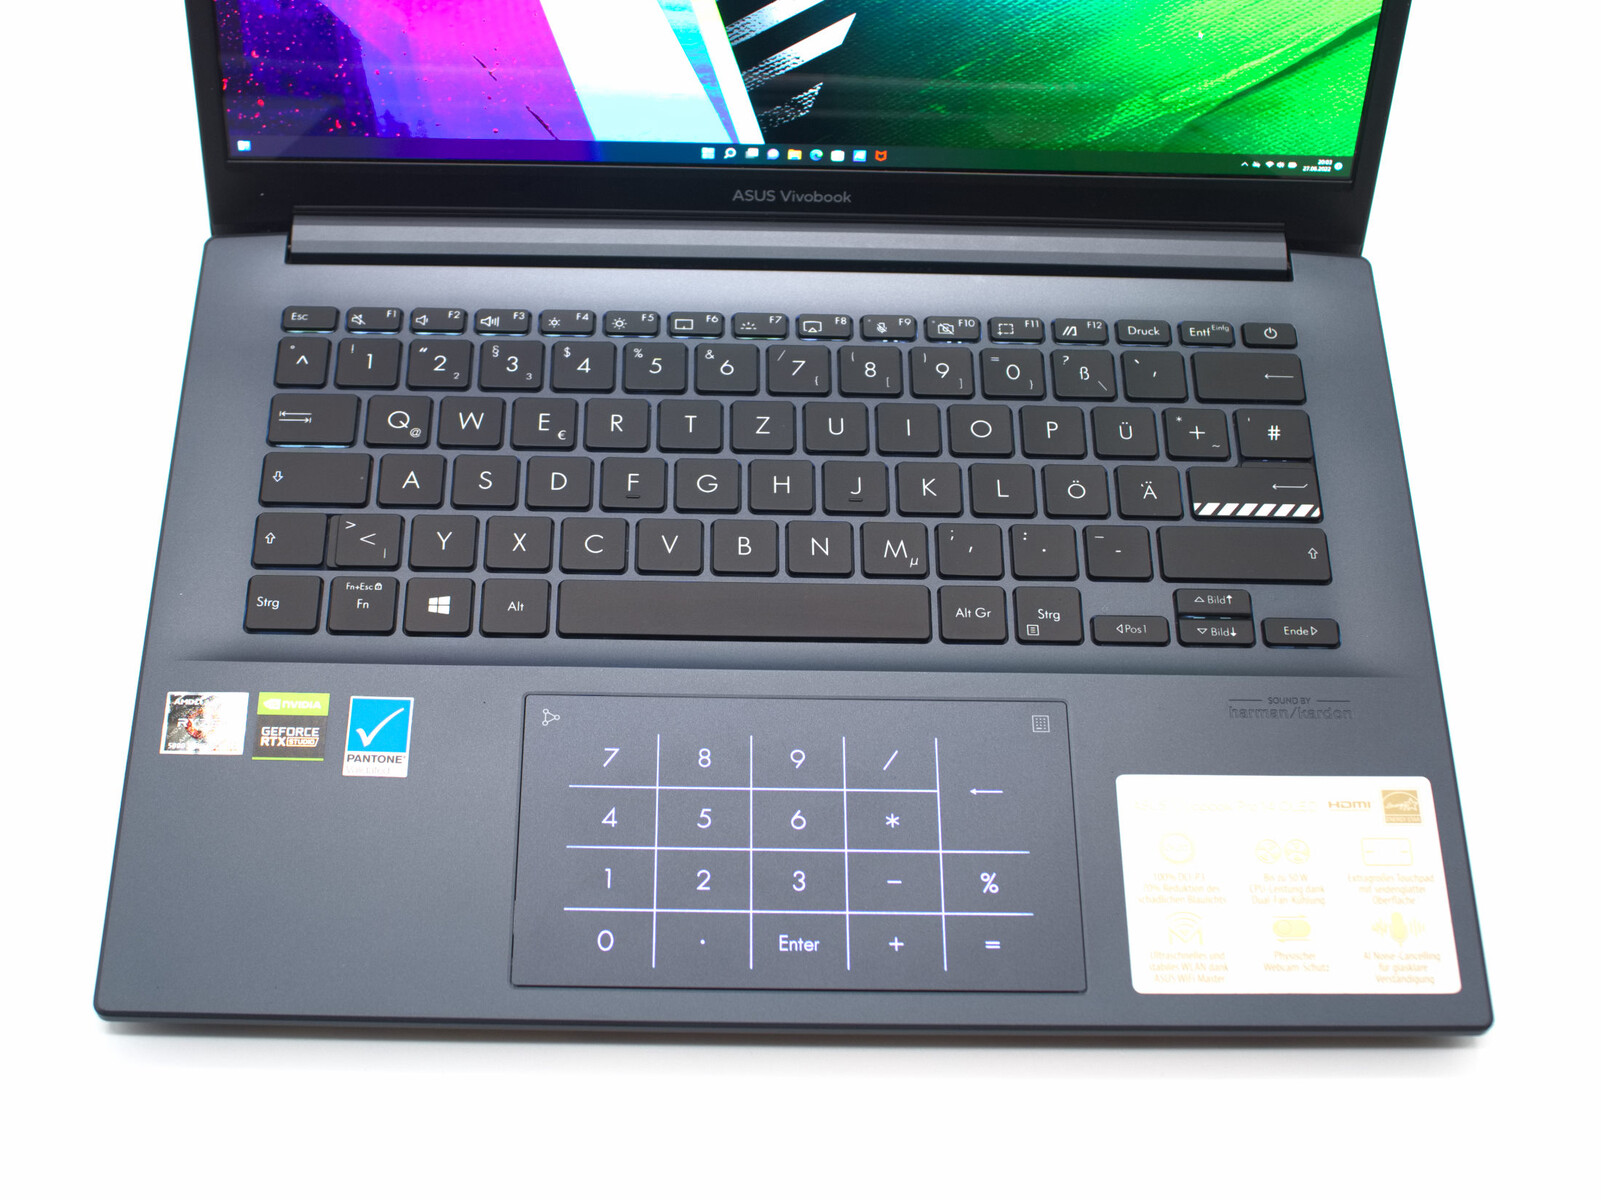
输入设备 - 触摸板中的Numpad
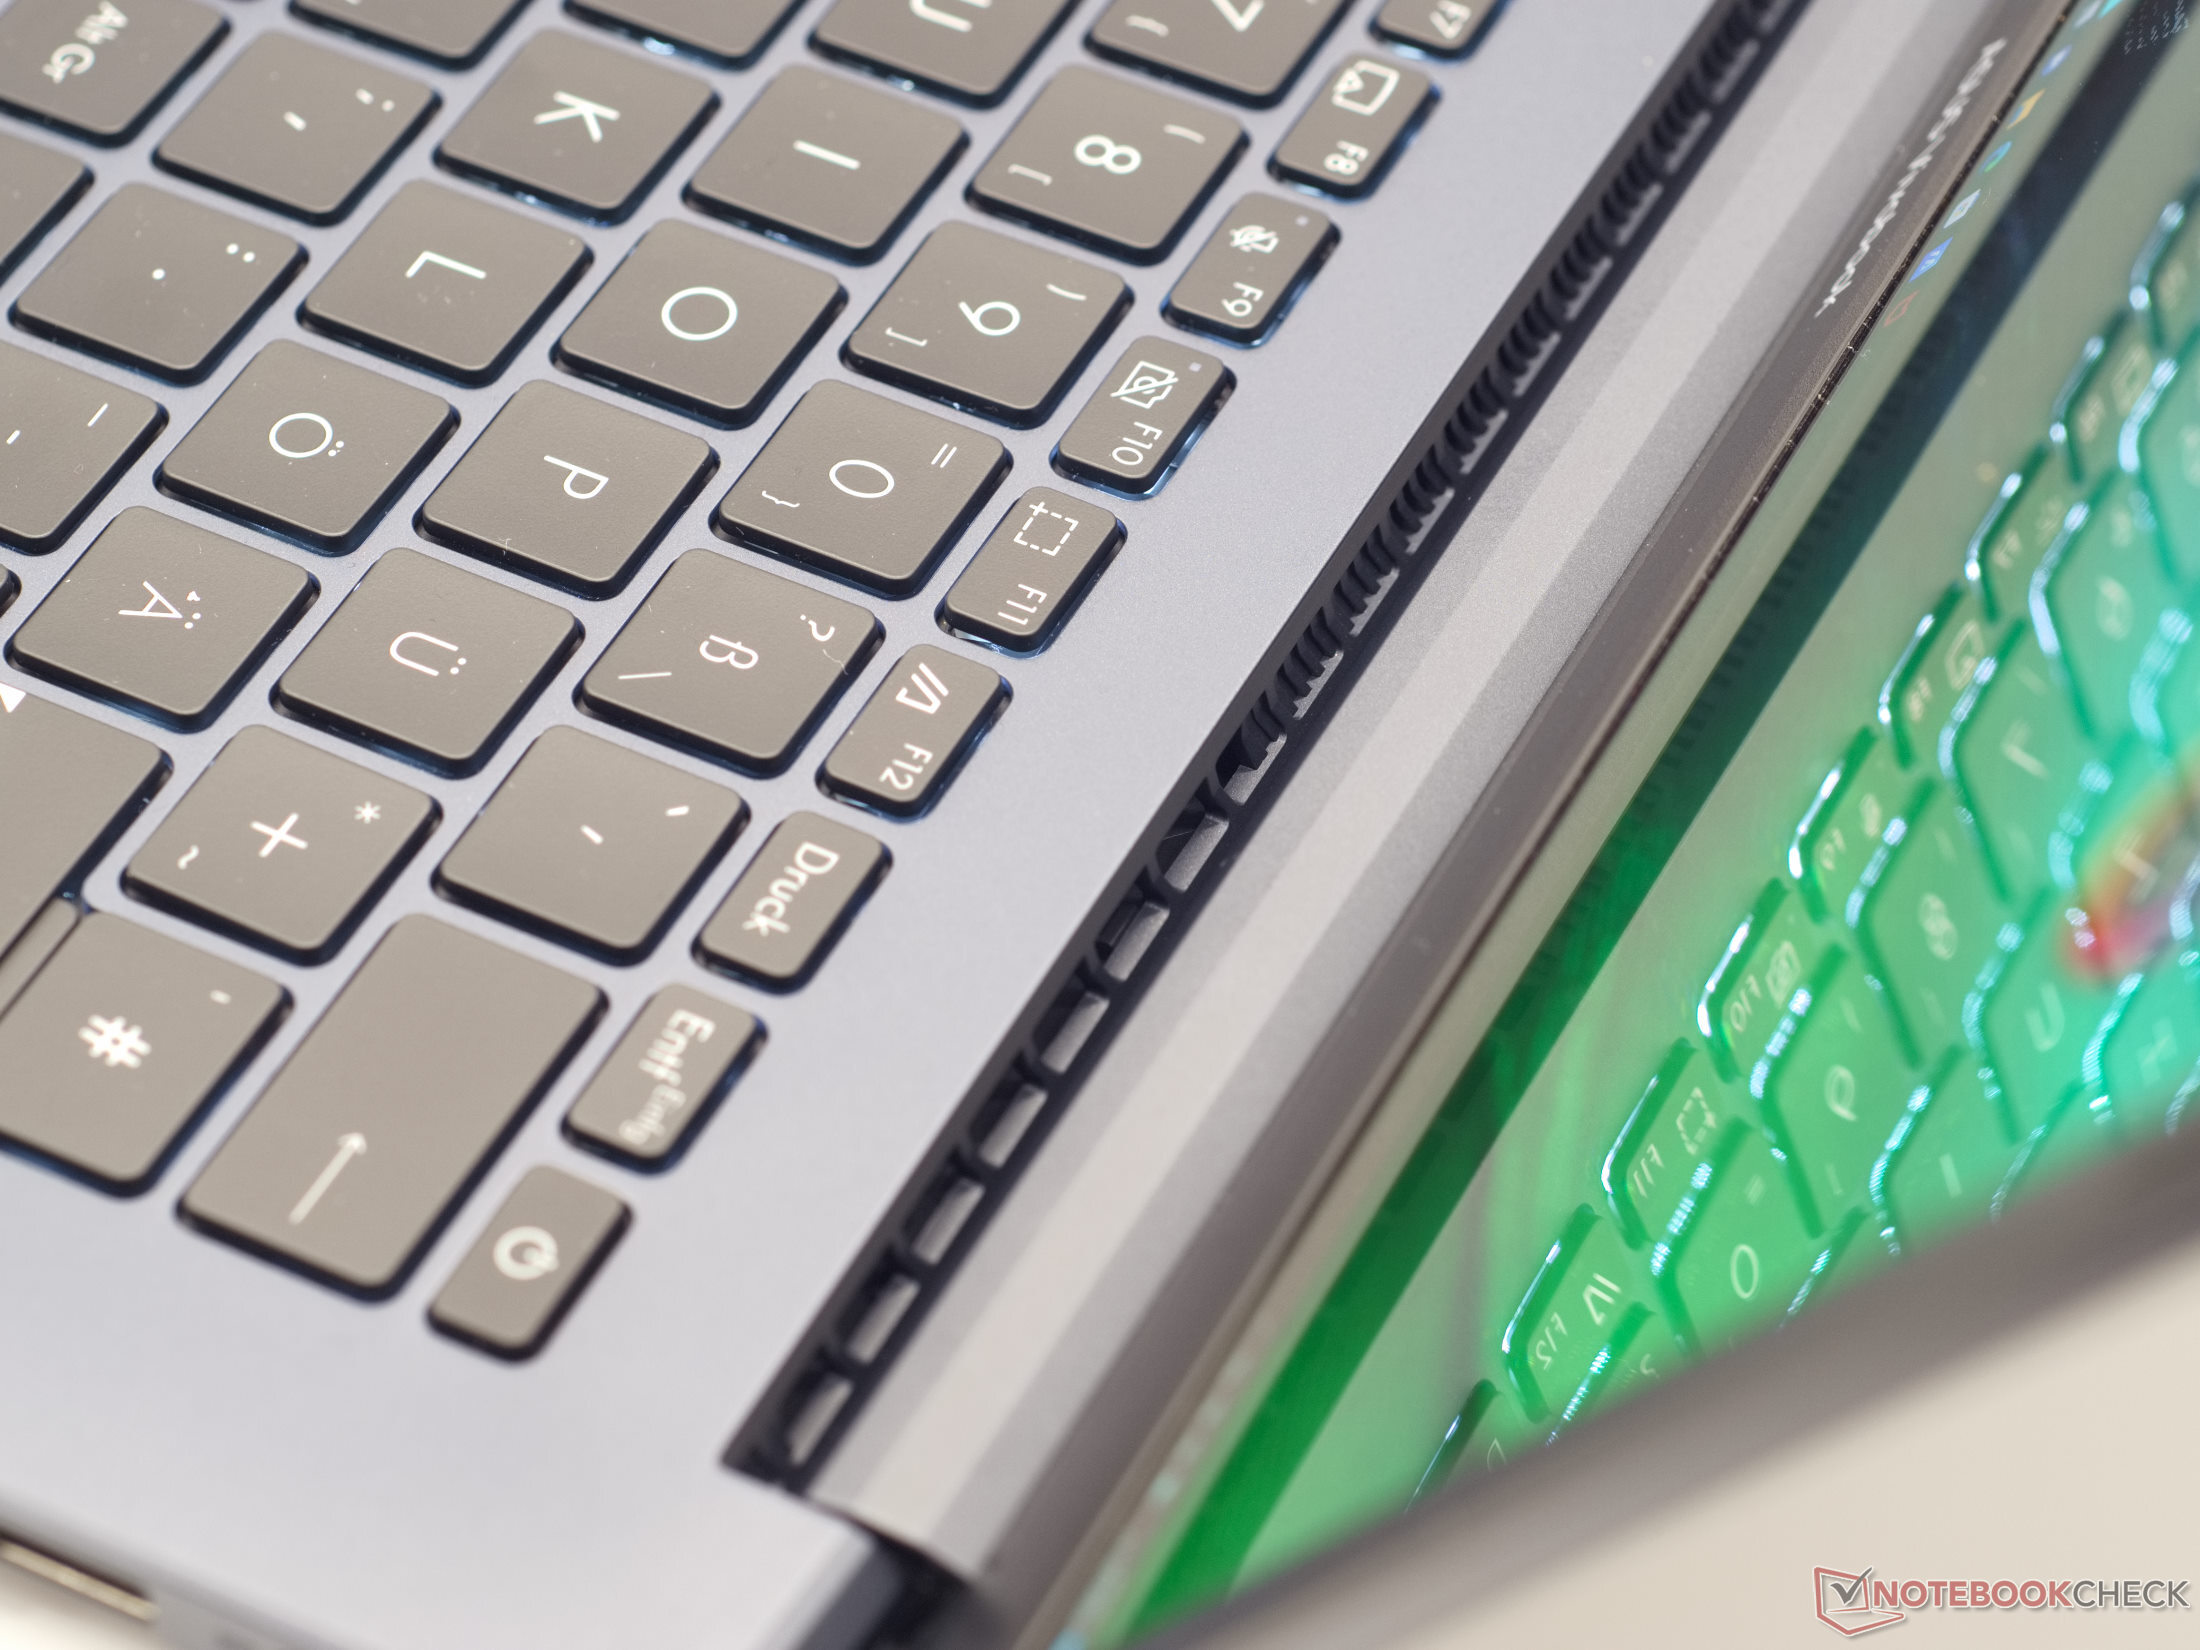
键盘
VivoBook Pro 14 OLED的背光键盘提供的打字体验几乎可以接受。这是由于其平庸的键程和适度的触觉反馈。然而,敲击键盘是令人愉快的安静,而且按键有良好的布局。
触摸板
像许多最近的华硕笔记本电脑一样,VivoBook Pro 14 OLED的触摸板上有一个隐藏的小键盘。一旦激活,它就会在黑色ClickPad后面亮起。鼠标控制仍然是可能的,但有些局限性,因为点击并不触发鼠标点击,而是在适用的地方输入一个符号。在实践中,虚拟数字键盘被证明在输入数据时很有帮助。
然而,由于其丝质的哑光和滑腻的表面,ClickPad可以做得更好一些。在这里你可以看到边缘有明显的缝隙,而且ClickPad感觉有点摇晃。这并没有导致鼠标控制方面的任何缺点。感觉上,输入被检测到并实施,没有延迟。
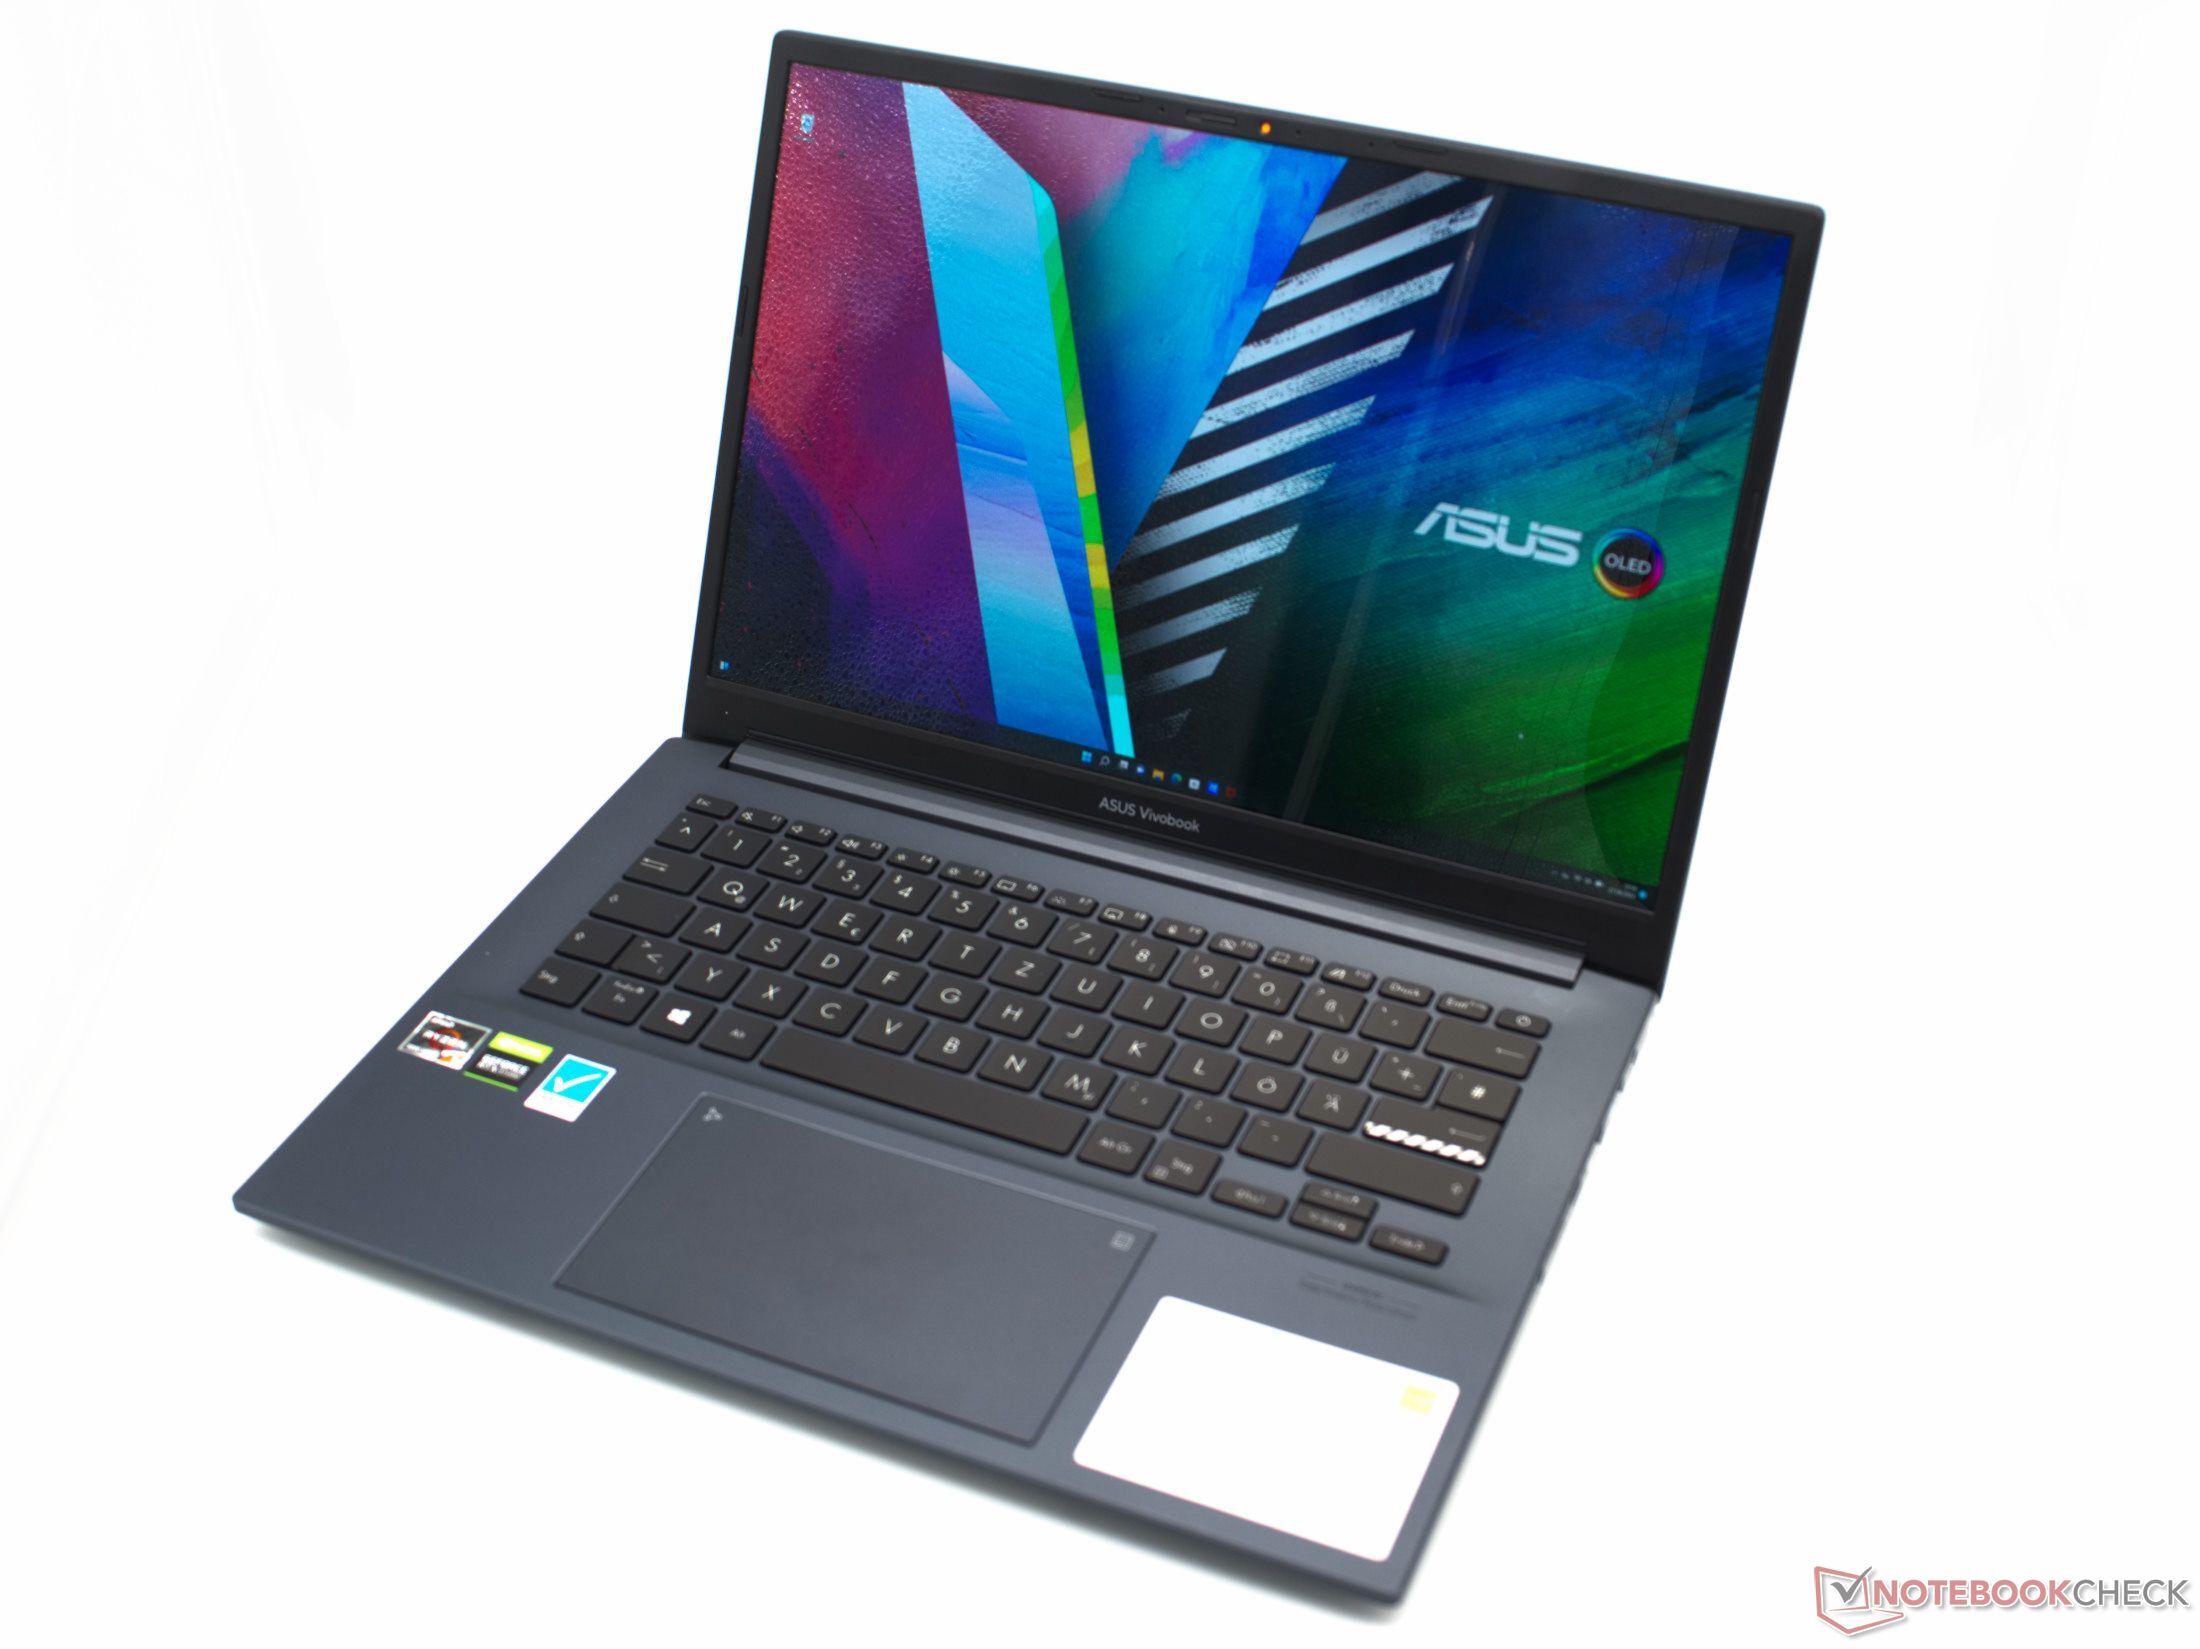
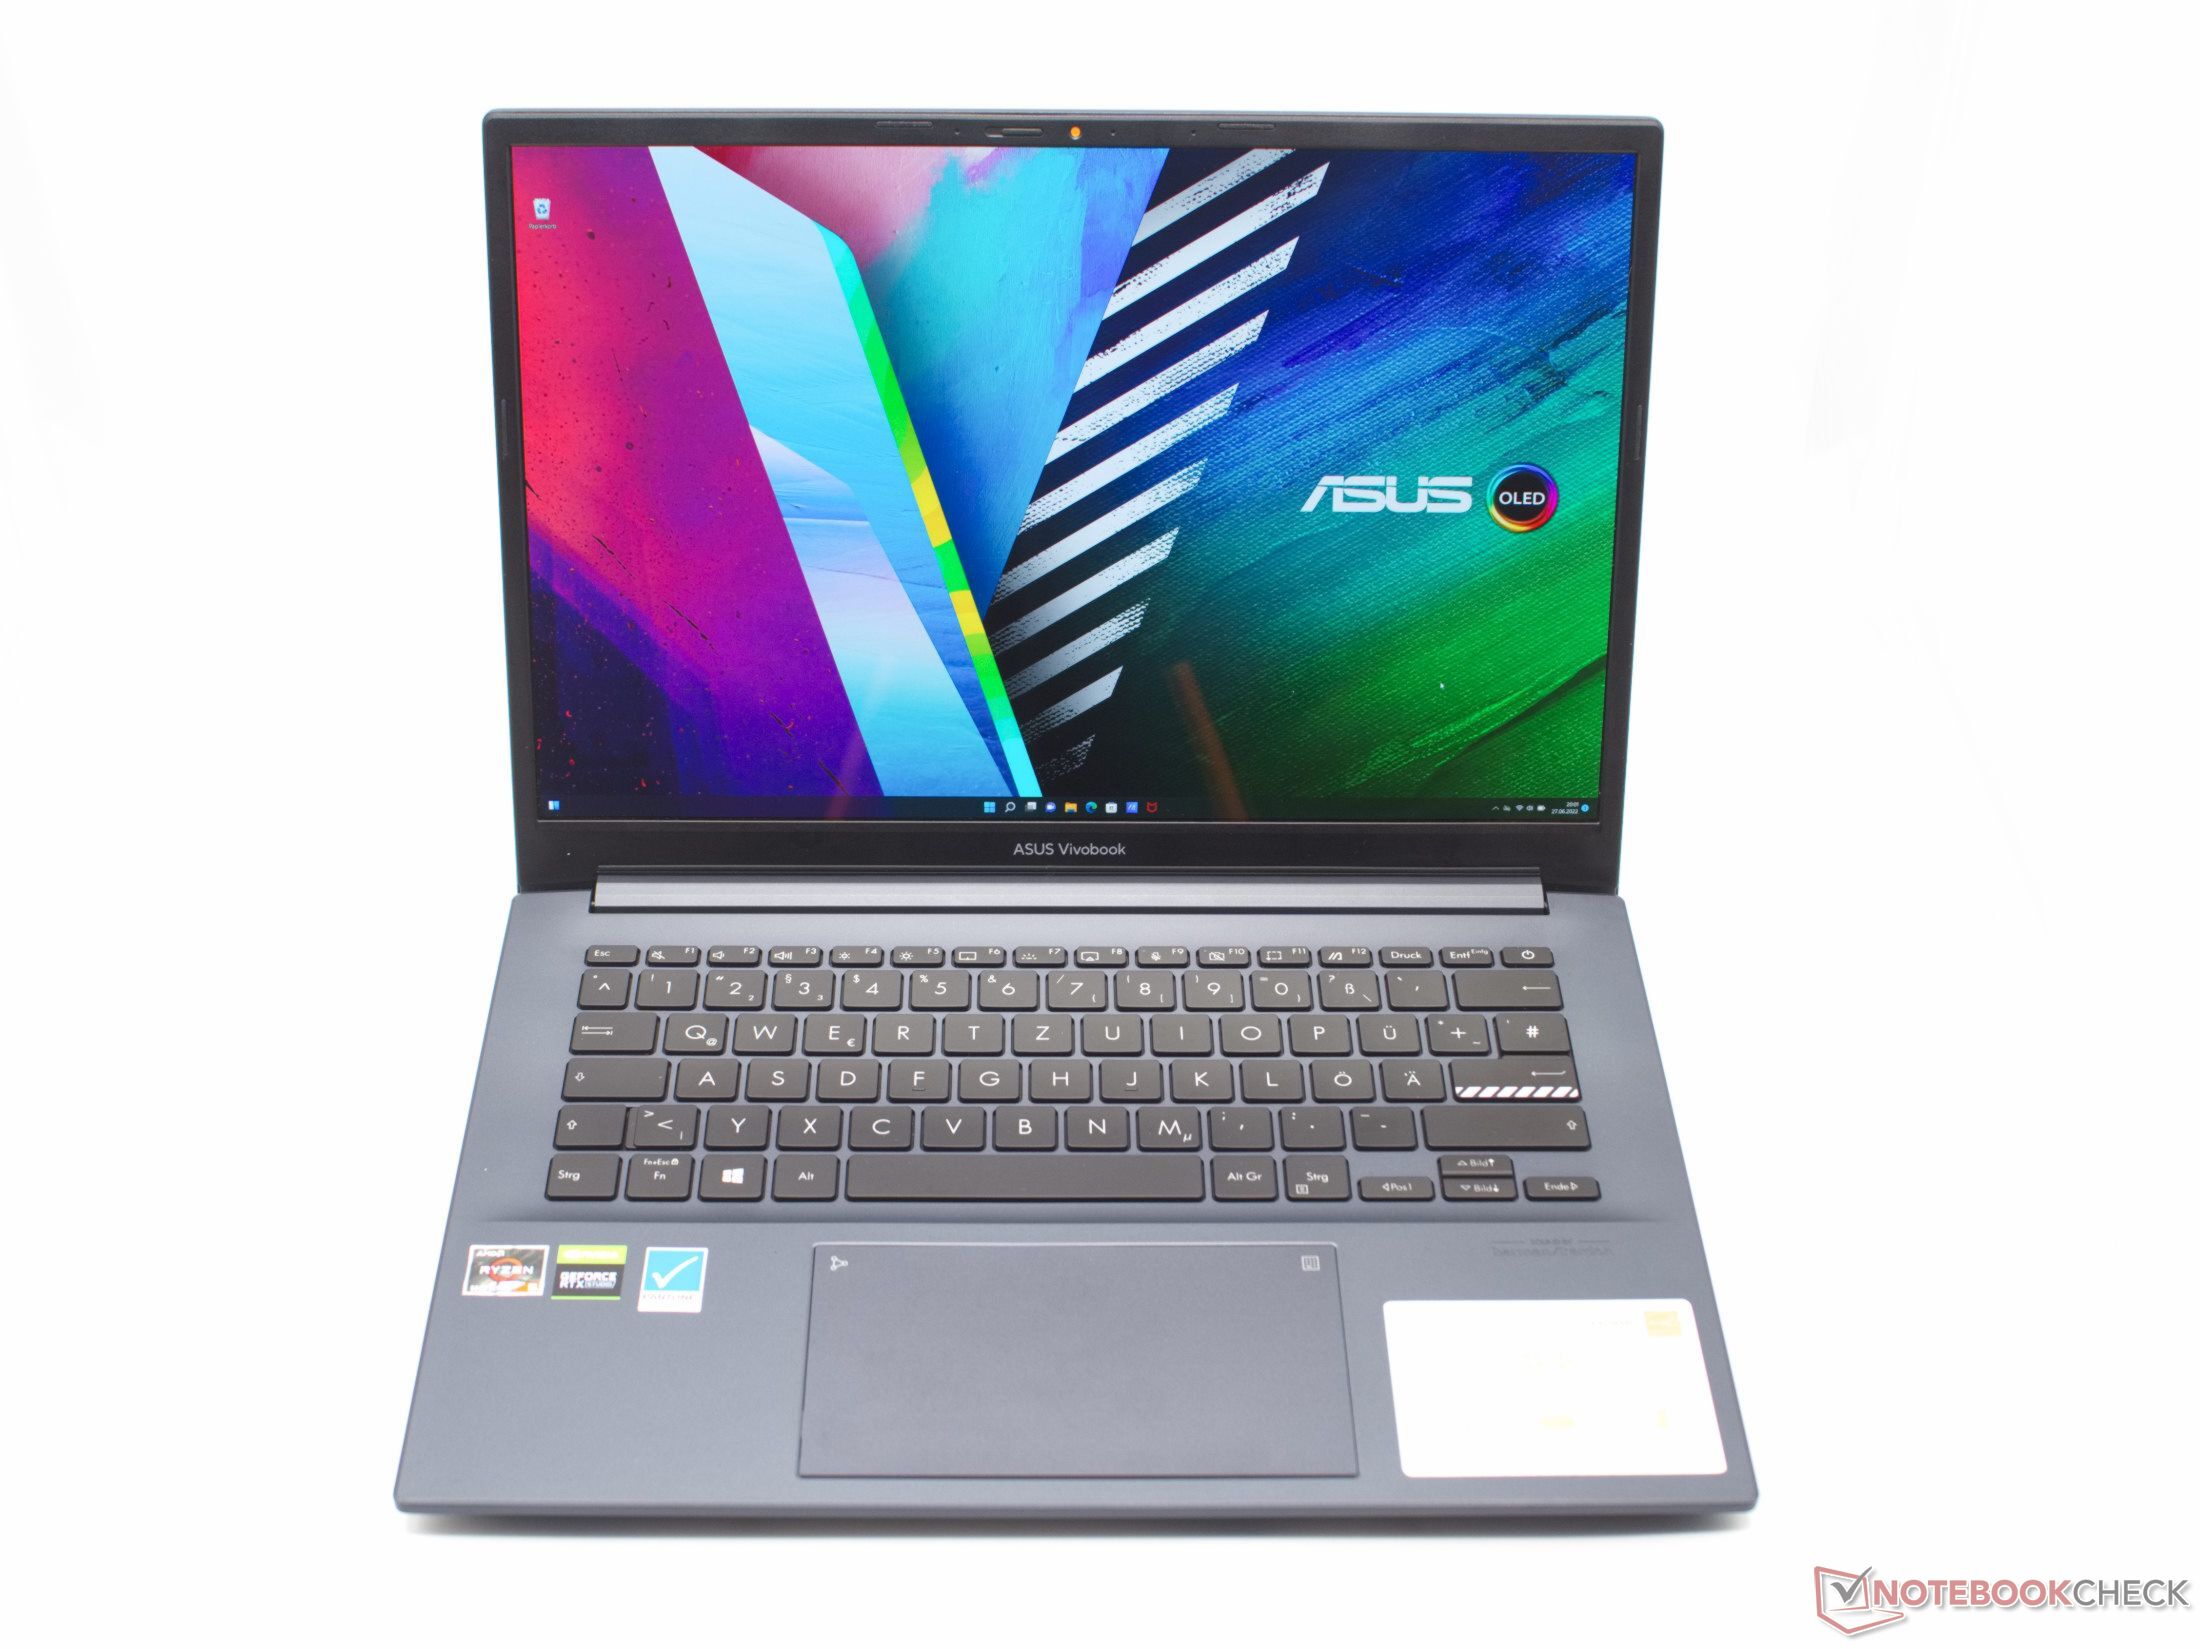
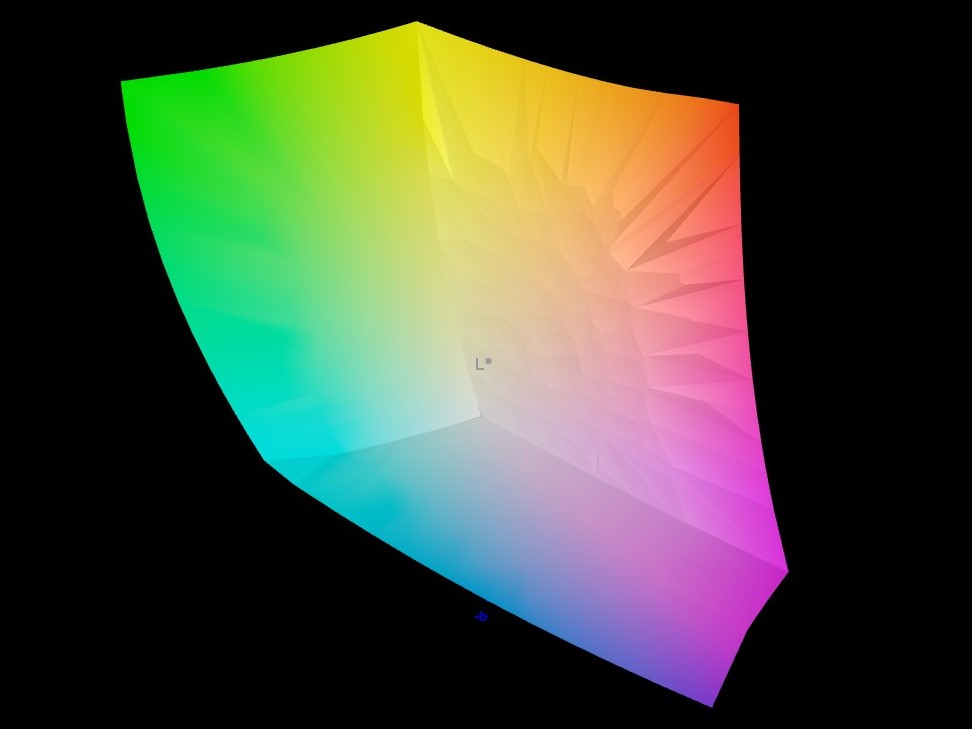
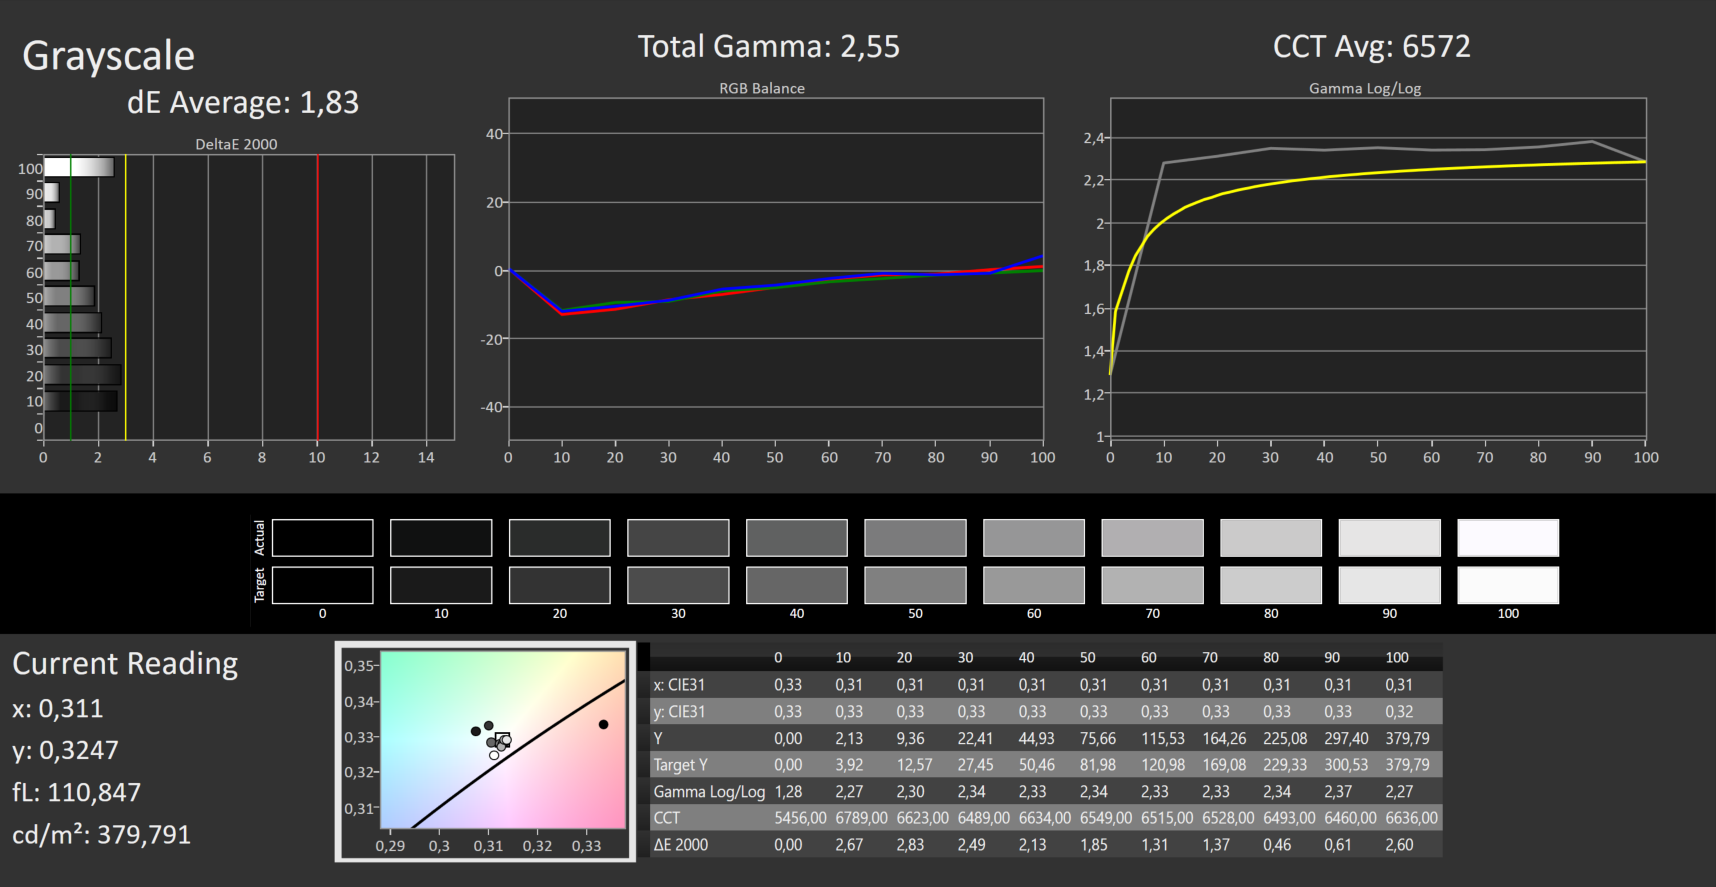
显示屏 - 潘通验证的OLED显示屏

顾名思义,华硕VivoBook Pro 14 OLED有一个OLED显示屏。在16:10的格式下,2880×1800像素提供了243 ppi的清晰图像。作为典型的显示技术,这里没有照明方面的缺陷。在384cd/m²的情况下,显示屏很亮。然而,笔记本电脑的大量反射表面可能有点吃力。寻找更高的显示分辨率的用户将在VivoBook Pro 14的其他配置变体中找到它。
90赫兹的显示屏也是相当无闪烁的。快速的响应时间使笔记本电脑即使对游戏者来说也很有趣。在播放视频时,你也会清楚地注意到,在快速移动过程中,重影是没有机会的。
| |||||||||||||||||||||||||
Brightness Distribution: 98 %
Center on Battery: 384 cd/m²
Contrast: 5486:1 (Black: 0.07 cd/m²)
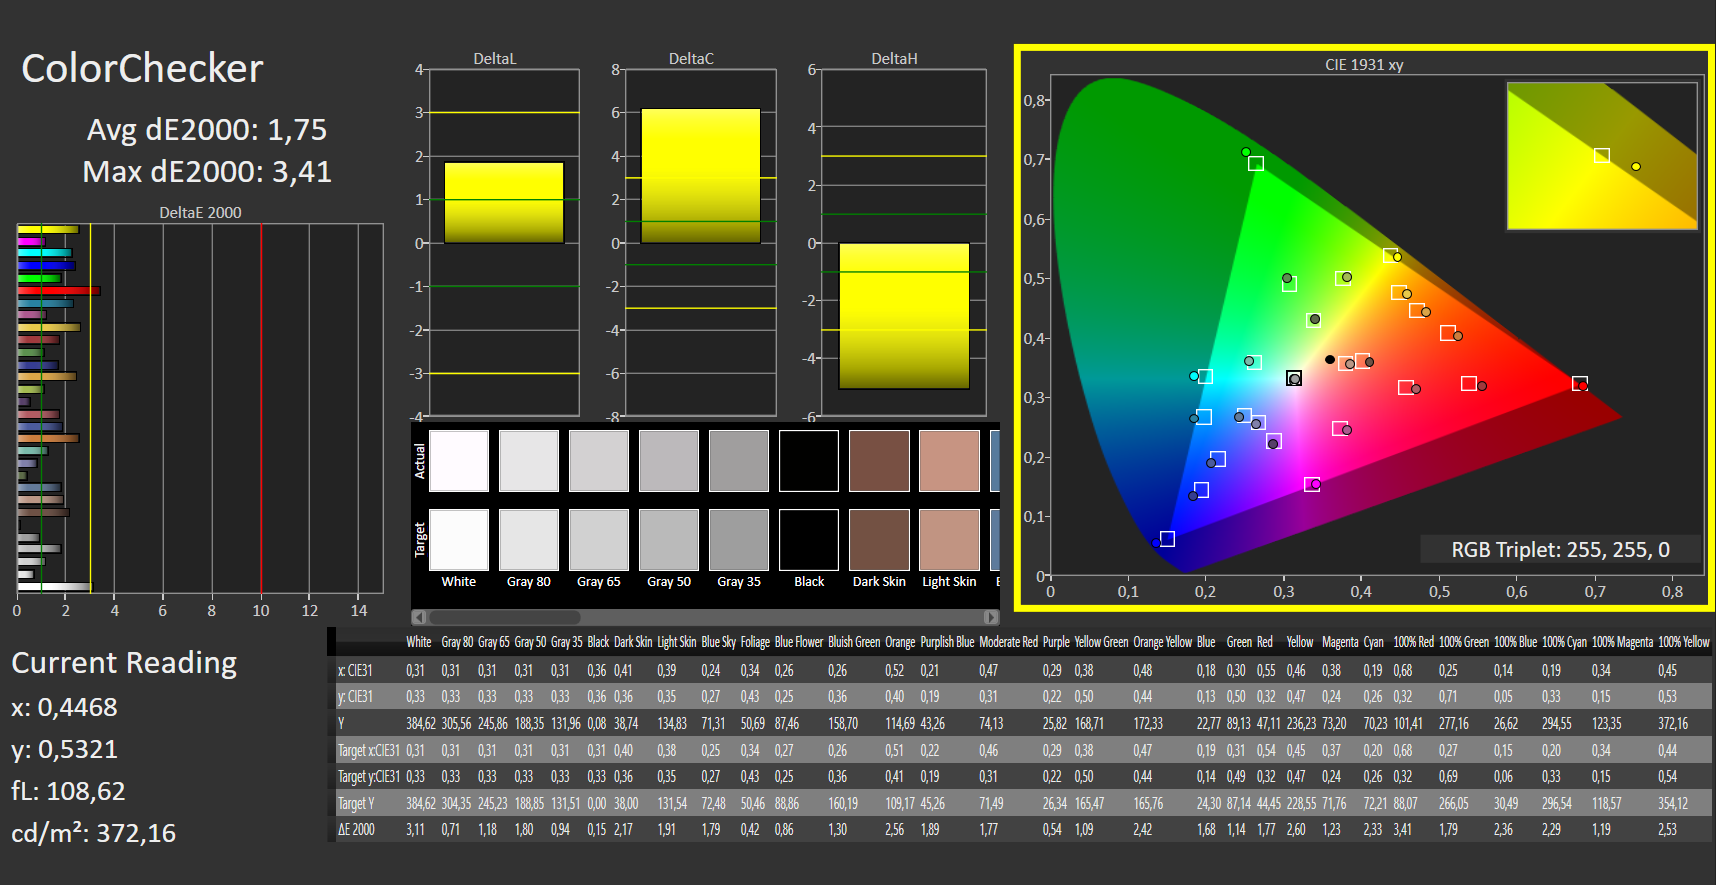
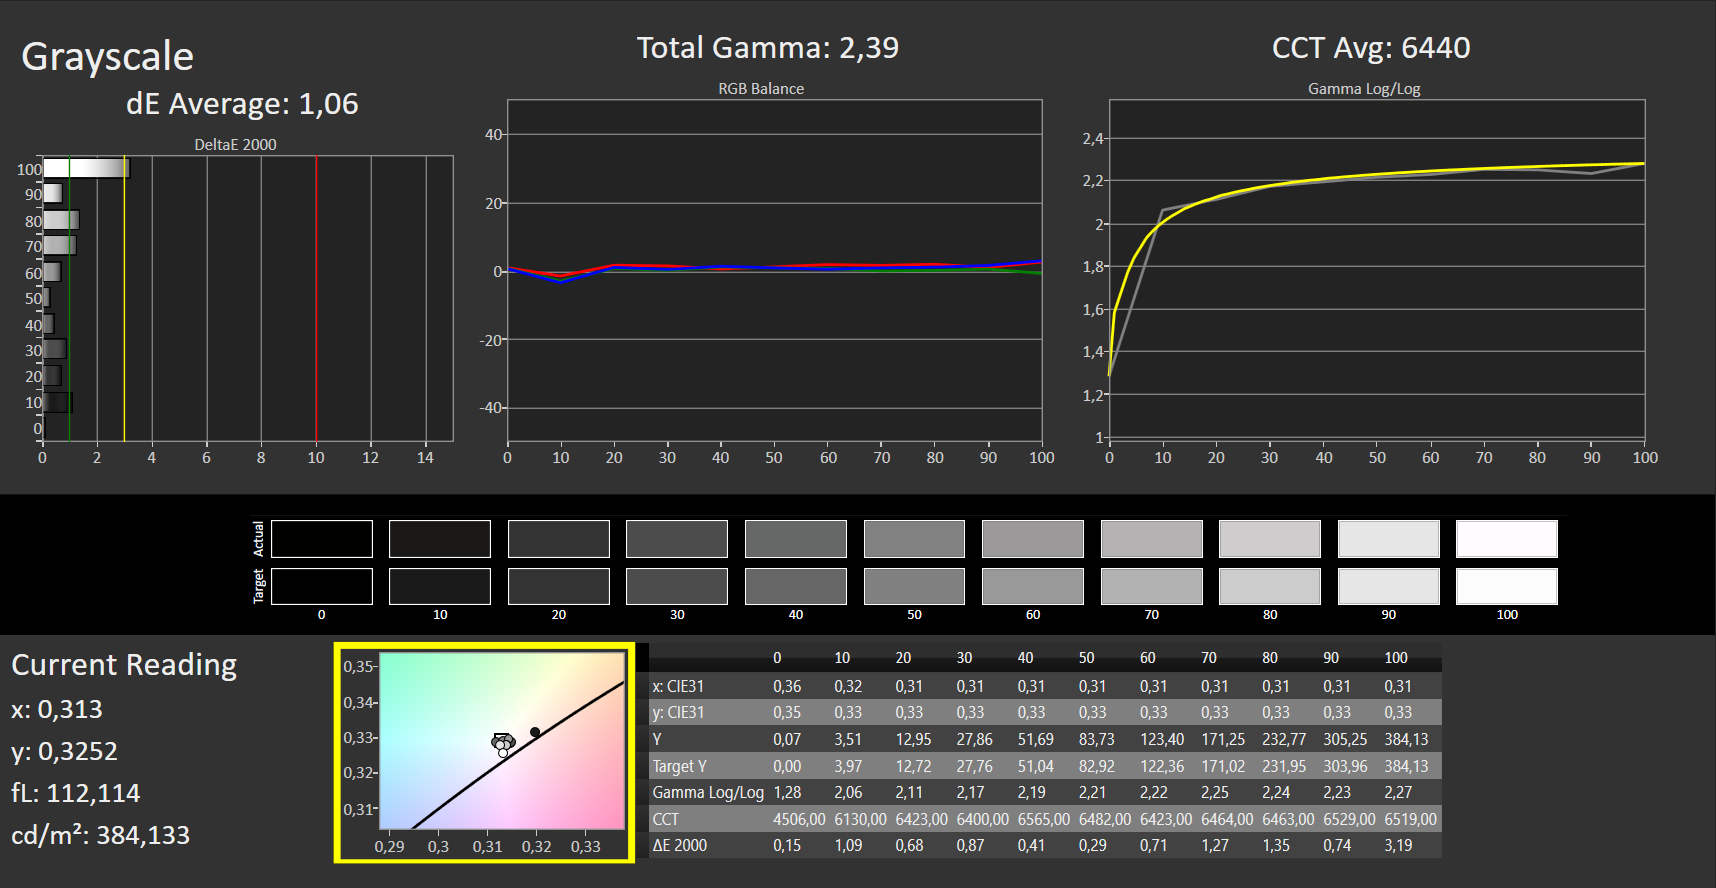
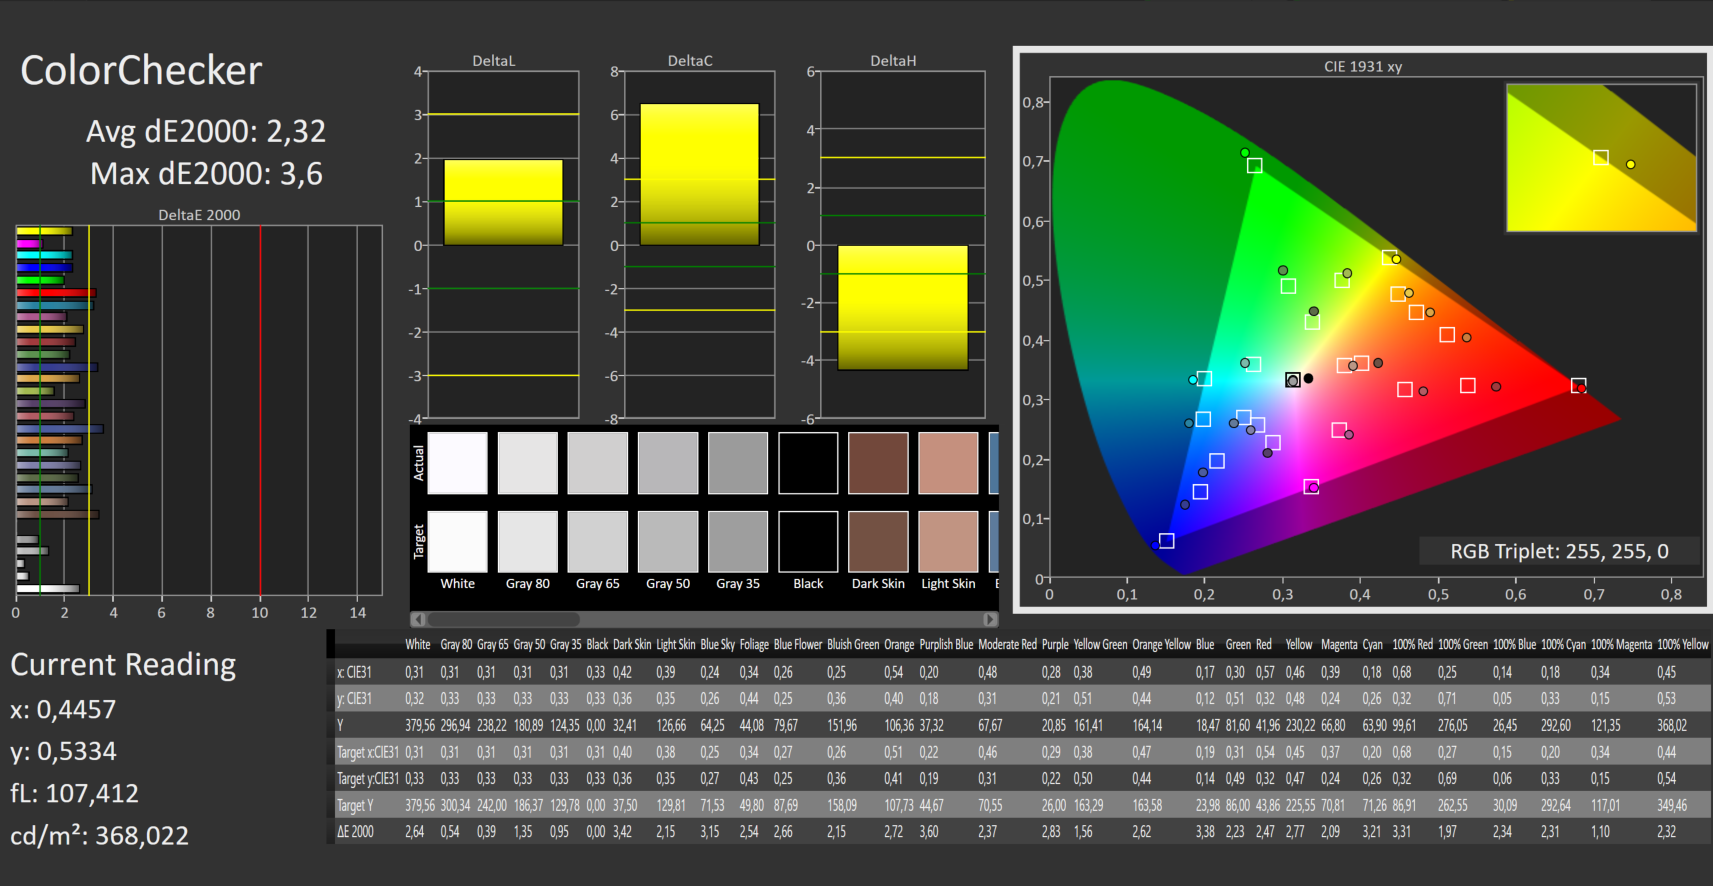
ΔE ColorChecker Calman: 1.75 | ∀{0.5-29.43 Ø4.71}
calibrated: 2.32
ΔE Greyscale Calman: 1.06 | ∀{0.09-98 Ø4.96}
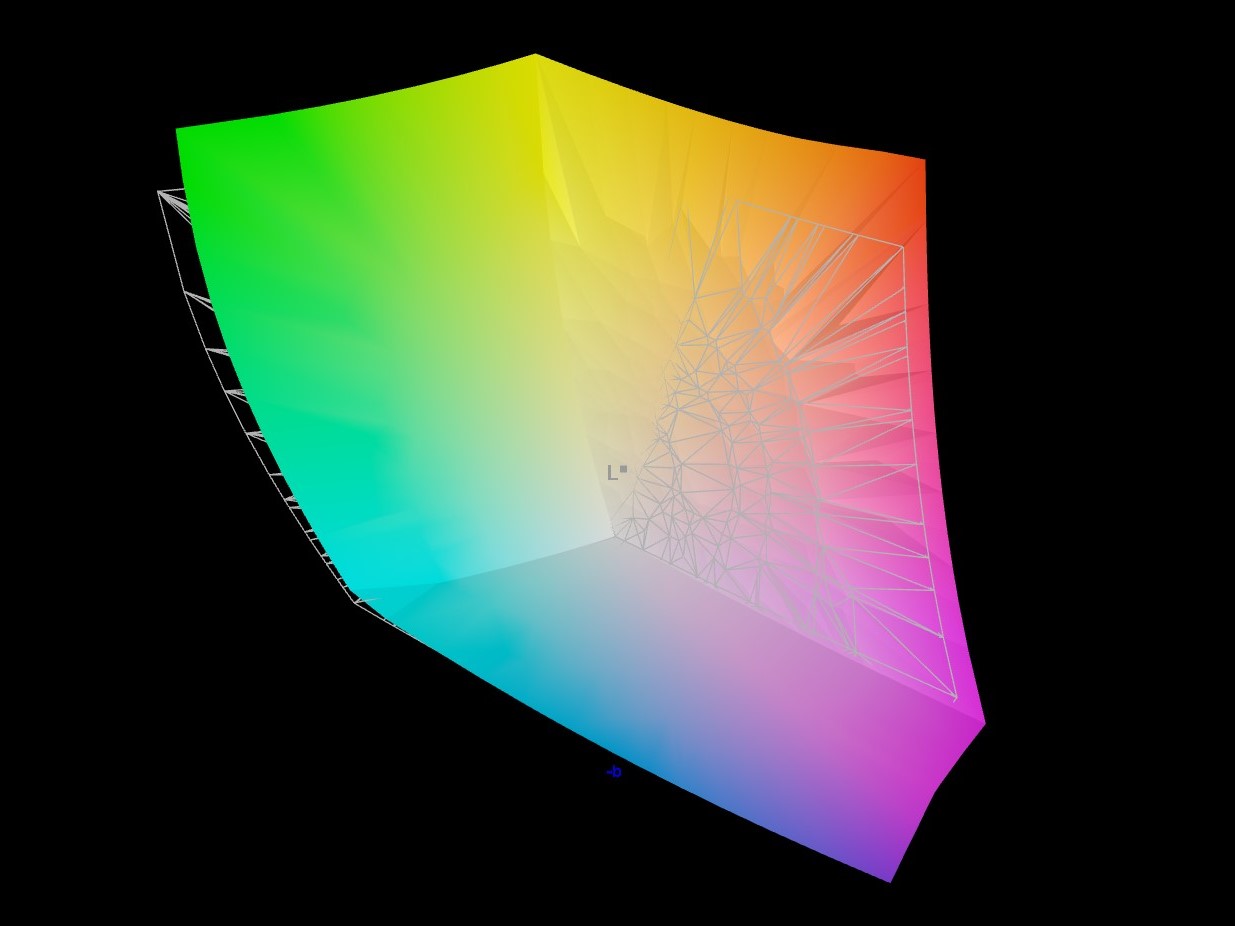
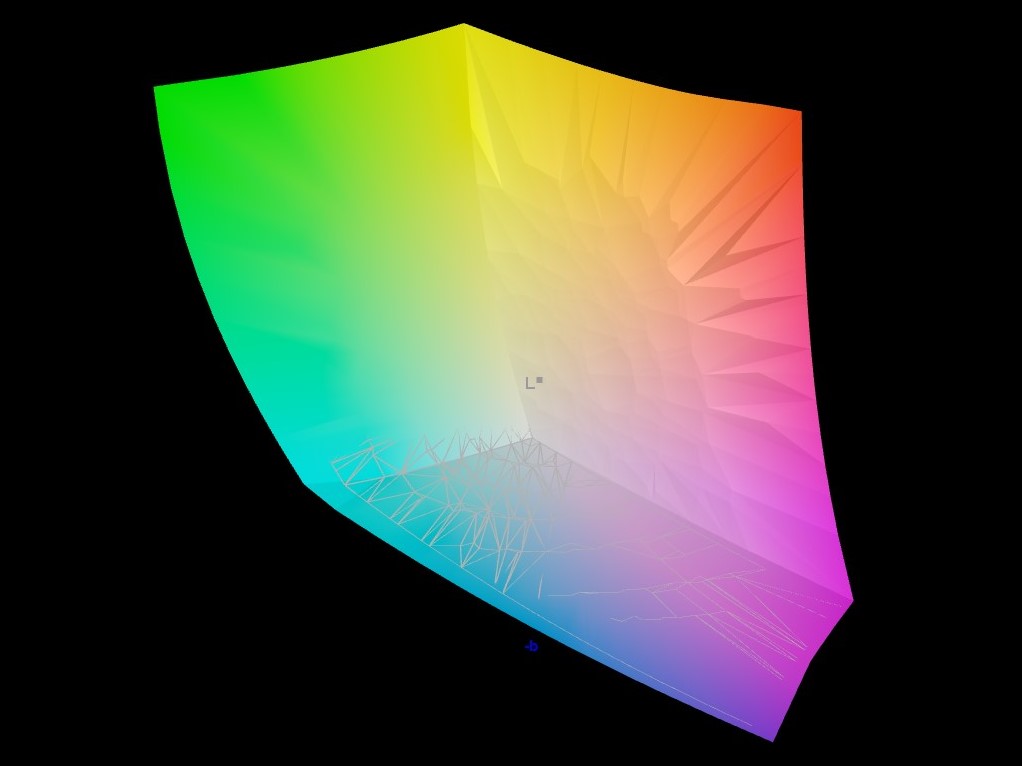
94.79% AdobeRGB 1998 (Argyll 3D)
99.94% sRGB (Argyll 3D)
99.41% Display P3 (Argyll 3D)
Gamma: 2.39
CCT: 6440 K
| Asus Vivobook Pro 14 M3401QC-KM007T SAMSUNG: SDC4171, OLED, 2880x1800, 14" | Acer Swift X SFX14-41G-R7F3 AUO B140HAN06, IPS, 1920x1080, 14" | Microsoft Surface Laptop Studio i7 RTX 3050 Ti LQ144P1JX01, IPS, 2400x1600, 14.4" | Acer Swift 3X SF314-510G-70DW AU Optronics AUO683D, IPS, 1920x1080, 14" | Asus Zenbook Pro 15 OLED UM535Q Samsung ATNA56YX03-0, OLED, 1920x1080, 15.6" | Schenker Vision 14 MNE007ZA1, IPS, 2880x1800, 14" | |
|---|---|---|---|---|---|---|
| Display | -17% | -12% | -18% | -11% | -16% | |
| Display P3 Coverage (%) | 99.41 | 72 -28% | 80.6 -19% | 71.5 -28% | 79.3 -20% | 74.3 -25% |
| sRGB Coverage (%) | 99.94 | 99 -1% | 99.9 0% | 99 -1% | 95.6 -4% | 97.6 -2% |
| AdobeRGB 1998 Coverage (%) | 94.79 | 73 -23% | 78.5 -17% | 72.5 -24% | 87.3 -8% | 75.7 -20% |
| Response Times | -1250% | -1274% | -1167% | 27% | -880% | |
| Response Time Grey 50% / Grey 80% * (ms) | 3 ? | 49 ? -1533% | 58.4 ? -1847% | 48 ? -1500% | 2.1 ? 30% | 40.4 ? -1247% |
| Response Time Black / White * (ms) | 3 ? | 32 ? -967% | 24 ? -700% | 28 ? -833% | 2.3 ? 23% | 18.4 ? -513% |
| PWM Frequency (Hz) | 360 | 5000 ? | 60.2 | |||
| Screen | -181% | -33% | -52% | -29% | -60% | |
| Brightness middle (cd/m²) | 384 | 395 3% | 497 29% | 364 -5% | 342.9 -11% | 407 6% |
| Brightness (cd/m²) | 385 | 391 2% | 491 28% | 372 -3% | 346 -10% | 407 6% |
| Brightness Distribution (%) | 98 | 89 -9% | 92 -6% | 89 -9% | 98 0% | 94 -4% |
| Black Level * (cd/m²) | 0.07 | 0.18 -157% | 0.29 -314% | 0.19 -171% | 0.25 -257% | |
| Contrast (:1) | 5486 | 2194 -60% | 1714 -69% | 1916 -65% | 1628 -70% | |
| Colorchecker dE 2000 * | 1.75 | 9.73 -456% | 1.2 31% | 2.18 -25% | 2.42 -38% | 2.6 -49% |
| Colorchecker dE 2000 max. * | 3.41 | 16.33 -379% | 2.8 18% | 4.01 -18% | 4.05 -19% | 4.4 -29% |
| Colorchecker dE 2000 calibrated * | 2.32 | 1.41 39% | 0.8 66% | 2 14% | ||
| Greyscale dE 2000 * | 1.06 | 7.5 -608% | 1.9 -79% | 2.34 -121% | 2.1 -98% | 2.7 -155% |
| Gamma | 2.39 92% | 1.5 147% | 2.14 103% | 2.37 93% | 2.21 100% | 2.18 101% |
| CCT | 6440 101% | 6678 97% | 6821 95% | 6533 99% | 6364 102% | 6316 103% |
| Total Average (Program / Settings) | -483% /
-298% | -440% /
-206% | -412% /
-216% | -4% /
-14% | -319% /
-168% |
* ... smaller is better
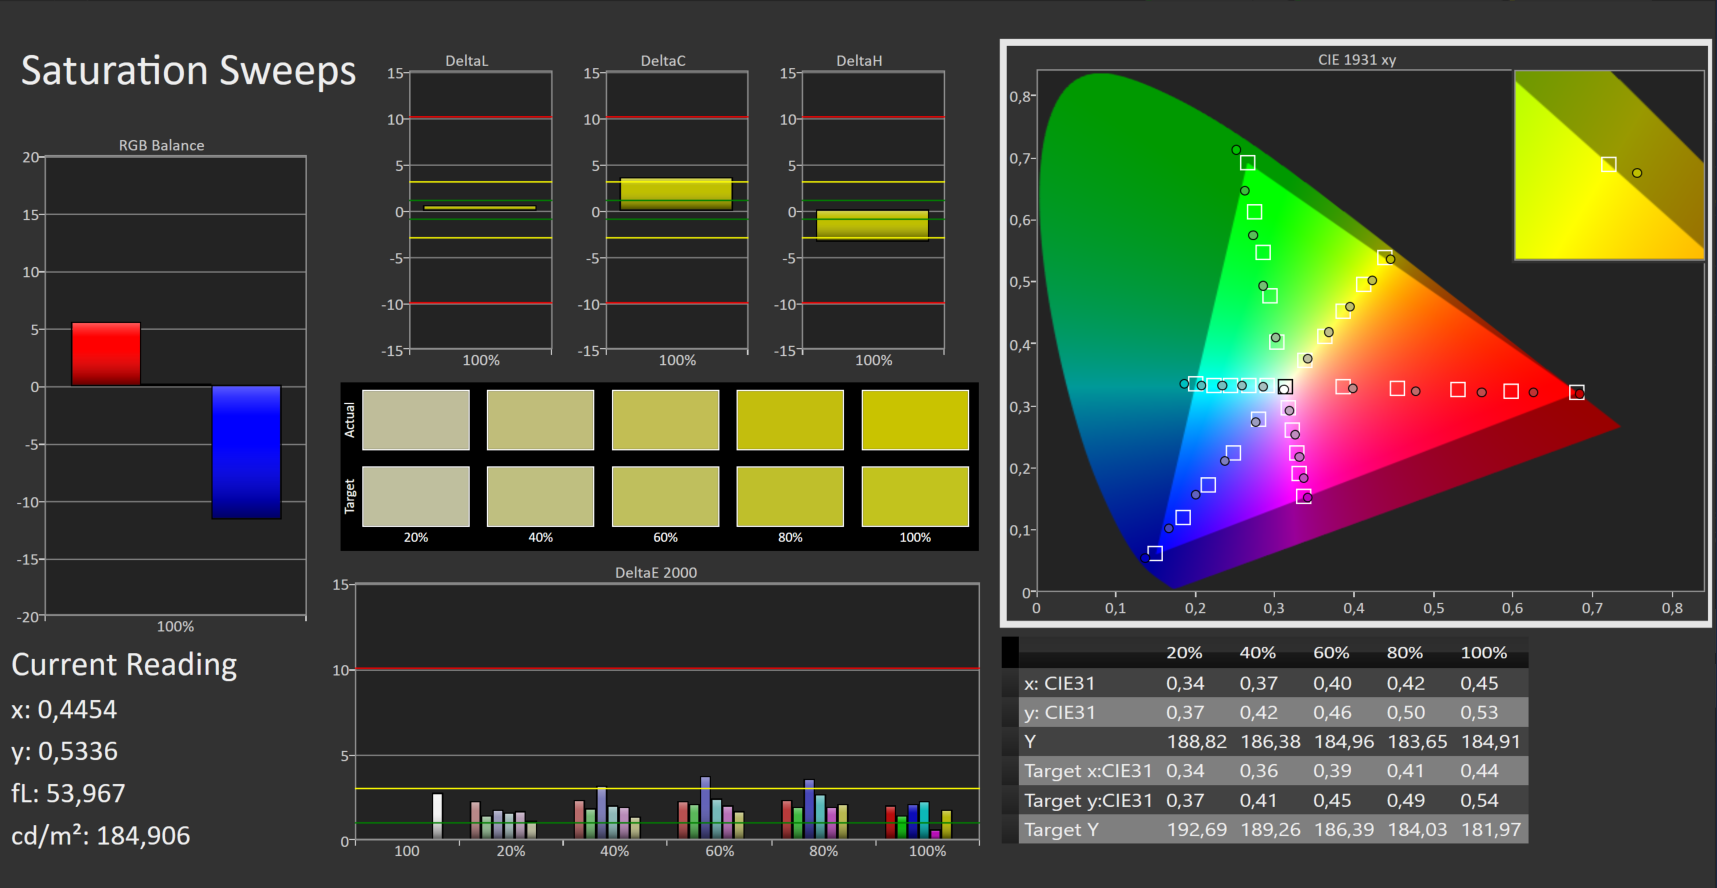
华硕VivoBook Pro 14 OLED的显示屏是Pantone验证的。.这意味着潘通公司作为最准确的色标制造商,已经测试并验证了色彩再现的准确性。我们的测量结果表明,这款笔记本电脑的显示屏具有非常宽的色彩空间和良好的色彩再现。平均而言,开箱后的颜色偏差几乎无法察觉,DeltaE为1.75。
在实践中,该显示器以鲜艳的色彩闪耀。该显示器非常适合于图像和视频编辑。

Display Response Times
| ↔ Response Time Black to White | ||
|---|---|---|
| 3 ms ... rise ↗ and fall ↘ combined | ↗ 1 ms rise |  |
| ↘ 2 ms fall | ||
| The screen shows very fast response rates in our tests and should be very well suited for fast-paced gaming. In comparison, all tested devices range from 0.1 (minimum) to 240 (maximum) ms. » 15 % of all devices are better. This means that the measured response time is better than the average of all tested devices (19.8 ms). | ||
| ↔ Response Time 50% Grey to 80% Grey | ||
| 3 ms ... rise ↗ and fall ↘ combined | ↗ 1 ms rise |  |
| ↘ 2 ms fall | ||
| The screen shows very fast response rates in our tests and should be very well suited for fast-paced gaming. In comparison, all tested devices range from 0.165 (minimum) to 636 (maximum) ms. » 13 % of all devices are better. This means that the measured response time is better than the average of all tested devices (31 ms). | ||
Screen Flickering / PWM (Pulse-Width Modulation)
| Screen flickering / PWM detected | 360 Hz |    | |
The display backlight flickers at 360 Hz (worst case, e.g., utilizing PWM) . The frequency of 360 Hz is relatively high, so most users sensitive to PWM should not notice any flickering. However, there are reports that some users are still sensitive to PWM at 500 Hz and above, so be aware. In comparison: 52 % of all tested devices do not use PWM to dim the display. If PWM was detected, an average of 7754 (minimum: 5 - maximum: 343500) Hz was measured. | |||
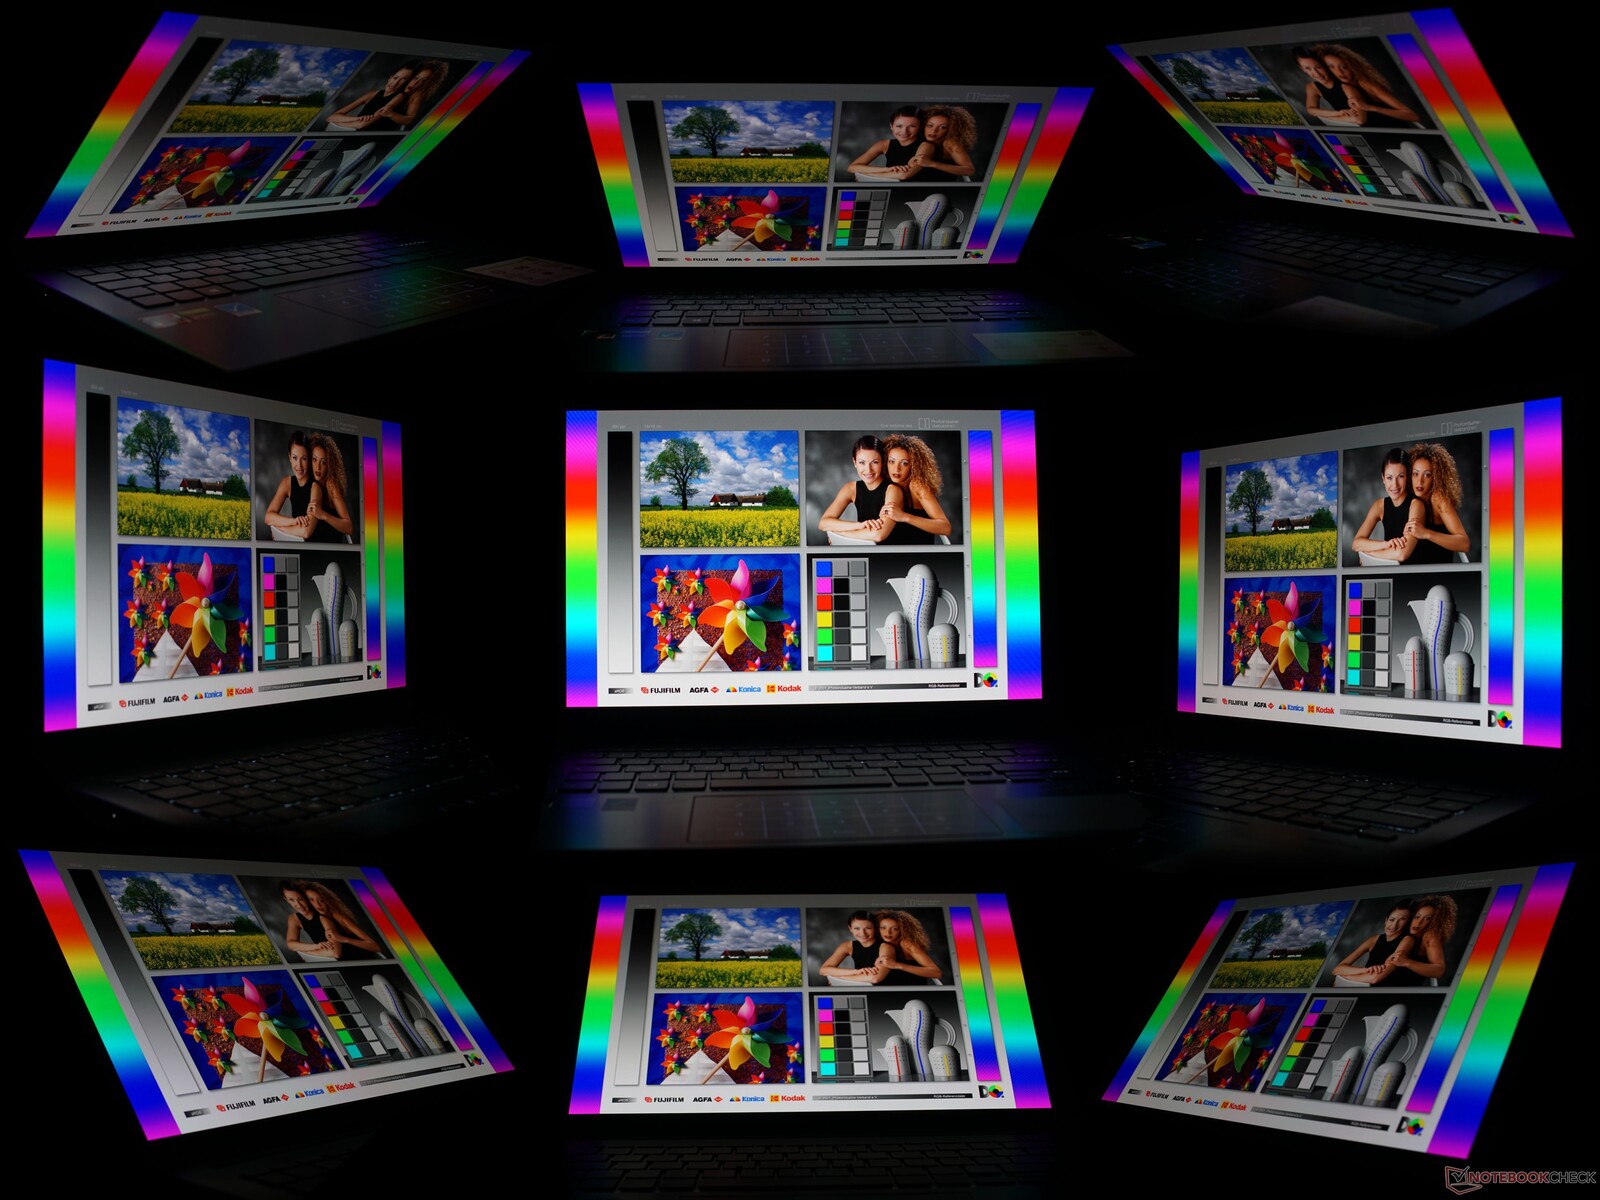
光滑的OLED显示屏在户外使用时不能完全证明自己。根据观察角度,你会得到强烈的反射或环境光的折射,这是OLED的典型特征。尽管如此,通常可以找到一个屏幕内容可读的位置。
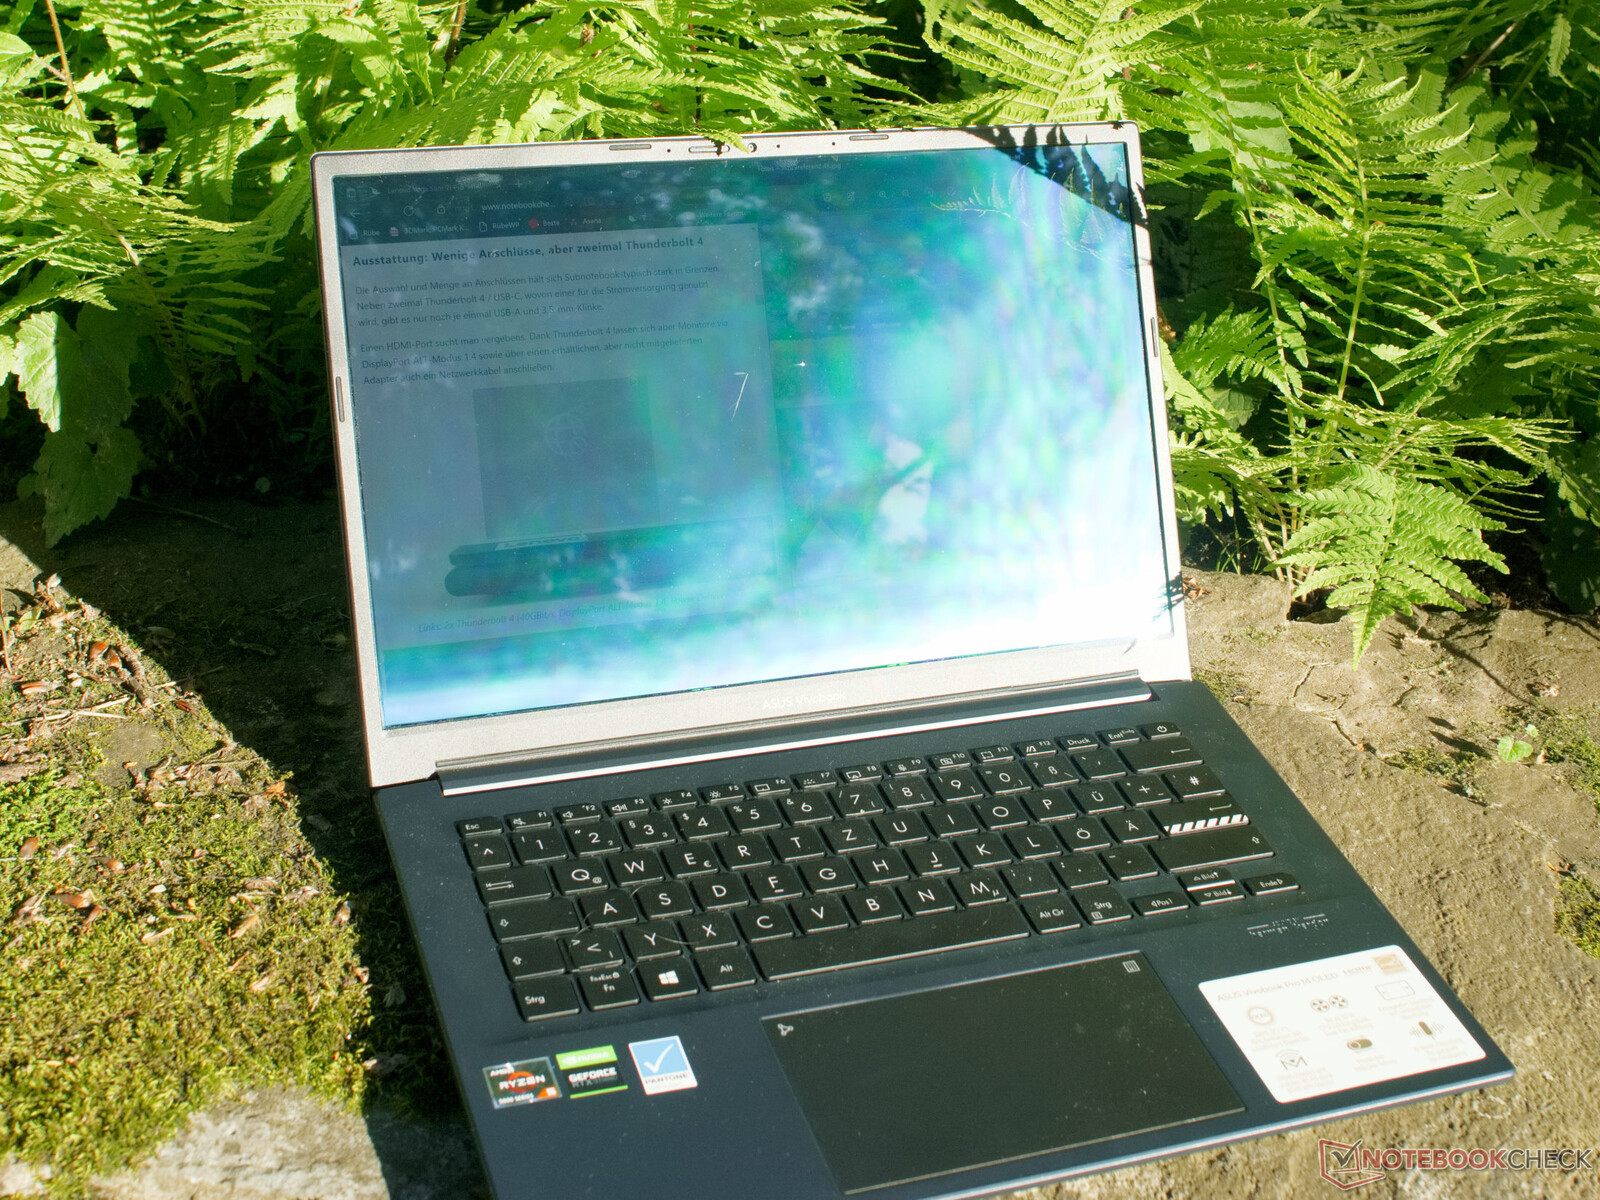
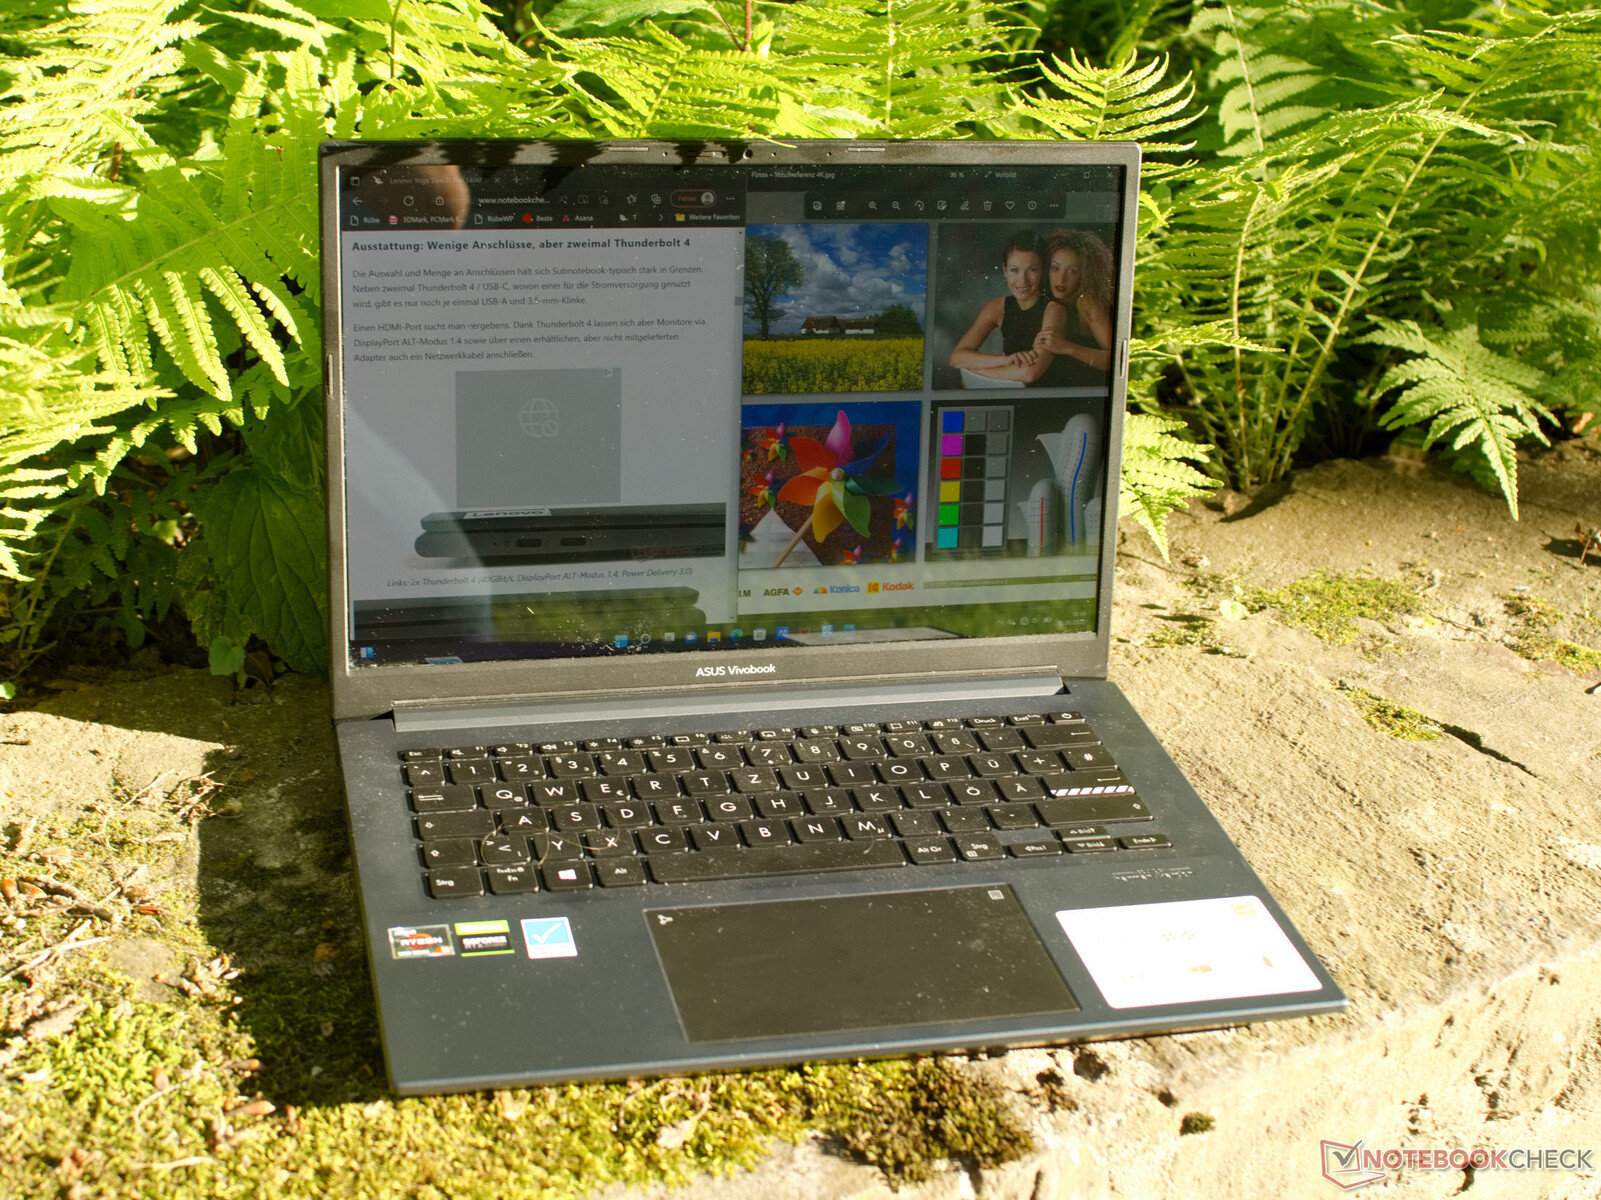
即使从更斜的观察角度,也无法观察到颜色的偏移或亮度的明显变化。华硕笔记本电脑的显示屏从各个方向看都是色彩准确的。
性能 - Ryzen 5和GeForce RTX的持续高性能
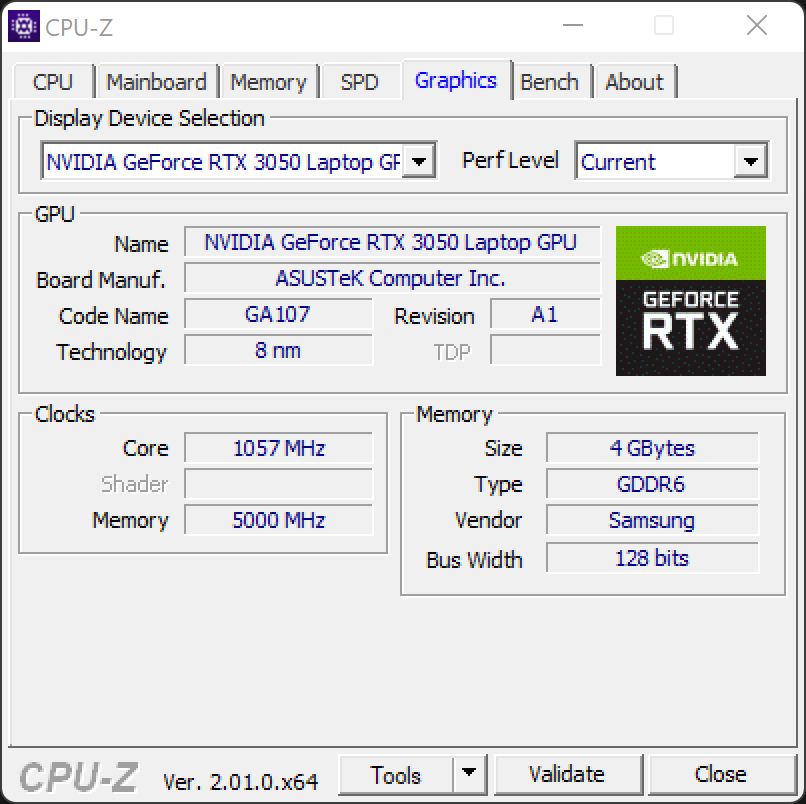
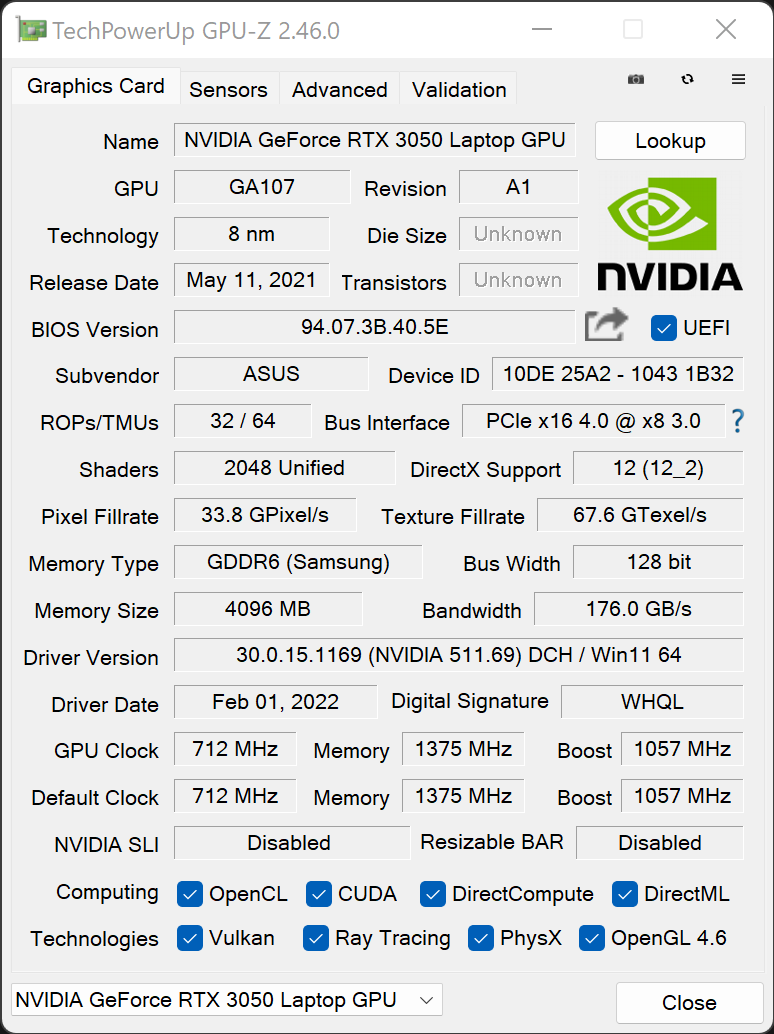
凭借其 锐龙5600H和NvidiaGeForce RTX 3050这款多媒体笔记本电脑是一个强大的全能型选手。图像和视频编辑以及最新的游戏对拥有16GB内存的华硕VivoBook Pro 14 OLED来说没有问题。这款笔记本电脑也可以在其他配置中使用英特尔处理器或没有专用显卡。
测试条件
MyASUS应用程序允许你设置三种不同的性能模式。这里有性能模式、标准模式和轻声模式。性能模式只能与外部电源一起使用。
我们根据测试要求选择不同的性能模式。这样,基准测试是在性能模式下进行的。负载下的电池耐力和平均负载下的能量测量是在标准模式下进行的。悄悄话模式被选作电池运行时间测量和空闲能量测量。最大能量消耗是在性能模式下测量的。所有三种性能模式也进行了噪声排放测试。
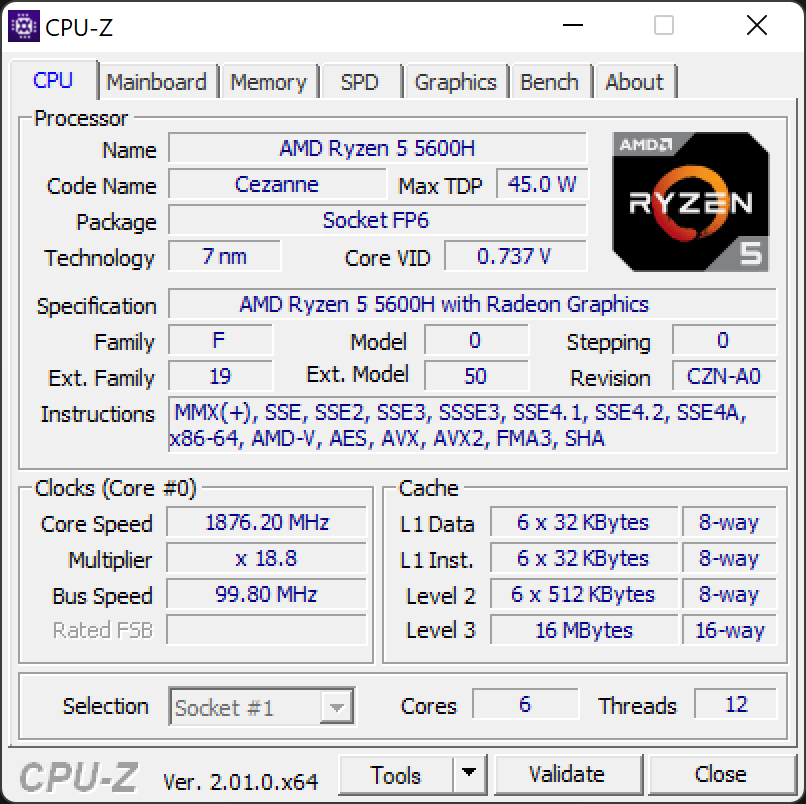
处理器
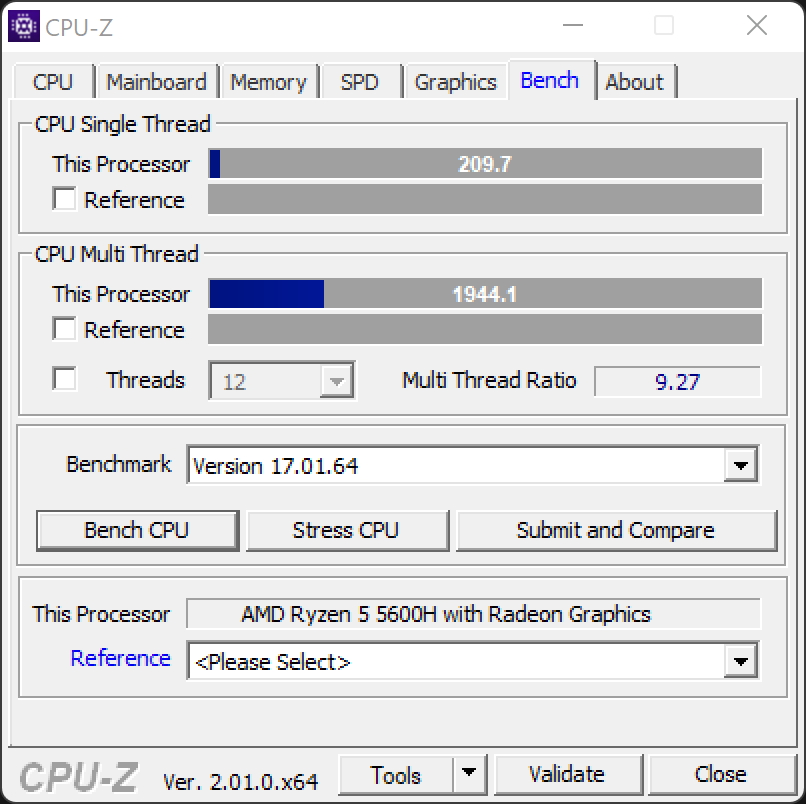
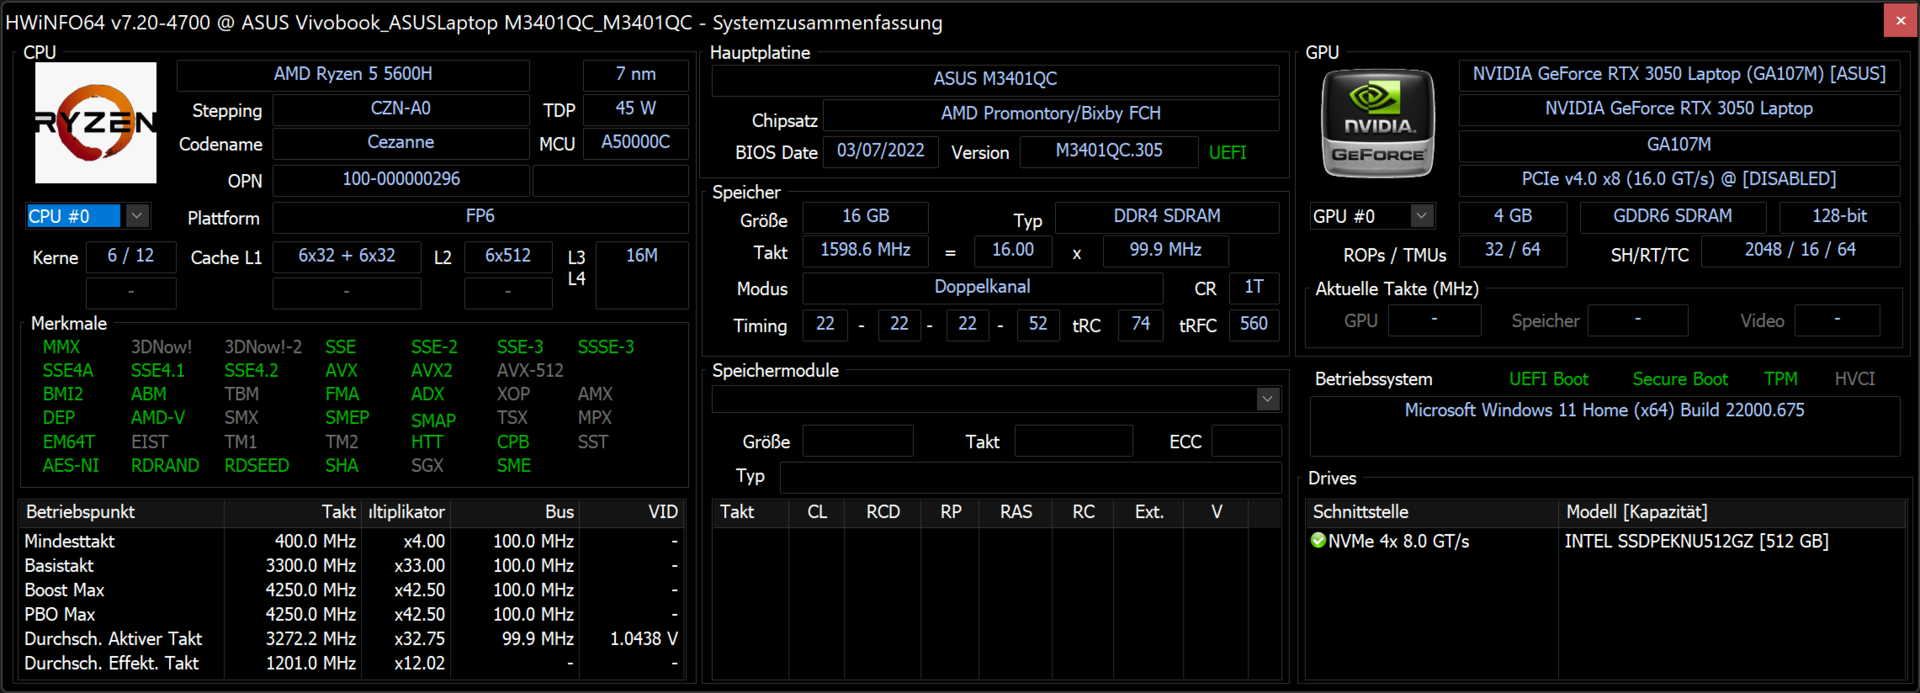
淘宝网AMD Ryzen 5 5600H是一个相对强大的移动处理器,有六个核心和十二个线程。在日常使用中,Ryzen 5能够轻松管理所有的负载水平。在性能基准测试中,该处理器显示了AMD典型的高多核性能,而在单核基准测试中明显落后于英特尔的处理器。
即使在长时间的负载下,该处理器也能保持其高性能。然而,在我们的数据库中,有几台笔记本电脑的AMD Ryzen 5 5600H的笔记本电脑,从该处理器中获得了更多的性能。根据性能模式,华硕VivoBook Pro 14中的Ryzen 5被允许以略高于50瓦的功率运行,甚至在更长的距离内,只要不需要NvidiaGeForce'的性能。在电池供电的情况下,笔记本电脑的性能控制只允许处理器以15瓦的功率运行。这几乎使Cinebench R13中的25次运行时间增加了一倍。
Cinebench R15 Multi endurance test
Cinebench R23: Multi Core | Single Core
Cinebench R20: CPU (Multi Core) | CPU (Single Core)
Cinebench R15: CPU Multi 64Bit | CPU Single 64Bit
Blender: v2.79 BMW27 CPU
7-Zip 18.03: 7z b 4 | 7z b 4 -mmt1
Geekbench 5.5: Multi-Core | Single-Core
HWBOT x265 Benchmark v2.2: 4k Preset
LibreOffice : 20 Documents To PDF
R Benchmark 2.5: Overall mean
| CPU Performance rating | |
| Average of class Multimedia | |
| Asus Zenbook Pro 15 OLED UM535Q | |
| Average AMD Ryzen 5 5600H | |
| Asus Vivobook Pro 14 M3401QC-KM007T | |
| Schenker Vision 14 | |
| Acer Swift 3X SF314-510G-70DW | |
| Acer Swift X SFX14-41G-R7F3 -1! | |
| Microsoft Surface Laptop Studio i7 RTX 3050 Ti | |
| MSI Modern 14 B11SB-085 | |
| Cinebench R23 / Multi Core | |
| Average of class Multimedia (4861 - 33362, n=74, last 2 years) | |
| Asus Zenbook Pro 15 OLED UM535Q | |
| Average AMD Ryzen 5 5600H (7945 - 10416, n=13) | |
| Asus Vivobook Pro 14 M3401QC-KM007T | |
| Acer Swift X SFX14-41G-R7F3 | |
| Microsoft Surface Laptop Studio i7 RTX 3050 Ti | |
| Acer Swift 3X SF314-510G-70DW | |
| Schenker Vision 14 | |
| MSI Modern 14 B11SB-085 | |
| Cinebench R23 / Single Core | |
| Average of class Multimedia (1128 - 2459, n=66, last 2 years) | |
| Acer Swift 3X SF314-510G-70DW | |
| MSI Modern 14 B11SB-085 | |
| Microsoft Surface Laptop Studio i7 RTX 3050 Ti | |
| Asus Zenbook Pro 15 OLED UM535Q | |
| Schenker Vision 14 | |
| Average AMD Ryzen 5 5600H (1316 - 1381, n=13) | |
| Asus Vivobook Pro 14 M3401QC-KM007T | |
| Acer Swift X SFX14-41G-R7F3 | |
| Cinebench R20 / CPU (Multi Core) | |
| Average of class Multimedia (1887 - 12912, n=57, last 2 years) | |
| Asus Zenbook Pro 15 OLED UM535Q | |
| Average AMD Ryzen 5 5600H (3074 - 4059, n=16) | |
| Asus Vivobook Pro 14 M3401QC-KM007T | |
| Acer Swift X SFX14-41G-R7F3 | |
| Microsoft Surface Laptop Studio i7 RTX 3050 Ti | |
| Schenker Vision 14 | |
| Acer Swift 3X SF314-510G-70DW | |
| MSI Modern 14 B11SB-085 | |
| Cinebench R20 / CPU (Single Core) | |
| Average of class Multimedia (425 - 853, n=57, last 2 years) | |
| Schenker Vision 14 | |
| Acer Swift 3X SF314-510G-70DW | |
| MSI Modern 14 B11SB-085 | |
| Microsoft Surface Laptop Studio i7 RTX 3050 Ti | |
| Asus Zenbook Pro 15 OLED UM535Q | |
| Average AMD Ryzen 5 5600H (527 - 538, n=15) | |
| Asus Vivobook Pro 14 M3401QC-KM007T | |
| Acer Swift X SFX14-41G-R7F3 | |
| Cinebench R15 / CPU Multi 64Bit | |
| Average of class Multimedia (856 - 5224, n=61, last 2 years) | |
| Asus Zenbook Pro 15 OLED UM535Q | |
| Average AMD Ryzen 5 5600H (1319 - 1723, n=16) | |
| Asus Vivobook Pro 14 M3401QC-KM007T | |
| Acer Swift X SFX14-41G-R7F3 | |
| Schenker Vision 14 | |
| Schenker Vision 14 | |
| Microsoft Surface Laptop Studio i7 RTX 3050 Ti | |
| Acer Swift 3X SF314-510G-70DW | |
| MSI Modern 14 B11SB-085 | |
| Cinebench R15 / CPU Single 64Bit | |
| Average of class Multimedia (184.8 - 326, n=59, last 2 years) | |
| Asus Zenbook Pro 15 OLED UM535Q | |
| Schenker Vision 14 | |
| Acer Swift 3X SF314-510G-70DW | |
| Microsoft Surface Laptop Studio i7 RTX 3050 Ti | |
| Average AMD Ryzen 5 5600H (218 - 225, n=14) | |
| Asus Vivobook Pro 14 M3401QC-KM007T | |
| MSI Modern 14 B11SB-085 | |
| Acer Swift X SFX14-41G-R7F3 | |
| Blender / v2.79 BMW27 CPU | |
| MSI Modern 14 B11SB-085 | |
| Acer Swift 3X SF314-510G-70DW | |
| Microsoft Surface Laptop Studio i7 RTX 3050 Ti | |
| Schenker Vision 14 | |
| Acer Swift X SFX14-41G-R7F3 | |
| Asus Vivobook Pro 14 M3401QC-KM007T | |
| Average AMD Ryzen 5 5600H (300 - 384, n=14) | |
| Average of class Multimedia (100 - 557, n=58, last 2 years) | |
| Asus Zenbook Pro 15 OLED UM535Q | |
| 7-Zip 18.03 / 7z b 4 | |
| Average of class Multimedia (26062 - 130368, n=55, last 2 years) | |
| Asus Zenbook Pro 15 OLED UM535Q | |
| Average AMD Ryzen 5 5600H (36315 - 46562, n=14) | |
| Asus Vivobook Pro 14 M3401QC-KM007T | |
| Acer Swift X SFX14-41G-R7F3 | |
| Schenker Vision 14 | |
| Microsoft Surface Laptop Studio i7 RTX 3050 Ti | |
| Acer Swift 3X SF314-510G-70DW | |
| MSI Modern 14 B11SB-085 | |
| 7-Zip 18.03 / 7z b 4 -mmt1 | |
| Average of class Multimedia (3666 - 7545, n=56, last 2 years) | |
| Asus Zenbook Pro 15 OLED UM535Q | |
| Schenker Vision 14 | |
| Acer Swift 3X SF314-510G-70DW | |
| Average AMD Ryzen 5 5600H (5213 - 5446, n=14) | |
| Asus Vivobook Pro 14 M3401QC-KM007T | |
| MSI Modern 14 B11SB-085 | |
| Microsoft Surface Laptop Studio i7 RTX 3050 Ti | |
| Acer Swift X SFX14-41G-R7F3 | |
| Geekbench 5.5 / Multi-Core | |
| Average of class Multimedia (4652 - 20422, n=56, last 2 years) | |
| Asus Zenbook Pro 15 OLED UM535Q | |
| Average AMD Ryzen 5 5600H (4990 - 7253, n=14) | |
| Asus Vivobook Pro 14 M3401QC-KM007T | |
| Acer Swift X SFX14-41G-R7F3 | |
| Acer Swift 3X SF314-510G-70DW | |
| Schenker Vision 14 | |
| Microsoft Surface Laptop Studio i7 RTX 3050 Ti | |
| MSI Modern 14 B11SB-085 | |
| Geekbench 5.5 / Single-Core | |
| Average of class Multimedia (805 - 2974, n=56, last 2 years) | |
| Schenker Vision 14 | |
| Acer Swift 3X SF314-510G-70DW | |
| Microsoft Surface Laptop Studio i7 RTX 3050 Ti | |
| Asus Zenbook Pro 15 OLED UM535Q | |
| MSI Modern 14 B11SB-085 | |
| Average AMD Ryzen 5 5600H (1365 - 1445, n=14) | |
| Asus Vivobook Pro 14 M3401QC-KM007T | |
| Acer Swift X SFX14-41G-R7F3 | |
| HWBOT x265 Benchmark v2.2 / 4k Preset | |
| Average of class Multimedia (5.26 - 36.1, n=56, last 2 years) | |
| Asus Zenbook Pro 15 OLED UM535Q | |
| Average AMD Ryzen 5 5600H (9.92 - 13.3, n=14) | |
| Asus Vivobook Pro 14 M3401QC-KM007T | |
| Acer Swift X SFX14-41G-R7F3 | |
| Schenker Vision 14 | |
| Microsoft Surface Laptop Studio i7 RTX 3050 Ti | |
| Acer Swift 3X SF314-510G-70DW | |
| MSI Modern 14 B11SB-085 | |
| LibreOffice / 20 Documents To PDF | |
| Asus Vivobook Pro 14 M3401QC-KM007T | |
| Average AMD Ryzen 5 5600H (52.2 - 81.5, n=14) | |
| Microsoft Surface Laptop Studio i7 RTX 3050 Ti | |
| MSI Modern 14 B11SB-085 | |
| Average of class Multimedia (23.9 - 146.7, n=57, last 2 years) | |
| Asus Zenbook Pro 15 OLED UM535Q | |
| Schenker Vision 14 | |
| Acer Swift 3X SF314-510G-70DW | |
| R Benchmark 2.5 / Overall mean | |
| Acer Swift X SFX14-41G-R7F3 | |
| Microsoft Surface Laptop Studio i7 RTX 3050 Ti | |
| Asus Vivobook Pro 14 M3401QC-KM007T | |
| MSI Modern 14 B11SB-085 | |
| Acer Swift 3X SF314-510G-70DW | |
| Schenker Vision 14 | |
| Average AMD Ryzen 5 5600H (0.526 - 0.596, n=14) | |
| Asus Zenbook Pro 15 OLED UM535Q | |
| Average of class Multimedia (0.3604 - 0.947, n=56, last 2 years) | |
* ... smaller is better
AIDA64: FP32 Ray-Trace | FPU Julia | CPU SHA3 | CPU Queen | FPU SinJulia | FPU Mandel | CPU AES | CPU ZLib | FP64 Ray-Trace | CPU PhotoWorxx
| Performance rating | |
| Asus Zenbook Pro 15 OLED UM535Q | |
| Average of class Multimedia | |
| Average AMD Ryzen 5 5600H | |
| Asus Vivobook Pro 14 M3401QC-KM007T | |
| Acer Swift X SFX14-41G-R7F3 | |
| Acer Swift 3X SF314-510G-70DW | |
| Schenker Vision 14 | |
| Microsoft Surface Laptop Studio i7 RTX 3050 Ti | |
| MSI Modern 14 B11SB-085 | |
| AIDA64 / FP32 Ray-Trace | |
| Average of class Multimedia (2214 - 50388, n=53, last 2 years) | |
| Asus Zenbook Pro 15 OLED UM535Q | |
| Average AMD Ryzen 5 5600H (9181 - 12636, n=14) | |
| Asus Vivobook Pro 14 M3401QC-KM007T | |
| Acer Swift X SFX14-41G-R7F3 | |
| Schenker Vision 14 | |
| Acer Swift 3X SF314-510G-70DW | |
| Microsoft Surface Laptop Studio i7 RTX 3050 Ti | |
| MSI Modern 14 B11SB-085 | |
| AIDA64 / FPU Julia | |
| Asus Zenbook Pro 15 OLED UM535Q | |
| Average of class Multimedia (12867 - 201874, n=54, last 2 years) | |
| Average AMD Ryzen 5 5600H (51994 - 78250, n=14) | |
| Asus Vivobook Pro 14 M3401QC-KM007T | |
| Acer Swift X SFX14-41G-R7F3 | |
| Schenker Vision 14 | |
| Acer Swift 3X SF314-510G-70DW | |
| Microsoft Surface Laptop Studio i7 RTX 3050 Ti | |
| MSI Modern 14 B11SB-085 | |
| AIDA64 / CPU SHA3 | |
| Average of class Multimedia (626 - 8623, n=54, last 2 years) | |
| Asus Zenbook Pro 15 OLED UM535Q | |
| Average AMD Ryzen 5 5600H (1587 - 2675, n=14) | |
| Schenker Vision 14 | |
| Asus Vivobook Pro 14 M3401QC-KM007T | |
| Acer Swift 3X SF314-510G-70DW | |
| Microsoft Surface Laptop Studio i7 RTX 3050 Ti | |
| MSI Modern 14 B11SB-085 | |
| Acer Swift X SFX14-41G-R7F3 | |
| AIDA64 / CPU Queen | |
| Asus Zenbook Pro 15 OLED UM535Q | |
| Average AMD Ryzen 5 5600H (66699 - 77213, n=14) | |
| Average of class Multimedia (13483 - 181505, n=41, last 2 years) | |
| Asus Vivobook Pro 14 M3401QC-KM007T | |
| Acer Swift X SFX14-41G-R7F3 | |
| Schenker Vision 14 | |
| Acer Swift 3X SF314-510G-70DW | |
| Microsoft Surface Laptop Studio i7 RTX 3050 Ti | |
| MSI Modern 14 B11SB-085 | |
| AIDA64 / FPU SinJulia | |
| Asus Zenbook Pro 15 OLED UM535Q | |
| Acer Swift X SFX14-41G-R7F3 | |
| Average AMD Ryzen 5 5600H (8340 - 9159, n=14) | |
| Average of class Multimedia (886 - 28794, n=54, last 2 years) | |
| Asus Vivobook Pro 14 M3401QC-KM007T | |
| Schenker Vision 14 | |
| Acer Swift 3X SF314-510G-70DW | |
| Microsoft Surface Laptop Studio i7 RTX 3050 Ti | |
| MSI Modern 14 B11SB-085 | |
| AIDA64 / FPU Mandel | |
| Asus Zenbook Pro 15 OLED UM535Q | |
| Average of class Multimedia (6395 - 105740, n=53, last 2 years) | |
| Average AMD Ryzen 5 5600H (28268 - 43274, n=14) | |
| Asus Vivobook Pro 14 M3401QC-KM007T | |
| Acer Swift X SFX14-41G-R7F3 | |
| Schenker Vision 14 | |
| Acer Swift 3X SF314-510G-70DW | |
| Microsoft Surface Laptop Studio i7 RTX 3050 Ti | |
| MSI Modern 14 B11SB-085 | |
| AIDA64 / CPU AES | |
| Asus Zenbook Pro 15 OLED UM535Q | |
| Asus Vivobook Pro 14 M3401QC-KM007T | |
| Schenker Vision 14 | |
| Average AMD Ryzen 5 5600H (39852 - 98939, n=14) | |
| Acer Swift 3X SF314-510G-70DW | |
| Average of class Multimedia (8171 - 126790, n=54, last 2 years) | |
| Microsoft Surface Laptop Studio i7 RTX 3050 Ti | |
| MSI Modern 14 B11SB-085 | |
| Acer Swift X SFX14-41G-R7F3 | |
| AIDA64 / CPU ZLib | |
| Average of class Multimedia (143.8 - 2022, n=54, last 2 years) | |
| Asus Zenbook Pro 15 OLED UM535Q | |
| Acer Swift X SFX14-41G-R7F3 | |
| Average AMD Ryzen 5 5600H (507 - 649, n=14) | |
| Asus Vivobook Pro 14 M3401QC-KM007T | |
| Schenker Vision 14 | |
| Acer Swift 3X SF314-510G-70DW | |
| MSI Modern 14 B11SB-085 | |
| Microsoft Surface Laptop Studio i7 RTX 3050 Ti | |
| AIDA64 / FP64 Ray-Trace | |
| Average of class Multimedia (1014 - 26875, n=54, last 2 years) | |
| Asus Zenbook Pro 15 OLED UM535Q | |
| Average AMD Ryzen 5 5600H (4811 - 6652, n=14) | |
| Asus Vivobook Pro 14 M3401QC-KM007T | |
| Acer Swift X SFX14-41G-R7F3 | |
| Schenker Vision 14 | |
| Acer Swift 3X SF314-510G-70DW | |
| Microsoft Surface Laptop Studio i7 RTX 3050 Ti | |
| MSI Modern 14 B11SB-085 | |
| AIDA64 / CPU PhotoWorxx | |
| Average of class Multimedia (8187 - 88154, n=54, last 2 years) | |
| Acer Swift 3X SF314-510G-70DW | |
| Microsoft Surface Laptop Studio i7 RTX 3050 Ti | |
| Schenker Vision 14 | |
| Acer Swift X SFX14-41G-R7F3 | |
| Asus Zenbook Pro 15 OLED UM535Q | |
| Average AMD Ryzen 5 5600H (7419 - 24746, n=14) | |
| Asus Vivobook Pro 14 M3401QC-KM007T | |
| MSI Modern 14 B11SB-085 | |
系统性能
与其他配备dGPU的多媒体笔记本电脑相比,华硕VivoBook Pro 14并没有表现出最好的性能,但该笔记本电脑在PCMark和CrossMark中的得分却异常出色。使用Nvidia Studio驱动程序,该笔记本电脑主要可以在数字内容创作子类别中取得非常高的分数。这再次表明,这款多媒体笔记本电脑也是针对内容创作者的。
CrossMark: Overall | Productivity | Creativity | Responsiveness
| PCMark 10 / Score | |
| Average of class Multimedia (4325 - 10386, n=52, last 2 years) | |
| Asus Zenbook Pro 15 OLED UM535Q | |
| Schenker Vision 14 | |
| Average AMD Ryzen 5 5600H, NVIDIA GeForce RTX 3050 4GB Laptop GPU (5748 - 5905, n=2) | |
| Asus Vivobook Pro 14 M3401QC-KM007T | |
| Microsoft Surface Laptop Studio i7 RTX 3050 Ti | |
| Acer Swift 3X SF314-510G-70DW | |
| MSI Modern 14 B11SB-085 | |
| Acer Swift X SFX14-41G-R7F3 | |
| PCMark 10 / Essentials | |
| Average of class Multimedia (8025 - 11664, n=51, last 2 years) | |
| Asus Zenbook Pro 15 OLED UM535Q | |
| Acer Swift 3X SF314-510G-70DW | |
| Average AMD Ryzen 5 5600H, NVIDIA GeForce RTX 3050 4GB Laptop GPU (9372 - 9987, n=2) | |
| Asus Vivobook Pro 14 M3401QC-KM007T | |
| Schenker Vision 14 | |
| Microsoft Surface Laptop Studio i7 RTX 3050 Ti | |
| Acer Swift X SFX14-41G-R7F3 | |
| MSI Modern 14 B11SB-085 | |
| PCMark 10 / Productivity | |
| Average of class Multimedia (7323 - 18233, n=51, last 2 years) | |
| Asus Zenbook Pro 15 OLED UM535Q | |
| Schenker Vision 14 | |
| Microsoft Surface Laptop Studio i7 RTX 3050 Ti | |
| Average AMD Ryzen 5 5600H, NVIDIA GeForce RTX 3050 4GB Laptop GPU (7975 - 8627, n=2) | |
| Asus Vivobook Pro 14 M3401QC-KM007T | |
| MSI Modern 14 B11SB-085 | |
| Acer Swift 3X SF314-510G-70DW | |
| Acer Swift X SFX14-41G-R7F3 | |
| PCMark 10 / Digital Content Creation | |
| Average of class Multimedia (3651 - 16240, n=51, last 2 years) | |
| Asus Zenbook Pro 15 OLED UM535Q | |
| Asus Vivobook Pro 14 M3401QC-KM007T | |
| Average AMD Ryzen 5 5600H, NVIDIA GeForce RTX 3050 4GB Laptop GPU (6486 - 6897, n=2) | |
| Schenker Vision 14 | |
| Microsoft Surface Laptop Studio i7 RTX 3050 Ti | |
| Acer Swift X SFX14-41G-R7F3 | |
| Acer Swift 3X SF314-510G-70DW | |
| MSI Modern 14 B11SB-085 | |
| CrossMark / Overall | |
| Average of class Multimedia (866 - 2728, n=60, last 2 years) | |
| Schenker Vision 14 | |
| Asus Zenbook Pro 15 OLED UM535Q | |
| Microsoft Surface Laptop Studio i7 RTX 3050 Ti | |
| Asus Vivobook Pro 14 M3401QC-KM007T | |
| Average AMD Ryzen 5 5600H, NVIDIA GeForce RTX 3050 4GB Laptop GPU (n=1) | |
| Acer Swift X SFX14-41G-R7F3 | |
| CrossMark / Productivity | |
| Average of class Multimedia (931 - 2489, n=60, last 2 years) | |
| Schenker Vision 14 | |
| Asus Zenbook Pro 15 OLED UM535Q | |
| Microsoft Surface Laptop Studio i7 RTX 3050 Ti | |
| Asus Vivobook Pro 14 M3401QC-KM007T | |
| Average AMD Ryzen 5 5600H, NVIDIA GeForce RTX 3050 4GB Laptop GPU (n=1) | |
| Acer Swift X SFX14-41G-R7F3 | |
| CrossMark / Creativity | |
| Average of class Multimedia (907 - 3465, n=60, last 2 years) | |
| Microsoft Surface Laptop Studio i7 RTX 3050 Ti | |
| Asus Zenbook Pro 15 OLED UM535Q | |
| Schenker Vision 14 | |
| Asus Vivobook Pro 14 M3401QC-KM007T | |
| Average AMD Ryzen 5 5600H, NVIDIA GeForce RTX 3050 4GB Laptop GPU (n=1) | |
| Acer Swift X SFX14-41G-R7F3 | |
| CrossMark / Responsiveness | |
| Average of class Multimedia (605 - 2024, n=60, last 2 years) | |
| Schenker Vision 14 | |
| Asus Zenbook Pro 15 OLED UM535Q | |
| Microsoft Surface Laptop Studio i7 RTX 3050 Ti | |
| Asus Vivobook Pro 14 M3401QC-KM007T | |
| Average AMD Ryzen 5 5600H, NVIDIA GeForce RTX 3050 4GB Laptop GPU (n=1) | |
| Acer Swift X SFX14-41G-R7F3 | |
| PCMark 10 Score | 5748 points | |
Help | ||
| AIDA64 / Memory Copy | |
| Average of class Multimedia (11299 - 132135, n=54, last 2 years) | |
| Acer Swift 3X SF314-510G-70DW | |
| Microsoft Surface Laptop Studio i7 RTX 3050 Ti | |
| Schenker Vision 14 | |
| Asus Zenbook Pro 15 OLED UM535Q | |
| Asus Vivobook Pro 14 M3401QC-KM007T | |
| Acer Swift X SFX14-41G-R7F3 | |
| Average AMD Ryzen 5 5600H (20549 - 42141, n=14) | |
| MSI Modern 14 B11SB-085 | |
| AIDA64 / Memory Read | |
| Average of class Multimedia (11624 - 174586, n=54, last 2 years) | |
| Acer Swift 3X SF314-510G-70DW | |
| Microsoft Surface Laptop Studio i7 RTX 3050 Ti | |
| Schenker Vision 14 | |
| Acer Swift X SFX14-41G-R7F3 | |
| Asus Vivobook Pro 14 M3401QC-KM007T | |
| Average AMD Ryzen 5 5600H (22917 - 47595, n=14) | |
| Asus Zenbook Pro 15 OLED UM535Q | |
| MSI Modern 14 B11SB-085 | |
| AIDA64 / Memory Write | |
| Average of class Multimedia (11755 - 134998, n=54, last 2 years) | |
| Acer Swift 3X SF314-510G-70DW | |
| Microsoft Surface Laptop Studio i7 RTX 3050 Ti | |
| Schenker Vision 14 | |
| Asus Zenbook Pro 15 OLED UM535Q | |
| Acer Swift X SFX14-41G-R7F3 | |
| Average AMD Ryzen 5 5600H (20226 - 44872, n=14) | |
| Asus Vivobook Pro 14 M3401QC-KM007T | |
| MSI Modern 14 B11SB-085 | |
| AIDA64 / Memory Latency | |
| Average of class Multimedia (7 - 535, n=53, last 2 years) | |
| Acer Swift X SFX14-41G-R7F3 | |
| Microsoft Surface Laptop Studio i7 RTX 3050 Ti | |
| Asus Zenbook Pro 15 OLED UM535Q | |
| Acer Swift 3X SF314-510G-70DW | |
| Asus Vivobook Pro 14 M3401QC-KM007T | |
| Average AMD Ryzen 5 5600H (75 - 89.1, n=14) | |
| MSI Modern 14 B11SB-085 | |
| Schenker Vision 14 | |
* ... smaller is better
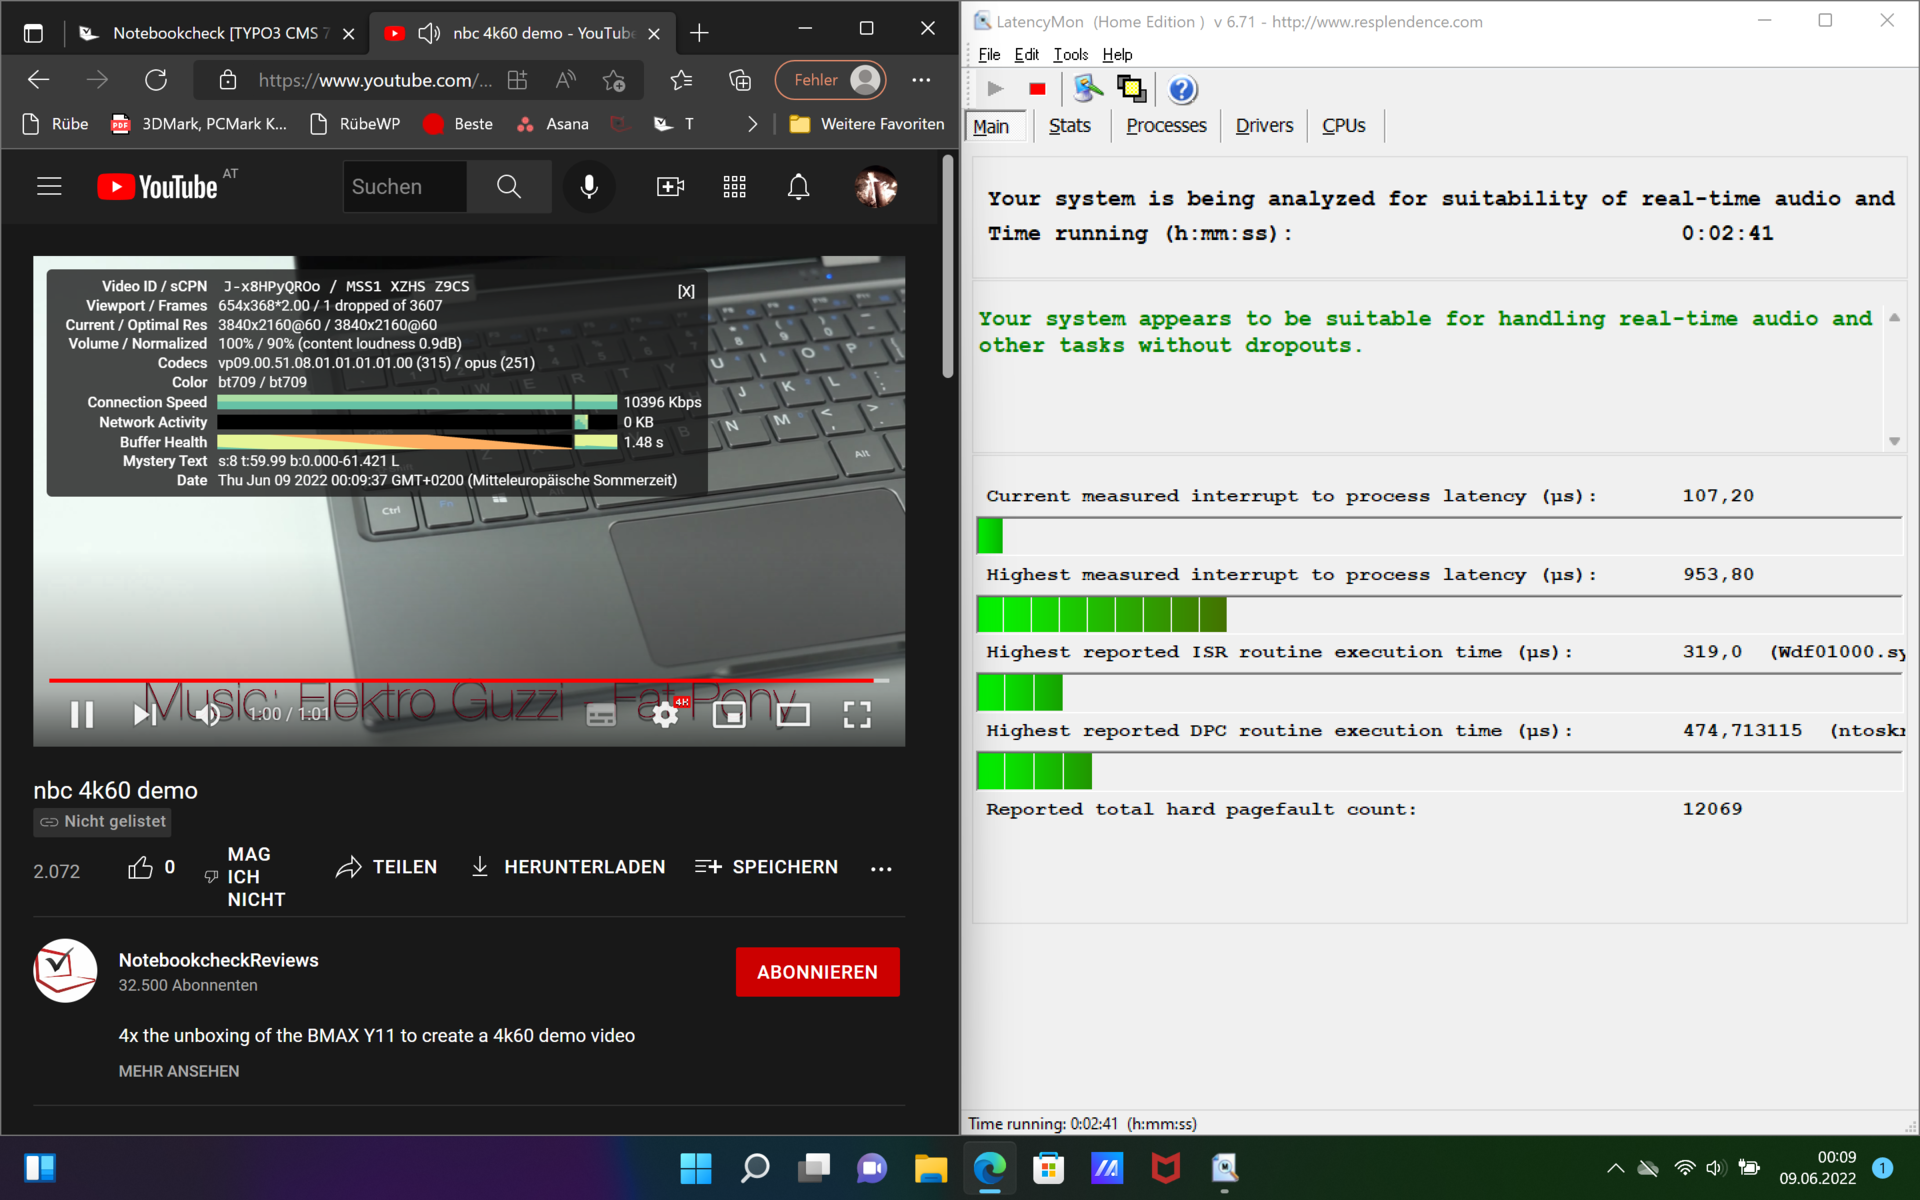
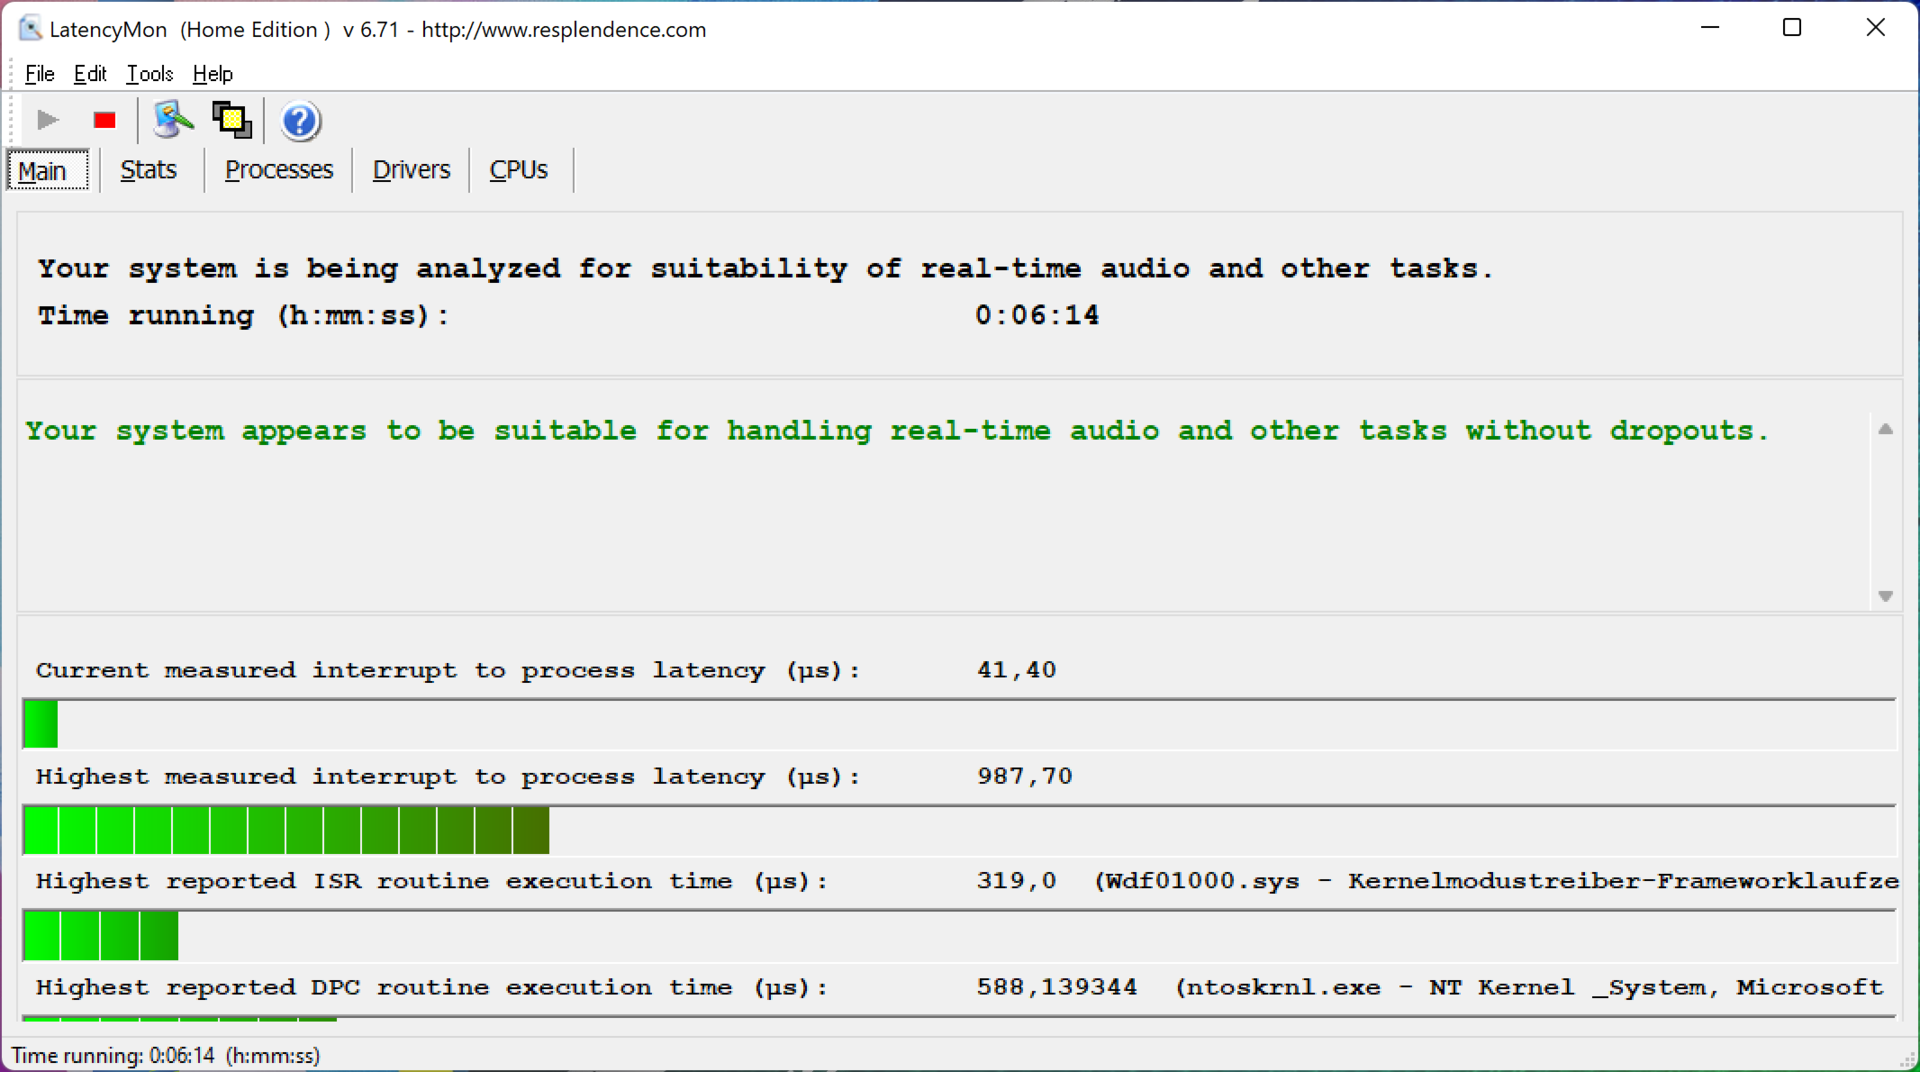
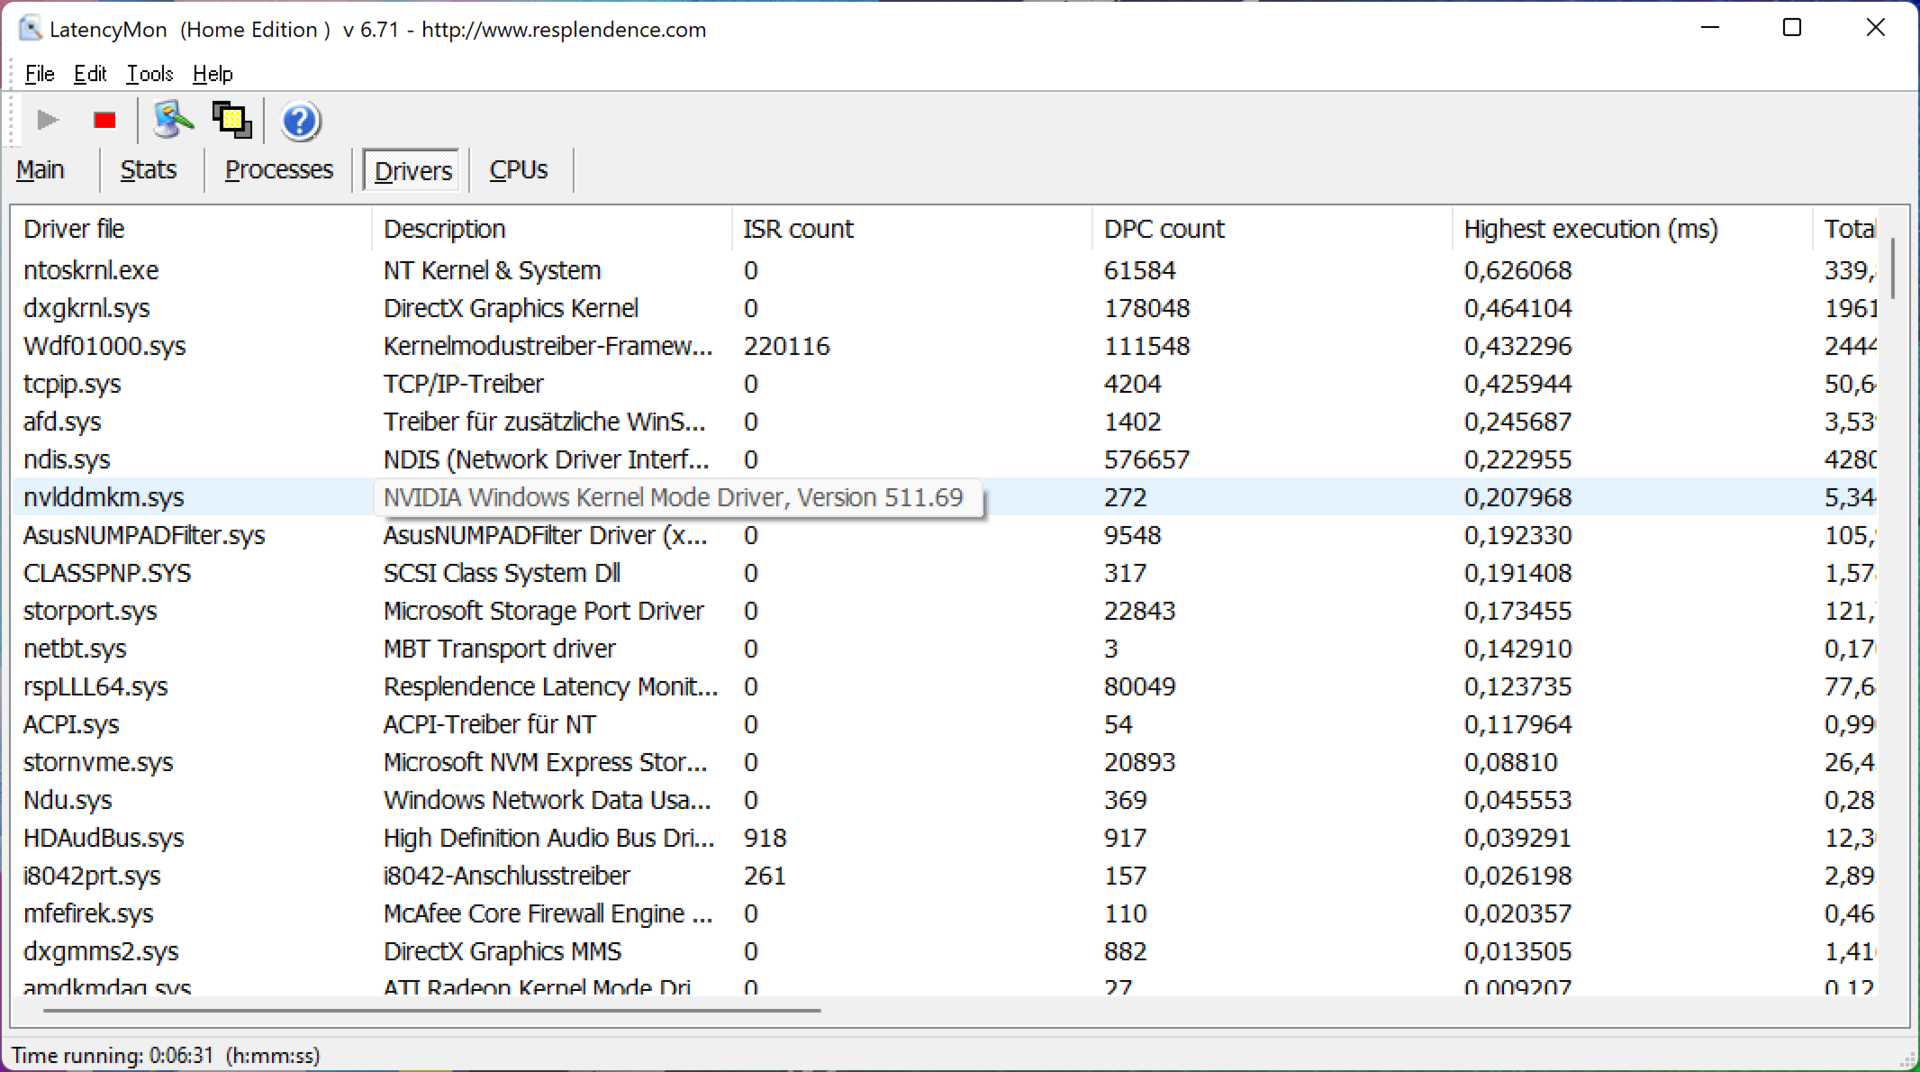
DPC延迟
用LatencyMon进行的延迟测试结果是,延迟略低于1毫秒。这意味着,在我们测试的硬件和软件配置中,这台笔记本电脑正好能够处理实时应用。在播放我们的4K 60 Hz YouTube测试视频时没有丢帧。
| DPC Latencies / LatencyMon - interrupt to process latency (max), Web, Youtube, Prime95 | |
| Acer Swift 3X SF314-510G-70DW | |
| Acer Swift X SFX14-41G-R7F3 | |
| Schenker Vision 14 | |
| Asus Vivobook Pro 14 M3401QC-KM007T | |
| MSI Modern 14 B11SB-085 | |
| Microsoft Surface Laptop Studio i7 RTX 3050 Ti | |
| Asus Zenbook Pro 15 OLED UM535Q | |
* ... smaller is better
储存
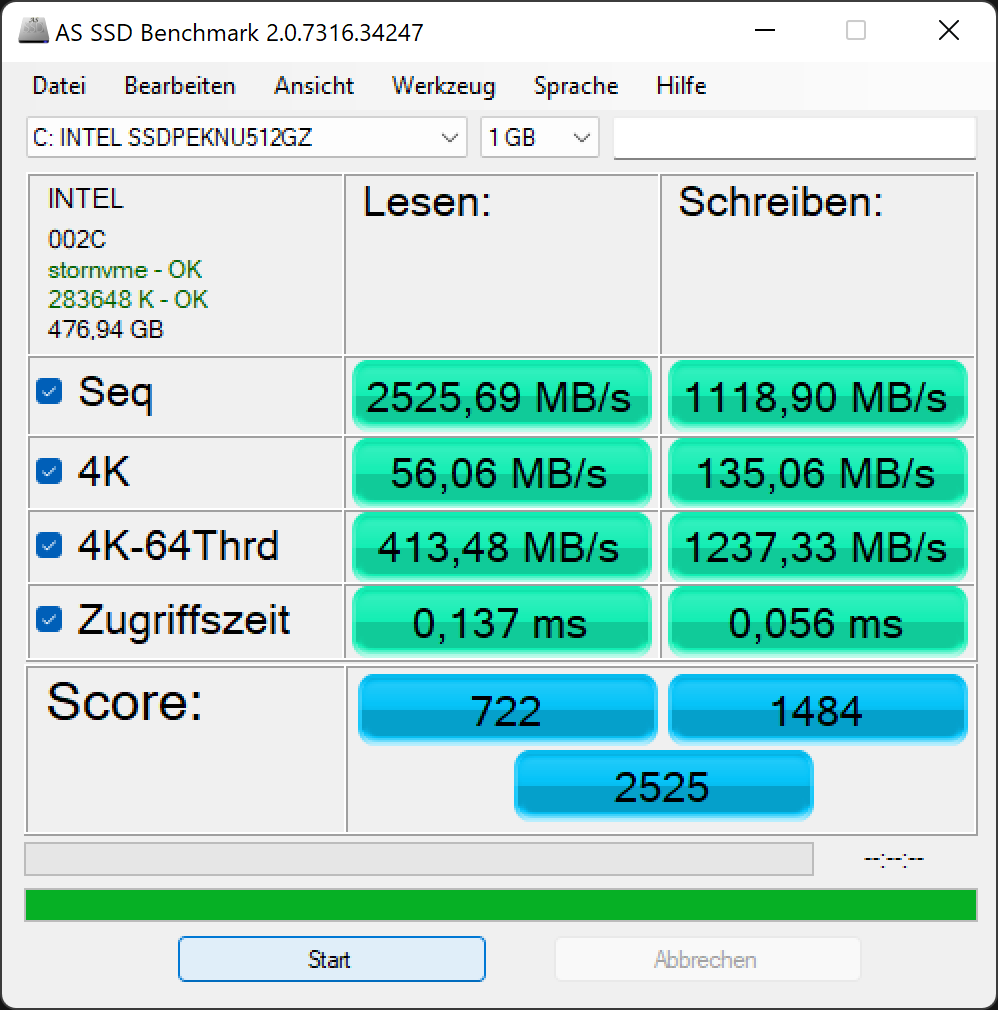
内置的英特尔固态硬盘在我们的《HDD/SSD基准测试》中排名较低。 硬盘/SSD基准测试文章中排名靠后.因此,华硕笔记本电脑的存储速度也不是特别快,这并不令人惊讶。尽管如此,数据传输速度对大多数使用情况来说是足够的。

* ... smaller is better
Continuous load read: DiskSpd Read Loop, Queue Depth 8
图形卡
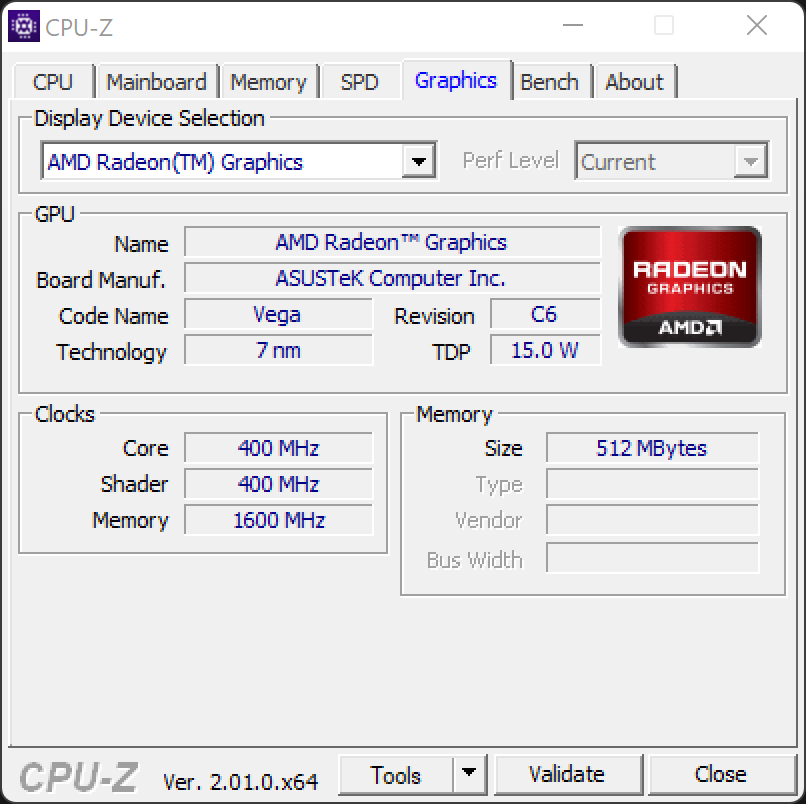
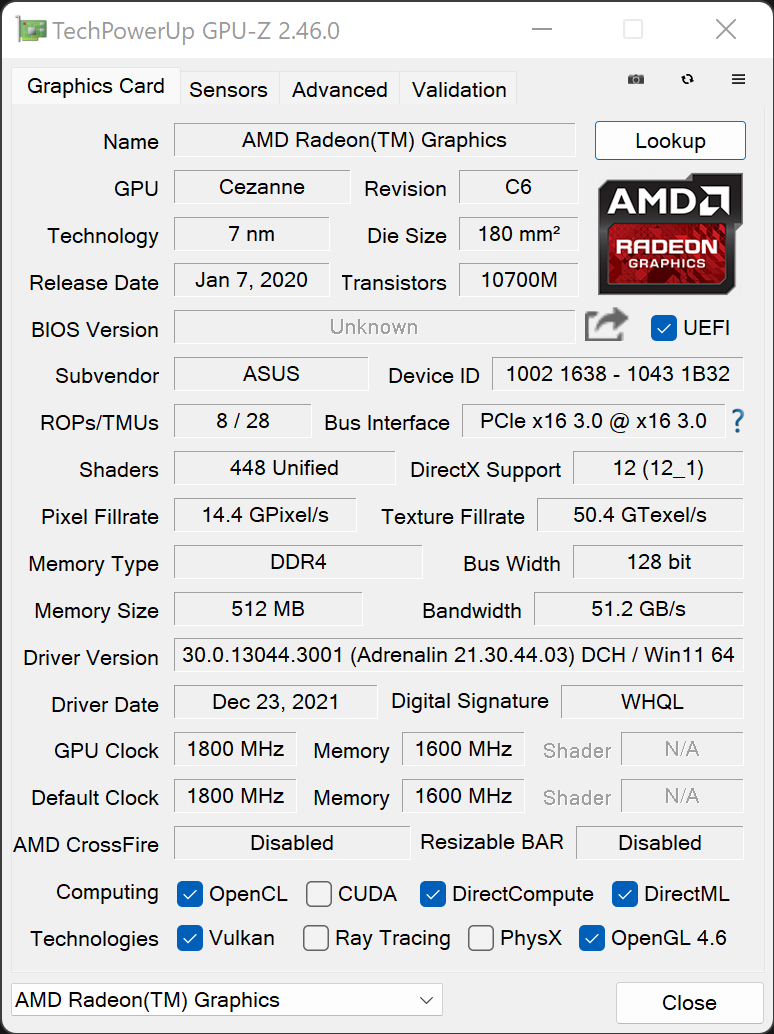
的AMD Radeon RX Vega 6集成到Ryzen 5中,可以解决大多数日常任务。如果需要更多的图形性能,那么NvidiaGeForce RTX 3050就会启动。根据性能模式或电源的不同,显卡的工作功率为30至50瓦。这在某些情况下会导致性能大幅下降。将不同模式与3DMark中的Fire Strike 基准进行比较,结果是以下比率。
| 性能模式 | 标准模式 | 低声模式 | 电池电量 | |
|---|---|---|---|---|
| GPU功率消耗 | 50瓦 | 40瓦 | 35瓦 | 30瓦 |
| Fire Strike GPU得分 | 11,356 | 10,516 | 9,974 | 8,806 |
由于华硕VivoBook Pro 14的显卡可以在长期内保持其相对较高的性能,所以RTX 3050能够跟上稍微强大的RTX 3050 Ti在竞争对手的设备中也是如此。这就是VivoBook在3DMark和3DMark 11的各种基准测试中的高分。
华硕在这里安装了GeForce RTX 3050的Nvidia Studio驱动程序。这个驱动程序为用于3D编辑和视频编辑的高要求程序进行了更好的优化。然而,3DMark并没有提供针对该驱动程序优化的基准,所以有可能另一个图形驱动程序可以产生更好的分数。
| 3DMark 11 Performance | 14890 points | |
| 3DMark Cloud Gate Standard Score | 34692 points | |
| 3DMark Fire Strike Score | 10427 points | |
| 3DMark Time Spy Score | 4708 points | |
Help | ||
游戏性能
华硕VivoBook Pro 14 OLED在我们测试的所有游戏中都取得了良好的帧率,甚至使用高设置。这台多媒体笔记本电脑甚至可以轻松处理当前的Ghostwire Tokyo,这显示了它的游戏技能。结合了Ryzen 5 5600H和GeForce RTX 3050在这里提供了巨大的性能。
| The Witcher 3 | |
| 1920x1080 High Graphics & Postprocessing (Nvidia HairWorks Off) | |
| Asus Zenbook Pro 15 OLED UM535Q | |
| Average of class Multimedia (22 - 224, n=7, last 2 years) | |
| Microsoft Surface Laptop Studio i7 RTX 3050 Ti | |
| Average NVIDIA GeForce RTX 3050 4GB Laptop GPU (53.5 - 105.1, n=17) | |
| Schenker Vision 14 | |
| Asus Vivobook Pro 14 M3401QC-KM007T | |
| Acer Swift X SFX14-41G-R7F3 | |
| Acer Swift 3X SF314-510G-70DW | |
| MSI Modern 14 B11SB-085 | |
| 1920x1080 Ultra Graphics & Postprocessing (HBAO+) | |
| Average of class Multimedia (11 - 121, n=7, last 2 years) | |
| Asus Zenbook Pro 15 OLED UM535Q | |
| Asus Vivobook Pro 14 M3401QC-KM007T | |
| Average NVIDIA GeForce RTX 3050 4GB Laptop GPU (31.5 - 55.8, n=21) | |
| Microsoft Surface Laptop Studio i7 RTX 3050 Ti | |
| Schenker Vision 14 | |
| Acer Swift X SFX14-41G-R7F3 | |
| MSI Modern 14 B11SB-085 | |
| Acer Swift 3X SF314-510G-70DW | |
| 1920x1080 Medium Graphics & Postprocessing | |
| Asus Vivobook Pro 14 M3401QC-KM007T | |
| Average NVIDIA GeForce RTX 3050 4GB Laptop GPU (80.1 - 98, n=3) | |
| GTA V | |
| 1920x1080 High/On (Advanced Graphics Off) AA:2xMSAA + FX AF:8x | |
| Asus Zenbook Pro 15 OLED UM535Q | |
| Asus Vivobook Pro 14 M3401QC-KM007T | |
| Average NVIDIA GeForce RTX 3050 4GB Laptop GPU (89.9 - 148.2, n=19) | |
| Microsoft Surface Laptop Studio i7 RTX 3050 Ti | |
| Schenker Vision 14 | |
| Average of class Multimedia (19.5 - 186.1, n=47, last 2 years) | |
| MSI Modern 14 B11SB-085 | |
| Acer Swift 3X SF314-510G-70DW | |
| 1920x1080 Highest AA:4xMSAA + FX AF:16x | |
| Asus Zenbook Pro 15 OLED UM535Q | |
| Microsoft Surface Laptop Studio i7 RTX 3050 Ti | |
| Average NVIDIA GeForce RTX 3050 4GB Laptop GPU (48 - 72.5, n=21) | |
| Asus Vivobook Pro 14 M3401QC-KM007T | |
| Average of class Multimedia (7.92 - 141.6, n=55, last 2 years) | |
| Schenker Vision 14 | |
| MSI Modern 14 B11SB-085 | |
| Acer Swift 3X SF314-510G-70DW | |
| F1 2021 | |
| 1920x1080 High Preset AA:T AF:16x | |
| Average NVIDIA GeForce RTX 3050 4GB Laptop GPU (93.4 - 130.1, n=7) | |
| Asus Vivobook Pro 14 M3401QC-KM007T | |
| Microsoft Surface Laptop Studio i7 RTX 3050 Ti | |
| Schenker Vision 14 | |
| Acer Swift X SFX14-41G-R7F3 | |
| MSI Modern 14 B11SB-085 | |
| 1920x1080 Ultra High Preset + Raytracing AA:T AF:16x | |
| Acer Swift X SFX14-41G-R7F3 | |
| Asus Vivobook Pro 14 M3401QC-KM007T | |
| Average NVIDIA GeForce RTX 3050 4GB Laptop GPU (44.1 - 62, n=8) | |
| Schenker Vision 14 | |
| Microsoft Surface Laptop Studio i7 RTX 3050 Ti | |
| 1920x1080 Medium Preset AA:T AF:16x | |
| Average NVIDIA GeForce RTX 3050 4GB Laptop GPU (112 - 164.7, n=7) | |
| Microsoft Surface Laptop Studio i7 RTX 3050 Ti | |
| Asus Vivobook Pro 14 M3401QC-KM007T | |
| Schenker Vision 14 | |
| Acer Swift X SFX14-41G-R7F3 | |
| MSI Modern 14 B11SB-085 | |
| Far Cry 6 | |
| 1920x1080 High Graphics Quality AA:T | |
| Asus Vivobook Pro 14 M3401QC-KM007T | |
| Average NVIDIA GeForce RTX 3050 4GB Laptop GPU (52 - 67, n=3) | |
| 1920x1080 Ultra Graphics Quality + HD Textures AA:T | |
| Asus Vivobook Pro 14 M3401QC-KM007T | |
| Average NVIDIA GeForce RTX 3050 4GB Laptop GPU (45 - 59, n=3) | |
| 2560x1440 Ultra Graphics Quality + HD Textures AA:T | |
| Asus Vivobook Pro 14 M3401QC-KM007T | |
| Average NVIDIA GeForce RTX 3050 4GB Laptop GPU (n=1) | |
| Ghostwire Tokyo | |
| 1920x1080 High Settings | |
| Average NVIDIA GeForce RTX 3050 4GB Laptop GPU (55.7 - 79.7, n=3) | |
| Asus Vivobook Pro 14 M3401QC-KM007T | |
| 1920x1080 Highest Settings | |
| Average NVIDIA GeForce RTX 3050 4GB Laptop GPU (53.9 - 79.4, n=3) | |
| Asus Vivobook Pro 14 M3401QC-KM007T | |
| 2560x1440 Highest Settings | |
| Asus Vivobook Pro 14 M3401QC-KM007T | |
| Average NVIDIA GeForce RTX 3050 4GB Laptop GPU (n=1) | |
| low | med. | high | ultra | QHD | 4K | |
|---|---|---|---|---|---|---|
| GTA V (2015) | 171.7 | 114.9 | 59.7 | |||
| The Witcher 3 (2015) | 67.4 | 47.7 | ||||
| Dota 2 Reborn (2015) | 129.7 | 123.7 | 113 | 107.7 | 61.3 | |
| X-Plane 11.11 (2018) | 91 | 80.3 | 67.1 | 60.9 | ||
| Far Cry 5 (2018) | 90 | 68 | 64 | 61 | ||
| Strange Brigade (2018) | 239 | 114.1 | 93.7 | 80.7 | ||
| F1 2021 (2021) | 232 | 132.8 | 106.1 | 52.7 | ||
| Far Cry 6 (2021) | 87 | 64 | 62 | 53 | 50 | |
| Ghostwire Tokyo (2022) | 75.1 | 62.7 | 62.3 | 57 | 35.6 |
排放 - 通常是无声的,大部分是安静的
噪声排放
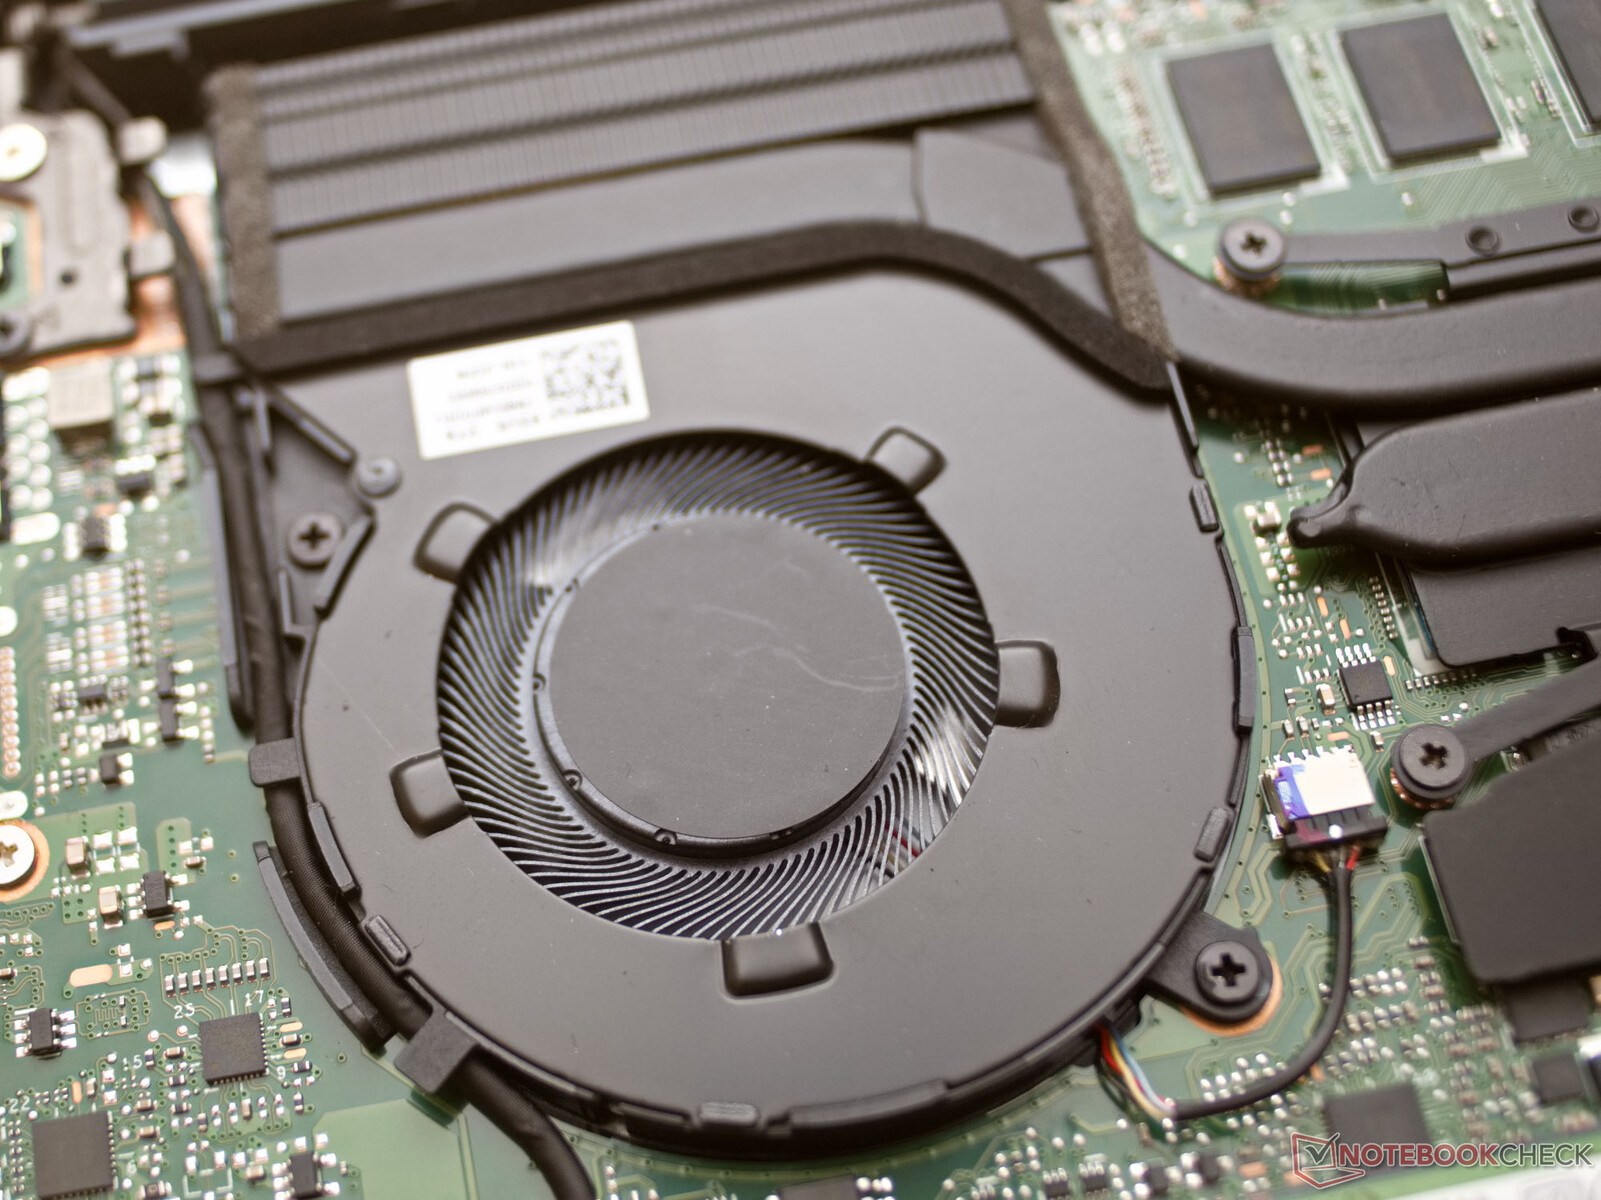
大多数时候,笔记本电脑的两个风扇几乎保持沉默。即使在中等负荷下,它们也只是轻微地转动起来,并保持在30dB(A)左右。只有在重载情况下,如电脑游戏,笔记本才会变得清晰可闻。尽管如此,VivoBook Pro 14的噪音特征只是稍微令人不安,因为它包含更多的中频。
Noise level
| Idle |
| 25.4 / 25.4 / 30.9 dB(A) |
| Load |
| 56 / 56 dB(A) |
 | ||
30 dB silent 40 dB(A) audible 50 dB(A) loud |
||
min: | ||
| Asus Vivobook Pro 14 M3401QC-KM007T GeForce RTX 3050 4GB Laptop GPU, R5 5600H, Intel SSD 670p SSDPEKNU512GZ | Acer Swift X SFX14-41G-R7F3 GeForce GTX 1650 Mobile, R5 5500U, WDC PC SN530 SDBPNPZ-1T00 | Microsoft Surface Laptop Studio i7 RTX 3050 Ti GeForce RTX 3050 Ti Laptop GPU, i7-11370H, SK Hynix PC711 1TB HFS001TDE9X084N | Acer Swift 3X SF314-510G-70DW Xe MAX, i7-1165G7, Micron 2210 MTFDHBA1T0QFD | Asus Zenbook Pro 15 OLED UM535Q GeForce RTX 3050 Ti Laptop GPU, R9 5900HX, WDC PC SN730 SDBPNTY-1T00 | Schenker Vision 14 GeForce RTX 3050 Ti Laptop GPU, i7-11370H, Samsung SSD 980 Pro 1TB MZ-V8P1T0BW | |
|---|---|---|---|---|---|---|
| Noise | 8% | 15% | 11% | 17% | 11% | |
| off / environment * (dB) | 25.4 | 26 -2% | 24.7 3% | 25 2% | 22.8 10% | 24.3 4% |
| Idle Minimum * (dB) | 25.4 | 26 -2% | 24.7 3% | 25 2% | 22.9 10% | 24.3 4% |
| Idle Average * (dB) | 25.4 | 27 -6% | 24.7 3% | 25 2% | 22.9 10% | 24.3 4% |
| Idle Maximum * (dB) | 30.9 | 27.4 11% | 24.7 20% | 25 19% | 22.9 26% | 25.9 16% |
| Load Average * (dB) | 56 | 42.2 25% | 33.2 41% | 44.2 21% | 33.2 41% | 43.3 23% |
| Load Maximum * (dB) | 56 | 44.3 21% | 46.7 17% | 44.2 21% | 52.8 6% | 49.5 12% |
| Witcher 3 ultra * (dB) | 44.5 | 47.3 | 44.6 |
* ... smaller is better
温度
即使笔记本电脑的表面温度在持续负载下上升,它仍然可以舒适地使用。顶面仍然相当舒适,键盘和掌托区域的最高温度为43°C(~109°F),略高于环境温度。箱子底部的温度可高达50°C(约122°F)。这也是可以承受的。
(±) The maximum temperature on the upper side is 42.3 °C / 108 F, compared to the average of 36.8 °C / 98 F, ranging from 21 to 71 °C for the class Multimedia.
(-) The bottom heats up to a maximum of 49.6 °C / 121 F, compared to the average of 39.1 °C / 102 F
(+) In idle usage, the average temperature for the upper side is 31.1 °C / 88 F, compared to the device average of 31.3 °C / 88 F.
(±) Playing The Witcher 3, the average temperature for the upper side is 32.9 °C / 91 F, compared to the device average of 31.3 °C / 88 F.
(+) The palmrests and touchpad are cooler than skin temperature with a maximum of 28.5 °C / 83.3 F and are therefore cool to the touch.
(±) The average temperature of the palmrest area of similar devices was 28.7 °C / 83.7 F (+0.2 °C / 0.4 F).
| Asus Vivobook Pro 14 M3401QC-KM007T AMD Ryzen 5 5600H, NVIDIA GeForce RTX 3050 4GB Laptop GPU | Acer Swift X SFX14-41G-R7F3 AMD Ryzen 5 5500U, NVIDIA GeForce GTX 1650 Mobile | Microsoft Surface Laptop Studio i7 RTX 3050 Ti Intel Core i7-11370H, NVIDIA GeForce RTX 3050 Ti Laptop GPU | MSI Modern 14 B11SB-085 Intel Core i7-1165G7, NVIDIA GeForce MX450 | Acer Swift 3X SF314-510G-70DW Intel Core i7-1165G7, Intel Iris Xe MAX Graphics | Asus Zenbook Pro 15 OLED UM535Q AMD Ryzen 9 5900HX, NVIDIA GeForce RTX 3050 Ti Laptop GPU | Schenker Vision 14 Intel Core i7-11370H, NVIDIA GeForce RTX 3050 Ti Laptop GPU | |
|---|---|---|---|---|---|---|---|
| Heat | 17% | 23% | -7% | 15% | 2% | 1% | |
| Maximum Upper Side * (°C) | 42.3 | 42.1 -0% | 42.3 -0% | 55.6 -31% | 40.8 4% | 36 15% | 49.7 -17% |
| Maximum Bottom * (°C) | 49.6 | 45.3 9% | 38.2 23% | 67.8 -37% | 45.2 9% | 47.2 5% | 56 -13% |
| Idle Upper Side * (°C) | 34.2 | 25.5 25% | 23.4 32% | 28.3 17% | 29.8 13% | 37 -8% | 28.8 16% |
| Idle Bottom * (°C) | 37.9 | 25.3 33% | 23.5 38% | 28.9 24% | 24.7 35% | 39.2 -3% | 30.6 19% |
* ... smaller is better
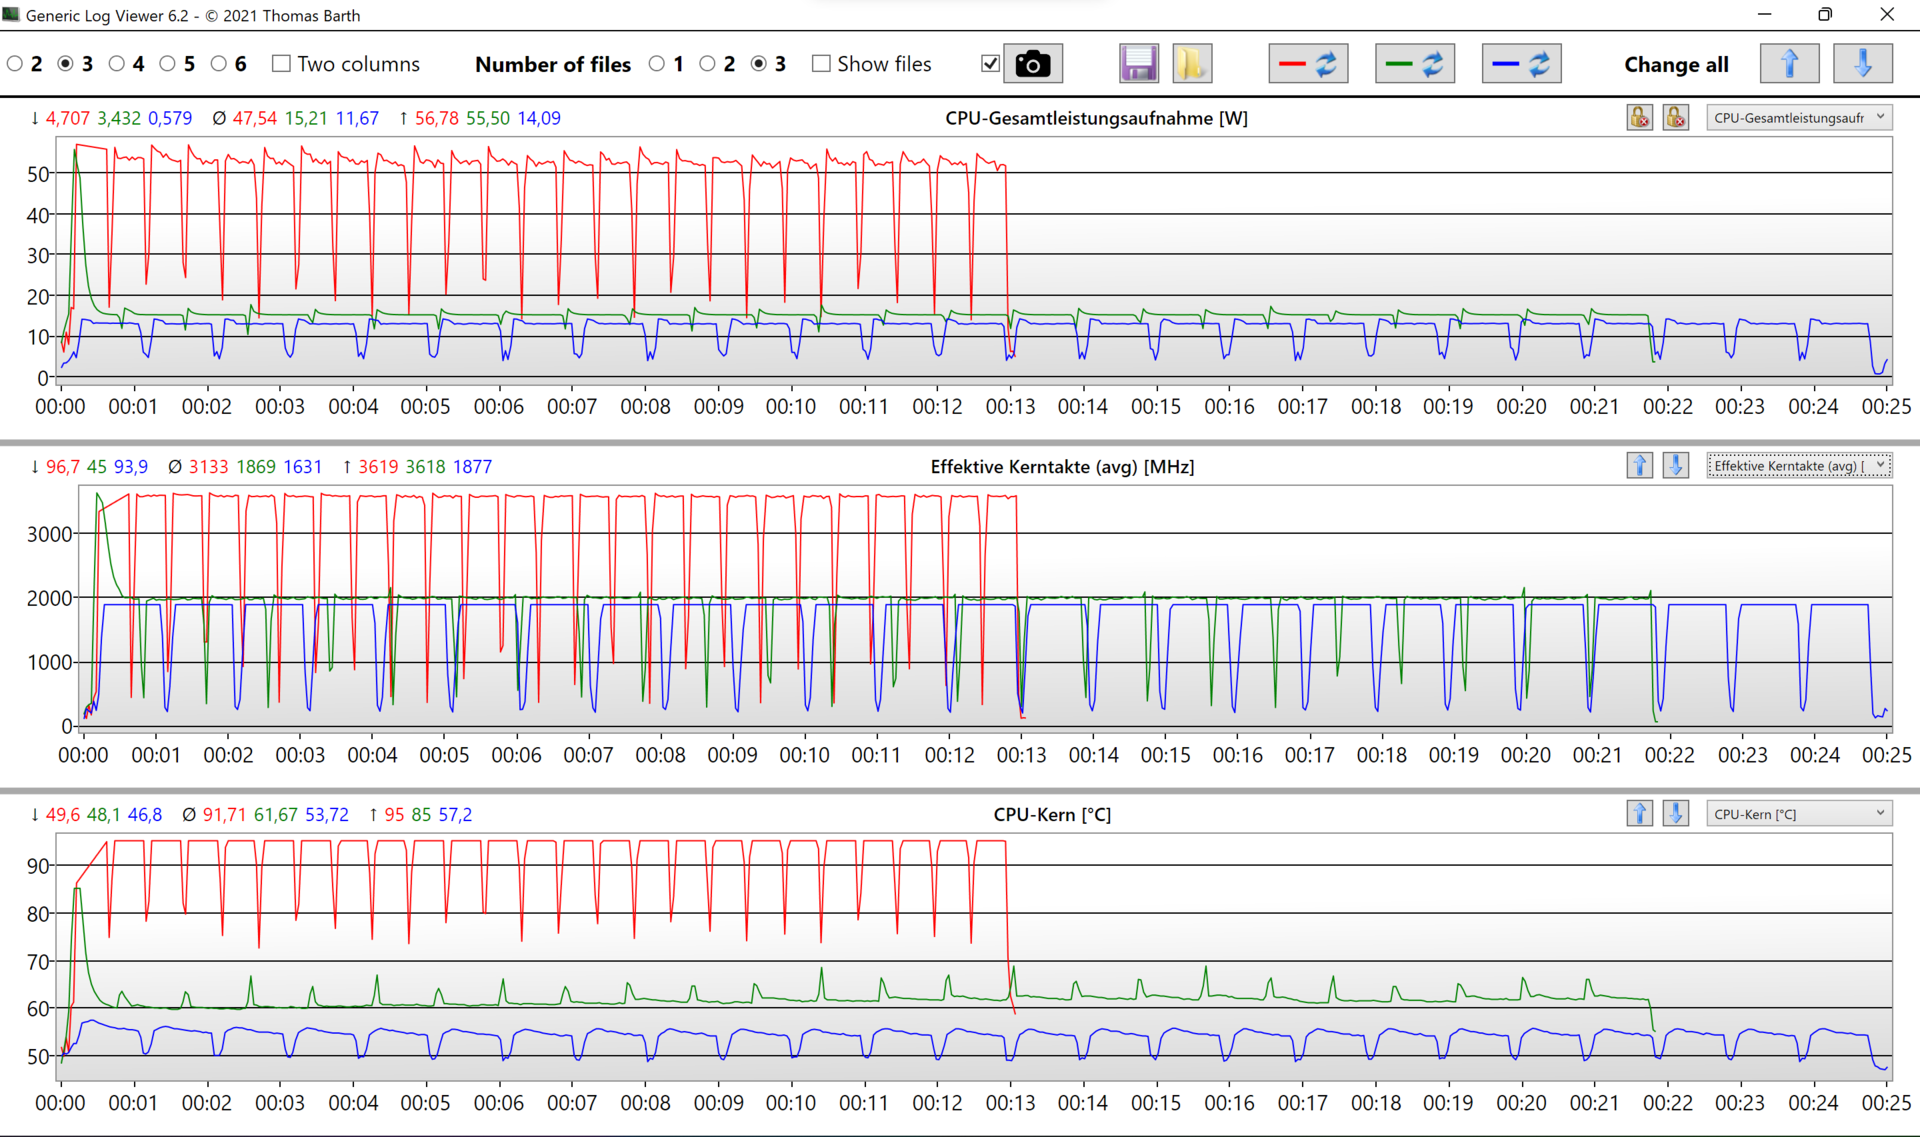
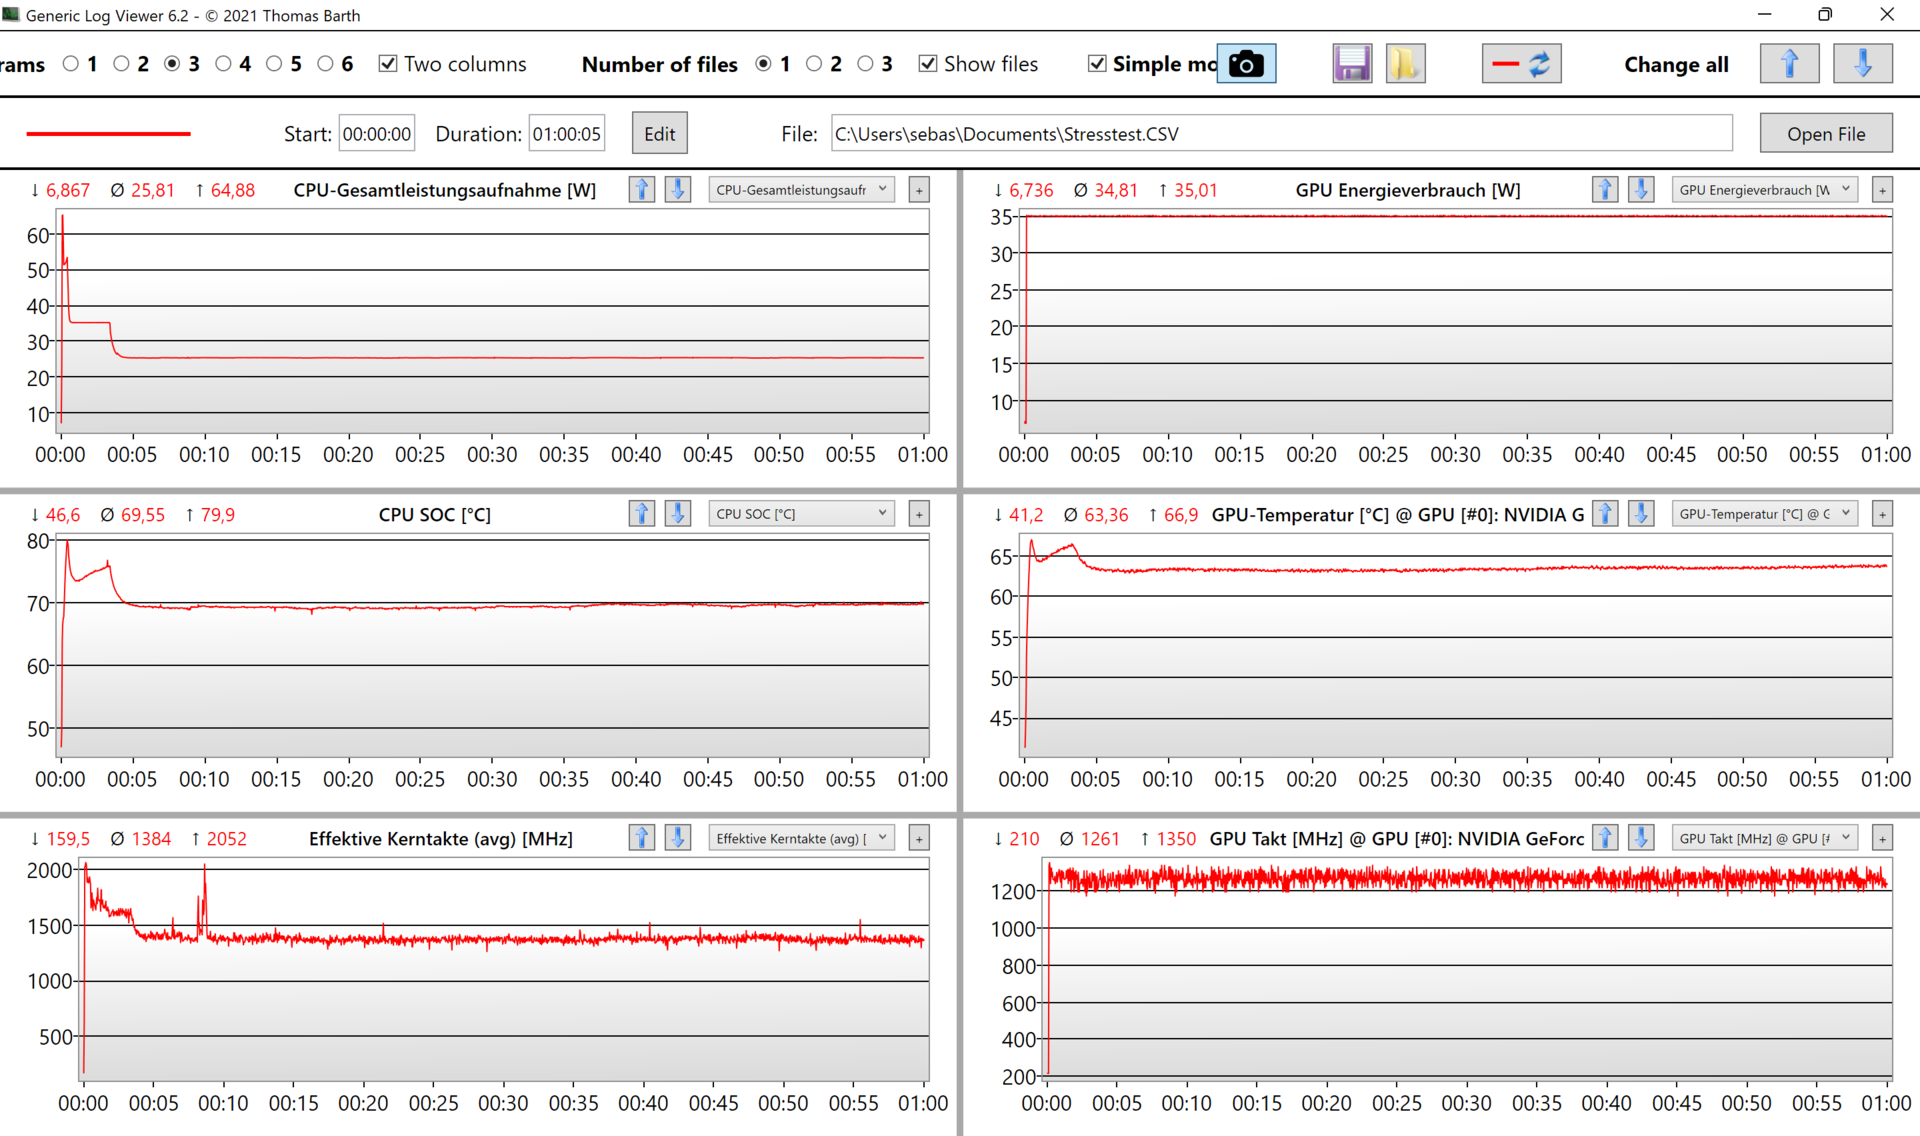
压力测试
用Prime95和FurMark进行的压力测试显示了处理器在开始时的高提升性能。在前三分钟,显卡和处理器以大约35瓦的功率运行。之后,Ryzen 5的性能降低到25瓦左右。GeForce RTX 3050持续以35瓦的功率运行。在一小时的测试中,CPU和dGPU的温度保持不变。
发言人
VivoBook Pro 14 OLED的扬声器的特点是中音和高音清晰。低音至少在高音量时可以更强一点,但它们在中等音量时保持得很好。总的来说,这款笔记本电脑的扬声器令人满意。
Asus Vivobook Pro 14 M3401QC-KM007T audio analysis
(±) | speaker loudness is average but good (75.31 dB)
Bass 100 - 315 Hz
(-) | nearly no bass - on average 21.8% lower than median
(±) | linearity of bass is average (12.9% delta to prev. frequency)
Mids 400 - 2000 Hz
(+) | balanced mids - only 3.9% away from median
(+) | mids are linear (6.5% delta to prev. frequency)
Highs 2 - 16 kHz
(+) | balanced highs - only 3.6% away from median
(+) | highs are linear (5% delta to prev. frequency)
Overall 100 - 16.000 Hz
(±) | linearity of overall sound is average (17% difference to median)
Compared to same class
» 46% of all tested devices in this class were better, 7% similar, 46% worse
» The best had a delta of 5%, average was 17%, worst was 45%
Compared to all devices tested
» 31% of all tested devices were better, 8% similar, 61% worse
» The best had a delta of 4%, average was 23%, worst was 134%
Microsoft Surface Laptop Studio i7 RTX 3050 Ti audio analysis
(+) | speakers can play relatively loud (82.9 dB)
Bass 100 - 315 Hz
(±) | reduced bass - on average 12.5% lower than median
(±) | linearity of bass is average (7.3% delta to prev. frequency)
Mids 400 - 2000 Hz
(+) | balanced mids - only 3.2% away from median
(+) | mids are linear (2.1% delta to prev. frequency)
Highs 2 - 16 kHz
(+) | balanced highs - only 1.2% away from median
(+) | highs are linear (2.4% delta to prev. frequency)
Overall 100 - 16.000 Hz
(+) | overall sound is linear (10.8% difference to median)
Compared to same class
» 16% of all tested devices in this class were better, 2% similar, 82% worse
» The best had a delta of 5%, average was 17%, worst was 45%
Compared to all devices tested
» 6% of all tested devices were better, 2% similar, 92% worse
» The best had a delta of 4%, average was 23%, worst was 134%
能源管理 - 由OLED显示屏定义的电池寿命
能源消耗
在没有负载的情况下,笔记本电脑的运行能耗在6.6至9.6瓦之间。然而,应该注意的是,OLED显示屏根据屏幕内容和亮度的不同需要不同的能量。这意味着,笔记本电脑在暗屏内容下需要的能量要少得多。
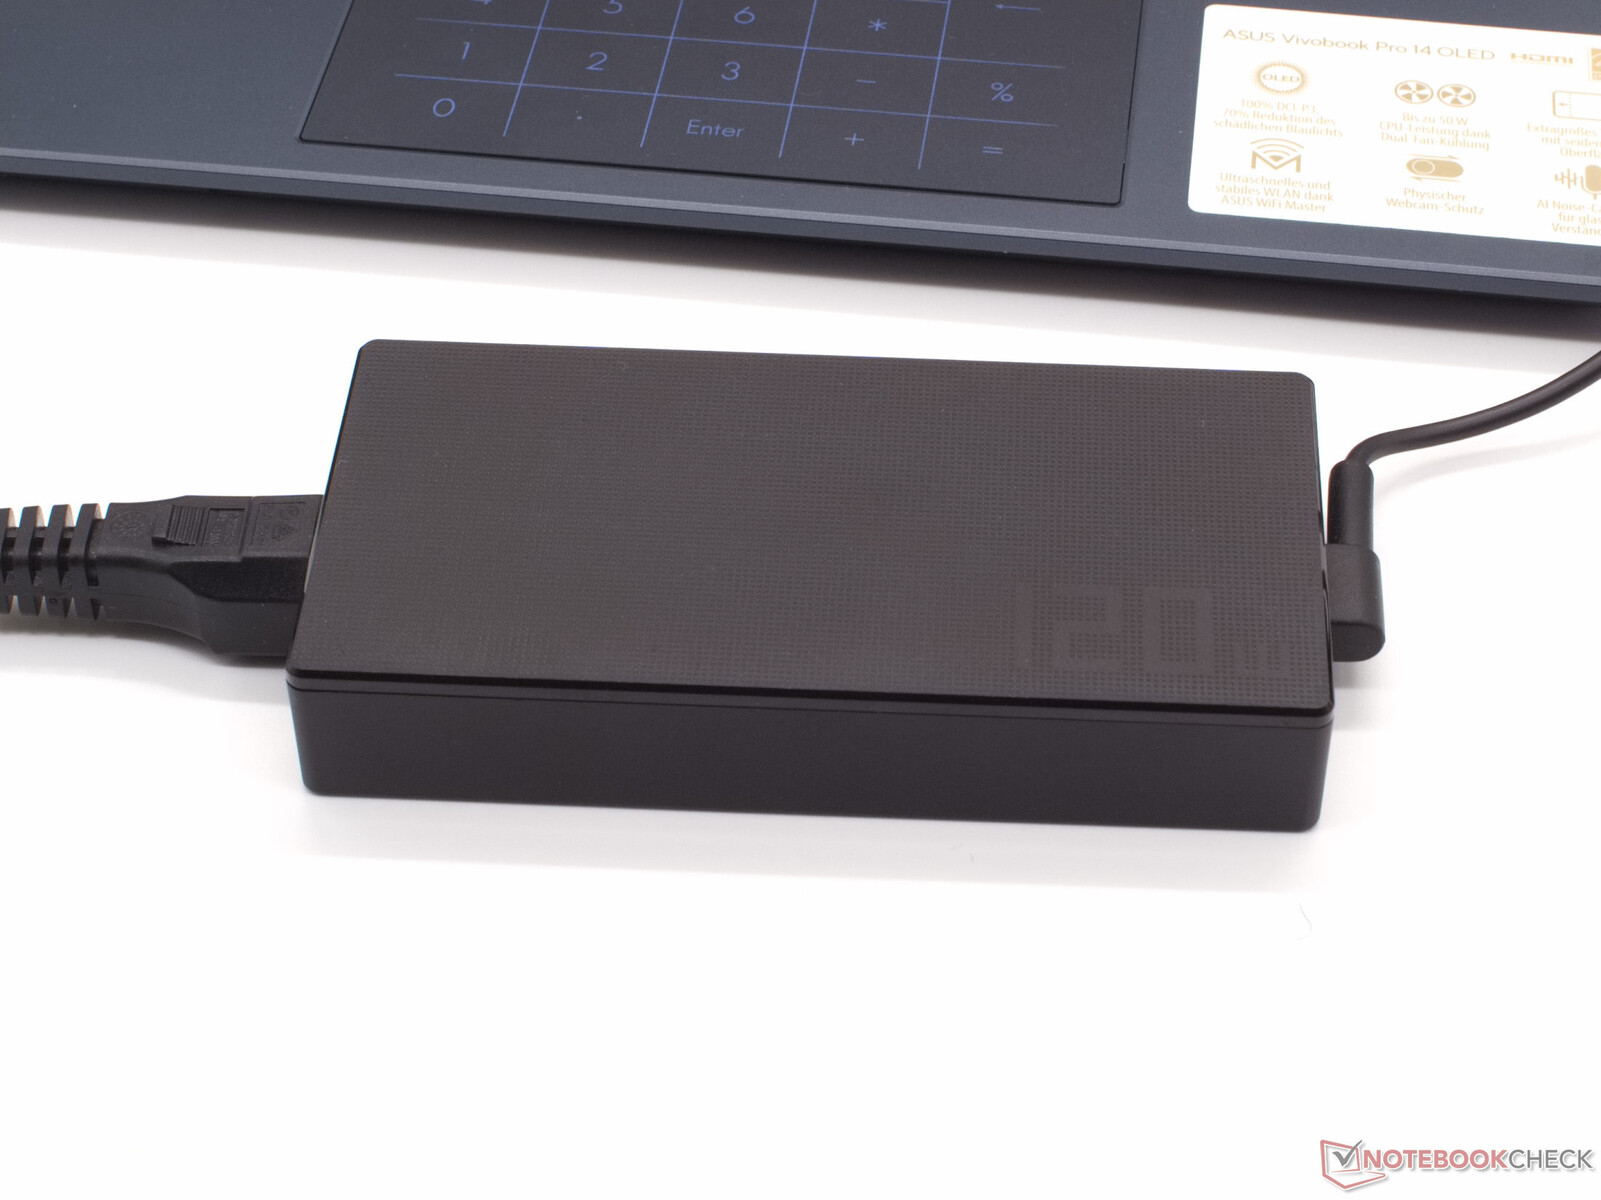
在更高的负载下,能源消耗在70至90瓦之间。笔记本电脑在短时间内也会接近电源适配器规定的120瓦。然而,从长远来看,VivoBook Pro 14保持着远低于电源适配器的容量,这意味着后者很适合笔记本电脑的性能。
| Off / Standby | |
| Idle | |
| Load |
|
Key:
min: | |
| Asus Vivobook Pro 14 M3401QC-KM007T R5 5600H, GeForce RTX 3050 4GB Laptop GPU, Intel SSD 670p SSDPEKNU512GZ, OLED, 2880x1800, 14" | Acer Swift X SFX14-41G-R7F3 R5 5500U, GeForce GTX 1650 Mobile, WDC PC SN530 SDBPNPZ-1T00, IPS, 1920x1080, 14" | MSI Modern 14 B11SB-085 i7-1165G7, GeForce MX450, Kingston OM8PCP3512F-AB, IPS, 1920x1080, 14" | Acer Swift 3X SF314-510G-70DW i7-1165G7, Xe MAX, Micron 2210 MTFDHBA1T0QFD, IPS, 1920x1080, 14" | Asus Zenbook Pro 15 OLED UM535Q R9 5900HX, GeForce RTX 3050 Ti Laptop GPU, WDC PC SN730 SDBPNTY-1T00, OLED, 1920x1080, 15.6" | Schenker Vision 14 i7-11370H, GeForce RTX 3050 Ti Laptop GPU, Samsung SSD 980 Pro 1TB MZ-V8P1T0BW, IPS, 2880x1800, 14" | Average NVIDIA GeForce RTX 3050 4GB Laptop GPU | Average of class Multimedia | |
|---|---|---|---|---|---|---|---|---|
| Power Consumption | 21% | 15% | 24% | -12% | -28% | -30% | -9% | |
| Idle Minimum * (Watt) | 6.6 | 3.4 48% | 3 55% | 3.6 45% | 5.5 17% | 6.7 -2% | 7.17 ? -9% | 5.66 ? 14% |
| Idle Average * (Watt) | 9.6 | 6 37% | 6.3 34% | 6.2 35% | 7.4 23% | 12.6 -31% | 10.4 ? -8% | 10.2 ? -6% |
| Idle Maximum * (Watt) | 7.3 | 9.2 -26% | 10.3 -41% | 10.4 -42% | 14.9 -104% | 15.4 -111% | 14.8 ? -103% | 12.5 ? -71% |
| Load Average * (Watt) | 73 | 57 22% | 66 10% | 55.1 25% | 78.2 -7% | 85.7 -17% | 89.7 ? -23% | 65.2 ? 11% |
| Witcher 3 ultra * (Watt) | 74.4 | 57.3 23% | 66.6 10% | 54.1 27% | 80.1 -8% | 83 -12% | ||
| Load Maximum * (Watt) | 119 | 93.6 21% | 90.6 24% | 58 51% | 110.9 7% | 110.9 7% | 124.8 ? -5% | 113.5 ? 5% |
* ... smaller is better
Energy consumption during our The Witcher 3 test / stress test
Energy consumption with an external monitor
电池寿命
只要多媒体笔记本电脑的要求不对dGPU造成压力,它就能提供无可挑剔的电池运行时间。在Wi-Fi网络浏览测试中,高达9:29小时的电池寿命的结果证明,VivoBook Pro 14可以度过一个完整的工作天。这也是由于内置电池的容量相对较高。它相当慷慨,有63Wh。因此,即使在负载情况下,这款笔记本电脑可以拥有近2小时的电池寿命,这只是有点令人惊讶。
| Asus Vivobook Pro 14 M3401QC-KM007T R5 5600H, GeForce RTX 3050 4GB Laptop GPU, 63 Wh | Acer Swift X SFX14-41G-R7F3 R5 5500U, GeForce GTX 1650 Mobile, 58.7 Wh | MSI Modern 14 B11SB-085 i7-1165G7, GeForce MX450, 52.4 Wh | Acer Swift 3X SF314-510G-70DW i7-1165G7, Xe MAX, 58 Wh | Asus Zenbook Pro 15 OLED UM535Q R9 5900HX, GeForce RTX 3050 Ti Laptop GPU, 96 Wh | Schenker Vision 14 i7-11370H, GeForce RTX 3050 Ti Laptop GPU, 53 Wh | Average of class Multimedia | |
|---|---|---|---|---|---|---|---|
| Battery runtime | -13% | -8% | 67% | 84% | -34% | 44% | |
| Reader / Idle (h) | 11.5 | 7.6 -34% | 26.2 128% | 24.9 ? 117% | |||
| WiFi v1.3 (h) | 9.5 | 10.1 6% | 8.7 -8% | 12.7 34% | 12.8 35% | 5.5 -42% | 12.2 ? 28% |
| Load (h) | 1.9 | 1.7 -11% | 3.8 100% | 3.6 89% | 1.4 -26% | 1.664 ? -12% | |
| Witcher 3 ultra (h) | 1.2 | ||||||
| H.264 (h) | 17.8 | 6.8 | 17.1 ? |
Pros
Cons
结论 - 令人印象深刻的显示和高性能潜力


华硕VivoBook Pro 14 OLED的亮点是其出色的显示屏。该显示屏具有16:10格式的3K分辨率,几乎100%覆盖了Display P3色彩空间,几乎没有任何需要改进的地方。华硕笔记本电脑在一般系统性能方面也显示出无可挑剔的速率。Ryzen 5和NvidiaGeForce RTX 3050确保现代游戏的快速响应时间和高帧率。结合长电池寿命、低噪音排放和相对较好的扬声器,这款笔记本电脑可以推荐给那些可以接受在连接方面妥协的用户。这是因为华硕VivoBook在这方面只提供最基本的功能。USB 2.0和microSD读卡器,也只提供USB 2.0的速度,已经不是最新的了。
然而,这里也应该考虑到该笔记本的低价位。一些零售商和华硕已经将VivoBook Pro 14 OLED上市,价格低于1,000欧元(约1,018美元)。因此,这款多媒体笔记本电脑配备了GeForce RTX 3050,提供了良好的性价比。
VivoBook Pro 14 OLED为中档笔记本电脑的显示屏设定了标准。这款笔记本电脑的计算能力也是绰绰有余。
强大的硬件与出色的显示屏的结合,与其他的连接方式形成对比,似乎几乎是廉价的,这可能看起来不寻常。尽管如此,华硕在VivoBook中,在只对生产力有轻微影响的领域中偷工减料。因此,VivoBook也应该引起那些利用业余时间进行创造性图像编辑的人的兴趣。
价格和可用性
在撰写本报告时,美国的主要型号似乎是VivoBook Pro 14 OLED,配备的是 AMD Ryzen 7 5800H CPU,NvidiaGeForce RTX 3050,16GB内存,以及1TB SSD。目前,你可以在亚马逊上以1199.99美元的价格买到这个配置。以及百思买的网上商店.
Asus Vivobook Pro 14 M3401QC-KM007T
- 07/11/2022 v7 (old)
Marc Herter
Price comparison

