戴尔Inspiron 14 Plus 7420笔记本电脑评论。适用于预算有限的电力用户
戴尔为2022年推出了三种独立的14英寸Inspiron 14 7420机型:标准Inspiron 14 7420、Inspiron 14 7420二合一和Inspiron 14 7420 Plus。这次审查的重点是Plus型号,它带有更快的酷睿H系列处理器和独立的NvidiaGeForce RTX图形,专为对通常的酷睿U系列超极本不满意的电力用户设计。
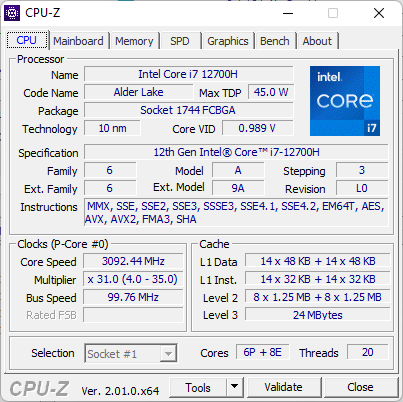
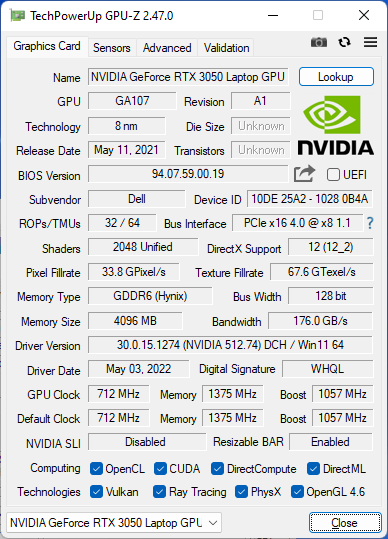
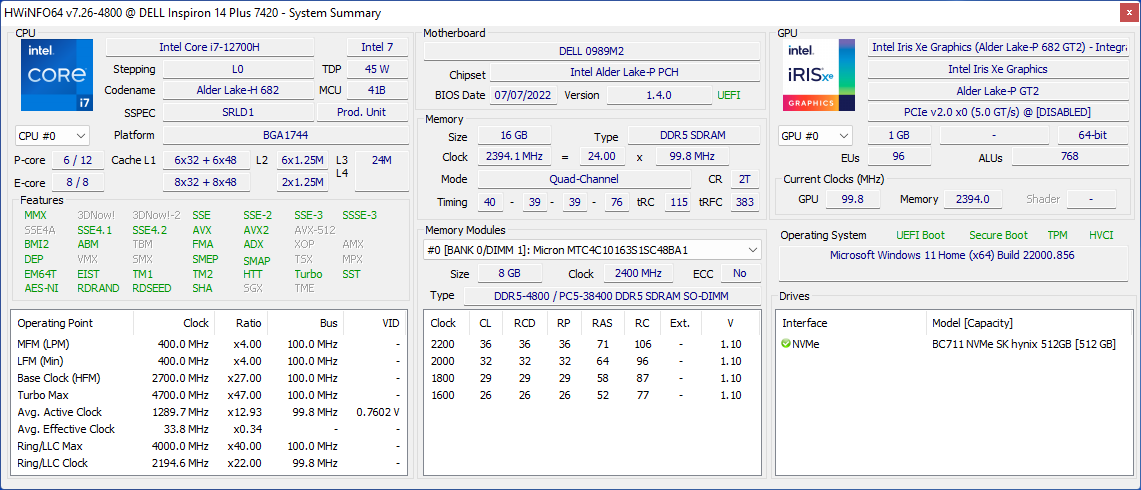
我们的具体审查单位配备了Alder Lake-H Core i7-12700H CPU和GeForce RTX 3050 GPU,零售价约为1400美元。其他SKU配备Core i5-12500H、RTX 3050 Ti或集成显卡,并计划配备较小的54Wh电池,但所有配置都配备相同的2K 2240 x 1400分辨率面板。
竞争对手包括其他高性能14英寸笔记本电脑,如华硕VivoBook Pro 14 ,惠普Pavilion 14 Plus , 申科Vision 14 ,惠普Envy 14 ,或联想IdeaPad 5 Pro 14 。Razer Blade 14 和Asus Zephyrus G14 也可以考虑作为替代品,但它们的价格明显更高。
更多戴尔评论。
潜在的竞争对手比较
Rating | Date | Model | Weight | Height | Size | Resolution | Price |
|---|---|---|---|---|---|---|---|
| 87.2 % v7 (old) | 09 / 2022 | Dell Inspiron 14 Plus 7420 i7-12700H, GeForce RTX 3050 4GB Laptop GPU | 1.7 kg | 18.87 mm | 14.00" | 2240x1400 | |
| 86.3 % v7 (old) | 07 / 2022 | Asus Vivobook Pro 14 M3401QC-KM007T R5 5600H, GeForce RTX 3050 4GB Laptop GPU | 1.5 kg | 19 mm | 14.00" | 2880x1800 | |
| 83.7 % v7 (old) | 06 / 2022 | Dell Inspiron 14 7420 2-in-1 i7-1255U, Iris Xe G7 96EUs | 1.6 kg | 17.86 mm | 14.00" | 1920x1200 | |
| 87.7 % v7 (old) | 01 / 2022 | Schenker Vision 14 i7-11370H, GeForce RTX 3050 Ti Laptop GPU | 1.1 kg | 15.6 mm | 14.00" | 2880x1800 | |
v (old) | 10 / 2021 | Asus Zenbook 14X UX5400E i7-1165G7, GeForce MX450 | 1.4 kg | 16.9 mm | 14.00" | 2880x1800 | |
| 82.3 % v7 (old) | 09 / 2021 | MSI Summit E14 A11SCS i7-1185G7, GeForce GTX 1650 Ti Max-Q | 1.3 kg | 16 mm | 14.00" | 3840x2160 | |
| 86.5 % v7 (old) | 02 / 2021 | HP Envy 14-eb0010nr i5-1135G7, GeForce GTX 1650 Ti Max-Q | 1.6 kg | 17.9 mm | 14.00" | 1920x1200 |
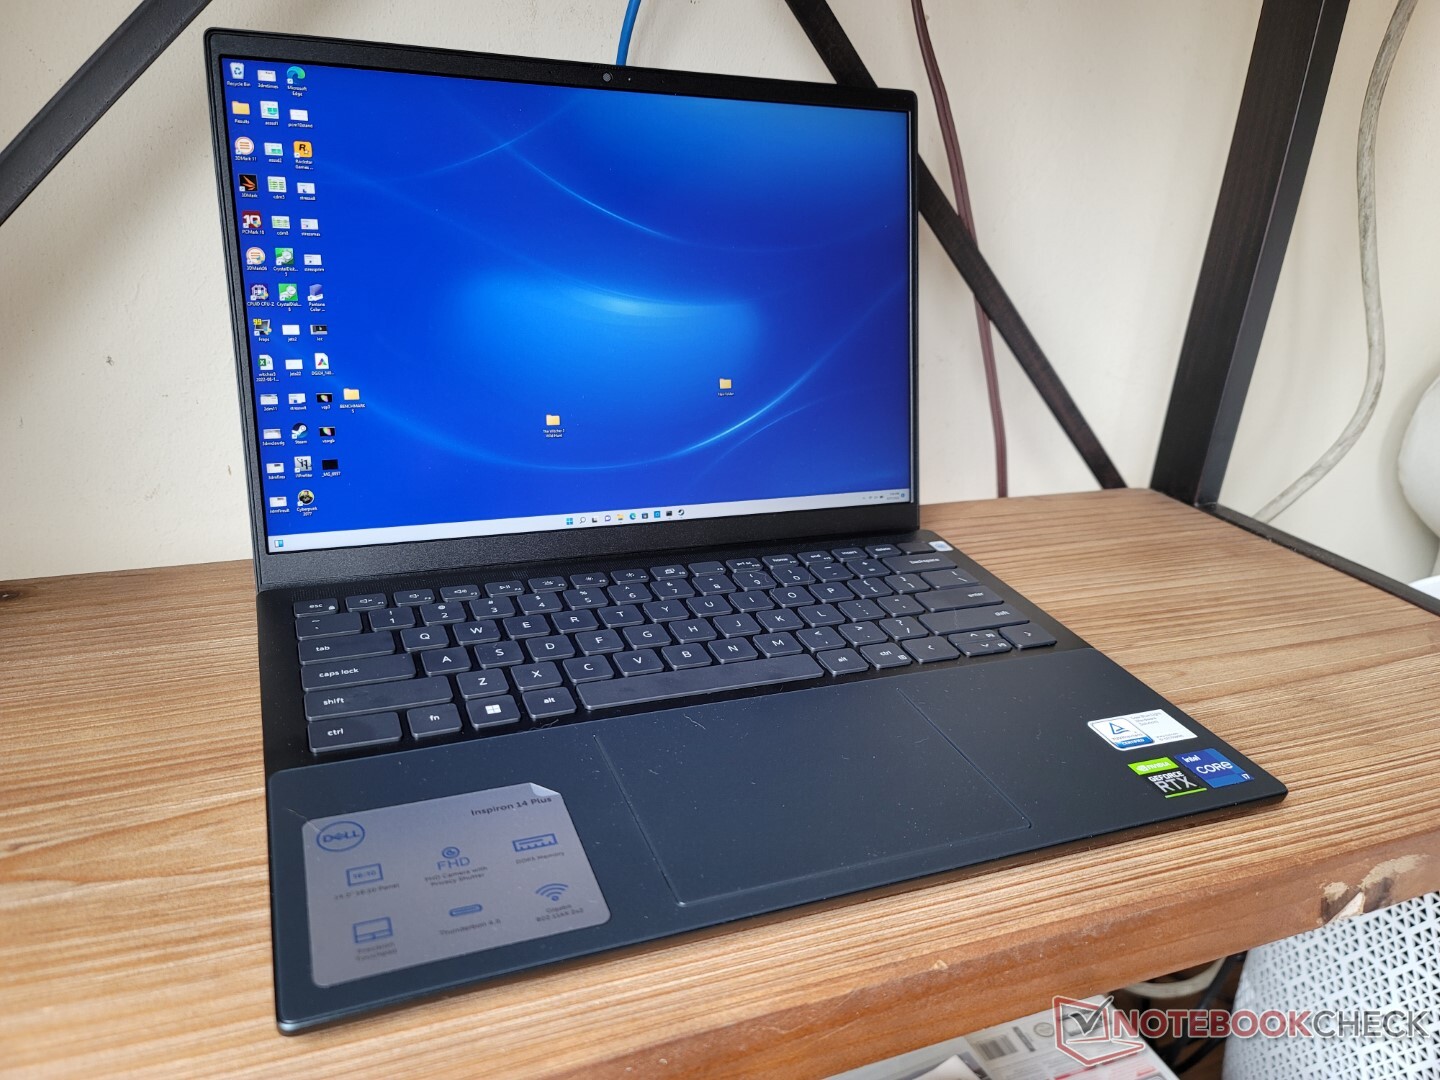
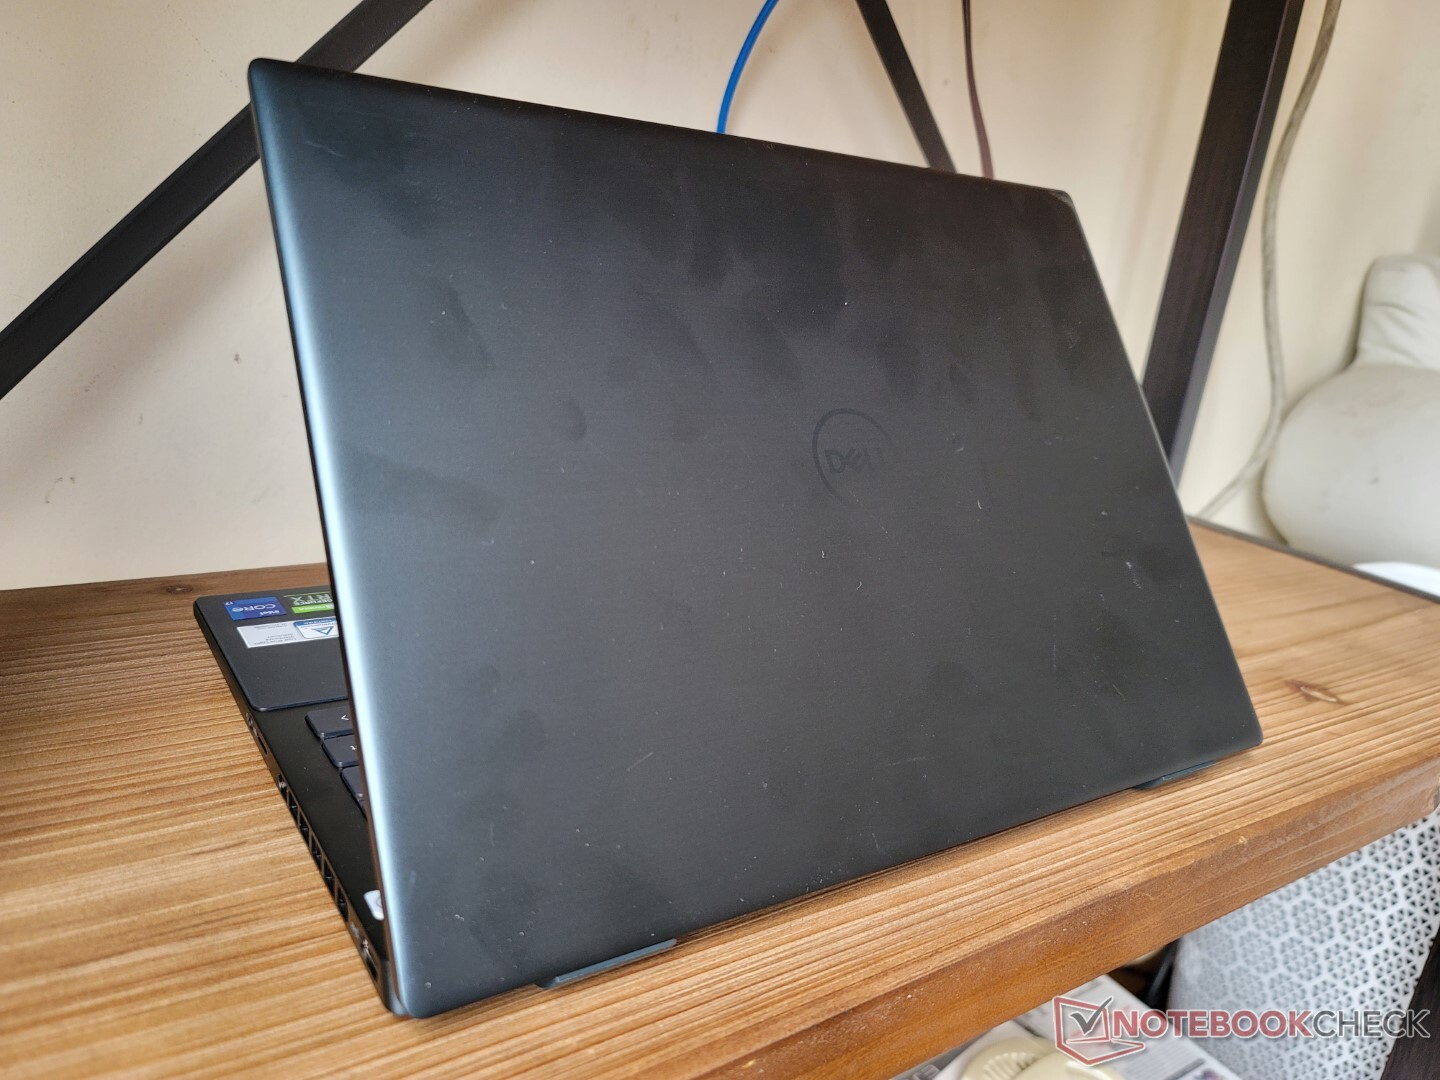
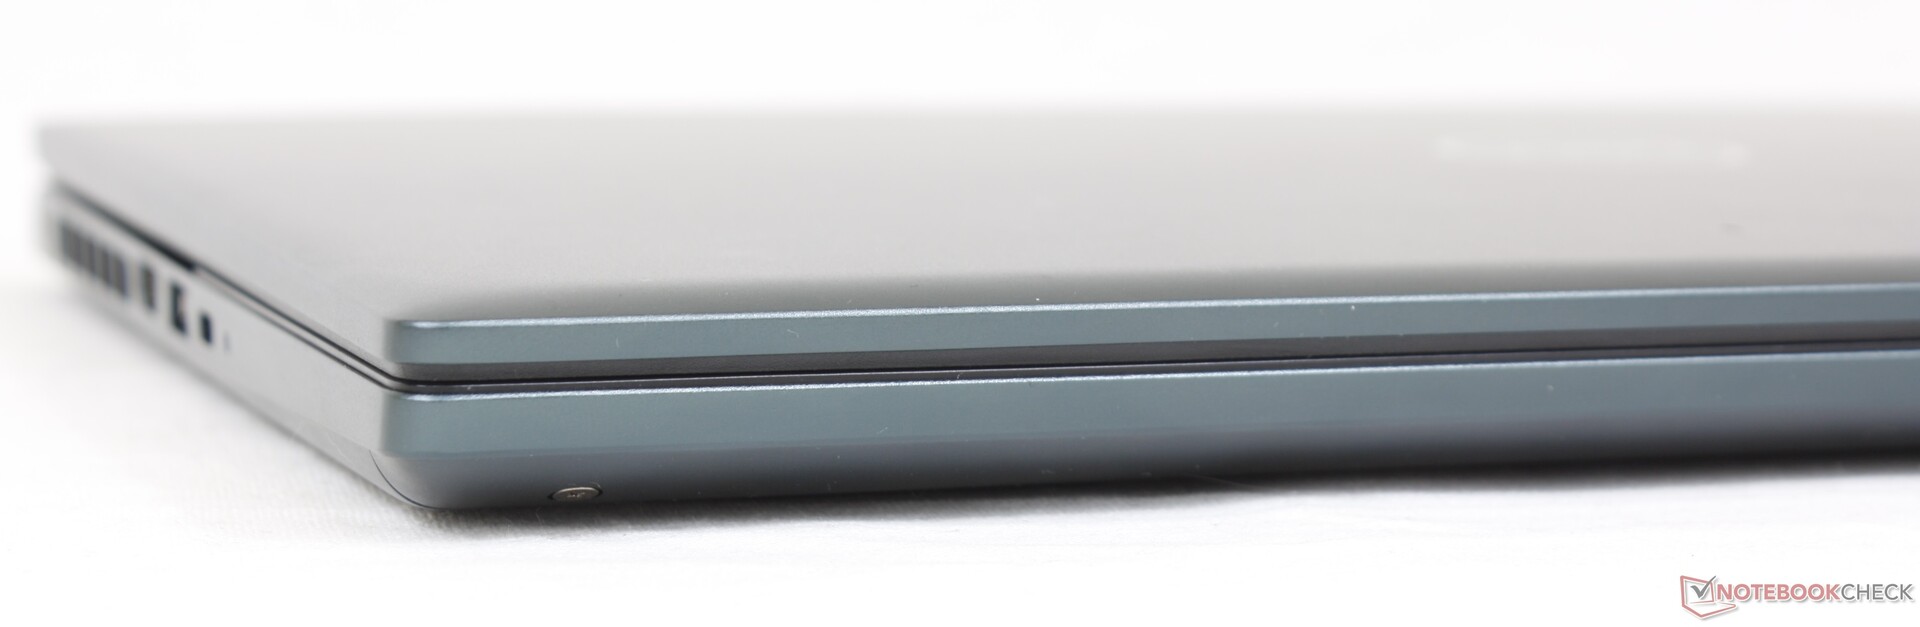
箱子 - 一个微型的Inspiron 16 7620
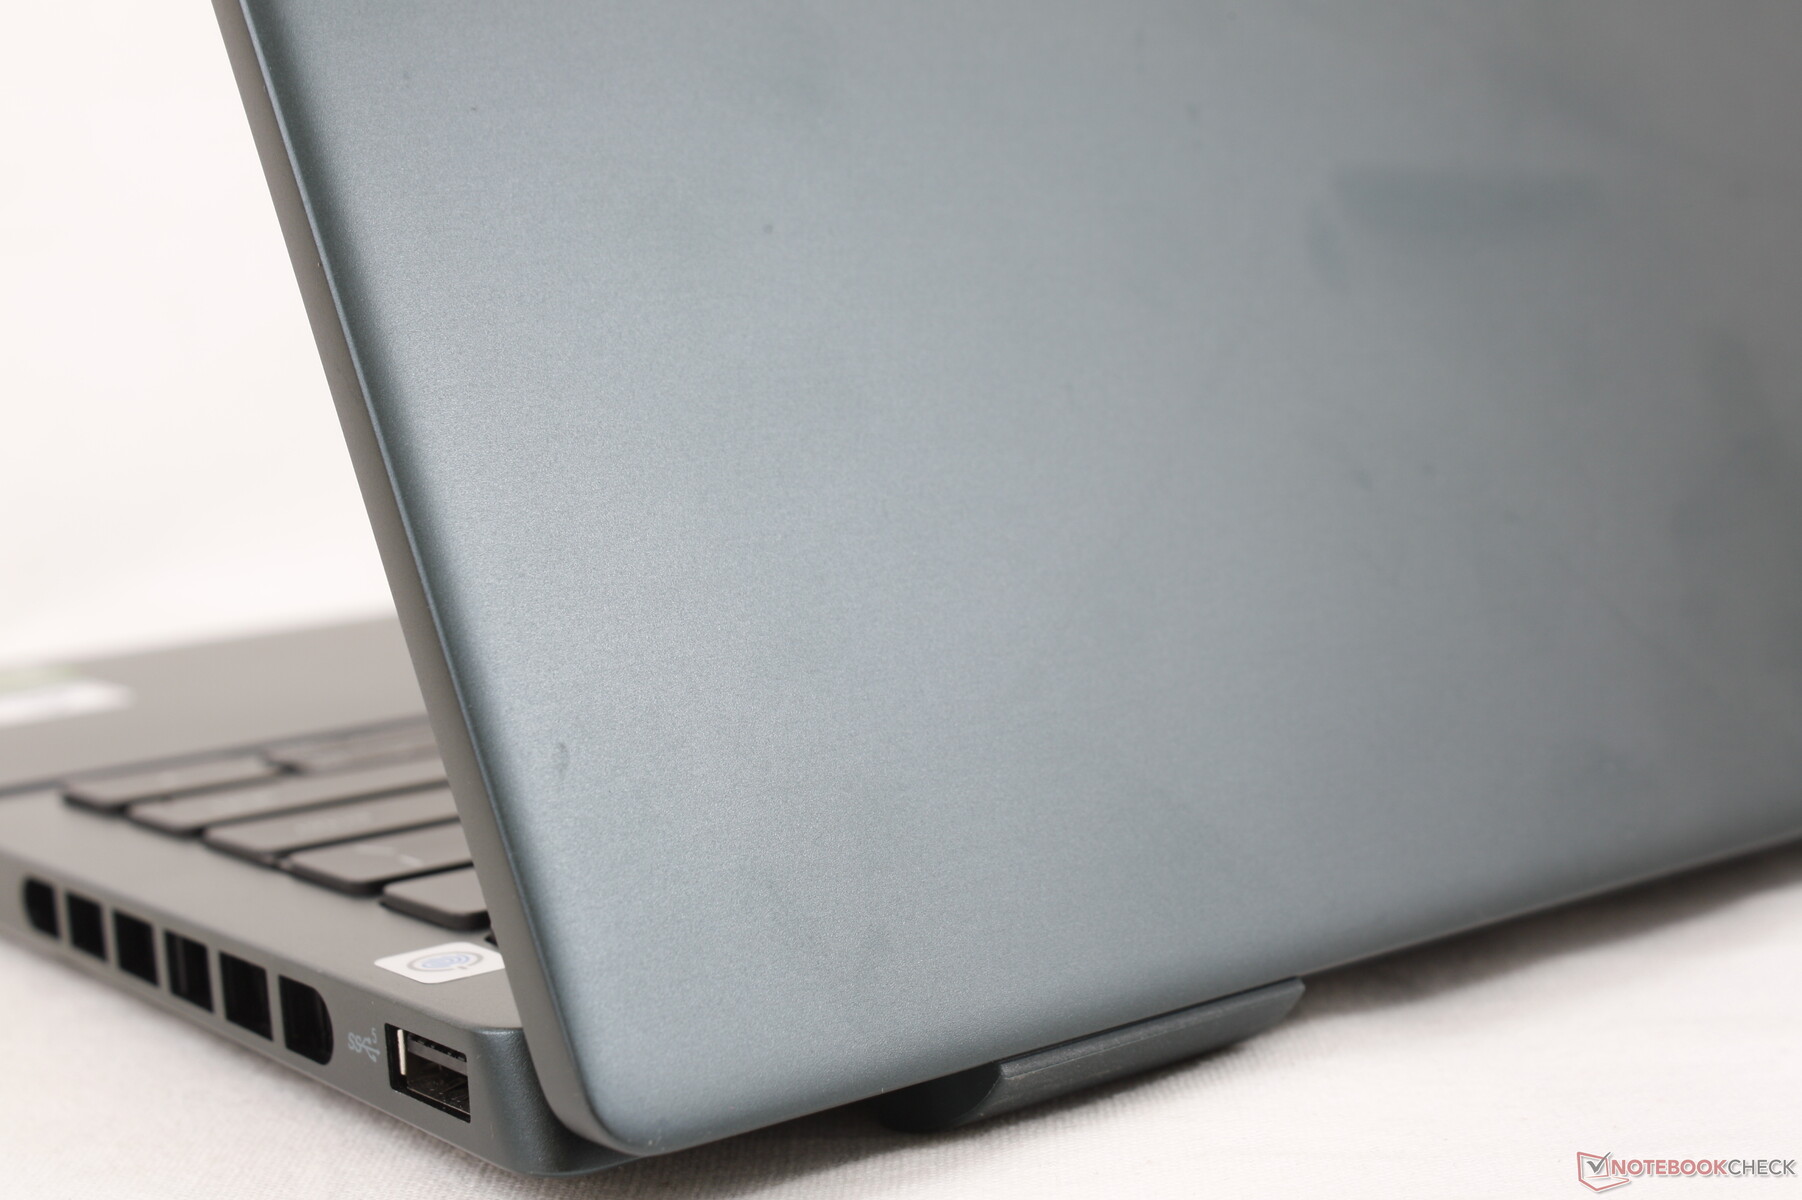
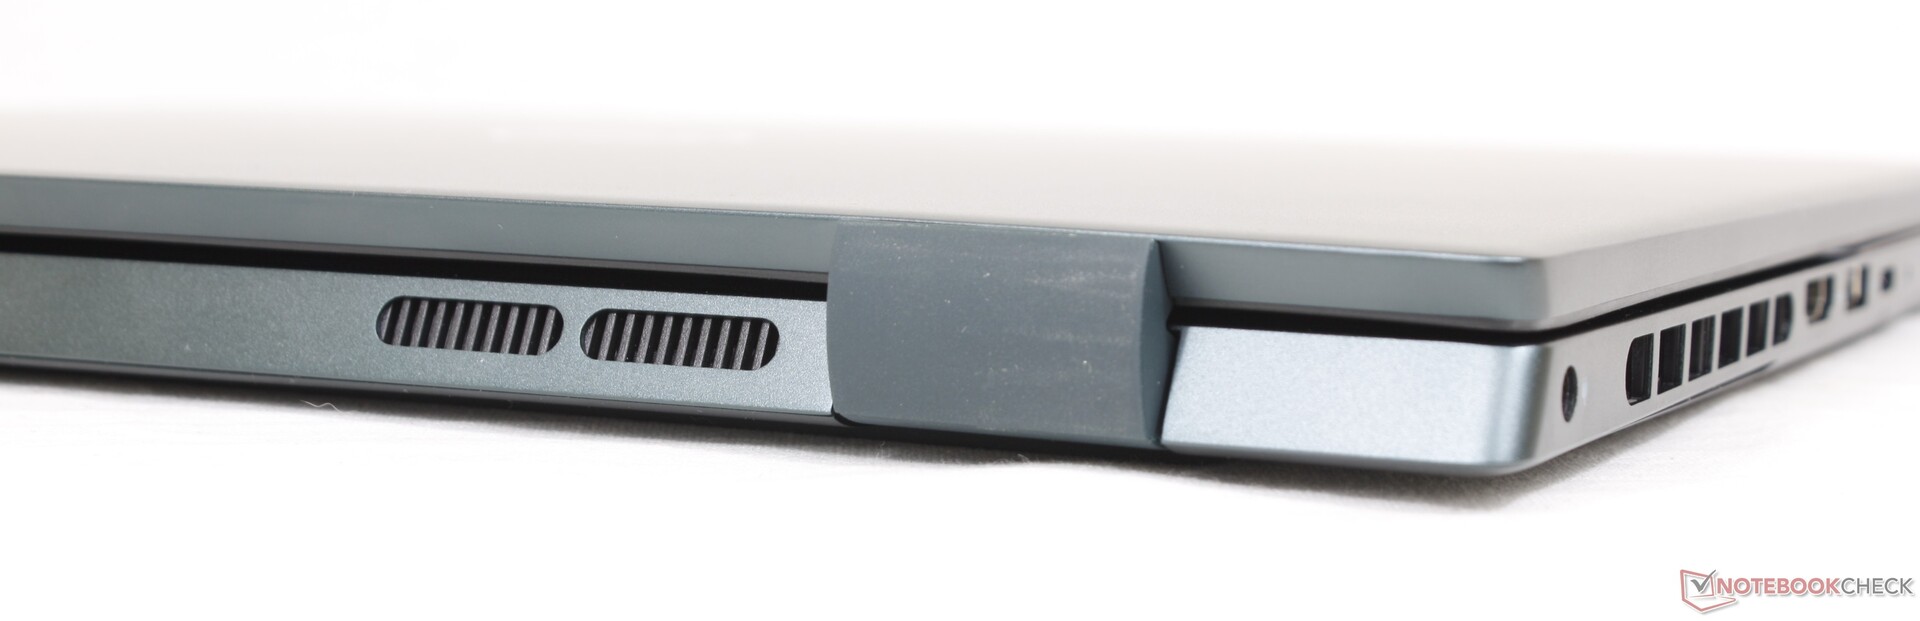
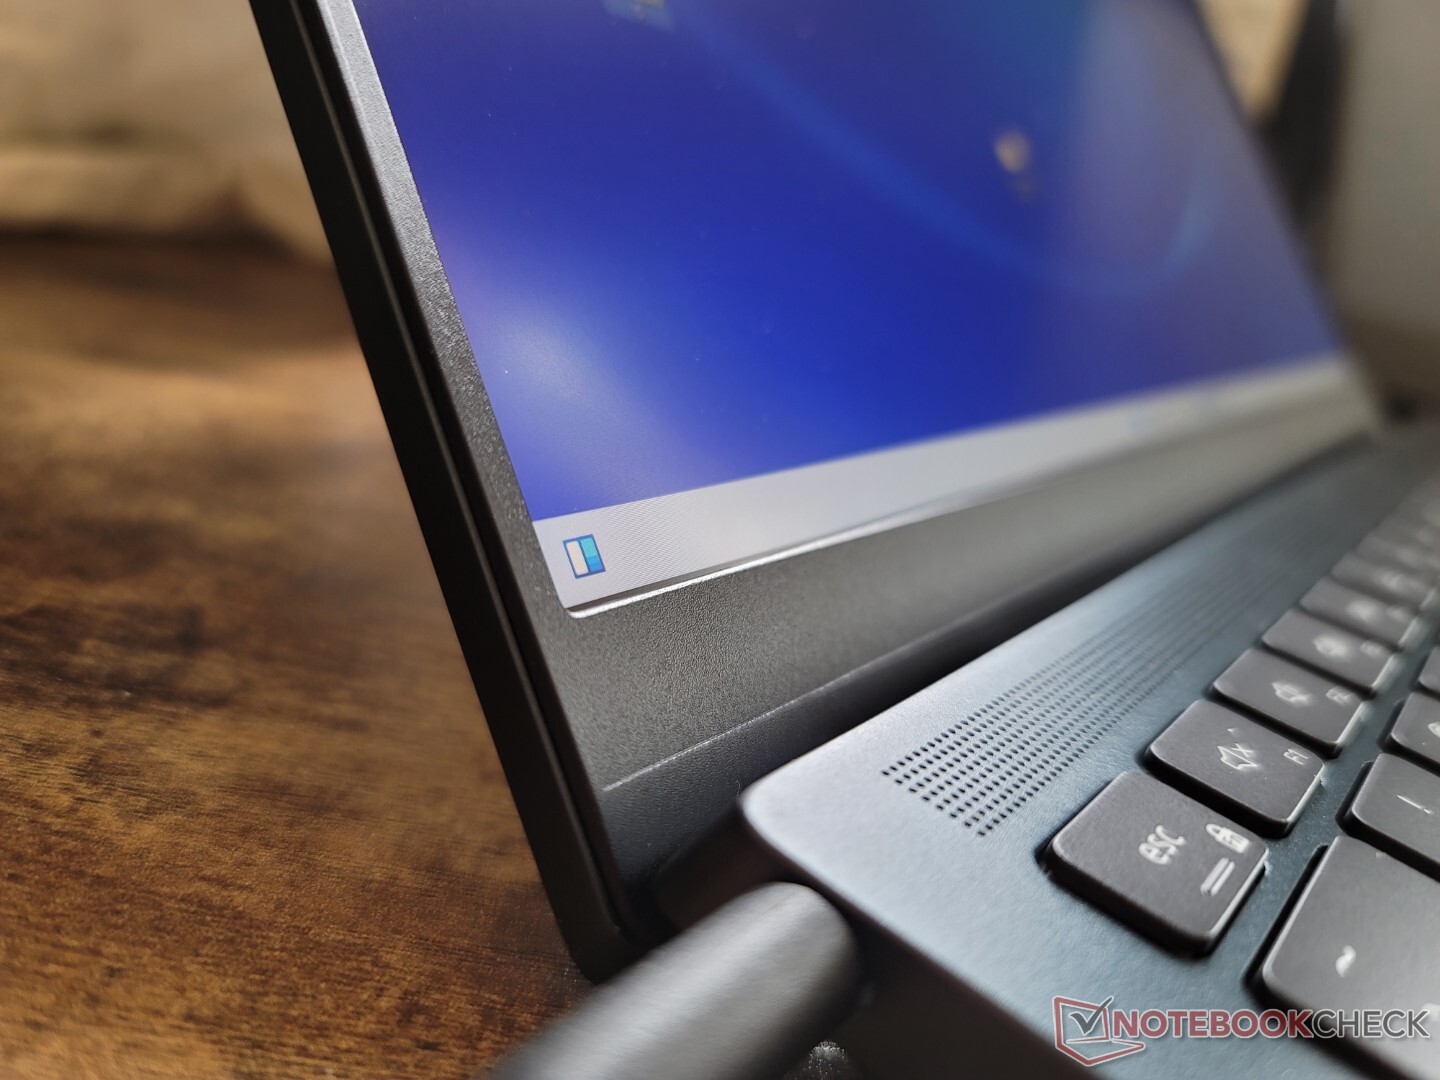
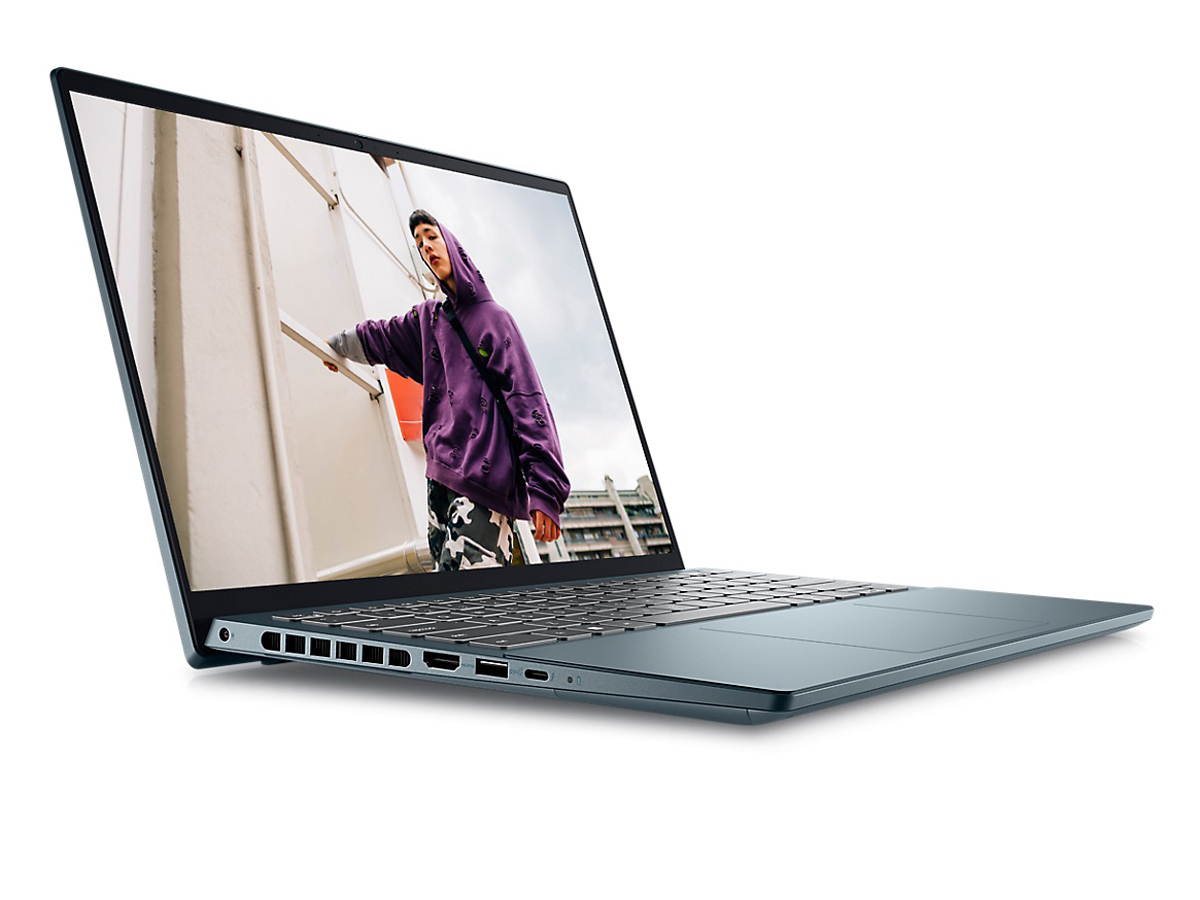
该机箱可以说是一个较小版本的 Inspiron 16 7620 Plus因为它们都采用了相同的视觉设计语言。金属底盘和点击板及掌托上的一层Mylar所使用的材料也因此与较大的Inspiron相似。它从上到下都是光滑的磨砂感觉,几乎模仿了XPS 15的光滑金属外盖。 XPS 15.
骨架最薄弱的方面也许是盖子,因为它很容易扭曲。扭动底座时可以听到轻微的吱吱声,对键盘中心施加压力也会使其表面轻微翘起。尽管该机型的售价几乎与戴尔XPS 15一样,但不要指望它能像戴尔XPS 15那样坚固。
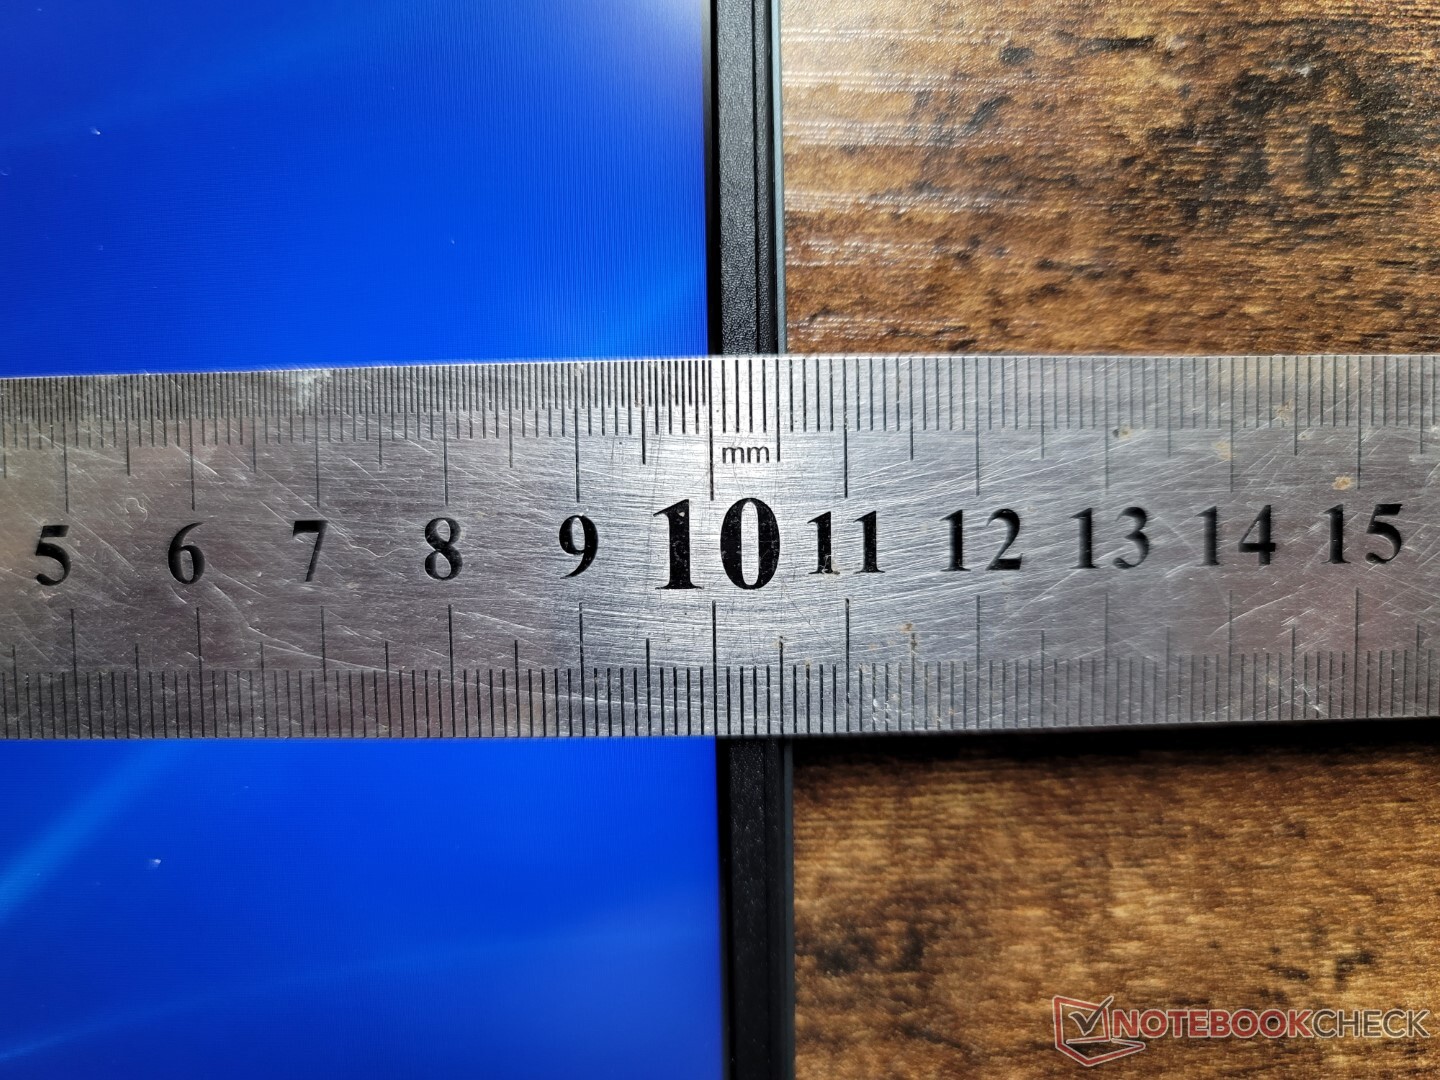
人们可能期望Inspiron 14 Plus 7620比Inspiron 14 7620二合一机型更大、更重,但实际情况并非如此。它的占地面积与二合一版本相同,尽管里面的硬件功能明显更强大,但也只是略微厚重一些。尽管如此,它仍然比大多数其他14英寸笔记本电脑(如惠普Envy 14)更重、更大。华硕Zenbook 14X或Schenker Vision 14等其他14英寸笔记本电脑相比,更重更大,这些笔记本电脑也都配备了独立的Nvidia显卡。
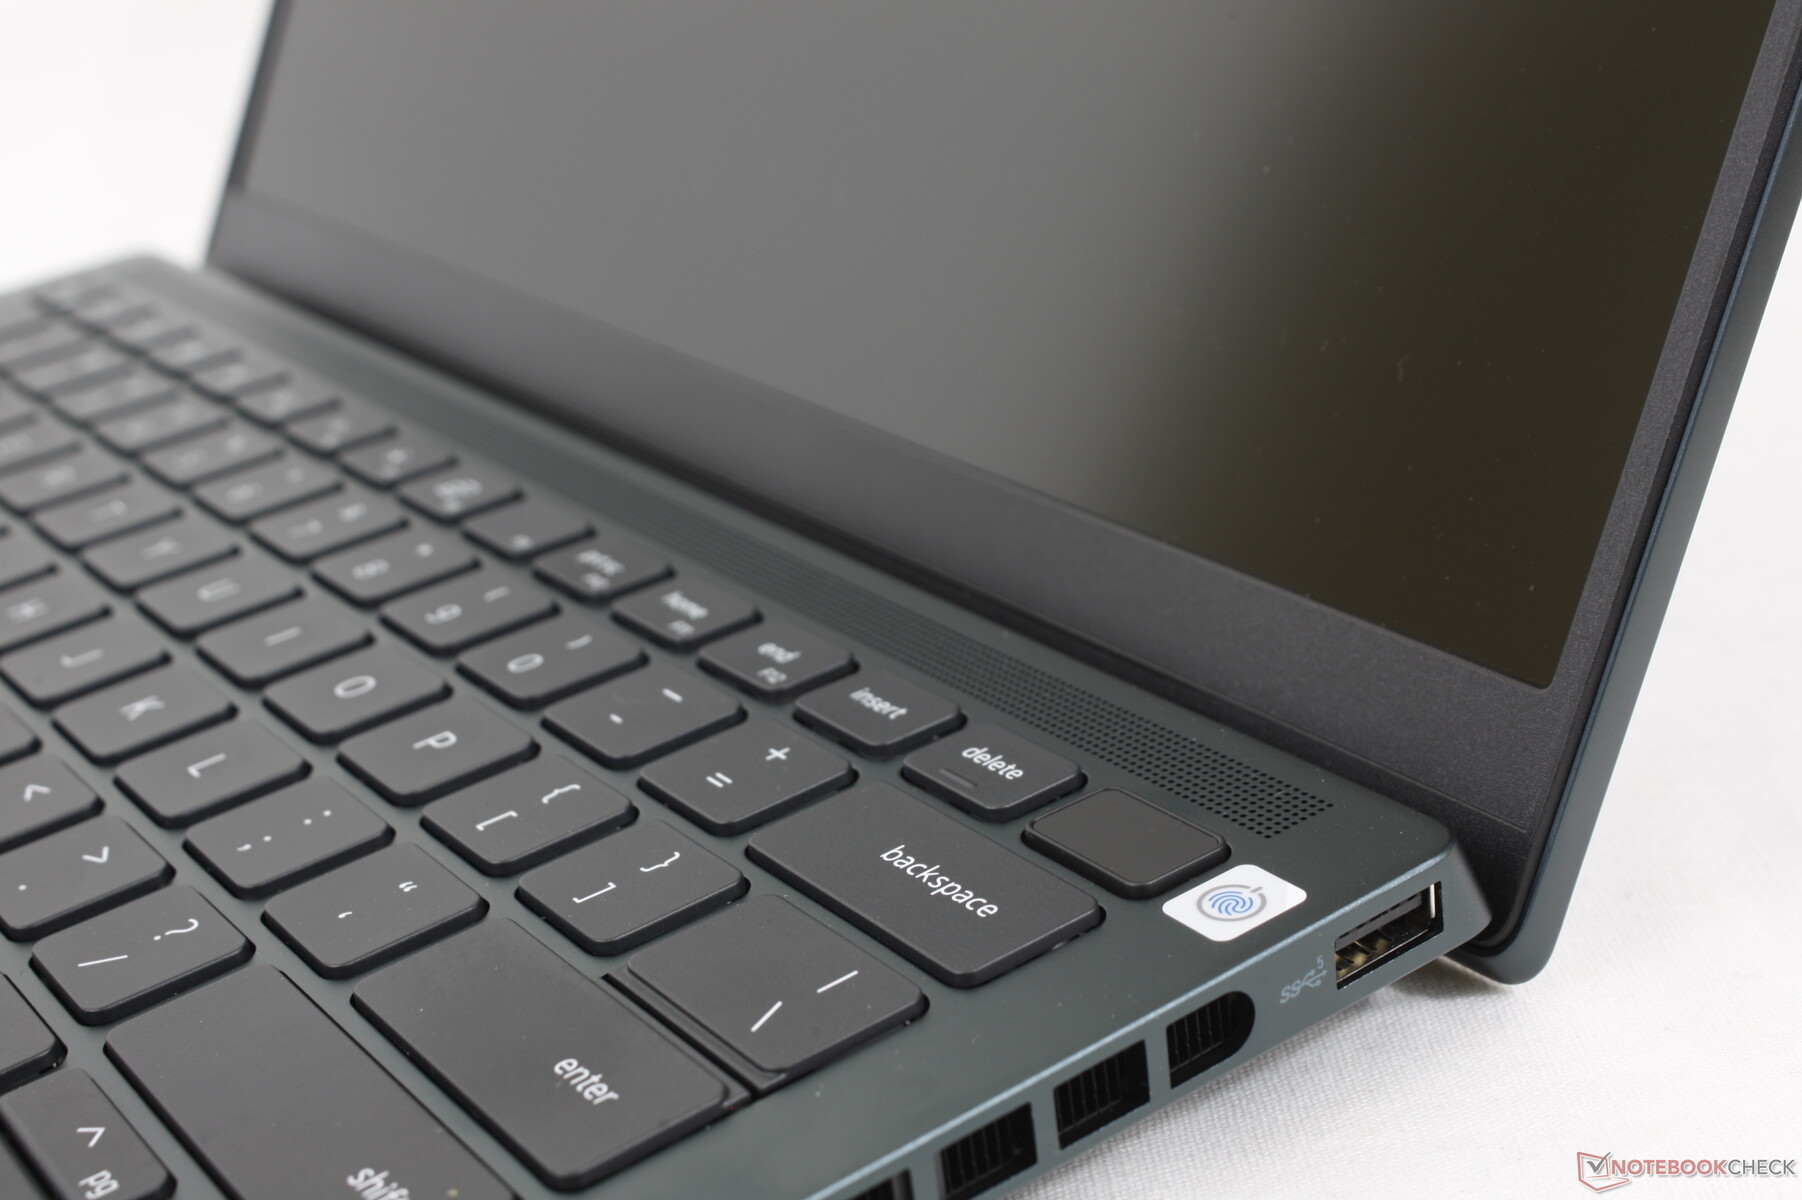
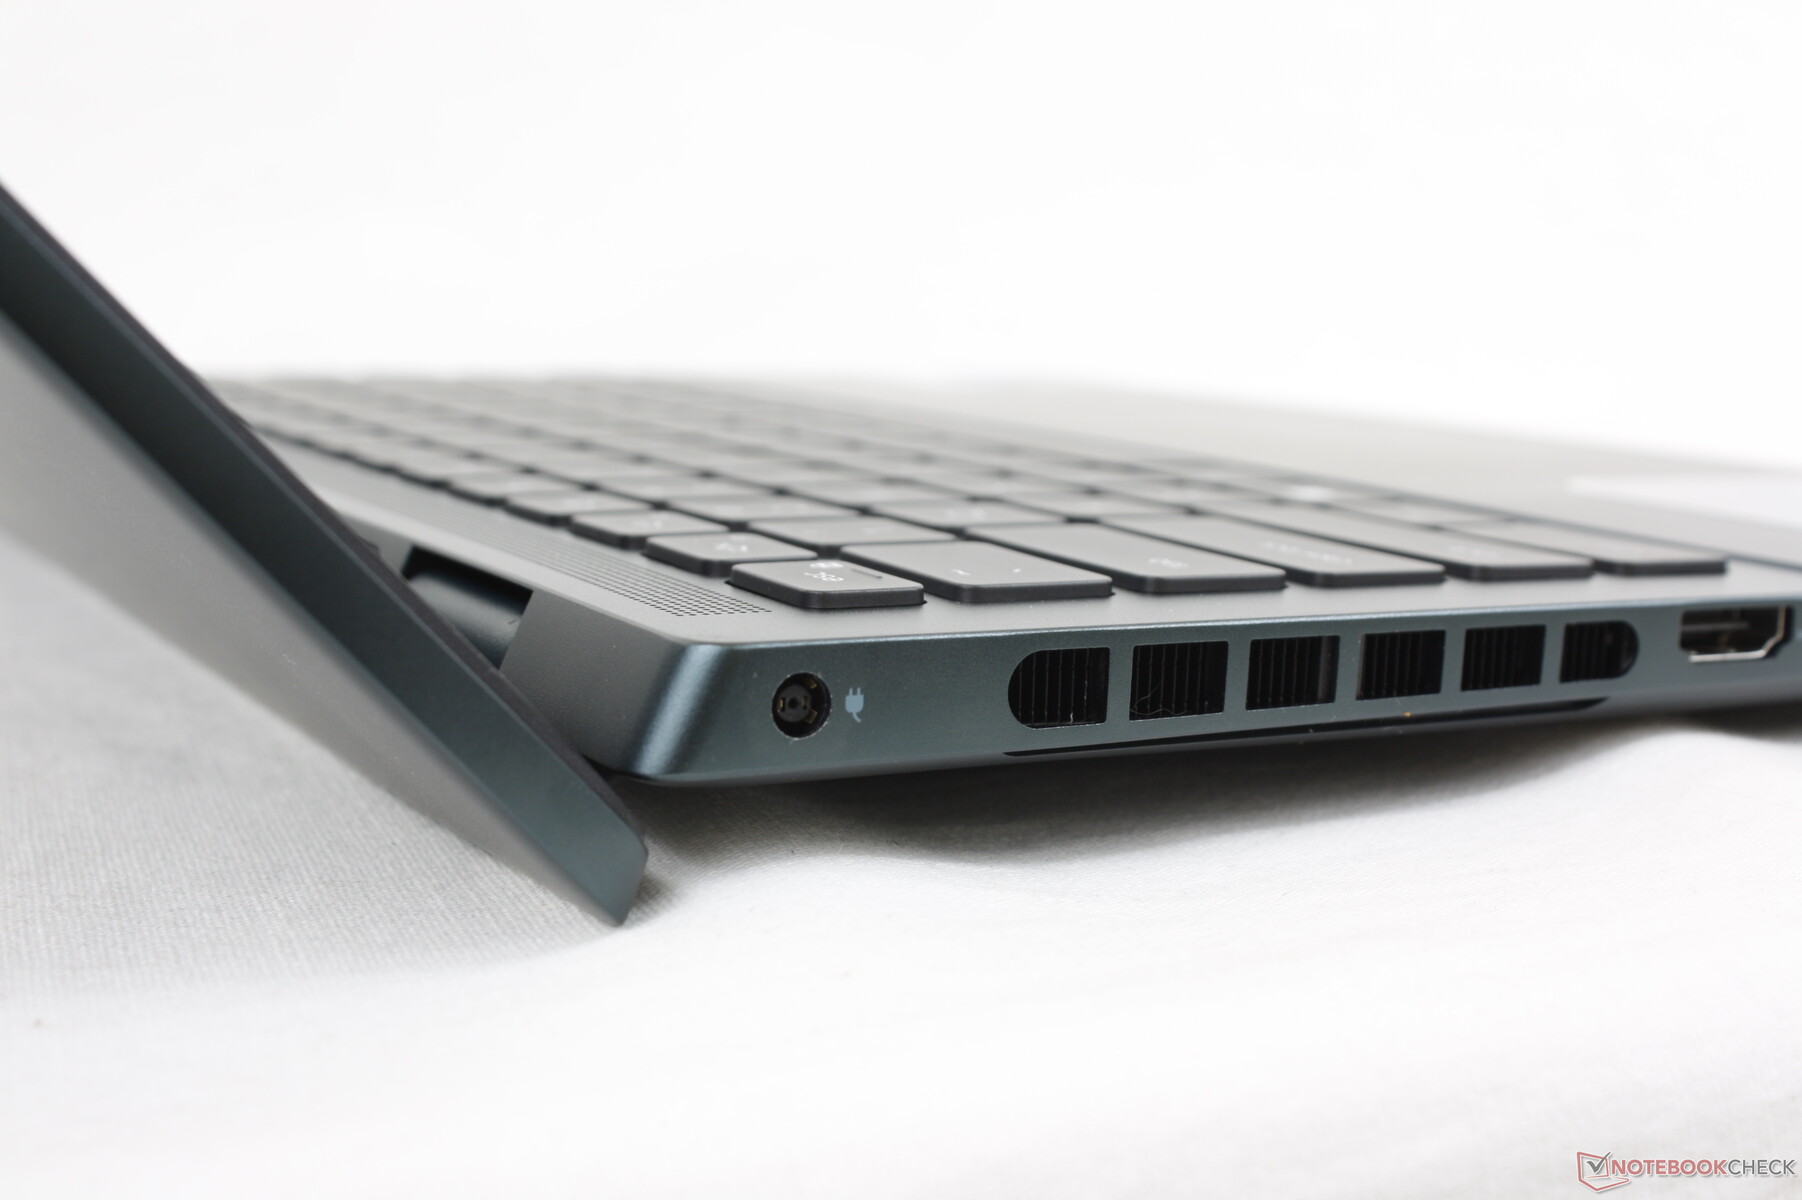
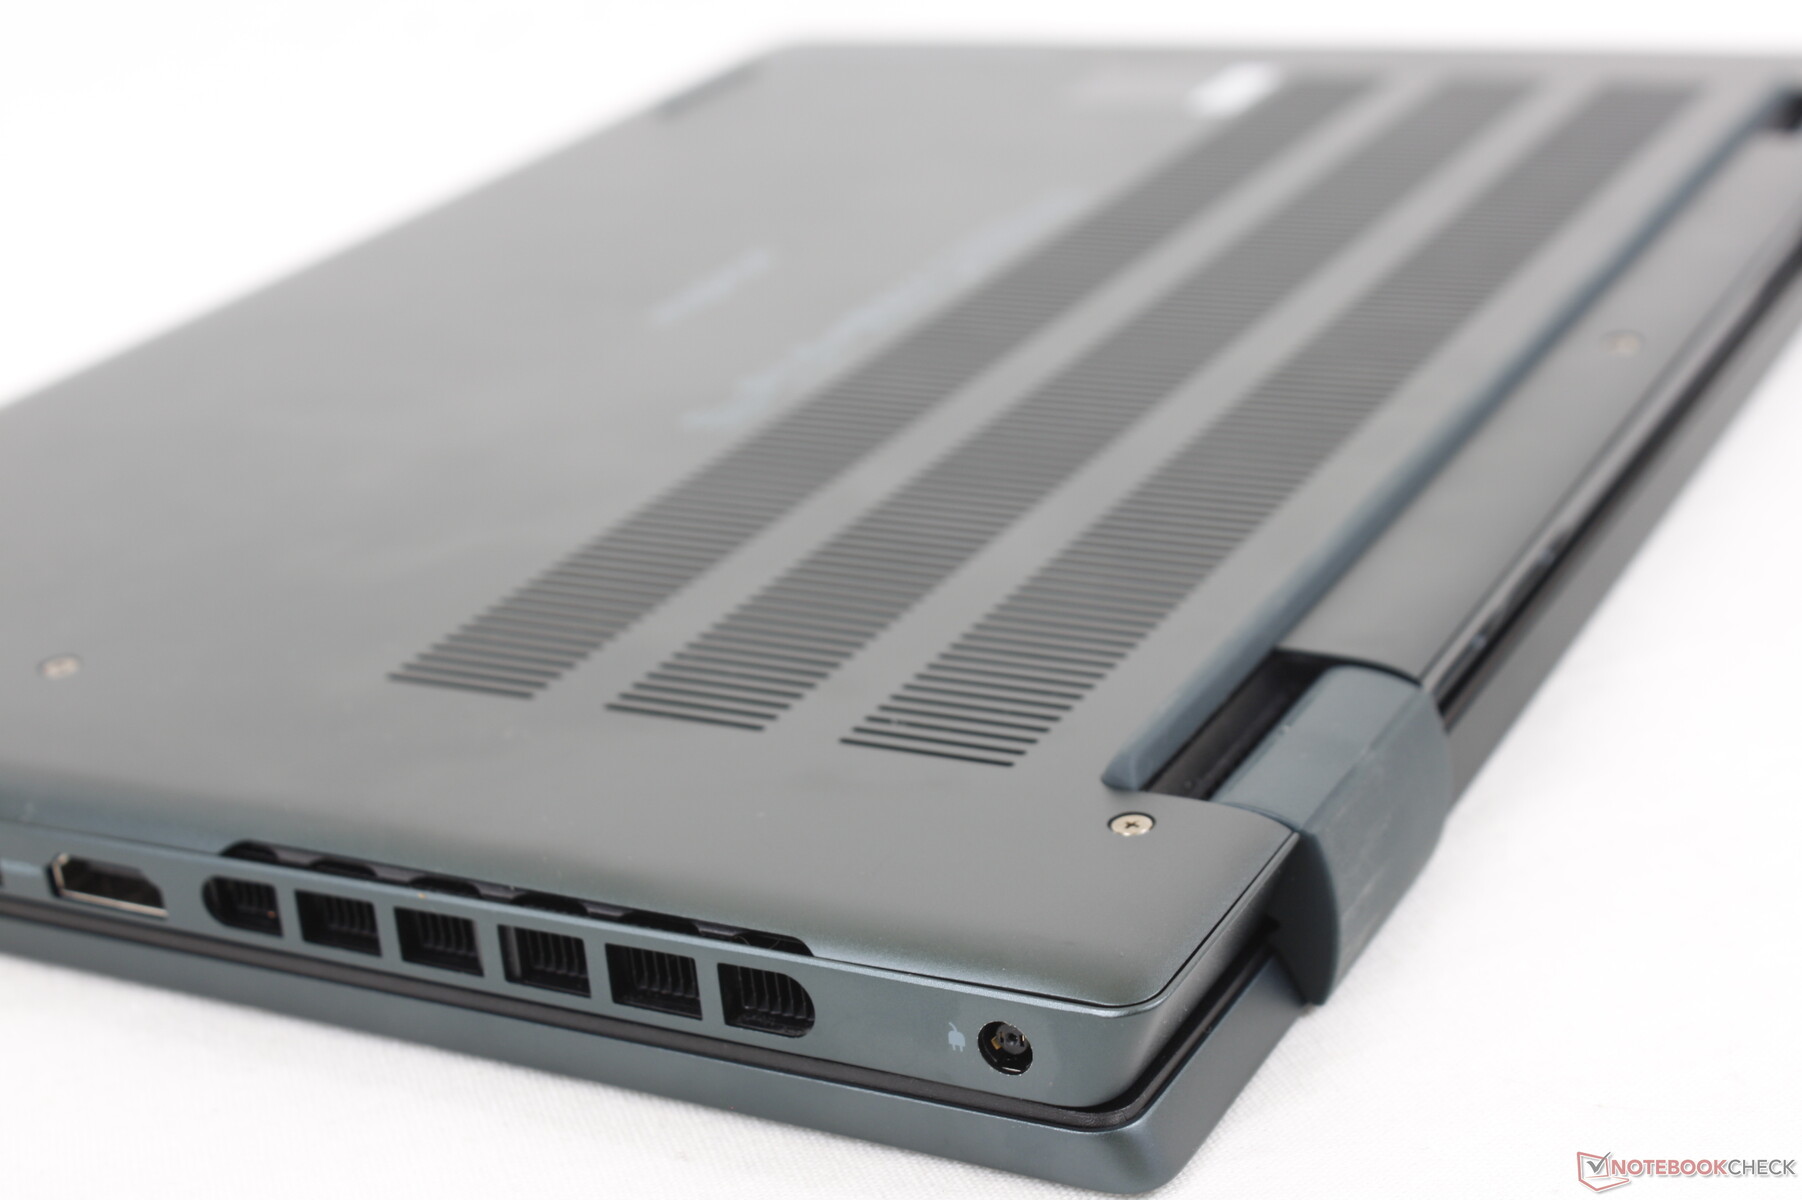
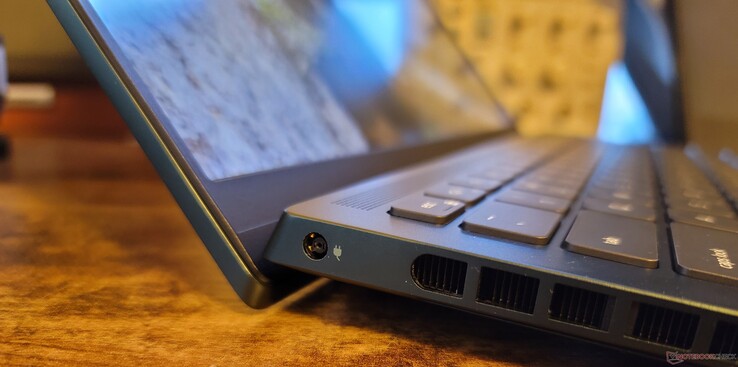
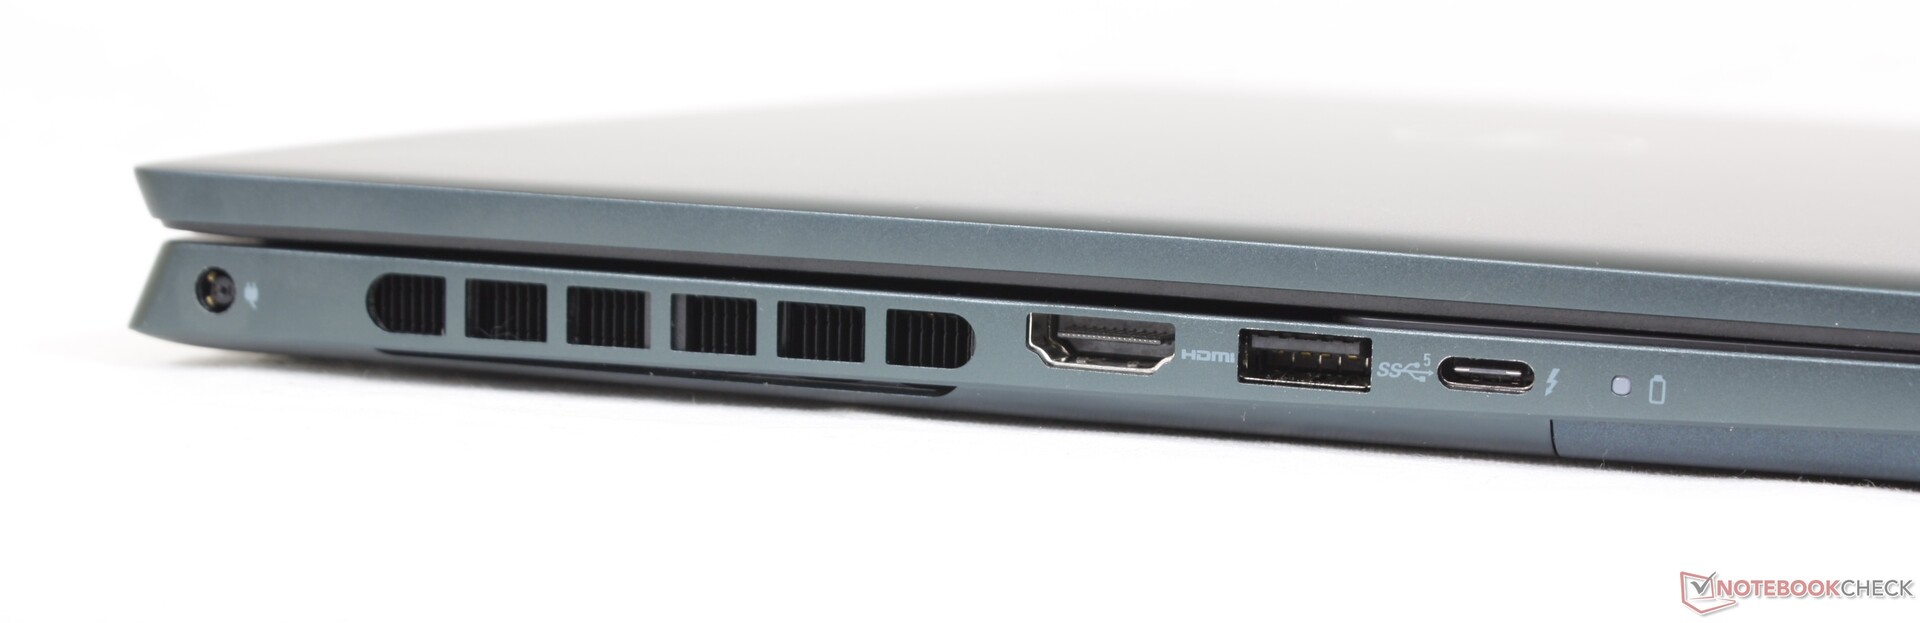
连接性 - 支持Thunderbolt 4
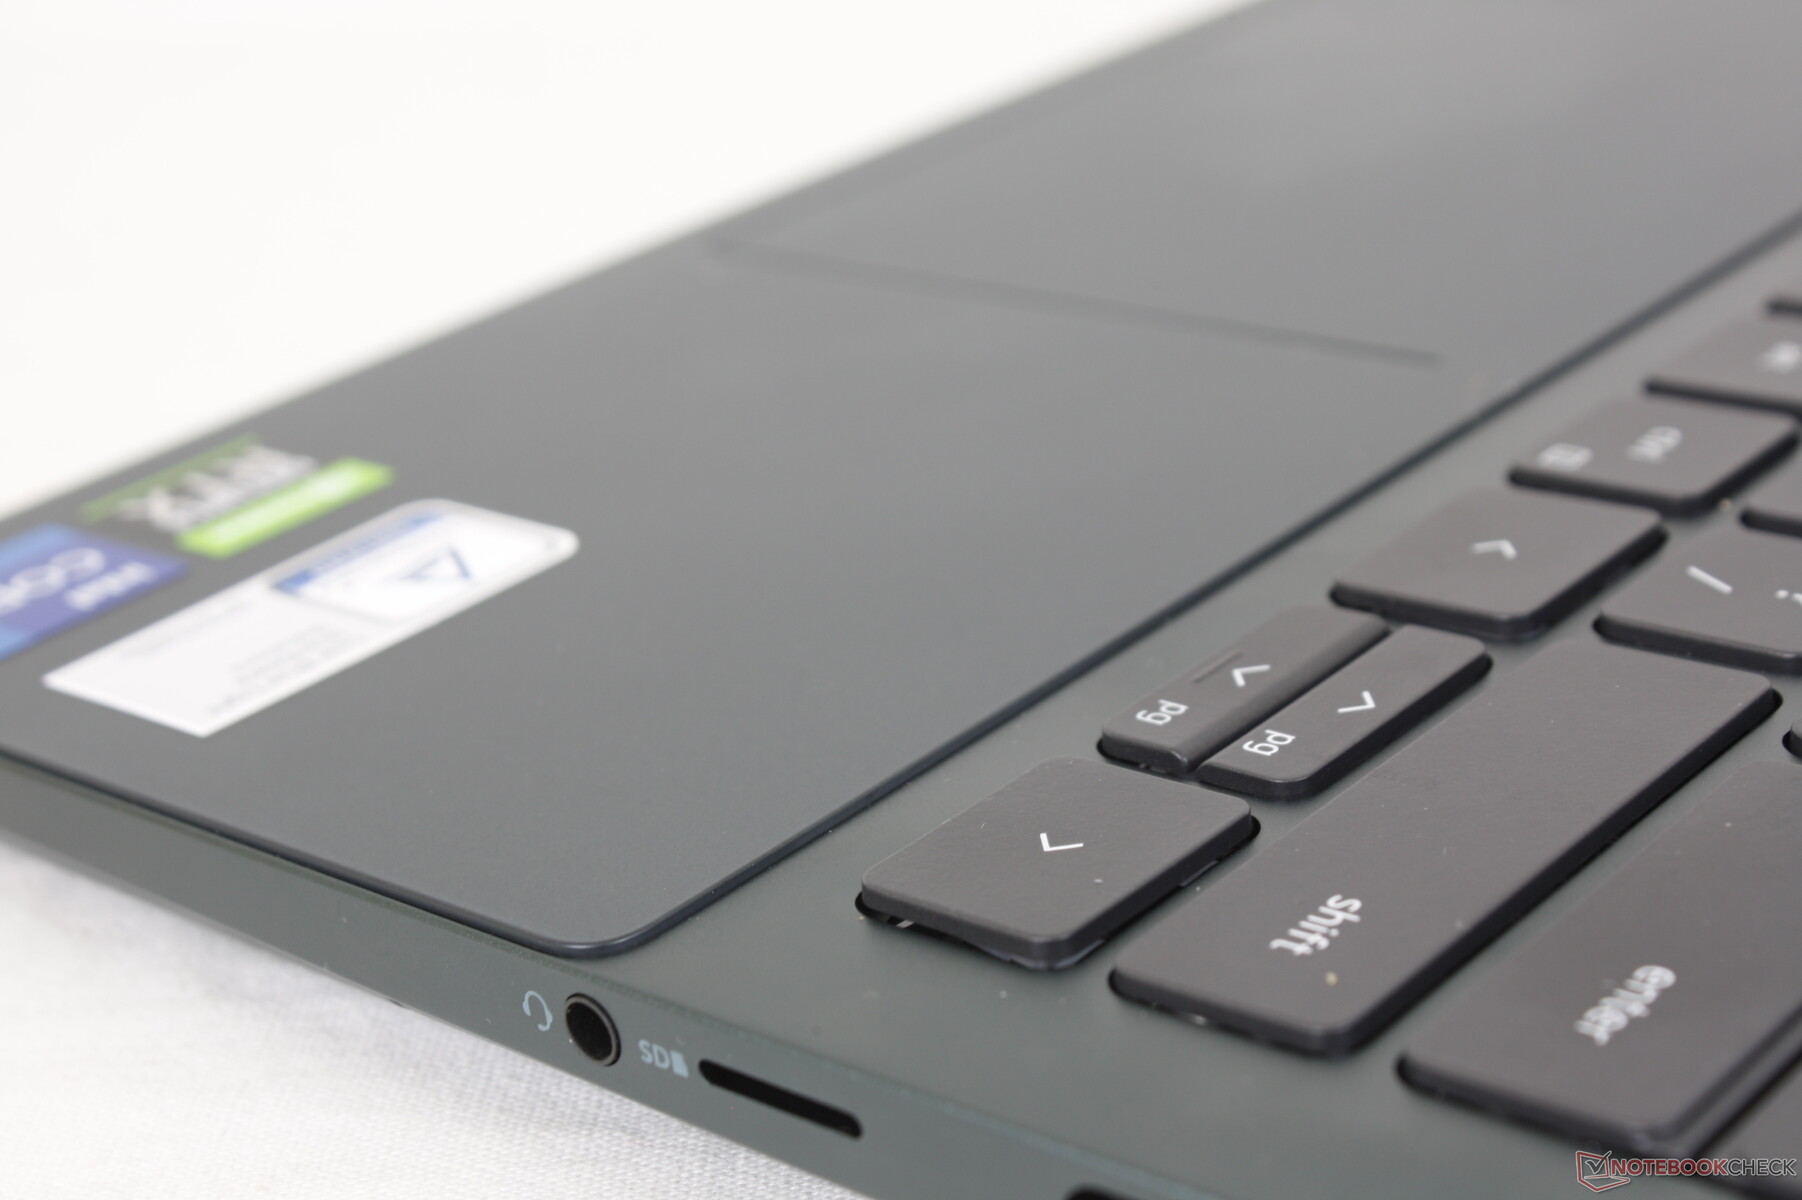
端口选项与Inspiron 16 Plus 7620相同,尽管全尺寸的SD读卡器被换成了一个较小的microSD。我们很欣赏对Thunderbolt 4的支持,因为竞争者都没有 惠普Pavilion Plus 14和华硕Vivobook Pro 14 OLED都不支持Thunderbolt,尽管它们有USB-C接口。
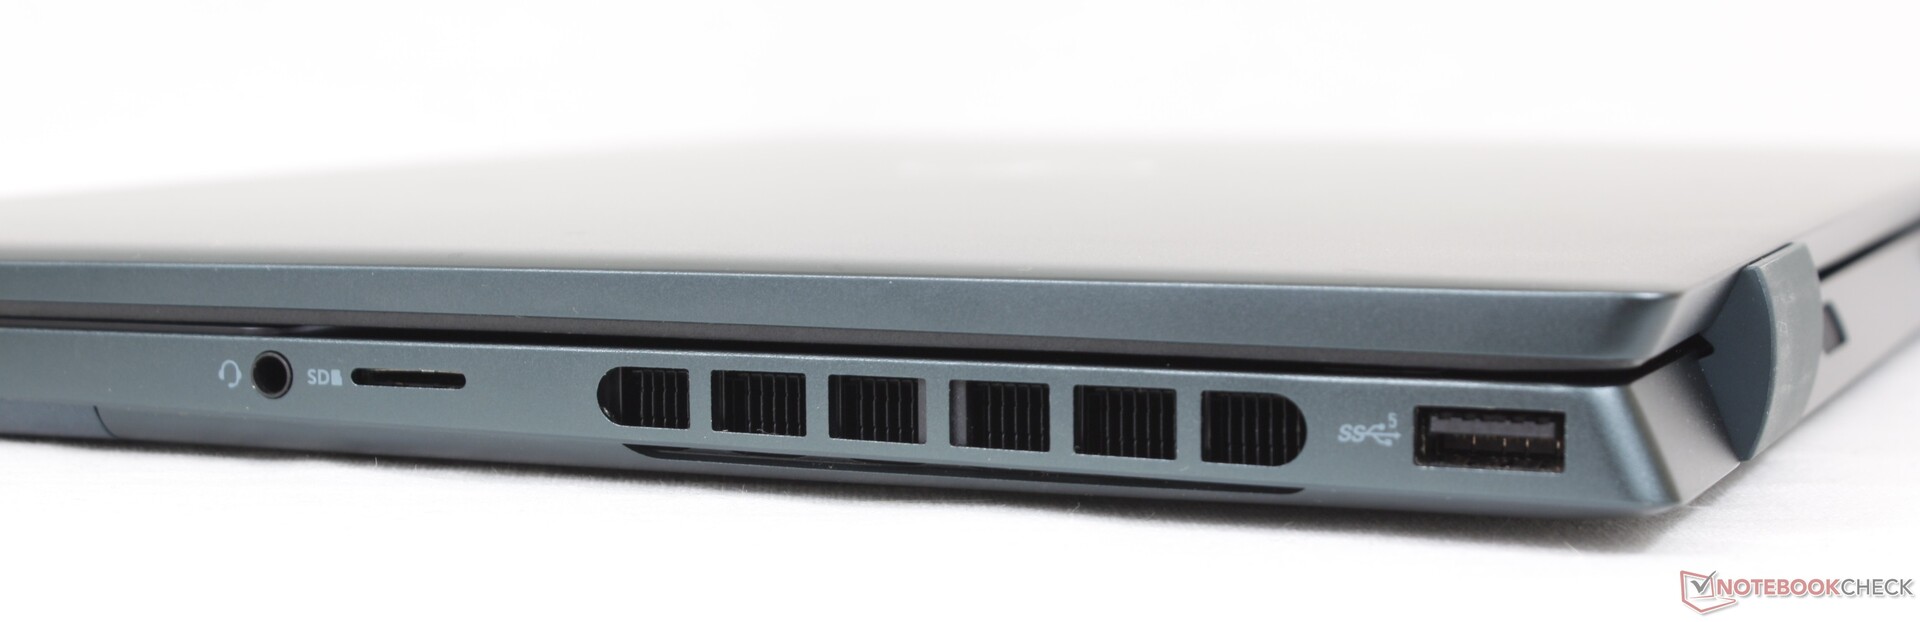
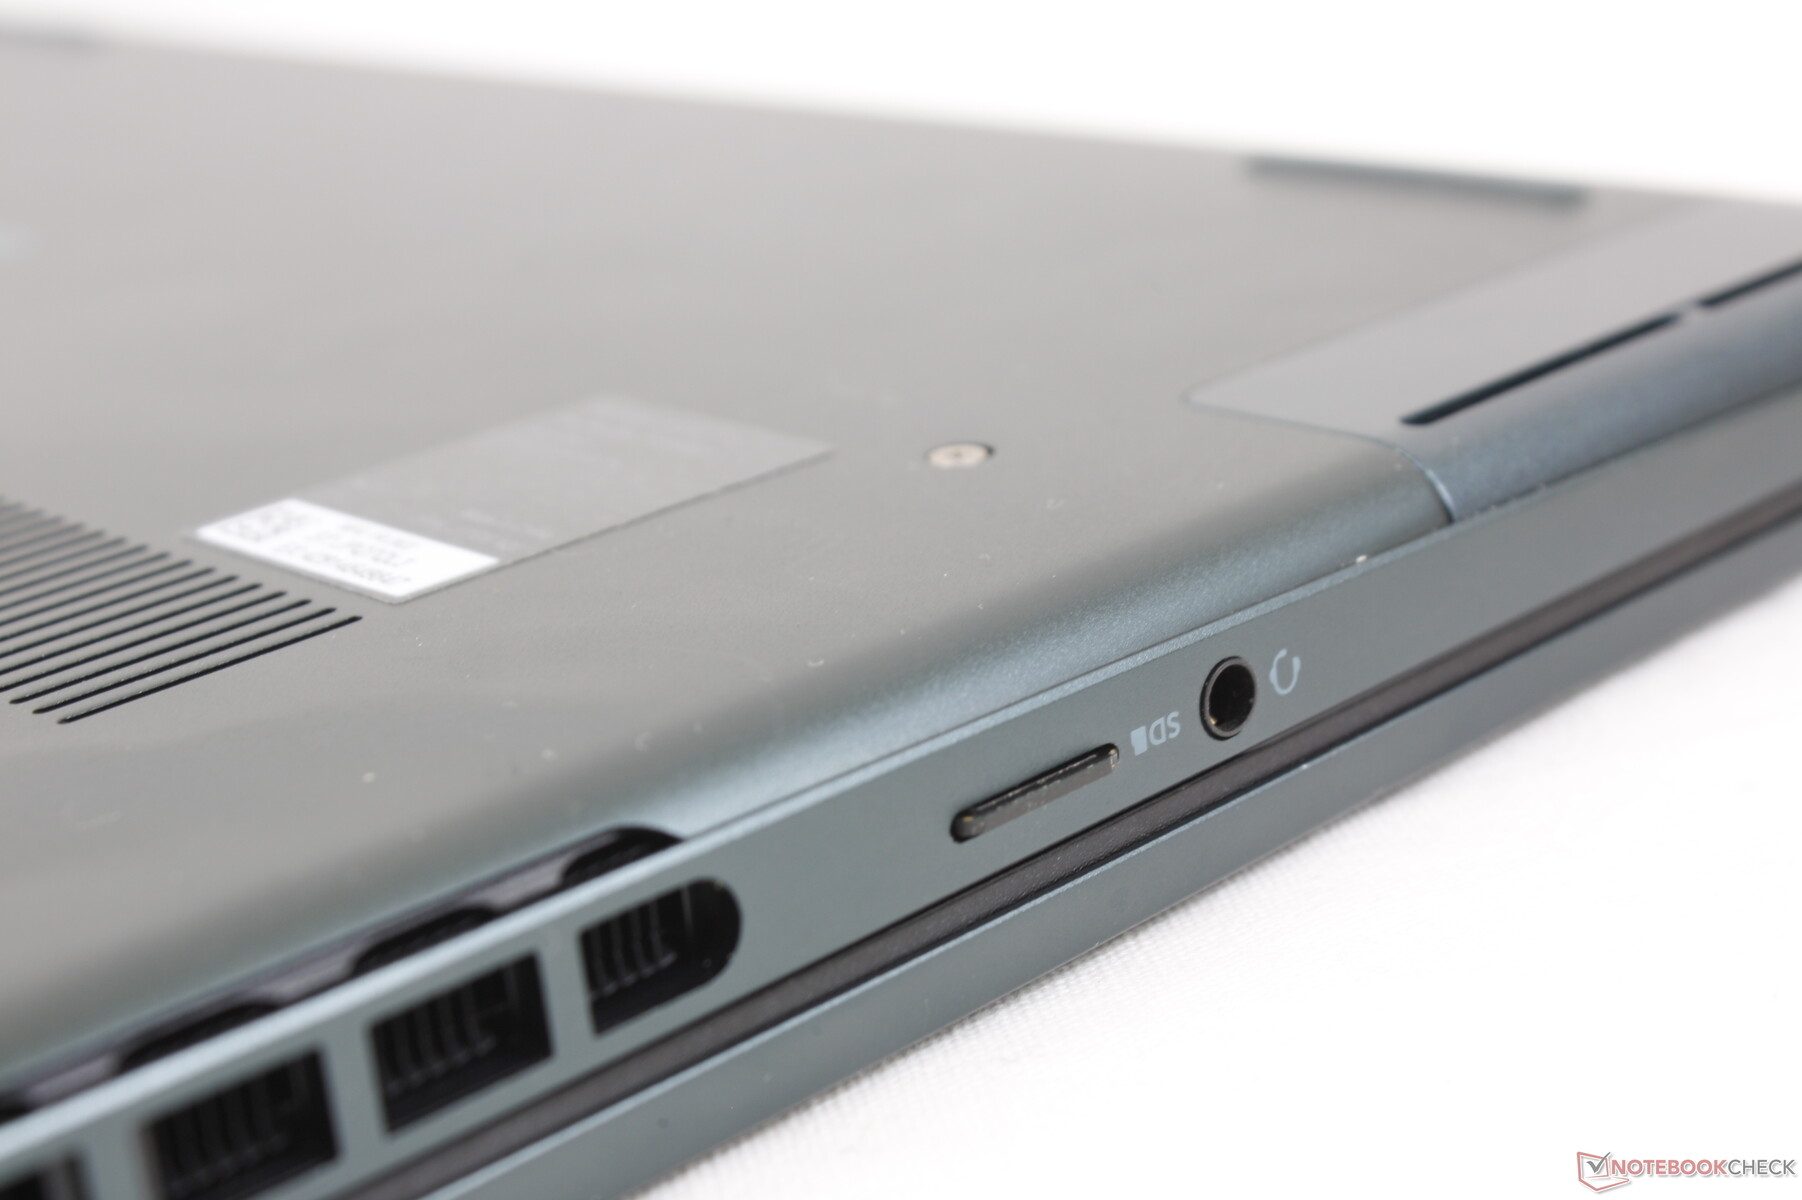
SD卡阅读器
集成的弹簧式MicroSD读卡器的传输速度很慢,就像我们在Inspiron 14 7420二合一上观察到的那样。将1GB的图片从我们的UHS-II测试卡移动到桌面需要大约45秒。
| SD Card Reader | |
| average JPG Copy Test (av. of 3 runs) | |
| MSI Summit E14 A11SCS (AV Pro V60) | |
| Schenker Vision 14 (Angelbird AV Pro V60) | |
| HP Envy 14-eb0010nr (Toshiba Exceria Pro M501 microSDXC 32GB) | |
| Asus Zenbook 14X UX5400E (AV Pro SD microSD 128 GB V60) | |
| Asus Vivobook Pro 14 M3401QC-KM007T (AV Pro SD microSD 128 GB V60) | |
| Dell Inspiron 14 Plus 7420 (AV PRO microSD 128 GB V60) | |
| Dell Inspiron 14 7420 2-in-1 (Toshiba Exceria Pro SDXC 64 GB UHS-II) | |
| maximum AS SSD Seq Read Test (1GB) | |
| MSI Summit E14 A11SCS (AV Pro V60) | |
| Schenker Vision 14 (Angelbird AV Pro V60) | |
| HP Envy 14-eb0010nr (Toshiba Exceria Pro M501 microSDXC 32GB) | |
| Asus Zenbook 14X UX5400E (AV Pro SD microSD 128 GB V60) | |
| Asus Vivobook Pro 14 M3401QC-KM007T (AV Pro SD microSD 128 GB V60) | |
| Dell Inspiron 14 Plus 7420 (AV PRO microSD 128 GB V60) | |
| Dell Inspiron 14 7420 2-in-1 (Toshiba Exceria Pro SDXC 64 GB UHS-II) | |
沟通
英特尔AX211是Wi-Fi 6E和蓝牙5.2连接的标准配置。虽然我们在与6GHz网络配对时没有遇到任何问题,但如下图所示,发射率会比接收率略微不稳定。
| Networking | |
| iperf3 transmit AX12 | |
| Schenker Vision 14 | |
| HP Envy 14-eb0010nr | |
| MSI Summit E14 A11SCS | |
| Asus Zenbook 14X UX5400E | |
| iperf3 receive AX12 | |
| Schenker Vision 14 | |
| MSI Summit E14 A11SCS | |
| HP Envy 14-eb0010nr | |
| Asus Zenbook 14X UX5400E | |
| iperf3 receive AXE11000 6GHz | |
| Dell Inspiron 14 Plus 7420 | |
| Dell Inspiron 14 7420 2-in-1 | |
| Asus Vivobook Pro 14 M3401QC-KM007T | |
| iperf3 transmit AXE11000 6GHz | |
| Dell Inspiron 14 Plus 7420 | |
| Dell Inspiron 14 7420 2-in-1 | |
| Asus Vivobook Pro 14 M3401QC-KM007T | |
网络摄像头
200万像素的网络摄像头提供了与标准Inspiron 14 7420二合一产品上的200万像素网络摄像头类似的图像质量。物理隐私快门是标准配置,不支持Windows Hello和IR。


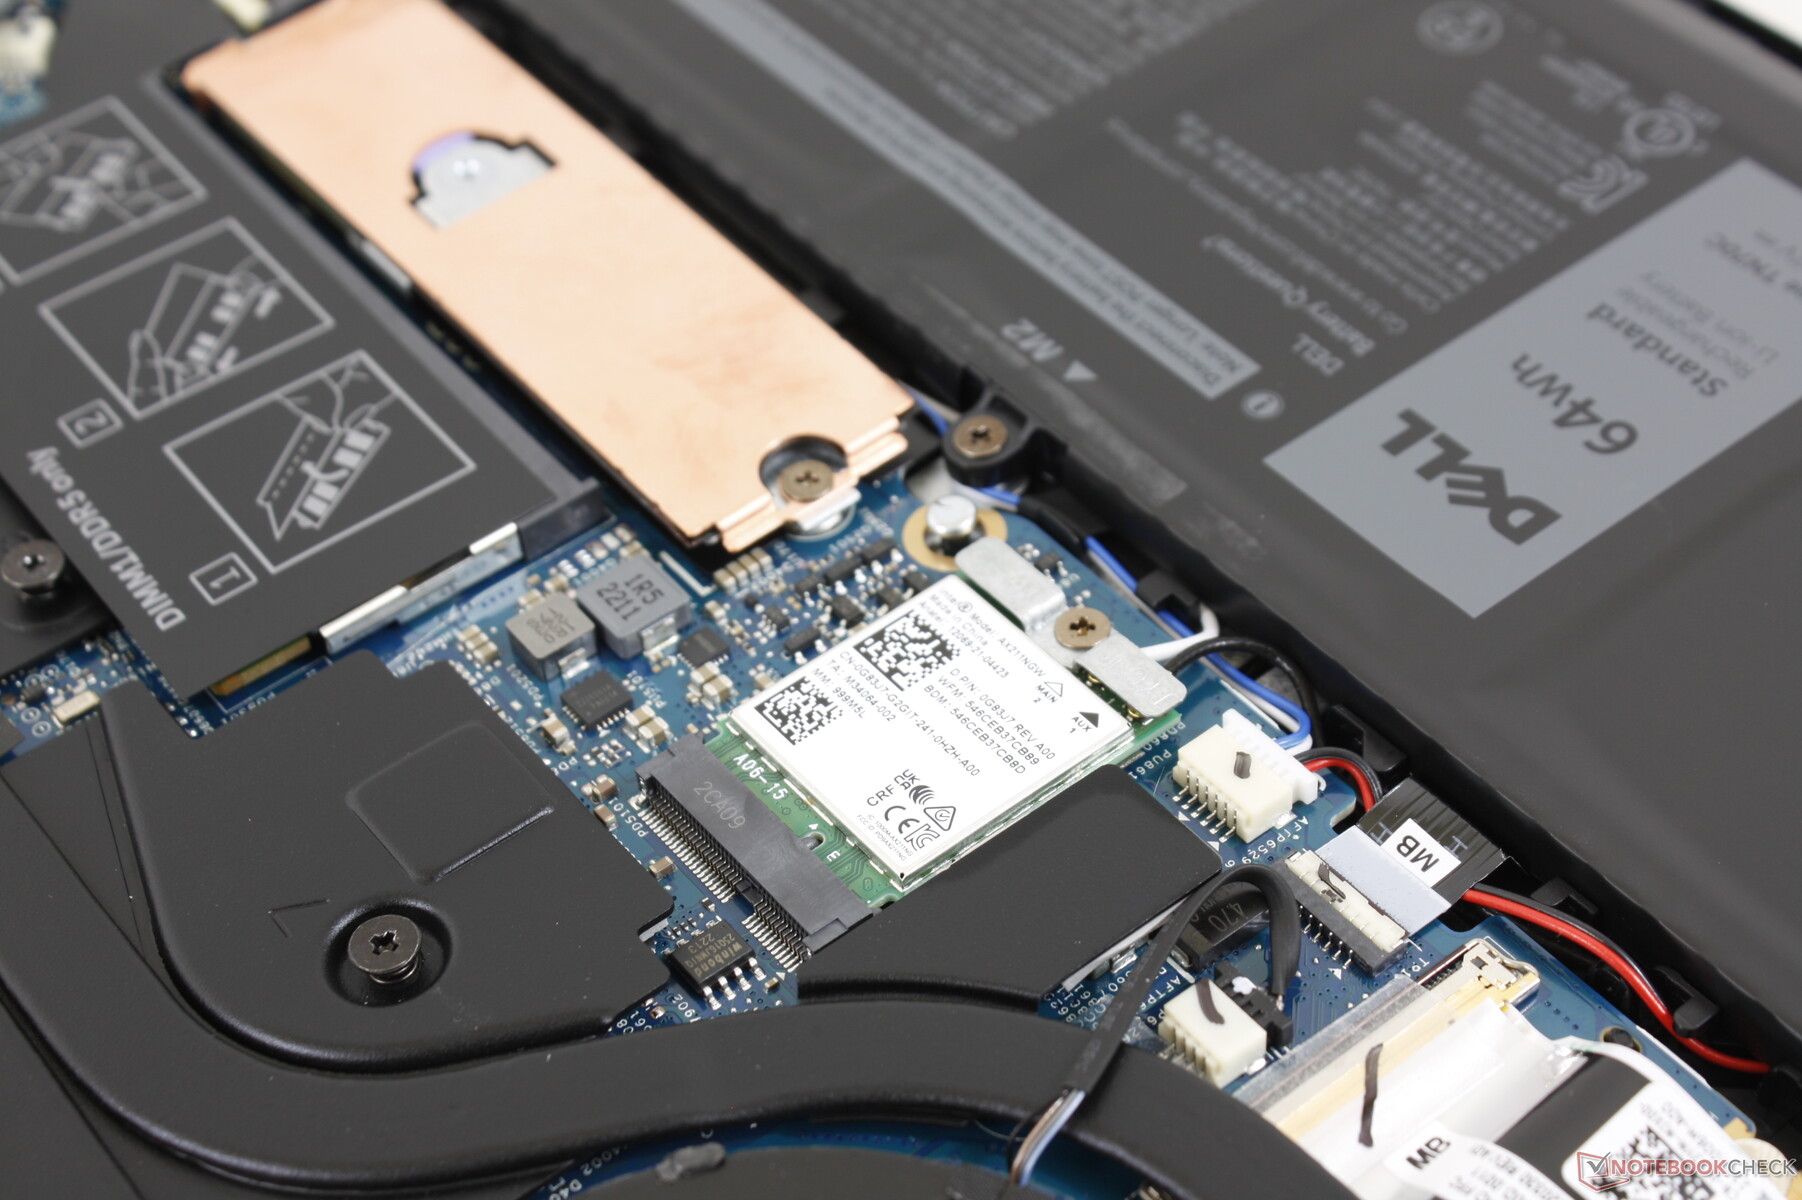
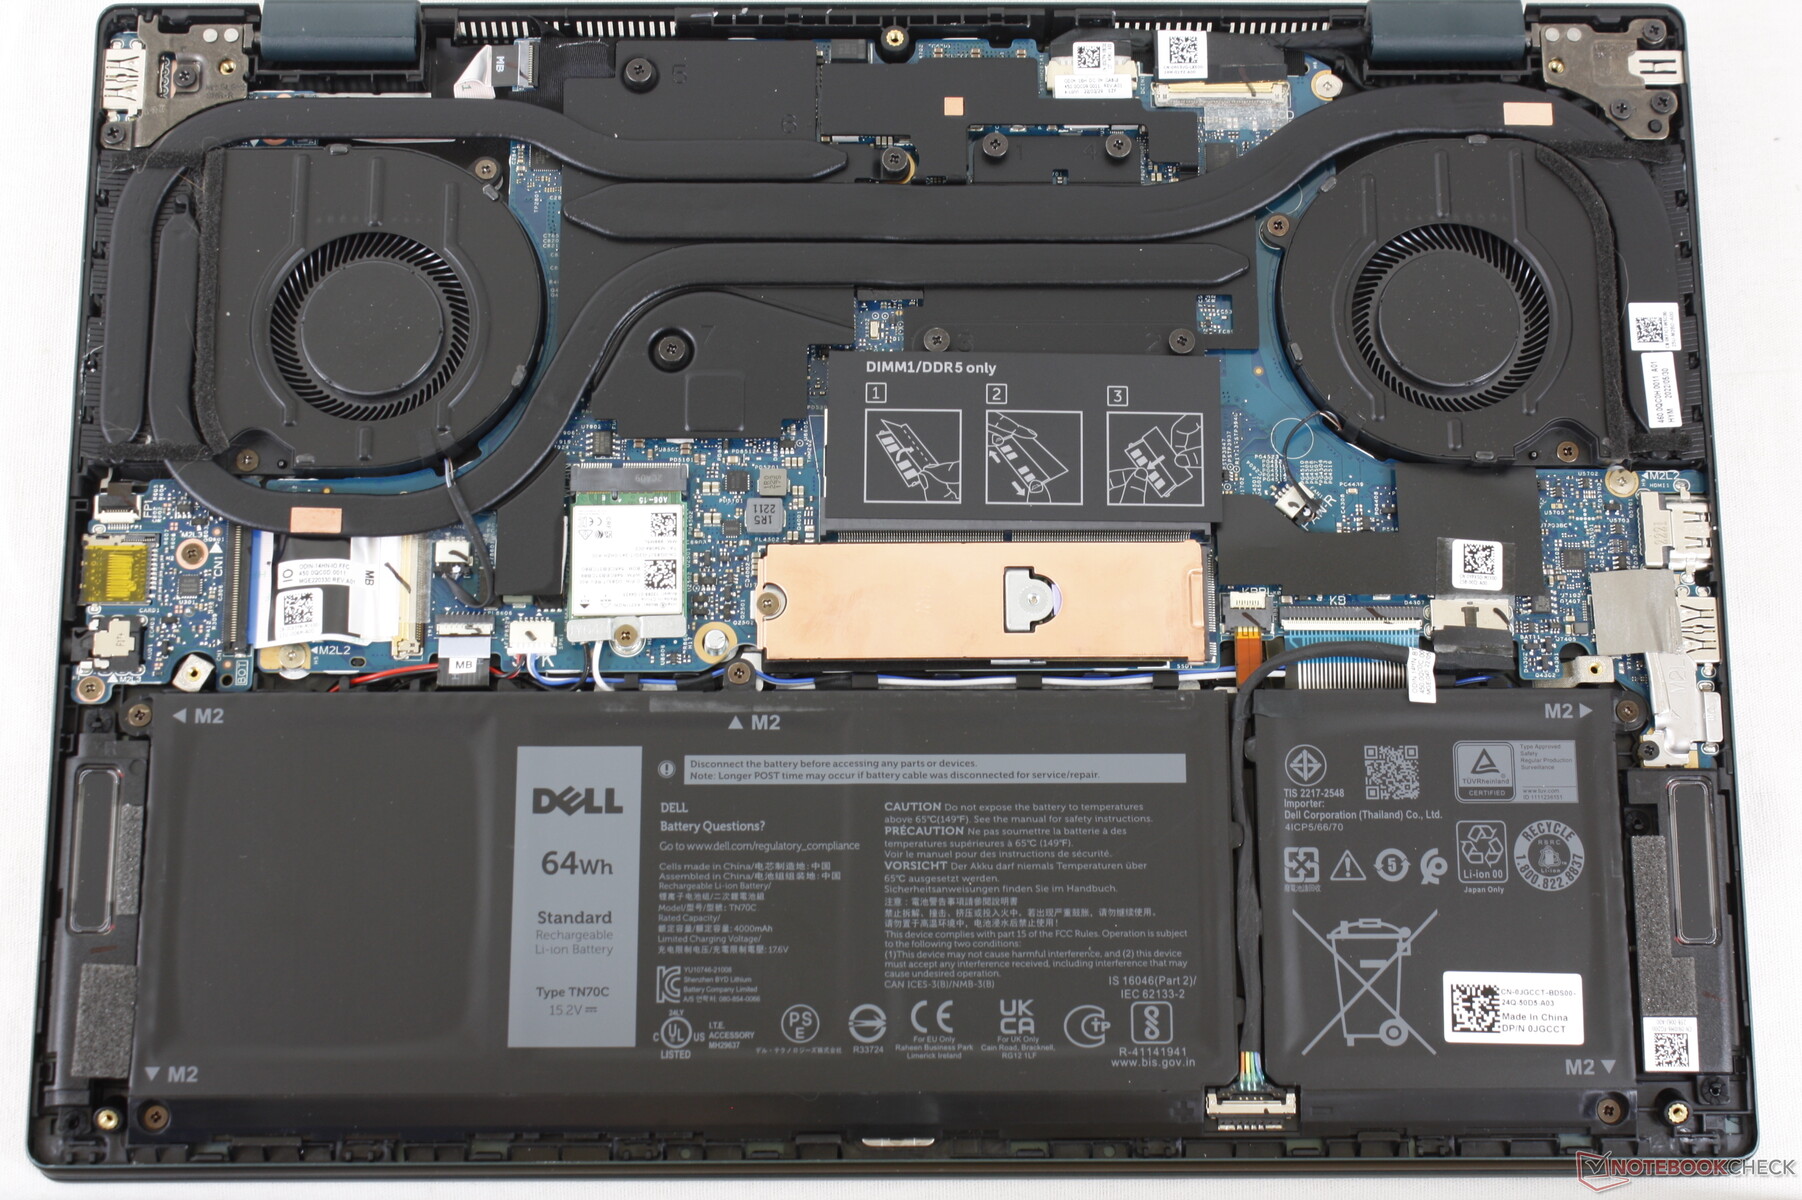
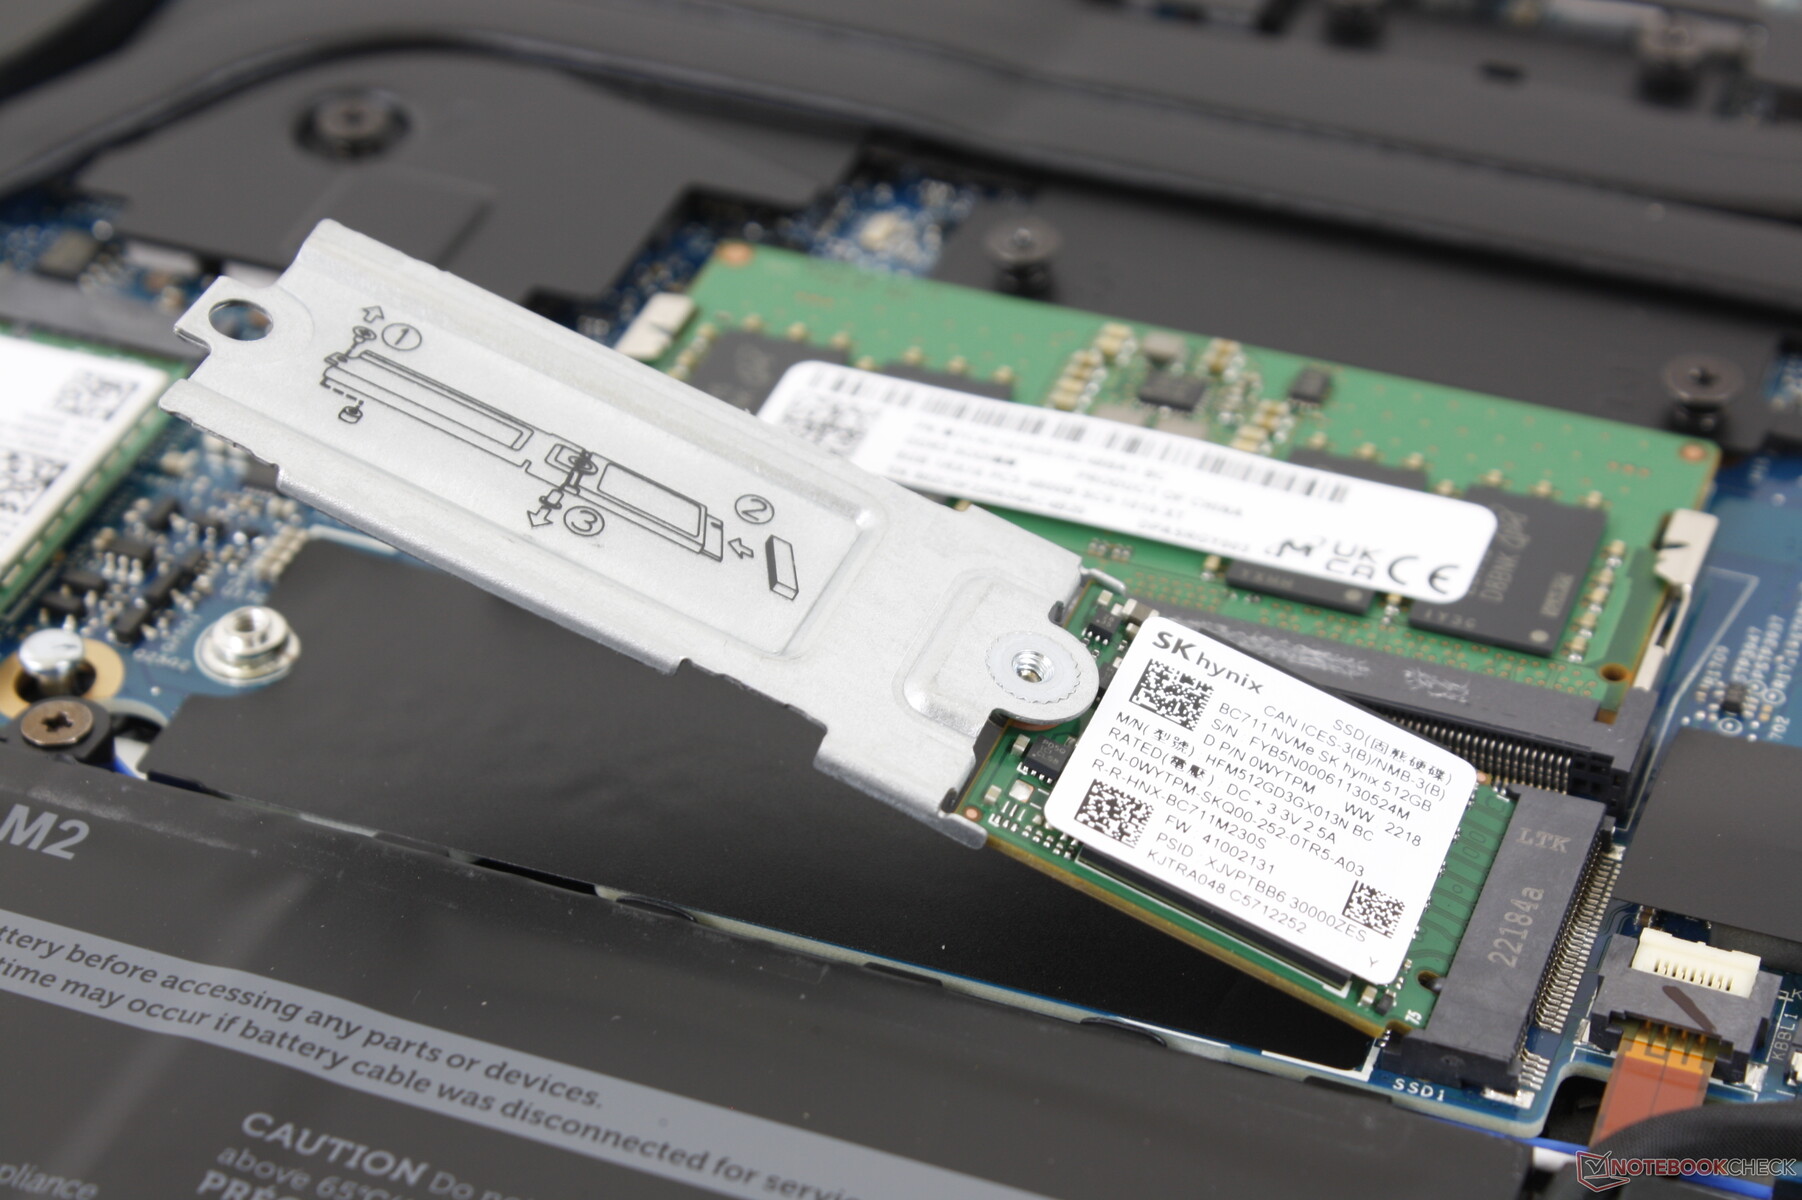
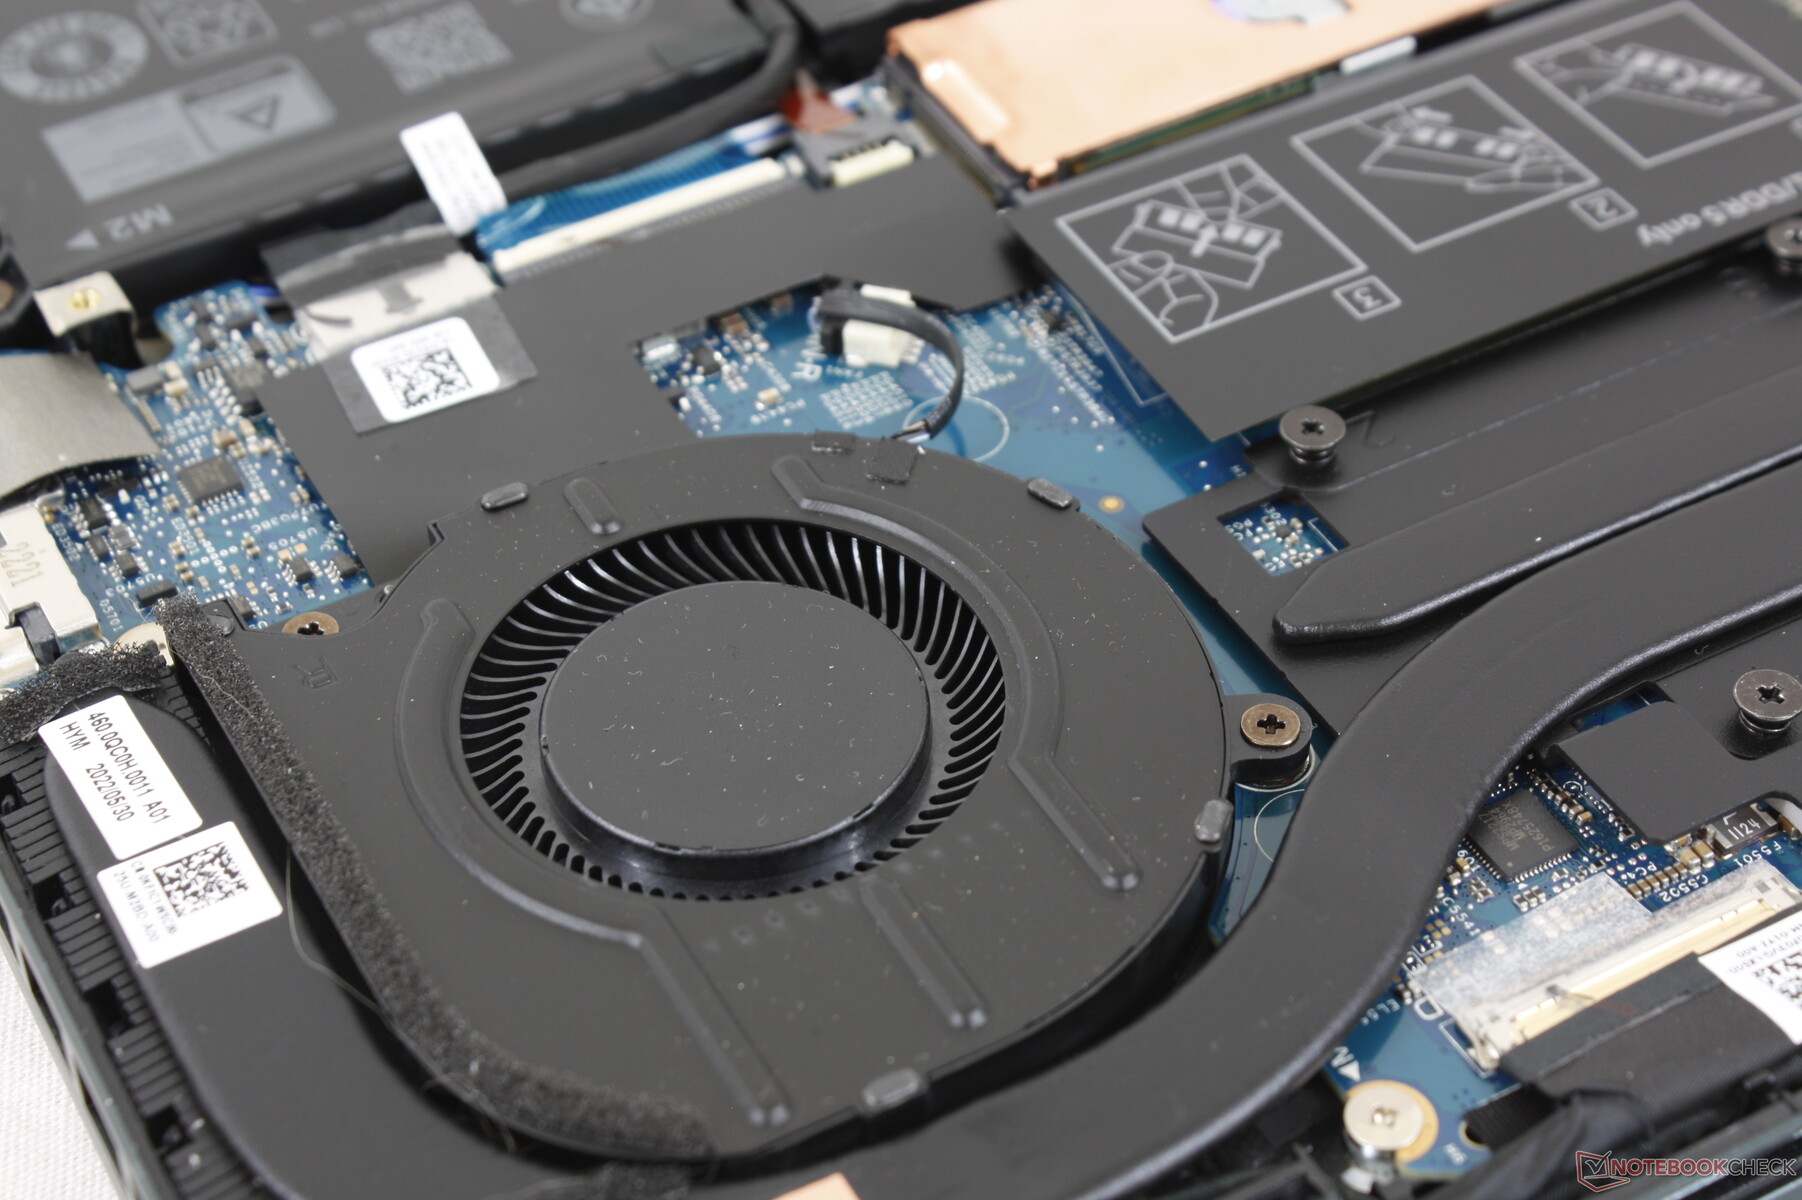
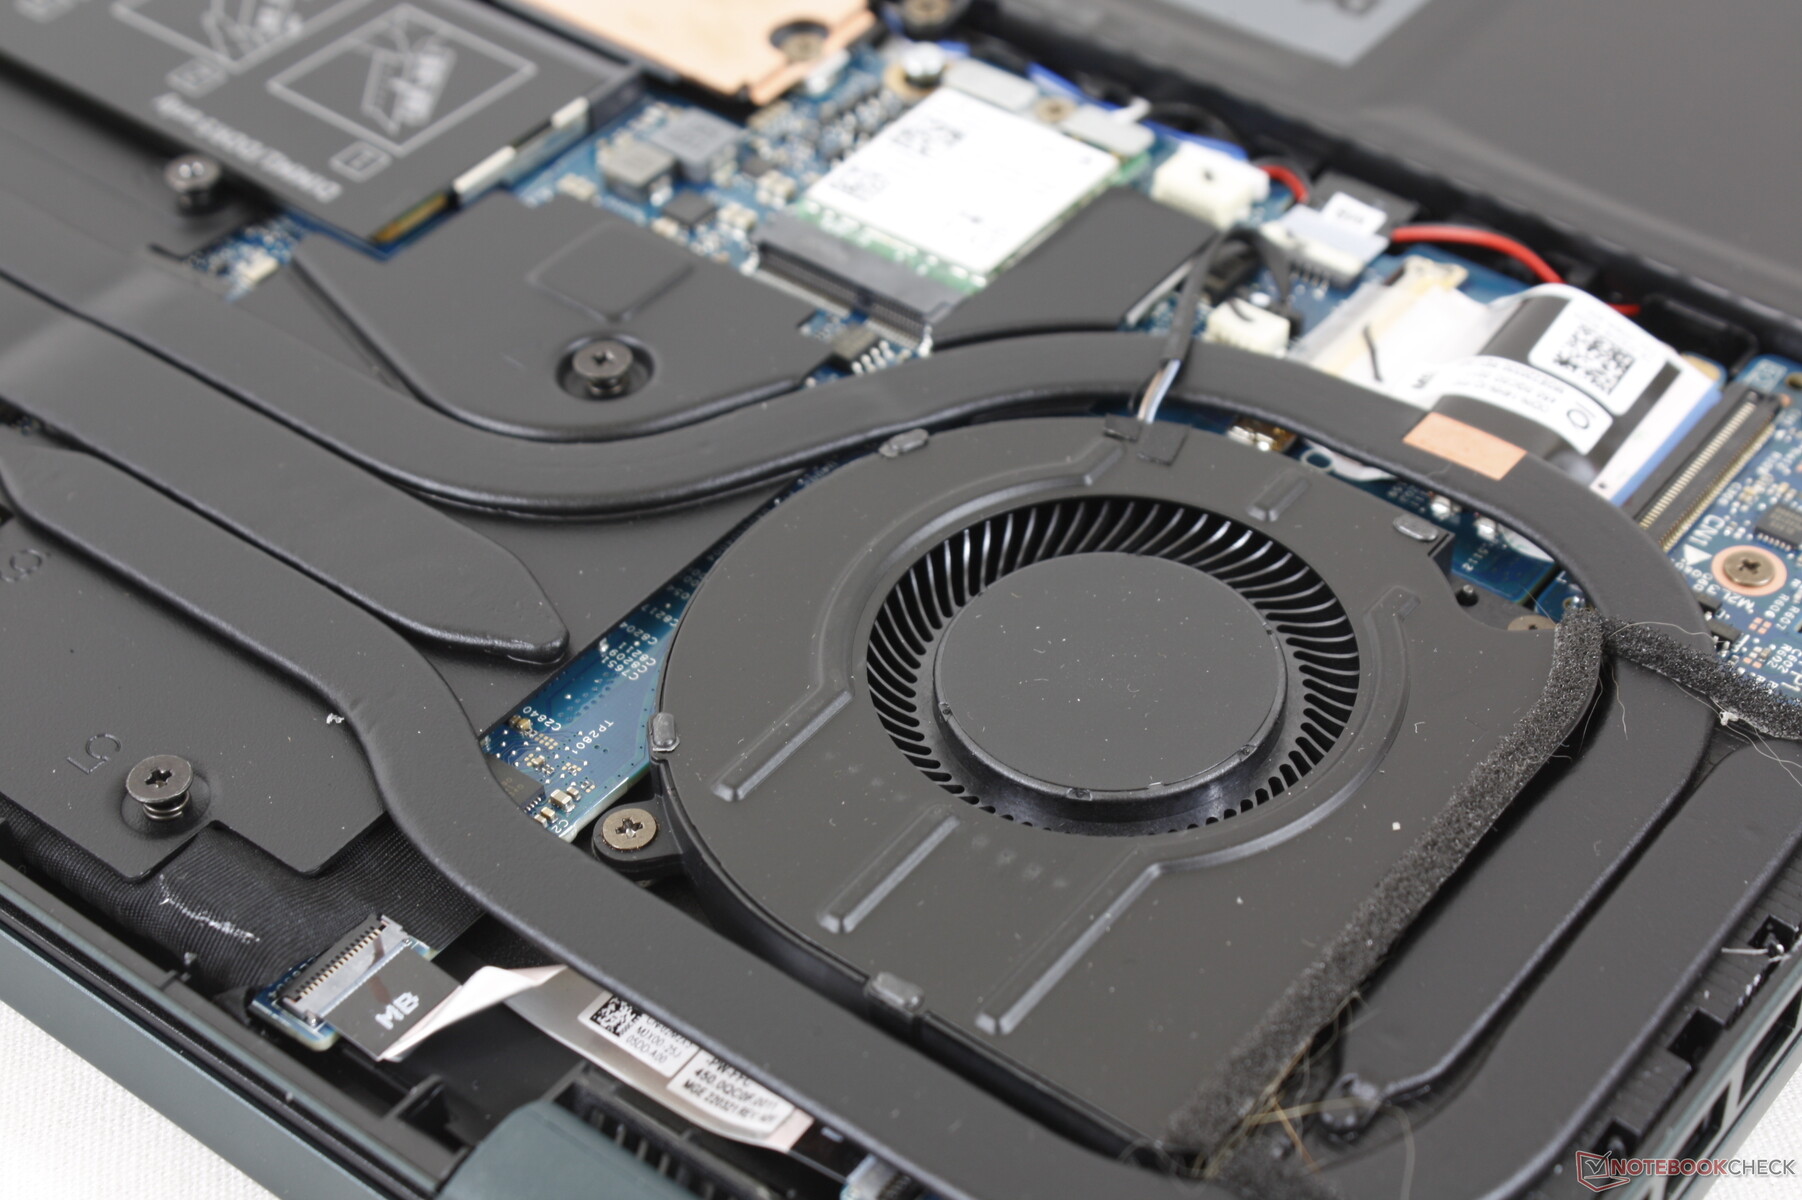
维护
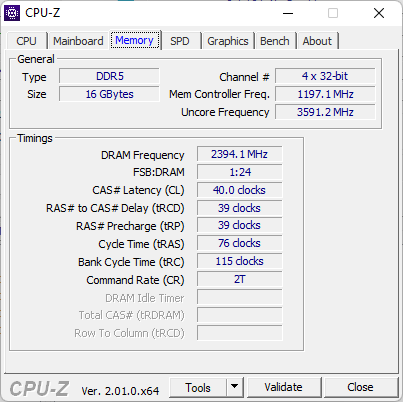
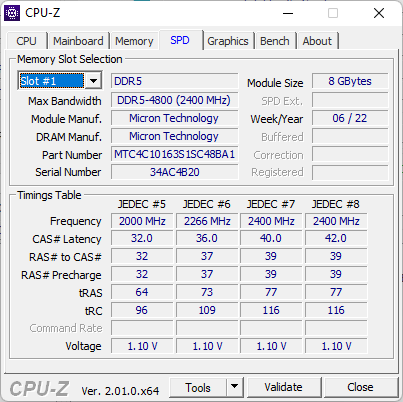
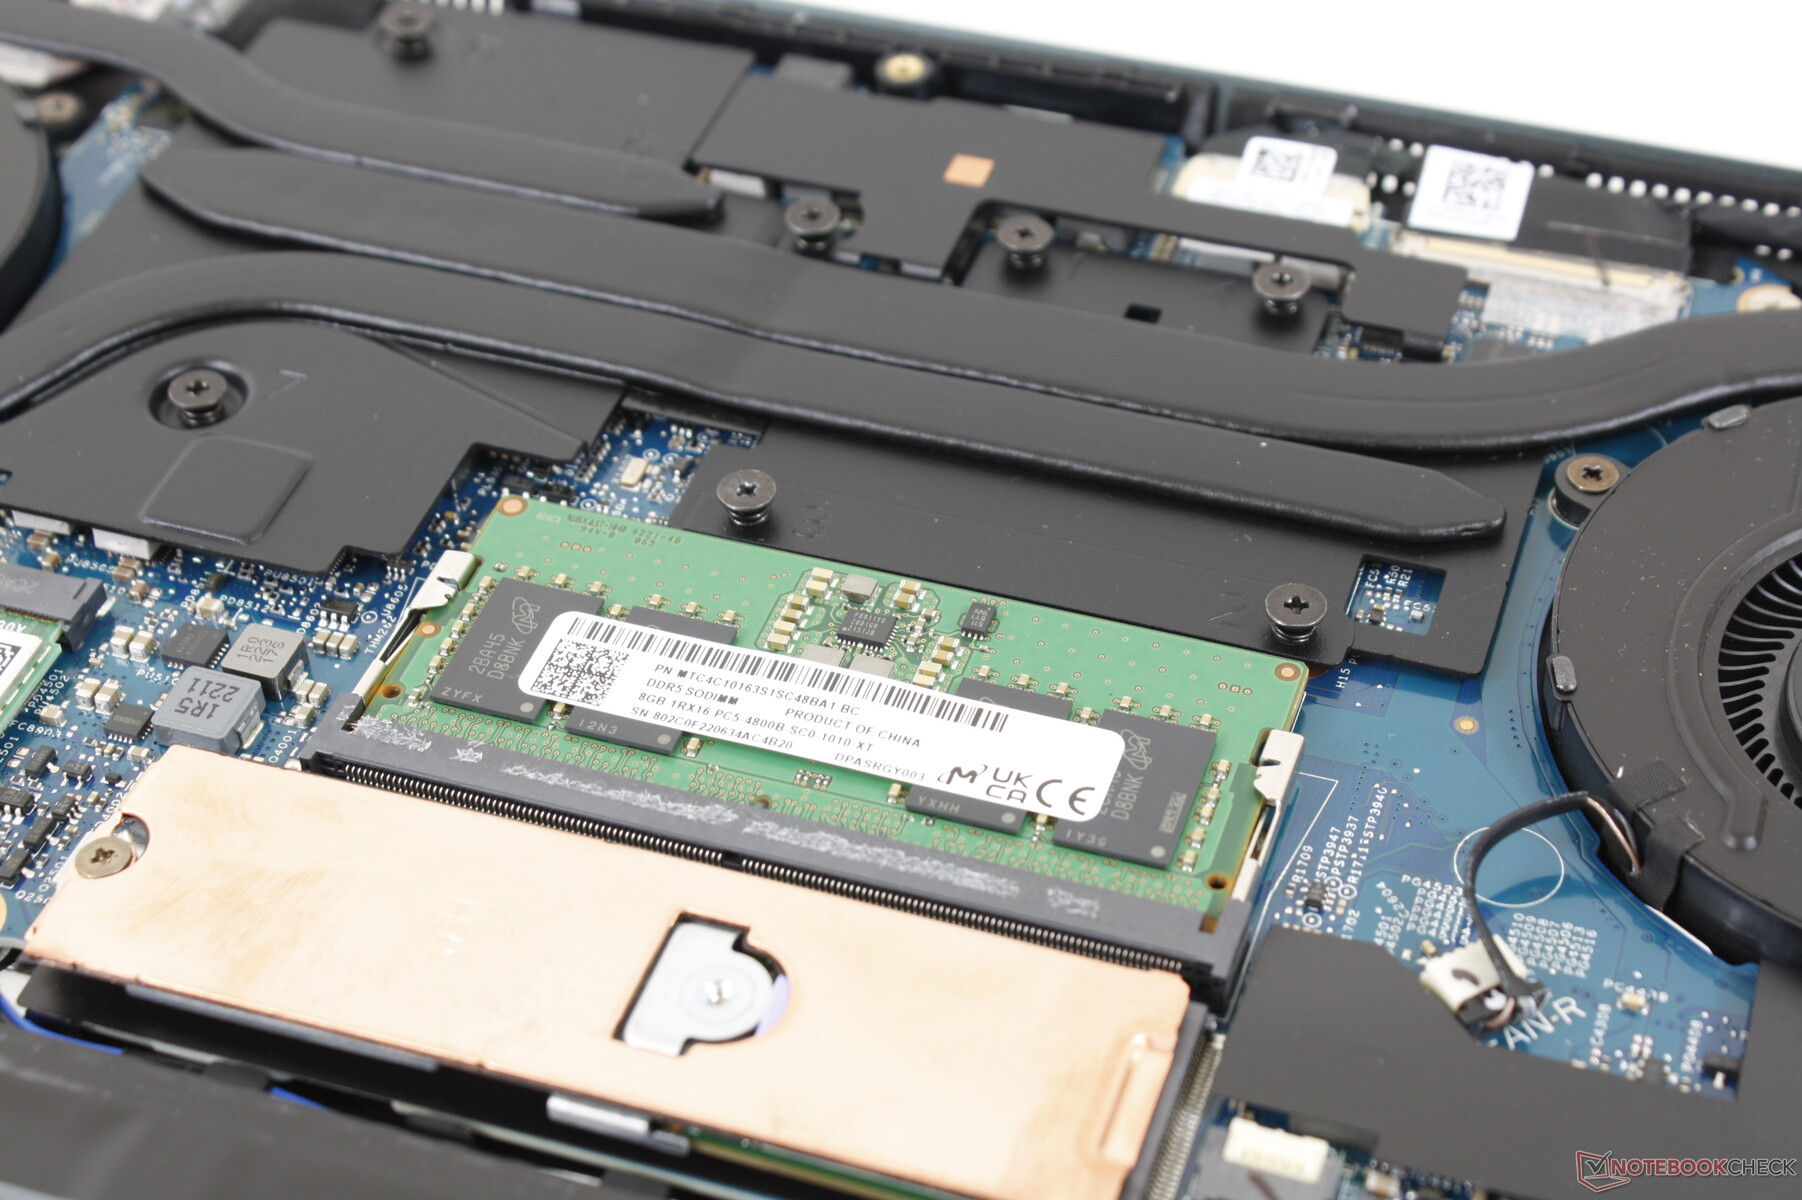
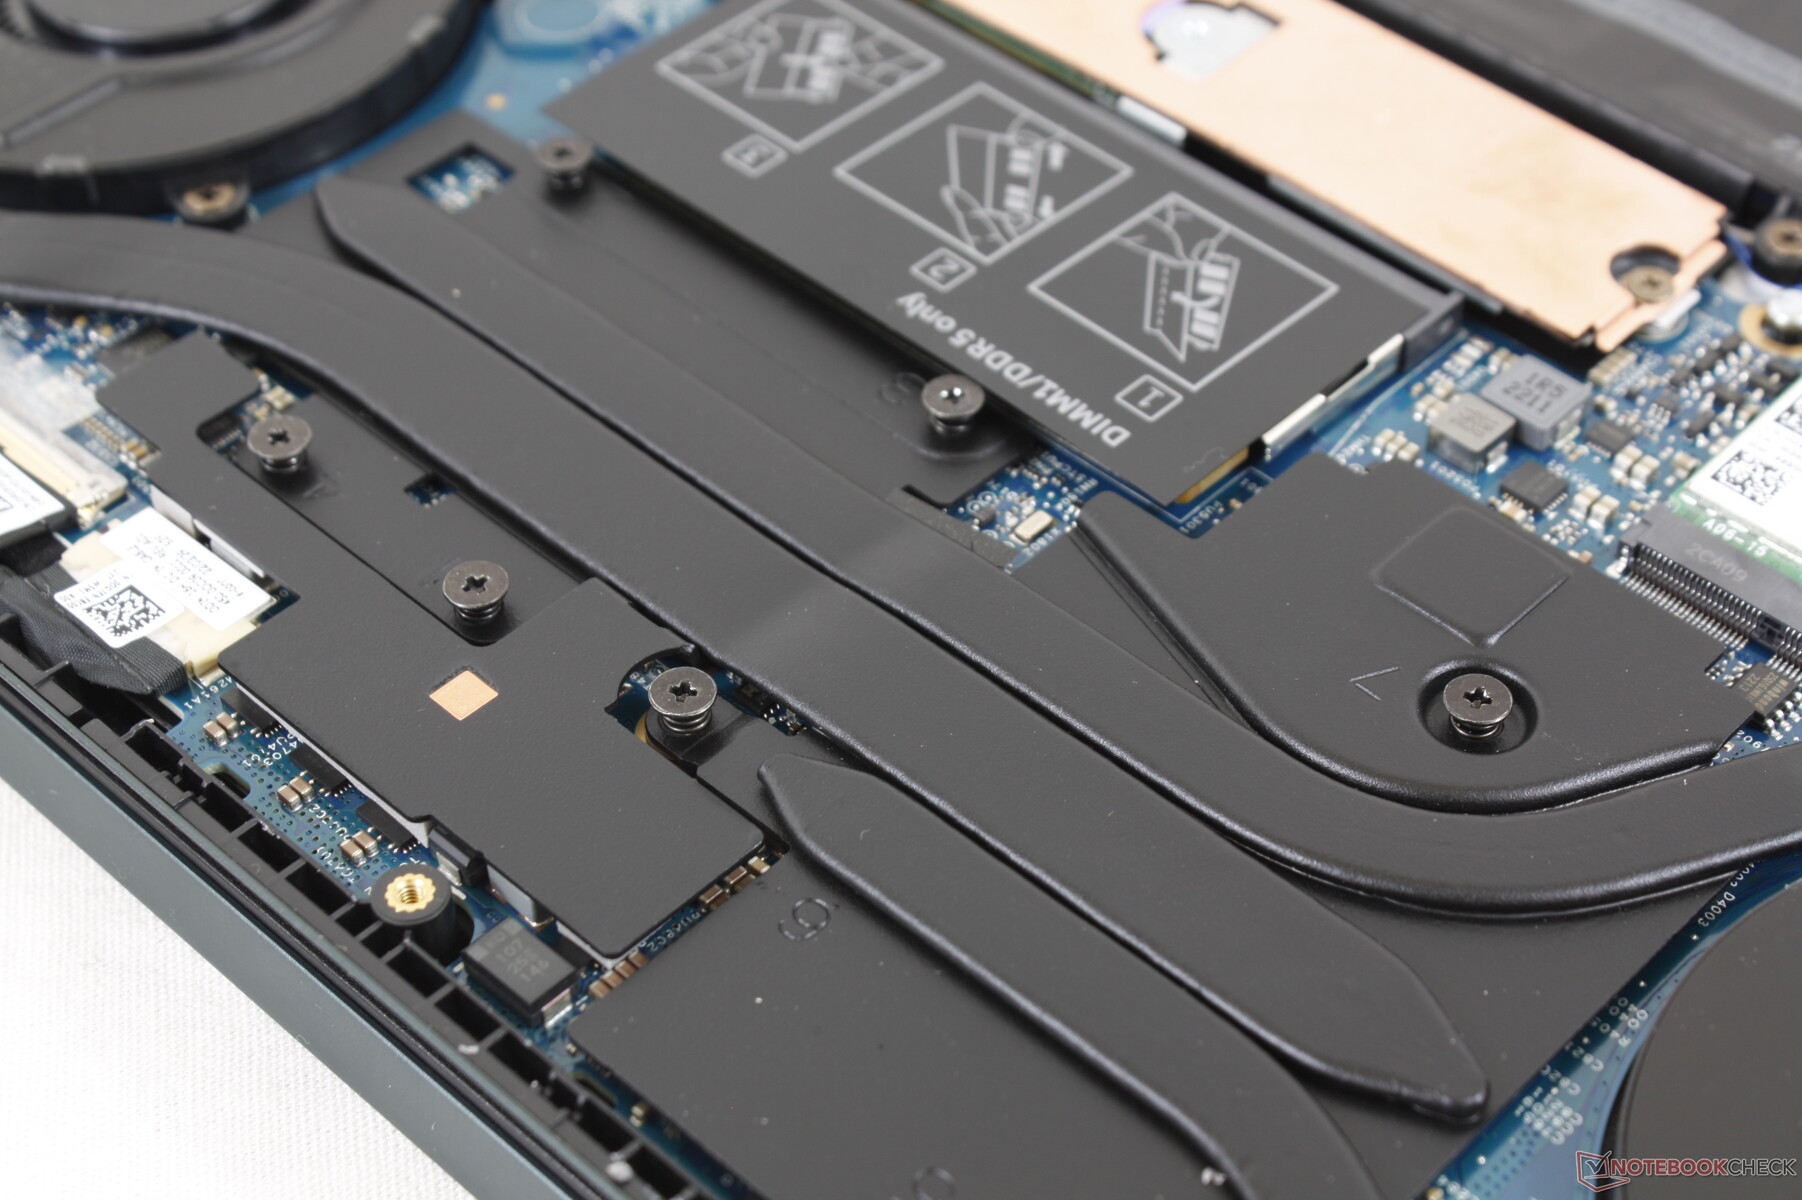
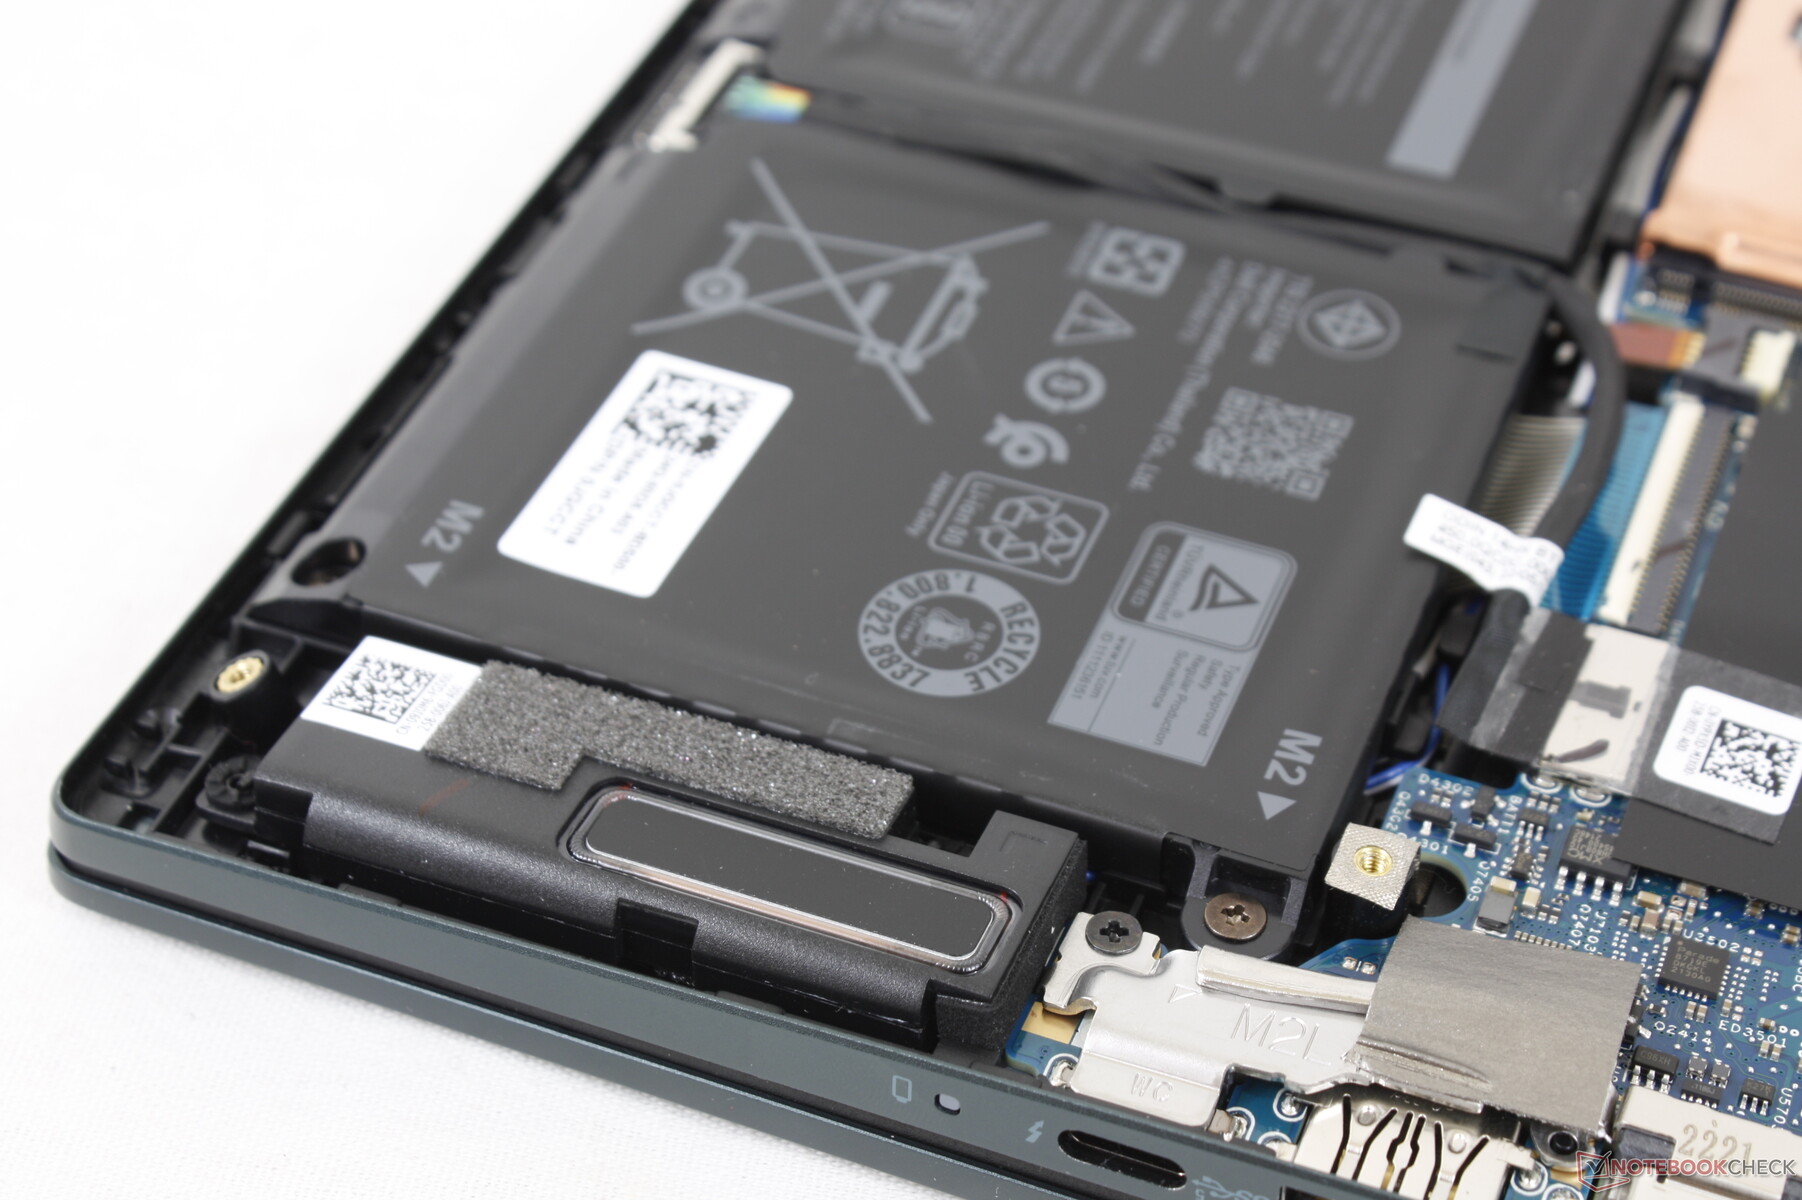
底部面板用飞利浦螺丝刀和锋利的塑料边缘相当容易弹出。一旦进入,用户可以维修电池、1个M.2 2280存储插槽、1个DDR5 SODIMM插槽和M.2 WLAN模块。请注意,所有SKU上都焊接了8GB的内存,这意味着用户可以只添加一个模块,最大的内存容量为40GB。
配件和保修
除了交流电适配器和文件外,盒子里没有其他额外的东西。如果在美国购买,通常有一年的有限保修。
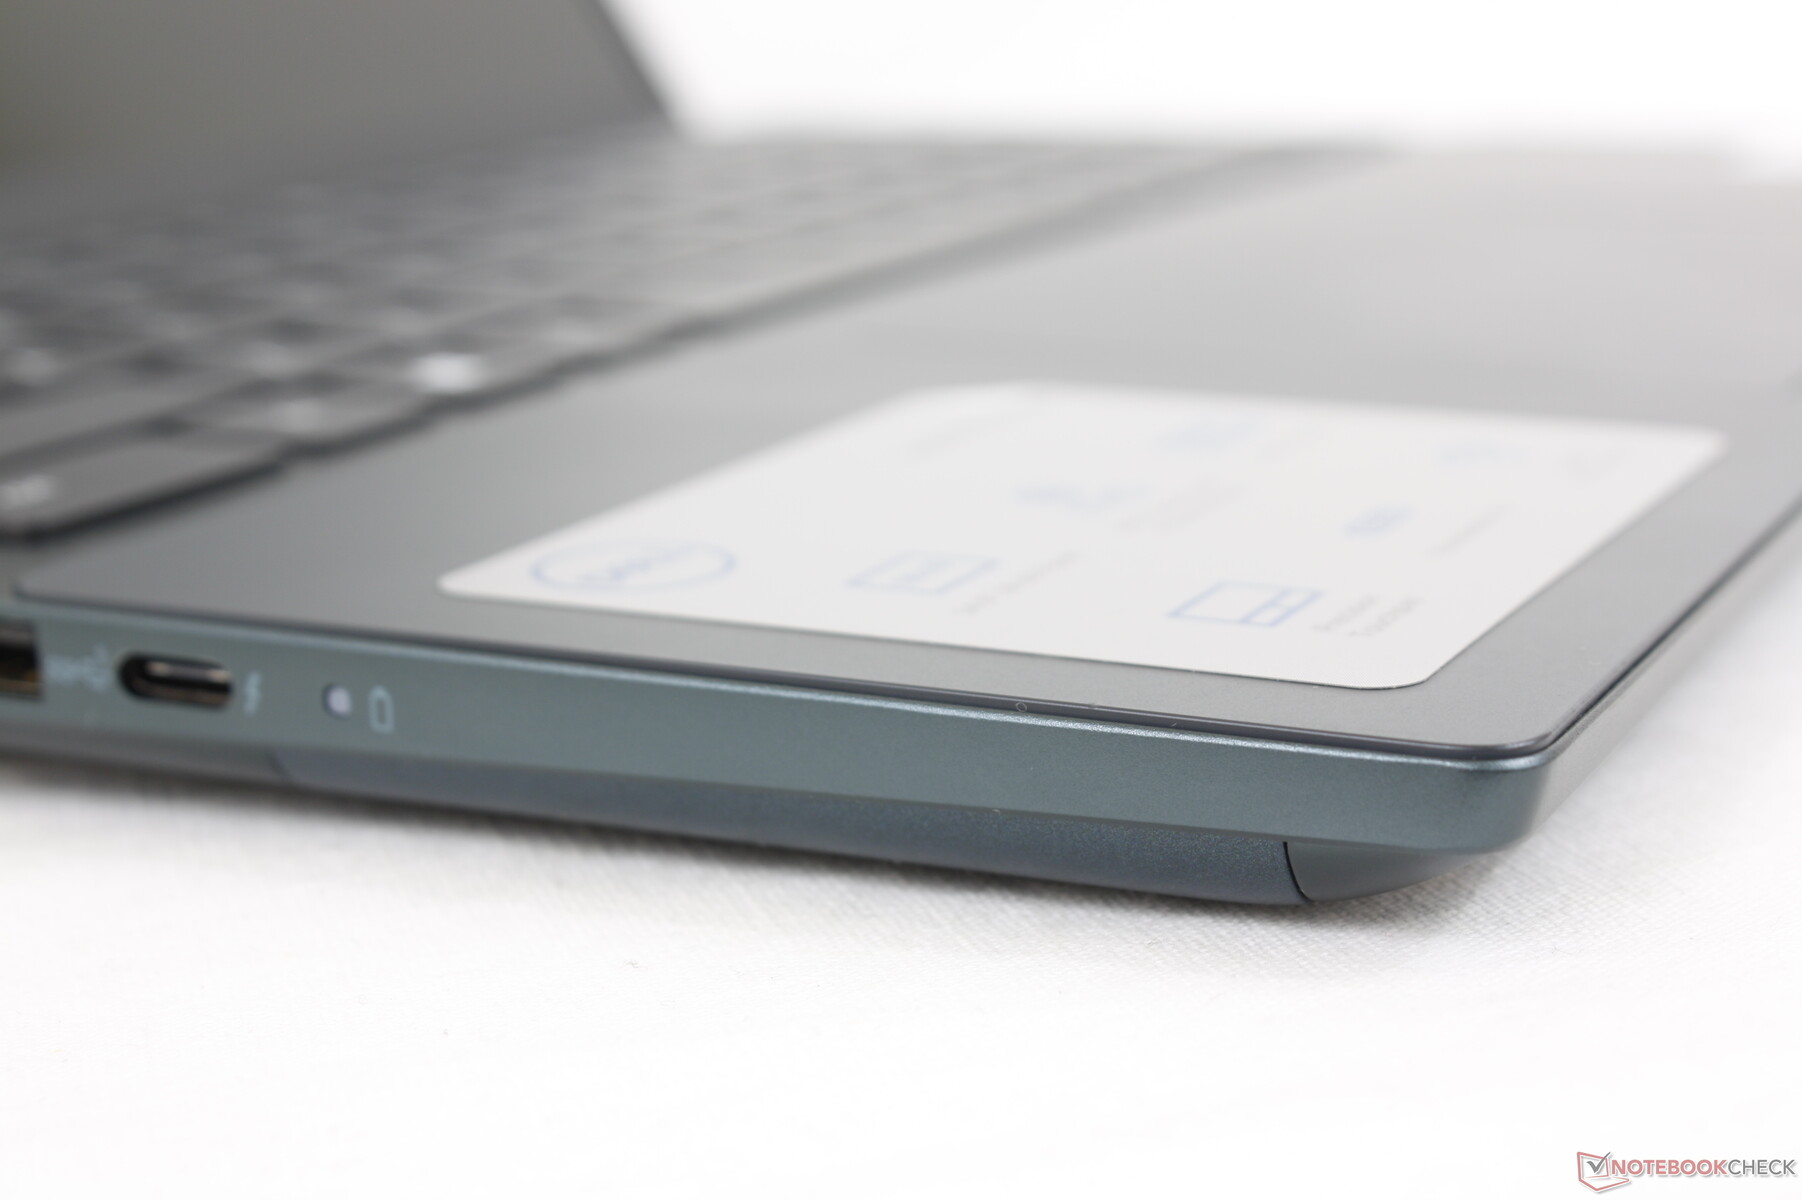
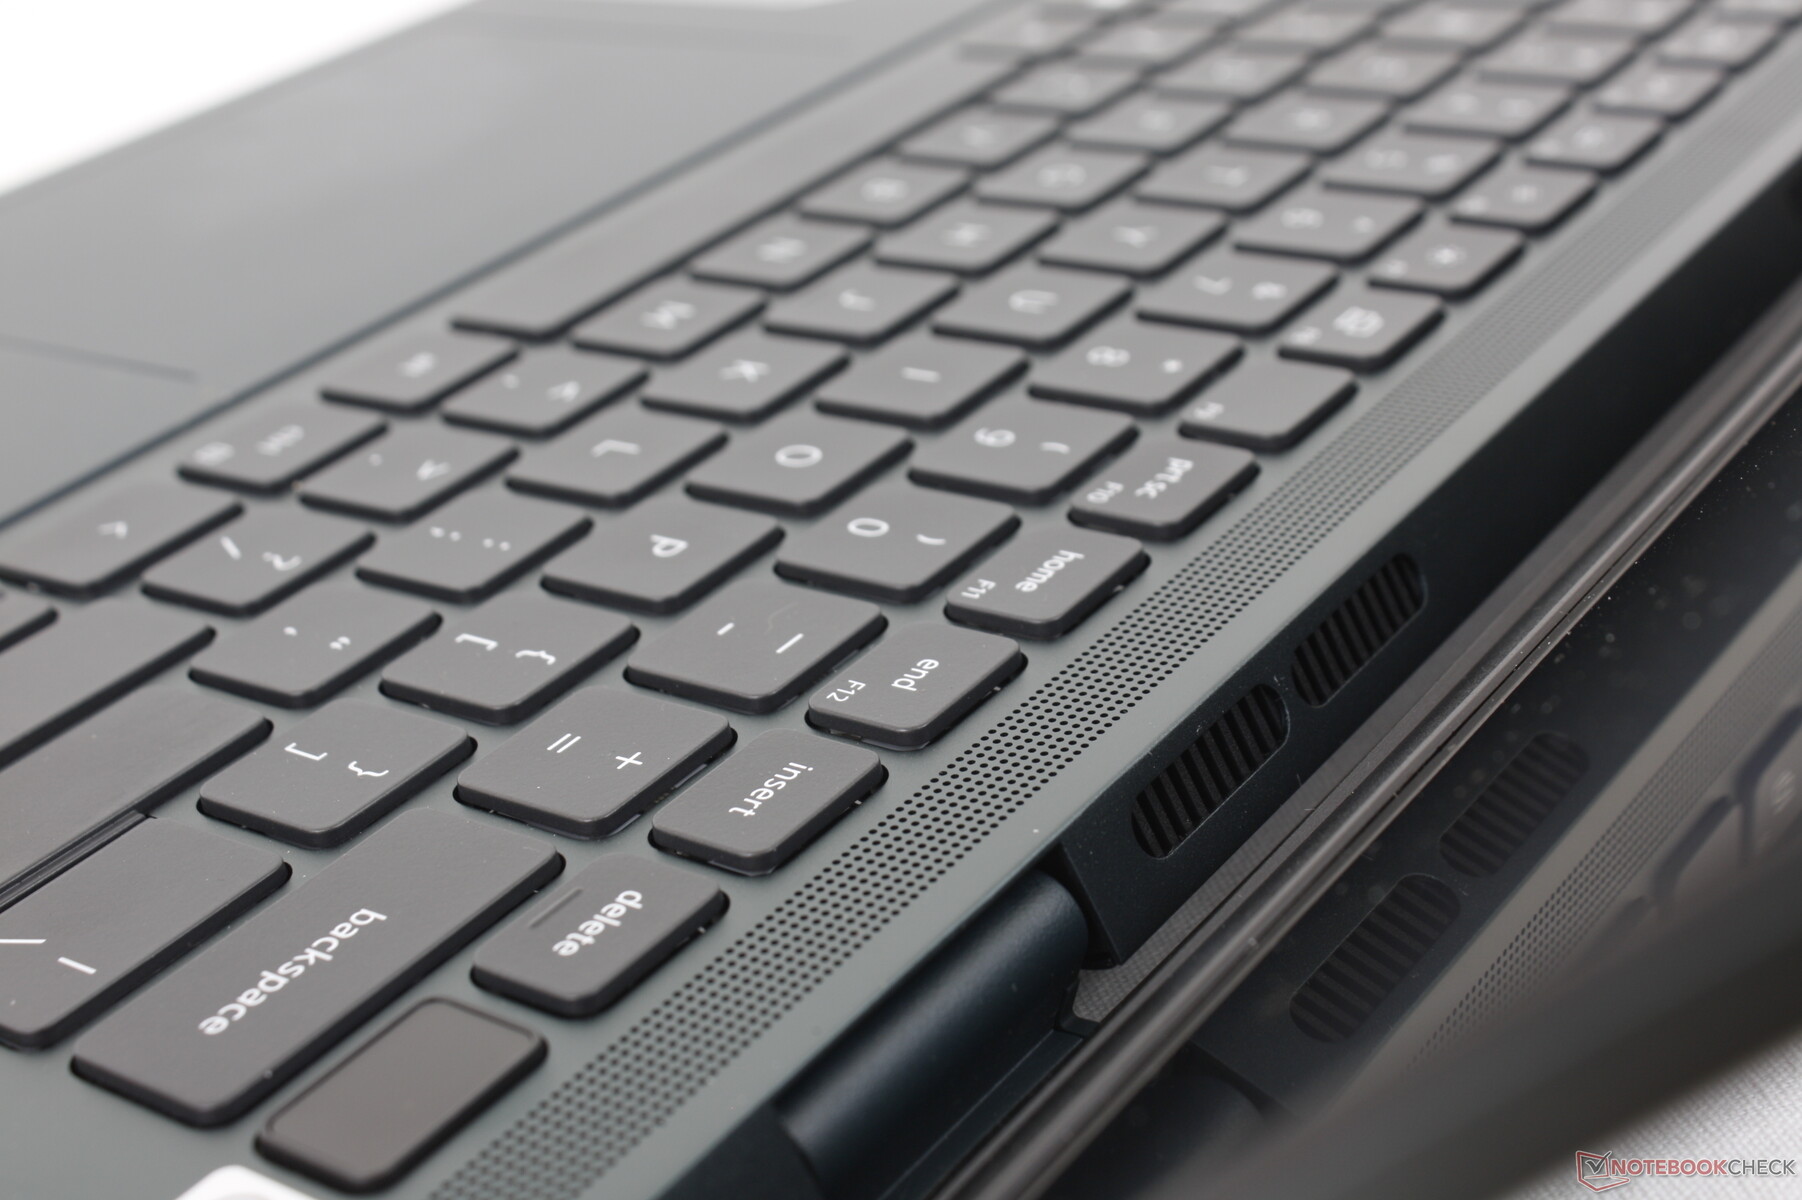
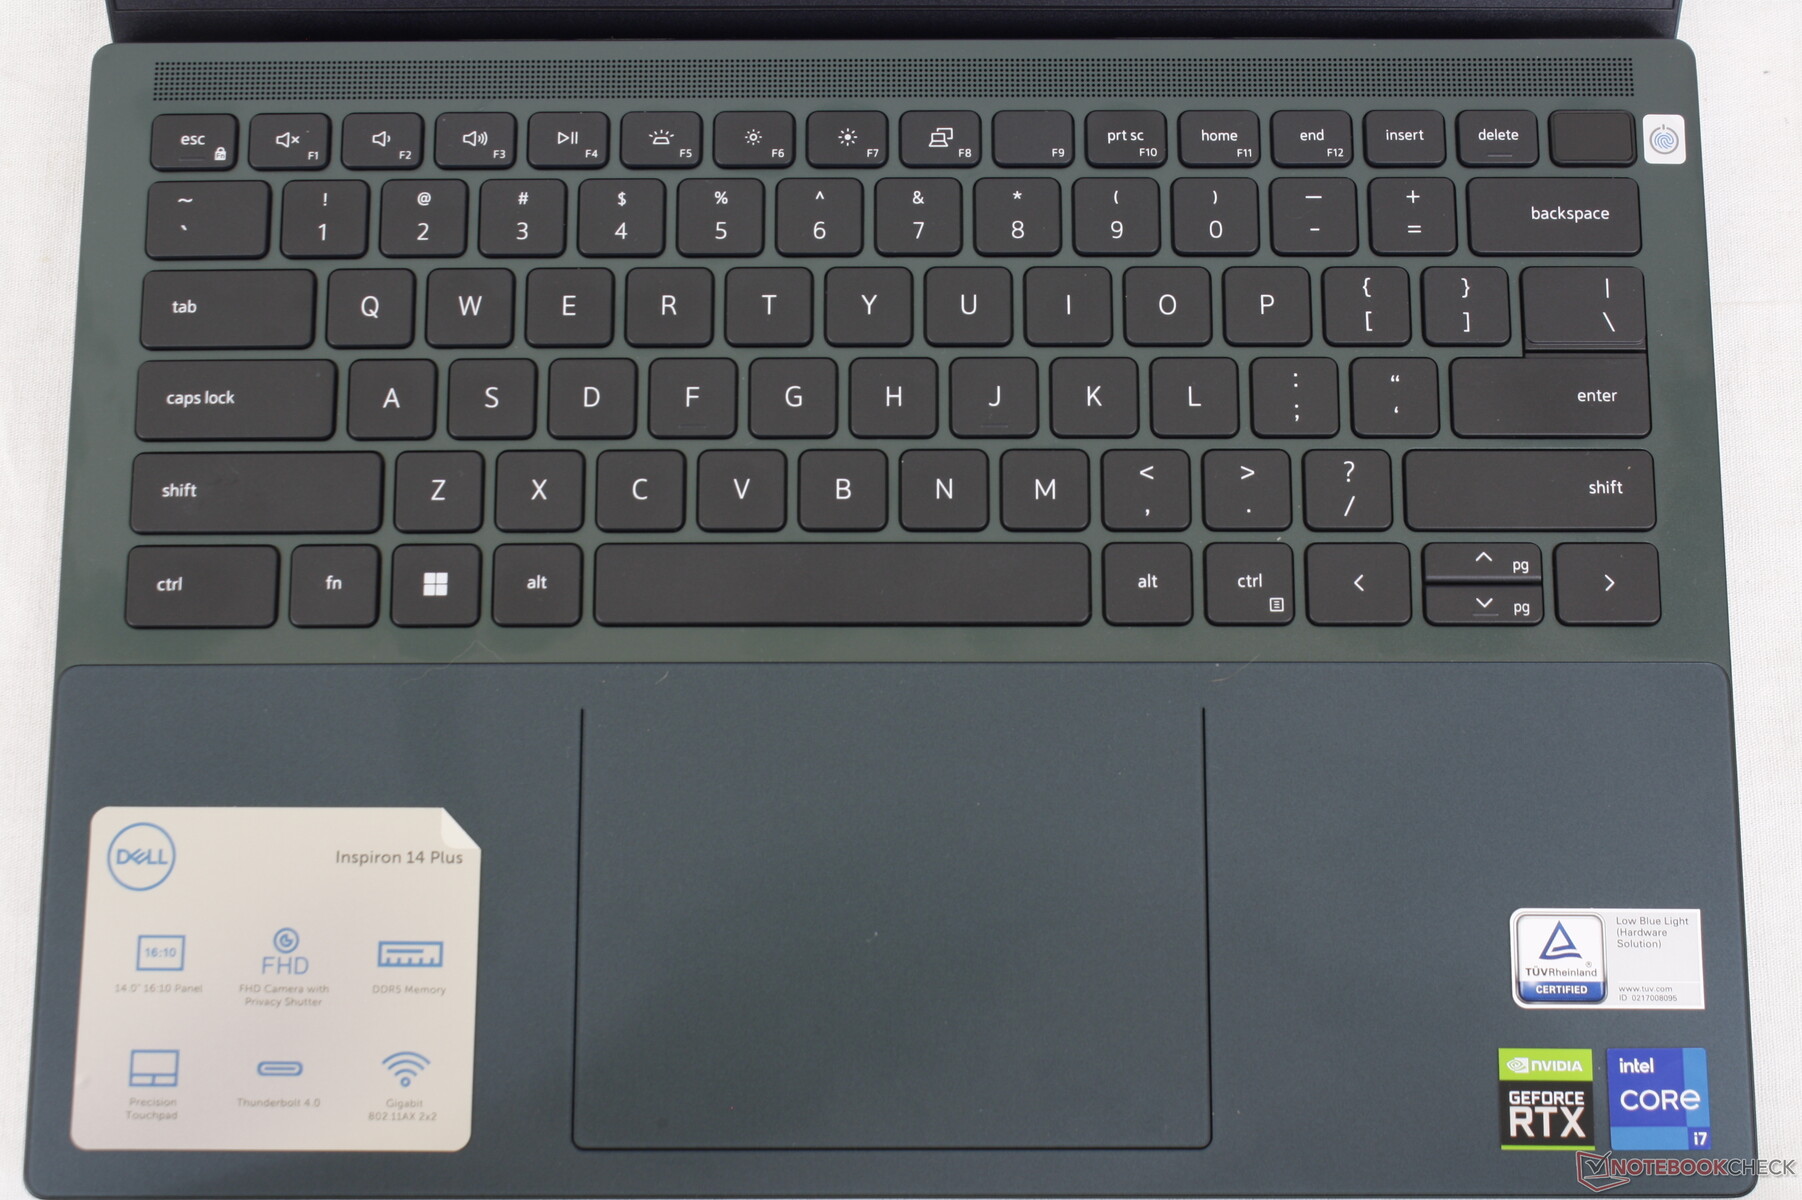
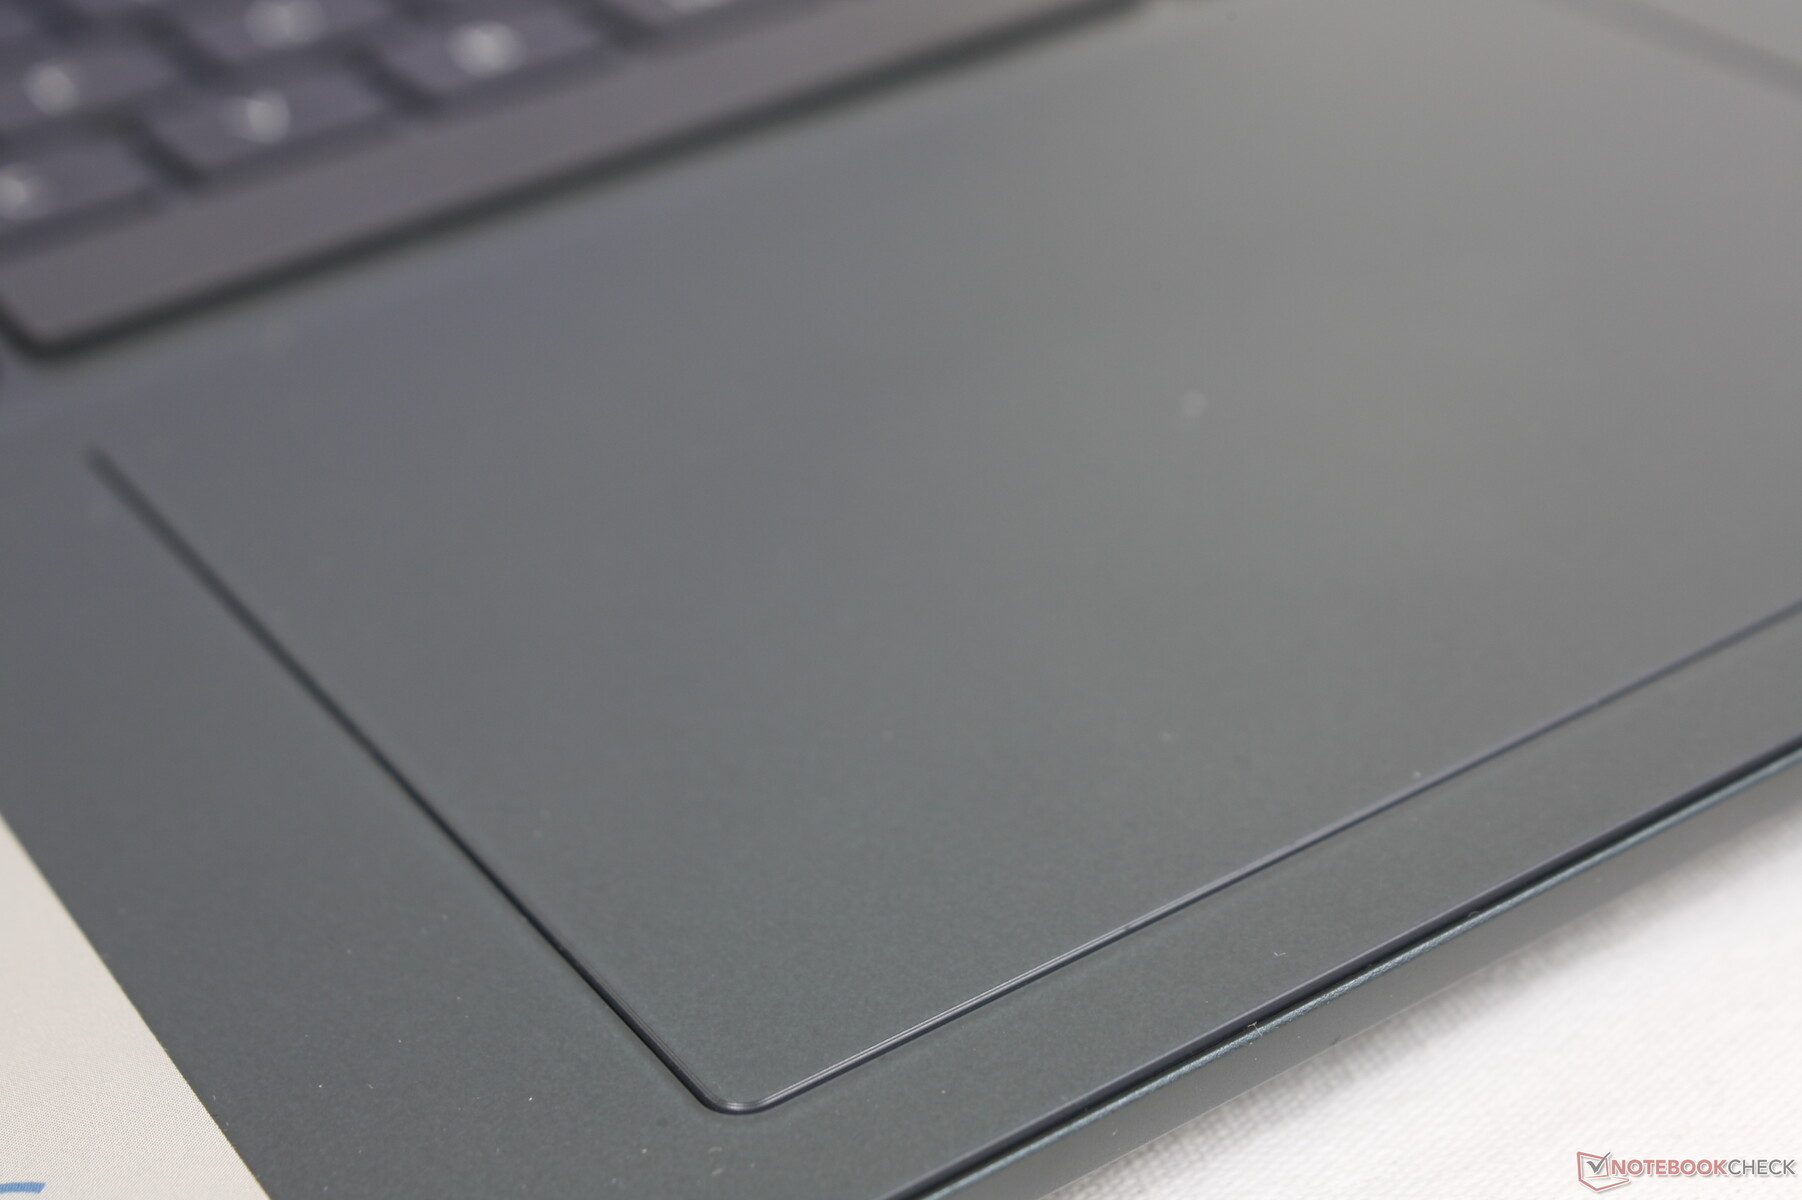
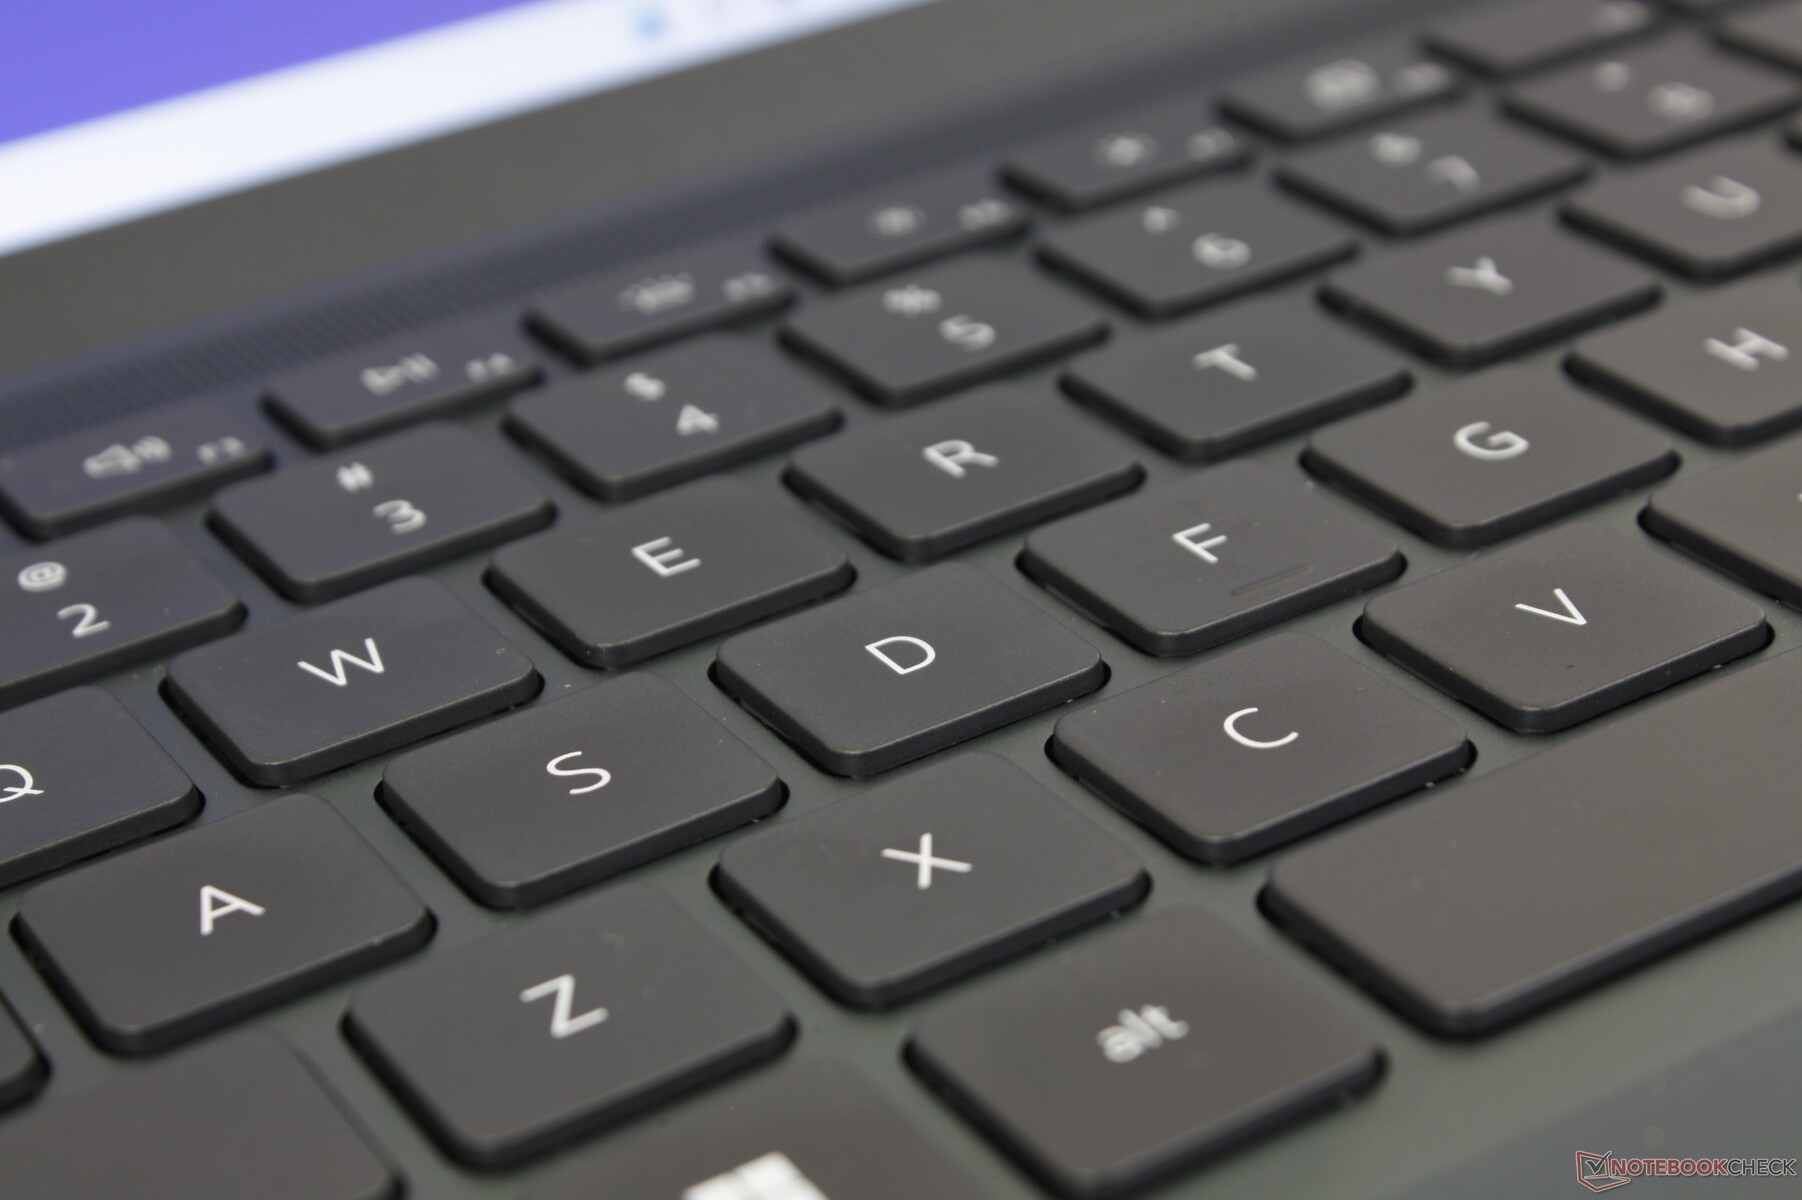
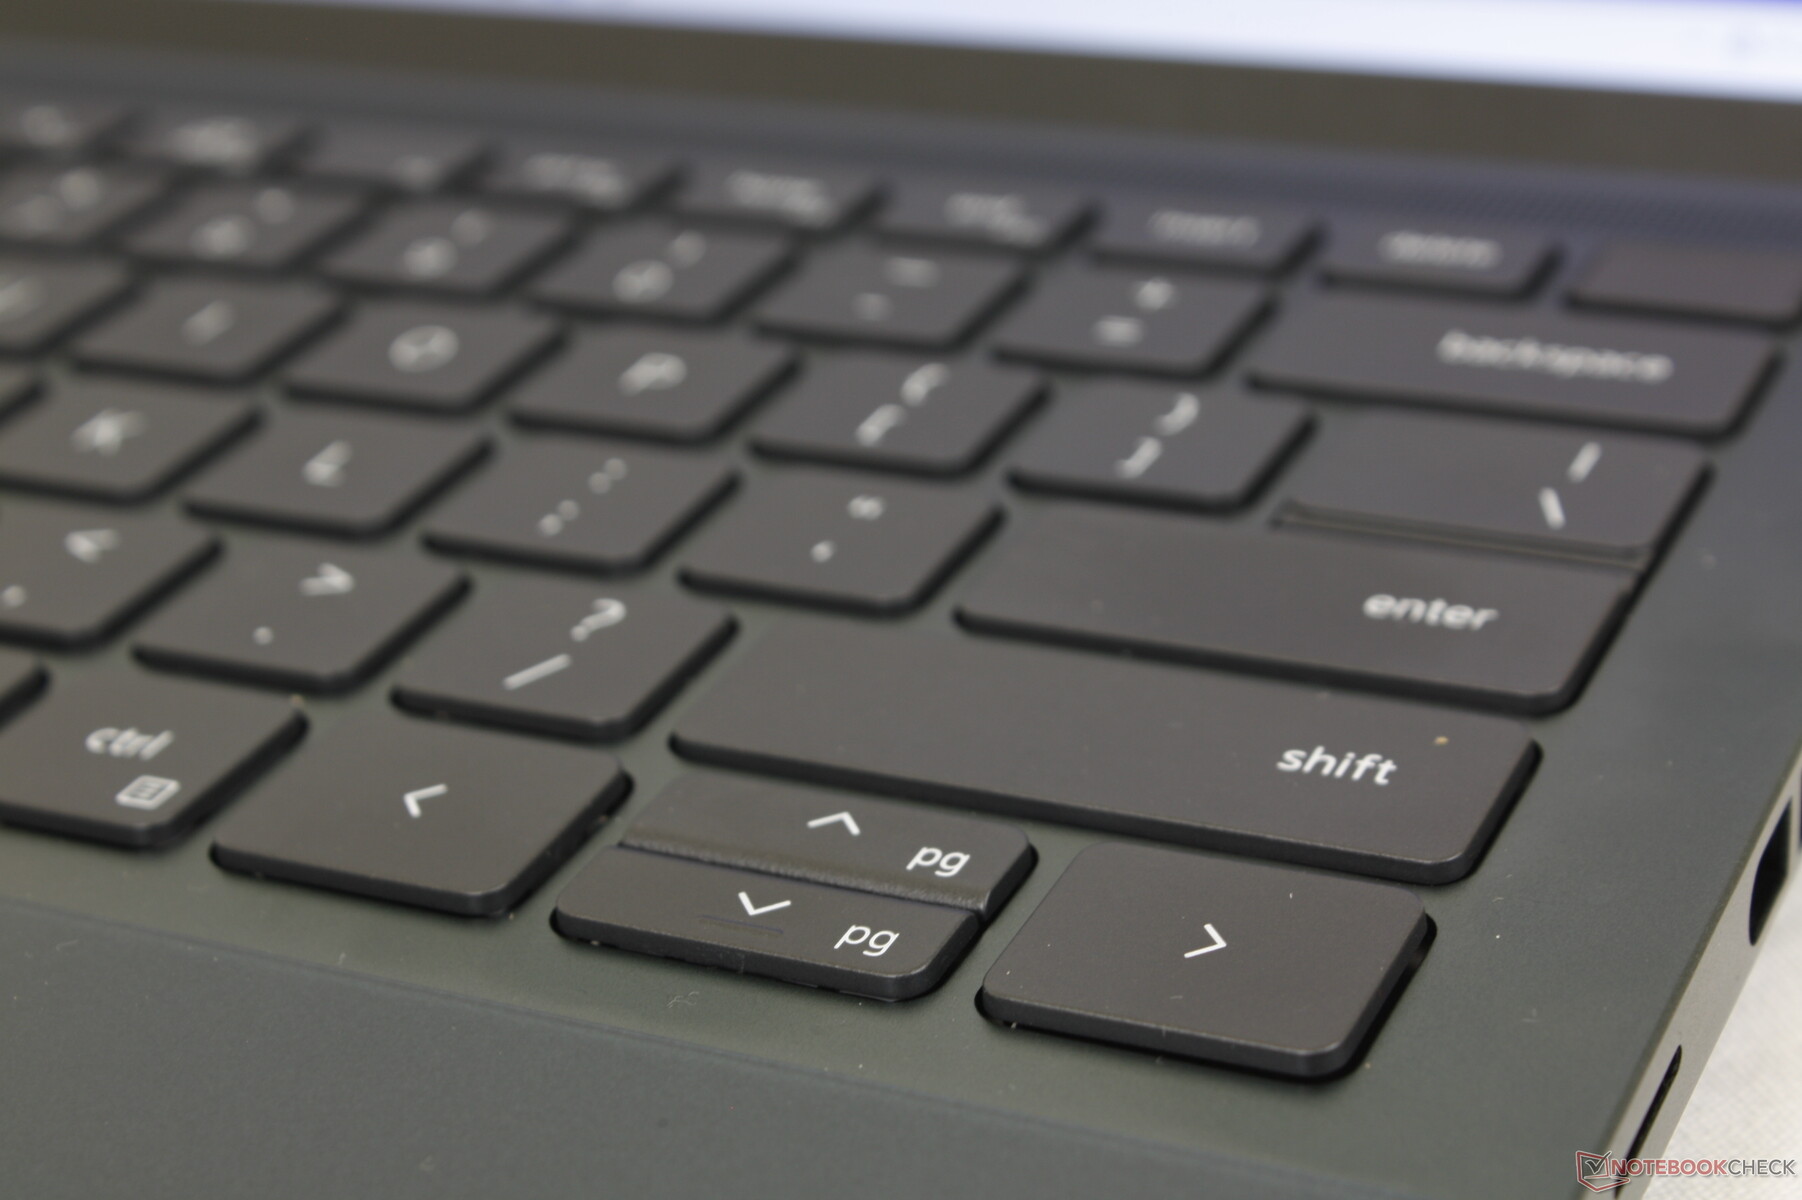
输入设备--来过这里,见过那里
键盘和触摸板
打字的体验与Inspiron 16 Plus 7620相同。 键盘输入体验与Inspiron 16 Plus 7620相同。,Inspiron 16 7620 2合1或 Inspiron 14 7420 2-in-1因为这四种机型都有相同的键盘按键和Mylar点击板。即使是主键和副键的符号以及点击板的尺寸(11.5 x 8厘米)在各型号之间也是相同的,而不考虑任何屏幕尺寸差异。简而言之,除了感觉有点太浅的空格键之外,按键有足够的反馈和适度的咔哒声。同样,点击板的表面对于标准的光标控制来说是可靠的,而其集成的按键在拖放时则过于柔软和有弹性。
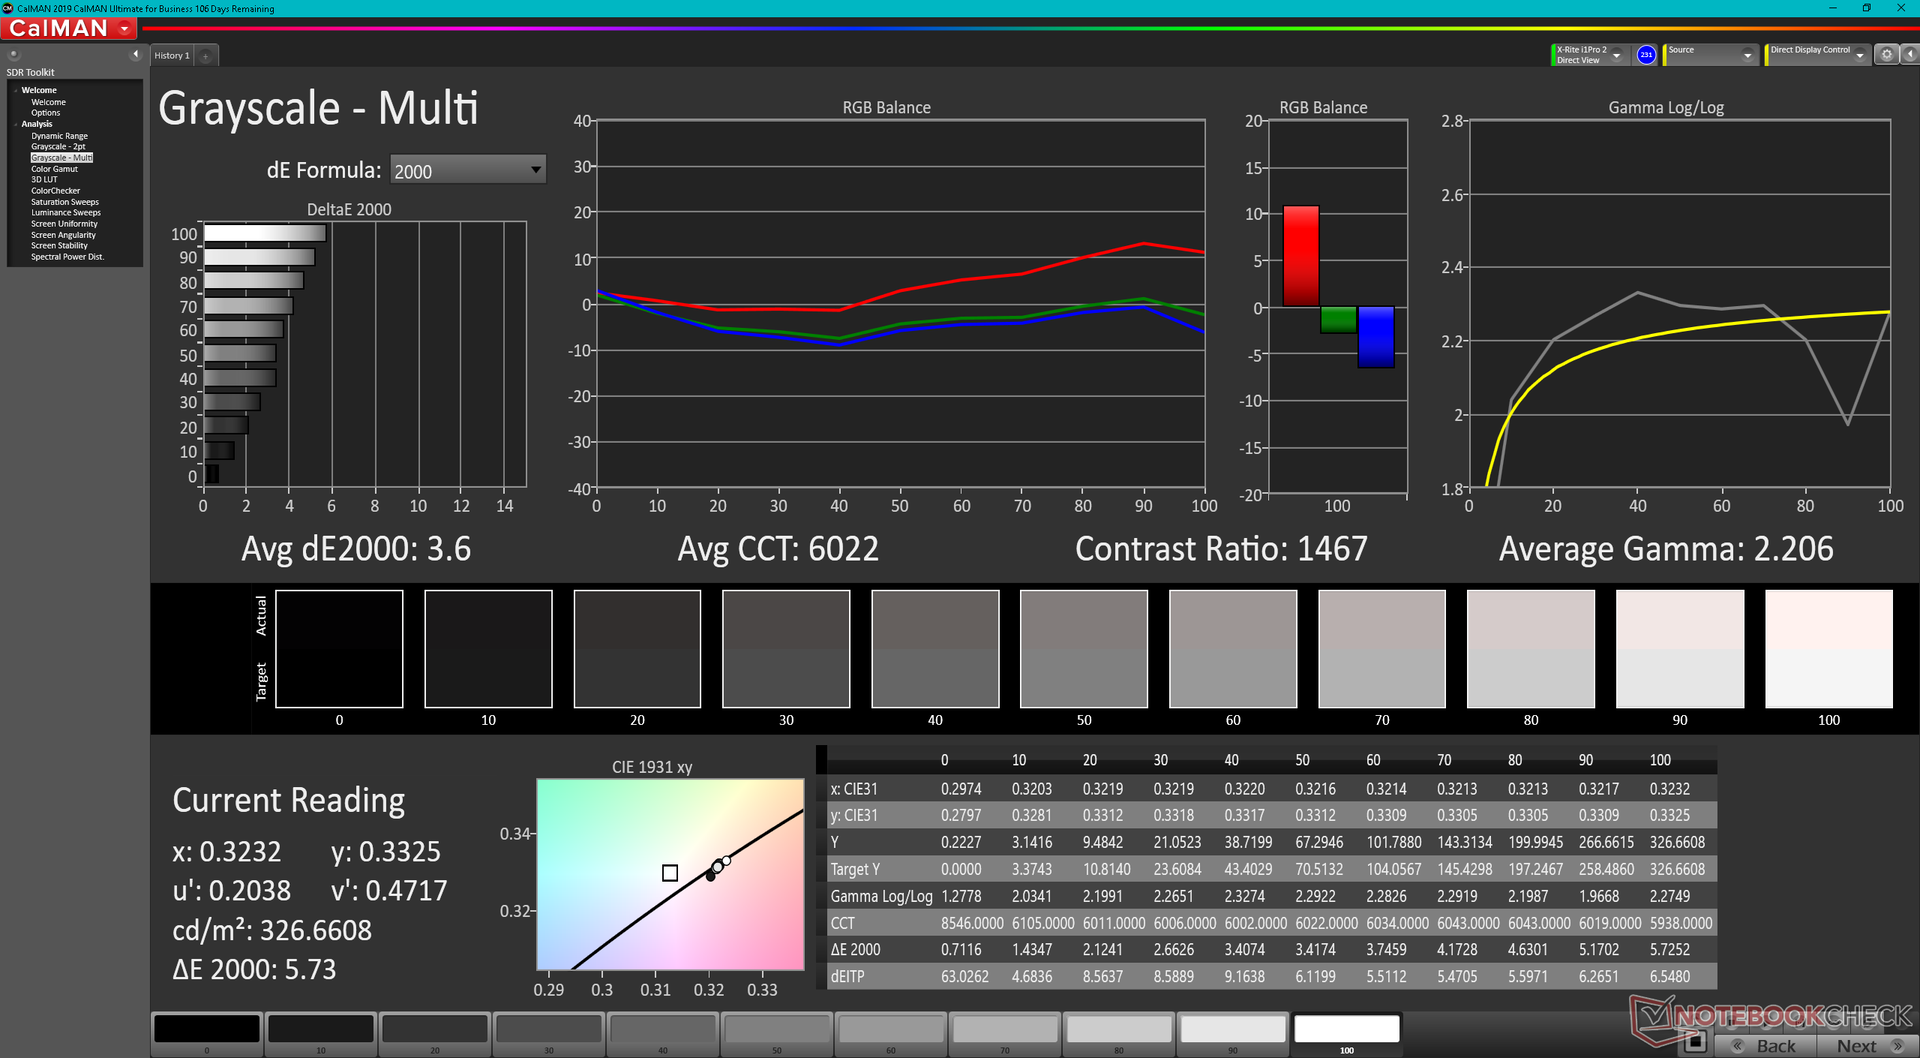
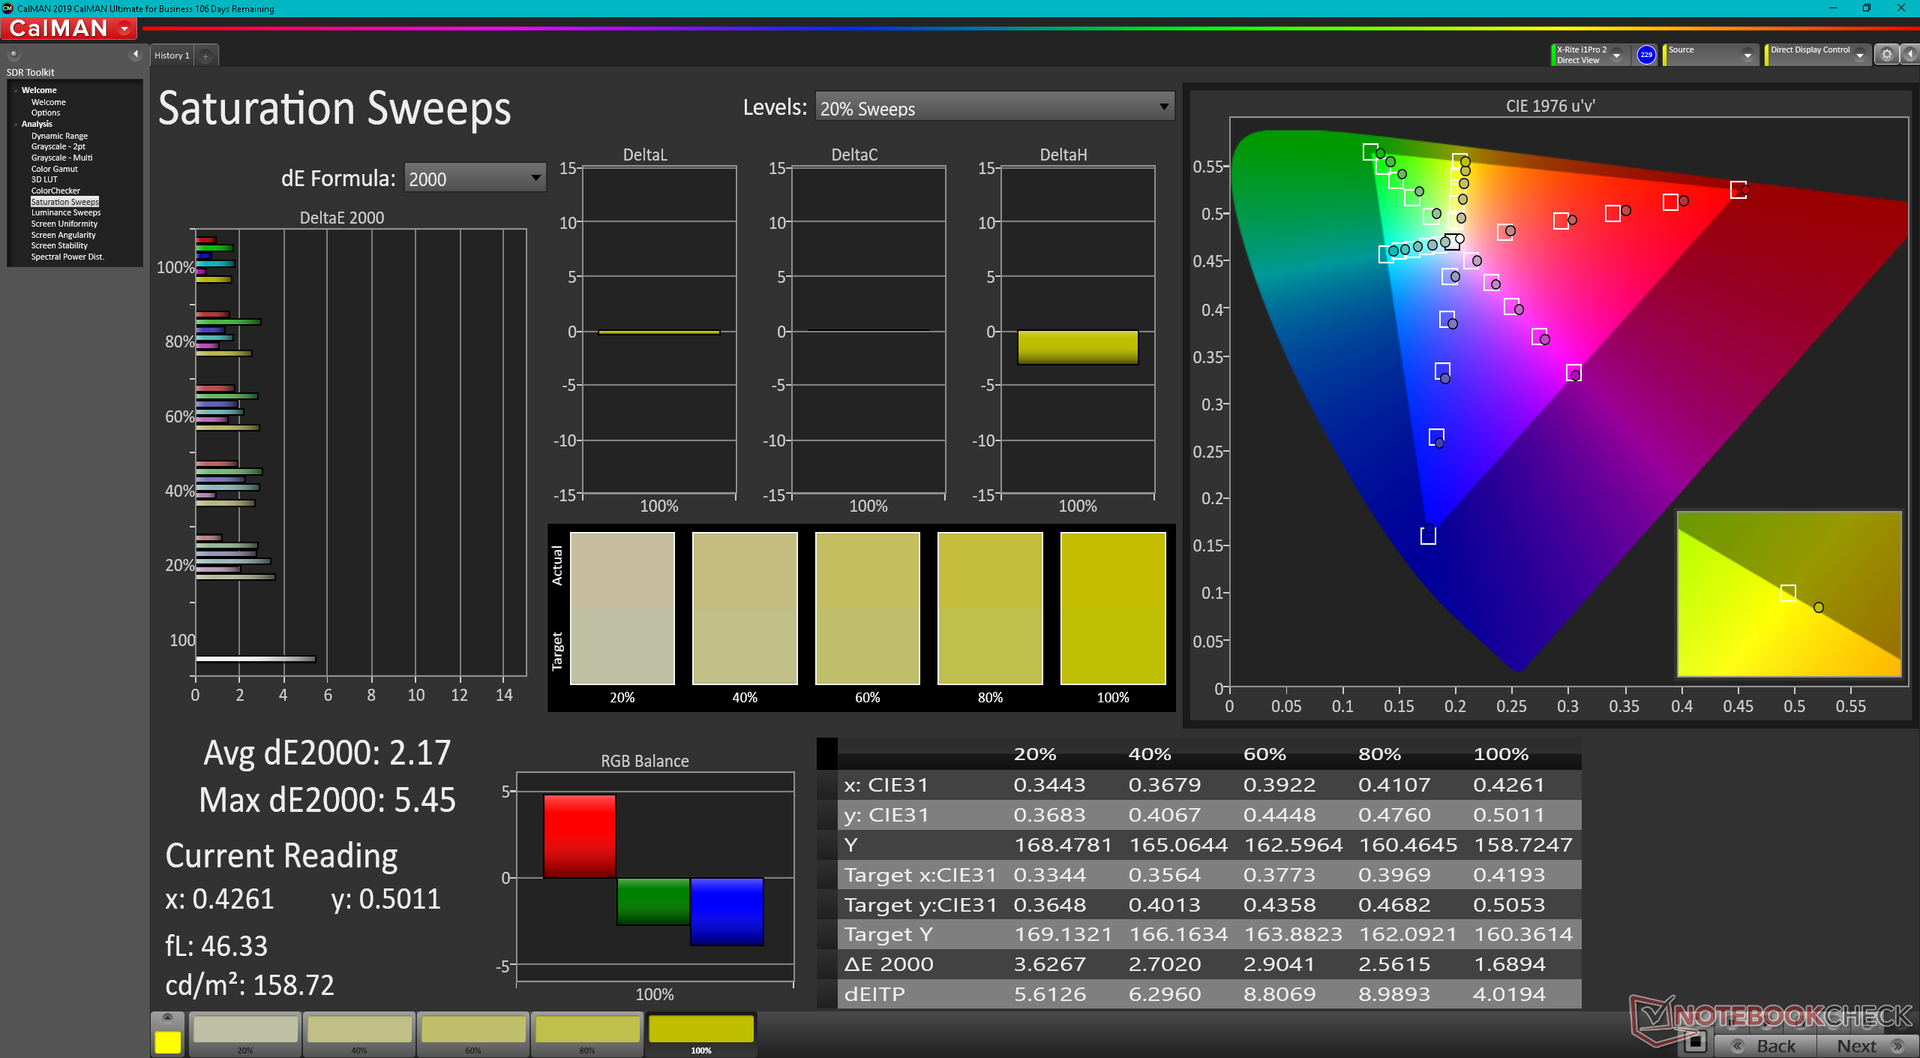
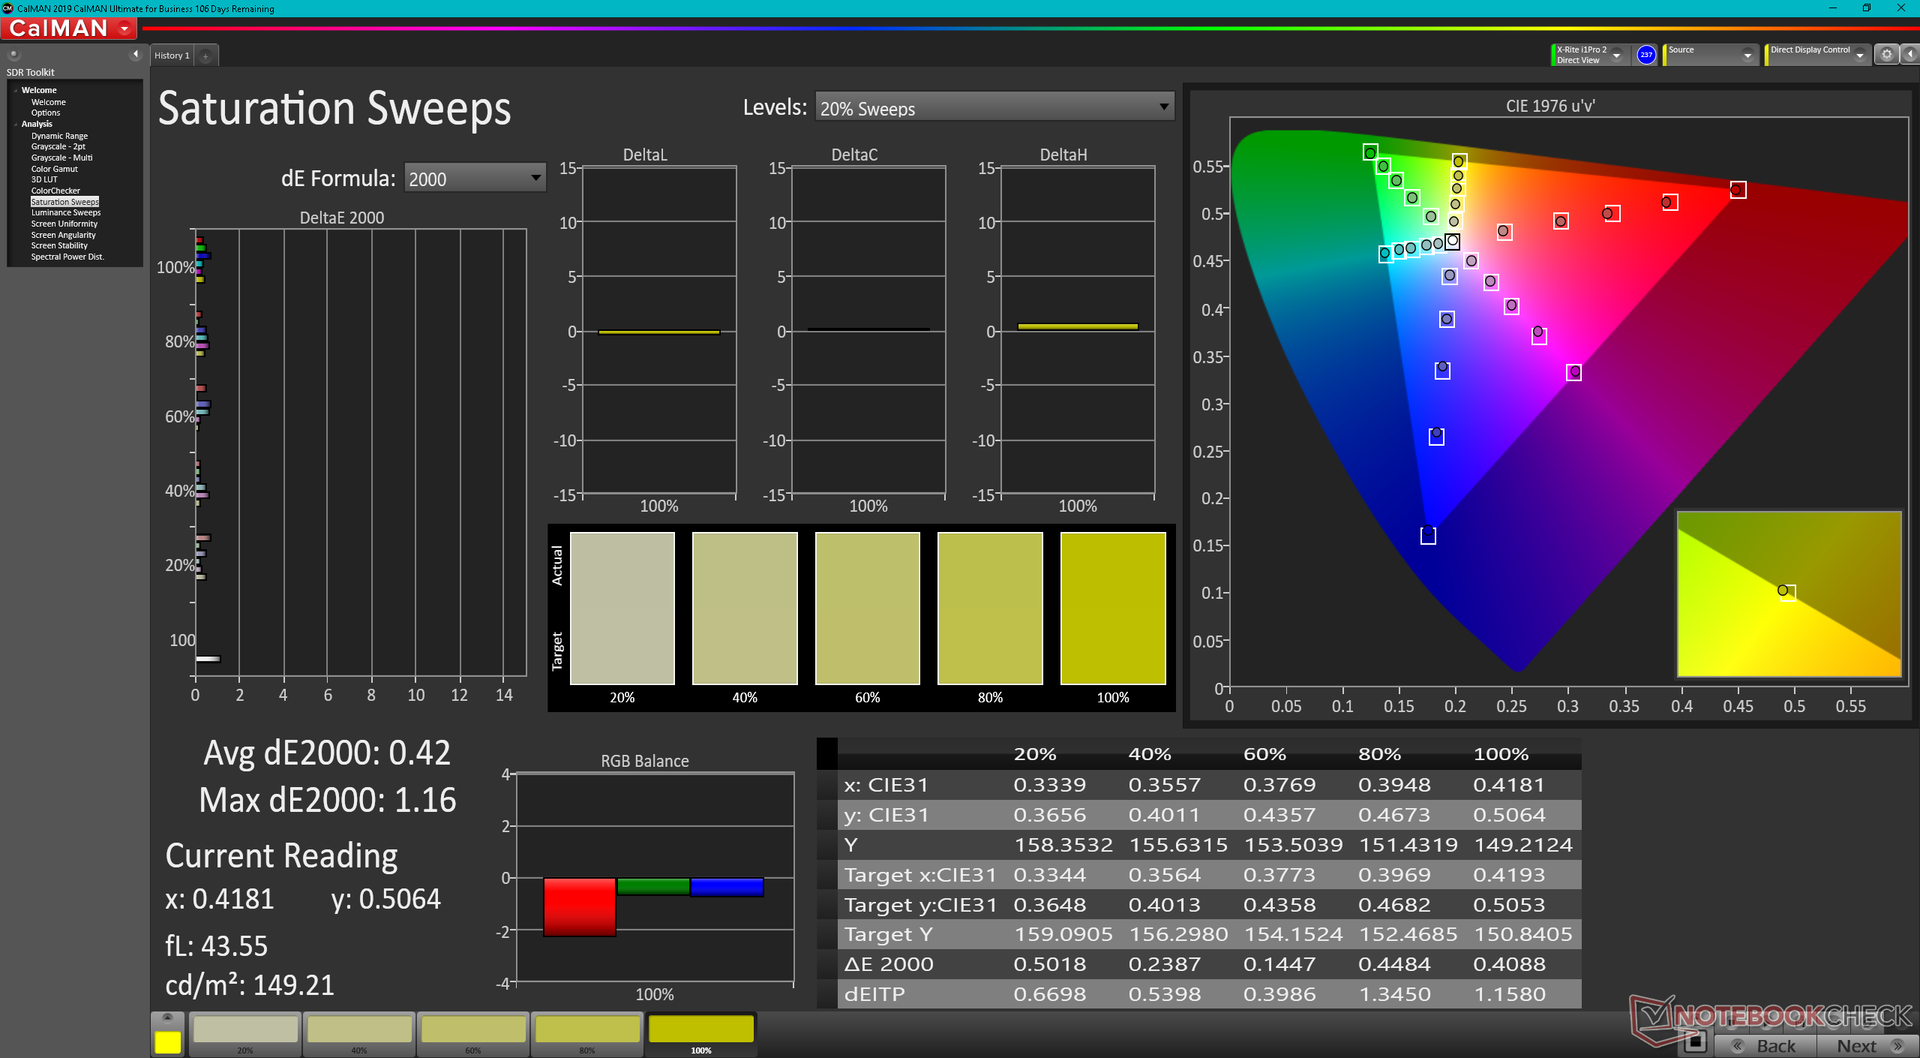
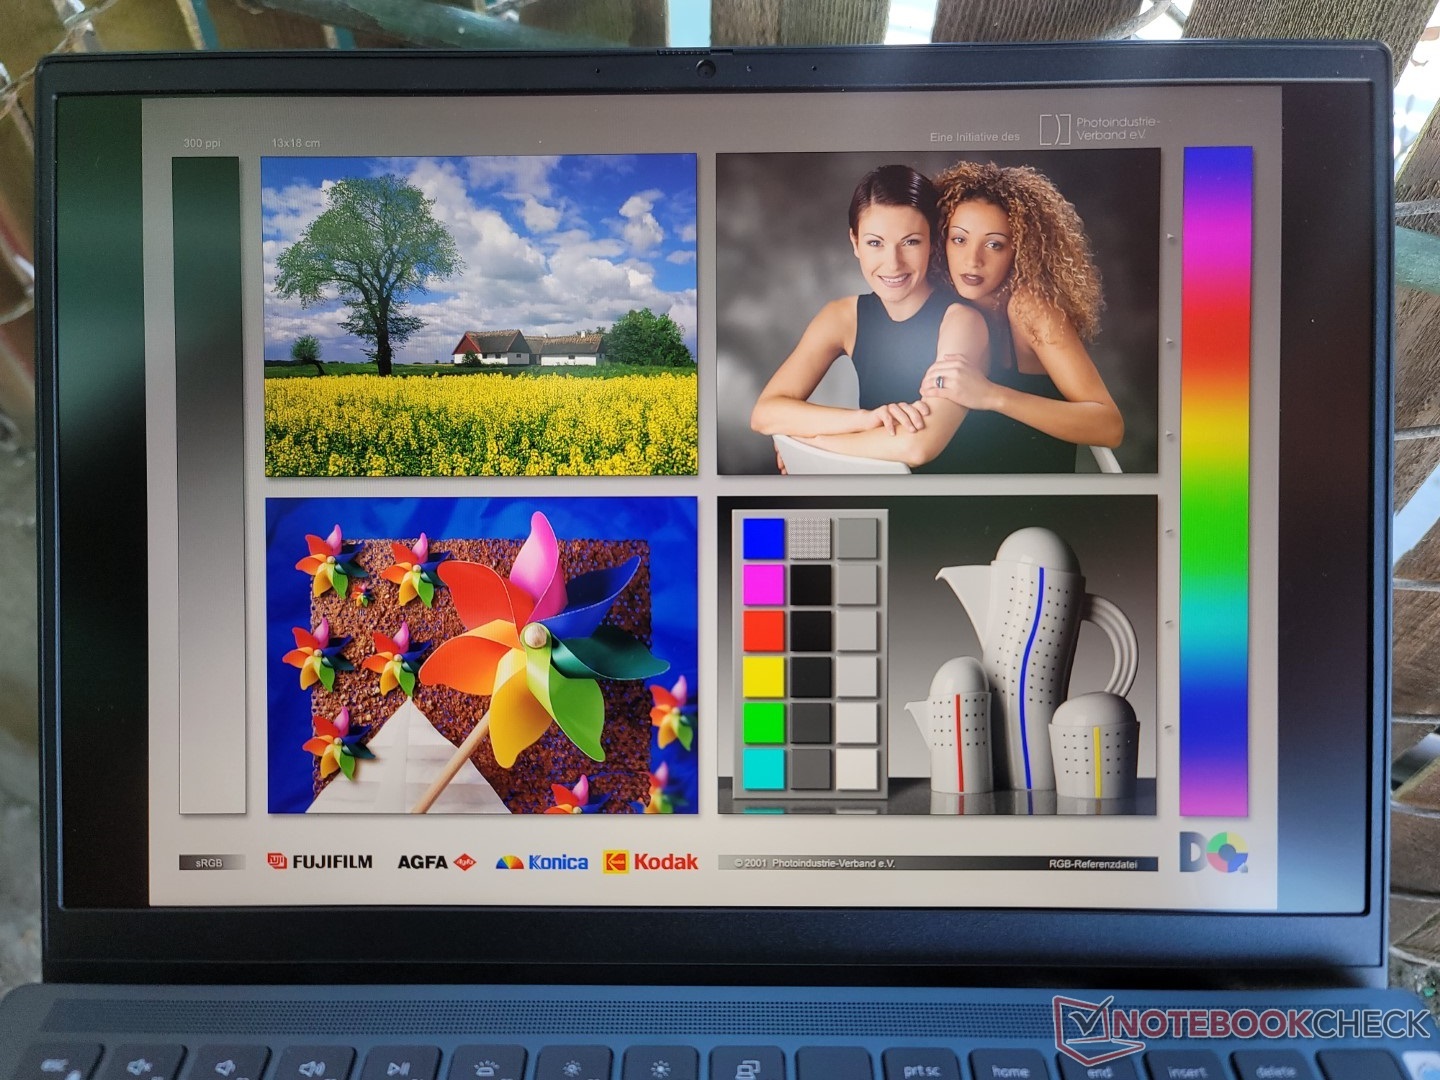
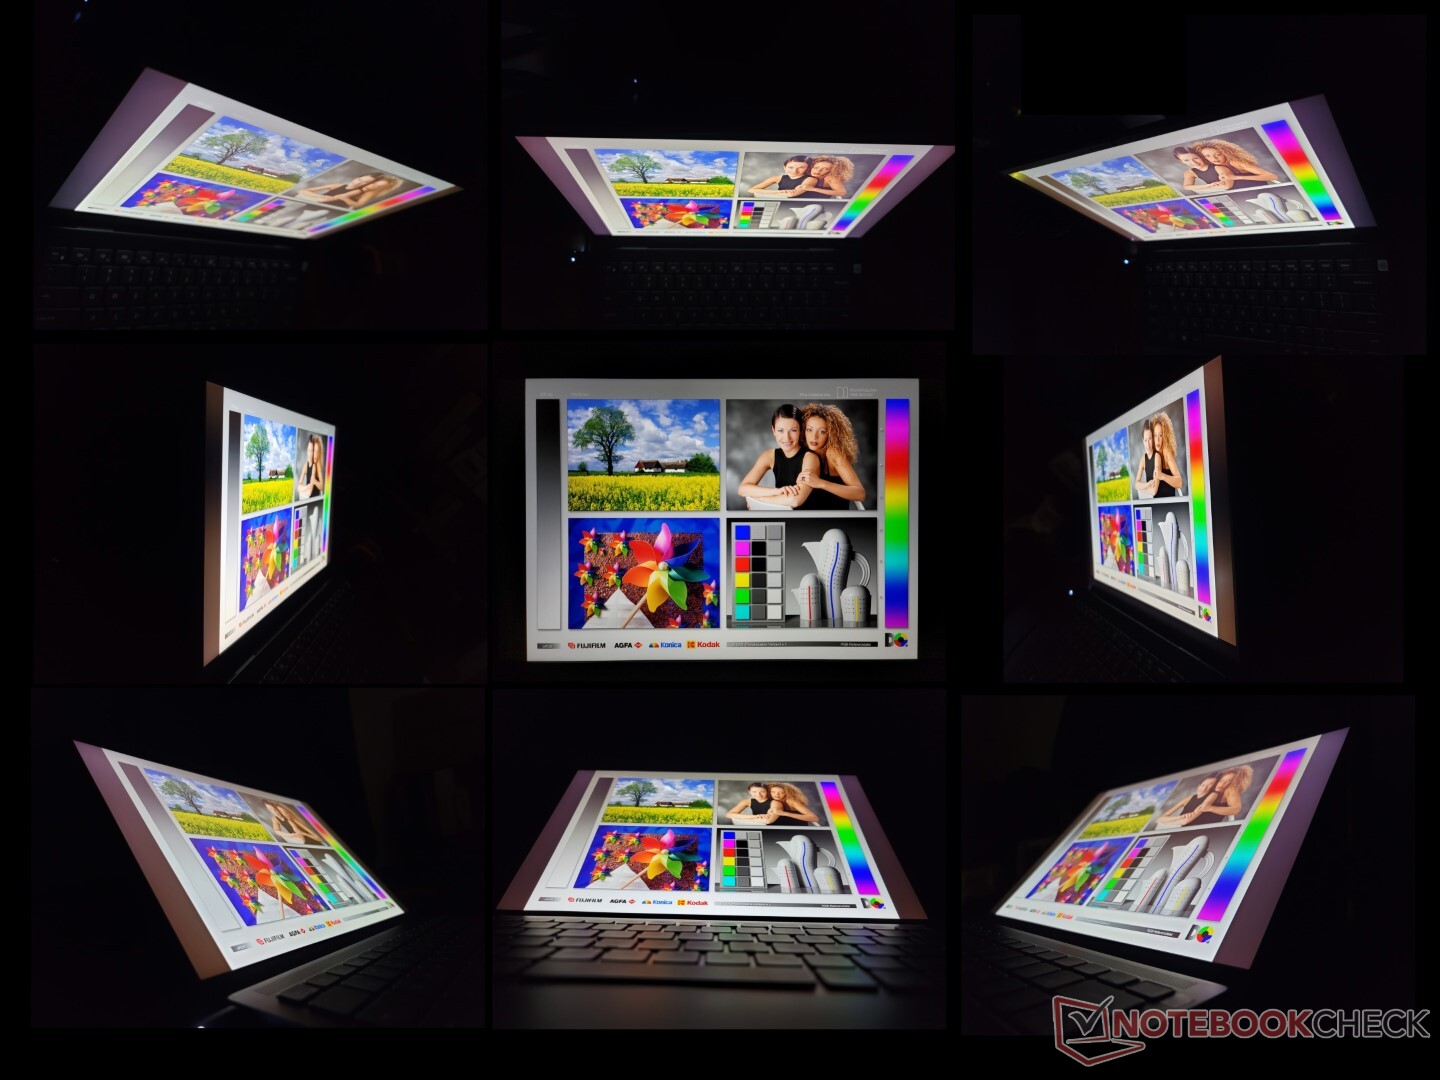
显示器 - 全sRGB覆盖和60赫兹
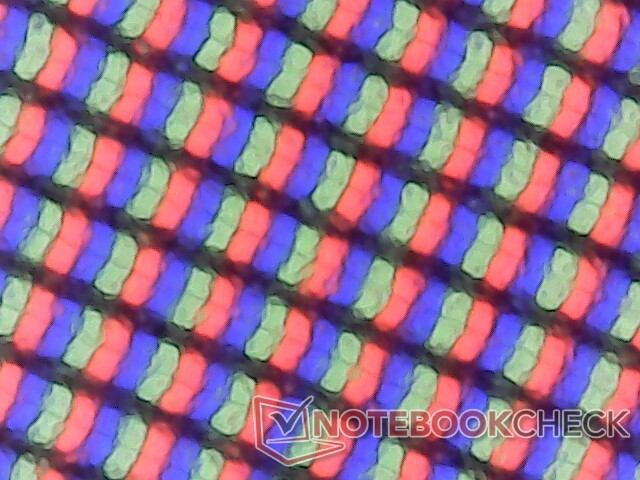
虽然其他14英寸笔记本电脑通常以1200p、1800p或2160p的原生分辨率为目标,但Inspiron 14 Plus 7420标配了相对不常见的2.2K或2240 x 1400面板。其他核心属性都很扎实,包括全sRGB覆盖率、约1000:1的对比度,以及对其尺寸级别来说不错的响应时间。令人遗憾的是,OLED或光面选项无法进一步提高色彩或锐度。
| |||||||||||||||||||||||||
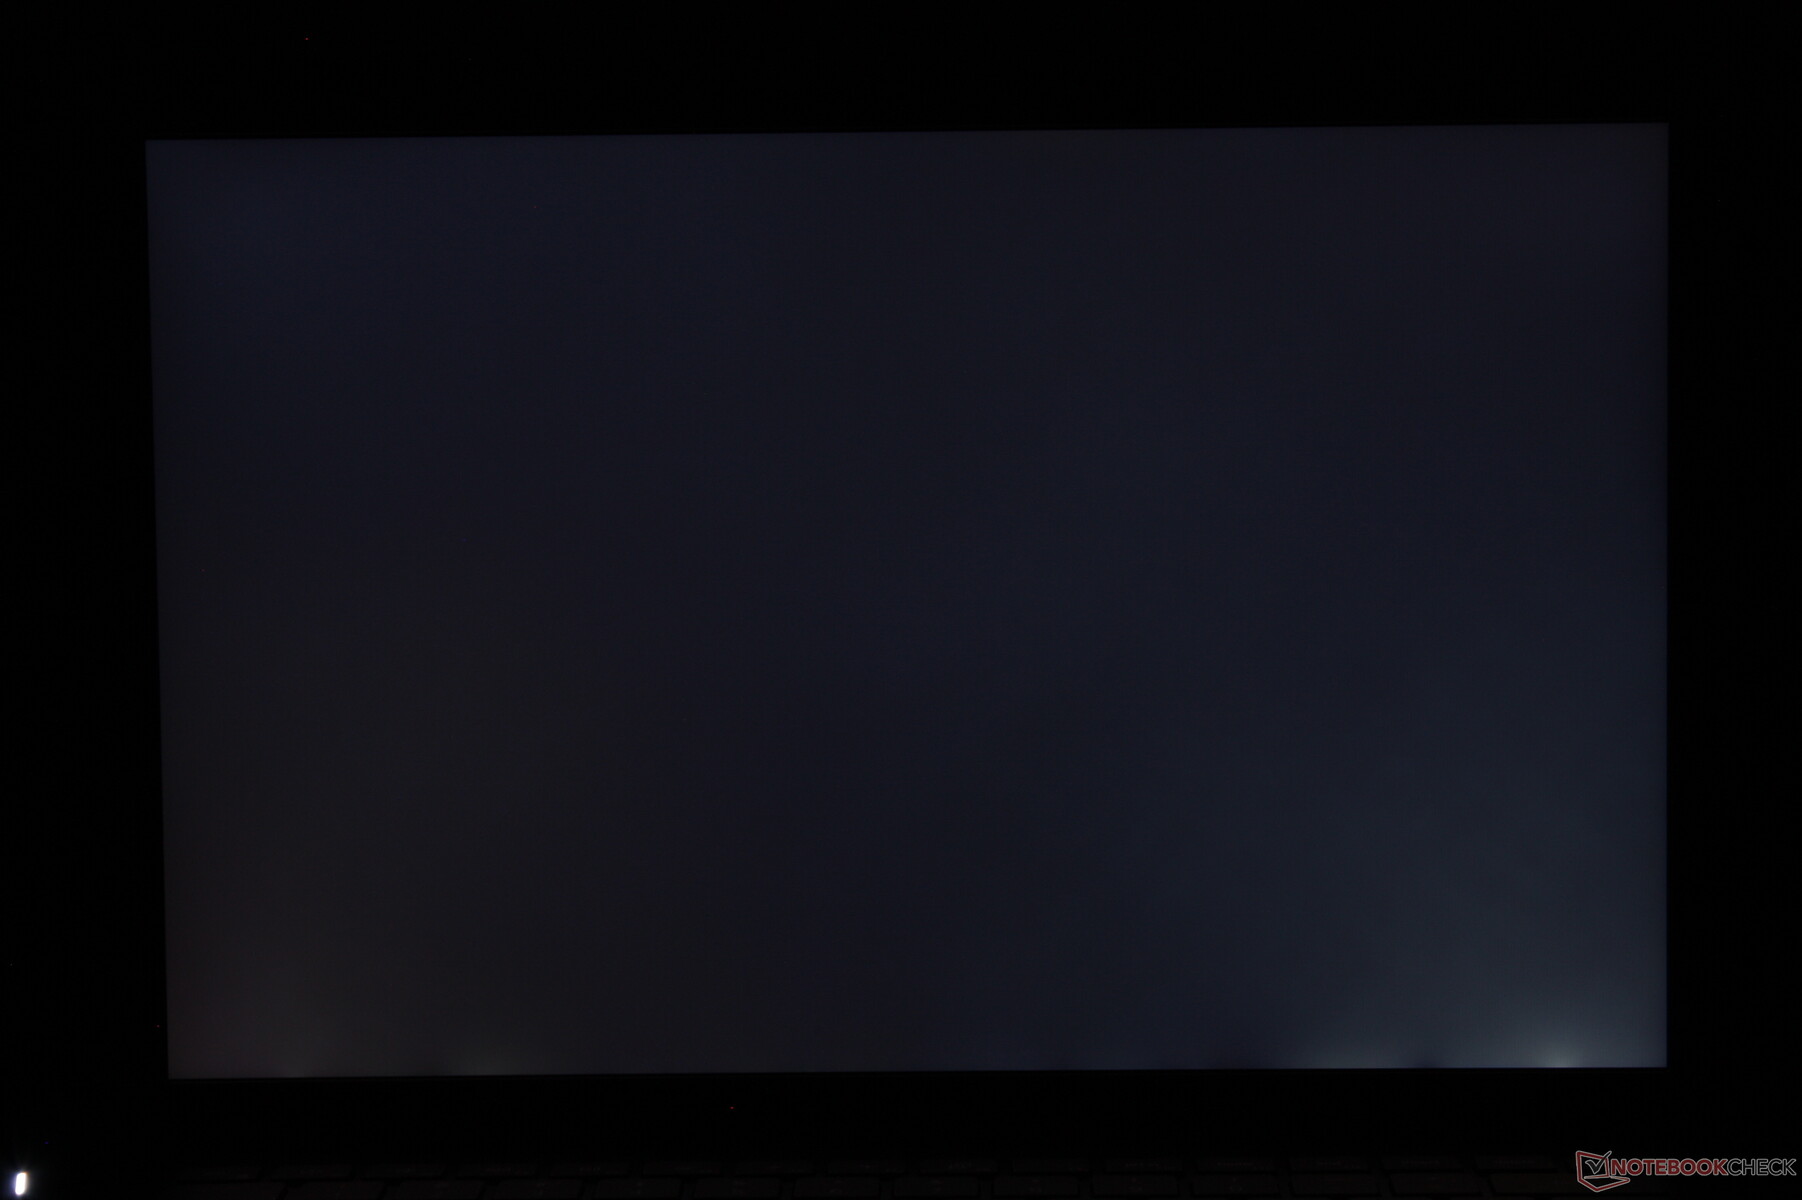
Brightness Distribution: 85 %
Center on Battery: 331.1 cd/m²
Contrast: 1142:1 (Black: 0.29 cd/m²)
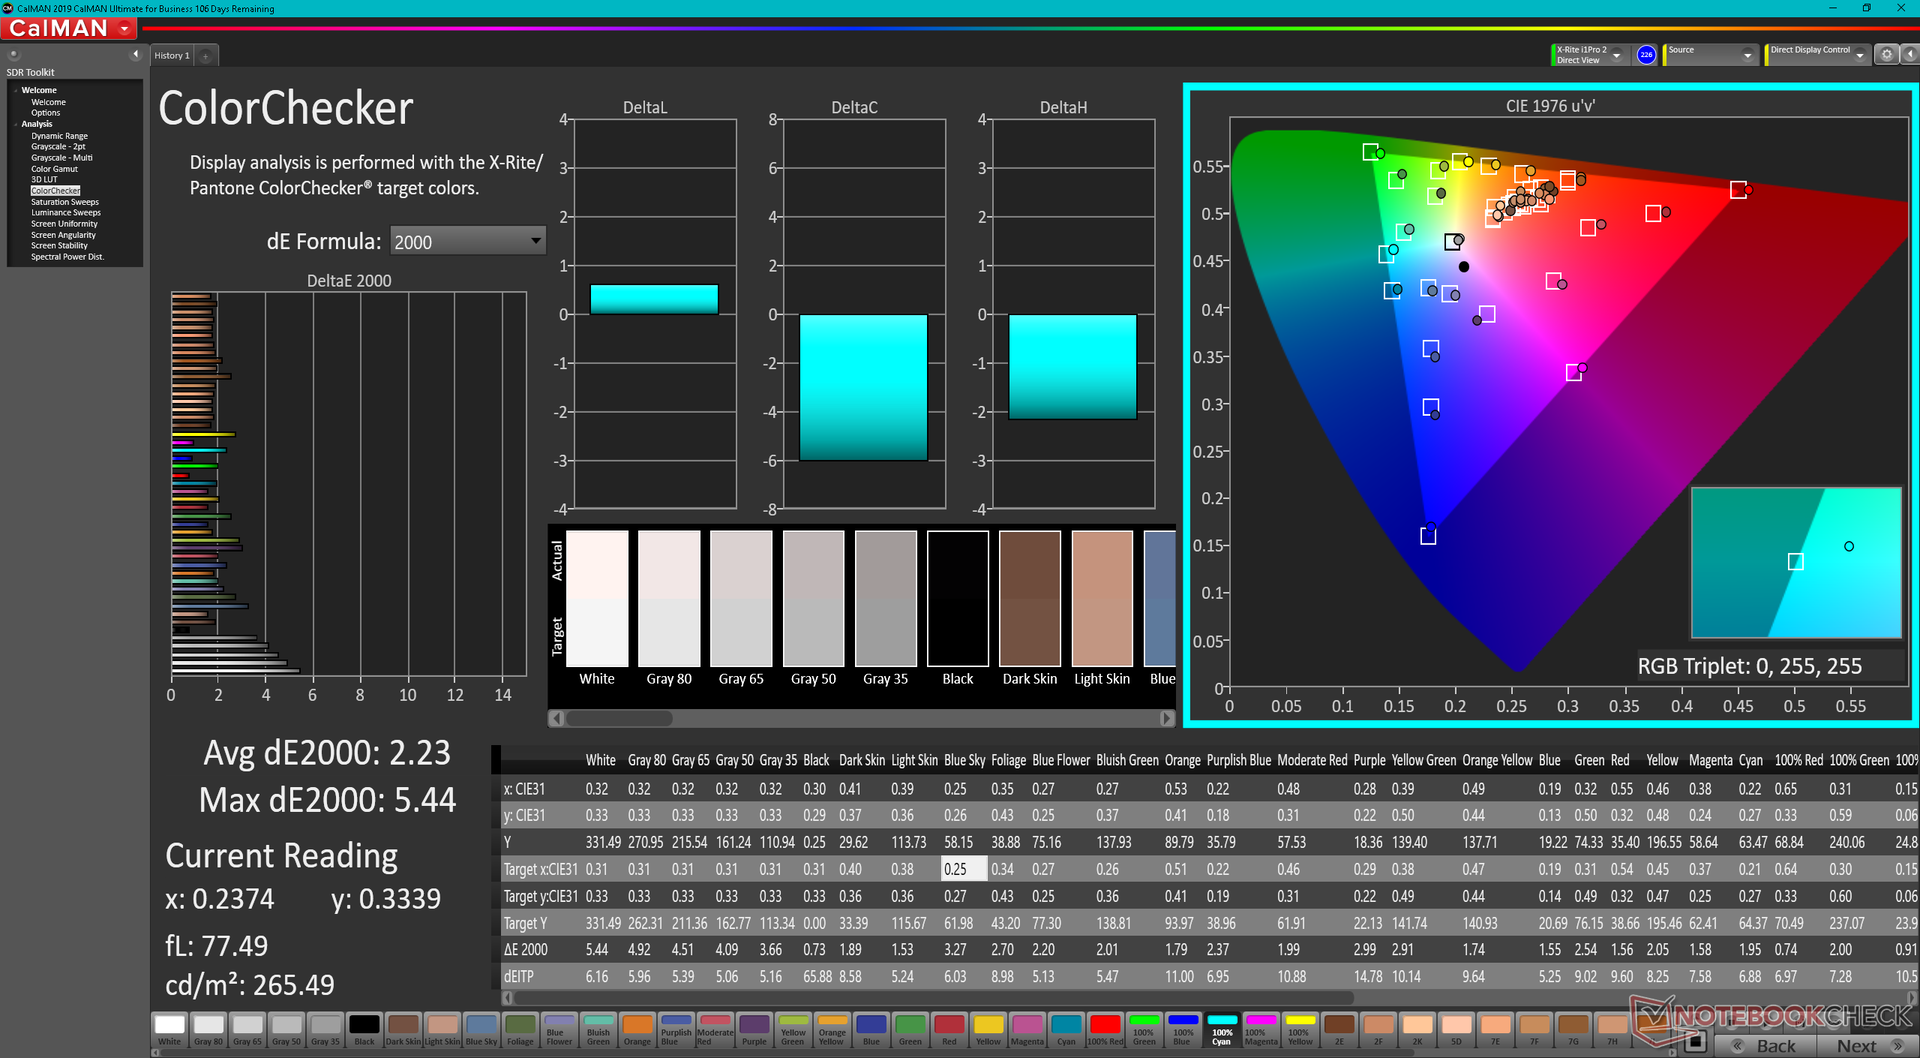
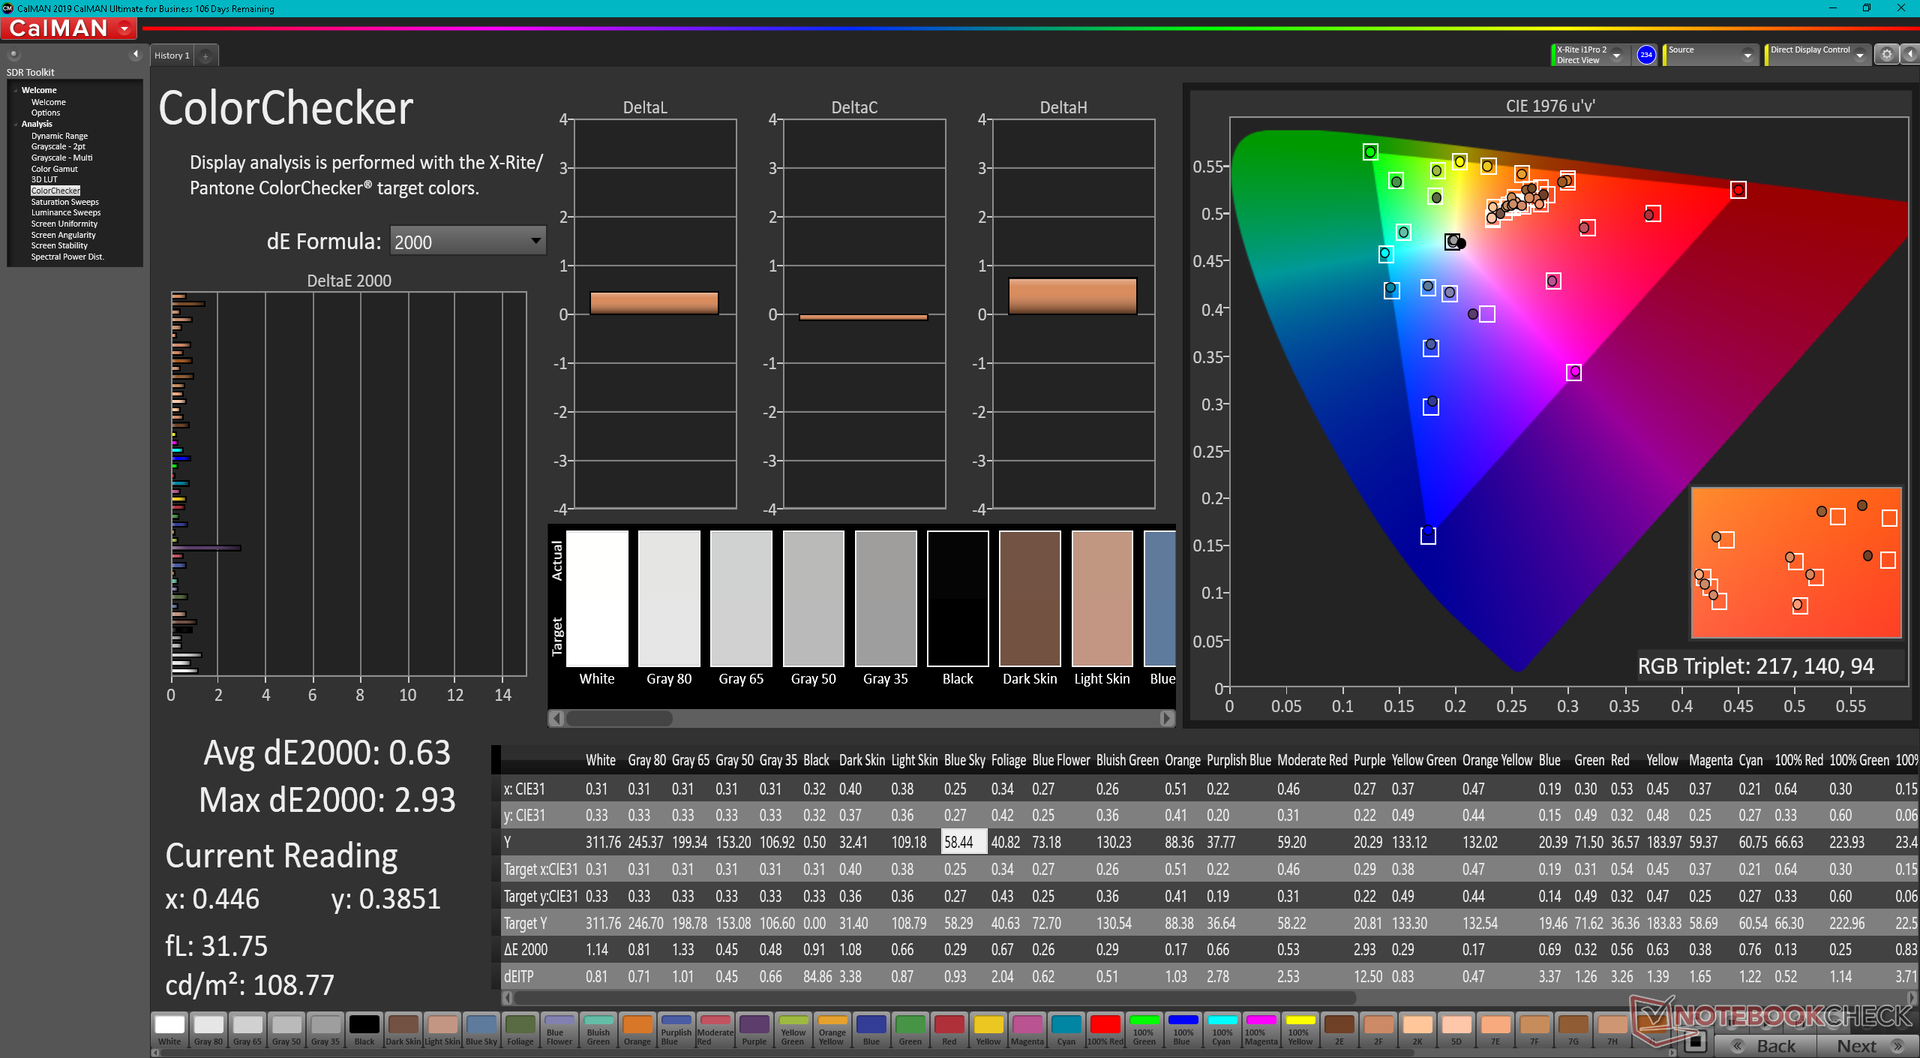
ΔE ColorChecker Calman: 2.23 | ∀{0.5-29.43 Ø4.71}
calibrated: 0.63
ΔE Greyscale Calman: 3.6 | ∀{0.09-98 Ø4.96}
69.5% AdobeRGB 1998 (Argyll 3D)
99.3% sRGB (Argyll 3D)
68.8% Display P3 (Argyll 3D)
Gamma: 2.21
CCT: 6022 K
| Dell Inspiron 14 Plus 7420 InfoVision 140NWHE, IPS, 2240x1400, 14" | Asus Vivobook Pro 14 M3401QC-KM007T SAMSUNG: SDC4171, OLED, 2880x1800, 14" | Dell Inspiron 14 7420 2-in-1 BOE NV14N42, IPS, 1920x1200, 14" | Schenker Vision 14 MNE007ZA1, IPS, 2880x1800, 14" | Asus Zenbook 14X UX5400E Samsung SDC4154, OLED, 2880x1800, 14" | MSI Summit E14 A11SCS AU Optronics AUO123B, IPS, 3840x2160, 14" | HP Envy 14-eb0010nr AU Optronics AUOF392, IPS, 1920x1200, 14" | |
|---|---|---|---|---|---|---|---|
| Display | 27% | -43% | 5% | 28% | 24% | 8% | |
| Display P3 Coverage (%) | 68.8 | 99.41 44% | 38.6 -44% | 74.3 8% | 100 45% | 87.5 27% | 77.1 12% |
| sRGB Coverage (%) | 99.3 | 99.94 1% | 56.2 -43% | 97.6 -2% | 100 1% | 100 1% | 99.8 1% |
| AdobeRGB 1998 Coverage (%) | 69.5 | 94.79 36% | 39.9 -43% | 75.7 9% | 96 38% | 99.4 43% | 76.7 10% |
| Response Times | 89% | 13% | -2% | 93% | -47% | -95% | |
| Response Time Grey 50% / Grey 80% * (ms) | 32.8 ? | 3 ? 91% | 27.2 ? 17% | 40.4 ? -23% | 2 ? 94% | 52 ? -59% | 61.2 ? -87% |
| Response Time Black / White * (ms) | 22.8 ? | 3 ? 87% | 20.8 ? 9% | 18.4 ? 19% | 2 ? 91% | 30.8 ? -35% | 46 ? -102% |
| PWM Frequency (Hz) | 360 | ||||||
| Screen | 41% | -113% | -8% | 13% | -70% | -8% | |
| Brightness middle (cd/m²) | 331.1 | 384 16% | 269.4 -19% | 407 23% | 379 14% | 593.3 79% | 412 24% |
| Brightness (cd/m²) | 326 | 385 18% | 260 -20% | 407 25% | 381 17% | 571 75% | 392 20% |
| Brightness Distribution (%) | 85 | 98 15% | 89 5% | 94 11% | 93 9% | 87 2% | 81 -5% |
| Black Level * (cd/m²) | 0.29 | 0.07 76% | 0.41 -41% | 0.25 14% | 0.1 66% | 0.53 -83% | 0.32 -10% |
| Contrast (:1) | 1142 | 5486 380% | 657 -42% | 1628 43% | 3790 232% | 1119 -2% | 1288 13% |
| Colorchecker dE 2000 * | 2.23 | 1.75 22% | 6.53 -193% | 2.6 -17% | 2.3 -3% | 4.42 -98% | 1.88 16% |
| Colorchecker dE 2000 max. * | 5.44 | 3.41 37% | 19.76 -263% | 4.4 19% | 4.16 24% | 7.16 -32% | 3.06 44% |
| Colorchecker dE 2000 calibrated * | 0.63 | 2.32 -268% | 3.13 -397% | 2 -217% | 2.42 -284% | 4.3 -583% | 1.96 -211% |
| Greyscale dE 2000 * | 3.6 | 1.06 71% | 5.4 -50% | 2.7 25% | 2.12 41% | 3.2 11% | 2.2 39% |
| Gamma | 2.21 100% | 2.39 92% | 2.05 107% | 2.18 101% | 2.42 91% | 2.04 108% | 2.1 105% |
| CCT | 6022 108% | 6440 101% | 6007 108% | 6316 103% | 6737 96% | 6650 98% | |
| Color Space (Percent of AdobeRGB 1998) (%) | 68.7 | ||||||
| Color Space (Percent of sRGB) (%) | 99.8 | ||||||
| Total Average (Program / Settings) | 52% /
45% | -48% /
-80% | -2% /
-5% | 45% /
28% | -31% /
-47% | -32% /
-17% |
* ... smaller is better
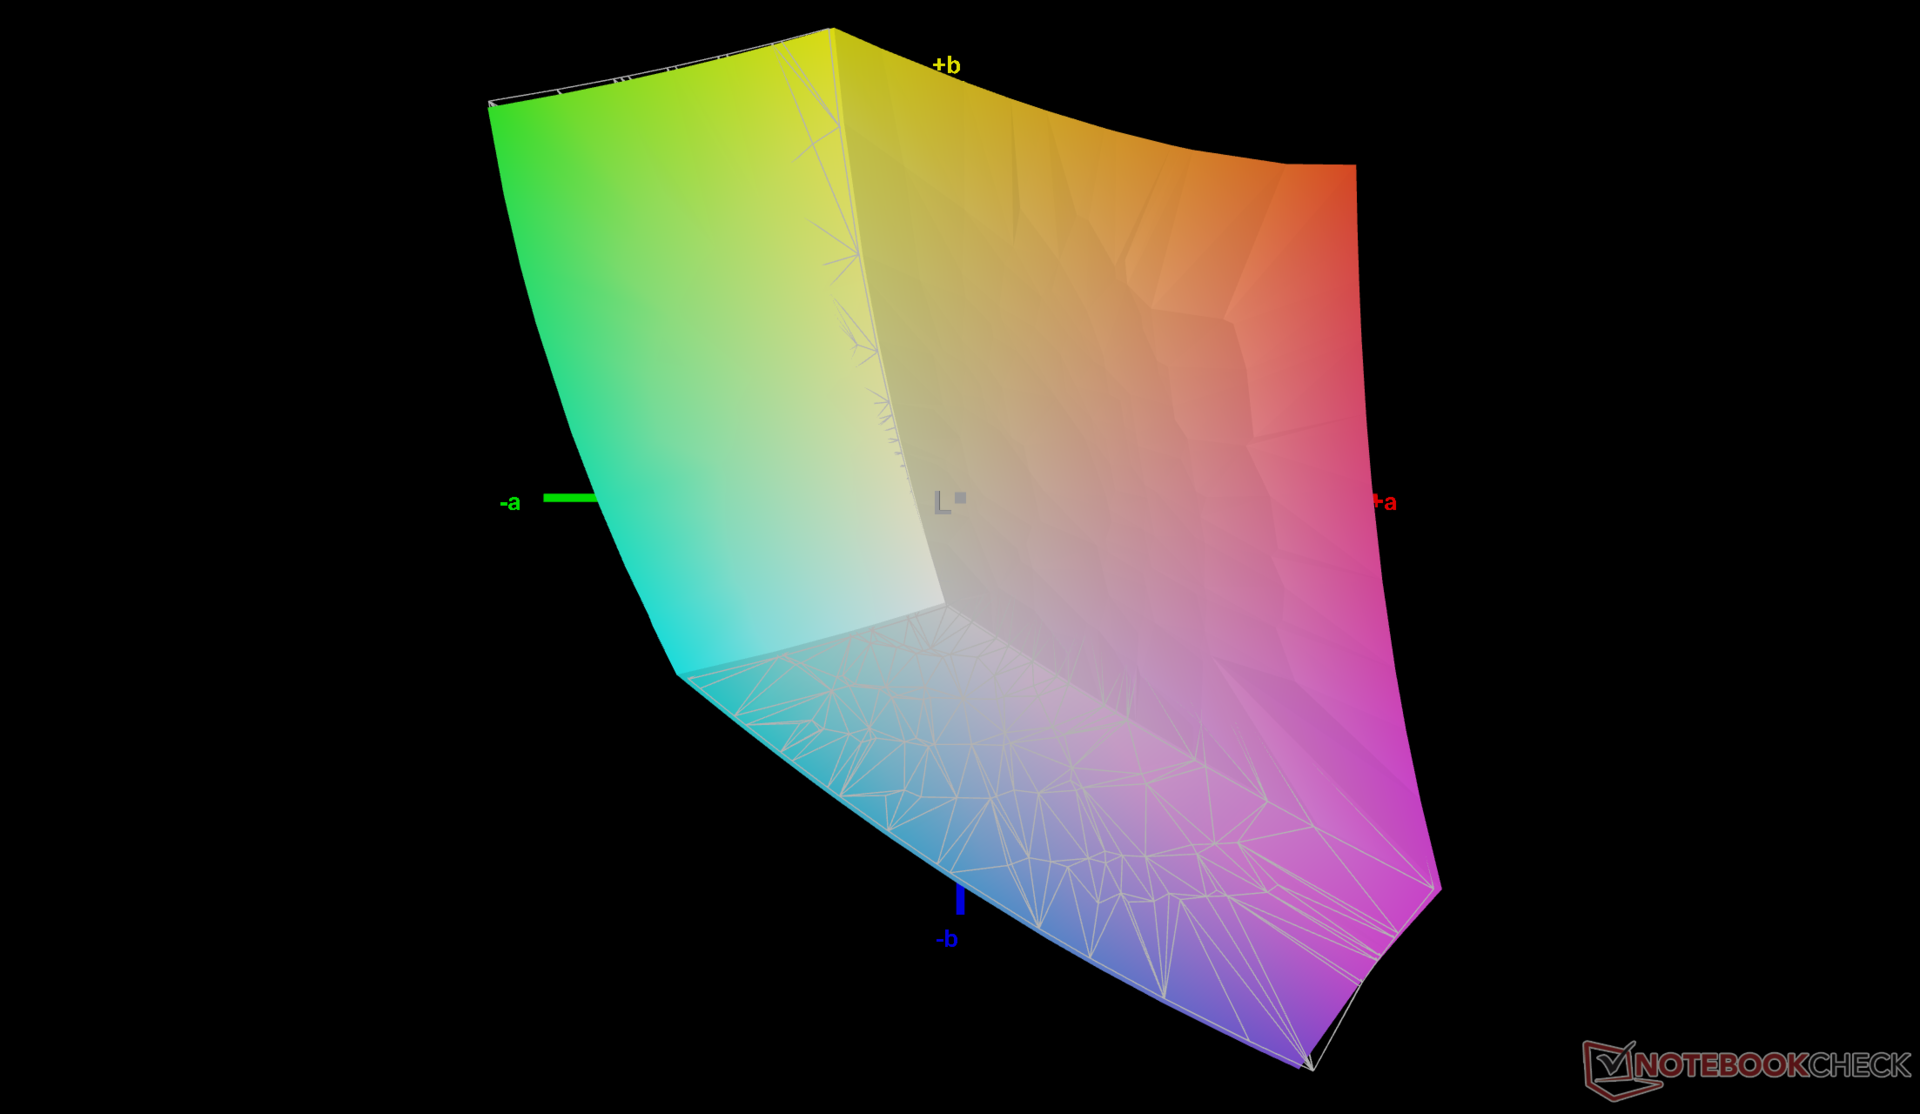
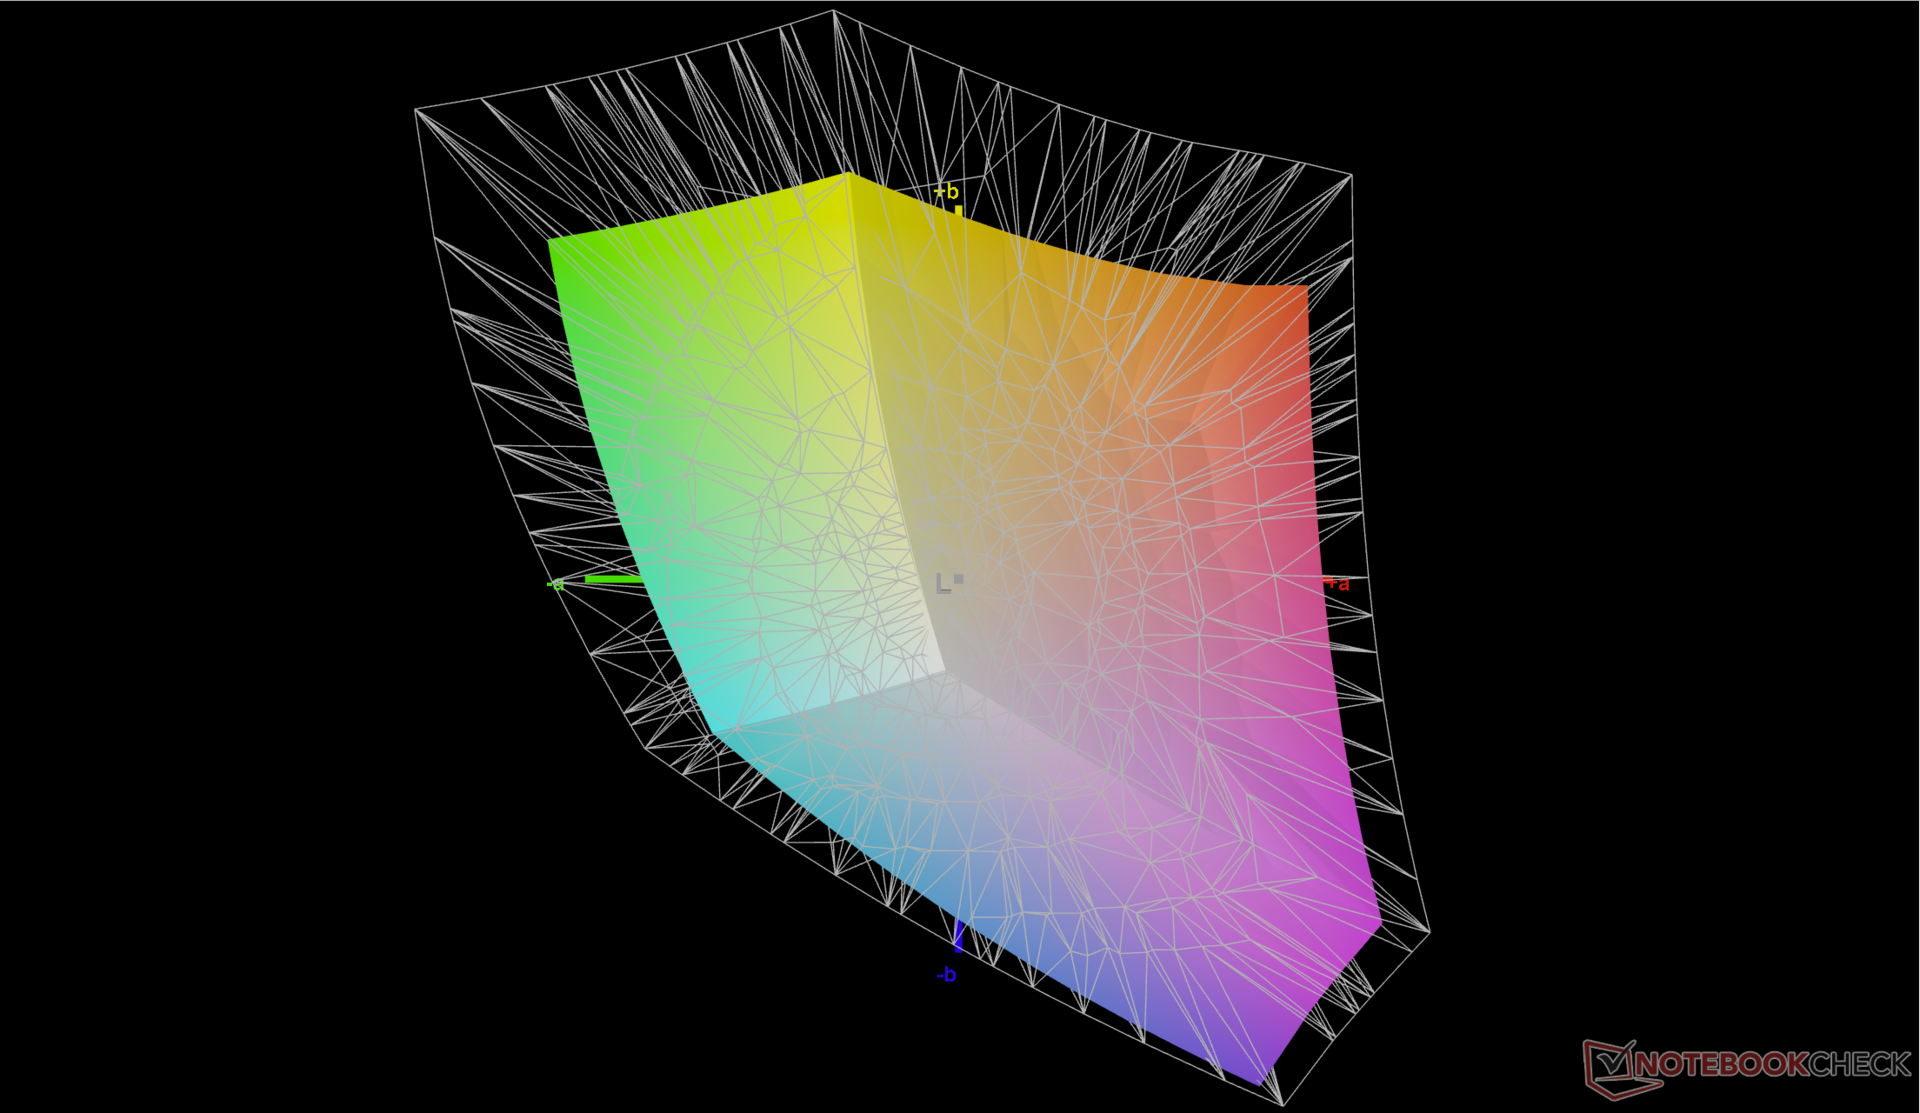
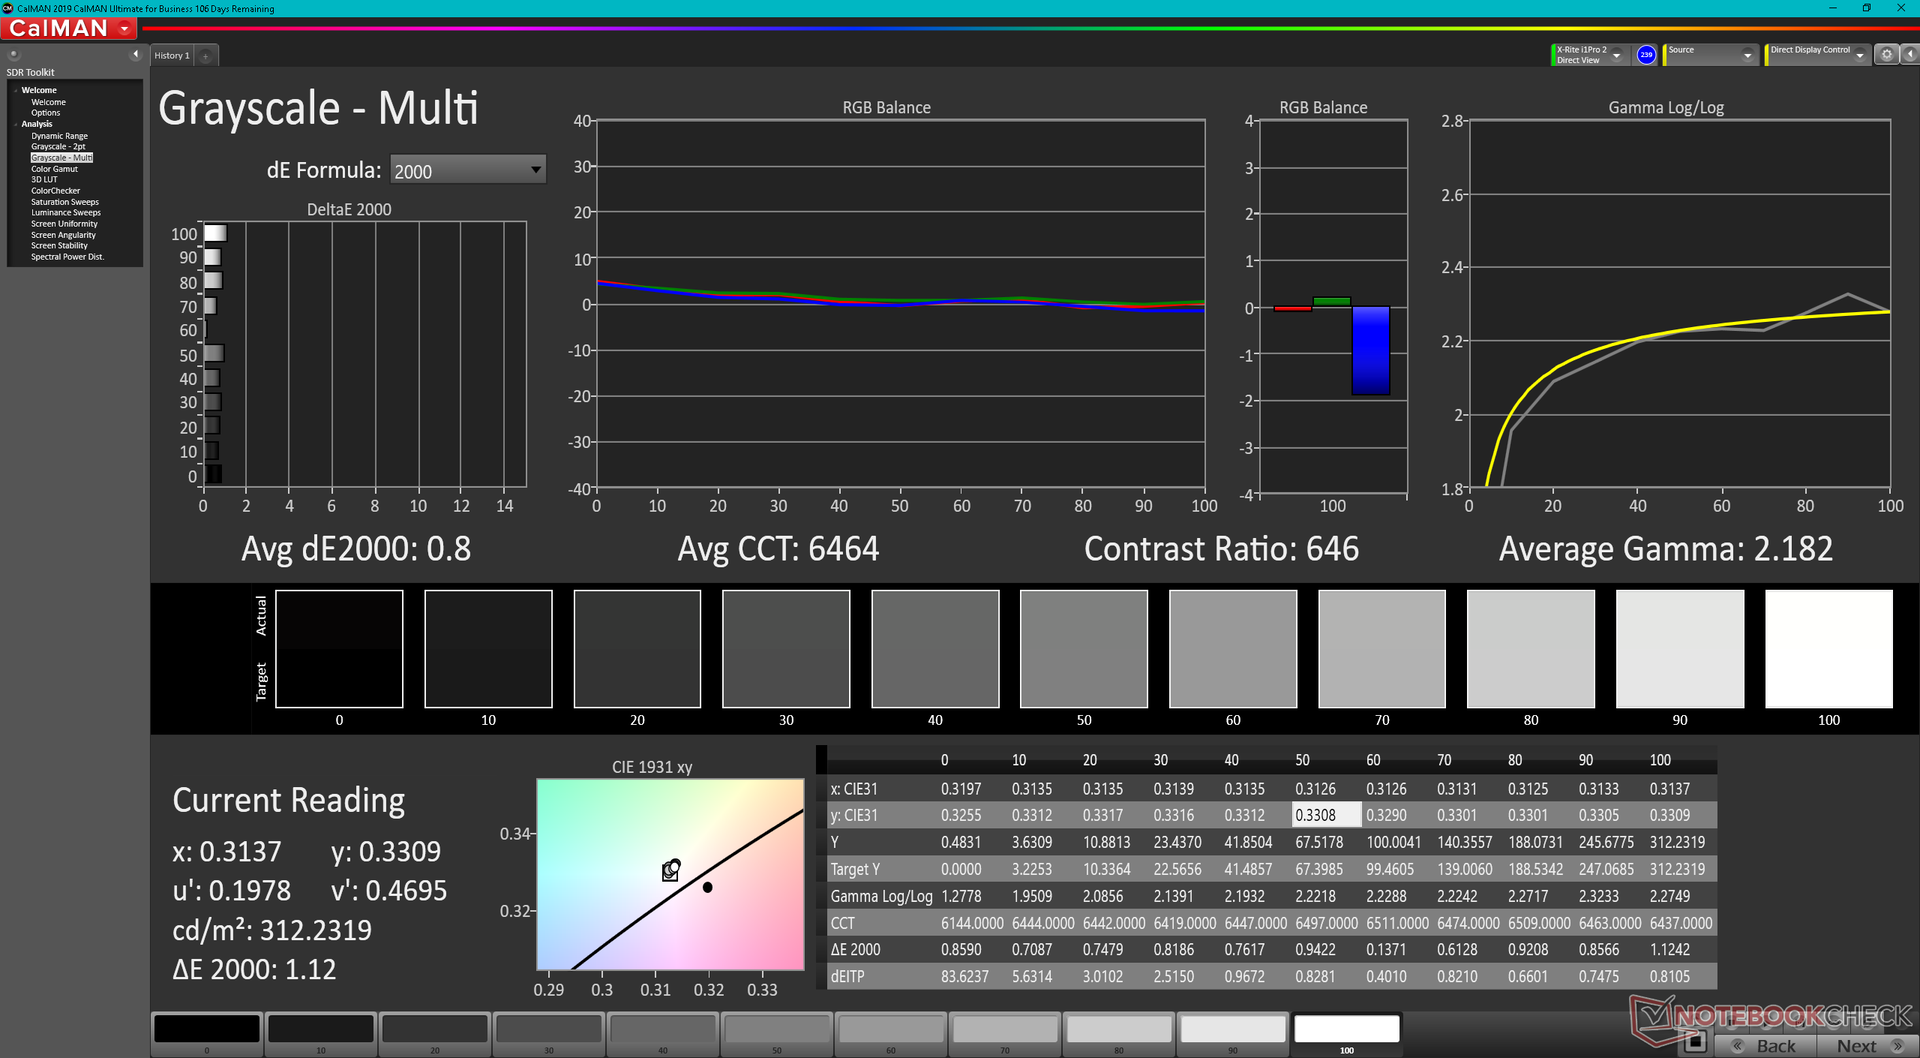
该显示器在出厂时没有经过校准,因此它的颜色并不像它们可能的那样准确。尤其是色温,与sRGB标准的6500目标值相比,6000左右的色温过于温暖。用我们的X-Rite色度计进行适当的校准后,平均灰度和彩色DeltaE值将从3.6和2.23分别提高到0.8和0.63。我们建议进行终端用户校准,以充分利用面板100%的sRGB覆盖率。
Display Response Times
| ↔ Response Time Black to White | ||
|---|---|---|
| 22.8 ms ... rise ↗ and fall ↘ combined | ↗ 12 ms rise | 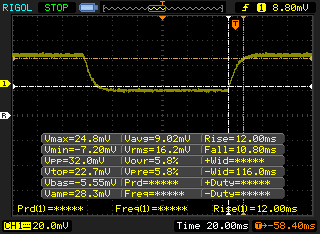 |
| ↘ 10.8 ms fall | ||
| The screen shows good response rates in our tests, but may be too slow for competitive gamers. In comparison, all tested devices range from 0.1 (minimum) to 240 (maximum) ms. » 51 % of all devices are better. This means that the measured response time is worse than the average of all tested devices (19.8 ms). | ||
| ↔ Response Time 50% Grey to 80% Grey | ||
| 32.8 ms ... rise ↗ and fall ↘ combined | ↗ 16 ms rise | 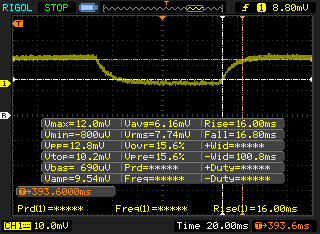 |
| ↘ 16.8 ms fall | ||
| The screen shows slow response rates in our tests and will be unsatisfactory for gamers. In comparison, all tested devices range from 0.165 (minimum) to 636 (maximum) ms. » 45 % of all devices are better. This means that the measured response time is similar to the average of all tested devices (31 ms). | ||
Screen Flickering / PWM (Pulse-Width Modulation)
| Screen flickering / PWM not detected |  | ||
In comparison: 52 % of all tested devices do not use PWM to dim the display. If PWM was detected, an average of 7754 (minimum: 5 - maximum: 343500) Hz was measured. | |||
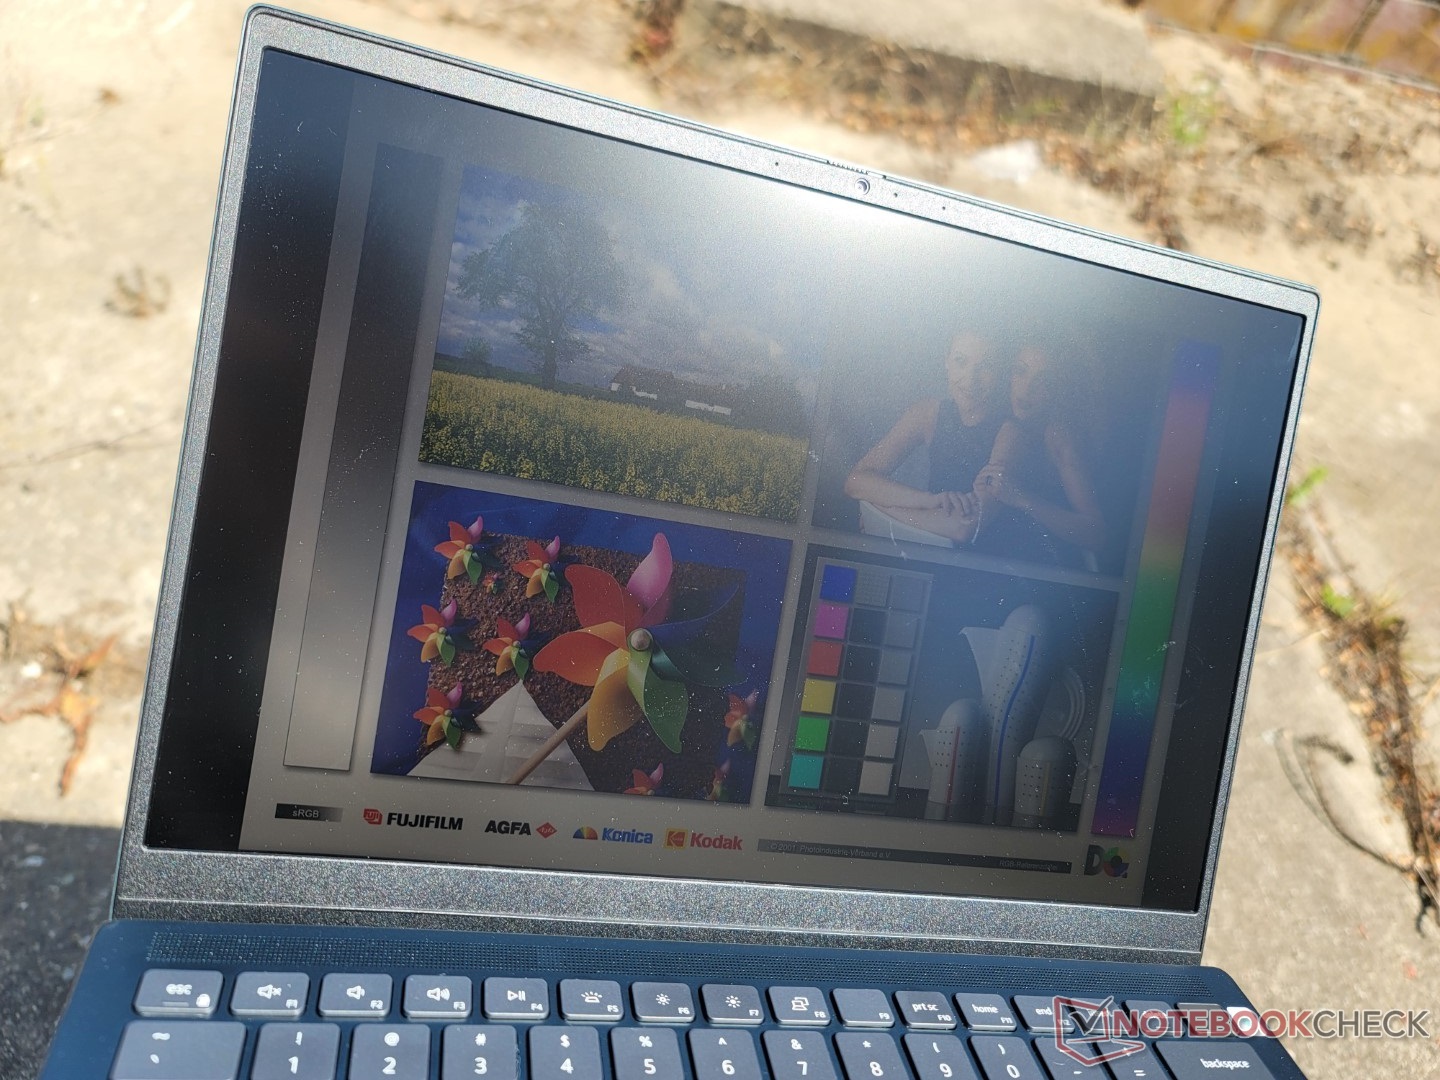
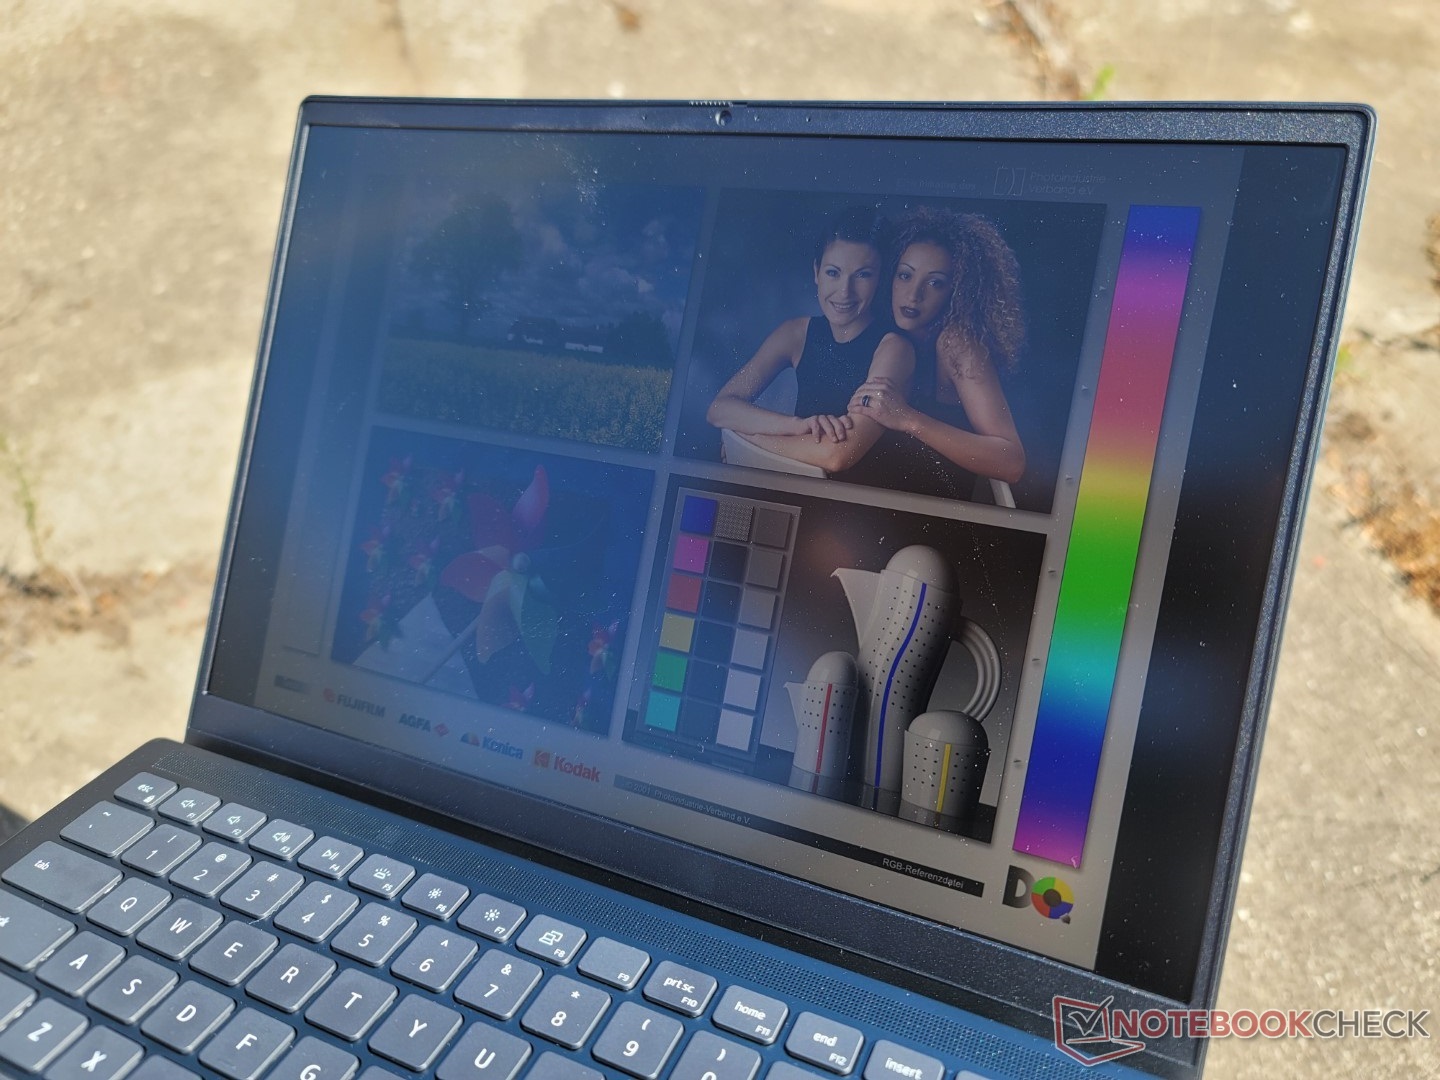
户外能见度不高,因为显示屏在最大设置下平均只有300尼特。如果在户外,你要尽可能在阴凉处工作,否则屏幕在较亮的环境光线下会被冲淡。微星微星Summit E14携带一个明显更亮的屏幕,同时仍然提供独立的GPU选项,与之相比。
性能--14英寸的增压机
测试条件
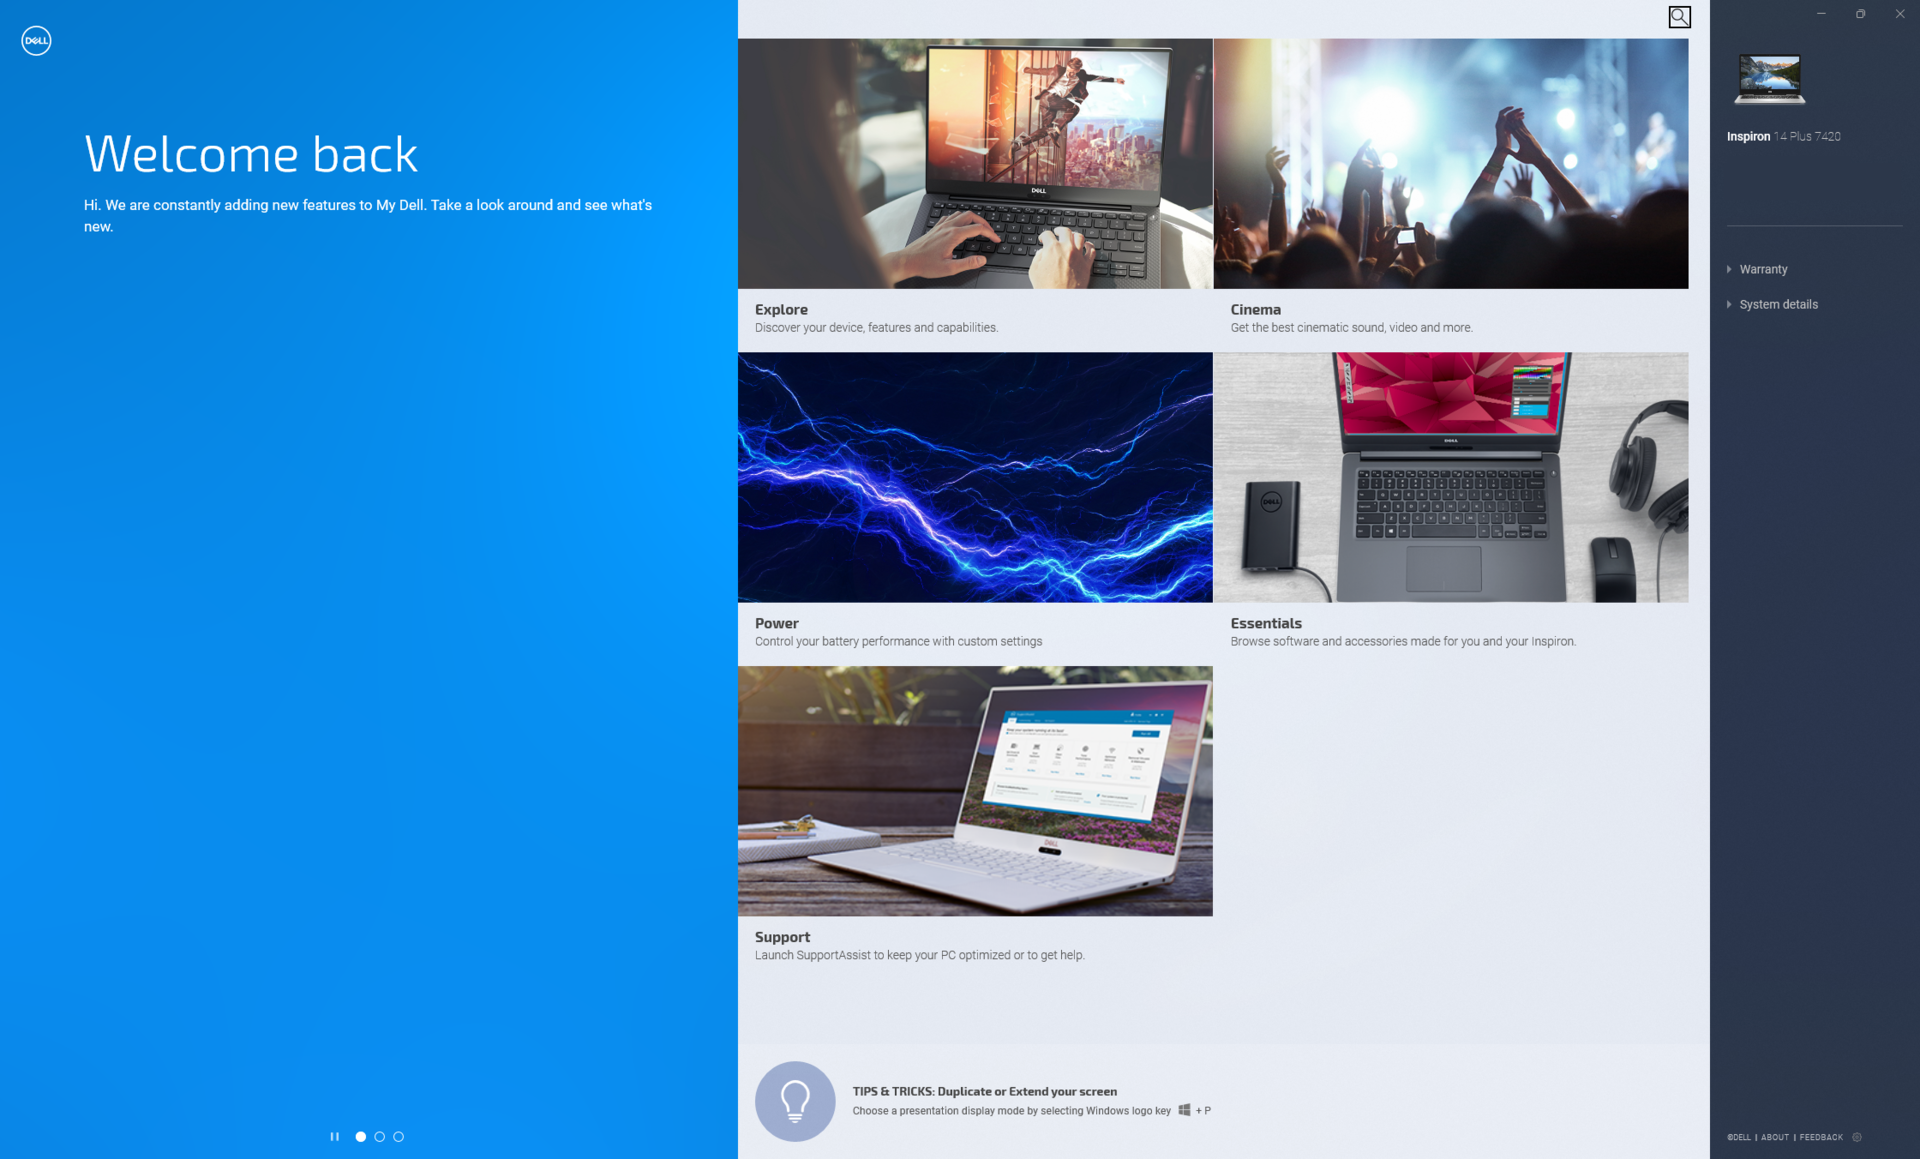
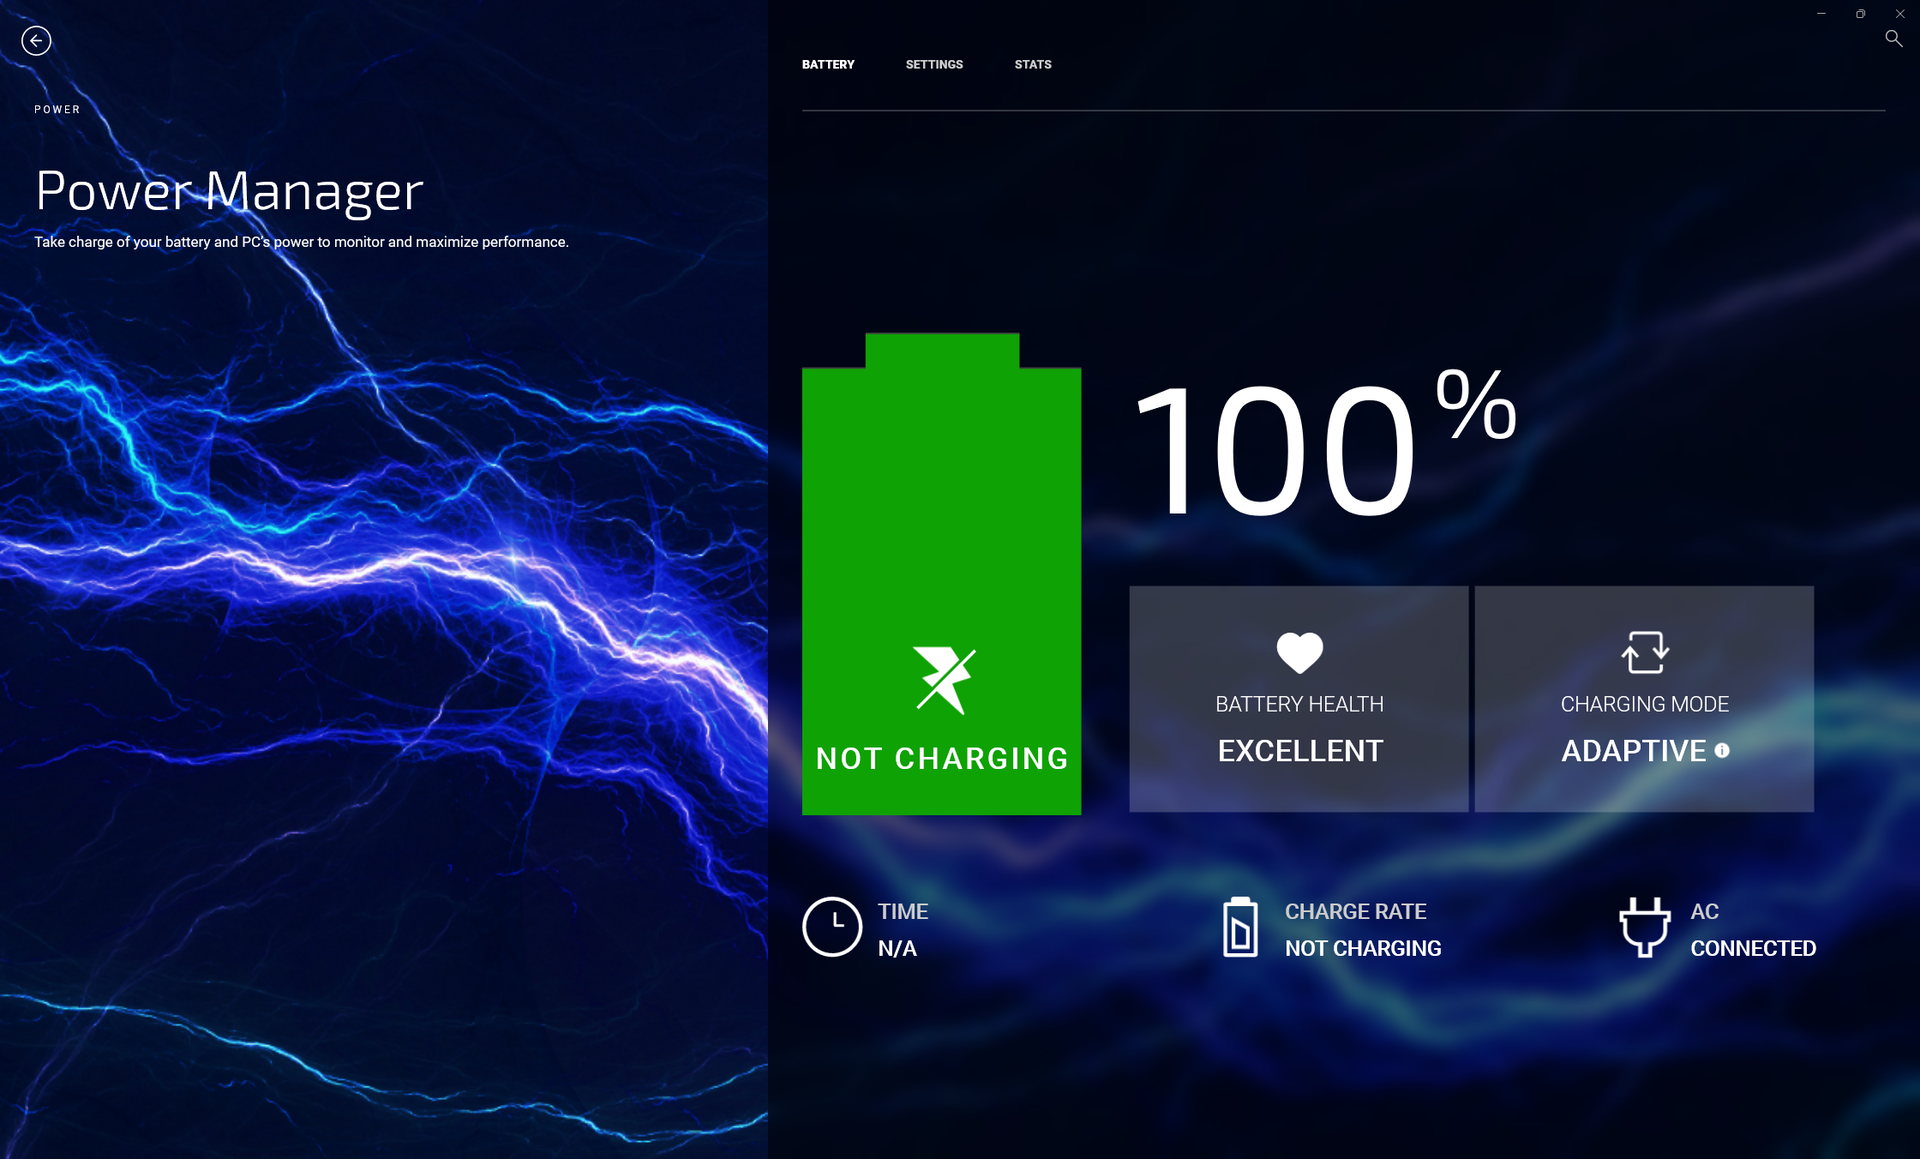
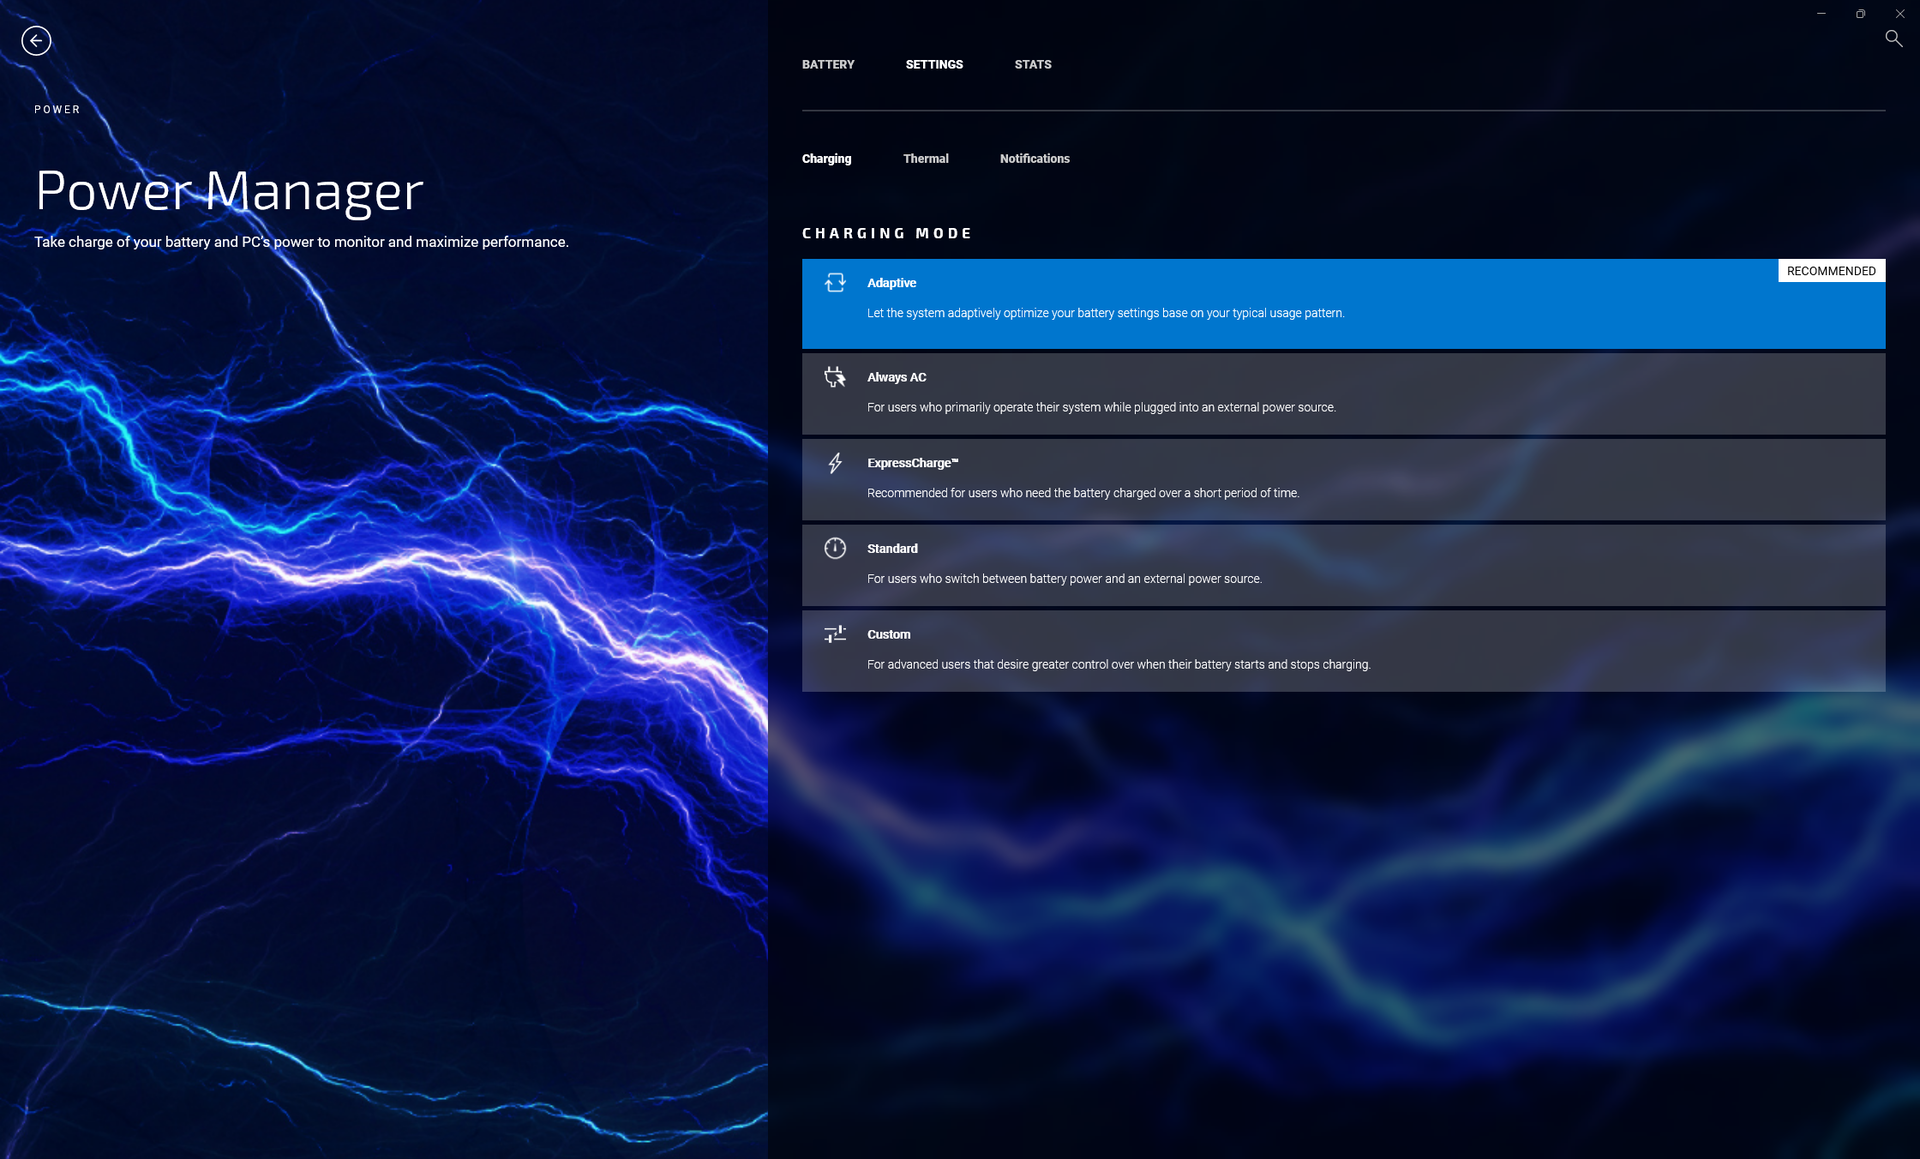
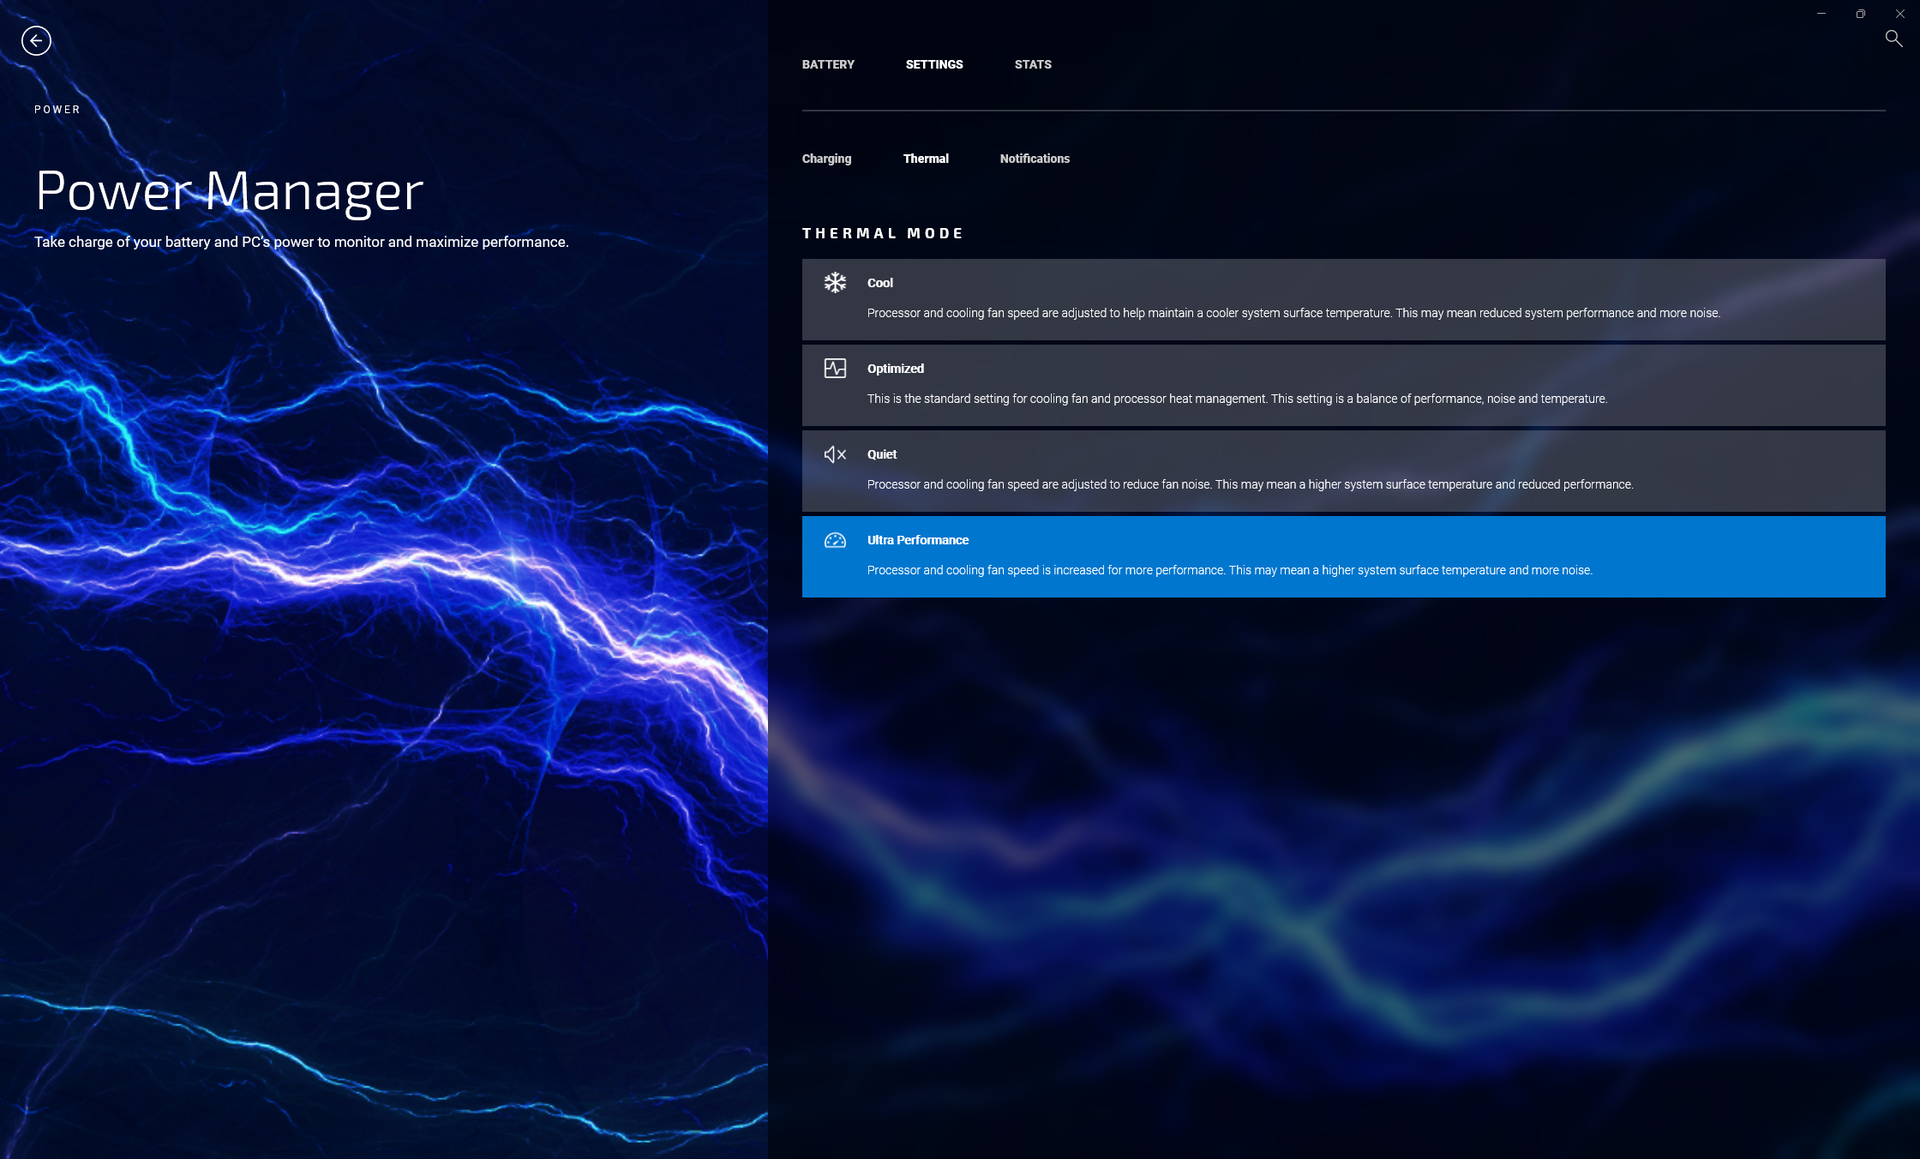
在运行以下任何基准测试之前,我们通过 "我的戴尔 "软件将我们的设备设置为超性能模式。建议业主熟悉 "我的戴尔",因为它是保修支持、电池充电行为、系统性能等方面的门户,如下文截图所示。
支持标准Optimus,在集成和独立的GeForce RTX 3050 GPU之间切换。不支持高级Optimus、MUX和WhisperMode。
处理器
CPU的性能可以从玻璃半满或玻璃半空的角度进行分析。从悲观的角度来看,45W的 酷睿i7-12700H有点令人失望,因为它的多线程性能比其他配备相同处理器的笔记本电脑慢10%左右。从乐观的角度来看,戴尔的速度明显快于其他大多数14英寸笔记本电脑,其中15W、25W或35W的CPU更为常见。这是你能得到的配备酷睿i7-12700H的小型笔记本电脑之一,但反过来说,与配备相同处理器选项的大型笔记本电脑相比,其Turbo Boost性能随之受到更多限制。毕竟,酷睿i7-12700H也经常出现在成熟的游戏笔记本上。例如,采用相同CPU的16英寸联想Legion Slim 7,其性能比我们的Inspiron 14 Plus快30%。
我们的CPU的Turbo Boost性能有限,可以通过循环运行CineBench R15 xT来证明。如下图所示,我们最初的2410分,到第三或第四个循环时将下降21%,代表着明显的性能下降。
Cinebench R15 Multi Loop
Cinebench R23: Multi Core | Single Core
Cinebench R15: CPU Multi 64Bit | CPU Single 64Bit
Blender: v2.79 BMW27 CPU
7-Zip 18.03: 7z b 4 | 7z b 4 -mmt1
Geekbench 5.5: Multi-Core | Single-Core
HWBOT x265 Benchmark v2.2: 4k Preset
LibreOffice : 20 Documents To PDF
R Benchmark 2.5: Overall mean
* ... smaller is better
AIDA64: FP32 Ray-Trace | FPU Julia | CPU SHA3 | CPU Queen | FPU SinJulia | FPU Mandel | CPU AES | CPU ZLib | FP64 Ray-Trace | CPU PhotoWorxx
| Performance rating | |
| Average Intel Core i7-12700H | |
| Dell Inspiron 14 Plus 7420 | |
| Asus Vivobook Pro 14 M3401QC-KM007T | |
| Schenker Vision 14 | |
| Asus Zenbook 14X UX5400E | |
| MSI Summit E14 A11SCS | |
| Dell Inspiron 14 7420 2-in-1 | |
| AIDA64 / FP32 Ray-Trace | |
| Dell Inspiron 14 Plus 7420 | |
| Average Intel Core i7-12700H (2585 - 17957, n=64) | |
| Asus Vivobook Pro 14 M3401QC-KM007T | |
| Schenker Vision 14 | |
| Asus Zenbook 14X UX5400E | |
| MSI Summit E14 A11SCS | |
| Dell Inspiron 14 7420 2-in-1 | |
| AIDA64 / FPU Julia | |
| Asus Vivobook Pro 14 M3401QC-KM007T | |
| Dell Inspiron 14 Plus 7420 | |
| Average Intel Core i7-12700H (12439 - 90760, n=64) | |
| Schenker Vision 14 | |
| Asus Zenbook 14X UX5400E | |
| MSI Summit E14 A11SCS | |
| Dell Inspiron 14 7420 2-in-1 | |
| AIDA64 / CPU SHA3 | |
| Average Intel Core i7-12700H (833 - 4242, n=64) | |
| Dell Inspiron 14 Plus 7420 | |
| Schenker Vision 14 | |
| Asus Vivobook Pro 14 M3401QC-KM007T | |
| Asus Zenbook 14X UX5400E | |
| MSI Summit E14 A11SCS | |
| Dell Inspiron 14 7420 2-in-1 | |
| AIDA64 / CPU Queen | |
| Average Intel Core i7-12700H (57923 - 103202, n=63) | |
| Dell Inspiron 14 Plus 7420 | |
| Asus Vivobook Pro 14 M3401QC-KM007T | |
| Dell Inspiron 14 7420 2-in-1 | |
| Schenker Vision 14 | |
| Asus Zenbook 14X UX5400E | |
| MSI Summit E14 A11SCS | |
| AIDA64 / FPU SinJulia | |
| Average Intel Core i7-12700H (3249 - 9939, n=64) | |
| Asus Vivobook Pro 14 M3401QC-KM007T | |
| Dell Inspiron 14 Plus 7420 | |
| Schenker Vision 14 | |
| Asus Zenbook 14X UX5400E | |
| MSI Summit E14 A11SCS | |
| Dell Inspiron 14 7420 2-in-1 | |
| AIDA64 / FPU Mandel | |
| Asus Vivobook Pro 14 M3401QC-KM007T | |
| Dell Inspiron 14 Plus 7420 | |
| Average Intel Core i7-12700H (7135 - 44760, n=64) | |
| Schenker Vision 14 | |
| MSI Summit E14 A11SCS | |
| Asus Zenbook 14X UX5400E | |
| Dell Inspiron 14 7420 2-in-1 | |
| AIDA64 / CPU AES | |
| Asus Vivobook Pro 14 M3401QC-KM007T | |
| Average Intel Core i7-12700H (31839 - 144360, n=64) | |
| Schenker Vision 14 | |
| Asus Zenbook 14X UX5400E | |
| Dell Inspiron 14 Plus 7420 | |
| MSI Summit E14 A11SCS | |
| Dell Inspiron 14 7420 2-in-1 | |
| AIDA64 / CPU ZLib | |
| Average Intel Core i7-12700H (305 - 1171, n=64) | |
| Dell Inspiron 14 Plus 7420 | |
| Asus Vivobook Pro 14 M3401QC-KM007T | |
| Dell Inspiron 14 7420 2-in-1 | |
| Schenker Vision 14 | |
| Asus Zenbook 14X UX5400E | |
| MSI Summit E14 A11SCS | |
| AIDA64 / FP64 Ray-Trace | |
| Dell Inspiron 14 Plus 7420 | |
| Average Intel Core i7-12700H (1437 - 9692, n=64) | |
| Asus Vivobook Pro 14 M3401QC-KM007T | |
| Schenker Vision 14 | |
| Asus Zenbook 14X UX5400E | |
| MSI Summit E14 A11SCS | |
| Dell Inspiron 14 7420 2-in-1 | |
| AIDA64 / CPU PhotoWorxx | |
| MSI Summit E14 A11SCS | |
| Dell Inspiron 14 Plus 7420 | |
| Average Intel Core i7-12700H (12863 - 52207, n=64) | |
| Asus Zenbook 14X UX5400E | |
| Schenker Vision 14 | |
| Dell Inspiron 14 7420 2-in-1 | |
| Asus Vivobook Pro 14 M3401QC-KM007T | |
系统性能
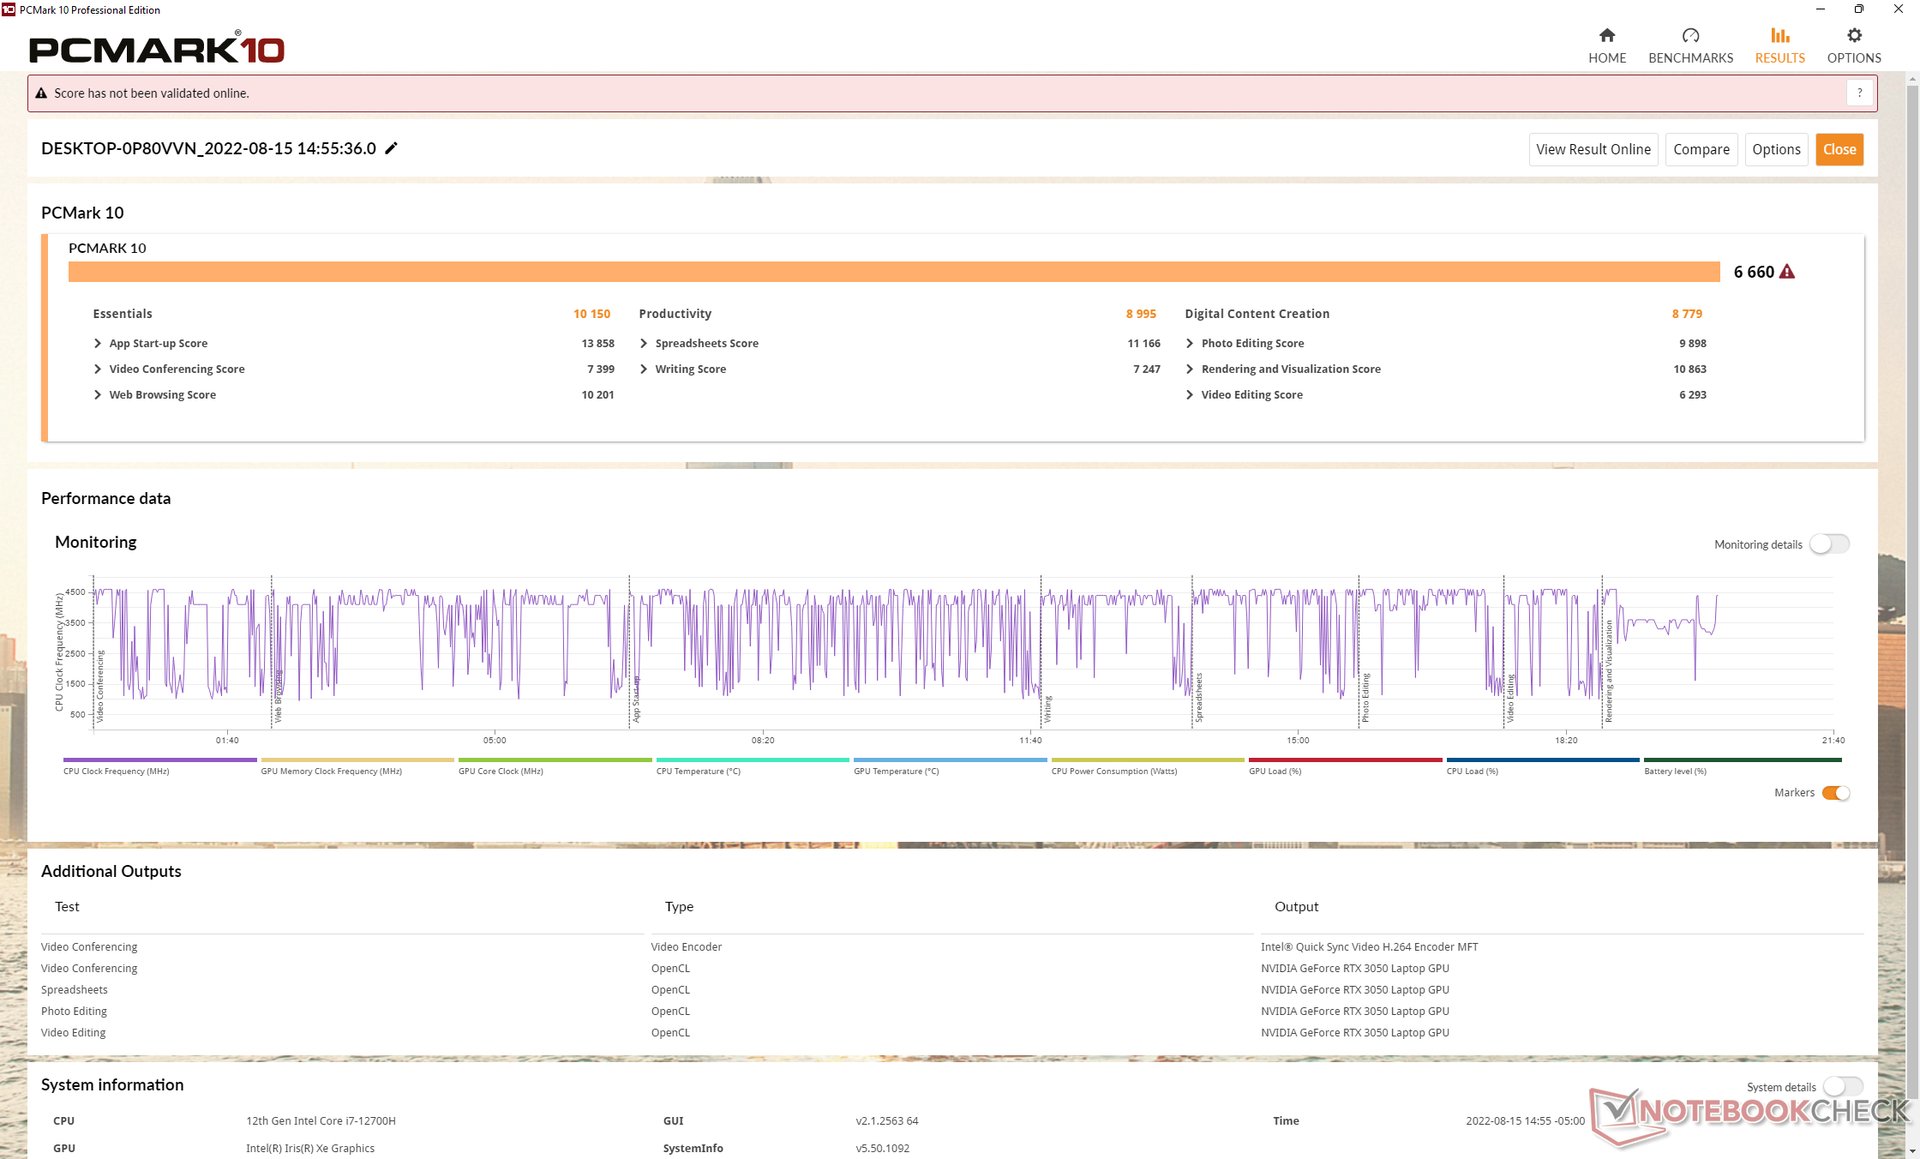
PCMark 10的结果是优秀的,甚至高于竞争对手,如Schenker Vision 14与更快的RTX 3050 Ti图形或华硕Vivobook Pro 14采用AMD Ryzen 5600H CPU。毫无疑问,酷睿i7-12700H在提升Inspiron 14 Plus 7420的整体性能方面发挥了巨大作用,超过了其他大多数14英寸多媒体笔记本电脑。
CrossMark: Overall | Productivity | Creativity | Responsiveness
| PCMark 10 / Score | |
| Average Intel Core i7-12700H, NVIDIA GeForce RTX 3050 4GB Laptop GPU (6660 - 6879, n=3) | |
| Dell Inspiron 14 Plus 7420 | |
| Schenker Vision 14 | |
| Asus Vivobook Pro 14 M3401QC-KM007T | |
| HP Envy 14-eb0010nr | |
| MSI Summit E14 A11SCS | |
| Dell Inspiron 14 7420 2-in-1 | |
| Asus Zenbook 14X UX5400E | |
| PCMark 10 / Essentials | |
| Average Intel Core i7-12700H, NVIDIA GeForce RTX 3050 4GB Laptop GPU (10150 - 10369, n=3) | |
| Dell Inspiron 14 7420 2-in-1 | |
| Dell Inspiron 14 Plus 7420 | |
| Asus Vivobook Pro 14 M3401QC-KM007T | |
| Schenker Vision 14 | |
| HP Envy 14-eb0010nr | |
| MSI Summit E14 A11SCS | |
| Asus Zenbook 14X UX5400E | |
| PCMark 10 / Productivity | |
| Average Intel Core i7-12700H, NVIDIA GeForce RTX 3050 4GB Laptop GPU (8995 - 9397, n=3) | |
| Dell Inspiron 14 Plus 7420 | |
| Schenker Vision 14 | |
| Asus Zenbook 14X UX5400E | |
| HP Envy 14-eb0010nr | |
| MSI Summit E14 A11SCS | |
| Asus Vivobook Pro 14 M3401QC-KM007T | |
| Dell Inspiron 14 7420 2-in-1 | |
| PCMark 10 / Digital Content Creation | |
| Average Intel Core i7-12700H, NVIDIA GeForce RTX 3050 4GB Laptop GPU (8779 - 9203, n=3) | |
| Dell Inspiron 14 Plus 7420 | |
| Asus Vivobook Pro 14 M3401QC-KM007T | |
| Schenker Vision 14 | |
| Dell Inspiron 14 7420 2-in-1 | |
| HP Envy 14-eb0010nr | |
| MSI Summit E14 A11SCS | |
| Asus Zenbook 14X UX5400E | |
| CrossMark / Overall | |
| Average Intel Core i7-12700H, NVIDIA GeForce RTX 3050 4GB Laptop GPU (1717 - 1857, n=3) | |
| Dell Inspiron 14 Plus 7420 | |
| Schenker Vision 14 | |
| Dell Inspiron 14 7420 2-in-1 | |
| Asus Vivobook Pro 14 M3401QC-KM007T | |
| CrossMark / Productivity | |
| Average Intel Core i7-12700H, NVIDIA GeForce RTX 3050 4GB Laptop GPU (1620 - 1735, n=3) | |
| Dell Inspiron 14 Plus 7420 | |
| Schenker Vision 14 | |
| Dell Inspiron 14 7420 2-in-1 | |
| Asus Vivobook Pro 14 M3401QC-KM007T | |
| CrossMark / Creativity | |
| Average Intel Core i7-12700H, NVIDIA GeForce RTX 3050 4GB Laptop GPU (1911 - 2067, n=3) | |
| Dell Inspiron 14 Plus 7420 | |
| Dell Inspiron 14 7420 2-in-1 | |
| Schenker Vision 14 | |
| Asus Vivobook Pro 14 M3401QC-KM007T | |
| CrossMark / Responsiveness | |
| Average Intel Core i7-12700H, NVIDIA GeForce RTX 3050 4GB Laptop GPU (1481 - 1651, n=3) | |
| Schenker Vision 14 | |
| Dell Inspiron 14 Plus 7420 | |
| Dell Inspiron 14 7420 2-in-1 | |
| Asus Vivobook Pro 14 M3401QC-KM007T | |
| PCMark 10 Score | 6660 points | |
Help | ||
| AIDA64 / Memory Copy | |
| MSI Summit E14 A11SCS | |
| Asus Zenbook 14X UX5400E | |
| Dell Inspiron 14 Plus 7420 | |
| Average Intel Core i7-12700H (25615 - 80511, n=64) | |
| Schenker Vision 14 | |
| Dell Inspiron 14 7420 2-in-1 | |
| Asus Vivobook Pro 14 M3401QC-KM007T | |
| AIDA64 / Memory Read | |
| Dell Inspiron 14 Plus 7420 | |
| MSI Summit E14 A11SCS | |
| Asus Zenbook 14X UX5400E | |
| Average Intel Core i7-12700H (25586 - 79442, n=64) | |
| Schenker Vision 14 | |
| Asus Vivobook Pro 14 M3401QC-KM007T | |
| Dell Inspiron 14 7420 2-in-1 | |
| AIDA64 / Memory Write | |
| Asus Zenbook 14X UX5400E | |
| MSI Summit E14 A11SCS | |
| Dell Inspiron 14 Plus 7420 | |
| Average Intel Core i7-12700H (23679 - 88660, n=64) | |
| Schenker Vision 14 | |
| Dell Inspiron 14 7420 2-in-1 | |
| Asus Vivobook Pro 14 M3401QC-KM007T | |
| AIDA64 / Memory Latency | |
| Dell Inspiron 14 Plus 7420 | |
| Asus Zenbook 14X UX5400E | |
| MSI Summit E14 A11SCS | |
| Asus Vivobook Pro 14 M3401QC-KM007T | |
| Average Intel Core i7-12700H (76.2 - 133.9, n=62) | |
| Schenker Vision 14 | |
| Dell Inspiron 14 7420 2-in-1 | |
* ... smaller is better
DPC延时
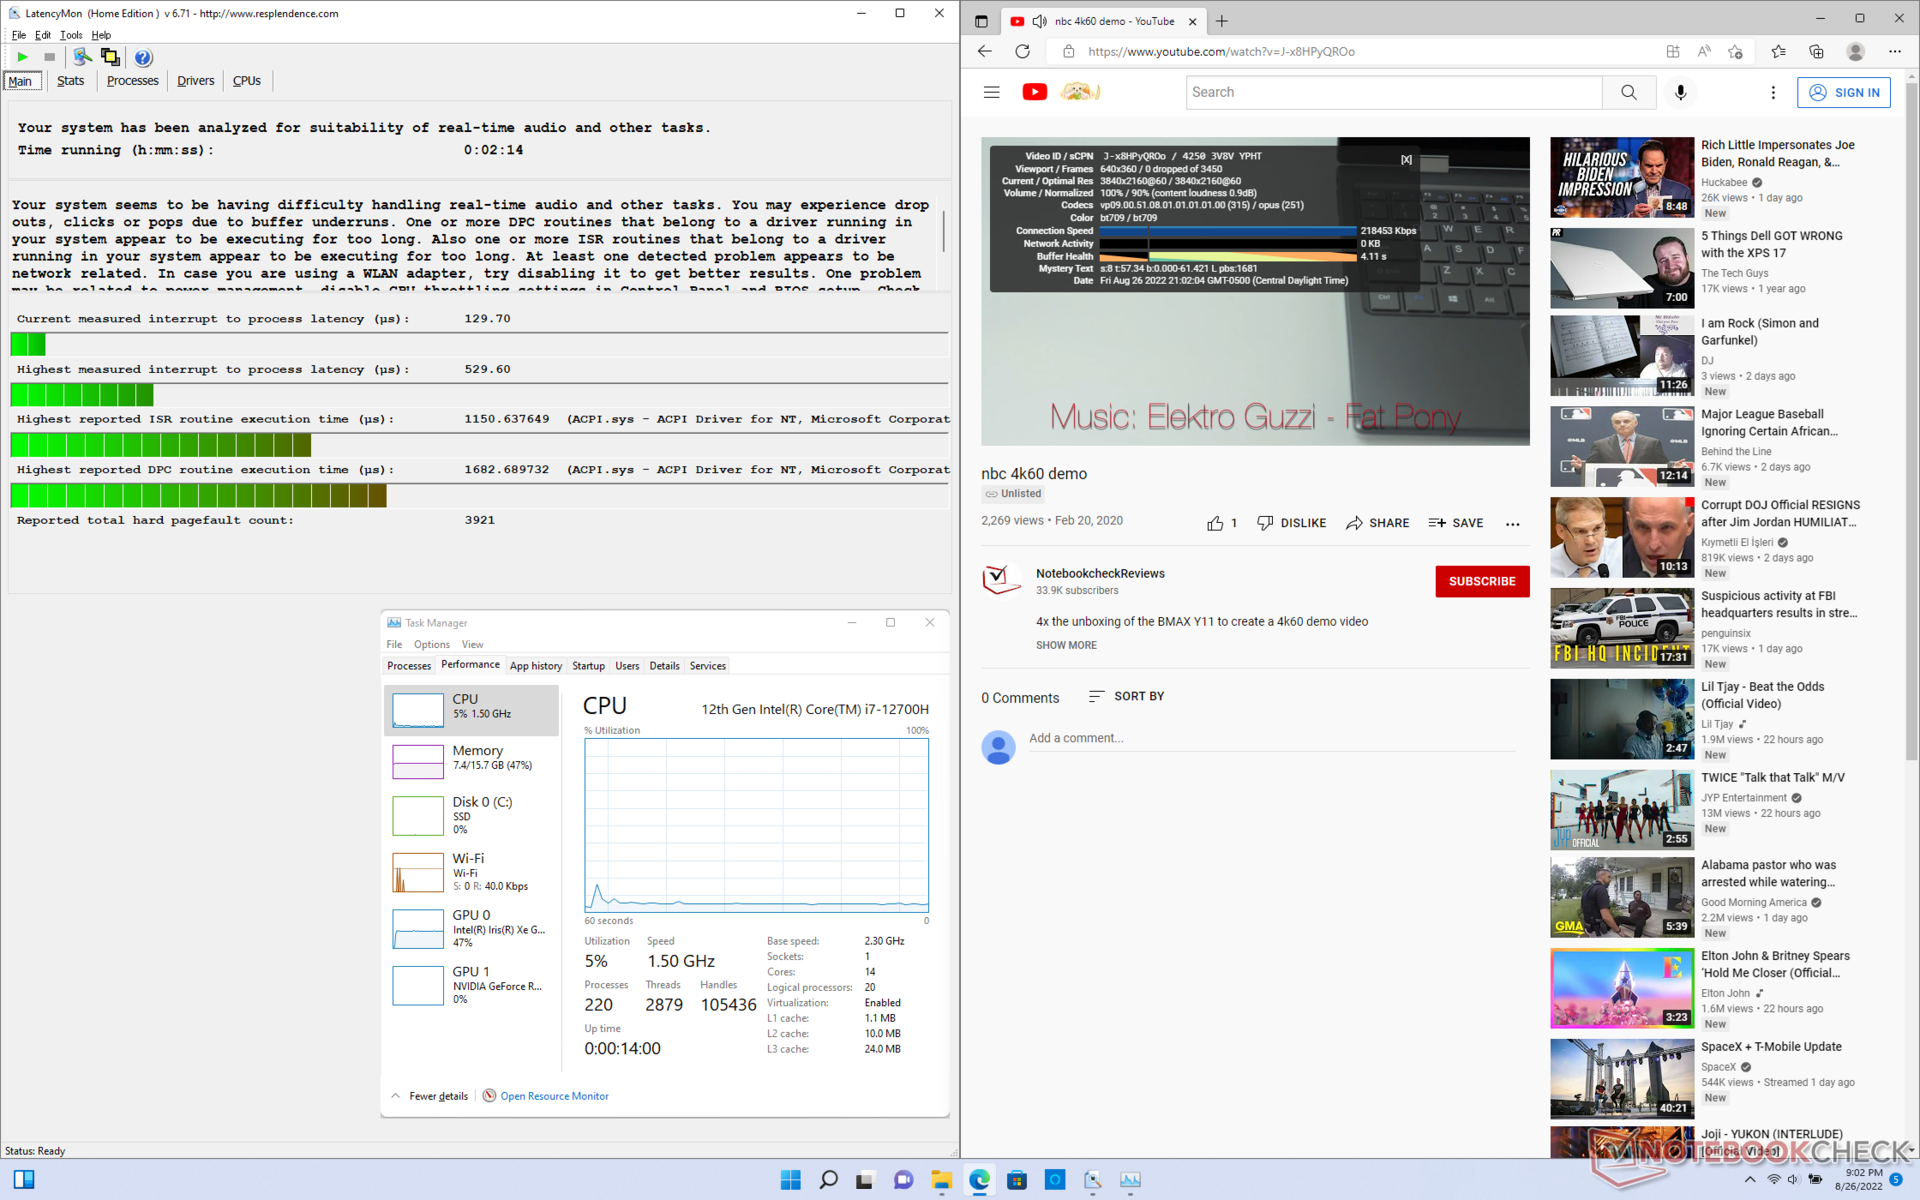
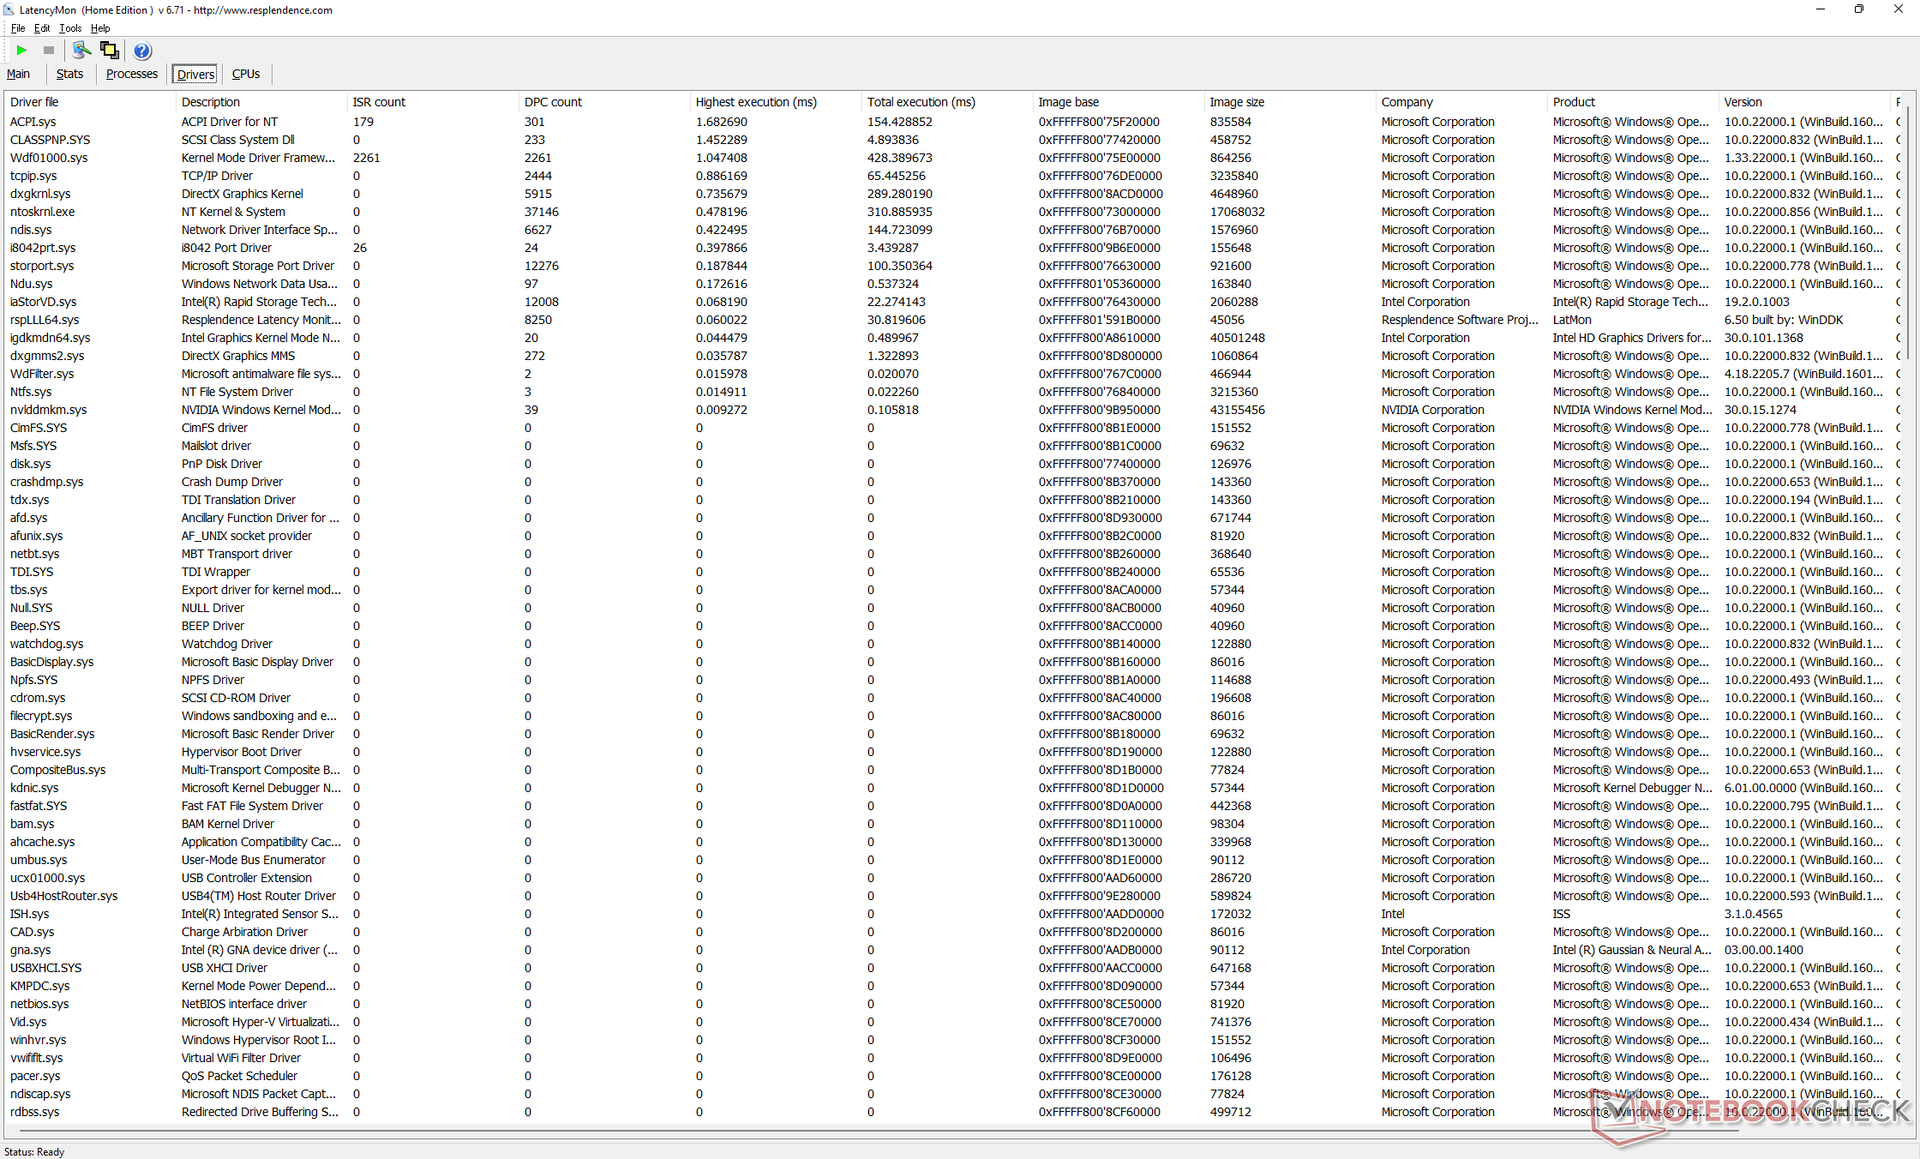
LatencyMon显示,在打开我们主页的多个浏览器标签时,有轻微的DPC问题。在60FPS下的4K视频播放是顺畅的,完全没有任何丢帧。
| DPC Latencies / LatencyMon - interrupt to process latency (max), Web, Youtube, Prime95 | |
| HP Envy 14-eb0010nr | |
| Schenker Vision 14 | |
| MSI Summit E14 A11SCS | |
| Asus Vivobook Pro 14 M3401QC-KM007T | |
| Asus Zenbook 14X UX5400E | |
| Dell Inspiron 14 7420 2-in-1 | |
| Dell Inspiron 14 Plus 7420 | |
* ... smaller is better
存储设备--包括散热片
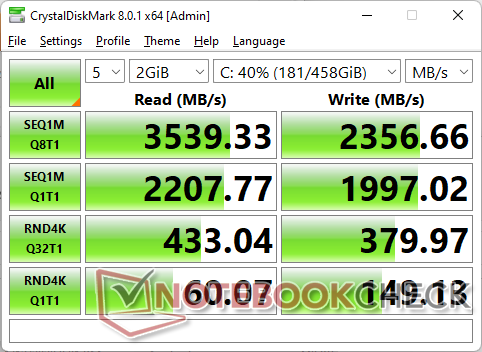
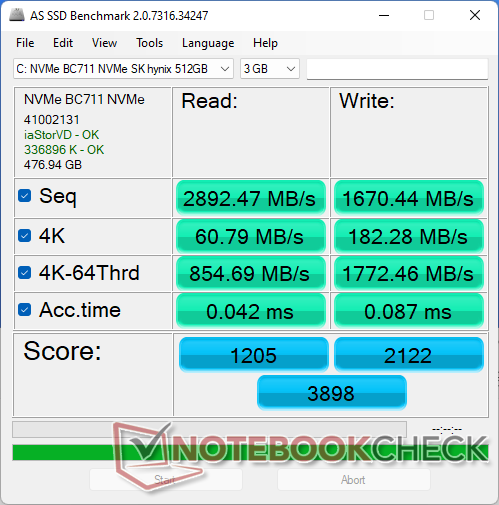
我们的设备配备了一个512GB的 SK Hynix BC711PCIe3 NVMe固态硬盘,连续读取率高达3600 MB/s。在循环运行DiskSpd时,该驱动器不会表现出性能节流的问题,因为它预装了自己的散热片。相比之下,大多数其他OEM厂商在其经济型甚至中档笔记本电脑型号中都不包括一个。不过,如果在Inspiron 14 Plus 7420上看到更快的PCIe4选项就更好了。

* ... smaller is better
Disk Throttling: DiskSpd Read Loop, Queue Depth 8
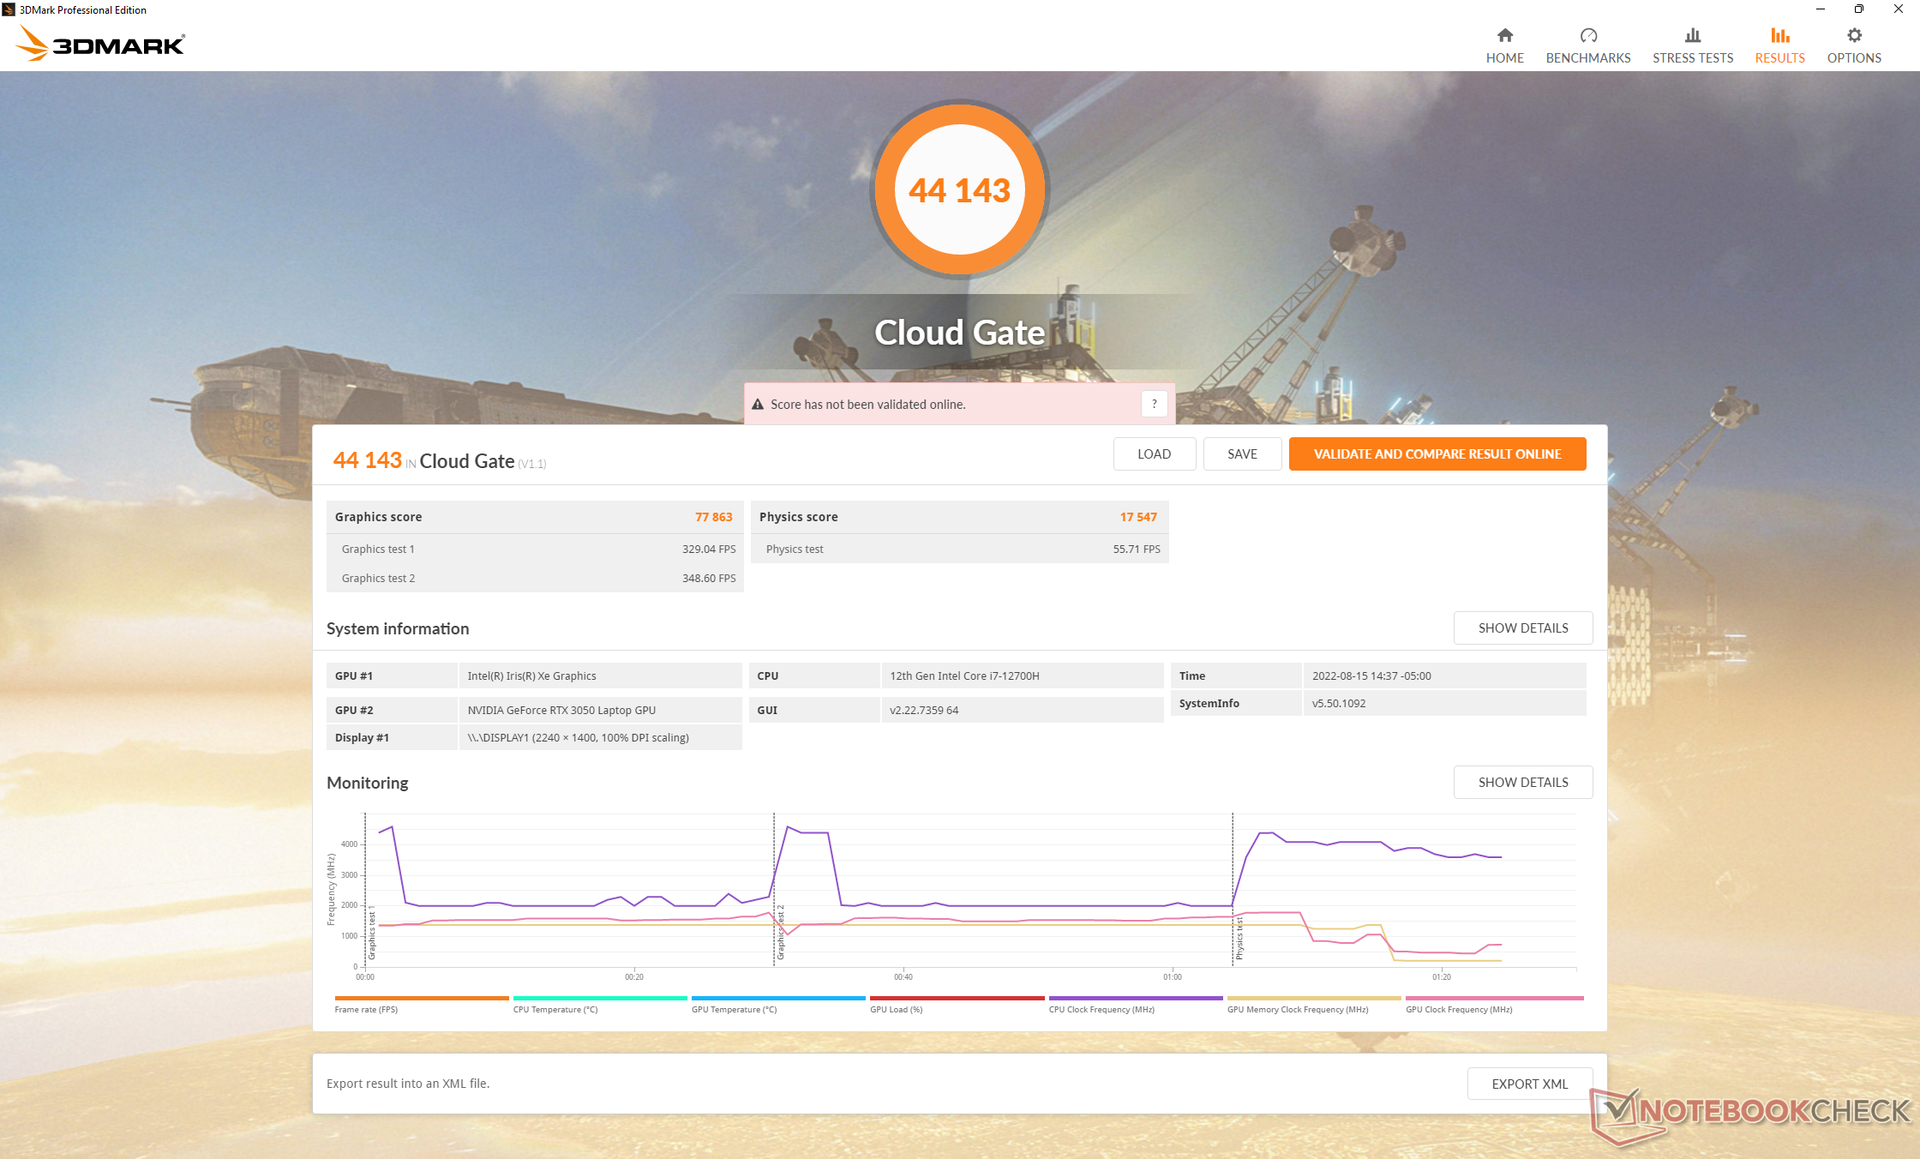
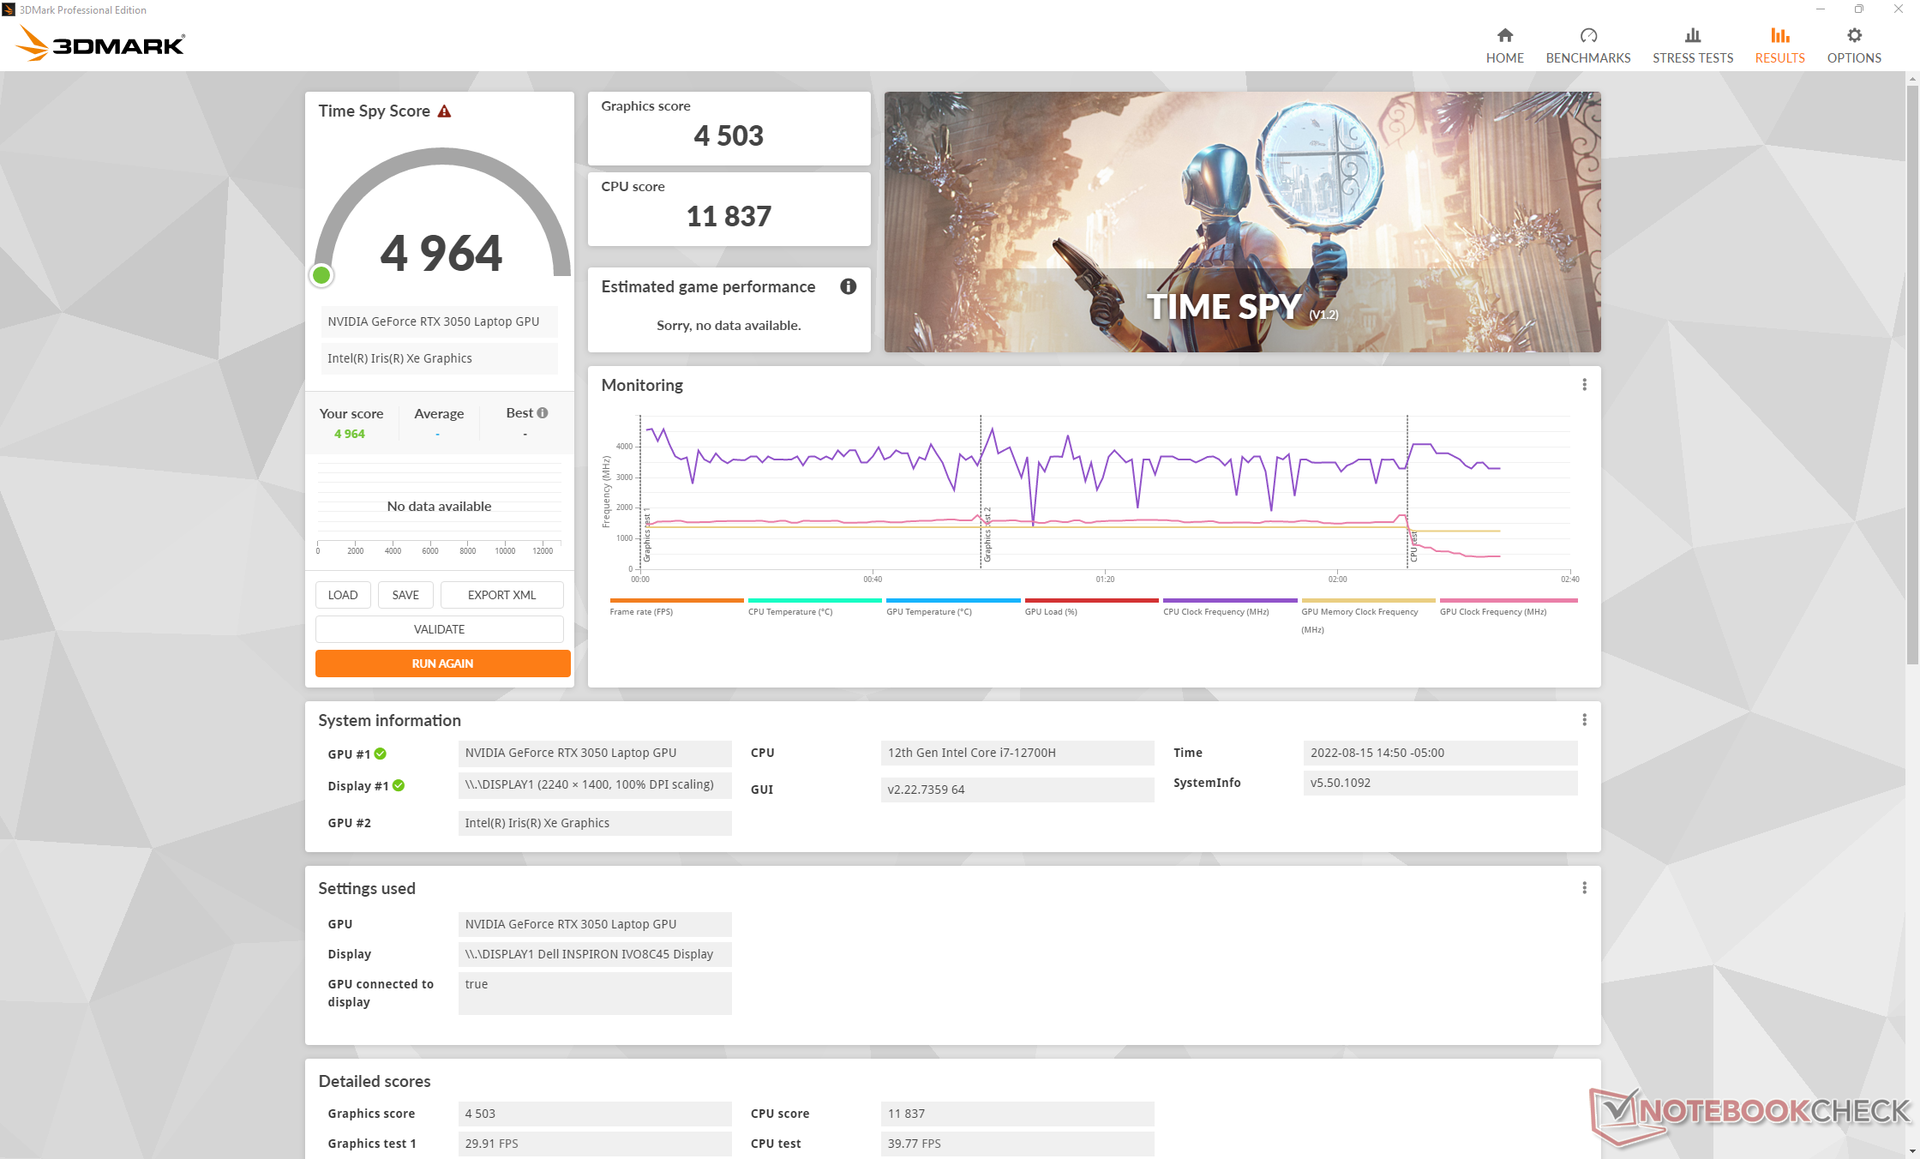
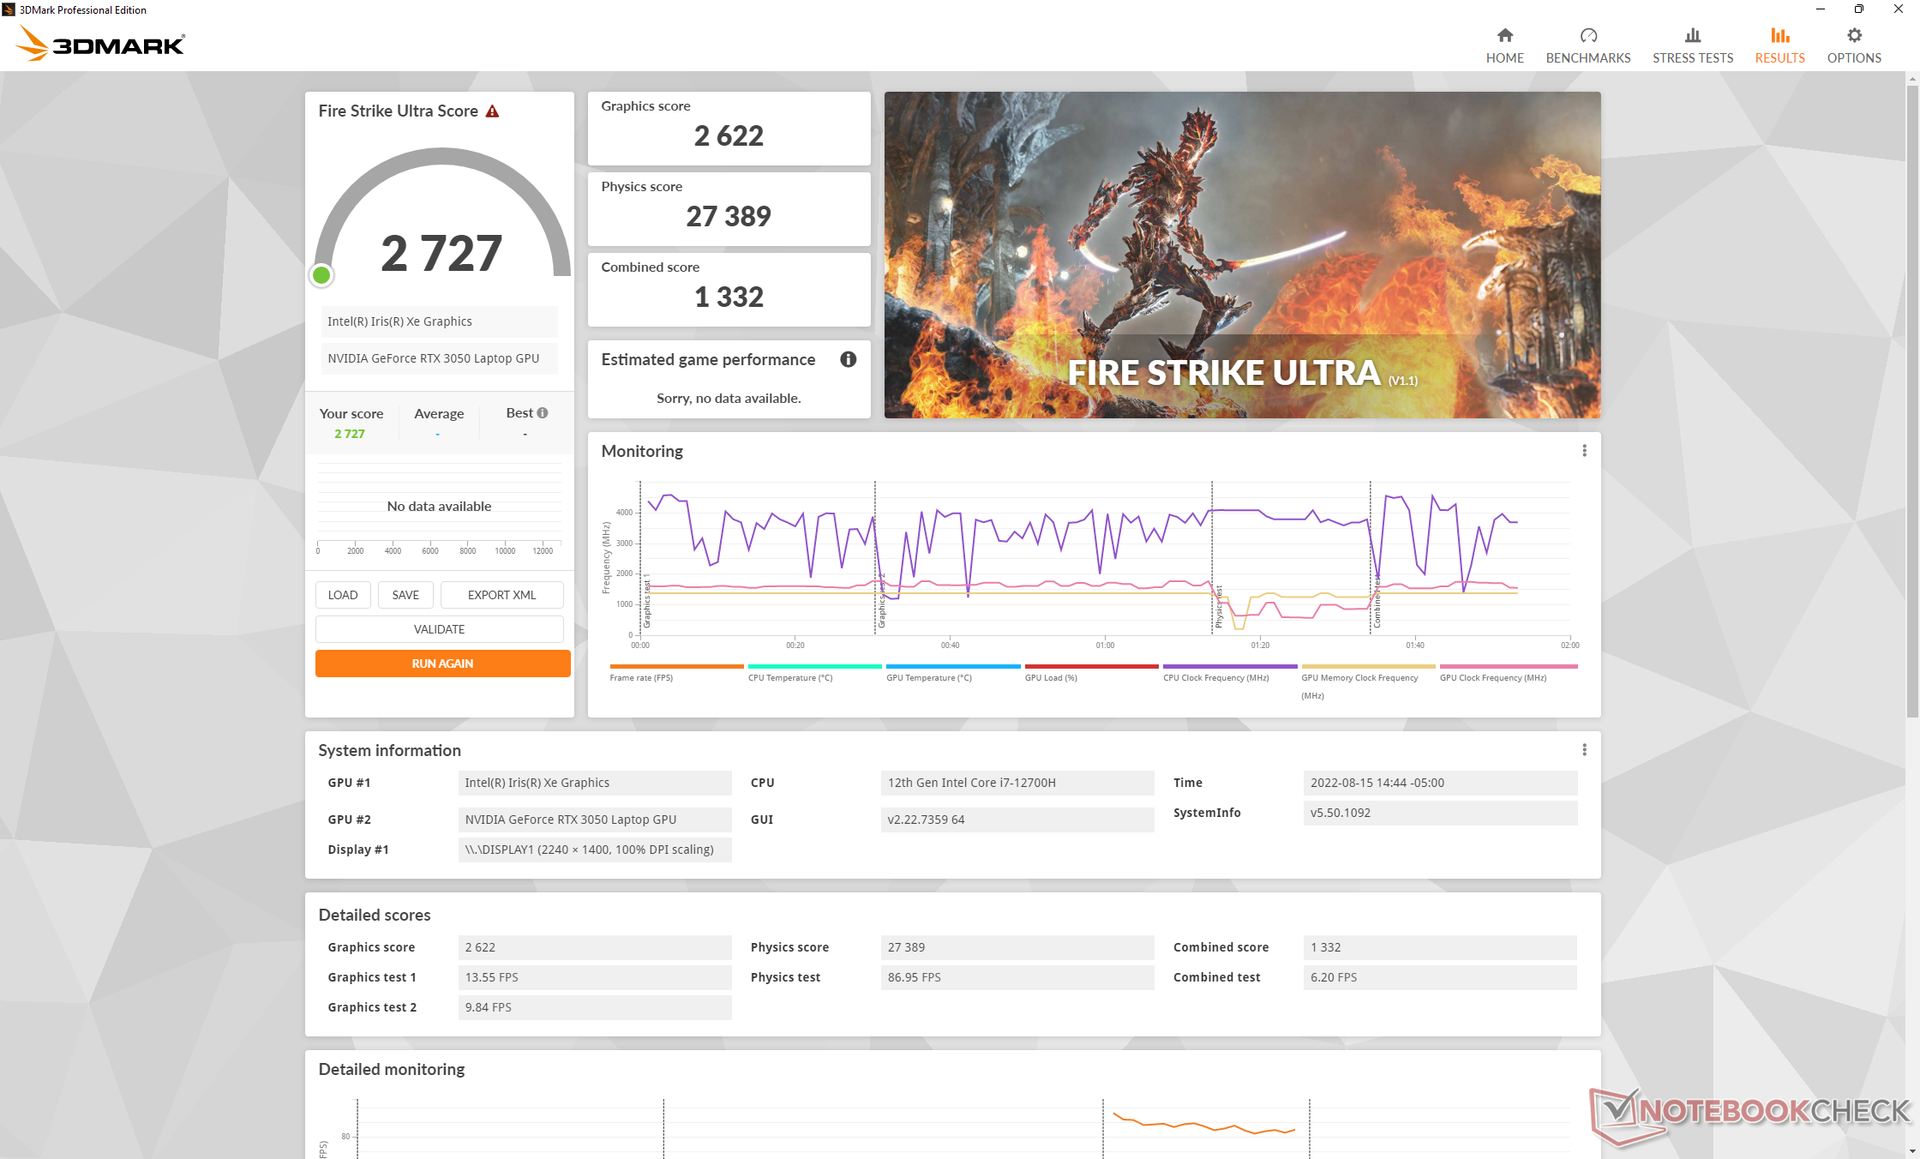
GPU性能--对于尺寸和价格而言是快速的
图形性能是我们所期望的,相对于其他具有相同性能的笔记本电脑而言 GeForce RTX 3050GPU。事实上,其结果与Schenker Vision 14或Schenker Flow Z13上的RTX 3050 Ti相当。华硕ROG Flow Z13.戴尔可能会在不久的将来推出带有RTX 3050 Ti的SKU,但我们不推荐它,因为它可能最多只是比我们的基本RTX 3050 SKU略快。
从老得多的GTX 1650 Ti Max-Q 升级的用户将看到约50%的显著改善。
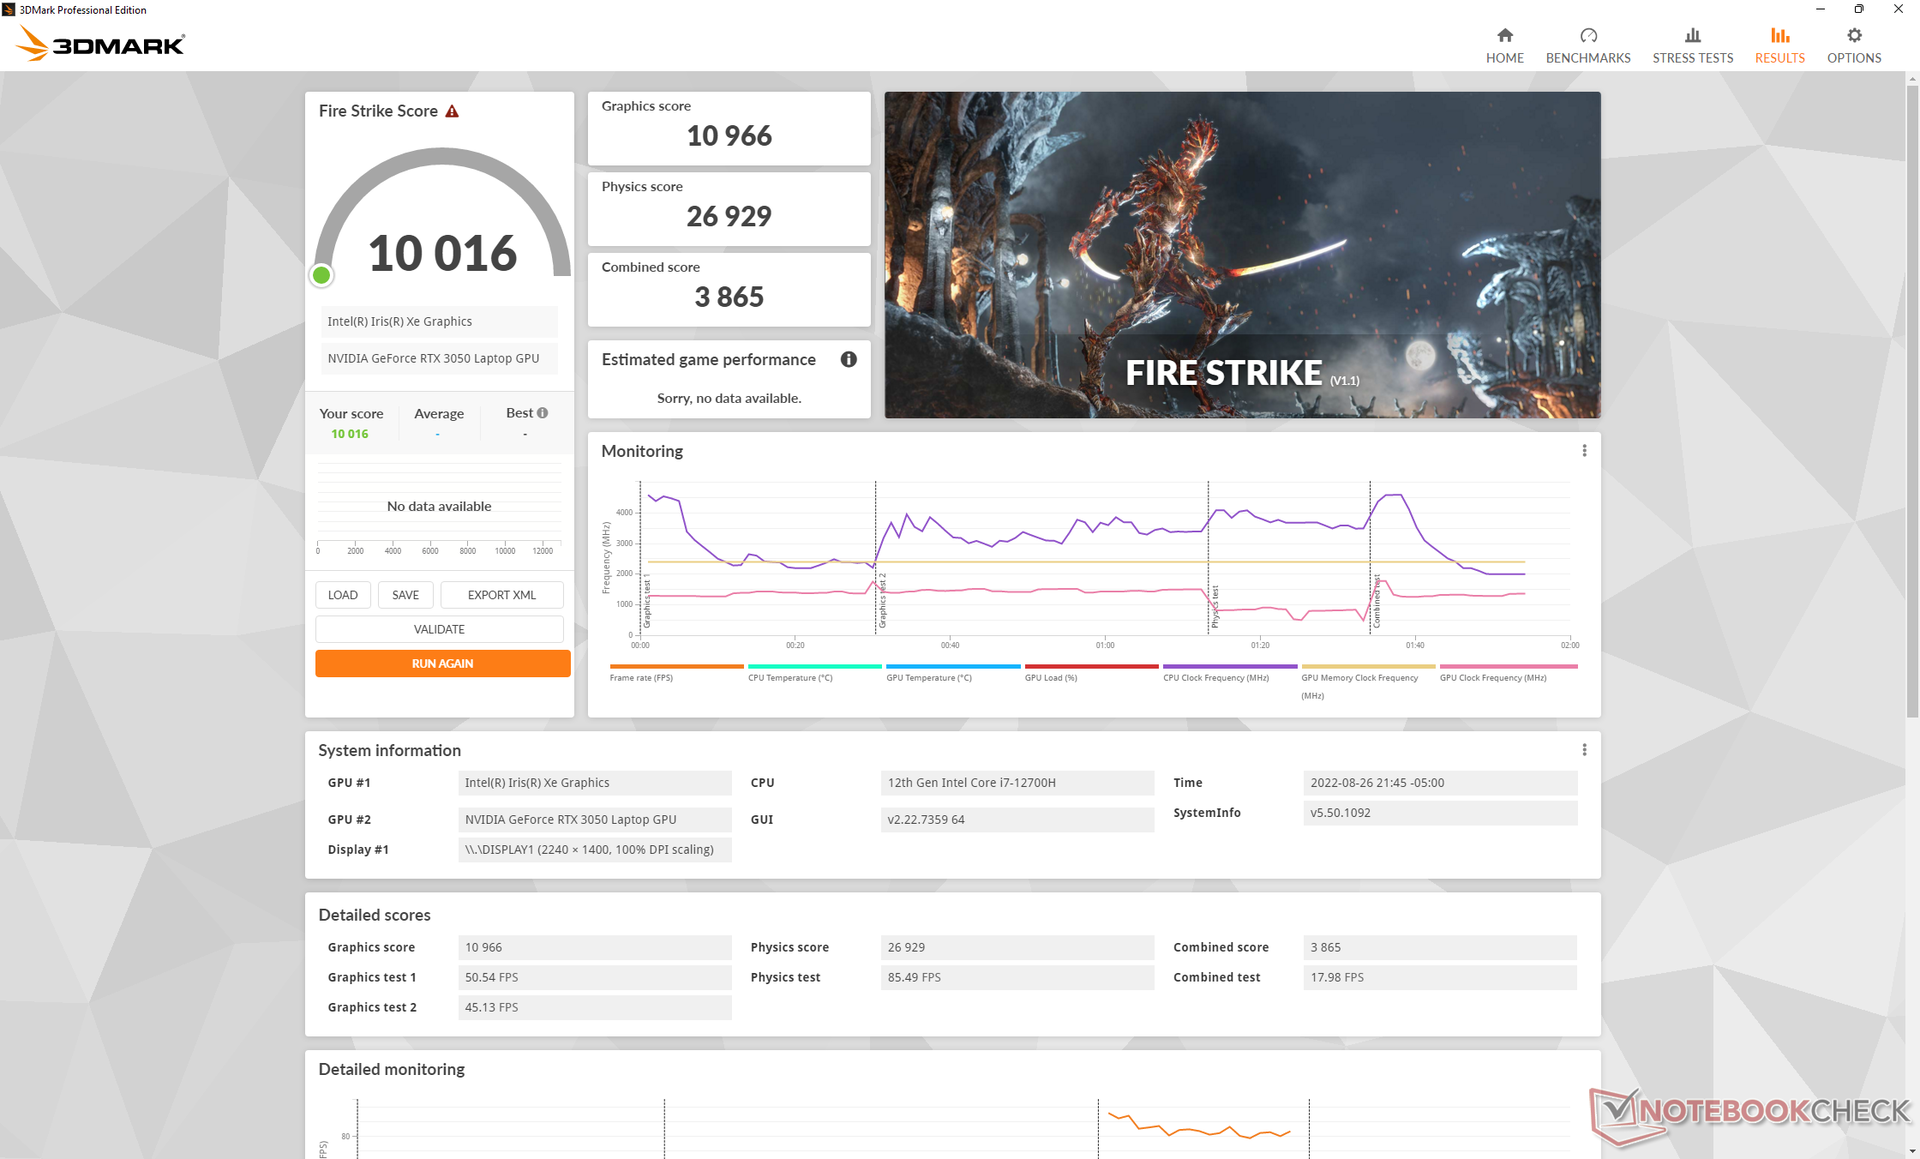
请记住,如果在戴尔优化模式而不是戴尔超性能模式下运行,图形性能会降低。在优化模式下进行的Fire Strike 测试将返回10966分的图形分数,而在超性能模式下则为12125分。
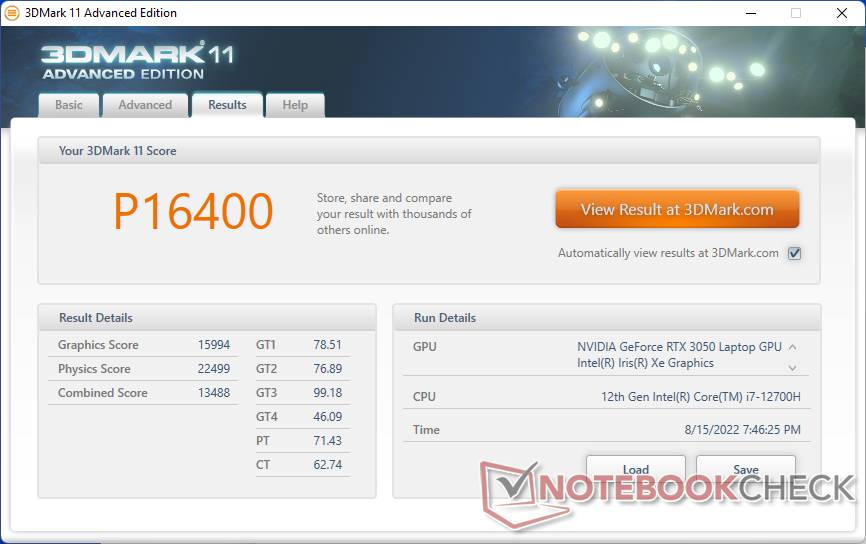

| 3DMark 11 Performance | 16400 points | |
| 3DMark Cloud Gate Standard Score | 44143 points | |
| 3DMark Fire Strike Score | 11060 points | |
| 3DMark Time Spy Score | 4964 points | |
Help | ||
Witcher 3 FPS Chart
| low | med. | high | ultra | |
|---|---|---|---|---|
| GTA V (2015) | 181.8 | 161.4 | 111.5 | 61.8 |
| The Witcher 3 (2015) | 222.2 | 150.4 | 83.5 | 46 |
| Dota 2 Reborn (2015) | 174.4 | 158.7 | 145 | 134.4 |
| Final Fantasy XV Benchmark (2018) | 113.5 | 66.1 | 47.4 | |
| X-Plane 11.11 (2018) | 137.8 | 117.2 | 94.4 | |
| Strange Brigade (2018) | 263 | 118.2 | 94.7 | 82.4 |
| Cyberpunk 2077 1.6 (2022) | 68.6 | 55 | 41 | 33.8 |
排放--像玩家一样响亮
系统噪音
该系统中的双风扇对高负载很敏感。例如,当启动3DMark 06时,风扇噪音会迅速增加,然后在第一个基准场景结束时稳定在47 dB(A)左右,而Schenker Vision 14的噪音为43 dB(A),Schenker Vision 14的噪音为35 dB(A)。 HP Envy 14每台电脑都有独立的GeForce 图形。
在超性能模式下运行游戏会导致风扇噪音达到近52分贝(A),这与许多具有更快的图形的专用游戏笔记本电脑相当。如果在戴尔优化模式下进行游戏,风扇噪音将降至48分贝(A),但如上所述,这将导致图形性能的小幅削减。因此,如果用户希望榨取GeForce GPU的全部50W功率包络,他们必须忍受风扇的最大转速。
值得庆幸的是,在浏览网页或视频流等比较平凡的任务中,风扇是相当安静的,只有26.5分贝(A),而背景是23.2分贝(A)。只有当更高的负载被引入时,它们才会开始快速上升。
Noise level
| Idle |
| 23.2 / 23.2 / 23.2 dB(A) |
| Load |
| 47.5 / 51.7 dB(A) |
 | ||
30 dB silent 40 dB(A) audible 50 dB(A) loud |
||
min: | ||
| Dell Inspiron 14 Plus 7420 GeForce RTX 3050 4GB Laptop GPU, i7-12700H, SK Hynix BC711 512GB HFM512GD3GX013N | Asus Vivobook Pro 14 M3401QC-KM007T GeForce RTX 3050 4GB Laptop GPU, R5 5600H, Intel SSD 670p SSDPEKNU512GZ | Dell Inspiron 14 7420 2-in-1 Iris Xe G7 96EUs, i7-1255U, WDC PC SN530 SDBPMPZ-512G | Schenker Vision 14 GeForce RTX 3050 Ti Laptop GPU, i7-11370H, Samsung SSD 980 Pro 1TB MZ-V8P1T0BW | Asus Zenbook 14X UX5400E GeForce MX450, i7-1165G7, SK Hynix HFM001TD3JX013N | HP Envy 14-eb0010nr GeForce GTX 1650 Ti Max-Q, i5-1135G7, Samsung SSD PM981a MZVLB256HBHQ | |
|---|---|---|---|---|---|---|
| Noise | -14% | 7% | 0% | -0% | 3% | |
| off / environment * (dB) | 23.2 | 25.4 -9% | 23.1 -0% | 24.3 -5% | 26 -12% | 25.9 -12% |
| Idle Minimum * (dB) | 23.2 | 25.4 -9% | 24.7 -6% | 24.3 -5% | 26 -12% | 26 -12% |
| Idle Average * (dB) | 23.2 | 25.4 -9% | 24.7 -6% | 24.3 -5% | 26 -12% | 26 -12% |
| Idle Maximum * (dB) | 23.2 | 30.9 -33% | 24.7 -6% | 25.9 -12% | 26.3 -13% | 26 -12% |
| Load Average * (dB) | 47.5 | 56 -18% | 27.7 42% | 43.3 9% | 37.1 22% | 34.9 27% |
| Witcher 3 ultra * (dB) | 51.7 | 45.1 13% | 44.6 14% | 34.5 33% | ||
| Load Maximum * (dB) | 51.7 | 56 -8% | 45.1 13% | 49.5 4% | 38 26% | 48.7 6% |
* ... smaller is better
温度
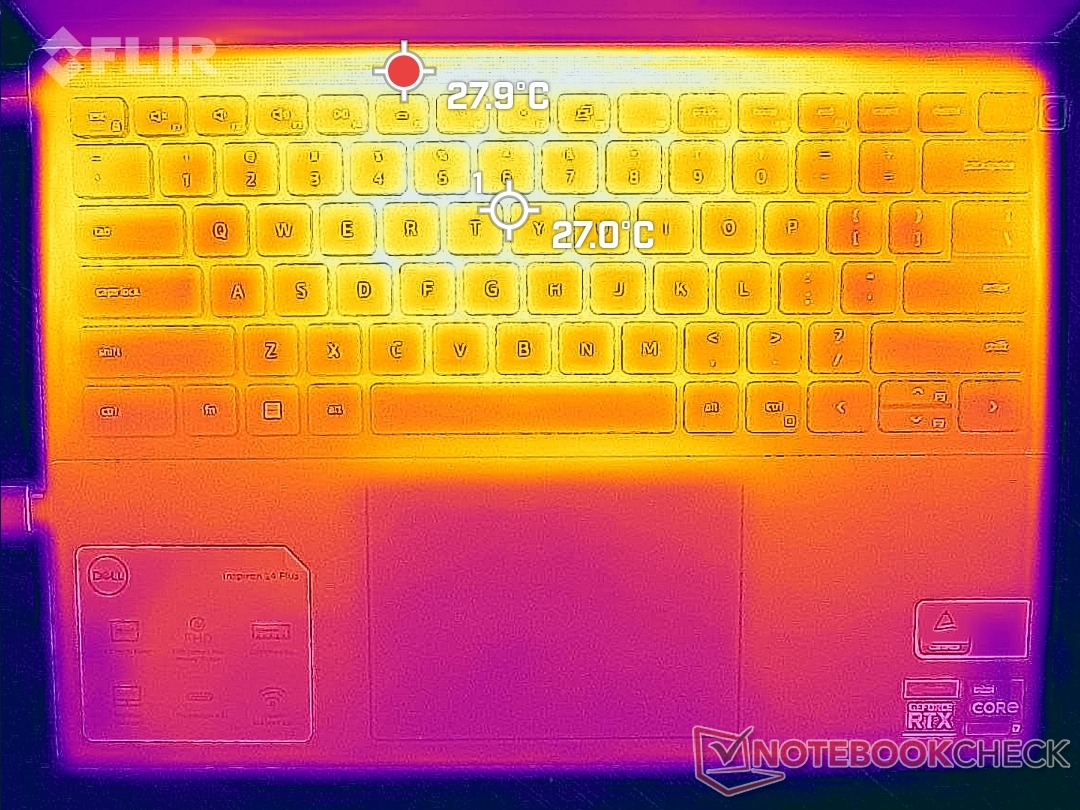
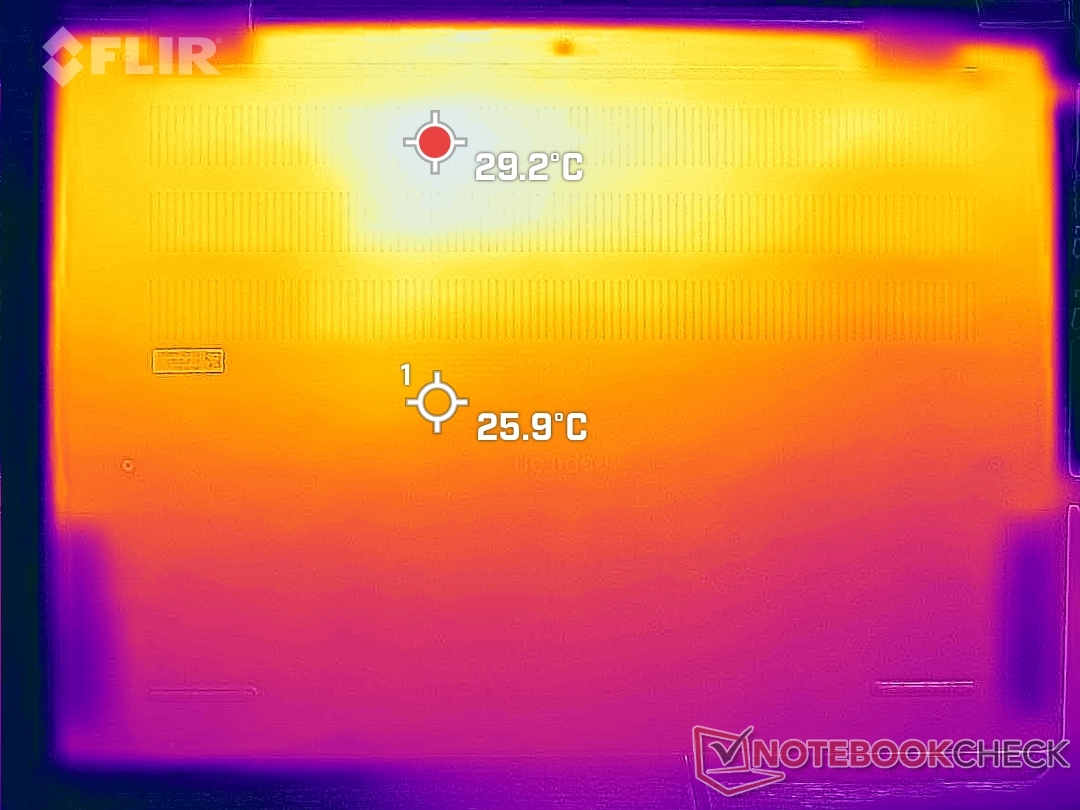
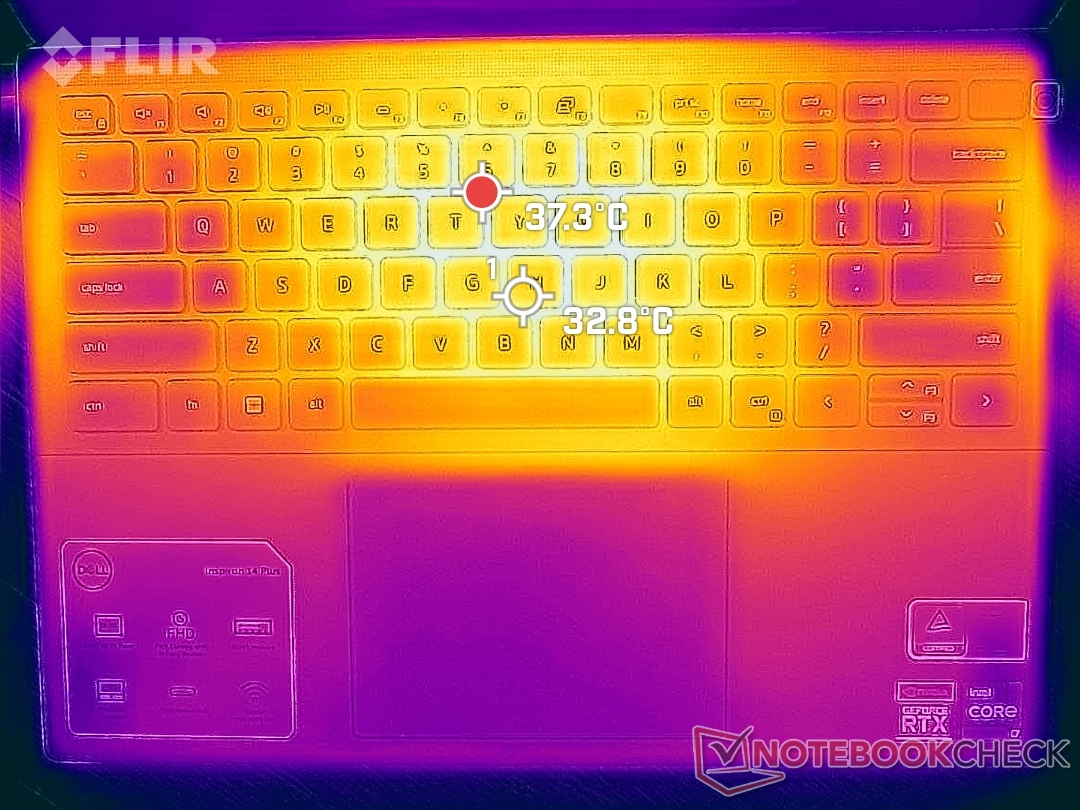
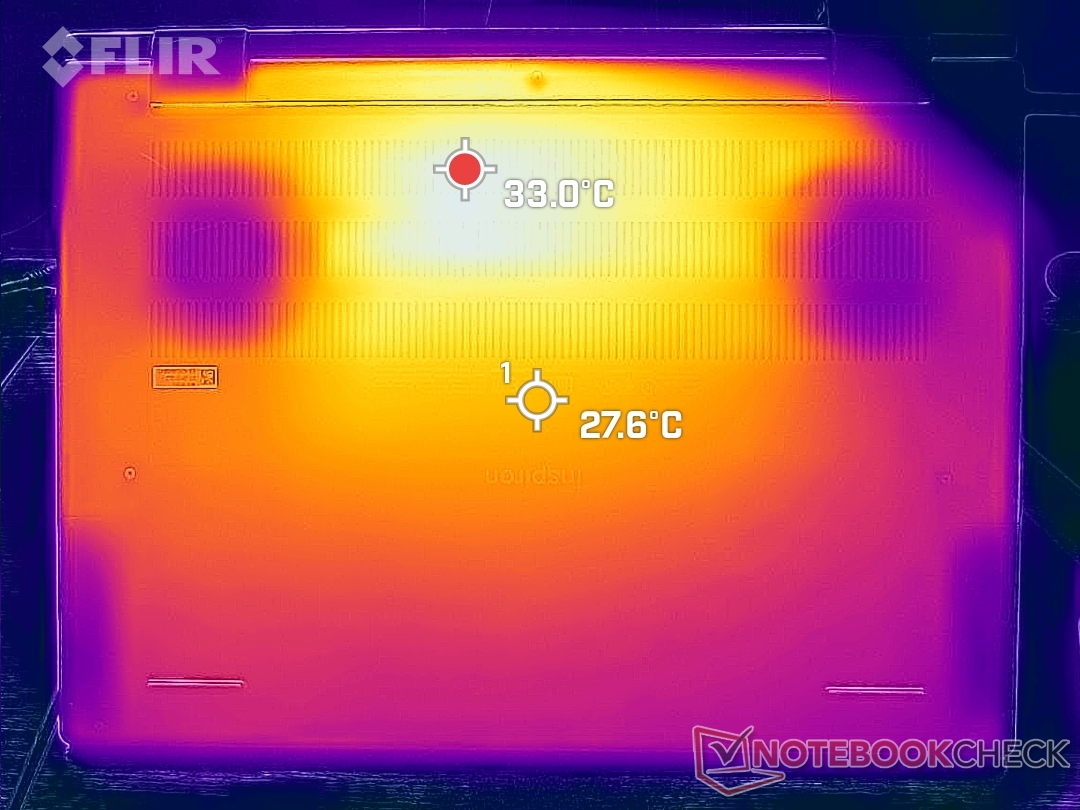
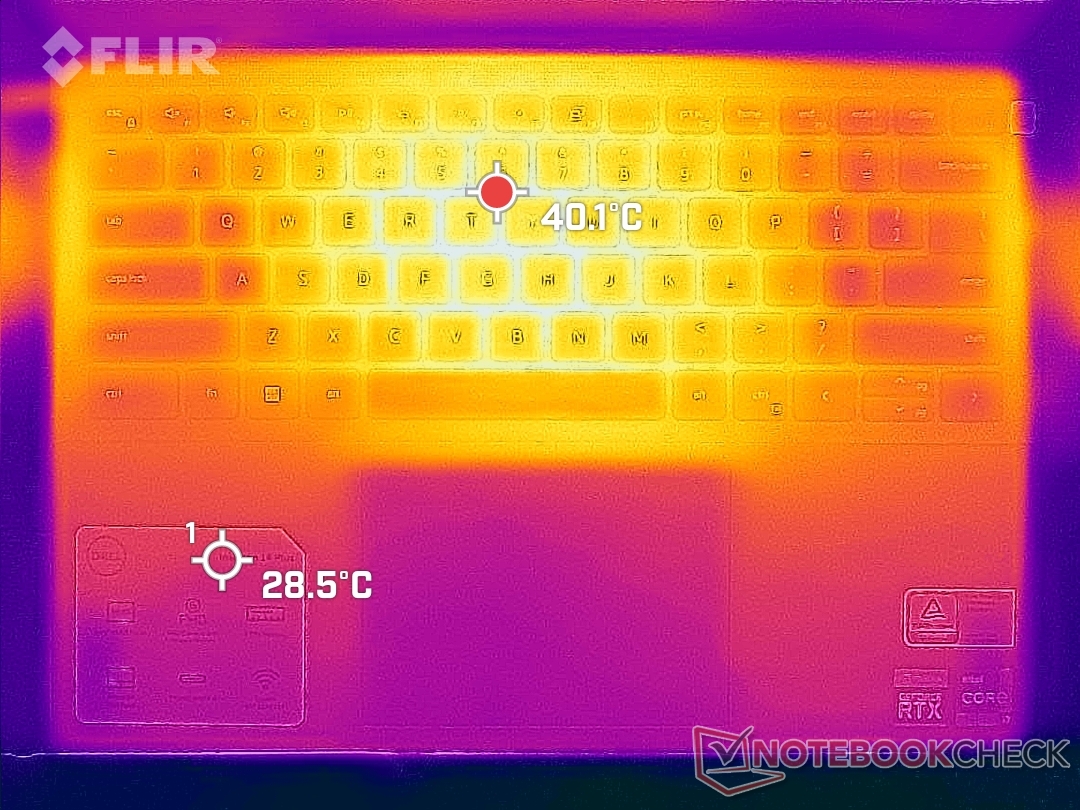
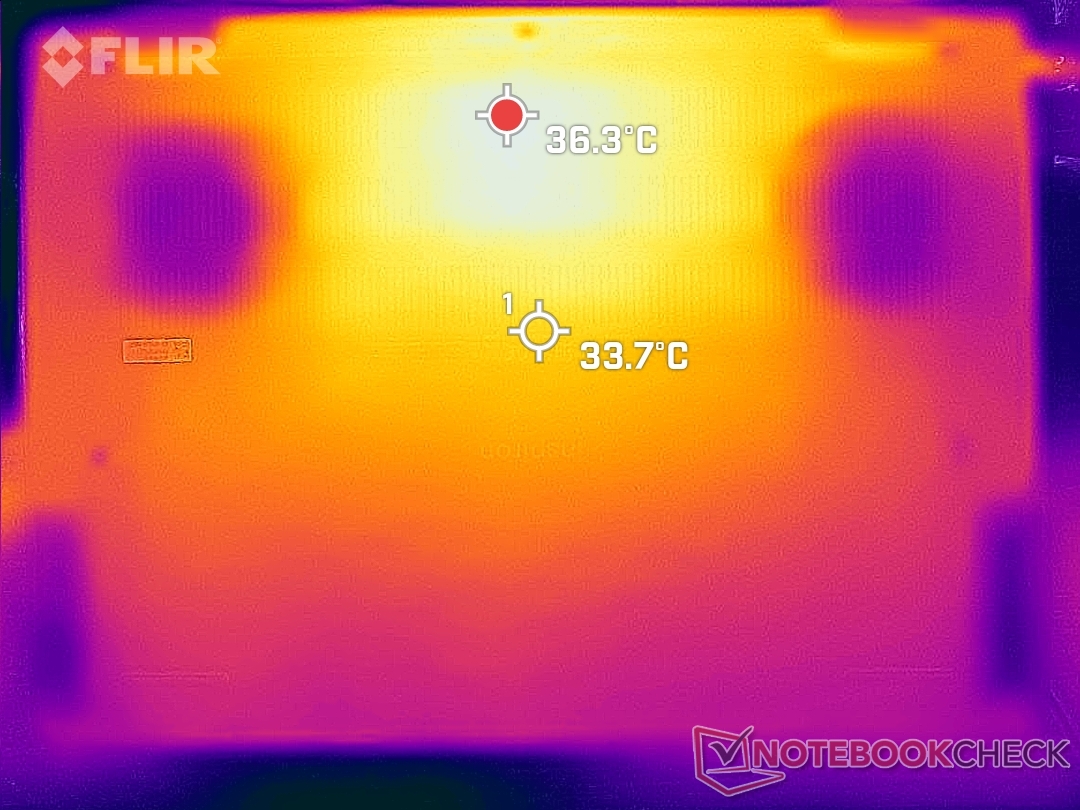
闲置时的表面温度在顶部和底部均为28摄氏度左右,这与其他带有独立显卡的薄型多媒体笔记本电脑类似。华硕Vivobook Pro 14或Schenker Vision 14。在游戏时,键盘中心和机箱后部附近的热点可以达到略高于40摄氏度,而脚垫则在30摄氏度以下的范围内保持比较舒适。这里的热点通常比上述华硕或Schenker更冷,后者可以达到45℃至55℃。
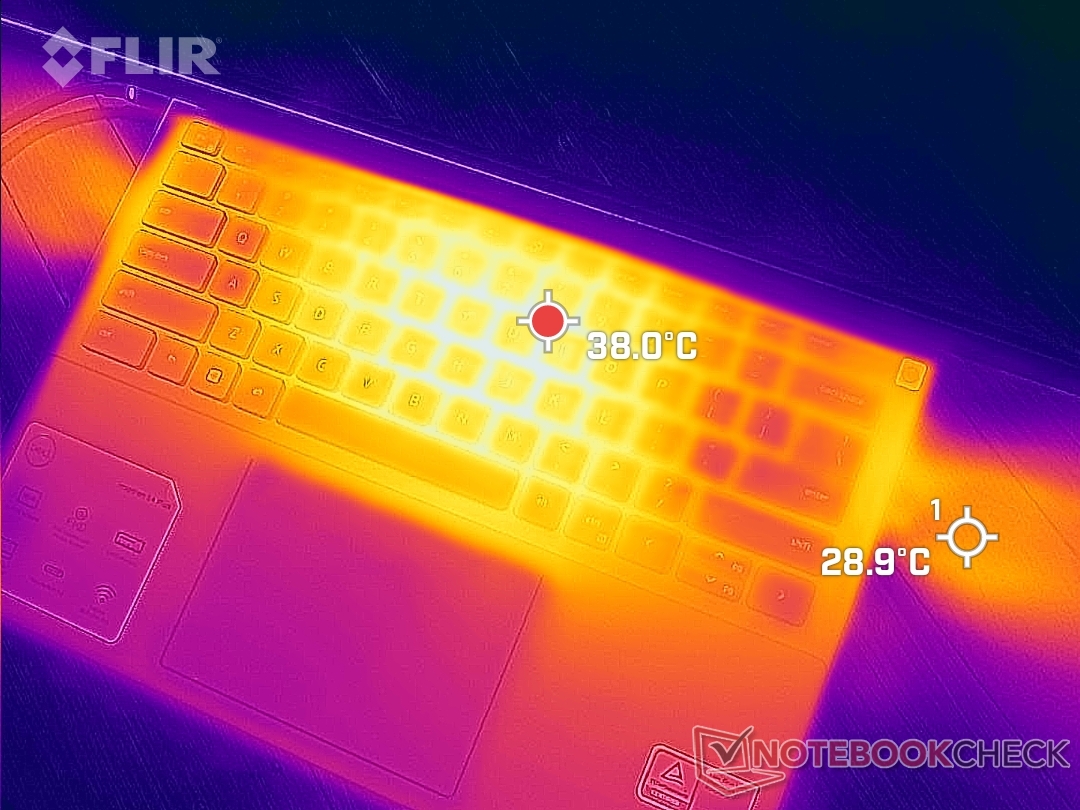
(±) The maximum temperature on the upper side is 40 °C / 104 F, compared to the average of 36.8 °C / 98 F, ranging from 21 to 71 °C for the class Multimedia.
(+) The bottom heats up to a maximum of 36.4 °C / 98 F, compared to the average of 39.1 °C / 102 F
(+) In idle usage, the average temperature for the upper side is 24.2 °C / 76 F, compared to the device average of 31.3 °C / 88 F.
(+) Playing The Witcher 3, the average temperature for the upper side is 28.6 °C / 83 F, compared to the device average of 31.3 °C / 88 F.
(+) The palmrests and touchpad are cooler than skin temperature with a maximum of 29.4 °C / 84.9 F and are therefore cool to the touch.
(±) The average temperature of the palmrest area of similar devices was 28.7 °C / 83.7 F (-0.7 °C / -1.2 F).
| Dell Inspiron 14 Plus 7420 Intel Core i7-12700H, NVIDIA GeForce RTX 3050 4GB Laptop GPU | Asus Vivobook Pro 14 M3401QC-KM007T AMD Ryzen 5 5600H, NVIDIA GeForce RTX 3050 4GB Laptop GPU | Dell Inspiron 14 7420 2-in-1 Intel Core i7-1255U, Intel Iris Xe Graphics G7 96EUs | Schenker Vision 14 Intel Core i7-11370H, NVIDIA GeForce RTX 3050 Ti Laptop GPU | Asus Zenbook 14X UX5400E Intel Core i7-1165G7, NVIDIA GeForce MX450 | MSI Summit E14 A11SCS Intel Core i7-1185G7, NVIDIA GeForce GTX 1650 Ti Max-Q | HP Envy 14-eb0010nr Intel Core i5-1135G7, NVIDIA GeForce GTX 1650 Ti Max-Q | |
|---|---|---|---|---|---|---|---|
| Heat | -25% | -5% | -23% | -17% | -33% | -19% | |
| Maximum Upper Side * (°C) | 40 | 42.3 -6% | 38.2 4% | 49.7 -24% | 42.4 -6% | 49.4 -23% | 41.2 -3% |
| Maximum Bottom * (°C) | 36.4 | 49.6 -36% | 45.6 -25% | 56 -54% | 47.7 -31% | 60.6 -66% | 45.6 -25% |
| Idle Upper Side * (°C) | 27 | 34.2 -27% | 27.4 -1% | 28.8 -7% | 32.3 -20% | 30.6 -13% | 31.8 -18% |
| Idle Bottom * (°C) | 29.2 | 37.9 -30% | 28.4 3% | 30.6 -5% | 31.9 -9% | 37.4 -28% | 37.8 -29% |
* ... smaller is better
压力测试
运行Prime95对CPU施加压力会导致时钟频率、温度和电路板功耗分别飙升至3.5 GHz、100 C和80 W,持续约10秒左右。此后,时钟频率、温度和电路板功耗将稳步下降,然后分别稳定在1.9 GHz、80 C和38 W,以保持温度的控制。性能的下降是比较陡峭的,因为 惠普Pavilion Plus 14在接受同样的测试时,相同的CPU能够保持更快的2.2至2.9GHz的范围。
运行 Witcher 3显示GeForce GPU稳定在1590 MHz、74 C和50 W。相比之下,更大的Inspiron 16 Plus中的RTX 3050 Ti将稳定在1627 MHz、84 C和63 W。核心温度高是毫不奇怪的,因为这是少数同时配备Core H系列CPU和GeForce RTX GPU的14英寸笔记本电脑之一。将电源配置文件从 "超性能 "改为 "优化",可以将GPU的功耗降至约45W或更低。
用电池运行限制了性能。在电池上进行的Fire Strike ,物理学和图形学的分数分别为9493和7637分,而在电源上则为26940和12125分。
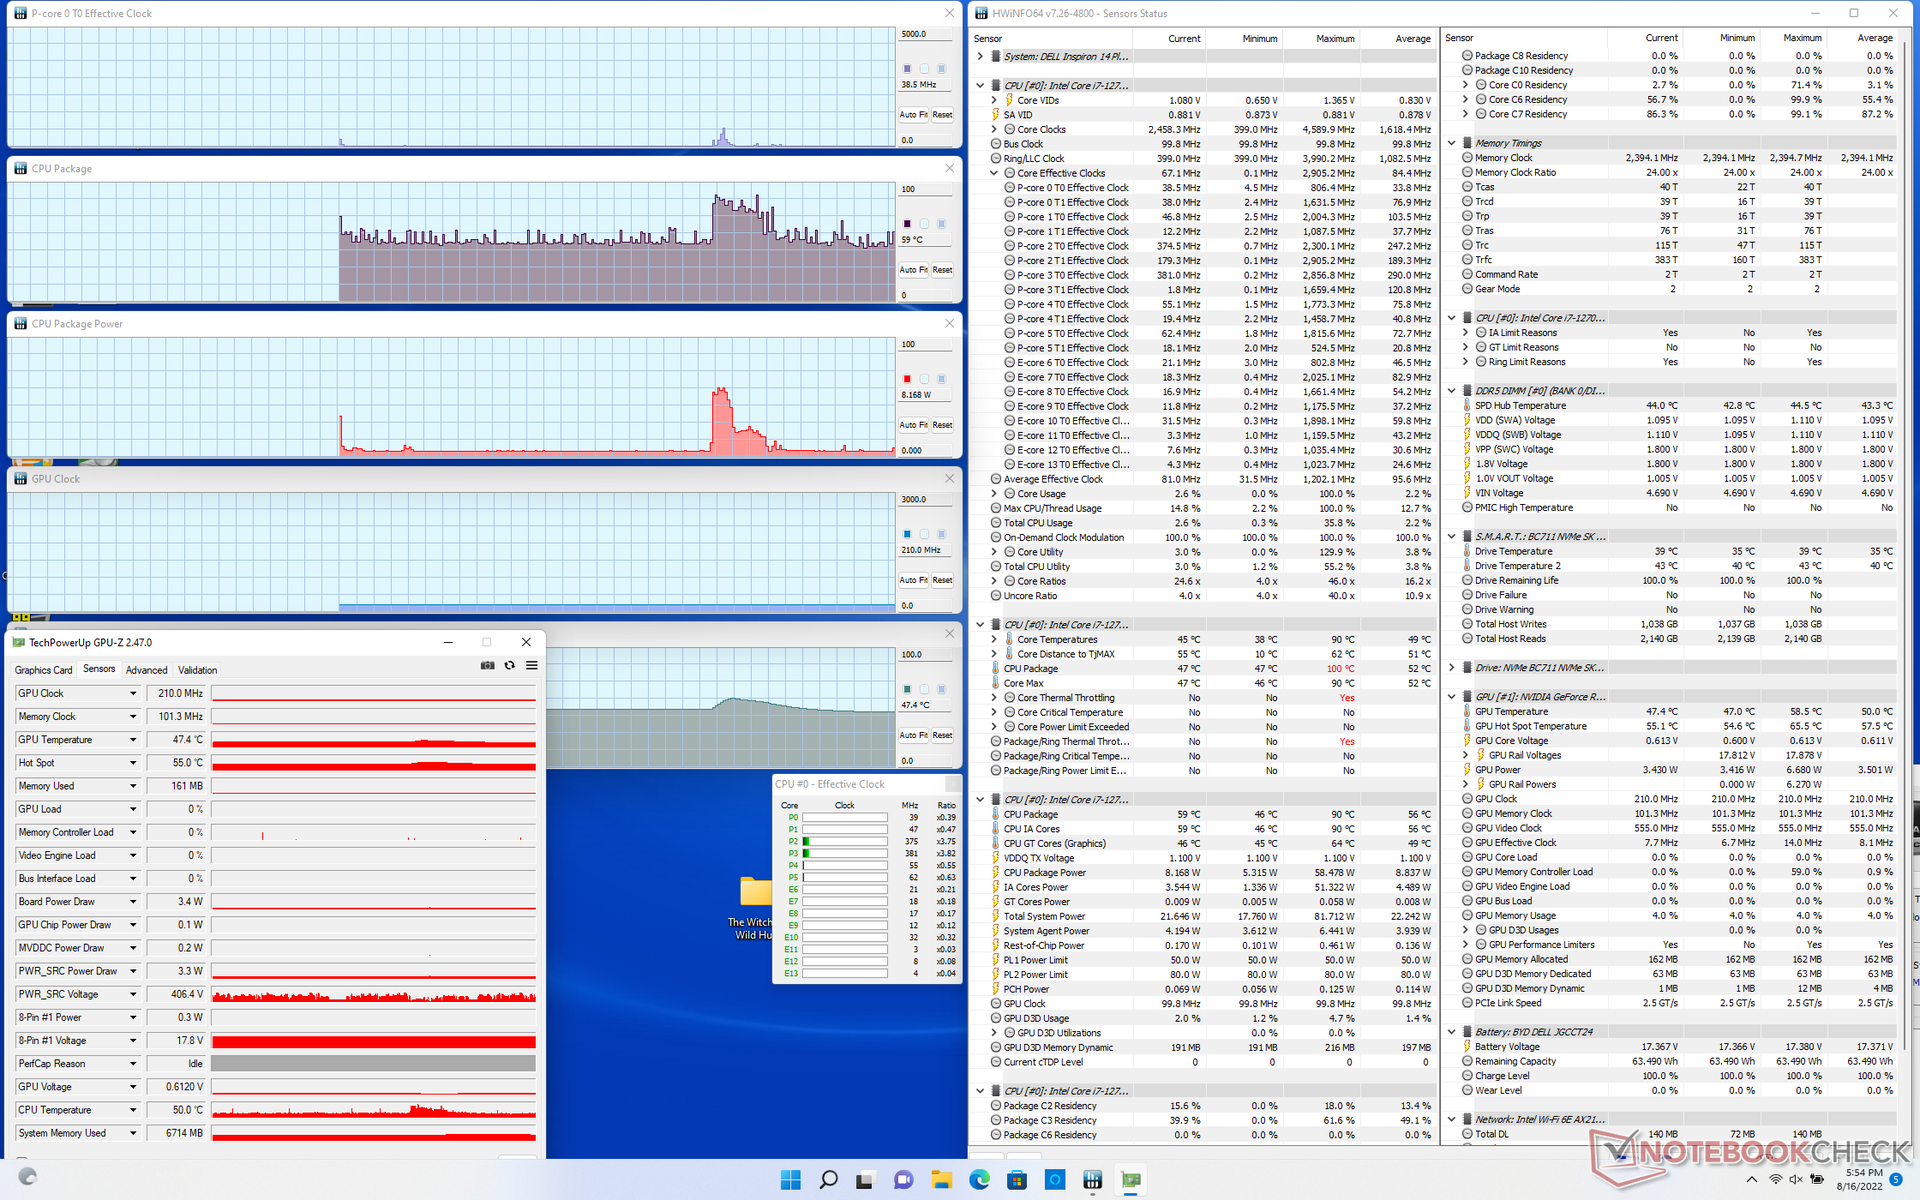
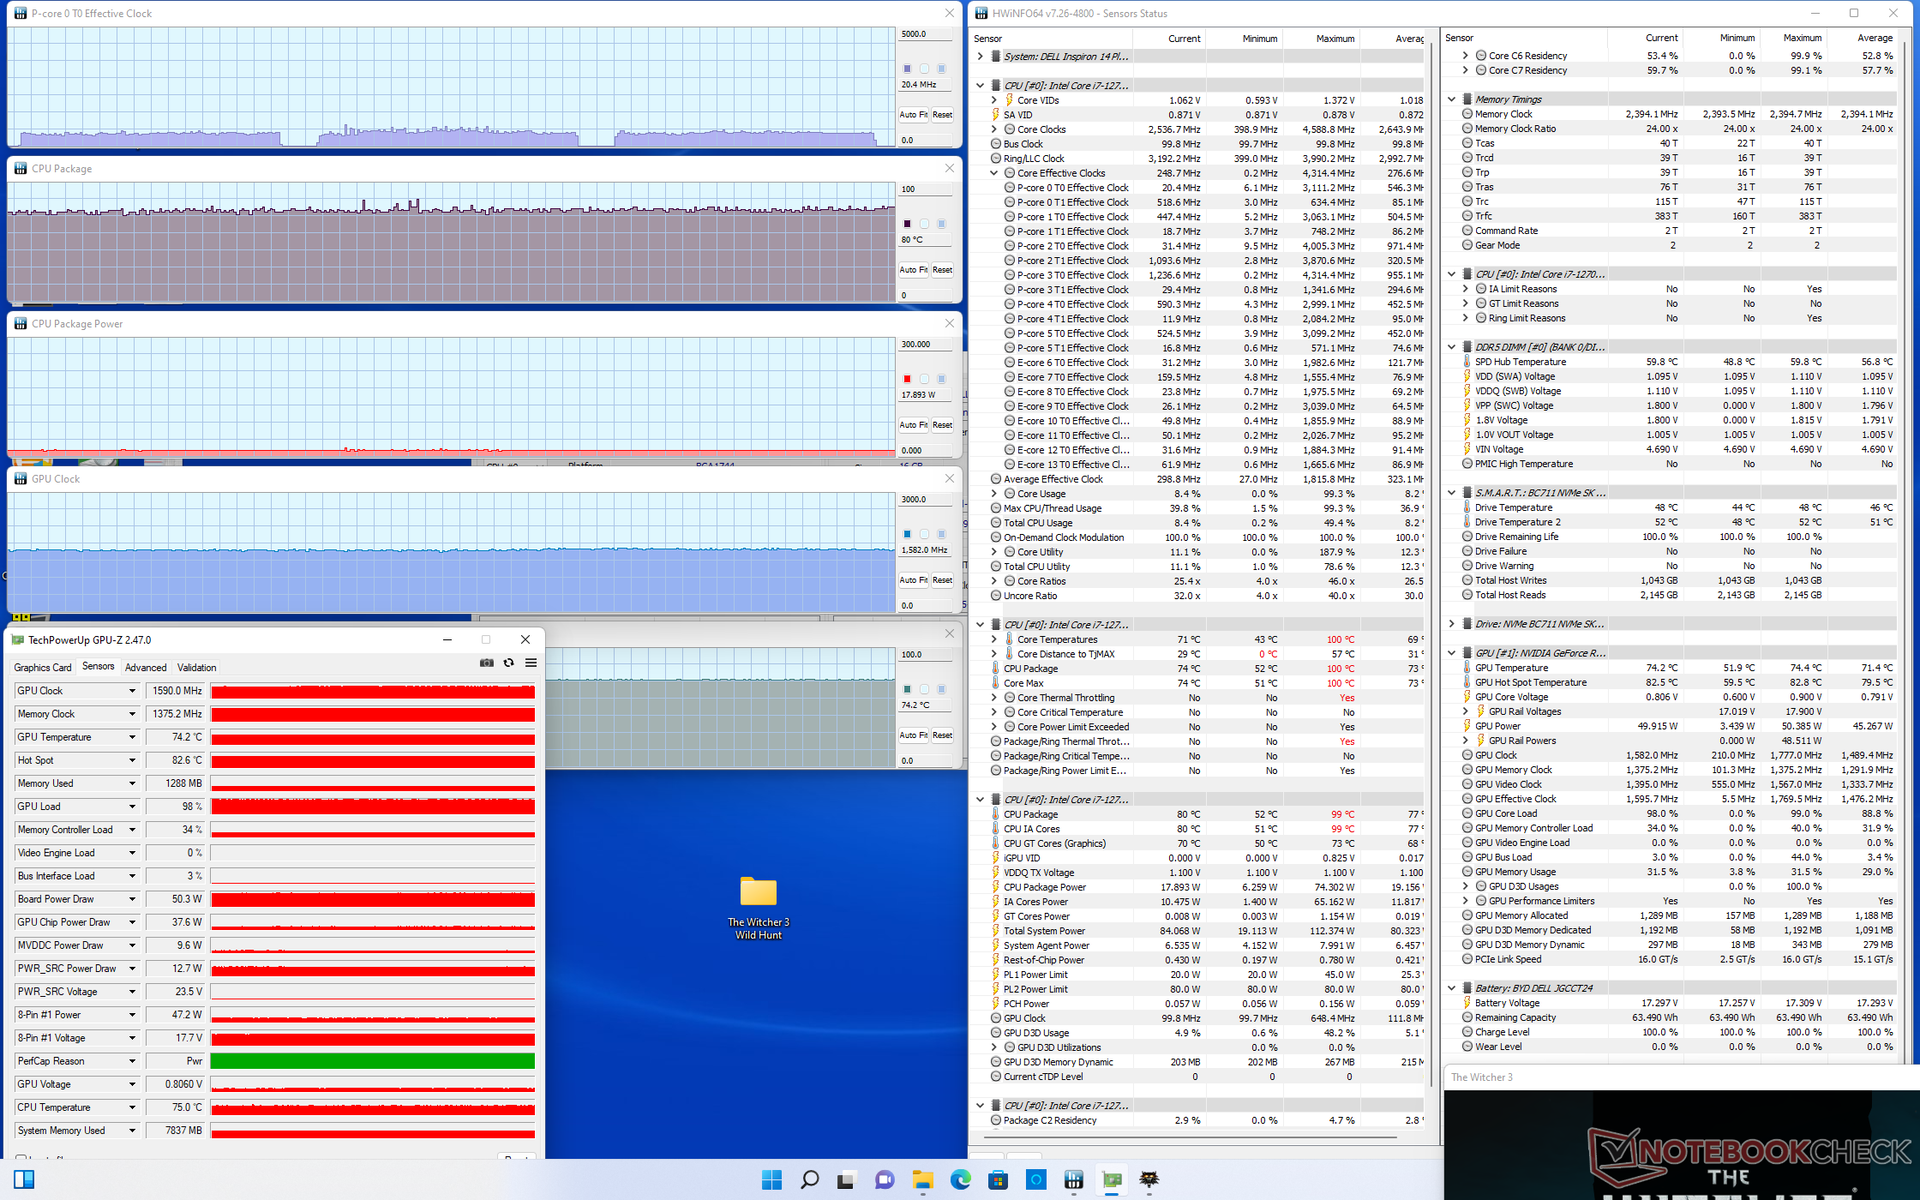
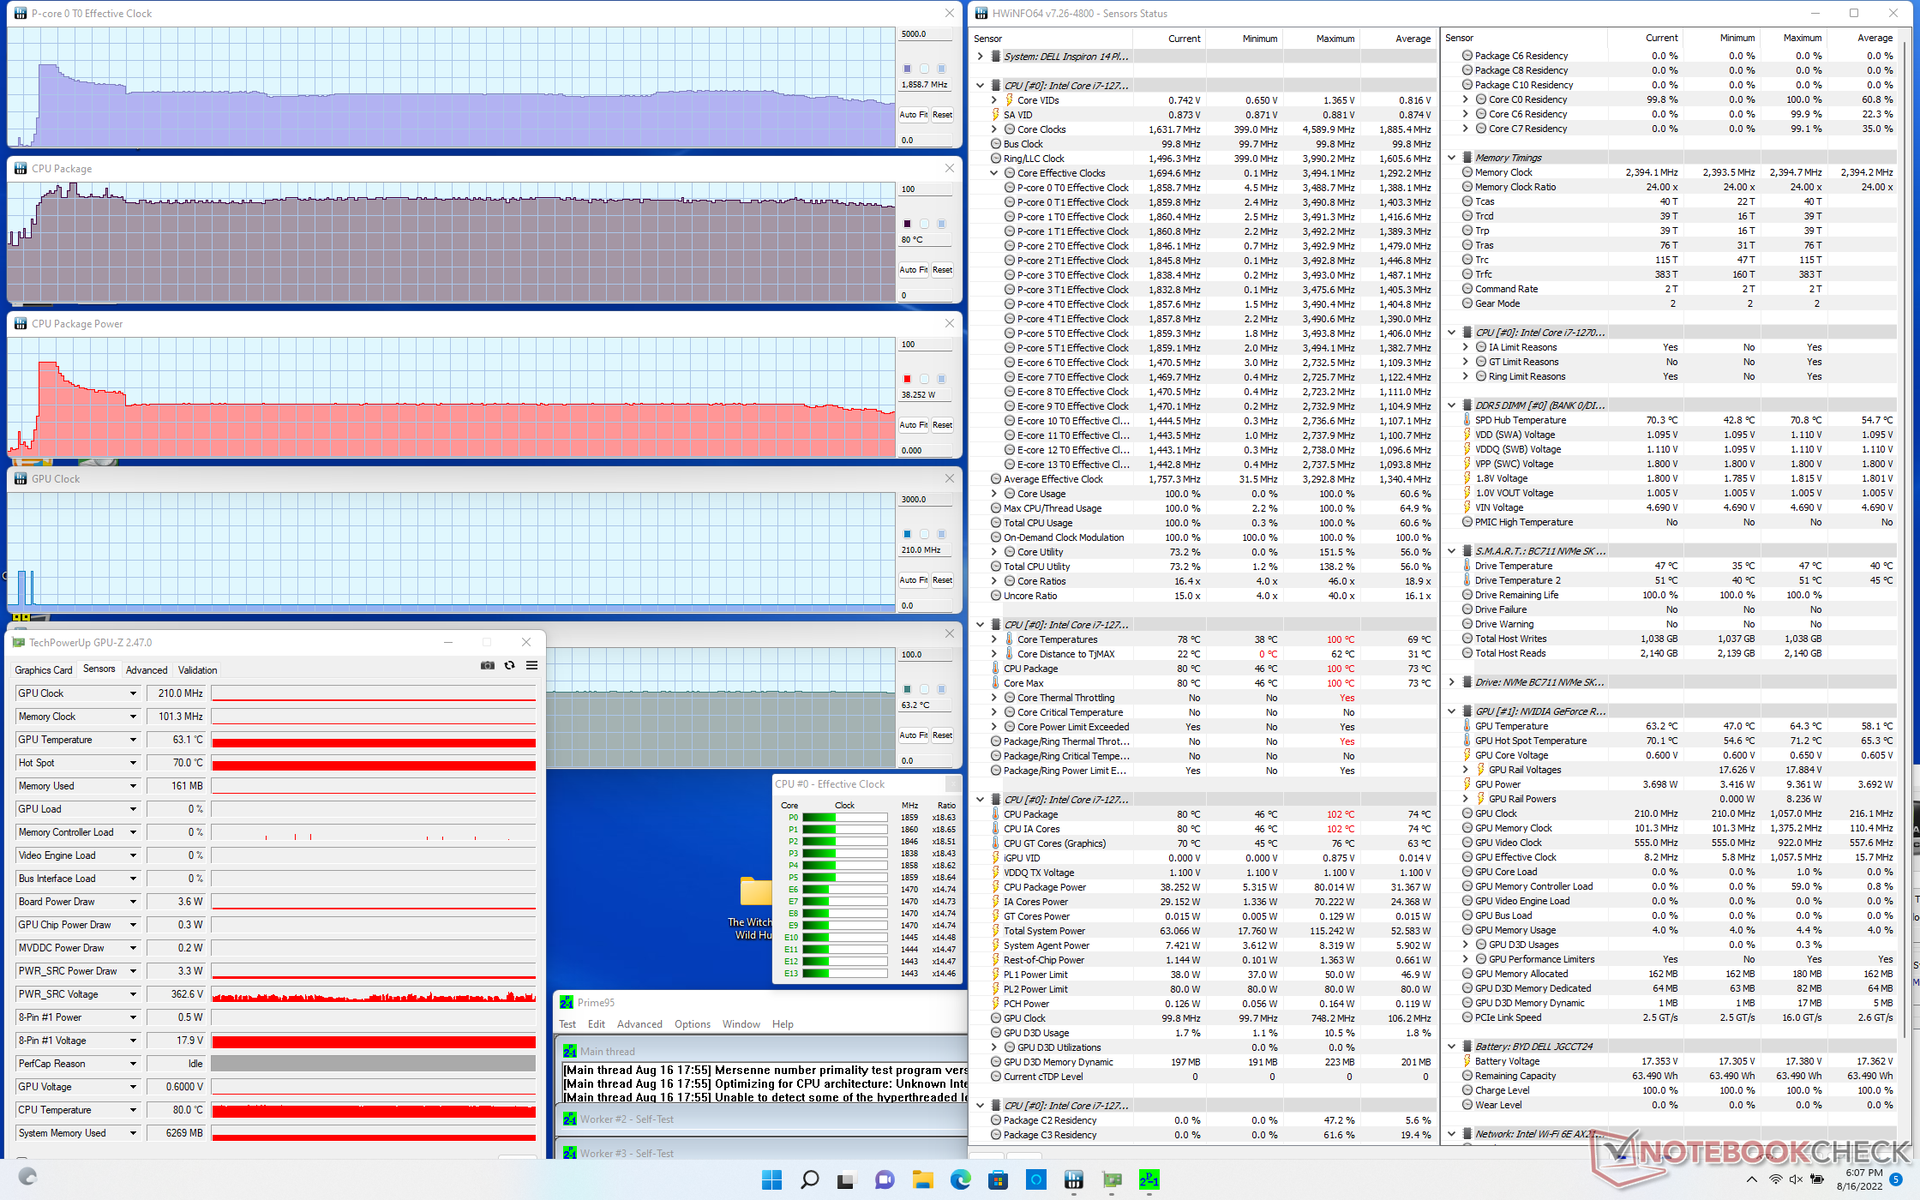
| CPU时钟(GHz) | GPU时钟(MHz) | CPU平均温度(℃) | GPU平均温度(℃) | |
| 系统空闲 | -- | -- | 59 | 47 |
| Prime95压力 | 1.9 | -- | 80 | 63 |
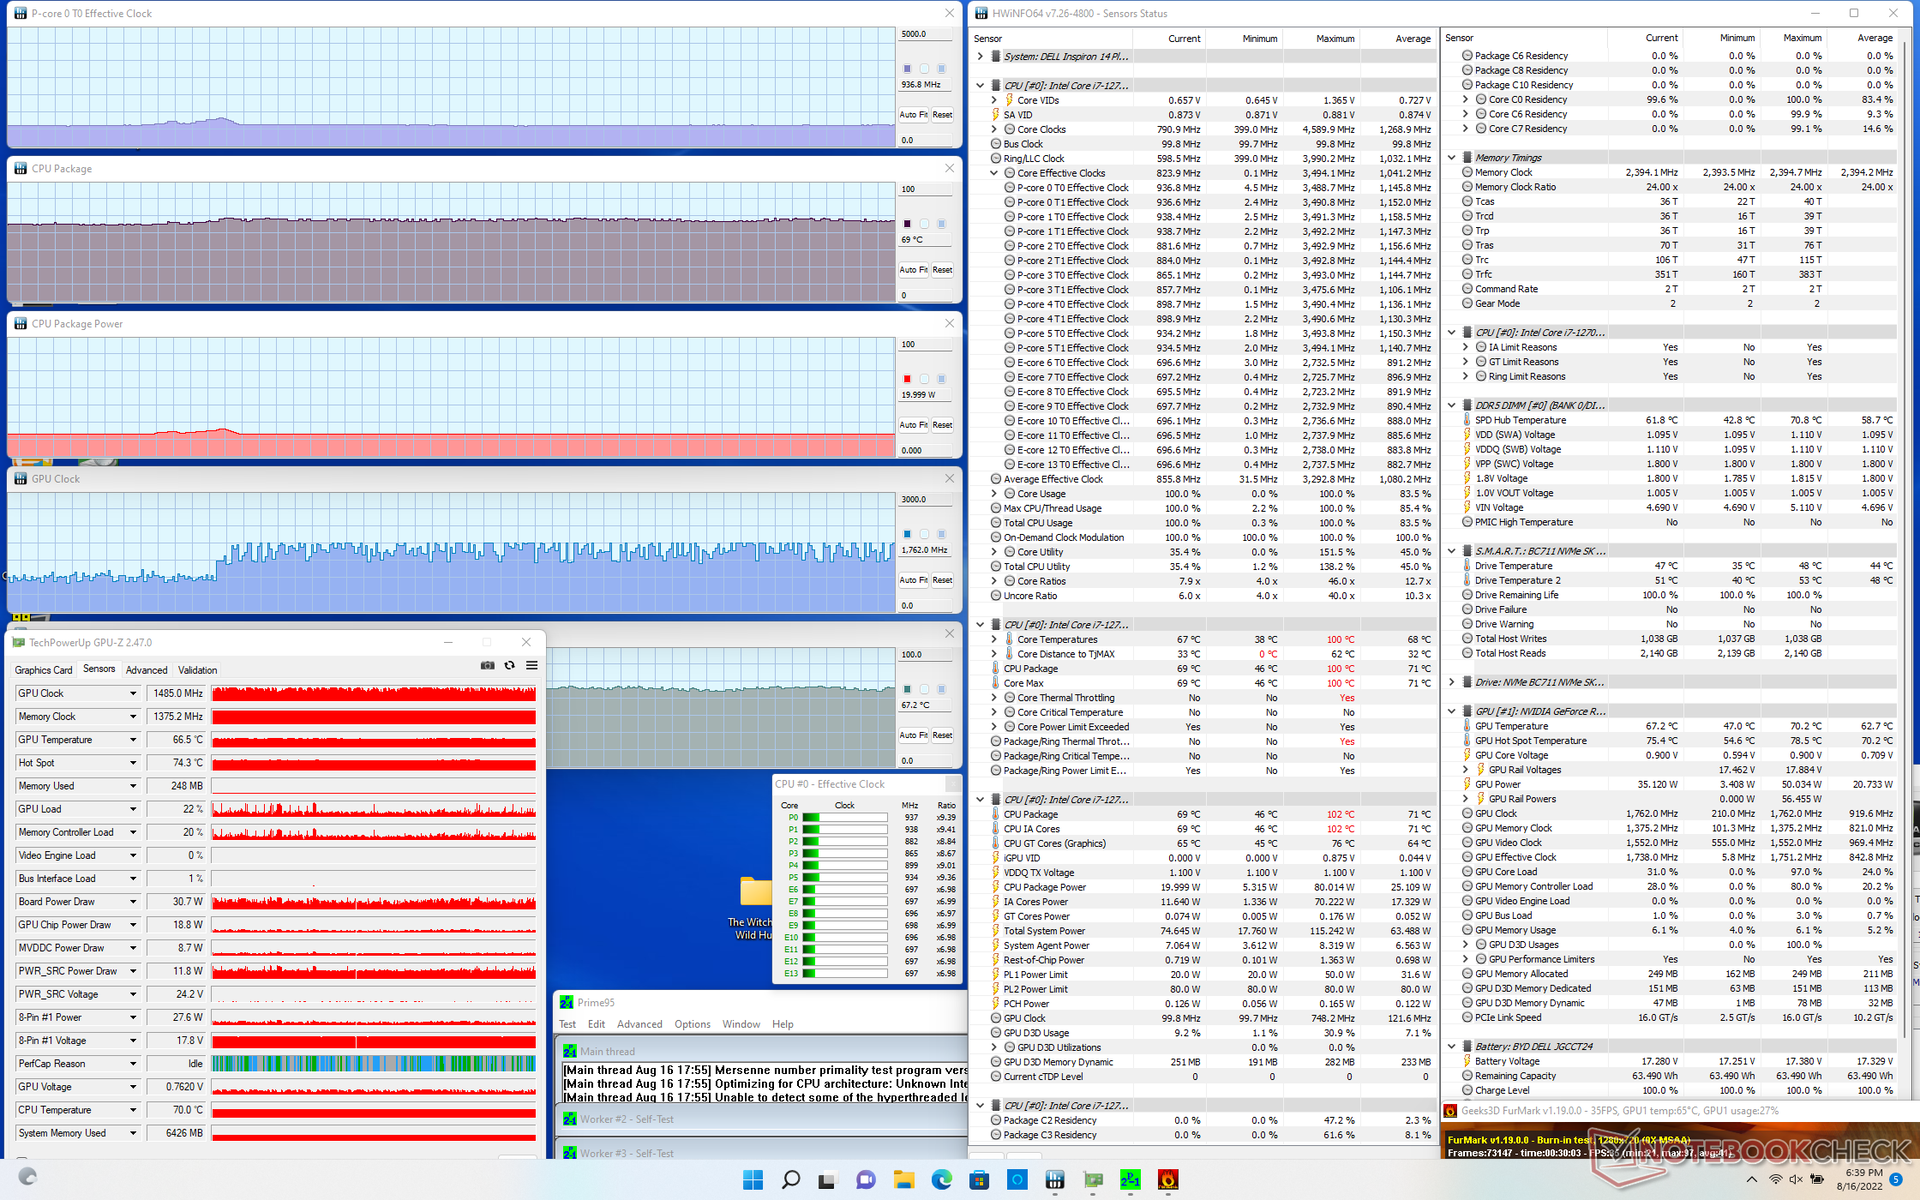
| Prime95 + FurMark 压力 | 0.9 | ~1485 | 69 | 67 |
| Witcher 3 应力 | ~1.1 | 1590 | 80 | 74 |
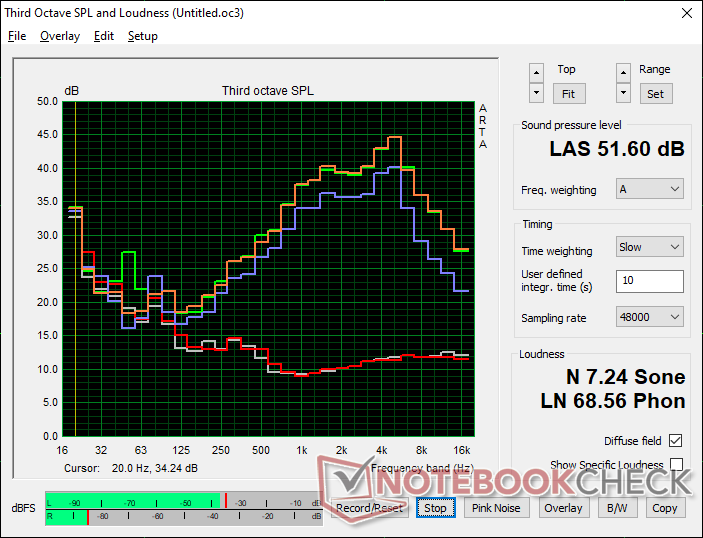
发言人
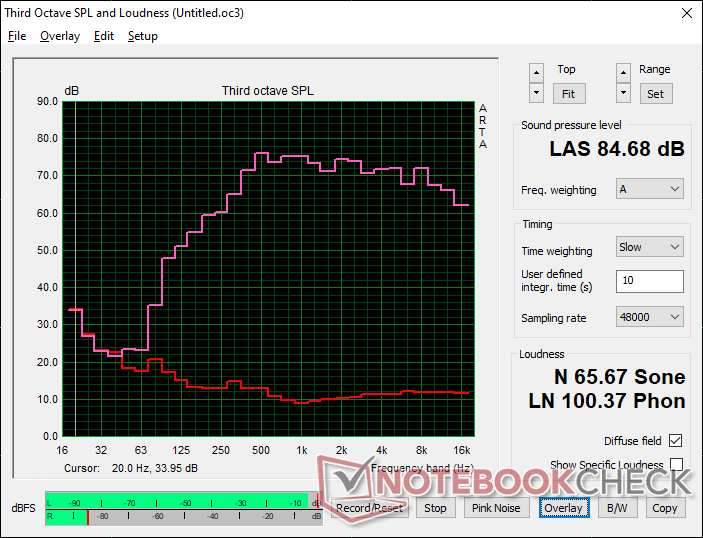
Dell Inspiron 14 Plus 7420 audio analysis
(+) | speakers can play relatively loud (84.7 dB)
Bass 100 - 315 Hz
(±) | reduced bass - on average 14.7% lower than median
(±) | linearity of bass is average (8.3% delta to prev. frequency)
Mids 400 - 2000 Hz
(+) | balanced mids - only 2.6% away from median
(+) | mids are linear (4.8% delta to prev. frequency)
Highs 2 - 16 kHz
(+) | balanced highs - only 1.8% away from median
(+) | highs are linear (4.4% delta to prev. frequency)
Overall 100 - 16.000 Hz
(+) | overall sound is linear (10.4% difference to median)
Compared to same class
» 15% of all tested devices in this class were better, 1% similar, 84% worse
» The best had a delta of 5%, average was 17%, worst was 45%
Compared to all devices tested
» 5% of all tested devices were better, 1% similar, 93% worse
» The best had a delta of 4%, average was 23%, worst was 134%
Apple MacBook Pro 16 2021 M1 Pro audio analysis
(+) | speakers can play relatively loud (84.7 dB)
Bass 100 - 315 Hz
(+) | good bass - only 3.8% away from median
(+) | bass is linear (5.2% delta to prev. frequency)
Mids 400 - 2000 Hz
(+) | balanced mids - only 1.3% away from median
(+) | mids are linear (2.1% delta to prev. frequency)
Highs 2 - 16 kHz
(+) | balanced highs - only 1.9% away from median
(+) | highs are linear (2.7% delta to prev. frequency)
Overall 100 - 16.000 Hz
(+) | overall sound is linear (4.6% difference to median)
Compared to same class
» 0% of all tested devices in this class were better, 0% similar, 100% worse
» The best had a delta of 5%, average was 17%, worst was 45%
Compared to all devices tested
» 0% of all tested devices were better, 0% similar, 100% worse
» The best had a delta of 4%, average was 23%, worst was 134%
能源管理--苛刻的小机器
消耗功率
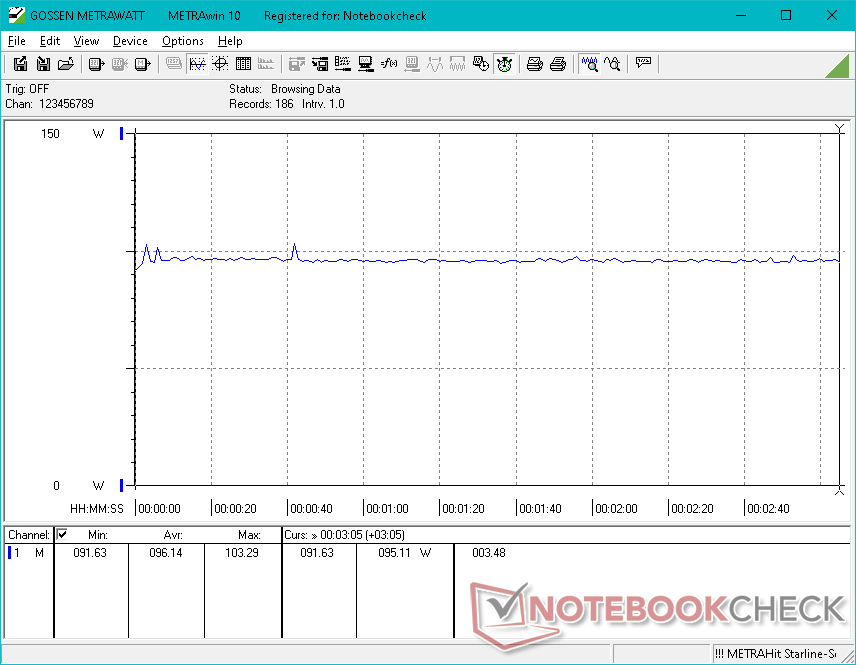
在省电模式下,如果在最低亮度设置下,功耗在6W之间,如果在最大设置下,功耗在10W之间。在Nvidia GPU激活的情况下,将电源配置文件更改为超性能模式,将空闲功耗提高到20瓦,这大约是大多数由U系列CPU驱动的较慢的14英寸笔记本电脑的两倍。
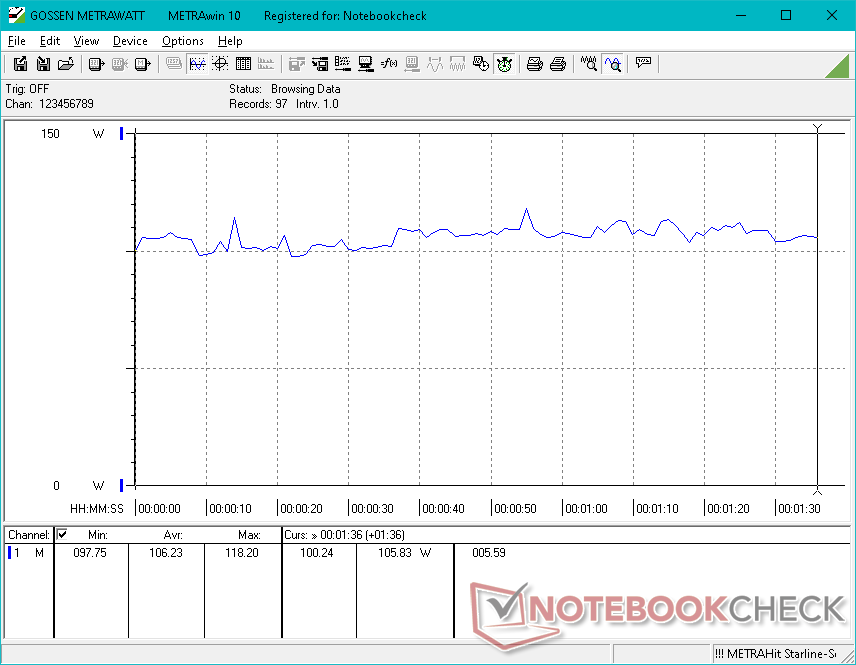
游戏需要96瓦至106瓦,而传统的U系列处理器只需要40瓦或50瓦。众所周知,英特尔第12代H系列在已经要求很高的独立GPU的基础上要求非常高。因此,难怪Inspiron 14 Plus比一般的14英寸笔记本电脑运行时声音更大、温度更高。
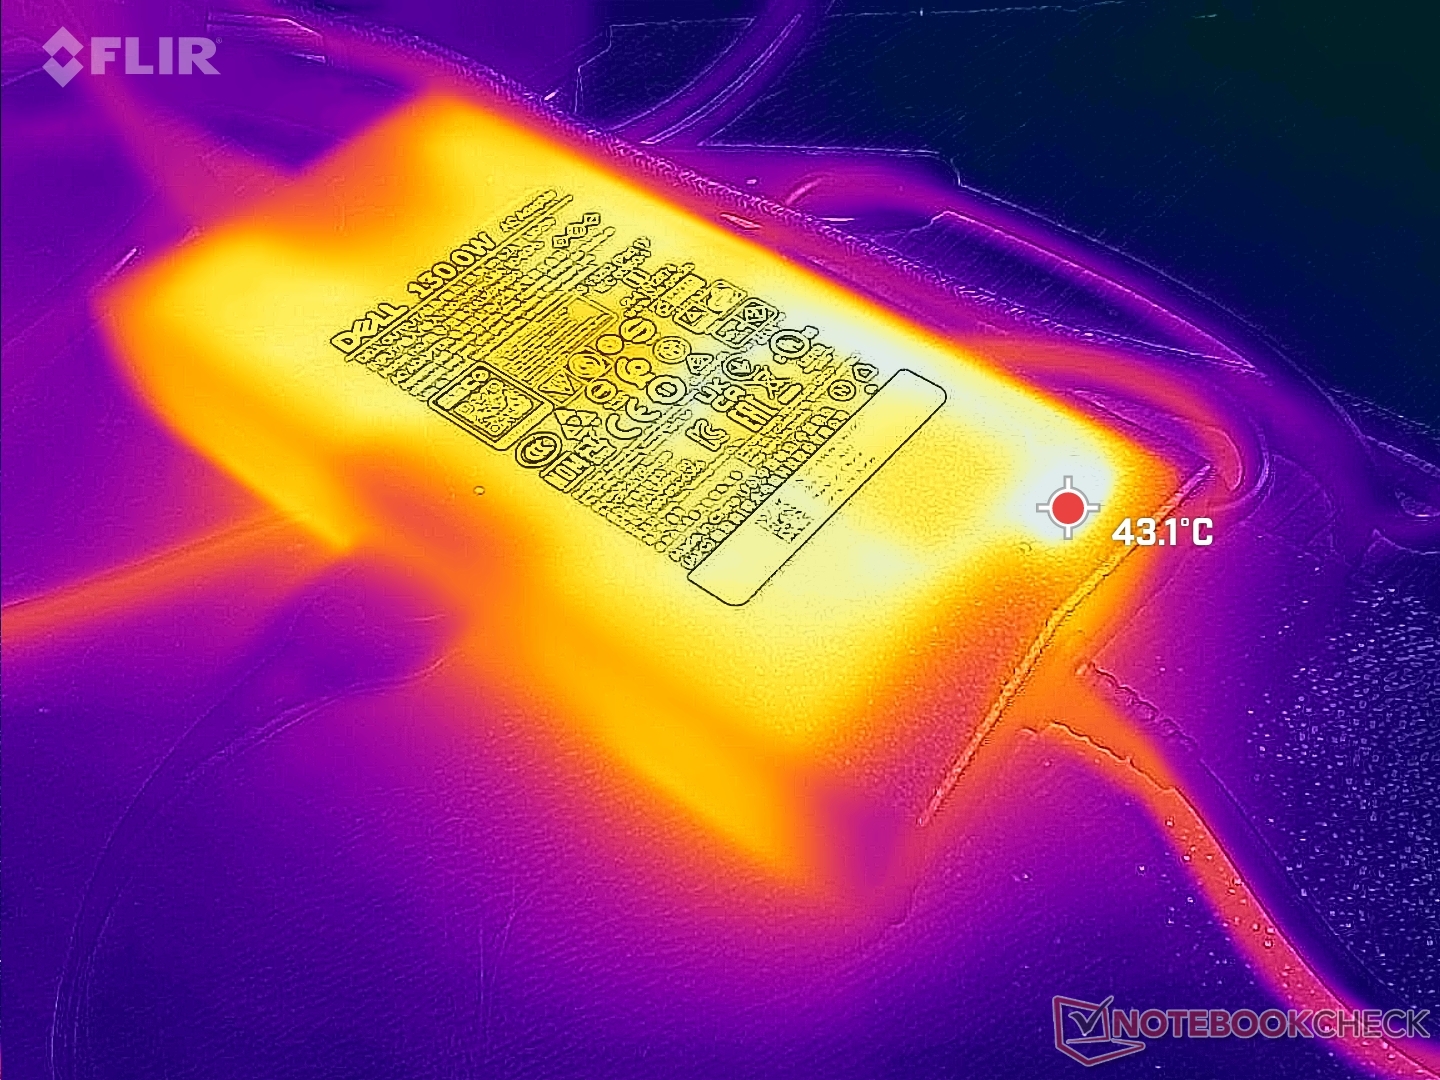
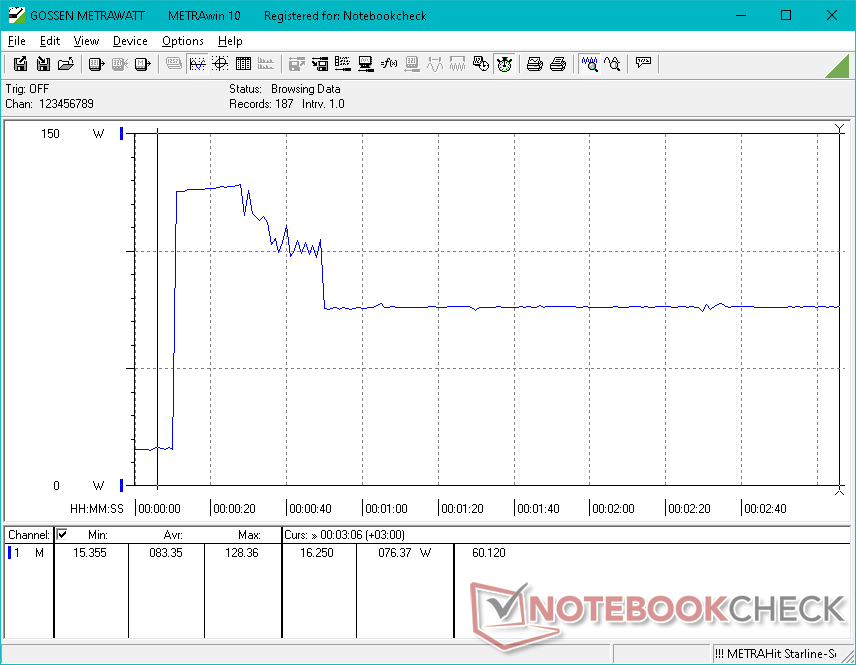
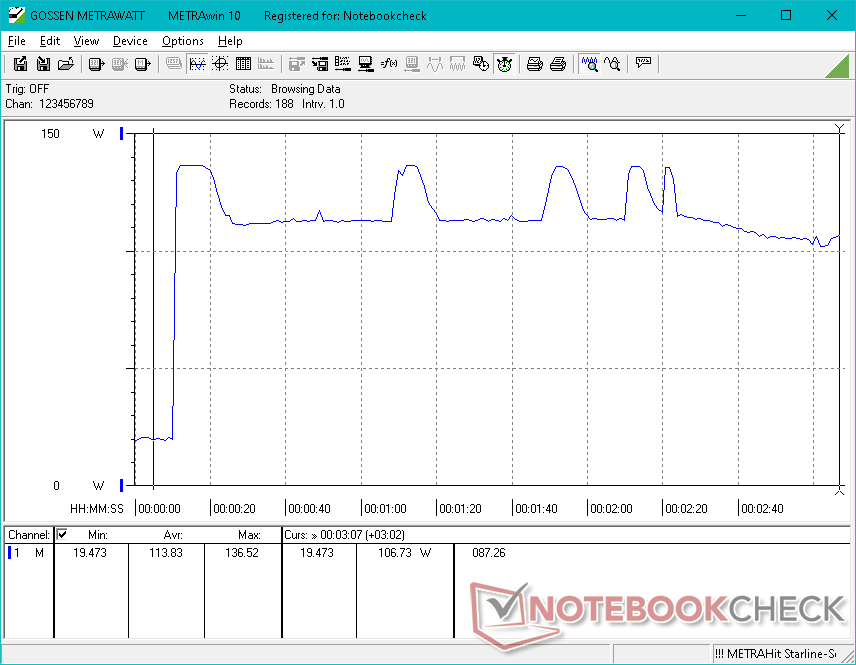
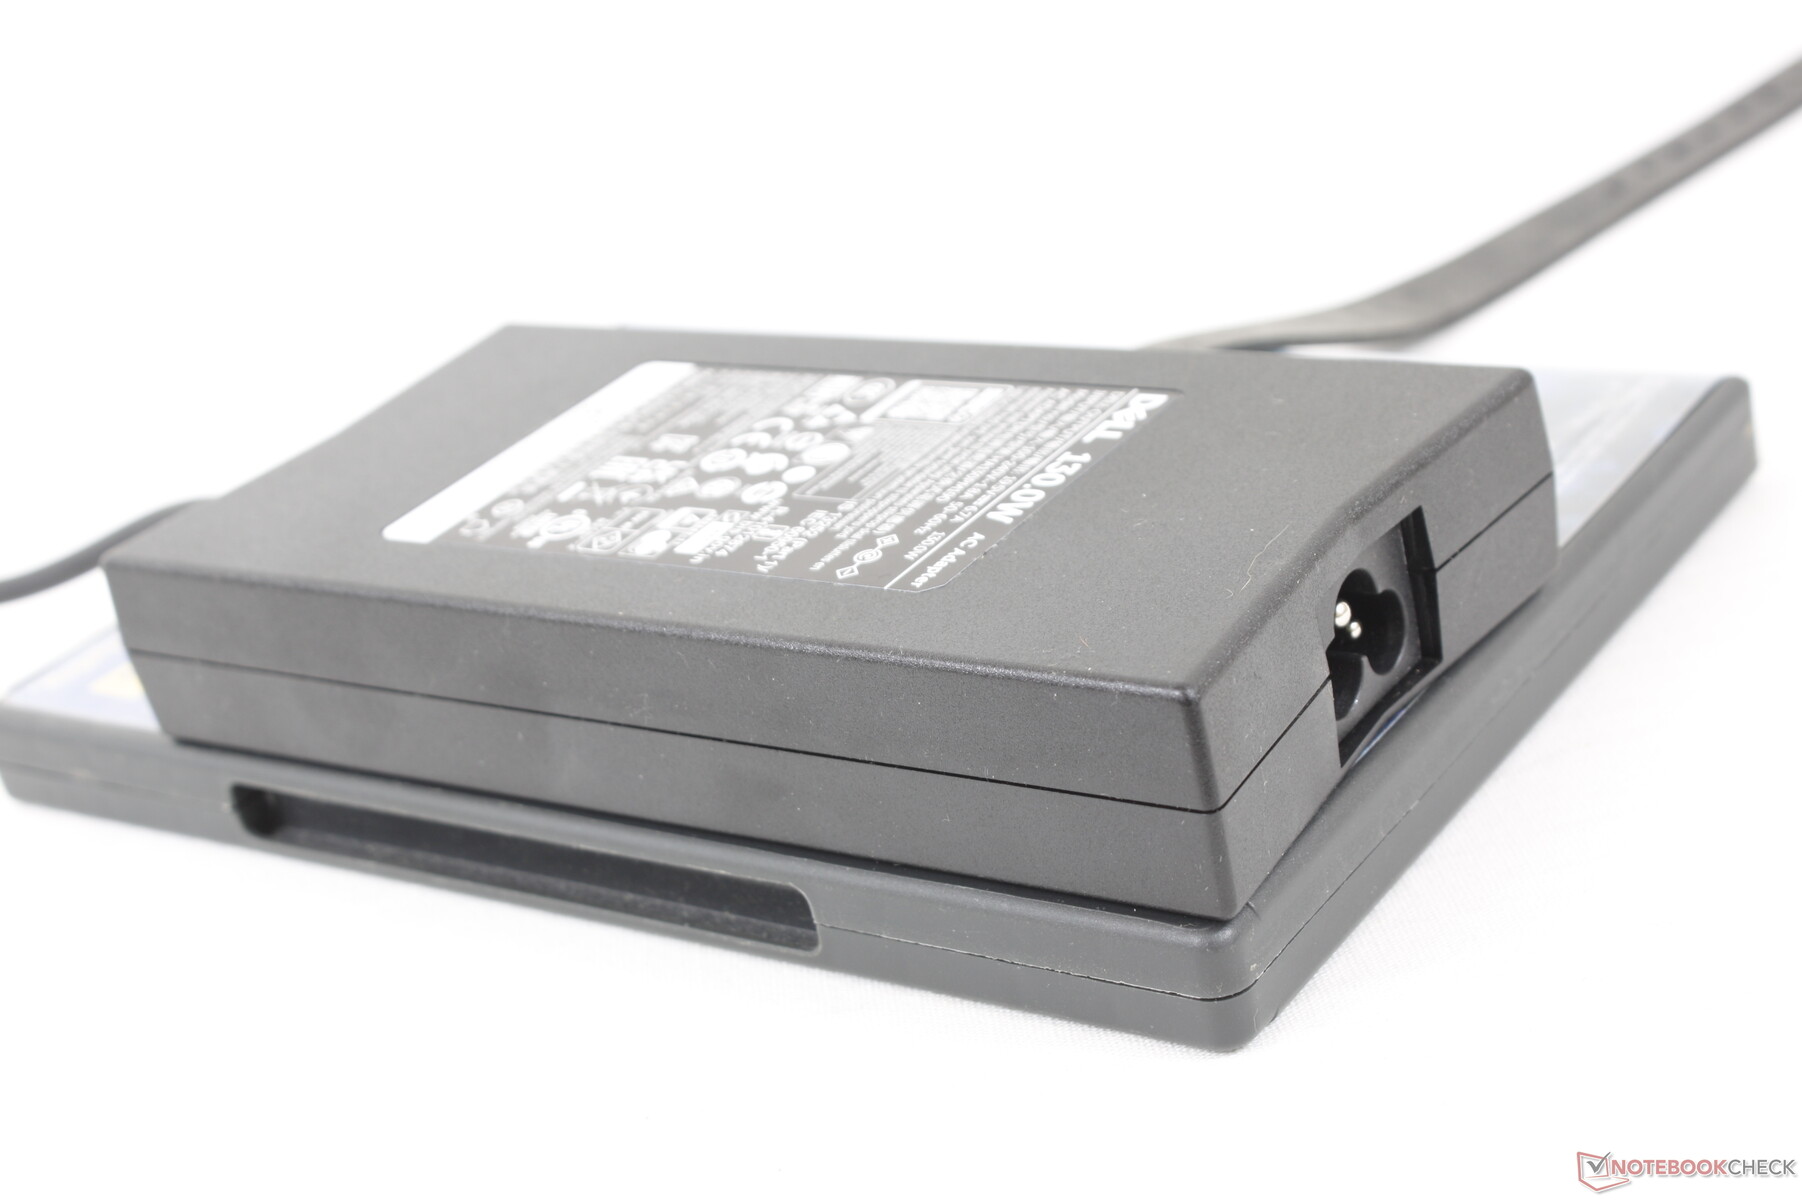
当同时运行Prime95和FurMark时,我们能够从中等大小(约15.3 x 7.5 x 2.6厘米)的130瓦交流适配器中记录到137瓦的最大消耗。正如我们下面的截图所示,消耗量往往在110瓦和137瓦之间循环。如果运行这样的负荷,预计充电速度会比较慢。
| Off / Standby | |
| Idle | |
| Load |
|
Key:
min: | |
| Dell Inspiron 14 Plus 7420 i7-12700H, GeForce RTX 3050 4GB Laptop GPU, SK Hynix BC711 512GB HFM512GD3GX013N, IPS, 2240x1400, 14" | Asus Vivobook Pro 14 M3401QC-KM007T R5 5600H, GeForce RTX 3050 4GB Laptop GPU, Intel SSD 670p SSDPEKNU512GZ, OLED, 2880x1800, 14" | Dell Inspiron 14 7420 2-in-1 i7-1255U, Iris Xe G7 96EUs, WDC PC SN530 SDBPMPZ-512G, IPS, 1920x1200, 14" | Schenker Vision 14 i7-11370H, GeForce RTX 3050 Ti Laptop GPU, Samsung SSD 980 Pro 1TB MZ-V8P1T0BW, IPS, 2880x1800, 14" | Asus Zenbook 14X UX5400E i7-1165G7, GeForce MX450, SK Hynix HFM001TD3JX013N, OLED, 2880x1800, 14" | MSI Summit E14 A11SCS i7-1185G7, GeForce GTX 1650 Ti Max-Q, Phison 1TB SM2801T24GKBB4S-E162, IPS, 3840x2160, 14" | HP Envy 14-eb0010nr i5-1135G7, GeForce GTX 1650 Ti Max-Q, Samsung SSD PM981a MZVLB256HBHQ, IPS, 1920x1200, 14" | |
|---|---|---|---|---|---|---|---|
| Power Consumption | 22% | 44% | 8% | 24% | -10% | 5% | |
| Idle Minimum * (Watt) | 6.3 | 6.6 -5% | 5.2 17% | 6.7 -6% | 7.2 -14% | 9.9 -57% | 4.2 33% |
| Idle Average * (Watt) | 10.3 | 9.6 7% | 8.2 20% | 12.6 -22% | 10.4 -1% | 17.4 -69% | 18.3 -78% |
| Idle Maximum * (Watt) | 20 | 7.3 63% | 9.9 50% | 15.4 23% | 11 45% | 22.5 -13% | 19.2 4% |
| Load Average * (Watt) | 106.2 | 73 31% | 44.4 58% | 85.7 19% | 61.7 42% | 85.6 19% | 72.9 31% |
| Witcher 3 ultra * (Watt) | 96.1 | 74.4 23% | 35 64% | 83 14% | 53.6 44% | 70.9 26% | 61.5 36% |
| Load Maximum * (Watt) | 136.5 | 119 13% | 62.5 54% | 110.9 19% | 96 30% | 91.1 33% | 127.8 6% |
* ... smaller is better
Power Consumption Witcher 3 / Stresstest
Power Consumption external Monitor
电池寿命
运行时间比预期的要好,实际使用WLAN的时间超过7小时,这与我们在较慢的Inspiron 14 7420二合一产品上记录的时间非常接近,该产品根本没有专用图形。然而,请注意,我们的结果只反映了64Wh的配置,而不是较小的54Wh配置,后者的电池寿命应该略短。
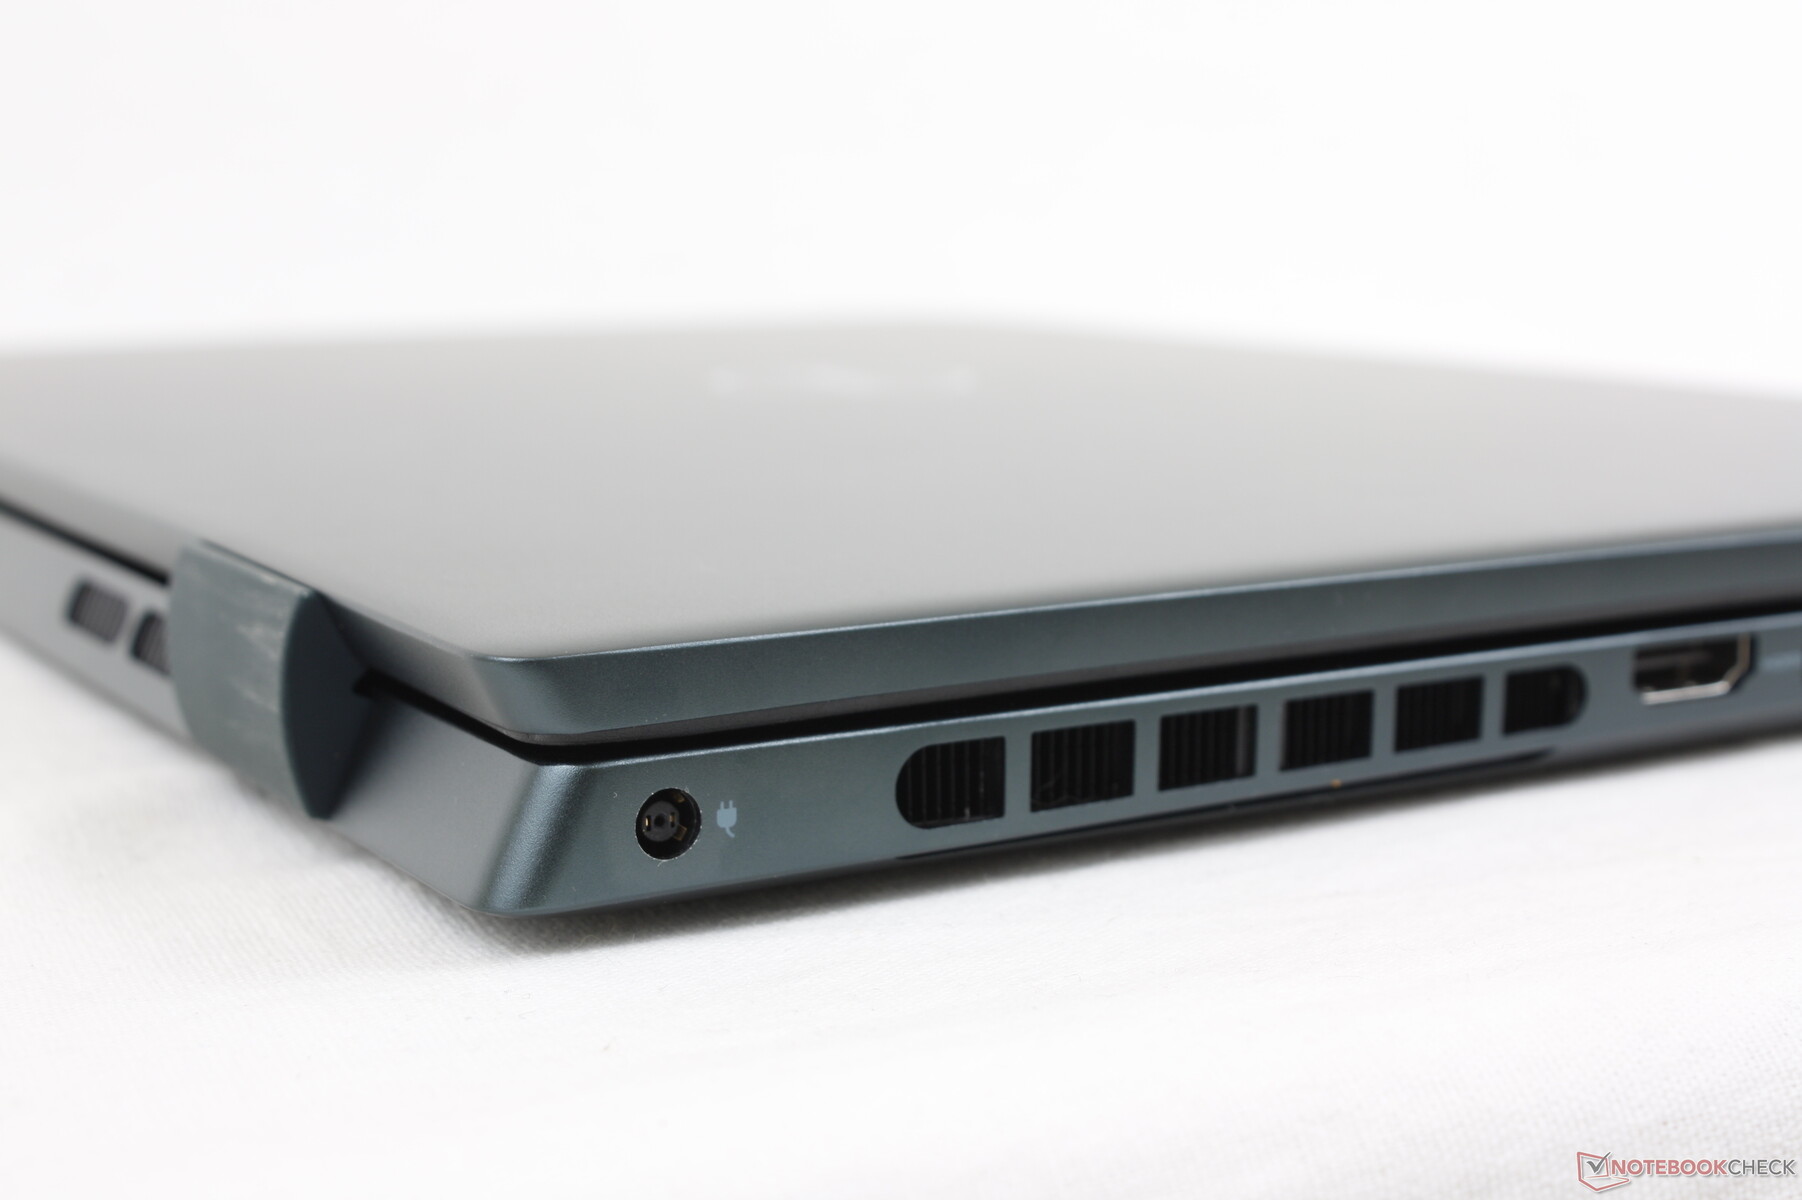
用附带的桶式交流电适配器从空电到满电大约需要2小时。支持通过第三方USB-C交流适配器进行充电。
| Dell Inspiron 14 Plus 7420 i7-12700H, GeForce RTX 3050 4GB Laptop GPU, 64 Wh | Asus Vivobook Pro 14 M3401QC-KM007T R5 5600H, GeForce RTX 3050 4GB Laptop GPU, 63 Wh | Dell Inspiron 14 7420 2-in-1 i7-1255U, Iris Xe G7 96EUs, 54 Wh | Schenker Vision 14 i7-11370H, GeForce RTX 3050 Ti Laptop GPU, 53 Wh | Asus Zenbook 14X UX5400E i7-1165G7, GeForce MX450, 63 Wh | MSI Summit E14 A11SCS i7-1185G7, GeForce GTX 1650 Ti Max-Q, 52 Wh | HP Envy 14-eb0010nr i5-1135G7, GeForce GTX 1650 Ti Max-Q, 63.3 Wh | |
|---|---|---|---|---|---|---|---|
| Battery runtime | 47% | 58% | 16% | 65% | -24% | 83% | |
| Reader / Idle (h) | 11.9 | 11.5 -3% | 15.9 34% | 34 186% | 6.6 -45% | 27.7 133% | |
| WiFi v1.3 (h) | 7.2 | 9.5 32% | 7.6 6% | 5.5 -24% | 5.4 -25% | 4.5 -37% | 10.8 50% |
| Load (h) | 0.9 | 1.9 111% | 2.1 133% | 1.4 56% | 1.2 33% | 1 11% | 1.5 67% |
| H.264 (h) | 6.8 |
Pros
Cons
结论--大尺寸的性能,大尺寸的重量
如果你想在你的下一个14英寸笔记本电脑上最大限度地提高CPU和GPU性能,那么可以考虑价格更高的 雷蛇刀片14或 华硕Zephyrus G14.如果你正在寻找一款轻薄的14英寸超极本,那么 华硕Zenbook 14或 LG Gram 14可能是更好的选择。然而,对于两方面的最佳选择,戴尔Inspiron 14 Plus 7420在极端性能和便携性之间游刃有余,同时将价格保持在合理水平。经常旅行的人如果对性能的依赖超过了酷睿U系列和集成显卡系列所能提供的,会发现戴尔是一个坚实的解决方案。
将如此强大的动力装入14英寸的机箱,会带来通常的缺点:温度较高,风扇噪音较大,重量较重,以及比14英寸类别中的大多数其他笔记本电脑的功耗更高。在这四个缺点中,我们认为重量可以得到最大的改善,因为竞争者的华硕Vivobook Pro 14配备了AMD H系列CPU和相同的GeForce RTX 3050 GPU,而重量却轻了几百克。风扇至少在较低的处理负荷中保持安静,因此只有在运行要求较高的应用程序时才会有声音。
Inspiron 14 Plus 7420可能很重,但它能以比一般超极本更快的速度完成工作。
其他缺点包括海绵状的点击板和灵活的盖子。对于这么重的14英寸笔记本电脑,如果有一个更坚硬的盖子就更好了。与这个价格范围内的大多数14英寸笔记本电脑相比,其性能优势是该系统的主要亮点。
价格和可用性
Inspiron 14 Plus 7420外壳现已在亚马逊上发货。 和Newegg 价格分别为1300美元和1400美元。但是,配置目前只限于集成显卡。我们建议直接从戴尔购买https://www.dell.com/en-us/shop/laptops/new-inspiron-14-plus/spd/inspiron-14-7420-laptop如果你想要GeForce RTX 3050 SKU。
Dell Inspiron 14 Plus 7420
- 08/30/2022 v7 (old)
Allen Ngo
Price comparison

