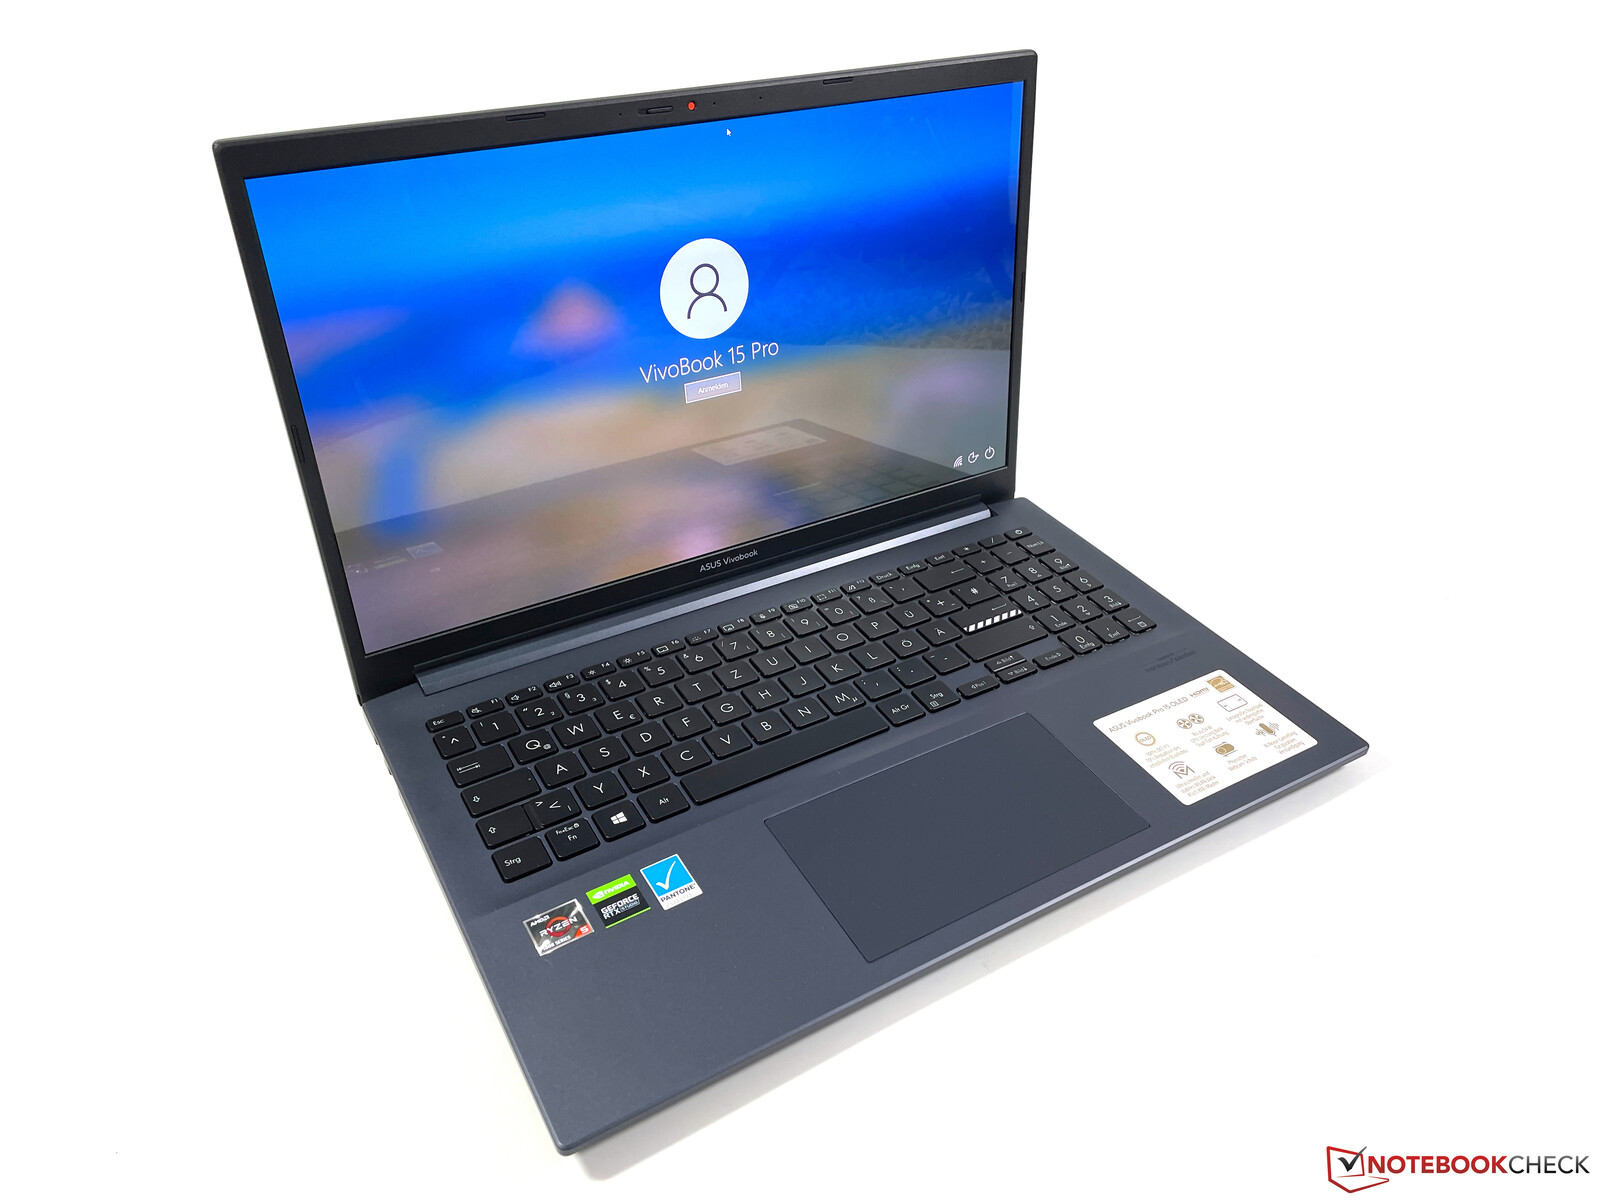
华硕VivoBook 15 Pro OLED回顾。负担得起的多媒体笔记本电脑,性能高

通过新的VivoBook Pro型号,华硕提供了具有良好性价比的多媒体笔记本电脑,现在还可以选择配备1080p OLED显示屏。用户可以选择AMD和英特尔的CPU,以及集成GPU或Nvidia的专用显卡。我们的测试装置结合了目前的 Ryzen 5 5600H处理器与专用的 NvidiaGeForce RTX 3050GPU和16GB的内存。此外,还有一个512GB PCIe SSD和可选的1080p OLED显示屏。我们的具体配置是不含Windows的Campus机型,售价999欧元(约1155美元),但普通客户将为该机型(包括Windows)支付1199欧元(约1387美元)。
Possible Competitors in Comparison
Rating | Date | Model | Weight | Height | Size | Resolution | Price |
|---|---|---|---|---|---|---|---|
| 85.9 % v7 (old) | 11 / 2021 | Asus VivoBook 15 Pro M3500QC-L1062 R5 5600H, GeForce RTX 3050 4GB Laptop GPU | 1.7 kg | 19.9 mm | 15.60" | 1920x1080 | |
| 82.7 % v7 (old) | 10 / 2021 | Dell G15 5515 R7 5800H, GeForce RTX 3050 Ti Laptop GPU | 2.4 kg | 24.9 mm | 15.60" | 1920x1080 | |
| 83.2 % v7 (old) | 10 / 2021 | Schenker XMG Focus 15 i7-11800H, GeForce RTX 3050 Ti Laptop GPU | 1.9 kg | 22 mm | 15.60" | 1920x1080 | |
| 81.2 % v7 (old) | 07 / 2021 | HP Pavilion 15-eg i7-1165G7, GeForce MX450 | 1.7 kg | 17.9 mm | 15.60" | 1920x1080 | |
| 86.1 % v7 (old) | 09 / 2021 | Lenovo IdeaPad 5 Pro 16ACH R7 5800H, GeForce GTX 1650 Mobile | 2 kg | 17.5 mm | 16.00" | 2560x1600 | |
| 88.4 % v7 (old) | 09 / 2021 | Dell XPS 15 9510 11800H RTX 3050 Ti OLED i7-11800H, GeForce RTX 3050 Ti Laptop GPU | 1.9 kg | 18 mm | 15.60" | 3456x2160 |
外壳 - VivoBook Pro使用塑料
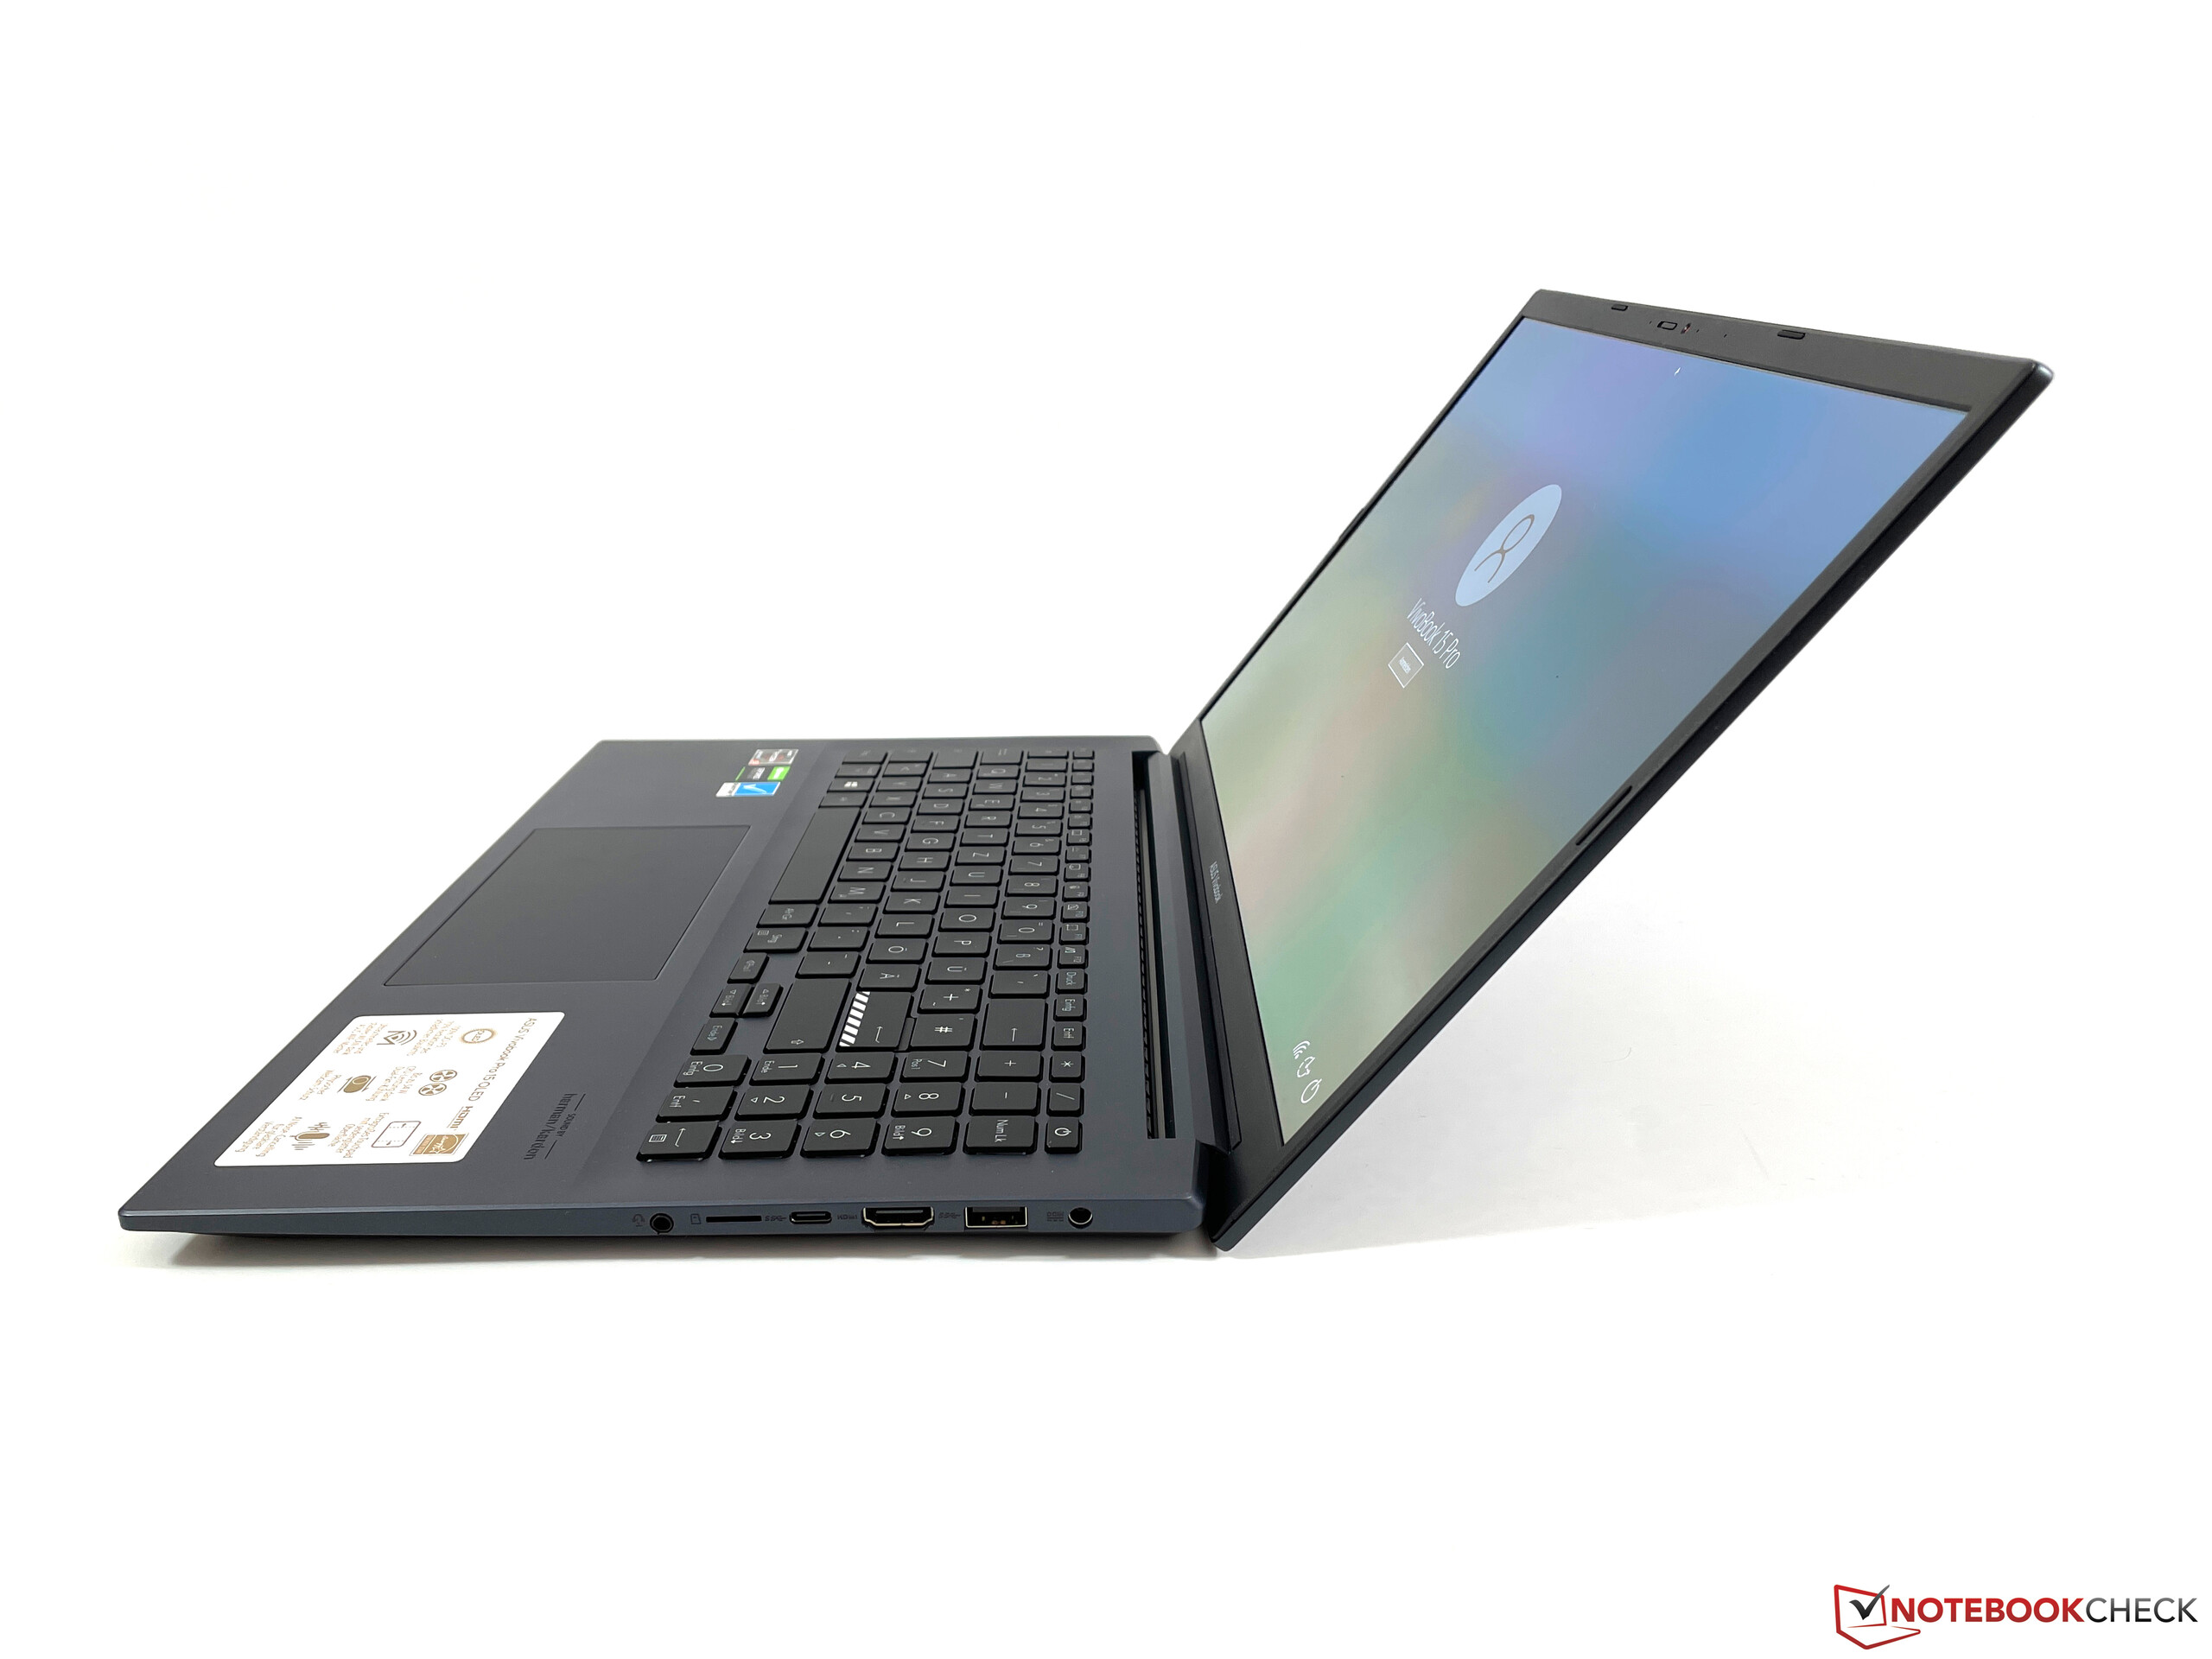
VivoBook 15 Pro相对较低的入门级价格在塑料外壳上变得很明显。虽然它在视觉上看起来不错,而且我们也喜欢我们的测试单元的颜色(安静的蓝色),但你可以注意到与金属外壳的区别,如(明显更昂贵的)戴尔XPS 15在稳定性和触觉方面的区别。掌托可以被压下去一点,当打开显示器盖子时,通常会有一些吱吱作响的声音。盖子本身给人留下的印象更好。尽管它仍然可以略微翘起,但没有吱吱嘎嘎的声音,而且我们无法通过在某些地方按压来引发图像错误。另一方面,铰链的最大开启角度约为135度,可以更好地调整,因为不能避免显示器的一些反弹,例如在改变开启角度时。
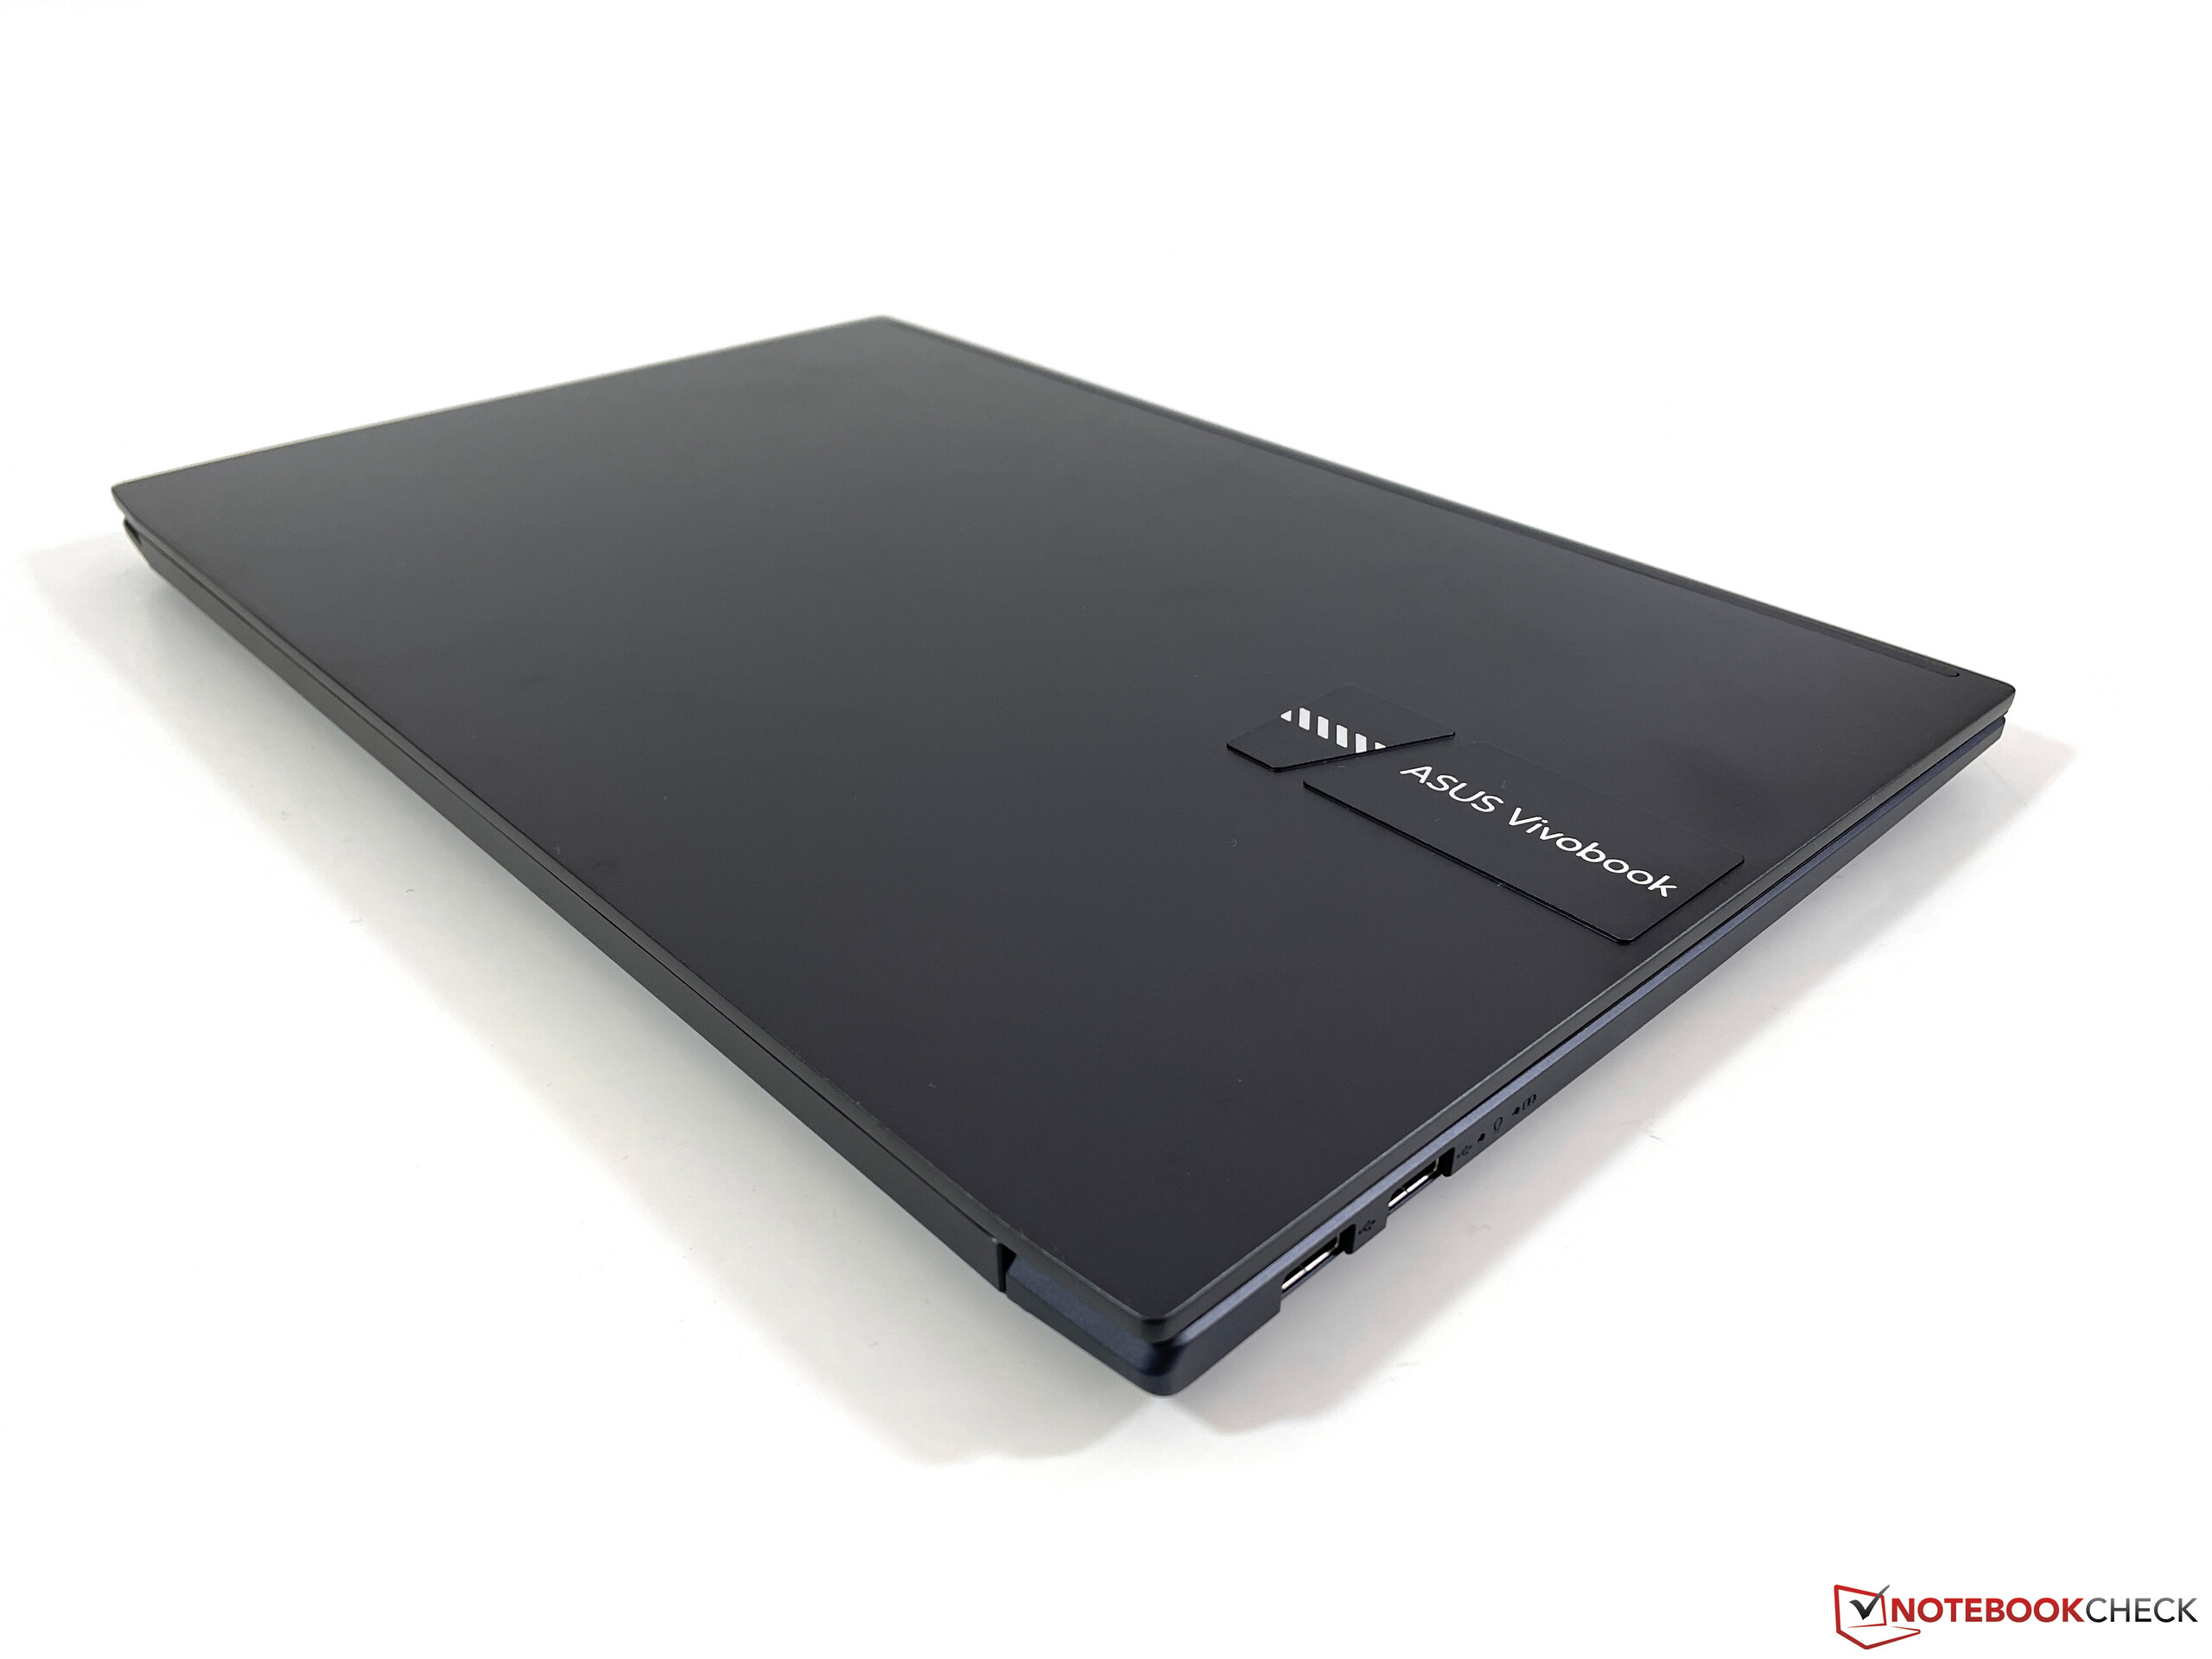
两侧的边框非常小,有助于呈现出现代的外观。华硕还使用了其他设计元素,如盖子上凸起的3D标志和回车键上的条纹图案。底座不大容易沾染指纹,只有盖子需要经常清洗。

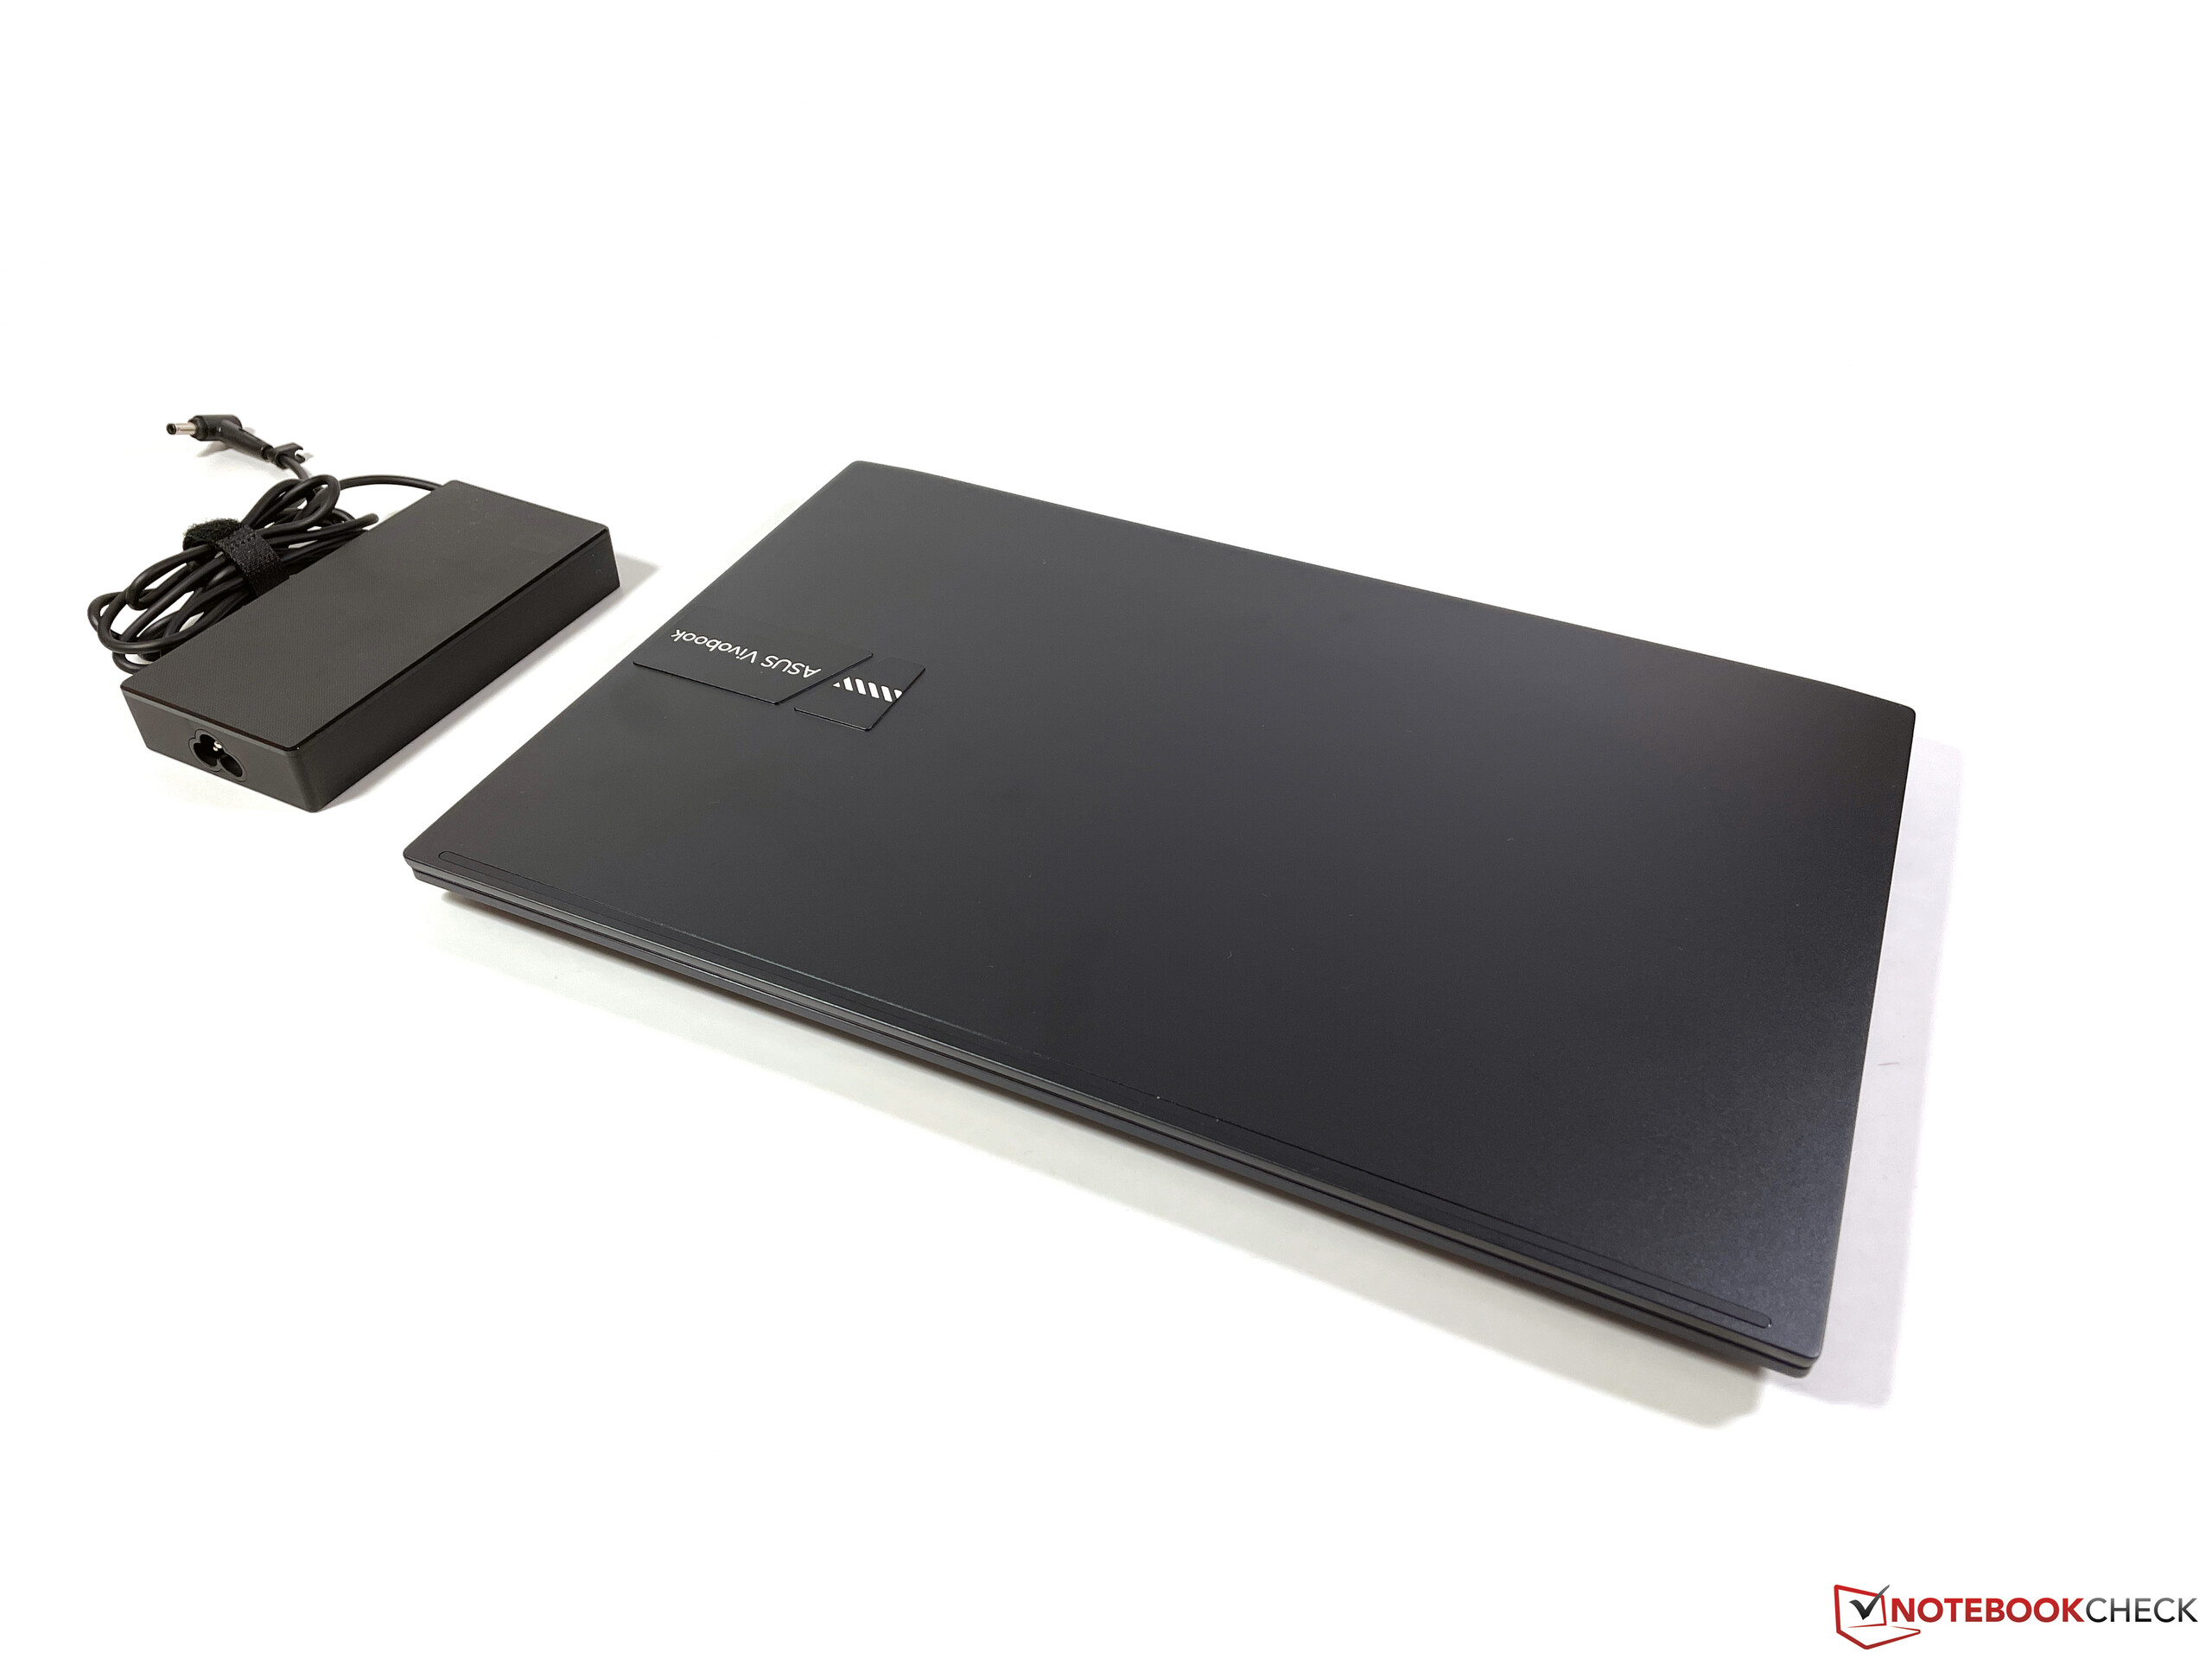
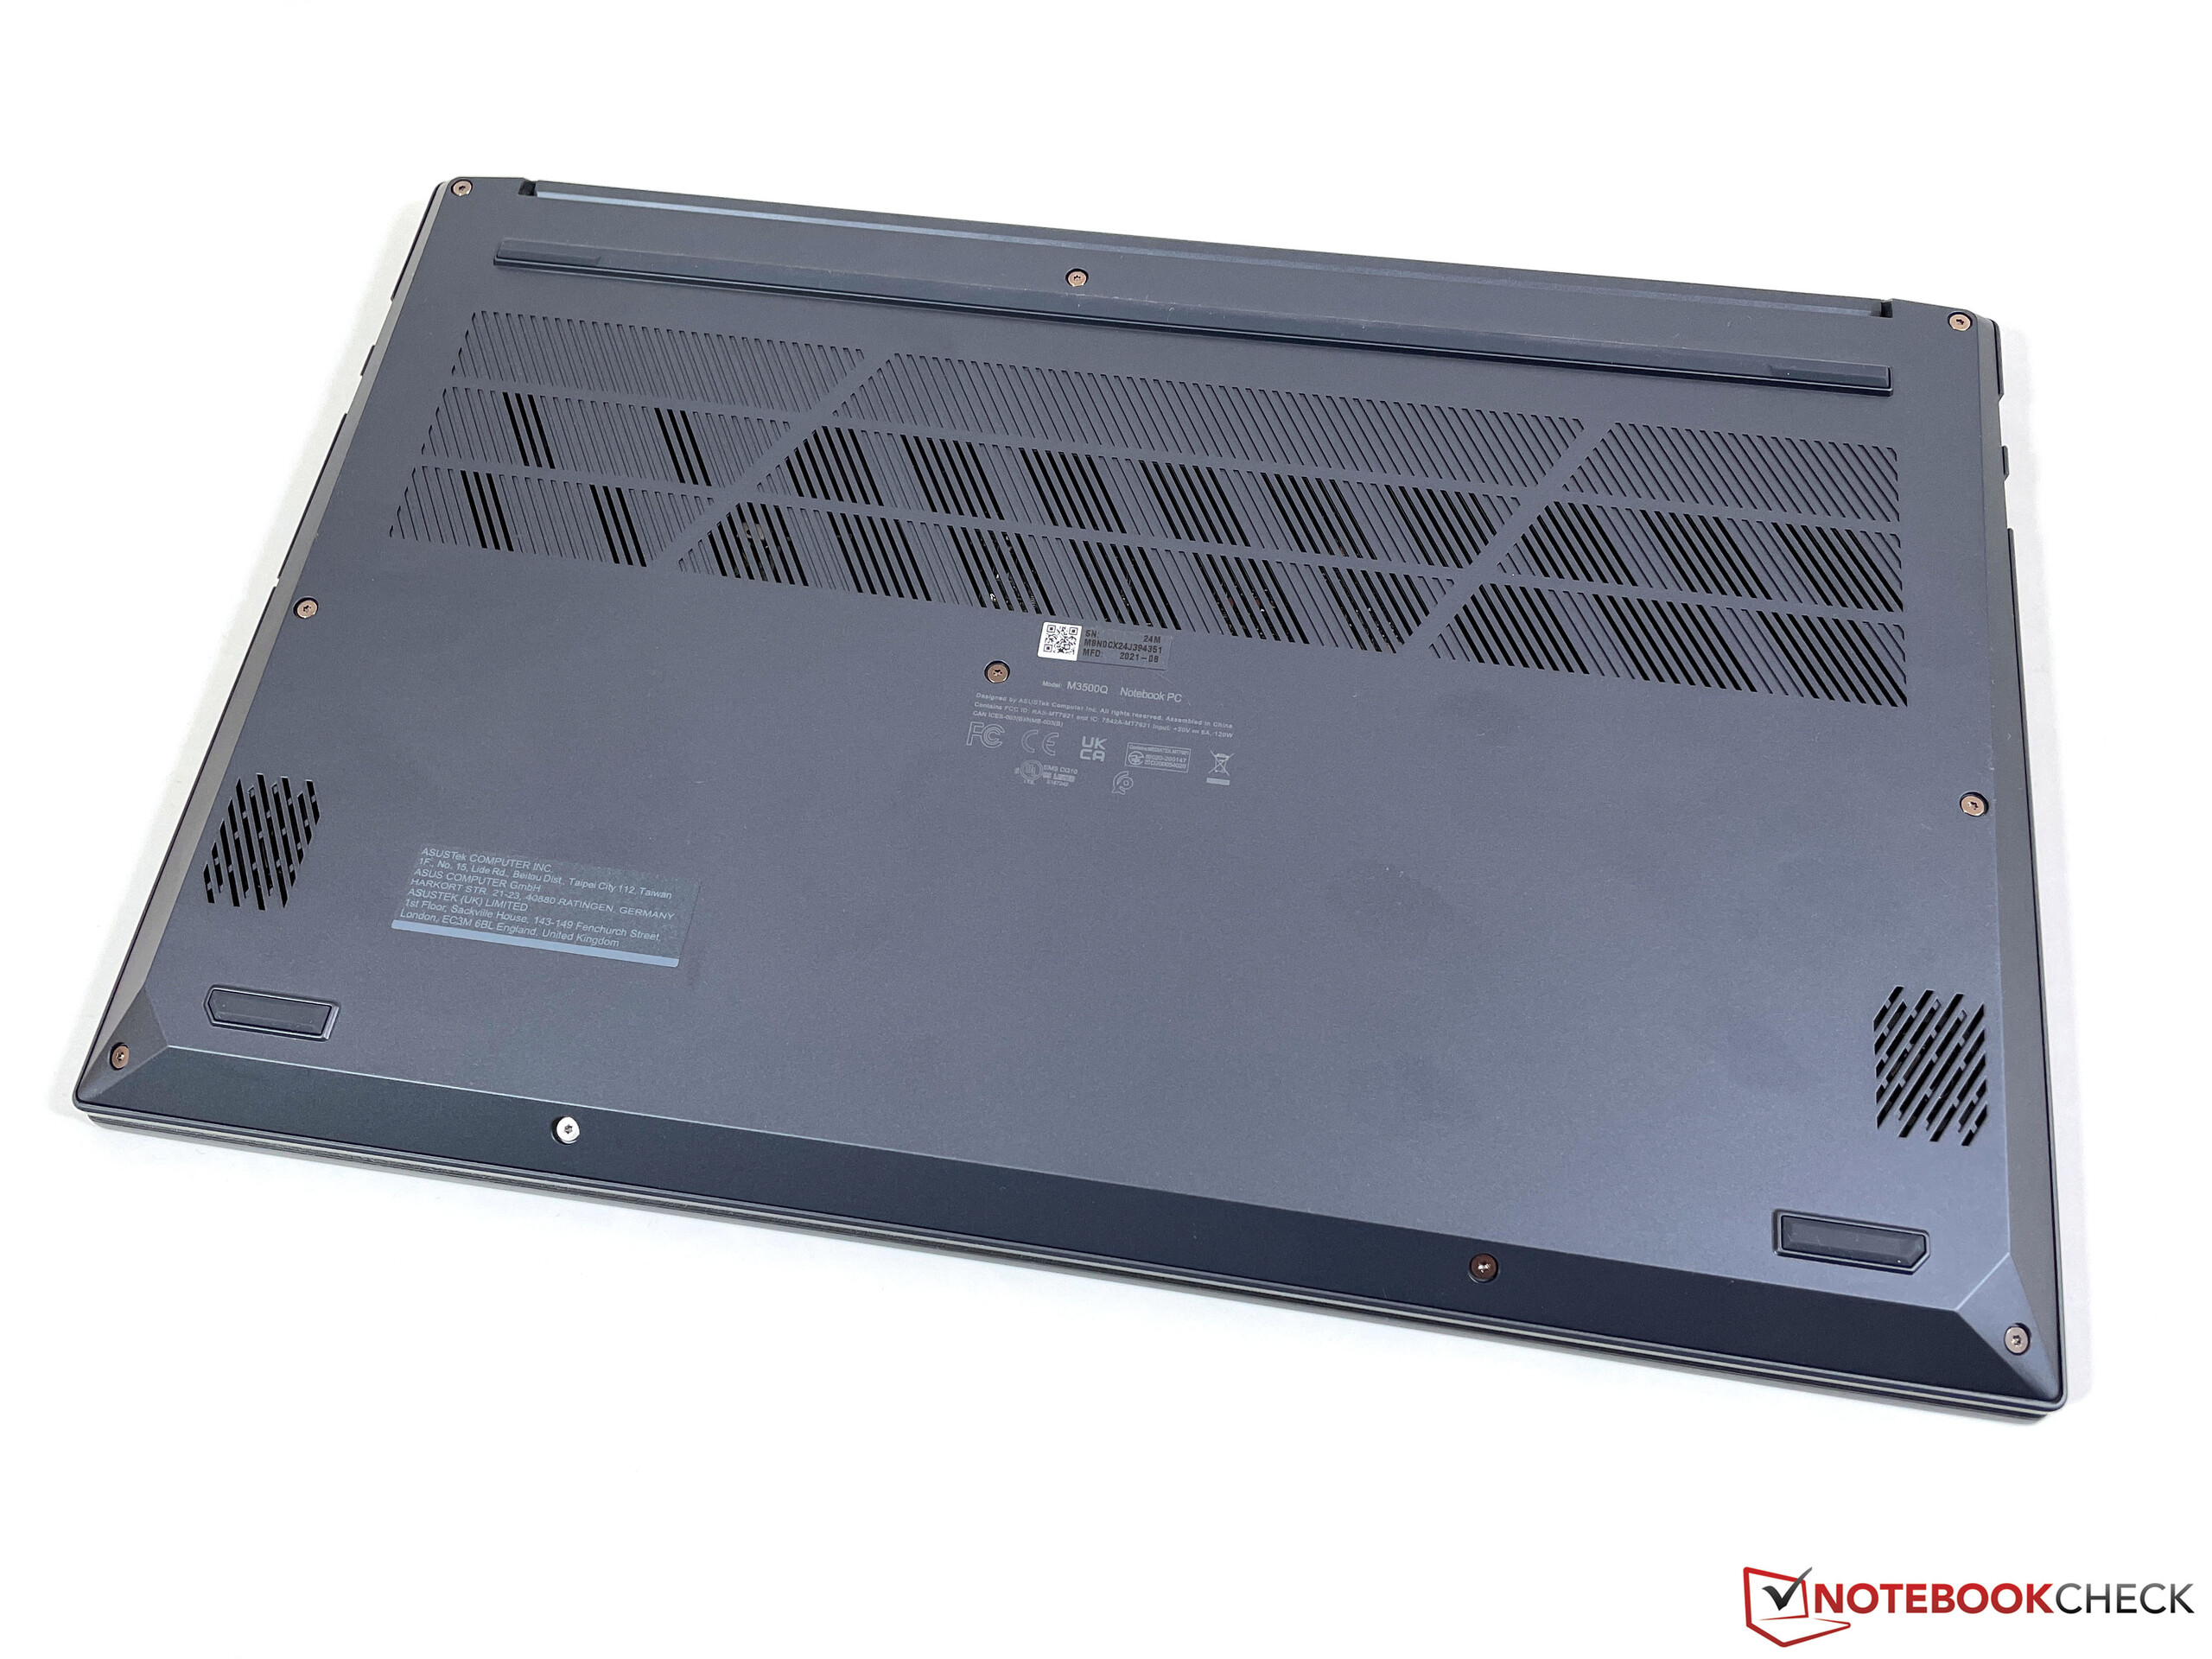
该测试装置是我们的比较组中最紧凑的,也是最轻的笔记本电脑之一,仅有1.7公斤(约3.75磅)。你还必须为充电器再增加450克(约1磅)。
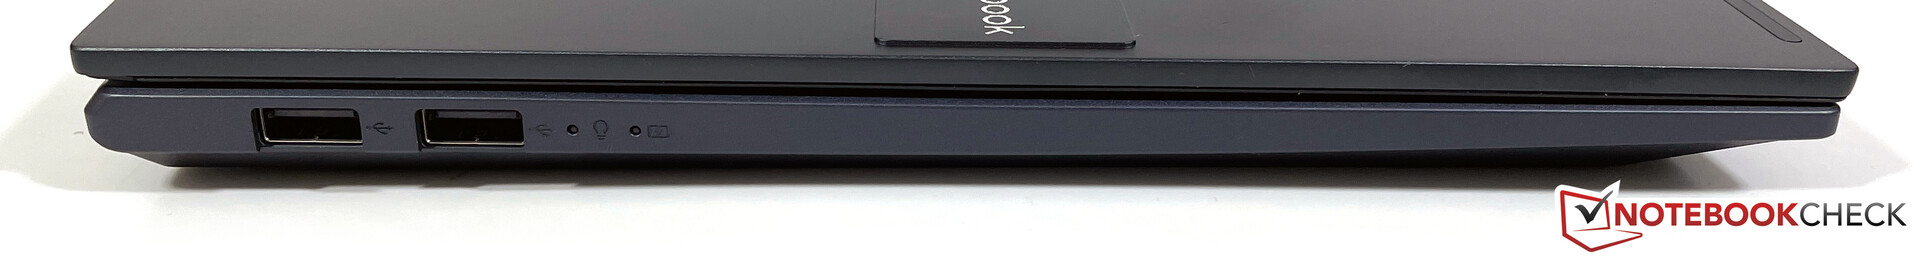
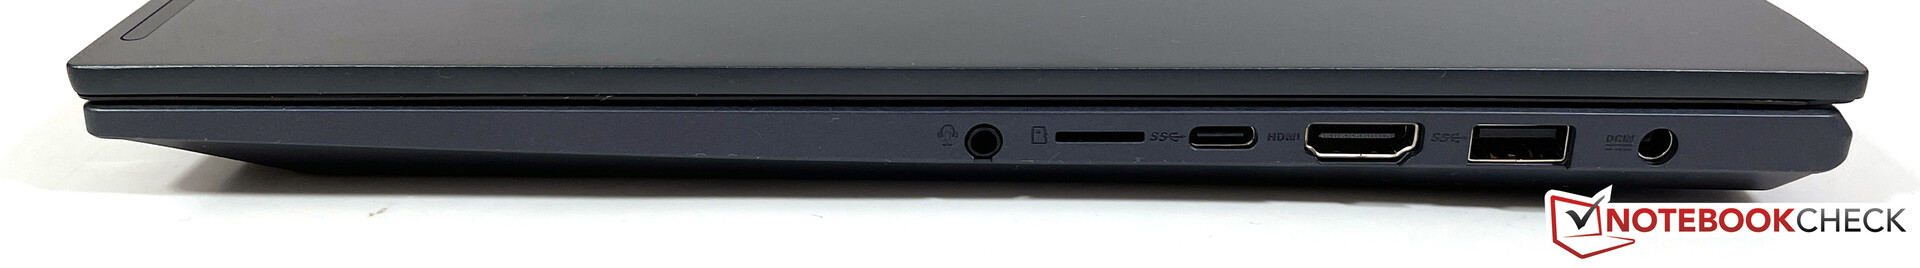
设备--华硕在连接方面做了一些削减
虽然乍一看,所有重要的连接包括USB-A、USB-C和HDMI都有,但它们的标准已经过时了。USB-C连接只支持3.2 Gen 1标准,也不能用于视频输出或充电,三个USB-A连接中有两个只支持旧的2.0标准。HDMI也是过时的1.4b标准,所以它不能驱动60赫兹的外部4k显示器。即使一些机型在电源按钮中提供了指纹传感器,我们的测试装置也不包括它。
SD卡阅读器
VivoBook提供了一个microSD读卡器,但它不是特别快。使用我们的AV Pro V60 UHS-II参考卡,传输速率低于40 MB/s,这明显低于竞争对手通常达到的70-80 MB/s。
| SD Card Reader | |
| average JPG Copy Test (av. of 3 runs) | |
| Dell XPS 15 9510 11800H RTX 3050 Ti OLED (AV Pro V60) | |
| Average of class Multimedia (22.3 - 531, n=37, last 2 years) | |
| Schenker XMG Focus 15 (AV PRO microSD 128 GB V60) | |
| Lenovo IdeaPad 5 Pro 16ACH (AV PRO V60) | |
| HP Pavilion 15-eg (AV PRO microSD 128 GB V60) | |
| Asus VivoBook 15 Pro M3500QC-L1062 (AV Pro V60) | |
| maximum AS SSD Seq Read Test (1GB) | |
| Dell XPS 15 9510 11800H RTX 3050 Ti OLED (AV Pro V60) | |
| Average of class Multimedia (37.3 - 1455, n=36, last 2 years) | |
| Schenker XMG Focus 15 (AV PRO microSD 128 GB V60) | |
| Lenovo IdeaPad 5 Pro 16ACH (AV PRO V60) | |
| HP Pavilion 15-eg (AV PRO microSD 128 GB V60) | |
| Asus VivoBook 15 Pro M3500QC-L1062 (AV Pro V60) | |
沟通
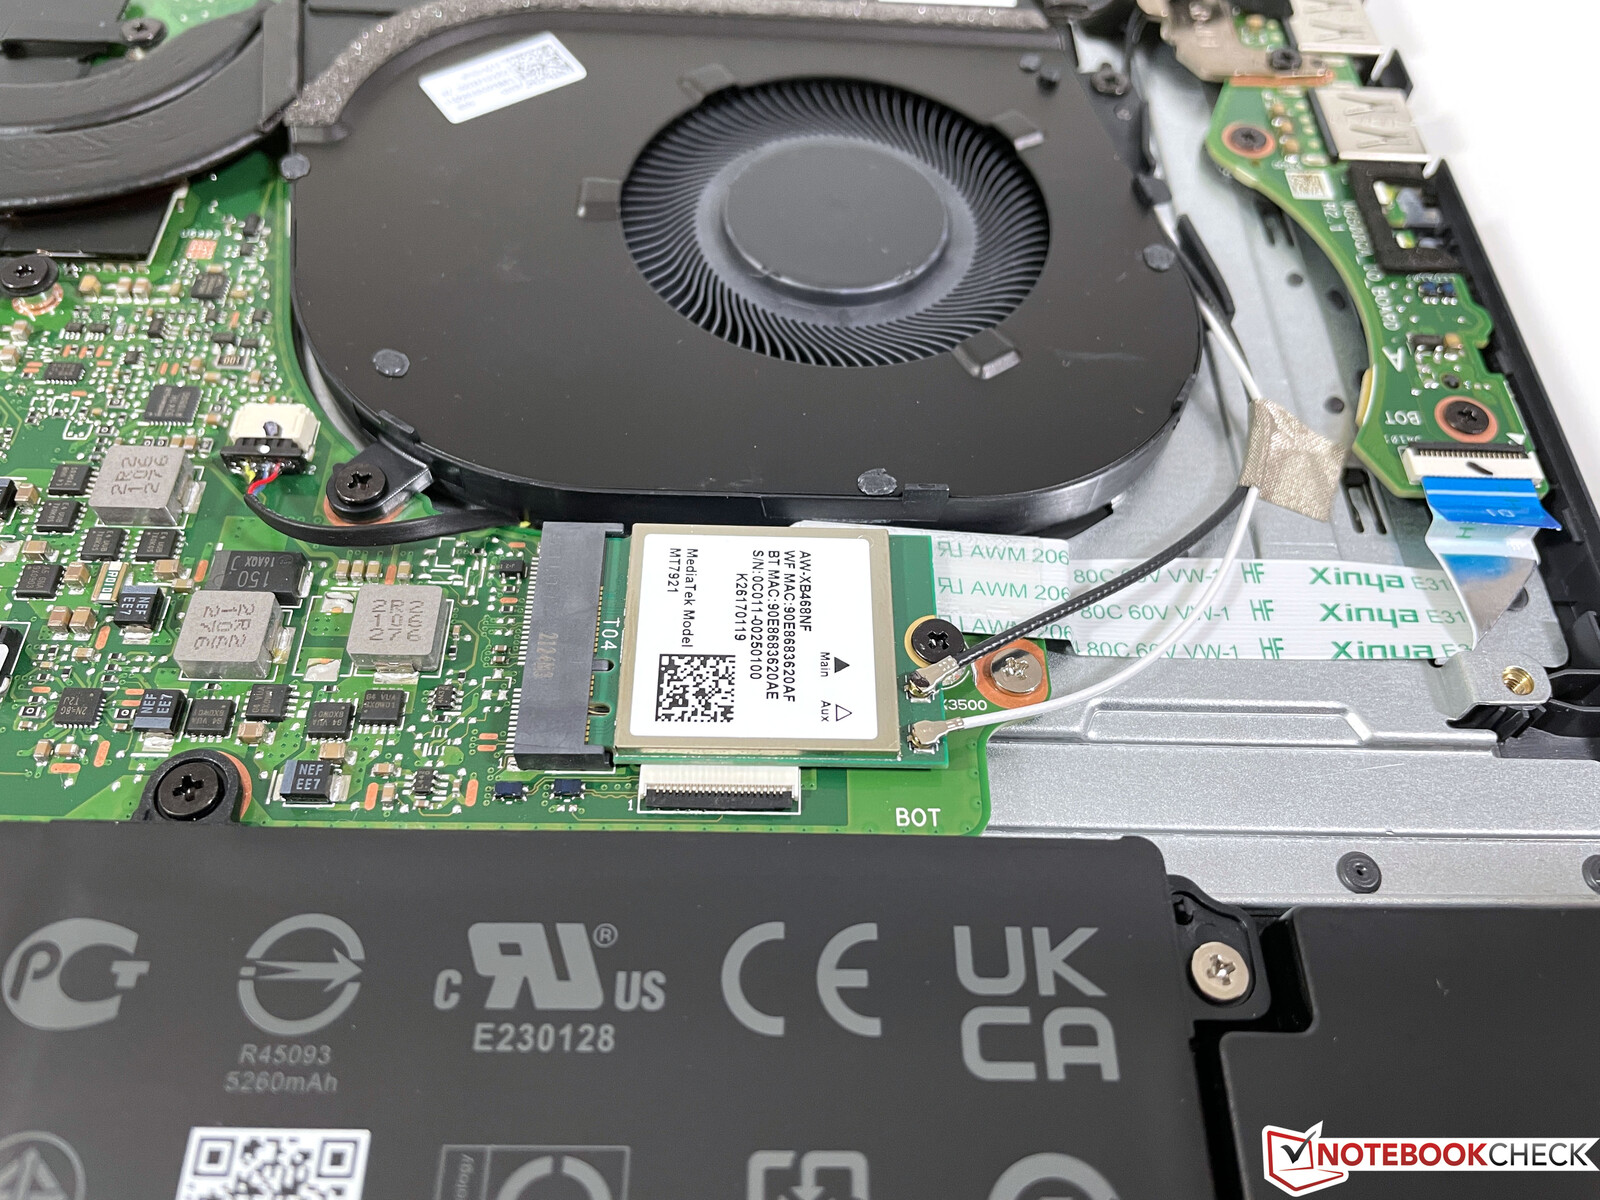
华硕使用了联发科的WLAN模块(MT7921,2x2),理论上可以支持快速的WLAN 6标准(802.11ax)。然而,在我们与Netgear Nighthawk RAX120参考路由器的测试中,笔记本电脑根本拒绝通过WLAN 6连接,只使用WLAN 5(802.11ac),这也是为什么传输速率仍然低于应该可能的原因。另一方面,WLAN信号很稳定,不显眼。
网络摄像头
VivoBook的网络摄像头包括一个机械盖,有一个红点显示摄像头被锁定。正如预期的那样,720p的传感器的图像质量并不好,即使在良好的光线条件下,颜色也显得相当苍白,内容也不是很清晰。


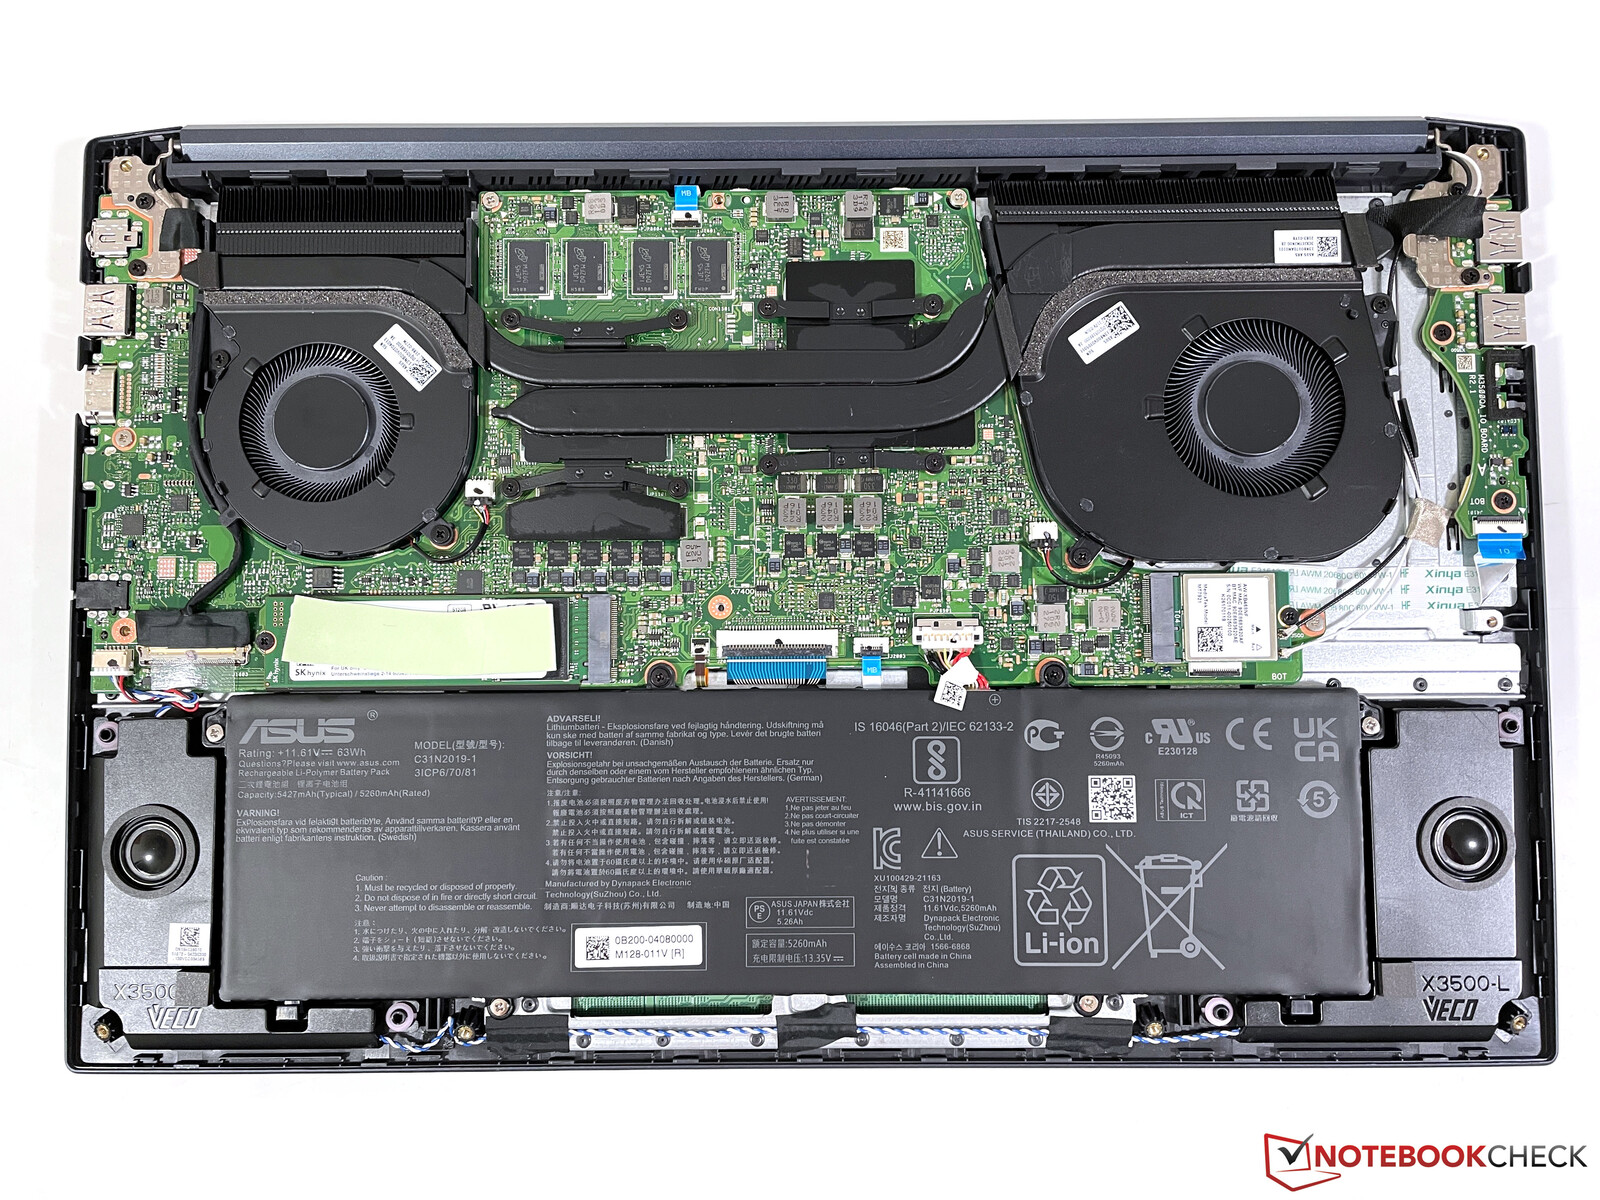
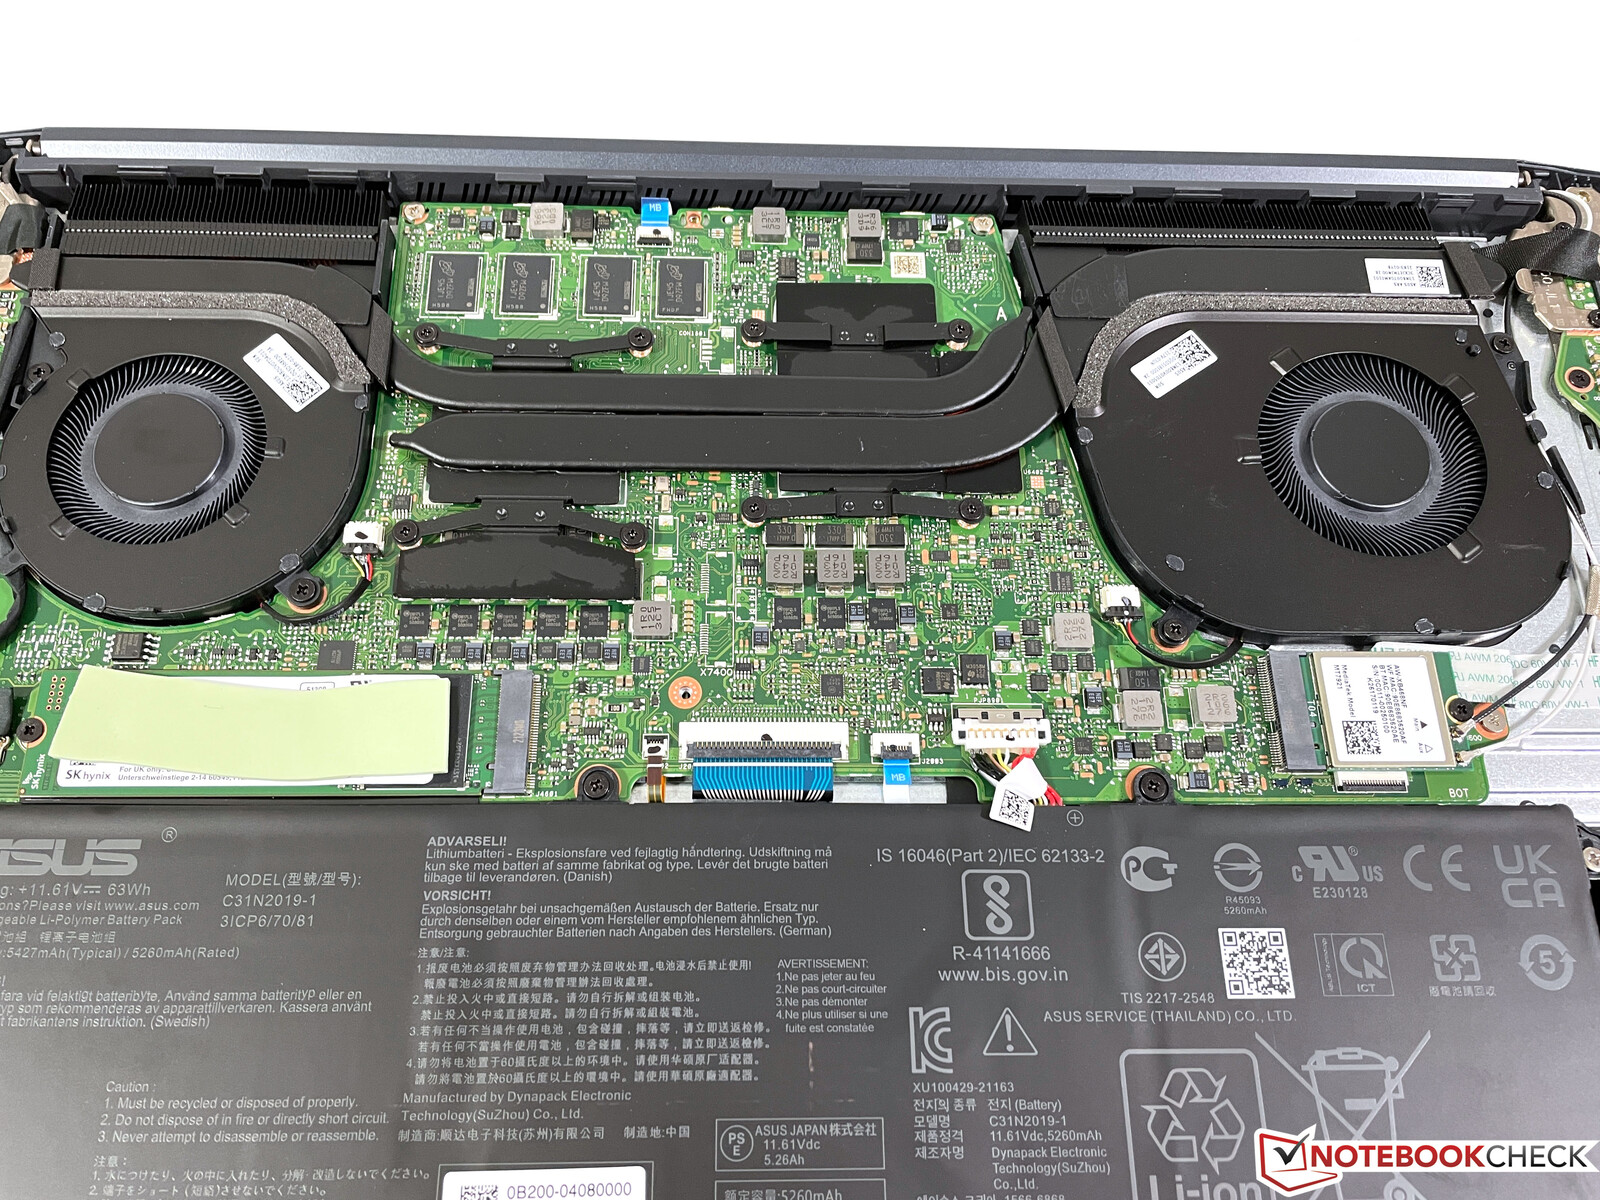
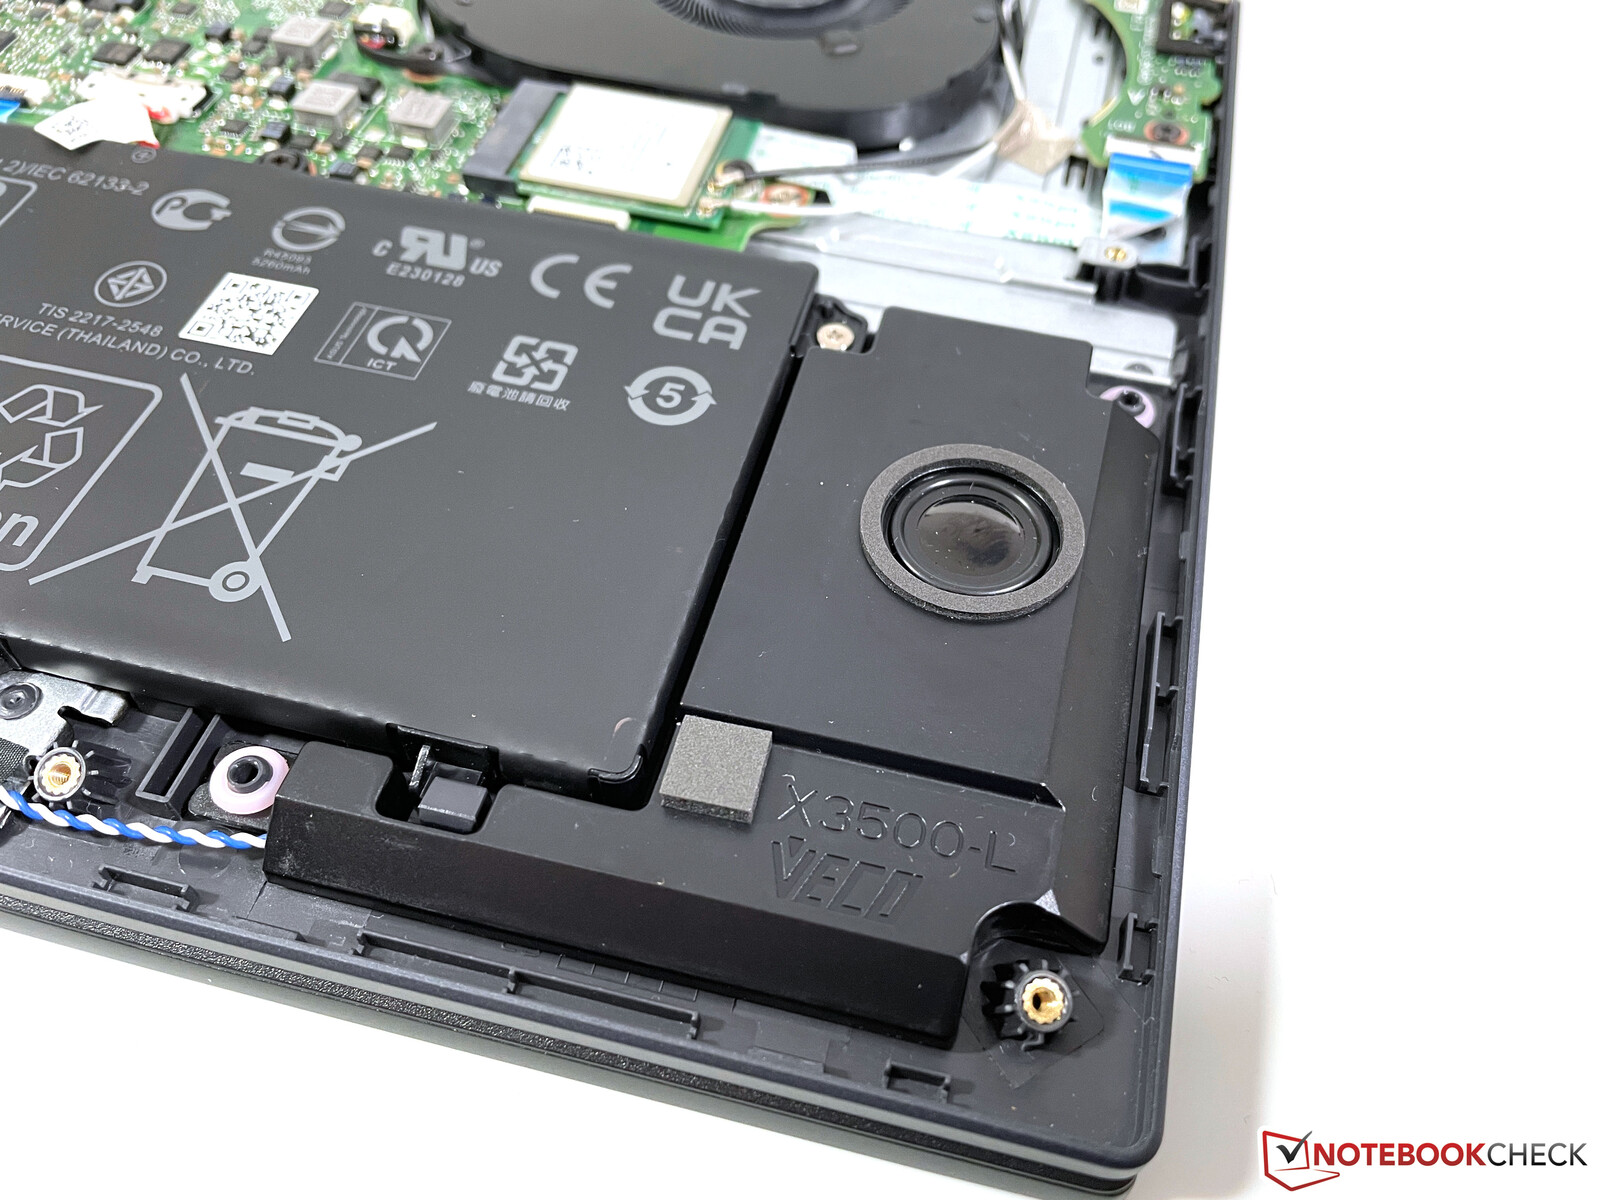
维护
机箱的底部用Torx螺丝(T6)固定,可以很容易地拆下来。但由于VivoBook 15 Pro的工作存储器是焊接在一起的,所以维修选项仅限于SSD的M.2-2280插槽和WLAN模块。你也可以清洁风扇。
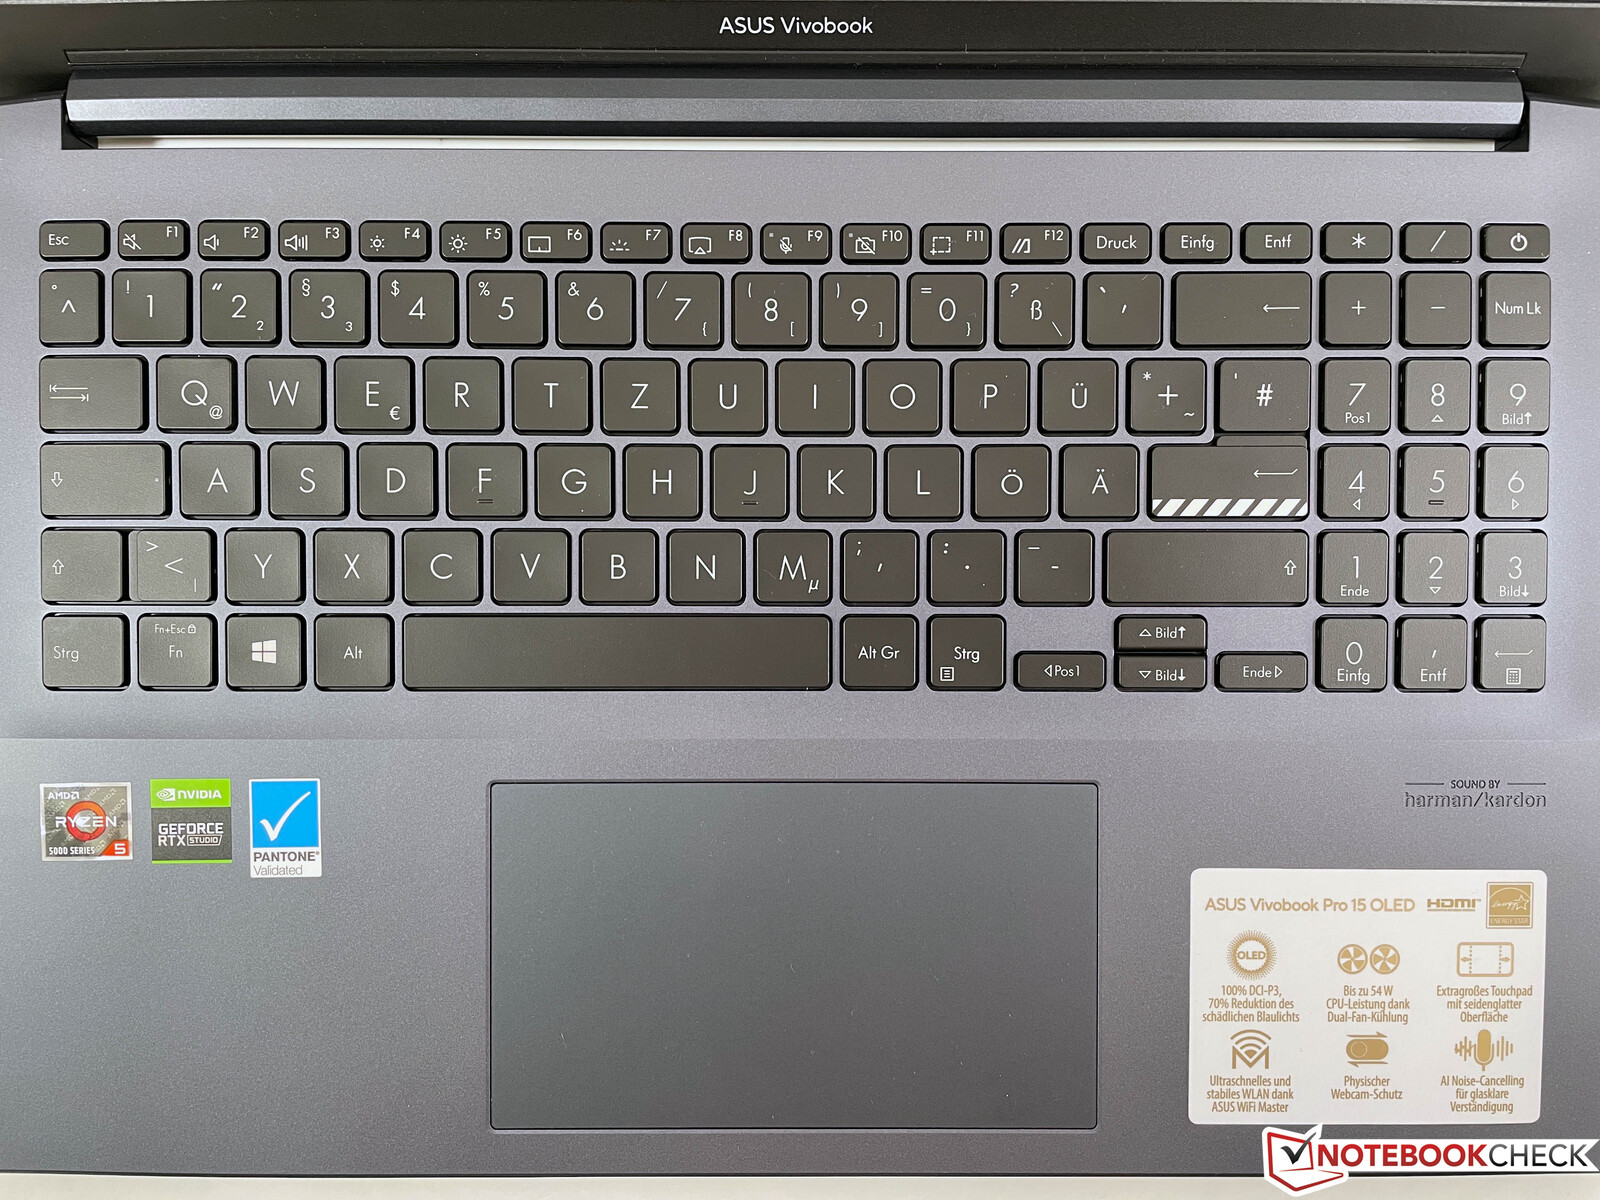
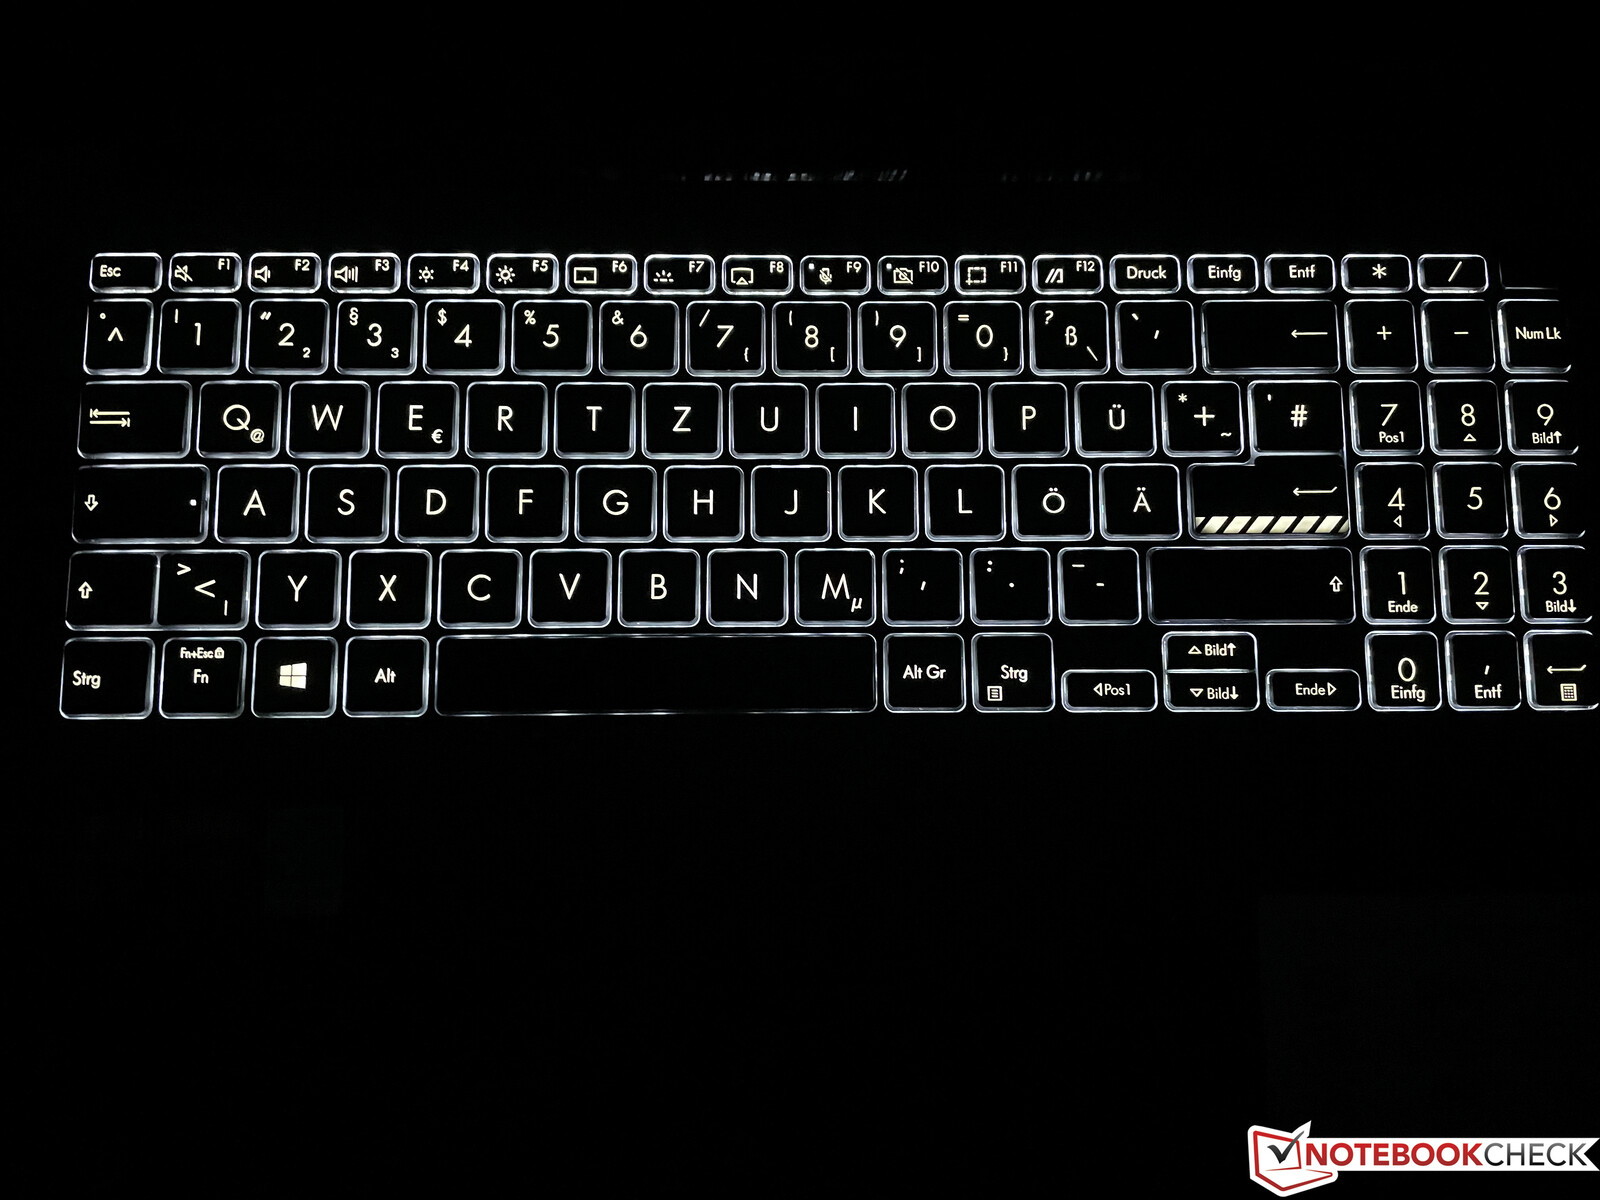
输入设备 - 一个带数字键盘的键盘
华硕在VivoBook 15 Pro中使用了一个键程为1.35毫米的键盘,右侧有专门的数字块。打字体验很好,在字母键上打字也很舒服安静。只有较大的按键,如回车键和空格键,才会有一点响声。遗憾的是,回车键只占一排,它延续了显示屏盖子上的凹槽图案,这使它很容易感觉到。对于黑暗的环境,还有一个白色背景照明,可以分三步调整。
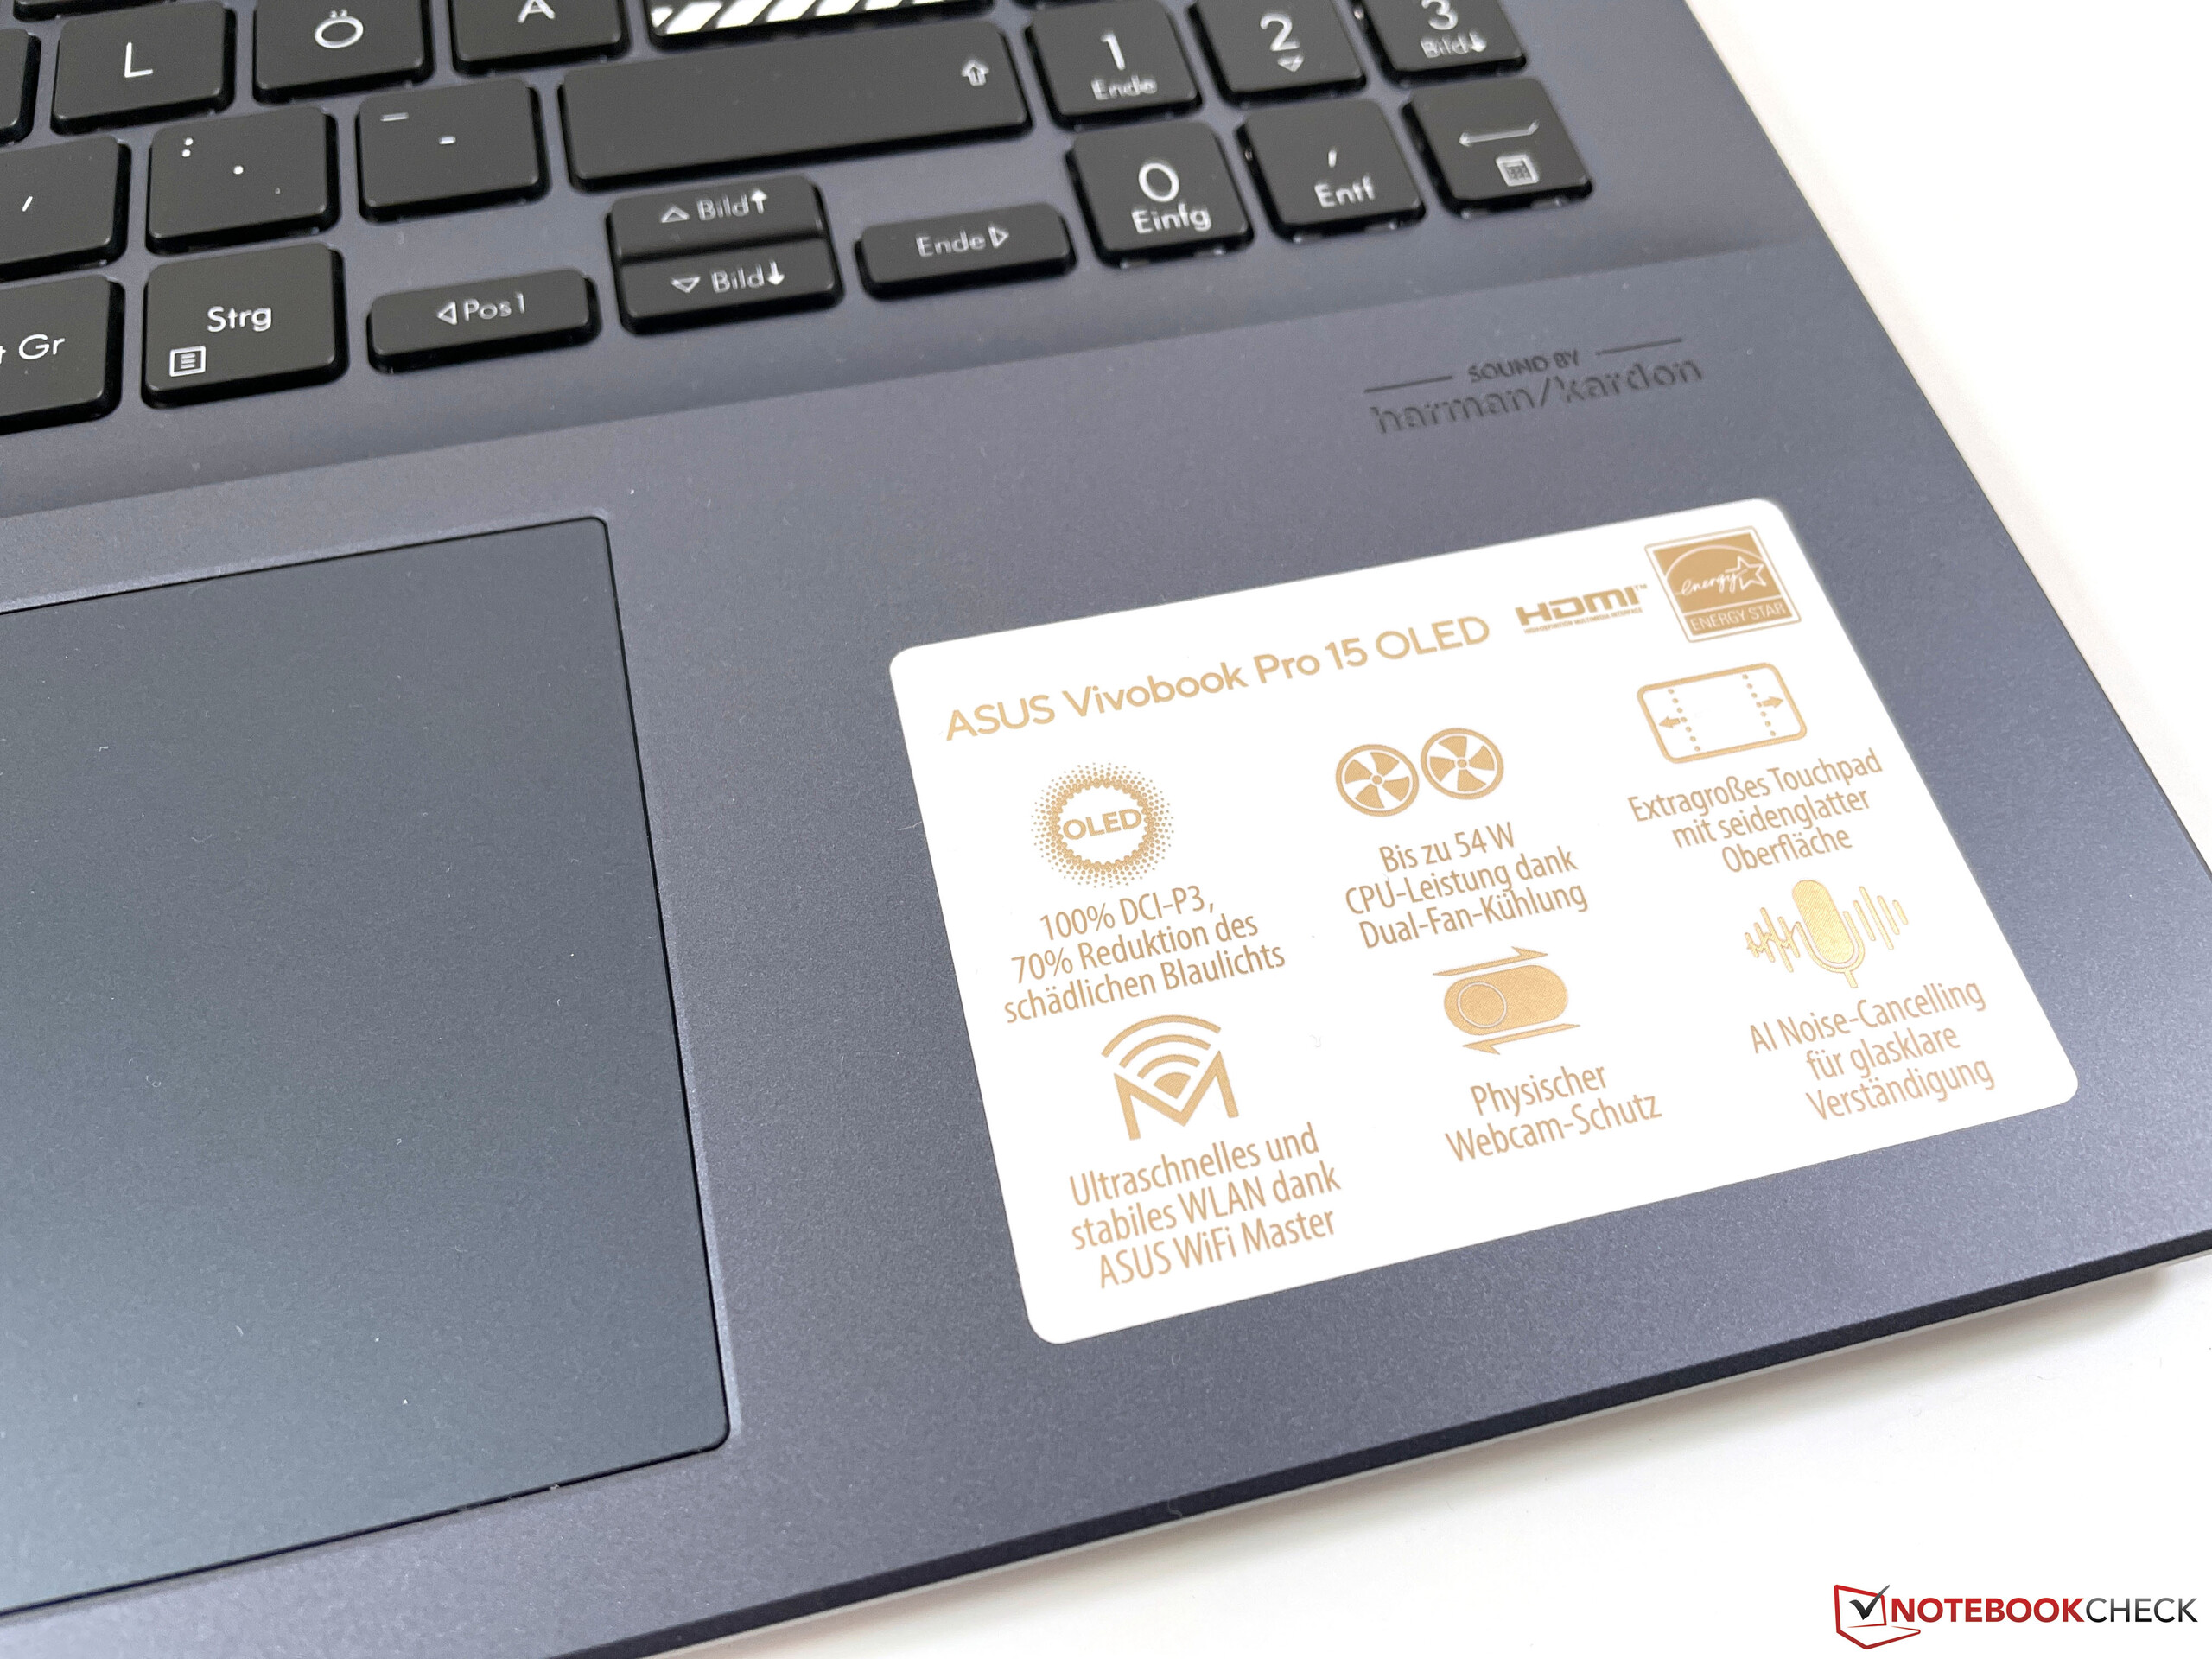
ClickPad具有良好的滑动特性,13 x 7.5厘米(约5.1 x 3英寸)的宽度非常大。在测试过程中,我们没有遇到任何问题,鼠标控制工作得很完美。与这个价格范围内的其他笔记本电脑一样,只有点击的声音相当大。
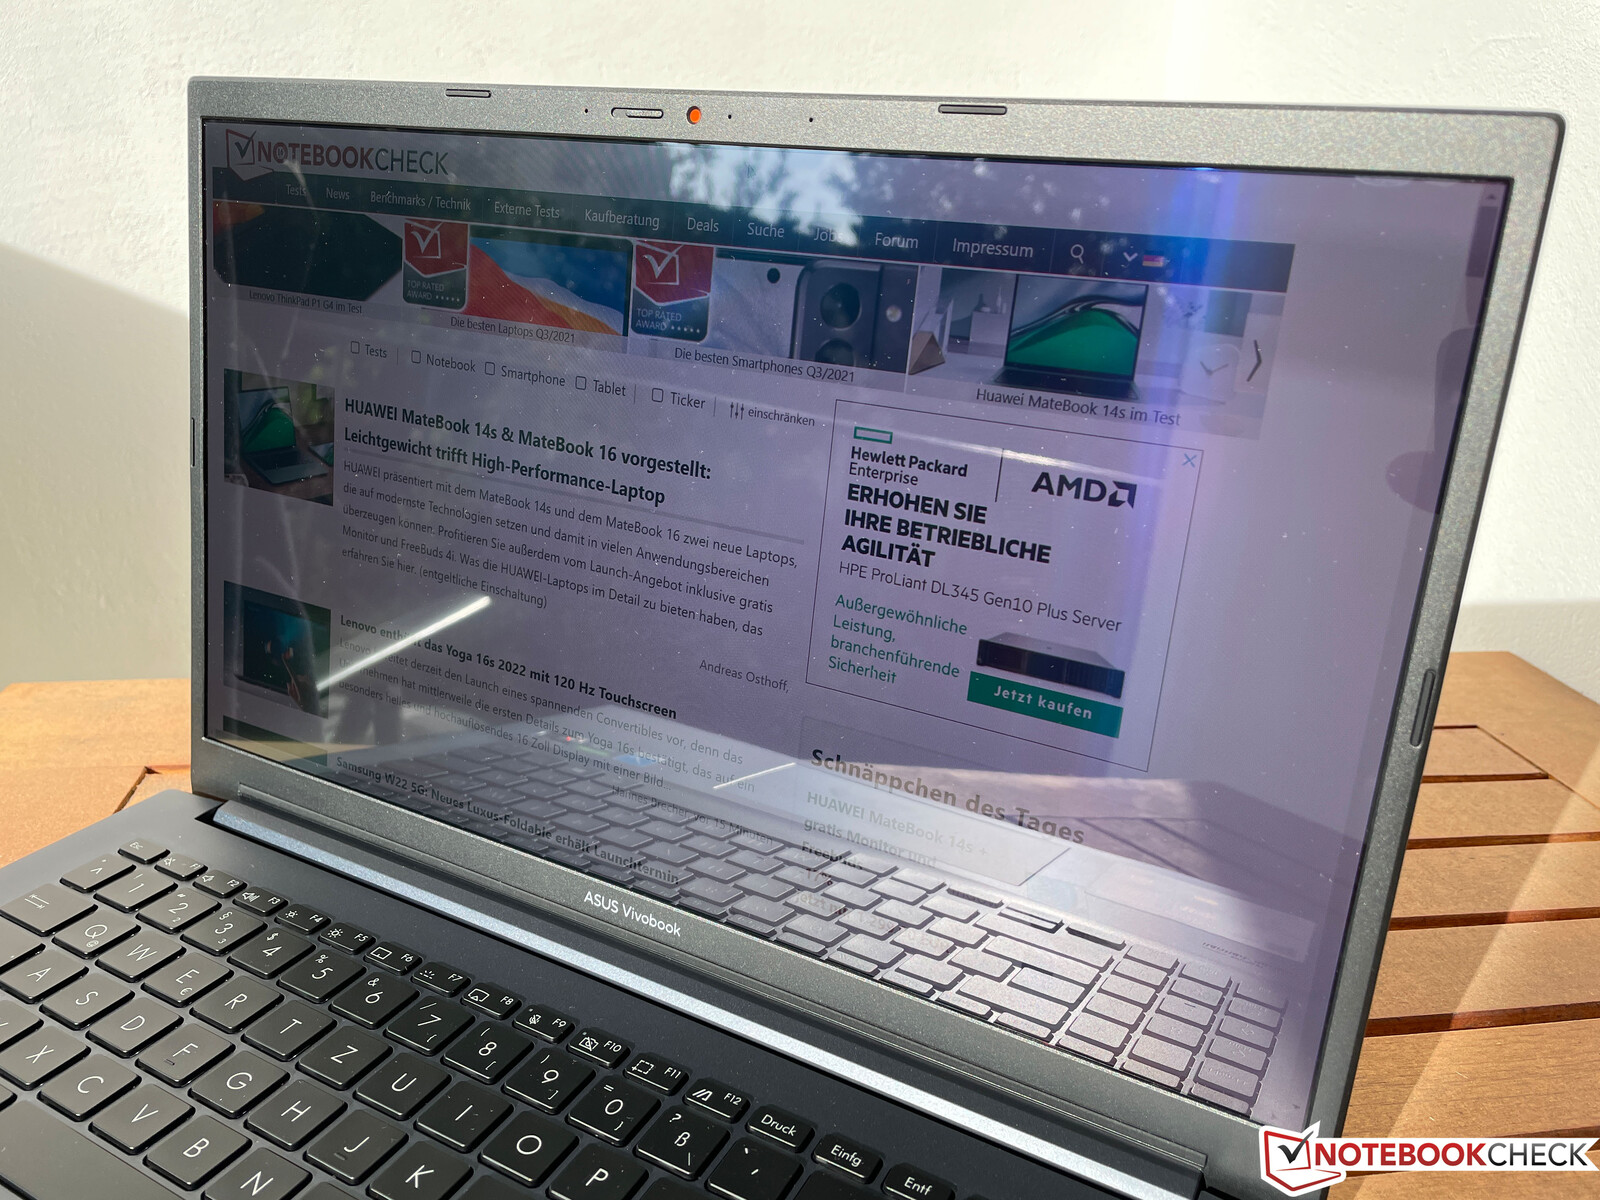
显示屏 - 三星的1080p AMOLED

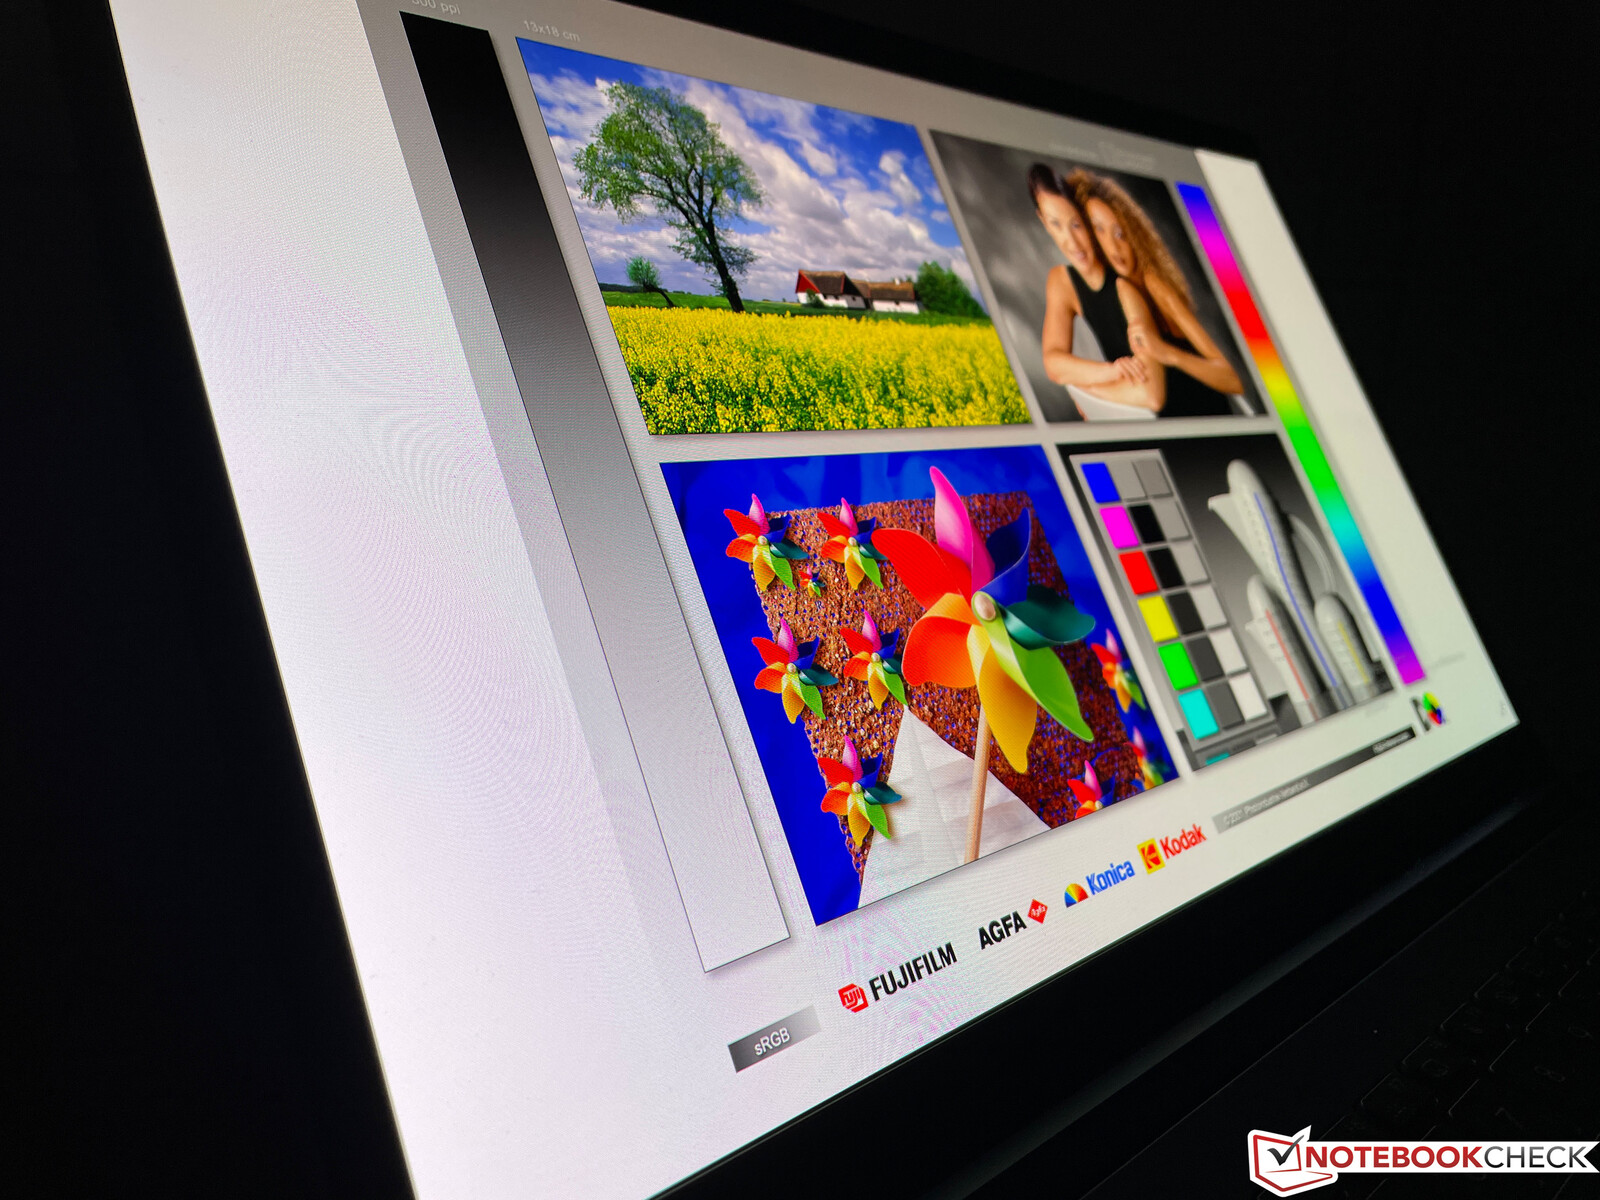
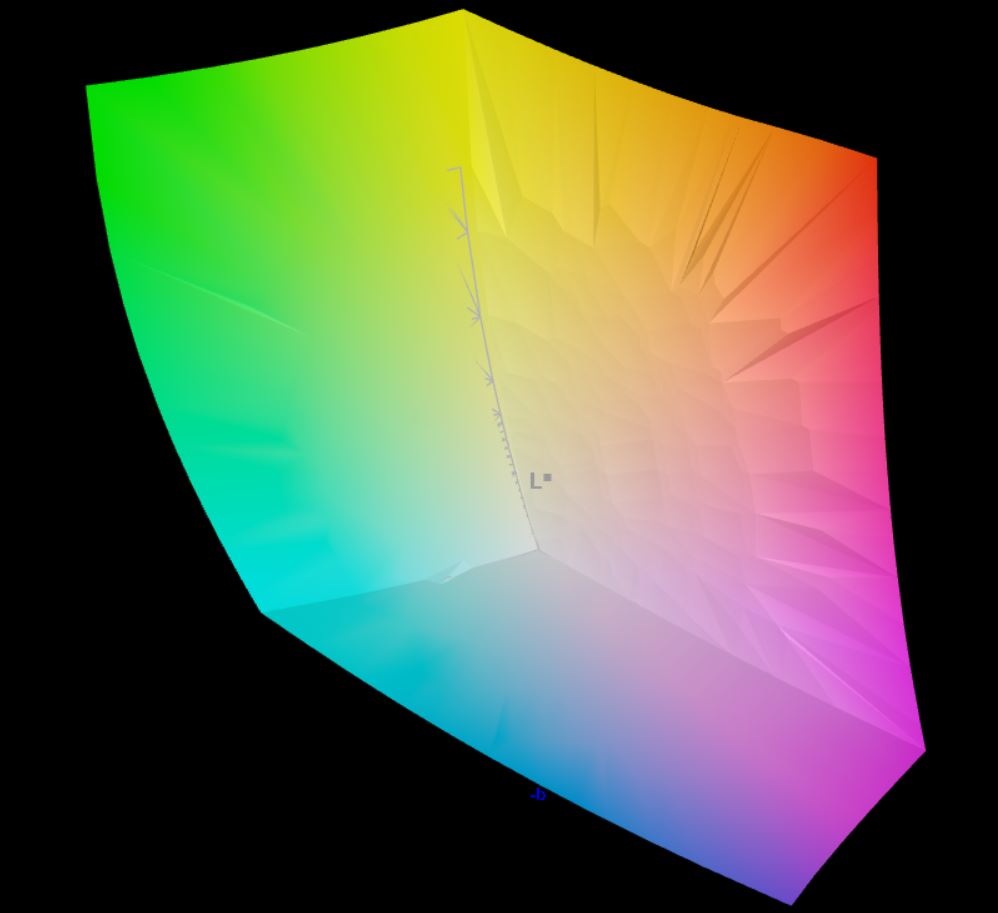
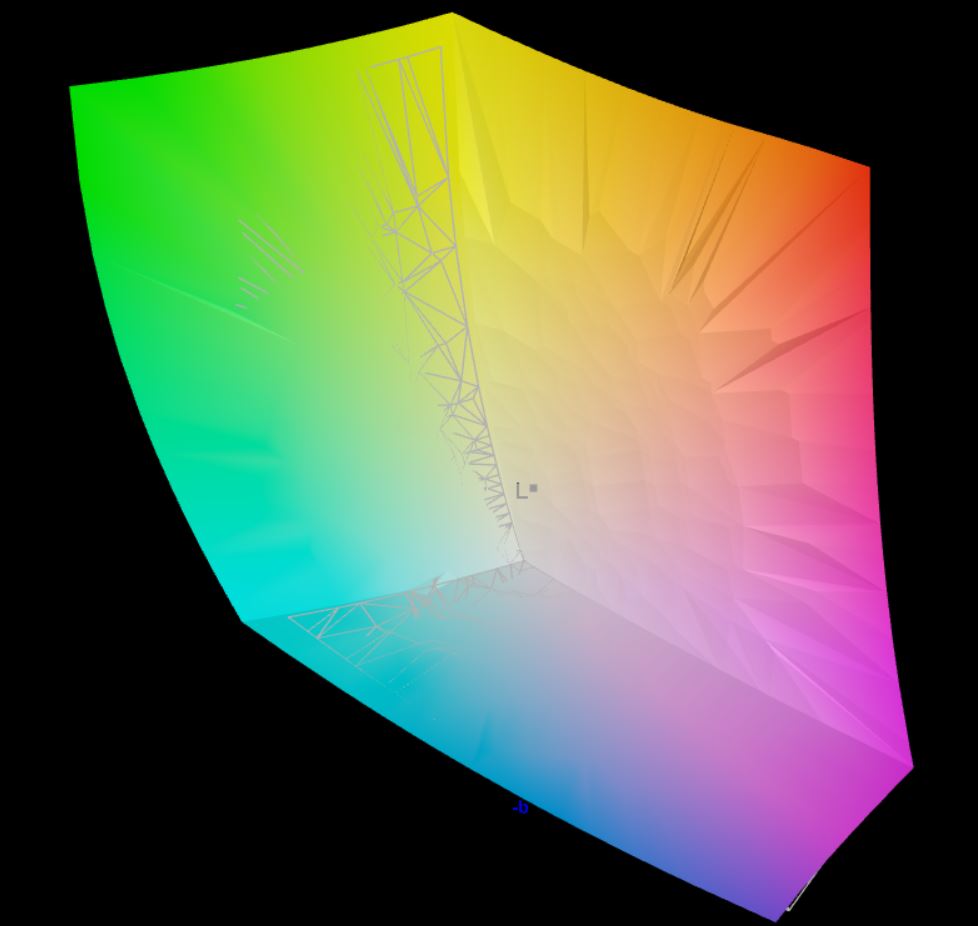
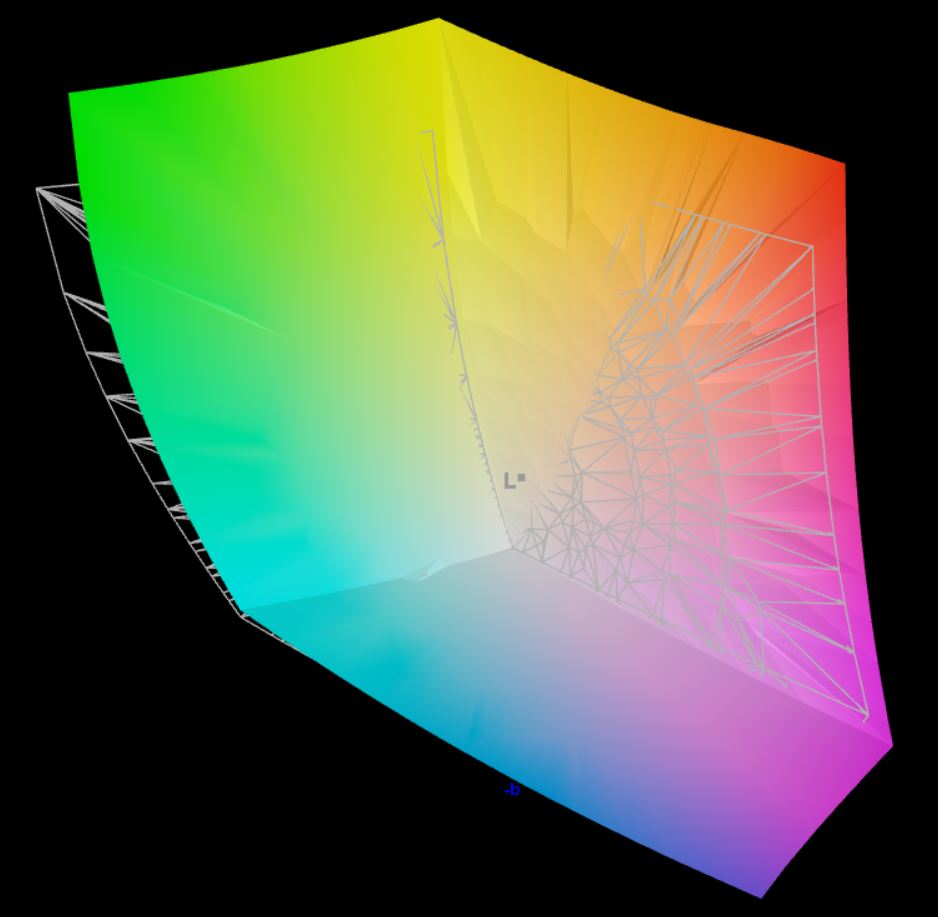
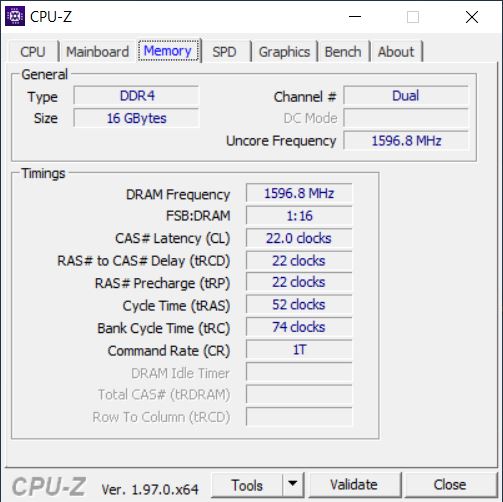
华硕在我们的测试装置中使用了15.6英寸的三星AMOLED显示屏,分辨率为1920 x 1080像素(全高清),但也提供普通的IPS面板。由于低黑值及其产生的极高对比度,OLED面板的主观图像质量非常好。与普通IPS面板相比,黑色显得非常黑,颜色也非常鲜艳。与采用IPS显示屏的竞争对手相比,VivoBook 15 Pro在这里具有真正的优势。
在我们用CalMAN软件和X-Rite i1 Pro 2进行的分析中,标有 "SDC4161 "的面板在整个过程中实现了近400cd/m²的亮度,只有很低的变化。在99%的情况下,亮度分布几乎是完美的。这些数值甚至高于XPS 15中的OLED面板的数值。 XPS 15中的OLED面板。.视角的稳定性也很好。虽然你可以从一些特定角度看到轻微的蓝色色调,但这对OLED面板来说是正常的。
OLED显示屏的另一个优点是响应速度极快,这也使其非常适用于游戏。然而,即使是这种面板也不是完全没有问题的,因为我们能够在60%或更低的亮度下开始测量PWM,频率仅为60赫兹。这可能会给一些用户带来问题。
为了防止图像内容被烧毁,华硕提供了一些功能,如像素转移,这在实践中并不明显。任务栏可以自动隐藏,屏幕保护程序默认在30分钟后启动。所有这些设置都可以在预装的MyAsus应用程序中停用。
| |||||||||||||||||||||||||
Brightness Distribution: 99 %
Center on Battery: 396 cd/m²
Contrast: ∞:1 (Black: 0 cd/m²)
ΔE ColorChecker Calman: 2 | ∀{0.5-29.43 Ø4.71}
calibrated: 1.8
ΔE Greyscale Calman: 1 | ∀{0.09-98 Ø4.96}
95.8% AdobeRGB 1998 (Argyll 3D)
99.9% sRGB (Argyll 3D)
99.9% Display P3 (Argyll 3D)
Gamma: 2.17
CCT: 6608 K
| Asus VivoBook 15 Pro M3500QC-L1062 ATNA56YX03-0, AMOLED, 1920x1080, 15.6" | Dell G15 5515 BOE092A, IPS, 1920x1080, 15.6" | Schenker XMG Focus 15 LG Philips LP156WFG-SPB5, IPS, 1920x1080, 15.6" | HP Pavilion 15-eg Chi Mei CMN1523, IPS, 1920x1080, 15.6" | Lenovo IdeaPad 5 Pro 16ACH IPS LED, 2560x1600, 16" | Dell XPS 15 9510 11800H RTX 3050 Ti OLED SDC414D, OLED, 3456x2160, 15.6" | |
|---|---|---|---|---|---|---|
| Display | -54% | -24% | -49% | -18% | 1% | |
| Display P3 Coverage (%) | 99.9 | 39.1 -61% | 64.6 -35% | 42.9 -57% | 71 -29% | 99.9 0% |
| sRGB Coverage (%) | 99.9 | 56.9 -43% | 95.3 -5% | 64 -36% | 99 -1% | 100 0% |
| AdobeRGB 1998 Coverage (%) | 95.8 | 40.4 -58% | 66.5 -31% | 44.4 -54% | 73.3 -23% | 98.1 2% |
| Response Times | -556% | -319% | -626% | -294% | 0% | |
| Response Time Grey 50% / Grey 80% * (ms) | 3.2 ? | 25.2 ? -687% | 18 ? -463% | 22.8 ? -613% | 16.4 ? -412% | 3.6 ? -13% |
| Response Time Black / White * (ms) | 3.2 ? | 16.8 ? -425% | 8.8 ? -175% | 23.6 ? -638% | 8.8 ? -175% | 2.8 ? 13% |
| PWM Frequency (Hz) | 60.2 ? | 200 ? | 26320 ? | 24940 ? | 59.5 ? | |
| Screen | -135% | -18% | -115% | -37% | -13% | |
| Brightness middle (cd/m²) | 396 | 278 -30% | 418 6% | 294.3 -26% | 395 0% | 362 -9% |
| Brightness (cd/m²) | 397 | 262 -34% | 376 -5% | 251 -37% | 375 -6% | 367 -8% |
| Brightness Distribution (%) | 99 | 83 -16% | 83 -16% | 76 -23% | 90 -9% | 97 -2% |
| Black Level * (cd/m²) | 0.36 | 0.41 | 0.26 | 0.32 | 0.06 | |
| Colorchecker dE 2000 * | 2 | 5.74 -187% | 1.67 16% | 4.08 -104% | 2.6 -30% | 2.1 -5% |
| Colorchecker dE 2000 max. * | 4.8 | 19.63 -309% | 3.88 19% | 19.49 -306% | 5.4 -13% | 4.1 15% |
| Colorchecker dE 2000 calibrated * | 1.8 | 4.7 -161% | 0.98 46% | 3.7 -106% | 1.1 39% | 2.5 -39% |
| Greyscale dE 2000 * | 1 | 3.1 -210% | 2.9 -190% | 3 -200% | 3.4 -240% | 1.4 -40% |
| Gamma | 2.17 101% | 2.011 109% | 2.26 97% | 2.21 100% | 2.12 104% | 2.18 101% |
| CCT | 6608 98% | 6207 105% | 6209 105% | 6616 98% | 6140 106% | 6608 98% |
| Contrast (:1) | 772 | 1020 | 1132 | 1234 | 6033 | |
| Total Average (Program / Settings) | -248% /
-185% | -120% /
-69% | -263% /
-183% | -116% /
-75% | -4% /
-7% |
* ... smaller is better
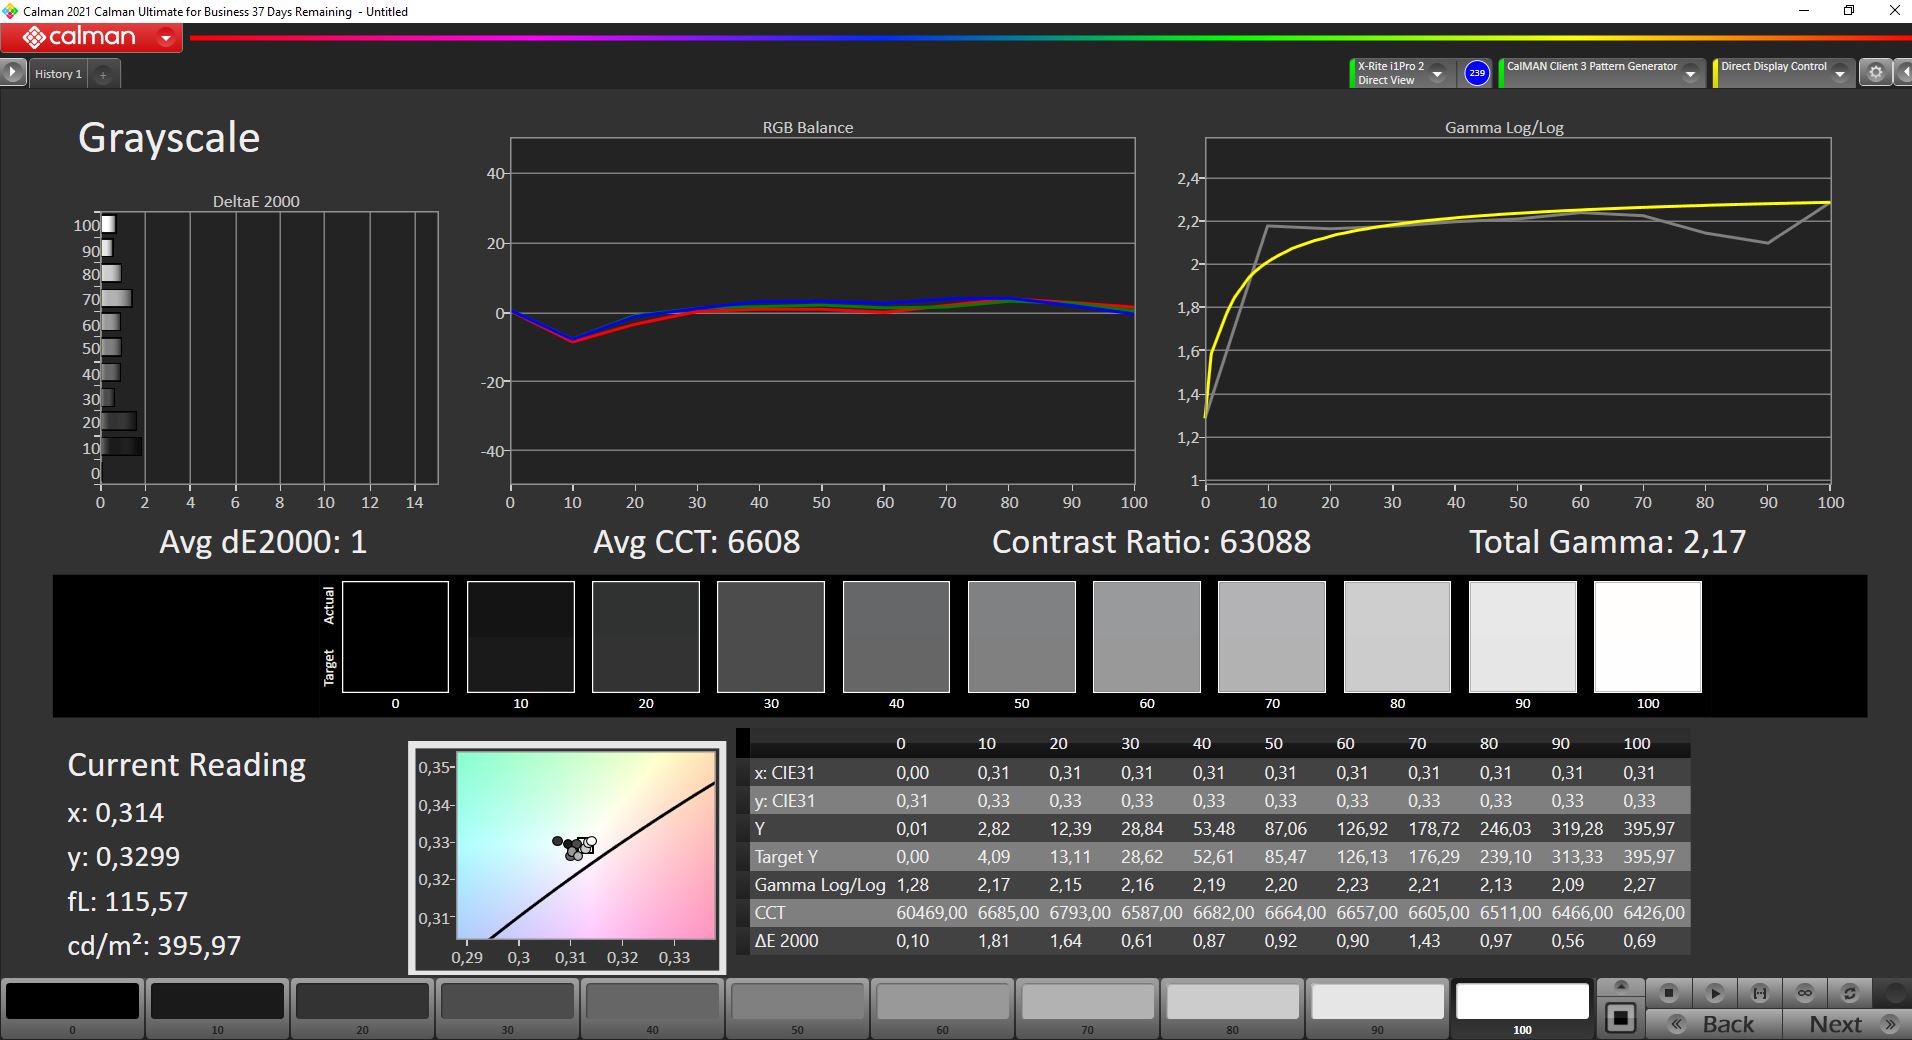
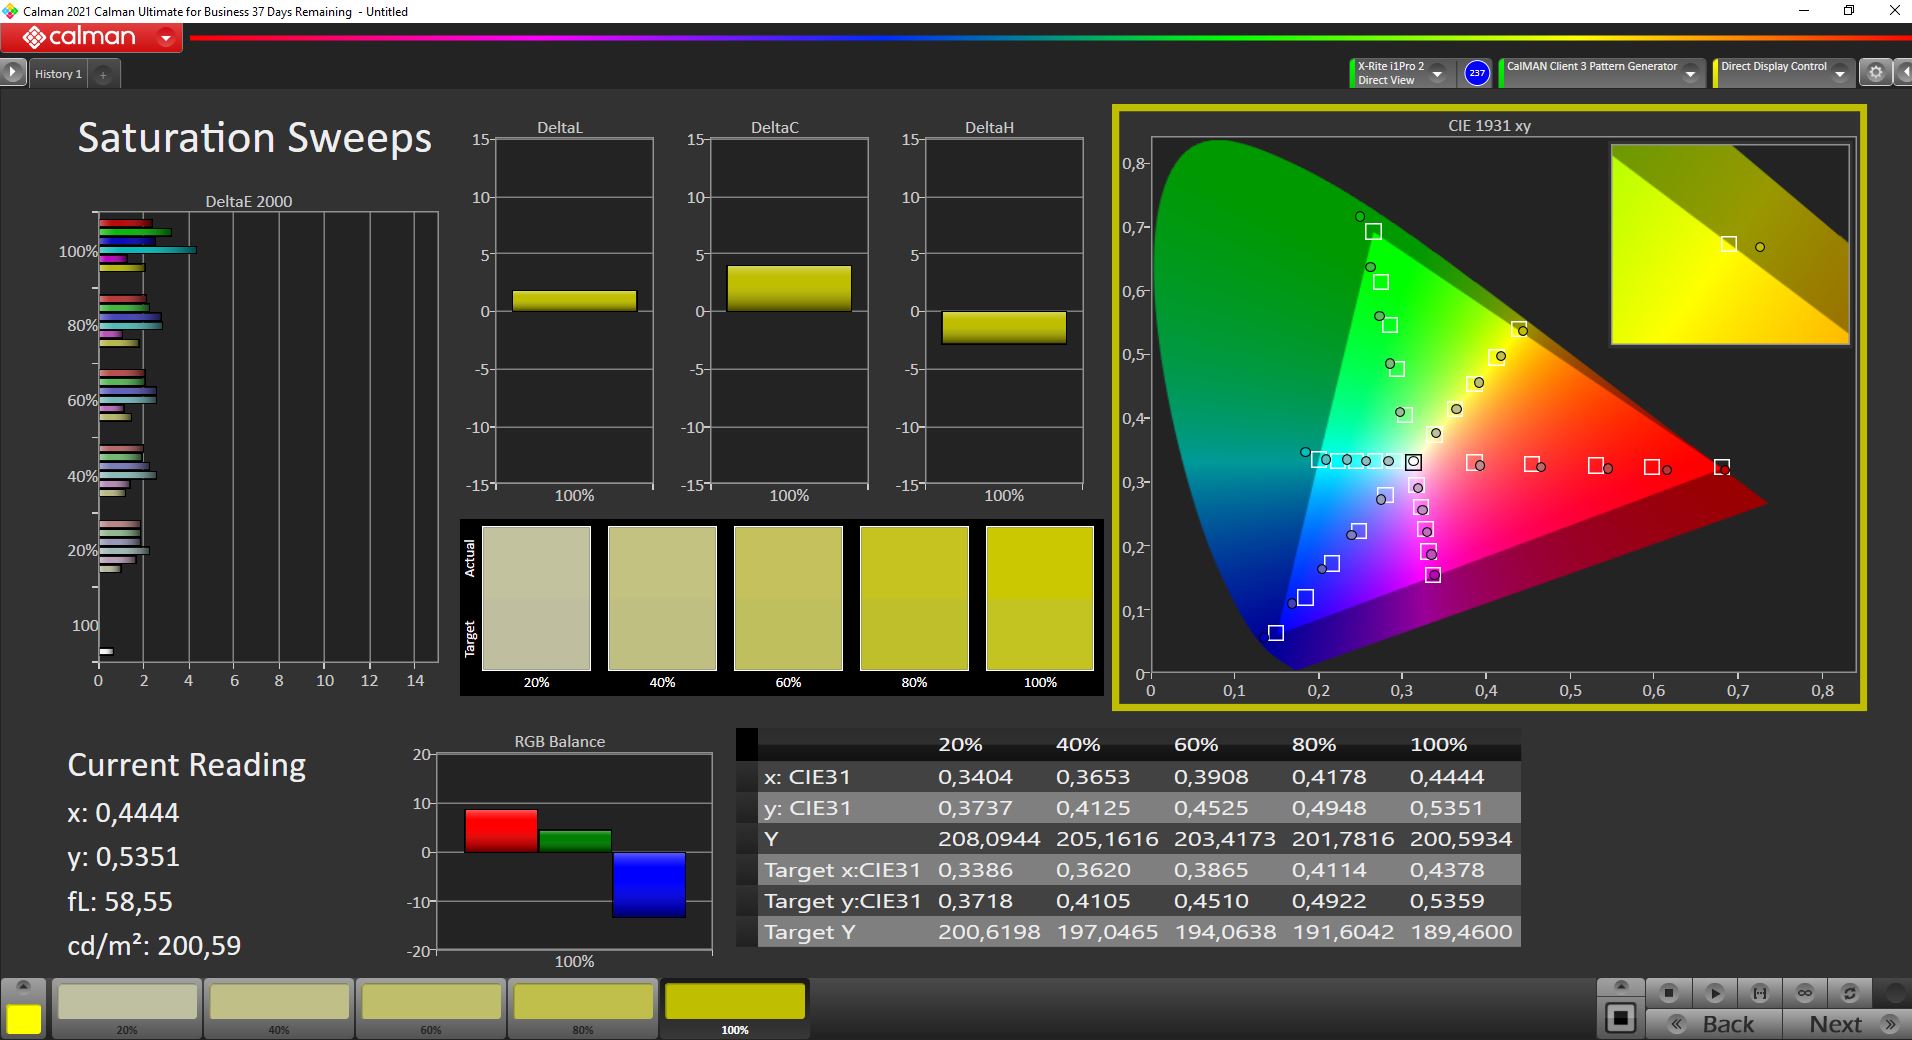
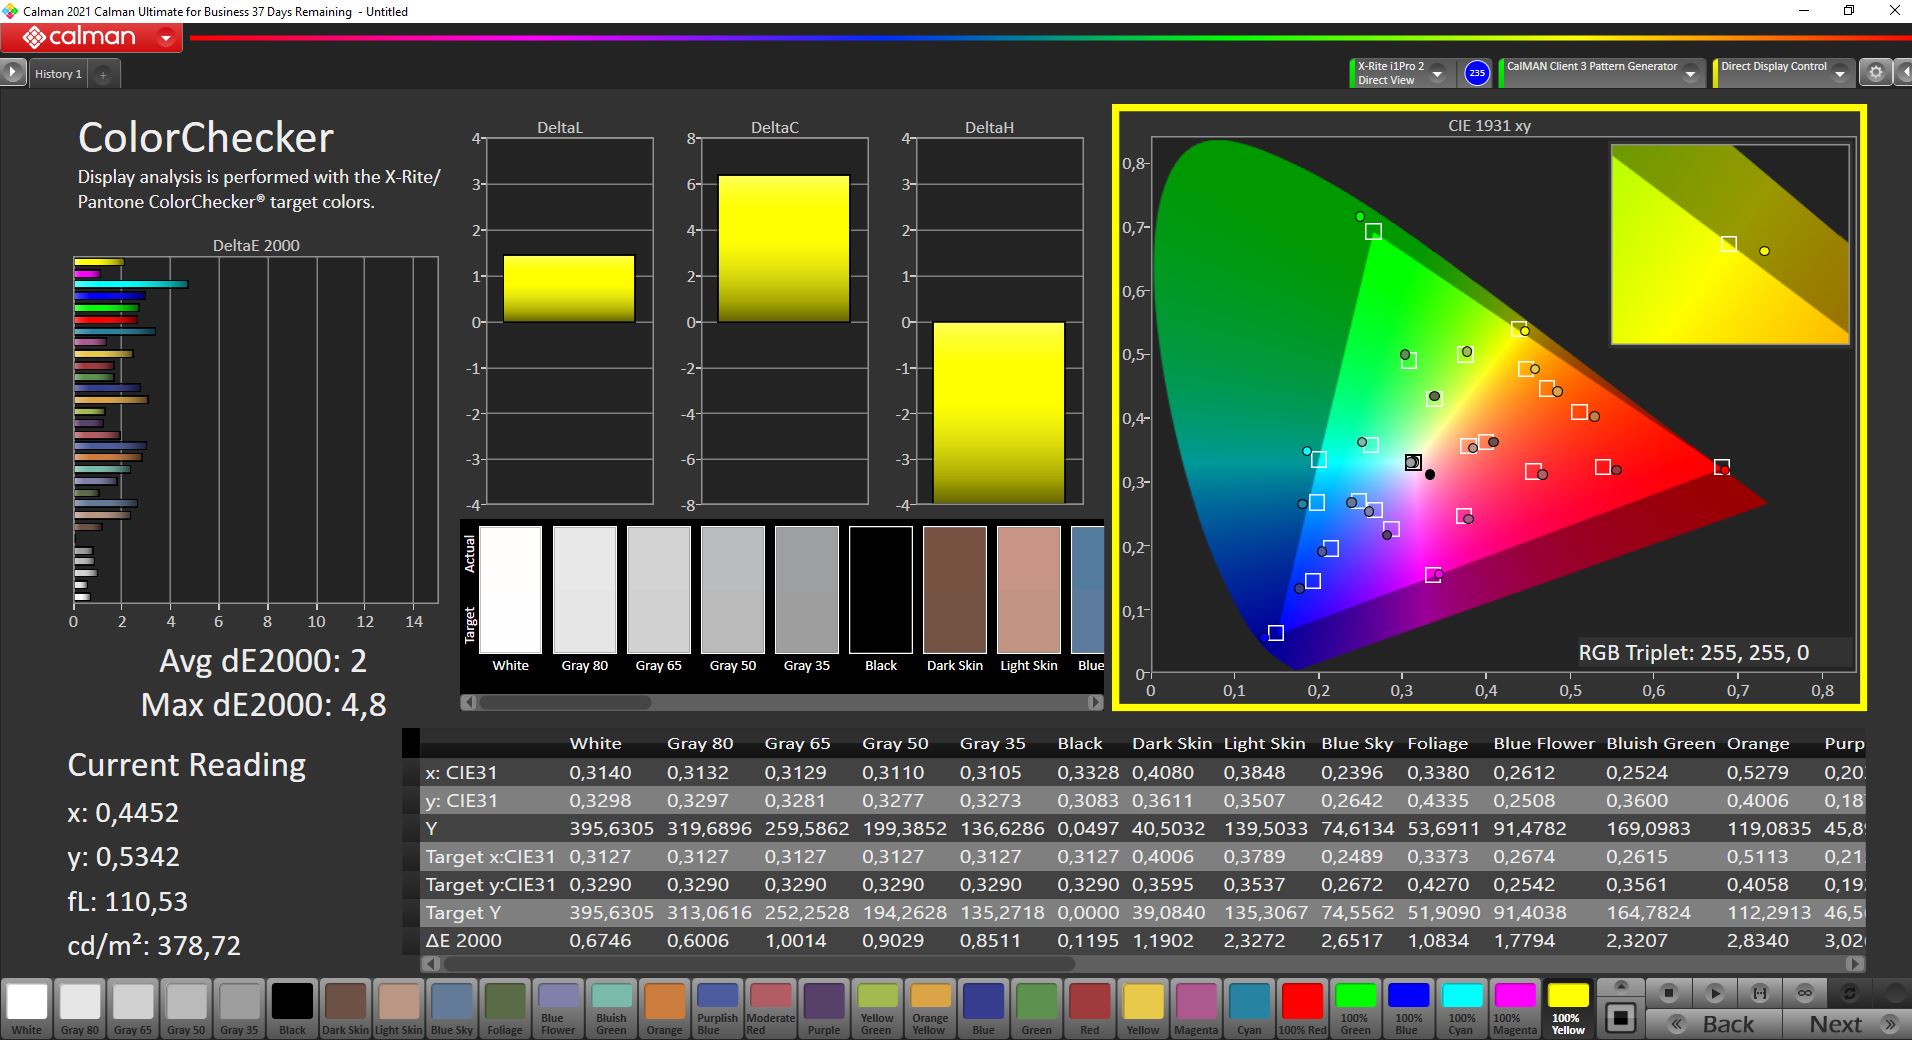

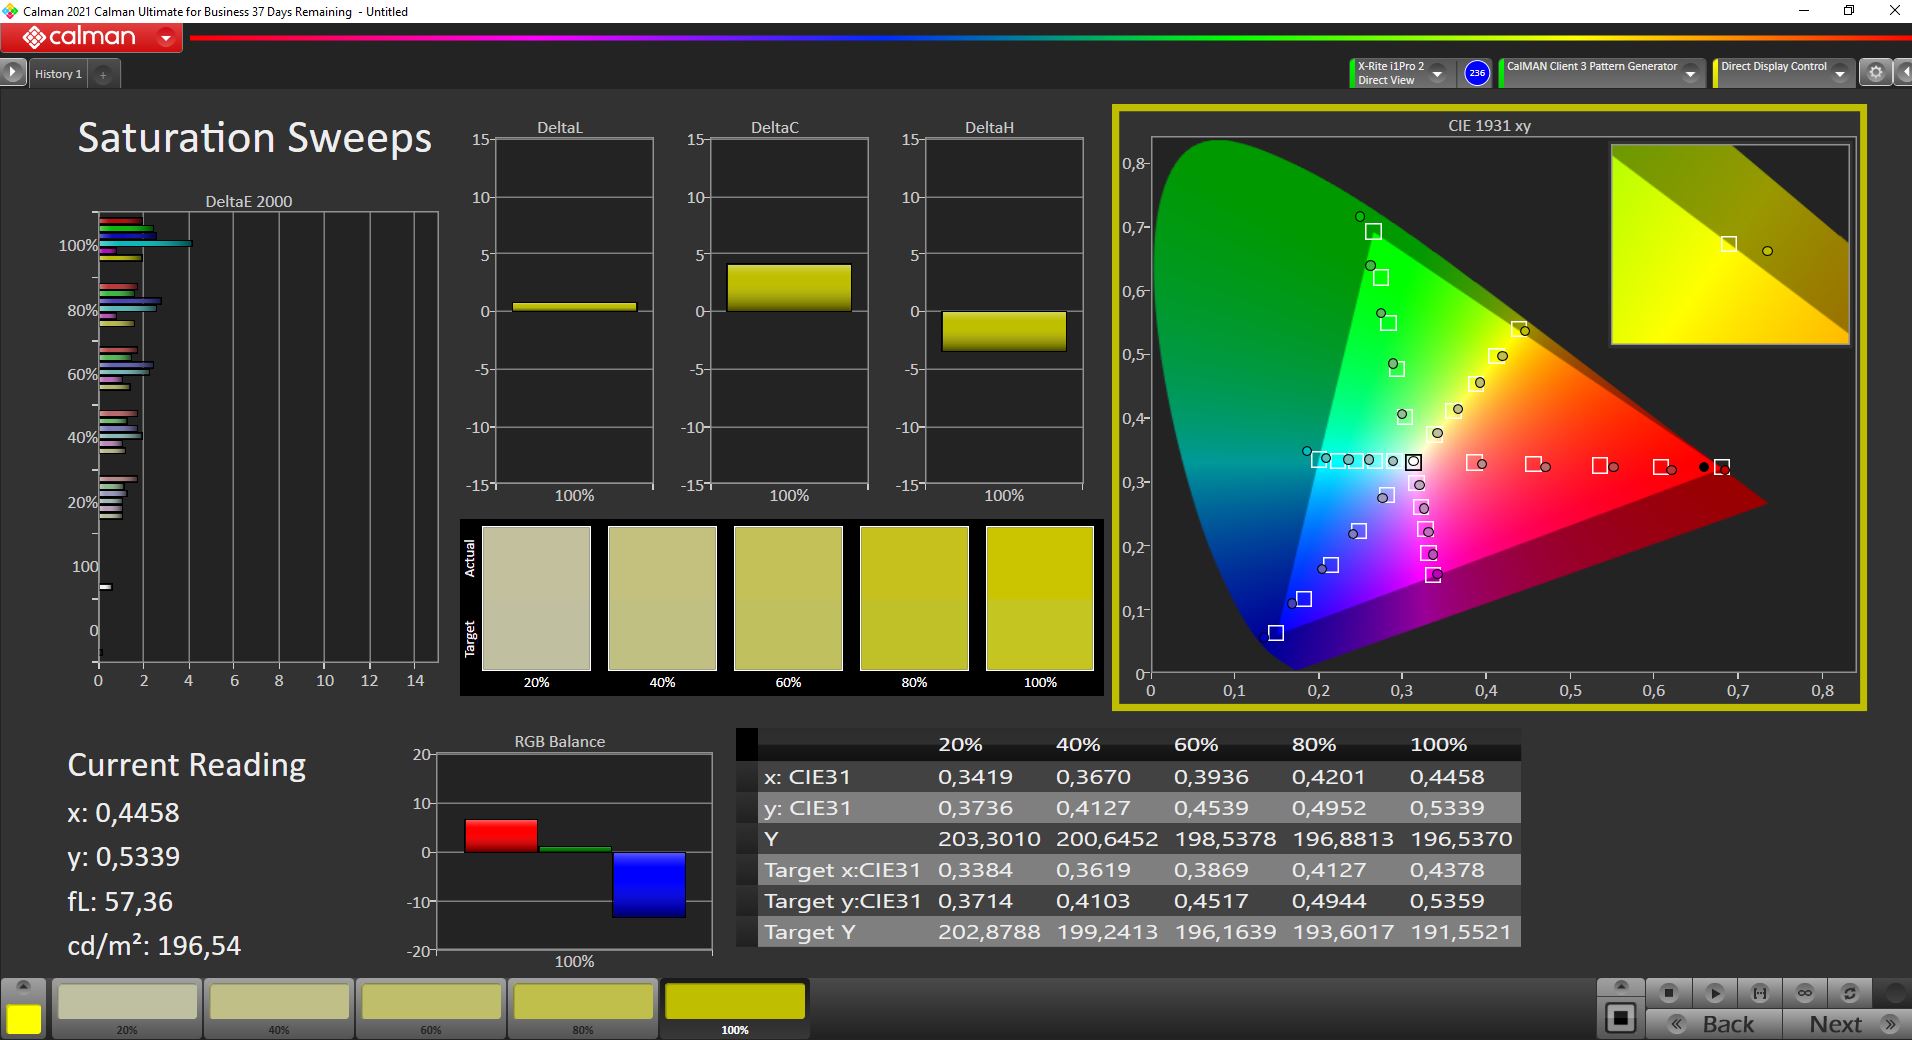

在交付状态下,面板已经被调整得很好,没有彩色的色调。与DCI P3参考色彩空间相比,色彩偏差非常低。通过校准(上面有免费下载的配置文件),我们能够进一步改善DeltaE 2000的偏差(尽管青色的异常值仍然存在),但这并不是真正必要的。 由于DCI P3色彩空间的完整覆盖,视频和图像处理也可以在这个设备上进行。
Display Response Times
| ↔ Response Time Black to White | ||
|---|---|---|
| 3.2 ms ... rise ↗ and fall ↘ combined | ↗ 1.6 ms rise | 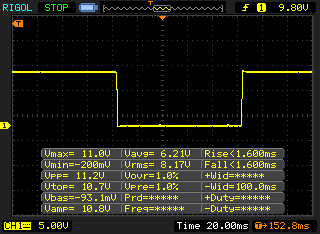 |
| ↘ 1.6 ms fall | ||
| The screen shows very fast response rates in our tests and should be very well suited for fast-paced gaming. In comparison, all tested devices range from 0.1 (minimum) to 240 (maximum) ms. » 15 % of all devices are better. This means that the measured response time is better than the average of all tested devices (19.8 ms). | ||
| ↔ Response Time 50% Grey to 80% Grey | ||
| 3.2 ms ... rise ↗ and fall ↘ combined | ↗ 1.6 ms rise | 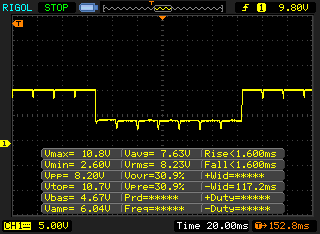 |
| ↘ 1.6 ms fall | ||
| The screen shows very fast response rates in our tests and should be very well suited for fast-paced gaming. In comparison, all tested devices range from 0.165 (minimum) to 636 (maximum) ms. » 13 % of all devices are better. This means that the measured response time is better than the average of all tested devices (30.9 ms). | ||
Screen Flickering / PWM (Pulse-Width Modulation)
| Screen flickering / PWM detected | 60.2 Hz | ≤ 60 % brightness setting | 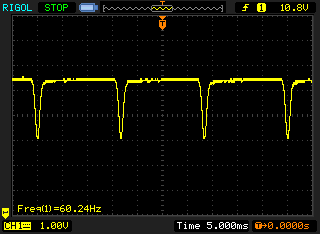 |
The display backlight flickers at 60.2 Hz (worst case, e.g., utilizing PWM) Flickering detected at a brightness setting of 60 % and below. There should be no flickering or PWM above this brightness setting. The frequency of 60.2 Hz is very low, so the flickering may cause eyestrain and headaches after extended use. In comparison: 52 % of all tested devices do not use PWM to dim the display. If PWM was detected, an average of 7741 (minimum: 5 - maximum: 343500) Hz was measured. | |||
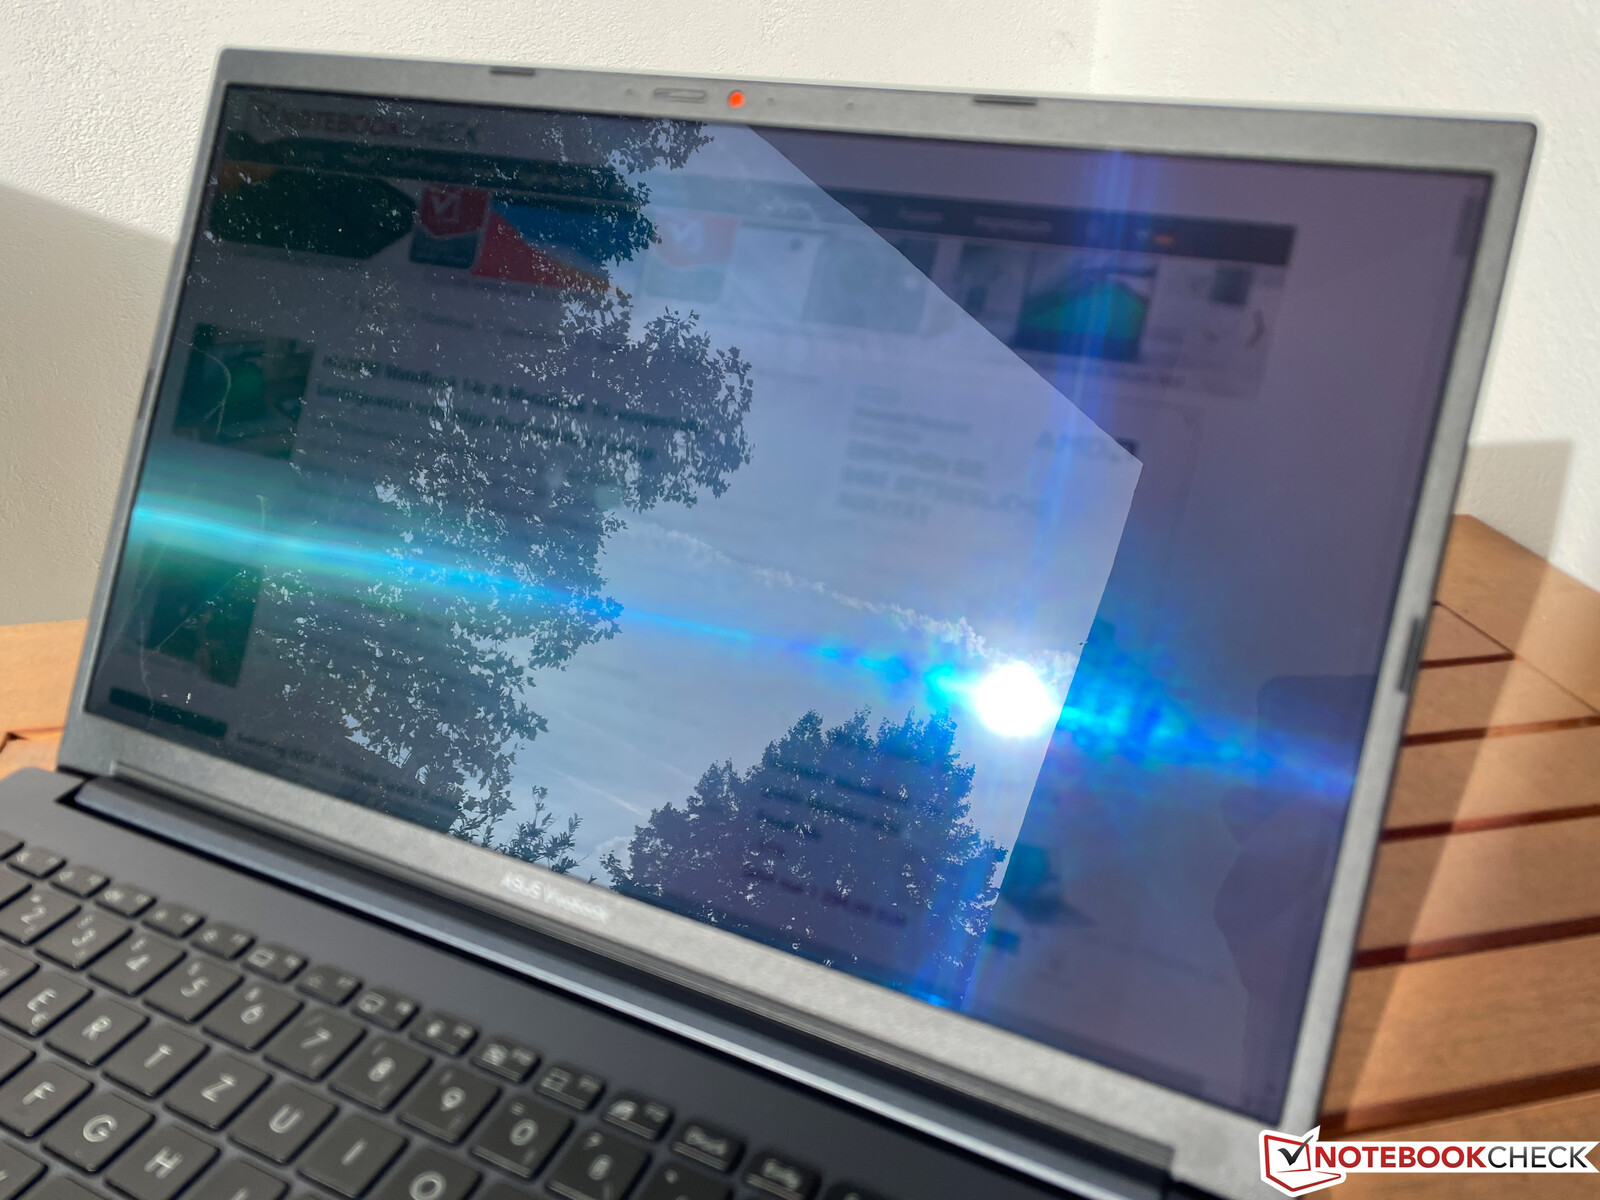
显示屏表面具有高度反射性,这也影响了在明亮环境中使用该设备。在明亮的阳光下,你很难在户外使用该设备,因为持续的反射会成为一种障碍。
性能--AMD Ryzen遇到GeForce RTX
我们的VivoBook 15 Pro测试单元使用的是目前的AMDRyzen 5000处理器(45瓦级),并结合专用的 GeForce RTX-3050图形卡从Nvidia。MyAsus应用程序提供各种性能配置文件,对处理器和显卡的性能都有影响。
| 性能模式 | CPU负载 | GPU负载 | CPU/GPU综合负载 |
|---|---|---|---|
| 低声模式 | 65W->45W | 35W | CPU。15W, GPU:35W |
| 标准模式 | 65W -> 54W | 40W | CPU: 25W, GPU:40W |
| 性能模式 | 65W->54W | 50W | CPU。35W, GPU:50W |
一般来说,我们使用预设的标准模式运行以下基准和测量。然而,在某些类别中,我们也看了其他两种模式的效果。特别是耳语模式对于日常工作甚至游戏来说可能真的很有趣,但后面会有更多的内容。
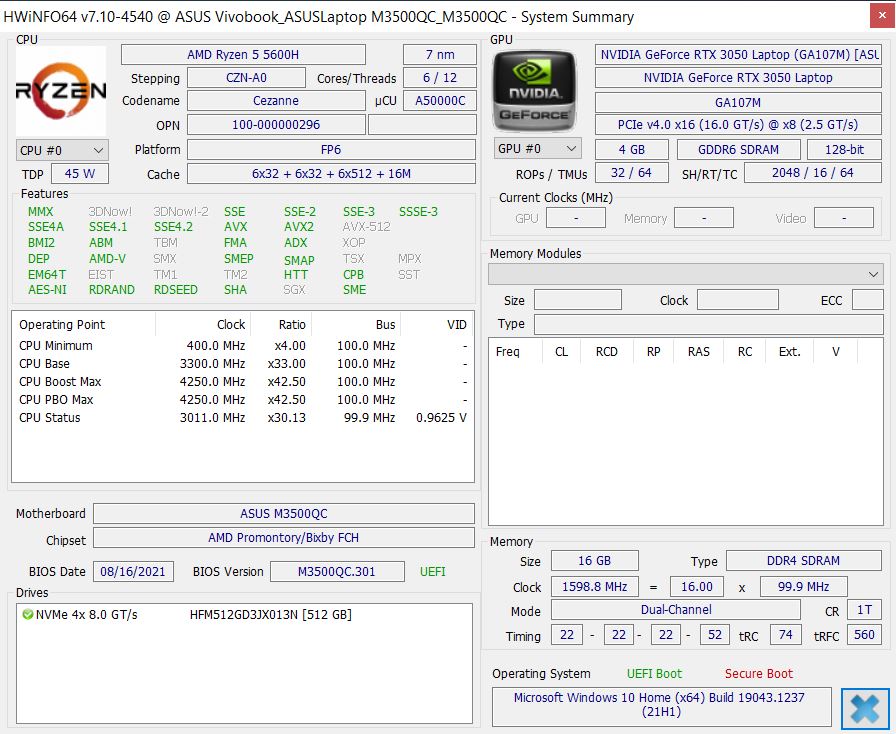
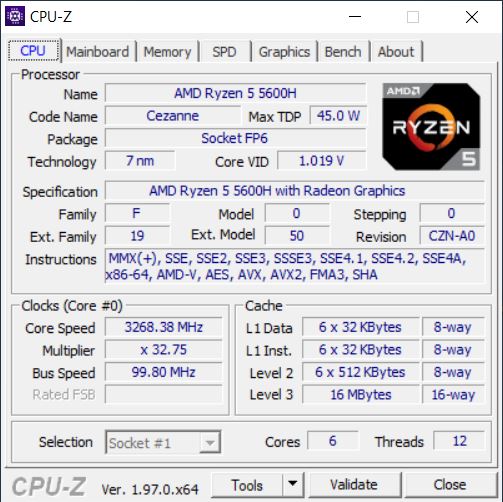
处理器 - Ryzen 5 5600H (Zen 3)
华硕使用目前的AMD Ryzen 5 5600H具有6个核心(12个线程)的处理器。由于高TDP值,它提供了非常好的性能,在标准以及性能模式下,即使在持续负载下,性能也保持稳定。正如预期的那样,配备8核CPU的竞争者具有优势,但由于其在较长负荷下的性能发展不佳,所以 XPS 15甚至没有领先那么多。总的来说,Ryzen 5的性能在大多数情况下是完全足够的,即使是更苛刻的任务。
VivoBook 15 Pro的英特尔型号使用的是 酷睿i7-11370H4个核心(8个线程),我们已经在MateBook 14s中用类似的TDP值进行了测试。MateBook 14s.在多核测试中,i7最终落后Ryzen 5约30%,但在单核测试中,它的优势略高于10%。由于Ryzen处理器采用现代7纳米制造工艺,效率更高,因此总体上是更好的选择。
在电池运行中,CPU的性能被限制在30瓦左右(即使在可选的性能模式下),但这只在多核测试中变得很明显,下降了约15%。你可以找到更多的CPU基准测试 这里.
Cinebench R15 Multi Constant Load Test
Cinebench R23: Multi Core | Single Core
Cinebench R20: CPU (Multi Core) | CPU (Single Core)
Cinebench R15: CPU Multi 64Bit | CPU Single 64Bit
Blender: v2.79 BMW27 CPU
7-Zip 18.03: 7z b 4 | 7z b 4 -mmt1
Geekbench 5.5: Multi-Core | Single-Core
HWBOT x265 Benchmark v2.2: 4k Preset
LibreOffice : 20 Documents To PDF
R Benchmark 2.5: Overall mean
| CPU Performance rating | |
| Average of class Multimedia | |
| Lenovo IdeaPad 5 Pro 16ACH | |
| Dell XPS 15 9510 11800H RTX 3050 Ti OLED | |
| Schenker XMG Focus 15 | |
| Dell G15 5515 | |
| Average AMD Ryzen 5 5600H | |
| Asus VivoBook 15 Pro M3500QC-L1062 | |
| Huawei MateBook 14s i7 | |
| HP Pavilion 15-eg -2! | |
| Cinebench R23 / Multi Core | |
| Average of class Multimedia (4861 - 33362, n=66, last 2 years) | |
| Dell G15 5515 | |
| Lenovo IdeaPad 5 Pro 16ACH | |
| Schenker XMG Focus 15 | |
| Dell XPS 15 9510 11800H RTX 3050 Ti OLED | |
| Average AMD Ryzen 5 5600H (7945 - 10416, n=13) | |
| Asus VivoBook 15 Pro M3500QC-L1062 | |
| Huawei MateBook 14s i7 | |
| HP Pavilion 15-eg | |
| Cinebench R23 / Single Core | |
| Average of class Multimedia (1128 - 2459, n=65, last 2 years) | |
| Huawei MateBook 14s i7 | |
| Dell XPS 15 9510 11800H RTX 3050 Ti OLED | |
| HP Pavilion 15-eg | |
| Dell G15 5515 | |
| Schenker XMG Focus 15 | |
| Lenovo IdeaPad 5 Pro 16ACH | |
| Average AMD Ryzen 5 5600H (1316 - 1381, n=13) | |
| Asus VivoBook 15 Pro M3500QC-L1062 | |
| Cinebench R20 / CPU (Multi Core) | |
| Average of class Multimedia (1887 - 12912, n=57, last 2 years) | |
| Dell G15 5515 | |
| Lenovo IdeaPad 5 Pro 16ACH | |
| Schenker XMG Focus 15 | |
| Dell XPS 15 9510 11800H RTX 3050 Ti OLED | |
| Average AMD Ryzen 5 5600H (3074 - 4059, n=16) | |
| Asus VivoBook 15 Pro M3500QC-L1062 | |
| Huawei MateBook 14s i7 | |
| HP Pavilion 15-eg | |
| Cinebench R20 / CPU (Single Core) | |
| Average of class Multimedia (425 - 853, n=57, last 2 years) | |
| Huawei MateBook 14s i7 | |
| Dell XPS 15 9510 11800H RTX 3050 Ti OLED | |
| HP Pavilion 15-eg | |
| Dell G15 5515 | |
| Lenovo IdeaPad 5 Pro 16ACH | |
| Schenker XMG Focus 15 | |
| Average AMD Ryzen 5 5600H (527 - 538, n=15) | |
| Asus VivoBook 15 Pro M3500QC-L1062 | |
| Cinebench R15 / CPU Multi 64Bit | |
| Average of class Multimedia (856 - 5224, n=61, last 2 years) | |
| Dell XPS 15 9510 11800H RTX 3050 Ti OLED (Ultra Performance) | |
| Dell XPS 15 9510 11800H RTX 3050 Ti OLED | |
| Lenovo IdeaPad 5 Pro 16ACH | |
| Dell G15 5515 | |
| Schenker XMG Focus 15 | |
| Average AMD Ryzen 5 5600H (1319 - 1723, n=16) | |
| Asus VivoBook 15 Pro M3500QC-L1062 (Performance Mode) | |
| Asus VivoBook 15 Pro M3500QC-L1062 (Standard) | |
| Asus VivoBook 15 Pro M3500QC-L1062 (Quiet Mode) | |
| Huawei MateBook 14s i7 | |
| HP Pavilion 15-eg | |
| Cinebench R15 / CPU Single 64Bit | |
| Average of class Multimedia (184.8 - 326, n=59, last 2 years) | |
| Huawei MateBook 14s i7 | |
| Dell G15 5515 | |
| Dell XPS 15 9510 11800H RTX 3050 Ti OLED | |
| Lenovo IdeaPad 5 Pro 16ACH | |
| Asus VivoBook 15 Pro M3500QC-L1062 | |
| Average AMD Ryzen 5 5600H (218 - 225, n=14) | |
| HP Pavilion 15-eg | |
| Schenker XMG Focus 15 | |
| Blender / v2.79 BMW27 CPU | |
| HP Pavilion 15-eg | |
| Huawei MateBook 14s i7 | |
| Asus VivoBook 15 Pro M3500QC-L1062 | |
| Average AMD Ryzen 5 5600H (300 - 384, n=14) | |
| Dell XPS 15 9510 11800H RTX 3050 Ti OLED | |
| Schenker XMG Focus 15 | |
| Lenovo IdeaPad 5 Pro 16ACH | |
| Dell G15 5515 | |
| Average of class Multimedia (100 - 557, n=58, last 2 years) | |
| 7-Zip 18.03 / 7z b 4 | |
| Average of class Multimedia (26062 - 130368, n=55, last 2 years) | |
| Dell G15 5515 | |
| Lenovo IdeaPad 5 Pro 16ACH | |
| Schenker XMG Focus 15 | |
| Average AMD Ryzen 5 5600H (36315 - 46562, n=14) | |
| Asus VivoBook 15 Pro M3500QC-L1062 | |
| Dell XPS 15 9510 11800H RTX 3050 Ti OLED | |
| Huawei MateBook 14s i7 | |
| HP Pavilion 15-eg | |
| 7-Zip 18.03 / 7z b 4 -mmt1 | |
| Average of class Multimedia (3666 - 7545, n=56, last 2 years) | |
| Dell G15 5515 | |
| Asus VivoBook 15 Pro M3500QC-L1062 | |
| Dell XPS 15 9510 11800H RTX 3050 Ti OLED | |
| HP Pavilion 15-eg | |
| Huawei MateBook 14s i7 | |
| Average AMD Ryzen 5 5600H (5213 - 5446, n=14) | |
| Lenovo IdeaPad 5 Pro 16ACH | |
| Schenker XMG Focus 15 | |
| Geekbench 5.5 / Multi-Core | |
| Average of class Multimedia (4652 - 20422, n=56, last 2 years) | |
| Schenker XMG Focus 15 | |
| Dell XPS 15 9510 11800H RTX 3050 Ti OLED | |
| Dell G15 5515 | |
| Lenovo IdeaPad 5 Pro 16ACH | |
| Average AMD Ryzen 5 5600H (4990 - 7253, n=14) | |
| Asus VivoBook 15 Pro M3500QC-L1062 | |
| Huawei MateBook 14s i7 | |
| Geekbench 5.5 / Single-Core | |
| Average of class Multimedia (805 - 2974, n=56, last 2 years) | |
| Huawei MateBook 14s i7 | |
| Dell XPS 15 9510 11800H RTX 3050 Ti OLED | |
| Schenker XMG Focus 15 | |
| Dell G15 5515 | |
| Lenovo IdeaPad 5 Pro 16ACH | |
| Asus VivoBook 15 Pro M3500QC-L1062 | |
| Average AMD Ryzen 5 5600H (1365 - 1445, n=14) | |
| HWBOT x265 Benchmark v2.2 / 4k Preset | |
| Average of class Multimedia (5.26 - 36.1, n=56, last 2 years) | |
| Dell G15 5515 | |
| Lenovo IdeaPad 5 Pro 16ACH | |
| Schenker XMG Focus 15 | |
| Dell XPS 15 9510 11800H RTX 3050 Ti OLED | |
| Average AMD Ryzen 5 5600H (9.92 - 13.3, n=14) | |
| Asus VivoBook 15 Pro M3500QC-L1062 | |
| Huawei MateBook 14s i7 | |
| HP Pavilion 15-eg | |
| LibreOffice / 20 Documents To PDF | |
| Dell G15 5515 | |
| Average AMD Ryzen 5 5600H (52.2 - 81.5, n=14) | |
| Asus VivoBook 15 Pro M3500QC-L1062 | |
| Average of class Multimedia (23.9 - 146.7, n=57, last 2 years) | |
| Dell XPS 15 9510 11800H RTX 3050 Ti OLED | |
| Lenovo IdeaPad 5 Pro 16ACH | |
| Schenker XMG Focus 15 | |
| HP Pavilion 15-eg | |
| Huawei MateBook 14s i7 | |
| R Benchmark 2.5 / Overall mean | |
| Schenker XMG Focus 15 | |
| Dell XPS 15 9510 11800H RTX 3050 Ti OLED | |
| HP Pavilion 15-eg | |
| Huawei MateBook 14s i7 | |
| Lenovo IdeaPad 5 Pro 16ACH | |
| Average AMD Ryzen 5 5600H (0.526 - 0.596, n=14) | |
| Asus VivoBook 15 Pro M3500QC-L1062 | |
| Dell G15 5515 | |
| Average of class Multimedia (0.3604 - 0.947, n=56, last 2 years) | |
* ... smaller is better
AIDA64: FP32 Ray-Trace | FPU Julia | CPU SHA3 | CPU Queen | FPU SinJulia | FPU Mandel | CPU AES | CPU ZLib | FP64 Ray-Trace | CPU PhotoWorxx
| Performance rating | |
| Average of class Multimedia | |
| Dell G15 5515 | |
| Lenovo IdeaPad 5 Pro 16ACH | |
| Asus VivoBook 15 Pro M3500QC-L1062 | |
| Average AMD Ryzen 5 5600H | |
| HP Pavilion 15-eg | |
| AIDA64 / FP32 Ray-Trace | |
| Average of class Multimedia (2214 - 50388, n=54, last 2 years) | |
| Dell G15 5515 | |
| Lenovo IdeaPad 5 Pro 16ACH | |
| Average AMD Ryzen 5 5600H (9181 - 12636, n=14) | |
| Asus VivoBook 15 Pro M3500QC-L1062 | |
| HP Pavilion 15-eg | |
| AIDA64 / FPU Julia | |
| Dell G15 5515 | |
| Lenovo IdeaPad 5 Pro 16ACH | |
| Average of class Multimedia (12867 - 201874, n=54, last 2 years) | |
| Average AMD Ryzen 5 5600H (51994 - 78250, n=14) | |
| Asus VivoBook 15 Pro M3500QC-L1062 | |
| HP Pavilion 15-eg | |
| AIDA64 / CPU SHA3 | |
| Average of class Multimedia (626 - 8623, n=54, last 2 years) | |
| Dell G15 5515 | |
| Lenovo IdeaPad 5 Pro 16ACH | |
| Asus VivoBook 15 Pro M3500QC-L1062 | |
| Average AMD Ryzen 5 5600H (1587 - 2675, n=14) | |
| HP Pavilion 15-eg | |
| AIDA64 / CPU Queen | |
| Dell G15 5515 | |
| Lenovo IdeaPad 5 Pro 16ACH | |
| Average AMD Ryzen 5 5600H (66699 - 77213, n=14) | |
| Asus VivoBook 15 Pro M3500QC-L1062 | |
| Average of class Multimedia (13483 - 181505, n=40, last 2 years) | |
| HP Pavilion 15-eg | |
| AIDA64 / FPU SinJulia | |
| Dell G15 5515 | |
| Lenovo IdeaPad 5 Pro 16ACH | |
| Average AMD Ryzen 5 5600H (8340 - 9159, n=14) | |
| Asus VivoBook 15 Pro M3500QC-L1062 | |
| Average of class Multimedia (886 - 28794, n=54, last 2 years) | |
| HP Pavilion 15-eg | |
| AIDA64 / FPU Mandel | |
| Dell G15 5515 | |
| Lenovo IdeaPad 5 Pro 16ACH | |
| Average of class Multimedia (6395 - 105740, n=54, last 2 years) | |
| Average AMD Ryzen 5 5600H (28268 - 43274, n=14) | |
| Asus VivoBook 15 Pro M3500QC-L1062 | |
| HP Pavilion 15-eg | |
| AIDA64 / CPU AES | |
| Lenovo IdeaPad 5 Pro 16ACH | |
| Dell G15 5515 | |
| Asus VivoBook 15 Pro M3500QC-L1062 | |
| Average AMD Ryzen 5 5600H (39852 - 98939, n=14) | |
| Average of class Multimedia (8171 - 126790, n=54, last 2 years) | |
| HP Pavilion 15-eg | |
| AIDA64 / CPU ZLib | |
| Average of class Multimedia (143.8 - 2022, n=54, last 2 years) | |
| Lenovo IdeaPad 5 Pro 16ACH | |
| Dell G15 5515 | |
| Average AMD Ryzen 5 5600H (507 - 649, n=14) | |
| Asus VivoBook 15 Pro M3500QC-L1062 | |
| HP Pavilion 15-eg | |
| AIDA64 / FP64 Ray-Trace | |
| Average of class Multimedia (1014 - 26875, n=54, last 2 years) | |
| Lenovo IdeaPad 5 Pro 16ACH | |
| Dell G15 5515 | |
| Average AMD Ryzen 5 5600H (4811 - 6652, n=14) | |
| Asus VivoBook 15 Pro M3500QC-L1062 | |
| HP Pavilion 15-eg | |
| AIDA64 / CPU PhotoWorxx | |
| Average of class Multimedia (8187 - 88533, n=54, last 2 years) | |
| HP Pavilion 15-eg | |
| Average AMD Ryzen 5 5600H (7419 - 24746, n=14) | |
| Asus VivoBook 15 Pro M3500QC-L1062 | |
| Lenovo IdeaPad 5 Pro 16ACH | |
| Dell G15 5515 | |
系统性能
正如你所期望的那样,VivoBook 15 Pro拥有快速的组件,是一个反应非常迅速的系统,这也被合成基准测试所证实。从AMD iGPU到Nvidia GPU的自动图形切换也没有问题或停顿。新的Windows 11可以安装在VivoBook 15 Pro上。
| PCMark 10 / Score | |
| Average of class Multimedia (4325 - 10386, n=52, last 2 years) | |
| Schenker XMG Focus 15 | |
| Dell G15 5515 | |
| Dell XPS 15 9510 11800H RTX 3050 Ti OLED | |
| Asus VivoBook 15 Pro M3500QC-L1062 | |
| Lenovo IdeaPad 5 Pro 16ACH | |
| Average AMD Ryzen 5 5600H, NVIDIA GeForce RTX 3050 4GB Laptop GPU (5748 - 5905, n=2) | |
| HP Pavilion 15-eg | |
| PCMark 10 / Essentials | |
| Average of class Multimedia (8025 - 11664, n=51, last 2 years) | |
| Schenker XMG Focus 15 | |
| Lenovo IdeaPad 5 Pro 16ACH | |
| Asus VivoBook 15 Pro M3500QC-L1062 | |
| HP Pavilion 15-eg | |
| Average AMD Ryzen 5 5600H, NVIDIA GeForce RTX 3050 4GB Laptop GPU (9372 - 9987, n=2) | |
| Dell G15 5515 | |
| Dell XPS 15 9510 11800H RTX 3050 Ti OLED | |
| PCMark 10 / Productivity | |
| Average of class Multimedia (7323 - 18233, n=51, last 2 years) | |
| HP Pavilion 15-eg | |
| Schenker XMG Focus 15 | |
| Asus VivoBook 15 Pro M3500QC-L1062 | |
| Dell G15 5515 | |
| Dell XPS 15 9510 11800H RTX 3050 Ti OLED | |
| Average AMD Ryzen 5 5600H, NVIDIA GeForce RTX 3050 4GB Laptop GPU (7975 - 8627, n=2) | |
| Lenovo IdeaPad 5 Pro 16ACH | |
| PCMark 10 / Digital Content Creation | |
| Average of class Multimedia (3651 - 16240, n=51, last 2 years) | |
| Schenker XMG Focus 15 | |
| Dell XPS 15 9510 11800H RTX 3050 Ti OLED | |
| Dell G15 5515 | |
| Average AMD Ryzen 5 5600H, NVIDIA GeForce RTX 3050 4GB Laptop GPU (6486 - 6897, n=2) | |
| Lenovo IdeaPad 5 Pro 16ACH | |
| Asus VivoBook 15 Pro M3500QC-L1062 | |
| HP Pavilion 15-eg | |
| PCMark 10 Score | 5905 points | |
Help | ||
| AIDA64 / Memory Copy | |
| Average of class Multimedia (11299 - 132135, n=54, last 2 years) | |
| HP Pavilion 15-eg | |
| Lenovo IdeaPad 5 Pro 16ACH | |
| Dell G15 5515 | |
| Asus VivoBook 15 Pro M3500QC-L1062 | |
| Average AMD Ryzen 5 5600H (20549 - 42141, n=14) | |
| AIDA64 / Memory Read | |
| Average of class Multimedia (11624 - 174586, n=54, last 2 years) | |
| HP Pavilion 15-eg | |
| Asus VivoBook 15 Pro M3500QC-L1062 | |
| Lenovo IdeaPad 5 Pro 16ACH | |
| Dell G15 5515 | |
| Average AMD Ryzen 5 5600H (22917 - 47595, n=14) | |
| AIDA64 / Memory Write | |
| Average of class Multimedia (11755 - 134998, n=54, last 2 years) | |
| HP Pavilion 15-eg | |
| Average AMD Ryzen 5 5600H (20226 - 44872, n=14) | |
| Asus VivoBook 15 Pro M3500QC-L1062 | |
| Lenovo IdeaPad 5 Pro 16ACH | |
| Dell G15 5515 | |
| AIDA64 / Memory Latency | |
| Average of class Multimedia (7 - 535, n=53, last 2 years) | |
| Lenovo IdeaPad 5 Pro 16ACH | |
| Average AMD Ryzen 5 5600H (75 - 89.1, n=14) | |
| Dell G15 5515 | |
| Asus VivoBook 15 Pro M3500QC-L1062 | |
| HP Pavilion 15-eg | |
| Dell XPS 15 9510 11800H RTX 3050 Ti OLED | |
* ... smaller is better
DPC延迟
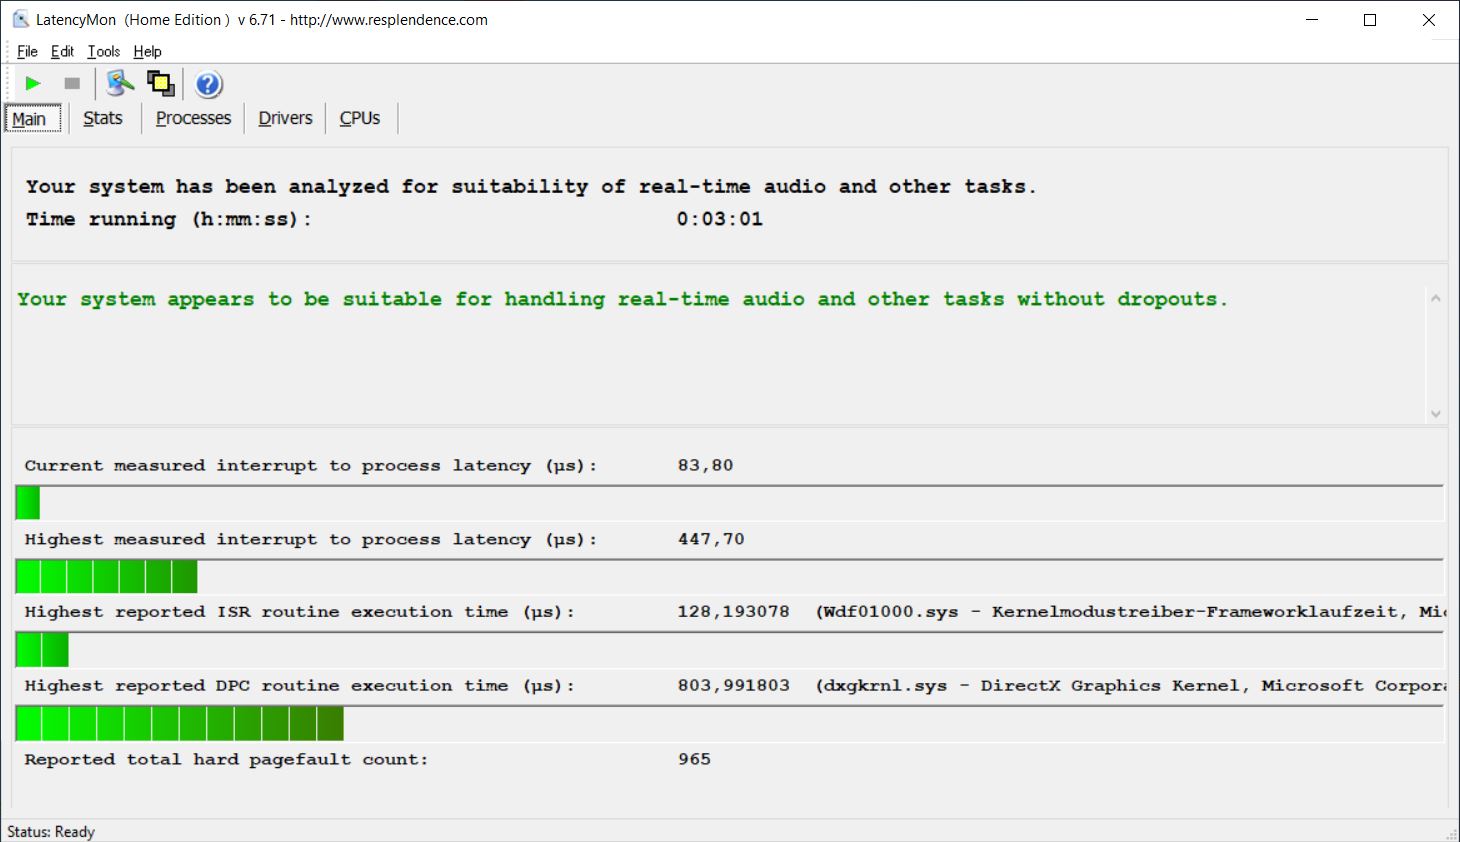
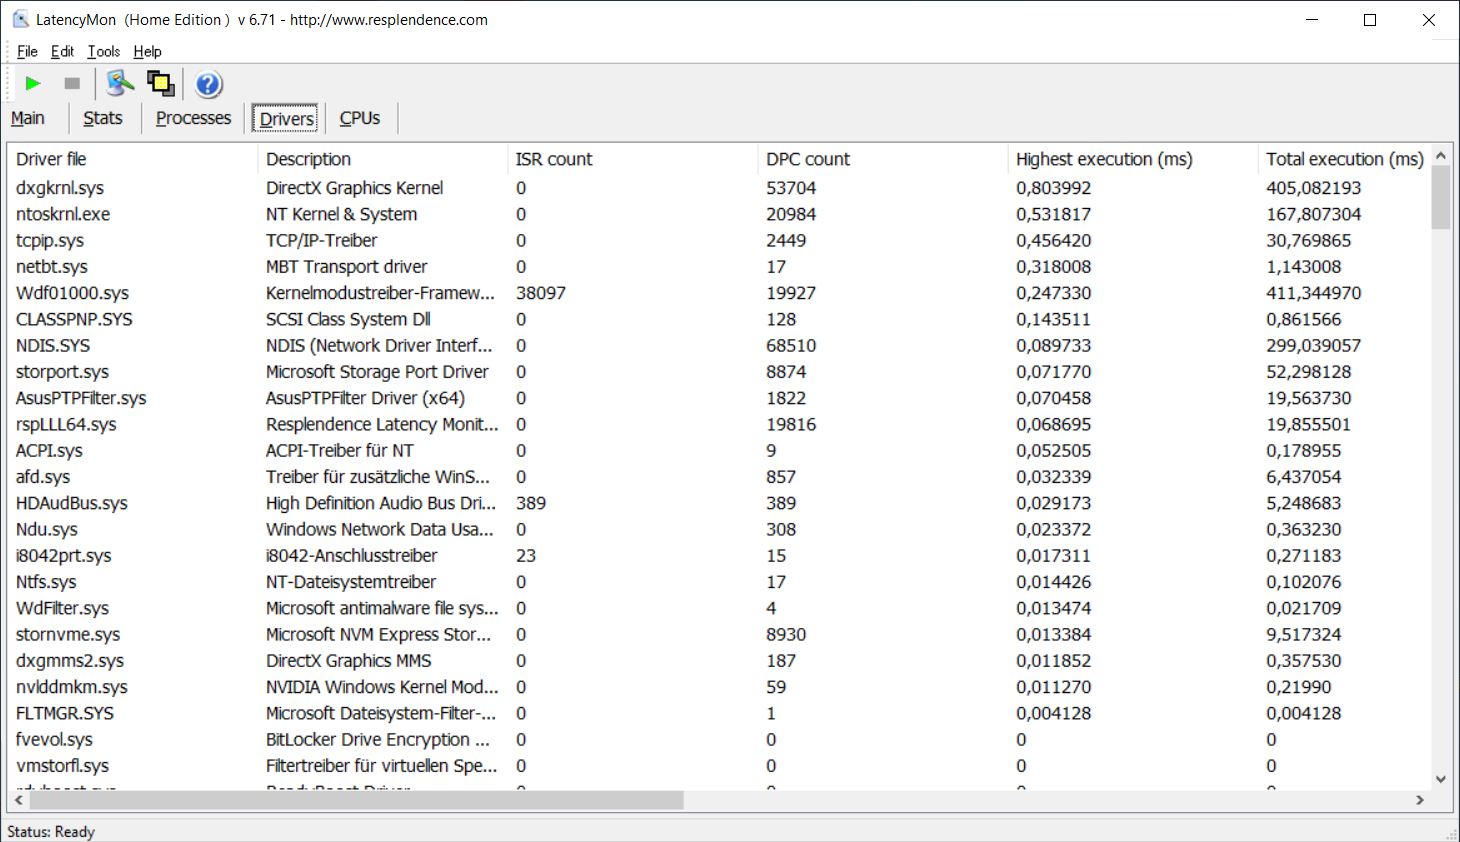
在我们的标准化延迟测试中,在上网、YouTube 4K视频再现和CPU负载方面,VivoBook 15 Pro没有显示出任何限制,这使得它也适合实时音频应用。
| DPC Latencies / LatencyMon - interrupt to process latency (max), Web, Youtube, Prime95 | |
| HP Pavilion 15-eg | |
| Dell XPS 15 9510 11800H RTX 3050 Ti OLED | |
| Lenovo IdeaPad 5 Pro 16ACH | |
| Dell G15 5515 | |
| Schenker XMG Focus 15 | |
| Asus VivoBook 15 Pro M3500QC-L1062 | |
* ... smaller is better
存储解决方案
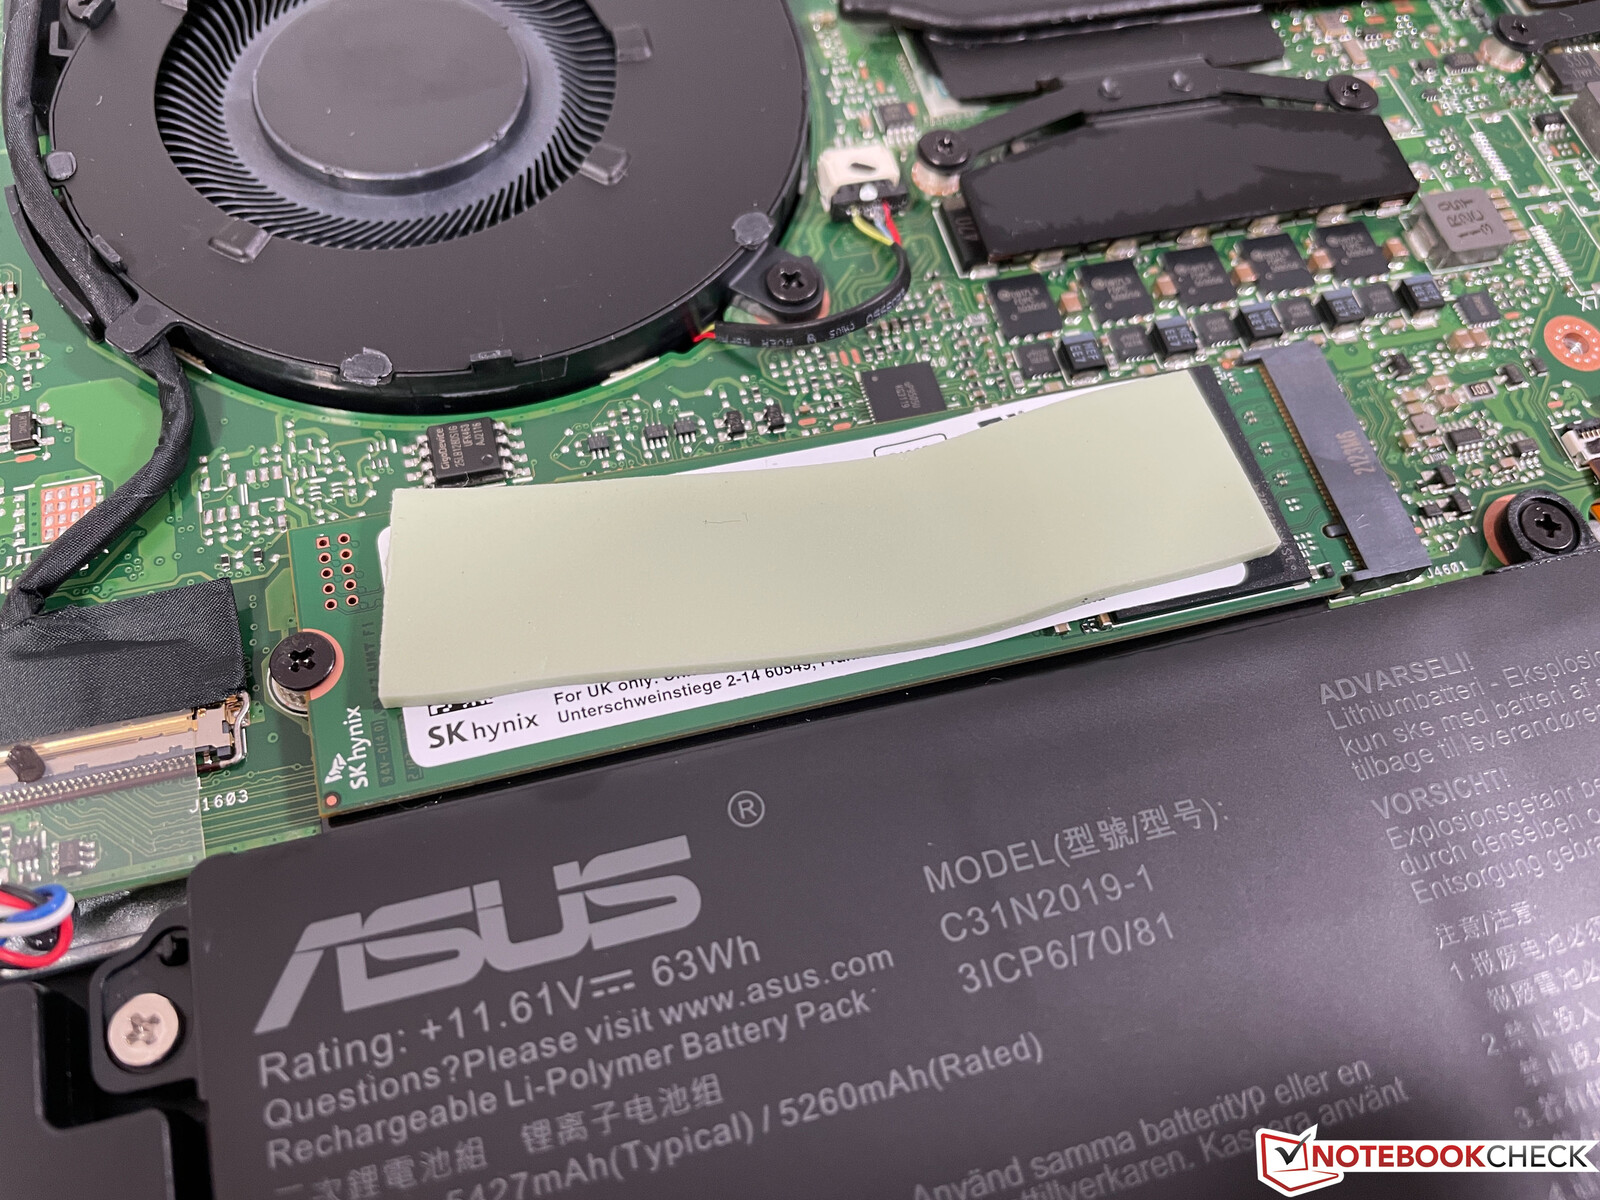
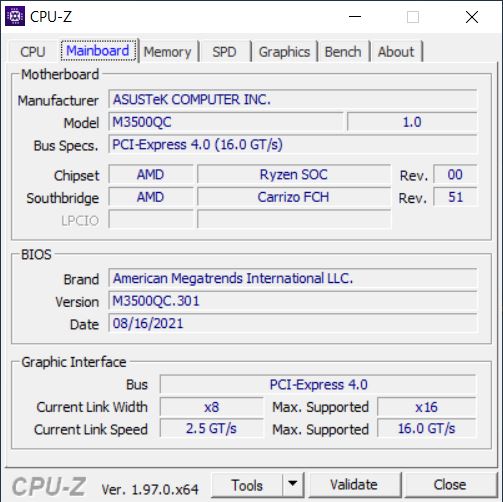
VivoBook 15 Pro提供一个M.2-2280插槽,通过PCIe 3.0 x4连接。我们的测试装置配备了SK Hynik BC711。这提供了512GB的存储容量,其中446GB在第一次启动系统后仍可供用户使用。在基准测试中,存储性能非常好,我们预计不会出现任何问题。你可以找到更多的SSD基准测试这里.
* ... smaller is better

Constant Performance Reading: DiskSpd Read Loop, Queue Depth 8
GPU性能
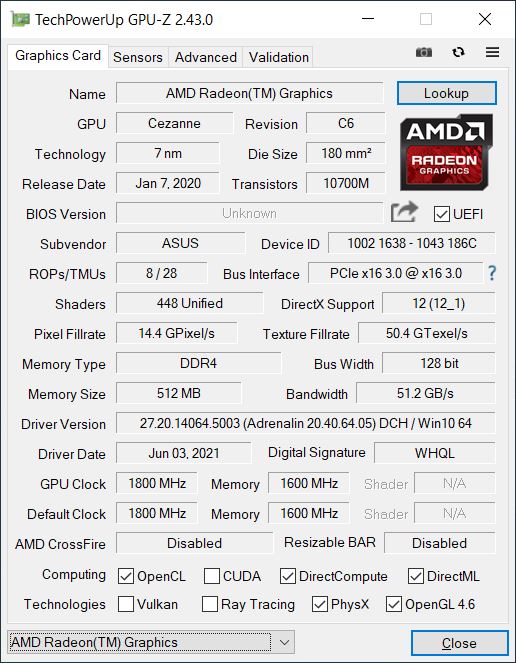
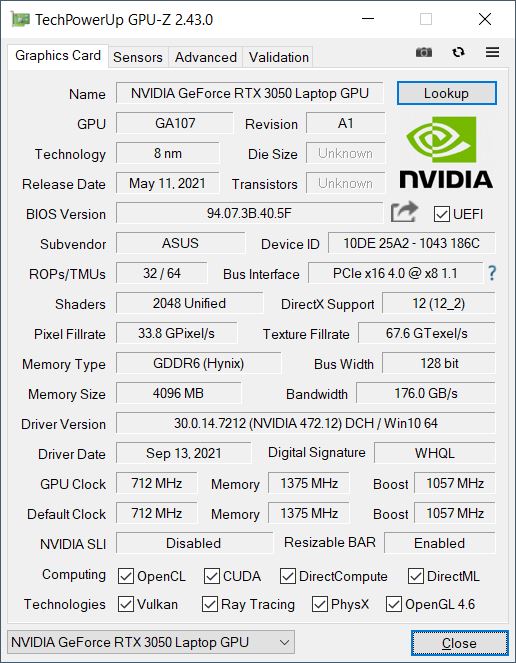
在日常操作中,图形输出通常由集成的 Radeon RX Vega 6处理器处理,它的视频解码器非常高效,特别能打分。一旦你需要更多的图形性能(例如用于游戏),它就会自动切换到专用的GeForce RTX 3050.根据不同的性能模式,GPU运行时使用35瓦,最高为50瓦,所以总体而言,这款GPU的性能范围处于中下水平,最大允许使用80瓦。各种模式之间的性能差异约为10%。
| 耳语模式 | 标准模式 | 性能模式 | |
|---|---|---|---|
| 3DMarkFire Strike GPU | 9,728分 | 10,497分 | 11,635分 |
在性能模式下,VivoBook 15 Pro非常接近于 RTX 3050 Ti的XPS 15,这确实应该更快。它也明显领先于旧的 GeForce GTX 1650中的IdeaPad 5 Pro 16.图形性能在所有三种性能模式下都很稳定,即使是在恒定负载下。
与处理器一样,图形性能在电池操作中被限制在30瓦,即使在可选的性能模式下也是如此。这相当于在主电源操作中,与标准模式相比,减少了约20%。你可以找到更多的GPU基准测试 这里.
| 3DMark 11 Performance | 13203 points | |
| 3DMark Cloud Gate Standard Score | 30830 points | |
| 3DMark Fire Strike Score | 9485 points | |
| 3DMark Time Spy Score | 4118 points | |
Help | ||
游戏性能
| The Witcher 3 - 1920x1080 Ultra Graphics & Postprocessing (HBAO+) | |
| Dell G15 5515 | |
| Schenker XMG Focus 15 | |
| Average of class Multimedia (11 - 107, n=5, last 2 years) | |
| Average NVIDIA GeForce RTX 3050 4GB Laptop GPU (31.5 - 55.8, n=21) | |
| Dell XPS 15 9510 11800H RTX 3050 Ti OLED (BIOS 1.4 Ultra Performance) | |
| Dell XPS 15 9510 11800H RTX 3050 Ti OLED (BIOS 1.4) | |
| Dell XPS 15 9510 11800H RTX 3050 Ti OLED (BIOS 1.3.2 Ultra Performance) | |
| Dell XPS 15 9510 11800H RTX 3050 Ti OLED (BIOS 1.3.2) | |
| Asus VivoBook 15 Pro M3500QC-L1062 (Performance Mode) | |
| Asus VivoBook 15 Pro M3500QC-L1062 (Standard) | |
| Asus VivoBook 15 Pro M3500QC-L1062 (Quiet Mode) | |
| Lenovo IdeaPad 5 Pro 16ACH | |
| HP Pavilion 15-eg | |
| F1 2020 - 1920x1080 Ultra High Preset AA:T AF:16x | |
| Dell XPS 15 9510 11800H RTX 3050 Ti OLED (759689) | |
| Average NVIDIA GeForce RTX 3050 4GB Laptop GPU (66 - 81, n=2) | |
| Asus VivoBook 15 Pro M3500QC-L1062 | |
| Lenovo IdeaPad 5 Pro 16ACH (759689) | |
| Strange Brigade - 1920x1080 ultra AA:ultra AF:16 | |
| Dell G15 5515 (1.47.22.14 D3D12) | |
| Schenker XMG Focus 15 (1.47.22.14 D3D12) | |
| Average of class Multimedia (13.3 - 303, n=55, last 2 years) | |
| Dell XPS 15 9510 11800H RTX 3050 Ti OLED | |
| Average NVIDIA GeForce RTX 3050 4GB Laptop GPU (57.9 - 95.1, n=21) | |
| Asus VivoBook 15 Pro M3500QC-L1062 | |
| Lenovo IdeaPad 5 Pro 16ACH (1.47.22.14 D3D12) | |
| F1 2021 - 1920x1080 Ultra High Preset + Raytracing AA:T AF:16x | |
| Dell G15 5515 (807588) | |
| Dell XPS 15 9510 11800H RTX 3050 Ti OLED (797778) | |
| Average NVIDIA GeForce RTX 3050 4GB Laptop GPU (44.1 - 62, n=8) | |
| Asus VivoBook 15 Pro M3500QC-L1062 (815237) | |
在所有三种性能模式下,游戏性能保持稳定,这在我们的"TheWitcher 3" 持续性能测试中很容易看到。在电池运行时,性能略有下降(32对38 FPS @Witcher 3 Ultra),但你仍然可以流畅地游戏。只有在电池水平为5%时,性能才开始真正下降。你可以在我们的 "游戏 "部分找到更多的游戏基准测试。 游戏部分.
The Witcher 3 FPS Chart
| low | med. | high | ultra | |
|---|---|---|---|---|
| GTA V (2015) | 168 | 162 | 103 | 55.5 |
| The Witcher 3 (2015) | 199 | 76 | 41.7 | |
| Dota 2 Reborn (2015) | 139 | 130 | 116 | 109 |
| Final Fantasy XV Benchmark (2018) | 98.4 | 56.4 | 41.3 | |
| X-Plane 11.11 (2018) | 91.8 | 80.4 | 68 | |
| Strange Brigade (2018) | 192 | 104 | 84 | 72 |
| F1 2020 (2020) | 183 | 102 | 87 | 66 |
| Cyberpunk 2077 1.0 (2020) | 64 | 37 | 31 | 26 |
| F1 2021 (2021) | 196 | 112 | 93.4 | 47.1 |
| Far Cry 6 (2021) | 75 | 57 | 52 | 45 |
排放--具有良好冷却效果的VivoBook
风扇噪音
在简单的或日常的任务中,如上网或视频复制,VivoBook 15 Pro的两个风扇通常保持完全停用,在几乎没有27 dB(A)的情况下,风扇的第一个激活水平也只能注意到非常安静的呼啸声。 然而,只要你在处理器或显卡上增加负荷,风扇就会迅速达到最大水平,这取决于性能模式,如下表所示。
| 性能模式 | TheWitcher 3 | 压力测试 |
|---|---|---|
| 低音模式 | 33.9 dB(A) | 33.9 dB(A) |
| 标准模式 | 42.8 dB(A) | 42.8 dB(A) |
| 性能模式 | 46.3 dB(A) | 48.3 dB(A) |
特别是在游戏时,性能模式之间的差异非常明显,如果你有足够的性能来顺利游戏,我们总是建议使用低语模式。例如,"TheWitcher 3 ,"就是这种情况。标准模式下的噪音音量仍然可以,但在安静的场景中可能会变得很烦人,而且你应该只使用性能模式和耳机,因为否则你不会听到很多游戏的声音。我们没有注意到任何其他电子噪音,如线圈啸叫。
| Asus VivoBook 15 Pro M3500QC-L1062 GeForce RTX 3050 4GB Laptop GPU, R5 5600H, SK Hynix HFM512GD3JX013N | Dell G15 5515 GeForce RTX 3050 Ti Laptop GPU, R7 5800H, Samsung PM991a MZ9LQ512HBLU-00BD1 | Schenker XMG Focus 15 GeForce RTX 3050 Ti Laptop GPU, i7-11800H, Samsung SSD 970 EVO Plus 1TB | HP Pavilion 15-eg GeForce MX450, i7-1165G7, Samsung PM991 MZVLQ1T0HALB | Lenovo IdeaPad 5 Pro 16ACH GeForce GTX 1650 Mobile, R7 5800H, Micron 2300 512GB MTFDHBA512TDV | Dell XPS 15 9510 11800H RTX 3050 Ti OLED GeForce RTX 3050 Ti Laptop GPU, i7-11800H, Micron 2300 512GB MTFDHBA512TDV | |
|---|---|---|---|---|---|---|
| Noise | -5% | -26% | 2% | -2% | 9% | |
| off / environment * (dB) | 24.8 | 24 3% | 24 3% | 25.4 -2% | 24.04 3% | 23.8 4% |
| Idle Minimum * (dB) | 24.8 | 25 -1% | 25 -1% | 25.6 -3% | 24.04 3% | 23.8 4% |
| Idle Average * (dB) | 24.8 | 26 -5% | 30 -21% | 25.6 -3% | 24.04 3% | 23.8 4% |
| Idle Maximum * (dB) | 26.4 | 30 -14% | 43 -63% | 25.6 3% | 24.04 9% | 23.8 10% |
| Load Average * (dB) | 42.8 | 44 -3% | 56 -31% | 39.2 8% | 41.3 4% | 36 16% |
| Witcher 3 ultra * (dB) | 42.8 | 44 -3% | 56 -31% | 39.1 9% | 49.21 -15% | 36 16% |
| Load Maximum * (dB) | 42.8 | 48 -12% | 58 -36% | 41.5 3% | 52.93 -24% | 38.2 11% |
* ... smaller is better
Noise level
| Idle |
| 24.8 / 24.8 / 26.4 dB(A) |
| Load |
| 42.8 / 42.8 dB(A) |
 | ||
30 dB silent 40 dB(A) audible 50 dB(A) loud |
||
min: | ||
温度
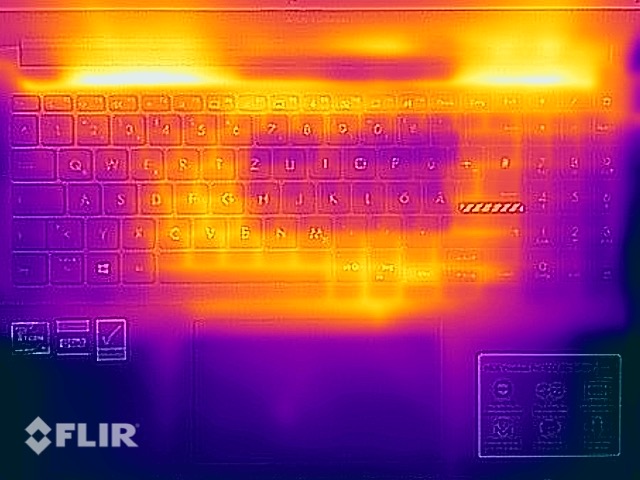
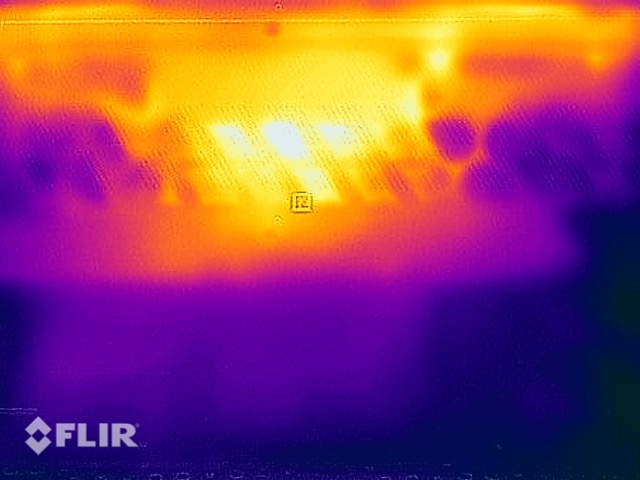
VivoBook 15 Pro的表面温度完全没有理由让人担心。在日常操作中,该设备几乎没有升温,即使在负载情况下,也确实只有底部向后的中央区域有一个热点。然而,你仍然可以在你的膝盖上使用该设备,而且在游戏或负载下,键盘保持在一个舒适的温度。
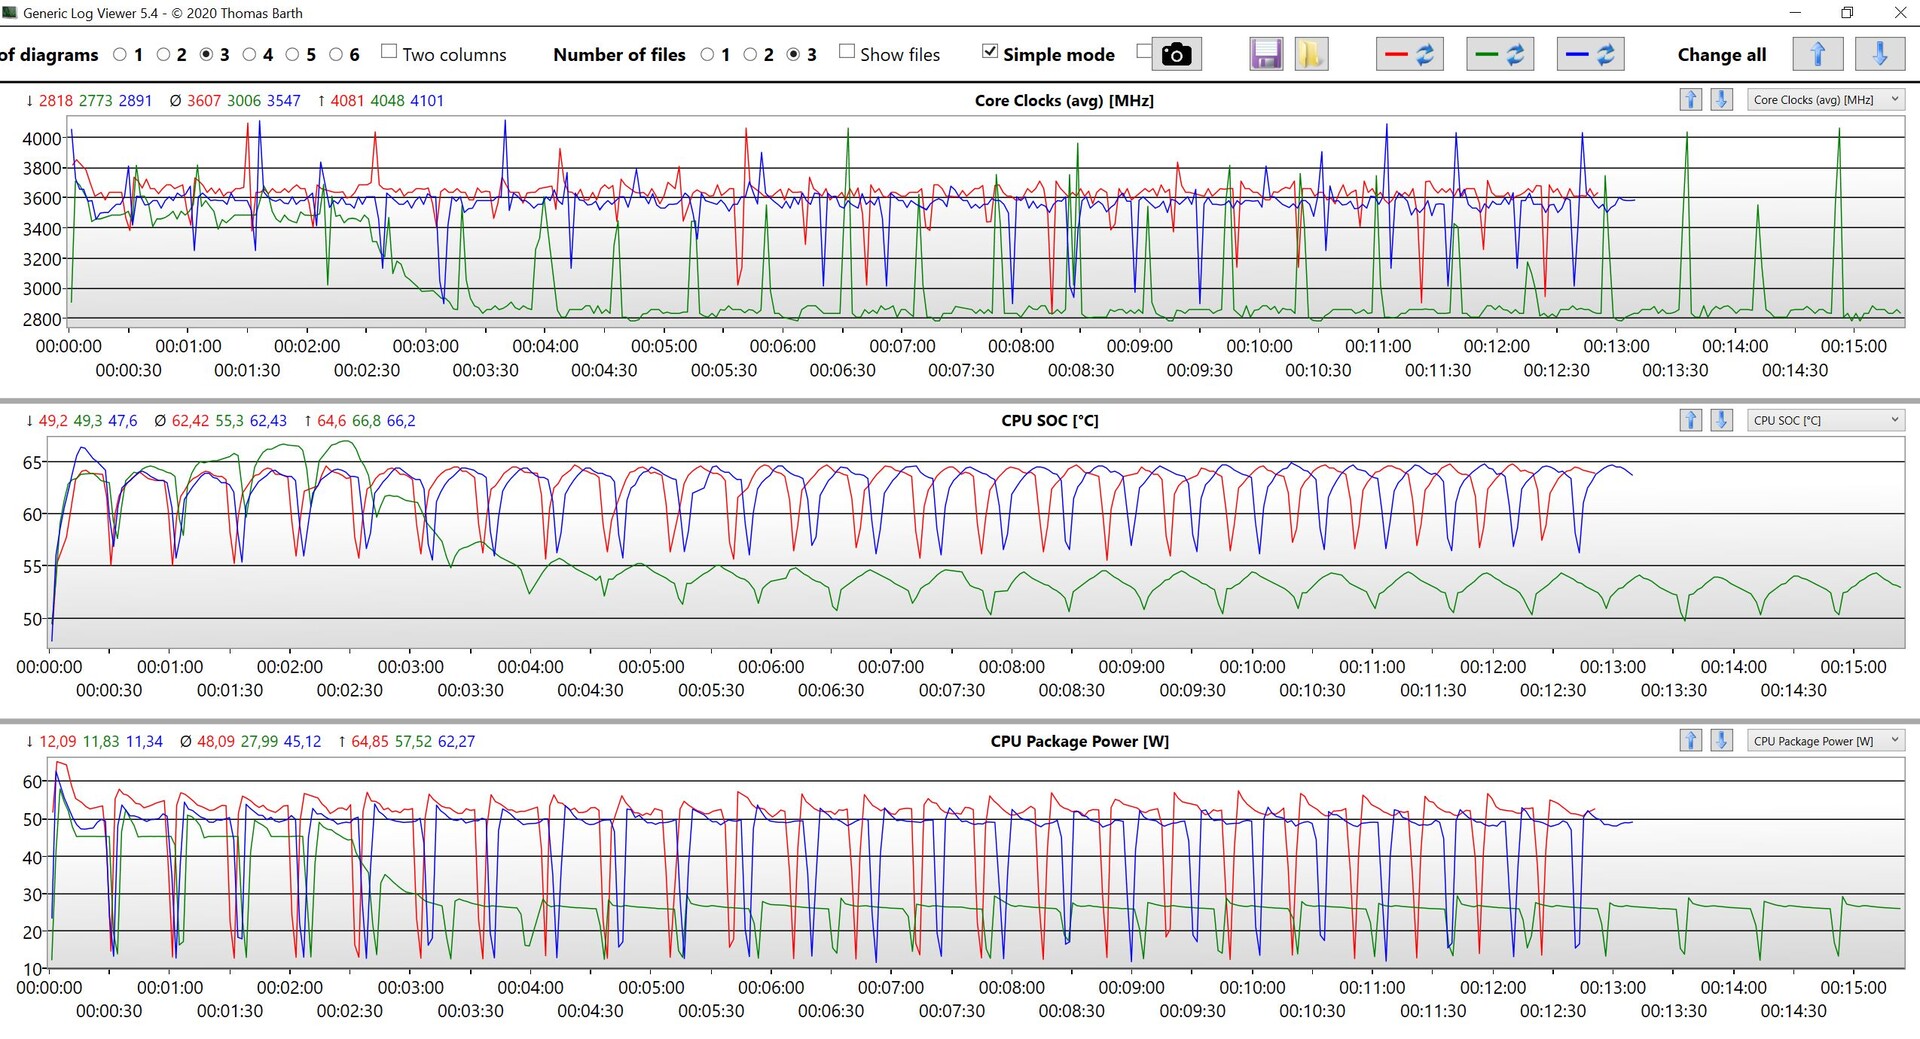
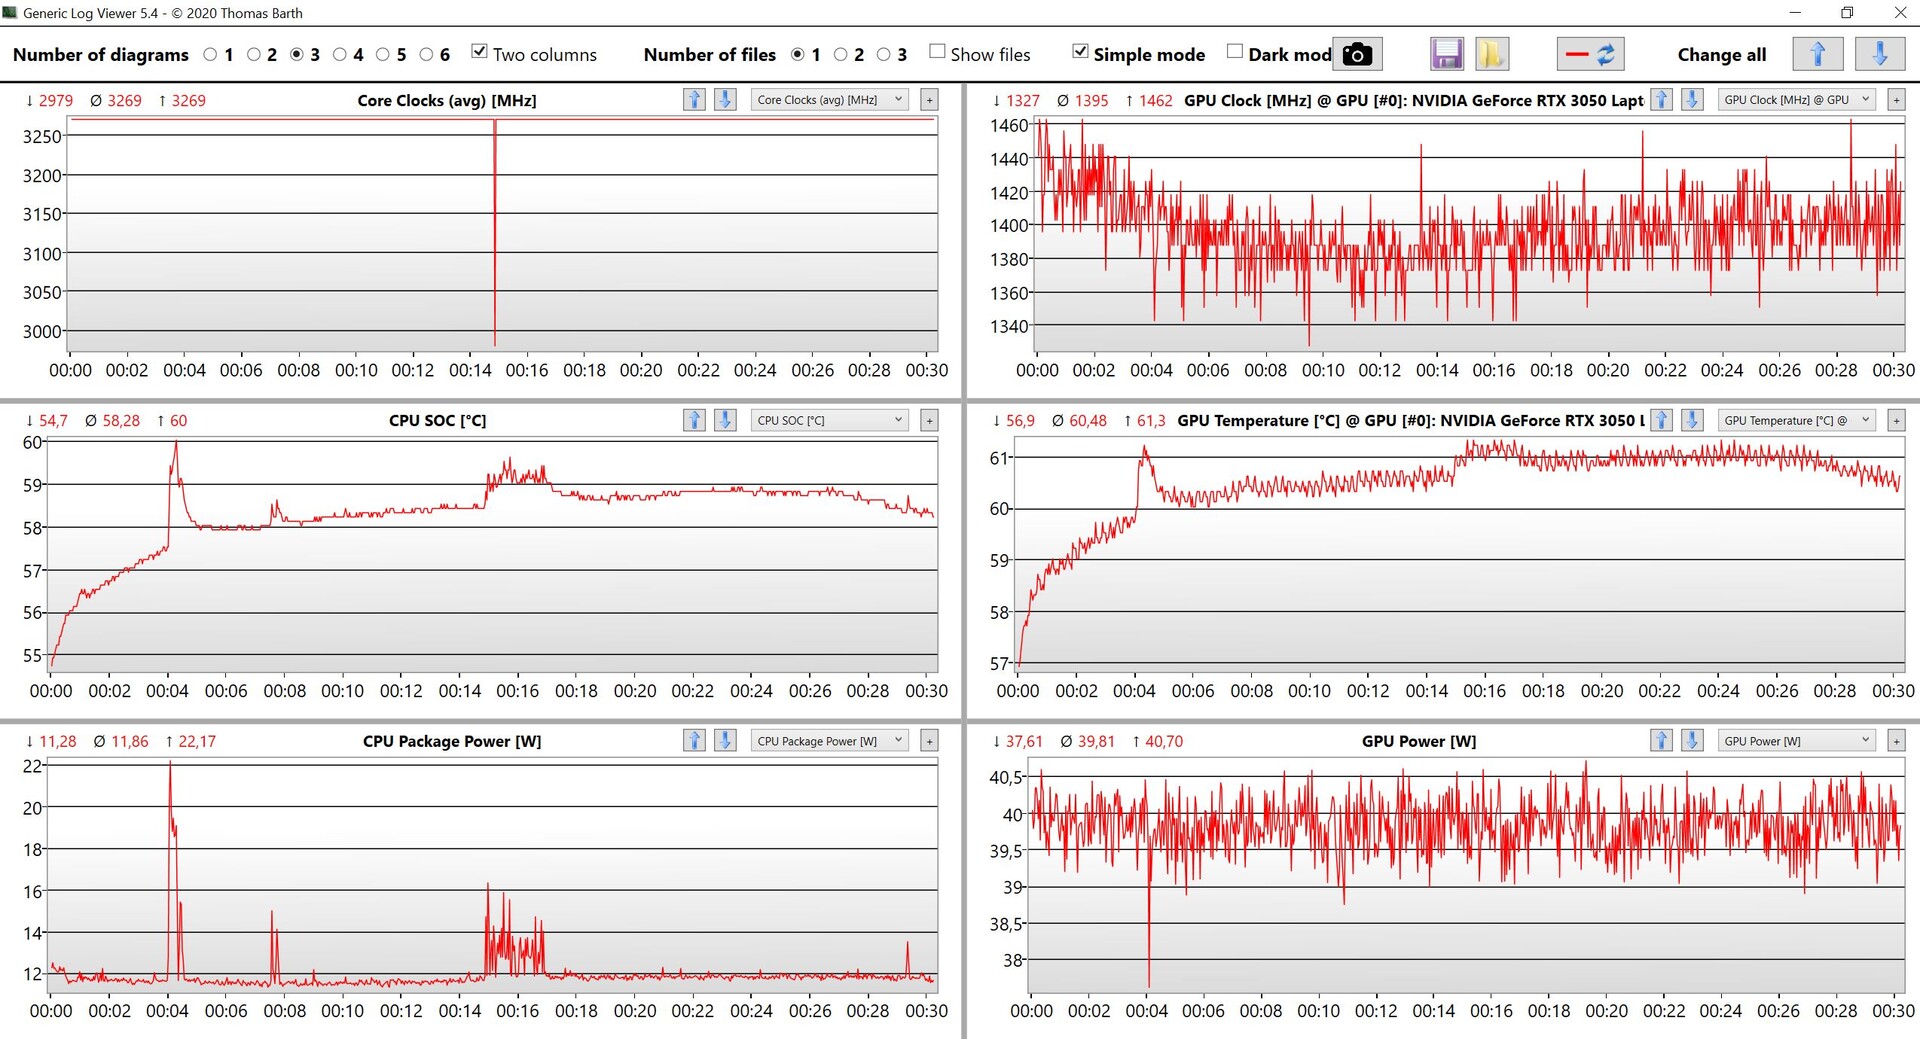
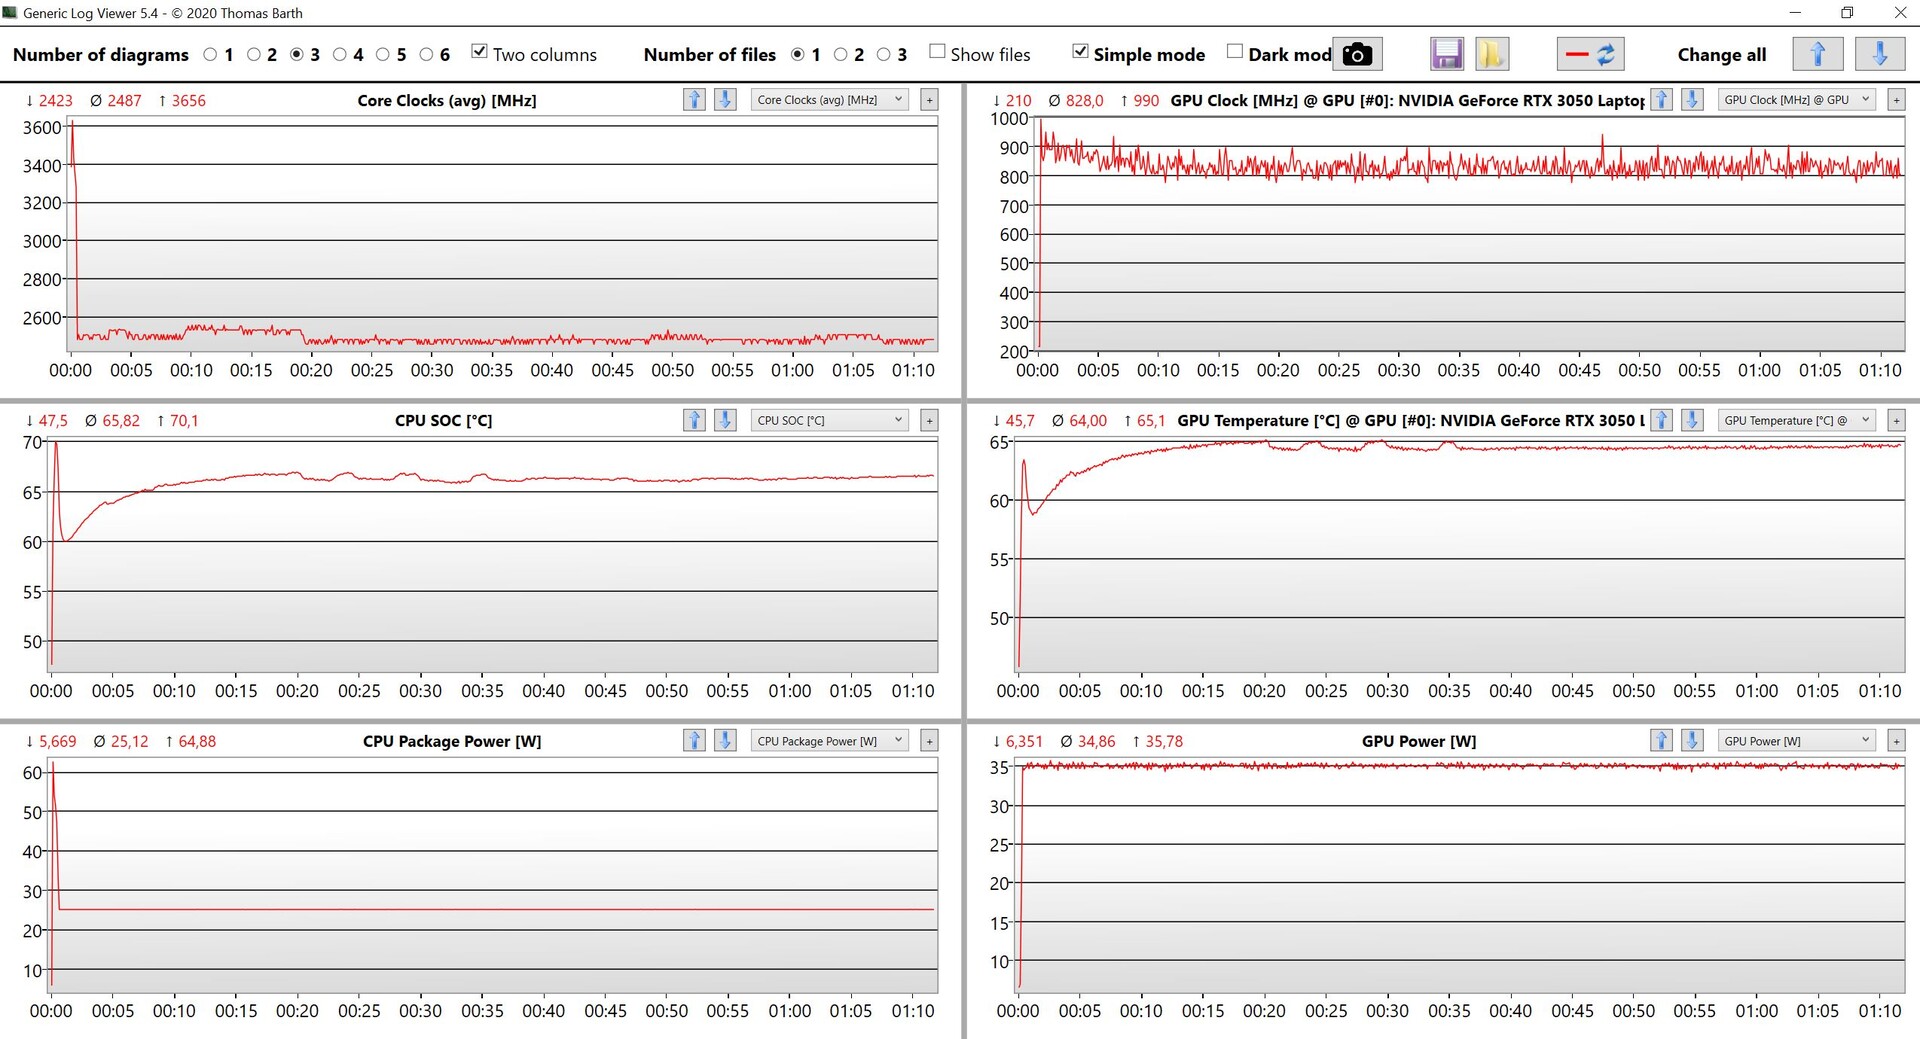
在压力测试期间,性能稳定,笔记本电脑能够保持各种性能模式的相应TDP/TGP值,没有任何问题。这意味着,即使在较长时间的负载下,这里的性能也不会受到限制。
(+) The maximum temperature on the upper side is 37.8 °C / 100 F, compared to the average of 36.8 °C / 98 F, ranging from 21 to 71 °C for the class Multimedia.
(-) The bottom heats up to a maximum of 48.4 °C / 119 F, compared to the average of 39.2 °C / 103 F
(+) In idle usage, the average temperature for the upper side is 23.2 °C / 74 F, compared to the device average of 31.3 °C / 88 F.
(+) Playing The Witcher 3, the average temperature for the upper side is 31.9 °C / 89 F, compared to the device average of 31.3 °C / 88 F.
(+) The palmrests and touchpad are cooler than skin temperature with a maximum of 24.3 °C / 75.7 F and are therefore cool to the touch.
(+) The average temperature of the palmrest area of similar devices was 28.7 °C / 83.7 F (+4.4 °C / 8 F).
发言人
底部正面的两个扬声器听起来相当不错,但它们缺乏一些音量和声压。它们对于观看一些视频或播放背景音乐绝对是足够的,但如果要获得良好的游戏音效或电影,最好使用耳机或外部扬声器。
Asus VivoBook 15 Pro M3500QC-L1062 audio analysis
(±) | speaker loudness is average but good (79.3 dB)
Bass 100 - 315 Hz
(-) | nearly no bass - on average 21.5% lower than median
(±) | linearity of bass is average (9.5% delta to prev. frequency)
Mids 400 - 2000 Hz
(+) | balanced mids - only 2.9% away from median
(±) | linearity of mids is average (7.2% delta to prev. frequency)
Highs 2 - 16 kHz
(+) | balanced highs - only 3.7% away from median
(+) | highs are linear (5.6% delta to prev. frequency)
Overall 100 - 16.000 Hz
(±) | linearity of overall sound is average (17.2% difference to median)
Compared to same class
» 49% of all tested devices in this class were better, 7% similar, 44% worse
» The best had a delta of 5%, average was 17%, worst was 45%
Compared to all devices tested
» 32% of all tested devices were better, 8% similar, 60% worse
» The best had a delta of 4%, average was 23%, worst was 134%
Lenovo IdeaPad 5 Pro 16ACH audio analysis
(-) | not very loud speakers (68.8 dB)
Bass 100 - 315 Hz
(-) | nearly no bass - on average 24.4% lower than median
(±) | linearity of bass is average (13.3% delta to prev. frequency)
Mids 400 - 2000 Hz
(+) | balanced mids - only 3.2% away from median
(+) | mids are linear (4.1% delta to prev. frequency)
Highs 2 - 16 kHz
(+) | balanced highs - only 2% away from median
(+) | highs are linear (6.3% delta to prev. frequency)
Overall 100 - 16.000 Hz
(±) | linearity of overall sound is average (22.5% difference to median)
Compared to same class
» 80% of all tested devices in this class were better, 4% similar, 16% worse
» The best had a delta of 5%, average was 17%, worst was 45%
Compared to all devices tested
» 66% of all tested devices were better, 6% similar, 28% worse
» The best had a delta of 4%, average was 23%, worst was 134%
Dell XPS 15 9510 11800H RTX 3050 Ti OLED audio analysis
(+) | speakers can play relatively loud (88.8 dB)
Bass 100 - 315 Hz
(±) | reduced bass - on average 5.6% lower than median
(+) | bass is linear (4.3% delta to prev. frequency)
Mids 400 - 2000 Hz
(+) | balanced mids - only 3.9% away from median
(+) | mids are linear (4.1% delta to prev. frequency)
Highs 2 - 16 kHz
(+) | balanced highs - only 2.4% away from median
(+) | highs are linear (4.9% delta to prev. frequency)
Overall 100 - 16.000 Hz
(+) | overall sound is linear (8.4% difference to median)
Compared to same class
» 9% of all tested devices in this class were better, 2% similar, 89% worse
» The best had a delta of 5%, average was 17%, worst was 45%
Compared to all devices tested
» 2% of all tested devices were better, 1% similar, 97% worse
» The best had a delta of 4%, average was 23%, worst was 134%
电源管理--由于OLED显示屏的原因,电池寿命也有所不同
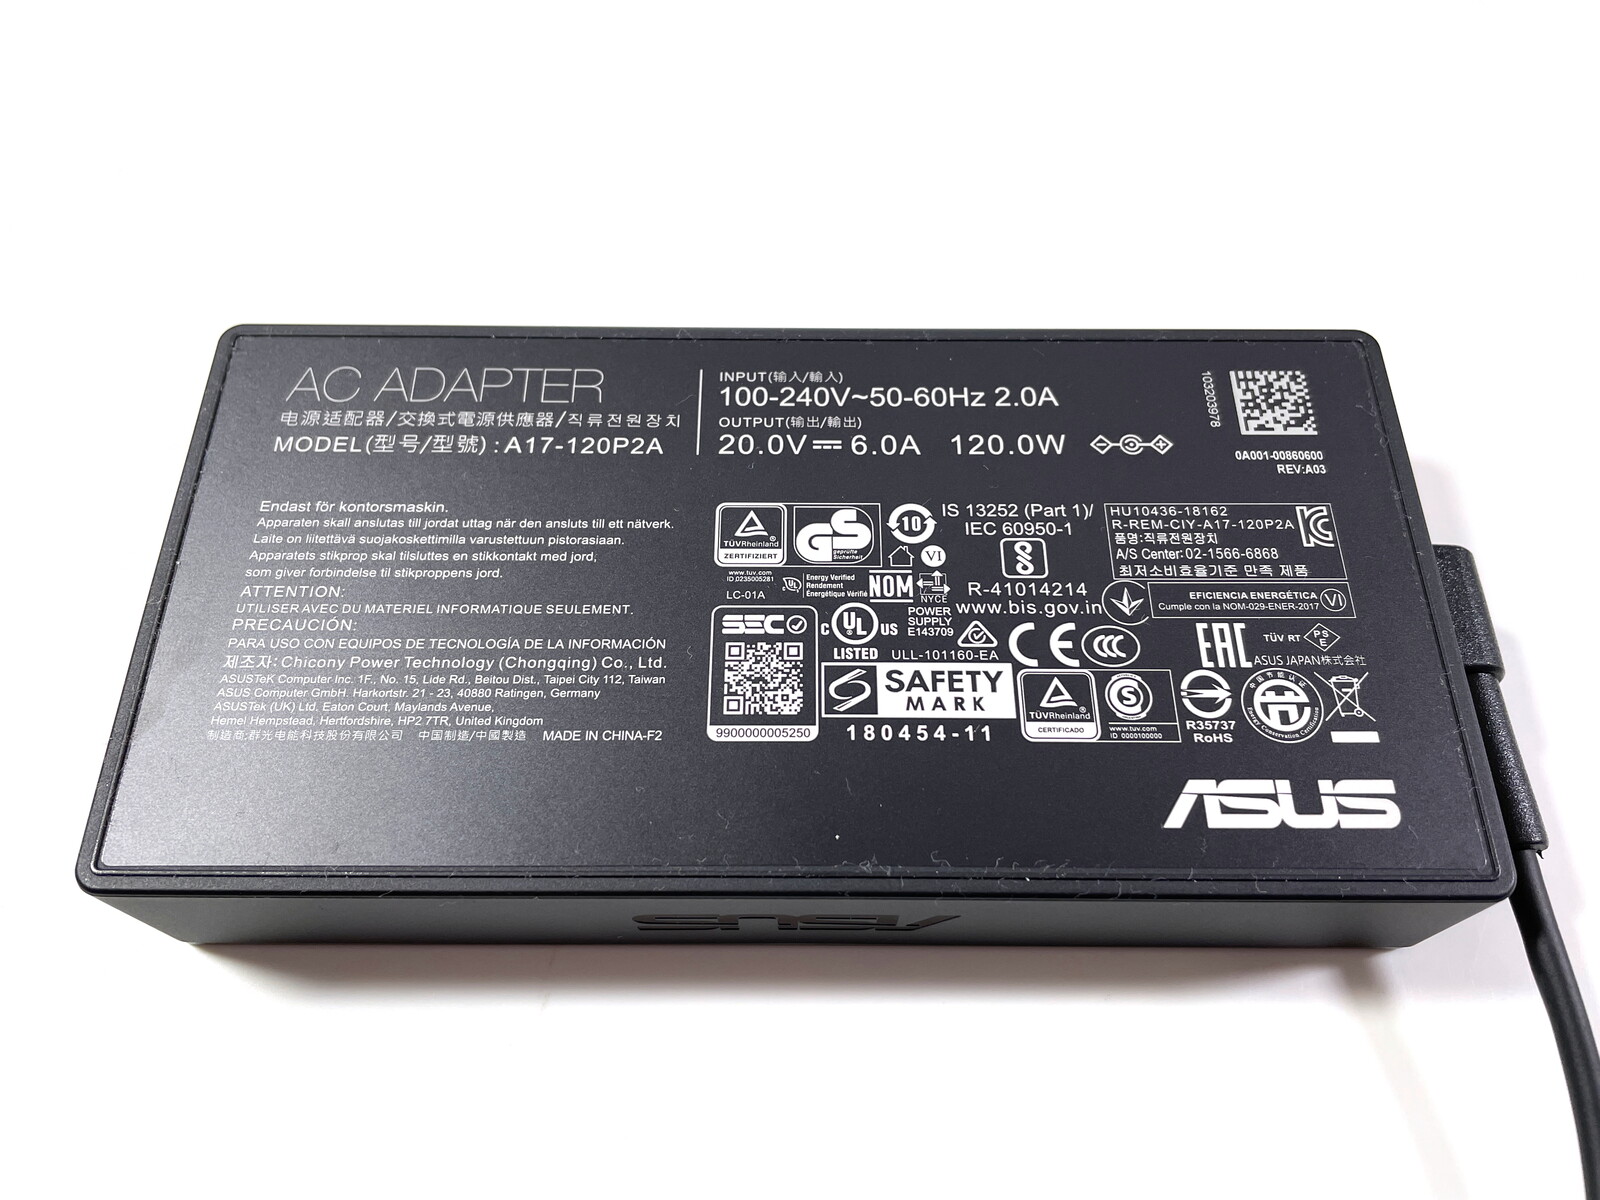
对于OLED显示屏,功耗主要取决于内容,较亮的图像会导致较高的功耗。然而,VivoBook 15 Pro在空闲运行期间的测量结果相当好。即使在负载下,也没有什么意外。虽然压力测试期间的最大消耗是107瓦,但它很快就平息在一个稳定的76瓦。这意味着附带的120瓦电源是完全足够的。
| Off / Standby | |
| Idle | |
| Load |
|
Key:
min: | |
| Asus VivoBook 15 Pro M3500QC-L1062 R5 5600H, GeForce RTX 3050 4GB Laptop GPU, SK Hynix HFM512GD3JX013N, AMOLED, 1920x1080, 15.6" | Dell G15 5515 R7 5800H, GeForce RTX 3050 Ti Laptop GPU, Samsung PM991a MZ9LQ512HBLU-00BD1, IPS, 1920x1080, 15.6" | Schenker XMG Focus 15 i7-11800H, GeForce RTX 3050 Ti Laptop GPU, Samsung SSD 970 EVO Plus 1TB, IPS, 1920x1080, 15.6" | HP Pavilion 15-eg i7-1165G7, GeForce MX450, Samsung PM991 MZVLQ1T0HALB, IPS, 1920x1080, 15.6" | Lenovo IdeaPad 5 Pro 16ACH R7 5800H, GeForce GTX 1650 Mobile, Micron 2300 512GB MTFDHBA512TDV, IPS LED, 2560x1600, 16" | Dell XPS 15 9510 11800H RTX 3050 Ti OLED i7-11800H, GeForce RTX 3050 Ti Laptop GPU, Micron 2300 512GB MTFDHBA512TDV, OLED, 3456x2160, 15.6" | Average NVIDIA GeForce RTX 3050 4GB Laptop GPU | Average of class Multimedia | |
|---|---|---|---|---|---|---|---|---|
| Power Consumption | -45% | -154% | 7% | -17% | -20% | -30% | -8% | |
| Idle Minimum * (Watt) | 4.7 | 5 -6% | 23 -389% | 4.9 -4% | 5.7 -21% | 7.6 -62% | 7.17 ? -53% | 5.59 ? -19% |
| Idle Average * (Watt) | 9.4 | 9 4% | 25 -166% | 7.9 16% | 9.3 1% | 9.9 -5% | 10.4 ? -11% | 10.1 ? -7% |
| Idle Maximum * (Watt) | 10 | 20 -100% | 29 -190% | 14.2 -42% | 11 -10% | 10.8 -8% | 14.8 ? -48% | 12.4 ? -24% |
| Load Average * (Watt) | 74.3 | 94 -27% | 106 -43% | 64.3 13% | 83.4 -12% | 81 -9% | 89.7 ? -21% | 64.9 ? 13% |
| Witcher 3 ultra * (Watt) | 67.7 | 123 -82% | 128 -89% | 55.6 18% | 94.4 -39% | 76.2 -13% | ||
| Load Maximum * (Watt) | 106.9 | 172 -61% | 156 -46% | 65.4 39% | 128.7 -20% | 131 -23% | 124.8 ? -17% | 111.7 ? -4% |
* ... smaller is better
Power Consumption The Witcher 3 / Stress Test
电池寿命
我们在WLAN测试中使用了许多明亮的网站,这实际上代表了OLED显示屏的最坏情况,但使用63瓦时电池的电池寿命仍然是可以的。在150cd/m²的调整亮度下,它仍然可以持续近8.5小时,而在全亮度下则少3小时。另一方面,在150cd/m²的视频测试中,运行时间超过了12小时。移动游戏也是可以的,但那时只能持续一个多小时。
笔记本电脑完全充电需要略多于2小时,但你在勉强26分钟后已经有50%的可用电量,52分钟后有80%的可用电量(在笔记本电脑打开时)。
| Asus VivoBook 15 Pro M3500QC-L1062 R5 5600H, GeForce RTX 3050 4GB Laptop GPU, 63 Wh | Dell G15 5515 R7 5800H, GeForce RTX 3050 Ti Laptop GPU, 56 Wh | Schenker XMG Focus 15 i7-11800H, GeForce RTX 3050 Ti Laptop GPU, 49 Wh | HP Pavilion 15-eg i7-1165G7, GeForce MX450, 41 Wh | Lenovo IdeaPad 5 Pro 16ACH R7 5800H, GeForce GTX 1650 Mobile, 75 Wh | Dell XPS 15 9510 11800H RTX 3050 Ti OLED i7-11800H, GeForce RTX 3050 Ti Laptop GPU, 86 Wh | Average of class Multimedia | |
|---|---|---|---|---|---|---|---|
| Battery runtime | -5% | -42% | -14% | 23% | 3% | 38% | |
| H.264 (h) | 12.1 | 8.8 -27% | 10.4 -14% | 10.4 -14% | 16.8 ? 39% | ||
| WiFi v1.3 (h) | 8.3 | 8 -4% | 3.9 -53% | 6.6 -20% | 12.6 52% | 7 -16% | 12.4 ? 49% |
| Witcher 3 ultra (h) | 1.2 | ||||||
| Load (h) | 1.3 | 1.5 15% | 0.9 -31% | 1.2 -8% | 1.7 31% | 1.8 38% | 1.657 ? 27% |
| Reader / Idle (h) | 13.5 | 6.5 | 15 | 24.9 ? |
Pros
Cons
结论 - VivoBook 15 Pro主要以其性能和显示屏给人留下深刻印象
经过我们的测试,我们能够证明新的VivoBook 15 Pro主要有一个高性能的发展和良好的显示质量。使用可用的性能模式,用户可以影响笔记本电脑的性能和噪音特性。当前Ryzen处理器和RTX 3050的组合为1080p面板提供了一个体面的游戏性能。
OLED显示屏也以出色的色彩和极高的对比度给人留下深刻印象,但也有一些缺点,如高反射表面或PWM闪烁,可能会给一些用户带来问题。
华硕显然在连接设备方面做了一些削减,尤其是旧的连接标准在这里显得很消极。在2021年年底,两个旧的USB 2.0连接和一个HDMI 1.4端口确实不再是最新的了。此外,我们更希望在一台15英寸的多媒体笔记本电脑中采用可更换的内存模块。
新的VivoBook 15 Pro特别提供了大量的性能和出色的OLED面板,但在连接设备方面有一些妥协。
VivoBook实际上与价格明显更高的 戴尔XPS 15.虽然OLED面板几乎不相上下(除了外形因素),戴尔使用了非常高质量的外壳和现代连接(但只有USB-C),但XPS 15主要表现为性能发展薄弱。尽管其组件明显较弱,但VivoBook 15 Pro在实践中并没有真正明显的慢,无论是在CPU还是游戏性能方面。
那些需要更高的性能的人应该看一下 申克XMG Focus 15但你在那里也会遇到更多嘈杂的风扇。戴尔 戴尔G15也提供了更高的游戏性能,但明显更笨重,而 IdeaPad 5 Pro 16联想的IdeaPad 5 Pro 16则得益于更快的Ryzen 7处理器。
Asus VivoBook 15 Pro M3500QC-L1062
- 08/30/2022 v7 (old)
Andreas Osthoff
Price comparison

