华硕TUF Dash F15 FX517ZC笔记本评测。1440p、165赫兹和全P3颜色,价格低于1000美元
与华硕ROG旗舰系列不同,华硕TUF系列是中端游戏笔记本的主场,通常省略了RGB灯或华硕键鼠等豪华功能,以支持更实惠的价格。尤其是TUF Dash F15 FX517系列可以配置预算GeForce RTX 3050选项(FX517ZC),一直到RTX 3070(FX517ZR)。本评论侧重于RTX 3050选项。
我们建议查看我们对RTX 3070配置的现有评论,因为它与RTX 3050配置共享相同的1440p 165 Hz显示屏、Core i7-12650H CPU和基本相同的物理功能。这一领域的竞争者包括其他零售价为1000美元或更低的经济型游戏笔记本电脑,如 戴尔G15 5510, MSI Bravo 15, 联想IdeaPad Gaming 3 15, 或 技嘉G5.
更多华硕评论。
潜在的竞争对手比较
Rating | Date | Model | Weight | Height | Size | Resolution | Price |
|---|---|---|---|---|---|---|---|
| 84.9 % v7 (old) | 08 / 2022 | Asus TUF Dash F15 FX517ZC i7-12650H, GeForce RTX 3050 4GB Laptop GPU | 1.9 kg | 20.7 mm | 15.60" | 2560x1440 | |
| 85.8 % v7 (old) | 07 / 2022 | Asus TUF Dash F15 FX517ZR i7-12650H, GeForce RTX 3070 Laptop GPU | 2 kg | 20.7 mm | 15.60" | 2560x1440 | |
| 81 % v7 (old) | 06 / 2022 | Dell G15 5510 i5-10500H, GeForce RTX 3050 4GB Laptop GPU | 2.5 kg | 23 mm | 15.60" | 1920x1080 | |
| 78.2 % v7 (old) | 04 / 2022 | MSI Bravo 15 B5DD-010US R5 5600H, Radeon RX 5500M | 2.3 kg | 24.95 mm | 15.60" | 1920x1080 | |
| 79.7 % v7 (old) | 03 / 2022 | Lenovo Ideapad Gaming 3 15IHU-82K1002RGE i5-11300H, GeForce RTX 3050 Ti Laptop GPU | 2 kg | 24.2 mm | 15.60" | 1920x1080 | |
| 81.7 % v7 (old) | 11 / 2021 | Gigabyte G5 GD i5-11400H, GeForce RTX 3050 4GB Laptop GPU | 2.1 kg | 31.6 mm | 15.60" | 1920x1080 |
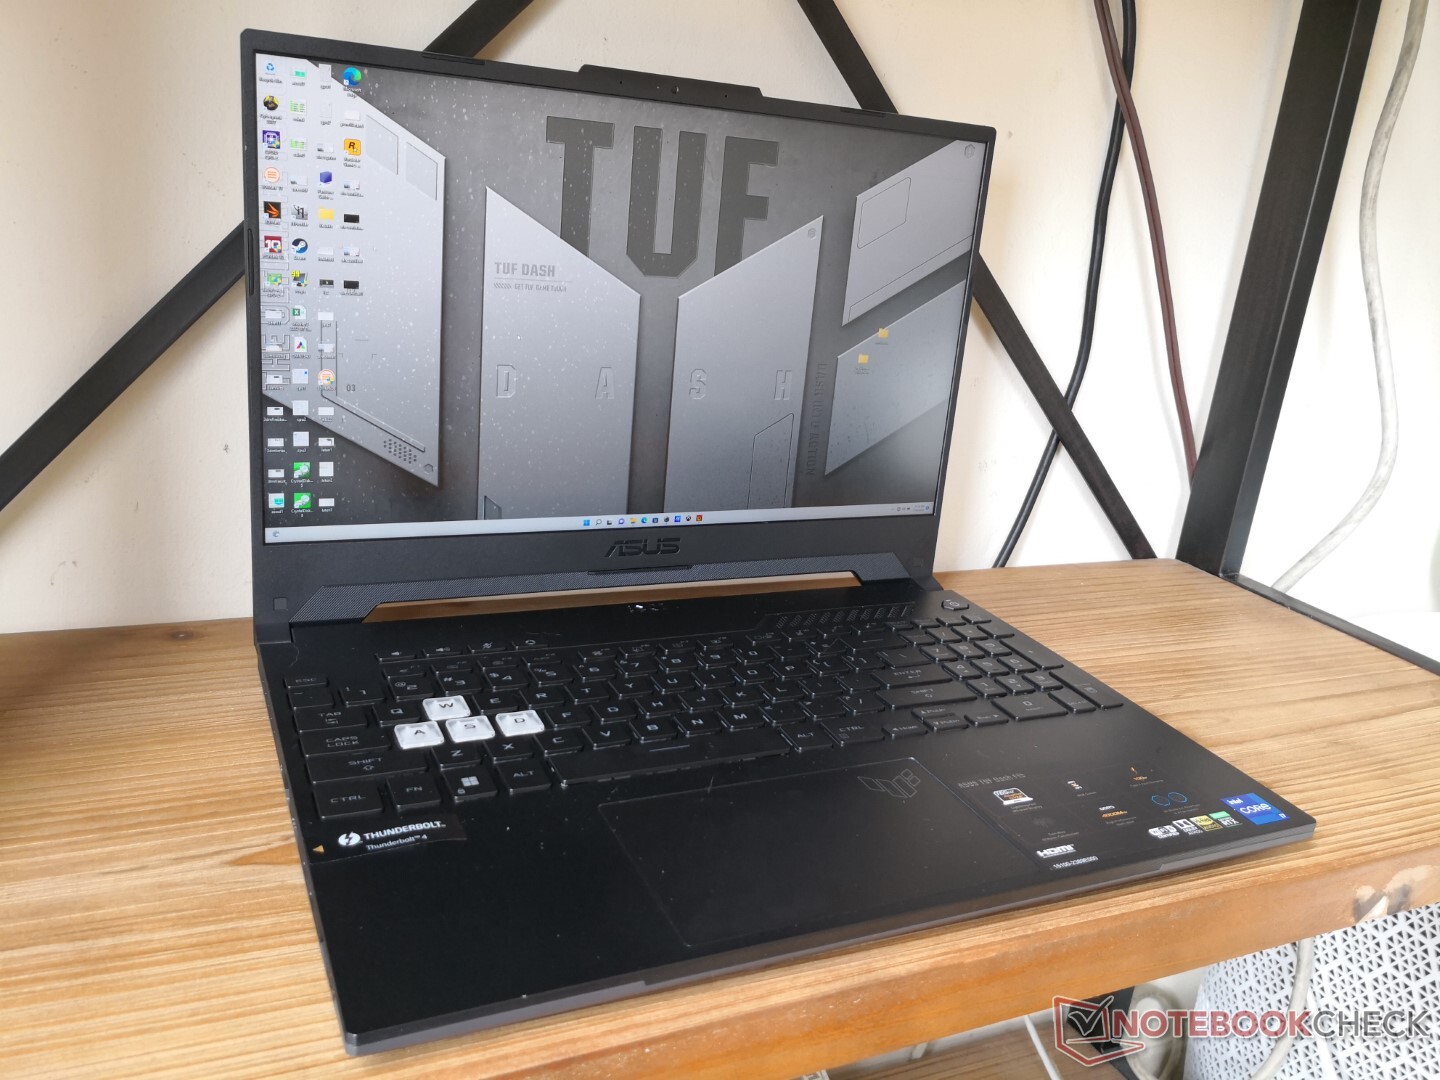
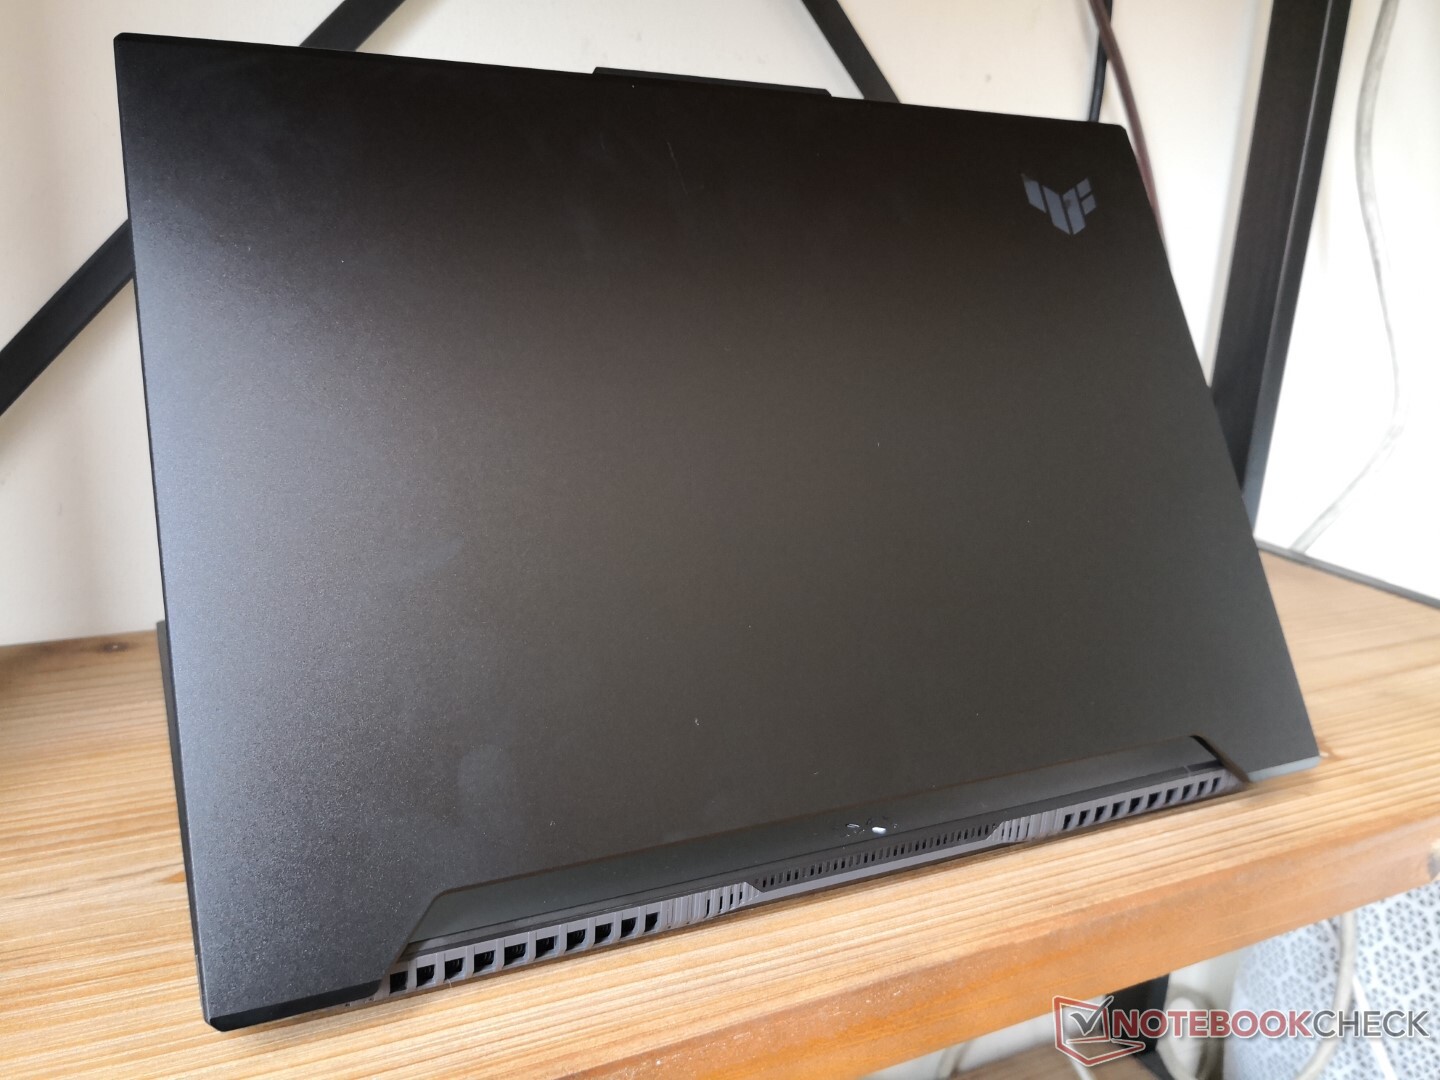
案例
连接性
值得注意的是,虽然有两个USB-C接口,但只有最靠近前缘的那个支持USB-C充电。除此之外,这两个端口都能够使用DisplayPort-over-USB。
沟通
该模型没有Wi-Fi 6E支持,可能是为了节省成本。不过,对于经济型游戏玩家的目标受众来说,性能是足够的,也足够稳定。
| Networking | |
| iperf3 transmit AX12 | |
| Gigabyte G5 GD | |
| Lenovo Ideapad Gaming 3 15IHU-82K1002RGE | |
| MSI Bravo 15 B5DD-010US | |
| iperf3 receive AX12 | |
| Lenovo Ideapad Gaming 3 15IHU-82K1002RGE | |
| Gigabyte G5 GD | |
| MSI Bravo 15 B5DD-010US | |
| iperf3 receive AXE11000 | |
| Dell G15 5510 | |
| Asus TUF Dash F15 FX517ZR | |
| Asus TUF Dash F15 FX517ZC | |
| iperf3 transmit AXE11000 | |
| Asus TUF Dash F15 FX517ZR | |
| Asus TUF Dash F15 FX517ZC | |
网络摄像头
集成的网络摄像头是标准的100万像素,没有隐私快门或红外功能。


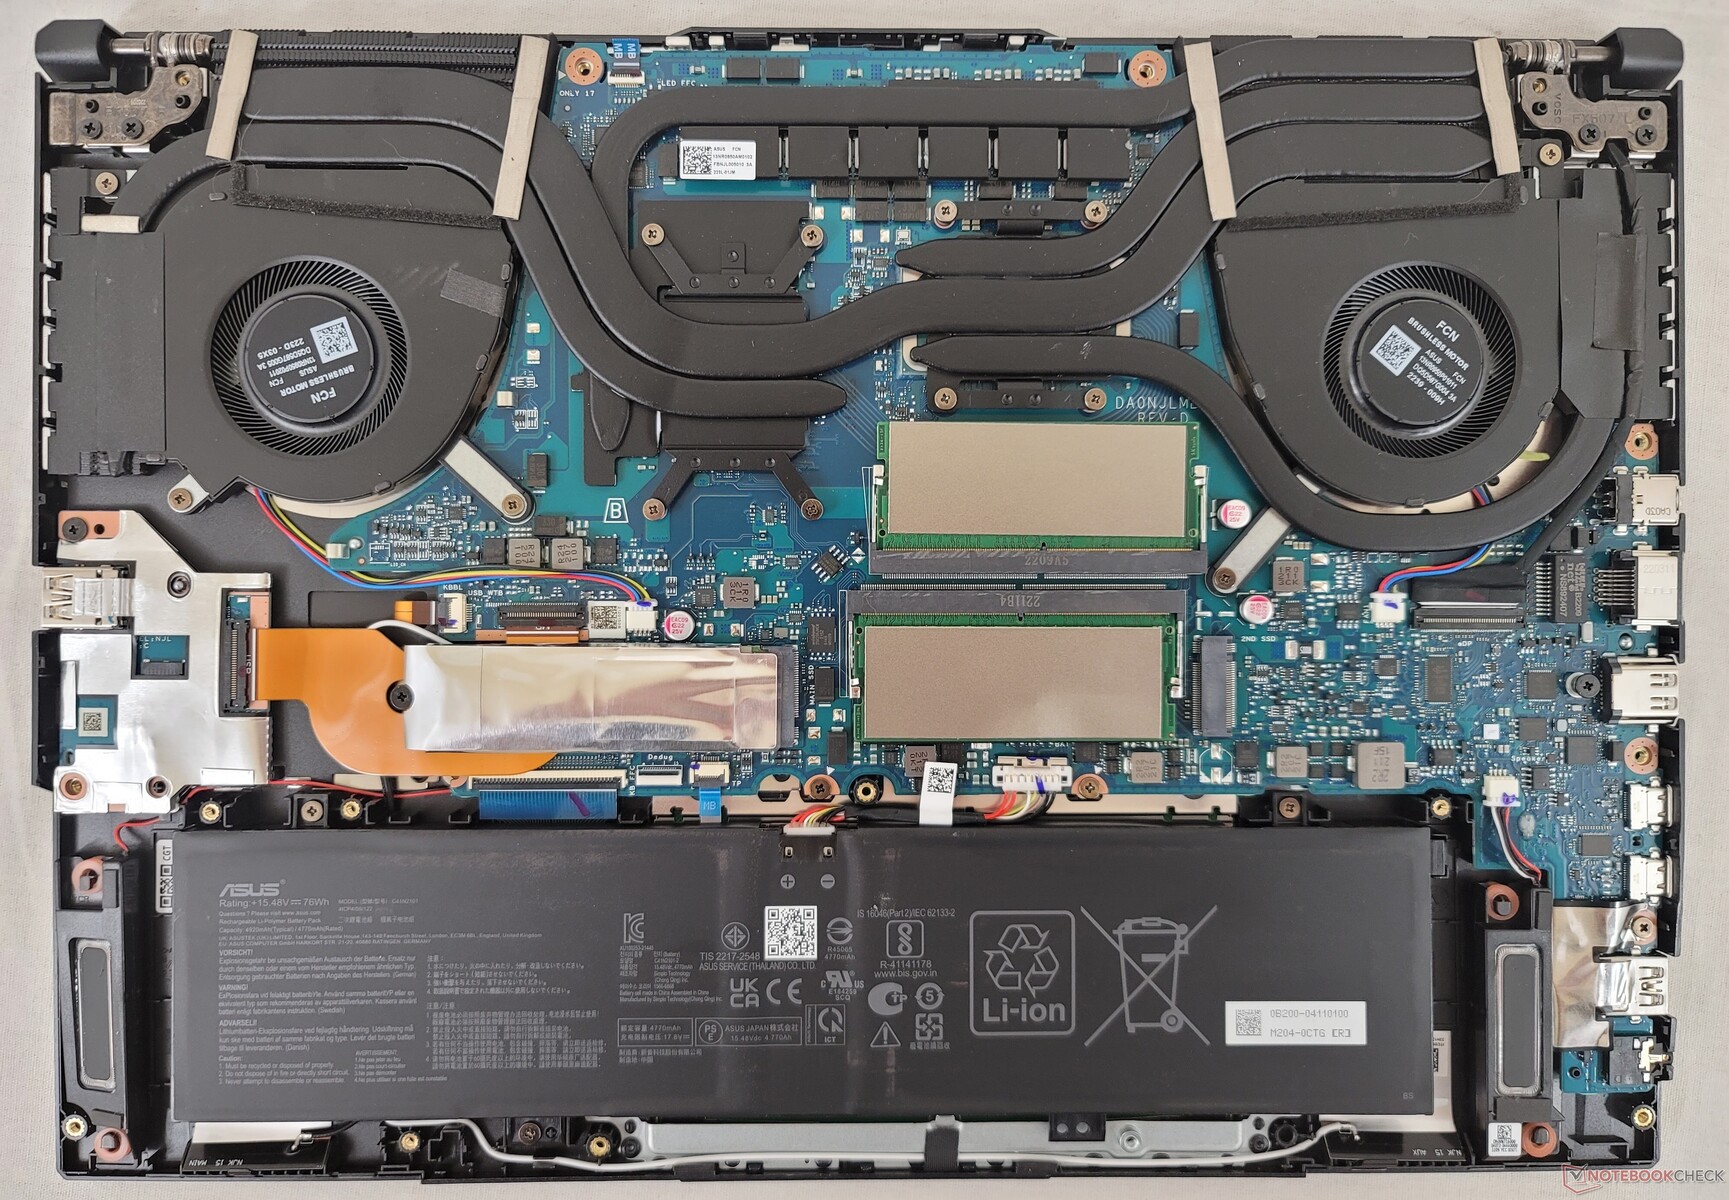
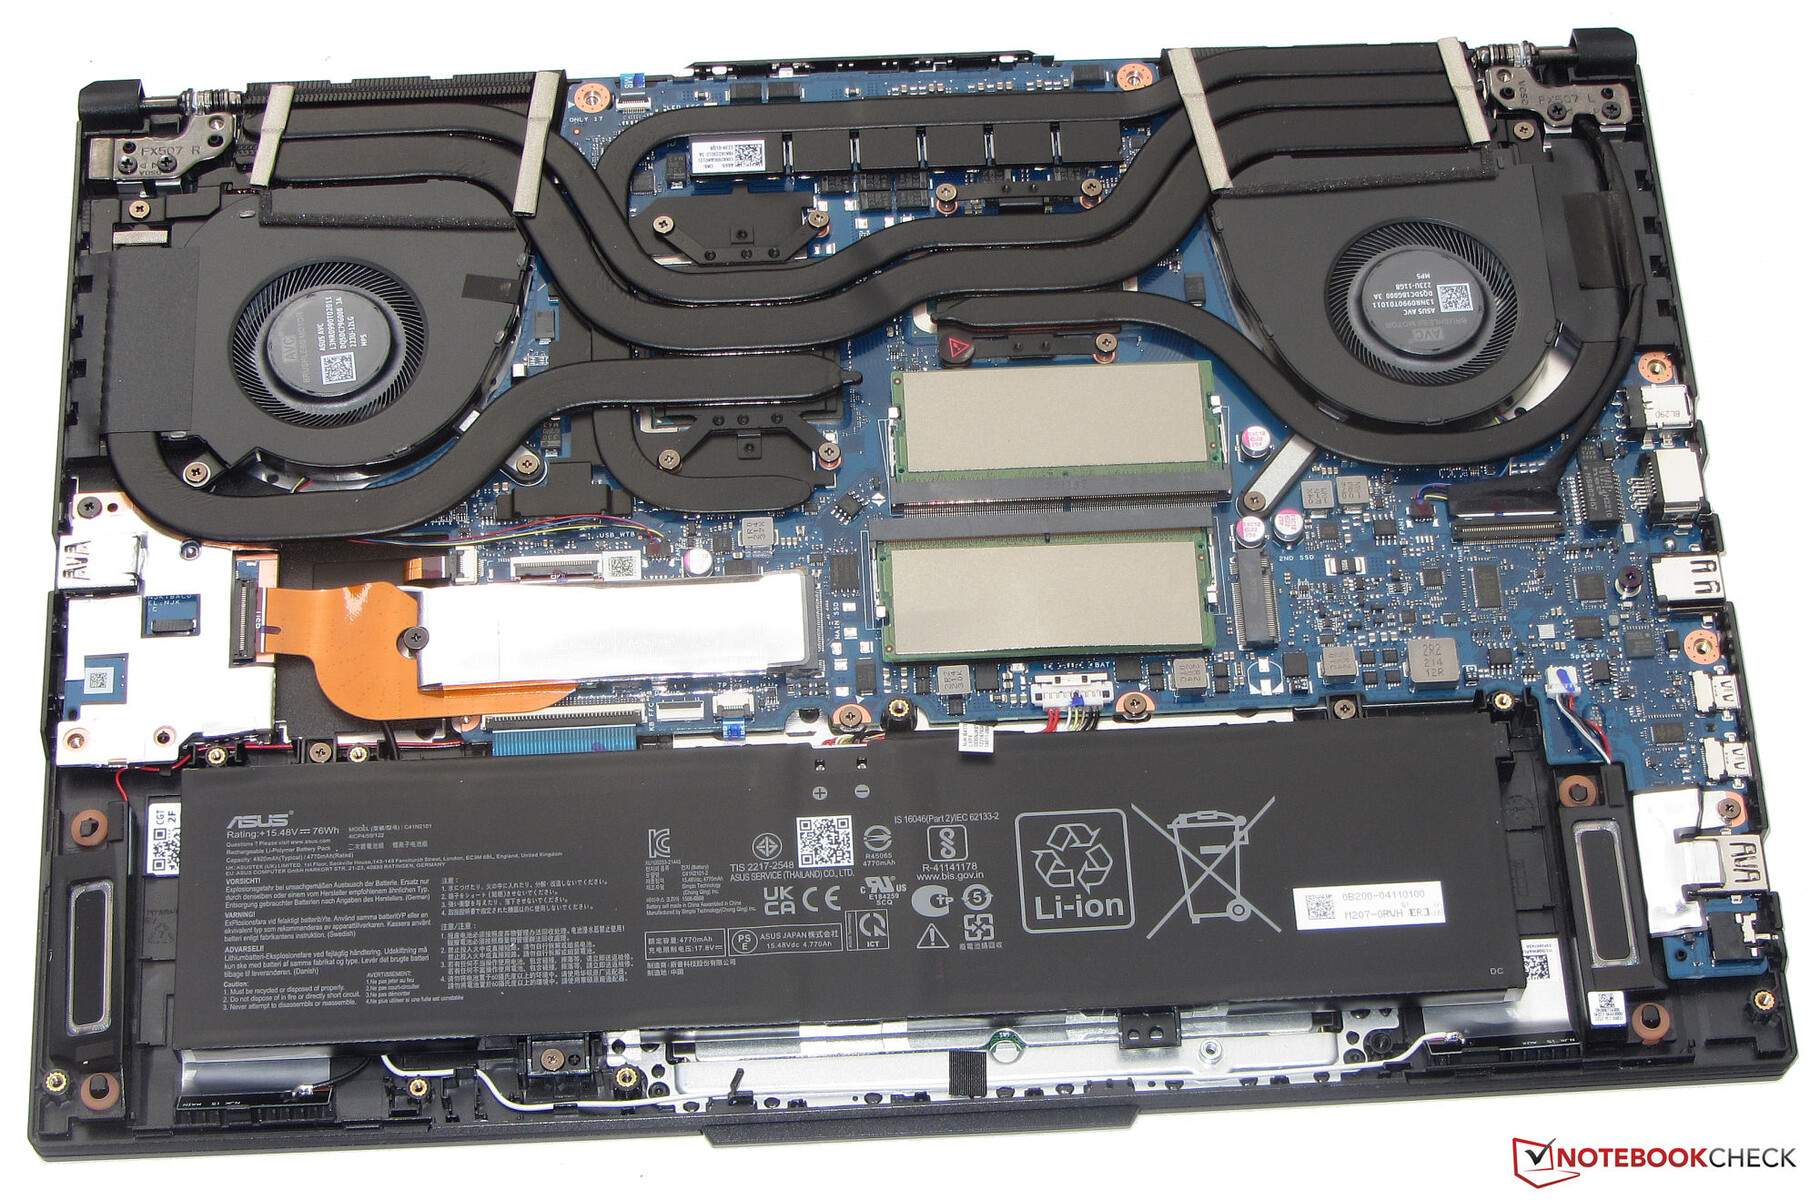
维护
底部面板只需一把飞利浦螺丝刀就可以非常容易地拆下,露出2个M.2存储托架、2个SODIMM插槽,以及藏在主M.2固态硬盘下面的WLAN模块。与FX517ZR相比,我们的FX517ZC在GPU上使用了较少的铜热管,如下图所示,重量稍轻。
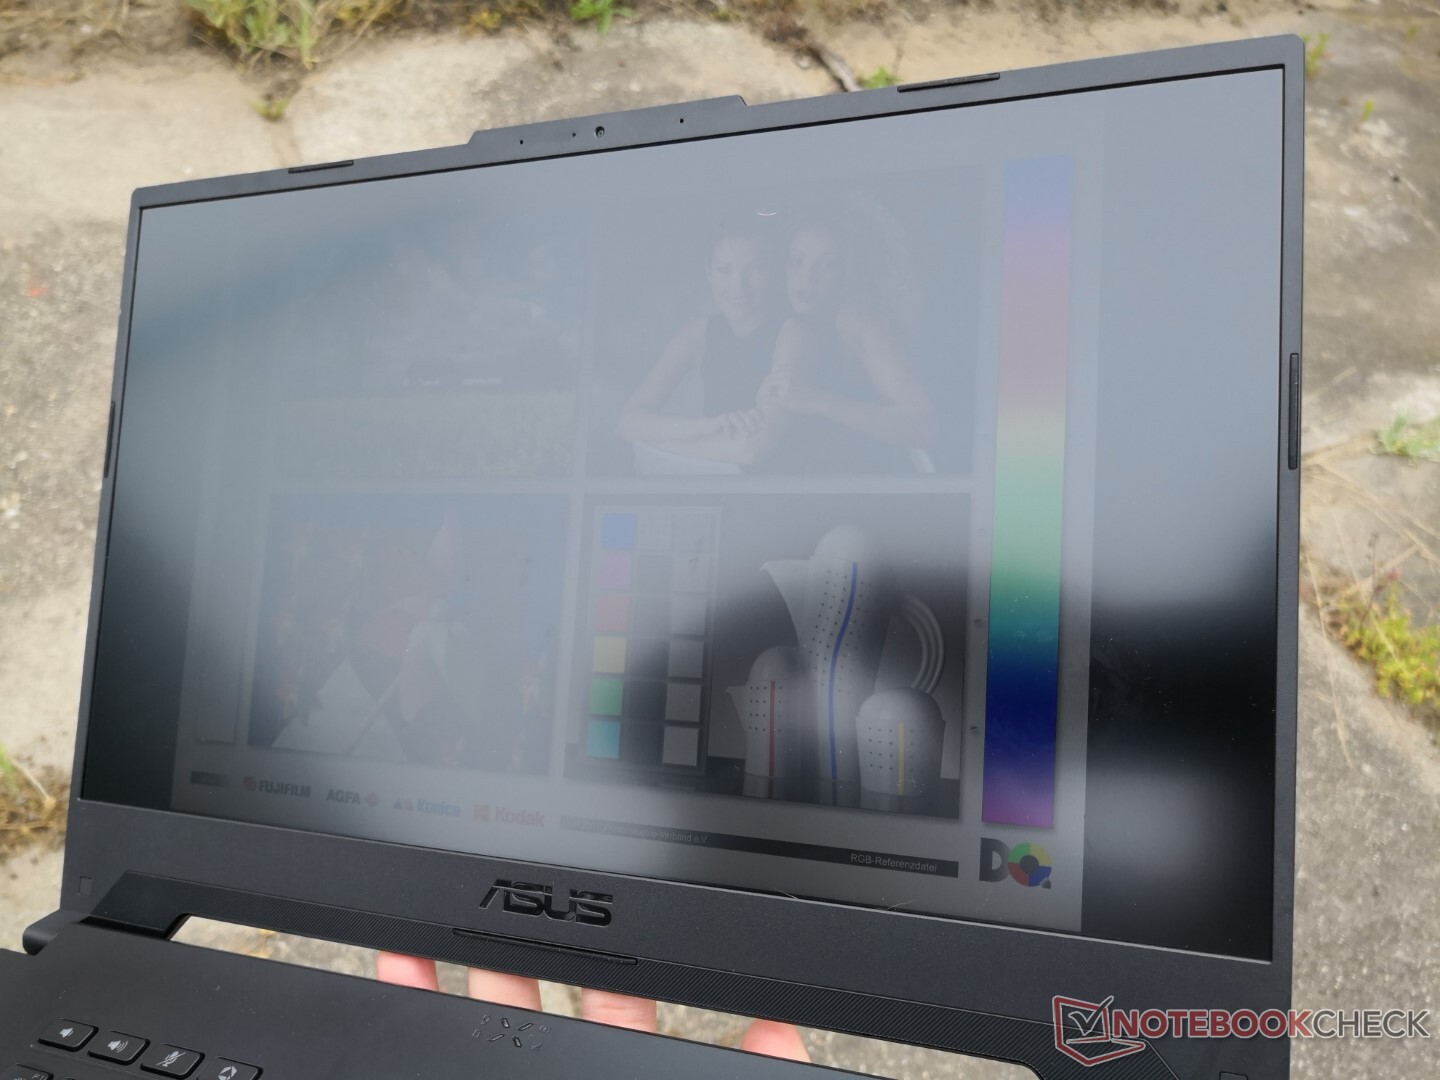
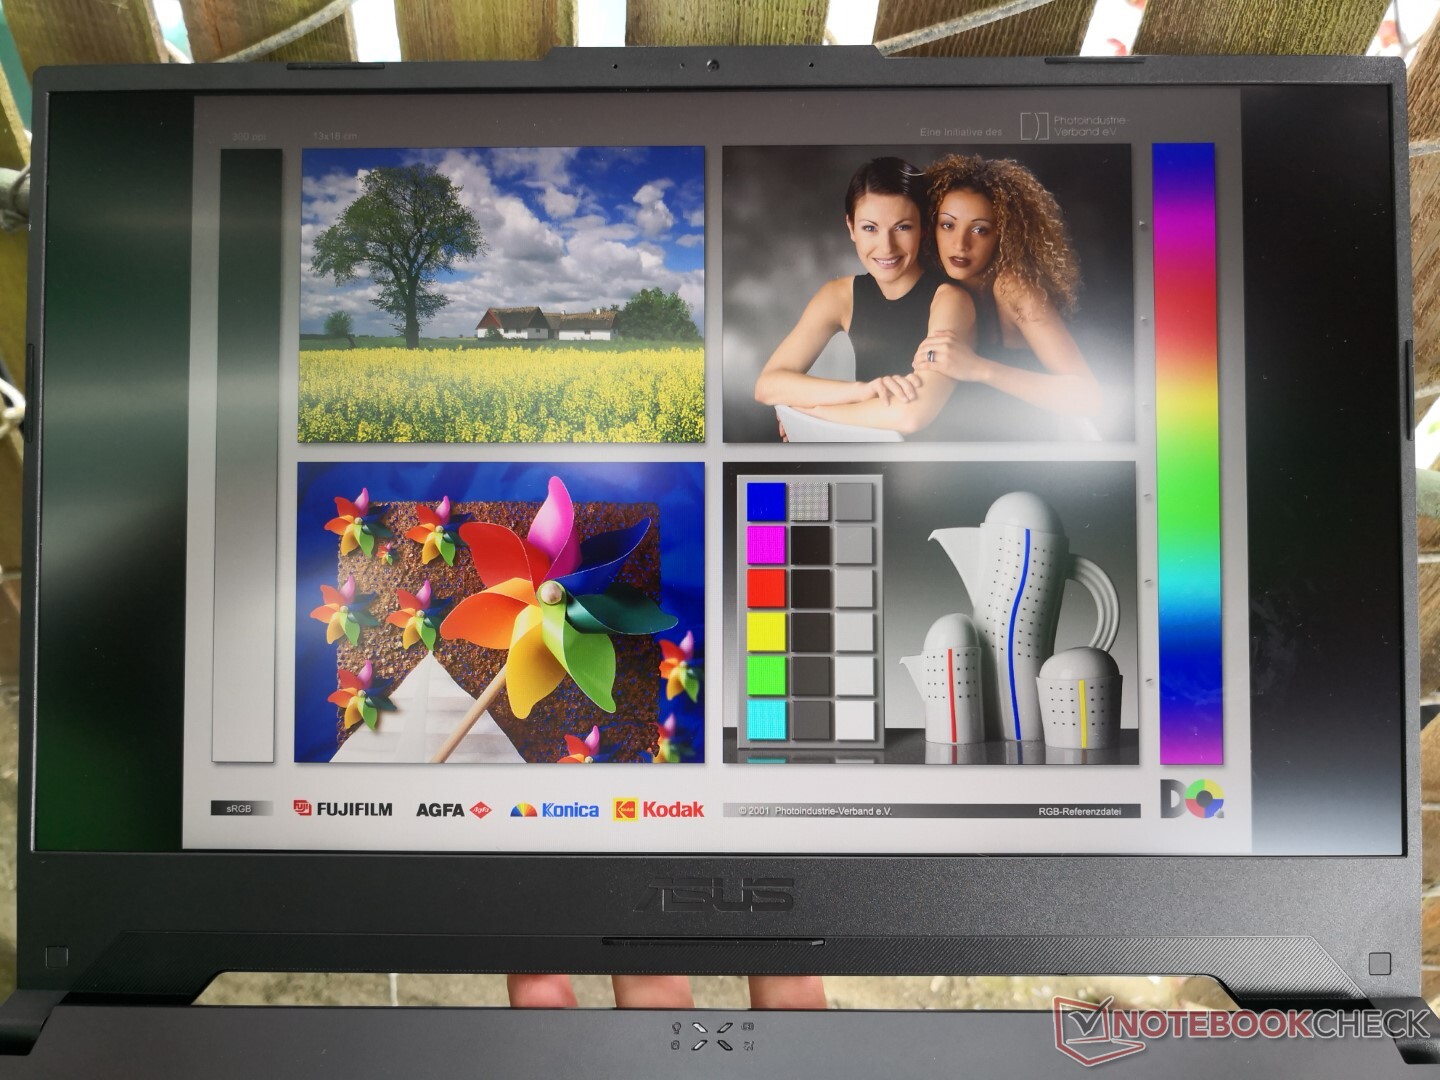
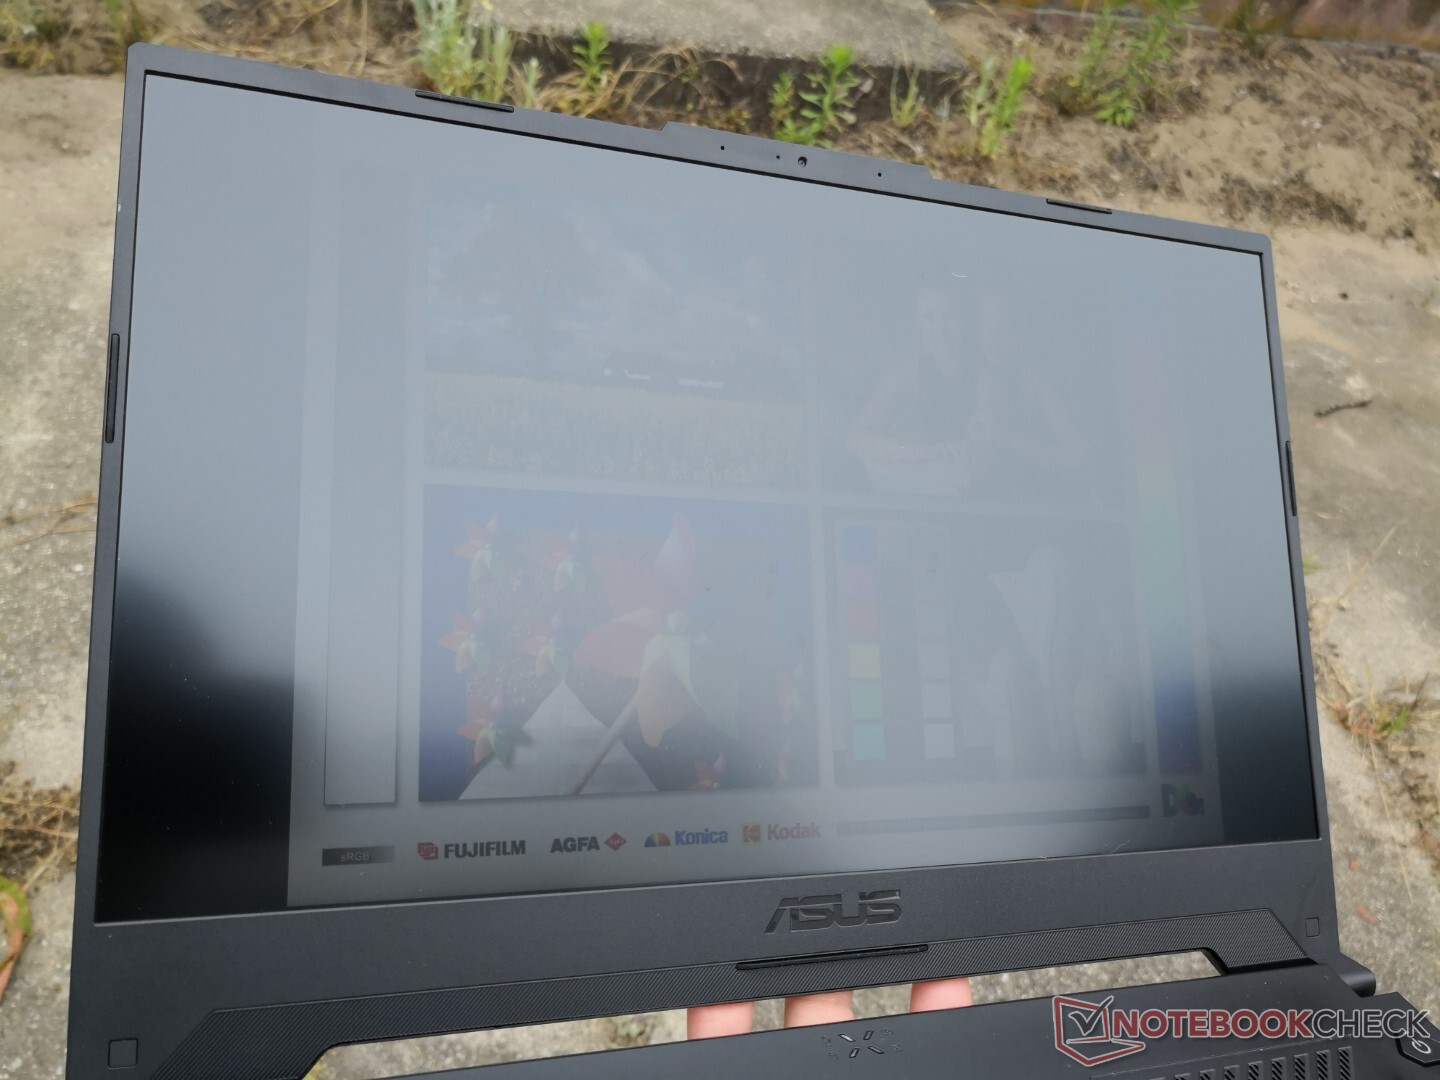
显示


| |||||||||||||||||||||||||
Brightness Distribution: 88 %
Center on Battery: 354.2 cd/m²
Contrast: 1107:1 (Black: 0.32 cd/m²)
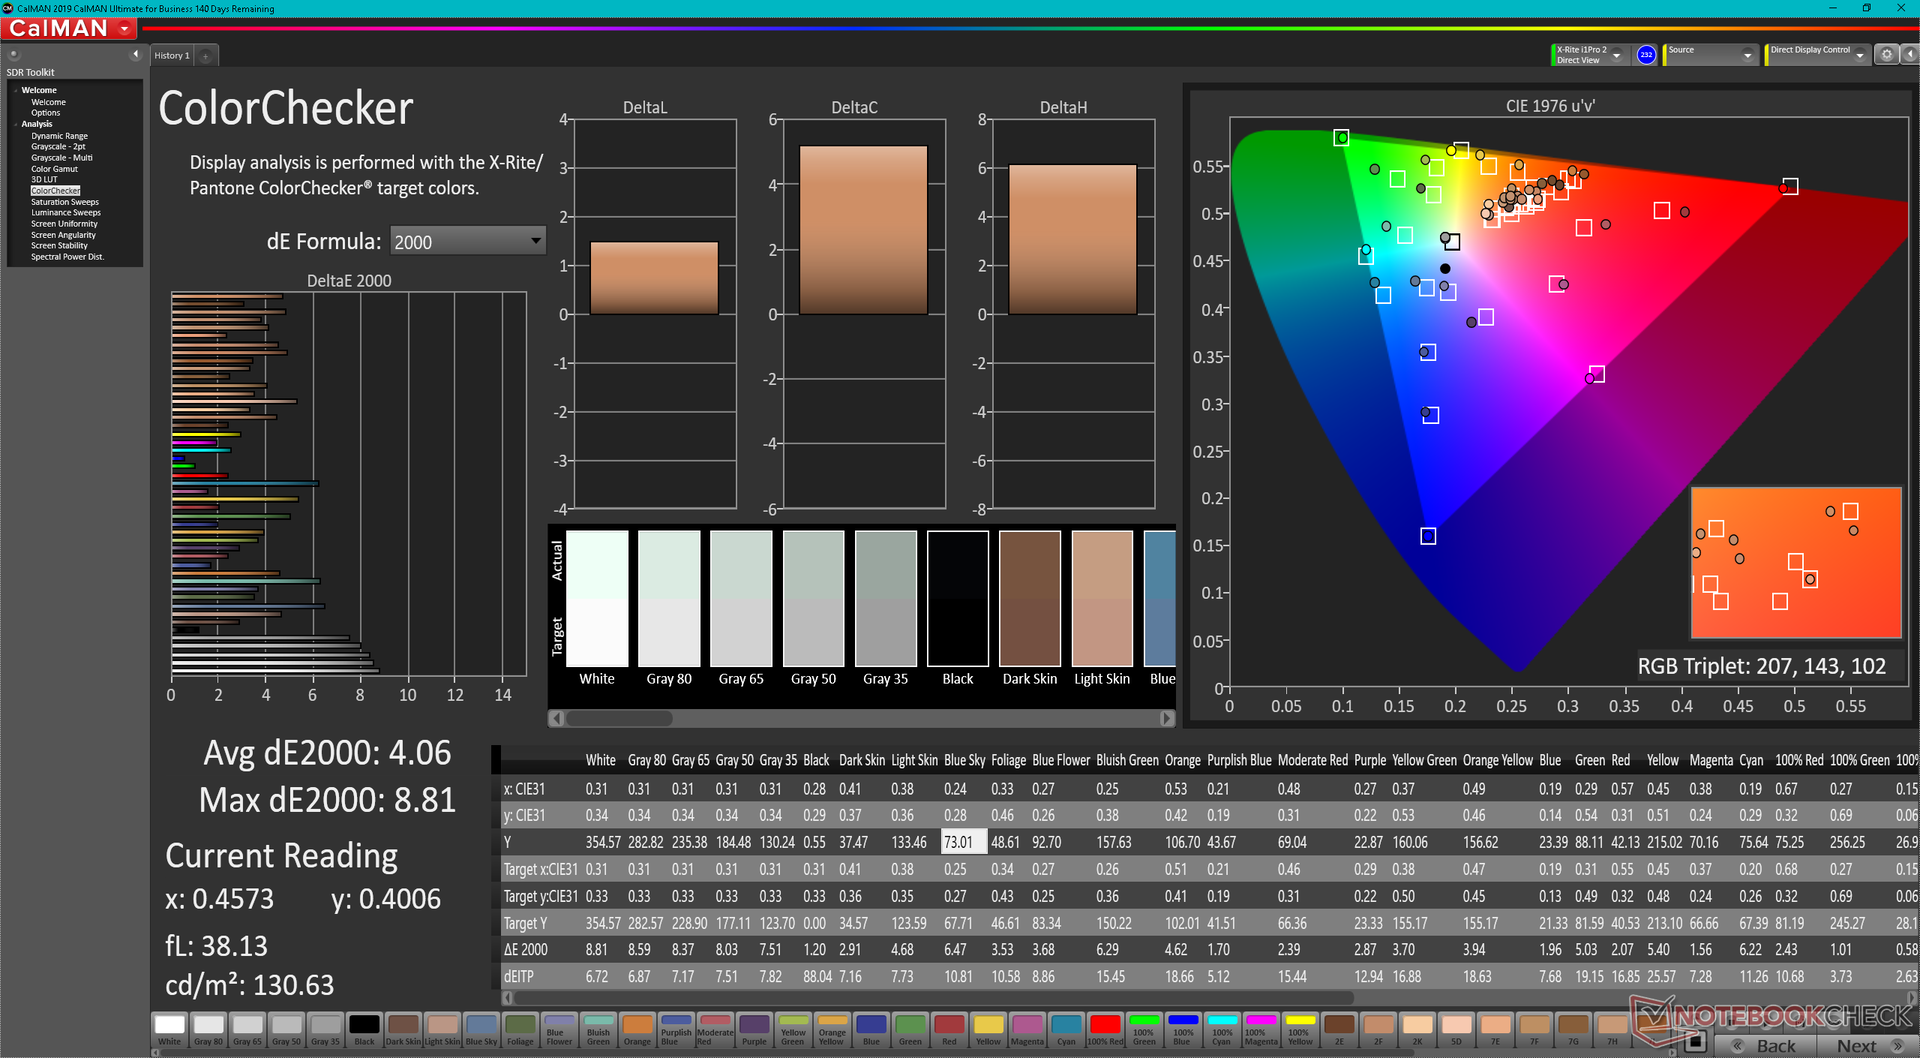
ΔE ColorChecker Calman: 4.06 | ∀{0.5-29.43 Ø4.71}
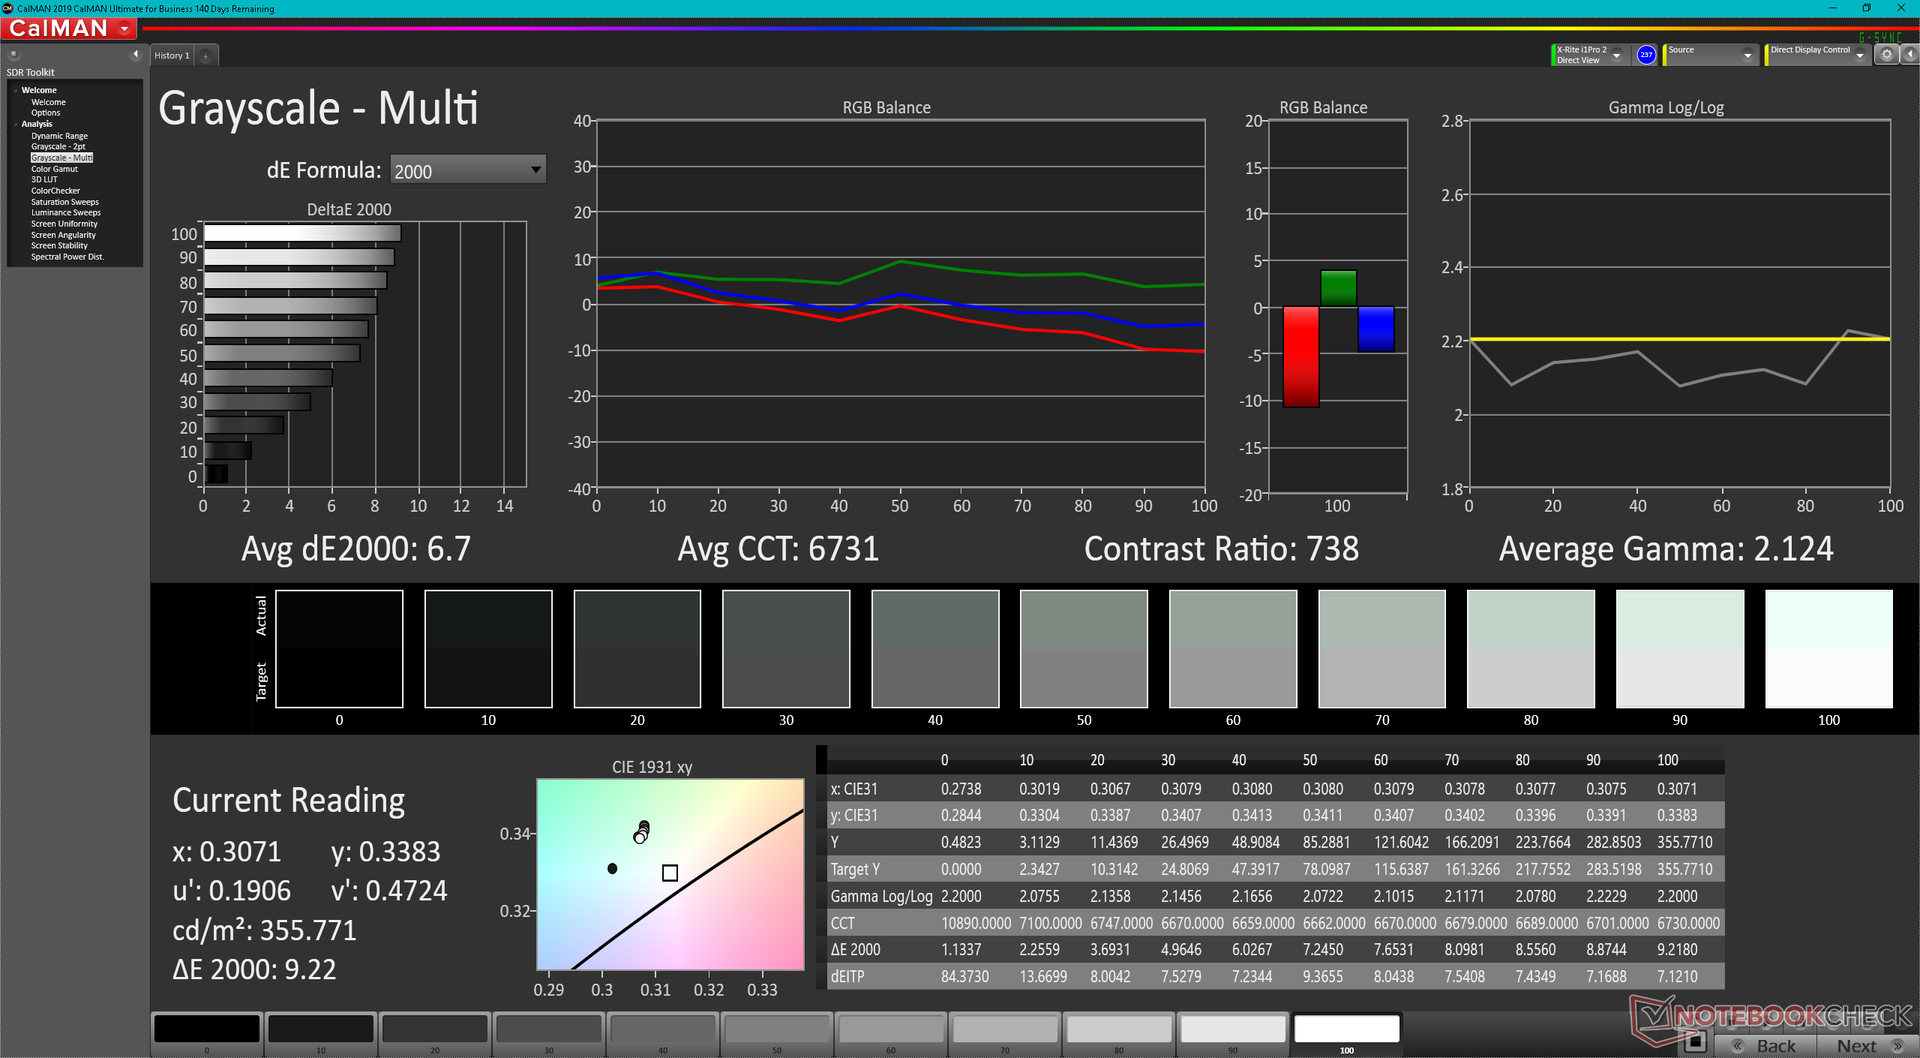
ΔE Greyscale Calman: 6.7 | ∀{0.09-98 Ø4.96}
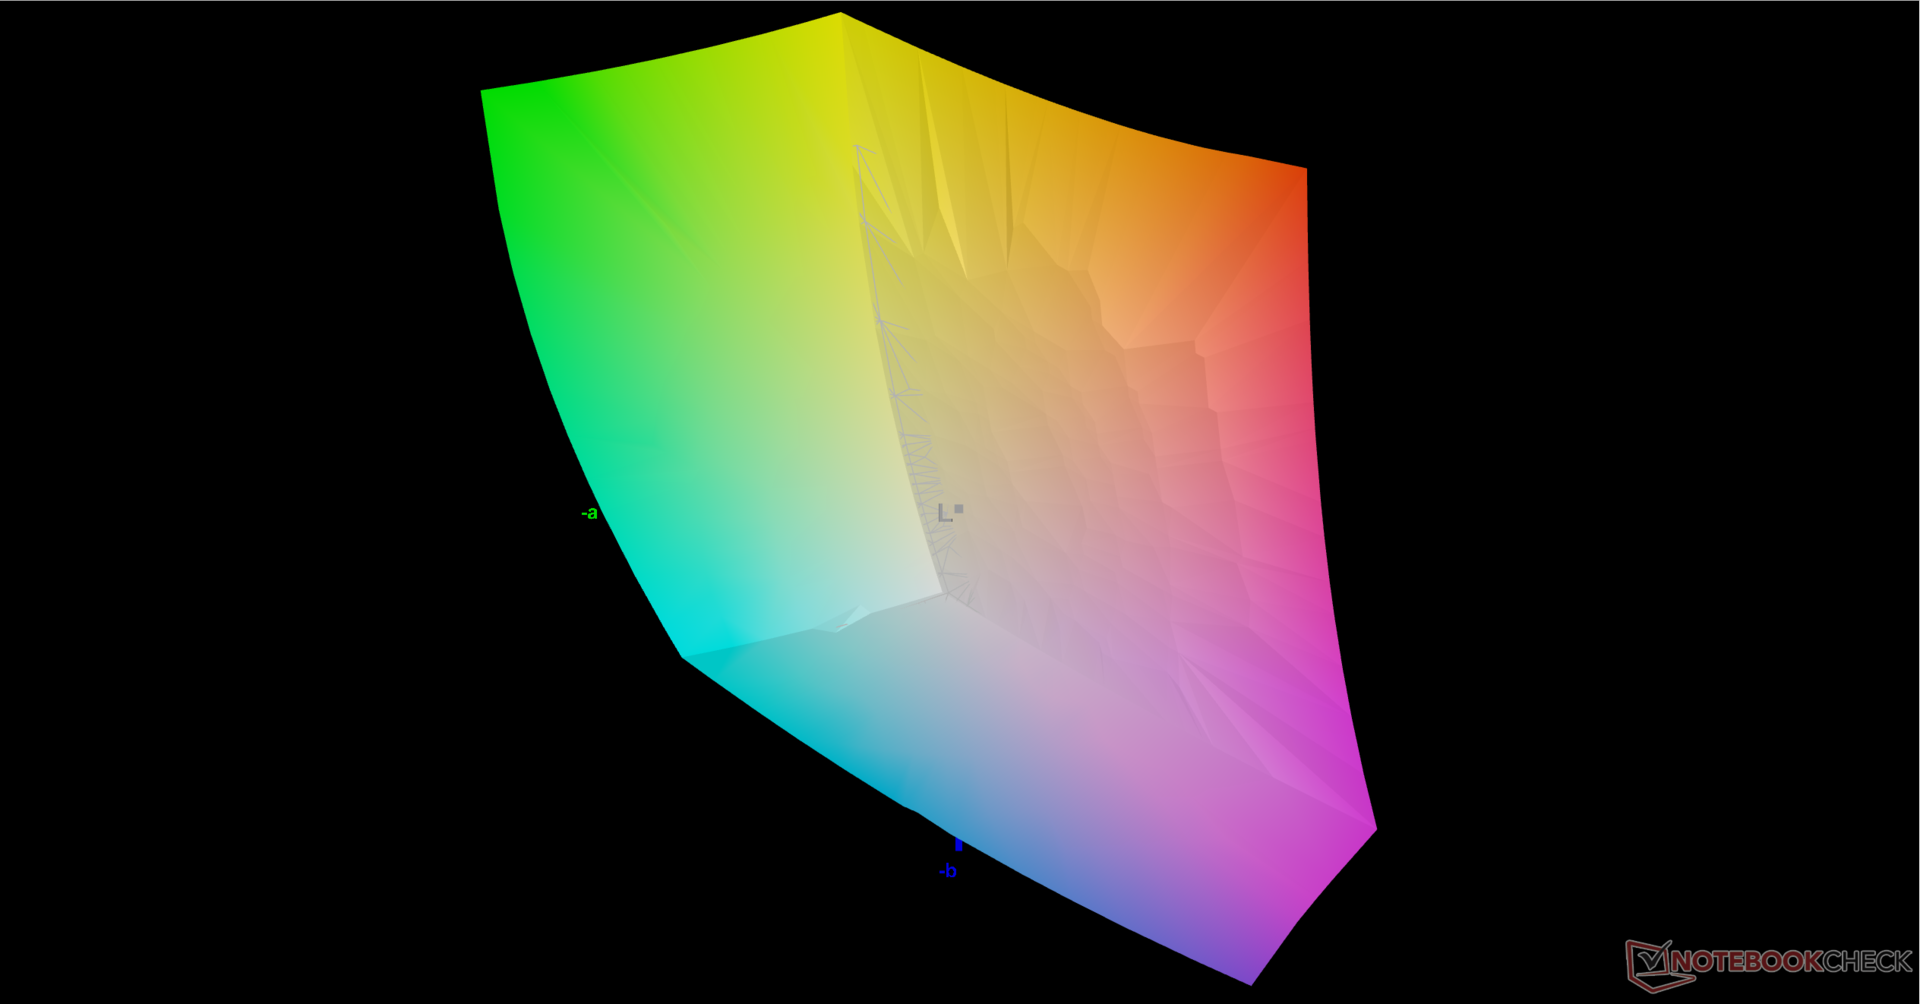
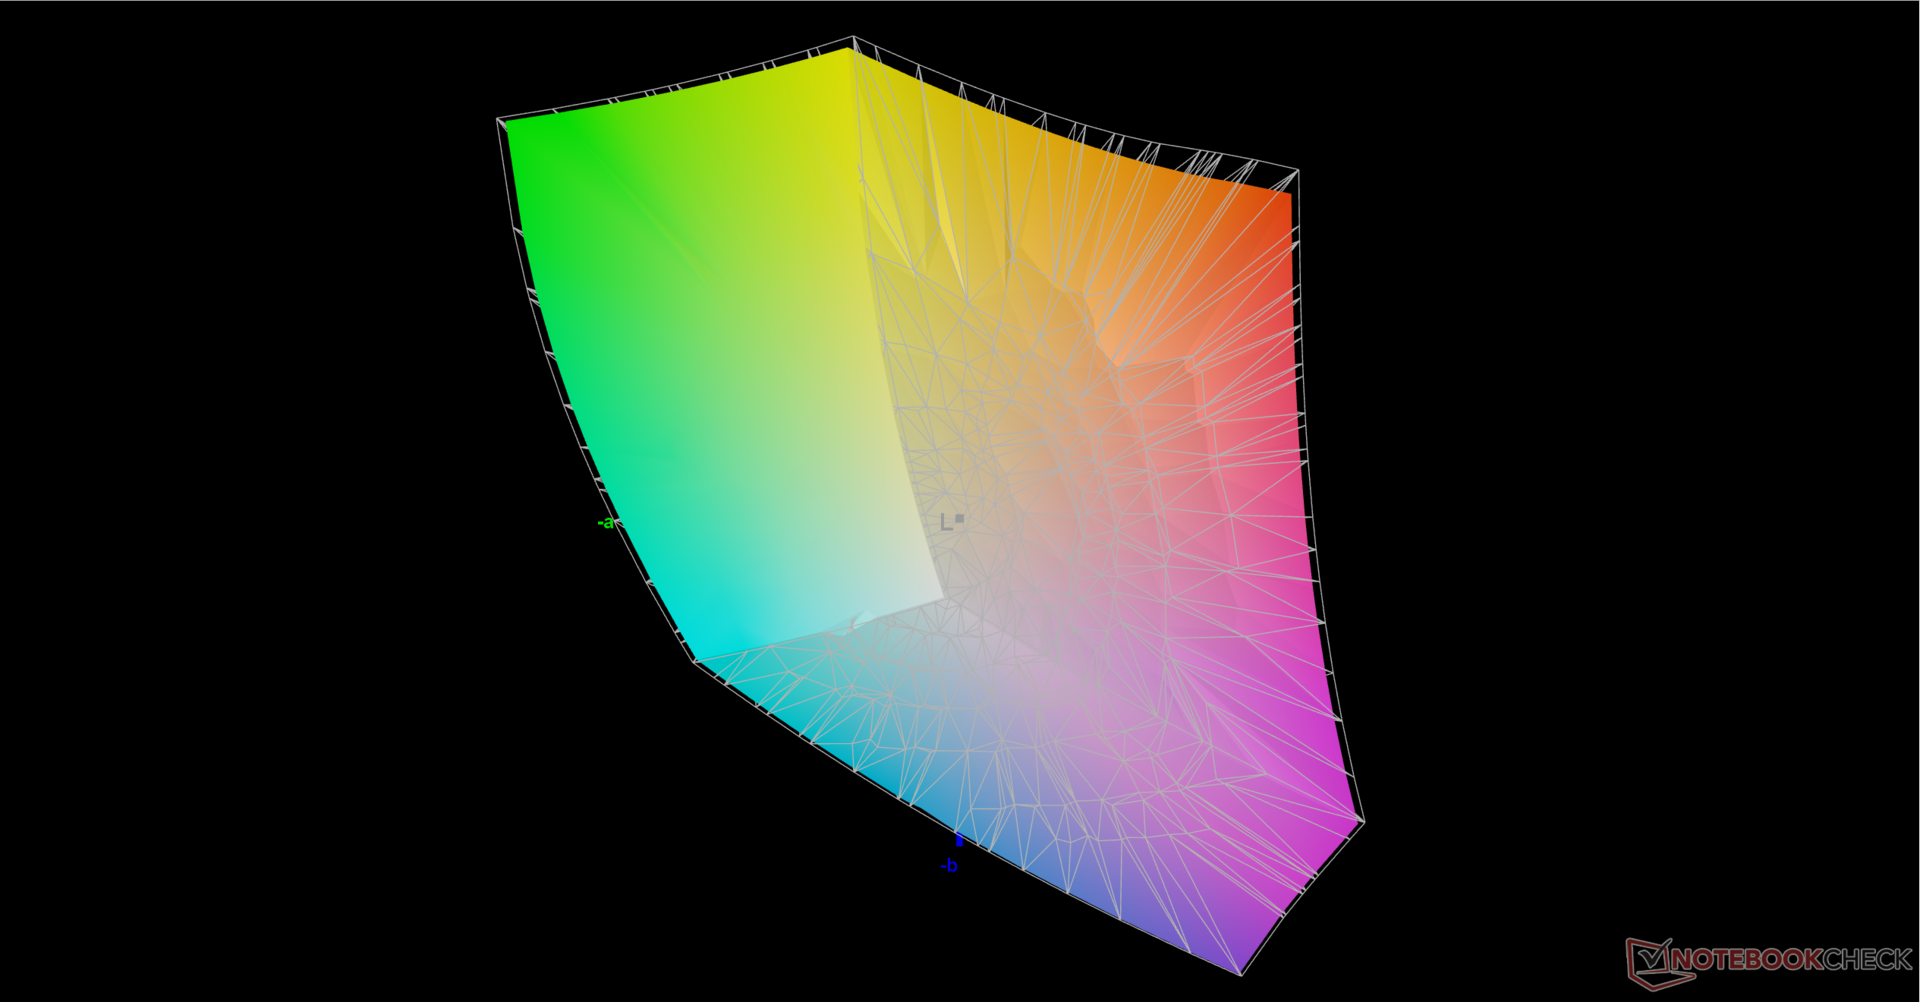
85.1% AdobeRGB 1998 (Argyll 3D)
99.9% sRGB (Argyll 3D)
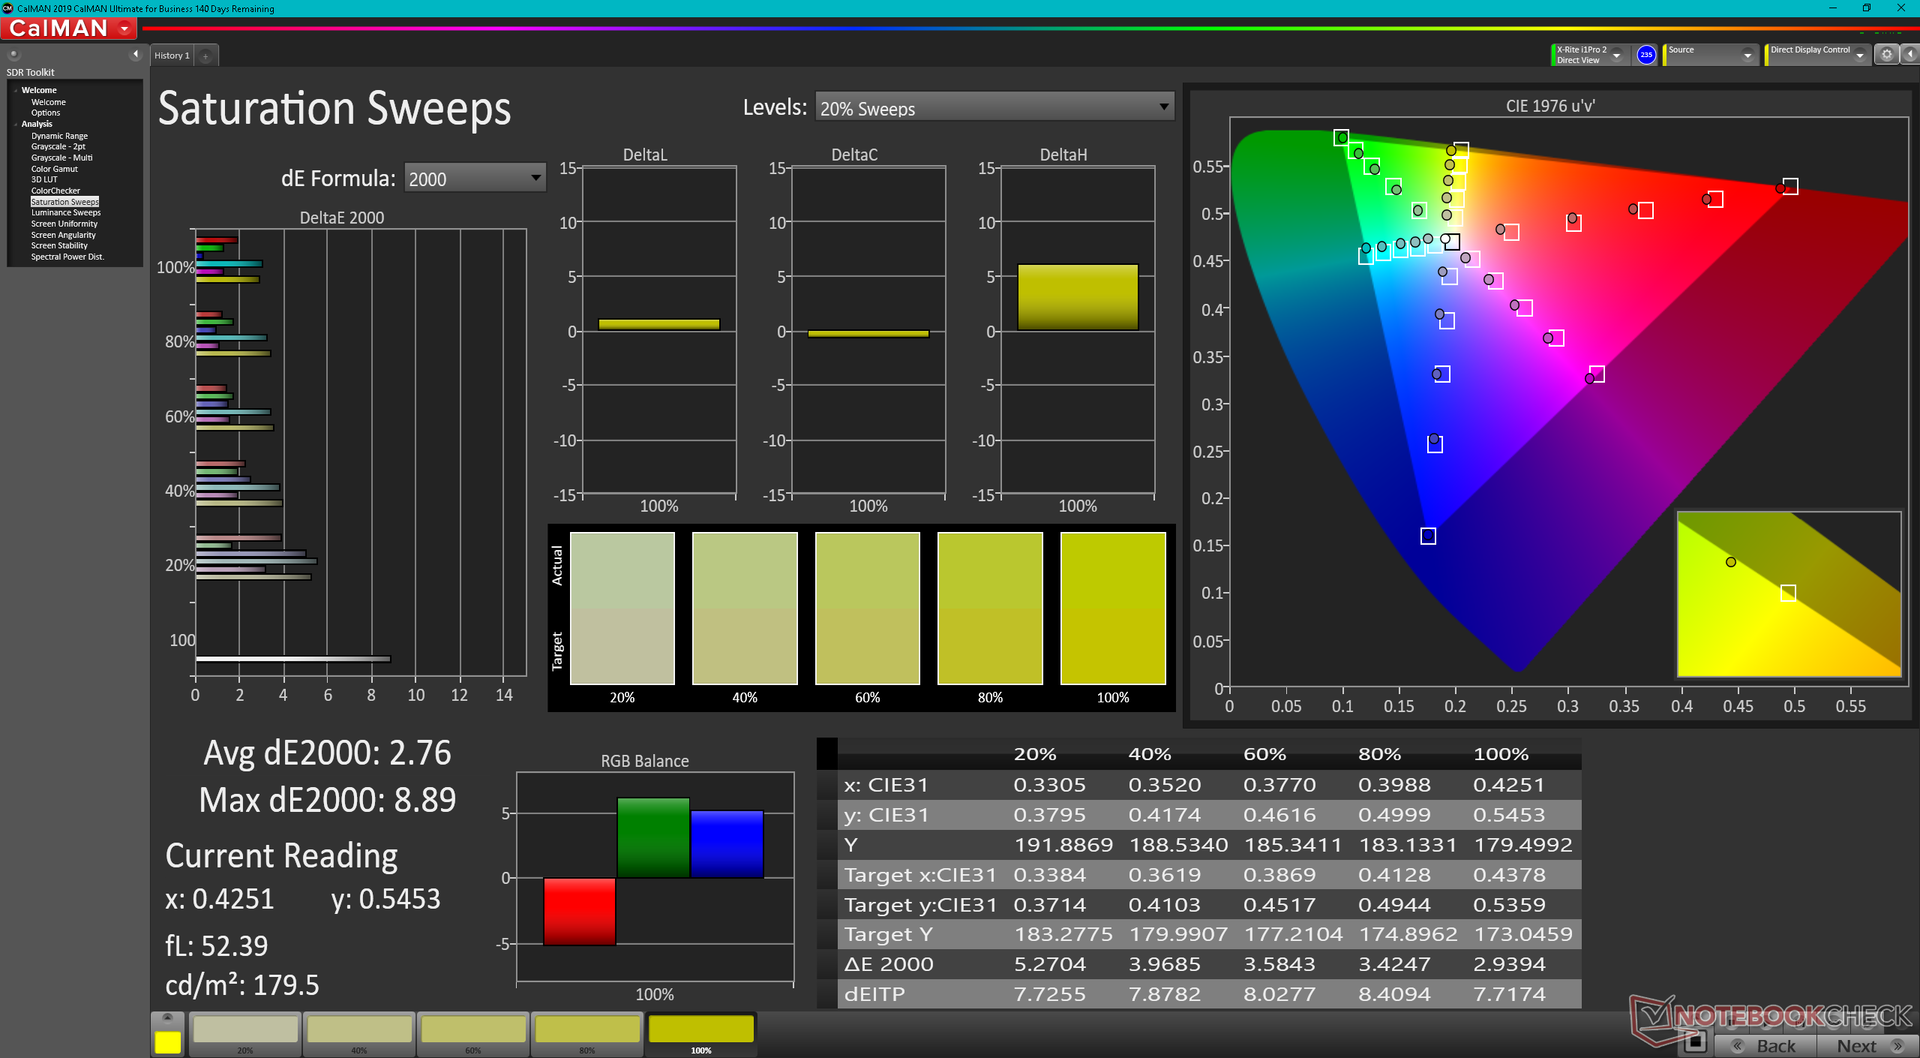
95.8% Display P3 (Argyll 3D)
Gamma: 2.12
CCT: 6731 K
| Asus TUF Dash F15 FX517ZC BOE CQ NE156QHM-NY1, IPS, 2560x1440, 15.6" | Asus TUF Dash F15 FX517ZR BOE CQ NE156QHM-NY1, IPS, 2560x1440, 15.6" | Dell G15 5510 YMHWH_156HRA (CMN1522), IPS, 1920x1080, 15.6" | MSI Bravo 15 B5DD-010US Chi Mei N156HRA-EA1, IPS, 1920x1080, 15.6" | Lenovo Ideapad Gaming 3 15IHU-82K1002RGE LEN156FHD, IPS, 1920x1080, 15.6" | Gigabyte G5 GD Chi Mei N156HRA-EA1, IPS, 1920x1080, 15.6" | |
|---|---|---|---|---|---|---|
| Display | 1% | -48% | -47% | -50% | -48% | |
| Display P3 Coverage (%) | 95.8 | 98.4 3% | 41.6 -57% | 42.1 -56% | 39.7 -59% | 41.8 -56% |
| sRGB Coverage (%) | 99.9 | 99.9 0% | 62.2 -38% | 62.8 -37% | 59.6 -40% | 62.3 -38% |
| AdobeRGB 1998 Coverage (%) | 85.1 | 85.9 1% | 43 -49% | 43.6 -49% | 41.1 -52% | 43.2 -49% |
| Response Times | 22% | -198% | -162% | -345% | -217% | |
| Response Time Grey 50% / Grey 80% * (ms) | 8.4 ? | 5.6 ? 33% | 33.3 ? -296% | 25.6 ? -205% | 46.4 ? -452% | 34.4 ? -310% |
| Response Time Black / White * (ms) | 10.4 ? | 9.4 ? 10% | 20.7 ? -99% | 22.8 ? -119% | 35.2 ? -238% | 23.2 ? -123% |
| PWM Frequency (Hz) | ||||||
| Screen | 17% | -5% | -25% | -15% | -5% | |
| Brightness middle (cd/m²) | 354.2 | 286 -19% | 288 -19% | 265.1 -25% | 307 -13% | 261 -26% |
| Brightness (cd/m²) | 330 | 266 -19% | 264 -20% | 245 -26% | 292 -12% | 246 -25% |
| Brightness Distribution (%) | 88 | 87 -1% | 88 0% | 87 -1% | 88 0% | 87 -1% |
| Black Level * (cd/m²) | 0.32 | 0.25 22% | 0.24 25% | 0.35 -9% | 0.21 34% | 0.19 41% |
| Contrast (:1) | 1107 | 1144 3% | 1200 8% | 757 -32% | 1462 32% | 1374 24% |
| Colorchecker dE 2000 * | 4.06 | 2.14 47% | 3.67 10% | 4.68 -15% | 5.9 -45% | 3.9 4% |
| Colorchecker dE 2000 max. * | 8.81 | 5.22 41% | 18.12 -106% | 19.96 -127% | 21.6 -145% | 19.26 -119% |
| Greyscale dE 2000 * | 6.7 | 2.8 58% | 2.6 61% | 4.5 33% | 4.9 27% | 2.7 60% |
| Gamma | 2.12 104% | 2.23 99% | 2.187 101% | 2.22 99% | 2.26 97% | 2.248 98% |
| CCT | 6731 97% | 7092 92% | 6971 93% | 6632 98% | 6504 100% | 6828 95% |
| Colorchecker dE 2000 calibrated * | 0.67 | 3.22 | 3.7 | 4.8 | 3.24 | |
| Total Average (Program / Settings) | 13% /
14% | -84% /
-45% | -78% /
-51% | -137% /
-74% | -90% /
-48% |
* ... smaller is better
Display Response Times
| ↔ Response Time Black to White | ||
|---|---|---|
| 10.4 ms ... rise ↗ and fall ↘ combined | ↗ 6.4 ms rise | 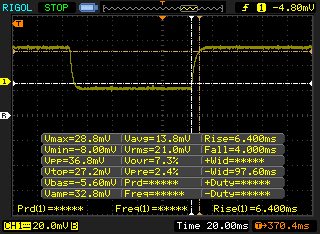 |
| ↘ 4 ms fall | ||
| The screen shows good response rates in our tests, but may be too slow for competitive gamers. In comparison, all tested devices range from 0.1 (minimum) to 240 (maximum) ms. » 28 % of all devices are better. This means that the measured response time is better than the average of all tested devices (19.8 ms). | ||
| ↔ Response Time 50% Grey to 80% Grey | ||
| 8.4 ms ... rise ↗ and fall ↘ combined | ↗ 4.4 ms rise | 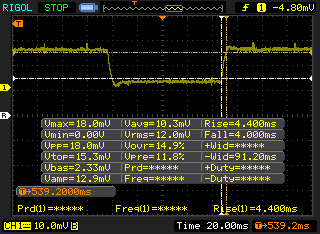 |
| ↘ 4 ms fall | ||
| The screen shows fast response rates in our tests and should be suited for gaming. In comparison, all tested devices range from 0.165 (minimum) to 636 (maximum) ms. » 22 % of all devices are better. This means that the measured response time is better than the average of all tested devices (31 ms). | ||
Screen Flickering / PWM (Pulse-Width Modulation)
| Screen flickering / PWM not detected | 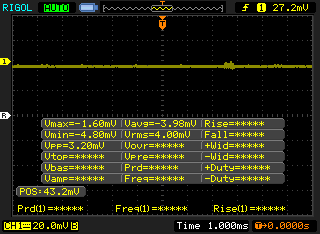 | ||
In comparison: 52 % of all tested devices do not use PWM to dim the display. If PWM was detected, an average of 7757 (minimum: 5 - maximum: 343500) Hz was measured. | |||

业绩
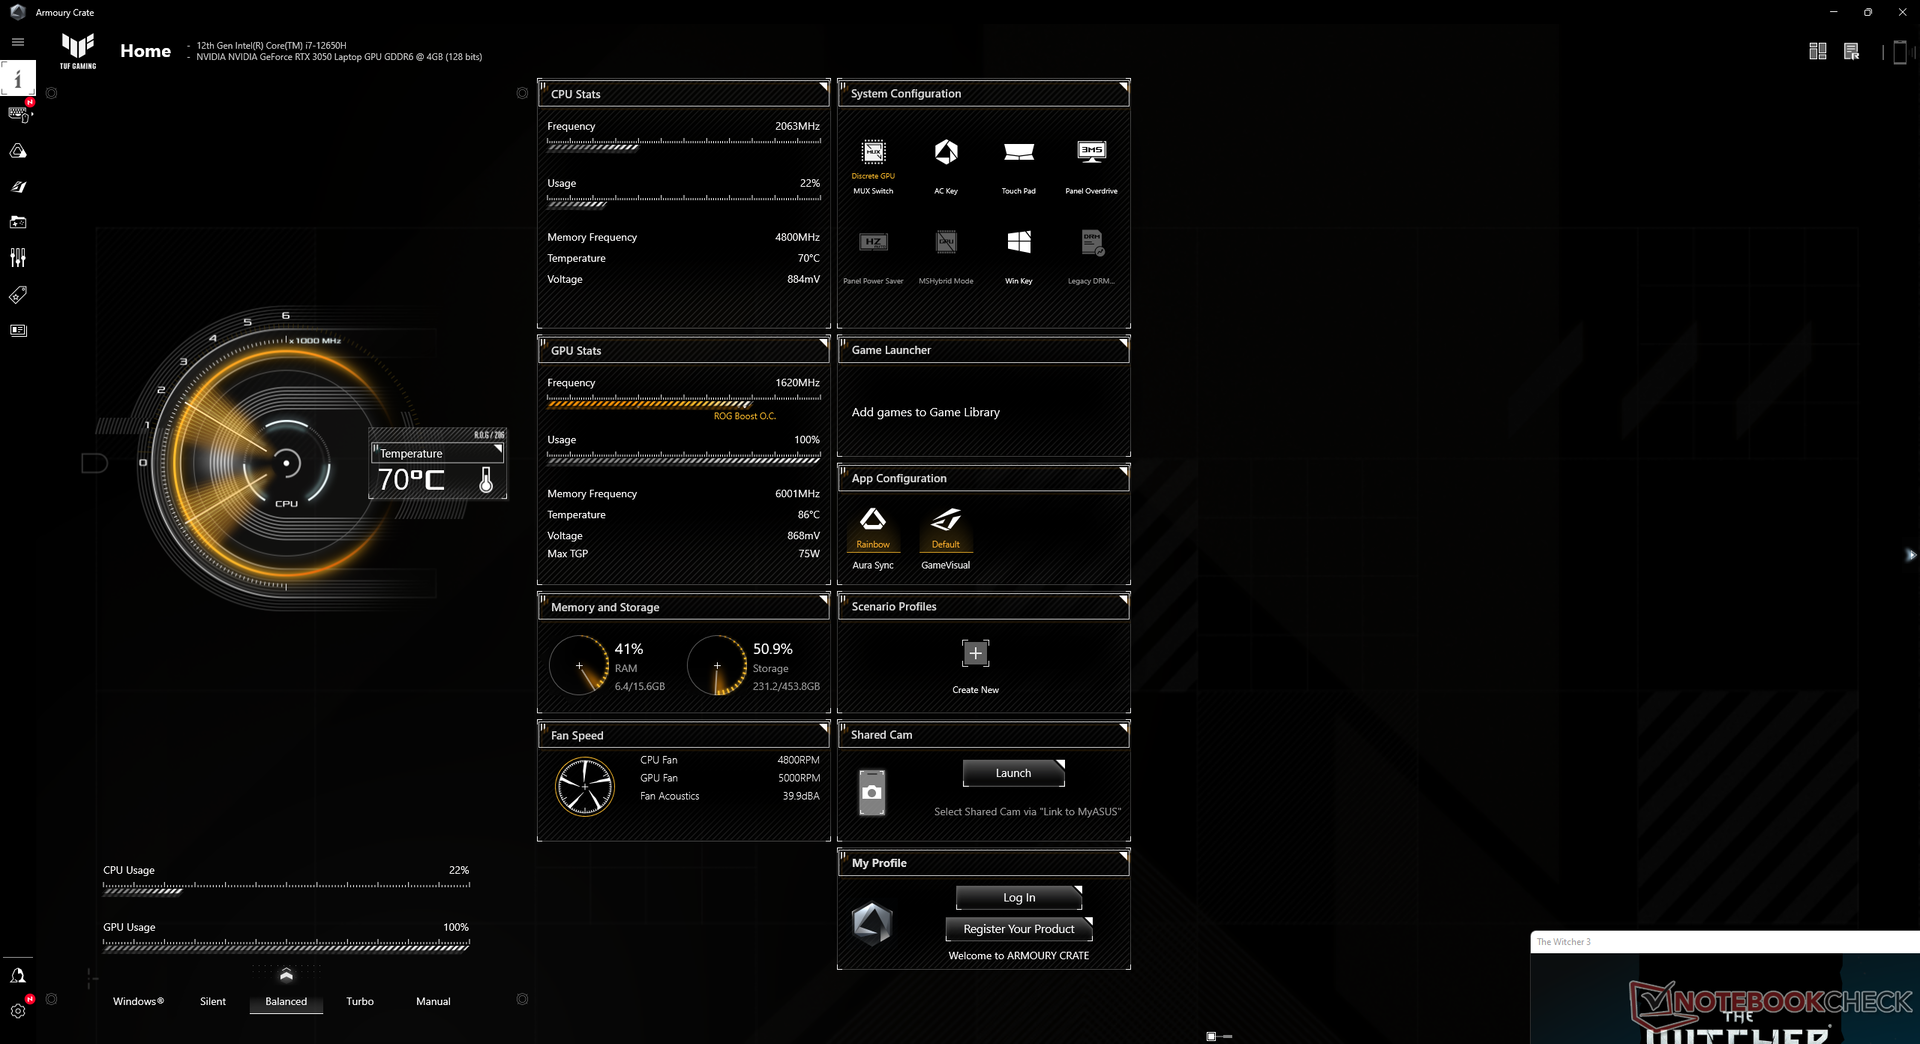
测试条件
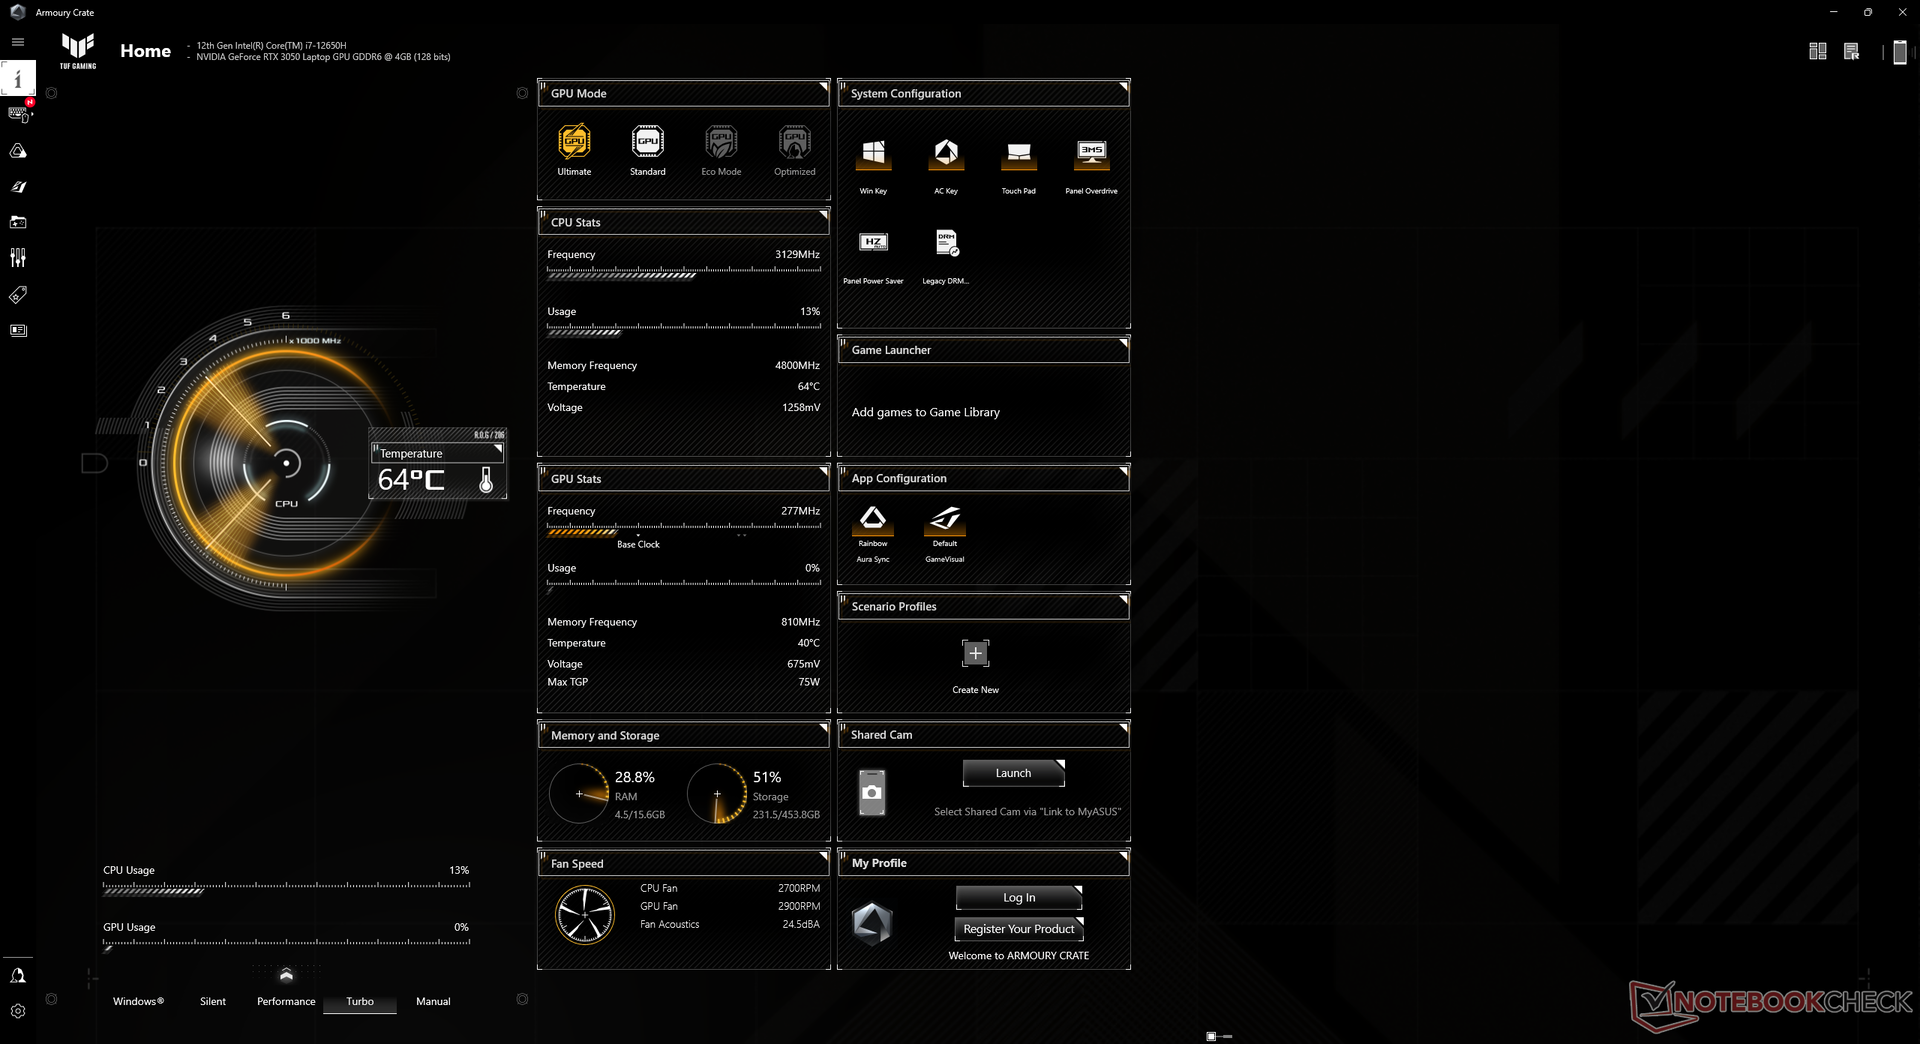
在运行下面的任何性能基准测试之前,我们将我们的设备设置为涡轮和独立GPU模式。该系统利用MSHybrid/MUX进行图形切换,用户可以通过Armoury Crate软件进行切换。我们强烈建议用户熟悉Armoury Crate,因为它是系统的指挥中心。该模型甚至在键盘上有一个方便的专用键来启动该应用程序。

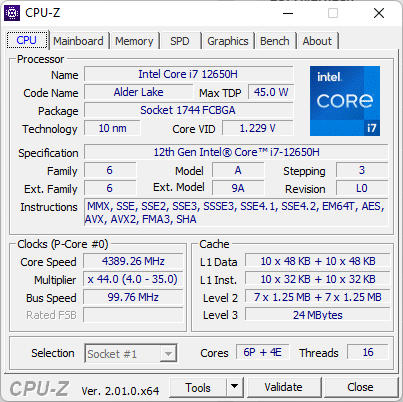
处理器
CPU的总体性能与以下方面最为相似 酷睿i7-11800H在多线程应用中,与酷睿i7-11800H最为相似,而在单线程应用中则快了约15%至20%。
Cinebench R15 Multi Loop
Cinebench R23: Multi Core | Single Core
Cinebench R15: CPU Multi 64Bit | CPU Single 64Bit
Blender: v2.79 BMW27 CPU
7-Zip 18.03: 7z b 4 | 7z b 4 -mmt1
Geekbench 5.5: Multi-Core | Single-Core
HWBOT x265 Benchmark v2.2: 4k Preset
LibreOffice : 20 Documents To PDF
R Benchmark 2.5: Overall mean
| Cinebench R20 / CPU (Multi Core) | |
| MSI GE67 HX 12UGS | |
| MSI Vector GP66 12UGS | |
| Acer Nitro 5 AN515-58-72QR | |
| MSI Raider GE66 12UHS | |
| Gigabyte A5 X1 | |
| MSI GP66 Leopard 11UH-028 | |
| Asus TUF Dash F15 FX517ZC | |
| Dell G15 5515 | |
| Average Intel Core i7-12650H (2106 - 6009, n=14) | |
| MSI GS66 Stealth 10UG | |
| MSI Bravo 15 B5DD-010US | |
| Gigabyte G5 GD | |
| Cinebench R20 / CPU (Single Core) | |
| MSI Vector GP66 12UGS | |
| MSI Raider GE66 12UHS | |
| Acer Nitro 5 AN515-58-72QR | |
| Asus TUF Dash F15 FX517ZC | |
| MSI GE67 HX 12UGS | |
| Average Intel Core i7-12650H (552 - 696, n=14) | |
| MSI GP66 Leopard 11UH-028 | |
| Gigabyte A5 X1 | |
| Gigabyte G5 GD | |
| Dell G15 5515 | |
| MSI Bravo 15 B5DD-010US | |
| MSI GS66 Stealth 10UG | |
| Cinebench R15 / CPU Multi 64Bit | |
| MSI GE67 HX 12UGS | |
| Acer Nitro 5 AN515-58-72QR | |
| MSI Raider GE66 12UHS | |
| MSI Vector GP66 12UGS | |
| Gigabyte A5 X1 | |
| MSI GP66 Leopard 11UH-028 | |
| Dell G15 5515 | |
| Asus TUF Dash F15 FX517ZC | |
| Average Intel Core i7-12650H (753 - 2253, n=14) | |
| MSI GS66 Stealth 10UG | |
| Gigabyte G5 GD | |
| MSI Bravo 15 B5DD-010US | |
| Cinebench R15 / CPU Single 64Bit | |
| MSI Vector GP66 12UGS | |
| MSI Raider GE66 12UHS | |
| Acer Nitro 5 AN515-58-72QR | |
| MSI GE67 HX 12UGS | |
| Asus TUF Dash F15 FX517ZC | |
| Average Intel Core i7-12650H (206 - 261, n=14) | |
| Gigabyte A5 X1 | |
| Dell G15 5515 | |
| MSI GP66 Leopard 11UH-028 | |
| MSI Bravo 15 B5DD-010US | |
| Gigabyte G5 GD | |
| MSI GS66 Stealth 10UG | |
| HWBOT x265 Benchmark v2.2 / 4k Preset | |
| MSI GE67 HX 12UGS | |
| MSI Vector GP66 12UGS | |
| MSI Raider GE66 12UHS | |
| Acer Nitro 5 AN515-58-72QR | |
| Gigabyte A5 X1 | |
| MSI GP66 Leopard 11UH-028 | |
| Dell G15 5515 | |
| Asus TUF Dash F15 FX517ZC | |
| Average Intel Core i7-12650H (6.62 - 17.4, n=16) | |
| MSI GS66 Stealth 10UG | |
| MSI Bravo 15 B5DD-010US | |
| Gigabyte G5 GD | |
| LibreOffice / 20 Documents To PDF | |
| Dell G15 5515 | |
| Gigabyte A5 X1 | |
| MSI Bravo 15 B5DD-010US | |
| Asus TUF Dash F15 FX517ZC | |
| MSI GP66 Leopard 11UH-028 | |
| MSI GS66 Stealth 10UG | |
| Average Intel Core i7-12650H (35.1 - 58.5, n=14) | |
| Gigabyte G5 GD | |
| MSI GE67 HX 12UGS | |
| Acer Nitro 5 AN515-58-72QR | |
| MSI Vector GP66 12UGS | |
| MSI Raider GE66 12UHS | |
| R Benchmark 2.5 / Overall mean | |
| MSI GS66 Stealth 10UG | |
| Gigabyte G5 GD | |
| MSI GP66 Leopard 11UH-028 | |
| MSI Bravo 15 B5DD-010US | |
| Dell G15 5515 | |
| Gigabyte A5 X1 | |
| Asus TUF Dash F15 FX517ZC | |
| Average Intel Core i7-12650H (0.4584 - 0.515, n=14) | |
| MSI GE67 HX 12UGS | |
| Acer Nitro 5 AN515-58-72QR | |
| MSI Raider GE66 12UHS | |
| MSI Vector GP66 12UGS | |
* ... smaller is better
AIDA64: FP32 Ray-Trace | FPU Julia | CPU SHA3 | CPU Queen | FPU SinJulia | FPU Mandel | CPU AES | CPU ZLib | FP64 Ray-Trace | CPU PhotoWorxx
| Performance rating | |
| Asus TUF Dash F15 FX517ZR | |
| MSI Bravo 15 B5DD-010US | |
| Average Intel Core i7-12650H | |
| Gigabyte G5 GD | |
| Dell G15 5510 | |
| Asus TUF Dash F15 FX517ZC | |
| Lenovo Ideapad Gaming 3 15IHU-82K1002RGE | |
| AIDA64 / FP32 Ray-Trace | |
| Asus TUF Dash F15 FX517ZR | |
| Average Intel Core i7-12650H (5422 - 15620, n=14) | |
| MSI Bravo 15 B5DD-010US | |
| Gigabyte G5 GD | |
| Dell G15 5510 | |
| Lenovo Ideapad Gaming 3 15IHU-82K1002RGE | |
| Asus TUF Dash F15 FX517ZC | |
| AIDA64 / FPU Julia | |
| Asus TUF Dash F15 FX517ZR | |
| MSI Bravo 15 B5DD-010US | |
| Average Intel Core i7-12650H (26386 - 76434, n=14) | |
| Dell G15 5510 | |
| Gigabyte G5 GD | |
| Lenovo Ideapad Gaming 3 15IHU-82K1002RGE | |
| Asus TUF Dash F15 FX517ZC | |
| AIDA64 / CPU SHA3 | |
| Asus TUF Dash F15 FX517ZR | |
| Gigabyte G5 GD | |
| Average Intel Core i7-12650H (1479 - 3244, n=14) | |
| MSI Bravo 15 B5DD-010US | |
| Lenovo Ideapad Gaming 3 15IHU-82K1002RGE | |
| Dell G15 5510 | |
| Asus TUF Dash F15 FX517ZC | |
| AIDA64 / CPU Queen | |
| Asus TUF Dash F15 FX517ZR | |
| Average Intel Core i7-12650H (59278 - 89537, n=14) | |
| MSI Bravo 15 B5DD-010US | |
| Asus TUF Dash F15 FX517ZC | |
| Dell G15 5510 | |
| Gigabyte G5 GD | |
| Lenovo Ideapad Gaming 3 15IHU-82K1002RGE | |
| AIDA64 / FPU SinJulia | |
| MSI Bravo 15 B5DD-010US | |
| Asus TUF Dash F15 FX517ZR | |
| Dell G15 5510 | |
| Average Intel Core i7-12650H (4690 - 8726, n=14) | |
| Gigabyte G5 GD | |
| Asus TUF Dash F15 FX517ZC | |
| Lenovo Ideapad Gaming 3 15IHU-82K1002RGE | |
| AIDA64 / FPU Mandel | |
| MSI Bravo 15 B5DD-010US | |
| Asus TUF Dash F15 FX517ZR | |
| Average Intel Core i7-12650H (15001 - 37738, n=14) | |
| Gigabyte G5 GD | |
| Dell G15 5510 | |
| Lenovo Ideapad Gaming 3 15IHU-82K1002RGE | |
| Asus TUF Dash F15 FX517ZC | |
| AIDA64 / CPU AES | |
| Gigabyte G5 GD | |
| MSI Bravo 15 B5DD-010US | |
| Lenovo Ideapad Gaming 3 15IHU-82K1002RGE | |
| Asus TUF Dash F15 FX517ZR | |
| Average Intel Core i7-12650H (32702 - 92530, n=14) | |
| Asus TUF Dash F15 FX517ZC | |
| Dell G15 5510 | |
| AIDA64 / CPU ZLib | |
| Asus TUF Dash F15 FX517ZR | |
| Average Intel Core i7-12650H (443 - 891, n=14) | |
| Asus TUF Dash F15 FX517ZC | |
| MSI Bravo 15 B5DD-010US | |
| Gigabyte G5 GD | |
| Dell G15 5510 | |
| Lenovo Ideapad Gaming 3 15IHU-82K1002RGE | |
| AIDA64 / FP64 Ray-Trace | |
| Asus TUF Dash F15 FX517ZR | |
| Average Intel Core i7-12650H (3096 - 8448, n=14) | |
| Gigabyte G5 GD | |
| MSI Bravo 15 B5DD-010US | |
| Dell G15 5510 | |
| Lenovo Ideapad Gaming 3 15IHU-82K1002RGE | |
| Asus TUF Dash F15 FX517ZC | |
| AIDA64 / CPU PhotoWorxx | |
| Asus TUF Dash F15 FX517ZR | |
| Average Intel Core i7-12650H (22046 - 44164, n=14) | |
| Asus TUF Dash F15 FX517ZC | |
| Gigabyte G5 GD | |
| MSI Bravo 15 B5DD-010US | |
| Dell G15 5510 | |
| Lenovo Ideapad Gaming 3 15IHU-82K1002RGE | |
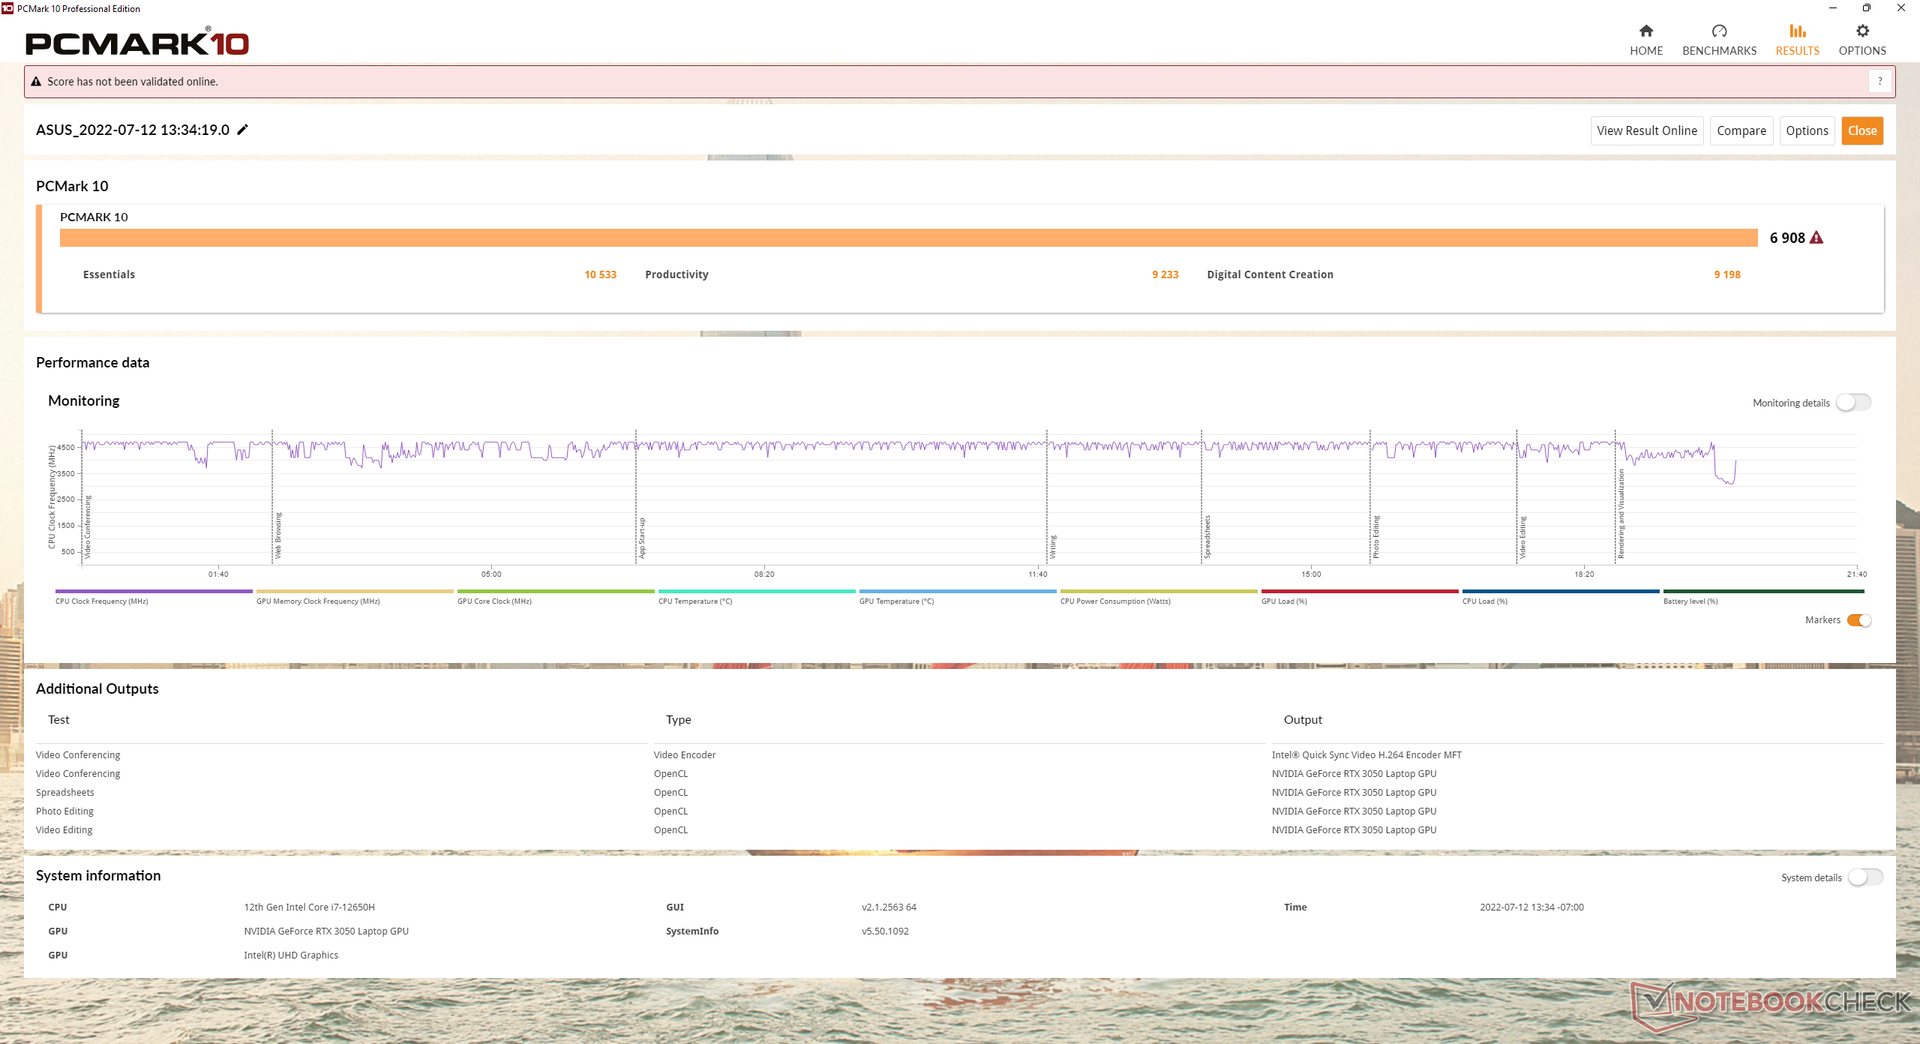
系统性能
CrossMark: Overall | Productivity | Creativity | Responsiveness
| PCMark 10 / Score | |
| Asus TUF Dash F15 FX517ZC | |
| Average Intel Core i7-12650H, NVIDIA GeForce RTX 3050 4GB Laptop GPU (n=1) | |
| Asus TUF Dash F15 FX517ZR | |
| MSI Bravo 15 B5DD-010US | |
| Gigabyte G5 GD | |
| Lenovo Ideapad Gaming 3 15IHU-82K1002RGE | |
| Dell G15 5510 | |
| PCMark 10 / Essentials | |
| Asus TUF Dash F15 FX517ZC | |
| Average Intel Core i7-12650H, NVIDIA GeForce RTX 3050 4GB Laptop GPU (n=1) | |
| Asus TUF Dash F15 FX517ZR | |
| MSI Bravo 15 B5DD-010US | |
| Gigabyte G5 GD | |
| Lenovo Ideapad Gaming 3 15IHU-82K1002RGE | |
| Dell G15 5510 | |
| PCMark 10 / Productivity | |
| Asus TUF Dash F15 FX517ZR | |
| Asus TUF Dash F15 FX517ZC | |
| Average Intel Core i7-12650H, NVIDIA GeForce RTX 3050 4GB Laptop GPU (n=1) | |
| Lenovo Ideapad Gaming 3 15IHU-82K1002RGE | |
| MSI Bravo 15 B5DD-010US | |
| Gigabyte G5 GD | |
| Dell G15 5510 | |
| PCMark 10 / Digital Content Creation | |
| Asus TUF Dash F15 FX517ZC | |
| Average Intel Core i7-12650H, NVIDIA GeForce RTX 3050 4GB Laptop GPU (n=1) | |
| Asus TUF Dash F15 FX517ZR | |
| MSI Bravo 15 B5DD-010US | |
| Gigabyte G5 GD | |
| Dell G15 5510 | |
| Lenovo Ideapad Gaming 3 15IHU-82K1002RGE | |
| CrossMark / Overall | |
| Asus TUF Dash F15 FX517ZR | |
| Asus TUF Dash F15 FX517ZC | |
| Average Intel Core i7-12650H, NVIDIA GeForce RTX 3050 4GB Laptop GPU (n=1) | |
| Lenovo Ideapad Gaming 3 15IHU-82K1002RGE | |
| CrossMark / Productivity | |
| Asus TUF Dash F15 FX517ZC | |
| Average Intel Core i7-12650H, NVIDIA GeForce RTX 3050 4GB Laptop GPU (n=1) | |
| Asus TUF Dash F15 FX517ZR | |
| Lenovo Ideapad Gaming 3 15IHU-82K1002RGE | |
| CrossMark / Creativity | |
| Asus TUF Dash F15 FX517ZR | |
| Asus TUF Dash F15 FX517ZC | |
| Average Intel Core i7-12650H, NVIDIA GeForce RTX 3050 4GB Laptop GPU (n=1) | |
| Lenovo Ideapad Gaming 3 15IHU-82K1002RGE | |
| CrossMark / Responsiveness | |
| Asus TUF Dash F15 FX517ZC | |
| Average Intel Core i7-12650H, NVIDIA GeForce RTX 3050 4GB Laptop GPU (n=1) | |
| Asus TUF Dash F15 FX517ZR | |
| Lenovo Ideapad Gaming 3 15IHU-82K1002RGE | |
| PCMark 10 Score | 6908 points | |
Help | ||
| AIDA64 / Memory Copy | |
| Asus TUF Dash F15 FX517ZR | |
| Average Intel Core i7-12650H (43261 - 69735, n=14) | |
| Asus TUF Dash F15 FX517ZC | |
| Gigabyte G5 GD | |
| MSI Bravo 15 B5DD-010US | |
| Dell G15 5510 | |
| Lenovo Ideapad Gaming 3 15IHU-82K1002RGE | |
| AIDA64 / Memory Read | |
| Asus TUF Dash F15 FX517ZR | |
| Average Intel Core i7-12650H (47313 - 67412, n=14) | |
| Asus TUF Dash F15 FX517ZC | |
| Gigabyte G5 GD | |
| MSI Bravo 15 B5DD-010US | |
| Dell G15 5510 | |
| Lenovo Ideapad Gaming 3 15IHU-82K1002RGE | |
| AIDA64 / Memory Write | |
| Asus TUF Dash F15 FX517ZR | |
| Average Intel Core i7-12650H (45617 - 59361, n=14) | |
| Asus TUF Dash F15 FX517ZC | |
| Gigabyte G5 GD | |
| Dell G15 5510 | |
| MSI Bravo 15 B5DD-010US | |
| Lenovo Ideapad Gaming 3 15IHU-82K1002RGE | |
| AIDA64 / Memory Latency | |
| Asus TUF Dash F15 FX517ZR | |
| Gigabyte G5 GD | |
| Lenovo Ideapad Gaming 3 15IHU-82K1002RGE | |
| Average Intel Core i7-12650H (71.6 - 103.9, n=14) | |
| Dell G15 5510 | |
| MSI Bravo 15 B5DD-010US | |
| Asus TUF Dash F15 FX517ZC | |
* ... smaller is better
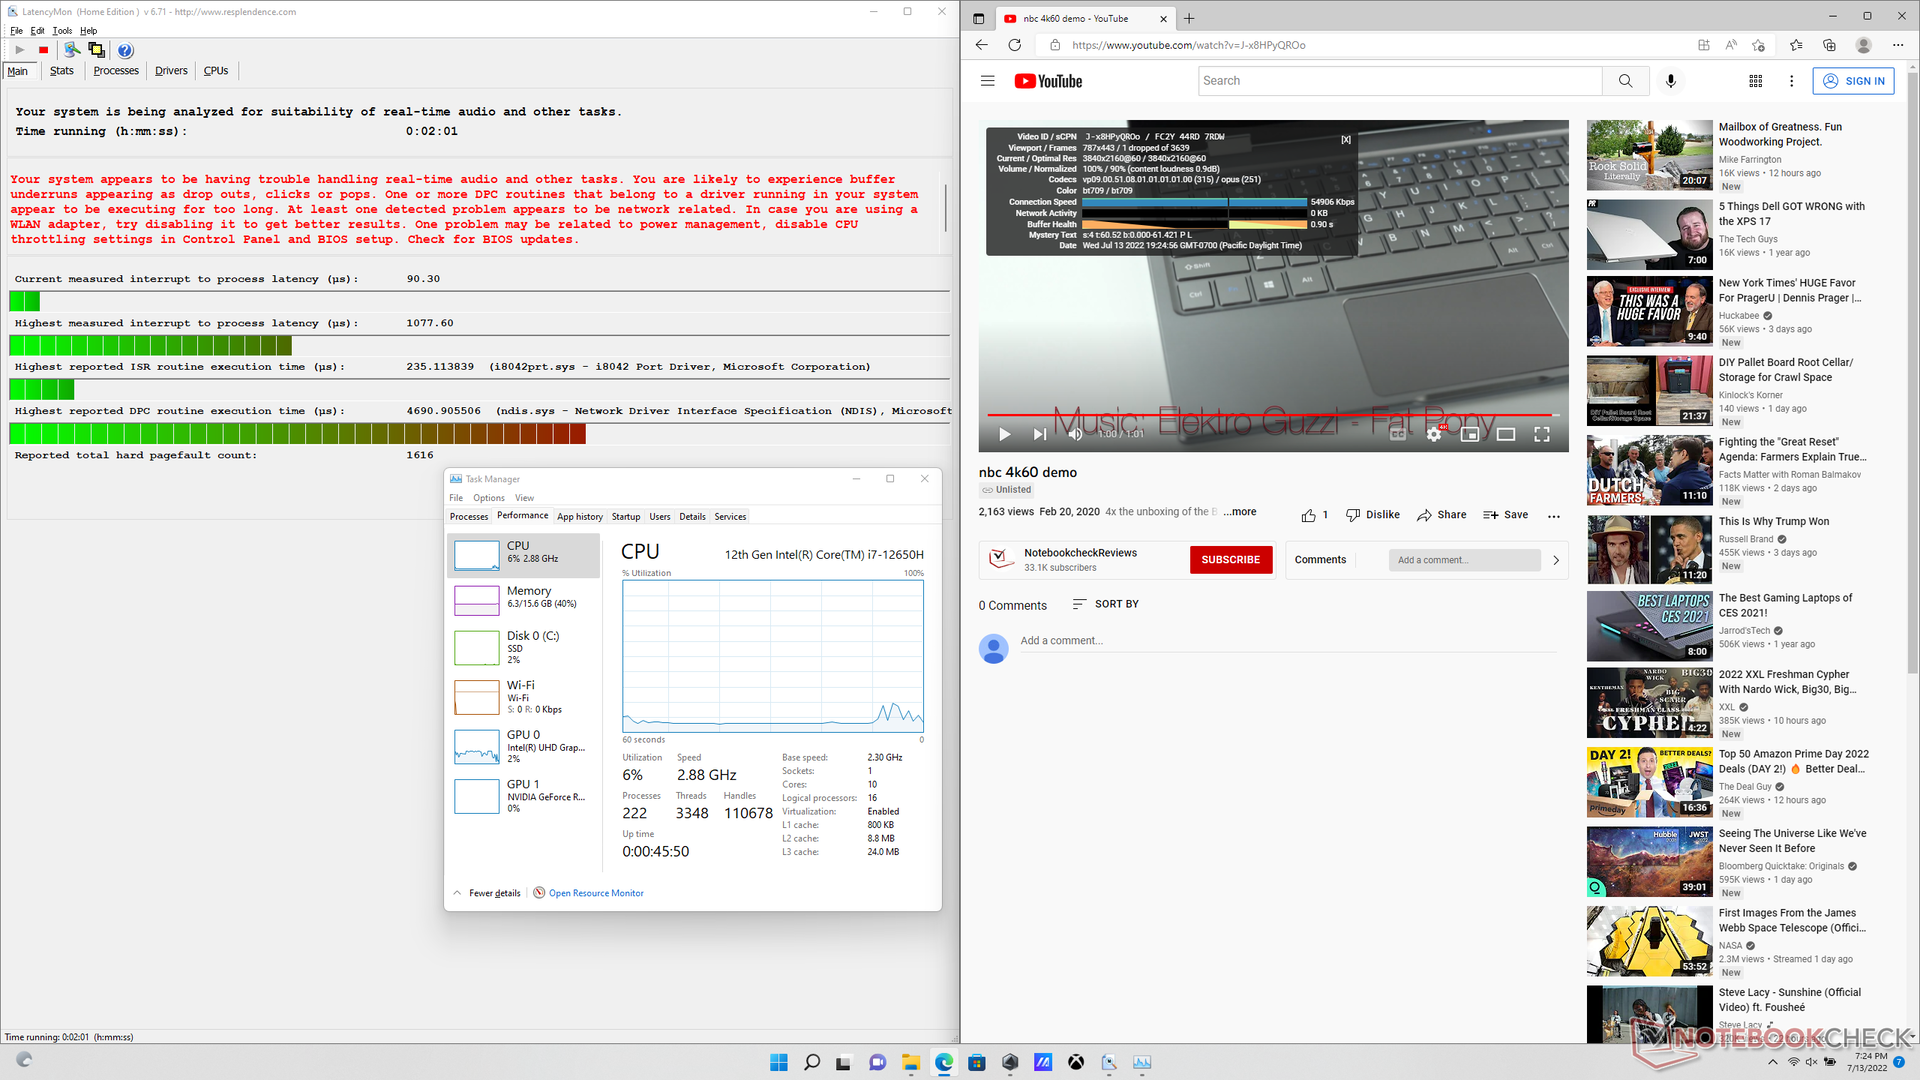
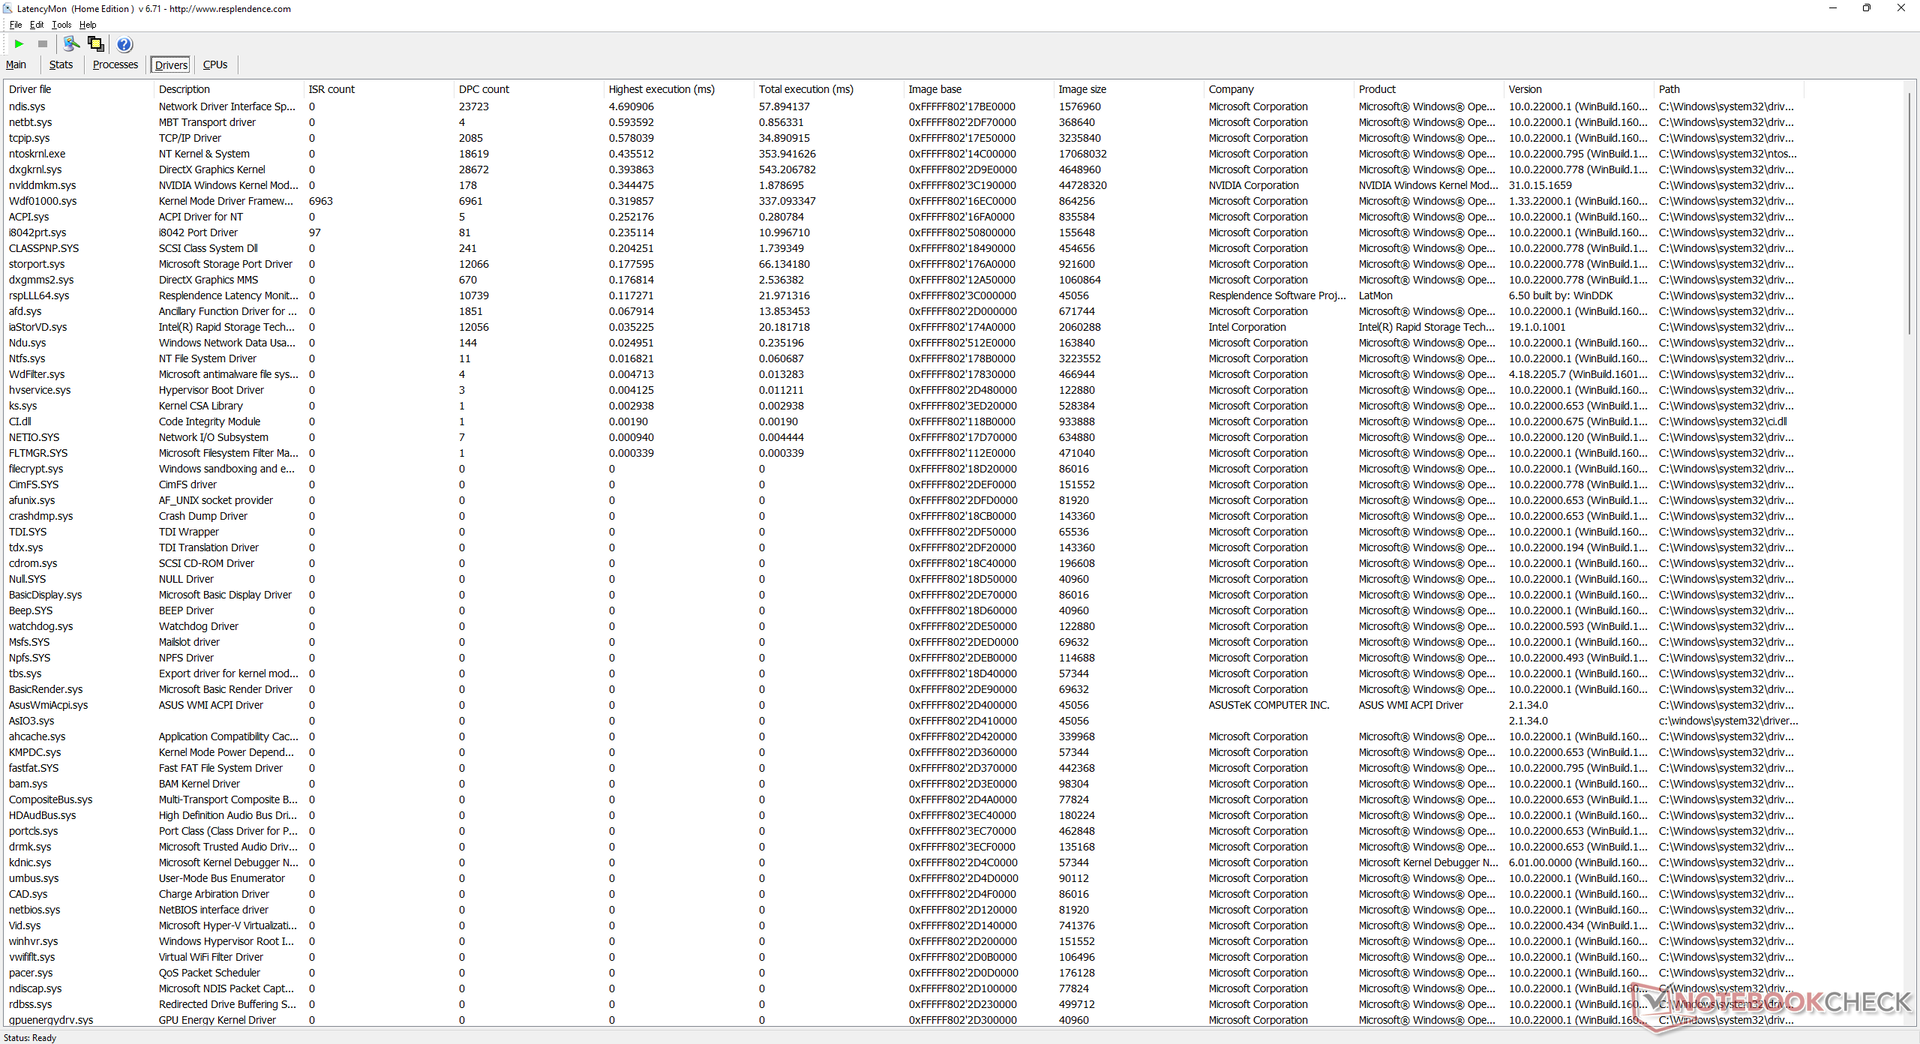
DPC延时
我们在主页上打开多个浏览器标签时遇到了DPC问题。在60FPS下的4K视频播放是完美的,在我们长达1分钟的视频中只有一个掉帧。
| DPC Latencies / LatencyMon - interrupt to process latency (max), Web, Youtube, Prime95 | |
| Dell G15 5510 | |
| MSI Bravo 15 B5DD-010US | |
| Asus TUF Dash F15 FX517ZC | |
| Lenovo Ideapad Gaming 3 15IHU-82K1002RGE | |
| Asus TUF Dash F15 FX517ZR | |
| Gigabyte G5 GD | |
* ... smaller is better
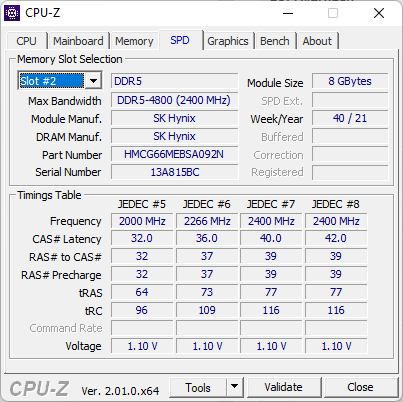
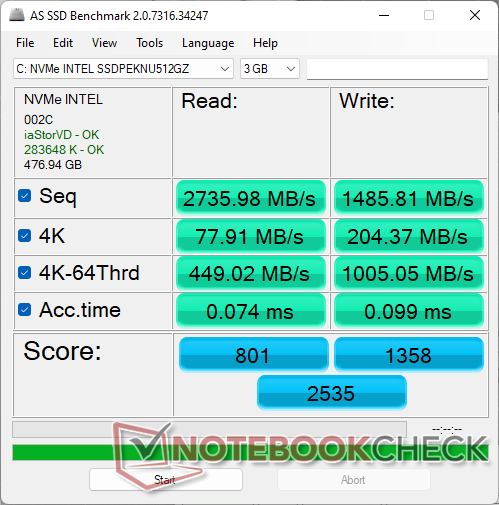
存储设备 - 支持多达2个M.2 SSDs
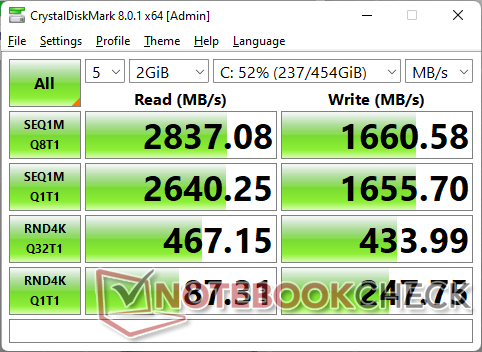
我们的测试设备配备了一个中档的 英特尔670p固态硬盘以获得约2300MB/s的持续连续读取率。该系统可以同时支持两个内部M.2 2280 SSD。

| Drive Performance rating - Percent | |
| Gigabyte G5 GD | |
| Asus TUF Dash F15 FX517ZR | |
| Dell G15 5510 | |
| Asus TUF Dash F15 FX517ZC | |
| Lenovo Ideapad Gaming 3 15IHU-82K1002RGE | |
| MSI Bravo 15 B5DD-010US | |
* ... smaller is better
Disk Throttling: DiskSpd Read Loop, Queue Depth 8
GPU性能
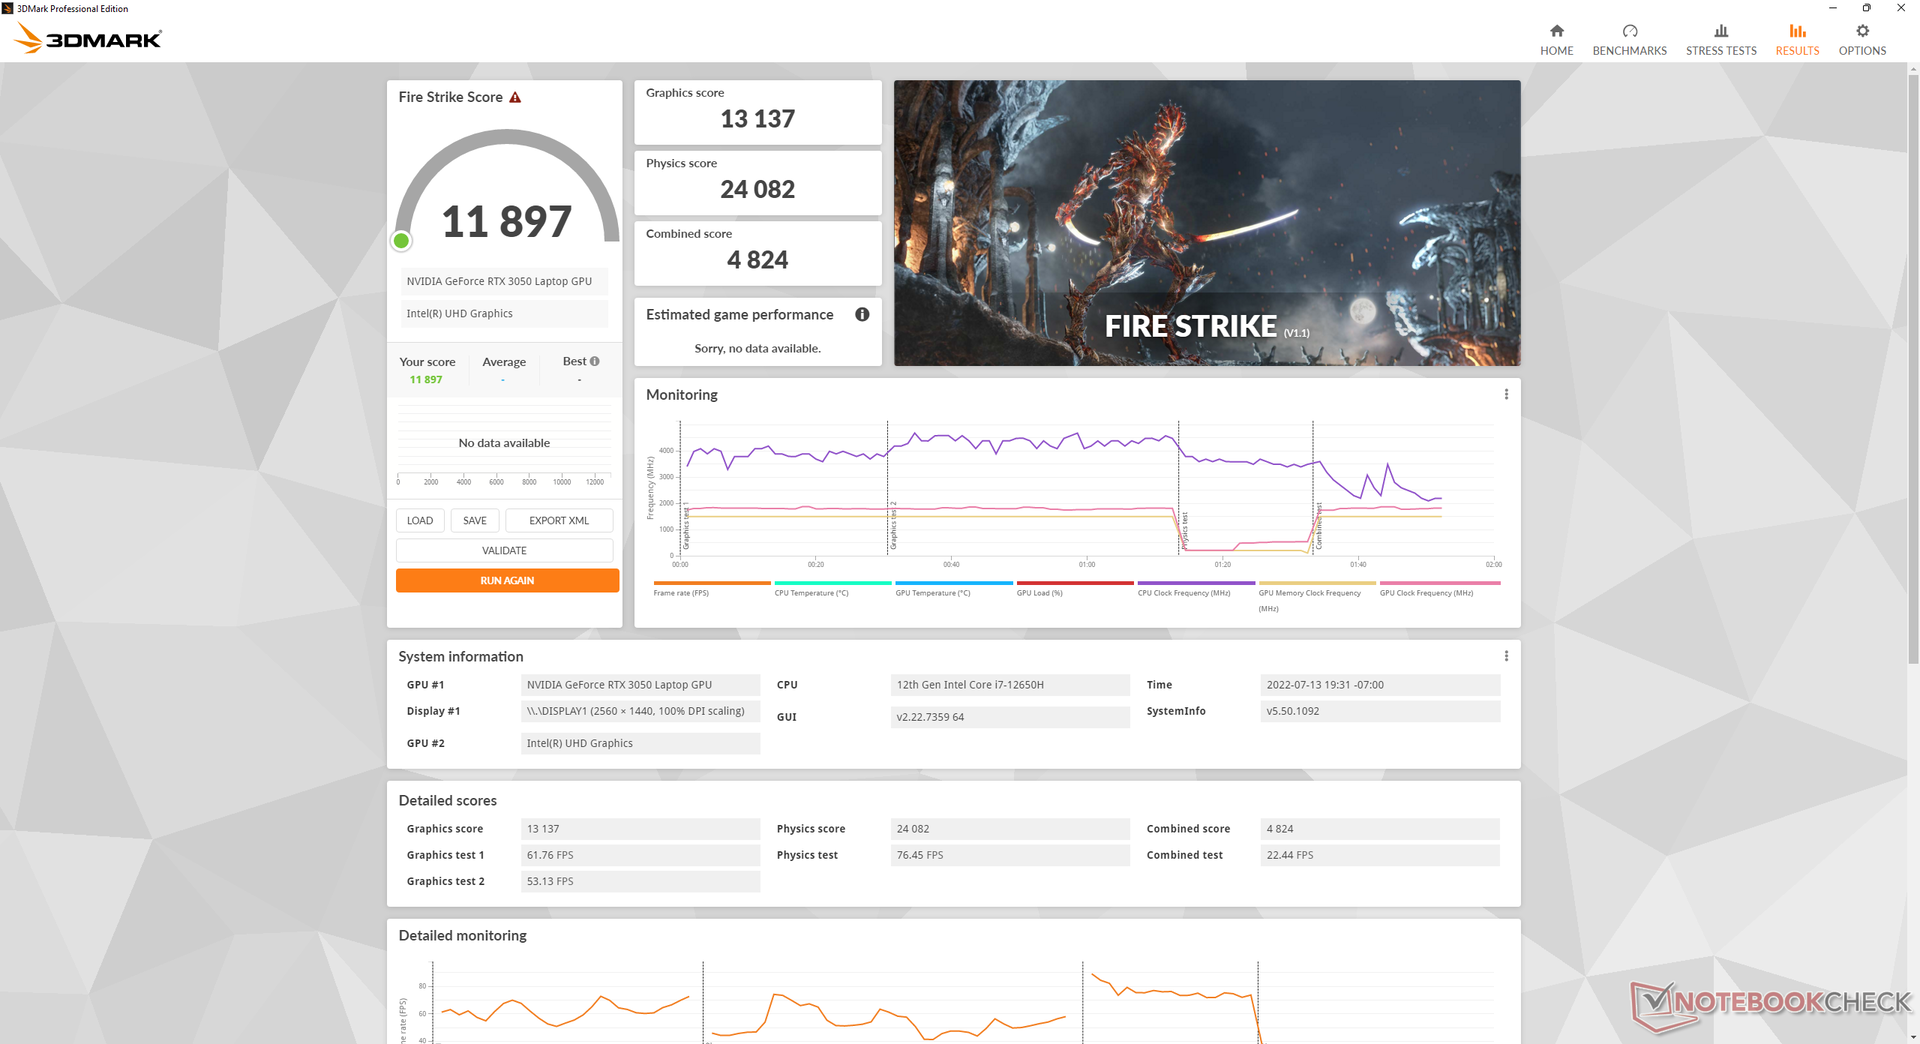
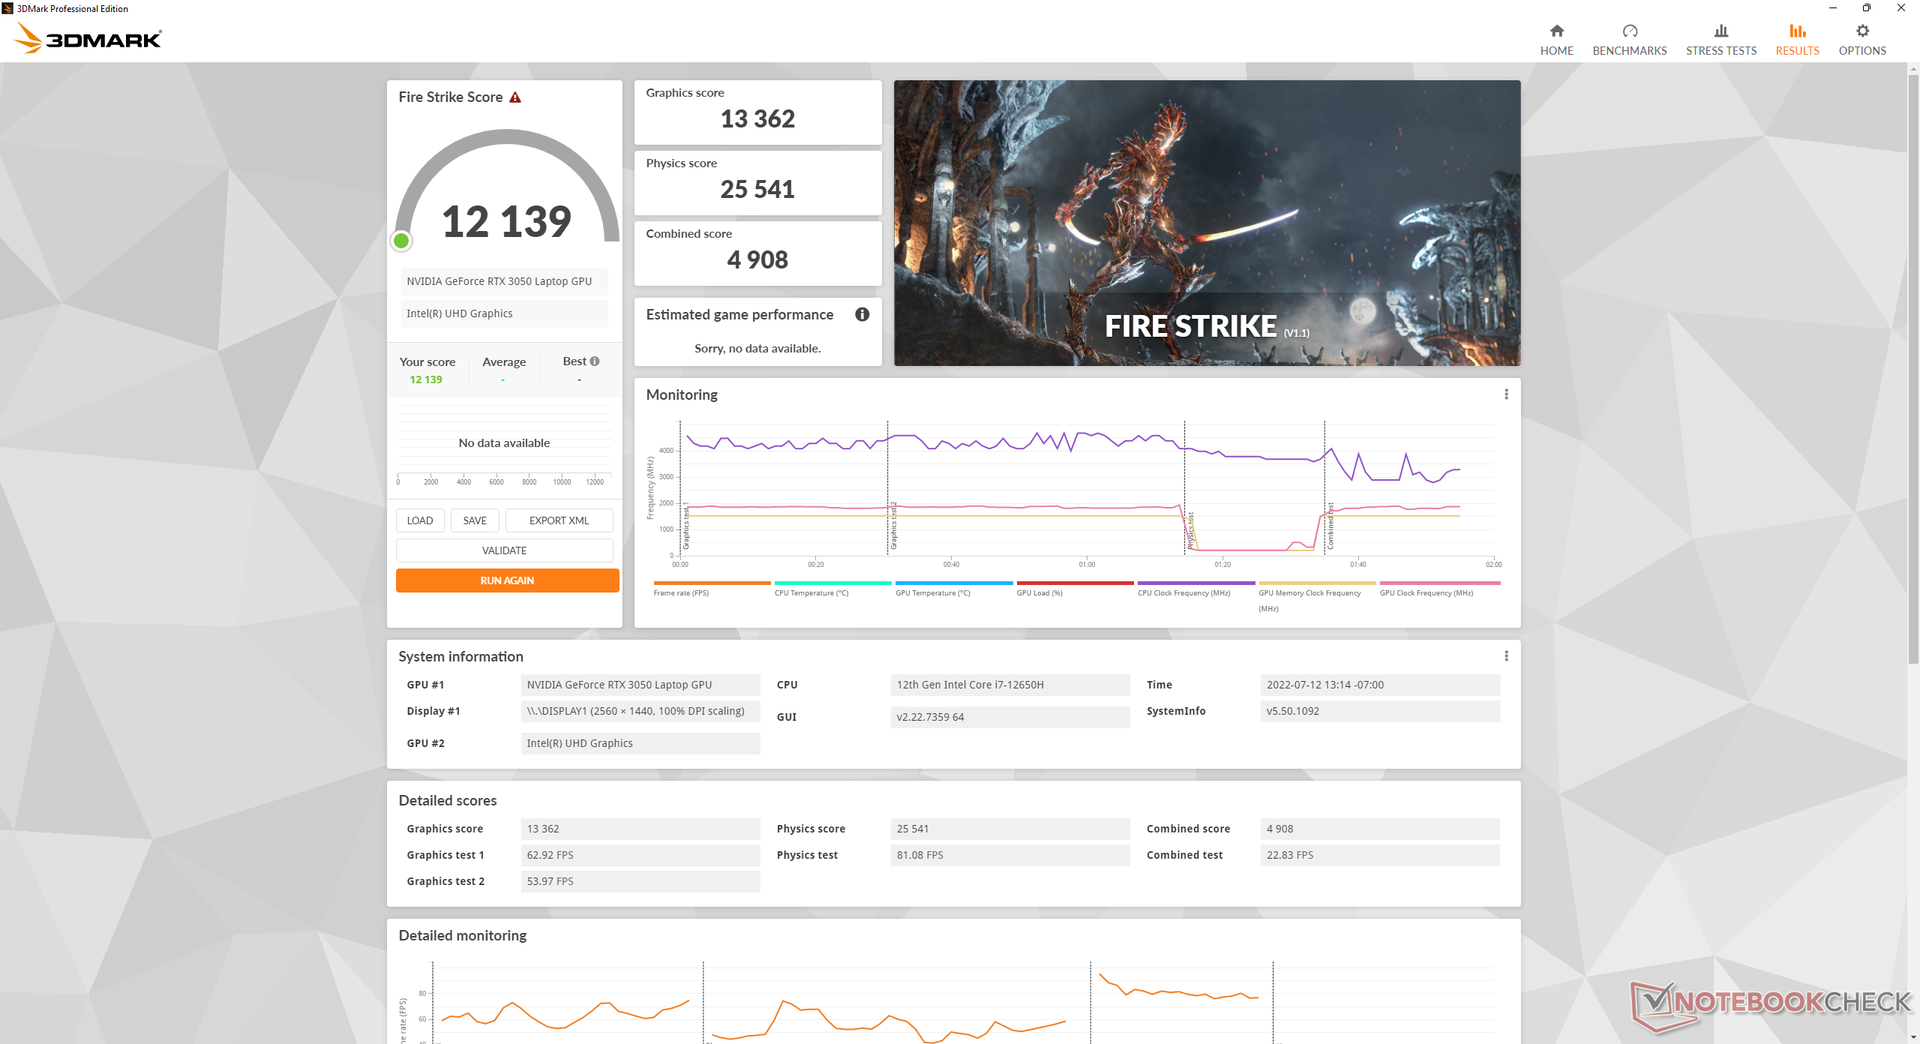
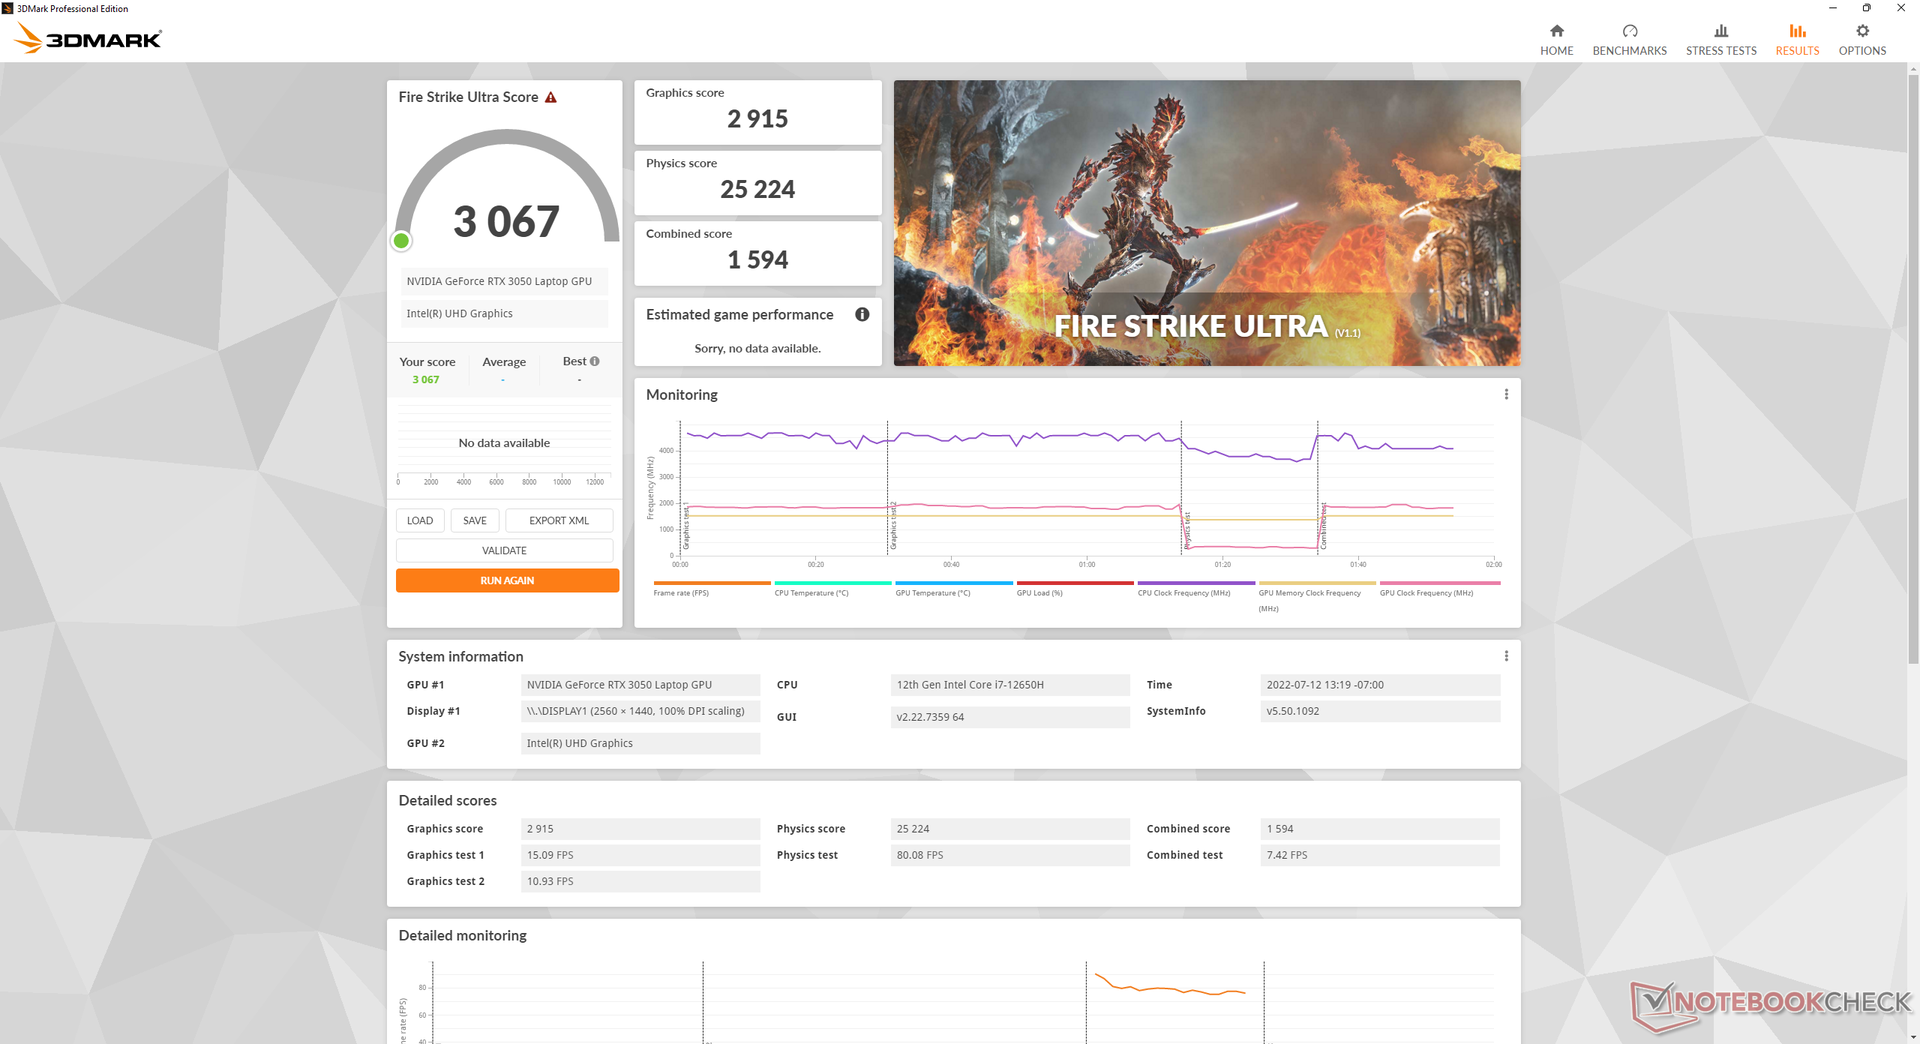
我们的75W GeForce RTX 3050的性能比105W的RTX 3050大约慢40%。 GeForce RTX 3070在FX517ZR中。当运行像《赛博朋克2077》这样的GPU重度游戏时,这种差异变得更加明显,我们的RTX 3050几乎落后50%。仍在使用旧版RTX 2060的笔记本玩家并没有错过什么,因为图灵GPU比RTX 3050快大约25%。
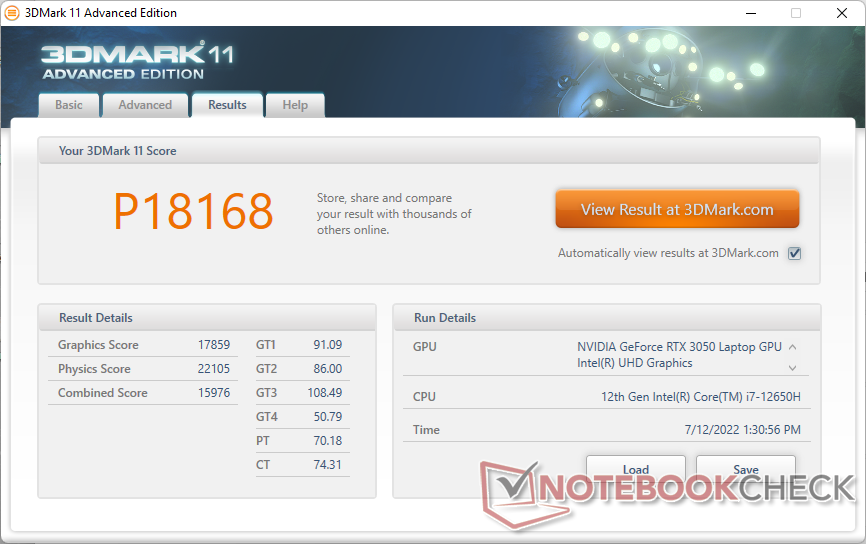
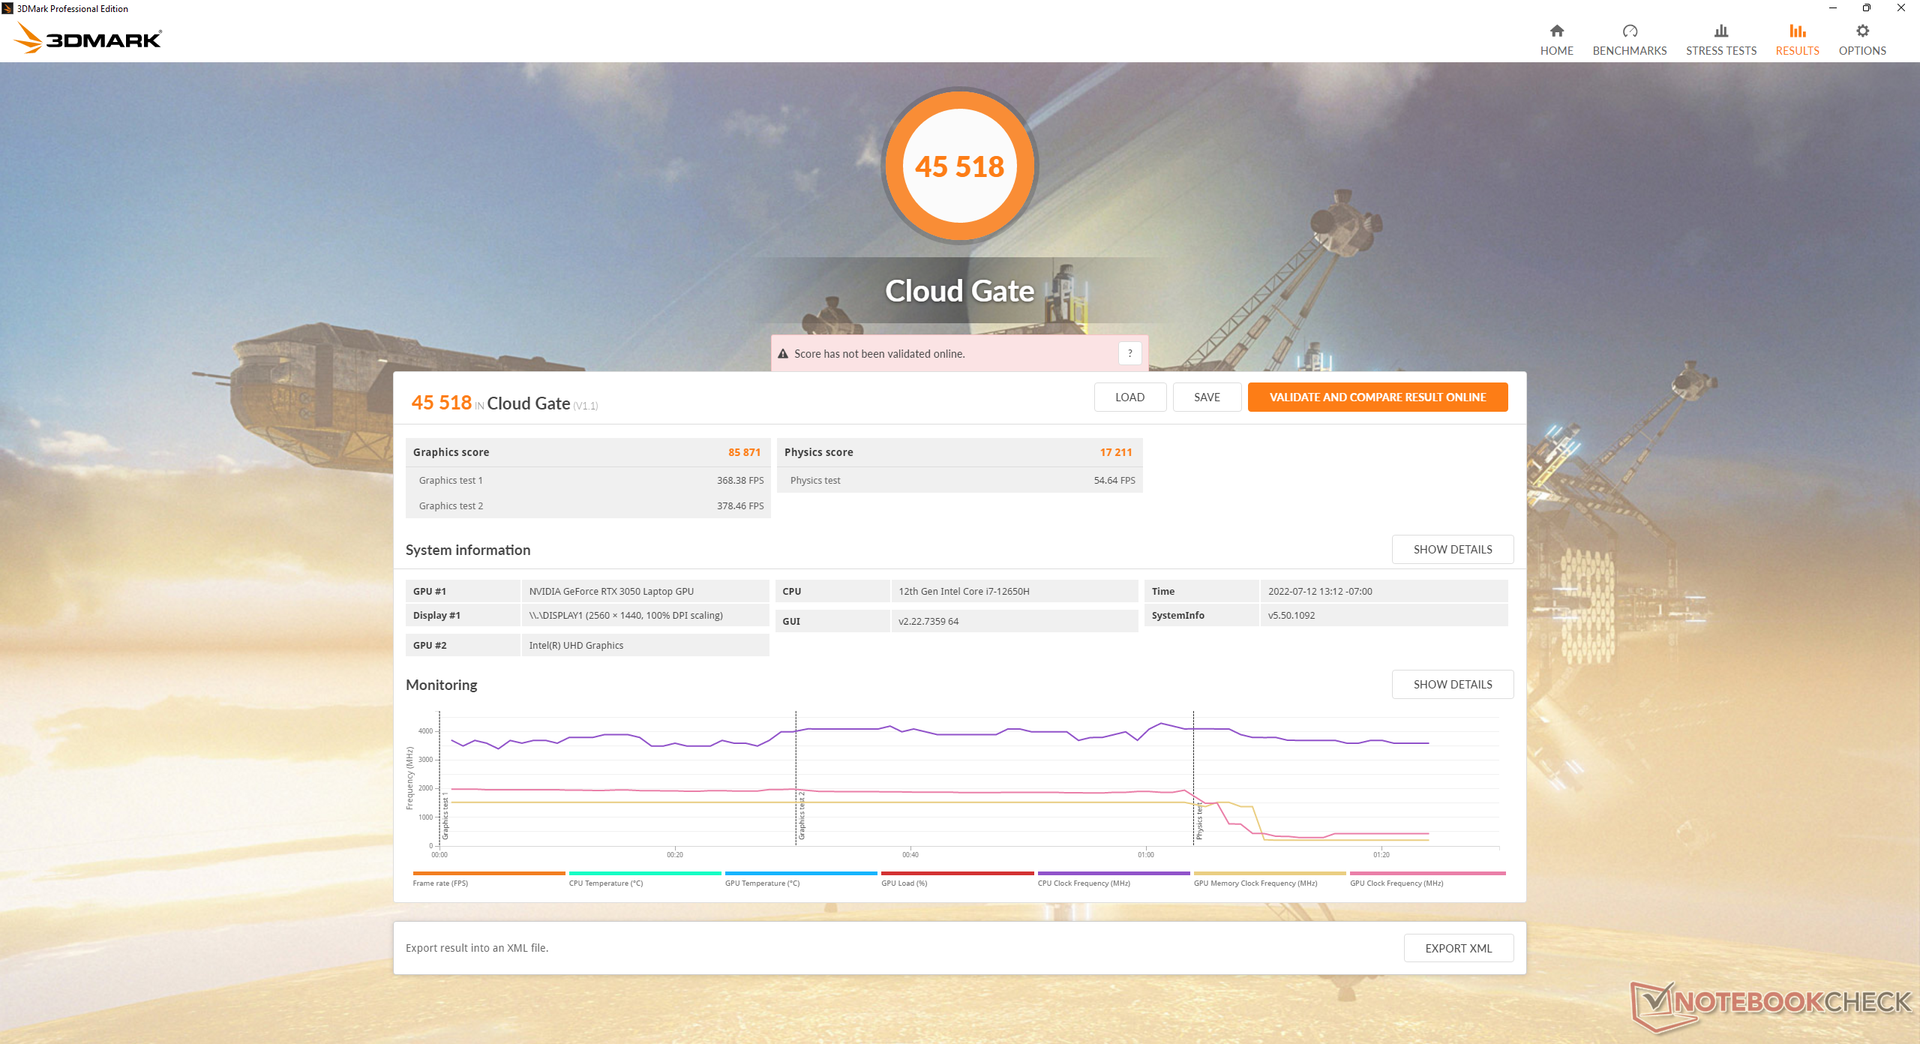
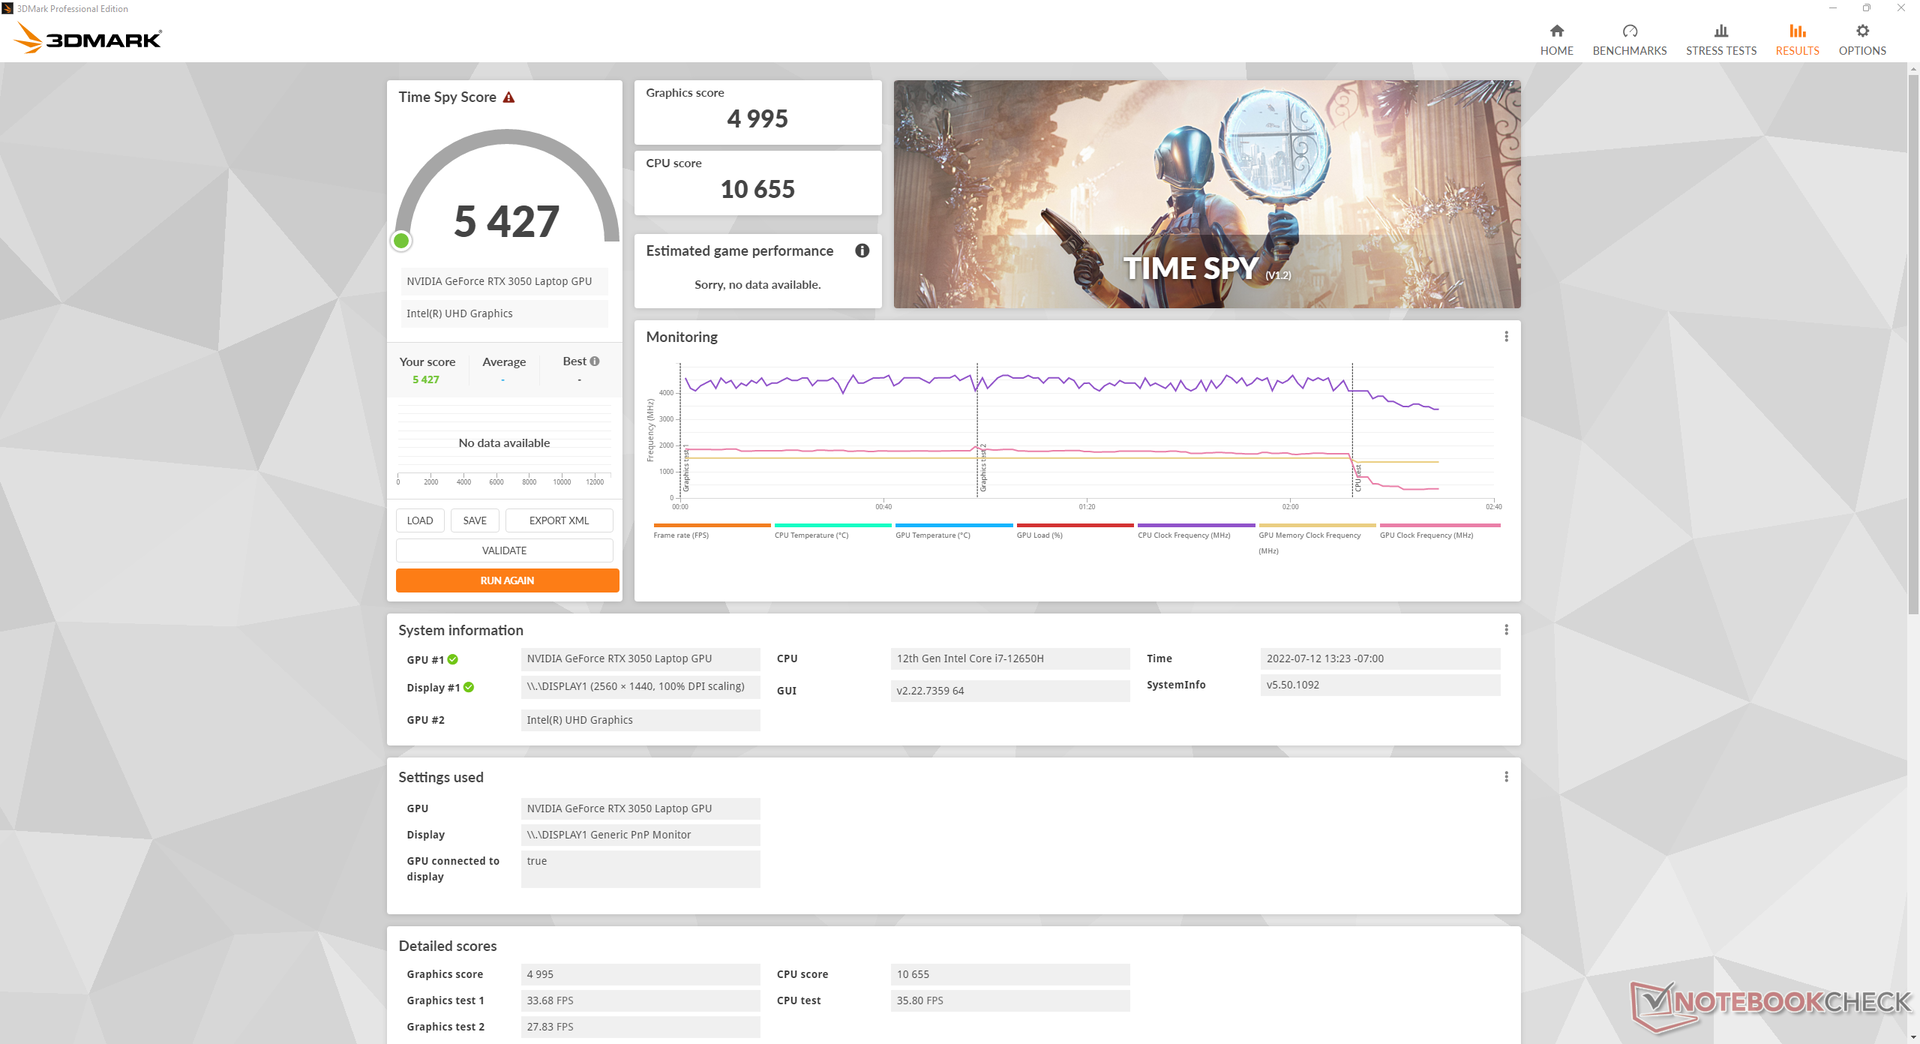
| 3DMark 11 Performance | 18168 points | |
| 3DMark Cloud Gate Standard Score | 45518 points | |
| 3DMark Fire Strike Score | 12139 points | |
| 3DMark Time Spy Score | 5427 points | |
Help | ||
Witcher 3 FPS Chart
| low | med. | high | ultra | |
|---|---|---|---|---|
| GTA V (2015) | 184 | 179 | 148.2 | 70.9 |
| The Witcher 3 (2015) | 282.1 | 171.6 | 98.7 | 51.9 |
| Dota 2 Reborn (2015) | 176.5 | 163.2 | 156.3 | 147.7 |
| Final Fantasy XV Benchmark (2018) | 143.4 | 74 | 51 | |
| X-Plane 11.11 (2018) | 148.1 | 129.9 | 103.1 | |
| Strange Brigade (2018) | 320 | 135.8 | 108.1 | 90.8 |
| Cyberpunk 2077 1.6 (2022) | 77.9 | 62.1 | 44 | 36.1 |
排放
系统噪音 - 游戏时超过50dB(A)
风扇噪音在很大程度上取决于Armoury Crate的电源配置文件设置。Windows、静音、平衡、涡轮和手动。如果只是简单的网络浏览或流媒体,我们强烈建议使用静音模式,否则内部风扇会相当响。例如,如果在平衡模式下,风扇会经常脉冲到32 dB(A),而沉默的背景是24 dB(A),仅仅是网络浏览。
在平衡模式和涡轮模式下玩游戏时,风扇噪音将分别稳定在48.7分贝(A)和53.4分贝(A)。我们下面的压力测试部分显示,只有在Turbo模式下才能获得更高的TDP和TGP,这意味着如果用户想获得笔记本的全部性能,就必须忍受更响亮的风扇。50多分贝(A)的范围高于大多数其他游戏笔记本电脑,包括戴尔G15 5510或联想Ideapad Gaming 3 15 ,每个都有相同的RTX 3050 GPU。
Noise level
| Idle |
| 24 / 24 / 32.3 dB(A) |
| Load |
| 43.7 / 53.6 dB(A) |
 | ||
30 dB silent 40 dB(A) audible 50 dB(A) loud |
||
min: | ||
| Asus TUF Dash F15 FX517ZC GeForce RTX 3050 4GB Laptop GPU, i7-12650H, Intel SSD 670p SSDPEKNU512GZ | Asus TUF Dash F15 FX517ZR GeForce RTX 3070 Laptop GPU, i7-12650H, Samsung PM991a MZVLQ1T0HBLB | Dell G15 5510 GeForce RTX 3050 4GB Laptop GPU, i5-10500H, SK Hynix BC711 HFM512GD3HX015N | MSI Bravo 15 B5DD-010US Radeon RX 5500M, R5 5600H, Kingston OM8PCP3512F-AB | Lenovo Ideapad Gaming 3 15IHU-82K1002RGE GeForce RTX 3050 Ti Laptop GPU, i5-11300H, Micron 2210 MTFDHBA512QFD | Gigabyte G5 GD GeForce RTX 3050 4GB Laptop GPU, i5-11400H, ESR512GTLG-E6GBTNB4 | |
|---|---|---|---|---|---|---|
| Noise | -6% | -1% | -2% | 4% | -9% | |
| off / environment * (dB) | 23.9 | 26 -9% | 26 -9% | 24.5 -3% | 23.9 -0% | 24 -0% |
| Idle Minimum * (dB) | 24 | 26 -8% | 26 -8% | 24.5 -2% | 23.9 -0% | 29 -21% |
| Idle Average * (dB) | 24 | 32 -33% | 27 -13% | 32.8 -37% | 26.8 -12% | 30 -25% |
| Idle Maximum * (dB) | 32.3 | 33 -2% | 33 -2% | 32.8 -2% | 26.8 17% | 32 1% |
| Load Average * (dB) | 43.7 | 48 -10% | 45 -3% | 34.5 21% | 43.5 -0% | 53 -21% |
| Witcher 3 ultra * (dB) | 53.4 | 47 12% | 45 16% | 42.5 20% | 43.5 19% | 52 3% |
| Load Maximum * (dB) | 53.6 | 49 9% | 47 12% | 58.5 -9% | 53.1 1% | 54 -1% |
* ... smaller is better
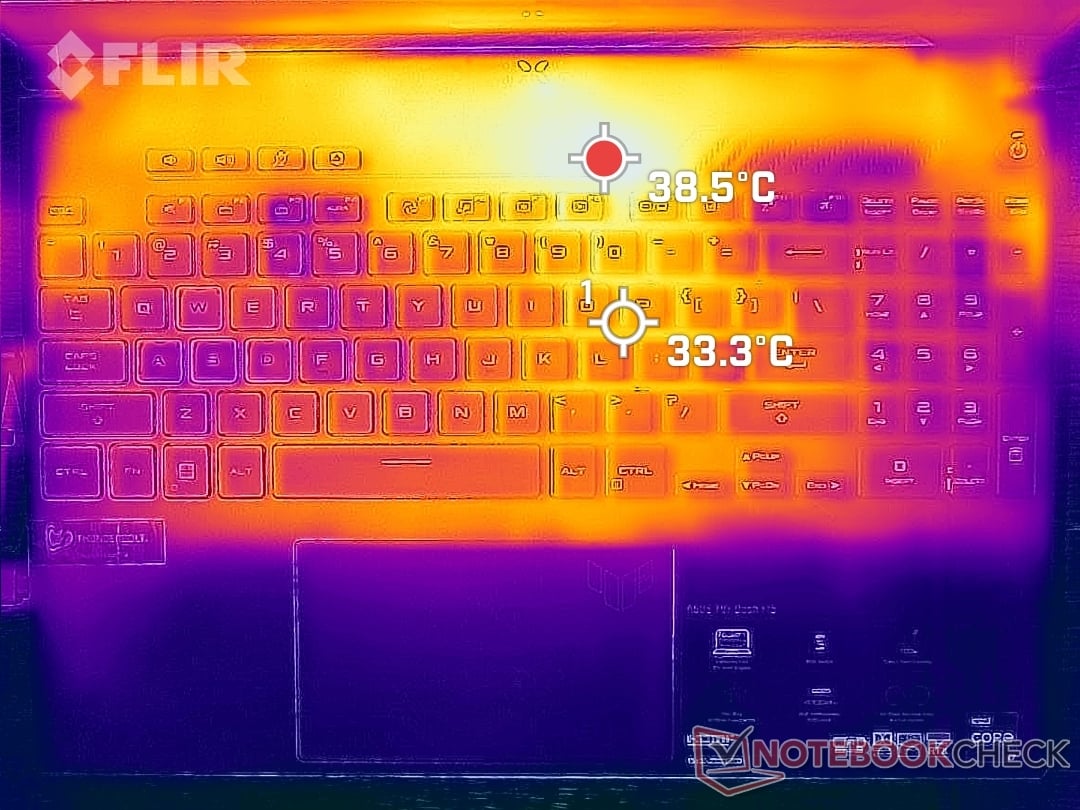
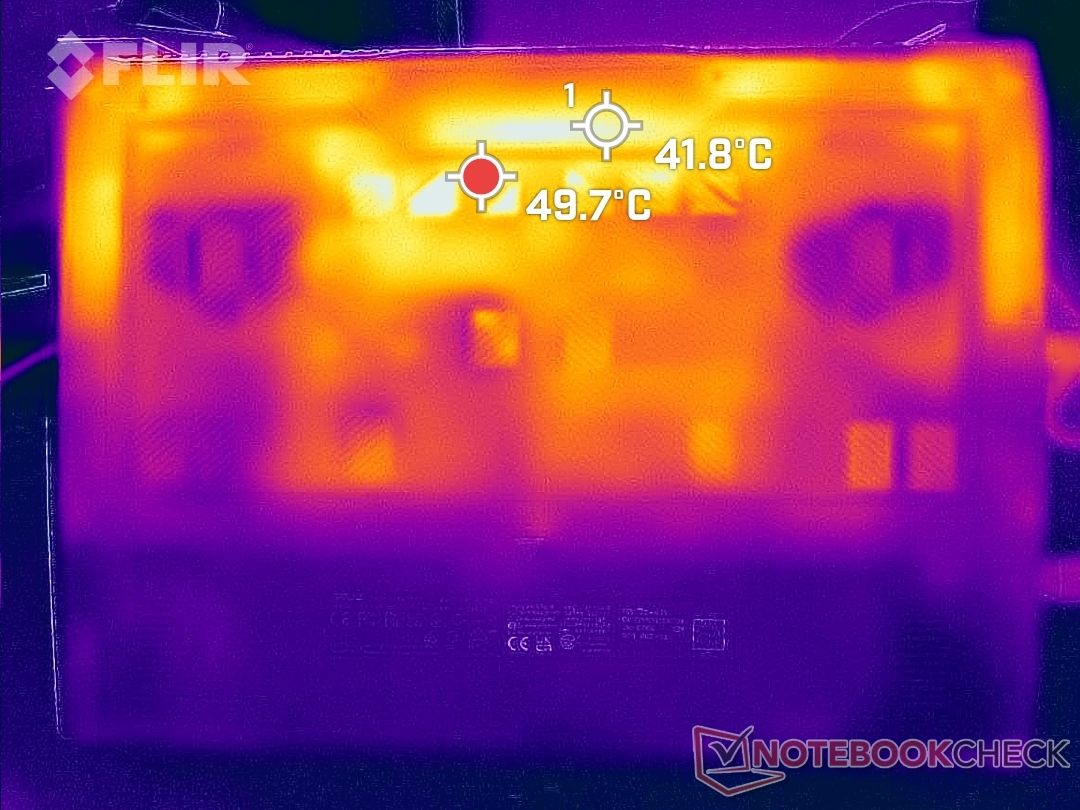
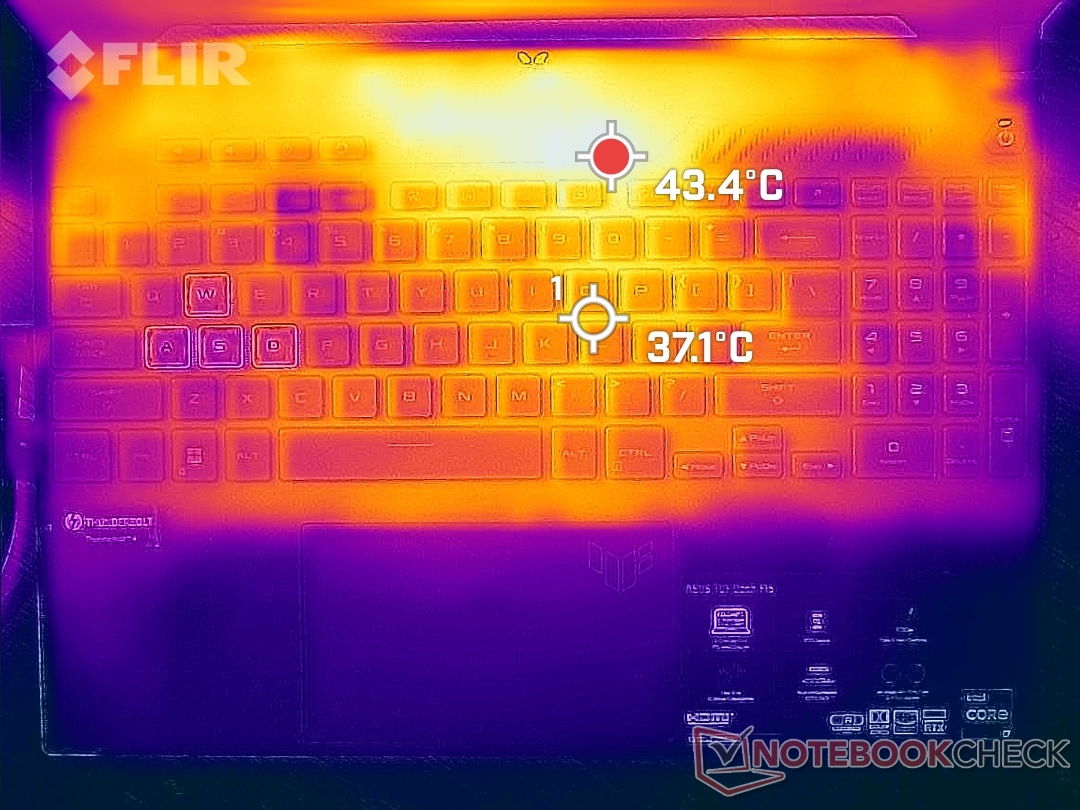
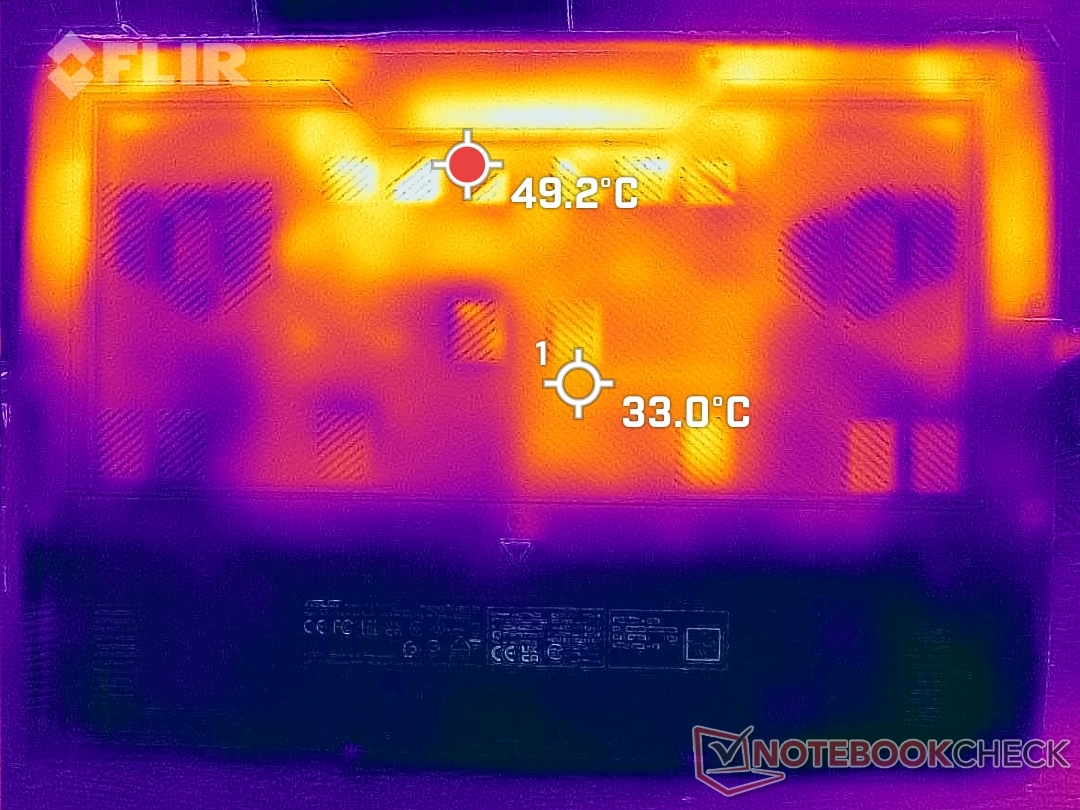
温度
在游戏时,键盘中心的表面温度可以达到33摄氏度到37摄氏度,这比我们观察到的更冷。 Acer Swift X 16配备相同的RTX 3050 GPU的温度要低几度以上。华硕的热点可以达到43摄氏度或更高,但值得庆幸的是,这个区域在第一排键盘按键上方,正如下面的温度图所示,用户在游戏时不太可能触摸到这个区域。
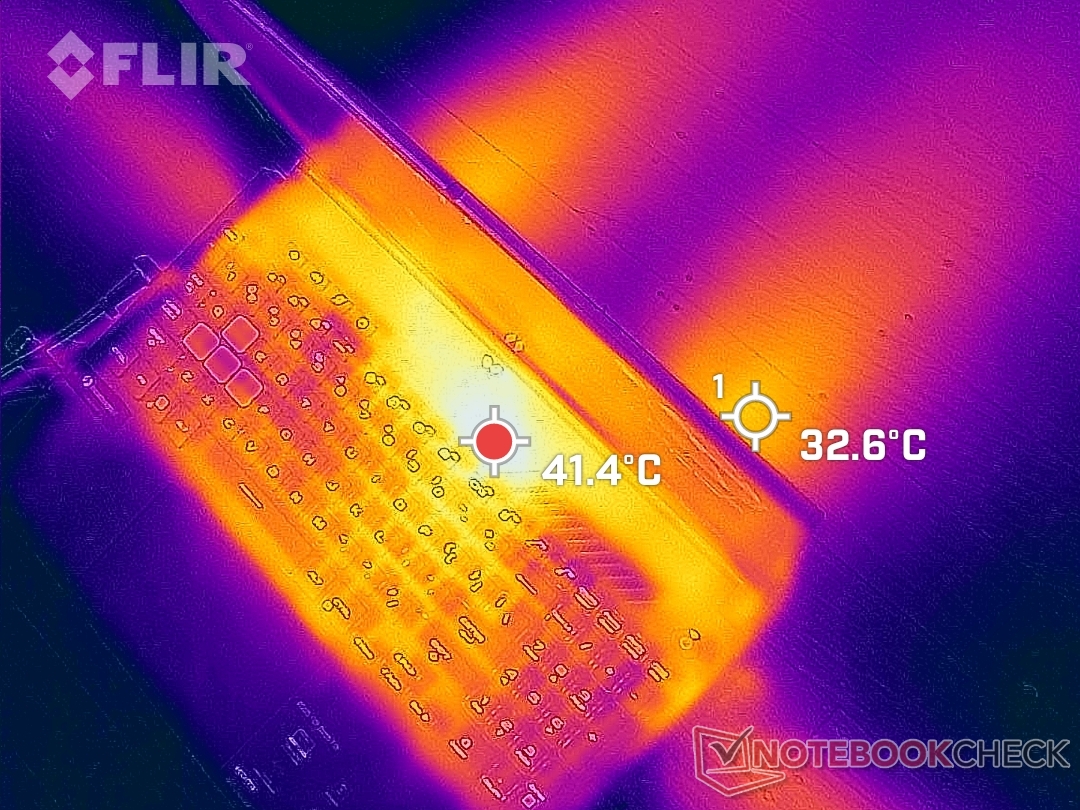
(±) The maximum temperature on the upper side is 43.4 °C / 110 F, compared to the average of 40.4 °C / 105 F, ranging from 21.2 to 68.8 °C for the class Gaming.
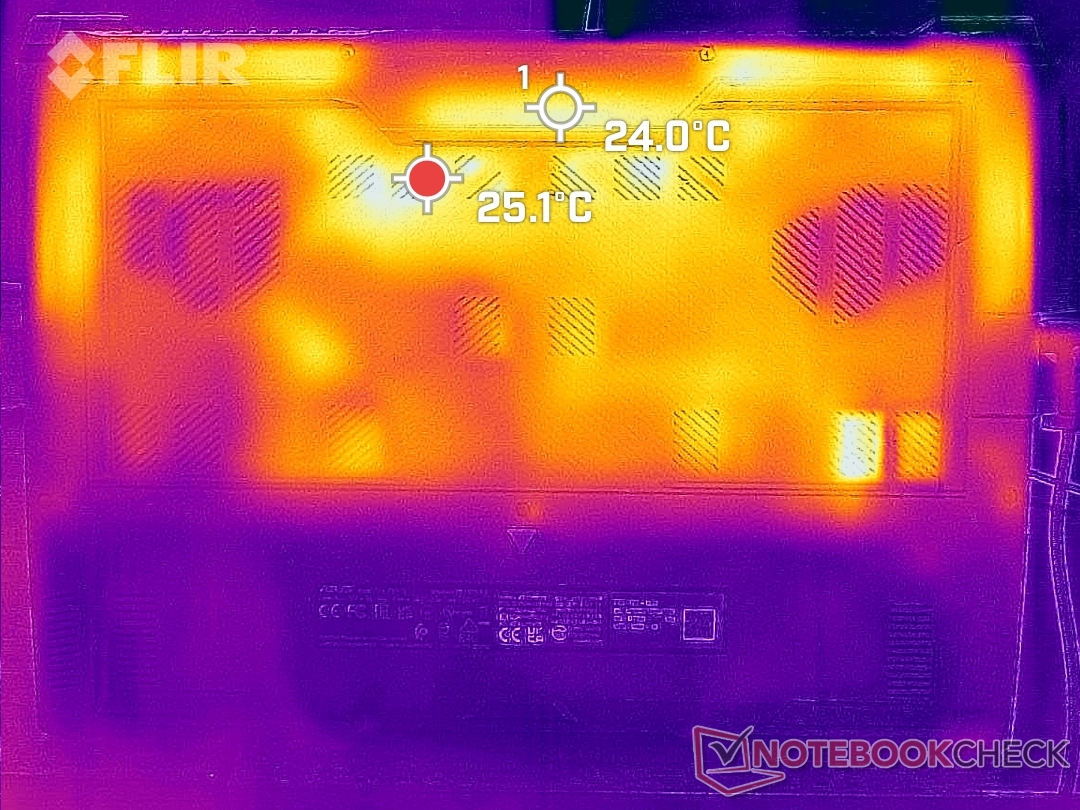
(±) The bottom heats up to a maximum of 44.4 °C / 112 F, compared to the average of 43.2 °C / 110 F
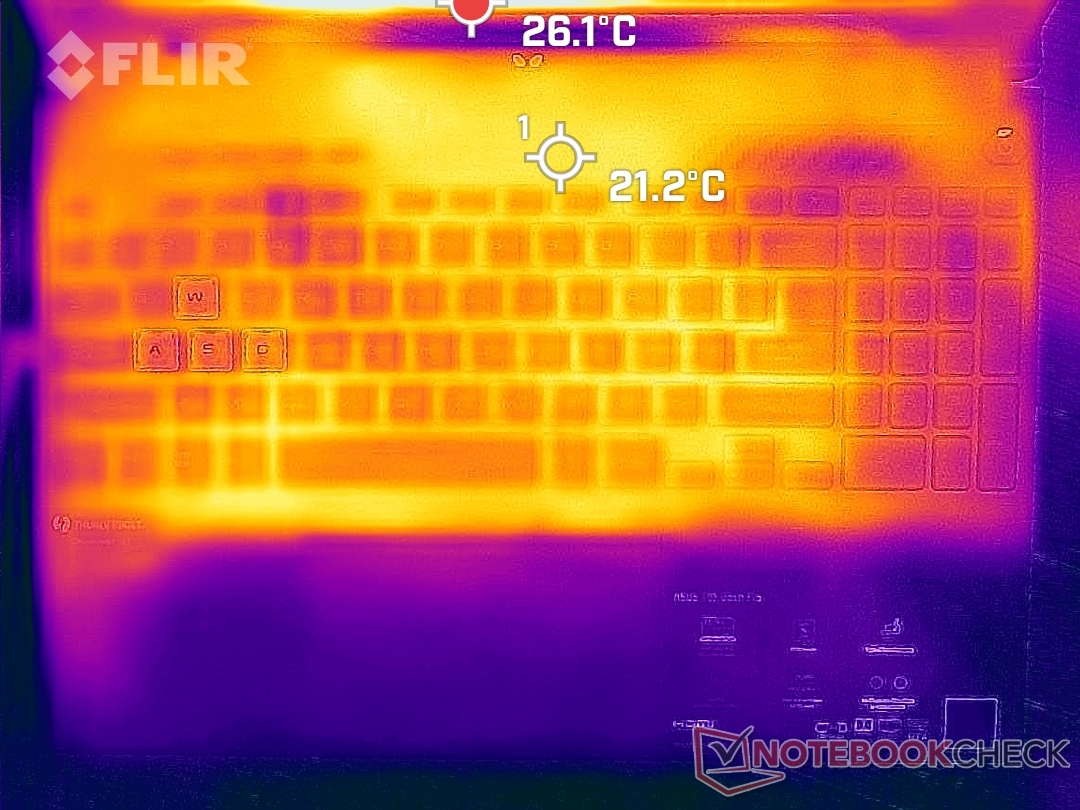
(+) In idle usage, the average temperature for the upper side is 19.2 °C / 67 F, compared to the device average of 33.9 °C / 93 F.
(+) Playing The Witcher 3, the average temperature for the upper side is 26.3 °C / 79 F, compared to the device average of 33.9 °C / 93 F.
(+) The palmrests and touchpad are cooler than skin temperature with a maximum of 19.4 °C / 66.9 F and are therefore cool to the touch.
(+) The average temperature of the palmrest area of similar devices was 28.8 °C / 83.8 F (+9.4 °C / 16.9 F).
| Asus TUF Dash F15 FX517ZC Intel Core i7-12650H, NVIDIA GeForce RTX 3050 4GB Laptop GPU | Asus TUF Dash F15 FX517ZR Intel Core i7-12650H, NVIDIA GeForce RTX 3070 Laptop GPU | Dell G15 5510 Intel Core i5-10500H, NVIDIA GeForce RTX 3050 4GB Laptop GPU | MSI Bravo 15 B5DD-010US AMD Ryzen 5 5600H, AMD Radeon RX 5500M | Lenovo Ideapad Gaming 3 15IHU-82K1002RGE Intel Core i5-11300H, NVIDIA GeForce RTX 3050 Ti Laptop GPU | Gigabyte G5 GD Intel Core i5-11400H, NVIDIA GeForce RTX 3050 4GB Laptop GPU | |
|---|---|---|---|---|---|---|
| Heat | -36% | -15% | -32% | -10% | -20% | |
| Maximum Upper Side * (°C) | 43.4 | 52 -20% | 52 -20% | 52.2 -20% | 43.2 -0% | 45 -4% |
| Maximum Bottom * (°C) | 44.4 | 52 -17% | 49 -10% | 48.6 -9% | 47.9 -8% | 50 -13% |
| Idle Upper Side * (°C) | 21.2 | 33 -56% | 26 -23% | 38 -79% | 24.9 -17% | 28 -32% |
| Idle Bottom * (°C) | 24 | 36 -50% | 26 -8% | 28.4 -18% | 27 -13% | 31 -29% |
* ... smaller is better
压力测试
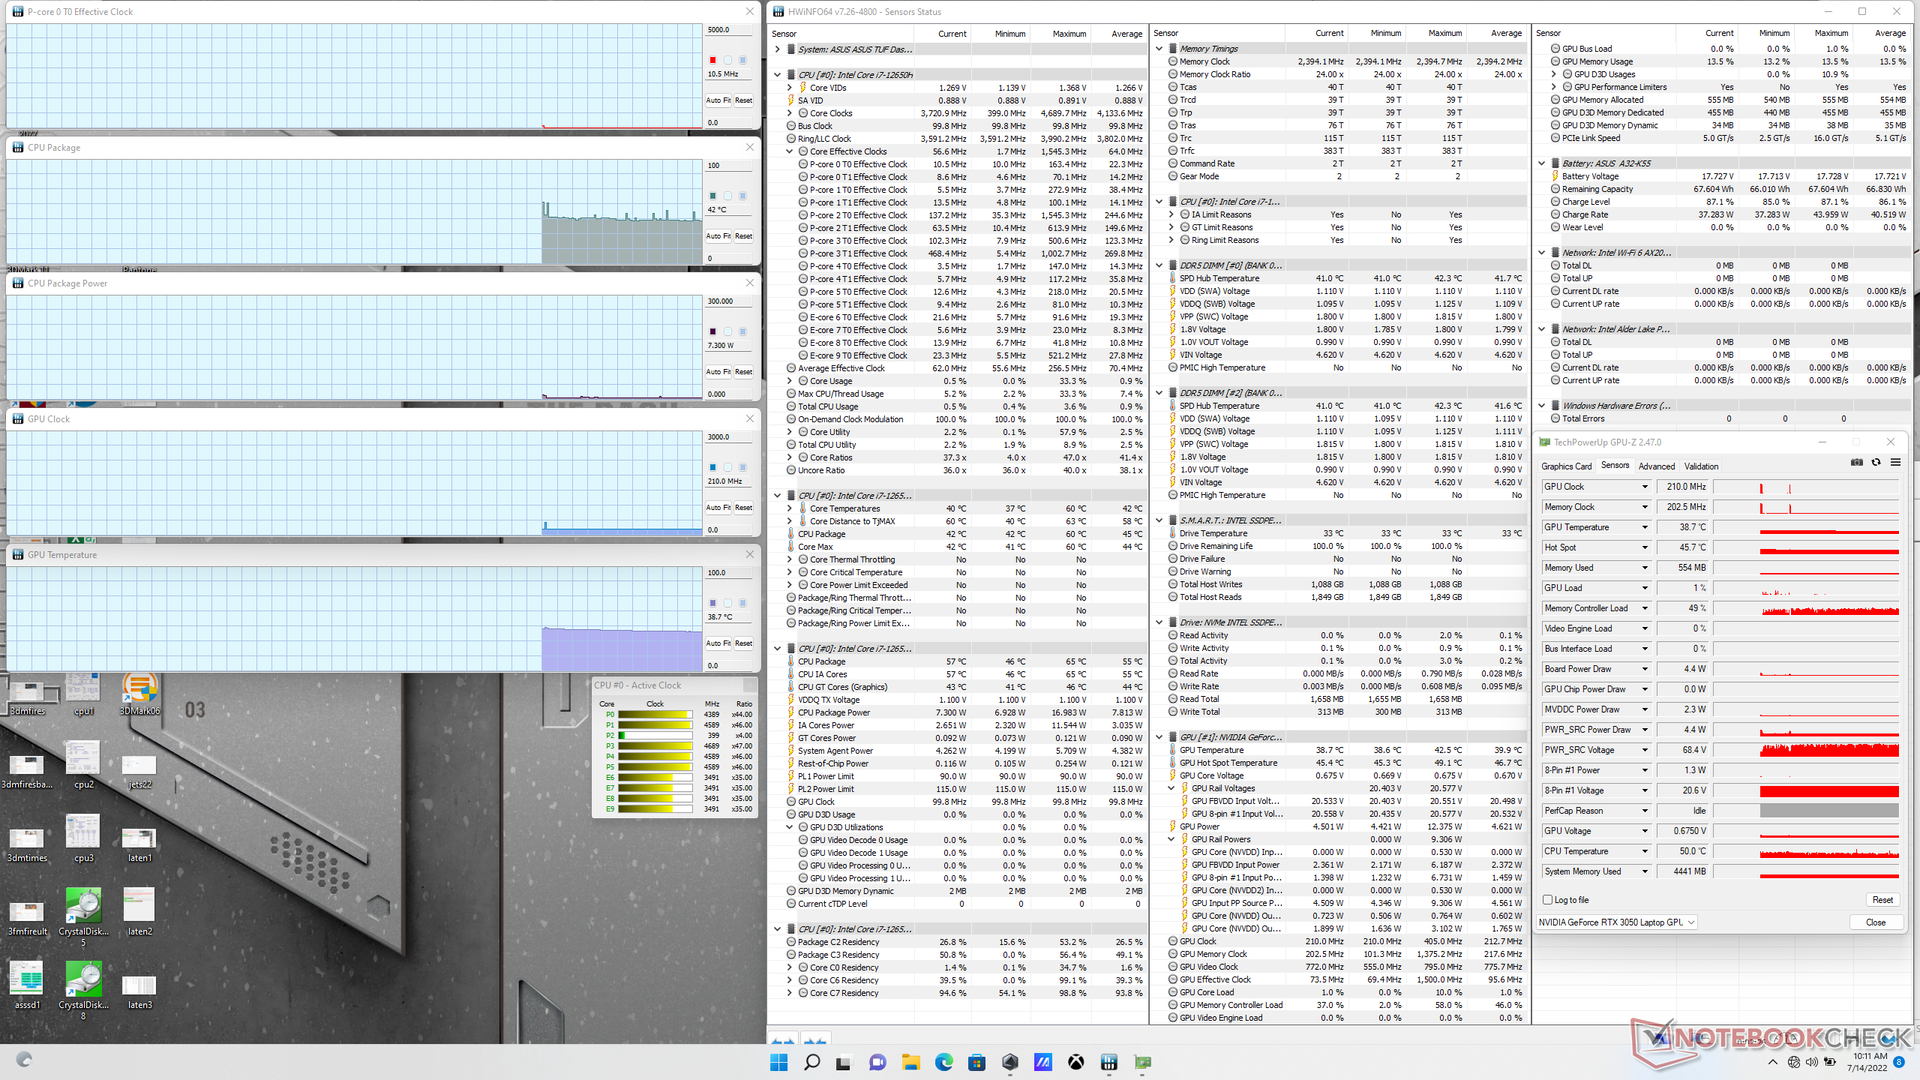
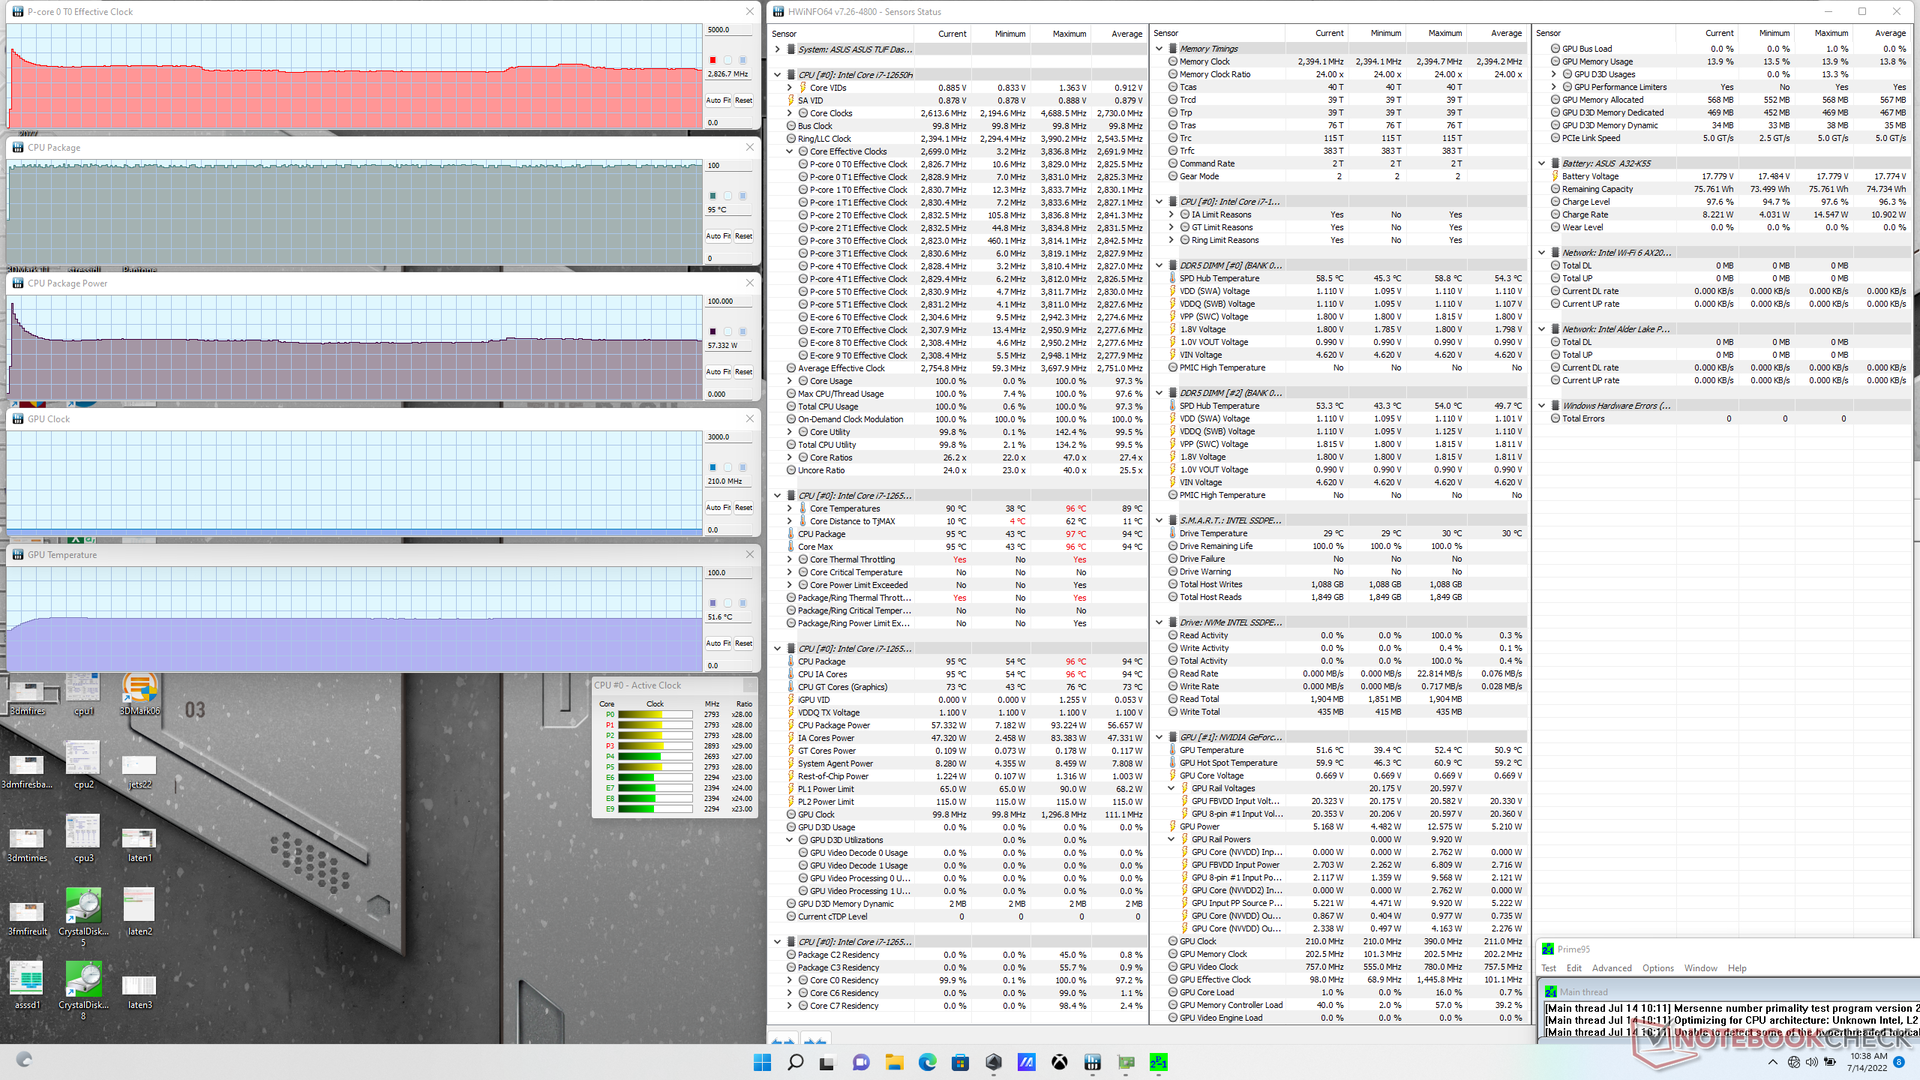
在启动Prime95压力时,CPU时钟速率、核心温度和封装功耗将分别飙升至3.7 GHz、95 C和93 W。然而,时钟频率将立即开始下降,最终稳定在2.9GHz和57W的封装功耗,以防止核心温度达到任何更高。很明显,冷却解决方案是提高CPU性能的一个限制因素。
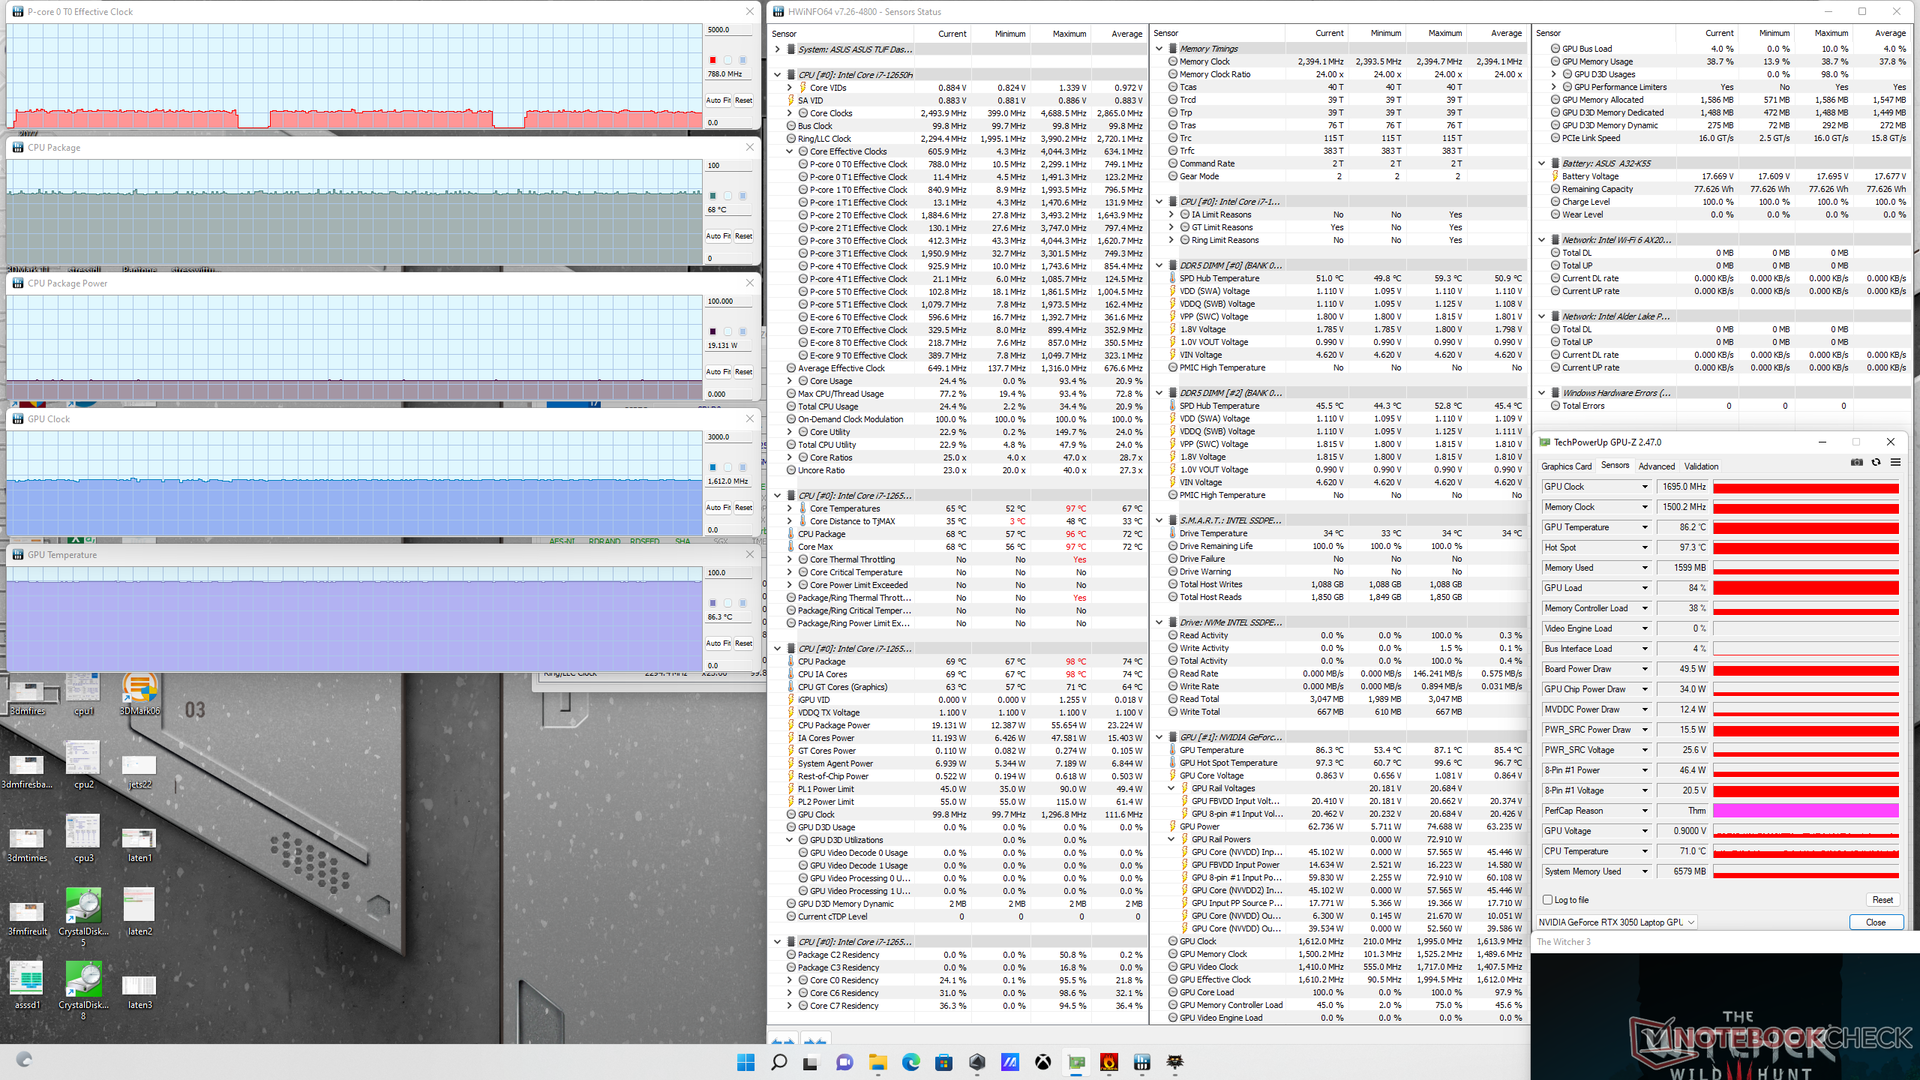
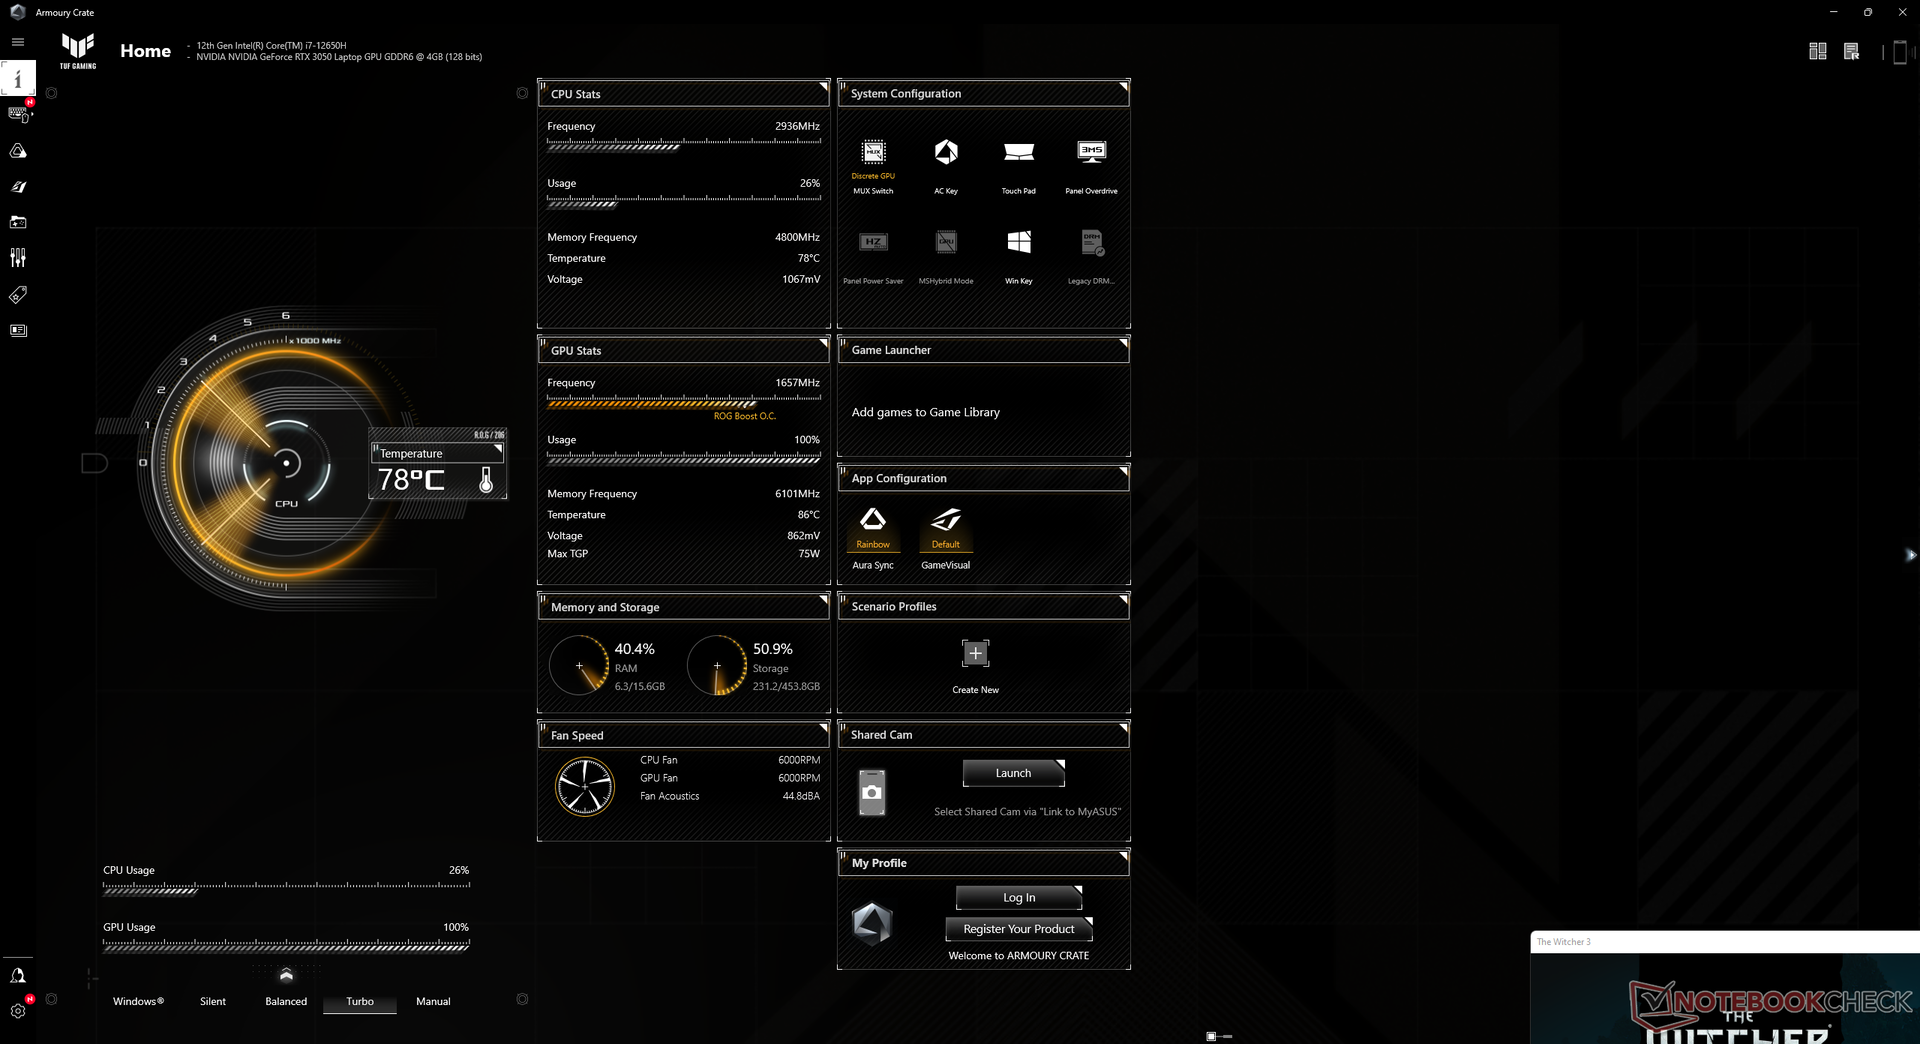
当运行在平衡电源配置文件时,GPU时钟、内存时钟和核心温度将分别稳定在1612 MHz、1500 MHz和86 C。 Witcher 3 在平衡电源配置文件上运行时,GPU时钟和内存时钟将分别稳定在1612 MHz、1500 MHz和86 C。如果在Turbo模式下运行,GPU时钟和内存时钟将略有增加,但GPU温度将保持不变,因为如上所述,Turbo模式下的风扇噪音更高,以补偿更高的时钟。请注意,在Turbo模式下运行时,GPU和CPU封装的功耗将分别从50W增加到65W和19W增加到28W。 Witcher 3在Turbo模式下,GPU和CPU的功耗将分别从50W和19W增加到28W。
游戏时的GPU温度与FX517ZR一样高,尽管我们的GPU速度要慢得多。
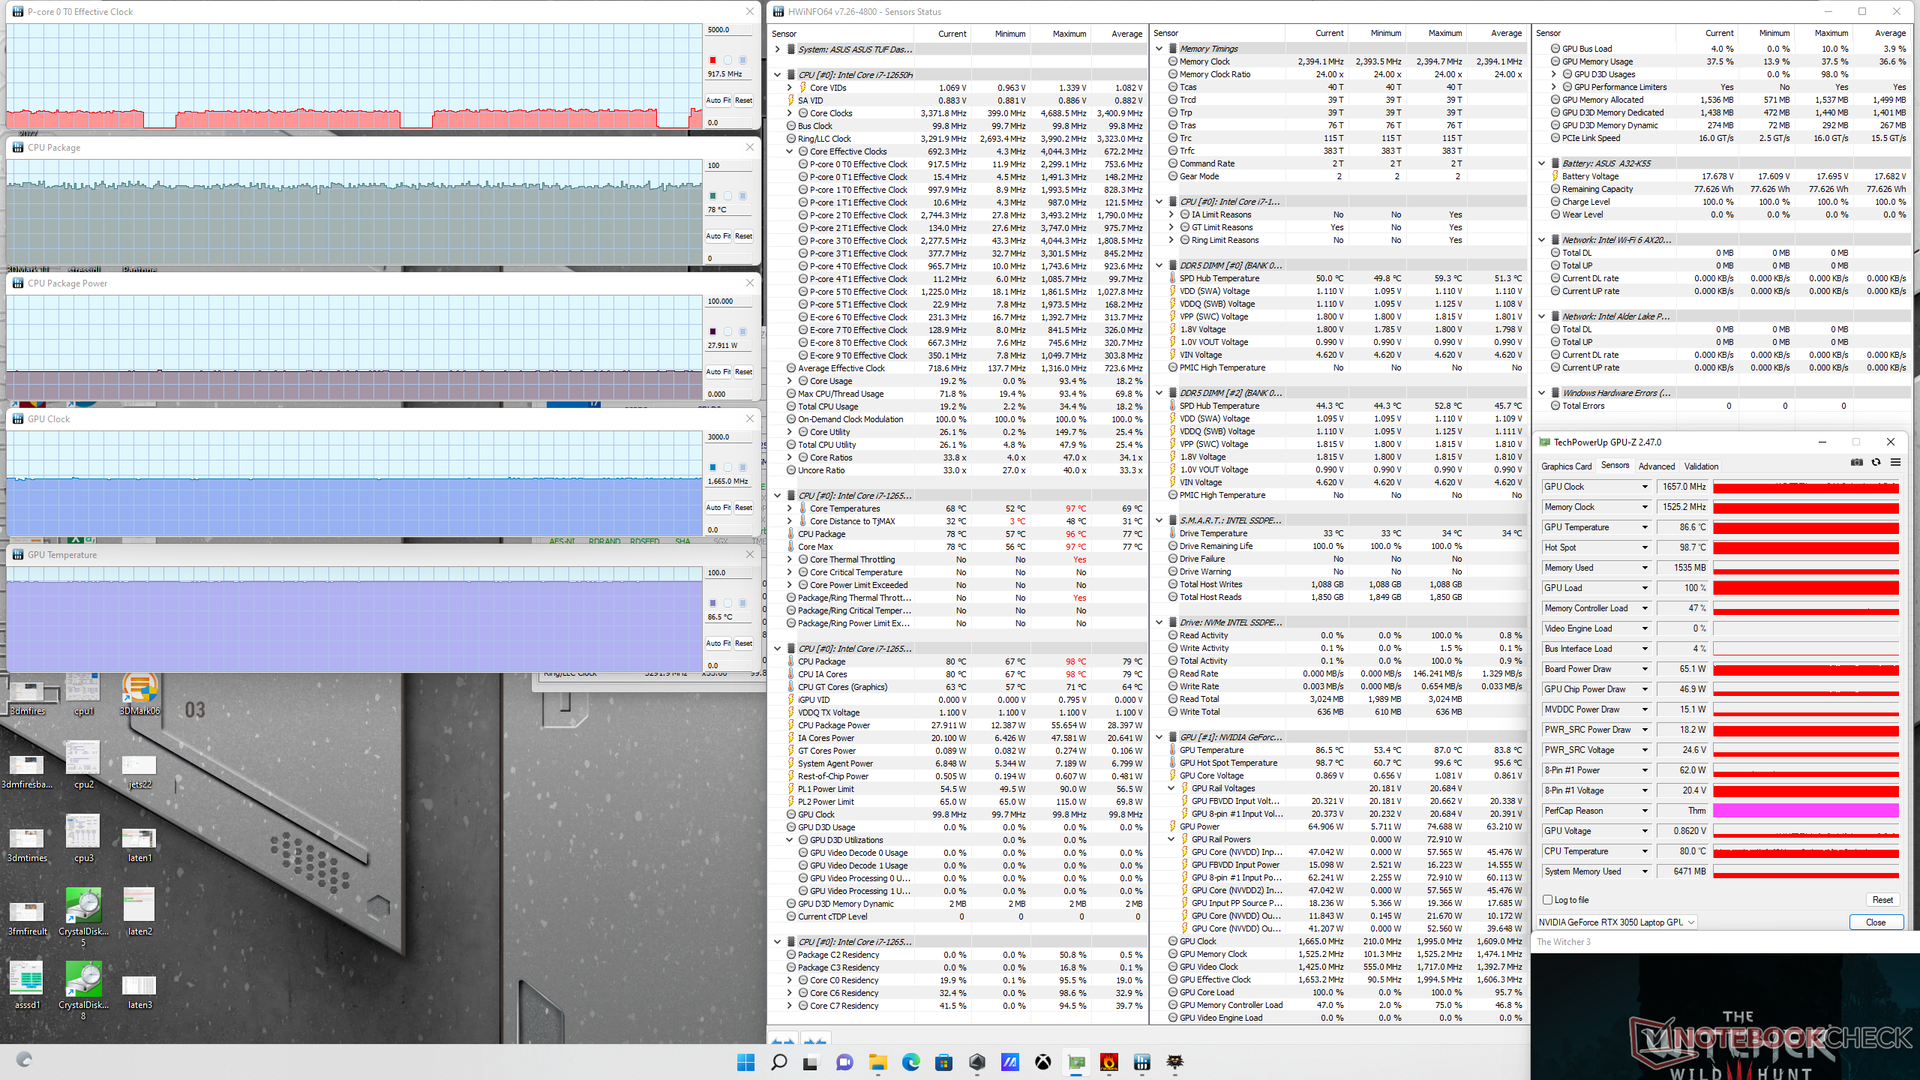
| CPU时钟(GHz) | GPU时钟(MHz) | CPU平均温度(℃) | GPU平均温度(℃) | |
| 系统空闲 | -- | -- | 42 | 39 |
| Prime95压力 | ~2.9 | -- | 95 | 52 |
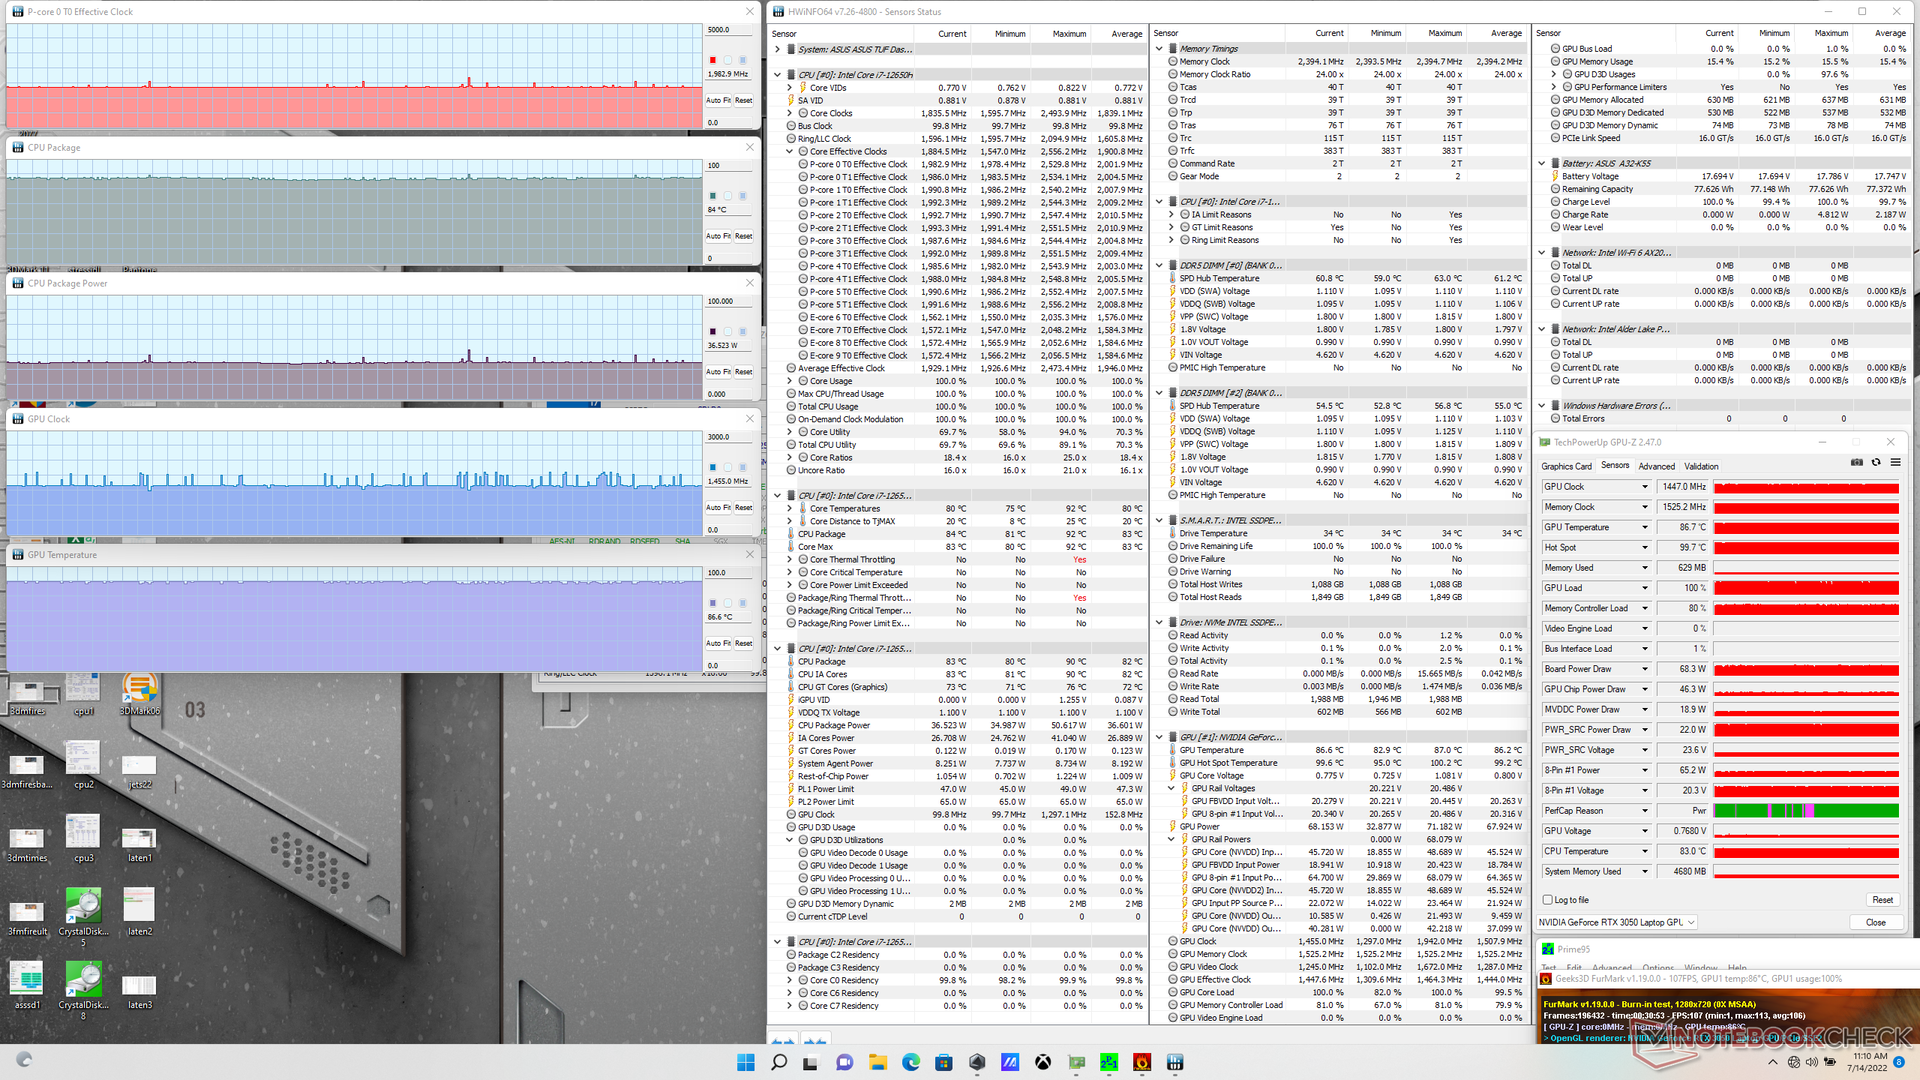
| Prime95 + FurMark 压力 | 2.0 | 1455 | 84 | 87 |
| Witcher 3 应力(平衡模式) | ~0.8 | 1612 | 68 | 86 |
| Witcher 3 应力(涡轮模式) | ~0.9 | 1665 | 78 | 86 |
发言人
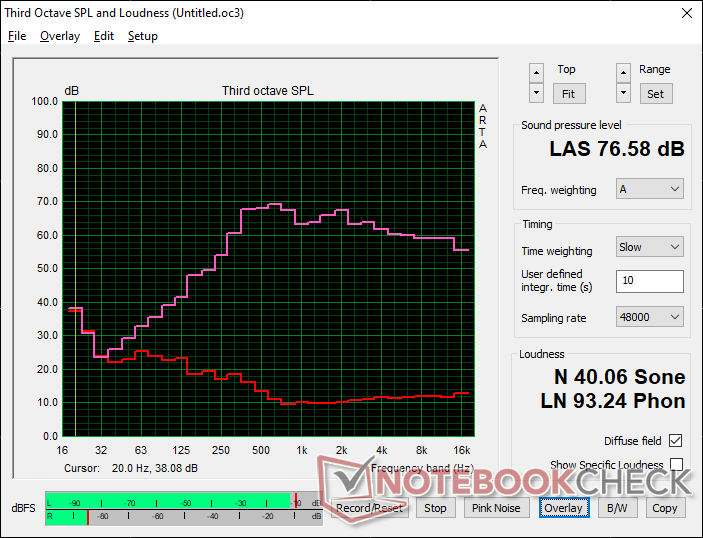
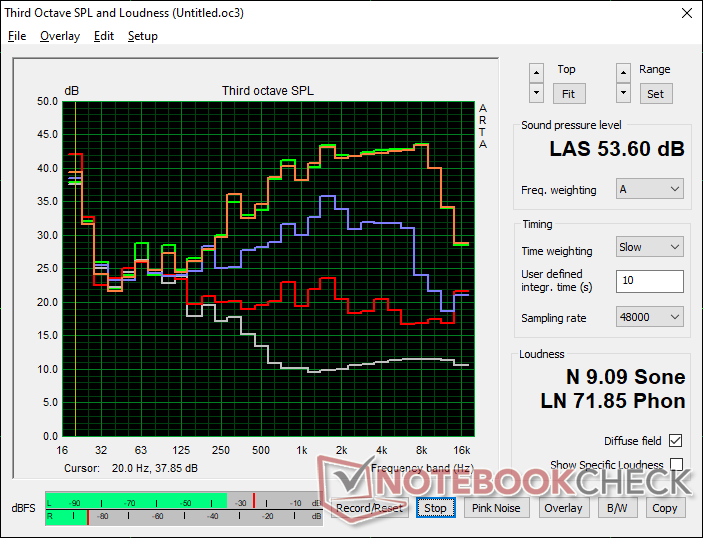
Asus TUF Dash F15 FX517ZC audio analysis
(±) | speaker loudness is average but good (76.6 dB)
Bass 100 - 315 Hz
(±) | reduced bass - on average 11.8% lower than median
(±) | linearity of bass is average (8.6% delta to prev. frequency)
Mids 400 - 2000 Hz
(±) | higher mids - on average 6.1% higher than median
(+) | mids are linear (4.9% delta to prev. frequency)
Highs 2 - 16 kHz
(+) | balanced highs - only 1.6% away from median
(+) | highs are linear (2.8% delta to prev. frequency)
Overall 100 - 16.000 Hz
(+) | overall sound is linear (14.2% difference to median)
Compared to same class
» 25% of all tested devices in this class were better, 7% similar, 68% worse
» The best had a delta of 6%, average was 18%, worst was 132%
Compared to all devices tested
» 17% of all tested devices were better, 4% similar, 79% worse
» The best had a delta of 4%, average was 23%, worst was 134%
Apple MacBook Pro 16 2021 M1 Pro audio analysis
(+) | speakers can play relatively loud (84.7 dB)
Bass 100 - 315 Hz
(+) | good bass - only 3.8% away from median
(+) | bass is linear (5.2% delta to prev. frequency)
Mids 400 - 2000 Hz
(+) | balanced mids - only 1.3% away from median
(+) | mids are linear (2.1% delta to prev. frequency)
Highs 2 - 16 kHz
(+) | balanced highs - only 1.9% away from median
(+) | highs are linear (2.7% delta to prev. frequency)
Overall 100 - 16.000 Hz
(+) | overall sound is linear (4.6% difference to median)
Compared to same class
» 0% of all tested devices in this class were better, 0% similar, 100% worse
» The best had a delta of 5%, average was 17%, worst was 45%
Compared to all devices tested
» 0% of all tested devices were better, 0% similar, 100% worse
» The best had a delta of 4%, average was 23%, worst was 134%
能源管理--仍旧是耗电大户
消耗功率
如果RTX 3050比RTX 3070慢40%,这是否意味着我们可以预期功耗也会降低40%?不幸的是,我们的FX517ZC在相同的图形设置下运行相同的游戏时,需求仅比FX517ZR少7%。
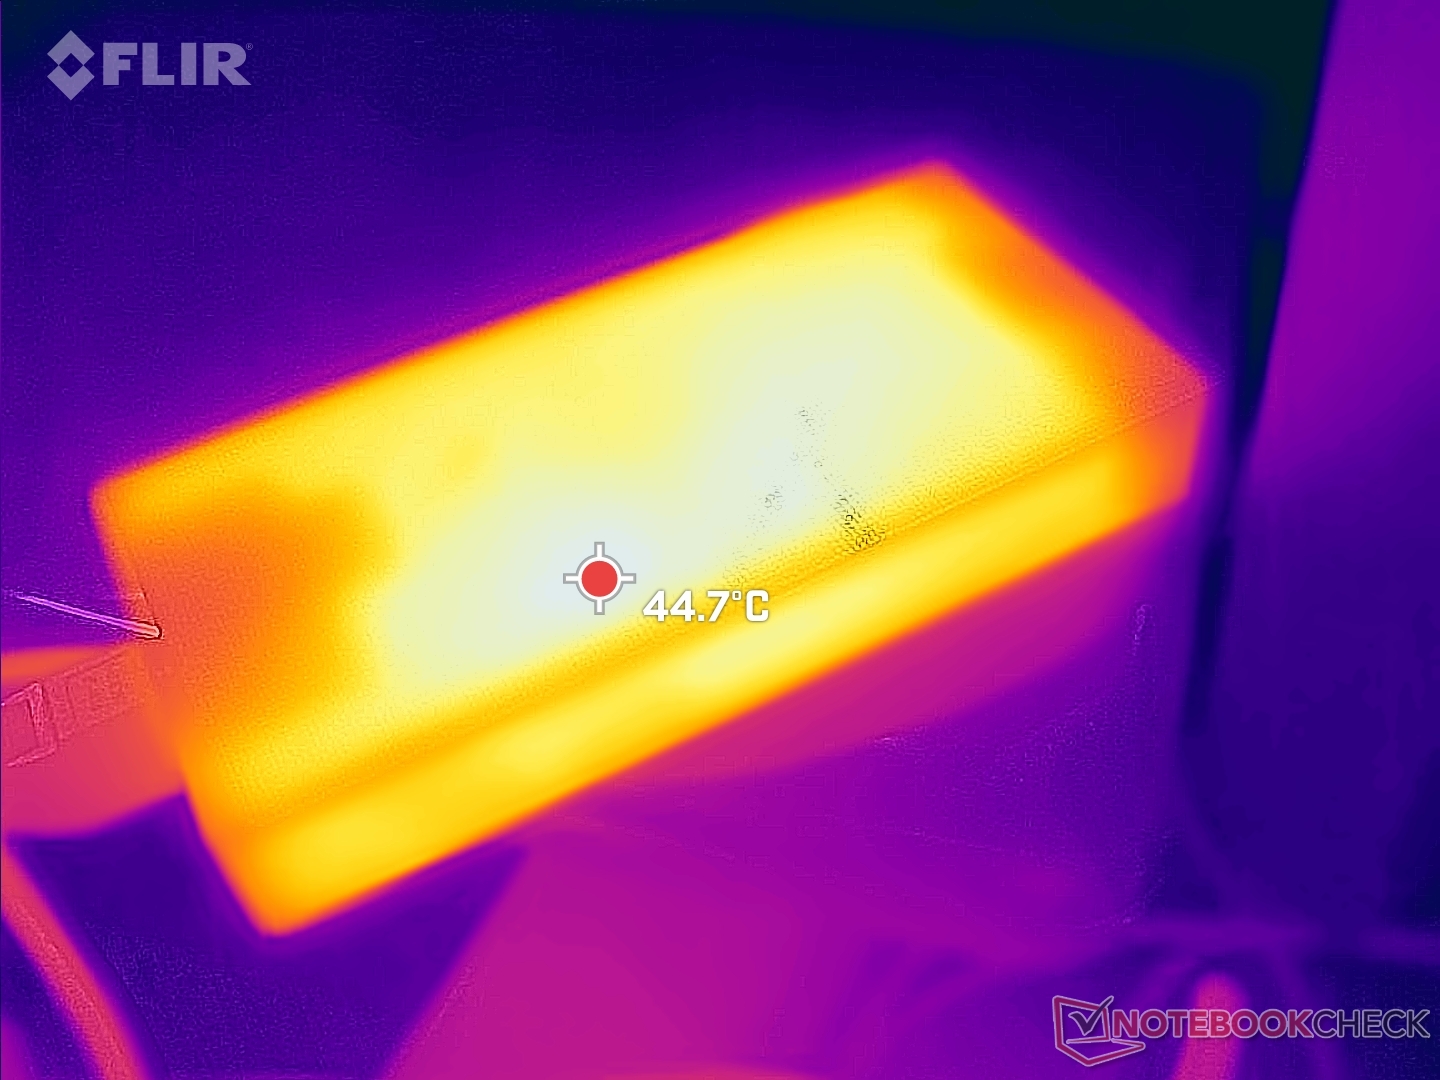
请注意,FX517ZC使用的是180瓦的交流适配器(约15 x 7.2 x 2.3厘米),而FX517ZR使用的是稍大的200瓦适配器。
| Off / Standby | |
| Idle | |
| Load |
|
Key:
min: | |
| Asus TUF Dash F15 FX517ZC i7-12650H, GeForce RTX 3050 4GB Laptop GPU, Intel SSD 670p SSDPEKNU512GZ, IPS, 2560x1440, 15.6" | Asus TUF Dash F15 FX517ZR i7-12650H, GeForce RTX 3070 Laptop GPU, Samsung PM991a MZVLQ1T0HBLB, IPS, 2560x1440, 15.6" | Dell G15 5510 i5-10500H, GeForce RTX 3050 4GB Laptop GPU, SK Hynix BC711 HFM512GD3HX015N, IPS, 1920x1080, 15.6" | MSI Bravo 15 B5DD-010US R5 5600H, Radeon RX 5500M, Kingston OM8PCP3512F-AB, IPS, 1920x1080, 15.6" | Lenovo Ideapad Gaming 3 15IHU-82K1002RGE i5-11300H, GeForce RTX 3050 Ti Laptop GPU, Micron 2210 MTFDHBA512QFD, IPS, 1920x1080, 15.6" | Gigabyte G5 GD i5-11400H, GeForce RTX 3050 4GB Laptop GPU, ESR512GTLG-E6GBTNB4, IPS, 1920x1080, 15.6" | |
|---|---|---|---|---|---|---|
| Power Consumption | 4% | 28% | 33% | 35% | 6% | |
| Idle Minimum * (Watt) | 9.2 | 10 -9% | 3 67% | 6.6 28% | 4.9 47% | 13 -41% |
| Idle Average * (Watt) | 15.9 | 14 12% | 8 50% | 9.8 38% | 8.3 48% | 15 6% |
| Idle Maximum * (Watt) | 29.5 | 20 32% | 13 56% | 10.8 63% | 8.9 70% | 20 32% |
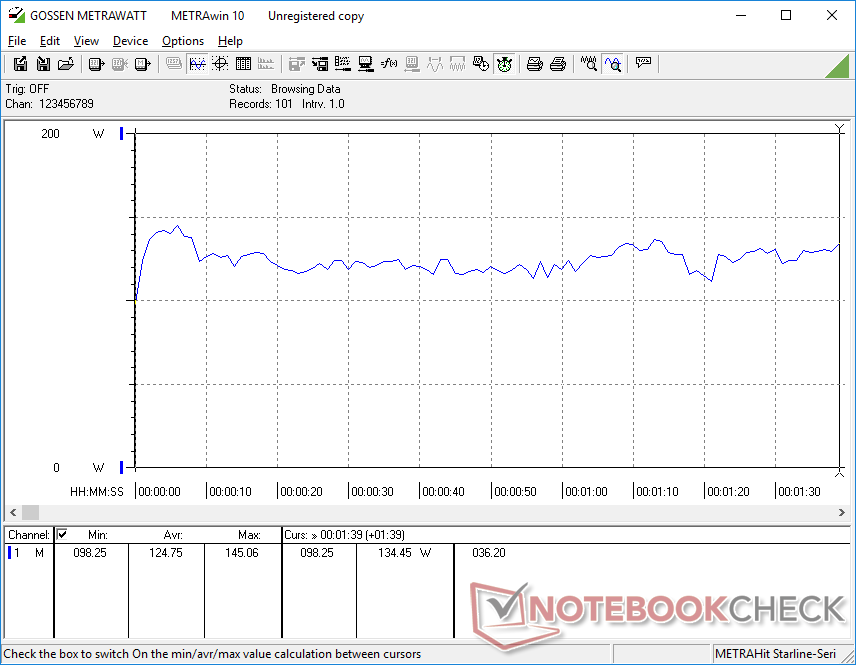
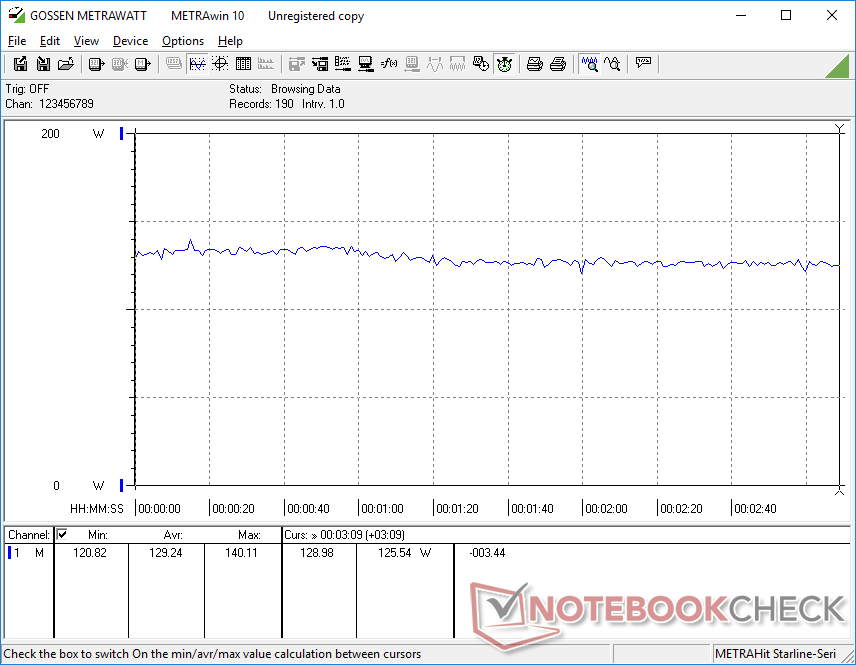
| Load Average * (Watt) | 124.8 | 122 2% | 103 17% | 70.5 44% | 81 35% | 102 18% |
| Witcher 3 ultra * (Watt) | 129.2 | 138.6 -7% | 139.5 -8% | 103.2 20% | 119 8% | 124 4% |
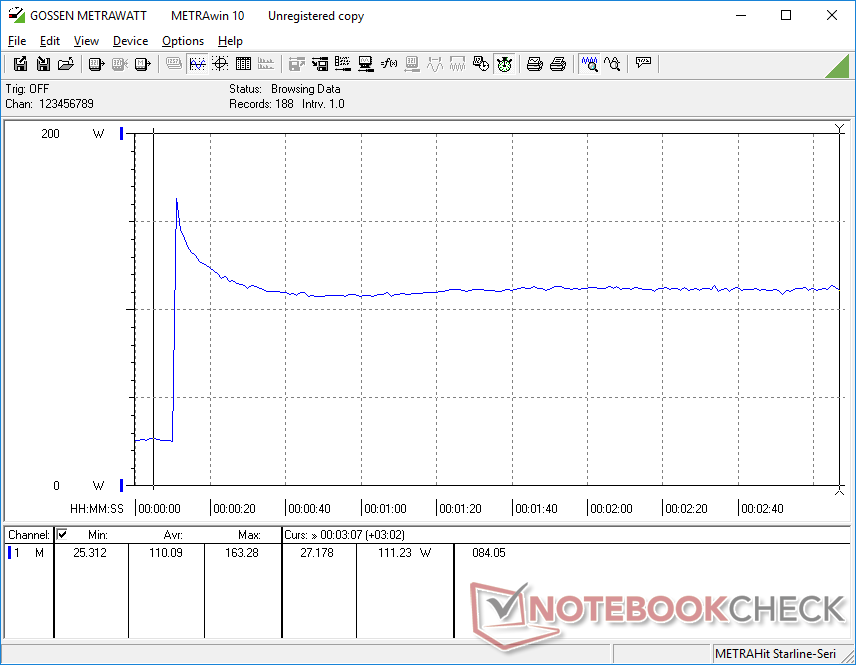
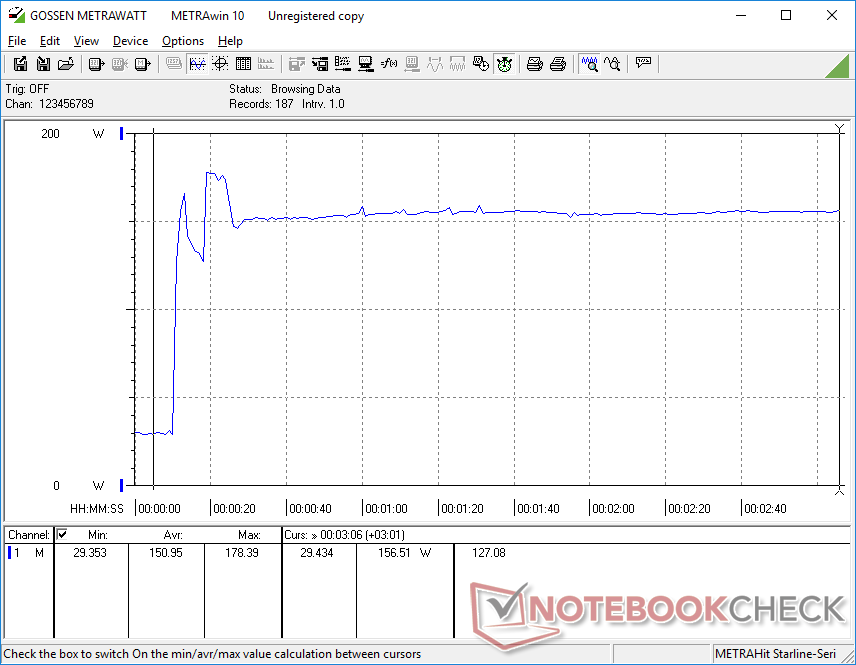
| Load Maximum * (Watt) | 178.4 | 189 -6% | 204 -14% | 175 2% | 172 4% | 148 17% |
* ... smaller is better
Power Consumption Witcher 3 / Stresstest
Power Consumption external Monitor
电池寿命 - 没有那么长
电池寿命比预期的要短,但我们预计它是一个错误。当设置为平衡电源配置文件,并通过MSHybrid激活集成GPU时,我们只能记录到4小时的运行时间,而FX517ZR为7小时。即使在重复测试后,结果也不会改善。
| Asus TUF Dash F15 FX517ZC i7-12650H, GeForce RTX 3050 4GB Laptop GPU, 76 Wh | Asus TUF Dash F15 FX517ZR i7-12650H, GeForce RTX 3070 Laptop GPU, 76 Wh | Dell G15 5510 i5-10500H, GeForce RTX 3050 4GB Laptop GPU, 56 Wh | MSI Bravo 15 B5DD-010US R5 5600H, Radeon RX 5500M, 53 Wh | Lenovo Ideapad Gaming 3 15IHU-82K1002RGE i5-11300H, GeForce RTX 3050 Ti Laptop GPU, 45 Wh | Gigabyte G5 GD i5-11400H, GeForce RTX 3050 4GB Laptop GPU, 41 Wh | |
|---|---|---|---|---|---|---|
| Battery runtime | 75% | 50% | 58% | 65% | -22% | |
| WiFi v1.3 (h) | 4 | 7 75% | 6 50% | 6.3 58% | 6.6 65% | 3.1 -22% |
| Reader / Idle (h) | 10.8 | 11.3 | 9.2 | 5.7 | ||
| H.264 (h) | 5.8 | 7.7 | 3.6 | |||
| Load (h) | 2.3 | 1 | 1 | 1.1 | 1.1 |
Pros
Cons
结论 - 入门级的价格和出色的高级别显示
除了明显的价格节省,人们可能更喜欢入门级游戏笔记本电脑,因为与更强大的高端选项相比,它们的风扇更安静,温度更低,电池寿命更长,功耗更低。因此,我们期望华硕TUF Dash F15 FX517ZC及其RTX 3050比其TUF Dash F15 FX517ZR RTX 3070对应产品更安静、更冷、更持久、要求更低。现实情况是,FX517ZC和FX517ZR之间在温度、功耗和噪音方面的任何差异,相对于它们之间非常大的GPU性能差距而言,都是不幸的小事。换句话说,如果你希望FX517ZC比它的高端配置明显更安静、更冷、更持久,那么你可能会感到失望。
华硕TUF Dash F15 FX517ZC配备的1440p165 IPS显示屏比其价格范围的预期要好。然而,功耗、风扇噪音和电池寿命并没有比更快的高端机型好。
然而,对于一个入门级的游戏笔记本电脑,FX517ZC仍然是相当不错的,因为它没有吝啬在显示器、内存或CPU上,而这是许多其他产品所不具备的。 许多其他游戏笔记本电脑往往在1000美元和以下的范围内做。1440p面板提供全P3覆盖,快速响应时间,自适应同步,以及165赫兹,这在预算系统中是非常罕见的。第12代酷睿i7-12650H CPU,虽然与第11代酷睿i7-11800H没有什么不同,但在这种情况下,与经济实惠的RTX 3050 GPU搭配得很好。
价格和可用性
华硕TUF Dash F15 FX517系列现在已经在网上广泛销售。然而,我们特定的RTX 3050 SKU并不常见。用户会发现RTX 3050 Ti、RTX 3060和RTX 3070的配置在写这篇文章时更容易获得。RTX 3060配置可以在亚马逊上找到https://www.amazon.com/ASUS-Display-i7-12650H-Thunderbolt-FX517ZM-AS73/dp/B09RMH9B6F/?tag=nbcnewsnet-20售价1070美元,而RTX 3050 Ti可以在百思买上找到,售价1200美元。售价为1200美元。
Asus TUF Dash F15 FX517ZC
- 08/08/2022 v7 (old)
Allen Ngo
Price comparison

