Reviews for the Intel Core i5-11400H processor
Blackview MP200 迷你电脑评测--采用英特尔酷睿 i5-11400H 处理器的小型台式电脑,外壳极具吸引力
我们已经从智能手机和平板电脑领域了解了 Blackview,但现在,这家制造商还在其产品组合中加入了几款迷你 PC。通过 MP200,我们看到了一款适合日常办公的外观精美的小型 PC。不过,处理器已不再是最年轻的处理器之一。在这篇评测中,我们将了解Tiger Lake SoC 在 Blackview MP200 中的表现。
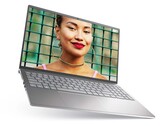
Intel Core i5-11400H, UHD Graphics Xe 16EUs, 678 g戴尔Inspiron 15 Plus笔记本电脑评测。接近于完美的全能型产品
通过Inspiron 15 Plus,戴尔提供了一款时尚而紧凑的多媒体笔记本电脑,适用于各种用途。我们对这款15英寸的笔记本电脑进行了详细了解。
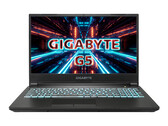
Intel Core i5-11400H, NVIDIA GeForce RTX 3050 4GB Laptop GPU, 15.6", 1.9 kg技嘉G5 GD在回顾。经济实惠的游戏笔记本电脑,没有Windows
只需不到750欧元(约848美元),你就可以得到G5 GD,这是一款配备了Tiger Lake 六核处理器和GeForce RTX 3050笔记本GPU的游戏笔记本电脑。这款笔记本电脑提供了最多三个存储驱动器的空间。
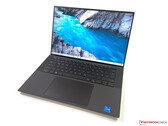
Intel Core i5-11400H, NVIDIA GeForce RTX 3050 4GB Laptop GPU, 15.6", 2.1 kg戴尔XPS 15 9510酷睿i5笔记本电脑回顾。踩着刹车的基本款
戴尔XPS 15仍然是为数不多的高端多媒体笔记本电脑之一,它还可以选择不提供专用显卡。因此,虽然那些只想寻找快速处理器的人应该真的在这里找到了合适的地方,但戴尔也不必要地限制了CPU的性能。
Intel Core i5-11400H, UHD Graphics Xe 16EUs, 15.6", 1.8 kgAcer Nitro 5 AN515-57, GTX 1650: NVIDIA GeForce GTX 1650 Mobile, 15.60", 2.3 kg
External Review » Acer Nitro 5 AN515-57, GTX 1650
Asus TUF Gaming F17 FX706HF: NVIDIA GeForce RTX 2050 Mobile, 17.30", 2.6 kg
External Review » Asus TUF Gaming F17 FX706HF
Asus TUF Gaming F15 FX506HF: NVIDIA GeForce RTX 2050 Mobile, 15.60", 2.3 kg
External Review » Asus TUF Gaming FX506HF
MSI GF63 Thin 11UC-680NL: NVIDIA GeForce RTX 3050 4GB Laptop GPU, 15.60", 1.9 kg
External Review » MSI GF63 Thin 11UC-680NL
HP Victus 16-d0019ns: NVIDIA GeForce GTX 1650 Mobile, 16.10", 2.5 kg
External Review » HP Victus 16-d0019ns
Asus TUF Gaming F17 FX706HC-HX007W: NVIDIA GeForce RTX 3050 4GB Laptop GPU, 17.30", 2.6 kg
External Review » Asus TUF Gaming F17 FX706HC-HX007W
Asus TUF Gaming F15 FX506HC-HN004: NVIDIA GeForce RTX 3050 4GB Laptop GPU, 15.60", 2.3 kg
External Review » Asus TUF Gaming F15 FX506HC-HN004
MSI GF63 Thin 11SC: NVIDIA GeForce GTX 1650 Mobile, 15.60", 1.9 kg
External Review » MSI GF63 Thin 11SC
MSI GV15 Thin 11SC-633: NVIDIA GeForce GTX 1650 Max-Q, 15.60", 1.9 kg
External Review » MSI GV15 Thin 11SC-633
Acer Predator Triton 300 PT315-53-54XN: NVIDIA GeForce RTX 3050 Ti Laptop GPU, 15.60", 2.1 kg
External Review » Acer Predator Triton 300 PT315-53-54XN
Acer Nitro 5 AN515-57-505V: NVIDIA GeForce RTX 3050 Ti Laptop GPU, 15.60", 2.2 kg
External Review » Acer Nitro 5 AN515-57-505V
Gigabyte G7 GD: NVIDIA GeForce RTX 3050 4GB Laptop GPU, 17.30", 2.4 kg
External Review » Gigabyte G7 GD
Acer Predator Helios 300 PH315-54 NH.QC5EP.00A: NVIDIA GeForce RTX 3050 Ti Laptop GPU, 15.60", 2.2 kg
External Review » Acer Predator Helios 300 PH315-54 NH.QC5EP.00A
Acer Predator Helios 300 PH315-54-582Q: NVIDIA GeForce RTX 3050 Ti Laptop GPU, 15.60", 2.9 kg
External Review » Acer Predator Helios 300 PH315-54-582Q
Asus TUF Gaming F15 FX506HE-HN012: NVIDIA GeForce RTX 3050 Ti Laptop GPU, 15.60", 2.3 kg
External Review » Asus TUF Gaming F15 FX506HE-HN012
MSI GF63 Thin 11UC-447XES: NVIDIA GeForce RTX 3050 4GB Laptop GPU, 15.60", 1.9 kg
External Review » MSI GF63 Thin 11UC-447XES
MSI Katana GF66 11UD-1222PL: NVIDIA GeForce RTX 3050 Ti Laptop GPU, 15.60", 2.1 kg
External Review » MSI Katana GF66 11UD-1222PL
HP Envy 15-ep1008ns: NVIDIA GeForce RTX 3050 4GB Laptop GPU, 15.60", 2.2 kg
External Review » HP Envy 15-ep1008ns
MSI Katana GF66 11UD-480XUA: NVIDIA GeForce RTX 3050 Ti Laptop GPU, 15.60", 2.1 kg
External Review » MSI Katana GF66 11UD-480XUA
Asus TUF Gaming F15 FX506HCB-HN256T: NVIDIA GeForce RTX 3050 4GB Laptop GPU, 15.60", 2.3 kg
External Review » Asus TUF Gaming F15 FX506HCB-HN256T
Gigabyte G5 KD-52DE123SD: NVIDIA GeForce RTX 3060 Laptop GPU, 15.60", 2 kg
External Review » Gigabyte G5 KD-52DE123SD
Dell Vostro 15 7510, i5-11400H RTX 3050: NVIDIA GeForce RTX 3050 4GB Laptop GPU, 15.60", 1.9 kg
External Review » Dell Vostro 15 7510, i5-11400H RTX 3050
HP Victus 16-d0206nf: NVIDIA GeForce RTX 3060 Laptop GPU, 16.10", 2.5 kg
External Review » HP Victus 16-d0206nf
HP Victus 16-d0655ng: NVIDIA GeForce RTX 3060 Laptop GPU, 16.10", 2.5 kg
External Review » HP Victus 16-d0655ng
Dell XPS 15 9510 i5 11400H FHD: Intel UHD Graphics Xe 16EUs, 15.60", 1.8 kg
External Review » Dell XPS 15 9510 i5 11400H FHD
Asus TUF Gaming F15 FX506HM-HN016: NVIDIA GeForce RTX 3060 Laptop GPU, 15.60", 2.3 kg
External Review » Asus TUF Gaming F15 FX506HM-HN016
Asus TUF Gaming F15 FX506HCB-HN243T: NVIDIA GeForce RTX 3050 Ti Laptop GPU, 15.60", 2.3 kg
External Review » Asus TUF Gaming F15 FX506HCB-HN243T
Lenovo Legion 5 17ITH6H-82JM000FGE: NVIDIA GeForce RTX 3060 Laptop GPU, 17.30", 3 kg
External Review » Lenovo Legion 5 17ITH6H-82JM000FGE
Gigabyte G5 GD: NVIDIA GeForce RTX 3050 4GB Laptop GPU, 15.60", 2.1 kg
External Review » Gigabyte G5 GD
HP Victus 16-d0367ng: NVIDIA GeForce RTX 3050 Ti Laptop GPU, 16.10", 2.5 kg
External Review » HP Victus 16-d0367ng
Asus TUF Gaming F15 FX506HM-HN184: NVIDIA GeForce RTX 3060 Laptop GPU, 15.60", 2.3 kg
External Review » Asus TUF Gaming F15 FX506HM-HN184
Gigabyte G5 MD-51US123SH: NVIDIA GeForce RTX 3050 Ti Laptop GPU, 15.60", 2.2 kg
External Review » Gigabyte G5 MD-51US123SH
MSI Katana GF66 11UD-836XFR: NVIDIA GeForce RTX 3050 Ti Laptop GPU, 15.60", 2.1 kg
External Review » MSI Katana GF66 11UD-836XFR
Acer Nitro 5 AN515-57-56HH: NVIDIA GeForce RTX 3050 4GB Laptop GPU, 15.60", 2.3 kg
External Review » Acer Nitro 5 AN515-57-56HH
HP Victus 16-d0146ng: NVIDIA GeForce RTX 3050 4GB Laptop GPU, 16.10", 2.5 kg
External Review » HP Victus 16-d0146ng
MSI Sword 15 A11UE: NVIDIA GeForce RTX 3060 Laptop GPU, 15.60", 2.3 kg
External Review » MSI Sword 15 A11UE
HP Victus 16-d0057ng: NVIDIA GeForce RTX 3050 4GB Laptop GPU, 16.10", 2.5 kg
External Review » HP Victus 16-d0057ng
Acer Nitro 5 AN515-57-545N: NVIDIA GeForce RTX 3060 Laptop GPU, 15.60", 2.3 kg
External Review » Acer Nitro 5 AN515-57-545N
MSI Katana GF66 11UC-093: NVIDIA GeForce RTX 3050 4GB Laptop GPU, 15.60", 2.1 kg
External Review » MSI Katana GF66 11UC-093