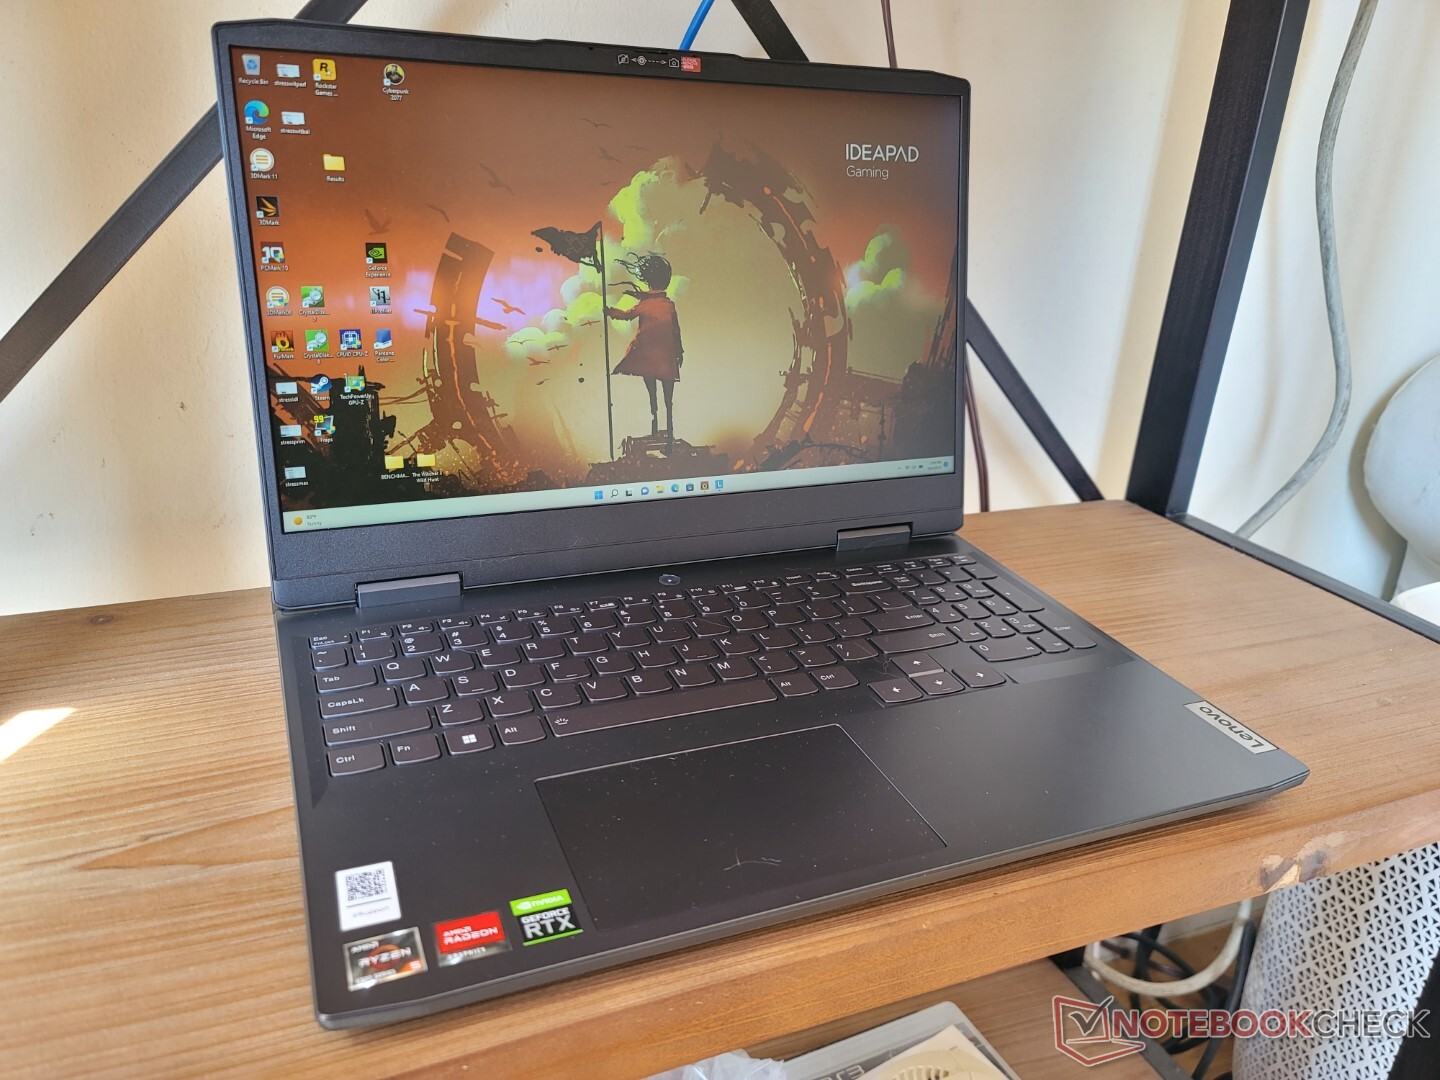
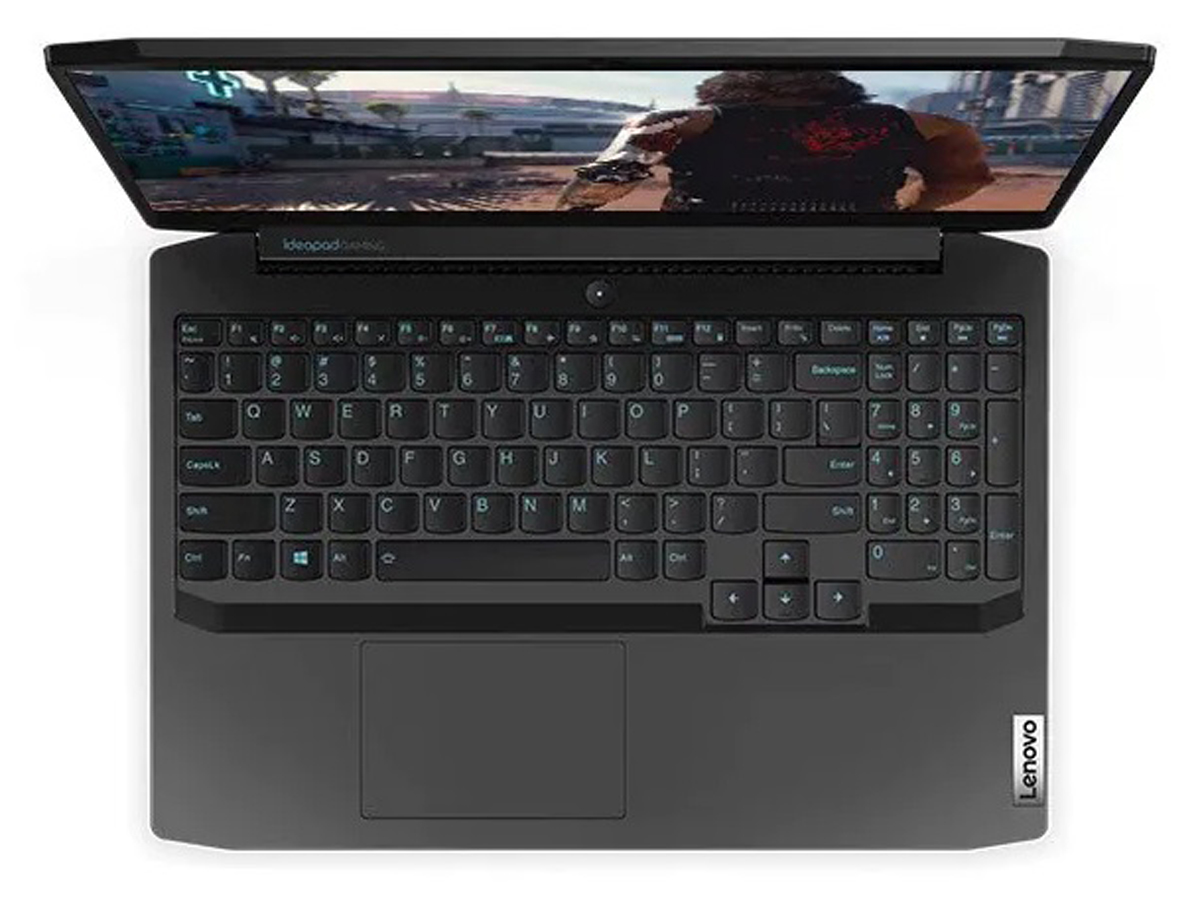
Ryzen 5 6600H性能首次亮相。联想IdeaPad Gaming 3 15ARH7笔记本电脑评测
IdeaPad游戏3系列是联想一些最便宜的游戏笔记本电脑的家,以对比中档的Legion 5 Pro系列和更高端的Legion 7系列。这款最新的2022年型号值得注意的是,它是第一批携带AMD Zen 3+ Ryzen 5 6600H CPU的机型之一,以取代10代英特尔解决方案中的 2020年IdeaPad Gaming 3i.它还引入了一个新的机箱设计,以进一步区别于老一代机型。
配置包括Ryzen 5 6600H或Ryzen 7 6800H CPU与85 WGeForce RTX 3050或3050 Ti GPU。所有SKU上都有相同的120 Hz 1080p IPS面板。我们的具体审查单位与6600H,RTX 3050,256 GB SSD和8 GB RAM是最低端的选择,零售价约800美元。
竞争者包括其他预算的15.6或16英寸游戏笔记本电脑,如 Acer Nitro 5, 惠普Victus, 华硕TUF Dash 15, 或 微星GF系列.
更多联想评论。
潜在的竞争对手比较
Rating | Date | Model | Weight | Height | Size | Resolution | Price |
|---|---|---|---|---|---|---|---|
| 80.8 % v7 (old) | 09 / 2022 | Lenovo IdeaPad Gaming 3 15ARH7 R5 6600H, GeForce RTX 3050 4GB Laptop GPU | 2.4 kg | 21.8 mm | 15.60" | 1920x1080 | |
| 78.4 % v7 (old) | 08 / 2020 | Lenovo IdeaPad Gaming 3i 15IMH05 i5-10300H, GeForce GTX 1650 Mobile | 2.2 kg | 24.9 mm | 15.60" | 1920x1080 | |
| 82.6 % v7 (old) | 05 / 2022 | Lenovo Legion 5 15ACH6A-82NW0010GE R5 5600H, Radeon RX 6600M | 2.5 kg | 25.75 mm | 15.60" | 1920x1080 | |
| 82.3 % v7 (old) | 09 / 2022 | Gigabyte A5 K1 R5 5600H, GeForce RTX 3060 Laptop GPU | 2.2 kg | 34 mm | 15.60" | 1920x1080 | |
| 85.8 % v7 (old) | 07 / 2022 | Asus TUF Dash F15 FX517ZR i7-12650H, GeForce RTX 3070 Laptop GPU | 2 kg | 20.7 mm | 15.60" | 2560x1440 | |
| 81 % v7 (old) | 06 / 2022 | Dell G15 5510 i5-10500H, GeForce RTX 3050 4GB Laptop GPU | 2.5 kg | 23 mm | 15.60" | 1920x1080 |
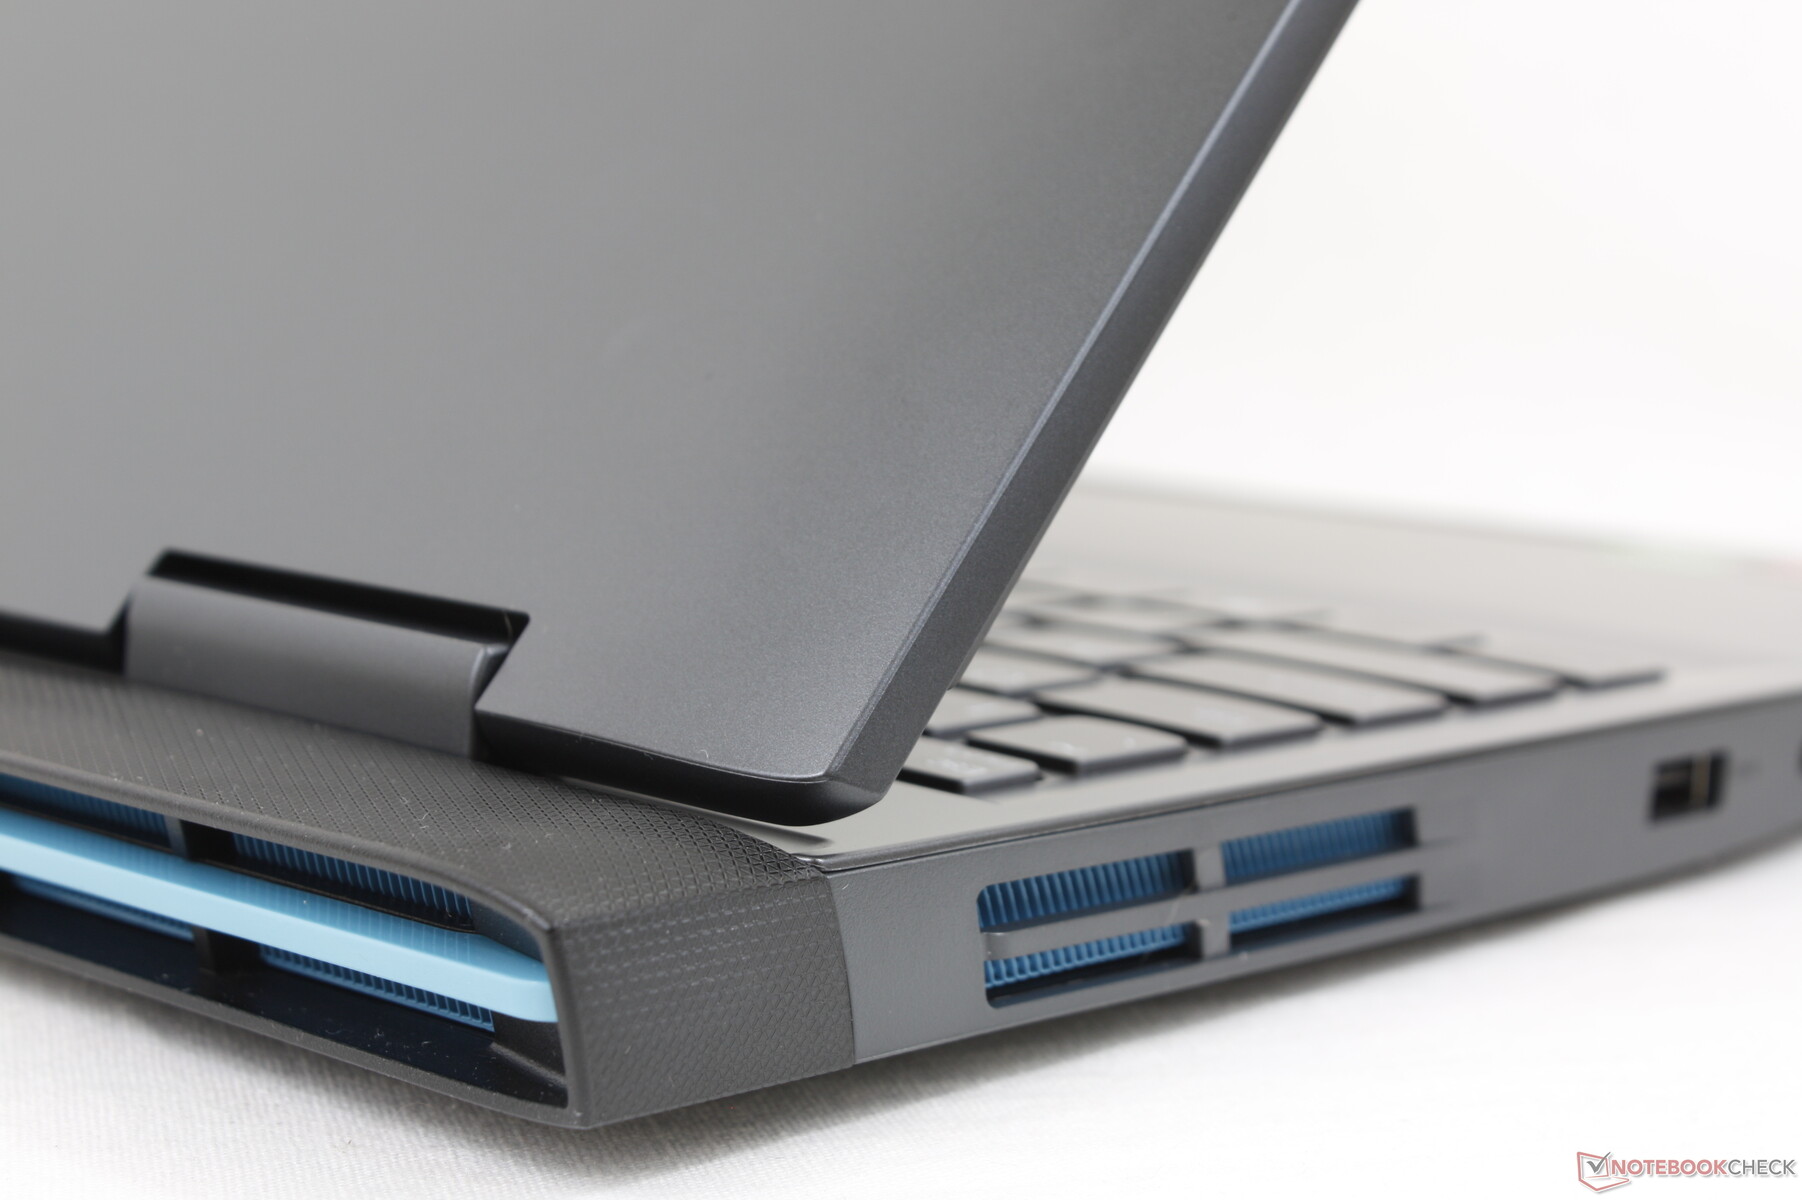
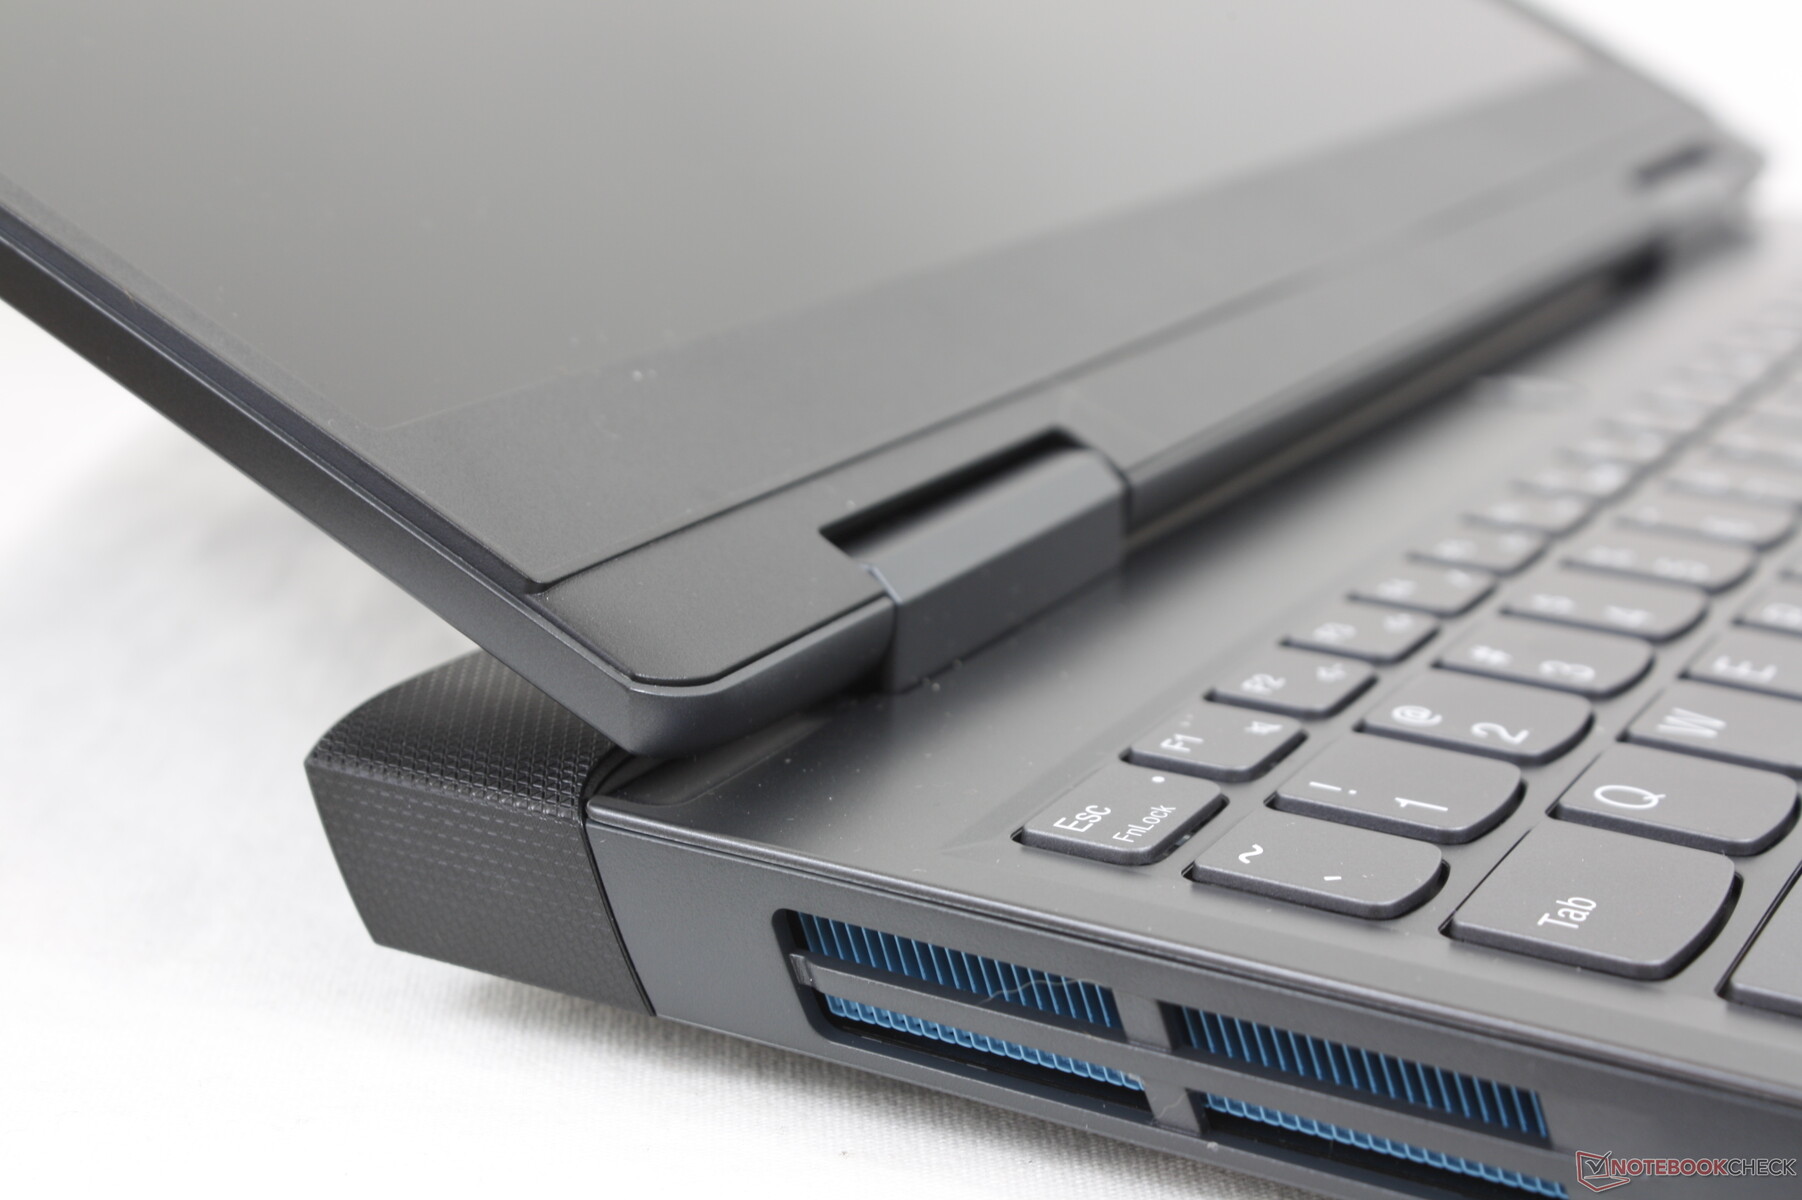
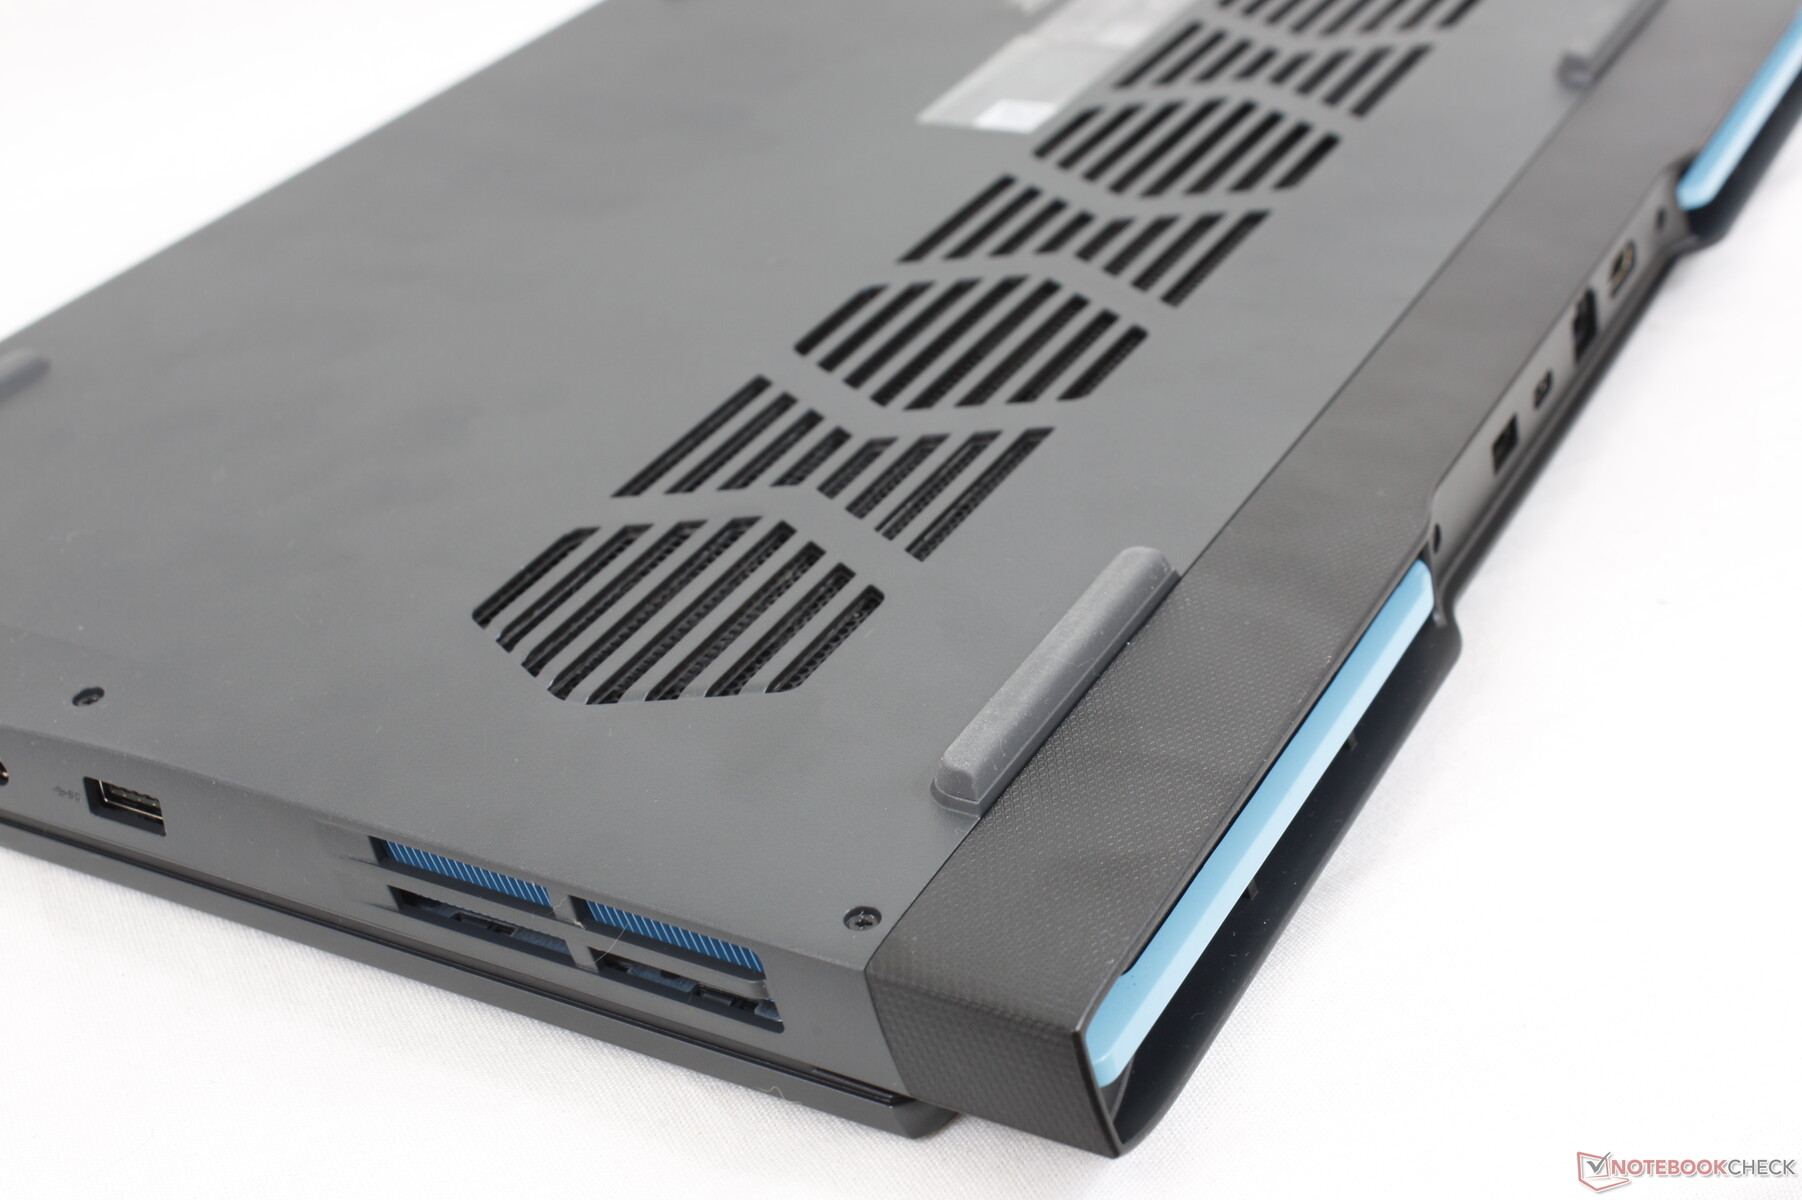
案例 - 新面貌 灵感来自Legion
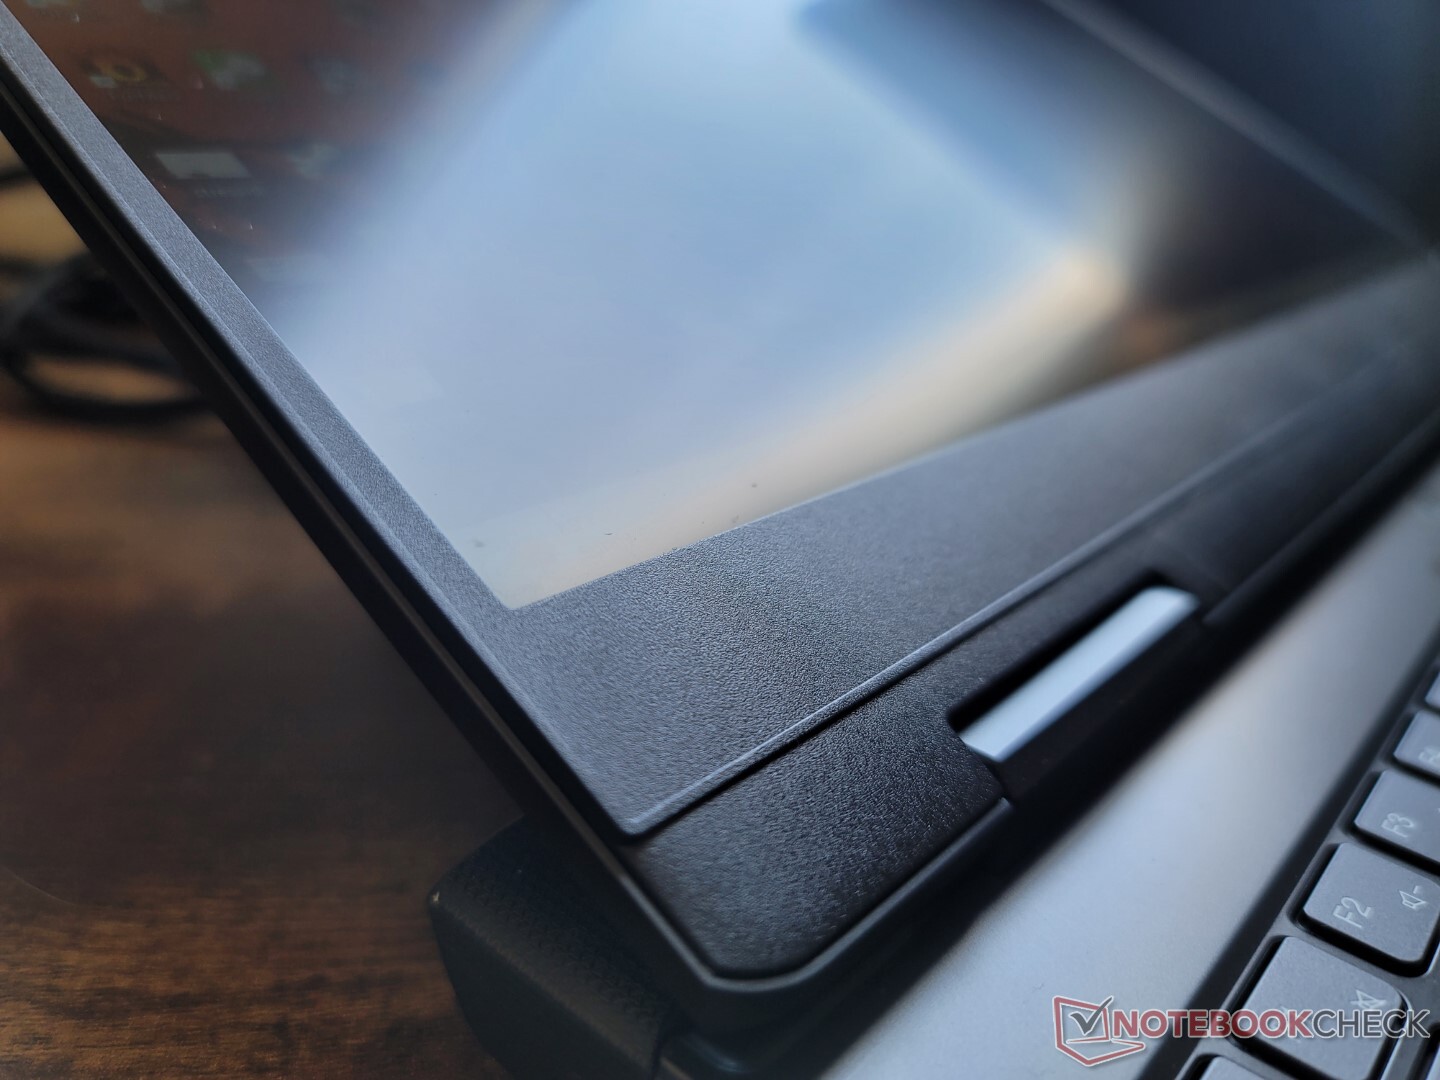
重新设计的底盘可以说是一个更便宜的版本。 Legion 5;而后者主要由金属合金组成,新的IdeaPad Gaming 3 15主要是聚碳酸酯和塑料。最明显的视觉变化来自 2020年IdeaPad设计与新的后部设计有关,旨在改善冷却,但代价是更大的占地面积和更重的重量。
底座周围的底盘刚性相当好,因为相对于其他廉价的游戏笔记本电脑,如微星GF63或或的扭曲和凹陷是最小的。 HPPavilion Gaming 15.然而,铰链是一个不同的故事,因为在调整角度时,显示器往往比我们想要的更容易摇晃。当显示器被完全打开时,吱吱作响的声音变得可闻,这可能是几年后的一个潜在问题。
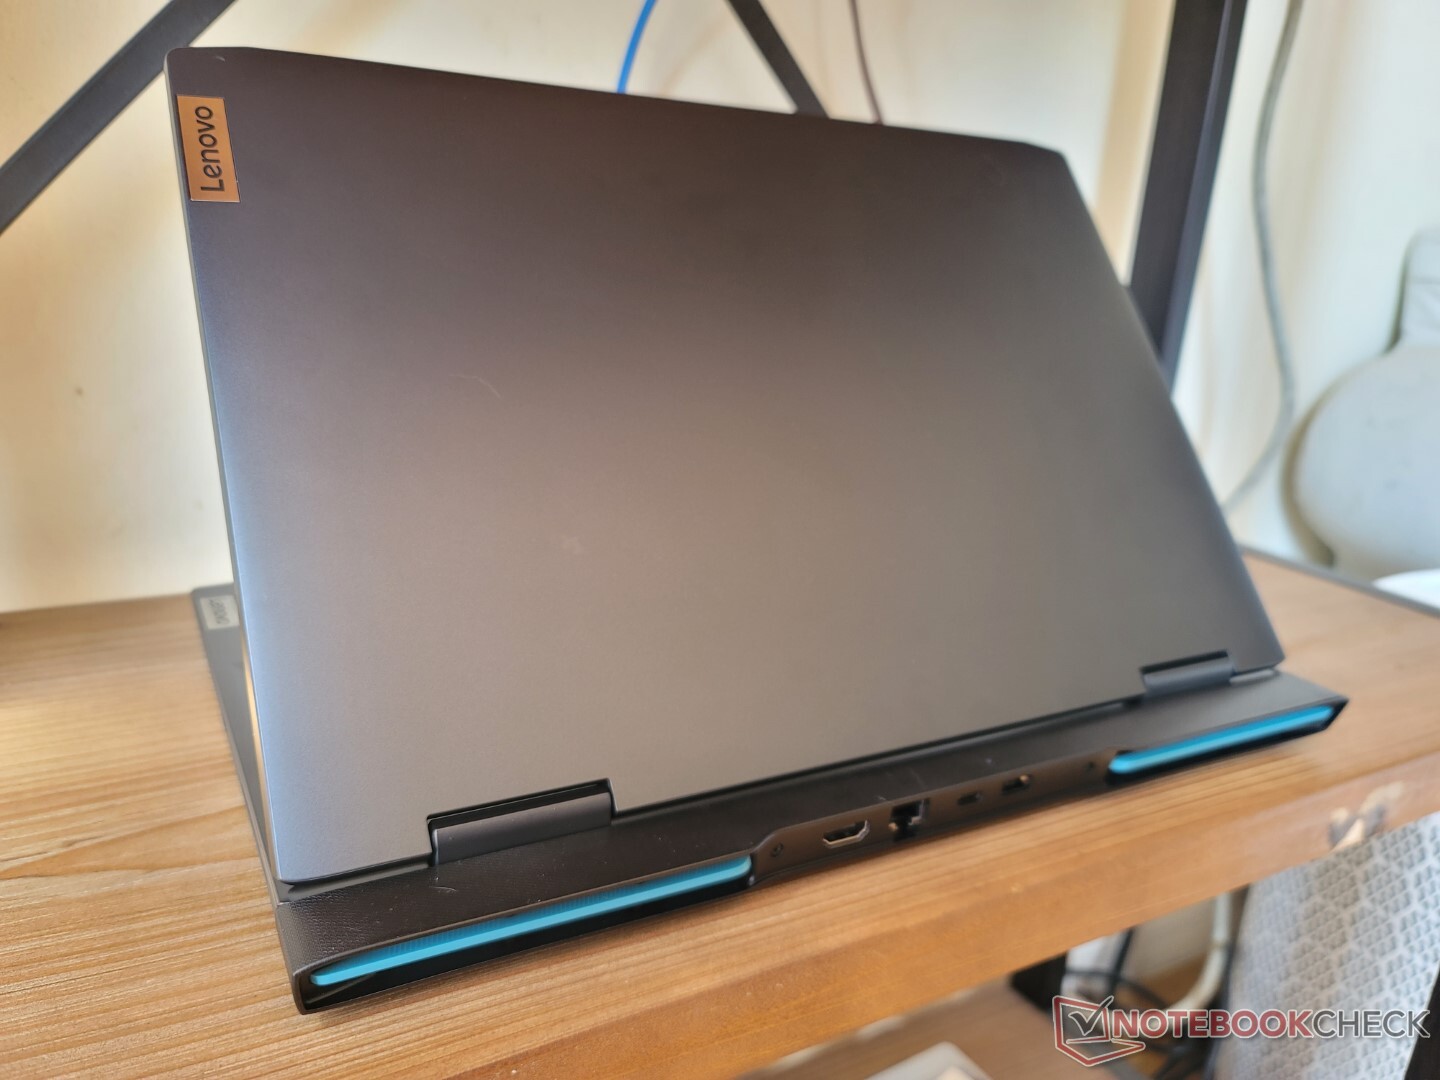
与2020年的IdeaPad Gaming 3相比,我们的2022型号更大,重了约200克。它也薄了几毫米,但稍薄的外形并不能安抚明显更庞大的底盘。尺寸和重量的增加可以归因于新的拉长的后部,其灵感来自于Legion 系列。
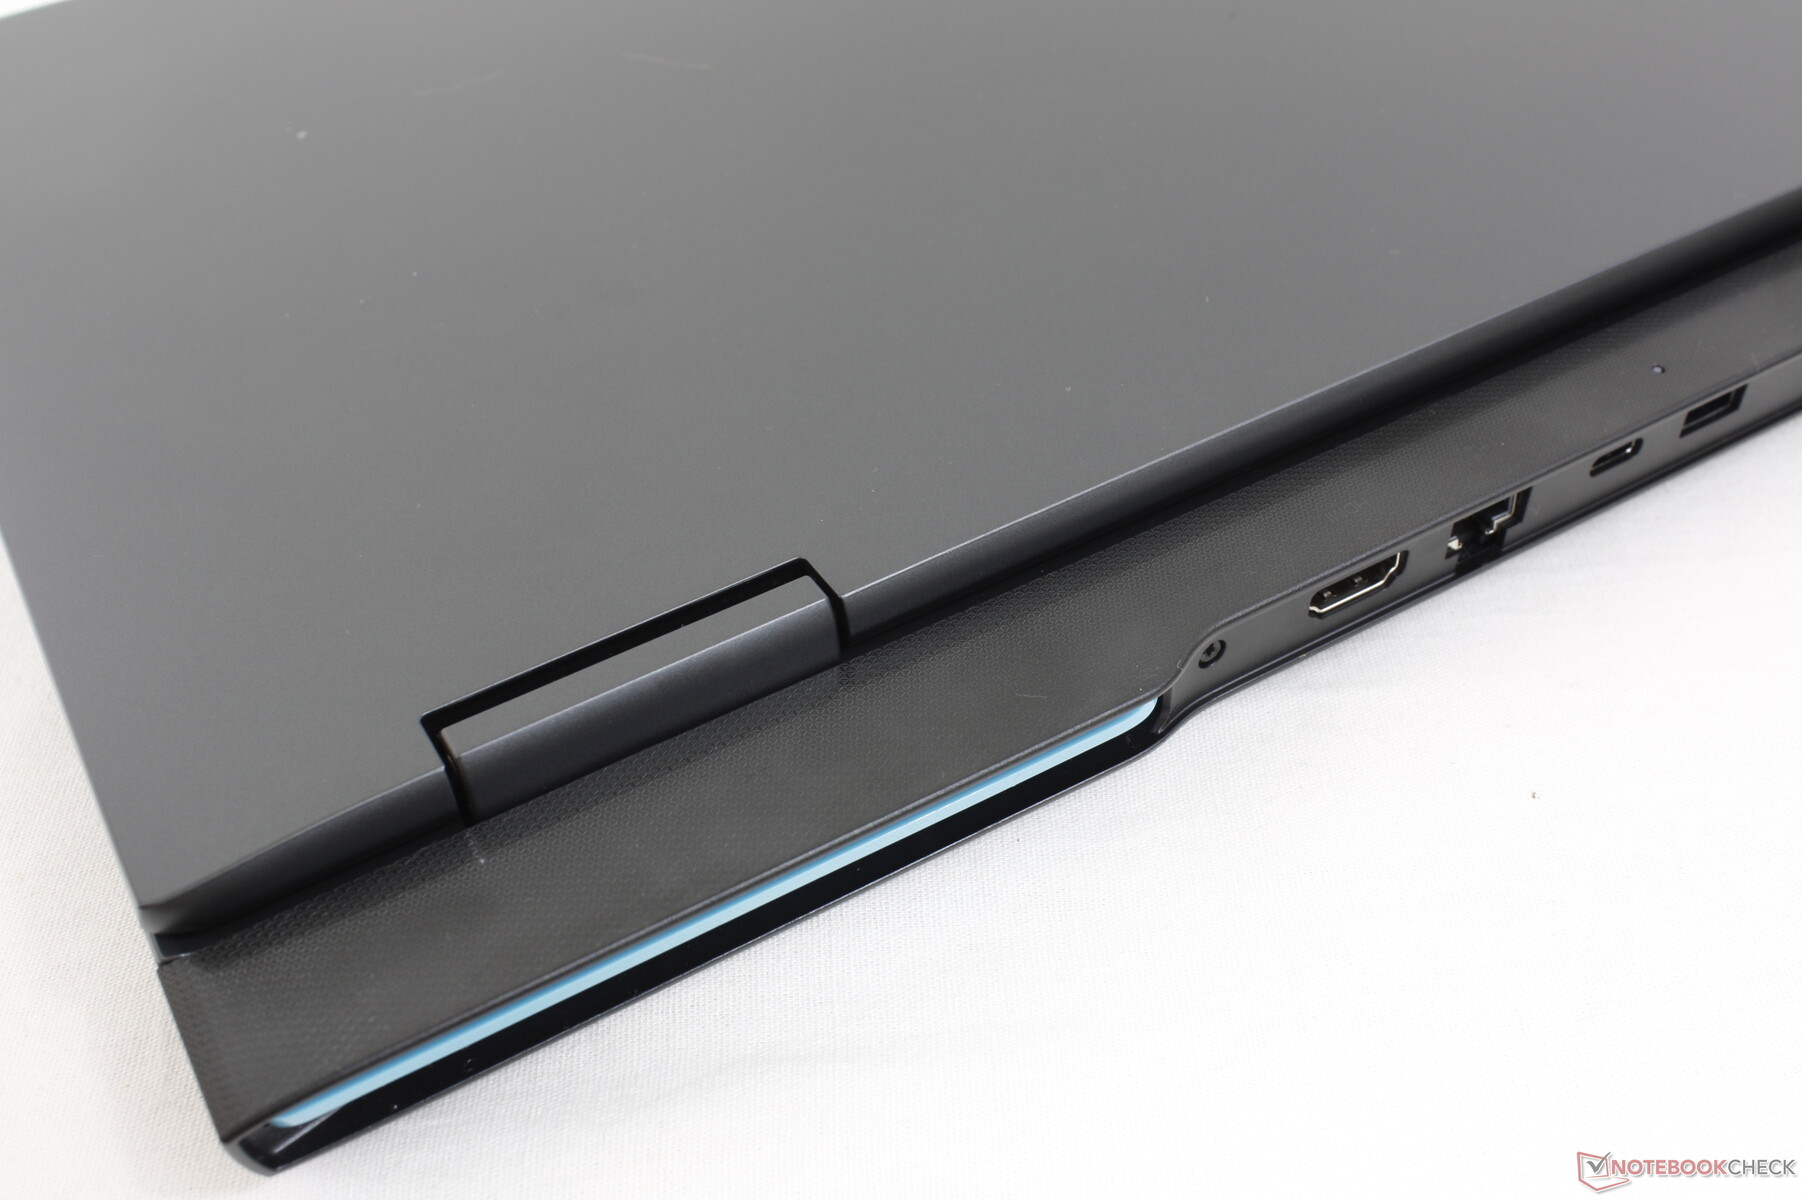
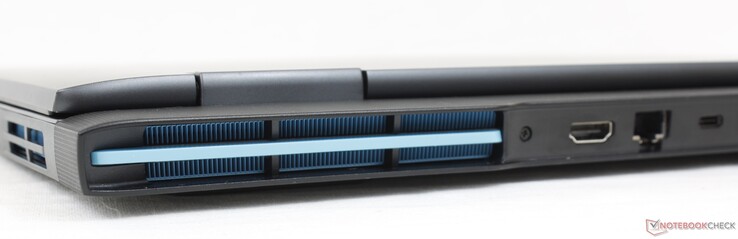
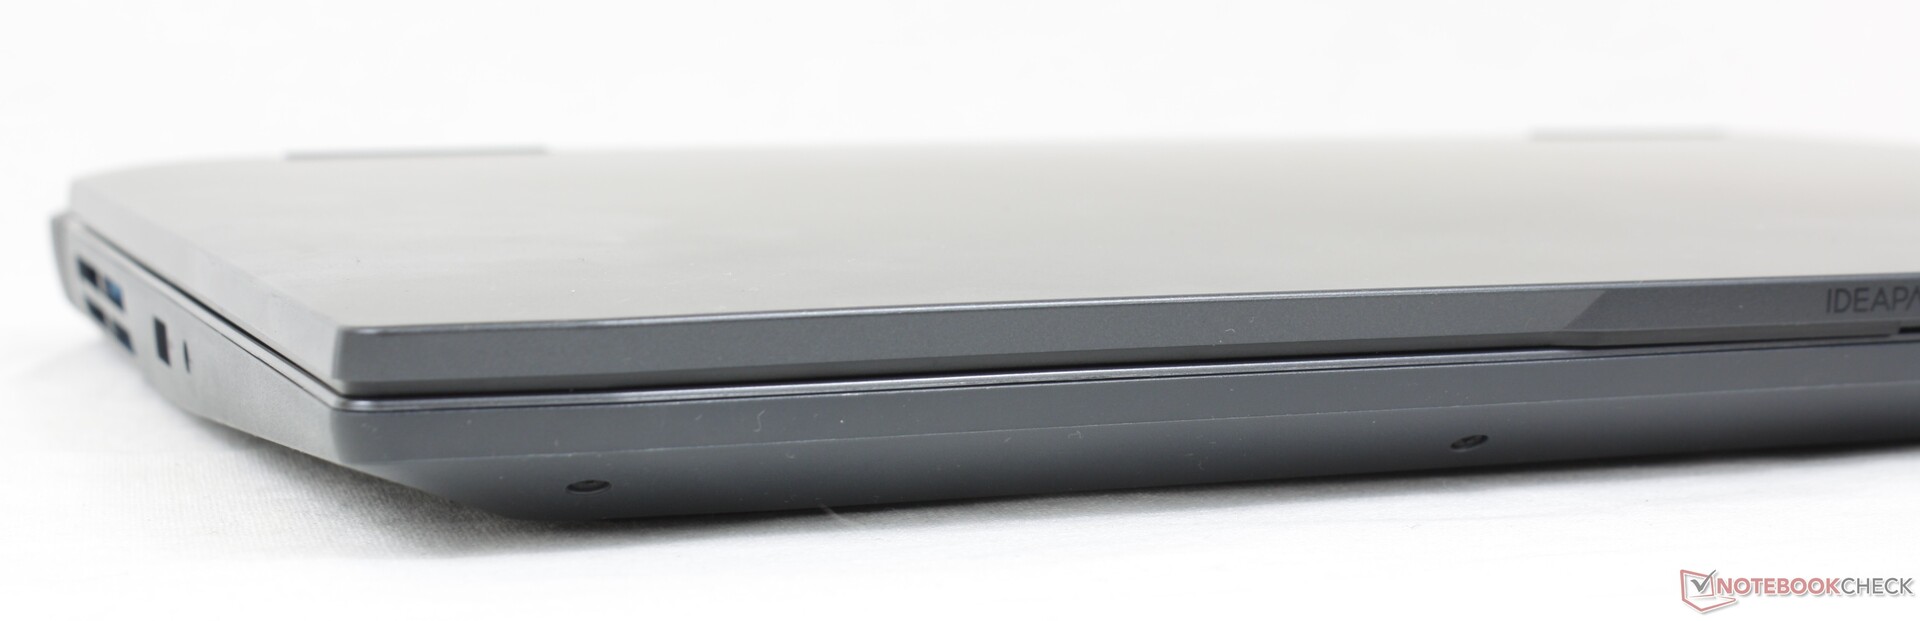
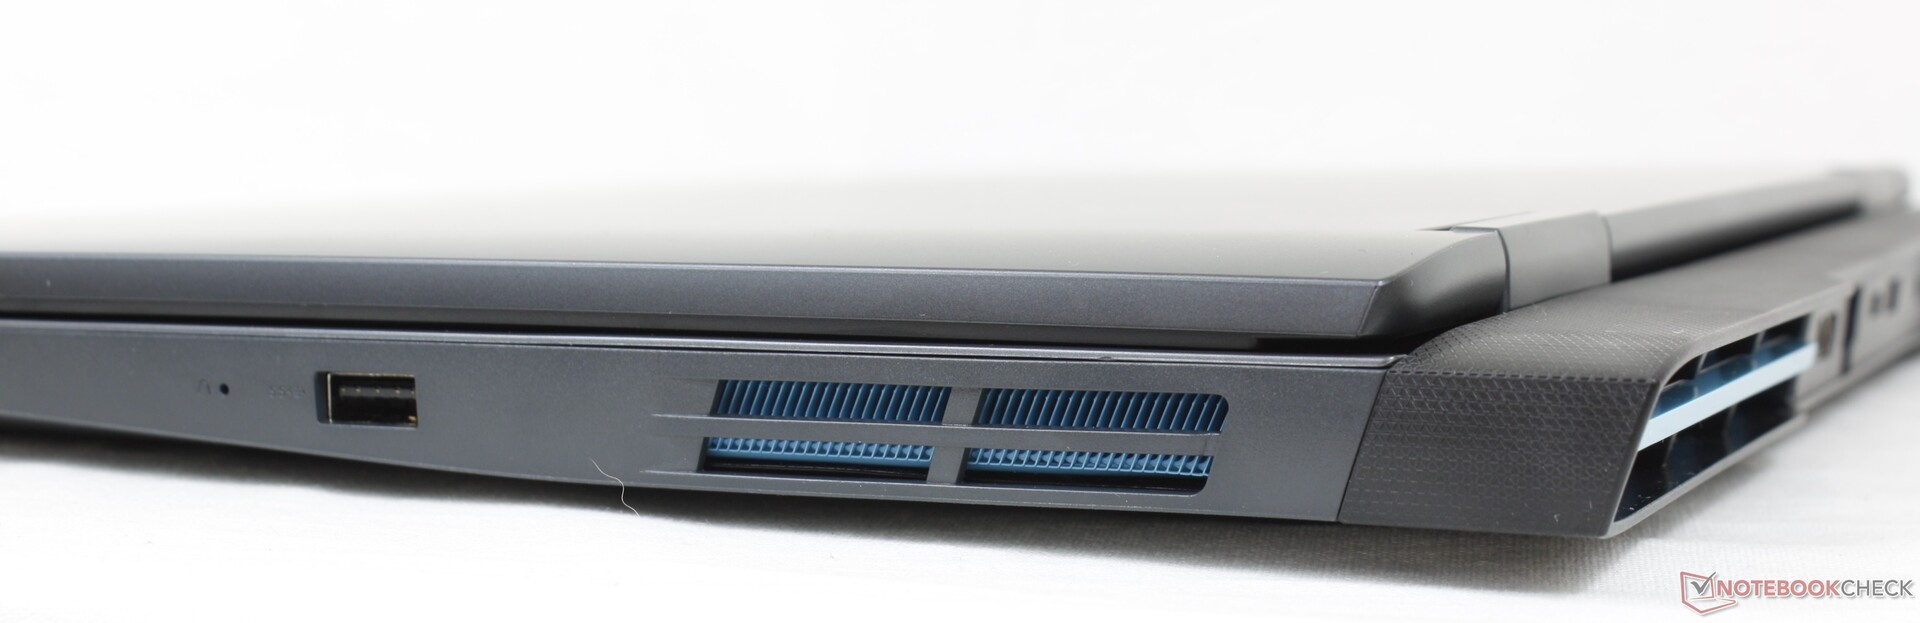
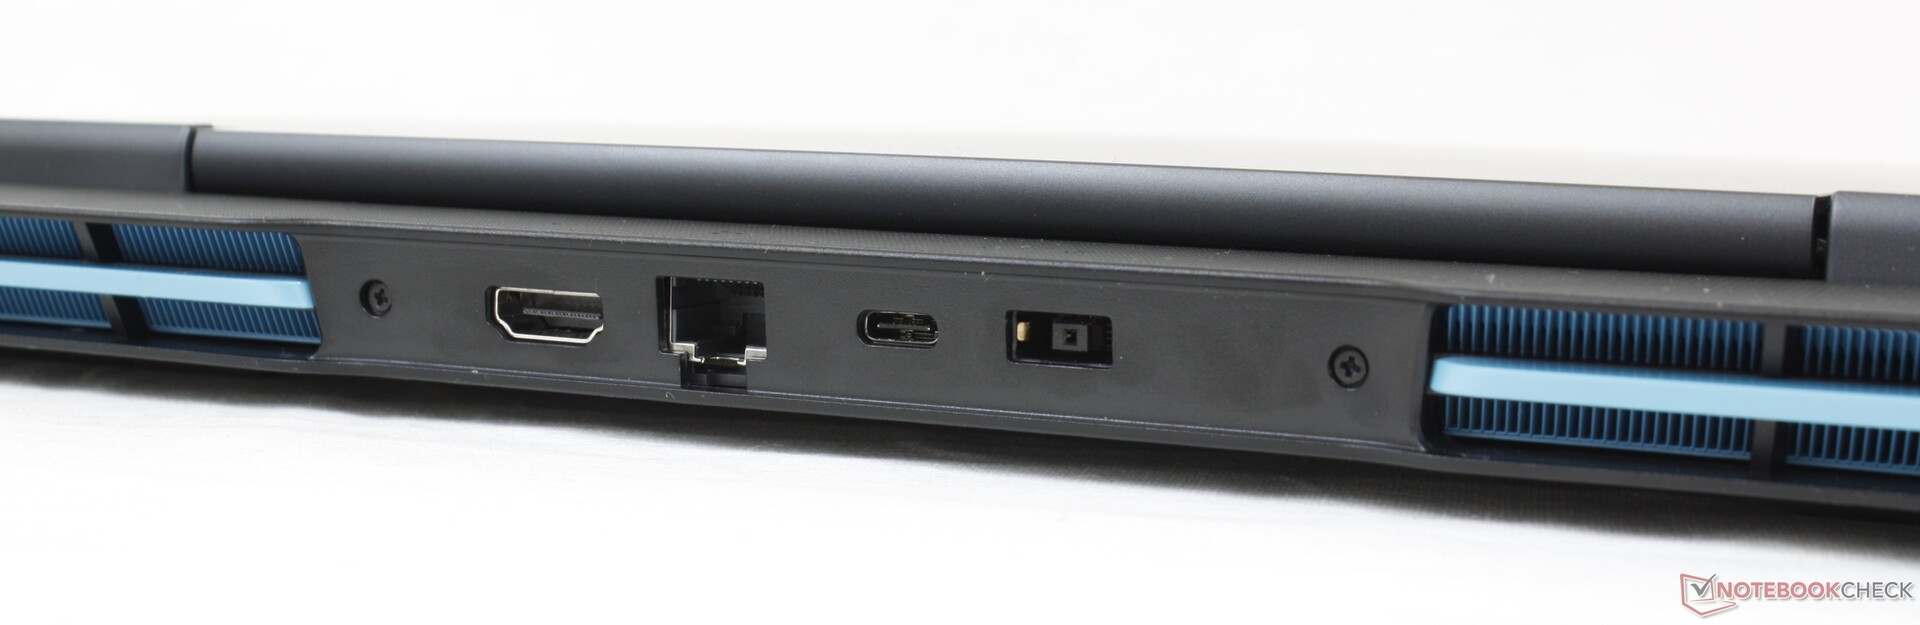
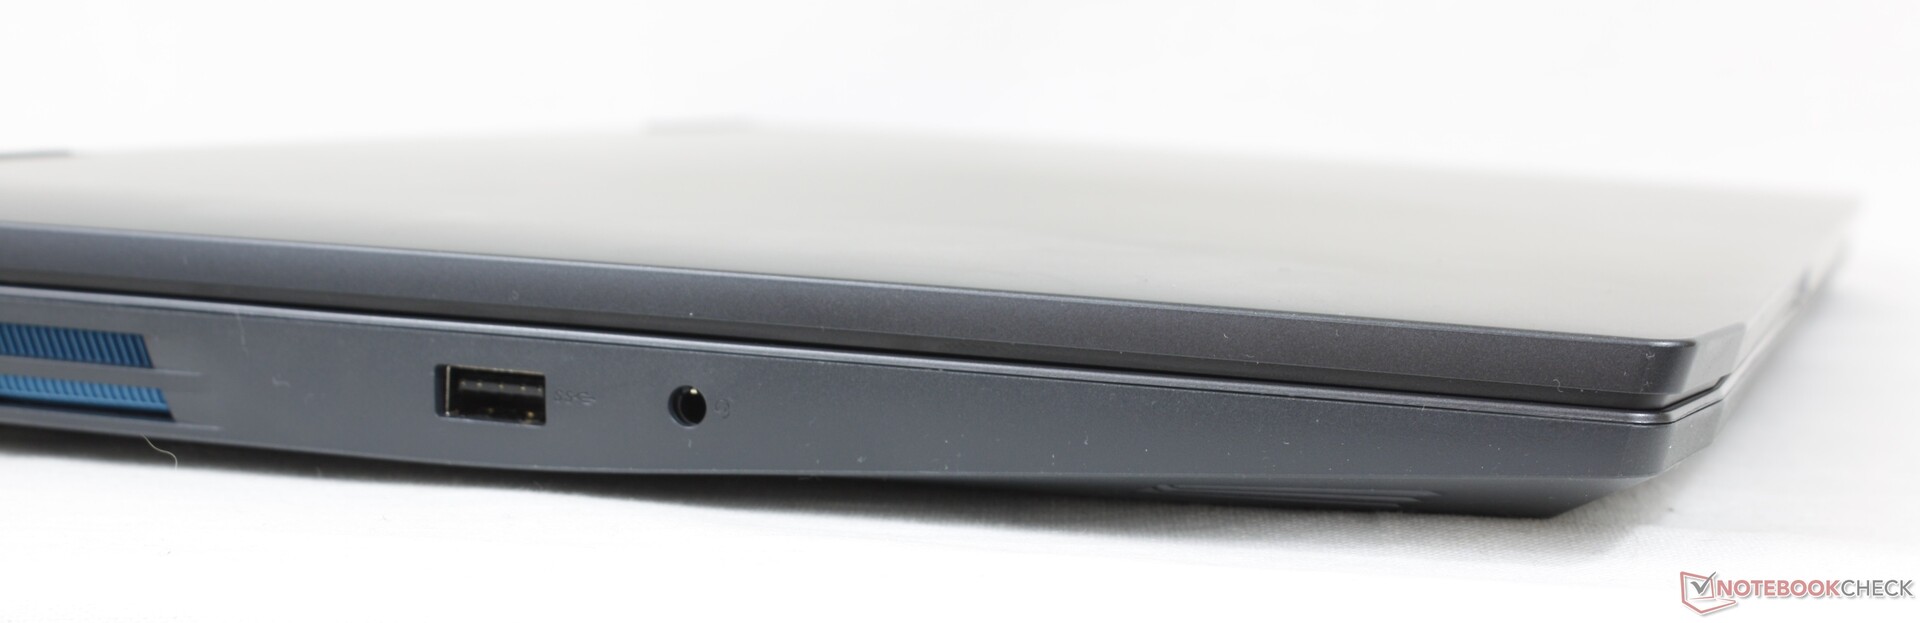
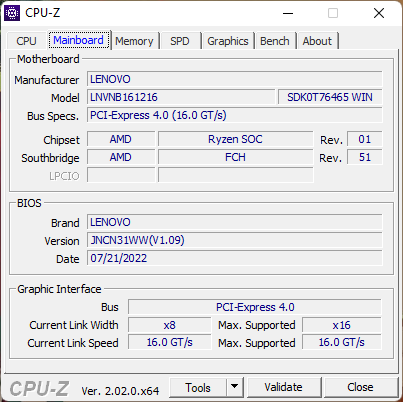
连接性 - 不支持Thunderbolt
端口选项是体面的,可与其他预算游戏笔记本相媲美。然而,端口定位是一个混合袋,因为大多数端口是沿着设备的后部,它们可能难以到达。请记住,与许多英特尔驱动的游戏笔记本不同,Thunderbolt不被支持。
沟通
该设备配备了Realtek RTL8852BE,用于Wi-Fi 6和蓝牙5.1连接,而不是英特尔AX模块,可能是为了节省成本。传输速率明显较慢,但它们仍然是稳定的,对于包括4K视频流或下载在内的大多数用途来说,速度足够快。
| Networking | |
| iperf3 transmit AX12 | |
| Lenovo Legion 5 15ACH6A-82NW0010GE | |
| Lenovo IdeaPad Gaming 3i 15IMH05 | |
| iperf3 receive AX12 | |
| Lenovo Legion 5 15ACH6A-82NW0010GE | |
| Lenovo IdeaPad Gaming 3i 15IMH05 | |
| iperf3 receive AXE11000 | |
| Gigabyte A5 K1 | |
| Dell G15 5510 | |
| Asus TUF Dash F15 FX517ZR | |
| Lenovo IdeaPad Gaming 3 15ARH7 | |
| iperf3 transmit AXE11000 | |
| Gigabyte A5 K1 | |
| Asus TUF Dash F15 FX517ZR | |
| Lenovo IdeaPad Gaming 3 15ARH7 | |
网络摄像头
集成的网络摄像头只有100万像素,画面浑浊。虽然有一个用于保护隐私的快门,但没有用于支持你好的红外线。


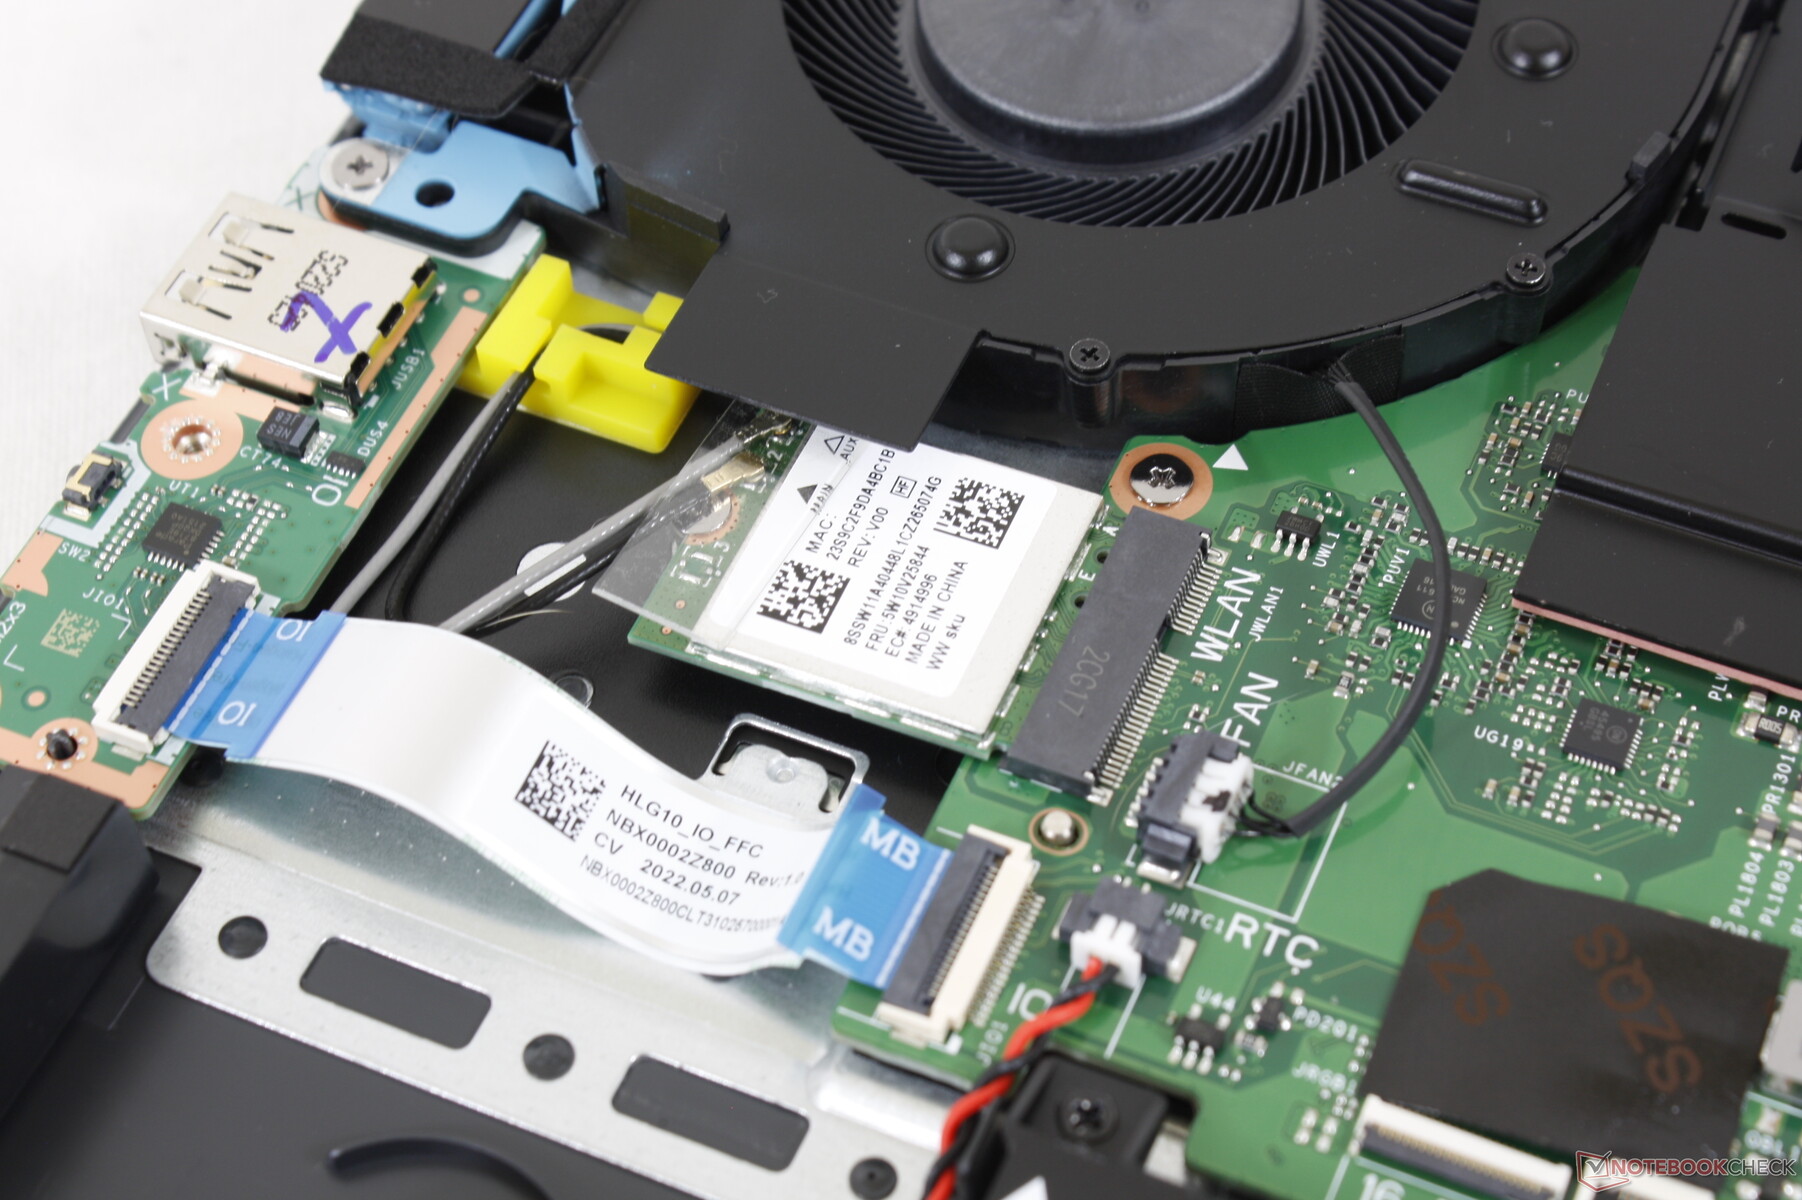
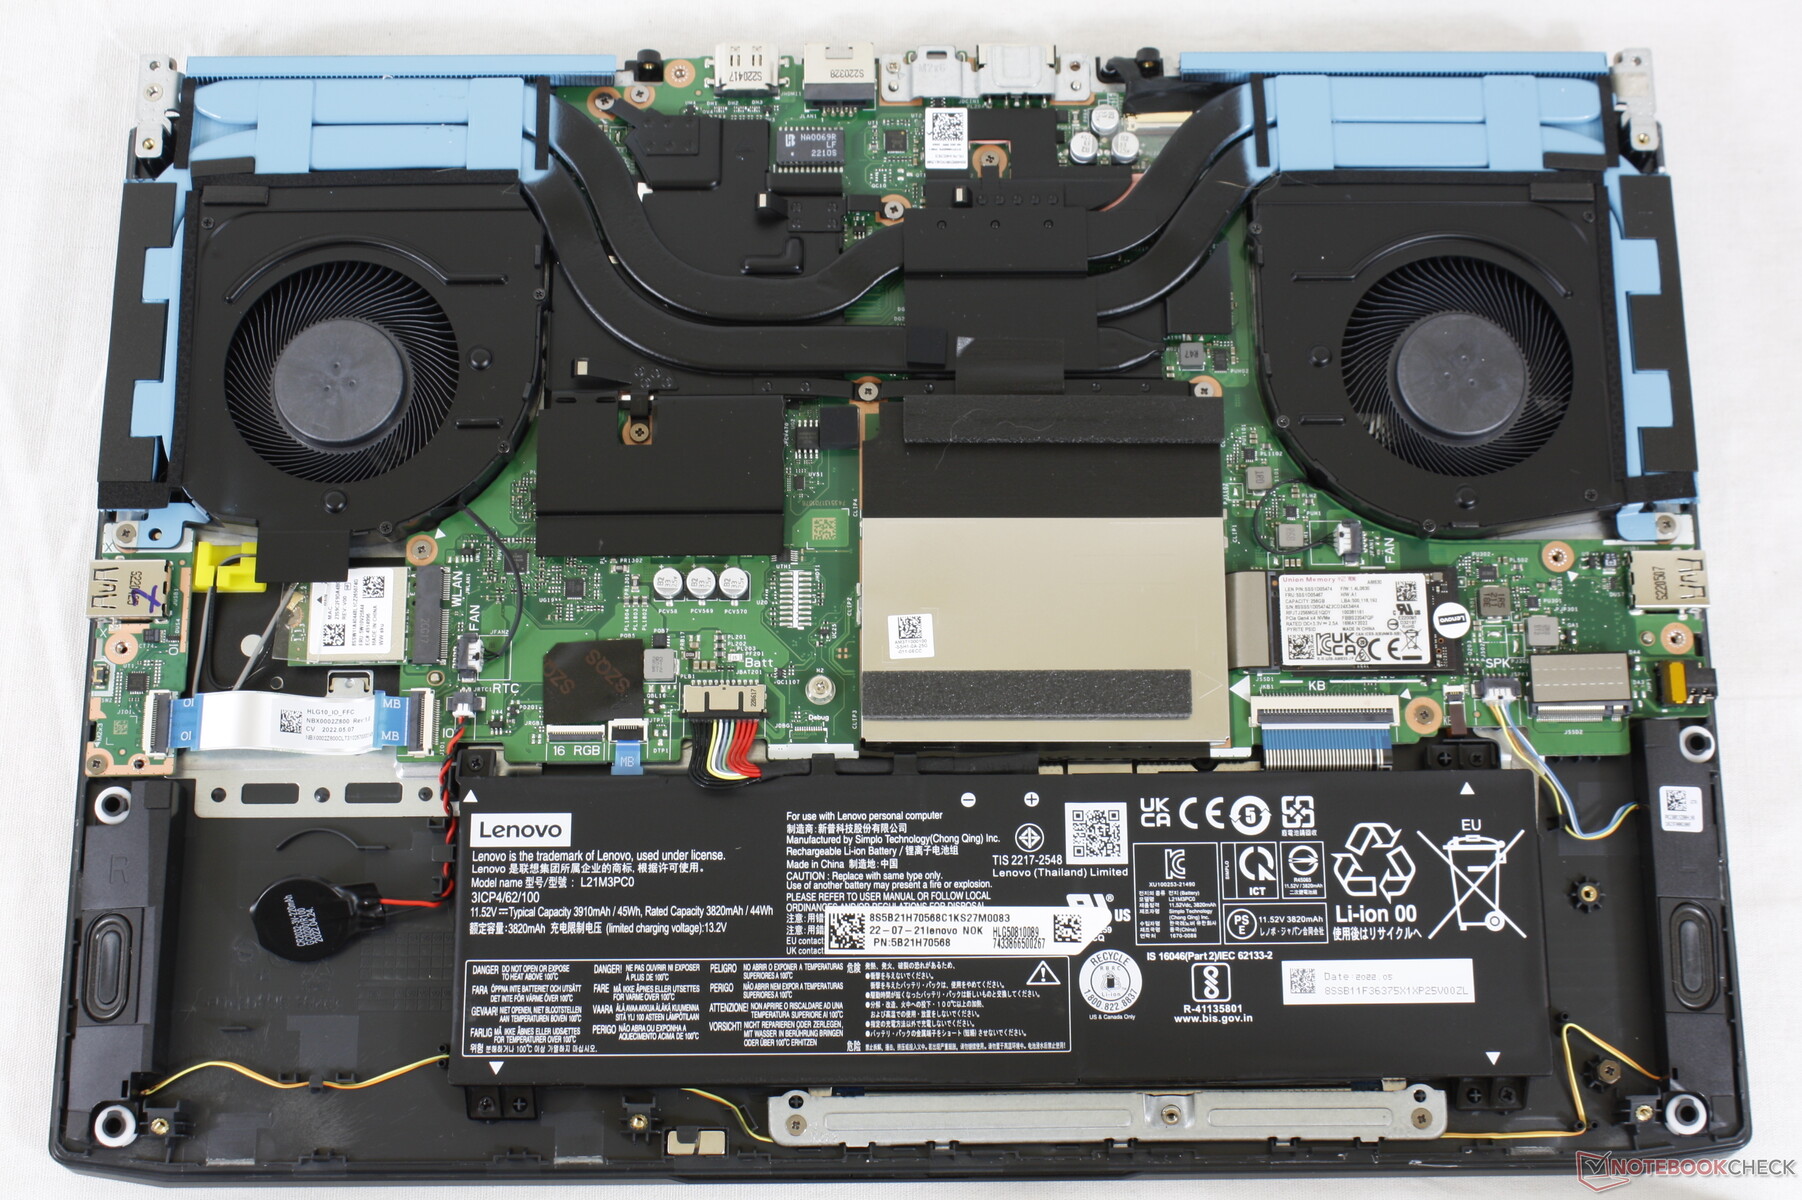
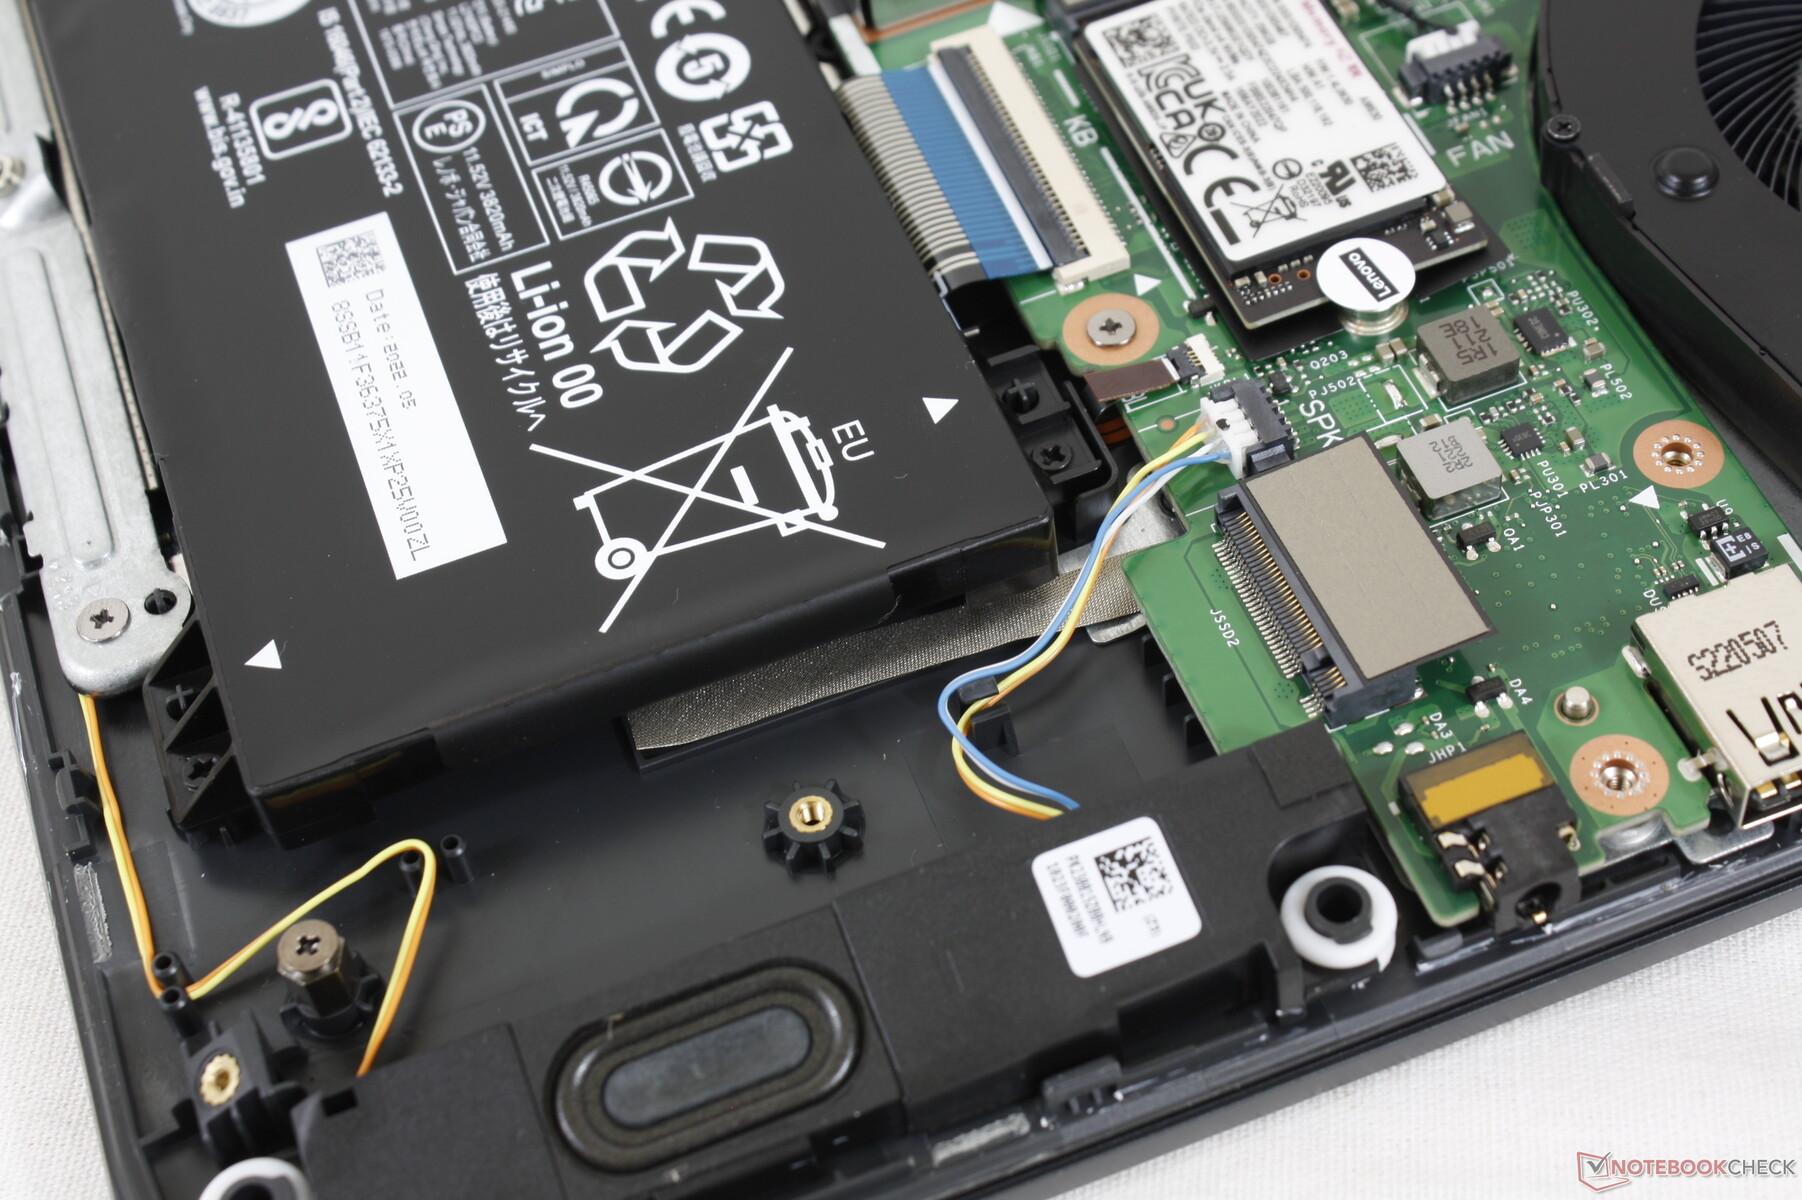
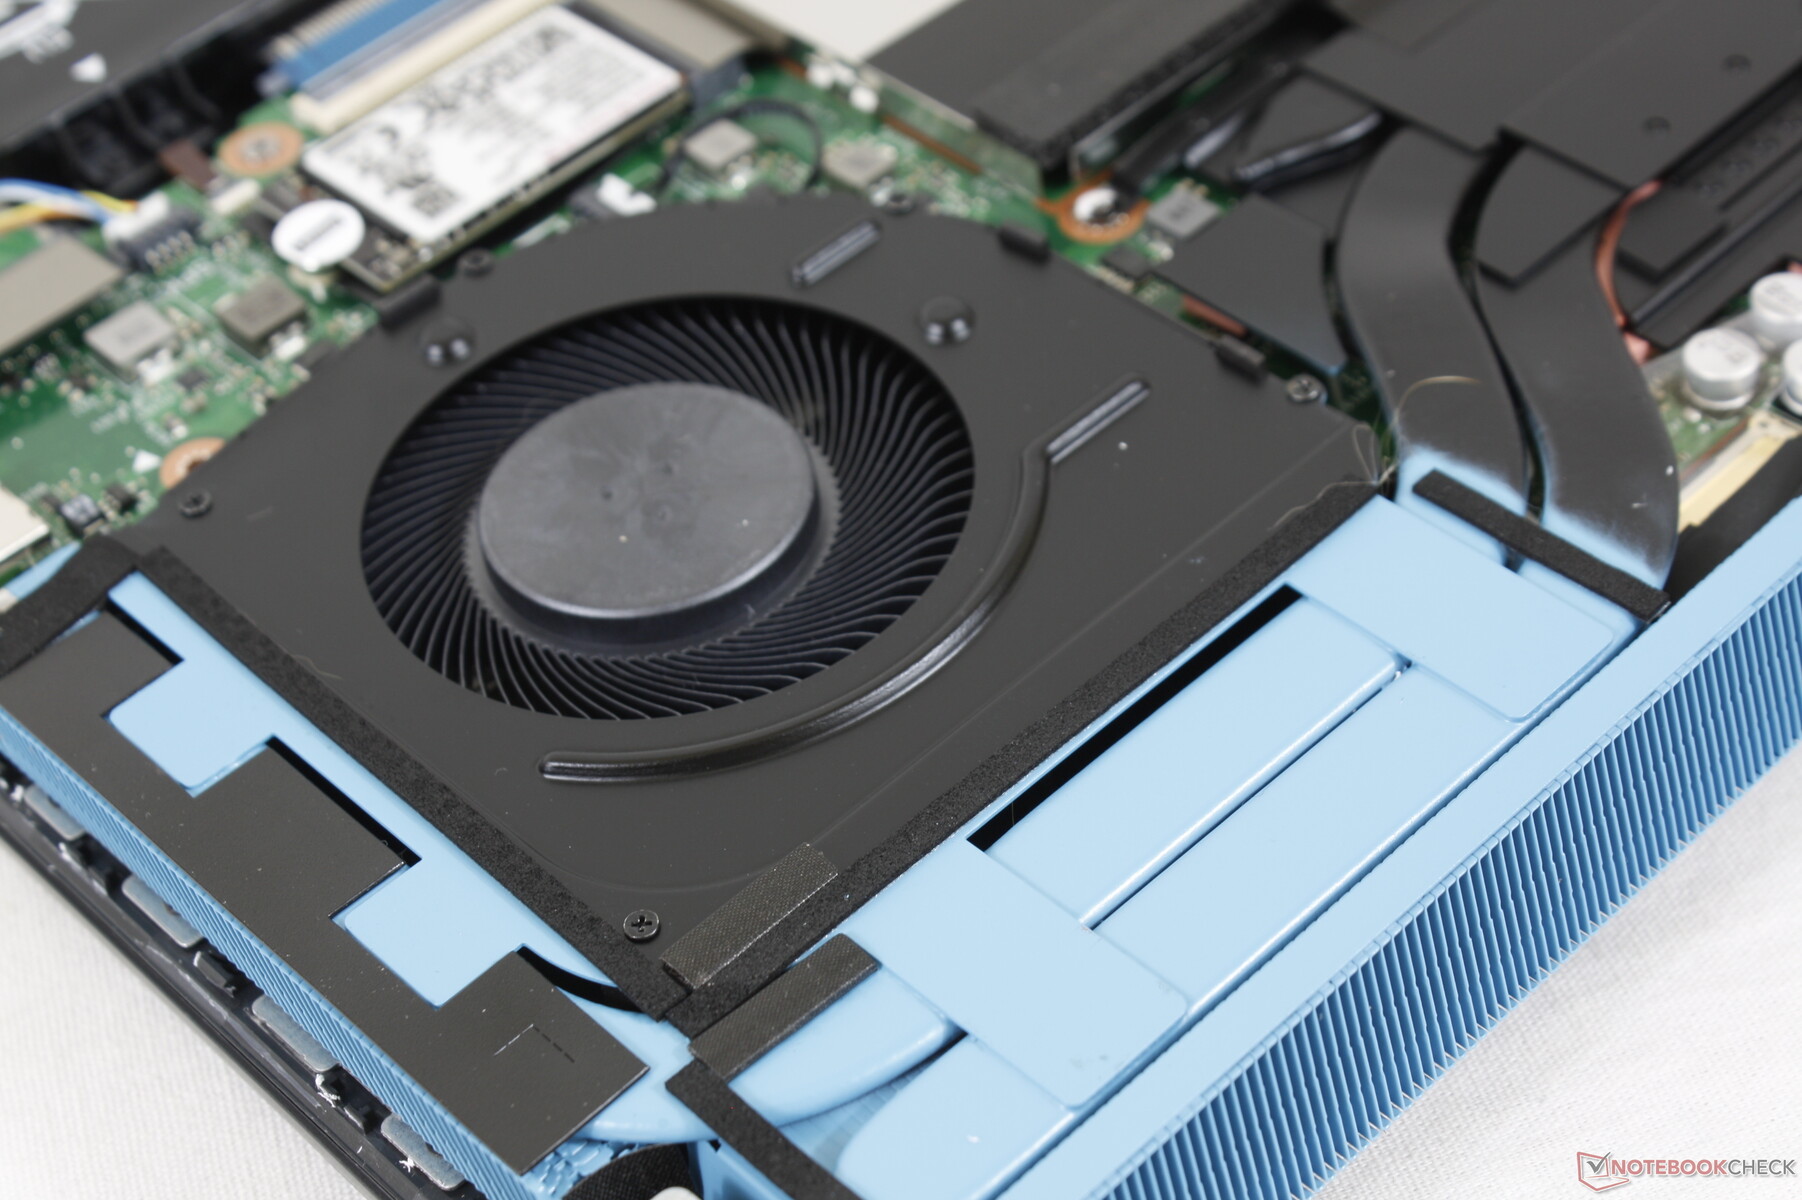
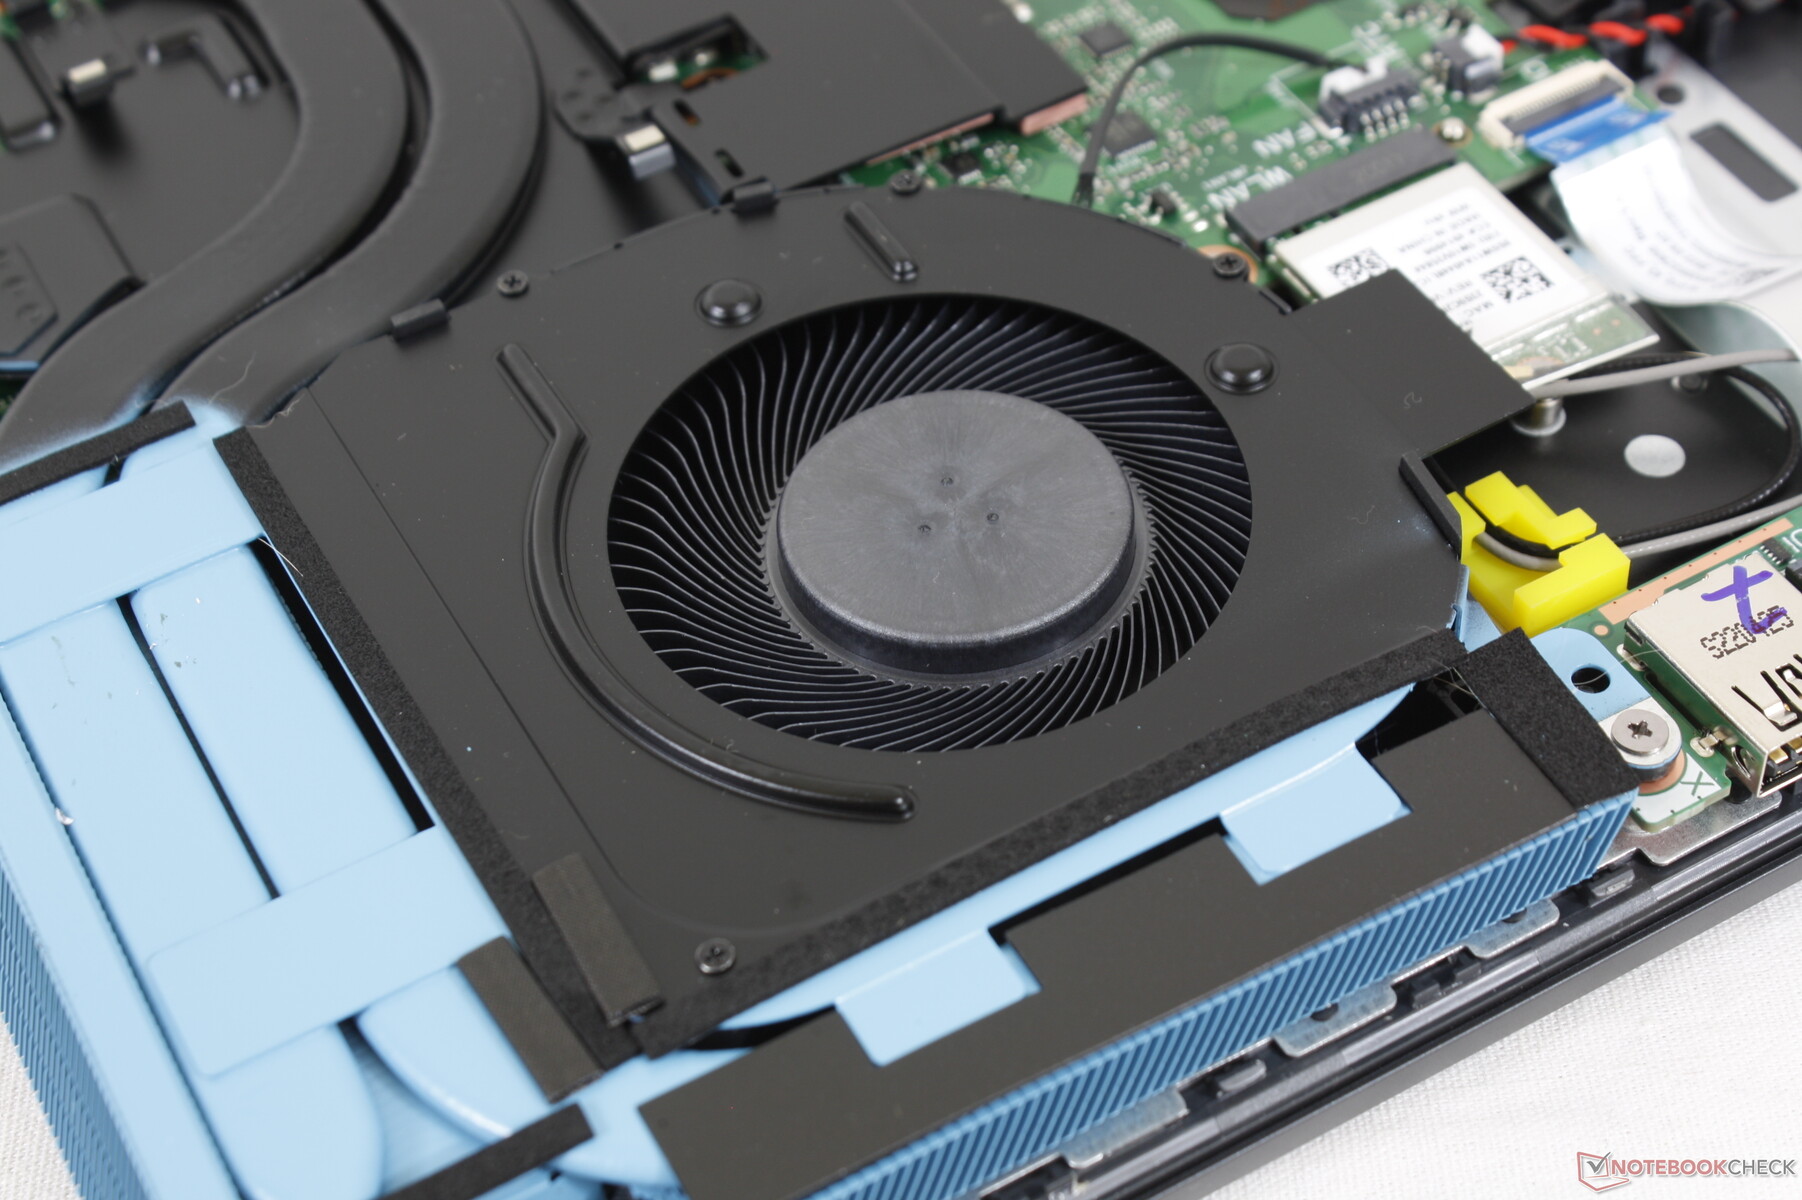
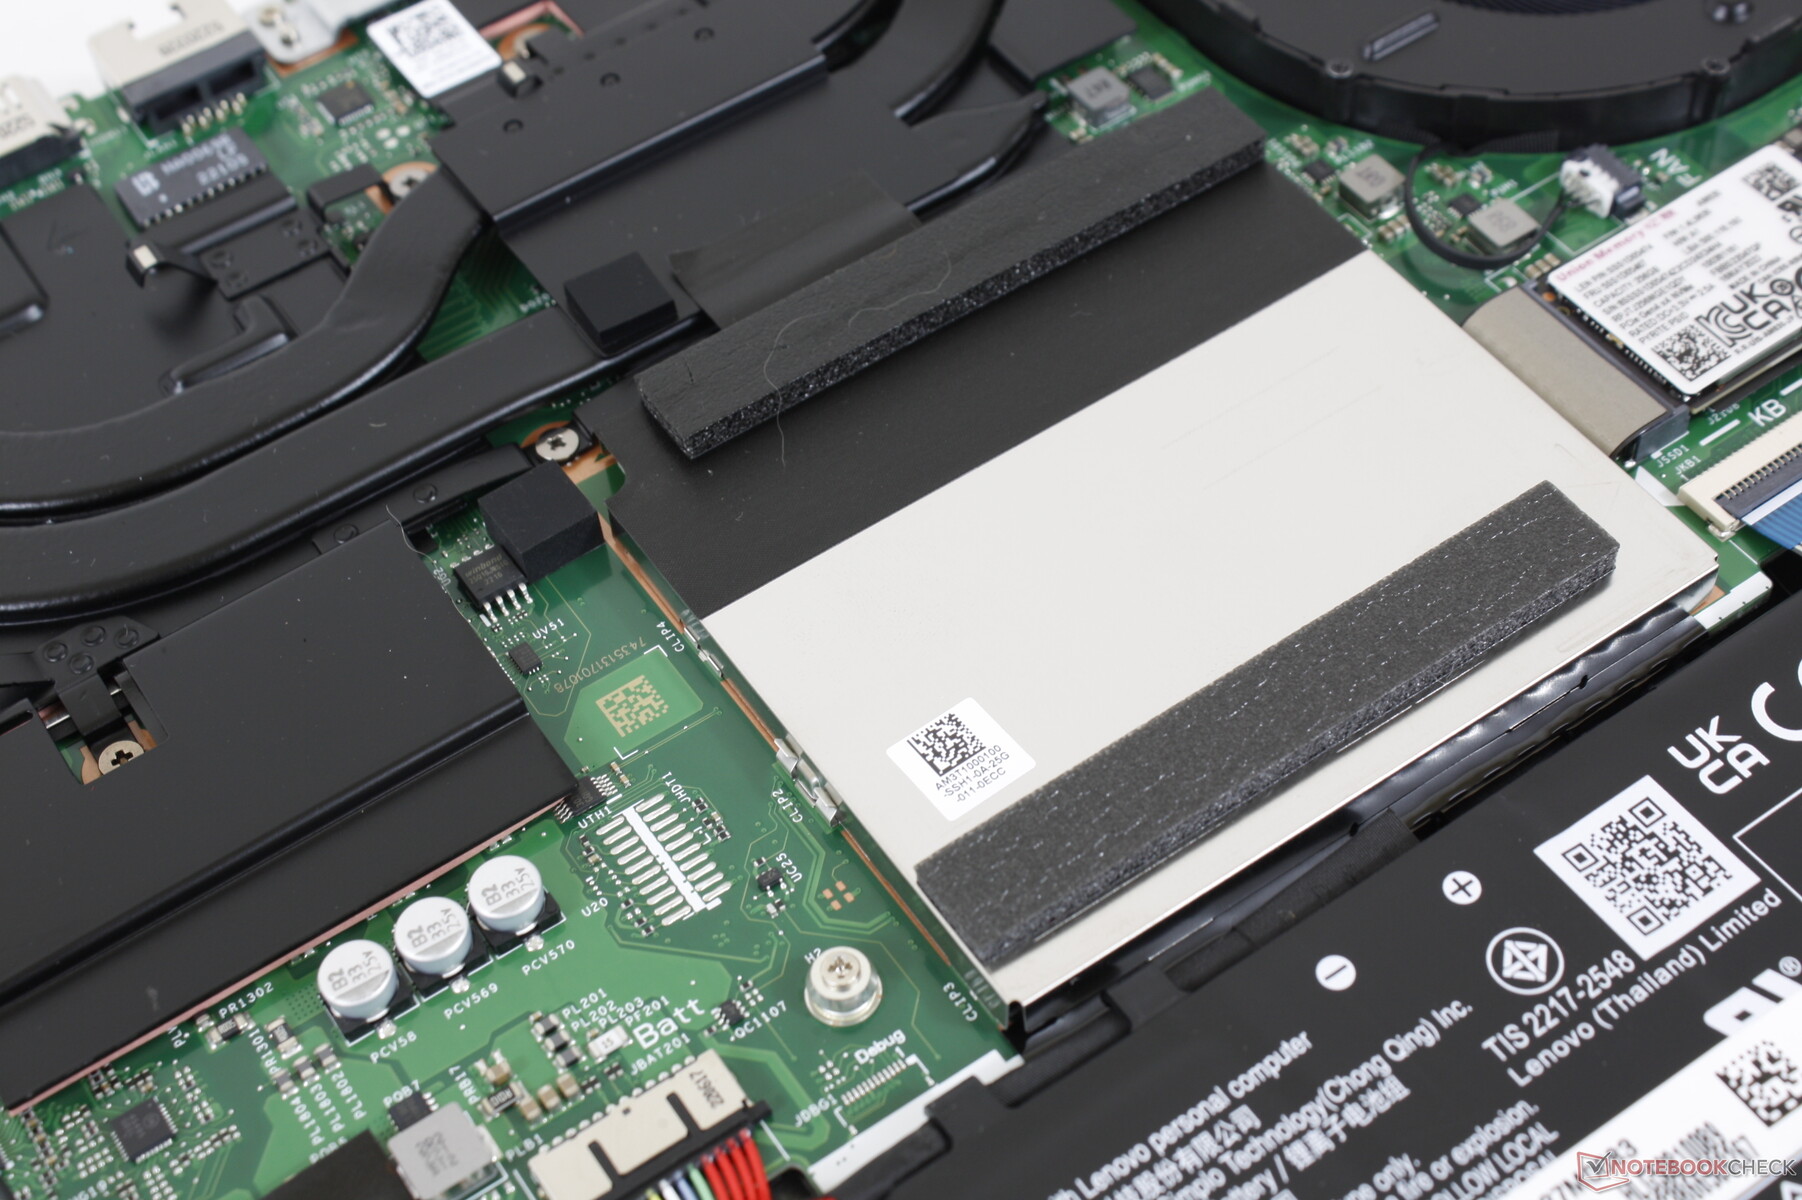
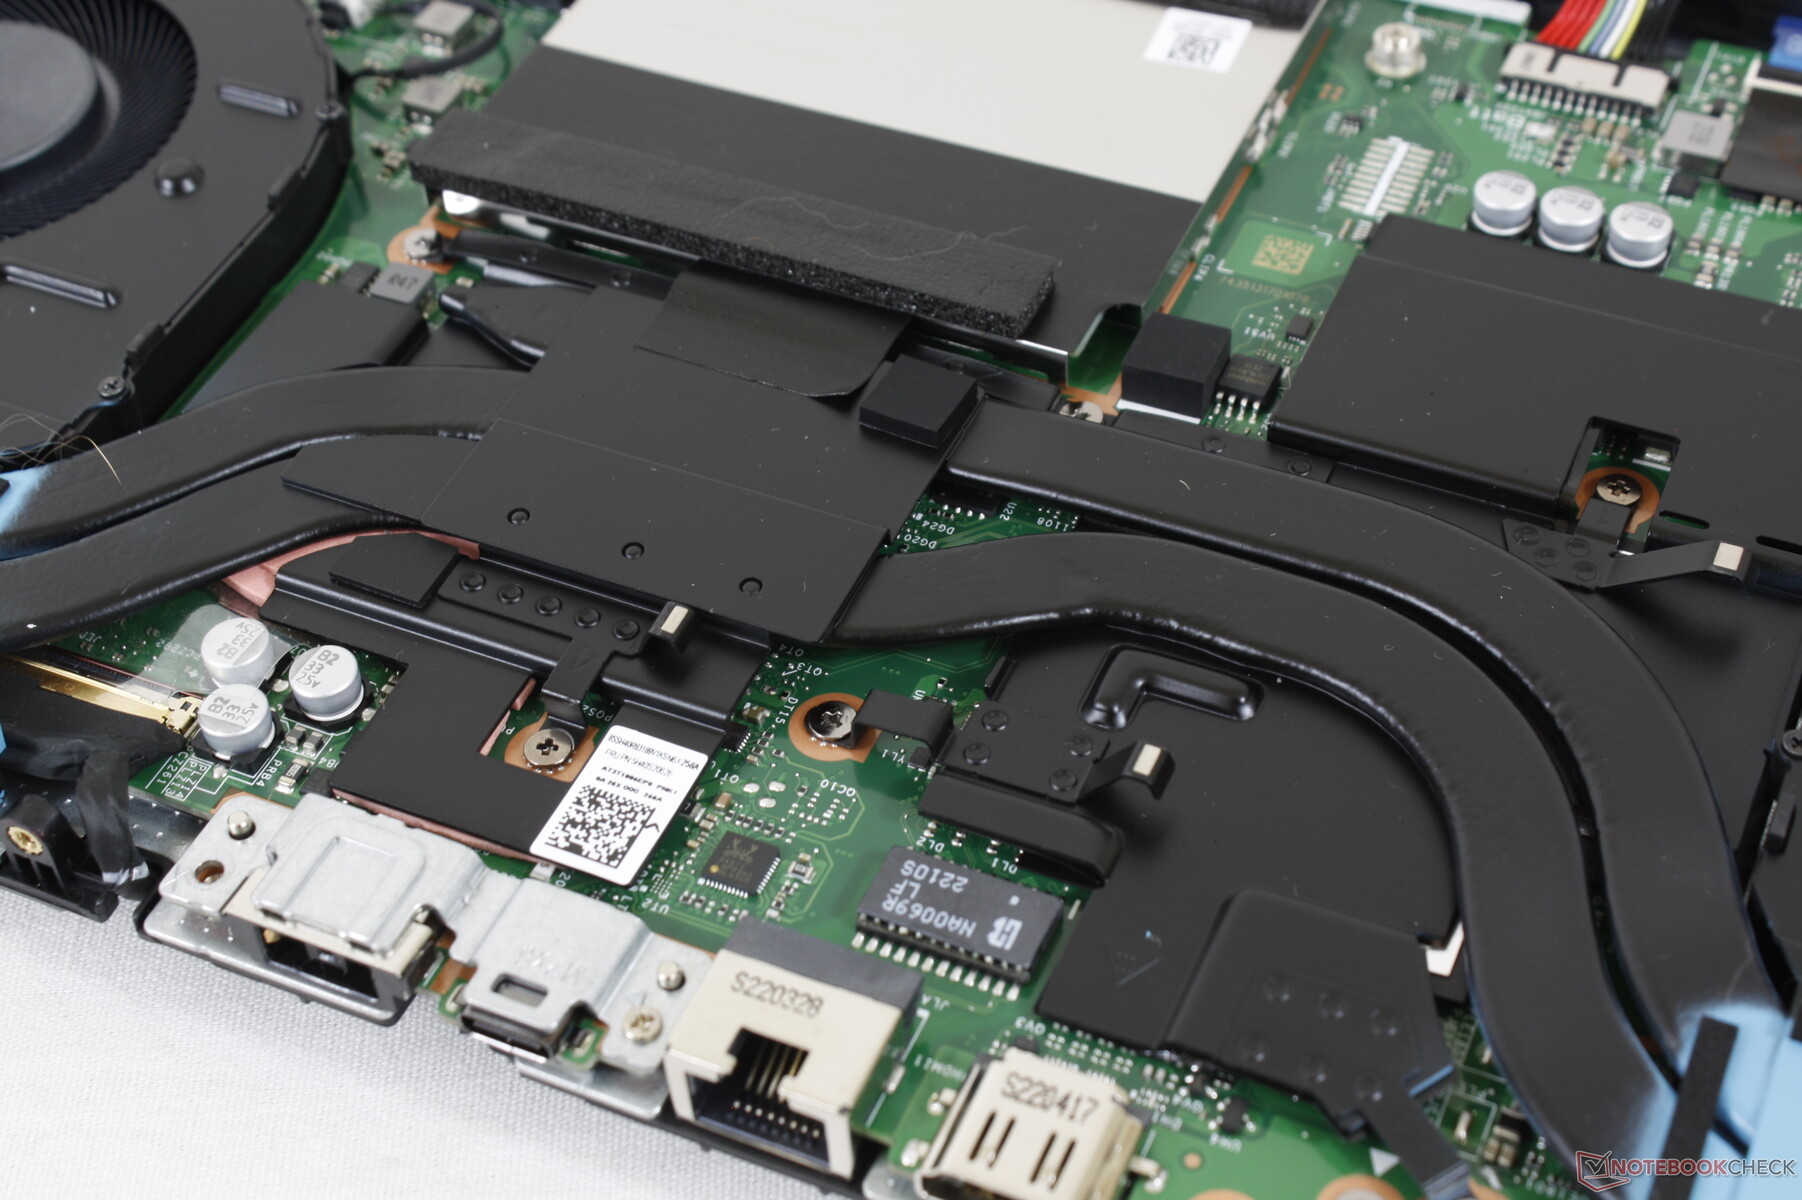
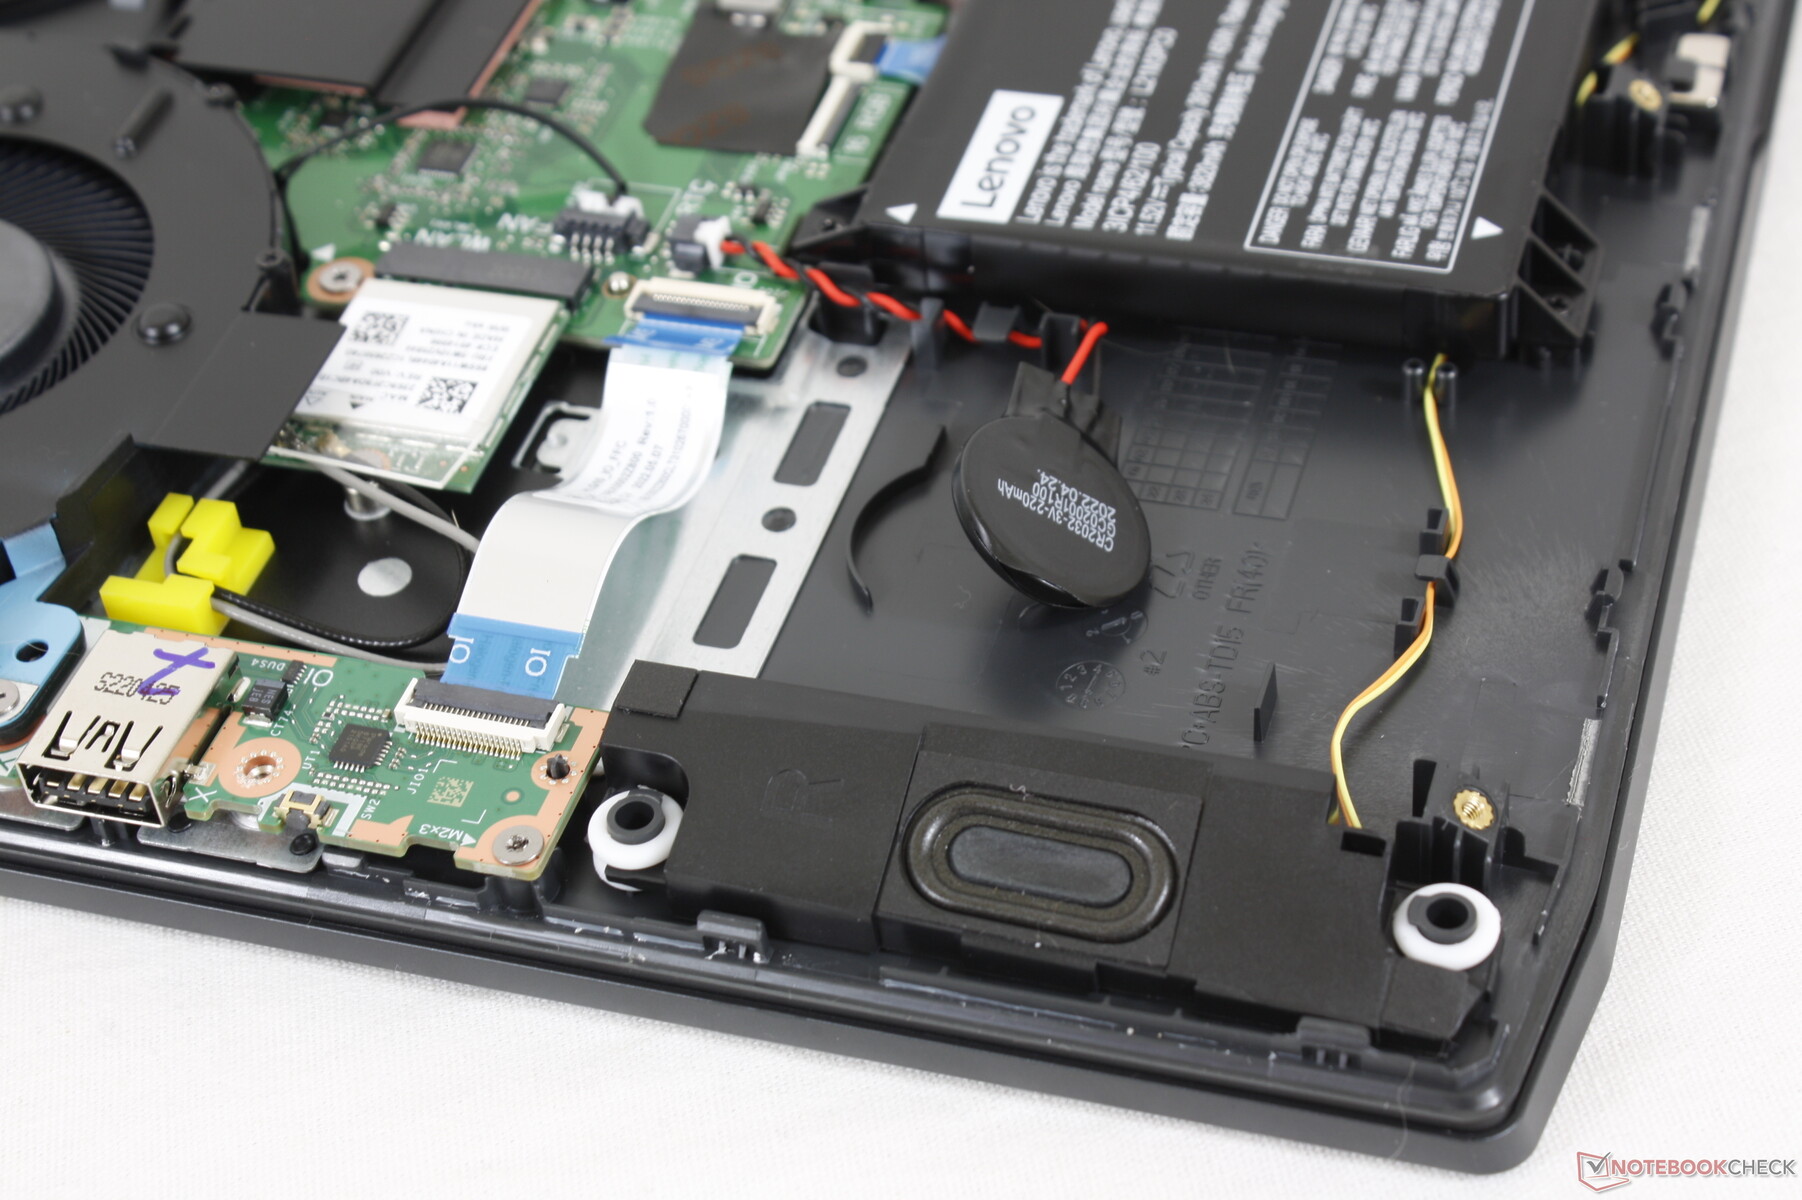
维修 - 难以打开
底部面板非常难以拆除。它由12颗飞利浦螺钉固定,但只有8颗是容易接触的。要访问其他4个,必须先拆开后壳,后壳是由后面的端口附近的两个螺丝固定的。从机身上拆下这个后壳是一个额外的步骤,这在大多数其他游戏笔记本上是不存在的。很明显,联想在设计IdeaPad Gaming 3 15时没有考虑到终端用户可以轻松升级,这是一个耻辱,因为实际上有很多升级途径,包括2个SODIMM插槽和2个M.2存储槽。
配件和保修
除了交流电适配器和文件之外,盒子里没有其他的东西。如果在美国购买,通常有一年的有限保修。
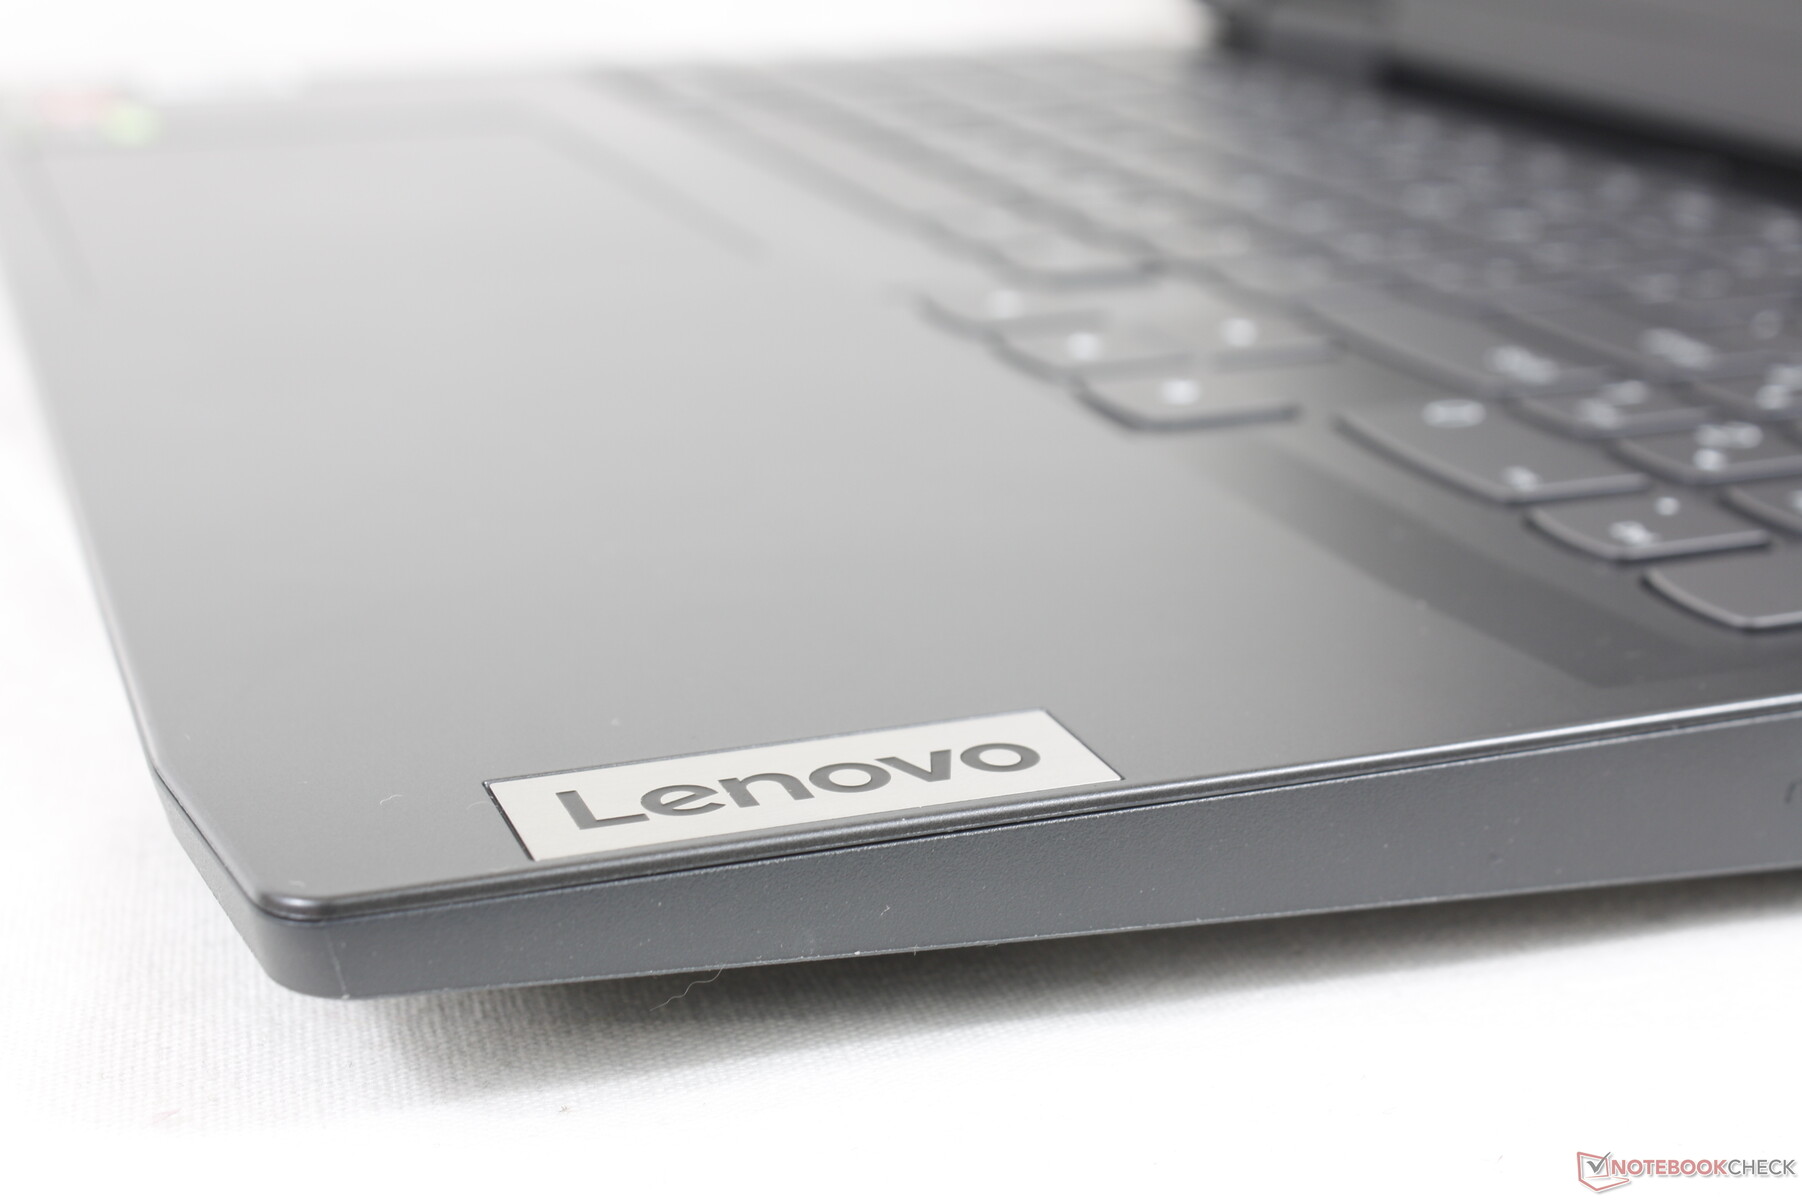
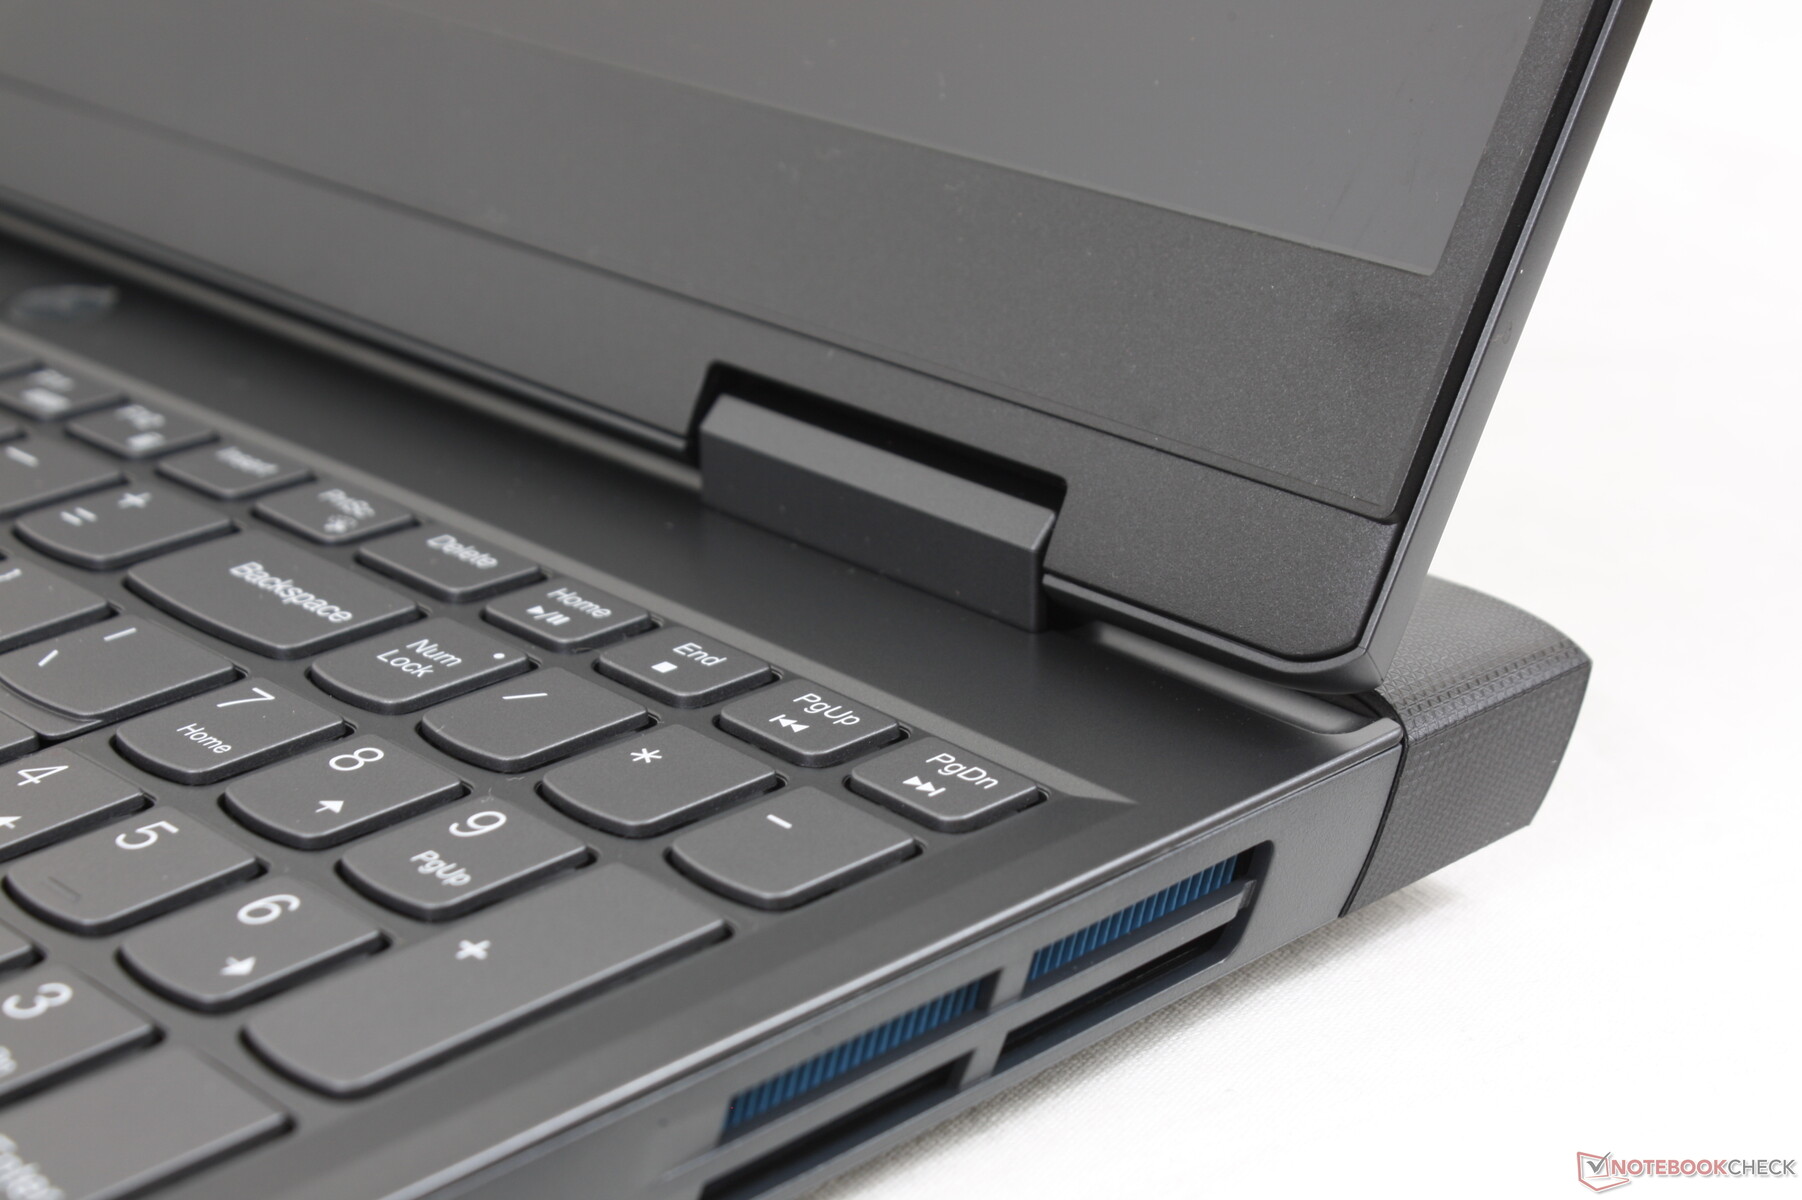
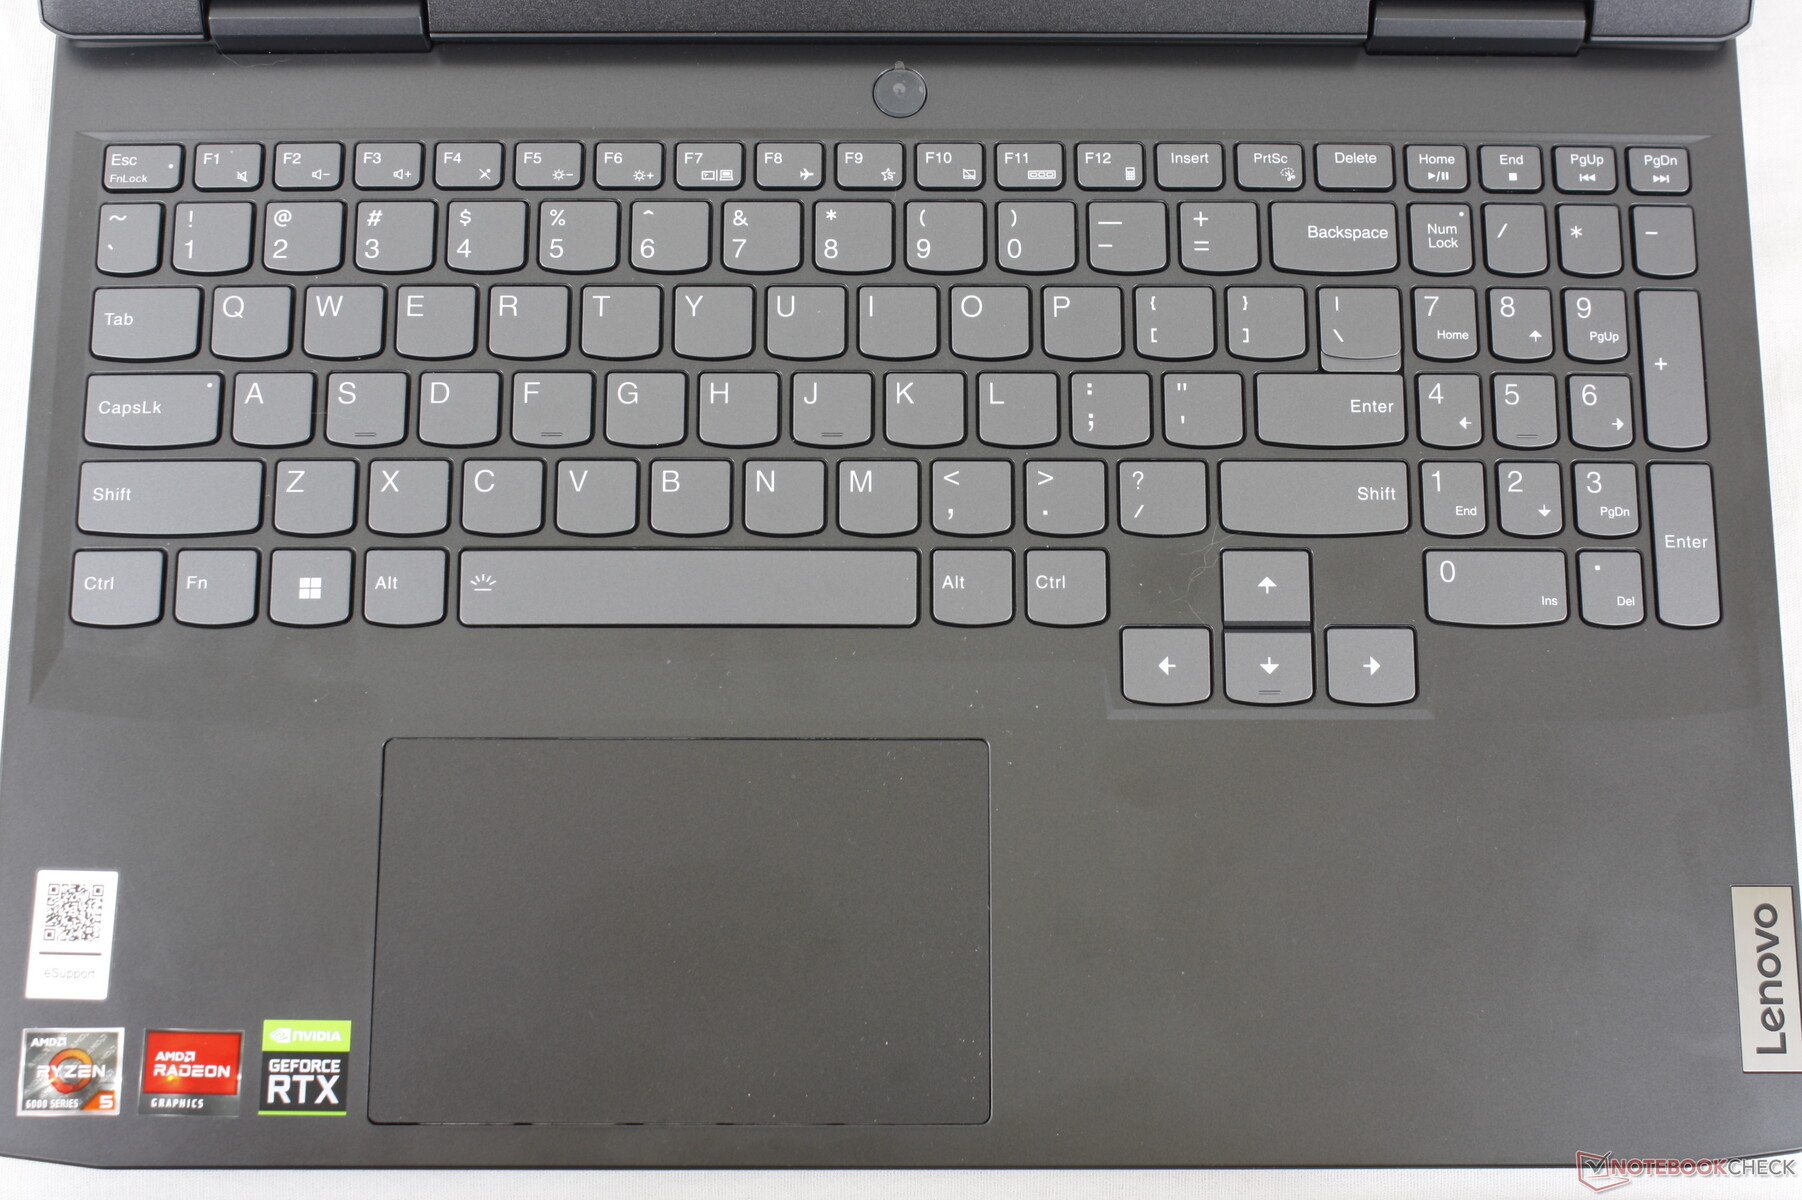
输入设备 - 经典IdeaPad
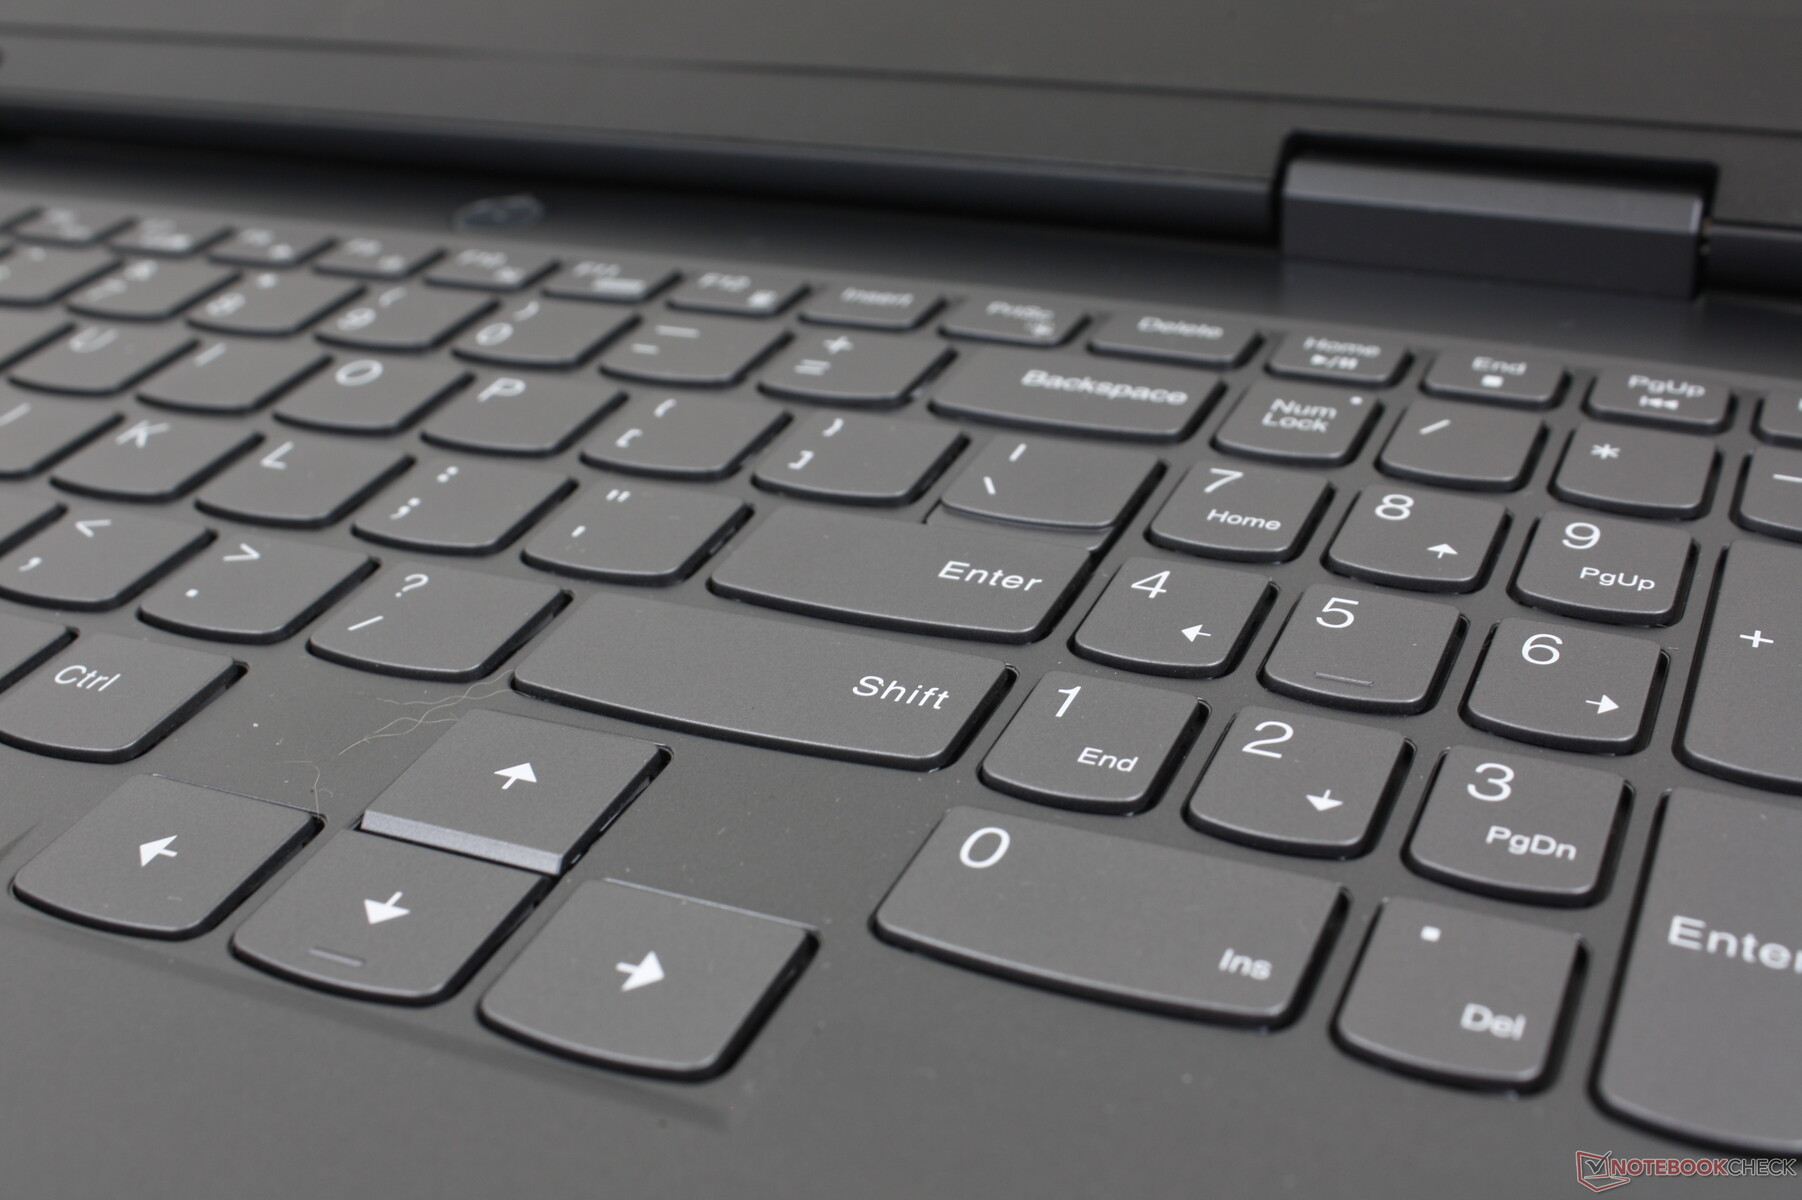
键盘
每个键上的字母和符号现在都是白色的,而在2020年的IdeaPad Gaming 3i上是浅蓝色。否则,尽管机箱发生了变化,但从按键的大小和感觉来看,两款机型之间的打字体验基本相同。按键反馈是轻而浅的,与许多预算和中档超极本相似,如 华硕VivoBook或标准IdeaPad。
两级白色背光是标准配置,用于照亮每个键上的印刷,包括较小的二级符号。
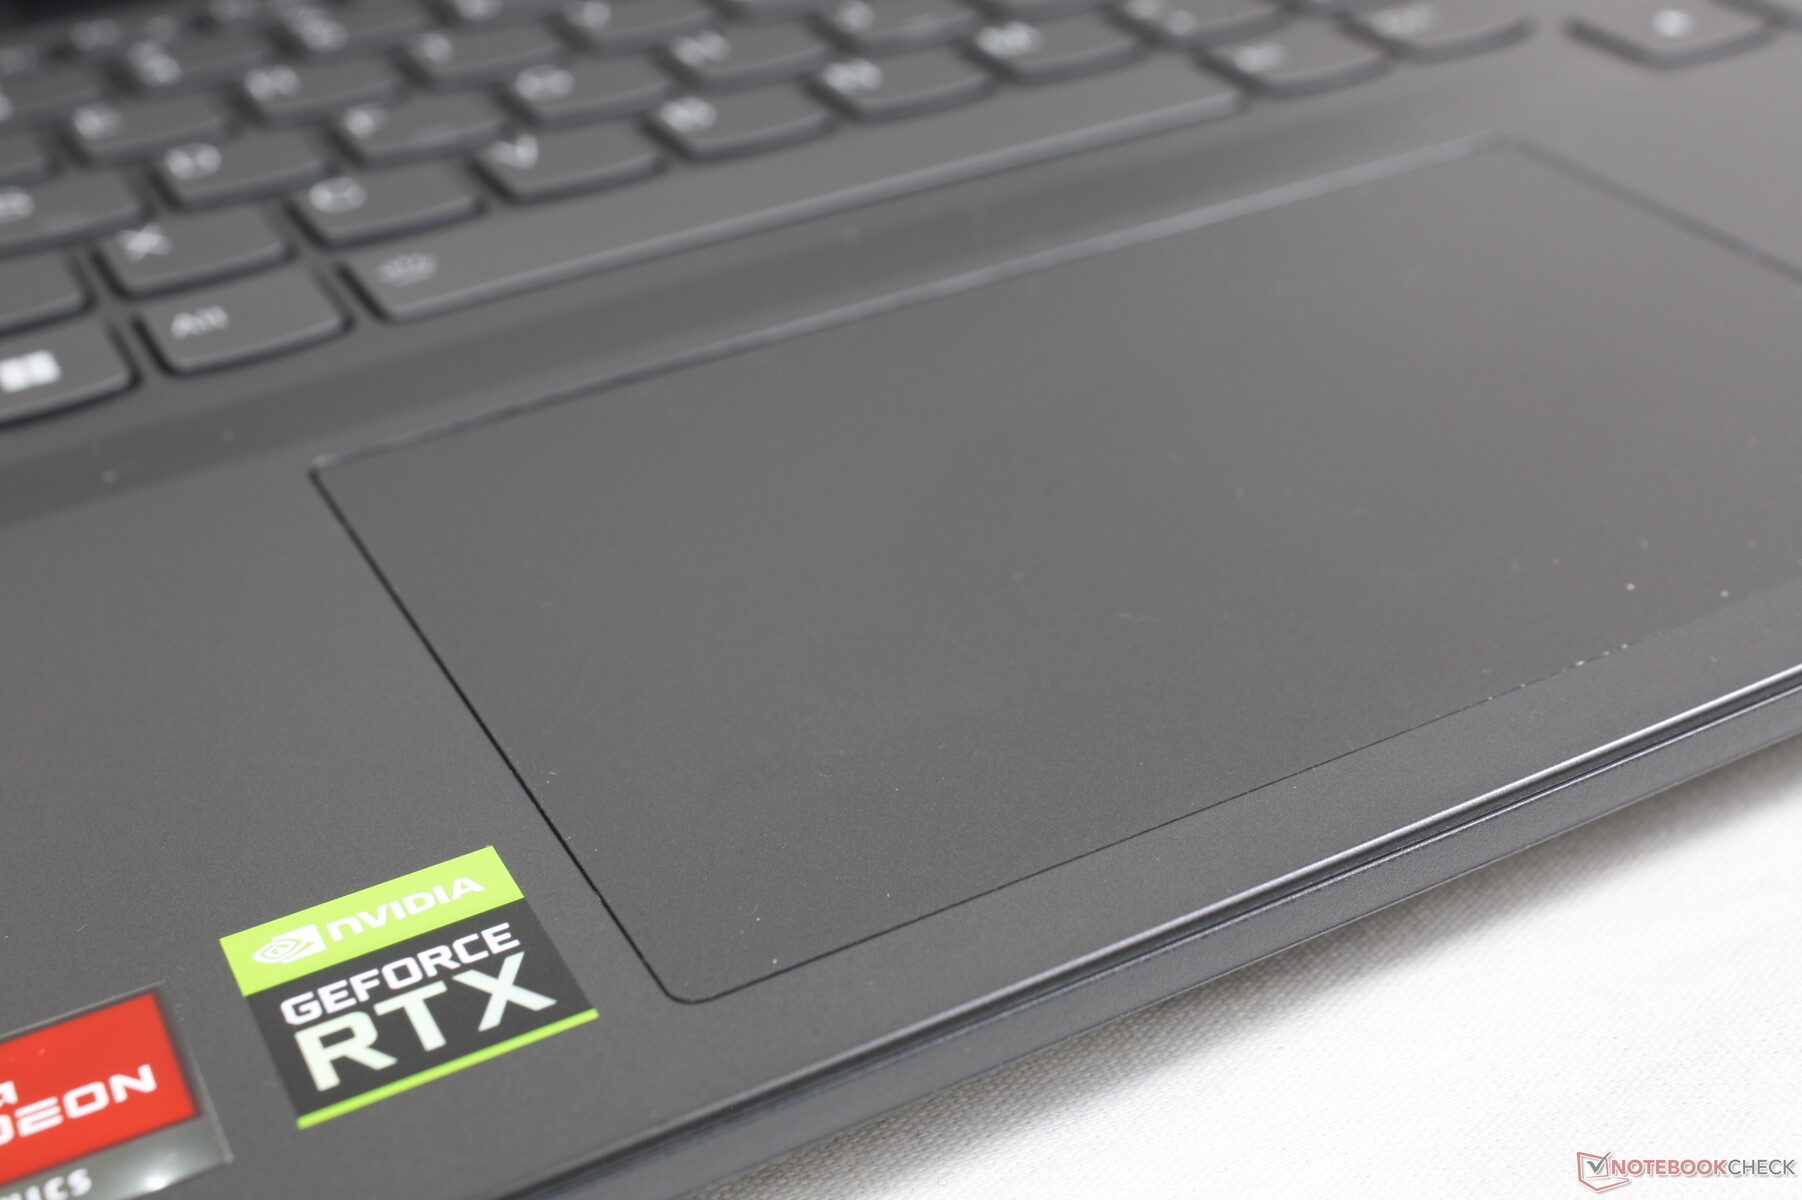
触摸板
触摸板的尺寸比微星的触摸板要大。 MSI Bravo 15(12.5 x 7.5 cm vs. 10.5 x 6.5 cm)。不幸的是,牵引力和反馈都比其他大多数笔记本电脑更粘稠,也更有弹性,用户体验更差。当以中等速度滑行时,手指经常被粘住,而且由于软绵绵的反馈,点击也不令人满意。

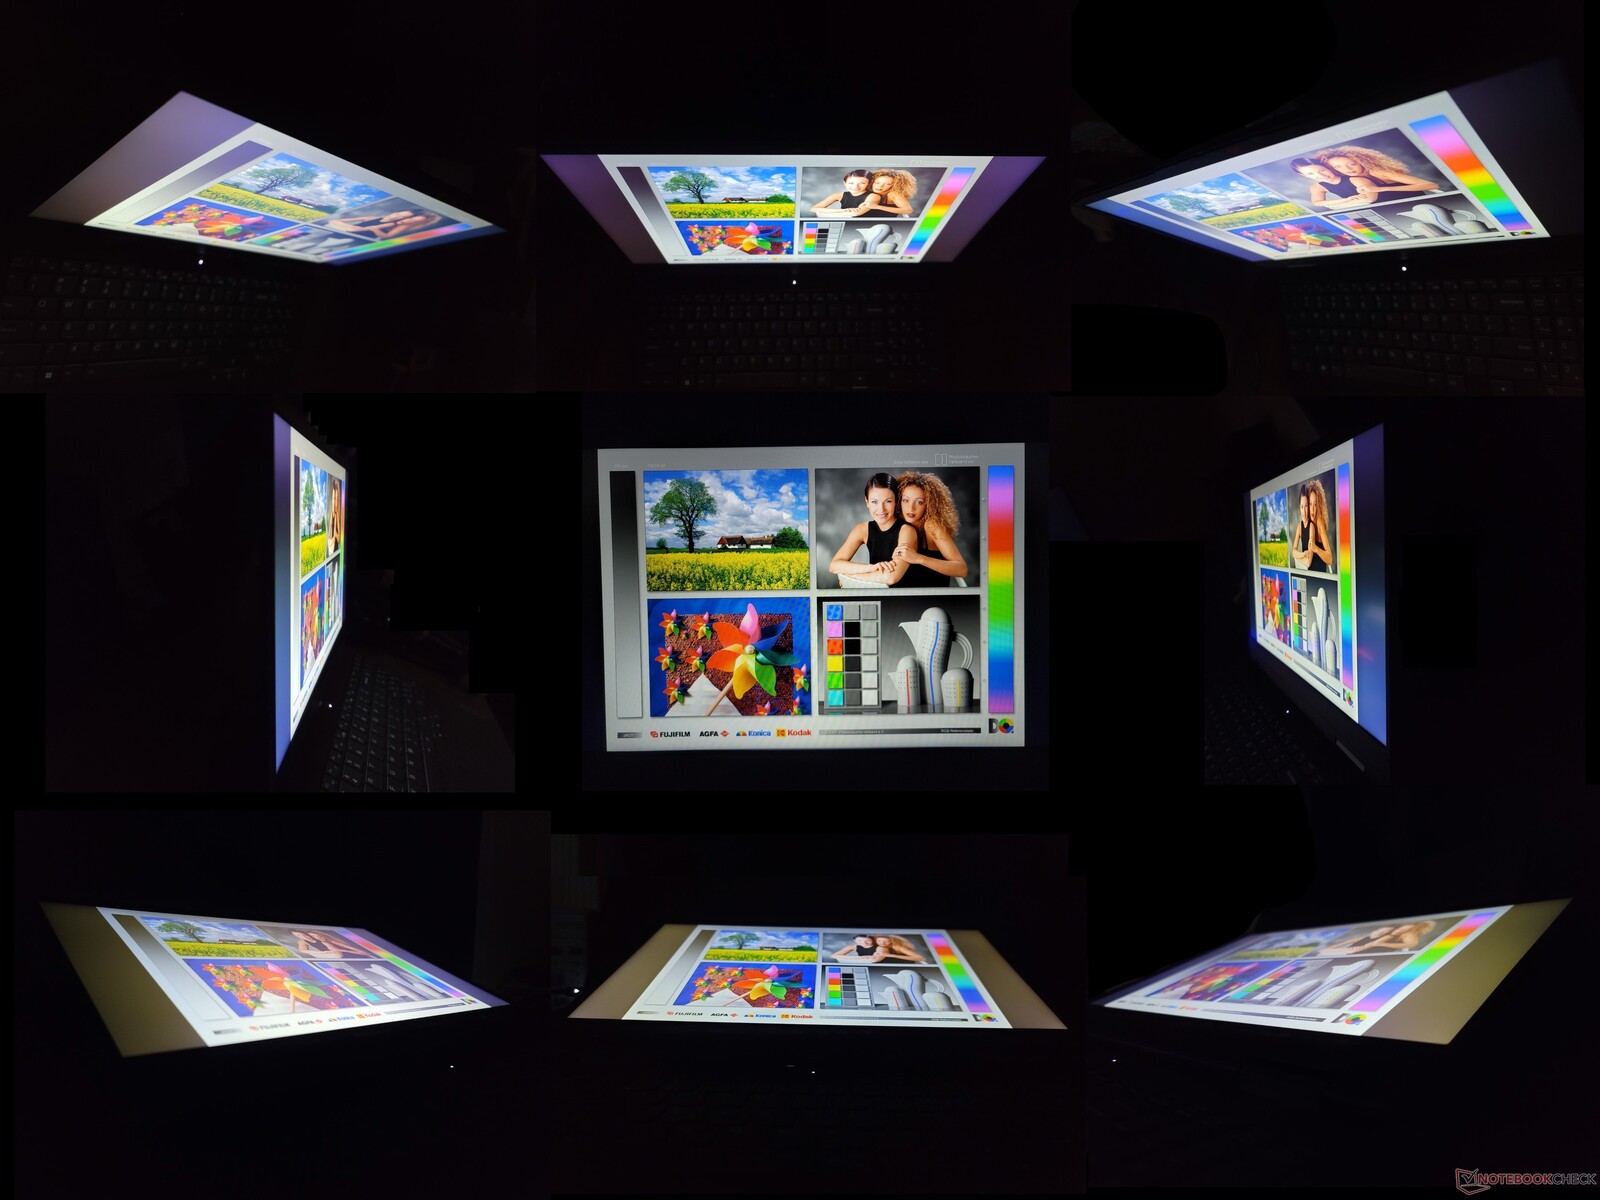
显示器 - FreeSync和120赫兹是标准配置
该显示器的积极特征包括支持原生120赫兹刷新率和FreeSync。黑白和灰白的响应时间也很不错,分别为9至10毫秒。在游戏方面,当涉及到最大限度地减少重影和屏幕撕裂时,该显示器可以完成工作。
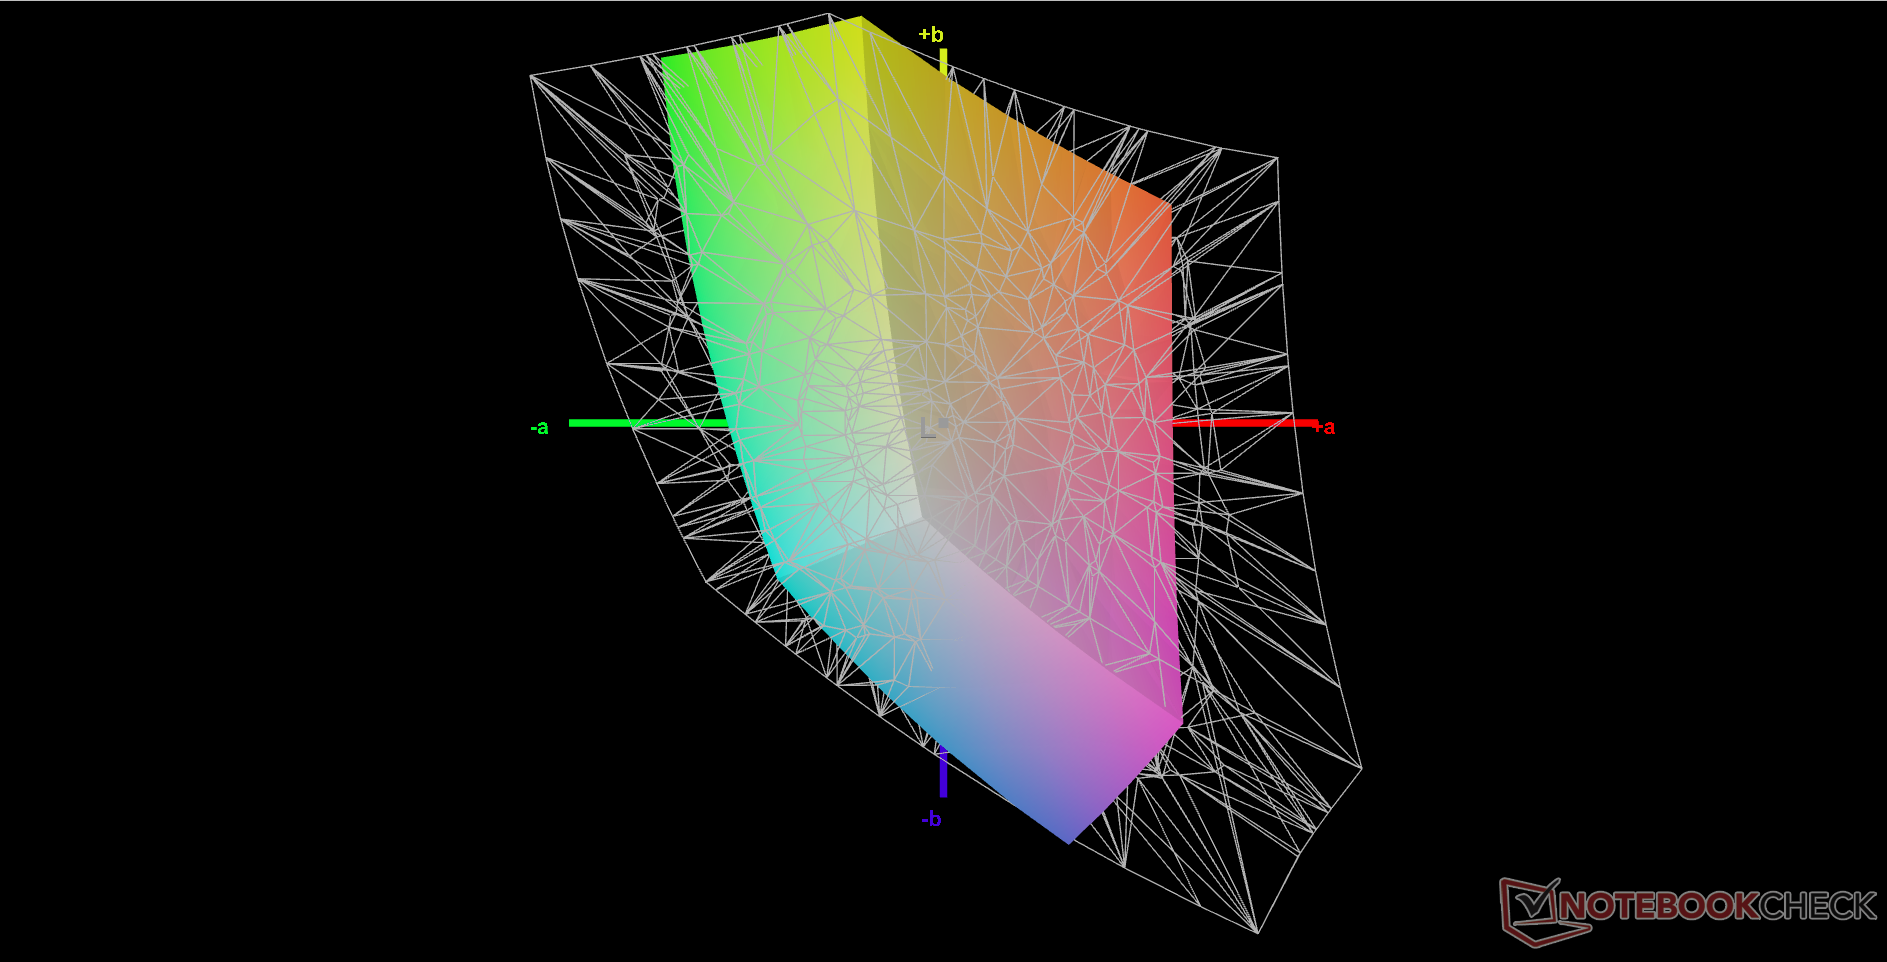
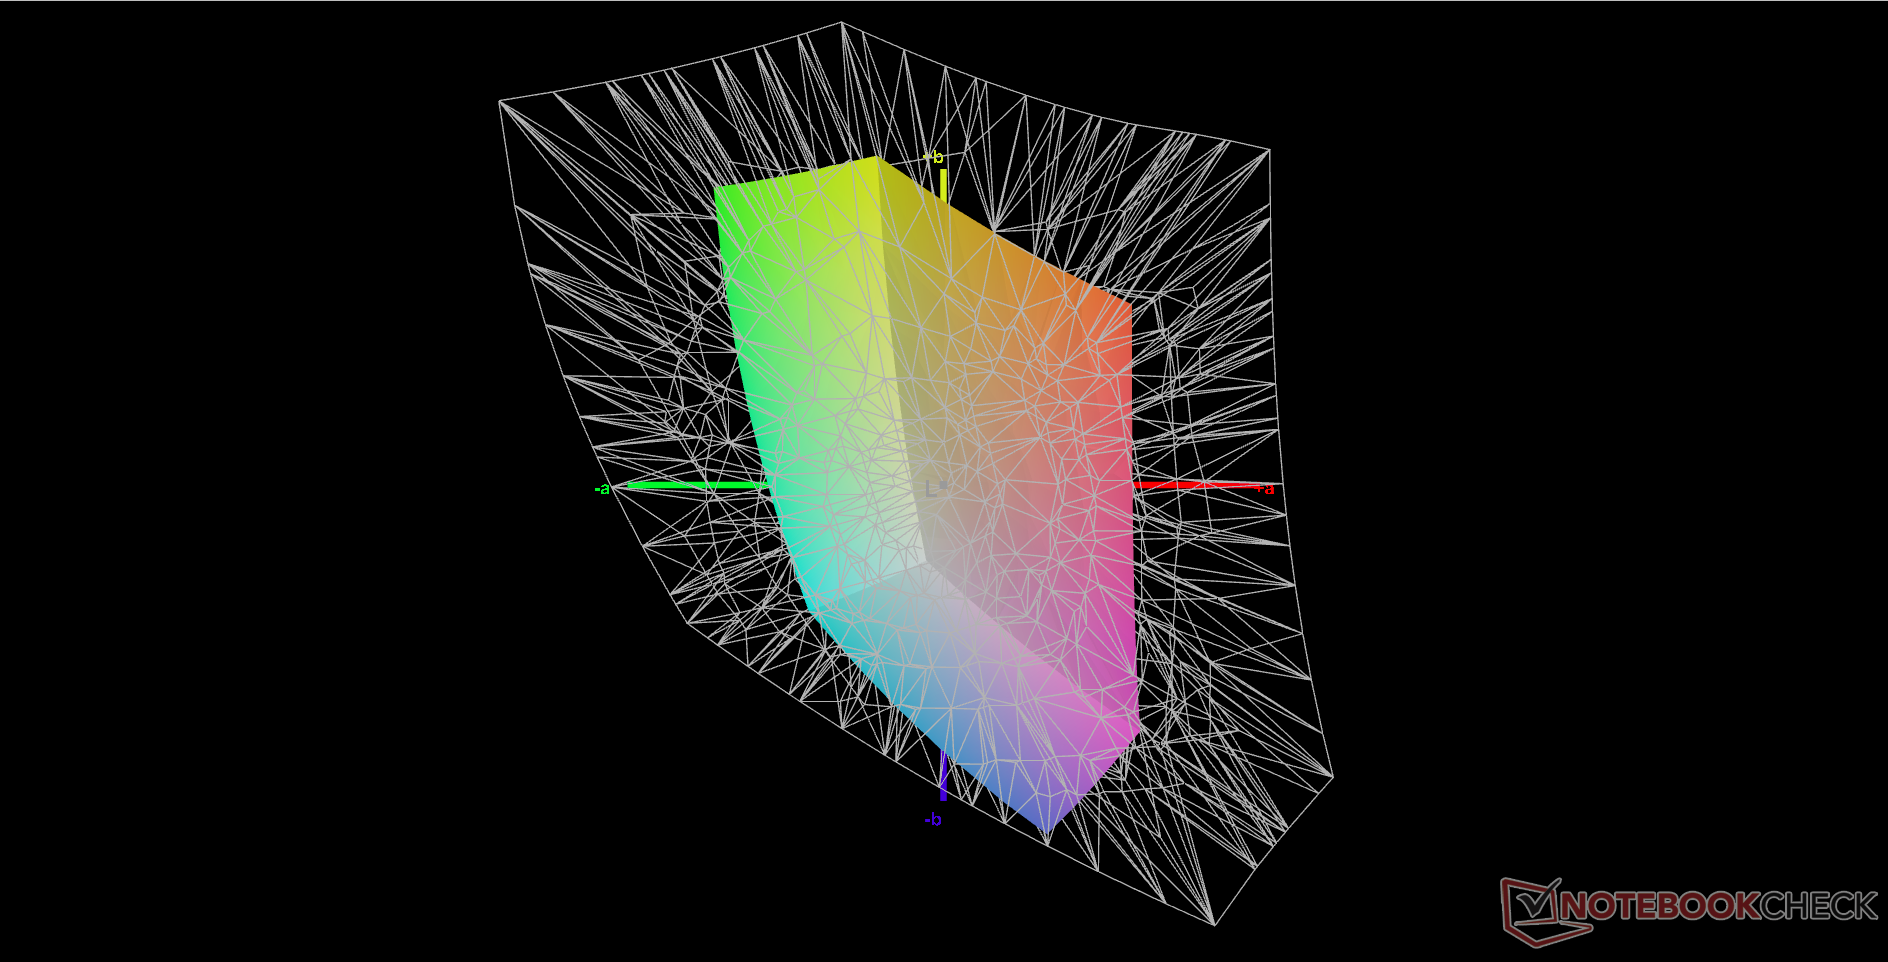
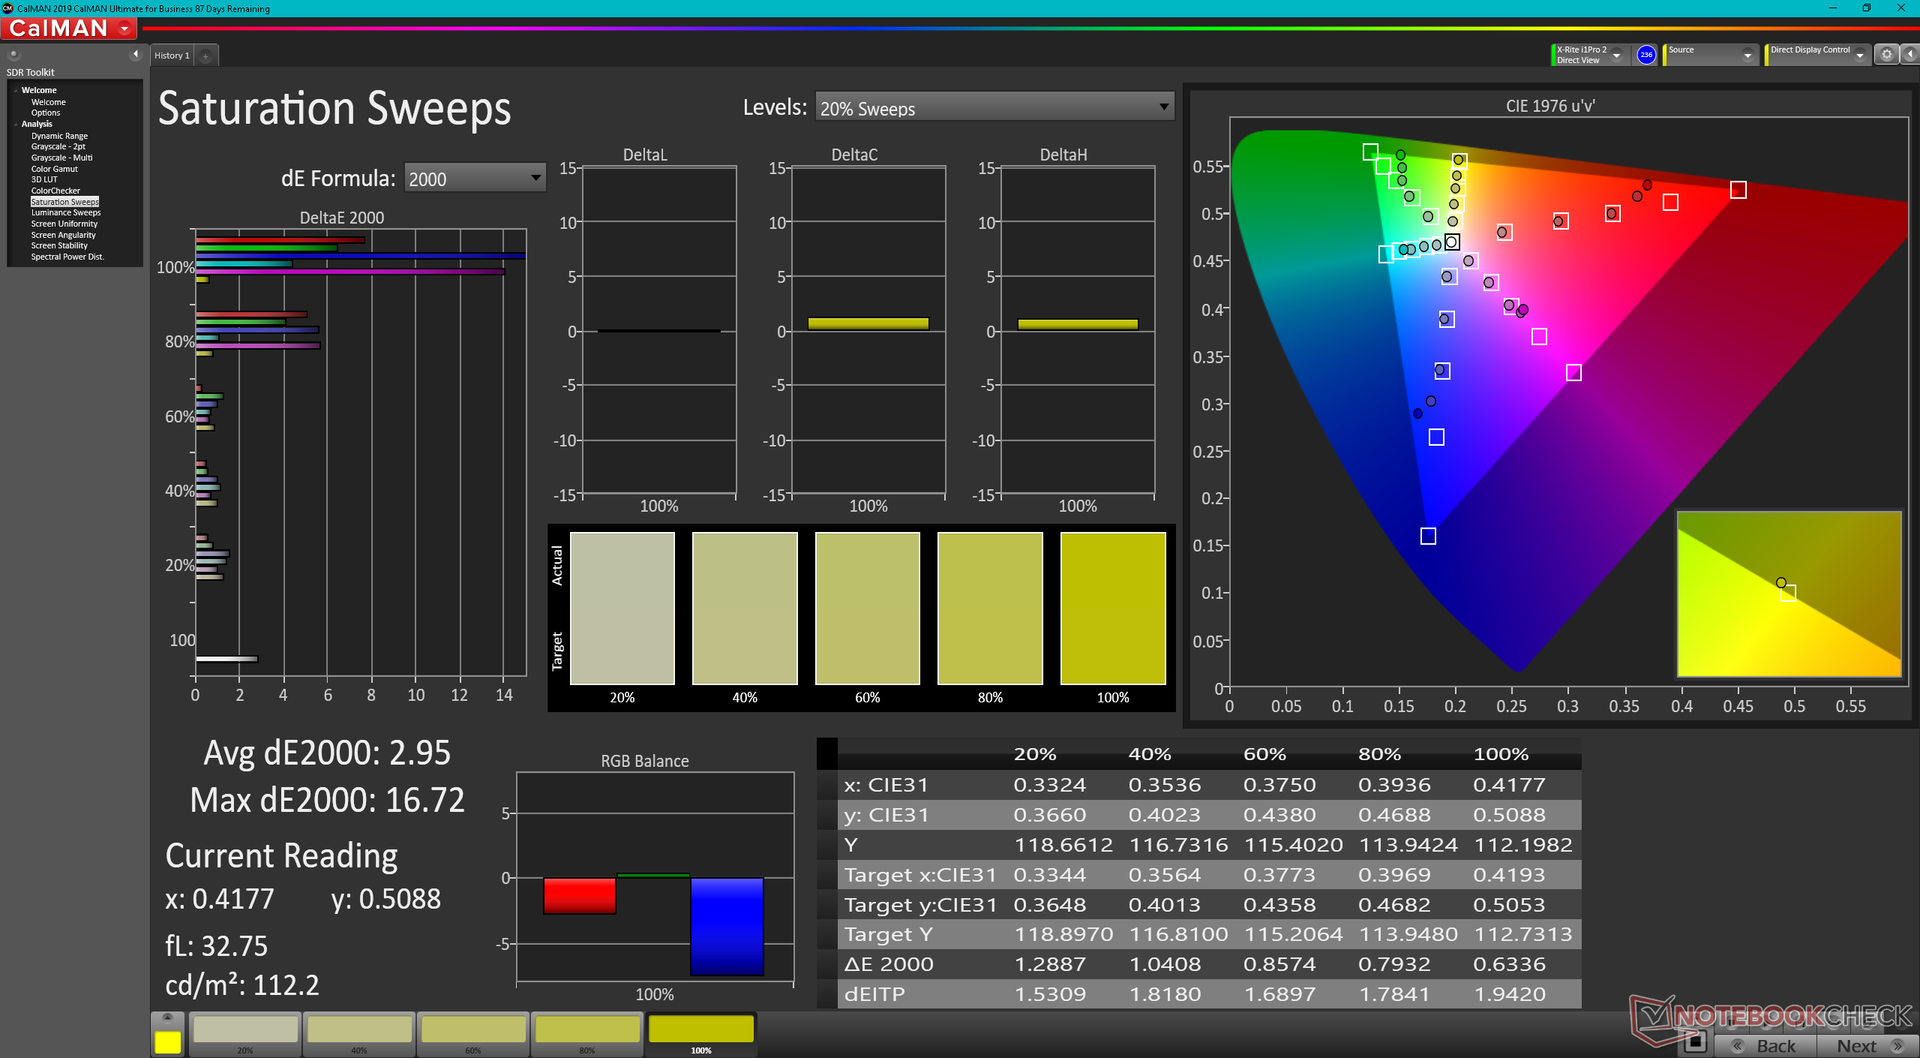
这款显示器最糟糕的方面是其有限的色彩配置文件,仅占sRGB的58%,显示出一个不适合大多数编辑的预算面板。联想希望用户升级到其Legion 系列笔记本电脑,以获得更好的色彩和更明亮的背光,因为在这个特定的IdeaPad模型上没有其他显示选项可供选择。
请注意,虽然这里的面板与LEN156FHD的ID相同,但在 ThinkBook 15 G4或 IdeaPad 5 15ALC05但它们在某些方面仍然非常不同。例如,上述ThinkBook或IdeaPad 5的显示屏不支持120赫兹或FreeSync。


| |||||||||||||||||||||||||
Brightness Distribution: 86 %
Center on Battery: 287.8 cd/m²
Contrast: 959:1 (Black: 0.3 cd/m²)
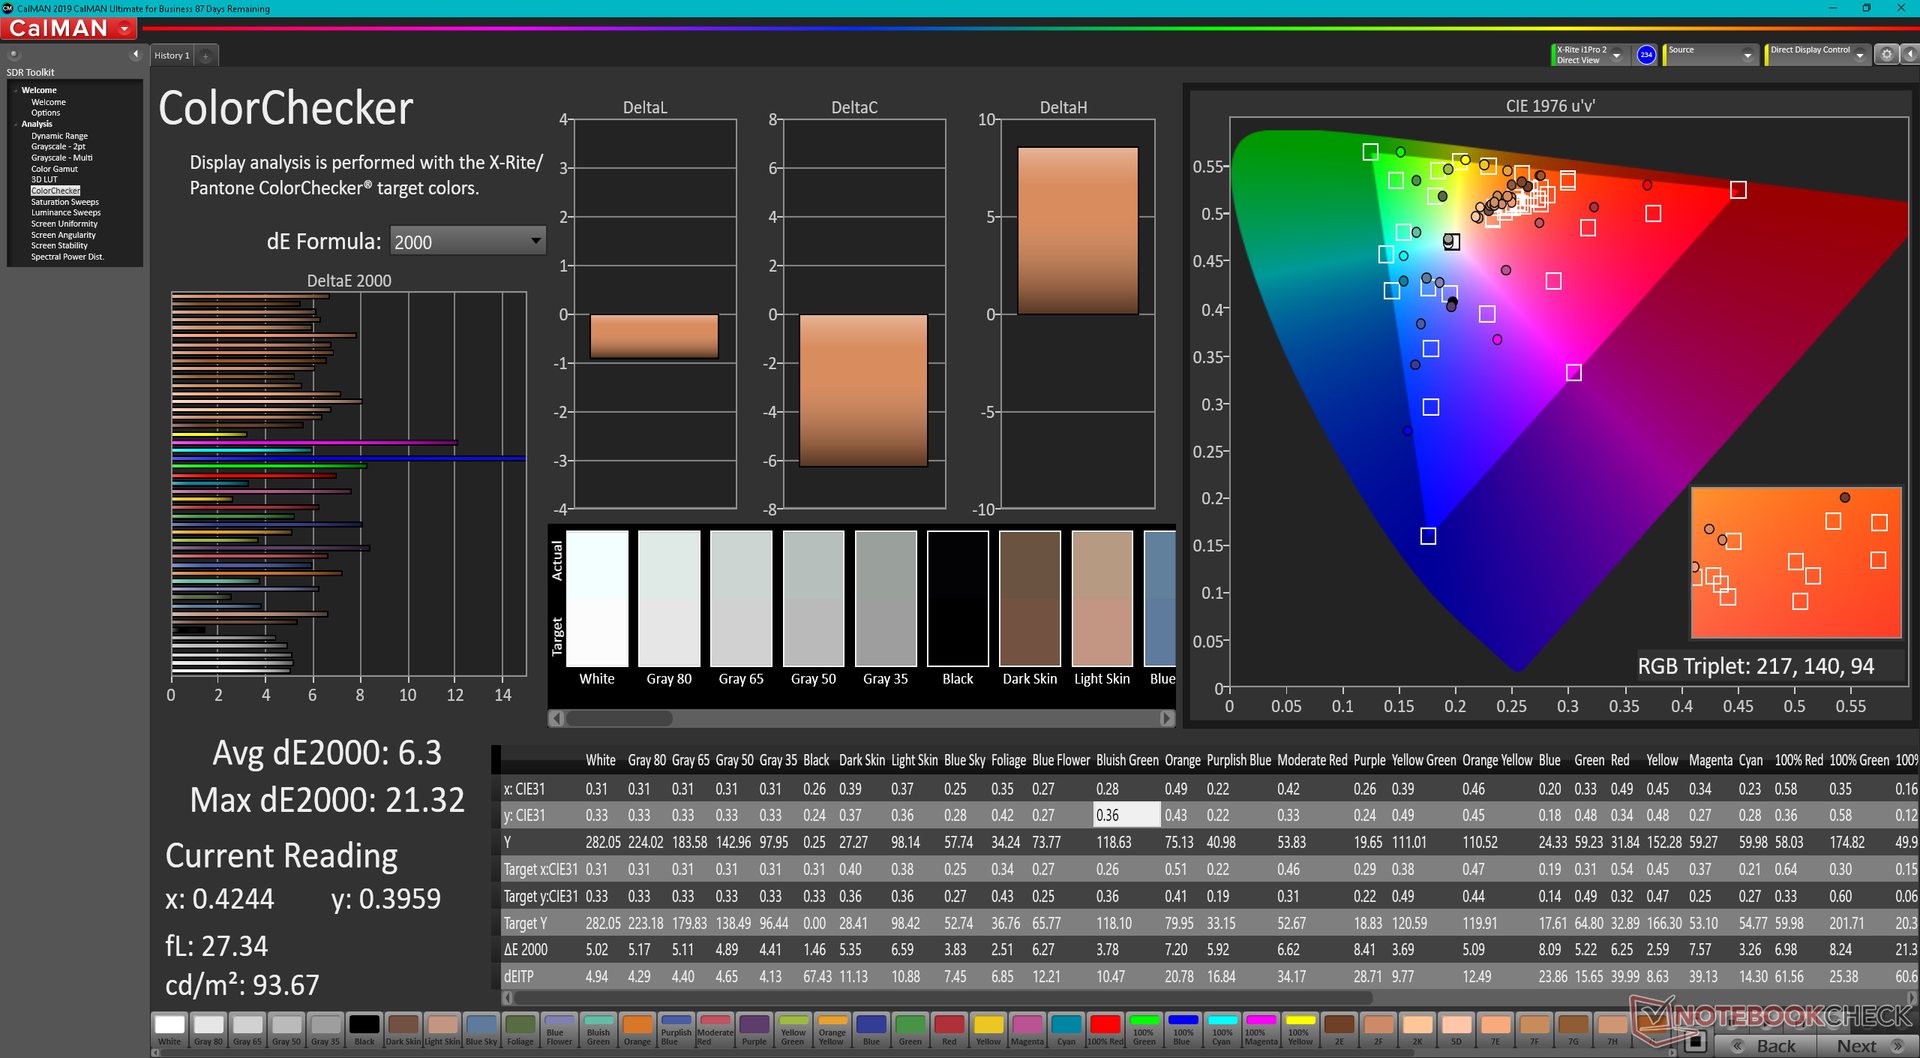
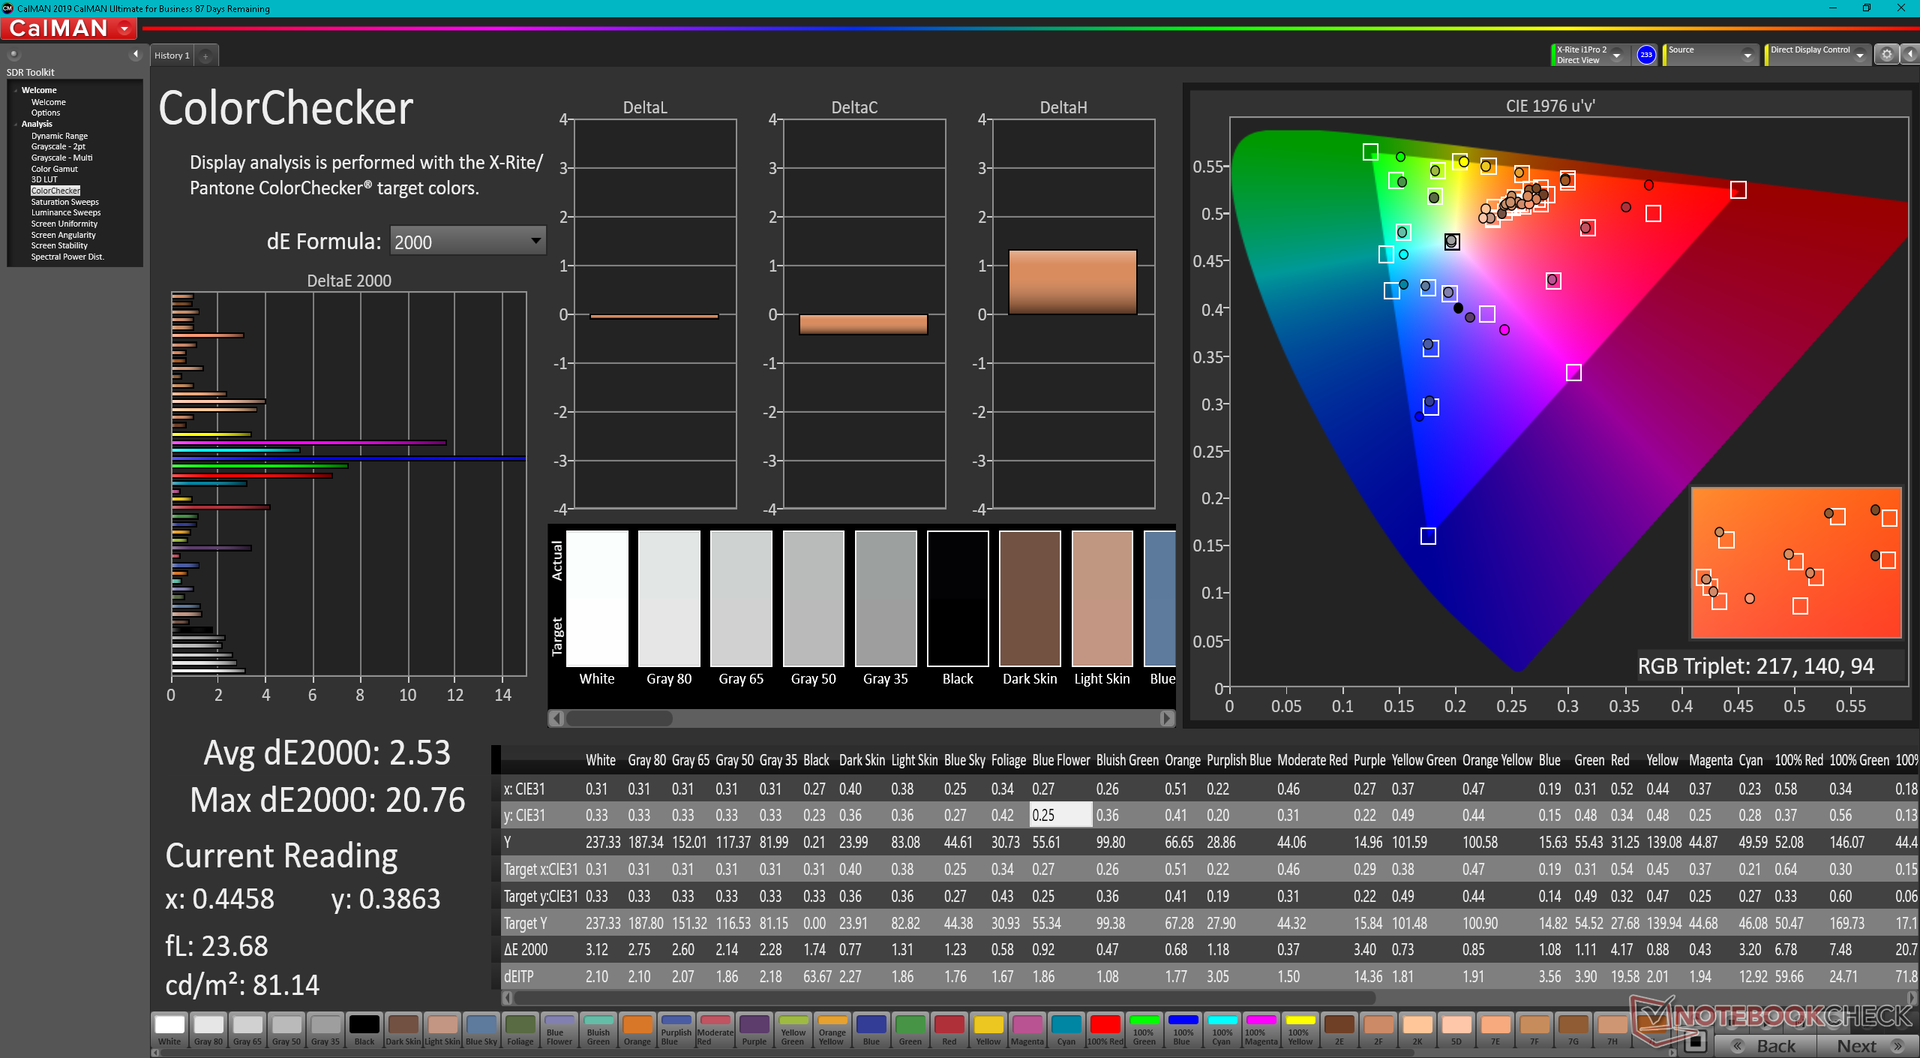
ΔE ColorChecker Calman: 6.3 | ∀{0.5-29.43 Ø4.71}
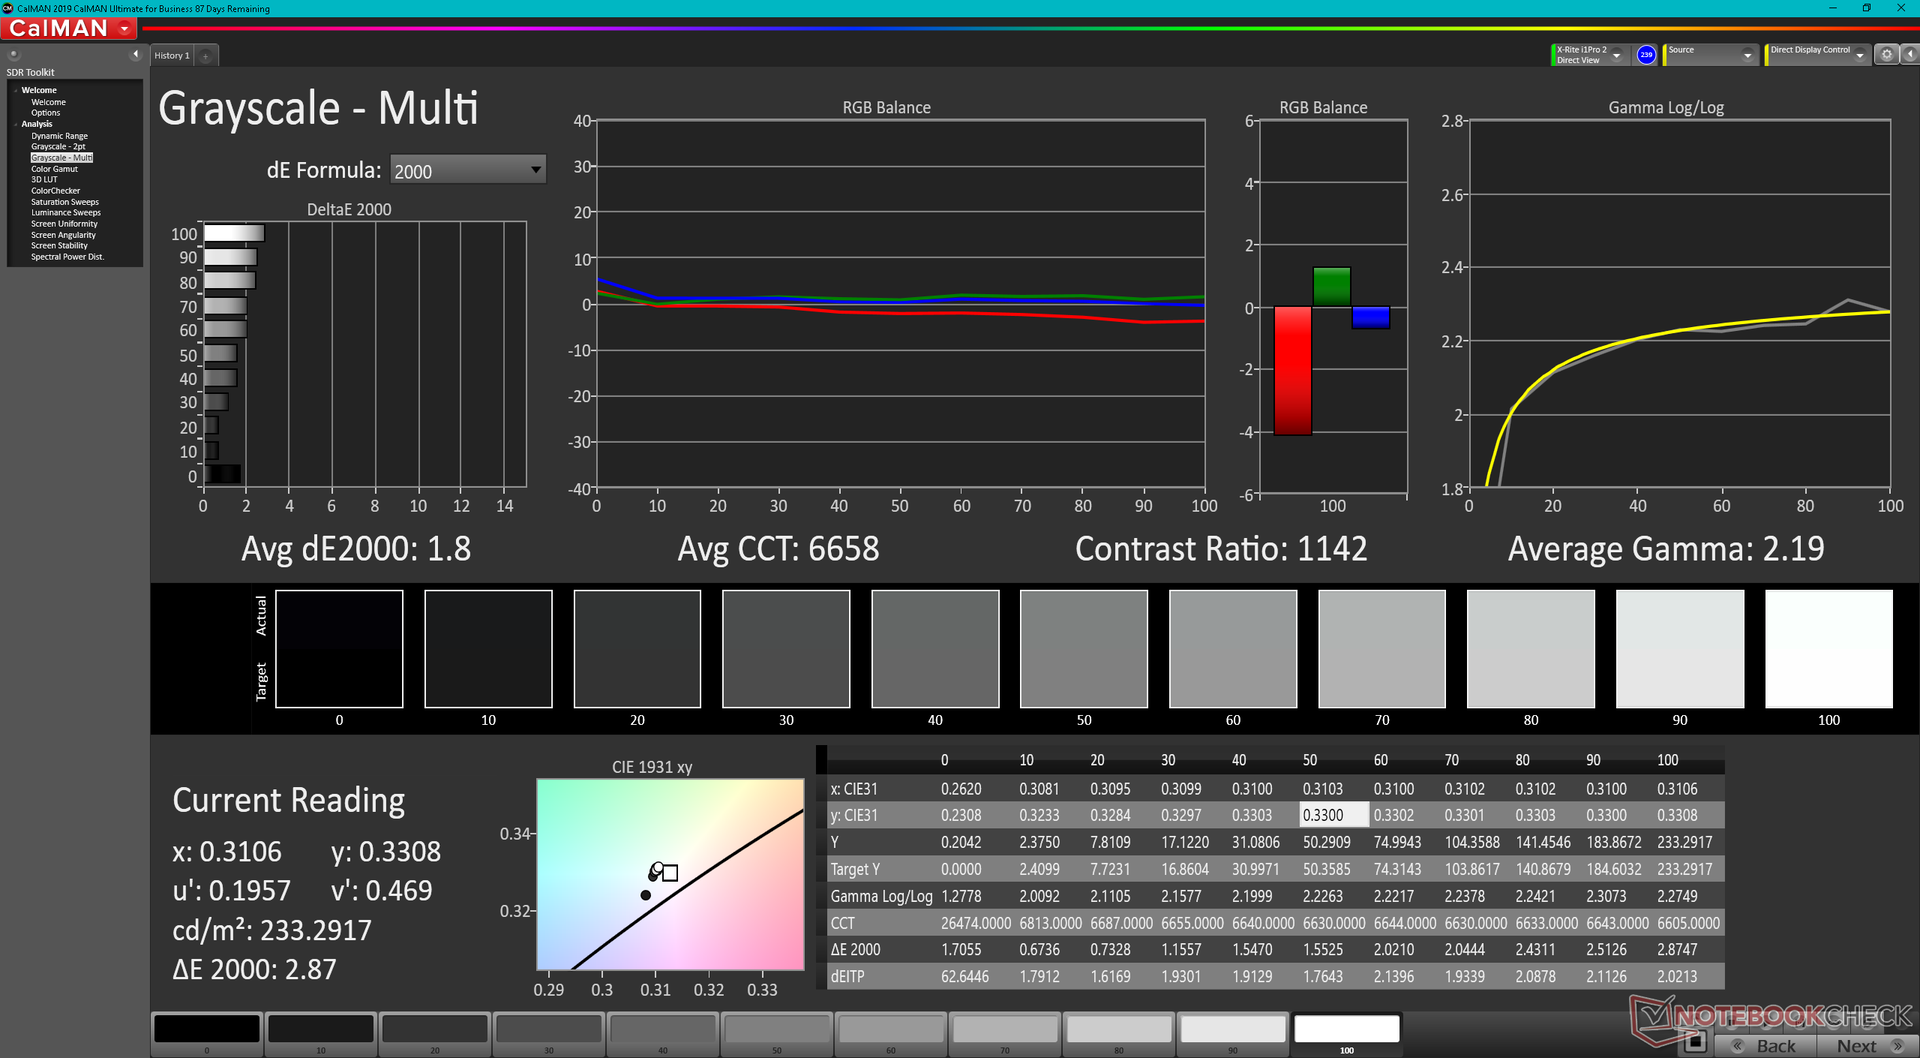
calibrated: 2.53
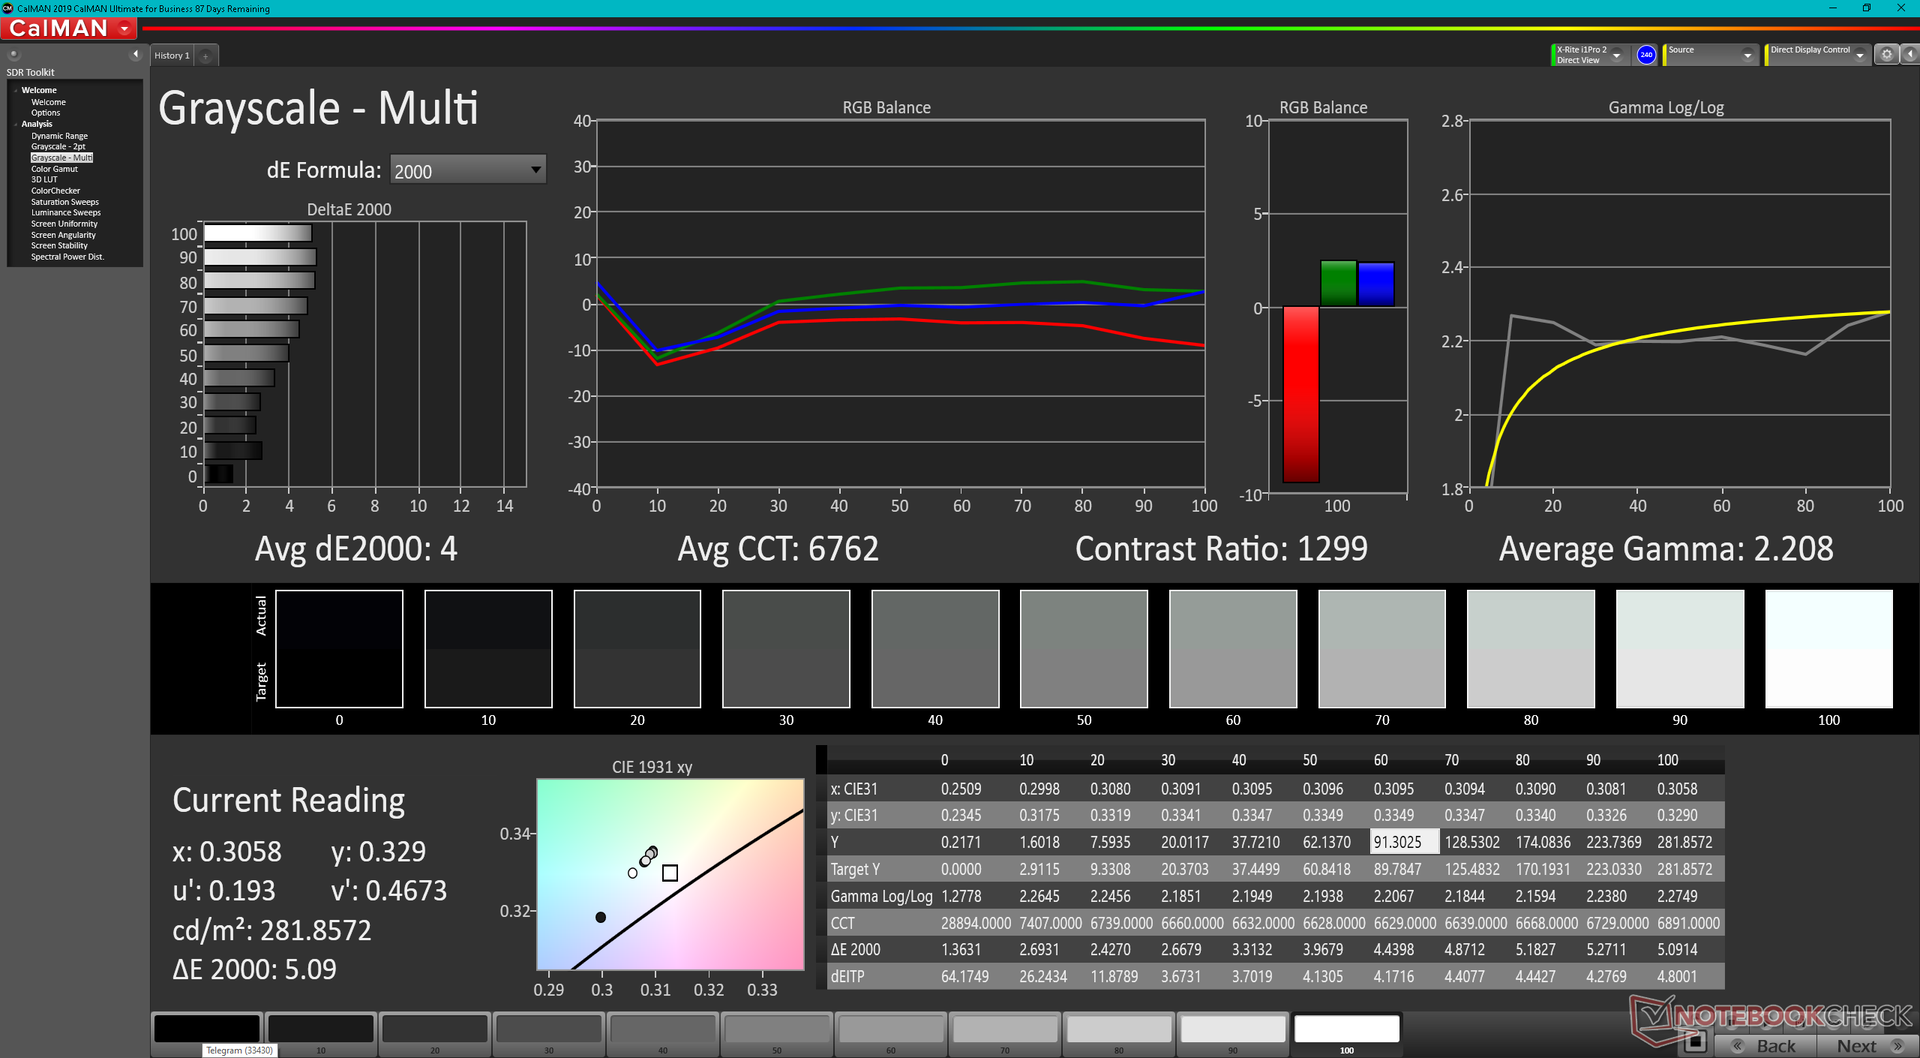
ΔE Greyscale Calman: 4 | ∀{0.09-98 Ø4.96}
40.7% AdobeRGB 1998 (Argyll 3D)
58% sRGB (Argyll 3D)
39.4% Display P3 (Argyll 3D)
Gamma: 2.21
CCT: 6762 K
| Lenovo IdeaPad Gaming 3 15ARH7 LEN156FHD, IPS, 1920x1080, 15.6" | Lenovo IdeaPad Gaming 3i 15IMH05 BOE CQ NV156FHM-NX1, IPS, 1920x1080, 15.6" | Lenovo Legion 5 15ACH6A-82NW0010GE LGD06A5, IPS, 1920x1080, 15.6" | Gigabyte A5 K1 BOEhydis NV156FHM-N4K (BOE08B3), IPS, 1920x1080, 15.6" | Asus TUF Dash F15 FX517ZR BOE CQ NE156QHM-NY1, IPS, 2560x1440, 15.6" | Dell G15 5510 YMHWH_156HRA (CMN1522), IPS, 1920x1080, 15.6" | |
|---|---|---|---|---|---|---|
| Display | -3% | 76% | 61% | 111% | 6% | |
| Display P3 Coverage (%) | 39.4 | 38.04 -3% | 71.1 80% | 64.4 63% | 98.4 150% | 41.6 6% |
| sRGB Coverage (%) | 58 | 56.6 -2% | 99.1 71% | 92.5 59% | 99.9 72% | 62.2 7% |
| AdobeRGB 1998 Coverage (%) | 40.7 | 39.3 -3% | 72.3 78% | 66.1 62% | 85.9 111% | 43 6% |
| Response Times | -6% | 48% | 39% | 61% | -37% | |
| Response Time Grey 50% / Grey 80% * (ms) | 20.8 ? | 25 ? -20% | 15 ? 28% | 14.5 ? 30% | 5.6 ? 73% | 33.3 ? -60% |
| Response Time Black / White * (ms) | 18.4 ? | 17 ? 8% | 6 ? 67% | 9.5 ? 48% | 9.4 ? 49% | 20.7 ? -13% |
| PWM Frequency (Hz) | ||||||
| Screen | -16% | 24% | 19% | 31% | 12% | |
| Brightness middle (cd/m²) | 287.8 | 305 6% | 371 29% | 295 3% | 286 -1% | 288 0% |
| Brightness (cd/m²) | 268 | 294 10% | 328 22% | 281 5% | 266 -1% | 264 -1% |
| Brightness Distribution (%) | 86 | 70 -19% | 85 -1% | 83 -3% | 87 1% | 88 2% |
| Black Level * (cd/m²) | 0.3 | 0.405 -35% | 0.32 -7% | 0.29 3% | 0.25 17% | 0.24 20% |
| Contrast (:1) | 959 | 753 -21% | 1159 21% | 1017 6% | 1144 19% | 1200 25% |
| Colorchecker dE 2000 * | 6.3 | 6.01 5% | 3.25 48% | 4.36 31% | 2.14 66% | 3.67 42% |
| Colorchecker dE 2000 max. * | 21.32 | 21.9 -3% | 6.33 70% | 6.92 68% | 5.22 76% | 18.12 15% |
| Colorchecker dE 2000 calibrated * | 2.53 | 5.12 -102% | 1.11 56% | 1.2 53% | 0.67 74% | 3.22 -27% |
| Greyscale dE 2000 * | 4 | 3.23 19% | 4.94 -24% | 3.9 2% | 2.8 30% | 2.6 35% |
| Gamma | 2.21 100% | 2.43 91% | 2.45 90% | 2.106 104% | 2.23 99% | 2.187 101% |
| CCT | 6762 96% | 6818 95% | 6064 107% | 7300 89% | 7092 92% | 6971 93% |
| Color Space (Percent of AdobeRGB 1998) (%) | 36 | |||||
| Color Space (Percent of sRGB) (%) | 56 | |||||
| Total Average (Program / Settings) | -8% /
-11% | 49% /
38% | 40% /
31% | 68% /
53% | -6% /
4% |
* ... smaller is better
显示器在出厂时没有经过校准,这对于一台预算游戏笔记本来说是可以预期的。尽管如此,开箱后的平均灰度和色彩deltaE值实际上并不可怕,分别为4和6.3。自己校准显示器可以将这些值分别提高到1.8和2.53,但由于上述的窄色域,饱和的颜色仍然非常不准确。

Display Response Times
| ↔ Response Time Black to White | ||
|---|---|---|
| 18.4 ms ... rise ↗ and fall ↘ combined | ↗ 10 ms rise | 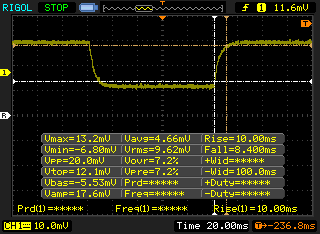 |
| ↘ 8.4 ms fall | ||
| The screen shows good response rates in our tests, but may be too slow for competitive gamers. In comparison, all tested devices range from 0.1 (minimum) to 240 (maximum) ms. » 41 % of all devices are better. This means that the measured response time is similar to the average of all tested devices (19.8 ms). | ||
| ↔ Response Time 50% Grey to 80% Grey | ||
| 20.8 ms ... rise ↗ and fall ↘ combined | ↗ 11.2 ms rise | 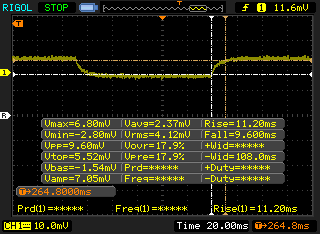 |
| ↘ 9.6 ms fall | ||
| The screen shows good response rates in our tests, but may be too slow for competitive gamers. In comparison, all tested devices range from 0.165 (minimum) to 636 (maximum) ms. » 33 % of all devices are better. This means that the measured response time is better than the average of all tested devices (31 ms). | ||
Screen Flickering / PWM (Pulse-Width Modulation)
| Screen flickering / PWM not detected | 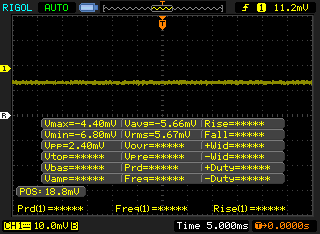 | ||
In comparison: 52 % of all tested devices do not use PWM to dim the display. If PWM was detected, an average of 7754 (minimum: 5 - maximum: 343500) Hz was measured. | |||
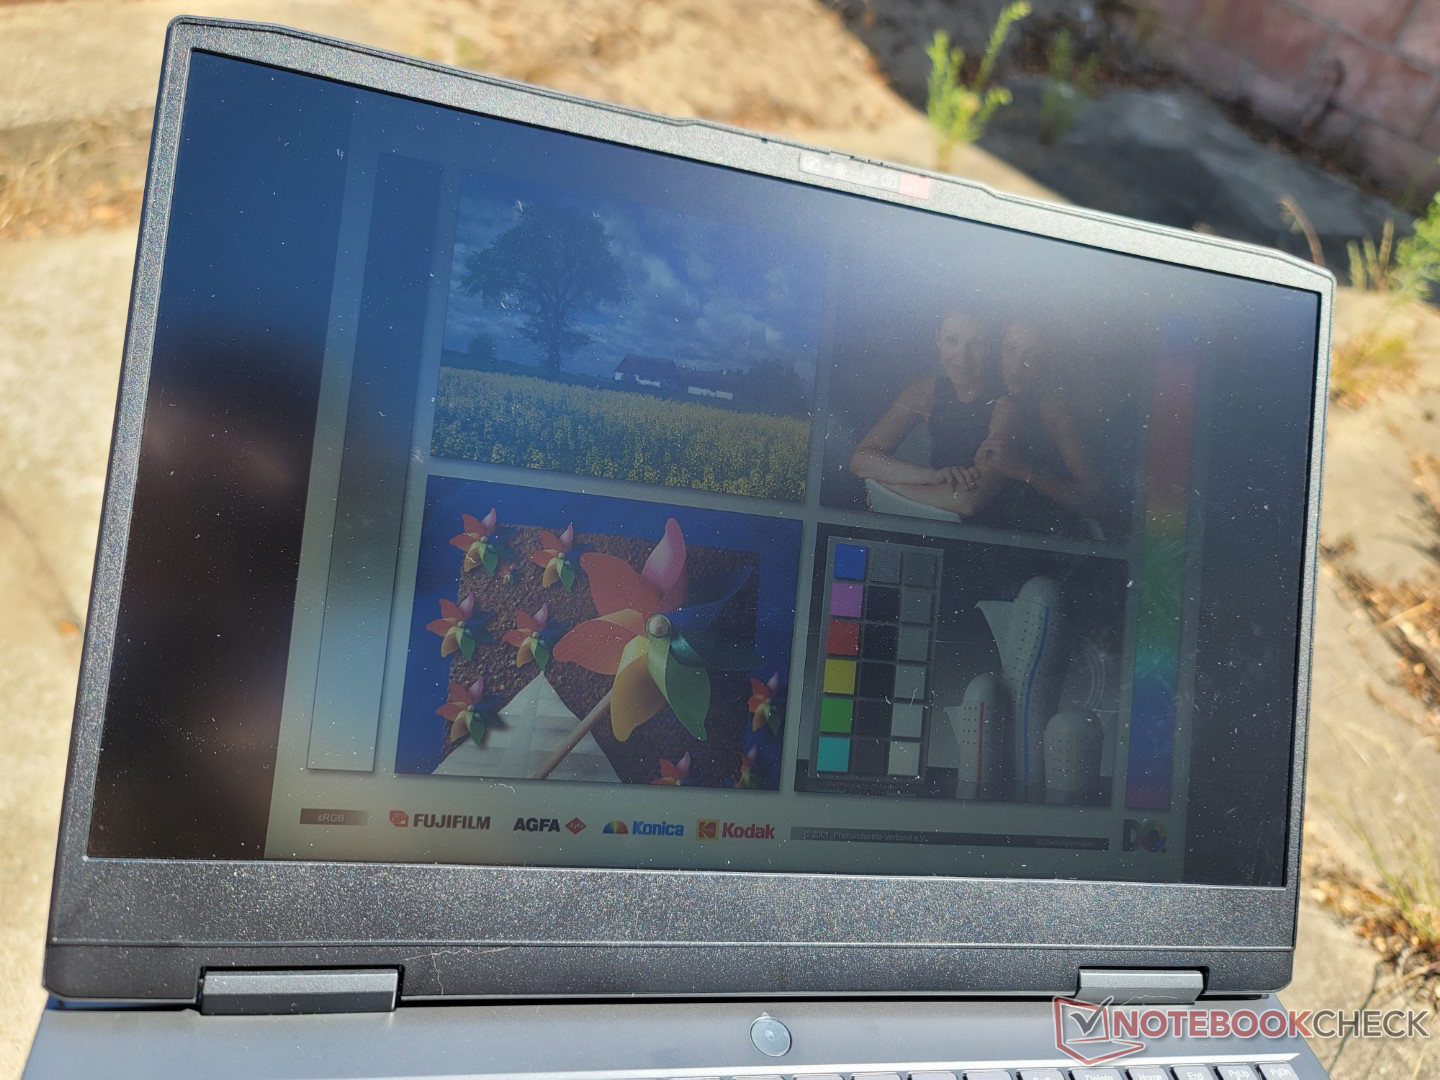
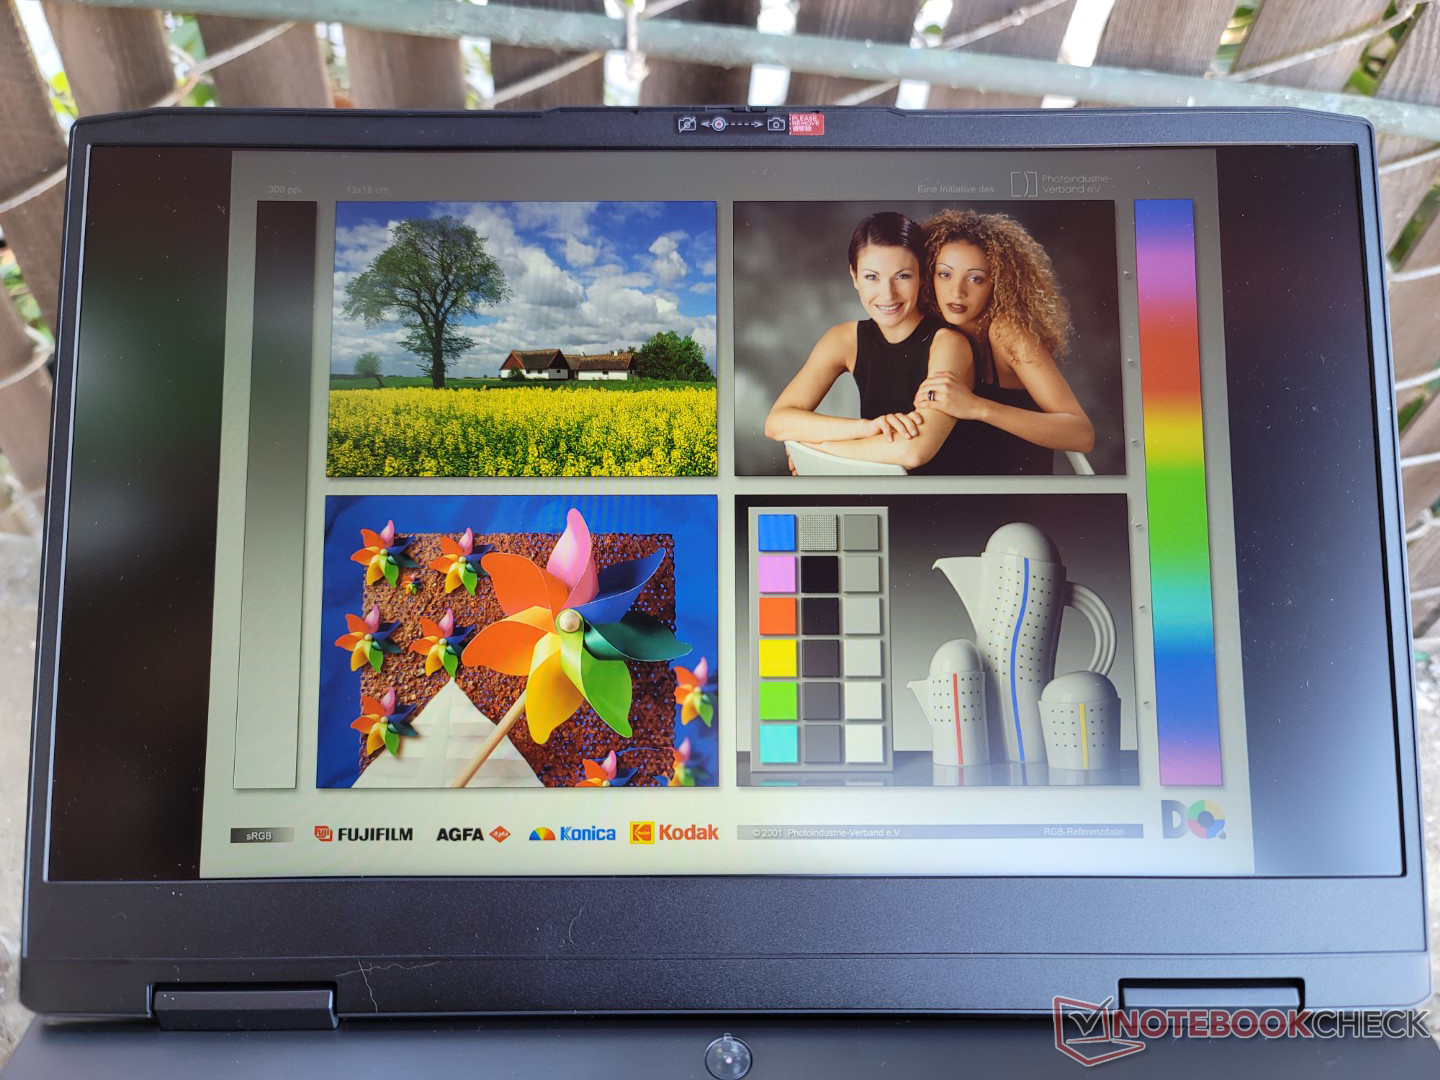
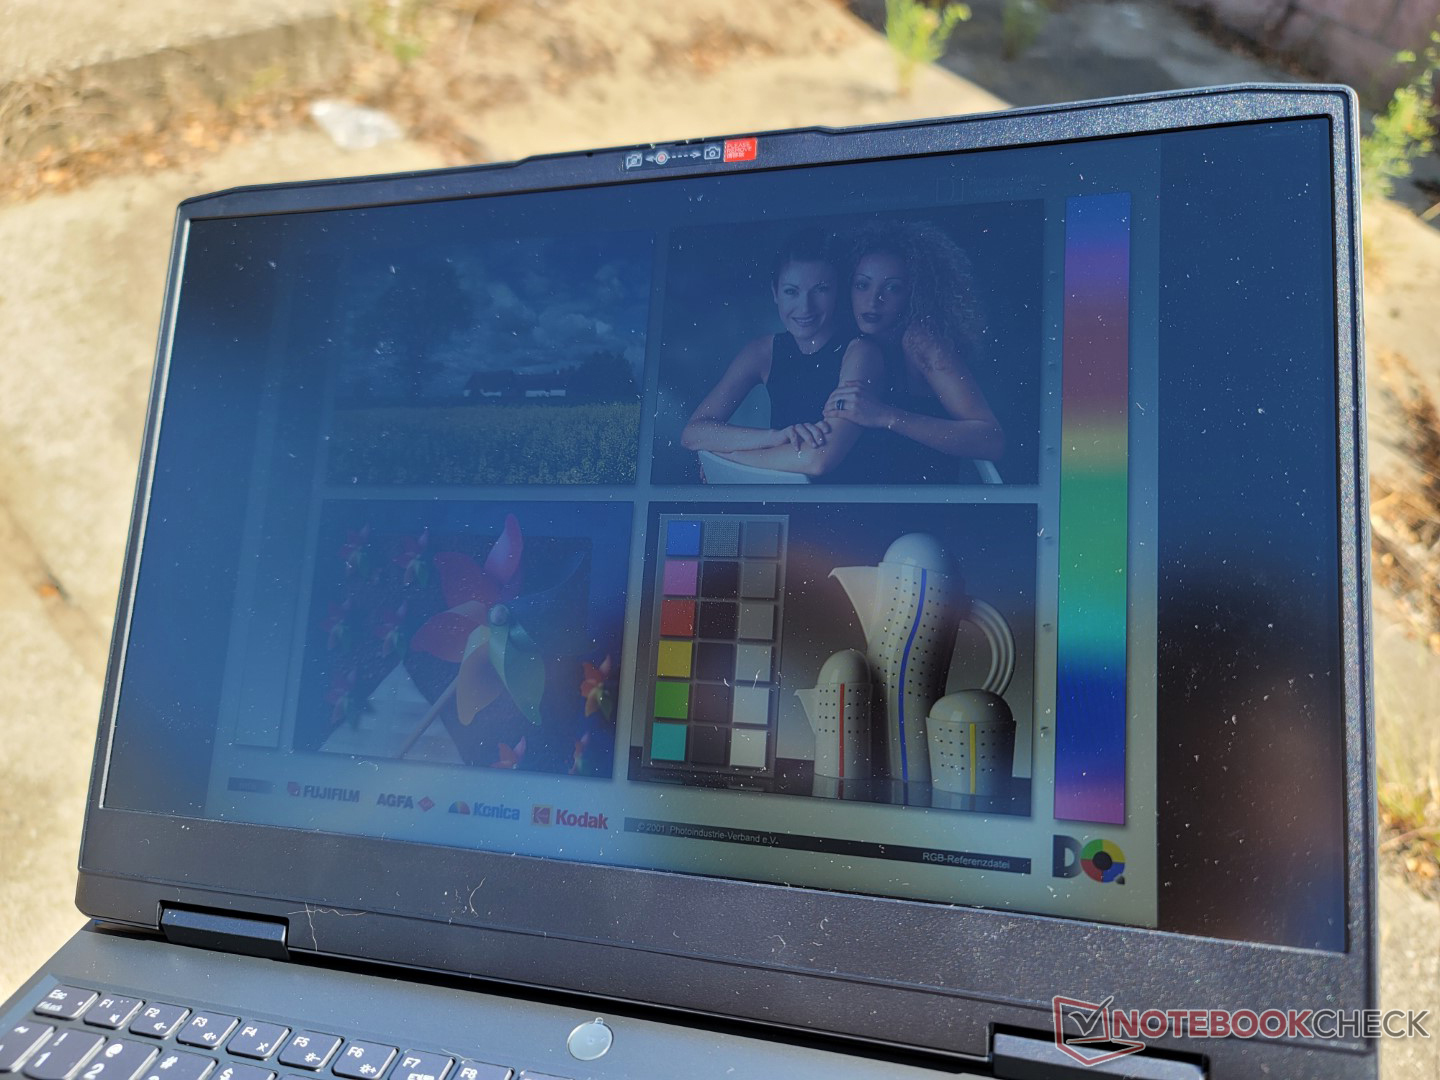
户外能见度并不比其他大多数预算甚至高端游戏笔记本电脑好或差,因为这些类型的系统并不是为经常在户外使用而设计的。你要尽可能在阴凉处工作,否则屏幕会被洗掉。
业绩
测试条件
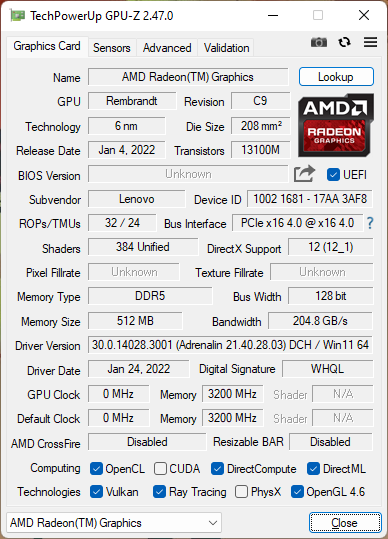
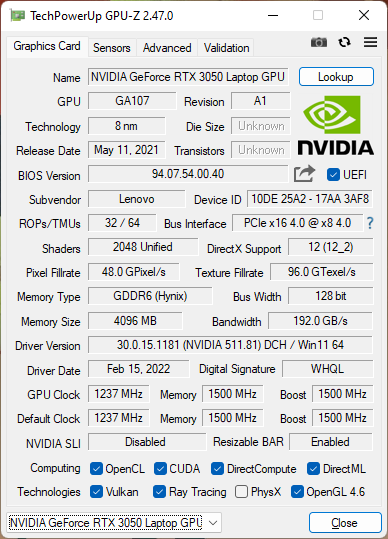
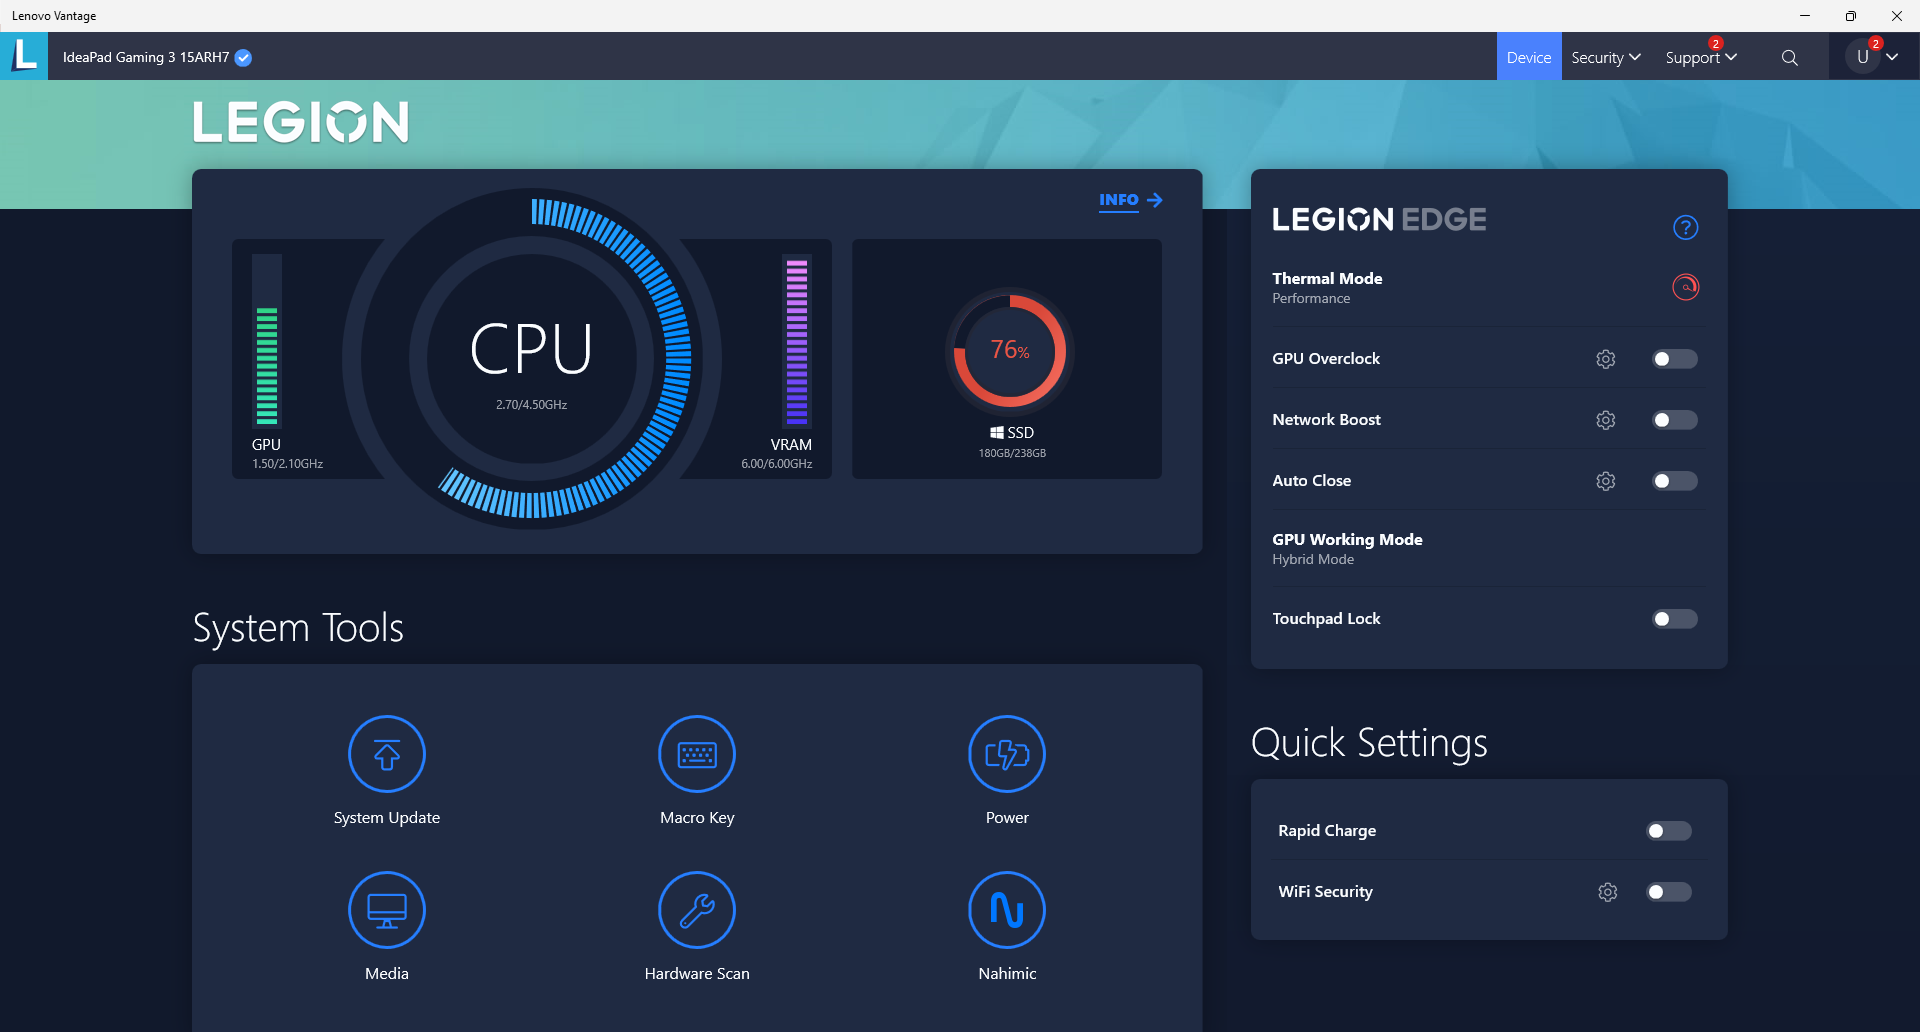
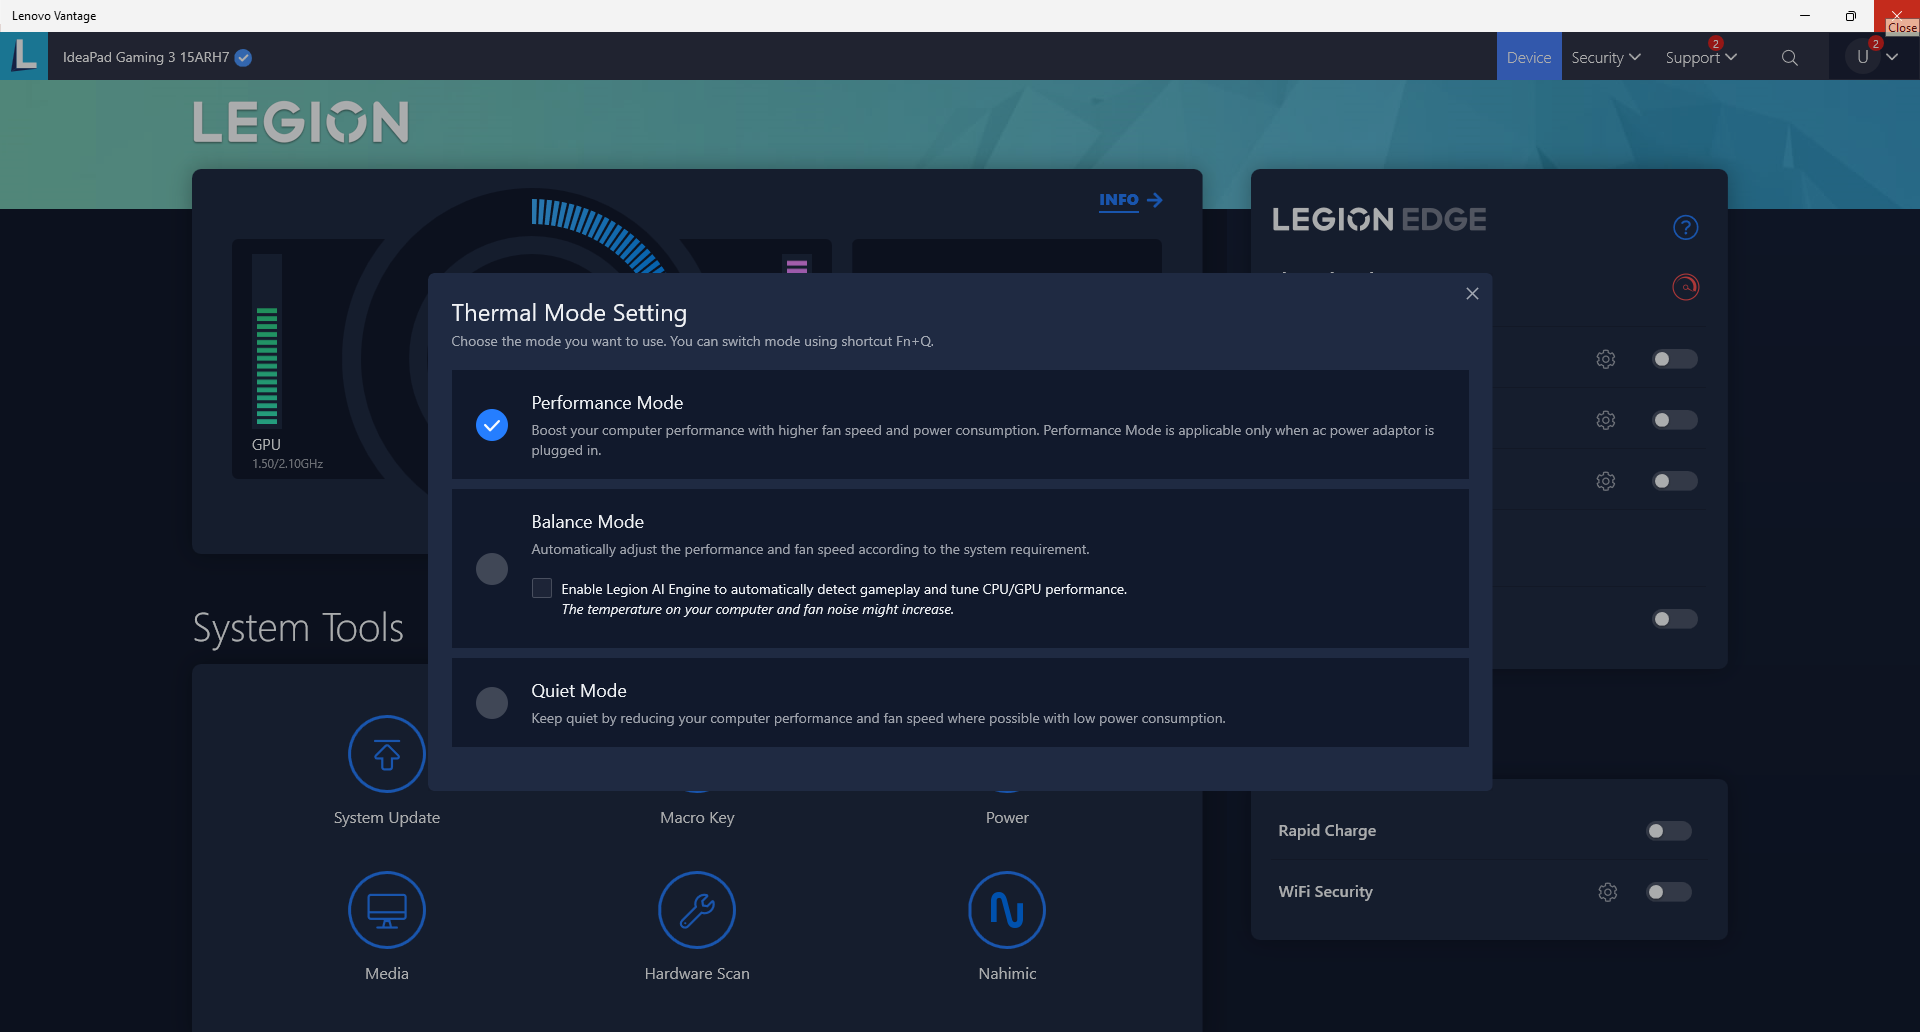
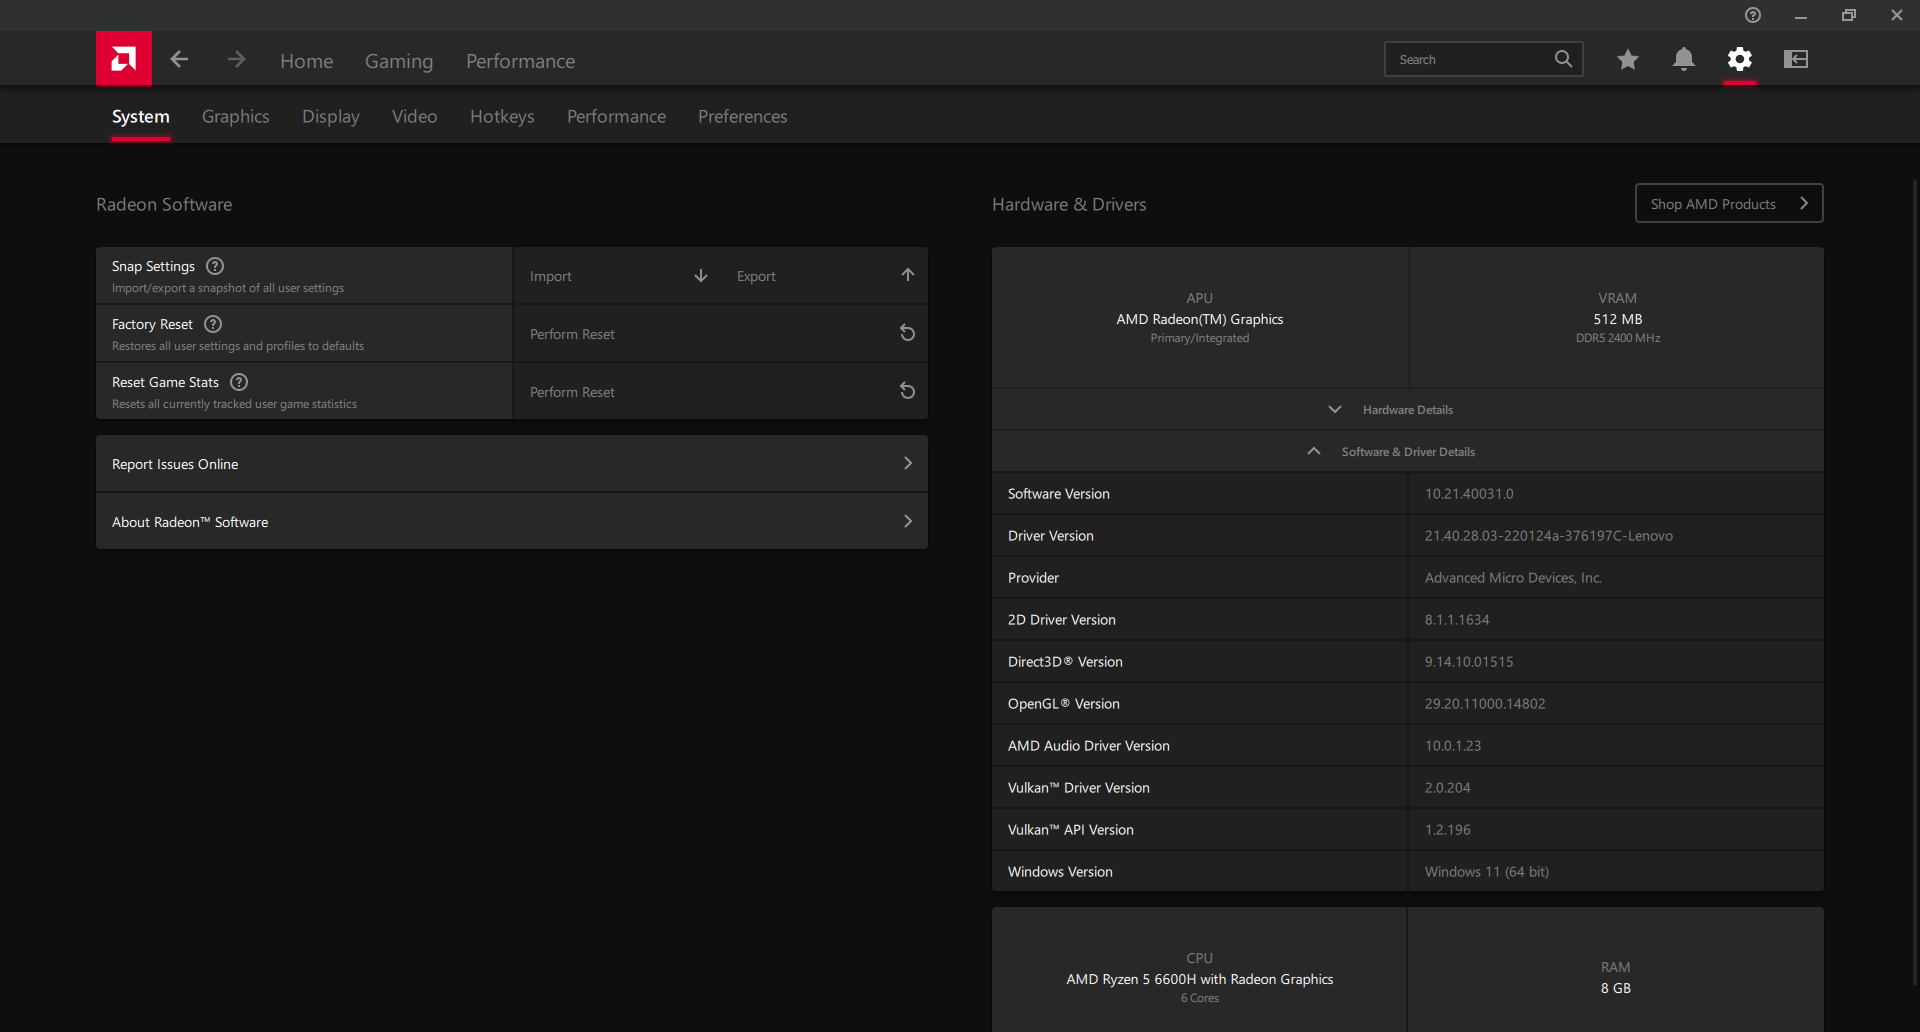
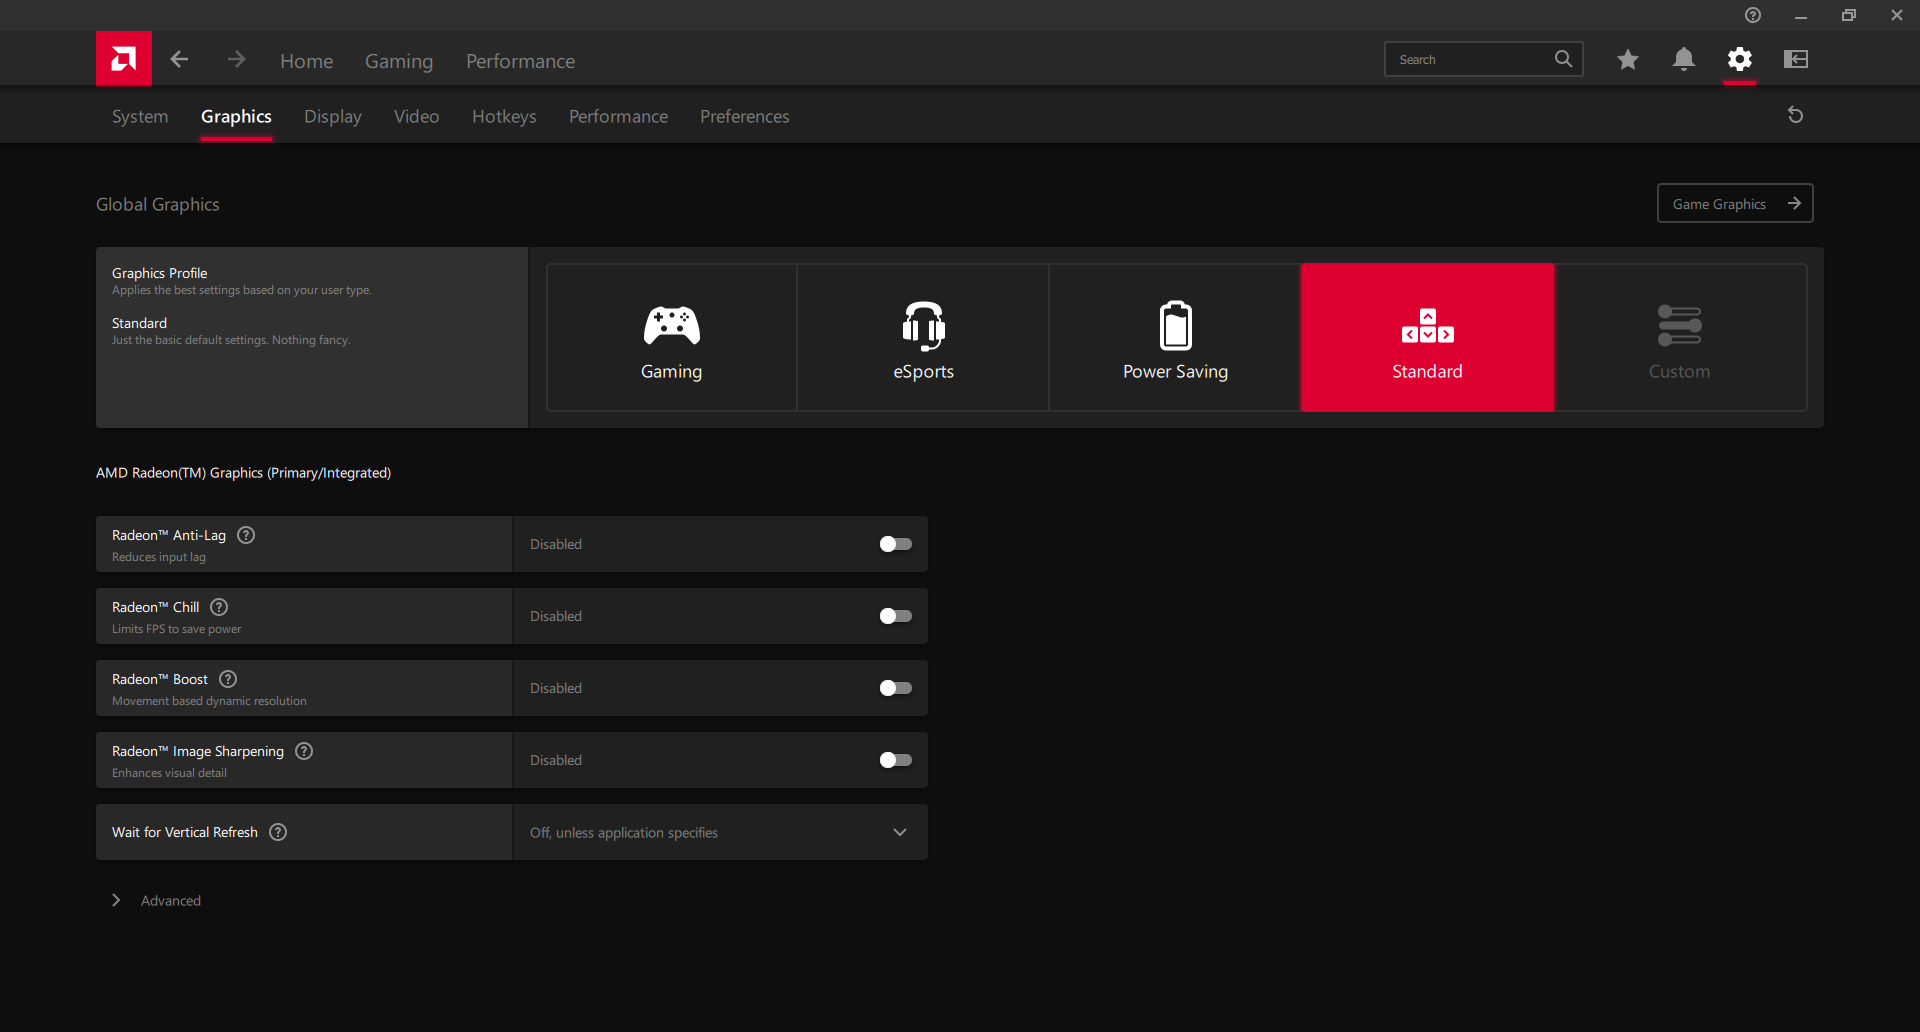
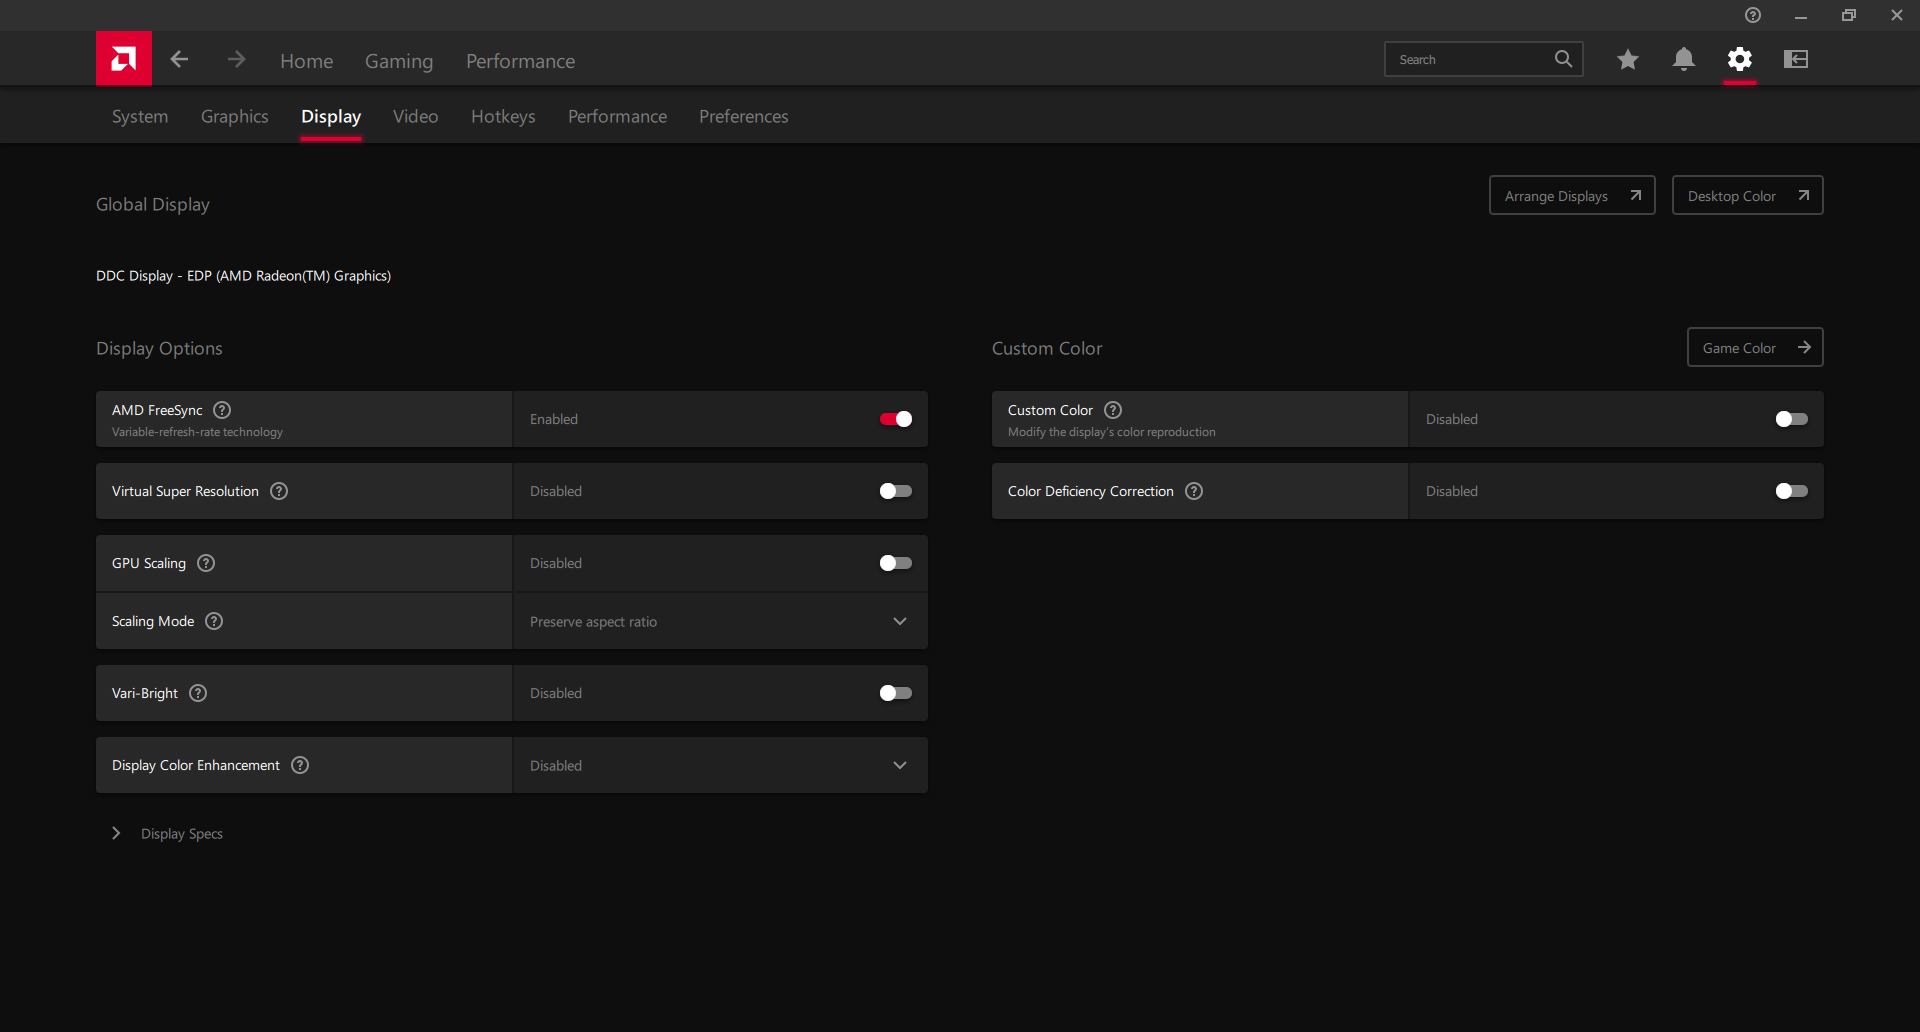
在运行以下基准测试之前,我们的设备在Windows和预装的联想Vantage软件中都被设置为性能模式。我们还确保Nvidia GPU通过Nvidia控制面板处于激活状态,Radeon软件上的全局图形设置被设置为标准。建议用户熟悉Vantage和Radeon软件,因为它们分别作为联想更新和大多数显示设置的控制中心。
没有MUX开关,这在预算游戏机上是可以预期的。

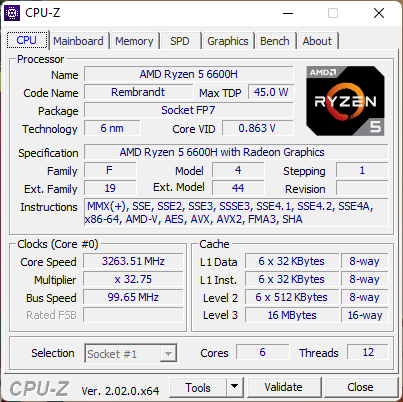
处理器--性能类似于Ryzen 5 5600H
禅3 Ryzen 5 5600H已经比Zen 2有了明显的提升。 Ryzen 5 4600H.因此,从Zen 3 Ryzen 5600H到Zen3+ Ryzen 5 6600H,预计最多只是提供微小的CPU优势。事实上,这些好处是如此之小,以至于它们之间的基准测试结果几乎是一样的。这款Gigabyte A5 K15600H,例如,与我们联想的6600H相比,只差几个百分点。上一代的 Ryzen 7 5800H或 酷睿i7-11800H因此,他们仍然是更快的处理器。
请参阅我们的专门页面,了解 Ryzen 5 6600H了解该处理器的概况。
Cinebench R15 Multi Loop
Cinebench R23: Multi Core | Single Core
Cinebench R15: CPU Multi 64Bit | CPU Single 64Bit
Blender: v2.79 BMW27 CPU
7-Zip 18.03: 7z b 4 | 7z b 4 -mmt1
Geekbench 5.5: Multi-Core | Single-Core
HWBOT x265 Benchmark v2.2: 4k Preset
LibreOffice : 20 Documents To PDF
R Benchmark 2.5: Overall mean
Cinebench R23: Multi Core | Single Core
Cinebench R15: CPU Multi 64Bit | CPU Single 64Bit
Blender: v2.79 BMW27 CPU
7-Zip 18.03: 7z b 4 | 7z b 4 -mmt1
Geekbench 5.5: Multi-Core | Single-Core
HWBOT x265 Benchmark v2.2: 4k Preset
LibreOffice : 20 Documents To PDF
R Benchmark 2.5: Overall mean
* ... smaller is better
AIDA64: FP32 Ray-Trace | FPU Julia | CPU SHA3 | CPU Queen | FPU SinJulia | FPU Mandel | CPU AES | CPU ZLib | FP64 Ray-Trace | CPU PhotoWorxx
| Performance rating | |
| Asus TUF Dash F15 FX517ZR | |
| Average AMD Ryzen 5 6600H | |
| Lenovo IdeaPad Gaming 3 15ARH7 | |
| Lenovo Legion 5 15ACH6A-82NW0010GE | |
| Gigabyte A5 K1 | |
| Dell G15 5510 | |
| Lenovo IdeaPad Gaming 3i 15IMH05 | |
| AIDA64 / FP32 Ray-Trace | |
| Asus TUF Dash F15 FX517ZR | |
| Lenovo Legion 5 15ACH6A-82NW0010GE | |
| Gigabyte A5 K1 | |
| Lenovo IdeaPad Gaming 3 15ARH7 | |
| Average AMD Ryzen 5 6600H (10645 - 12871, n=4) | |
| Dell G15 5510 | |
| Lenovo IdeaPad Gaming 3i 15IMH05 | |
| AIDA64 / FPU Julia | |
| Lenovo Legion 5 15ACH6A-82NW0010GE | |
| Gigabyte A5 K1 | |
| Lenovo IdeaPad Gaming 3 15ARH7 | |
| Average AMD Ryzen 5 6600H (66739 - 78277, n=4) | |
| Asus TUF Dash F15 FX517ZR | |
| Dell G15 5510 | |
| Lenovo IdeaPad Gaming 3i 15IMH05 | |
| AIDA64 / CPU SHA3 | |
| Asus TUF Dash F15 FX517ZR | |
| Lenovo Legion 5 15ACH6A-82NW0010GE | |
| Lenovo IdeaPad Gaming 3 15ARH7 | |
| Average AMD Ryzen 5 6600H (2231 - 2689, n=4) | |
| Gigabyte A5 K1 | |
| Dell G15 5510 | |
| Lenovo IdeaPad Gaming 3i 15IMH05 | |
| AIDA64 / CPU Queen | |
| Asus TUF Dash F15 FX517ZR | |
| Average AMD Ryzen 5 6600H (77711 - 82119, n=4) | |
| Lenovo IdeaPad Gaming 3 15ARH7 | |
| Gigabyte A5 K1 | |
| Lenovo Legion 5 15ACH6A-82NW0010GE | |
| Dell G15 5510 | |
| Lenovo IdeaPad Gaming 3i 15IMH05 | |
| AIDA64 / FPU SinJulia | |
| Average AMD Ryzen 5 6600H (9184 - 9739, n=4) | |
| Lenovo IdeaPad Gaming 3 15ARH7 | |
| Gigabyte A5 K1 | |
| Lenovo Legion 5 15ACH6A-82NW0010GE | |
| Asus TUF Dash F15 FX517ZR | |
| Dell G15 5510 | |
| Lenovo IdeaPad Gaming 3i 15IMH05 | |
| AIDA64 / FPU Mandel | |
| Lenovo Legion 5 15ACH6A-82NW0010GE | |
| Gigabyte A5 K1 | |
| Lenovo IdeaPad Gaming 3 15ARH7 | |
| Average AMD Ryzen 5 6600H (36591 - 43222, n=4) | |
| Asus TUF Dash F15 FX517ZR | |
| Dell G15 5510 | |
| Lenovo IdeaPad Gaming 3i 15IMH05 | |
| AIDA64 / CPU AES | |
| Lenovo IdeaPad Gaming 3 15ARH7 | |
| Lenovo Legion 5 15ACH6A-82NW0010GE | |
| Average AMD Ryzen 5 6600H (43461 - 104138, n=4) | |
| Asus TUF Dash F15 FX517ZR | |
| Gigabyte A5 K1 | |
| Dell G15 5510 | |
| Lenovo IdeaPad Gaming 3i 15IMH05 | |
| AIDA64 / CPU ZLib | |
| Asus TUF Dash F15 FX517ZR | |
| Lenovo IdeaPad Gaming 3 15ARH7 | |
| Lenovo Legion 5 15ACH6A-82NW0010GE | |
| Gigabyte A5 K1 | |
| Average AMD Ryzen 5 6600H (523 - 660, n=4) | |
| Dell G15 5510 | |
| Lenovo IdeaPad Gaming 3i 15IMH05 | |
| AIDA64 / FP64 Ray-Trace | |
| Asus TUF Dash F15 FX517ZR | |
| Lenovo Legion 5 15ACH6A-82NW0010GE | |
| Gigabyte A5 K1 | |
| Lenovo IdeaPad Gaming 3 15ARH7 | |
| Average AMD Ryzen 5 6600H (5659 - 6911, n=4) | |
| Dell G15 5510 | |
| Lenovo IdeaPad Gaming 3i 15IMH05 | |
| AIDA64 / CPU PhotoWorxx | |
| Asus TUF Dash F15 FX517ZR | |
| Average AMD Ryzen 5 6600H (16218 - 29621, n=4) | |
| Gigabyte A5 K1 | |
| Lenovo IdeaPad Gaming 3i 15IMH05 | |
| Lenovo IdeaPad Gaming 3 15ARH7 | |
| Dell G15 5510 | |
| Lenovo Legion 5 15ACH6A-82NW0010GE | |
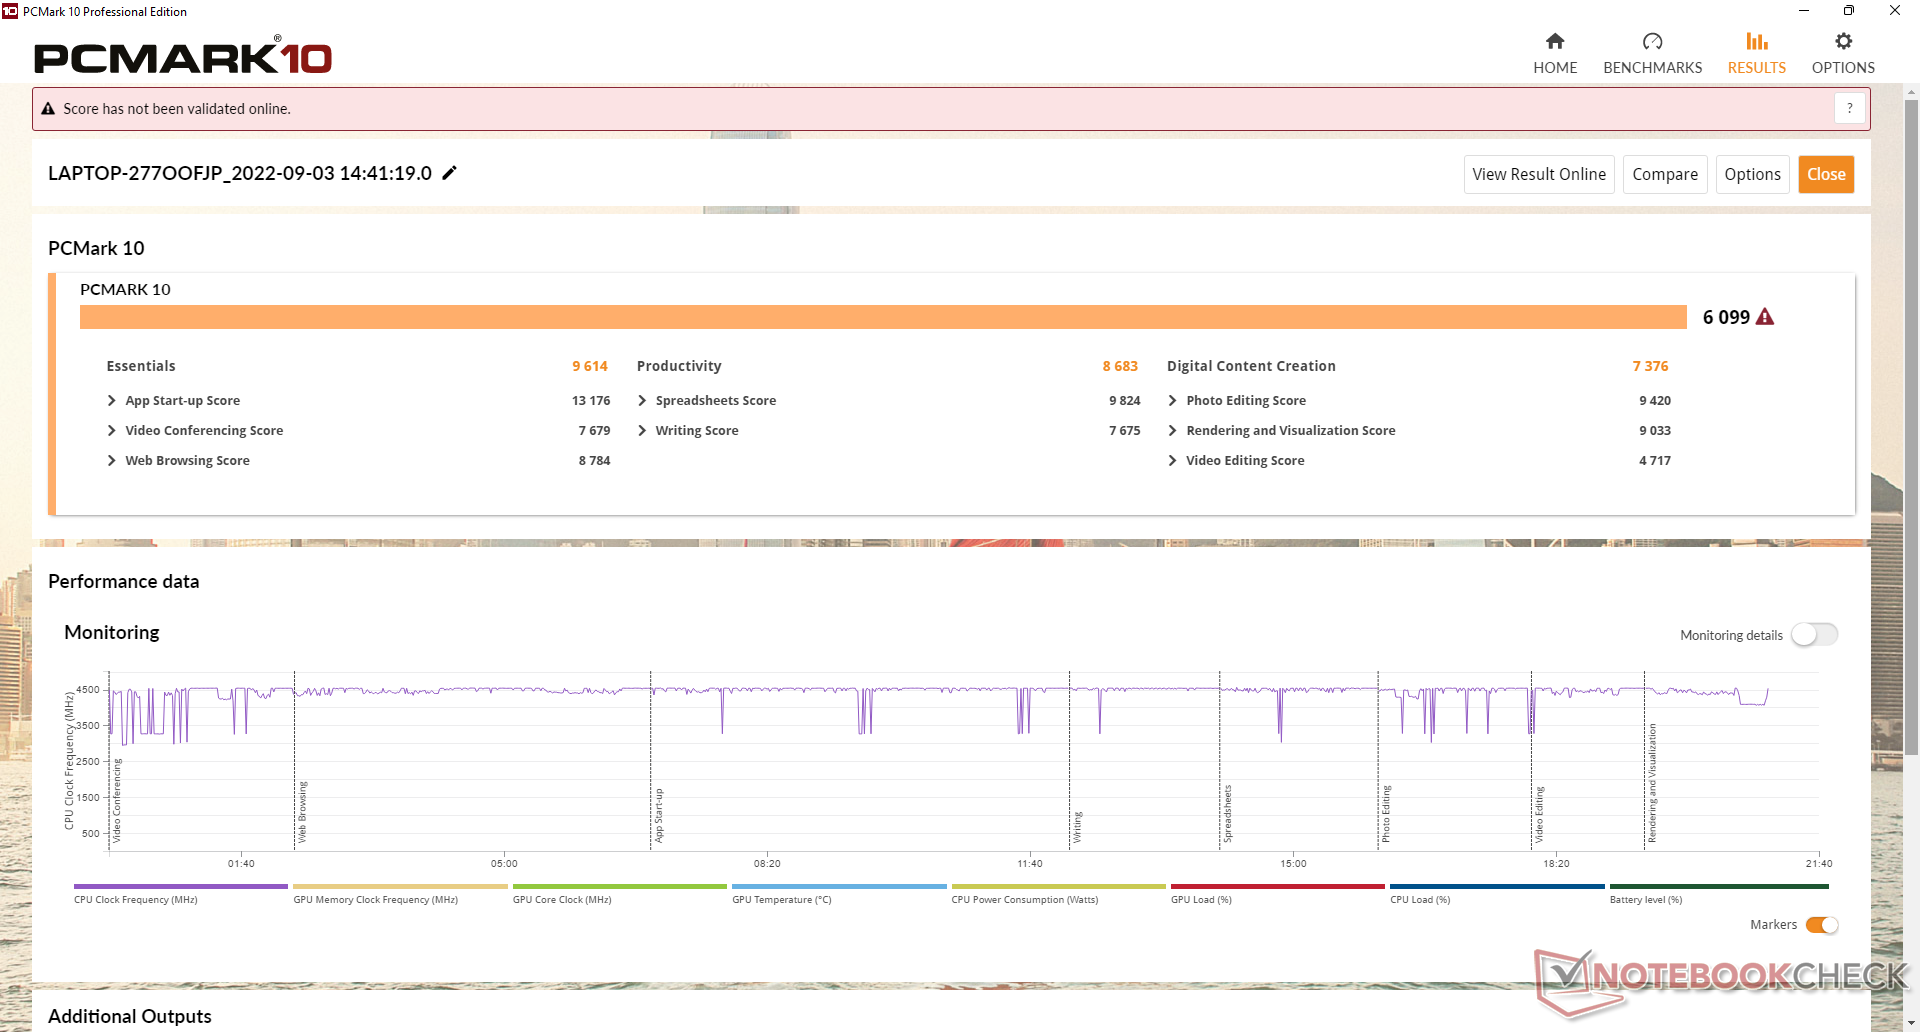
系统性能
PCMark分数一直高于老款IdeaPad Gaming 3i 15IMH05,但仍低于 Legion 5 15ACH6A拥有更强大的Radeon RX 6600M GPU。特别是数字内容创作子分数明显好于IdeaPad Gaming 3i 15IMH05,因为图形性能有了一代的飞跃。
CrossMark: Overall | Productivity | Creativity | Responsiveness
| PCMark 10 / Score | |
| Lenovo Legion 5 15ACH6A-82NW0010GE | |
| Asus TUF Dash F15 FX517ZR | |
| Gigabyte A5 K1 | |
| Lenovo IdeaPad Gaming 3 15ARH7 | |
| Average AMD Ryzen 5 6600H, NVIDIA GeForce RTX 3050 4GB Laptop GPU (n=1) | |
| Dell G15 5510 | |
| Lenovo IdeaPad Gaming 3i 15IMH05 | |
| PCMark 10 / Essentials | |
| Lenovo Legion 5 15ACH6A-82NW0010GE | |
| Gigabyte A5 K1 | |
| Asus TUF Dash F15 FX517ZR | |
| Lenovo IdeaPad Gaming 3 15ARH7 | |
| Average AMD Ryzen 5 6600H, NVIDIA GeForce RTX 3050 4GB Laptop GPU (n=1) | |
| Lenovo IdeaPad Gaming 3i 15IMH05 | |
| Dell G15 5510 | |
| PCMark 10 / Productivity | |
| Asus TUF Dash F15 FX517ZR | |
| Lenovo Legion 5 15ACH6A-82NW0010GE | |
| Gigabyte A5 K1 | |
| Lenovo IdeaPad Gaming 3 15ARH7 | |
| Average AMD Ryzen 5 6600H, NVIDIA GeForce RTX 3050 4GB Laptop GPU (n=1) | |
| Lenovo IdeaPad Gaming 3i 15IMH05 | |
| Dell G15 5510 | |
| PCMark 10 / Digital Content Creation | |
| Lenovo Legion 5 15ACH6A-82NW0010GE | |
| Asus TUF Dash F15 FX517ZR | |
| Gigabyte A5 K1 | |
| Lenovo IdeaPad Gaming 3 15ARH7 | |
| Average AMD Ryzen 5 6600H, NVIDIA GeForce RTX 3050 4GB Laptop GPU (n=1) | |
| Dell G15 5510 | |
| Lenovo IdeaPad Gaming 3i 15IMH05 | |
| CrossMark / Overall | |
| Asus TUF Dash F15 FX517ZR | |
| Lenovo IdeaPad Gaming 3 15ARH7 | |
| Average AMD Ryzen 5 6600H, NVIDIA GeForce RTX 3050 4GB Laptop GPU (n=1) | |
| CrossMark / Productivity | |
| Asus TUF Dash F15 FX517ZR | |
| Lenovo IdeaPad Gaming 3 15ARH7 | |
| Average AMD Ryzen 5 6600H, NVIDIA GeForce RTX 3050 4GB Laptop GPU (n=1) | |
| CrossMark / Creativity | |
| Asus TUF Dash F15 FX517ZR | |
| Lenovo IdeaPad Gaming 3 15ARH7 | |
| Average AMD Ryzen 5 6600H, NVIDIA GeForce RTX 3050 4GB Laptop GPU (n=1) | |
| CrossMark / Responsiveness | |
| Asus TUF Dash F15 FX517ZR | |
| Lenovo IdeaPad Gaming 3 15ARH7 | |
| Average AMD Ryzen 5 6600H, NVIDIA GeForce RTX 3050 4GB Laptop GPU (n=1) | |
| PCMark 10 Score | 6099 points | |
Help | ||
| AIDA64 / Memory Copy | |
| Asus TUF Dash F15 FX517ZR | |
| Average AMD Ryzen 5 6600H (28335 - 50886, n=4) | |
| Gigabyte A5 K1 | |
| Lenovo Legion 5 15ACH6A-82NW0010GE | |
| Dell G15 5510 | |
| Lenovo IdeaPad Gaming 3i 15IMH05 | |
| Lenovo IdeaPad Gaming 3 15ARH7 | |
| AIDA64 / Memory Read | |
| Asus TUF Dash F15 FX517ZR | |
| Gigabyte A5 K1 | |
| Average AMD Ryzen 5 6600H (34300 - 51684, n=4) | |
| Lenovo Legion 5 15ACH6A-82NW0010GE | |
| Lenovo IdeaPad Gaming 3i 15IMH05 | |
| Dell G15 5510 | |
| Lenovo IdeaPad Gaming 3 15ARH7 | |
| AIDA64 / Memory Write | |
| Asus TUF Dash F15 FX517ZR | |
| Average AMD Ryzen 5 6600H (31788 - 55160, n=4) | |
| Gigabyte A5 K1 | |
| Dell G15 5510 | |
| Lenovo IdeaPad Gaming 3i 15IMH05 | |
| Lenovo IdeaPad Gaming 3 15ARH7 | |
| Lenovo Legion 5 15ACH6A-82NW0010GE | |
| AIDA64 / Memory Latency | |
| Asus TUF Dash F15 FX517ZR | |
| Average AMD Ryzen 5 6600H (81.7 - 112.7, n=4) | |
| Lenovo Legion 5 15ACH6A-82NW0010GE | |
| Lenovo IdeaPad Gaming 3 15ARH7 | |
| Dell G15 5510 | |
| Gigabyte A5 K1 | |
| Lenovo IdeaPad Gaming 3i 15IMH05 | |
* ... smaller is better
DPC延时
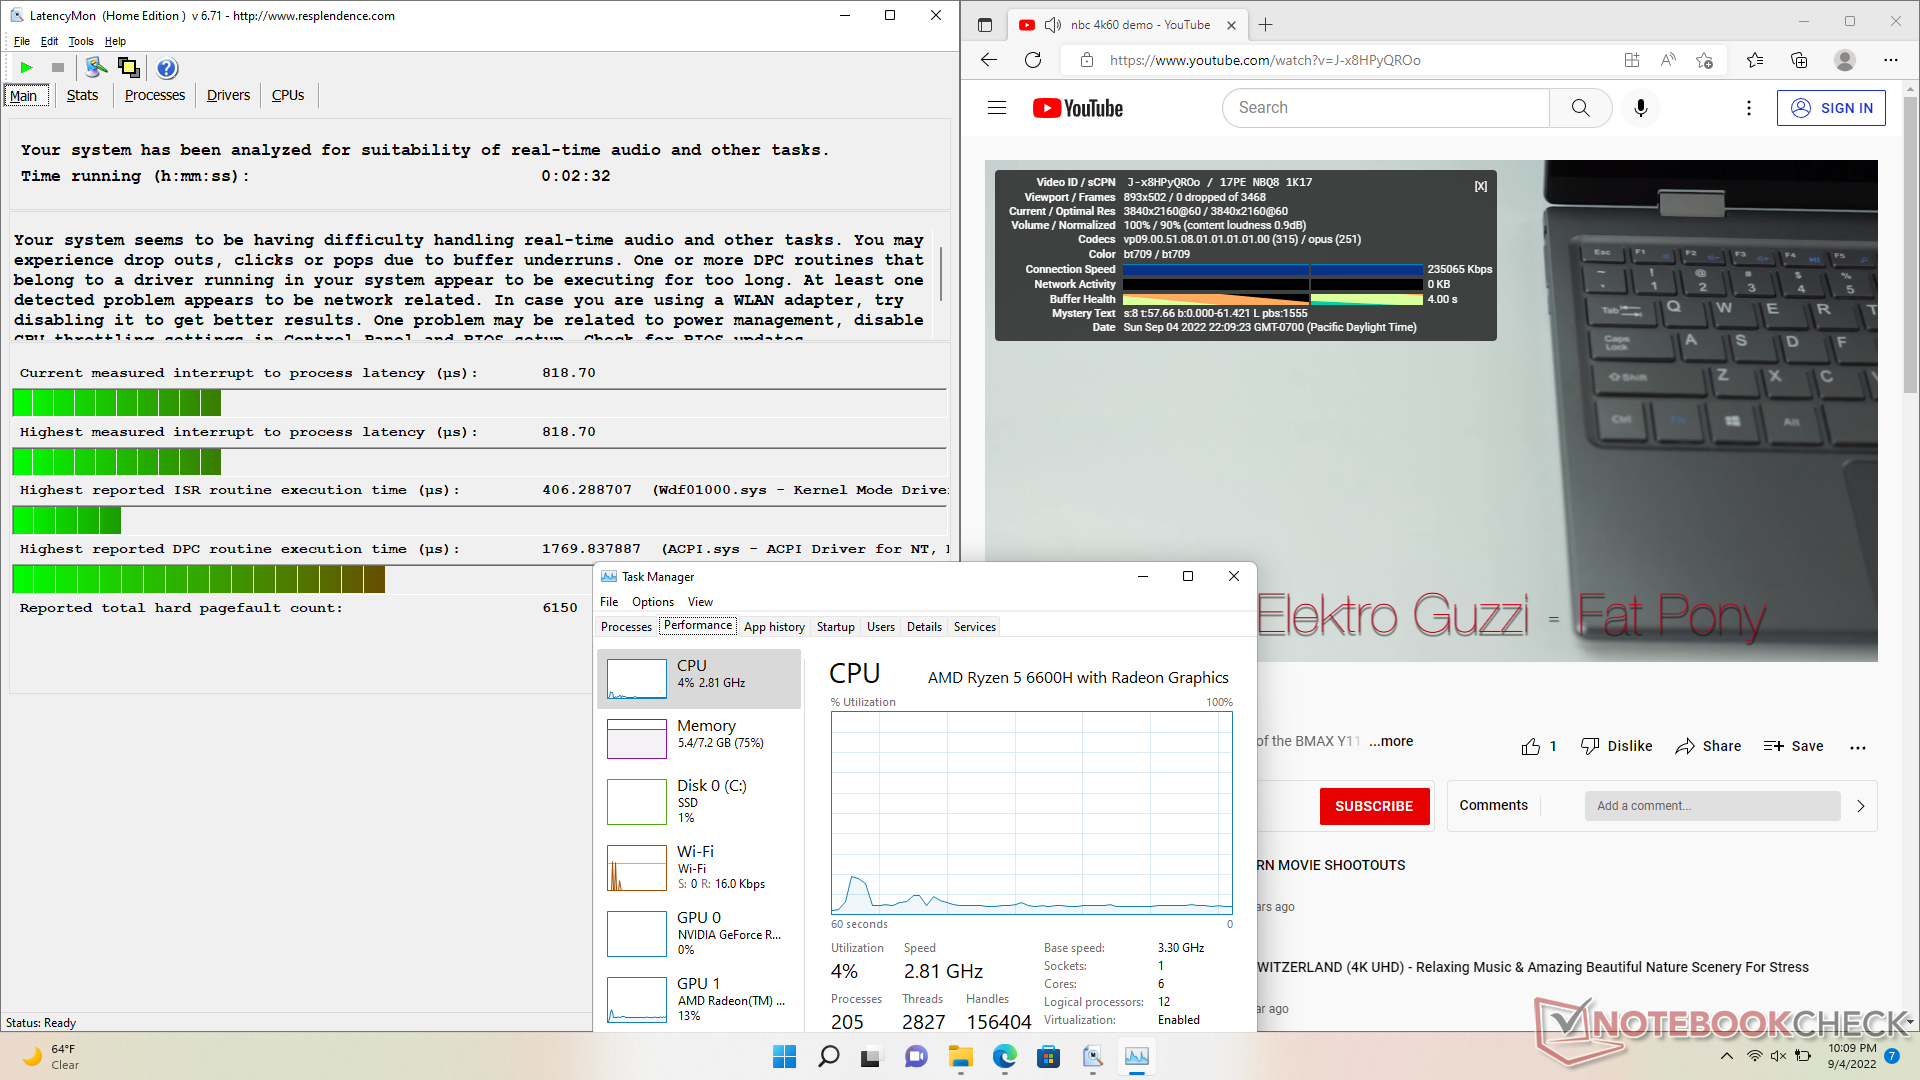
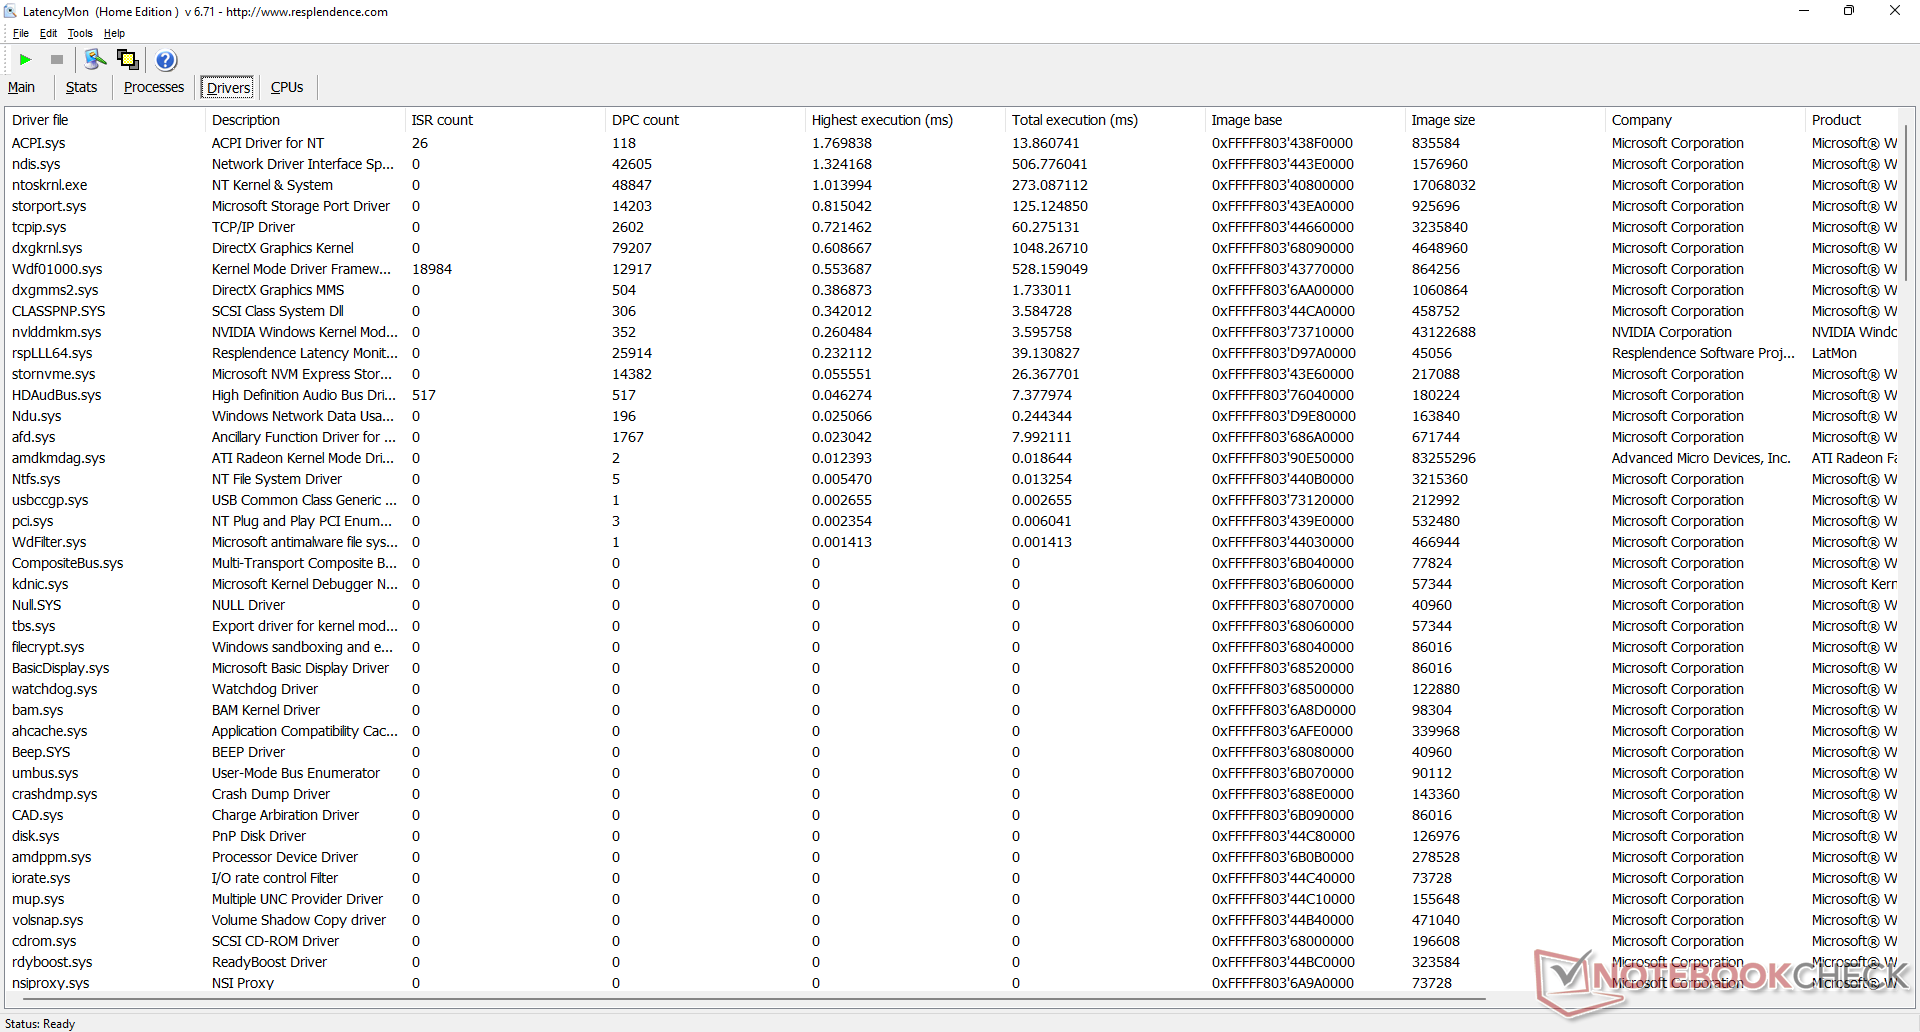
LatencyMon显示,在打开我们主页的多个浏览器标签时,存在轻微的DPC问题。在60 FPS下的4K视频播放是完美的,没有丢帧,而且与英特尔酷睿U系列Iris Xe相比,iGPU的利用率更低(13%对~40%)。
| DPC Latencies / LatencyMon - interrupt to process latency (max), Web, Youtube, Prime95 | |
| Dell G15 5510 | |
| Gigabyte A5 K1 | |
| Lenovo Legion 5 15ACH6A-82NW0010GE | |
| Lenovo IdeaPad Gaming 3 15ARH7 | |
| Lenovo IdeaPad Gaming 3i 15IMH05 | |
| Asus TUF Dash F15 FX517ZR | |
* ... smaller is better
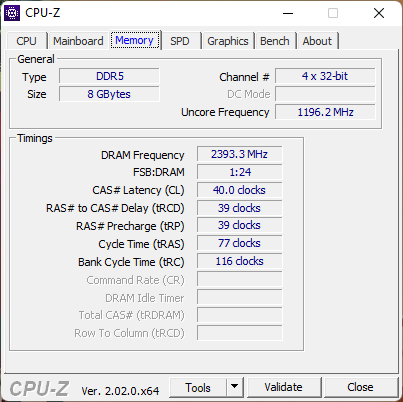
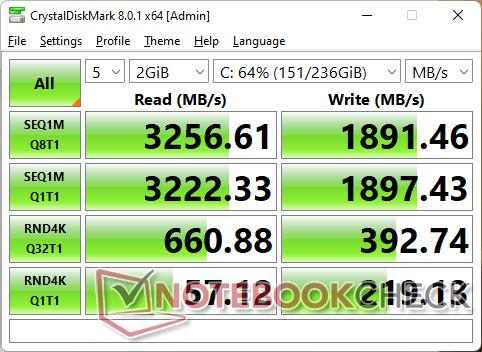
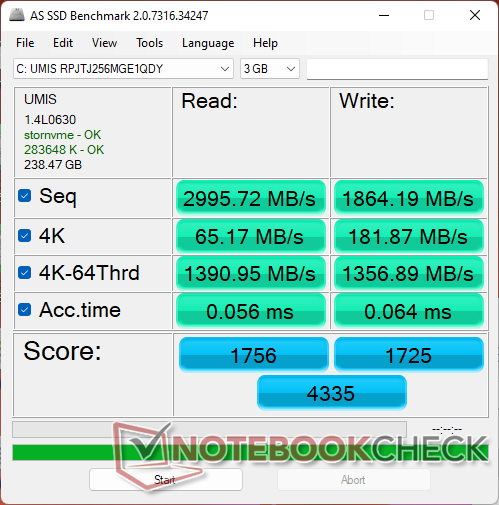
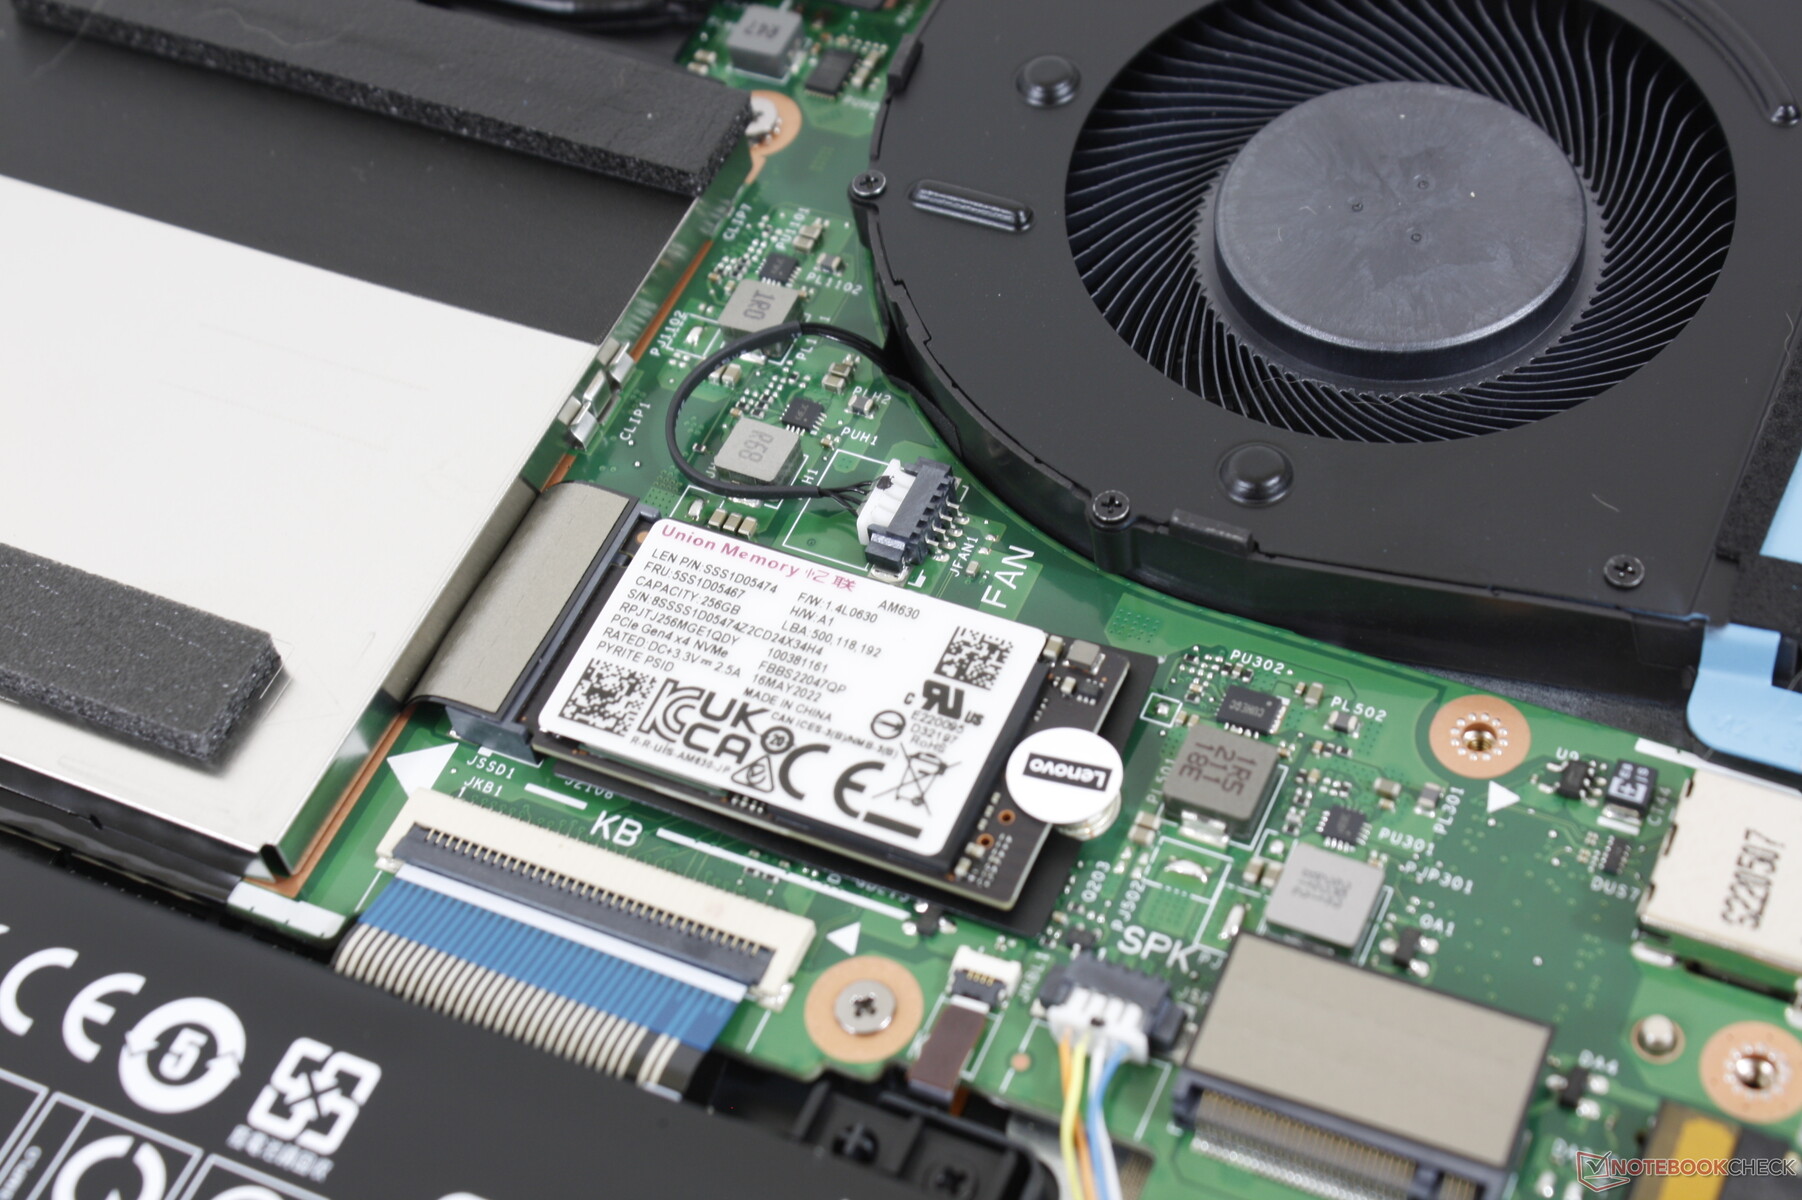
存储设备 - 多达两个PCIe4 x4固态硬盘
尽管系统可以同时支持两个M.2 PCIe4 x4 NVMe SSD,但256 GB PCIe4 x4 联想AM630固态硬盘相对于其他PCIe4 x4固态硬盘来说,我们的测试单元的速度很慢。例如,三星PM9A1的速度可以达到7000MB/s,而我们的IdeaPad上只有约3000MB/s。此外,我们单位的驱动器在循环运行DiskSpd时,会降到2000MB/s的范围,如下图所示,这意味着它不能长时间维持其最大传输速率。然而,对于一台经济型游戏笔记本电脑来说,这并不是一个特别重要的抱怨。

| Drive Performance rating - Percent | |
| Lenovo IdeaPad Gaming 3 15ARH7 | |
| Asus TUF Dash F15 FX517ZR | |
| Gigabyte A5 K1 | |
| Dell G15 5510 | |
| Lenovo Legion 5 15ACH6A-82NW0010GE | |
| Lenovo IdeaPad Gaming 3i 15IMH05 | |
* ... smaller is better
Disk Throttling: DiskSpd Read Loop, Queue Depth 8
GPU性能
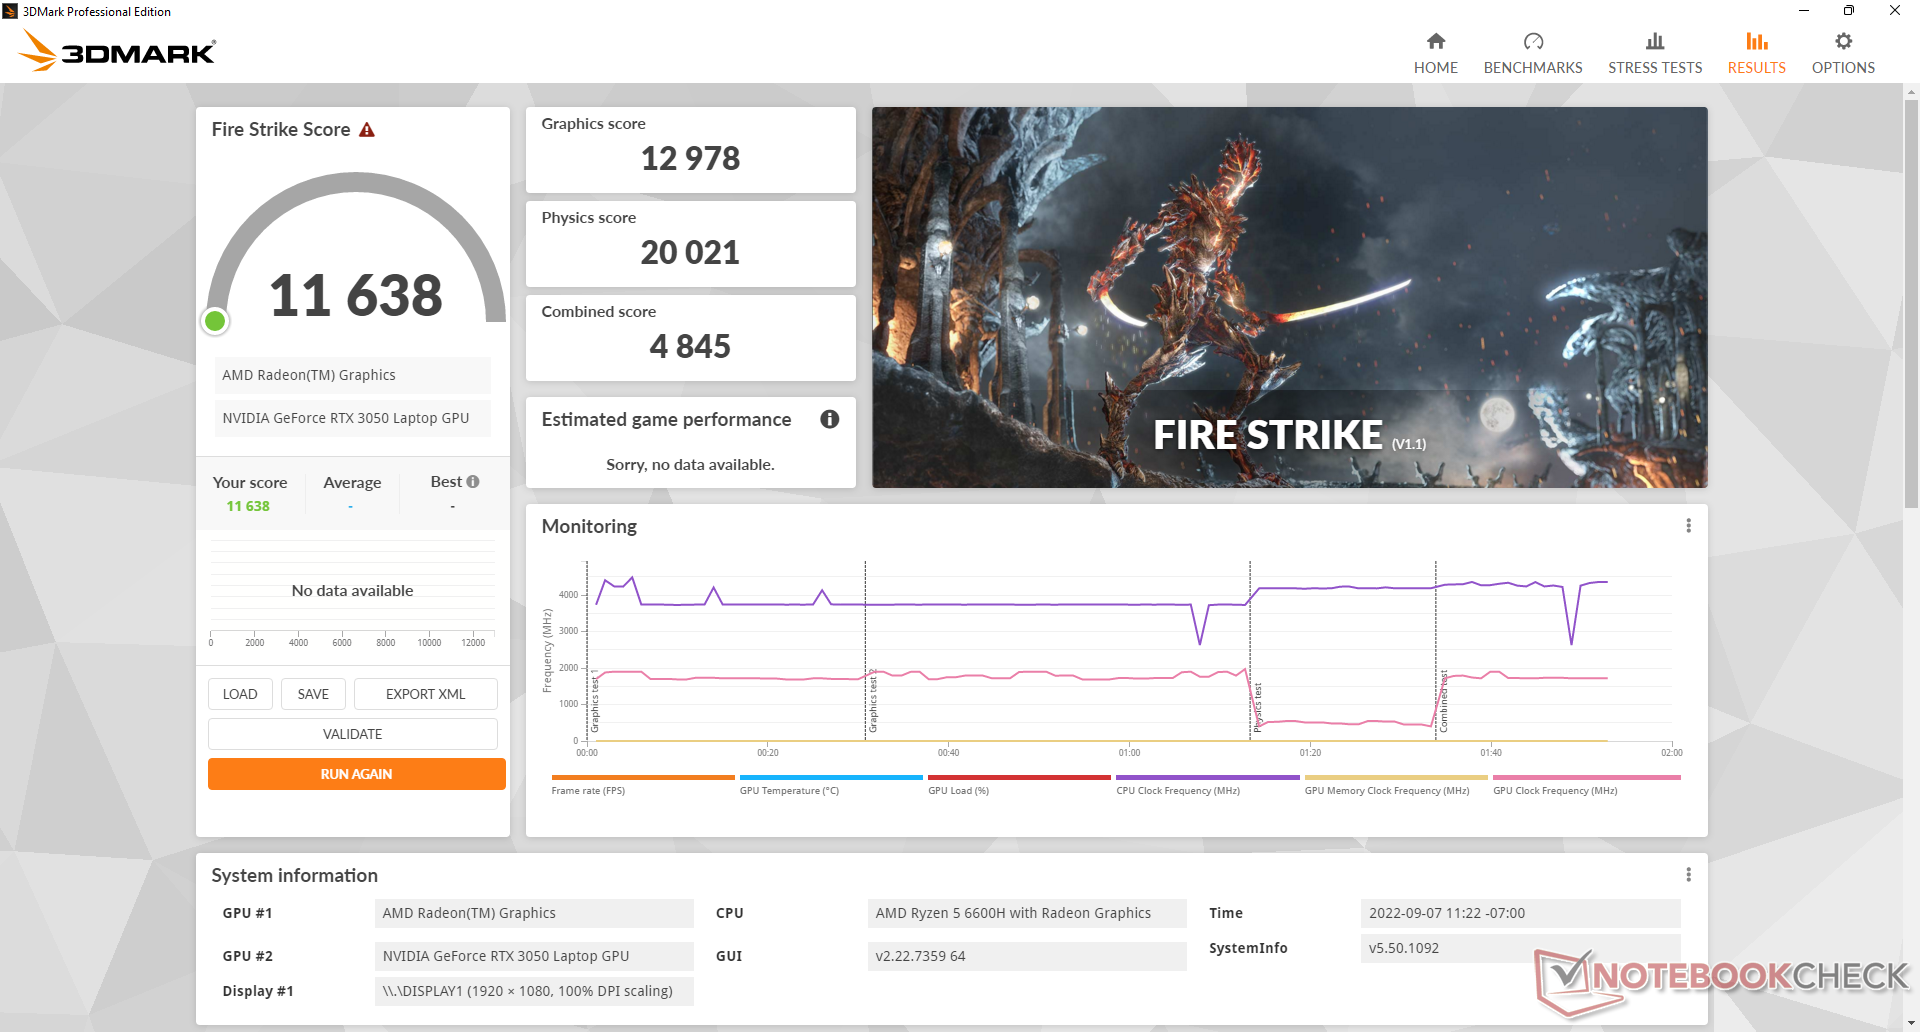
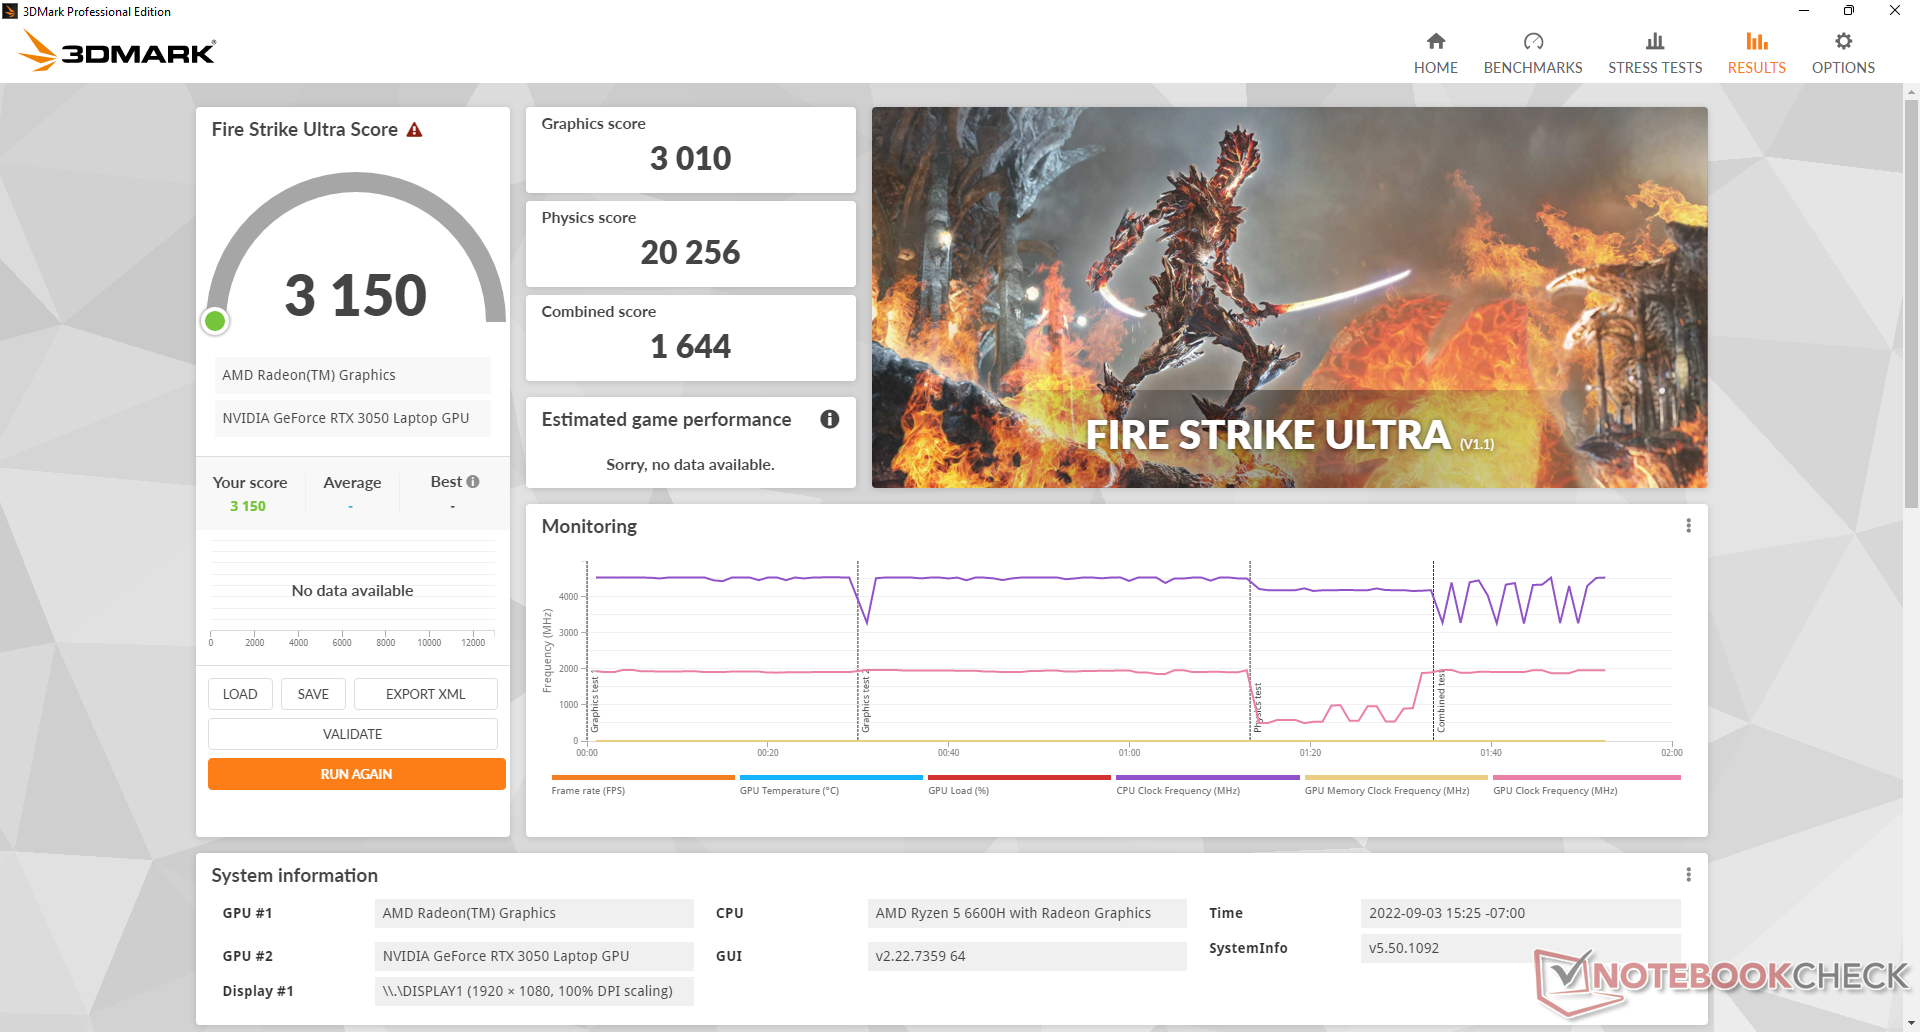
图形性能比我们数据库中配备相同的笔记本电脑的平均速度快约15%。 GeForce RTX 3050GPU。升级到 RTX 3050 Ti根据我们对其他RTX 3050 Ti笔记本电脑的经验,升级到RTX 3050 Ti可能只会再提高10%的性能。寻找RTX 3060选项的用户将不得不考虑价格更高的Legion 系列。
如果在平衡电源配置文件上运行,性能会降低。在平衡模式下进行的Fire Strike 测试将使图形性能降低8%(14157点对12978点),而CPU性能保持不变。
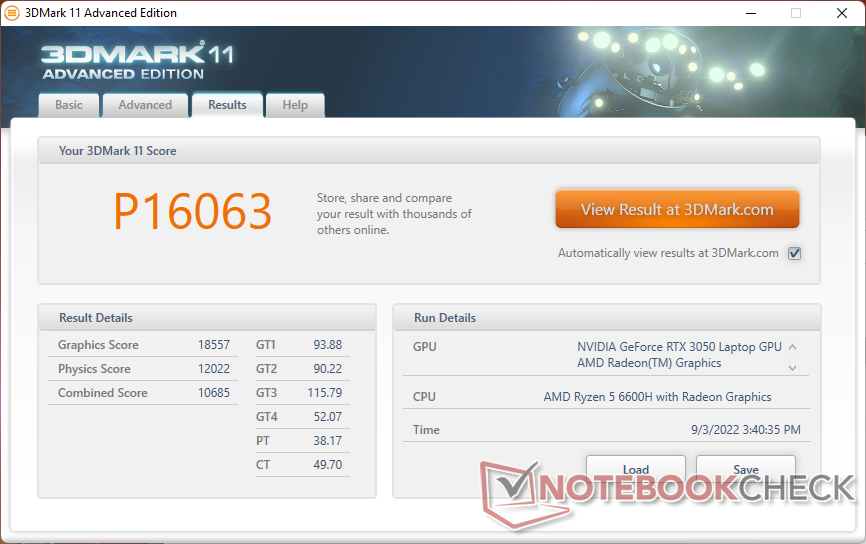

| 3DMark 11 Performance | 16063 points | |
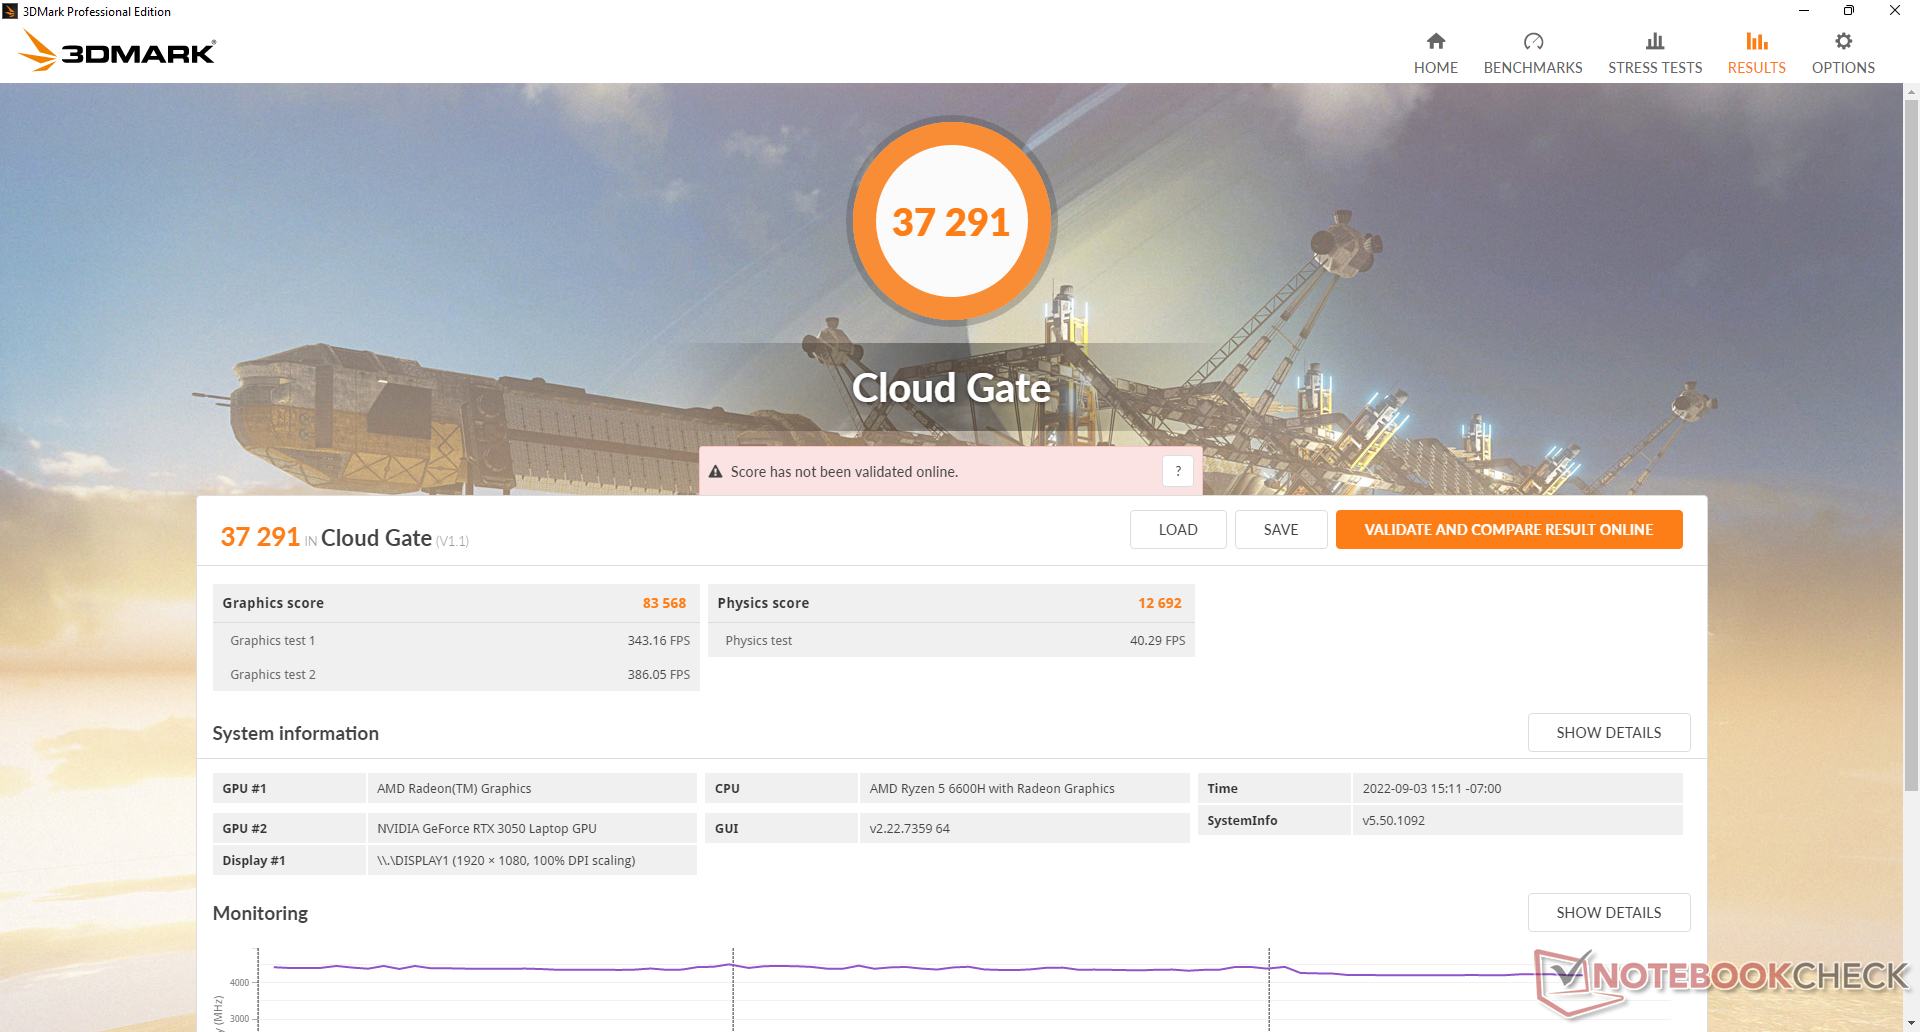
| 3DMark Cloud Gate Standard Score | 37291 points | |
| 3DMark Fire Strike Score | 12525 points | |
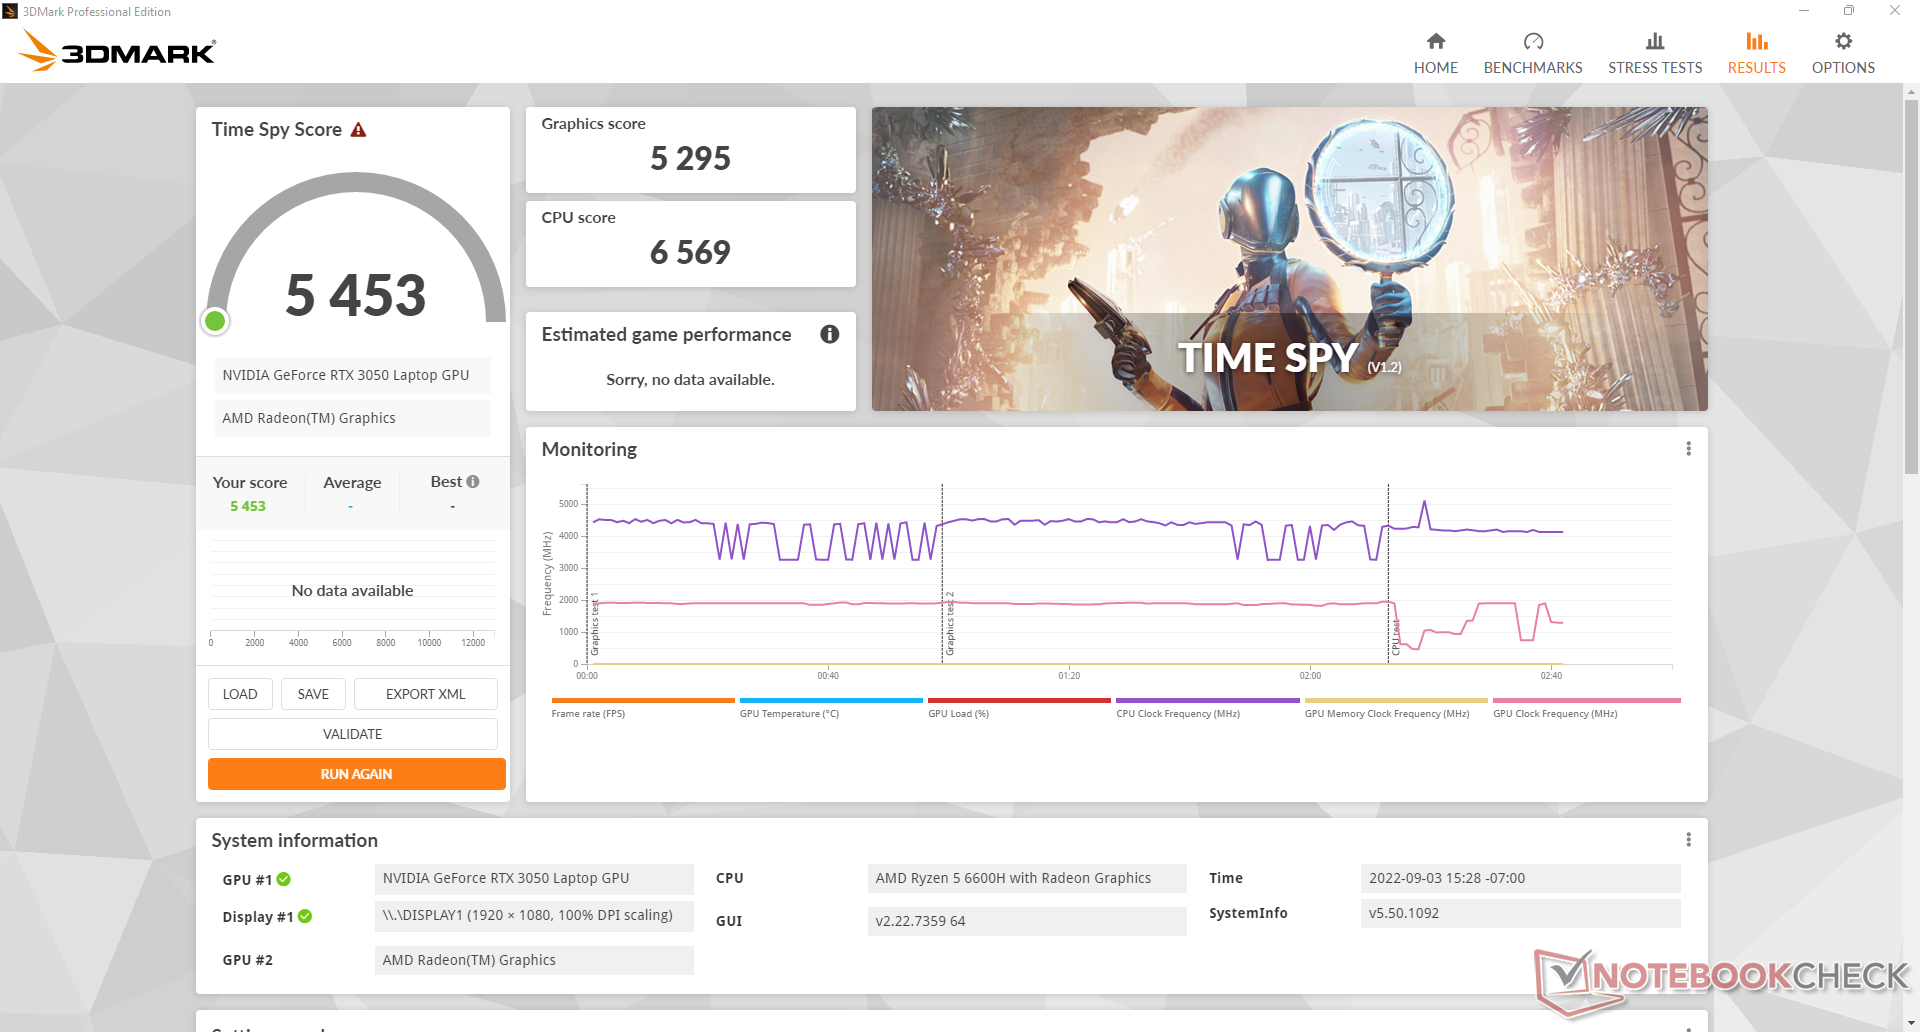
| 3DMark Time Spy Score | 5453 points | |
Help | ||
Witcher 3 FPS Chart
| low | med. | high | ultra | |
|---|---|---|---|---|
| GTA V (2015) | 144 | 133.3 | 103.5 | 60.3 |
| The Witcher 3 (2015) | 213.9 | 167.7 | 105.1 | 55.8 |
| Dota 2 Reborn (2015) | 117.2 | 106.4 | 100.6 | 95.2 |
| Final Fantasy XV Benchmark (2018) | 116.4 | 73.6 | 53.5 | |
| X-Plane 11.11 (2018) | 84.4 | 77.1 | 63.6 | |
| Strange Brigade (2018) | 248 | 134.7 | 109.1 | 95.1 |
| Cyberpunk 2077 1.6 (2022) | 72.9 | 62.4 | 45.5 | 36.5 |
排放--游戏时近50分贝(A)
系统噪音
空转时的风扇噪音可低至23.8分贝,如果在性能电源配置文件设置下,则可高至27.3分贝(A)。因此,如果只是简单的网络浏览或流媒体,不建议使用性能模式。在大多数日常负载下,预计噪音水平约为31.4 dB(A)或更低。
在性能模式下进行游戏时,风扇的声音可以达到49.3 dB(A),这与大多数其他游戏笔记本包括联想自己的笔记本相当。 Legion 5 15.如果在平衡电源模式下进行游戏,风扇噪音会明显下降到43.9 dB(A),但如上所述,这要以图形性能为代价。然而,一些玩家可能会发现,为了一个整体上更安静的机器,降低的性能是非常值得的。
Noise level
| Idle |
| 23.8 / 23.8 / 27.2 dB(A) |
| Load |
| 34.8 / 49.4 dB(A) |
 | ||
30 dB silent 40 dB(A) audible 50 dB(A) loud |
||
min: | ||
| Lenovo IdeaPad Gaming 3 15ARH7 GeForce RTX 3050 4GB Laptop GPU, R5 6600H, Lenovo UMIS AM630 RPJTJ256MGE1QDY | Lenovo IdeaPad Gaming 3i 15IMH05 GeForce GTX 1650 Mobile, i5-10300H, SK hynix BC511 HFM512GDHTNI-87A0B | Lenovo Legion 5 15ACH6A-82NW0010GE Radeon RX 6600M, R5 5600H, Micron 2210 MTFDHBA512QFD | Gigabyte A5 K1 GeForce RTX 3060 Laptop GPU, R5 5600H, ESR512GTLG-E6GBTNB4 | Asus TUF Dash F15 FX517ZR GeForce RTX 3070 Laptop GPU, i7-12650H, Samsung PM991a MZVLQ1T0HBLB | Dell G15 5510 GeForce RTX 3050 4GB Laptop GPU, i5-10500H, SK Hynix BC711 HFM512GD3HX015N | |
|---|---|---|---|---|---|---|
| Noise | -20% | -16% | -22% | -15% | -10% | |
| off / environment * (dB) | 23.3 | 30.7 -32% | 25 -7% | 26 -12% | 26 -12% | 26 -12% |
| Idle Minimum * (dB) | 23.8 | 30.7 -29% | 25 -5% | 26 -9% | 26 -9% | 26 -9% |
| Idle Average * (dB) | 23.8 | 30.7 -29% | 25 -5% | 29 -22% | 32 -34% | 27 -13% |
| Idle Maximum * (dB) | 27.2 | 30.7 -13% | 34.5 -27% | 32 -18% | 33 -21% | 33 -21% |
| Load Average * (dB) | 34.8 | 49.7 -43% | 51.1 -47% | 57 -64% | 48 -38% | 45 -29% |
| Witcher 3 ultra * (dB) | 49.3 | 47 5% | 56 -14% | 47 5% | 45 9% | |
| Load Maximum * (dB) | 49.4 | 50.3 -2% | 51.3 -4% | 58 -17% | 49 1% | 47 5% |
* ... smaller is better
温度
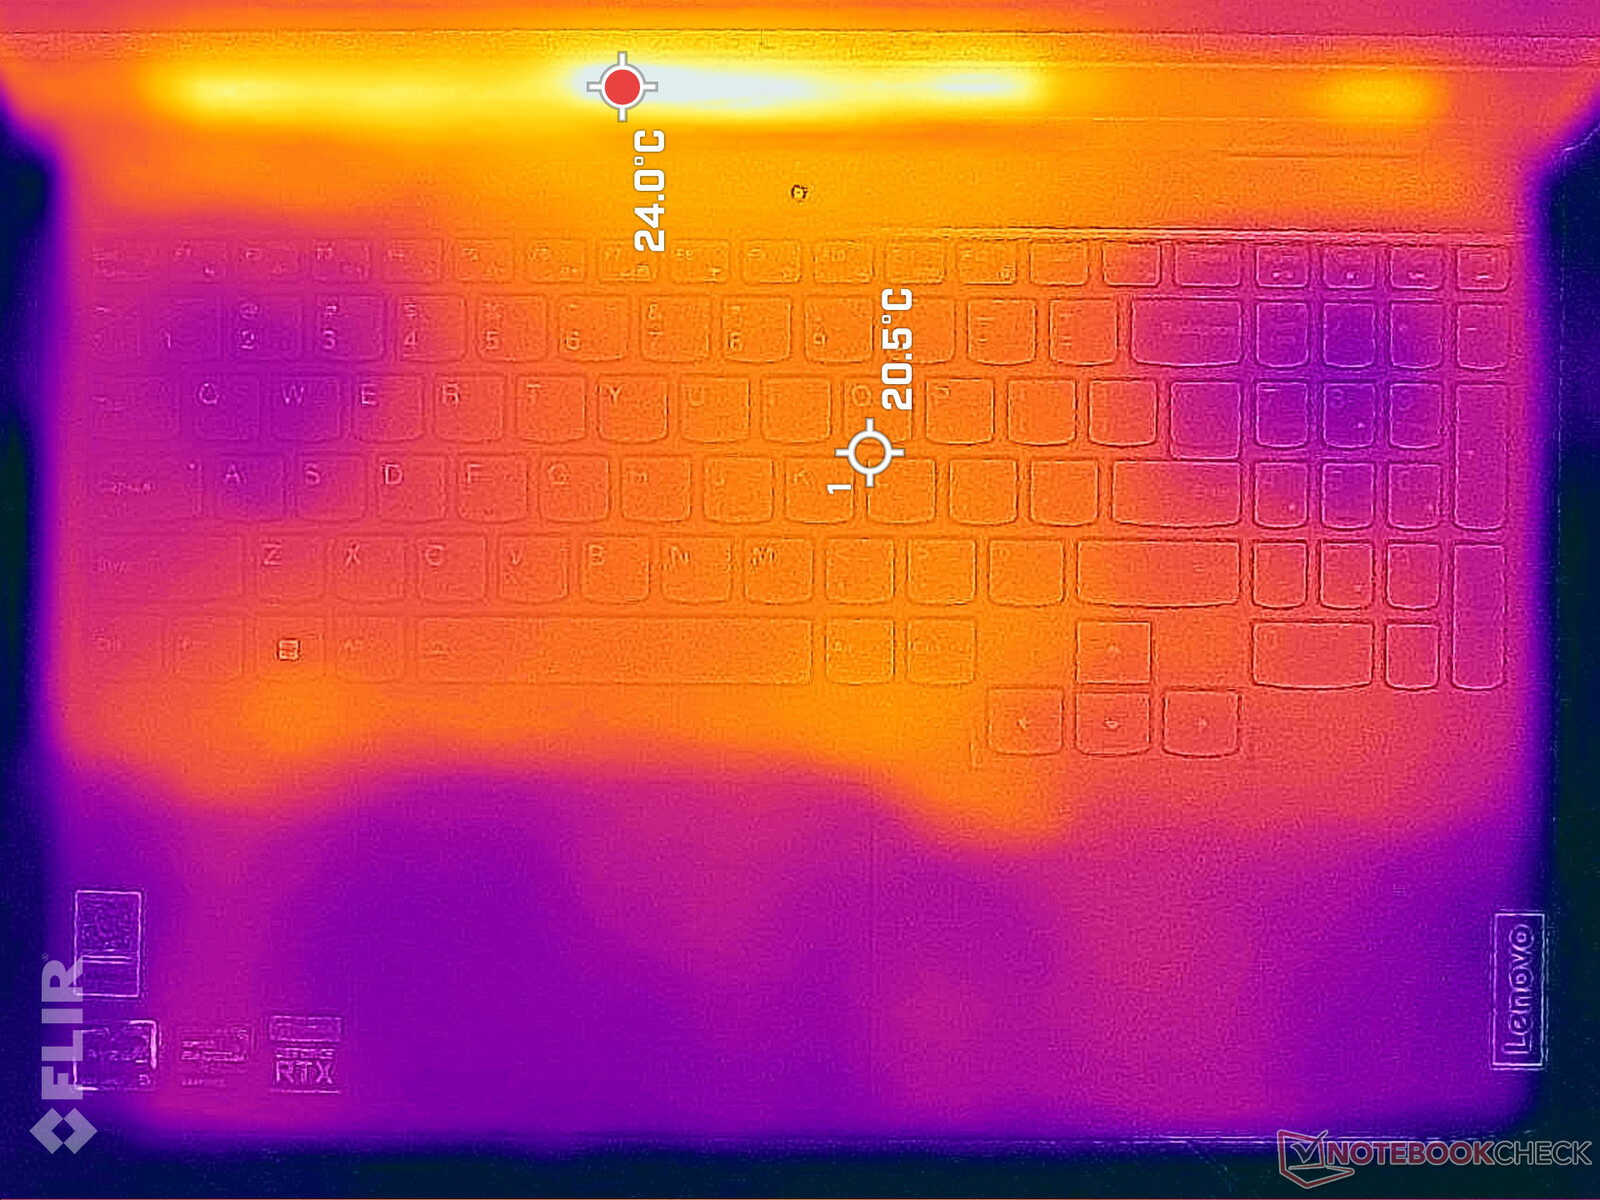
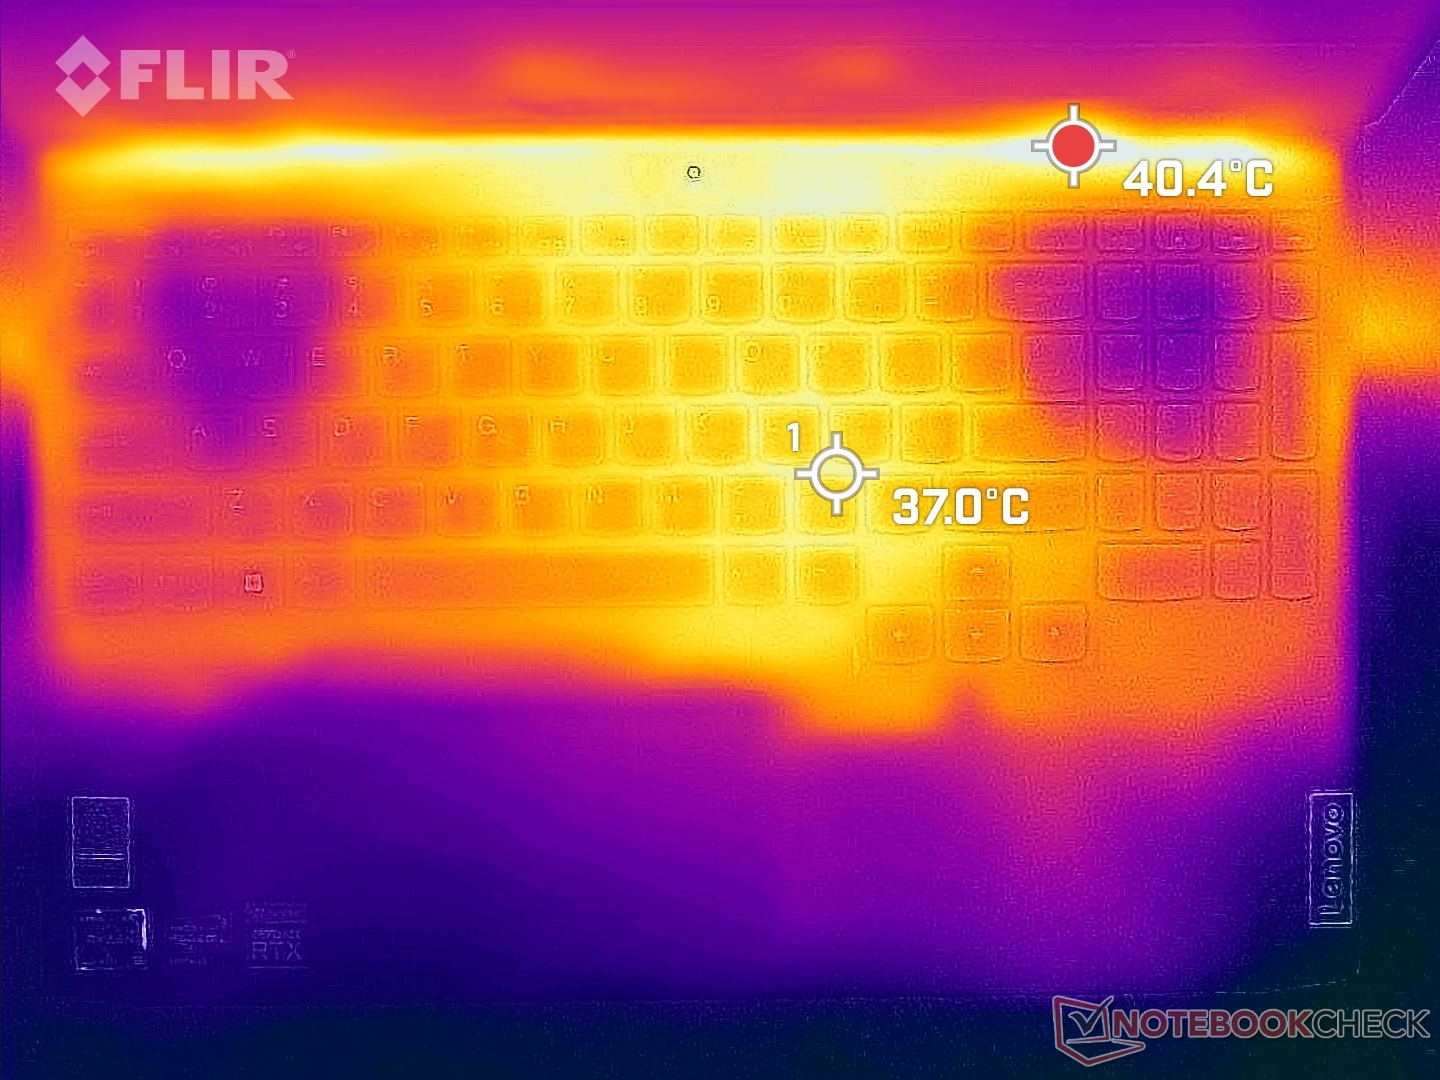
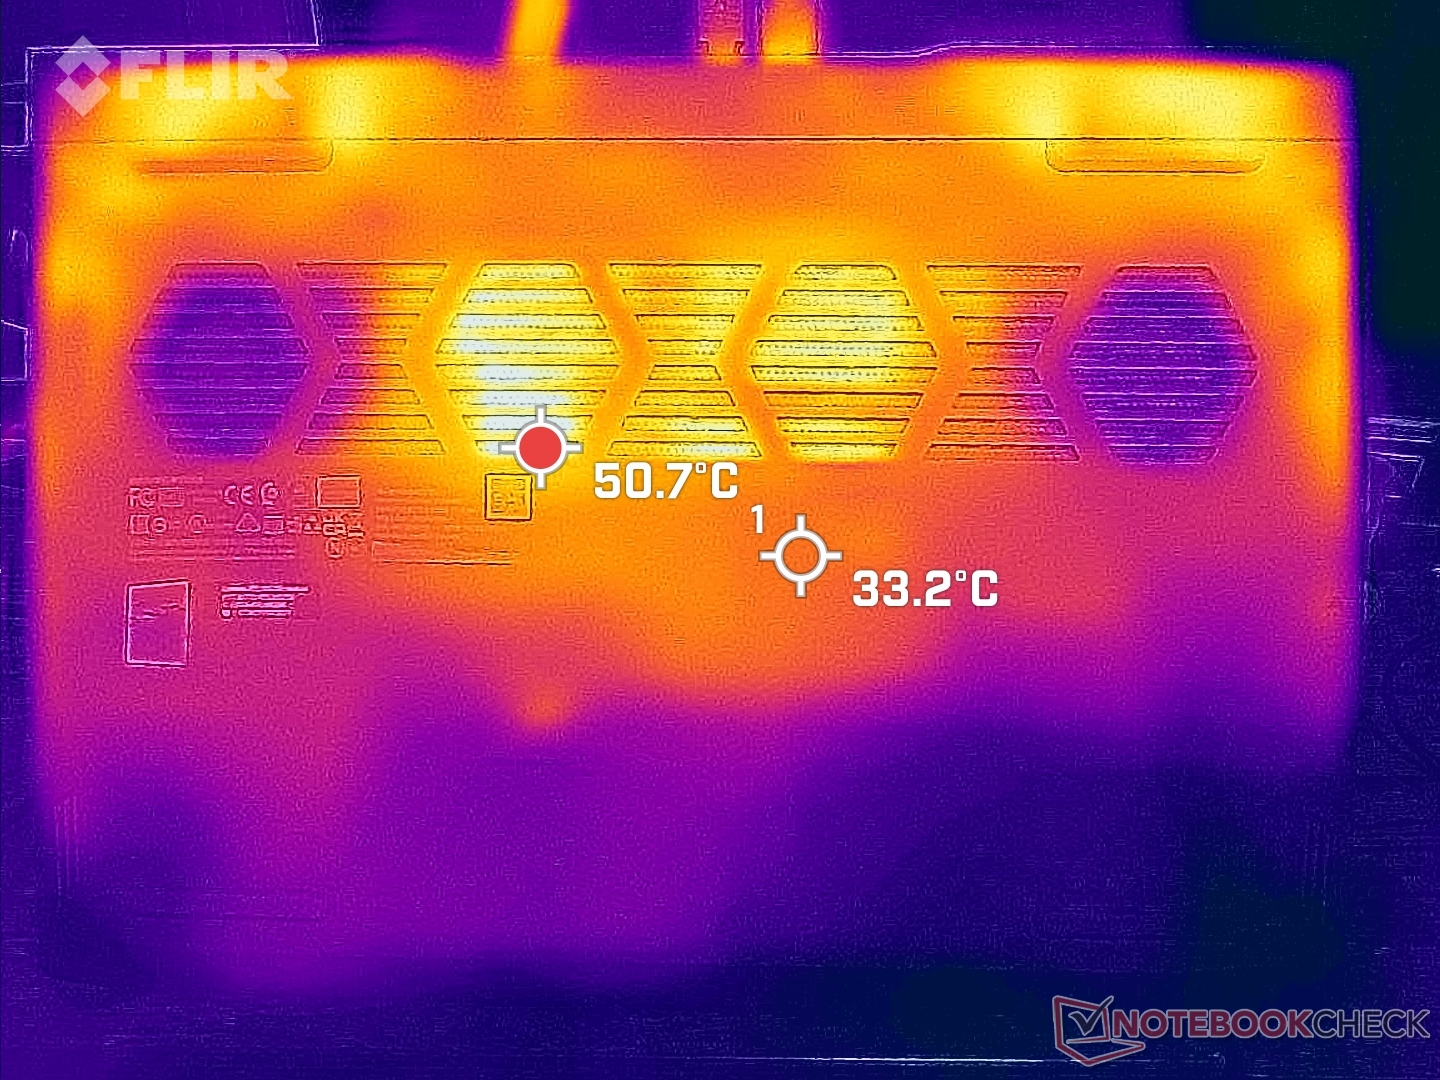
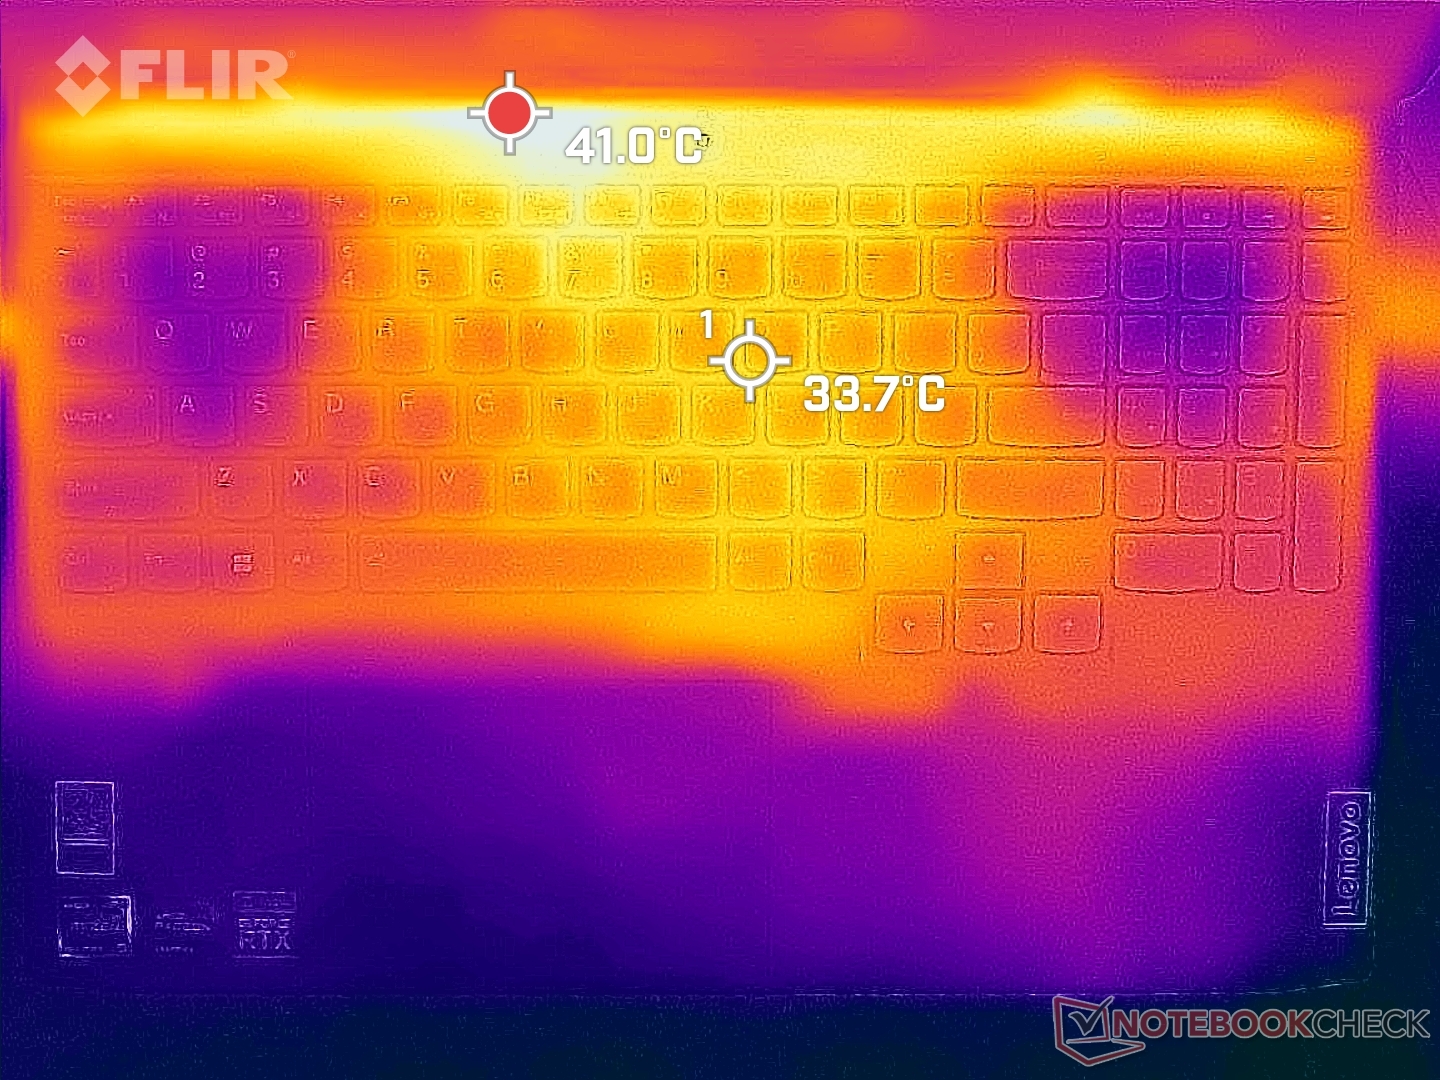
靠近键盘中心的表面温度最高,而WASD和小键盘的温度要低得多,因为新鲜空气被拉过这些按键,正如下面的温度图所示。这比旧的IdeaPad Gaming 3i 15IMH05或Dell G15 5510更好。戴尔G15 5510相比,它们的WASD键更热。游戏时,键盘热点可以达到43摄氏度,这仍然与上述IdeaPad和Dell G15的热点相当。
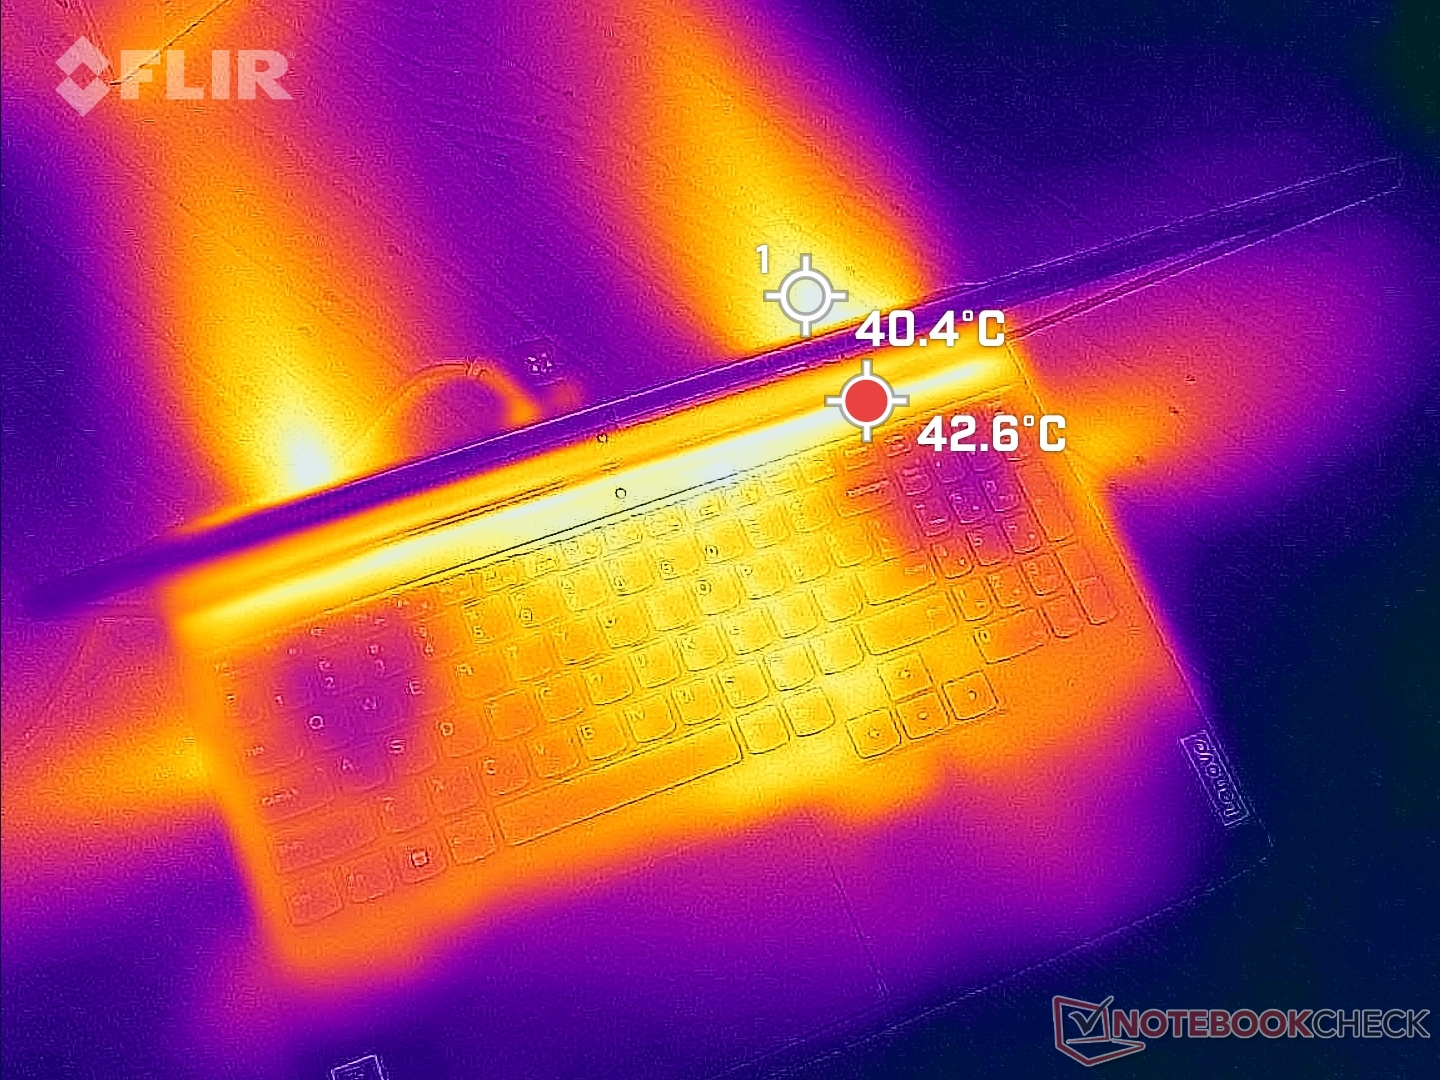
(-) The maximum temperature on the upper side is 47.6 °C / 118 F, compared to the average of 40.4 °C / 105 F, ranging from 21.2 to 68.8 °C for the class Gaming.
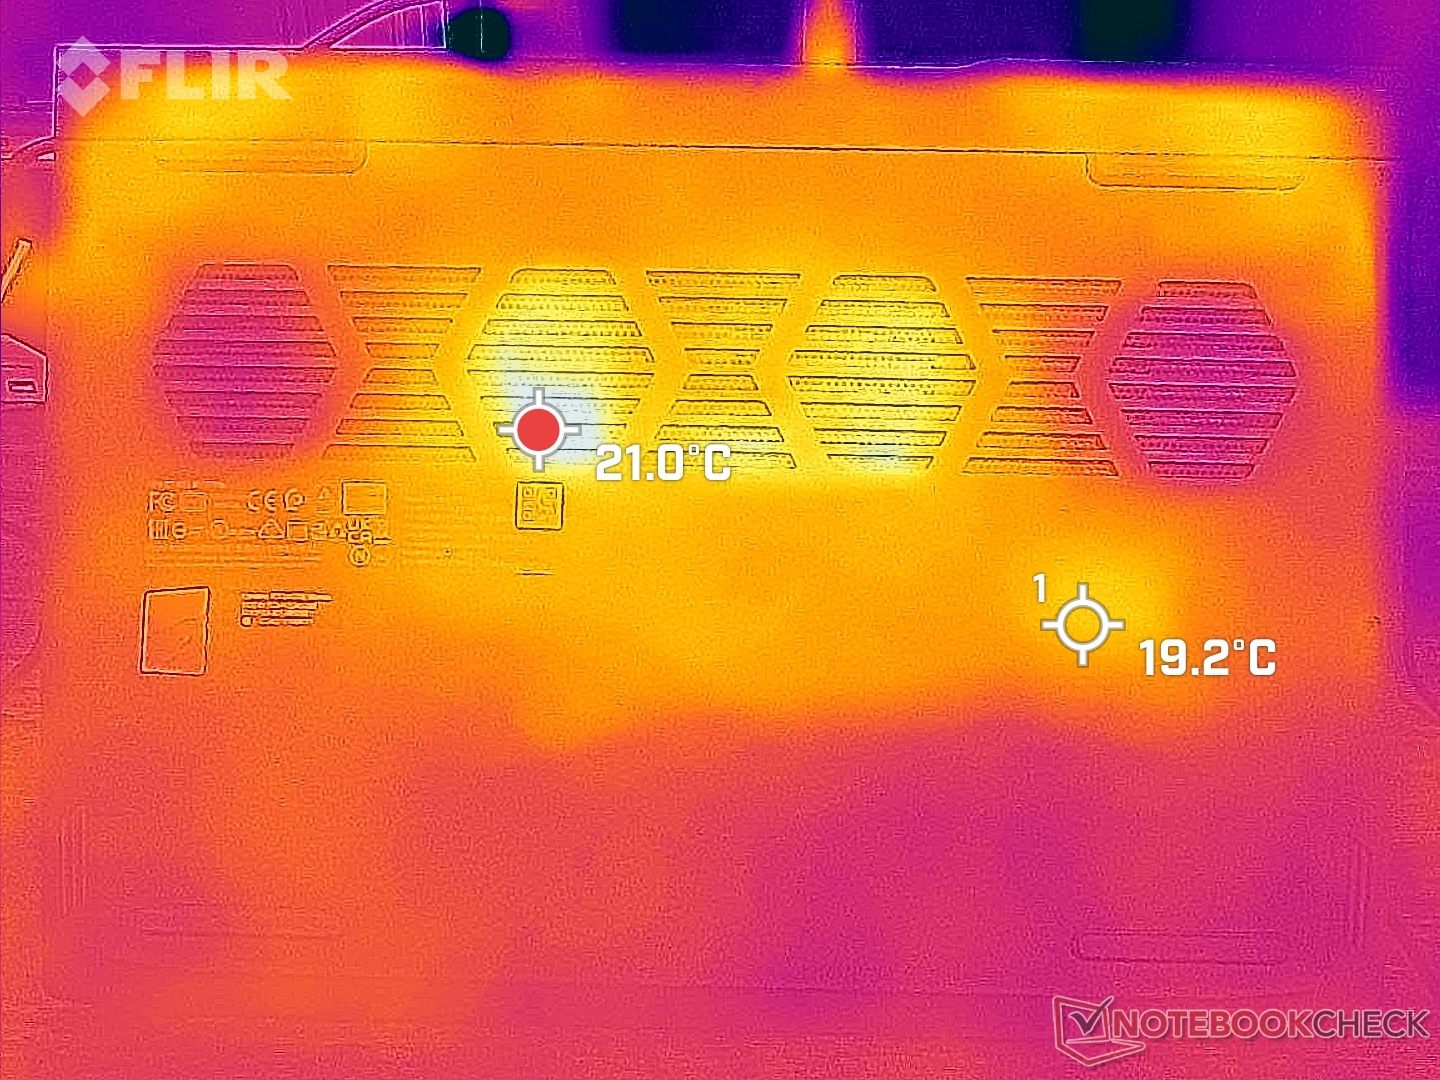
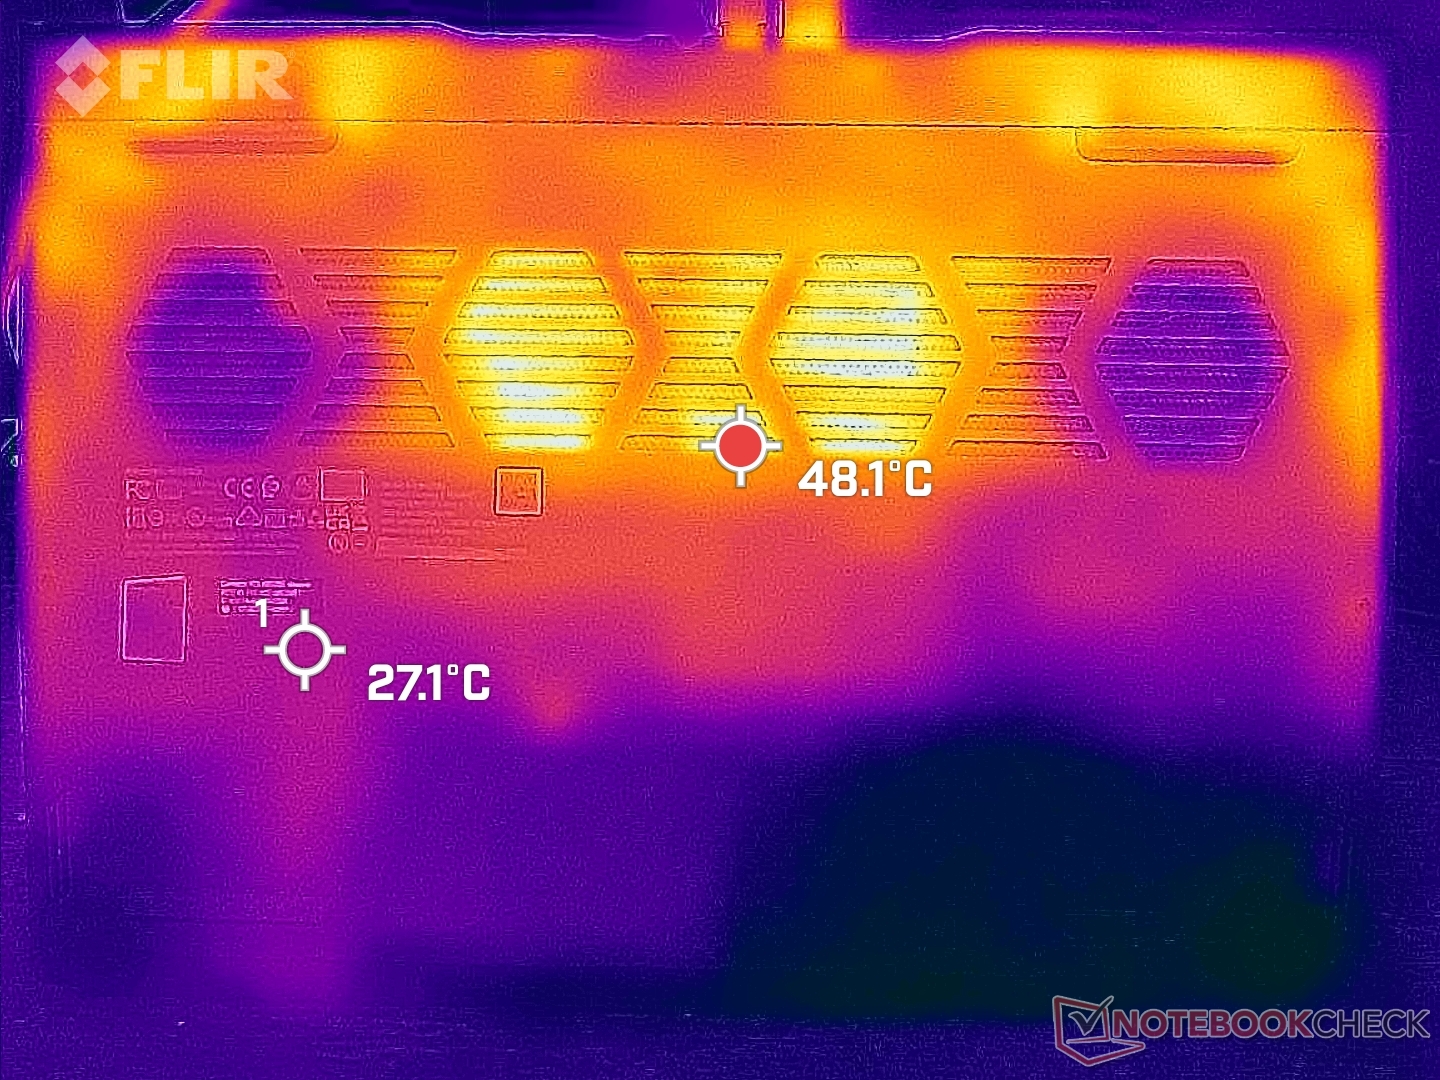
(-) The bottom heats up to a maximum of 46.6 °C / 116 F, compared to the average of 43.2 °C / 110 F
(+) In idle usage, the average temperature for the upper side is 25.7 °C / 78 F, compared to the device average of 33.9 °C / 93 F.
(±) Playing The Witcher 3, the average temperature for the upper side is 36.4 °C / 98 F, compared to the device average of 33.9 °C / 93 F.
(+) The palmrests and touchpad are reaching skin temperature as a maximum (34.2 °C / 93.6 F) and are therefore not hot.
(-) The average temperature of the palmrest area of similar devices was 28.8 °C / 83.8 F (-5.4 °C / -9.8 F).
| Lenovo IdeaPad Gaming 3 15ARH7 AMD Ryzen 5 6600H, NVIDIA GeForce RTX 3050 4GB Laptop GPU | Lenovo IdeaPad Gaming 3i 15IMH05 Intel Core i5-10300H, NVIDIA GeForce GTX 1650 Mobile | Lenovo Legion 5 15ACH6A-82NW0010GE AMD Ryzen 5 5600H, AMD Radeon RX 6600M | Gigabyte A5 K1 AMD Ryzen 5 5600H, NVIDIA GeForce RTX 3060 Laptop GPU | Asus TUF Dash F15 FX517ZR Intel Core i7-12650H, NVIDIA GeForce RTX 3070 Laptop GPU | Dell G15 5510 Intel Core i5-10500H, NVIDIA GeForce RTX 3050 4GB Laptop GPU | |
|---|---|---|---|---|---|---|
| Heat | 0% | -5% | -11% | -19% | -2% | |
| Maximum Upper Side * (°C) | 47.6 | 43 10% | 39.9 16% | 50 -5% | 52 -9% | 52 -9% |
| Maximum Bottom * (°C) | 46.6 | 50.6 -9% | 43.8 6% | 51 -9% | 52 -12% | 49 -5% |
| Idle Upper Side * (°C) | 27.2 | 27.2 -0% | 34.1 -25% | 30 -10% | 33 -21% | 26 4% |
| Idle Bottom * (°C) | 27.2 | 27.5 -1% | 31.7 -17% | 33 -21% | 36 -32% | 26 4% |
* ... smaller is better
压力测试
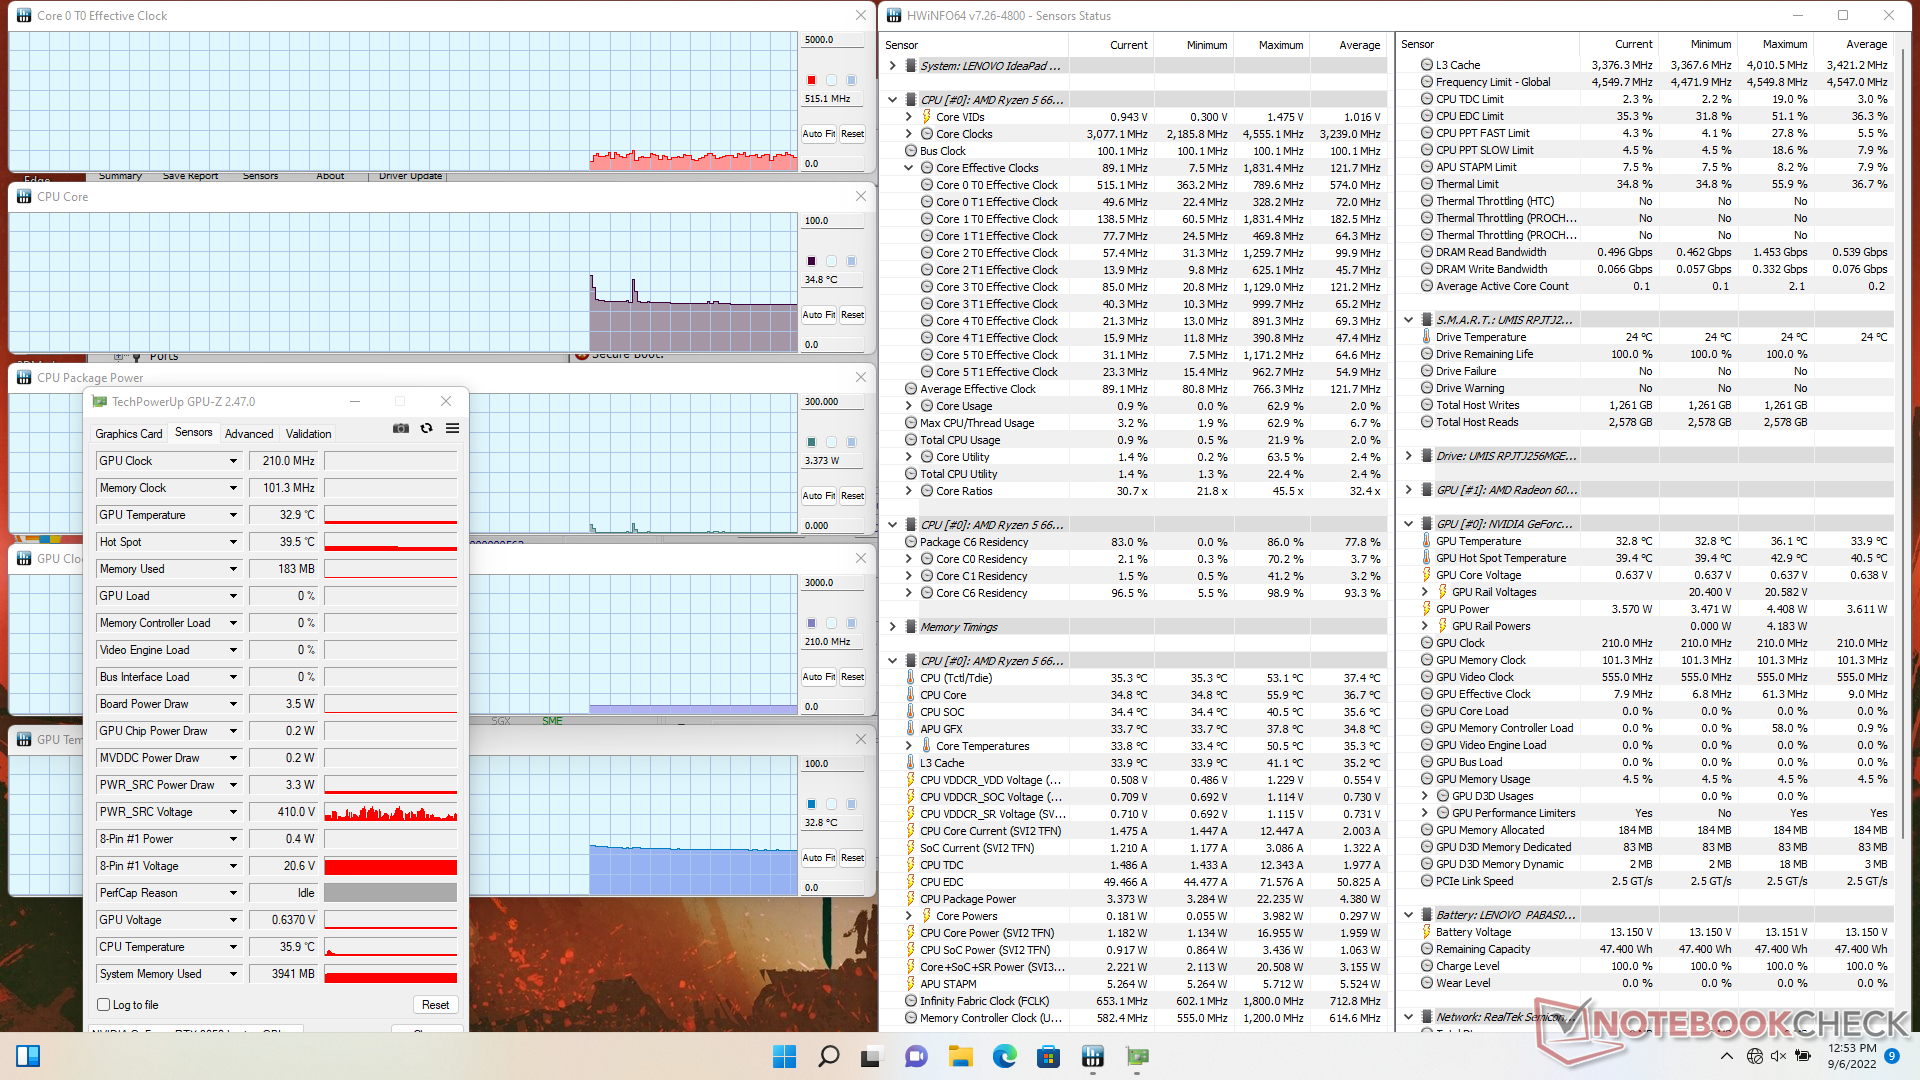
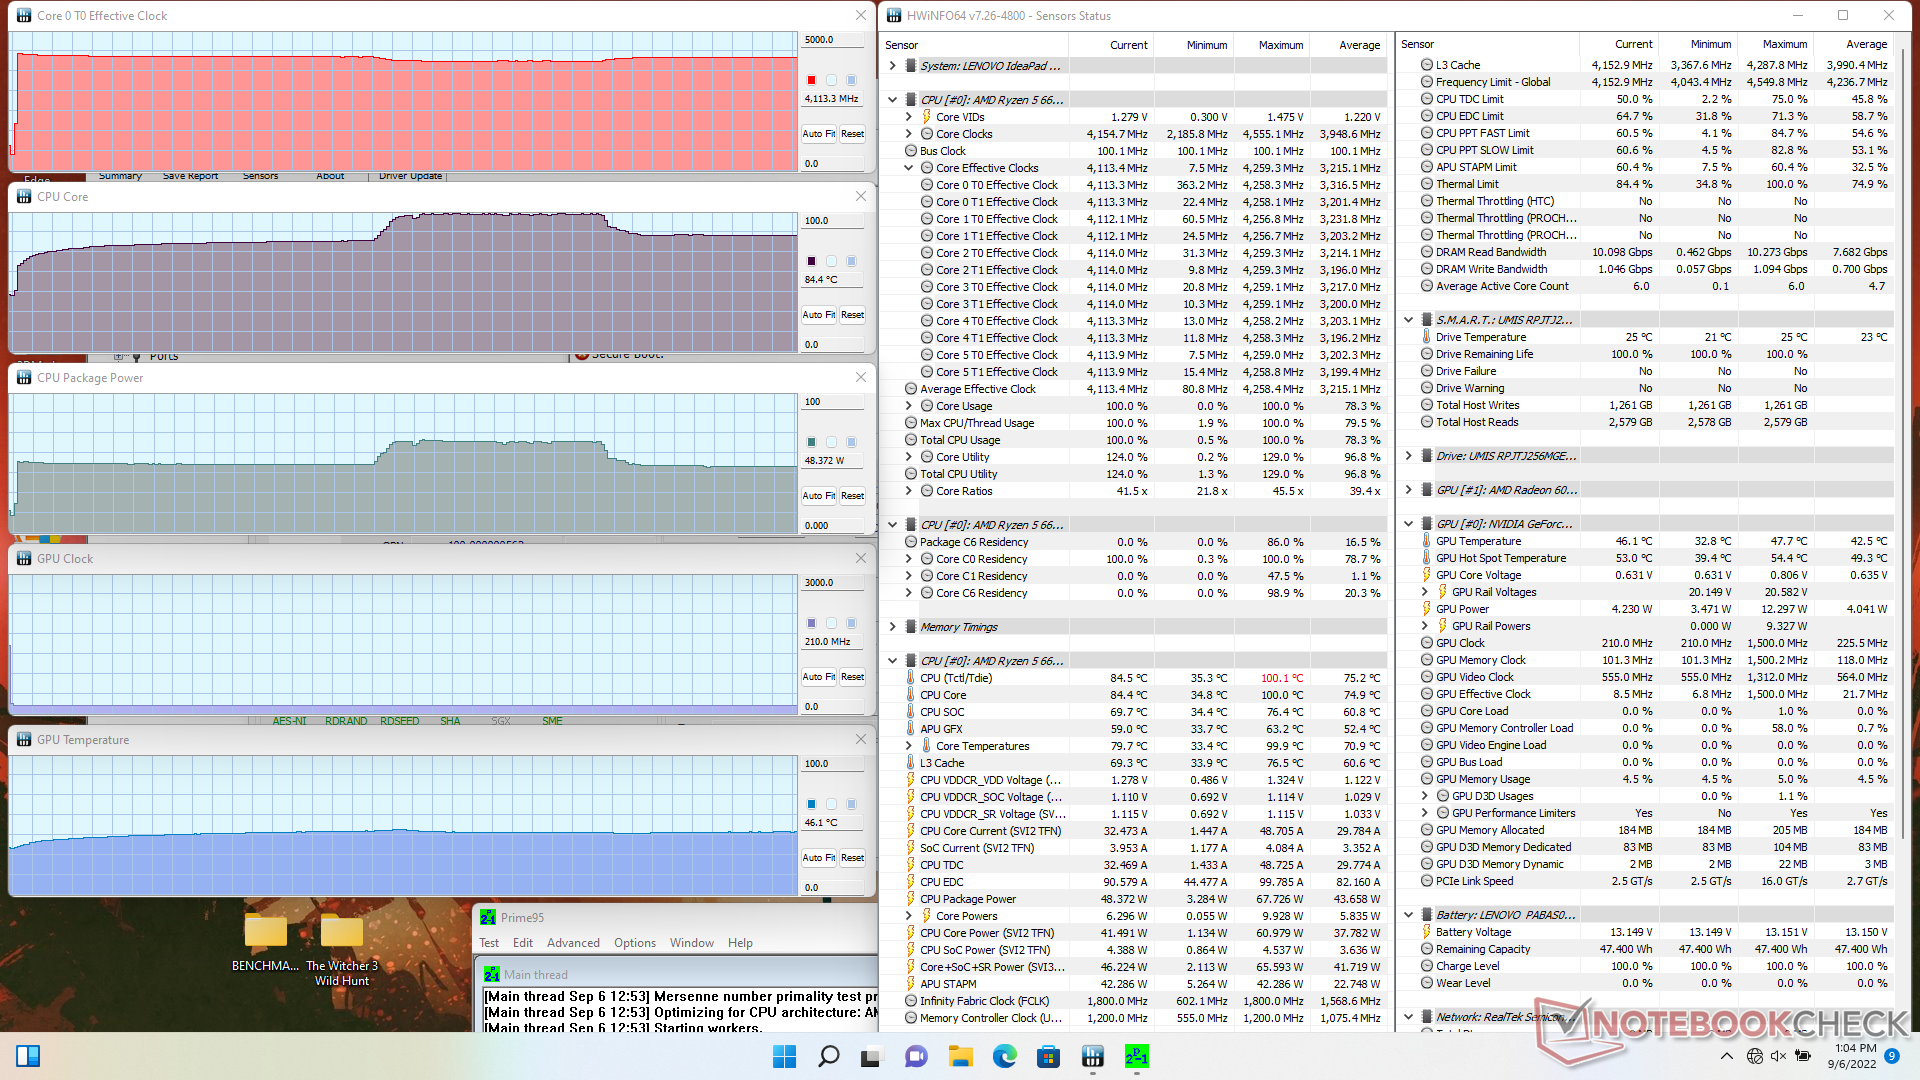
有趣的是,核心温度和电路板功耗在几分钟后会分别飙升至67W和100C,然后回落到48W和84C,如下图所示。即使长期处于100%的利用率下,处理器也不会出现任何节流现象,这与我们上面的CineBench R15 xT结果一致。
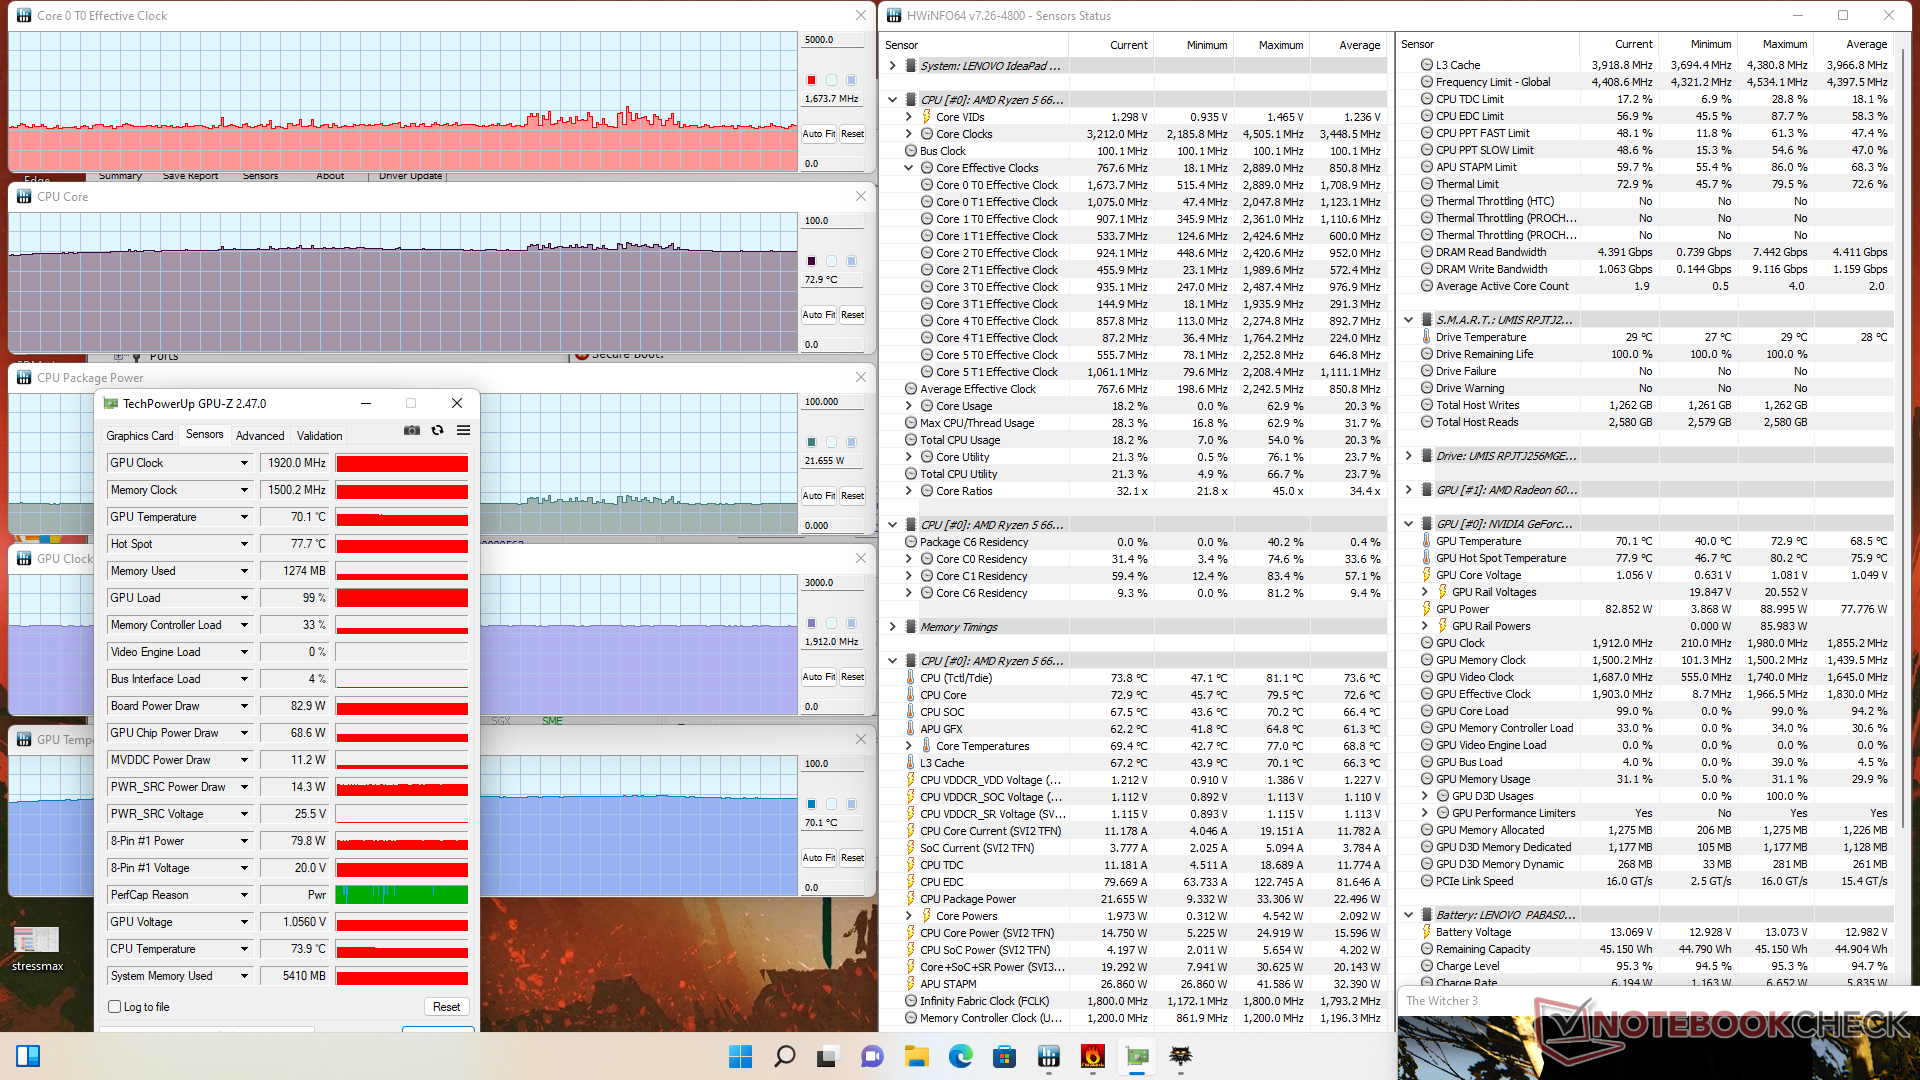
在性能模式下运行时,GPU的时钟速率、温度和板卡功耗将稳定在1920年的水平。 Witcher 3 在性能模式下将分别稳定在1920 MHz、70 C和83 W,而在平衡模式下则为1770 MHz、62 C和48 W。由于平衡模式下的风扇噪音降低了,如果用户希望充分发挥GPU的作用,他们必须忍受笔记本在性能模式下的最大风扇噪音。
在电池上运行,对GPU的限制比CPU的限制更大。在电池上进行的Fire Strike ,物理和图形得分分别为19770和9119分,而在主电源上则为20214和14157分。
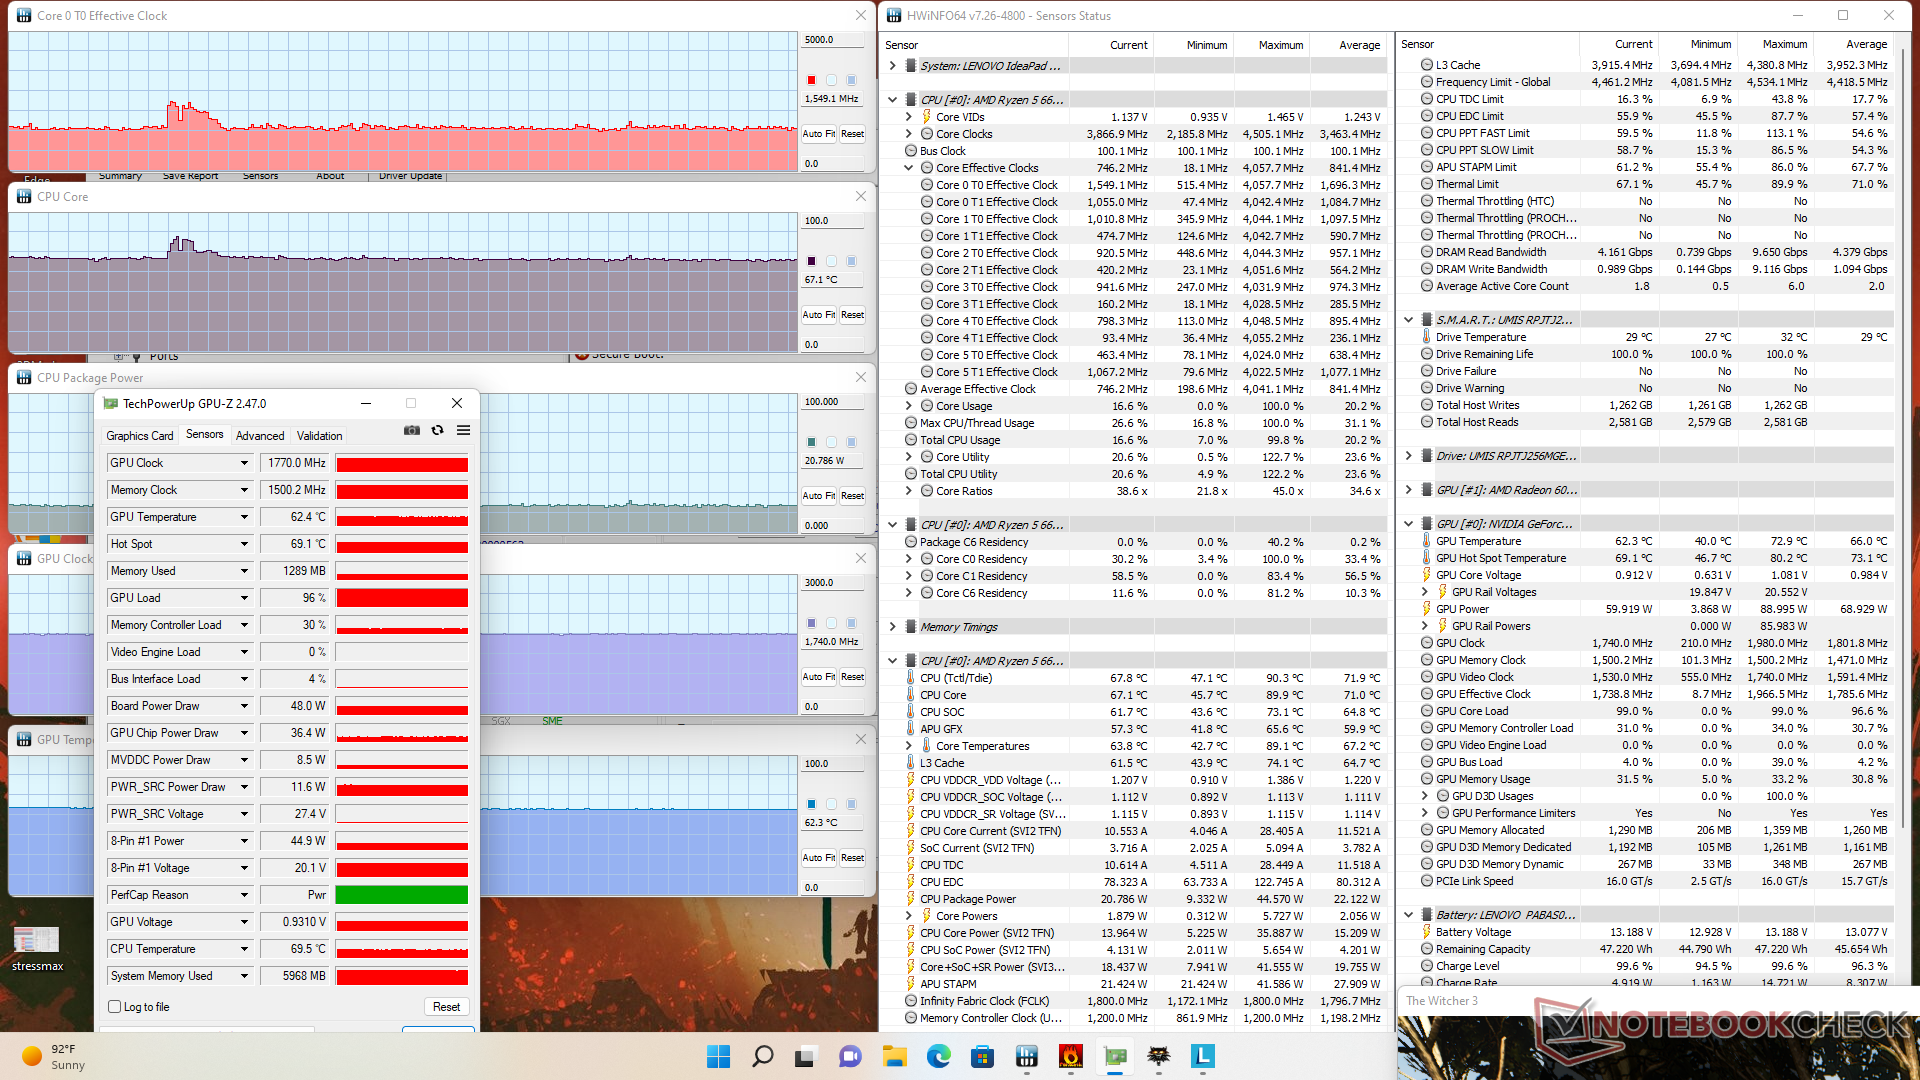
| CPU时钟(GHz) | GPU时钟(MHz) | CPU平均温度(°C) | GPU平均温度(°C) | |
| 系统空闲 | -- | -- | 35 | 33 |
| Prime95压力 | 4.0 - 4.1 | -- | 85 | 46 |
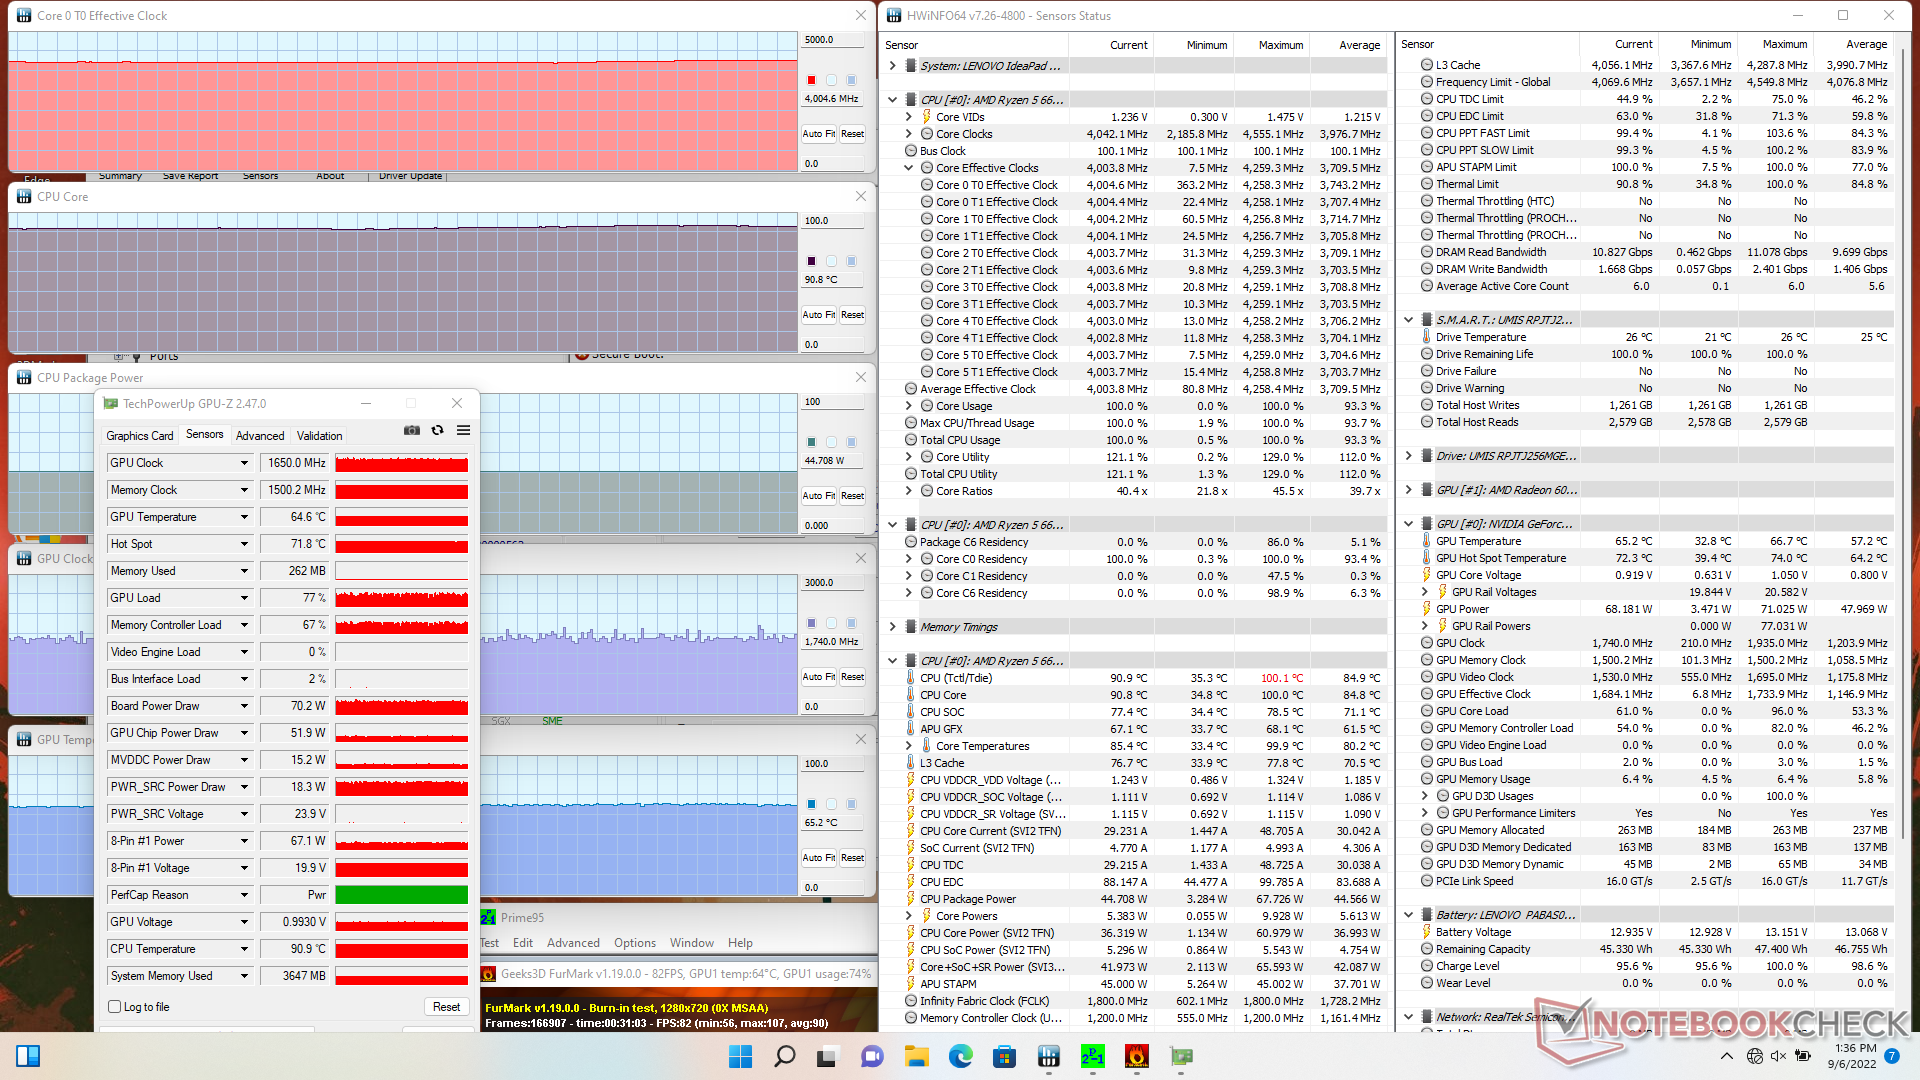
| Prime95 + FurMark压力 | 4.0 | 1650 | 91 | 65 |
| Witcher 3 压力(性能模式) | 1.7 | 1920 | 73 | 70 |
| Witcher 3 压力(平衡模式) | 1.6 | 1770 | 67 | 62 |
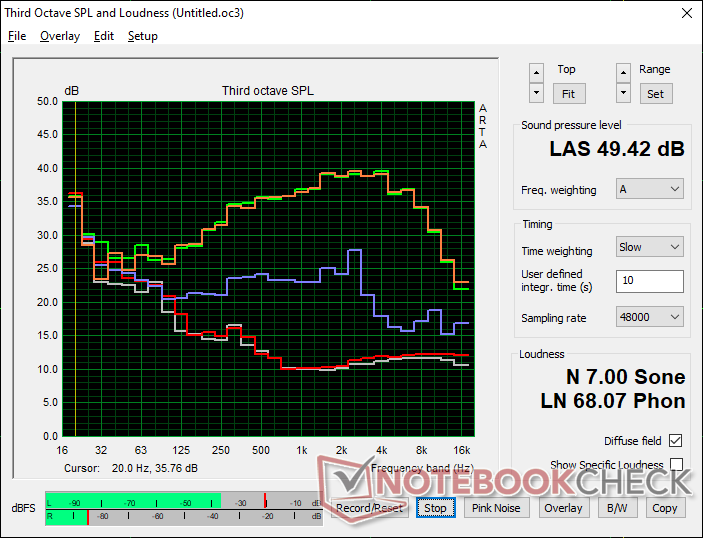
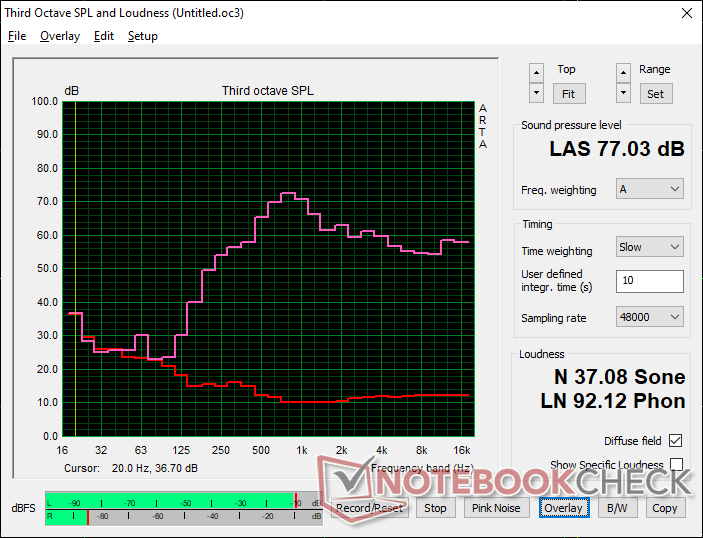
发言人
Lenovo IdeaPad Gaming 3 15ARH7 audio analysis
(±) | speaker loudness is average but good (77 dB)
Bass 100 - 315 Hz
(-) | nearly no bass - on average 15.6% lower than median
(±) | linearity of bass is average (12.2% delta to prev. frequency)
Mids 400 - 2000 Hz
(±) | higher mids - on average 8% higher than median
(±) | linearity of mids is average (7.7% delta to prev. frequency)
Highs 2 - 16 kHz
(+) | balanced highs - only 2.5% away from median
(+) | highs are linear (3.8% delta to prev. frequency)
Overall 100 - 16.000 Hz
(±) | linearity of overall sound is average (18.8% difference to median)
Compared to same class
» 62% of all tested devices in this class were better, 8% similar, 30% worse
» The best had a delta of 6%, average was 18%, worst was 132%
Compared to all devices tested
» 43% of all tested devices were better, 8% similar, 49% worse
» The best had a delta of 4%, average was 23%, worst was 134%
Apple MacBook Pro 16 2021 M1 Pro audio analysis
(+) | speakers can play relatively loud (84.7 dB)
Bass 100 - 315 Hz
(+) | good bass - only 3.8% away from median
(+) | bass is linear (5.2% delta to prev. frequency)
Mids 400 - 2000 Hz
(+) | balanced mids - only 1.3% away from median
(+) | mids are linear (2.1% delta to prev. frequency)
Highs 2 - 16 kHz
(+) | balanced highs - only 1.9% away from median
(+) | highs are linear (2.7% delta to prev. frequency)
Overall 100 - 16.000 Hz
(+) | overall sound is linear (4.6% difference to median)
Compared to same class
» 0% of all tested devices in this class were better, 0% similar, 100% worse
» The best had a delta of 5%, average was 17%, worst was 45%
Compared to all devices tested
» 0% of all tested devices were better, 0% similar, 100% worse
» The best had a delta of 4%, average was 23%, worst was 134%
能源管理 - 与上一代相似
消耗功率
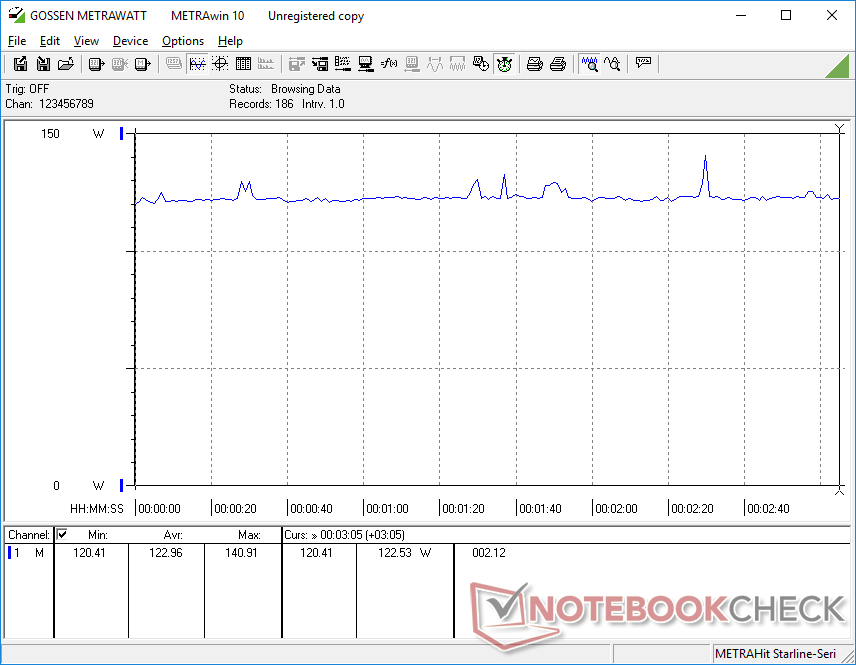
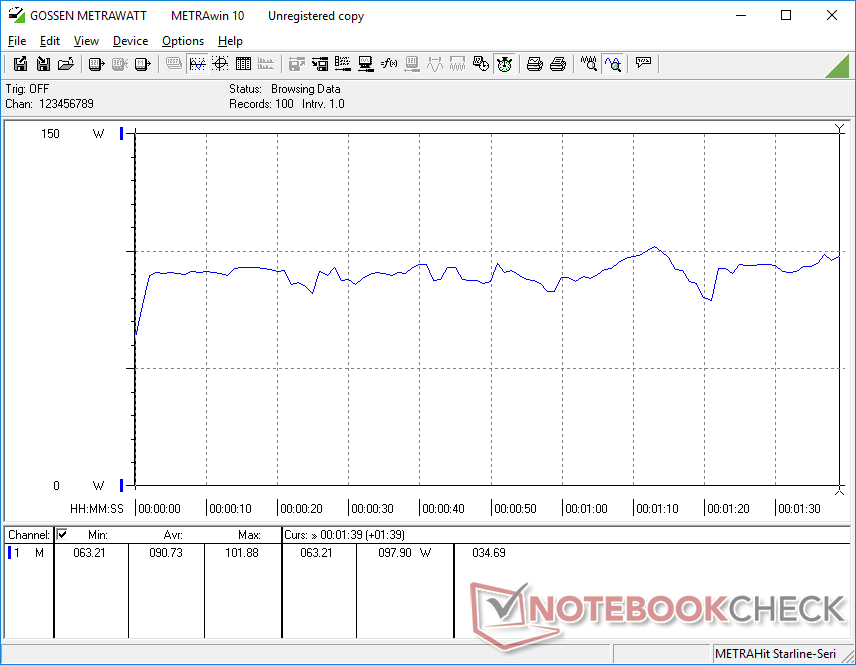
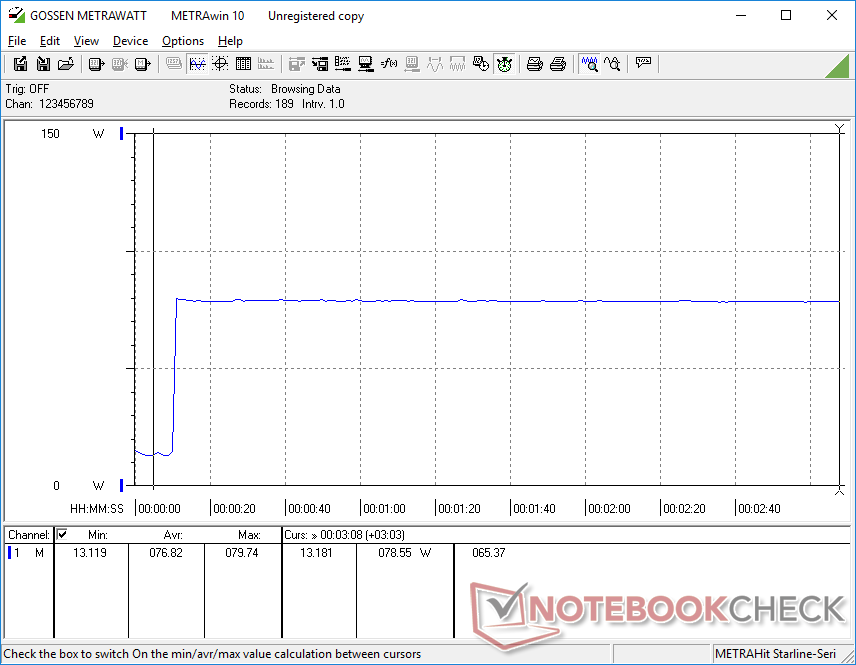
游戏时的功耗在90瓦和123瓦之间,而戴尔G5 5510配备了相同的GPU,但10代酷睿i5-10500H CPU的功耗为103瓦和140瓦。我们的联想在运行Prime95时的消耗量也普遍较低,尽管它的性能比酷睿i5提升了40%,每瓦特性能优越。然而,它并不比Ryzen 5 5600H更有效,这使得6600H更像是一个重塑品牌。
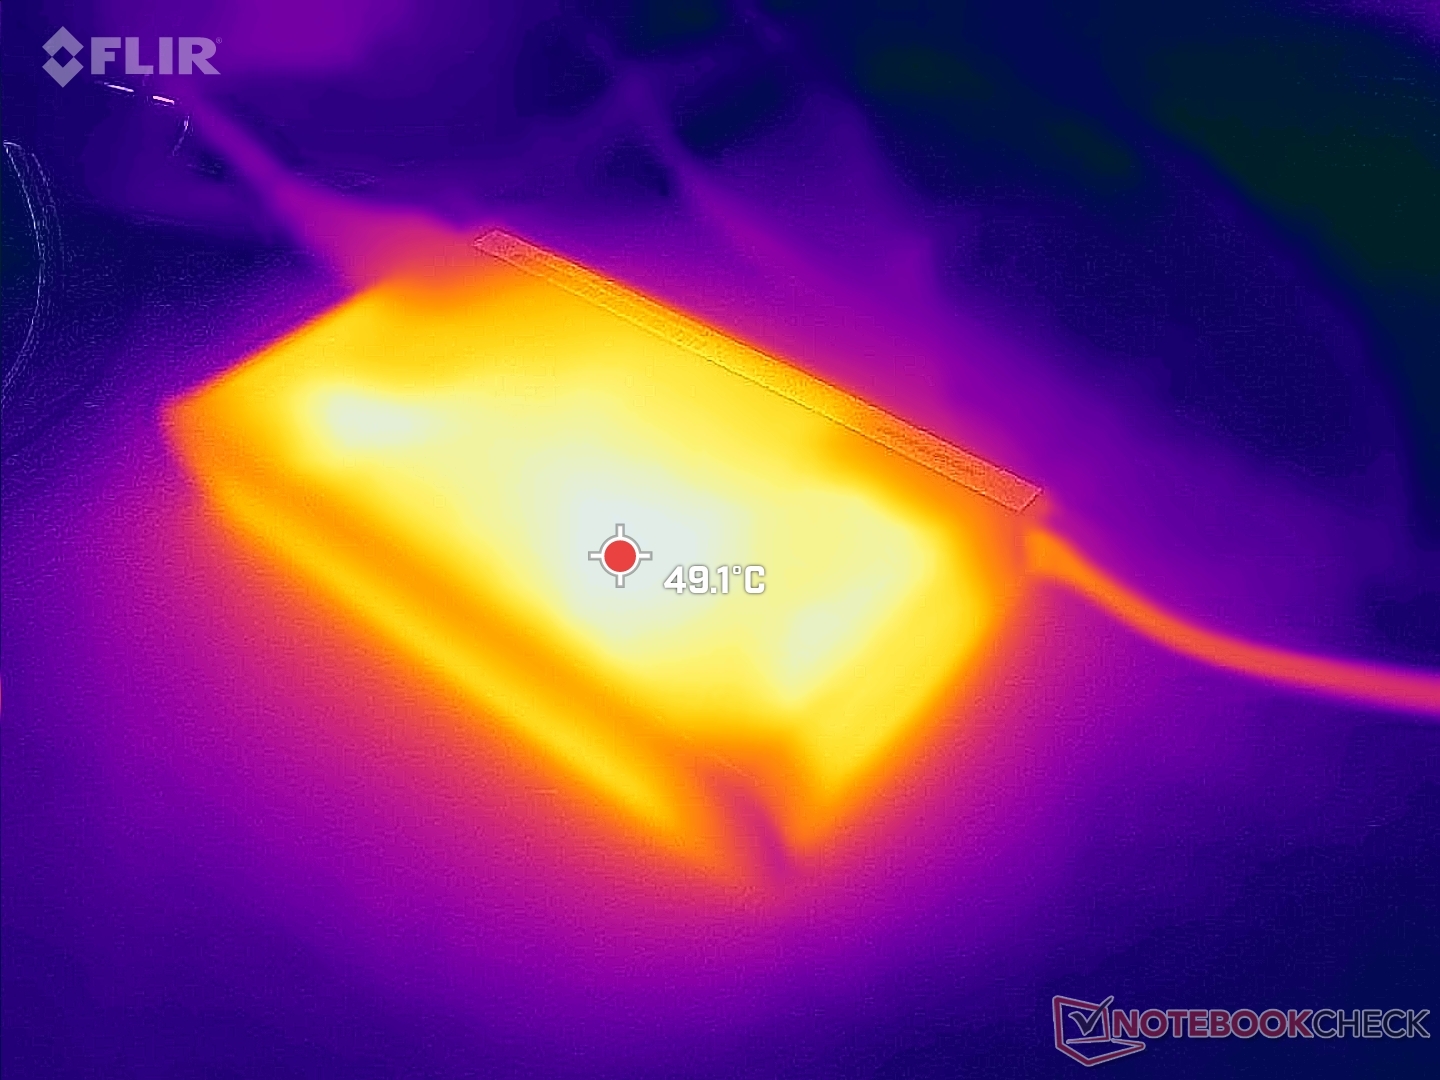
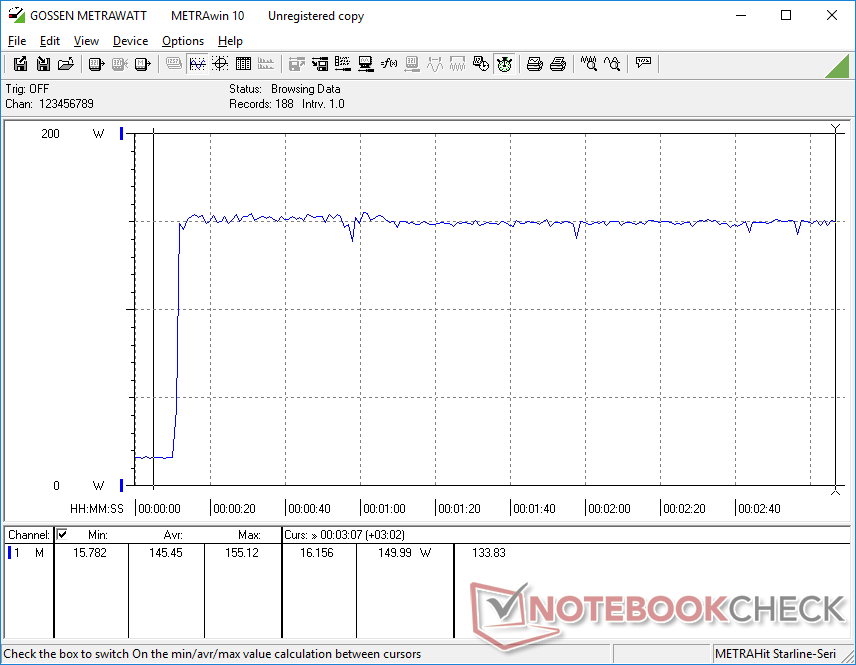
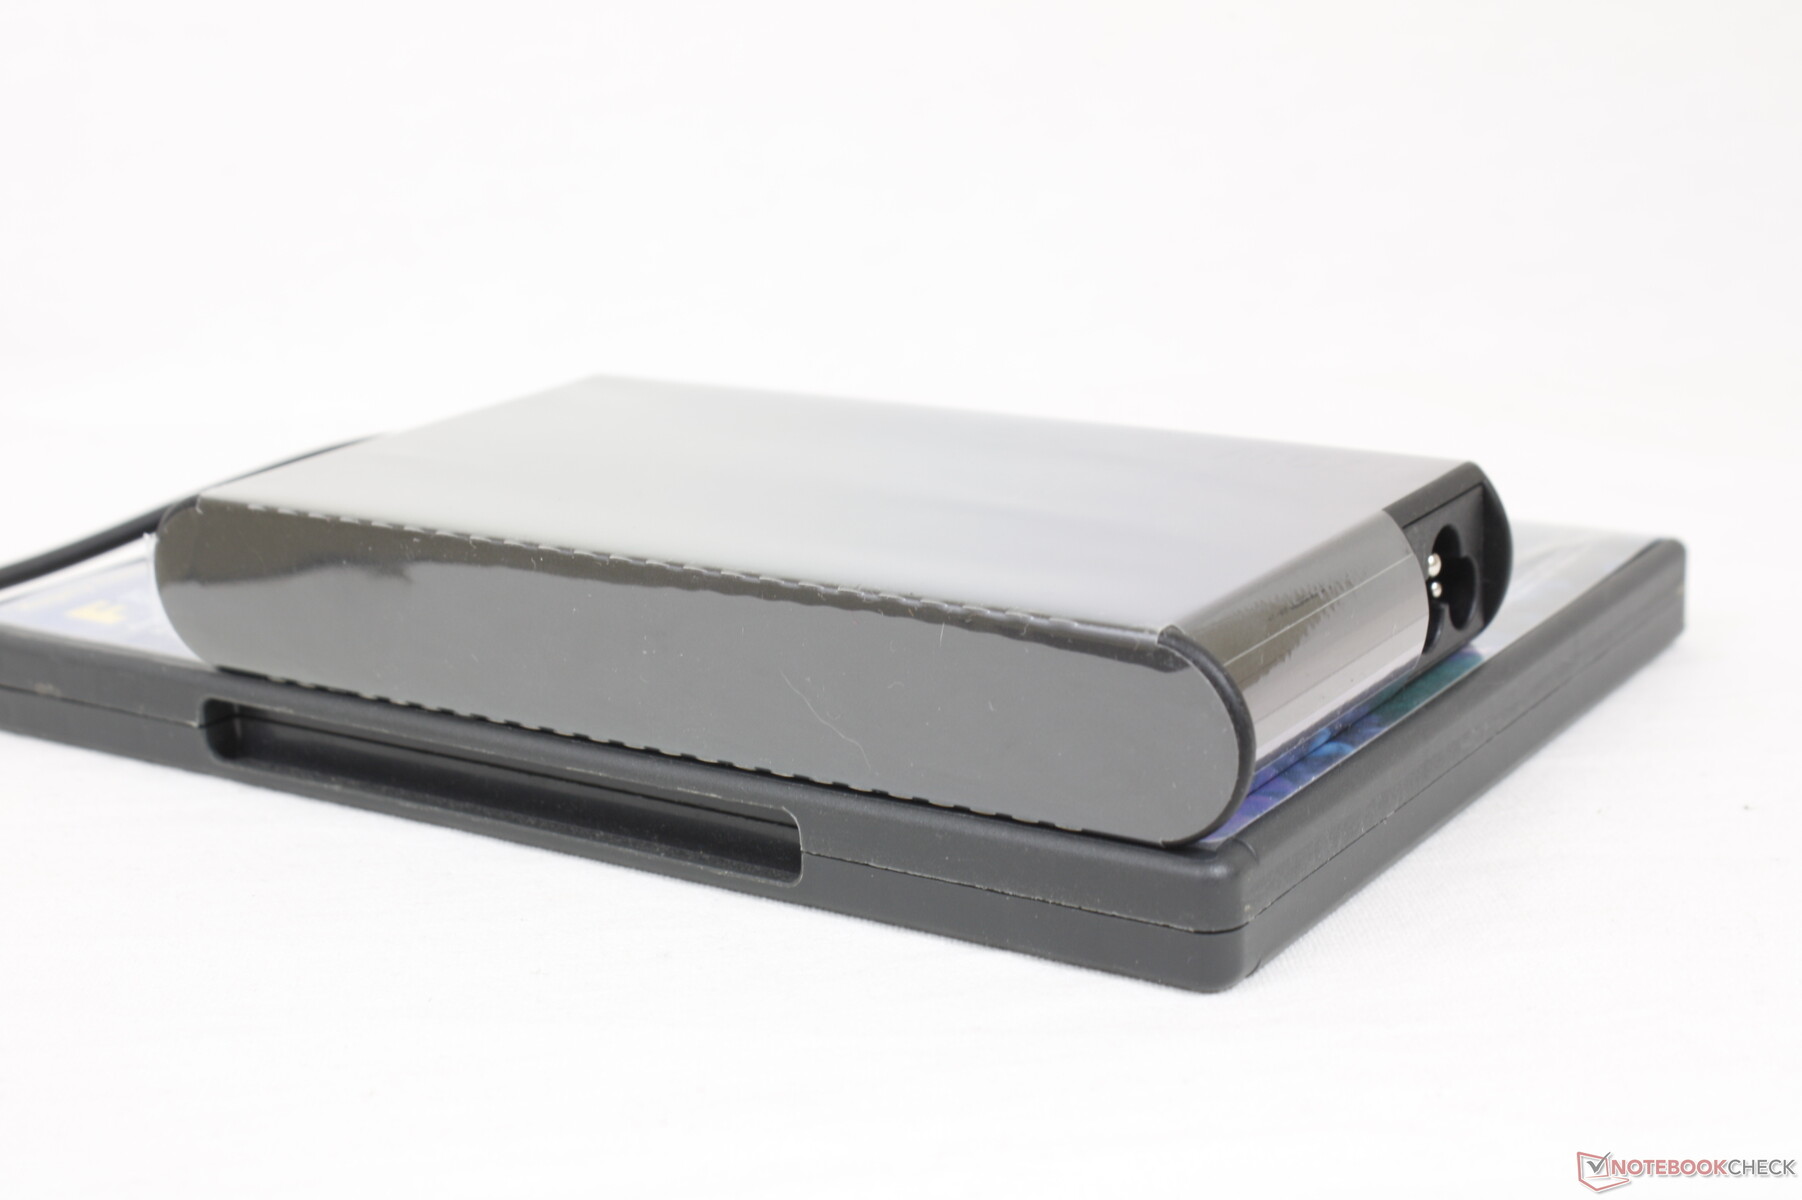
在同时运行Prime95和FurMark时,我们能够从中小型(约14.8 x 7.8 x 2.2厘米)的170瓦交流适配器测量到156瓦的最大消耗。在半小时内,电池充电水平实际上会从100%下降到95%,然后在我们结束压力测试后恢复到100%。
| Off / Standby | |
| Idle | |
| Load |
|
Key:
min: | |
| Lenovo IdeaPad Gaming 3 15ARH7 R5 6600H, GeForce RTX 3050 4GB Laptop GPU, Lenovo UMIS AM630 RPJTJ256MGE1QDY, IPS, 1920x1080, 15.6" | Lenovo IdeaPad Gaming 3i 15IMH05 i5-10300H, GeForce GTX 1650 Mobile, SK hynix BC511 HFM512GDHTNI-87A0B, IPS, 1920x1080, 15.6" | Lenovo Legion 5 15ACH6A-82NW0010GE R5 5600H, Radeon RX 6600M, Micron 2210 MTFDHBA512QFD, IPS, 1920x1080, 15.6" | Gigabyte A5 K1 R5 5600H, GeForce RTX 3060 Laptop GPU, ESR512GTLG-E6GBTNB4, IPS, 1920x1080, 15.6" | Asus TUF Dash F15 FX517ZR i7-12650H, GeForce RTX 3070 Laptop GPU, Samsung PM991a MZVLQ1T0HBLB, IPS, 2560x1440, 15.6" | Dell G15 5510 i5-10500H, GeForce RTX 3050 4GB Laptop GPU, SK Hynix BC711 HFM512GD3HX015N, IPS, 1920x1080, 15.6" | |
|---|---|---|---|---|---|---|
| Power Consumption | 8% | -39% | -34% | -30% | 5% | |
| Idle Minimum * (Watt) | 7.7 | 5.1 34% | 10 -30% | 10 -30% | 10 -30% | 3 61% |
| Idle Average * (Watt) | 9.1 | 8.2 10% | 13.2 -45% | 12 -32% | 14 -54% | 8 12% |
| Idle Maximum * (Watt) | 15.6 | 10.6 32% | 15.6 -0% | 17 -9% | 20 -28% | 13 17% |
| Load Average * (Watt) | 90.7 | 128 -41% | 178 -96% | 113 -25% | 122 -35% | 103 -14% |
| Witcher 3 ultra * (Watt) | 122.9 | 109 11% | 181 -47% | 181.4 -48% | 138.6 -13% | 139.5 -14% |
| Load Maximum * (Watt) | 155.2 | 150 3% | 180 -16% | 245 -58% | 189 -22% | 204 -31% |
* ... smaller is better
Power Consumption Witcher 3 / Stresstest
Power Consumption external Monitor
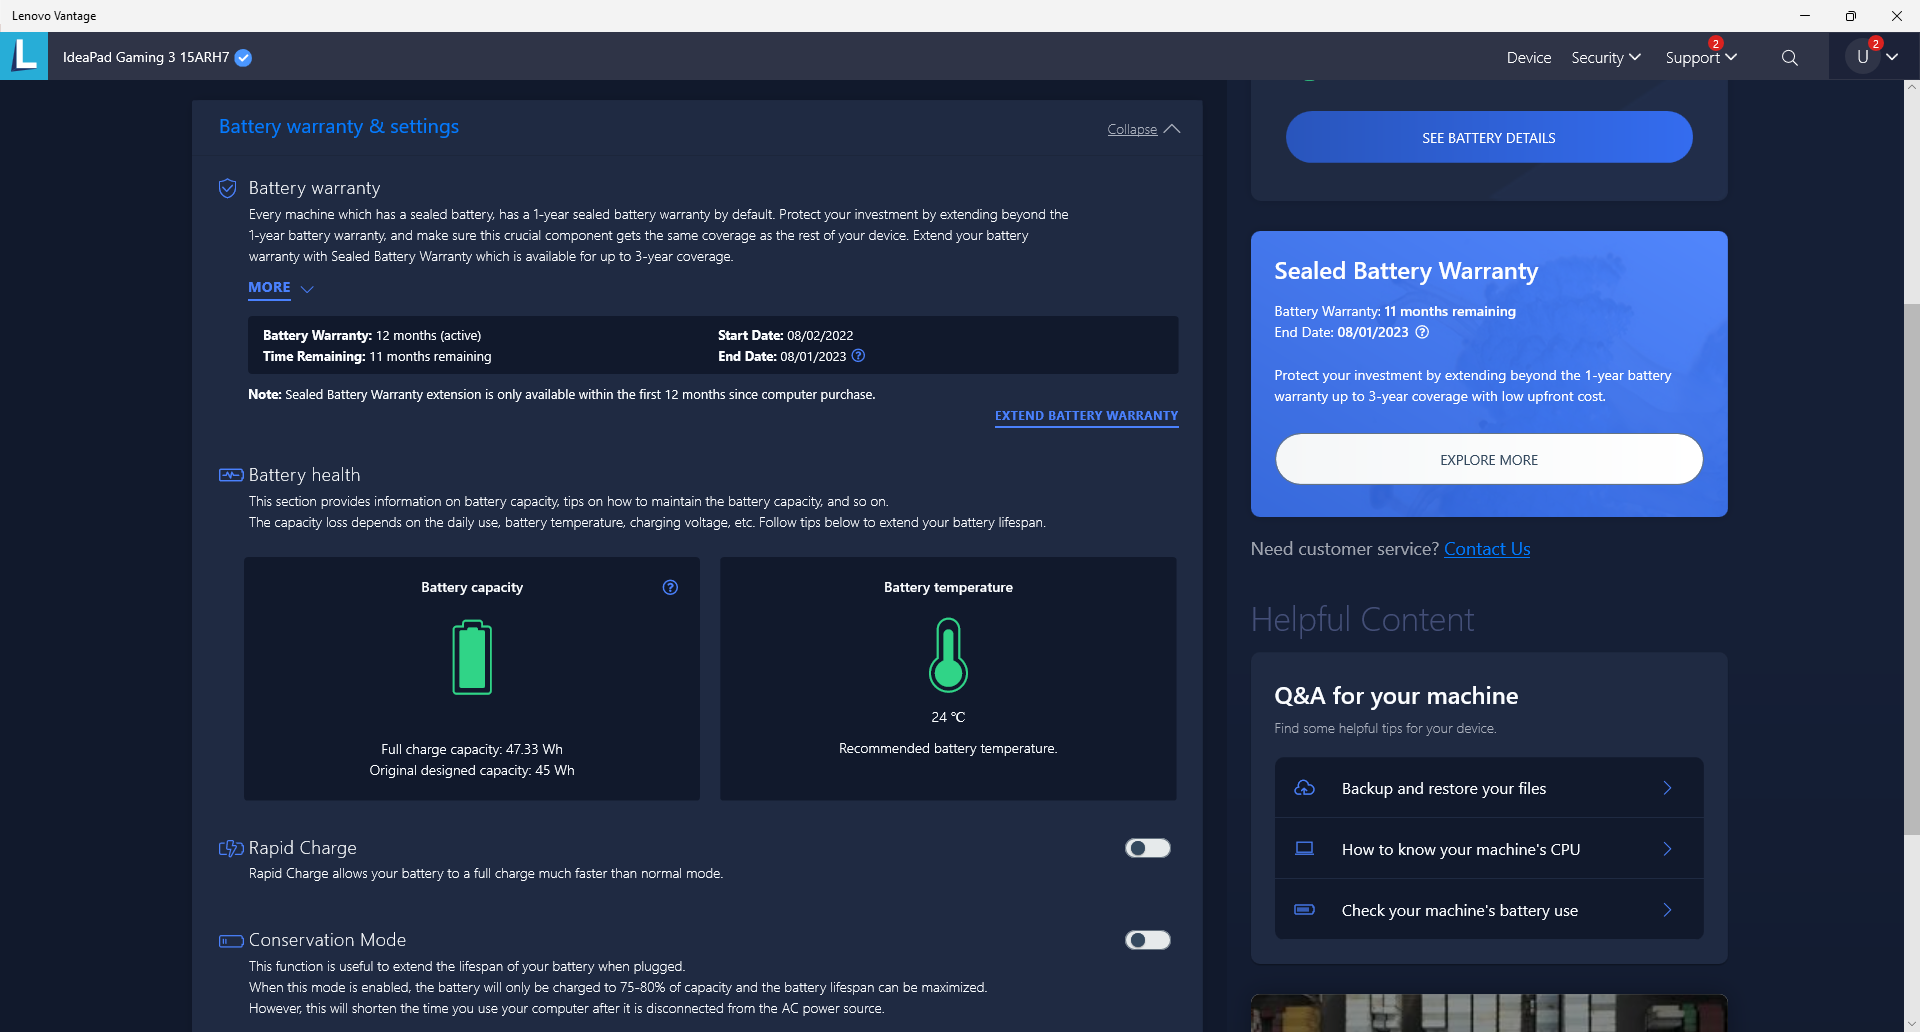
电池寿命
电池容量很小,只有45Wh,这是预算游戏笔记本电脑的典型范围。在集成GPU激活的平衡电源配置文件上的真实世界网络浏览将持续约6.5小时,然后才需要充电,这与我们在IdeaPad Gaming 3i.
用附带的专用交流适配器从空到满的充电时间约为1.5至2小时。我们可以确认,大多数USB-C充电器也能为系统充电。
我们应该提到,在iGPU处于激活状态且显示屏亮度设置为最低的情况下,节电模式(或联想静音模式)的电池寿命异常短暂,只有2小时22分钟。为了确定,我们重复了这个测试,结果不会改变。有可能是在某些设置和电池条件下,系统出现了耗电问题。
| Lenovo IdeaPad Gaming 3 15ARH7 R5 6600H, GeForce RTX 3050 4GB Laptop GPU, 45 Wh | Lenovo IdeaPad Gaming 3i 15IMH05 i5-10300H, GeForce GTX 1650 Mobile, 45 Wh | Lenovo Legion 5 15ACH6A-82NW0010GE R5 5600H, Radeon RX 6600M, 80 Wh | Gigabyte A5 K1 R5 5600H, GeForce RTX 3060 Laptop GPU, 48.96 Wh | Asus TUF Dash F15 FX517ZR i7-12650H, GeForce RTX 3070 Laptop GPU, 76 Wh | Dell G15 5510 i5-10500H, GeForce RTX 3050 4GB Laptop GPU, 56 Wh | |
|---|---|---|---|---|---|---|
| Battery runtime | 171% | 199% | 6% | 171% | 125% | |
| Reader / Idle (h) | 2.4 | 12.4 417% | 12.8 433% | 10.8 350% | 11.3 371% | |
| WiFi v1.3 (h) | 6.5 | 6.3 -3% | 9.2 42% | 6.9 6% | 7 8% | 6 -8% |
| Load (h) | 0.9 | 1.8 100% | 2 122% | 2.3 156% | 1 11% | |
| H.264 (h) | 7.3 | 5.8 |
Pros
Cons
结论--新的Ryzen 5 6600U CPU没有为游戏笔记本电脑提供很多东西
差异最大的是 的最大区别是,Ryzen 5 5600H和 Ryzen 5 6600H的最大区别是,前者配备了集成的Radeon RX Vega显卡,而后者配备了集成的Radeon 660M,iGPU性能明显更快。否则,这两款处理器在CPU性能方面几乎是相同的。这在游戏笔记本上的问题是,几乎所有的游戏笔记本型号都已经配备了更快的独立显卡,这使得集成解决方案在绝大多数情况下几乎没有用处。因此,为了最大限度地提高游戏性能,你会想跳过Radeon 660M或680M,而是瞄准更快的GPU,如 RTX 3060即使这意味着满足于最后一代Ryzen 5 5600H或Ryzen 7 5800HAMD CPU。
因此,Ryzen 5 6600H在没有专用GPU选项的笔记本电脑和迷你PC上表现最好。只有这样,集成的Radeon 660M的性能和效率才能真正发挥出来。
至于联想笔记本电脑本身,它当然值得称赞,因为它有大的方向键,低的起价,以及标准的120赫兹1080p IPS显示屏,既有FreeSync又有体面的响应时间。颜色很差,但这是像这样的廉价游戏笔记本的一个常见缺点。我们最关键的批评涉及到笔记本电脑难以维修和沉重的重量。预算替代品,如 微星GF63, Acer Nitro 5, HPPavilion Gaming 15, 或 华硕TUF Dash系列都更轻,更容易升级。试图在IdeaPad Gaming 3中添加更多的内存或存储,相比之下,令人讨厌的是更加不方便。
价格和可用性
Lenovo IdeaPad Gaming 3 15ARH7
- 09/09/2022 v7 (old)
Allen Ngo
Price comparison

