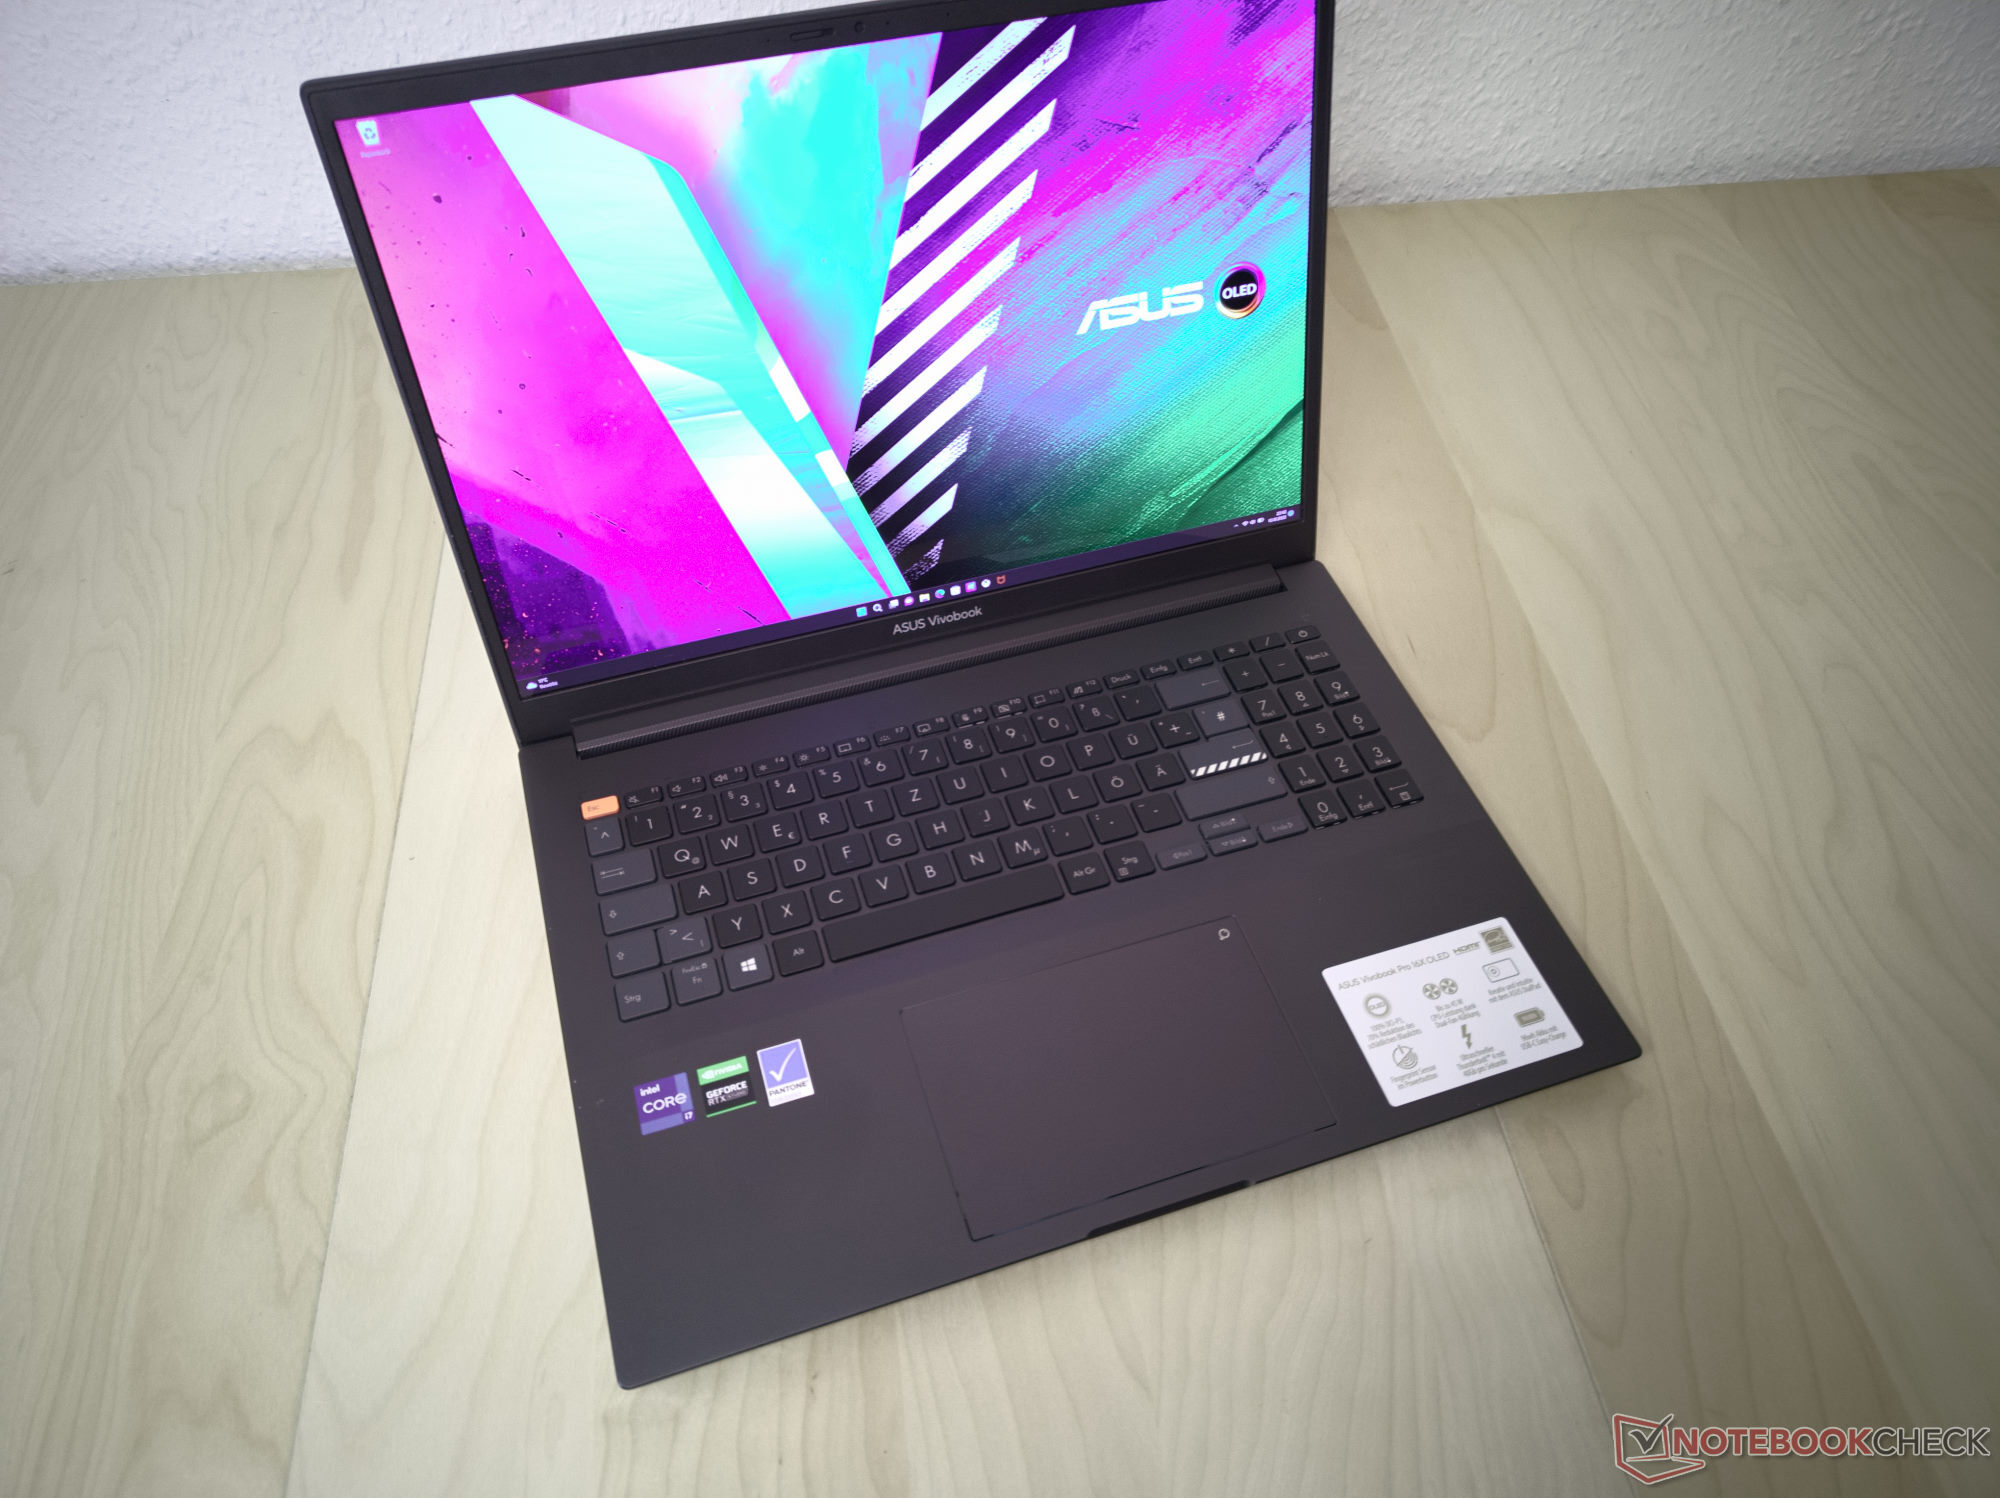
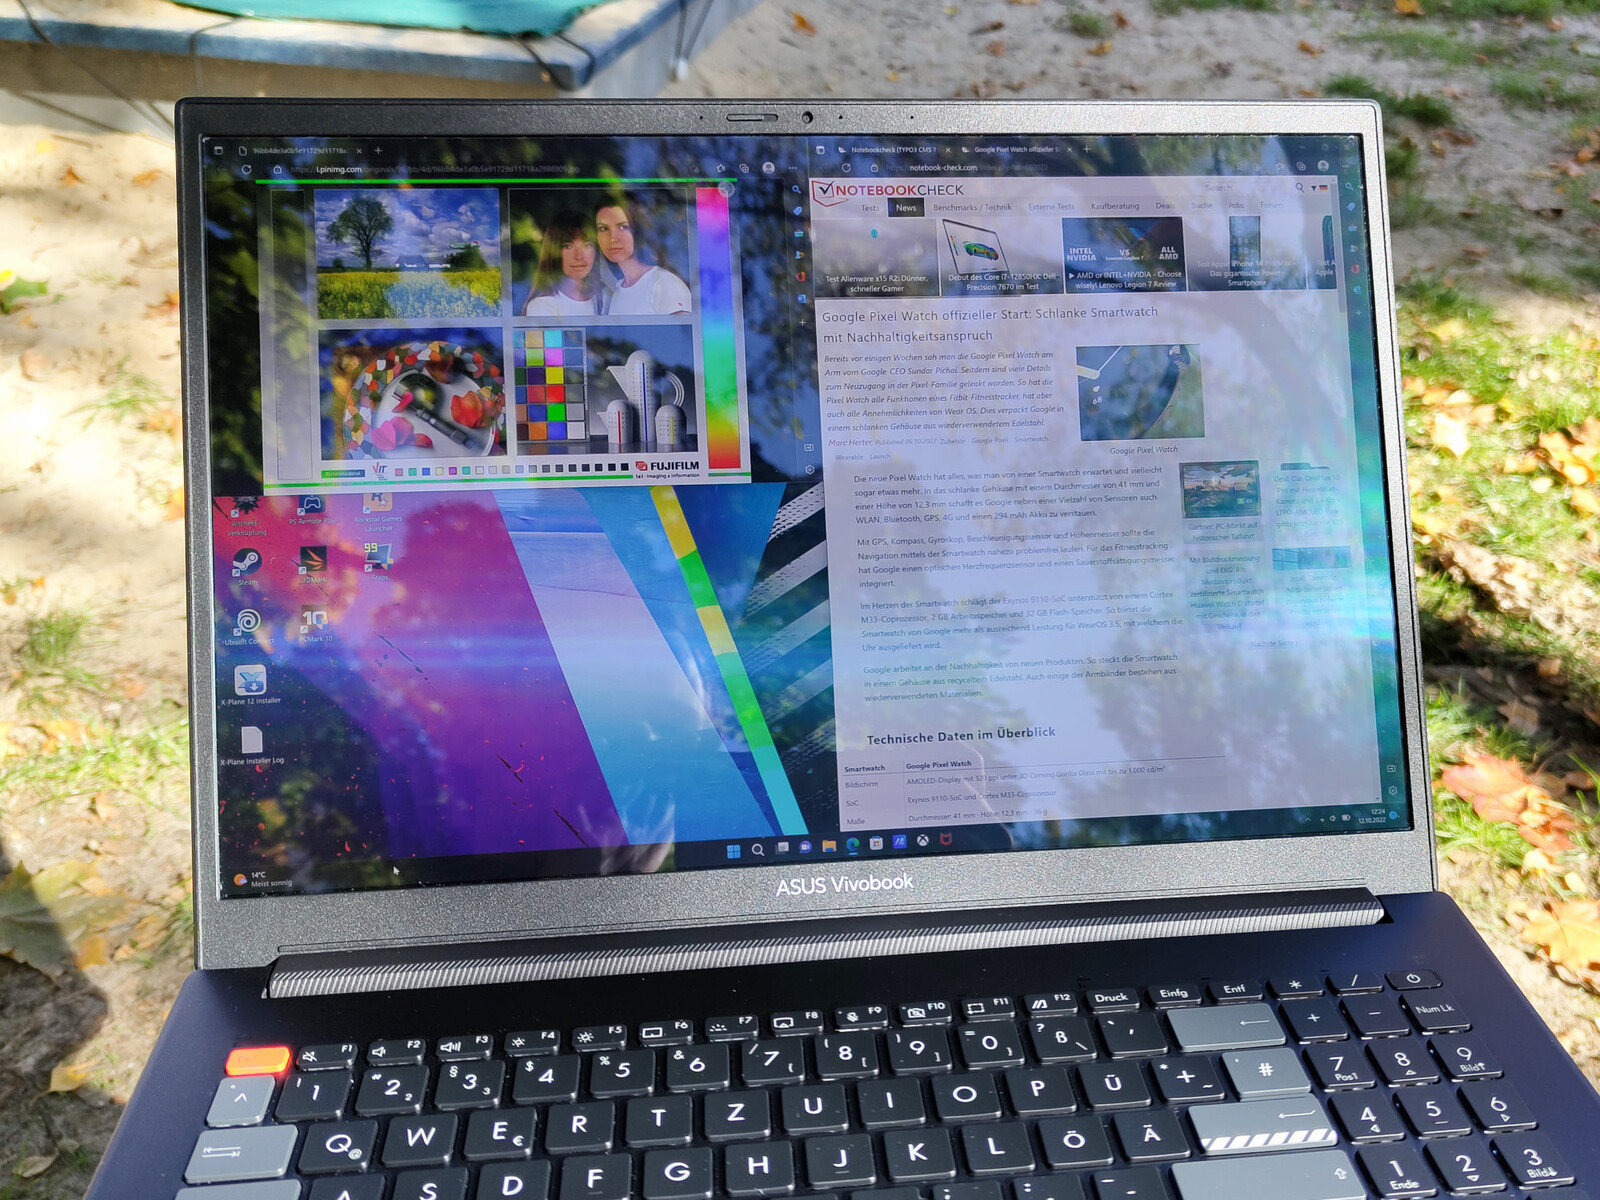
华硕Vivobook Pro 16X笔记本电脑回顾。拥有顶级OLED显示屏的华硕系统

考虑到其功能,华硕Vivobook Pro 16X似乎是针对创作者的。它配备了出色的16:10 OLED显示屏,在各种基准测试中取得了良好的成绩。这是由一个 英特尔酷睿i7-11370H从上一代和一个 NvidiaGeForce RTX 3050.另外,Vivobook Pro 16X也有许多其他配置,其中包括最新的AMD或英特尔处理器和几个Nvidia GPU选项。
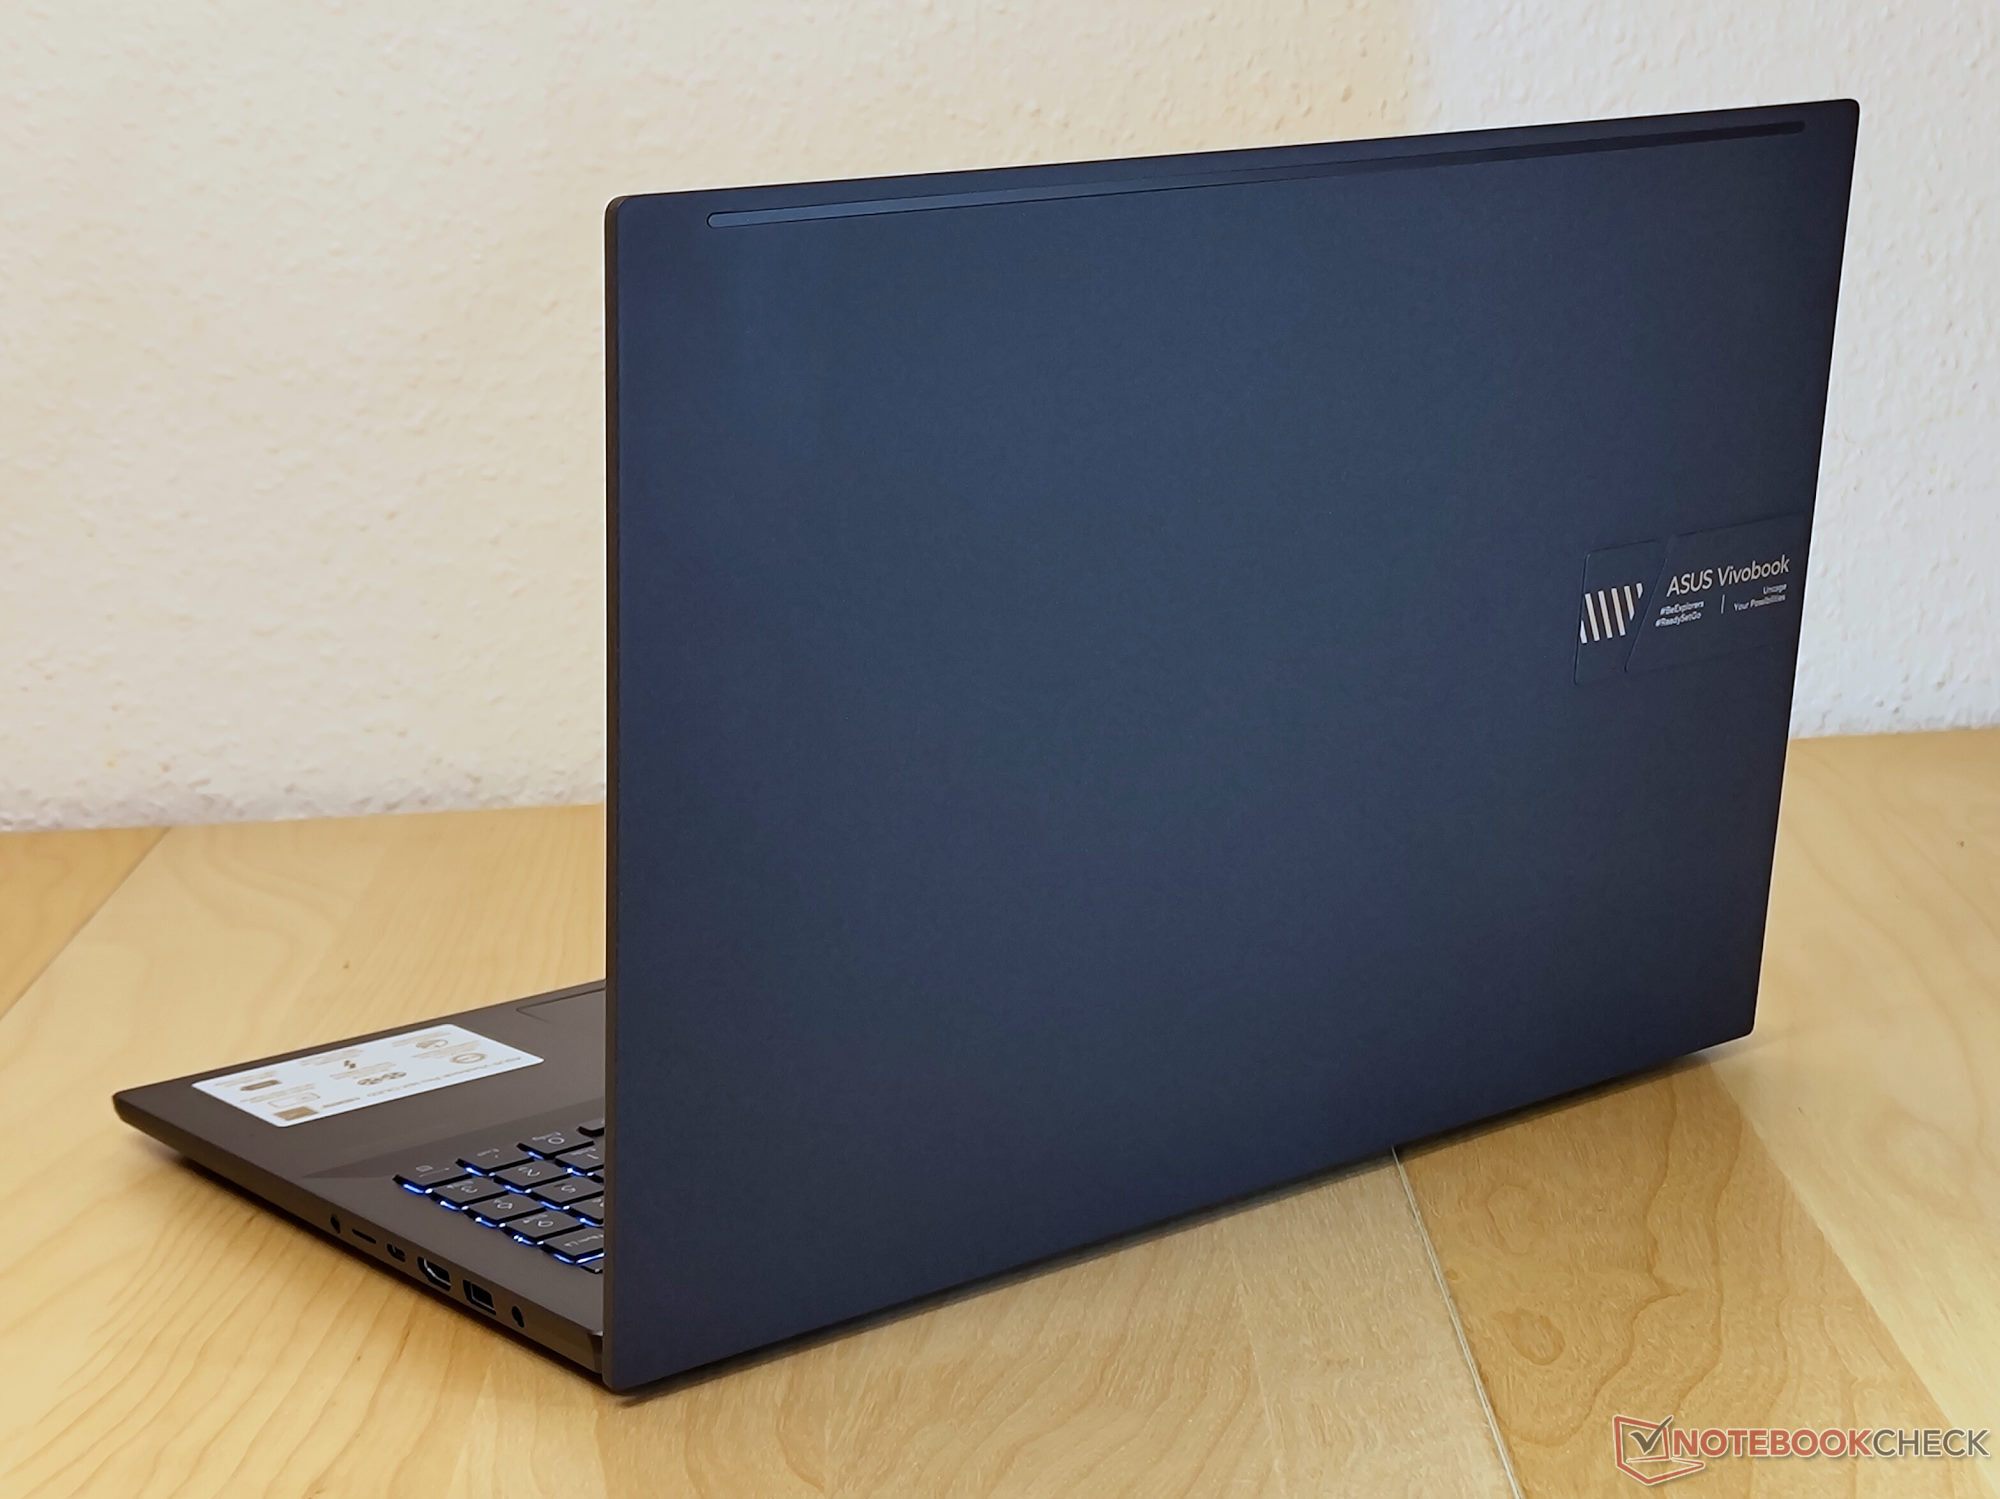
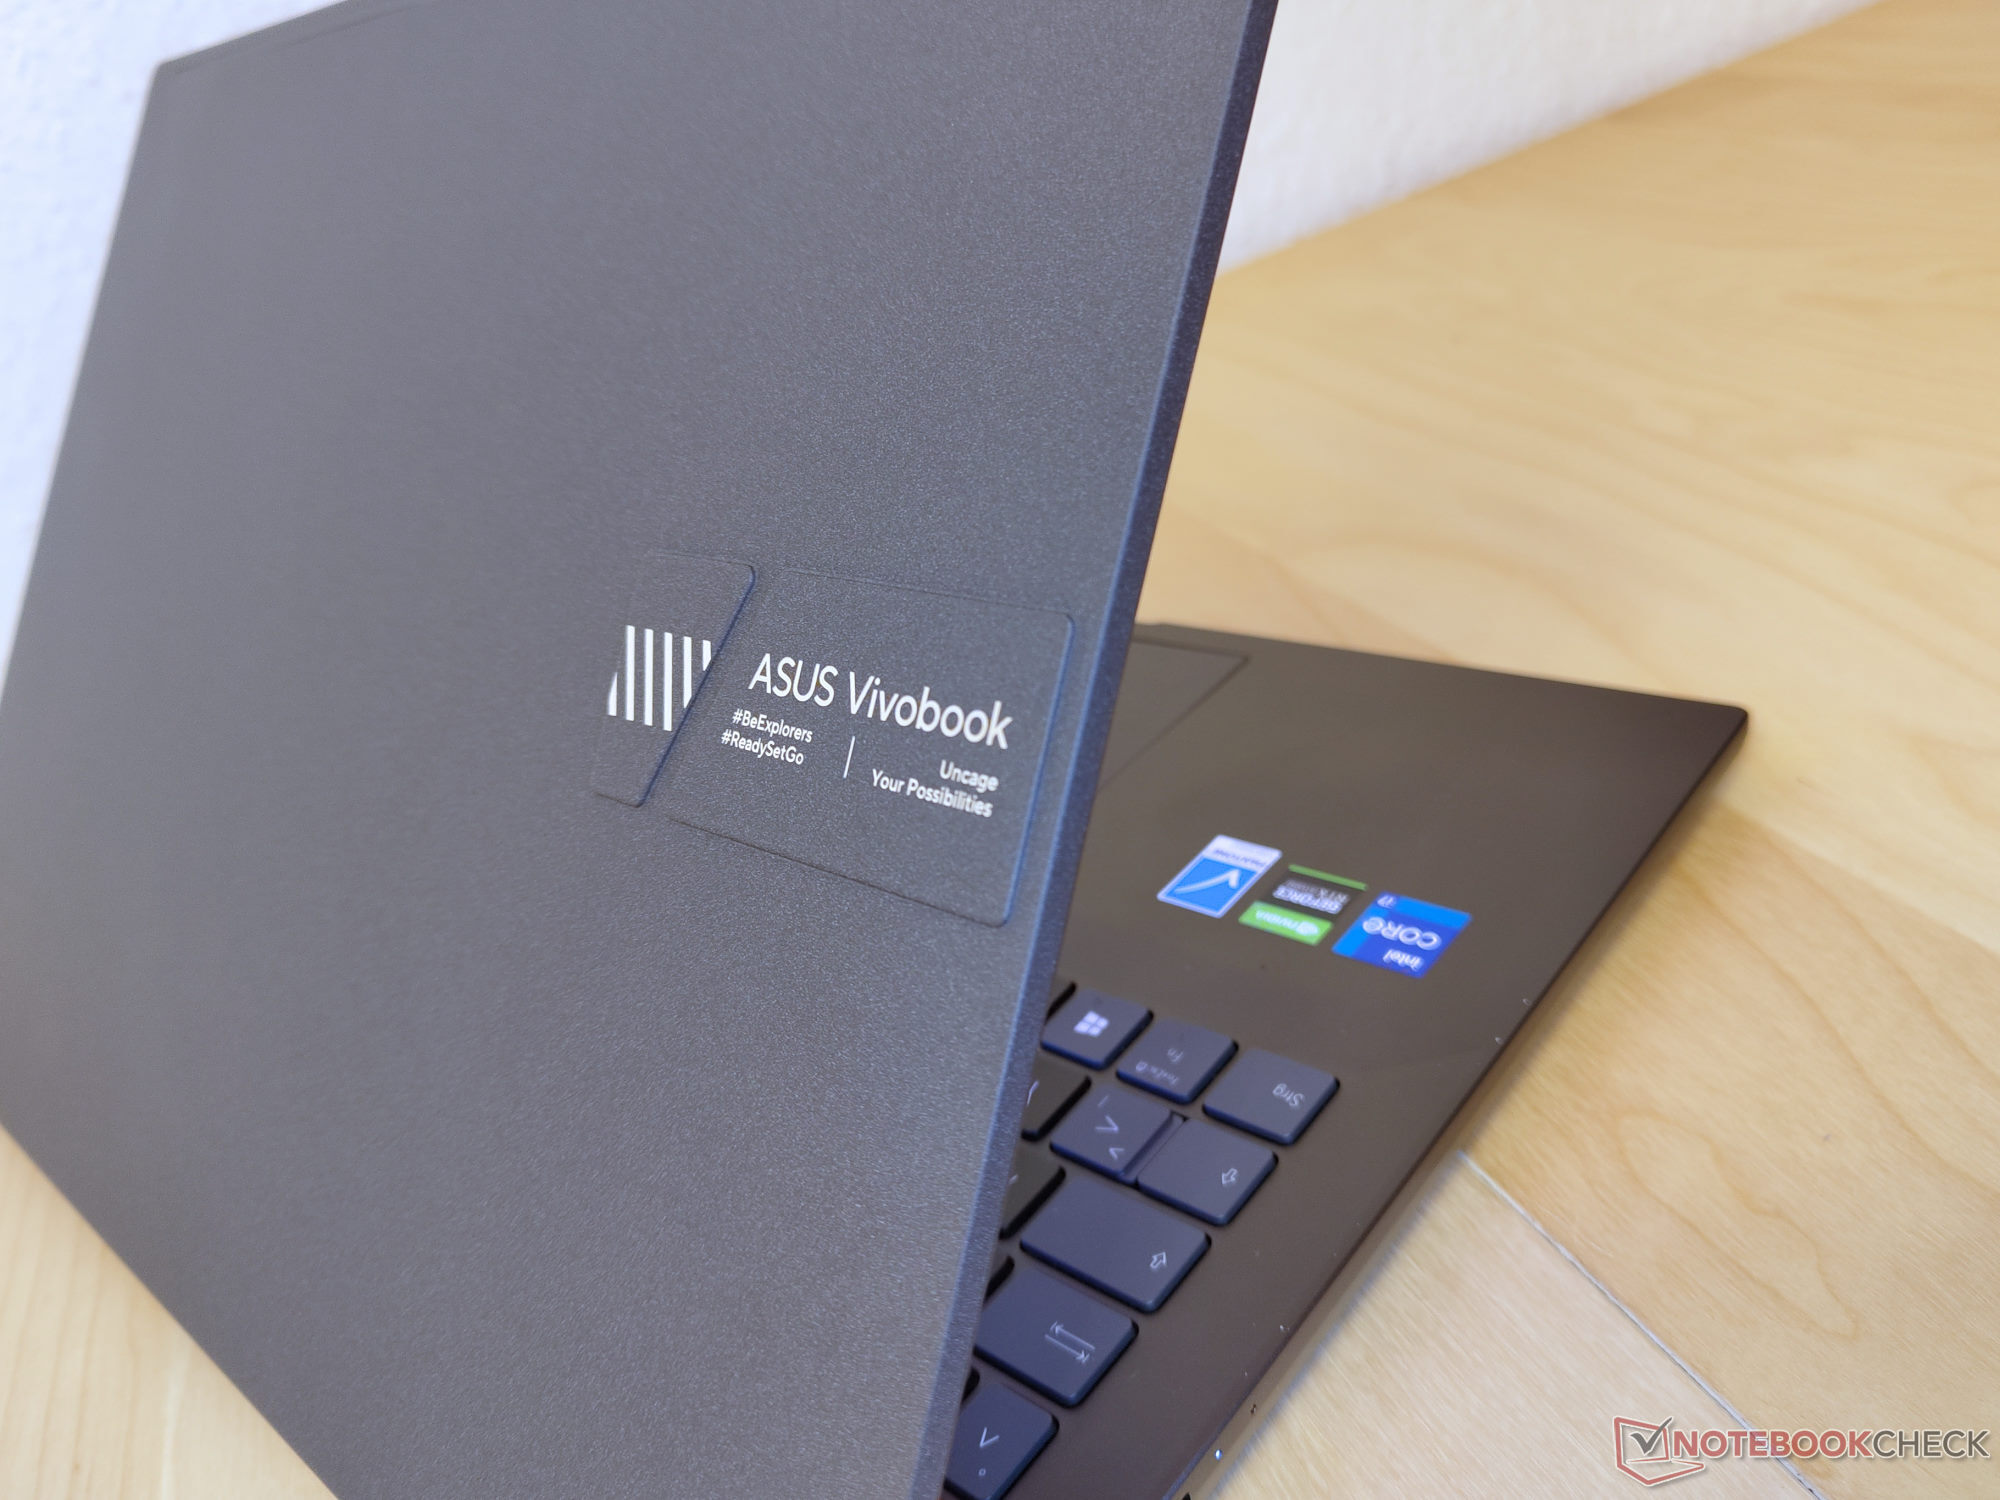
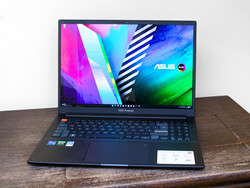
笔记本电脑的视觉表现得益于铝的大量使用。由于其编织的表面处理,盖子特别耐刮擦和油污。
由于多媒体笔记本电脑配备了强大的组件,我们选择了不同类别的笔记本电脑进行比较。例如,无论是便宜的 戴尔 Inspiron 16 Plus 7610和贵得多的 ThinkPad X1 Extreme G4在功能方面非常相似。无论如何,由于其出色的OLED显示屏,Vivobook能够将自己从竞争中脱颖而出。
潜在的竞争对手比较
Rating | Date | Model | Weight | Height | Size | Resolution | Price |
|---|---|---|---|---|---|---|---|
| 83.7 % v7 (old) | 11 / 2022 | Asus VivoBook Pro 16X OLED N7600PC-L2026X i7-11370H, GeForce RTX 3050 4GB Laptop GPU | 2 kg | 18.9 mm | 16.00" | 3840x2400 | |
| 84.2 % v7 (old) | 10 / 2022 | MSI Summit E16 Flip A12UDT-031 i7-1280P, GeForce RTX 3050 Ti Laptop GPU | 1.9 kg | 16.85 mm | 16.00" | 2560x1600 | |
| 89 % v7 (old) | 03 / 2022 | Microsoft Surface Laptop Studio i7 RTX 3050 Ti i7-11370H, GeForce RTX 3050 Ti Laptop GPU | 1.8 kg | 19 mm | 14.40" | 2400x1600 | |
| 86.7 % v7 (old) | 10 / 2021 | Dell Inspiron 16 Plus 7610 i7-11800H, GeForce RTX 3050 4GB Laptop GPU | 2 kg | 18.99 mm | 16.00" | 3072x1920 | |
| 89 % v7 (old) | 11 / 2021 | Lenovo ThinkPad X1 Extreme G4-20Y5CTO1WW (3050 Ti) i7-11800H, GeForce RTX 3050 Ti Laptop GPU | 2 kg | 18.2 mm | 16.00" | 3840x2400 | |
| 83.2 % v7 (old) | 10 / 2021 | Schenker XMG Focus 15 i7-11800H, GeForce RTX 3050 Ti Laptop GPU | 1.9 kg | 22 mm | 15.60" | 1920x1080 |
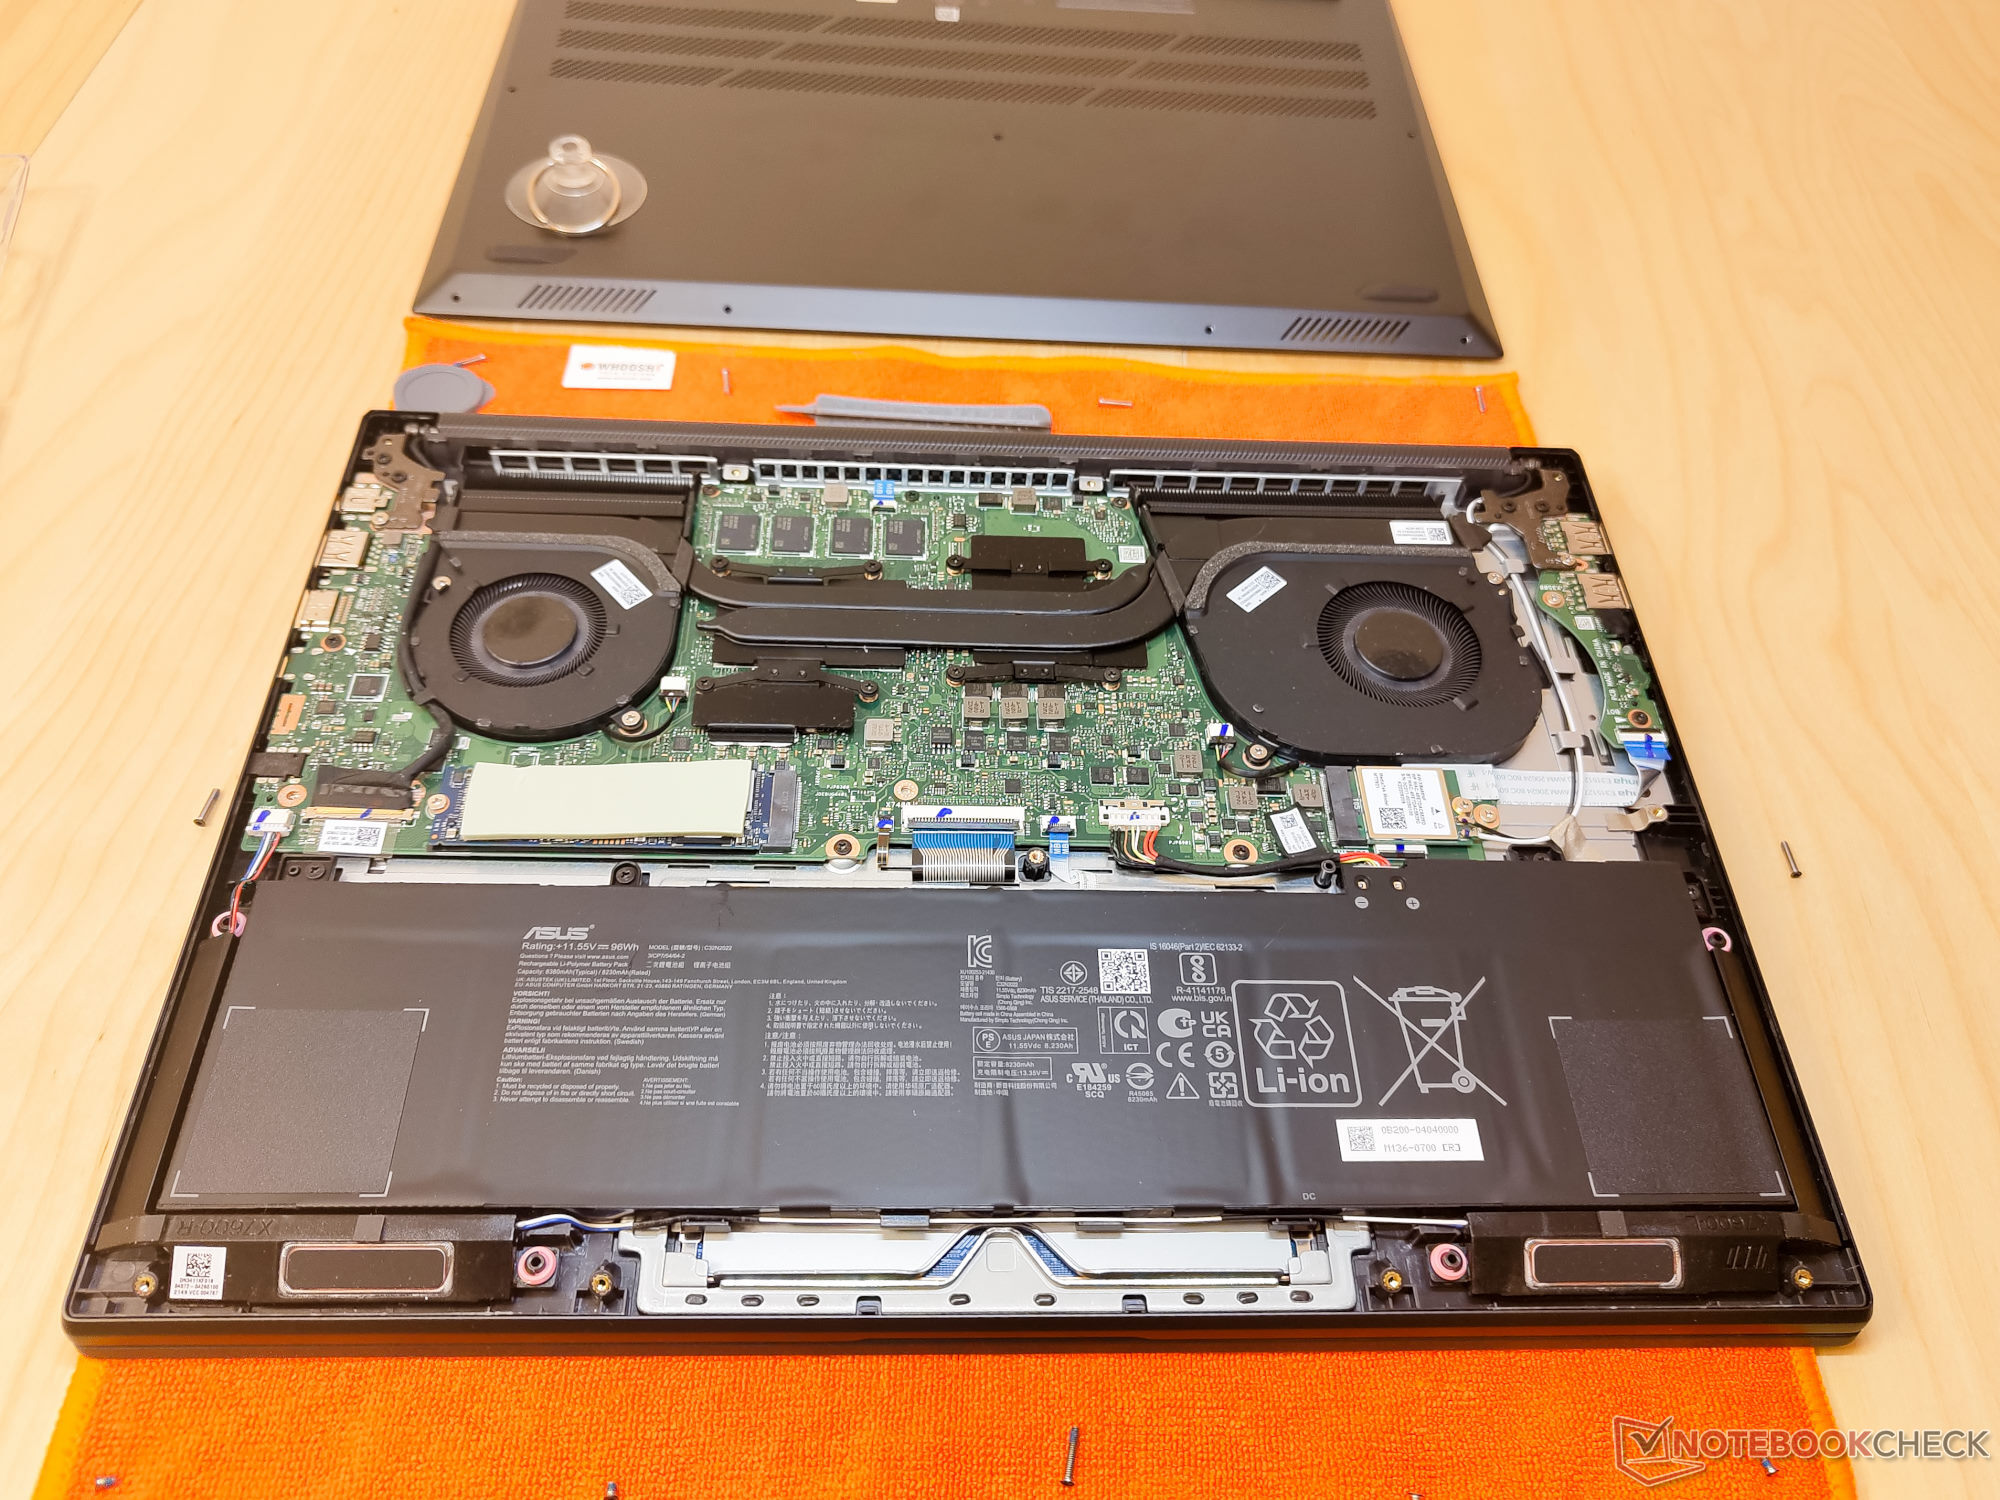
外壳 - 铝制顶部、底部和中部
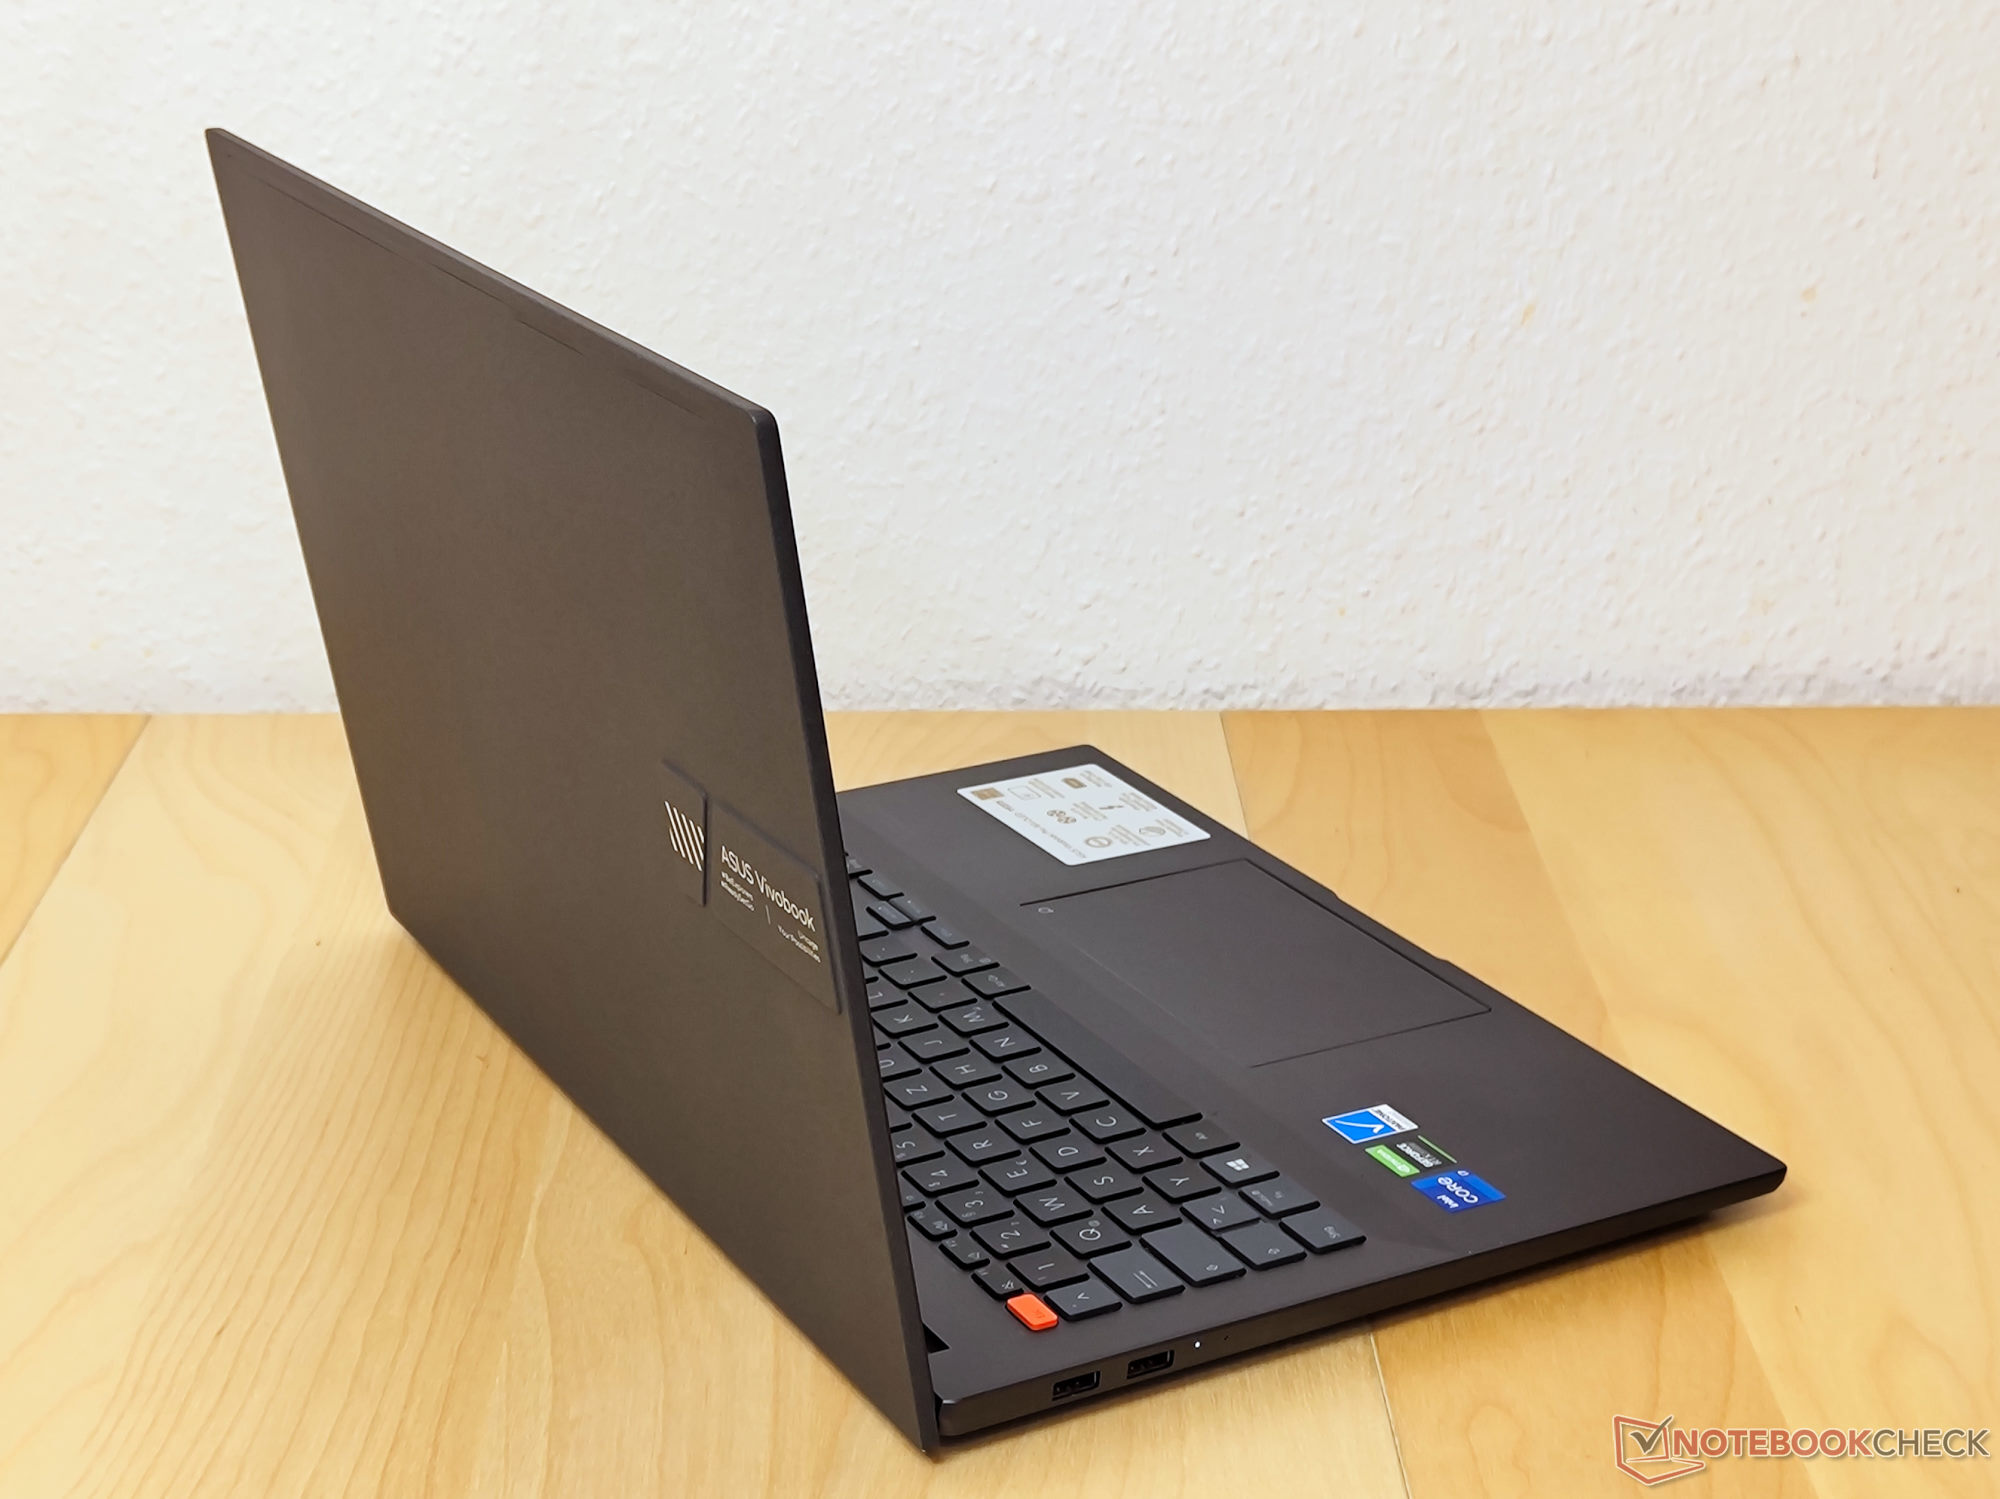
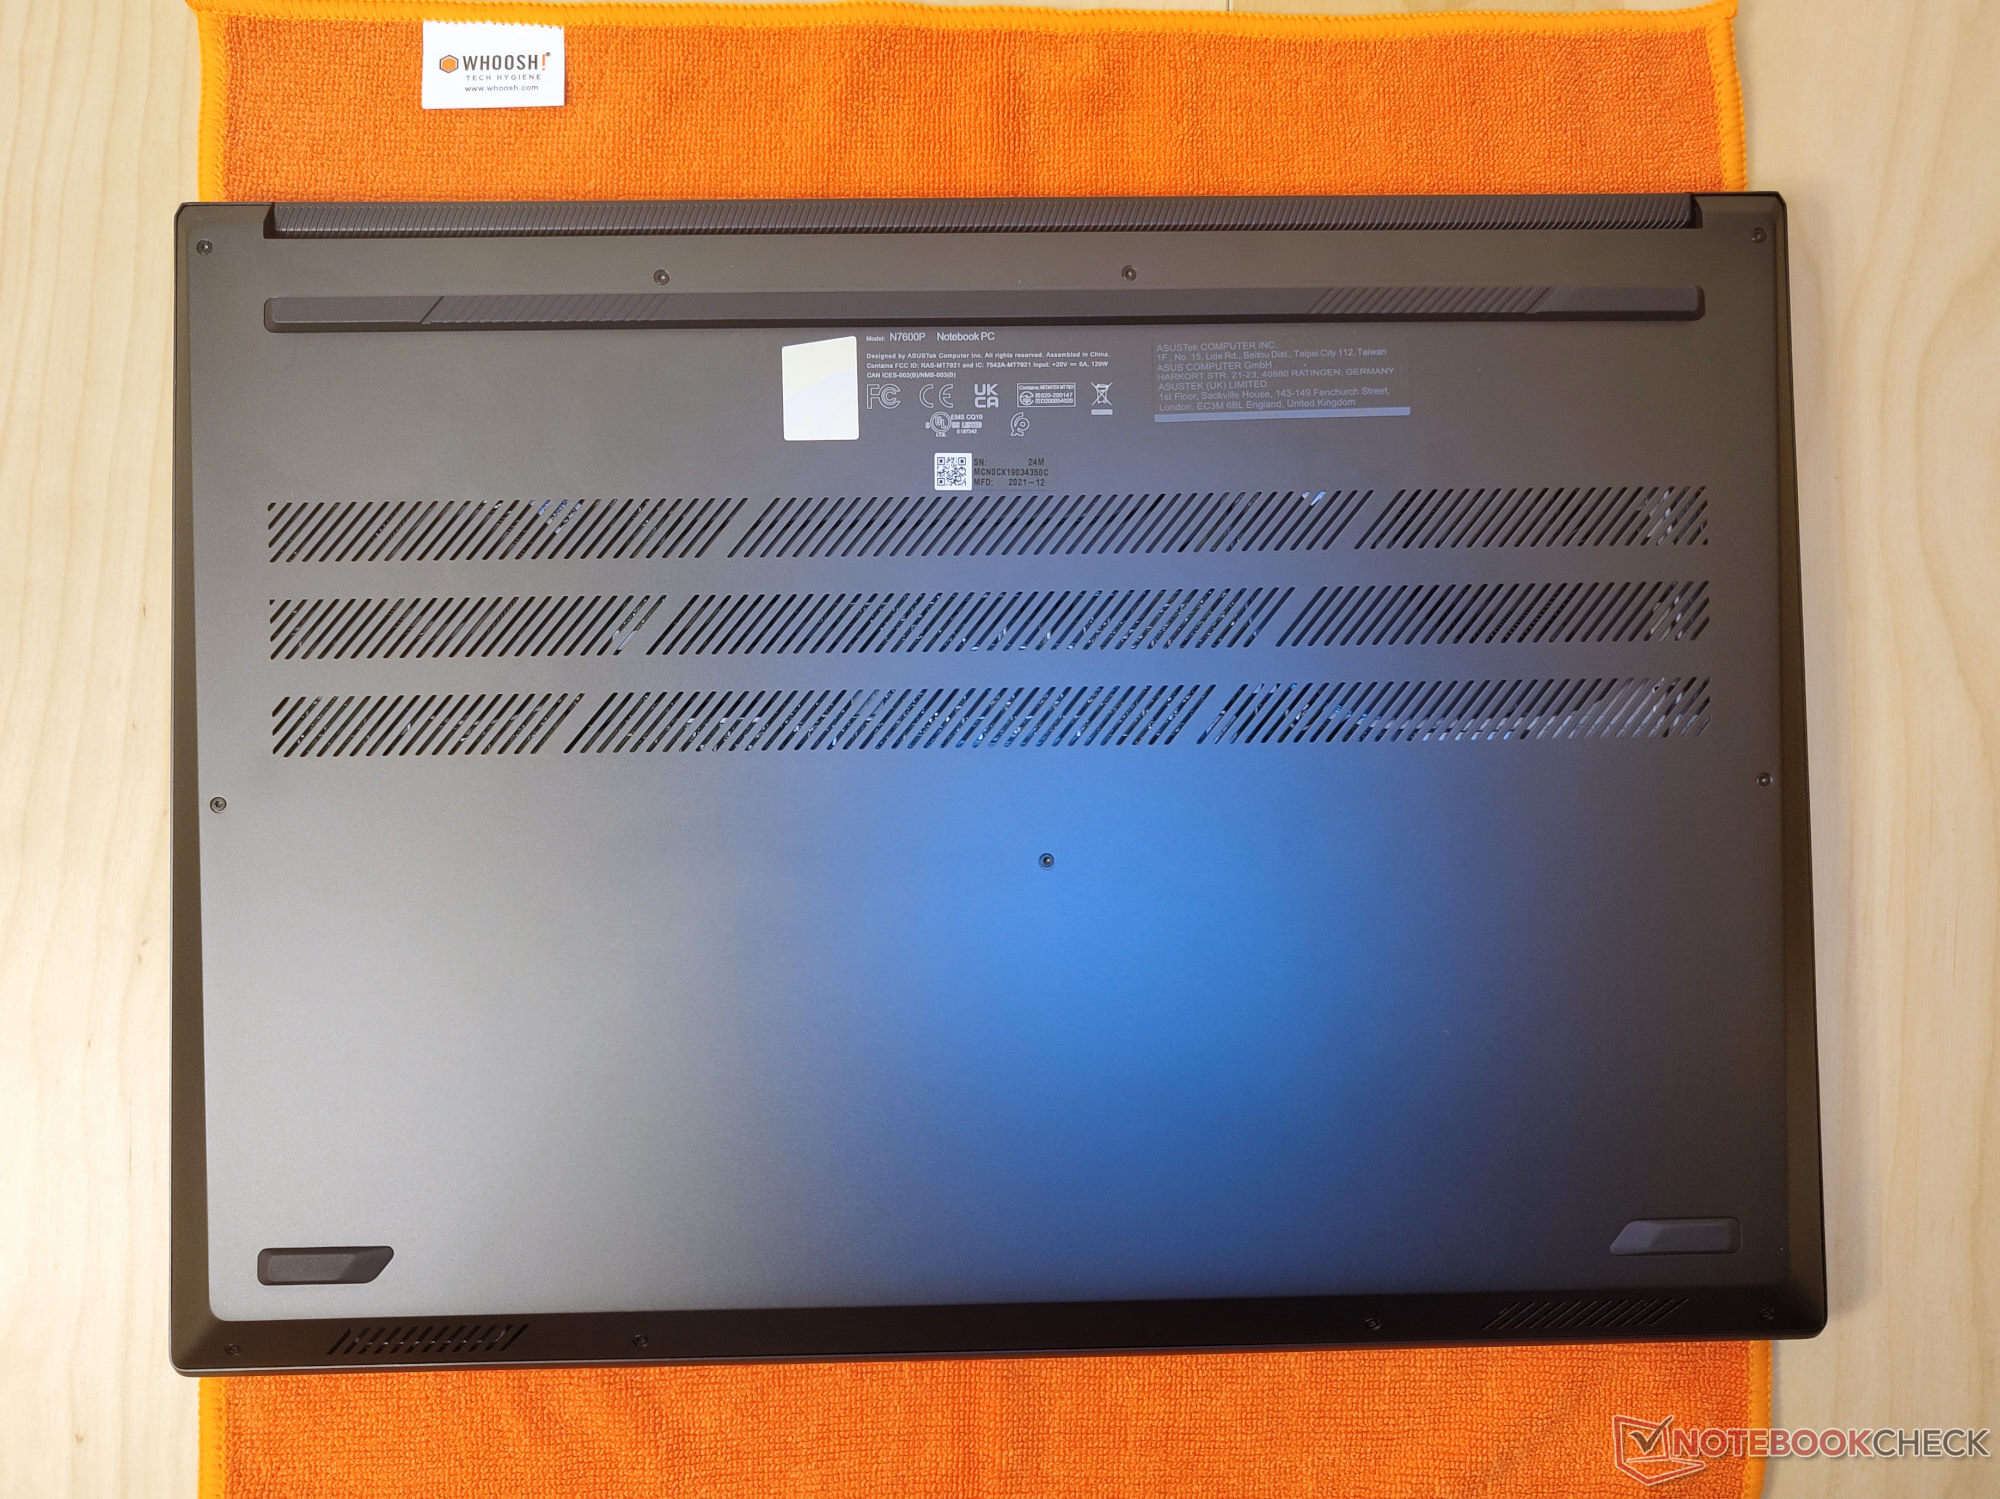
尽管第一眼可能看不出来,但Vivobook 16X的整个底盘几乎都是由铝组成的。底部装置被涂成无烟煤色,而深灰色涂层覆盖在盖子上。后者是哑光的,非常坚固,不会吸引油污。华硕将其作为编织涂层进行销售。根据光线照射在表面的角度,它可以显得非常光滑或非常粗糙。在盖子背面的一个独立区域有一个特有的华硕标志。这款多媒体笔记本电脑的设计在其他方面相对简单。
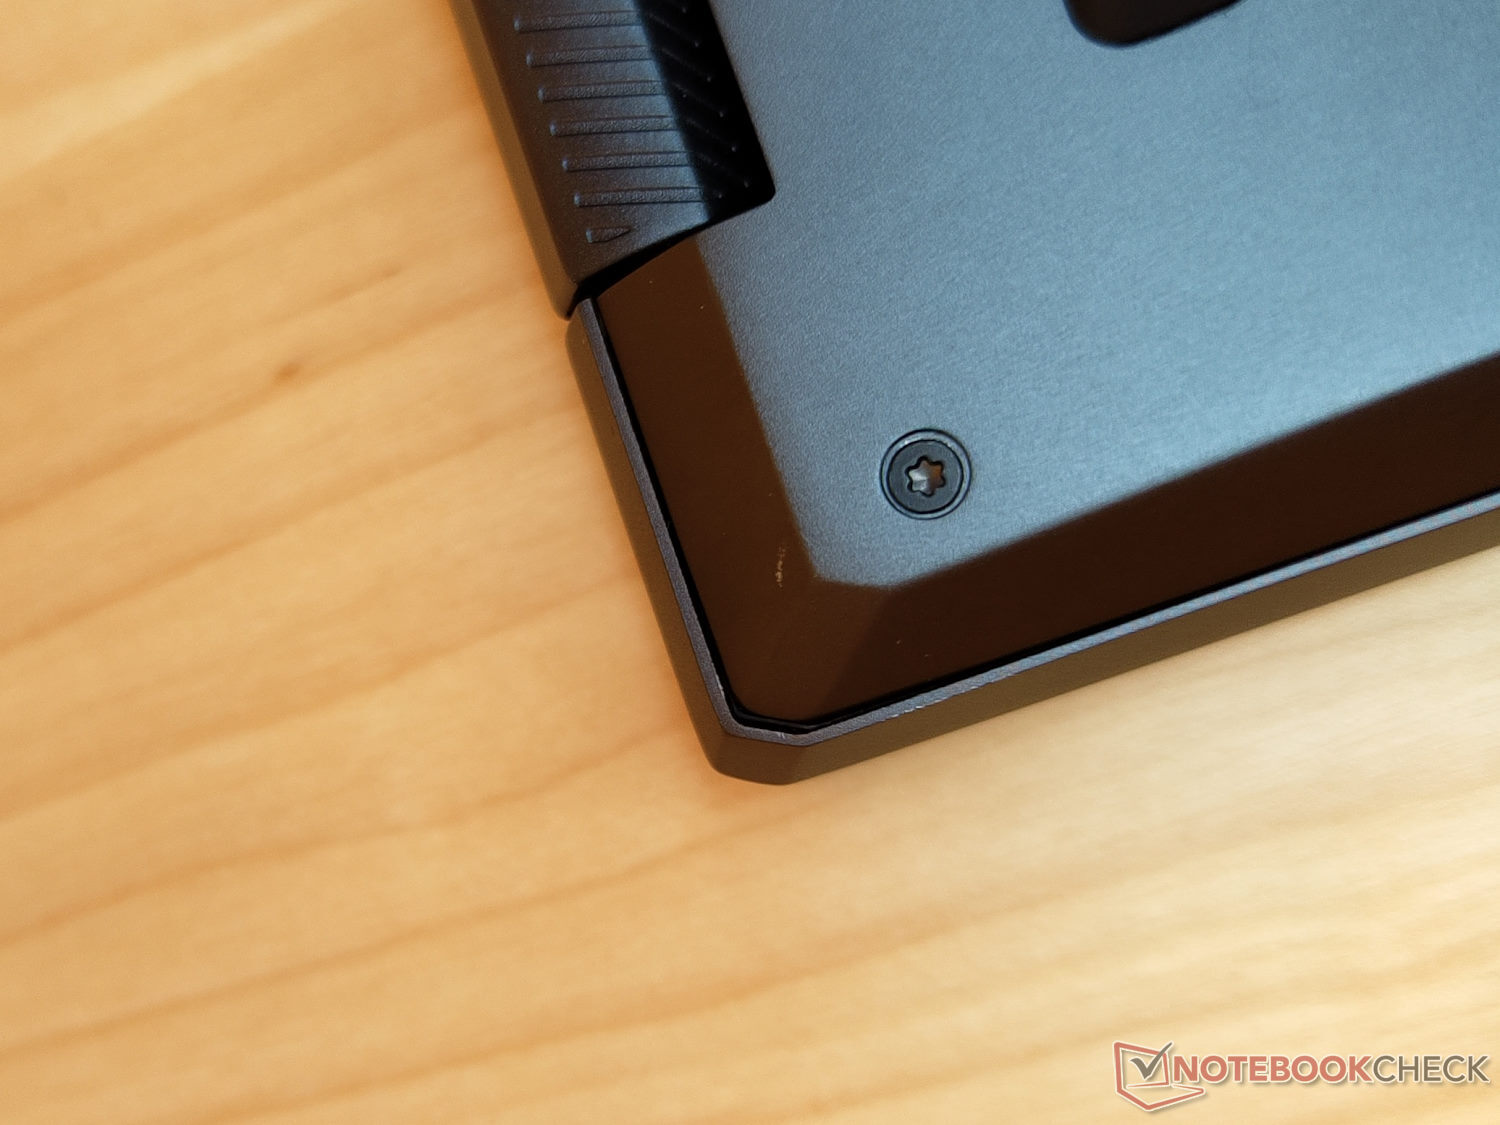
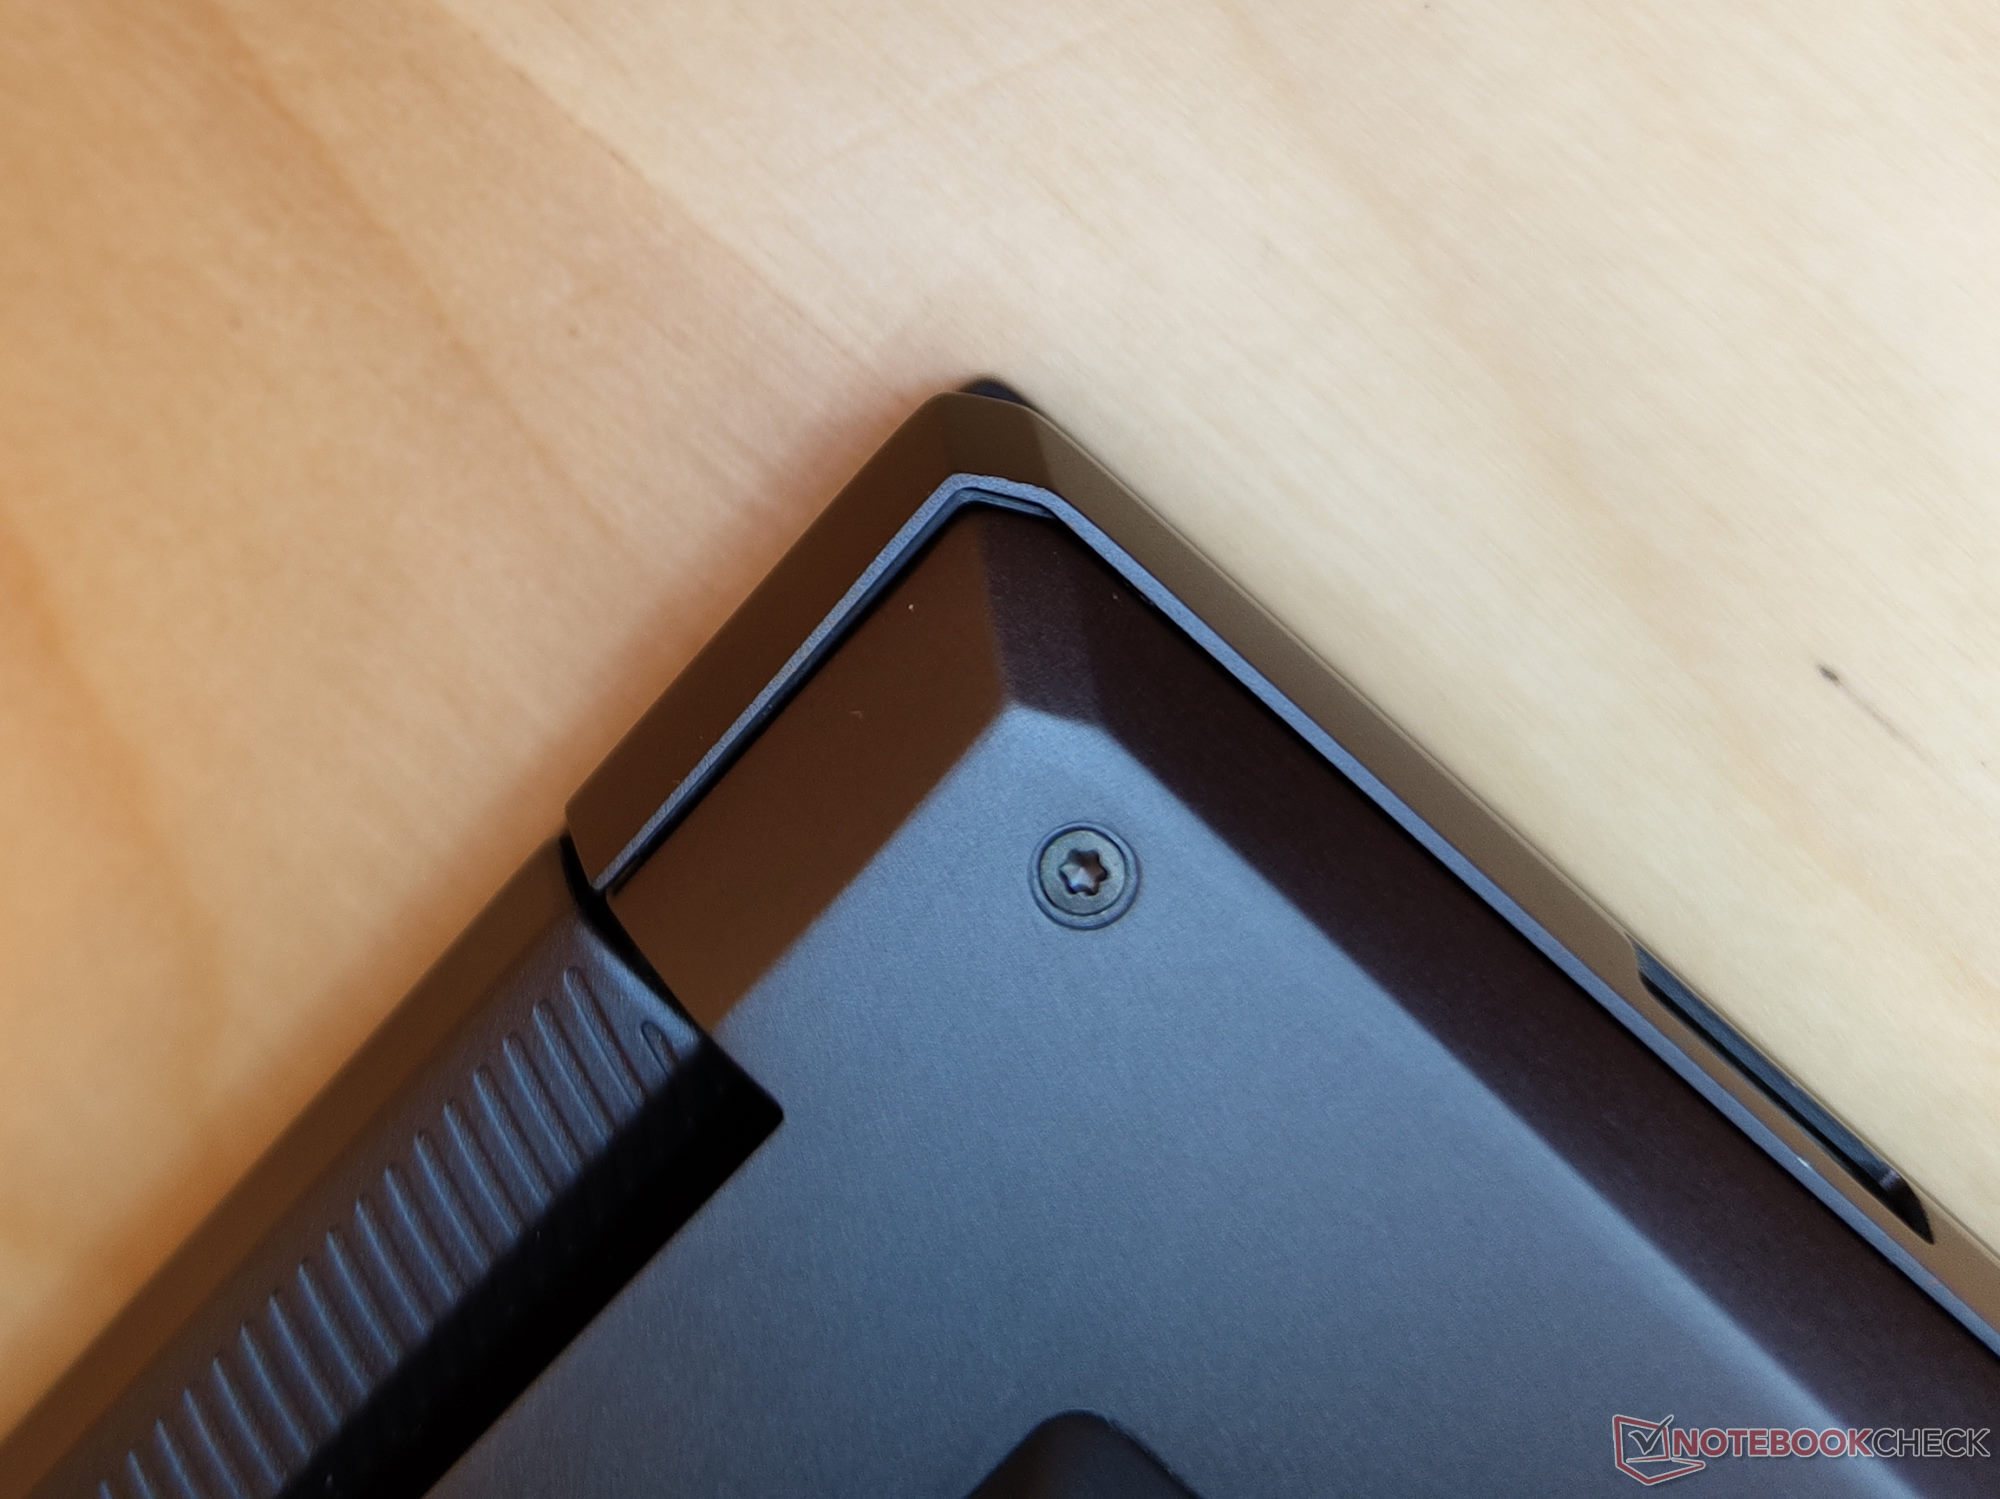
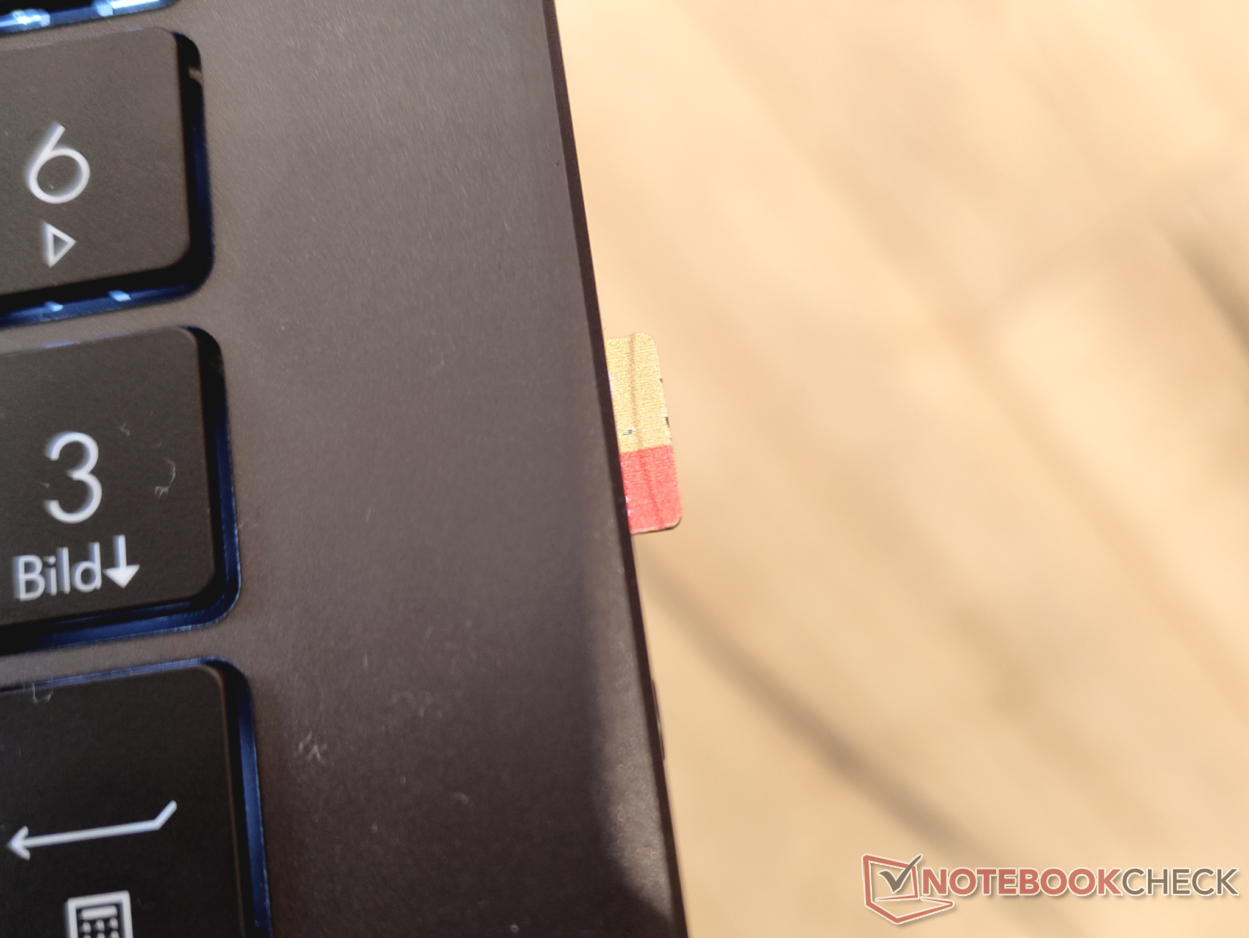
16英寸系统的刚性明显得益于对金属的大量使用。我们无法从角落里有意义地扭转笔记本电脑的基本单元。虽然显示屏的情况不尽相同,但我们至少没有注意到任何嘎吱声。虽然盖子可以用一只手打开到大约130度的最大角度,但没有大的晃动。不幸的是,在几个地方的间隙并不完全均匀。在点击板的左下角,有一个间隙,暴露了机箱的内部结构。同样,底部也有多处间隙不均匀的地方。我们的图片库显示了一些我们发现的缝隙的例子。这引出了一个问题,即较大的间隙是为了补偿更大的热膨胀,还是制造公差太大。
由于边框相当纤细,尽管Vivobook 16X OLED本身是一个16英寸的设备,但它往往比其他16英寸的笔记本电脑略小。此外,如果考虑到专用GPU和强大的CPU,它是相当薄的。相比之下,其重量相当高。1969克(约4.34磅)的重量,很难说是轻巧。加上额外的446克(约0.98磅)的交流适配器及其电缆,Vivobook 16X总共有2.4公斤(约5.29磅)。
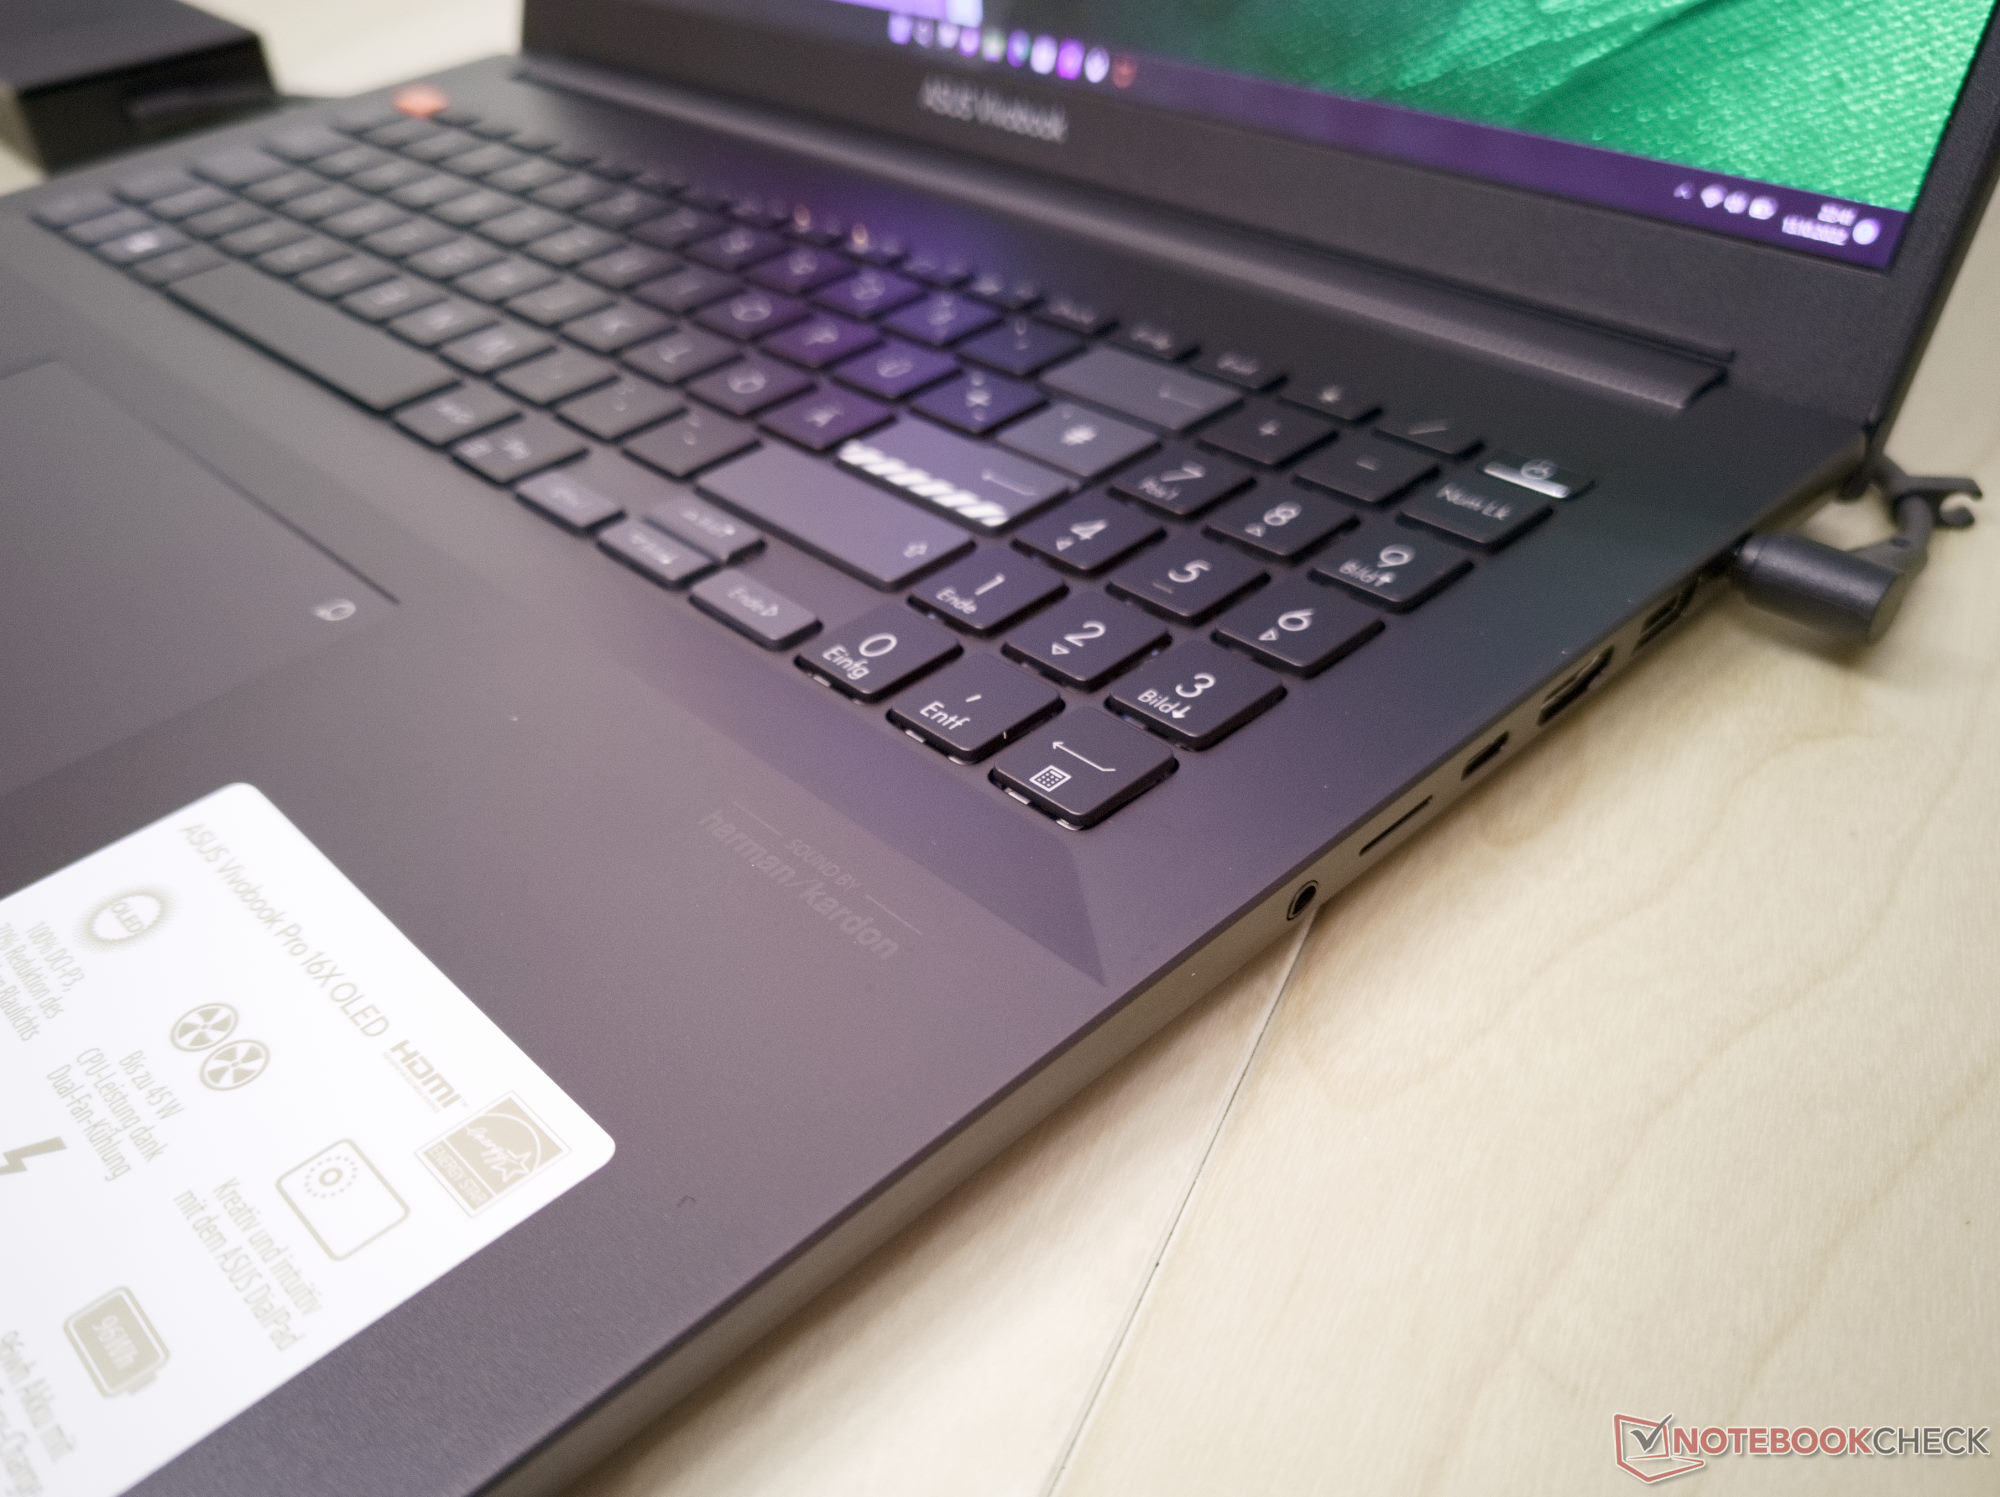
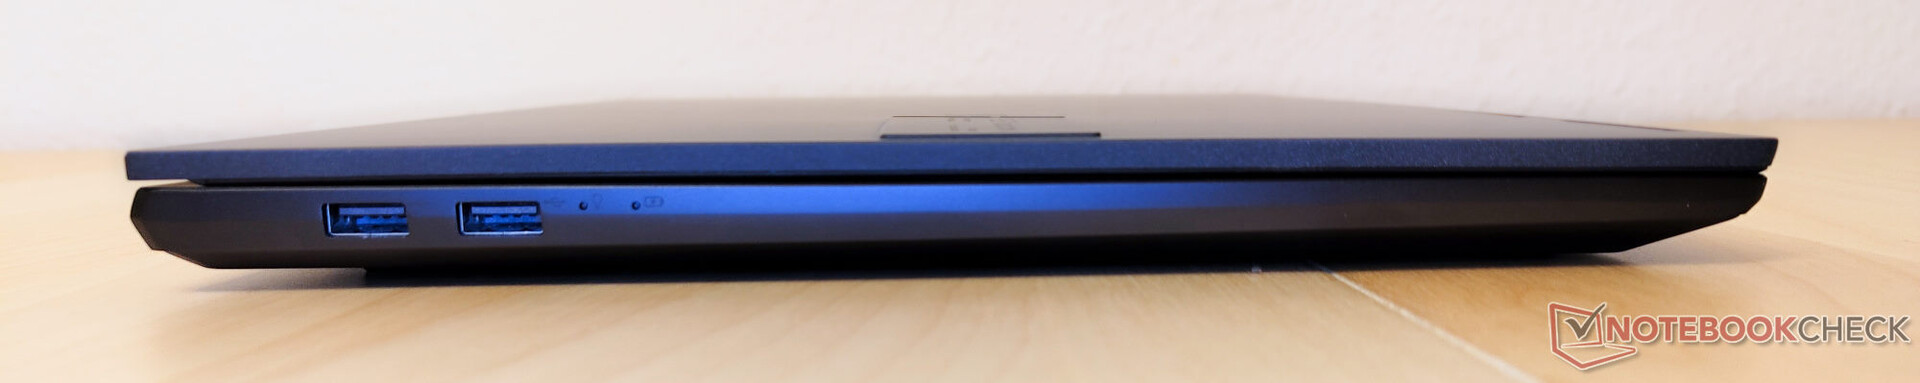
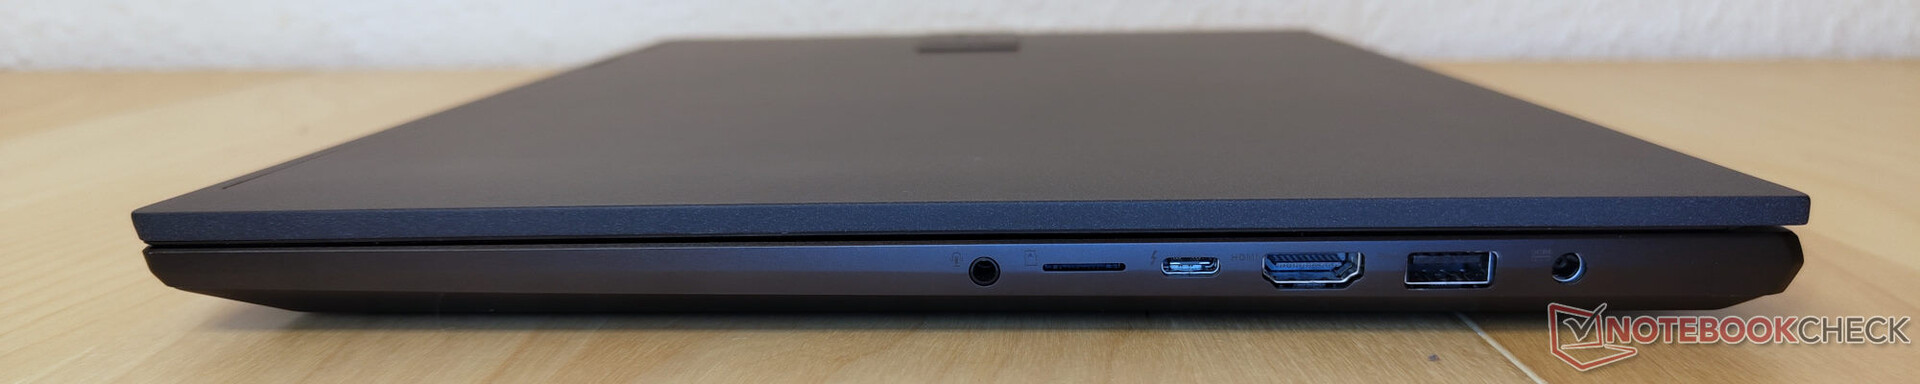
连接性 - 右侧为USB-C与Thunderbolt 4,左侧为USB 2.0
由于带有Thunderbolt 4和Power Delivery的USB type-C以及3x USB type-A和HDMI 2.1,用户在配件方面得到了很大的灵活性。这使得缓慢的microSD读卡器成为一个完全不可原谅的选择。对于一个针对内容创作者的设备来说,一个具有体面传输速度的全尺寸SD卡读卡器可能更适合。左边的两个USB Type-A端口只支持USB 2.0。大多数可用的端口都位于右侧。对于希望使用外部鼠标的右手用户来说,这可能是一个轻微的不便。
SD卡阅读器
SD卡阅读器不是Vivobook的优势之一。由于它只通过USB 2.0连接,即使使用我们参考的AV PRO microSD 128 GB V60卡也不能达到良好的速度。事实上,即使是microSD卡也不能完全插入,这也让人感到有些失望。
| SD Card Reader | |
| average JPG Copy Test (av. of 3 runs) | |
| MSI Summit E16 Flip A12UDT-031 (AV Pro SD microSD 128 GB V60) | |
| Lenovo ThinkPad X1 Extreme G4-20Y5CTO1WW (3050 Ti) (AV Pro V60) | |
| Average of class Multimedia (23 - 531, n=37, last 2 years) | |
| Schenker XMG Focus 15 (AV PRO microSD 128 GB V60) | |
| Asus VivoBook Pro 16X OLED N7600PC-L2026X | |
| Dell Inspiron 16 Plus 7610 (AV PRO microSD 128 GB V60) | |
| maximum AS SSD Seq Read Test (1GB) | |
| Average of class Multimedia (37.3 - 1455, n=36, last 2 years) | |
| Lenovo ThinkPad X1 Extreme G4-20Y5CTO1WW (3050 Ti) (AV Pro V60) | |
| MSI Summit E16 Flip A12UDT-031 (AV Pro SD microSD 128 GB V60) | |
| Schenker XMG Focus 15 (AV PRO microSD 128 GB V60) | |
| Asus VivoBook Pro 16X OLED N7600PC-L2026X | |
| Dell Inspiron 16 Plus 7610 (AV PRO microSD 128 GB V60) | |
沟通
金属底盘往往使制造商的Wi-Fi天线的位置变得复杂。这似乎也是华硕Vivobook 16X的情况,因为大约700Mb/s的上行和下载速度低于我们对Wi-Fi 6的期望,而且在我们的比较中也不合格。
网络摄像头
华硕使用了一个0.9MP的网络摄像头,这是消费类笔记本电脑的一个常见选择。不幸的是,它的质量也同样很差,结果是。正如 联想Thinkbook 14 G4和 15 G4最近显示,还有改进的余地。


")
")
安全问题
指纹传感器被集成到电源按钮中。其他安全功能仅限于英特尔酷睿i7的TPM 2.0和其他软件解决方案。
辅料
Vivobook 16X OLED的包装只包括精华部分。交流电适配器、文件和笔记本电脑的包装上都有少量的塑料。
维护
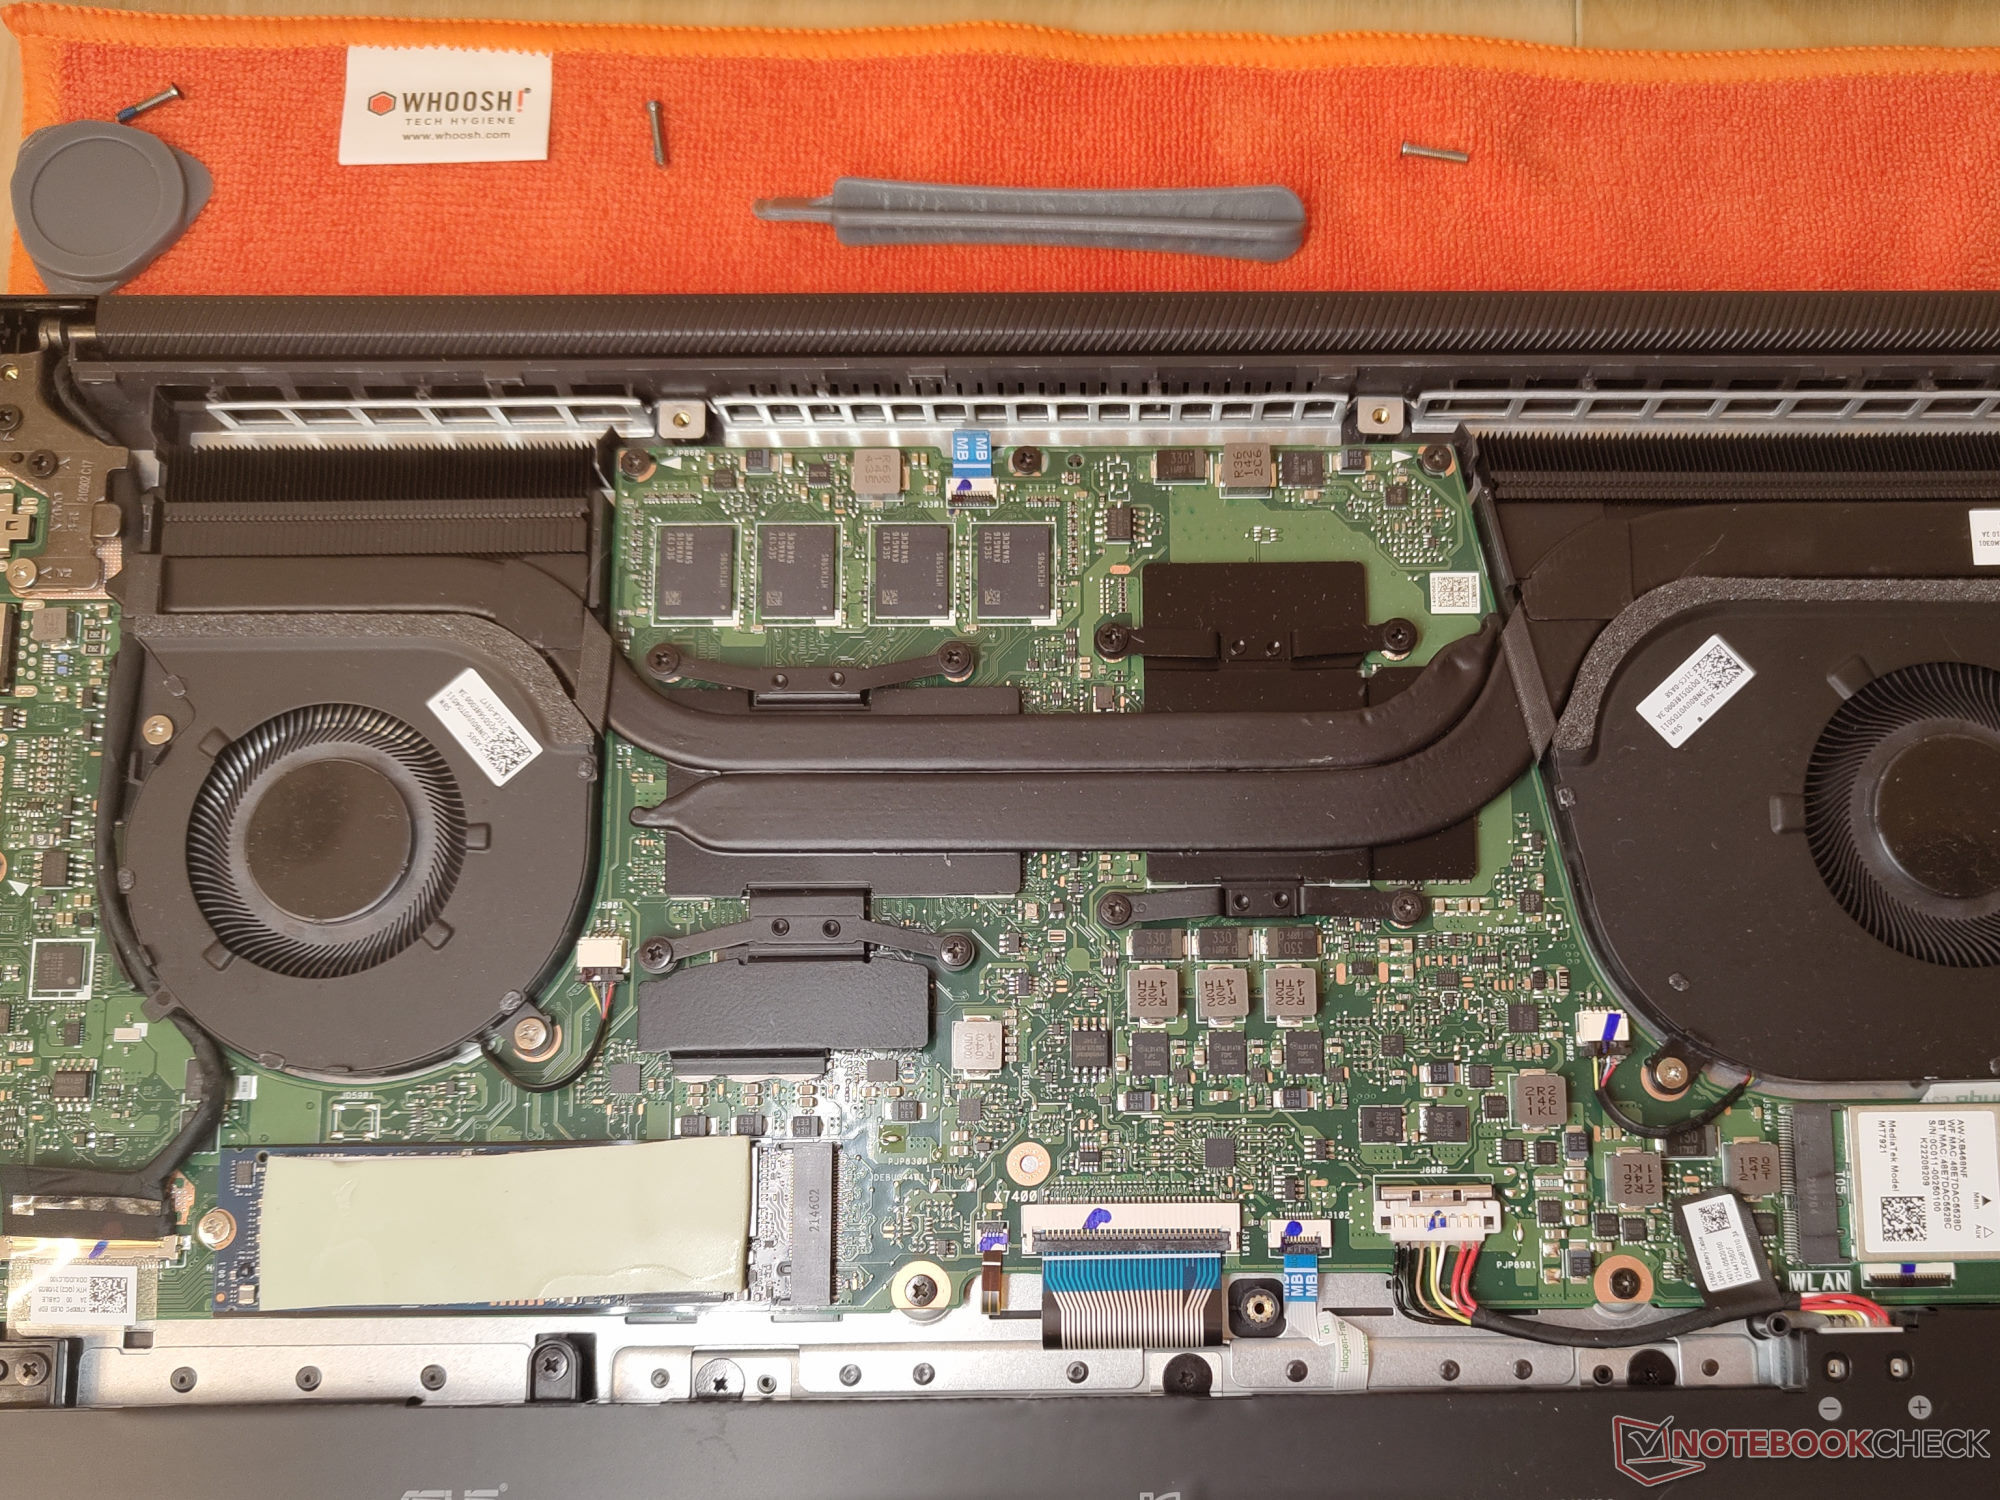
底部装置由11颗TX5螺丝固定。松开这些螺丝后,底部仍然不能轻易拆除。在此,我们建议使用吸盘和塑料铲子来小心地拆开盖子。16GB的内存被焊接在主板上,因此无法升级。易于升级的部分仅限于Wi-Fi模块和M.2 SSD。Vivobook上没有其他可升级的部件。
担保
在美国购买Vivobook Pro 16X时,有一个标准的一年有限保修。
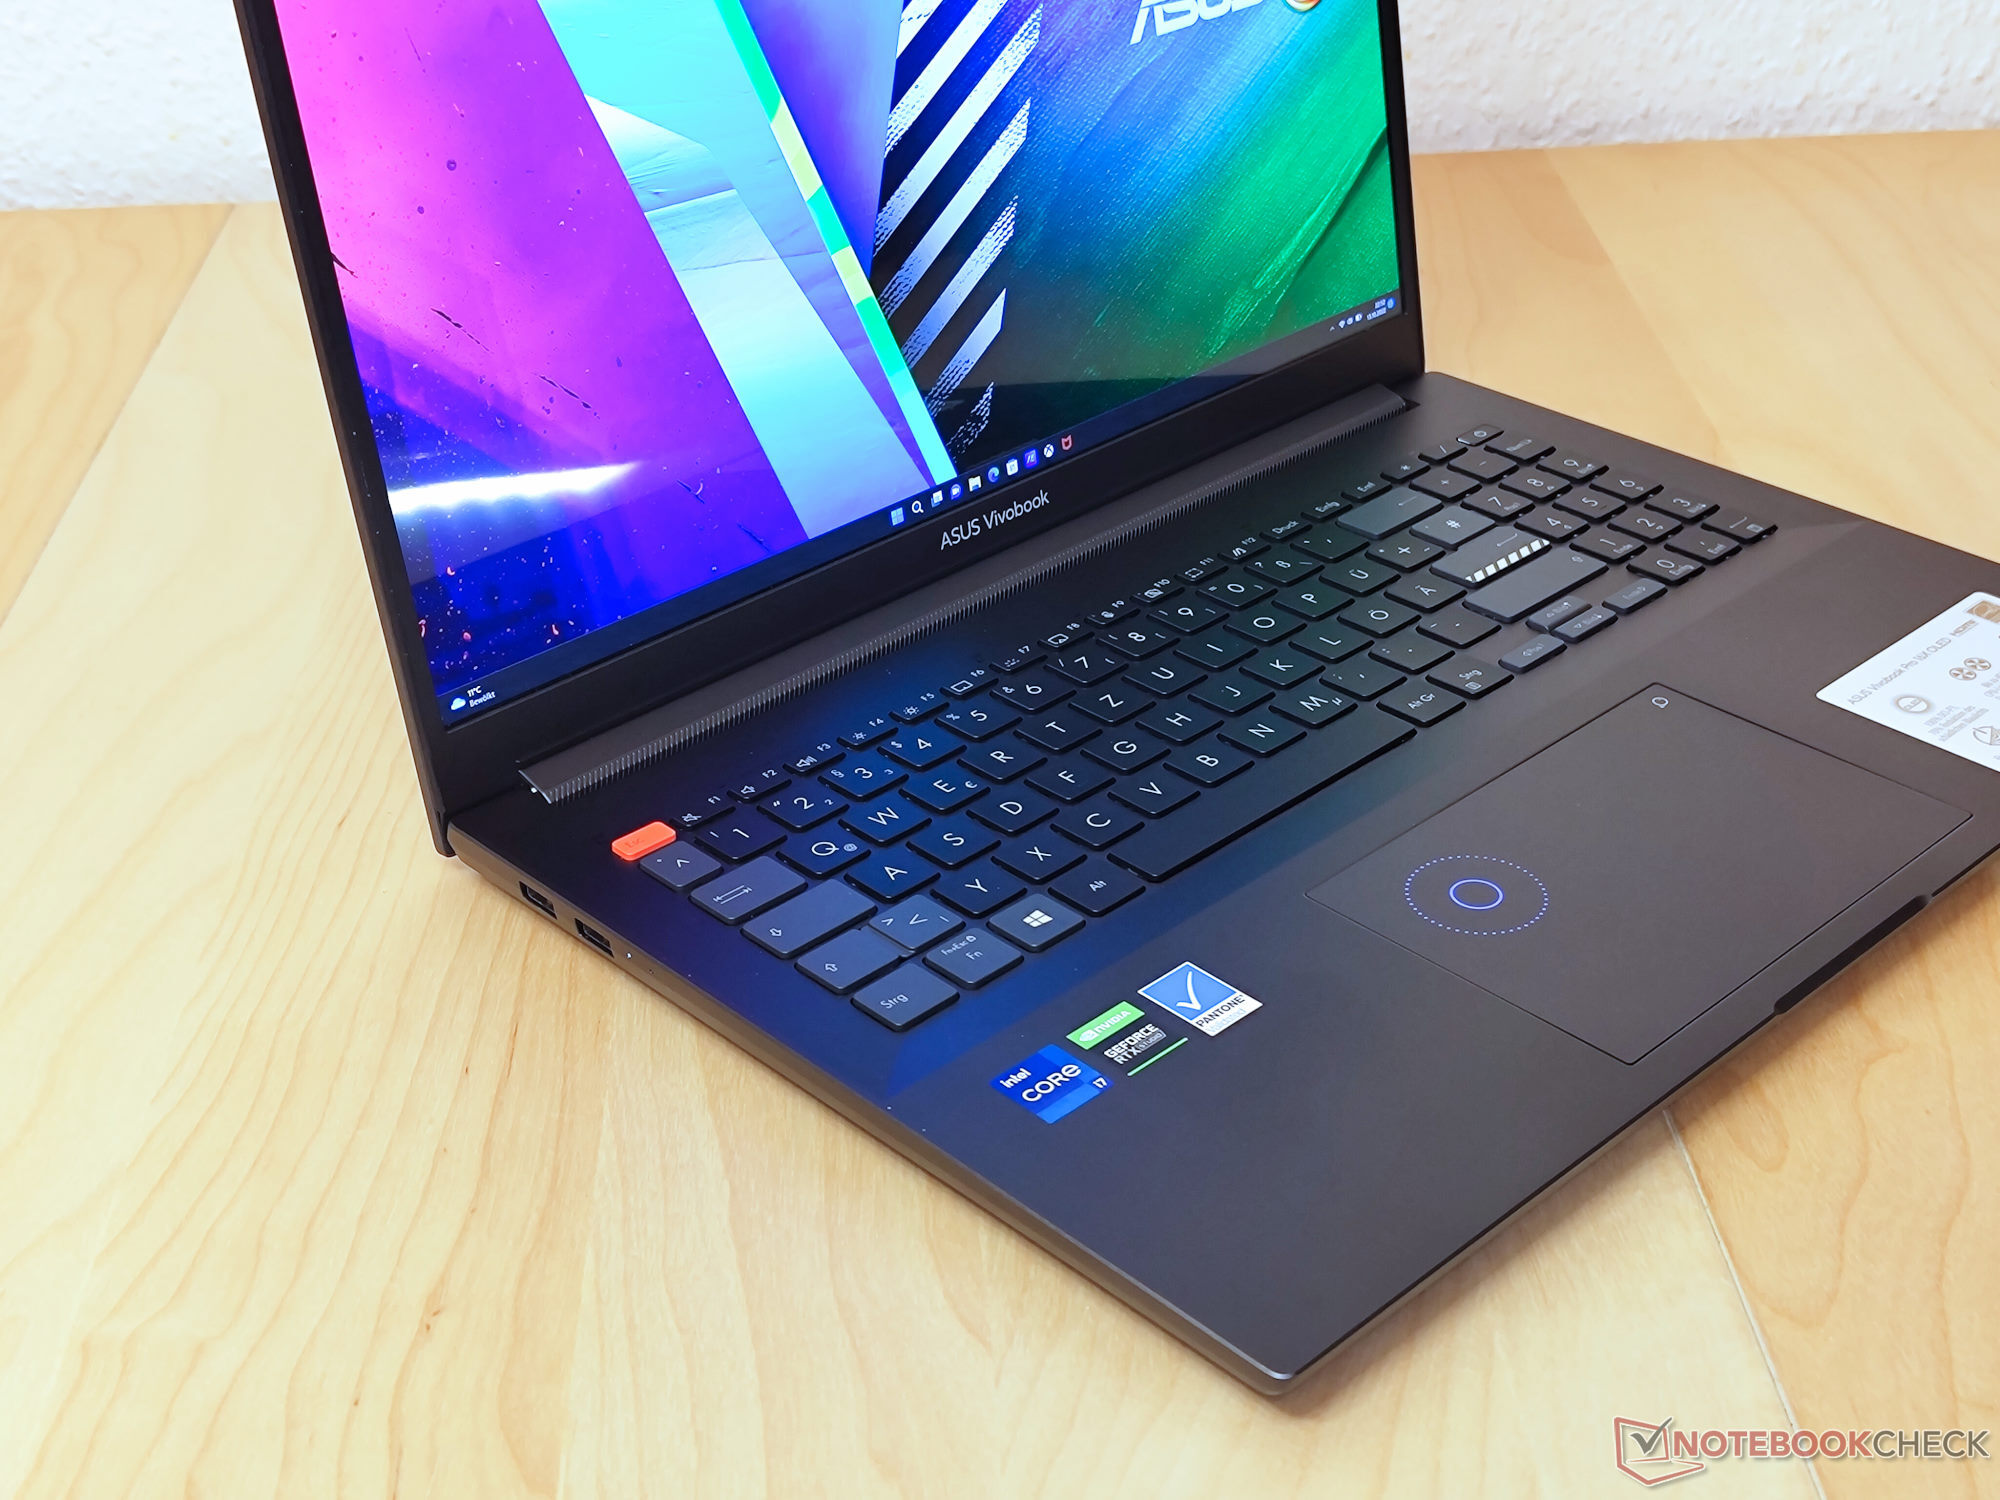
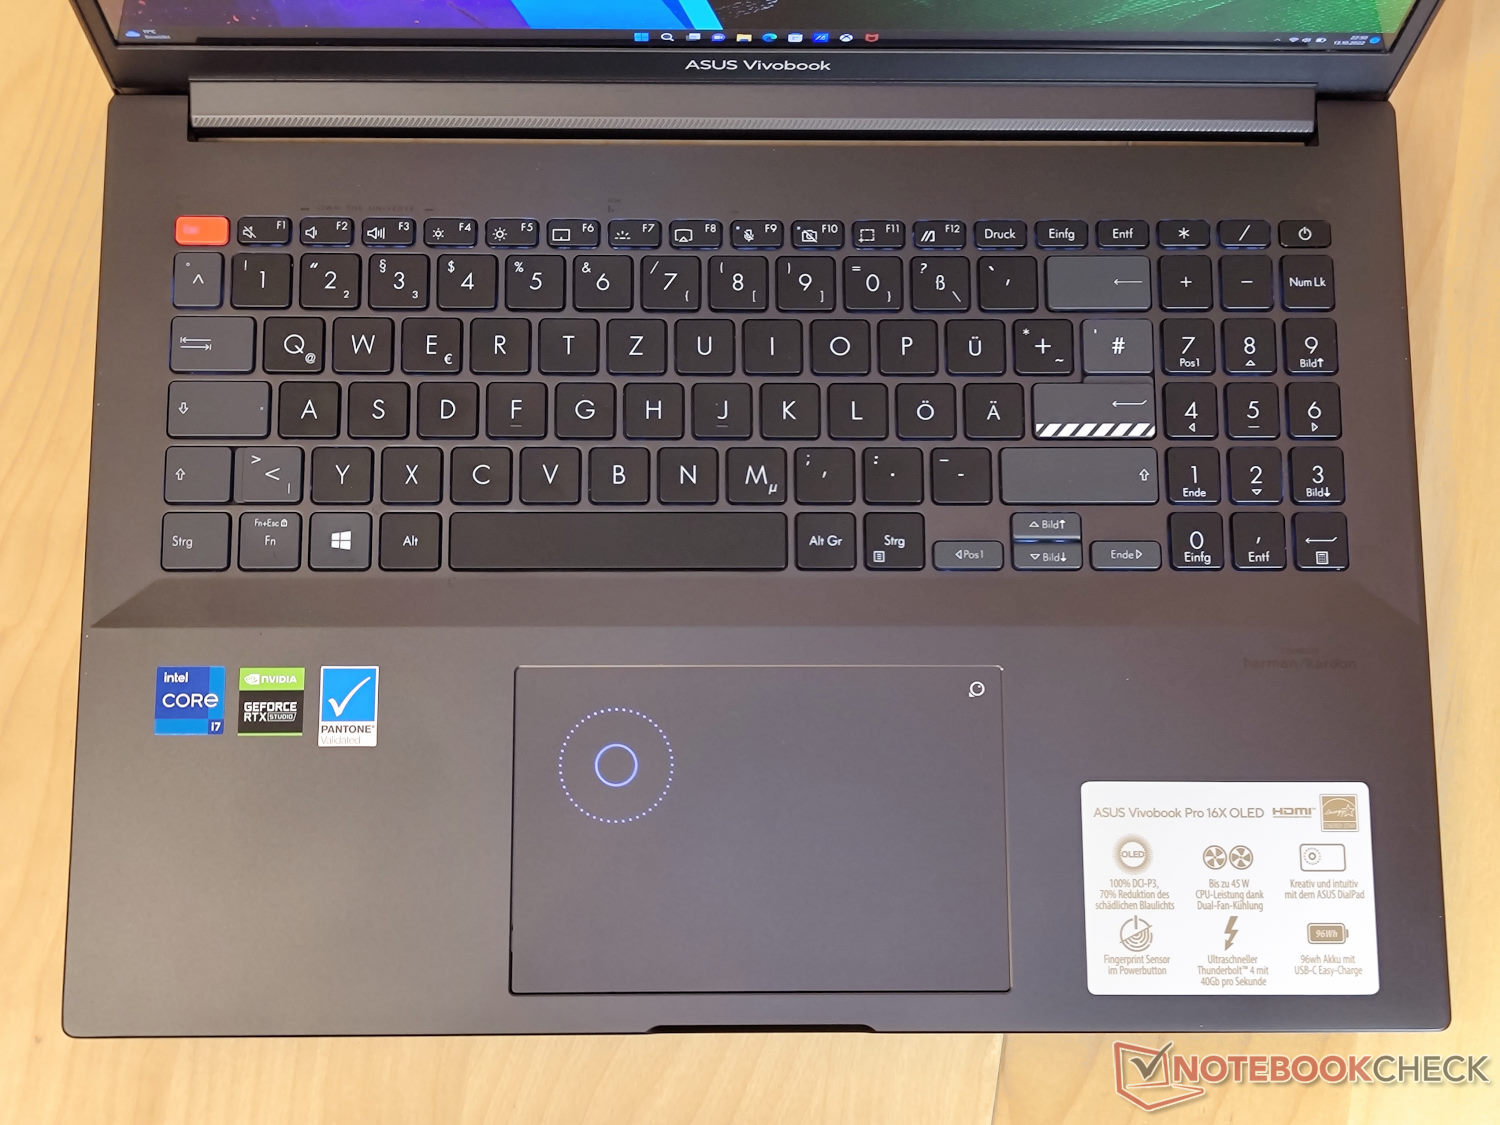
输入设备 - 华硕Dail和一个全尺寸键盘
键盘
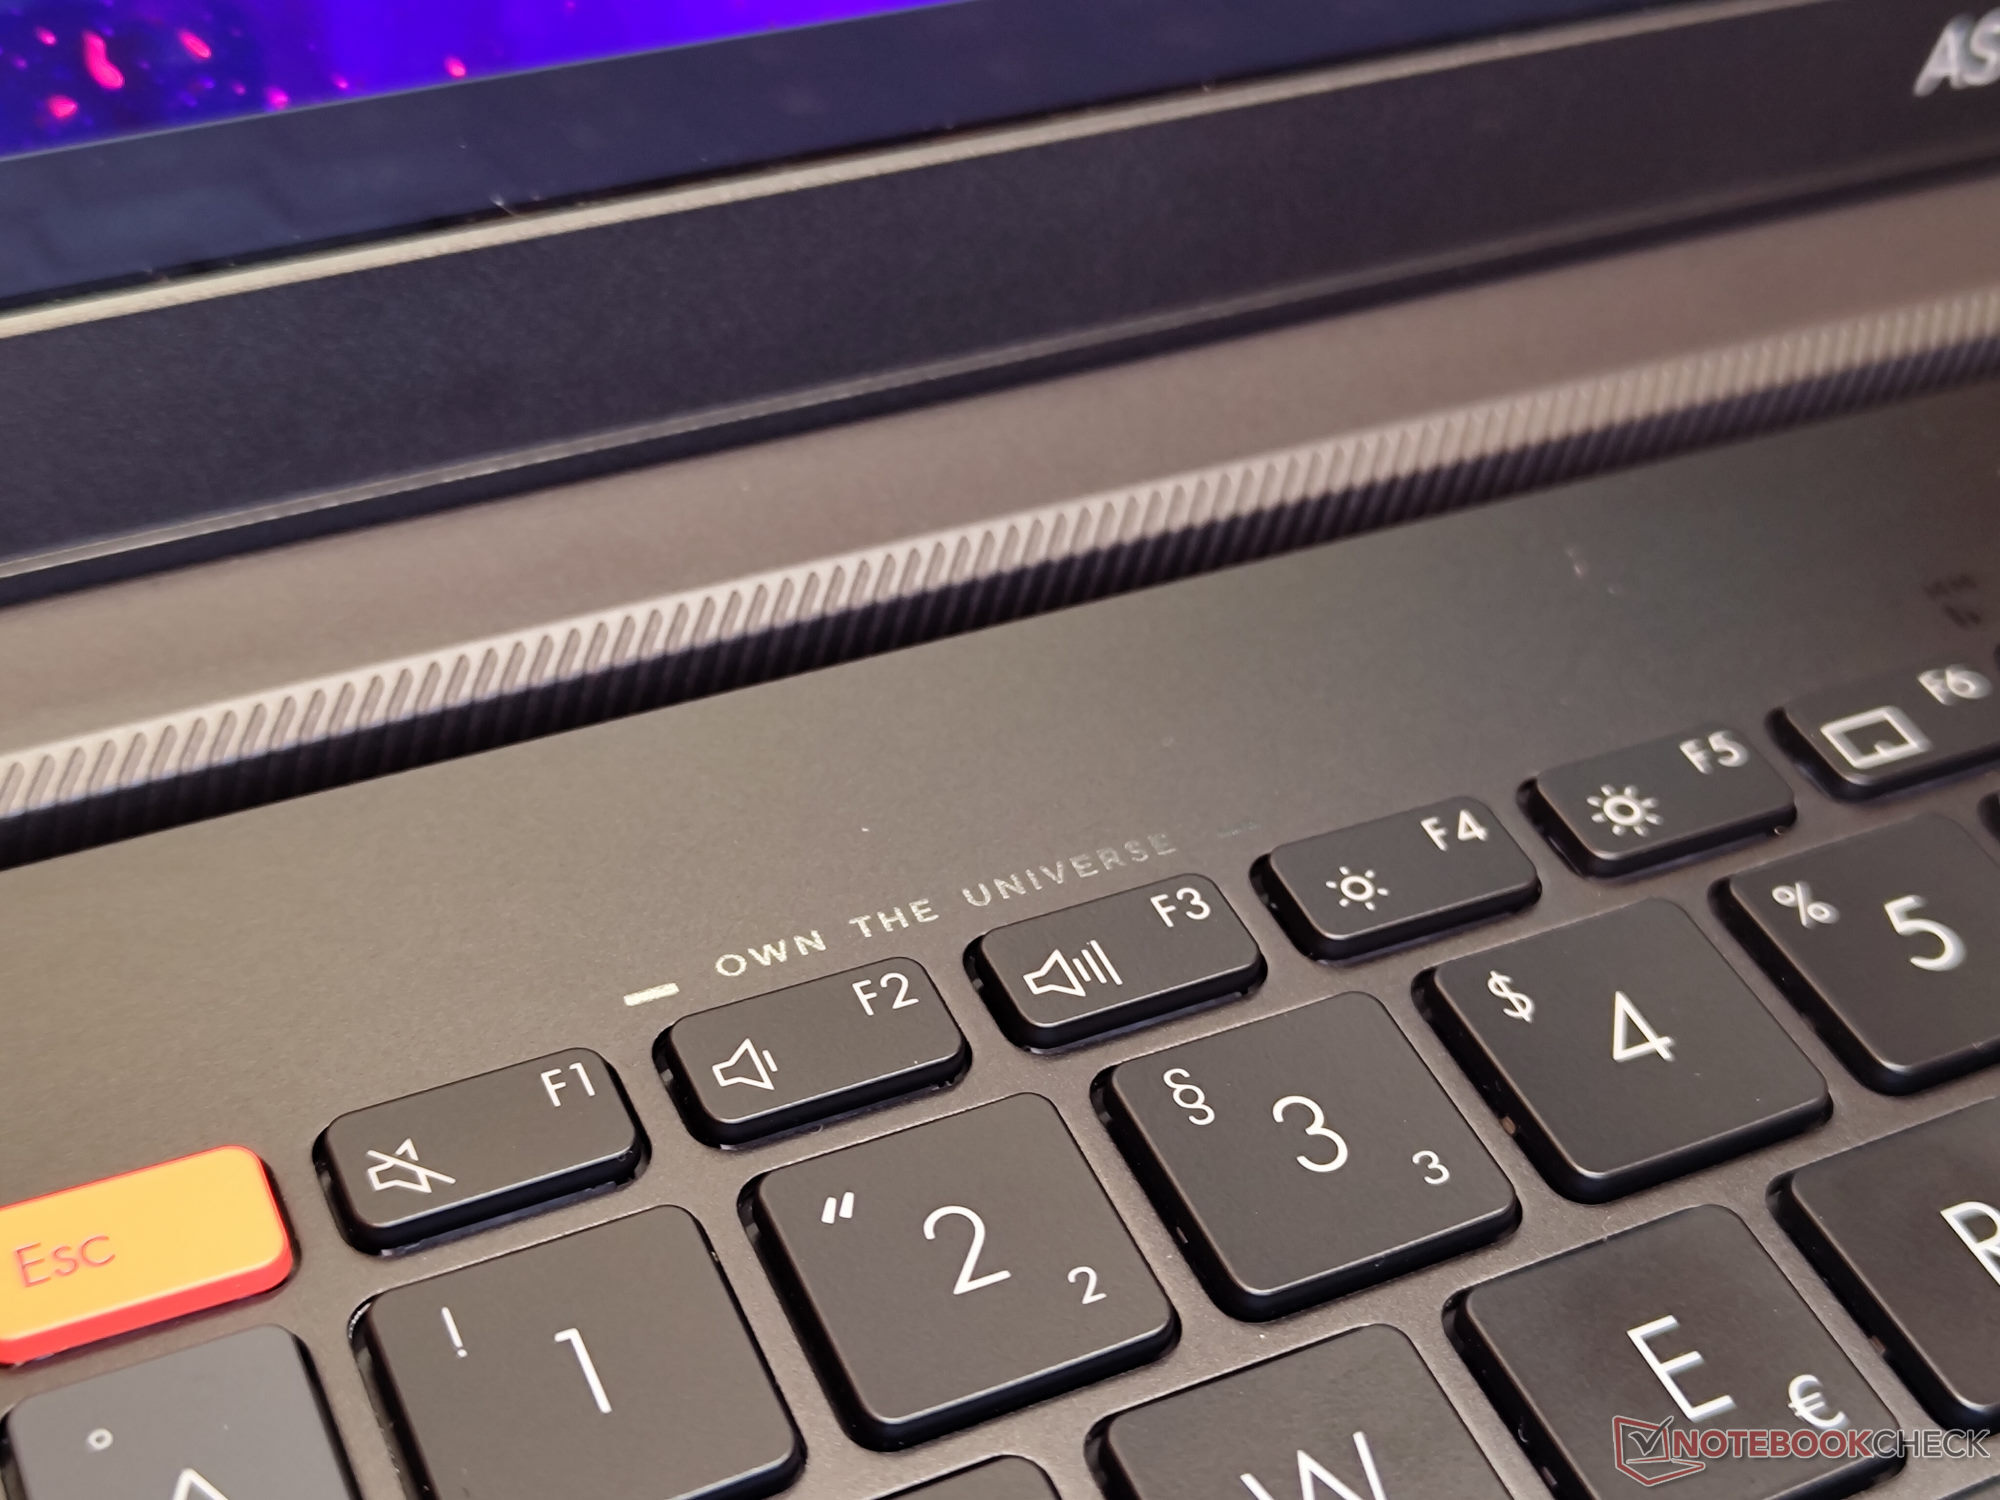
Vivobook Pro 16X的键盘利用了16英寸笔记本电脑的可用空间,除了正常高度的按键外,还提供了一个小键盘。最常用的功能可以通过功能键访问。15毫米(约0.59英寸)的方形按钮提供了1.6毫米(约0.06英寸)的舒适行程和良好的触觉反馈。
触摸板
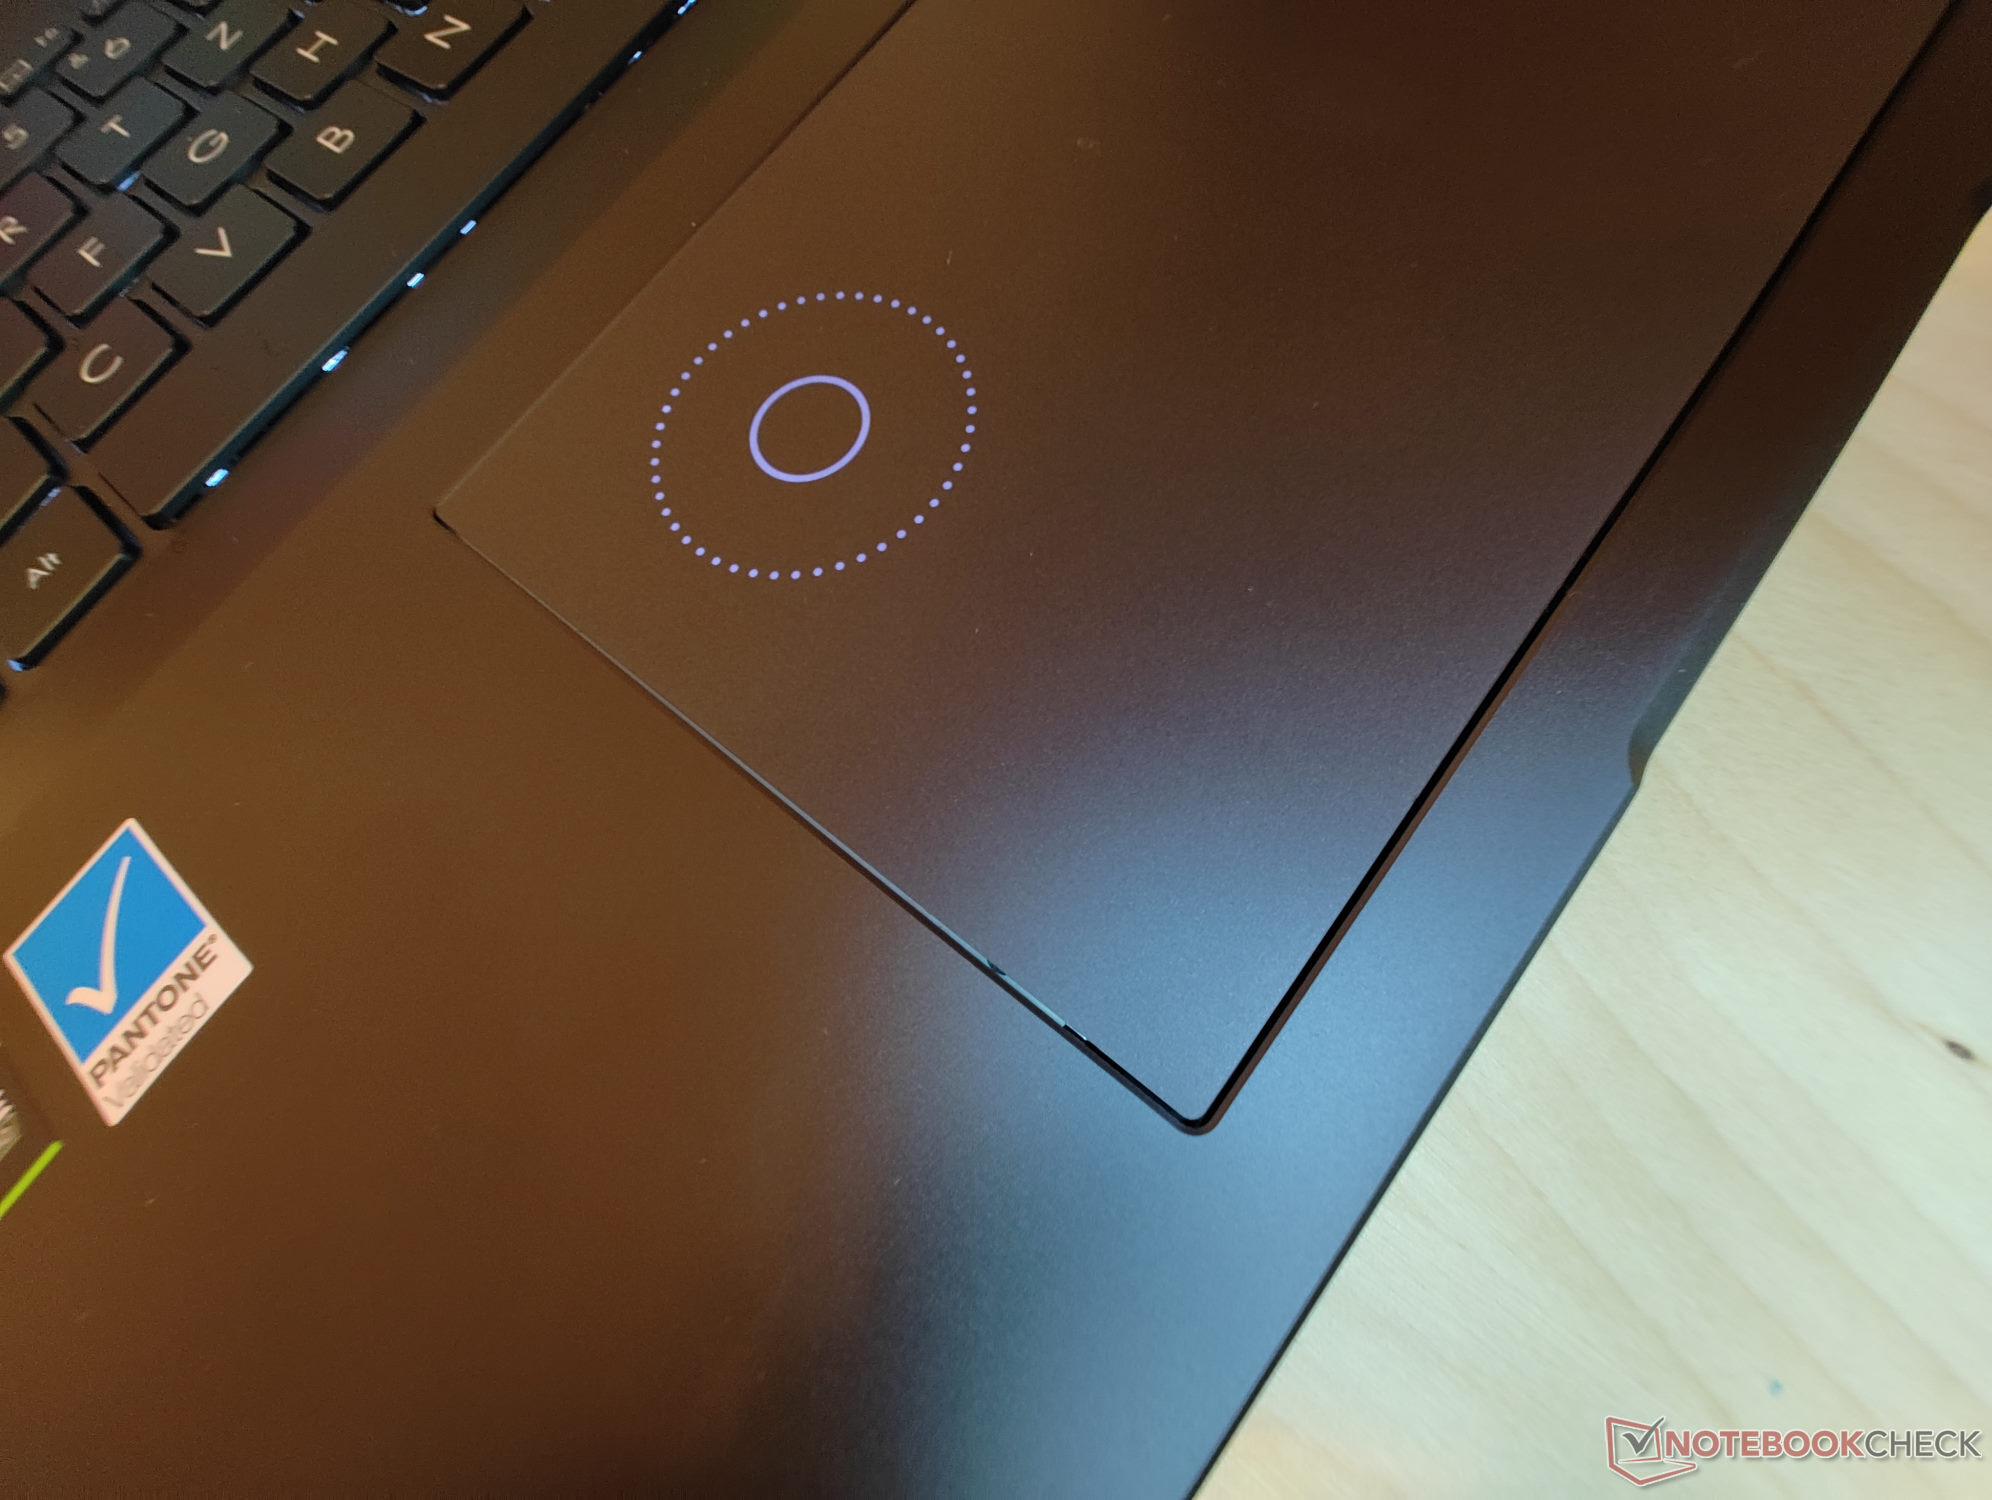
与华硕其他某些型号一样,Vivobook Pro 16X也配备了集成在触摸板上的华硕拨号。该输入面允许用户在从右上角向下滑动进入该功能后改变各种设置。另外,也可以使用微软Surface Dial功能。触摸板的对角线尺寸为15.5厘米(约6.10英寸),具有良好的滑行性能,同时反应非常灵敏。
显示屏 - 带16:10 OLED的Windows PC

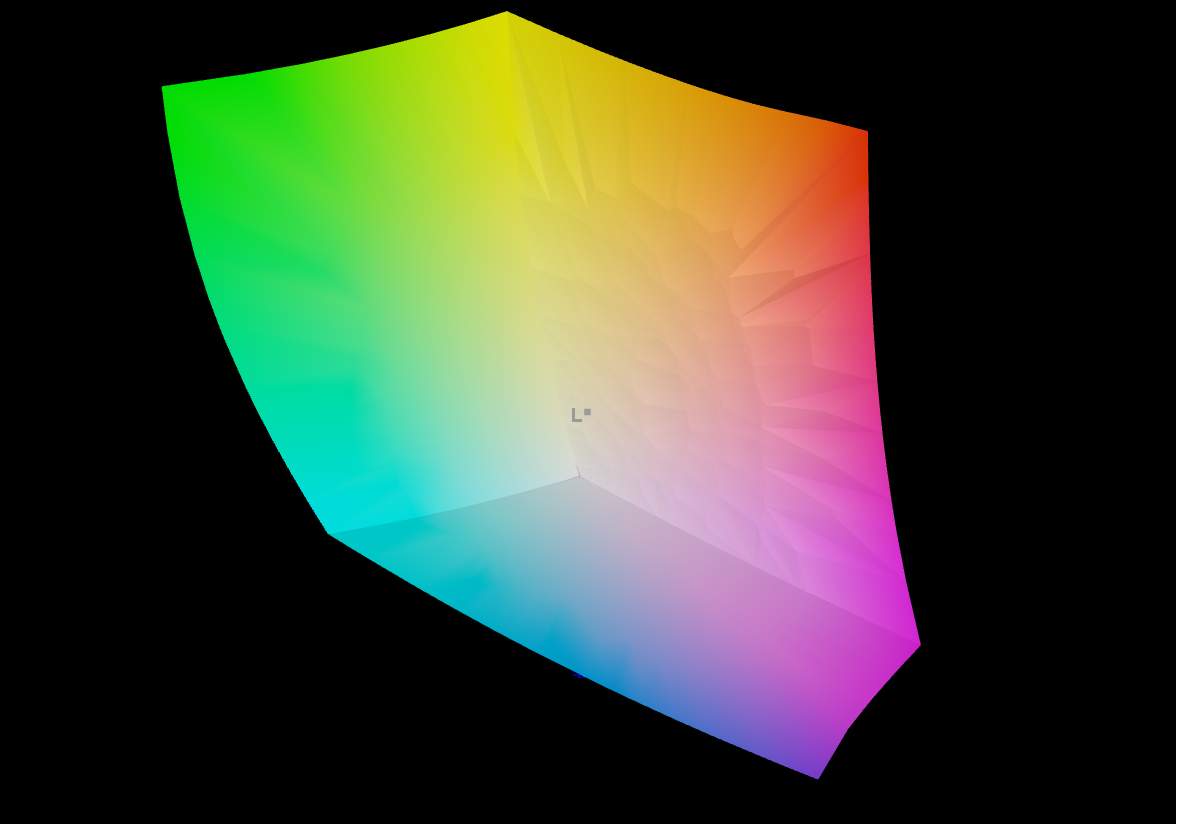
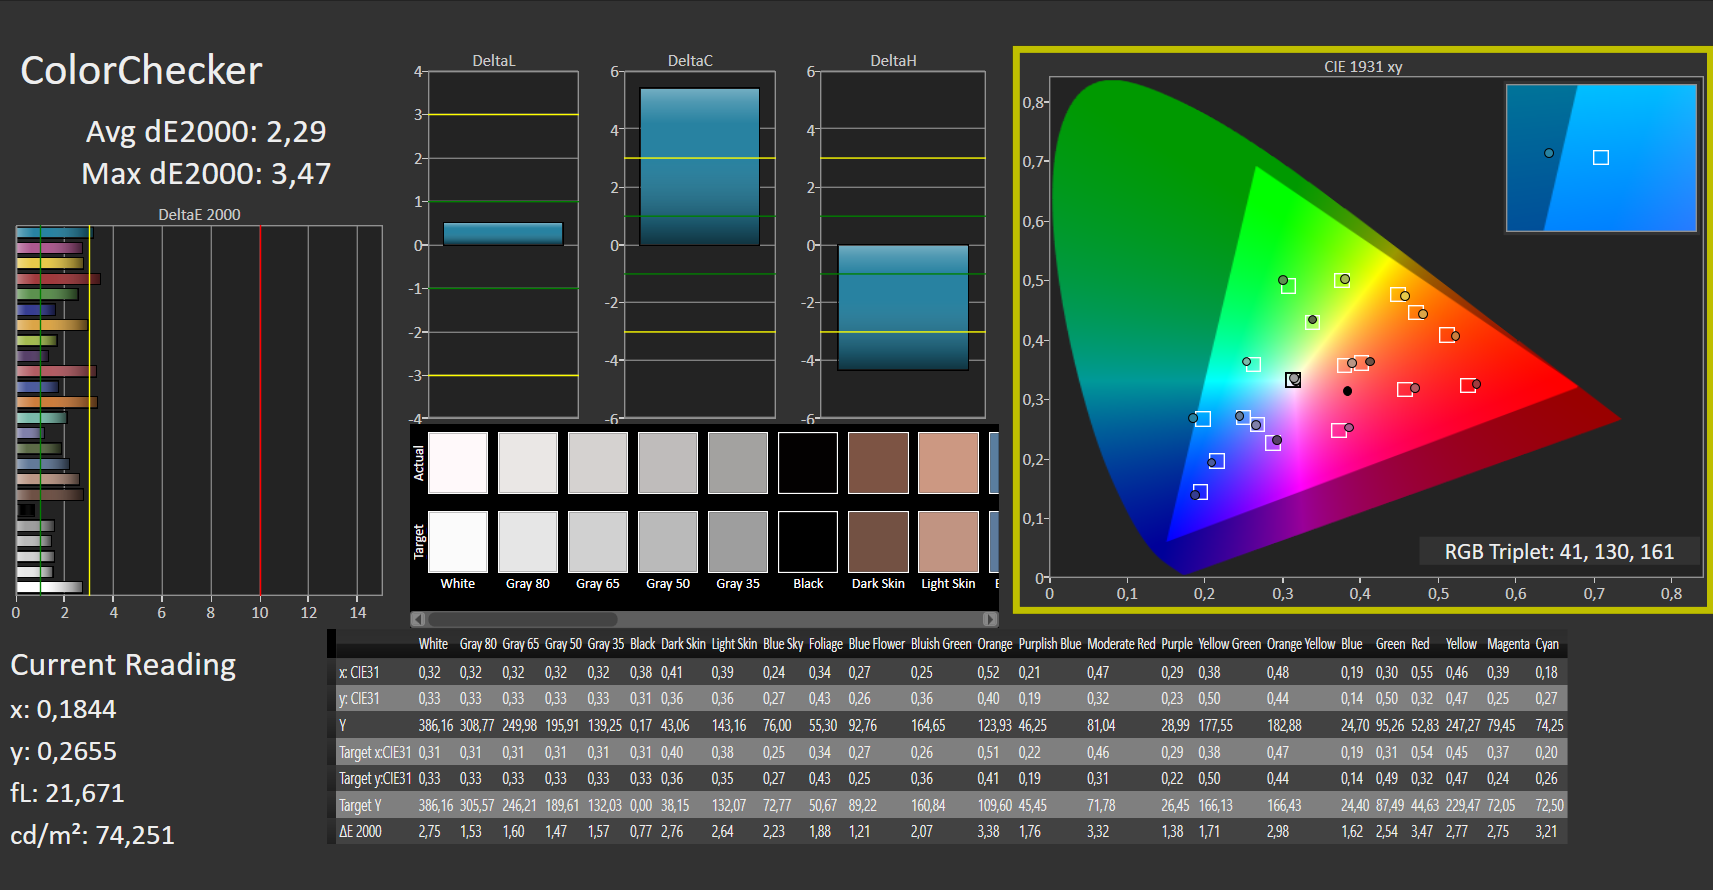
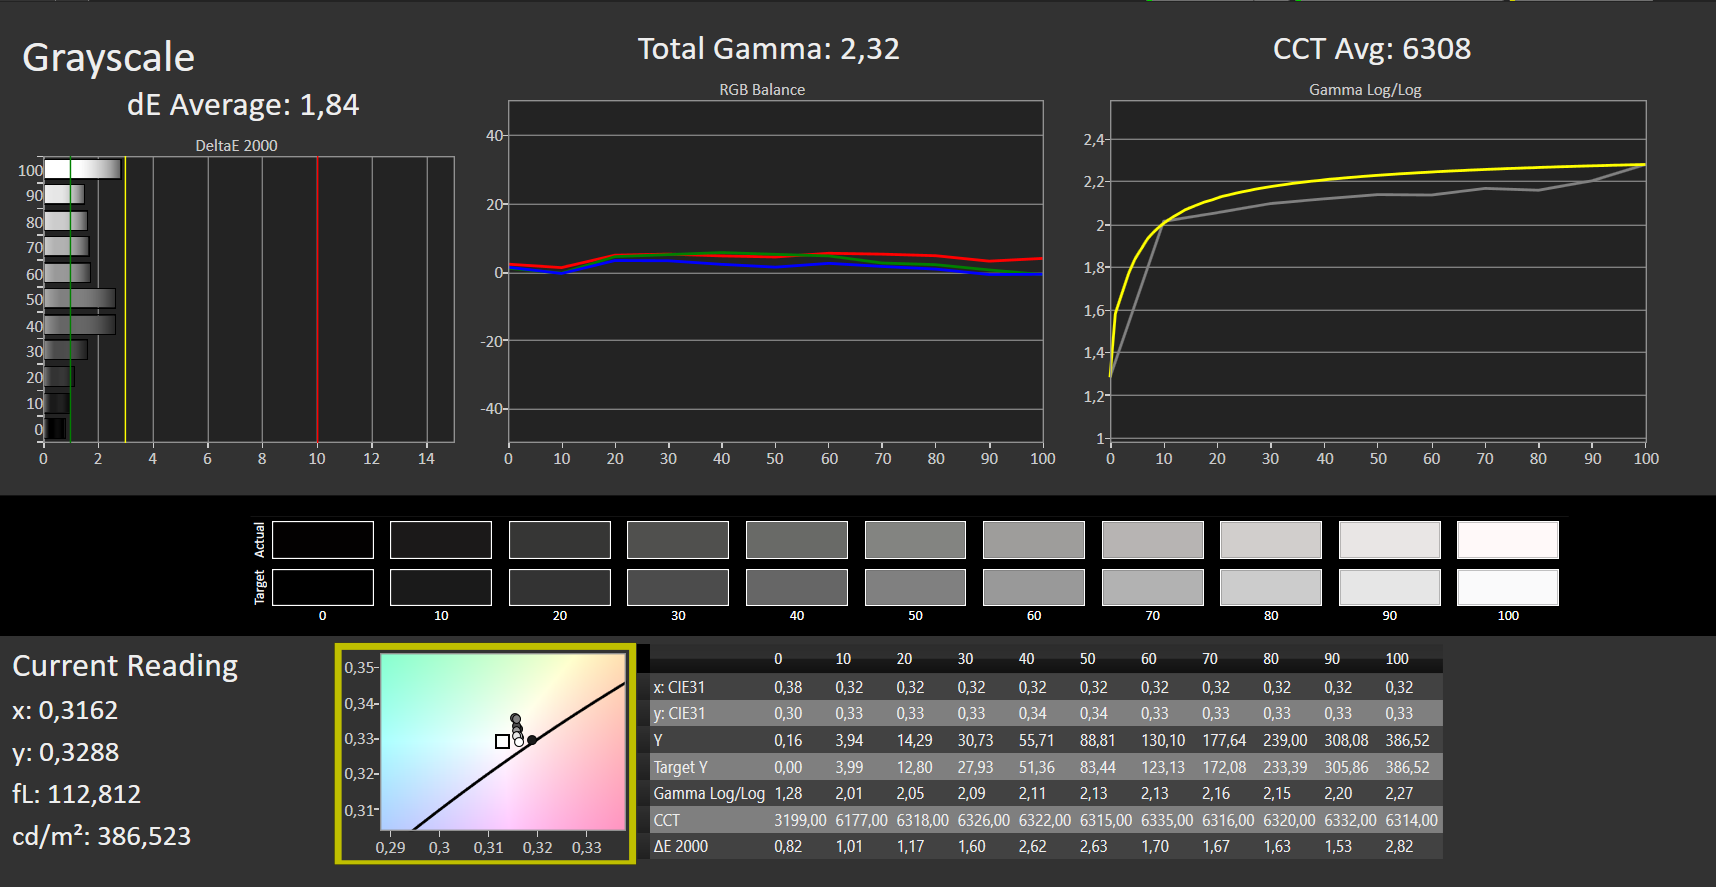
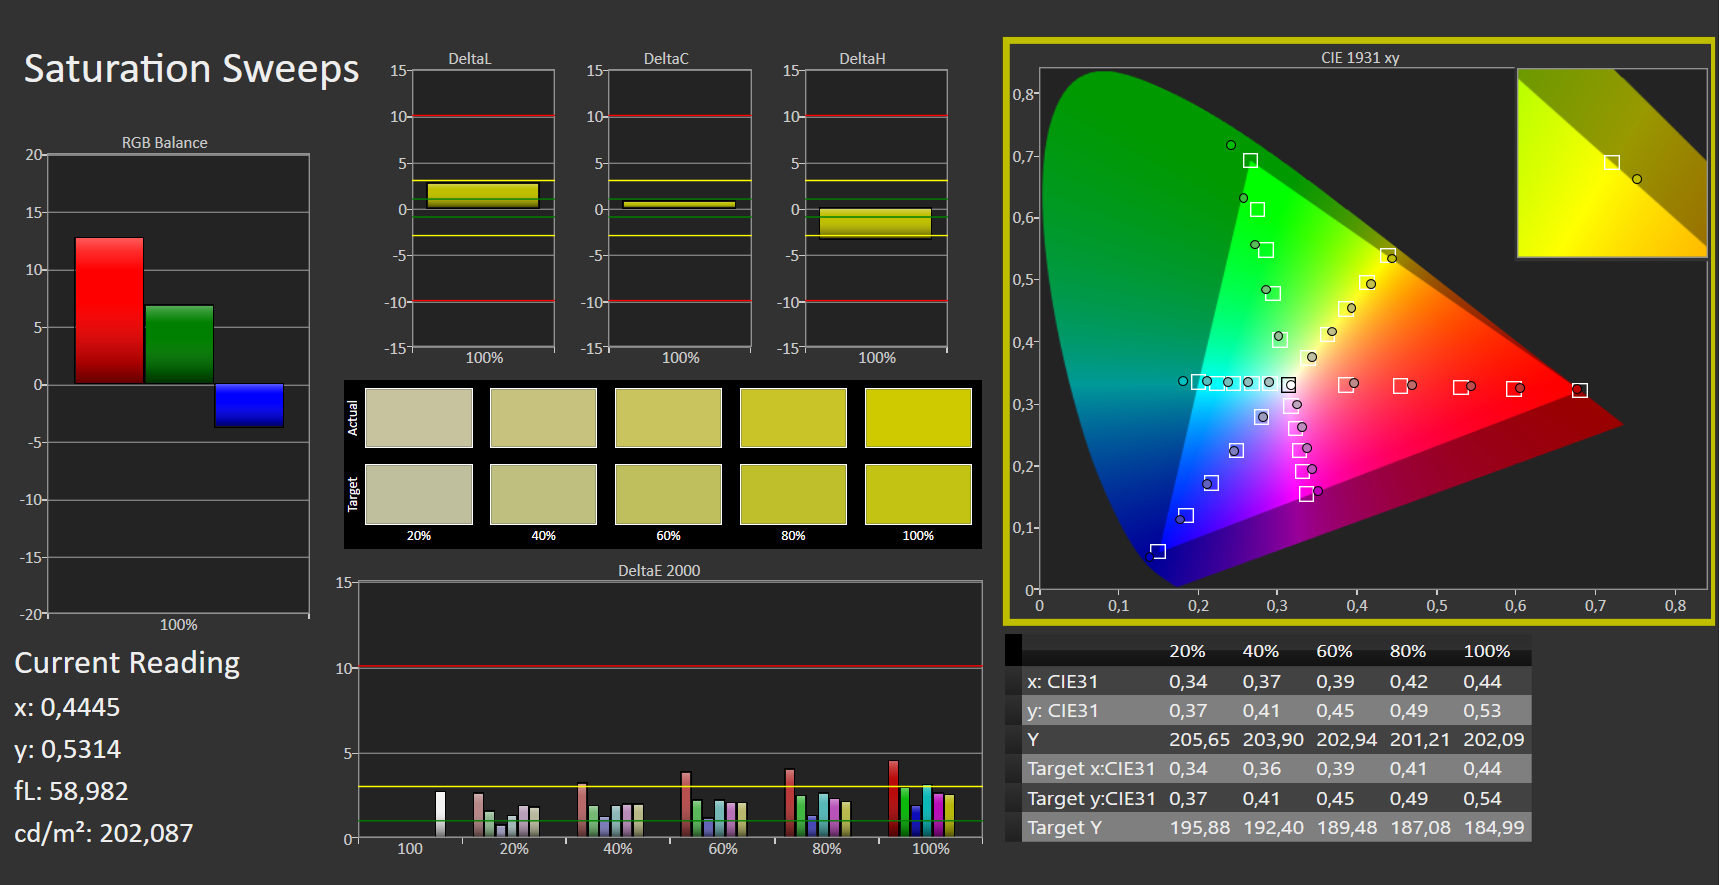
到目前为止,Vivobook Pro 16X OLED的巨大显示屏是其最好的特征--这既是好事也是坏事。该屏幕经过潘通(Pantone)验证,具有出色的色彩空间覆盖,出厂时的色彩偏差非常低。16:10的显示屏提供自然的色彩、高最大亮度和3840 x 2400像素的原生分辨率。然而,光面OLED面板也有缺点。眩光和反射在阳光下或次优照明条件下是很常见的。
照度非常均匀,这是OLED显示器的典型特征。与390尼特平均值的最大偏差只有7尼特。由于基础技术的原因,没有屏幕出血。同样,2394:1的对比度也很好。
| |||||||||||||||||||||||||
Brightness Distribution: 96 %
Center on Battery: 383 cd/m²
Contrast: 14185:1 (Black: 0.027 cd/m²)
ΔE ColorChecker Calman: 2.29 | ∀{0.5-29.43 Ø4.71}
ΔE Greyscale Calman: 1.84 | ∀{0.09-98 Ø4.96}
98.05% AdobeRGB 1998 (Argyll 3D)
100% sRGB (Argyll 3D)
99.9% Display P3 (Argyll 3D)
Gamma: 2.32
CCT: 6308 K
| Asus VivoBook Pro 16X OLED N7600PC-L2026X Samsung ATNA60YV02-0, OLED, 3840x2400, 16" | MSI Summit E16 Flip A12UDT-031 AU Optronics B16QAN02.N, IPS, 2560x1600, 16" | Microsoft Surface Laptop Studio i7 RTX 3050 Ti LQ144P1JX01, IPS, 2400x1600, 14.4" | Dell Inspiron 16 Plus 7610 AU Optronics B160QAN, IPS, 3072x1920, 16" | Lenovo ThinkPad X1 Extreme G4-20Y5CTO1WW (3050 Ti) LP160UQ1-SPB1, IPS LED, 3840x2400, 16" | Schenker XMG Focus 15 LG Philips LP156WFG-SPB5, IPS, 1920x1080, 15.6" | |
|---|---|---|---|---|---|---|
| Display | -4% | -13% | -17% | -6% | -24% | |
| Display P3 Coverage (%) | 99.9 | 98.9 -1% | 80.6 -19% | 74.1 -26% | 84.3 -16% | 64.6 -35% |
| sRGB Coverage (%) | 100 | 100 0% | 99.9 0% | 99.4 -1% | 98.3 -2% | 95.3 -5% |
| AdobeRGB 1998 Coverage (%) | 98.05 | 86.5 -12% | 78.5 -20% | 75.8 -23% | 97.8 0% | 66.5 -32% |
| Response Times | -775% | -3420% | -3280% | -3950% | -1020% | |
| Response Time Grey 50% / Grey 80% * (ms) | 1 | 13 ? -1200% | 58.4 ? -5740% | 49.2 ? -4820% | 60 ? -5900% | 18 ? -1700% |
| Response Time Black / White * (ms) | 2 ? | 9 ? -350% | 24 ? -1100% | 36.8 ? -1740% | 42 ? -2000% | 8.8 ? -340% |
| PWM Frequency (Hz) | 247 ? | 5000 ? | ||||
| Screen | -161% | -118% | -114% | -208% | -196% | |
| Brightness middle (cd/m²) | 383 | 314 -18% | 497 30% | 296.8 -23% | 639 67% | 418 9% |
| Brightness (cd/m²) | 390 | 294 -25% | 491 26% | 292 -25% | 612 57% | 376 -4% |
| Brightness Distribution (%) | 96 | 89 -7% | 92 -4% | 87 -9% | 84 -12% | 83 -14% |
| Black Level * (cd/m²) | 0.027 | 0.28 -937% | 0.29 -974% | 0.21 -678% | 0.47 -1641% | 0.41 -1419% |
| Contrast (:1) | 14185 | 1121 -92% | 1714 -88% | 1413 -90% | 1360 -90% | 1020 -93% |
| Colorchecker dE 2000 * | 2.29 | 3.08 -34% | 1.2 48% | 2.56 -12% | 2.2 4% | 1.67 27% |
| Colorchecker dE 2000 max. * | 3.47 | 5.49 -58% | 2.8 19% | 4.76 -37% | 5.3 -53% | 3.88 -12% |
| Greyscale dE 2000 * | 1.84 | 3.99 -117% | 1.9 -3% | 2.6 -41% | 1.7 8% | 2.9 -58% |
| Gamma | 2.32 95% | 2.3 96% | 2.14 103% | 2.07 106% | 2.31 95% | 2.26 97% |
| CCT | 6308 103% | 6219 105% | 6821 95% | 6628 98% | 6390 102% | 6209 105% |
| Colorchecker dE 2000 calibrated * | 0.88 | 0.8 | 1.86 | 1.4 | 0.98 | |
| Total Average (Program / Settings) | -313% /
-219% | -1184% /
-602% | -1137% /
-579% | -1388% /
-737% | -413% /
-283% |
* ... smaller is better
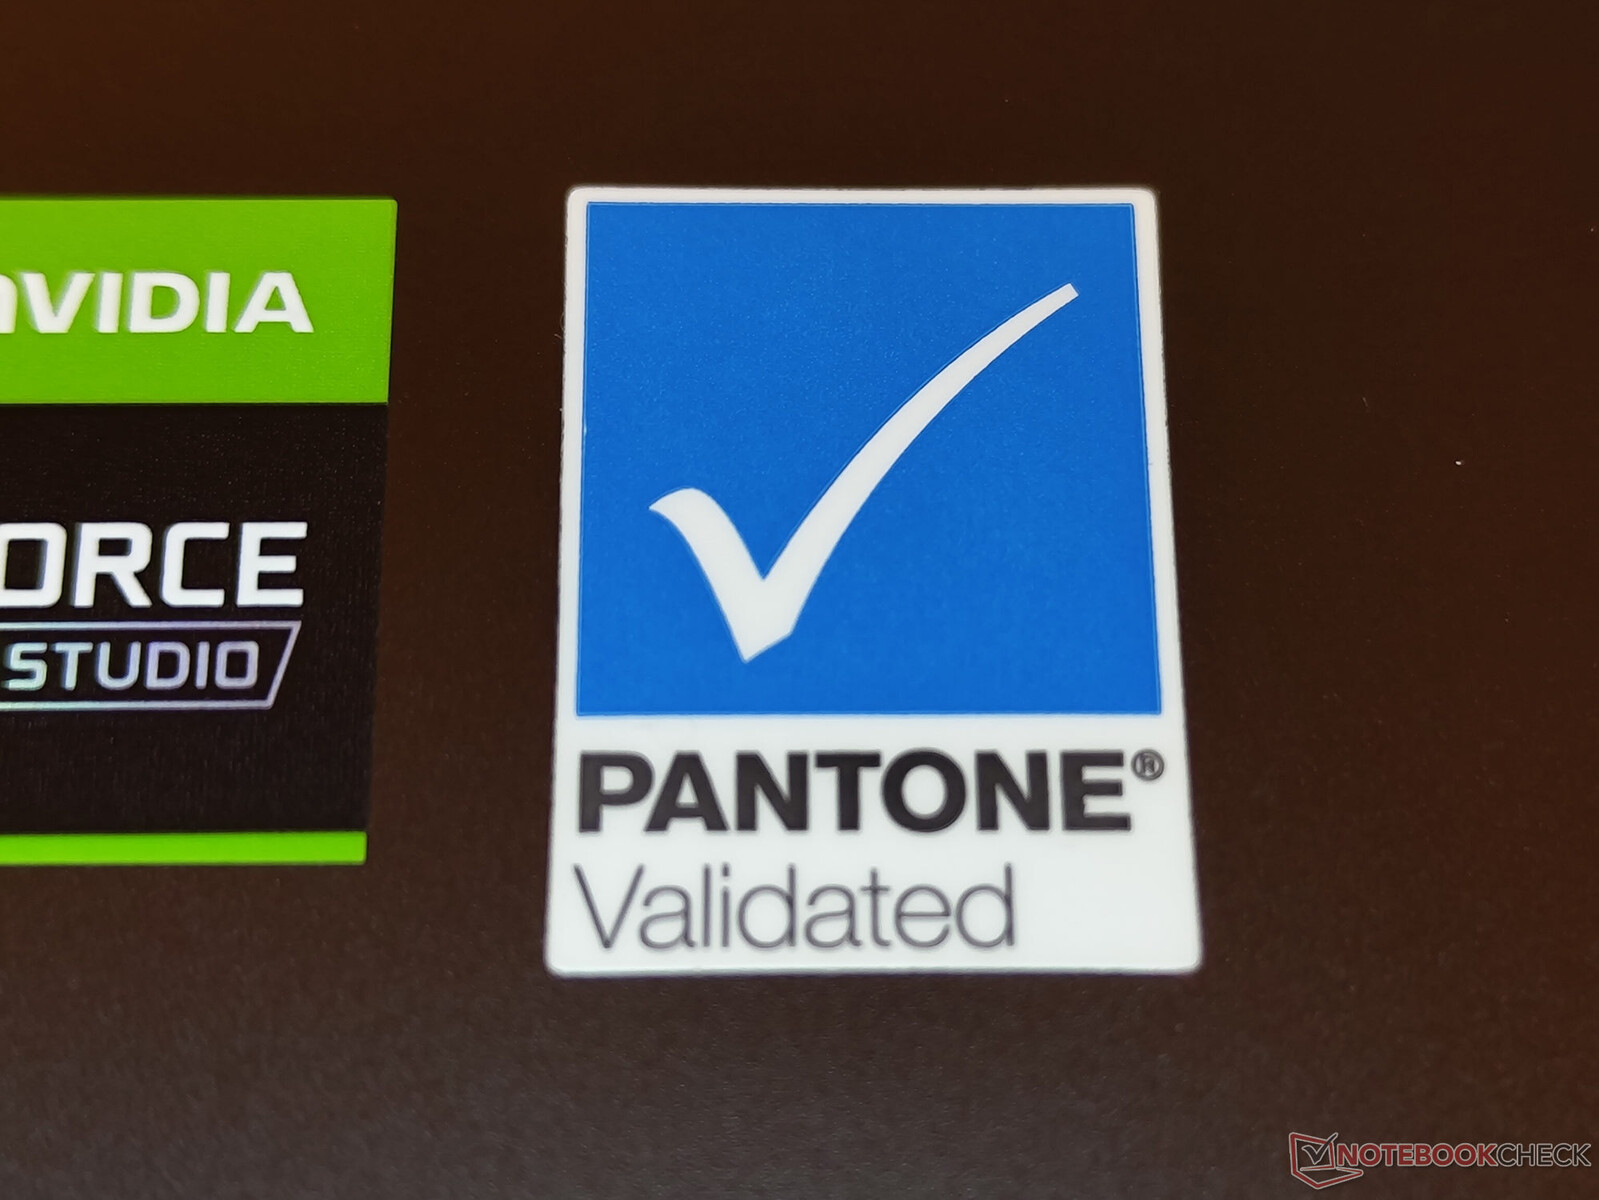
显示器的潘通验证不一定在所有情况下都能转化为广泛的色彩空间覆盖或极其准确的色彩。潘通颜色系统的引入是为了使产品和印刷品的颜色更具有可比性和可预测性。虽然该色彩系统包括1867种印刷品的单独色彩和更多产品的具体色彩,但它不一定完全覆盖DisplayP3等大色彩空间。因此,一个只涵盖较小的sRGB色彩空间的显示器仍然可以满足Pantone匹配系统的要求。此外,Pantone系统以外的颜色偏差可能更大。
综上所述,即使是经过潘通验证的显示器,确定一个屏幕能够显示哪些色彩空间以及适合哪些使用情况,仍然是值得的。视频编辑的要求可能与印刷媒体的图形设计有很大的不同。
华硕Vivobook的OLED面板几乎涵盖了三个相关色彩空间的100%。由于良好的AdobeRGB和DisplayP3覆盖率,该显示器分别很适合摄影和视频编辑。
华硕Vivobook的Pantone验证显示器在出厂时具有非常低的色彩偏差。在我们用CalMAN ColorChecker软件进行的测试中,最大的颜色偏差只略微超过了3的目标deltaE值。
Display Response Times
| ↔ Response Time Black to White | ||
|---|---|---|
| 2 ms ... rise ↗ and fall ↘ combined | ↗ 1 ms rise |  |
| ↘ 1 ms fall | ||
| The screen shows very fast response rates in our tests and should be very well suited for fast-paced gaming. In comparison, all tested devices range from 0.1 (minimum) to 240 (maximum) ms. » 11 % of all devices are better. This means that the measured response time is better than the average of all tested devices (19.8 ms). | ||
| ↔ Response Time 50% Grey to 80% Grey | ||
| 1 ms ... rise ↗ and fall ↘ combined | ↗ 0 ms rise |  |
| ↘ 0 ms fall | ||
| The screen shows very fast response rates in our tests and should be very well suited for fast-paced gaming. In comparison, all tested devices range from 0.165 (minimum) to 636 (maximum) ms. » 4 % of all devices are better. This means that the measured response time is better than the average of all tested devices (31 ms). | ||
Screen Flickering / PWM (Pulse-Width Modulation)
| Screen flickering / PWM detected | 247 Hz | ≤ 50 % brightness setting |  |
The display backlight flickers at 247 Hz (worst case, e.g., utilizing PWM) Flickering detected at a brightness setting of 50 % and below. There should be no flickering or PWM above this brightness setting. The frequency of 247 Hz is relatively low, so sensitive users will likely notice flickering and experience eyestrain at the stated brightness setting and below. In comparison: 52 % of all tested devices do not use PWM to dim the display. If PWM was detected, an average of 7754 (minimum: 5 - maximum: 343500) Hz was measured. | |||
按照惯例,OLED显示屏的闪烁根据亮度设置以及显示的图像而变化。在Vivobook Pro 16X的情况下,我们只在50%和更低的亮度水平上检测到闪烁。正如预期的那样,显示屏不会同时整体变暗,而是只在某些行中降低亮度。与具有相同闪烁频率的LCD显示屏相比,这减少了OLED显示屏的眼疲劳。


尽管其最大亮度很高,但光面OLED显示屏并不适合在户外使用。眩光和反射降低了感知的图像质量,特别是在阳光照射下。在太阳或其他明亮的光源下,在特别不利的角度,OLED显示屏显示出特有的绿色折射图案。
在我们的视角分析中,16英寸显示屏没有显示任何弱点。即使从极端的角度看,显示屏的感知亮度和色彩准确性也很好。

性能--Nvidia Studio驱动程序的喜悦和悲伤
华硕Vivobook Pro 16X OLED有多种配置可供选择。除了英特尔第11代和第12代处理器外,制造商还提供AMD-Ryzen-5000和AMD-Ryzen-6000系列CPU。dGPU的选择范围从NvidiaGeForce RTX 3050到3070 Ti GPU。
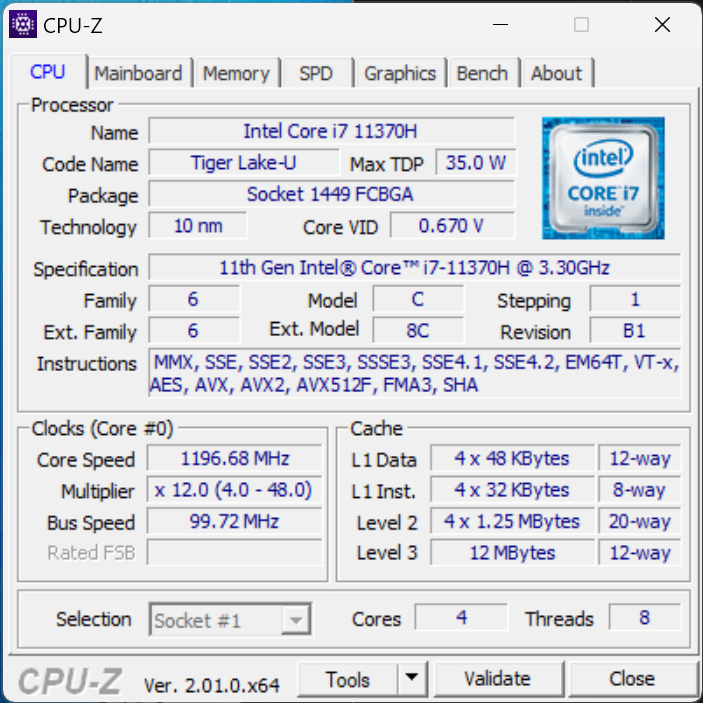
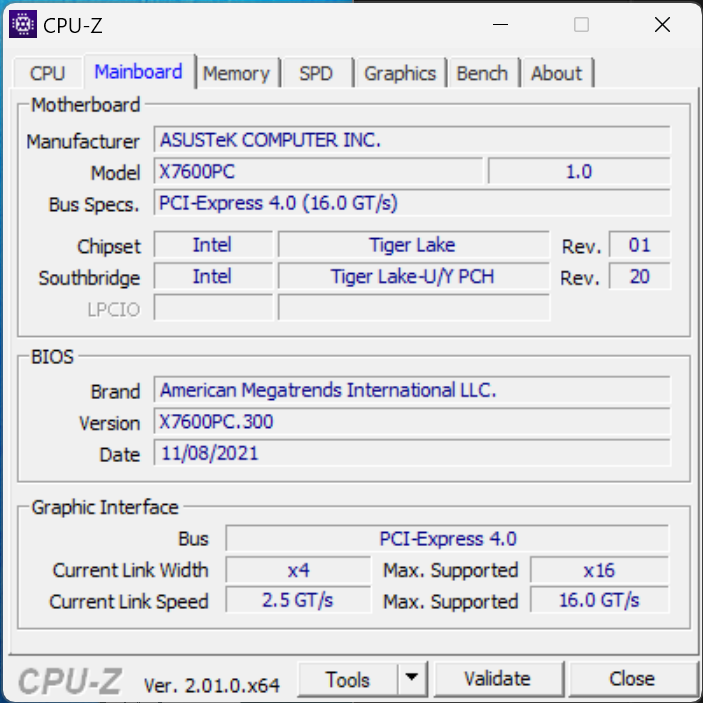
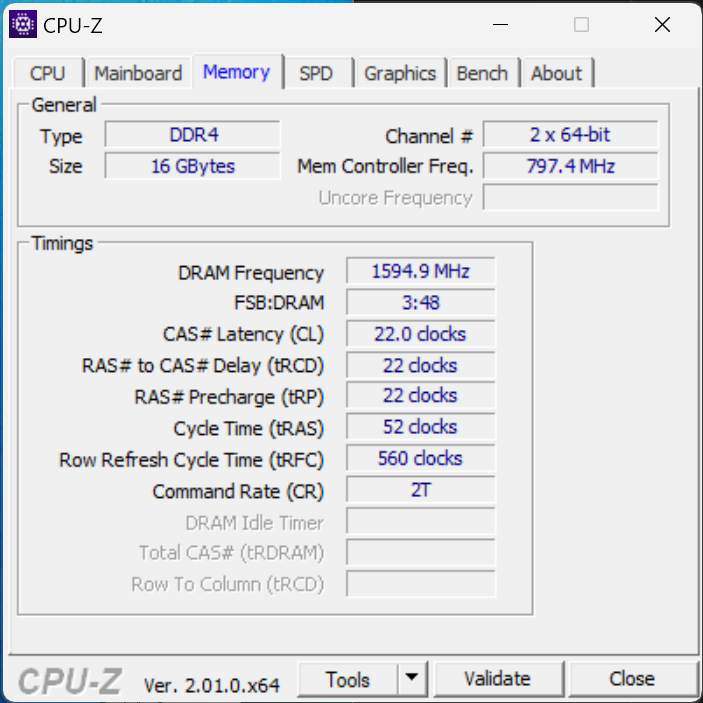
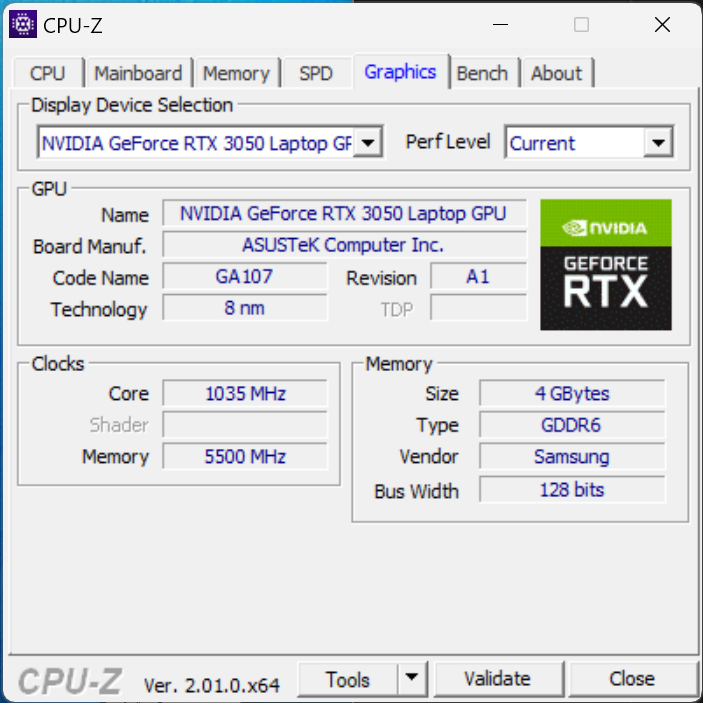
我们的配置依靠的是一个 英特尔酷睿i7 11370HCPU,一个 GeForce RTX 3050GPU,以及16GB的内存。
测试条件
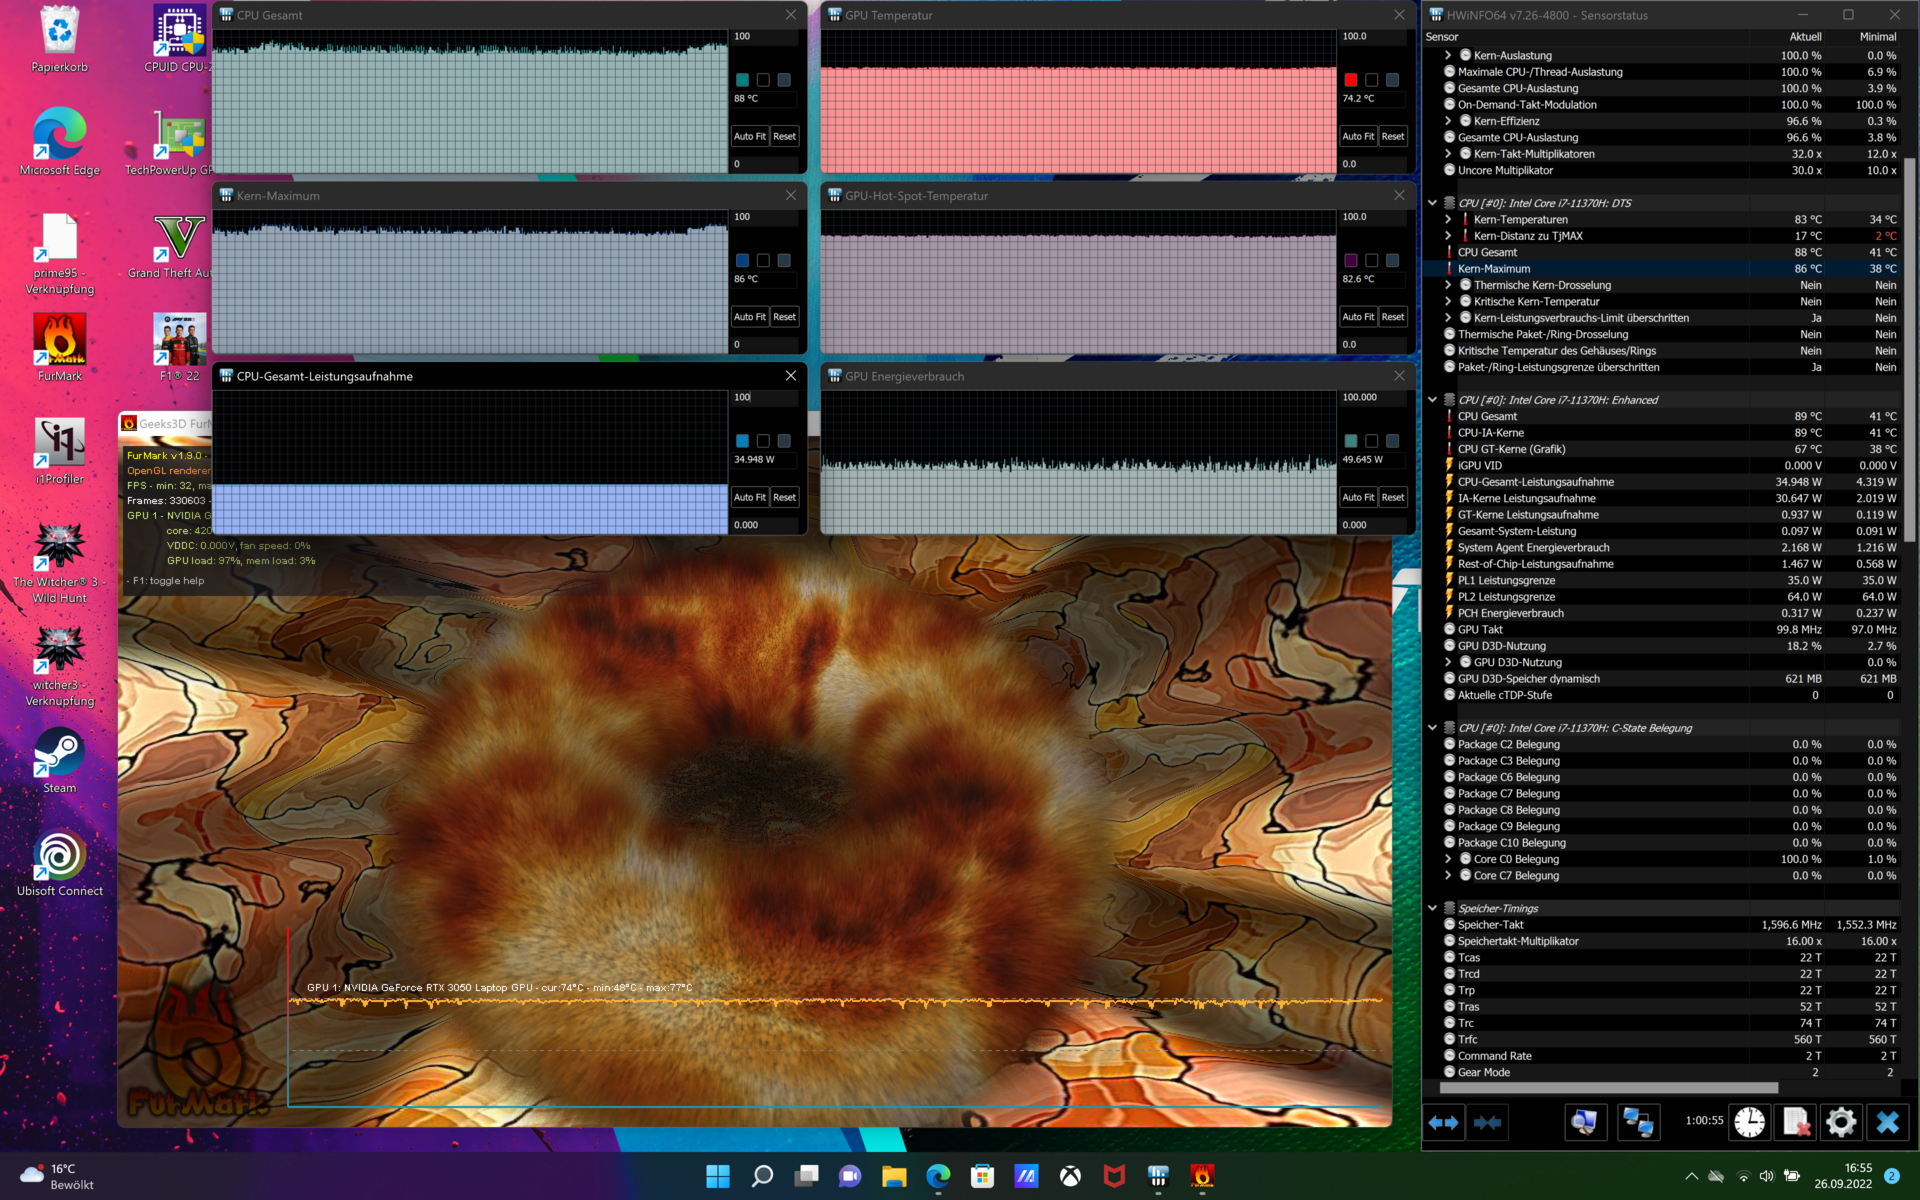
当涉及到笔记本电脑的电源设置时,华硕使用的数值在某些情况下超过了英特尔推荐的TDP。根据我们的日志,英特尔酷睿i7 11370H在短时间内可以维持高达45W的功率消耗。然而,CPU的能耗可以降到25W,这取决于风扇的设置。Vivobook内的专用NvidiaGeForce RTX 3050 GPU被限制在50瓦。该型号似乎是较小的Max-Q图形卡的变体。为了吸足50瓦,显卡必须利用它与处理器共享的电源预算。在性能模式下,综合消耗不得超过85瓦。同时,默认模式和低语模式允许的综合消耗量分别只有60瓦和45瓦。
在执行以下基准测试之前,我们选择了华硕的性能模式。为了确定电池寿命,我们选择了节能模式。对于我们的噪音测试,我们使用了所有三种风扇模式。
处理器
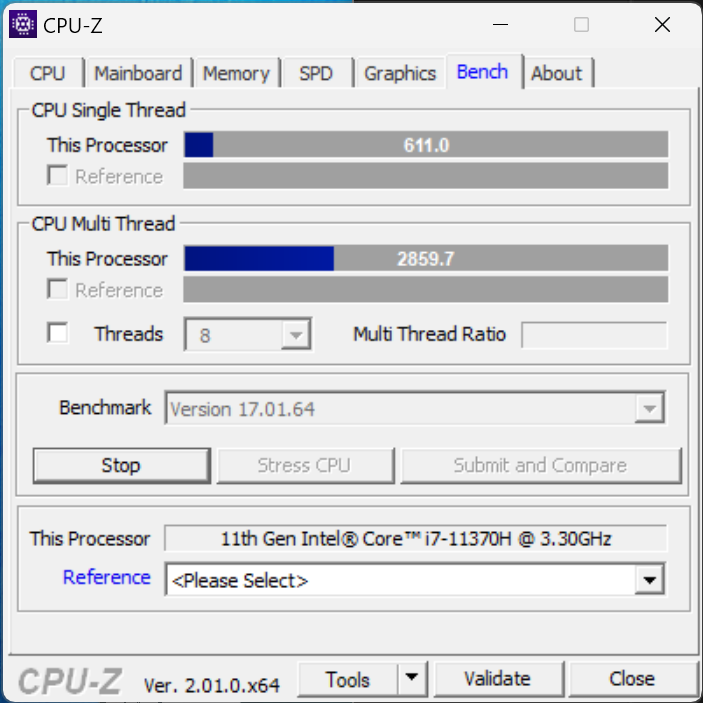
我们的测试设备使用英特尔酷睿i7-11370H处理器。这种处理器是为超薄但功能强大的笔记本电脑设计的,TDP可以相对自由地配置。华硕的功率为35瓦,甚至超过了英特尔的最大推荐值。然而,这个值只有在只有CPU受到压力时才会达到,即使如此也仅限于几分钟。55瓦的提升性能意味着英特尔SoC有很大的空间。也就是说,华硕Vivobook Pro更像是一个短跑运动员,而不是一个马拉松运动员。笔记本电脑使用11370H能够达到的高性能水平,在短时间内就迅速下降。第11代的i7也无法与更强大的英特尔第12代处理器竞争。
由于正常使用最经常需要短时的性能爆发,Vivobook在日常使用中的反应令人愉快。相比之下,这款多媒体笔记本电脑在长时间的压力下会在基准测试中落后。
Cinebench R15 Multi Loop
Cinebench R23: Multi Core | Single Core
Cinebench R20: CPU (Multi Core) | CPU (Single Core)
Cinebench R15: CPU Multi 64Bit | CPU Single 64Bit
Blender: v2.79 BMW27 CPU
7-Zip 18.03: 7z b 4 | 7z b 4 -mmt1
Geekbench 5.5: Multi-Core | Single-Core
HWBOT x265 Benchmark v2.2: 4k Preset
LibreOffice : 20 Documents To PDF
R Benchmark 2.5: Overall mean
| CPU Performance rating | |
| Average of class Multimedia | |
| MSI Summit E16 Flip A12UDT-031 | |
| Lenovo ThinkPad X1 Extreme G4-20Y5CTO1WW (3050 Ti) | |
| Schenker XMG Focus 15 | |
| Dell Inspiron 16 Plus 7610 -2! | |
| Microsoft Surface Laptop Studio i7 RTX 3050 Ti | |
| Average Intel Core i7-11370H | |
| Xiaomi Mi NoteBook Pro | |
| Asus VivoBook Pro 16X OLED N7600PC-L2026X | |
| Cinebench R23 / Multi Core | |
| Average of class Multimedia (4861 - 33362, n=74, last 2 years) | |
| MSI Summit E16 Flip A12UDT-031 | |
| Lenovo ThinkPad X1 Extreme G4-20Y5CTO1WW (3050 Ti) | |
| Schenker XMG Focus 15 | |
| Dell Inspiron 16 Plus 7610 | |
| Microsoft Surface Laptop Studio i7 RTX 3050 Ti | |
| Average Intel Core i7-11370H (3696 - 6646, n=12) | |
| Xiaomi Mi NoteBook Pro | |
| Asus VivoBook Pro 16X OLED N7600PC-L2026X | |
| Cinebench R23 / Single Core | |
| Average of class Multimedia (1128 - 2459, n=66, last 2 years) | |
| MSI Summit E16 Flip A12UDT-031 | |
| Asus VivoBook Pro 16X OLED N7600PC-L2026X | |
| Lenovo ThinkPad X1 Extreme G4-20Y5CTO1WW (3050 Ti) | |
| Dell Inspiron 16 Plus 7610 | |
| Microsoft Surface Laptop Studio i7 RTX 3050 Ti | |
| Xiaomi Mi NoteBook Pro | |
| Average Intel Core i7-11370H (1081 - 1556, n=11) | |
| Schenker XMG Focus 15 | |
| Cinebench R20 / CPU (Multi Core) | |
| Average of class Multimedia (1887 - 12912, n=57, last 2 years) | |
| MSI Summit E16 Flip A12UDT-031 | |
| Lenovo ThinkPad X1 Extreme G4-20Y5CTO1WW (3050 Ti) | |
| Schenker XMG Focus 15 | |
| Dell Inspiron 16 Plus 7610 | |
| Microsoft Surface Laptop Studio i7 RTX 3050 Ti | |
| Average Intel Core i7-11370H (1438 - 2578, n=11) | |
| Xiaomi Mi NoteBook Pro | |
| Asus VivoBook Pro 16X OLED N7600PC-L2026X | |
| Cinebench R20 / CPU (Single Core) | |
| Average of class Multimedia (425 - 853, n=57, last 2 years) | |
| MSI Summit E16 Flip A12UDT-031 | |
| Asus VivoBook Pro 16X OLED N7600PC-L2026X | |
| Lenovo ThinkPad X1 Extreme G4-20Y5CTO1WW (3050 Ti) | |
| Dell Inspiron 16 Plus 7610 | |
| Microsoft Surface Laptop Studio i7 RTX 3050 Ti | |
| Average Intel Core i7-11370H (475 - 601, n=11) | |
| Xiaomi Mi NoteBook Pro | |
| Schenker XMG Focus 15 | |
| Cinebench R15 / CPU Multi 64Bit | |
| Average of class Multimedia (856 - 5224, n=61, last 2 years) | |
| MSI Summit E16 Flip A12UDT-031 | |
| Lenovo ThinkPad X1 Extreme G4-20Y5CTO1WW (3050 Ti) | |
| Schenker XMG Focus 15 | |
| Dell Inspiron 16 Plus 7610 | |
| Asus VivoBook Pro 16X OLED N7600PC-L2026X | |
| Microsoft Surface Laptop Studio i7 RTX 3050 Ti | |
| Average Intel Core i7-11370H (606 - 1086, n=17) | |
| Xiaomi Mi NoteBook Pro | |
| Cinebench R15 / CPU Single 64Bit | |
| Average of class Multimedia (184.8 - 326, n=59, last 2 years) | |
| MSI Summit E16 Flip A12UDT-031 | |
| Lenovo ThinkPad X1 Extreme G4-20Y5CTO1WW (3050 Ti) | |
| Dell Inspiron 16 Plus 7610 | |
| Asus VivoBook Pro 16X OLED N7600PC-L2026X | |
| Asus VivoBook Pro 16X OLED N7600PC-L2026X | |
| Microsoft Surface Laptop Studio i7 RTX 3050 Ti | |
| Xiaomi Mi NoteBook Pro | |
| Average Intel Core i7-11370H (162.9 - 233, n=15) | |
| Schenker XMG Focus 15 | |
| Blender / v2.79 BMW27 CPU | |
| Xiaomi Mi NoteBook Pro | |
| Average Intel Core i7-11370H (432 - 762, n=11) | |
| Microsoft Surface Laptop Studio i7 RTX 3050 Ti | |
| Asus VivoBook Pro 16X OLED N7600PC-L2026X | |
| MSI Summit E16 Flip A12UDT-031 | |
| Schenker XMG Focus 15 | |
| Dell Inspiron 16 Plus 7610 | |
| Lenovo ThinkPad X1 Extreme G4-20Y5CTO1WW (3050 Ti) | |
| Average of class Multimedia (100 - 557, n=58, last 2 years) | |
| 7-Zip 18.03 / 7z b 4 | |
| Average of class Multimedia (26062 - 130368, n=55, last 2 years) | |
| Lenovo ThinkPad X1 Extreme G4-20Y5CTO1WW (3050 Ti) | |
| Schenker XMG Focus 15 | |
| Dell Inspiron 16 Plus 7610 | |
| MSI Summit E16 Flip A12UDT-031 | |
| Asus VivoBook Pro 16X OLED N7600PC-L2026X | |
| Microsoft Surface Laptop Studio i7 RTX 3050 Ti | |
| Average Intel Core i7-11370H (18961 - 28520, n=11) | |
| Xiaomi Mi NoteBook Pro | |
| 7-Zip 18.03 / 7z b 4 -mmt1 | |
| Average of class Multimedia (3666 - 7545, n=56, last 2 years) | |
| Lenovo ThinkPad X1 Extreme G4-20Y5CTO1WW (3050 Ti) | |
| Dell Inspiron 16 Plus 7610 | |
| Asus VivoBook Pro 16X OLED N7600PC-L2026X | |
| Xiaomi Mi NoteBook Pro | |
| Average Intel Core i7-11370H (5074 - 5550, n=11) | |
| MSI Summit E16 Flip A12UDT-031 | |
| Schenker XMG Focus 15 | |
| Microsoft Surface Laptop Studio i7 RTX 3050 Ti | |
| Geekbench 5.5 / Multi-Core | |
| Average of class Multimedia (4652 - 20422, n=56, last 2 years) | |
| MSI Summit E16 Flip A12UDT-031 | |
| Schenker XMG Focus 15 | |
| Lenovo ThinkPad X1 Extreme G4-20Y5CTO1WW (3050 Ti) | |
| Microsoft Surface Laptop Studio i7 RTX 3050 Ti | |
| Average Intel Core i7-11370H (3828 - 6115, n=10) | |
| Xiaomi Mi NoteBook Pro | |
| Asus VivoBook Pro 16X OLED N7600PC-L2026X | |
| Geekbench 5.5 / Single-Core | |
| Average of class Multimedia (805 - 2974, n=56, last 2 years) | |
| MSI Summit E16 Flip A12UDT-031 | |
| Lenovo ThinkPad X1 Extreme G4-20Y5CTO1WW (3050 Ti) | |
| Xiaomi Mi NoteBook Pro | |
| Microsoft Surface Laptop Studio i7 RTX 3050 Ti | |
| Average Intel Core i7-11370H (1376 - 1607, n=10) | |
| Asus VivoBook Pro 16X OLED N7600PC-L2026X | |
| Schenker XMG Focus 15 | |
| HWBOT x265 Benchmark v2.2 / 4k Preset | |
| Average of class Multimedia (5.26 - 36.1, n=56, last 2 years) | |
| Schenker XMG Focus 15 | |
| Lenovo ThinkPad X1 Extreme G4-20Y5CTO1WW (3050 Ti) | |
| Dell Inspiron 16 Plus 7610 | |
| MSI Summit E16 Flip A12UDT-031 | |
| Microsoft Surface Laptop Studio i7 RTX 3050 Ti | |
| Average Intel Core i7-11370H (4.98 - 8.82, n=11) | |
| Xiaomi Mi NoteBook Pro | |
| Asus VivoBook Pro 16X OLED N7600PC-L2026X | |
| LibreOffice / 20 Documents To PDF | |
| Microsoft Surface Laptop Studio i7 RTX 3050 Ti | |
| Asus VivoBook Pro 16X OLED N7600PC-L2026X | |
| MSI Summit E16 Flip A12UDT-031 | |
| Average of class Multimedia (23.9 - 146.7, n=57, last 2 years) | |
| Schenker XMG Focus 15 | |
| Dell Inspiron 16 Plus 7610 | |
| Average Intel Core i7-11370H (23.6 - 56.5, n=11) | |
| Xiaomi Mi NoteBook Pro | |
| Lenovo ThinkPad X1 Extreme G4-20Y5CTO1WW (3050 Ti) | |
| R Benchmark 2.5 / Overall mean | |
| Schenker XMG Focus 15 | |
| Microsoft Surface Laptop Studio i7 RTX 3050 Ti | |
| Xiaomi Mi NoteBook Pro | |
| Average Intel Core i7-11370H (0.544 - 0.596, n=11) | |
| Dell Inspiron 16 Plus 7610 | |
| Asus VivoBook Pro 16X OLED N7600PC-L2026X | |
| Lenovo ThinkPad X1 Extreme G4-20Y5CTO1WW (3050 Ti) | |
| MSI Summit E16 Flip A12UDT-031 | |
| Average of class Multimedia (0.3604 - 0.947, n=56, last 2 years) | |
* ... smaller is better
AIDA64: FP32 Ray-Trace | FPU Julia | CPU SHA3 | CPU Queen | FPU SinJulia | FPU Mandel | CPU AES | CPU ZLib | FP64 Ray-Trace | CPU PhotoWorxx
| Performance rating | |
| Average of class Multimedia | |
| Lenovo ThinkPad X1 Extreme G4-20Y5CTO1WW (3050 Ti) | |
| MSI Summit E16 Flip A12UDT-031 | |
| Average Intel Core i7-11370H | |
| Microsoft Surface Laptop Studio i7 RTX 3050 Ti | |
| Xiaomi Mi NoteBook Pro | |
| Asus VivoBook Pro 16X OLED N7600PC-L2026X | |
| AIDA64 / FP32 Ray-Trace | |
| Average of class Multimedia (2214 - 50388, n=53, last 2 years) | |
| Lenovo ThinkPad X1 Extreme G4-20Y5CTO1WW (3050 Ti) | |
| MSI Summit E16 Flip A12UDT-031 | |
| Microsoft Surface Laptop Studio i7 RTX 3050 Ti | |
| Average Intel Core i7-11370H (5204 - 8413, n=10) | |
| Xiaomi Mi NoteBook Pro | |
| Asus VivoBook Pro 16X OLED N7600PC-L2026X | |
| AIDA64 / FPU Julia | |
| Average of class Multimedia (12867 - 201874, n=54, last 2 years) | |
| MSI Summit E16 Flip A12UDT-031 | |
| Lenovo ThinkPad X1 Extreme G4-20Y5CTO1WW (3050 Ti) | |
| Microsoft Surface Laptop Studio i7 RTX 3050 Ti | |
| Average Intel Core i7-11370H (23958 - 34020, n=10) | |
| Xiaomi Mi NoteBook Pro | |
| Asus VivoBook Pro 16X OLED N7600PC-L2026X | |
| AIDA64 / CPU SHA3 | |
| Lenovo ThinkPad X1 Extreme G4-20Y5CTO1WW (3050 Ti) | |
| Average of class Multimedia (626 - 8623, n=54, last 2 years) | |
| MSI Summit E16 Flip A12UDT-031 | |
| Average Intel Core i7-11370H (1656 - 2297, n=10) | |
| Microsoft Surface Laptop Studio i7 RTX 3050 Ti | |
| Xiaomi Mi NoteBook Pro | |
| Asus VivoBook Pro 16X OLED N7600PC-L2026X | |
| AIDA64 / CPU Queen | |
| MSI Summit E16 Flip A12UDT-031 | |
| Lenovo ThinkPad X1 Extreme G4-20Y5CTO1WW (3050 Ti) | |
| Average of class Multimedia (13483 - 181505, n=41, last 2 years) | |
| Xiaomi Mi NoteBook Pro | |
| Average Intel Core i7-11370H (42086 - 52930, n=10) | |
| Microsoft Surface Laptop Studio i7 RTX 3050 Ti | |
| Asus VivoBook Pro 16X OLED N7600PC-L2026X | |
| AIDA64 / FPU SinJulia | |
| Lenovo ThinkPad X1 Extreme G4-20Y5CTO1WW (3050 Ti) | |
| Average of class Multimedia (886 - 28794, n=54, last 2 years) | |
| MSI Summit E16 Flip A12UDT-031 | |
| Xiaomi Mi NoteBook Pro | |
| Average Intel Core i7-11370H (3755 - 5027, n=10) | |
| Microsoft Surface Laptop Studio i7 RTX 3050 Ti | |
| Asus VivoBook Pro 16X OLED N7600PC-L2026X | |
| AIDA64 / FPU Mandel | |
| Average of class Multimedia (6395 - 105740, n=53, last 2 years) | |
| Lenovo ThinkPad X1 Extreme G4-20Y5CTO1WW (3050 Ti) | |
| MSI Summit E16 Flip A12UDT-031 | |
| Average Intel Core i7-11370H (14433 - 20417, n=10) | |
| Microsoft Surface Laptop Studio i7 RTX 3050 Ti | |
| Xiaomi Mi NoteBook Pro | |
| Asus VivoBook Pro 16X OLED N7600PC-L2026X | |
| AIDA64 / CPU AES | |
| Lenovo ThinkPad X1 Extreme G4-20Y5CTO1WW (3050 Ti) | |
| Xiaomi Mi NoteBook Pro | |
| Average Intel Core i7-11370H (44267 - 76866, n=10) | |
| Average of class Multimedia (8171 - 126790, n=54, last 2 years) | |
| MSI Summit E16 Flip A12UDT-031 | |
| Asus VivoBook Pro 16X OLED N7600PC-L2026X | |
| Microsoft Surface Laptop Studio i7 RTX 3050 Ti | |
| AIDA64 / CPU ZLib | |
| Average of class Multimedia (143.8 - 2022, n=54, last 2 years) | |
| MSI Summit E16 Flip A12UDT-031 | |
| Lenovo ThinkPad X1 Extreme G4-20Y5CTO1WW (3050 Ti) | |
| Xiaomi Mi NoteBook Pro | |
| Average Intel Core i7-11370H (289 - 422, n=10) | |
| Microsoft Surface Laptop Studio i7 RTX 3050 Ti | |
| Asus VivoBook Pro 16X OLED N7600PC-L2026X | |
| AIDA64 / FP64 Ray-Trace | |
| Average of class Multimedia (1014 - 26875, n=54, last 2 years) | |
| Lenovo ThinkPad X1 Extreme G4-20Y5CTO1WW (3050 Ti) | |
| MSI Summit E16 Flip A12UDT-031 | |
| Average Intel Core i7-11370H (2756 - 4551, n=10) | |
| Microsoft Surface Laptop Studio i7 RTX 3050 Ti | |
| Xiaomi Mi NoteBook Pro | |
| Asus VivoBook Pro 16X OLED N7600PC-L2026X | |
| AIDA64 / CPU PhotoWorxx | |
| Average of class Multimedia (8187 - 88154, n=54, last 2 years) | |
| MSI Summit E16 Flip A12UDT-031 | |
| Microsoft Surface Laptop Studio i7 RTX 3050 Ti | |
| Average Intel Core i7-11370H (15892 - 40069, n=10) | |
| Xiaomi Mi NoteBook Pro | |
| Asus VivoBook Pro 16X OLED N7600PC-L2026X | |
| Lenovo ThinkPad X1 Extreme G4-20Y5CTO1WW (3050 Ti) | |
系统性能
在我们的系统性能、基准测试中,Vivobook Pro 16X OLED总体上取得了不错的成绩。多媒体系统的排名远远高于平均水平。然而,在同一时间,Vivobook不能完全匹配我们比较中的其他设备。由于两个问题,该笔记本在PCMark 10和CrossMark中的性能有所下降。其中一个是性能配置文件设置,它在短时间内迅速限制了CPU和GPU的性能潜力,第二个问题是笔记本电脑的内存速度相当慢。因此,AIDA内存测试的分数相对较低,延迟较高。
不管怎么说,Vivobook Pro在日常使用中反应非常灵敏,能够处理偶尔的高要求任务,没有任何问题。大多数基准测试对笔记本电脑的压力明显大于正常工作流程。
CrossMark: Overall | Productivity | Creativity | Responsiveness
| PCMark 10 / Score | |
| Average of class Multimedia (4325 - 10386, n=52, last 2 years) | |
| Lenovo ThinkPad X1 Extreme G4-20Y5CTO1WW (3050 Ti) | |
| Schenker XMG Focus 15 | |
| Dell Inspiron 16 Plus 7610 | |
| MSI Summit E16 Flip A12UDT-031 | |
| Schenker Vision 14 | |
| Asus VivoBook Pro 16X OLED N7600PC-L2026X | |
| Average Intel Core i7-11370H, NVIDIA GeForce RTX 3050 4GB Laptop GPU (n=1) | |
| Microsoft Surface Laptop Studio i7 RTX 3050 Ti | |
| Lenovo IdeaPad Slim 7i Pro 14IHU5 | |
| Xiaomi Mi NoteBook Pro | |
| PCMark 10 / Essentials | |
| Lenovo ThinkPad X1 Extreme G4-20Y5CTO1WW (3050 Ti) | |
| Average of class Multimedia (8025 - 11664, n=51, last 2 years) | |
| Lenovo IdeaPad Slim 7i Pro 14IHU5 | |
| Schenker XMG Focus 15 | |
| Xiaomi Mi NoteBook Pro | |
| Dell Inspiron 16 Plus 7610 | |
| MSI Summit E16 Flip A12UDT-031 | |
| Schenker Vision 14 | |
| Asus VivoBook Pro 16X OLED N7600PC-L2026X | |
| Average Intel Core i7-11370H, NVIDIA GeForce RTX 3050 4GB Laptop GPU (n=1) | |
| Microsoft Surface Laptop Studio i7 RTX 3050 Ti | |
| PCMark 10 / Productivity | |
| Average of class Multimedia (7323 - 18233, n=51, last 2 years) | |
| Schenker Vision 14 | |
| Schenker XMG Focus 15 | |
| Asus VivoBook Pro 16X OLED N7600PC-L2026X | |
| Average Intel Core i7-11370H, NVIDIA GeForce RTX 3050 4GB Laptop GPU (n=1) | |
| Lenovo ThinkPad X1 Extreme G4-20Y5CTO1WW (3050 Ti) | |
| Dell Inspiron 16 Plus 7610 | |
| Microsoft Surface Laptop Studio i7 RTX 3050 Ti | |
| MSI Summit E16 Flip A12UDT-031 | |
| Xiaomi Mi NoteBook Pro | |
| Lenovo IdeaPad Slim 7i Pro 14IHU5 | |
| PCMark 10 / Digital Content Creation | |
| Average of class Multimedia (3651 - 16240, n=51, last 2 years) | |
| Schenker XMG Focus 15 | |
| Lenovo ThinkPad X1 Extreme G4-20Y5CTO1WW (3050 Ti) | |
| Dell Inspiron 16 Plus 7610 | |
| MSI Summit E16 Flip A12UDT-031 | |
| Schenker Vision 14 | |
| Asus VivoBook Pro 16X OLED N7600PC-L2026X | |
| Average Intel Core i7-11370H, NVIDIA GeForce RTX 3050 4GB Laptop GPU (n=1) | |
| Microsoft Surface Laptop Studio i7 RTX 3050 Ti | |
| Lenovo IdeaPad Slim 7i Pro 14IHU5 | |
| Xiaomi Mi NoteBook Pro | |
| CrossMark / Overall | |
| Average of class Multimedia (866 - 2728, n=60, last 2 years) | |
| MSI Summit E16 Flip A12UDT-031 | |
| Schenker Vision 14 | |
| Microsoft Surface Laptop Studio i7 RTX 3050 Ti | |
| Xiaomi Mi NoteBook Pro | |
| Asus VivoBook Pro 16X OLED N7600PC-L2026X | |
| Average Intel Core i7-11370H, NVIDIA GeForce RTX 3050 4GB Laptop GPU (n=1) | |
| CrossMark / Productivity | |
| Average of class Multimedia (931 - 2489, n=60, last 2 years) | |
| MSI Summit E16 Flip A12UDT-031 | |
| Schenker Vision 14 | |
| Xiaomi Mi NoteBook Pro | |
| Microsoft Surface Laptop Studio i7 RTX 3050 Ti | |
| Asus VivoBook Pro 16X OLED N7600PC-L2026X | |
| Average Intel Core i7-11370H, NVIDIA GeForce RTX 3050 4GB Laptop GPU (n=1) | |
| CrossMark / Creativity | |
| Average of class Multimedia (907 - 3465, n=60, last 2 years) | |
| MSI Summit E16 Flip A12UDT-031 | |
| Microsoft Surface Laptop Studio i7 RTX 3050 Ti | |
| Schenker Vision 14 | |
| Xiaomi Mi NoteBook Pro | |
| Asus VivoBook Pro 16X OLED N7600PC-L2026X | |
| Average Intel Core i7-11370H, NVIDIA GeForce RTX 3050 4GB Laptop GPU (n=1) | |
| CrossMark / Responsiveness | |
| MSI Summit E16 Flip A12UDT-031 | |
| Average of class Multimedia (605 - 2024, n=60, last 2 years) | |
| Schenker Vision 14 | |
| Xiaomi Mi NoteBook Pro | |
| Microsoft Surface Laptop Studio i7 RTX 3050 Ti | |
| Asus VivoBook Pro 16X OLED N7600PC-L2026X | |
| Average Intel Core i7-11370H, NVIDIA GeForce RTX 3050 4GB Laptop GPU (n=1) | |
| PCMark 10 Score | 5619 points | |
Help | ||
| AIDA64 / Memory Copy | |
| Average of class Multimedia (11299 - 132135, n=54, last 2 years) | |
| MSI Summit E16 Flip A12UDT-031 | |
| Microsoft Surface Laptop Studio i7 RTX 3050 Ti | |
| Average Intel Core i7-11370H (32035 - 64524, n=10) | |
| Lenovo ThinkPad X1 Extreme G4-20Y5CTO1WW (3050 Ti) | |
| Xiaomi Mi NoteBook Pro | |
| Asus VivoBook Pro 16X OLED N7600PC-L2026X | |
| AIDA64 / Memory Read | |
| Average of class Multimedia (11624 - 174586, n=54, last 2 years) | |
| MSI Summit E16 Flip A12UDT-031 | |
| Microsoft Surface Laptop Studio i7 RTX 3050 Ti | |
| Average Intel Core i7-11370H (37216 - 62417, n=10) | |
| Lenovo ThinkPad X1 Extreme G4-20Y5CTO1WW (3050 Ti) | |
| Xiaomi Mi NoteBook Pro | |
| Asus VivoBook Pro 16X OLED N7600PC-L2026X | |
| AIDA64 / Memory Write | |
| Average of class Multimedia (11755 - 134998, n=54, last 2 years) | |
| Microsoft Surface Laptop Studio i7 RTX 3050 Ti | |
| MSI Summit E16 Flip A12UDT-031 | |
| Average Intel Core i7-11370H (36920 - 65610, n=10) | |
| Lenovo ThinkPad X1 Extreme G4-20Y5CTO1WW (3050 Ti) | |
| Asus VivoBook Pro 16X OLED N7600PC-L2026X | |
| Xiaomi Mi NoteBook Pro | |
| AIDA64 / Memory Latency | |
| MSI Summit E16 Flip A12UDT-031 | |
| Average of class Multimedia (7 - 535, n=53, last 2 years) | |
| Microsoft Surface Laptop Studio i7 RTX 3050 Ti | |
| Asus VivoBook Pro 16X OLED N7600PC-L2026X | |
| Average Intel Core i7-11370H (73.4 - 103, n=10) | |
| Lenovo ThinkPad X1 Extreme G4-20Y5CTO1WW (3050 Ti) | |
| Xiaomi Mi NoteBook Pro | |
| Dell Inspiron 16 Plus 7610 | |
* ... smaller is better
DPC延时
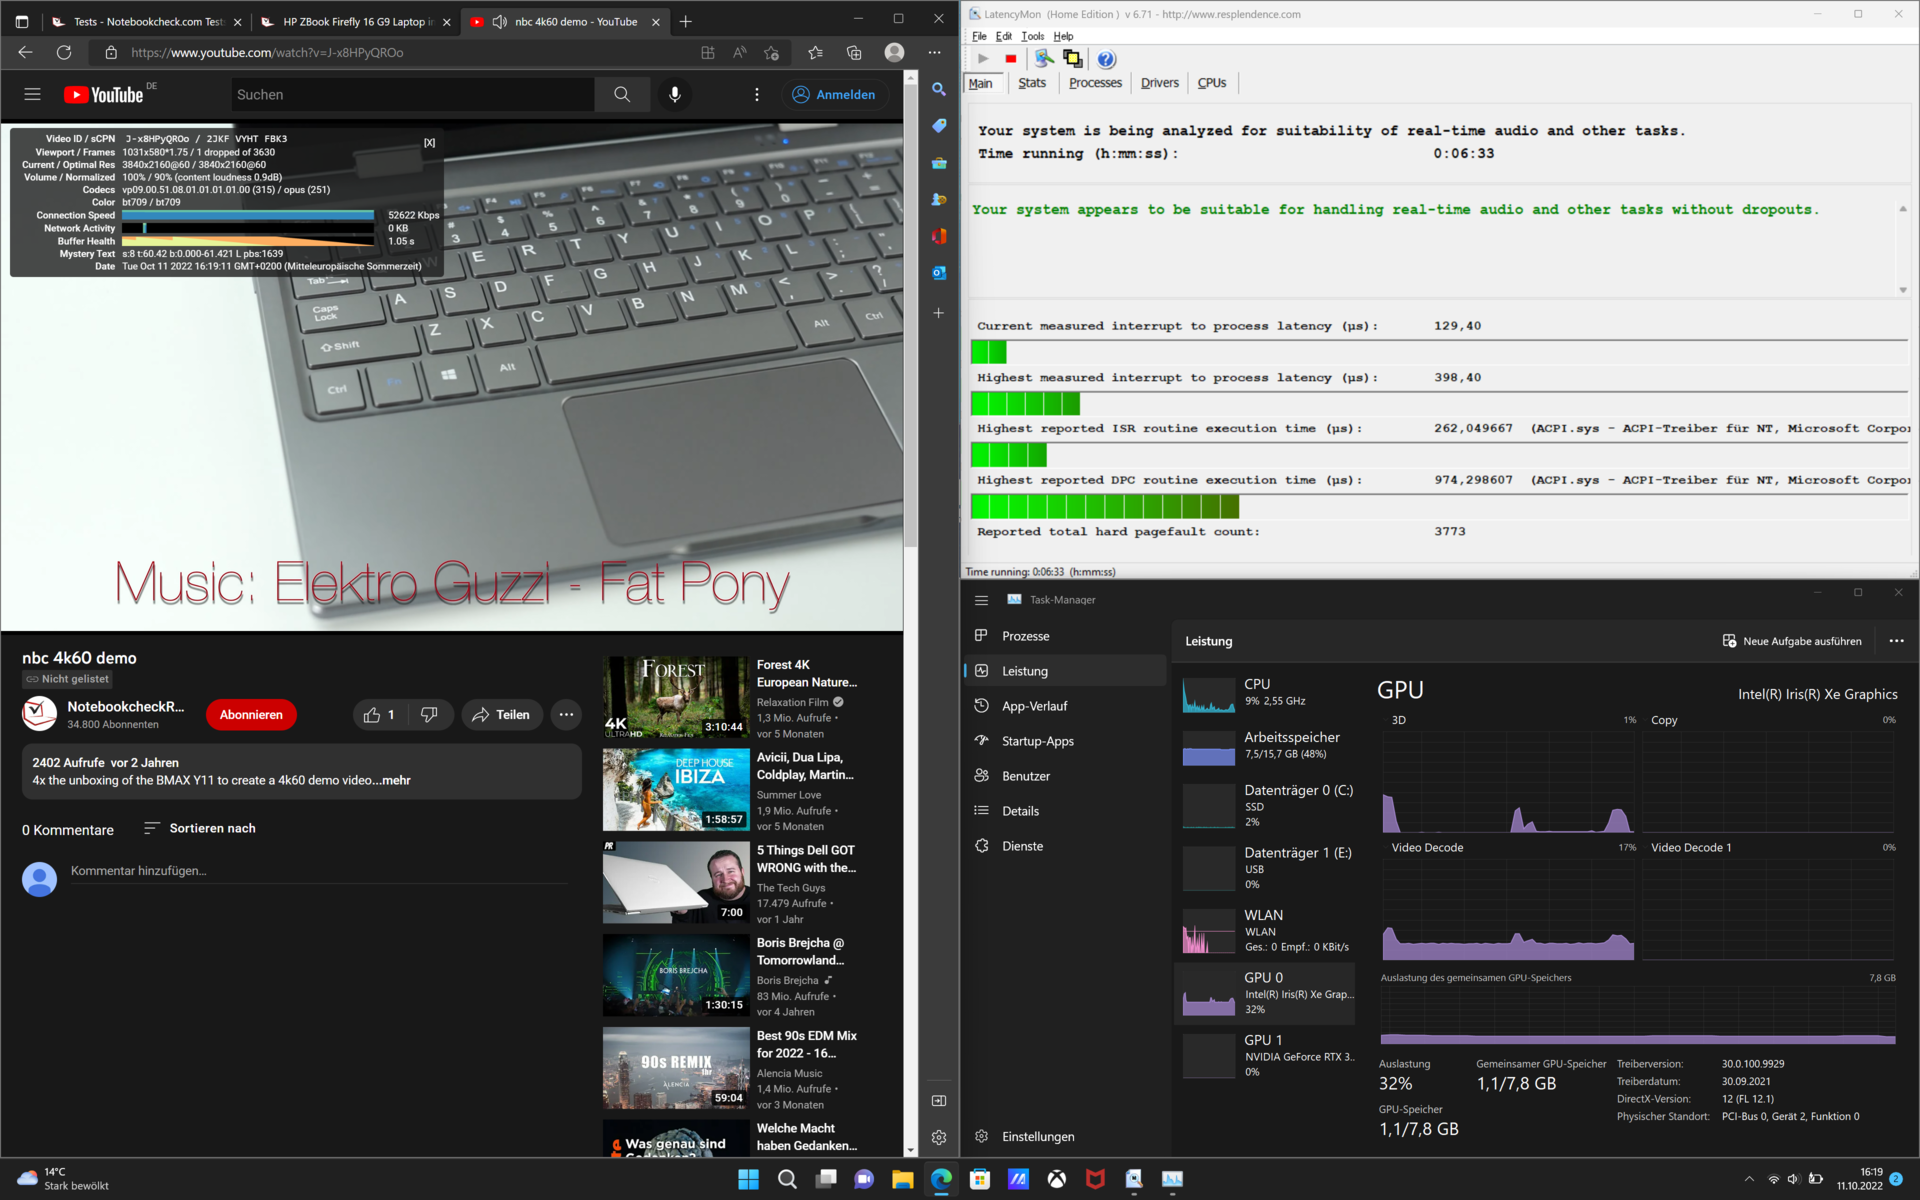
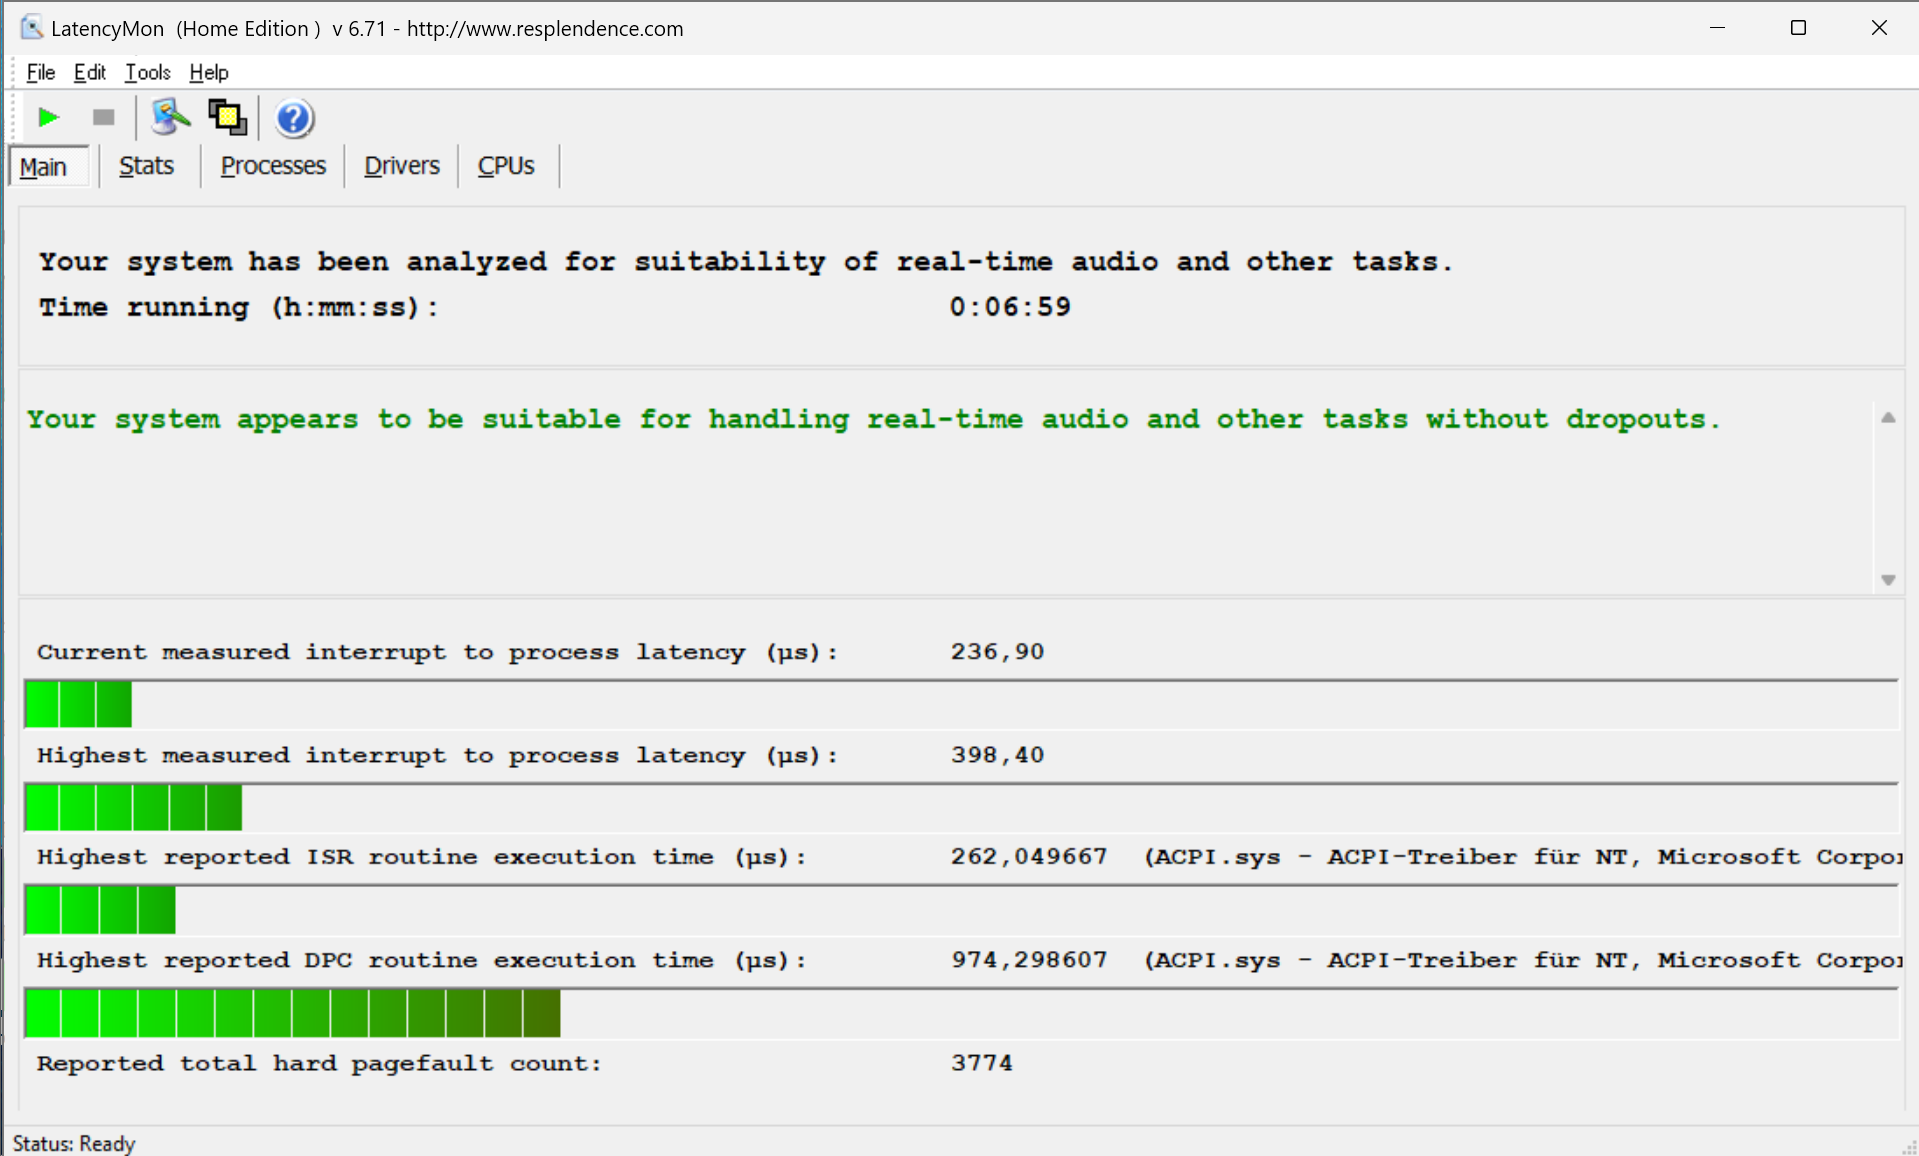
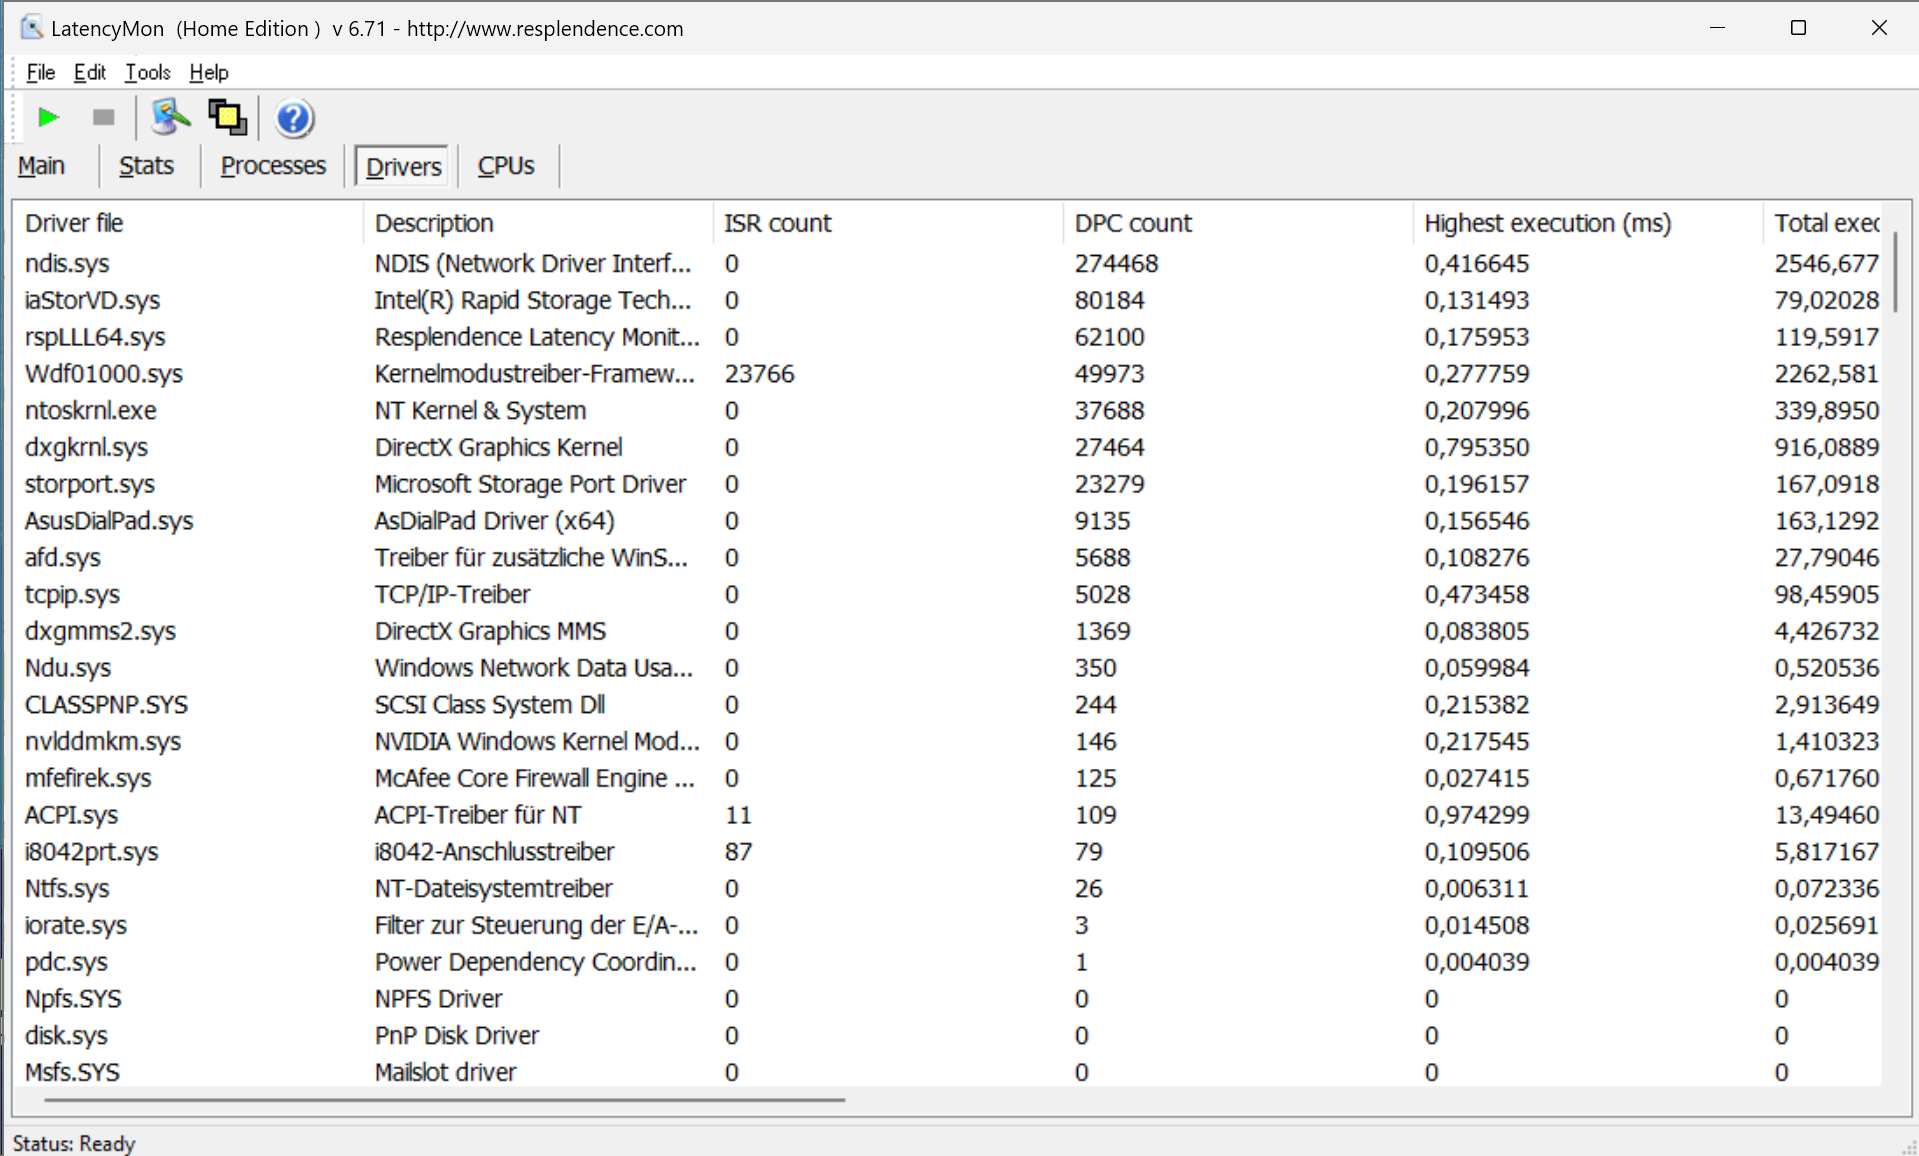
在执行我们的基准测试之前,我们用所有可用的驱动程序和最新的Windows更新来更新设备。在Vivobook Pro 16X上,这导致了非常低的DPC延迟。在以60赫兹播放4K YouTube视频时,我们记录了一个丢帧。在目前的软件和硬件配置下,这台笔记本电脑运行得非常好。
| DPC Latencies / LatencyMon - interrupt to process latency (max), Web, Youtube, Prime95 | |
| Dell Inspiron 16 Plus 7610 | |
| Lenovo ThinkPad X1 Extreme G4-20Y5CTO1WW (3050 Ti) | |
| MSI Summit E16 Flip A12UDT-031 | |
| Microsoft Surface Laptop Studio i7 RTX 3050 Ti | |
| Schenker XMG Focus 15 | |
| Asus VivoBook Pro 16X OLED N7600PC-L2026X | |
* ... smaller is better
存储解决方案
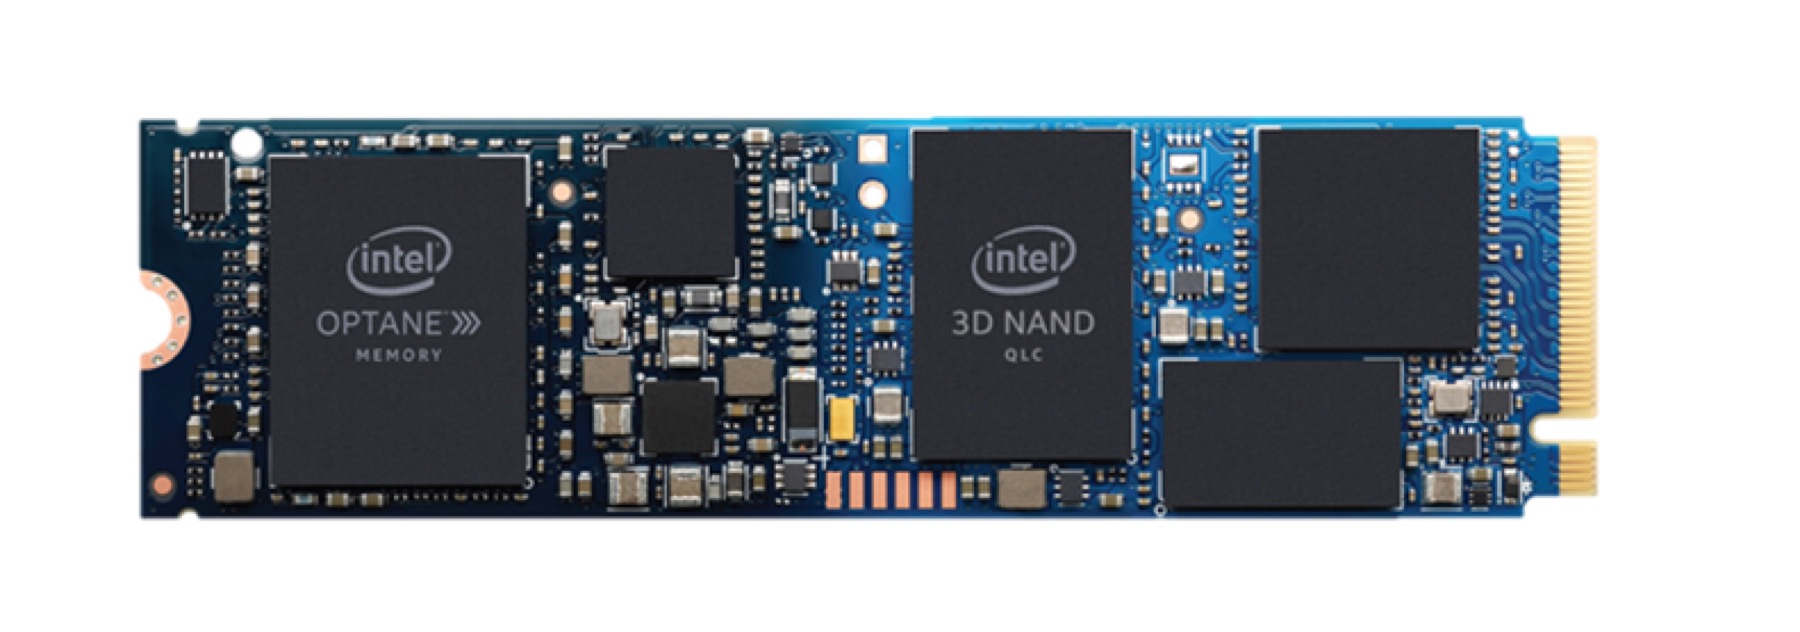
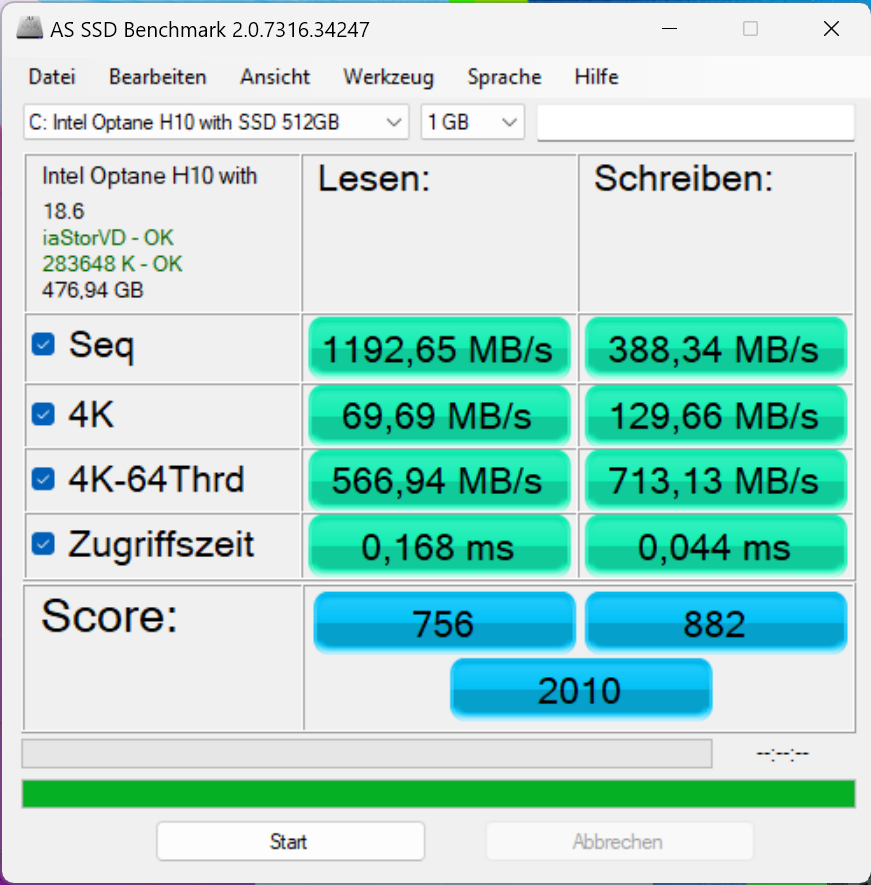
英特尔的Optane内存H10 NVMe SSD是一个有趣的概念。PCB上有两种不同的内存类型和控制器。在靠近接口的一侧,有一个512-GB的英特尔QLC 3D NAND内存模块,有一个合适的控制器。在M.2-2280内存的后面,有一个32-GB的英特尔Optane内存模块。尽管这样,它不再是最快的驱动器选项之一。在我们的 SSD和HDD表,英特尔模块现在是最低的位置之一。应该注意的是,英特尔Optane技术驱动器 是在2019年首次推出的,在撰写本文时,它已经有三年的历史了。集成了低延迟Optane缓存的NVMe SSD只通过PCIe3.0x4连接,而不是现在常见的PCIe 4.0。
我们的DiskSpd读取循环迅速显示了SSD的内部布局。一旦内存控制器登记了对某个文件的频繁访问,它就会被转移到Optane内存并从那里进行访问。这导致了显著的性能提升。

* ... smaller is better
Disk Throttling: DiskSpd Read Loop, Queue Depth 8
GPU性能
Vivobook同时使用了英特尔酷睿i7的iGPU。 英特尔酷睿i7和 NvidiaGeForce RTX 3050.在要求不高的工作负载中,iGPU是活跃的。同时,GeForce dGPU负责要求更高的任务。在我们的测试中,我们记录到GPU的峰值消耗为50瓦。虽然性能不错,但应该注意的是,这是Nvidia RTX 3000系列中最弱的选择。正如我们的Blender测试所示,该GPU能够快速渲染场景。相比之下,它在3DMark基准测试中没有达到我们的预期。这可能是由安装的Nvidia Studio驱动程序造成的。它对游戏性能的优化较少。作为交换,许多专业应用程序,如Blender、Autodesk Maya和Adobe Illustrator都得到了性能提升。关于Nvidia Studio驱动程序所支持的程序的官方概述。可以在制造商的网站上找到。
电池模式下的性能是有限的。在这里,TGP下降到25瓦左右。这大致上将图形性能削减了一半。然而,3DMark基准测试结果令人惊讶地没有像预期的那样受到严重影响。
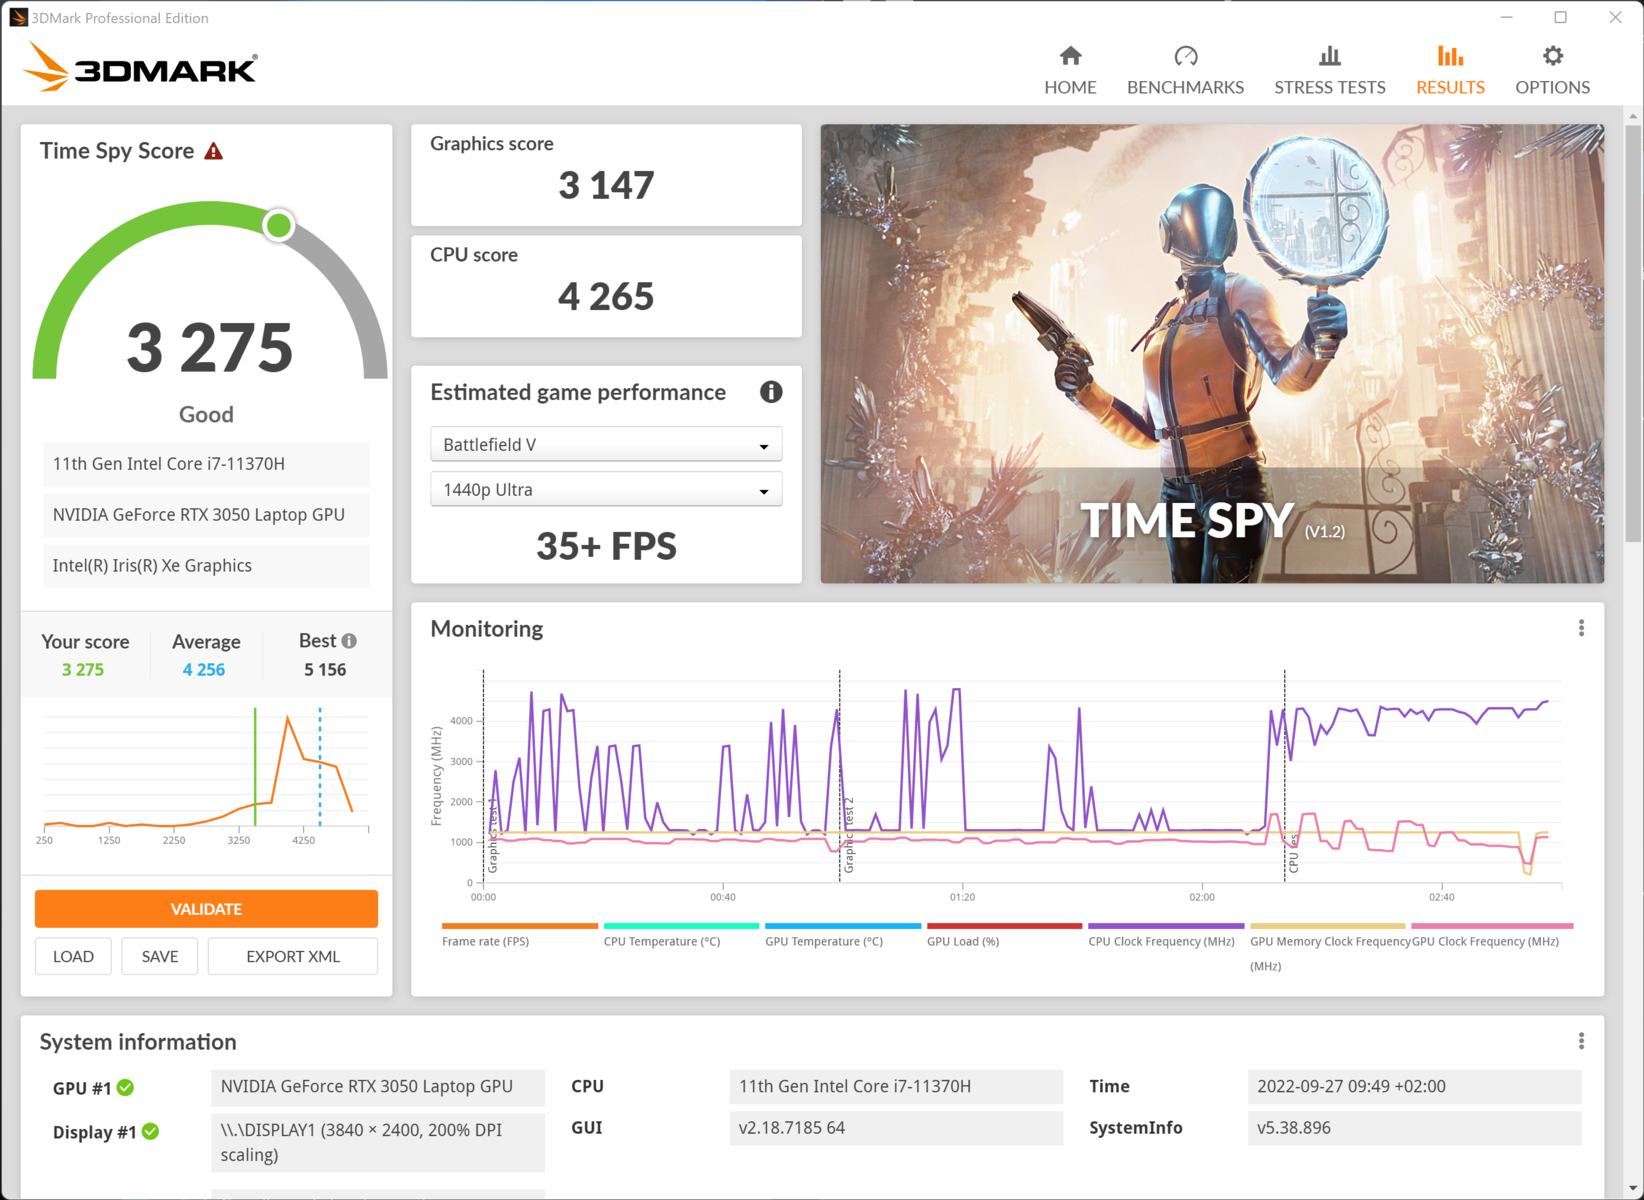
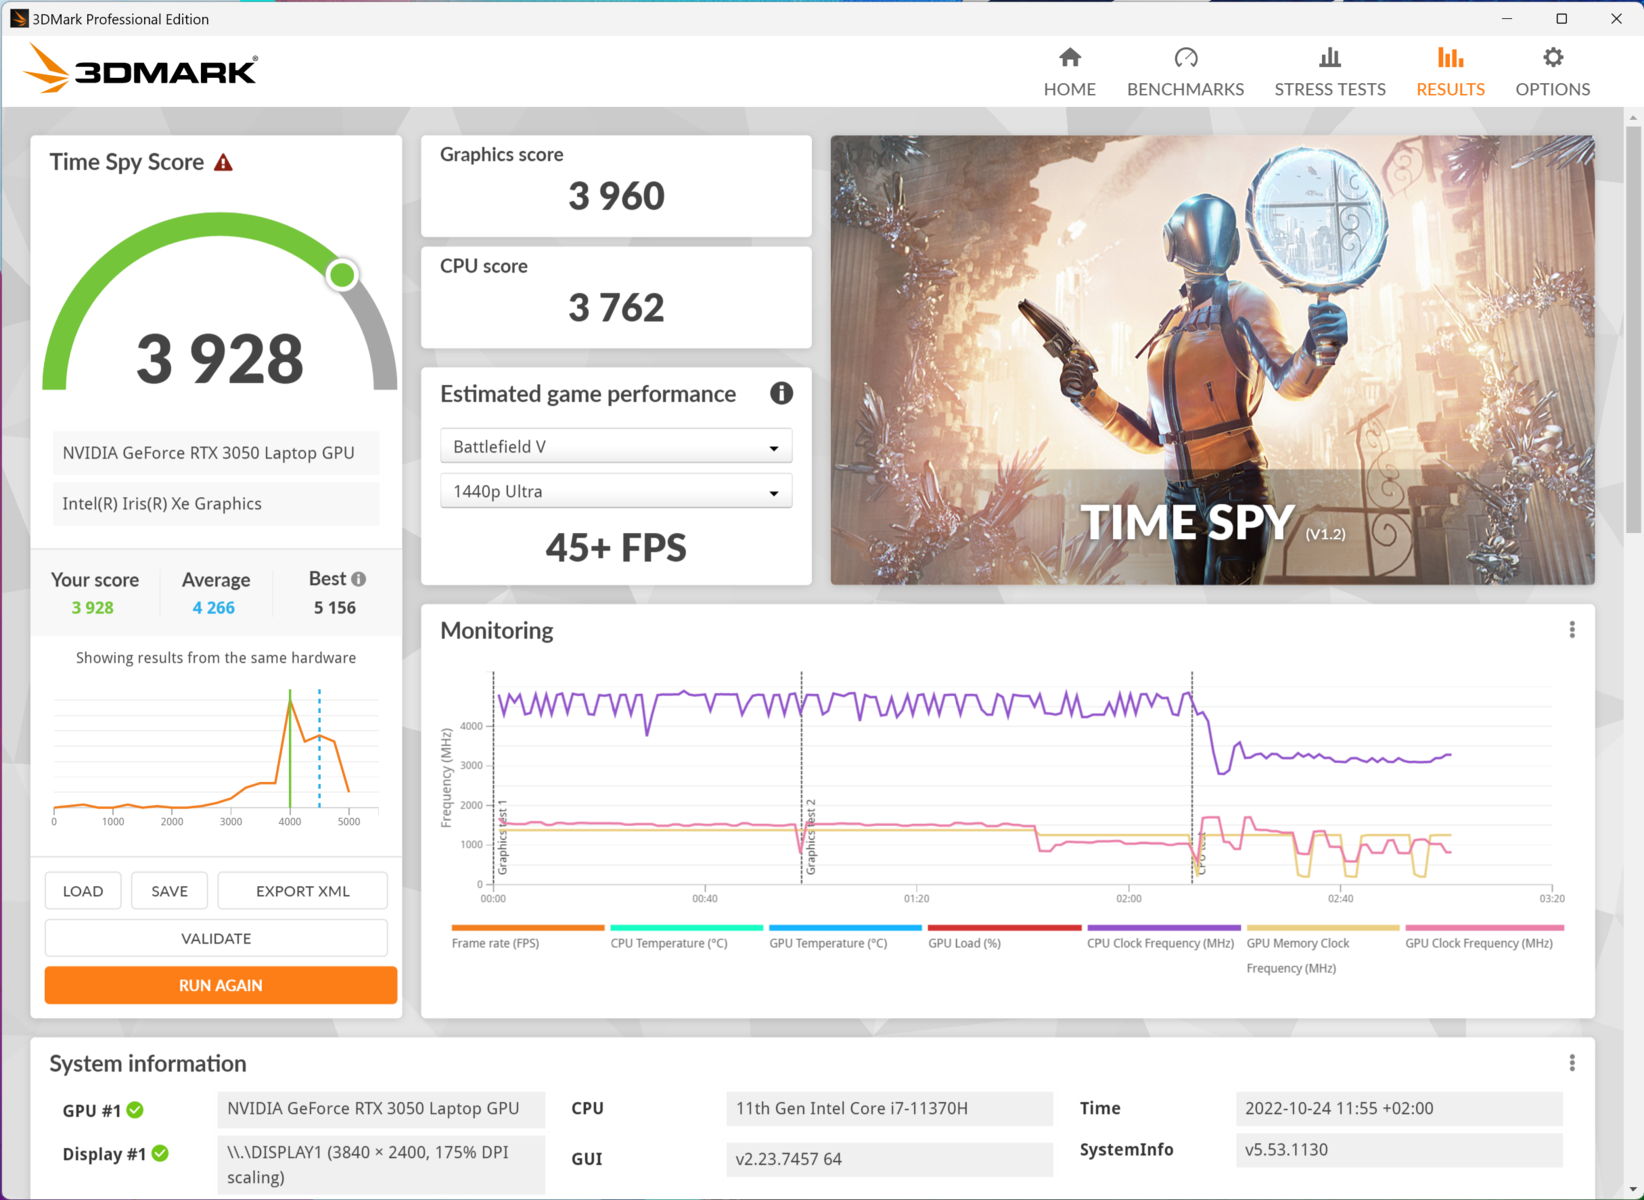
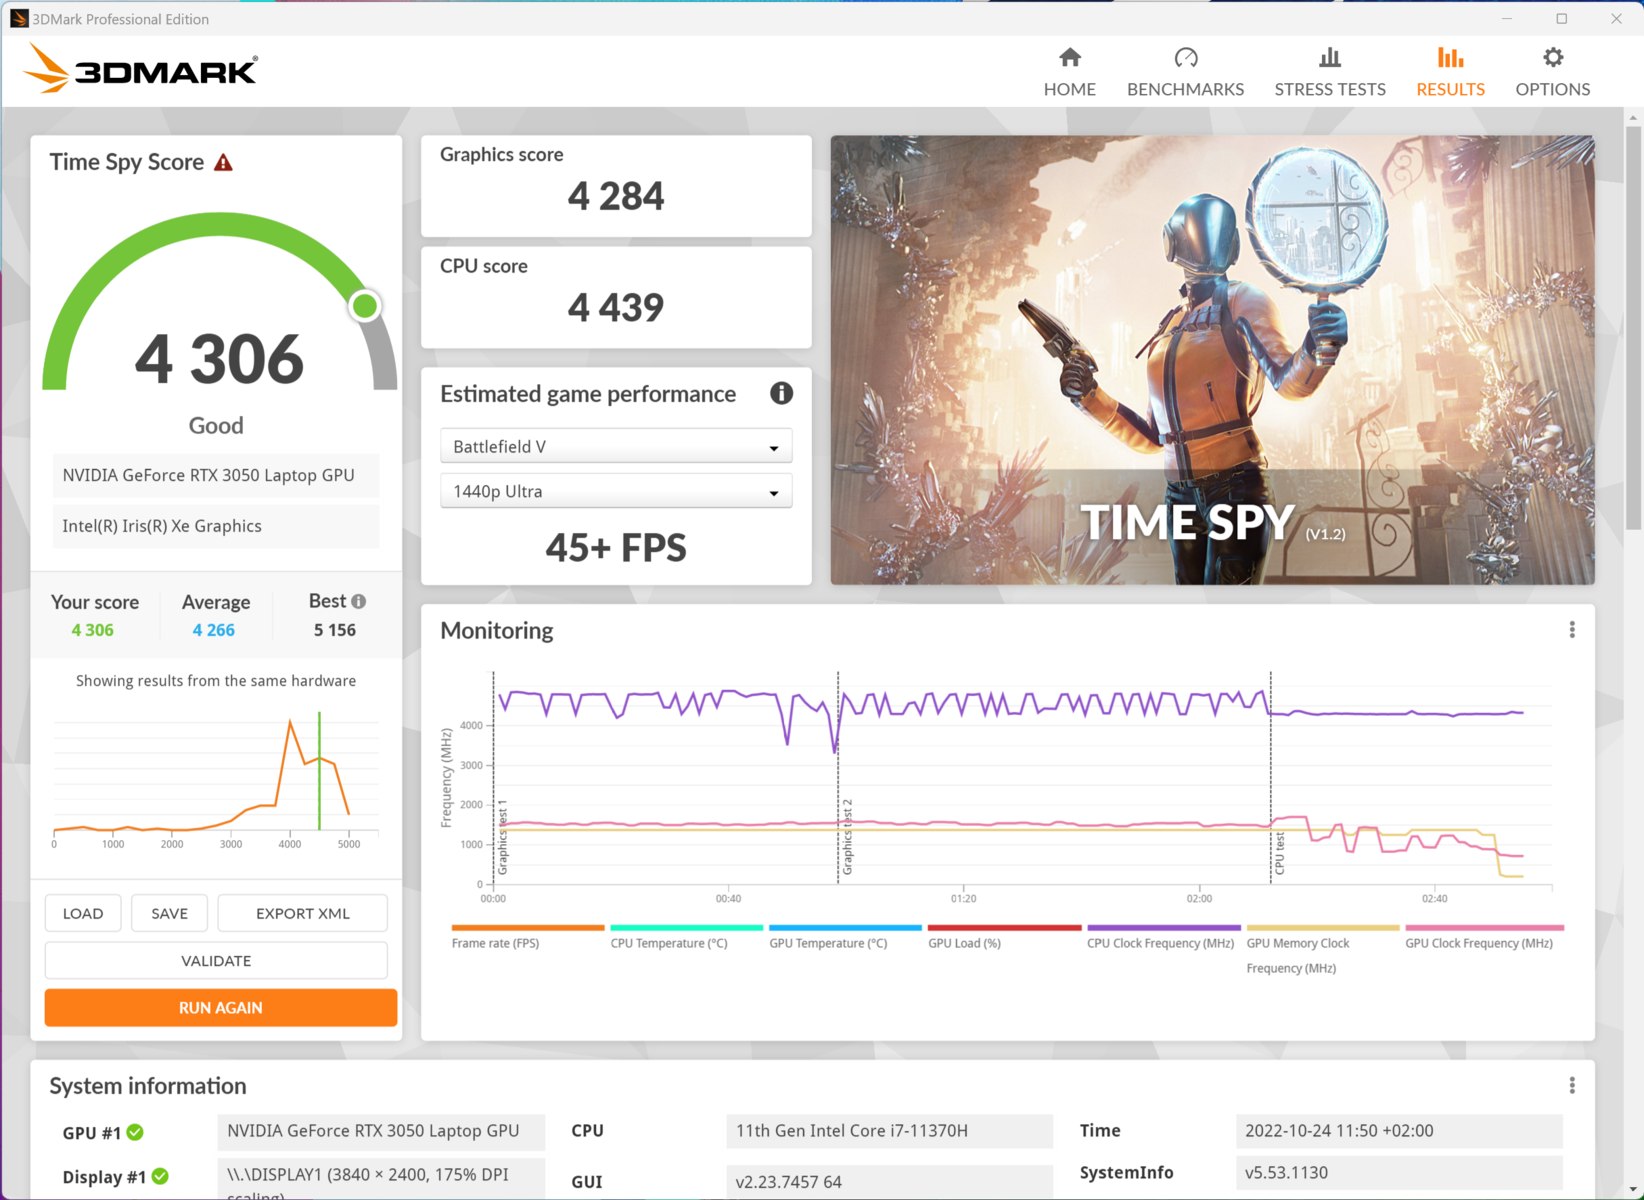
| 3DMark 11 Performance | 13624 points | |
| 3DMark Ice Storm Standard Score | 34267 points | |
| 3DMark Cloud Gate Standard Score | 20526 points | |
| 3DMark Fire Strike Score | 9732 points | |
| 3DMark Time Spy Score | 4310 points | |
Help | ||
* ... smaller is better
游戏性能
在我们测试的几乎所有游戏中,其性能都足以在全高清条件下达到60 FPS以上。Far Cry 5是一个例外。该游戏显示一个错误,表明不支持Nvidia Studio驱动程序。F1 2022也显示了类似的错误信息。
3050的性能储备对于4K OLED显示屏的高原始分辨率来说是勉强够用的。虽然在某些情况下,帧率仍然可以接受,但我们的概述"笔记本电脑显卡上的电脑游戏"显示,RTX 3050在4K时往往会低于30 FPS。
虽然Vivobook与我们比较中的其他设备相比,总体上取得了平均结果,但这台多媒体笔记本电脑设法超越了一些替代品,其名义上更快的3050 Ti。
| low | med. | high | ultra | QHD | 4K | |
|---|---|---|---|---|---|---|
| GTA V (2015) | 146.6 | 100.4 | 54.9 | |||
| The Witcher 3 (2015) | 193.3 | 117.8 | 61.3 | 47 | ||
| Dota 2 Reborn (2015) | 120.7 | 111.4 | 103.7 | 100.3 | 62.4 | |
| Final Fantasy XV Benchmark (2018) | 62 | 64.8 | 44.4 | 30.2 | ||
| X-Plane 11.11 (2018) | 95.3 | 78.4 | 66.9 | 41.4 | ||
| Far Cry 5 (2018) | 37 | 36 | 35 | 47 | ||
| Strange Brigade (2018) | 244 | 112.5 | 92.4 | 78.9 | ||
| F1 22 (2022) | 112.7 | 104.3 | 75 | 21.8 |
排放 - 笔记本电脑可以是无声的
噪声排放
虽然不是很安静,但Vivobook在大多数负载下仍然相当安静。在正常使用过程中,笔记本电脑不超过40 dB(A)。只有在玩游戏或执行其他计算密集型任务时,噪音水平才会增加到62.9分贝(A)。在这些情况下,风扇可能会让人分心,特别是因为噪音相对较高。在耳语模式下,风扇保持非常安静或闲置。
不管是哪种风扇模式,风扇控制都试图尽可能长时间地保持较低的风扇速度。虽然这对Vivobook Pro的噪音水平是有利的,但它对负载下的性能是不利的。
Noise level
| Idle |
| 30 / 30 / 30 dB(A) |
| Load |
| 57.6 / 62.9 dB(A) |
 | ||
30 dB silent 40 dB(A) audible 50 dB(A) loud |
||
min: | ||
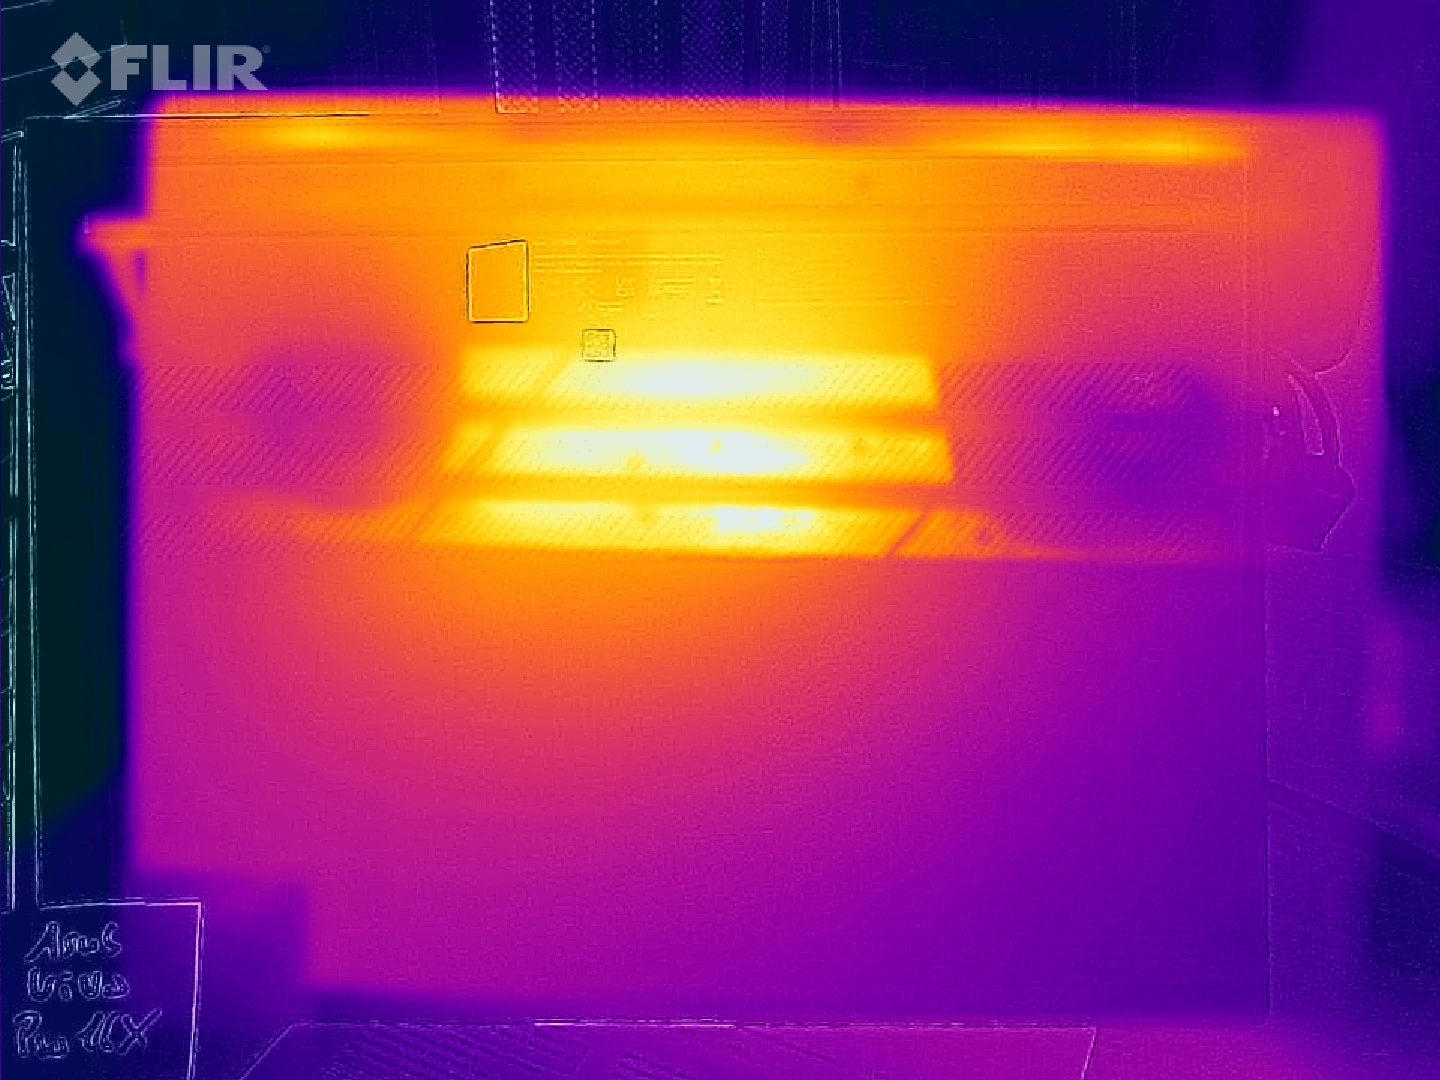
温度
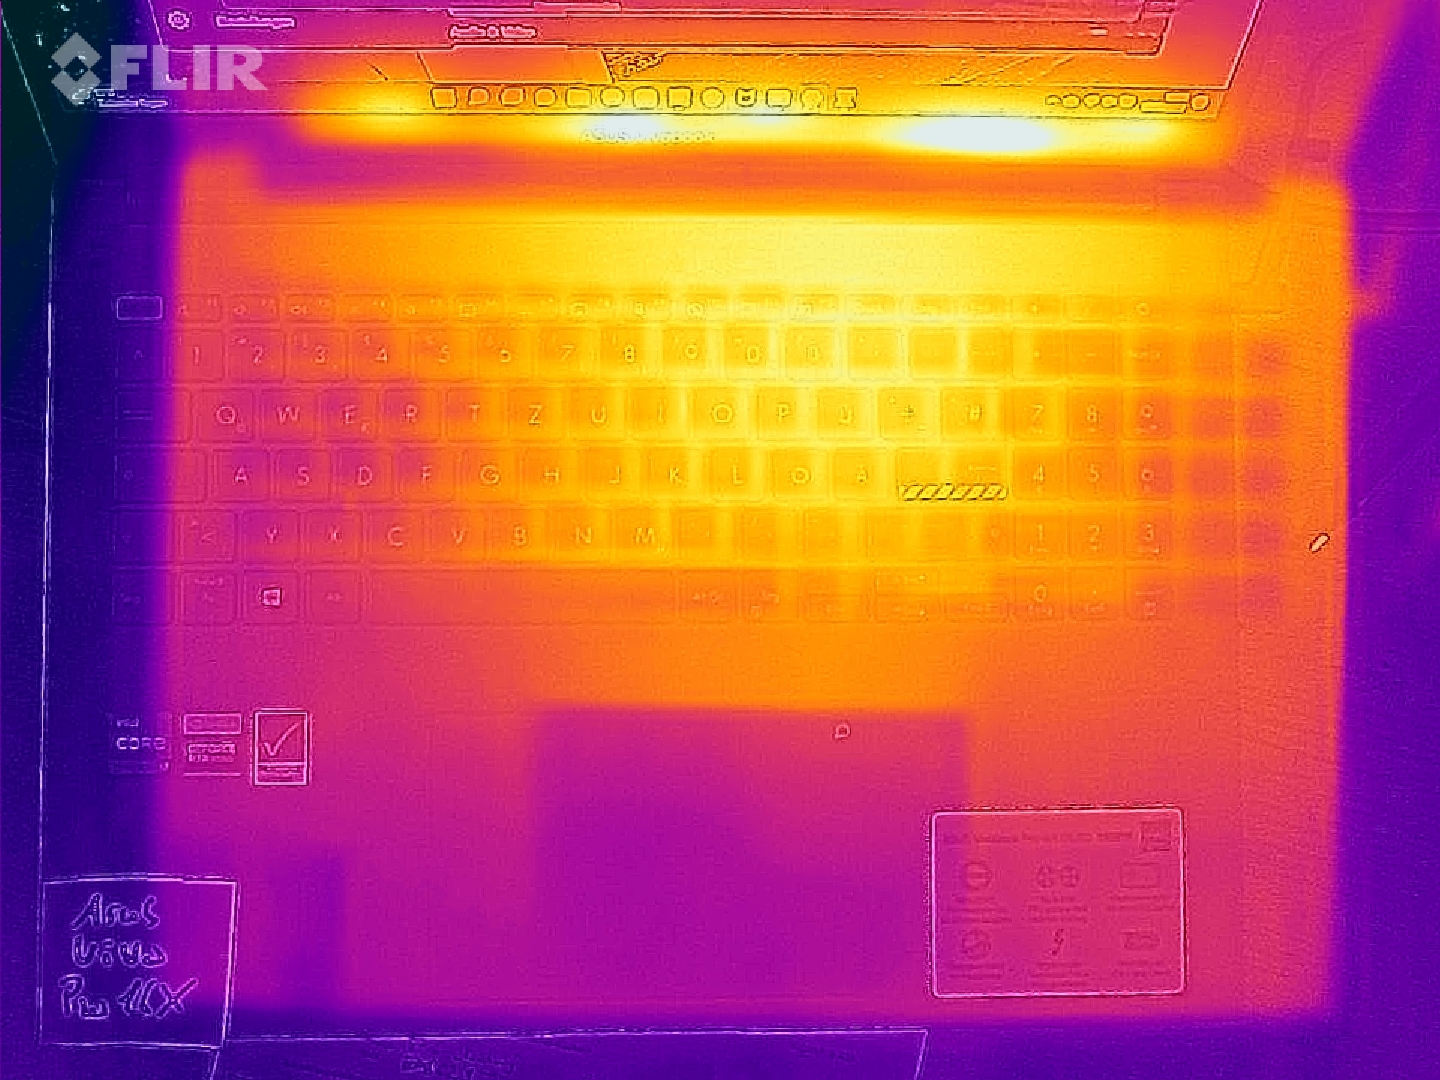
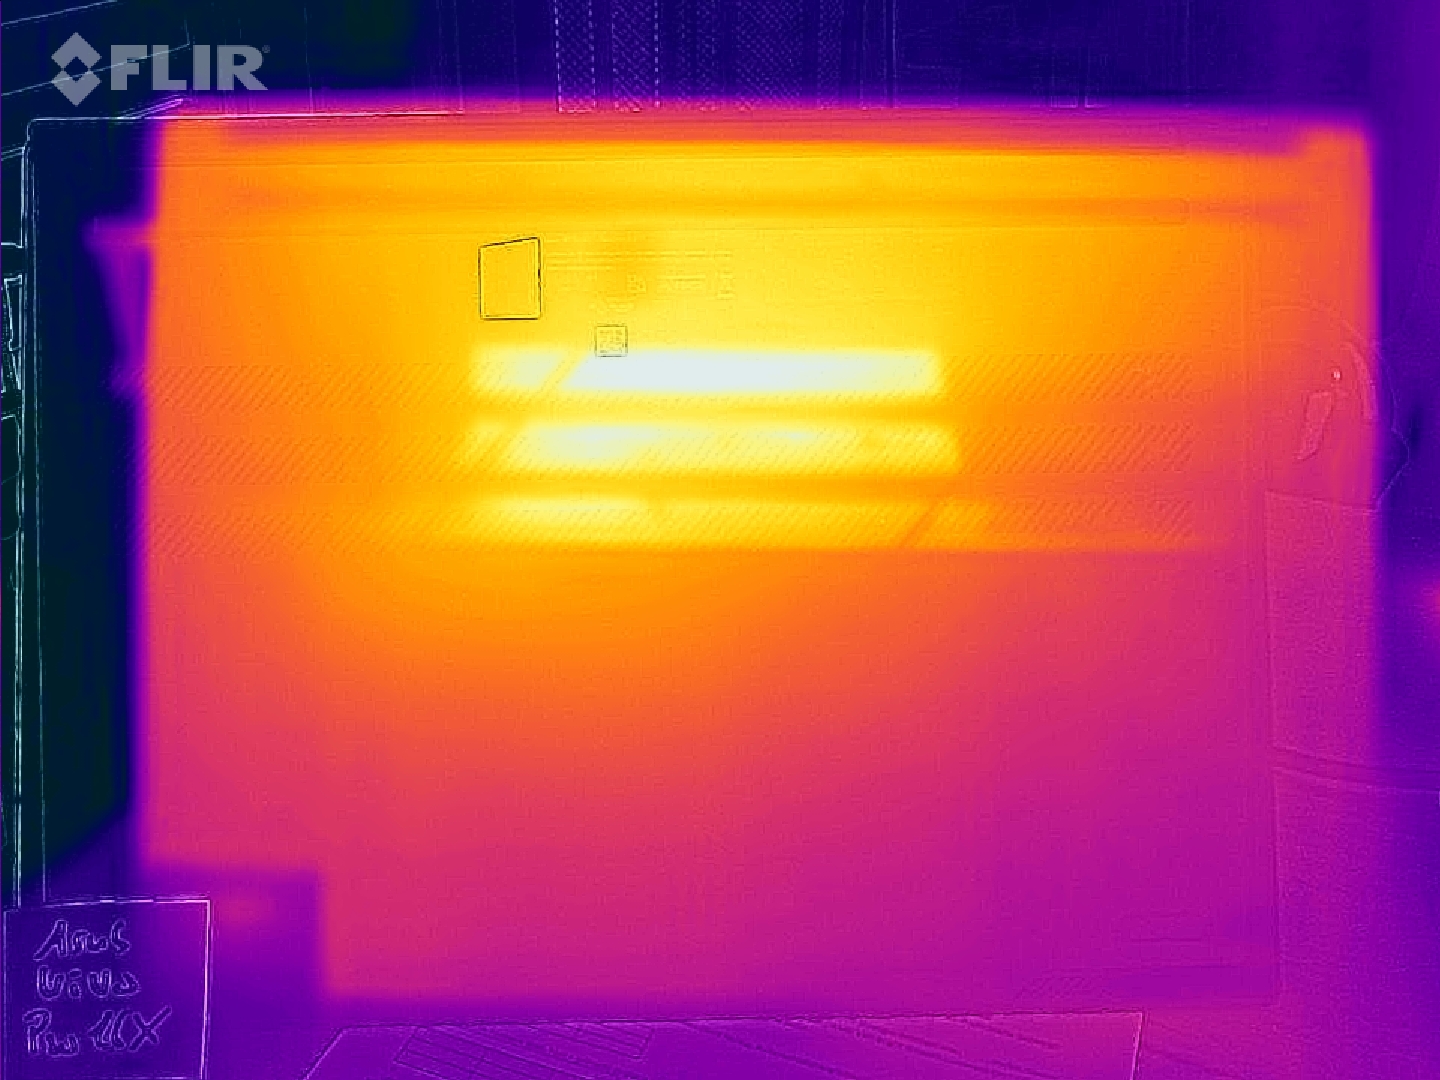
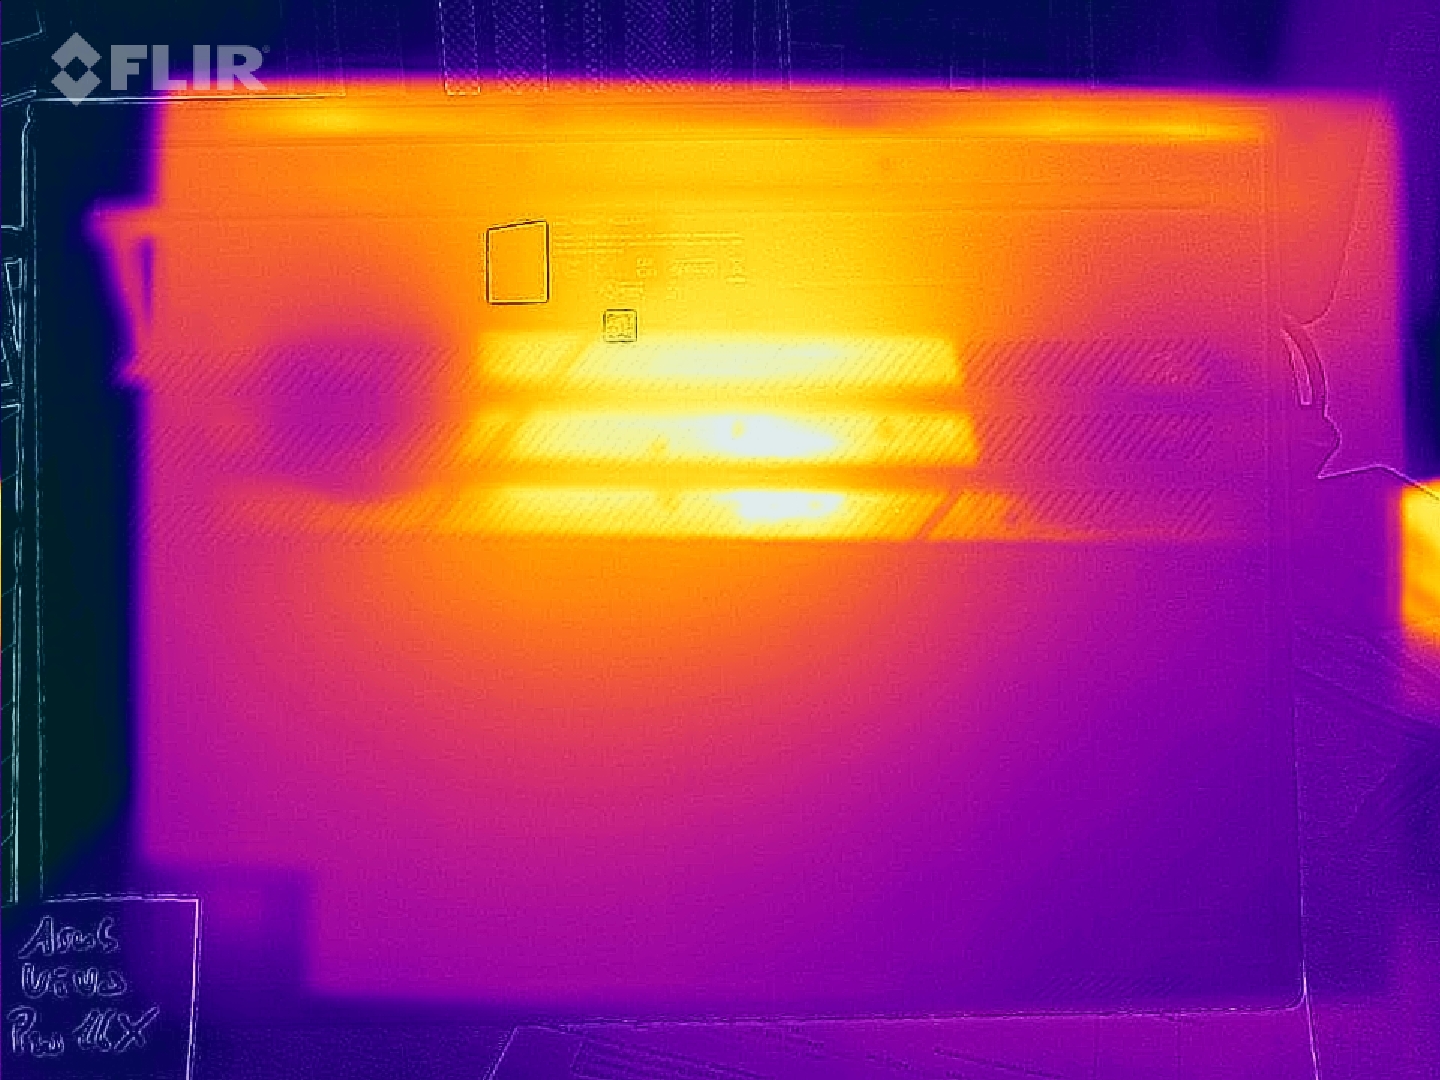
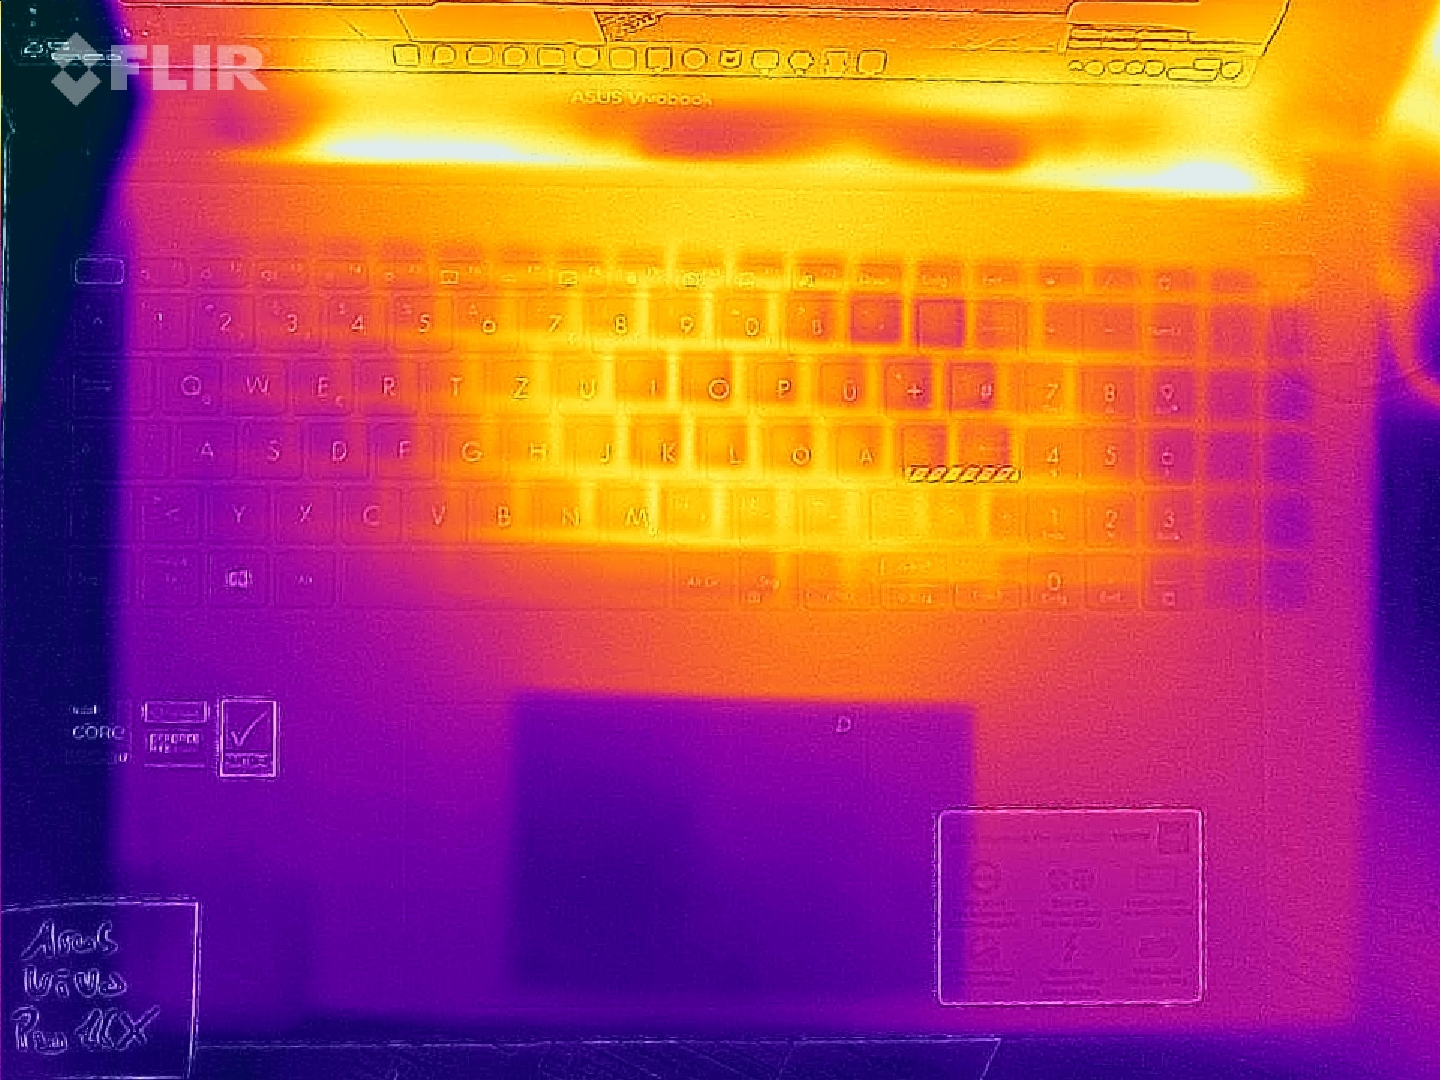
Vivobook的表面温度总体上保持在合理的水平,尽管我们确实在适度的室温下,在负载下记录了超过30℃(86°F)的掌托温度。当受到压力时,底部的热点会变得令人不舒服的温度。底部50 °C (122 °F)的温度太高了,长时间放在腿上使用时不舒服。幸运的是,笔记本中心的热点区域相当小。因此,Vivobook Pro仍然可以被放置在一个不存在这个问题的地方。

| Asus VivoBook Pro 16X OLED N7600PC-L2026X GeForce RTX 3050 4GB Laptop GPU, i7-11370H, Intel Optane Memory H10 with Solid State Storage 32GB + 512GB HBRPEKNX0202A(L/H) | MSI Summit E16 Flip A12UDT-031 GeForce RTX 3050 Ti Laptop GPU, i7-1280P, Samsung PM9A1 MZVL22T0HBLB | Microsoft Surface Laptop Studio i7 RTX 3050 Ti GeForce RTX 3050 Ti Laptop GPU, i7-11370H, SK Hynix PC711 1TB HFS001TDE9X084N | Dell Inspiron 16 Plus 7610 GeForce RTX 3050 4GB Laptop GPU, i7-11800H, Kingston OM3PDP3512B | Lenovo ThinkPad X1 Extreme G4-20Y5CTO1WW (3050 Ti) GeForce RTX 3050 Ti Laptop GPU, i7-11800H, Samsung PM9A1 MZVL21T0HCLR | Schenker XMG Focus 15 GeForce RTX 3050 Ti Laptop GPU, i7-11800H, Samsung SSD 970 EVO Plus 1TB | |
|---|---|---|---|---|---|---|
| Noise | 13% | 21% | 16% | 19% | -2% | |
| off / environment * (dB) | 25.15 | 25 1% | 24.7 2% | 24.4 3% | 23.52 6% | 24 5% |
| Idle Minimum * (dB) | 30 | 25 17% | 24.7 18% | 24.4 19% | 23.52 22% | 25 17% |
| Idle Average * (dB) | 30 | 25 17% | 24.7 18% | 24.4 19% | 23.52 22% | 30 -0% |
| Idle Maximum * (dB) | 30 | 28.9 4% | 24.7 18% | 24.4 19% | 23.52 22% | 43 -43% |
| Load Average * (dB) | 57.6 | 49.3 14% | 33.2 42% | 48.3 16% | 42.9 26% | 56 3% |
| Load Maximum * (dB) | 62.9 | 48.2 23% | 46.7 26% | 48.9 22% | 52.45 17% | 58 8% |
| Witcher 3 ultra * (dB) | 44.5 | 48.9 | 52.5 | 56 |
* ... smaller is better
(±) The maximum temperature on the upper side is 40.6 °C / 105 F, compared to the average of 36.8 °C / 98 F, ranging from 21 to 71 °C for the class Multimedia.
(-) The bottom heats up to a maximum of 53 °C / 127 F, compared to the average of 39.1 °C / 102 F
(+) In idle usage, the average temperature for the upper side is 26.3 °C / 79 F, compared to the device average of 31.3 °C / 88 F.
(±) Playing The Witcher 3, the average temperature for the upper side is 33.7 °C / 93 F, compared to the device average of 31.3 °C / 88 F.
(+) The palmrests and touchpad are cooler than skin temperature with a maximum of 30.6 °C / 87.1 F and are therefore cool to the touch.
(±) The average temperature of the palmrest area of similar devices was 28.7 °C / 83.7 F (-1.9 °C / -3.4 F).
| Asus VivoBook Pro 16X OLED N7600PC-L2026X Intel Core i7-11370H, NVIDIA GeForce RTX 3050 4GB Laptop GPU | MSI Summit E16 Flip A12UDT-031 Intel Core i7-1280P, NVIDIA GeForce RTX 3050 Ti Laptop GPU | Microsoft Surface Laptop Studio i7 RTX 3050 Ti Intel Core i7-11370H, NVIDIA GeForce RTX 3050 Ti Laptop GPU | Dell Inspiron 16 Plus 7610 Intel Core i7-11800H, NVIDIA GeForce RTX 3050 4GB Laptop GPU | Lenovo ThinkPad X1 Extreme G4-20Y5CTO1WW (3050 Ti) Intel Core i7-11800H, NVIDIA GeForce RTX 3050 Ti Laptop GPU | Schenker XMG Focus 15 Intel Core i7-11800H, NVIDIA GeForce RTX 3050 Ti Laptop GPU | Xiaomi Mi NoteBook Pro Intel Core i7-11370H, Intel Iris Xe Graphics G7 96EUs | |
|---|---|---|---|---|---|---|---|
| Heat | -6% | 15% | -14% | -5% | -17% | -7% | |
| Maximum Upper Side * (°C) | 40.6 | 49.2 -21% | 42.3 -4% | 46.4 -14% | 49 -21% | 43 -6% | 48 -18% |
| Maximum Bottom * (°C) | 53 | 50.2 5% | 38.2 28% | 54.8 -3% | 44.4 16% | 46 13% | 45.8 14% |
| Idle Upper Side * (°C) | 29 | 29.4 -1% | 23.4 19% | 31.4 -8% | 32.1 -11% | 39 -34% | 32.2 -11% |
| Idle Bottom * (°C) | 28.3 | 30 -6% | 23.5 17% | 36.6 -29% | 29.8 -5% | 40 -41% | 32.2 -14% |
* ... smaller is better
压力测试
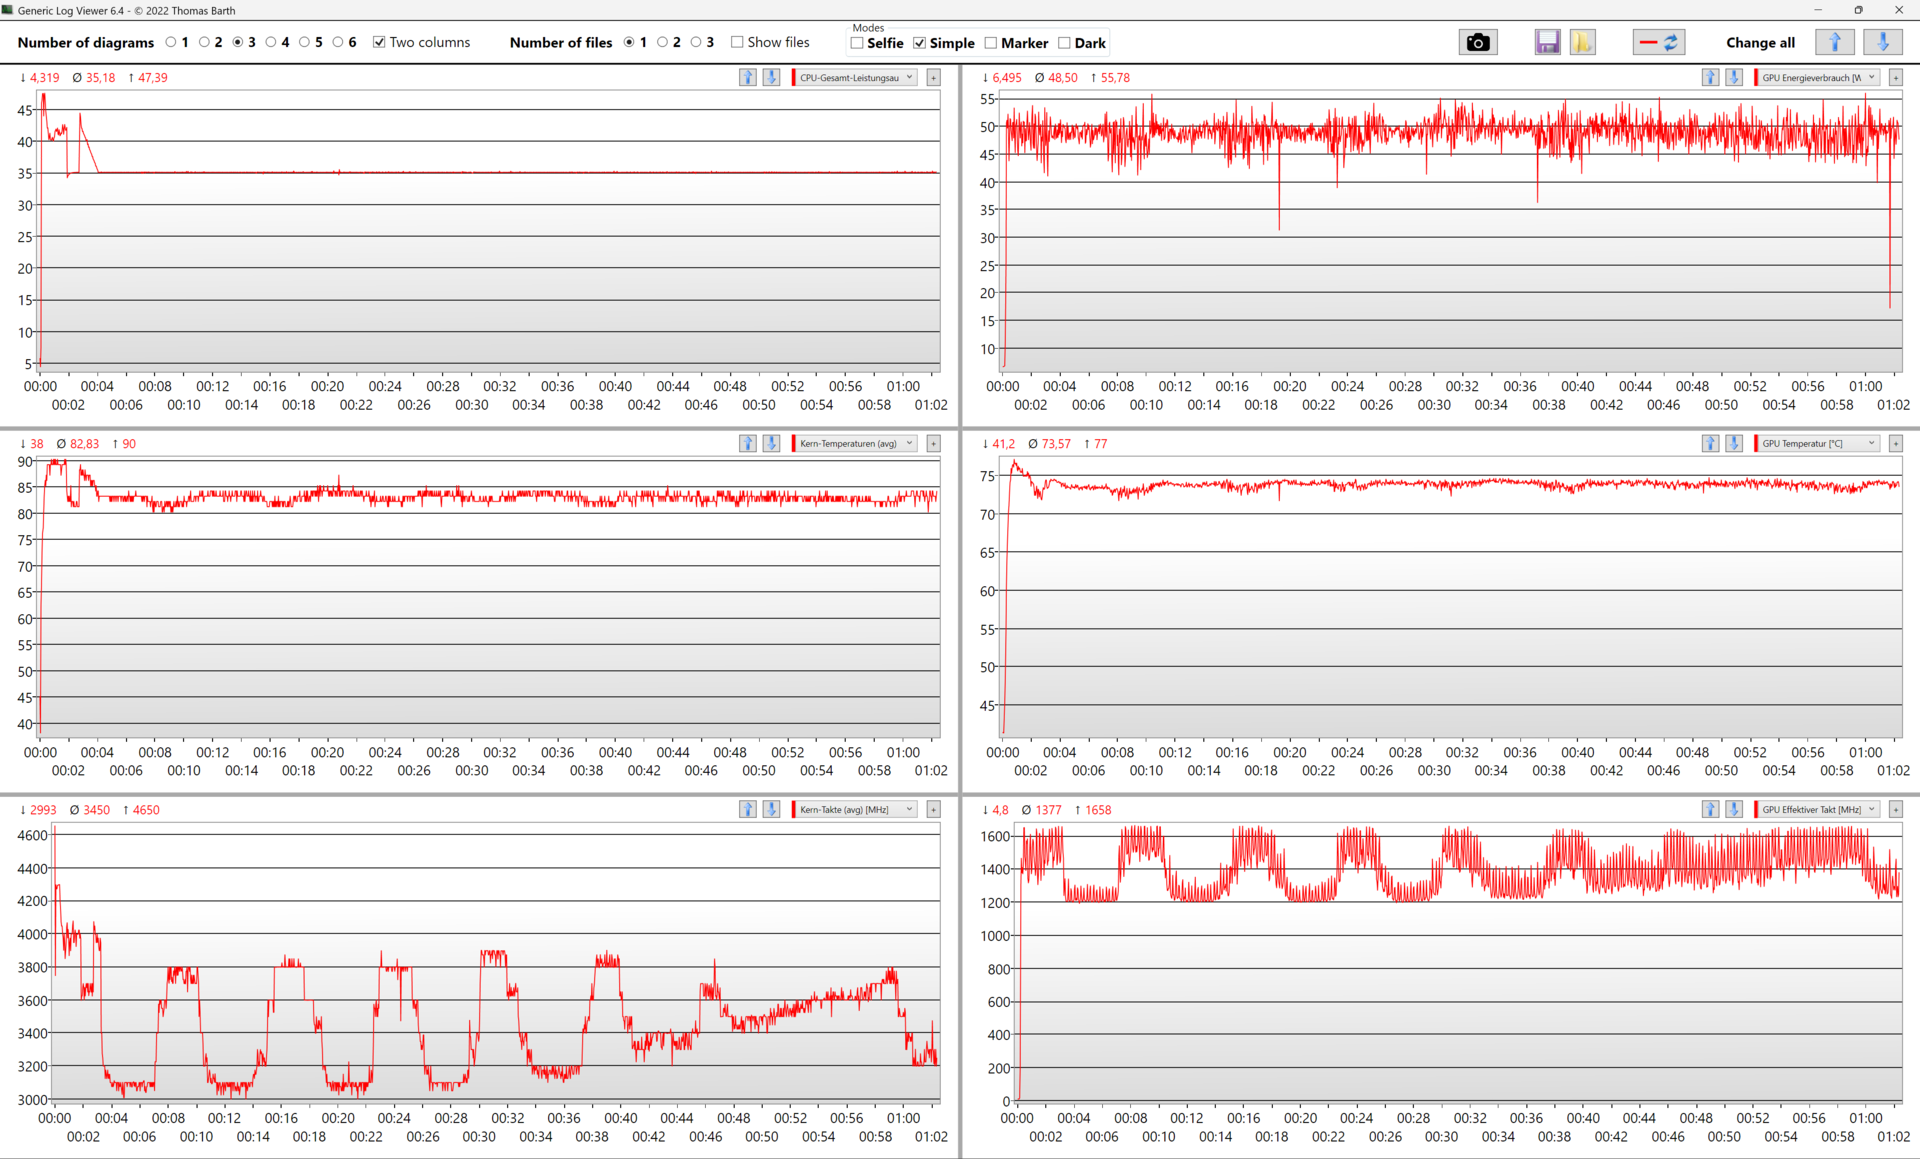
Vivobook Pro 16X的性能在最初两分钟内大量下降。随后,笔记本电脑的性能保持稳定。这也可以被认为是一个特别长的提升窗口。处理器以令人印象深刻的46瓦特开始压力测试,然后慢慢下降到35瓦特。这与英特尔酷睿i7-11370H的理论最大PL1相符。 英特尔酷睿i7-11370H.即使在持续的压力下,温度仍然是非关键性的。没有一个传感器报告超过90℃(194°F)。因此,表面温度在大多数情况下也保持舒适。
发言人
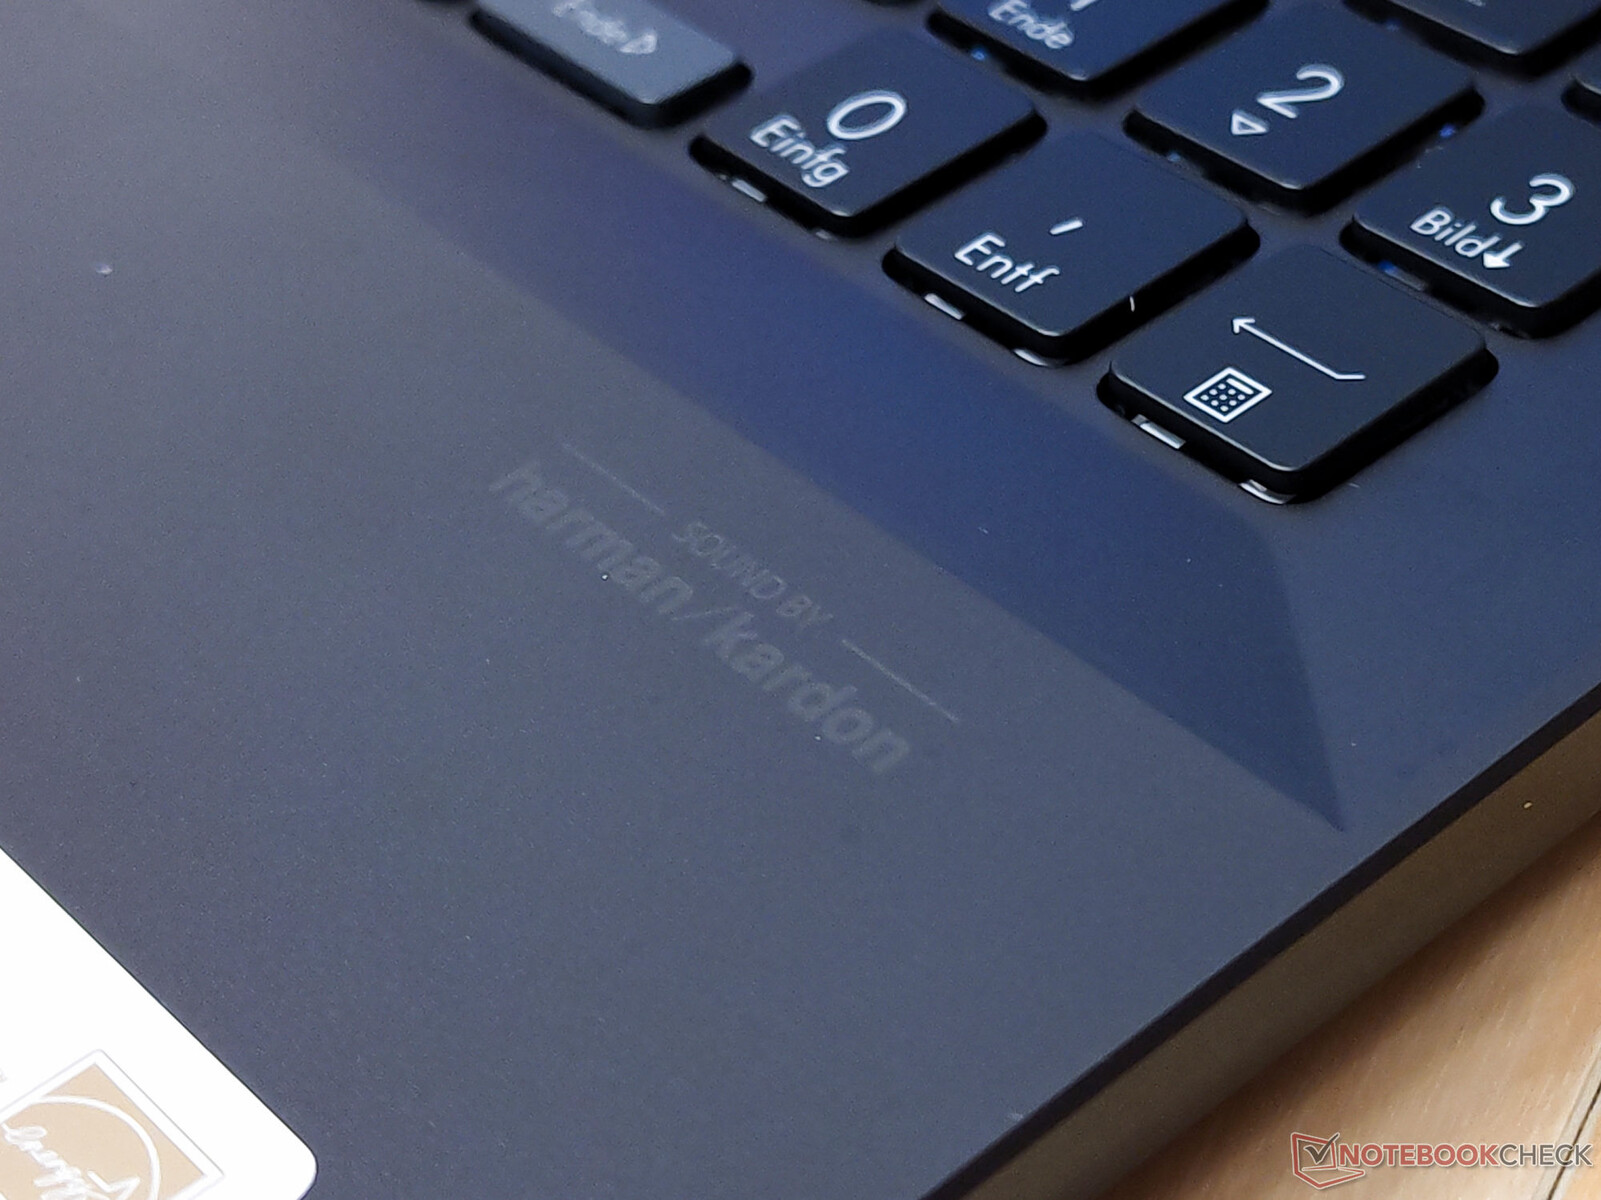
Vivobook在产生线性声音方面很努力。尽管有 "Sound by Harman/Kardon "的标志,但音频体验却相对较差。小型扬声器缺乏低音。高频的明显过度调制是一个更主要的问题。即使在较低的音量下,它们也常常过于响亮。在这方面,还有改进的余地。
Asus VivoBook Pro 16X OLED N7600PC-L2026X audio analysis
(+) | speakers can play relatively loud (89 dB)
Bass 100 - 315 Hz
(-) | nearly no bass - on average 19.4% lower than median
(±) | linearity of bass is average (7.8% delta to prev. frequency)
Mids 400 - 2000 Hz
(+) | balanced mids - only 1.3% away from median
(+) | mids are linear (2.7% delta to prev. frequency)
Highs 2 - 16 kHz
(±) | higher highs - on average 7.7% higher than median
(+) | highs are linear (6.8% delta to prev. frequency)
Overall 100 - 16.000 Hz
(±) | linearity of overall sound is average (16% difference to median)
Compared to same class
» 40% of all tested devices in this class were better, 6% similar, 54% worse
» The best had a delta of 5%, average was 17%, worst was 45%
Compared to all devices tested
» 25% of all tested devices were better, 5% similar, 69% worse
» The best had a delta of 4%, average was 23%, worst was 134%
MSI Summit E16 Flip A12UDT-031 audio analysis
(±) | speaker loudness is average but good (79.8 dB)
Bass 100 - 315 Hz
(-) | nearly no bass - on average 23.6% lower than median
(-) | bass is not linear (15.1% delta to prev. frequency)
Mids 400 - 2000 Hz
(±) | higher mids - on average 5.6% higher than median
(±) | linearity of mids is average (7.4% delta to prev. frequency)
Highs 2 - 16 kHz
(±) | higher highs - on average 5.6% higher than median
(+) | highs are linear (4.5% delta to prev. frequency)
Overall 100 - 16.000 Hz
(±) | linearity of overall sound is average (22.6% difference to median)
Compared to same class
» 68% of all tested devices in this class were better, 5% similar, 27% worse
» The best had a delta of 6%, average was 20%, worst was 57%
Compared to all devices tested
» 67% of all tested devices were better, 6% similar, 28% worse
» The best had a delta of 4%, average was 23%, worst was 134%
Schenker XMG Focus 15 audio analysis
(±) | speaker loudness is average but good (78 dB)
Bass 100 - 315 Hz
(-) | nearly no bass - on average 25.5% lower than median
(±) | linearity of bass is average (8.4% delta to prev. frequency)
Mids 400 - 2000 Hz
(+) | balanced mids - only 4.9% away from median
(+) | mids are linear (5.6% delta to prev. frequency)
Highs 2 - 16 kHz
(+) | balanced highs - only 1.7% away from median
(+) | highs are linear (4.1% delta to prev. frequency)
Overall 100 - 16.000 Hz
(±) | linearity of overall sound is average (20% difference to median)
Compared to same class
» 70% of all tested devices in this class were better, 7% similar, 23% worse
» The best had a delta of 6%, average was 18%, worst was 132%
Compared to all devices tested
» 51% of all tested devices were better, 8% similar, 41% worse
» The best had a delta of 4%, average was 23%, worst was 134%
能源管理 - 尽管有96瓦时的电池,但没有记录运行时间
能源消耗
Vivobook Pro 16X OLED在我们的测试中显示了合理的消耗值。当然,在执行高要求的任务时,强大的硬件需要稍多的电力。在空闲时,与我们比较中的其他设备相比,华硕笔记本电脑的能耗略微增加了几瓦特。然而,我们经常发现,与LCD机型相比,采用OLED显示屏的笔记本电脑在这方面略显劣势。
| Off / Standby | |
| Idle | |
| Load |
|
Key:
min: | |
| Asus VivoBook Pro 16X OLED N7600PC-L2026X i7-11370H, GeForce RTX 3050 4GB Laptop GPU, Intel Optane Memory H10 with Solid State Storage 32GB + 512GB HBRPEKNX0202A(L/H), OLED, 3840x2400, 16" | MSI Summit E16 Flip A12UDT-031 i7-1280P, GeForce RTX 3050 Ti Laptop GPU, Samsung PM9A1 MZVL22T0HBLB, IPS, 2560x1600, 16" | Microsoft Surface Laptop Studio i7 RTX 3050 Ti i7-11370H, GeForce RTX 3050 Ti Laptop GPU, SK Hynix PC711 1TB HFS001TDE9X084N, IPS, 2400x1600, 14.4" | Dell Inspiron 16 Plus 7610 i7-11800H, GeForce RTX 3050 4GB Laptop GPU, Kingston OM3PDP3512B, IPS, 3072x1920, 16" | Lenovo ThinkPad X1 Extreme G4-20Y5CTO1WW (3050 Ti) i7-11800H, GeForce RTX 3050 Ti Laptop GPU, Samsung PM9A1 MZVL21T0HCLR, IPS LED, 3840x2400, 16" | Schenker XMG Focus 15 i7-11800H, GeForce RTX 3050 Ti Laptop GPU, Samsung SSD 970 EVO Plus 1TB, IPS, 1920x1080, 15.6" | Average NVIDIA GeForce RTX 3050 4GB Laptop GPU | Average of class Multimedia | |
|---|---|---|---|---|---|---|---|---|
| Power Consumption | -12% | 30% | -12% | -47% | -89% | -2% | 12% | |
| Idle Minimum * (Watt) | 8.9 | 9.8 -10% | 2.6 71% | 7.7 13% | 10.3 -16% | 23 -158% | 7.17 ? 19% | 5.66 ? 36% |
| Idle Average * (Watt) | 10.2 | 15.3 -50% | 7.1 30% | 10.7 -5% | 22.06 -116% | 25 -145% | 10.4 ? -2% | 10.2 ? -0% |
| Idle Maximum * (Watt) | 12 | 16.3 -36% | 7.9 34% | 16.8 -40% | 23 -92% | 29 -142% | 14.8 ? -23% | 12.5 ? -4% |
| Load Average * (Watt) | 94 | 87 7% | 76.8 18% | 100.39 -7% | 102.57 -9% | 106 -13% | 89.7 ? 5% | 65.2 ? 31% |
| Witcher 3 ultra * (Watt) | 93.1 | 86.1 8% | 83 11% | 108 -16% | 106 -14% | 128 -37% | ||
| Load Maximum * (Watt) | 112 | 100 11% | 97.3 13% | 129 -15% | 147.8 -32% | 156 -39% | 124.8 ? -11% | 113.5 ? -1% |
* ... smaller is better
Consumption Witcher 3 / Stress Test
Consumption external Monitor
电池寿命
由于96Wh的高电池容量,人们可以期待很长的电池寿命。这个容量几乎达到了笔记本电脑的法定上限。然而,高分辨率的16英寸OLED显示屏对电池资源的使用显然是慷慨的。在最大亮度下,我们的华硕测试设备在现实世界的Wi-Fi测试中只持续了约6:30小时。将亮度降低到150尼特已经使运行时间增加了2小时。OLED显示屏的一个流行的节能方法是尽可能地强制使用黑暗模式。显示器上的每个明亮区域都会消耗电能。由于在我们的网络浏览测试中经常显示许多大的白色区域,这对OLED显示器来说是特别不容易的。
| Asus VivoBook Pro 16X OLED N7600PC-L2026X i7-11370H, GeForce RTX 3050 4GB Laptop GPU, 96 Wh | MSI Summit E16 Flip A12UDT-031 i7-1280P, GeForce RTX 3050 Ti Laptop GPU, 82 Wh | Microsoft Surface Laptop Studio i7 RTX 3050 Ti i7-11370H, GeForce RTX 3050 Ti Laptop GPU, 58 Wh | Dell Inspiron 16 Plus 7610 i7-11800H, GeForce RTX 3050 4GB Laptop GPU, 86 Wh | Lenovo ThinkPad X1 Extreme G4-20Y5CTO1WW (3050 Ti) i7-11800H, GeForce RTX 3050 Ti Laptop GPU, 90 Wh | Schenker XMG Focus 15 i7-11800H, GeForce RTX 3050 Ti Laptop GPU, 49 Wh | Average of class Multimedia | |
|---|---|---|---|---|---|---|---|
| Battery runtime | -18% | -34% | 44% | -38% | -53% | 44% | |
| Reader / Idle (h) | 11.1 | 20.5 85% | 6.5 -41% | 24.9 ? 124% | |||
| WiFi v1.3 (h) | 8.7 | 7.1 -18% | 8 -8% | 9.9 14% | 6.6 -24% | 3.9 -55% | 12.2 ? 40% |
| Load (h) | 2.5 | 1 -60% | 3.3 32% | 1.2 -52% | 0.9 -64% | 1.664 ? -33% | |
| H.264 (h) | 12.3 | 6.7 | 17.1 ? |
Pros
Cons
评语 - 性能一般,显示效果突出
华硕Vivobook Pro 16X OLED的屏幕可以说是它最好的特征。OLED面板闪耀着自然的色彩和非常快的响应时间。它的缺点几乎完全限于在户外使用。这款笔记本电脑的功能大多符合我们对中高档多媒体笔记本电脑的期望。也就是说,有点迟钝的Optane存储和左边的USB端口的低版本号有点令人失望。按照今天的标准,USB 2.0已经过时了。
铝制机箱很微妙,但视觉上很吸引人。编织涂层出乎意料地抗油污,触感舒适,而且始终是一道有趣的风景。不幸的是,华硕在建造质量方面掉了链子。整体印象受困于多个区域的不均匀间隙。
华硕Vivobook Pro 16X的梦幻般的OLED显示屏是关注的焦点。然而,这款笔记本电脑还提供了一个中高的性能水平和一个整体上不错的案例。华硕表盘等有趣的功能使该包装更加完美。
就价格而言,1600美元左右的Vivobook处于中上水平。相对于这个类别的其他设备,其功能、制造质量和设计都是足够的。同时, 戴尔Inspiron 16 Plus 7610则要便宜得多。后者提供类似的功能和良好的IPS显示屏,可以从各种零售商处以略高于1000美元的价格购买。也就是说,华硕Vivobook 16X的其他配置也可以以更低的价格买到,这取决于型号。
价格和可用性
类似配置的华硕Vivobook在Amazon.com上有售。售价约为1500美元。在新蛋网,同样的配置,但有16GB而不是32GB的内存,,目前正在出售999美元(原价1399美元)。
Asus VivoBook Pro 16X OLED N7600PC-L2026X
- 11/07/2022 v7 (old)
Marc Herter
Price comparison

