宏碁Swift X 16评论。RTX 3050在多媒体笔记本电脑中大放异彩
宏碁Swift X 16基本上不同于Acer Swift 3 (SF316)只在图形卡方面,前者使用了 Nvidia的GeForce RTX 3050这款多媒体笔记本电脑由一个 酷睿i5-11320H或 酷睿i7-11390H四核CPU -Tiger Lake Refresh,TDP为35瓦。没有AMD的变种是提供像它的小兄弟, 的 Acer Swift X 14.内存始终是焊接的16GB LPDDR4X-4266,而PCIe 3.0固态硬盘拥有512GB。
我们的审查特别感兴趣的是,显示和多媒体性能的基准是否在1200美元的价格中得到了适当的反映。毕竟,竞争对手的设备,如 戴尔的Inspiron 16 Plus, 联想的IdeaPad 5 Pro 16和 华硕的VivoBook Pro 16X都是不容小觑的。
潜在的竞争对手比较
Rating | Date | Model | Weight | Height | Size | Resolution | Price |
|---|---|---|---|---|---|---|---|
| 86.2 % v7 (old) | 07 / 2022 | Acer Swift X SFX16-51G-5388 i5-11320H, GeForce RTX 3050 4GB Laptop GPU | 1.8 kg | 18.9 mm | 16.10" | 1920x1080 | |
| 86.4 % v7 (old) | 10 / 2021 | Acer Swift 3 SF316-51 i7-11370H, Iris Xe G7 96EUs | 1.7 kg | 15.9 mm | 16.10" | 1920x1080 | |
| 85.6 % v7 (old) | 03 / 2022 | Acer Swift X SFX14-41G-R7F3 R5 5500U, GeForce GTX 1650 Mobile | 1.4 kg | 18.89 mm | 14.00" | 1920x1080 | |
| 86.1 % v7 (old) | 09 / 2021 | Lenovo IdeaPad 5 Pro 16ACH R7 5800H, GeForce GTX 1650 Mobile | 2 kg | 17.5 mm | 16.00" | 2560x1600 | |
| 86.7 % v7 (old) | 10 / 2021 | Dell Inspiron 16 Plus 7610 i7-11800H, GeForce RTX 3050 4GB Laptop GPU | 2 kg | 18.99 mm | 16.00" | 3072x1920 | |
v (old) | 12 / 2021 | Asus Vivobook Pro 16X-M7600QE R9 5900HX, GeForce RTX 3050 Ti Laptop GPU | 1.9 kg | 19 mm | 16.10" | 3840x2400 | |
| 86.5 % v7 (old) | 10 / 2021 | Huawei MateBook 16 R7 5800H R7 5800H, Vega 8 | 2 kg | 17.8 mm | 16.00" | 2520x1680 |
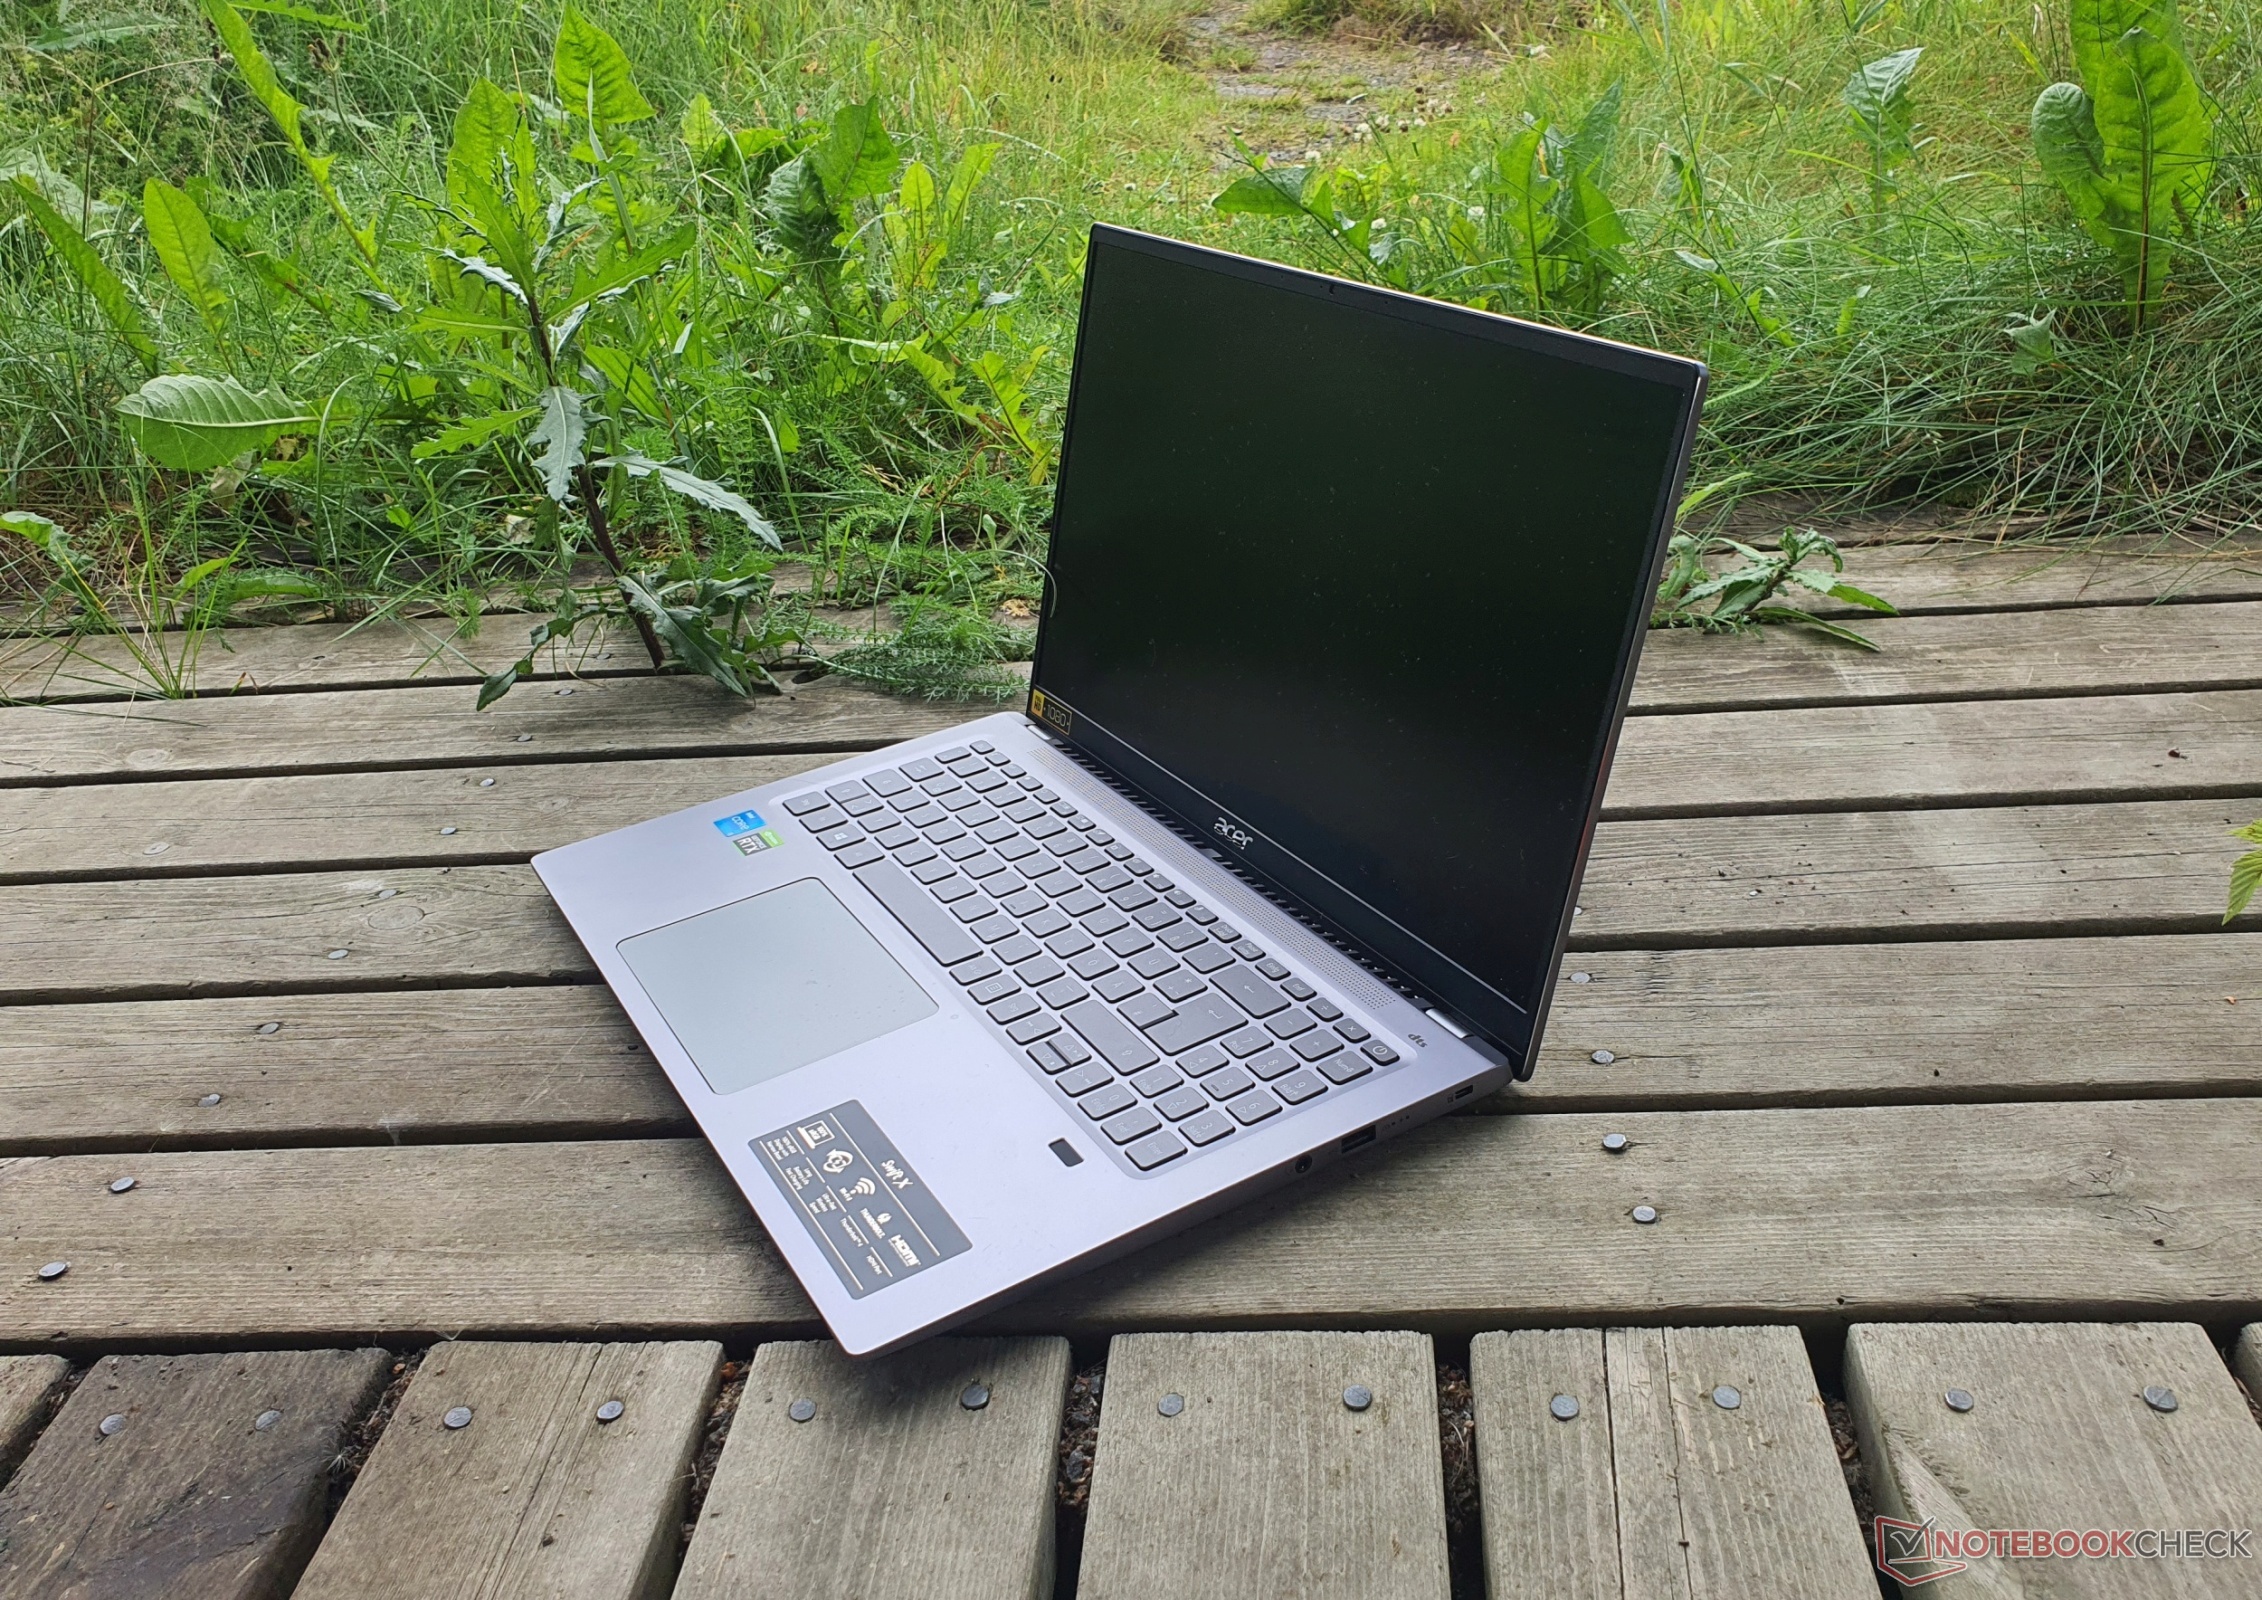
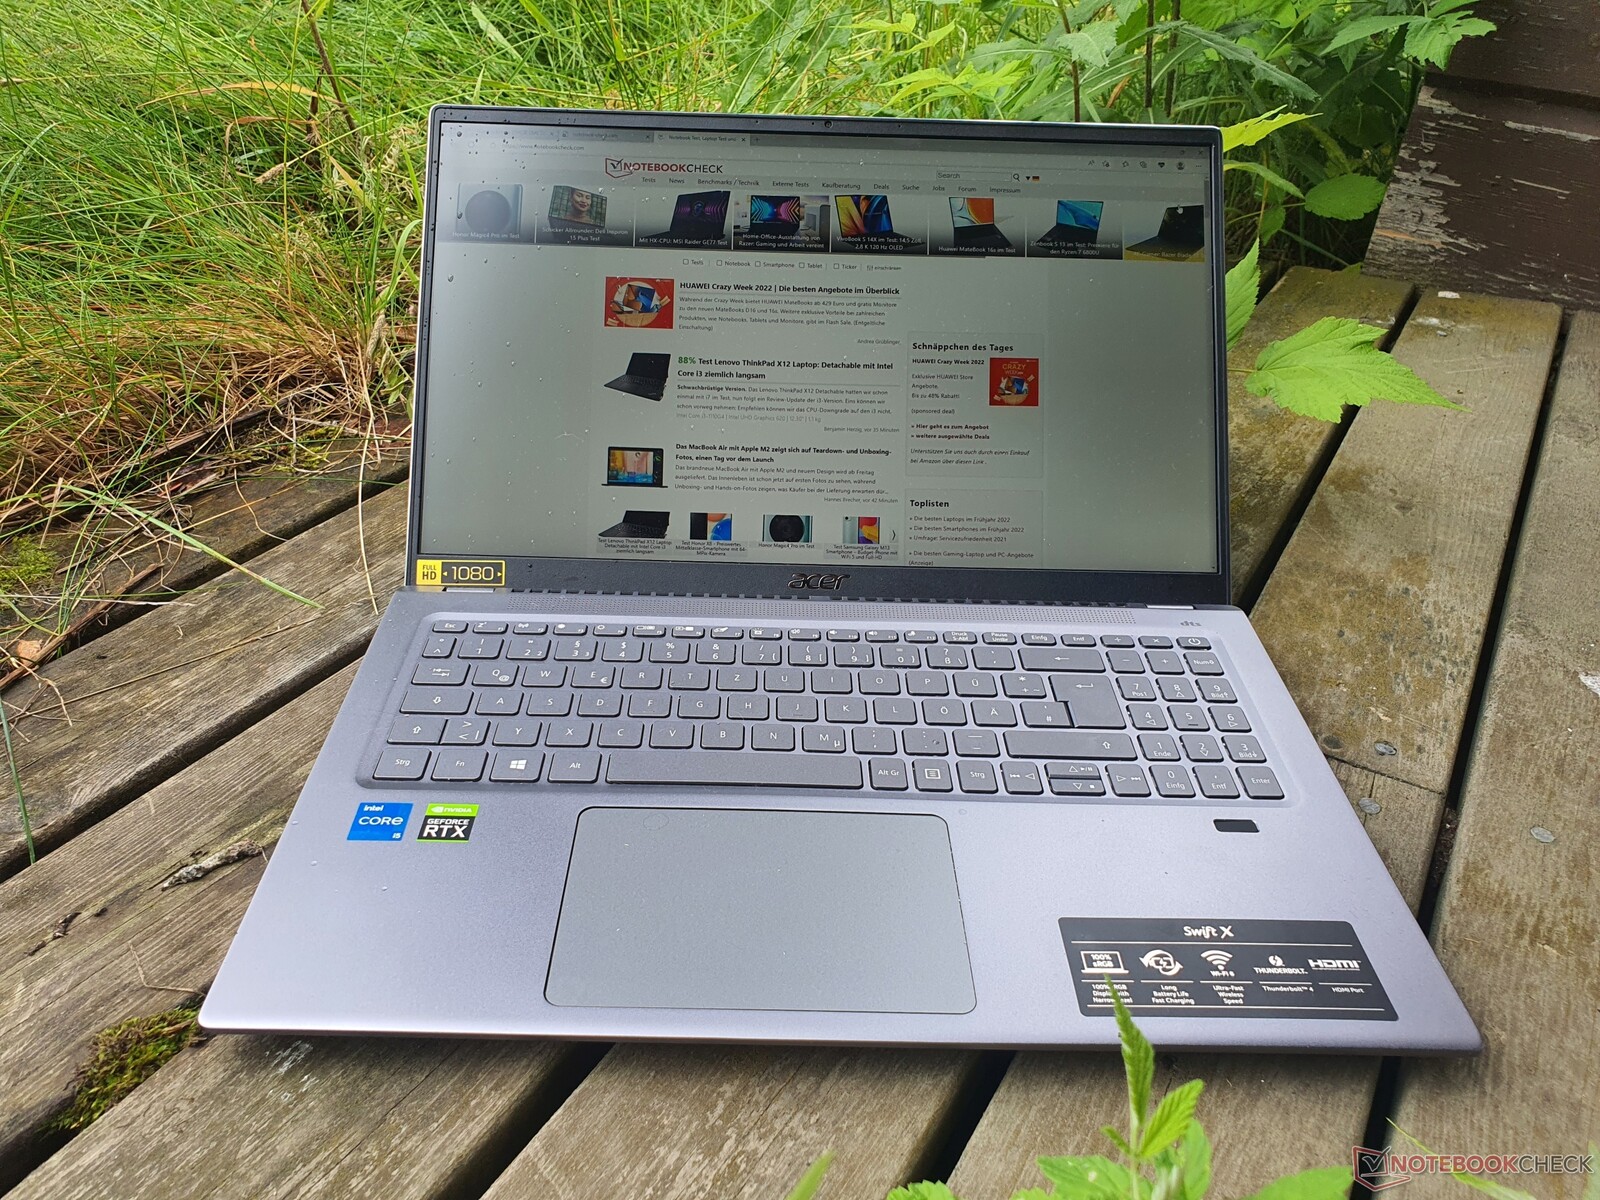
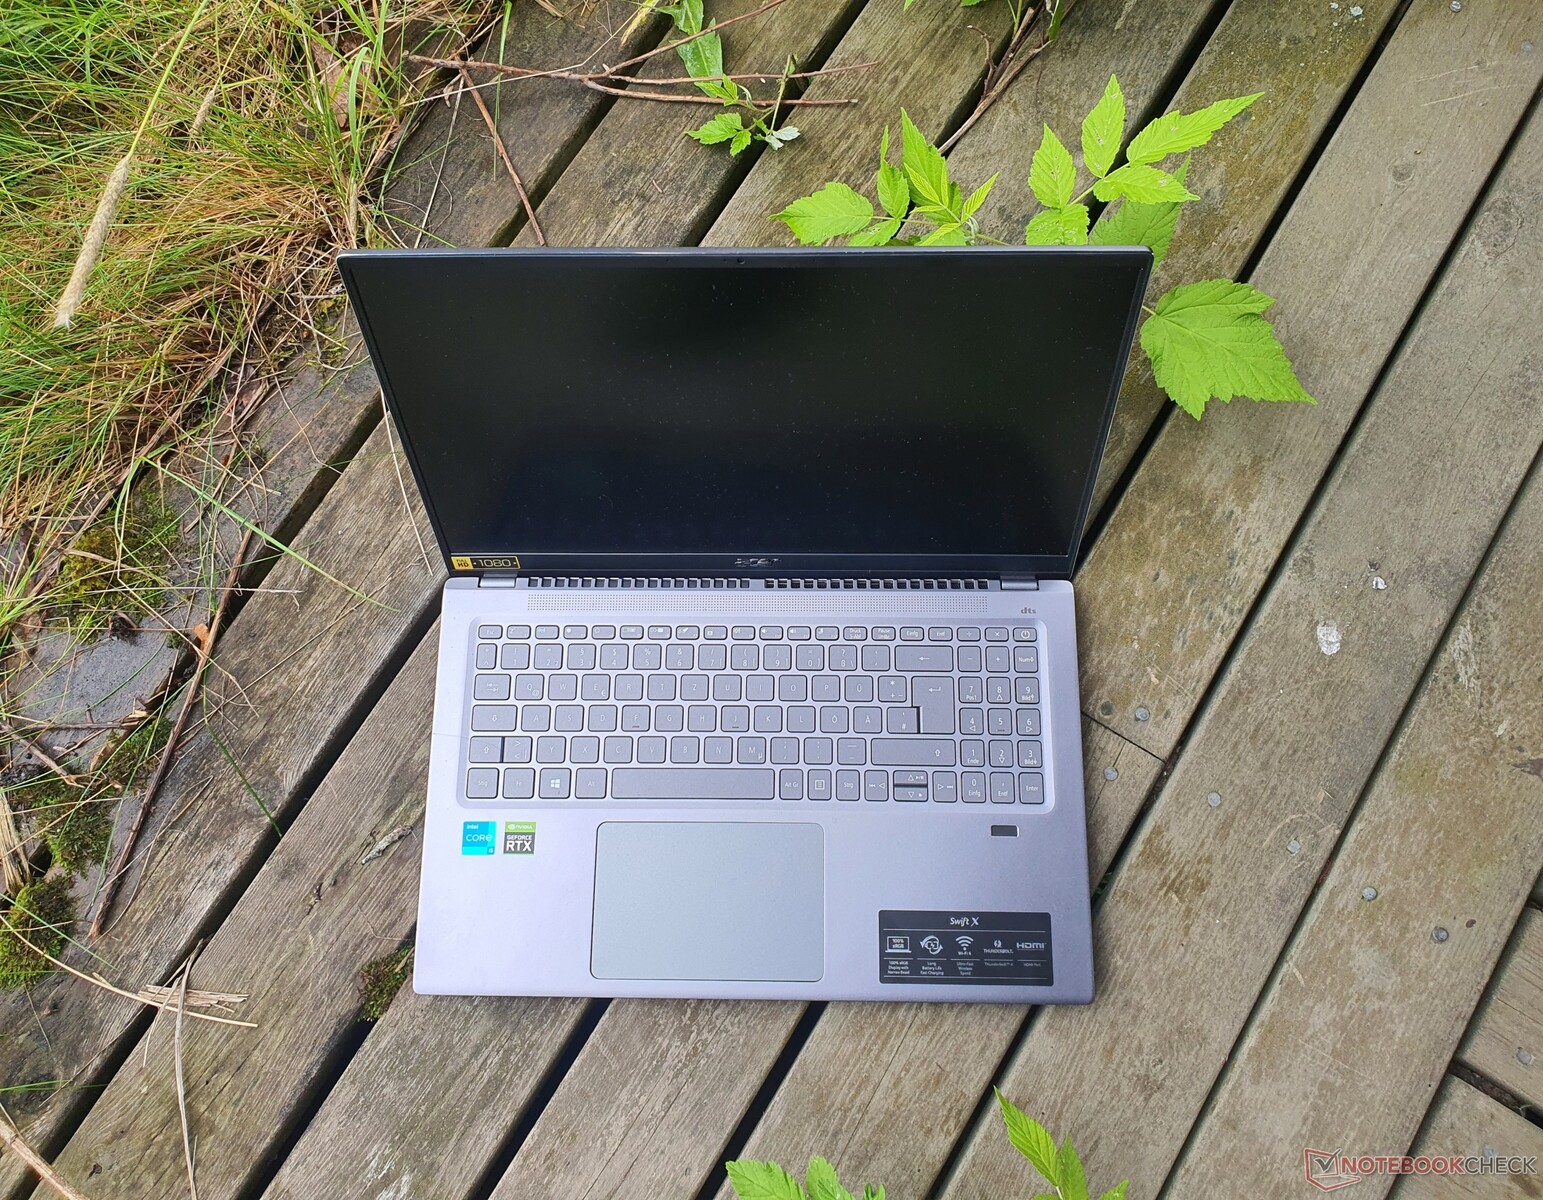
铝制外壳使宏碁Swift X 16具有稳定性
灰蓝色和哑光的铝制外壳有一种高质量的感觉,而且相当稳定;掌托上的弯曲程度很小。铰链很紧,所以屏幕只是轻微晃动,但同时允许单手打开。
然而,盖子的抗扭性可以更强一些,在选定的压力应用下,它的表现也不太理想。但在日常使用中,这几乎不是一个问题。做工方面没有任何缝隙或突起,最大开启角度为相对较小的130度。
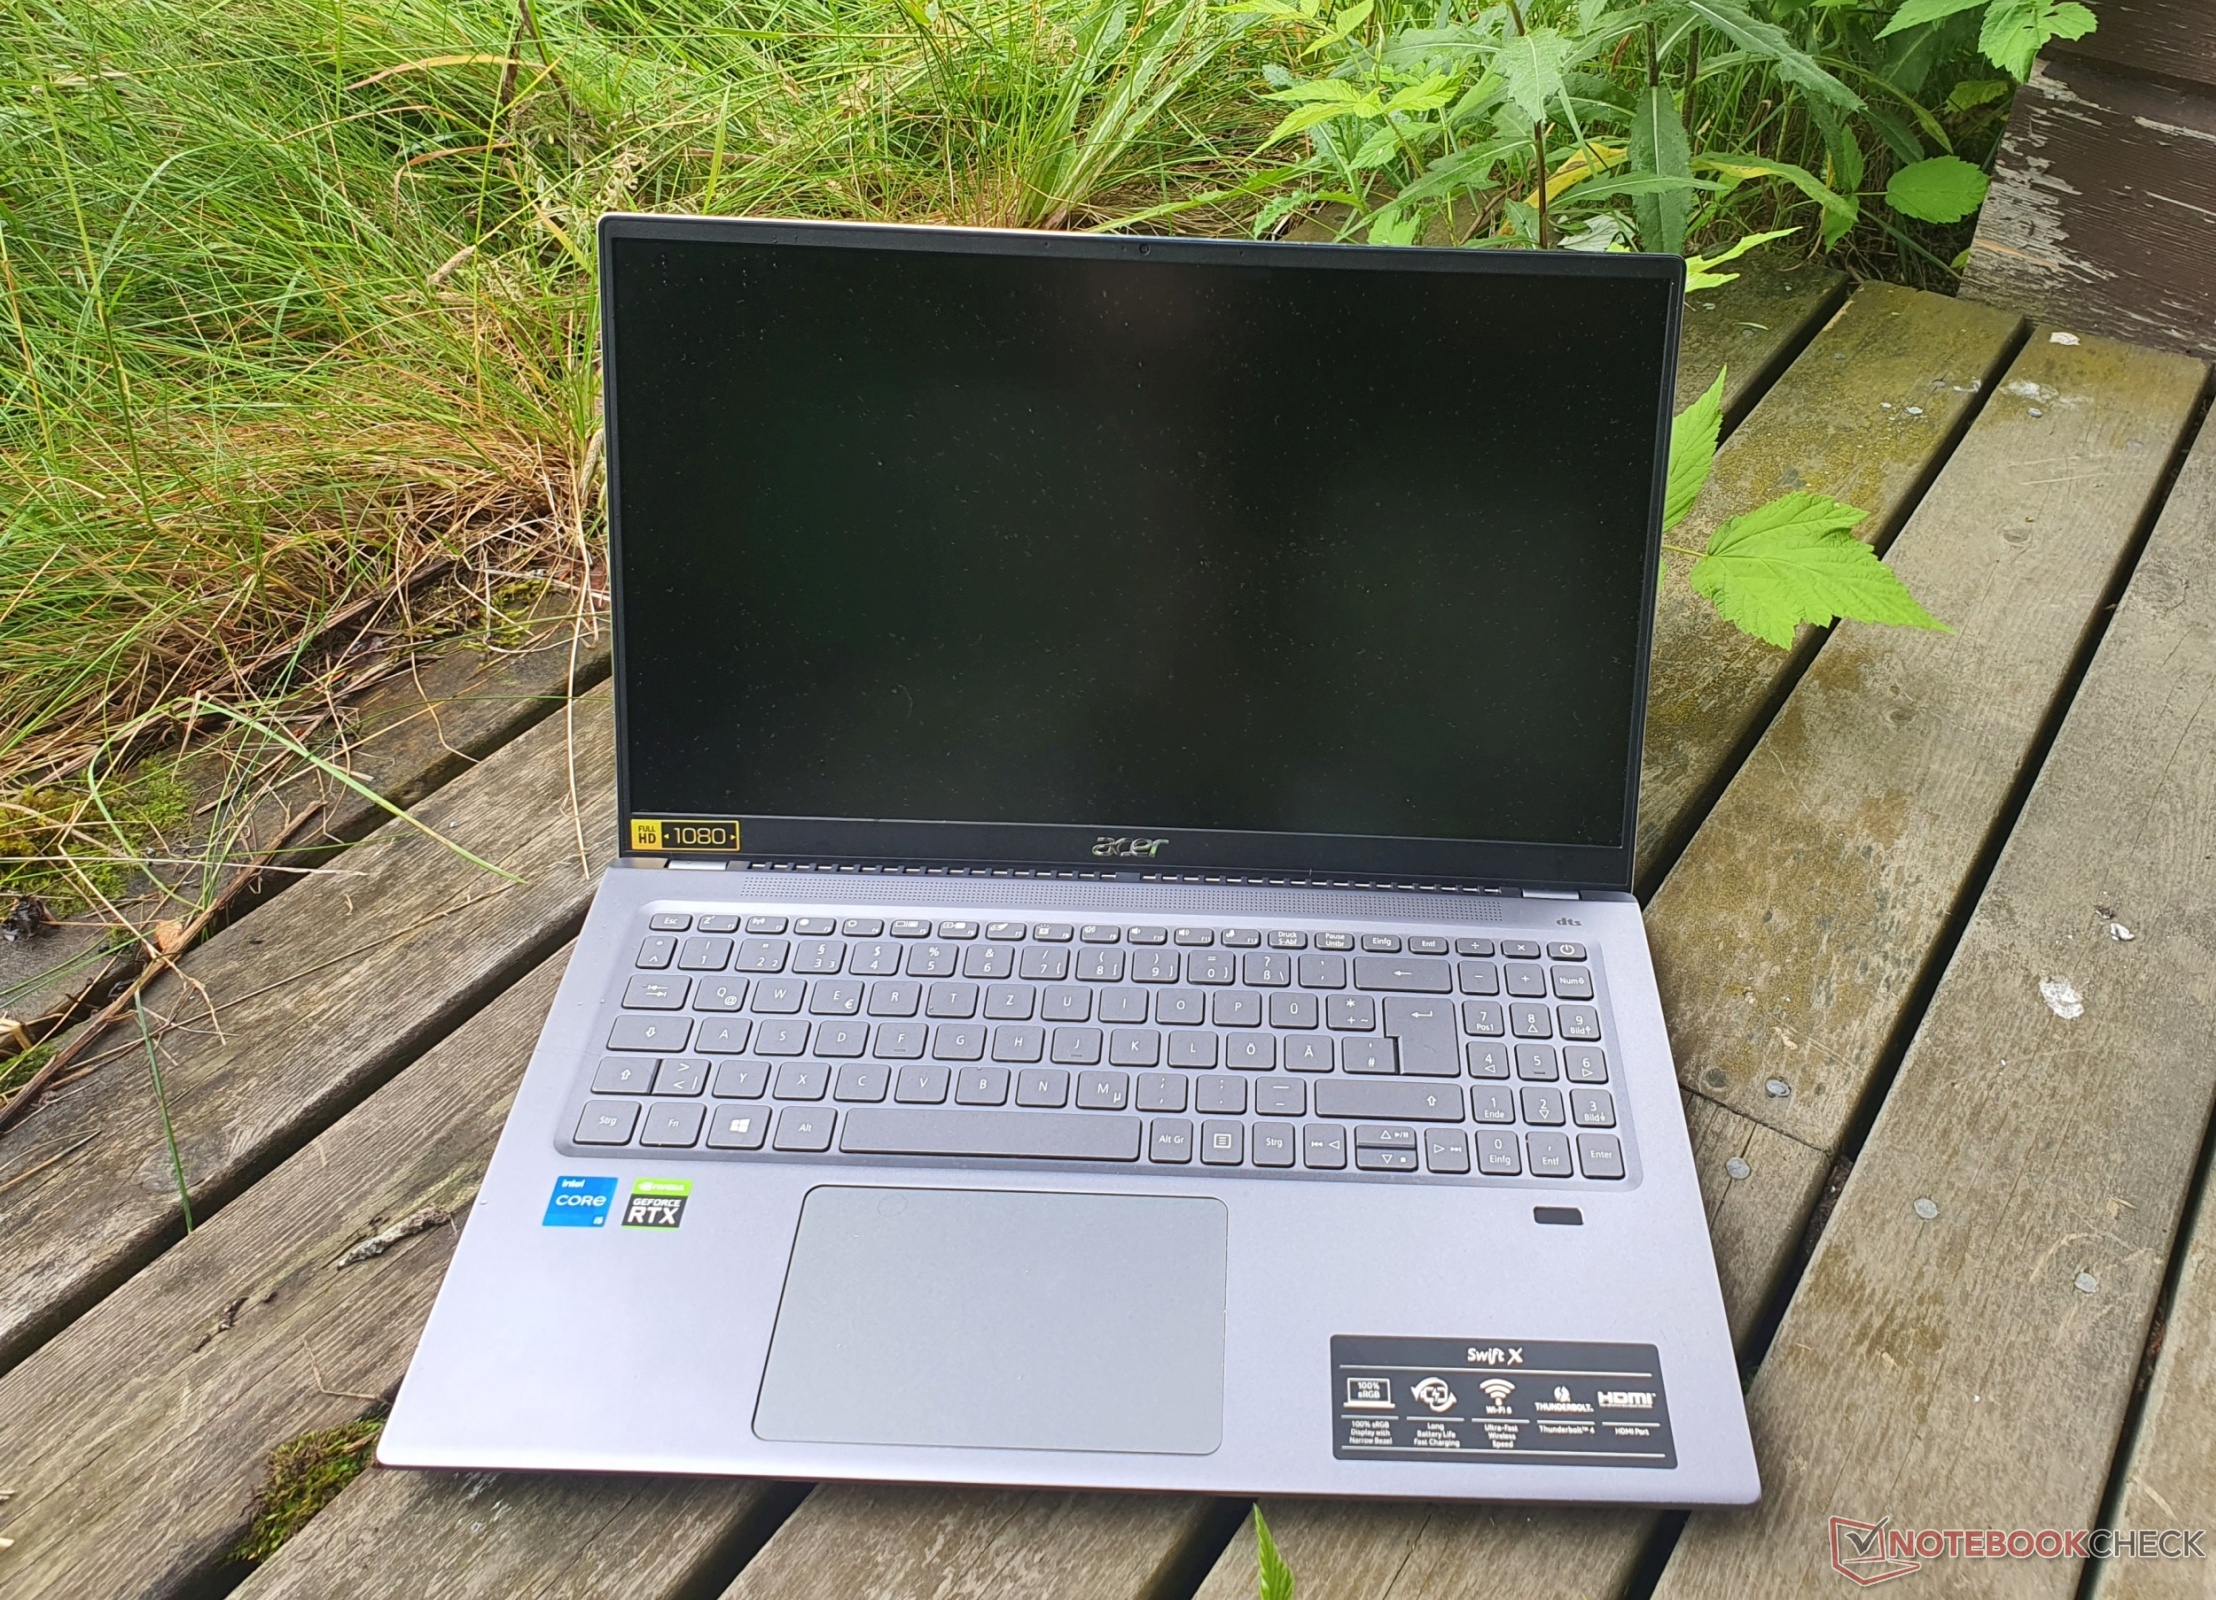
由于采用16:9格式的16.1英寸屏幕,宏碁Swift X略长,但宽度较小,重量相对较轻,为1.8公斤。由于没有dGPU,Swift 3的重量少了约130克。所有其他对比设备都提供16:10格式的16英寸显示屏,重量约为2公斤。
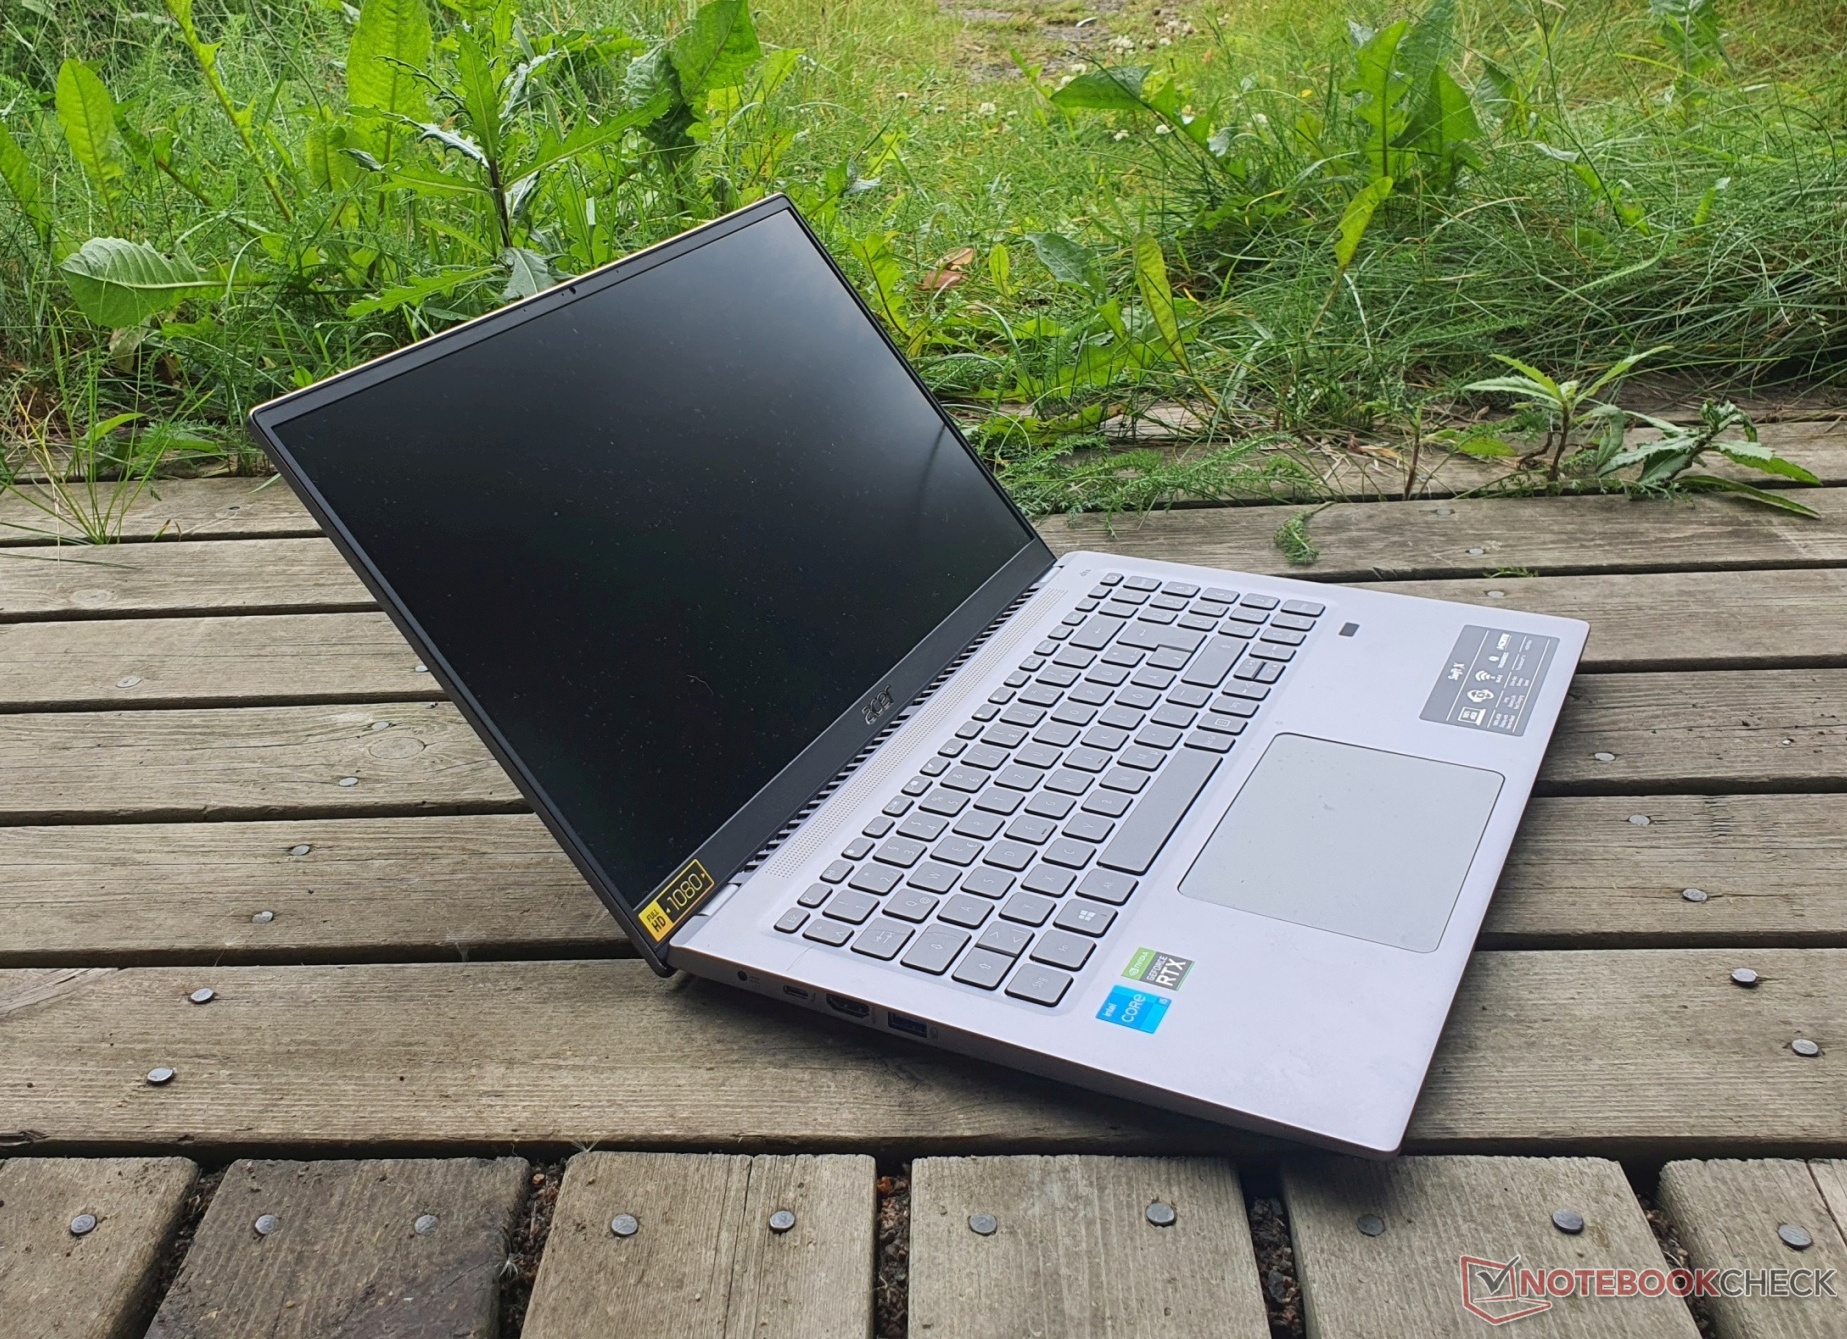
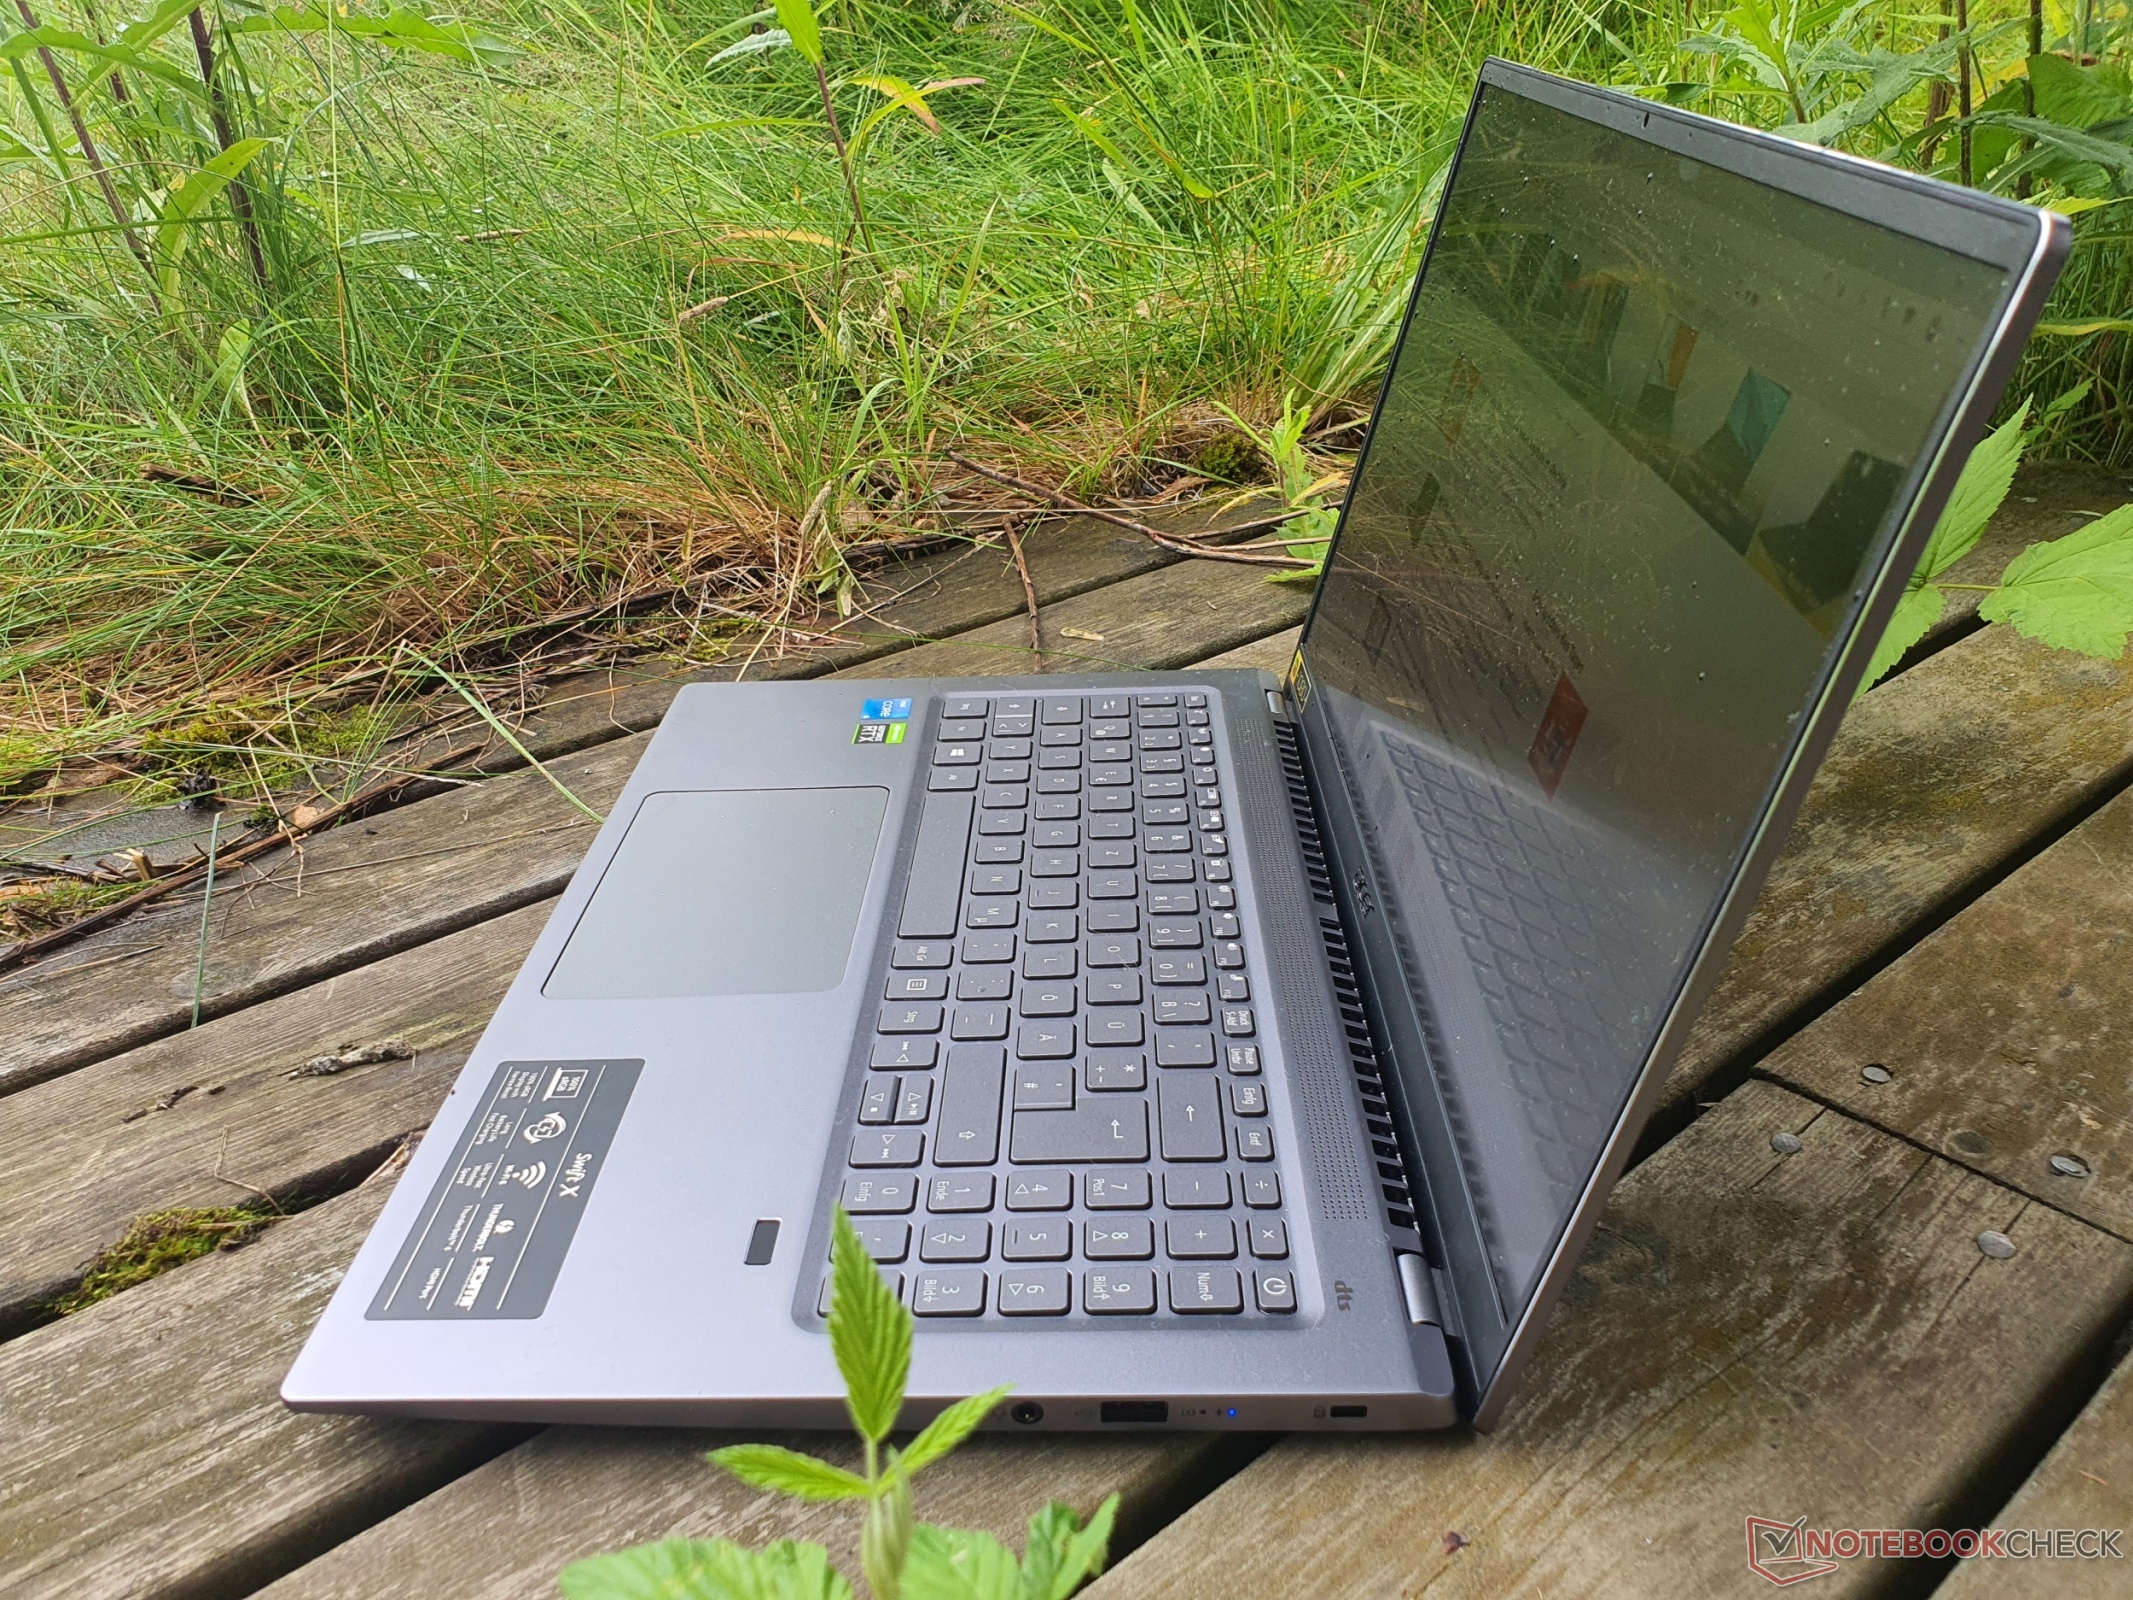
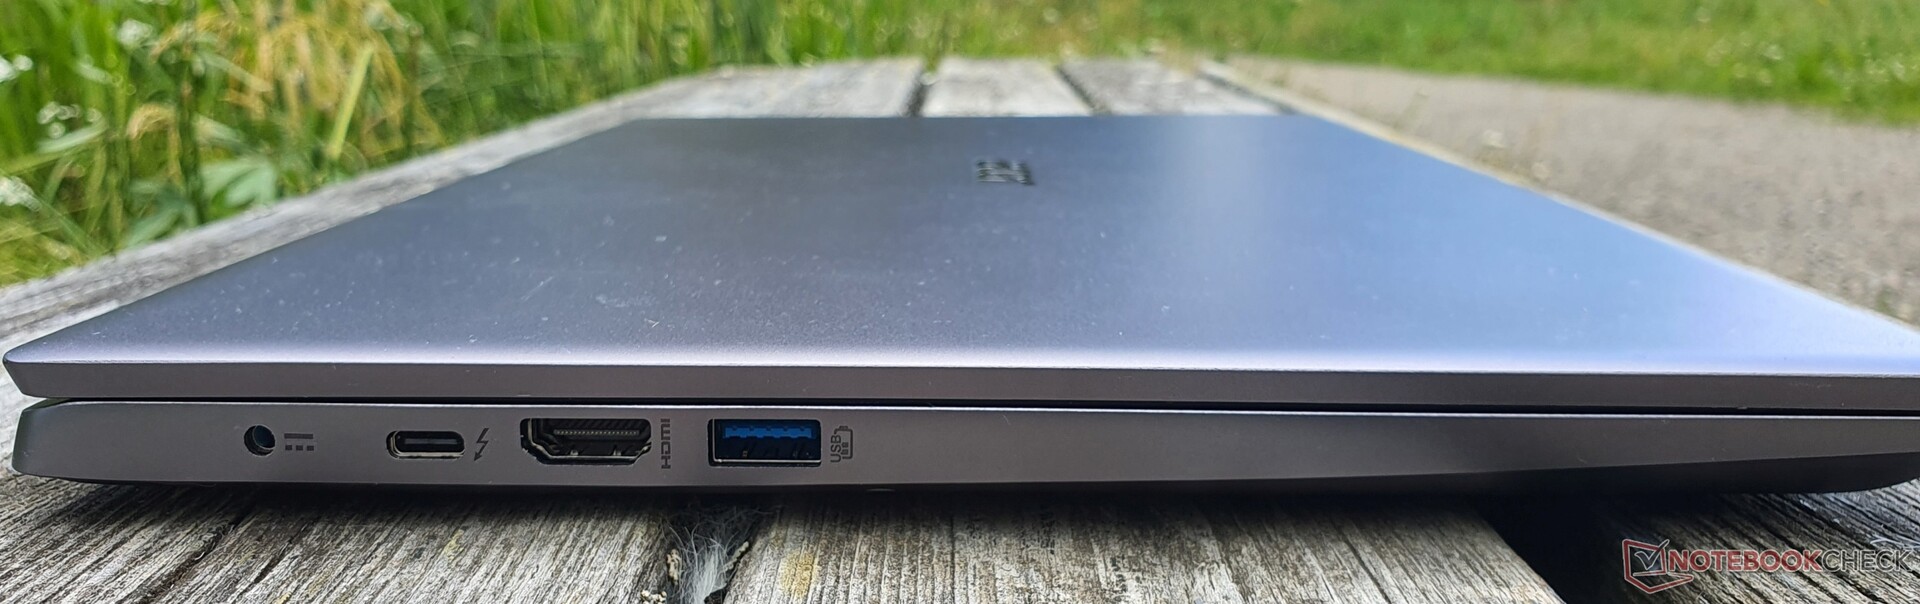
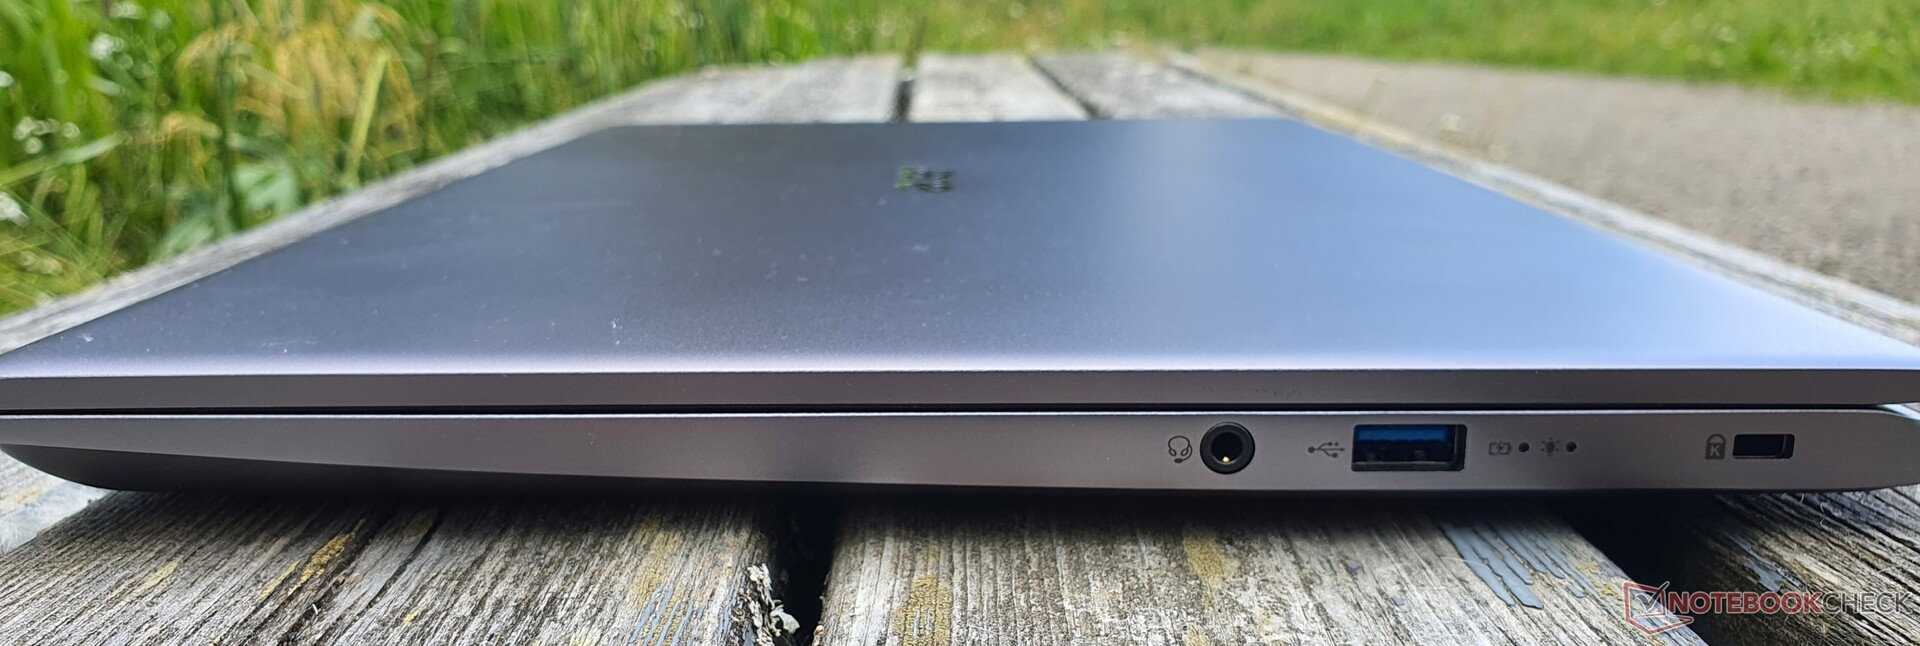
设备。宏碁采用Thunderbolt 4的 "迅捷"。
宏碁Swift X上的端口都有足够的间距,不会相互遮挡。一个HDMI 2.0端口和通过Thunderbolt 4的DisplayPort 1.4可用于外部显示器。
还有两个USB-A 3.2 Gen1端口,两侧各一个。还提供了一个音频插孔和一个Kensington设备,但没有SD读卡器或LAN端口。充电是通过专有连接或USB-C进行的。
沟通
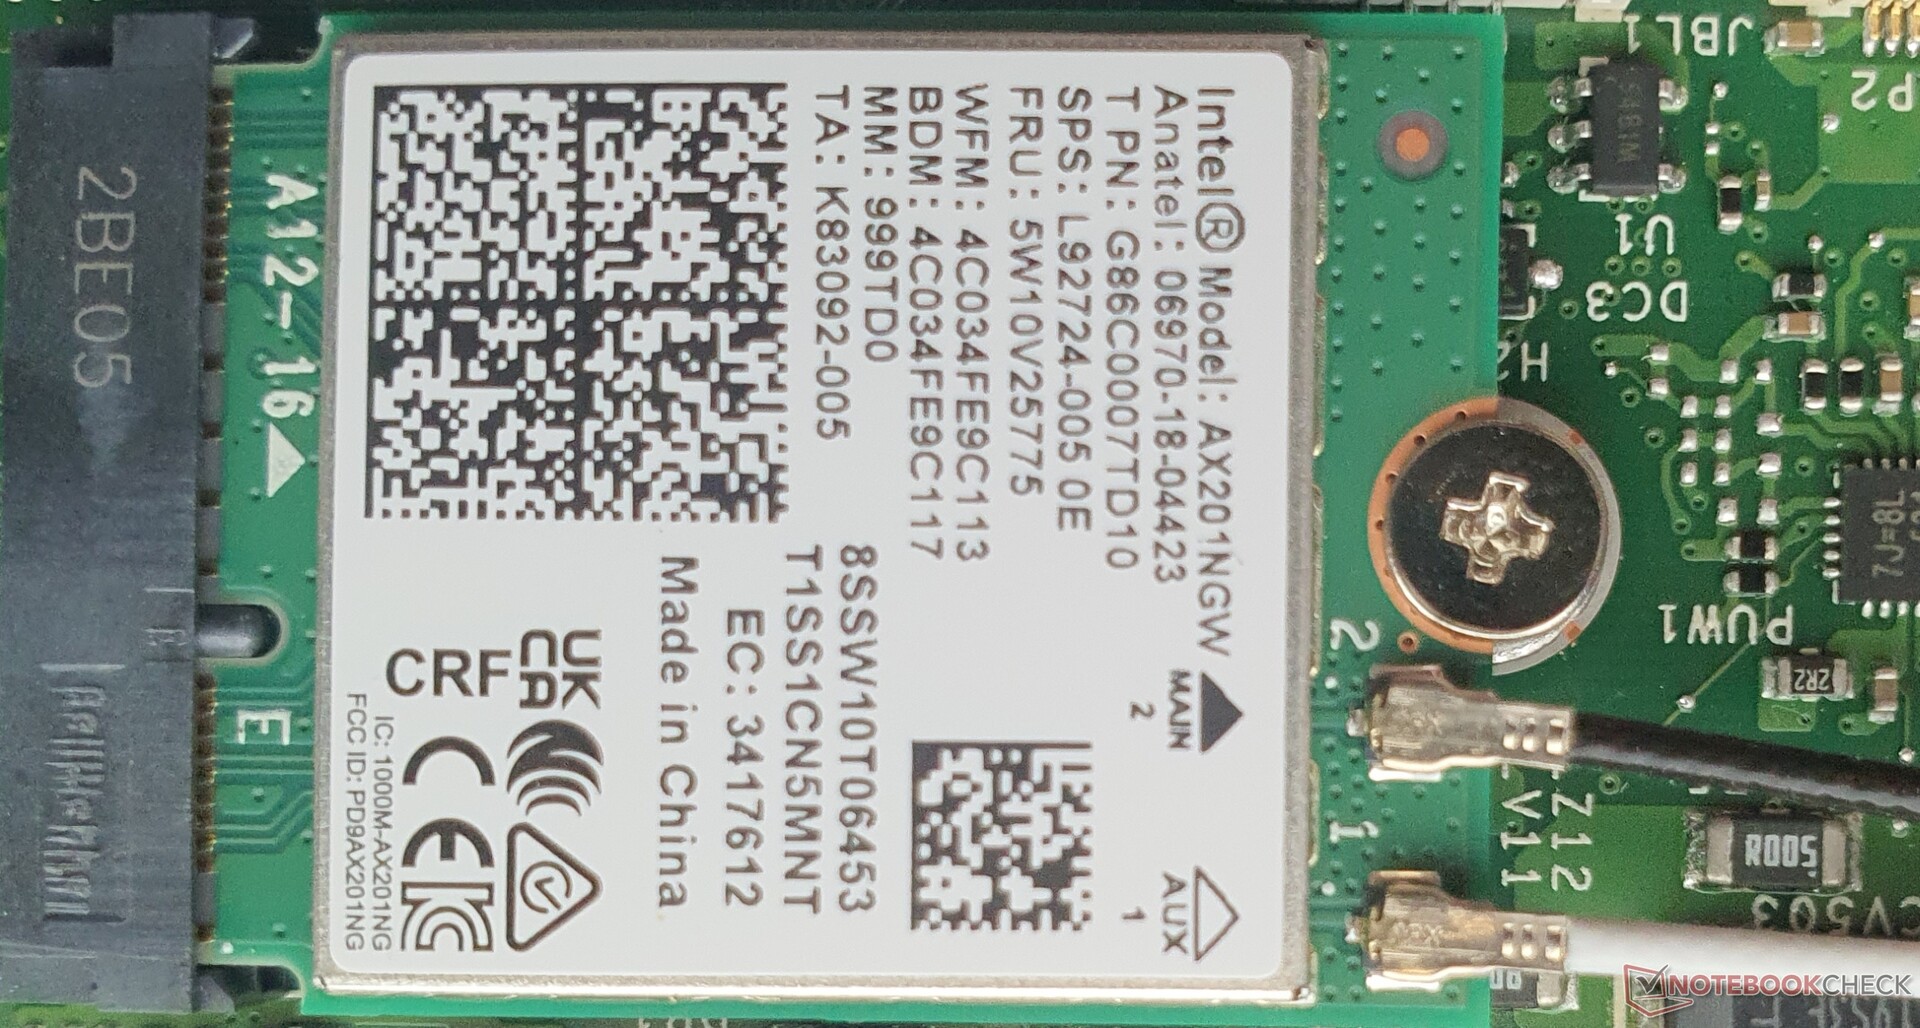
由于插入了英特尔AX201 WiFi 6模块,传输速度达到了一个非常好的水平。只有华为的Matebook 16在发送方面要快一些。蓝牙5.0被包括在内,但没有WWAN和NFC的选项。
网络摄像头

正如通常的情况一样,内置的720p网络摄像头(1,280 x 720)的质量还有待提高:图像有噪音、模糊和冲刷。DeltaE值(平均为10.4)最多只能提供平均的色彩准确性。没有网络摄像头光圈或用于Windows Hello的红外线,但有带降噪的双阵列麦克风。


安全问题
除了TPM 2.0安全芯片外,还有一个Kensington锁装置(nano)和一个指纹识别器,只要用手指轻轻一碰就能快速可靠地完成工作。
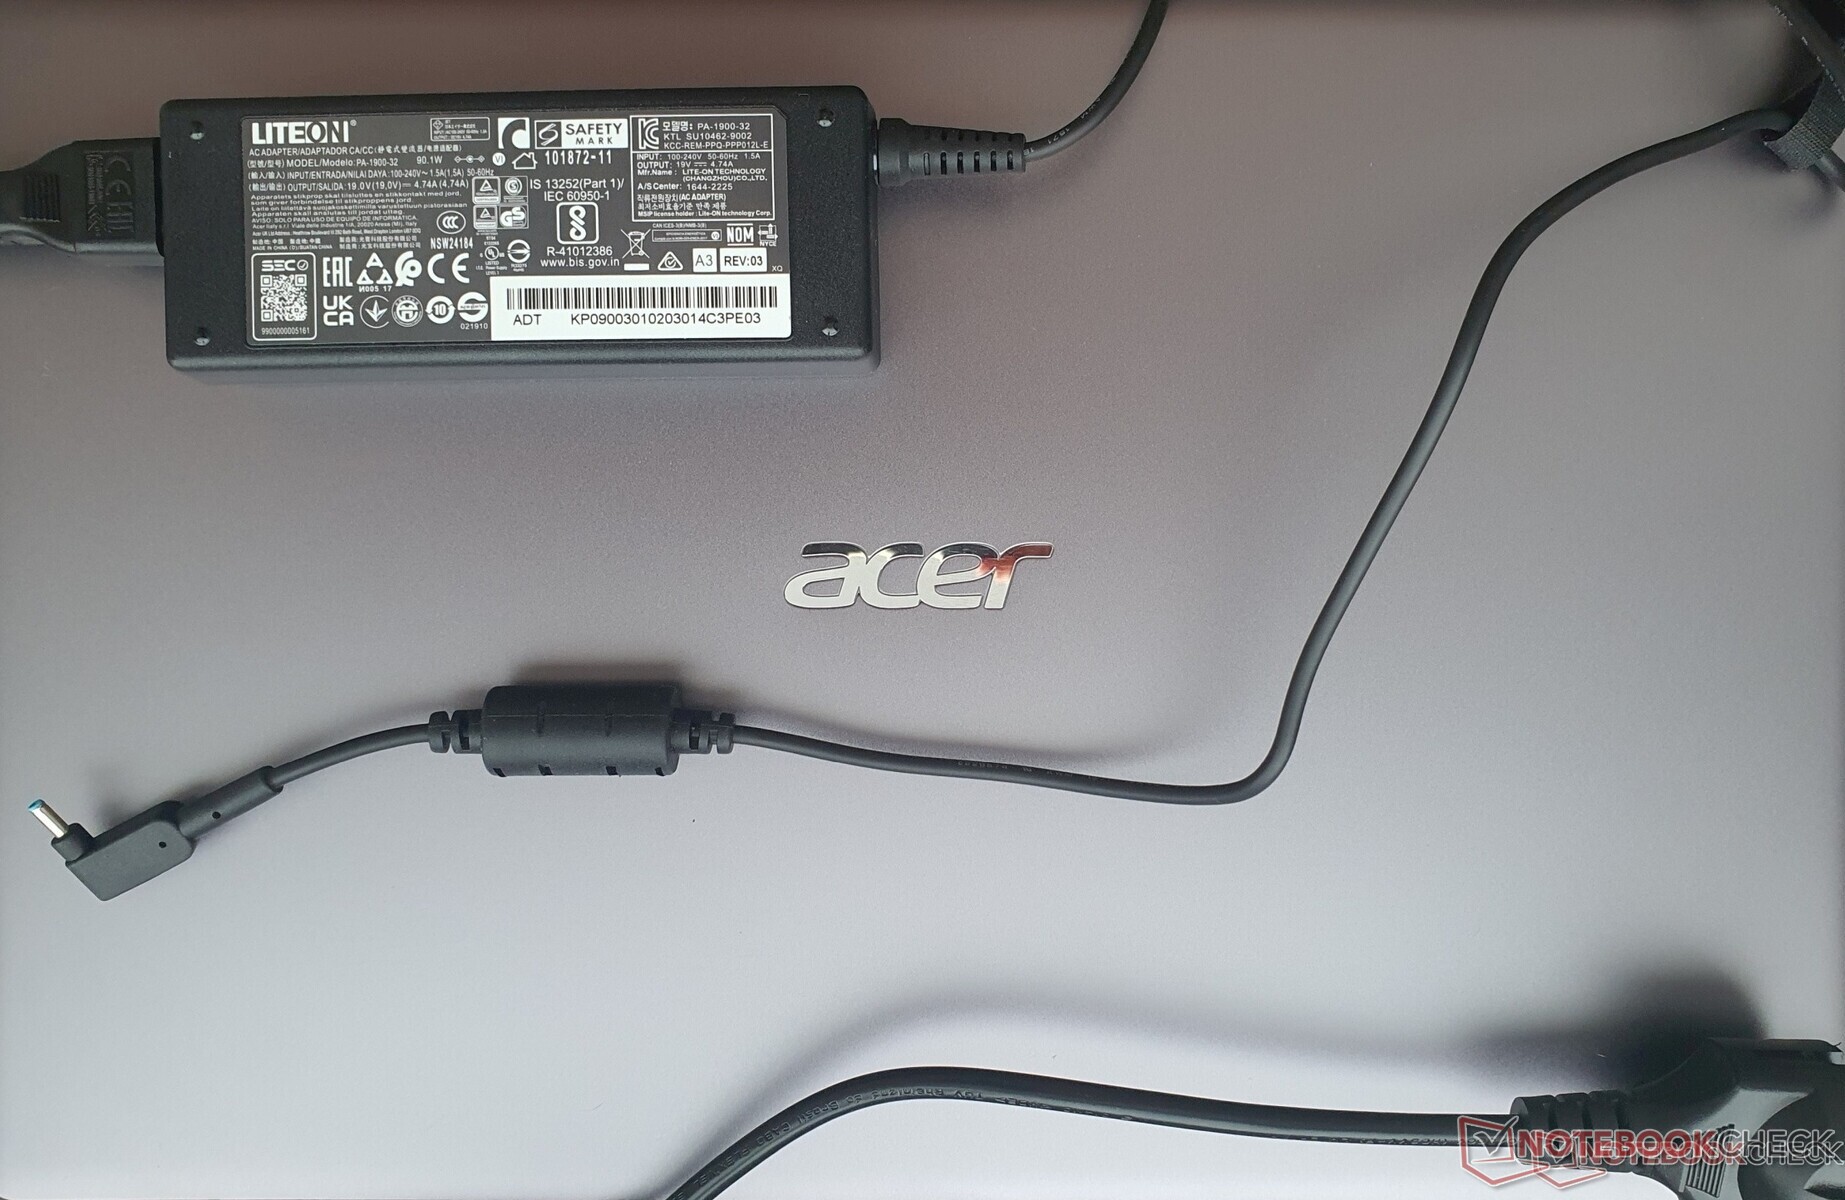
辅料
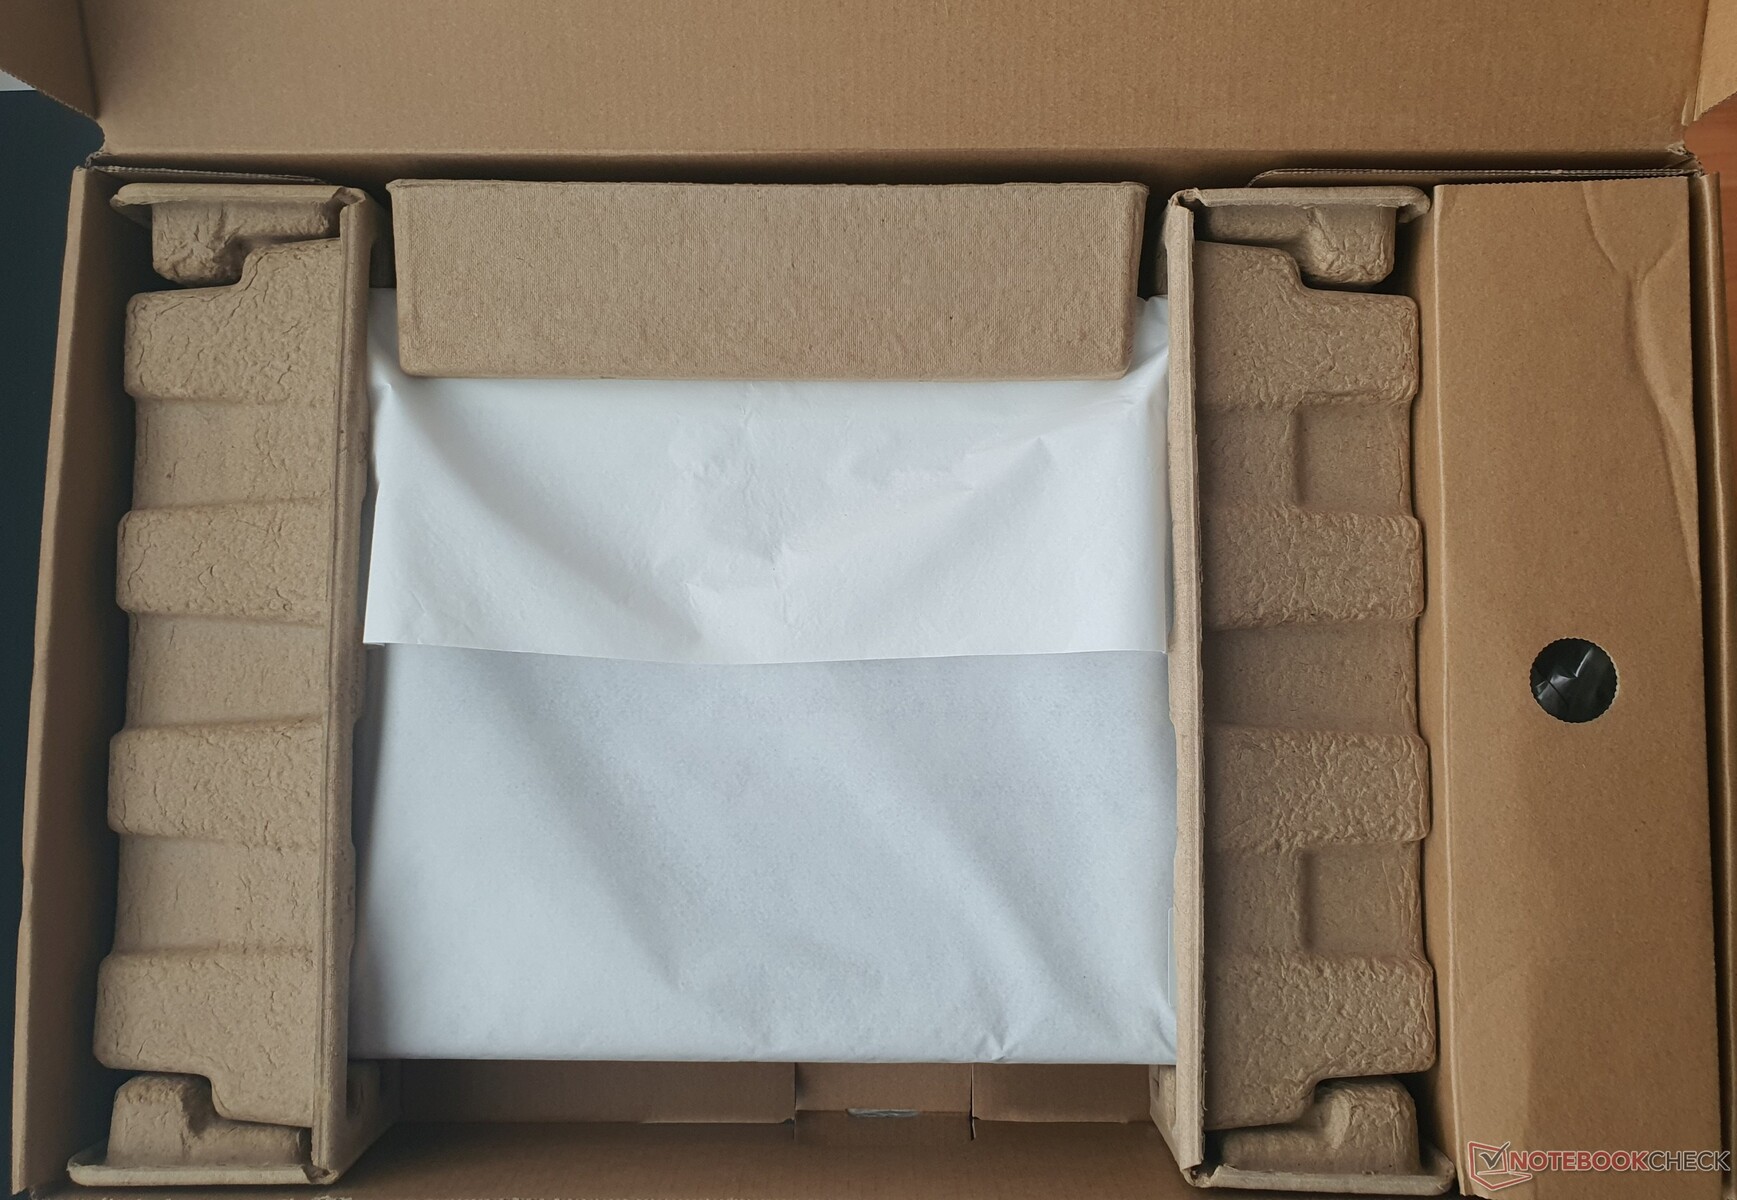
除了Nvidia GPU所需的90瓦LiteON品牌电源外,不包括其他附件。宏碁为Swift X设定了环保的包装--使用了很少的塑料。
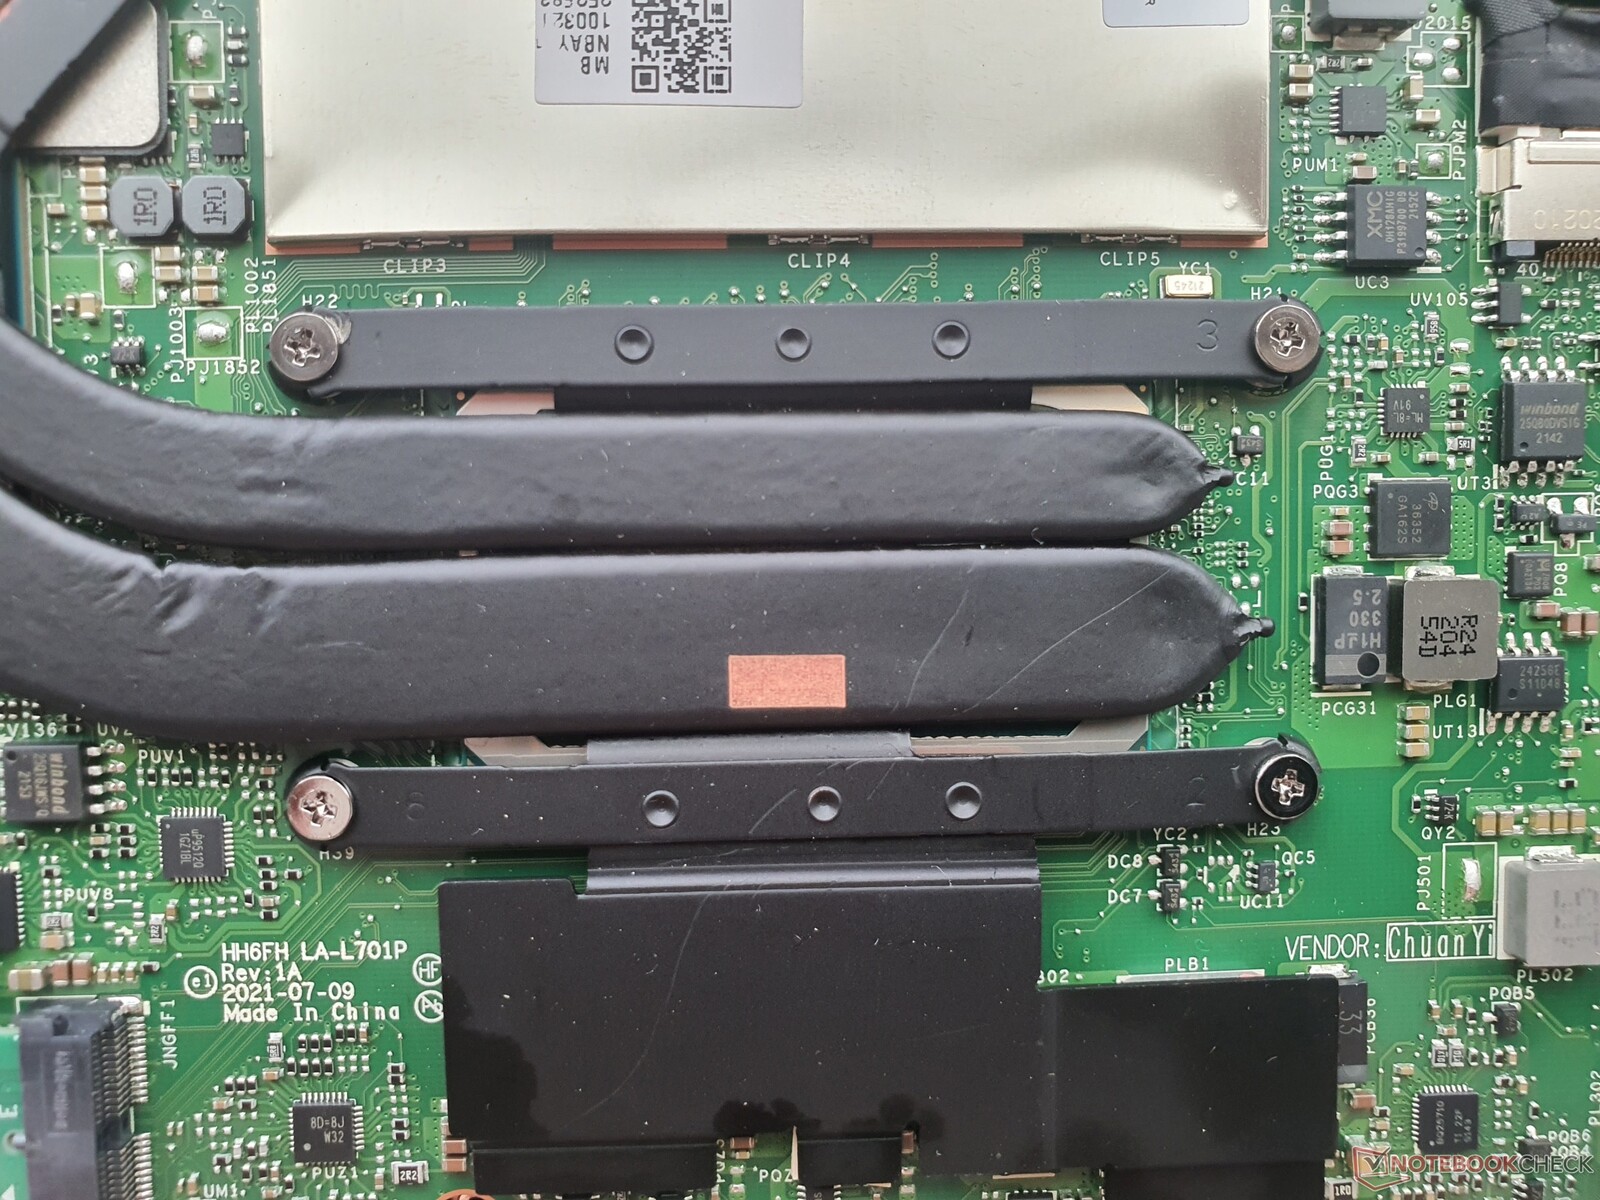
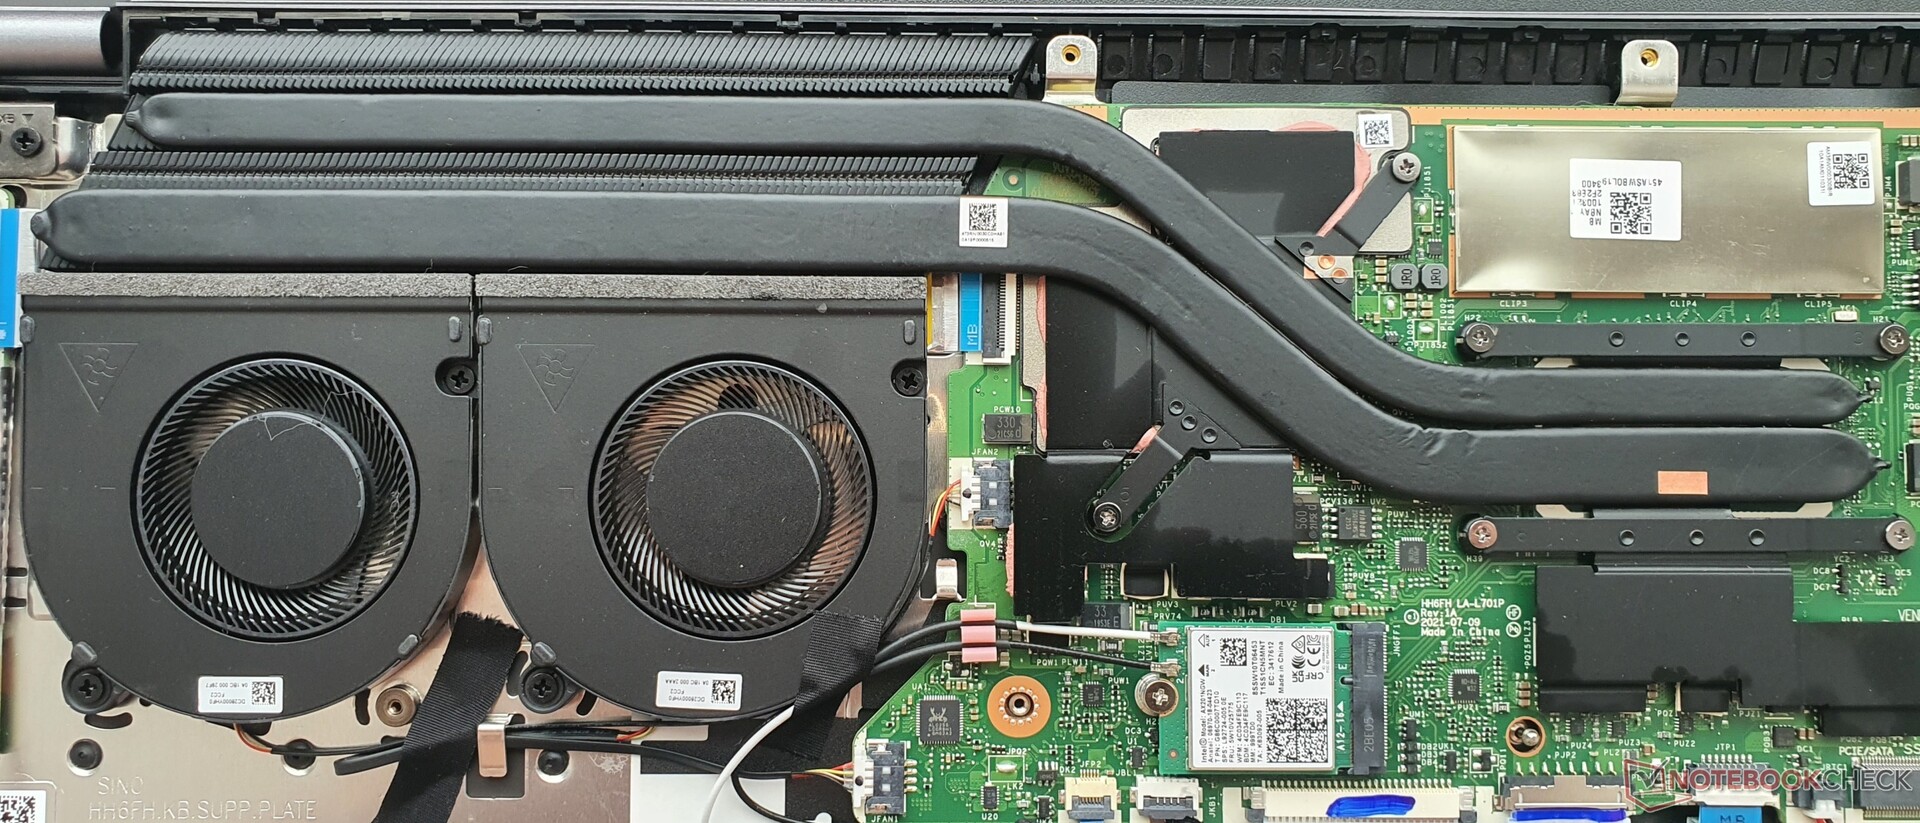
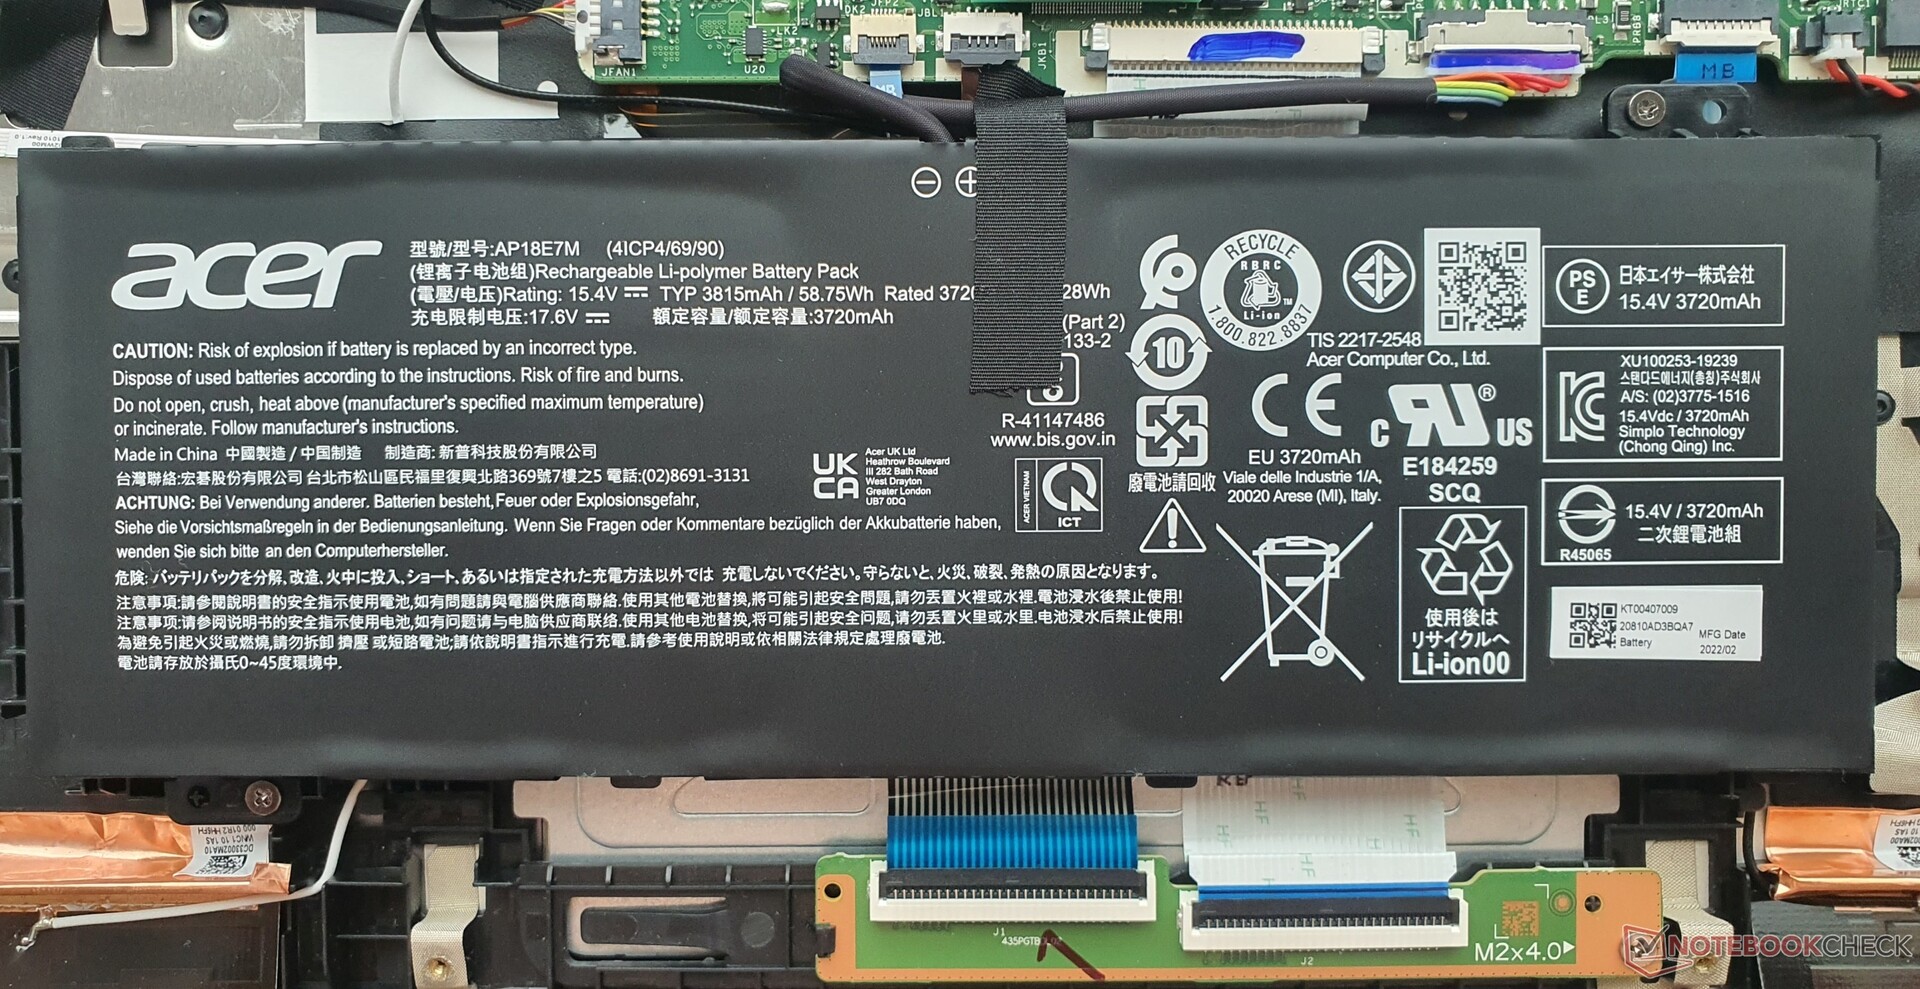
维护
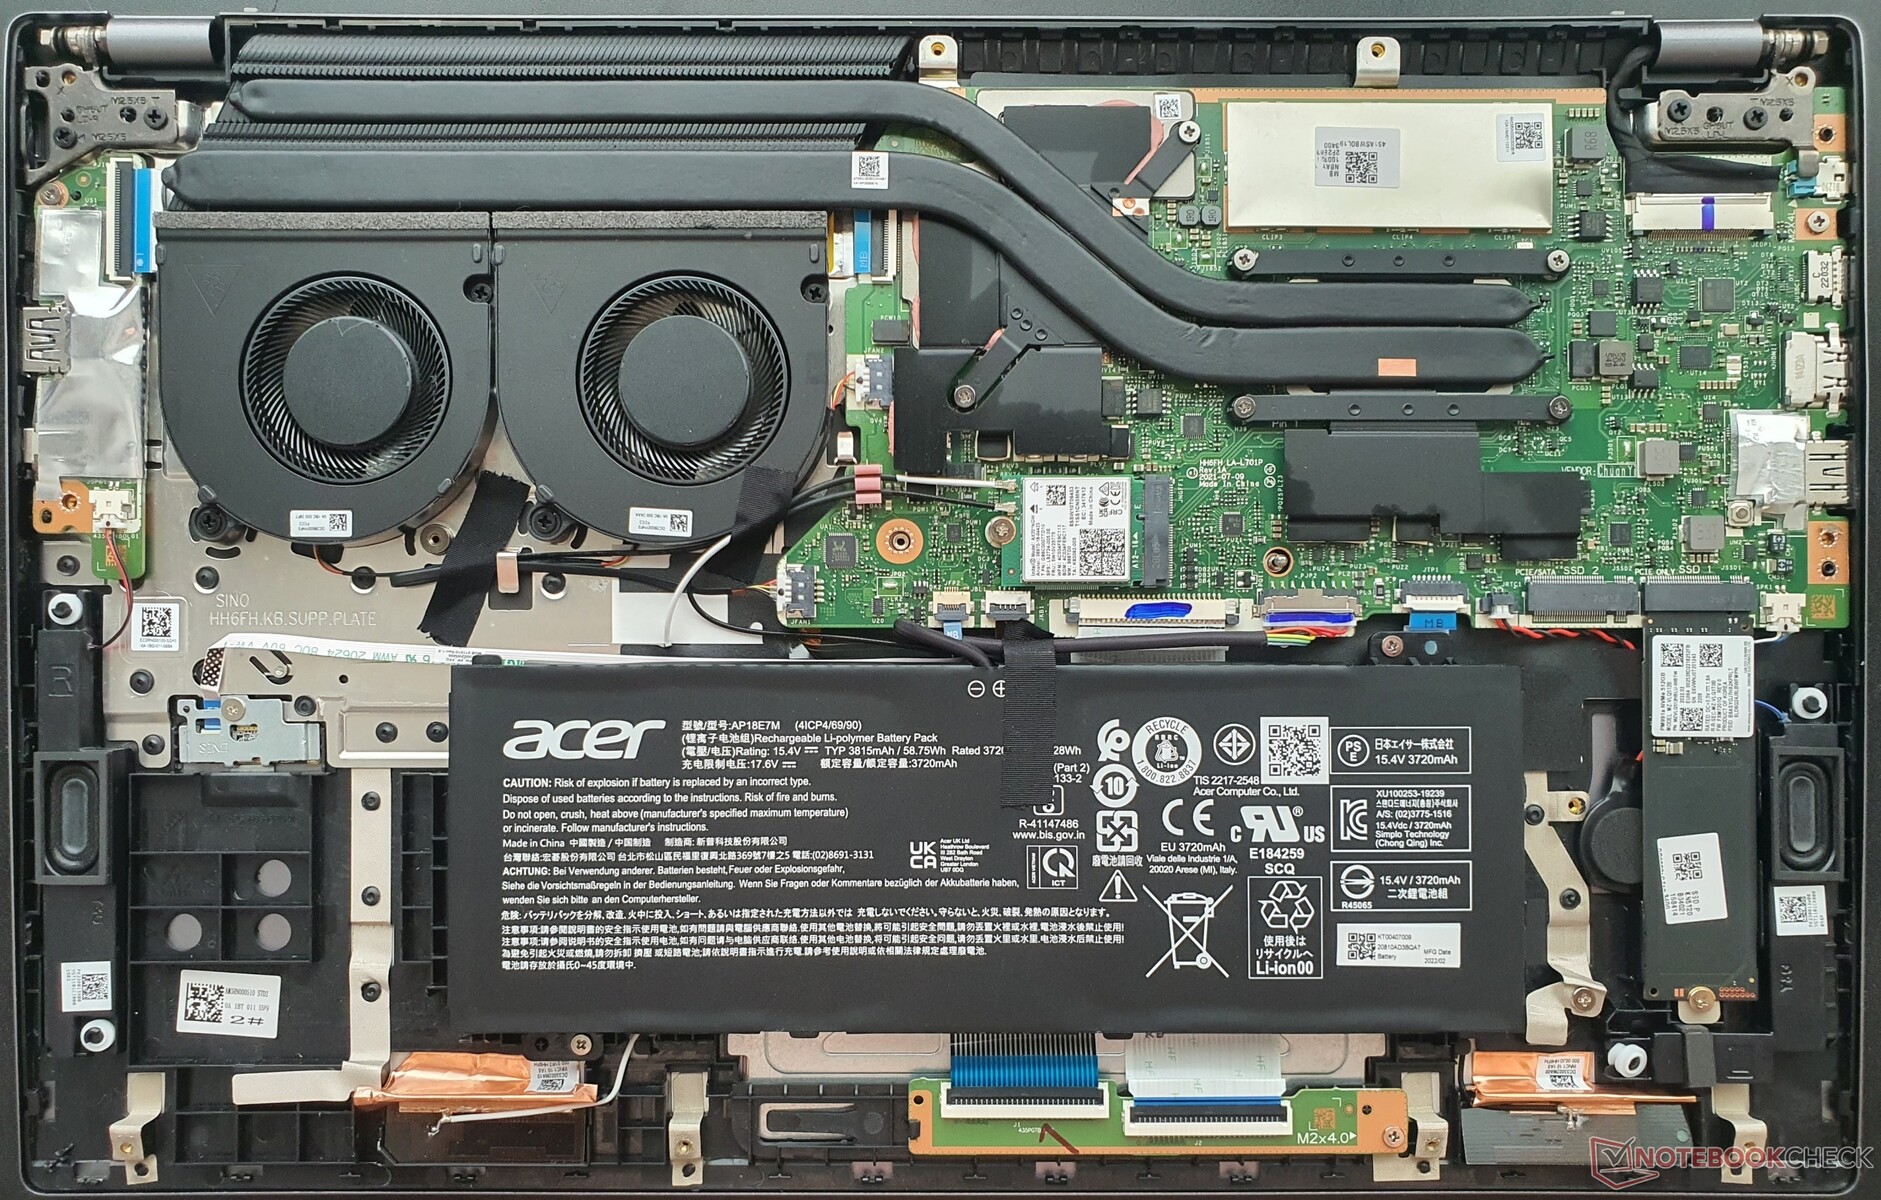
松开12颗小的Torx螺丝后,借助于一个扁平的塑料铲子,可以很容易地拆下底板。内存是完全焊接的,但有两个M.2-2280插槽。WLAN模块和带螺丝的电池是可以更换的,风扇也可以清洗。
担保
在大多数国家,宏碁对其笔记本电脑提供1年有限保修。这可能有所不同,所以在购买前一定要向供应商查询。
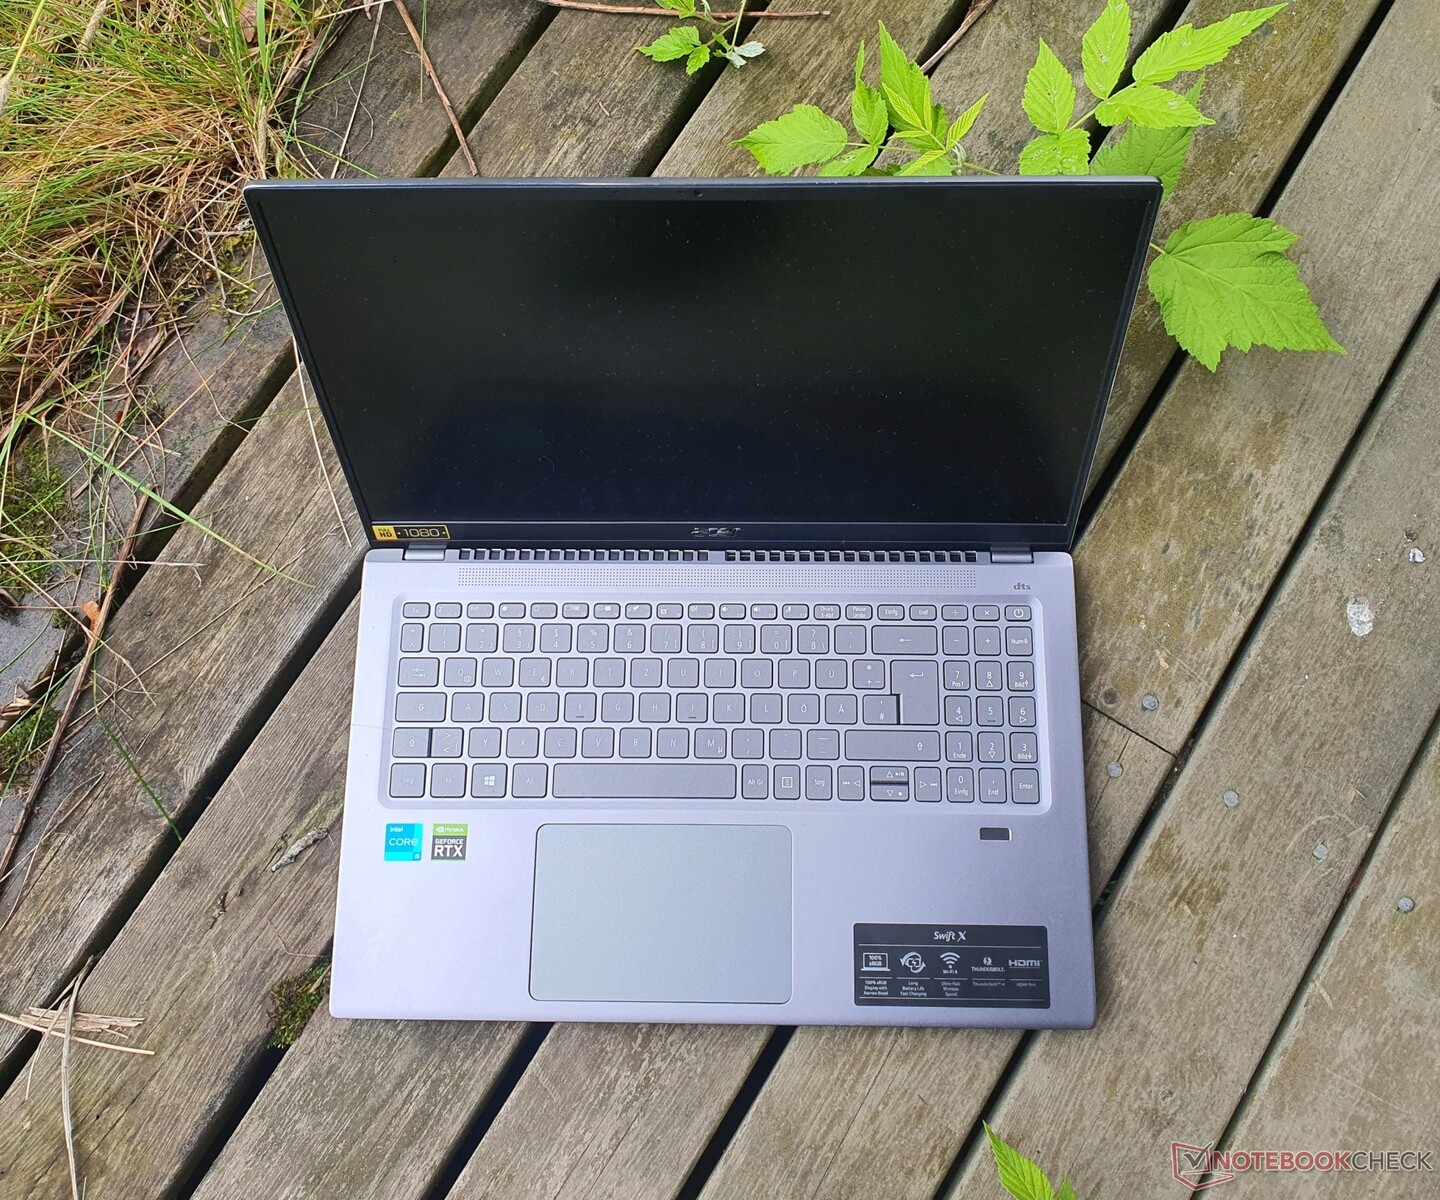
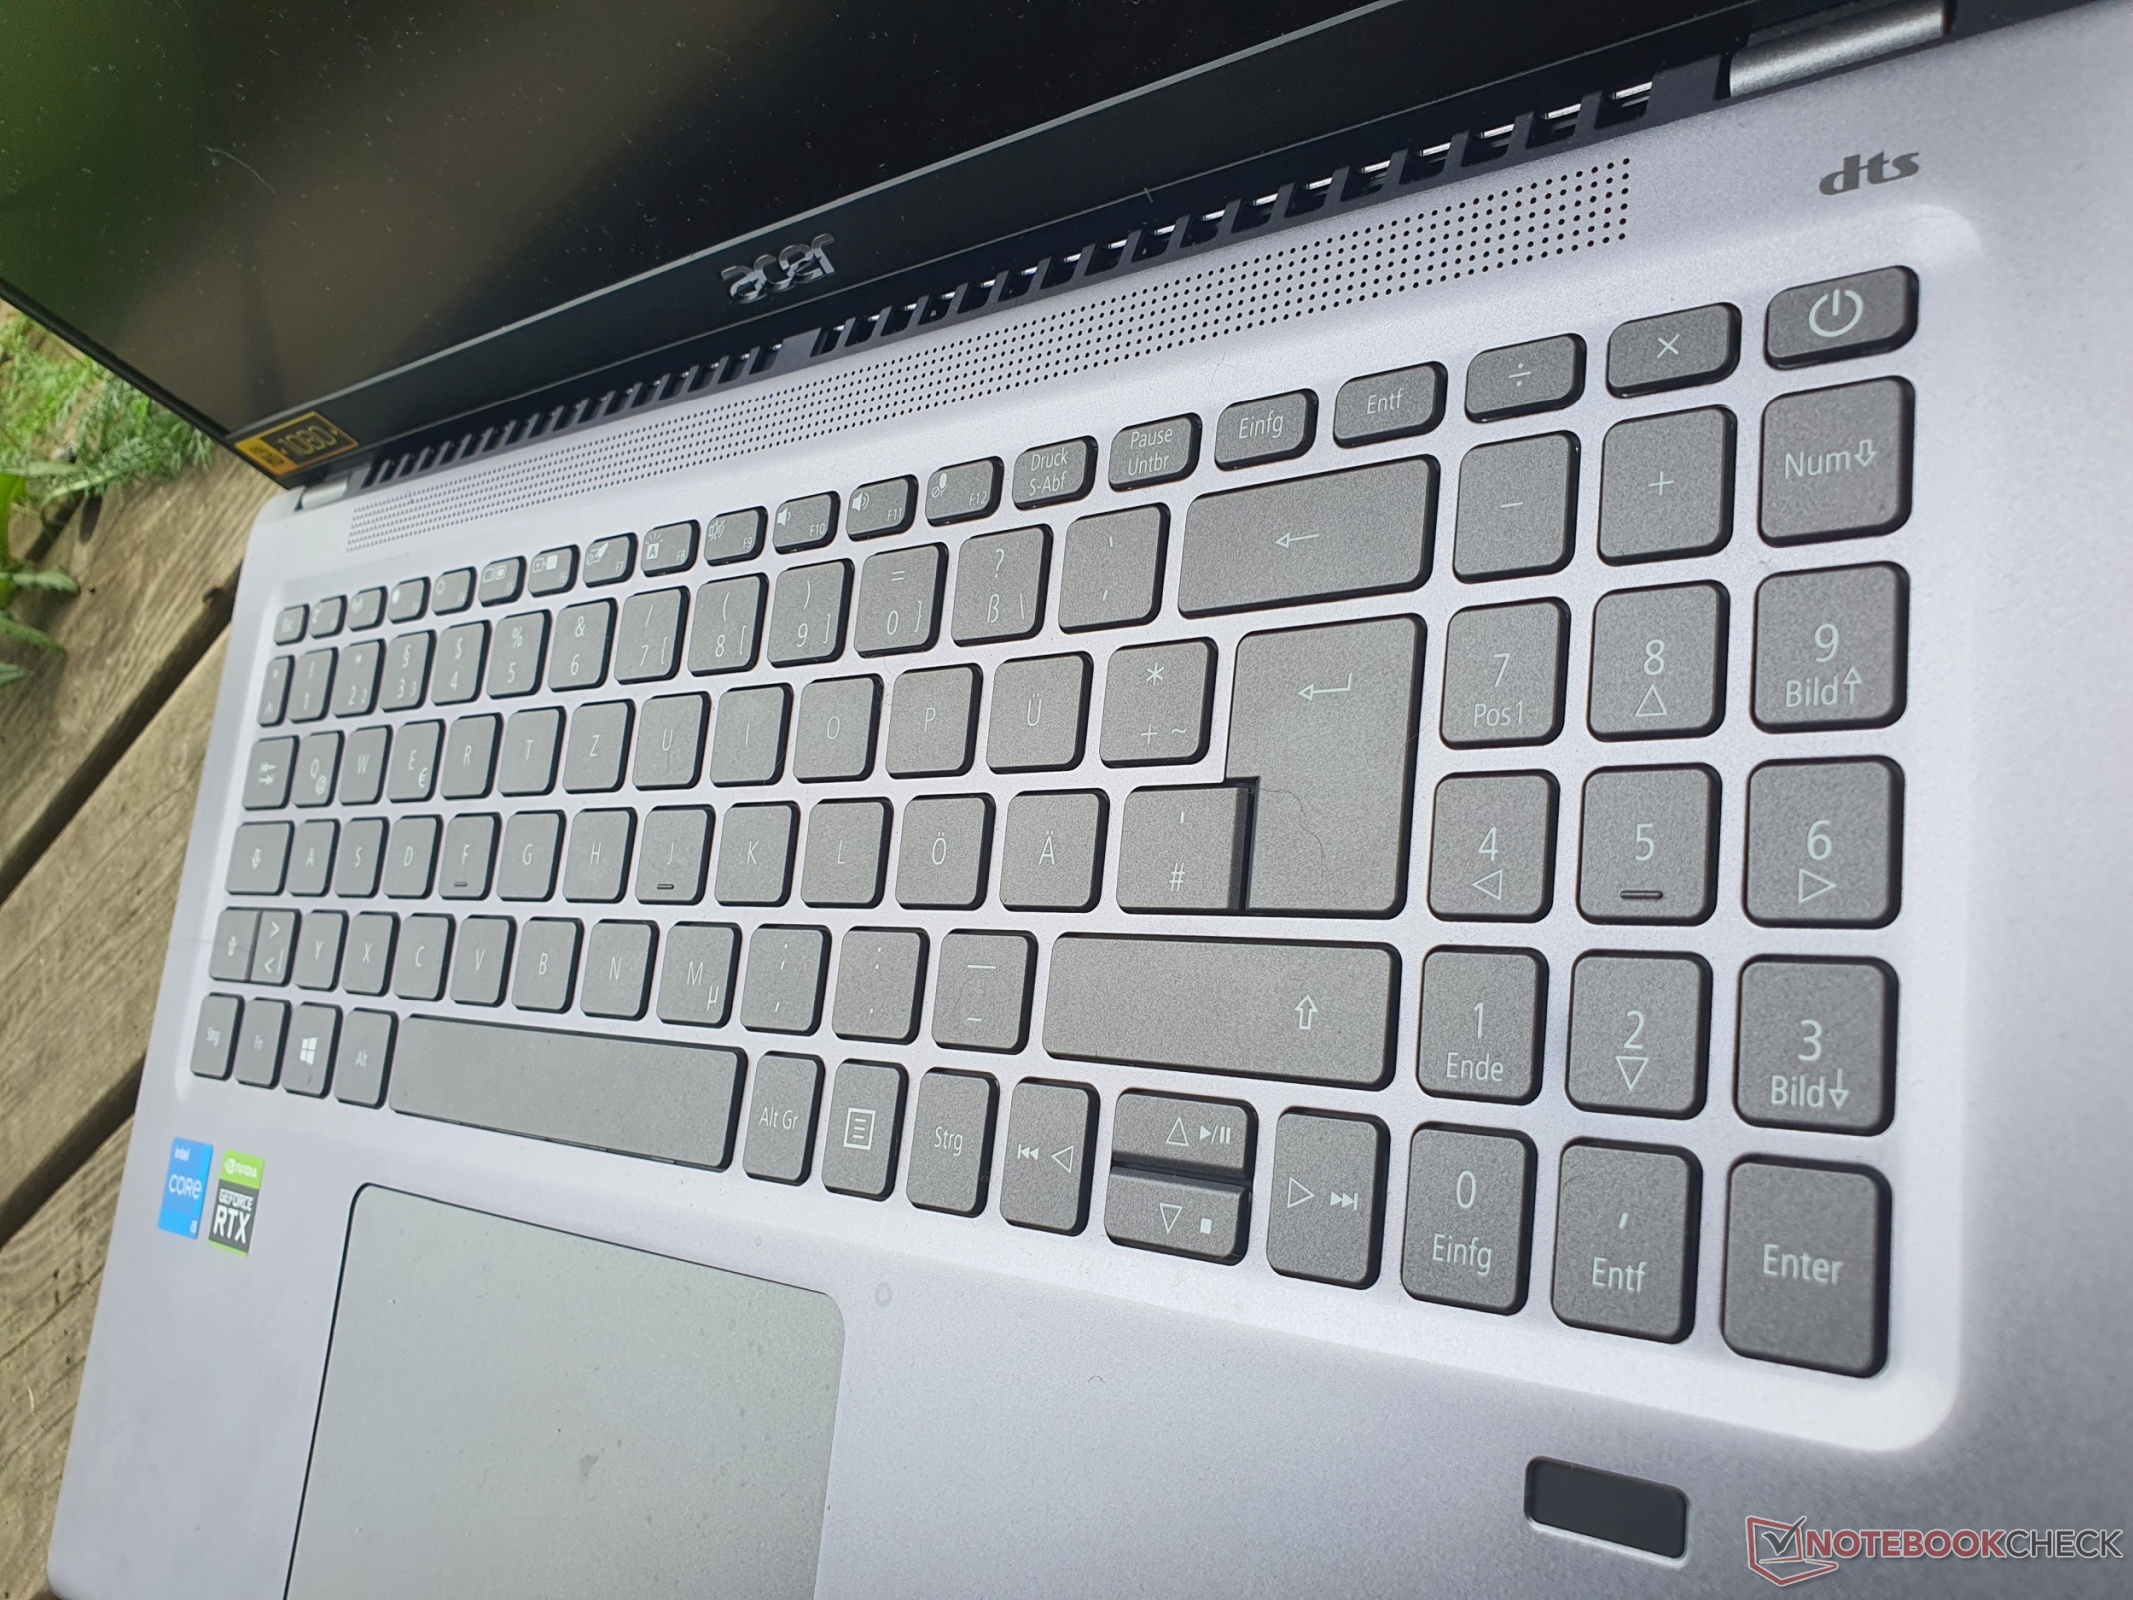
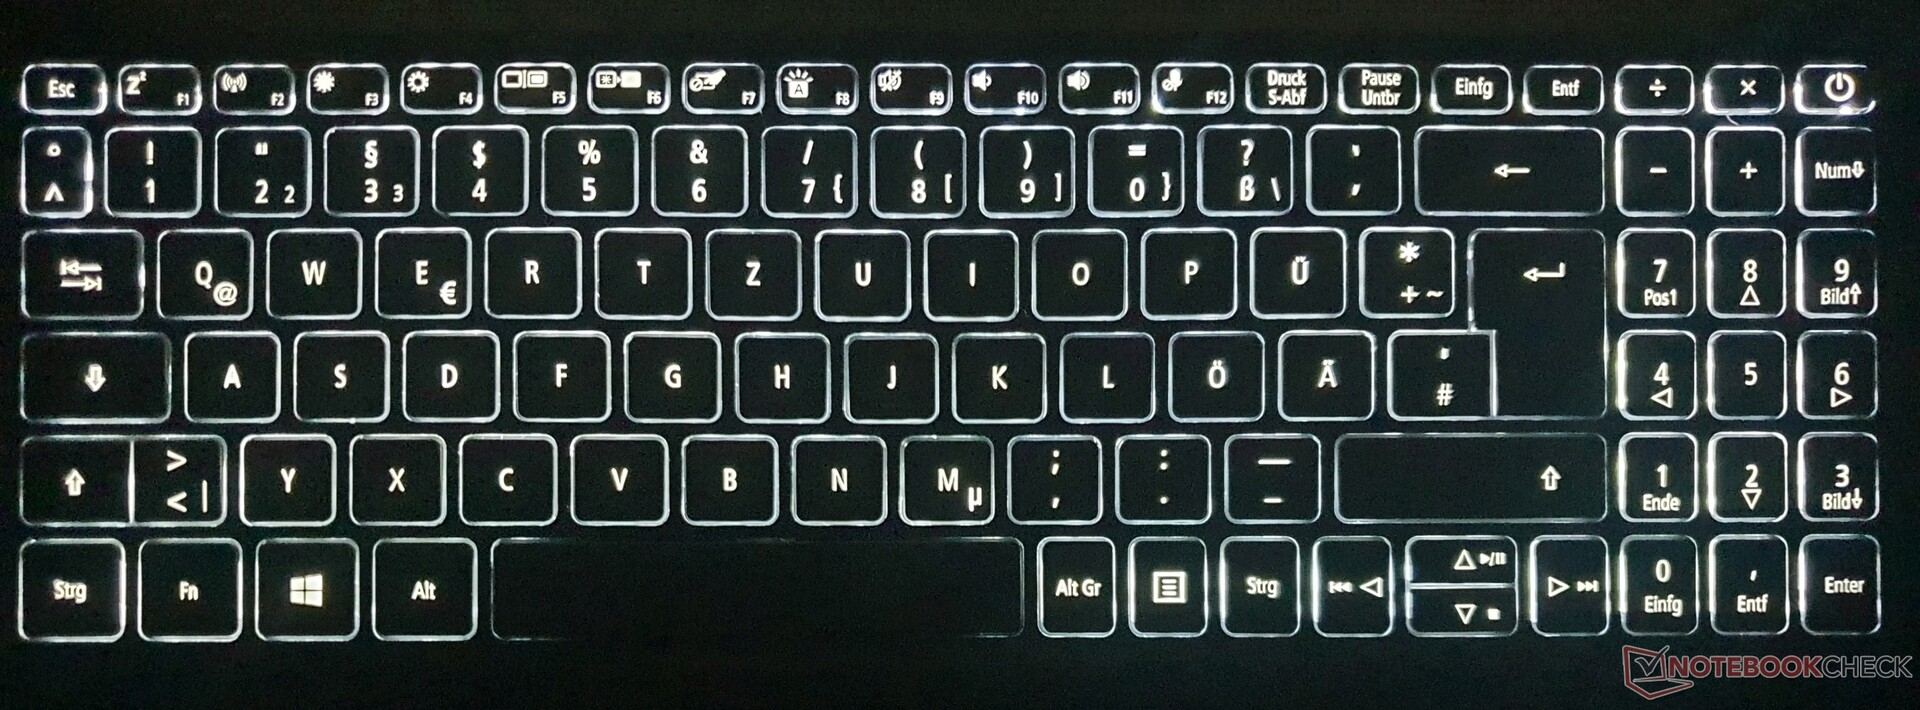
输入设备。在背光键盘上快速打字
键盘
Swift X的按键有点小,特别是顶排的NumPad和垂直方向键。键程很短,压力点分布合理,阻力清晰。总的来说,在单层背光的宏碁键盘上可以快速打字,它的工作也很安静。
键盘布局很好,有 "位置1/结束 "和一些多媒体功能(播放、暂停、倒带)的双重分配。键盘在压力下会略微弯曲,但在打字时这不是一个问题。
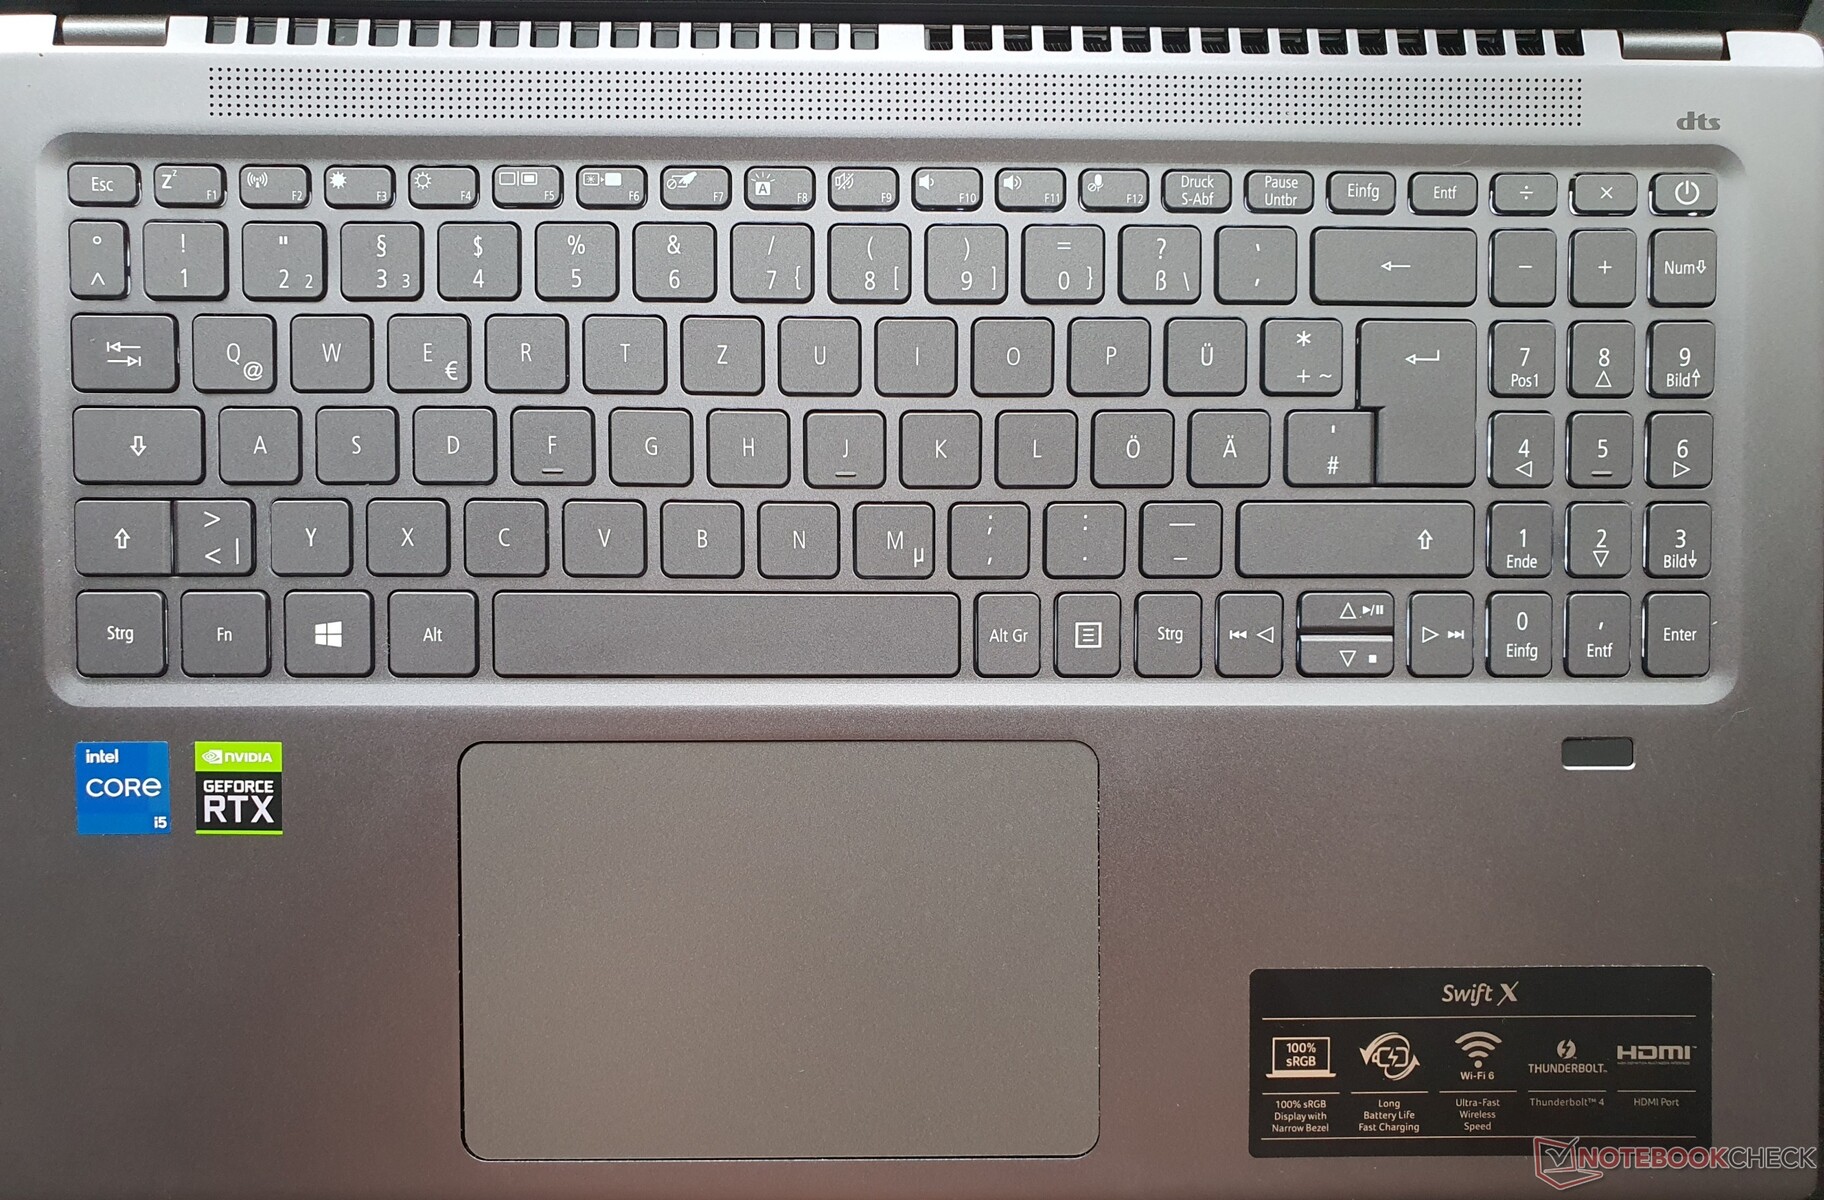
触摸板
触摸板的尺寸为12.5 x 8厘米,在光滑的表面上滑行鼠标指针是小儿科的事情。触摸板下部的集成按钮行程较短,需要比平常更多的力量来点击,并提供适度的反馈(对于评论员的口味)。
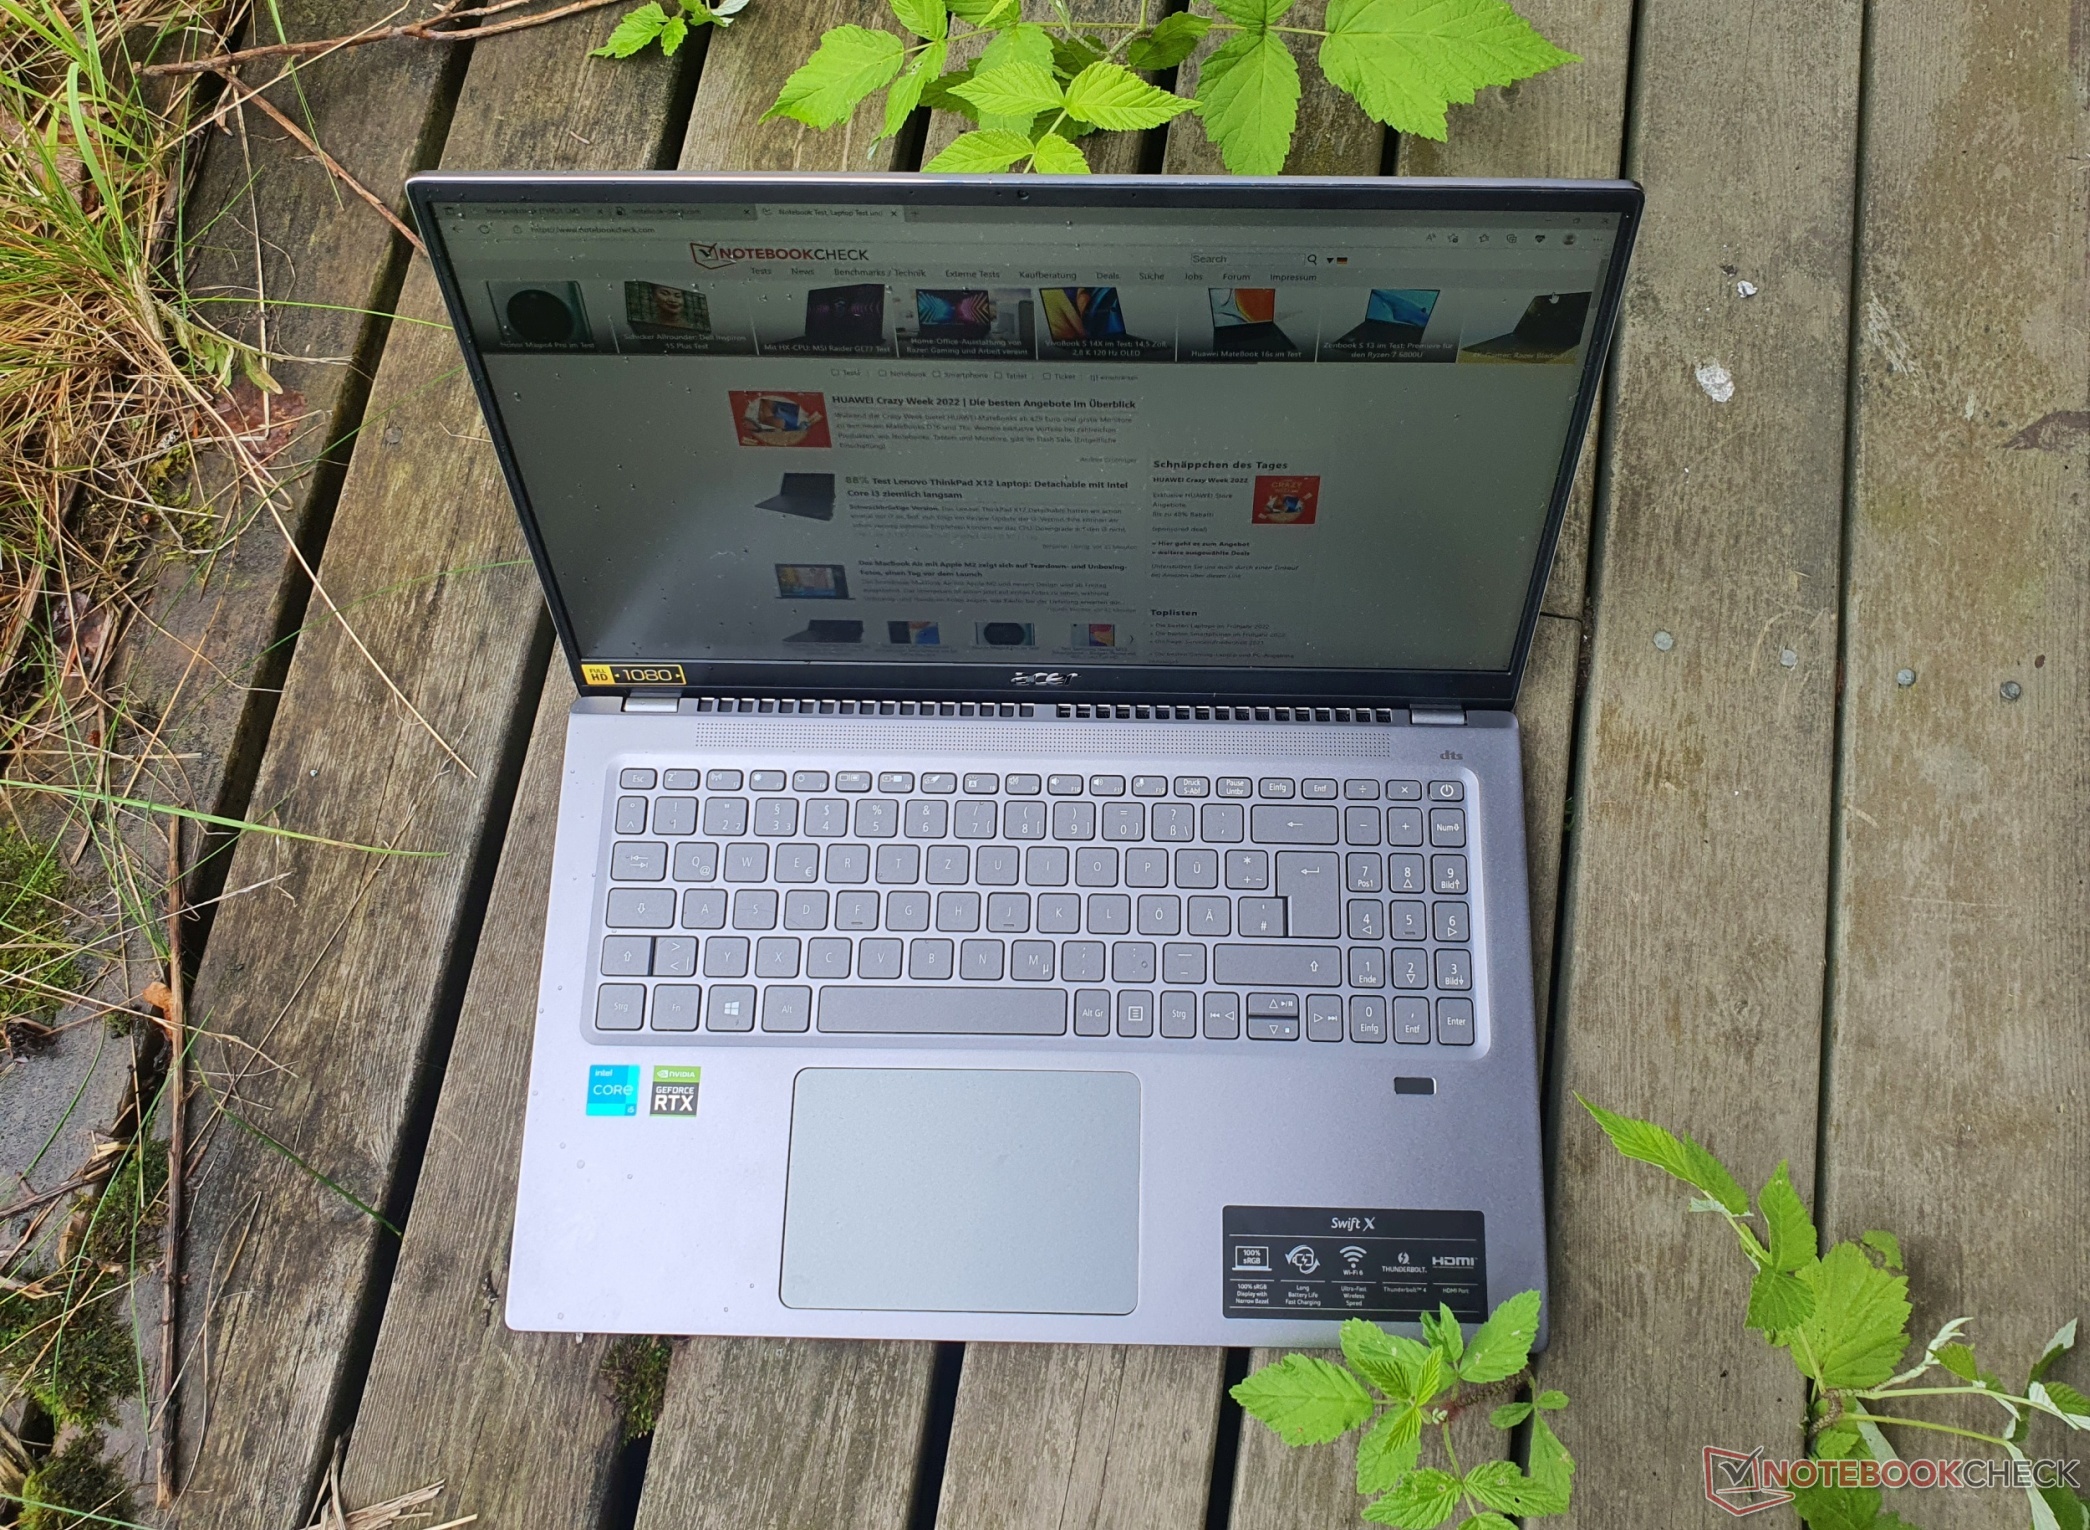
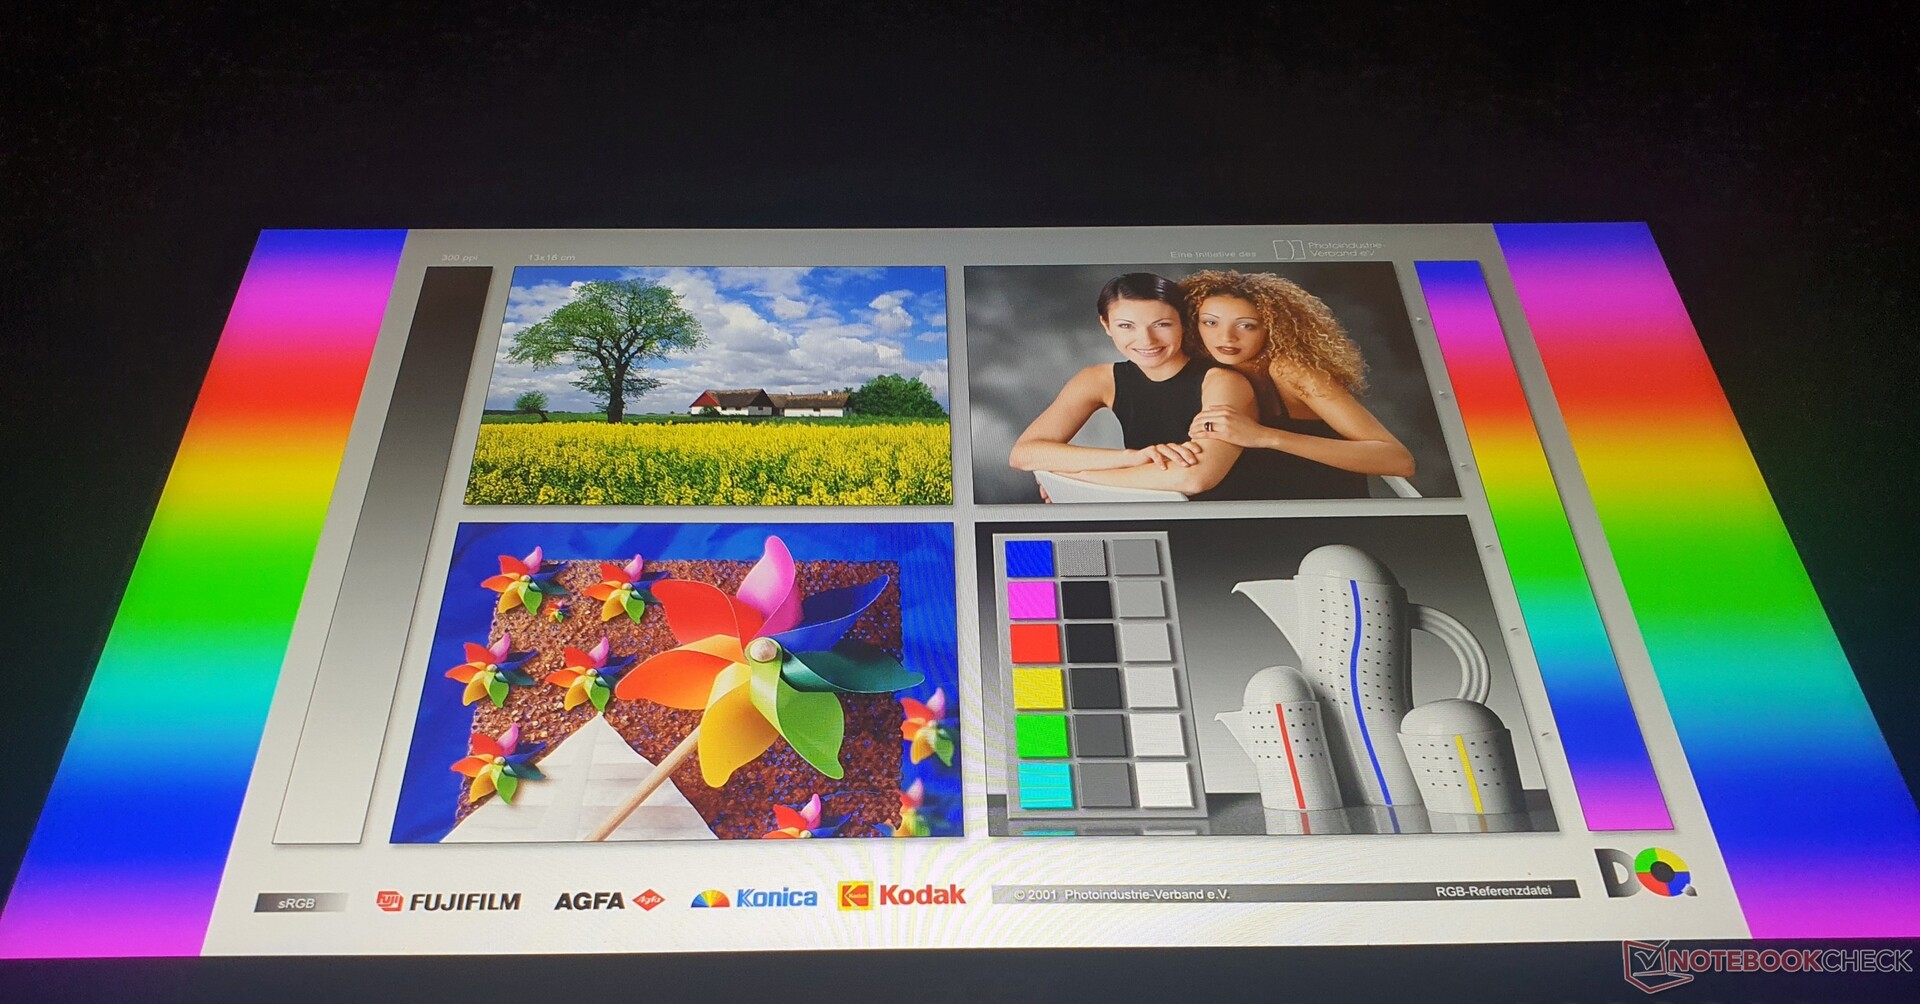
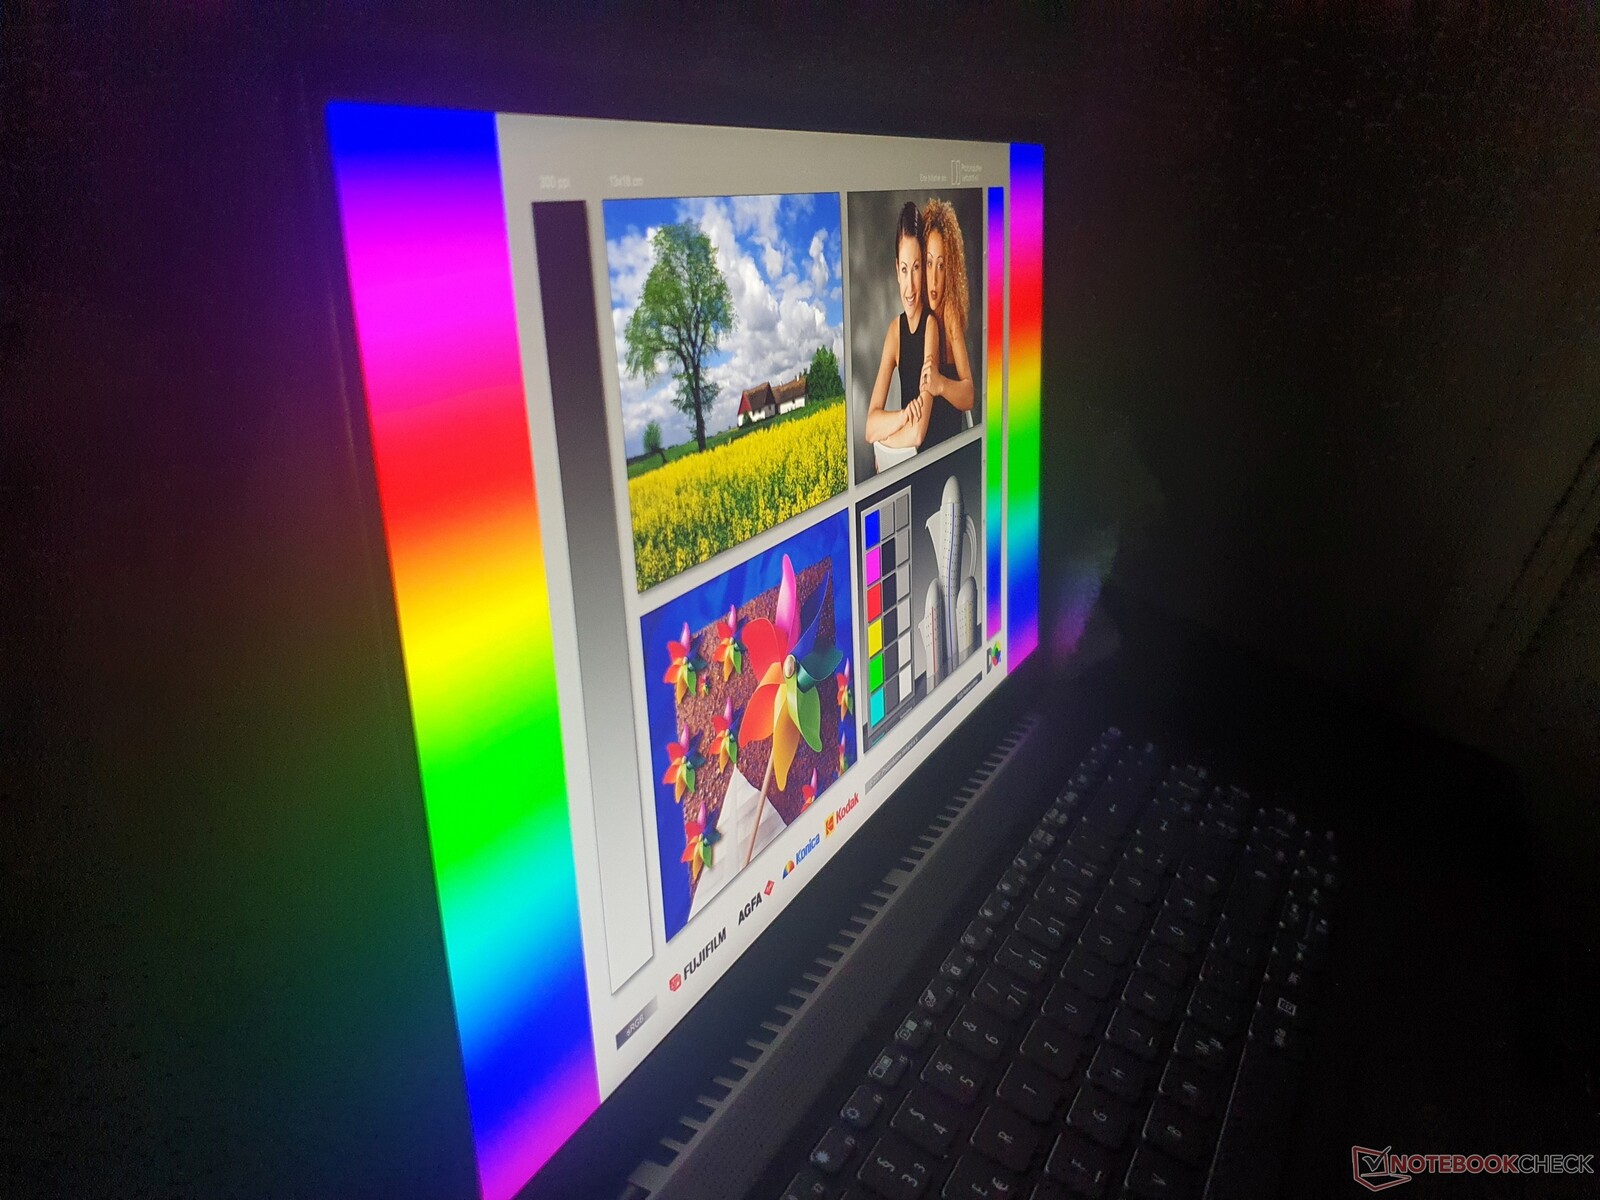
显示器。宏碁承诺为Swift X 16提供100%的sRGB信号

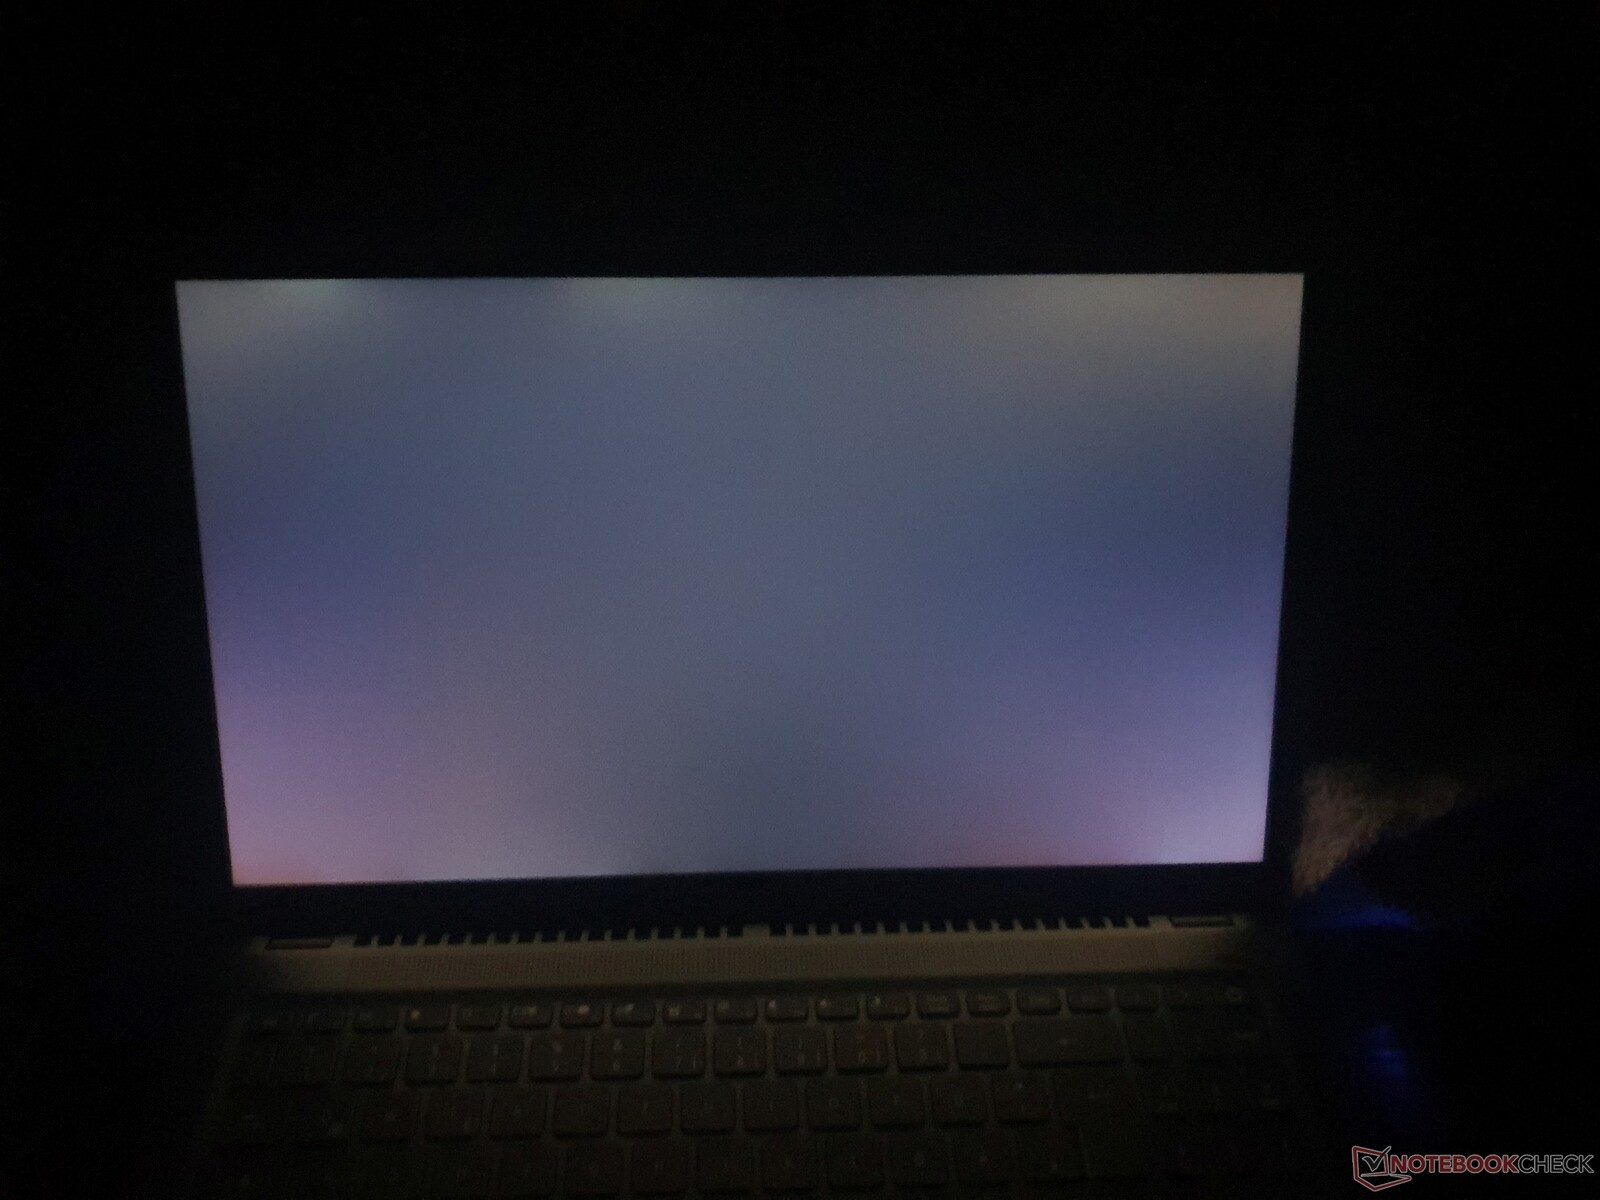
宏碁Swift X的哑光显示屏尺寸为16.1英寸,但保留了16:9的格式(适合媒体,不太适合办公任务),而竞争对手通常使用16:10。1,920 x 1,080像素的分辨率在16英寸上没有问题,这意味着Windows的缩放比例可以保持在100%(最佳图像清晰度)。
一个缺点是测得的264尼特的低亮度,在室内是足够的,但是次优的。没有其他显示选项。此外,在电池模式下,亮度再次下降到只有180尼特。
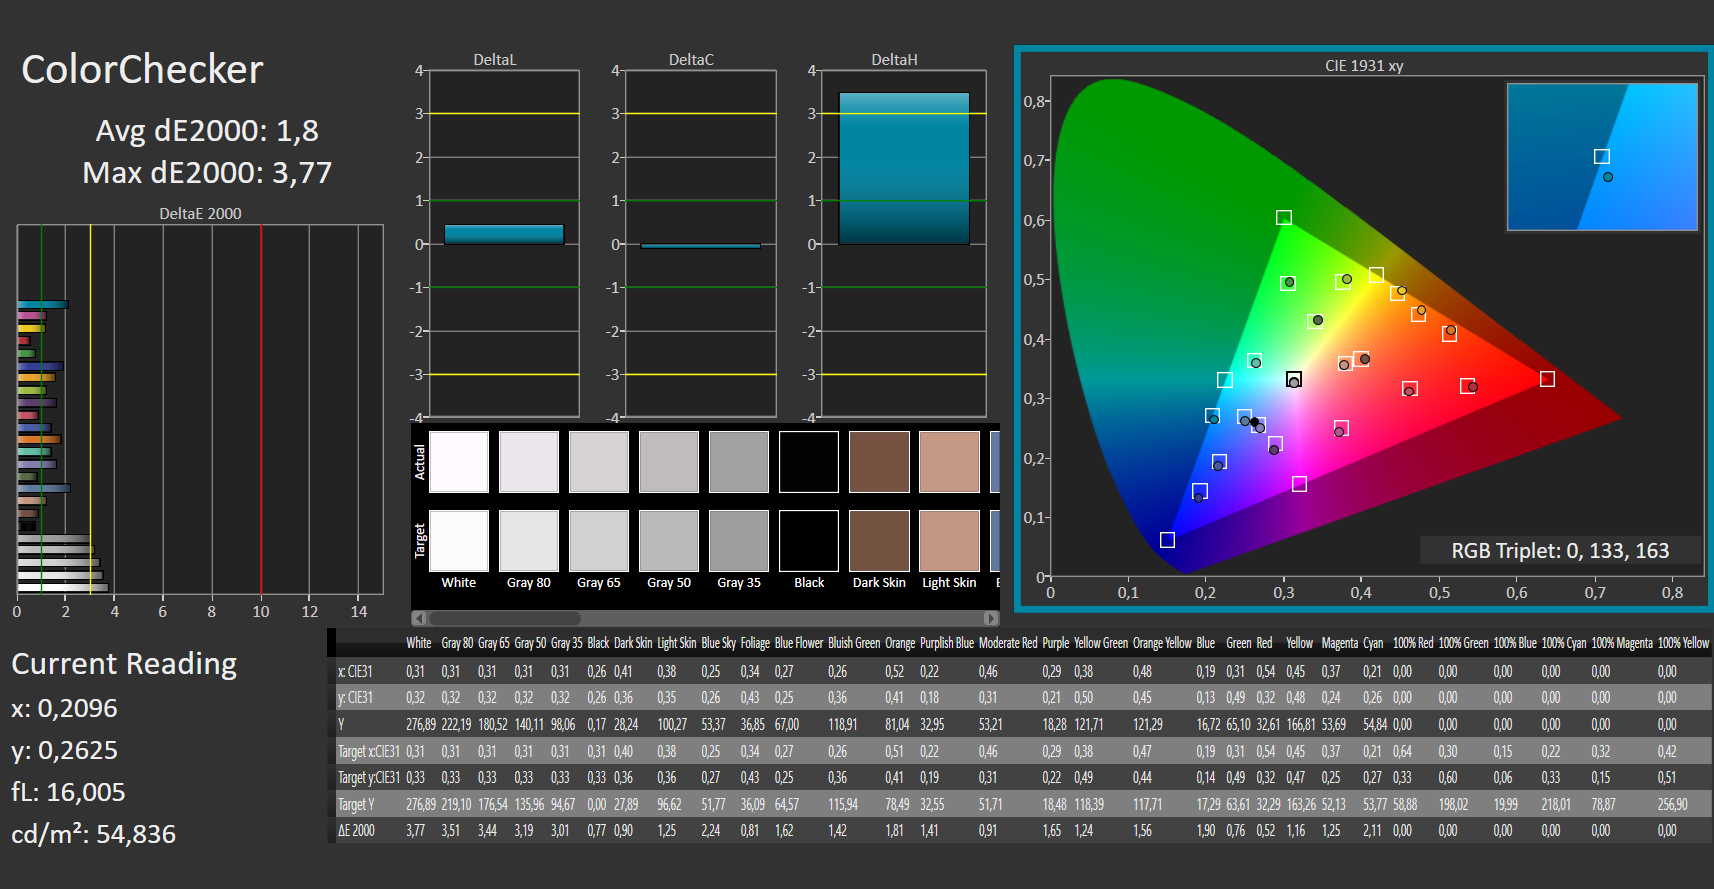
对比度(1,725:1)和黑电平(0.16尼特)对于IPS显示器来说是非常好的,低的DeltaE值导致足够的色彩表现。该面板的响应时间既不好也不坏,但对于休闲游戏来说是足够的。没有检测到PWM闪烁。
面板本身从根本上说是坚实的,但在我们的比较表中,竞争的笔记本电脑始终拥有更好的面板,具有更高的分辨率和亮度值。笔记本 联想IdeaPad 5 Pro 16也有一个120赫兹的刷新率,而 华硕Vivobook Pro 16X有一个4K OLED面板。
| |||||||||||||||||||||||||
Brightness Distribution: 85 %
Center on Battery: 180 cd/m²
Contrast: 1725:1 (Black: 0.16 cd/m²)
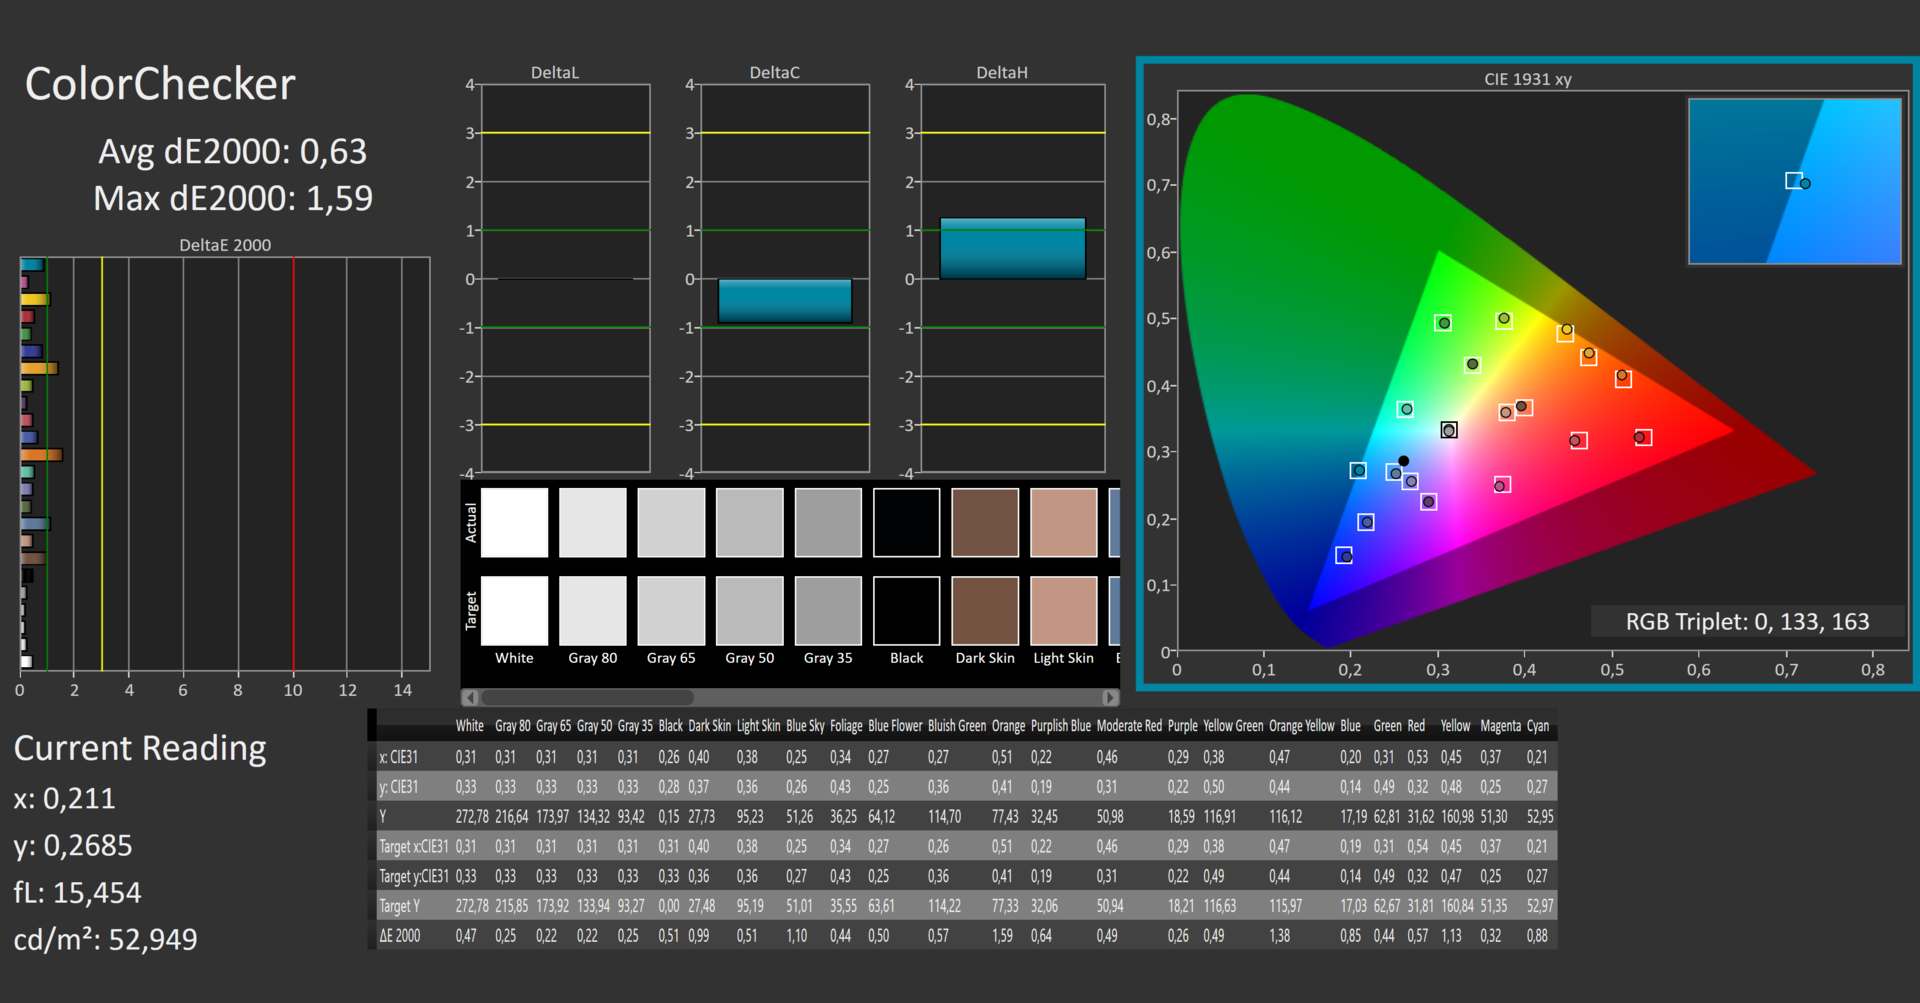
ΔE ColorChecker Calman: 1.8 | ∀{0.5-29.43 Ø4.72}
calibrated: 0.63
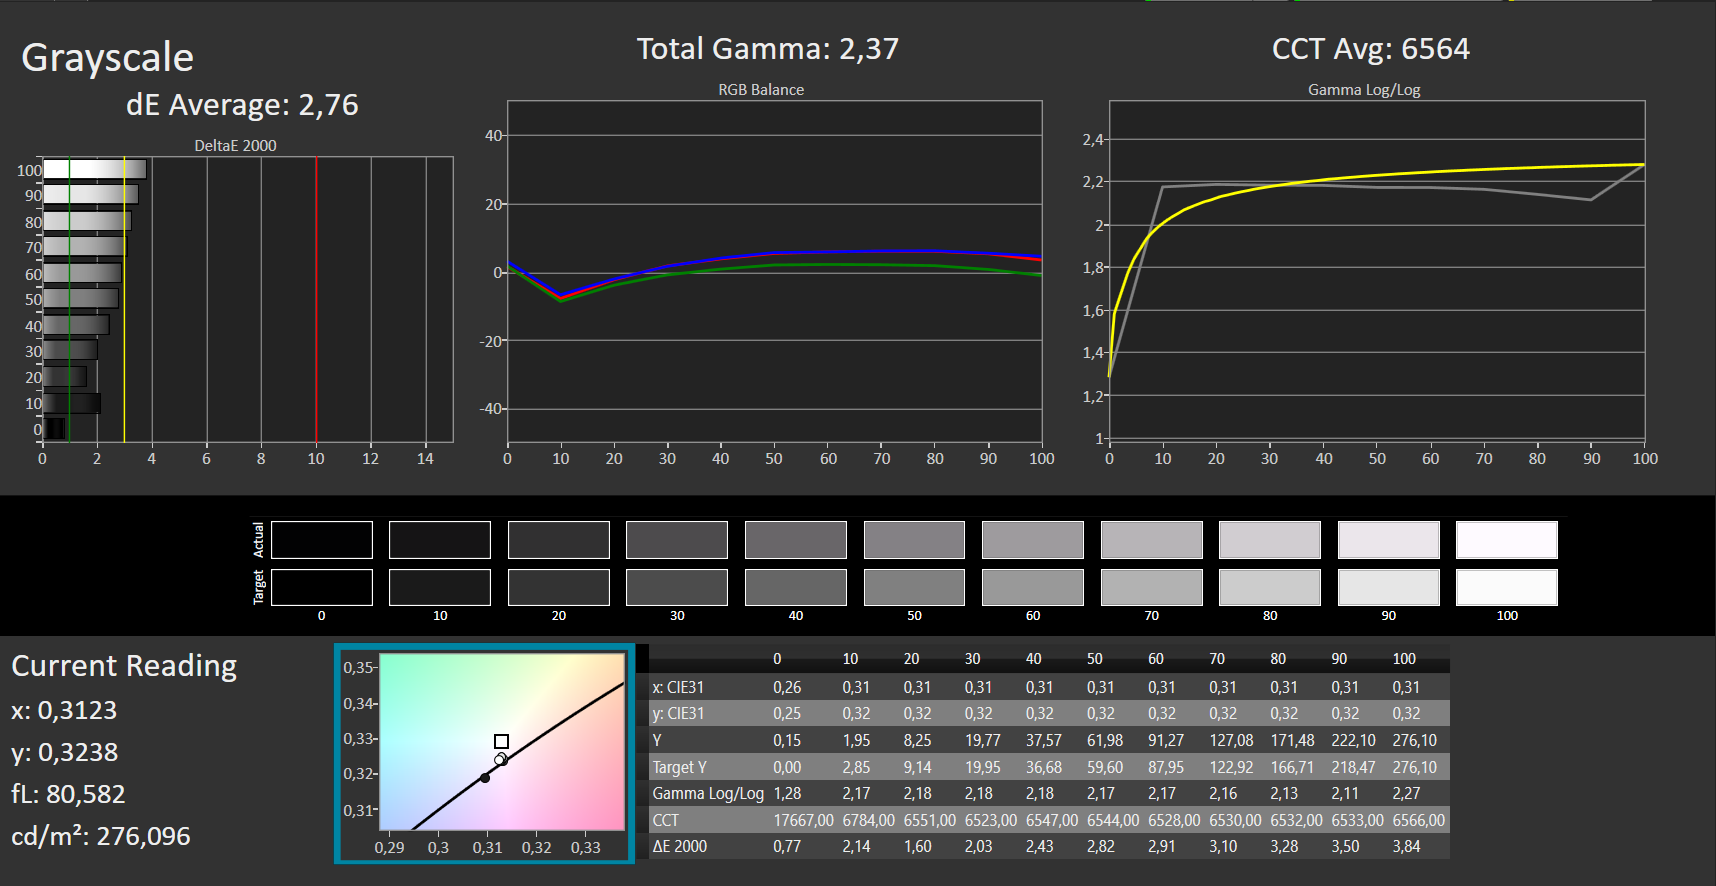
ΔE Greyscale Calman: 2.76 | ∀{0.09-98 Ø4.97}
66.75% AdobeRGB 1998 (Argyll 3D)
95.65% sRGB (Argyll 3D)
65.1% Display P3 (Argyll 3D)
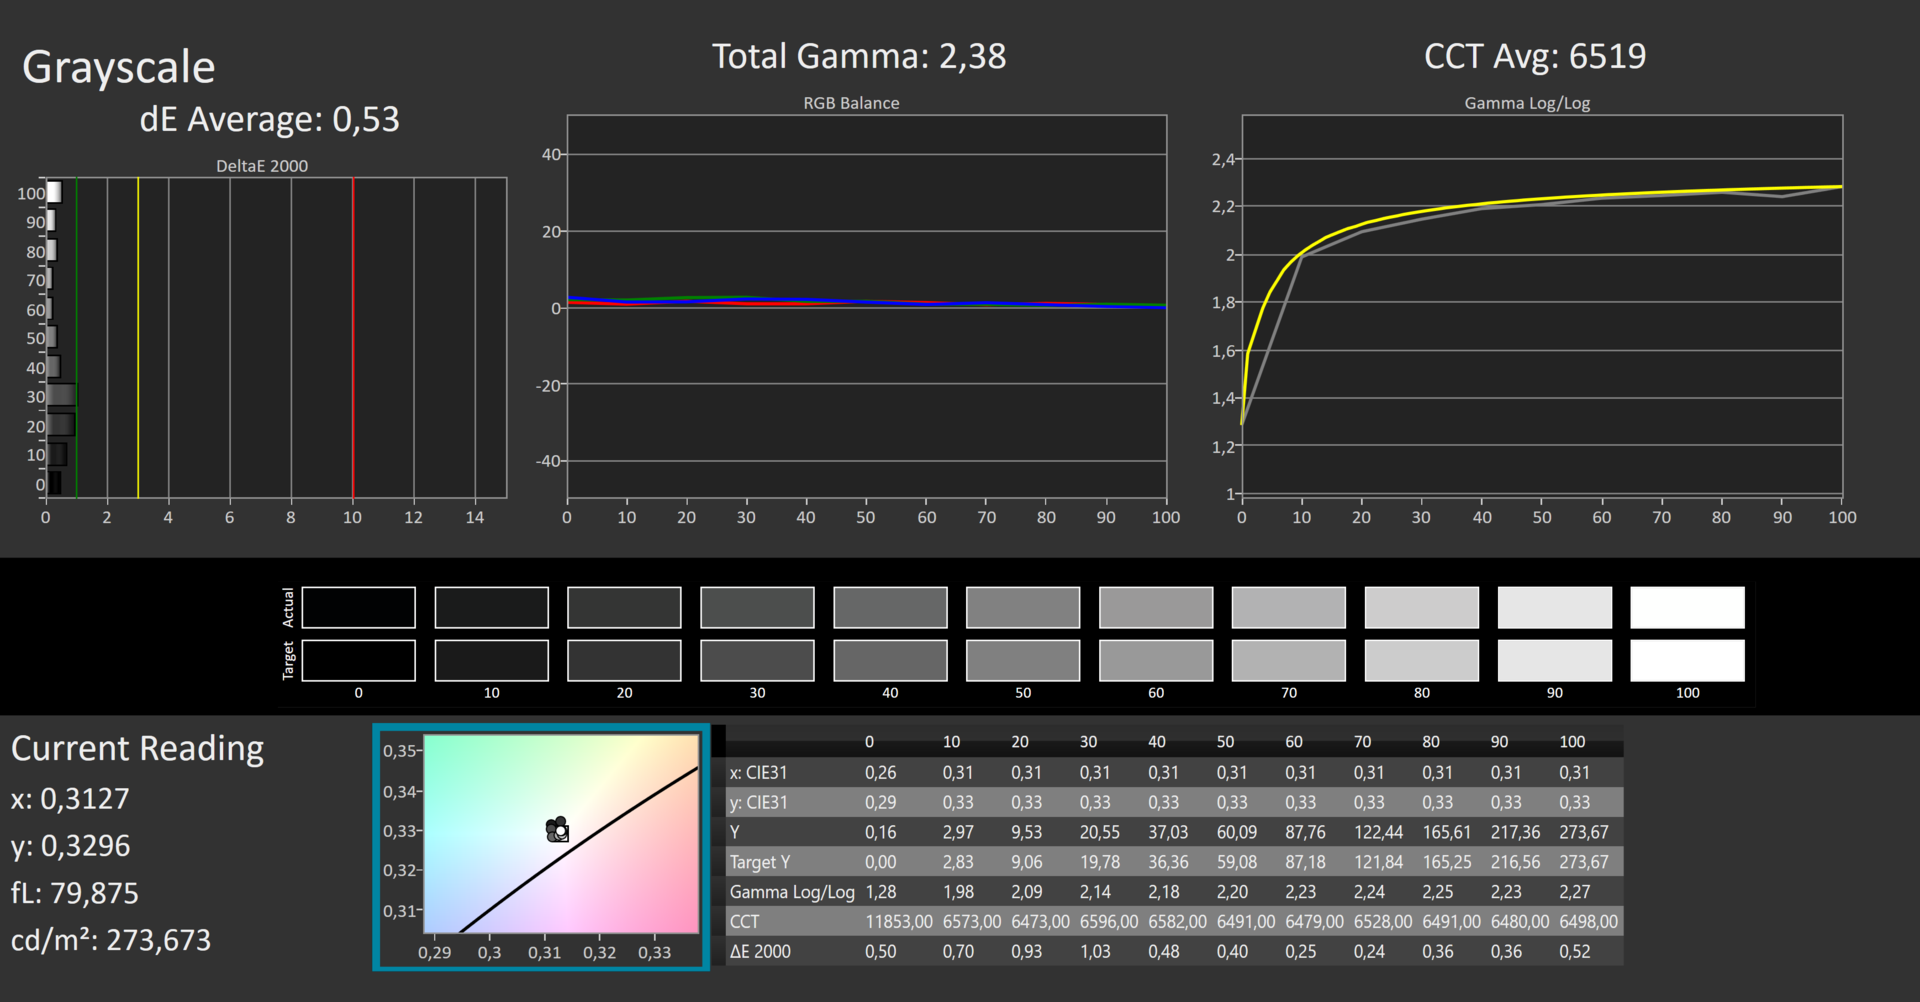
Gamma: 2.37
CCT: 6564 K
| Acer Swift X SFX16-51G-5388 Chi Mei N161HCA-EA3, , 1920x1080, 16.1" | Acer Swift 3 SF316-51 Chi Mei CMN160B, IPS, 1920x1080, 16.1" | Lenovo IdeaPad 5 Pro 16ACH IPS LED, 2560x1600, 16" | Dell Inspiron 16 Plus 7610 AU Optronics B160QAN, IPS, 3072x1920, 16" | Asus Vivobook Pro 16X-M7600QE Samsung ATNA60YV02-0, OLED, 3840x2400, 16.1" | Huawei MateBook 16 R7 5800H BOE TV160DKT-NH0, , 2520x1680, 16" | |
|---|---|---|---|---|---|---|
| Display | 3% | 8% | 11% | 34% | -2% | |
| Display P3 Coverage (%) | 65.1 | 66.6 2% | 71 9% | 74.1 14% | 99.8 53% | 63.1 -3% |
| sRGB Coverage (%) | 95.65 | 99.5 4% | 99 4% | 99.4 4% | 100 5% | 94.9 -1% |
| AdobeRGB 1998 Coverage (%) | 66.75 | 68.5 3% | 73.3 10% | 75.8 14% | 96.9 45% | 65.1 -2% |
| Response Times | -4% | 51% | -74% | 92% | -35% | |
| Response Time Grey 50% / Grey 80% * (ms) | 30 ? | 32 ? -7% | 16.4 ? 45% | 49.2 ? -64% | 2 ? 93% | 41.2 ? -37% |
| Response Time Black / White * (ms) | 20 ? | 20 ? -0% | 8.8 ? 56% | 36.8 ? -84% | 2 ? 90% | 26.4 ? -32% |
| PWM Frequency (Hz) | 2500 ? | 24940 ? | 60 ? | |||
| Screen | 7% | -25% | -32% | -5% | 7% | |
| Brightness middle (cd/m²) | 276 | 304 10% | 395 43% | 296.8 8% | 392 42% | 357 29% |
| Brightness (cd/m²) | 264 | 284 8% | 375 42% | 292 11% | 396 50% | 349 32% |
| Brightness Distribution (%) | 85 | 88 4% | 90 6% | 87 2% | 98 15% | 93 9% |
| Black Level * (cd/m²) | 0.16 | 0.165 -3% | 0.32 -100% | 0.21 -31% | 0.21 -31% | |
| Contrast (:1) | 1725 | 1842 7% | 1234 -28% | 1413 -18% | 1700 -1% | |
| Colorchecker dE 2000 * | 1.8 | 1.44 20% | 2.6 -44% | 2.56 -42% | 1.74 3% | 1.6 11% |
| Colorchecker dE 2000 max. * | 3.77 | 3.62 4% | 5.4 -43% | 4.76 -26% | 3.18 16% | 3.9 -3% |
| Colorchecker dE 2000 calibrated * | 0.63 | 1.1 -75% | 1.86 -195% | 1.85 -194% | 0.6 5% | |
| Greyscale dE 2000 * | 2.76 | 2.6 6% | 3.4 -23% | 2.6 6% | 1.77 36% | 2.4 13% |
| Gamma | 2.37 93% | 2.41 91% | 2.12 104% | 2.07 106% | 2.22 99% | 2.14 103% |
| CCT | 6564 99% | 6527 100% | 6140 106% | 6628 98% | 6483 100% | 6728 97% |
| Color Space (Percent of AdobeRGB 1998) (%) | 68.5 | |||||
| Color Space (Percent of sRGB) (%) | 99.5 | |||||
| Total Average (Program / Settings) | 2% /
4% | 11% /
-7% | -32% /
-29% | 40% /
21% | -10% /
-1% |
* ... smaller is better
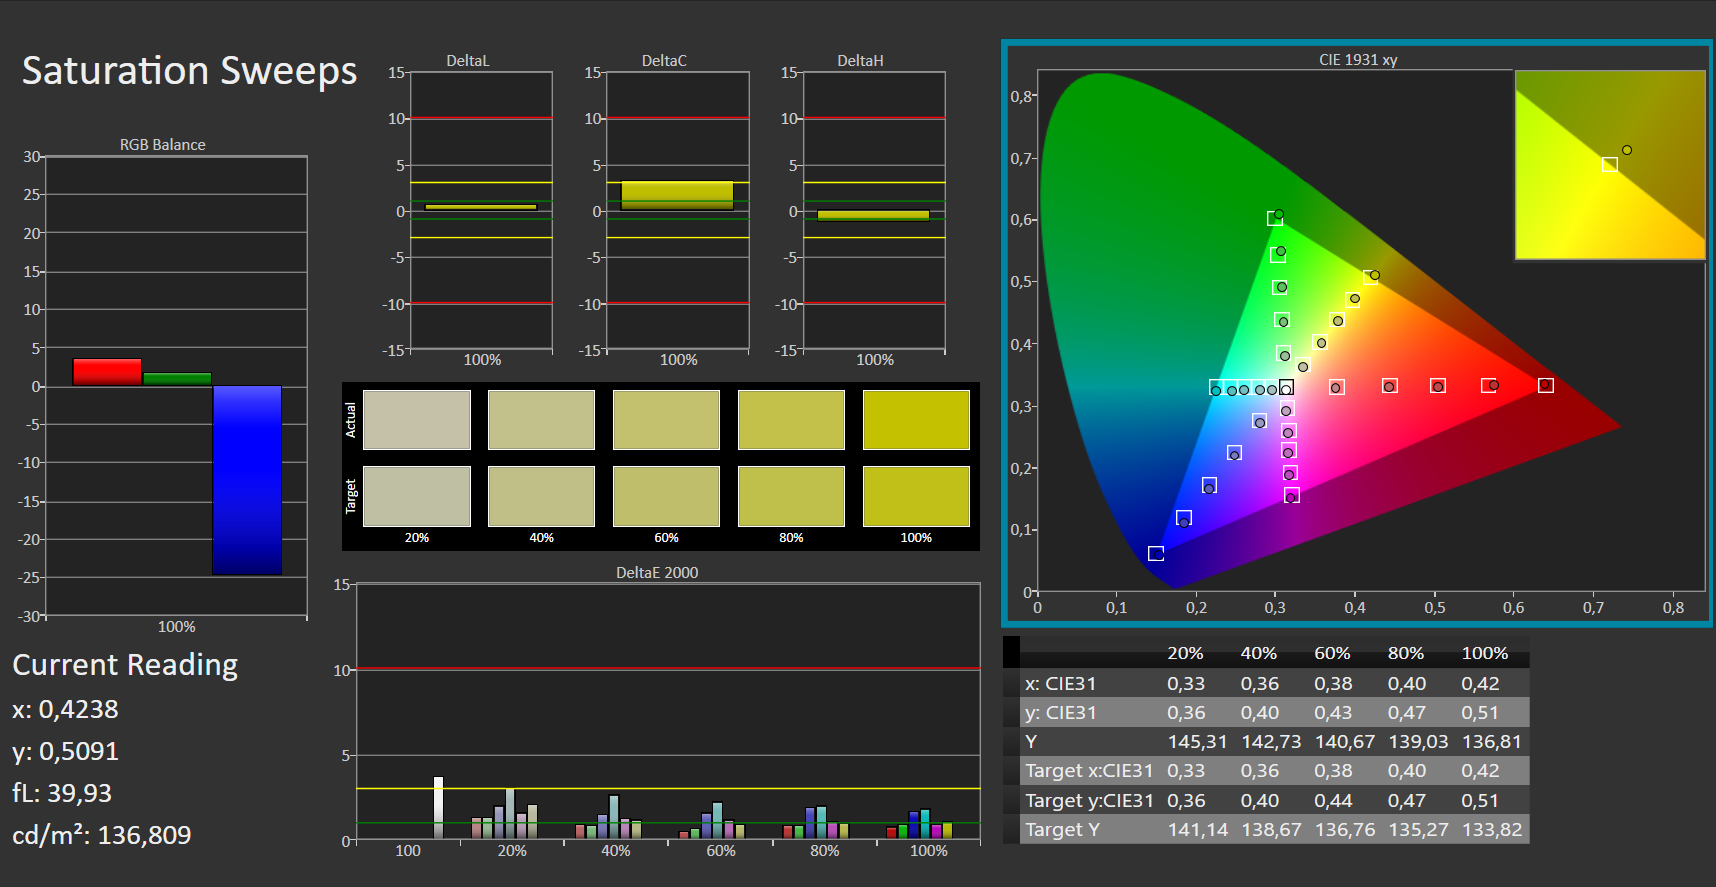
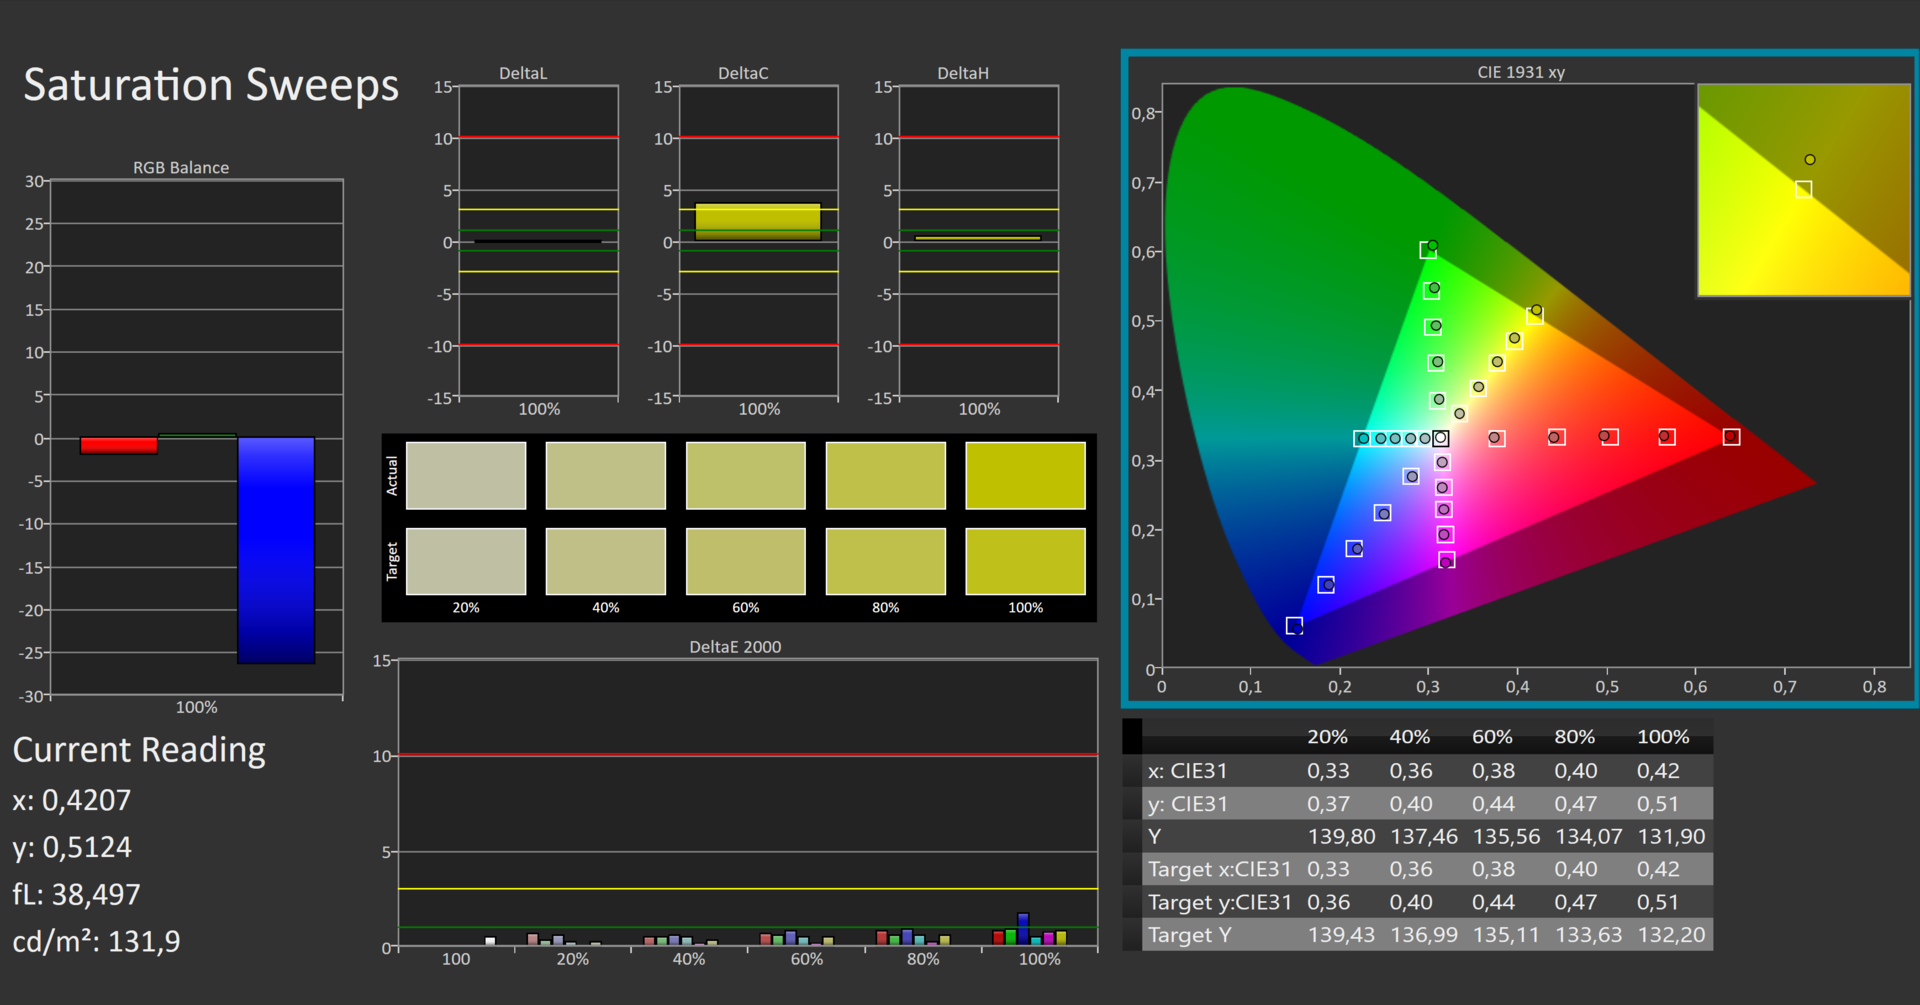
宏碁承诺完全覆盖sRGB,这在我们95.7%的测量中得到了证实。对于Adobe RGB和DCI-P3色彩空间,我们分别记录了66.8%和65.1%。这使得半专业的图像和视频编辑成为可能。
显示器已经被校准得相当好了,但我们能够进一步改善结果。像往常一样,我们的ICC色彩配置文件可以在照明图形旁边下载。
Display Response Times
| ↔ Response Time Black to White | ||
|---|---|---|
| 20 ms ... rise ↗ and fall ↘ combined | ↗ 11 ms rise |  |
| ↘ 9 ms fall | ||
| The screen shows good response rates in our tests, but may be too slow for competitive gamers. In comparison, all tested devices range from 0.1 (minimum) to 240 (maximum) ms. » 44 % of all devices are better. This means that the measured response time is similar to the average of all tested devices (19.8 ms). | ||
| ↔ Response Time 50% Grey to 80% Grey | ||
| 30 ms ... rise ↗ and fall ↘ combined | ↗ 14 ms rise |  |
| ↘ 16 ms fall | ||
| The screen shows slow response rates in our tests and will be unsatisfactory for gamers. In comparison, all tested devices range from 0.165 (minimum) to 636 (maximum) ms. » 40 % of all devices are better. This means that the measured response time is similar to the average of all tested devices (31 ms). | ||
Screen Flickering / PWM (Pulse-Width Modulation)
| Screen flickering / PWM not detected |  | ||
In comparison: 52 % of all tested devices do not use PWM to dim the display. If PWM was detected, an average of 7747 (minimum: 5 - maximum: 343500) Hz was measured. | |||
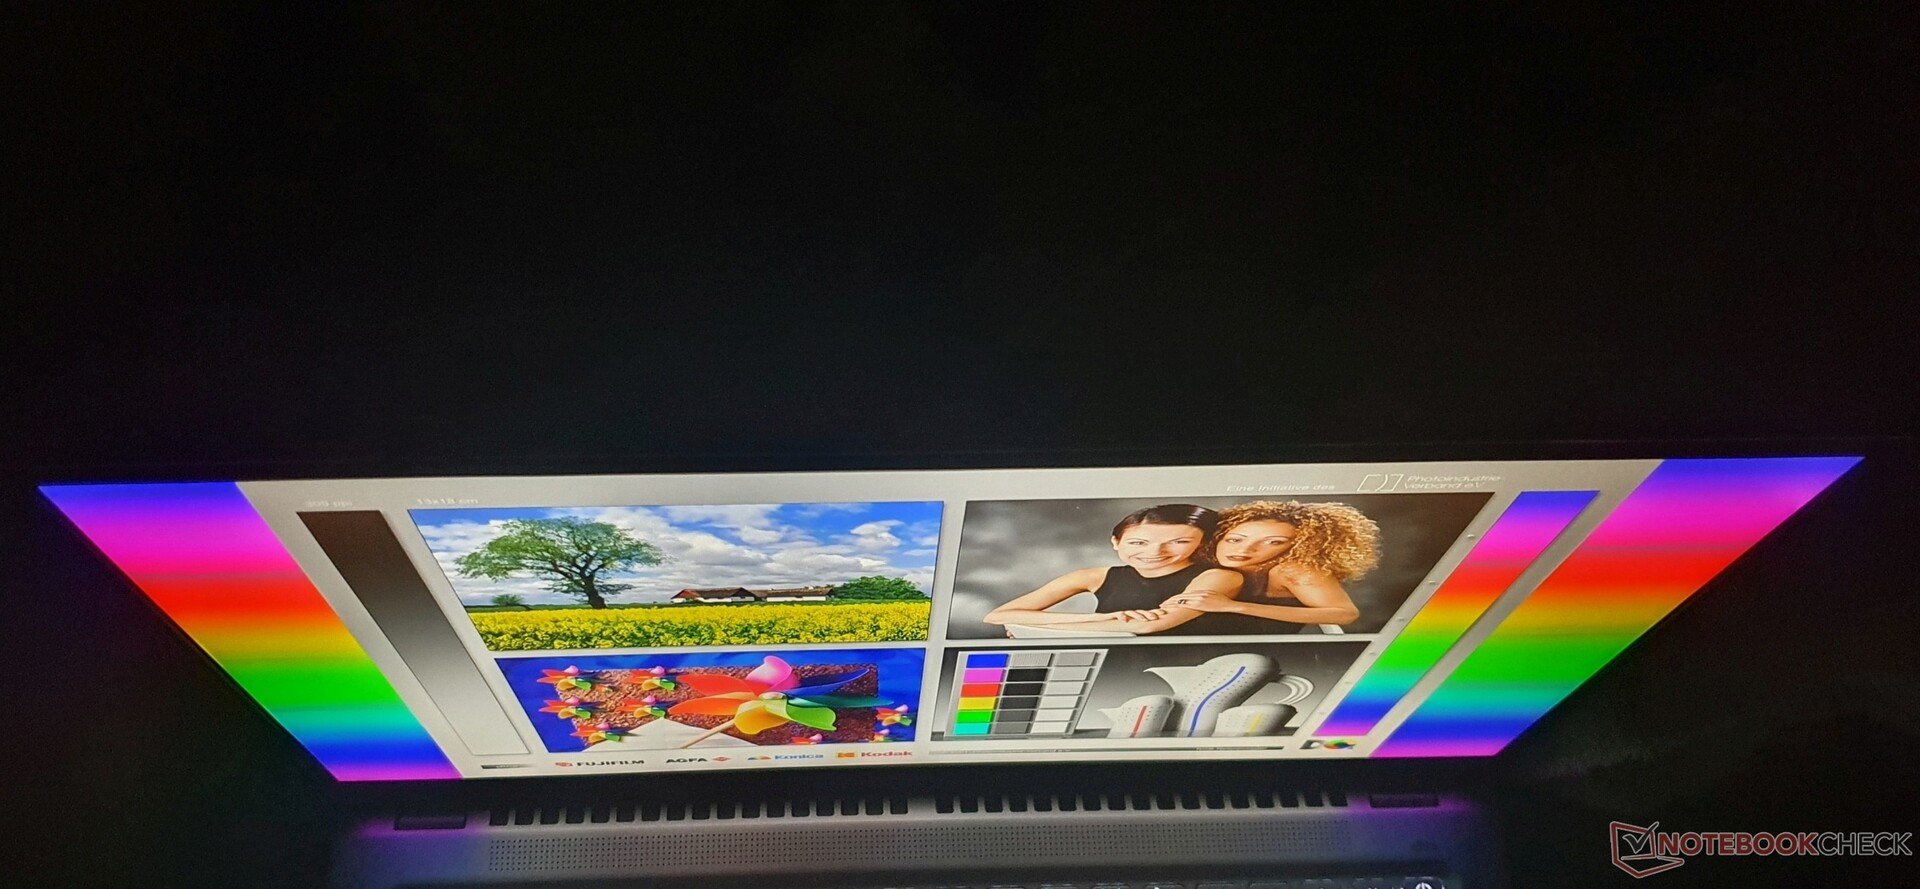
对于户外使用,宏碁Swift X 16只能在阴凉处使用。尽管有磨砂表面,但显示屏的亮度根本不足以经受住阳光的照射。
性能。Swift X表现良好,但固态硬盘被扼杀了
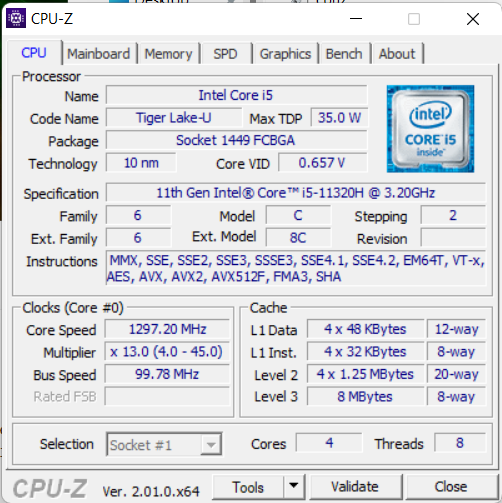
宏碁为其Swift X 16提供了两个CPU选项:一个是英特尔 酷睿i5-11320H带4.5GHz涡轮增压(在我们的模型中)和一个 酷睿i7-11390H带5GHz涡轮增压。两者都是四核处理器。
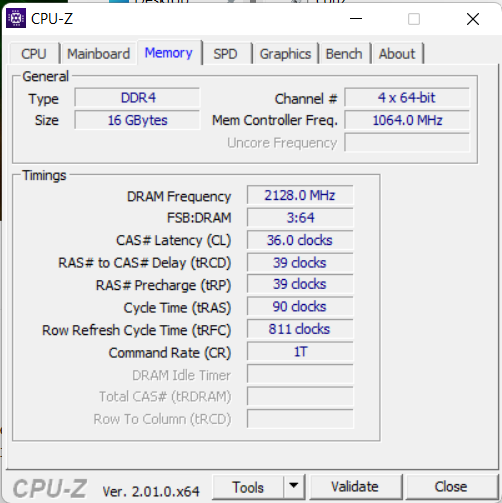
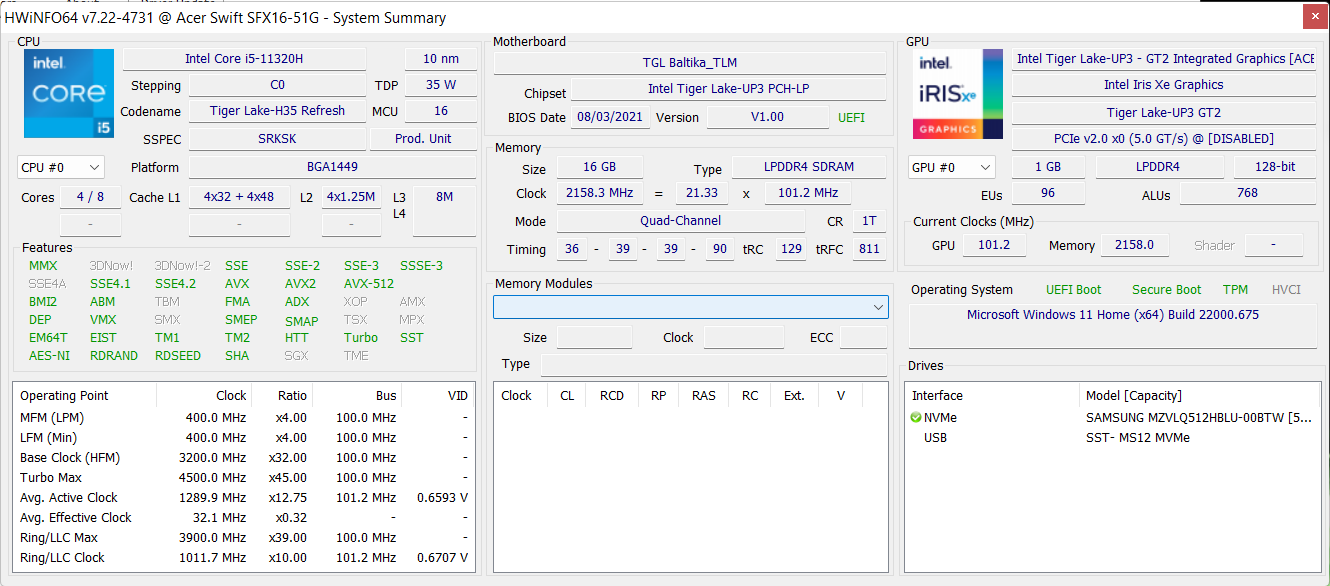
笔记本电脑通常配备一个Nvidia GeForce RTX 3050和16GB焊接的LPDDR4X-4266内存。至于存储空间,512GB SSD(PCIe 3.0)是标准配置,尽管在其他国家的一些配置中提供了1TB SDD。总的来说,这种水平的硬件足以满足多媒体用途,如简单的视频编辑、音频编辑或FHD游戏,以及一般办公用途。


测试条件
宏碁提供三种不同的电源模式,可以通过组合键 "Fn + F "进行切换。"静音"、"正常 "和 "性能"。
这些模式直接影响风扇的音量和性能限制。因此,风扇在静音 模式下明显更安静,而在正常 模式下干扰性更小(相对于性能模式)。涡轮增压不受影响,在静音 模式下,CPU的原始性能只是略有下降--在恒定负载下(6%的热节流)。GPU从未被节制,但 "动态提升 "的额外5瓦只在性能 模式下可用。
最安静的设置是在Windows选项 "最佳省电 "+宏碁的静音 模式下实现的。我们的基准测试是在性能 模式下进行的,而电池运行时间(网上冲浪和视频)是在平衡 模式下确定的。
| 以瓦特为单位的TDP | 以瓦特为单位的TGP | kombiniert | |
|---|---|---|---|
| 静音模式 | 35 | 35 | 20+35 |
| 正常-Modus | 35 | 35 | 25+35 |
| 性能-Modus | 35 | 40 | 25+40 |
| Akkubetrieb | 25 | 30 | 15+30 |
| Win11: Beste Einsparung | 12,5 | 30 | 12,5+30 |
处理器
英特尔 酷睿i5-11320H是一款四核CPU,TDP为35瓦,基本时钟为3.2GHz。涡轮增压被指定为4.5GHz。该CPU与Core i5-1155G7大致相同。,可在15瓦和最大28瓦之间配置。
在Turbo状态下,英特尔处理器最初在4.15GHz时的耗电量为55瓦特。然后在不到一分钟的时间里,功耗永久地下降到指定的35瓦,这样,3.2GHz的基本时钟就发挥作用了。
在性能方面,Swift X在比较领域中居于领先地位。在电池模式下,CPU仍然可以消耗25瓦,但性能下降了~25%。
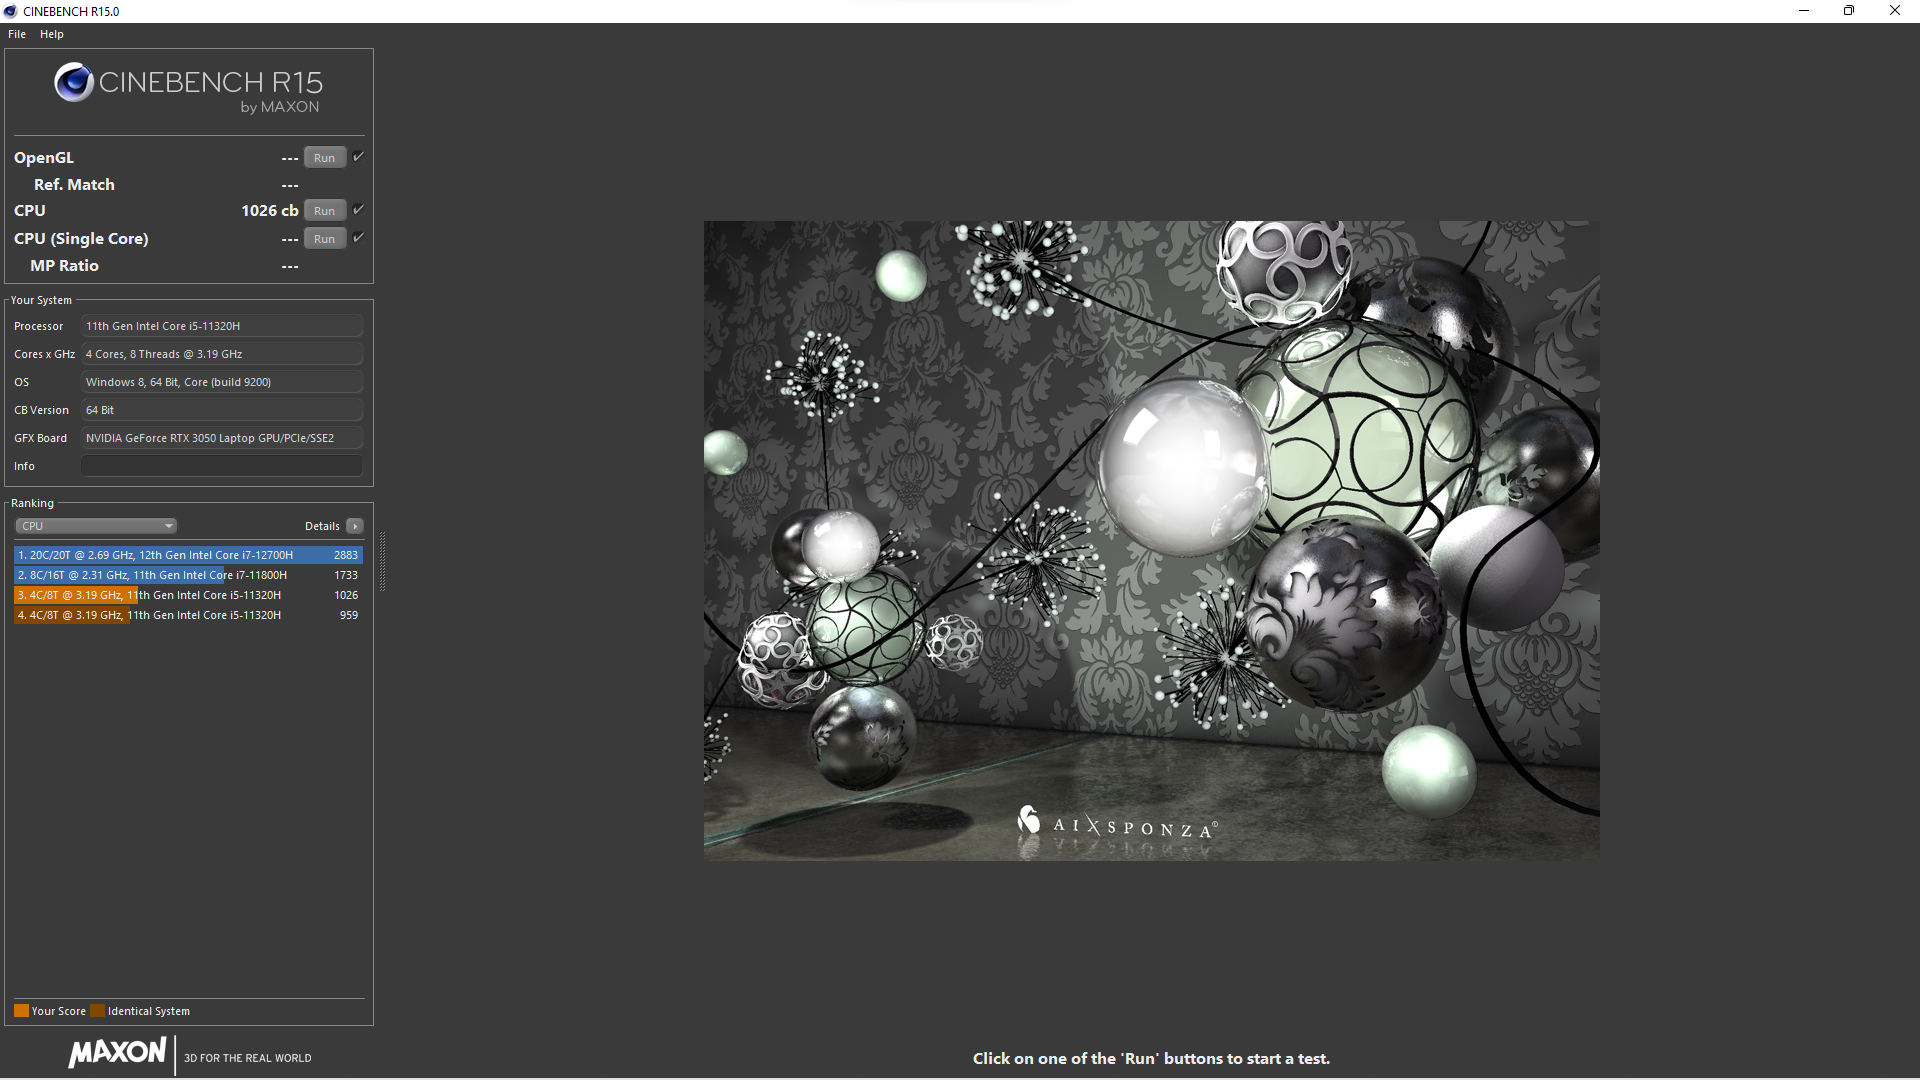

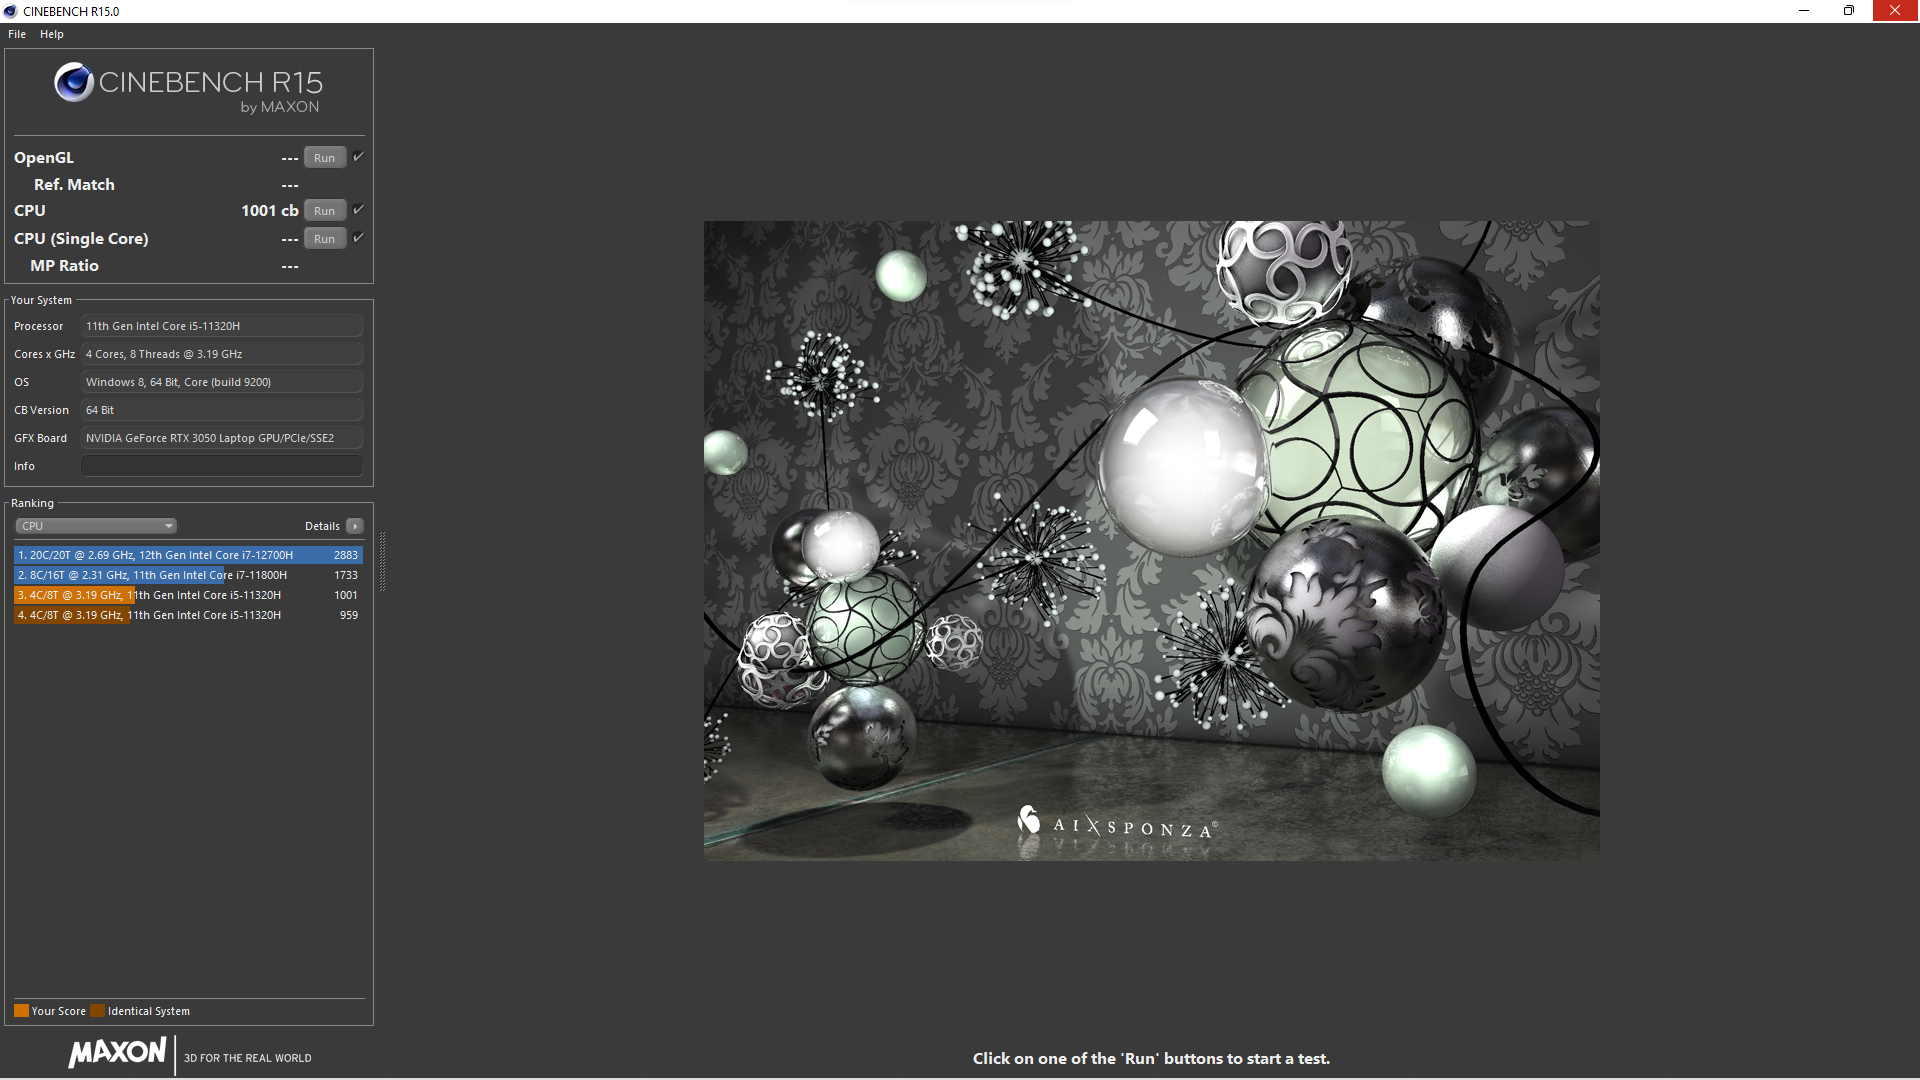
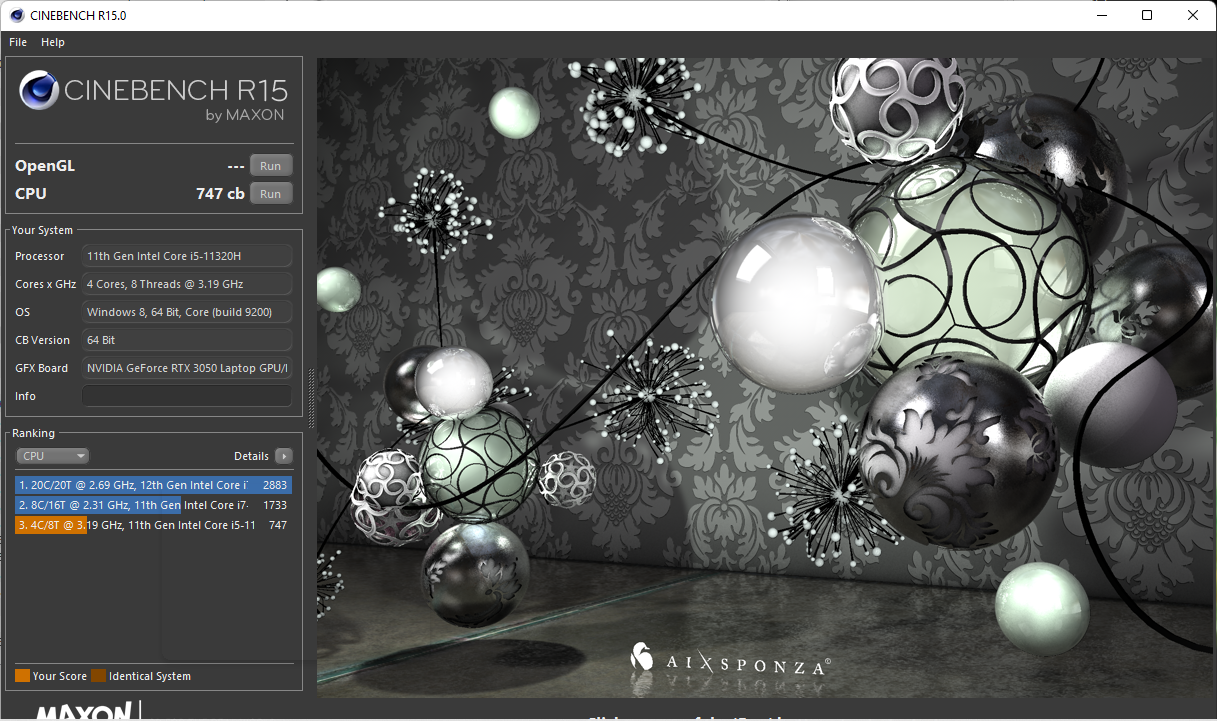
Cinebench R15 Multi Sustained Load
Cinebench R23: Multi Core | Single Core
Cinebench R20: CPU (Multi Core) | CPU (Single Core)
Cinebench R15: CPU Multi 64Bit | CPU Single 64Bit
Blender: v2.79 BMW27 CPU | v3.3 Classroom CPU | v3.3 Classroom CUDA
7-Zip 18.03: 7z b 4 | 7z b 4 -mmt1
Geekbench 5.5: Multi-Core | Single-Core | OpenCL Score
HWBOT x265 Benchmark v2.2: 4k Preset
LibreOffice : 20 Documents To PDF
R Benchmark 2.5: Overall mean
V-Ray 5 Benchmark: CPU | GPU CUDA
WebXPRT 3: Overall
WebXPRT 4: Overall
Mozilla Kraken 1.1: Total
Octane V2: Total Score
Jetstream 2: 2.0 Total
| CPU Performance rating | |
| Average of class Multimedia | |
| Asus Vivobook Pro 16X-M7600QE -7! | |
| Lenovo IdeaPad 5 Pro 16ACH -7! | |
| Dell Inspiron 16 Plus 7610 -8! | |
| Acer Swift 3 SF316-51 -7! | |
| Acer Swift X SFX14-41G-R7F3 -7! | |
| Acer Swift X SFX16-51G-5388 | |
| Average Intel Core i5-11320H | |
| Cinebench R23 / Multi Core | |
| Average of class Multimedia (4861 - 33362, n=77, last 2 years) | |
| Asus Vivobook Pro 16X-M7600QE | |
| Asus Vivobook Pro 16X-M7600QE | |
| Lenovo IdeaPad 5 Pro 16ACH | |
| Dell Inspiron 16 Plus 7610 | |
| Acer Swift X SFX14-41G-R7F3 | |
| Acer Swift 3 SF316-51 | |
| Acer Swift X SFX16-51G-5388 | |
| Average Intel Core i5-11320H (5720 - 6051, n=4) | |
| Cinebench R23 / Single Core | |
| Average of class Multimedia (1128 - 2459, n=69, last 2 years) | |
| Acer Swift 3 SF316-51 | |
| Dell Inspiron 16 Plus 7610 | |
| Asus Vivobook Pro 16X-M7600QE | |
| Asus Vivobook Pro 16X-M7600QE | |
| Average Intel Core i5-11320H (1341 - 1467, n=4) | |
| Lenovo IdeaPad 5 Pro 16ACH | |
| Acer Swift X SFX16-51G-5388 | |
| Acer Swift X SFX14-41G-R7F3 | |
| Cinebench R20 / CPU (Multi Core) | |
| Average of class Multimedia (1887 - 12912, n=60, last 2 years) | |
| Asus Vivobook Pro 16X-M7600QE | |
| Asus Vivobook Pro 16X-M7600QE | |
| Lenovo IdeaPad 5 Pro 16ACH | |
| Dell Inspiron 16 Plus 7610 | |
| Acer Swift X SFX14-41G-R7F3 | |
| Acer Swift X SFX16-51G-5388 | |
| Acer Swift 3 SF316-51 | |
| Average Intel Core i5-11320H (2208 - 2349, n=4) | |
| Cinebench R20 / CPU (Single Core) | |
| Average of class Multimedia (425 - 853, n=60, last 2 years) | |
| Acer Swift 3 SF316-51 | |
| Dell Inspiron 16 Plus 7610 | |
| Asus Vivobook Pro 16X-M7600QE | |
| Asus Vivobook Pro 16X-M7600QE | |
| Average Intel Core i5-11320H (557 - 567, n=4) | |
| Acer Swift X SFX16-51G-5388 | |
| Lenovo IdeaPad 5 Pro 16ACH | |
| Acer Swift X SFX14-41G-R7F3 | |
| Cinebench R15 / CPU Multi 64Bit | |
| Average of class Multimedia (856 - 5224, n=64, last 2 years) | |
| Asus Vivobook Pro 16X-M7600QE | |
| Asus Vivobook Pro 16X-M7600QE | |
| Lenovo IdeaPad 5 Pro 16ACH | |
| Dell Inspiron 16 Plus 7610 | |
| Acer Swift X SFX14-41G-R7F3 | |
| Acer Swift X SFX16-51G-5388 | |
| Acer Swift 3 SF316-51 | |
| Average Intel Core i5-11320H (857 - 1019, n=4) | |
| Cinebench R15 / CPU Single 64Bit | |
| Average of class Multimedia (184.8 - 326, n=62, last 2 years) | |
| Asus Vivobook Pro 16X-M7600QE | |
| Asus Vivobook Pro 16X-M7600QE | |
| Acer Swift 3 SF316-51 | |
| Dell Inspiron 16 Plus 7610 | |
| Lenovo IdeaPad 5 Pro 16ACH | |
| Acer Swift X SFX16-51G-5388 | |
| Average Intel Core i5-11320H (212 - 215, n=4) | |
| Acer Swift X SFX14-41G-R7F3 | |
| Blender / v2.79 BMW27 CPU | |
| Average Intel Core i5-11320H (507 - 543, n=4) | |
| Acer Swift 3 SF316-51 | |
| Acer Swift X SFX16-51G-5388 | |
| Acer Swift X SFX14-41G-R7F3 | |
| Dell Inspiron 16 Plus 7610 | |
| Lenovo IdeaPad 5 Pro 16ACH | |
| Asus Vivobook Pro 16X-M7600QE | |
| Asus Vivobook Pro 16X-M7600QE | |
| Average of class Multimedia (100 - 557, n=61, last 2 years) | |
| Blender / v3.3 Classroom CPU | |
| Average Intel Core i5-11320H (937 - 1010, n=3) | |
| Acer Swift X SFX16-51G-5388 | |
| Average of class Multimedia (134.5 - 1042, n=64, last 2 years) | |
| Blender / v3.3 Classroom CUDA | |
| Acer Swift X SFX16-51G-5388 | |
| Average Intel Core i5-11320H (n=1) | |
| Average of class Multimedia (20 - 186, n=23, last 2 years) | |
| 7-Zip 18.03 / 7z b 4 | |
| Asus Vivobook Pro 16X-M7600QE | |
| Asus Vivobook Pro 16X-M7600QE | |
| Average of class Multimedia (26062 - 130368, n=58, last 2 years) | |
| Lenovo IdeaPad 5 Pro 16ACH | |
| Dell Inspiron 16 Plus 7610 | |
| Acer Swift X SFX14-41G-R7F3 | |
| Acer Swift 3 SF316-51 | |
| Average Intel Core i5-11320H (24718 - 26858, n=4) | |
| Acer Swift X SFX16-51G-5388 | |
| 7-Zip 18.03 / 7z b 4 -mmt1 | |
| Average of class Multimedia (3666 - 7545, n=59, last 2 years) | |
| Asus Vivobook Pro 16X-M7600QE | |
| Asus Vivobook Pro 16X-M7600QE | |
| Dell Inspiron 16 Plus 7610 | |
| Acer Swift 3 SF316-51 | |
| Lenovo IdeaPad 5 Pro 16ACH | |
| Average Intel Core i5-11320H (4813 - 5119, n=4) | |
| Acer Swift X SFX16-51G-5388 | |
| Acer Swift X SFX14-41G-R7F3 | |
| Geekbench 5.5 / Multi-Core | |
| Average of class Multimedia (4652 - 20422, n=59, last 2 years) | |
| Asus Vivobook Pro 16X-M7600QE | |
| Asus Vivobook Pro 16X-M7600QE | |
| Lenovo IdeaPad 5 Pro 16ACH | |
| Acer Swift 3 SF316-51 | |
| Acer Swift X SFX16-51G-5388 | |
| Acer Swift X SFX14-41G-R7F3 | |
| Average Intel Core i5-11320H (4927 - 5955, n=4) | |
| Geekbench 5.5 / Single-Core | |
| Average of class Multimedia (805 - 2974, n=59, last 2 years) | |
| Acer Swift 3 SF316-51 | |
| Asus Vivobook Pro 16X-M7600QE | |
| Asus Vivobook Pro 16X-M7600QE | |
| Average Intel Core i5-11320H (1453 - 1523, n=4) | |
| Acer Swift X SFX16-51G-5388 | |
| Lenovo IdeaPad 5 Pro 16ACH | |
| Acer Swift X SFX14-41G-R7F3 | |
| Geekbench 5.5 / OpenCL Score | |
| Average of class Multimedia (11562 - 217159, n=59, last 2 years) | |
| Asus Vivobook Pro 16X-M7600QE | |
| Asus Vivobook Pro 16X-M7600QE | |
| Acer Swift X SFX16-51G-5388 | |
| Lenovo IdeaPad 5 Pro 16ACH | |
| Acer Swift X SFX14-41G-R7F3 | |
| Average Intel Core i5-11320H (17641 - 50997, n=4) | |
| Acer Swift 3 SF316-51 | |
| HWBOT x265 Benchmark v2.2 / 4k Preset | |
| Average of class Multimedia (5.26 - 36.1, n=59, last 2 years) | |
| Asus Vivobook Pro 16X-M7600QE | |
| Asus Vivobook Pro 16X-M7600QE | |
| Lenovo IdeaPad 5 Pro 16ACH | |
| Dell Inspiron 16 Plus 7610 | |
| Acer Swift X SFX14-41G-R7F3 | |
| Acer Swift X SFX16-51G-5388 | |
| Acer Swift 3 SF316-51 | |
| Average Intel Core i5-11320H (7.25 - 7.91, n=4) | |
| LibreOffice / 20 Documents To PDF | |
| Asus Vivobook Pro 16X-M7600QE | |
| Asus Vivobook Pro 16X-M7600QE | |
| Acer Swift X SFX16-51G-5388 | |
| Average of class Multimedia (23.9 - 146.7, n=60, last 2 years) | |
| Average Intel Core i5-11320H (44 - 50, n=4) | |
| Lenovo IdeaPad 5 Pro 16ACH | |
| Dell Inspiron 16 Plus 7610 | |
| Acer Swift 3 SF316-51 | |
| R Benchmark 2.5 / Overall mean | |
| Acer Swift X SFX14-41G-R7F3 | |
| Average Intel Core i5-11320H (0.581 - 0.622, n=4) | |
| Acer Swift X SFX16-51G-5388 | |
| Dell Inspiron 16 Plus 7610 | |
| Acer Swift 3 SF316-51 | |
| Lenovo IdeaPad 5 Pro 16ACH | |
| Asus Vivobook Pro 16X-M7600QE | |
| Asus Vivobook Pro 16X-M7600QE | |
| Average of class Multimedia (0.3604 - 0.947, n=59, last 2 years) | |
| V-Ray 5 Benchmark / CPU | |
| Average of class Multimedia (3126 - 16017, n=27, last 2 years) | |
| Dell Inspiron 16 Plus 7610 | |
| Acer Swift X SFX16-51G-5388 | |
| Average Intel Core i5-11320H (3985 - 4415, n=4) | |
| V-Ray 5 Benchmark / GPU CUDA | |
| Average of class Multimedia (277 - 1482, n=7, last 2 years) | |
| Acer Swift X SFX16-51G-5388 | |
| Average Intel Core i5-11320H (99 - 374, n=2) | |
| WebXPRT 3 / Overall | |
| Average of class Multimedia (136.4 - 596, n=66, last 2 years) | |
| Asus Vivobook Pro 16X-M7600QE | |
| Lenovo IdeaPad 5 Pro 16ACH | |
| Acer Swift 3 SF316-51 | |
| Average Intel Core i5-11320H (243 - 269, n=4) | |
| Dell Inspiron 16 Plus 7610 | |
| Acer Swift X SFX16-51G-5388 | |
| Acer Swift X SFX14-41G-R7F3 | |
| WebXPRT 4 / Overall | |
| Average of class Multimedia (167.3 - 402, n=68, last 2 years) | |
| Average Intel Core i5-11320H (202 - 206, n=3) | |
| Acer Swift X SFX16-51G-5388 | |
| Mozilla Kraken 1.1 / Total | |
| Acer Swift X SFX14-41G-R7F3 | |
| Acer Swift X SFX16-51G-5388 | |
| Average Intel Core i5-11320H (662 - 680, n=4) | |
| Lenovo IdeaPad 5 Pro 16ACH | |
| Dell Inspiron 16 Plus 7610 | |
| Acer Swift 3 SF316-51 | |
| Asus Vivobook Pro 16X-M7600QE | |
| Asus Vivobook Pro 16X-M7600QE | |
| Average of class Multimedia (228 - 835, n=69, last 2 years) | |
| Octane V2 / Total Score | |
| Average of class Multimedia (64079 - 153175, n=32, last 2 years) | |
| Acer Swift X SFX16-51G-5388 | |
| Average Intel Core i5-11320H (n=1) | |
| Acer Swift X SFX14-41G-R7F3 | |
| Jetstream 2 / 2.0 Total | |
| Average of class Multimedia (287 - 481, n=33, last 2 years) | |
| Acer Swift X SFX16-51G-5388 | |
| Average Intel Core i5-11320H (174.3 - 208, n=3) | |
| Dell Inspiron 16 Plus 7610 | |
* ... smaller is better
AIDA64: FP32 Ray-Trace | FPU Julia | CPU SHA3 | CPU Queen | FPU SinJulia | FPU Mandel | CPU AES | CPU ZLib | FP64 Ray-Trace | CPU PhotoWorxx
| Performance rating | |
| Average of class Multimedia | |
| Asus Vivobook Pro 16X-M7600QE | |
| Lenovo IdeaPad 5 Pro 16ACH | |
| Acer Swift X SFX14-41G-R7F3 | |
| Average Intel Core i5-11320H | |
| Acer Swift X SFX16-51G-5388 | |
| Dell Inspiron 16 Plus 7610 -9! | |
| AIDA64 / FP32 Ray-Trace | |
| Average of class Multimedia (2214 - 50388, n=56, last 2 years) | |
| Asus Vivobook Pro 16X-M7600QE | |
| Asus Vivobook Pro 16X-M7600QE | |
| Lenovo IdeaPad 5 Pro 16ACH | |
| Acer Swift X SFX14-41G-R7F3 | |
| Average Intel Core i5-11320H (6369 - 7489, n=4) | |
| Acer Swift X SFX16-51G-5388 | |
| AIDA64 / FPU Julia | |
| Asus Vivobook Pro 16X-M7600QE | |
| Asus Vivobook Pro 16X-M7600QE | |
| Lenovo IdeaPad 5 Pro 16ACH | |
| Average of class Multimedia (12867 - 201874, n=57, last 2 years) | |
| Acer Swift X SFX14-41G-R7F3 | |
| Average Intel Core i5-11320H (27391 - 31637, n=4) | |
| Acer Swift X SFX16-51G-5388 | |
| AIDA64 / CPU SHA3 | |
| Average of class Multimedia (626 - 8623, n=57, last 2 years) | |
| Asus Vivobook Pro 16X-M7600QE | |
| Asus Vivobook Pro 16X-M7600QE | |
| Lenovo IdeaPad 5 Pro 16ACH | |
| Average Intel Core i5-11320H (1847 - 2099, n=4) | |
| Acer Swift X SFX16-51G-5388 | |
| Acer Swift X SFX14-41G-R7F3 | |
| AIDA64 / CPU Queen | |
| Asus Vivobook Pro 16X-M7600QE | |
| Asus Vivobook Pro 16X-M7600QE | |
| Lenovo IdeaPad 5 Pro 16ACH | |
| Average of class Multimedia (13483 - 181505, n=44, last 2 years) | |
| Acer Swift X SFX14-41G-R7F3 | |
| Average Intel Core i5-11320H (43565 - 52477, n=4) | |
| Acer Swift X SFX16-51G-5388 | |
| AIDA64 / FPU SinJulia | |
| Asus Vivobook Pro 16X-M7600QE | |
| Asus Vivobook Pro 16X-M7600QE | |
| Lenovo IdeaPad 5 Pro 16ACH | |
| Acer Swift X SFX14-41G-R7F3 | |
| Average of class Multimedia (886 - 28794, n=57, last 2 years) | |
| Average Intel Core i5-11320H (4381 - 5011, n=4) | |
| Acer Swift X SFX16-51G-5388 | |
| AIDA64 / FPU Mandel | |
| Asus Vivobook Pro 16X-M7600QE | |
| Asus Vivobook Pro 16X-M7600QE | |
| Lenovo IdeaPad 5 Pro 16ACH | |
| Average of class Multimedia (6395 - 105740, n=56, last 2 years) | |
| Acer Swift X SFX14-41G-R7F3 | |
| Average Intel Core i5-11320H (16659 - 18770, n=4) | |
| Acer Swift X SFX16-51G-5388 | |
| AIDA64 / CPU AES | |
| Asus Vivobook Pro 16X-M7600QE | |
| Asus Vivobook Pro 16X-M7600QE | |
| Lenovo IdeaPad 5 Pro 16ACH | |
| Average Intel Core i5-11320H (59851 - 76500, n=4) | |
| Average of class Multimedia (8171 - 126790, n=57, last 2 years) | |
| Acer Swift X SFX16-51G-5388 | |
| Acer Swift X SFX14-41G-R7F3 | |
| AIDA64 / CPU ZLib | |
| Average of class Multimedia (143.8 - 2022, n=57, last 2 years) | |
| Asus Vivobook Pro 16X-M7600QE | |
| Asus Vivobook Pro 16X-M7600QE | |
| Lenovo IdeaPad 5 Pro 16ACH | |
| Acer Swift X SFX14-41G-R7F3 | |
| Average Intel Core i5-11320H (330 - 410, n=4) | |
| Acer Swift X SFX16-51G-5388 | |
| Dell Inspiron 16 Plus 7610 | |
| AIDA64 / FP64 Ray-Trace | |
| Average of class Multimedia (1014 - 26875, n=57, last 2 years) | |
| Asus Vivobook Pro 16X-M7600QE | |
| Asus Vivobook Pro 16X-M7600QE | |
| Lenovo IdeaPad 5 Pro 16ACH | |
| Acer Swift X SFX14-41G-R7F3 | |
| Average Intel Core i5-11320H (3536 - 4021, n=4) | |
| Acer Swift X SFX16-51G-5388 | |
| AIDA64 / CPU PhotoWorxx | |
| Average of class Multimedia (8187 - 88154, n=57, last 2 years) | |
| Acer Swift X SFX16-51G-5388 | |
| Average Intel Core i5-11320H (25964 - 36644, n=4) | |
| Asus Vivobook Pro 16X-M7600QE | |
| Asus Vivobook Pro 16X-M7600QE | |
| Acer Swift X SFX14-41G-R7F3 | |
| Lenovo IdeaPad 5 Pro 16ACH | |
系统性能
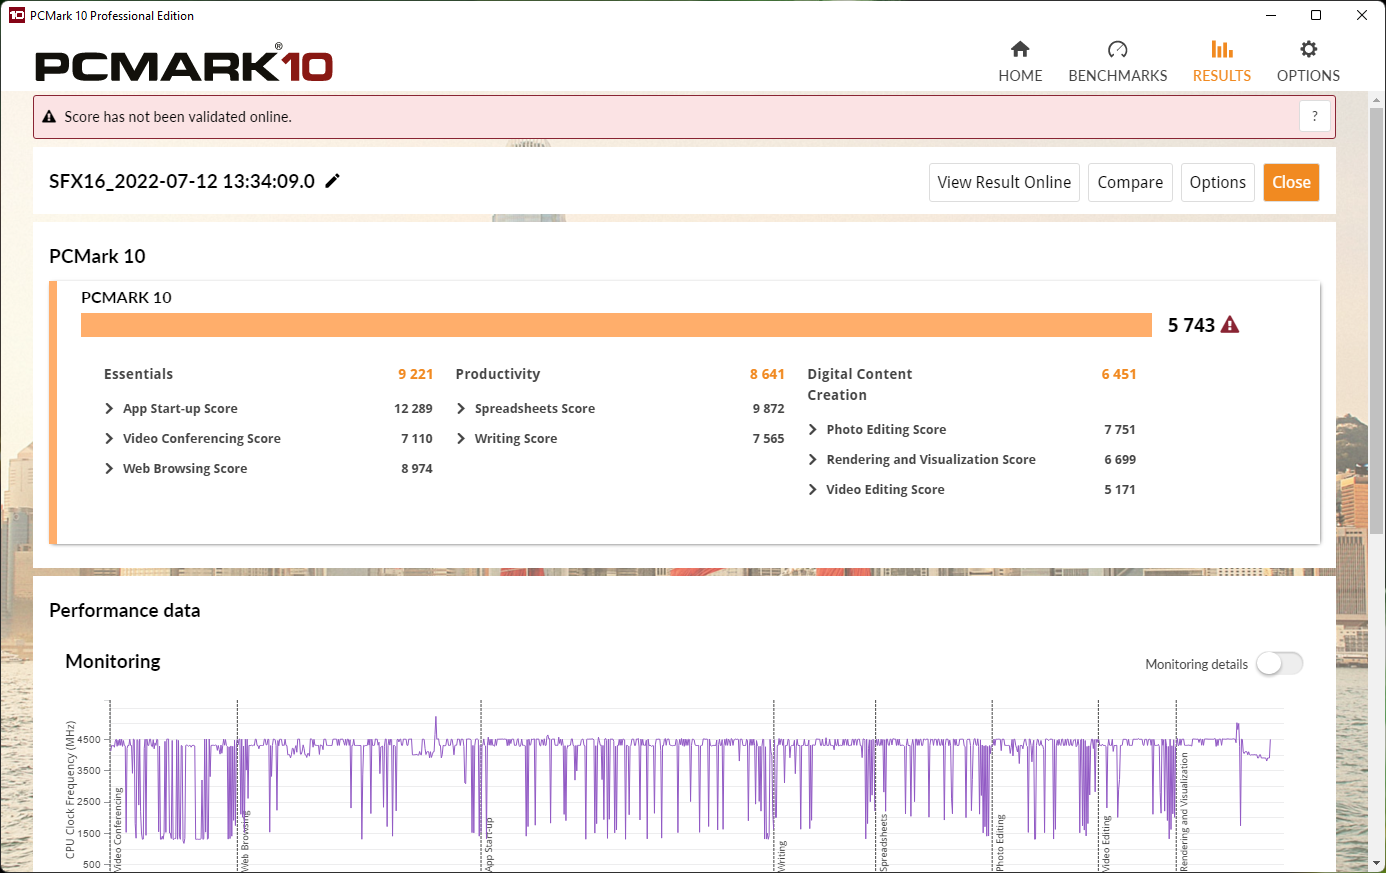
该系统的工作速度非常快,没有滞后,即使在使用多个标签和在后台播放4K YouTube视频时也是如此。
在我们的比较领域中,PCMark 10的分数相对接近。宏碁Swift X在AIDA64/内存得分方面最为突出,可能是由于其快速的LPDDR4X内存。
CrossMark: Overall | Productivity | Creativity | Responsiveness
| PCMark 10 / Score | |
| Average of class Multimedia (4325 - 10386, n=55, last 2 years) | |
| Asus Vivobook Pro 16X-M7600QE | |
| Dell Inspiron 16 Plus 7610 | |
| Lenovo IdeaPad 5 Pro 16ACH | |
| Acer Swift X SFX16-51G-5388 | |
| Average Intel Core i5-11320H, NVIDIA GeForce RTX 3050 4GB Laptop GPU (n=1) | |
| Acer Swift 3 SF316-51 | |
| Acer Swift X SFX14-41G-R7F3 | |
| PCMark 10 / Essentials | |
| Average of class Multimedia (8025 - 11664, n=54, last 2 years) | |
| Asus Vivobook Pro 16X-M7600QE | |
| Acer Swift 3 SF316-51 | |
| Lenovo IdeaPad 5 Pro 16ACH | |
| Dell Inspiron 16 Plus 7610 | |
| Acer Swift X SFX16-51G-5388 | |
| Average Intel Core i5-11320H, NVIDIA GeForce RTX 3050 4GB Laptop GPU (n=1) | |
| Acer Swift X SFX14-41G-R7F3 | |
| PCMark 10 / Productivity | |
| Average of class Multimedia (7323 - 18233, n=54, last 2 years) | |
| Asus Vivobook Pro 16X-M7600QE | |
| Acer Swift X SFX16-51G-5388 | |
| Average Intel Core i5-11320H, NVIDIA GeForce RTX 3050 4GB Laptop GPU (n=1) | |
| Dell Inspiron 16 Plus 7610 | |
| Lenovo IdeaPad 5 Pro 16ACH | |
| Acer Swift 3 SF316-51 | |
| Acer Swift X SFX14-41G-R7F3 | |
| PCMark 10 / Digital Content Creation | |
| Average of class Multimedia (3651 - 16240, n=54, last 2 years) | |
| Dell Inspiron 16 Plus 7610 | |
| Asus Vivobook Pro 16X-M7600QE | |
| Lenovo IdeaPad 5 Pro 16ACH | |
| Acer Swift X SFX16-51G-5388 | |
| Average Intel Core i5-11320H, NVIDIA GeForce RTX 3050 4GB Laptop GPU (n=1) | |
| Acer Swift 3 SF316-51 | |
| Acer Swift X SFX14-41G-R7F3 | |
| CrossMark / Overall | |
| Average of class Multimedia (866 - 2728, n=63, last 2 years) | |
| Acer Swift X SFX16-51G-5388 | |
| Average Intel Core i5-11320H, NVIDIA GeForce RTX 3050 4GB Laptop GPU (n=1) | |
| Acer Swift X SFX14-41G-R7F3 | |
| CrossMark / Productivity | |
| Average of class Multimedia (931 - 2489, n=63, last 2 years) | |
| Acer Swift X SFX16-51G-5388 | |
| Average Intel Core i5-11320H, NVIDIA GeForce RTX 3050 4GB Laptop GPU (n=1) | |
| Acer Swift X SFX14-41G-R7F3 | |
| CrossMark / Creativity | |
| Average of class Multimedia (907 - 3465, n=63, last 2 years) | |
| Acer Swift X SFX16-51G-5388 | |
| Average Intel Core i5-11320H, NVIDIA GeForce RTX 3050 4GB Laptop GPU (n=1) | |
| Acer Swift X SFX14-41G-R7F3 | |
| CrossMark / Responsiveness | |
| Average of class Multimedia (605 - 2024, n=63, last 2 years) | |
| Acer Swift X SFX16-51G-5388 | |
| Average Intel Core i5-11320H, NVIDIA GeForce RTX 3050 4GB Laptop GPU (n=1) | |
| Acer Swift X SFX14-41G-R7F3 | |
| PCMark 10 Score | 5743 points | |
Help | ||
| AIDA64 / Memory Copy | |
| Average of class Multimedia (11299 - 132135, n=57, last 2 years) | |
| Acer Swift X SFX16-51G-5388 | |
| Average Intel Core i5-11320H (41106 - 55961, n=4) | |
| Lenovo IdeaPad 5 Pro 16ACH | |
| Huawei MateBook 16 R7 5800H | |
| Acer Swift X SFX14-41G-R7F3 | |
| AIDA64 / Memory Read | |
| Average of class Multimedia (11624 - 174586, n=57, last 2 years) | |
| Acer Swift X SFX16-51G-5388 | |
| Average Intel Core i5-11320H (46516 - 52799, n=4) | |
| Acer Swift X SFX14-41G-R7F3 | |
| Lenovo IdeaPad 5 Pro 16ACH | |
| Huawei MateBook 16 R7 5800H | |
| AIDA64 / Memory Write | |
| Average of class Multimedia (11755 - 134998, n=57, last 2 years) | |
| Acer Swift X SFX16-51G-5388 | |
| Average Intel Core i5-11320H (46760 - 63323, n=4) | |
| Acer Swift X SFX14-41G-R7F3 | |
| Huawei MateBook 16 R7 5800H | |
| Lenovo IdeaPad 5 Pro 16ACH | |
| AIDA64 / Memory Latency | |
| Average of class Multimedia (7 - 535, n=56, last 2 years) | |
| Acer Swift X SFX14-41G-R7F3 | |
| Acer Swift X SFX16-51G-5388 | |
| Average Intel Core i5-11320H (77.6 - 114.1, n=4) | |
| Huawei MateBook 16 R7 5800H | |
| Lenovo IdeaPad 5 Pro 16ACH | |
| Dell Inspiron 16 Plus 7610 | |
* ... smaller is better
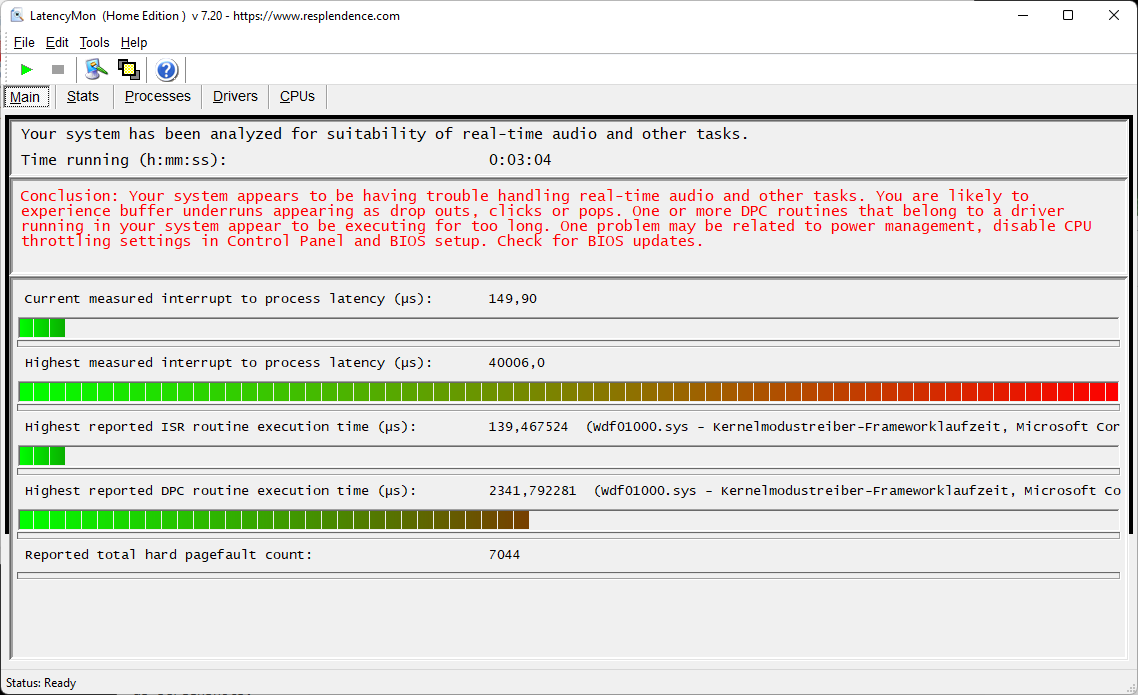
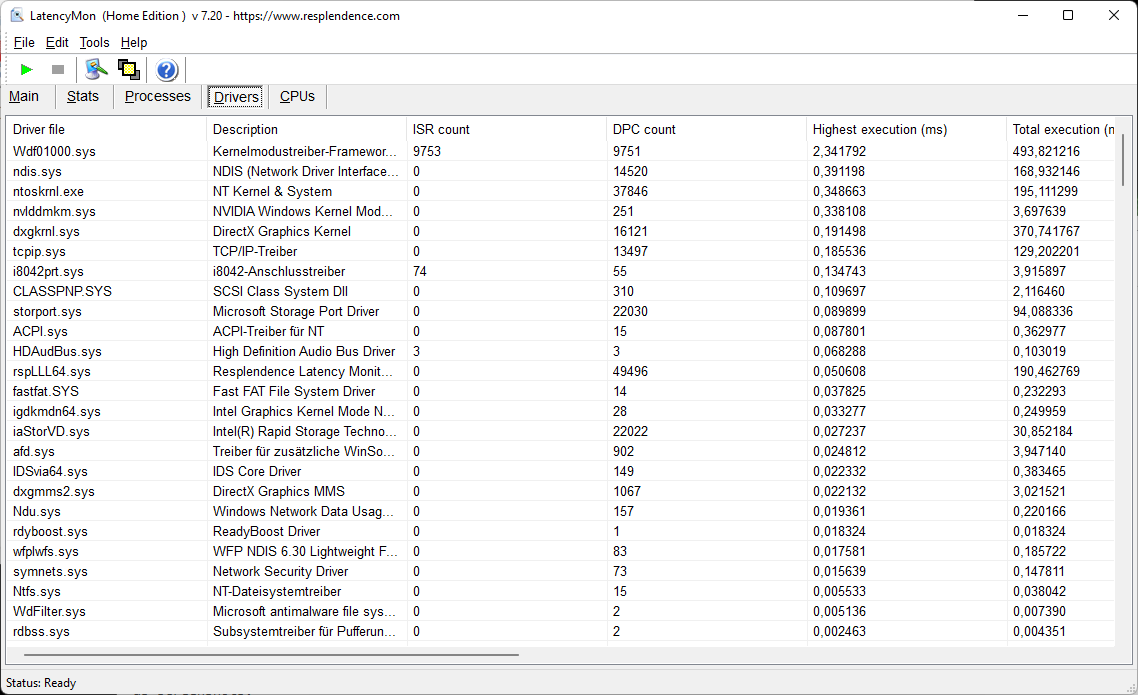
DPC延时
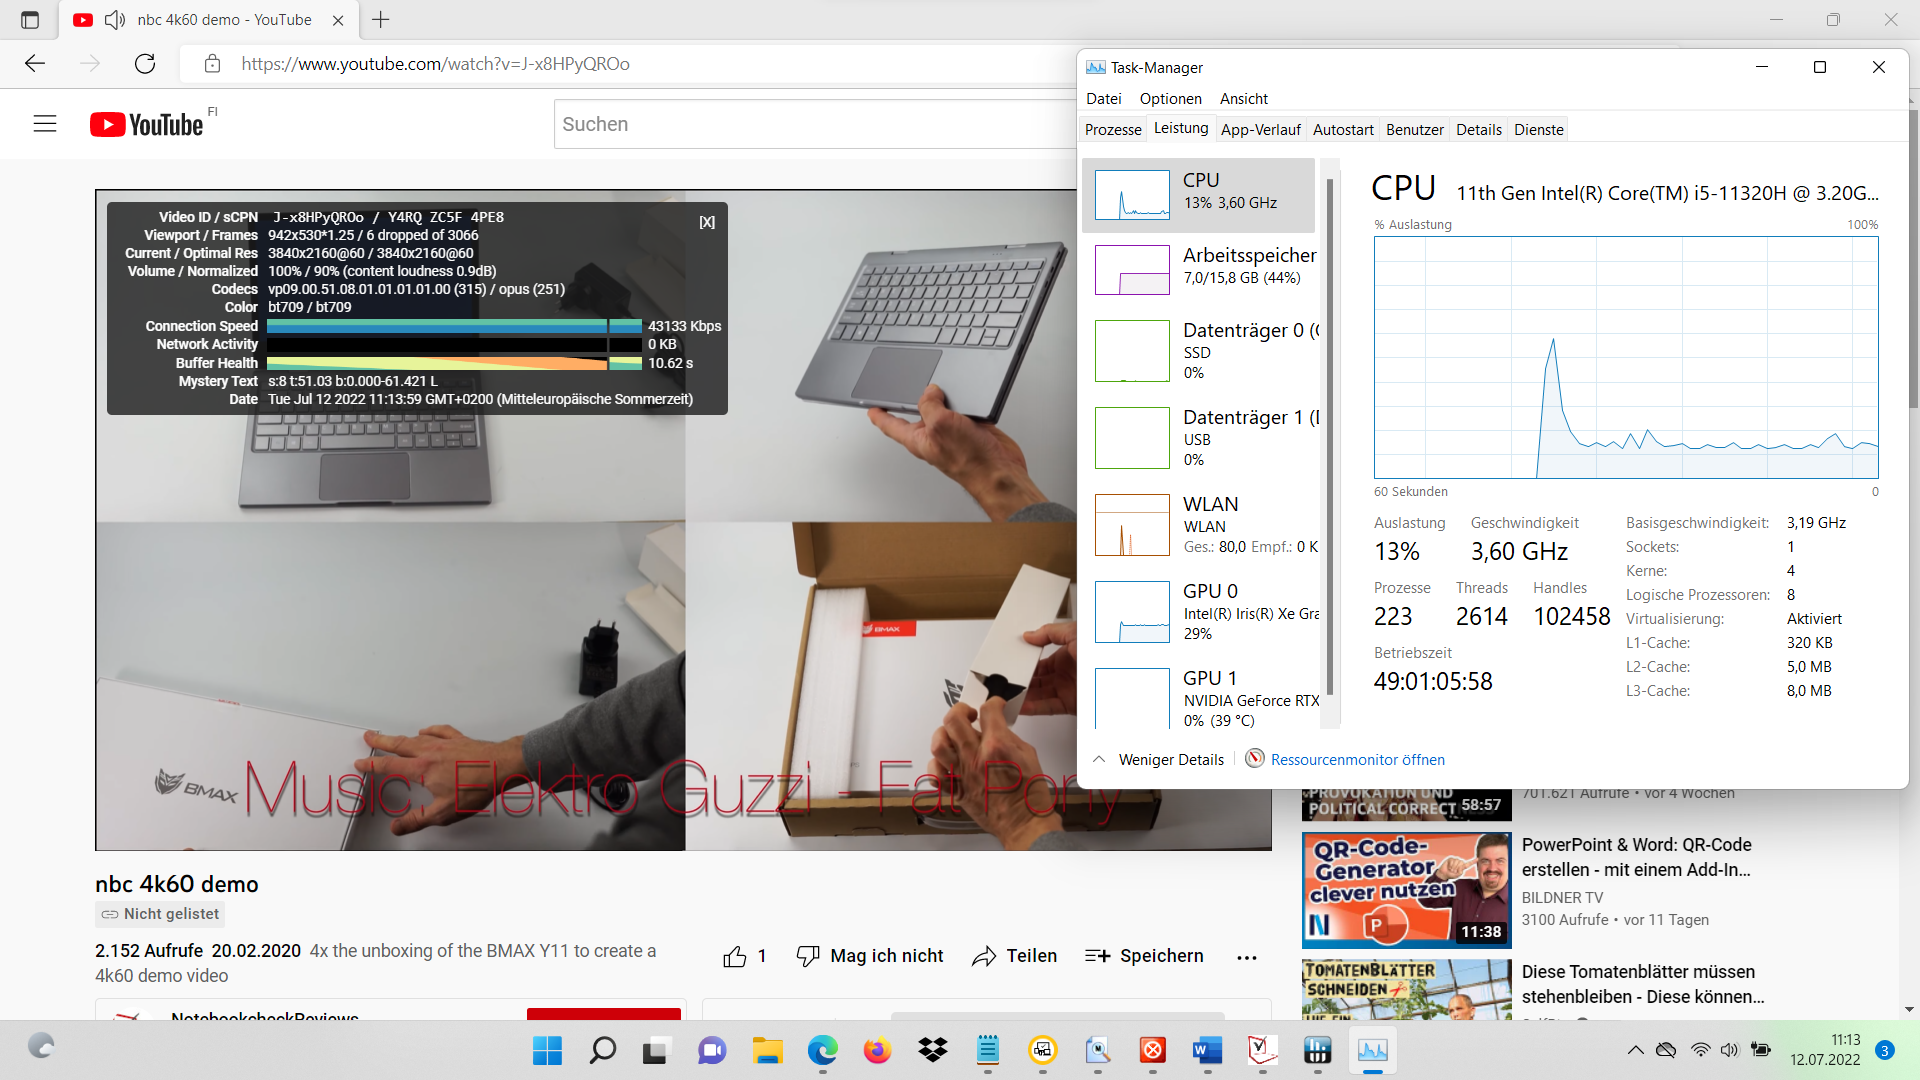
DPC的延迟出乎意料地高,这就是为什么我们重复了几次测试,但结果非常相似。 0.04秒的延迟非常慢,因此不建议使用实时应用程序(音频/视频)。宏碁应该紧急通过更新BIOS来改善这一点。
正如经常发生的情况一样,原因是核心模块的驱动程序。4K YouTube播放导致CPU负载达到13%,英特尔GPU的负载几乎达到30%。
| DPC Latencies / LatencyMon - interrupt to process latency (max), Web, Youtube, Prime95 | |
| Acer Swift X SFX16-51G-5388 | |
| Asus Vivobook Pro 16X-M7600QE | |
| Dell Inspiron 16 Plus 7610 | |
| Acer Swift X SFX14-41G-R7F3 | |
| Lenovo IdeaPad 5 Pro 16ACH | |
| Huawei MateBook 16 R7 5800H | |
| Acer Swift 3 SF316-51 | |
* ... smaller is better
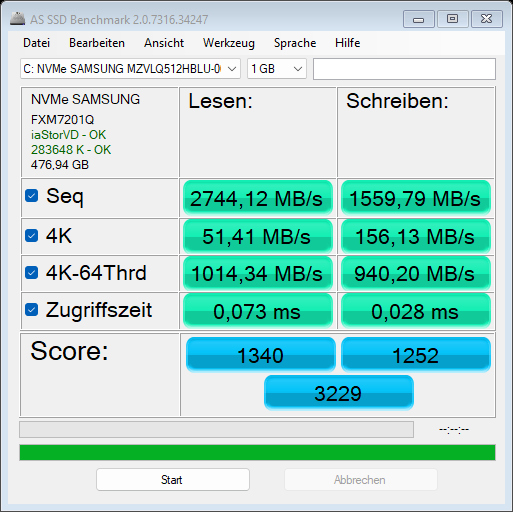
存储设备
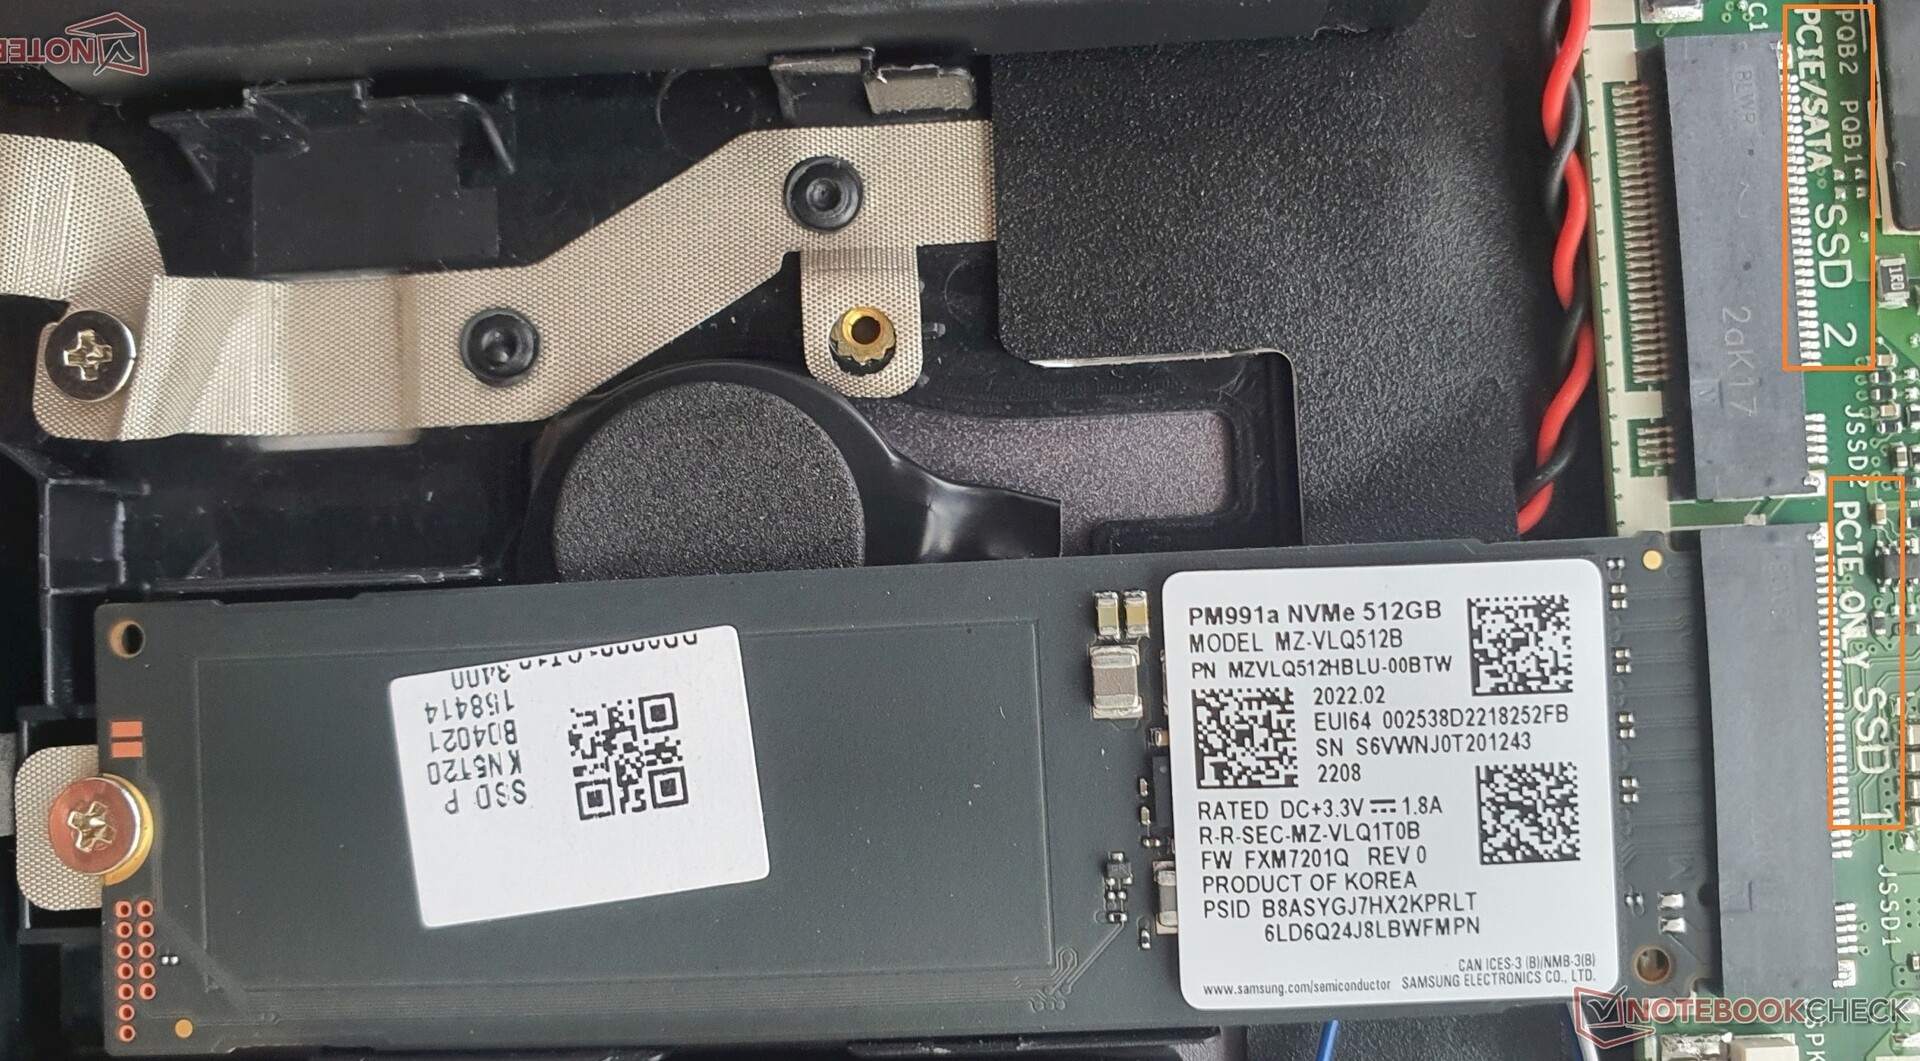
三星PM991 PCIe 3.0固态硬盘显示平均速度。然而,几分钟后,它下降了~40%,显然是由于过热。三星PM991在我们的其他一些笔记本电脑测试中也显示出这种行为,因此并不是宏碁Swift X 16所特有的。
与之相反的是 Swift 3有第二个M.2插槽,用于另一个固态硬盘。
| Acer Swift X SFX16-51G-5388 GeForce RTX 3050 4GB Laptop GPU, i5-11320H, Samsung PM991 MZVLQ512HBLU | Acer Swift 3 SF316-51 Iris Xe G7 96EUs, i7-11370H, Micron 2210 MTFDHBA512QFD | Acer Swift X SFX14-41G-R7F3 GeForce GTX 1650 Mobile, R5 5500U, WDC PC SN530 SDBPNPZ-1T00 | Lenovo IdeaPad 5 Pro 16ACH GeForce GTX 1650 Mobile, R7 5800H, Micron 2300 512GB MTFDHBA512TDV | Dell Inspiron 16 Plus 7610 GeForce RTX 3050 4GB Laptop GPU, i7-11800H, Kingston OM3PDP3512B | Asus Vivobook Pro 16X-M7600QE GeForce RTX 3050 Ti Laptop GPU, R9 5900HX, SK Hynix HFM001TD3JX013N | |
|---|---|---|---|---|---|---|
| AS SSD | -0% | -5% | -19% | -12% | 12% | |
| Seq Read (MB/s) | 2744.12 | 2015 -27% | 2091 -24% | 2643 -4% | 2077 -24% | 2913 6% |
| Seq Write (MB/s) | 1559.79 | 1055 -32% | 1856 19% | 1510 -3% | 778 -50% | 1806 16% |
| 4K Read (MB/s) | 51.41 | 73.9 44% | 27.51 -46% | 42.86 -17% | 49.6 -4% | 47.67 -7% |
| 4K Write (MB/s) | 156.13 | 223.2 43% | 116.3 -26% | 85.5 -45% | 236.1 51% | 101.5 -35% |
| 4K-64 Read (MB/s) | 1014.34 | 589 -42% | 812 -20% | 768 -24% | 801 -21% | 1382 36% |
| 4K-64 Write (MB/s) | 940.2 | 1029 9% | 1415 50% | 1983 111% | 942 0% | 2164 130% |
| Access Time Read * (ms) | 0.073 | 0.056 23% | 0.103 -41% | 0.06 18% | 0.044 40% | |
| Access Time Write * (ms) | 0.028 | 0.039 -39% | 0.033 -18% | 0.101 -261% | 0.073 -161% | 0.109 -289% |
| Score Read (Points) | 1340 | 865 -35% | 1048 -22% | 1075 -20% | 1059 -21% | 1720 28% |
| Score Write (Points) | 1252 | 1358 8% | 1717 37% | 2220 77% | 1256 0% | 2446 95% |
| Score Total (Points) | 3229 | 2644 -18% | 3292 2% | 3797 18% | 2804 -13% | 4995 55% |
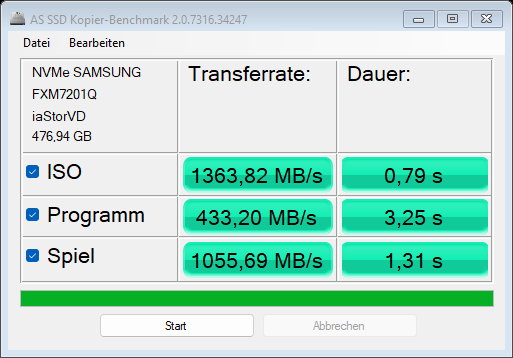
| Copy ISO MB/s (MB/s) | 1363.82 | 1186 -13% | 1028 -25% | 2649 94% | ||
| Copy Program MB/s (MB/s) | 433.2 | 782 81% | 794 83% | 372.8 -14% | ||
| Copy Game MB/s (MB/s) | 1055.69 | 1028 -3% | 987 -7% | 1126 7% |
* ... smaller is better
* ... smaller is better
Sustained Performance Read: DiskSpd Read Loop, Queue Depth 8
图形卡
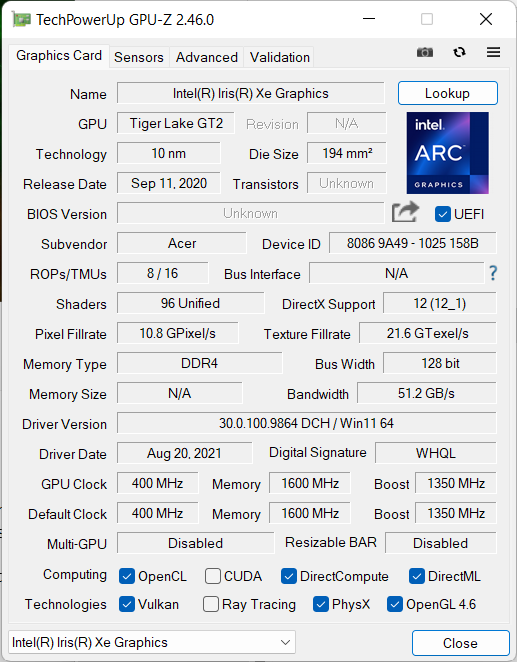
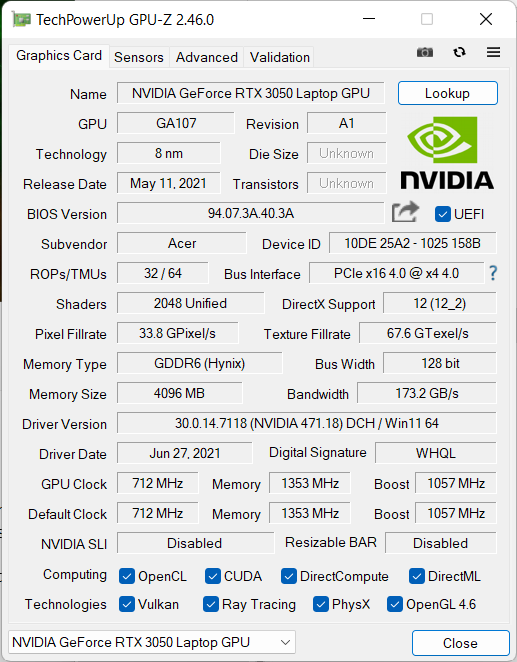
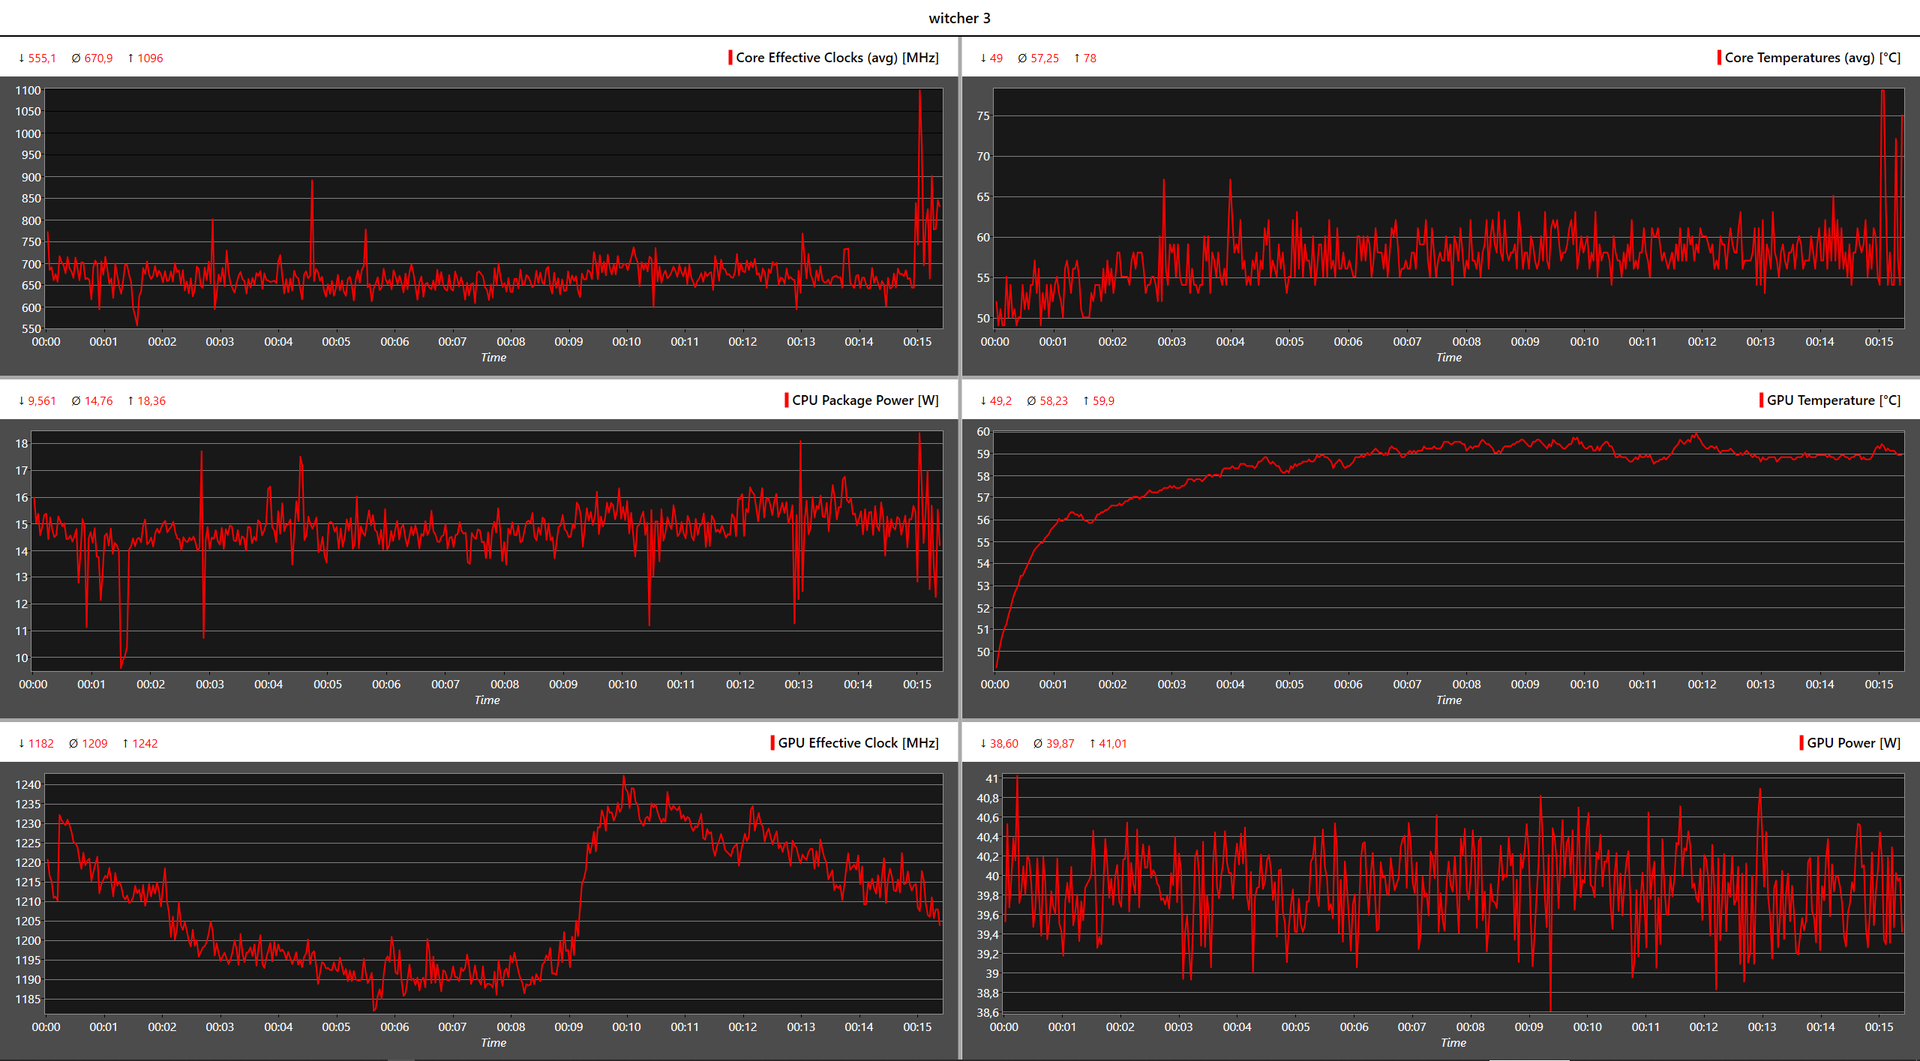
宏碁的Swift X 16配备了一个英特尔Xe G7 (96EUs)iGPU和 NvidiaGeForce RTX 3050在最小的变体中配有35瓦的TGP+5瓦的动态提升。这确保了新游戏可以在中高细节下以全高清显示,并允许渲染一些视频。
1,057 MHz的提升时钟被平均1,209 MHz所超越,这要归功于动态提升。GPU的温度甚至没有攀升到60℃。
在我们的比较领域,更快的游戏机只有华硕的 Vivobook Pro 16X(下降了~20 %)和 Dells Inspiron 16 Plus(约40 %),这让他们的RTX 3050有更高的TGP(分别为50和65瓦)。笔记本电脑 IdeaPad 5 Pro 16与 GTX 1650可以超过10-25%,这取决于基准测试/游戏。
在电池模式下,GPU性能下降了约15%。
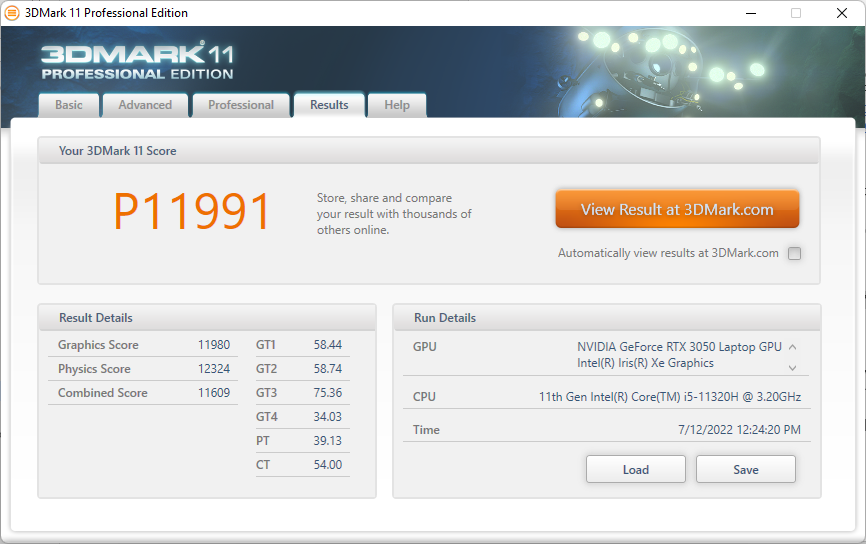
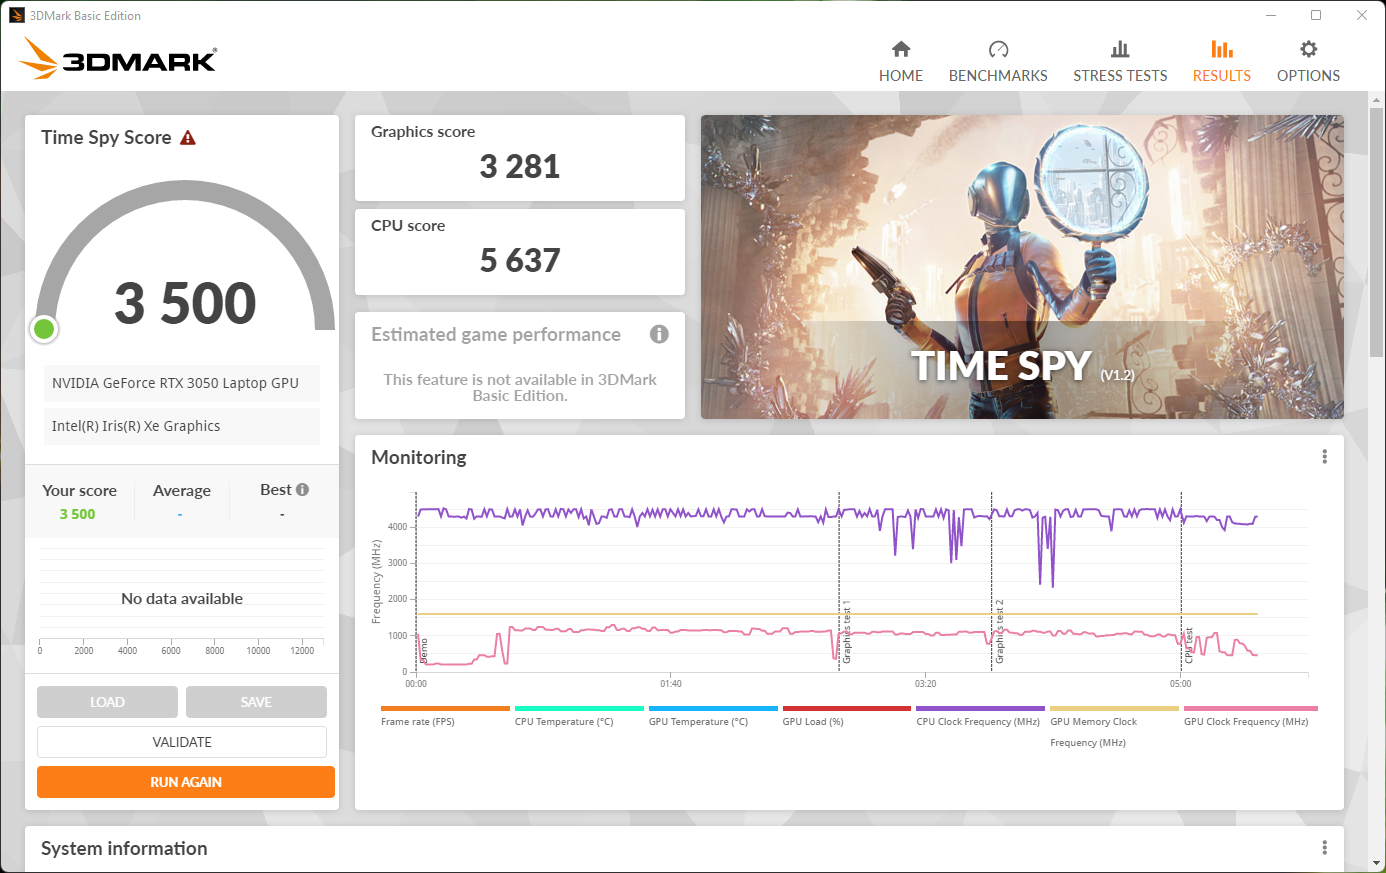
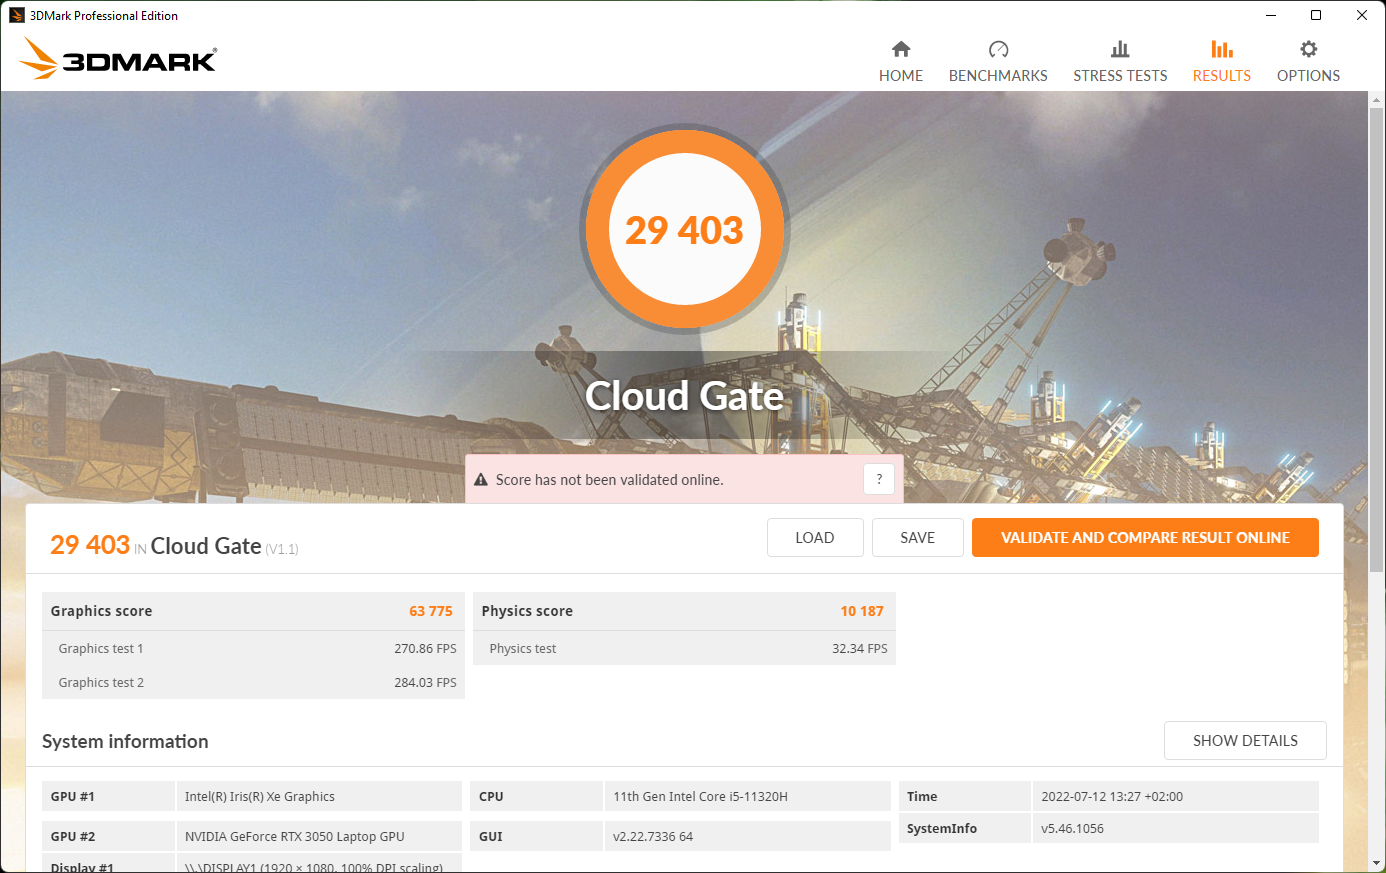
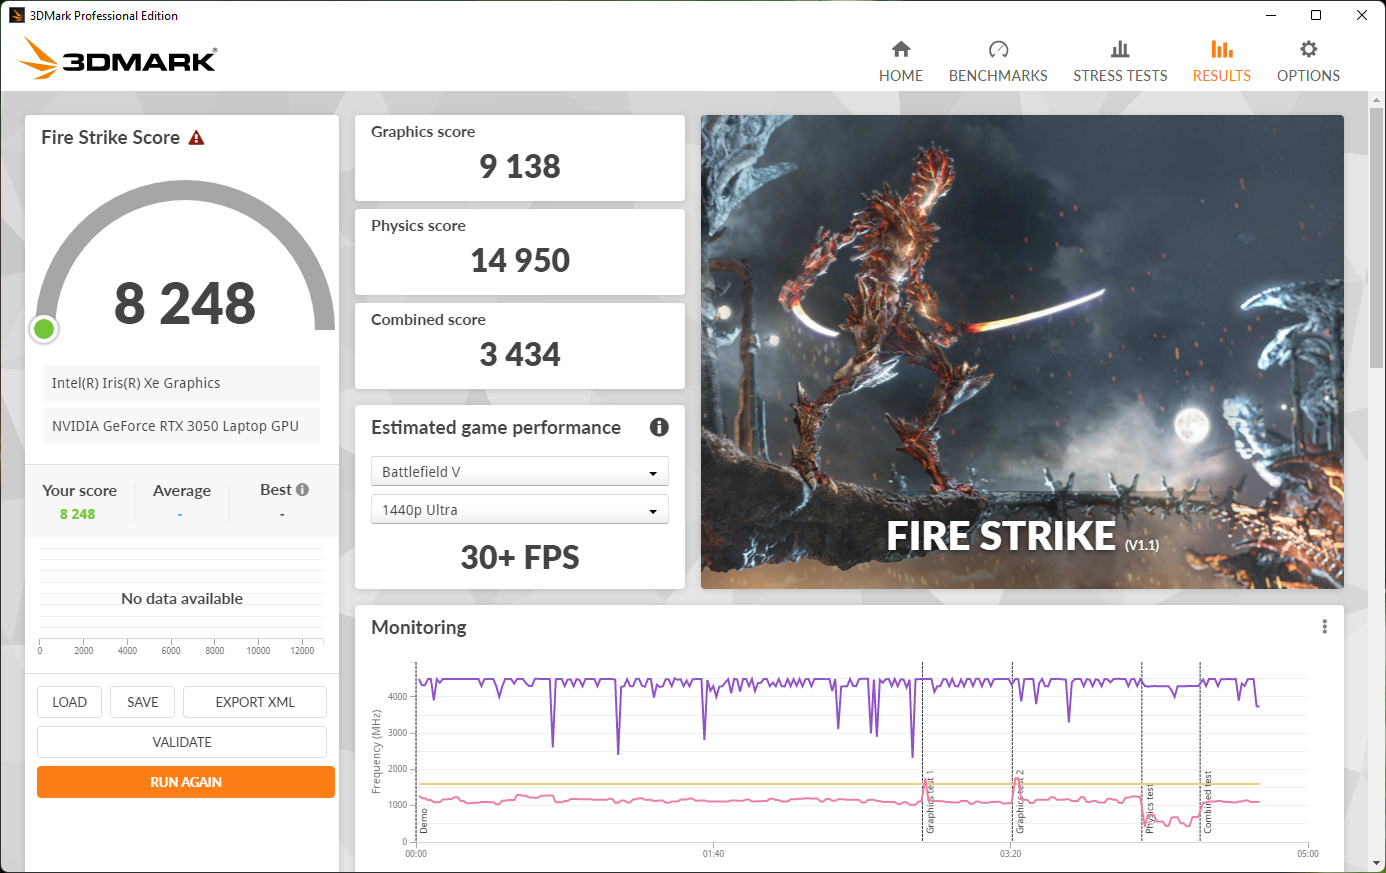
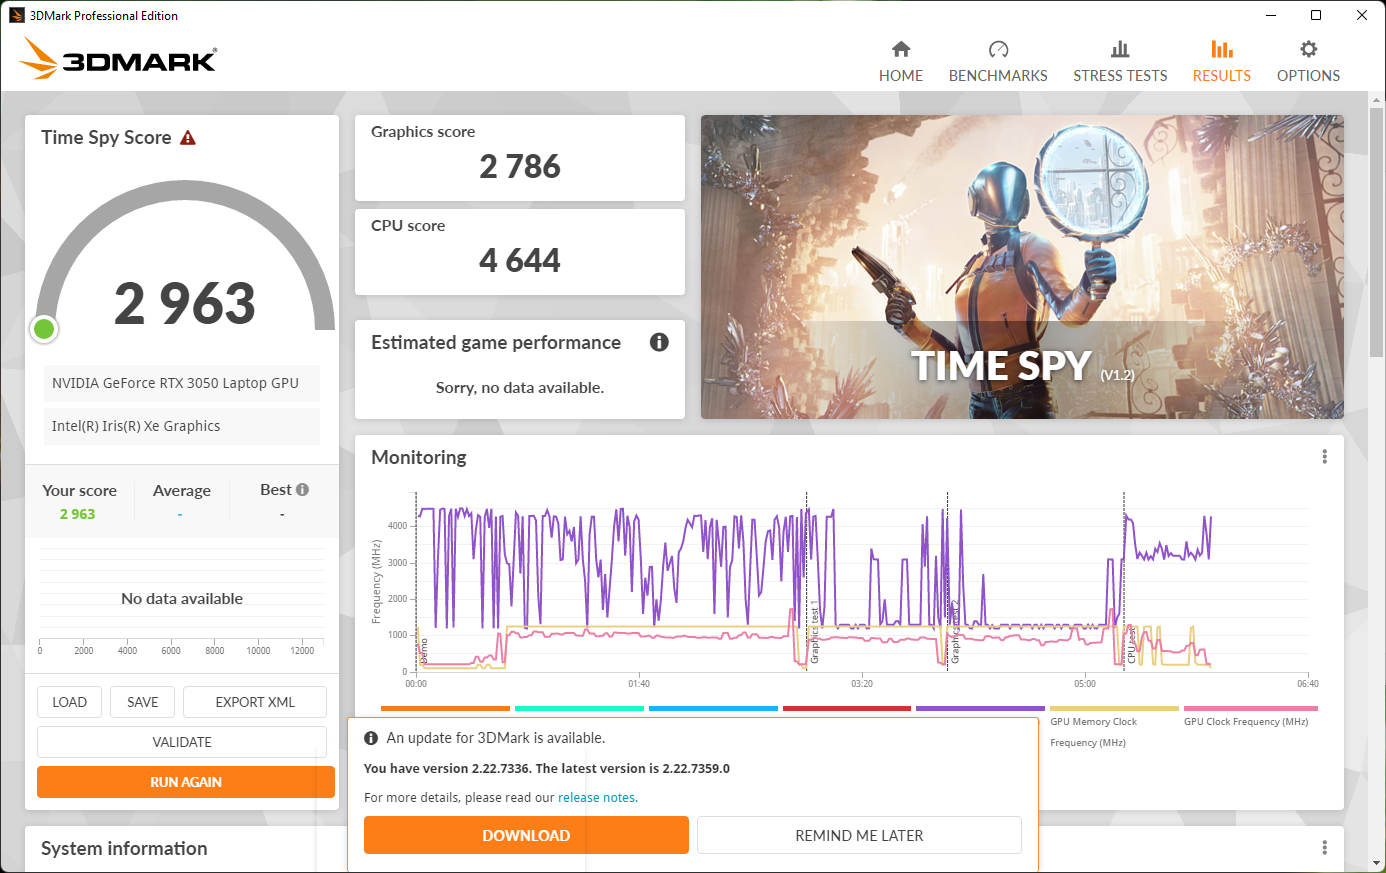
| 3DMark 11 Performance | 11991 points | |
| 3DMark Cloud Gate Standard Score | 29403 points | |
| 3DMark Fire Strike Score | 9249 points | |
| 3DMark Time Spy Score | 3500 points | |
Help | ||
| Ghostwire Tokyo - 1920x1080 High Settings | |
| Average NVIDIA GeForce RTX 3050 4GB Laptop GPU (55.7 - 79.7, n=3) | |
| Acer Swift X SFX16-51G-5388 | |
一小时的Wichter 3压力测试显示,根据FPS曲线,性能水平相当稳定
Witcher 3 FPS Chart
| low | med. | high | ultra | |
|---|---|---|---|---|
| GTA V (2015) | 170.4 | 163.1 | 99.2 | 48 |
| The Witcher 3 (2015) | 183.9 | 106.7 | 58.7 | 31.5 |
| Dota 2 Reborn (2015) | 138.6 | 122.7 | 119.4 | 116 |
| Final Fantasy XV Benchmark (2018) | 97.4 | 48.7 | 35.9 | |
| X-Plane 11.11 (2018) | 104.7 | 87 | 72.5 | |
| Far Cry 5 (2018) | 104 | 64 | 56 | 59 |
| Strange Brigade (2018) | 216 | 90.4 | 72.1 | 62.1 |
| Ghostwire Tokyo (2022) | 58.2 | 55.7 | 53.9 |
排放。Acer Swift X 16,带静音模式
系统噪音
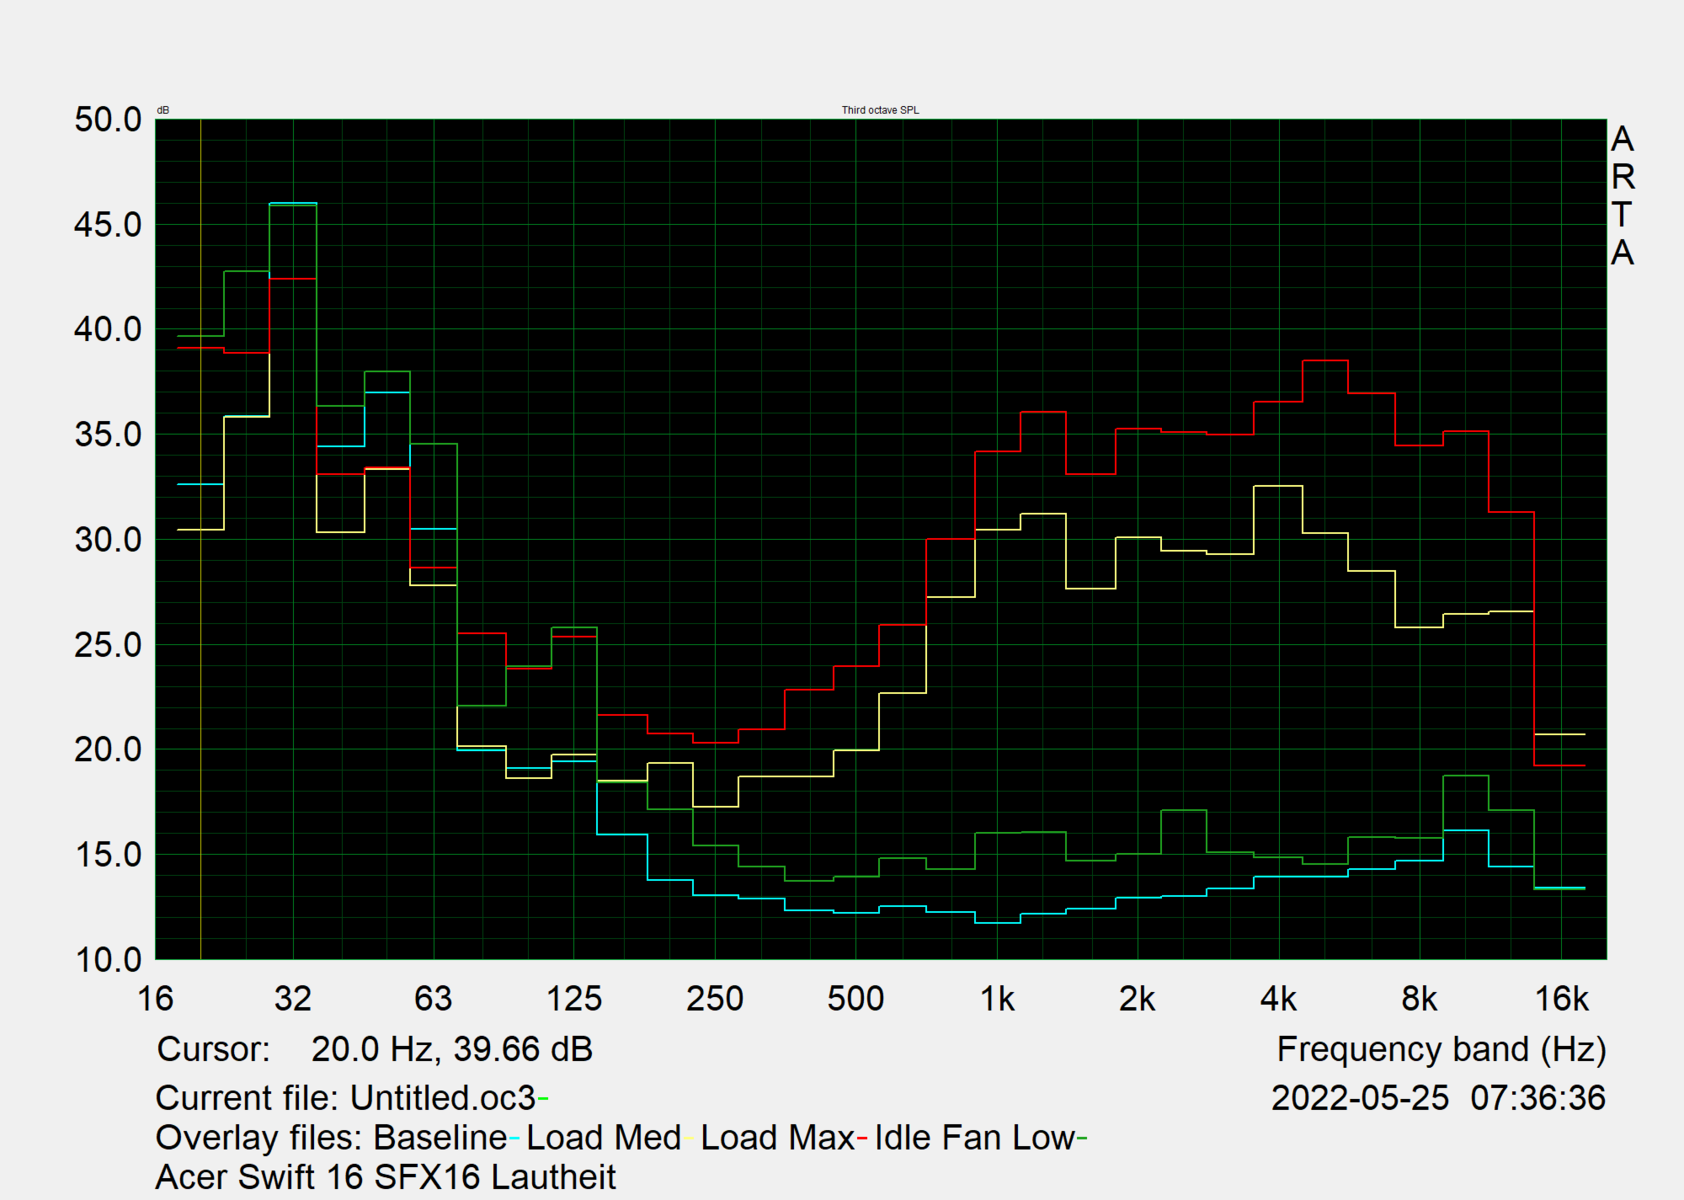
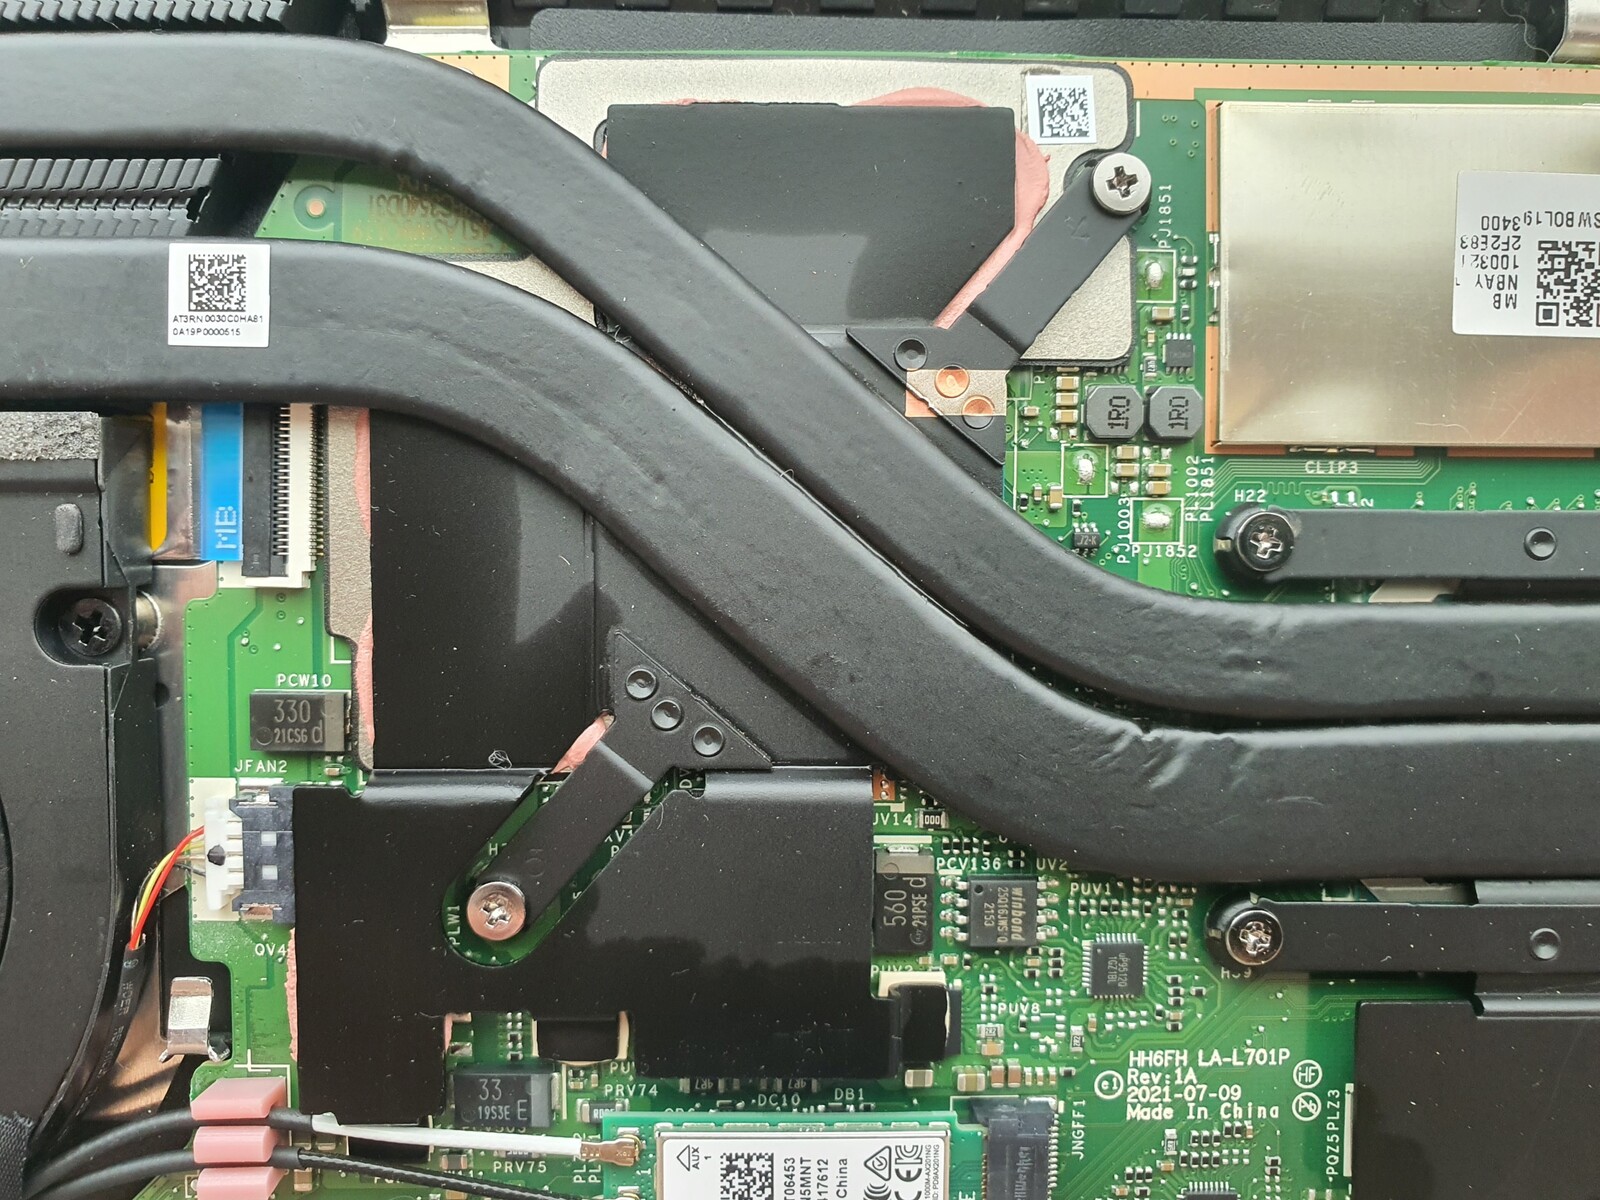
Swift X 16配备了两个中等大小的风扇和两个热管。不像 Swift 3,CPU与专用GPU共享冷却系统。
因此,风扇在负载下会变得更响,游戏也会导致不规则的风扇行为,但间隔时间更长,所以它并不真正突出。虽然负载下的41分贝(A)并不安静,但比起传统的游戏笔记本,它明显不那么令人讨厌。
带有专用GPU的对比设备大致处于同一水平,但 戴尔 Inspiron 16 Plus采用了更高的55W TGP,声音更大。宏碁自己的静音模式使事情变得更加安静。在网上冲浪时,风扇经常静止不动;在稍快的冲浪速度下,在舒适的音量下会有短暂的 "爆发"。
Noise level
| Idle |
| 25.4 / 25.4 / 27.8 dB(A) |
| Load |
| 41 / 47 dB(A) |
 | ||
30 dB silent 40 dB(A) audible 50 dB(A) loud |
||
min: | ||
| Acer Swift X SFX16-51G-5388 GeForce RTX 3050 4GB Laptop GPU, i5-11320H, Samsung PM991 MZVLQ512HBLU | Acer Swift 3 SF316-51 Iris Xe G7 96EUs, i7-11370H, Micron 2210 MTFDHBA512QFD | Acer Swift X SFX14-41G-R7F3 GeForce GTX 1650 Mobile, R5 5500U, WDC PC SN530 SDBPNPZ-1T00 | Lenovo IdeaPad 5 Pro 16ACH GeForce GTX 1650 Mobile, R7 5800H, Micron 2300 512GB MTFDHBA512TDV | Dell Inspiron 16 Plus 7610 GeForce RTX 3050 4GB Laptop GPU, i7-11800H, Kingston OM3PDP3512B | Asus Vivobook Pro 16X-M7600QE GeForce RTX 3050 Ti Laptop GPU, R9 5900HX, SK Hynix HFM001TD3JX013N | Huawei MateBook 16 R7 5800H Vega 8, R7 5800H, Lite-On CA5-8D512 | |
|---|---|---|---|---|---|---|---|
| Noise | 5% | -1% | 3% | 0% | -2% | 7% | |
| off / environment * (dB) | 25.4 | 26 -2% | 26 -2% | 24.04 5% | 24.4 4% | 26 -2% | 24.8 2% |
| Idle Minimum * (dB) | 25.4 | 26 -2% | 26 -2% | 24.04 5% | 24.4 4% | 27 -6% | 24.8 2% |
| Idle Average * (dB) | 25.4 | 26 -2% | 27 -6% | 24.04 5% | 24.4 4% | 27 -6% | 24.8 2% |
| Idle Maximum * (dB) | 27.8 | 27.7 -0% | 27.4 1% | 24.04 14% | 24.4 12% | 27.5 1% | 26.7 4% |
| Load Average * (dB) | 41 | 32.7 20% | 42.2 -3% | 41.3 -1% | 48.3 -18% | 41.7 -2% | 32 22% |
| Load Maximum * (dB) | 47 | 39 17% | 44.3 6% | 52.93 -13% | 48.9 -4% | 45.3 4% | 42.4 10% |
| Witcher 3 ultra * (dB) | 49.21 | 48.9 | 32 |
* ... smaller is better
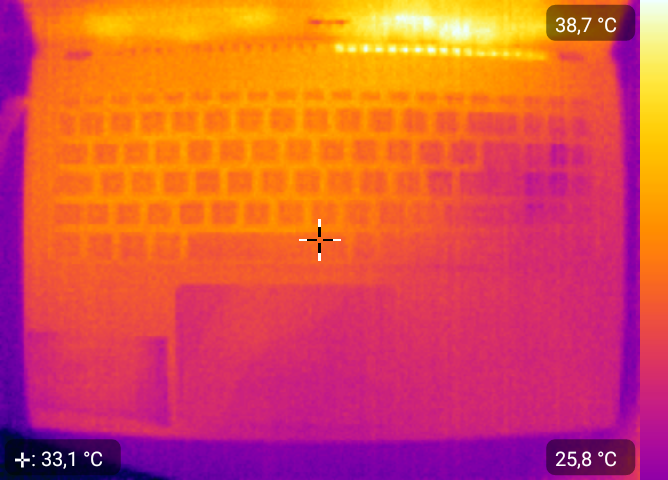
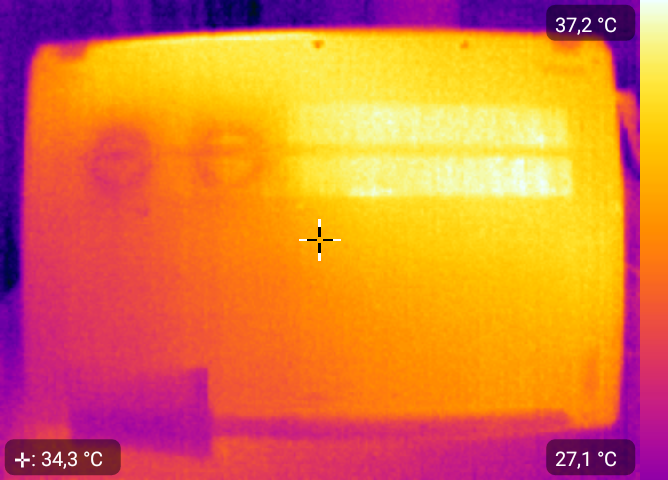
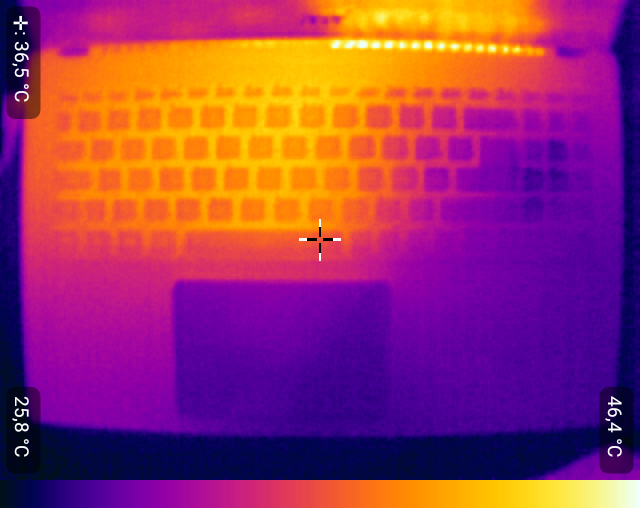
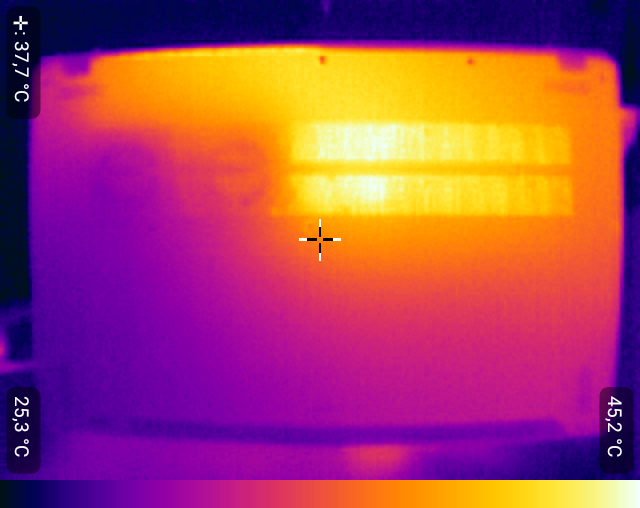
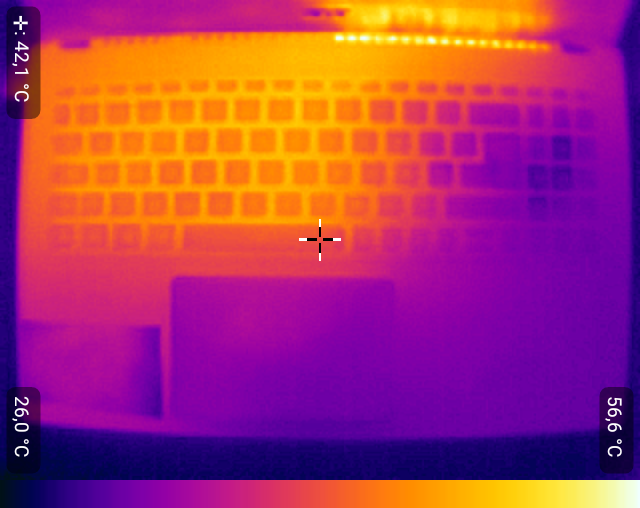
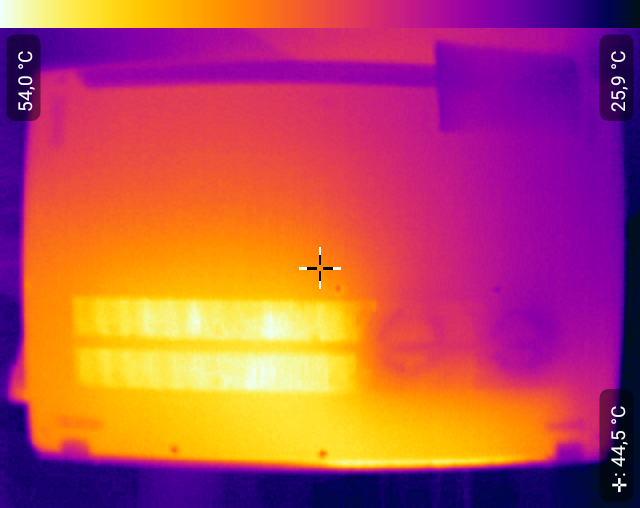
温度
在游戏时,温度保持在限制范围内,没有任何东西明显发热或有任何不良反应。热点只发生在综合压力测试下,特别是键盘上方。华硕 Vivobook Pro 16X仍然明显凉爽,尽管有 RTX 3050,而戴尔的 灵感16 Plus发热更明显。
(-) The maximum temperature on the upper side is 52.4 °C / 126 F, compared to the average of 36.8 °C / 98 F, ranging from 21 to 71 °C for the class Multimedia.
(-) The bottom heats up to a maximum of 50 °C / 122 F, compared to the average of 39.1 °C / 102 F
(+) In idle usage, the average temperature for the upper side is 27.8 °C / 82 F, compared to the device average of 31.3 °C / 88 F.
(±) Playing The Witcher 3, the average temperature for the upper side is 32.8 °C / 91 F, compared to the device average of 31.3 °C / 88 F.
(±) The palmrests and touchpad can get very hot to the touch with a maximum of 39.2 °C / 102.6 F.
(-) The average temperature of the palmrest area of similar devices was 28.7 °C / 83.7 F (-10.5 °C / -18.9 F).
| Acer Swift X SFX16-51G-5388 Intel Core i5-11320H, NVIDIA GeForce RTX 3050 4GB Laptop GPU | Acer Swift 3 SF316-51 Intel Core i7-11370H, Intel Iris Xe Graphics G7 96EUs | Lenovo IdeaPad 5 Pro 16ACH AMD Ryzen 7 5800H, NVIDIA GeForce GTX 1650 Mobile | Dell Inspiron 16 Plus 7610 Intel Core i7-11800H, NVIDIA GeForce RTX 3050 4GB Laptop GPU | Asus Vivobook Pro 16X-M7600QE AMD Ryzen 9 5900HX, NVIDIA GeForce RTX 3050 Ti Laptop GPU | Huawei MateBook 16 R7 5800H AMD Ryzen 7 5800H, AMD Radeon RX Vega 8 (Ryzen 4000/5000) | |
|---|---|---|---|---|---|---|
| Heat | 7% | 4% | -6% | 14% | 13% | |
| Maximum Upper Side * (°C) | 52.4 | 40 24% | 51.9 1% | 46.4 11% | 39.4 25% | 40.2 23% |
| Maximum Bottom * (°C) | 50 | 47 6% | 51.5 -3% | 54.8 -10% | 43.6 13% | 49.7 1% |
| Idle Upper Side * (°C) | 30.3 | 30.1 1% | 27.2 10% | 31.4 -4% | 27.6 9% | 26.4 13% |
| Idle Bottom * (°C) | 30.4 | 31.6 -4% | 28.5 6% | 36.6 -20% | 27.5 10% | 26.4 13% |
* ... smaller is better
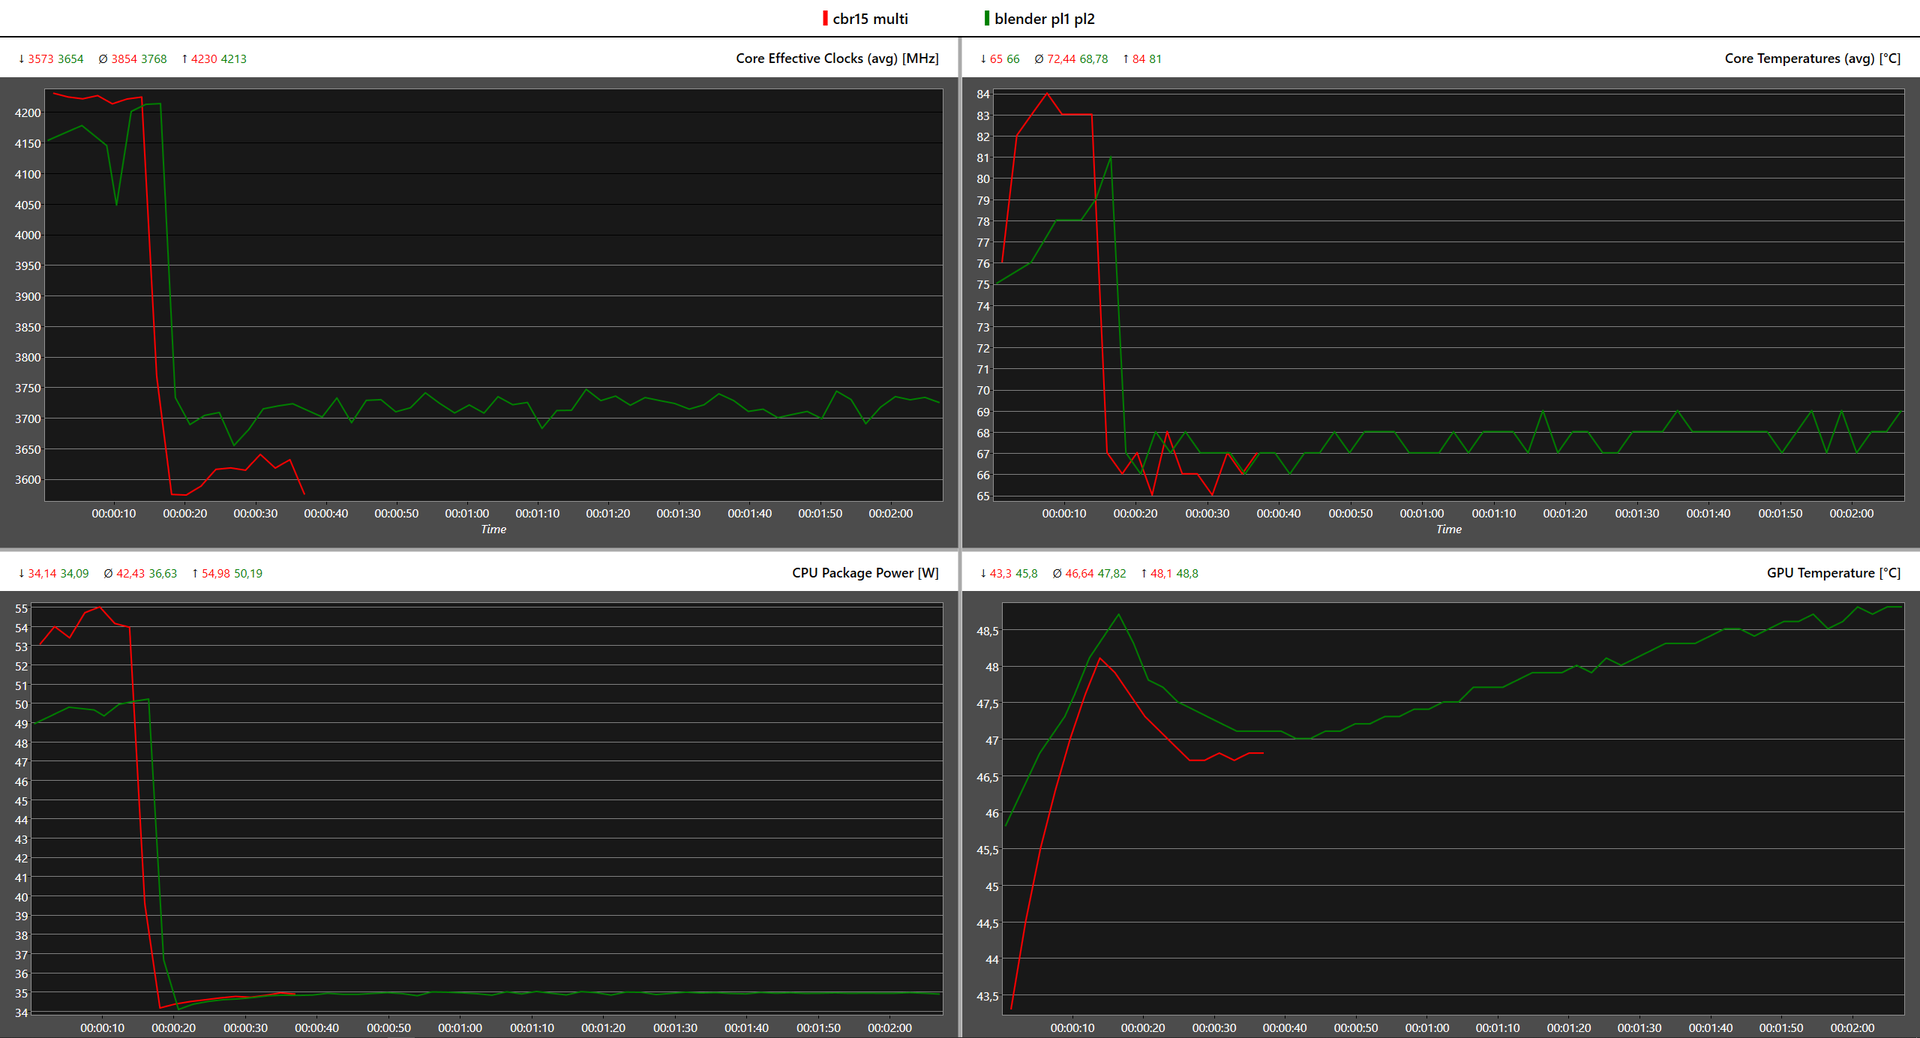
压力测试
在纯粹的CPU压力下,英特尔 酷睿i5-11320H的时钟频率为3GHz(比基本时钟低200MHz),温度达到73℃。
在纯粹的dGPU压力下,RTX 3050在纯dGPU压力下,RTX 3050的时钟频率为700 MHz,与它的基础时钟一致。综合负载(FurMark + Prime95)将CPU降低到2.4 GHz,而GPU仅在600 MHz时略有节流。温度分别为75℃和65℃左右。一个好的结果。
综合消耗是25W(CPU)+35W(GPU)=60瓦。在游戏中,这相当于15W+40W。在电池模式下,15W + 30W。
| CPU时钟(GHz) | GPU时钟(MHz) | CPU平均温度(℃) | GPU平均温度(℃) | PL1(瓦) | TGP(瓦) | |
| 系统空闲 | 0,04 | 200 | 29 | 34 | -- | -- |
| Prime95压力 | 3 | 200 | 73 | 52 | 35 | -- |
| Prime95 + FurMark Stress | 2,4 | 600 | 75 | 66 | 25 | 40 |
| FurMark 应力 | 0,1 | 700 | 48 | 56 | -- | 40 |
| Witcher 3 Stress | 0,7 | 1200 | 60 | 59 | 15 | 40 |
| Witcher 3 @Akku | 0,7 | 1057 | 59 | 58 | 15 | 30 |
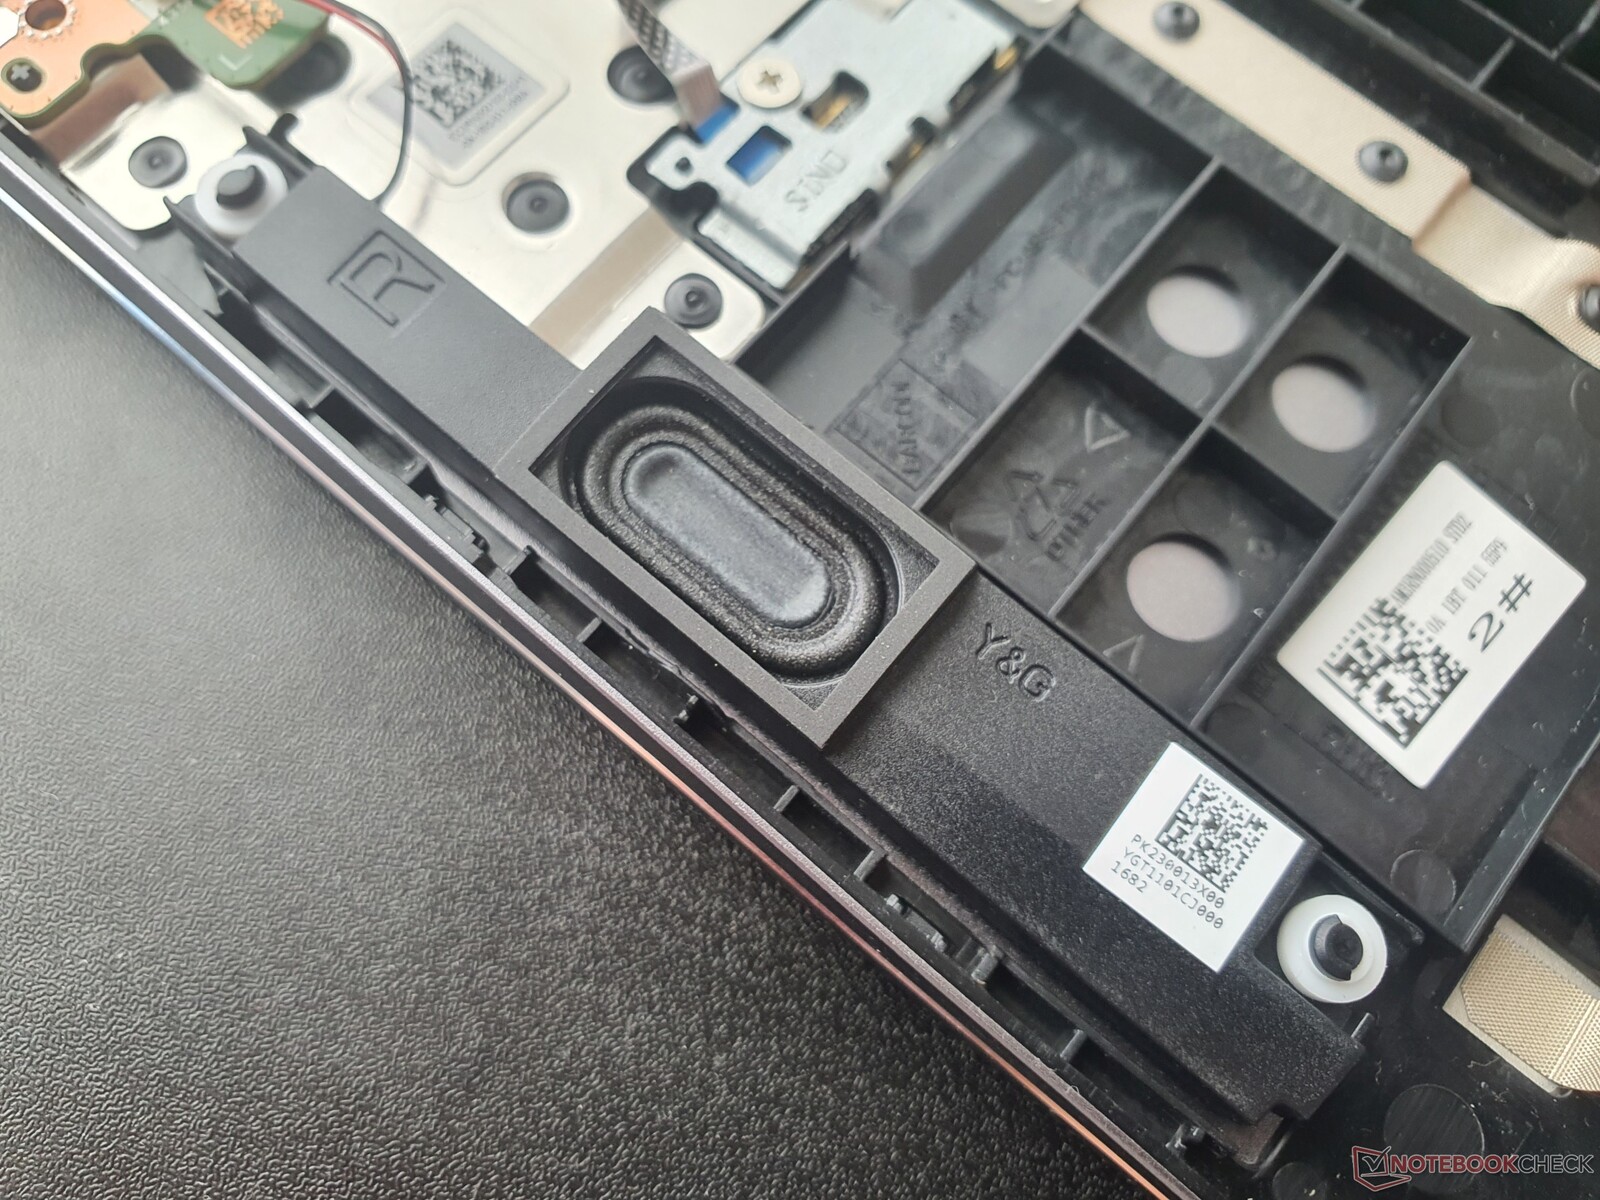
发言人
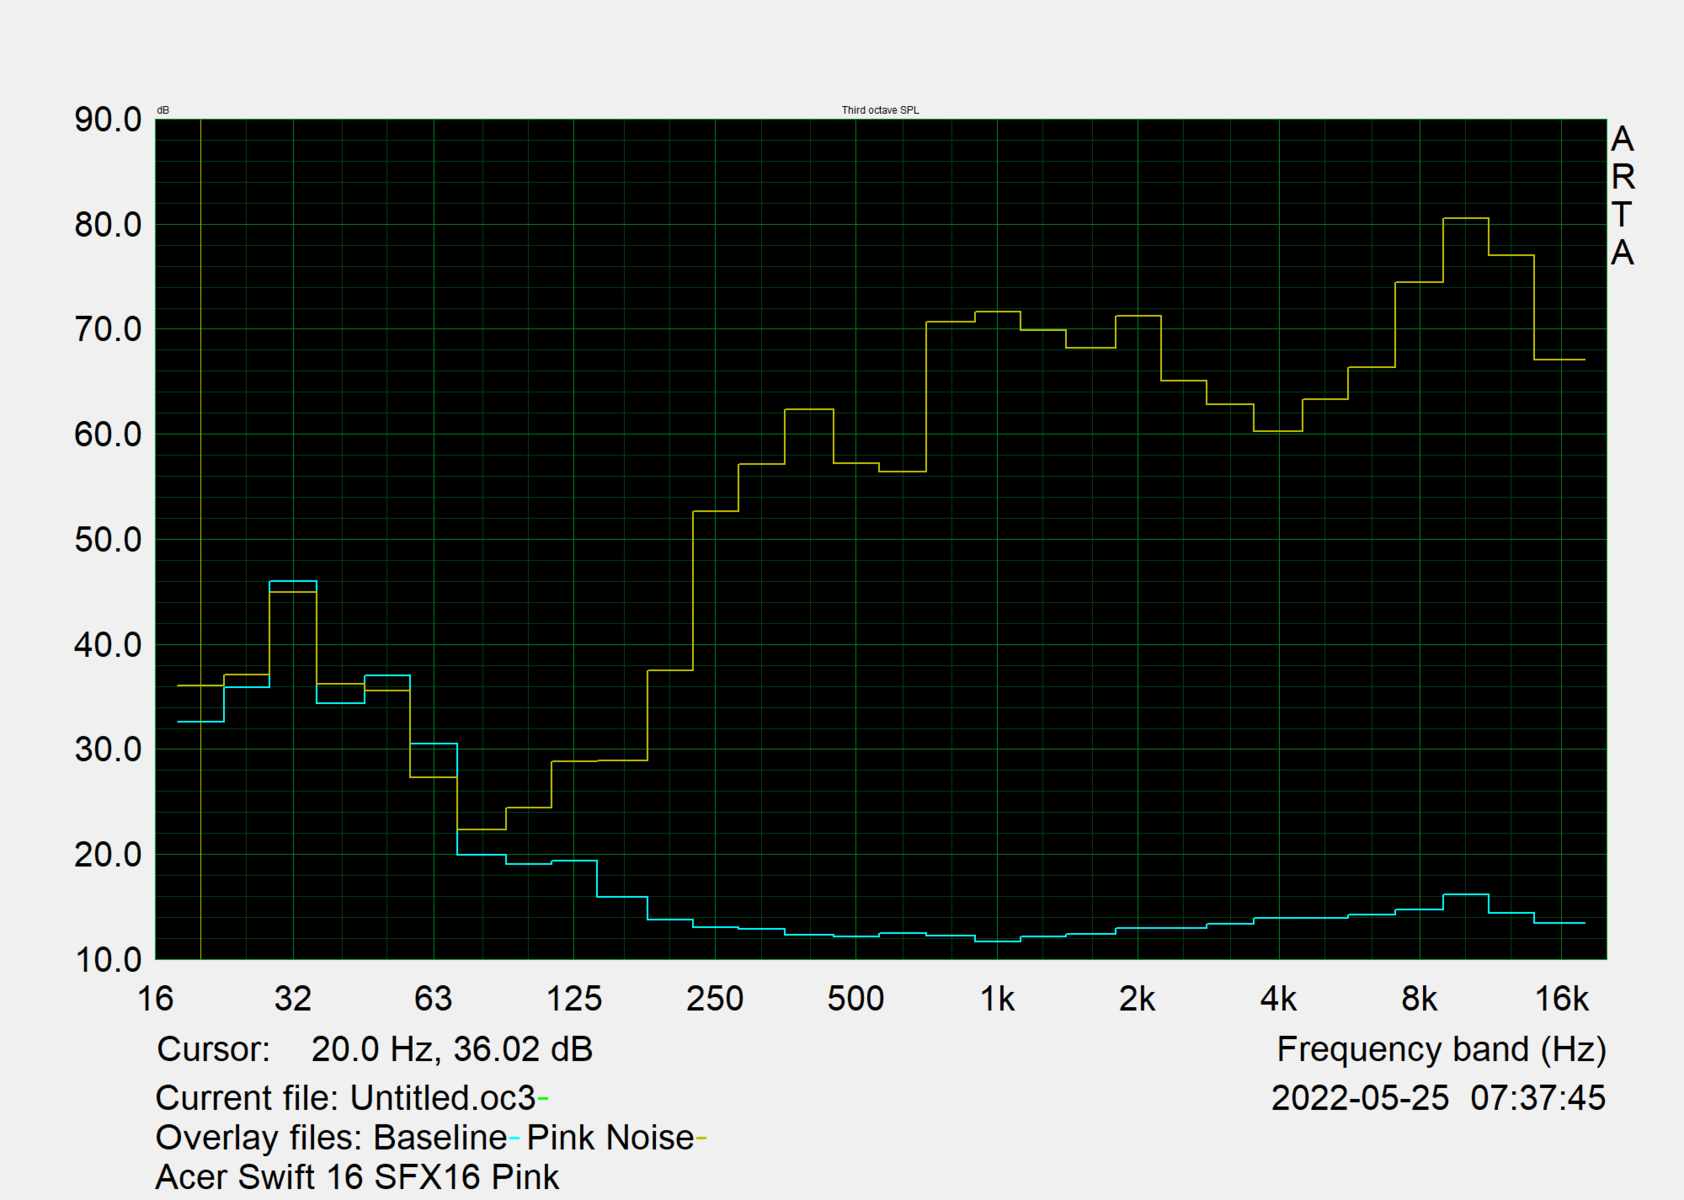
扬声器产生的声音质量不达标,这不应该是多媒体笔记本电脑的情况。声音太小,几乎没有任何低音,甚至中音和高音也只能以有限的精度再现。
因此,建议通过3.5毫米插孔或蓝牙使用外部音频外围设备。
Acer Swift X SFX16-51G-5388 audio analysis
(±) | speaker loudness is average but good (77 dB)
Bass 100 - 315 Hz
(-) | nearly no bass - on average 25% lower than median
(±) | linearity of bass is average (11.6% delta to prev. frequency)
Mids 400 - 2000 Hz
(±) | higher mids - on average 6.1% higher than median
(±) | linearity of mids is average (8.2% delta to prev. frequency)
Highs 2 - 16 kHz
(±) | higher highs - on average 5.3% higher than median
(±) | linearity of highs is average (8.9% delta to prev. frequency)
Overall 100 - 16.000 Hz
(±) | linearity of overall sound is average (22.9% difference to median)
Compared to same class
» 81% of all tested devices in this class were better, 5% similar, 14% worse
» The best had a delta of 5%, average was 17%, worst was 45%
Compared to all devices tested
» 68% of all tested devices were better, 6% similar, 26% worse
» The best had a delta of 4%, average was 23%, worst was 134%
Lenovo IdeaPad 5 Pro 16ACH audio analysis
(-) | not very loud speakers (68.8 dB)
Bass 100 - 315 Hz
(-) | nearly no bass - on average 24.4% lower than median
(±) | linearity of bass is average (13.3% delta to prev. frequency)
Mids 400 - 2000 Hz
(+) | balanced mids - only 3.2% away from median
(+) | mids are linear (4.1% delta to prev. frequency)
Highs 2 - 16 kHz
(+) | balanced highs - only 2% away from median
(+) | highs are linear (6.3% delta to prev. frequency)
Overall 100 - 16.000 Hz
(±) | linearity of overall sound is average (22.5% difference to median)
Compared to same class
» 80% of all tested devices in this class were better, 4% similar, 16% worse
» The best had a delta of 5%, average was 17%, worst was 45%
Compared to all devices tested
» 66% of all tested devices were better, 6% similar, 28% worse
» The best had a delta of 4%, average was 23%, worst was 134%
能源管理。斯威夫特X,就像很多时候一样,处于中间位置
消耗功率
Swift X在待机时很渴,需要整整3瓦。另一方面,空闲值是平庸的,与我们的对比领域大致相同。
在负载情况下,具有45瓦的CPU和更高的TGP的机器可以消耗更多的电力 - 高达100瓦 - 这有利于性能。宏碁的Swift X 16从电源中提取的最大功率为63瓦。因此,电源的大小为90瓦,这就足够了。
| Off / Standby | |
| Idle | |
| Load |
|
Key:
min: | |
| Acer Swift X SFX16-51G-5388 i5-11320H, GeForce RTX 3050 4GB Laptop GPU, Samsung PM991 MZVLQ512HBLU, , 1920x1080, 16.1" | Acer Swift 3 SF316-51 i7-11370H, Iris Xe G7 96EUs, Micron 2210 MTFDHBA512QFD, IPS, 1920x1080, 16.1" | Acer Swift X SFX14-41G-R7F3 R5 5500U, GeForce GTX 1650 Mobile, WDC PC SN530 SDBPNPZ-1T00, IPS, 1920x1080, 14" | Lenovo IdeaPad 5 Pro 16ACH R7 5800H, GeForce GTX 1650 Mobile, Micron 2300 512GB MTFDHBA512TDV, IPS LED, 2560x1600, 16" | Dell Inspiron 16 Plus 7610 i7-11800H, GeForce RTX 3050 4GB Laptop GPU, Kingston OM3PDP3512B, IPS, 3072x1920, 16" | Asus Vivobook Pro 16X-M7600QE R9 5900HX, GeForce RTX 3050 Ti Laptop GPU, SK Hynix HFM001TD3JX013N, OLED, 3840x2400, 16.1" | Huawei MateBook 16 R7 5800H R7 5800H, Vega 8, Lite-On CA5-8D512, , 2520x1680, 16" | Average NVIDIA GeForce RTX 3050 4GB Laptop GPU | Average of class Multimedia | |
|---|---|---|---|---|---|---|---|---|---|
| Power Consumption | 39% | 25% | -11% | -33% | -21% | 11% | -16% | 2% | |
| Idle Minimum * (Watt) | 7 | 4.8 31% | 3.4 51% | 5.7 19% | 7.7 -10% | 8.2 -17% | 4.6 34% | 7.17 ? -2% | 5.68 ? 19% |
| Idle Average * (Watt) | 10.1 | 7.4 27% | 6 41% | 9.3 8% | 10.7 -6% | 16.2 -60% | 10.5 -4% | 10.4 ? -3% | 10.2 ? -1% |
| Idle Maximum * (Watt) | 15 | 9 40% | 9.2 39% | 11 27% | 16.8 -12% | 19.7 -31% | 11.2 25% | 14.8 ? 1% | 12.4 ? 17% |
| Load Average * (Watt) | 63.3 | 34.9 45% | 57 10% | 83.4 -32% | 100.39 -59% | 65.8 -4% | 59.1 7% | 89.7 ? -42% | 65.4 ? -3% |
| Witcher 3 ultra * (Watt) | 63.3 | 34.9 45% | 57.3 9% | 94.4 -49% | 108 -71% | 65.6 -4% | 58.6 7% | ||
| Load Maximum * (Watt) | 94 | 51.4 45% | 93.6 -0% | 128.7 -37% | 129 -37% | 104 -11% | 98.3 -5% | 124.8 ? -33% | 113.3 ? -21% |
* ... smaller is better
Power consumption Witcher 3 / Stress test
Power consumption with an external monitor
电池寿命
在150尼特条件下上网时,电池寿命约为8小时,这是可以接受的,但它在我们的比较领域中排在最后。这款产品Swift 3不带dGPU的Swift 3持续时间超过一个半小时,而联想的IdeaPad 5 Pro 16实现了50%的运行时间。
| Acer Swift X SFX16-51G-5388 i5-11320H, GeForce RTX 3050 4GB Laptop GPU, 58.7 Wh | Acer Swift 3 SF316-51 i7-11370H, Iris Xe G7 96EUs, 56 Wh | Acer Swift X SFX14-41G-R7F3 R5 5500U, GeForce GTX 1650 Mobile, 58.7 Wh | Lenovo IdeaPad 5 Pro 16ACH R7 5800H, GeForce GTX 1650 Mobile, 75 Wh | Dell Inspiron 16 Plus 7610 i7-11800H, GeForce RTX 3050 4GB Laptop GPU, 86 Wh | Asus Vivobook Pro 16X-M7600QE R9 5900HX, GeForce RTX 3050 Ti Laptop GPU, 96 Wh | Average of class Multimedia | |
|---|---|---|---|---|---|---|---|
| Battery runtime | 19% | 19% | 31% | 71% | 7% | 49% | |
| H.264 (h) | 8.4 | 10.3 23% | 10.4 24% | 16.4 ? 95% | |||
| WiFi v1.3 (h) | 8.1 | 9.8 21% | 10.1 25% | 12.6 56% | 9.9 22% | 11.3 40% | 12.2 ? 51% |
| Gaming (h) | 1.1 | 1.533 ? 39% | |||||
| Load (h) | 1.5 | 1.7 13% | 1.7 13% | 1.7 13% | 3.3 120% | 1.1 -27% | 1.662 ? 11% |
| Reader / Idle (h) | 20.1 | 7.6 | 20.5 | 20.3 | 25.2 ? | ||
| Witcher 3 ultra (h) | 2.2 | 1.2 |
Pros
Cons
结论。宏碁Swift X 16的价格为1200美元,简直太贵了
紧凑的宏碁Swift X 16相当轻,只有1.8公斤,由于宏碁很好地实现了电源模式,在负载下很安静。输入设备很好,而Thunderbolt 4提高了连接性,尽管缺少SD读卡器以及LAN端口。
这个强大的多媒体办公混合机的图形性能足以应付全高清游戏或偶尔的内容创作。后者还得益于16英寸屏幕95%的sRGB色彩空间。这也是媒体享受的理想选择,但16:10的格式对工作更有利。考虑到相当高的价格,宏碁可以安装一个更强大的GeForce RTX 3050版本。
花1200美元,你可以得到一个高性能、相对安静和紧凑的工作设备,用于多媒体任务。不幸的是,16英寸的显示屏有点太暗,没有跟上竞争者的步伐,在扬声器和电池寿命方面也是如此。
考虑到这应该是一台多媒体笔记本电脑,有几件事让我们很恼火。例如,太暗的显示屏、糟糕的扬声器、网络摄像头和高DPC延迟。此外,内存是焊接的,8小时的电池寿命在笔记本电脑级别中是很平庸的。
华硕的Vivobook Pro 16X几乎在所有方面都有更好的表现:更亮的4K OLED显示屏,AMD Ryzen HX CPU,更长的运行时间,更好的扬声器和图形性能(更高的TGP)。我们也可以对以下产品做出类似的声明戴尔Inspiron 16 Plus和更便宜的 联想Ideapad 5 Pro 16.
价格和可用性
建议读者直接通过宏碁的网站查询他们国家的供货情况。请记住,宏碁提供的SFX16-51G的各种配置,因地而异。在下面的例子中,与我们审查的模型(SFX16-51G-5388:英特尔酷睿i5-11320H,NvidiaGeForce RTX 3050,16GB内存和512GB固态硬盘)的差异以粗体字突出。
美国,起价1199.99美元(英特尔酷睿i7-11390H,NvidiaGeForce RTX3050Ti,16GB内存和512GB SSD)
英国,起价为1199.99英镑(英特尔酷睿i7-11390H,英伟达GeForce RTX3050Ti,16GB内存和1TBSSD)
加拿大,起价为1299.99加元(英特尔酷睿i7-11370H,英特尔Iris Xe图形,16GB内存和512GB固态硬盘)
价格截至18.07.2022。作为比较,我们审查的设备的零售价为1200欧元(1200美元)。
Acer Swift X SFX16-51G-5388
- 07/15/2022 v7 (old)
Marvin Gollor
Price comparison

