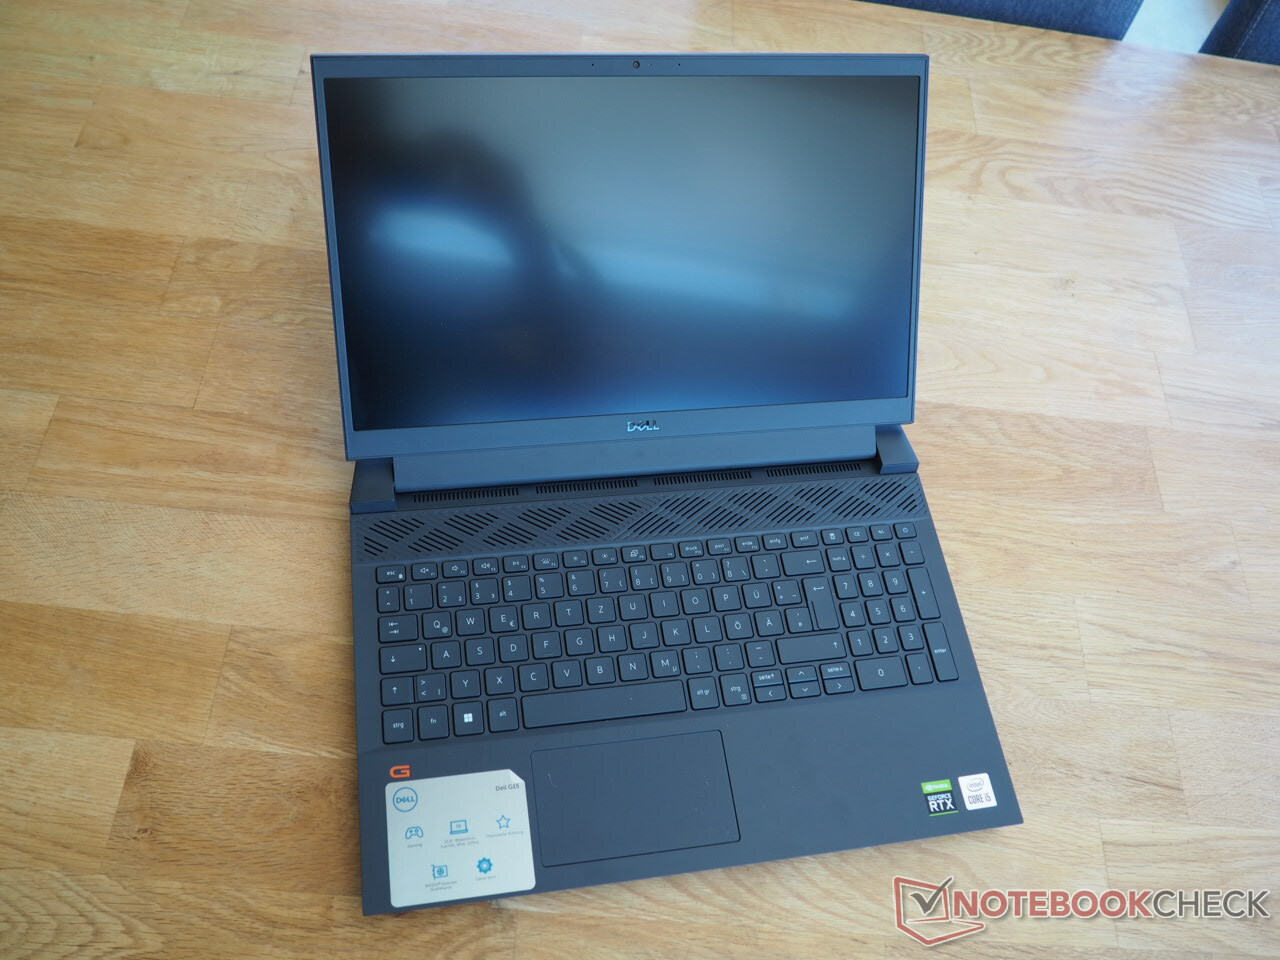
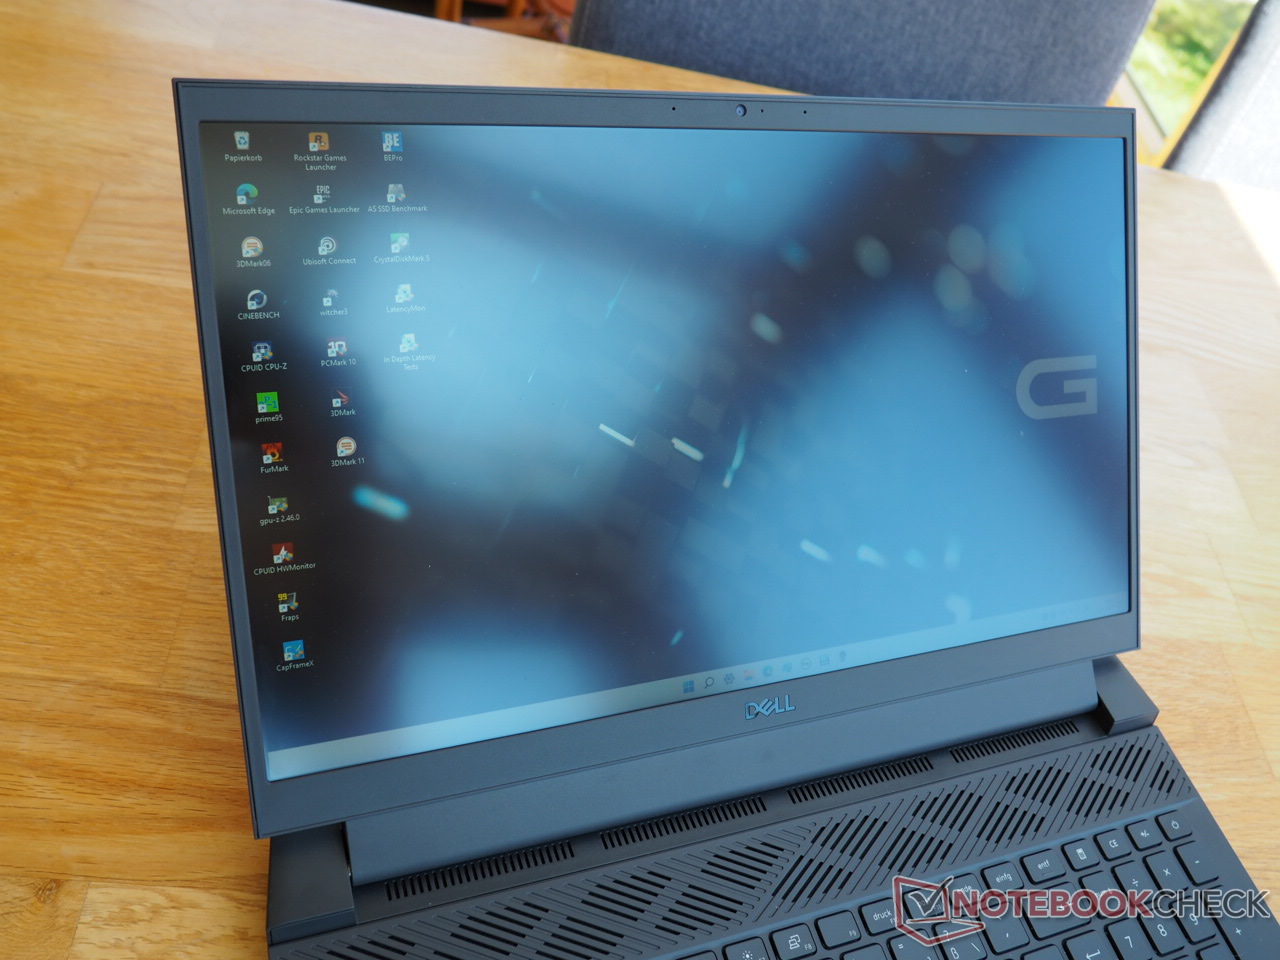
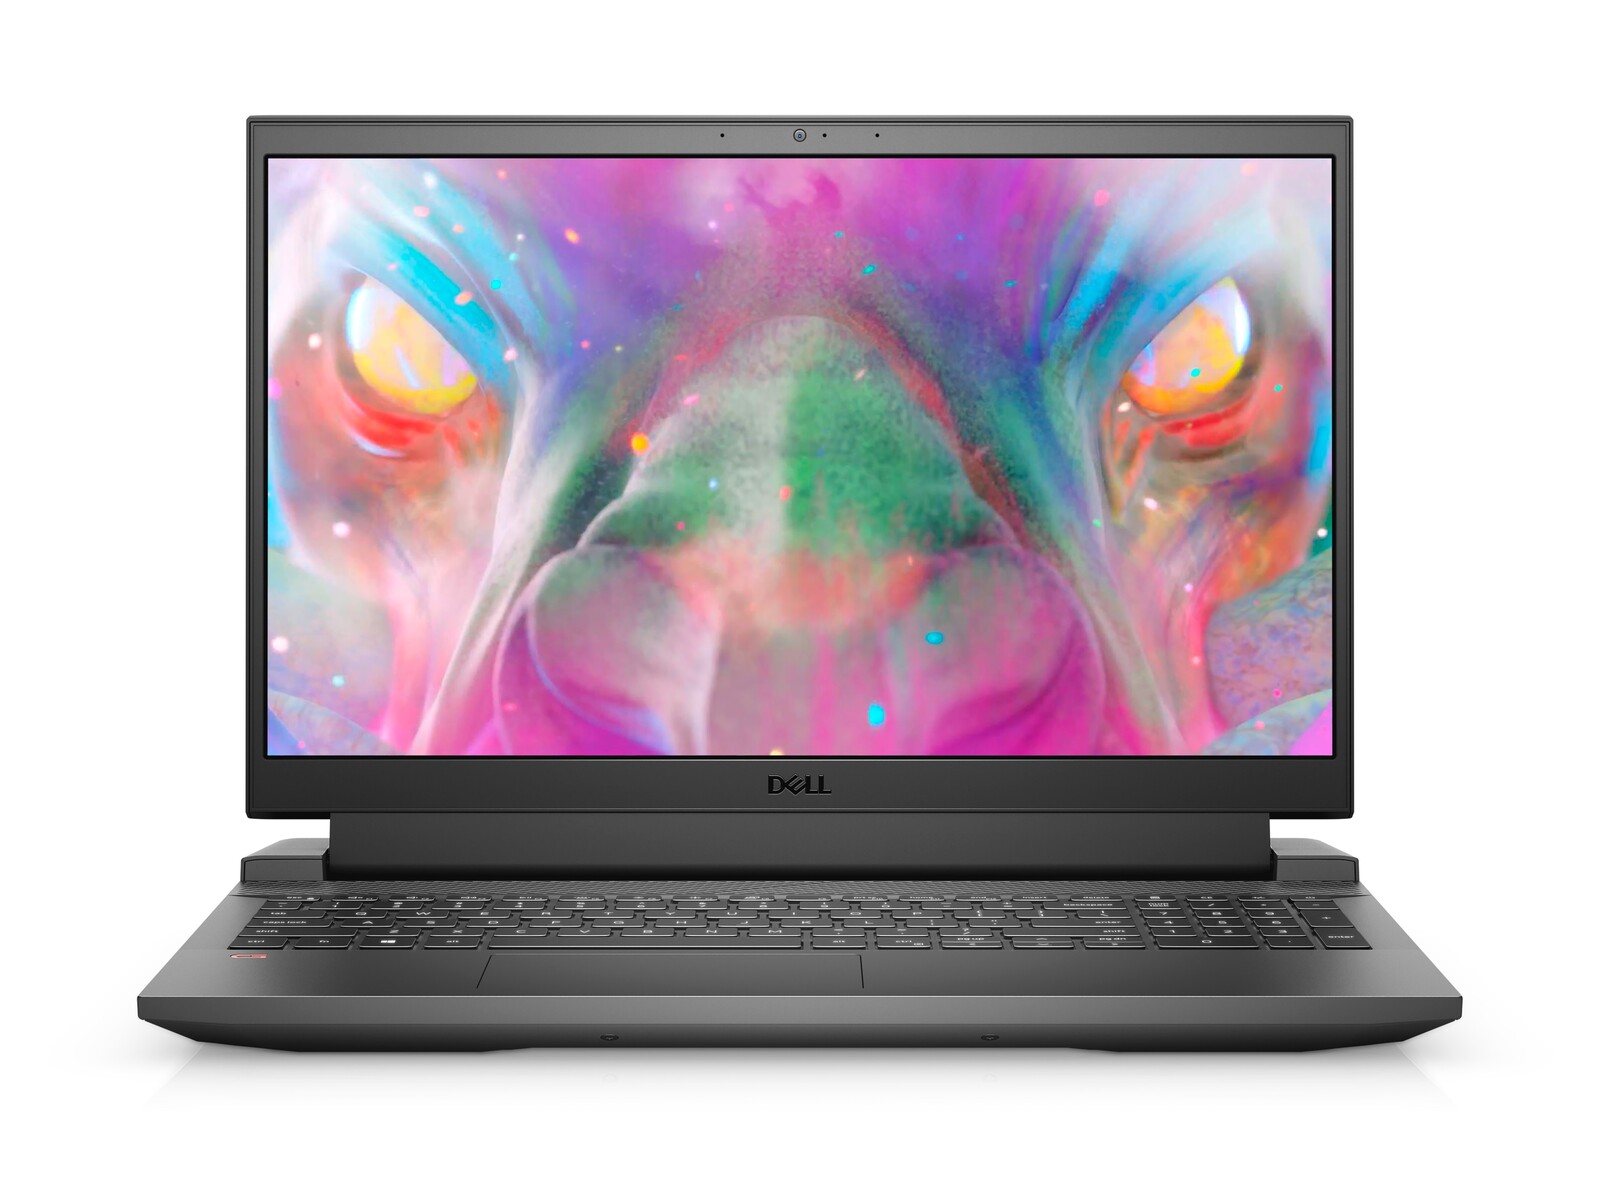
戴尔G15 5510笔记本电脑回顾。配备RTX 3050的经济型游戏笔记本

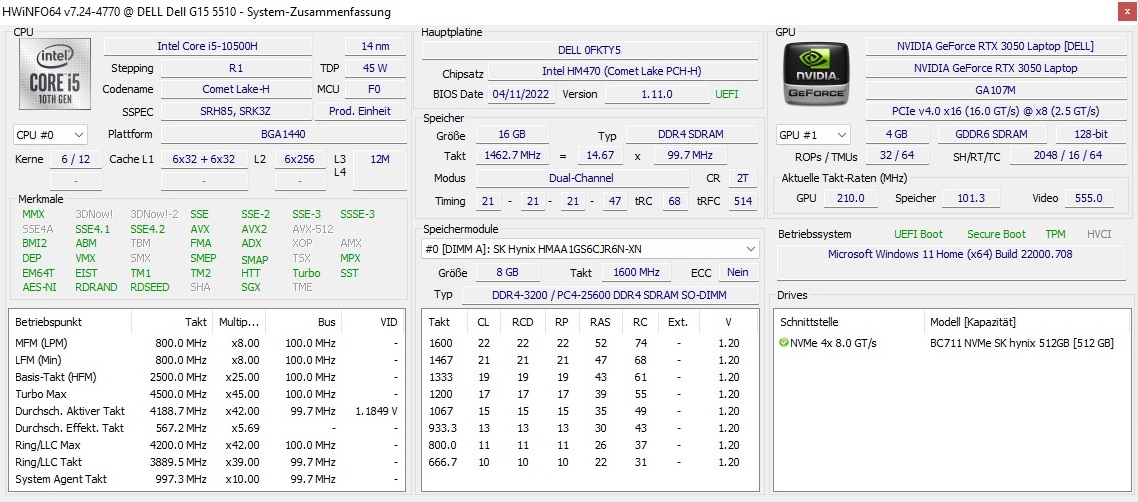
不愿意或没有能力花费超过1000欧元(约1050美元)购买游戏笔记本电脑的用户可能已经遇到了戴尔G15 5510。尽管我们审查的版本不再拥有最新的CPU,其 酷睿i5-10500H,6个核心和12个线程在2022年仍然是值得尊敬的。
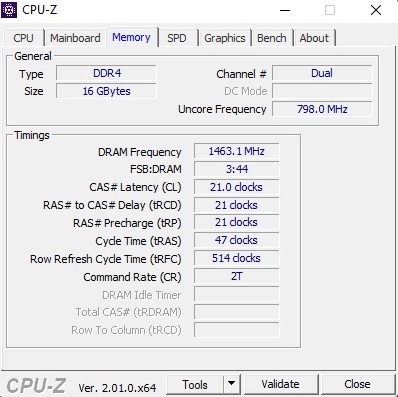
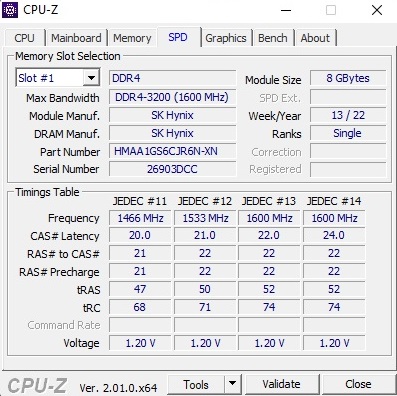
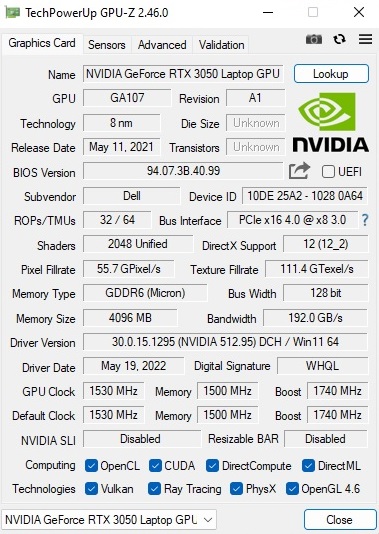
另一方面,由于支持光线追踪,显卡是最新的,即使是GeForce RTX 3050由于其低内存配置,在更高的分辨率和设置下很快就会耗尽能量。我们评测单元中的大容量存储驱动器是M.2格式的512GB NVMe SSD。除此之外,还有2个8GB DDR4-3200内存棒,采用双通道模式。一个刷新率为120赫兹的哑光宽视角面板处理图像再现。
戴尔G15 5510的竞争对手包括其他配备GeForce RTX 3050或RTX 3050 Ti的经济型游戏笔记本电脑,如 Acer Nitro 5 AN517,以及技嘉G5 GD,以及 联想IdeaPad Gaming 3 15IHU,所有这些都作为对比设备出现在表格中。
潜在的竞争对手比较
Rating | Date | Model | Weight | Height | Size | Resolution | Price |
|---|---|---|---|---|---|---|---|
| 81 % v7 (old) | 06 / 2022 | Dell G15 5510 i5-10500H, GeForce RTX 3050 4GB Laptop GPU | 2.5 kg | 23 mm | 15.60" | 1920x1080 | |
| 81.1 % v7 (old) | 08 / 2021 | Acer Nitro 5 AN517-53-54DQ i5-11300H, GeForce RTX 3050 4GB Laptop GPU | 2.6 kg | 25 mm | 17.30" | 1920x1080 | |
| 81.7 % v7 (old) | 11 / 2021 | Gigabyte G5 GD i5-11400H, GeForce RTX 3050 4GB Laptop GPU | 2.1 kg | 31.6 mm | 15.60" | 1920x1080 | |
| 79.7 % v7 (old) | 03 / 2022 | Lenovo Ideapad Gaming 3 15IHU-82K1002RGE i5-11300H, GeForce RTX 3050 Ti Laptop GPU | 2 kg | 24.2 mm | 15.60" | 1920x1080 | |
| 79.1 % v7 (old) | 05 / 2022 | Dell G15 5510-43NHT i5-10200H, GeForce RTX 3050 Ti Laptop GPU | 2.5 kg | 23.33 mm | 15.60" | 1920x1080 |
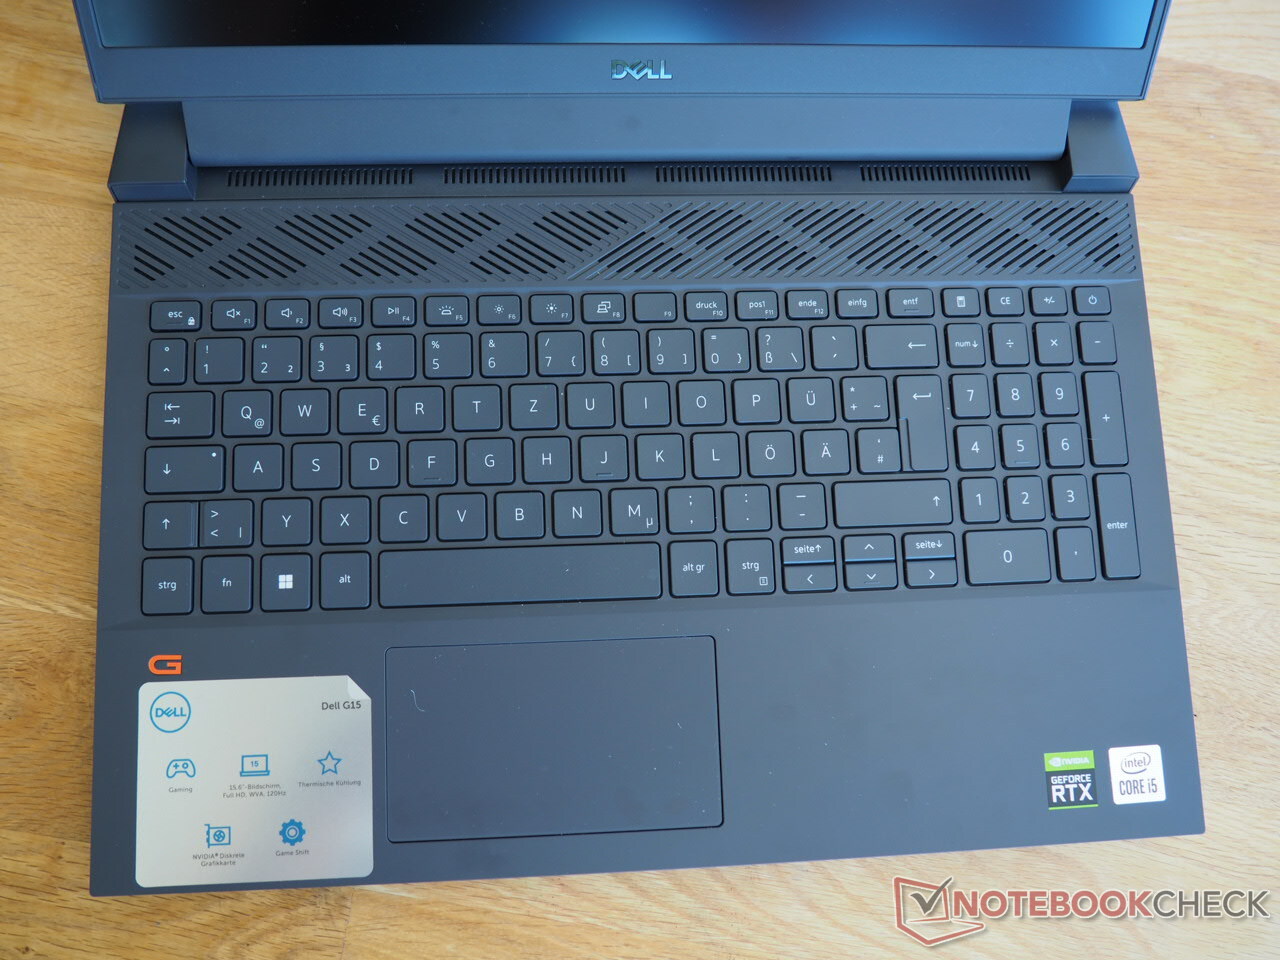
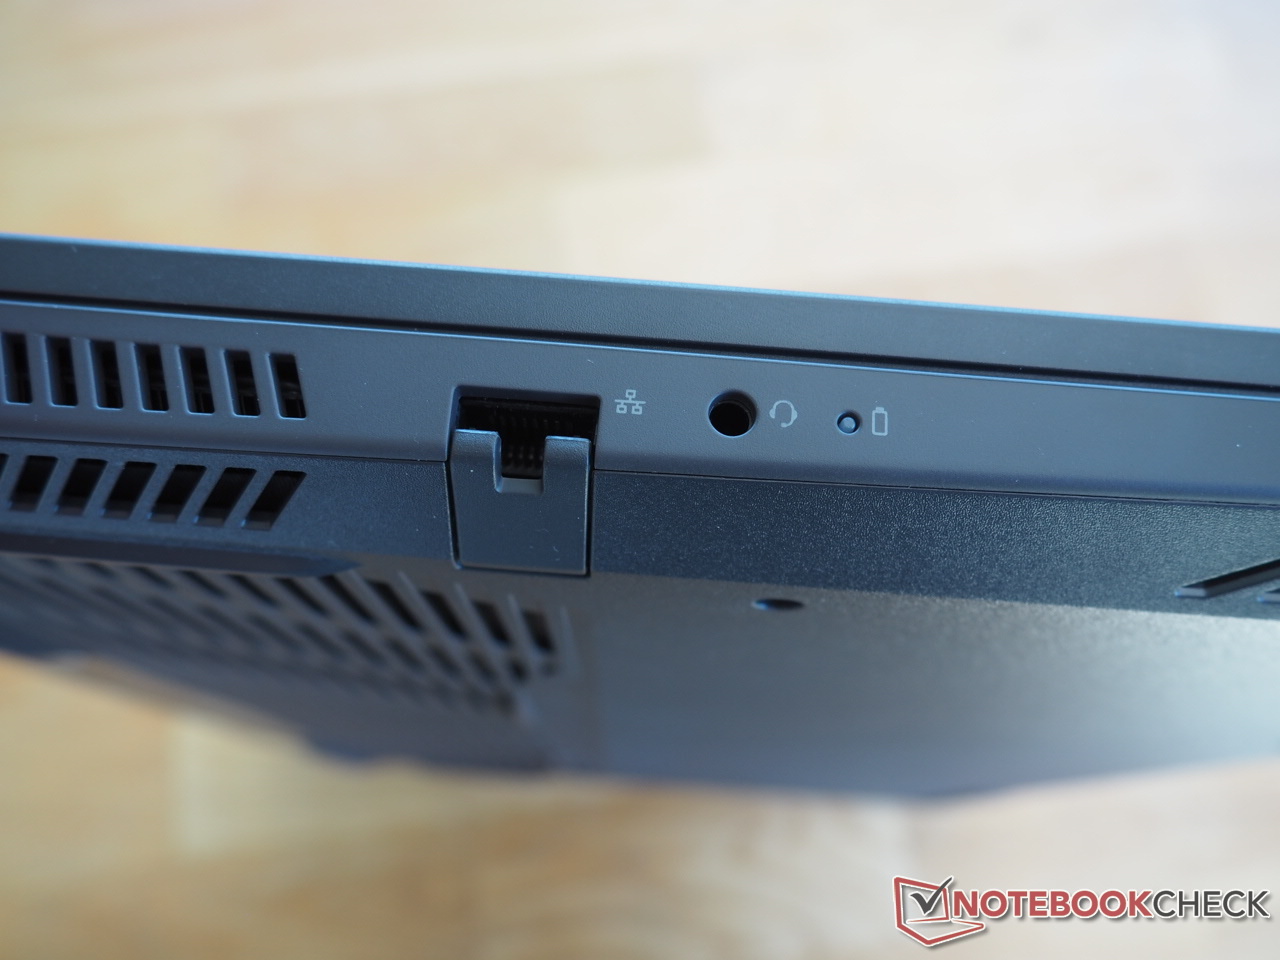
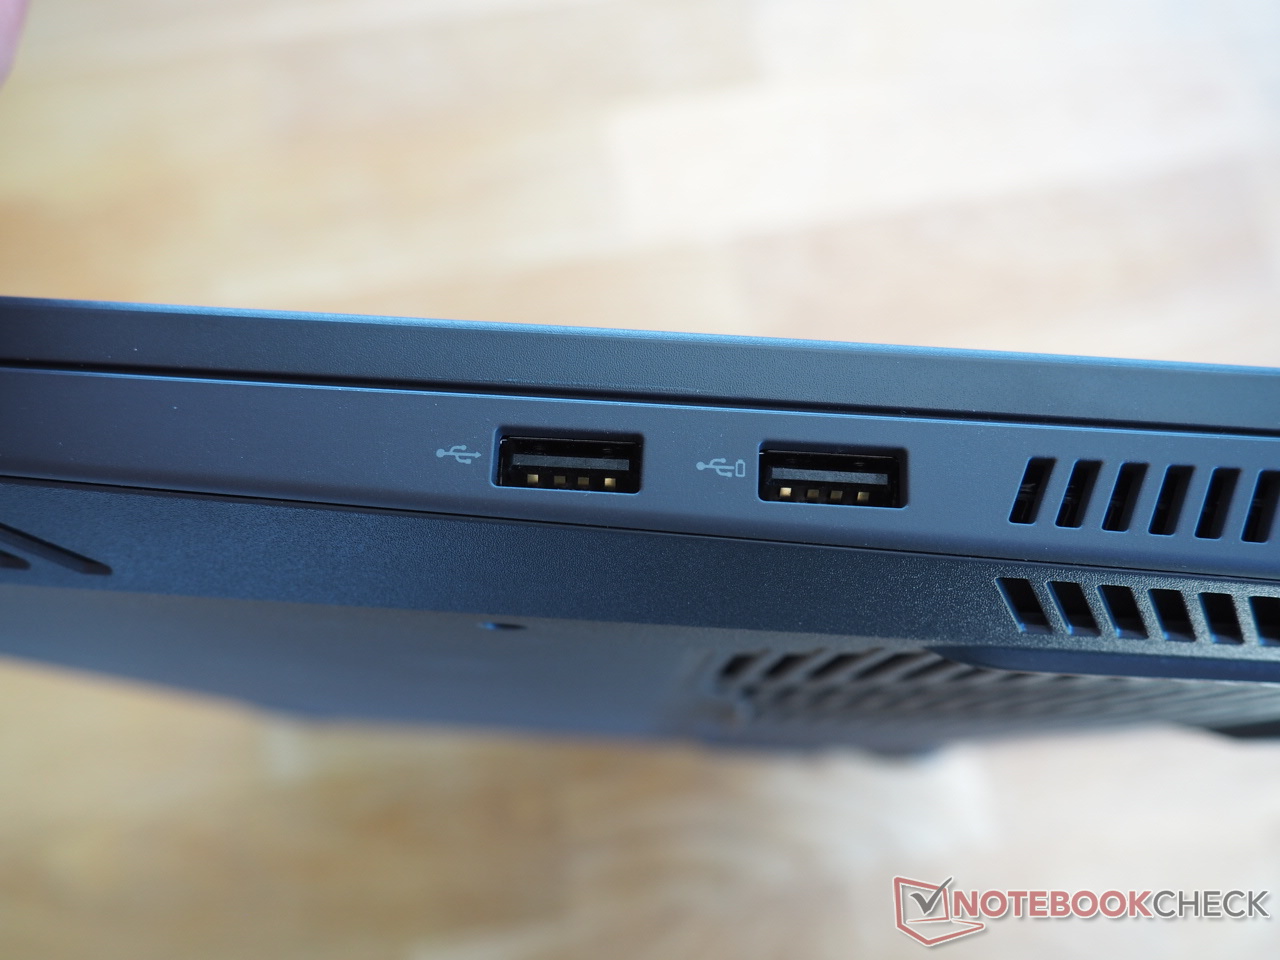
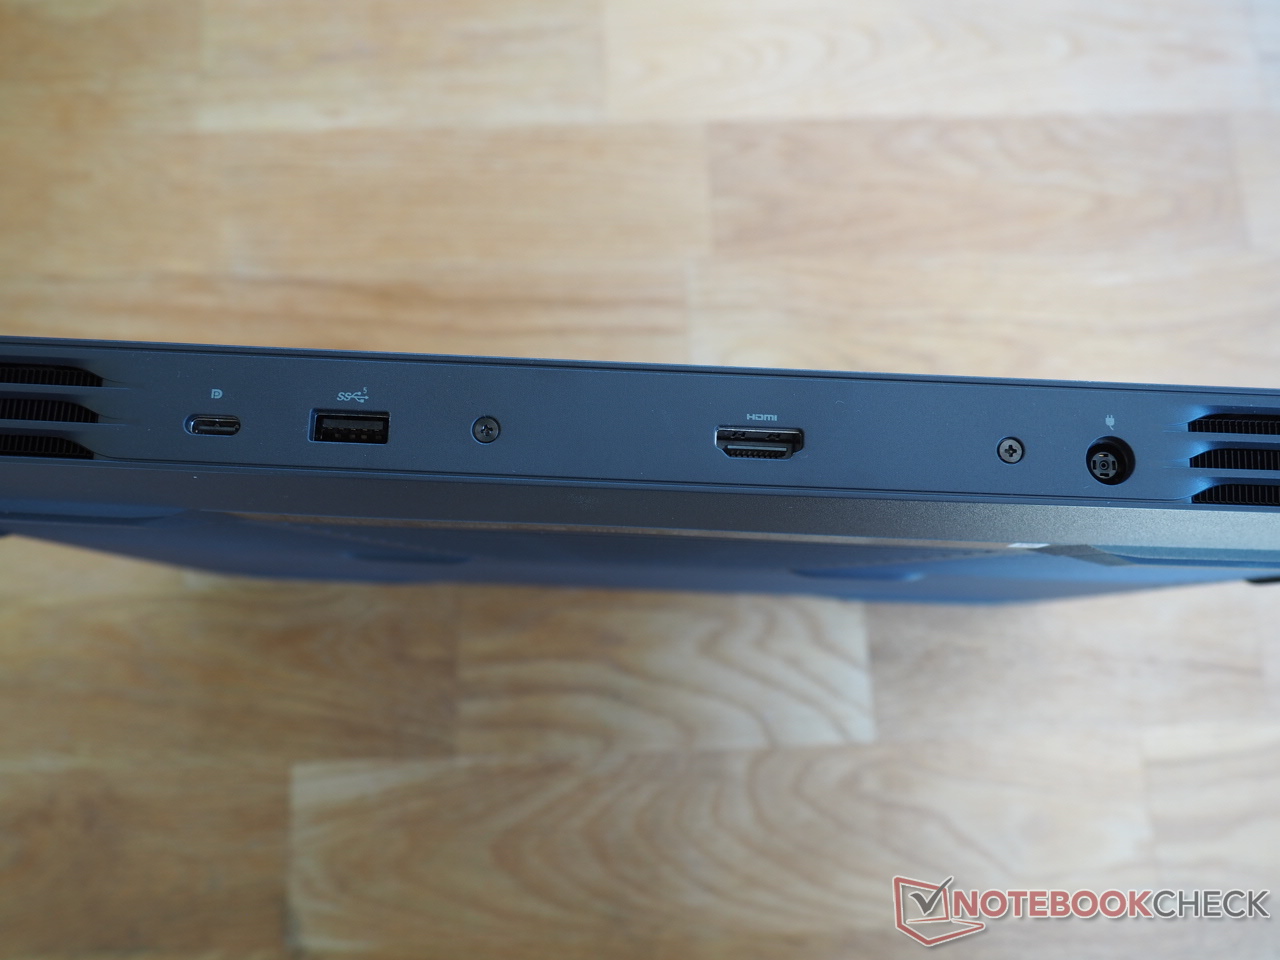
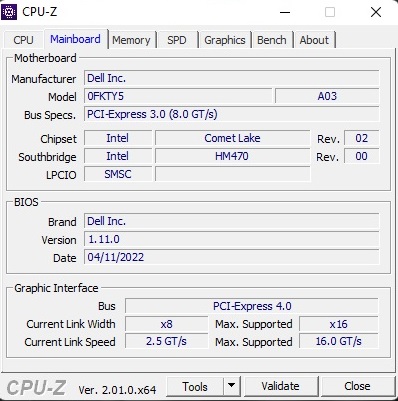
由于该机箱与最近评测的型号相同,带有酷睿i5-10200H和 RTX 3050 Ti我们不会在这里讨论有关机箱、连接(端口等)和输入设备的细节。相应的信息可以在以下文章中找到 链接文章.
沟通
| Networking - iperf3 receive AXE11000 | |
| Dell G15 5510 | |
| Average of class Gaming (680 - 1745, n=95, last 2 years) | |
网络摄像头


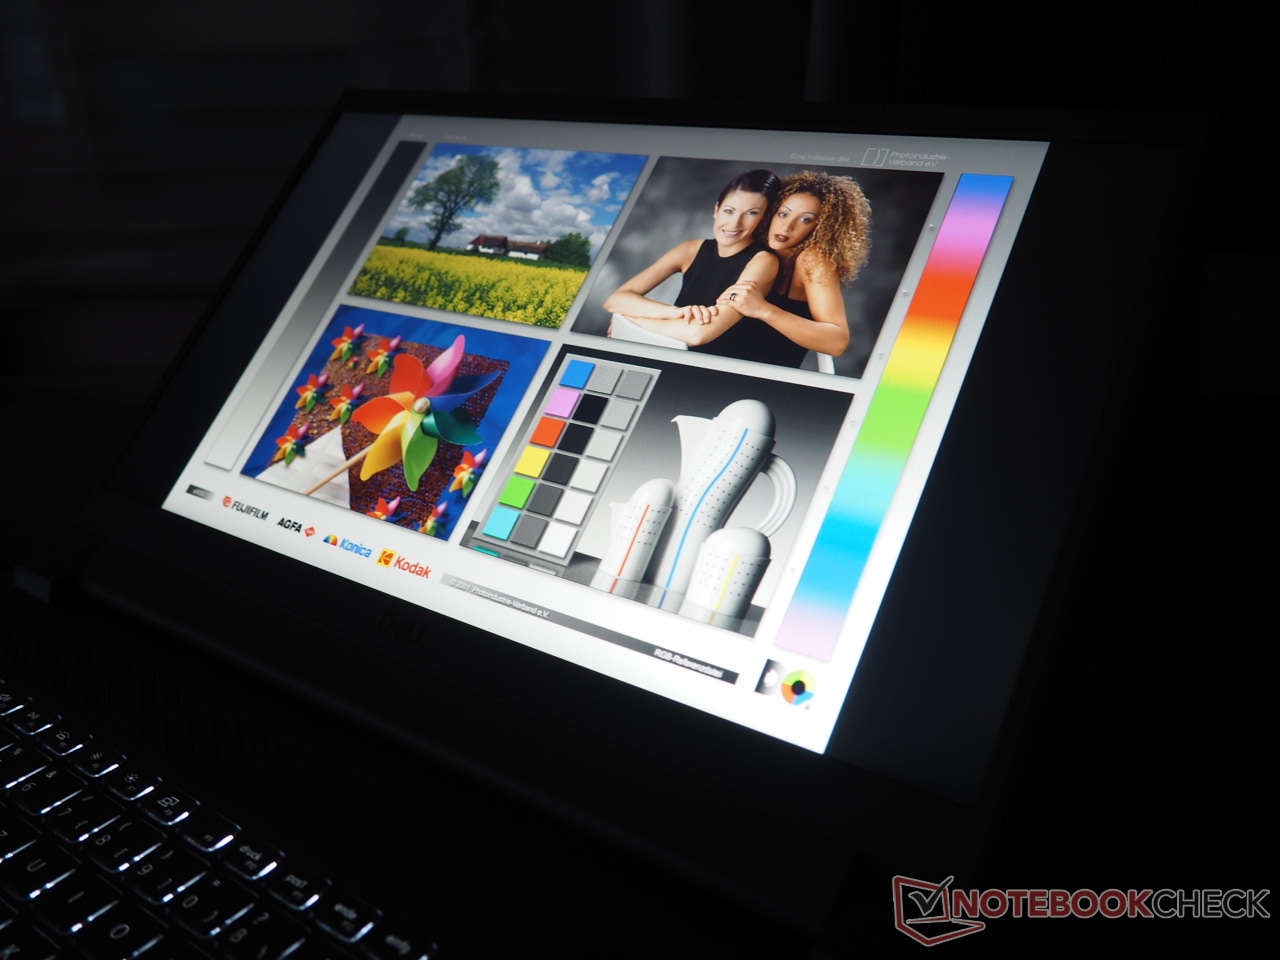
显示
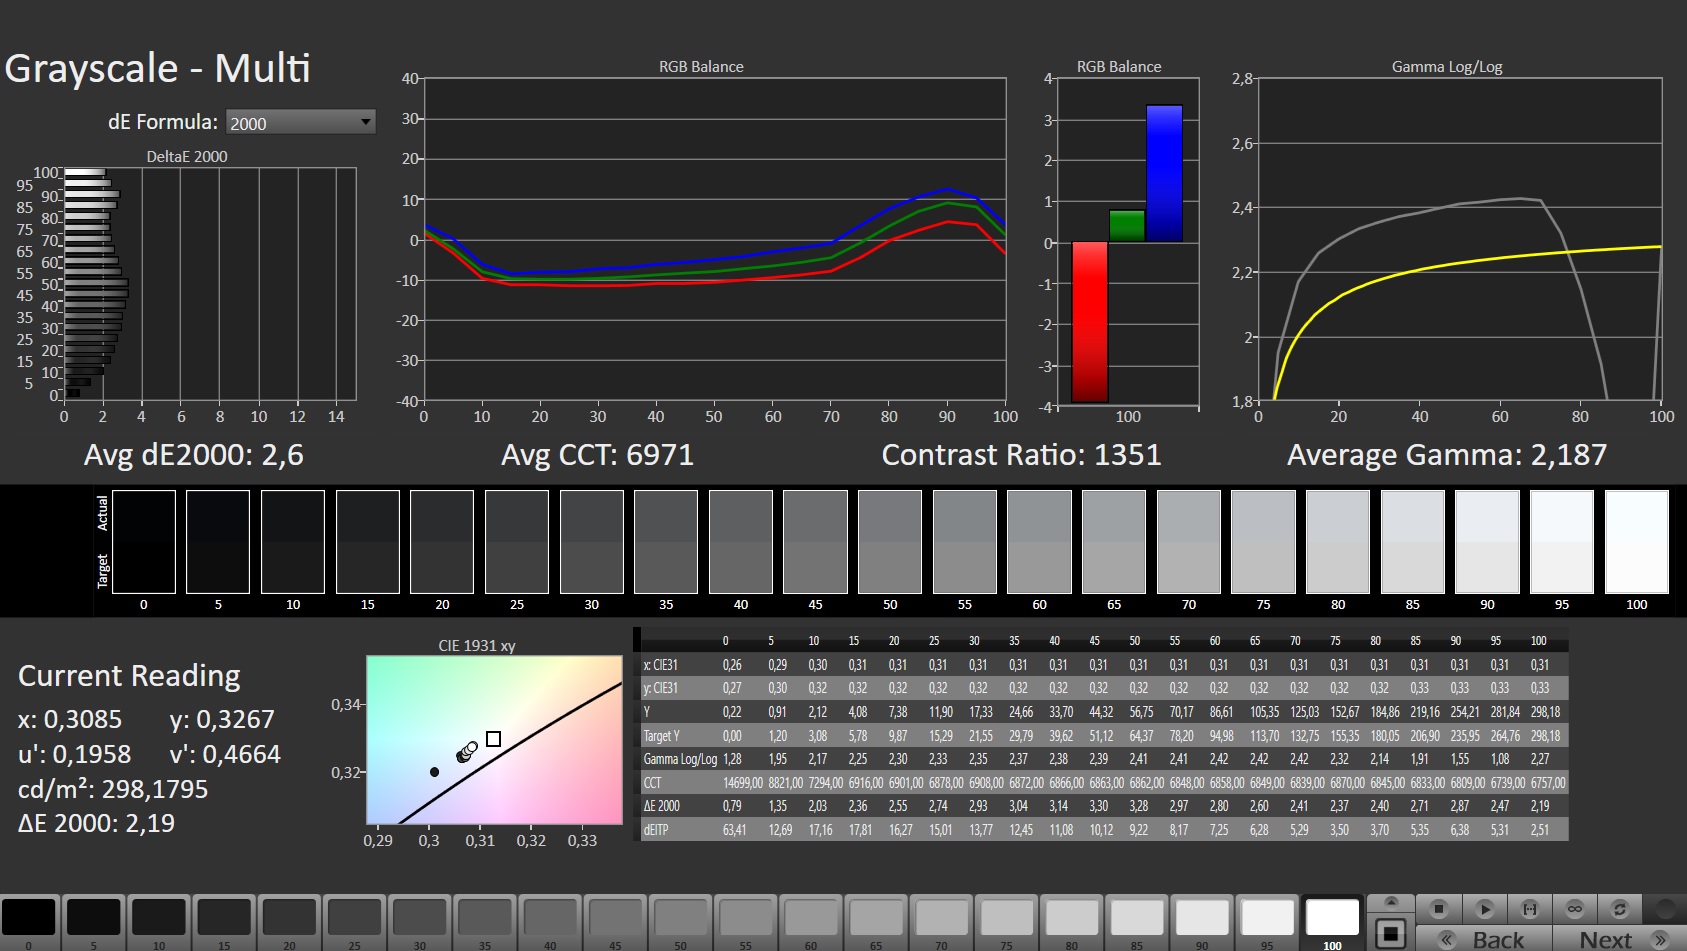
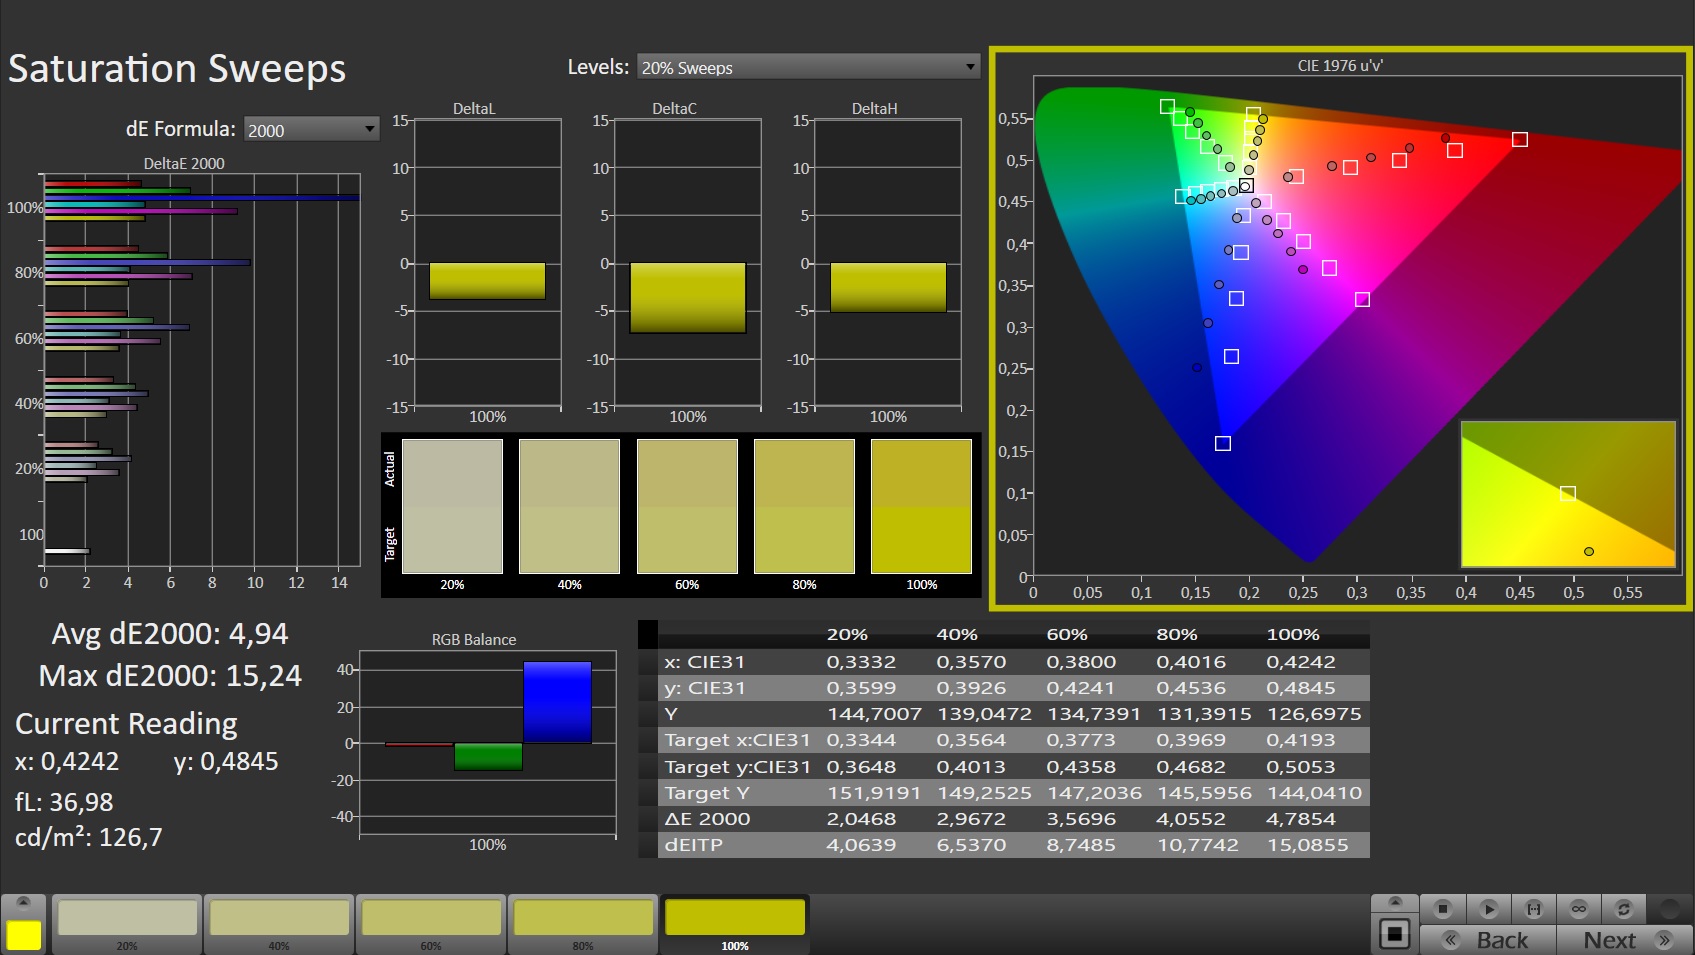
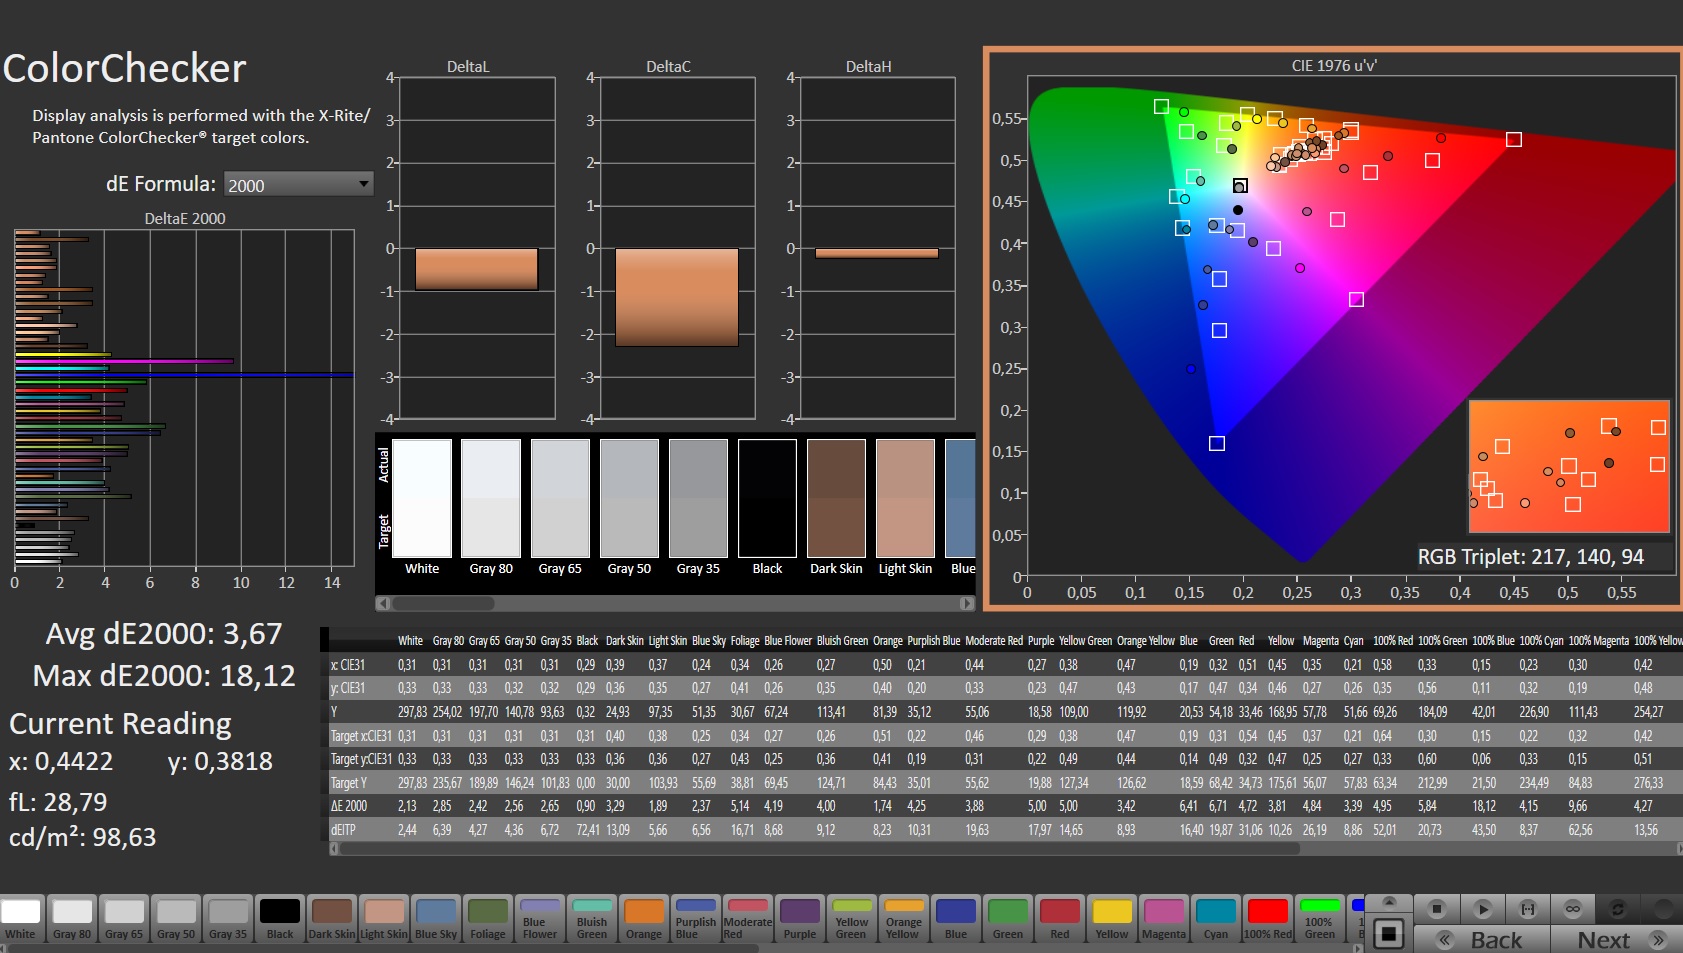
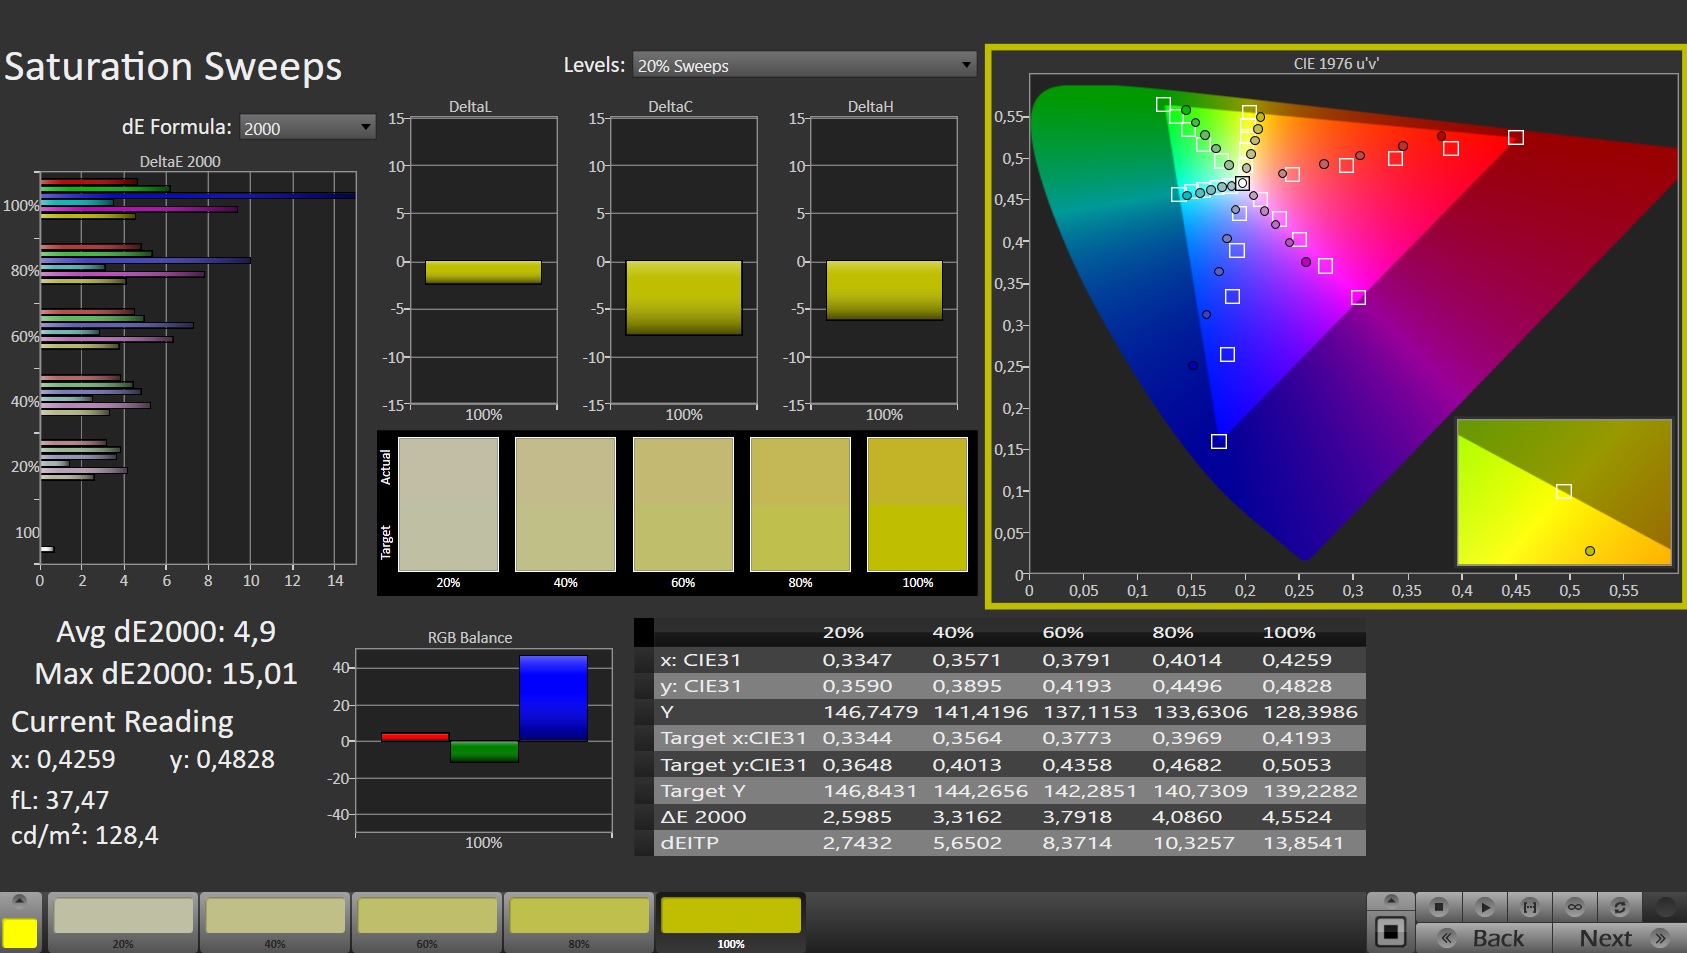
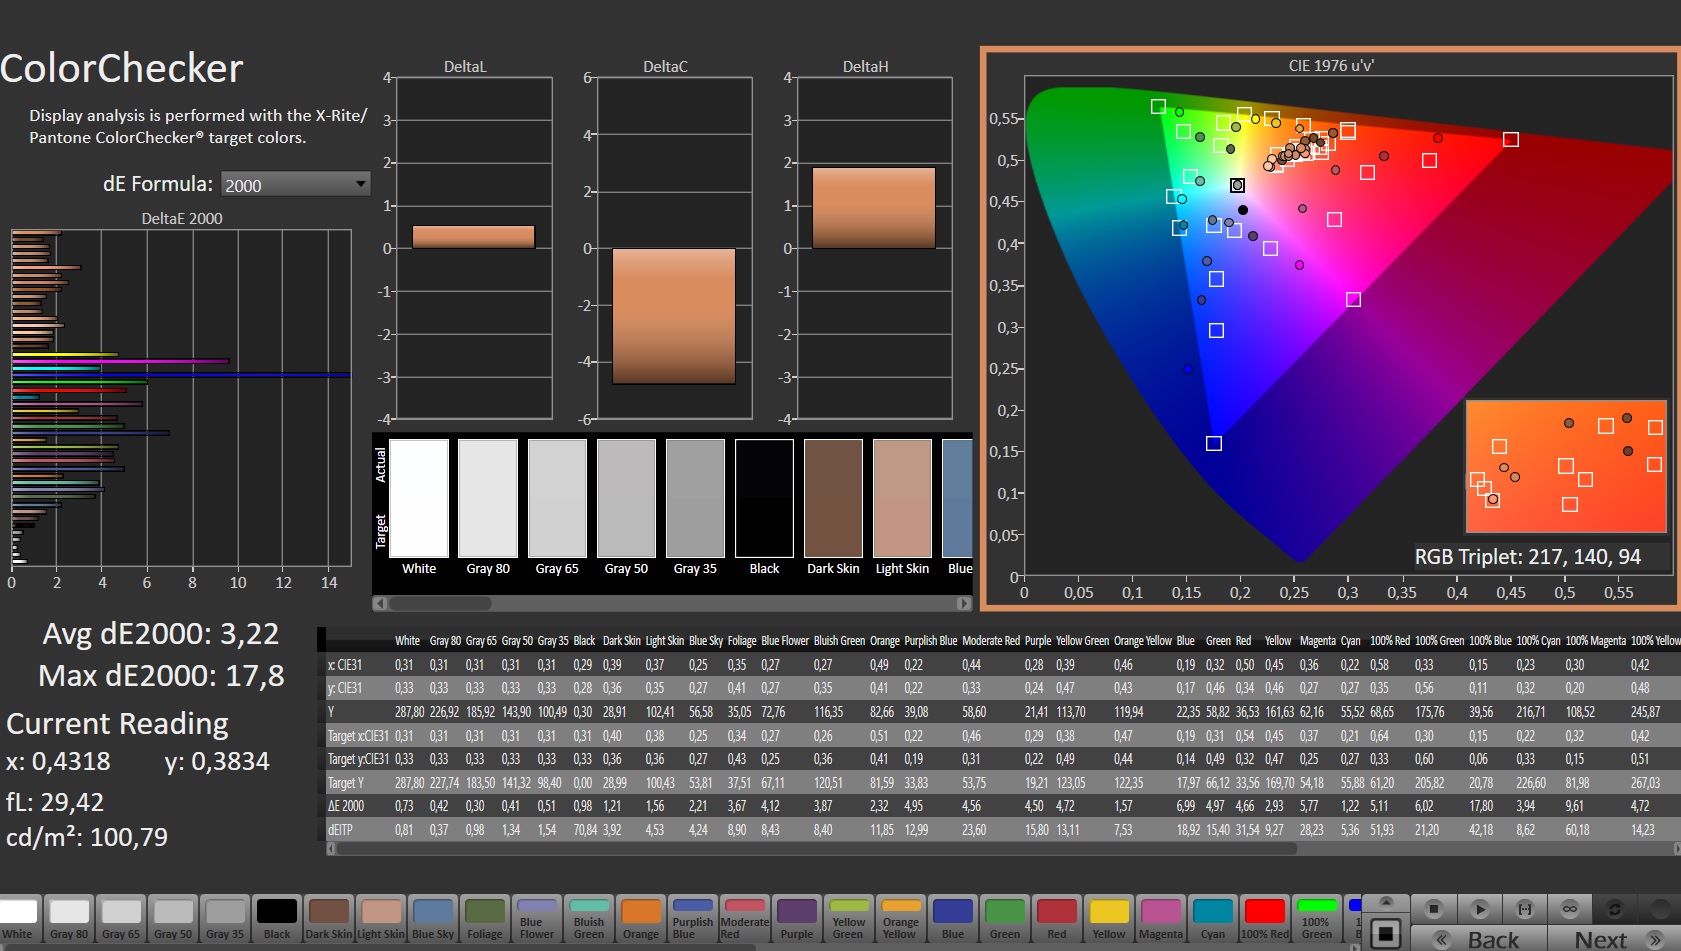
像大多数预算游戏笔记本一样,戴尔G15 5510不幸没有一个好的显示屏。虽然黑色水平和对比度对于采用IPS面板的笔记本电脑来说是比较体面的(分别为0.24cd/m²和1,200:1),但亮度和色彩空间还有待改进。平均264cd/m²的亮度意味着这台15英寸的笔记本不适合在户外使用。该显示器至少要达到350cd/m²才行。
微不足道的62%的sRGB覆盖率也导致了相对苍白的色彩,但色彩准确性是可以接受的。响应时间也比我们所熟悉的更昂贵的游戏笔记本要差。大约21毫秒的黑到白和33毫秒的灰到灰会导致在快速移动过程中的妥协(例如,在第一人称射击游戏中)。同时,在可视角度方面没有什么可抱怨的--这些都是令人愉快的稳定。
| |||||||||||||||||||||||||
Brightness Distribution: 88 %
Center on Battery: 288 cd/m²
Contrast: 1200:1 (Black: 0.24 cd/m²)
ΔE ColorChecker Calman: 3.67 | ∀{0.5-29.43 Ø4.73}
calibrated: 3.22
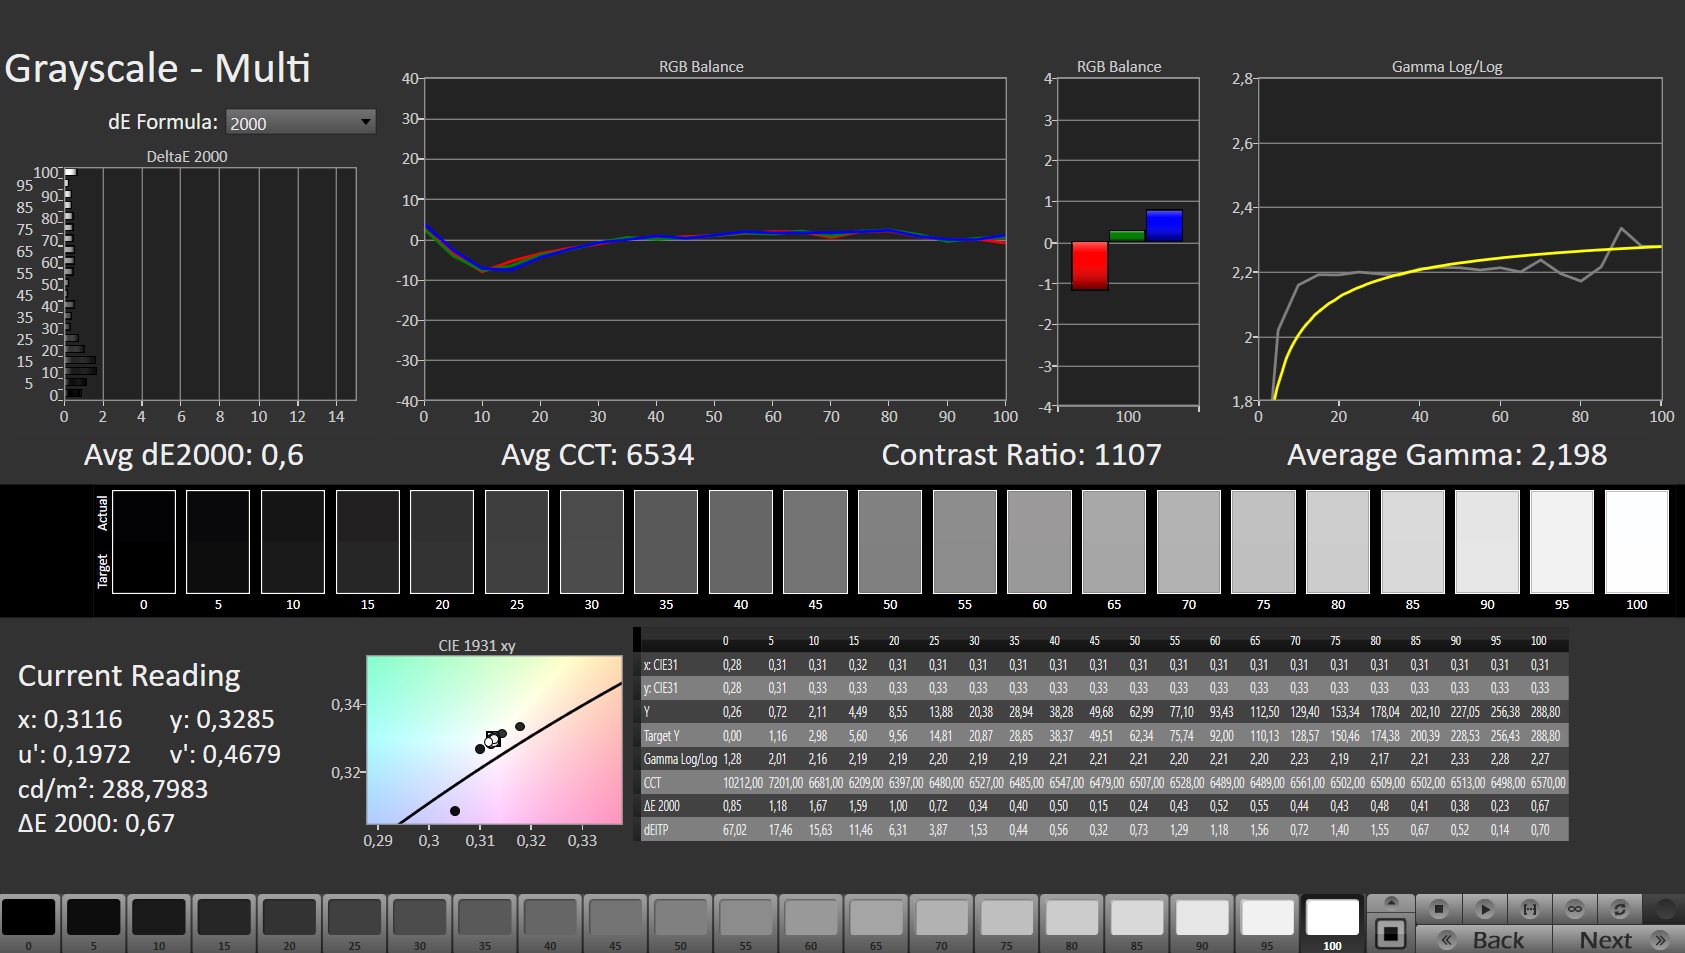
ΔE Greyscale Calman: 2.6 | ∀{0.09-98 Ø4.97}
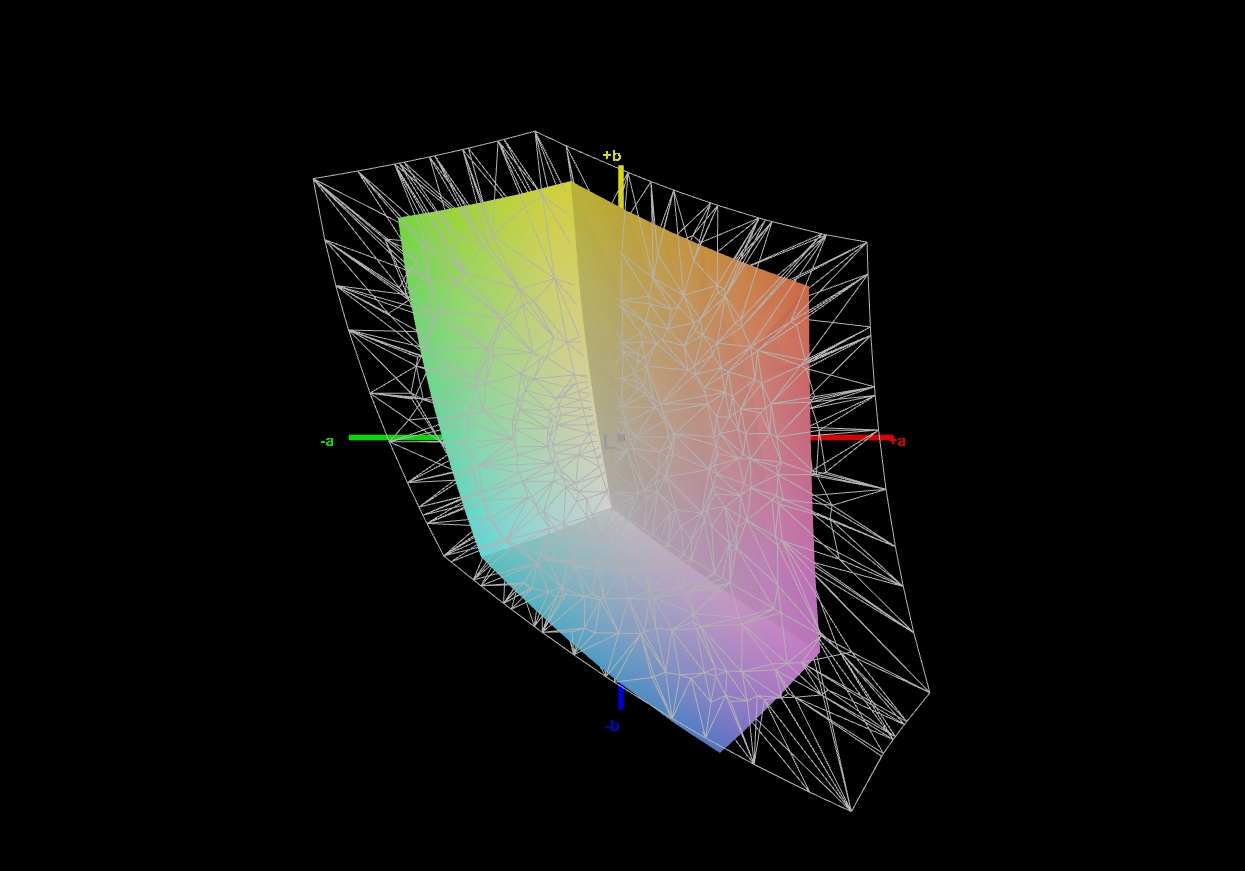
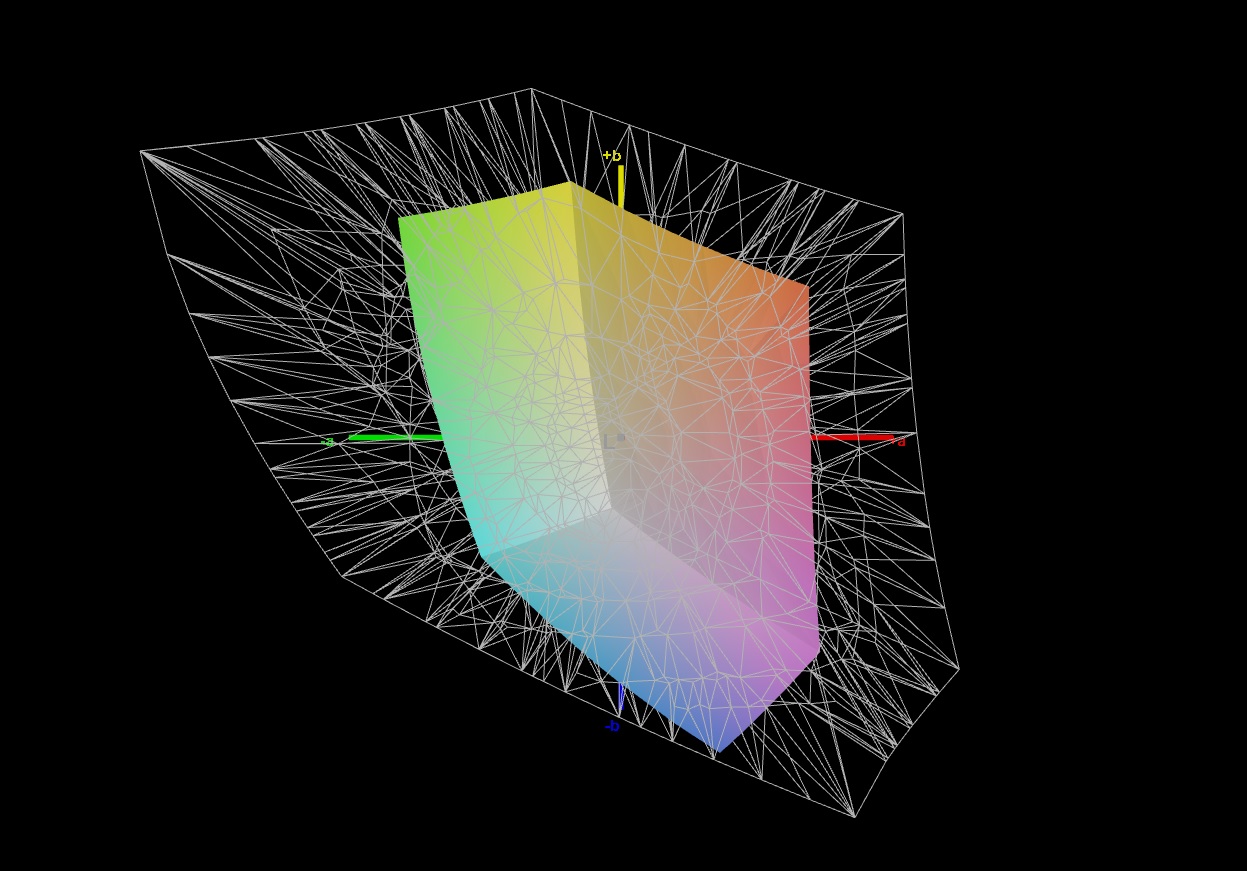
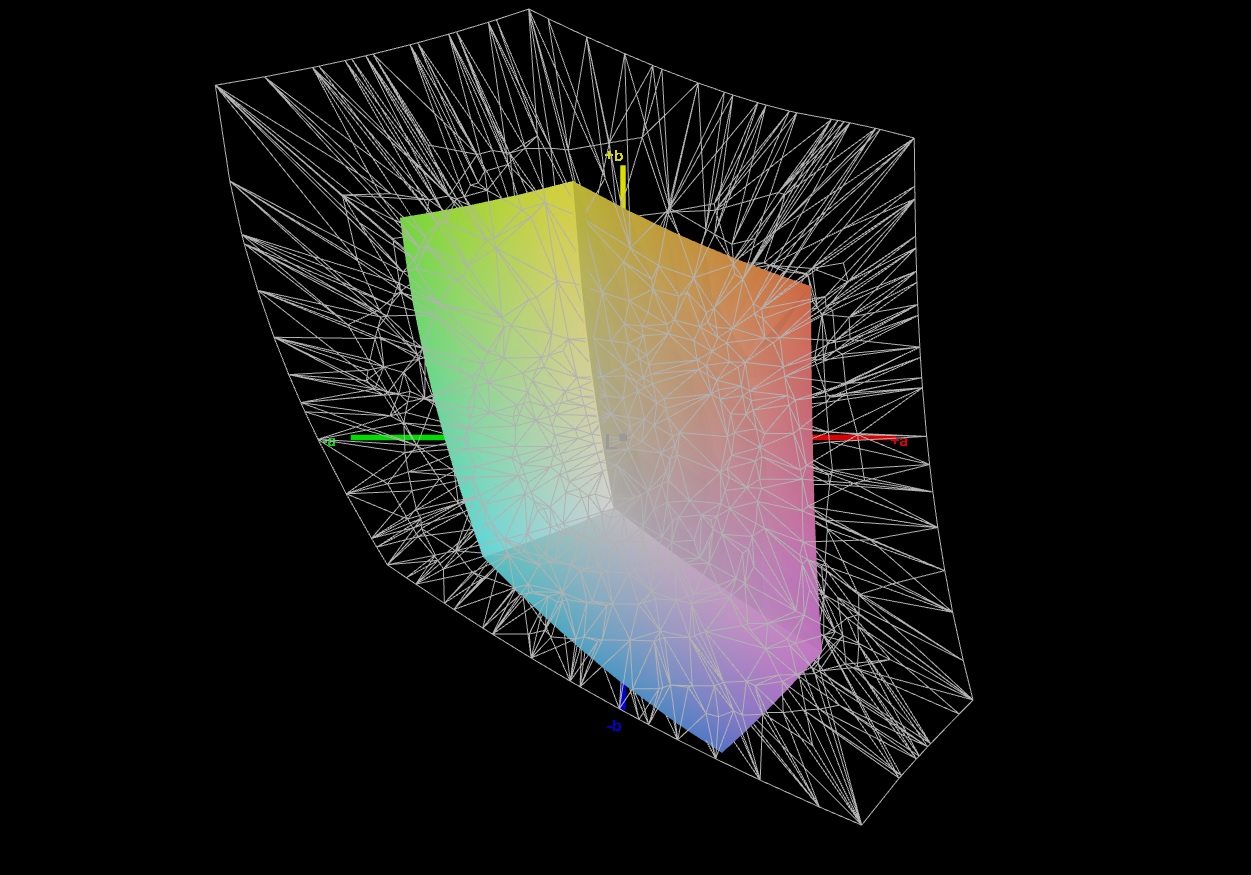
43% AdobeRGB 1998 (Argyll 3D)
62.2% sRGB (Argyll 3D)
41.6% Display P3 (Argyll 3D)
Gamma: 2.187
CCT: 6971 K
| Dell G15 5510 YMHWH_156HRA (CMN1522), IPS, 1920x1080, 15.6" | Acer Nitro 5 AN517-53-54DQ BOE NV173FHM-NX4 (BOE09B4), IPS, 1920x1080, 17.3" | Gigabyte G5 GD Chi Mei N156HRA-EA1, IPS, 1920x1080, 15.6" | Lenovo Ideapad Gaming 3 15IHU-82K1002RGE LEN156FHD, IPS, 1920x1080, 15.6" | Dell G15 5510-43NHT Dell 156GL05, IPS, 1920x1080, 15.6" | |
|---|---|---|---|---|---|
| Display | -12% | 0% | -4% | -2% | |
| Display P3 Coverage (%) | 41.6 | 36.7 -12% | 41.8 0% | 39.7 -5% | 40.8 -2% |
| sRGB Coverage (%) | 62.2 | 55 -12% | 62.3 0% | 59.6 -4% | 61.4 -1% |
| AdobeRGB 1998 Coverage (%) | 43 | 37.9 -12% | 43.2 0% | 41.1 -4% | 42.2 -2% |
| Response Times | 18% | -8% | -55% | -18% | |
| Response Time Grey 50% / Grey 80% * (ms) | 33.3 ? | 24.8 ? 26% | 34.4 ? -3% | 46.4 ? -39% | 35 ? -5% |
| Response Time Black / White * (ms) | 20.7 ? | 18.8 ? 9% | 23.2 ? -12% | 35.2 ? -70% | 27 ? -30% |
| PWM Frequency (Hz) | |||||
| Screen | -7% | 0% | -18% | -68% | |
| Brightness middle (cd/m²) | 288 | 286 -1% | 261 -9% | 307 7% | 290 1% |
| Brightness (cd/m²) | 264 | 261 -1% | 246 -7% | 292 11% | 267 1% |
| Brightness Distribution (%) | 88 | 83 -6% | 87 -1% | 88 0% | 87 -1% |
| Black Level * (cd/m²) | 0.24 | 0.23 4% | 0.19 21% | 0.21 12% | 1.085 -352% |
| Contrast (:1) | 1200 | 1243 4% | 1374 15% | 1462 22% | 267 -78% |
| Colorchecker dE 2000 * | 3.67 | 4.92 -34% | 3.9 -6% | 5.9 -61% | 6.5 -77% |
| Colorchecker dE 2000 max. * | 18.12 | 19.29 -6% | 19.26 -6% | 21.6 -19% | 16.96 6% |
| Colorchecker dE 2000 calibrated * | 3.22 | 4.73 -47% | 3.24 -1% | 4.8 -49% | 4.11 -28% |
| Greyscale dE 2000 * | 2.6 | 1.9 27% | 2.7 -4% | 4.9 -88% | 4.85 -87% |
| Gamma | 2.187 101% | 2.175 101% | 2.248 98% | 2.26 97% | 2.22 99% |
| CCT | 6971 93% | 6782 96% | 6828 95% | 6504 100% | 7401 88% |
| Total Average (Program / Settings) | -0% /
-4% | -3% /
-1% | -26% /
-21% | -29% /
-47% |
* ... smaller is better
Display Response Times
| ↔ Response Time Black to White | ||
|---|---|---|
| 20.7 ms ... rise ↗ and fall ↘ combined | ↗ 11.8 ms rise | 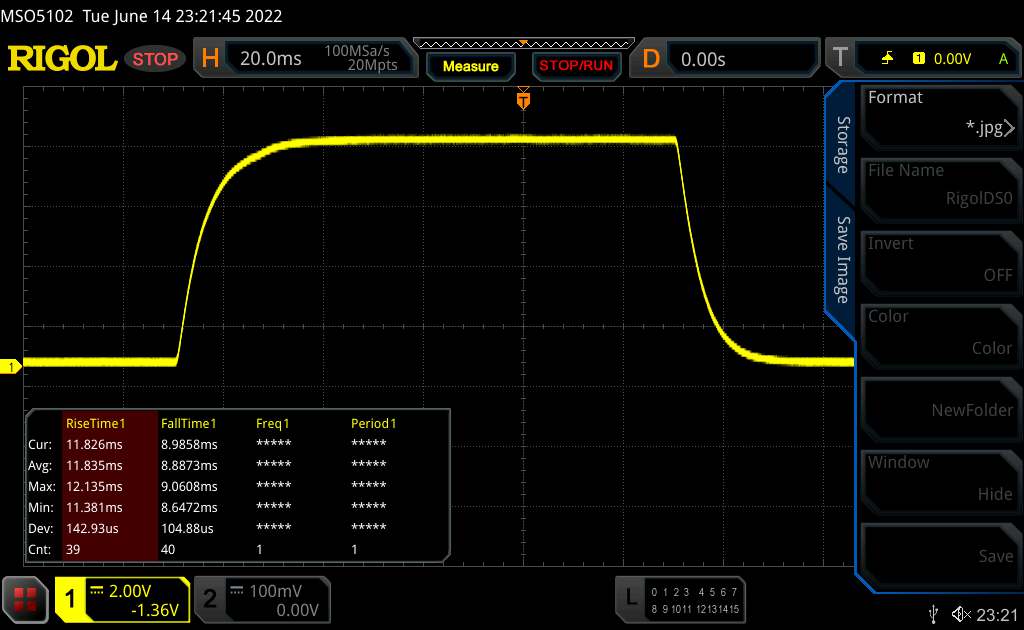 |
| ↘ 8.9 ms fall | ||
| The screen shows good response rates in our tests, but may be too slow for competitive gamers. In comparison, all tested devices range from 0.1 (minimum) to 240 (maximum) ms. » 46 % of all devices are better. This means that the measured response time is similar to the average of all tested devices (19.9 ms). | ||
| ↔ Response Time 50% Grey to 80% Grey | ||
| 33.3 ms ... rise ↗ and fall ↘ combined | ↗ 16.2 ms rise | 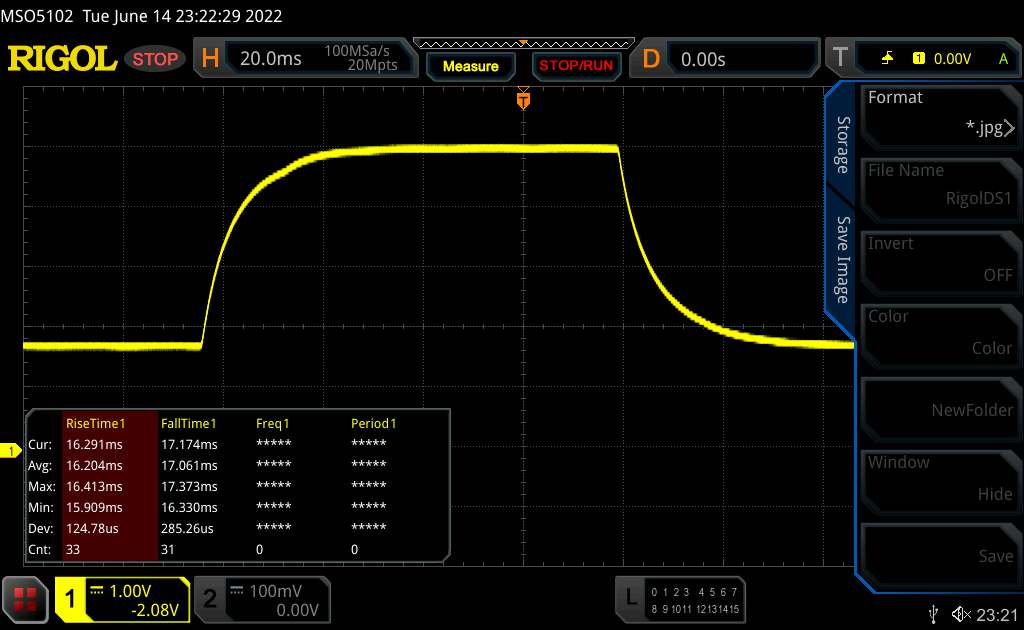 |
| ↘ 17.1 ms fall | ||
| The screen shows slow response rates in our tests and will be unsatisfactory for gamers. In comparison, all tested devices range from 0.165 (minimum) to 636 (maximum) ms. » 46 % of all devices are better. This means that the measured response time is similar to the average of all tested devices (31.1 ms). | ||
Screen Flickering / PWM (Pulse-Width Modulation)
| Screen flickering / PWM not detected |  | ||
In comparison: 52 % of all tested devices do not use PWM to dim the display. If PWM was detected, an average of 7794 (minimum: 5 - maximum: 343500) Hz was measured. | |||
业绩
酷睿i5-10500H和GeForce RTX 3050使戴尔G15处于中端水平。16GB内存和512GB存储也是预算游戏设备的标准配置。
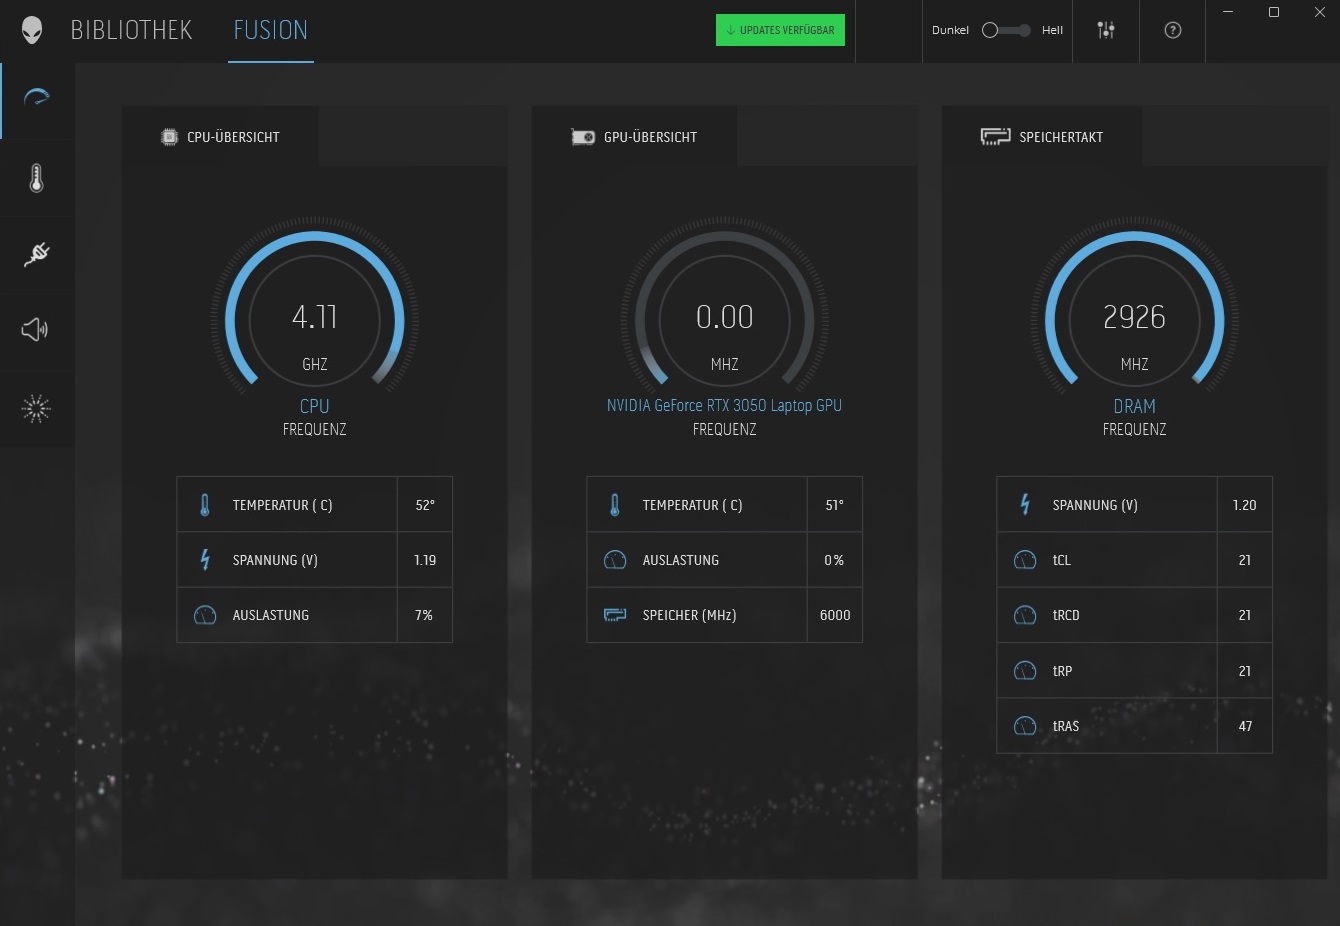
测试条件
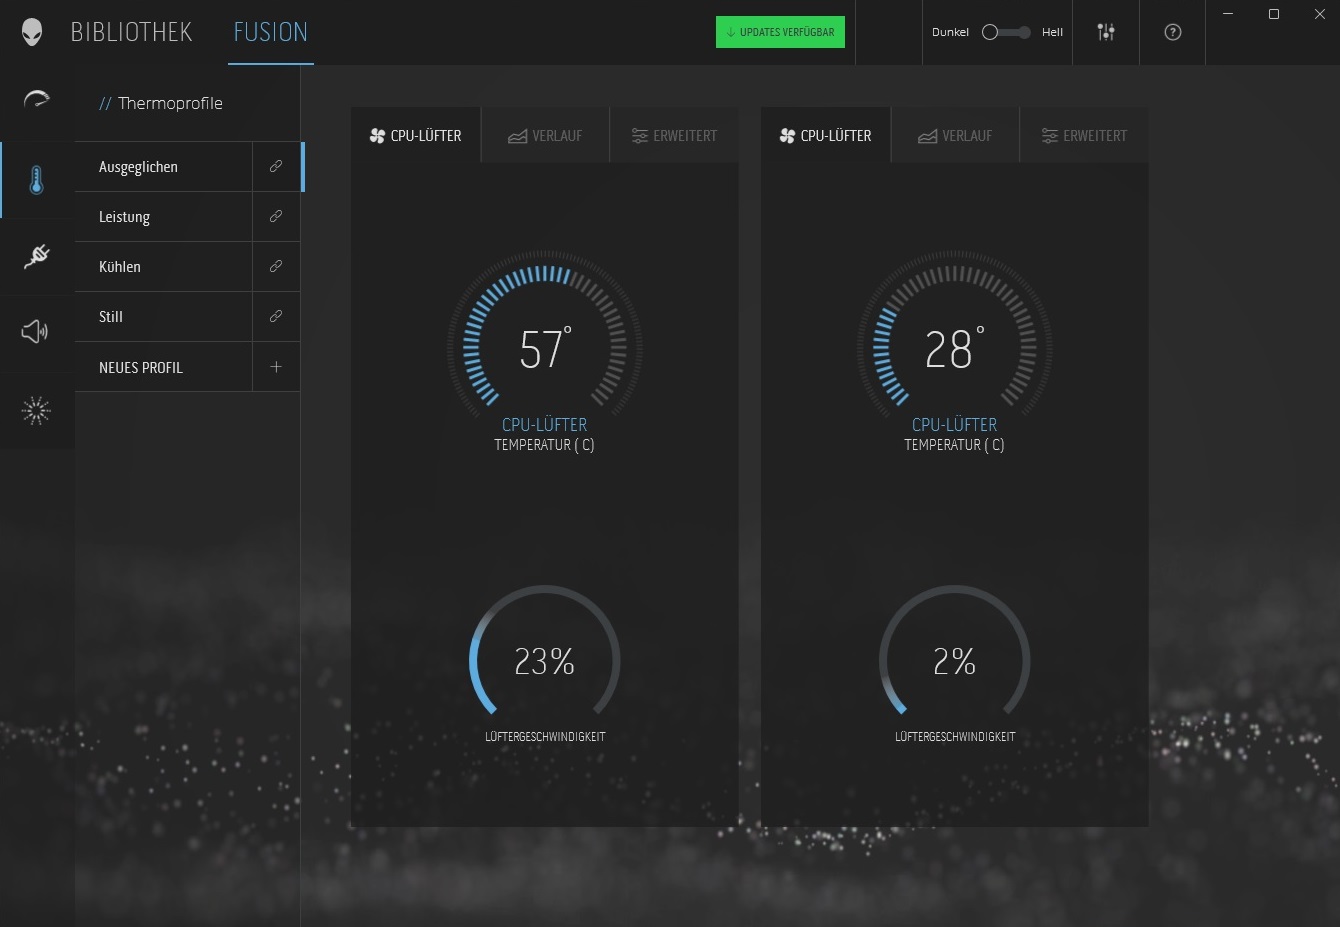
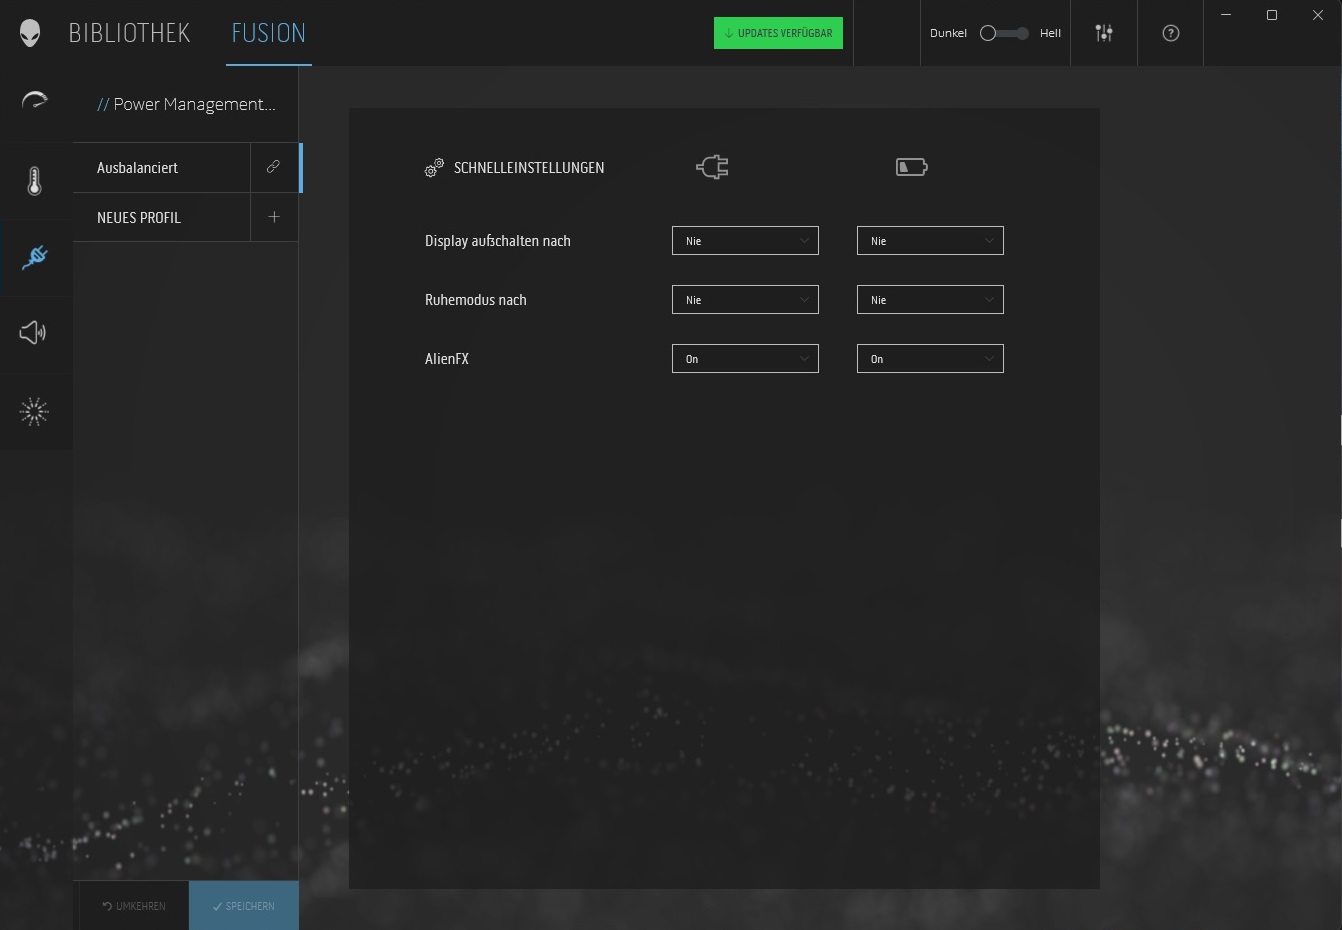
预装的Alienware命令中心可以让你调整几十个系统设置。我们的测试是使用默认配置进行的,其中电源管理和散热配置文件都设置为 "平衡"(见屏幕截图)。
处理器
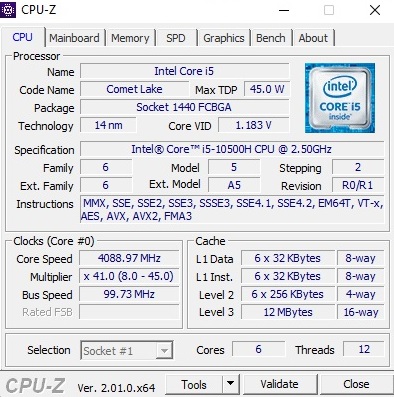
酷睿i5-10500H是英特尔Comet Lake一代中有点老的六核CPU,它采用过时的14纳米工艺制造。如前所述,这个45瓦的型号可以并行处理多达12个线程。当专用的Nvidia GPU处于空闲状态时,内部图形芯片,即UHD Graphics 630(Optimus技术),接手处理。
与采用较新CPU的竞争对手的笔记本电脑相比,我们的评测单元的性能还算不错。因此,i5-10500H舒适地安顿在酷睿i5-11300H和 酷睿i5-11400H在Cinebench R15循环中,它轻松地超过了其类似价格的兄弟姐妹机型中的i5-10200H。非常好。CPU的性能保持相当稳定,即使在长时间内也是如此。
Cinebench R15 Multi endurance test
| CPU Performance rating - Percent | |
| Average of class Gaming | |
| Gigabyte G5 GD | |
| Acer Nitro 5 AN517-53-54DQ | |
| Average Intel Core i5-10500H | |
| Dell G15 5510 | |
| Lenovo Ideapad Gaming 3 15IHU-82K1002RGE | |
| Dell G15 5510-43NHT | |
* ... smaller is better
AIDA64: FP32 Ray-Trace | FPU Julia | CPU SHA3 | CPU Queen | FPU SinJulia | FPU Mandel | CPU AES | CPU ZLib | FP64 Ray-Trace | CPU PhotoWorxx
| Performance rating | |
| Average of class Gaming | |
| Gigabyte G5 GD | |
| Average Intel Core i5-10500H | |
| Dell G15 5510 | |
| Acer Nitro 5 AN517-53-54DQ | |
| Lenovo Ideapad Gaming 3 15IHU-82K1002RGE | |
| Dell G15 5510-43NHT | |
| AIDA64 / FP32 Ray-Trace | |
| Average of class Gaming (10227 - 85542, n=109, last 2 years) | |
| Gigabyte G5 GD | |
| Average Intel Core i5-10500H (9253 - 9580, n=2) | |
| Dell G15 5510 | |
| Acer Nitro 5 AN517-53-54DQ | |
| Lenovo Ideapad Gaming 3 15IHU-82K1002RGE | |
| Dell G15 5510-43NHT | |
| AIDA64 / FPU Julia | |
| Average of class Gaming (51376 - 238426, n=109, last 2 years) | |
| Average Intel Core i5-10500H (44720 - 47454, n=2) | |
| Dell G15 5510 | |
| Gigabyte G5 GD | |
| Acer Nitro 5 AN517-53-54DQ | |
| Lenovo Ideapad Gaming 3 15IHU-82K1002RGE | |
| Dell G15 5510-43NHT | |
| AIDA64 / CPU SHA3 | |
| Average of class Gaming (2180 - 9817, n=109, last 2 years) | |
| Gigabyte G5 GD | |
| Acer Nitro 5 AN517-53-54DQ | |
| Lenovo Ideapad Gaming 3 15IHU-82K1002RGE | |
| Dell G15 5510 | |
| Average Intel Core i5-10500H (2208 - 2248, n=2) | |
| Dell G15 5510-43NHT | |
| AIDA64 / CPU Queen | |
| Average of class Gaming (49785 - 173351, n=100, last 2 years) | |
| Average Intel Core i5-10500H (70396 - 70505, n=2) | |
| Dell G15 5510 | |
| Gigabyte G5 GD | |
| Acer Nitro 5 AN517-53-54DQ | |
| Lenovo Ideapad Gaming 3 15IHU-82K1002RGE | |
| Dell G15 5510-43NHT | |
| AIDA64 / FPU SinJulia | |
| Average of class Gaming (4424 - 33636, n=109, last 2 years) | |
| Average Intel Core i5-10500H (7577 - 7586, n=2) | |
| Dell G15 5510 | |
| Gigabyte G5 GD | |
| Dell G15 5510-43NHT | |
| Acer Nitro 5 AN517-53-54DQ | |
| Lenovo Ideapad Gaming 3 15IHU-82K1002RGE | |
| AIDA64 / FPU Mandel | |
| Average of class Gaming (25115 - 128721, n=109, last 2 years) | |
| Gigabyte G5 GD | |
| Average Intel Core i5-10500H (22652 - 24130, n=2) | |
| Dell G15 5510 | |
| Acer Nitro 5 AN517-53-54DQ | |
| Lenovo Ideapad Gaming 3 15IHU-82K1002RGE | |
| Dell G15 5510-43NHT | |
| AIDA64 / CPU AES | |
| Average of class Gaming (39258 - 247074, n=109, last 2 years) | |
| Gigabyte G5 GD | |
| Acer Nitro 5 AN517-53-54DQ | |
| Lenovo Ideapad Gaming 3 15IHU-82K1002RGE | |
| Average Intel Core i5-10500H (28648 - 28670, n=2) | |
| Dell G15 5510 | |
| Dell G15 5510-43NHT | |
| AIDA64 / CPU ZLib | |
| Average of class Gaming (574 - 2531, n=109, last 2 years) | |
| Gigabyte G5 GD | |
| Average Intel Core i5-10500H (533 - 548, n=2) | |
| Dell G15 5510 | |
| Lenovo Ideapad Gaming 3 15IHU-82K1002RGE | |
| Acer Nitro 5 AN517-53-54DQ | |
| Dell G15 5510-43NHT | |
| AIDA64 / FP64 Ray-Trace | |
| Average of class Gaming (5509 - 45446, n=109, last 2 years) | |
| Gigabyte G5 GD | |
| Average Intel Core i5-10500H (5011 - 5291, n=2) | |
| Dell G15 5510 | |
| Acer Nitro 5 AN517-53-54DQ | |
| Lenovo Ideapad Gaming 3 15IHU-82K1002RGE | |
| Dell G15 5510-43NHT | |
| AIDA64 / CPU PhotoWorxx | |
| Average of class Gaming (12271 - 89891, n=109, last 2 years) | |
| Gigabyte G5 GD | |
| Average Intel Core i5-10500H (15629 - 21126, n=2) | |
| Dell G15 5510 | |
| Acer Nitro 5 AN517-53-54DQ | |
| Lenovo Ideapad Gaming 3 15IHU-82K1002RGE | |
| Dell G15 5510-43NHT | |
系统性能
该设备的系统性能满足了你对一台经济型游戏笔记本电脑的所有期望。虽然PCMark 10的结果只够在测试领域的倒数第二名,但从主观的角度来看,操作系统(Windows 11 Home)的响应速度令人愉快。
CrossMark: Overall | Productivity | Creativity | Responsiveness
| PCMark 10 / Score | |
| Average of class Gaming (5828 - 11574, n=95, last 2 years) | |
| Gigabyte G5 GD | |
| Acer Nitro 5 AN517-53-54DQ | |
| Lenovo Ideapad Gaming 3 15IHU-82K1002RGE | |
| Dell G15 5510 | |
| Dell G15 5510-43NHT | |
| PCMark 10 / Essentials | |
| Average of class Gaming (8810 - 12600, n=99, last 2 years) | |
| Acer Nitro 5 AN517-53-54DQ | |
| Gigabyte G5 GD | |
| Lenovo Ideapad Gaming 3 15IHU-82K1002RGE | |
| Dell G15 5510 | |
| Dell G15 5510-43NHT | |
| PCMark 10 / Productivity | |
| Average of class Gaming (6845 - 18766, n=97, last 2 years) | |
| Lenovo Ideapad Gaming 3 15IHU-82K1002RGE | |
| Acer Nitro 5 AN517-53-54DQ | |
| Gigabyte G5 GD | |
| Dell G15 5510 | |
| Dell G15 5510-43NHT | |
| PCMark 10 / Digital Content Creation | |
| Average of class Gaming (7602 - 19657, n=97, last 2 years) | |
| Gigabyte G5 GD | |
| Dell G15 5510 | |
| Acer Nitro 5 AN517-53-54DQ | |
| Lenovo Ideapad Gaming 3 15IHU-82K1002RGE | |
| Dell G15 5510-43NHT | |
| CrossMark / Overall | |
| Average of class Gaming (1366 - 2409, n=97, last 2 years) | |
| Lenovo Ideapad Gaming 3 15IHU-82K1002RGE | |
| CrossMark / Productivity | |
| Average of class Gaming (1386 - 2254, n=97, last 2 years) | |
| Lenovo Ideapad Gaming 3 15IHU-82K1002RGE | |
| CrossMark / Creativity | |
| Average of class Gaming (1343 - 2729, n=97, last 2 years) | |
| Lenovo Ideapad Gaming 3 15IHU-82K1002RGE | |
| CrossMark / Responsiveness | |
| Average of class Gaming (1226 - 2334, n=97, last 2 years) | |
| Lenovo Ideapad Gaming 3 15IHU-82K1002RGE | |
| PCMark 10 Score | 5235 points | |
Help | ||
| AIDA64 / Memory Copy | |
| Average of class Gaming (21750 - 129946, n=109, last 2 years) | |
| Gigabyte G5 GD | |
| Average Intel Core i5-10500H (31695 - 35357, n=2) | |
| Dell G15 5510 | |
| Acer Nitro 5 AN517-53-54DQ | |
| Lenovo Ideapad Gaming 3 15IHU-82K1002RGE | |
| Dell G15 5510-43NHT | |
| AIDA64 / Memory Read | |
| Average of class Gaming (22956 - 118858, n=109, last 2 years) | |
| Gigabyte G5 GD | |
| Average Intel Core i5-10500H (34772 - 40220, n=2) | |
| Dell G15 5510 | |
| Acer Nitro 5 AN517-53-54DQ | |
| Lenovo Ideapad Gaming 3 15IHU-82K1002RGE | |
| Dell G15 5510-43NHT | |
| AIDA64 / Memory Write | |
| Average of class Gaming (22297 - 135096, n=109, last 2 years) | |
| Gigabyte G5 GD | |
| Average Intel Core i5-10500H (37067 - 39449, n=2) | |
| Dell G15 5510 | |
| Acer Nitro 5 AN517-53-54DQ | |
| Lenovo Ideapad Gaming 3 15IHU-82K1002RGE | |
| Dell G15 5510-43NHT | |
| AIDA64 / Memory Latency | |
| Average of class Gaming (75.3 - 259, n=109, last 2 years) | |
| Gigabyte G5 GD | |
| Lenovo Ideapad Gaming 3 15IHU-82K1002RGE | |
| Acer Nitro 5 AN517-53-54DQ | |
| Dell G15 5510 | |
| Average Intel Core i5-10500H (57.5 - 76.9, n=2) | |
| Dell G15 5510-43NHT | |
* ... smaller is better
DPC延迟
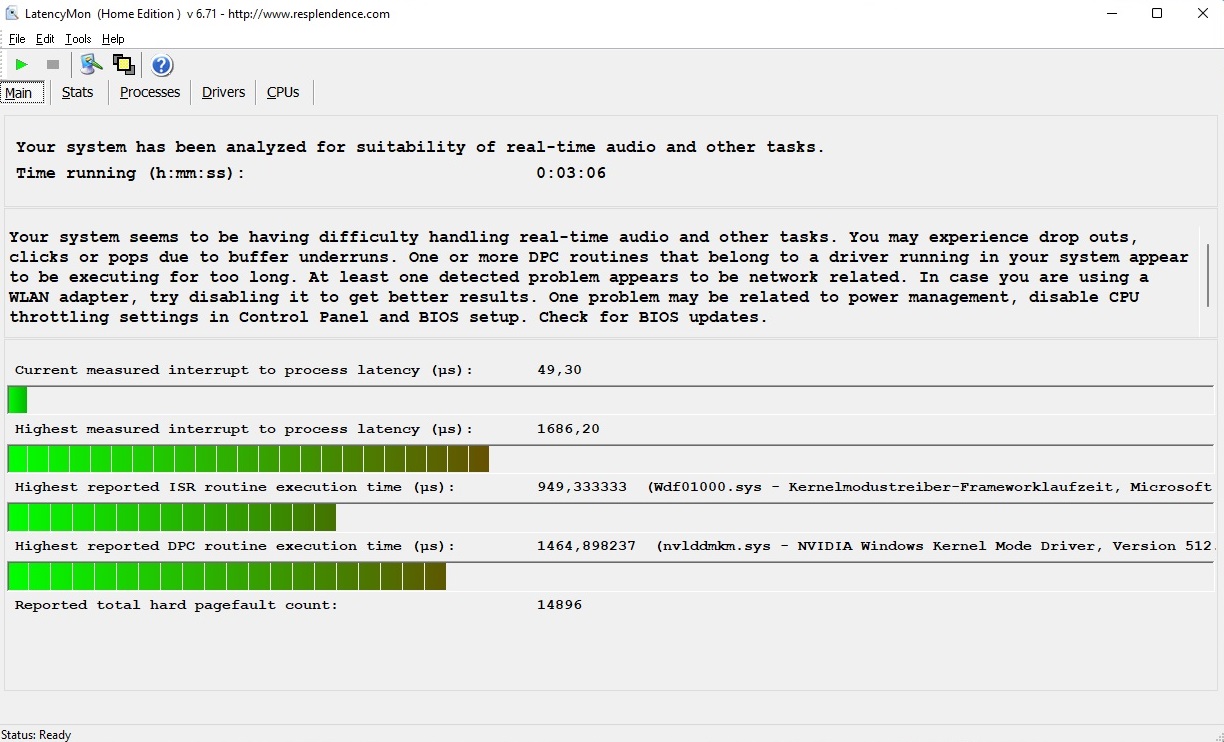
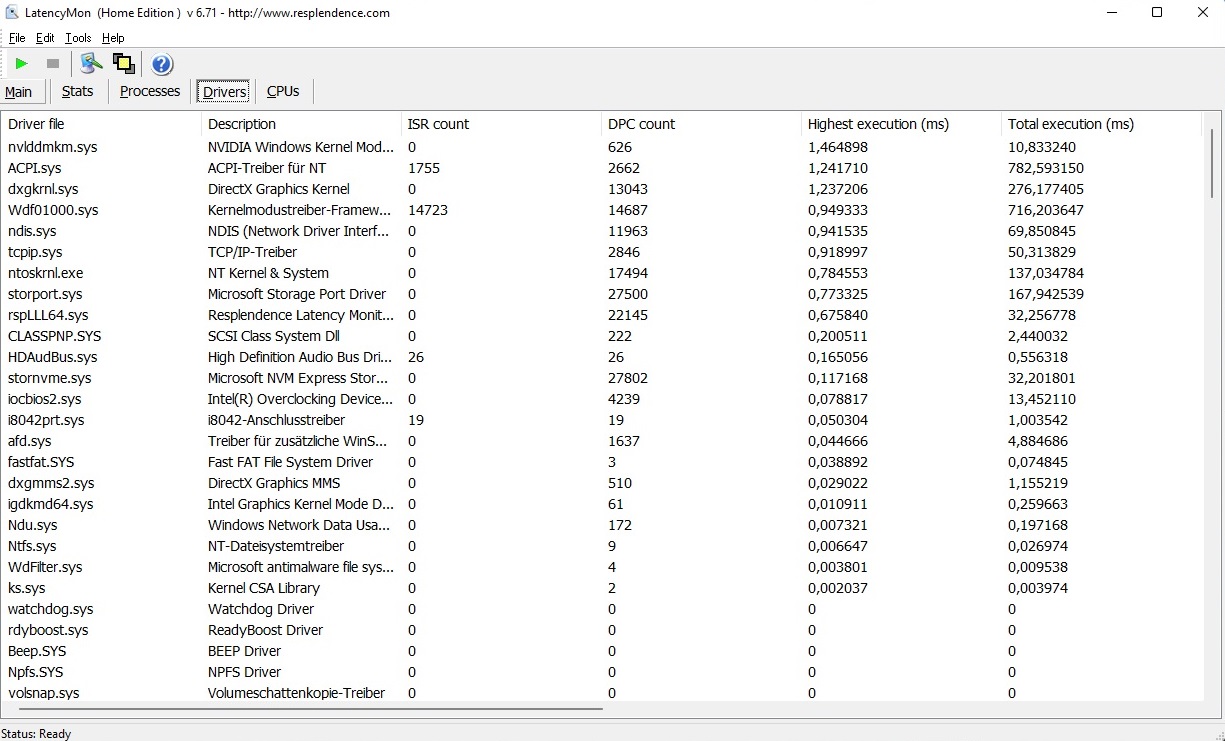
在延迟方面,戴尔肯定有改进的余地。开箱后,根据LatencyMon工具,G15 5510并不特别适合实时音频和视频编辑。一些竞争对手在这方面做得更好。
| DPC Latencies / LatencyMon - interrupt to process latency (max), Web, Youtube, Prime95 | |
| Dell G15 5510 | |
| Dell G15 5510-43NHT | |
| Acer Nitro 5 AN517-53-54DQ | |
| Lenovo Ideapad Gaming 3 15IHU-82K1002RGE | |
| Gigabyte G5 GD | |
* ... smaller is better
储存
内置的SK海力士M.2固态硬盘的性能相当不起眼。按照NVMe标准,512GB的驱动器既不慢也不特别快;相反,它的性能往往在中间地带。

| Drive Performance rating - Percent | |
| Average of class Gaming | |
| Gigabyte G5 GD | |
| Acer Nitro 5 AN517-53-54DQ | |
| Dell G15 5510 | |
| Lenovo Ideapad Gaming 3 15IHU-82K1002RGE | |
| Dell G15 5510-43NHT | |
* ... smaller is better
Continuous load read: DiskSpd Read Loop, Queue Depth 8
图形卡
戴尔在谈到显卡时更加积极。包括动态提升在内的95瓦的TGP对于RTX 3050来说是一个非常高的数值,它必须要有4GB的GDDR6 VRAM才行。这在我们的基准测试课程中也很明显。戴尔G15的性能几乎超过了其他所有配备RTX 3050的笔记本电脑。它甚至经常达到据称更好的RTX 3050 Ti的水平。
| 3DMark Performance rating - Percent | |
| Average of class Gaming | |
| Dell G15 5510-43NHT -1! | |
| Lenovo Ideapad Gaming 3 15IHU-82K1002RGE -1! | |
| Gigabyte G5 GD | |
| Dell G15 5510 | |
| Acer Nitro 5 AN517-53-54DQ | |
| Average NVIDIA GeForce RTX 3050 4GB Laptop GPU | |
| 3DMark 11 Performance | 15672 points | |
| 3DMark Cloud Gate Standard Score | 29259 points | |
| 3DMark Fire Strike Score | 11979 points | |
| 3DMark Time Spy Score | 5366 points | |
Help | ||
游戏性能
只要RTX 3050不用于光线追踪或分辨率超过1,920x1,080,DirectX 12模型就有足够的能力以高到最大的细节运行最新的游戏。只有要求非常高或VRAM密集型的游戏,如 毁灭之光2才会有问题。
| The Witcher 3 | |
| 1920x1080 High Graphics & Postprocessing (Nvidia HairWorks Off) | |
| Average of class Gaming (181 - 341, n=3, last 2 years) | |
| Gigabyte G5 GD | |
| Lenovo Ideapad Gaming 3 15IHU-82K1002RGE | |
| Dell G15 5510 | |
| Acer Nitro 5 AN517-53-54DQ | |
| Average NVIDIA GeForce RTX 3050 4GB Laptop GPU (53.5 - 105.1, n=17) | |
| Dell G15 5510-43NHT | |
| 1920x1080 Ultra Graphics & Postprocessing (HBAO+) | |
| Average of class Gaming (95 - 240, n=8, last 2 years) | |
| Dell G15 5510-43NHT | |
| Dell G15 5510 | |
| Gigabyte G5 GD | |
| Acer Nitro 5 AN517-53-54DQ | |
| Lenovo Ideapad Gaming 3 15IHU-82K1002RGE | |
| Average NVIDIA GeForce RTX 3050 4GB Laptop GPU (31.5 - 55.8, n=21) | |
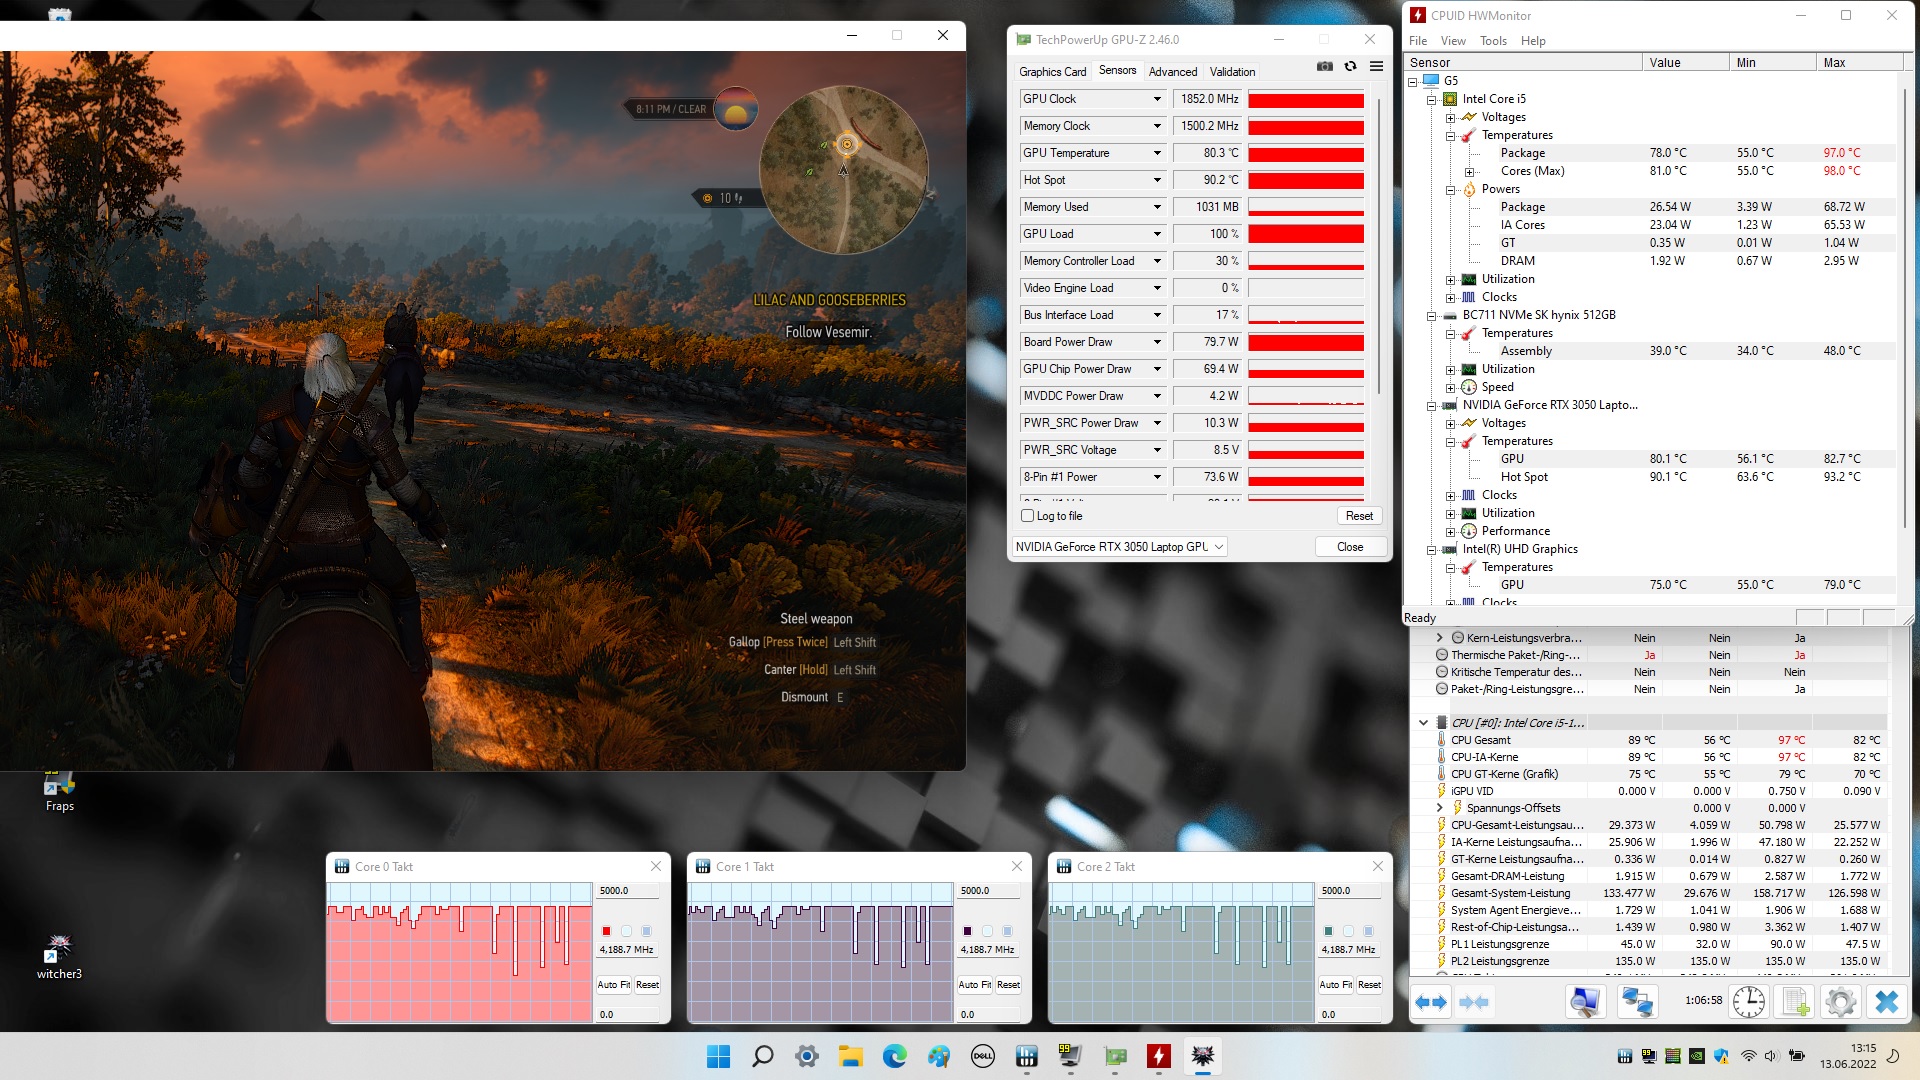
值得称赞的是。除了CPU性能,GPU性能在长时间内也保持稳定,这在我们对角色扮演游戏《Witcher 3》进行的一小时压力测试中得到了证明。
The Witcher 3 FPS diagram
| low | med. | high | ultra | |
|---|---|---|---|---|
| GTA V (2015) | 160.7 | 119 | 65.5 | |
| The Witcher 3 (2015) | 147 | 90.7 | 52.1 | |
| Dota 2 Reborn (2015) | 128.4 | 118.6 | 108.7 | 109.3 |
| Final Fantasy XV Benchmark (2018) | 74 | 52.5 | ||
| X-Plane 11.11 (2018) | 102.3 | 88.4 | 73.7 | |
| Strange Brigade (2018) | 132.4 | 105.7 | 90.7 | |
| Farming Simulator 22 (2021) | 123.1 | 105.3 | 90.1 | |
| Halo Infinite (2021) | 73.1 | 46.2 | 44.6 | |
| God of War (2022) | 59.6 | 47.1 | 31.7 | |
| Rainbow Six Extraction (2022) | 109 | 104 | 76 | |
| Dying Light 2 (2022) | 42.9 | 35.8 | ||
| GRID Legends (2022) | 113 | 98.6 | 72.9 | |
| Elden Ring (2022) | 58.6 | 56 | 52.8 | |
| Elex 2 (2022) | 55.6 | 54.2 | 48.2 | |
| Ghostwire Tokyo (2022) | 81.8 | 79.7 | 79.4 | |
| Tiny Tina's Wonderlands (2022) | 90.7 | 62.6 | 47.8 | |
| Vampire Bloodhunt (2022) | 121.5 | 117.4 | 113.3 | |
| F1 22 (2022) | 137 | 127 | 97 | 32 |
| The Quarry (2022) | 85.5 | 63.7 | 52 | 39.7 |
排放
噪声排放
风扇控制并不完全是戴尔的强项之一。我们也可以看到G15 5510的改进空间。在空闲使用时,不是让风扇在一个合适的噪音水平上持续运行,而是冷却系统要么完全关闭,要么突然大声启动。在负载情况下,噪音与宏碁Nitro 5相似。尽管45至47 dB(A)并不令人讨厌(还没有),但它仍然很好听。
Noise level
| Idle |
| 26 / 27 / 33 dB(A) |
| Load |
| 45 / 47 dB(A) |
 | ||
30 dB silent 40 dB(A) audible 50 dB(A) loud |
||
min: | ||
| Dell G15 5510 i5-10500H, GeForce RTX 3050 4GB Laptop GPU | Acer Nitro 5 AN517-53-54DQ i5-11300H, GeForce RTX 3050 4GB Laptop GPU | Gigabyte G5 GD i5-11400H, GeForce RTX 3050 4GB Laptop GPU | Lenovo Ideapad Gaming 3 15IHU-82K1002RGE i5-11300H, GeForce RTX 3050 Ti Laptop GPU | Dell G15 5510-43NHT i5-10200H, GeForce RTX 3050 Ti Laptop GPU | |
|---|---|---|---|---|---|
| Noise | -0% | -9% | 4% | 2% | |
| off / environment * (dB) | 26 | 25 4% | 24 8% | 23.9 8% | 25 4% |
| Idle Minimum * (dB) | 26 | 25 4% | 29 -12% | 23.9 8% | 25 4% |
| Idle Average * (dB) | 27 | 31 -15% | 30 -11% | 26.8 1% | 25 7% |
| Idle Maximum * (dB) | 33 | 33 -0% | 32 3% | 26.8 19% | 25 24% |
| Load Average * (dB) | 45 | 43 4% | 53 -18% | 43.5 3% | 52.2 -16% |
| Witcher 3 ultra * (dB) | 45 | 44 2% | 52 -16% | 43.5 3% | |
| Load Maximum * (dB) | 47 | 47 -0% | 54 -15% | 53.1 -13% | 52.2 -11% |
* ... smaller is better
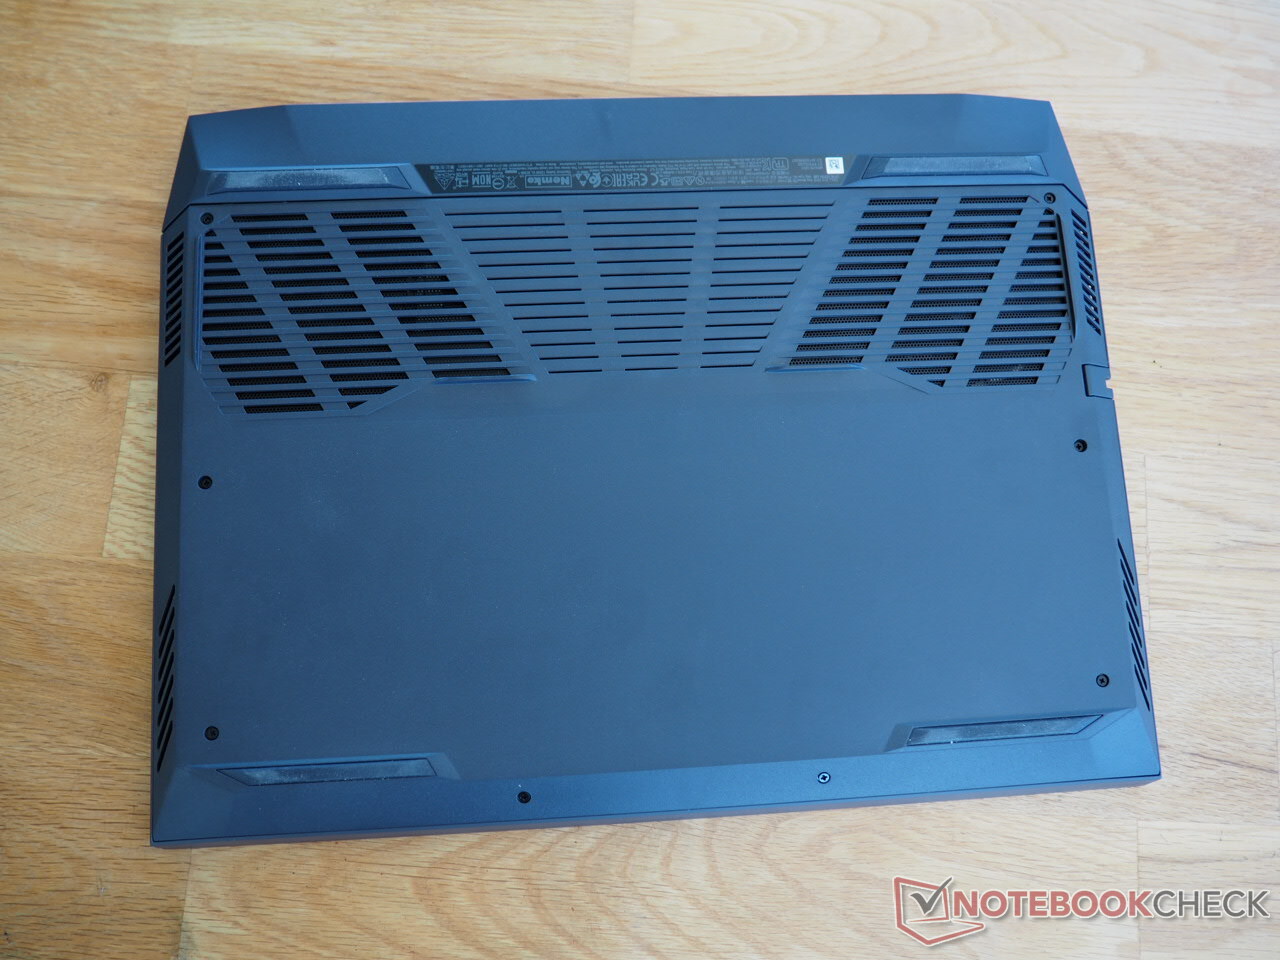
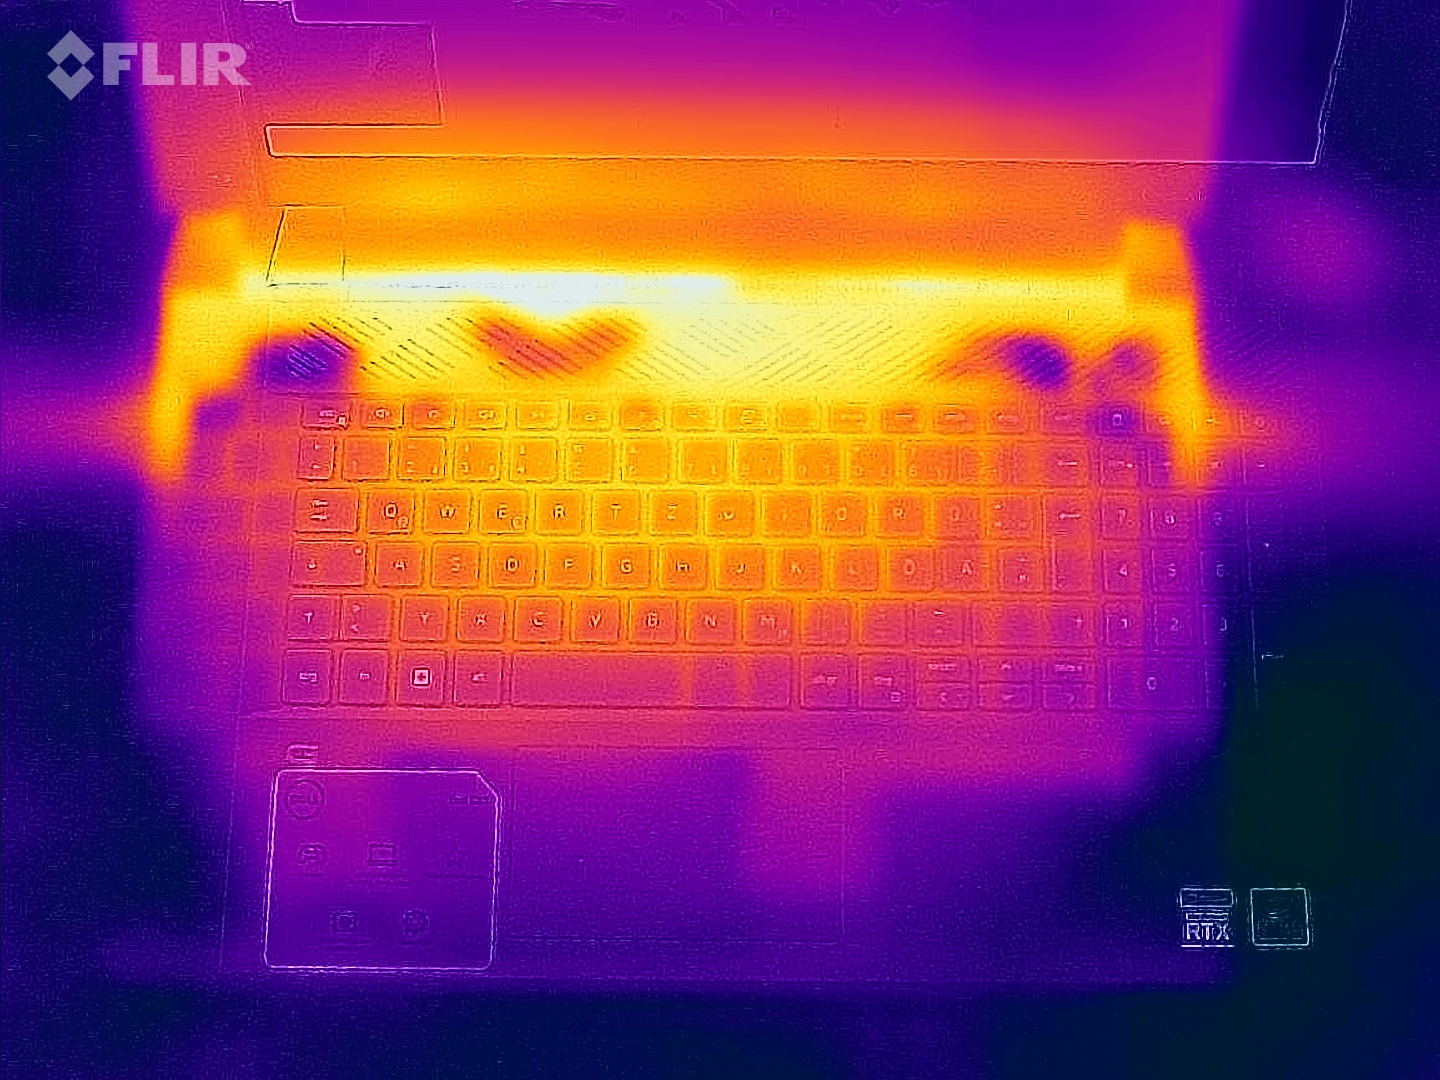
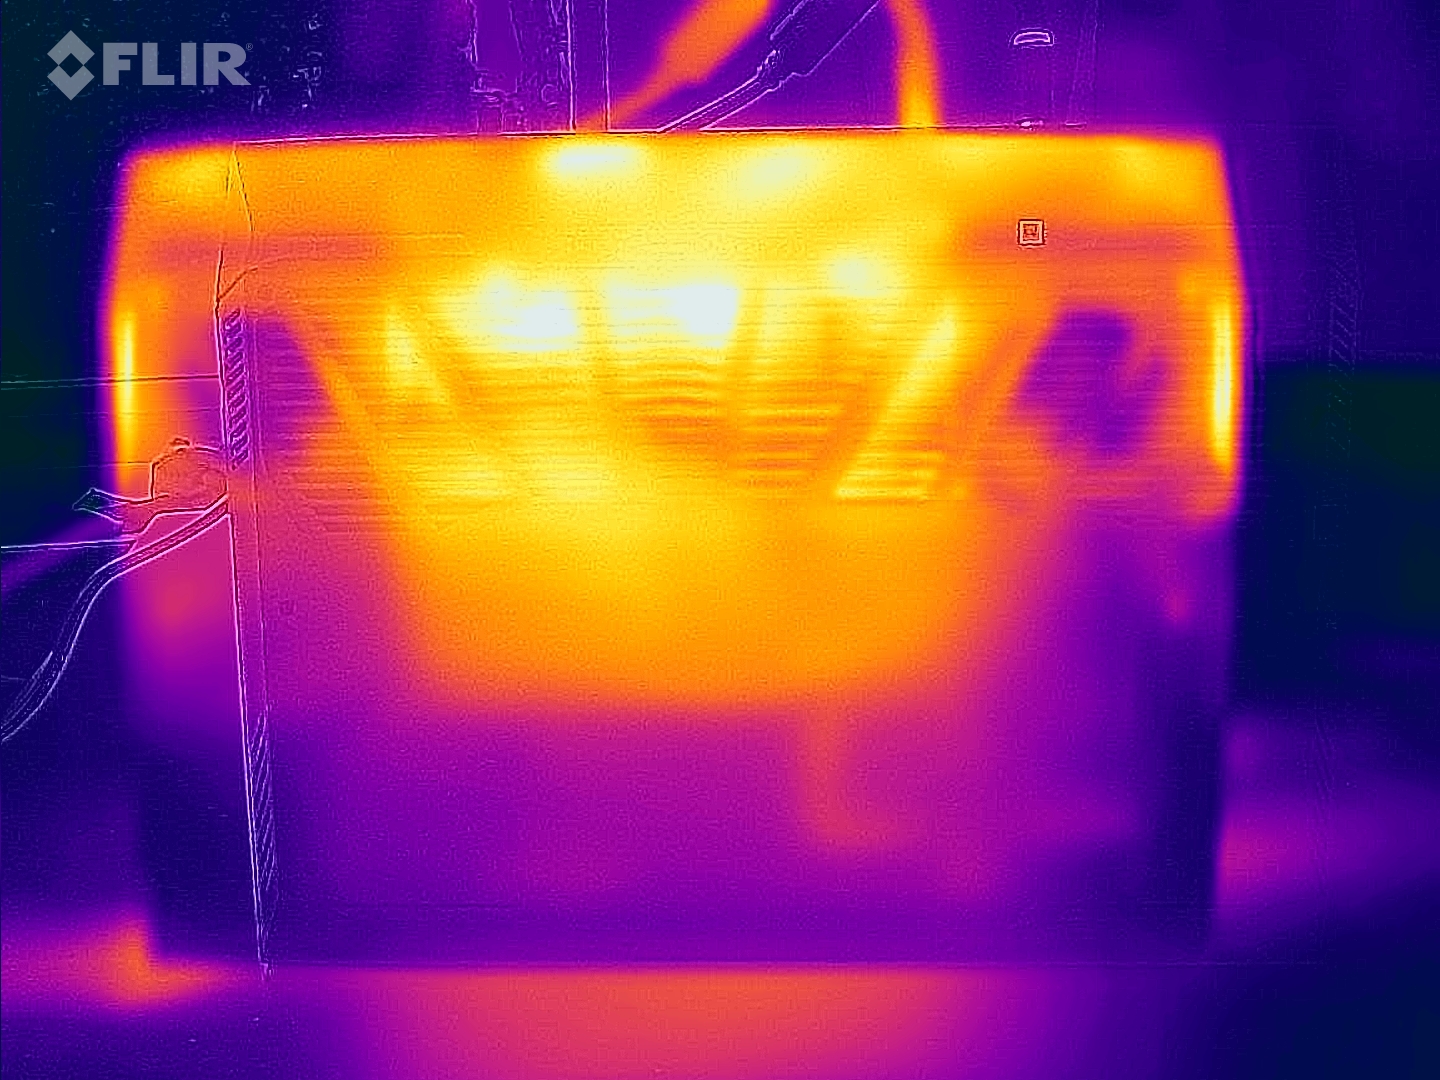
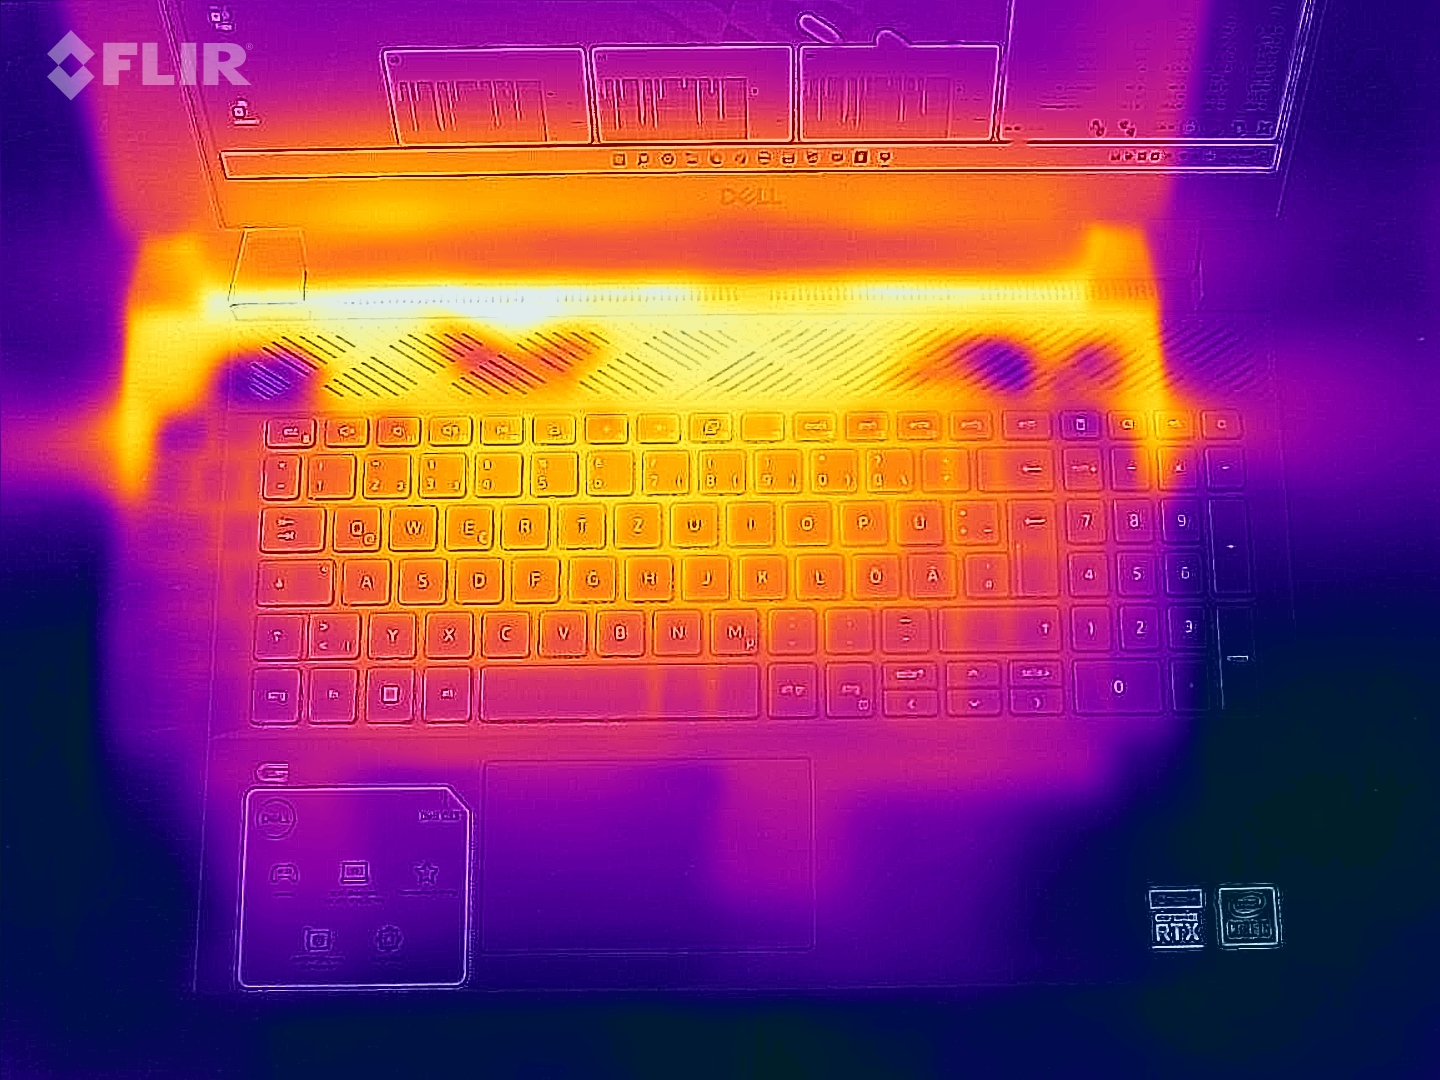
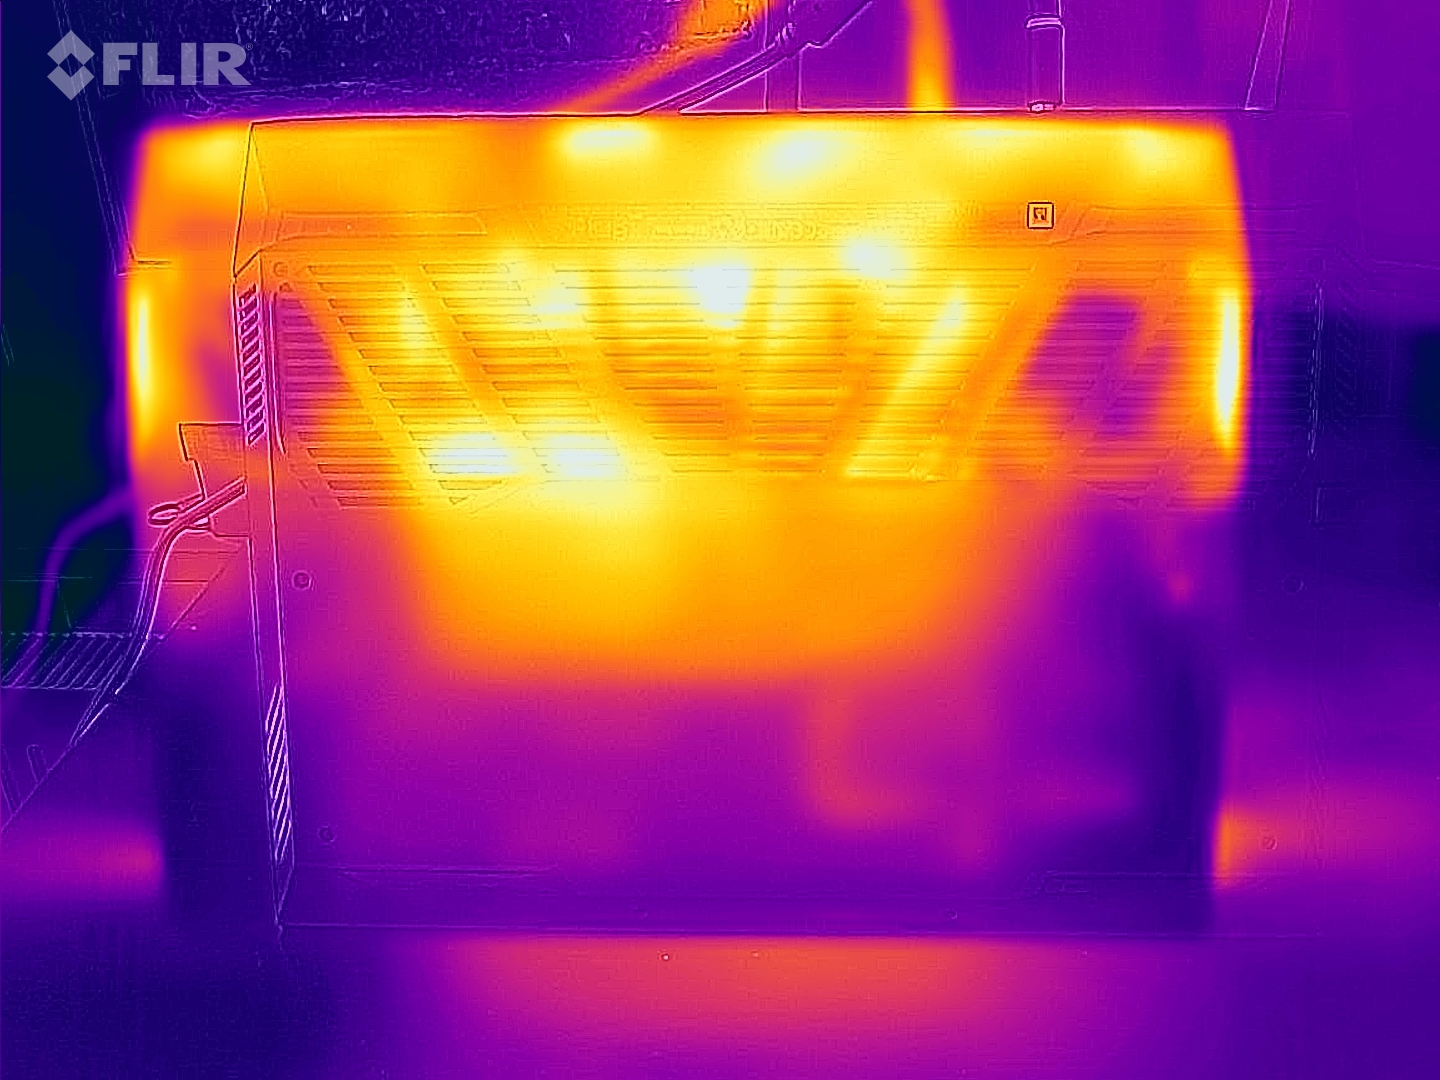
温度
热量的发展也与竞争者保持一致。箱子底部的最高温度为49 °C (~120 °F),倾向于反对在腿上使用设备的游戏会话。顶部甚至达到了52 °C (~126 °F),尽管这个数值只影响到笔记本的后三分之一。掌托区始终保持着令人愉快的凉爽。
(-) The maximum temperature on the upper side is 52 °C / 126 F, compared to the average of 40.4 °C / 105 F, ranging from 21.2 to 68.8 °C for the class Gaming.
(-) The bottom heats up to a maximum of 49 °C / 120 F, compared to the average of 43.2 °C / 110 F
(+) In idle usage, the average temperature for the upper side is 24.3 °C / 76 F, compared to the device average of 33.9 °C / 93 F.
(-) Playing The Witcher 3, the average temperature for the upper side is 41 °C / 106 F, compared to the device average of 33.9 °C / 93 F.
(+) The palmrests and touchpad are reaching skin temperature as a maximum (33 °C / 91.4 F) and are therefore not hot.
(-) The average temperature of the palmrest area of similar devices was 28.8 °C / 83.8 F (-4.2 °C / -7.6 F).
| Dell G15 5510 i5-10500H, GeForce RTX 3050 4GB Laptop GPU | Acer Nitro 5 AN517-53-54DQ i5-11300H, GeForce RTX 3050 4GB Laptop GPU | Gigabyte G5 GD i5-11400H, GeForce RTX 3050 4GB Laptop GPU | Lenovo Ideapad Gaming 3 15IHU-82K1002RGE i5-11300H, GeForce RTX 3050 Ti Laptop GPU | Dell G15 5510-43NHT i5-10200H, GeForce RTX 3050 Ti Laptop GPU | |
|---|---|---|---|---|---|
| Heat | 2% | -4% | 5% | -7% | |
| Maximum Upper Side * (°C) | 52 | 47 10% | 45 13% | 43.2 17% | 45.9 12% |
| Maximum Bottom * (°C) | 49 | 54 -10% | 50 -2% | 47.9 2% | 51.9 -6% |
| Idle Upper Side * (°C) | 26 | 25 4% | 28 -8% | 24.9 4% | 30.1 -16% |
| Idle Bottom * (°C) | 26 | 25 4% | 31 -19% | 27 -4% | 30.1 -16% |
* ... smaller is better
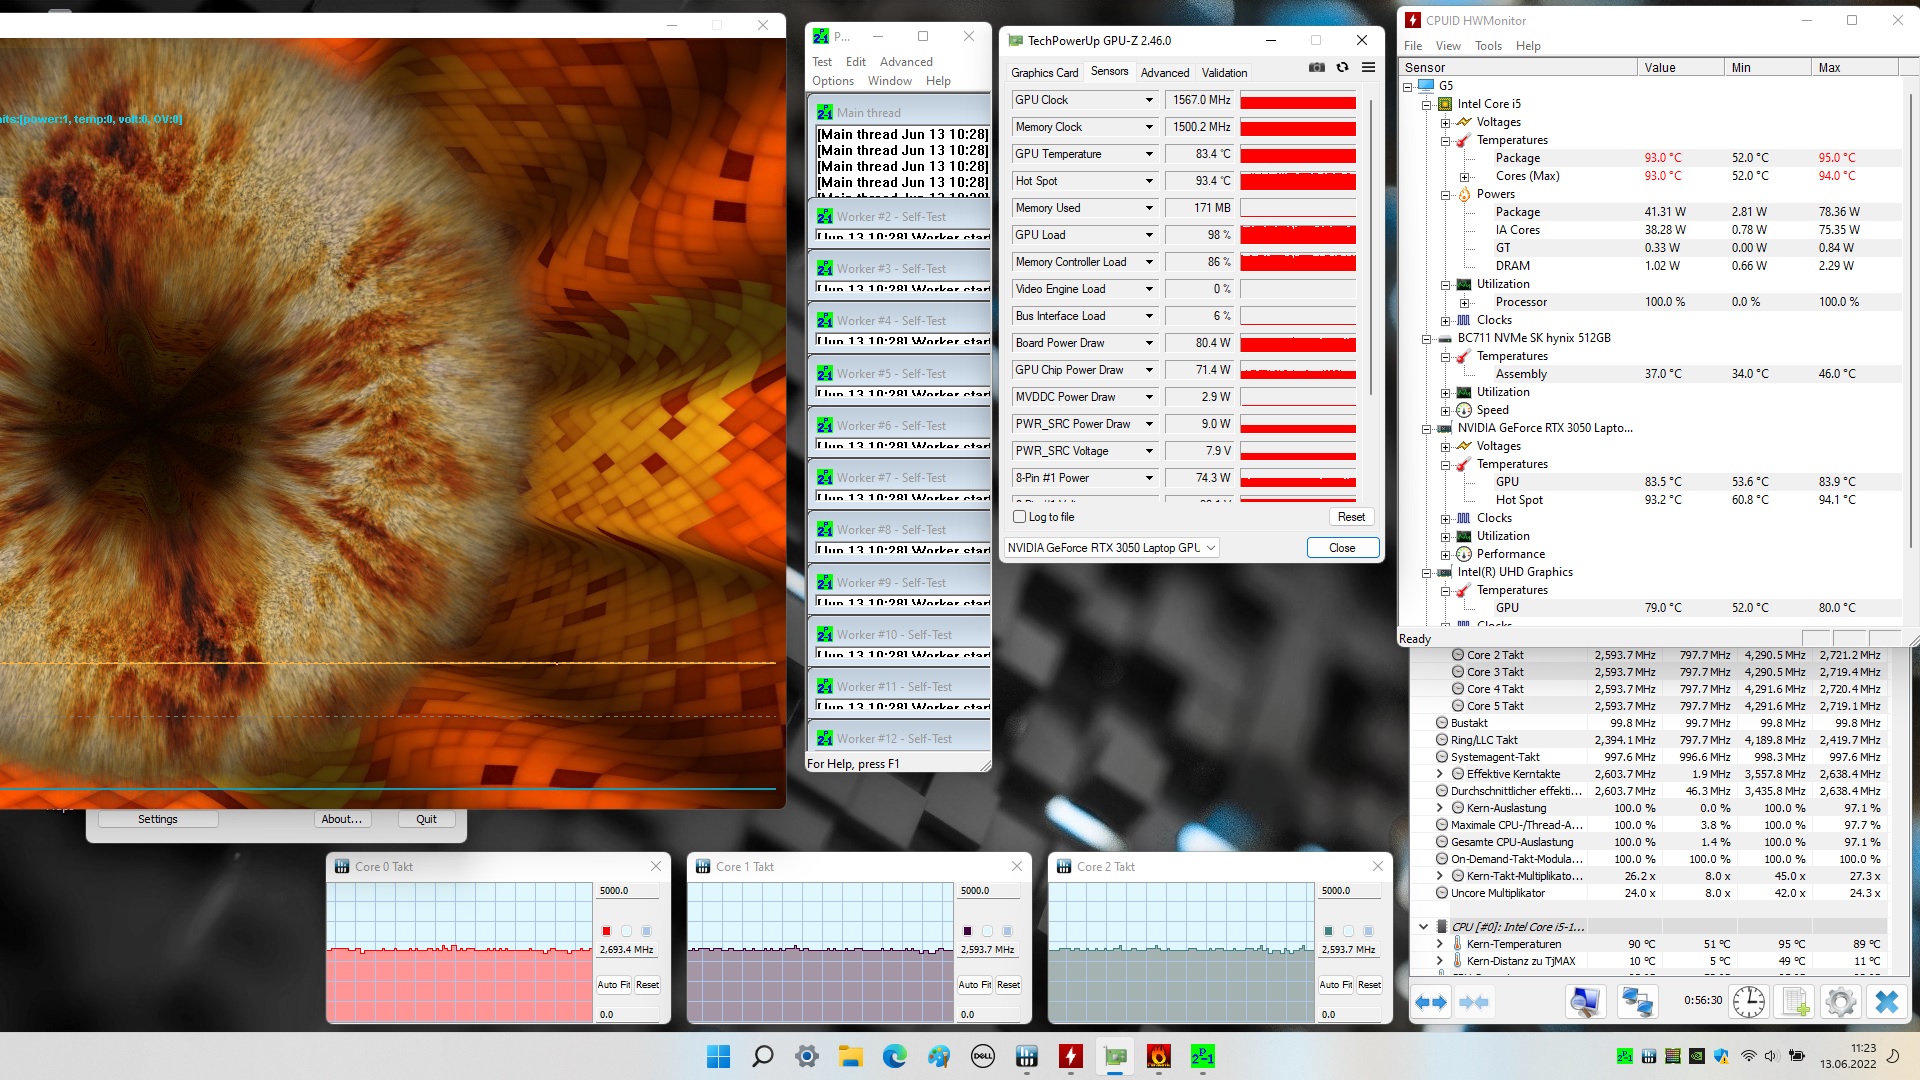
压力测试
用FurMark和Prime95工具进行的60分钟压力测试没有导致CPU或GPU的节流。虽然酷睿i5-10500H在93°C(约199°F)左右发热,但GeForce RTX 3050也在83°C(约181°F)的高温度下稳定下来,但仍然是不临界的。
发言人
Dell G15 5510 audio analysis
(+) | speakers can play relatively loud (84 dB)
Bass 100 - 315 Hz
(-) | nearly no bass - on average 23.4% lower than median
(±) | linearity of bass is average (11.6% delta to prev. frequency)
Mids 400 - 2000 Hz
(±) | higher mids - on average 9.6% higher than median
(+) | mids are linear (6.8% delta to prev. frequency)
Highs 2 - 16 kHz
(+) | balanced highs - only 3% away from median
(+) | highs are linear (5.5% delta to prev. frequency)
Overall 100 - 16.000 Hz
(±) | linearity of overall sound is average (23.3% difference to median)
Compared to same class
» 85% of all tested devices in this class were better, 4% similar, 11% worse
» The best had a delta of 6%, average was 18%, worst was 132%
Compared to all devices tested
» 70% of all tested devices were better, 5% similar, 25% worse
» The best had a delta of 4%, average was 24%, worst was 134%
Gigabyte G5 GD audio analysis
(±) | speaker loudness is average but good (80 dB)
Bass 100 - 315 Hz
(-) | nearly no bass - on average 25.4% lower than median
(-) | bass is not linear (16.2% delta to prev. frequency)
Mids 400 - 2000 Hz
(+) | balanced mids - only 3.2% away from median
(+) | mids are linear (4.6% delta to prev. frequency)
Highs 2 - 16 kHz
(+) | balanced highs - only 3.9% away from median
(±) | linearity of highs is average (10.1% delta to prev. frequency)
Overall 100 - 16.000 Hz
(±) | linearity of overall sound is average (19.1% difference to median)
Compared to same class
» 64% of all tested devices in this class were better, 7% similar, 28% worse
» The best had a delta of 6%, average was 18%, worst was 132%
Compared to all devices tested
» 46% of all tested devices were better, 7% similar, 47% worse
» The best had a delta of 4%, average was 24%, worst was 134%
能源管理
能源消耗
由于图形切换的实施,G15 5510在空闲使用时相当节俭,如果排除高于这一水平的短期异常值,则消耗量为3至13瓦。附带的240瓦的电源适配器在3D模式下要工作得更辛苦。对于中端游戏笔记本电脑来说,103至204瓦的功率相对较高。
| Off / Standby | |
| Idle | |
| Load |
|
Key:
min: | |
| Dell G15 5510 i5-10500H, GeForce RTX 3050 4GB Laptop GPU | Acer Nitro 5 AN517-53-54DQ i5-11300H, GeForce RTX 3050 4GB Laptop GPU | Gigabyte G5 GD i5-11400H, GeForce RTX 3050 4GB Laptop GPU | Lenovo Ideapad Gaming 3 15IHU-82K1002RGE i5-11300H, GeForce RTX 3050 Ti Laptop GPU | Dell G15 5510-43NHT i5-10200H, GeForce RTX 3050 Ti Laptop GPU | Average of class Gaming | |
|---|---|---|---|---|---|---|
| Power Consumption | 3% | -73% | 3% | -4% | -119% | |
| Idle Minimum * (Watt) | 3 | 4 -33% | 13 -333% | 4.9 -63% | 4.6 -53% | 13.2 ? -340% |
| Idle Average * (Watt) | 8 | 9 -13% | 15 -88% | 8.3 -4% | 6.5 19% | 18.9 ? -136% |
| Idle Maximum * (Watt) | 13 | 15 -15% | 20 -54% | 8.9 32% | 10.1 22% | 24.3 ? -87% |
| Load Average * (Watt) | 103 | 85 17% | 102 1% | 81 21% | 129 -25% | 108 ? -5% |
| Witcher 3 ultra * (Watt) | 139.5 | 104 25% | 124 11% | 119 15% | 129 8% | |
| Load Maximum * (Watt) | 204 | 135 34% | 148 27% | 172 16% | 195 4% | 254 ? -25% |
* ... smaller is better
Energy consumption during our The Witcher 3 / stress test
Energy consumption with an external monitor
电池寿命
电池寿命一点也不差。尽管56Wh的容量相当差,但G15 5510在理想条件下可持续使用11小时以上。买家可以期待在现实世界的场景中,如通过Wi-Fi浏览网页,大约6小时--这是一个坚实的比率。
| Dell G15 5510 i5-10500H, GeForce RTX 3050 4GB Laptop GPU, 56 Wh | Acer Nitro 5 AN517-53-54DQ i5-11300H, GeForce RTX 3050 4GB Laptop GPU, 57 Wh | Gigabyte G5 GD i5-11400H, GeForce RTX 3050 4GB Laptop GPU, 41 Wh | Lenovo Ideapad Gaming 3 15IHU-82K1002RGE i5-11300H, GeForce RTX 3050 Ti Laptop GPU, 45 Wh | Dell G15 5510-43NHT i5-10200H, GeForce RTX 3050 Ti Laptop GPU, 56 Wh | Average of class Gaming | |
|---|---|---|---|---|---|---|
| Battery runtime | 38% | -29% | 10% | 8% | 14% | |
| Reader / Idle (h) | 11.3 | 17.4 54% | 5.7 -50% | 8.71 ? -23% | ||
| WiFi v1.3 (h) | 6 | 7.2 20% | 3.1 -48% | 6.6 10% | 6.3 5% | 7.02 ? 17% |
| Load (h) | 1 | 1.4 40% | 1.1 10% | 1.1 10% | 1.1 10% | 1.47 ? 47% |
| H.264 (h) | 3.6 | 7.7 | 8.6 | 8.26 ? |
Pros
Cons
判决书
GeForce RTX 3050
的高TGP之外,戴尔G15 5510很难从众多的经济型游戏笔记本电脑中脱颖而出。与大多数竞争对手一样,这款15英寸的笔记本只配备了一个平庸的显示屏,既缺乏亮度,也缺乏像样的色彩空间。在我们看来,这种面板最多只能用于非常便宜的办公笔记本电脑。几乎所有的制造商在未来都应该在这个领域有很大的改进。
这款15英寸的笔记本的连接性也不是很先进。两个USB 2.0端口,以及缺乏读卡器和Thunderbolt端口,都令人瞠目结舌。否则,戴尔G15 5510既不是特别积极也不是特别消极。不管是关于输入设备、电池容量,还是排放。所确定的属性和测量结果都对得起这个预算价格。
总的来说,戴尔G15 5510与竞争对手(Acer Nitro 5,Gigabyte G5,Lenovo IdeaPad Gaming 3,...)相提并论,对于那些愿意妥协并且最多有1,000欧元(约1,050美元)可以支配的游戏玩家来说,它是有意义的。
戴尔在这里创造了一个很平衡的整体方案。
价格和可用性
Dell G15 5510
- 06/15/2022 v7 (old)
Florian Glaser
Price comparison

