戴尔Inspiron 15 Plus笔记本电脑评测。接近于完美的全能型产品
目前在戴尔的德国网站上有两款Inspiron 15 Plus 7510的变体。第一个是我们的评测版本,其中包括一个酷睿i5-11400H以及一个 GeForce RTX 3050价格略低于850欧元(约合852美元)。此外,还有一个带有GeForce RTX 3050 Ti和酷睿i7-11800H的变种,价格约为1000欧元(约合人民币100元)。然而,考虑到其外形尺寸和图形性能,后者相当 "强大"。
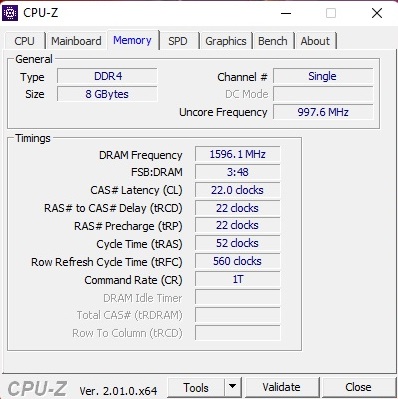
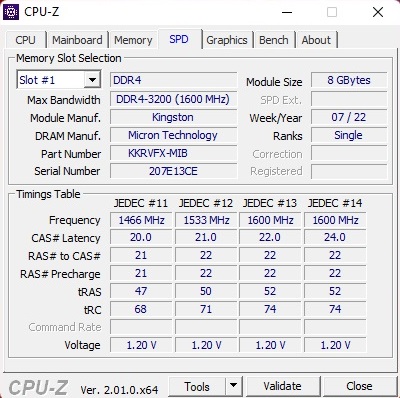
两种型号都有一个磨砂宽屏,刷新率为60赫兹,分辨率共同为1,920x1,080像素。一块512GB的NVMe固态硬盘作为存储,在单通道模式下只有微薄的8GB内存(我们将在后面解释其缺点)。在操作系统方面没有惊喜,是Windows 11 Home。
Inspiron 15 Plus的竞争对手包括其他配备GeForce RTX 3050 (Ti)的多媒体笔记本电脑,如 华硕VivoBook 15 Pro,以及华硕Zenbook Pro 15,或内部的 戴尔XPS 15 9510但其中一些的价格要贵得多。我们的对比图还包括16英寸的兄弟姐妹机型,即Inspiron 16 Plus。 Inspiron 16 Plus.
与可能的竞争对手比较
Rating | Date | Model | Weight | Height | Size | Resolution | Price |
|---|---|---|---|---|---|---|---|
| 83.5 % v7 (old) | 07 / 2022 | Dell Inspiron 15 Plus i5-11400H, GeForce RTX 3050 4GB Laptop GPU | 1.9 kg | 19 mm | 15.60" | 1920x1080 | |
| 86.7 % v7 (old) | 10 / 2021 | Dell Inspiron 16 Plus 7610 i7-11800H, GeForce RTX 3050 4GB Laptop GPU | 2 kg | 18.99 mm | 16.00" | 3072x1920 | |
| 85.9 % v7 (old) | 11 / 2021 | Asus VivoBook 15 Pro M3500QC-L1062 R5 5600H, GeForce RTX 3050 4GB Laptop GPU | 1.7 kg | 19.9 mm | 15.60" | 1920x1080 | |
| 88.4 % v7 (old) | 09 / 2021 | Dell XPS 15 9510 11800H RTX 3050 Ti OLED i7-11800H, GeForce RTX 3050 Ti Laptop GPU | 1.9 kg | 18 mm | 15.60" | 3456x2160 | |
| 87.7 % v7 (old) | 05 / 2022 | Asus Zenbook Pro 15 OLED UM535Q R9 5900HX, GeForce RTX 3050 Ti Laptop GPU | 1.9 kg | 18 mm | 15.60" | 1920x1080 |
案例
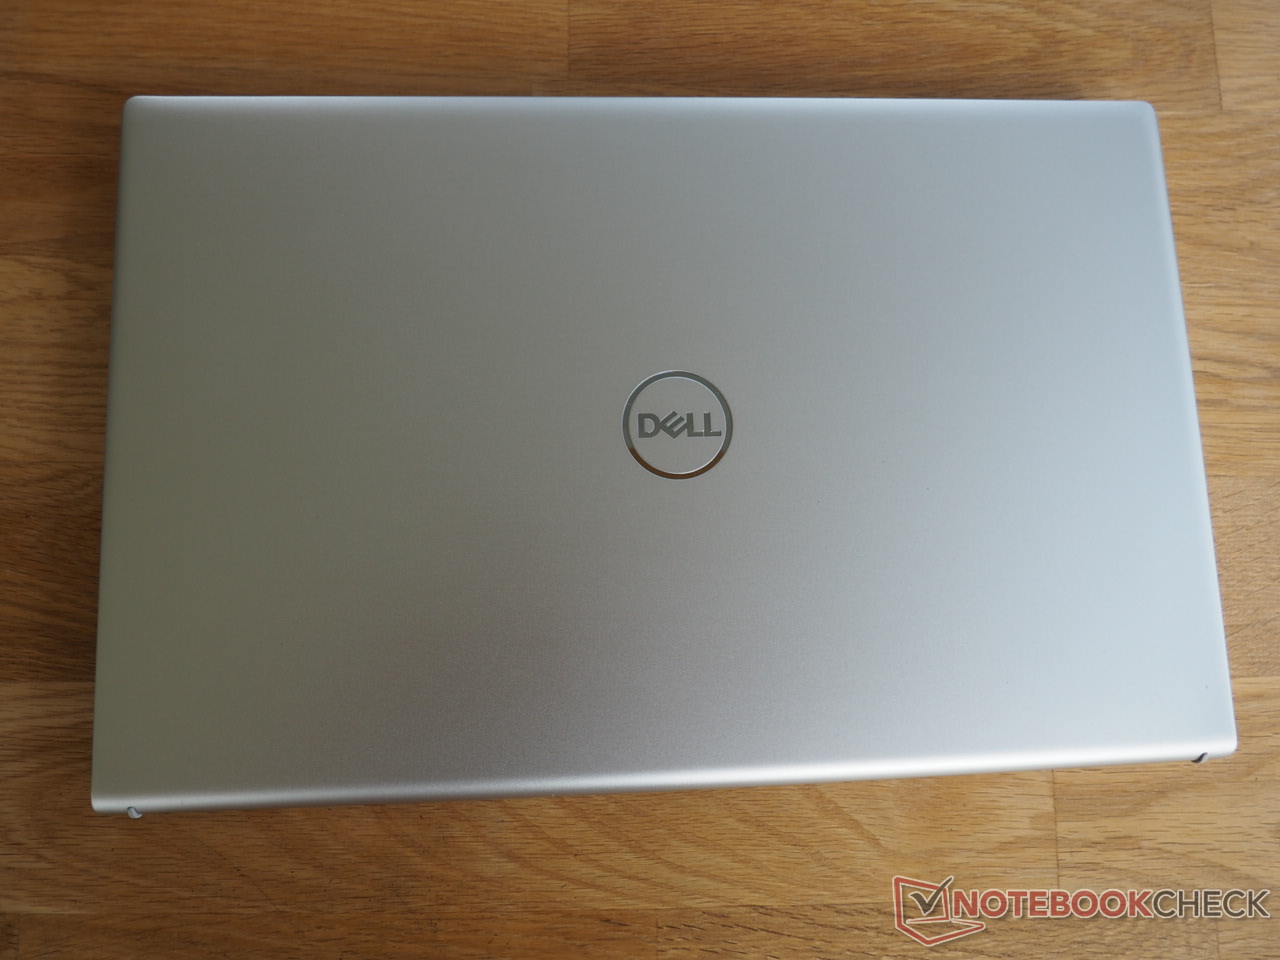
Inspiron 15 Plus的占地面积仅为35.6 x 22.9厘米,是比较紧凑的全能型笔记本电脑之一。1.9厘米的建筑高度也相当低,使戴尔的设备具有纤细的外观。谈到重量,情况也类似:1.9公斤对于一个15英寸的设备来说非常适中,而且它(仍然)可以舒适地运输。然而,这个箱子最大的优点是它的时尚设计。部分由金属制成的银色表面(盖子和顶部)看起来既时尚又优雅,在任何情况下或环境中(办公室、大学等)都显得很有特点。
Inspiron 15 Plus在做工方面的表现不尽如人意。不幸的是,在细节方面可以发现一些不一致的地方。例如,我们的评测样品中的触摸板并不完全合适,右下角有点突出。此外,盖子的油漆在开箱时就已经有轻微的损坏。戴尔应该相应地改进其质量控制(根据我们的经验,制造商在这方面经常出现问题)。
在坚固性方面没有什么可抱怨的。虽然底座在强大的压力下会在中间区域弯曲,但在正常使用时,"外壳弯曲 "被控制在一定范围内。盖子提供了一个可以容忍的稳定程度。
铰链的工作做得很好。打开盖子,提高了基本单元(更好的空气流动),也可以用一只手来操作。盖子在打开时被牢牢地固定住,而且相对不受表面振动的影响。
连接性
端口
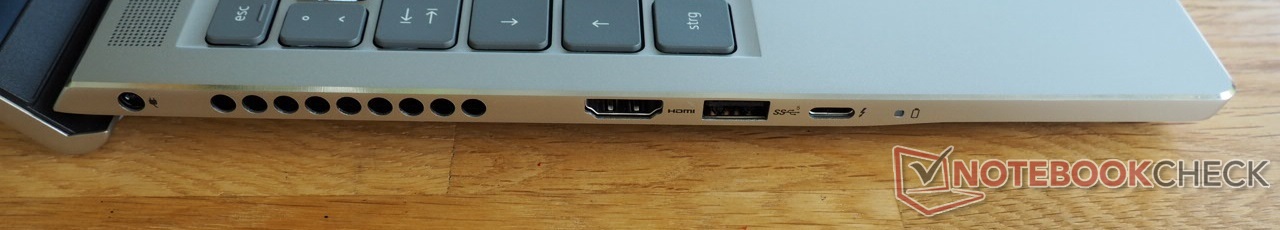
端口配置给人的印象不一。一方面,Inspiron 15 Plus提供了一个现代的Thunderbolt 4端口(支持DisplayPort的USB-C和Power Delivery),但另一方面,这款15英寸的笔记本缺少一个RJ45端口和一个Kensington锁。总共三个USB端口(2个Type-A 3.2 Gen 1)和一个音频插孔也有点有限。至少戴尔的设备配备了一个成熟的--虽然很慢--SD卡读卡器。
接口的分布并不理想。由于设备的设计和铰链,背部不包含任何端口,而两侧的后部区域被通风口占据,所以端口位于相当远的前方,这可能导致在左右两侧使用外部鼠标时的运动限制。
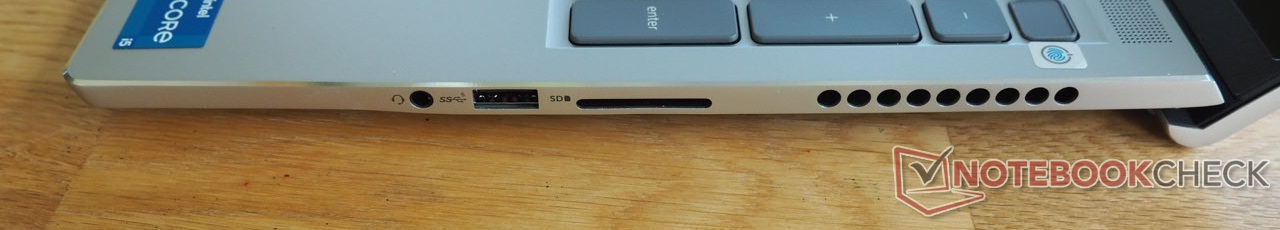
SD卡阅读器
如前所述,戴尔安装了一个极其缓慢的读卡器。传输照片的速度约为21MB/s,甚至不能与USB 2.0相提并论,与它的16英寸兄弟姐妹一起,我们的评测装置在测试领域中排名垫底。相比之下。Zenbook Pro 15达到了坚实的81MB/s,而XPS 15则是一流的224MB/s。
| SD Card Reader - average JPG Copy Test (av. of 3 runs) | |
| Dell XPS 15 9510 11800H RTX 3050 Ti OLED (AV Pro V60) | |
| Average of class Multimedia (23 - 531, n=37, last 2 years) | |
| Asus Zenbook Pro 15 OLED UM535Q (Toshiba Exceria Pro SDXC 64 GB UHS-II) | |
| Asus VivoBook 15 Pro M3500QC-L1062 (AV Pro V60) | |
| Dell Inspiron 15 Plus (AV PRO microSD 128 GB V60) | |
| Dell Inspiron 16 Plus 7610 (AV PRO microSD 128 GB V60) | |
沟通
在Wi-Fi性能方面,Inspiron 15 Plus的表现非常好。在距离我们的新参考路由器--华硕ROG Rapture GT-AXE11000一米的地方,英特尔Wi-Fi 6模块(AX201)在我们的接收测试中取得了平均1413 Mb/s的良好速率。
| Networking - iperf3 receive AXE11000 | |
| Dell Inspiron 15 Plus | |
| Average Intel Wi-Fi 6 AX201 (390 - 1734, n=79) | |
| Average of class Multimedia (682 - 1818, n=54, last 2 years) | |
网络摄像头
就质量而言,720p的网络摄像头并没有什么出奇之处。正如通常的情况一样,在色彩准确性以及图像清晰度方面存在问题。然而,隐私快门应该受到赞扬。可以使用滑块方便地遮盖网络摄像头。


安全问题
作为一项安全功能,Inspiron 15 Plus配备了一个指纹传感器,它被方便地集成到电源按钮中。
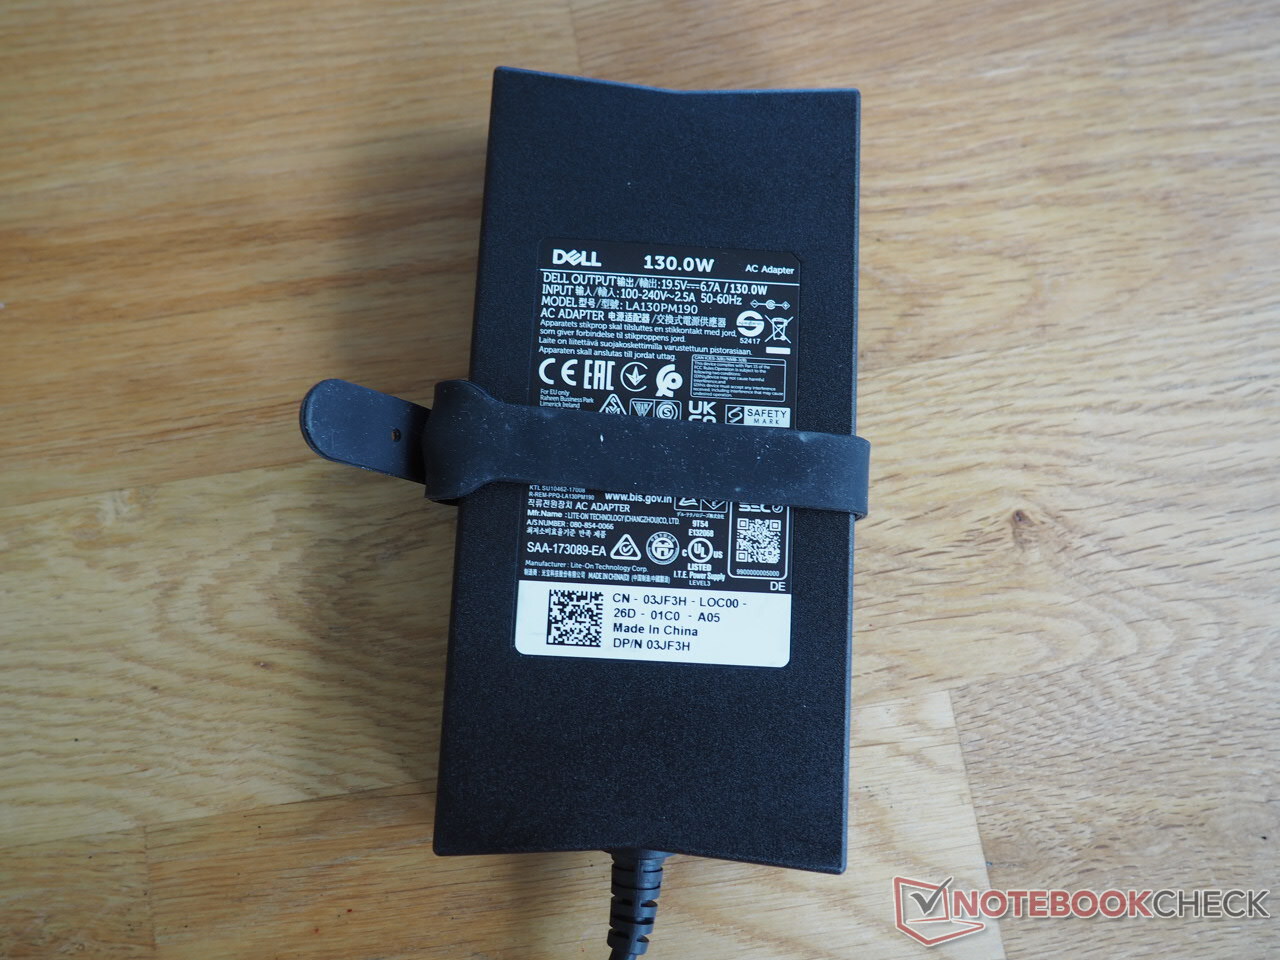
辅料
除了一些信息手册外,这款笔记本电脑当然还伴随着一个强制性的电源适配器。这款130瓦的机型重量不到400克,其15 x 7.5 x 2.5厘米的尺寸并不过分笨重。
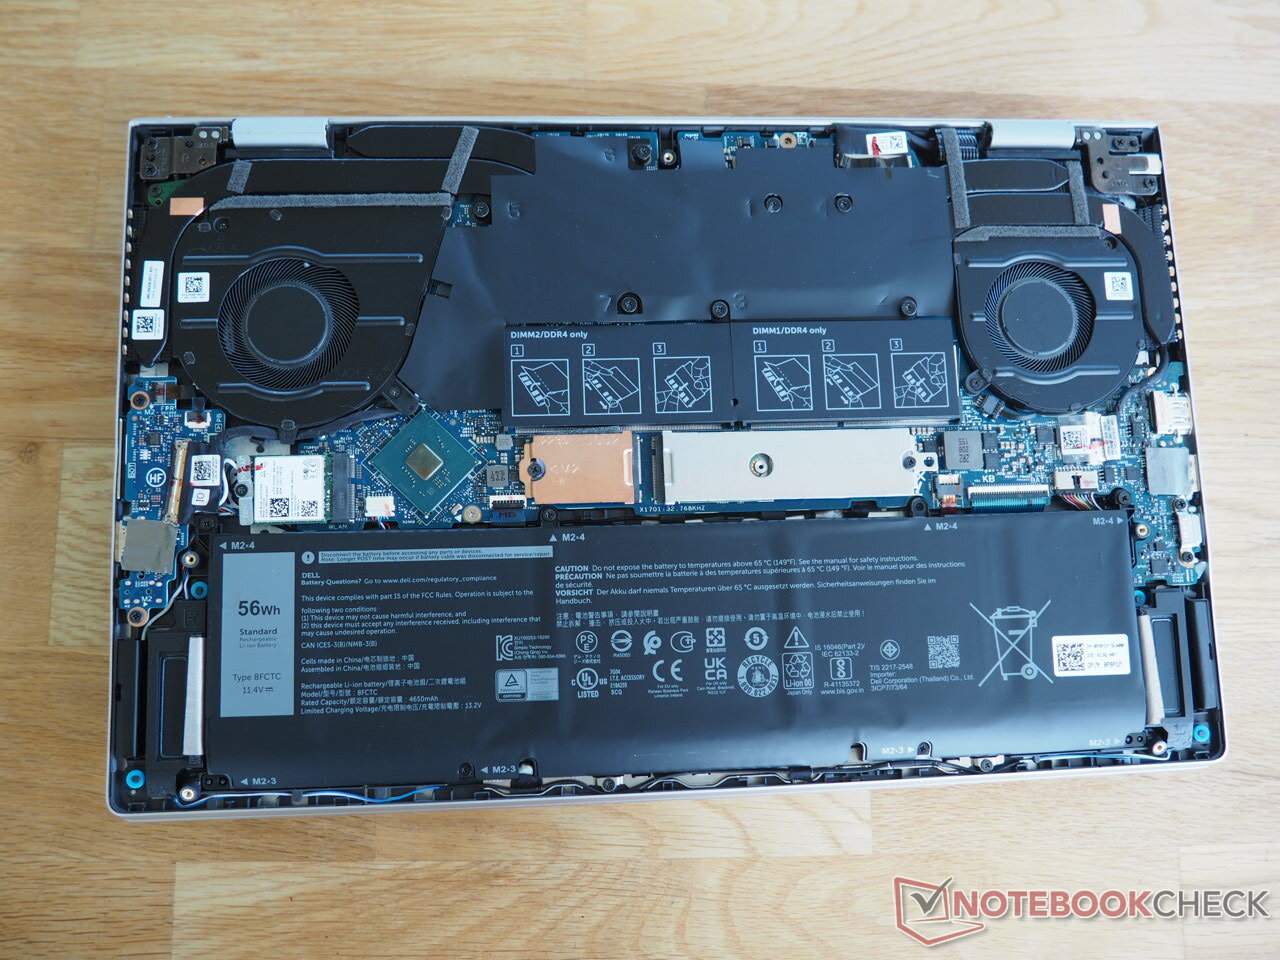
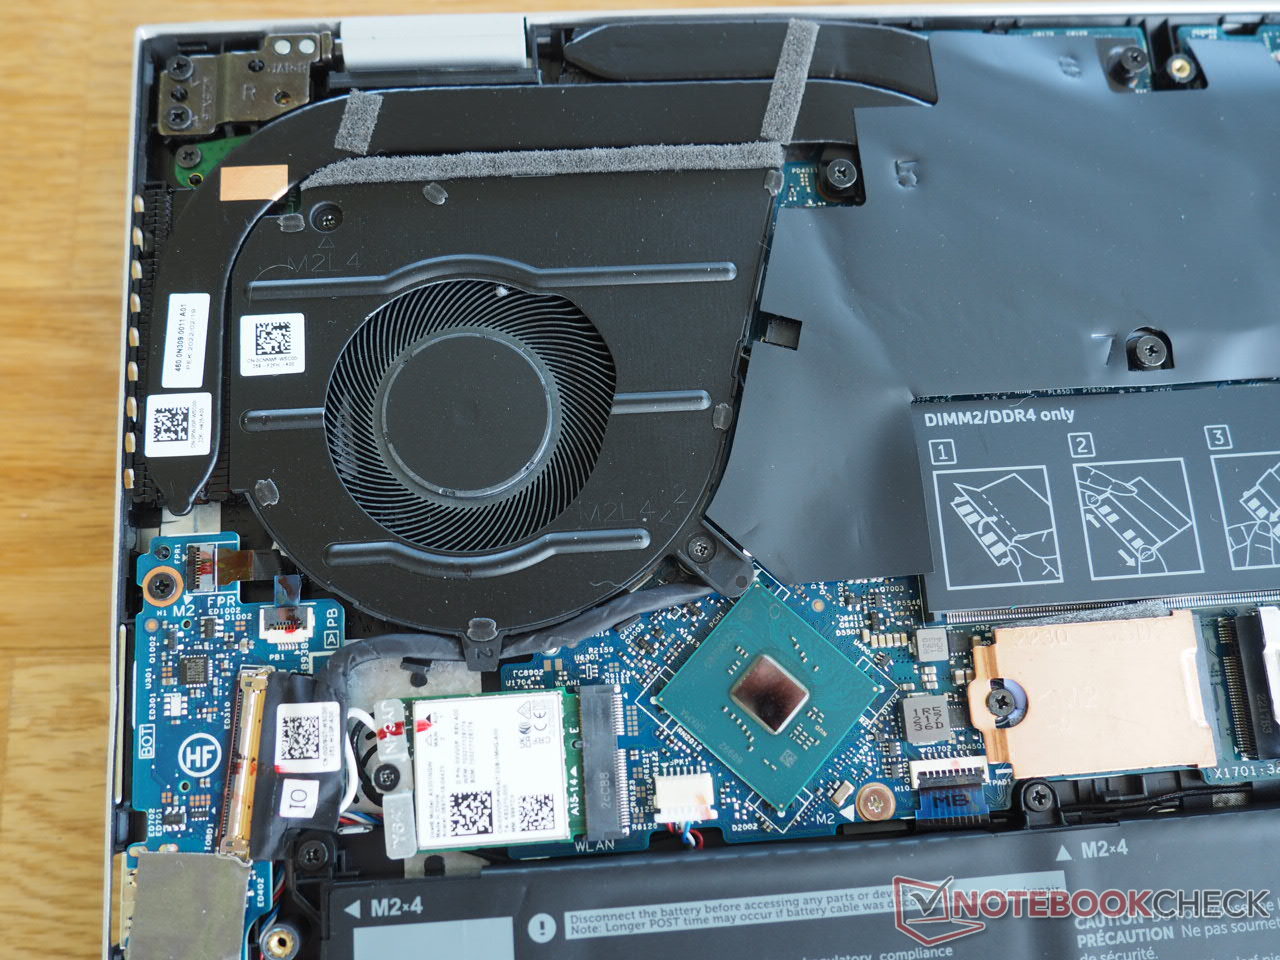
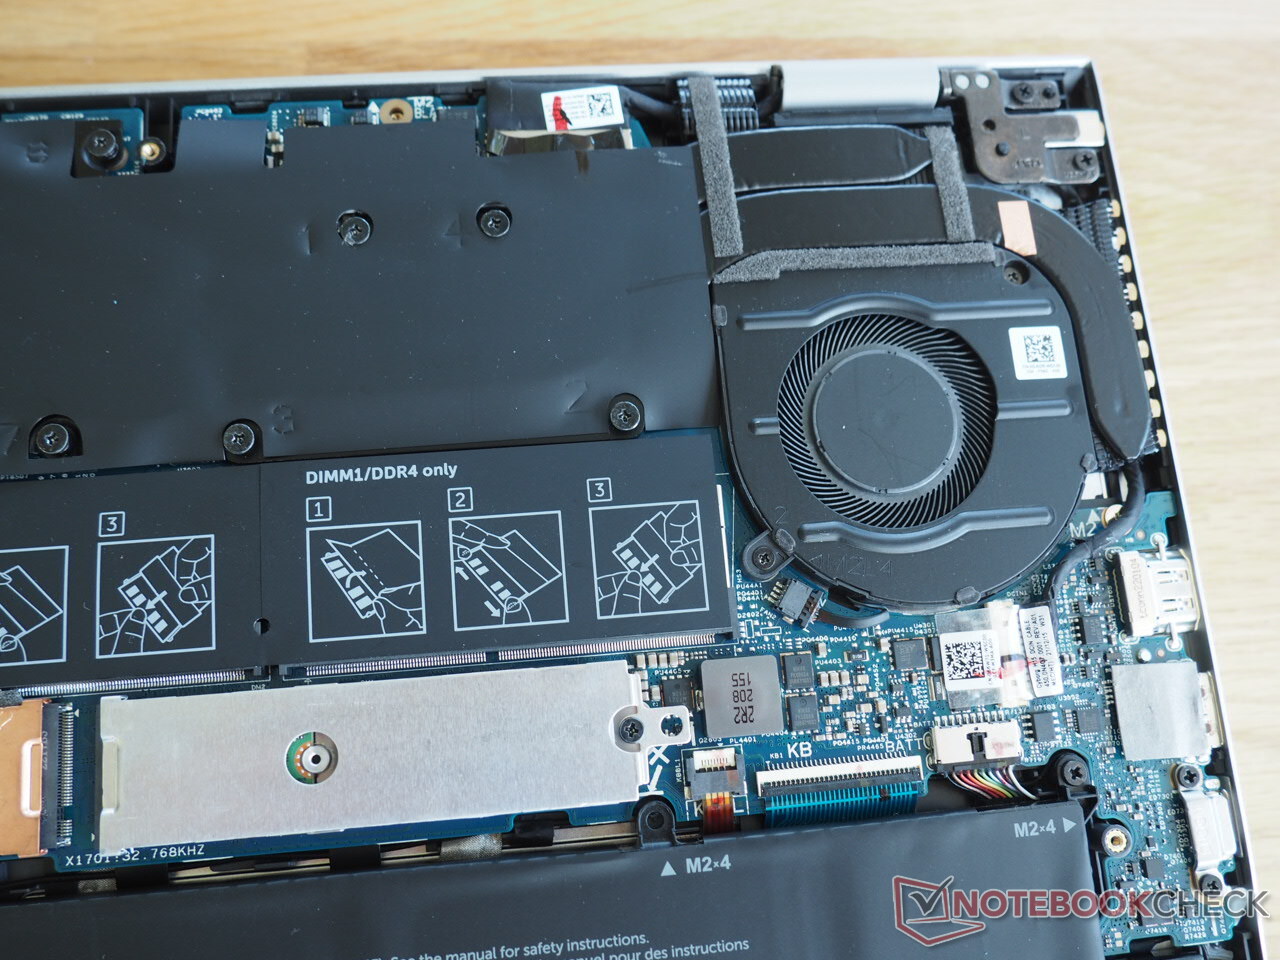
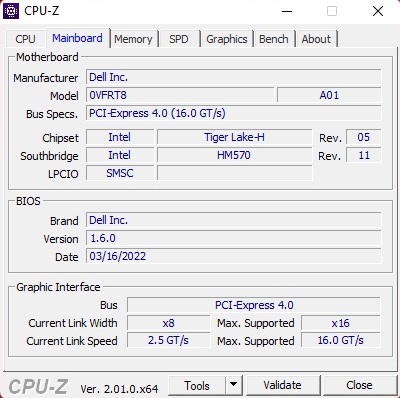
维护
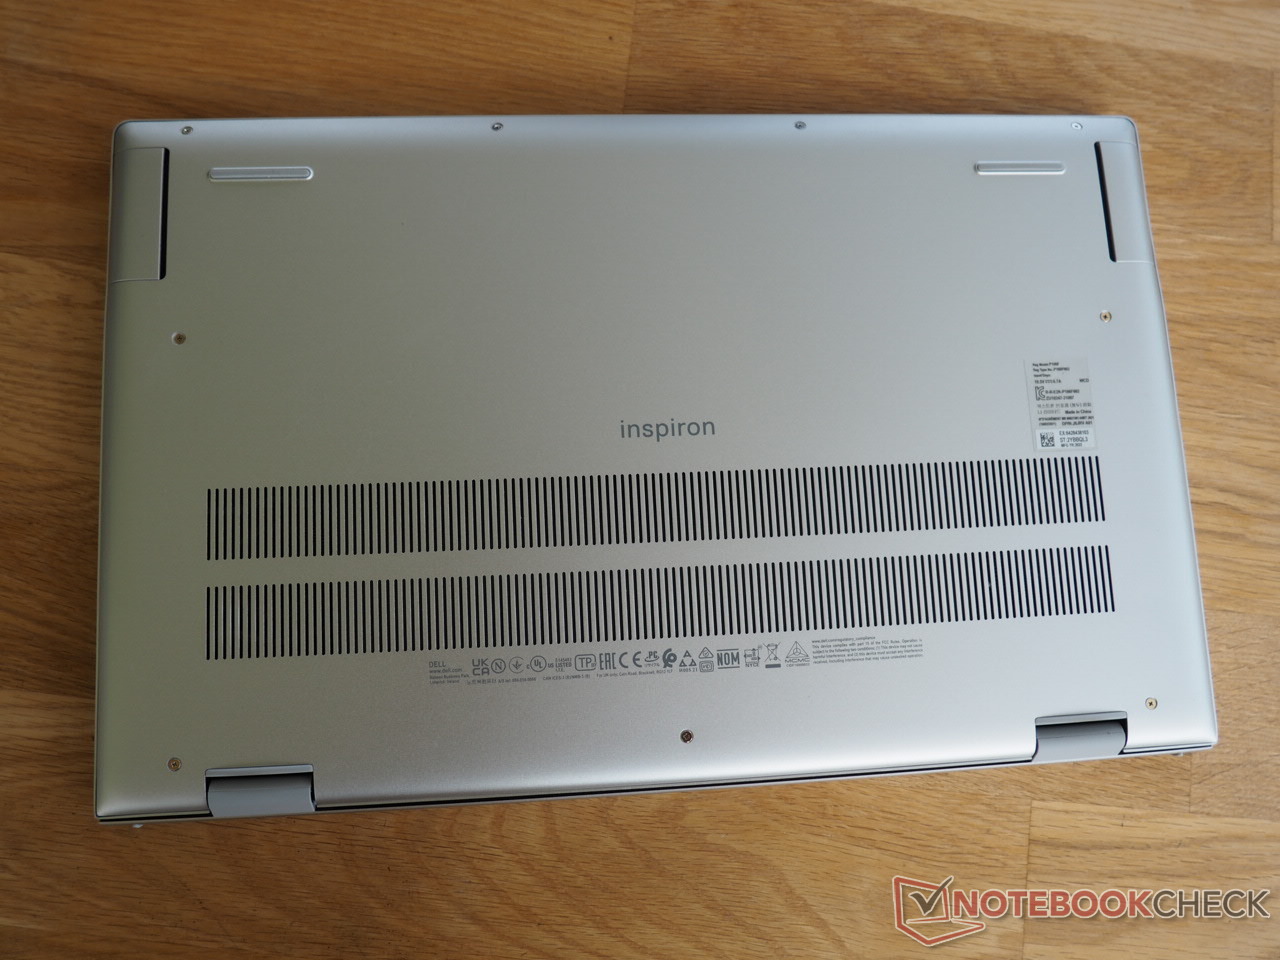
想进入Inspiron 15 Plus内部的用户首先要卸下九颗小十字头螺丝,并将底盖从固定处撬开。引擎盖下的画面是普通的。Wi-Fi模块、内存插槽(2个SO-DIMM DDR4)和大容量存储插槽(1个M.2 2230,1个M.2 2280)与电池和冷却系统一样容易接近(见照片)。
担保
基本保修期只包括12个月。然而,在配置笔记本电脑时,这一期限可以延长到三年,但需要额外收费,并且可以增加高级或高级强化支持。
输入设备
键盘
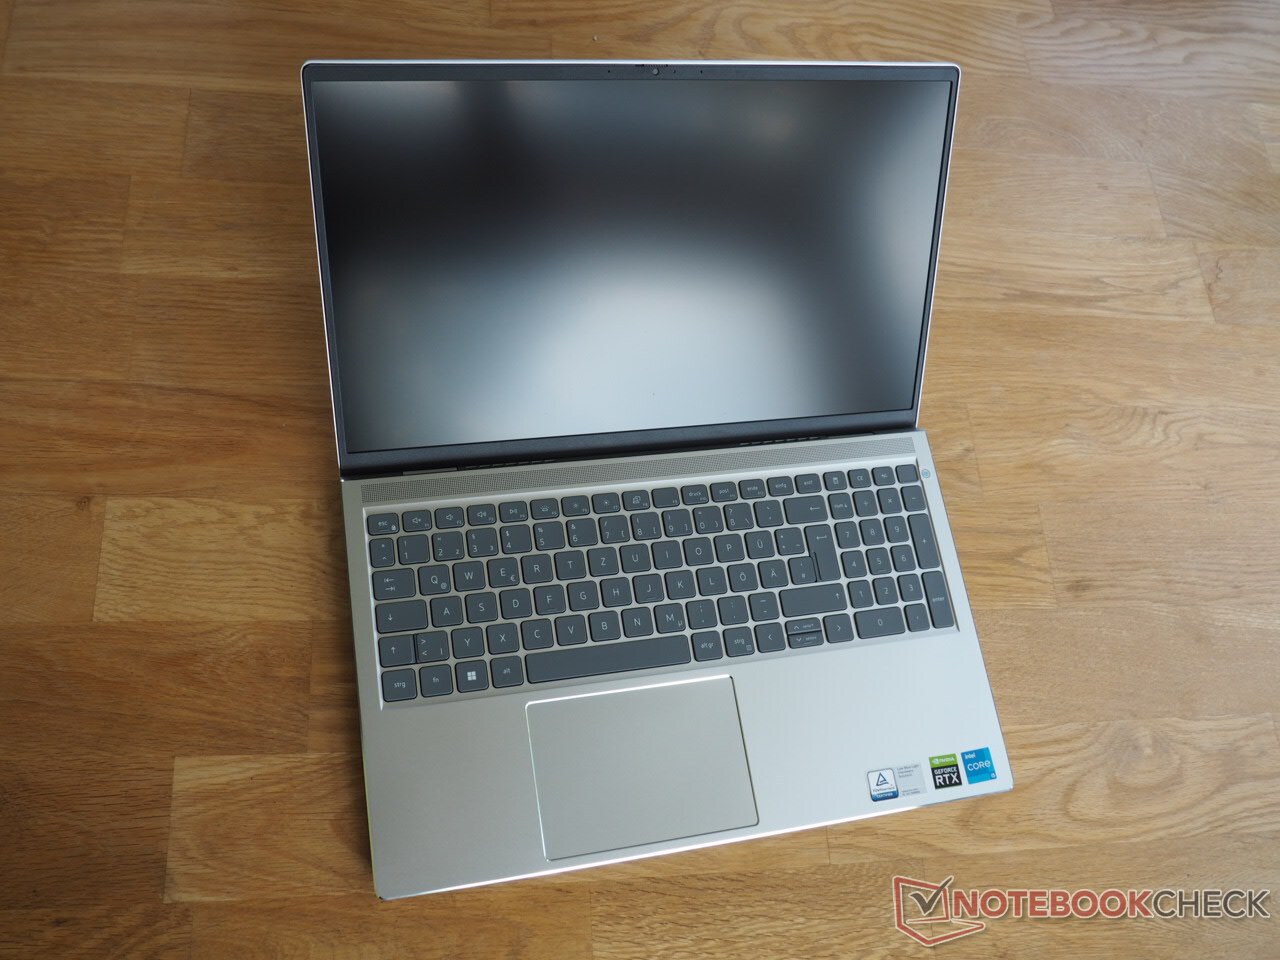
Inspiron 15 Plus的输入设备给人留下了良好印象。首先是键盘,它具有典型的笔记本Chiclet设计和深灰色按键。我们认为打字的体验相当清晰,适合日常使用,尽管作者希望打字的力度稍微大一些。此外,当你更用力地按下按键时,键盘并不特别安静。
精心设计的布局是一个优点。除了中间的小方向箭头之外,所有的键都有一个合适的尺寸,而且在大多数情况下,位置也很合理。此外,一些买家会高兴地看到一个完整的数字键盘已经被包括在内。白色的背光可以分两级调节,在黑暗的环境中特别有用。
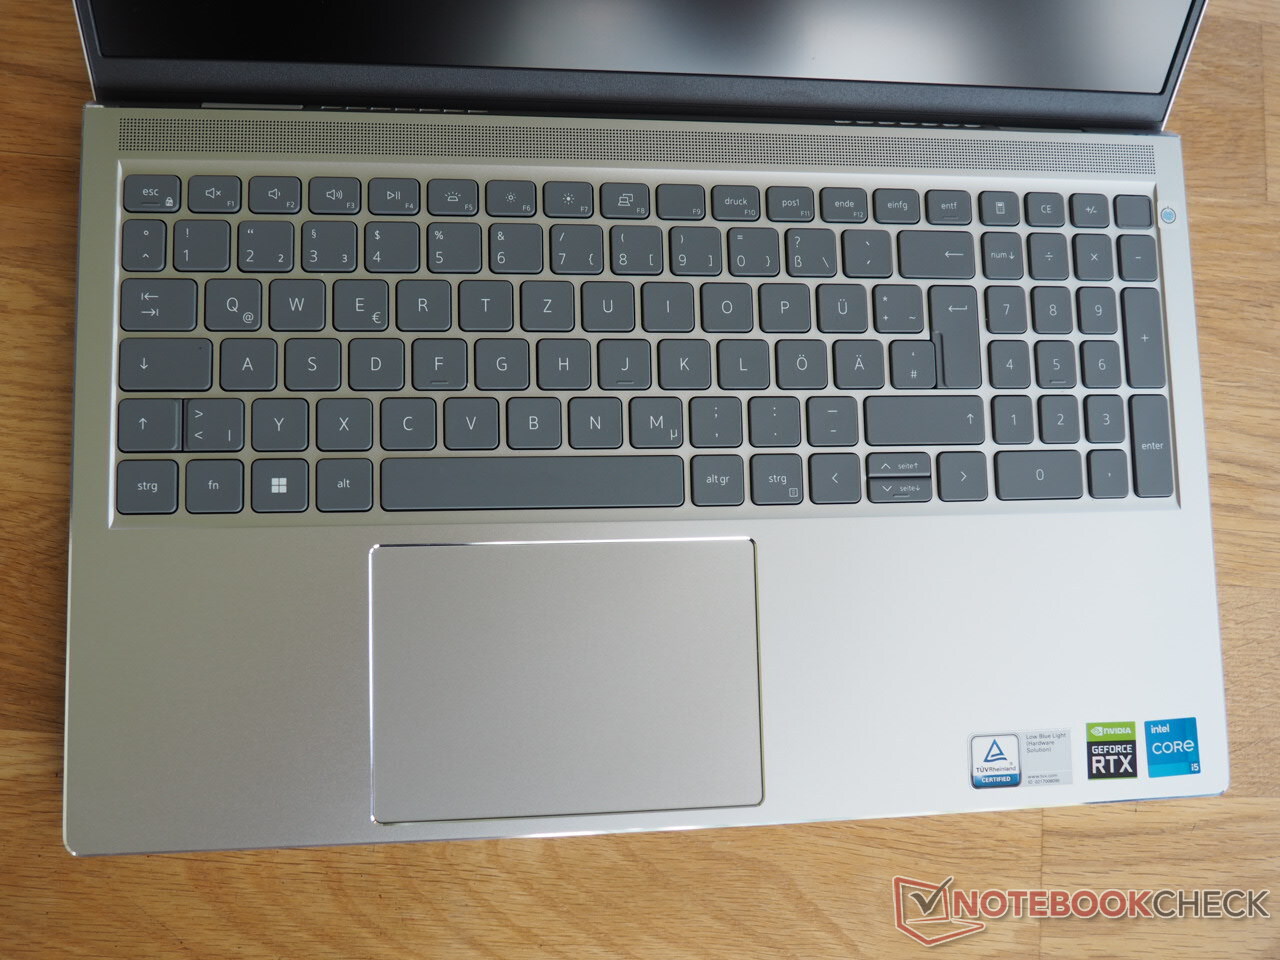
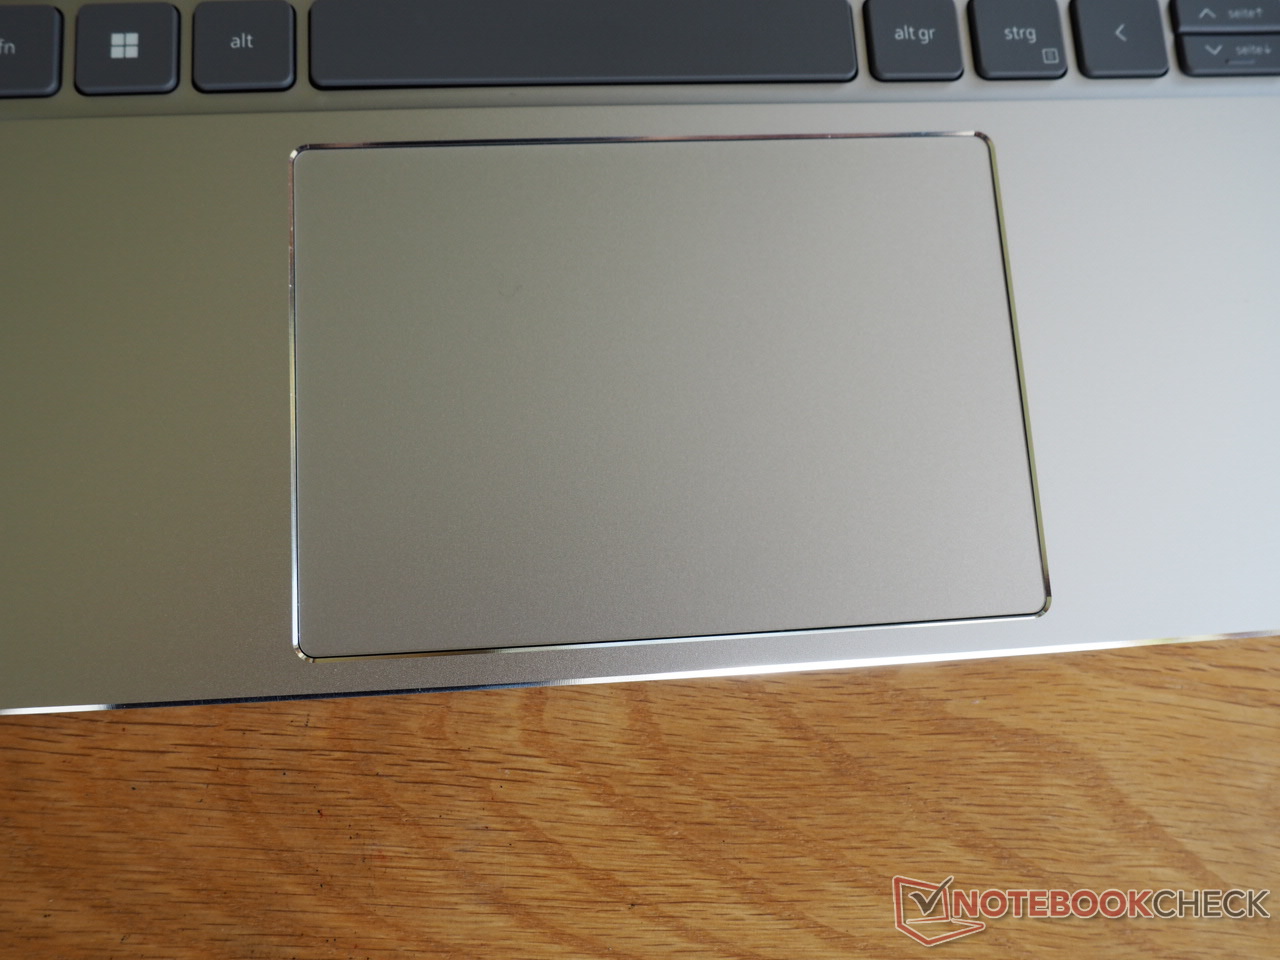
触摸板
除了上述的做工缺陷外,触摸板几乎没有什么可以批评的地方。11.5 x 8厘米的表面对于一个15英寸的设备来说是相当大的,而且它还允许你在更长的空间内移动光标,而不必重新设置你的手指。戴尔选择的相当光滑的表面也确保了良好的滑行性能。鼠标垫的精确度也令人满意。
戴尔唯一应该改进的是对多点触摸的支持。在测试中,所支持的手势(如缩放)偶尔会有点笨拙和草率。最后,底部的两个点击面以强烈的、但也相当响亮的反馈吸引了人们的注意。
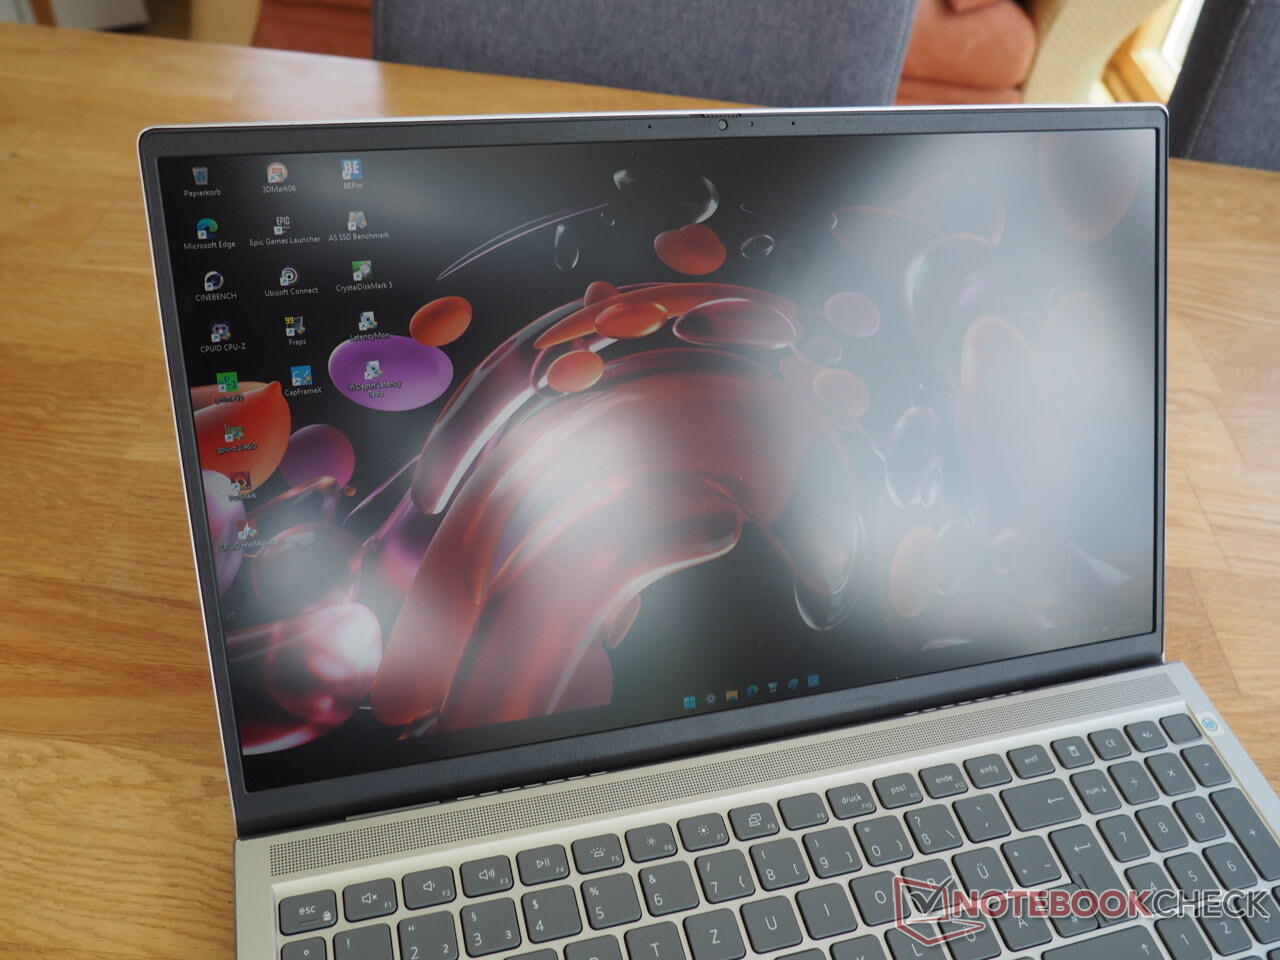
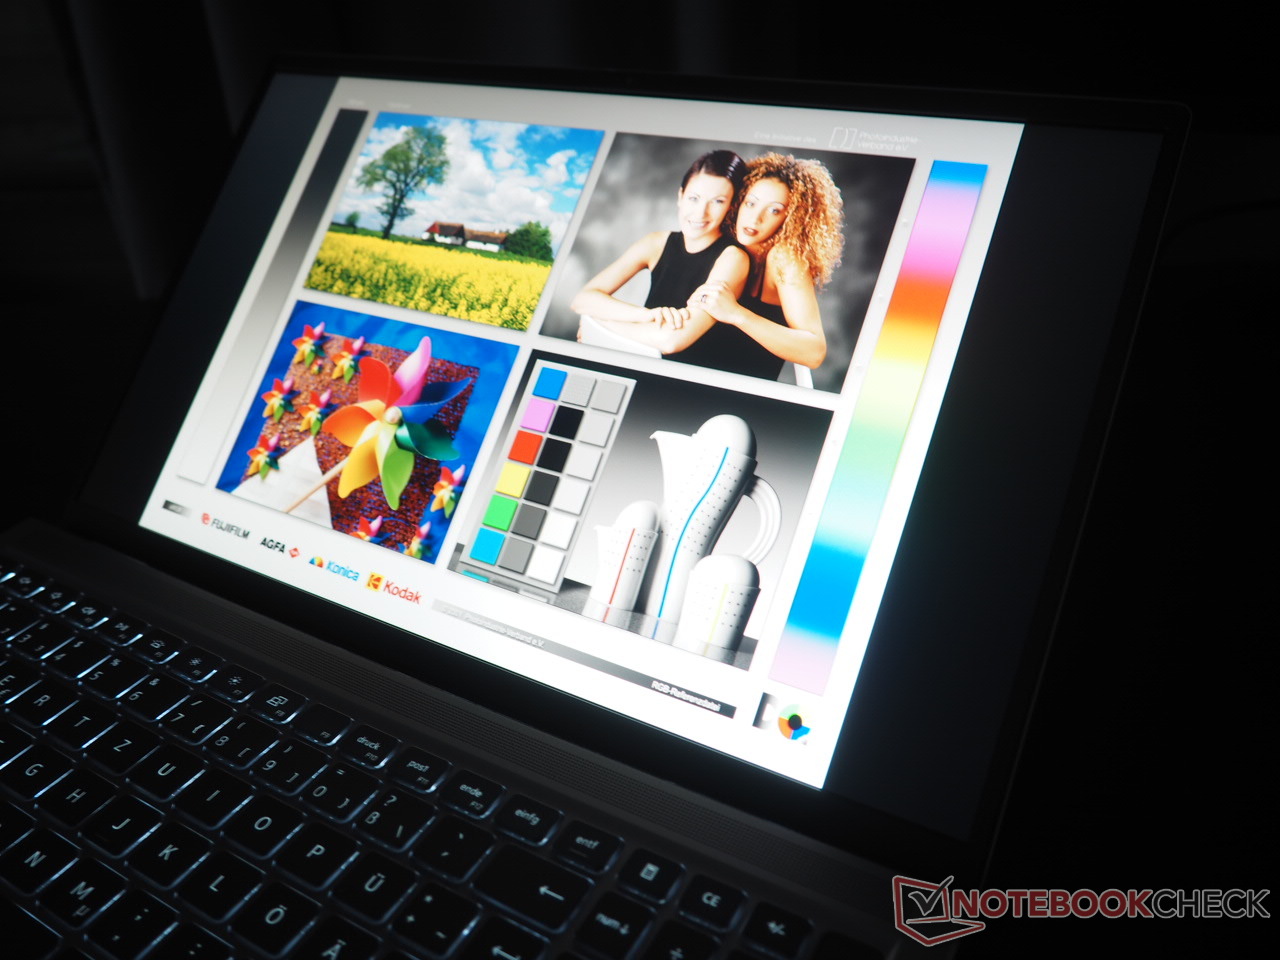
显示
虽然其他几款经济型全能产品在图像质量方面表现出明显的弱点,但Inspiron 15 Plus的显示屏却很不错。
| |||||||||||||||||||||||||
Brightness Distribution: 86 %
Center on Battery: 298 cd/m²
Contrast: 745:1 (Black: 0.4 cd/m²)
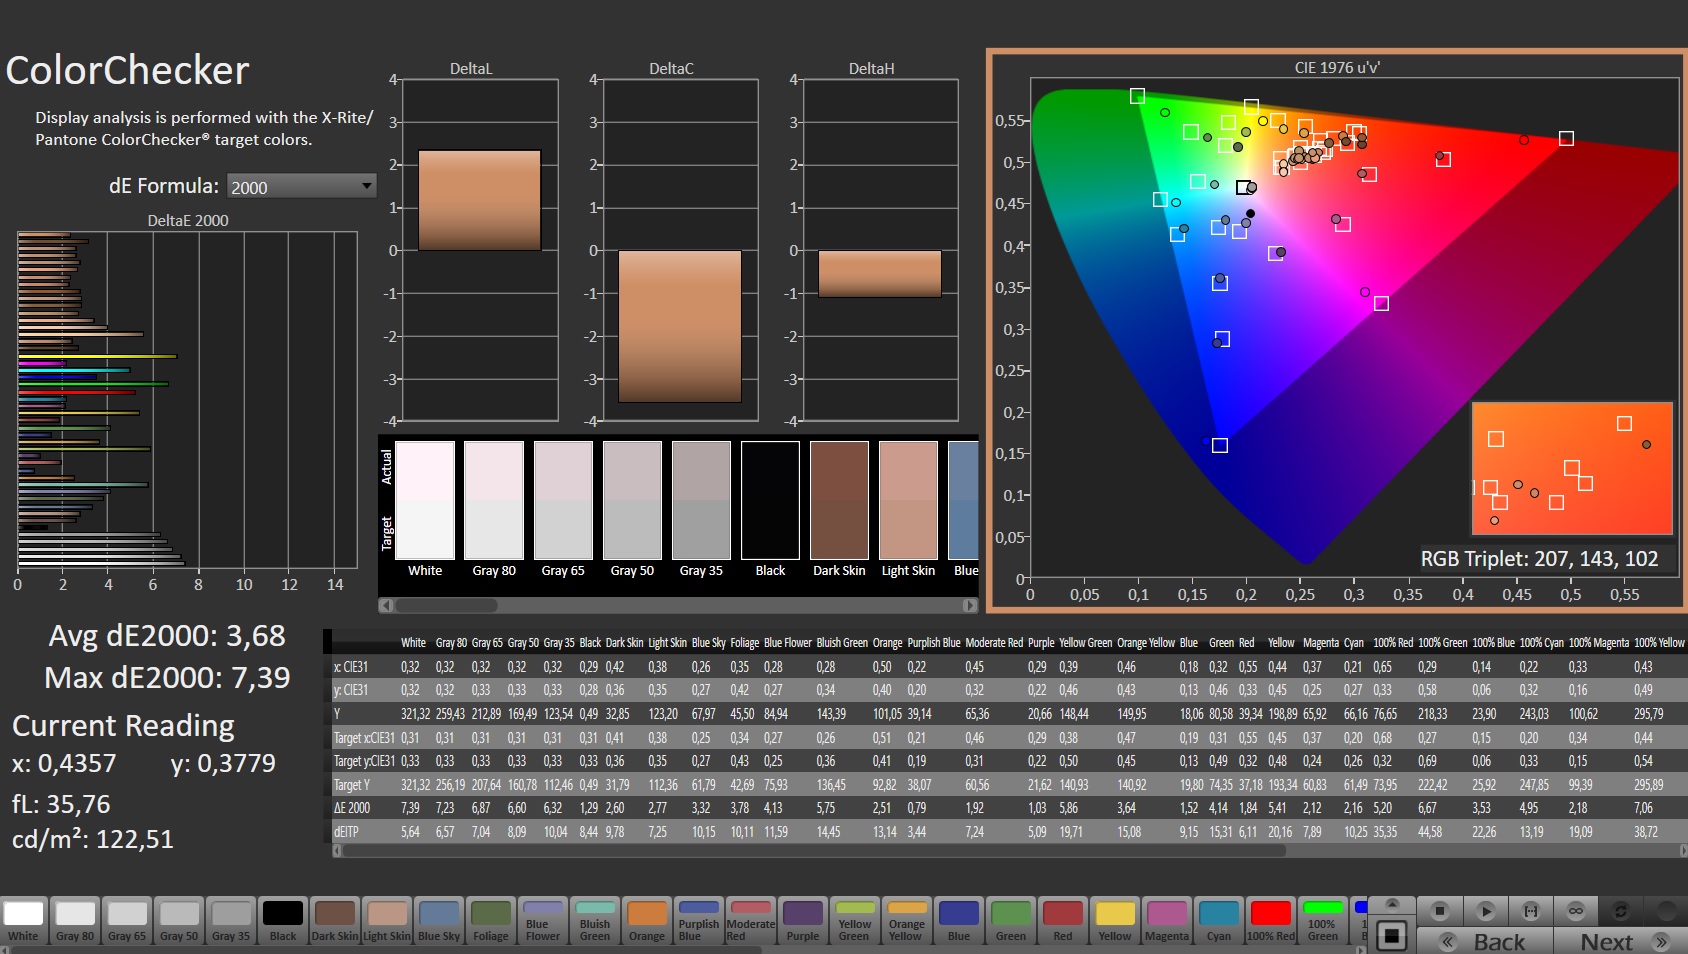
ΔE ColorChecker Calman: 3.68 | ∀{0.5-29.43 Ø4.71}
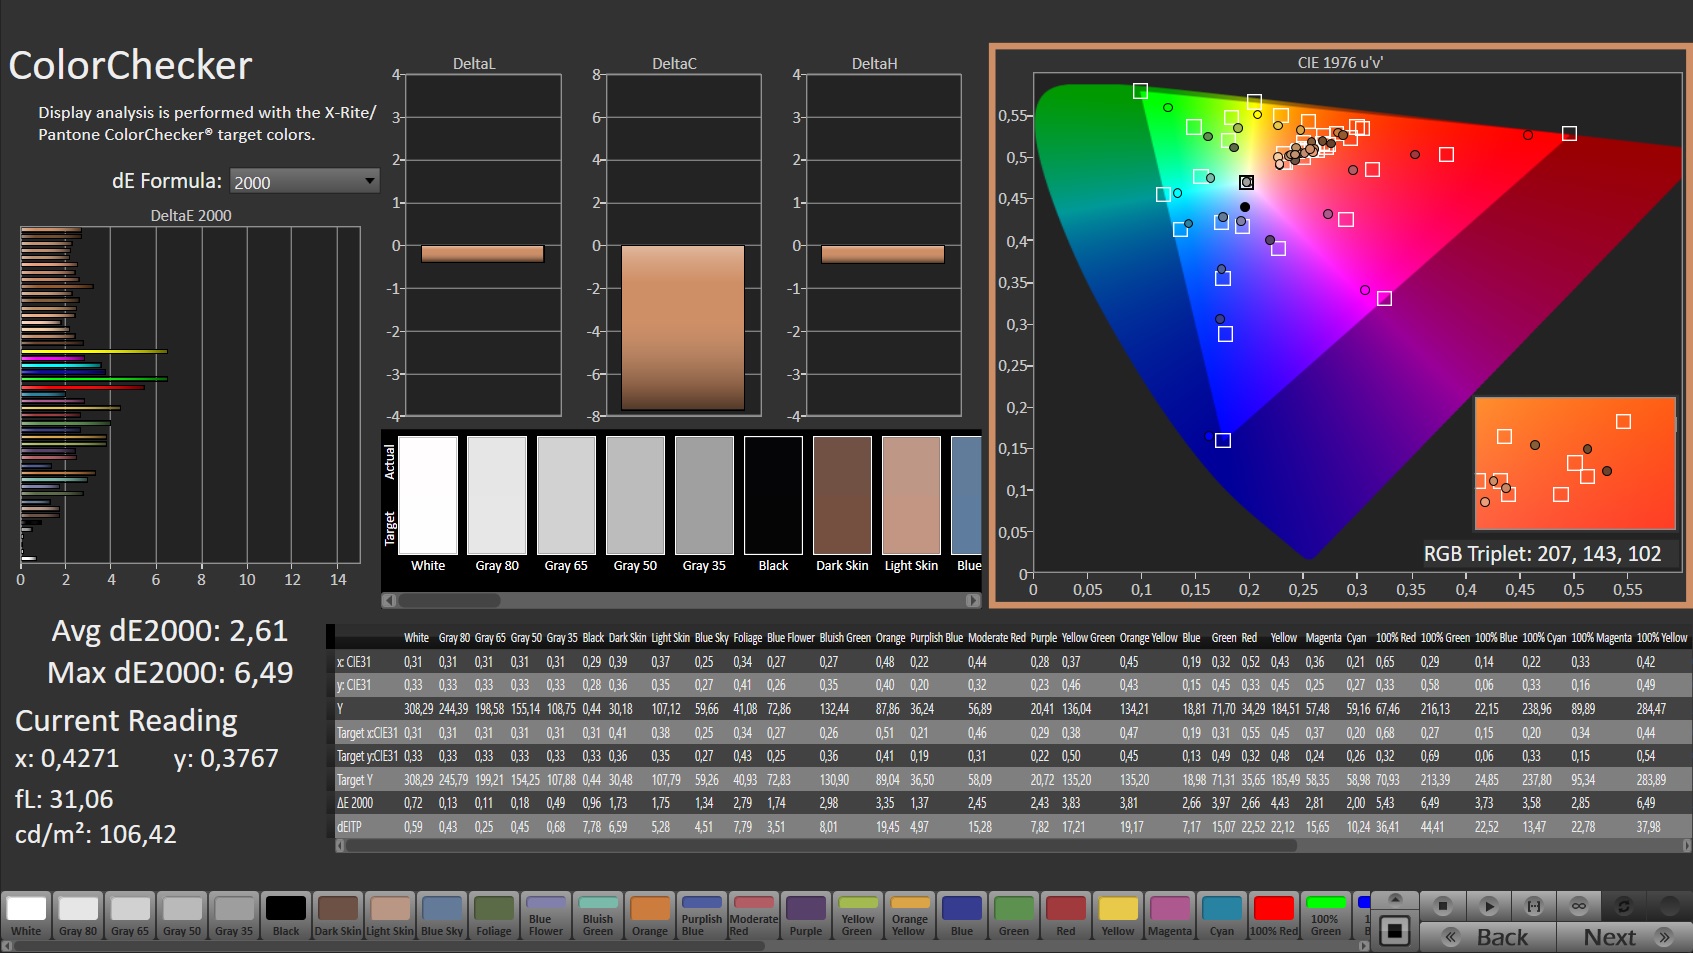
calibrated: 2.61
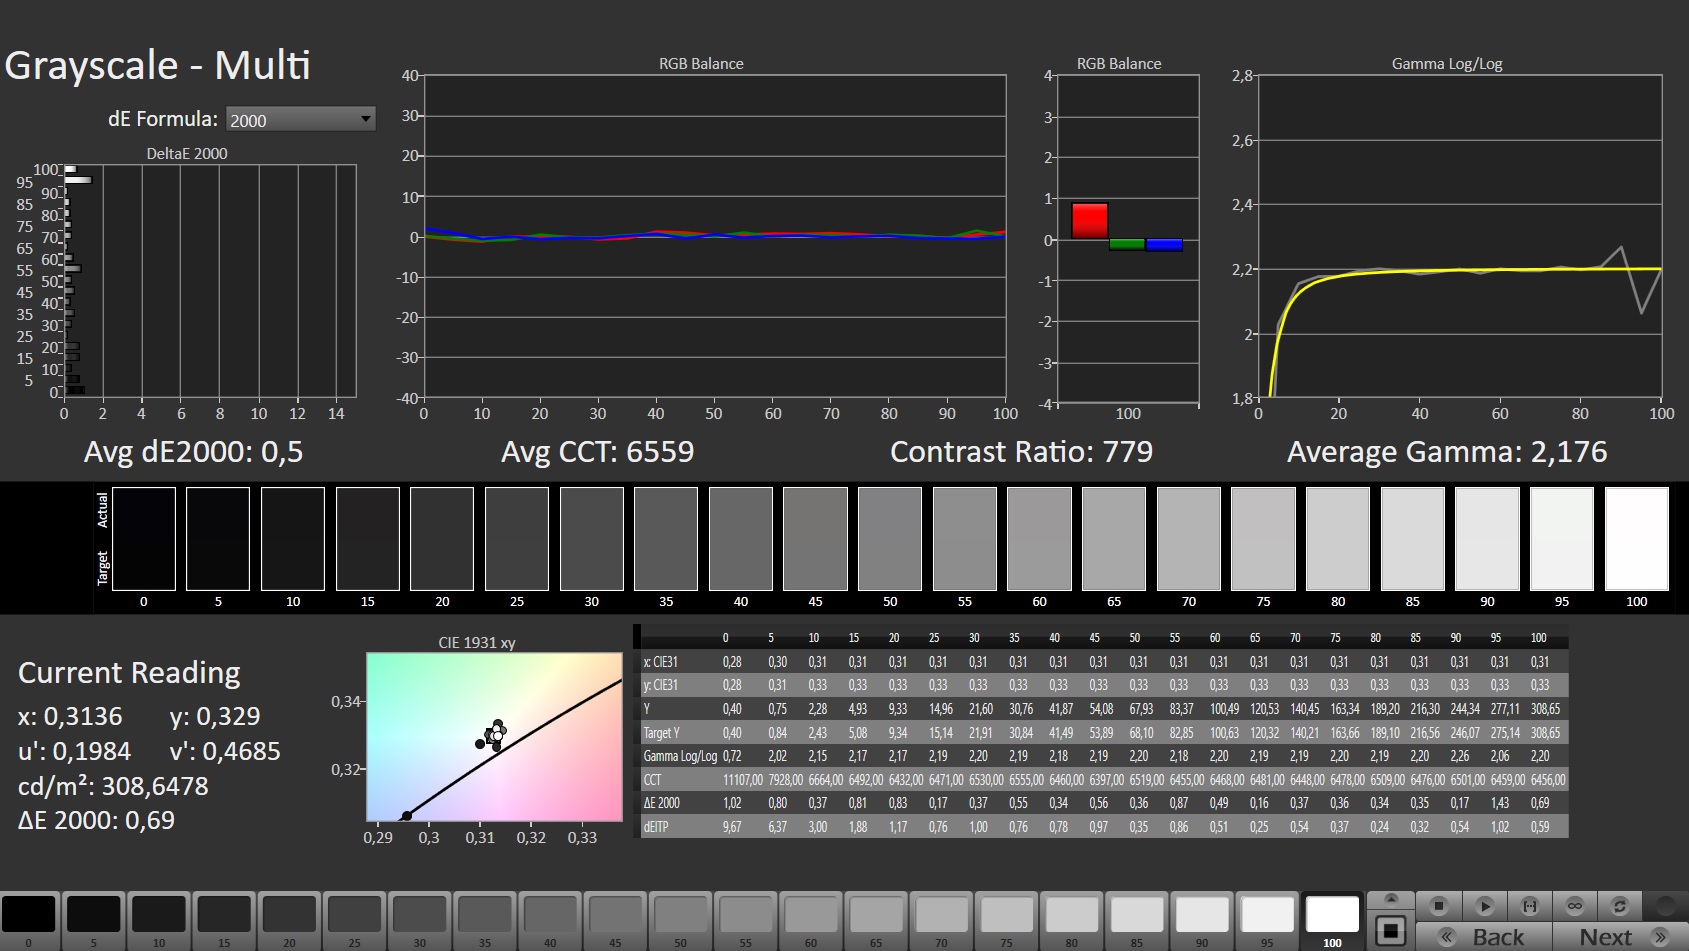
ΔE Greyscale Calman: 5.3 | ∀{0.09-98 Ø4.96}
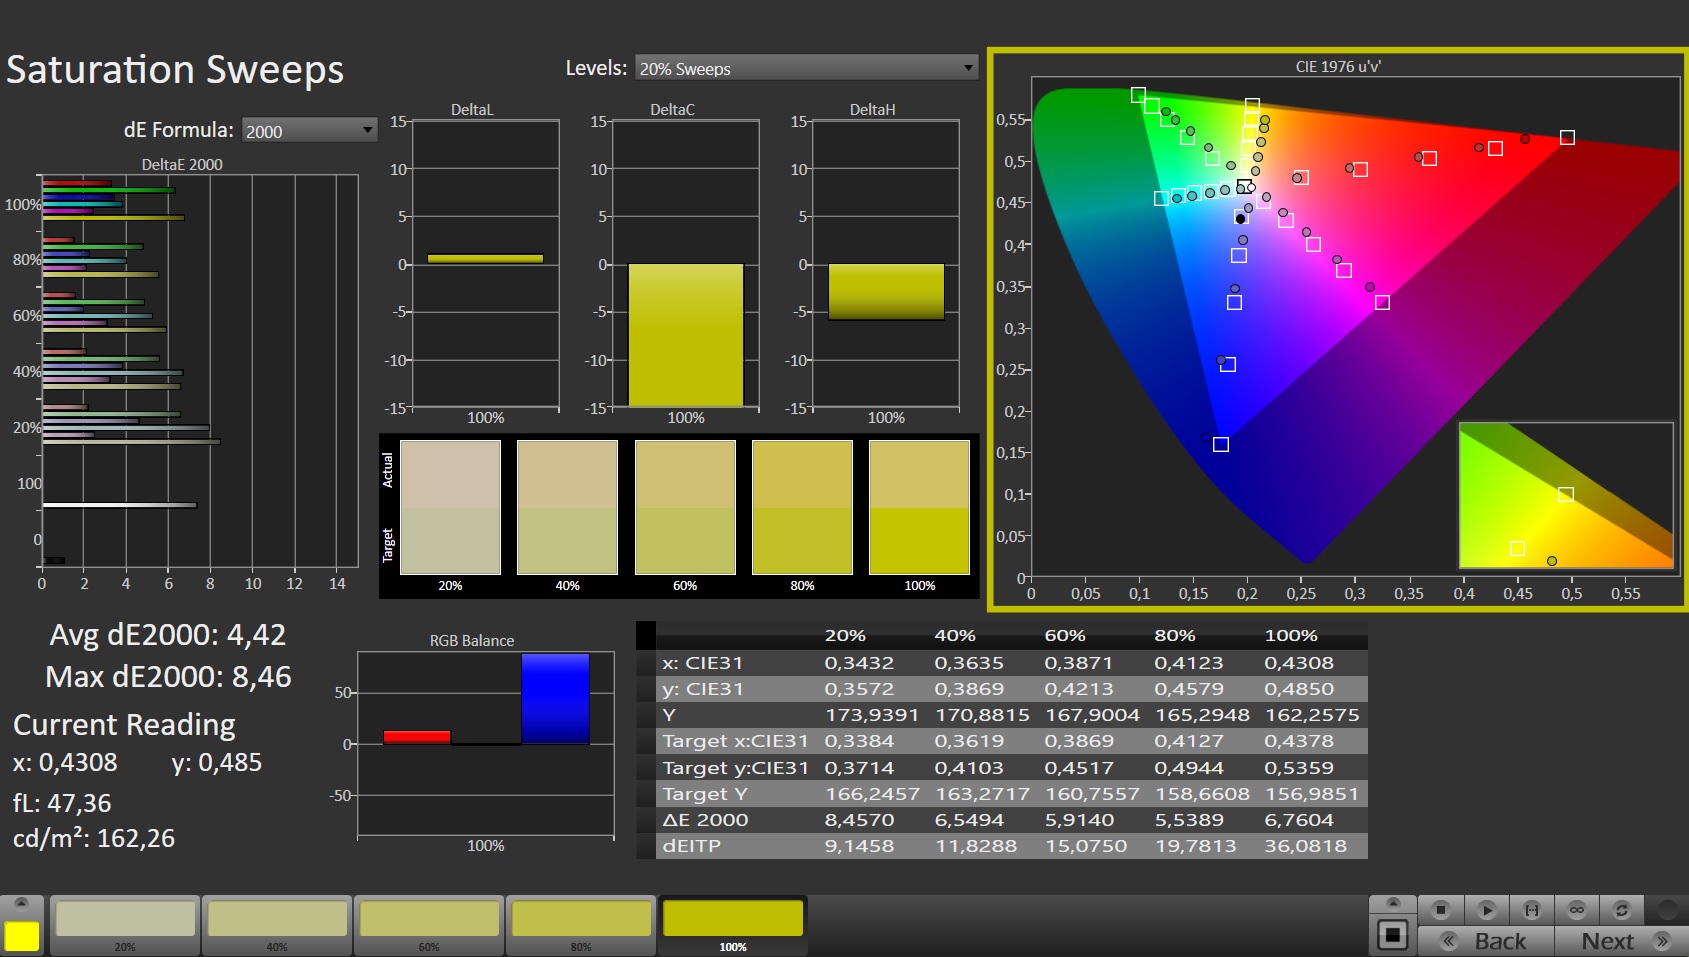
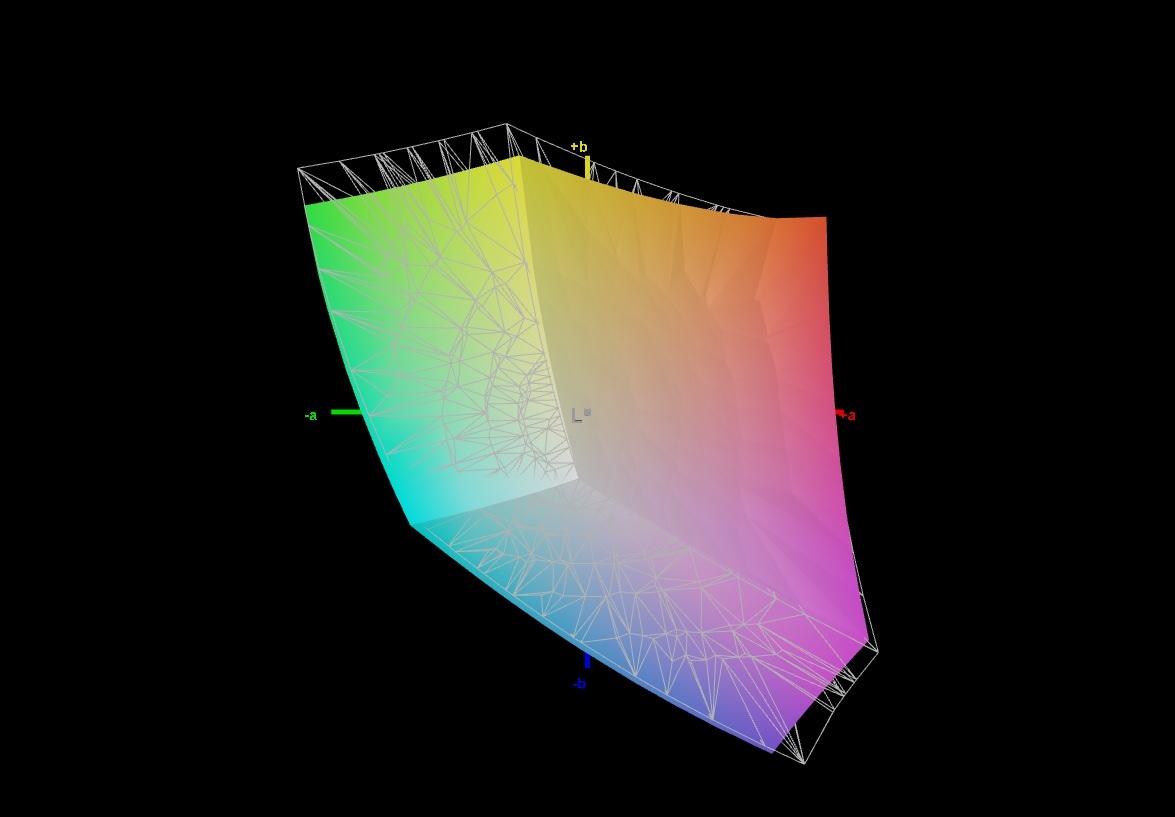
66.2% AdobeRGB 1998 (Argyll 3D)
92.8% sRGB (Argyll 3D)
64.1% Display P3 (Argyll 3D)
Gamma: 2.102
CCT: 6143 K
| Dell Inspiron 15 Plus Dell INSPIRON LGD06A6, IPS, 1920x1080, 15.6" | Dell Inspiron 16 Plus 7610 AU Optronics B160QAN, IPS, 3072x1920, 16" | Asus VivoBook 15 Pro M3500QC-L1062 ATNA56YX03-0, AMOLED, 1920x1080, 15.6" | Dell XPS 15 9510 11800H RTX 3050 Ti OLED SDC414D, OLED, 3456x2160, 15.6" | Asus Zenbook Pro 15 OLED UM535Q Samsung ATNA56YX03-0, OLED, 1920x1080, 15.6" | |
|---|---|---|---|---|---|
| Display | 13% | 36% | 37% | 20% | |
| Display P3 Coverage (%) | 64.1 | 74.1 16% | 99.9 56% | 99.9 56% | 79.3 24% |
| sRGB Coverage (%) | 92.8 | 99.4 7% | 99.9 8% | 100 8% | 95.6 3% |
| AdobeRGB 1998 Coverage (%) | 66.2 | 75.8 15% | 95.8 45% | 98.1 48% | 87.3 32% |
| Response Times | -63% | 88% | 88% | 91% | |
| Response Time Grey 50% / Grey 80% * (ms) | 31.6 ? | 49.2 ? -56% | 3.2 ? 90% | 3.6 ? 89% | 2.1 ? 93% |
| Response Time Black / White * (ms) | 21.6 ? | 36.8 ? -70% | 3.2 ? 85% | 2.8 ? 87% | 2.3 ? 89% |
| PWM Frequency (Hz) | 60.2 ? | 59.5 ? | 60.2 | ||
| Screen | 32% | 40% | 114% | 32% | |
| Brightness middle (cd/m²) | 298 | 296.8 0% | 396 33% | 362 21% | 342.9 15% |
| Brightness (cd/m²) | 285 | 292 2% | 397 39% | 367 29% | 346 21% |
| Brightness Distribution (%) | 86 | 87 1% | 99 15% | 97 13% | 98 14% |
| Black Level * (cd/m²) | 0.4 | 0.21 48% | 0.06 85% | ||
| Contrast (:1) | 745 | 1413 90% | 6033 710% | ||
| Colorchecker dE 2000 * | 3.68 | 2.56 30% | 2 46% | 2.1 43% | 2.42 34% |
| Colorchecker dE 2000 max. * | 7.39 | 4.76 36% | 4.8 35% | 4.1 45% | 4.05 45% |
| Colorchecker dE 2000 calibrated * | 2.61 | 1.86 29% | 1.8 31% | 2.5 4% | |
| Greyscale dE 2000 * | 5.3 | 2.6 51% | 1 81% | 1.4 74% | 2.1 60% |
| Gamma | 2.102 105% | 2.07 106% | 2.17 101% | 2.18 101% | 2.21 100% |
| CCT | 6143 106% | 6628 98% | 6608 98% | 6608 98% | 6364 102% |
| Total Average (Program / Settings) | -6% /
14% | 55% /
47% | 80% /
94% | 48% /
39% |
* ... smaller is better
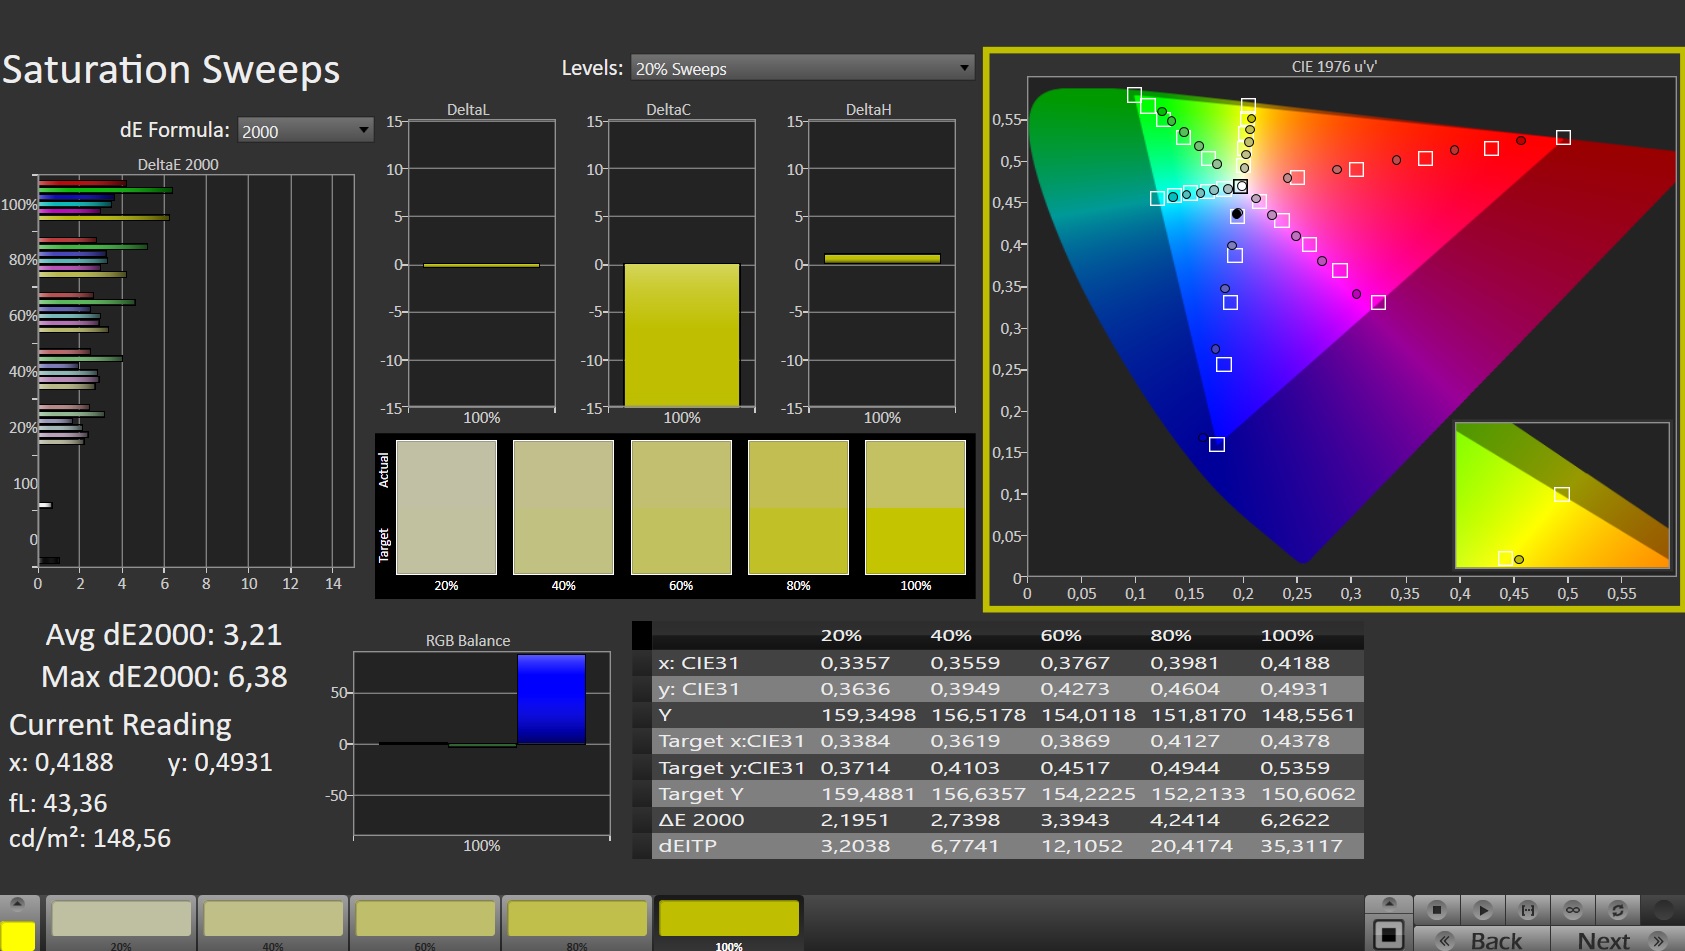
虽然745:1的对比度和286 cd/m²的平均亮度相当差(户外使用需要至少350 cd/m²),但全高清显示屏并没有显示任何其他主要缺点。93%的sRGB覆盖率和22至32毫秒的响应时间对于一台经济型多媒体笔记本电脑来说是可以的。色彩准确性也是如此。如果你排除了微妙的红色色调,这可以通过校准来纠正(我们的ICC文件链接在上面的亮度图旁边),该面板提供了一个坚实的色彩再现。
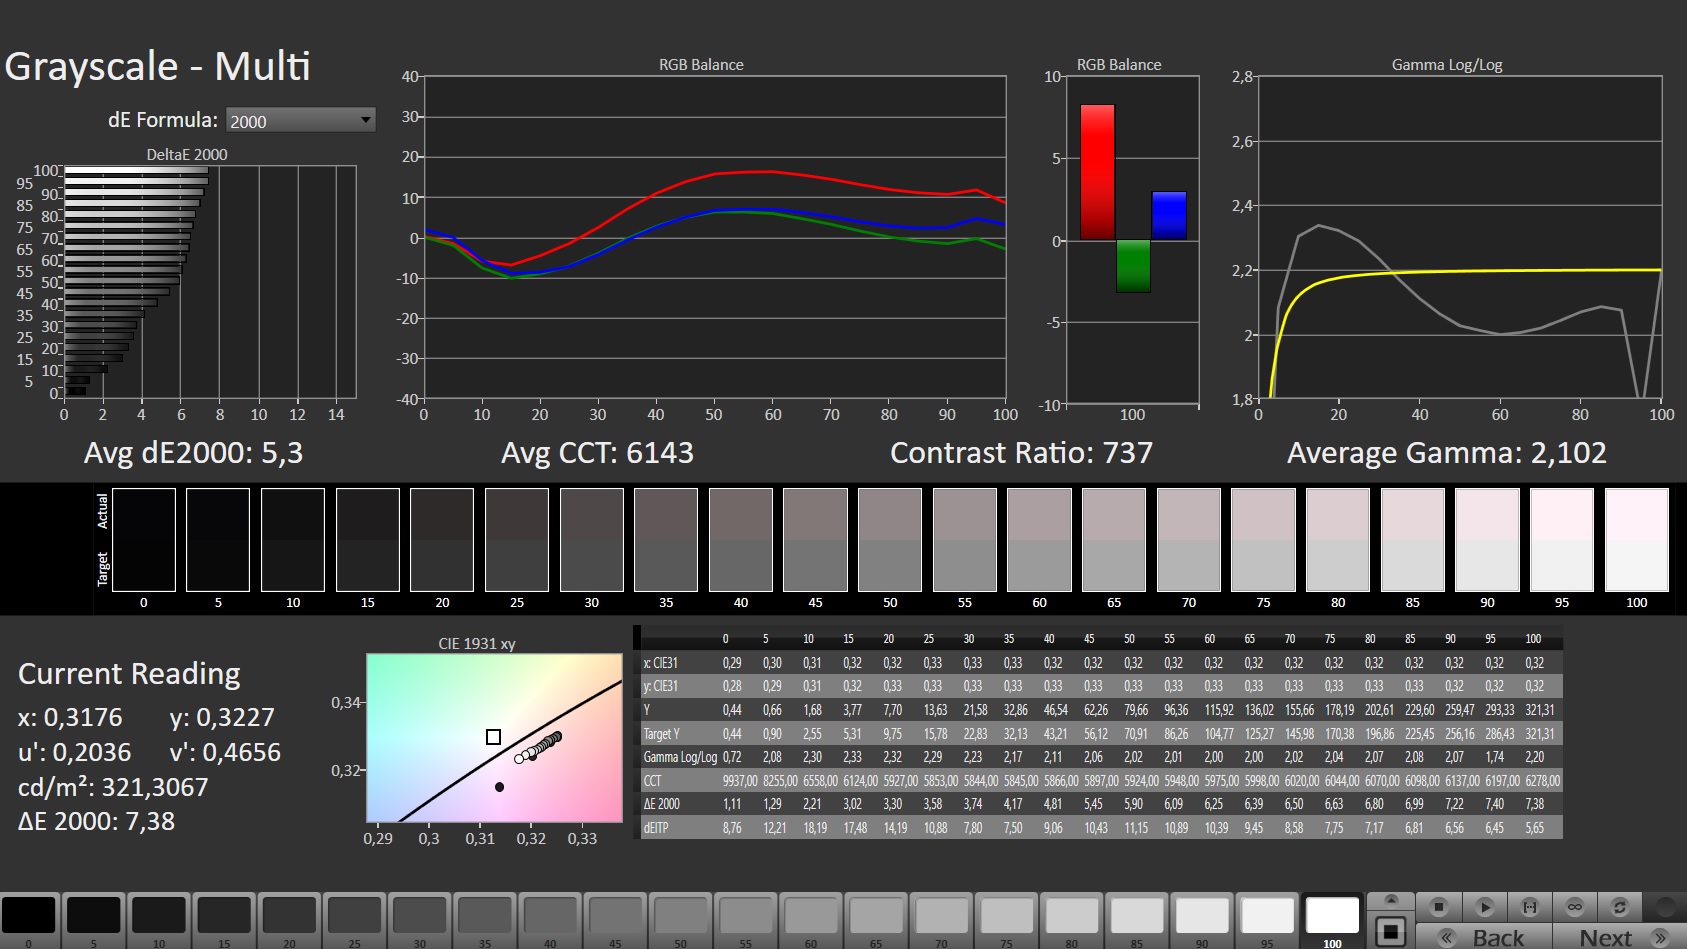
可视角度是典型的IPS水平,这意味着即使从斜向位置看,它们仍然相当稳定。
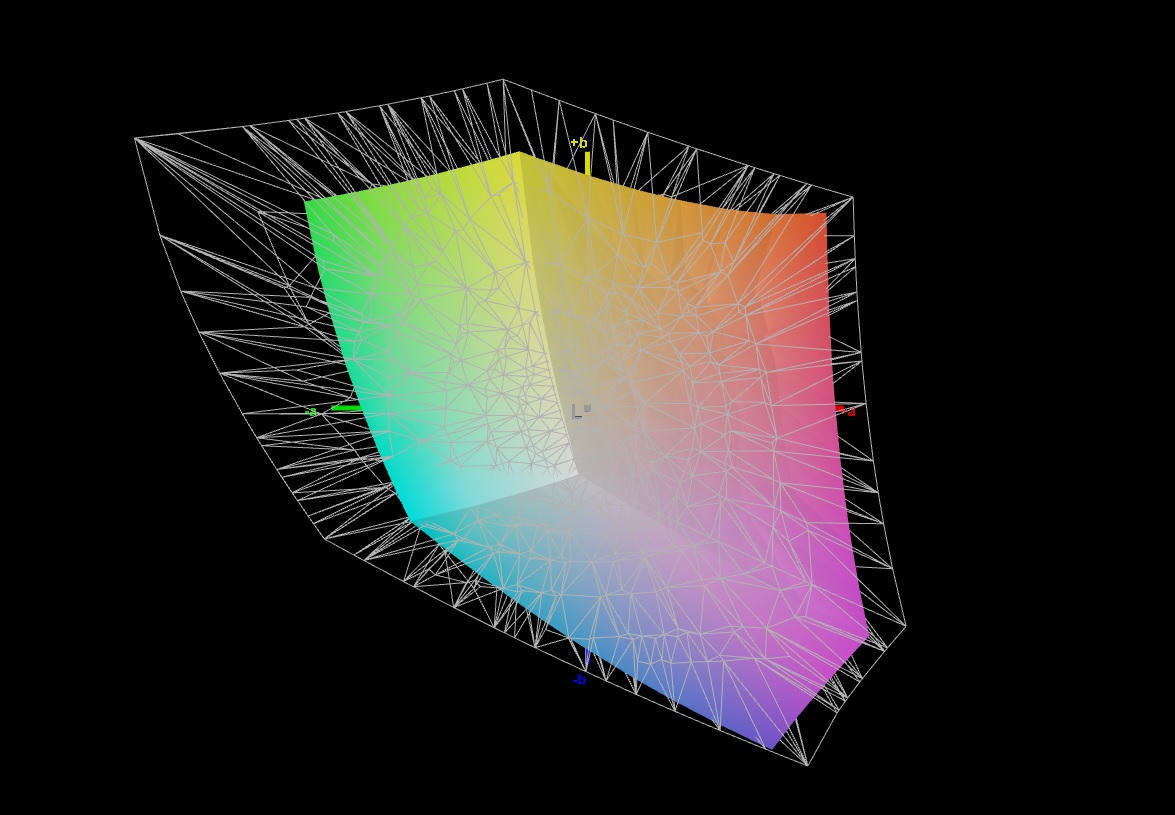
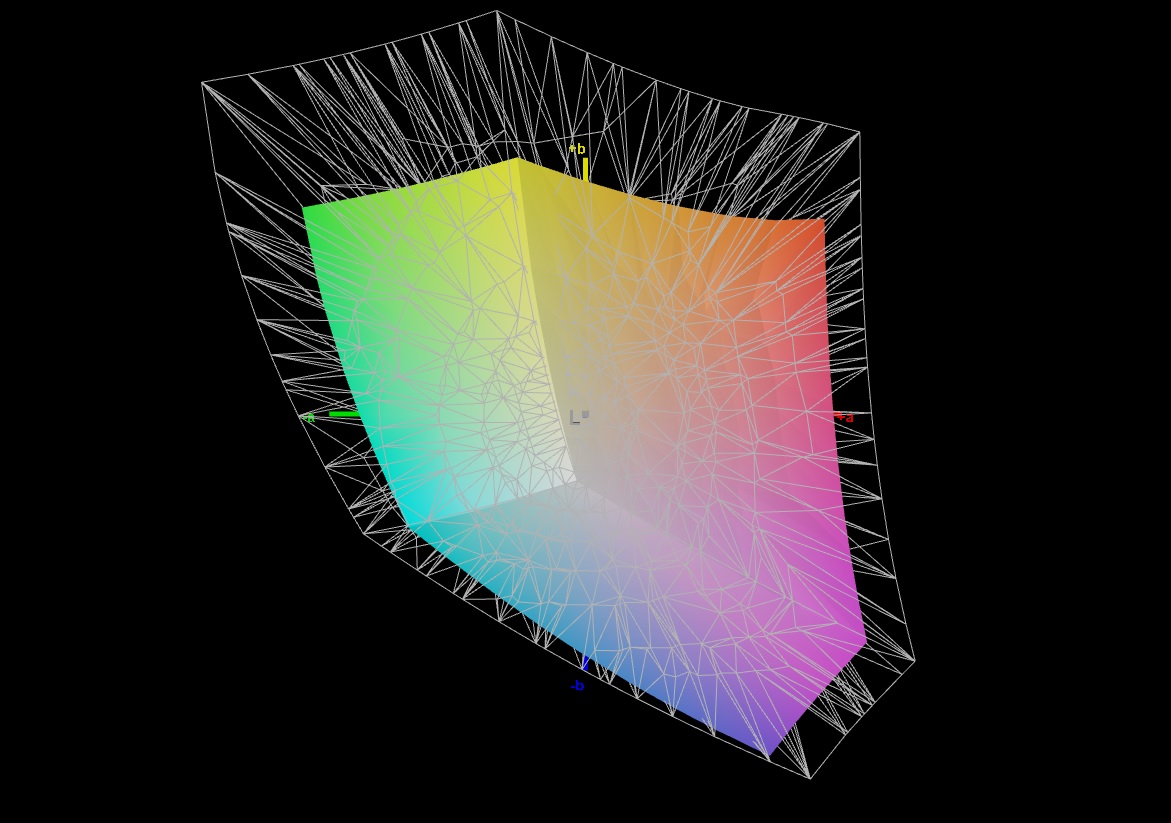
VivoBook 15 Pro、Zenbook Pro 15和XPS 15表明,在这方面花更多钱是值得的。它们的OLED显示屏在几乎所有的学科上都取得了更好的成绩--无论是色彩空间、响应时间、色彩再现、亮度、黑度,还是对比度。作为回报,Inspiron不需要PWM/闪烁。
Display Response Times
| ↔ Response Time Black to White | ||
|---|---|---|
| 21.6 ms ... rise ↗ and fall ↘ combined | ↗ 11.1 ms rise | 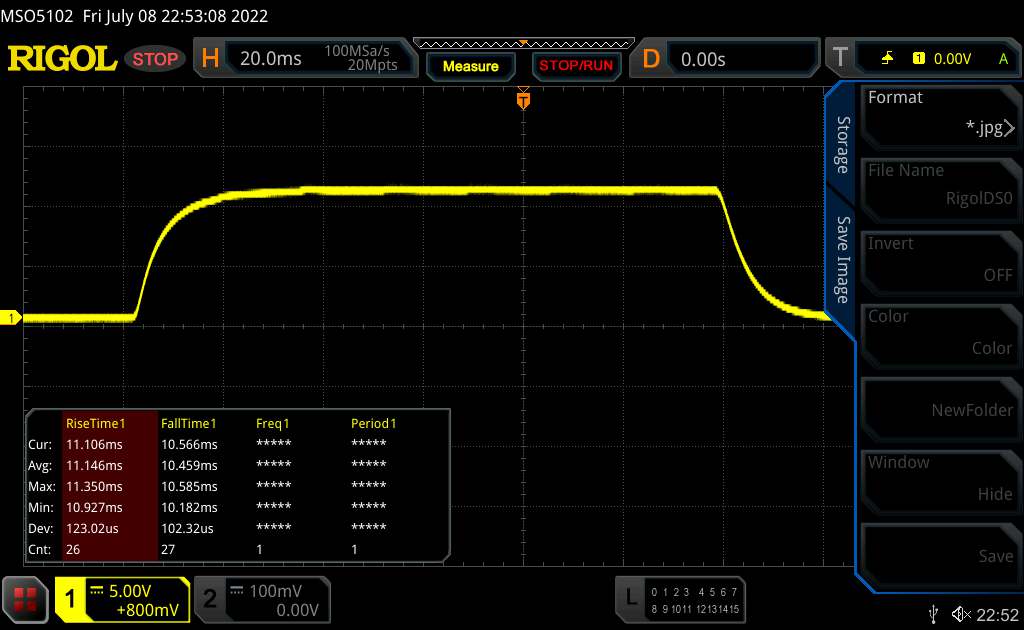 |
| ↘ 10.5 ms fall | ||
| The screen shows good response rates in our tests, but may be too slow for competitive gamers. In comparison, all tested devices range from 0.1 (minimum) to 240 (maximum) ms. » 48 % of all devices are better. This means that the measured response time is similar to the average of all tested devices (19.8 ms). | ||
| ↔ Response Time 50% Grey to 80% Grey | ||
| 31.6 ms ... rise ↗ and fall ↘ combined | ↗ 14.4 ms rise | 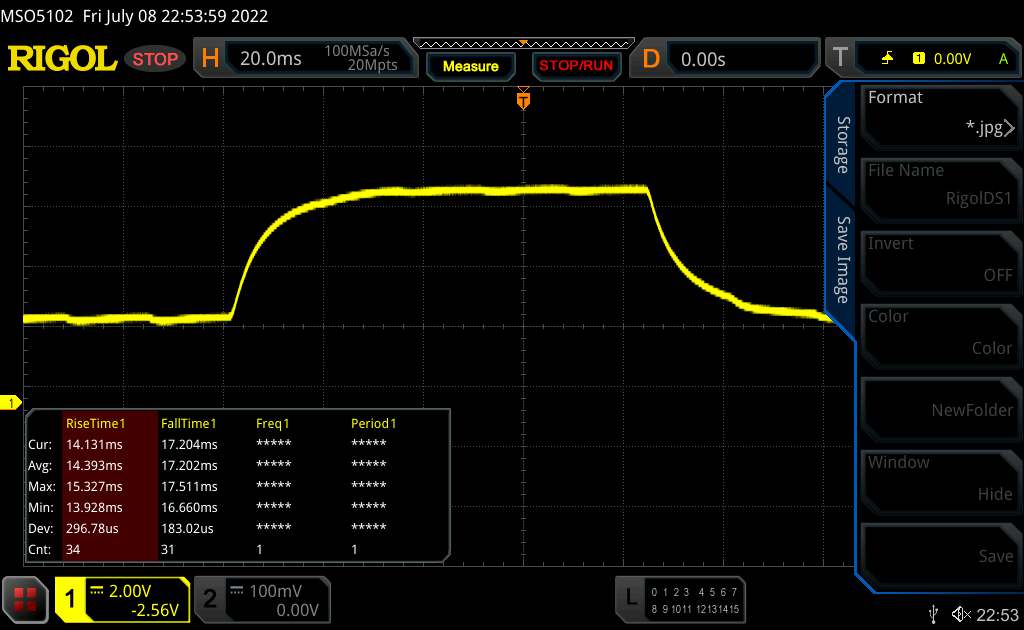 |
| ↘ 17.2 ms fall | ||
| The screen shows slow response rates in our tests and will be unsatisfactory for gamers. In comparison, all tested devices range from 0.165 (minimum) to 636 (maximum) ms. » 43 % of all devices are better. This means that the measured response time is similar to the average of all tested devices (31 ms). | ||
Screen Flickering / PWM (Pulse-Width Modulation)
| Screen flickering / PWM not detected | 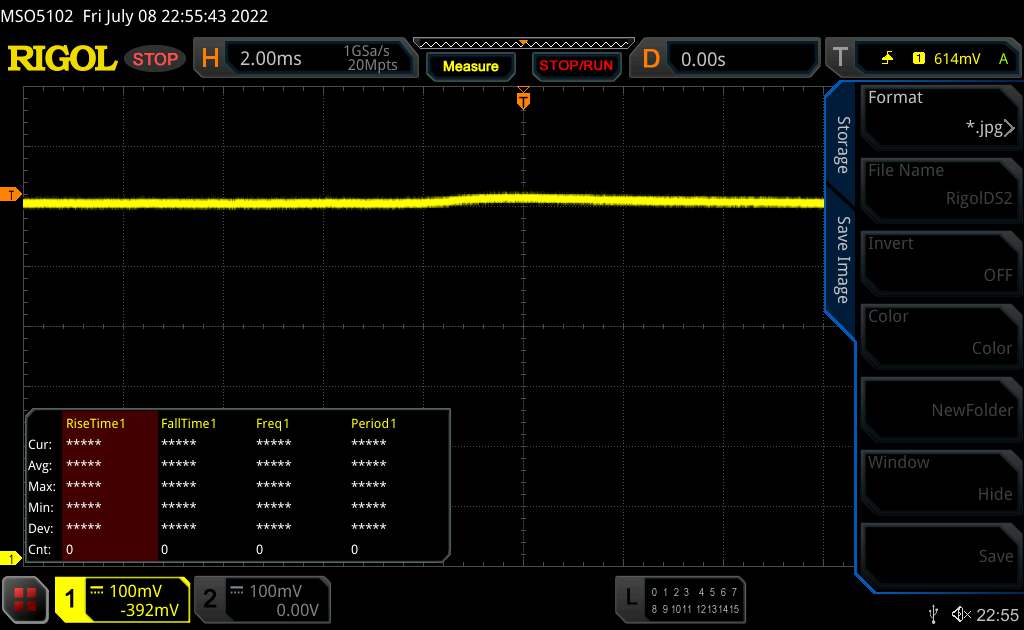 | ||
In comparison: 52 % of all tested devices do not use PWM to dim the display. If PWM was detected, an average of 7757 (minimum: 5 - maximum: 343500) Hz was measured. | |||
业绩
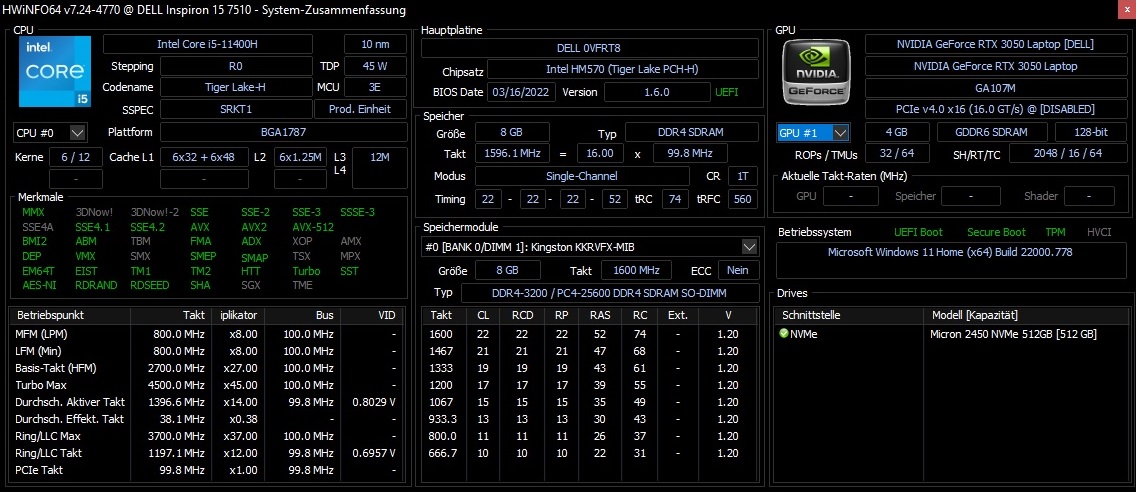
15 Plus是一款真正的中档笔记本电脑。在我们的评测配置中,组件是很平衡的,尽管只提供8GB的内存已经达到了极限,最好能扩展到16GB的双通道内存。
测试条件
不同的配置文件隐藏在预装的 "我的戴尔 "软件的 "性能"、"设置"、"温度 "下。我们所有的测量都是使用 "优化 "模式进行的,该模式默认是激活的。另外,"冷却"、"安静 "和 "超性能 "模式仍可选择。
处理器
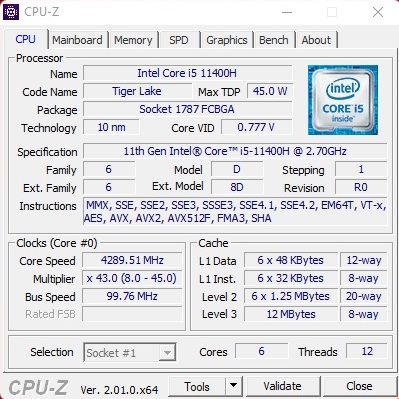
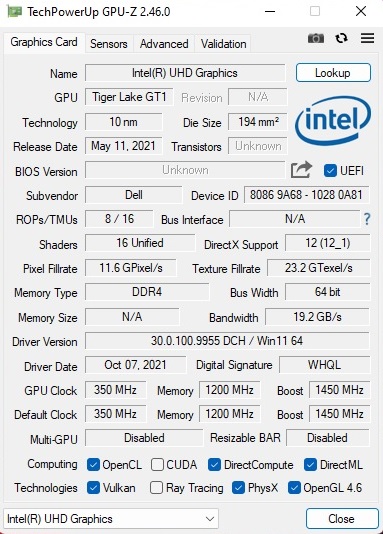
低价版Inspiron 15 Plus配备了一个六核处理器(通过超线程实现12个线程)。酷睿i5-11400H是基于英特尔的Tiger Lake 代,已经不完全是最新的了。它有12MB的L3缓存,最大时钟频率为4.5GHz。
尽管在Cinebench R15循环测试中速度保持相当稳定,但酷睿i5-11400H无法与AMD的六核竞争者,即 Ryzen 5 5600H,在性能方面。正如预期的那样,更昂贵的酷睿i7-11800H八核芯片完全无法达到。同样的情况发生在 Ryzen 9 5900HX.然而,酷睿i5-11400H对于典型的多媒体任务是完全足够的,它提供了一个平衡的性能。
Cinebench R15 Multi endurance test
* ... smaller is better
AIDA64: FP32 Ray-Trace | FPU Julia | CPU SHA3 | CPU Queen | FPU SinJulia | FPU Mandel | CPU AES | CPU ZLib | FP64 Ray-Trace | CPU PhotoWorxx
| Performance rating | |
| Asus Zenbook Pro 15 OLED UM535Q | |
| Average of class Multimedia | |
| Asus VivoBook 15 Pro M3500QC-L1062 | |
| Average Intel Core i5-11400H | |
| Dell Inspiron 15 Plus | |
| Dell Inspiron 16 Plus 7610 -9! | |
| Dell XPS 15 9510 11800H RTX 3050 Ti OLED -9! | |
| AIDA64 / FP32 Ray-Trace | |
| Average of class Multimedia (2214 - 50388, n=53, last 2 years) | |
| Asus Zenbook Pro 15 OLED UM535Q | |
| Asus VivoBook 15 Pro M3500QC-L1062 | |
| Average Intel Core i5-11400H (9569 - 10878, n=4) | |
| Dell Inspiron 15 Plus | |
| AIDA64 / FPU Julia | |
| Asus Zenbook Pro 15 OLED UM535Q | |
| Average of class Multimedia (12867 - 201874, n=54, last 2 years) | |
| Asus VivoBook 15 Pro M3500QC-L1062 | |
| Average Intel Core i5-11400H (40926 - 45602, n=4) | |
| Dell Inspiron 15 Plus | |
| AIDA64 / CPU SHA3 | |
| Average of class Multimedia (626 - 8623, n=54, last 2 years) | |
| Asus Zenbook Pro 15 OLED UM535Q | |
| Average Intel Core i5-11400H (2692 - 3103, n=4) | |
| Dell Inspiron 15 Plus | |
| Asus VivoBook 15 Pro M3500QC-L1062 | |
| AIDA64 / CPU Queen | |
| Asus Zenbook Pro 15 OLED UM535Q | |
| Asus VivoBook 15 Pro M3500QC-L1062 | |
| Average of class Multimedia (13483 - 181505, n=41, last 2 years) | |
| Average Intel Core i5-11400H (69196 - 70253, n=4) | |
| Dell Inspiron 15 Plus | |
| AIDA64 / FPU SinJulia | |
| Asus Zenbook Pro 15 OLED UM535Q | |
| Average of class Multimedia (886 - 28794, n=54, last 2 years) | |
| Asus VivoBook 15 Pro M3500QC-L1062 | |
| Average Intel Core i5-11400H (7038 - 7214, n=4) | |
| Dell Inspiron 15 Plus | |
| AIDA64 / FPU Mandel | |
| Asus Zenbook Pro 15 OLED UM535Q | |
| Average of class Multimedia (6395 - 105740, n=53, last 2 years) | |
| Asus VivoBook 15 Pro M3500QC-L1062 | |
| Average Intel Core i5-11400H (24039 - 27242, n=4) | |
| Dell Inspiron 15 Plus | |
| AIDA64 / CPU AES | |
| Asus Zenbook Pro 15 OLED UM535Q | |
| Average Intel Core i5-11400H (99449 - 107459, n=4) | |
| Dell Inspiron 15 Plus | |
| Asus VivoBook 15 Pro M3500QC-L1062 | |
| Average of class Multimedia (8171 - 126790, n=54, last 2 years) | |
| AIDA64 / CPU ZLib | |
| Average of class Multimedia (143.8 - 2022, n=54, last 2 years) | |
| Asus Zenbook Pro 15 OLED UM535Q | |
| Asus VivoBook 15 Pro M3500QC-L1062 | |
| Dell Inspiron 15 Plus | |
| Average Intel Core i5-11400H (531 - 593, n=5) | |
| Dell XPS 15 9510 11800H RTX 3050 Ti OLED | |
| Dell Inspiron 16 Plus 7610 | |
| AIDA64 / FP64 Ray-Trace | |
| Average of class Multimedia (1014 - 26875, n=54, last 2 years) | |
| Asus Zenbook Pro 15 OLED UM535Q | |
| Asus VivoBook 15 Pro M3500QC-L1062 | |
| Average Intel Core i5-11400H (5293 - 5884, n=4) | |
| Dell Inspiron 15 Plus | |
| AIDA64 / CPU PhotoWorxx | |
| Average of class Multimedia (8187 - 88154, n=54, last 2 years) | |
| Asus Zenbook Pro 15 OLED UM535Q | |
| Average Intel Core i5-11400H (8770 - 24104, n=4) | |
| Asus VivoBook 15 Pro M3500QC-L1062 | |
| Dell Inspiron 15 Plus | |
系统性能
糟糕的内存配置是导致系统性能只够在测试领域排在最后一位的原因之一。由于有了更快的CPU和16GB而不是8GB的内存,16英寸Inspiron 16 Plus的兄弟姐妹机型在PCMark 10中领先20%以上。
CrossMark: Overall | Productivity | Creativity | Responsiveness
| PCMark 10 / Score | |
| Average of class Multimedia (4325 - 10386, n=52, last 2 years) | |
| Asus Zenbook Pro 15 OLED UM535Q | |
| Dell Inspiron 16 Plus 7610 | |
| Dell XPS 15 9510 11800H RTX 3050 Ti OLED | |
| Asus VivoBook 15 Pro M3500QC-L1062 | |
| Average Intel Core i5-11400H, NVIDIA GeForce RTX 3050 4GB Laptop GPU (5136 - 5895, n=2) | |
| Dell Inspiron 15 Plus | |
| PCMark 10 / Essentials | |
| Average of class Multimedia (8025 - 11664, n=51, last 2 years) | |
| Asus Zenbook Pro 15 OLED UM535Q | |
| Asus VivoBook 15 Pro M3500QC-L1062 | |
| Dell Inspiron 16 Plus 7610 | |
| Dell XPS 15 9510 11800H RTX 3050 Ti OLED | |
| Average Intel Core i5-11400H, NVIDIA GeForce RTX 3050 4GB Laptop GPU (8610 - 9155, n=2) | |
| Dell Inspiron 15 Plus | |
| PCMark 10 / Productivity | |
| Average of class Multimedia (7323 - 18233, n=51, last 2 years) | |
| Asus Zenbook Pro 15 OLED UM535Q | |
| Asus VivoBook 15 Pro M3500QC-L1062 | |
| Dell Inspiron 16 Plus 7610 | |
| Dell XPS 15 9510 11800H RTX 3050 Ti OLED | |
| Average Intel Core i5-11400H, NVIDIA GeForce RTX 3050 4GB Laptop GPU (8149 - 8506, n=2) | |
| Dell Inspiron 15 Plus | |
| PCMark 10 / Digital Content Creation | |
| Average of class Multimedia (3651 - 16240, n=51, last 2 years) | |
| Asus Zenbook Pro 15 OLED UM535Q | |
| Dell Inspiron 16 Plus 7610 | |
| Dell XPS 15 9510 11800H RTX 3050 Ti OLED | |
| Asus VivoBook 15 Pro M3500QC-L1062 | |
| Average Intel Core i5-11400H, NVIDIA GeForce RTX 3050 4GB Laptop GPU (5242 - 7140, n=2) | |
| Dell Inspiron 15 Plus | |
| CrossMark / Overall | |
| Average of class Multimedia (866 - 2728, n=60, last 2 years) | |
| Asus Zenbook Pro 15 OLED UM535Q | |
| CrossMark / Productivity | |
| Average of class Multimedia (931 - 2489, n=60, last 2 years) | |
| Asus Zenbook Pro 15 OLED UM535Q | |
| CrossMark / Creativity | |
| Average of class Multimedia (907 - 3465, n=60, last 2 years) | |
| Asus Zenbook Pro 15 OLED UM535Q | |
| CrossMark / Responsiveness | |
| Average of class Multimedia (605 - 2024, n=60, last 2 years) | |
| Asus Zenbook Pro 15 OLED UM535Q | |
| PCMark 10 Score | 5136 points | |
Help | ||
| AIDA64 / Memory Copy | |
| Average of class Multimedia (11299 - 132135, n=54, last 2 years) | |
| Asus Zenbook Pro 15 OLED UM535Q | |
| Asus VivoBook 15 Pro M3500QC-L1062 | |
| Average Intel Core i5-11400H (20513 - 42471, n=4) | |
| Dell Inspiron 15 Plus | |
| AIDA64 / Memory Read | |
| Average of class Multimedia (11624 - 174586, n=54, last 2 years) | |
| Asus VivoBook 15 Pro M3500QC-L1062 | |
| Asus Zenbook Pro 15 OLED UM535Q | |
| Average Intel Core i5-11400H (23172 - 48221, n=4) | |
| Dell Inspiron 15 Plus | |
| AIDA64 / Memory Write | |
| Average of class Multimedia (11755 - 134998, n=54, last 2 years) | |
| Asus Zenbook Pro 15 OLED UM535Q | |
| Asus VivoBook 15 Pro M3500QC-L1062 | |
| Average Intel Core i5-11400H (21862 - 45893, n=4) | |
| Dell Inspiron 15 Plus | |
| AIDA64 / Memory Latency | |
| Average of class Multimedia (7 - 535, n=53, last 2 years) | |
| Asus Zenbook Pro 15 OLED UM535Q | |
| Dell Inspiron 15 Plus | |
| Asus VivoBook 15 Pro M3500QC-L1062 | |
| Average Intel Core i5-11400H (73.3 - 95.9, n=5) | |
| Dell XPS 15 9510 11800H RTX 3050 Ti OLED | |
| Dell Inspiron 16 Plus 7610 | |
* ... smaller is better
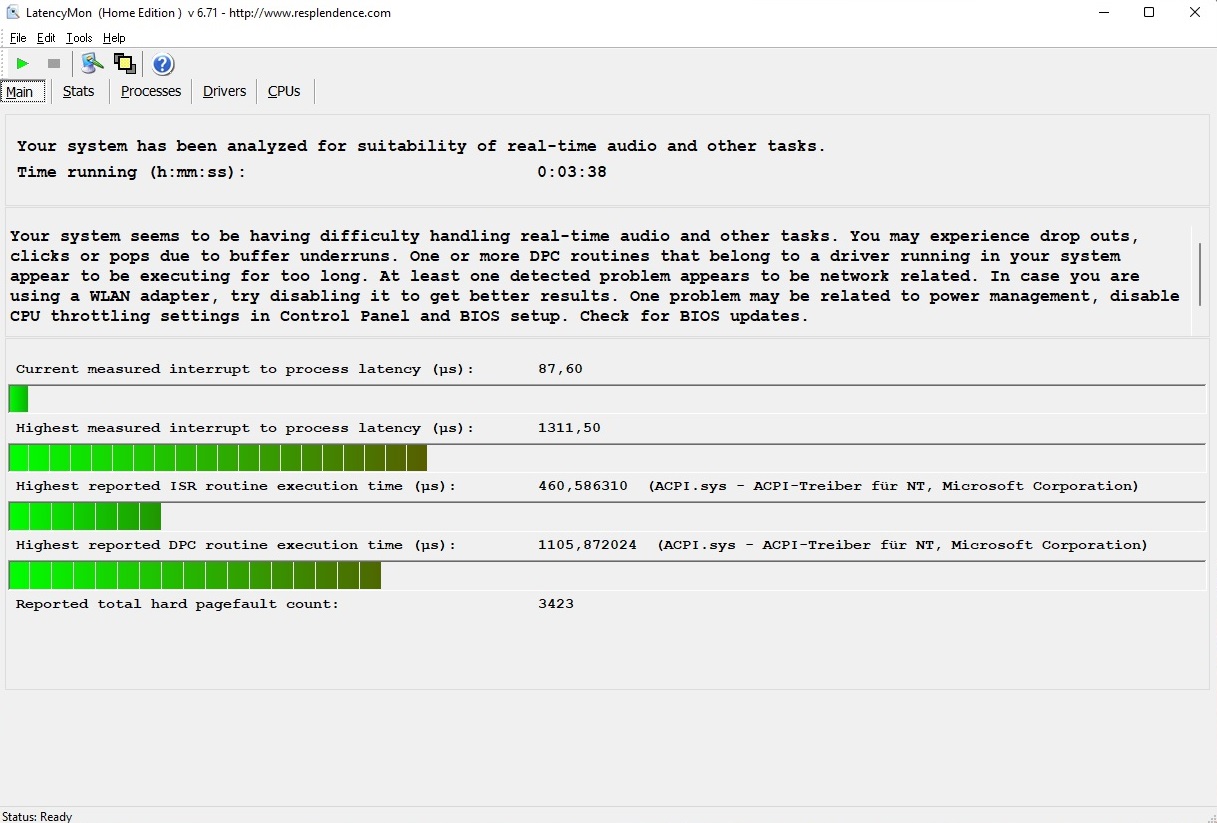
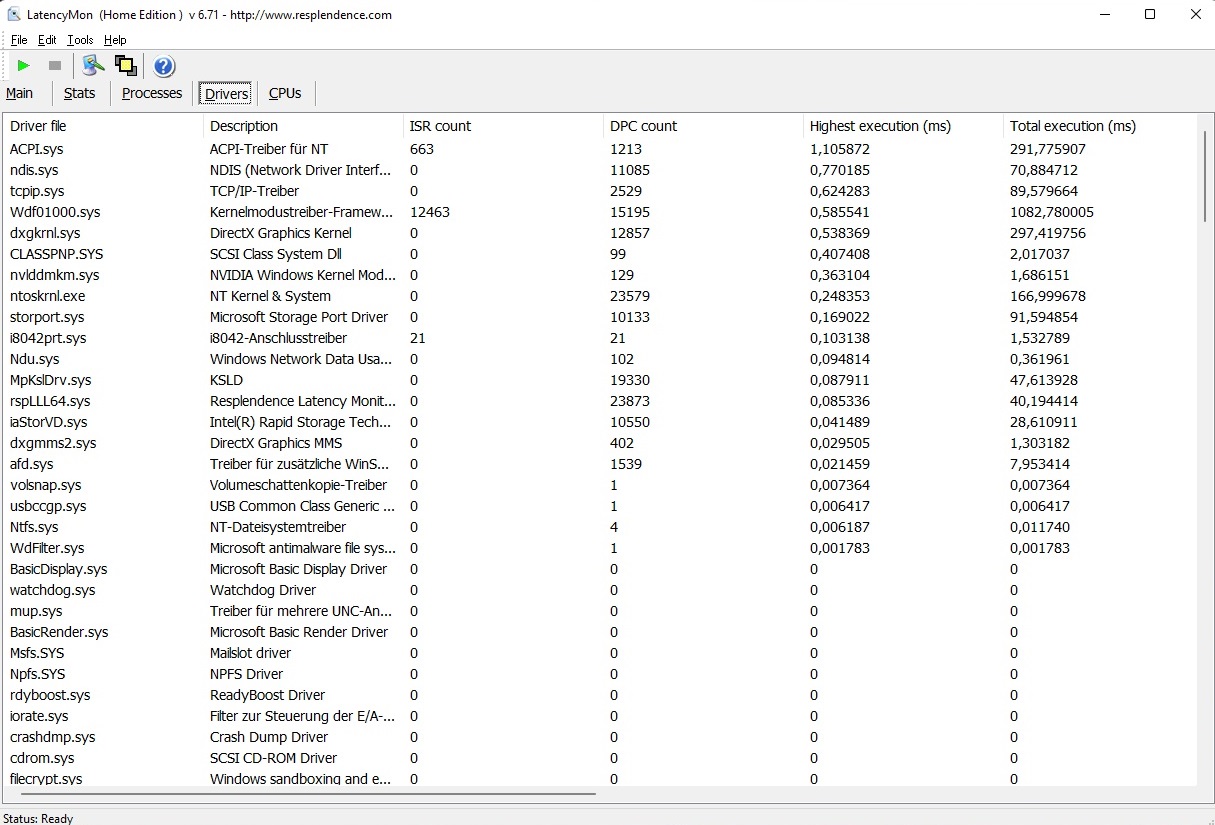
DPC延迟
在延迟测试中,这台15英寸的机器在其竞争对手之间安然无恙。根据LatencyMon工具,Inspiron 15 Plus不是实时音频和视频编辑的理想选择,除非做出调整。
| DPC Latencies / LatencyMon - interrupt to process latency (max), Web, Youtube, Prime95 | |
| Dell XPS 15 9510 11800H RTX 3050 Ti OLED | |
| Dell Inspiron 16 Plus 7610 | |
| Dell Inspiron 15 Plus | |
| Asus VivoBook 15 Pro M3500QC-L1062 | |
| Asus Zenbook Pro 15 OLED UM535Q | |
* ... smaller is better
储存
正如现代笔记本电脑所预期的那样,一个基于M.2的NVMe固态硬盘被用于大容量存储。内置的美光2450的512GB版本在我们的基准测试课程中提供了一个体面的性能。在理想情况下,连续速度分别超过2100MB/s(读取)和1300MB/s(写入)。从长远来看,需要更多存储空间的用户可以为该设备添加第二个M.2驱动器。

* ... smaller is better
Continuous load read: DiskSpd Read Loop, Queue Depth 8
图形卡
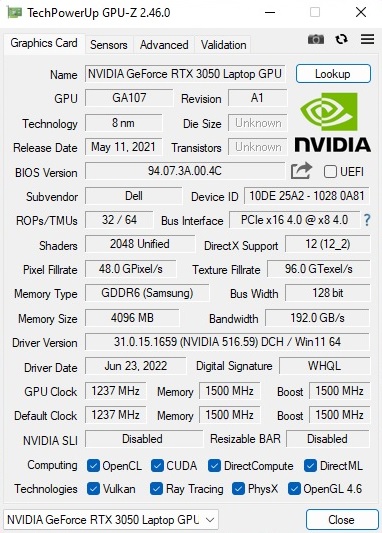
NvidiaGeForce RTX 3050是一款适用于多媒体笔记本电脑的好显卡。基于安培一代的DirectX 12模型有2,048个着色器和4GB GDDR6显存。就像你对当前Nvidia芯片的期望一样,性能极其依赖于TGP设置。在65瓦(包括动态提升),戴尔选择了一个既不高也不低的数值;相反,它的目标是中端,这与整体概念是一致的。
在图形基准测试中没有任何不正常或令人惊讶的情况。3DMark基准测试的GPU得分证明,Inspiron 15 Plus提供了一个稳定的性能,与竞争对手基本持平。
注:我们随后在笔记本上添加了第二个8GB模块,以便为测试目的实现16GB双通道配置。在3DMark 11中,物理和综合得分因此而大量增加,总体得分提高了10%以上(GPU得分几乎没有变化)。
| 3DMark 11 Performance | 12990 points | |
| 3DMark Cloud Gate Standard Score | 28274 points | |
| 3DMark Fire Strike Score | 10953 points | |
| 3DMark Time Spy Score | 4508 points | |
Help | ||
游戏性能
GeForce RTX 3050的游戏性能因标题、分辨率和质量水平的不同而有很大差异。虽然老的或要求不高的游戏,如《奇异旅团》和吸血鬼血猎在原生全高清分辨率下运行流畅,即使是最大的细节,但在CPU密集型或VRAM重的游戏中,Inspiron 15 Plus很快就达到了极限,例如 战争之神和Cyberpunk 2077因此,必须将细节降低到中等水平。
一般来说,你不应该期待RTX 3050的光线追踪。 F1 22例如,在全RT状态下会出现严重的停滞。可怜的单通道内存在中等设置和分辨率下再次变得明显。在某些情况下,具有可比性的TGP的其他RTX 3050笔记本电脑明显领先。
| The Witcher 3 | |
| 1920x1080 High Graphics & Postprocessing (Nvidia HairWorks Off) | |
| Dell Inspiron 16 Plus 7610 | |
| Asus Zenbook Pro 15 OLED UM535Q | |
| Average of class Multimedia (22 - 224, n=7, last 2 years) | |
| Average NVIDIA GeForce RTX 3050 4GB Laptop GPU (53.5 - 105.1, n=17) | |
| Dell Inspiron 15 Plus | |
| 1920x1080 Ultra Graphics & Postprocessing (HBAO+) | |
| Average of class Multimedia (11 - 121, n=7, last 2 years) | |
| Dell Inspiron 16 Plus 7610 | |
| Asus Zenbook Pro 15 OLED UM535Q | |
| Average NVIDIA GeForce RTX 3050 4GB Laptop GPU (31.5 - 55.8, n=21) | |
| Dell Inspiron 15 Plus | |
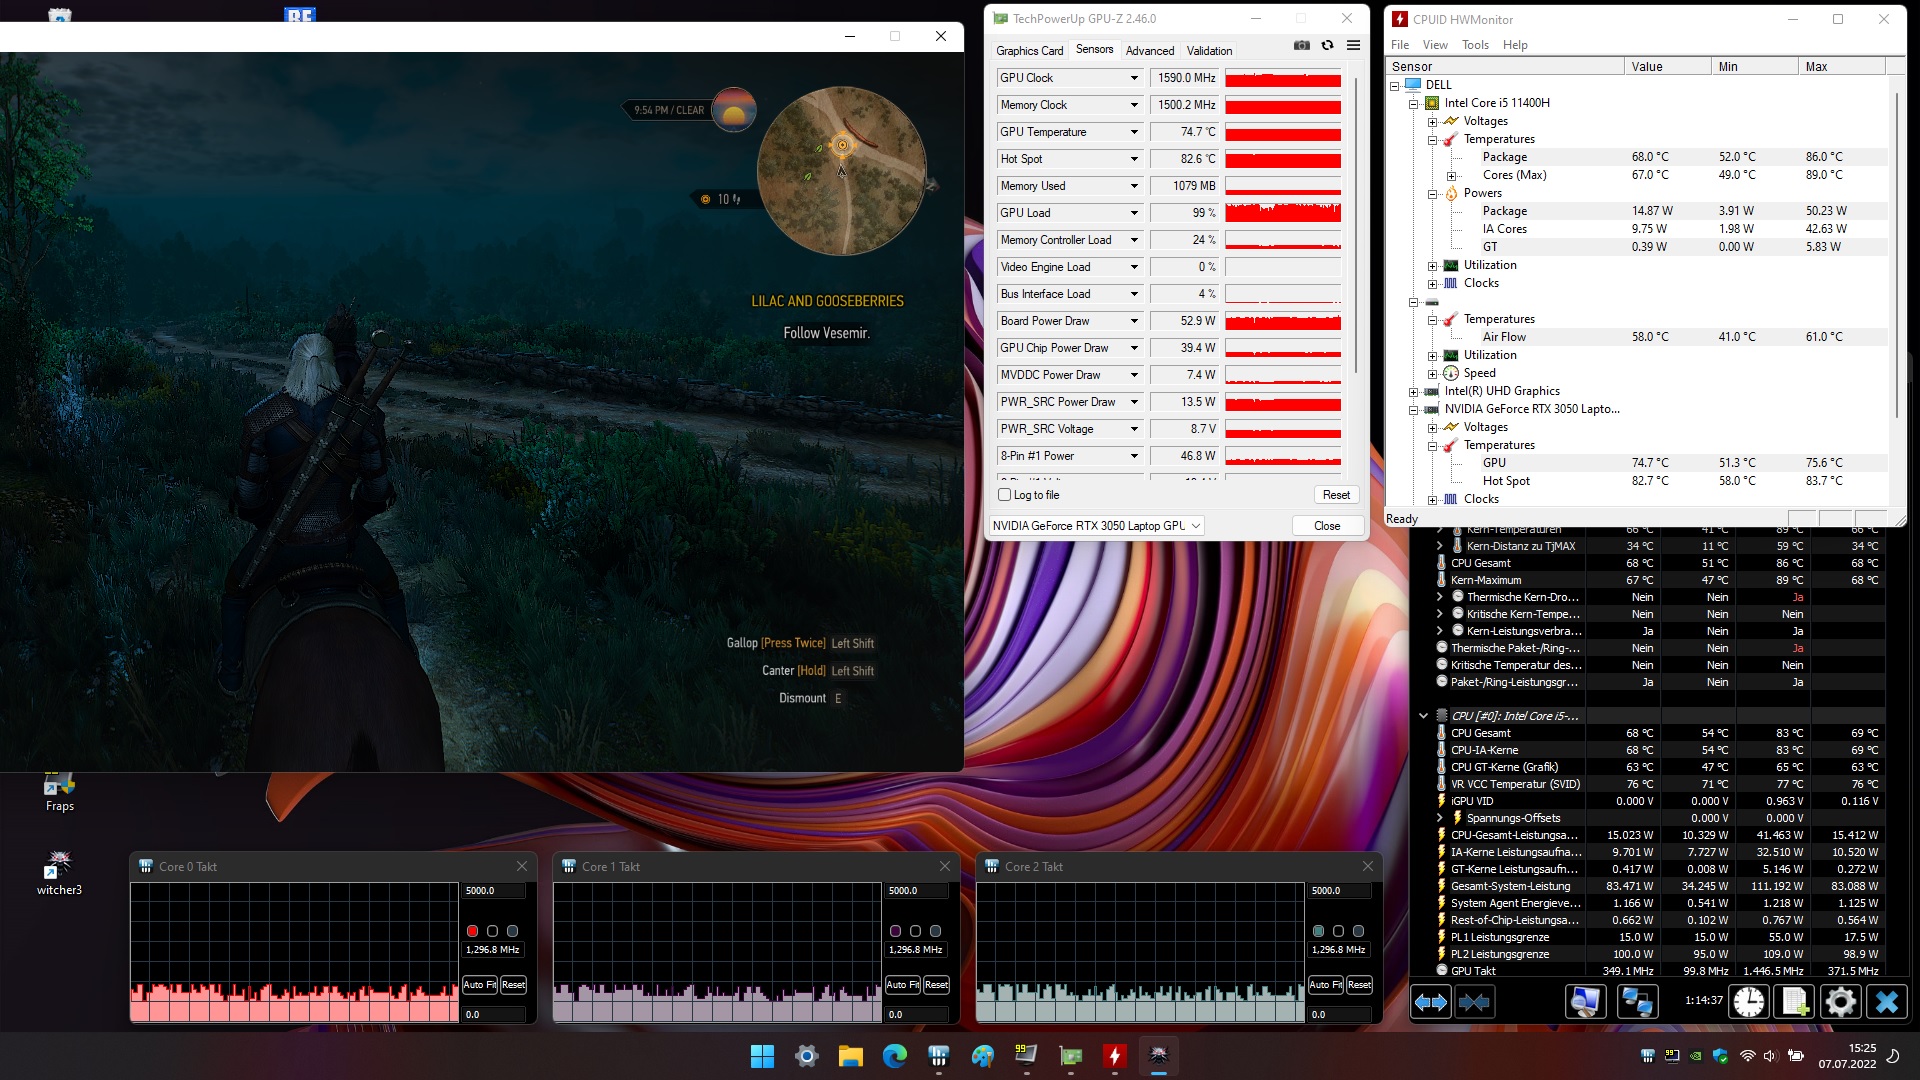
为了评估3D性能在较长一段时间内的表现,我们运行了角色扮演游戏游戏 Witcher 3在最大设置下运行了60分钟。你可以从图中看到,不时有短暂的性能下降或停顿。一个奇怪的事实是:一个小时后,当FPS测量已经结束时,CPU也开始节流(与压力测试部分的截图相比)。
The Witcher 3 FPS diagram
| low | med. | high | ultra | |
|---|---|---|---|---|
| GTA V (2015) | 117.3 | 96.2 | 58.6 | |
| The Witcher 3 (2015) | 125 | 73.3 | 43.9 | |
| Dota 2 Reborn (2015) | 91.1 | 90.3 | 84 | 82.8 |
| Final Fantasy XV Benchmark (2018) | 51.9 | 40 | ||
| X-Plane 11.11 (2018) | 83.8 | 68.3 | 56 | |
| Far Cry 5 (2018) | 64 | 62 | 58 | |
| Strange Brigade (2018) | 120 | 95.7 | 82.3 | |
| God of War (2022) | 42 | 34.8 | 23.4 | |
| Rainbow Six Extraction (2022) | 87 | 84 | 56 | |
| Dying Light 2 (2022) | 33.7 | 28.5 | ||
| GRID Legends (2022) | 72.4 | 66.4 | 58.8 | |
| Elden Ring (2022) | 38.8 | 37.9 | 37.8 | |
| Cyberpunk 2077 1.6 (2022) | 41.7 | 30.7 | 27.7 | |
| Elex 2 (2022) | 36.9 | 35.9 | 33.2 | |
| Tiny Tina's Wonderlands (2022) | 60 | 46.4 | 35.8 | |
| Vampire Bloodhunt (2022) | 86.7 | 77.2 | 76.6 | |
| F1 22 (2022) | 70 | 61 | 22 | |
| The Quarry (2022) | 49 | 40.3 | 31.7 |
排放
噪声排放
风扇控制并不是戴尔的拿手好戏。Inspiron 15 Plus在这方面也有改进的余地。尽管在空闲使用的较长时间里,风扇经常在一个合适的水平上持续运行,甚至完全关闭,但在执行假定无害的任务时,如与办公室工作、视频和网络浏览有关的任务时,笔记本在静音/安静和可听阶段之间波动(=不必要的速度增加),这可能会使一些买家感到恼火。
一般来说,15英寸机在负载情况下是非常容易听到的。46至48 dB(A)代表了一个明显的可听水平,这对于配备RTX 3050的中端笔记本电脑来说有点令人失望。我们本以为会像华硕VivoBook 15 Pro或戴尔XPS 15那样,在这里有一个较低的噪音水平。
Noise level
| Idle |
| 26 / 28 / 32 dB(A) |
| Load |
| 47 / 48 dB(A) |
 | ||
30 dB silent 40 dB(A) audible 50 dB(A) loud |
||
min: | ||
| Dell Inspiron 15 Plus i5-11400H, GeForce RTX 3050 4GB Laptop GPU | Dell Inspiron 16 Plus 7610 i7-11800H, GeForce RTX 3050 4GB Laptop GPU | Asus VivoBook 15 Pro M3500QC-L1062 R5 5600H, GeForce RTX 3050 4GB Laptop GPU | Dell XPS 15 9510 11800H RTX 3050 Ti OLED i7-11800H, GeForce RTX 3050 Ti Laptop GPU | Asus Zenbook Pro 15 OLED UM535Q R9 5900HX, GeForce RTX 3050 Ti Laptop GPU | |
|---|---|---|---|---|---|
| Noise | 5% | 9% | 17% | 12% | |
| off / environment * (dB) | 26 | 24.4 6% | 24.8 5% | 23.8 8% | 22.8 12% |
| Idle Minimum * (dB) | 26 | 24.4 6% | 24.8 5% | 23.8 8% | 22.9 12% |
| Idle Average * (dB) | 28 | 24.4 13% | 24.8 11% | 23.8 15% | 22.9 18% |
| Idle Maximum * (dB) | 32 | 24.4 24% | 26.4 17% | 23.8 26% | 22.9 28% |
| Load Average * (dB) | 47 | 48.3 -3% | 42.8 9% | 36 23% | 33.2 29% |
| Witcher 3 ultra * (dB) | 46 | 48.9 -6% | 42.8 7% | 36 22% | 47.3 -3% |
| Load Maximum * (dB) | 48 | 48.9 -2% | 42.8 11% | 38.2 20% | 52.8 -10% |
* ... smaller is better
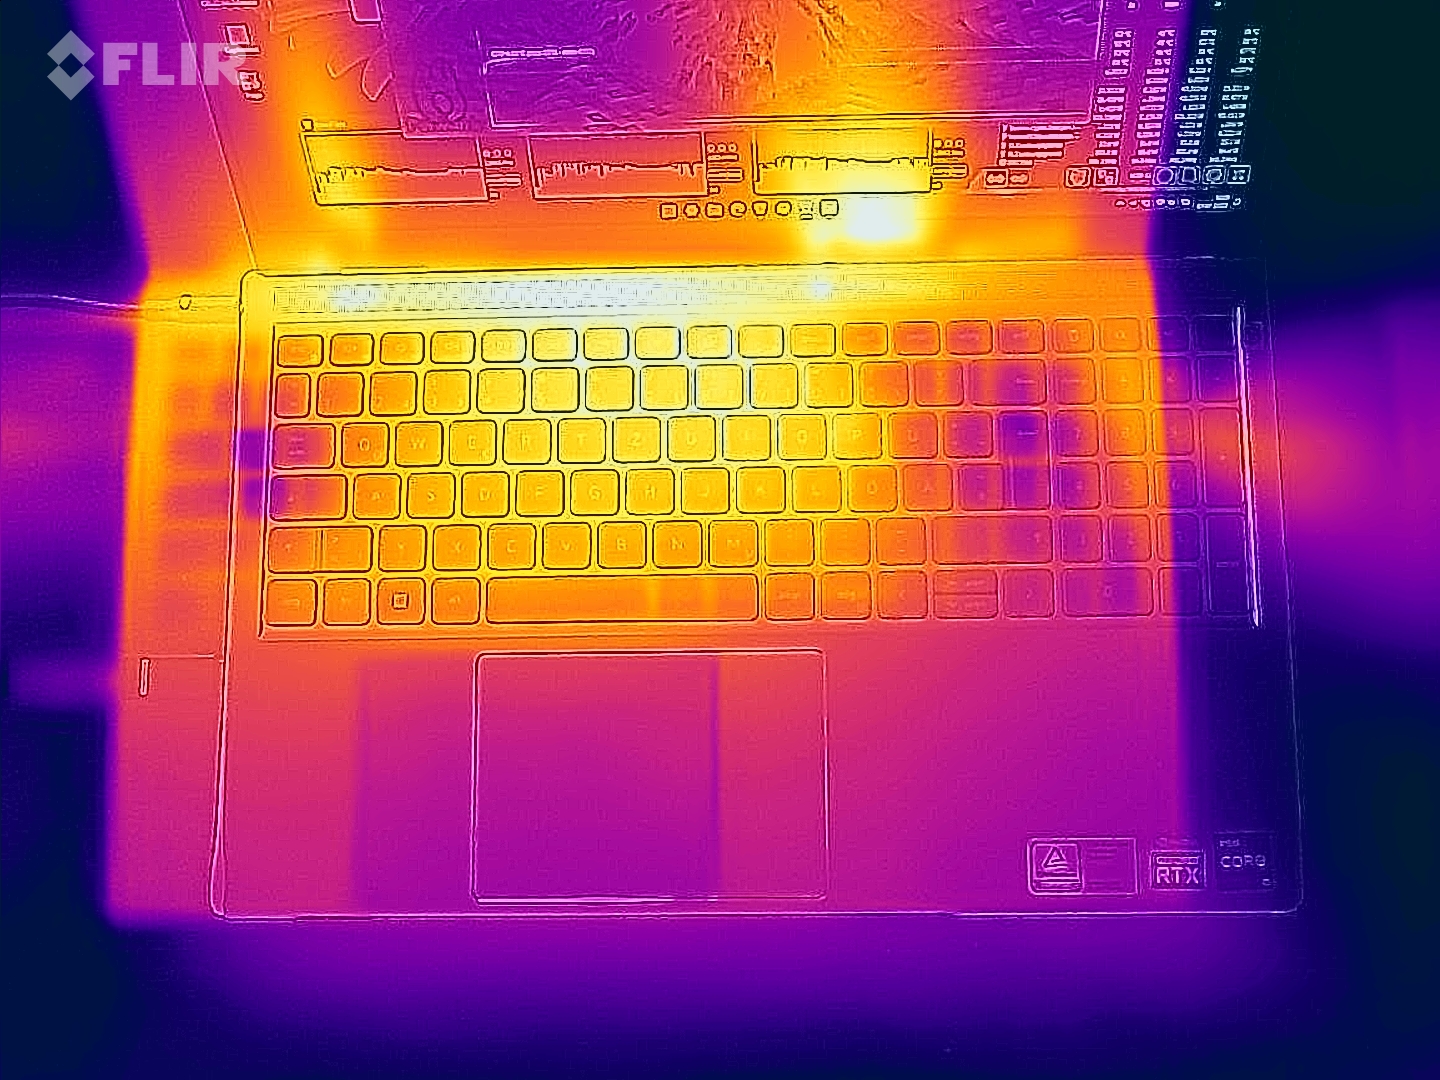
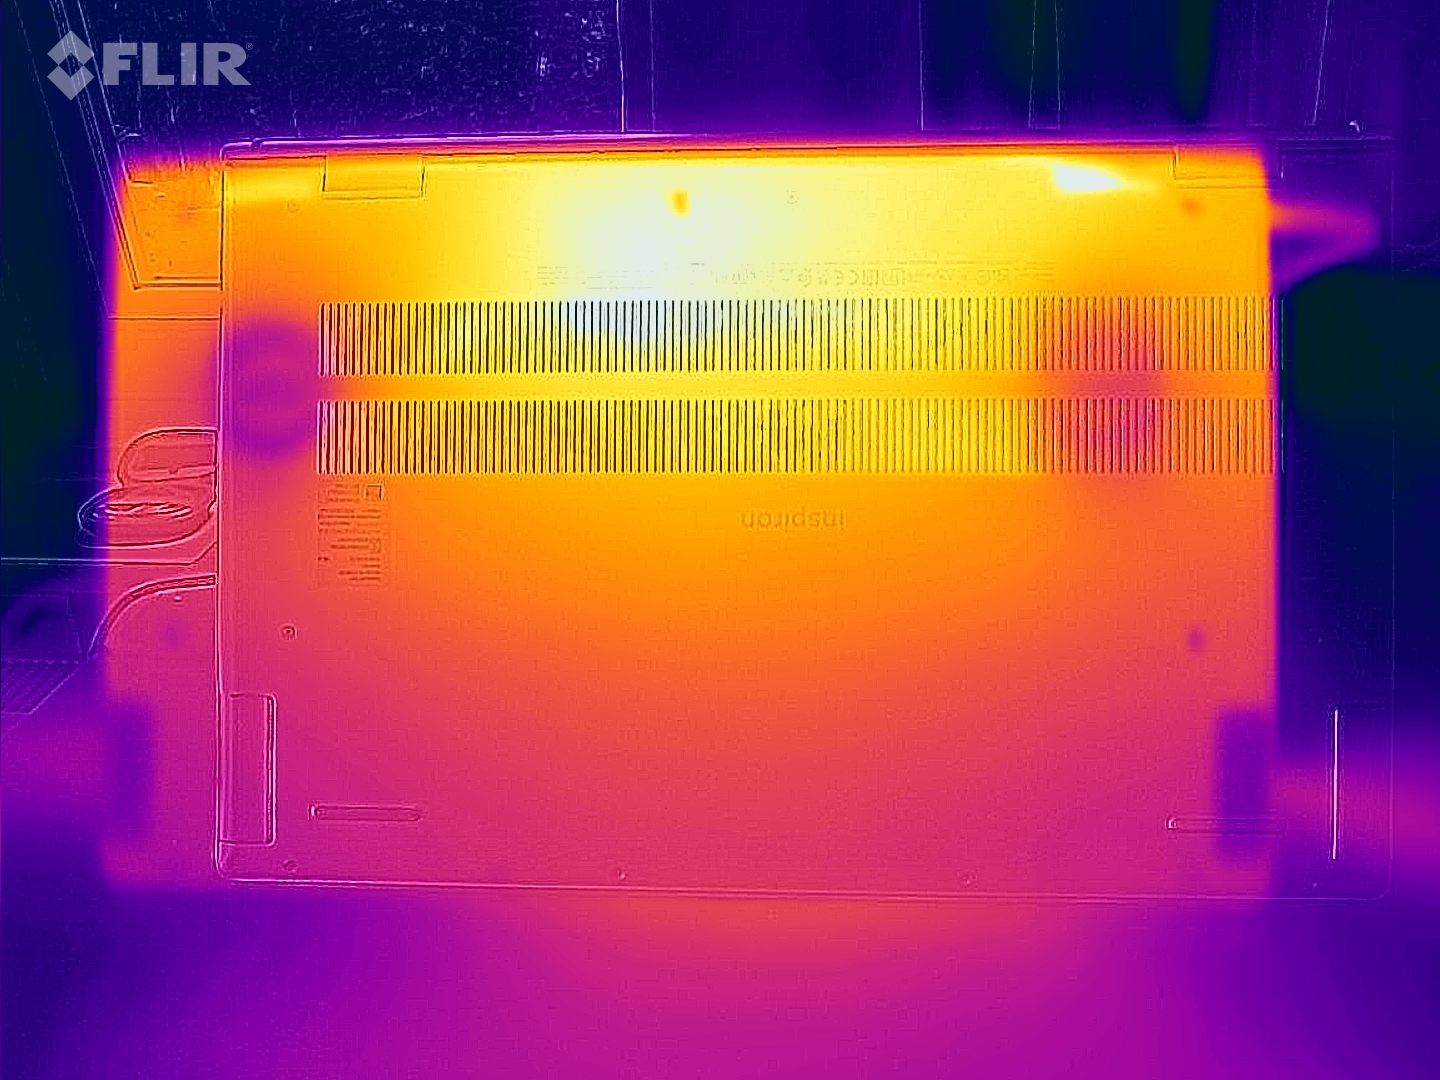
温度
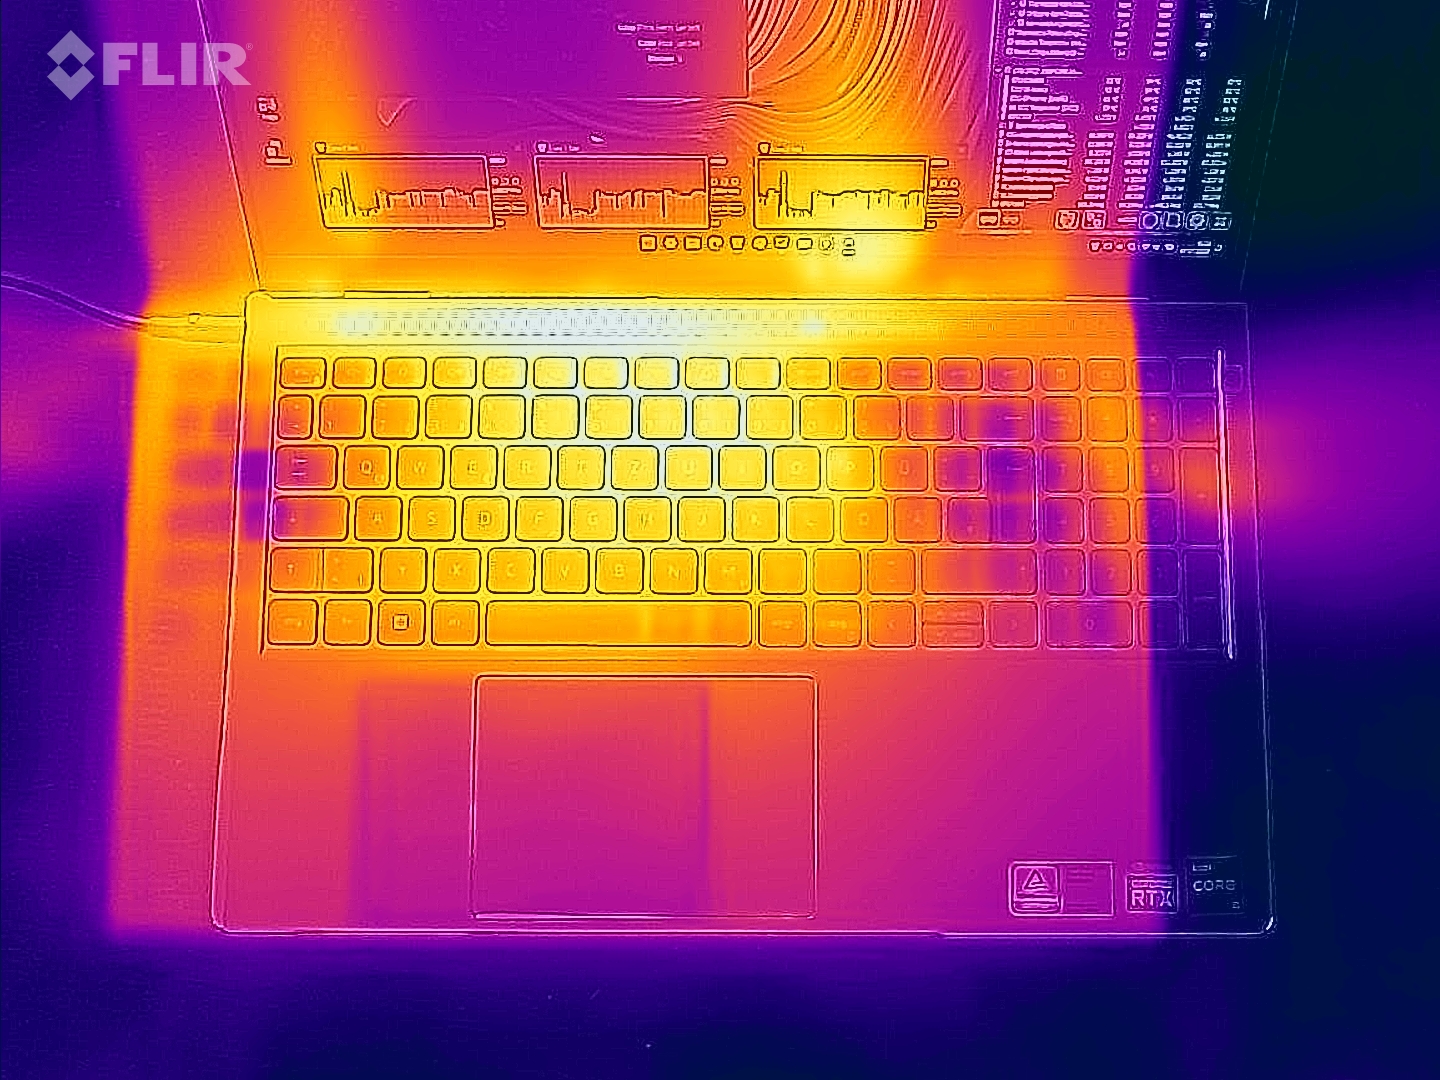
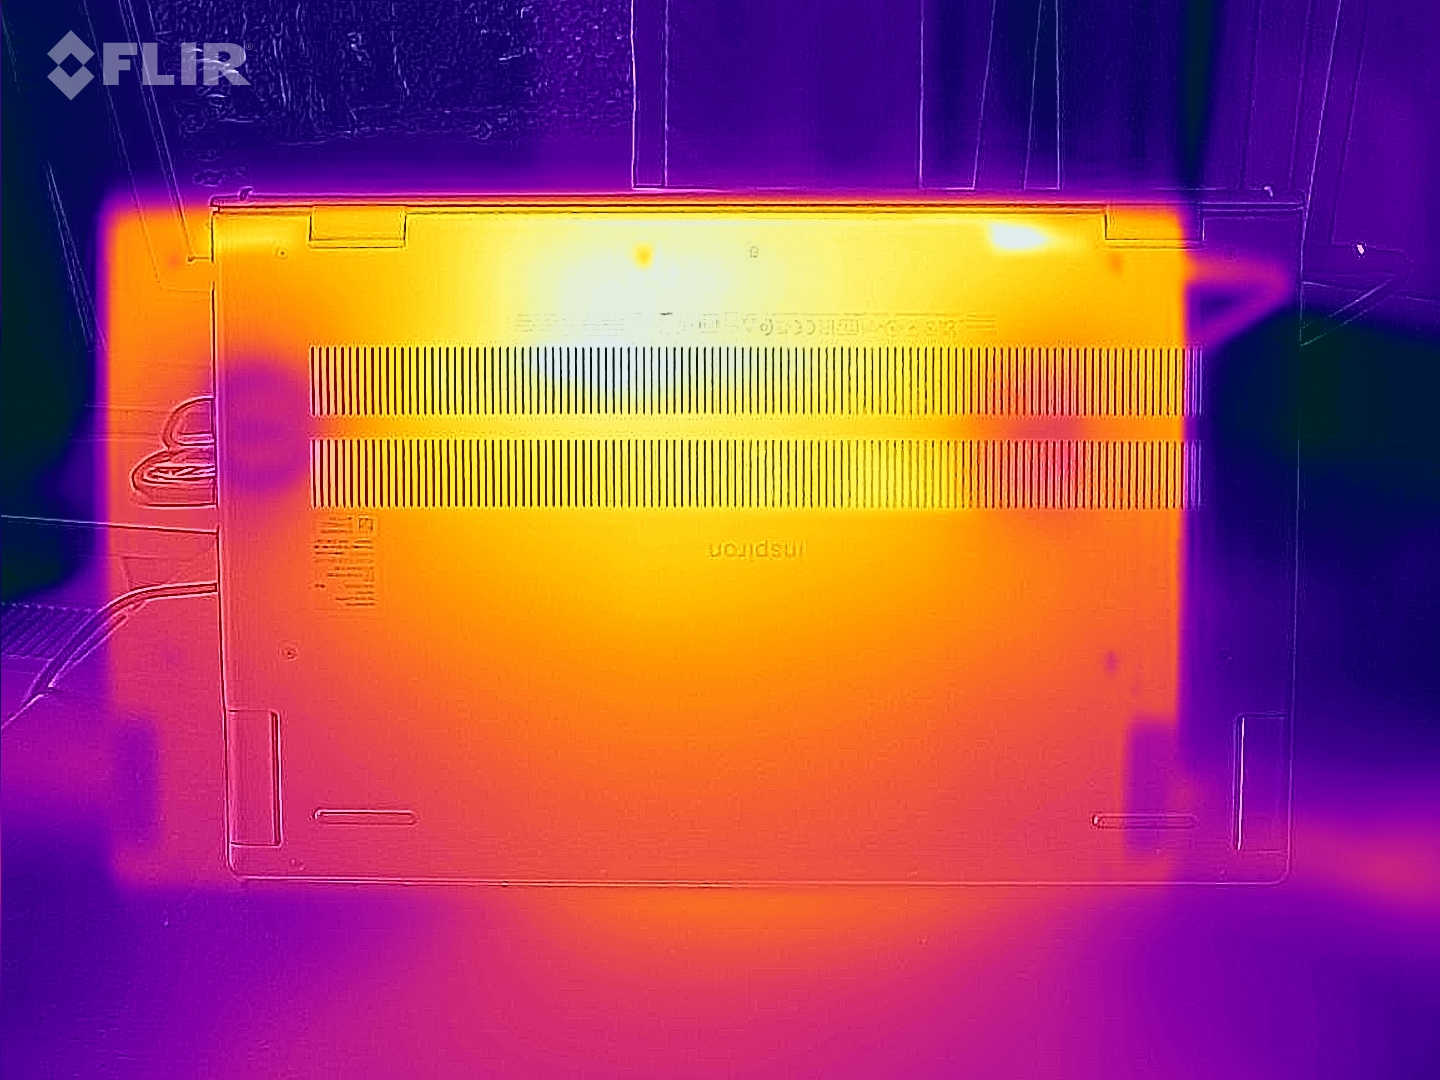
与竞争对手相比,机箱的温度也高于平均水平--尽管CPU比较弱。在用FurMark和Prime95工具进行的压力测试中,顶部的温度高达50℃(约122°F),而底部的温度高达51℃(约124°F)。机箱的闲置温度也不是最佳状态,在30°C(约86°F)至38°C(约100°F)。
(-) The maximum temperature on the upper side is 50 °C / 122 F, compared to the average of 36.8 °C / 98 F, ranging from 21 to 71 °C for the class Multimedia.
(-) The bottom heats up to a maximum of 51 °C / 124 F, compared to the average of 39.1 °C / 102 F
(±) In idle usage, the average temperature for the upper side is 33.8 °C / 93 F, compared to the device average of 31.3 °C / 88 F.
(-) Playing The Witcher 3, the average temperature for the upper side is 43.8 °C / 111 F, compared to the device average of 31.3 °C / 88 F.
(±) The palmrests and touchpad can get very hot to the touch with a maximum of 37 °C / 98.6 F.
(-) The average temperature of the palmrest area of similar devices was 28.7 °C / 83.7 F (-8.3 °C / -14.9 F).
| Dell Inspiron 15 Plus i5-11400H, GeForce RTX 3050 4GB Laptop GPU | Dell Inspiron 16 Plus 7610 i7-11800H, GeForce RTX 3050 4GB Laptop GPU | Asus VivoBook 15 Pro M3500QC-L1062 R5 5600H, GeForce RTX 3050 4GB Laptop GPU | Dell XPS 15 9510 11800H RTX 3050 Ti OLED i7-11800H, GeForce RTX 3050 Ti Laptop GPU | Asus Zenbook Pro 15 OLED UM535Q R9 5900HX, GeForce RTX 3050 Ti Laptop GPU | |
|---|---|---|---|---|---|
| Heat | 4% | 24% | 19% | 7% | |
| Maximum Upper Side * (°C) | 50 | 46.4 7% | 37.8 24% | 45.5 9% | 36 28% |
| Maximum Bottom * (°C) | 51 | 54.8 -7% | 48.4 5% | 44.2 13% | 47.2 7% |
| Idle Upper Side * (°C) | 38 | 31.4 17% | 24 37% | 27 29% | 37 3% |
| Idle Bottom * (°C) | 36 | 36.6 -2% | 25.1 30% | 26.7 26% | 39.2 -9% |
* ... smaller is better
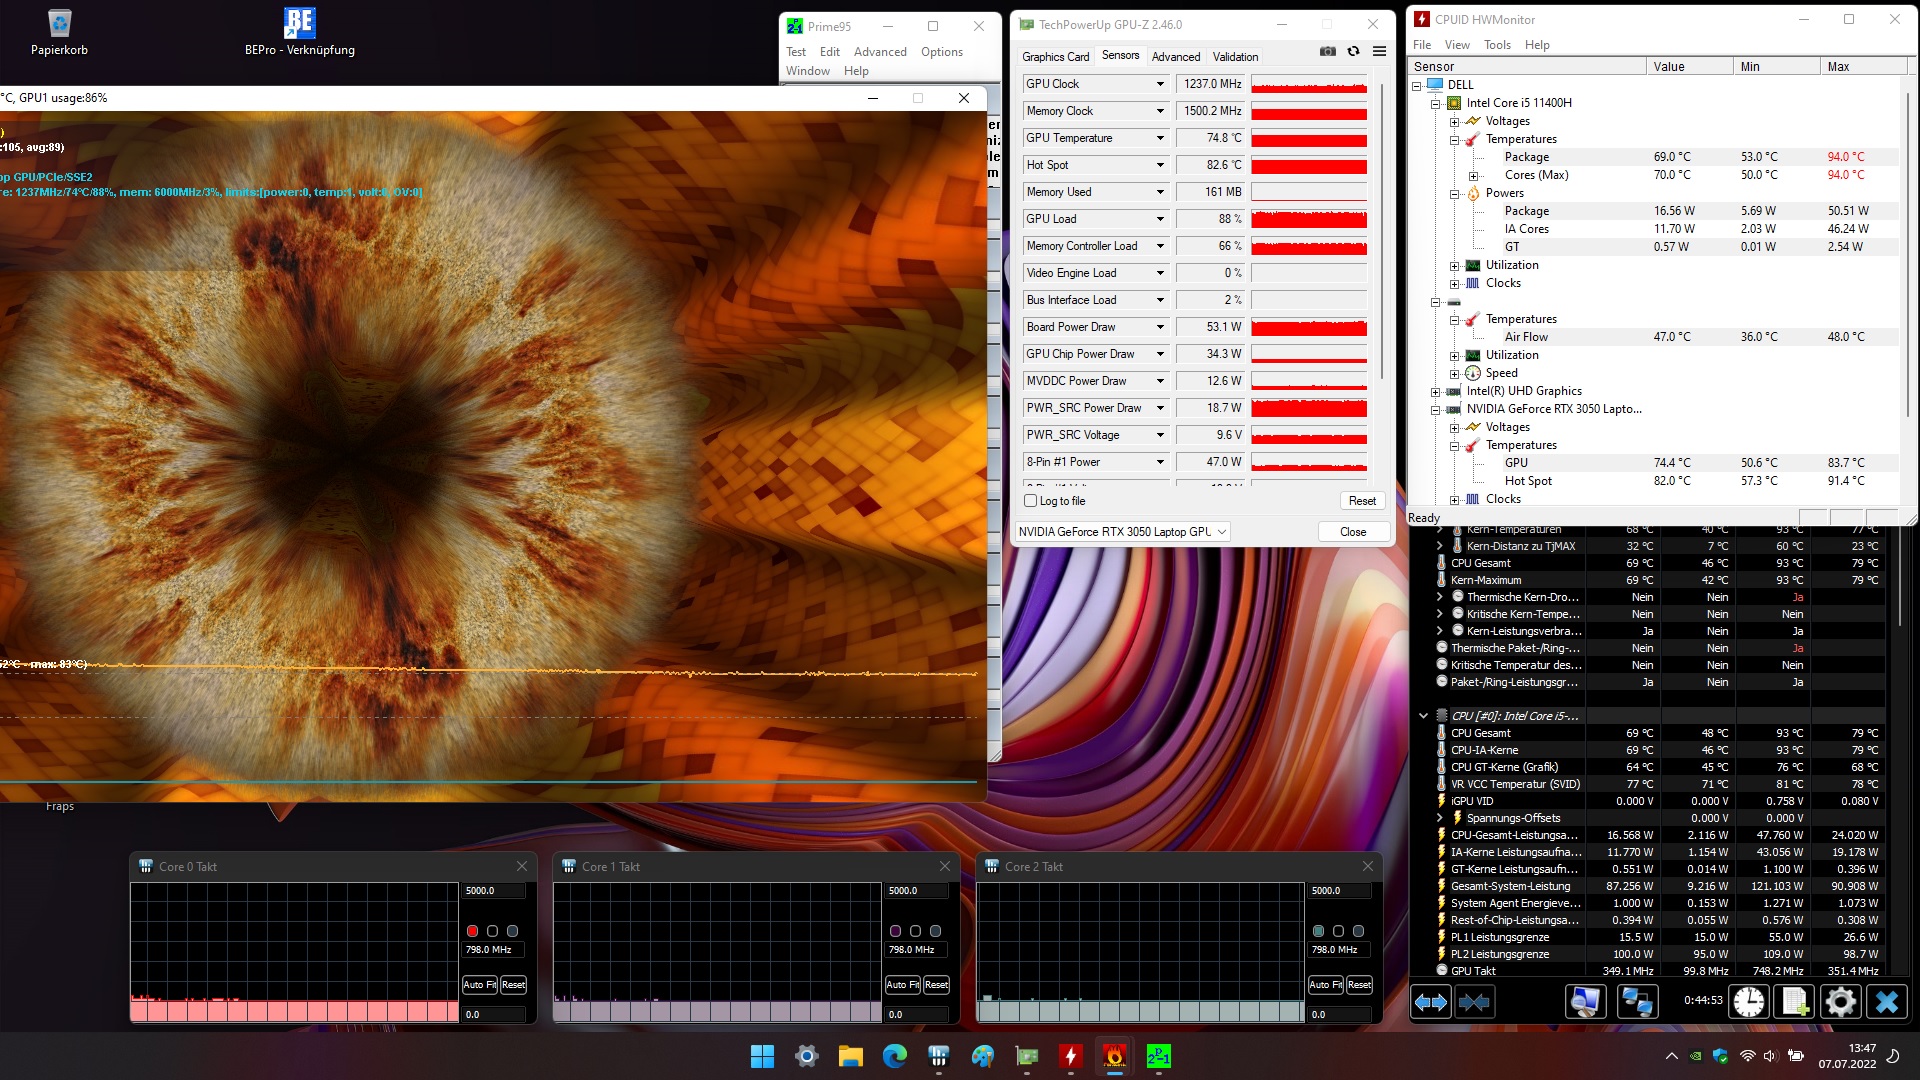
压力测试
关于组件还有几句话。虽然GPU时钟速度在压力测试中没有显示出任何重大波动,但CPU节流到了800MHz。
发言人
除了低沉的音调(微弱的低音)之外,Inspiron 15 Plus的声音绝对是值得尊敬的。根据我们的音频分析,其声音在多媒体笔记本电脑中属于中上水平。最大音量为78 dB(A),还算不错。
Dell Inspiron 15 Plus audio analysis
(±) | speaker loudness is average but good (78 dB)
Bass 100 - 315 Hz
(-) | nearly no bass - on average 20% lower than median
(±) | linearity of bass is average (8.3% delta to prev. frequency)
Mids 400 - 2000 Hz
(+) | balanced mids - only 3.1% away from median
(+) | mids are linear (5.5% delta to prev. frequency)
Highs 2 - 16 kHz
(+) | balanced highs - only 2.5% away from median
(+) | highs are linear (5.1% delta to prev. frequency)
Overall 100 - 16.000 Hz
(±) | linearity of overall sound is average (17.6% difference to median)
Compared to same class
» 50% of all tested devices in this class were better, 7% similar, 43% worse
» The best had a delta of 5%, average was 17%, worst was 45%
Compared to all devices tested
» 35% of all tested devices were better, 8% similar, 57% worse
» The best had a delta of 4%, average was 23%, worst was 134%
Dell Inspiron 16 Plus 7610 audio analysis
(±) | speaker loudness is average but good (75.3 dB)
Bass 100 - 315 Hz
(±) | reduced bass - on average 14.4% lower than median
(±) | linearity of bass is average (8.4% delta to prev. frequency)
Mids 400 - 2000 Hz
(±) | higher mids - on average 5.6% higher than median
(±) | linearity of mids is average (7.9% delta to prev. frequency)
Highs 2 - 16 kHz
(+) | balanced highs - only 3.9% away from median
(±) | linearity of highs is average (7.2% delta to prev. frequency)
Overall 100 - 16.000 Hz
(±) | linearity of overall sound is average (19.3% difference to median)
Compared to same class
» 62% of all tested devices in this class were better, 8% similar, 30% worse
» The best had a delta of 5%, average was 17%, worst was 45%
Compared to all devices tested
» 47% of all tested devices were better, 8% similar, 46% worse
» The best had a delta of 4%, average was 23%, worst was 134%
能源管理
能源消耗
戴尔仍然需要优化笔记本电脑的能源消耗。闲置时9到15瓦的能耗比竞争对手要高一些。即使在负载情况下,对于这种配置的笔记本电脑来说,15英寸的产品也不是特别节俭。
| Off / Standby | |
| Idle | |
| Load |
|
Key:
min: | |
| Dell Inspiron 15 Plus i5-11400H, GeForce RTX 3050 4GB Laptop GPU | Dell Inspiron 16 Plus 7610 i7-11800H, GeForce RTX 3050 4GB Laptop GPU | Asus VivoBook 15 Pro M3500QC-L1062 R5 5600H, GeForce RTX 3050 4GB Laptop GPU | Dell XPS 15 9510 11800H RTX 3050 Ti OLED i7-11800H, GeForce RTX 3050 Ti Laptop GPU | Asus Zenbook Pro 15 OLED UM535Q R9 5900HX, GeForce RTX 3050 Ti Laptop GPU | Average of class Multimedia | |
|---|---|---|---|---|---|---|
| Power Consumption | -1% | 28% | 15% | 21% | 21% | |
| Idle Minimum * (Watt) | 9 | 7.7 14% | 4.7 48% | 7.6 16% | 5.5 39% | 5.66 ? 37% |
| Idle Average * (Watt) | 11 | 10.7 3% | 9.4 15% | 9.9 10% | 7.4 33% | 10.2 ? 7% |
| Idle Maximum * (Watt) | 15 | 16.8 -12% | 10 33% | 10.8 28% | 14.9 1% | 12.5 ? 17% |
| Load Average * (Watt) | 97 | 100.39 -3% | 74.3 23% | 81 16% | 78.2 19% | 65.2 ? 33% |
| Witcher 3 ultra * (Watt) | 100.1 | 108 -8% | 67.7 32% | 76.2 24% | 80.1 20% | |
| Load Maximum * (Watt) | 129 | 129 -0% | 106.9 17% | 131 -2% | 110.9 14% | 113.5 ? 12% |
* ... smaller is better
Energy consumption during The Witcher 3 / stress test
Energy consumption with an external monitor
电池寿命
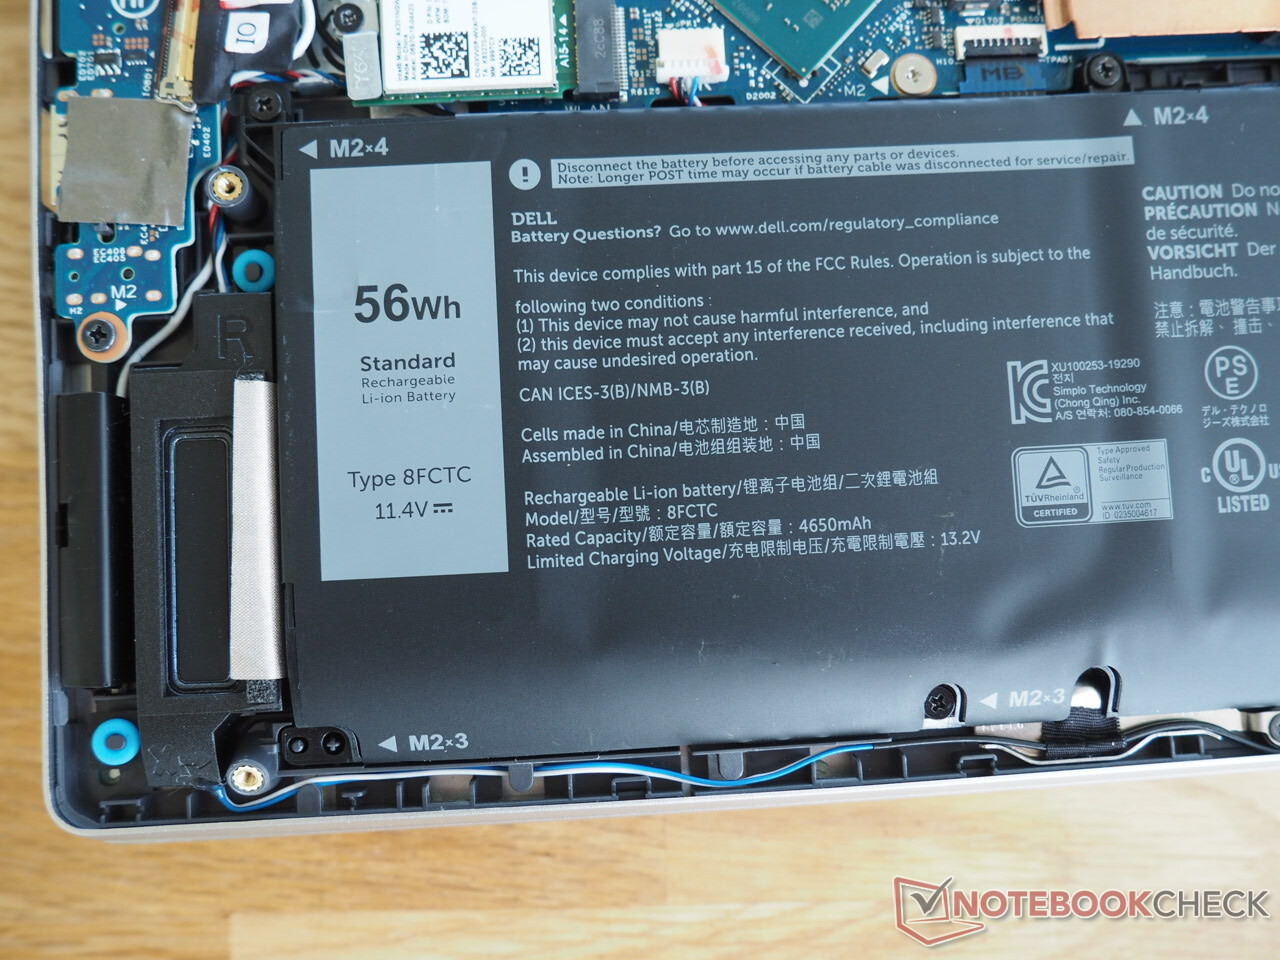
尽管Inspiron 15 Plus具有图形切换功能(Nvidia Optimus),但电池寿命只能算中等水平。高于平均水平的功耗和适度的电池容量相结合,使该设备无法实现引人注目的速率。在理想条件下(无负荷,最低亮度),单次充电不可能超过9小时。
在现实世界的情况下,如通过Wi-Fi浏览互联网(亮度降低到150cd/m²),你可以期待6小时左右--这也不是一个好结果。16英寸的兄弟姐妹机型由于其更大的电池(86瓦特对56瓦特),可以管理大约10个小时。
| Dell Inspiron 15 Plus i5-11400H, GeForce RTX 3050 4GB Laptop GPU, 56 Wh | Dell Inspiron 16 Plus 7610 i7-11800H, GeForce RTX 3050 4GB Laptop GPU, 86 Wh | Asus VivoBook 15 Pro M3500QC-L1062 R5 5600H, GeForce RTX 3050 4GB Laptop GPU, 63 Wh | Dell XPS 15 9510 11800H RTX 3050 Ti OLED i7-11800H, GeForce RTX 3050 Ti Laptop GPU, 86 Wh | Asus Zenbook Pro 15 OLED UM535Q R9 5900HX, GeForce RTX 3050 Ti Laptop GPU, 96 Wh | Average of class Multimedia | |
|---|---|---|---|---|---|---|
| Battery runtime | 125% | 25% | 35% | 172% | 110% | |
| Reader / Idle (h) | 8.8 | 20.5 133% | 26.2 198% | 24.9 ? 183% | ||
| WiFi v1.3 (h) | 5.9 | 9.9 68% | 8.3 41% | 7 19% | 12.8 117% | 12.2 ? 107% |
| Load (h) | 1.2 | 3.3 175% | 1.3 8% | 1.8 50% | 3.6 200% | 1.664 ? 39% |
| H.264 (h) | 12.1 | 10.4 | 17.1 ? | |||
| Witcher 3 ultra (h) | 1.2 |
Pros
Cons
判决书

戴尔Inspiron 15 Plus理论上有可能成为一个全能型的产品。
除了我们的评测样品有做工方面的缺陷(油漆损坏,触摸板边缘不平整),高质量的外壳看起来很时尚,而且由于其适度的尺寸和合理的重量,它可以很好地随身携带。大多数买家也会对输入设备和声音感到满意。
然而,最终得分只有 "好 "而不是 "非常好 "的事实主要是由于电池寿命差。连接性、风扇控制和负载下的速率(温度、时钟速率......)也可以做得更好。
然而,Inspiron 15 Plus推荐给那些有预算意识的用户,他们正在寻找一台移动的、多功能的全能型笔记本电脑(例如学生)。
另外,还值得一看的是华硕VivoBook 15 Pro配备(光面)OLED显示屏,价格在1,000欧元(约1,008美元)范围内。
价格和可用性
在撰写本文时,戴尔Inspiron 15 Plus 7510似乎在美国还没有上市。不过,你可以关注一下网站,如亚马逊看看该设备是否出现在那里。
Dell Inspiron 15 Plus
- 07/12/2022 v7 (old)
Florian Glaser
Price comparison

