戴尔XPS 17 9720评测--高端多媒体笔记本电脑开始显示其年龄
当其他制造商越来越多地转向16英寸多媒体笔记本电脑时,戴尔继续忠实于众所周知的XPS 17,今年再次带来了一个小的更新,尽管这特别集中在第12代的英特尔CPU上。除了45瓦的CPU(桤木湖),你可以再次在两个GeForce RTX GPU中选择,即RTX 3050和 RTX 3060,这两款产品的TGP都被规定为60瓦。这意味着戴尔在这里进行了降级,因为去年的XPS 17 9710的GPU仍被允许消耗70瓦。
我们已经能够测试一个美国型号的GeForce RTX 3060现在我们来看看配备RTX 3050的配置。虽然性能下降,但价格仍然很高,因为戴尔为我们的测试配置要价3000欧元(约3135美元),配备酷睿i7-12700H、RTX 3050、4K显示器、32GB内存和512GB SSD。
可能的竞争者比较
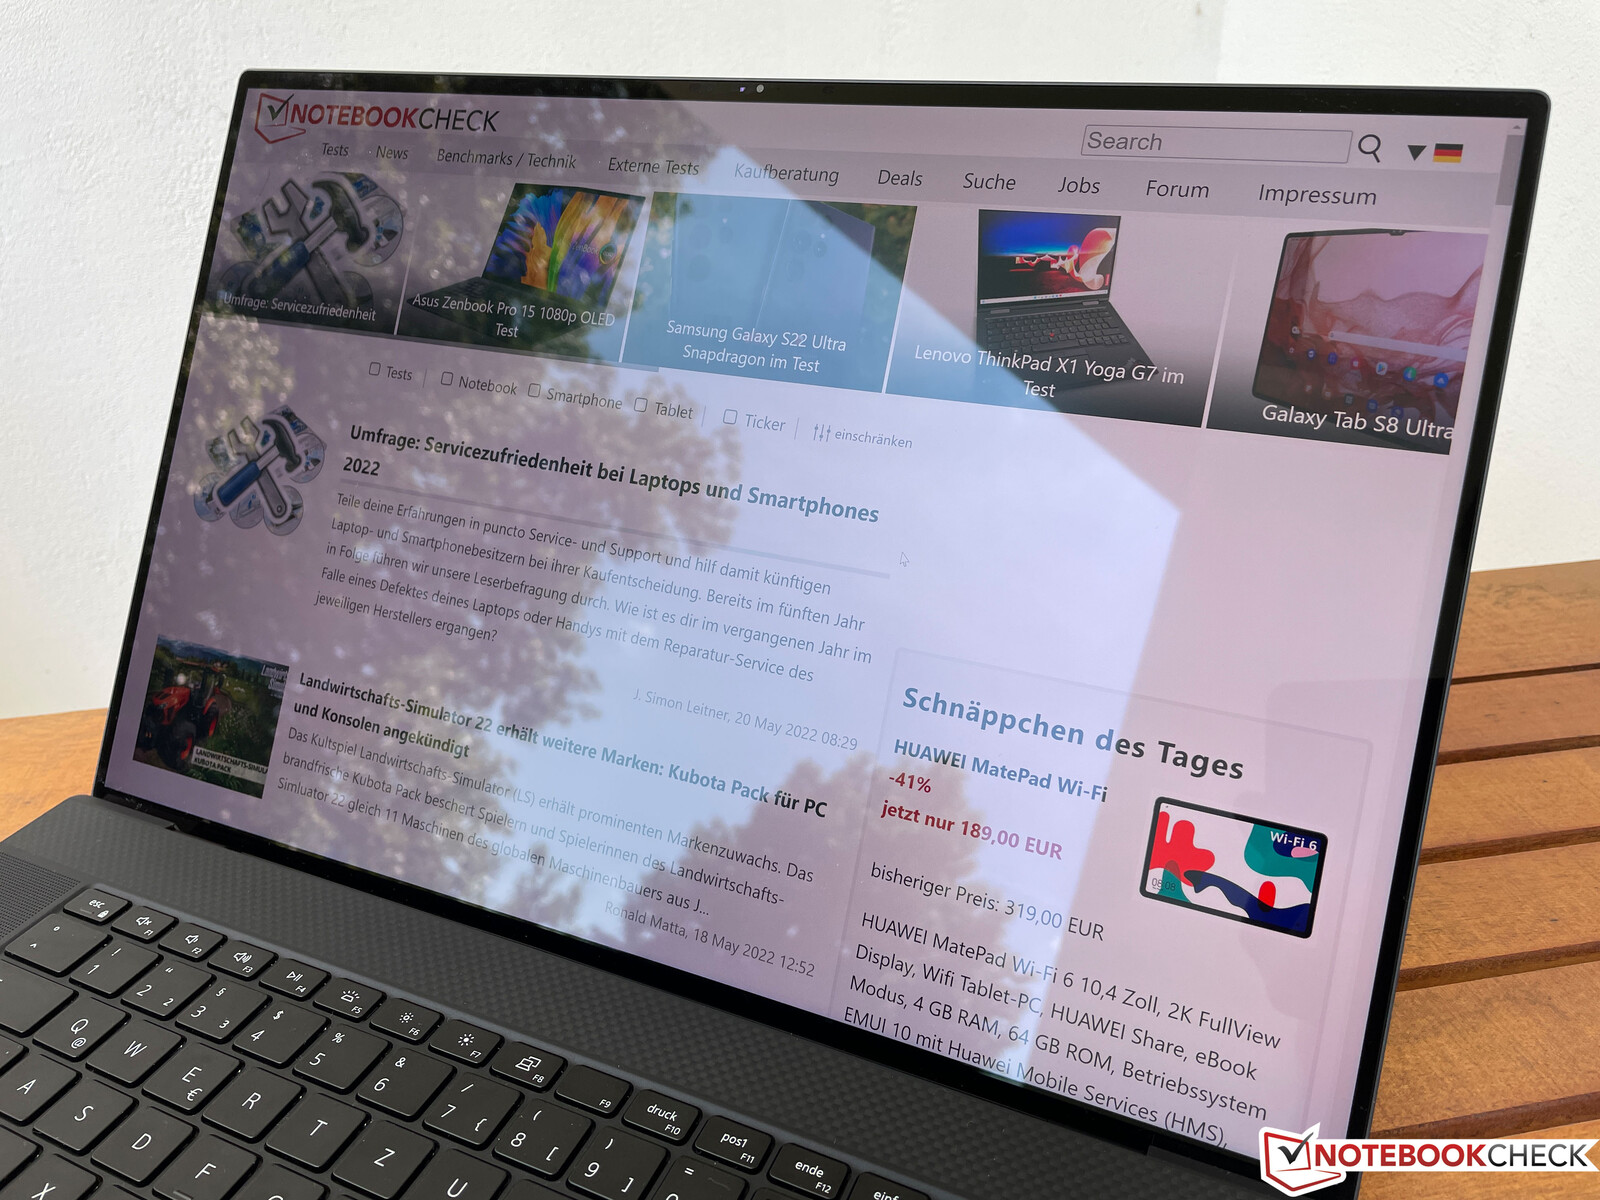
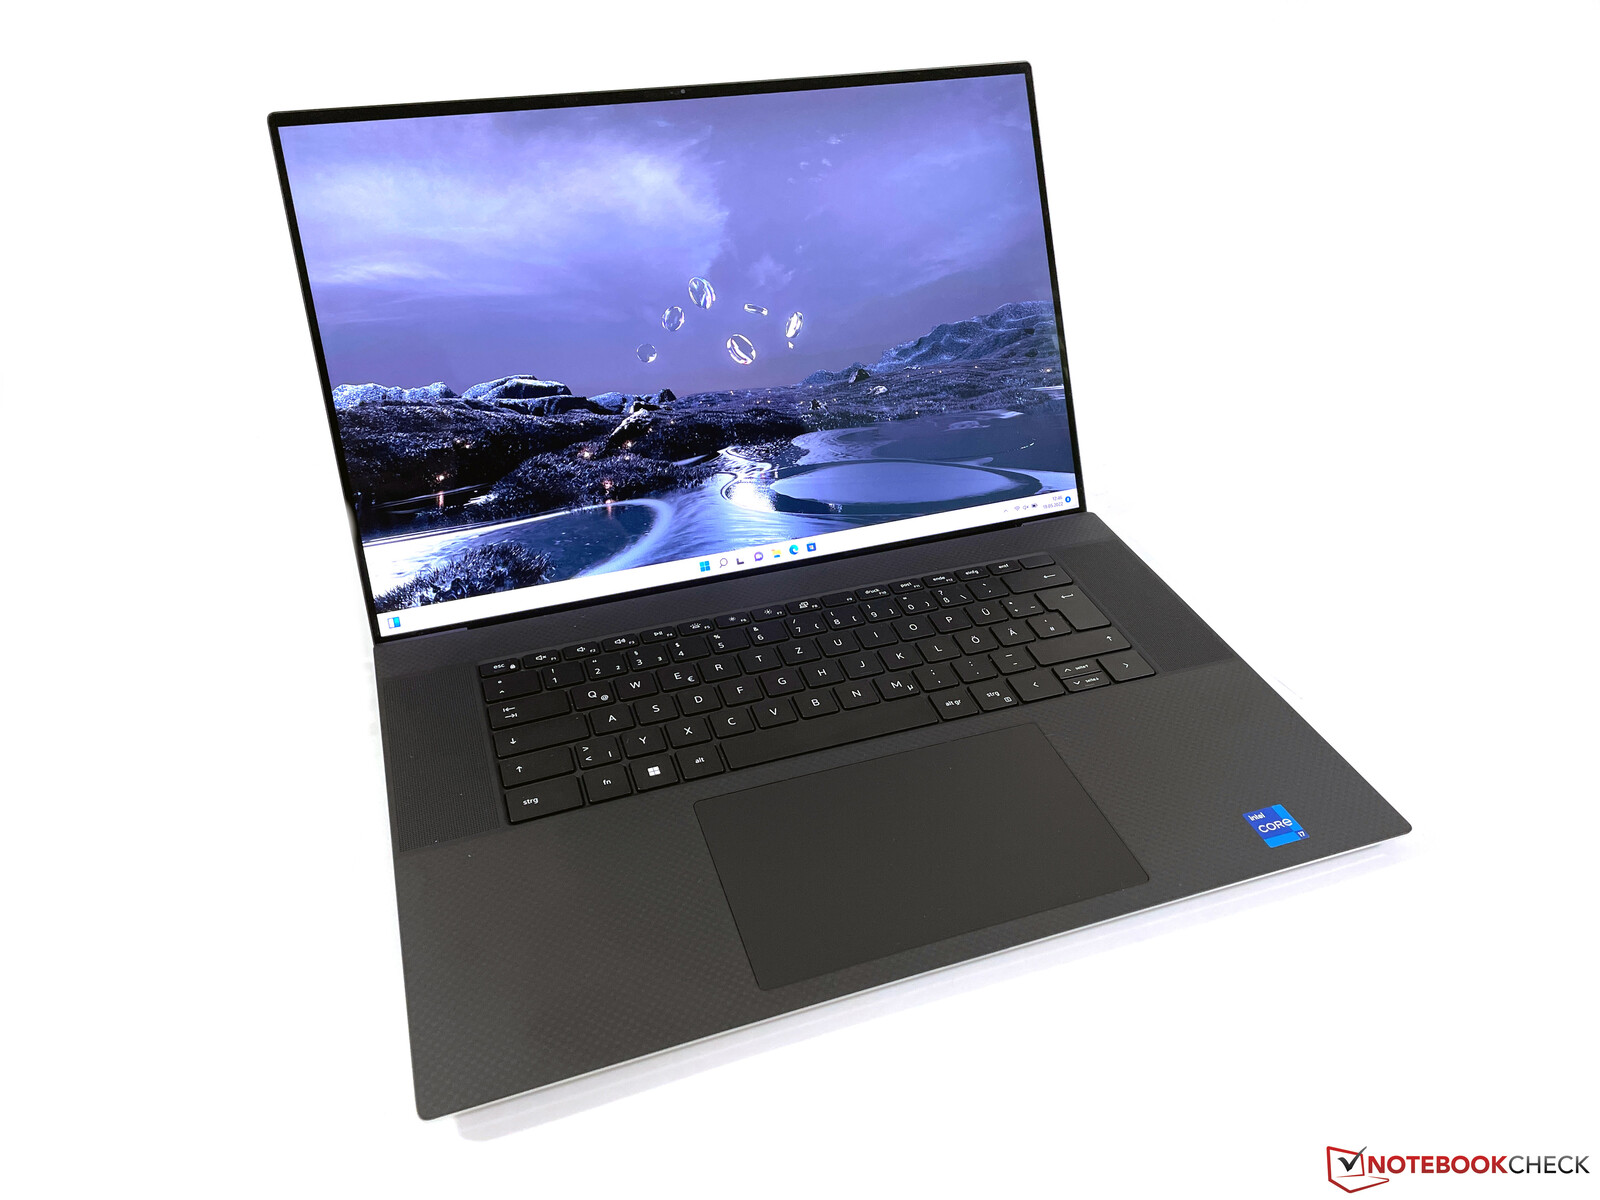
外壳 - XPS 17继续提供高品质,并且仍然很重
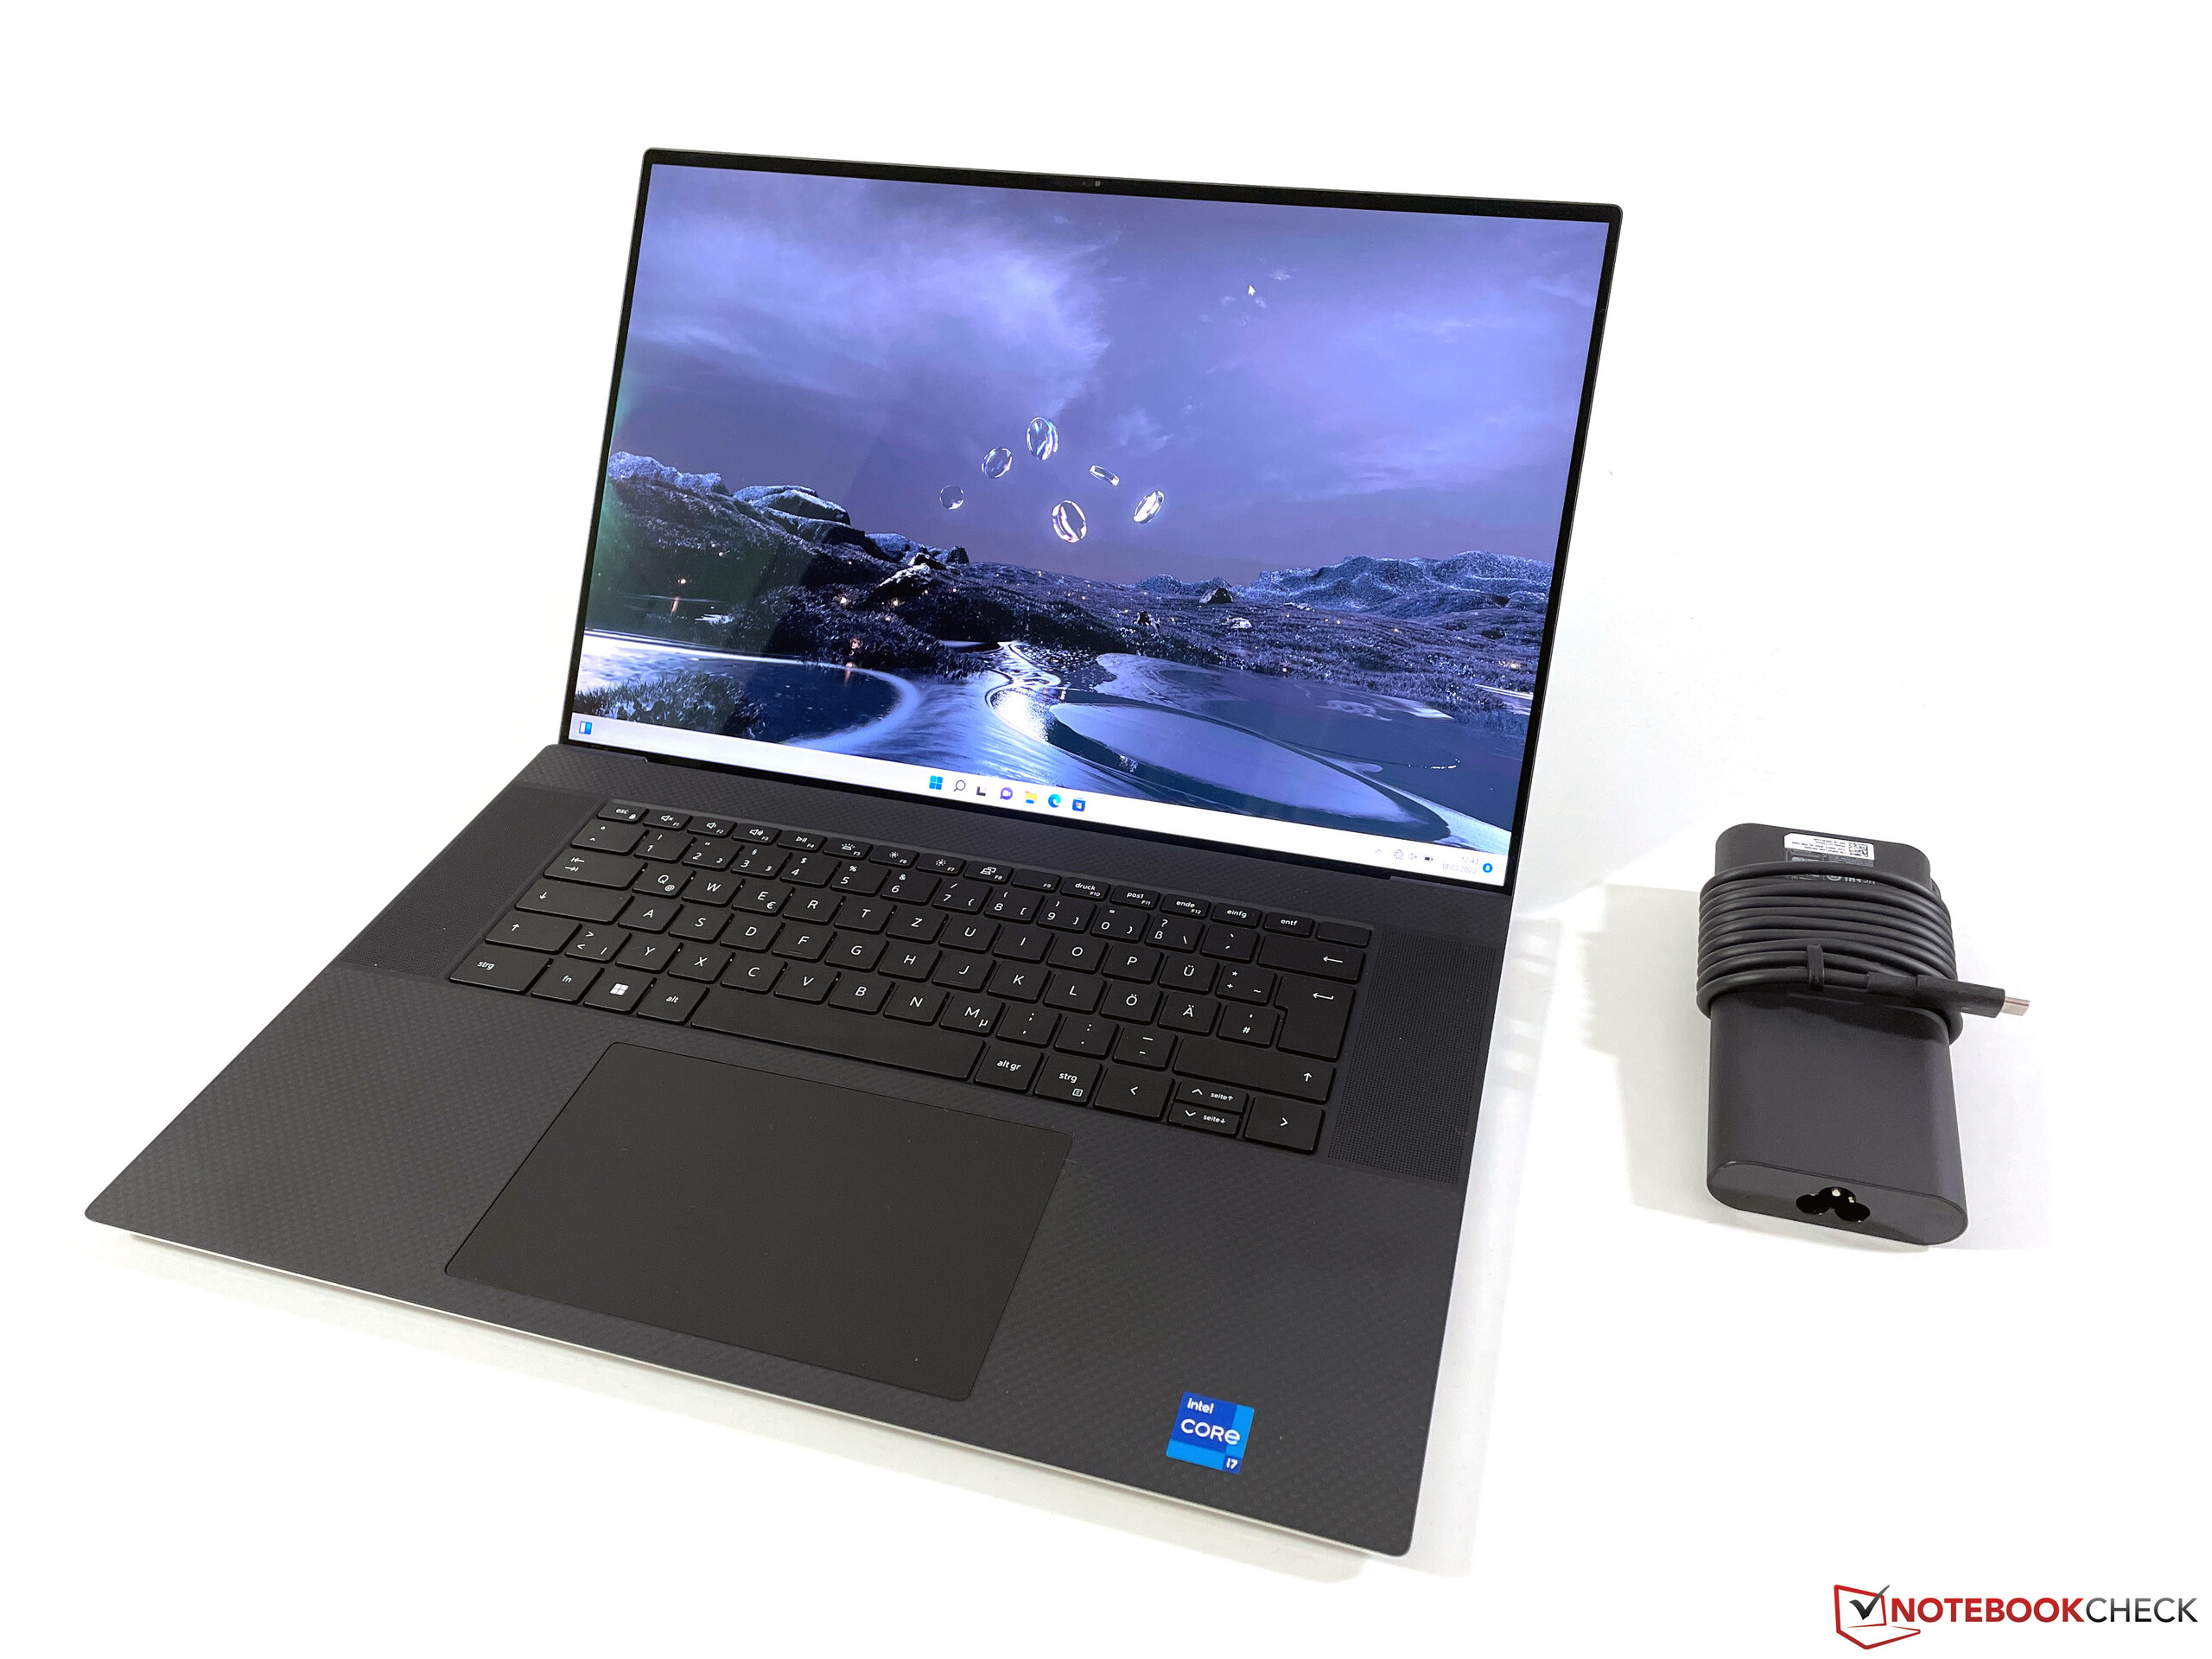
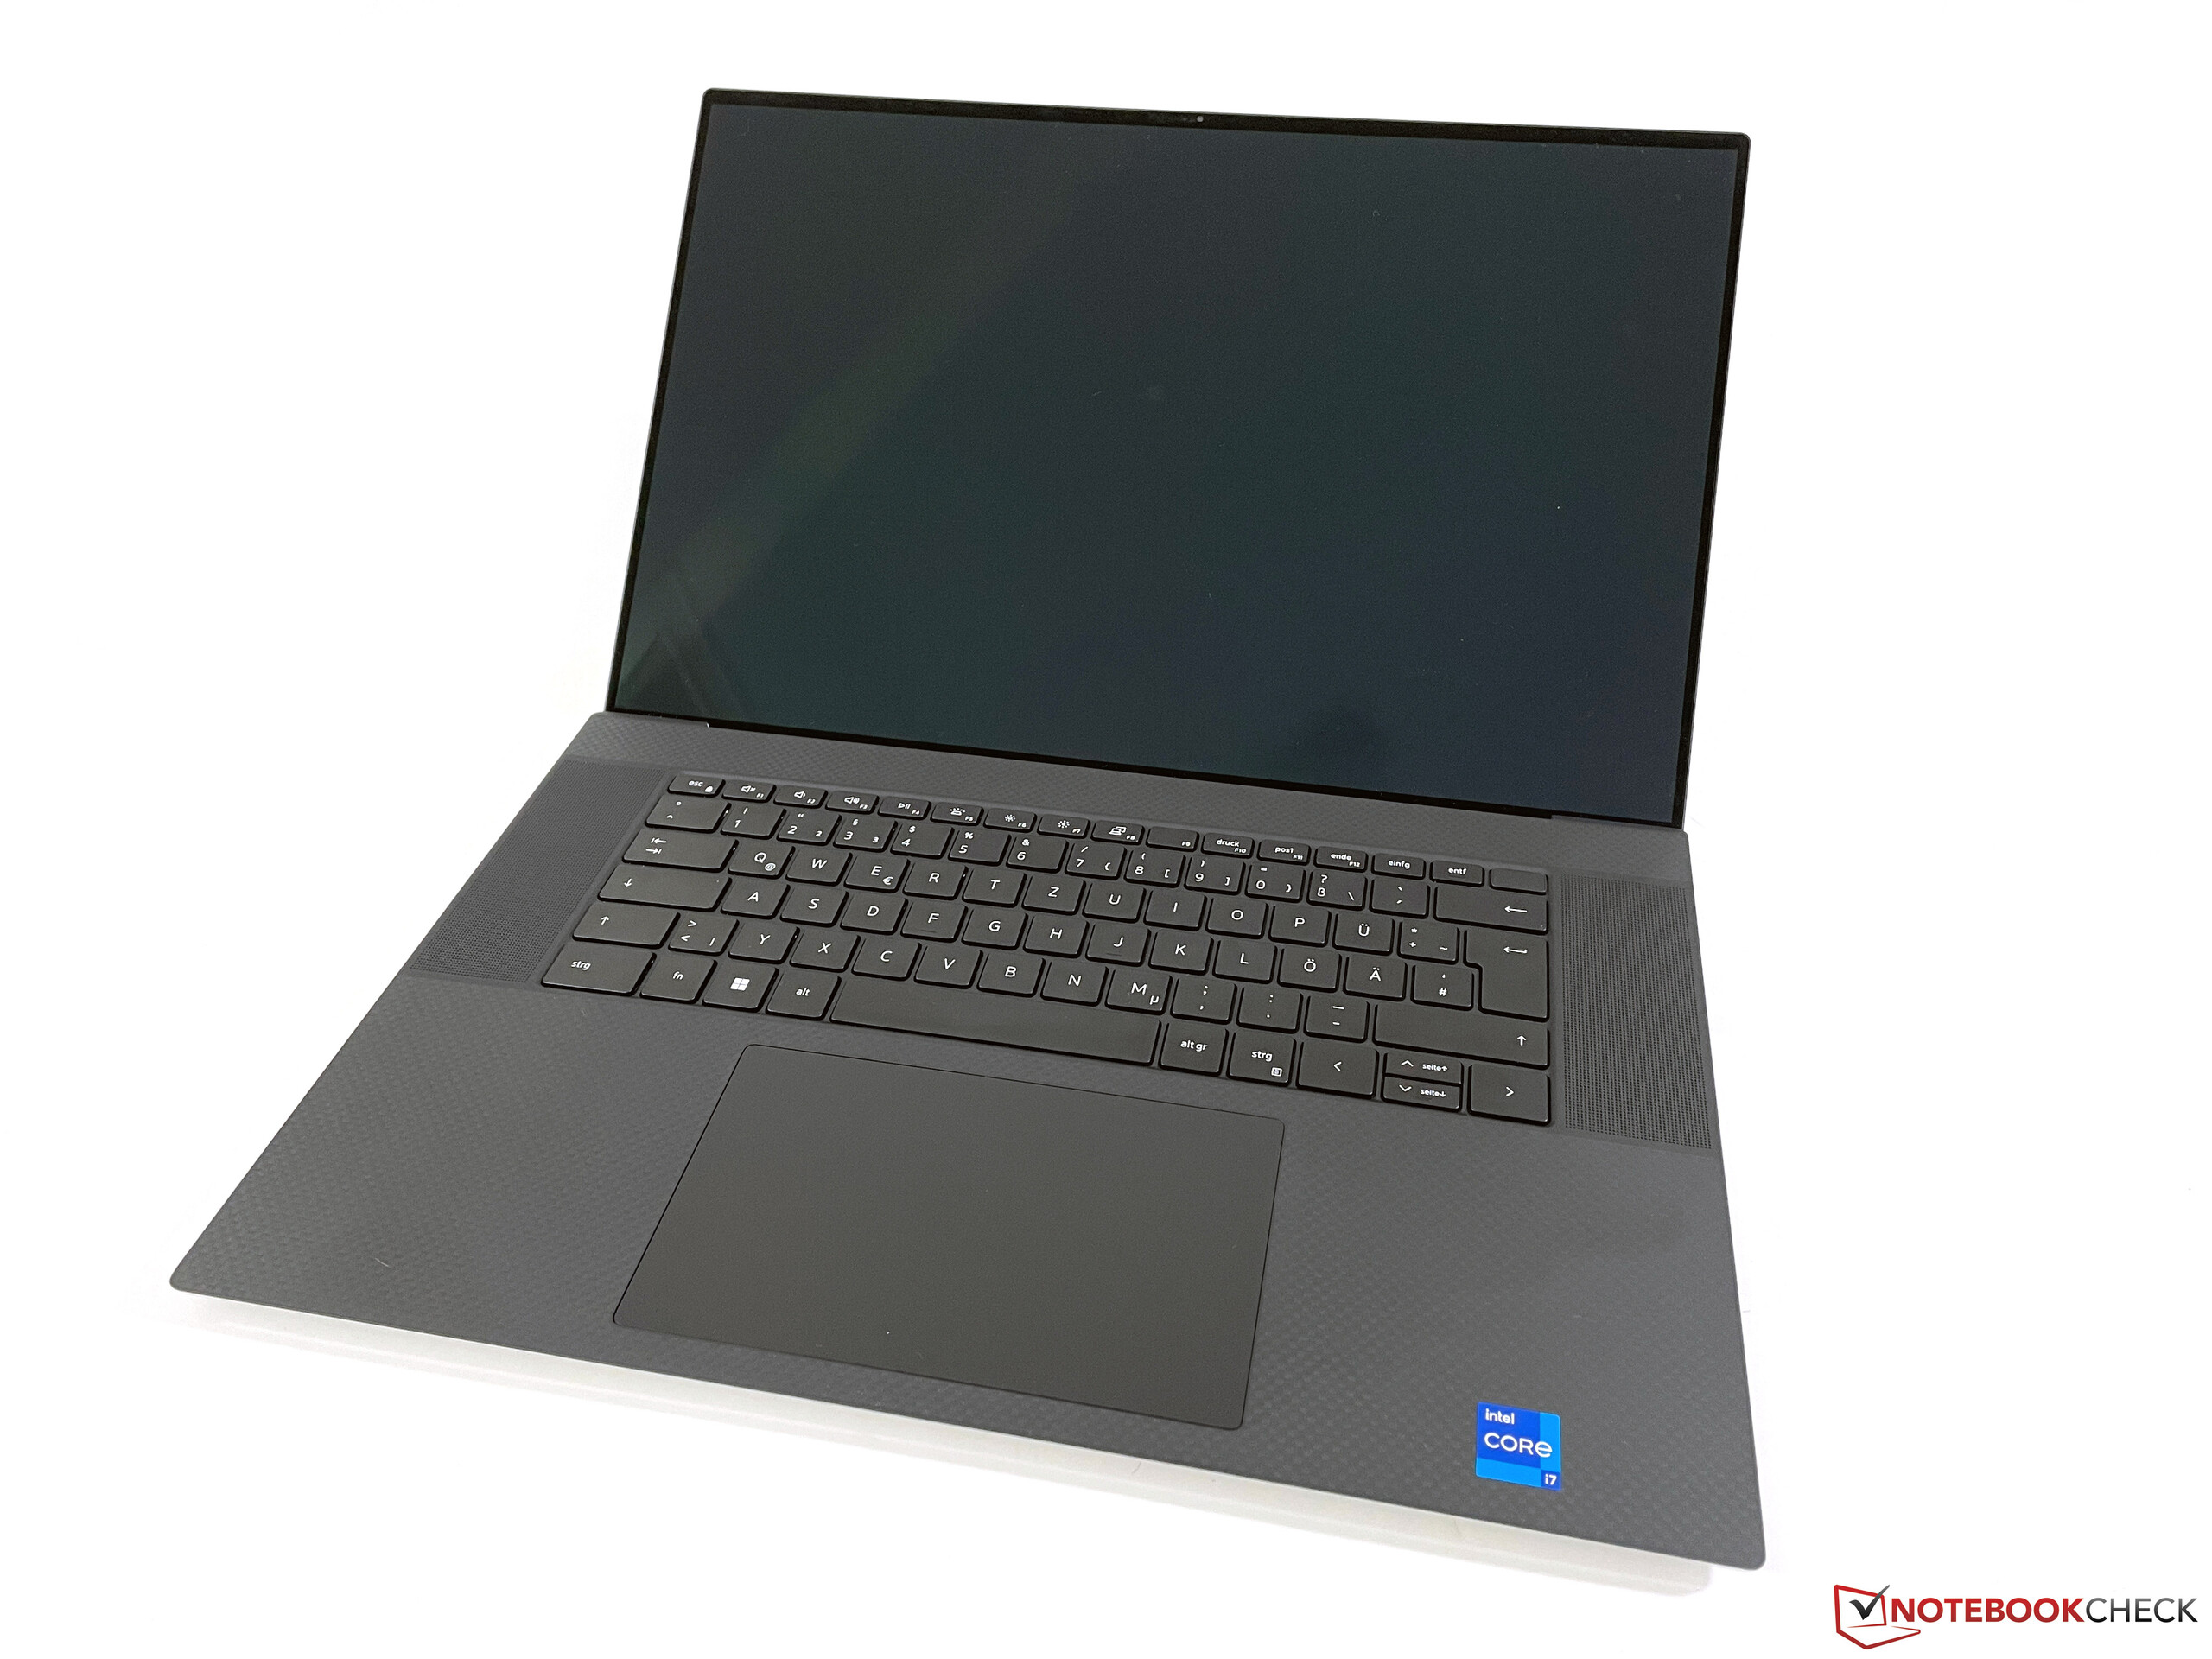
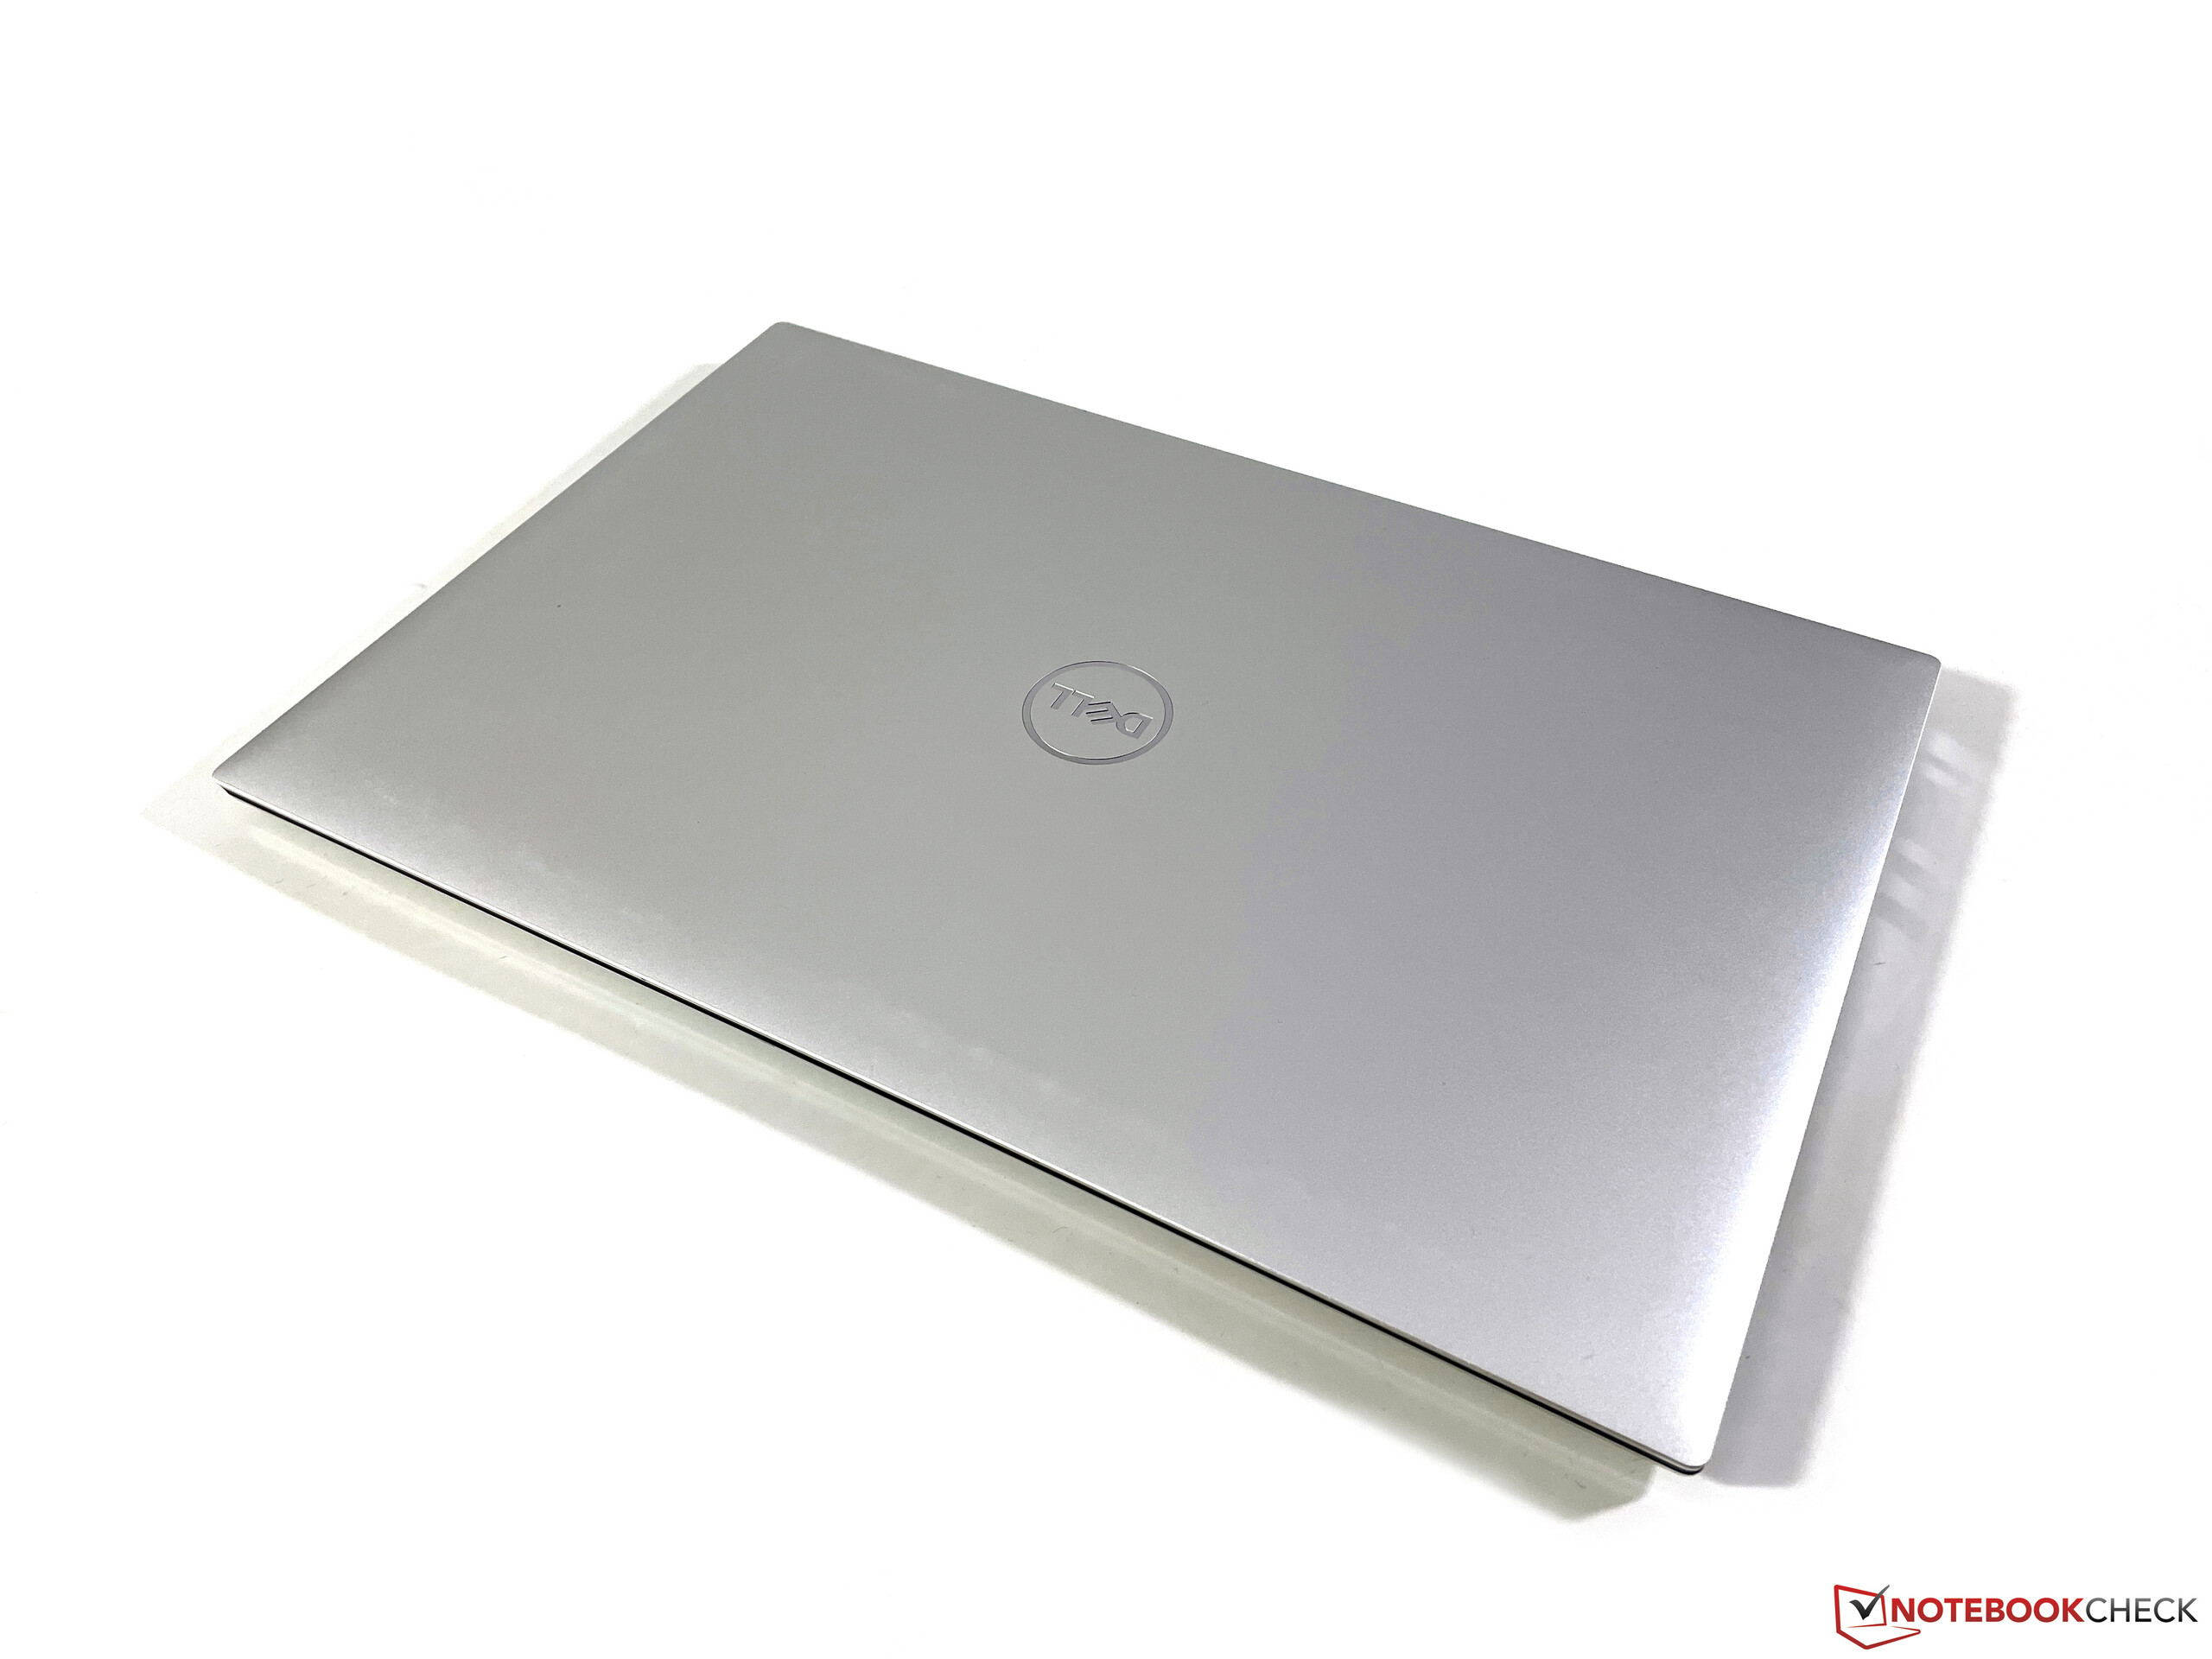
关于XPS 17的外壳,我们不必多说,因为做工提供了极高的质量,而且结构非常坚固。凭借其非常纤细的边框(导致屏幕与机身的比例达到91%),该设备继续看起来非常现代,一点都不显老。然而,基本单元顶部的黑色碳设计仍然很容易变脏。当你处理XPS 17时,很快就会发现它不是一台轻巧的笔记本电脑,我们的秤显示差不多有2.5公斤(约5.5磅)。对于电源,你还得再加400克(约0.9磅)。
尺寸比较
设备 - 不支持Wi-Fi 6E的XPS 17
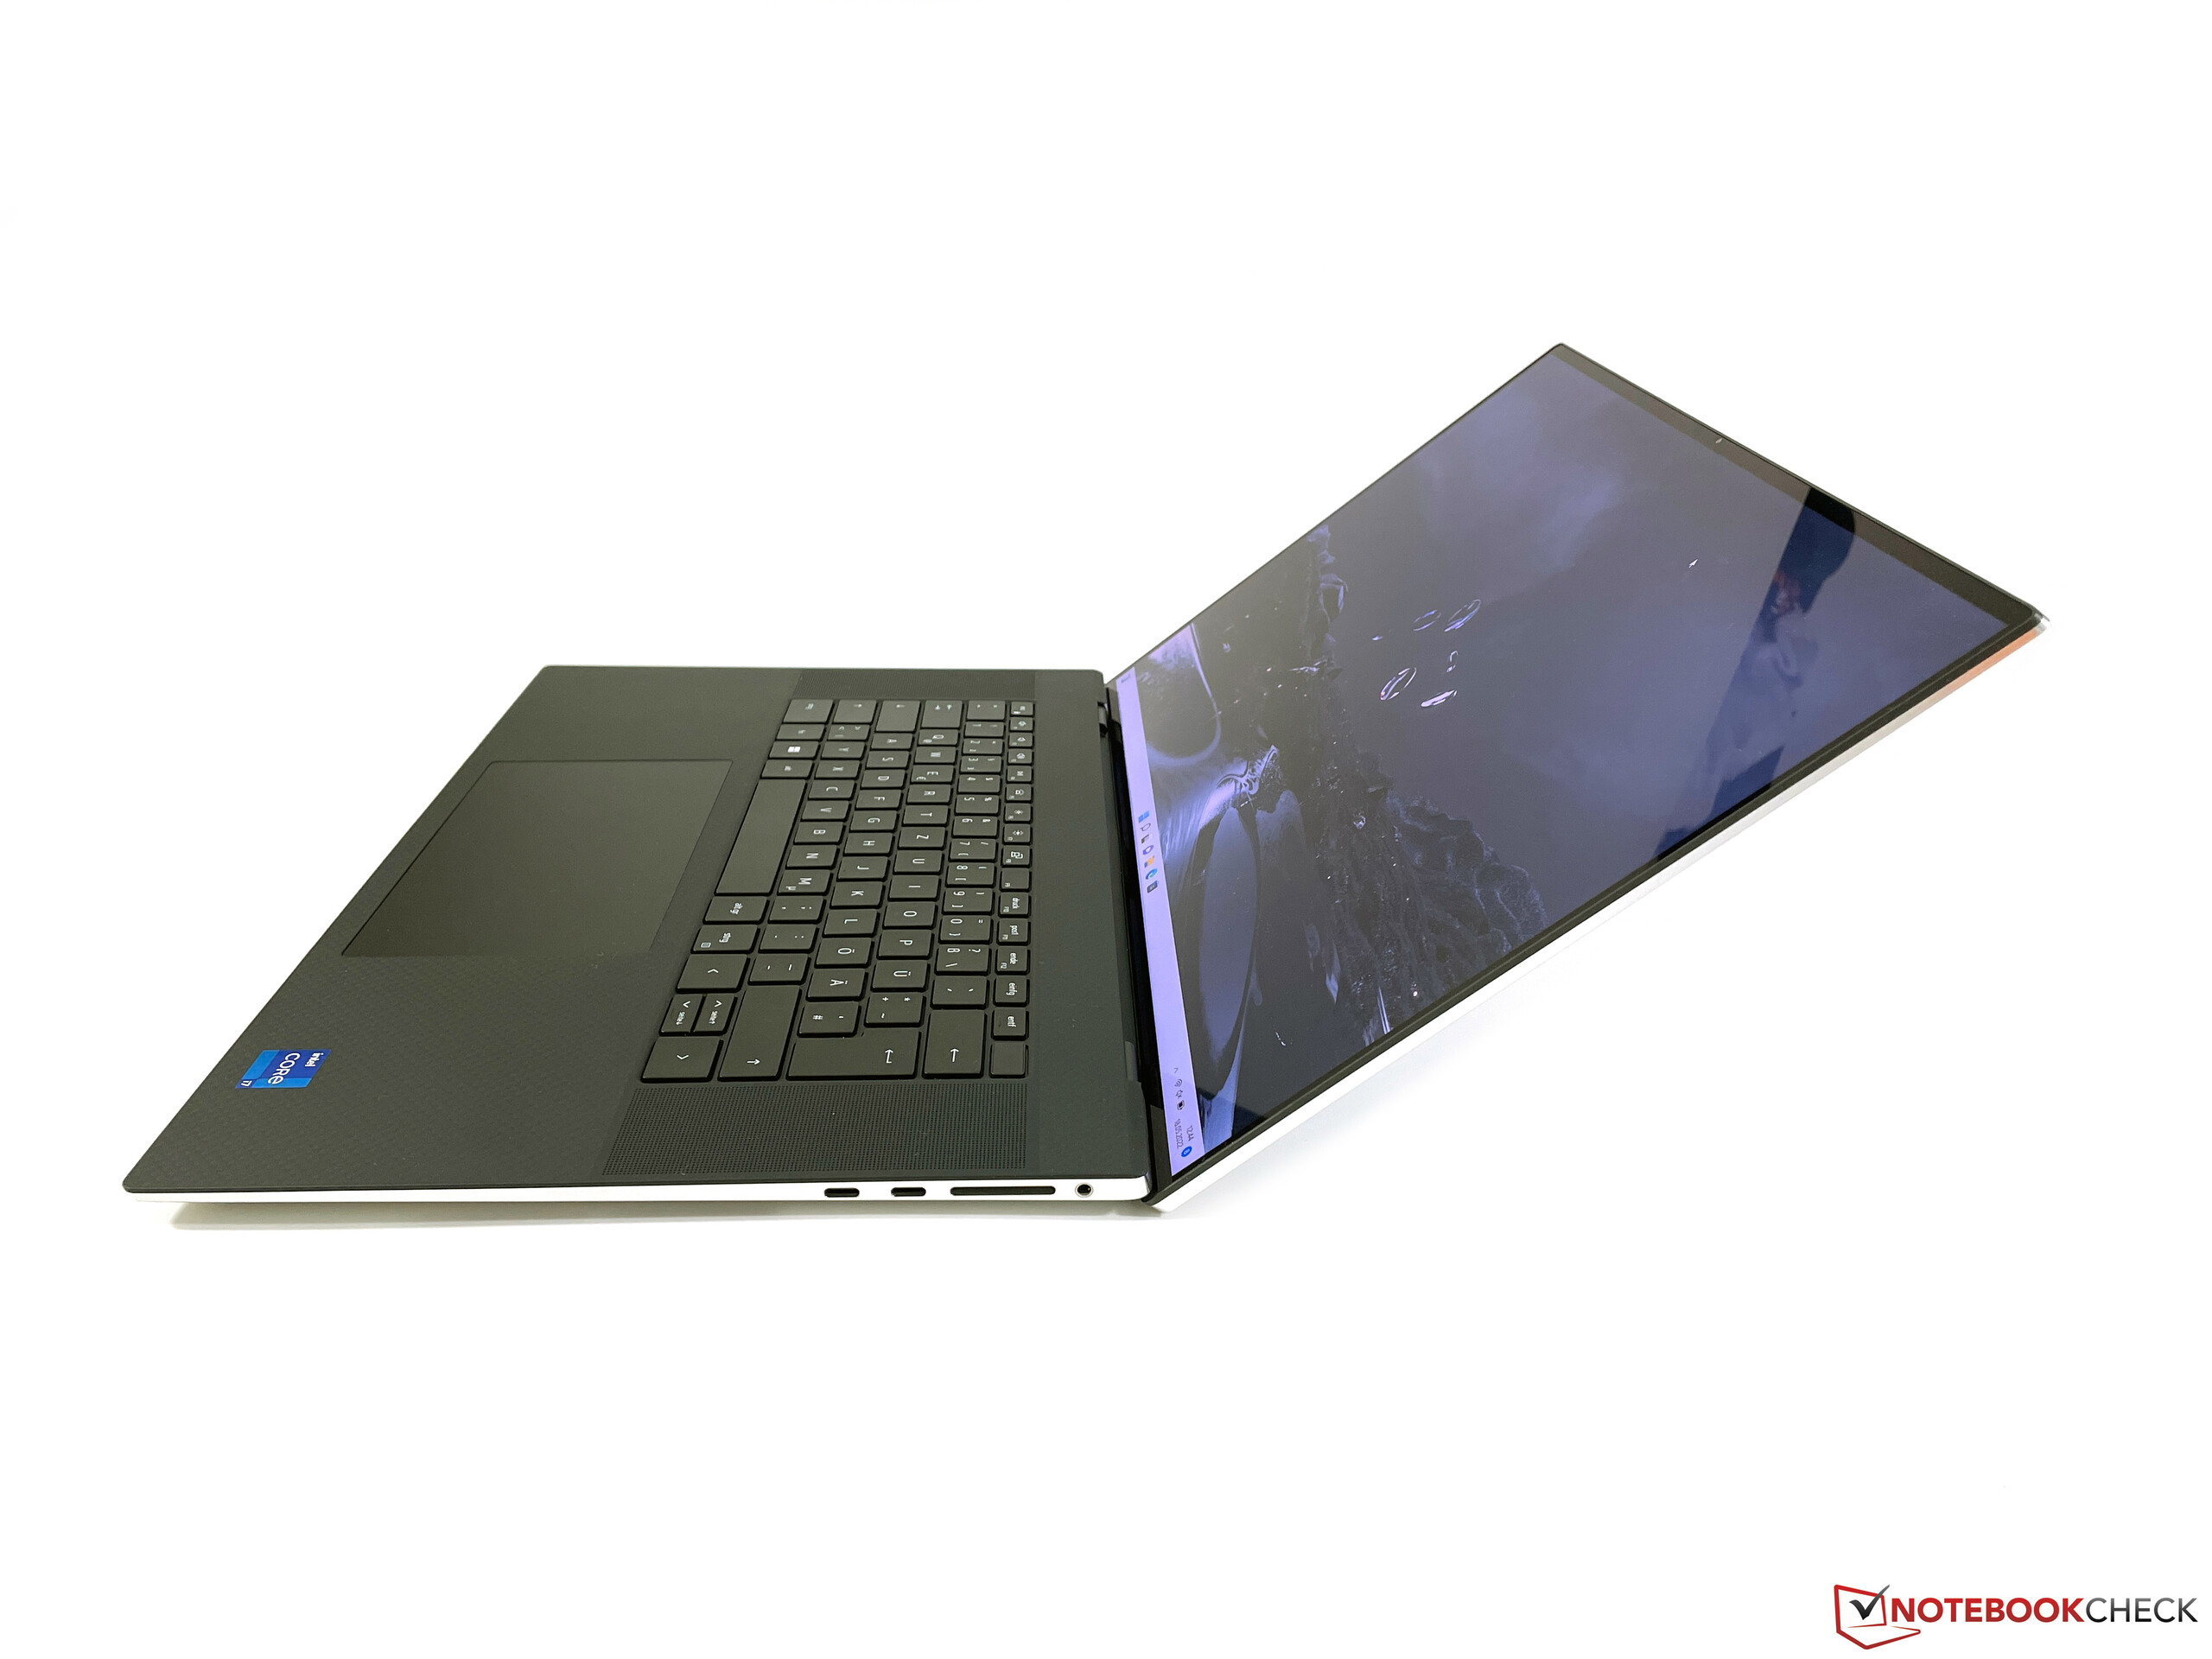
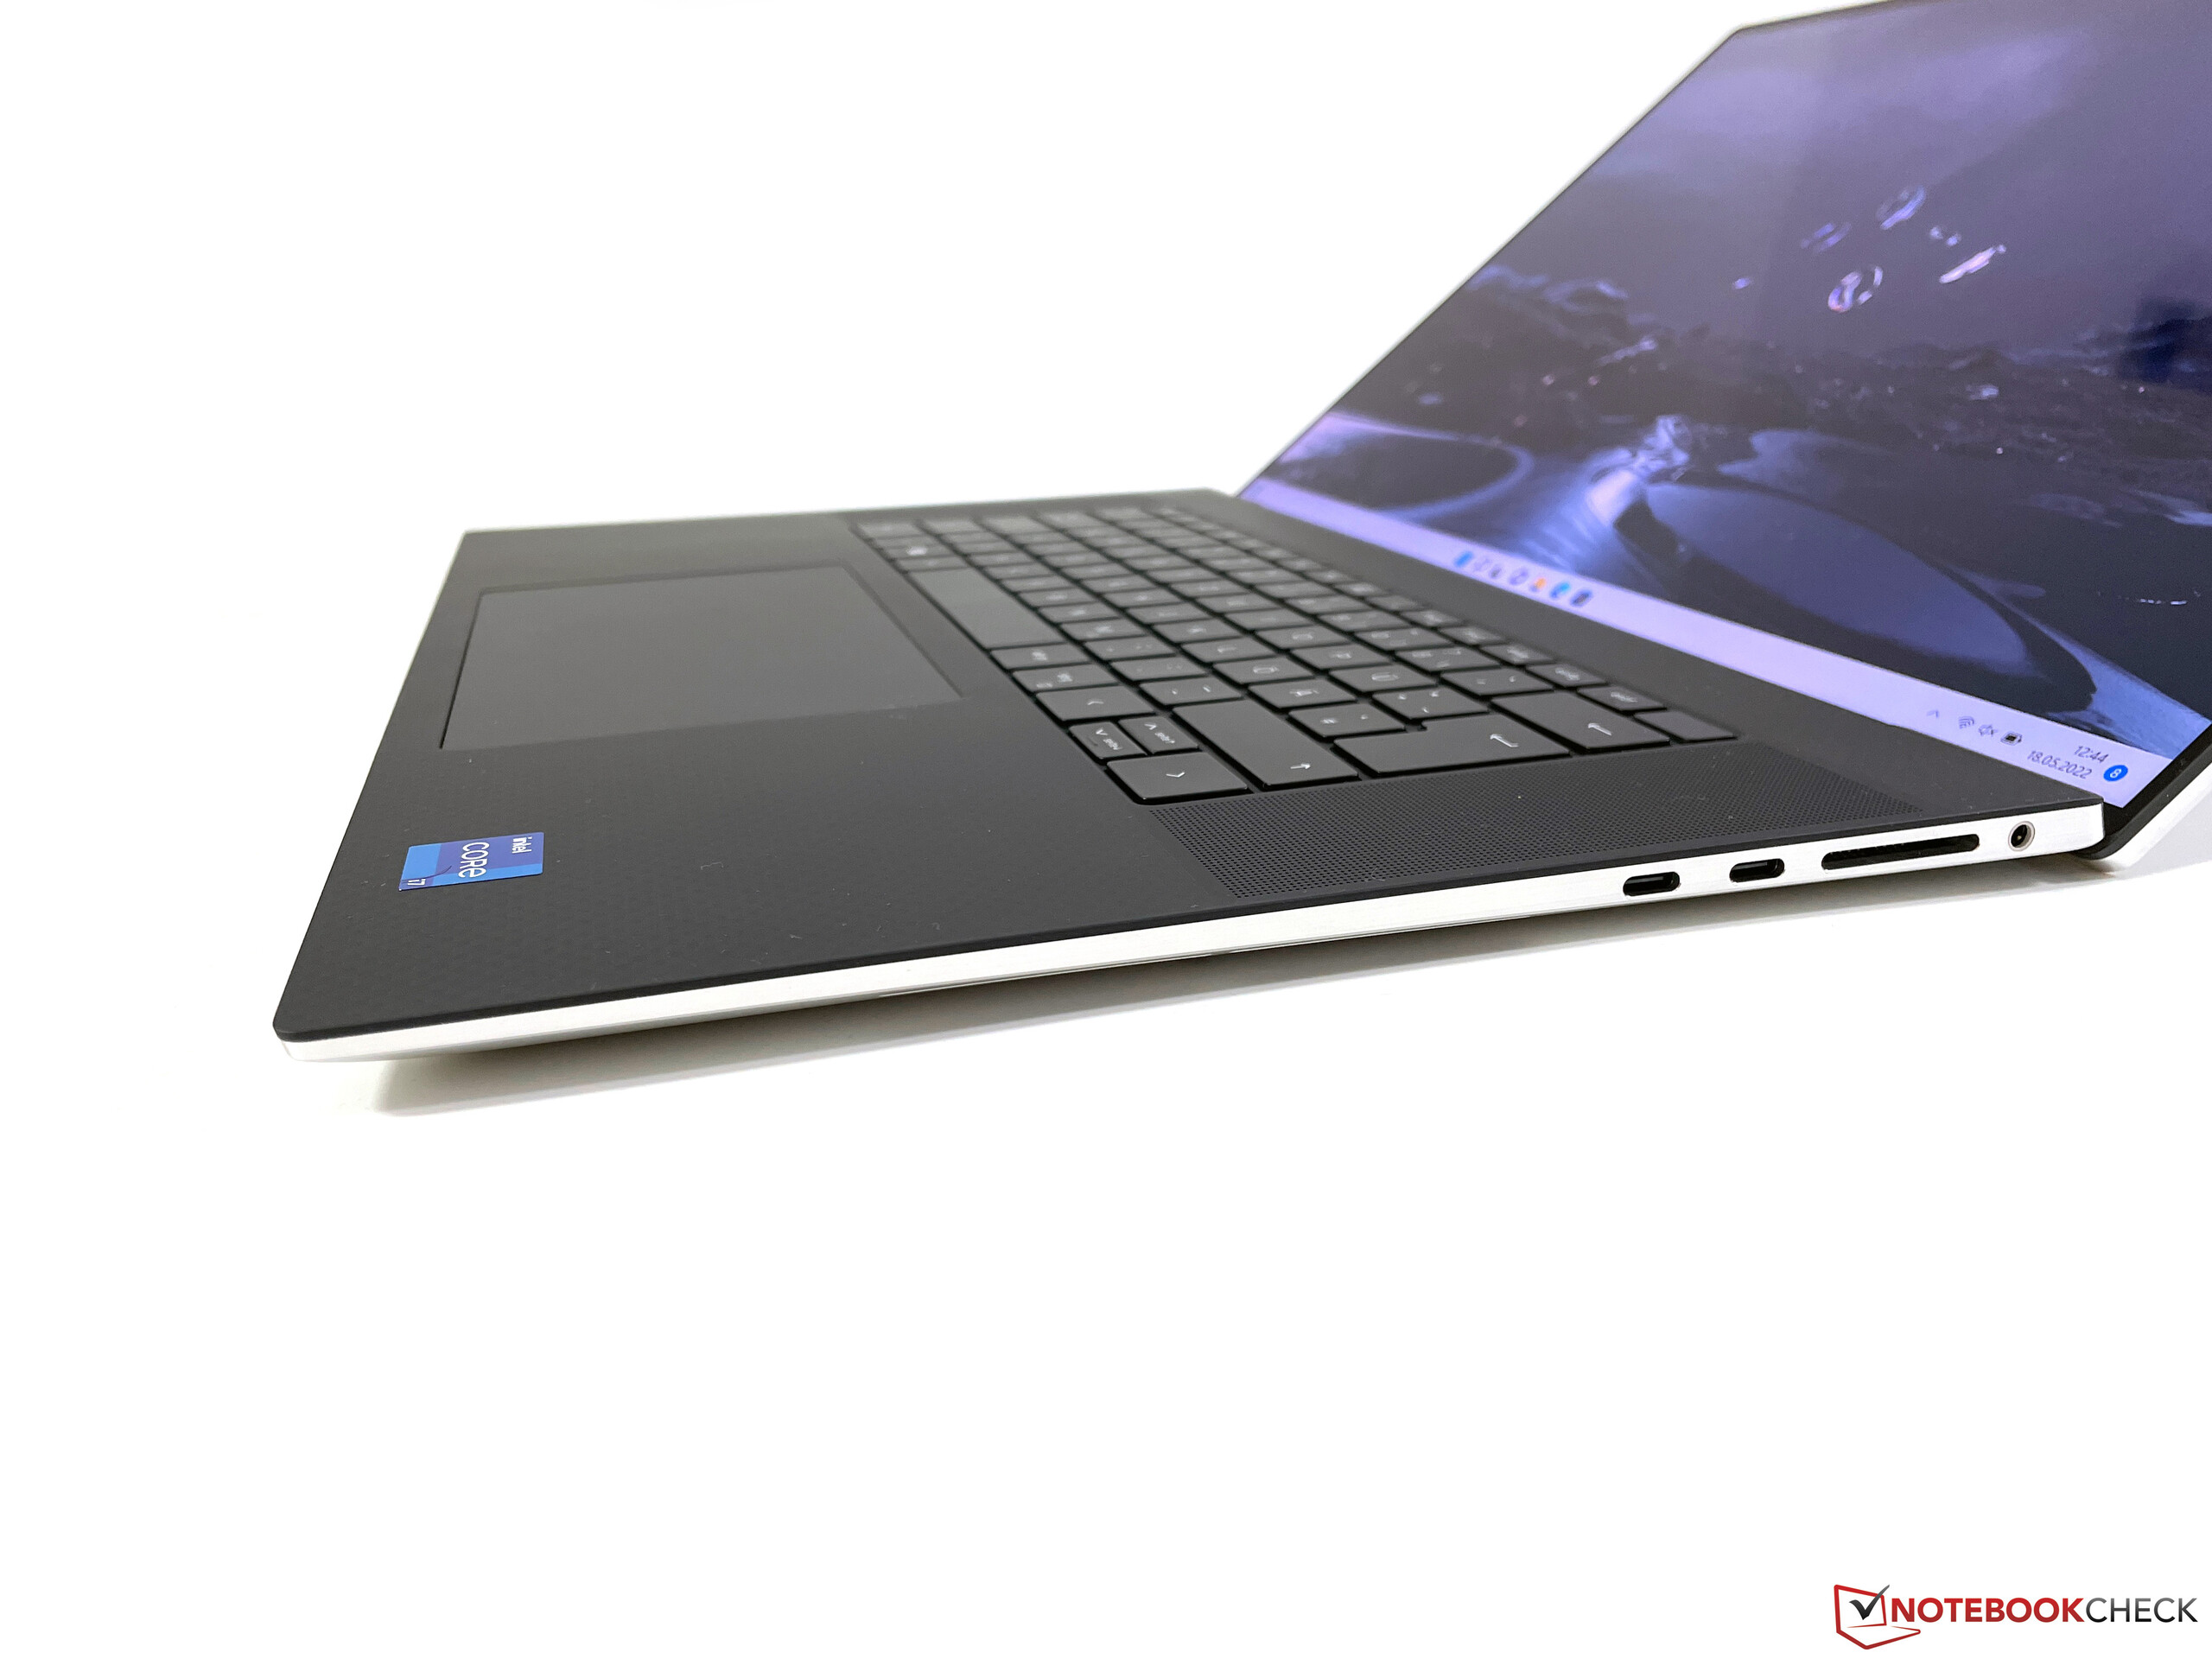
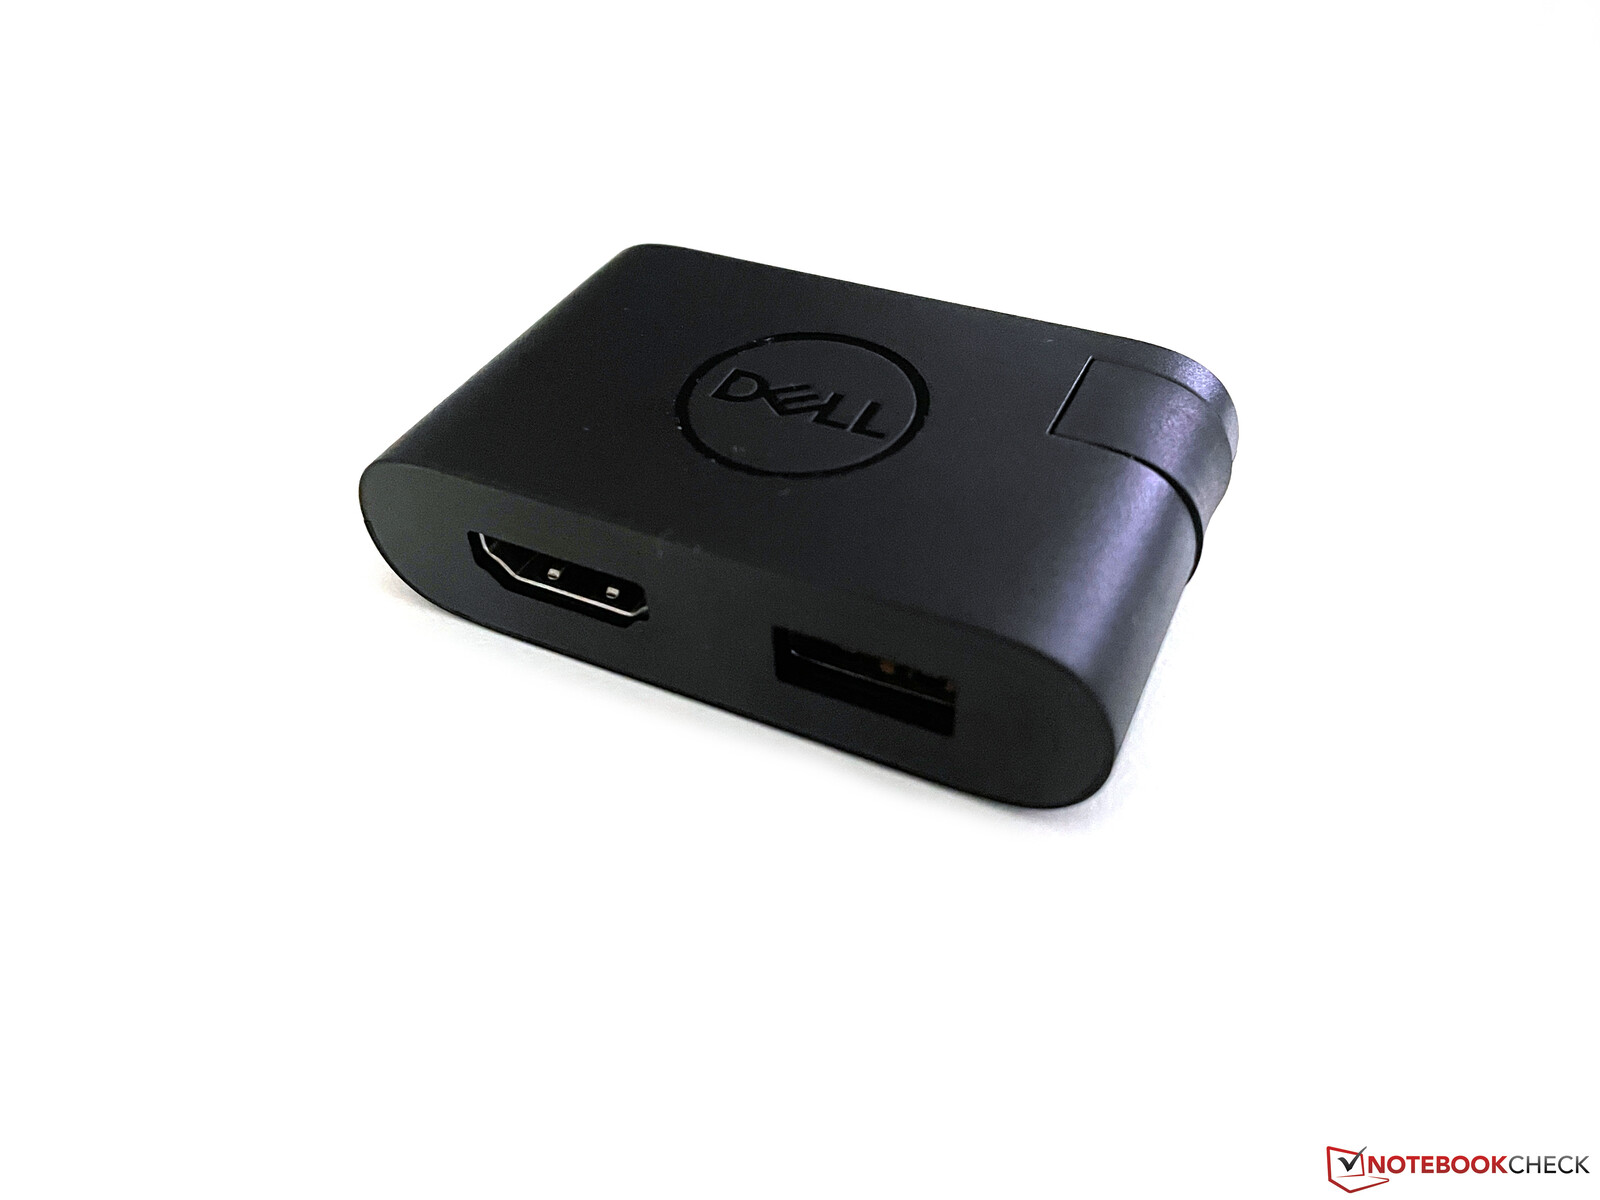
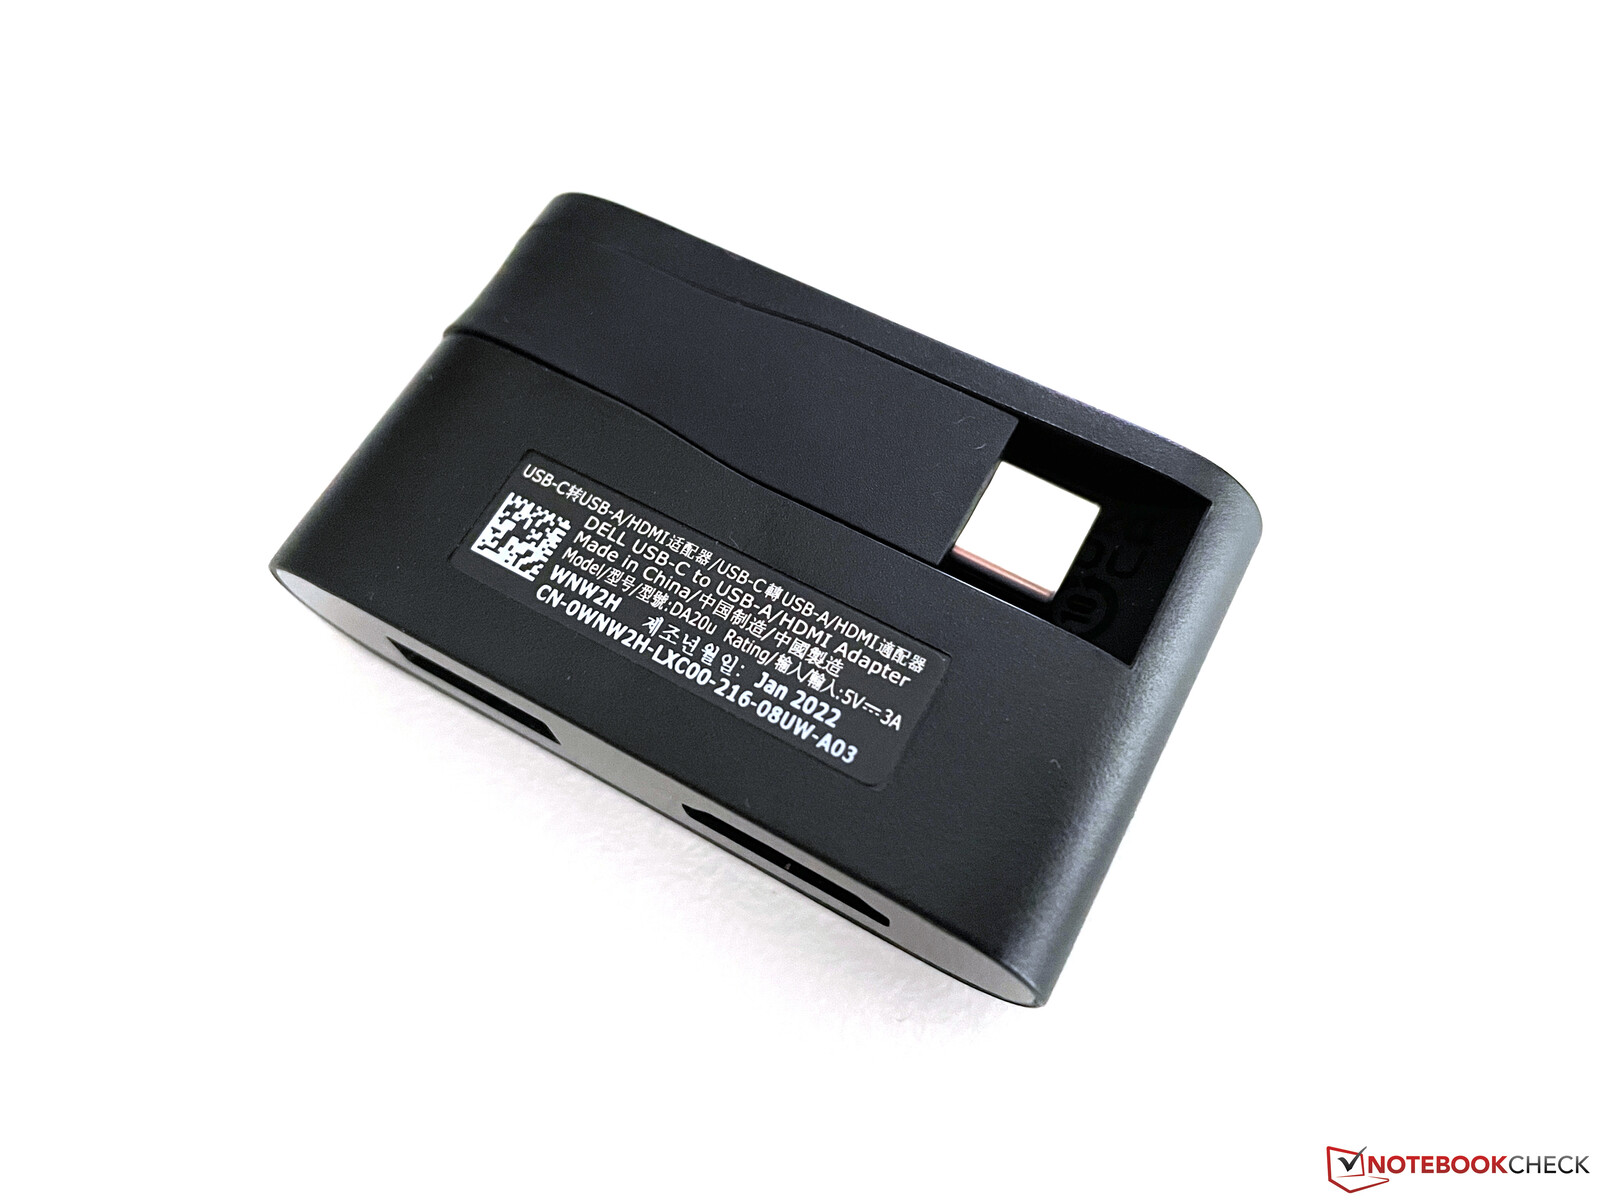
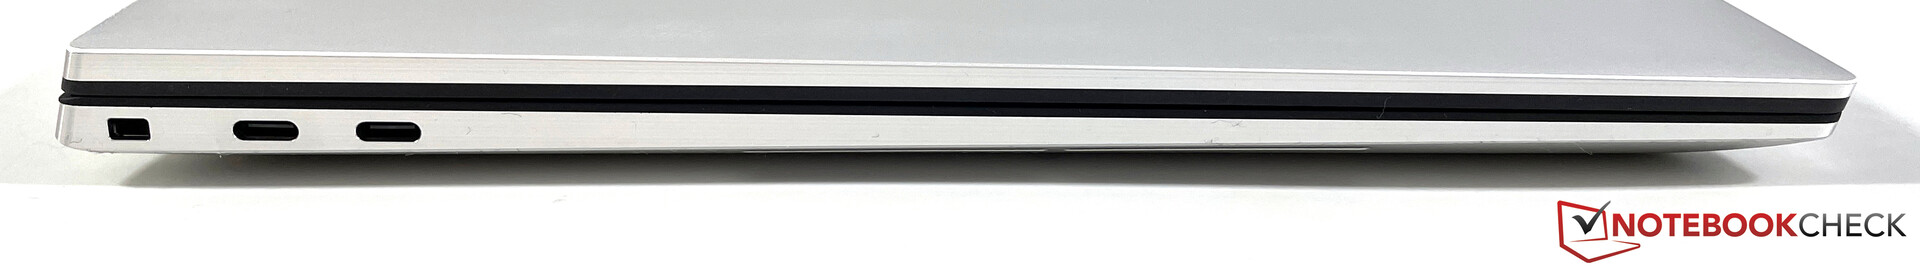
XPS 17继续提供四个带有USB-C接口的现代Thunderbolt端口。虽然它们当然是非常通用的,但在实践中它们也可能需要一些适配器。显然,戴尔也知道这一点,因为包括一个带有USB-A和HDMI的USB-C适配器。在过去,戴尔经常遵循Apple ,所以我们很好奇,下一代戴尔是否也会再次开始提供更多的集成连接,比如说,HDMI。

SD卡阅读器
和以前一样,XPS提供了一个全尺寸的SDXC读卡器,插入的卡片伸出来的部分很小。在速度方面,我们可以看到我们的参考卡之间的明显差异,因为Angelbird AV Pro V60在其他笔记本电脑中达到了超过220MB/s的传输速度,但在这里只限于约84MB/s。另一方面,我们的老东芝参考卡能够与戴尔的读卡器更好地相处,达到近200MB/s。
| SD Card Reader | |
| average JPG Copy Test (av. of 3 runs) | |
| Dell XPS 17 9720 RTX 3060 (Toshiba Exceria Pro SDXC 64 GB UHS-II) | |
| Dell XPS 17 9720 (Toshiba Exceria Pro SDXC 64 GB UHS-II) | |
| Dell XPS 17 9710 Core i7 RTX 3060 (AV PRO microSD 128 GB V60) | |
| Lenovo ThinkPad X1 Extreme G4-20Y5CTO1WW (3050 Ti) (AV Pro V60) | |
| Average of class Multimedia (23 - 531, n=43, last 2 years) | |
| Apple MacBook Pro 16 2021 M1 Pro (Angelbird AV Pro V60) | |
| Lenovo ThinkBook 16p G2 ACH | |
| Asus Vivobook Pro 16X-M7600QE (AV Pro SD microSD 128 GB V60) | |
| maximum AS SSD Seq Read Test (1GB) | |
| Dell XPS 17 9720 RTX 3060 (Toshiba Exceria Pro SDXC 64 GB UHS-II) | |
| Dell XPS 17 9720 (Toshiba Exceria Pro SDXC 64 GB UHS-II) | |
| Average of class Multimedia (27.9 - 1455, n=42, last 2 years) | |
| Dell XPS 17 9710 Core i7 RTX 3060 (AV PRO microSD 128 GB V60) | |
| Lenovo ThinkPad X1 Extreme G4-20Y5CTO1WW (3050 Ti) (AV Pro V60) | |
| Lenovo ThinkBook 16p G2 ACH | |
| Asus Vivobook Pro 16X-M7600QE (AV Pro SD microSD 128 GB V60) | |
沟通
正如我们在目前的其他XPS测试中已经看到的那样(也得到了戴尔的证实),XPS 17的天线根本不支持任何6-GHz网络,我们也无法连接到华硕参考路由器的6-GHz网络。戴尔仍然使用英特尔AX211E的Wi-Fi 6E模块,这只对规格表有意义。
然而,在常规的5-GHz网络(Wi-Fi 6)中的表现还是不错的,但是在发送数据时,有一些明显的变化是可以重现的(之前在美国的测试装置中已经出现过)。另一方面,由于数值仍在1GB/s以上,在日常操作中不会有任何明显的限制。
网络摄像头
XPS 17保留了其常用的720p摄像头。虽然它完成了自己的工作,但图像质量并不特别好。


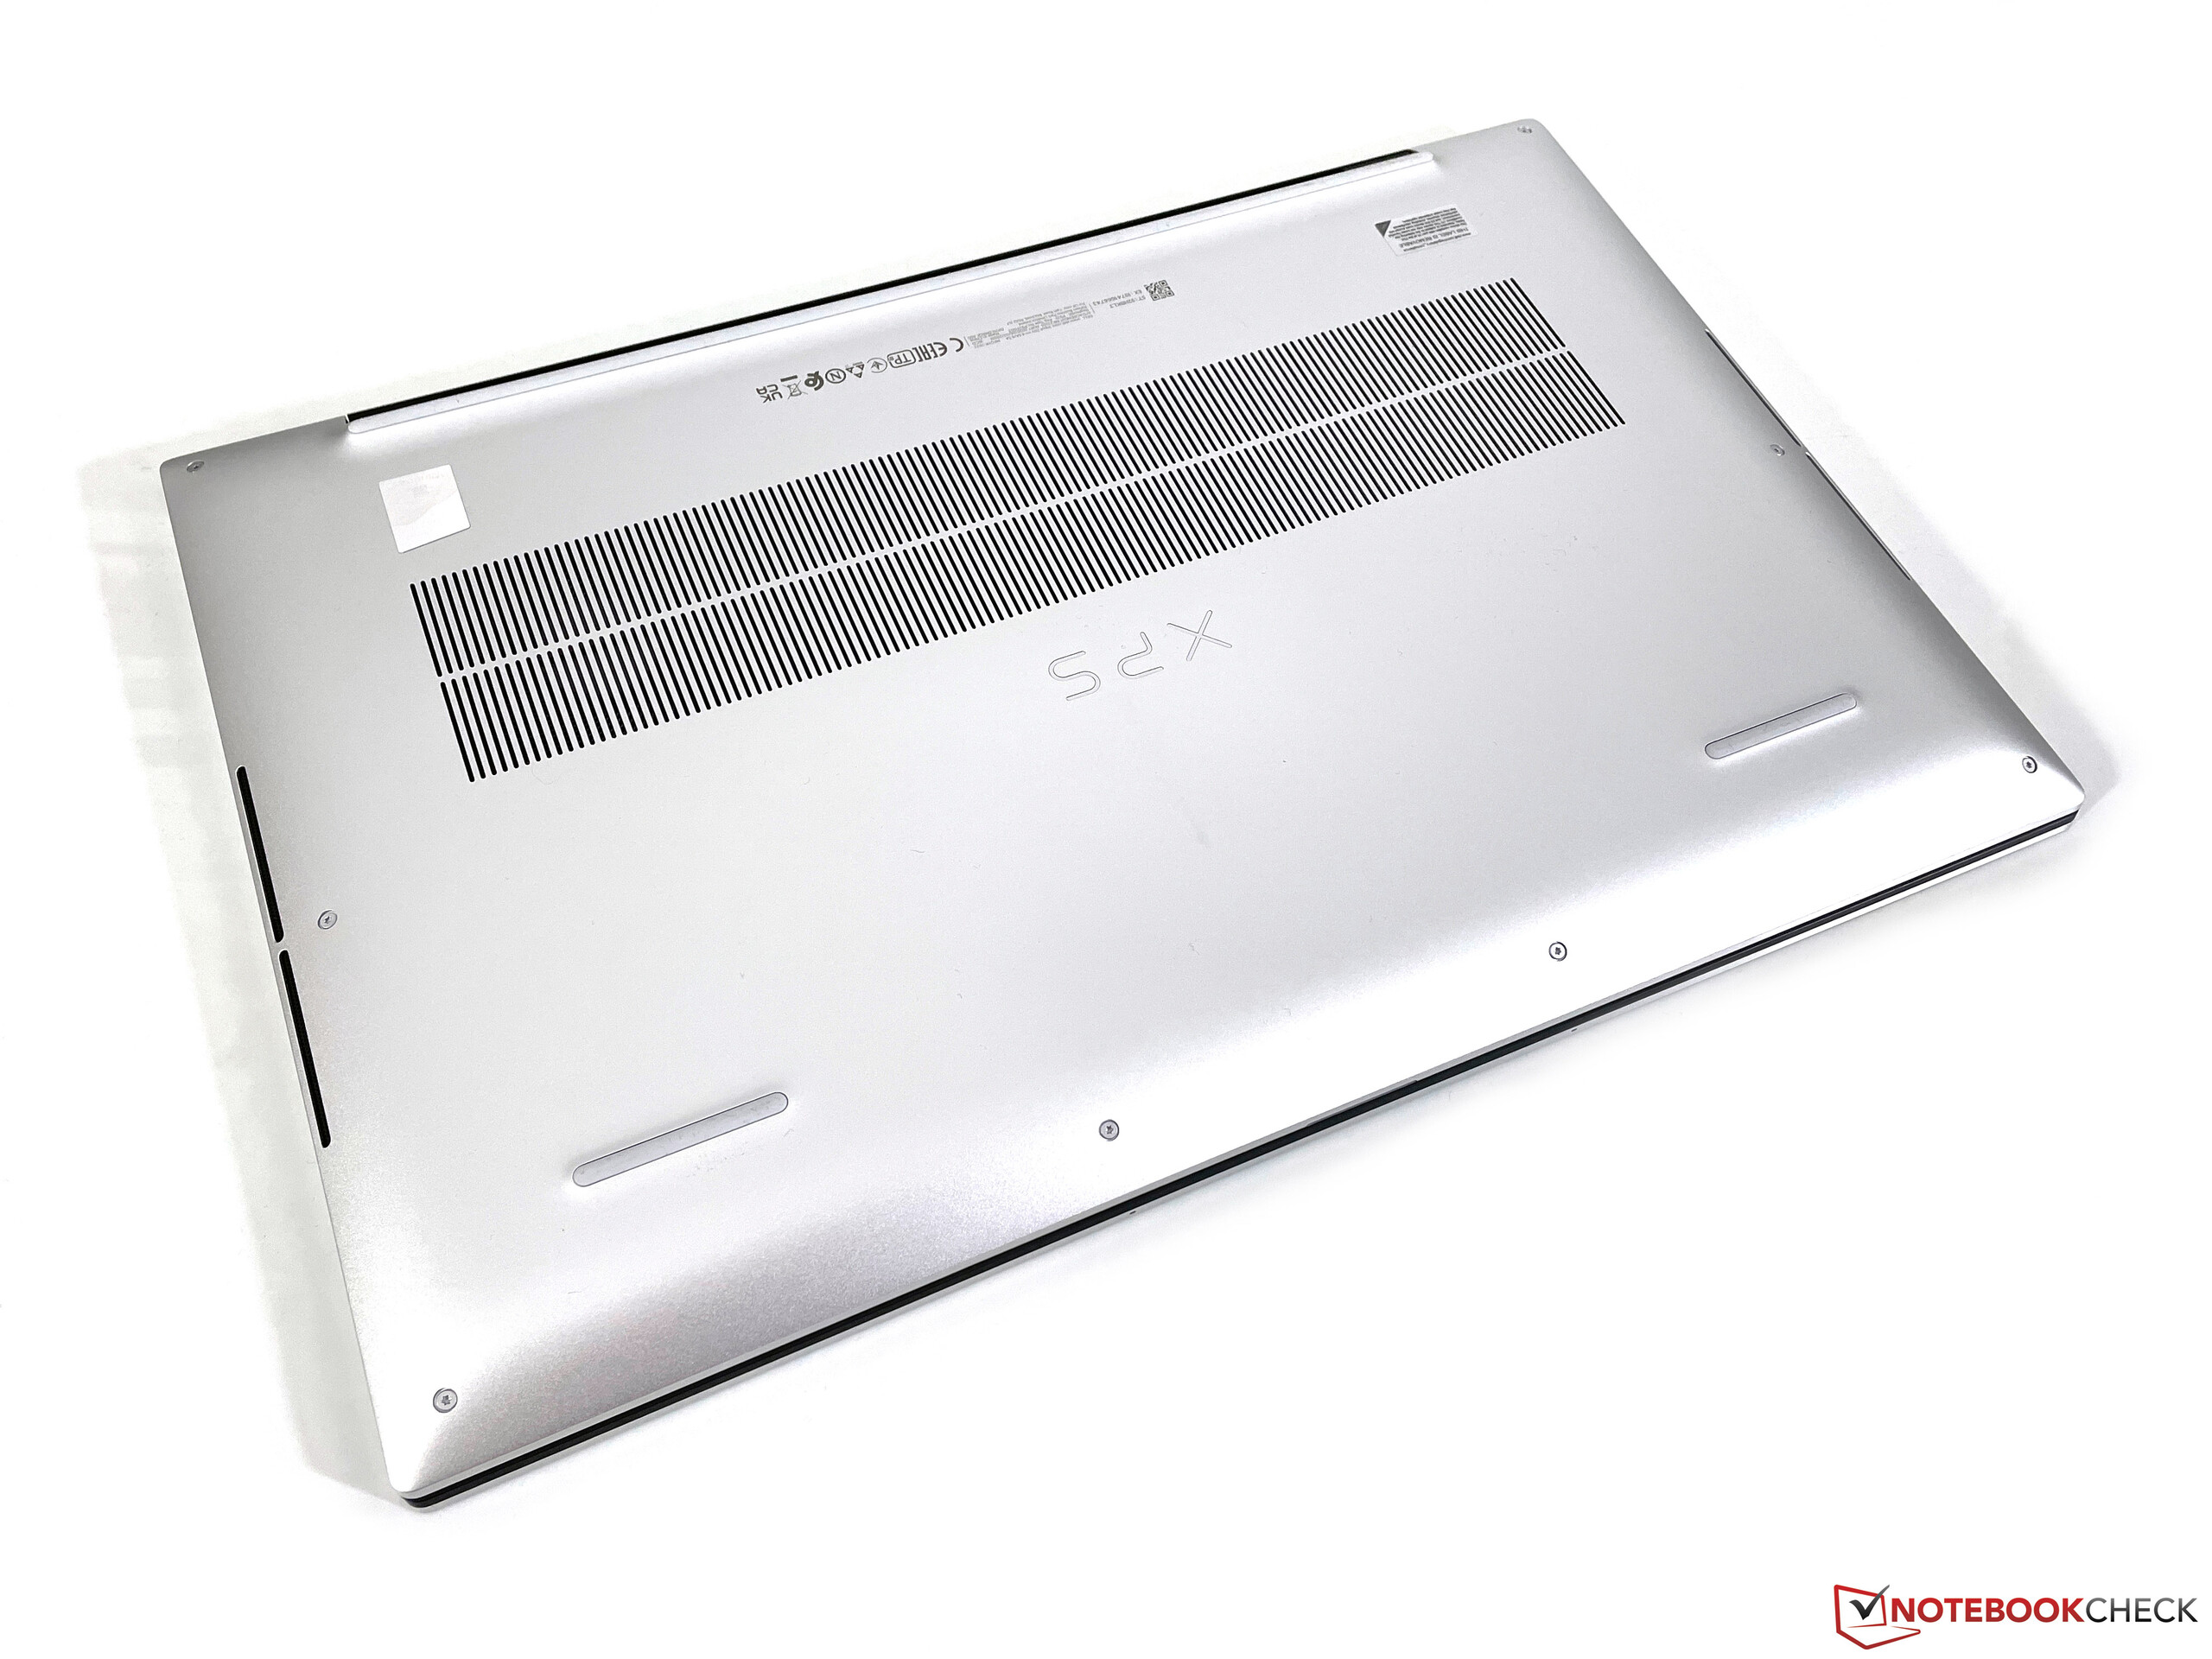
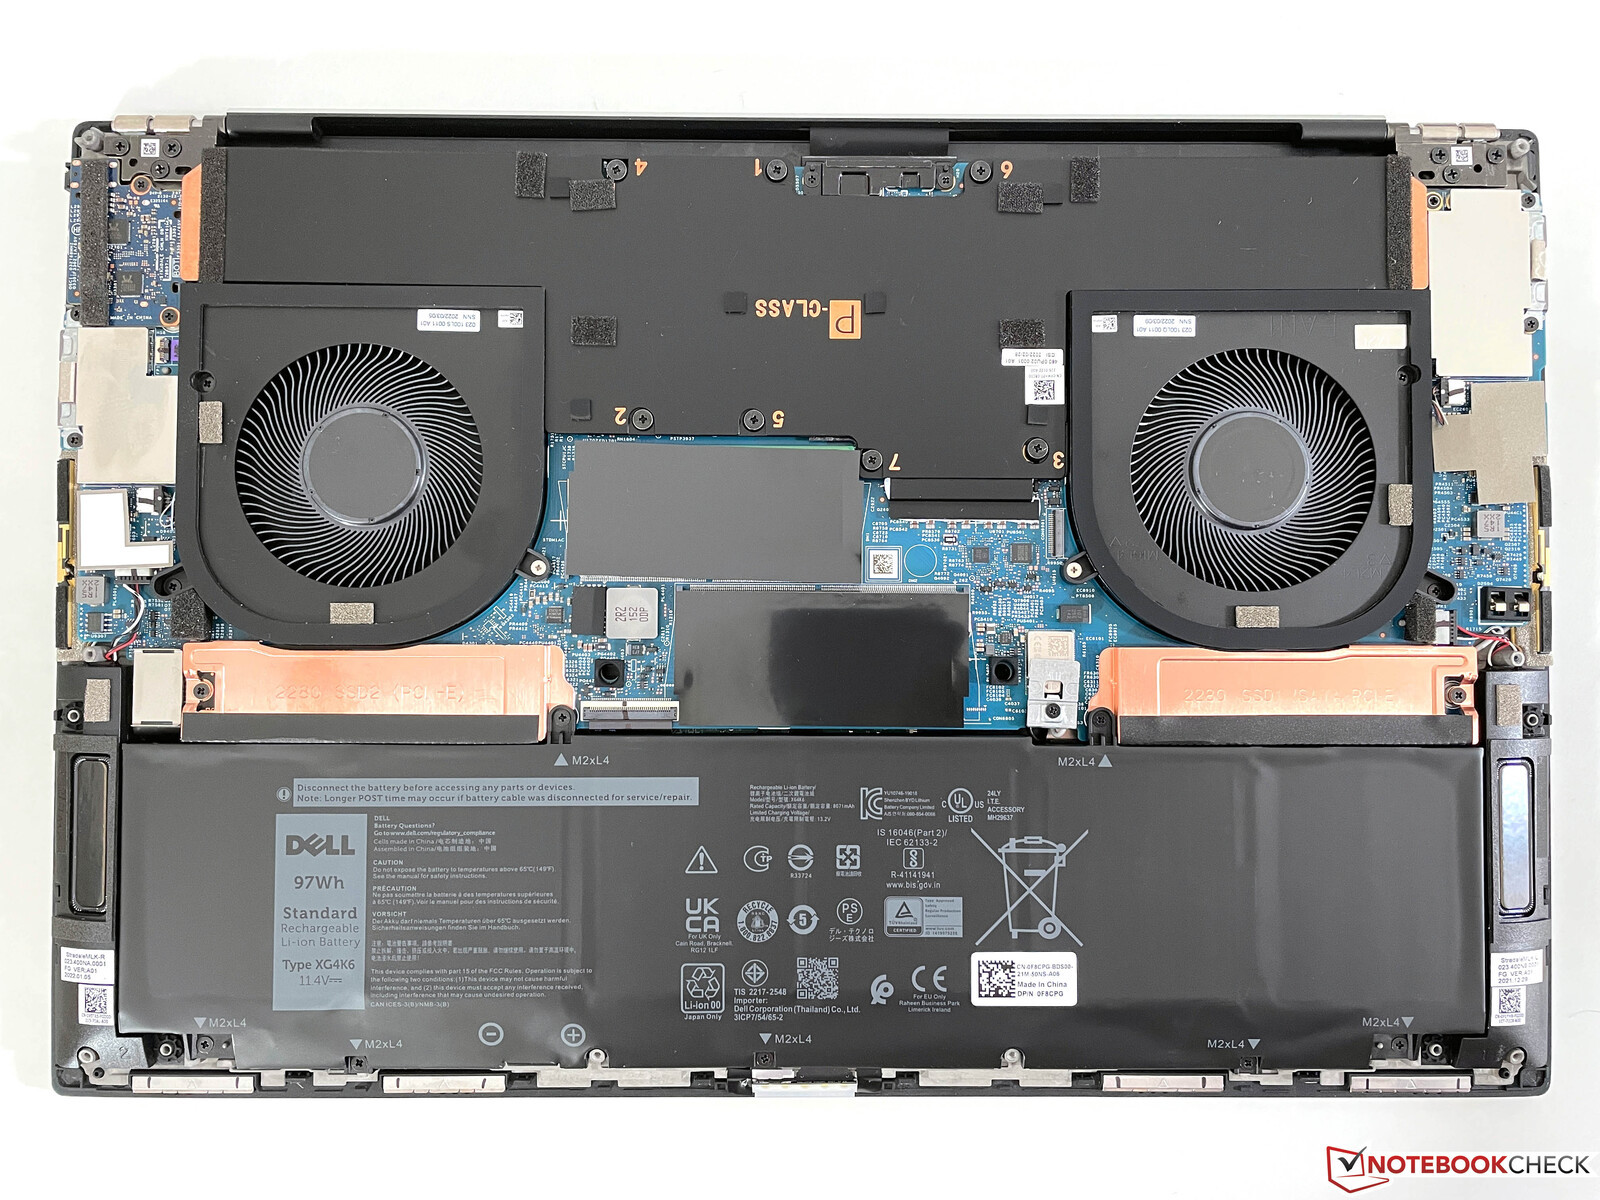
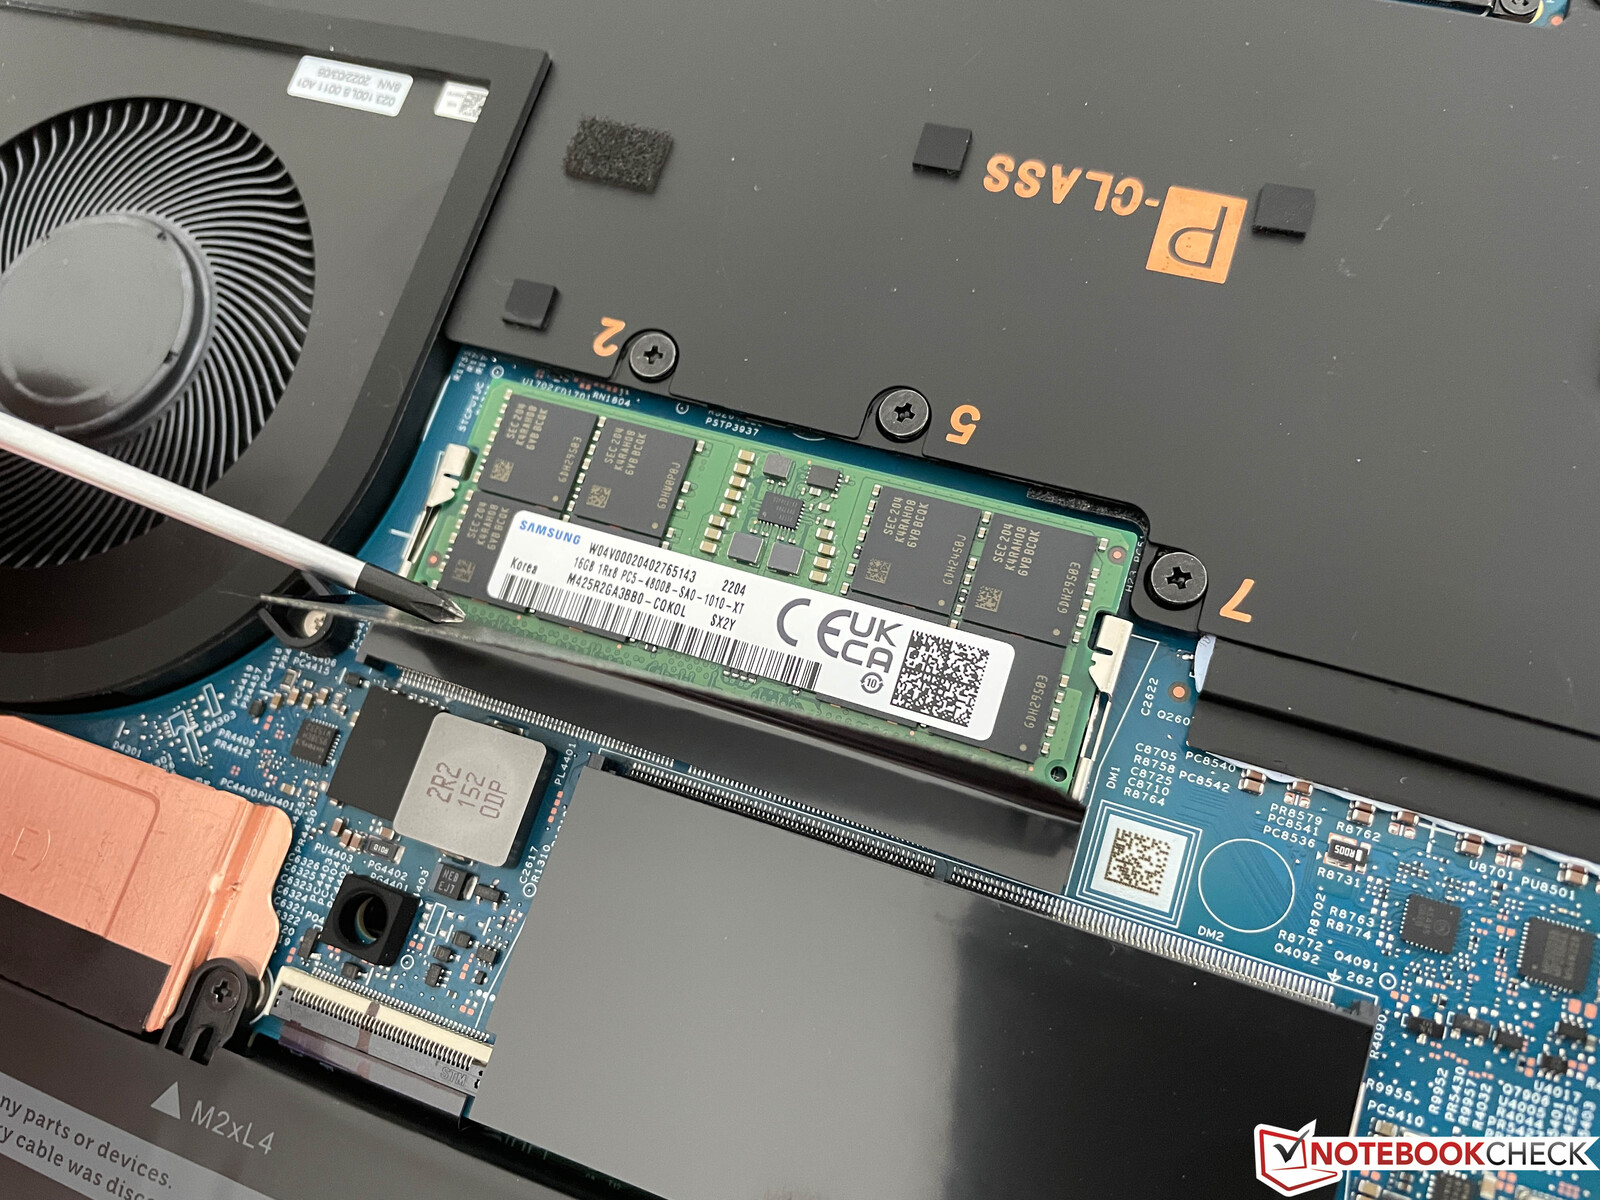
维护
底部的盖子可以很容易地取下,使用户能够访问工作存储器以及两个M.2-2280插槽。
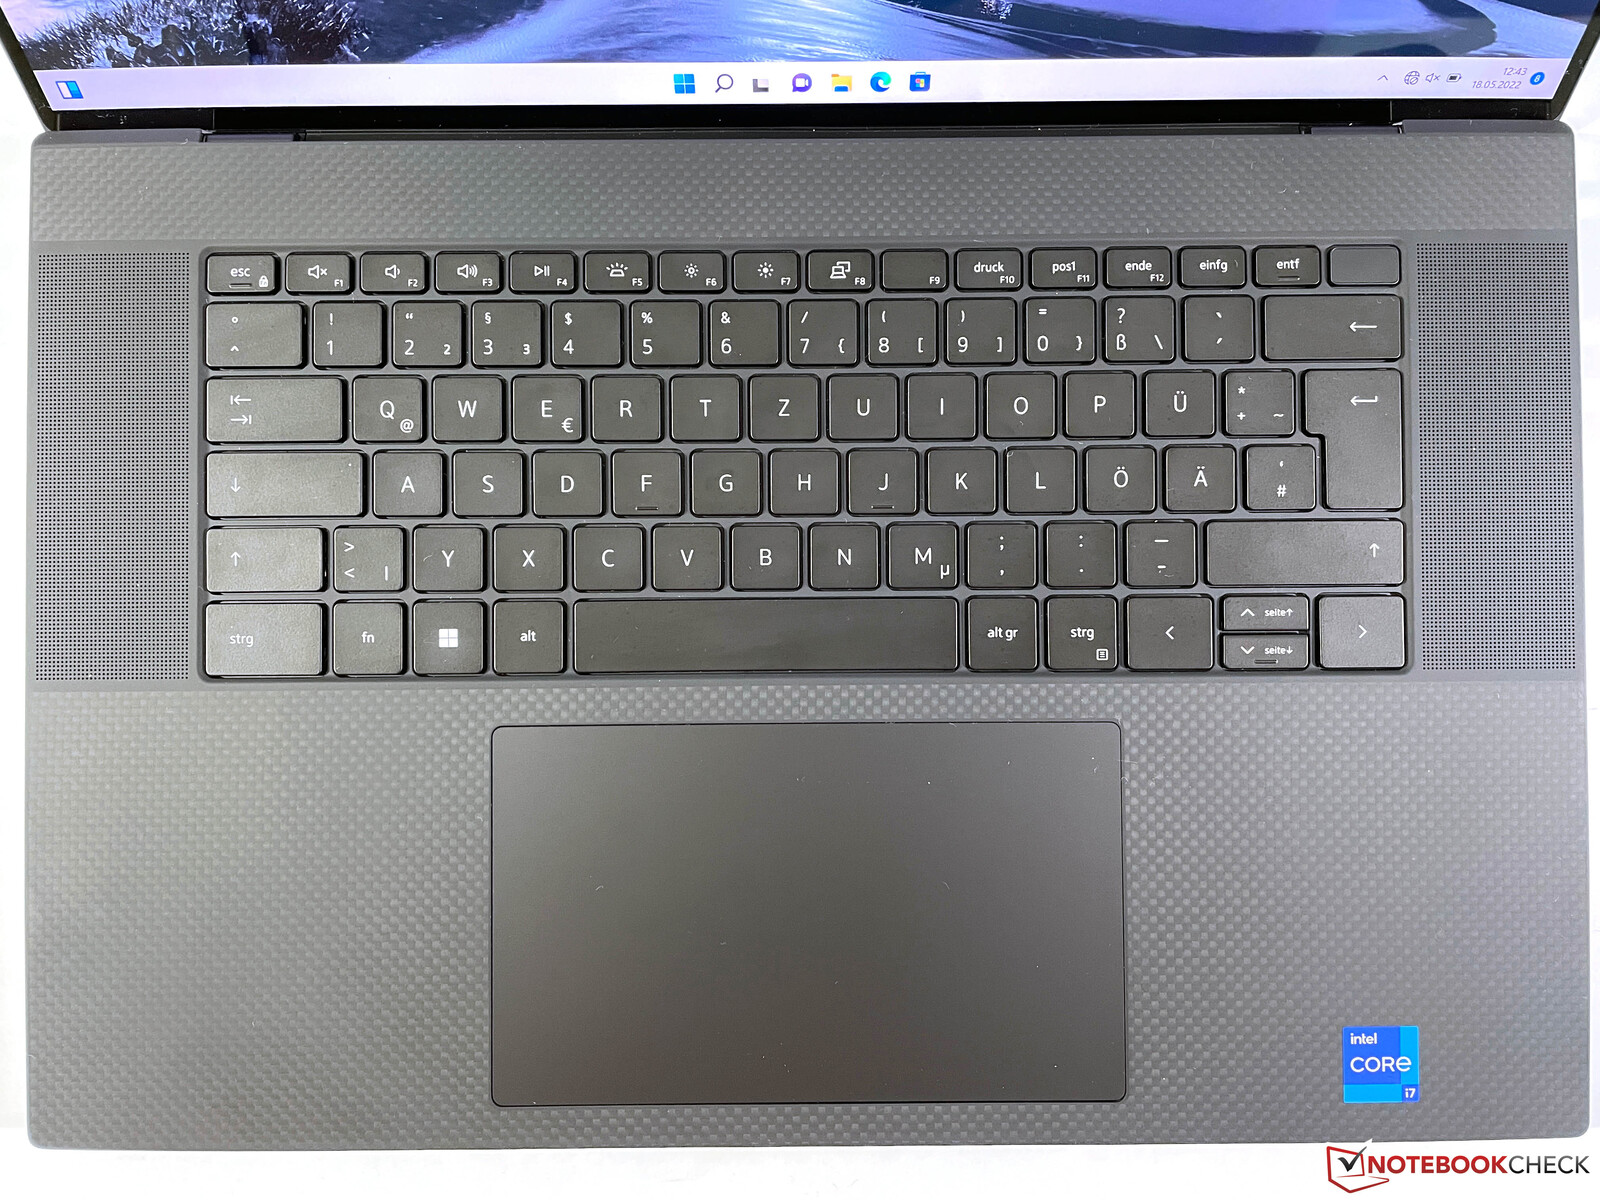
输入设备 - 键盘仍然是平均水平
与旧型号相比,输入设备没有任何变化。键盘位于中心位置,两边是扬声器开口。它的颜色与外壳颜色相匹配,所以它是黑色或白色。就机械装置本身而言,你仍然可以得到1.3毫米(约0.05英寸)的短键程,整体打字体验也只是平平。但这也是由于它给人的印象是哗哗作响。这里肯定有一些改进的余地,戴尔在他们的商务和工作站型号中也使用了更好的键盘。白色背景照明效果不错,但不能由亮度传感器自动激活。
另一方面,大型ClickPad让人没有理由抱怨。它不仅工作非常可靠,而且还为多达四个手指的手势提供了足够的空间。在我们的模型中,电容式触摸屏也可用于输入,这里也没有问题。然而,不支持带压力级别的笔输入。

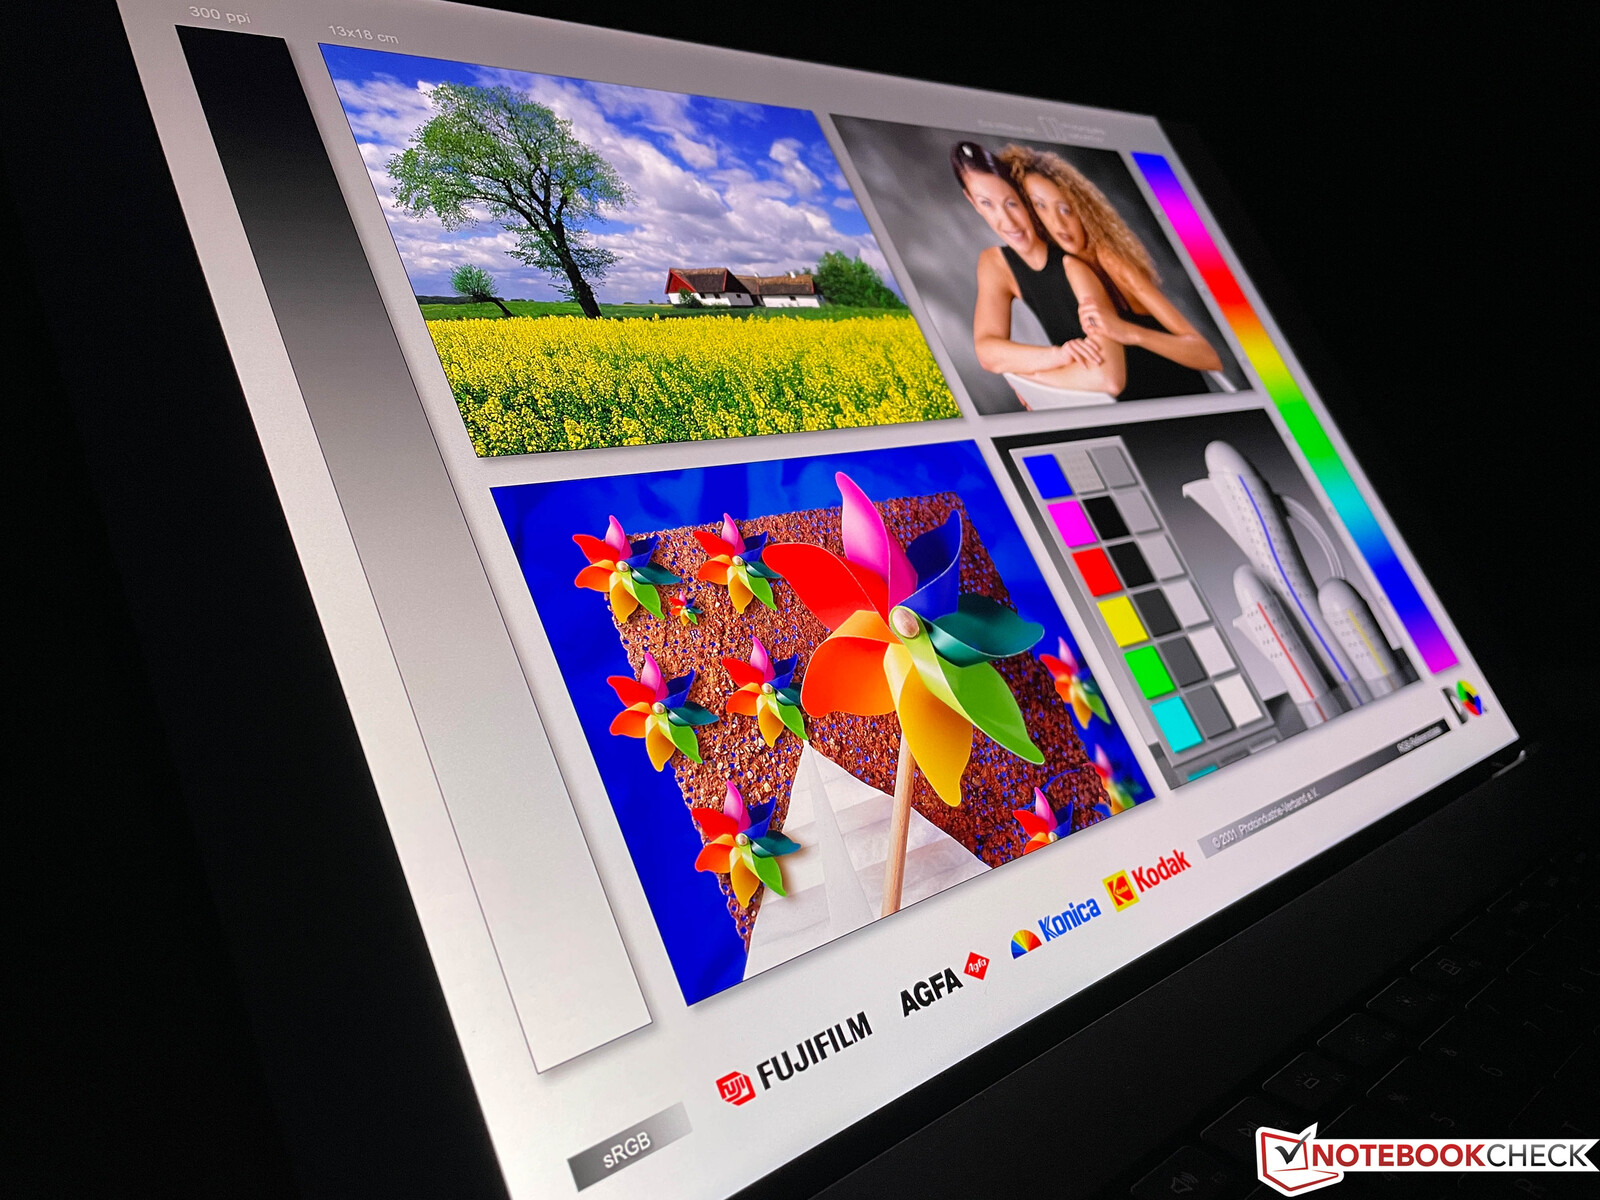
显示屏 - XPS 17继续提供一个伟大的4K IPS显示屏
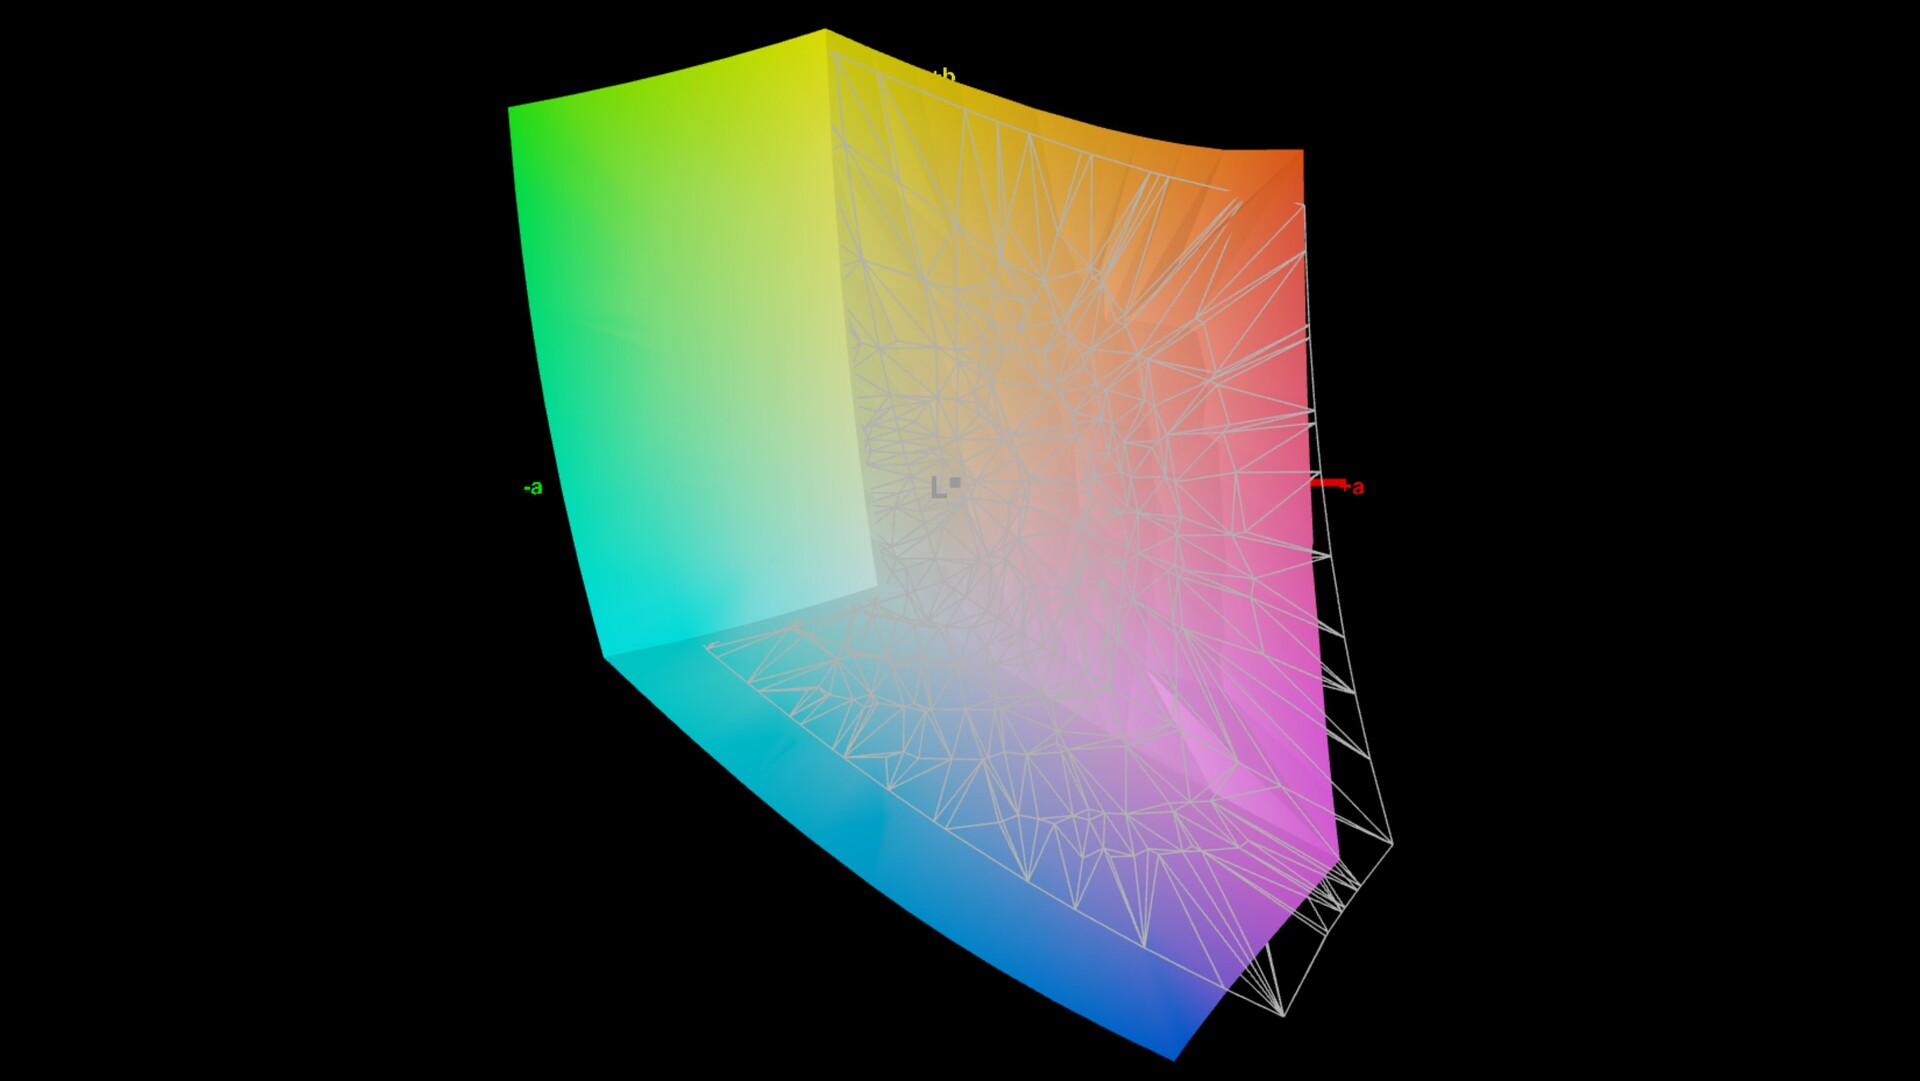
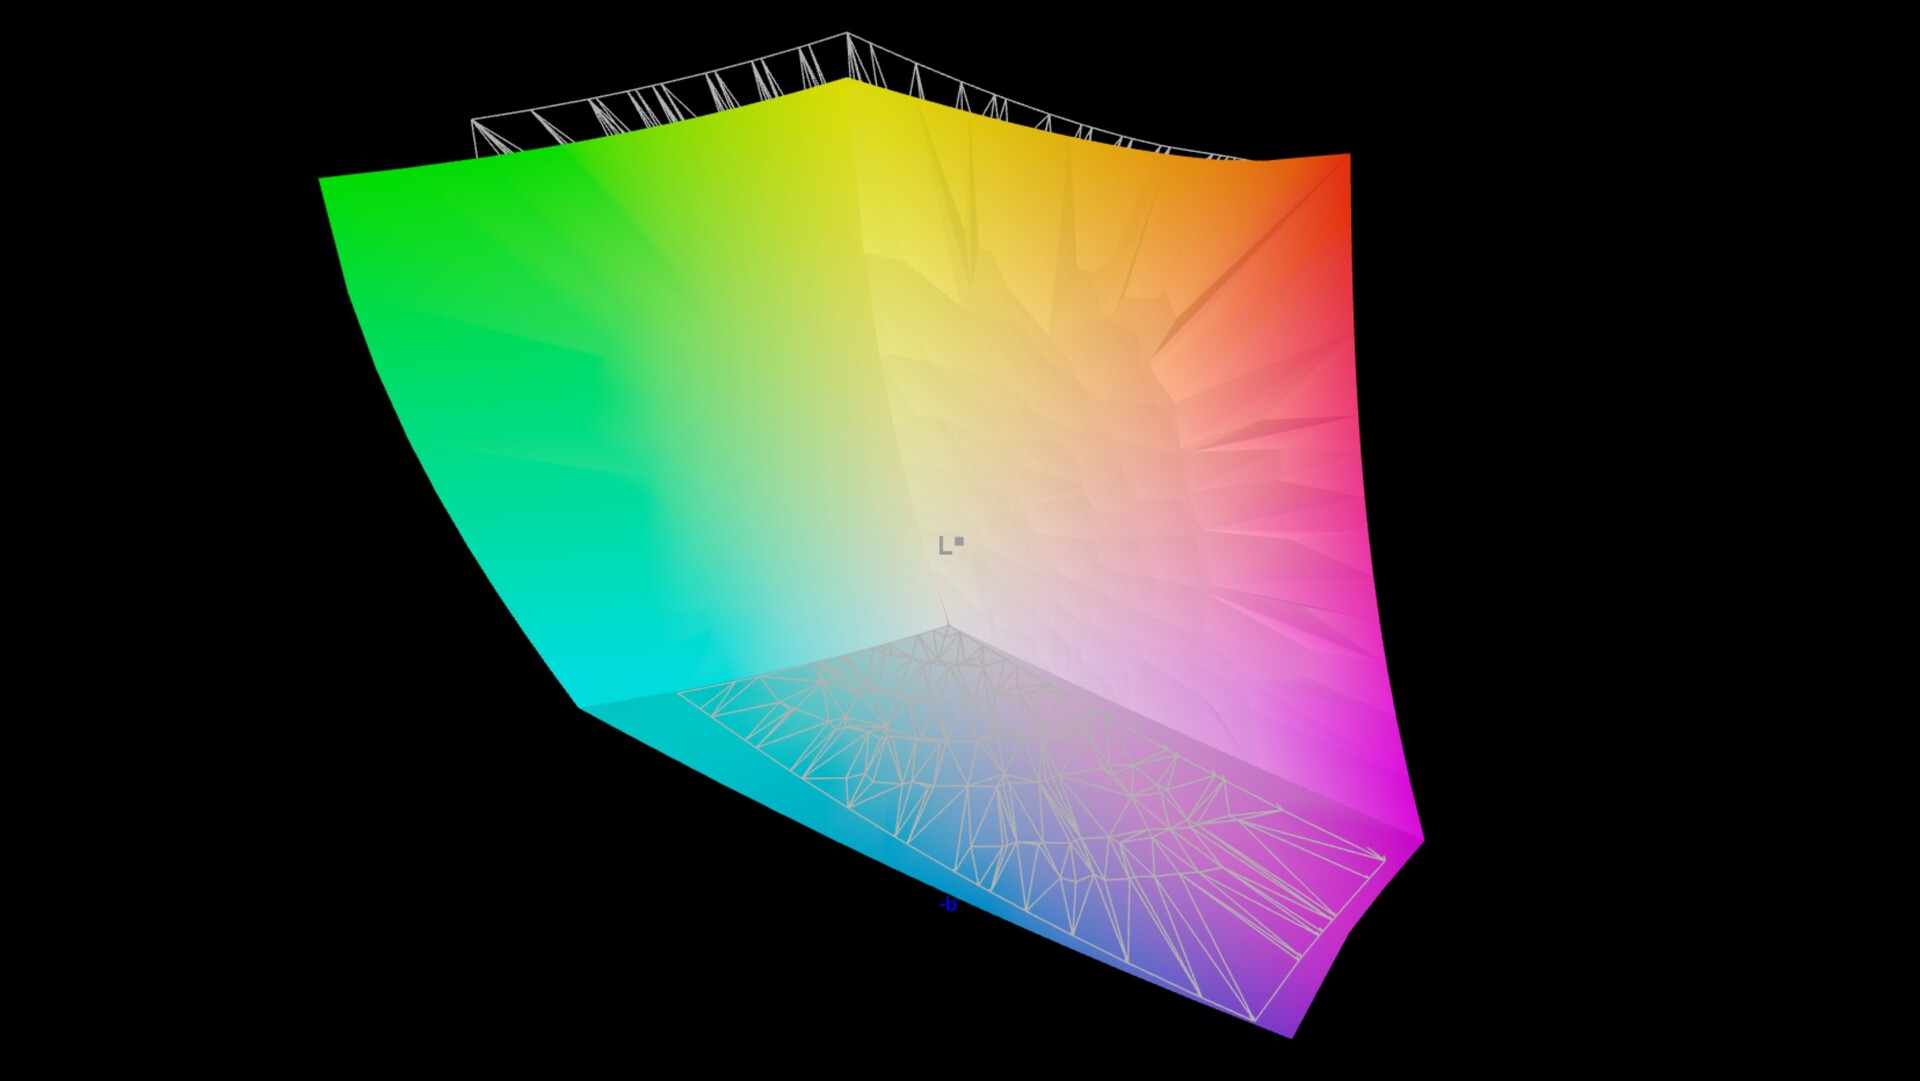
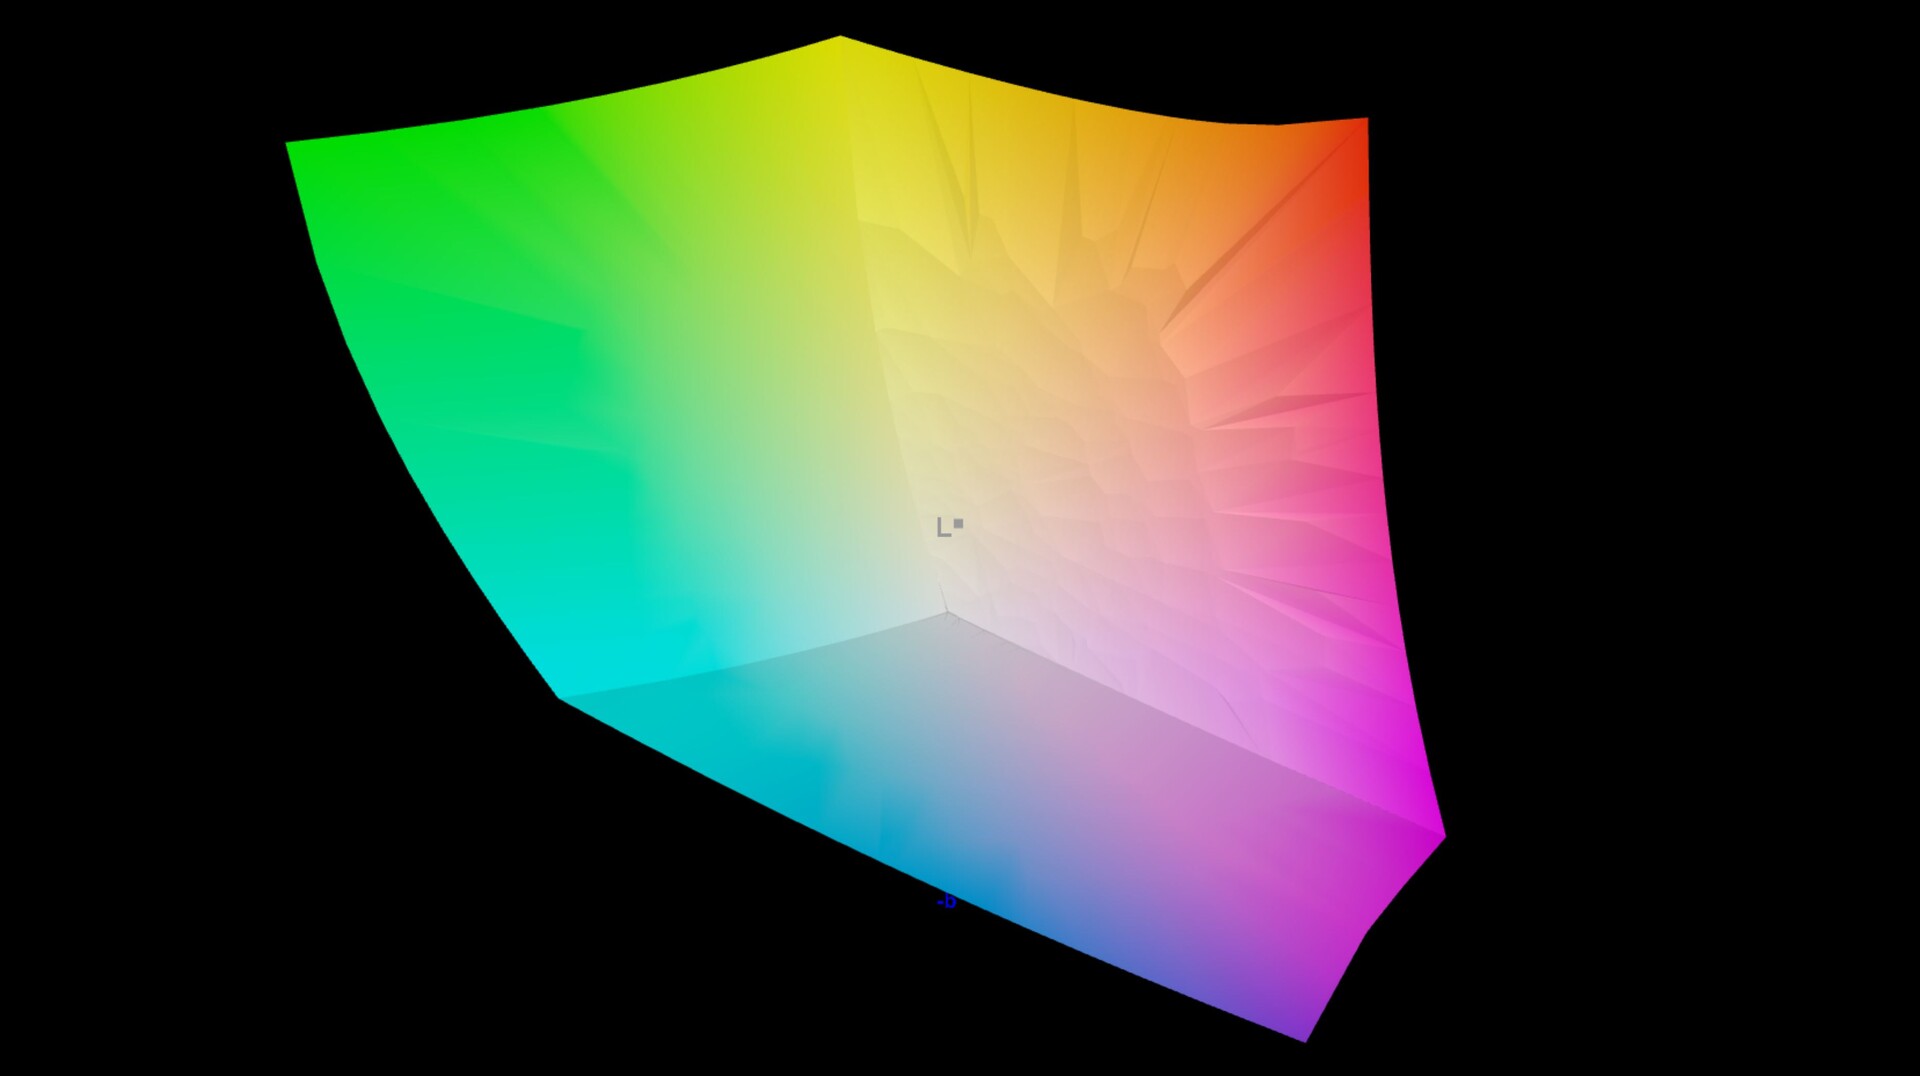
戴尔XPS 17仍然是为数不多的提供完全覆盖AdobeRGB的面板的笔记本电脑之一。在这一点上,这代表了一个例外,因为大多数OLED面板,甚至是惠普目前的DreamColor显示器都朝着DCI-P3标准调整。我们已经很了解夏普的16:10面板,分辨率为3840 x 2400像素,主观的图像印象非常出色。
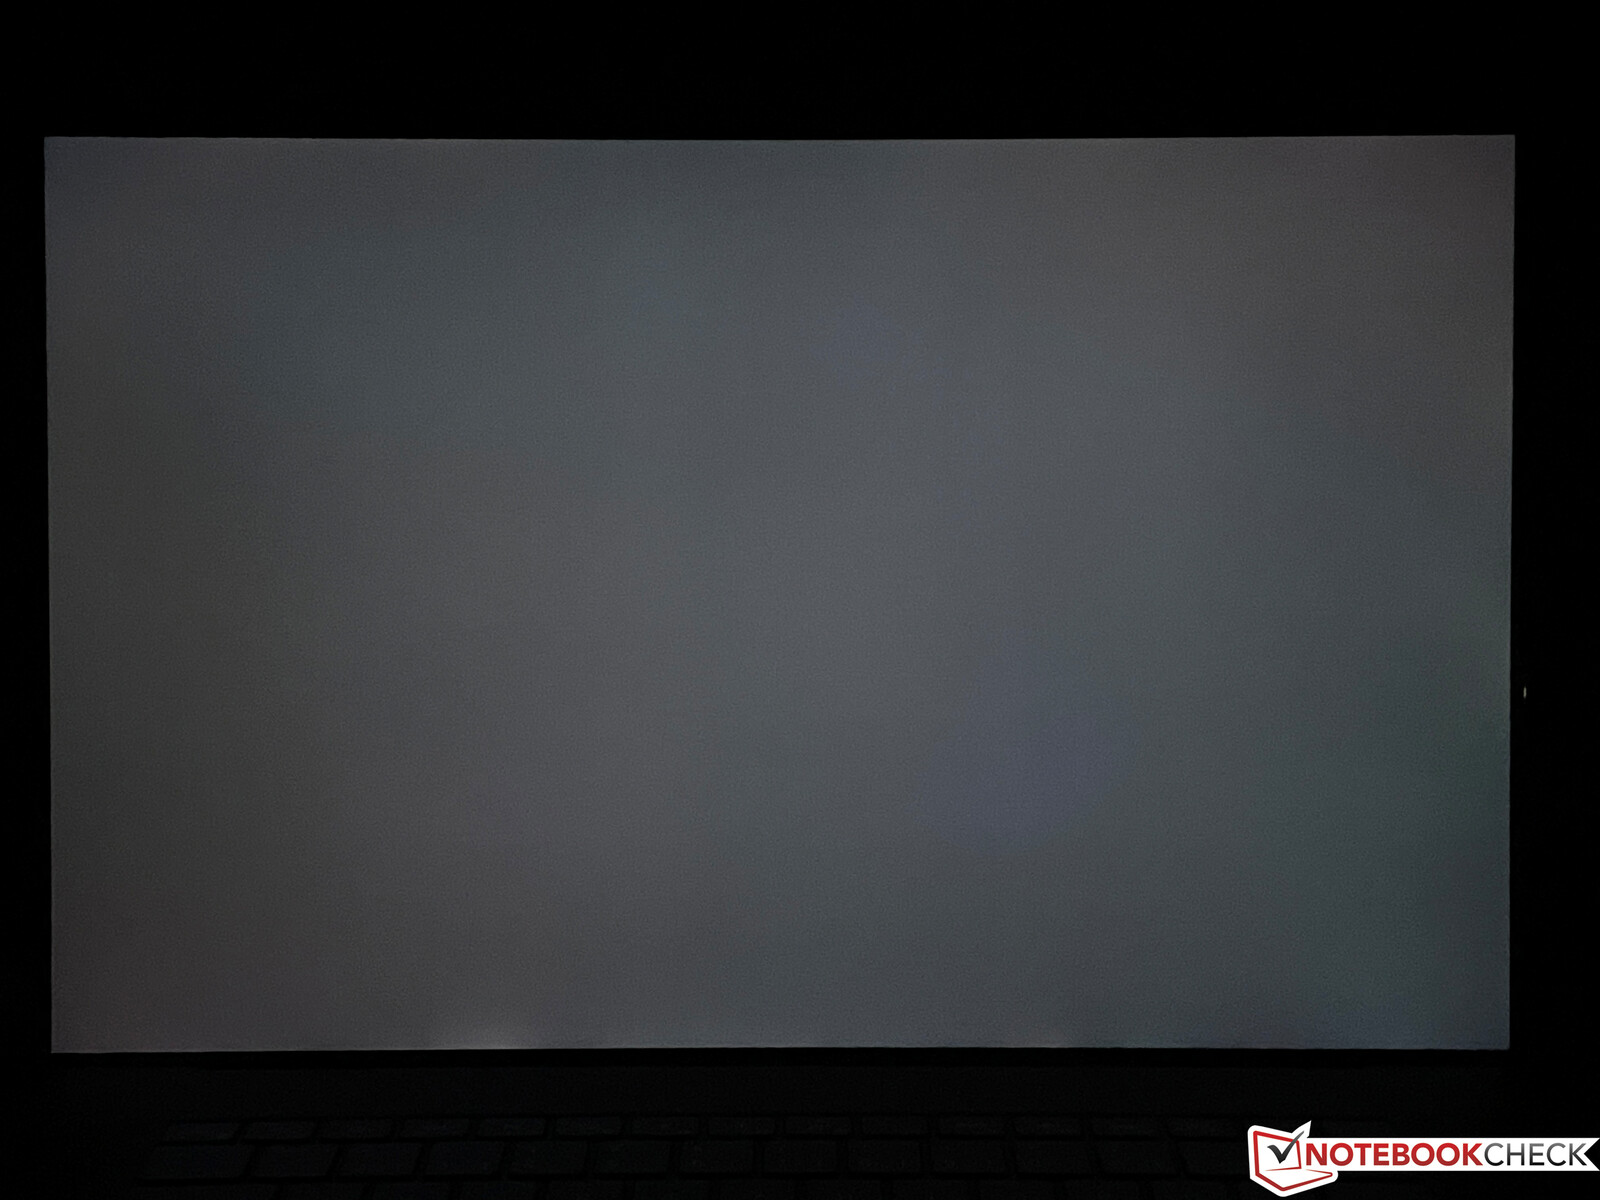
然而,在亮度方面,我们的测试装置的偏差略低,虽然美国的测试装置达到了500cd/m²以上,但这里的最大值只有438cd/m²。另一方面,黑值也很低,只有0.27cd/m²,从而使整体对比度非常高,超过1600:1。屏幕出血是没有问题的,但IPS面板的响应时间不属于最快的。在实践中,你也可以看到一些重影效果,例如在鼠标指针处。从40%或更低的亮度水平开始,我们也注意到在17.9kHz时有一些闪烁,但这应该不会导致任何问题。
| |||||||||||||||||||||||||
Brightness Distribution: 86 %
Center on Battery: 437 cd/m²
Contrast: 1622:1 (Black: 0.27 cd/m²)
ΔE ColorChecker Calman: 2.5 | ∀{0.5-29.43 Ø4.73}
calibrated: 0.8
ΔE Greyscale Calman: 4.2 | ∀{0.09-98 Ø4.97}
100% AdobeRGB 1998 (Argyll 3D)
100% sRGB (Argyll 3D)
94.8% Display P3 (Argyll 3D)
Gamma: 2.22
CCT: 7034 K
| Dell XPS 17 9720 Sharp LQ170R1, IPS, 3840x2400, 17" | Apple MacBook Pro 16 2021 M1 Pro Liquid Retina XDR, Mini-LED, 3456x2234, 16.2" | Dell XPS 17 9720 RTX 3060 Sharp LQ170R1, IPS, 3840x2400, 17" | Lenovo ThinkPad X1 Extreme G4-20Y5CTO1WW (3050 Ti) LP160UQ1-SPB1, IPS LED, 3840x2400, 16" | Asus Vivobook Pro 16X-M7600QE Samsung ATNA60YV02-0, OLED, 3840x2400, 16.1" | Lenovo ThinkBook 16p G2 ACH Lenovo LEN8A95 (AUO B160QAN02.M), IPS, 2560x1600, 16" | Dell XPS 17 9710 Core i7 RTX 3060 Sharp LQ170R1, IPS, 3840x2400, 17" | |
|---|---|---|---|---|---|---|---|
| Display | -2% | -6% | -5% | 1% | -14% | 0% | |
| Display P3 Coverage (%) | 94.8 | 99.1 5% | 92.9 -2% | 84.3 -11% | 99.8 5% | 76.4 -19% | 94.8 0% |
| sRGB Coverage (%) | 100 | 100 0% | 100 0% | 98.3 -2% | 100 0% | 100 0% | 100 0% |
| AdobeRGB 1998 Coverage (%) | 100 | 88 -12% | 85.3 -15% | 97.8 -2% | 96.9 -3% | 77.4 -23% | 100 0% |
| Response Times | -102% | -10% | -31% | 95% | 37% | 2% | |
| Response Time Grey 50% / Grey 80% * (ms) | 53.2 ? | 42.8 ? 20% | 51.2 ? 4% | 60 ? -13% | 2 ? 96% | 36 32% | 44.8 ? 16% |
| Response Time Black / White * (ms) | 28.4 ? | 91.6 ? -223% | 35.2 ? -24% | 42 ? -48% | 2 ? 93% | 16.4 42% | 32 ? -13% |
| PWM Frequency (Hz) | 17990 ? | 14880 | 60 ? | ||||
| Screen | 221% | -37% | 2% | 1% | -5% | -14% | |
| Brightness middle (cd/m²) | 438 | 514 17% | 512.7 17% | 639 46% | 392 -11% | 439 0% | 536.5 22% |
| Brightness (cd/m²) | 411 | 497 21% | 463 13% | 612 49% | 396 -4% | 397 -3% | 489 19% |
| Brightness Distribution (%) | 86 | 95 10% | 85 -1% | 84 -2% | 98 14% | 83 -3% | 85 -1% |
| Black Level * (cd/m²) | 0.27 | 0.02 93% | 0.32 -19% | 0.47 -74% | 0.44 -63% | 0.37 -37% | |
| Contrast (:1) | 1622 | 25700 1484% | 1602 -1% | 1360 -16% | 998 -38% | 1450 -11% | |
| Colorchecker dE 2000 * | 2.5 | 1.4 44% | 5.98 -139% | 2.2 12% | 1.74 30% | 1.68 33% | 2.46 2% |
| Colorchecker dE 2000 max. * | 6.3 | 2.8 56% | 12.09 -92% | 5.3 16% | 3.18 50% | 2.36 63% | 7.74 -23% |
| Colorchecker dE 2000 calibrated * | 0.8 | 1.4 -75% | 1.85 -131% | 1.57 -96% | 1.85 -131% | ||
| Greyscale dE 2000 * | 4.2 | 2.3 45% | 7.2 -71% | 1.7 60% | 1.77 58% | 1.64 61% | 2.9 31% |
| Gamma | 2.22 99% | 2.27 97% | 2.54 87% | 2.31 95% | 2.22 99% | 2.39 92% | 2.12 104% |
| CCT | 7034 92% | 6792 96% | 6914 94% | 6390 102% | 6483 100% | 6616 98% | 6868 95% |
| Total Average (Program / Settings) | 39% /
120% | -18% /
-25% | -11% /
-4% | 32% /
16% | 6% /
-1% | -4% /
-9% |
* ... smaller is better
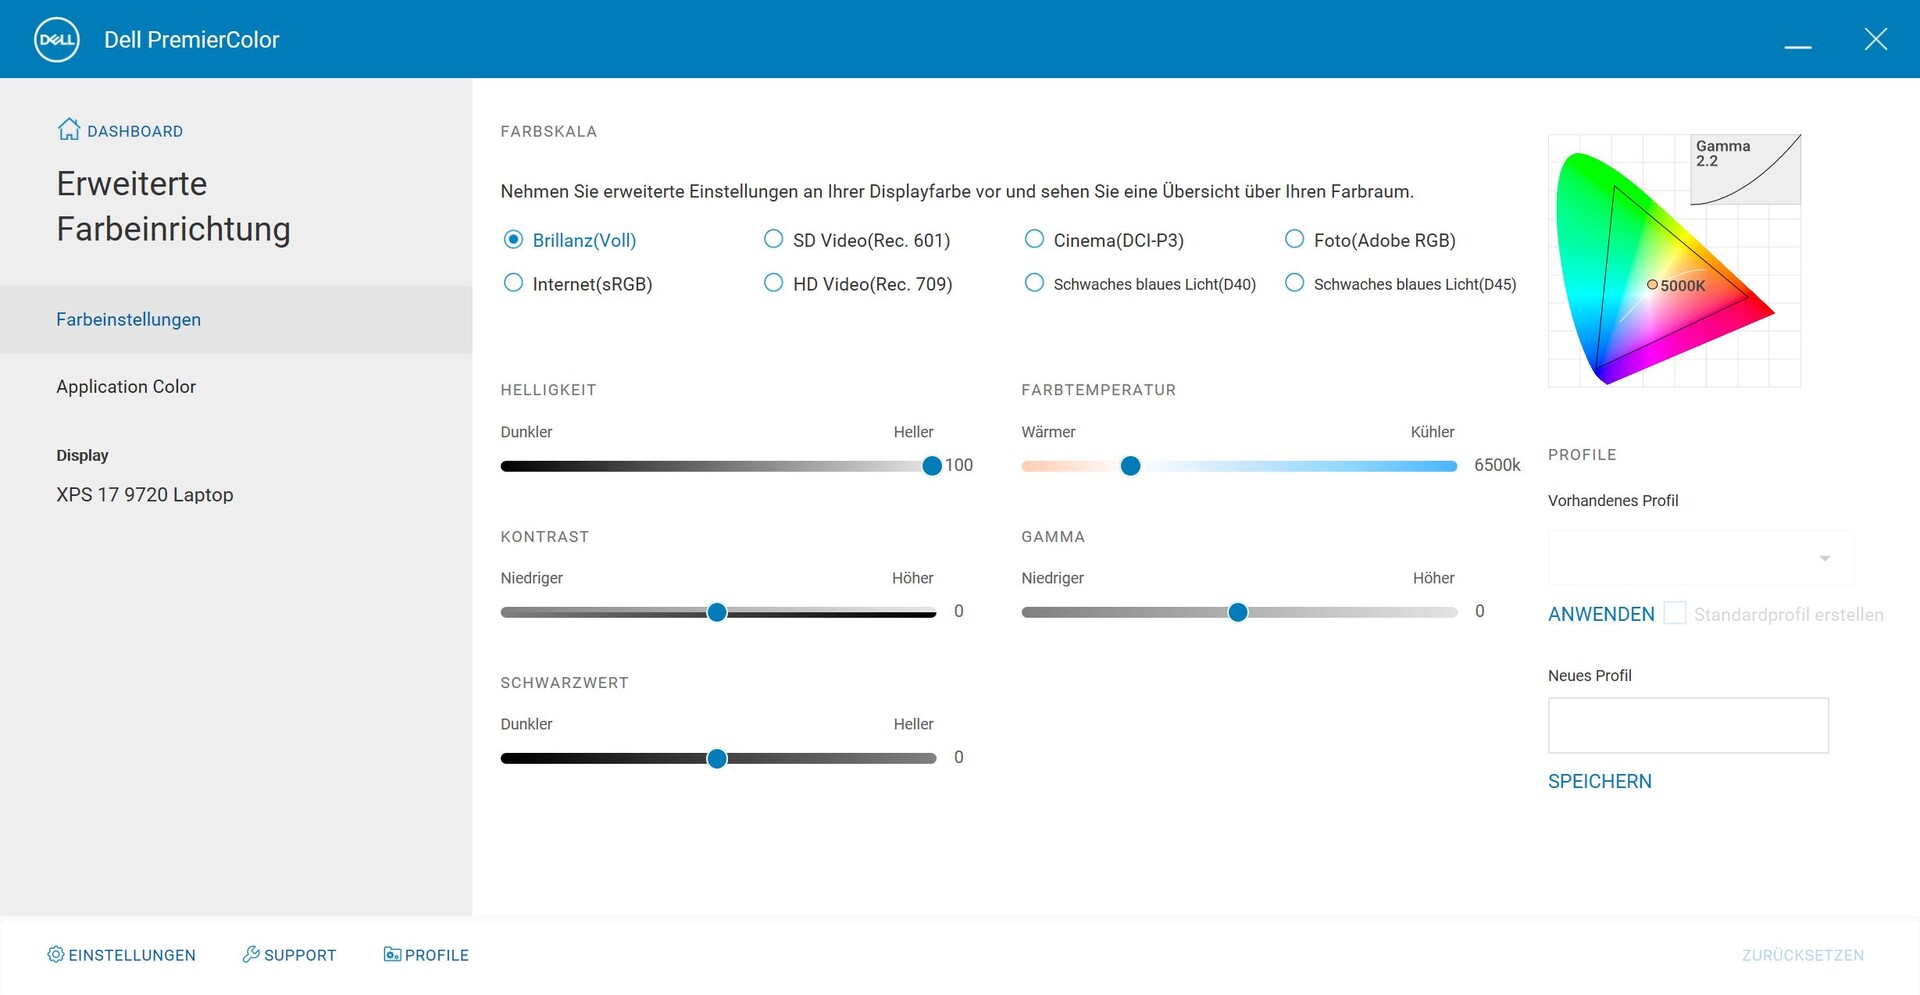
戴尔包括Premier Color软件,允许你在各种配置文件和色彩空间之间切换。我们用专业的CalMAN软件和X-Rite i1 Pro 2光谱光度计测量了显示器,发现照片配置文件(Adobe RGB)提供了最好的图像质量。你还应该检查Premier Color软件中的调整,因为在我们的测试设备中,默认情况下色温被调整得太暖(5000K而不是6500K)(你也可以在下面的户外图片中看到)。
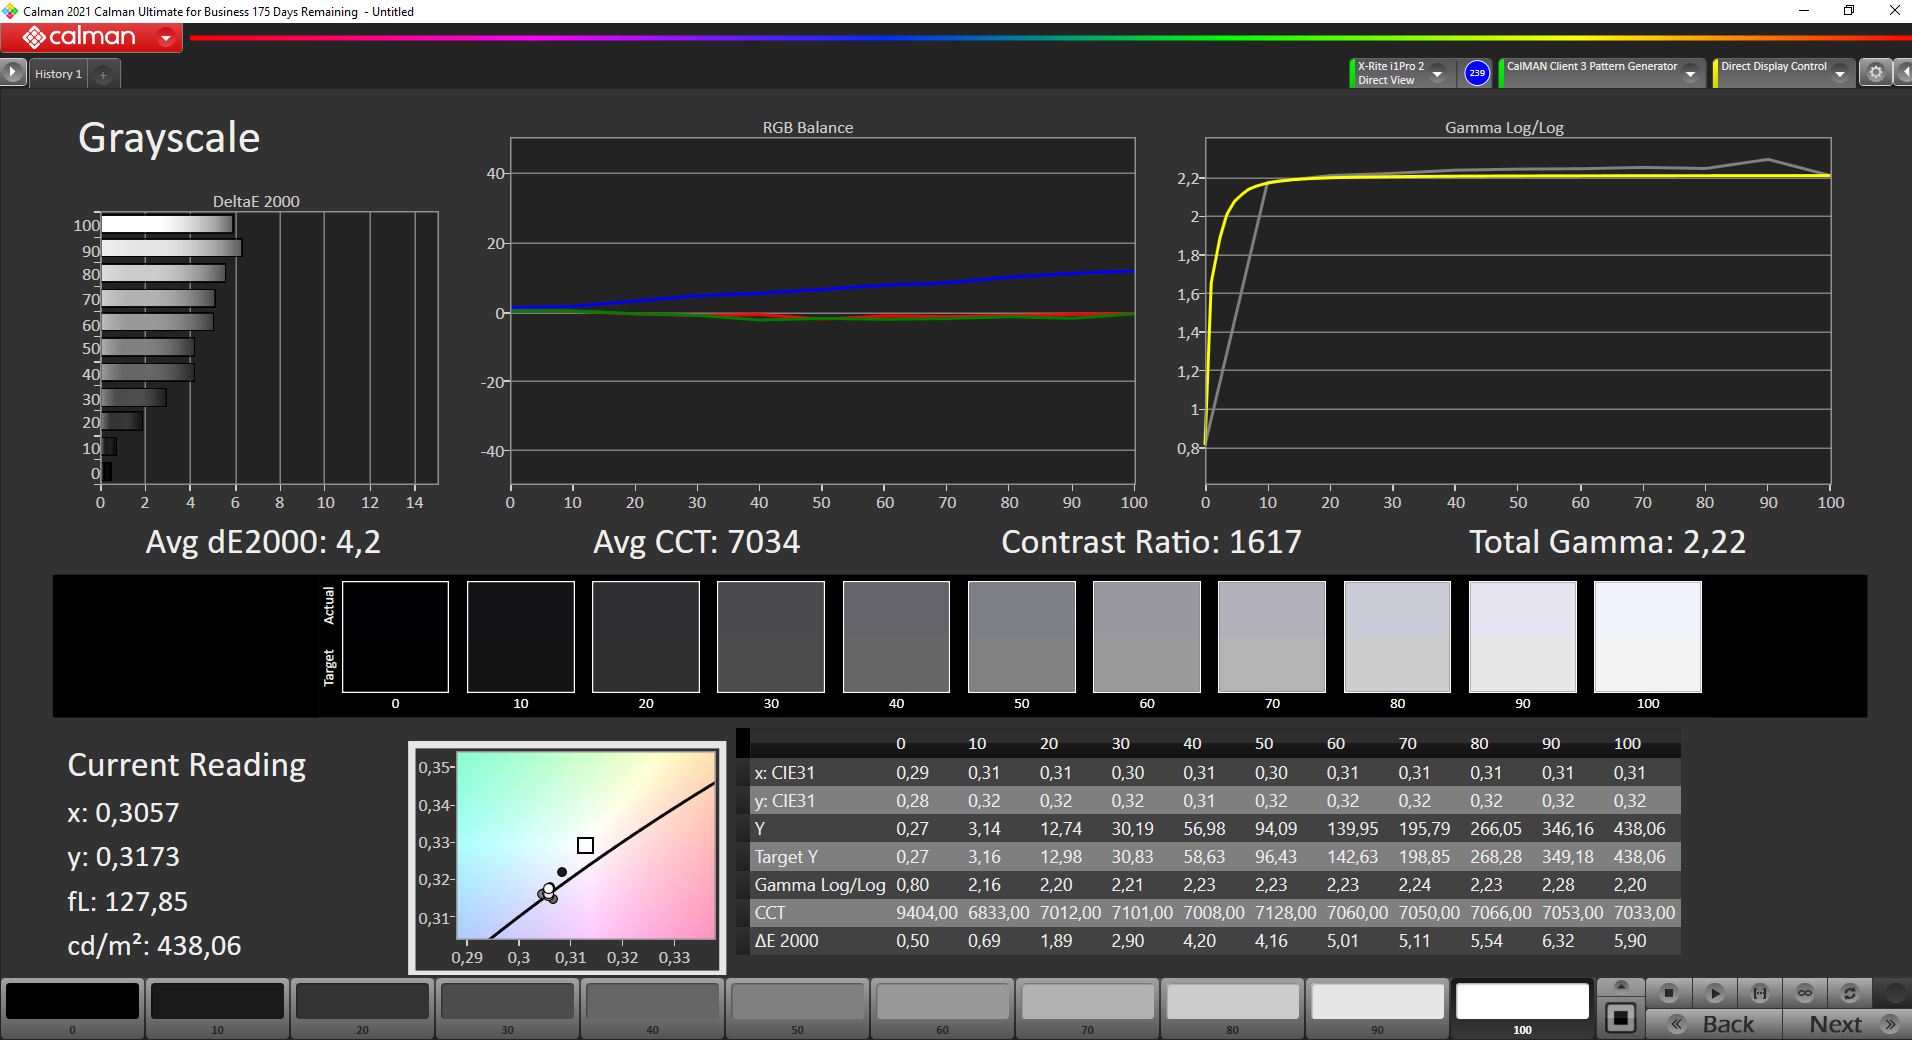
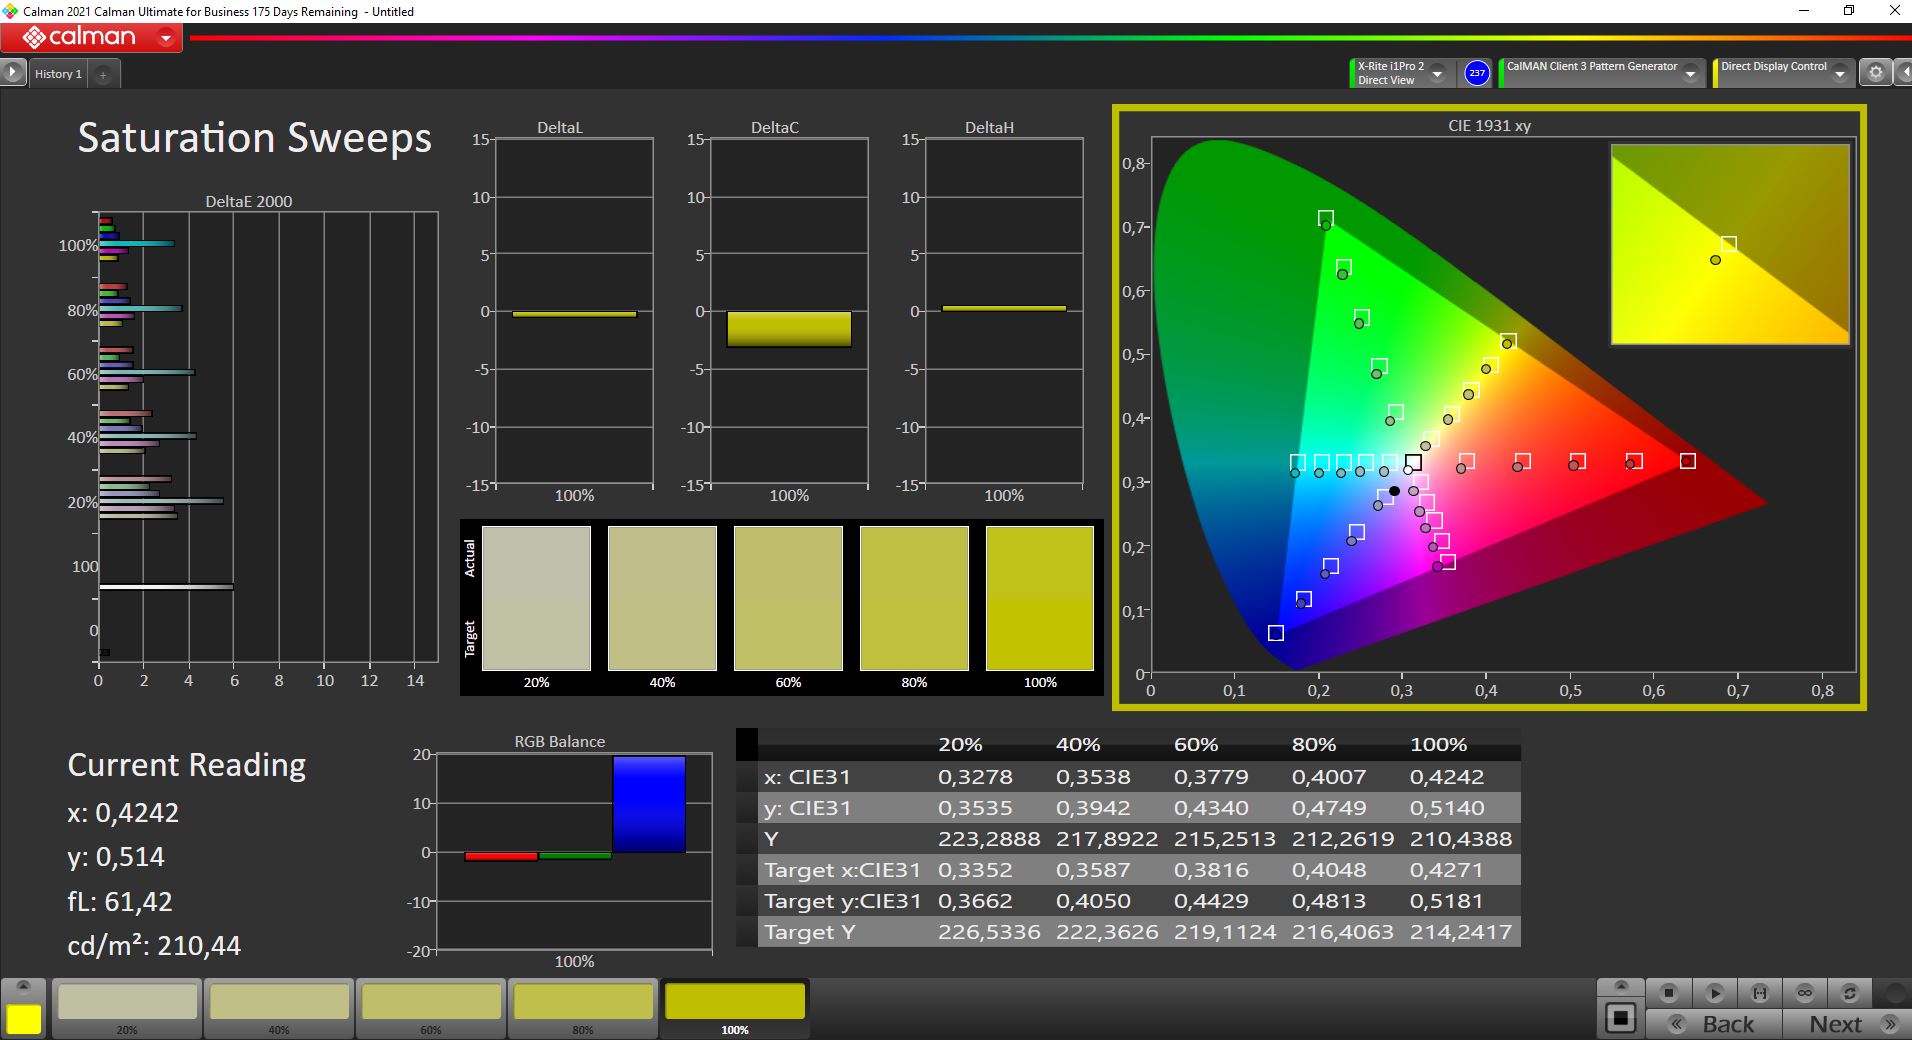
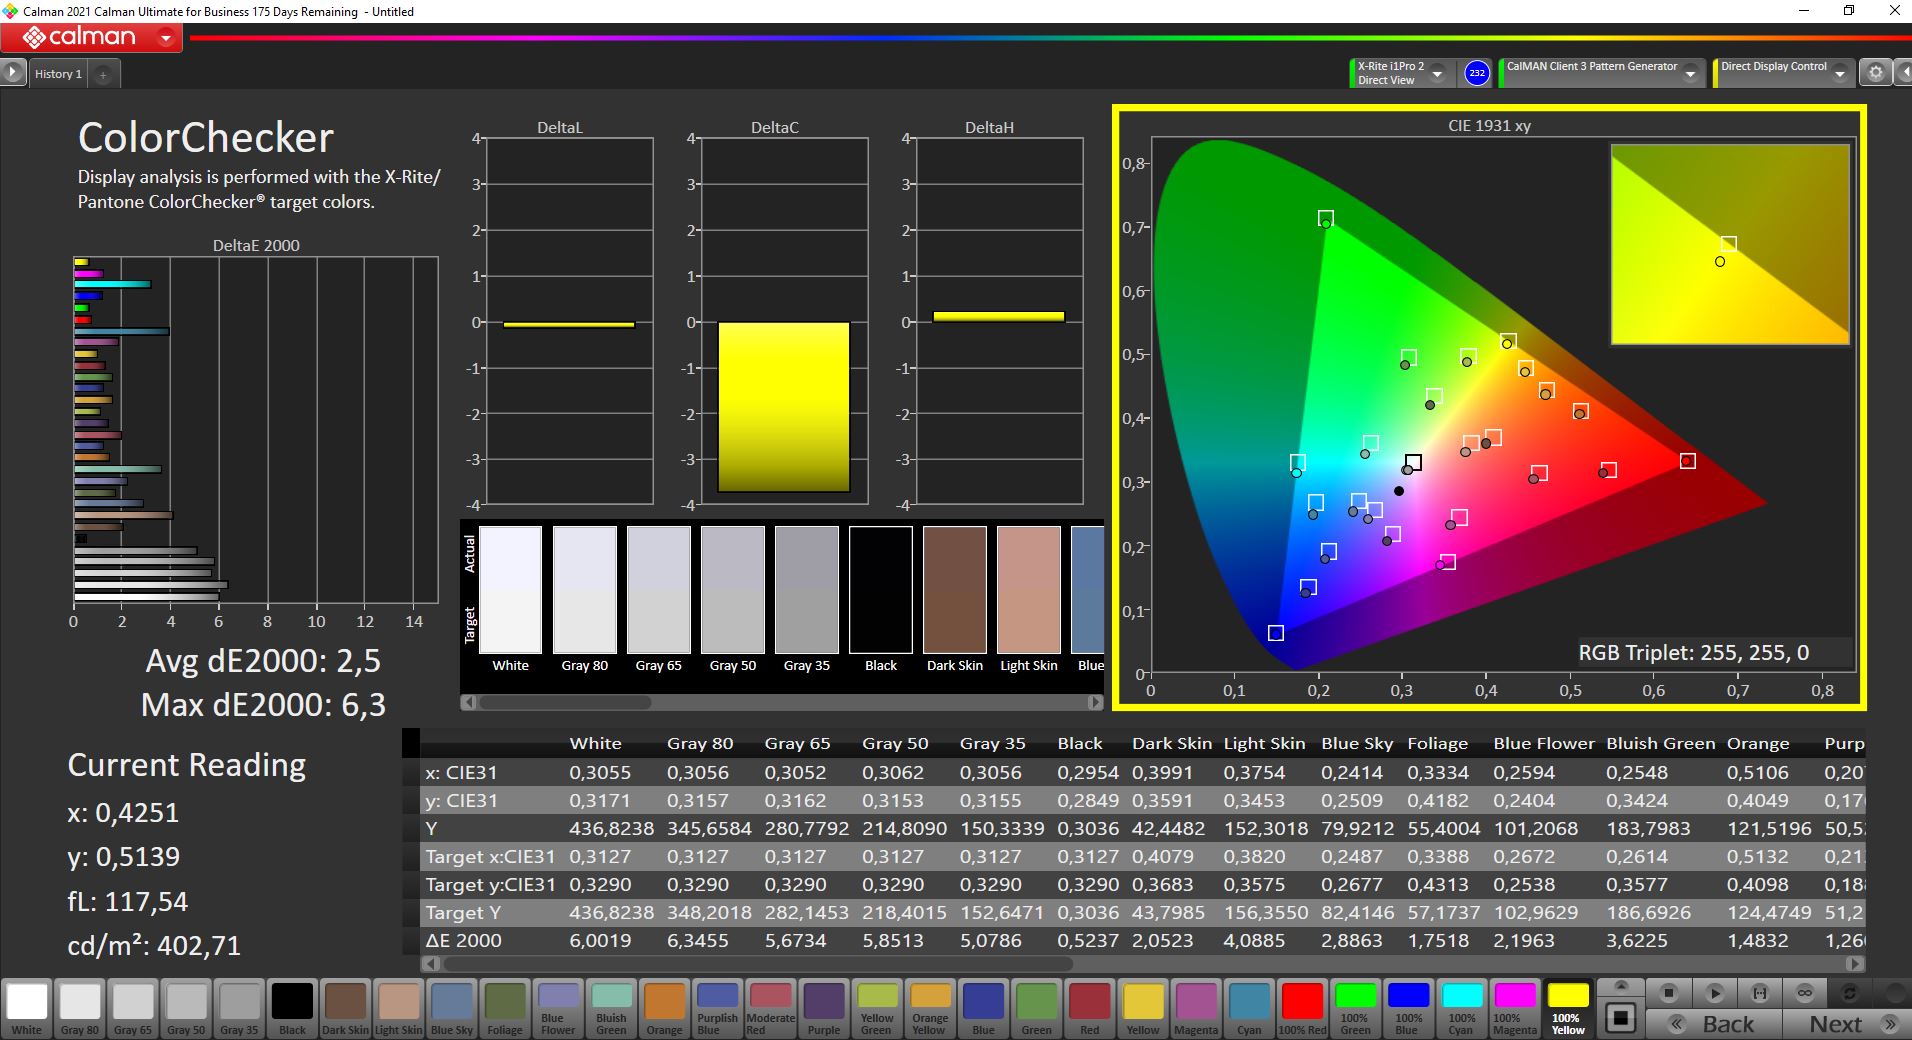
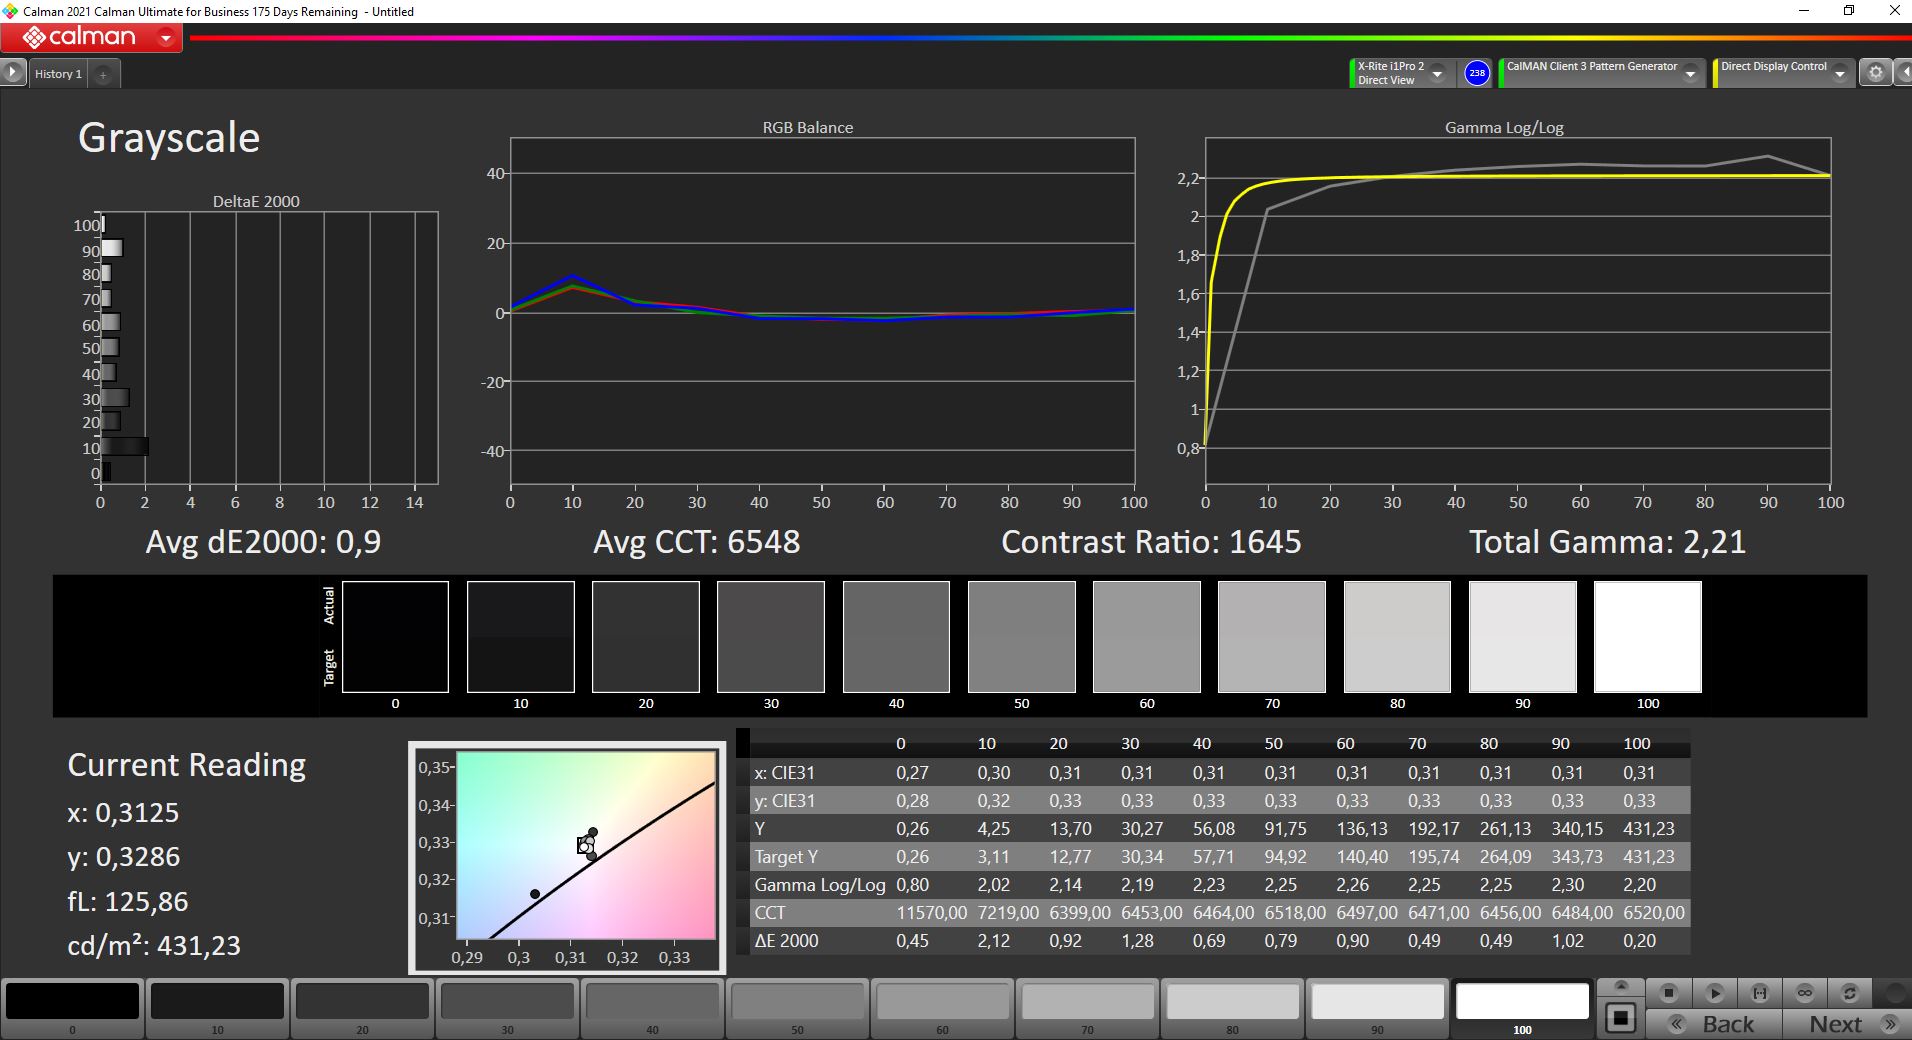

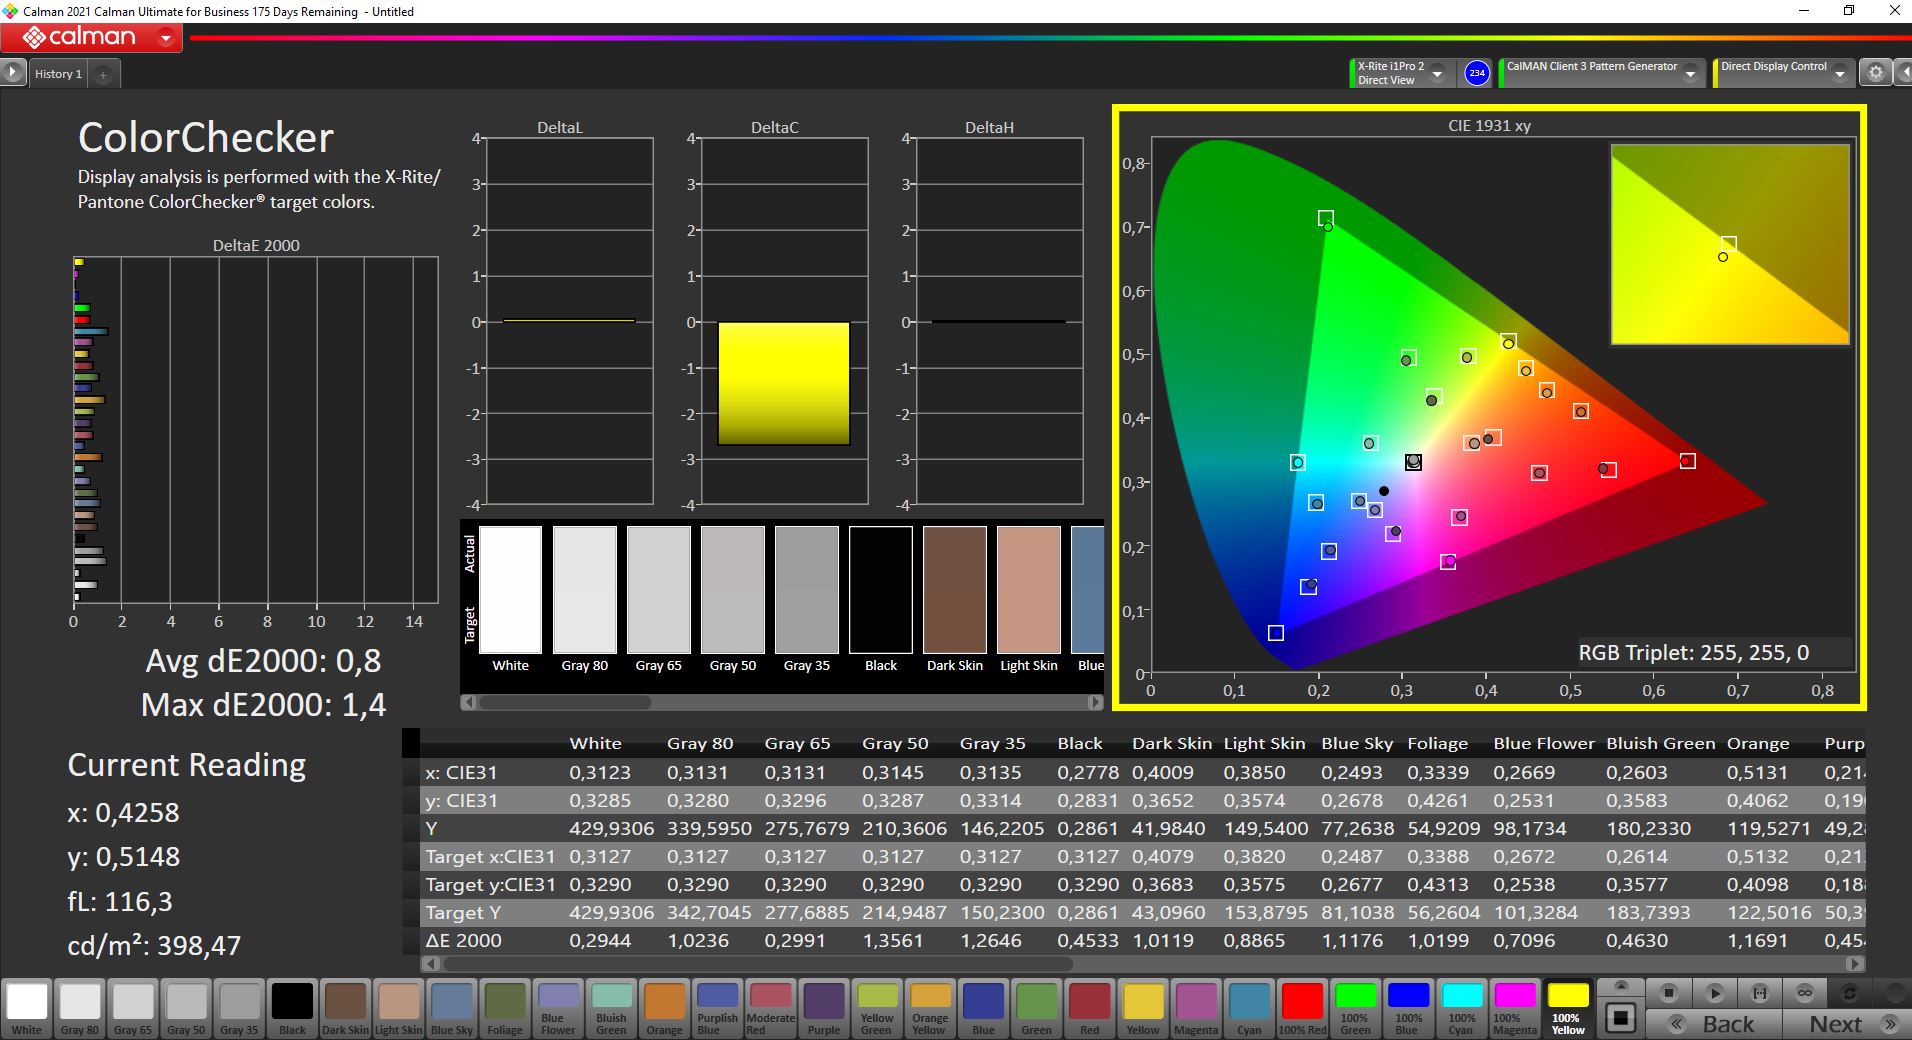
在交付状态下,该显示器在轻微的蓝色色调和略微过冷的色温中挣扎。然而,色彩再现已经非常好,只有少数异常值超过了重要的DeltaE 2000偏差3。我们的校准显示了该面板的全部潜力(校准后的配置文件可供您免费下载)。由于完全覆盖了AdobeRGB色彩空间,它非常适合于图像和视频处理。
Display Response Times
| ↔ Response Time Black to White | ||
|---|---|---|
| 28.4 ms ... rise ↗ and fall ↘ combined | ↗ 12.8 ms rise | 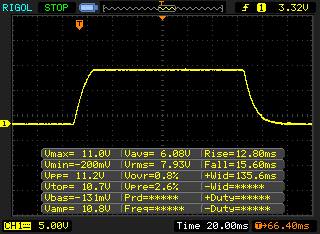 |
| ↘ 15.6 ms fall | ||
| The screen shows relatively slow response rates in our tests and may be too slow for gamers. In comparison, all tested devices range from 0.1 (minimum) to 240 (maximum) ms. » 75 % of all devices are better. This means that the measured response time is worse than the average of all tested devices (19.9 ms). | ||
| ↔ Response Time 50% Grey to 80% Grey | ||
| 53.2 ms ... rise ↗ and fall ↘ combined | ↗ 24.8 ms rise | 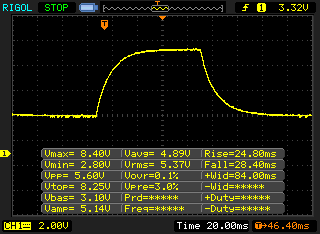 |
| ↘ 28.4 ms fall | ||
| The screen shows slow response rates in our tests and will be unsatisfactory for gamers. In comparison, all tested devices range from 0.165 (minimum) to 636 (maximum) ms. » 90 % of all devices are better. This means that the measured response time is worse than the average of all tested devices (31.1 ms). | ||
Screen Flickering / PWM (Pulse-Width Modulation)
| Screen flickering / PWM detected | 17990 Hz | ≤ 40 % brightness setting | 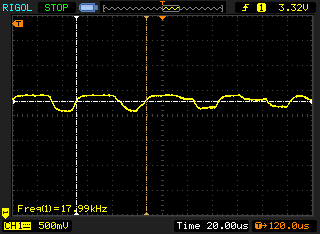 |
The display backlight flickers at 17990 Hz (worst case, e.g., utilizing PWM) Flickering detected at a brightness setting of 40 % and below. There should be no flickering or PWM above this brightness setting. The frequency of 17990 Hz is quite high, so most users sensitive to PWM should not notice any flickering. In comparison: 52 % of all tested devices do not use PWM to dim the display. If PWM was detected, an average of 7798 (minimum: 5 - maximum: 343500) Hz was measured. | |||
在户外,反射式显示器总是会在反射方面遇到困难,从主观上看,反射量也略高于在 Apple MacBooks,比如说。然而,由于亮度不错,在大多数情况下,你应该仍然能够找到一个可以轻松阅读显示内容的位置。IPS面板的视角稳定性没有理由抱怨。
性能 - 英特尔桤木湖,功率为45瓦
测试条件
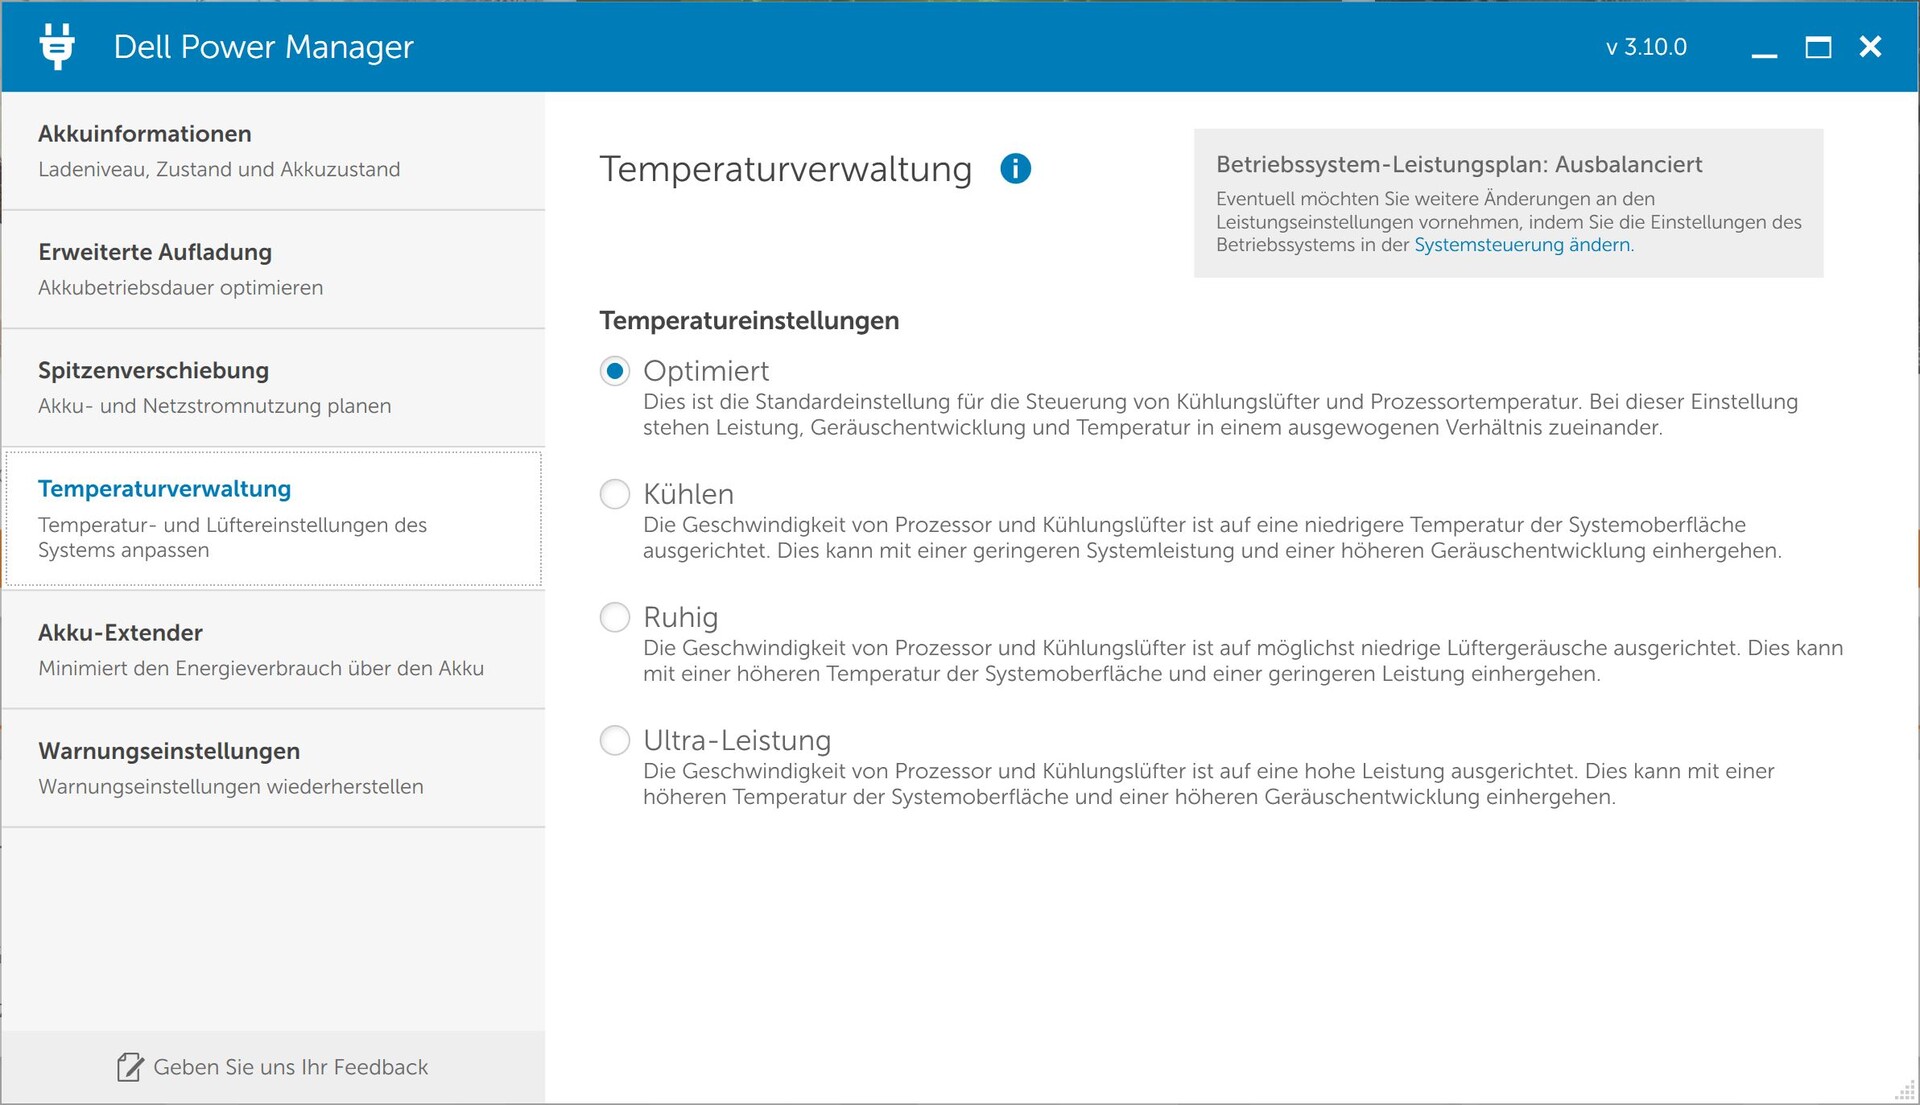
戴尔提供自己的电源管理设置,你可以从预装的电源管理器应用程序中选择。默认情况下,选择的是优化配置文件,我们在下面的基准测试和测量中也使用了这个配置文件。由于冷却几乎已经从一开始就在这里运行,超性能模式只在纯CPU负载(多核)和压力测试中增加了适度的性能优势。然而,在日常操作中,这几乎没有任何区别,而且在我们看来,性能的轻微提高并不能证明更高的风扇噪音是合理的。
| 性能模式 | CPU负载 | GPU负载 | 压力测试 |
|---|---|---|---|
| 优化后 | 115W -> 45W | 65W | CPU:40W -> 25WGPU:60W |
| 超性能 | 115W -> 55W | 65W | CPU: 40W -> 25WGPU: 60W。 40W -> 25WGPU:65W |
| 静音 | 96W -> 30W | 65W | CPU: 25WGPU:30W |
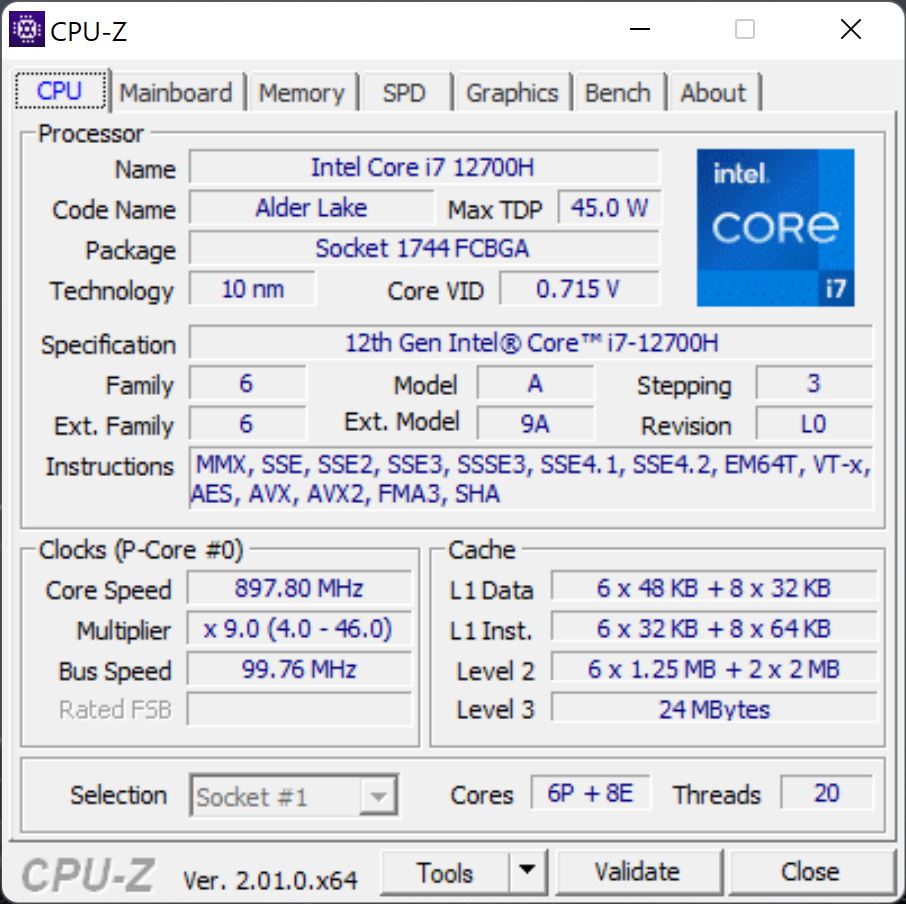
处理器 - 酷睿i7-12700H
在这一点上,我们已经知道英特尔酷睿i7-12700H非常了解。由6个性能核心和8个效率核心组成的混合架构(共20个线程)提供了大量的性能,但对于一个45瓦的处理器来说也消耗了大量的电力。就XPS 17而言,它的功率高达115瓦,但这也只是一瞬间的事,之后该数值迅速下降。稍微超过一分钟后,消耗量就会稳定在45瓦,或在超性能模式下的55瓦。
Cinebench R15 Multi Constant Load Test
高功率限制自然也导致了非常好的基准测试结果,特别是在短期测试中。然而,如果你真的把设备放在连续的负载下,优势就会急剧下降。例如,如果它的性能仍然比配备酷睿i7的XPS 17 9710高出近50%。 XPS 17 9710与Core i7-11800H在第一个CB R15循环中,优势在第6次运行(约3分钟)后已经下降到仅有8%。在超性能模式下,至少仍有20%左右。
在只有一个核心的负载下,Alder Lake芯片的新性能核心实现了很高的性能值,但你也为此付出了很高的功耗(单核心约26瓦)。
在电池运行时,单核性能保持不变,但在几个核心的负载下,CPU会更快地下降到45瓦的极限,导致性能下降约25%。你可以找到更多的CPU基准测试 这里.
Cinebench R23: Multi Core | Single Core
Cinebench R20: CPU (Multi Core) | CPU (Single Core)
Cinebench R15: CPU Multi 64Bit | CPU Single 64Bit
Blender: v2.79 BMW27 CPU
7-Zip 18.03: 7z b 4 | 7z b 4 -mmt1
Geekbench 5.5: Multi-Core | Single-Core
HWBOT x265 Benchmark v2.2: 4k Preset
LibreOffice : 20 Documents To PDF
R Benchmark 2.5: Overall mean
| CPU Performance rating | |
| Average of class Multimedia | |
| Dell XPS 17 9720 RTX 3060 | |
| Dell XPS 17 9720 | |
| Average Intel Core i7-12700H | |
| Apple MacBook Pro 16 2021 M1 Pro -5! | |
| Lenovo ThinkBook 16p G2 ACH | |
| Asus Vivobook Pro 16X-M7600QE | |
| Lenovo ThinkPad X1 Extreme G4-20Y5CTO1WW (3050 Ti) | |
| Dell XPS 17 9710 Core i7 RTX 3060 -2! | |
| Cinebench R23 / Multi Core | |
| Dell XPS 17 9720 RTX 3060 | |
| Average of class Multimedia (4861 - 33362, n=81, last 2 years) | |
| Dell XPS 17 9720 | |
| Average Intel Core i7-12700H (4032 - 19330, n=64) | |
| Lenovo ThinkBook 16p G2 ACH | |
| Lenovo ThinkPad X1 Extreme G4-20Y5CTO1WW (3050 Ti) | |
| Apple MacBook Pro 16 2021 M1 Pro | |
| Asus Vivobook Pro 16X-M7600QE | |
| Asus Vivobook Pro 16X-M7600QE | |
| Dell XPS 17 9710 Core i7 RTX 3060 | |
| Cinebench R23 / Single Core | |
| Average of class Multimedia (1128 - 2459, n=73, last 2 years) | |
| Dell XPS 17 9720 RTX 3060 | |
| Average Intel Core i7-12700H (778 - 1826, n=63) | |
| Dell XPS 17 9720 | |
| Apple MacBook Pro 16 2021 M1 Pro | |
| Lenovo ThinkPad X1 Extreme G4-20Y5CTO1WW (3050 Ti) | |
| Dell XPS 17 9710 Core i7 RTX 3060 | |
| Asus Vivobook Pro 16X-M7600QE | |
| Asus Vivobook Pro 16X-M7600QE | |
| Lenovo ThinkBook 16p G2 ACH | |
| Cinebench R20 / CPU (Multi Core) | |
| Dell XPS 17 9720 RTX 3060 | |
| Average of class Multimedia (1887 - 12912, n=64, last 2 years) | |
| Average Intel Core i7-12700H (1576 - 7407, n=64) | |
| Lenovo ThinkBook 16p G2 ACH | |
| Dell XPS 17 9720 | |
| Asus Vivobook Pro 16X-M7600QE | |
| Asus Vivobook Pro 16X-M7600QE | |
| Lenovo ThinkPad X1 Extreme G4-20Y5CTO1WW (3050 Ti) | |
| Dell XPS 17 9710 Core i7 RTX 3060 | |
| Apple MacBook Pro 16 2021 M1 Pro | |
| Cinebench R20 / CPU (Single Core) | |
| Average of class Multimedia (425 - 853, n=64, last 2 years) | |
| Average Intel Core i7-12700H (300 - 704, n=64) | |
| Dell XPS 17 9720 RTX 3060 | |
| Dell XPS 17 9720 | |
| Lenovo ThinkPad X1 Extreme G4-20Y5CTO1WW (3050 Ti) | |
| Lenovo ThinkBook 16p G2 ACH | |
| Dell XPS 17 9710 Core i7 RTX 3060 | |
| Asus Vivobook Pro 16X-M7600QE | |
| Asus Vivobook Pro 16X-M7600QE | |
| Apple MacBook Pro 16 2021 M1 Pro | |
| Cinebench R15 / CPU Multi 64Bit | |
| Dell XPS 17 9720 | |
| Dell XPS 17 9720 | |
| Average of class Multimedia (856 - 5224, n=68, last 2 years) | |
| Average Intel Core i7-12700H (1379 - 2916, n=70) | |
| Dell XPS 17 9720 RTX 3060 | |
| Lenovo ThinkBook 16p G2 ACH | |
| Asus Vivobook Pro 16X-M7600QE | |
| Asus Vivobook Pro 16X-M7600QE | |
| Lenovo ThinkPad X1 Extreme G4-20Y5CTO1WW (3050 Ti) | |
| Dell XPS 17 9710 Core i7 RTX 3060 | |
| Apple MacBook Pro 16 2021 M1 Pro | |
| Cinebench R15 / CPU Single 64Bit | |
| Average of class Multimedia (184.8 - 326, n=66, last 2 years) | |
| Dell XPS 17 9720 RTX 3060 | |
| Dell XPS 17 9720 | |
| Average Intel Core i7-12700H (113 - 263, n=65) | |
| Asus Vivobook Pro 16X-M7600QE | |
| Asus Vivobook Pro 16X-M7600QE | |
| Lenovo ThinkBook 16p G2 ACH | |
| Lenovo ThinkPad X1 Extreme G4-20Y5CTO1WW (3050 Ti) | |
| Dell XPS 17 9710 Core i7 RTX 3060 | |
| Apple MacBook Pro 16 2021 M1 Pro | |
| Blender / v2.79 BMW27 CPU | |
| Dell XPS 17 9710 Core i7 RTX 3060 | |
| Asus Vivobook Pro 16X-M7600QE | |
| Asus Vivobook Pro 16X-M7600QE | |
| Lenovo ThinkPad X1 Extreme G4-20Y5CTO1WW (3050 Ti) | |
| Average of class Multimedia (100 - 557, n=65, last 2 years) | |
| Dell XPS 17 9720 | |
| Lenovo ThinkBook 16p G2 ACH | |
| Average Intel Core i7-12700H (168 - 732, n=63) | |
| Dell XPS 17 9720 RTX 3060 | |
| Apple MacBook Pro 16 2021 M1 Pro | |
| 7-Zip 18.03 / 7z b 4 | |
| Dell XPS 17 9720 RTX 3060 | |
| Average Intel Core i7-12700H (22844 - 73067, n=63) | |
| Lenovo ThinkBook 16p G2 ACH | |
| Dell XPS 17 9720 | |
| Average of class Multimedia (29095 - 130368, n=62, last 2 years) | |
| Asus Vivobook Pro 16X-M7600QE | |
| Asus Vivobook Pro 16X-M7600QE | |
| Dell XPS 17 9710 Core i7 RTX 3060 | |
| Lenovo ThinkPad X1 Extreme G4-20Y5CTO1WW (3050 Ti) | |
| 7-Zip 18.03 / 7z b 4 -mmt1 | |
| Average of class Multimedia (3666 - 7545, n=63, last 2 years) | |
| Asus Vivobook Pro 16X-M7600QE | |
| Asus Vivobook Pro 16X-M7600QE | |
| Lenovo ThinkBook 16p G2 ACH | |
| Dell XPS 17 9720 | |
| Dell XPS 17 9720 RTX 3060 | |
| Average Intel Core i7-12700H (2743 - 5972, n=63) | |
| Lenovo ThinkPad X1 Extreme G4-20Y5CTO1WW (3050 Ti) | |
| Dell XPS 17 9710 Core i7 RTX 3060 | |
| Geekbench 5.5 / Multi-Core | |
| Dell XPS 17 9720 | |
| Average of class Multimedia (4652 - 20422, n=62, last 2 years) | |
| Apple MacBook Pro 16 2021 M1 Pro | |
| Dell XPS 17 9720 RTX 3060 | |
| Average Intel Core i7-12700H (5144 - 13745, n=64) | |
| Lenovo ThinkBook 16p G2 ACH | |
| Asus Vivobook Pro 16X-M7600QE | |
| Asus Vivobook Pro 16X-M7600QE | |
| Lenovo ThinkPad X1 Extreme G4-20Y5CTO1WW (3050 Ti) | |
| Geekbench 5.5 / Single-Core | |
| Average of class Multimedia (805 - 2974, n=62, last 2 years) | |
| Apple MacBook Pro 16 2021 M1 Pro | |
| Dell XPS 17 9720 | |
| Average Intel Core i7-12700H (803 - 1851, n=64) | |
| Dell XPS 17 9720 RTX 3060 | |
| Lenovo ThinkPad X1 Extreme G4-20Y5CTO1WW (3050 Ti) | |
| Asus Vivobook Pro 16X-M7600QE | |
| Asus Vivobook Pro 16X-M7600QE | |
| Lenovo ThinkBook 16p G2 ACH | |
| HWBOT x265 Benchmark v2.2 / 4k Preset | |
| Average of class Multimedia (5.26 - 36.1, n=63, last 2 years) | |
| Average Intel Core i7-12700H (4.67 - 21.8, n=64) | |
| Lenovo ThinkBook 16p G2 ACH | |
| Dell XPS 17 9720 RTX 3060 | |
| Asus Vivobook Pro 16X-M7600QE | |
| Asus Vivobook Pro 16X-M7600QE | |
| Dell XPS 17 9720 | |
| Dell XPS 17 9710 Core i7 RTX 3060 | |
| Lenovo ThinkPad X1 Extreme G4-20Y5CTO1WW (3050 Ti) | |
| LibreOffice / 20 Documents To PDF | |
| Lenovo ThinkBook 16p G2 ACH | |
| Asus Vivobook Pro 16X-M7600QE | |
| Asus Vivobook Pro 16X-M7600QE | |
| Average of class Multimedia (23.9 - 146.7, n=64, last 2 years) | |
| Average Intel Core i7-12700H (34.2 - 95.3, n=63) | |
| Dell XPS 17 9710 Core i7 RTX 3060 | |
| Dell XPS 17 9720 | |
| Dell XPS 17 9720 RTX 3060 | |
| Lenovo ThinkPad X1 Extreme G4-20Y5CTO1WW (3050 Ti) | |
| R Benchmark 2.5 / Overall mean | |
| Dell XPS 17 9710 Core i7 RTX 3060 | |
| Lenovo ThinkPad X1 Extreme G4-20Y5CTO1WW (3050 Ti) | |
| Lenovo ThinkBook 16p G2 ACH | |
| Asus Vivobook Pro 16X-M7600QE | |
| Asus Vivobook Pro 16X-M7600QE | |
| Average Intel Core i7-12700H (0.4441 - 1.052, n=63) | |
| Average of class Multimedia (0.3604 - 0.947, n=63, last 2 years) | |
| Dell XPS 17 9720 RTX 3060 | |
| Dell XPS 17 9720 | |
* ... smaller is better
AIDA64: FP32 Ray-Trace | FPU Julia | CPU SHA3 | CPU Queen | FPU SinJulia | FPU Mandel | CPU AES | CPU ZLib | FP64 Ray-Trace | CPU PhotoWorxx
| Performance rating | |
| Lenovo ThinkBook 16p G2 ACH | |
| Average of class Multimedia | |
| Asus Vivobook Pro 16X-M7600QE | |
| Lenovo ThinkPad X1 Extreme G4-20Y5CTO1WW (3050 Ti) | |
| Average Intel Core i7-12700H | |
| Dell XPS 17 9720 RTX 3060 | |
| Dell XPS 17 9720 | |
| Dell XPS 17 9710 Core i7 RTX 3060 -9! | |
| AIDA64 / FP32 Ray-Trace | |
| Average of class Multimedia (2214 - 50388, n=60, last 2 years) | |
| Lenovo ThinkBook 16p G2 ACH | |
| Lenovo ThinkPad X1 Extreme G4-20Y5CTO1WW (3050 Ti) | |
| Asus Vivobook Pro 16X-M7600QE | |
| Asus Vivobook Pro 16X-M7600QE | |
| Average Intel Core i7-12700H (2585 - 17957, n=64) | |
| Dell XPS 17 9720 RTX 3060 | |
| Dell XPS 17 9720 | |
| AIDA64 / FPU Julia | |
| Lenovo ThinkBook 16p G2 ACH | |
| Asus Vivobook Pro 16X-M7600QE | |
| Asus Vivobook Pro 16X-M7600QE | |
| Average of class Multimedia (12867 - 201874, n=61, last 2 years) | |
| Lenovo ThinkPad X1 Extreme G4-20Y5CTO1WW (3050 Ti) | |
| Average Intel Core i7-12700H (12439 - 90760, n=64) | |
| Dell XPS 17 9720 RTX 3060 | |
| Dell XPS 17 9720 | |
| AIDA64 / CPU SHA3 | |
| Lenovo ThinkPad X1 Extreme G4-20Y5CTO1WW (3050 Ti) | |
| Average of class Multimedia (653 - 8623, n=61, last 2 years) | |
| Lenovo ThinkBook 16p G2 ACH | |
| Asus Vivobook Pro 16X-M7600QE | |
| Asus Vivobook Pro 16X-M7600QE | |
| Average Intel Core i7-12700H (833 - 4242, n=64) | |
| Dell XPS 17 9720 RTX 3060 | |
| Dell XPS 17 9720 | |
| AIDA64 / CPU Queen | |
| Lenovo ThinkBook 16p G2 ACH | |
| Asus Vivobook Pro 16X-M7600QE | |
| Asus Vivobook Pro 16X-M7600QE | |
| Dell XPS 17 9720 | |
| Dell XPS 17 9720 RTX 3060 | |
| Average Intel Core i7-12700H (57923 - 103202, n=63) | |
| Lenovo ThinkPad X1 Extreme G4-20Y5CTO1WW (3050 Ti) | |
| Average of class Multimedia (13483 - 181505, n=49, last 2 years) | |
| AIDA64 / FPU SinJulia | |
| Asus Vivobook Pro 16X-M7600QE | |
| Asus Vivobook Pro 16X-M7600QE | |
| Lenovo ThinkBook 16p G2 ACH | |
| Lenovo ThinkPad X1 Extreme G4-20Y5CTO1WW (3050 Ti) | |
| Average of class Multimedia (1240 - 28794, n=61, last 2 years) | |
| Average Intel Core i7-12700H (3249 - 9939, n=64) | |
| Dell XPS 17 9720 RTX 3060 | |
| Dell XPS 17 9720 | |
| AIDA64 / FPU Mandel | |
| Lenovo ThinkBook 16p G2 ACH | |
| Asus Vivobook Pro 16X-M7600QE | |
| Asus Vivobook Pro 16X-M7600QE | |
| Average of class Multimedia (6395 - 105740, n=60, last 2 years) | |
| Lenovo ThinkPad X1 Extreme G4-20Y5CTO1WW (3050 Ti) | |
| Average Intel Core i7-12700H (7135 - 44760, n=64) | |
| Dell XPS 17 9720 RTX 3060 | |
| Dell XPS 17 9720 | |
| AIDA64 / CPU AES | |
| Lenovo ThinkPad X1 Extreme G4-20Y5CTO1WW (3050 Ti) | |
| Lenovo ThinkBook 16p G2 ACH | |
| Asus Vivobook Pro 16X-M7600QE | |
| Asus Vivobook Pro 16X-M7600QE | |
| Average Intel Core i7-12700H (31839 - 144360, n=64) | |
| Dell XPS 17 9720 RTX 3060 | |
| Dell XPS 17 9720 | |
| Average of class Multimedia (13243 - 126790, n=61, last 2 years) | |
| AIDA64 / CPU ZLib | |
| Average of class Multimedia (167.2 - 2022, n=61, last 2 years) | |
| Average Intel Core i7-12700H (305 - 1171, n=64) | |
| Dell XPS 17 9720 RTX 3060 | |
| Dell XPS 17 9720 | |
| Lenovo ThinkBook 16p G2 ACH | |
| Asus Vivobook Pro 16X-M7600QE | |
| Asus Vivobook Pro 16X-M7600QE | |
| Lenovo ThinkPad X1 Extreme G4-20Y5CTO1WW (3050 Ti) | |
| Dell XPS 17 9710 Core i7 RTX 3060 | |
| AIDA64 / FP64 Ray-Trace | |
| Average of class Multimedia (1014 - 26875, n=61, last 2 years) | |
| Lenovo ThinkBook 16p G2 ACH | |
| Lenovo ThinkPad X1 Extreme G4-20Y5CTO1WW (3050 Ti) | |
| Asus Vivobook Pro 16X-M7600QE | |
| Asus Vivobook Pro 16X-M7600QE | |
| Average Intel Core i7-12700H (1437 - 9692, n=64) | |
| Dell XPS 17 9720 RTX 3060 | |
| Dell XPS 17 9720 | |
| AIDA64 / CPU PhotoWorxx | |
| Average of class Multimedia (12860 - 88154, n=61, last 2 years) | |
| Dell XPS 17 9720 | |
| Dell XPS 17 9720 RTX 3060 | |
| Average Intel Core i7-12700H (12863 - 52207, n=64) | |
| Asus Vivobook Pro 16X-M7600QE | |
| Asus Vivobook Pro 16X-M7600QE | |
| Lenovo ThinkBook 16p G2 ACH | |
| Lenovo ThinkPad X1 Extreme G4-20Y5CTO1WW (3050 Ti) | |
系统性能
XPS 17 9720的主观性能印象非常好。除了快速的处理器,这当然也归功于PCIe固态硬盘,导致所有的输入都没有任何明显的延迟。 XPS交付时安装了Windows 11,我们在测试阶段没有遇到任何问题。
CrossMark: Overall | Productivity | Creativity | Responsiveness
| PCMark 10 / Score | |
| Average of class Multimedia (4325 - 10386, n=58, last 2 years) | |
| Dell XPS 17 9720 RTX 3060 | |
| Dell XPS 17 9720 | |
| Average Intel Core i7-12700H, NVIDIA GeForce RTX 3050 4GB Laptop GPU (6660 - 6879, n=3) | |
| Lenovo ThinkBook 16p G2 ACH | |
| Dell XPS 17 9710 Core i7 RTX 3060 | |
| Asus Vivobook Pro 16X-M7600QE | |
| Lenovo ThinkPad X1 Extreme G4-20Y5CTO1WW (3050 Ti) | |
| PCMark 10 / Essentials | |
| Lenovo ThinkPad X1 Extreme G4-20Y5CTO1WW (3050 Ti) | |
| Dell XPS 17 9720 RTX 3060 | |
| Average of class Multimedia (8025 - 11664, n=57, last 2 years) | |
| Asus Vivobook Pro 16X-M7600QE | |
| Dell XPS 17 9720 | |
| Lenovo ThinkBook 16p G2 ACH | |
| Average Intel Core i7-12700H, NVIDIA GeForce RTX 3050 4GB Laptop GPU (10150 - 10369, n=3) | |
| Dell XPS 17 9710 Core i7 RTX 3060 | |
| PCMark 10 / Productivity | |
| Average of class Multimedia (7323 - 18233, n=57, last 2 years) | |
| Asus Vivobook Pro 16X-M7600QE | |
| Dell XPS 17 9720 RTX 3060 | |
| Dell XPS 17 9720 | |
| Average Intel Core i7-12700H, NVIDIA GeForce RTX 3050 4GB Laptop GPU (8995 - 9397, n=3) | |
| Lenovo ThinkBook 16p G2 ACH | |
| Dell XPS 17 9710 Core i7 RTX 3060 | |
| Lenovo ThinkPad X1 Extreme G4-20Y5CTO1WW (3050 Ti) | |
| PCMark 10 / Digital Content Creation | |
| Average of class Multimedia (3651 - 16240, n=57, last 2 years) | |
| Dell XPS 17 9720 RTX 3060 | |
| Dell XPS 17 9710 Core i7 RTX 3060 | |
| Dell XPS 17 9720 | |
| Average Intel Core i7-12700H, NVIDIA GeForce RTX 3050 4GB Laptop GPU (8779 - 9203, n=3) | |
| Lenovo ThinkBook 16p G2 ACH | |
| Lenovo ThinkPad X1 Extreme G4-20Y5CTO1WW (3050 Ti) | |
| Asus Vivobook Pro 16X-M7600QE | |
| CrossMark / Overall | |
| Dell XPS 17 9720 RTX 3060 | |
| Dell XPS 17 9720 | |
| Average of class Multimedia (866 - 2728, n=67, last 2 years) | |
| Average Intel Core i7-12700H, NVIDIA GeForce RTX 3050 4GB Laptop GPU (1717 - 1857, n=3) | |
| Apple MacBook Pro 16 2021 M1 Pro | |
| CrossMark / Productivity | |
| Dell XPS 17 9720 RTX 3060 | |
| Average of class Multimedia (931 - 2489, n=67, last 2 years) | |
| Dell XPS 17 9720 | |
| Average Intel Core i7-12700H, NVIDIA GeForce RTX 3050 4GB Laptop GPU (1620 - 1735, n=3) | |
| Apple MacBook Pro 16 2021 M1 Pro | |
| CrossMark / Creativity | |
| Average of class Multimedia (907 - 3465, n=67, last 2 years) | |
| Dell XPS 17 9720 RTX 3060 | |
| Dell XPS 17 9720 | |
| Apple MacBook Pro 16 2021 M1 Pro | |
| Average Intel Core i7-12700H, NVIDIA GeForce RTX 3050 4GB Laptop GPU (1911 - 2067, n=3) | |
| CrossMark / Responsiveness | |
| Dell XPS 17 9720 RTX 3060 | |
| Dell XPS 17 9720 | |
| Average Intel Core i7-12700H, NVIDIA GeForce RTX 3050 4GB Laptop GPU (1481 - 1651, n=3) | |
| Average of class Multimedia (605 - 2024, n=67, last 2 years) | |
| Apple MacBook Pro 16 2021 M1 Pro | |
| PCMark 10 Score | 6879 points | |
Help | ||
| AIDA64 / Memory Copy | |
| Average of class Multimedia (21158 - 132135, n=61, last 2 years) | |
| Dell XPS 17 9720 | |
| Dell XPS 17 9720 RTX 3060 | |
| Average Intel Core i7-12700H (25615 - 80511, n=64) | |
| Asus Vivobook Pro 16X-M7600QE | |
| Asus Vivobook Pro 16X-M7600QE | |
| Lenovo ThinkBook 16p G2 ACH | |
| Lenovo ThinkPad X1 Extreme G4-20Y5CTO1WW (3050 Ti) | |
| AIDA64 / Memory Read | |
| Average of class Multimedia (19699 - 174586, n=61, last 2 years) | |
| Dell XPS 17 9720 RTX 3060 | |
| Dell XPS 17 9720 | |
| Average Intel Core i7-12700H (25586 - 79442, n=64) | |
| Asus Vivobook Pro 16X-M7600QE | |
| Asus Vivobook Pro 16X-M7600QE | |
| Lenovo ThinkBook 16p G2 ACH | |
| Lenovo ThinkPad X1 Extreme G4-20Y5CTO1WW (3050 Ti) | |
| AIDA64 / Memory Write | |
| Average of class Multimedia (17733 - 134998, n=61, last 2 years) | |
| Dell XPS 17 9720 | |
| Dell XPS 17 9720 RTX 3060 | |
| Average Intel Core i7-12700H (23679 - 88660, n=64) | |
| Asus Vivobook Pro 16X-M7600QE | |
| Asus Vivobook Pro 16X-M7600QE | |
| Lenovo ThinkBook 16p G2 ACH | |
| Lenovo ThinkPad X1 Extreme G4-20Y5CTO1WW (3050 Ti) | |
| AIDA64 / Memory Latency | |
| Average of class Multimedia (7 - 535, n=60, last 2 years) | |
| Dell XPS 17 9720 RTX 3060 | |
| Dell XPS 17 9720 | |
| Lenovo ThinkPad X1 Extreme G4-20Y5CTO1WW (3050 Ti) | |
| Average Intel Core i7-12700H (76.2 - 133.9, n=62) | |
| Lenovo ThinkBook 16p G2 ACH | |
| Asus Vivobook Pro 16X-M7600QE | |
| Asus Vivobook Pro 16X-M7600QE | |
| Dell XPS 17 9710 Core i7 RTX 3060 | |
* ... smaller is better
DPC延迟
在我们的标准化延迟测试中(网页浏览、4K YouTube、CPU负载),我们采用当前BIOS版本的测试装置显示出一些轻微的局限性,因此不是最适合使用实时音频应用程序。
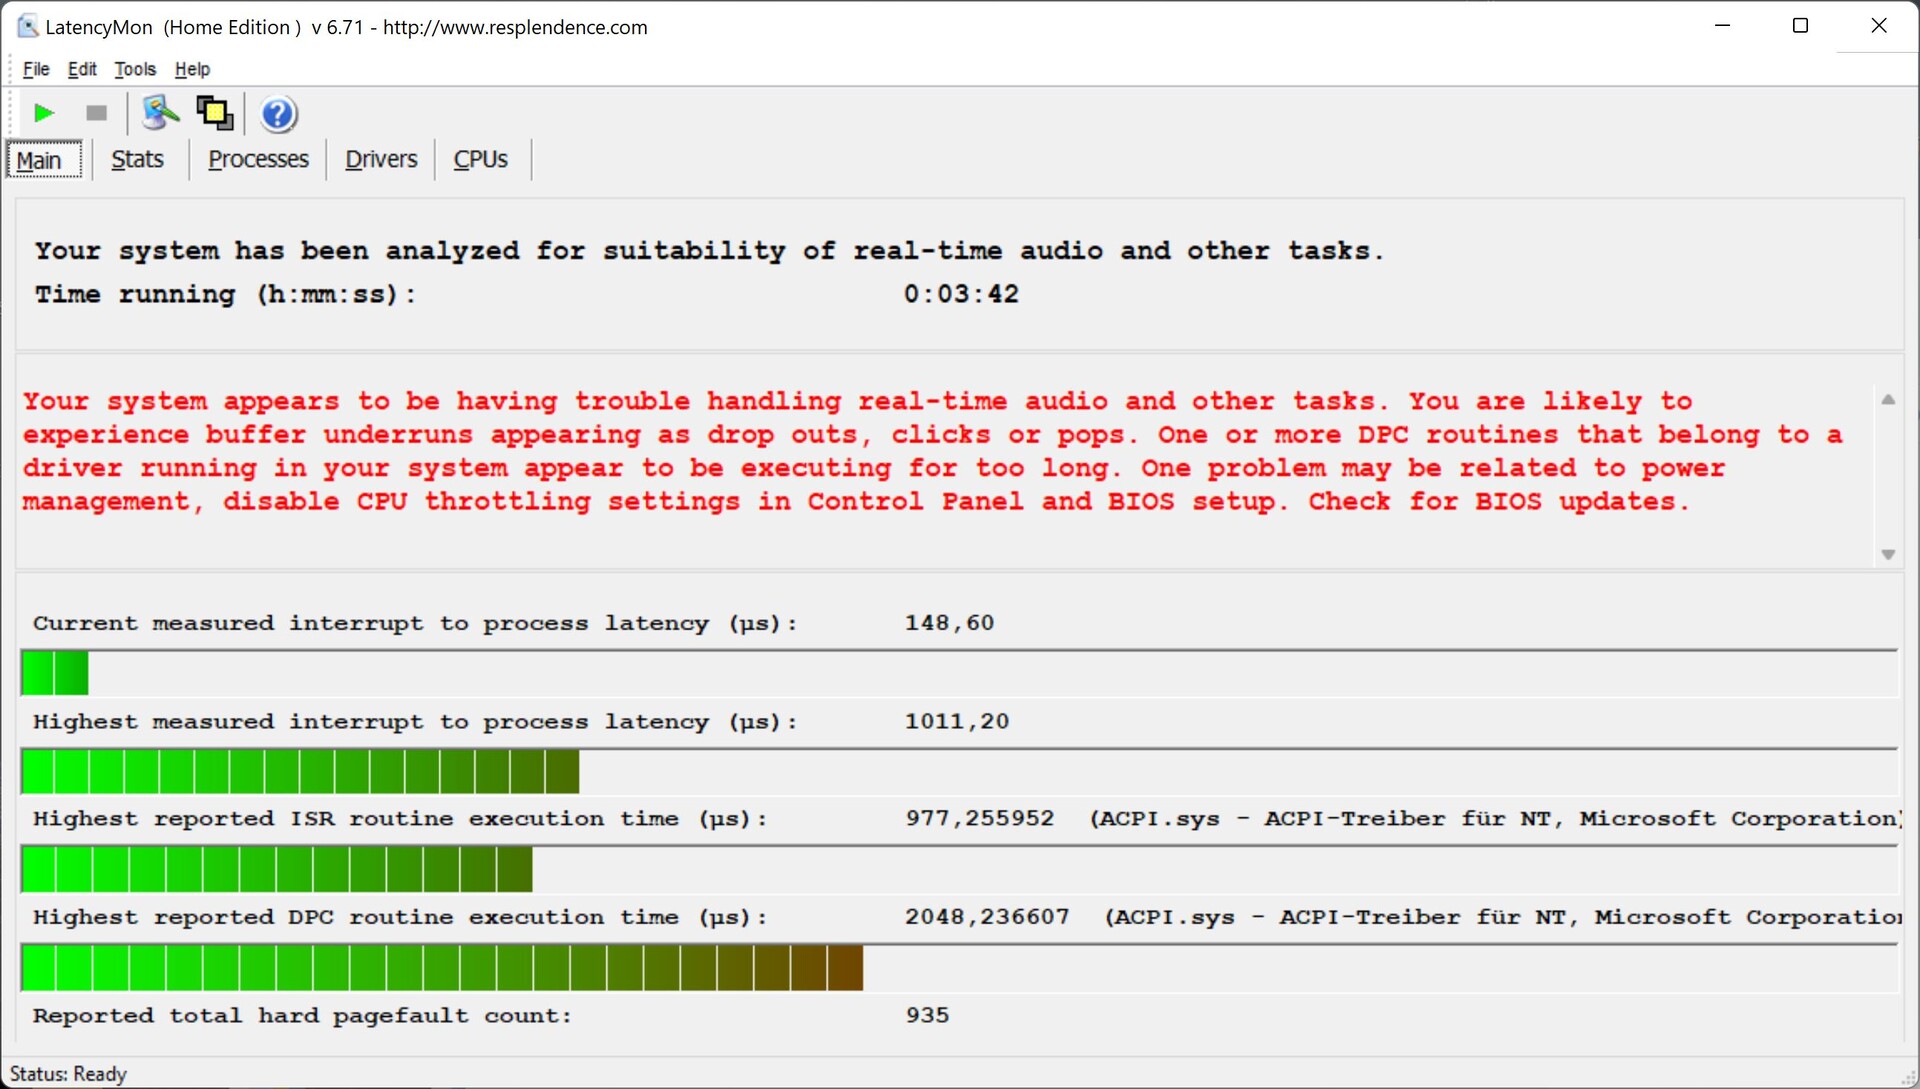
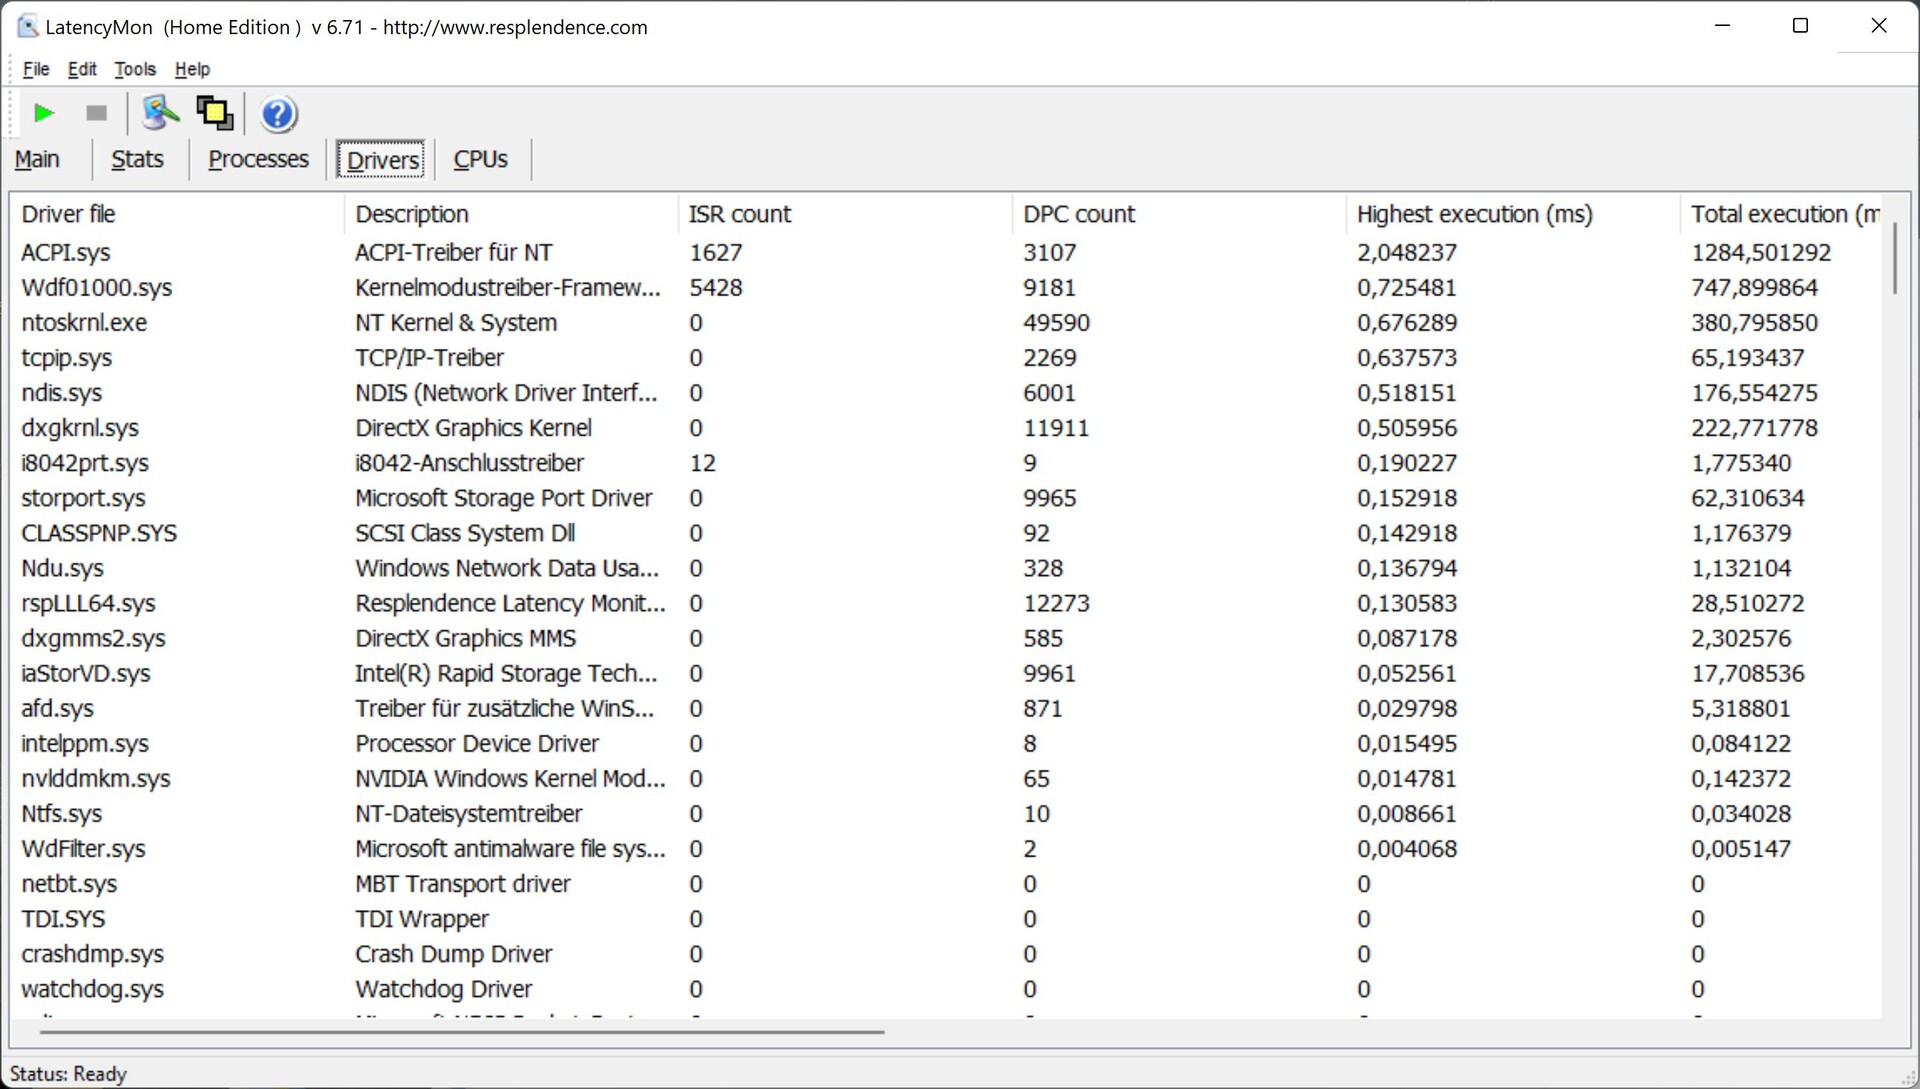
| DPC Latencies / LatencyMon - interrupt to process latency (max), Web, Youtube, Prime95 | |
| Asus Vivobook Pro 16X-M7600QE | |
| Dell XPS 17 9720 | |
| Lenovo ThinkPad X1 Extreme G4-20Y5CTO1WW (3050 Ti) | |
| Dell XPS 17 9710 Core i7 RTX 3060 | |
| Lenovo ThinkBook 16p G2 ACH | |
| Dell XPS 17 9720 RTX 3060 | |
* ... smaller is better
存储解决方案
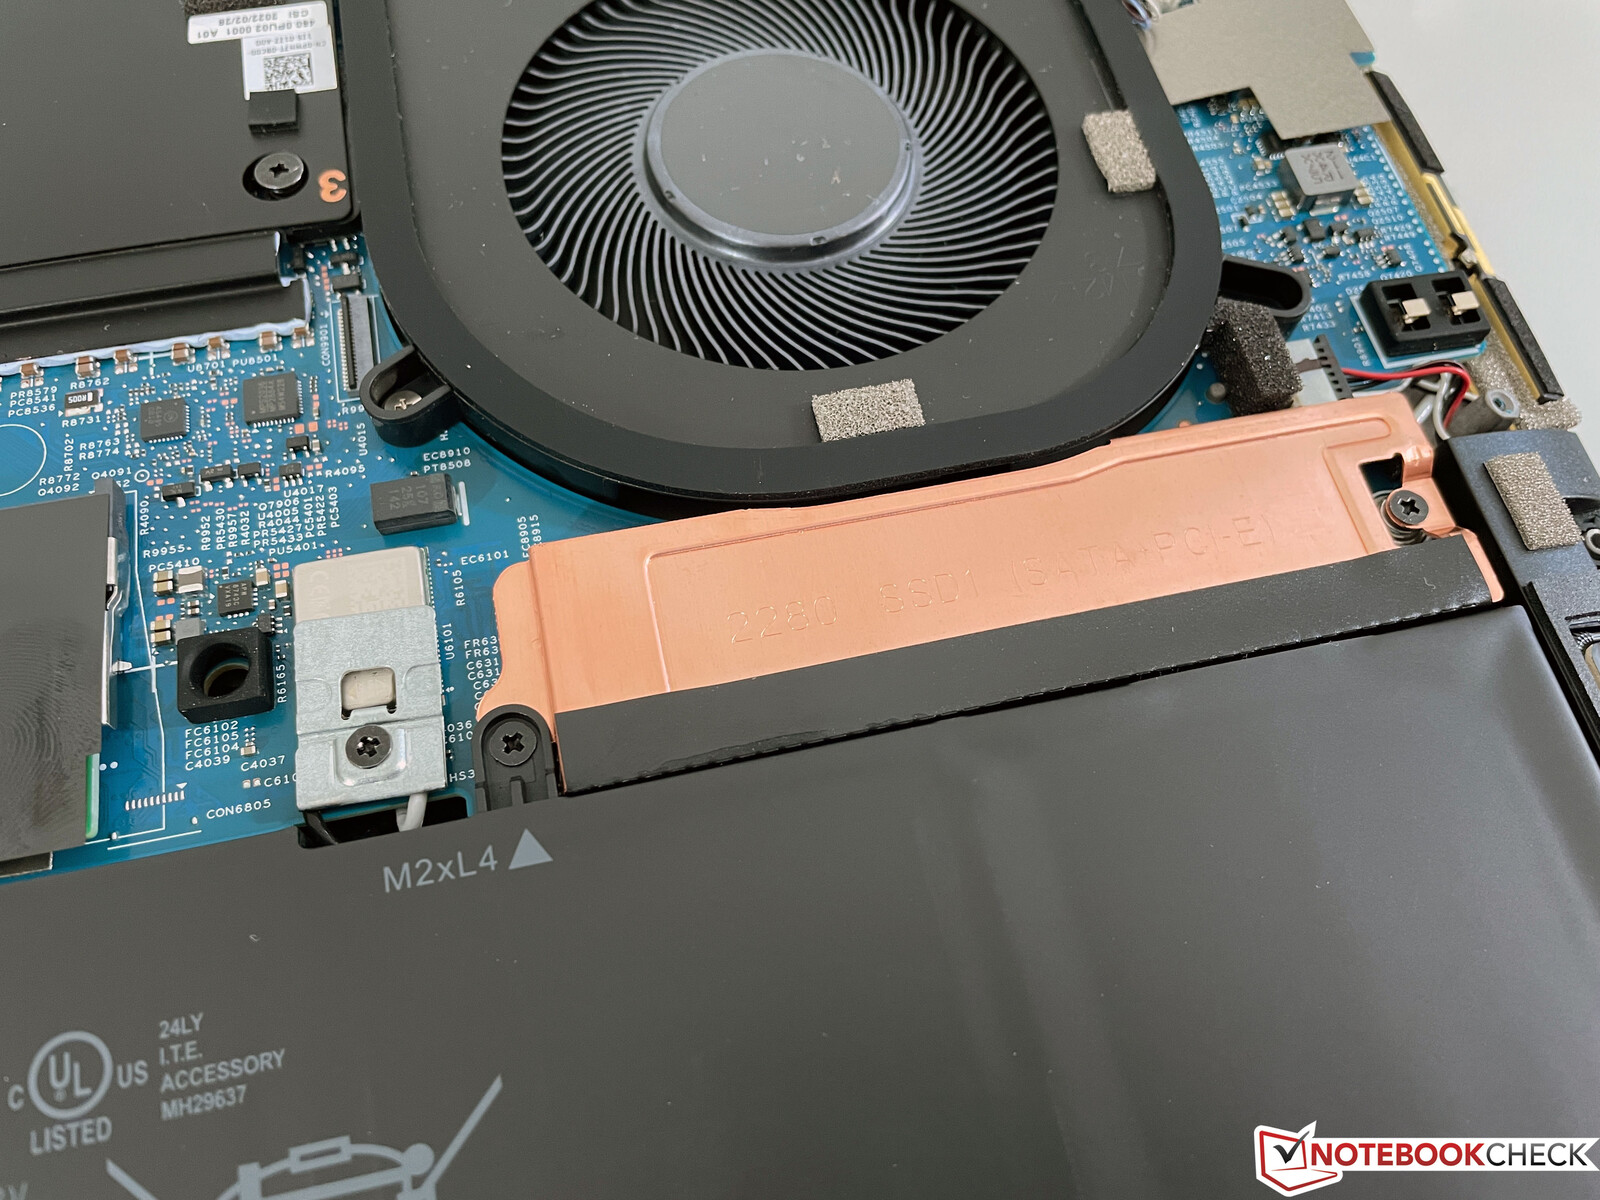
我们的XPS 17 9720测试装置使用美光3400固态硬盘,存储容量为512GB。在第一次运行后,仍有391GB可供用户使用。这是一款非常快的PCIe 4.0固态硬盘,在基准测试中,读取时的传输速度超过6GB/s,写入时的传输速度约为4GB/s。
在两个M.2插槽上方有额外的铜套,显然能够发挥其作用。在我们的测试中,与快速PCIe 4.0驱动器相比,我们越来越多地看到由于高温导致的性能下降,我们的XPS 17的测试装置在这里没有任何问题。你可以在我们的 "技术 "部分找到更多的SSD基准测试 技术部分.

* ... smaller is better
Constant Performance Reading: DiskSpd Read Loop, Queue Depth 8
显卡 -GeForce RTX 3050
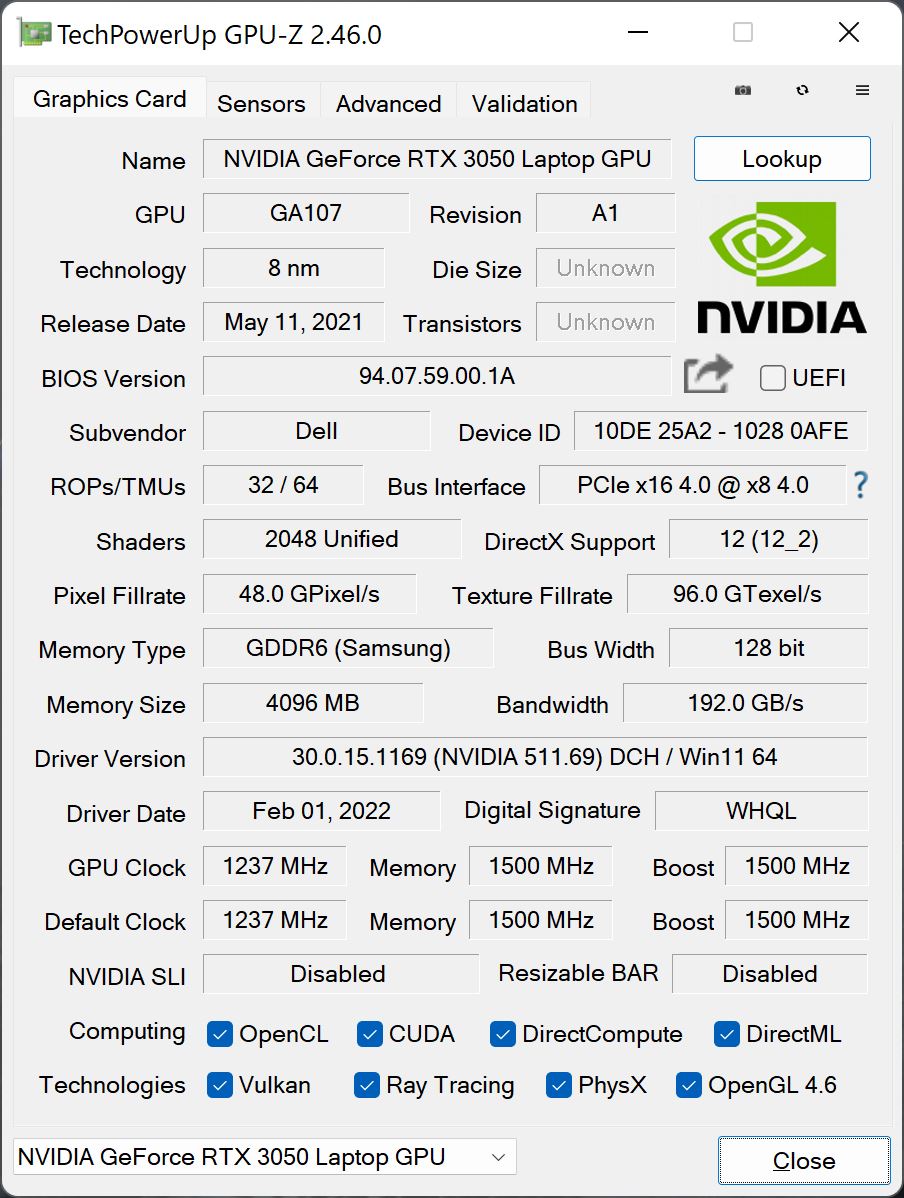
在日常操作中,主要是集成和高效的 Iris Xe Graphics G7处理器,它也能够毫无问题地处理高分辨率视频的再现。如果你需要更多的图形性能,专用的 NvidiaGeForce RTX 30504GB内存和1875兆赫的最大时钟速度被自动激活。正如我们已经提到的,今年只有60瓦版本的RTX 3050或RTX 3060被使用,而在旧的 XPS 17 9710.如果只有很少的处理器负载,它也可以使用处理器的额外5瓦特。
虽然我们没有用RTX 3050测试老款9710,但是 RTX 3060版本的XPS 17 9720特别是在对图形有高要求的测试中,仍然比前代产品落后约10%,因此我们预计RTX 3050也会有类似的距离。这是一个明显走向错误方向的发展。
在性能的稳定性方面也有一些限制,但这取决于CPU的负载。GPU性能本身保持稳定,但在同步负载下,CPU的消耗在几分钟后降至25瓦。这也是XPS 17 9720在3DMarkTime Spy 压力测试中失败的原因(甚至在Ultra性能模式下也没有),你必须预期有10%左右的亏损。
此外,GPU性能消耗也被限制在电池运行时的30瓦,导致性能下降了约30%(4960对3438分@Time Spy Graphics)。你可以找到更多的GPU基准测试 这里.
| 3DMark 11 Performance | 18259 points | |
| 3DMark Cloud Gate Standard Score | 42029 points | |
| 3DMark Fire Strike Score | 11906 points | |
| 3DMark Time Spy Score | 5470 points | |
Help | ||
游戏性能
RTX 3050的游戏性能基本上是不错的,但原生4K分辨率在大多数情况下要求太高。特别是在目前的游戏中,如《赛博朋克2077》,你还必须稍微减少细节,以便获得真正流畅的体验。那些想在XPS 17上玩更多游戏的人肯定应该决定使用 RTX 3060(溢价200欧元=~209美元)。
| Cyberpunk 2077 1.6 | |
| 1920x1080 High Preset | |
| Dell XPS 17 9720 RTX 3060 | |
| Dell XPS 17 9720 | |
| Average NVIDIA GeForce RTX 3050 4GB Laptop GPU (28.4 - 45.5, n=7) | |
| 1920x1080 Ultra Preset | |
| Dell XPS 17 9720 RTX 3060 | |
| Dell XPS 17 9720 | |
| Average NVIDIA GeForce RTX 3050 4GB Laptop GPU (25.3 - 36.5, n=7) | |
| F1 2021 | |
| 1920x1080 High Preset AA:T AF:16x | |
| Dell XPS 17 9720 | |
| Average NVIDIA GeForce RTX 3050 4GB Laptop GPU (93.4 - 130.1, n=7) | |
| Asus Vivobook Pro 16X-M7600QE | |
| 1920x1080 Ultra High Preset + Raytracing AA:T AF:16x | |
| Dell XPS 17 9720 | |
| Asus Vivobook Pro 16X-M7600QE | |
| Average NVIDIA GeForce RTX 3050 4GB Laptop GPU (44.1 - 62, n=8) | |
在我们的TheWitcher 3 循环中,游戏性能保持稳定,但CPU在这里也几乎没有被置于负荷之下。我们在评估中看到,处理器在这里只消耗了大约17瓦的电量。然而,如果你玩一个对处理器有更多要求的游戏,几分钟后就会出现轻微的性能下降,因为处理器的25瓦极限被击中。
在电池运行中,GPU的性能会被大幅削减,导致游戏性能也会下降。例如,在超级设置下玩《Witcher 3 》时,只有31而不是49FPS。你可以找到更多的游戏基准测试 这里.
The Witcher 3 FPS Chart
| low | med. | high | ultra | QHD | 4K | |
|---|---|---|---|---|---|---|
| GTA V (2015) | 186.8 | 180.2 | 146.6 | 72.5 | 51.3 | 43.6 |
| The Witcher 3 (2015) | 283 | 179 | 99 | 49 | ||
| Dota 2 Reborn (2015) | 187 | 170.8 | 160.3 | 145 | 70.4 | |
| Final Fantasy XV Benchmark (2018) | 128.4 | 73.1 | 52.7 | 38.5 | 21 | |
| X-Plane 11.11 (2018) | 135.7 | 114.8 | 95.8 | 66.1 | ||
| Far Cry 5 (2018) | 156 | 94 | 85 | 80 | 55 | |
| Strange Brigade (2018) | 296 | 131 | 105.3 | 90.6 | 66.1 | 35.7 |
| F1 2021 (2021) | 282 | 164.7 | 130.1 | 62 | 43 | 20.9 |
| Cyberpunk 2077 1.6 (2022) | 63 | 52 | 43 | 34 | 21 |
排放 - XPS在日常运行中通常是无声的
噪声排放
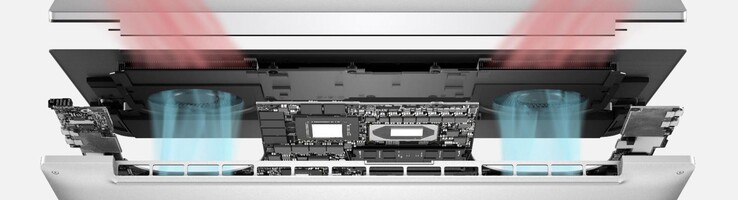
戴尔在XPS 17中使用了制造商可以使用的所有冷却材料和功能,如蒸汽室和特殊的GORE隔热材料,等等。戴尔指定能够持续冷却90瓦(但USB-C充电器可能也是这里的限制因素)。我们的测试也证实了这一点。但是,尽管有所有这些高端解决方案,XPS 17变得相当响亮,特别是考虑到降低的图形性能(相比之下 XPS 17 9710).在纯粹的CPU负载下(CB R23 Multi),尽管有45瓦的限制,但它几乎是44分贝(A),而在游戏和压力测试中,几乎是49分贝(A)。如果你使用超性能配置文件,你甚至很快就会达到近51分贝(A)。
| 性能模式 | Cinebench R23 Multi | TheWitcher 3 Ultra | 压力测试 |
|---|---|---|---|
| 优化 | 43.9 dB(A) | 48.4 dB(A) | 48.4 dB(A) |
| 超性能 | 48.4 dB(A) | 50.9 dB(A) | 50.9 dB(A) |
| 静音 | 38.8 dB(A) | 41.3 dB(A) | 41.3 dB(A) |
另一方面,我们也要提到,风扇的噪音不包含任何令人不舒服的频率。在简单的任务和日常情况下,XPS 17也通常是一台安静的笔记本电脑,它能够在不启动风扇的情况下处理短暂的峰值负载。我们没有注意到任何其他电子噪音。
Noise level
| Idle |
| 24 / 24 / 24 dB(A) |
| Load |
| 43.9 / 48.4 dB(A) |
 | ||
30 dB silent 40 dB(A) audible 50 dB(A) loud |
||
min: | ||
| Dell XPS 17 9720 GeForce RTX 3050 4GB Laptop GPU, i7-12700H, Micron 3400 MTFDKBA512TFH 512GB | Apple MacBook Pro 16 2021 M1 Pro M1 Pro 16-Core GPU, M1 Pro, Apple SSD AP1024R | Dell XPS 17 9720 RTX 3060 GeForce RTX 3060 Laptop GPU, i7-12700H, Samsung PM9A1 MZVL21T0HCLR | Lenovo ThinkPad X1 Extreme G4-20Y5CTO1WW (3050 Ti) GeForce RTX 3050 Ti Laptop GPU, i7-11800H, Samsung PM9A1 MZVL21T0HCLR | Asus Vivobook Pro 16X-M7600QE GeForce RTX 3050 Ti Laptop GPU, R9 5900HX, SK Hynix HFM001TD3JX013N | Lenovo ThinkBook 16p G2 ACH GeForce RTX 3060 Laptop GPU, R9 5900HX, WDC PC SN730 SDBPNTY-1T00 | Dell XPS 17 9710 Core i7 RTX 3060 GeForce RTX 3060 Laptop GPU, i7-11800H, Micron 2300 1TB MTFDHBA1T0TDV | |
|---|---|---|---|---|---|---|---|
| Noise | 9% | 1% | -1% | -6% | 5% | -4% | |
| off / environment * (dB) | 24 | 24.7 -3% | 23.8 1% | 23.52 2% | 26 -8% | 23 4% | 25.5 -6% |
| Idle Minimum * (dB) | 24 | 24.7 -3% | 24.1 -0% | 23.52 2% | 27 -13% | 23 4% | 25.2 -5% |
| Idle Average * (dB) | 24 | 24.7 -3% | 24.1 -0% | 23.52 2% | 27 -13% | 23 4% | 25.2 -5% |
| Idle Maximum * (dB) | 24 | 24.7 -3% | 24.1 -0% | 23.52 2% | 27.5 -15% | 23 4% | 25.2 -5% |
| Load Average * (dB) | 43.9 | 26.1 41% | 43.2 2% | 42.9 2% | 41.7 5% | 35.66 19% | 45.9 -5% |
| Witcher 3 ultra * (dB) | 48.4 | 48 1% | 52.5 -8% | 48.7 -1% | 49 -1% | ||
| Load Maximum * (dB) | 48.4 | 37.4 23% | 48 1% | 52.45 -8% | 45.3 6% | 48.13 1% | 50.4 -4% |
* ... smaller is better
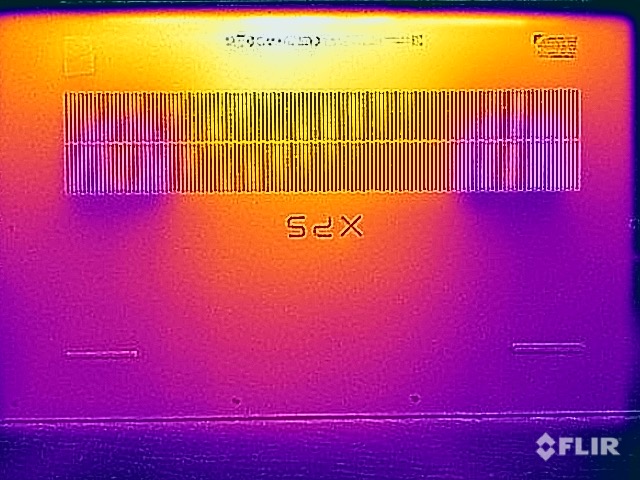
温度
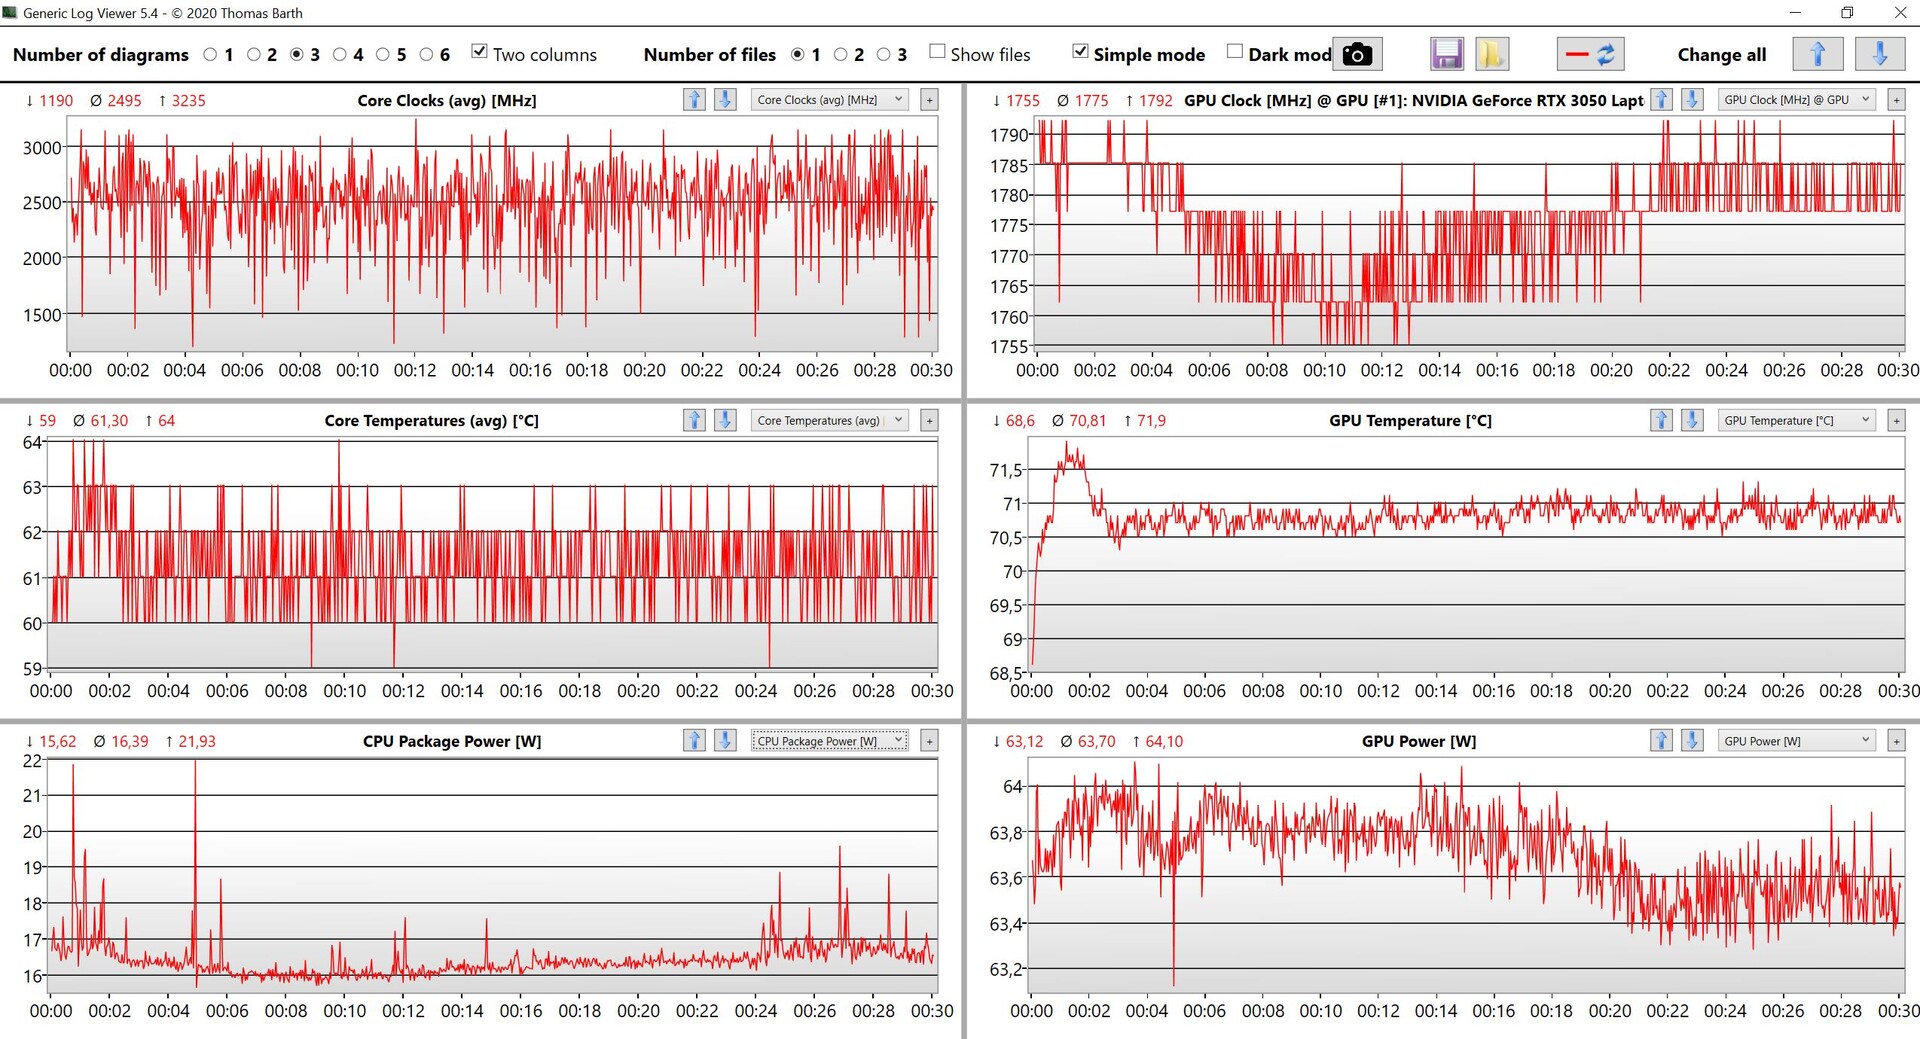
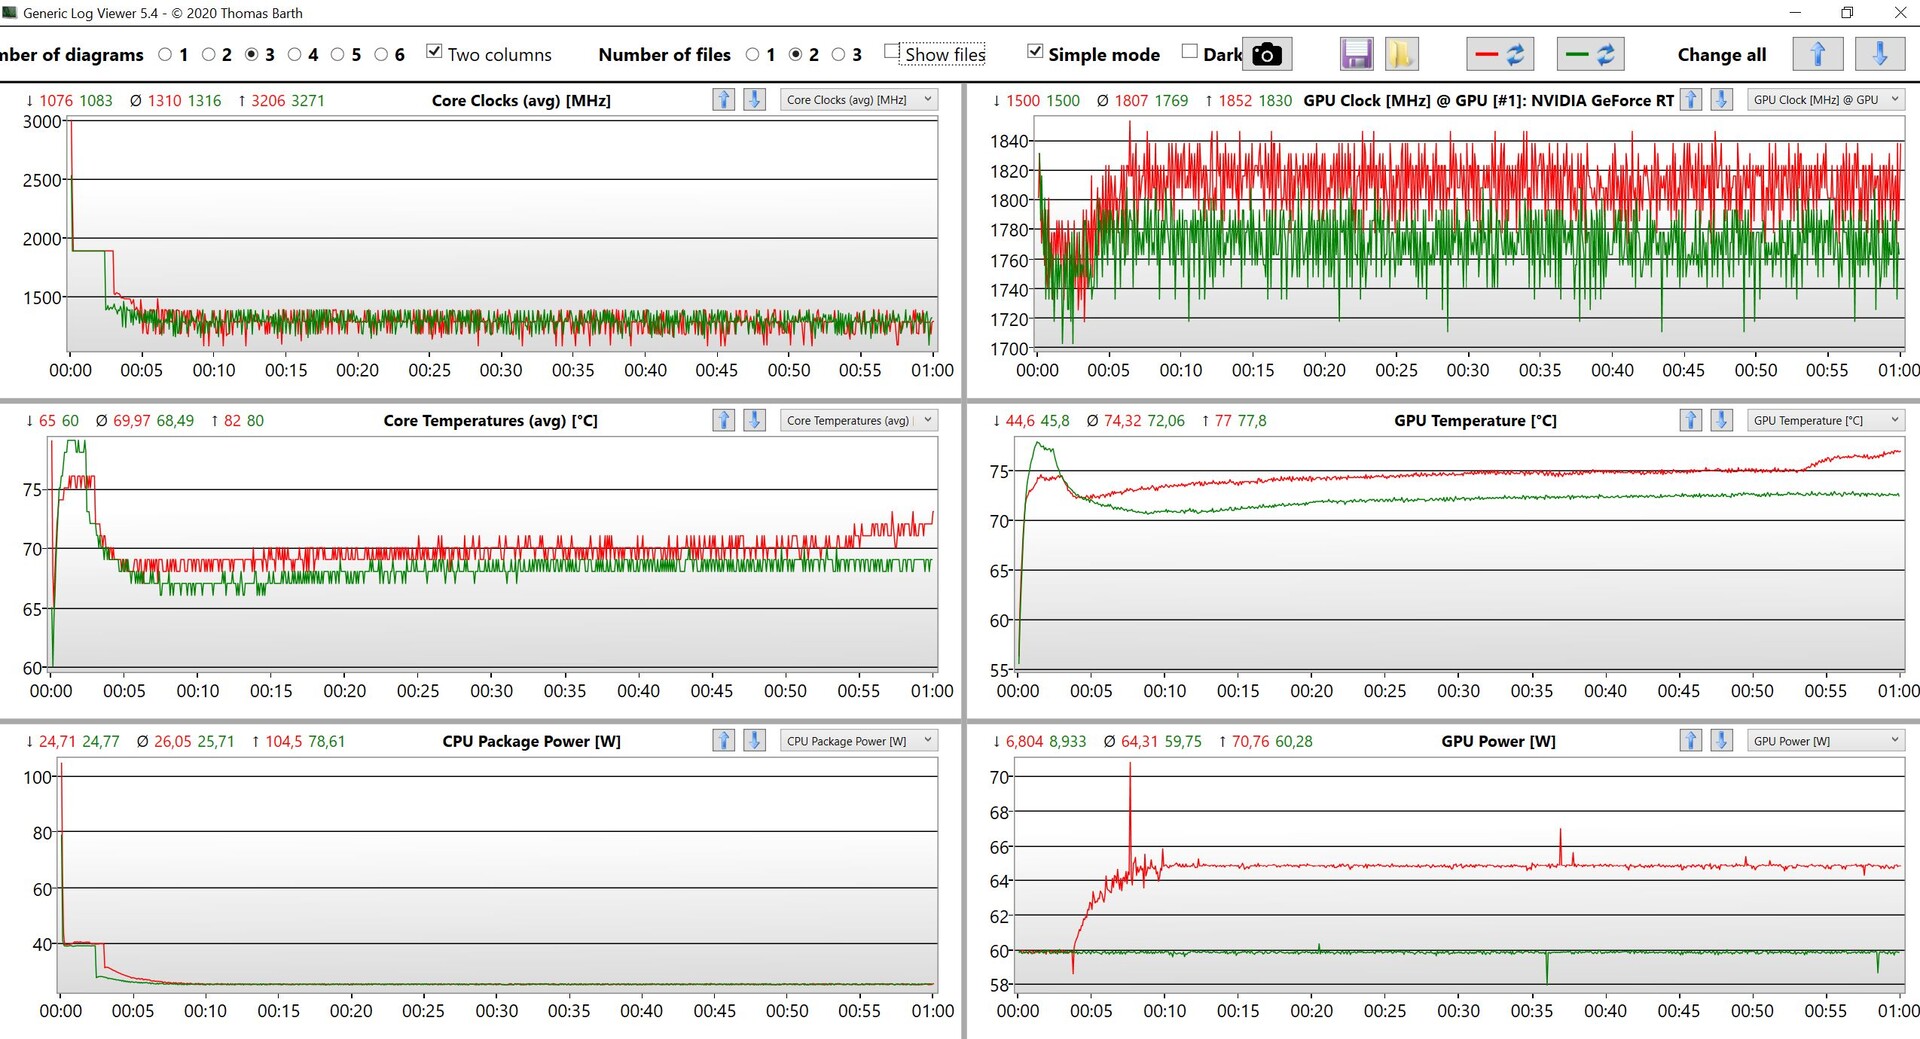
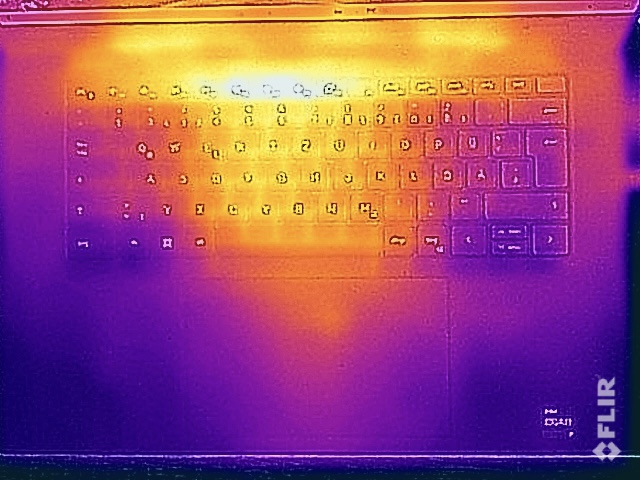
在日常操作中,XPS 17完全没有高温问题,即使在负载情况下将笔记本放在腿上也没有任何顾虑,即使考虑到机箱的尺寸,这似乎不太可能。 热点位于基座顶部朝后的中央区域,中央键盘区域也明显发热。虽然这里没有任何限制或顾虑,但你仍然可以得到温暖的手指。
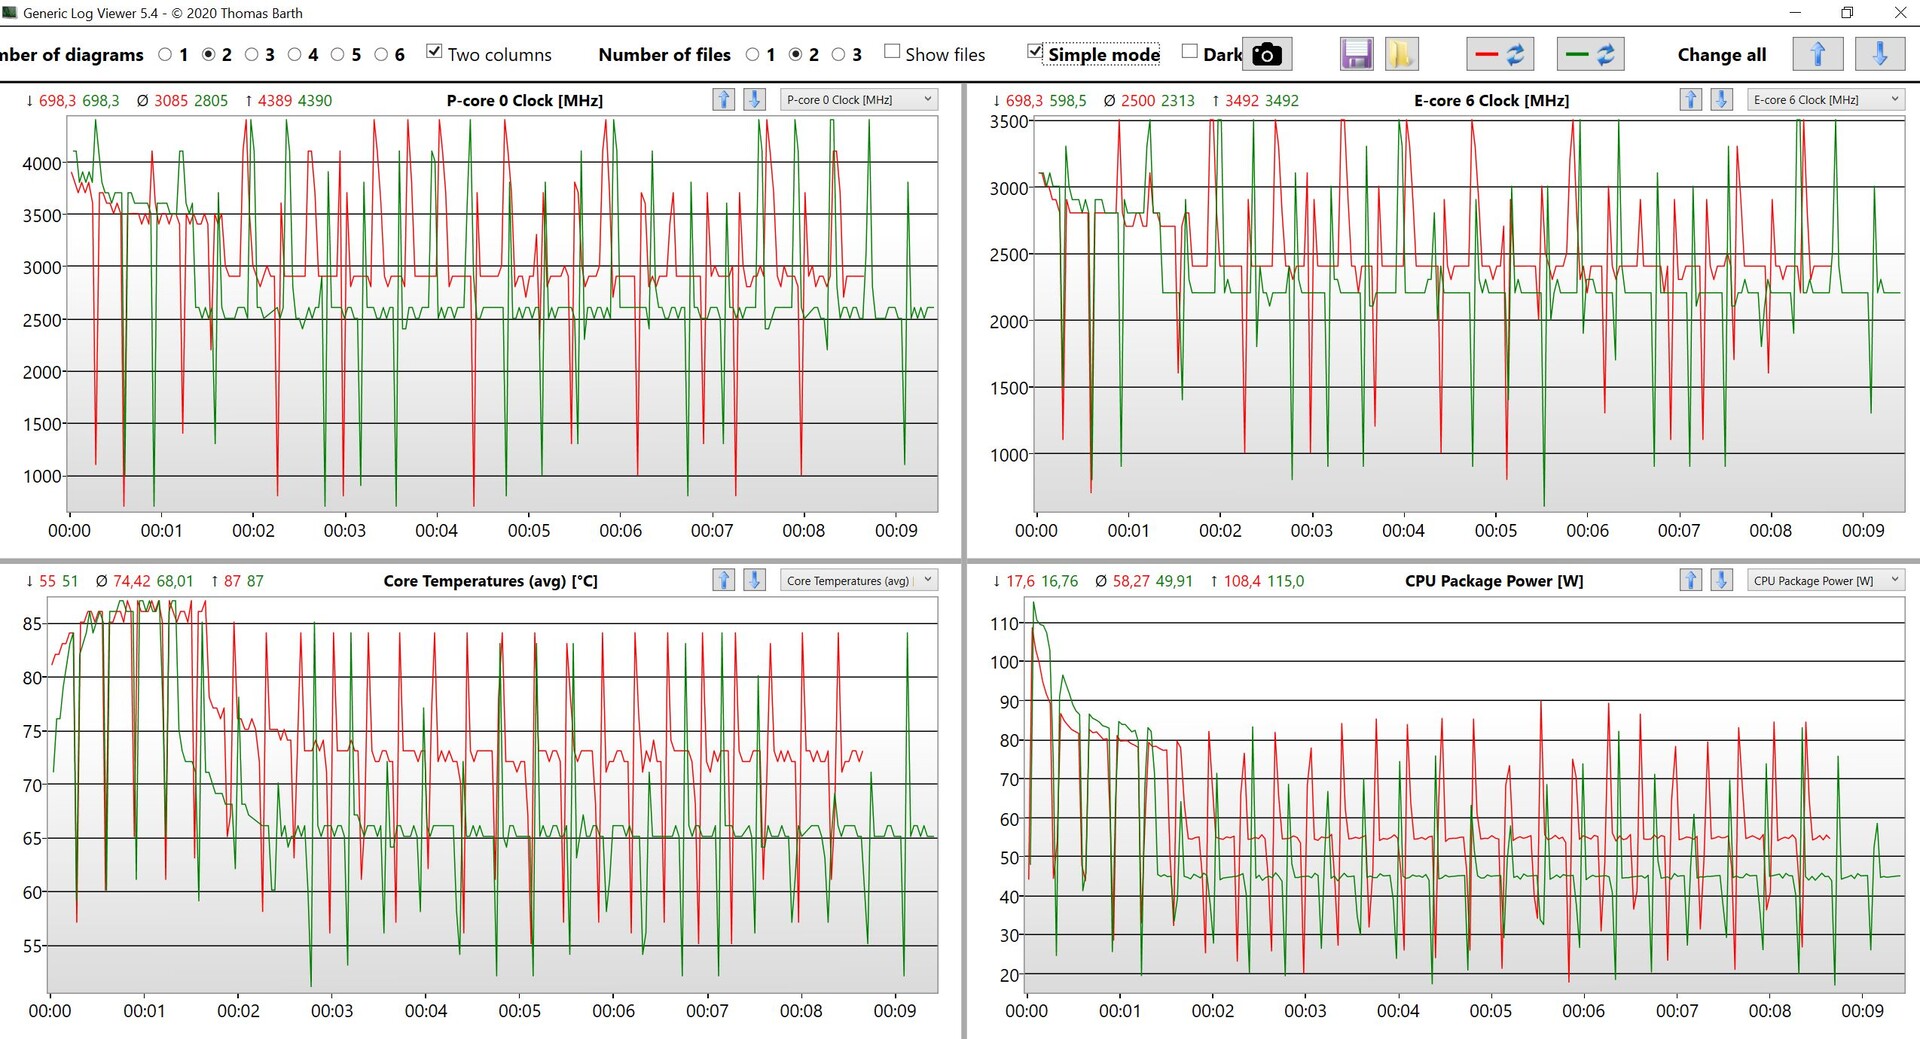
在压力测试中,显卡的性能在60瓦时保持稳定。虽然处理器最初稳定在40瓦,但几分钟后又下降到25瓦。我们看到原则上在超性能模式下也有同样的行为,但是一旦CPU的25瓦限制被激活,GPU就被允许额外消耗5瓦(总共65瓦)。
(-) The maximum temperature on the upper side is 49.5 °C / 121 F, compared to the average of 36.8 °C / 98 F, ranging from 21 to 71 °C for the class Multimedia.
(+) The bottom heats up to a maximum of 38.4 °C / 101 F, compared to the average of 39.1 °C / 102 F
(+) In idle usage, the average temperature for the upper side is 26.7 °C / 80 F, compared to the device average of 31.3 °C / 88 F.
(±) Playing The Witcher 3, the average temperature for the upper side is 37.3 °C / 99 F, compared to the device average of 31.3 °C / 88 F.
(+) The palmrests and touchpad are reaching skin temperature as a maximum (33.1 °C / 91.6 F) and are therefore not hot.
(-) The average temperature of the palmrest area of similar devices was 28.7 °C / 83.7 F (-4.4 °C / -7.9 F).
| Dell XPS 17 9720 Intel Core i7-12700H, NVIDIA GeForce RTX 3050 4GB Laptop GPU | Apple MacBook Pro 16 2021 M1 Pro Apple M1 Pro, Apple M1 Pro 16-Core GPU | Dell XPS 17 9720 RTX 3060 Intel Core i7-12700H, NVIDIA GeForce RTX 3060 Laptop GPU | Lenovo ThinkPad X1 Extreme G4-20Y5CTO1WW (3050 Ti) Intel Core i7-11800H, NVIDIA GeForce RTX 3050 Ti Laptop GPU | Asus Vivobook Pro 16X-M7600QE AMD Ryzen 9 5900HX, NVIDIA GeForce RTX 3050 Ti Laptop GPU | Lenovo ThinkBook 16p G2 ACH AMD Ryzen 9 5900HX, NVIDIA GeForce RTX 3060 Laptop GPU | Dell XPS 17 9710 Core i7 RTX 3060 Intel Core i7-11800H, NVIDIA GeForce RTX 3060 Laptop GPU | |
|---|---|---|---|---|---|---|---|
| Heat | 11% | -16% | -9% | 2% | -13% | -15% | |
| Maximum Upper Side * (°C) | 49.5 | 41 17% | 51.8 -5% | 49 1% | 39.4 20% | 50 -1% | 50.2 -1% |
| Maximum Bottom * (°C) | 38.4 | 39 -2% | 44.2 -15% | 44.4 -16% | 43.6 -14% | 53 -38% | 38.4 -0% |
| Idle Upper Side * (°C) | 28 | 24 14% | 34.8 -24% | 32.1 -15% | 27.6 1% | 29 -4% | 37.6 -34% |
| Idle Bottom * (°C) | 27.8 | 24 14% | 33.2 -19% | 29.8 -7% | 27.5 1% | 30 -8% | 34.2 -23% |
* ... smaller is better
发言人
扬声器系统仍然由两个低音炮组成,每个2.5瓦,两个高音炮,每个1.5瓦。此外,预装了MaxxAudio Pro音频软件,这也为声音增加了一些明显的动态效果。它提供了一些额外的调整选项,包括一个完整的均衡器。声音显得非常饱满,扬声器也可以变得非常响亮。另一方面,该系统相比之下缺乏一些冲击力。 MacBook Pro 16.
Dell XPS 17 9720 audio analysis
(+) | speakers can play relatively loud (83.6 dB)
Bass 100 - 315 Hz
(±) | reduced bass - on average 7.3% lower than median
(±) | linearity of bass is average (11.4% delta to prev. frequency)
Mids 400 - 2000 Hz
(+) | balanced mids - only 3.4% away from median
(±) | linearity of mids is average (7.6% delta to prev. frequency)
Highs 2 - 16 kHz
(+) | balanced highs - only 3.7% away from median
(±) | linearity of highs is average (7.1% delta to prev. frequency)
Overall 100 - 16.000 Hz
(+) | overall sound is linear (8.8% difference to median)
Compared to same class
» 11% of all tested devices in this class were better, 2% similar, 87% worse
» The best had a delta of 5%, average was 17%, worst was 45%
Compared to all devices tested
» 3% of all tested devices were better, 1% similar, 97% worse
» The best had a delta of 4%, average was 24%, worst was 134%
Apple MacBook Pro 16 2021 M1 Pro audio analysis
(+) | speakers can play relatively loud (84.7 dB)
Bass 100 - 315 Hz
(+) | good bass - only 3.8% away from median
(+) | bass is linear (5.2% delta to prev. frequency)
Mids 400 - 2000 Hz
(+) | balanced mids - only 1.3% away from median
(+) | mids are linear (2.1% delta to prev. frequency)
Highs 2 - 16 kHz
(+) | balanced highs - only 1.9% away from median
(+) | highs are linear (2.7% delta to prev. frequency)
Overall 100 - 16.000 Hz
(+) | overall sound is linear (4.6% difference to median)
Compared to same class
» 0% of all tested devices in this class were better, 0% similar, 100% worse
» The best had a delta of 5%, average was 17%, worst was 45%
Compared to all devices tested
» 0% of all tested devices were better, 0% similar, 100% worse
» The best had a delta of 4%, average was 24%, worst was 134%
电源管理 - 130瓦的电源接近其极限
消耗功率
在我们对功耗的测量中,明亮而大的4K显示屏当然变得很明显,但在最大17瓦的情况下,空闲运行期间的数值在同类产品的比较中一点都不差。在负载情况下,我们观察到将近136瓦(40瓦的CPU+60瓦的GPU),所以附带的130瓦的充电器(USB-C)已经达到了极限。我们检查了XPS 17在压力测试期间是否开始耗尽电池,但情况并非如此。只要CPU达到25瓦的极限,整体消耗也会下降到约122瓦。事实上,负载下的结果与配备更快的RTX 3060的版本几乎完全相同。 配备更快的RTX 3060的版本并不令人惊讶,因为那里有同样的功率限制。
| Off / Standby | |
| Idle | |
| Load |
|
Key:
min: | |
| Dell XPS 17 9720 i7-12700H, GeForce RTX 3050 4GB Laptop GPU, Micron 3400 MTFDKBA512TFH 512GB, IPS, 3840x2400, 17" | Apple MacBook Pro 16 2021 M1 Pro M1 Pro, M1 Pro 16-Core GPU, Apple SSD AP1024R, Mini-LED, 3456x2234, 16.2" | Dell XPS 17 9720 RTX 3060 i7-12700H, GeForce RTX 3060 Laptop GPU, Samsung PM9A1 MZVL21T0HCLR, IPS, 3840x2400, 17" | Lenovo ThinkPad X1 Extreme G4-20Y5CTO1WW (3050 Ti) i7-11800H, GeForce RTX 3050 Ti Laptop GPU, Samsung PM9A1 MZVL21T0HCLR, IPS LED, 3840x2400, 16" | Asus Vivobook Pro 16X-M7600QE R9 5900HX, GeForce RTX 3050 Ti Laptop GPU, SK Hynix HFM001TD3JX013N, OLED, 3840x2400, 16.1" | Lenovo ThinkBook 16p G2 ACH R9 5900HX, GeForce RTX 3060 Laptop GPU, WDC PC SN730 SDBPNTY-1T00, IPS, 2560x1600, 16" | Dell XPS 17 9710 Core i7 RTX 3060 i7-11800H, GeForce RTX 3060 Laptop GPU, Micron 2300 1TB MTFDHBA1T0TDV, IPS, 3840x2400, 17" | Average NVIDIA GeForce RTX 3050 4GB Laptop GPU | Average of class Multimedia | |
|---|---|---|---|---|---|---|---|---|---|
| Power Consumption | 26% | -7% | -17% | 13% | -11% | -2% | 16% | 29% | |
| Idle Minimum * (Watt) | 7.8 | 5 36% | 5.9 24% | 10.3 -32% | 8.2 -5% | 13.2 -69% | 7.5 4% | 7.17 ? 8% | 5.71 ? 27% |
| Idle Average * (Watt) | 15.1 | 15.1 -0% | 15.8 -5% | 22.06 -46% | 16.2 -7% | 17 -13% | 15.7 -4% | 10.4 ? 31% | 10.1 ? 33% |
| Idle Maximum * (Watt) | 17 | 15.5 9% | 26.7 -57% | 23 -35% | 19.7 -16% | 18.6 -9% | 23.1 -36% | 14.8 ? 13% | 12.4 ? 27% |
| Load Average * (Watt) | 114 | 54 53% | 117.4 -3% | 102.57 10% | 65.8 42% | 88.8 22% | 87.2 24% | 89.7 ? 21% | 65 ? 43% |
| Witcher 3 ultra * (Watt) | 115.2 | 114.8 -0% | 106 8% | 65.6 43% | 123 -7% 123 -7% | 116 -1% | |||
| Load Maximum * (Watt) | 135.6 | 90 34% | 136.6 -1% | 147.8 -9% | 104 23% | 132 3% | 131.6 3% | 124.8 ? 8% | 112.2 ? 17% |
* ... smaller is better
Power Consumption The Witcher 3 / Stress Test
Power Consumption With External Monitor
电池寿命
与竞争对手相比,97瓦时的电池寿命一点也不差,只有 MacBook Pro 16在这里发挥了不同的作用。在150cd/m²的WLAN测试中(在我们的测试设备中相当于52%的亮度),我们测得了9个小时的好成绩,而在全亮度下仍有6个小时左右。你甚至可以在150cd/m²下播放视频11小时。
在满负荷的情况下,尽管性能下降,你可以期待它的电池运行时间略长于1小时。运行TheWitcher 3 ,它持续了一个小时45分钟。如果打开笔记本电脑,需要大约2.5小时才能完全充电,差不多一小时后可使用50%的容量,所以没有快速充电功能。
| Dell XPS 17 9720 i7-12700H, GeForce RTX 3050 4GB Laptop GPU, 97 Wh | Apple MacBook Pro 16 2021 M1 Pro M1 Pro, M1 Pro 16-Core GPU, 99.6 Wh | Dell XPS 17 9720 RTX 3060 i7-12700H, GeForce RTX 3060 Laptop GPU, 97 Wh | Lenovo ThinkPad X1 Extreme G4-20Y5CTO1WW (3050 Ti) i7-11800H, GeForce RTX 3050 Ti Laptop GPU, 90 Wh | Asus Vivobook Pro 16X-M7600QE R9 5900HX, GeForce RTX 3050 Ti Laptop GPU, 96 Wh | Lenovo ThinkBook 16p G2 ACH R9 5900HX, GeForce RTX 3060 Laptop GPU, 71 Wh | Dell XPS 17 9710 Core i7 RTX 3060 i7-11800H, GeForce RTX 3060 Laptop GPU, 97 Wh | Average of class Multimedia | |
|---|---|---|---|---|---|---|---|---|
| Battery runtime | 70% | -11% | -23% | 8% | 7% | 50% | 39% | |
| H.264 (h) | 11.2 | 17.5 56% | 6.7 -40% | 7 -37% | 16.4 ? 46% | |||
| WiFi v1.3 (h) | 9.2 | 16.9 84% | 8.7 -5% | 6.6 -28% | 11.3 23% | 8.5 -8% | 7.6 -17% | 12 ? 30% |
| Witcher 3 ultra (h) | 1.7 | |||||||
| Load (h) | 1.2 | 1 -17% | 1.2 0% | 1.1 -8% | 2 67% | 2.6 117% | 1.675 ? 40% | |
| Reader / Idle (h) | 20.3 | 17.7 | 25.2 ? |
Pros
Cons
结论 - XPS 17 9720的GPU降级版
XPS 17已经在市场上销售了大约两年,但基本设计是基于较小的XPS 15,这就是为什么整体概念看起来如此熟悉的原因。毫无疑问,这仍然是一款高质量的高端产品,当你看到3000欧元(约3135美元)的价格时,你已经看到了这一点。然而,在测试中,这台多媒体笔记本电脑也显示出一些弱点,稍微损害了整体印象。
在我们看来,最大的问题是性能问题。虽然新的英特尔处理器基本上提供了体面的性能值,但与前代产品相比,它在持续负载下并没有带来任何重大优势。但这其实并不是戴尔的错,因为新的Alder Lake CPU只是消耗了大量的电力。因此,戴尔能做的最好的事情是转向AMD,但这是另一个话题。RTX 3050 的图形性能本身也还可以,但我们不明白为什么戴尔在运行GPU时与前代相比功耗更低,结果进一步降低了有效游戏性能。在综合负载下,XPS 17也无法大放异彩,例如在CPU密集型游戏中,性能就不太稳定。同时,XPS 17在负载下也不是特别安静。另一个问题是WLAN模块,因为尽管使用了现代Wi-Fi-6E模块,XPS 17根本不支持任何6-GHz网络。
XPS 17因其极其准确的AdobeRGB面板而大放异彩,这使得它特别适合图像处理。然而,你必须接受性能上的一些妥协,尽管使用相同的冷却,但与去年的XPS 17 9710相比,戴尔稍微降低了显卡的性能。
真正的亮点是显示屏,因为这是最后一款拥有覆盖AdobeRGB标准的真正高质量面板的笔记本电脑,与大多数在此时跳上DCI-P3浪潮的竞争对手相比,包括惠普的DreamColor显示屏。虽然面板仍应进行校准,但事后没有任何限制。
总而言之,XPS 17仍然是一款非常好的多媒体笔记本电脑,但戴尔必须注意与竞争对手相比,不要错过机会。MacBook Pro 16 或ThinkPad X1 Extreme ,例如,已经在使用16英寸的外形尺寸,只是更加紧凑,同时提供可比(甚至更好)的性能值。我们很好奇戴尔未来将如何处理这种情况。虽然XPS 15 和XPS 17的知名设计可能仍会有一段时间,但我们也可以想象,制造商在不久的将来也会向市场重新推出XPS 16。
价格和可用性
新的XPS 17 9720可从戴尔,起价1949美元。有各种配置选项,你也可以从亚马逊,例如。
Dell XPS 17 9720
- 06/17/2022 v7 (old)
Andreas Osthoff
Price comparison

