AMD Ryzen 9 7845HX 性能首次亮相:Alienware m16 R1 笔记本电脑评测

在推出 15.6 英寸 15.6 英寸、17 英寸 17 英寸和 18 英寸 和18英寸现在,戴尔准备出货 16 英寸 Alienware m16,配备最新的 Nvidia Ada Lovelace GPU,并可选择英特尔第 13 代 Raptor Lake 或 AMD Zen 4 处理器。Alienware m16 与最近推出的 x16的区别,后者更薄,规格和功能也不同。
我们的评测机是 AMD 的中高档配置,配备 Ryzen 9 7845HX、175 WGeForce RTX 4080 GPU 和 1600p240 IPS 显示屏,售价约 2350 美元。配备 Ryzen 7 7745HX CPU 和 Radeon RX 7600M GPU 的低端 SKU 售价为 2150 美元,而配备 Ryzen 9 7945HX 和 RTX 4090 的高价位 SKU 零售价可能超过 3100 美元,具体取决于内存和 SSD 偏好。与此同时,英特尔版本配备了相同的显示屏和 Nvidia GPU 选项,但使用的是酷睿 i7-13700HX 或 i9-13900HX。
竞争对手包括其他旗舰 16 英寸游戏笔记本电脑,如 惠普 Omen 16, 联想Legion Pro 7 16, 华硕 ROG Strix G16或 Razer Blade 16.
更多戴尔评测:
潜在的竞争对手比较
Rating | Date | Model | Weight | Height | Size | Resolution | Price |
|---|---|---|---|---|---|---|---|
| 89.2 % v7 (old) | 08 / 2023 | Alienware m16 R1 AMD R9 7845HX, GeForce RTX 4080 Laptop GPU | 3.1 kg | 25.4 mm | 16.00" | 2560x1600 | |
| 88.4 % v7 (old) | 06 / 2023 | Alienware x16 R1 i9-13900HK, GeForce RTX 4080 Laptop GPU | 2.6 kg | 18.57 mm | 16.00" | 2560x1600 | |
| 87.9 % v7 (old) | 08 / 2023 | HP Omen Transcend 16 i9-13900HX, GeForce RTX 4070 Laptop GPU | 2.3 kg | 19.8 mm | 16.00" | 2560x1600 | |
| 88.8 % v7 (old) | 06 / 2023 | Lenovo Legion Pro 7 RTX4090 i9-13900HX, GeForce RTX 4090 Laptop GPU | 2.7 kg | 26 mm | 16.00" | 2560x1600 | |
| 88.4 % v7 (old) | 03 / 2023 | Asus ROG Strix G16 G614JZ i9-13980HX, GeForce RTX 4080 Laptop GPU | 2.4 kg | 30.4 mm | 16.00" | 2560x1600 | |
| 91.2 % v7 (old) | 02 / 2023 | Razer Blade 16 Early 2023 i9-13950HX, GeForce RTX 4080 Laptop GPU | 2.4 kg | 21.99 mm | 16.00" | 2560x1600 |
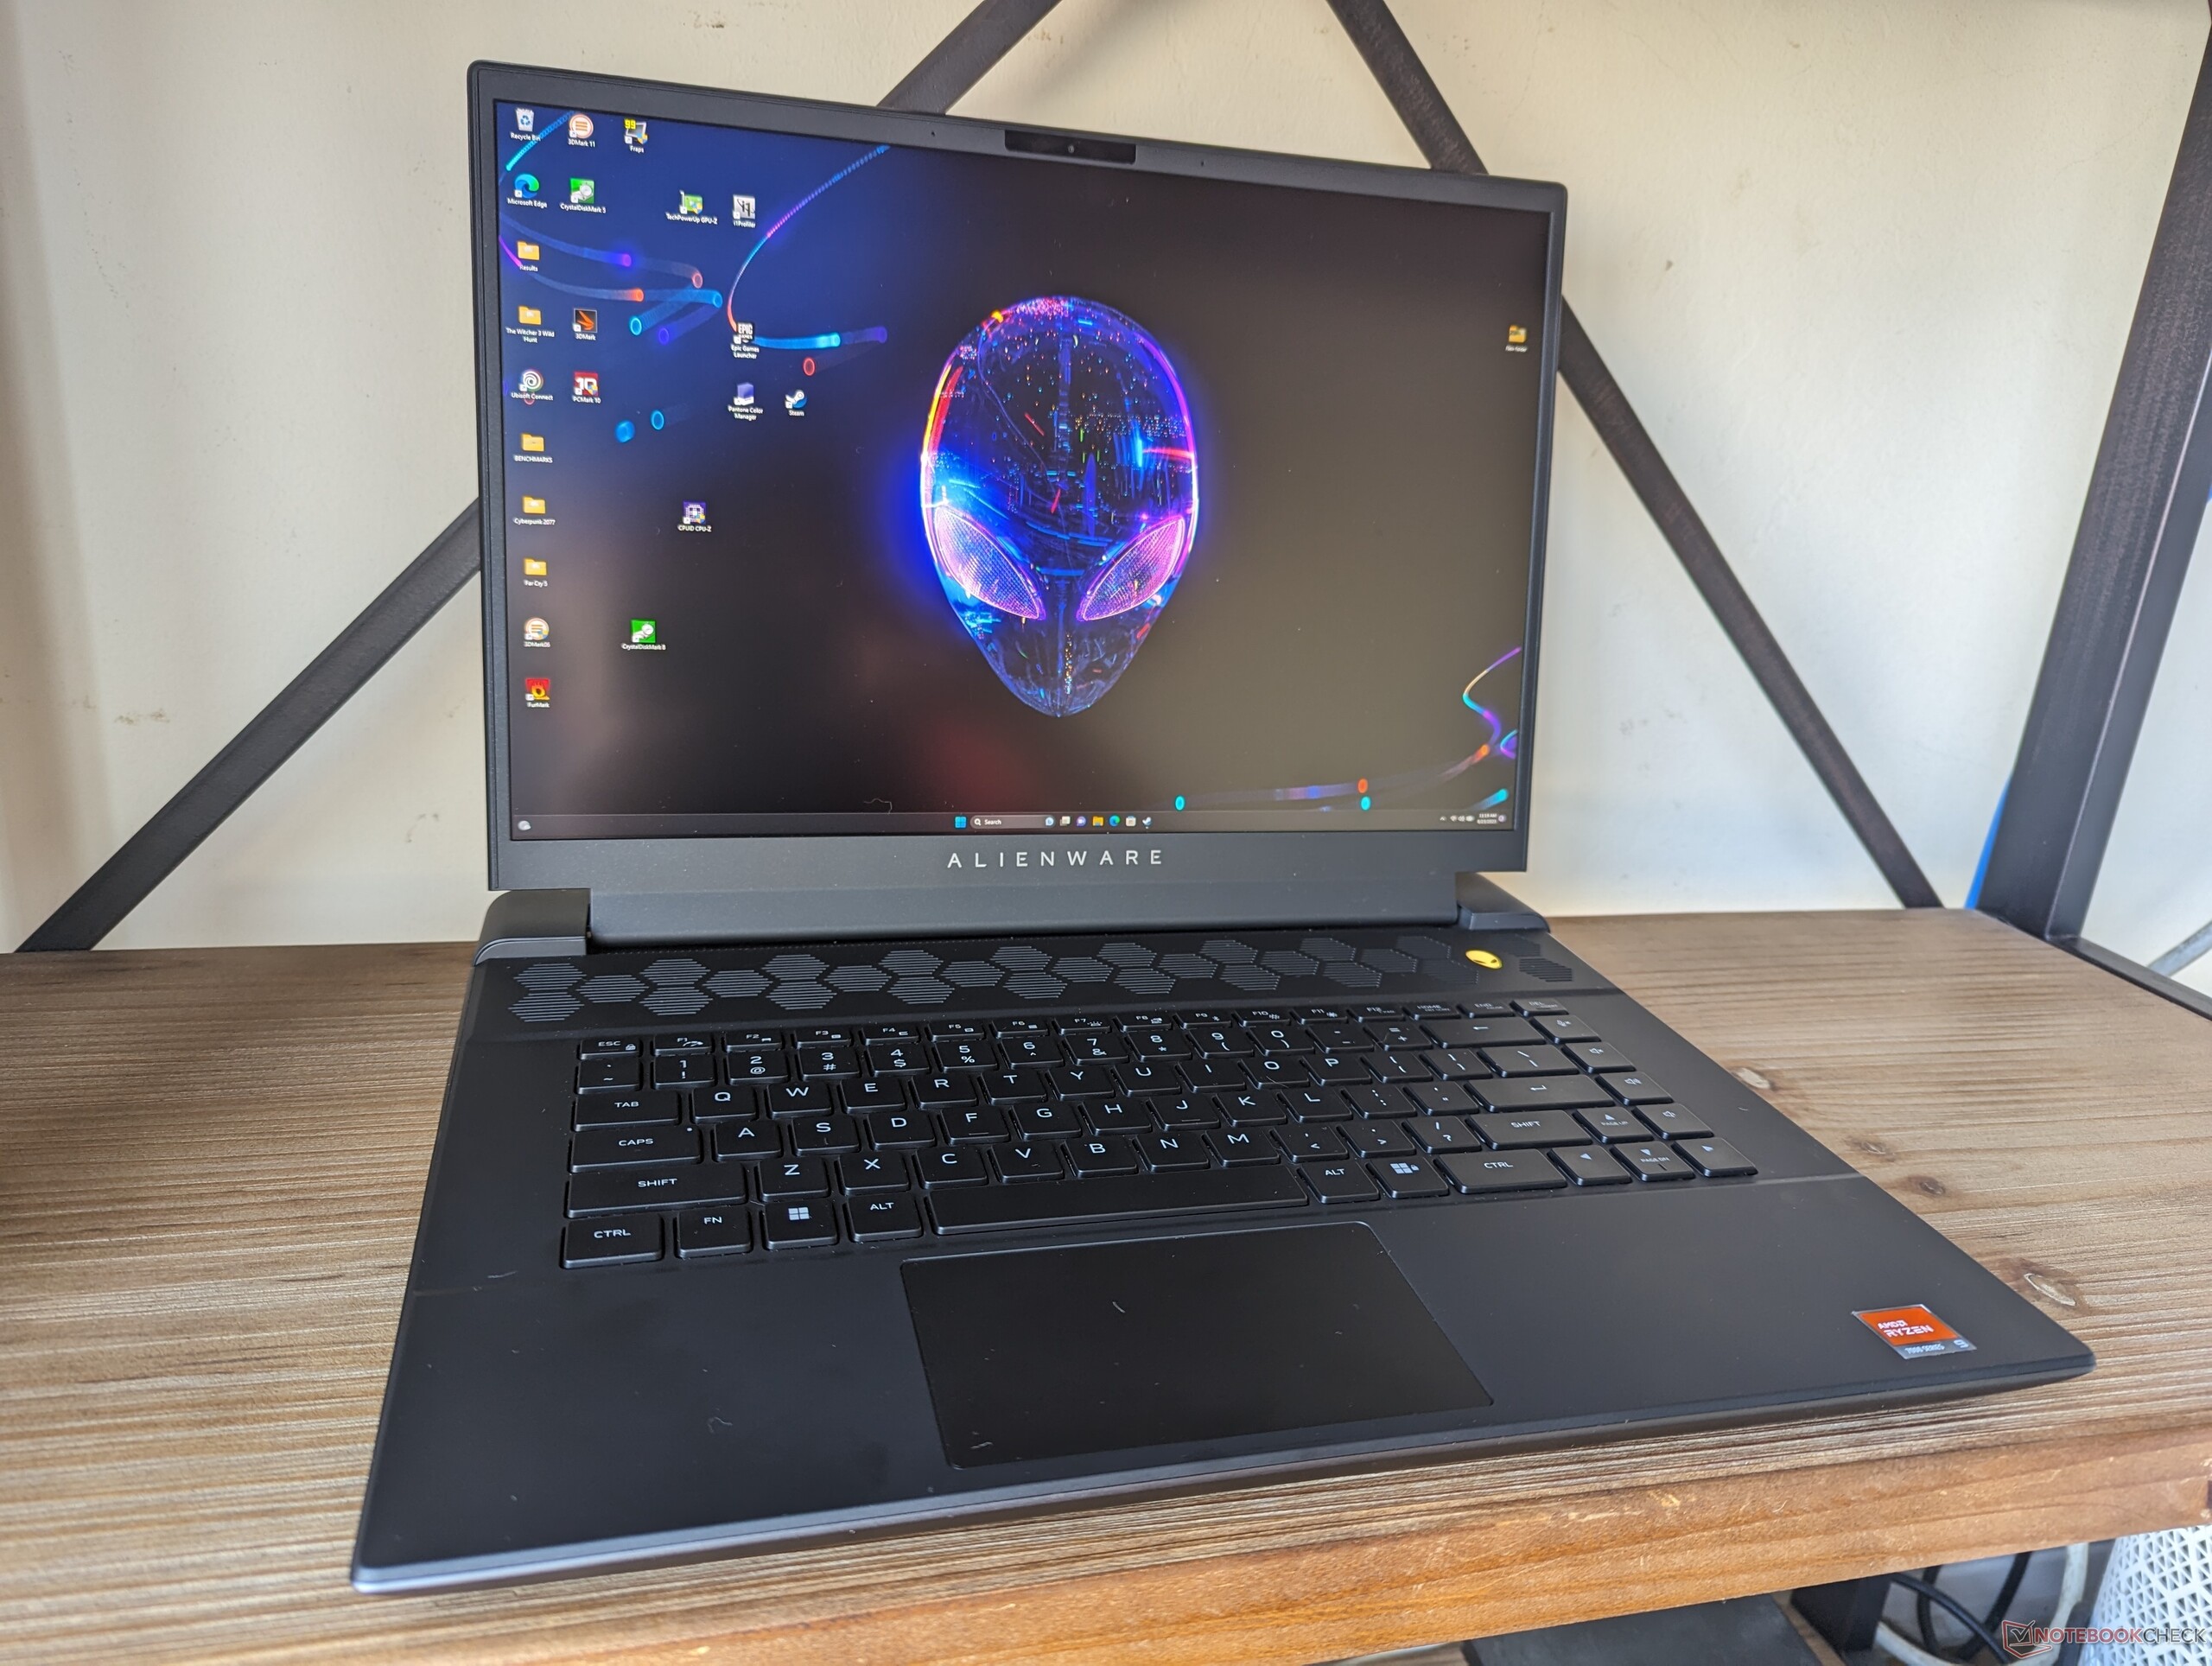
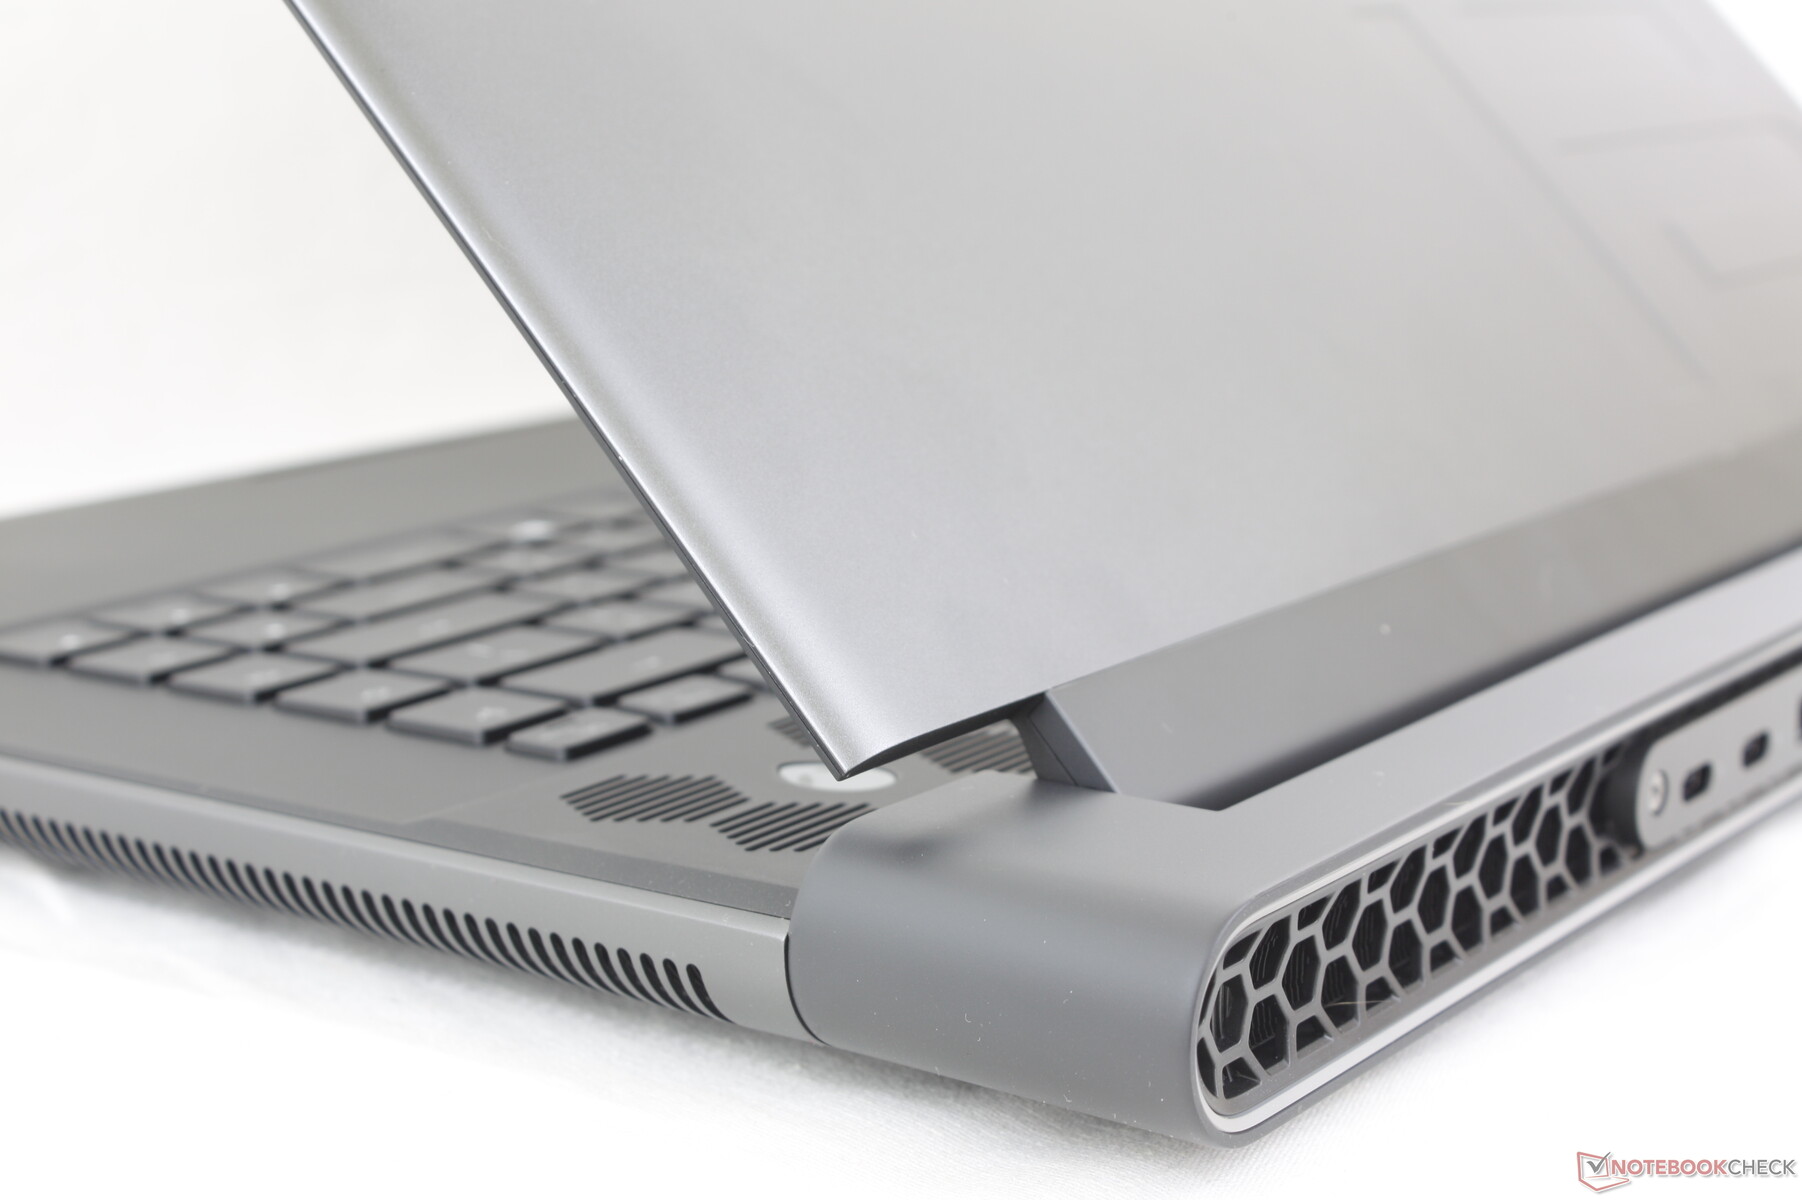
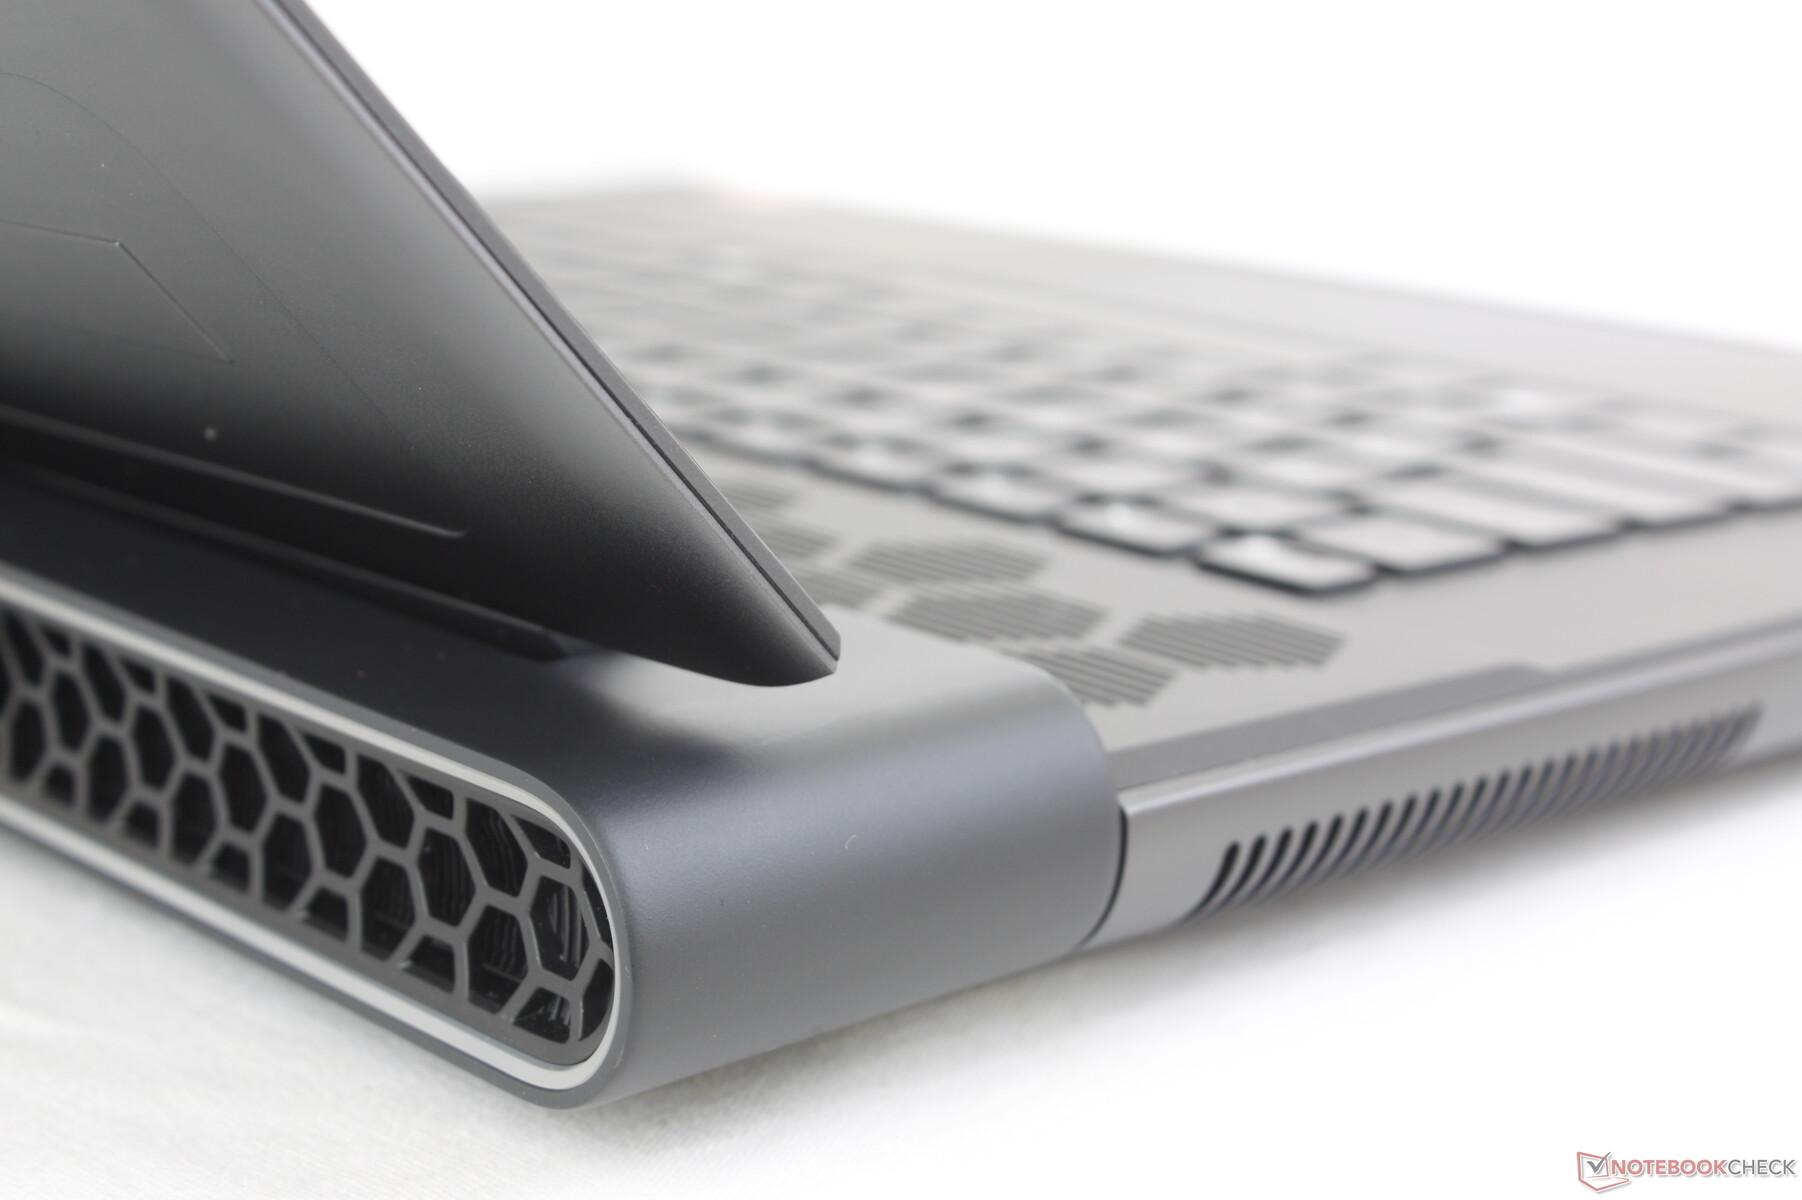
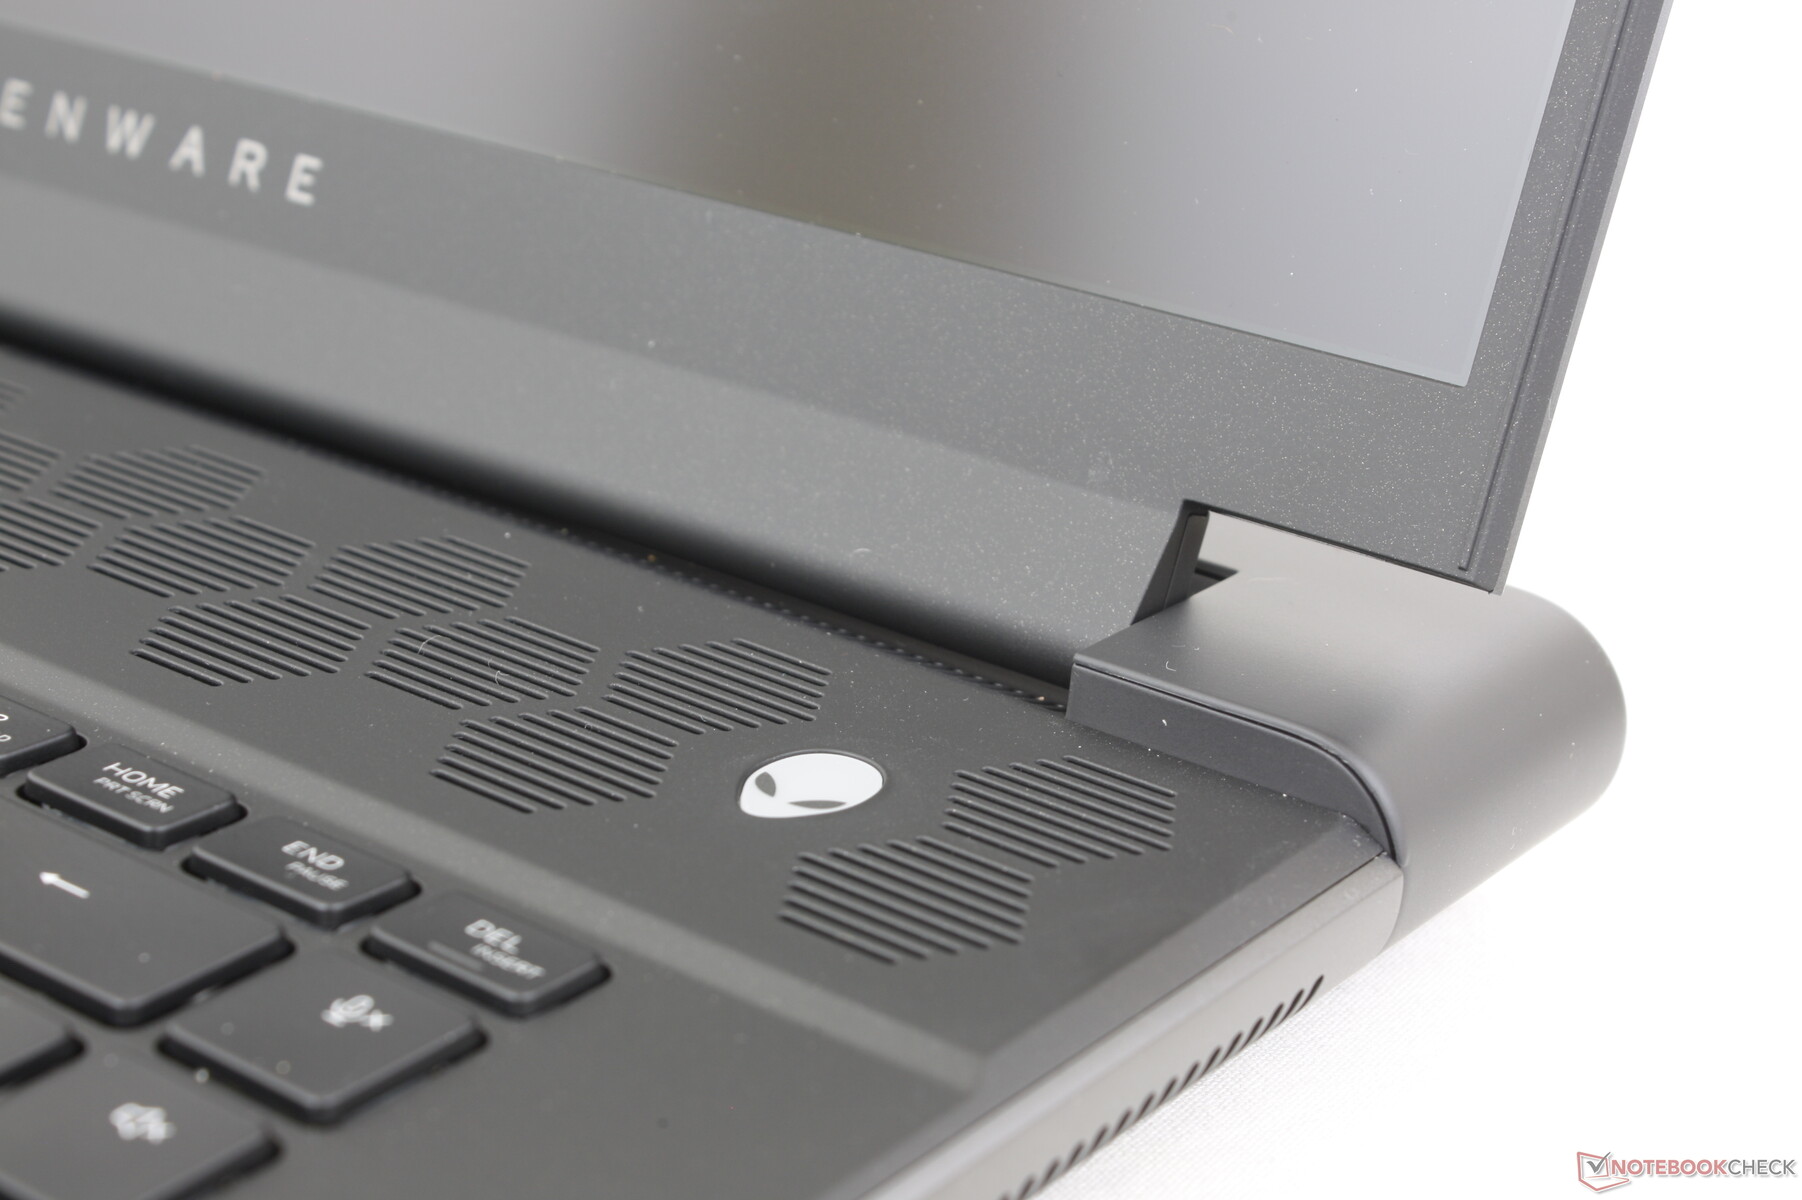
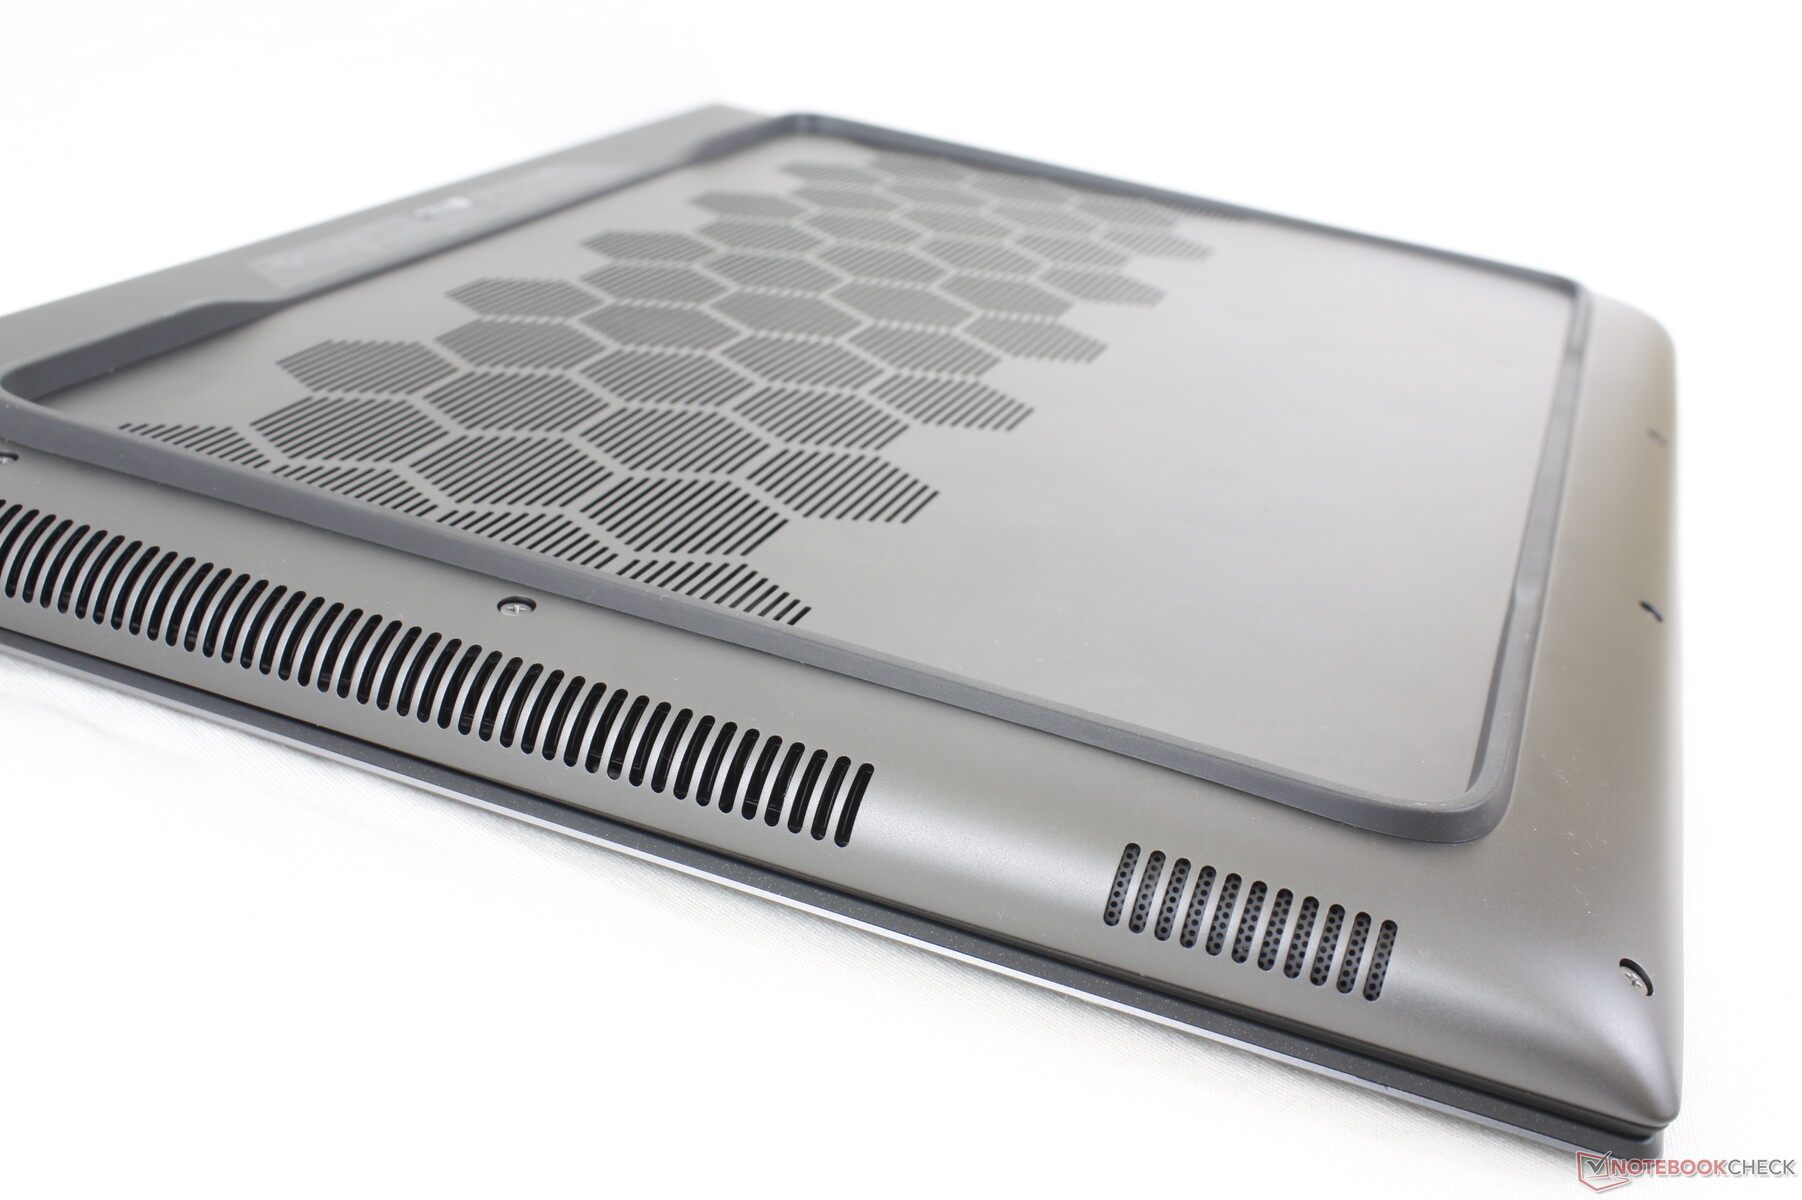
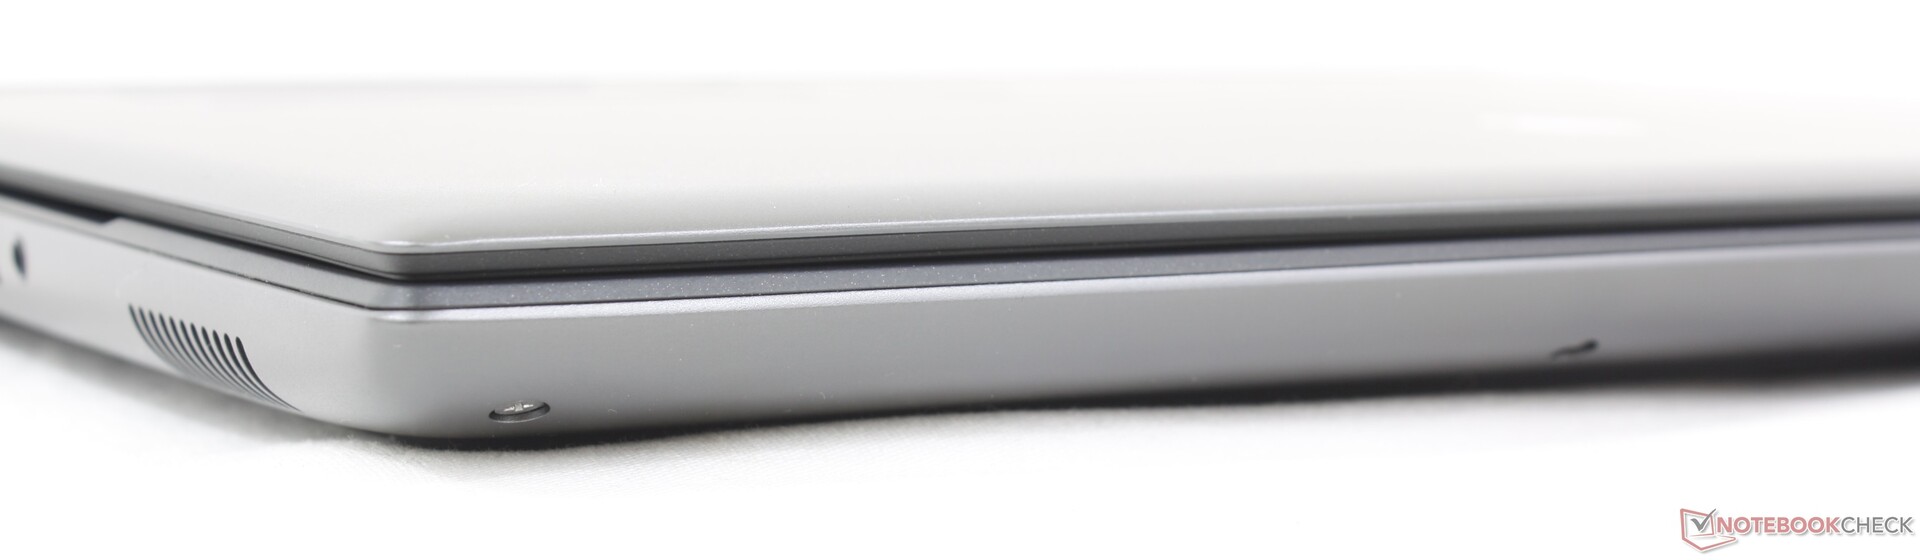
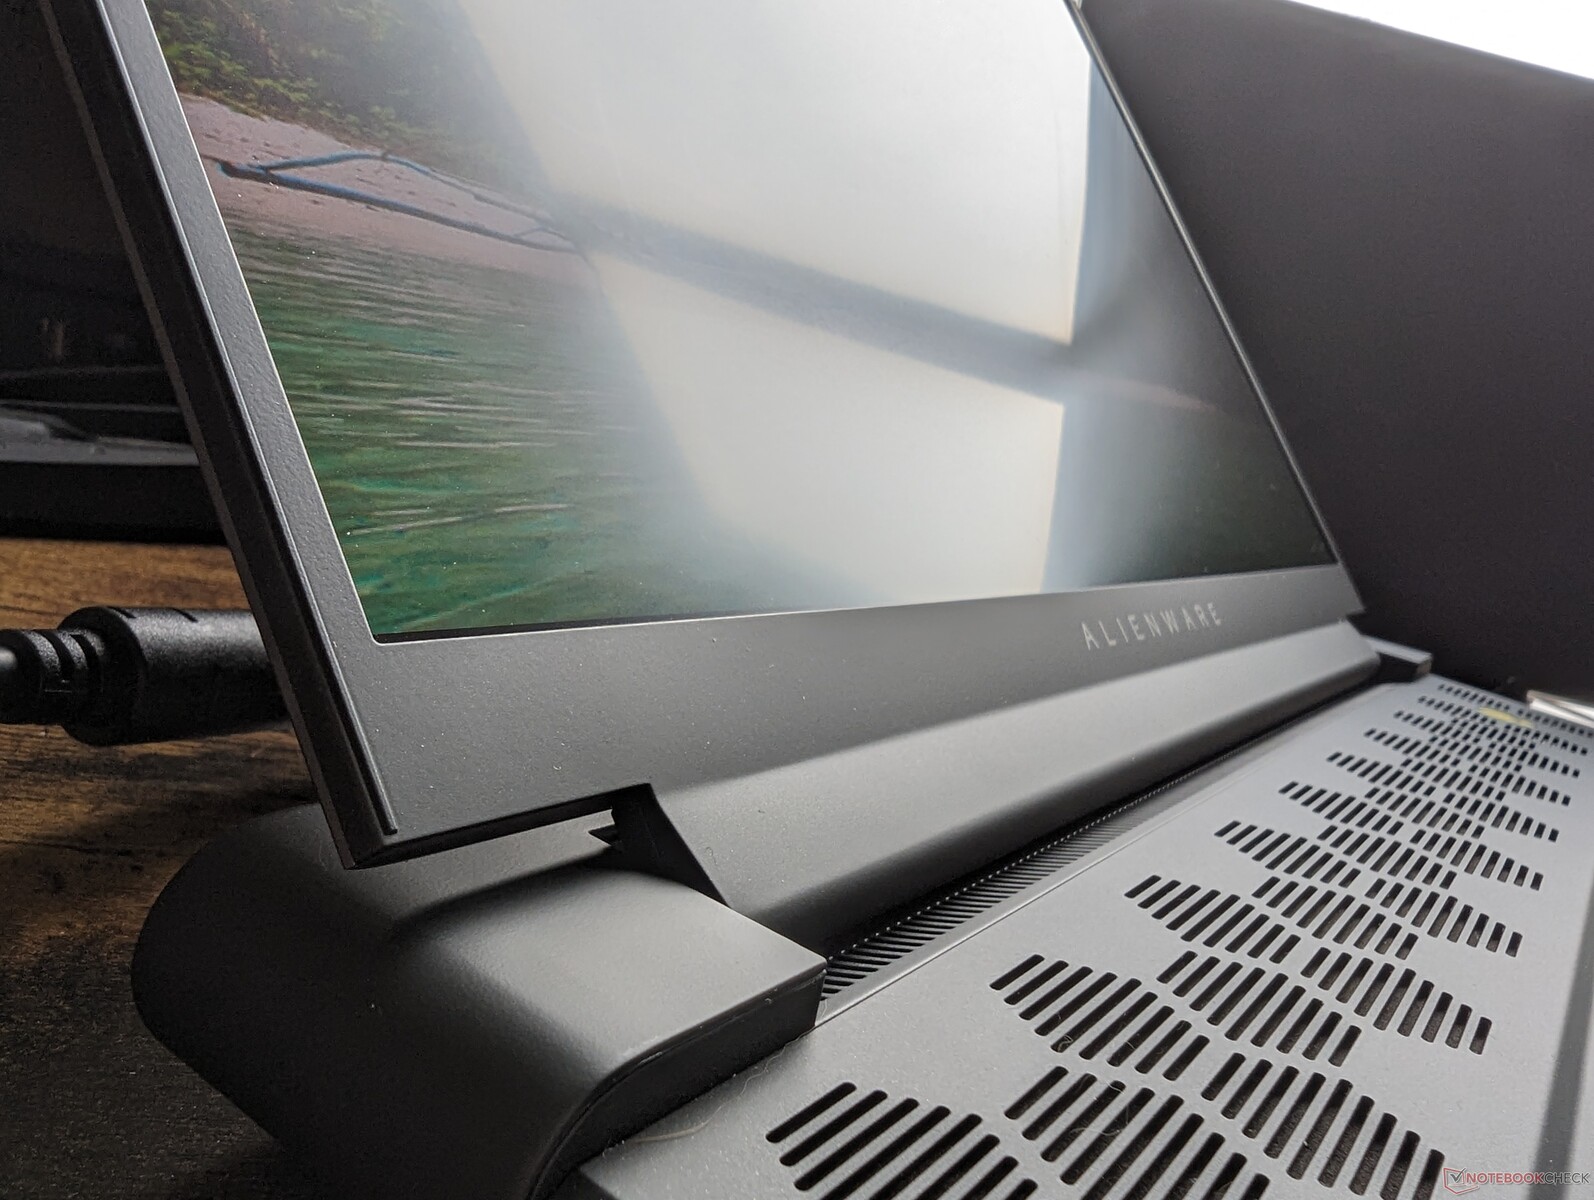
机箱 - 无与伦比的 Alienware
该机箱基本上是 Alienware x16 R1 的加厚版,因为两款机箱都基于相同的 Legend 3.0 工业设计。橡胶外围脚垫、铝制外盖、六角形通风栅、后 LED 环和哑光黑色键盘面板是任何竞争机型上都没有的组合。底座、盖子和铰链都非常坚固,在尝试扭转或弯曲它们时不会发出吱吱嘎嘎的响声,给人的第一印象就比其他同类产品更强烈。 华硕 TUF GAMING A16或联想Legion Pro 7 16 的第一印象更加强烈。
黑色的掌托、点击板和键盘按键仍然是指纹磁铁。戴尔目前没有提供除暗金属月色以外的其他颜色选择。
Alienware m16 R1 是最重的 16 英寸游戏笔记本电脑之一,由于其后部加长,因此也是长度和宽度最大的笔记本电脑之一。其密集的设计使其结构非常坚固,但却牺牲了便携性。Pro 7 Legion Pro 7为例,其重量比 Pro 7 轻 400 克,占地面积也小得多,但却配备了类似的 HX 级 CPU 和高端 GPU。
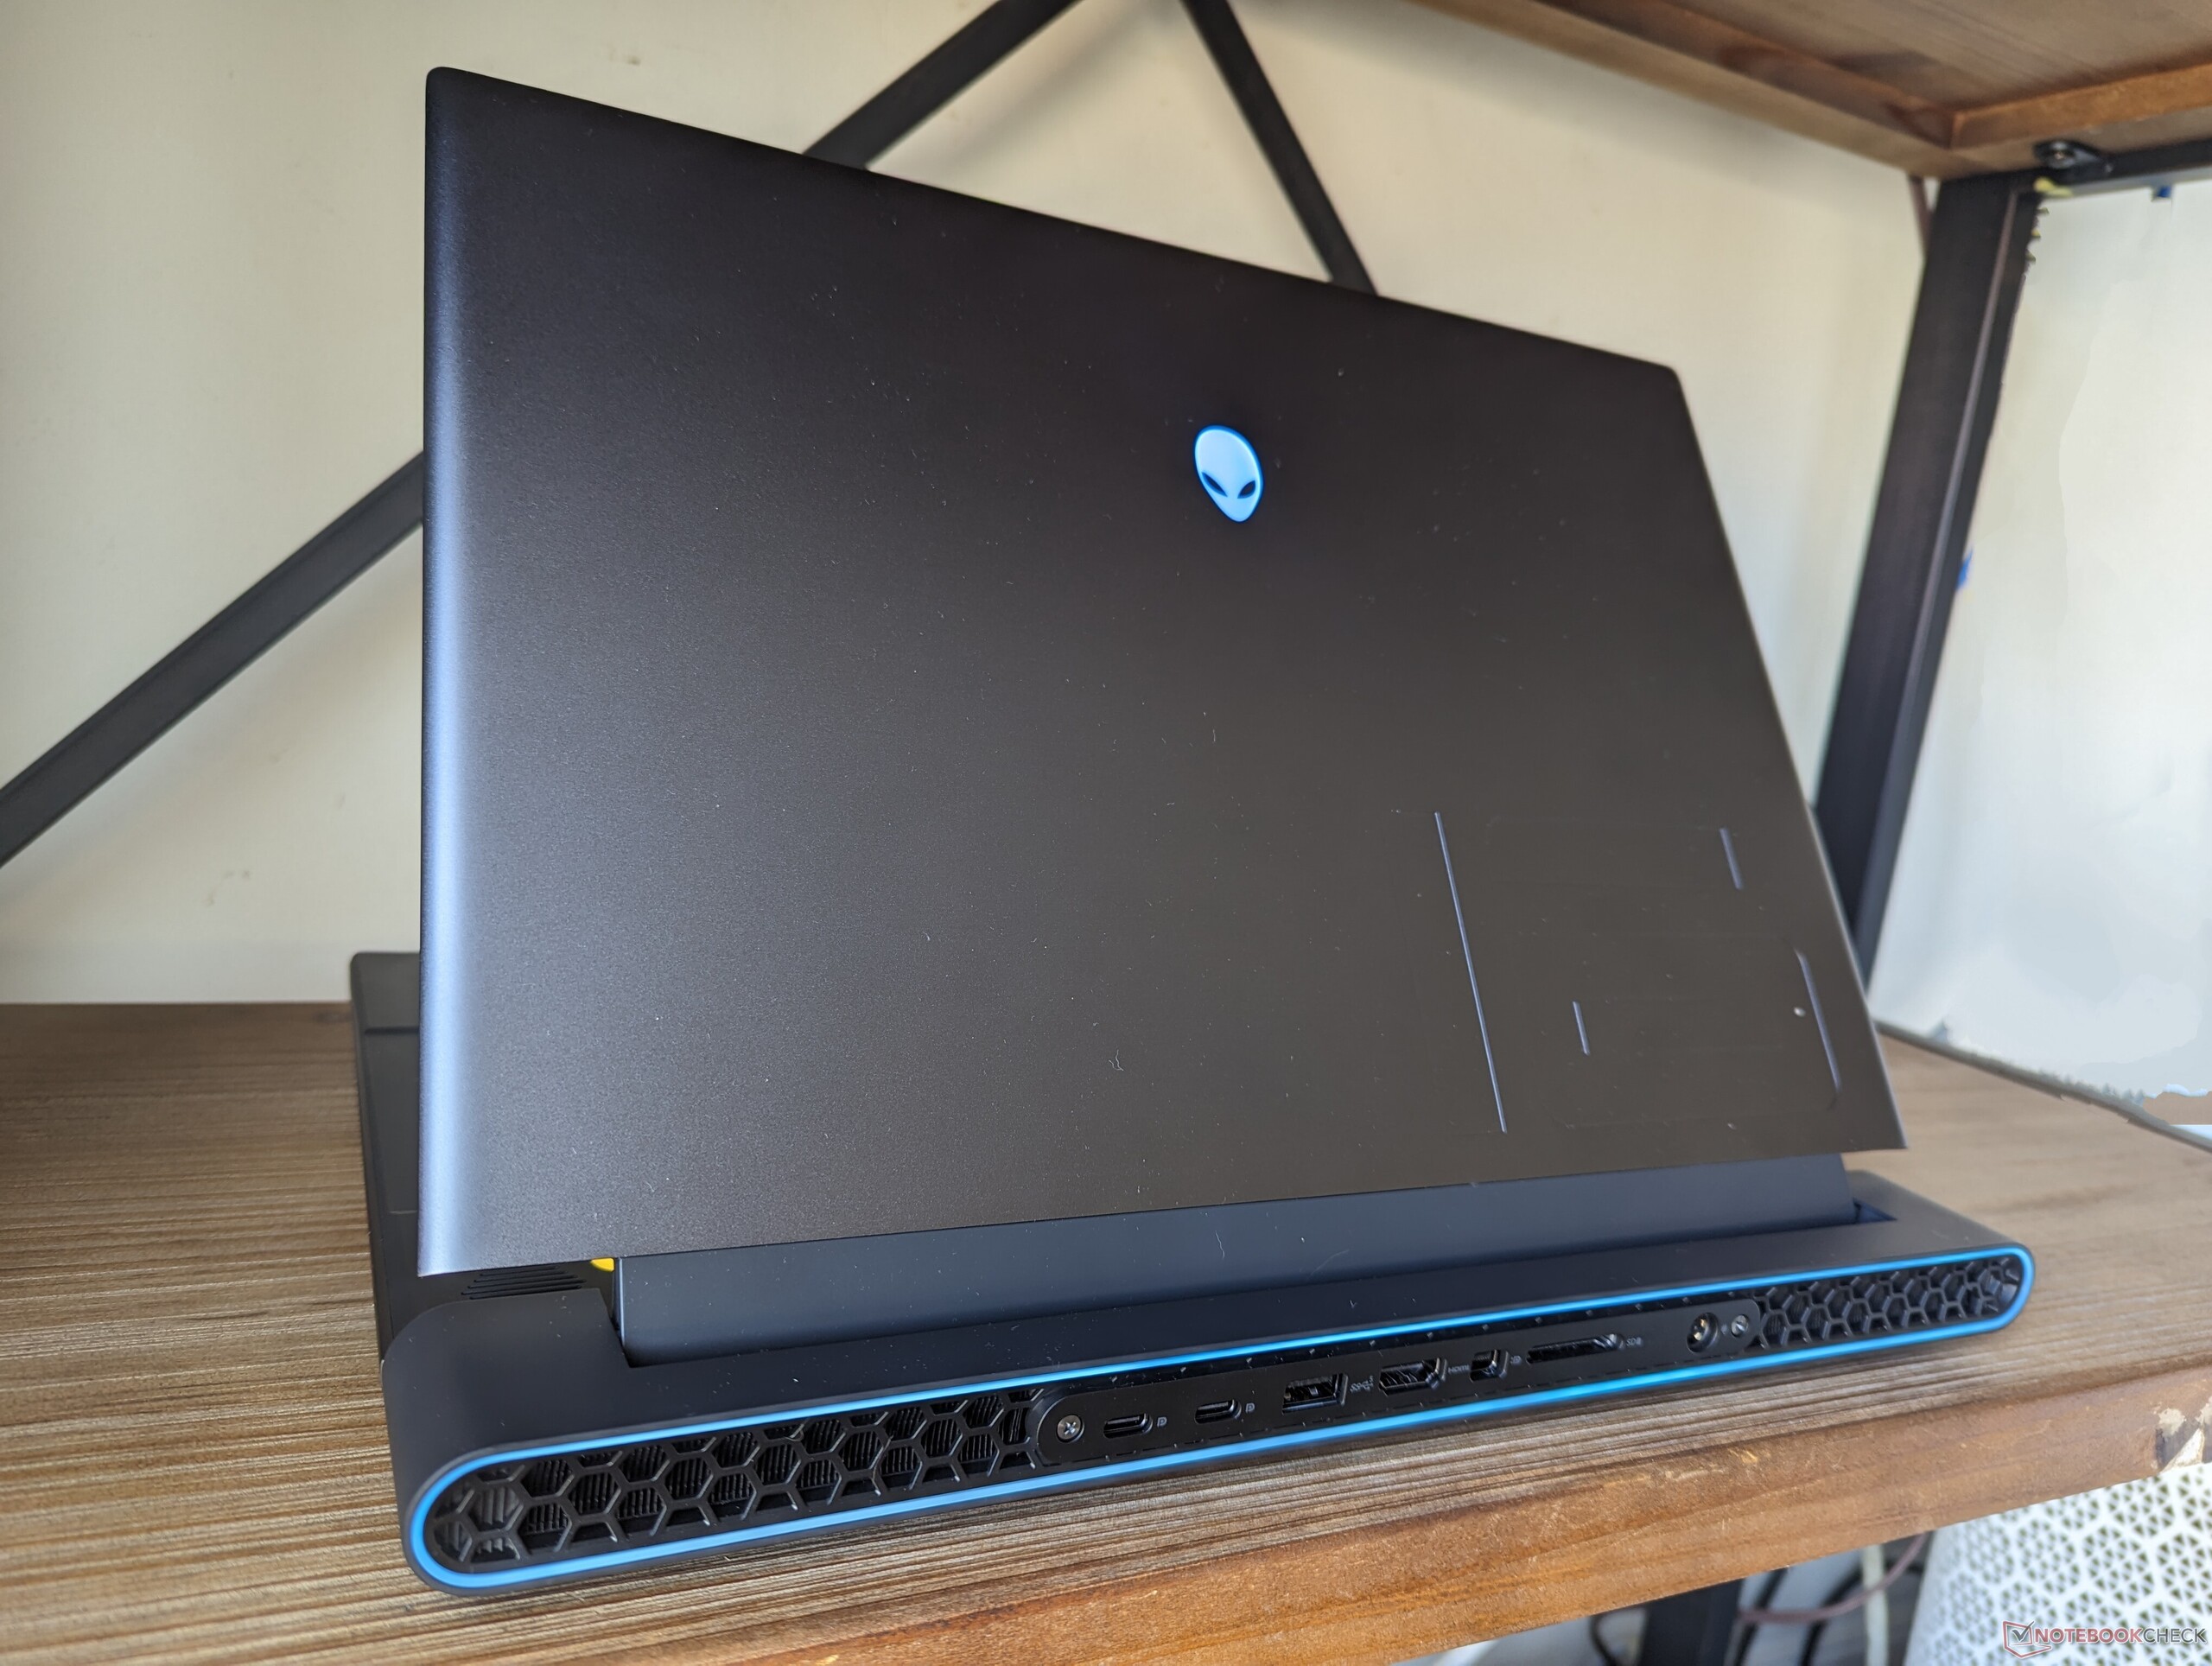
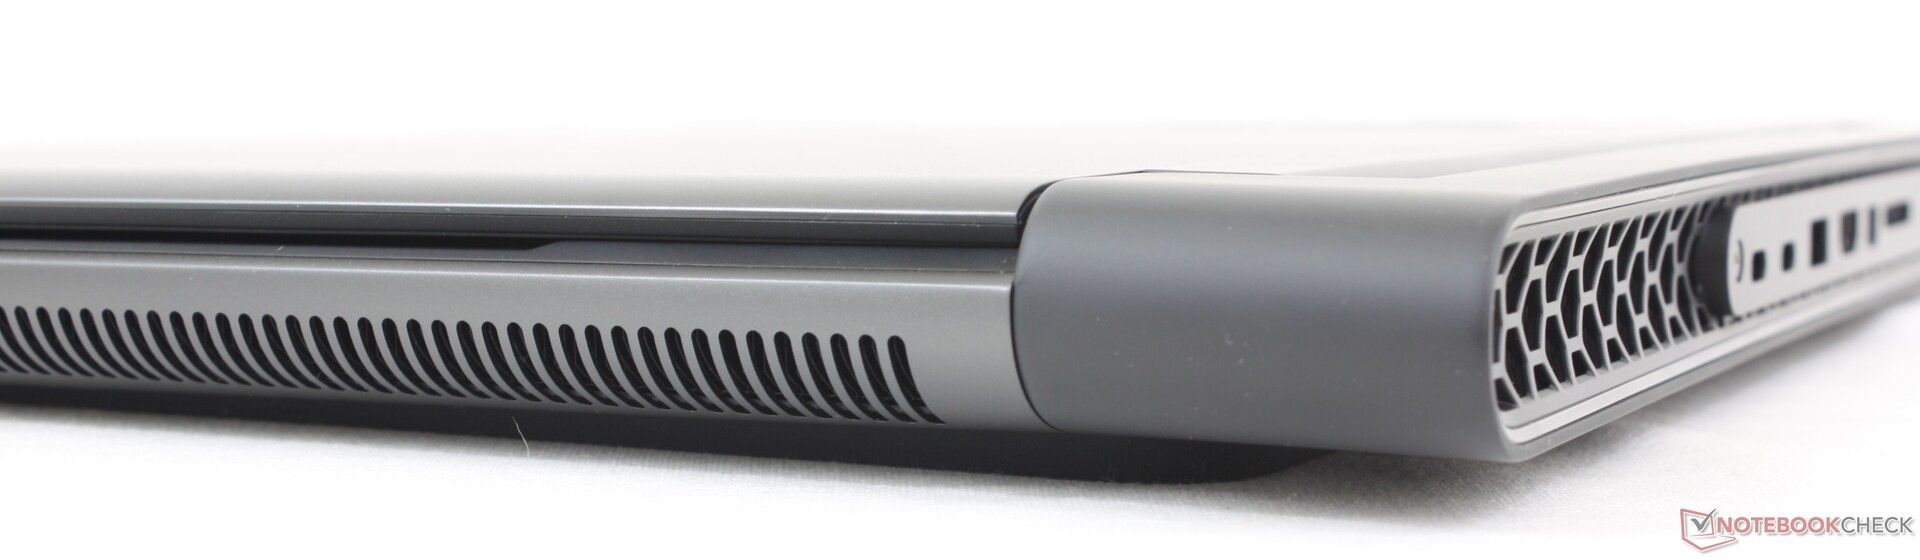
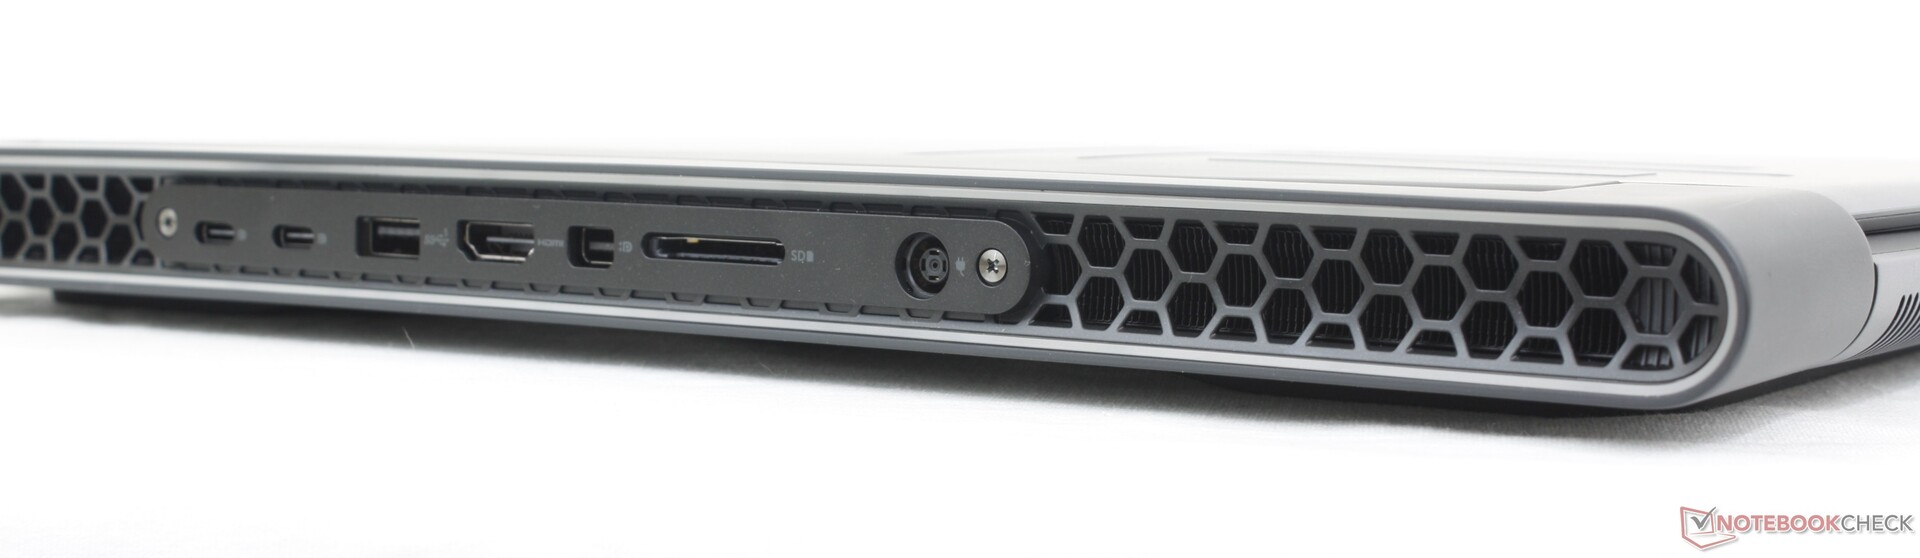
连接性 - Thunderbolt 仅适用于英特尔版本
端口选项包括 Alienware x16 R1 上的所有端口,外加 RJ-45 和全尺寸 SD 读卡器,而不是 MicroSD。一些端口也被移到了左侧边缘,而在 x16 上这些端口都被挤在了后部。迷你 DisplayPort 也值得注意,因为它在较新的游戏笔记本电脑上并不常见。
AMD 机型不支持 USB4 和 Thunderbolt。
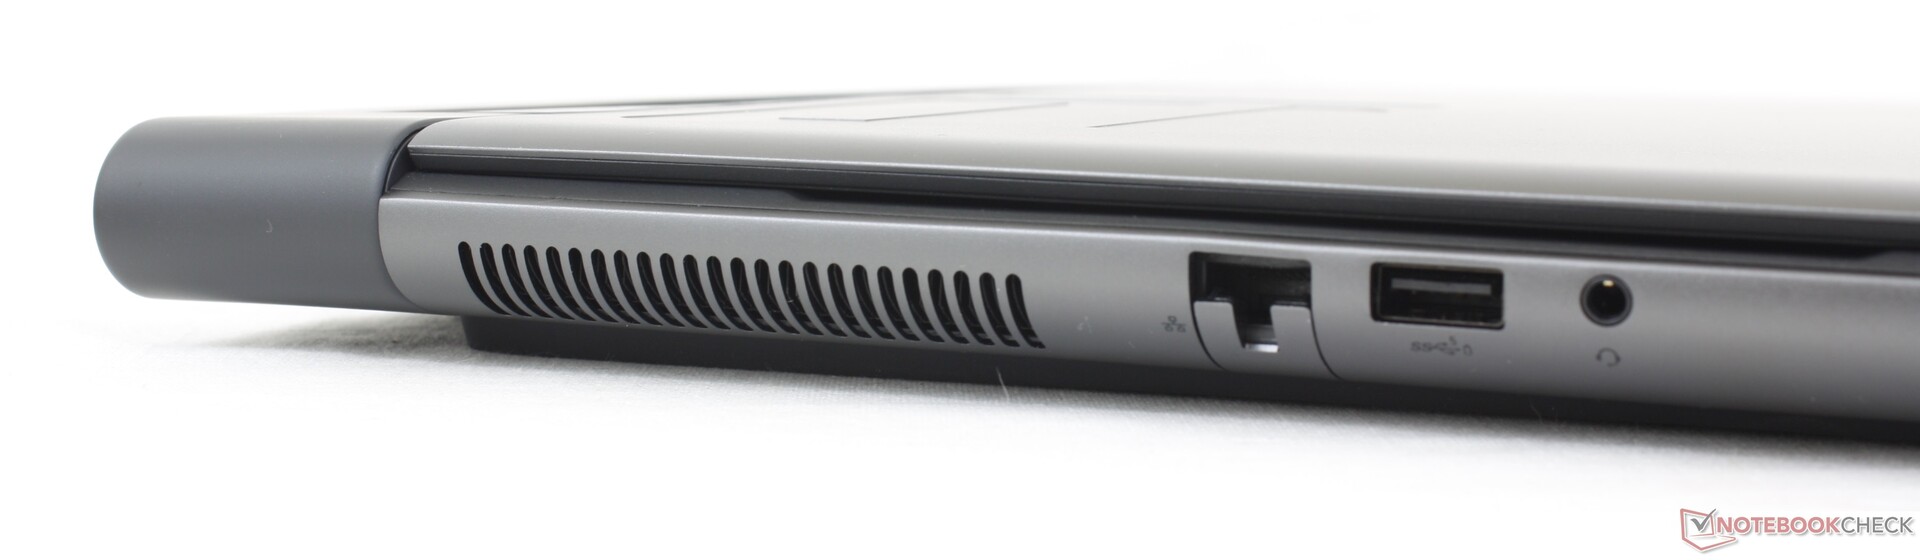
SD 读卡器
SD 读卡器的传输速度比其他大多数游戏笔记本电脑都要快,这应该能满足内容创作者的需求。将 1 GB 的图片从我们的 UHS-II 测试卡传输到台式机仅需 5 秒多一点。
| SD Card Reader | |
| average JPG Copy Test (av. of 3 runs) | |
| Alienware m16 R1 AMD (Toshiba Exceria Pro SDXC 64 GB UHS-II) | |
| Razer Blade 16 Early 2023 (AV PRO microSD 128 GB V60) | |
| Alienware x16 R1 (AV PRO microSD 128 GB V60) | |
| maximum AS SSD Seq Read Test (1GB) | |
| Alienware x16 R1 (AV PRO microSD 128 GB V60) | |
| Alienware m16 R1 AMD (Toshiba Exceria Pro SDXC 64 GB UHS-II) | |
| Razer Blade 16 Early 2023 (AV PRO microSD 128 GB V60) | |
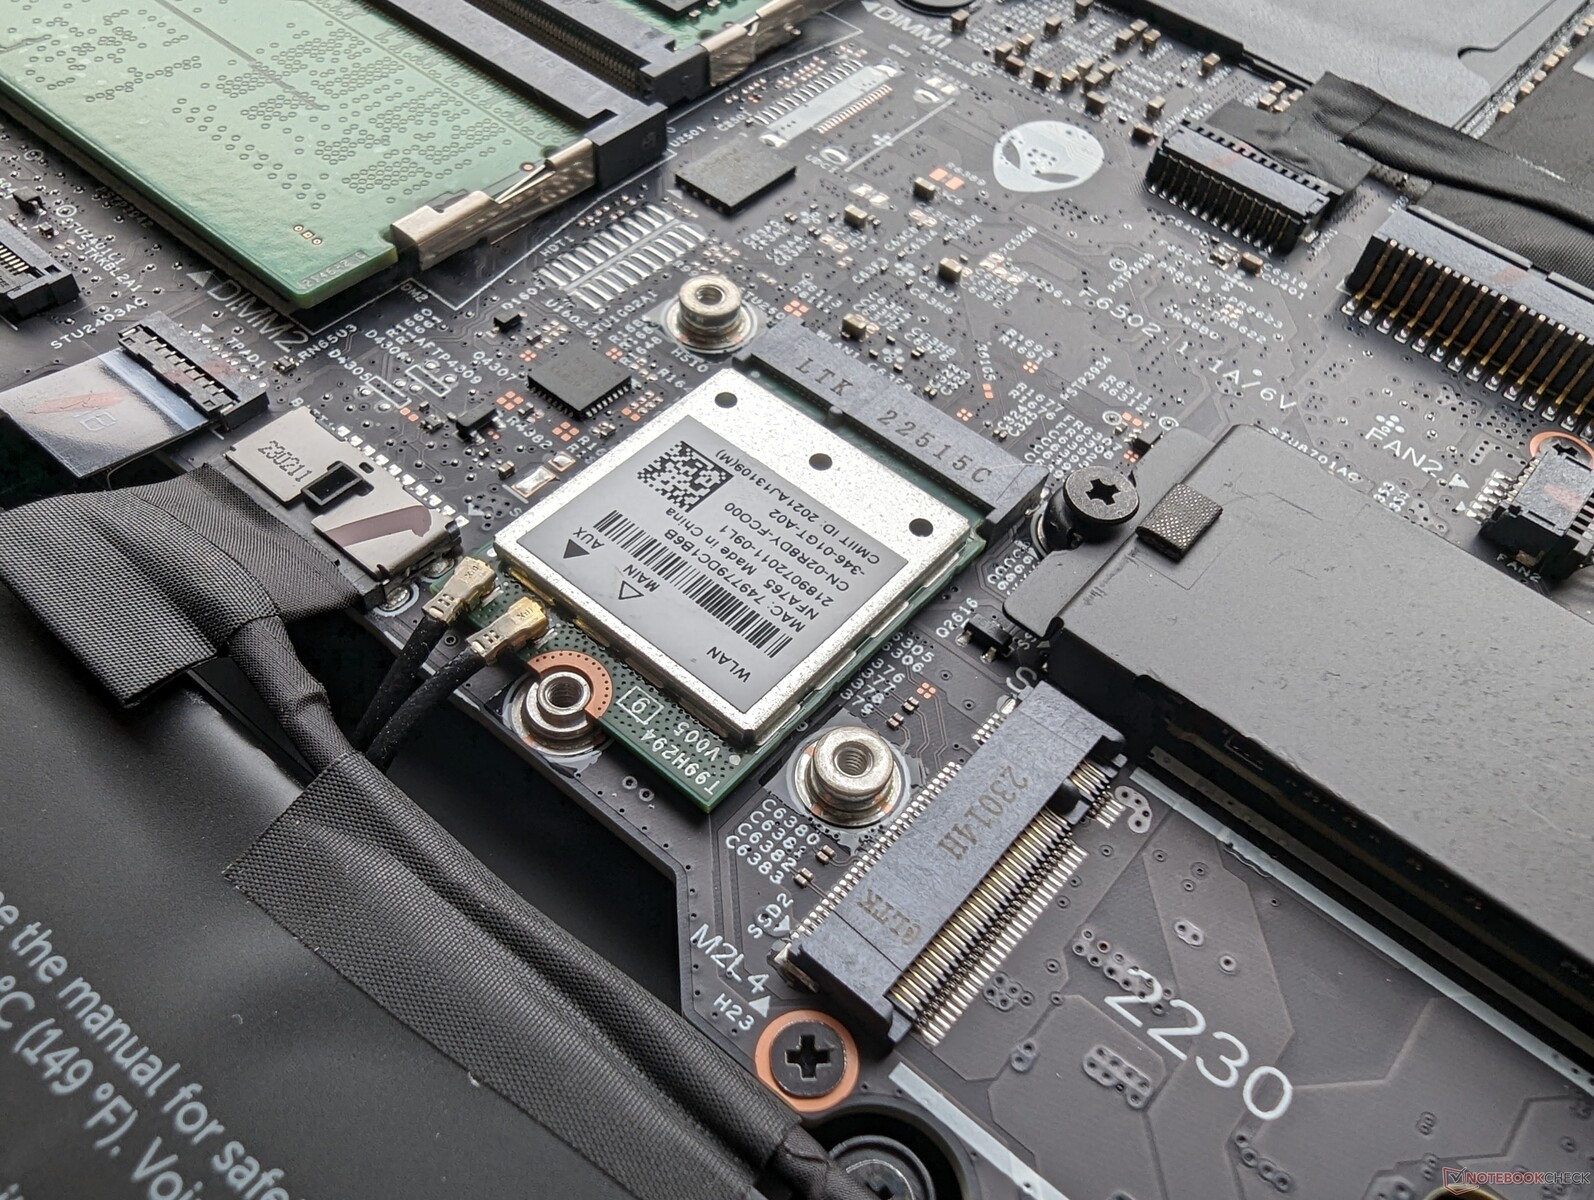
交流
AMD SKU 配备了高通公司的 WCN685x,而英特尔 SKU 则配备了 Killer AX1675,每个都具有 Wi-Fi 6E 连接功能。与我们的 6 GHz 网络配对后,性能既稳定又可靠。
| Networking | |
| iperf3 transmit AXE11000 | |
| Lenovo Legion Pro 7 RTX4090 | |
| Asus ROG Strix G16 G614JZ | |
| Alienware m16 R1 AMD | |
| HP Omen Transcend 16 | |
| Razer Blade 16 Early 2023 | |
| Alienware x16 R1 | |
| iperf3 receive AXE11000 | |
| Lenovo Legion Pro 7 RTX4090 | |
| Asus ROG Strix G16 G614JZ | |
| Alienware m16 R1 AMD | |
| HP Omen Transcend 16 | |
| Razer Blade 16 Early 2023 | |
| Alienware x16 R1 | |
| iperf3 transmit AXE11000 6GHz | |
| Alienware m16 R1 AMD | |
| HP Omen Transcend 16 | |
| Razer Blade 16 Early 2023 | |
| Alienware x16 R1 | |
| iperf3 receive AXE11000 6GHz | |
| Alienware m16 R1 AMD | |
| HP Omen Transcend 16 | |
| Razer Blade 16 Early 2023 | |
| Alienware x16 R1 | |
网络摄像头
它有一个 200 万像素的网络摄像头,带红外功能,与 Alienware x16 上的摄像头一样没有隐私快门。


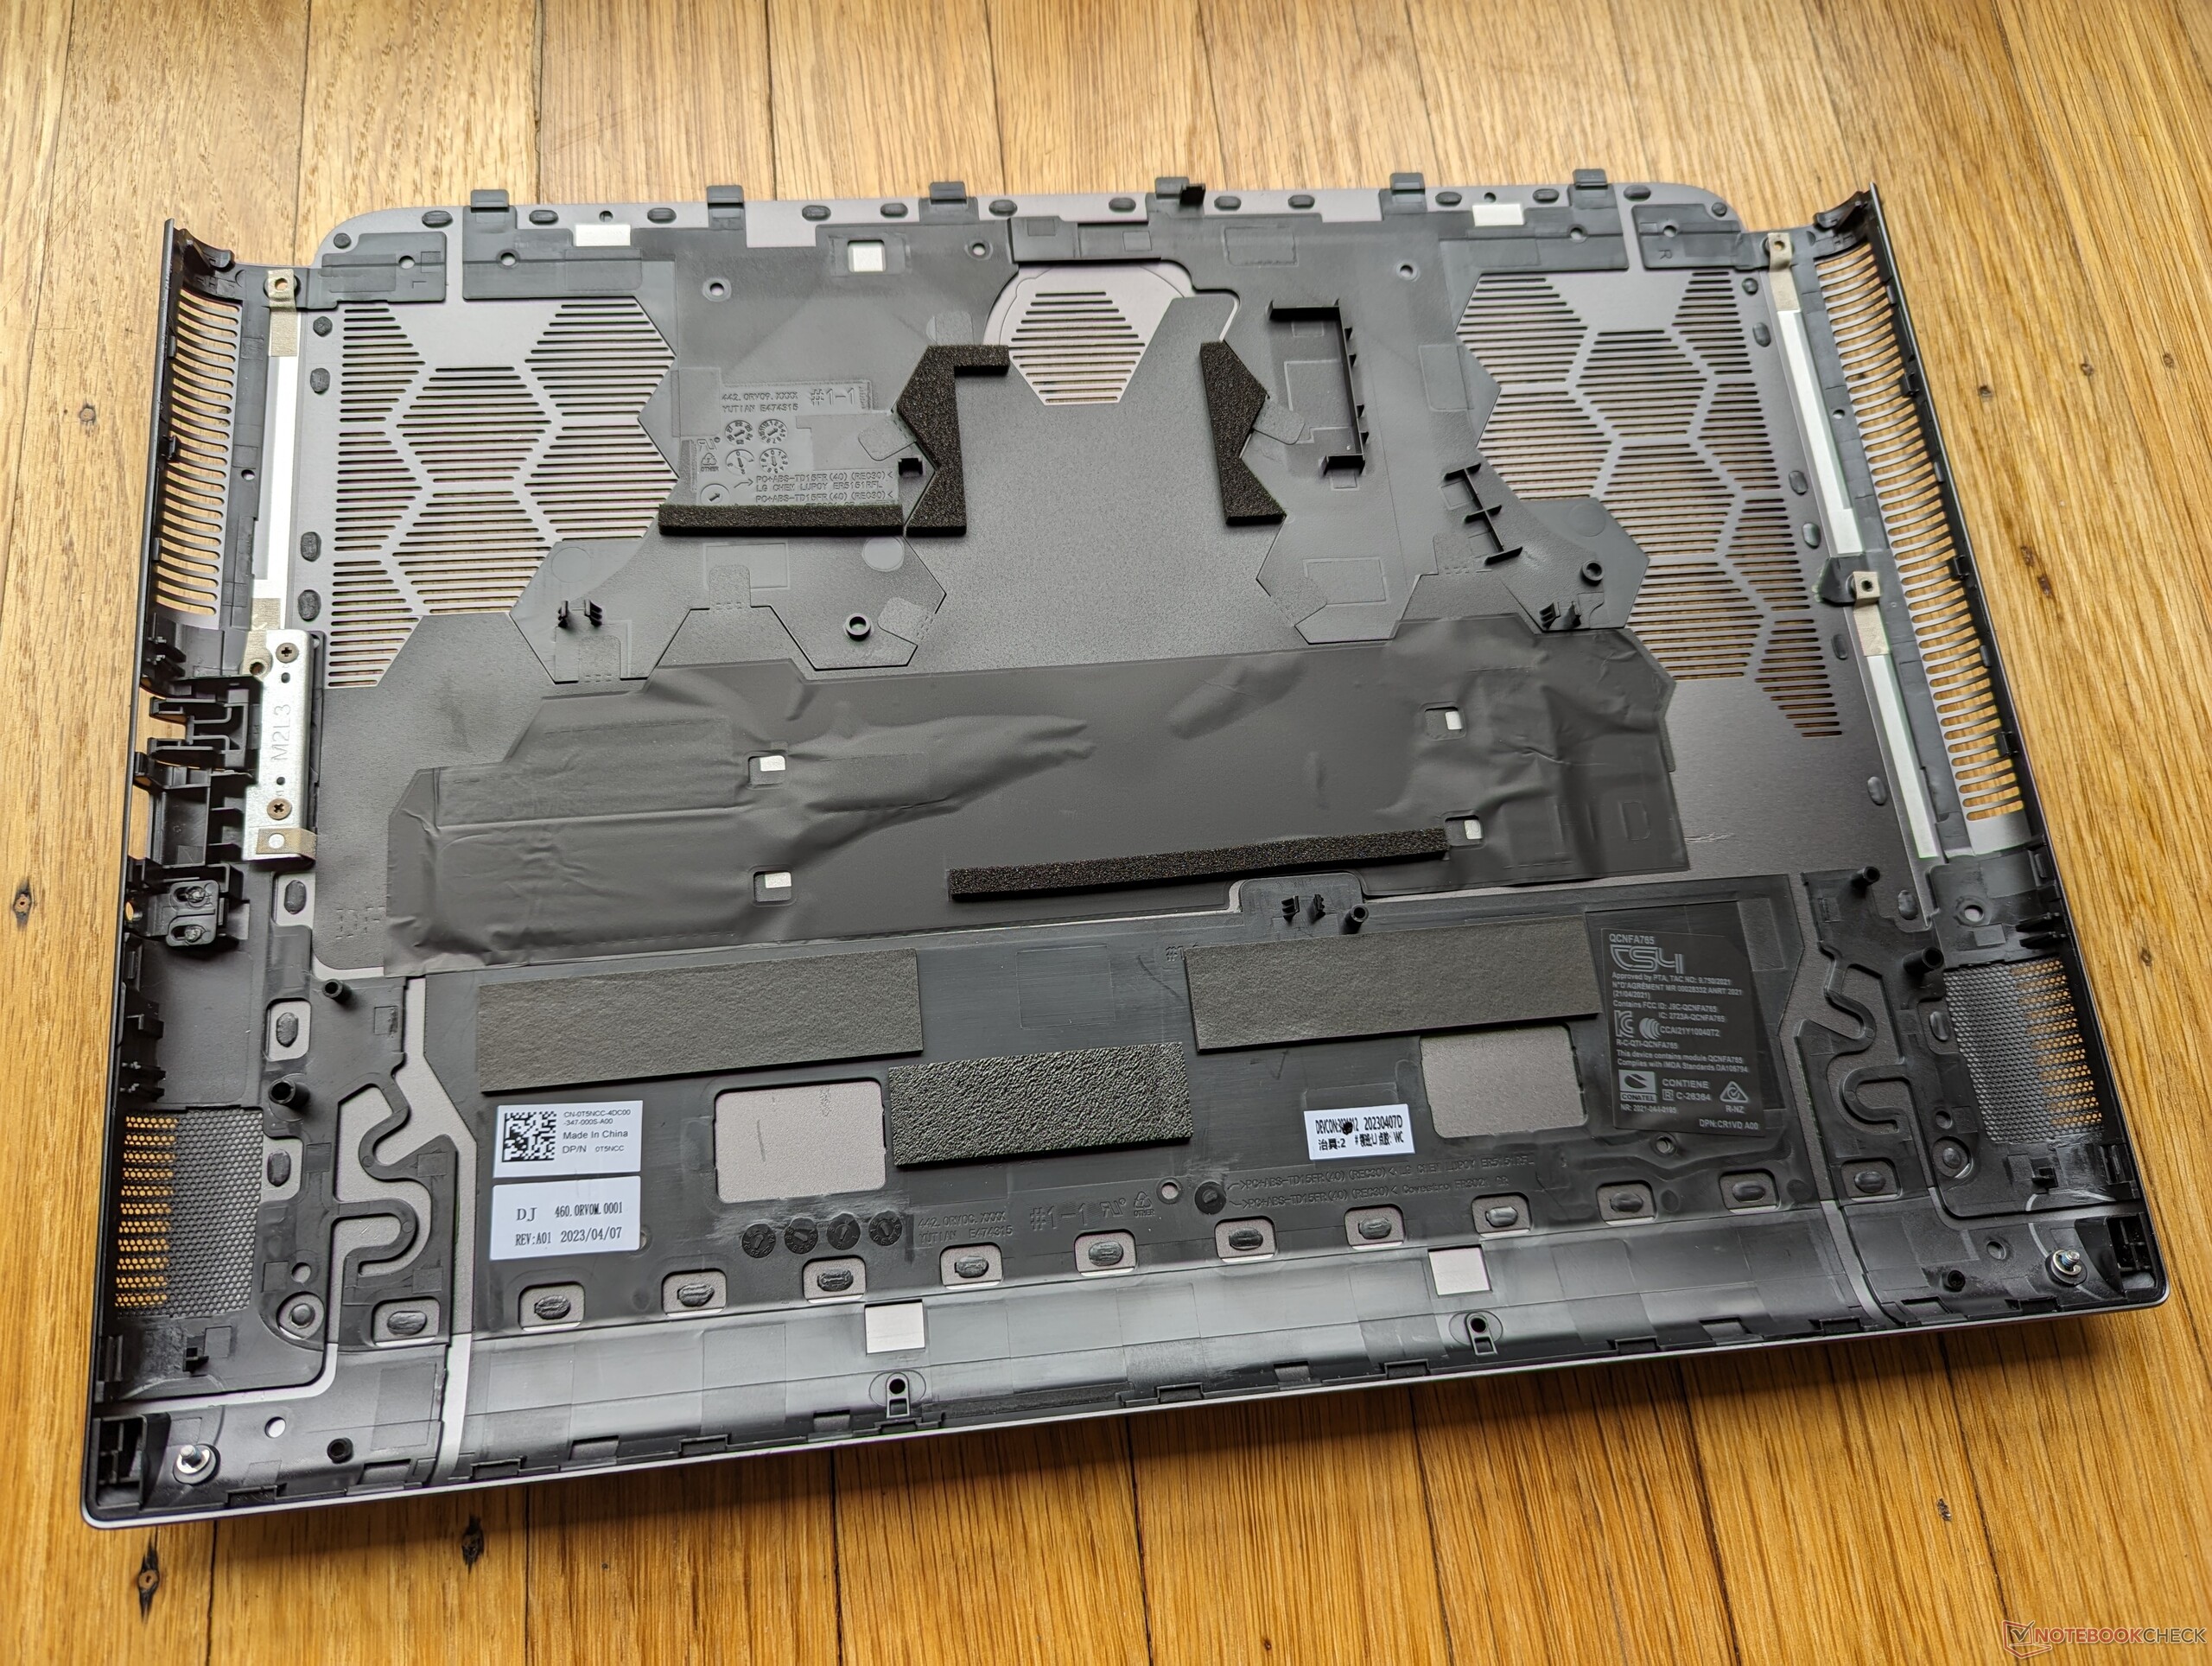
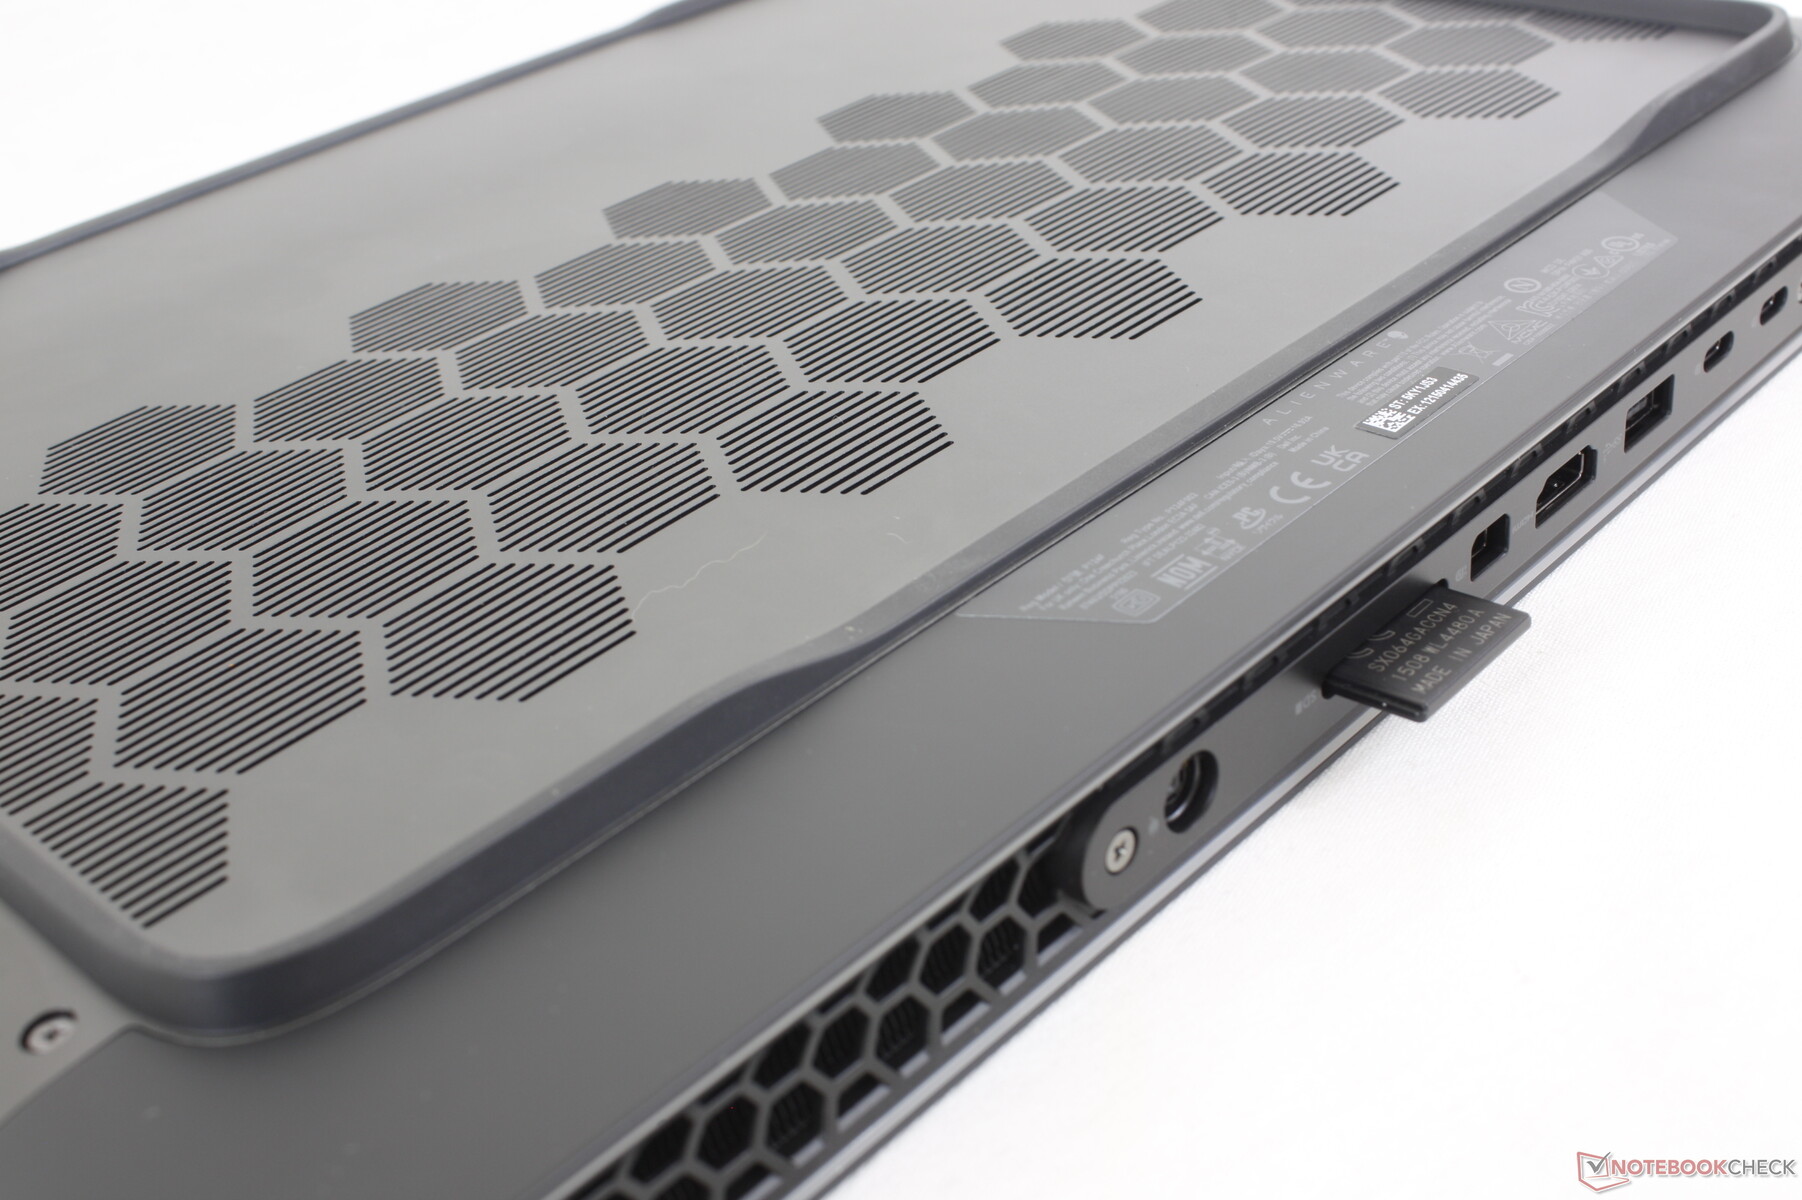
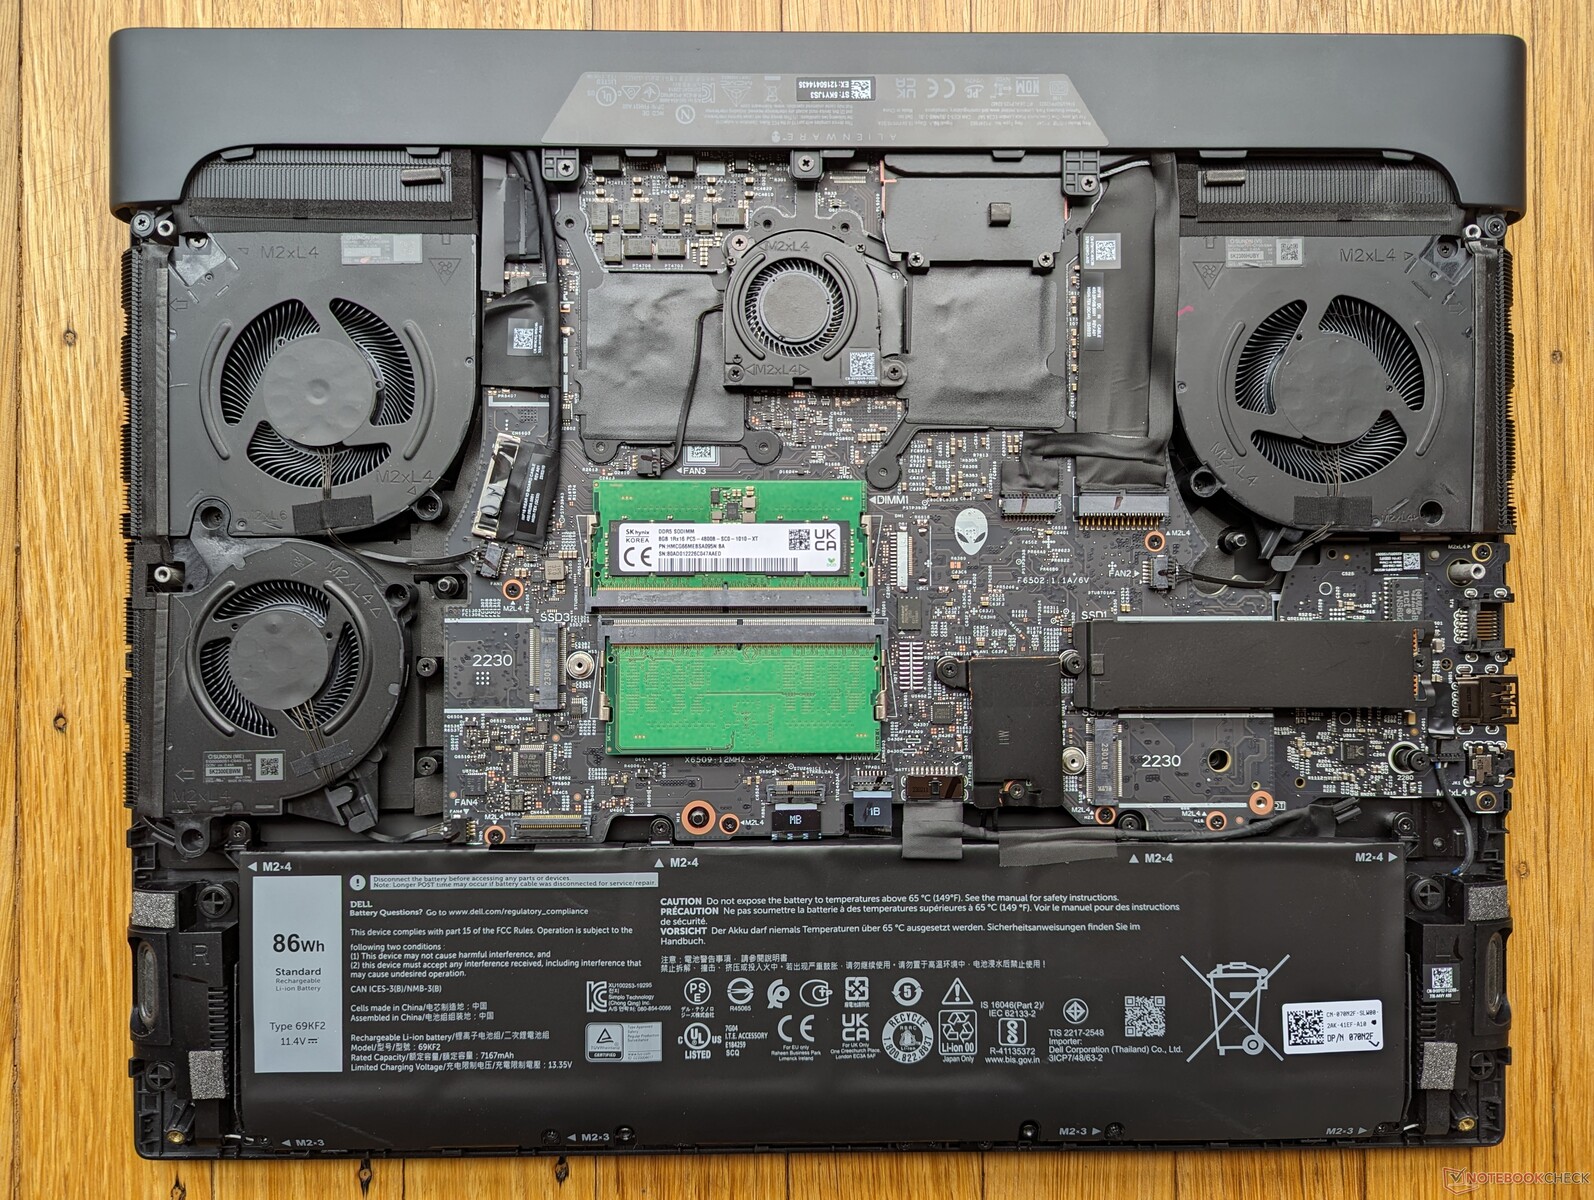
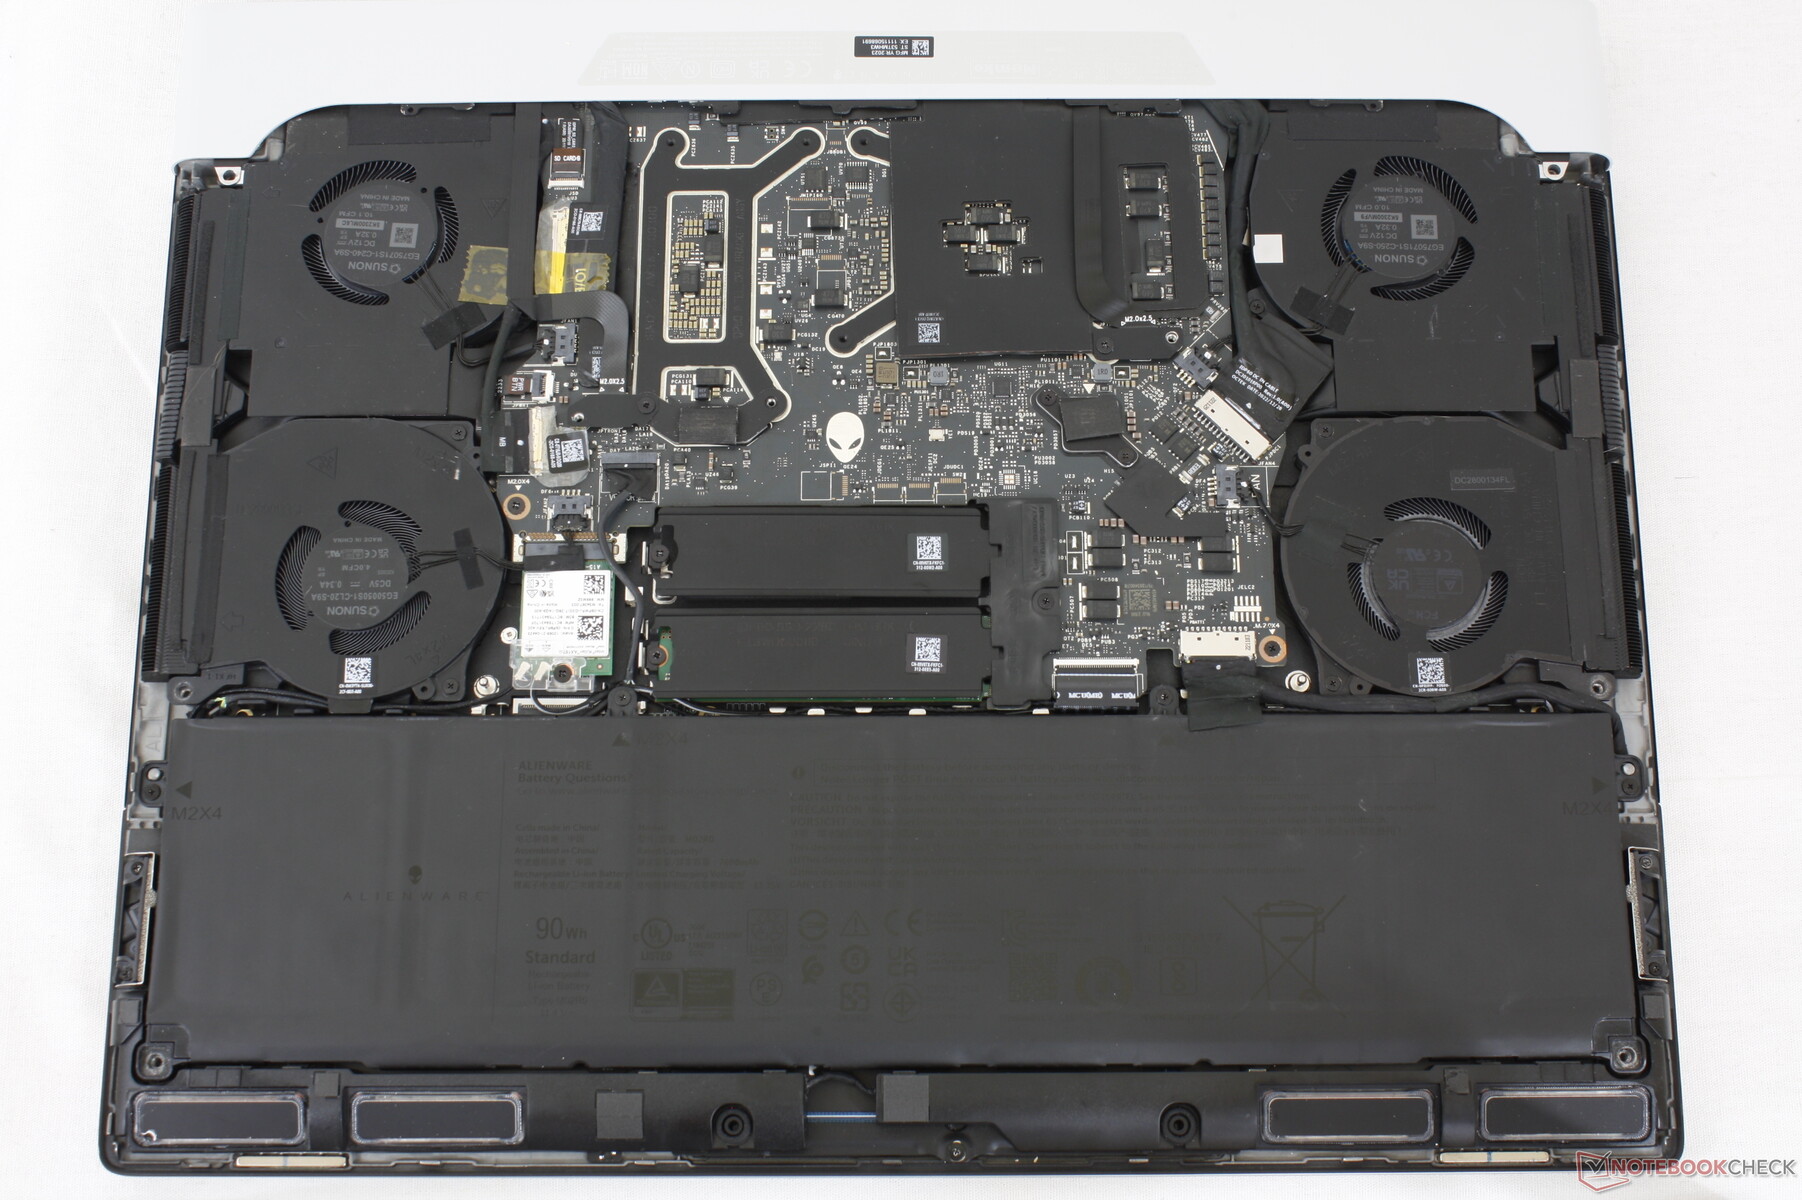
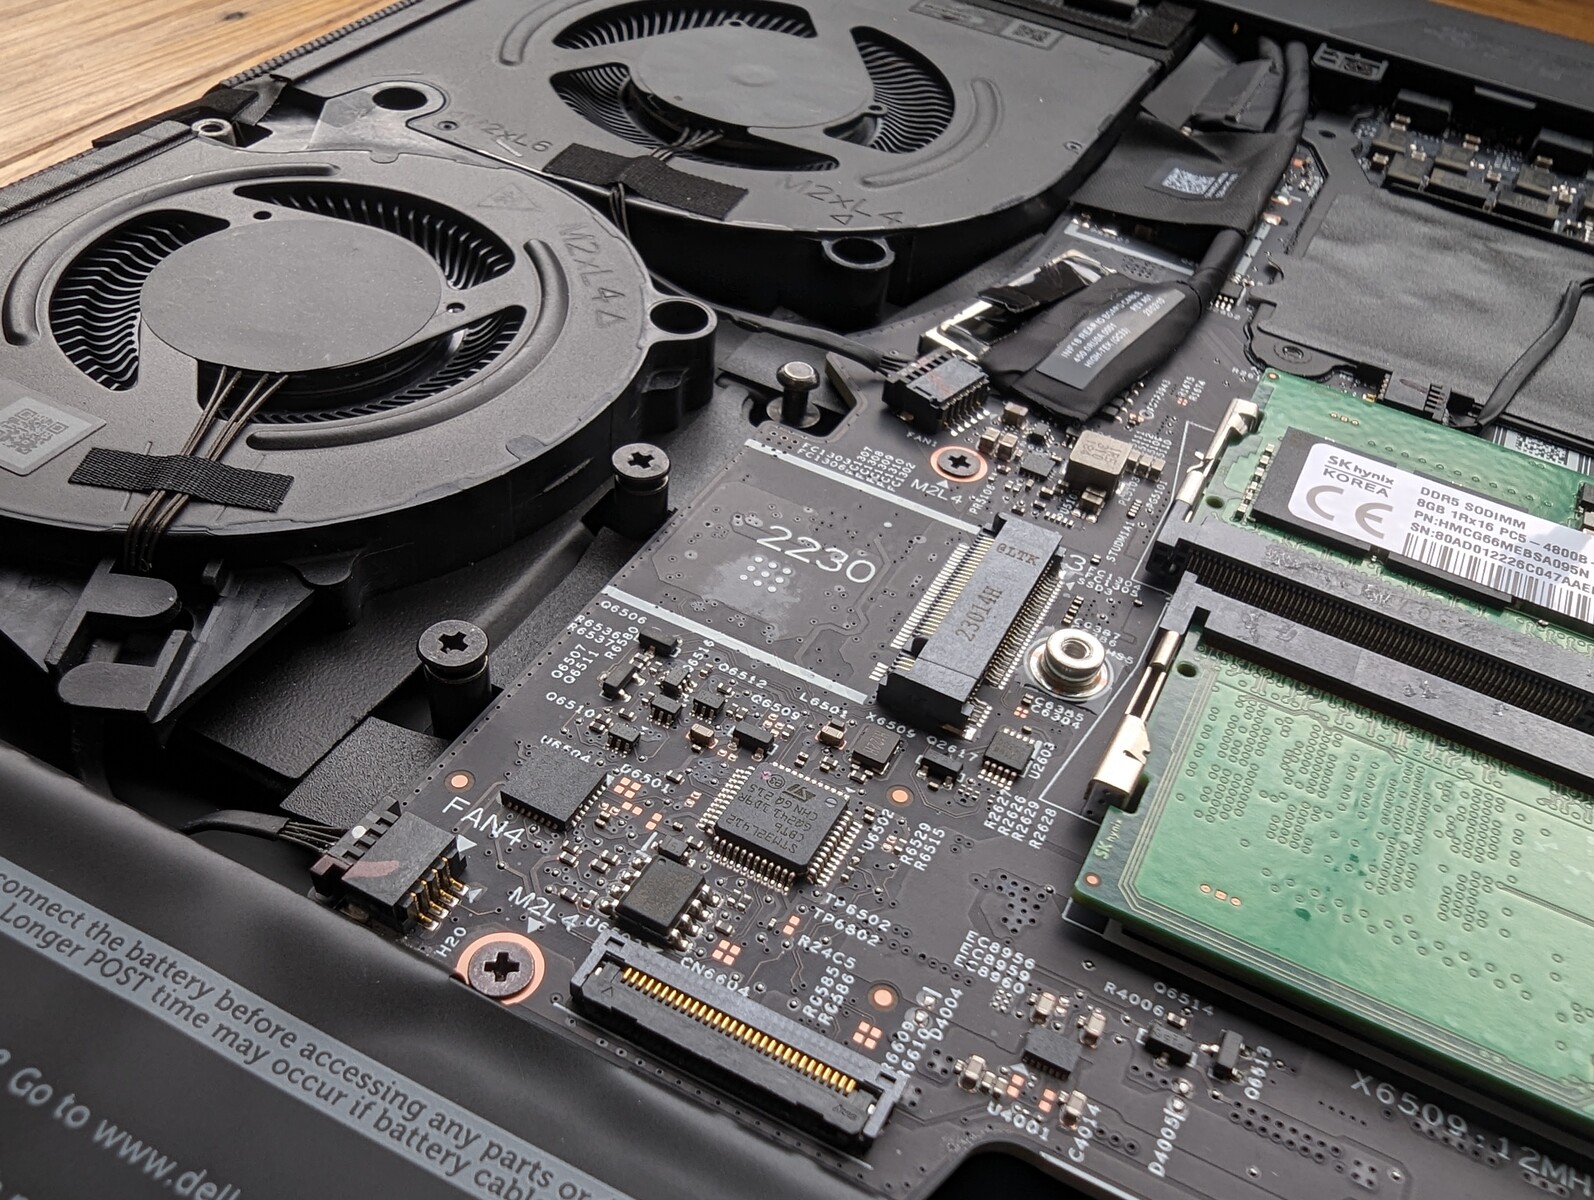
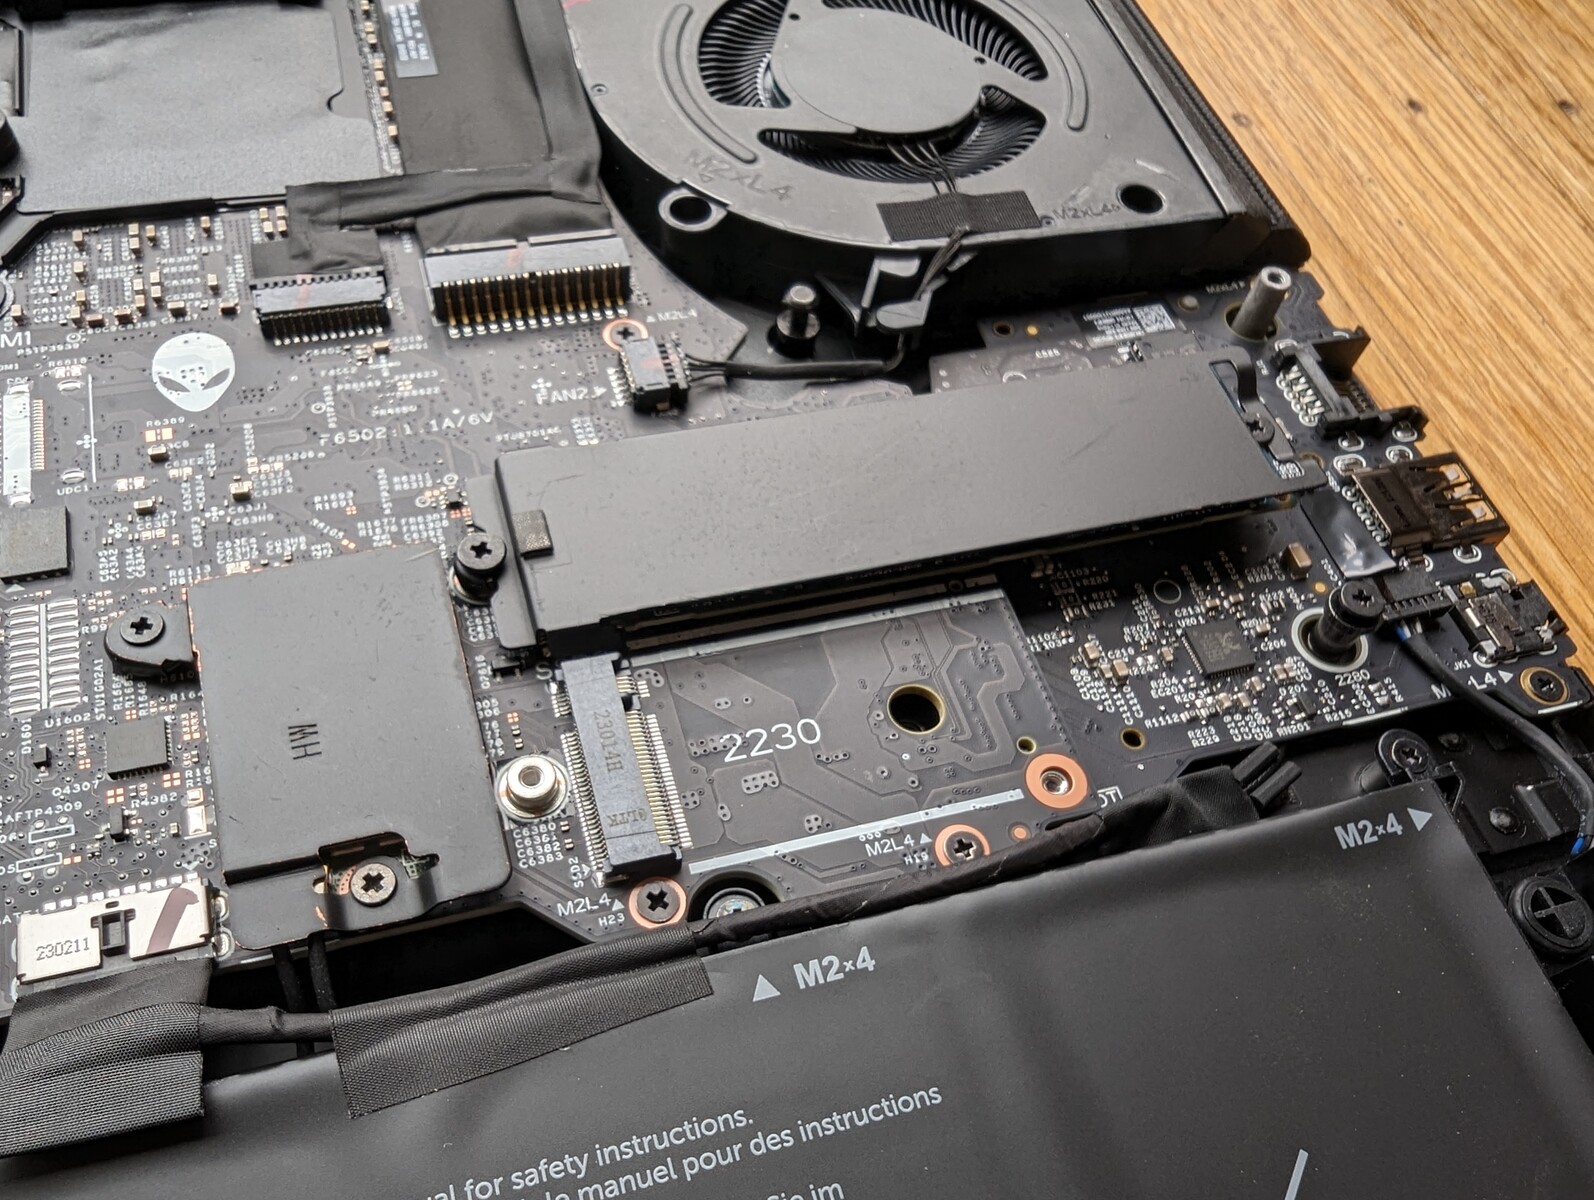
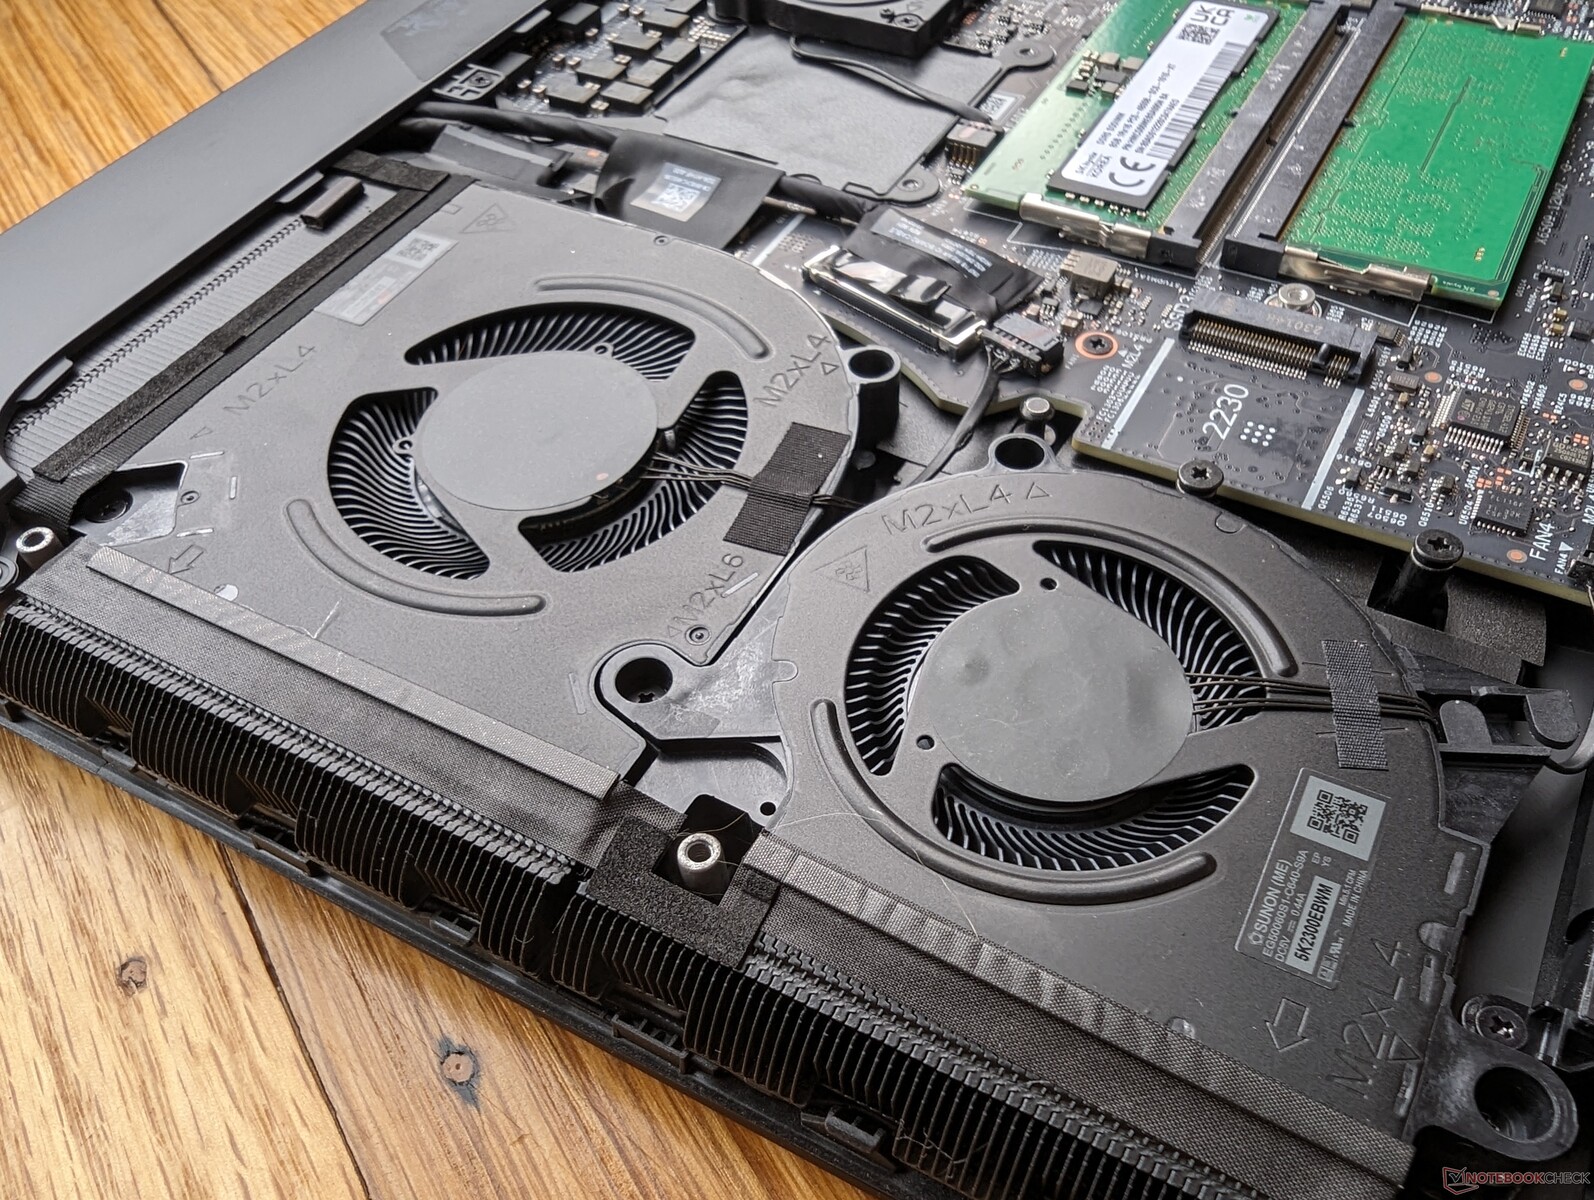
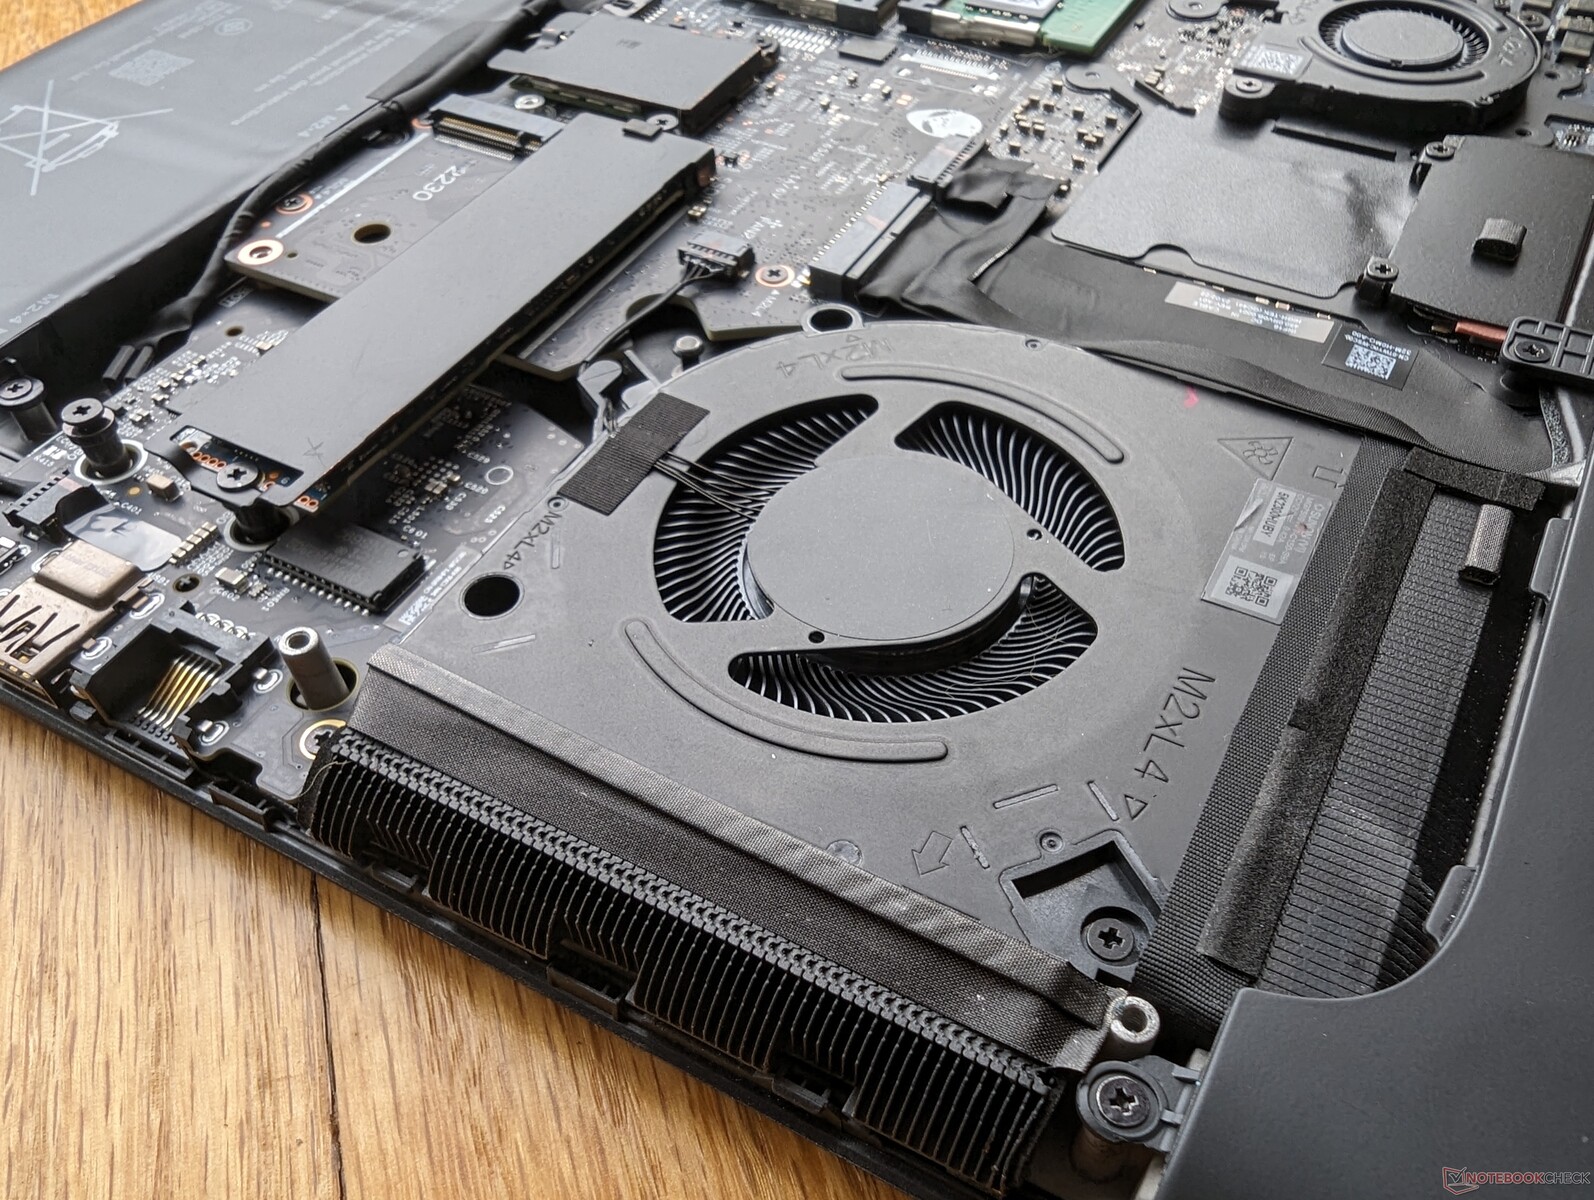
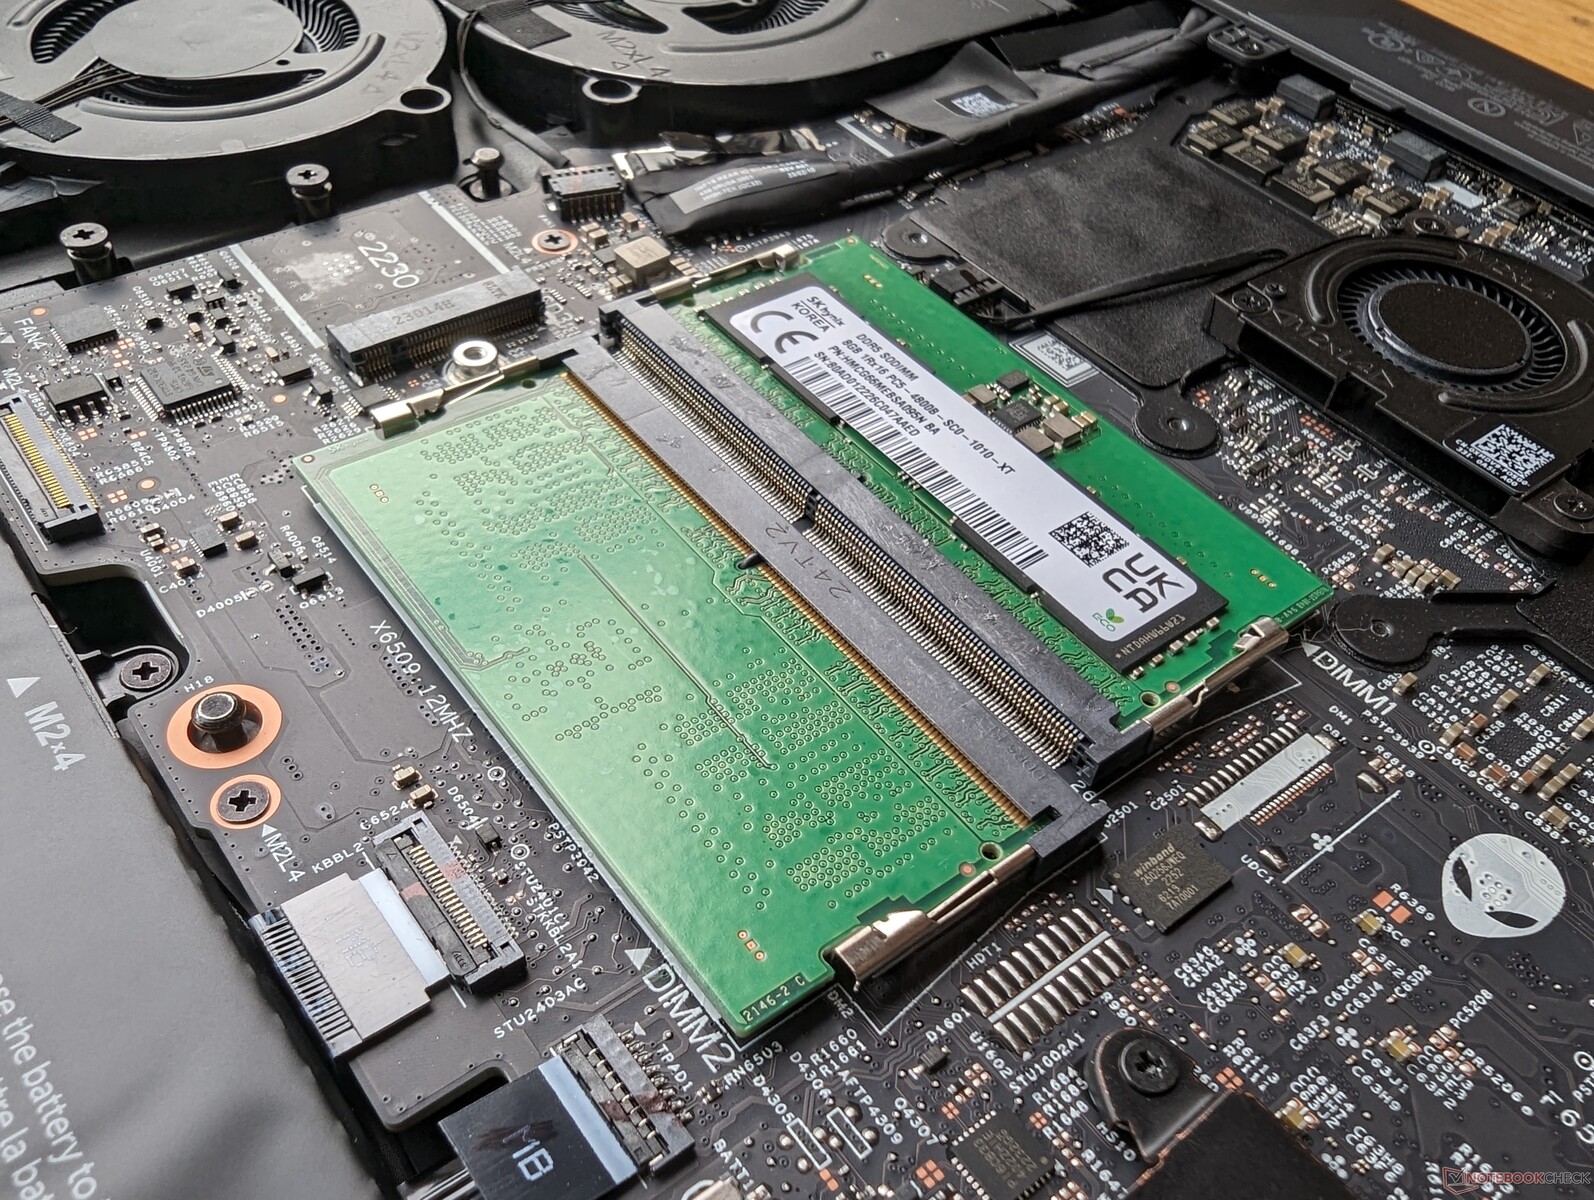
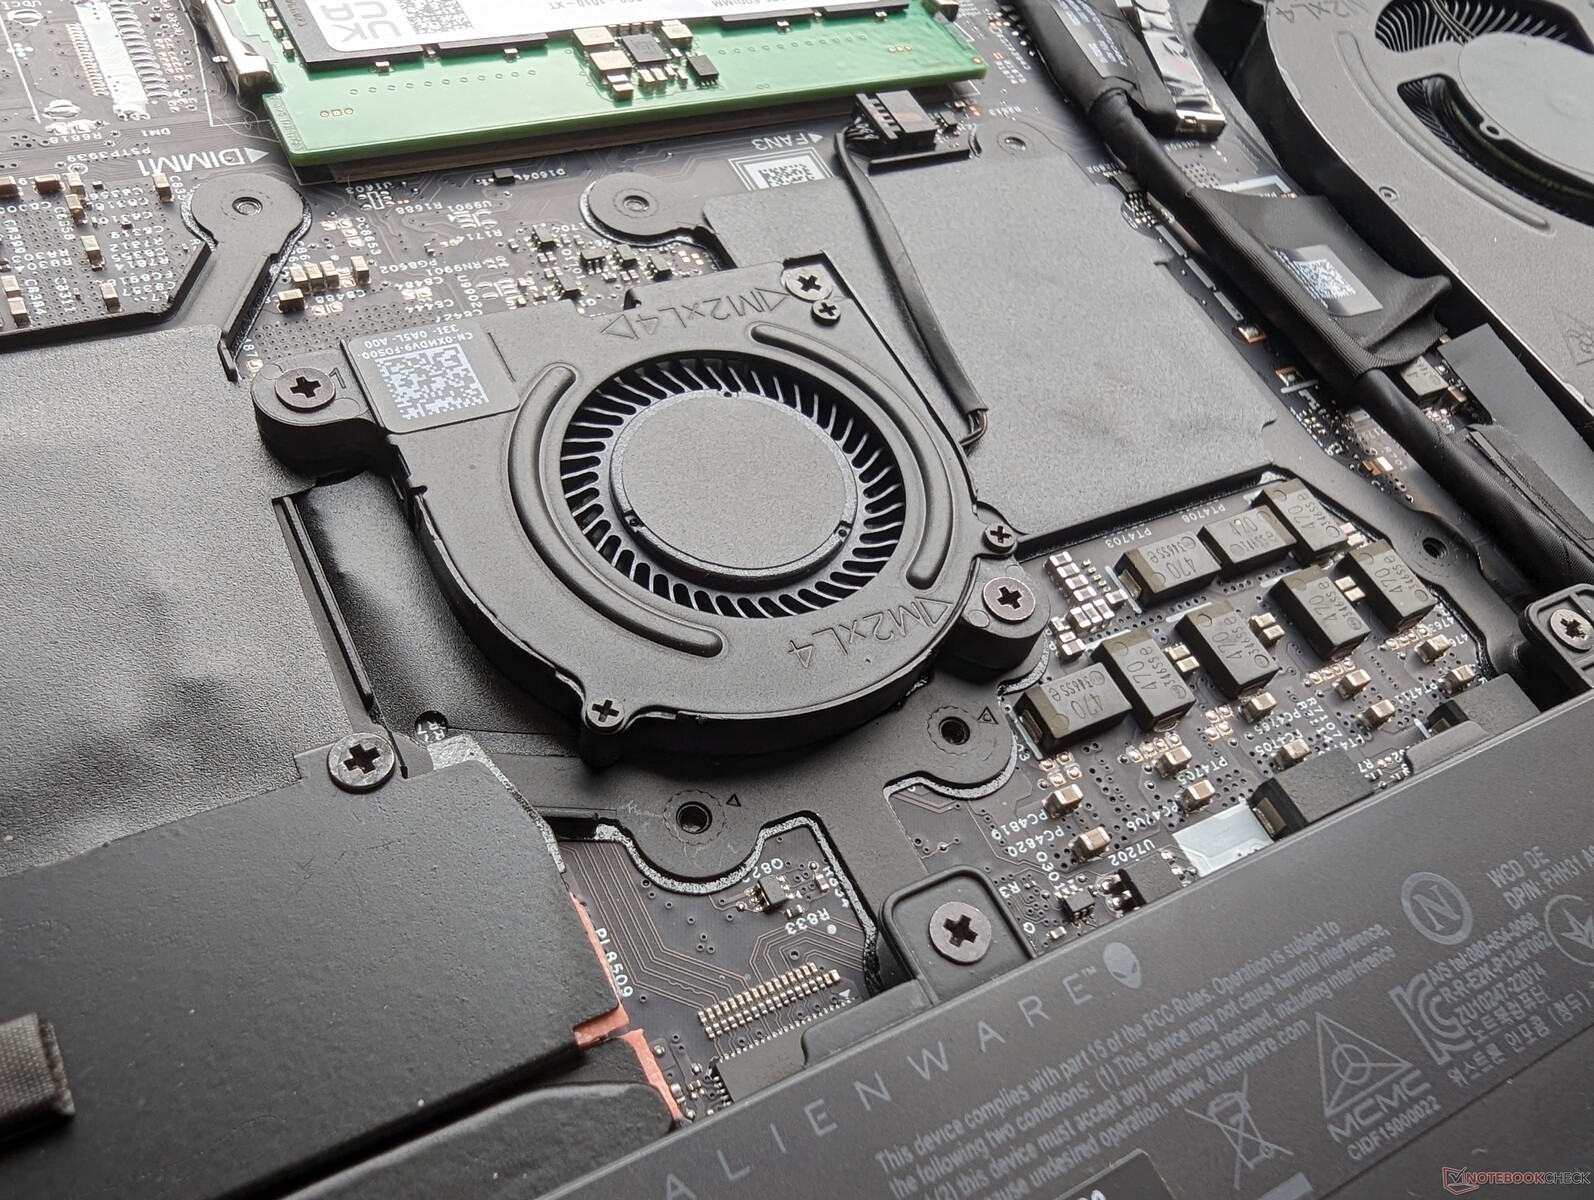
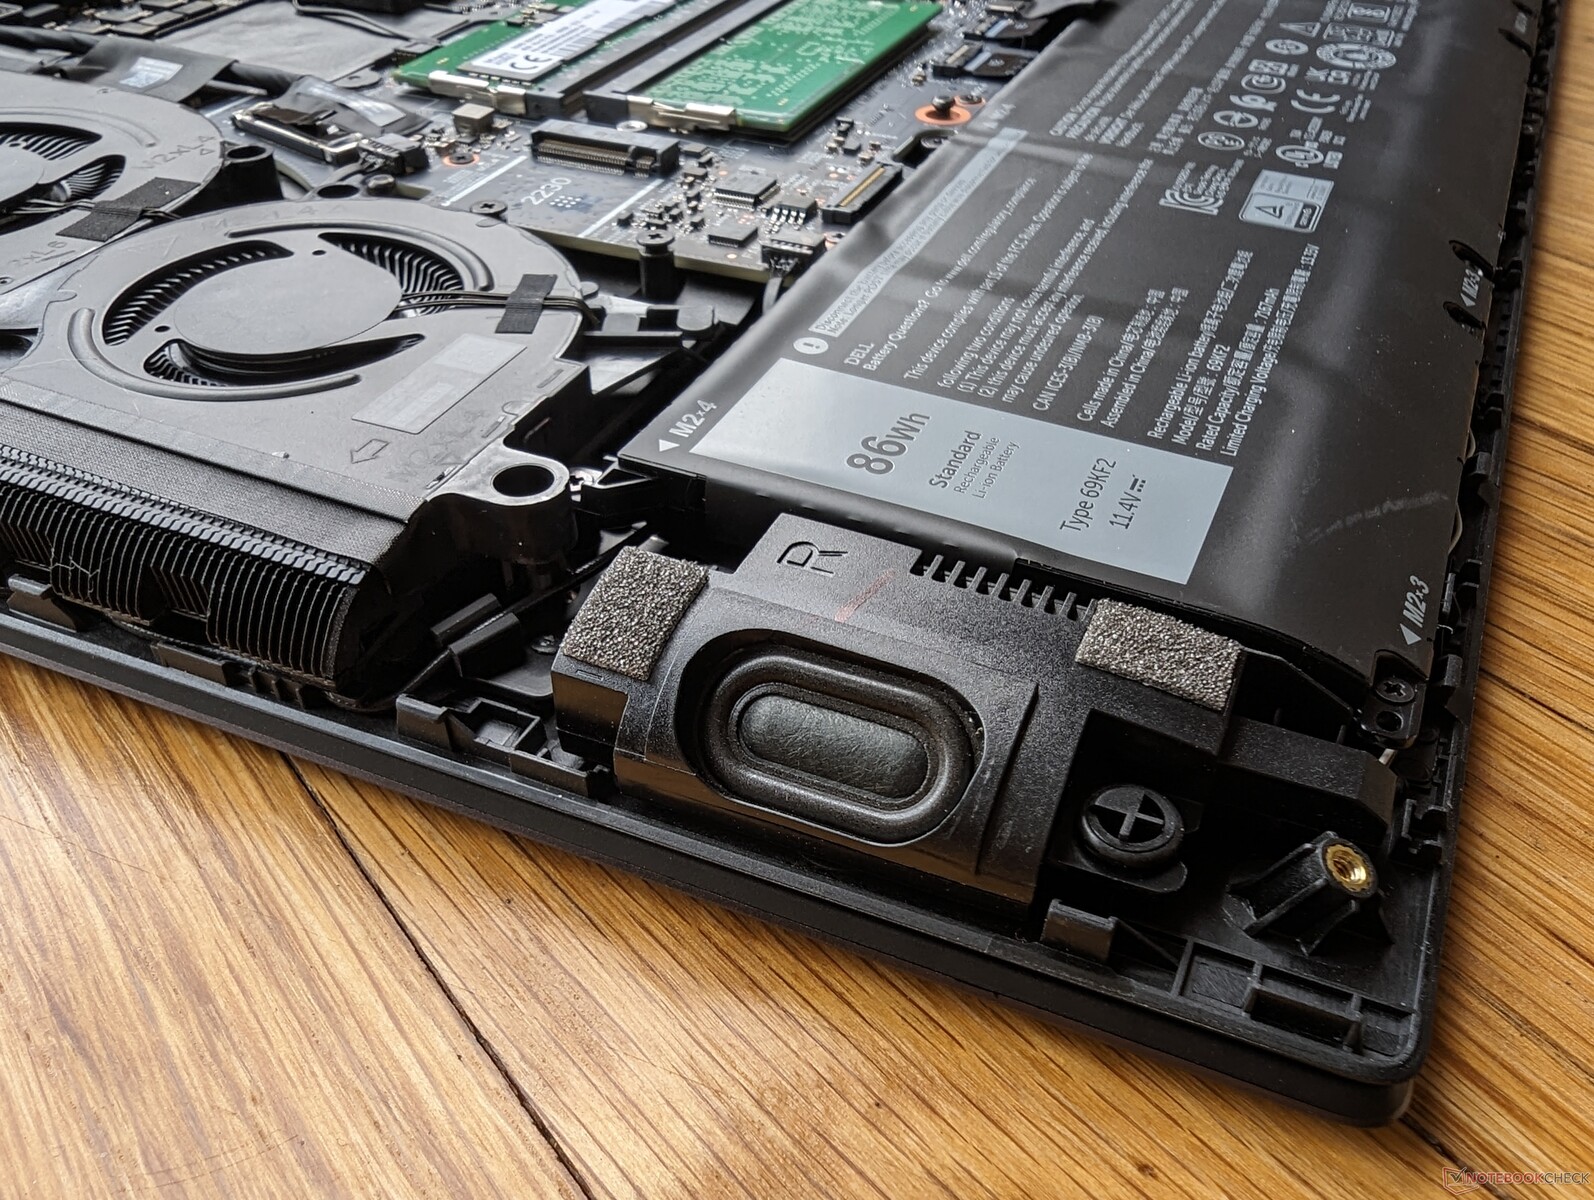
维护
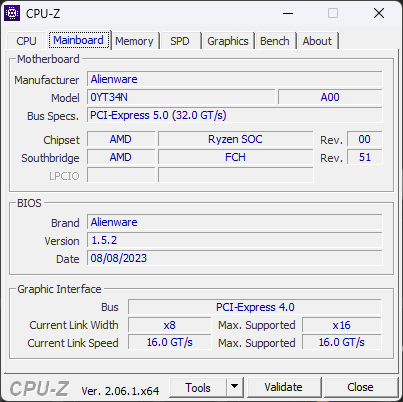
底部面板由 8 颗十字螺丝固定,便于维修。用户可直接访问 3 个存储托架、2 个 SODIMM 插槽和可拆卸的 WLAN 模块。需要注意的是,主板是上下颠倒的,这意味着处理器在反面。
主板设计与 Alienware x16 完全不同,尽管这两款机型共享许多外部功能。相反,它与 Alienware m18 最为相似。
配件和保修
零售包装盒内除了常见的交流适配器和文件外,还有两张 Alienware 徽标贴纸。如果在美国购买,制造商提供一年有限保修。
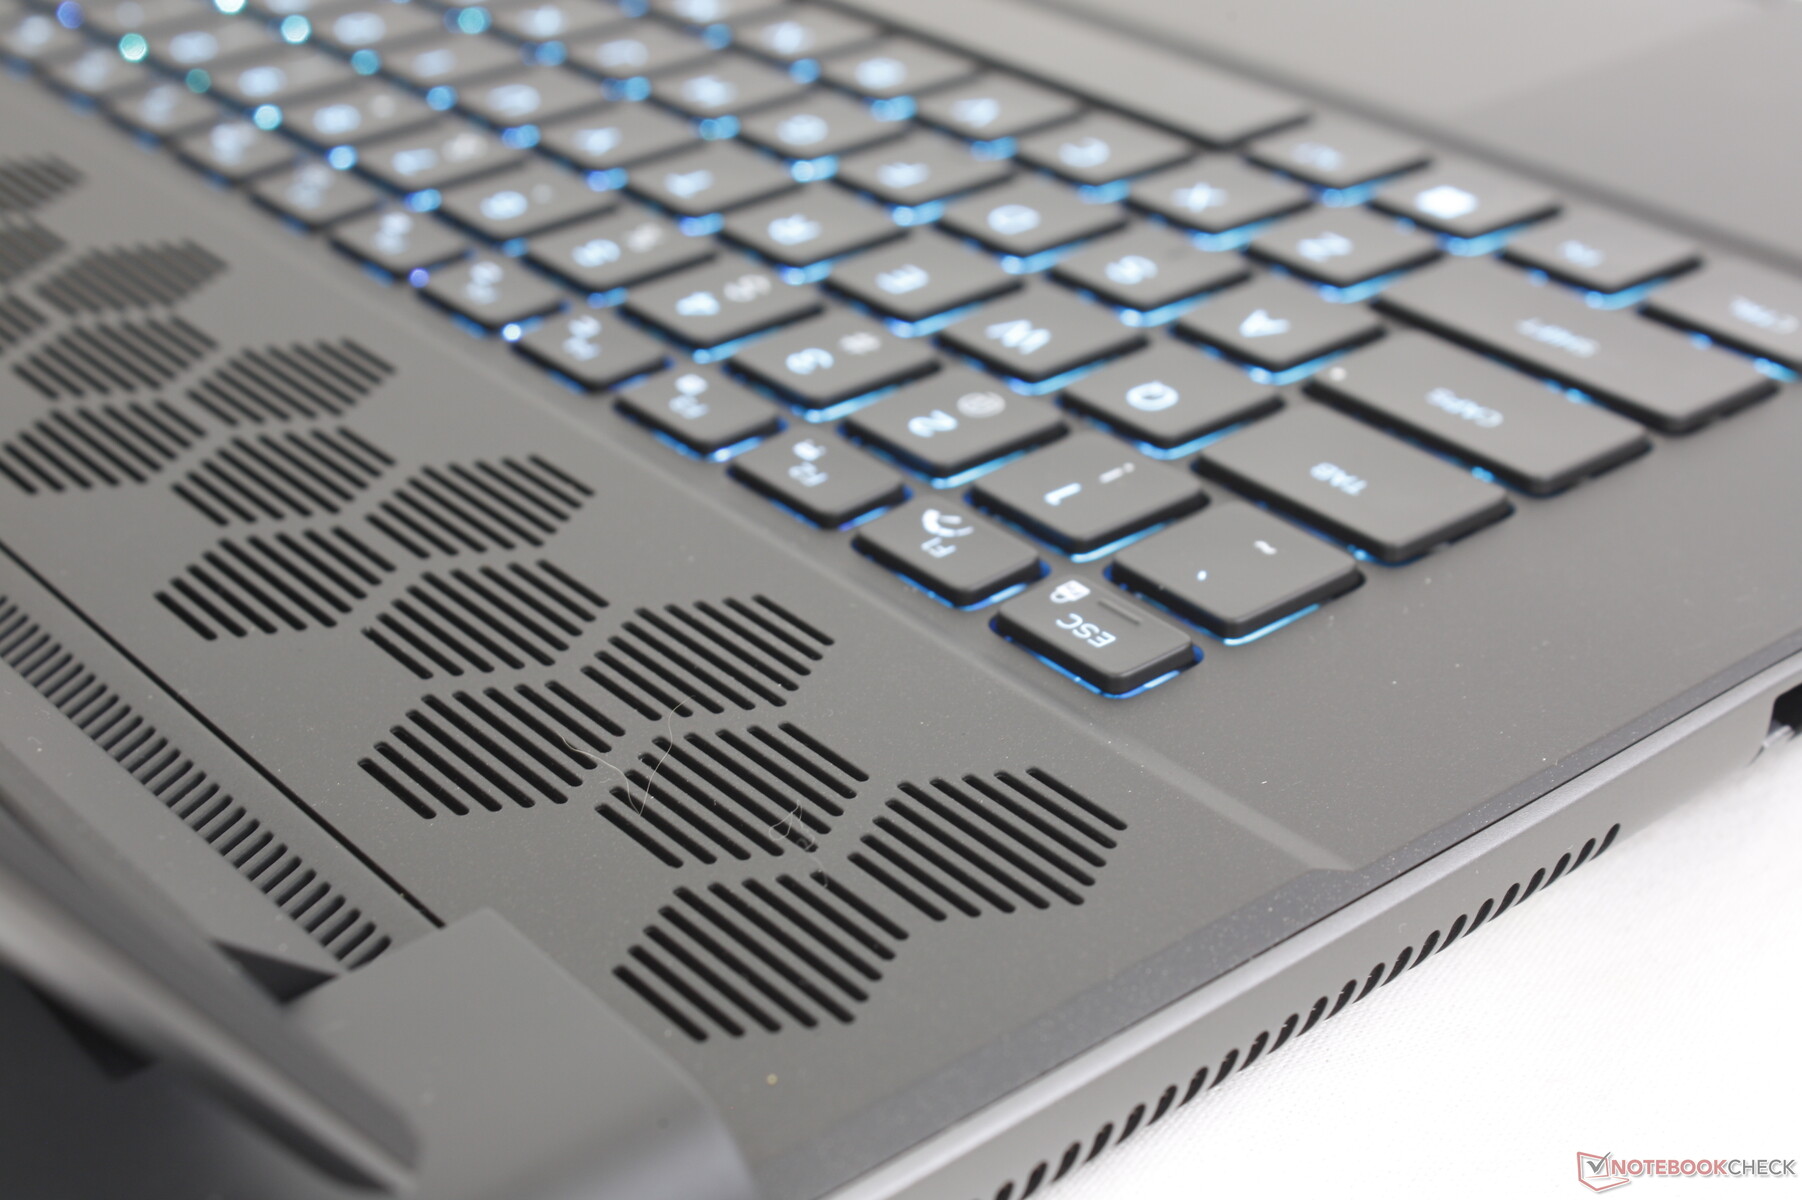
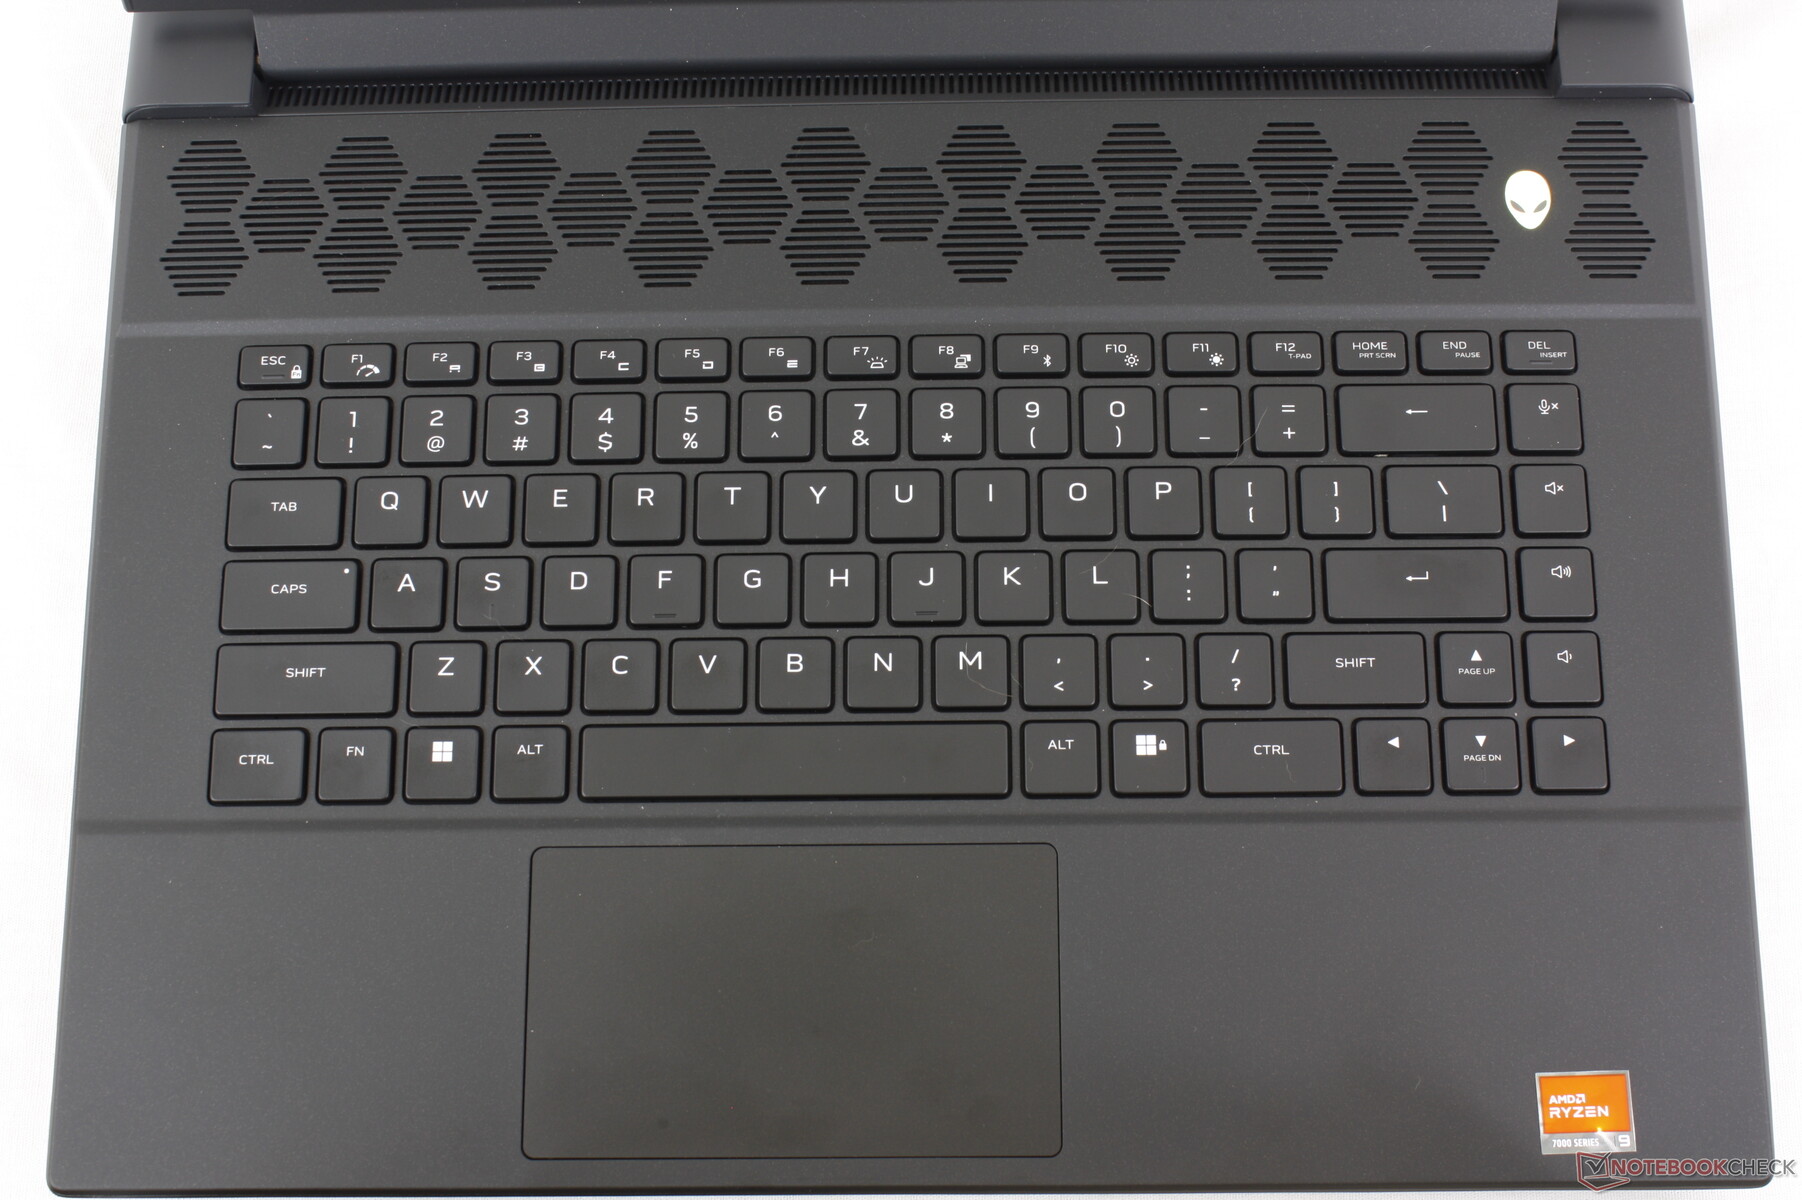
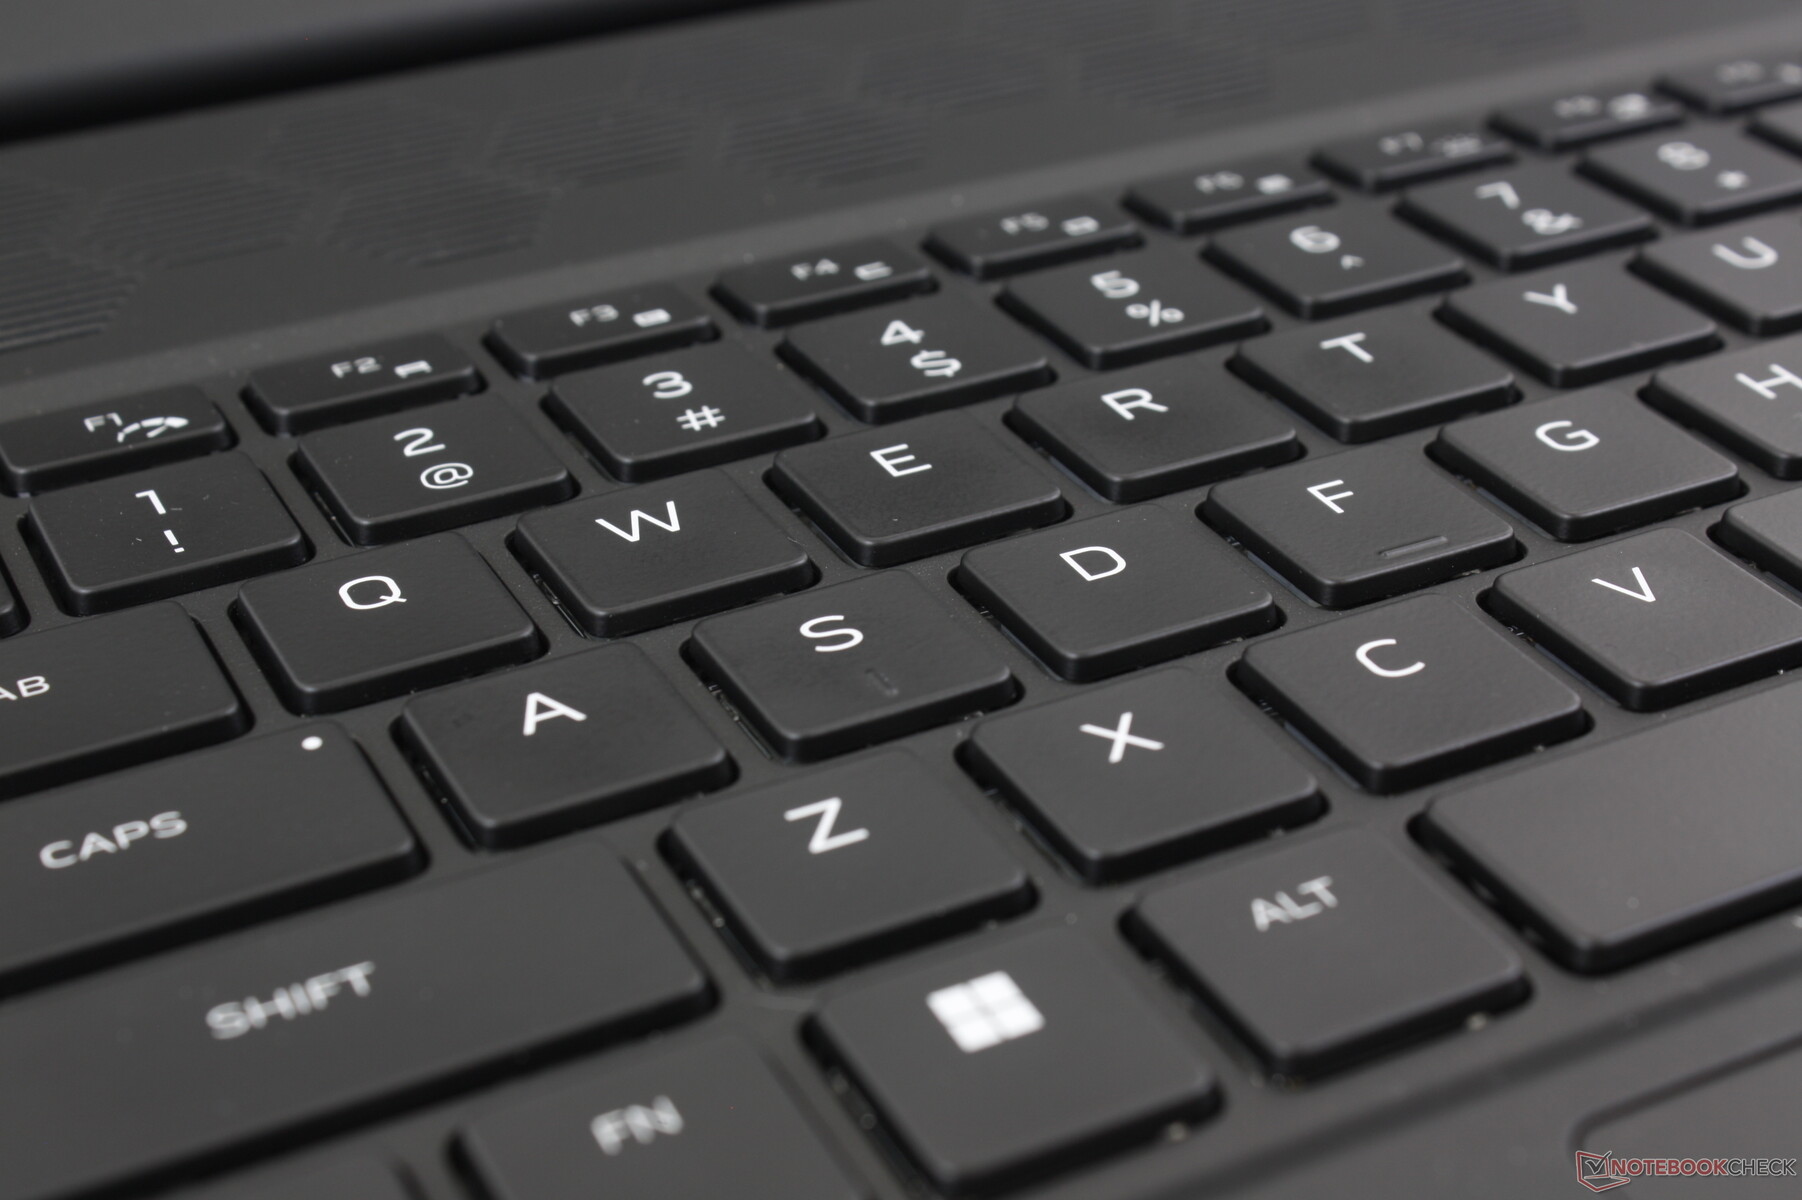
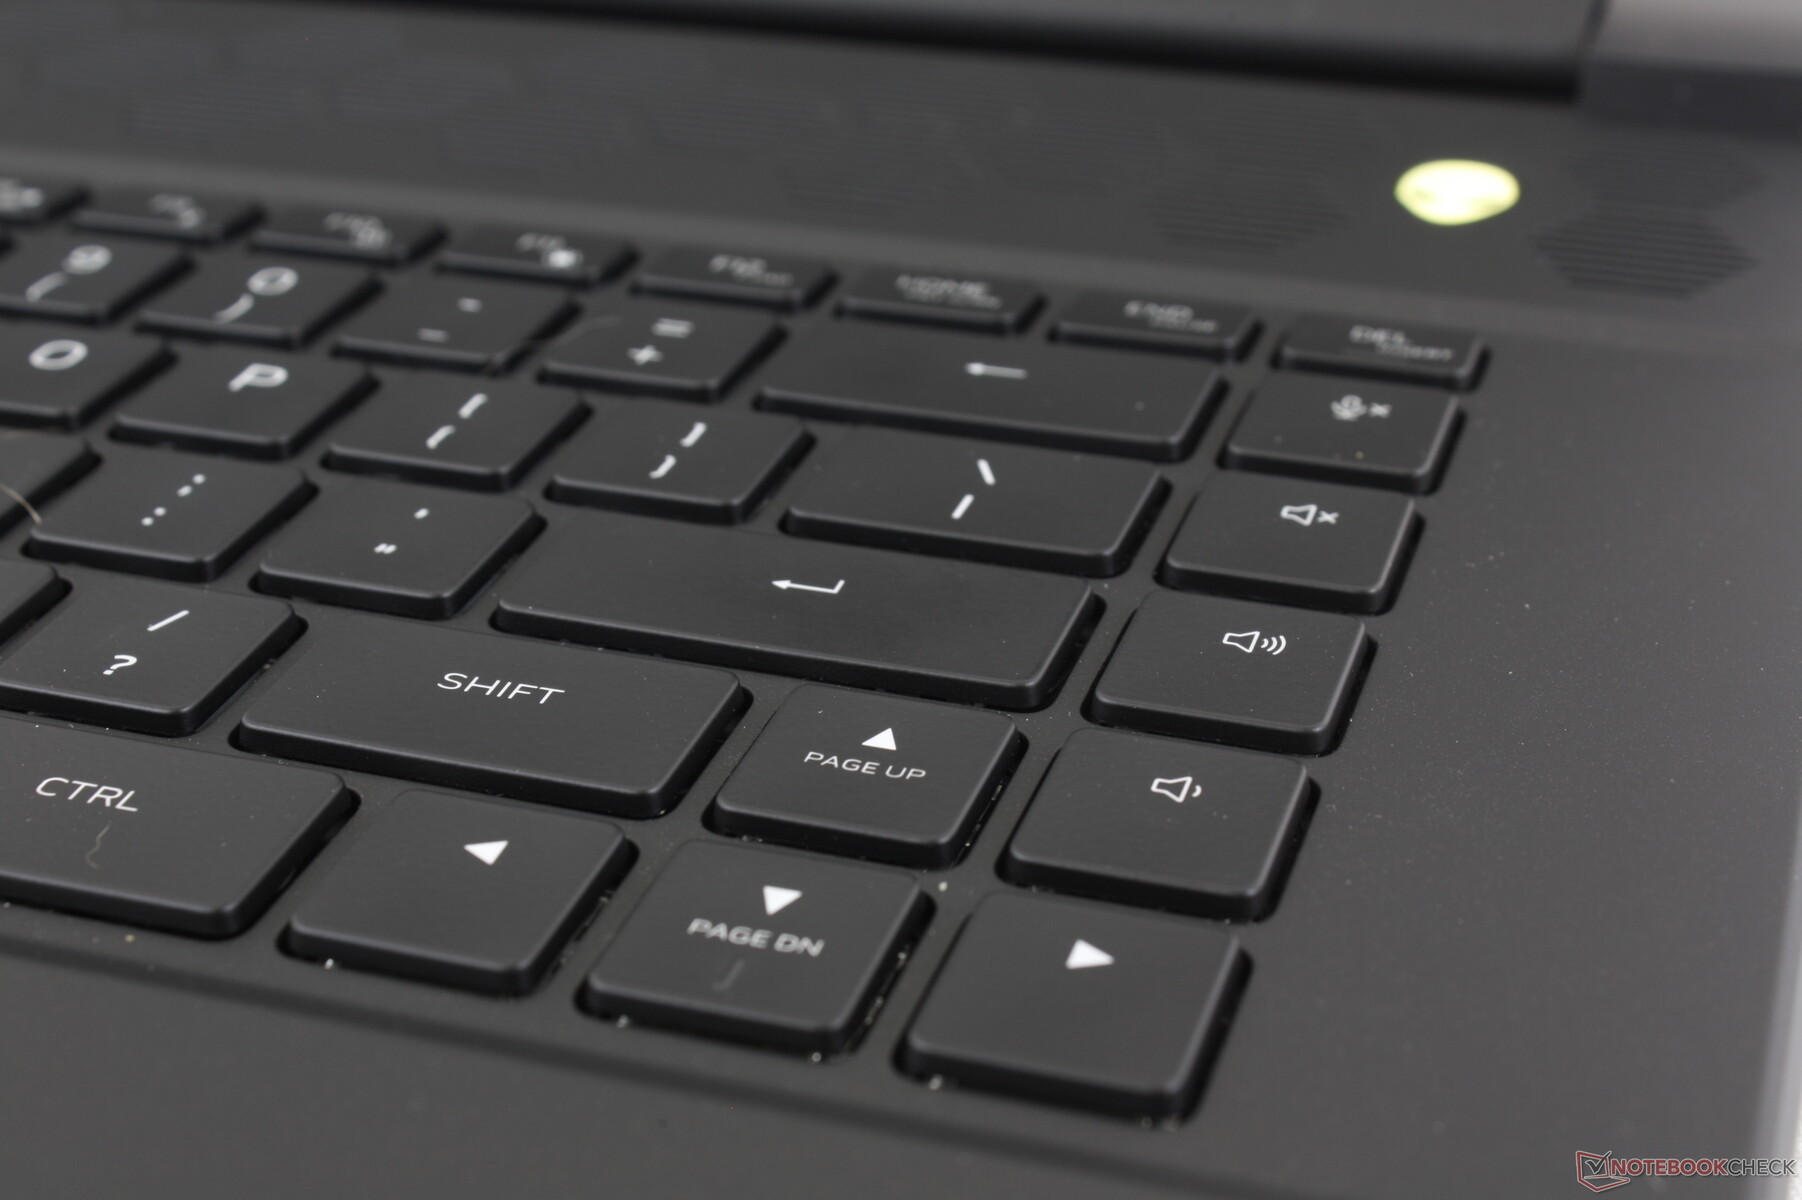
输入设备 - 机械或标准可选
键盘
用户可以配置标准薄膜式键盘或带按键 RGB 灯光的 CherryMX 超扁平机械键盘。CherryMX 键盘几年前在 Alienware x17 R1 我们最喜欢的游戏笔记本键盘之一,因为它具有咔哒声反馈和较深的键程。当然,它的主要缺点是会发出尖锐而响亮的咔嗒声。在图书馆、教室或宿舍等对噪音敏感的环境中,您可能需要考虑使用标准键盘。
背光灯可照亮所有按键和符号,而旧款键盘则没有这种功能。 而旧机型则没有.
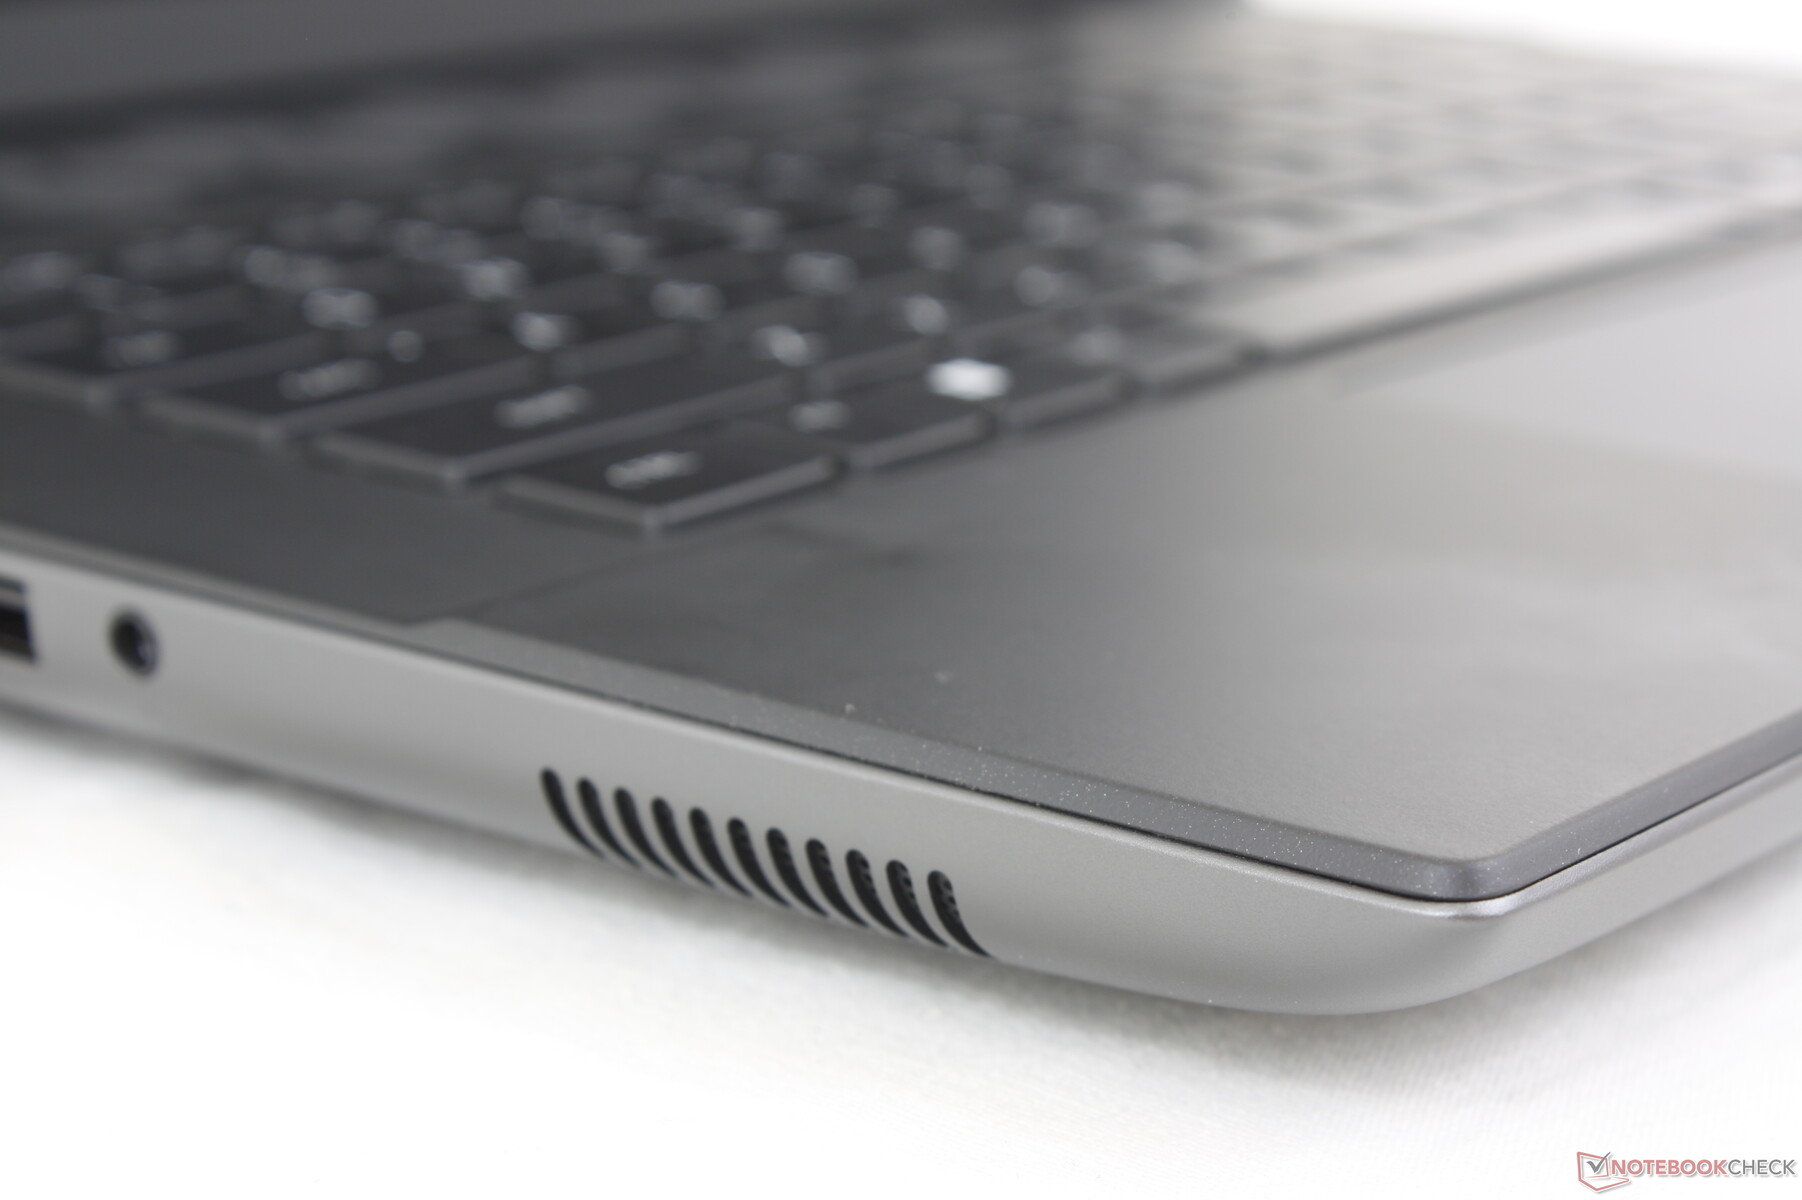
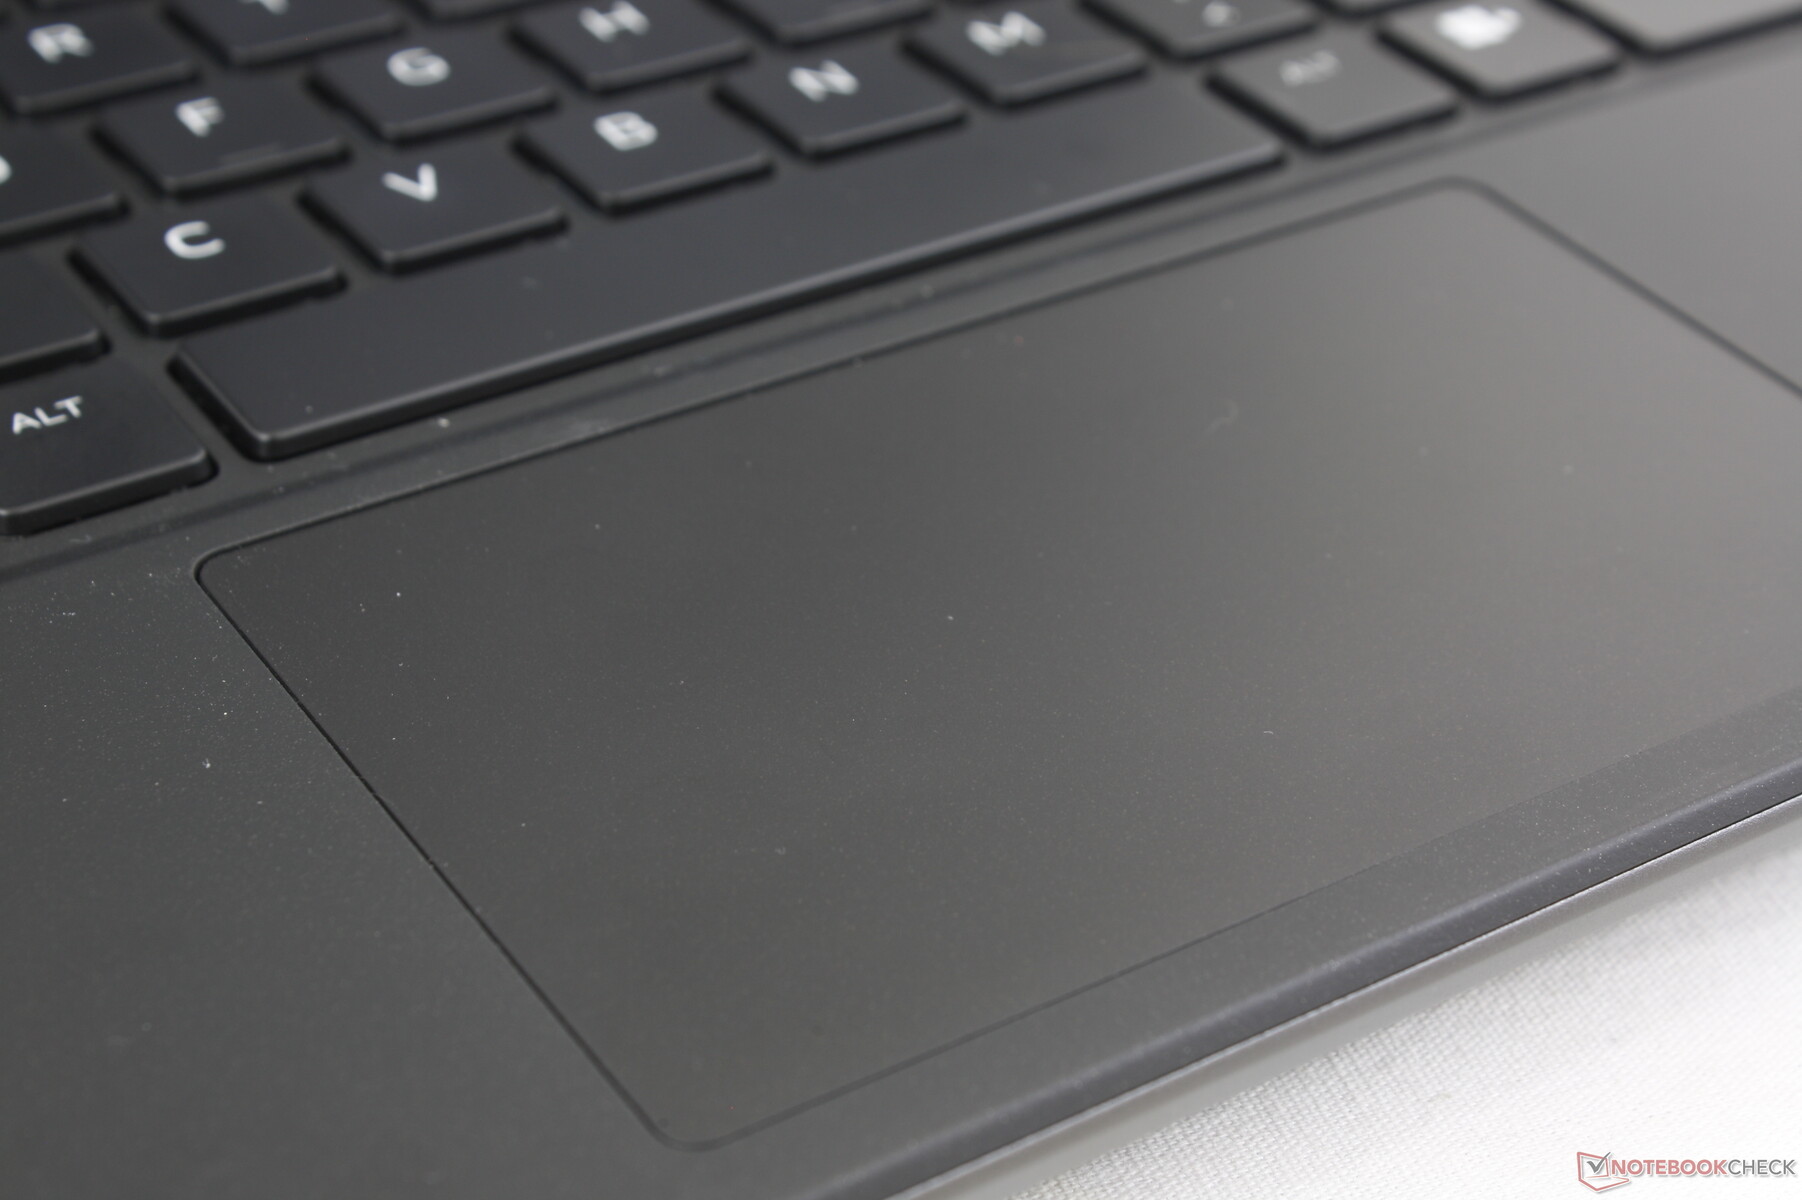
触摸板
由于键盘面板的大部分空间都被大型通风栅占据,因此点击板相对较小(11.3 x 6.6 厘米)。键盘上的点击板 HP Omen Transcend 16和 Razer Blade 16 的键盘则更为宽敞,分别为 12.5 x 8 厘米和 17 x 9.7 厘米。尽管表面面积狭小,但按压时仍能获得平滑、坚固和咔哒声反馈。
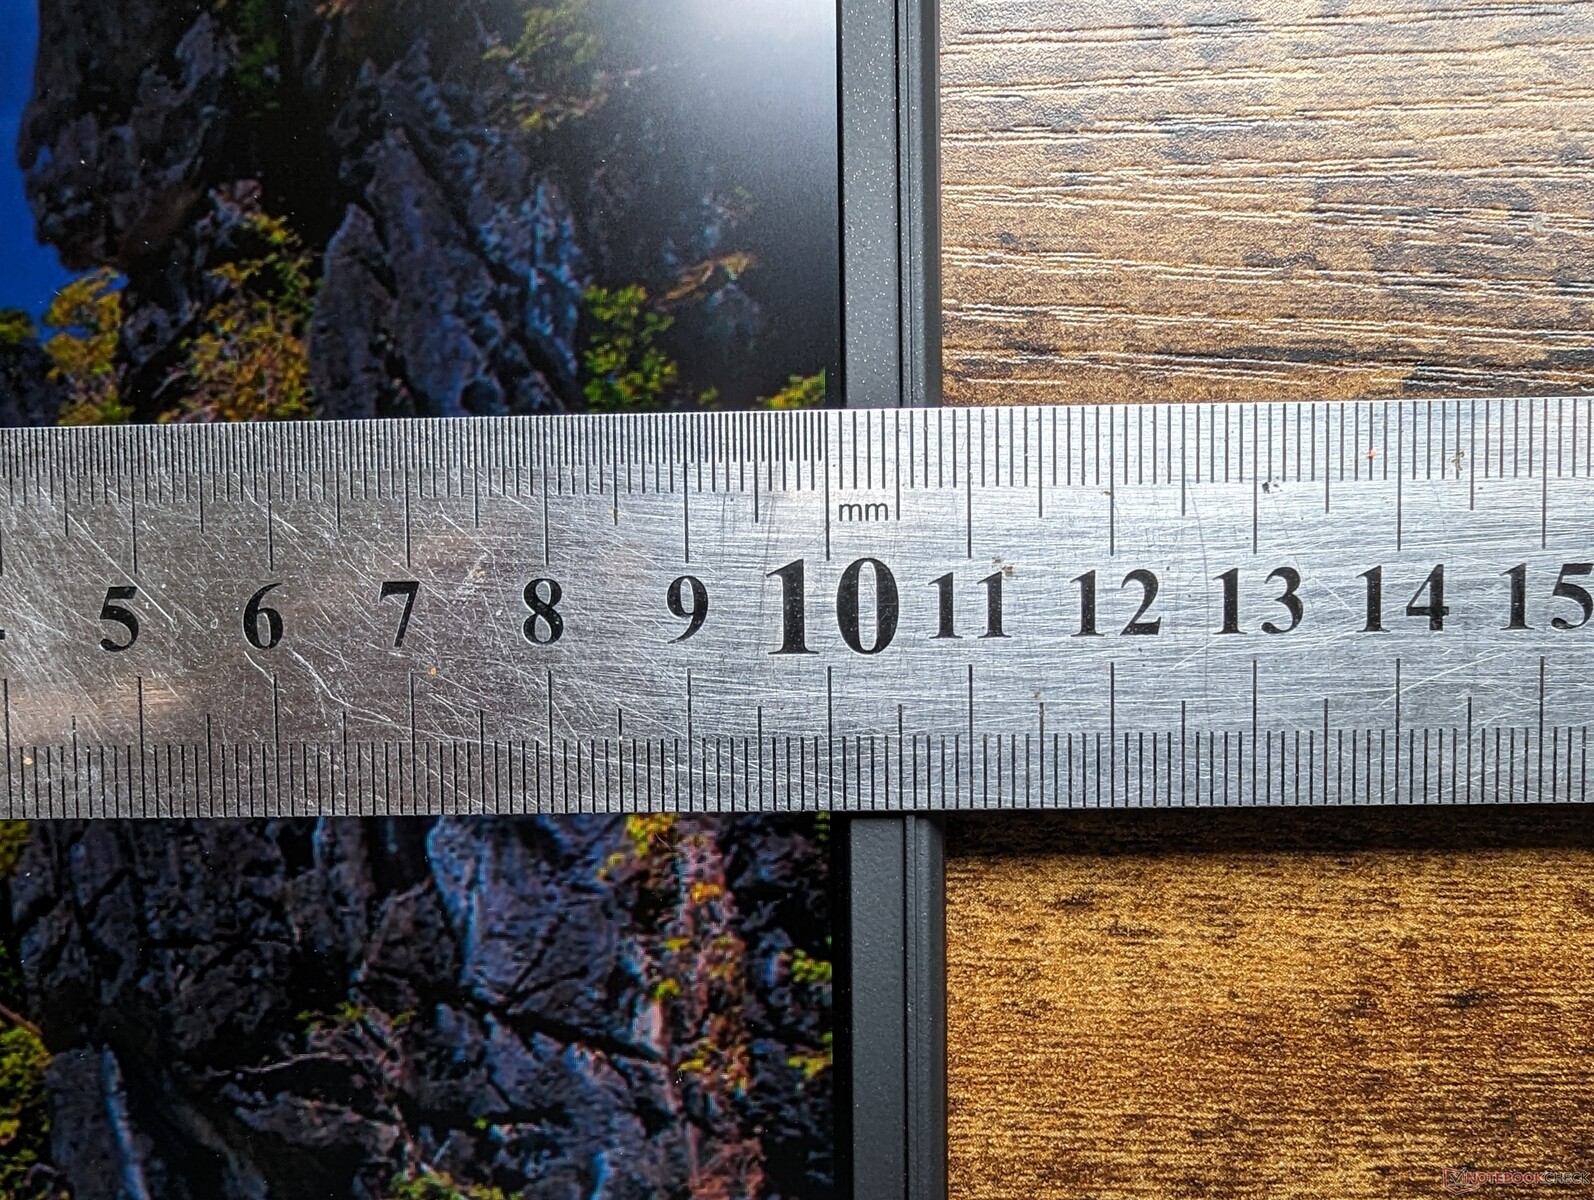
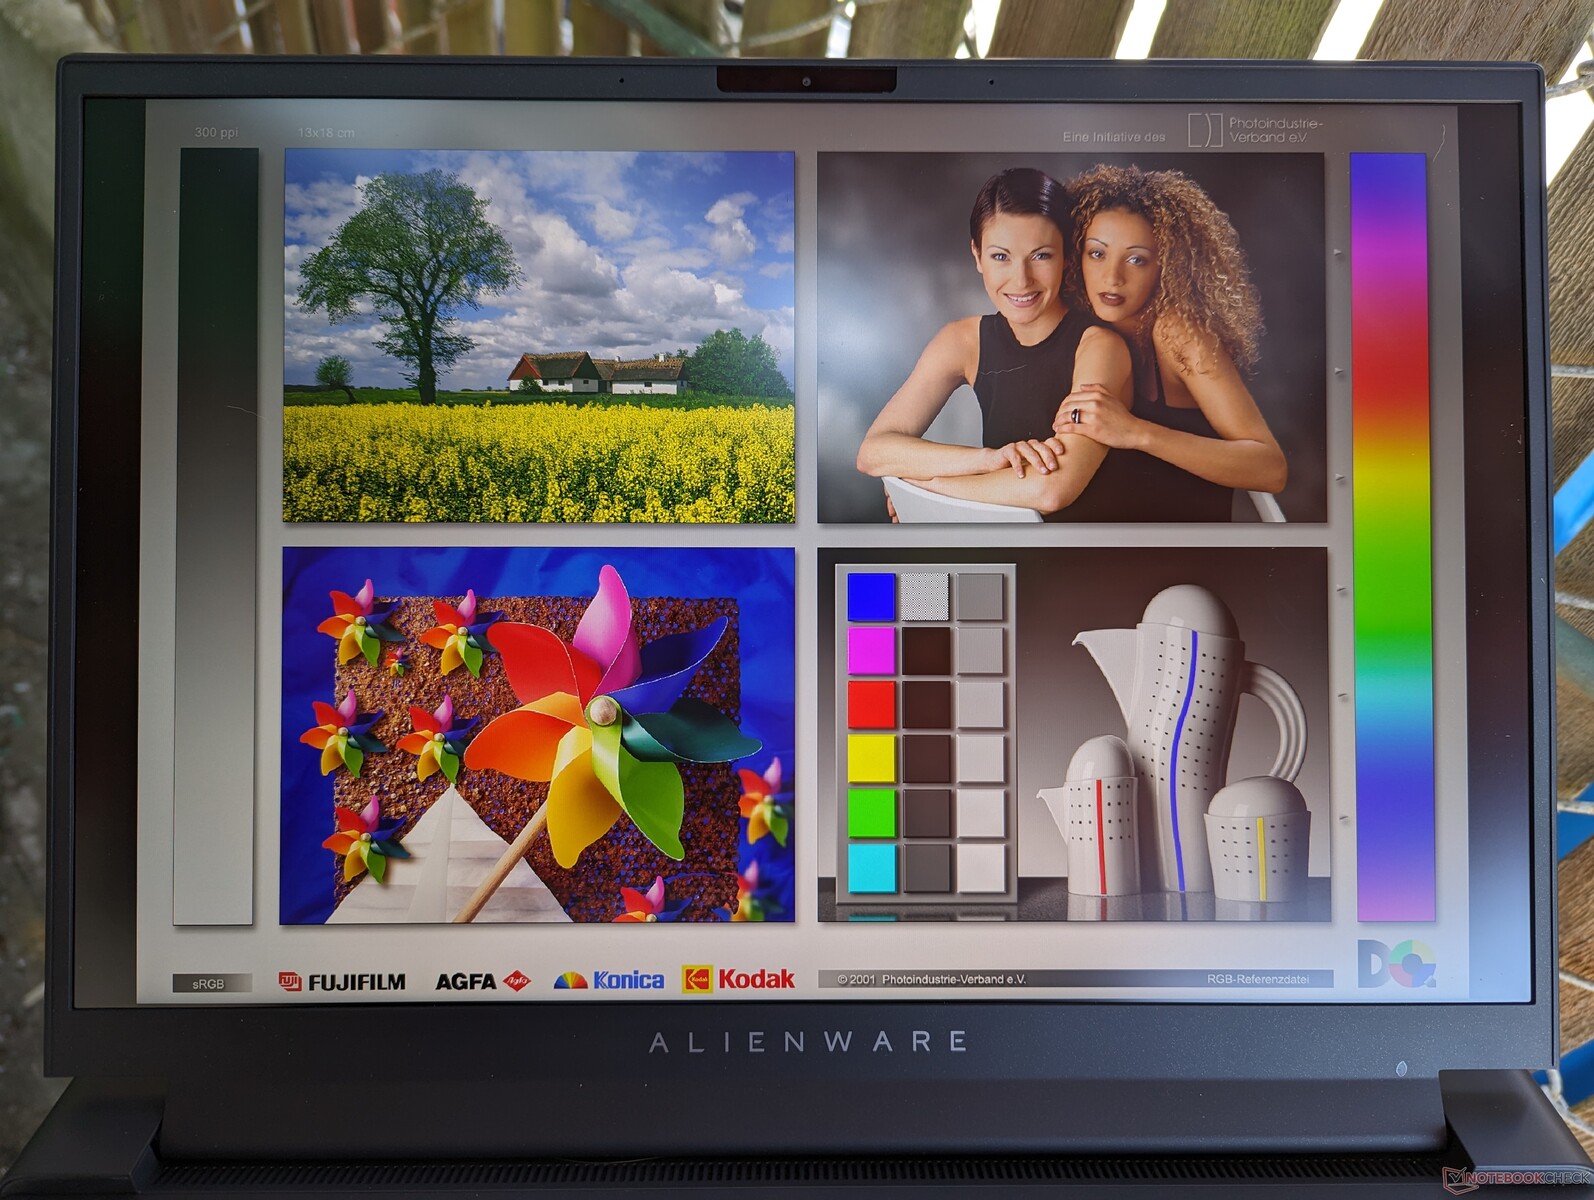
显示屏
有以下三种显示选项:
- 2560 x 1600、165 Hz、3 ms、IPS、100% sRGB
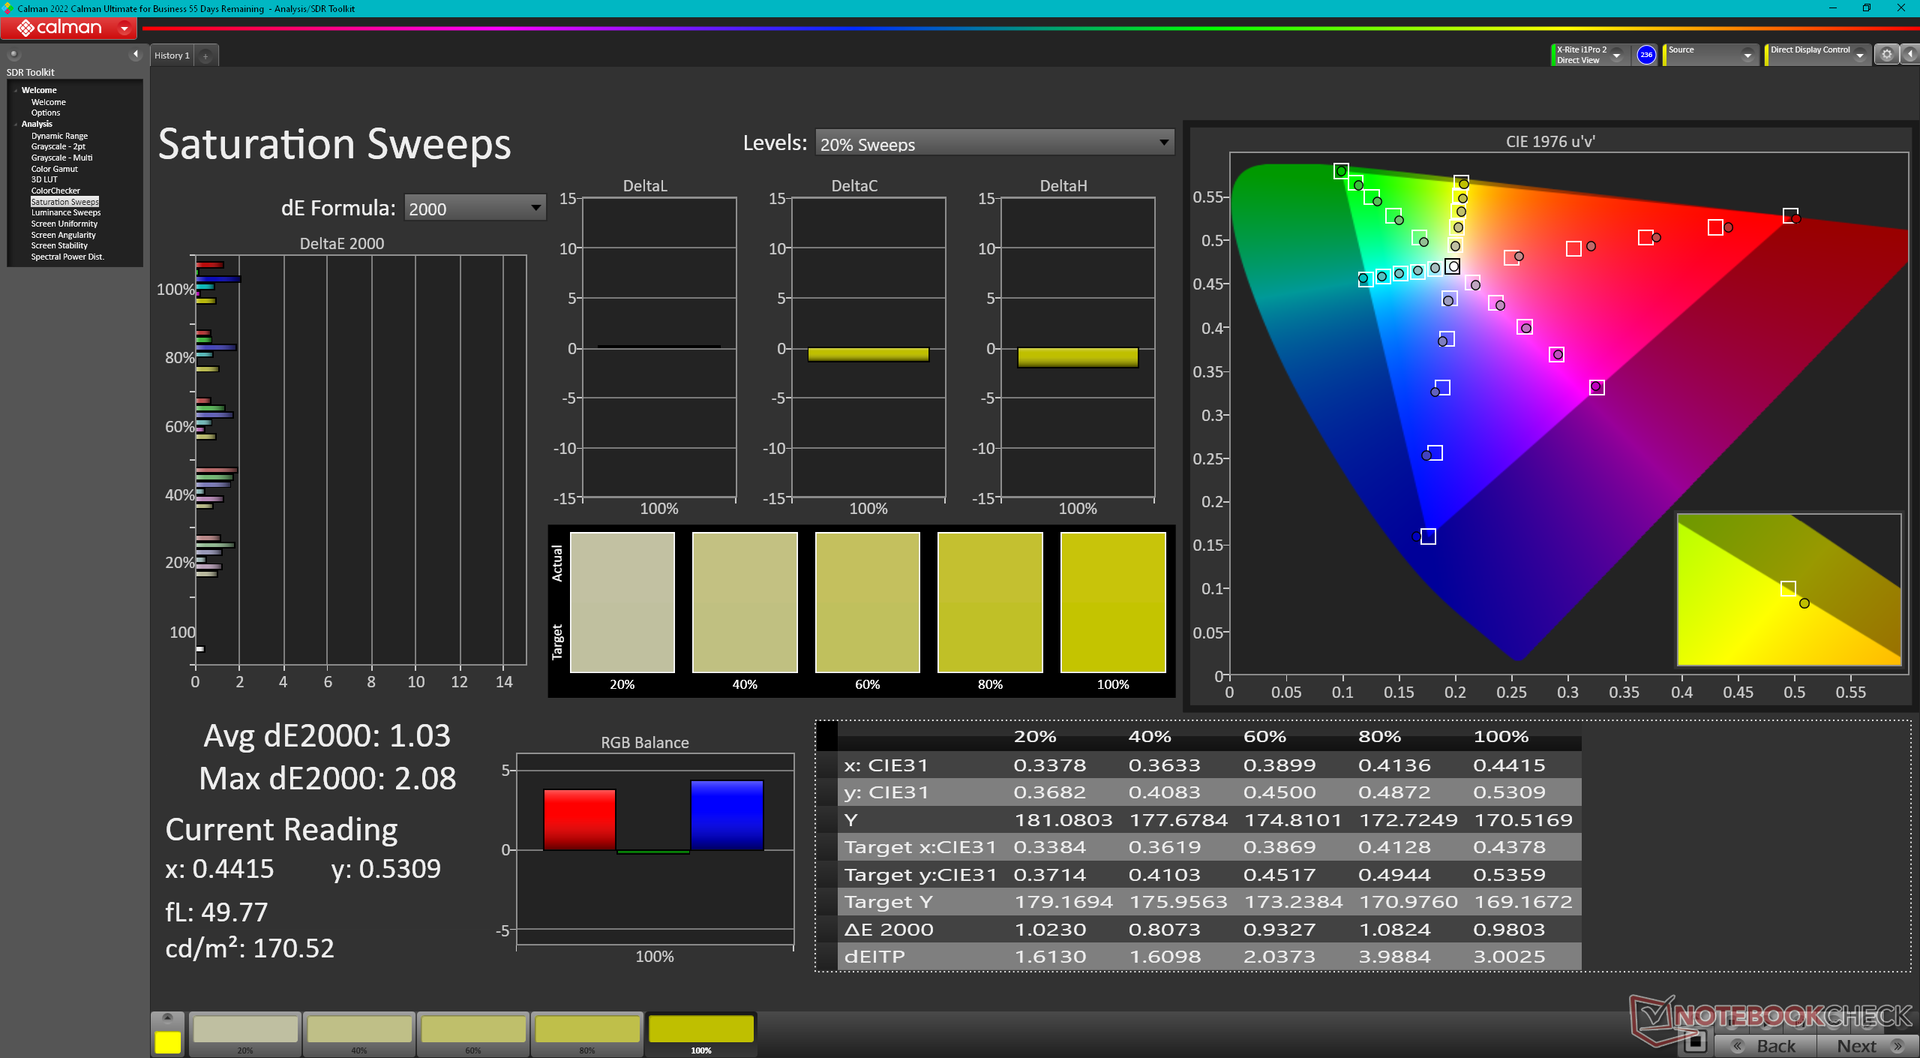
- 2560 x 1600、240 赫兹、3 毫秒、IPS、100% DCI-P3
- 1920 x 1200、480 Hz、3 ms、IPS、100% DCI-P3
我们的设备配置了上面加粗的选项,我们认为这是该机型的最佳配置,因为它提供了完整的 P3 色彩、快速刷新率和高分辨率一体化功能。1200p 选项提供更快的刷新率,但在 240 Hz 之后,其优势变得越来越微不足道。
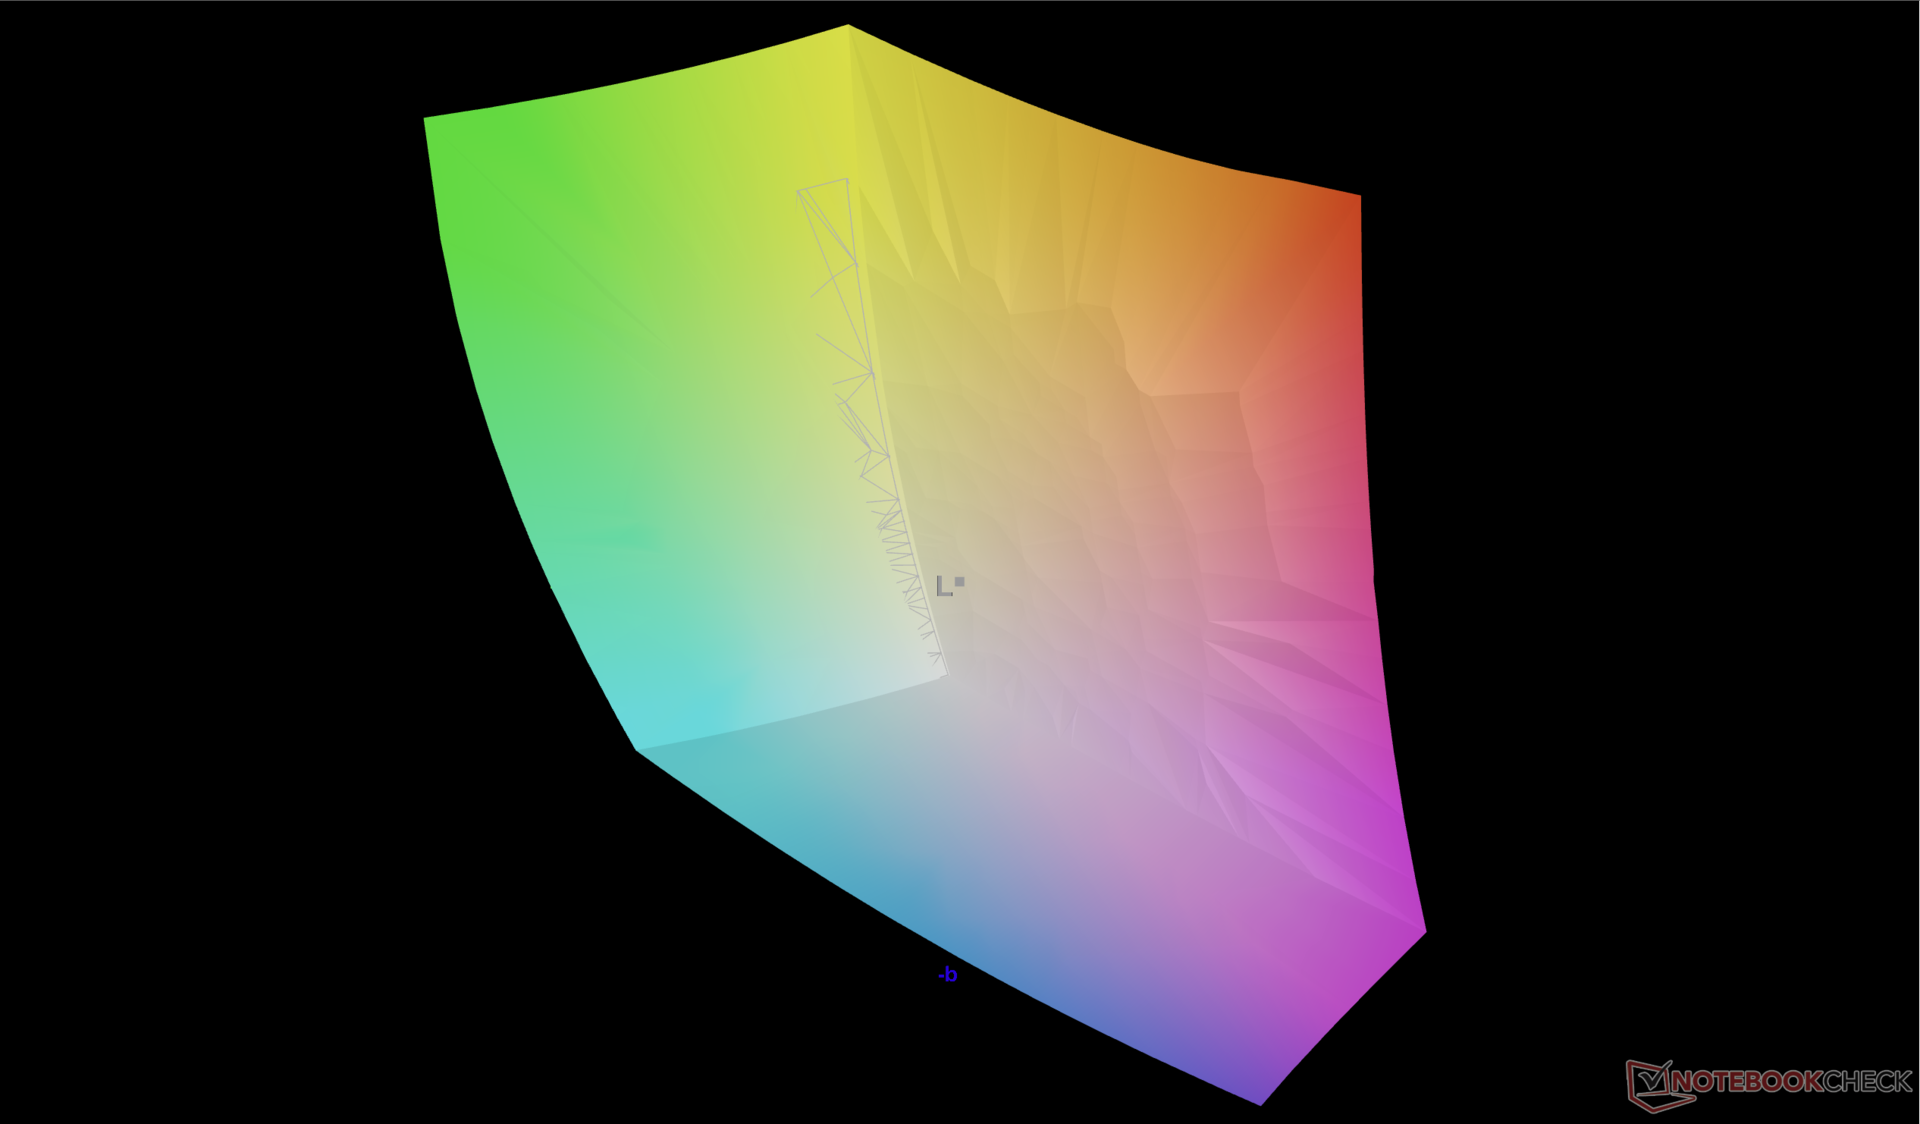
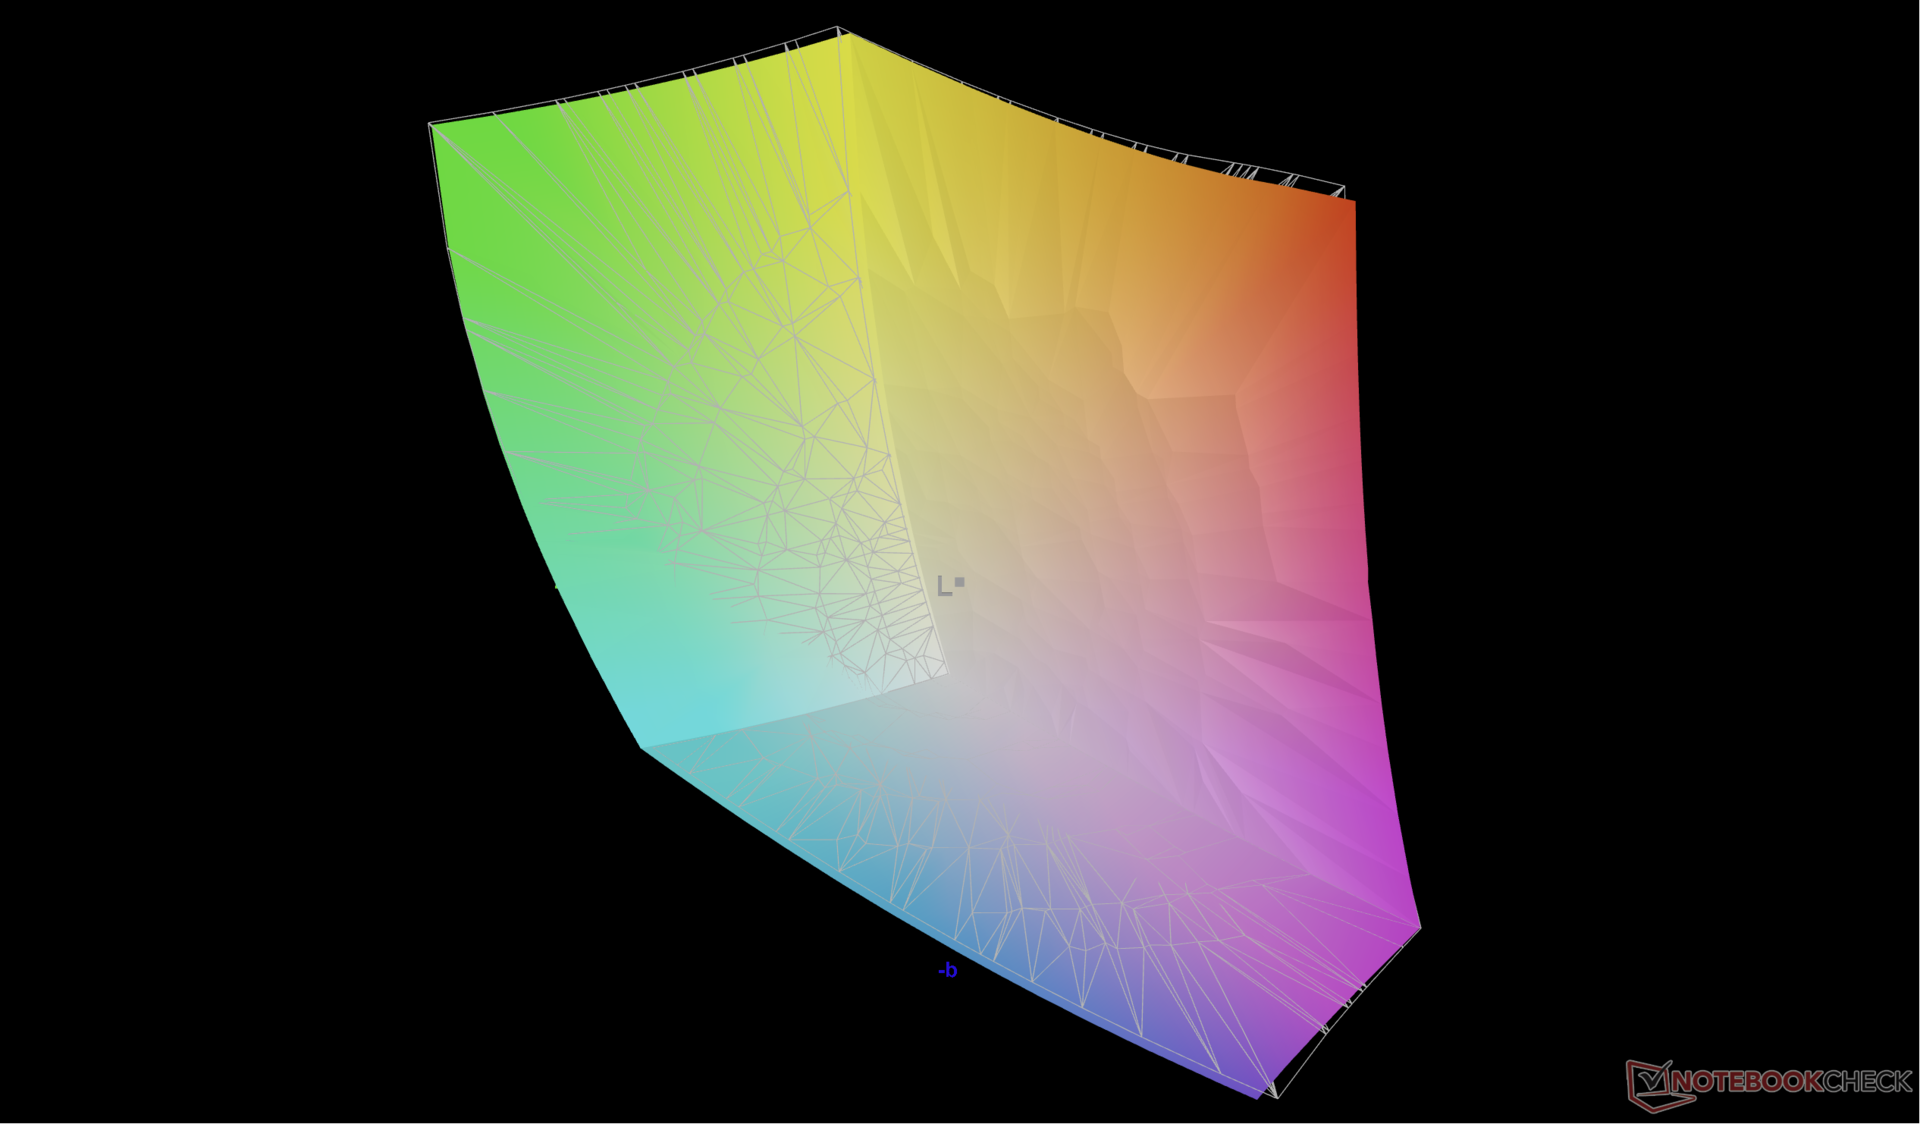
Alienware m16 R1 采用了与 Alienware x16 R1 相同的京东方 NE16NZ4 面板。x16 R1因此两款机型的观看体验基本相同。与Legion Pro 7 上的 MNG007DA2-3 面板相比,这种高端面板色彩更丰富,适合游戏和内容制作。不过,Razer Blade 16 Early 2023 或基于 Mini-LED 技术的 HP Omen Transcend 16的显示屏明显更亮,这对于 HDR 内容来说非常有用。

| |||||||||||||||||||||||||
Brightness Distribution: 89 %
Center on Battery: 329 cd/m²
Contrast: 1028:1 (Black: 0.32 cd/m²)
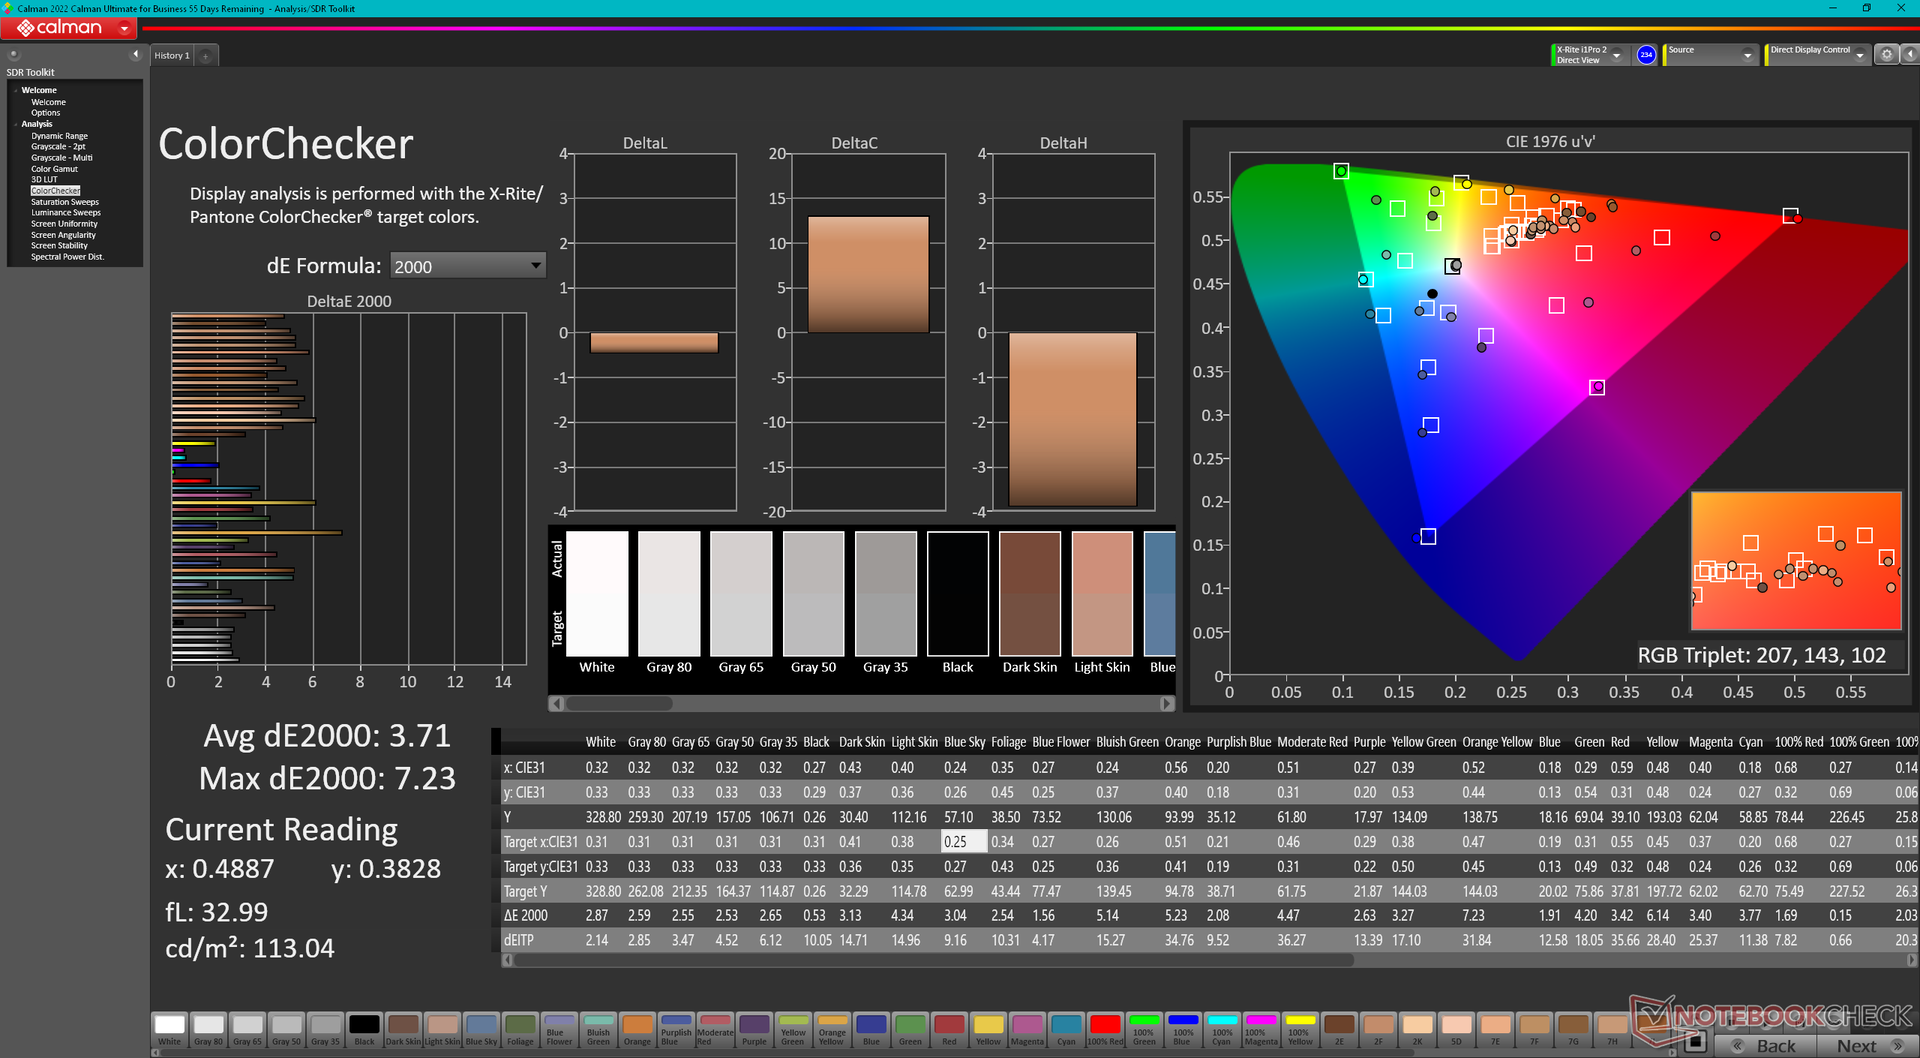
ΔE ColorChecker Calman: 3.71 | ∀{0.5-29.43 Ø4.71}
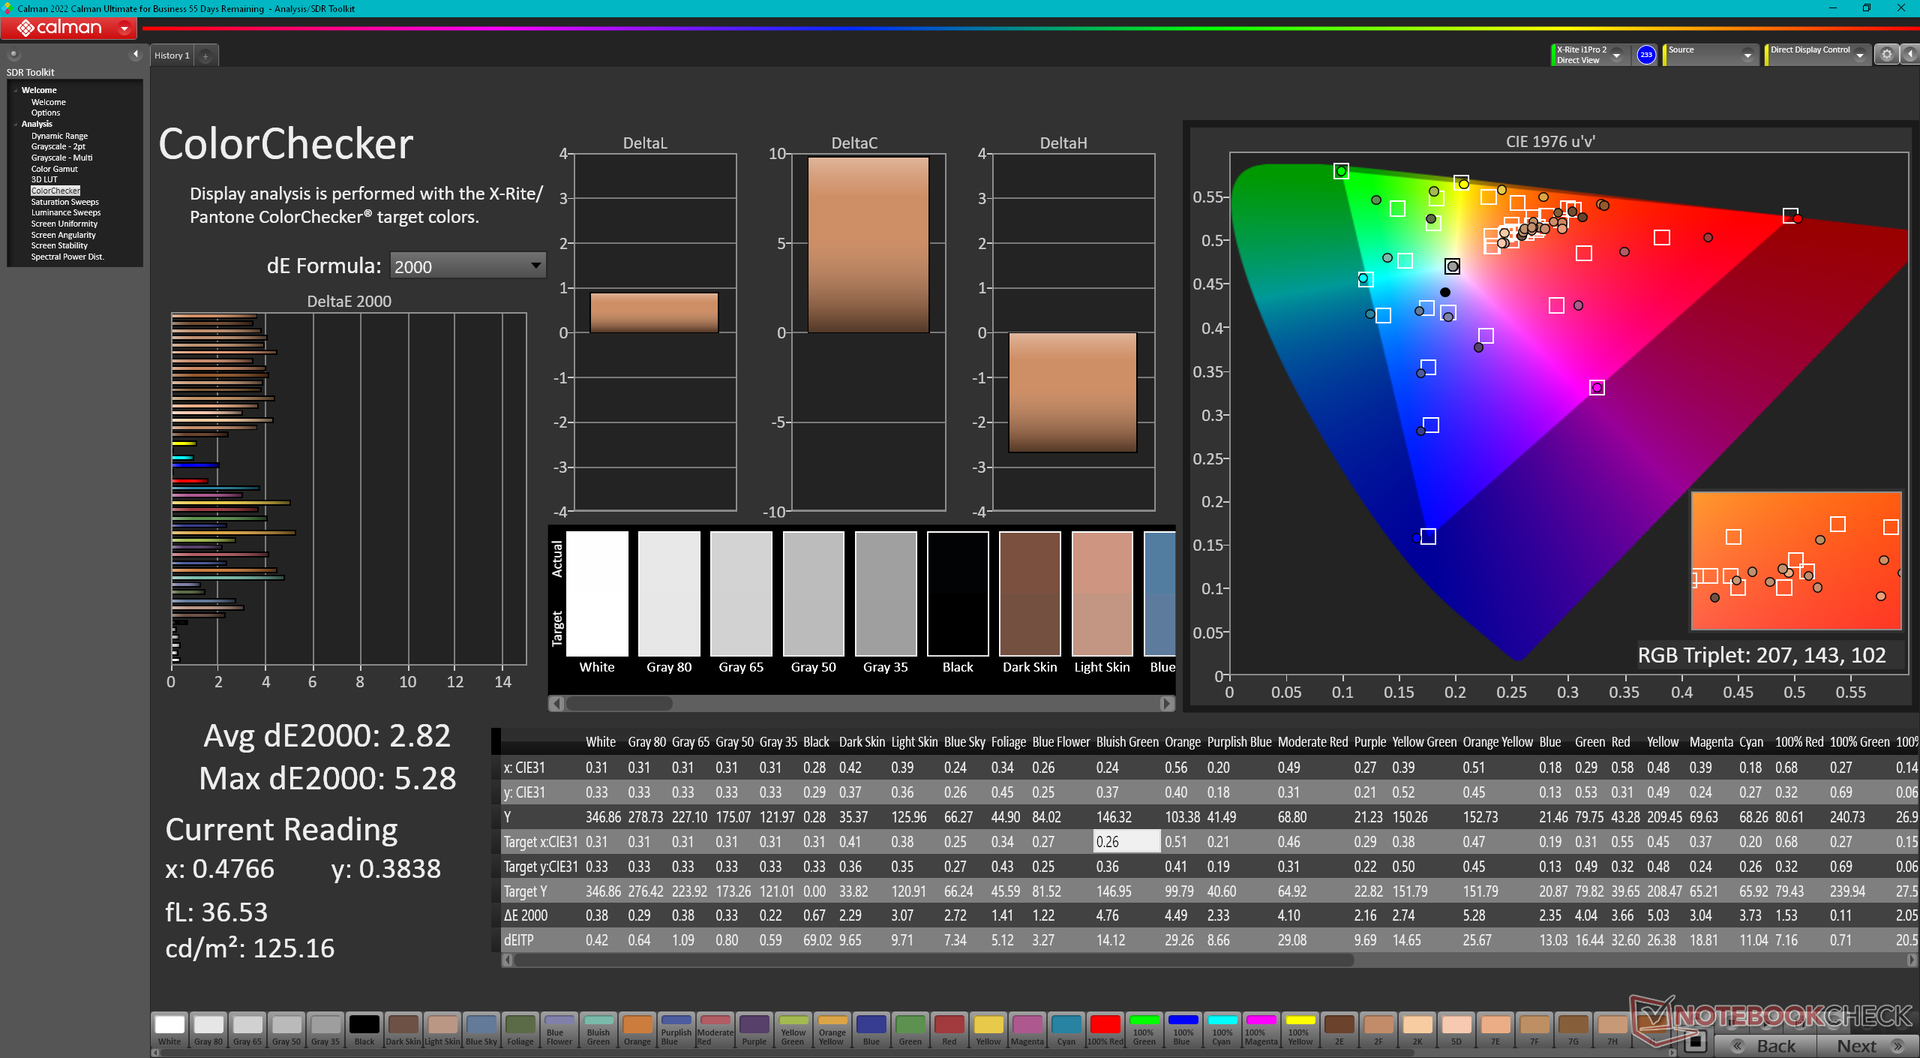
calibrated: 2.82
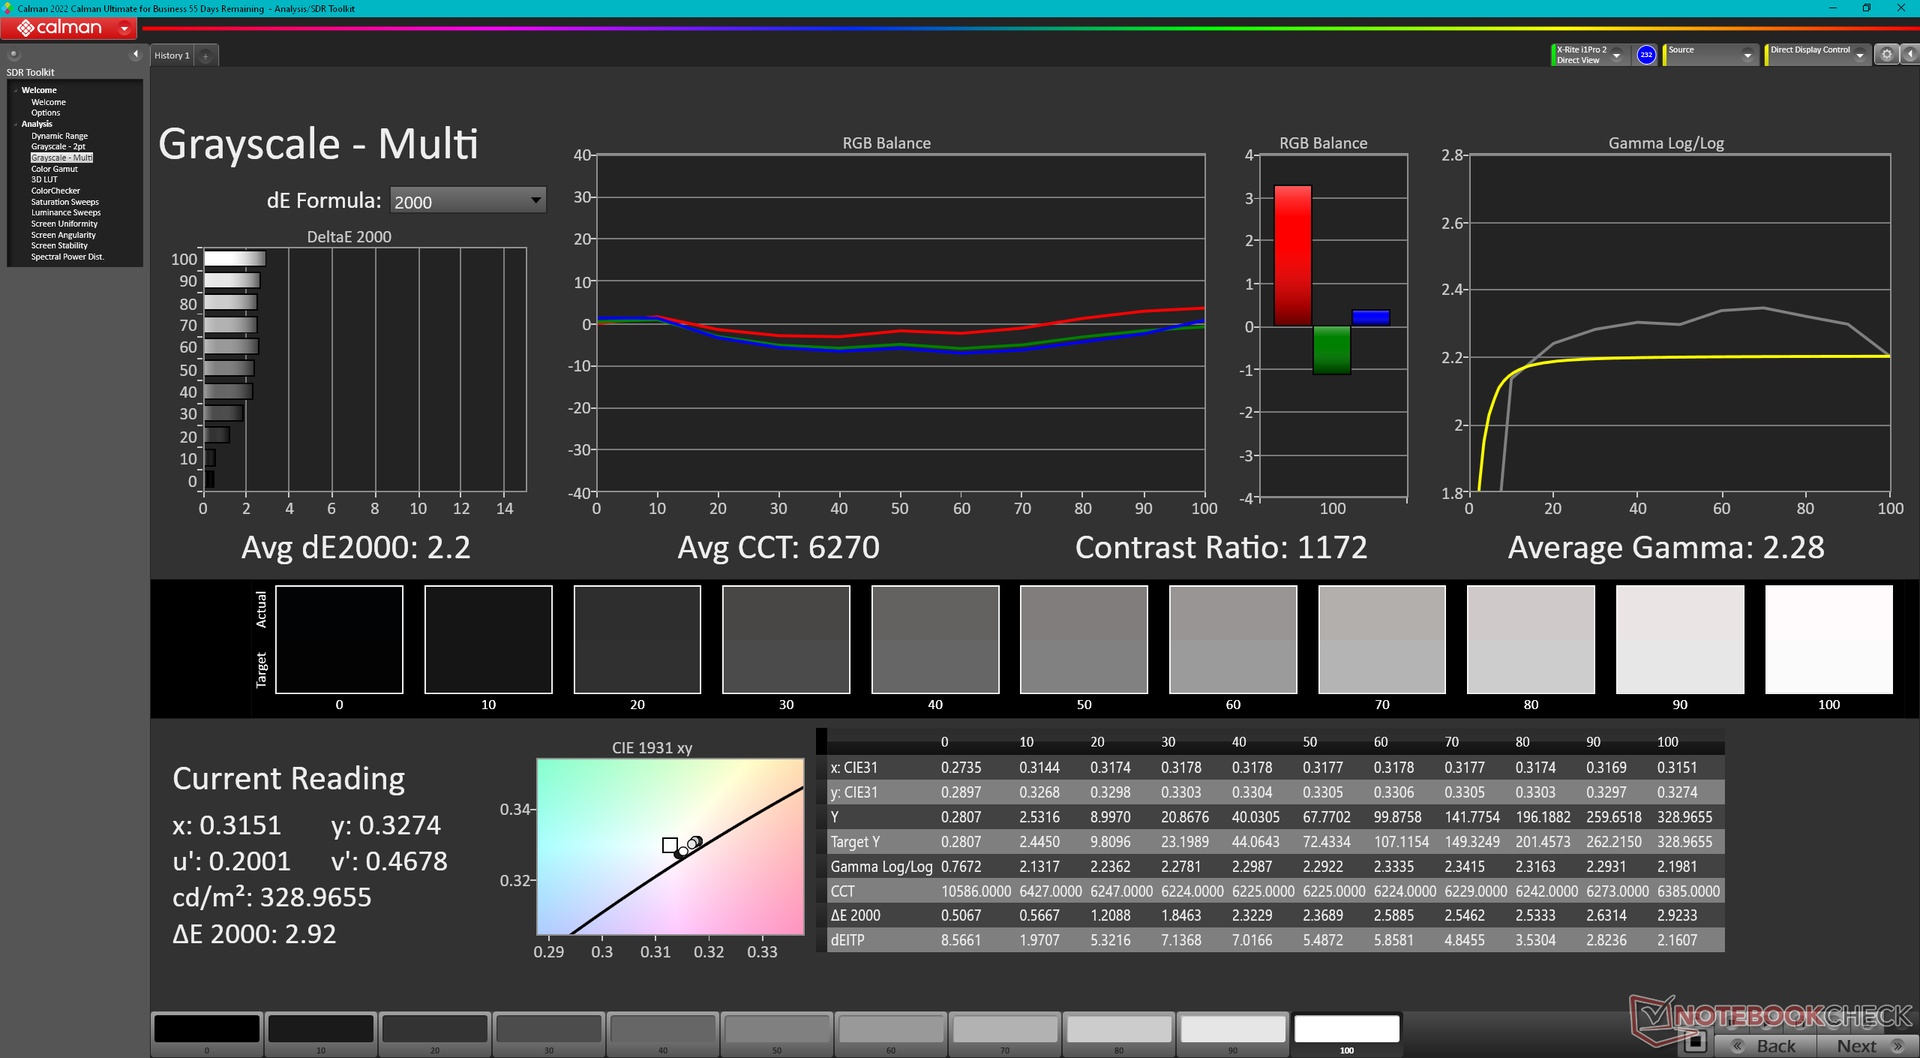
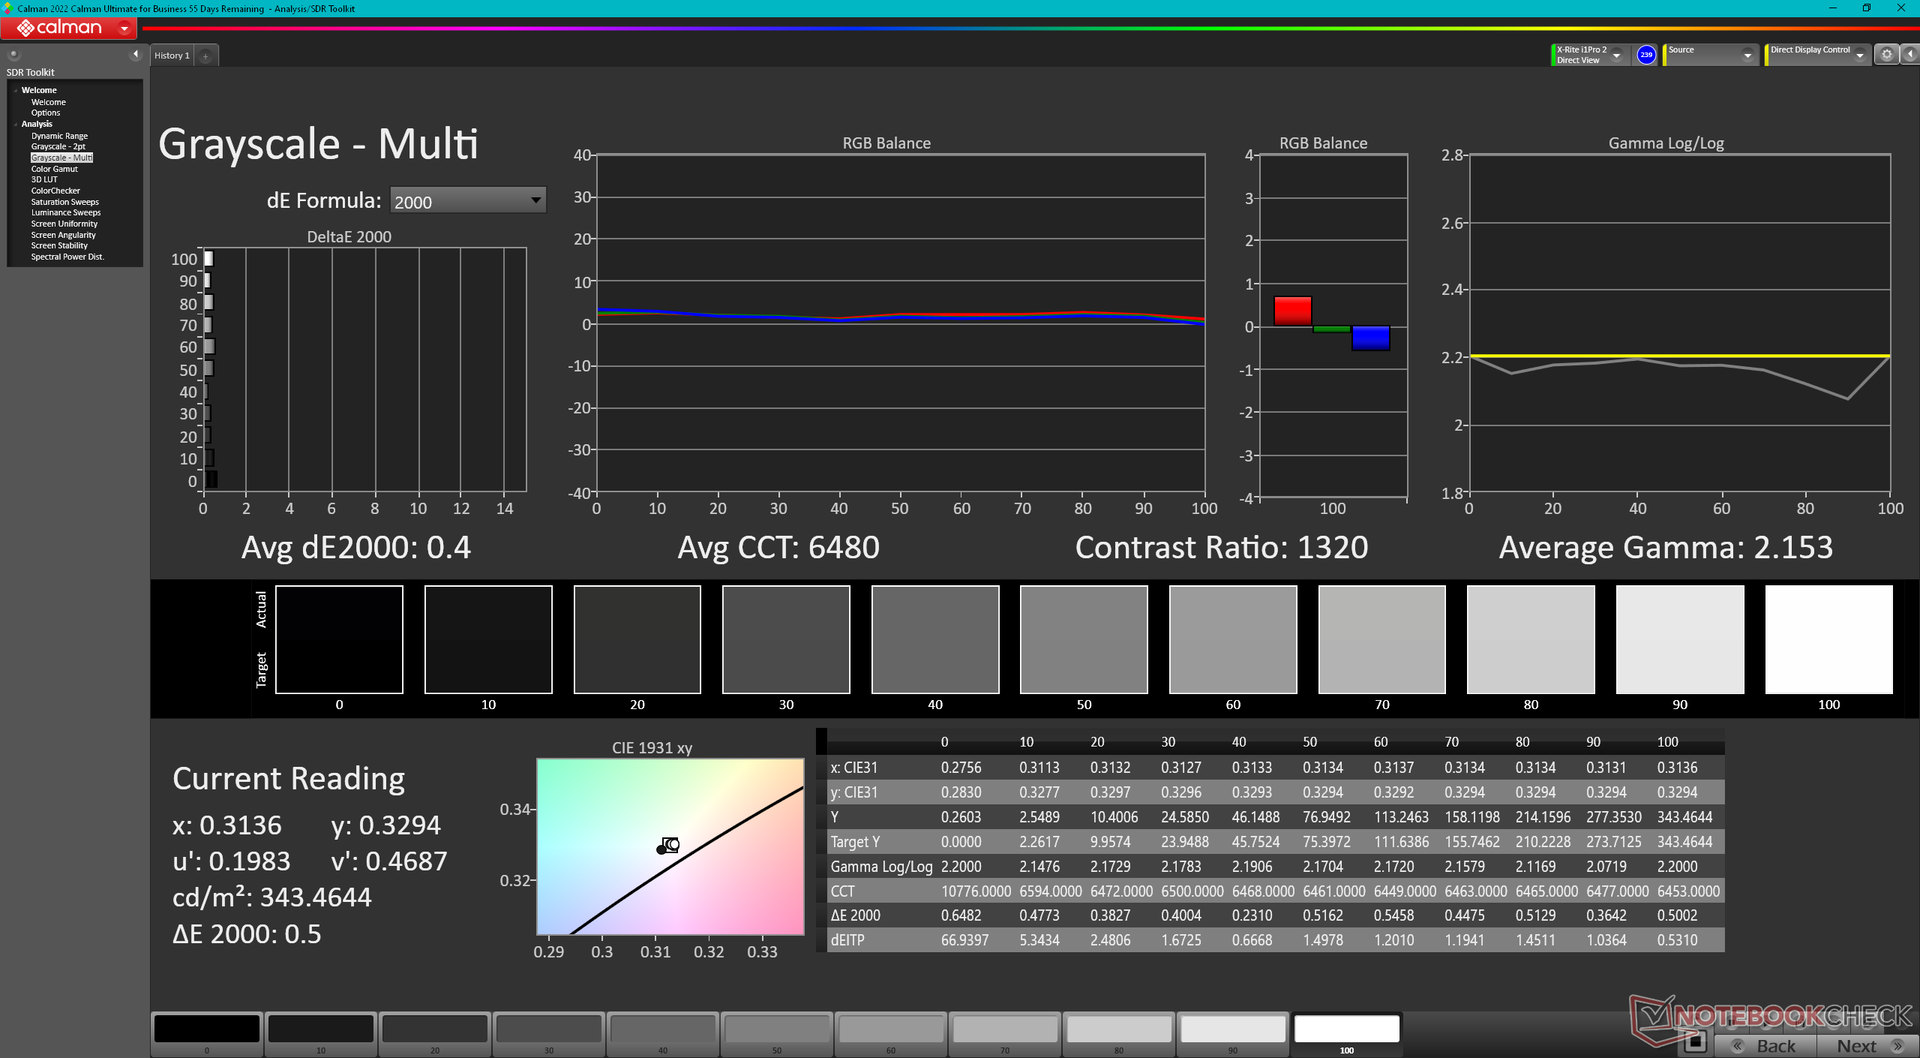
ΔE Greyscale Calman: 2.2 | ∀{0.09-98 Ø4.96}
88.9% AdobeRGB 1998 (Argyll 3D)
99.9% sRGB (Argyll 3D)
98.6% Display P3 (Argyll 3D)
Gamma: 2.3
CCT: 6270 K
| Alienware m16 R1 AMD BOE NE16NZ4, IPS, 2560x1600, 16" | Alienware x16 R1 BOE NE16NZ4, IPS, 2560x1600, 16" | HP Omen Transcend 16 AUOA3A6, Mini-LED, 2560x1600, 16" | Lenovo Legion Pro 7 RTX4090 MNG007DA2-3 (CSO1628), IPS, 2560x1600, 16" | Asus ROG Strix G16 G614JZ TL160ADMP03-0, IPS, 2560x1600, 16" | Razer Blade 16 Early 2023 CSOT T3 MNG007DA4-1, IPS, 2560x1600, 16" | |
|---|---|---|---|---|---|---|
| Display | 0% | 0% | -16% | -2% | 0% | |
| Display P3 Coverage (%) | 98.6 | 99.2 1% | 99.2 1% | 69.5 -30% | 97 -2% | 98.5 0% |
| sRGB Coverage (%) | 99.9 | 100 0% | 100 0% | 99.8 0% | 99.9 0% | 100 0% |
| AdobeRGB 1998 Coverage (%) | 88.9 | 88.6 0% | 87.6 -1% | 71.6 -19% | 84.9 -4% | 89.7 1% |
| Response Times | -7% | -316% | -33% | 14% | -31% | |
| Response Time Grey 50% / Grey 80% * (ms) | 5.1 ? | 5.1 ? -0% | 26.4 ? -418% | 10.9 ? -114% | 5.1 ? -0% | 6.6 ? -29% |
| Response Time Black / White * (ms) | 9 ? | 10.3 ? -14% | 28.2 ? -213% | 4.6 ? 49% | 6.6 ? 27% | 12 ? -33% |
| PWM Frequency (Hz) | 3506 ? | |||||
| Screen | 18% | 224% | 23% | 23% | 18% | |
| Brightness middle (cd/m²) | 329 | 302.2 -8% | 791.1 140% | 491 49% | 470 43% | 456.8 39% |
| Brightness (cd/m²) | 317 | 285 -10% | 800 152% | 472 49% | 459 45% | 437 38% |
| Brightness Distribution (%) | 89 | 89 0% | 95 7% | 91 2% | 93 4% | 83 -7% |
| Black Level * (cd/m²) | 0.32 | 0.26 19% | 0.04 87% | 0.4 -25% | 0.42 -31% | 0.35 -9% |
| Contrast (:1) | 1028 | 1162 13% | 19778 1824% | 1228 19% | 1119 9% | 1305 27% |
| Colorchecker dE 2000 * | 3.71 | 1.63 56% | 4.37 -18% | 1.6 57% | 1.86 50% | 3.7 -0% |
| Colorchecker dE 2000 max. * | 7.23 | 4.13 43% | 10.39 -44% | 5.15 29% | 3.87 46% | 6.42 11% |
| Colorchecker dE 2000 calibrated * | 2.82 | 1.17 59% | 1.04 63% | 0.97 66% | 0.93 67% | 0.66 77% |
| Greyscale dE 2000 * | 2.2 | 2.5 -14% | 6.5 -195% | 3 -36% | 2.7 -23% | 2.6 -18% |
| Gamma | 2.3 96% | 2.23 99% | 2.28 96% | 2.211 100% | 2.246 98% | 2.3 96% |
| CCT | 6270 104% | 6590 99% | 6000 108% | 6979 93% | 6711 97% | 6108 106% |
| Total Average (Program / Settings) | 4% /
10% | -31% /
99% | -9% /
7% | 12% /
17% | -4% /
7% |
* ... smaller is better
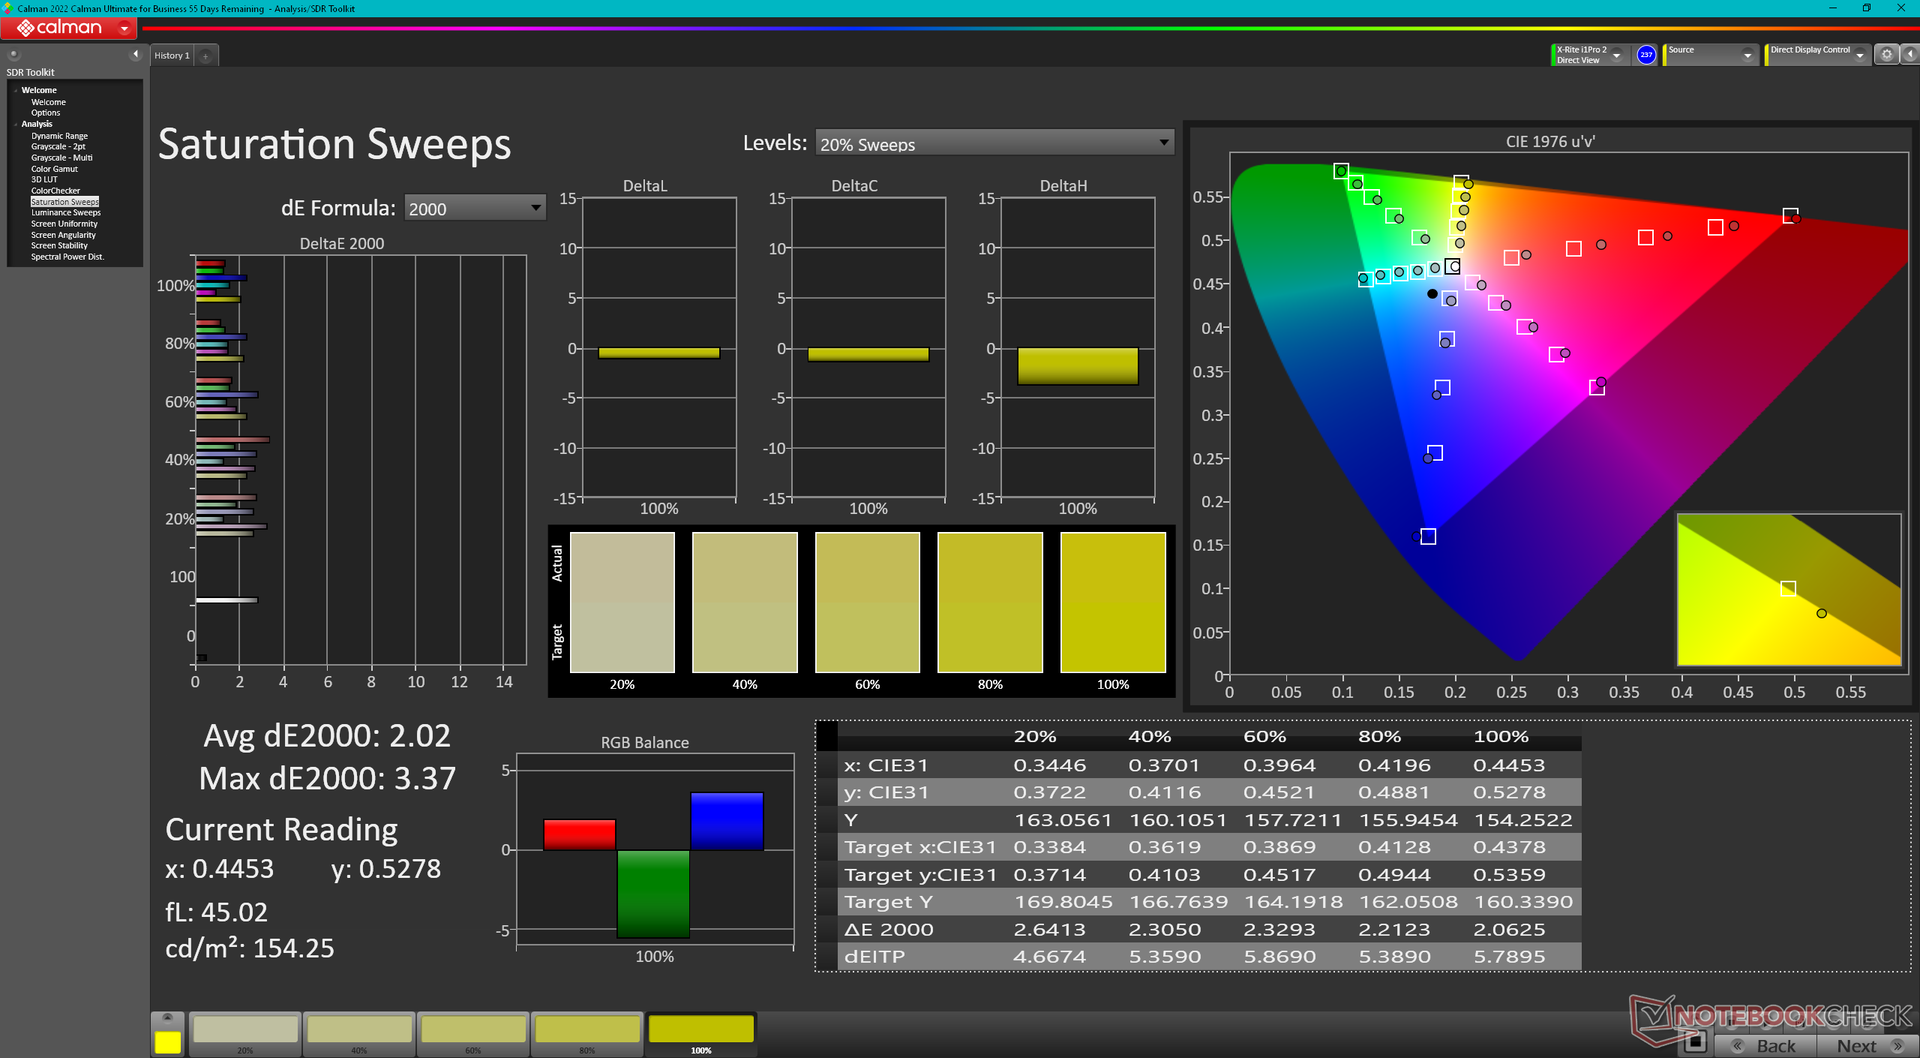
显示器开箱即按照 P3 标准校准,平均灰度和色彩 DeltaE 值分别仅为 2.2 和 3.71。如果使用 X-Rite 色差计对显示器进行校准,灰度将进一步提高,平均 DeltaE 值仅为 0.4,整体色彩更加准确。我们的校准 ICM 配置文件可在上面免费下载。
Display Response Times
| ↔ Response Time Black to White | ||
|---|---|---|
| 9 ms ... rise ↗ and fall ↘ combined | ↗ 4.8 ms rise | 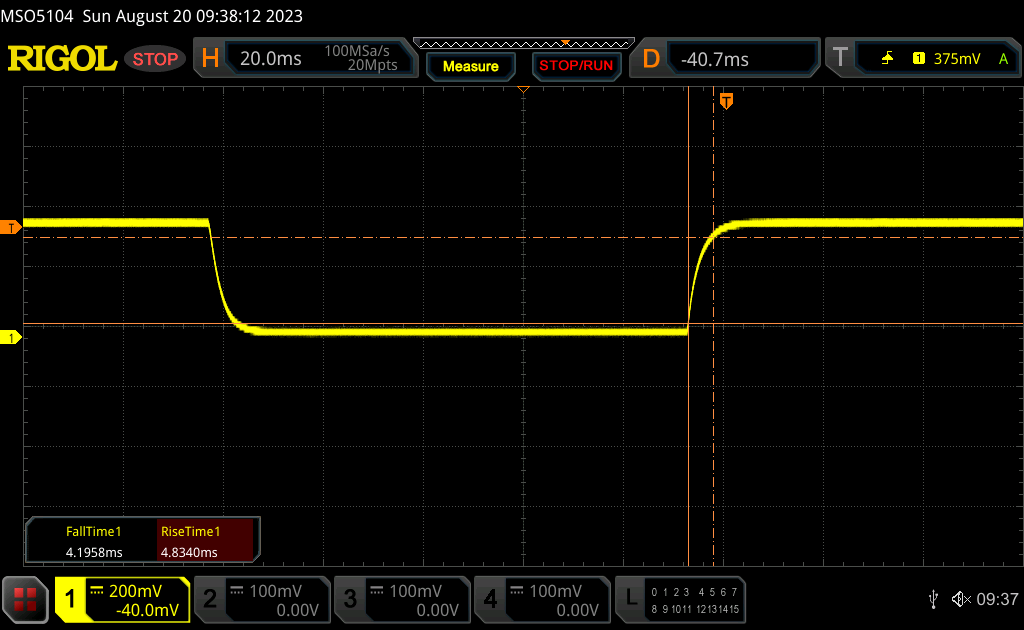 |
| ↘ 4.2 ms fall | ||
| The screen shows fast response rates in our tests and should be suited for gaming. In comparison, all tested devices range from 0.1 (minimum) to 240 (maximum) ms. » 25 % of all devices are better. This means that the measured response time is better than the average of all tested devices (19.8 ms). | ||
| ↔ Response Time 50% Grey to 80% Grey | ||
| 5.1 ms ... rise ↗ and fall ↘ combined | ↗ 2.5 ms rise | 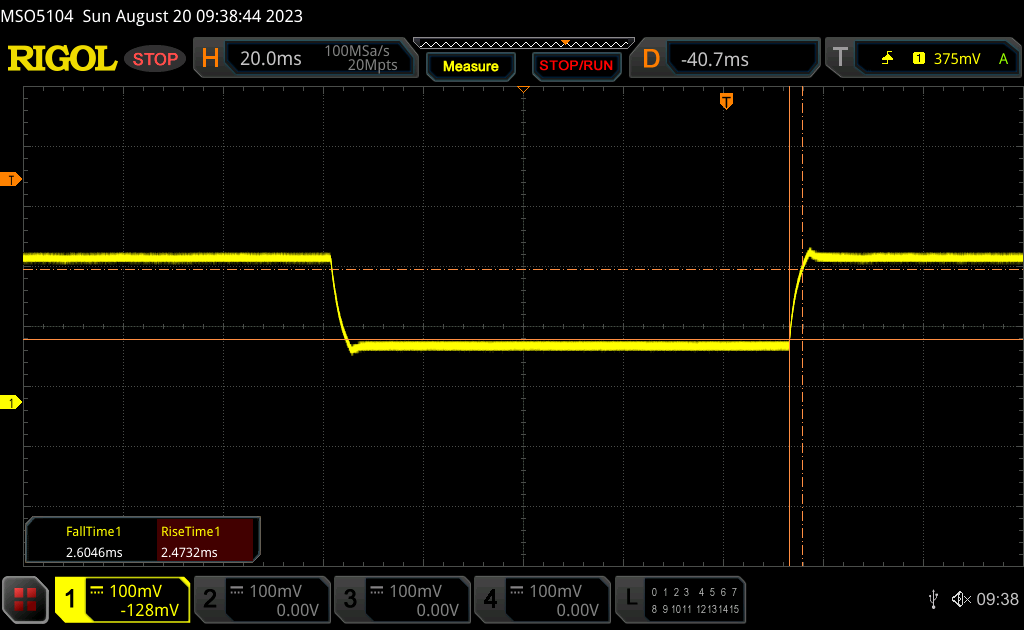 |
| ↘ 2.6 ms fall | ||
| The screen shows very fast response rates in our tests and should be very well suited for fast-paced gaming. In comparison, all tested devices range from 0.165 (minimum) to 636 (maximum) ms. » 17 % of all devices are better. This means that the measured response time is better than the average of all tested devices (31 ms). | ||
Screen Flickering / PWM (Pulse-Width Modulation)
| Screen flickering / PWM not detected | 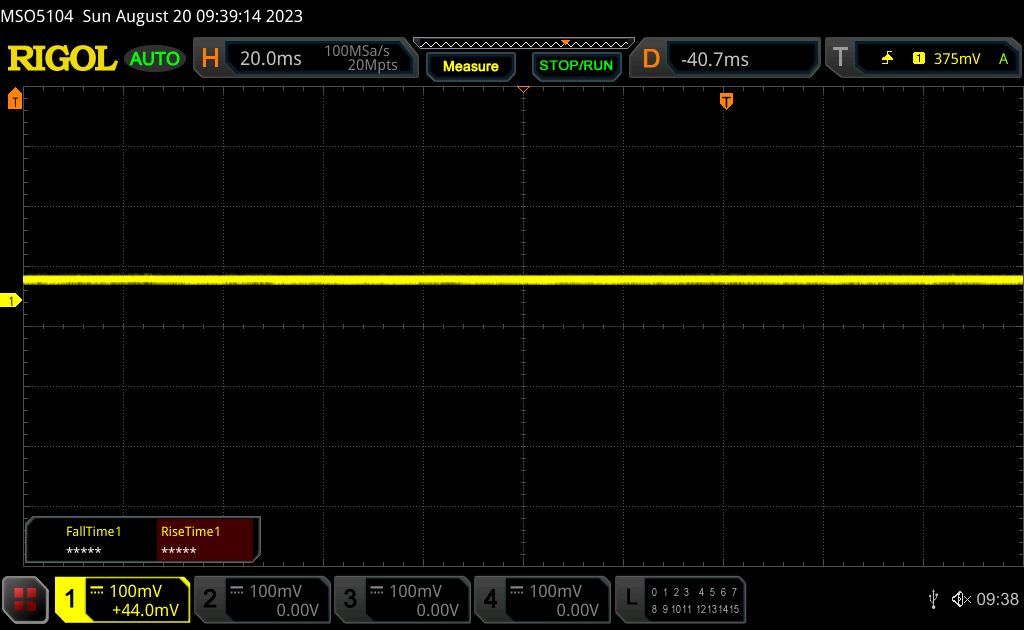 | ||
In comparison: 52 % of all tested devices do not use PWM to dim the display. If PWM was detected, an average of 7757 (minimum: 5 - maximum: 343500) Hz was measured. | |||
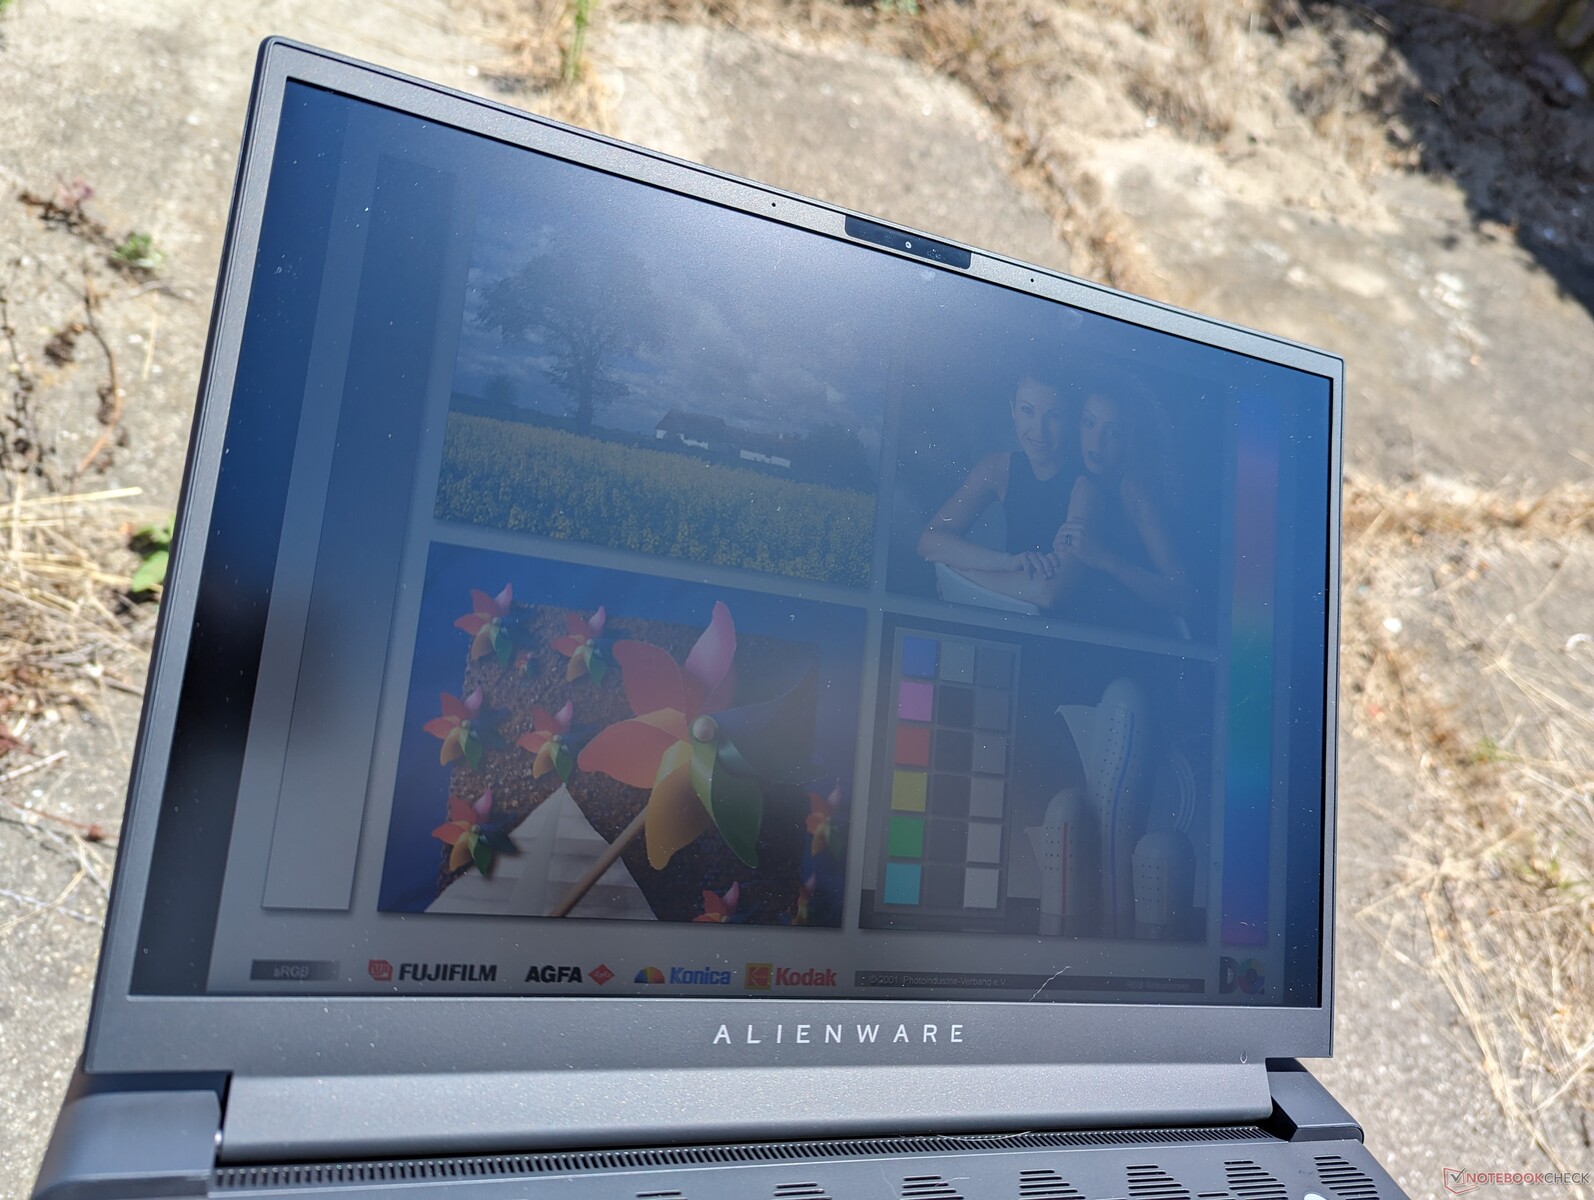
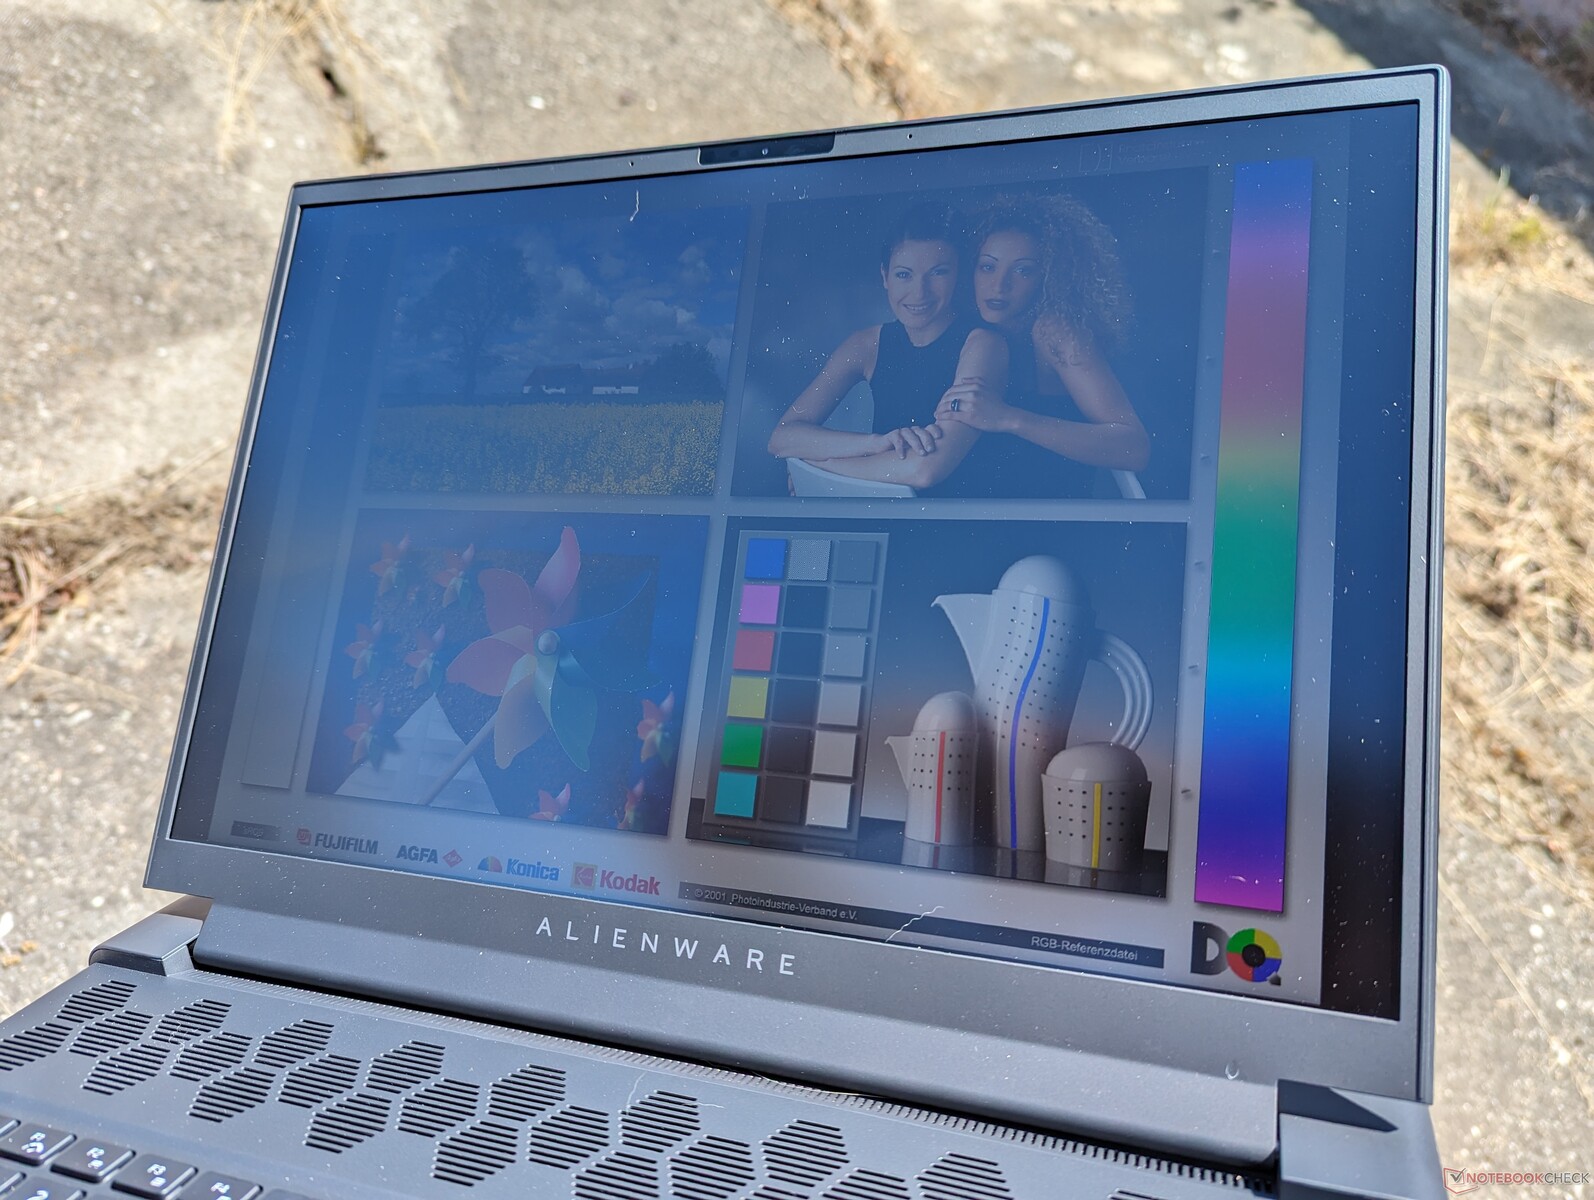
只有在阴凉处,室外能见度才比较高。如果担心室外能见度,Omen Transcend 16 及其微型 LED 显示屏的亮度要高出 2 倍以上。
性能--AMD 还是英特尔?
测试条件
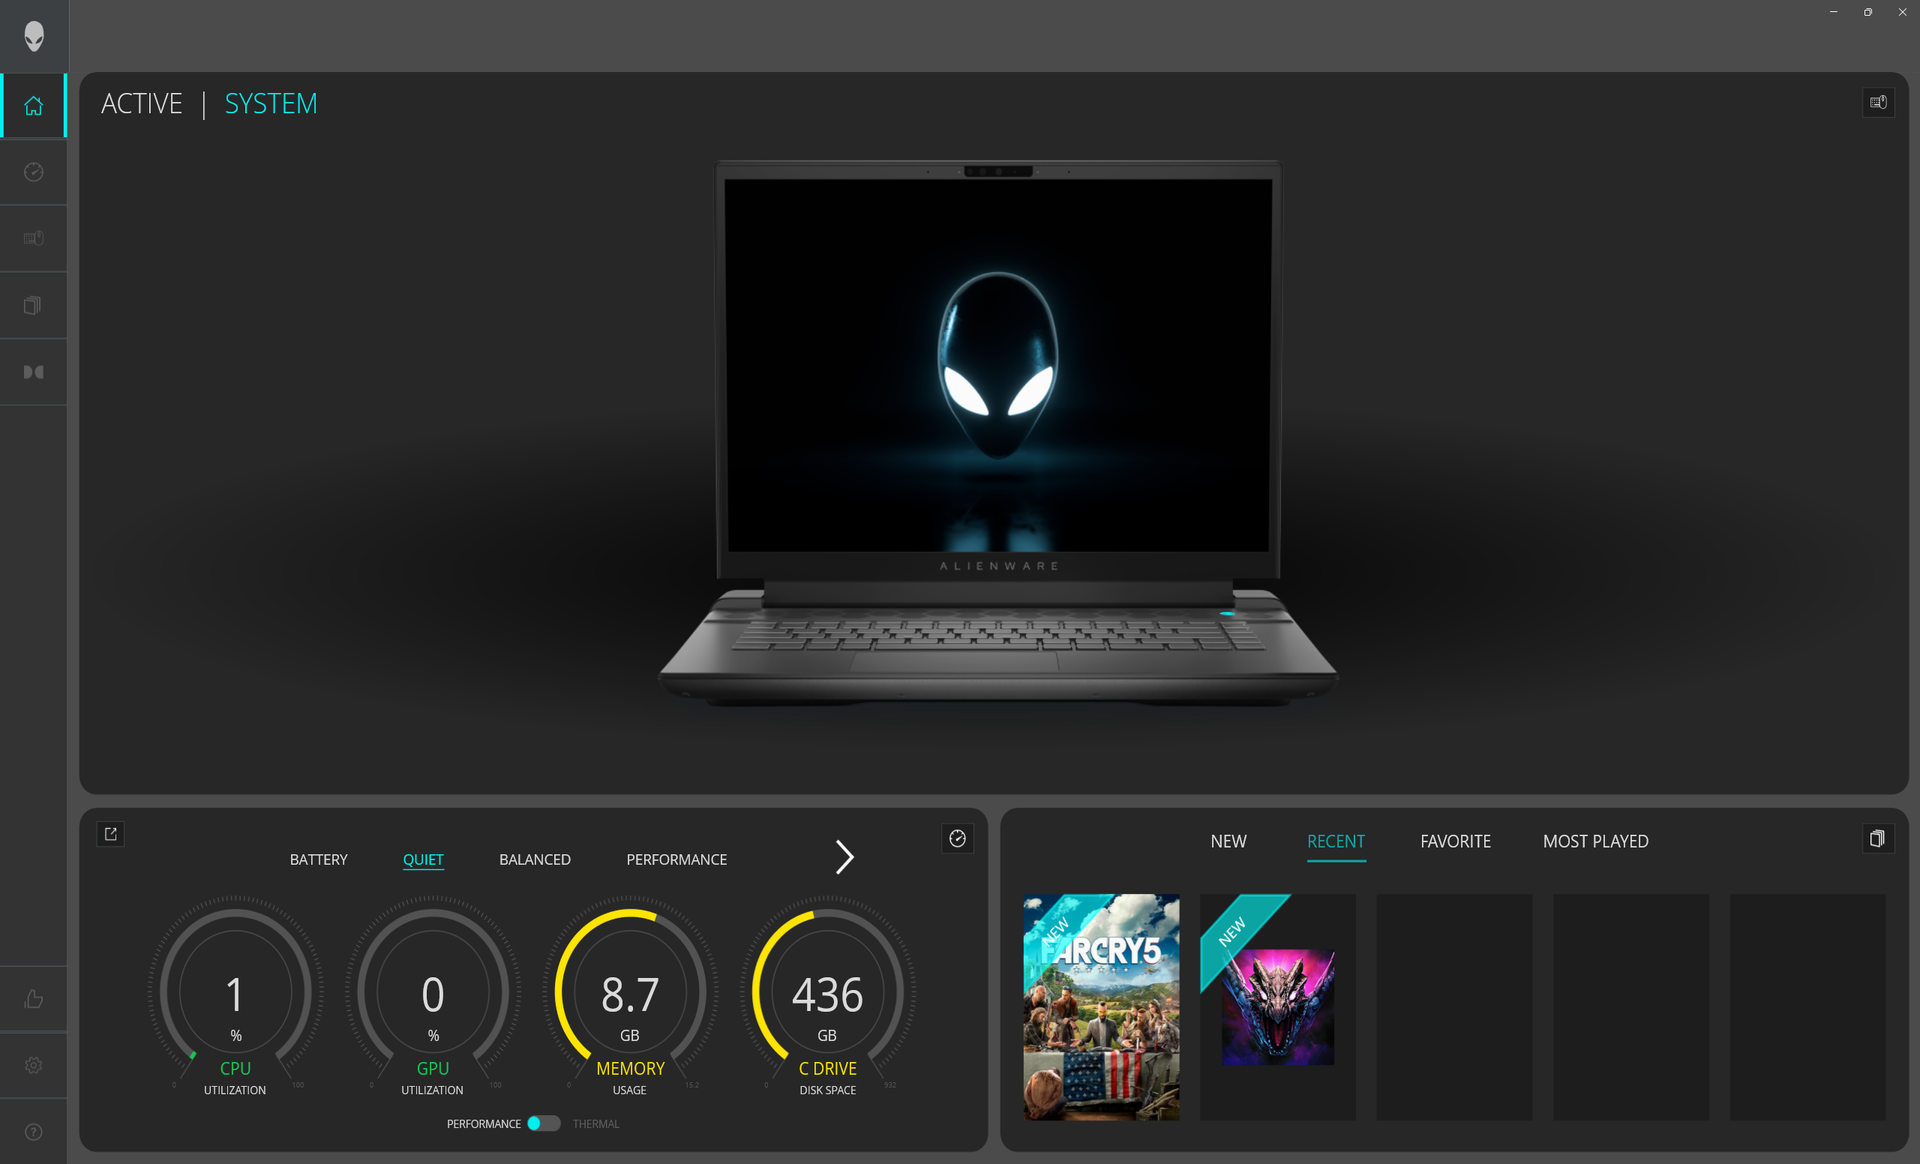
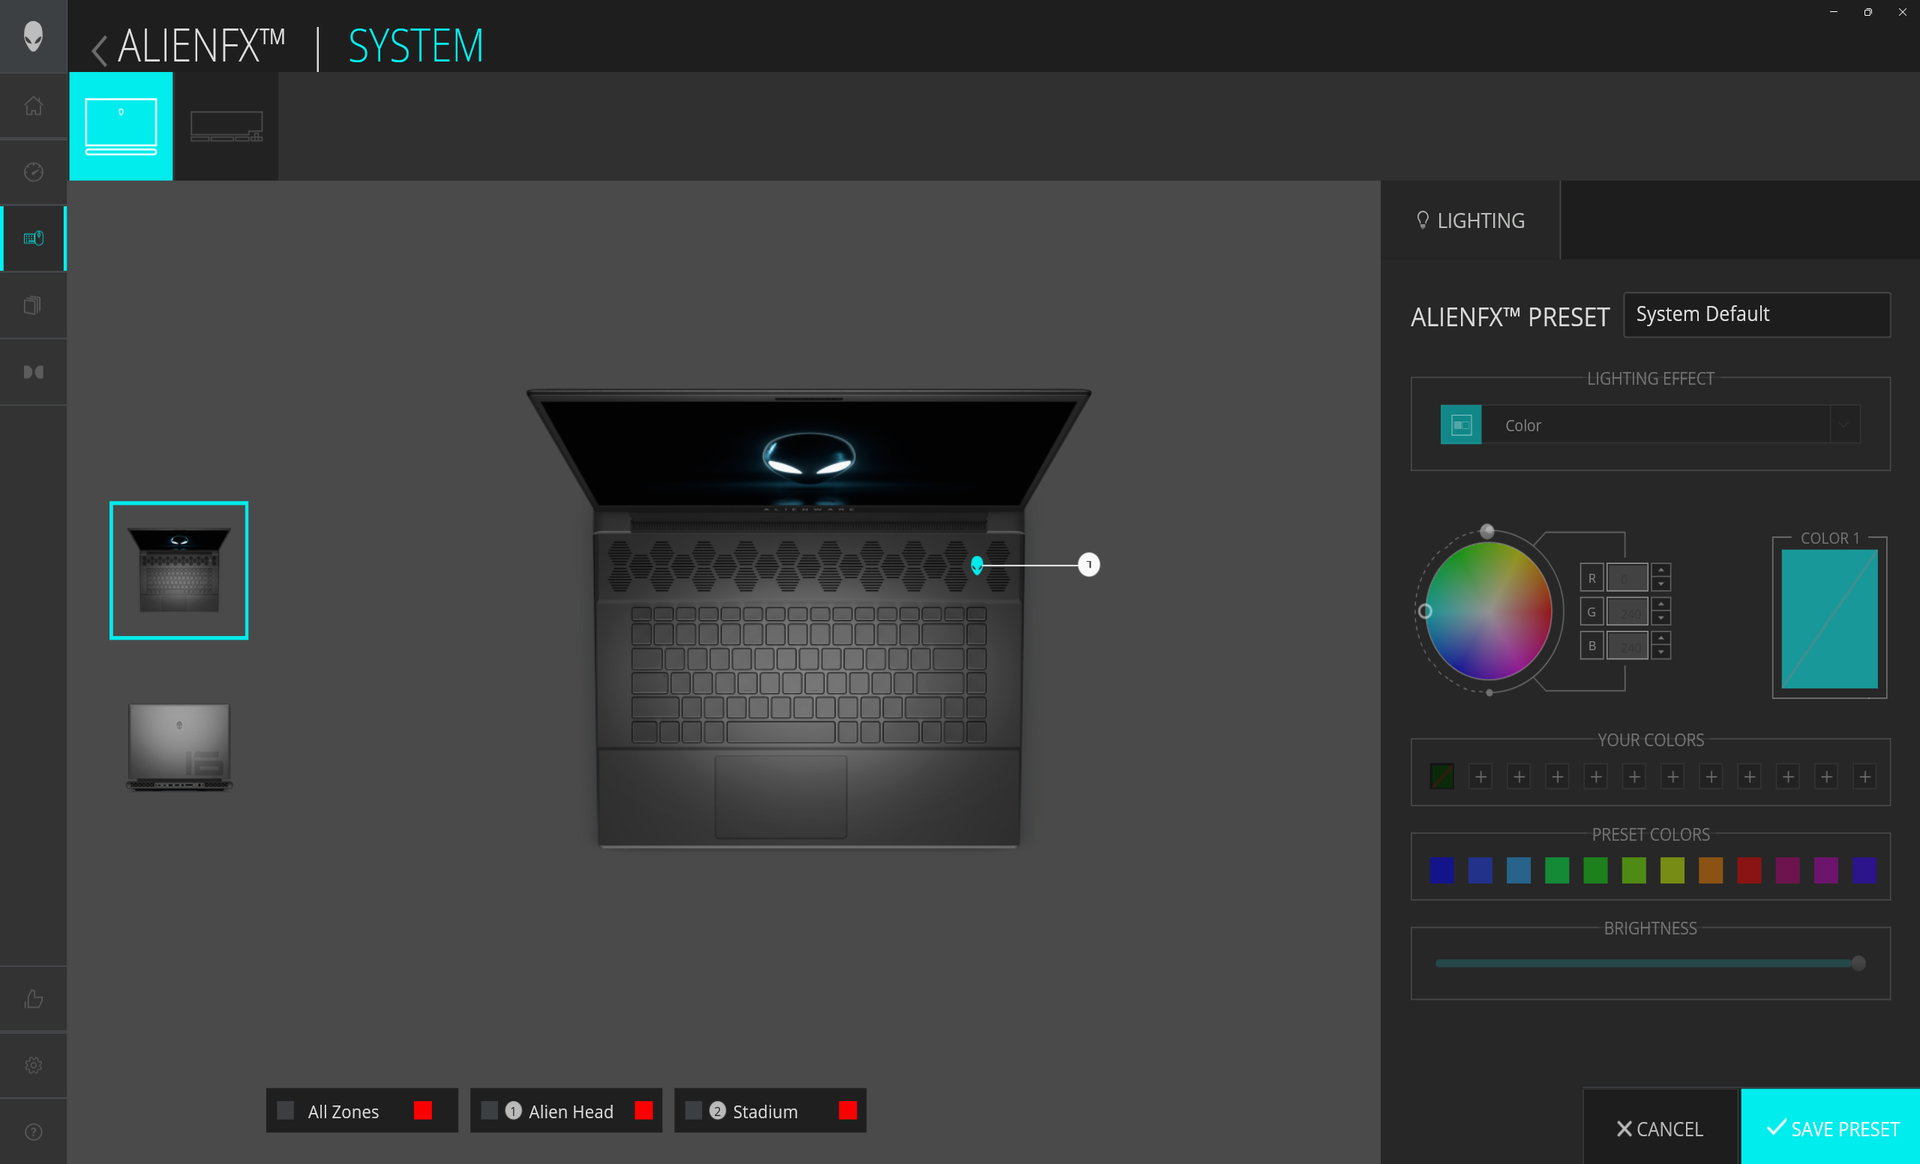
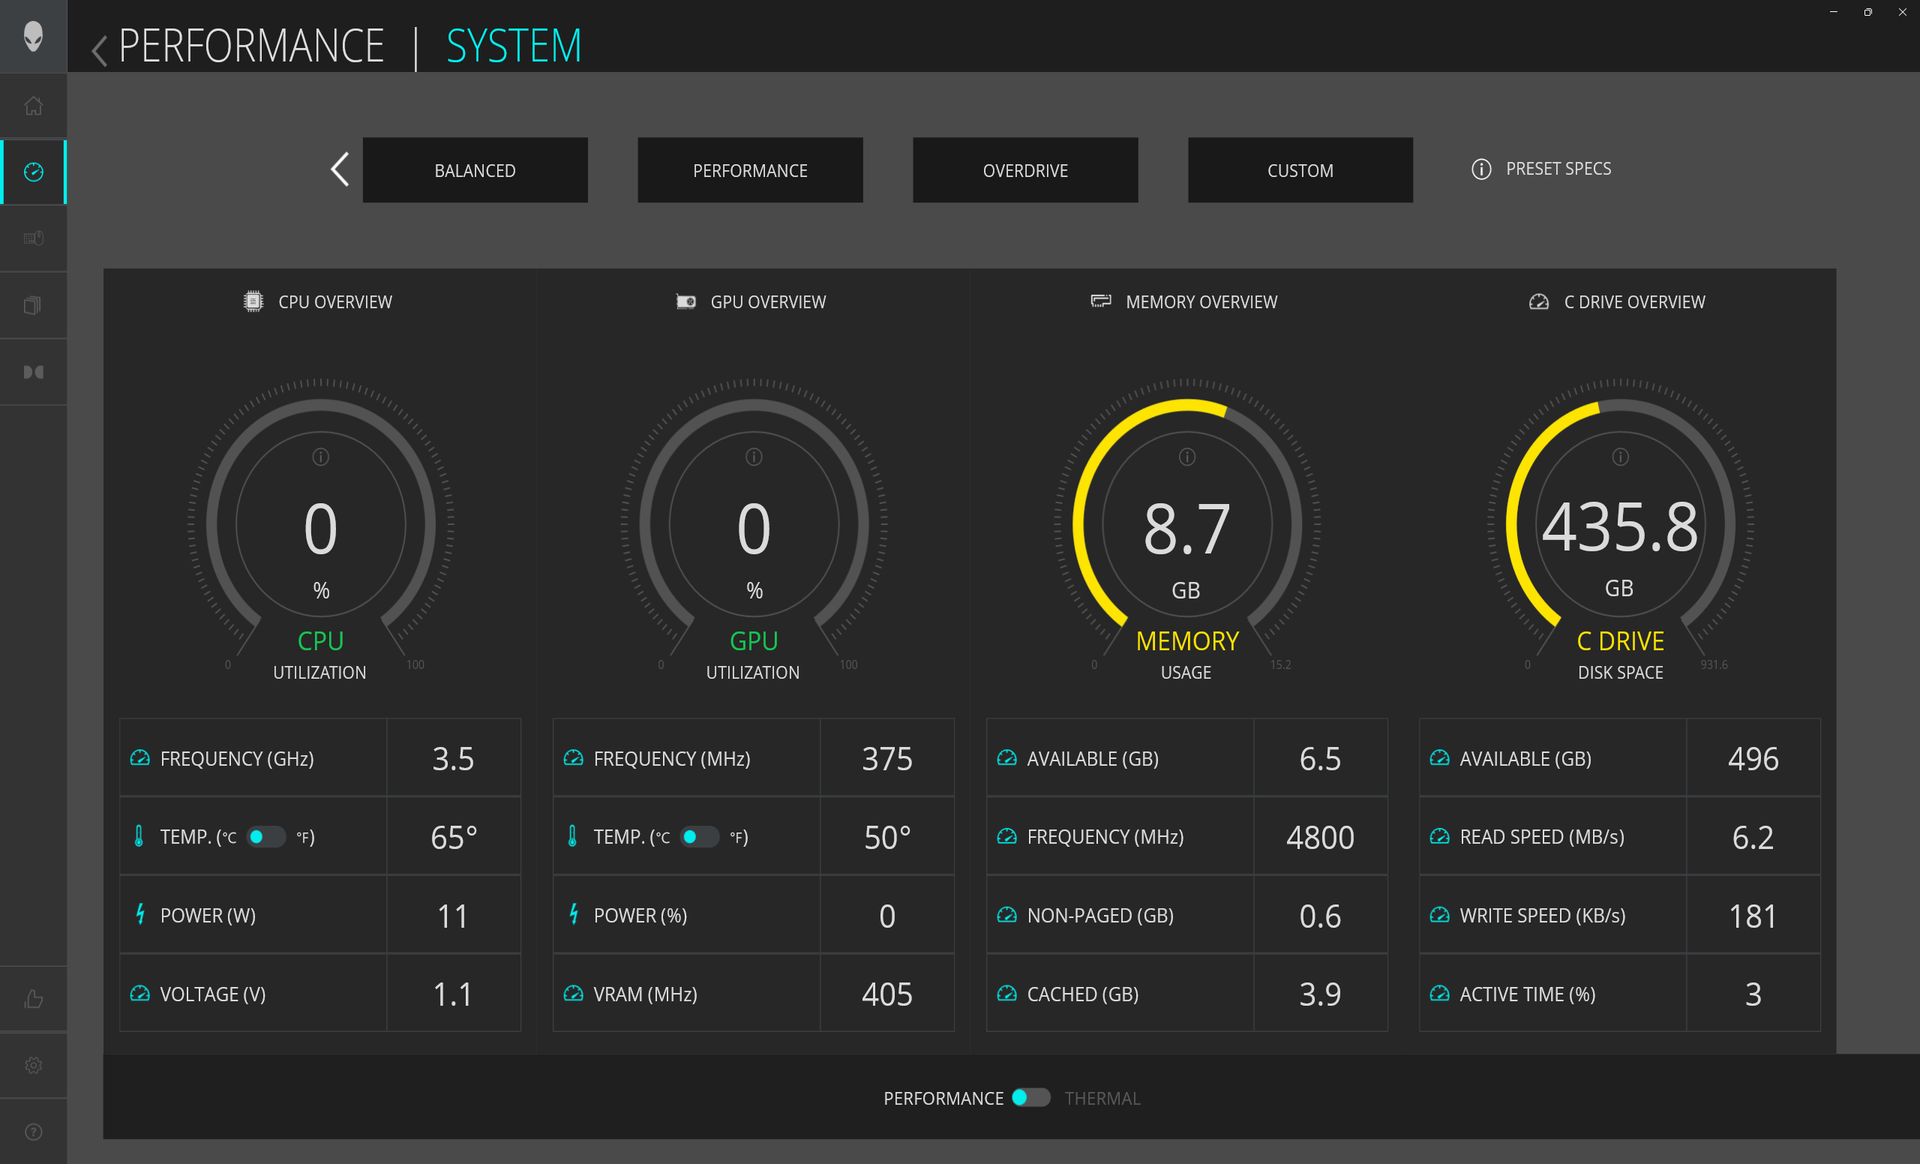
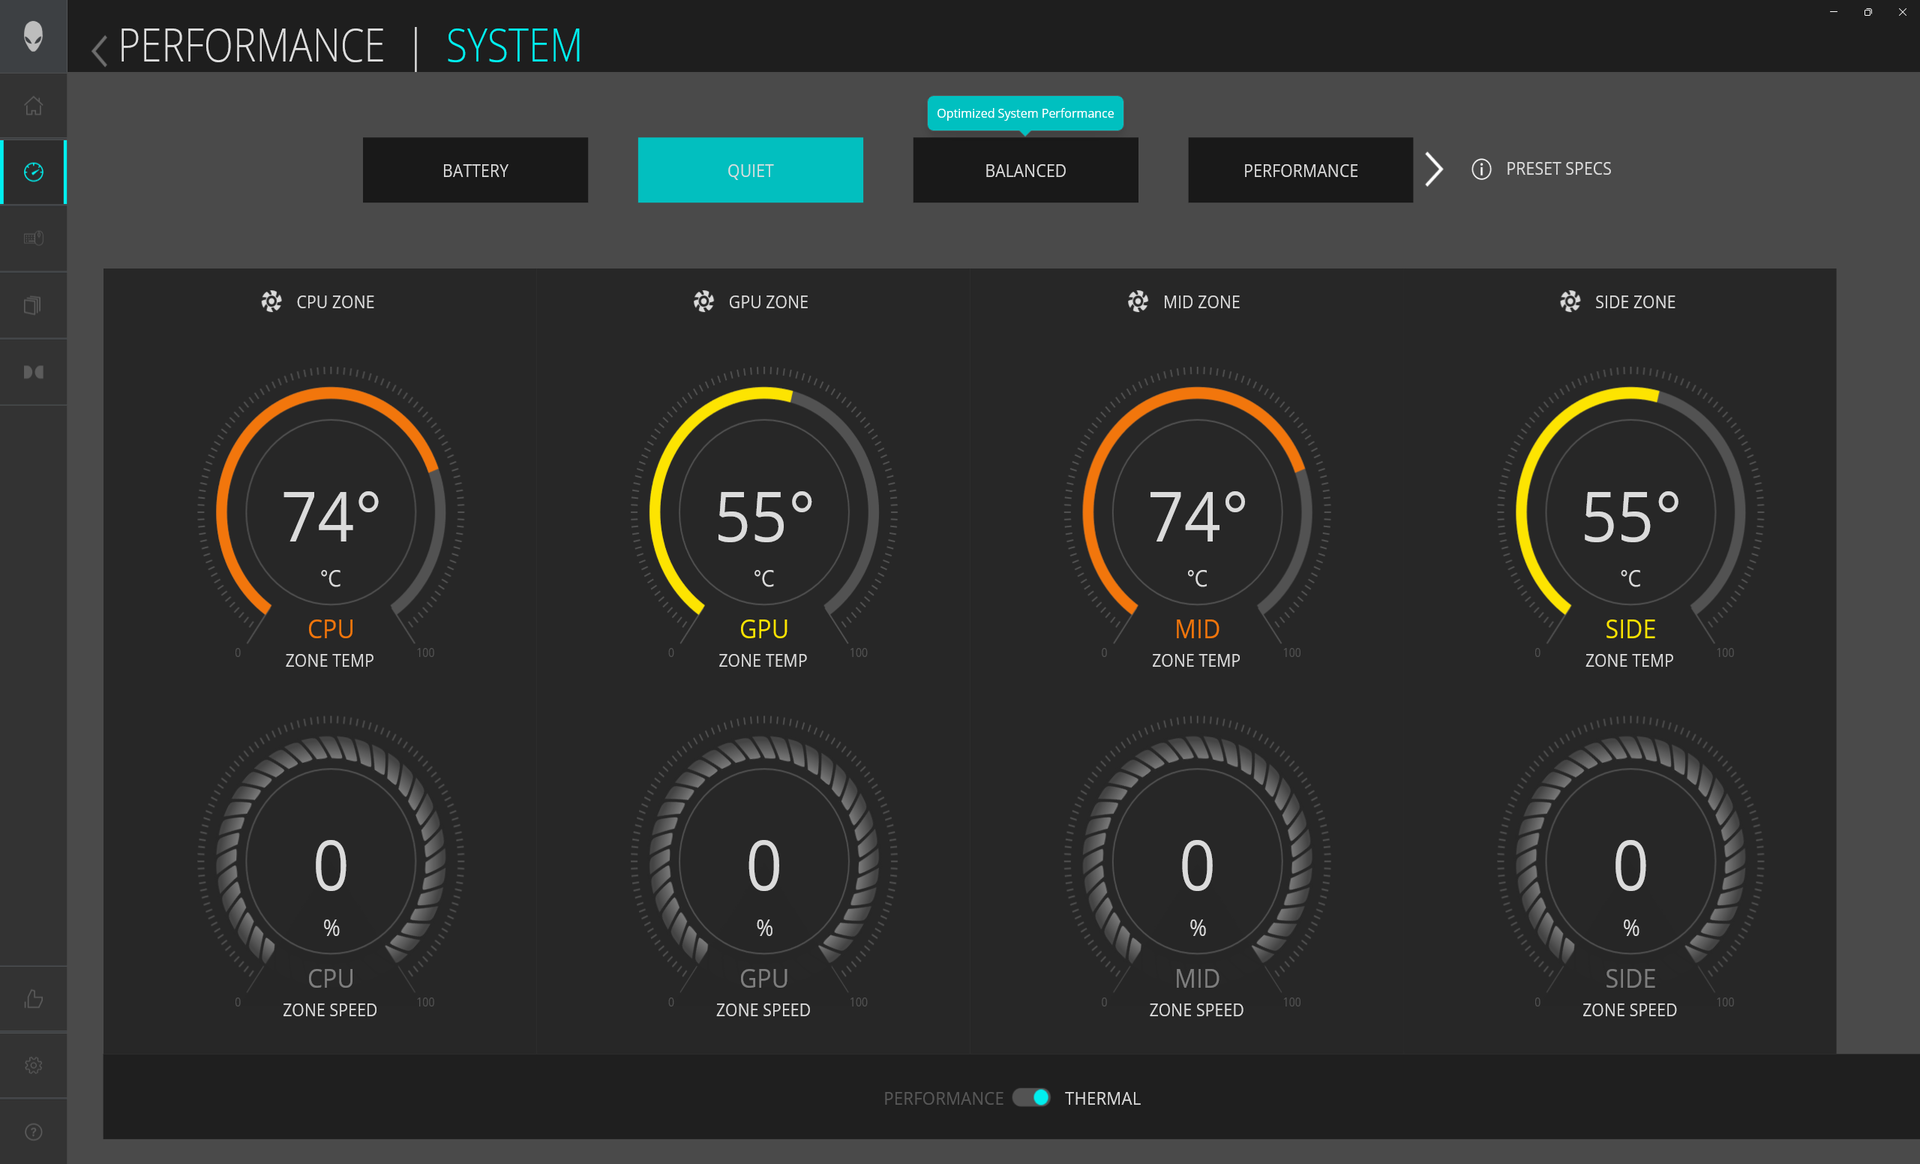
在运行下面的基准测试之前,我们通过 Alienware 命令中心将设备设置为 Overdrive 模式,并将 GPU 设置为 dGPU 模式。用户应该熟悉 "命令中心",因为它是与 "性能"、"生命体征 "和 "灯光 "相关的系统功能的控制中心。命令中心不应与 My Alienware 混淆,后者是保修和支持软件。
支持高级 Optimus 或 MUX。不过,AMD 版 Alienware m16 的内部显示屏不支持 G-Sync,因为该功能目前是英特尔版本独有的。取而代之的是支持 FreeSync。
处理器
性能 Ryzen 9 7845HX的性能更接近于令人印象深刻的 Ryzen 9 7945HX而不是 Ryzen 7 7745HX.多线程性能比 Ryzen 9 7945HX 约慢 20% 至 25%,比 Ryzen 7 7745HX 约快 50%。因此,该 CPU 与竞争对手 酷睿 i9-13900HX 但远远领先于 酷睿 i7-13700HX.选择 AMD 而不是英特尔,从而降低 CPU 性能的概念并不适用于这一代产品。
正如下面稳定的 Cinebench R15 xT 测试结果所示,性能的可持续性非常出色。
Cinebench R15 Multi Loop
Cinebench R23: Multi Core | Single Core
Cinebench R20: CPU (Multi Core) | CPU (Single Core)
Cinebench R15: CPU Multi 64Bit | CPU Single 64Bit
Blender: v2.79 BMW27 CPU
7-Zip 18.03: 7z b 4 | 7z b 4 -mmt1
Geekbench 5.5: Multi-Core | Single-Core
HWBOT x265 Benchmark v2.2: 4k Preset
LibreOffice : 20 Documents To PDF
R Benchmark 2.5: Overall mean
* ... smaller is better
AIDA64: FP32 Ray-Trace | FPU Julia | CPU SHA3 | CPU Queen | FPU SinJulia | FPU Mandel | CPU AES | CPU ZLib | FP64 Ray-Trace | CPU PhotoWorxx
| Performance rating | |
| Alienware m16 R1 AMD | |
| Average AMD Ryzen 9 7845HX | |
| Lenovo Legion Pro 7 RTX4090 | |
| Asus ROG Strix G16 G614JZ | |
| HP Omen Transcend 16 | |
| Razer Blade 16 Early 2023 | |
| Alienware x16 R1 | |
| AIDA64 / FP32 Ray-Trace | |
| Alienware m16 R1 AMD | |
| Average AMD Ryzen 9 7845HX (n=1) | |
| Asus ROG Strix G16 G614JZ | |
| Lenovo Legion Pro 7 RTX4090 | |
| Razer Blade 16 Early 2023 | |
| Razer Blade 16 Early 2023 | |
| Razer Blade 16 Early 2023 | |
| HP Omen Transcend 16 | |
| Alienware x16 R1 | |
| AIDA64 / FPU Julia | |
| Alienware m16 R1 AMD | |
| Average AMD Ryzen 9 7845HX (n=1) | |
| Lenovo Legion Pro 7 RTX4090 | |
| Asus ROG Strix G16 G614JZ | |
| Razer Blade 16 Early 2023 | |
| Razer Blade 16 Early 2023 | |
| Razer Blade 16 Early 2023 | |
| HP Omen Transcend 16 | |
| Alienware x16 R1 | |
| AIDA64 / CPU SHA3 | |
| Alienware m16 R1 AMD | |
| Average AMD Ryzen 9 7845HX (n=1) | |
| Lenovo Legion Pro 7 RTX4090 | |
| Asus ROG Strix G16 G614JZ | |
| Razer Blade 16 Early 2023 | |
| Razer Blade 16 Early 2023 | |
| Razer Blade 16 Early 2023 | |
| HP Omen Transcend 16 | |
| Alienware x16 R1 | |
| AIDA64 / CPU Queen | |
| Alienware m16 R1 AMD | |
| Average AMD Ryzen 9 7845HX (n=1) | |
| Asus ROG Strix G16 G614JZ | |
| Lenovo Legion Pro 7 RTX4090 | |
| Razer Blade 16 Early 2023 | |
| Razer Blade 16 Early 2023 | |
| HP Omen Transcend 16 | |
| Alienware x16 R1 | |
| AIDA64 / FPU SinJulia | |
| Alienware m16 R1 AMD | |
| Average AMD Ryzen 9 7845HX (n=1) | |
| Asus ROG Strix G16 G614JZ | |
| Razer Blade 16 Early 2023 | |
| Razer Blade 16 Early 2023 | |
| Razer Blade 16 Early 2023 | |
| Lenovo Legion Pro 7 RTX4090 | |
| HP Omen Transcend 16 | |
| Alienware x16 R1 | |
| AIDA64 / FPU Mandel | |
| Alienware m16 R1 AMD | |
| Average AMD Ryzen 9 7845HX (n=1) | |
| Lenovo Legion Pro 7 RTX4090 | |
| Asus ROG Strix G16 G614JZ | |
| Razer Blade 16 Early 2023 | |
| Razer Blade 16 Early 2023 | |
| Razer Blade 16 Early 2023 | |
| HP Omen Transcend 16 | |
| Alienware x16 R1 | |
| AIDA64 / CPU ZLib | |
| Lenovo Legion Pro 7 RTX4090 | |
| Asus ROG Strix G16 G614JZ | |
| Razer Blade 16 Early 2023 | |
| Razer Blade 16 Early 2023 | |
| Razer Blade 16 Early 2023 | |
| Alienware m16 R1 AMD | |
| Average AMD Ryzen 9 7845HX (n=1) | |
| HP Omen Transcend 16 | |
| Alienware x16 R1 | |
| AIDA64 / FP64 Ray-Trace | |
| Alienware m16 R1 AMD | |
| Average AMD Ryzen 9 7845HX (n=1) | |
| Asus ROG Strix G16 G614JZ | |
| Lenovo Legion Pro 7 RTX4090 | |
| Razer Blade 16 Early 2023 | |
| Razer Blade 16 Early 2023 | |
| Razer Blade 16 Early 2023 | |
| HP Omen Transcend 16 | |
| Alienware x16 R1 | |
| AIDA64 / CPU PhotoWorxx | |
| Razer Blade 16 Early 2023 | |
| Razer Blade 16 Early 2023 | |
| Razer Blade 16 Early 2023 | |
| Lenovo Legion Pro 7 RTX4090 | |
| HP Omen Transcend 16 | |
| Alienware x16 R1 | |
| Asus ROG Strix G16 G614JZ | |
| Alienware m16 R1 AMD | |
| Average AMD Ryzen 9 7845HX (n=1) | |
系统性能
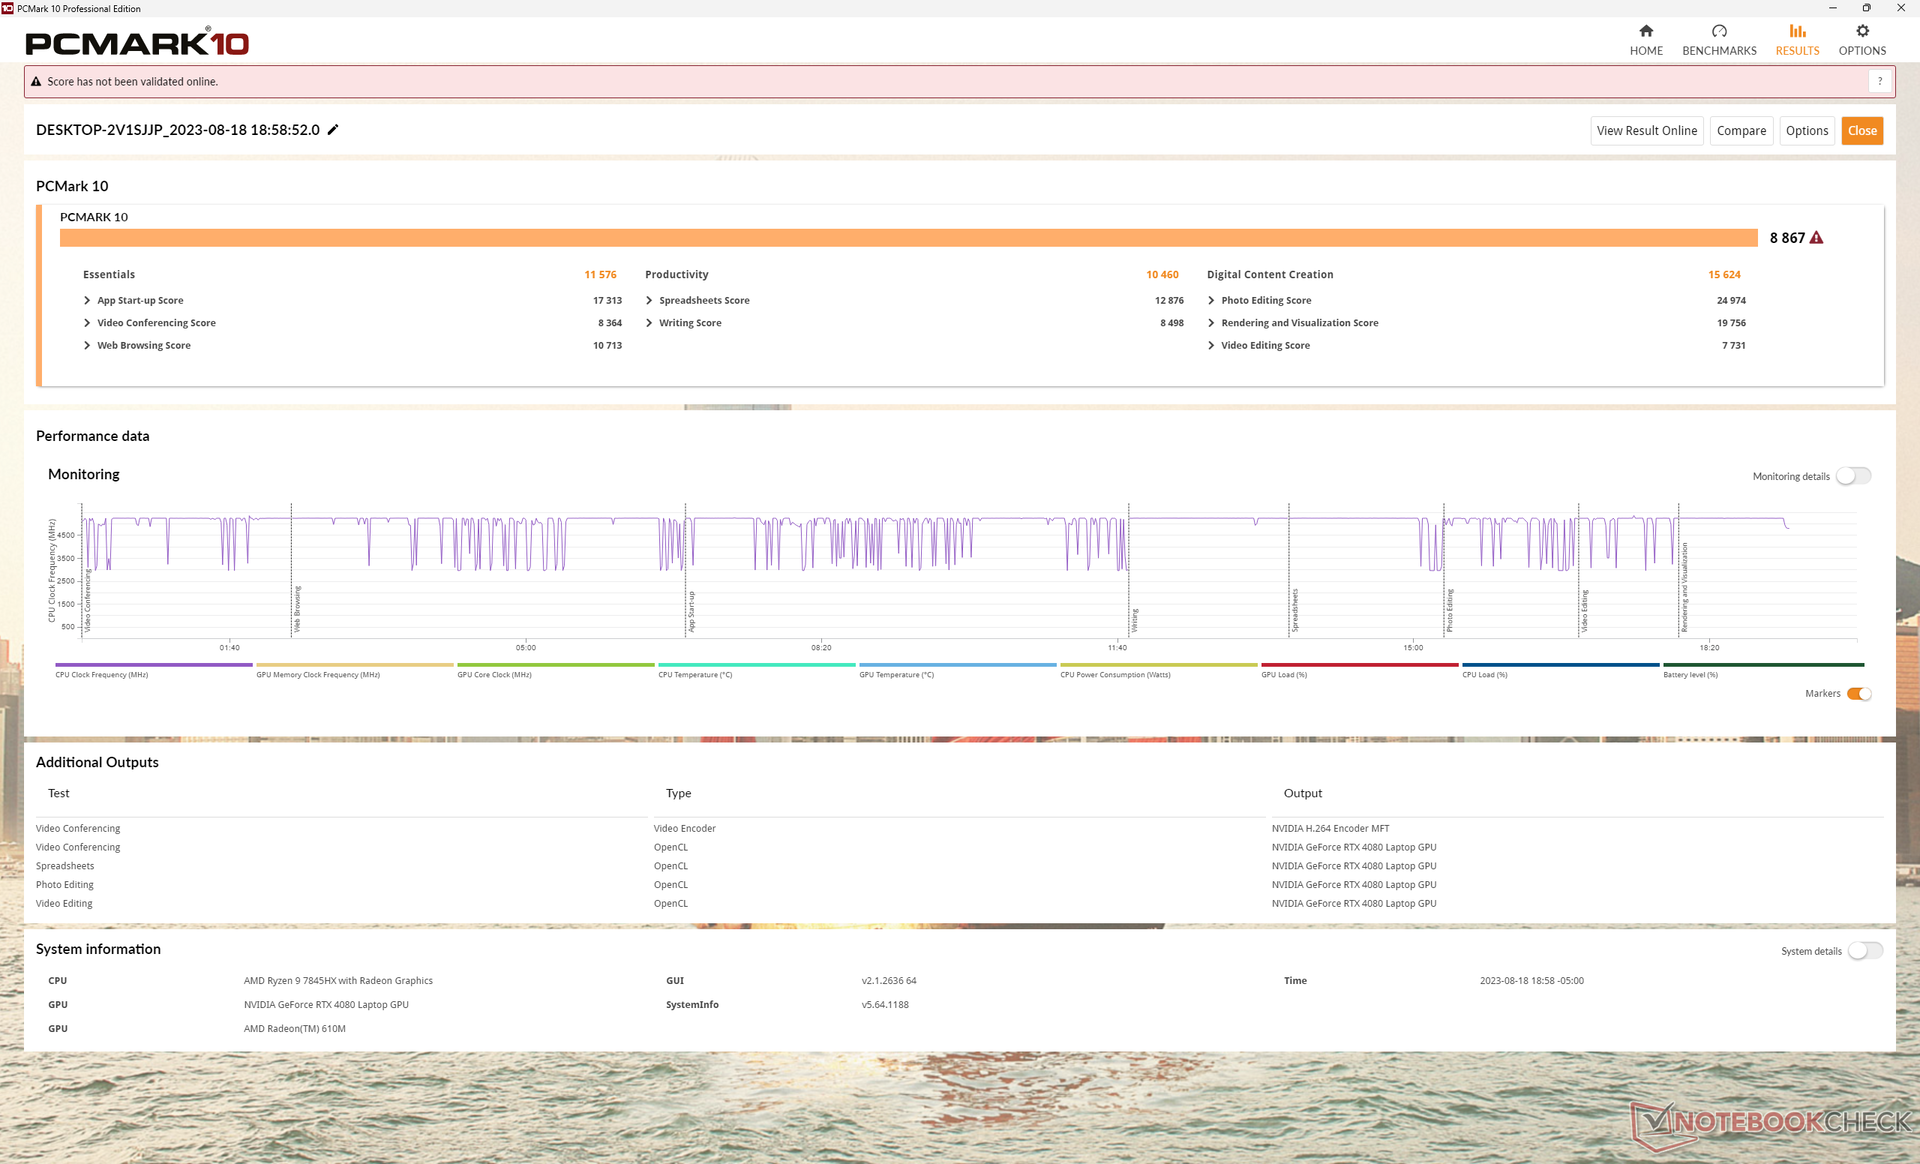
PCMark 分数是所有游戏笔记本电脑中最高的。差距最大的是专注于 CPU 性能的 Productivity 子测试。
遗憾的是,我们在测试设备上遇到了几个从睡眠中唤醒的问题。即使在评测时更新了戴尔和 Nvidia 的最新驱动程序,系统有时还是会在打开盖子时无故重启或显示蓝屏死机。
CrossMark: Overall | Productivity | Creativity | Responsiveness
| PCMark 10 / Score | |
| Alienware m16 R1 AMD | |
| Average AMD Ryzen 9 7845HX, NVIDIA GeForce RTX 4080 Laptop GPU (n=1) | |
| Alienware x16 R1 | |
| Lenovo Legion Pro 7 RTX4090 | |
| HP Omen Transcend 16 | |
| Razer Blade 16 Early 2023 | |
| Asus ROG Strix G16 G614JZ | |
| PCMark 10 / Essentials | |
| Asus ROG Strix G16 G614JZ | |
| Alienware m16 R1 AMD | |
| Average AMD Ryzen 9 7845HX, NVIDIA GeForce RTX 4080 Laptop GPU (n=1) | |
| HP Omen Transcend 16 | |
| Alienware x16 R1 | |
| Lenovo Legion Pro 7 RTX4090 | |
| Razer Blade 16 Early 2023 | |
| PCMark 10 / Productivity | |
| Alienware m16 R1 AMD | |
| Average AMD Ryzen 9 7845HX, NVIDIA GeForce RTX 4080 Laptop GPU (n=1) | |
| Alienware x16 R1 | |
| HP Omen Transcend 16 | |
| Lenovo Legion Pro 7 RTX4090 | |
| Razer Blade 16 Early 2023 | |
| Asus ROG Strix G16 G614JZ | |
| PCMark 10 / Digital Content Creation | |
| Alienware m16 R1 AMD | |
| Average AMD Ryzen 9 7845HX, NVIDIA GeForce RTX 4080 Laptop GPU (n=1) | |
| Lenovo Legion Pro 7 RTX4090 | |
| Razer Blade 16 Early 2023 | |
| Alienware x16 R1 | |
| HP Omen Transcend 16 | |
| Asus ROG Strix G16 G614JZ | |
| CrossMark / Overall | |
| Asus ROG Strix G16 G614JZ | |
| Alienware m16 R1 AMD | |
| Average AMD Ryzen 9 7845HX, NVIDIA GeForce RTX 4080 Laptop GPU (n=1) | |
| HP Omen Transcend 16 | |
| Alienware x16 R1 | |
| Razer Blade 16 Early 2023 | |
| CrossMark / Productivity | |
| Asus ROG Strix G16 G614JZ | |
| Alienware m16 R1 AMD | |
| Average AMD Ryzen 9 7845HX, NVIDIA GeForce RTX 4080 Laptop GPU (n=1) | |
| Alienware x16 R1 | |
| HP Omen Transcend 16 | |
| Razer Blade 16 Early 2023 | |
| CrossMark / Creativity | |
| Asus ROG Strix G16 G614JZ | |
| HP Omen Transcend 16 | |
| Alienware m16 R1 AMD | |
| Average AMD Ryzen 9 7845HX, NVIDIA GeForce RTX 4080 Laptop GPU (n=1) | |
| Alienware x16 R1 | |
| Razer Blade 16 Early 2023 | |
| CrossMark / Responsiveness | |
| Asus ROG Strix G16 G614JZ | |
| Alienware x16 R1 | |
| Alienware m16 R1 AMD | |
| Average AMD Ryzen 9 7845HX, NVIDIA GeForce RTX 4080 Laptop GPU (n=1) | |
| HP Omen Transcend 16 | |
| Razer Blade 16 Early 2023 | |
| PCMark 10 Score | 8867 points | |
Help | ||
| AIDA64 / Memory Copy | |
| Razer Blade 16 Early 2023 | |
| Razer Blade 16 Early 2023 | |
| Razer Blade 16 Early 2023 | |
| Lenovo Legion Pro 7 RTX4090 | |
| HP Omen Transcend 16 | |
| Alienware x16 R1 | |
| Asus ROG Strix G16 G614JZ | |
| Alienware m16 R1 AMD | |
| Average AMD Ryzen 9 7845HX (n=1) | |
| AIDA64 / Memory Read | |
| Lenovo Legion Pro 7 RTX4090 | |
| Razer Blade 16 Early 2023 | |
| Razer Blade 16 Early 2023 | |
| Razer Blade 16 Early 2023 | |
| HP Omen Transcend 16 | |
| Asus ROG Strix G16 G614JZ | |
| Alienware x16 R1 | |
| Alienware m16 R1 AMD | |
| Average AMD Ryzen 9 7845HX (n=1) | |
| AIDA64 / Memory Write | |
| Alienware x16 R1 | |
| Razer Blade 16 Early 2023 | |
| Razer Blade 16 Early 2023 | |
| Razer Blade 16 Early 2023 | |
| Lenovo Legion Pro 7 RTX4090 | |
| HP Omen Transcend 16 | |
| Asus ROG Strix G16 G614JZ | |
| Alienware m16 R1 AMD | |
| Average AMD Ryzen 9 7845HX (n=1) | |
| AIDA64 / Memory Latency | |
| Alienware x16 R1 | |
| Razer Blade 16 Early 2023 | |
| Razer Blade 16 Early 2023 | |
| Razer Blade 16 Early 2023 | |
| Alienware m16 R1 AMD | |
| Average AMD Ryzen 9 7845HX (n=1) | |
| HP Omen Transcend 16 | |
| Asus ROG Strix G16 G614JZ | |
| Lenovo Legion Pro 7 RTX4090 | |
* ... smaller is better
DPC 延迟
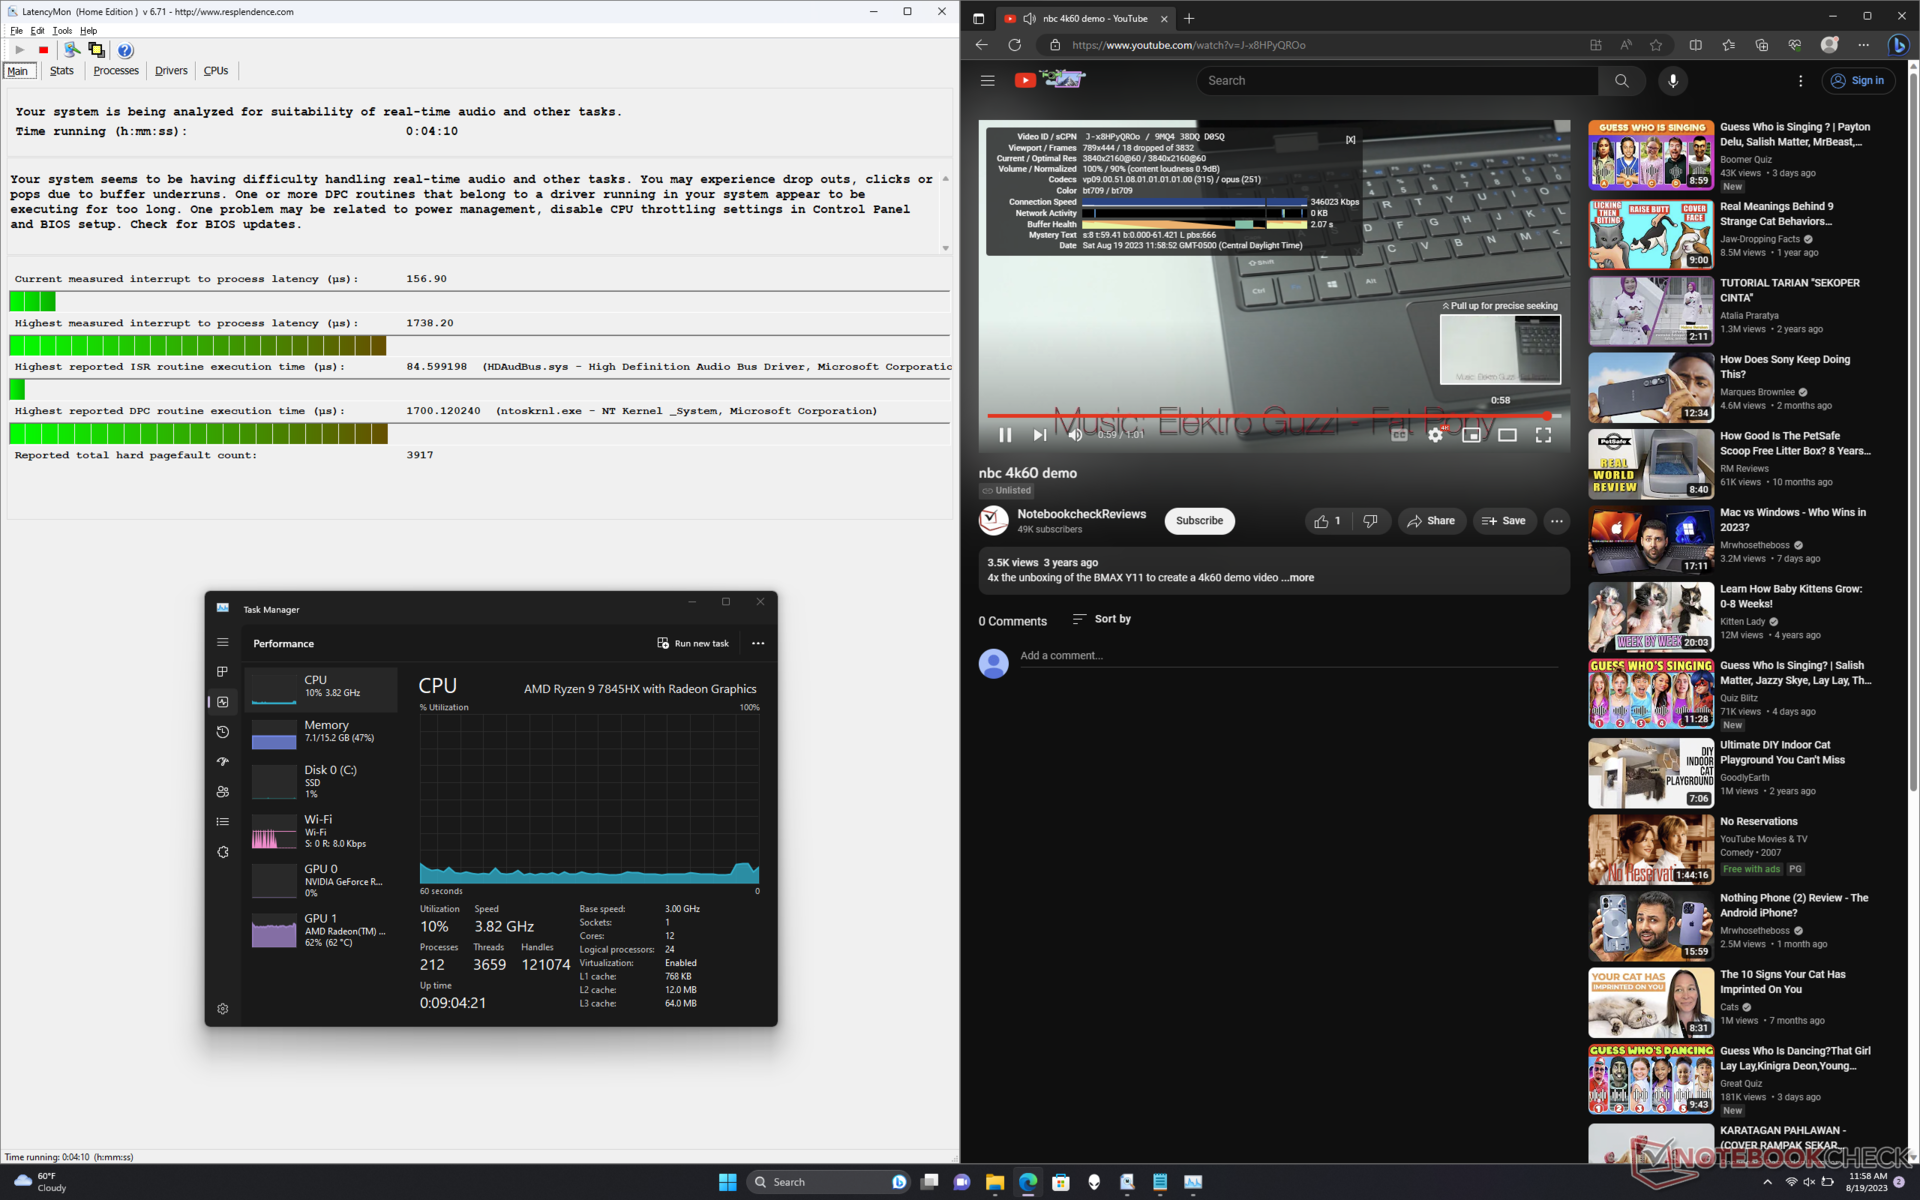
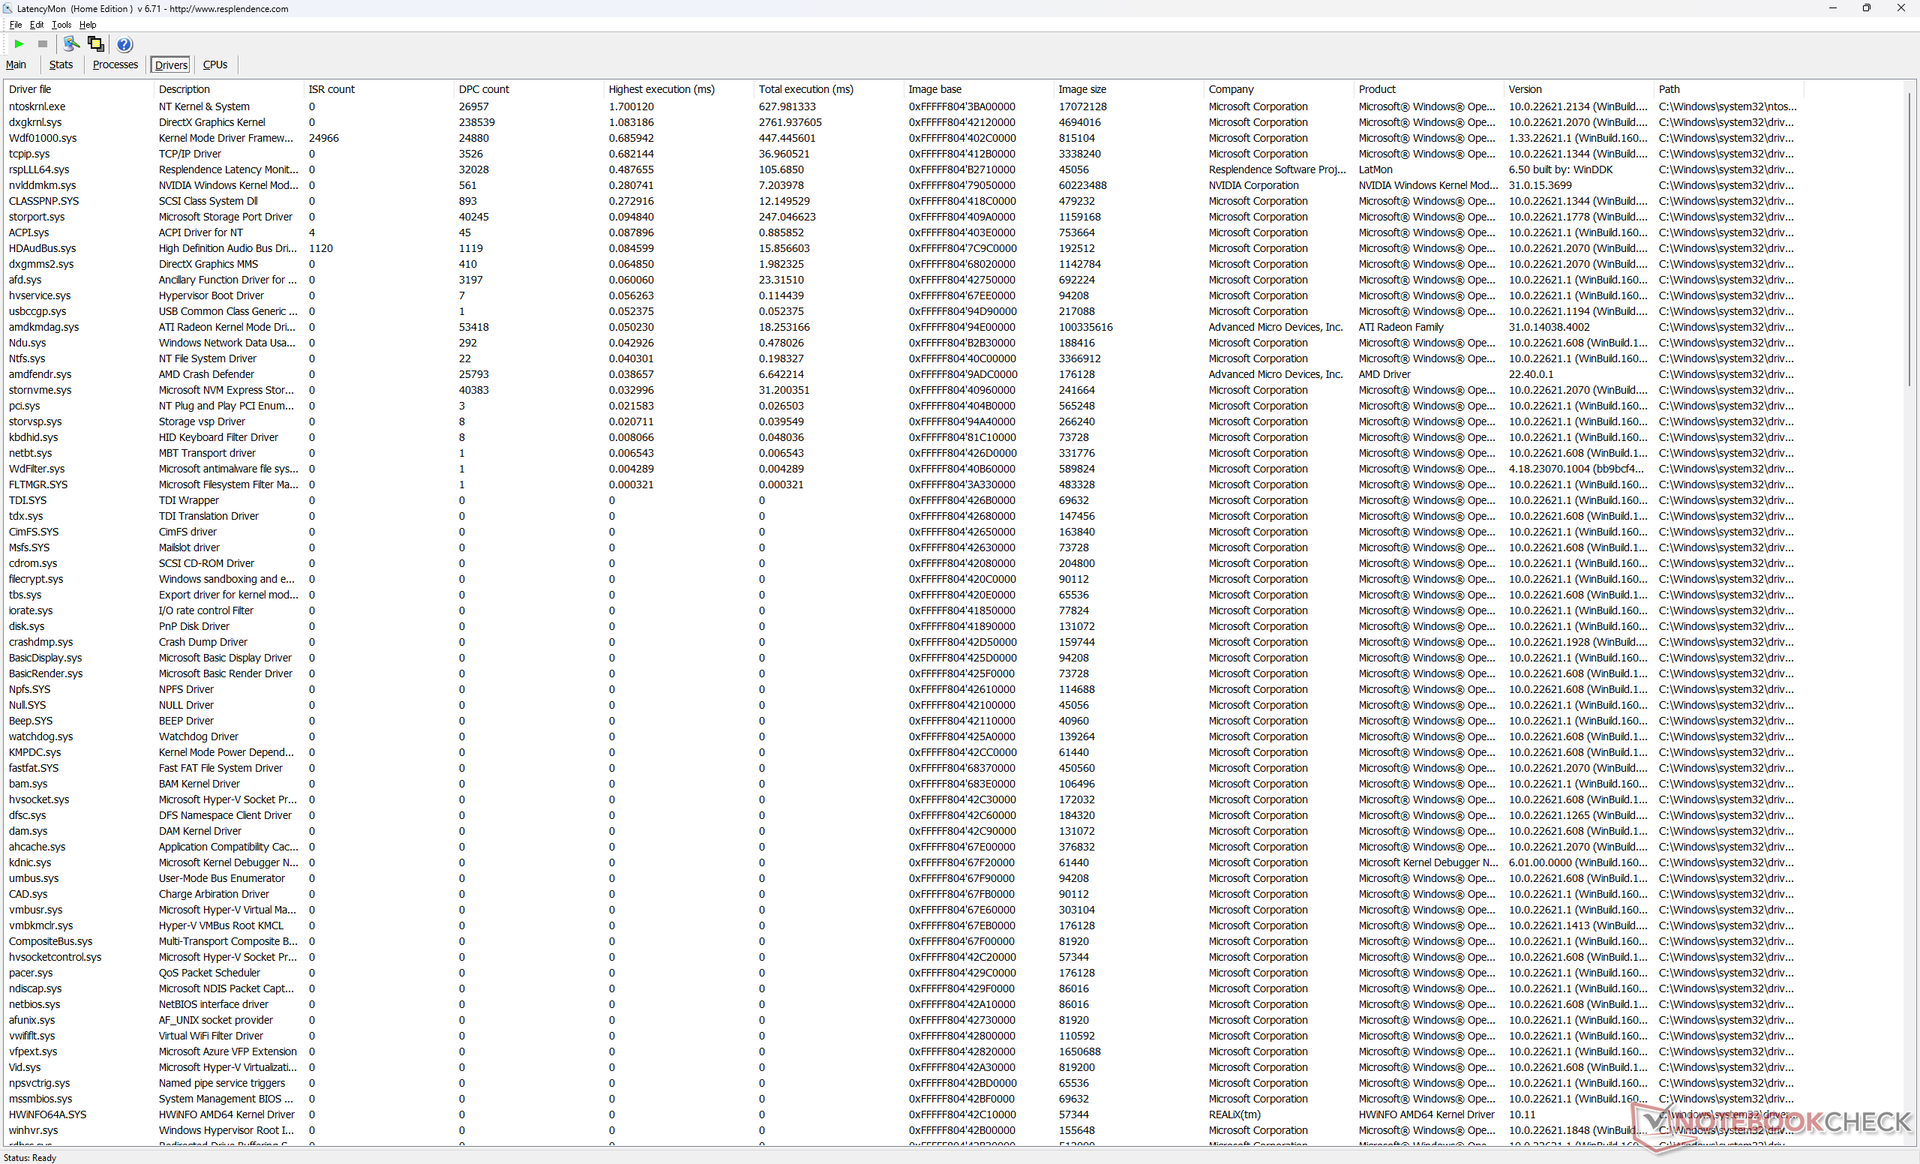
LatencyMon 显示了与 ntoskrnl.exe 有关的轻微 DPC 问题。此外,60 FPS 的 4K 视频回放也不完美,在一分钟的视频测试中记录到 18 个丢帧,表明 AMD 硬件加速存在潜在错误。即使重复测试,结果也没有改善。
| DPC Latencies / LatencyMon - interrupt to process latency (max), Web, Youtube, Prime95 | |
| Lenovo Legion Pro 7 RTX4090 | |
| Asus ROG Strix G16 G614JZ | |
| Razer Blade 16 Early 2023 | |
| Alienware m16 R1 AMD | |
| HP Omen Transcend 16 | |
| Alienware x16 R1 | |
* ... smaller is better
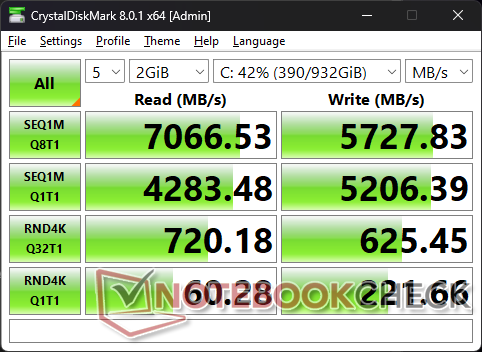
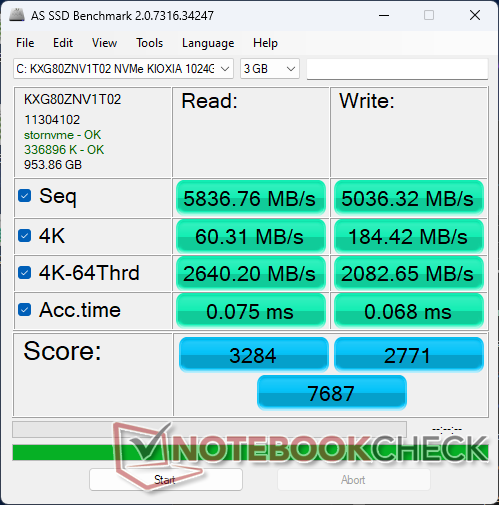
存储设备
我们的设备配备了高端 1 TB KXG80ZNV1T02据制造商称,它的连续读写速度分别高达 7000 MB/s 和 5600 MB/s。该硬盘能够长时间维持超过 6500 MB/s 的最大传输速率,且不会出现节流问题。
Alienware x16 和 HP Omen 16 最多可安装三个 M.2 固态硬盘。 惠普 Omen 16则最多只能支持两个。不过,第三块硬盘的长度必须为 30 毫米。

| Drive Performance rating - Percent | |
| Alienware x16 R1 | |
| Lenovo Legion Pro 7 RTX4090 | |
| Alienware m16 R1 AMD | |
| Razer Blade 16 Early 2023 | |
| HP Omen Transcend 16 | |
| Asus ROG Strix G16 G614JZ | |
* ... smaller is better
Disk Throttling: DiskSpd Read Loop, Queue Depth 8
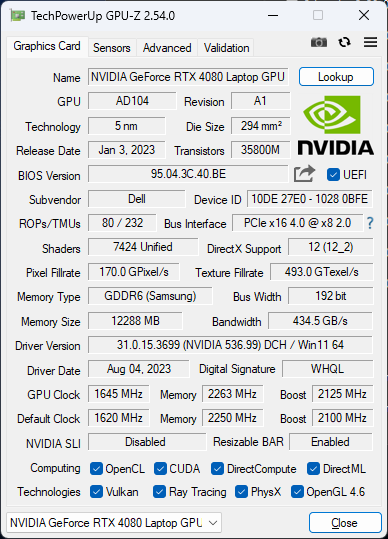
图形处理器性能 - 175 W TGP 图形处理器
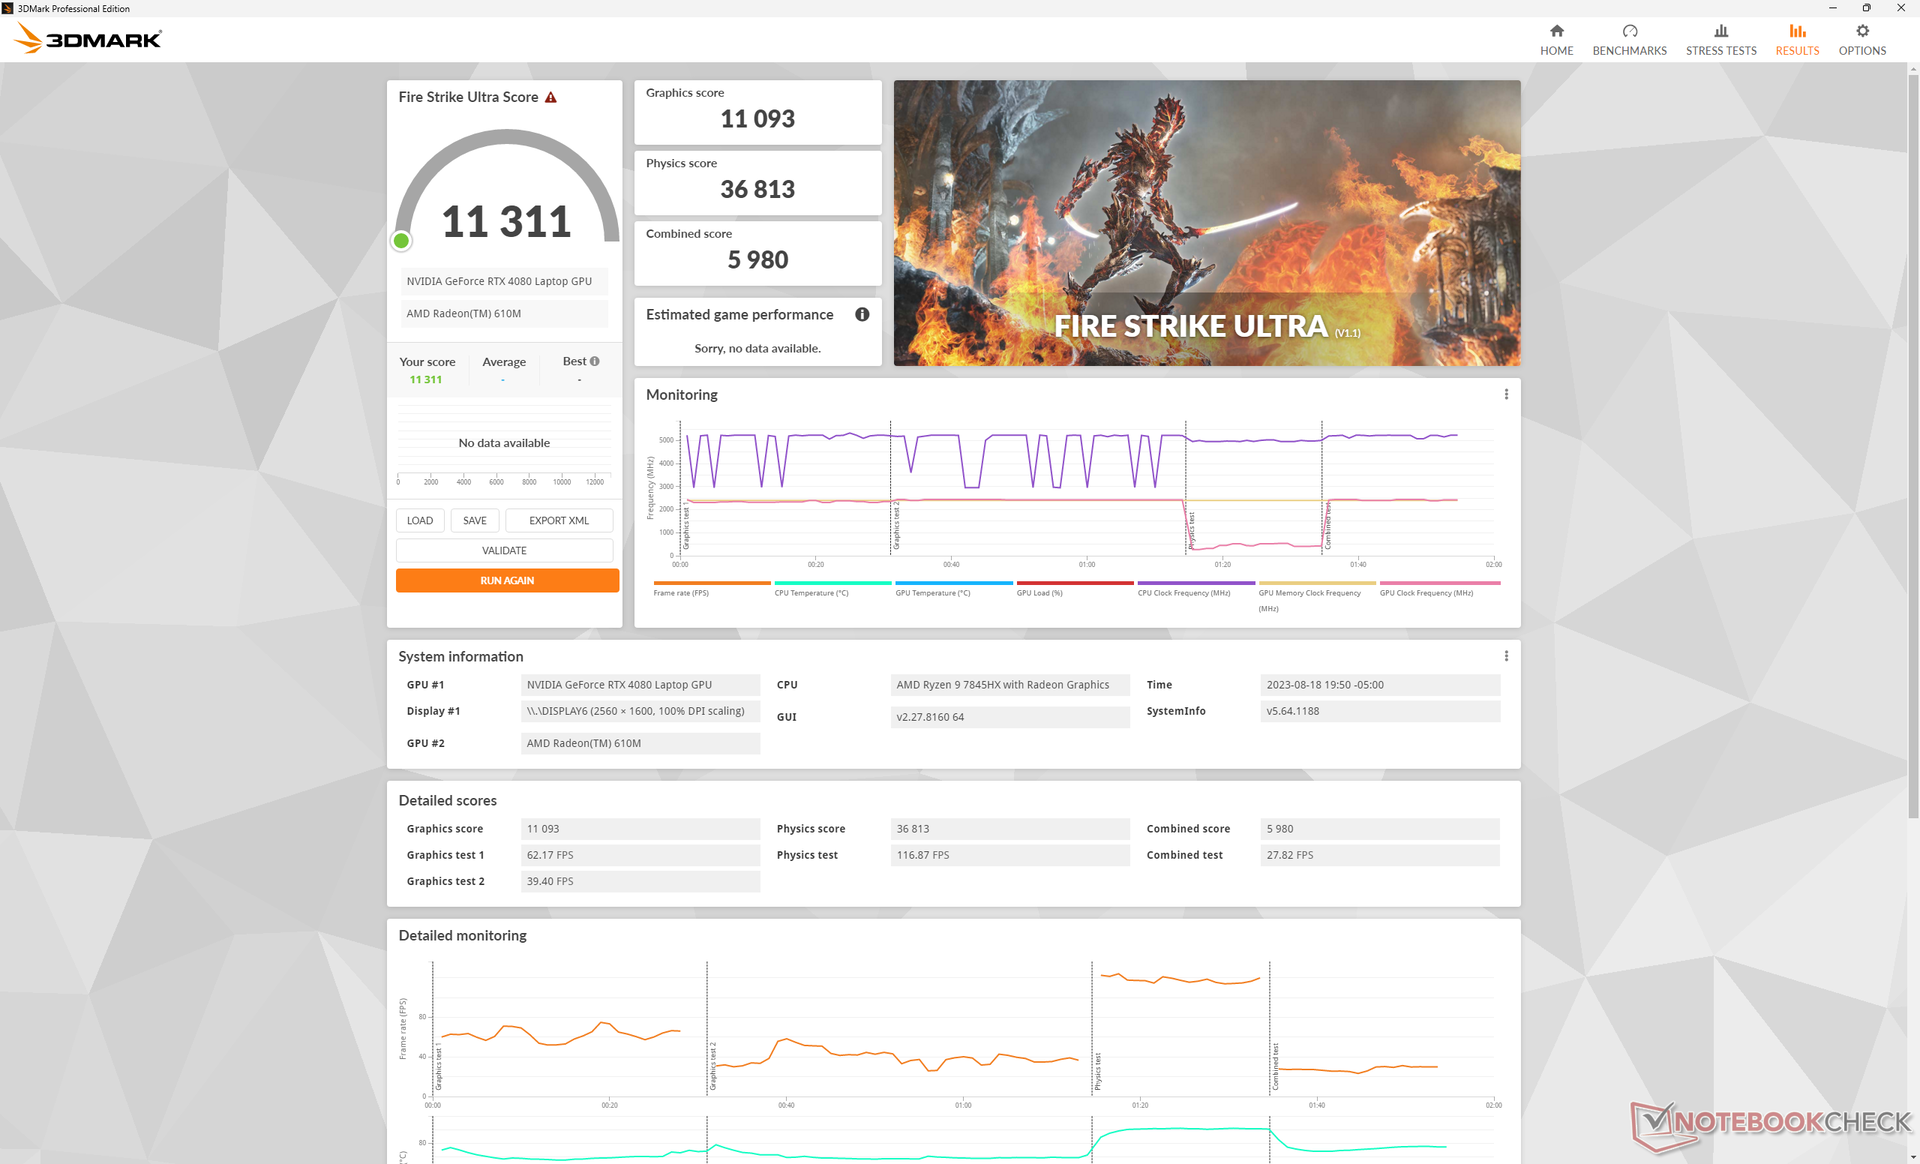
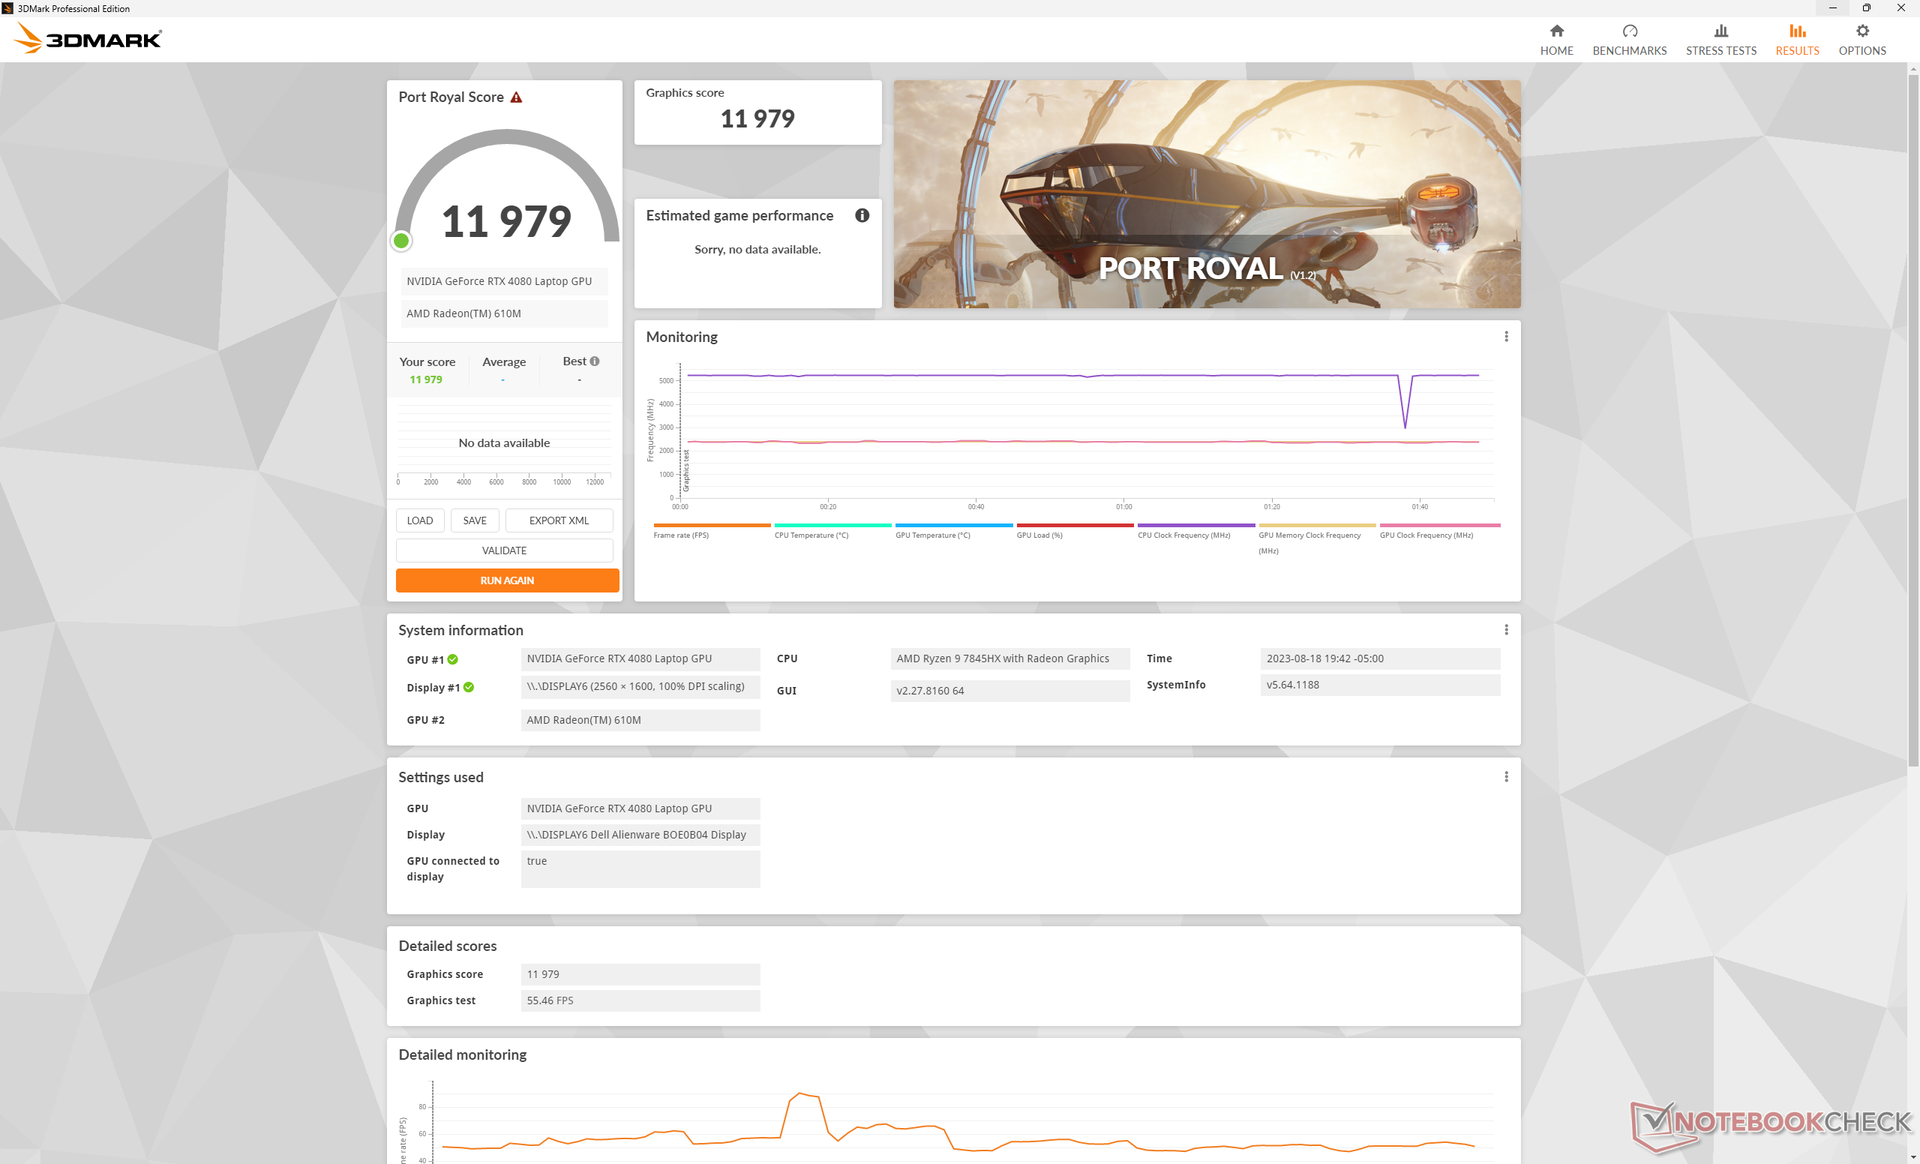
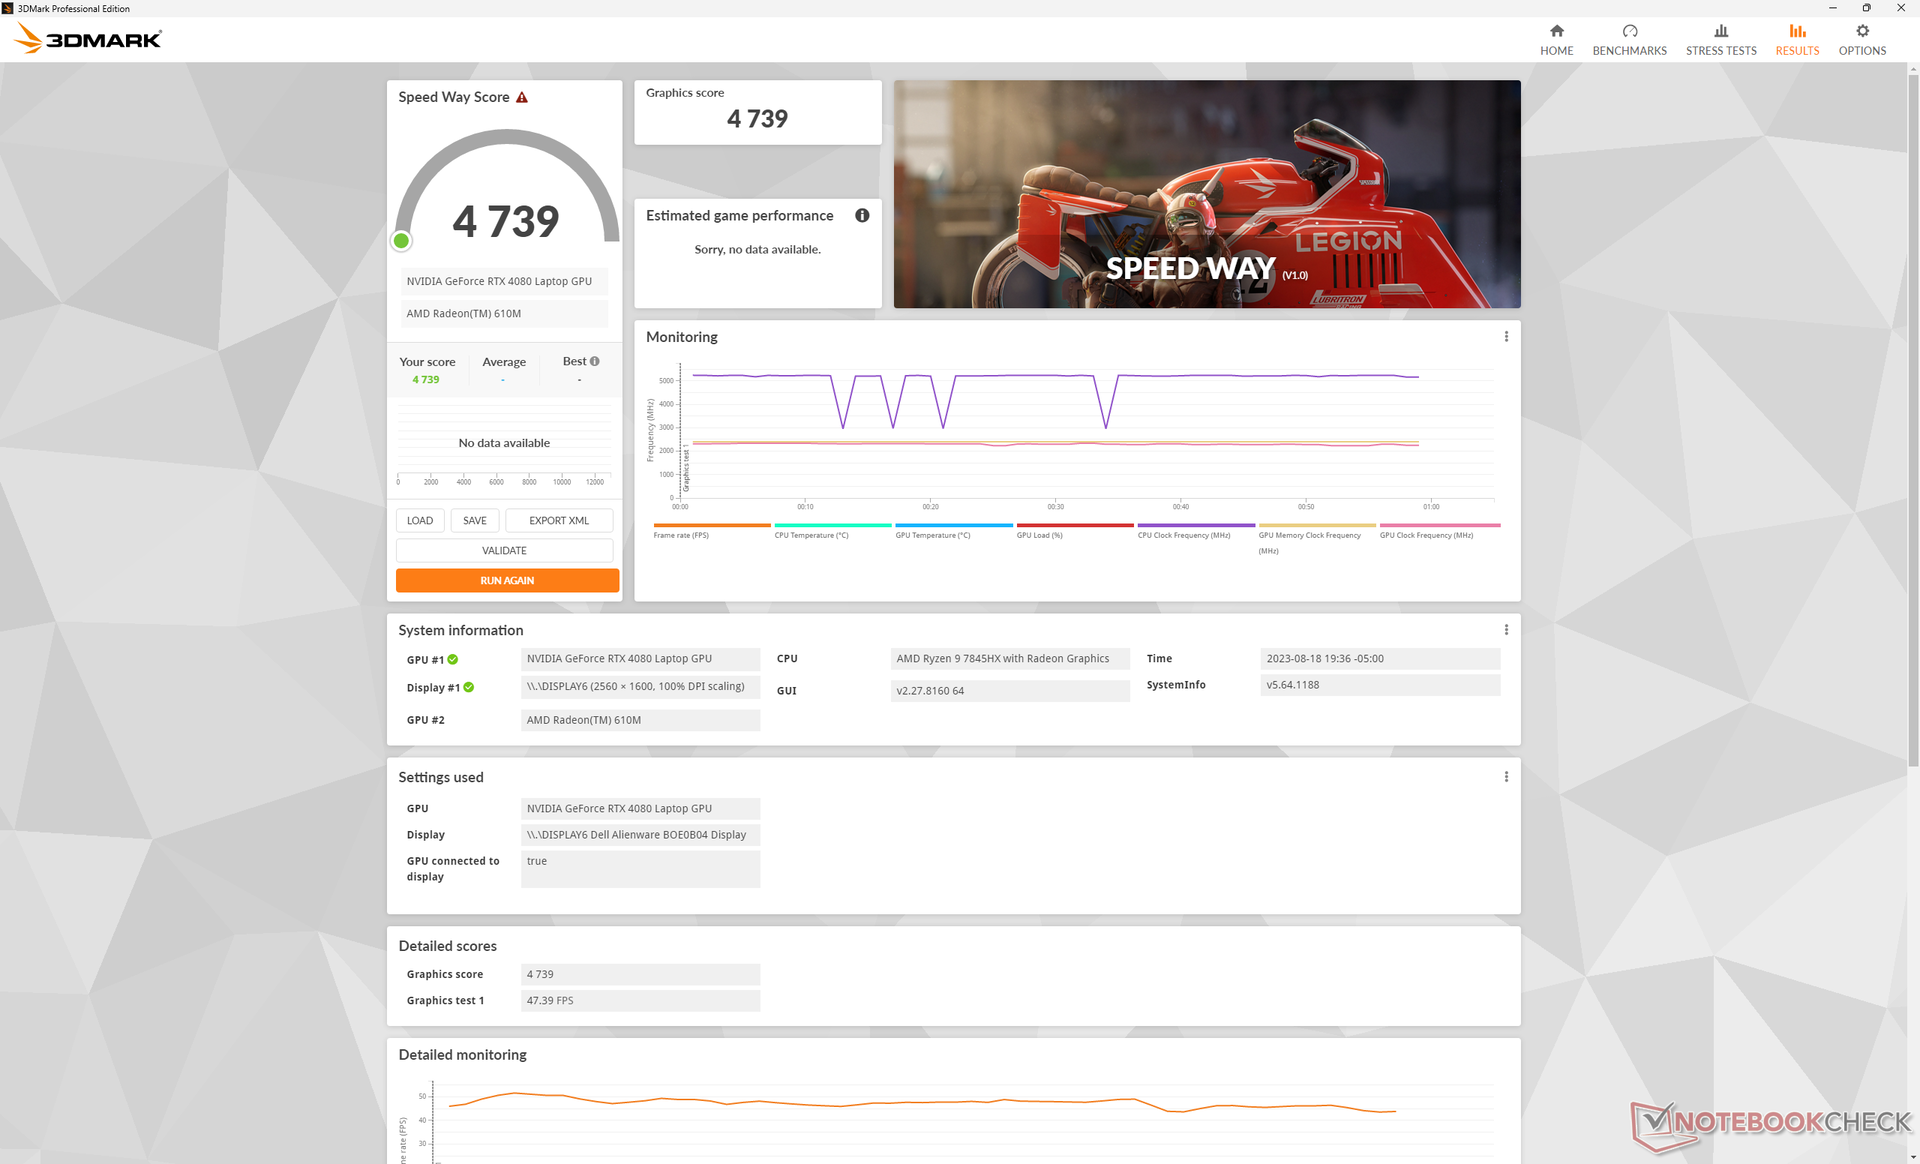
图形性能比我们数据库中配备相同 RTX 4080 GPU 的普通游戏笔记本电脑快 5% 至 10%。 同样的 RTX 4080 GPU因为 Alienware 的目标是相对较高的 175 W TGP。事实上,它的性能仅比华硕 Zephyrus Duo 16慢 5%。
升级到RTX 4090 SKU 预计将比我们的 RTX 4080 性能仅提升 10%,而降级到RTX 4070 时,根据我们使用HP Omen Transcend 16 的情况,性能将大幅下降 30% 至 40%。因此,发烧友至少应考虑采用 RTX 4080 的 SKU。
有趣的是,如下表Fire Strike 分数所示,平衡模式、性能模式和超速模式之间的性能差异很小。值得注意的是,这三种模式在风扇噪音方面差别很大。
| 电源配置文件 | 图形分数 | 物理得分 | 综合得分 |
| 电池电量 | 22290 (-50%) | 30178 (-17%) | 9109 (-35%) |
| 平衡模式 | 43406 (-3%) | 35237 (-4%) | 14721 (+5%) |
| 绩效模式 | 44306 (-1%) | 36106 (-1%) | 13682 (-3%) |
| 超速模式 | 44782 | 36557 | 14045 |
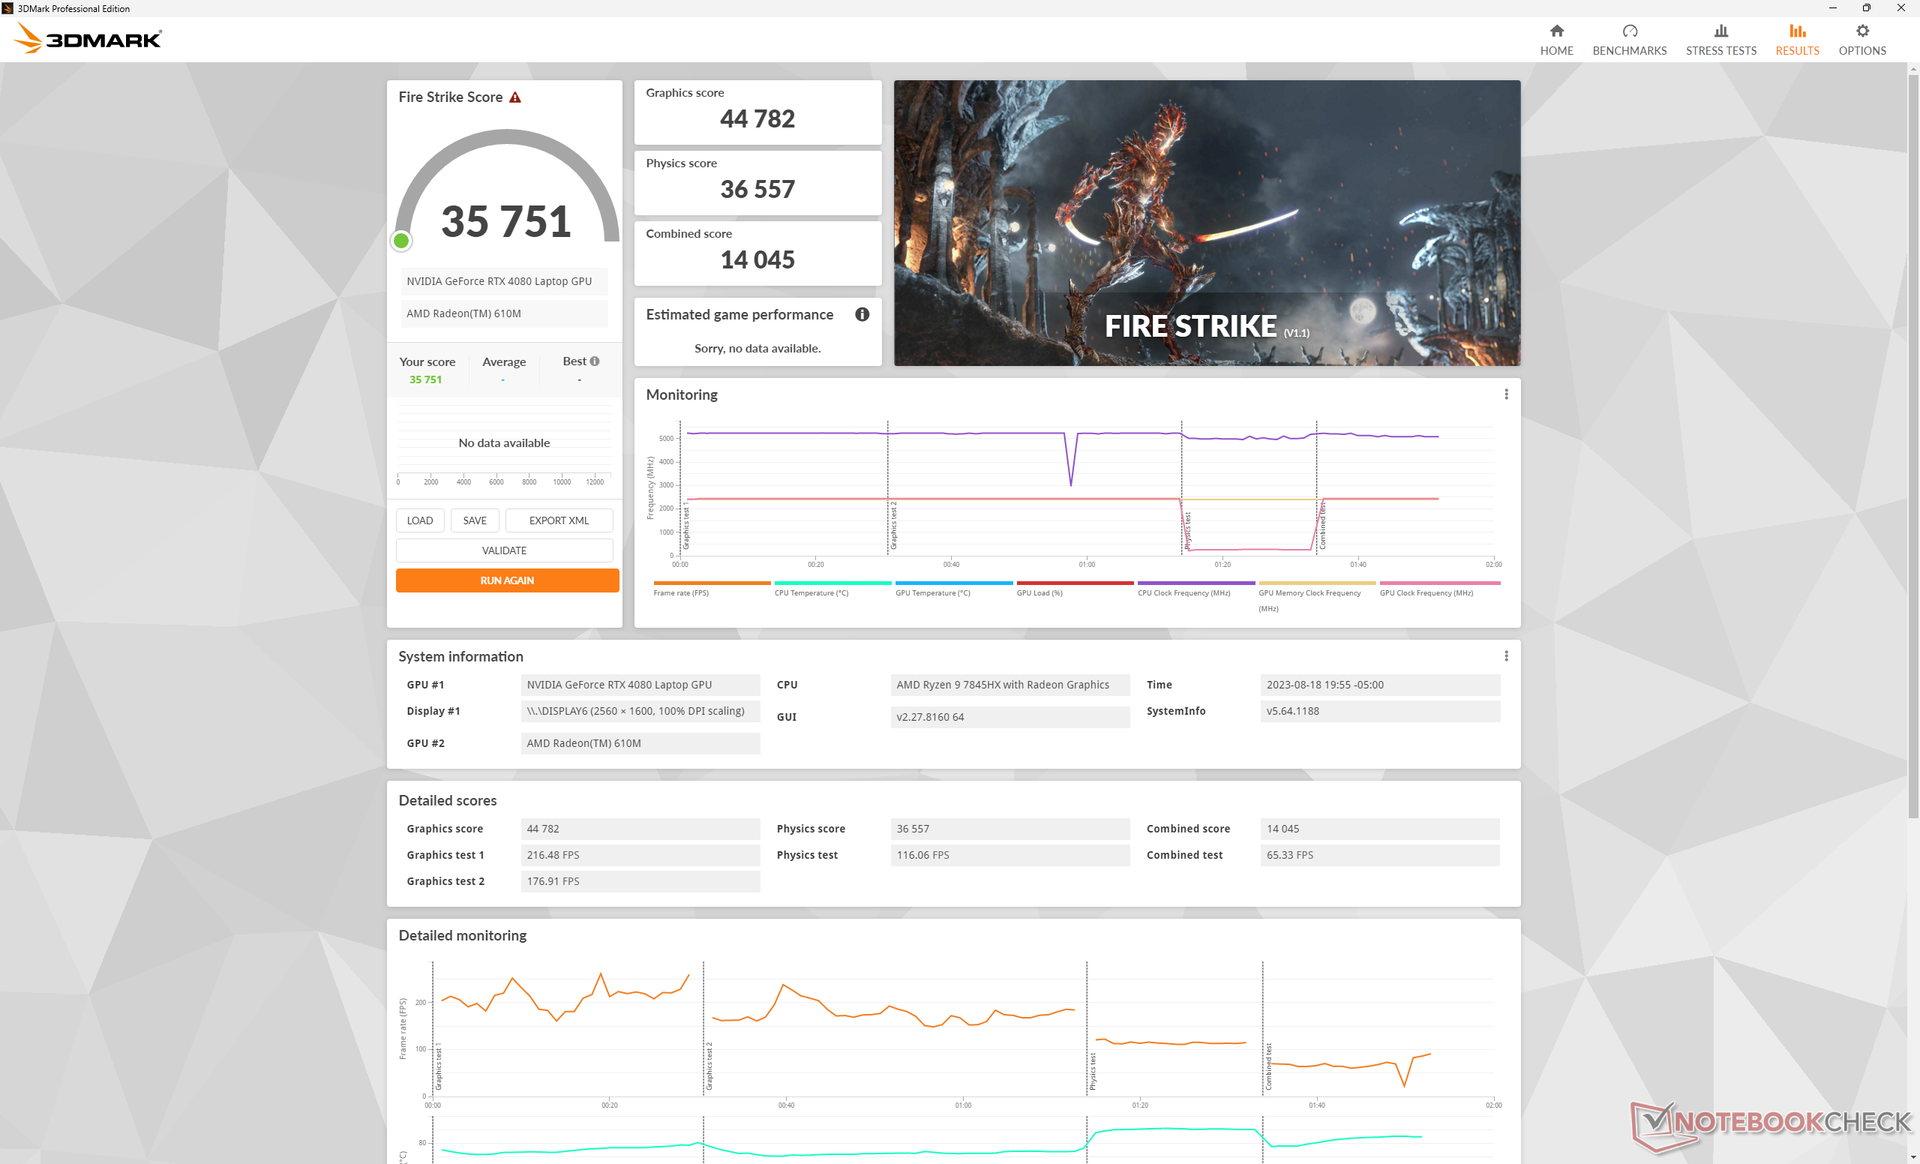

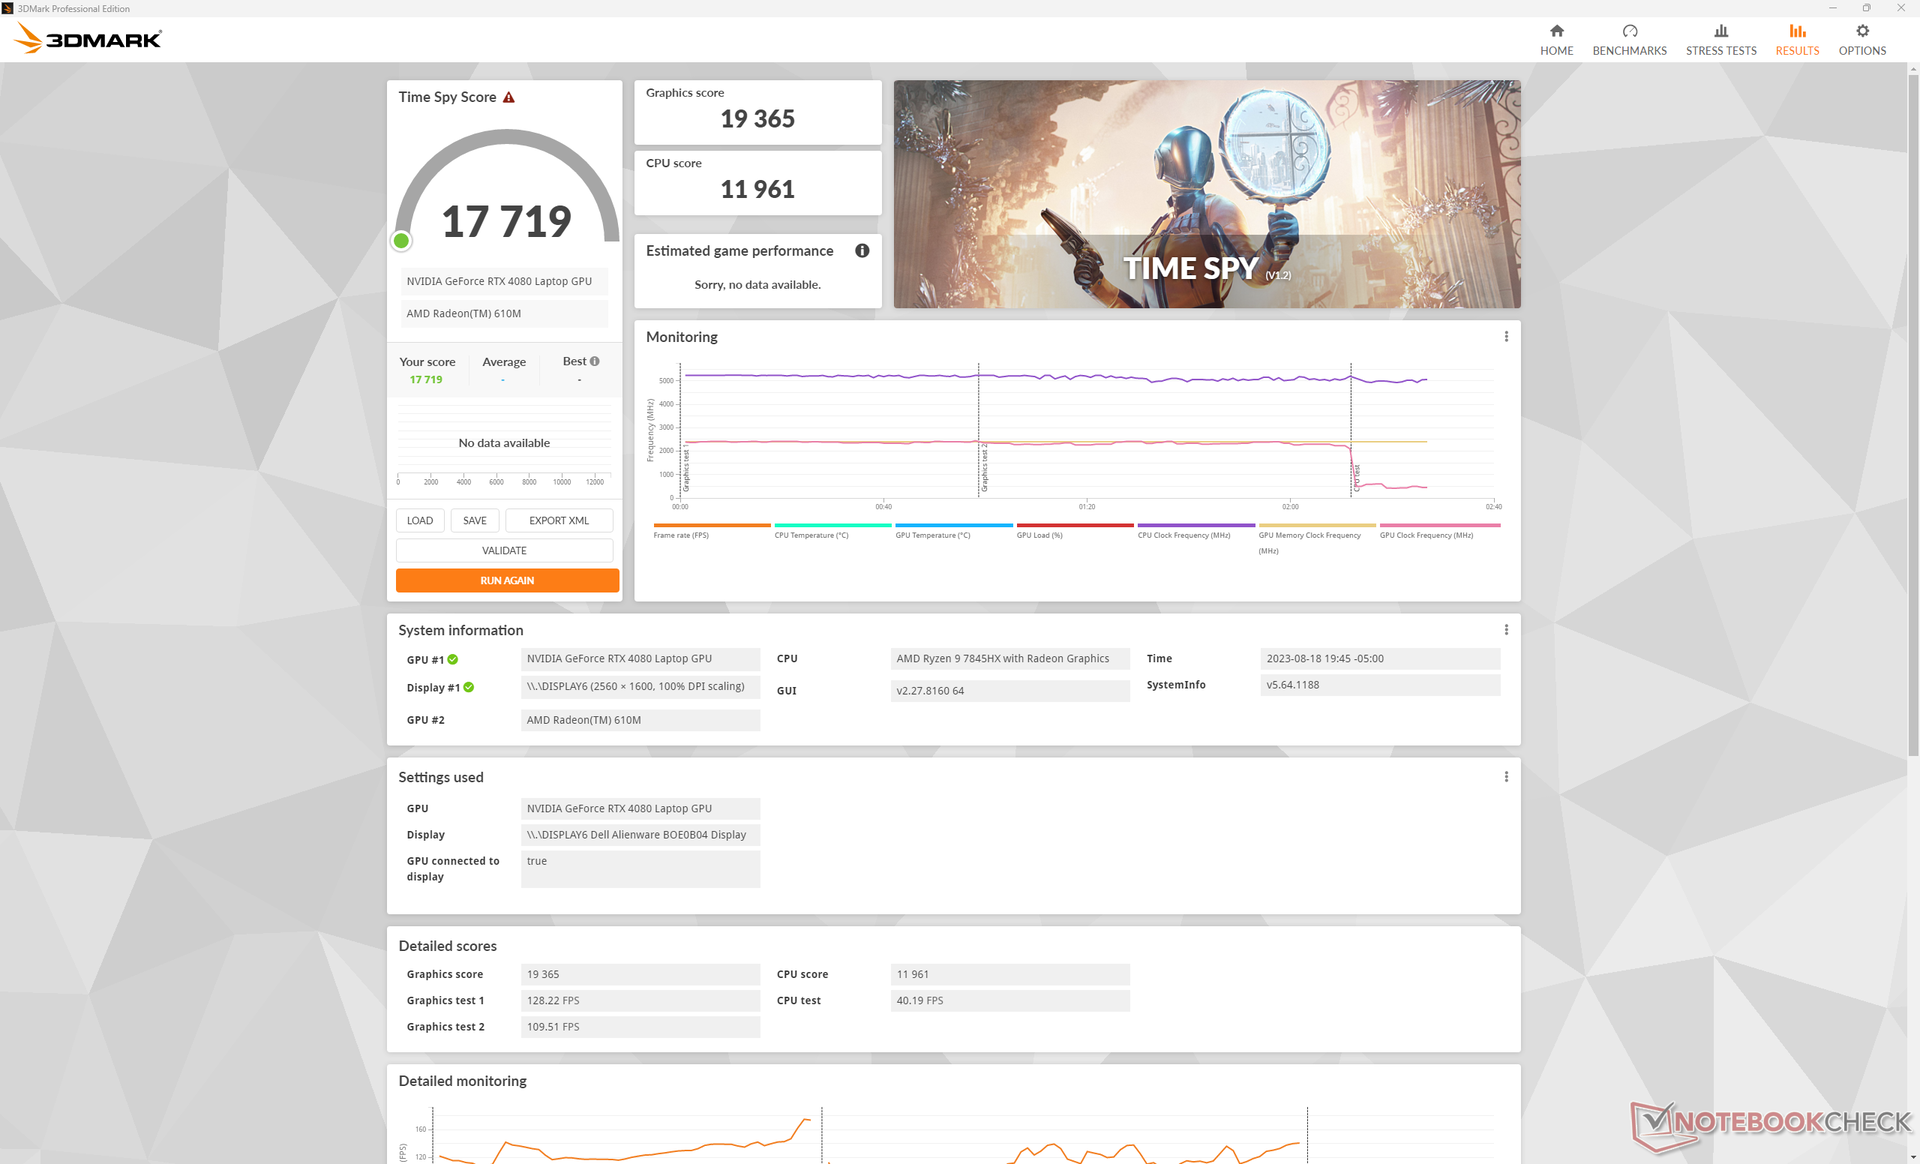
| 3DMark 11 Performance | 40681 points | |
| 3DMark Fire Strike Score | 35751 points | |
| 3DMark Time Spy Score | 17719 points | |
Help | ||
* ... smaller is better
游戏性能
游戏性能非常出色,根据 3DMark 的预测,比其他配备相同 RTX 4080 GPU 的笔记本电脑快 5% 到 10%。这些优势还延伸到了较低的图形设置,这对那些喜欢最大化帧率而非分辨率的游戏玩家大有裨益。移动 RTX 4080 功能强大,足以在原生 QHD+ 分辨率下以超过 60 FPS 的速度运行当前的任何游戏,即使它的性能比 桌面 RTX 4080.
遗憾的是,性能稳定性并不完美。例如,在Witcher 3 上闲置时,帧速率偶尔会停滞在 70 FPS,然后再反弹到 150+ FPS 的范围,如下图所示。这表明后台资源优化不佳,可能会干扰正在运行的应用程序。
Witcher 3 FPS Chart
| low | med. | high | ultra | QHD | 4K | |
|---|---|---|---|---|---|---|
| The Witcher 3 (2015) | 573.1 | 452.2 | 349.3 | 169.7 | 121.5 | |
| Dota 2 Reborn (2015) | 229 | 191.8 | 180.4 | 164.7 | 161 | |
| Final Fantasy XV Benchmark (2018) | 230 | 218 | 167.6 | 131.6 | 76.1 | |
| X-Plane 11.11 (2018) | 171.1 | 149 | 113.1 | 95 | ||
| Far Cry 5 (2018) | 160 | 145 | 141 | 136 | 131 | 91 |
| Strange Brigade (2018) | 572 | 461 | 400 | 357 | 248 | 123.1 |
| Cyberpunk 2077 1.6 (2022) | 154 | 151.4 | 137.5 | 128.3 | 84.5 | 39.7 |
| Tiny Tina's Wonderlands (2022) | 317.1 | 265.9 | 201.1 | 160.8 | 112.9 | 59 |
| F1 22 (2022) | 323 | 296 | 285 | 124.2 | 78.1 | 39.5 |
| Returnal (2023) | 128 | 122 | 117 | 107 | 80 | 44 |
排放量
系统噪声 - 不同功率曲线之间的巨大差异
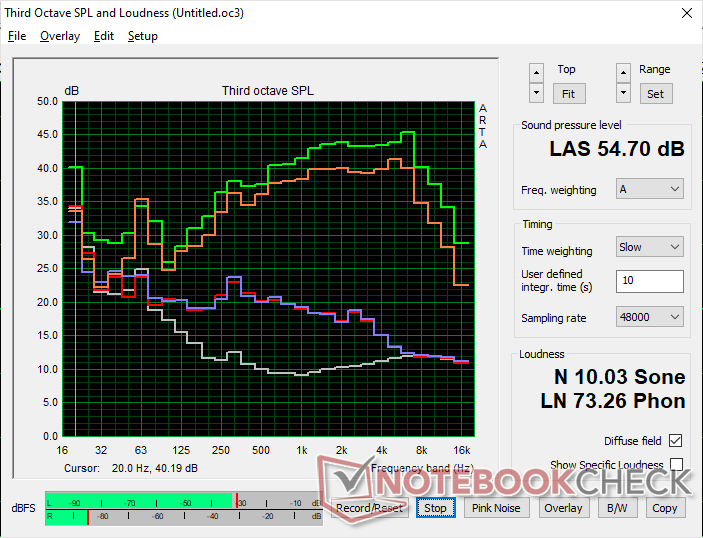
在 23 dB(A) 的静音背景下,风扇几乎总是以低于 30 dB(A) 的噪音运转。虽然声音听得见,但噪音至少是稳定的,因为风扇在运行浏览器或视频等要求不高的负载时不会发出更大的脉冲声。
在平衡、性能或超频模式下运行游戏时,风扇噪音分别高达 49.4 dB(A)、51 dB(A) 和 54.7 dB(A)。如上所述,由于平衡模式下的性能损失极小,用户可能会考虑在平衡模式下而不是性能或超频模式下进行游戏,以获得明显更安静的风扇噪音。其他 16 英寸游戏笔记本电脑,如 雷蛇刀锋 16或 Omen Transcend 16 等其他 16 英寸游戏笔记本电脑在运行游戏时,噪音往往会稳定在 50 分贝(A)左右。
Noise level
| Idle |
| 22.9 / 29.7 / 29.7 dB(A) |
| Load |
| 29.8 / 54.7 dB(A) |
 | ||
30 dB silent 40 dB(A) audible 50 dB(A) loud |
||
min: | ||
| Alienware m16 R1 AMD GeForce RTX 4080 Laptop GPU, R9 7845HX, Kioxia XG8 KXG80ZNV1T02 | Alienware x16 R1 GeForce RTX 4080 Laptop GPU, i9-13900HK, SK hynix PC801 HFS001TEJ9X101N | HP Omen Transcend 16 GeForce RTX 4070 Laptop GPU, i9-13900HX, SK hynix PC801 HFS002TEJ9X101N | Lenovo Legion Pro 7 RTX4090 GeForce RTX 4090 Laptop GPU, i9-13900HX, Samsung PM9A1 MZVL21T0HCLR | Asus ROG Strix G16 G614JZ GeForce RTX 4080 Laptop GPU, i9-13980HX, WD PC SN560 SDDPNQE-1T00 | Razer Blade 16 Early 2023 GeForce RTX 4080 Laptop GPU, i9-13950HX, SSSTC CA6-8D1024 | |
|---|---|---|---|---|---|---|
| Noise | 0% | -11% | -17% | -9% | 4% | |
| off / environment * (dB) | 22.9 | 22.7 1% | 22.9 -0% | 25 -9% | 25 -9% | 23 -0% |
| Idle Minimum * (dB) | 22.9 | 23.1 -1% | 29.1 -27% | 28 -22% | 26 -14% | 23 -0% |
| Idle Average * (dB) | 29.7 | 25.8 13% | 29.1 2% | 30 -1% | 28 6% | 23 23% |
| Idle Maximum * (dB) | 29.7 | 25.8 13% | 29.1 2% | 38 -28% | 30 -1% | 23.6 21% |
| Load Average * (dB) | 29.8 | 39.3 -32% | 45.7 -53% | 48 -61% | 48 -61% | 39 -31% |
| Witcher 3 ultra * (dB) | 54.7 | 49.9 9% | 54.3 1% | 53 3% | 49 10% | 51.6 6% |
| Load Maximum * (dB) | 54.7 | 54.8 -0% | 54.3 1% | 55 -1% | 52 5% | 51.3 6% |
* ... smaller is better
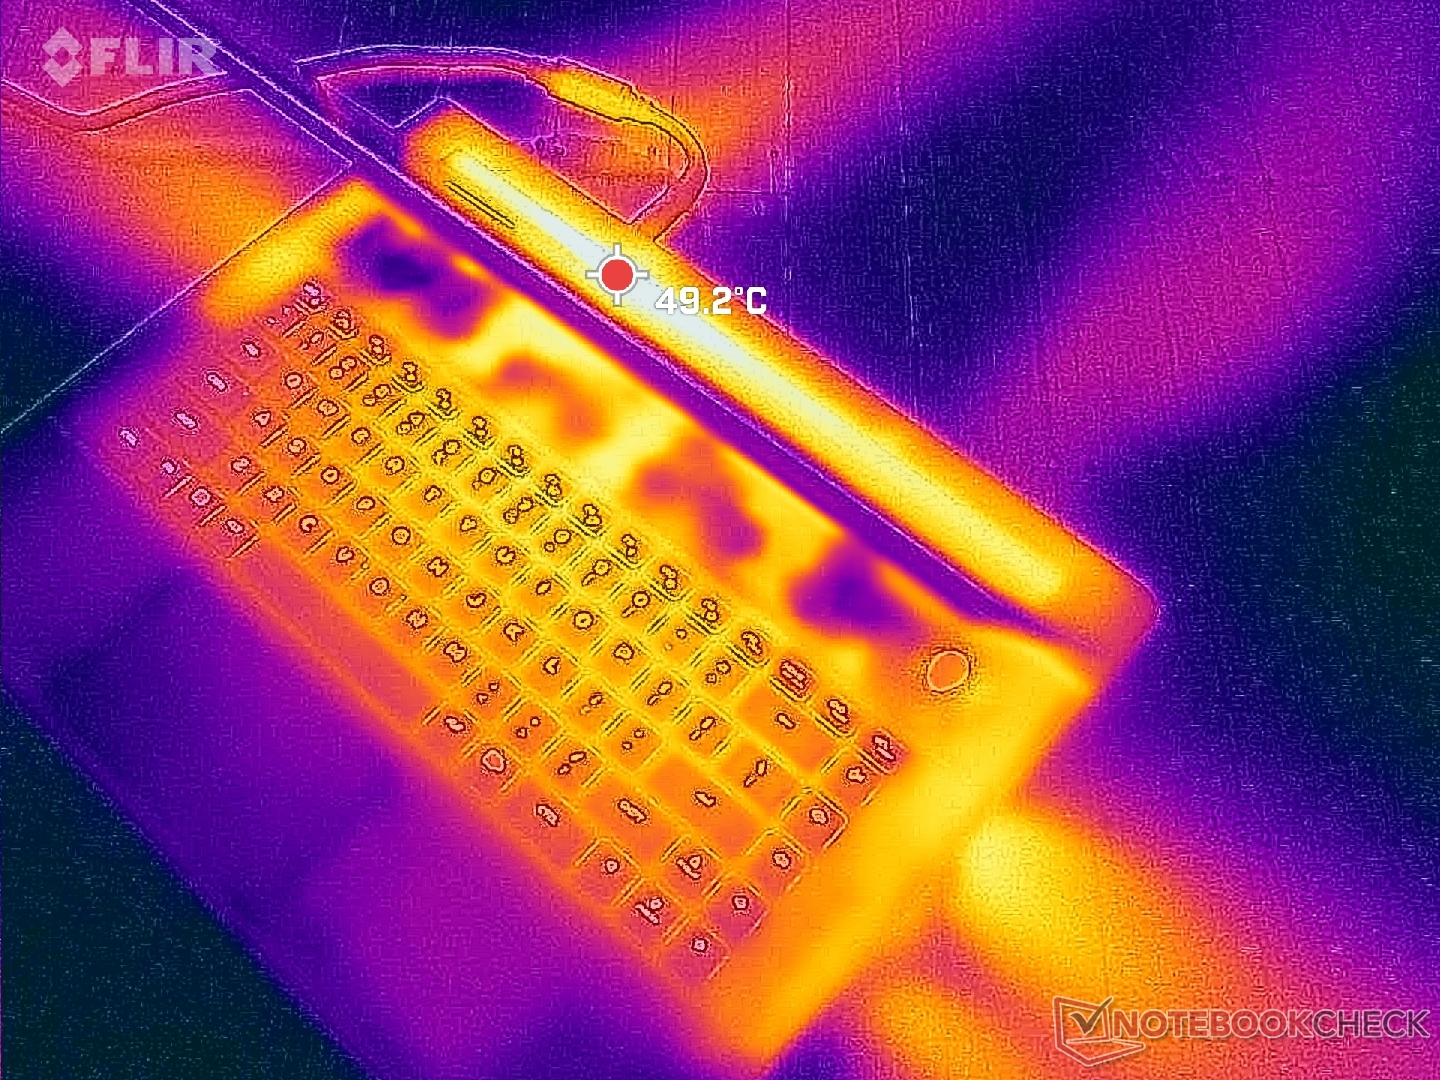
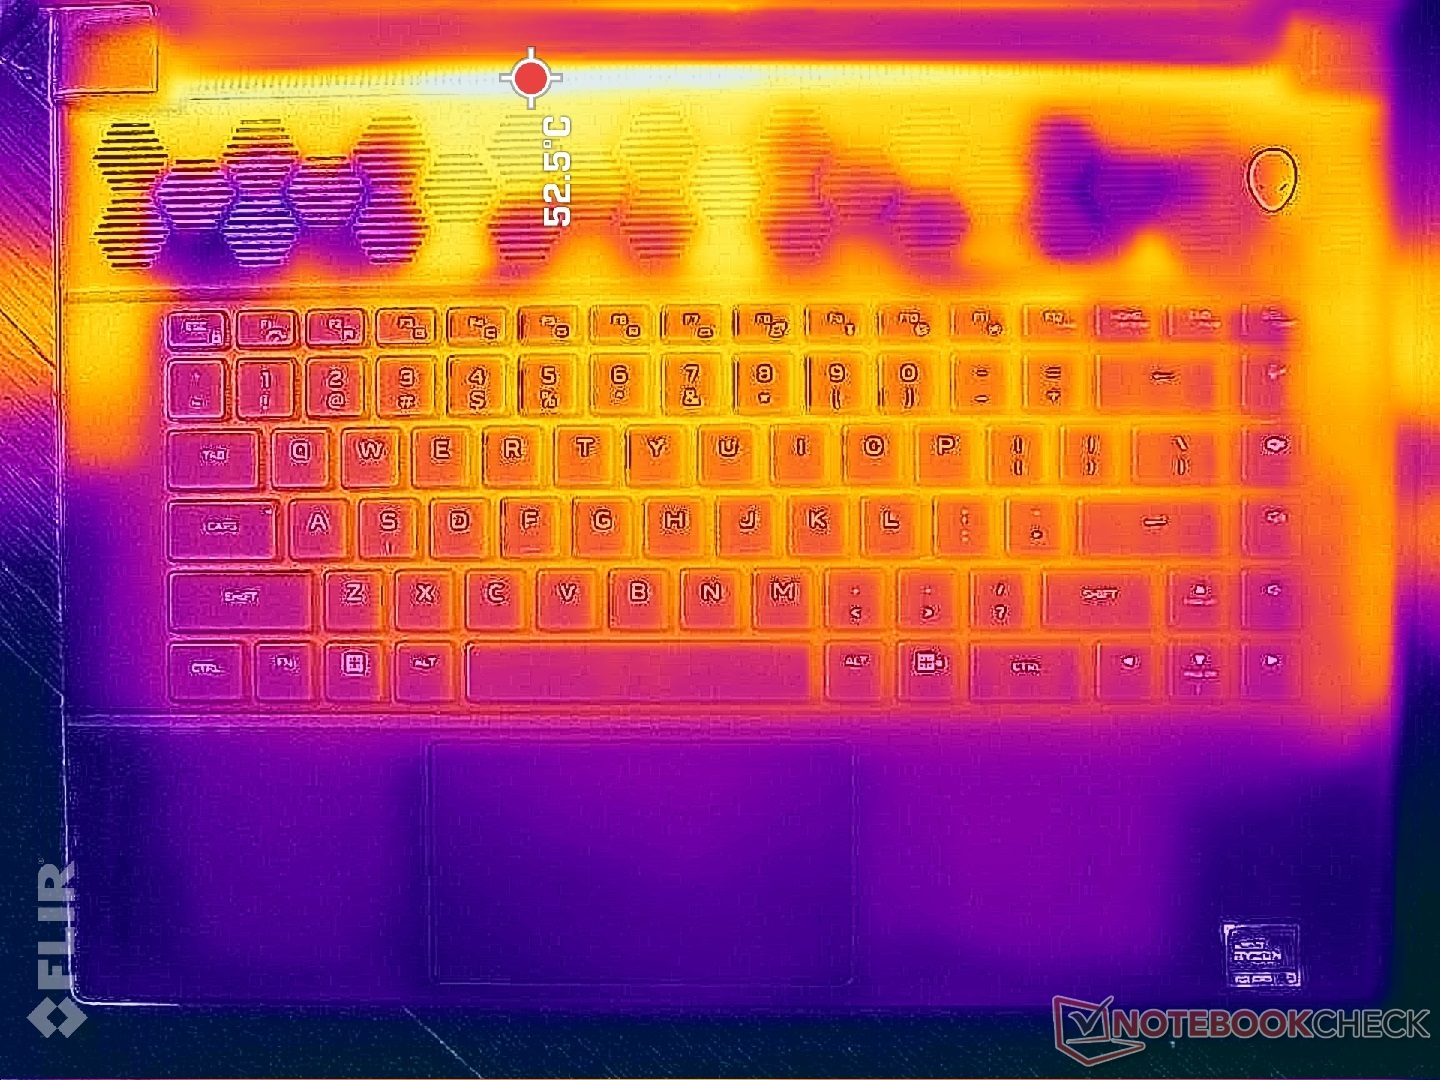
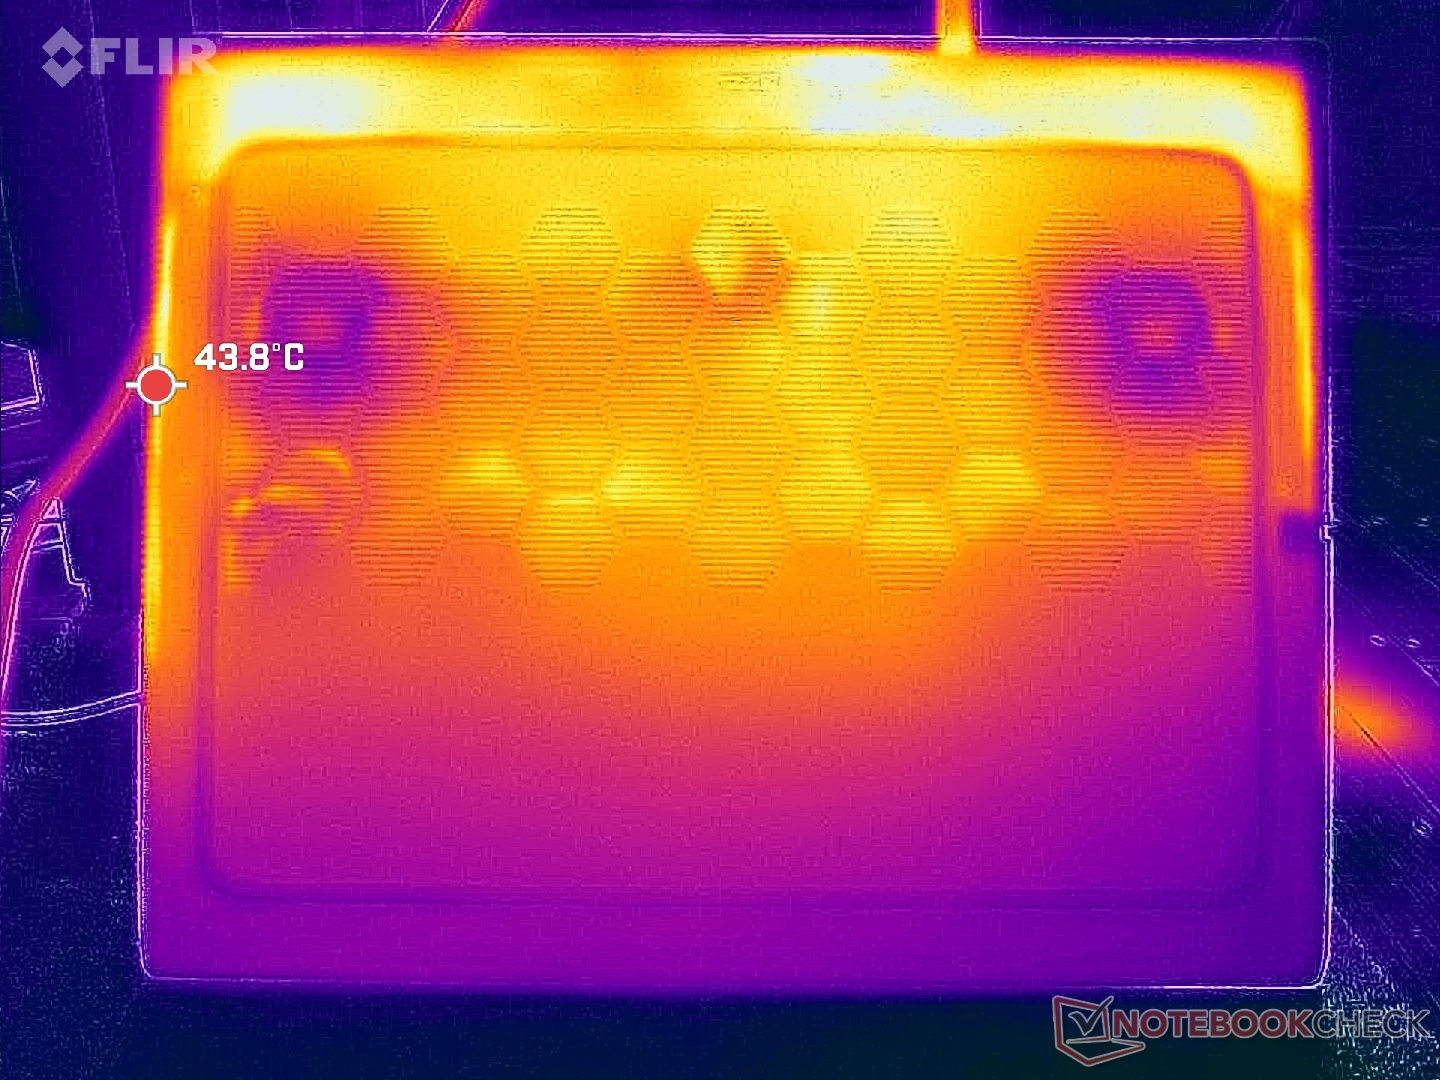
温度
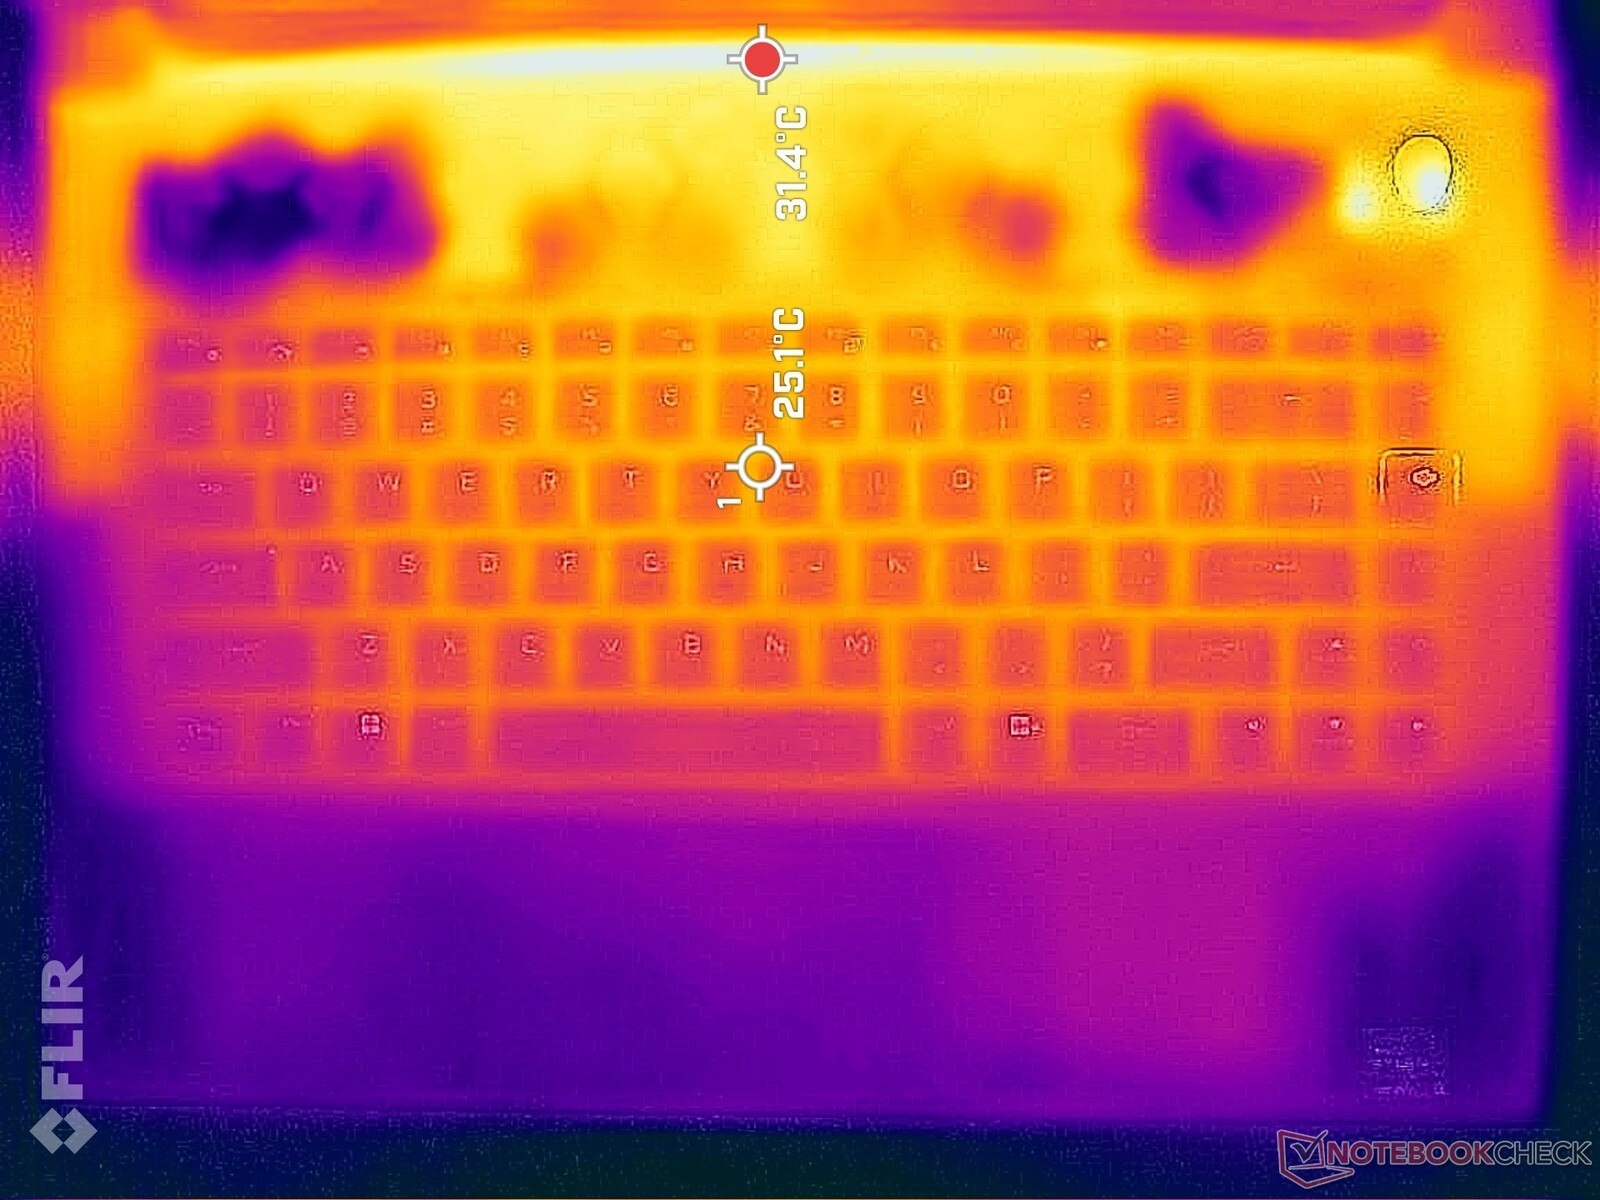
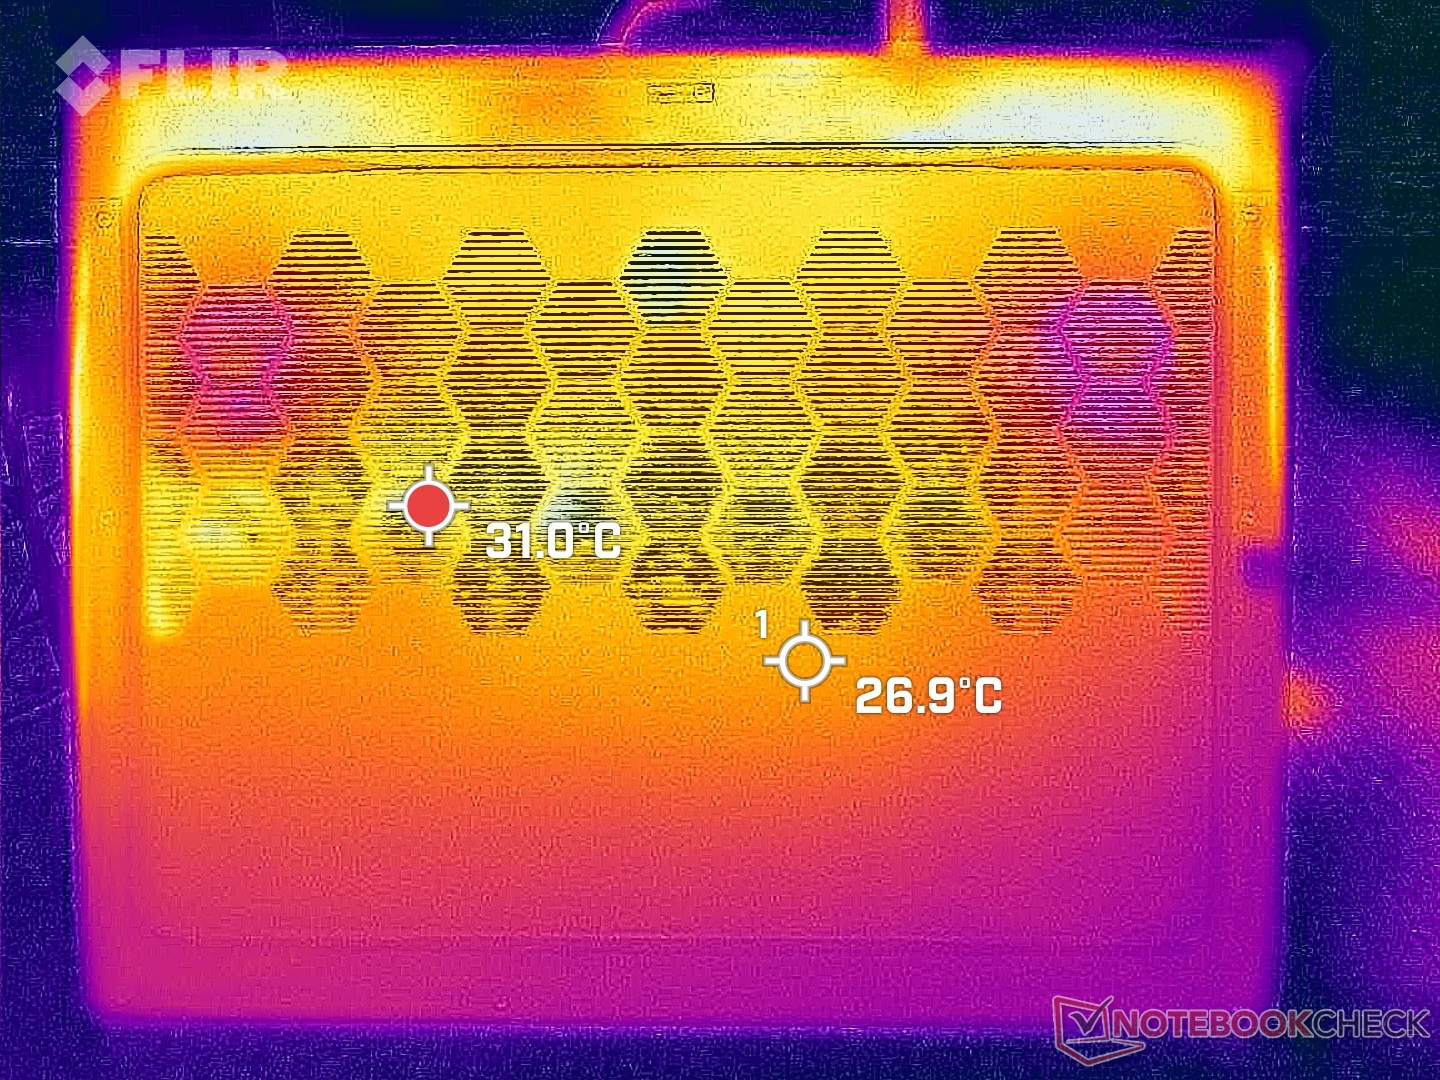
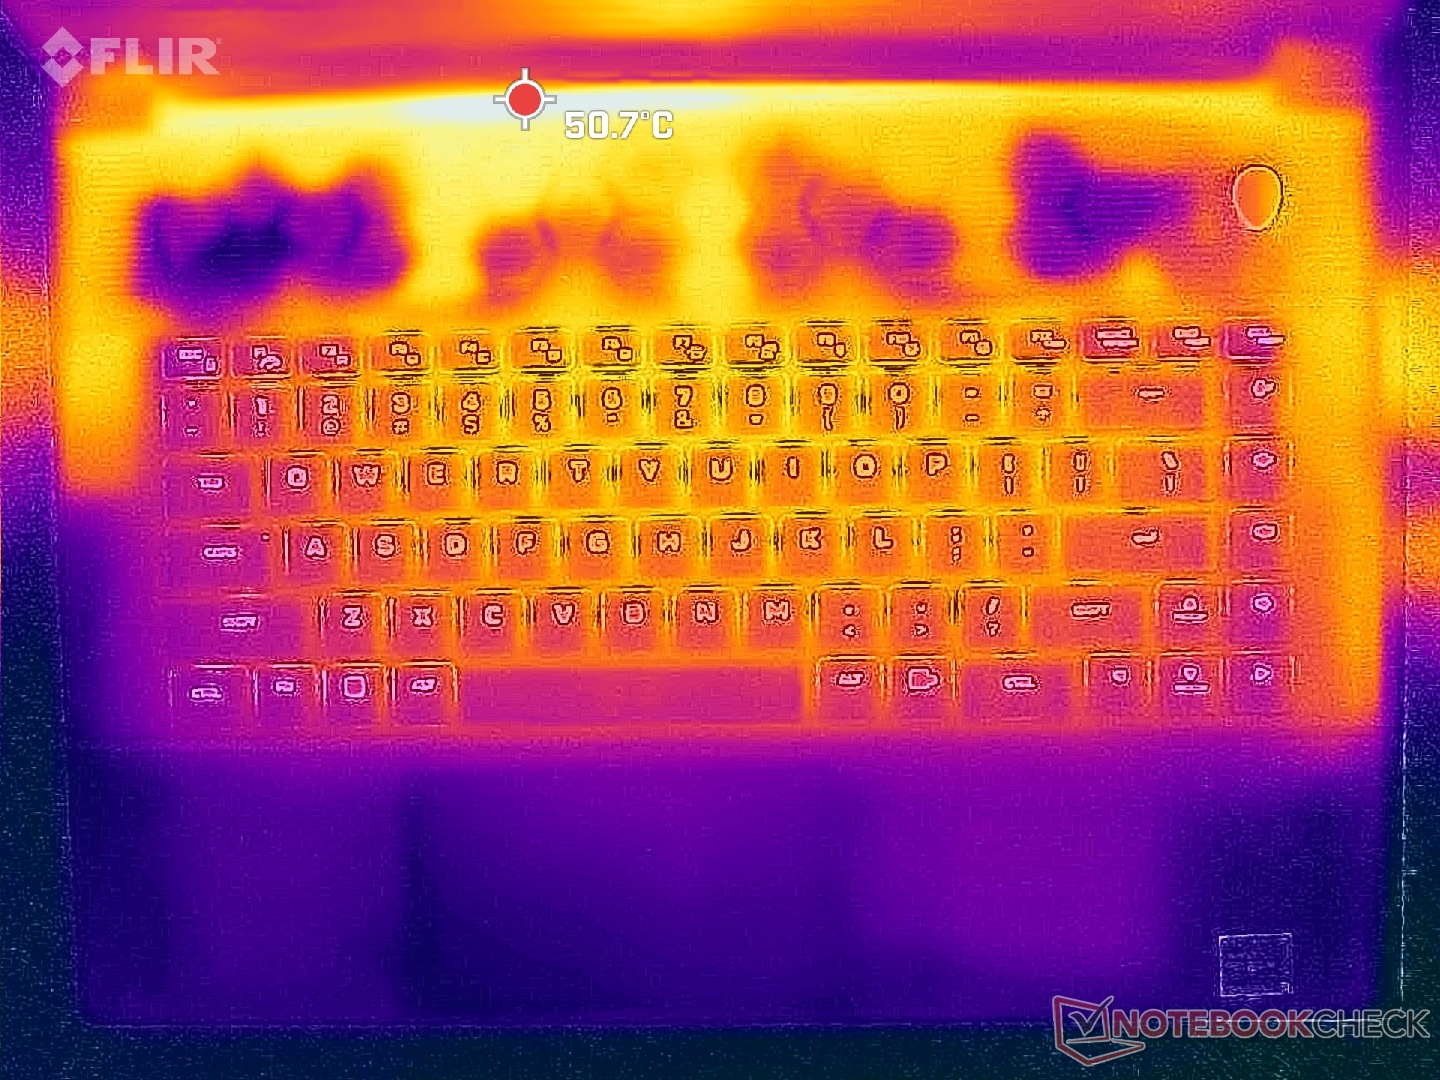
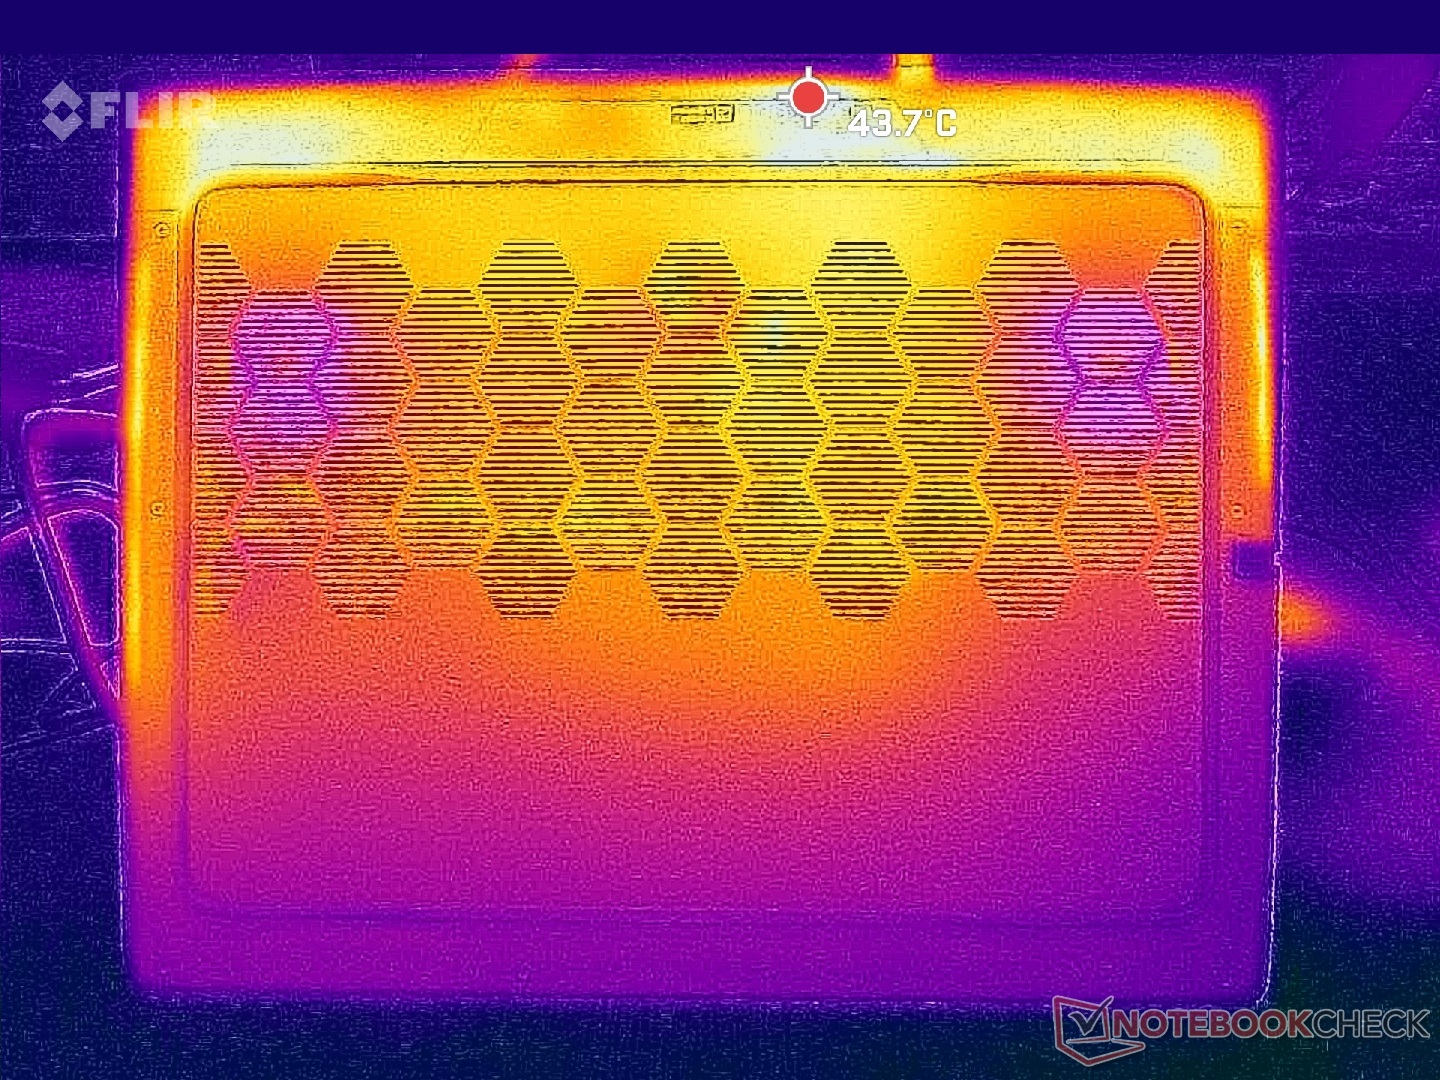
背面的表面温度可高达 50 摄氏度。值得庆幸的是,掌托和键盘区域的触感仍然比较凉爽,部分原因是采用了宽大的通风栅。例如,游戏时键盘中心的温度为 42 摄氏度,而联想Legion Pro 7 16 的温度为 46 摄氏度。
(-) The maximum temperature on the upper side is 48 °C / 118 F, compared to the average of 40.4 °C / 105 F, ranging from 21.2 to 68.8 °C for the class Gaming.
(+) The bottom heats up to a maximum of 39 °C / 102 F, compared to the average of 43.2 °C / 110 F
(±) In idle usage, the average temperature for the upper side is 32.2 °C / 90 F, compared to the device average of 33.9 °C / 93 F.
(-) Playing The Witcher 3, the average temperature for the upper side is 38.1 °C / 101 F, compared to the device average of 33.9 °C / 93 F.
(+) The palmrests and touchpad are cooler than skin temperature with a maximum of 30.4 °C / 86.7 F and are therefore cool to the touch.
(±) The average temperature of the palmrest area of similar devices was 28.8 °C / 83.8 F (-1.6 °C / -2.9 F).
| Alienware m16 R1 AMD AMD Ryzen 9 7845HX, NVIDIA GeForce RTX 4080 Laptop GPU | Alienware x16 R1 Intel Core i9-13900HK, NVIDIA GeForce RTX 4080 Laptop GPU | HP Omen Transcend 16 Intel Core i9-13900HX, NVIDIA GeForce RTX 4070 Laptop GPU | Lenovo Legion Pro 7 RTX4090 Intel Core i9-13900HX, NVIDIA GeForce RTX 4090 Laptop GPU | Asus ROG Strix G16 G614JZ Intel Core i9-13980HX, NVIDIA GeForce RTX 4080 Laptop GPU | Razer Blade 16 Early 2023 Intel Core i9-13950HX, NVIDIA GeForce RTX 4080 Laptop GPU | |
|---|---|---|---|---|---|---|
| Heat | -5% | 1% | -10% | -6% | 12% | |
| Maximum Upper Side * (°C) | 48 | 47.2 2% | 47.4 1% | 53 -10% | 54 -13% | 40 17% |
| Maximum Bottom * (°C) | 39 | 47.8 -23% | 54.4 -39% | 59 -51% | 55 -41% | 37.6 4% |
| Idle Upper Side * (°C) | 37 | 36.8 1% | 28.4 23% | 34 8% | 29 22% | 32.4 12% |
| Idle Bottom * (°C) | 36.2 | 35.8 1% | 29.2 19% | 32 12% | 33 9% | 31.4 13% |
* ... smaller is better
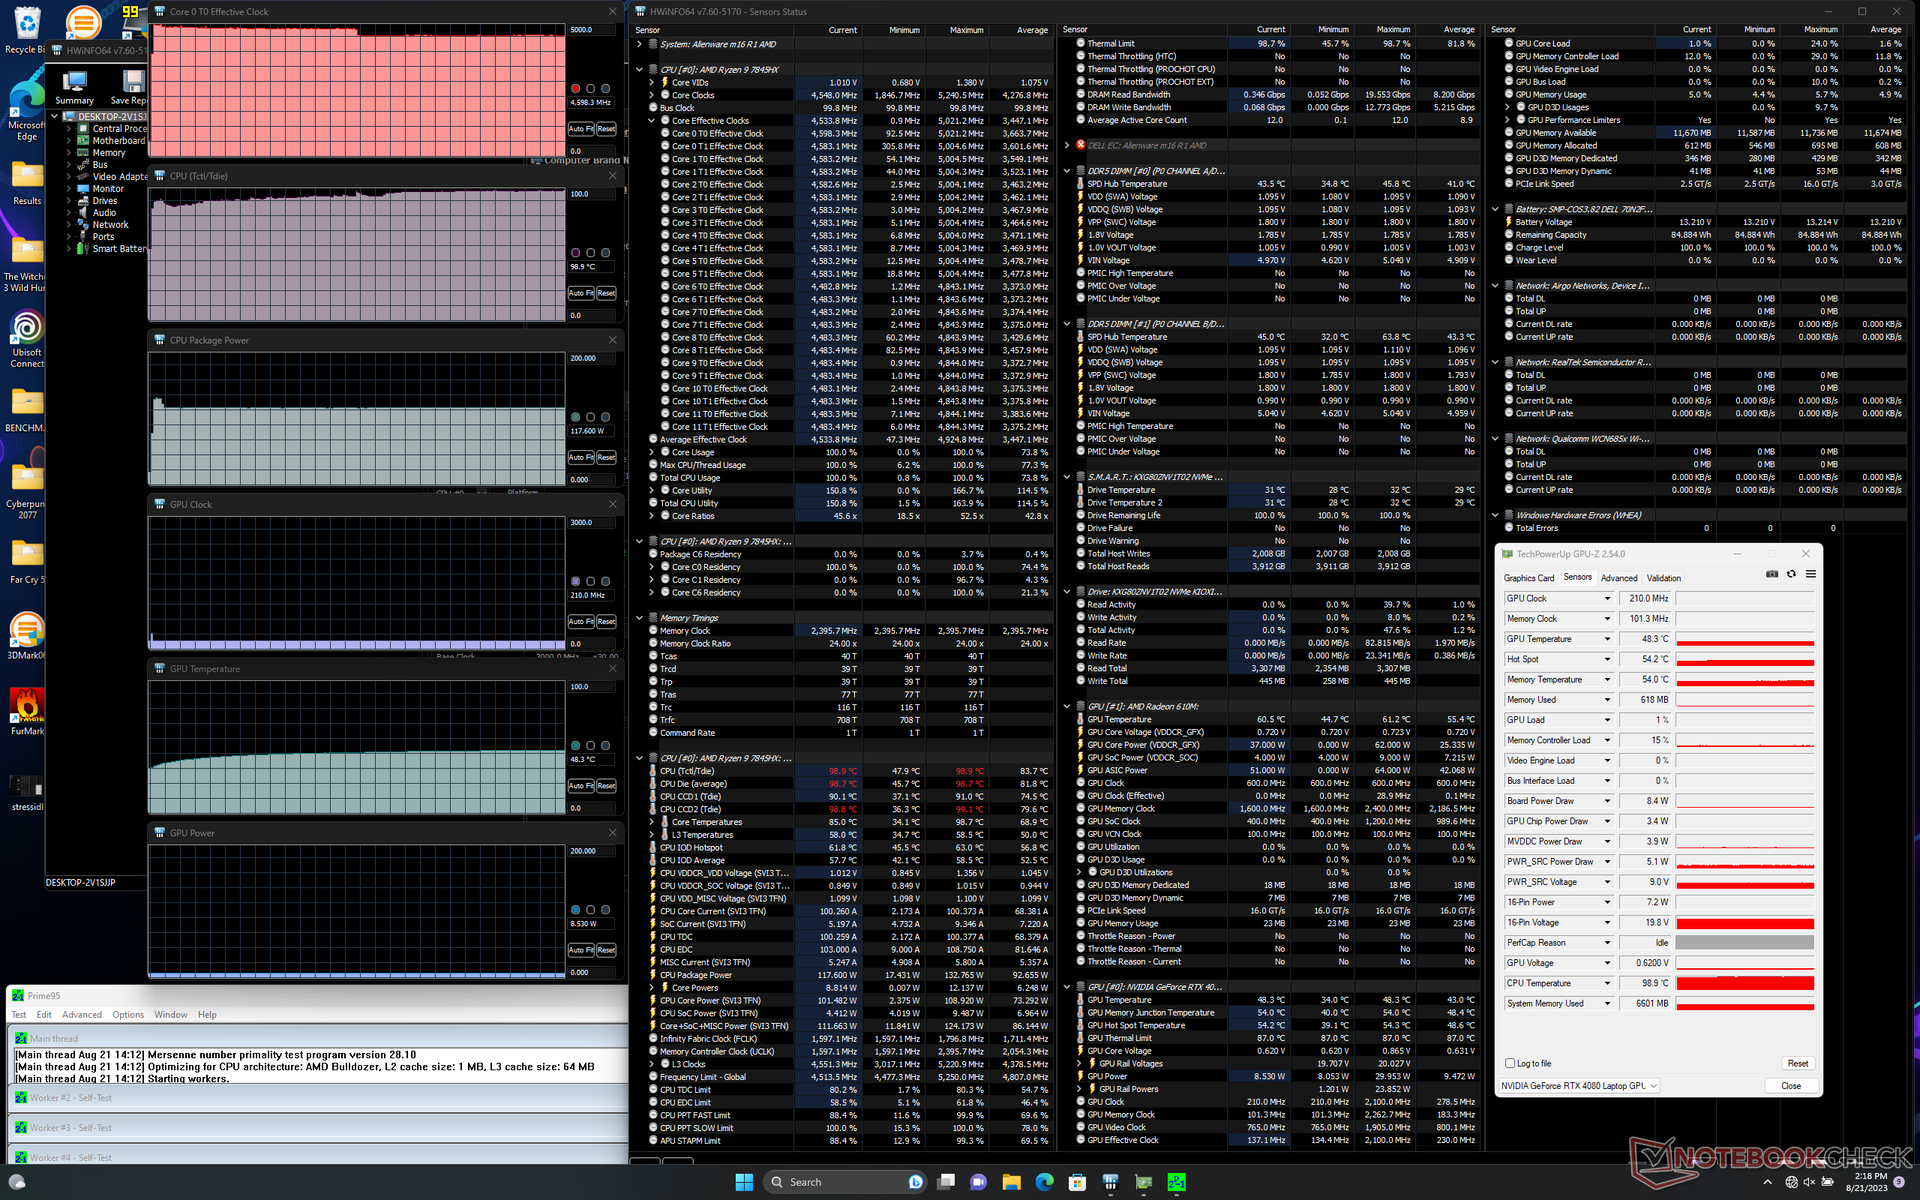
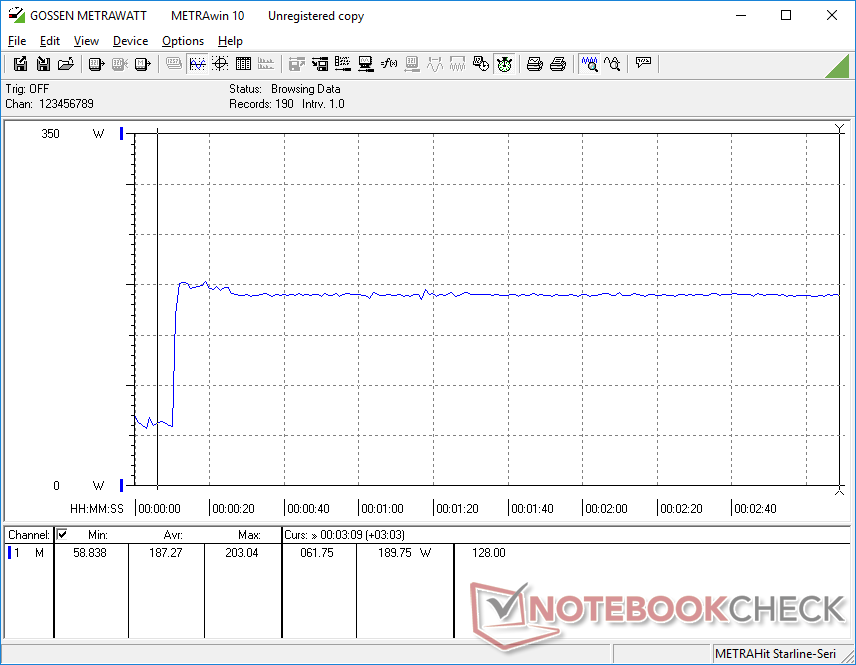
压力测试
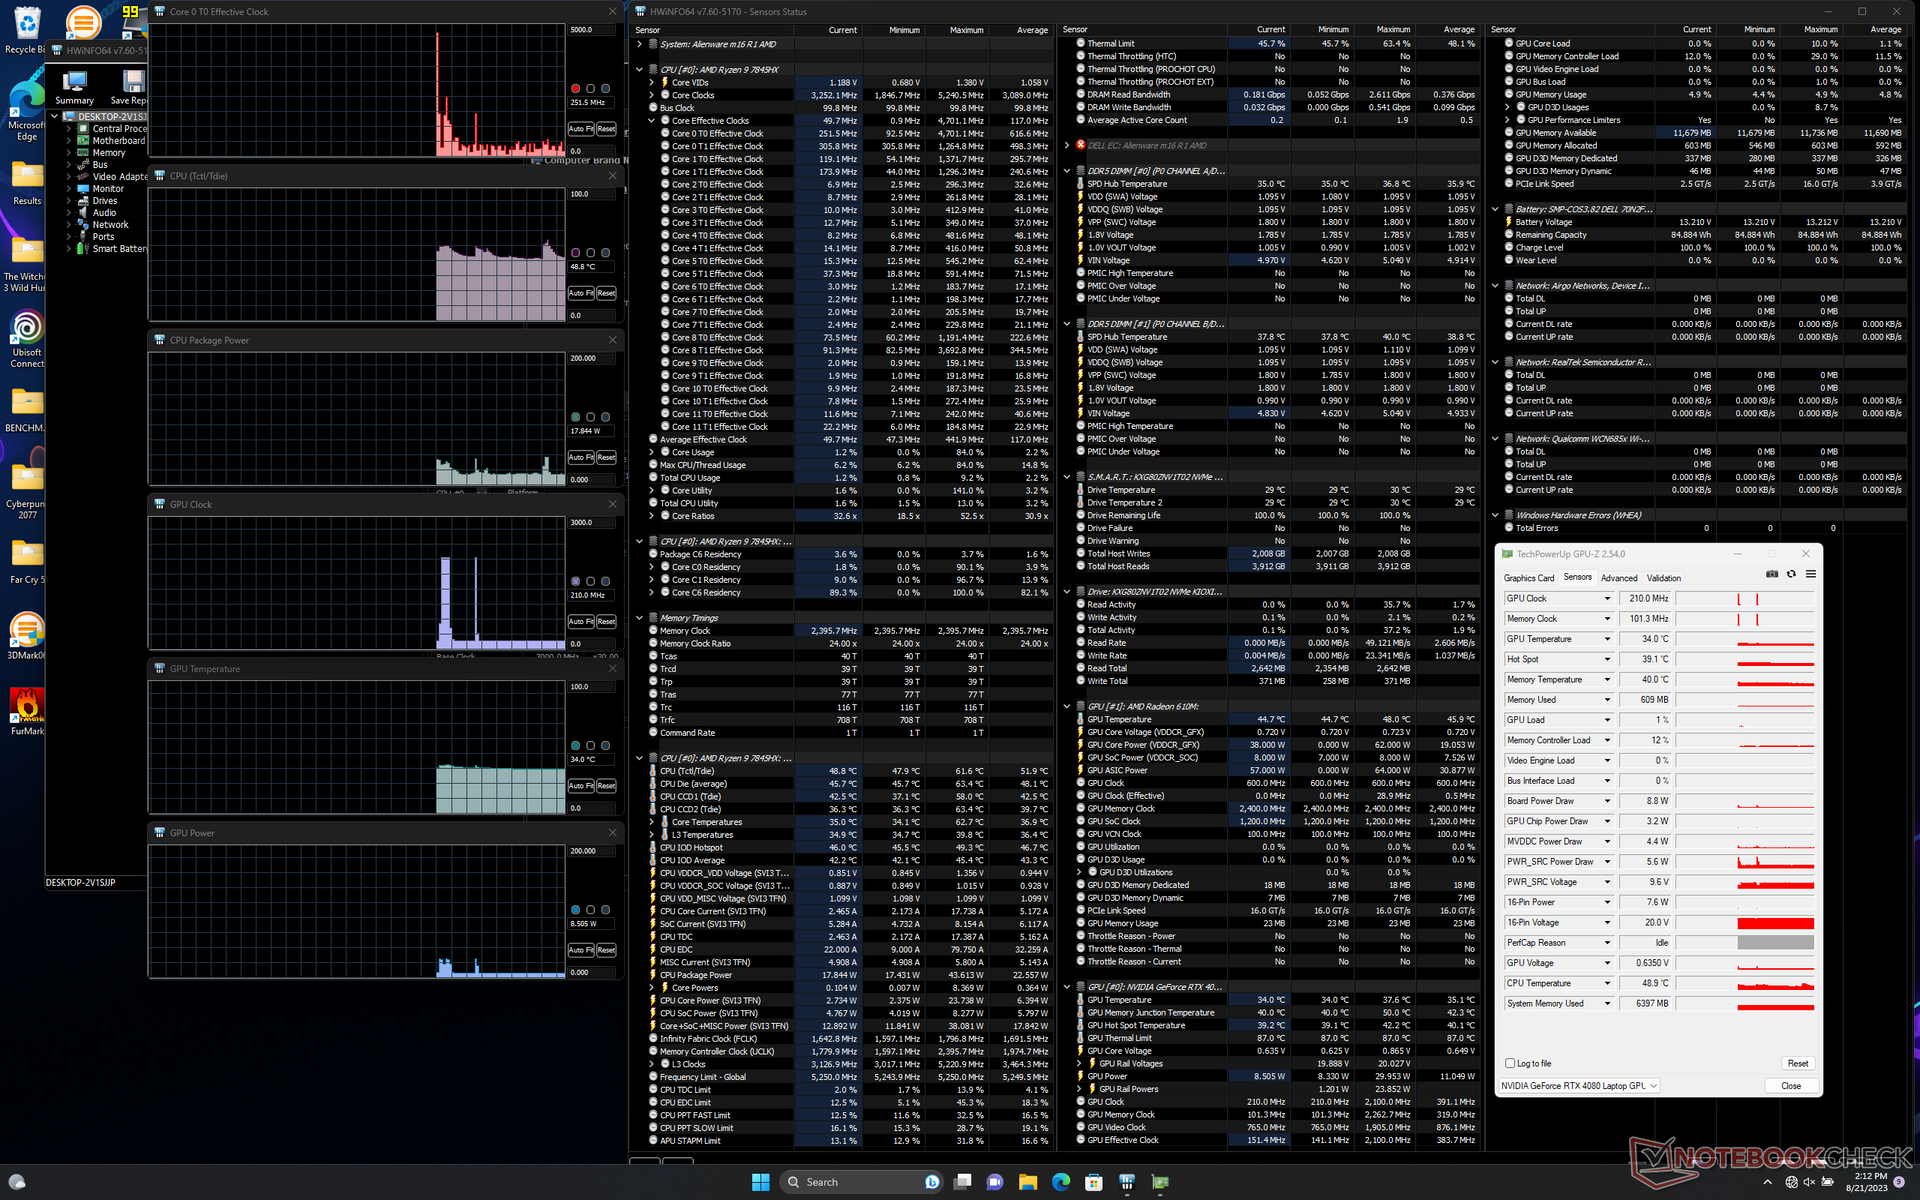
启动 Prime95 会使 CPU 频率升至 5 GHz、功耗升至 132 W、温度升至 99 C,持续数秒,最终稳定在 4.6 GHz、功耗 118 W、温度 85 C。
运行 Witcher 3在超频模式下,GPU 将稳定在 2430 MHz 时钟、2263 MHz VRAM 和 158 W 板载功耗,而根据 GPU-Z 的数据,在平衡模式下,GPU 将稳定在 2415 MHz 时钟、2250 MHz VRAM 和 156 W。两种模式下的性能差异很小,这与我们在Fire Strike 上观察到的结果一致。在平衡模式下,核心温度会比超频模式下高几度,因为风扇在平衡模式下明显更安静。
请注意,虽然 GPU 的额定 TGP 为 175 W,但我们在实际游戏条件下只能达到 160 W。
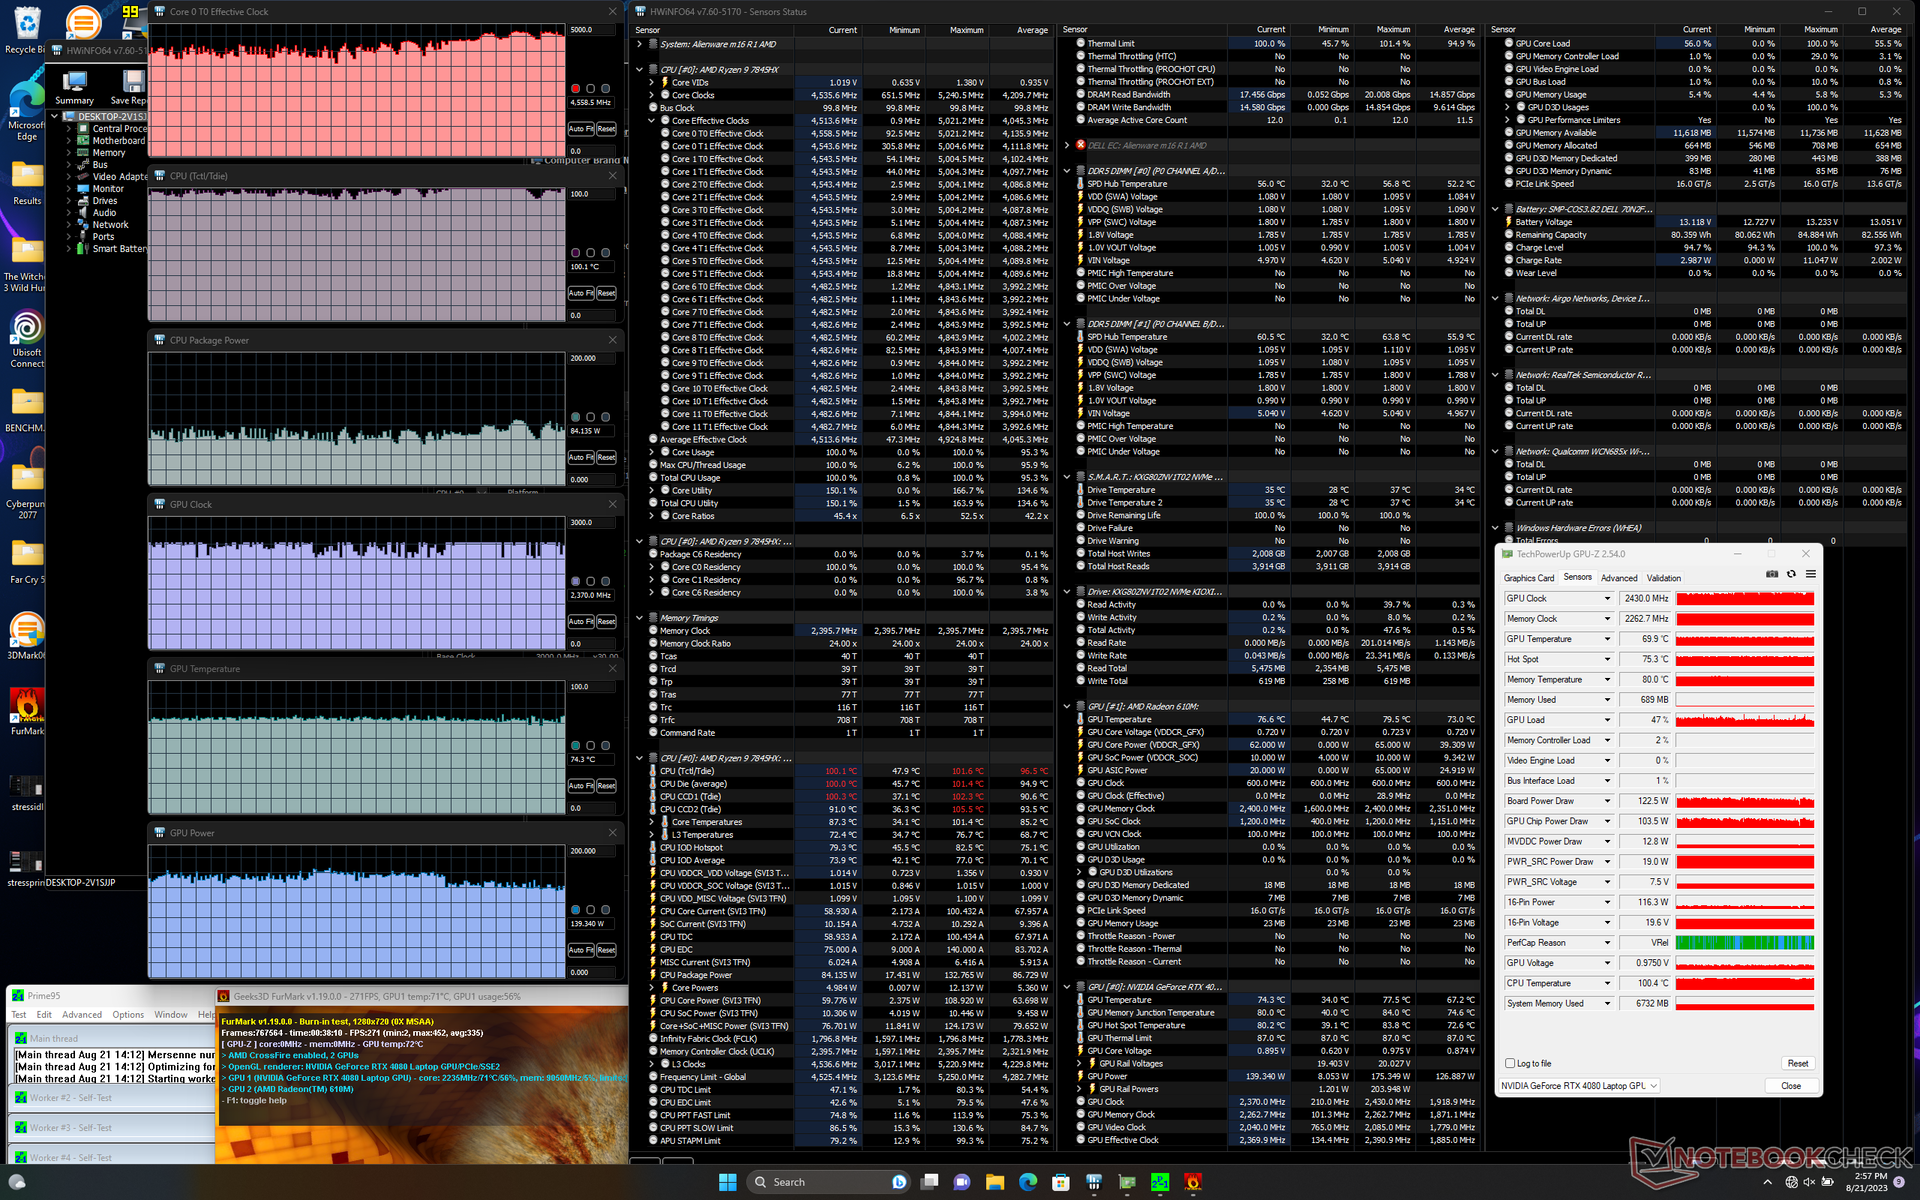
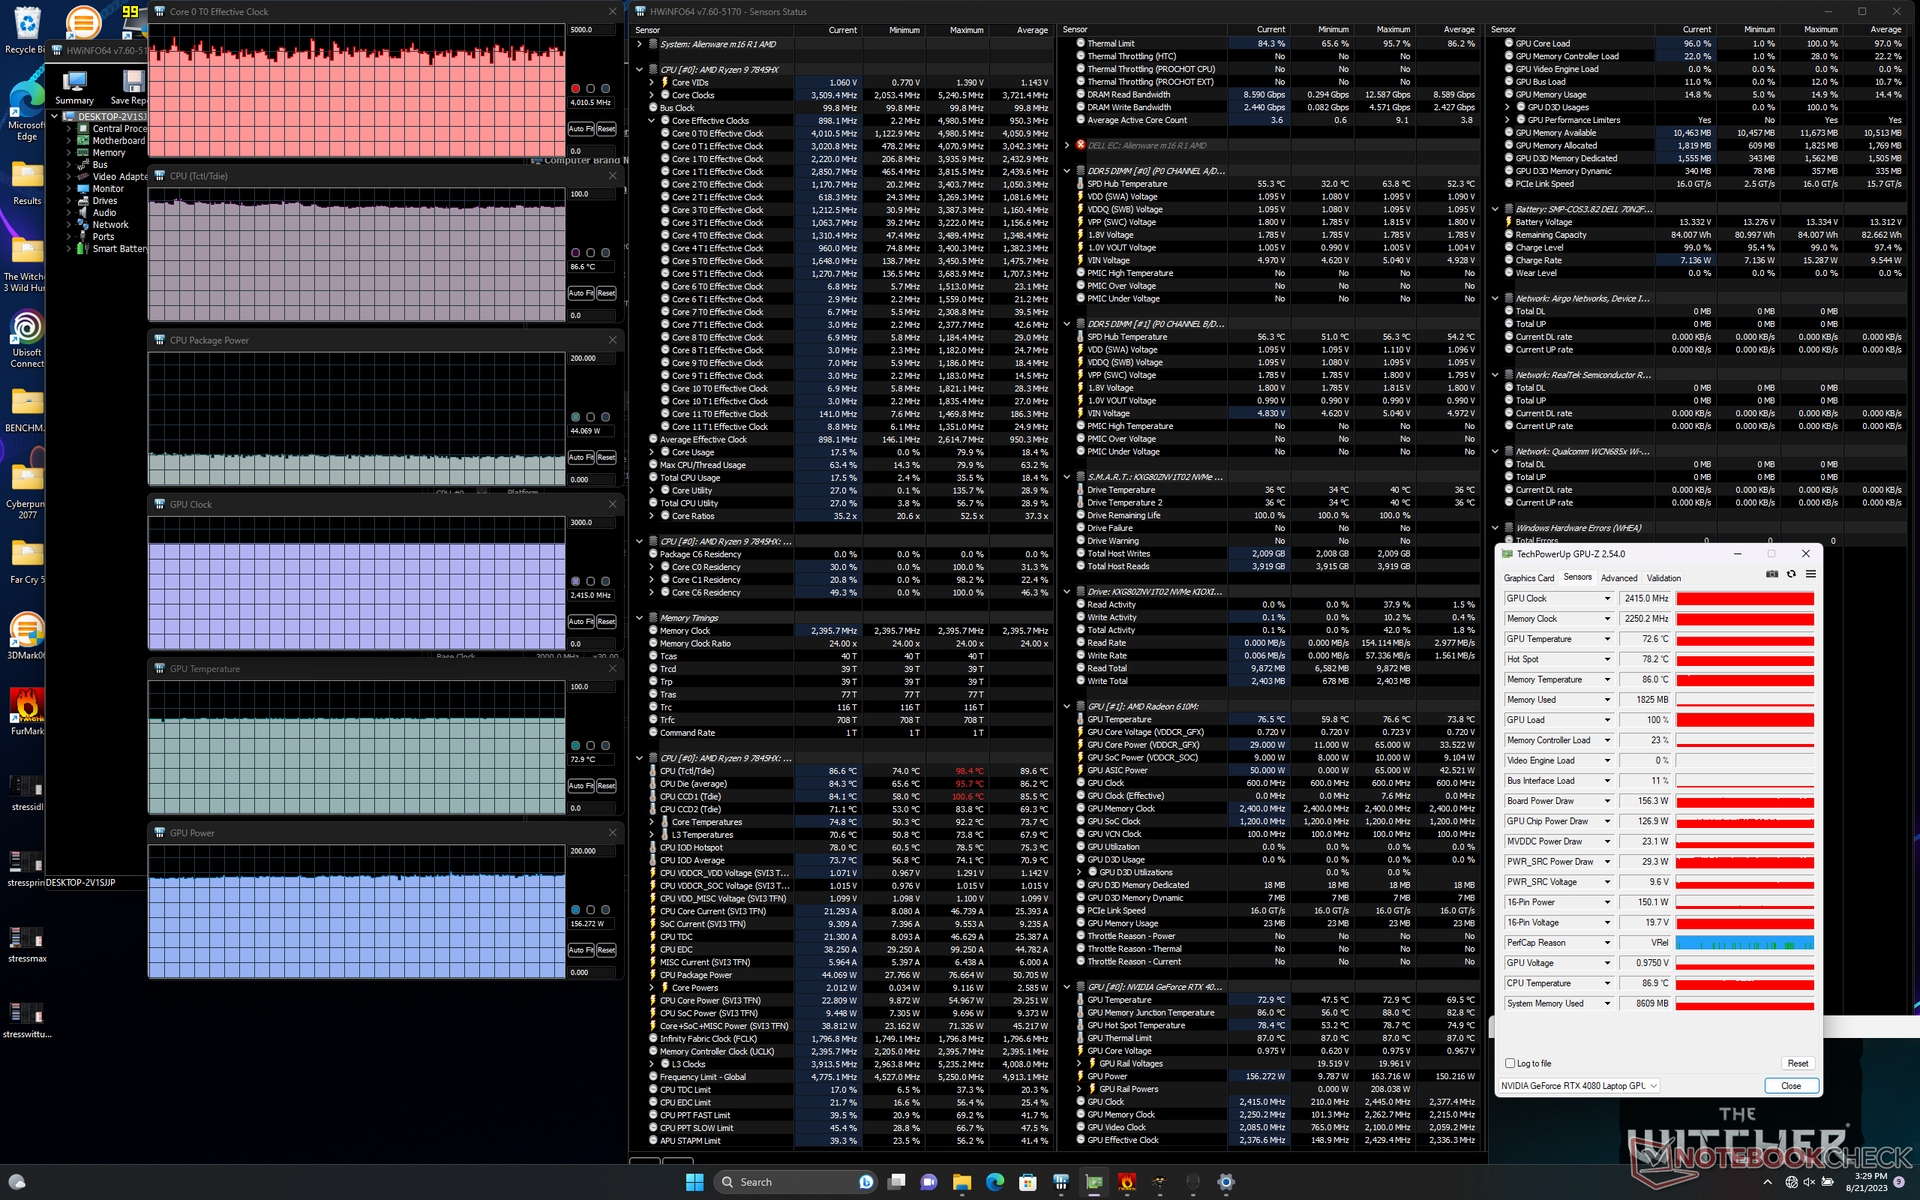
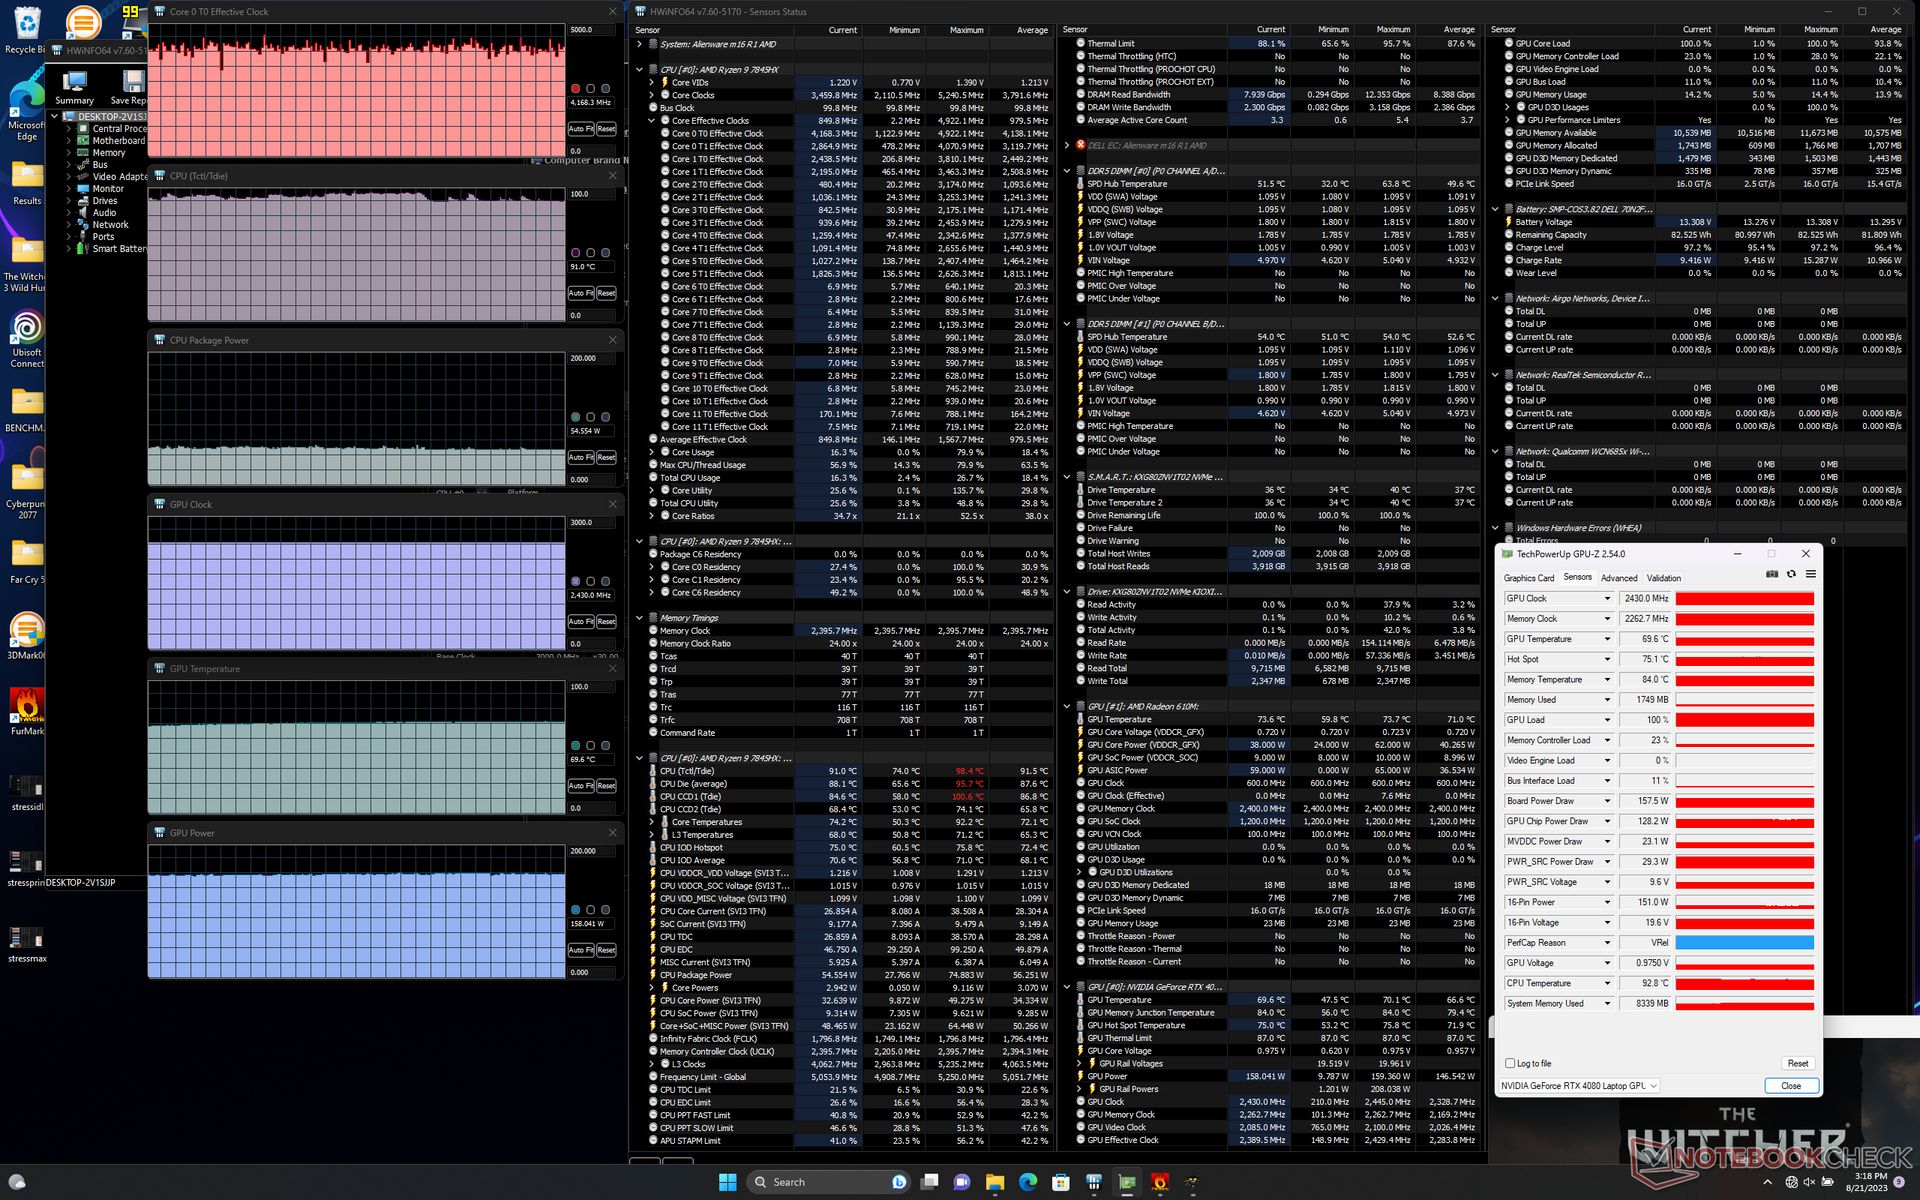
| CPU 时钟 (GHz) | GPU 时钟 (MHz) | CPU 平均温度 (°C) | GPU 平均温度(°C) | |
| 系统闲置 | -- | - | 49 | 34 |
| Prime95 压力 | 4.6 | -- | 85 | 49 |
| Prime95 + FurMark 压力 | ~4.0 - 4.6 | ~2430 | 87 | 74 |
| Witcher 3 压力(平衡模式) | ~4.1 | 2415 | 75 | 73 |
| Witcher 3 压力(超速模式) | ~4.1 | 2430 | 74 | 70 |
发言人
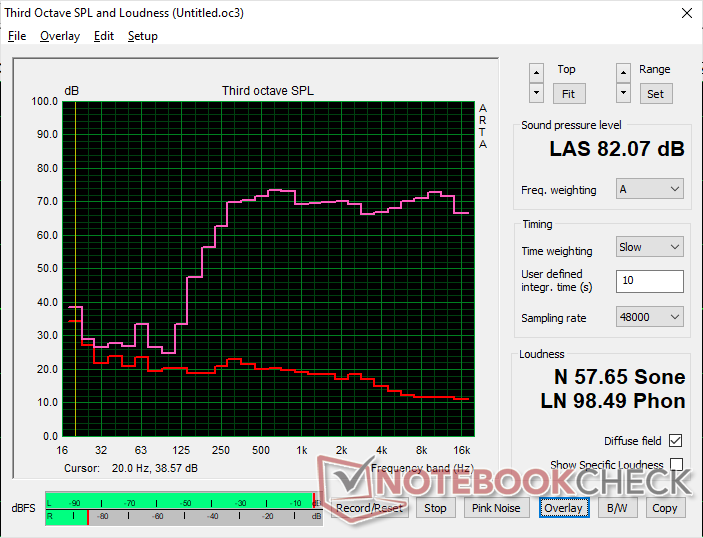
Alienware m16 R1 AMD audio analysis
(+) | speakers can play relatively loud (82.1 dB)
Bass 100 - 315 Hz
(-) | nearly no bass - on average 20.6% lower than median
(-) | bass is not linear (15.3% delta to prev. frequency)
Mids 400 - 2000 Hz
(+) | balanced mids - only 1.4% away from median
(+) | mids are linear (2.1% delta to prev. frequency)
Highs 2 - 16 kHz
(+) | balanced highs - only 1.9% away from median
(+) | highs are linear (2.9% delta to prev. frequency)
Overall 100 - 16.000 Hz
(+) | overall sound is linear (13.9% difference to median)
Compared to same class
» 22% of all tested devices in this class were better, 7% similar, 70% worse
» The best had a delta of 6%, average was 18%, worst was 132%
Compared to all devices tested
» 16% of all tested devices were better, 4% similar, 80% worse
» The best had a delta of 4%, average was 23%, worst was 134%
Apple MacBook Pro 16 2021 M1 Pro audio analysis
(+) | speakers can play relatively loud (84.7 dB)
Bass 100 - 315 Hz
(+) | good bass - only 3.8% away from median
(+) | bass is linear (5.2% delta to prev. frequency)
Mids 400 - 2000 Hz
(+) | balanced mids - only 1.3% away from median
(+) | mids are linear (2.1% delta to prev. frequency)
Highs 2 - 16 kHz
(+) | balanced highs - only 1.9% away from median
(+) | highs are linear (2.7% delta to prev. frequency)
Overall 100 - 16.000 Hz
(+) | overall sound is linear (4.6% difference to median)
Compared to same class
» 0% of all tested devices in this class were better, 0% similar, 100% worse
» The best had a delta of 5%, average was 17%, worst was 45%
Compared to all devices tested
» 0% of all tested devices were better, 0% similar, 100% worse
» The best had a delta of 4%, average was 23%, worst was 134%
能源管理
耗电量
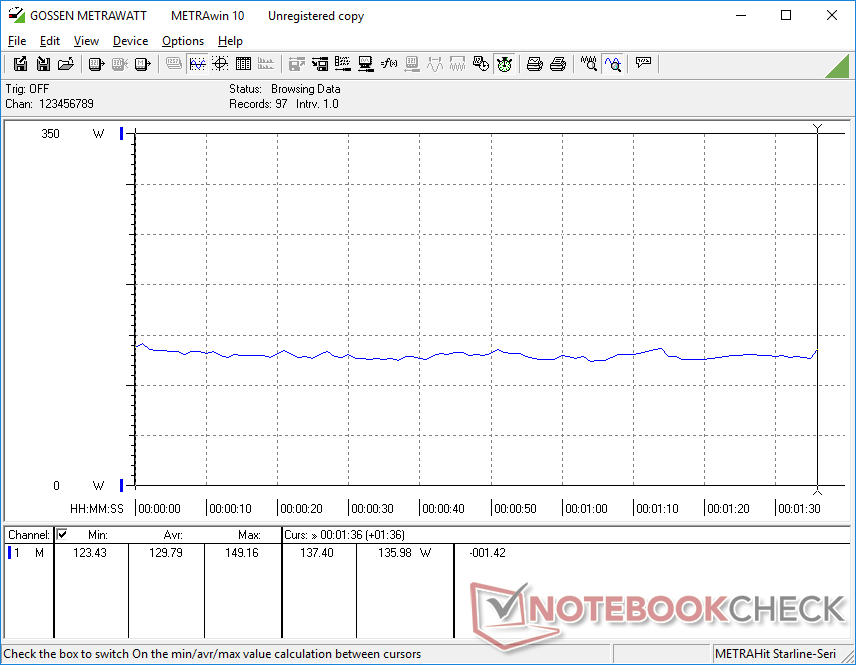
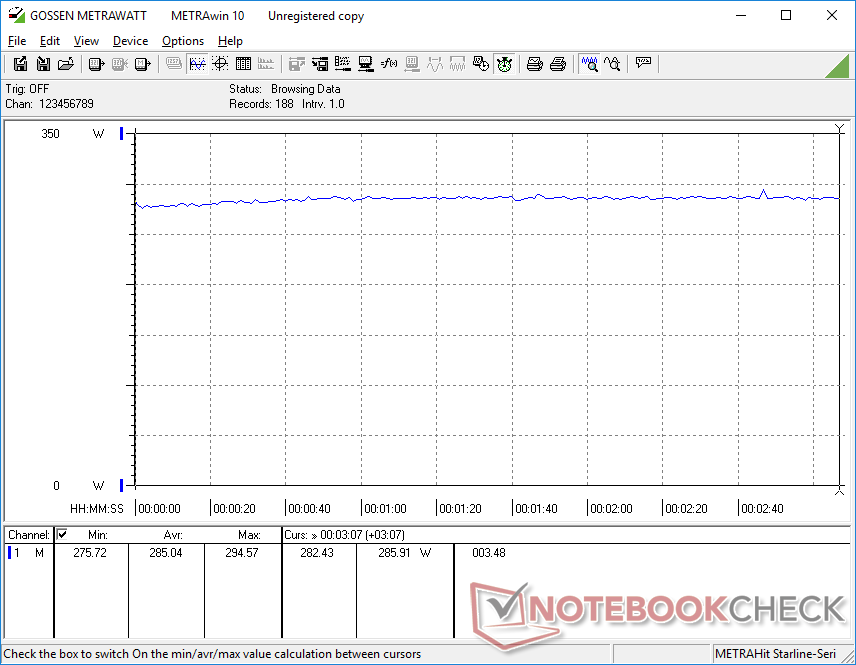
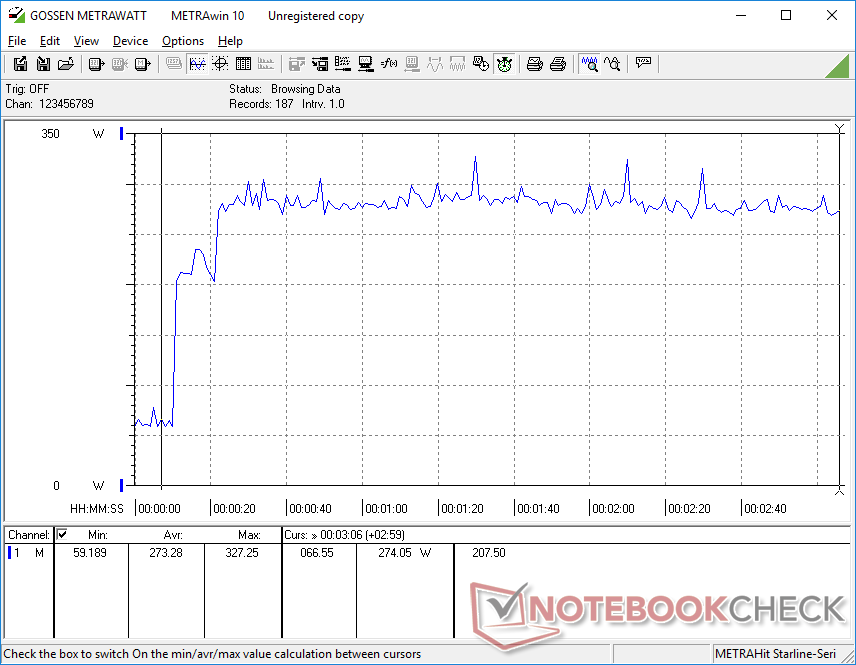
Alienware 笔记本电脑的功耗一直是最高的,我们的 Alienware m16 R1 也不例外。仅在台式机上空转耗电就在 39 W 到 69 W 之间,而联想Legion Pro 7 或华硕 ROG Strix G16 的耗电量不到一半。这些较高的空载水平很可能是导致下一节中电池续航时间不佳的原因。
游戏时的平均功耗为 285 W,再次超过大多数其他游戏笔记本电脑,甚至包括戴尔自己的 Alienware x16。
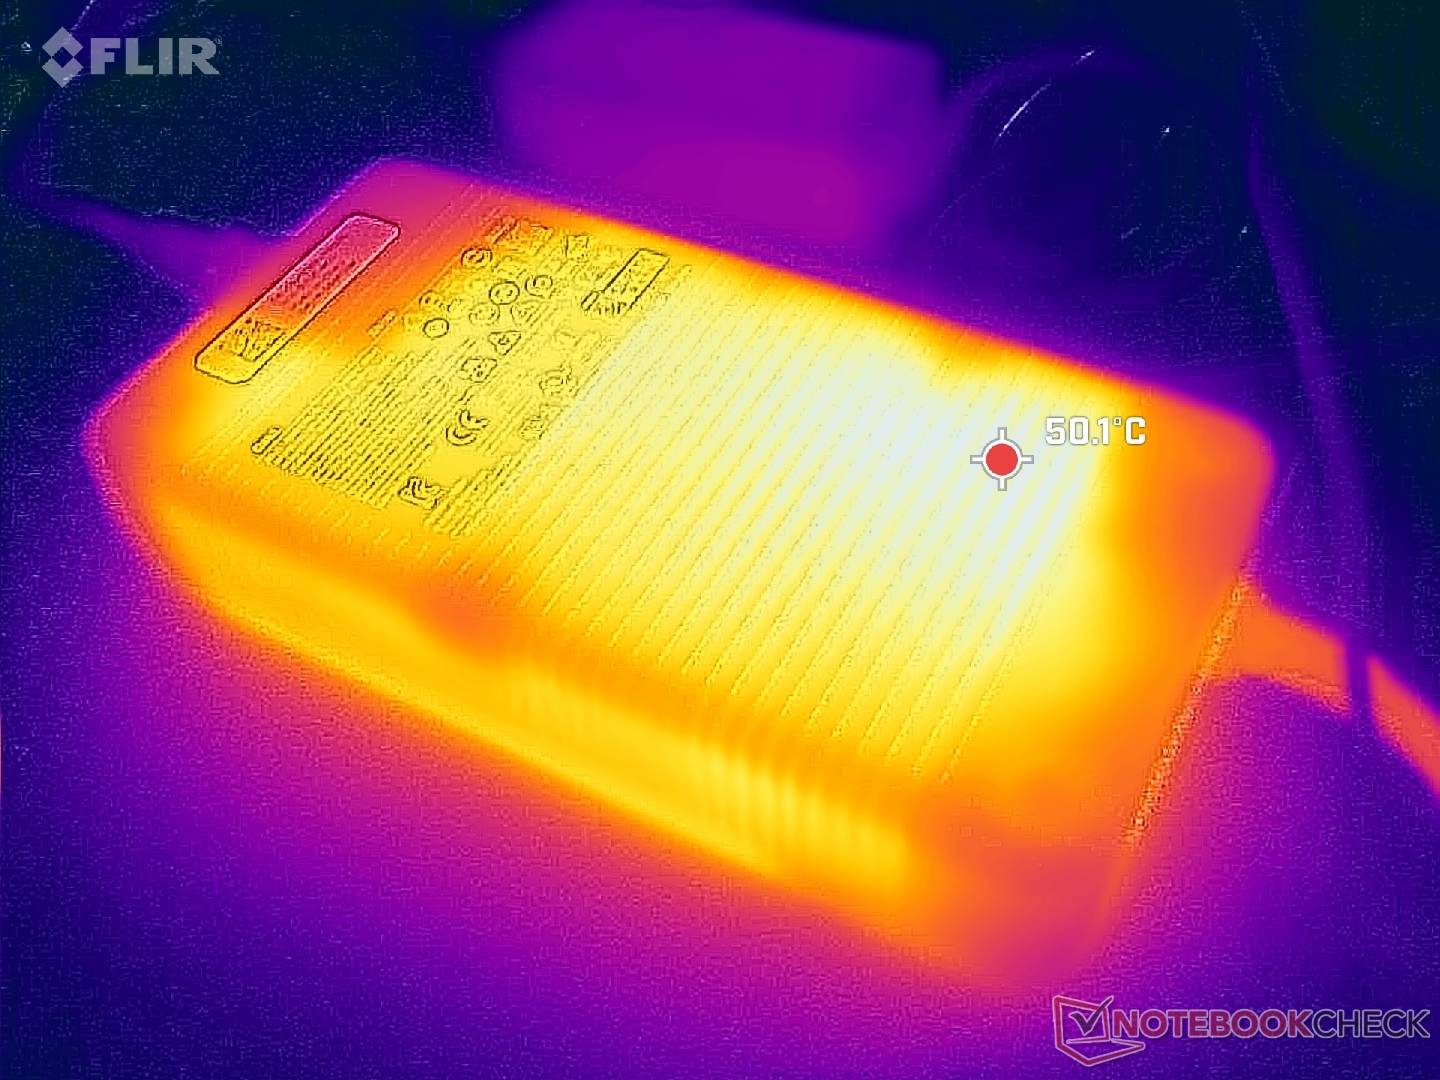
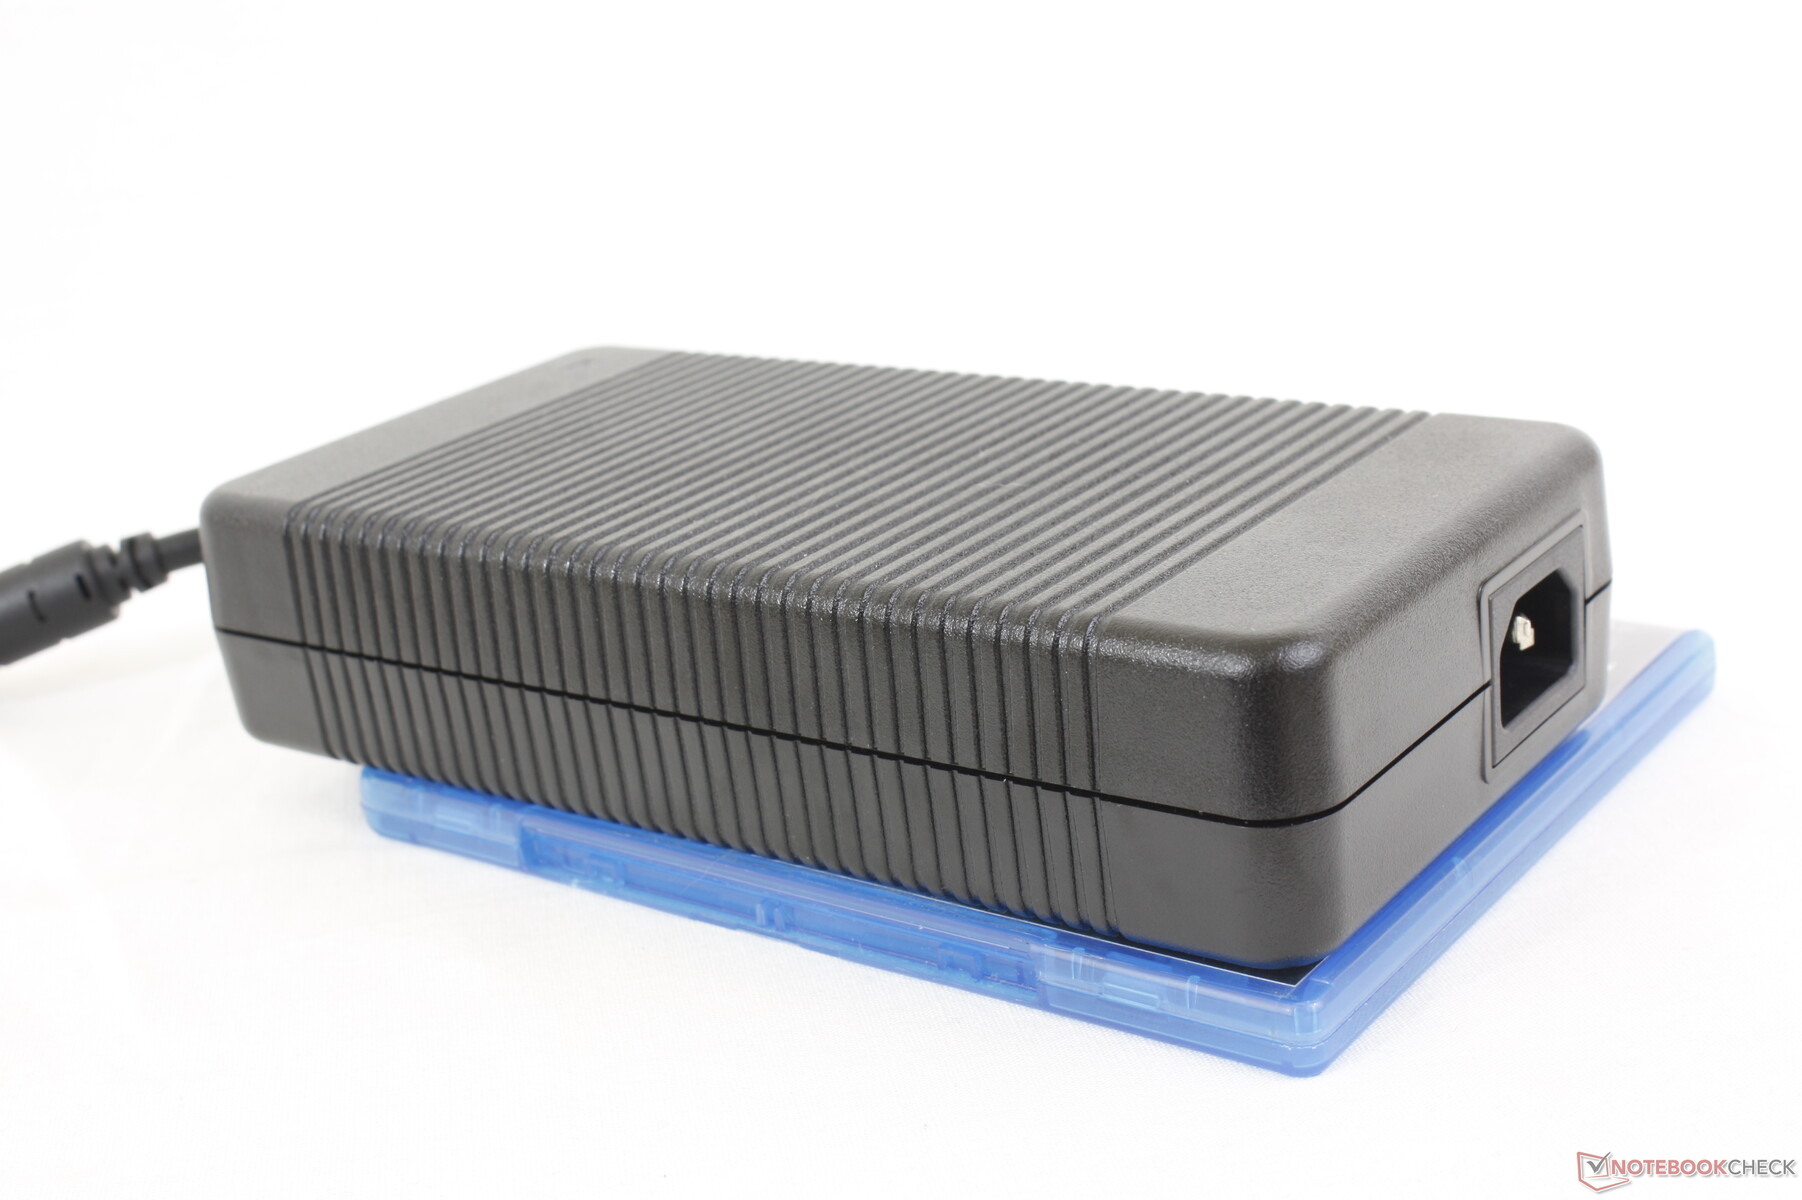
330 瓦交流适配器体积较大(约 20 x 10 x 4.5 厘米),而且笨重。相比之下,目前与最新款雷蛇笔记本电脑一起出货的 GaN 330 瓦交流适配器明显更加便携。
| Off / Standby | |
| Idle | |
| Load |
|
Key:
min: | |
| Alienware m16 R1 AMD R9 7845HX, GeForce RTX 4080 Laptop GPU, Kioxia XG8 KXG80ZNV1T02, IPS, 2560x1600, 16" | Alienware x16 R1 i9-13900HK, GeForce RTX 4080 Laptop GPU, SK hynix PC801 HFS001TEJ9X101N, IPS, 2560x1600, 16" | HP Omen Transcend 16 i9-13900HX, GeForce RTX 4070 Laptop GPU, SK hynix PC801 HFS002TEJ9X101N, Mini-LED, 2560x1600, 16" | Lenovo Legion Pro 7 RTX4090 i9-13900HX, GeForce RTX 4090 Laptop GPU, Samsung PM9A1 MZVL21T0HCLR, IPS, 2560x1600, 16" | Asus ROG Strix G16 G614JZ i9-13980HX, GeForce RTX 4080 Laptop GPU, WD PC SN560 SDDPNQE-1T00, IPS, 2560x1600, 16" | Razer Blade 16 Early 2023 i9-13950HX, GeForce RTX 4080 Laptop GPU, SSSTC CA6-8D1024, IPS, 2560x1600, 16" | |
|---|---|---|---|---|---|---|
| Power Consumption | 21% | 27% | 23% | 35% | 29% | |
| Idle Minimum * (Watt) | 39 | 25.2 35% | 19.2 51% | 20 49% | 10 74% | 15.2 61% |
| Idle Average * (Watt) | 44.6 | 29.9 33% | 22.7 49% | 25 44% | 16 64% | 22.8 49% |
| Idle Maximum * (Watt) | 68.1 | 49.8 27% | 55.4 19% | 35 49% | 27 60% | 49.8 27% |
| Load Average * (Watt) | 129.8 | 105.4 19% | 128.4 1% | 136 -5% | 129 1% | 121.2 7% |
| Witcher 3 ultra * (Watt) | 285 | 263 8% | 206 28% | 282 1% | 247 13% | 242 15% |
| Load Maximum * (Watt) | 327.3 | 313.8 4% | 292 11% | 320 2% | 342 -4% | 273.7 16% |
* ... smaller is better
Power Consumption Witcher 3 / Stresstest
Power Consumption external Monitor
电池寿命
在启用 iGPU 的情况下,使用 "平衡 "电源配置文件进行实际 WLAN 浏览时,电池续航时间仍然不足 4 小时。我们甚至尝试通过 Alienware Command Center 使用特殊的 "电池 "电源配置文件,结果仍然没有改善。联想Legion Pro 7 或华硕 ROG Strix G16 等竞争机型的续航时间要长得多。
从空电充至满电需要 2 个多小时。该系统还可以通过 USB-C 接口充电,尽管充电速度较慢。
| Alienware m16 R1 AMD R9 7845HX, GeForce RTX 4080 Laptop GPU, 86 Wh | Alienware x16 R1 i9-13900HK, GeForce RTX 4080 Laptop GPU, 90 Wh | HP Omen Transcend 16 i9-13900HX, GeForce RTX 4070 Laptop GPU, 97 Wh | Lenovo Legion Pro 7 RTX4090 i9-13900HX, GeForce RTX 4090 Laptop GPU, 99.9 Wh | Asus ROG Strix G16 G614JZ i9-13980HX, GeForce RTX 4080 Laptop GPU, 90 Wh | Razer Blade 16 Early 2023 i9-13950HX, GeForce RTX 4080 Laptop GPU, 95.2 Wh | |
|---|---|---|---|---|---|---|
| Battery runtime | 13% | 41% | 38% | 100% | 88% | |
| Reader / Idle (h) | 4 | 7.3 83% | 6.3 58% | 8.9 123% | ||
| WiFi v1.3 (h) | 3.7 | 2.5 -32% | 4.2 14% | 5.1 38% | 9.7 162% | 6.1 65% |
| Load (h) | 0.8 | 0.7 -13% | 1.2 50% | 1.1 38% | 1.4 75% |
Pros
Cons
结论:速度快、功能多,但需要优化

作为一款 16 英寸笔记本电脑,Alienware m16 R1 拥有超强的性能和功能。我们谈论的是液态金属、蒸汽室、四个风扇、3 个固态硬盘托架、CherryMX 机械键盘、175 W 显卡、可升级内存,甚至还有英特尔和 AMD 的 CPU 和 GPU 可供选择。与之竞争的 16 英寸游戏机型,如 HP Omen Transcend 16, Razer Blade 16或 华硕 Zephyrus M16这些产品的功能相对较少,即使配置与我们的测试配置相同的 GPU,速度也普遍较慢。考虑到 Alienware m16 R1 的配置如此密集,Alienware 的工程师们功不可没。
另一方面,由于 Alienware m16 比许多其他笔记本电脑更重、更大,一长串的集成功能也对笔记本电脑不利。无论电源配置文件设置如何,电池寿命都会受到严重影响。如果你看重便携性,那么你可能要另觅他处了。此外,该机型还缺少一些常用功能,如 OLED 和迷你 LED。
不可否认,Alienware m16 R1 速度快、功能多,整体性能高于平均水平。然而,性能优势的代价是较重的重量和较大的尺寸。
我们在评测过程中遇到的 Bug 也值得一提。4K 视频播放时的跳帧、游戏时的帧速率卡顿以及从睡眠中唤醒的问题,考虑到 Alienware 本应是一个发烧友品牌,这些问题令人遗憾。也许戴尔在众多英特尔-Nvidia、AMD-Nvidia 和 AMD-AMD 配置上咬得太紧,导致故障排除相当棘手。
Alienware m16 R1 AMD
- 08/23/2023 v7 (old)
Allen Ngo
Transparency
The selection of devices to be reviewed is made by our editorial team. The test sample was provided to the author as a loan by the manufacturer or retailer for the purpose of this review. The lender had no influence on this review, nor did the manufacturer receive a copy of this review before publication. There was no obligation to publish this review. As an independent media company, Notebookcheck is not subjected to the authority of manufacturers, retailers or publishers.
This is how Notebookcheck is testing
Every year, Notebookcheck independently reviews hundreds of laptops and smartphones using standardized procedures to ensure that all results are comparable. We have continuously developed our test methods for around 20 years and set industry standards in the process. In our test labs, high-quality measuring equipment is utilized by experienced technicians and editors. These tests involve a multi-stage validation process. Our complex rating system is based on hundreds of well-founded measurements and benchmarks, which maintains objectivity. Further information on our test methods can be found here.
Price comparison

