惠普 Omen 16 (2024) 评测:配备酷睿 i9 和 RTX 4080 的 QHD 游戏笔记本,售价 3,200 欧元
高端游戏笔记本电脑 Omen 16 的最新版本采用了与前代产品相同的机身和基本相同的硬件。 前代产品.CPU 得到了改进:Raptor Lake Refresh 取代了原来的 Raptor Lake。处理器 GeForce RTX 4080, 酷睿 i9-14900HX和 32 GB 内存,使这款笔记本电脑的价格升至 3,200 欧元(3,446 美元)。Omen 16 的竞争对手是游戏笔记本电脑,如 微星 Vector 16 HX A14V和 宏碁掠夺者 Helios 18和 Alienware m16 R1.
潜在的竞争对手比较
Rating | Date | Model | Weight | Height | Size | Resolution | Price |
|---|---|---|---|---|---|---|---|
| 86.7 % v7 (old) | 02 / 2024 | HP Omen 16 (2024) i9-14900HX, GeForce RTX 4080 Laptop GPU | 2.4 kg | 23.5 mm | 16.10" | 2560x1440 | |
| 88 % v7 (old) | 02 / 2024 | MSI Vector 16 HX A14V i9-14900HX, GeForce RTX 4080 Laptop GPU | 2.7 kg | 28.55 mm | 16.00" | 2560x1600 | |
| 89.2 % v7 (old) | 08 / 2023 | Alienware m16 R1 AMD R9 7845HX, GeForce RTX 4080 Laptop GPU | 3.1 kg | 25.4 mm | 16.00" | 2560x1600 | |
| 88.3 % v7 (old) | 10 / 2023 | Acer Predator Helios 18 N23Q2 i9-13900HX, GeForce RTX 4080 Laptop GPU | 3.2 kg | 29.15 mm | 18.00" | 2560x1600 |
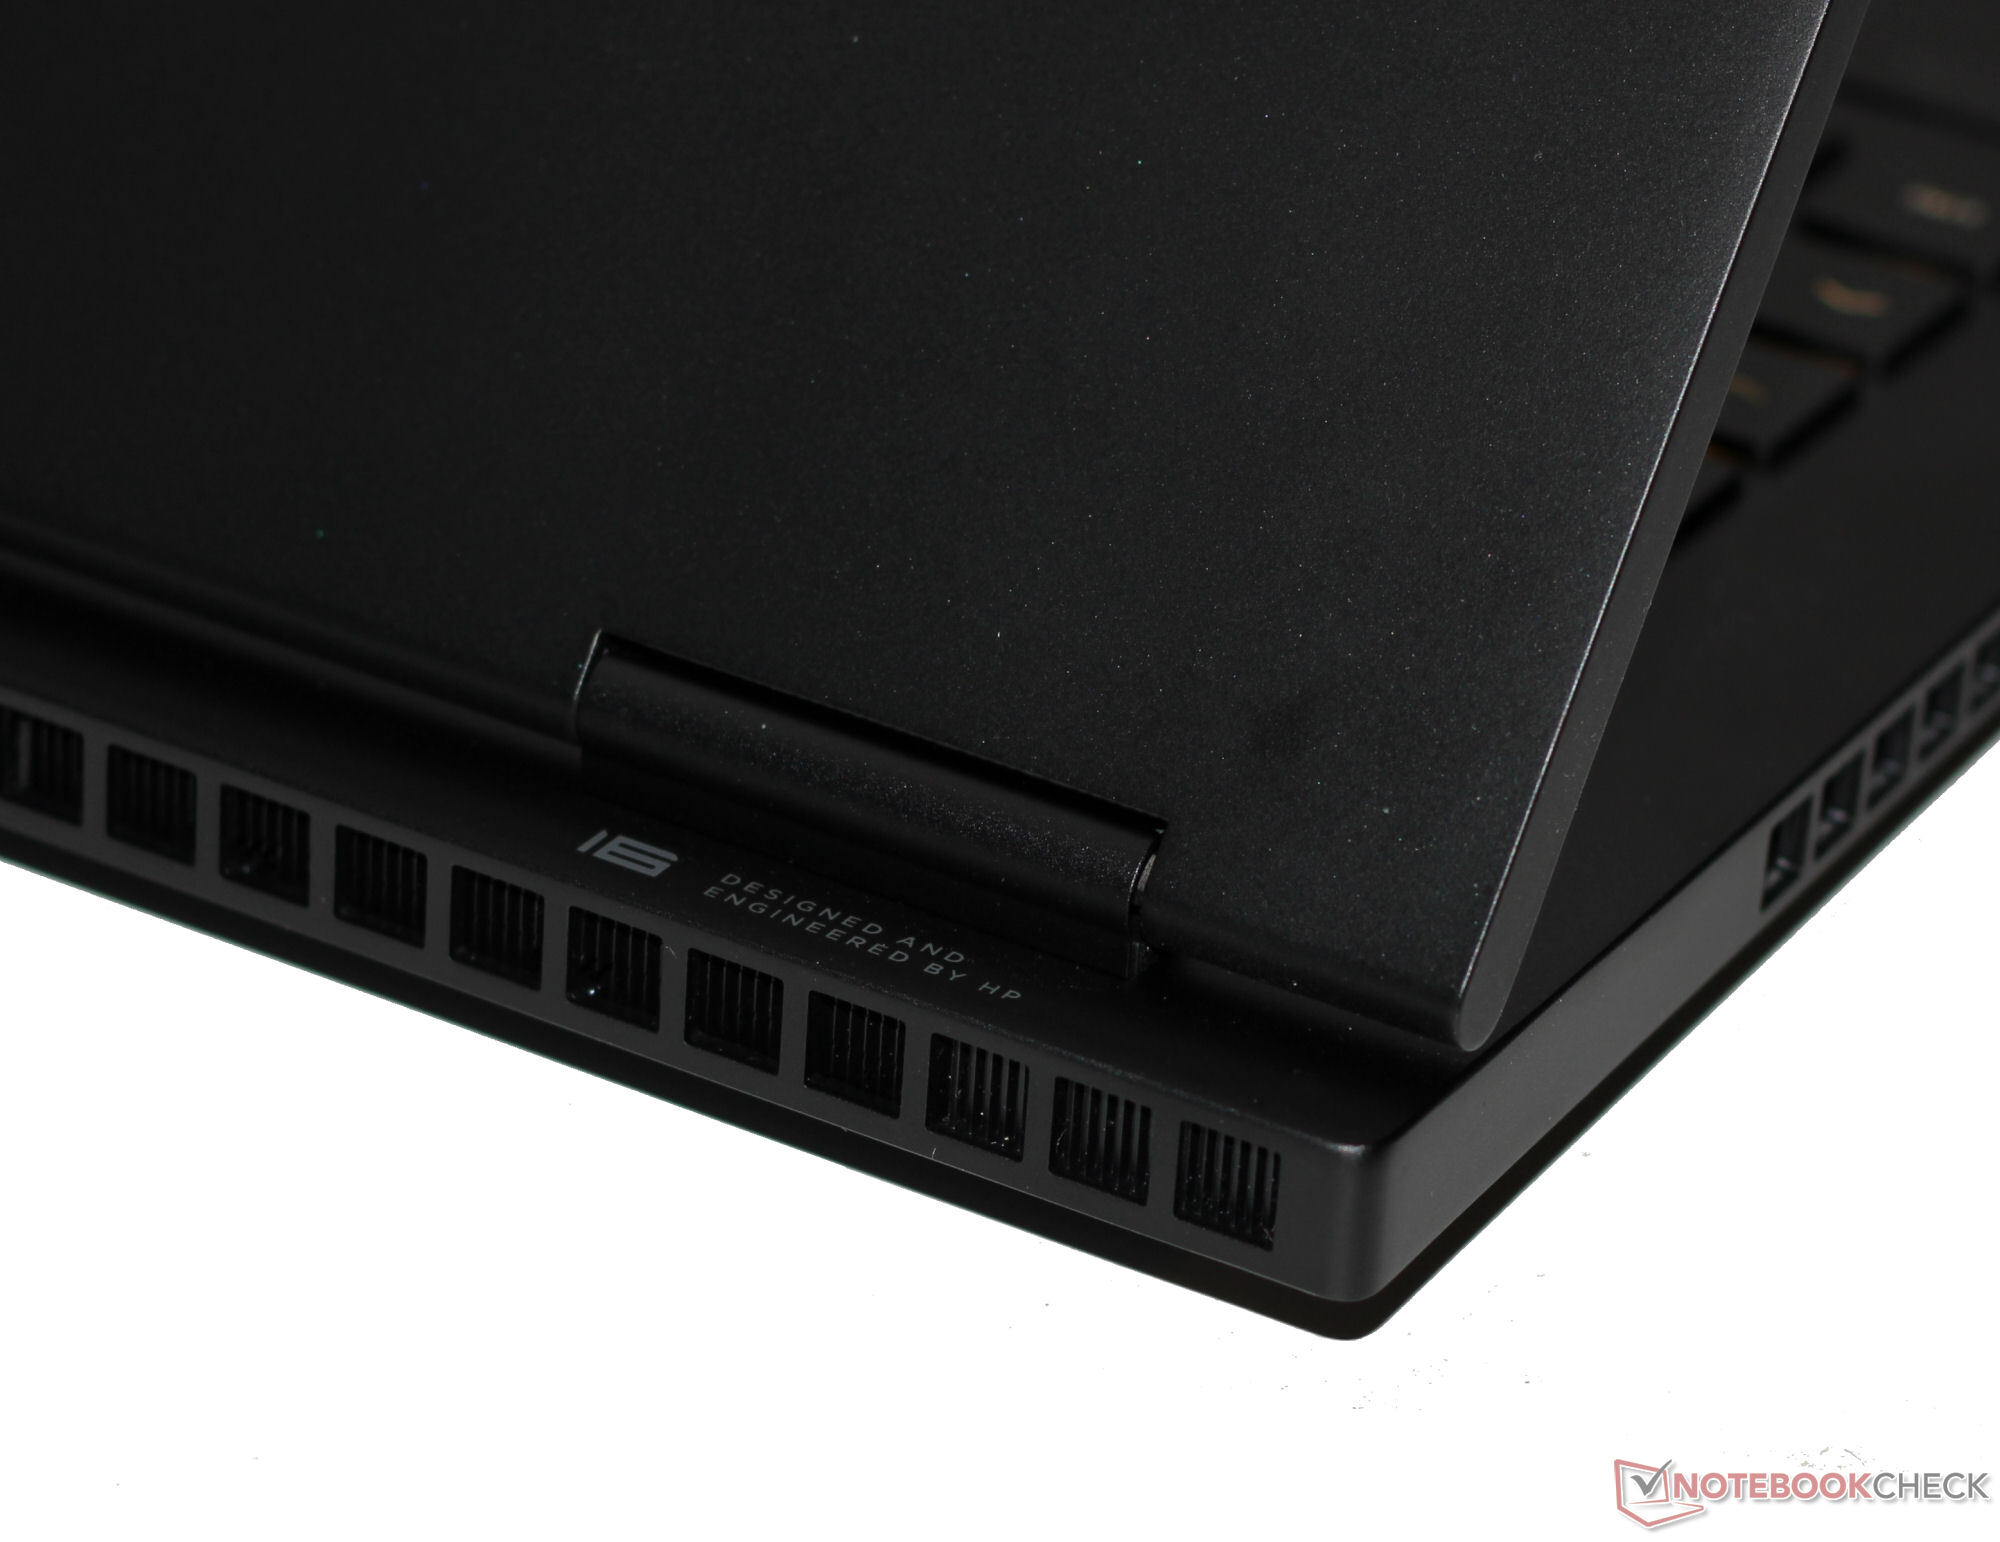
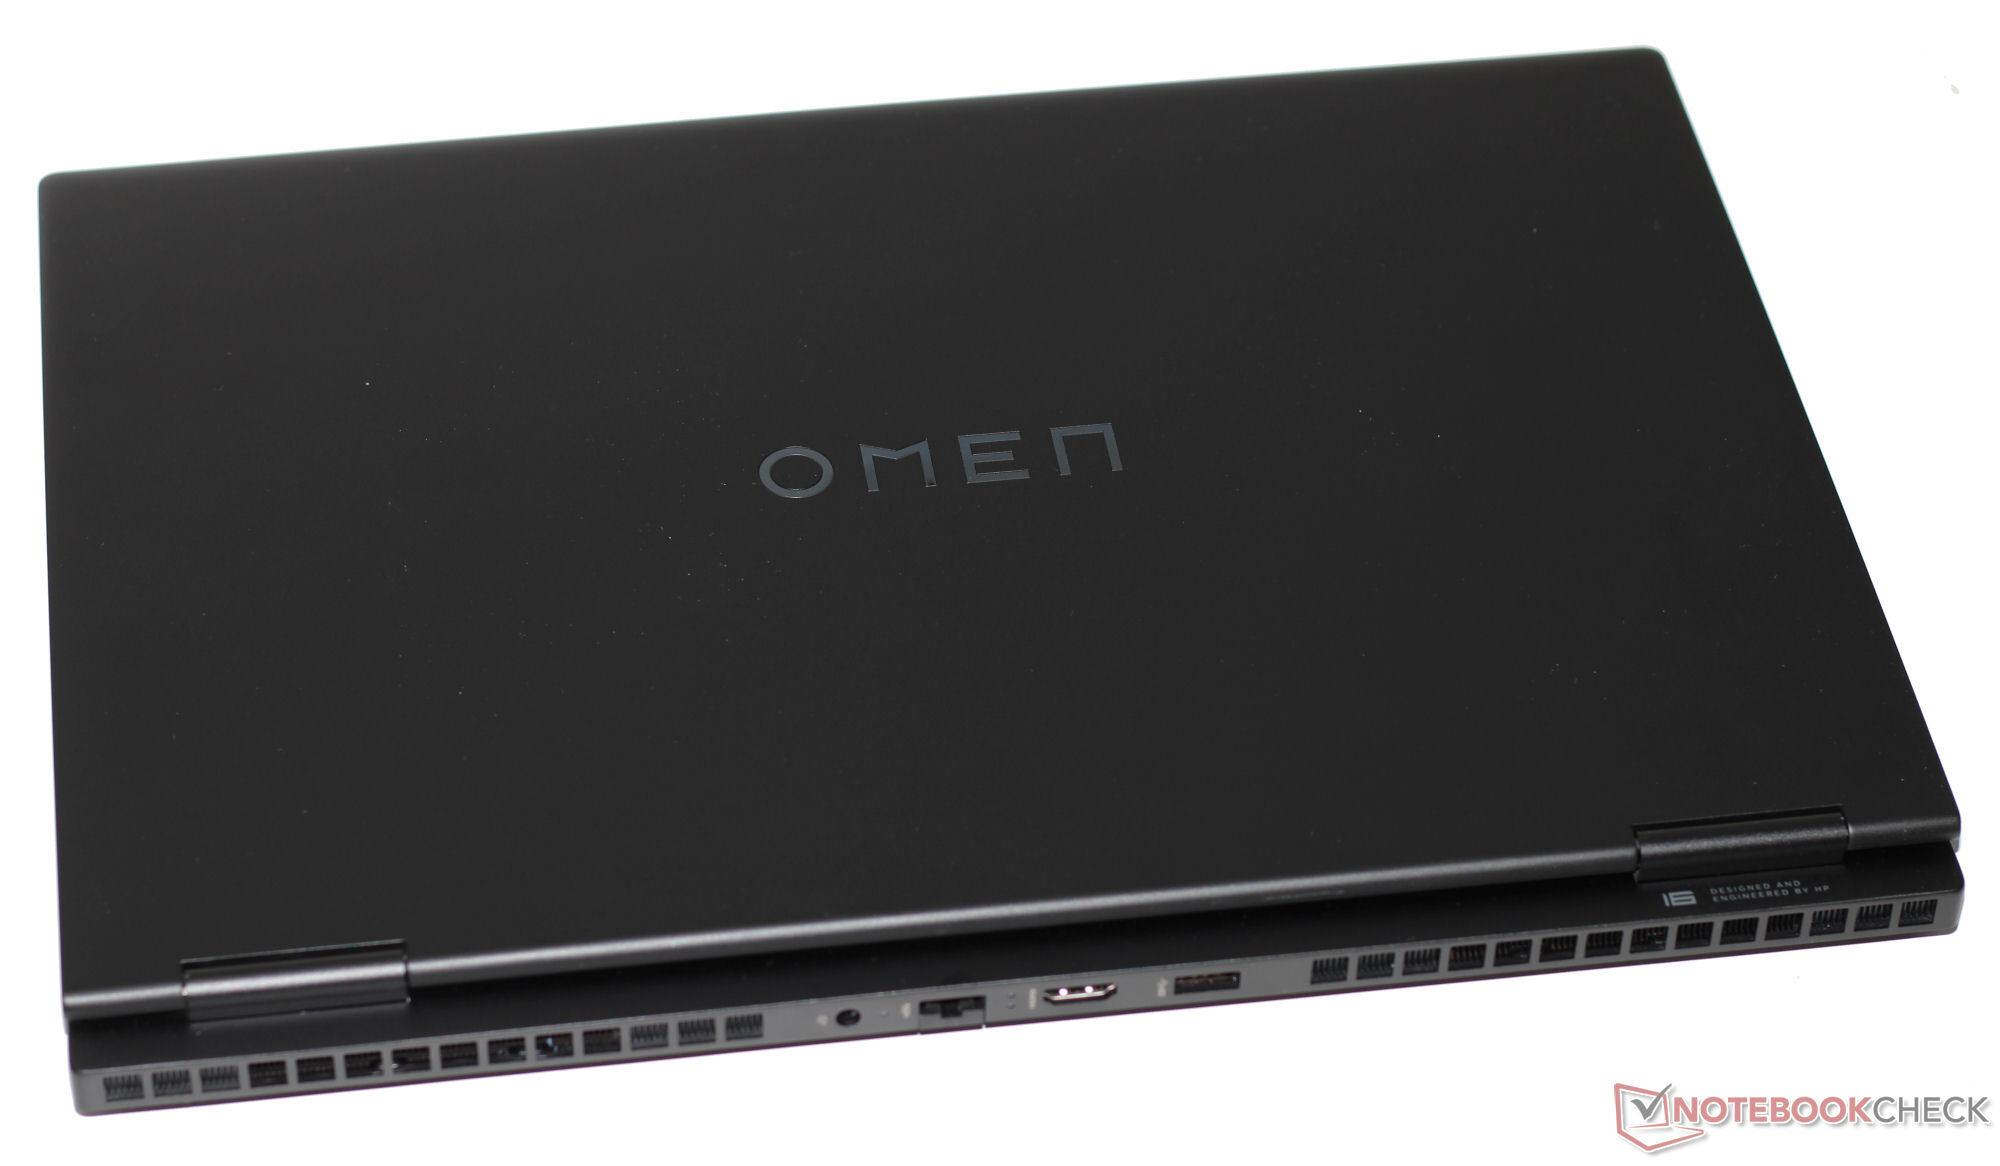
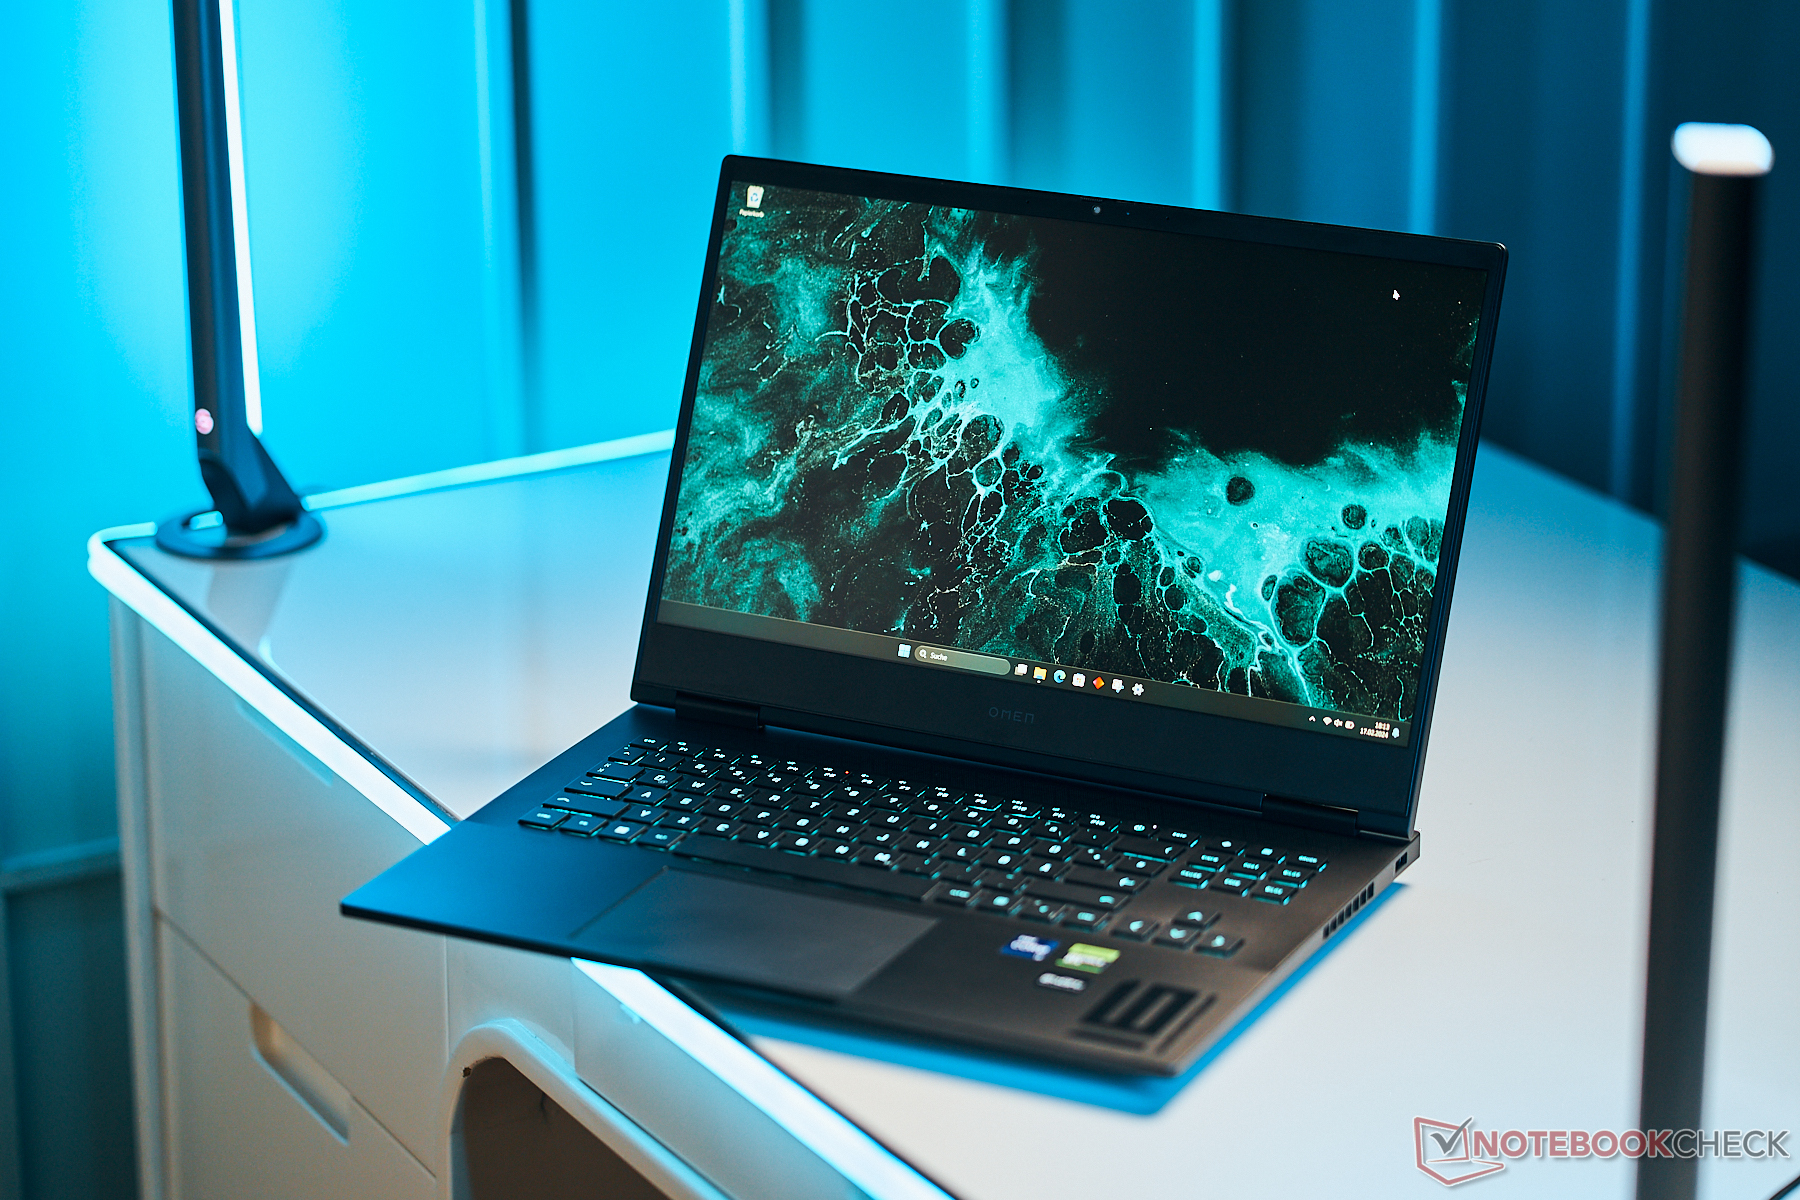
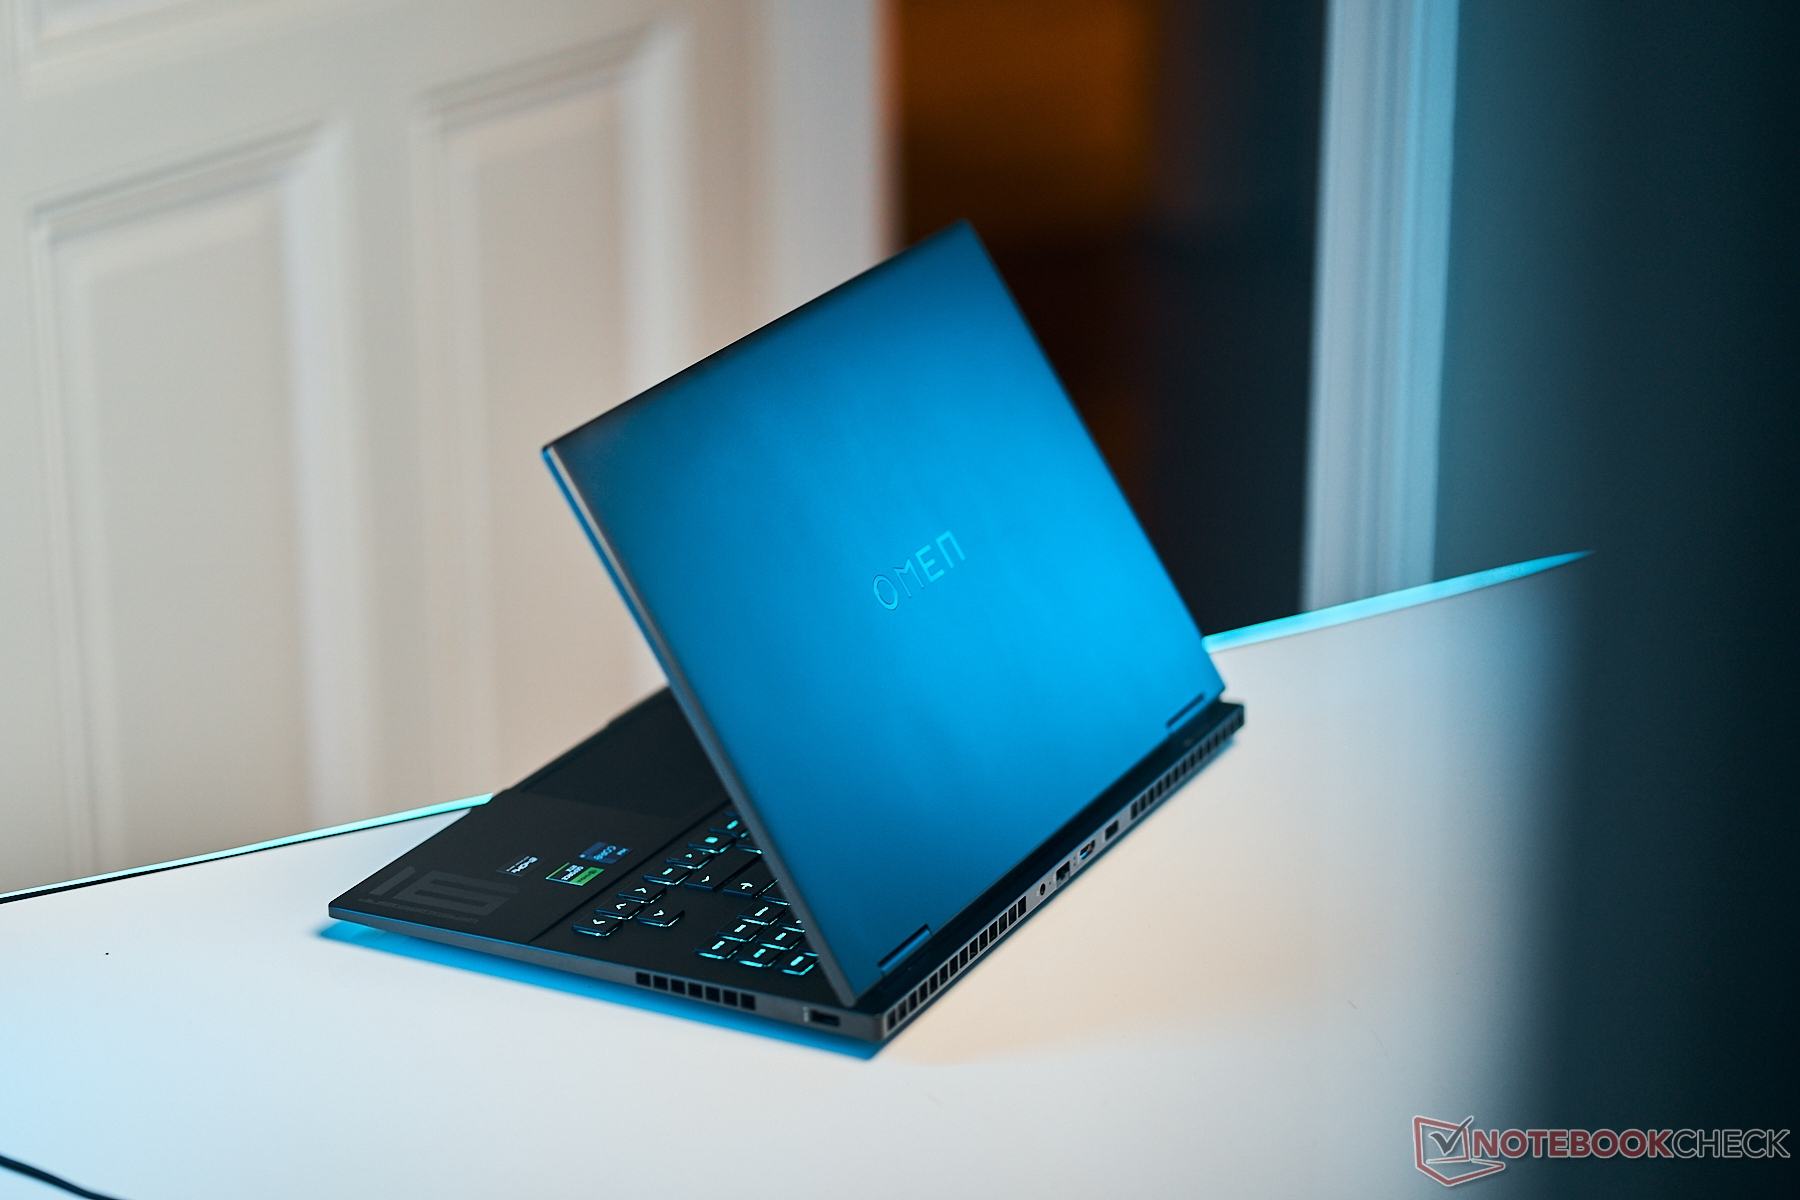
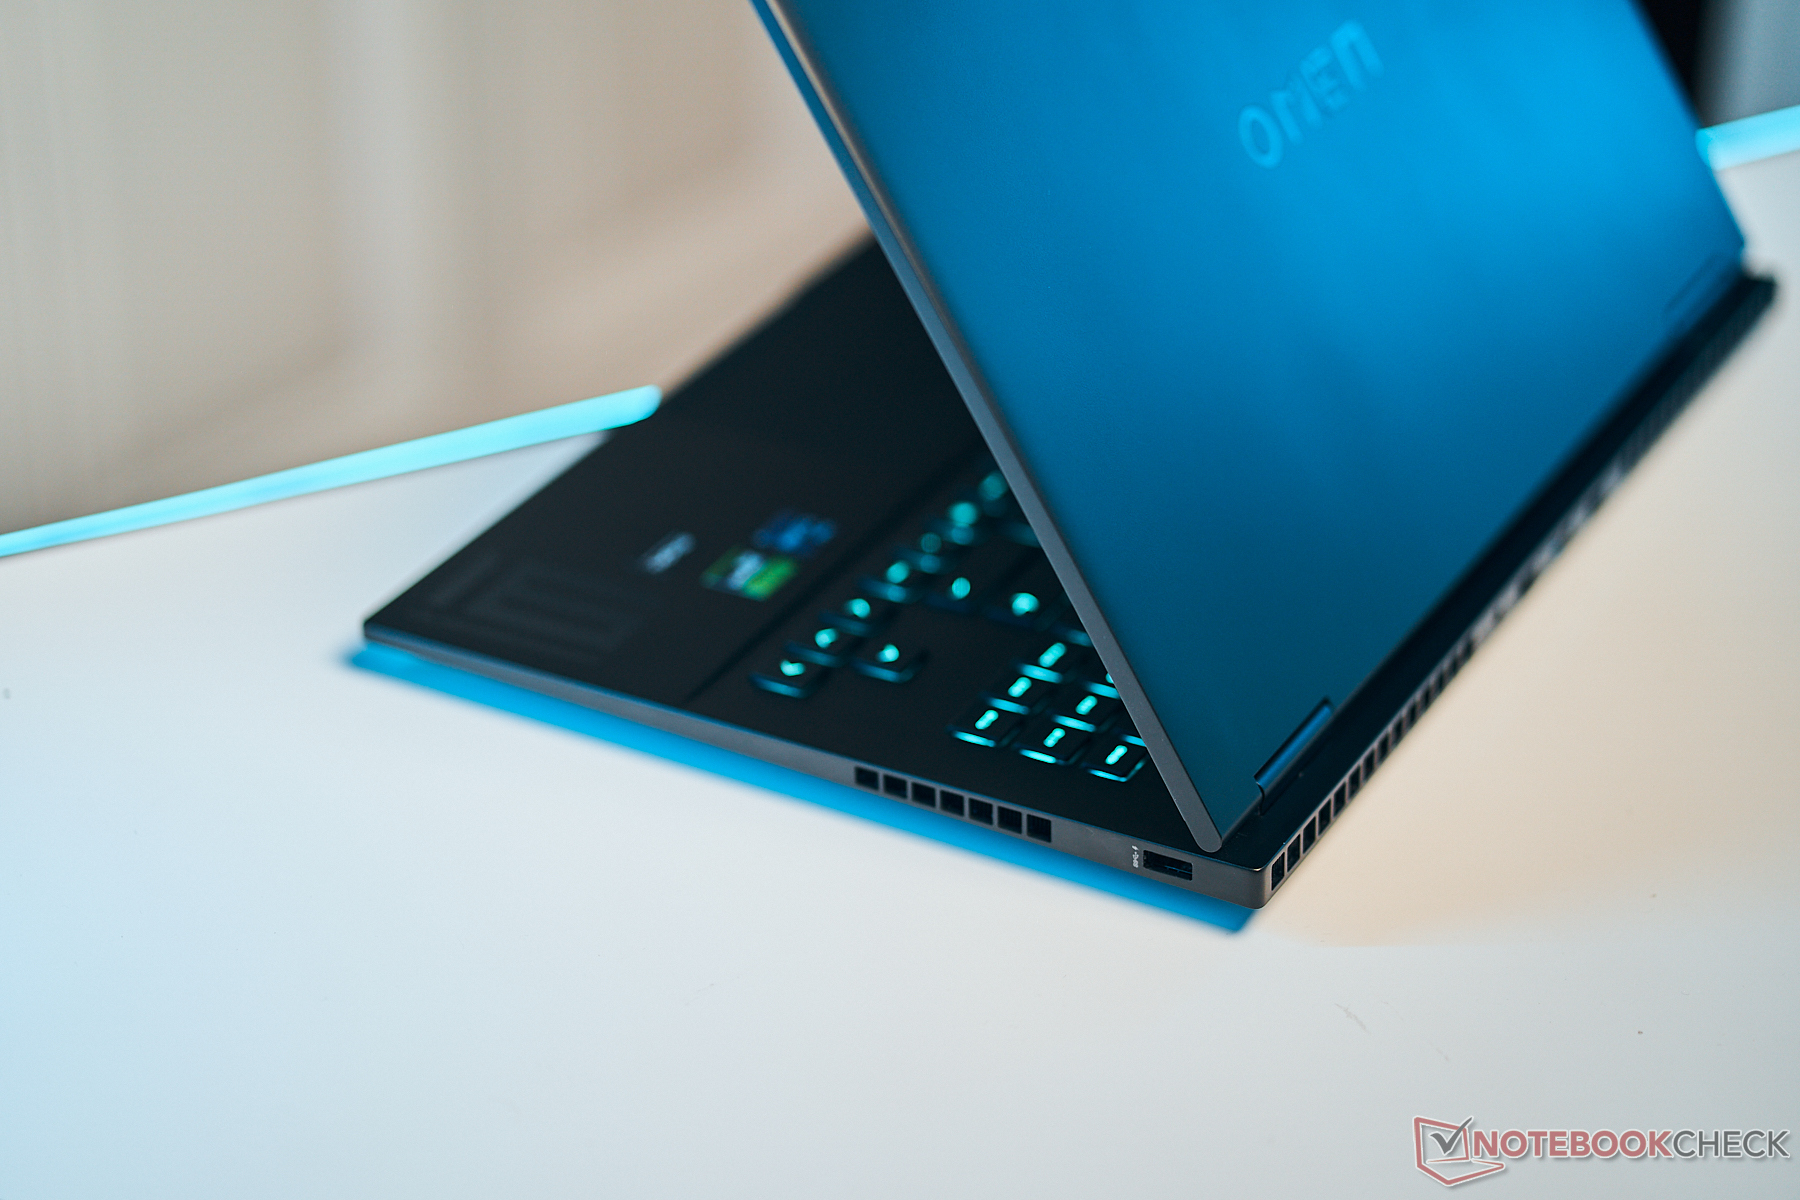
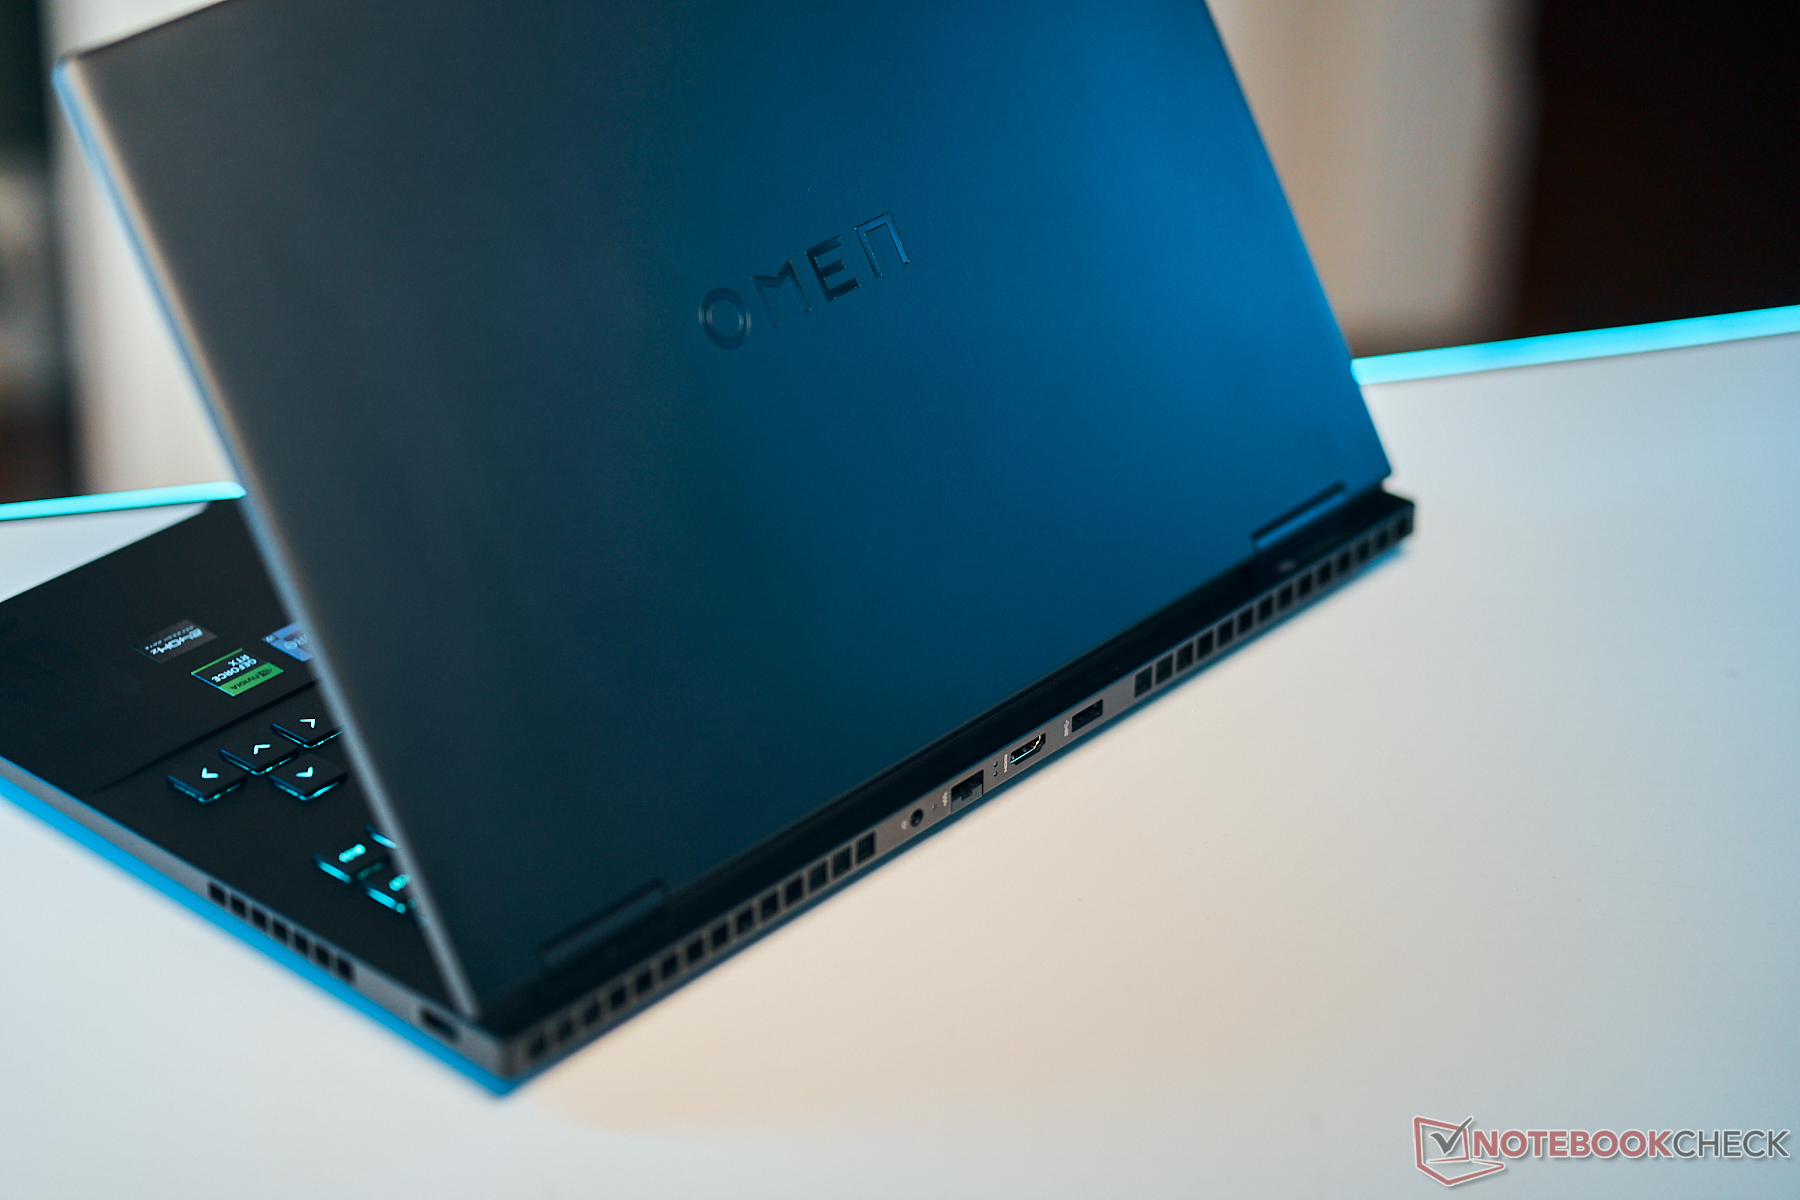
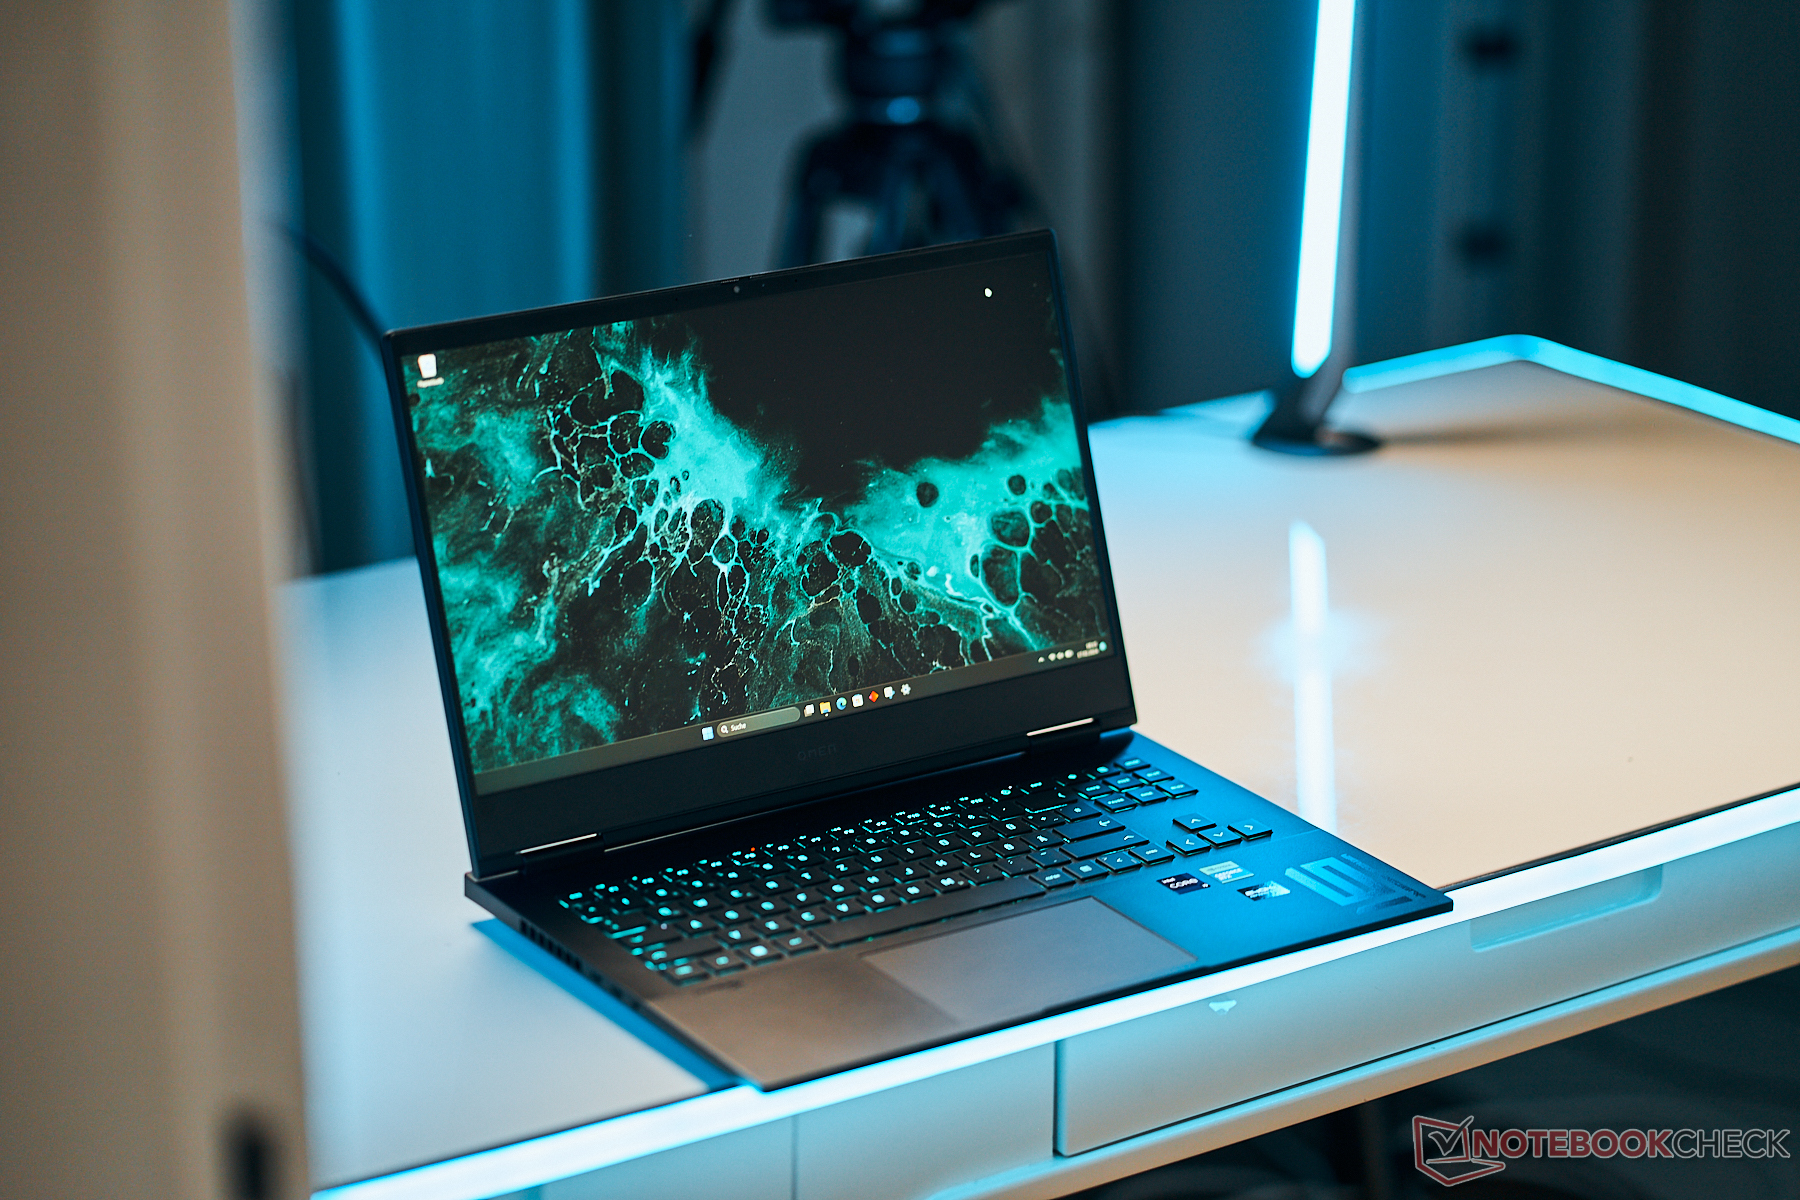
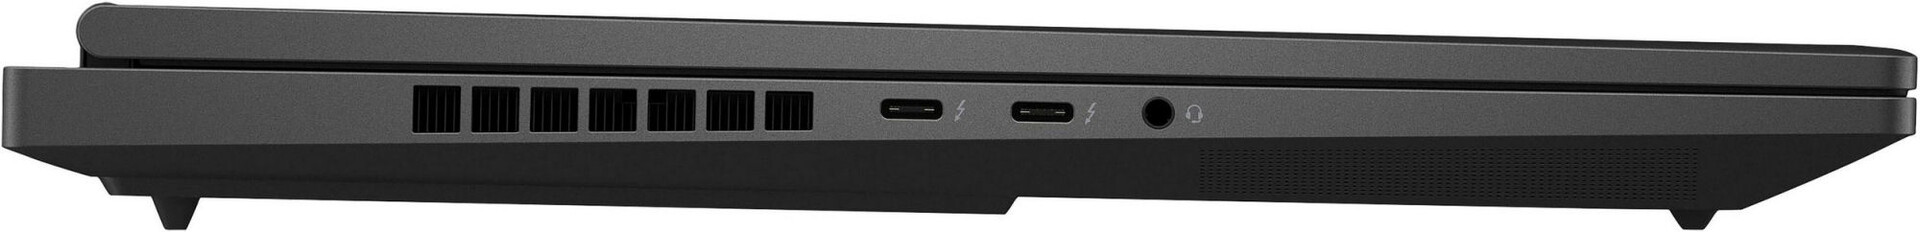
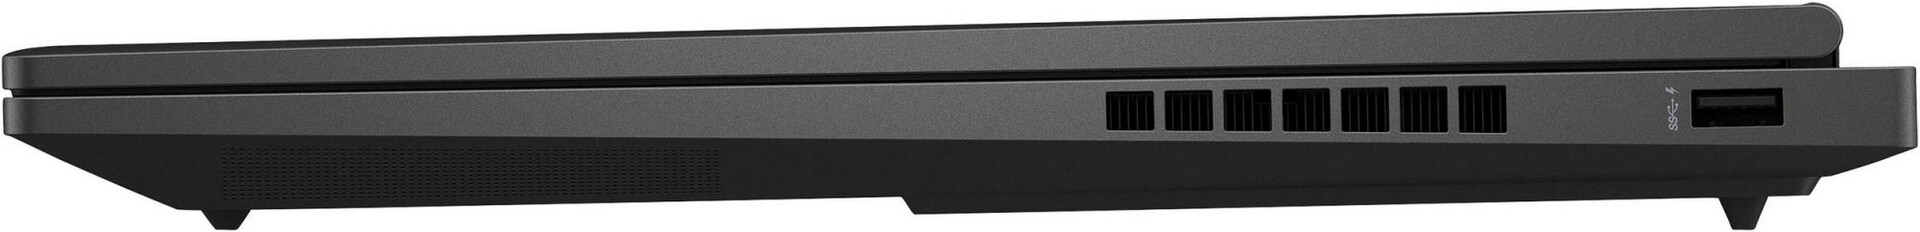
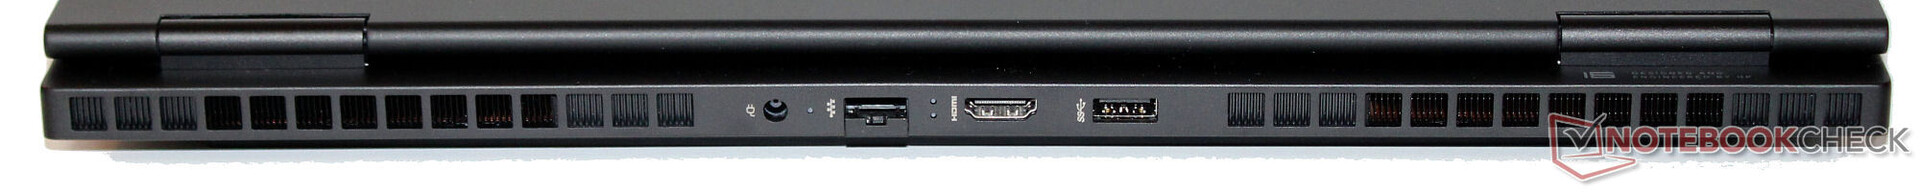
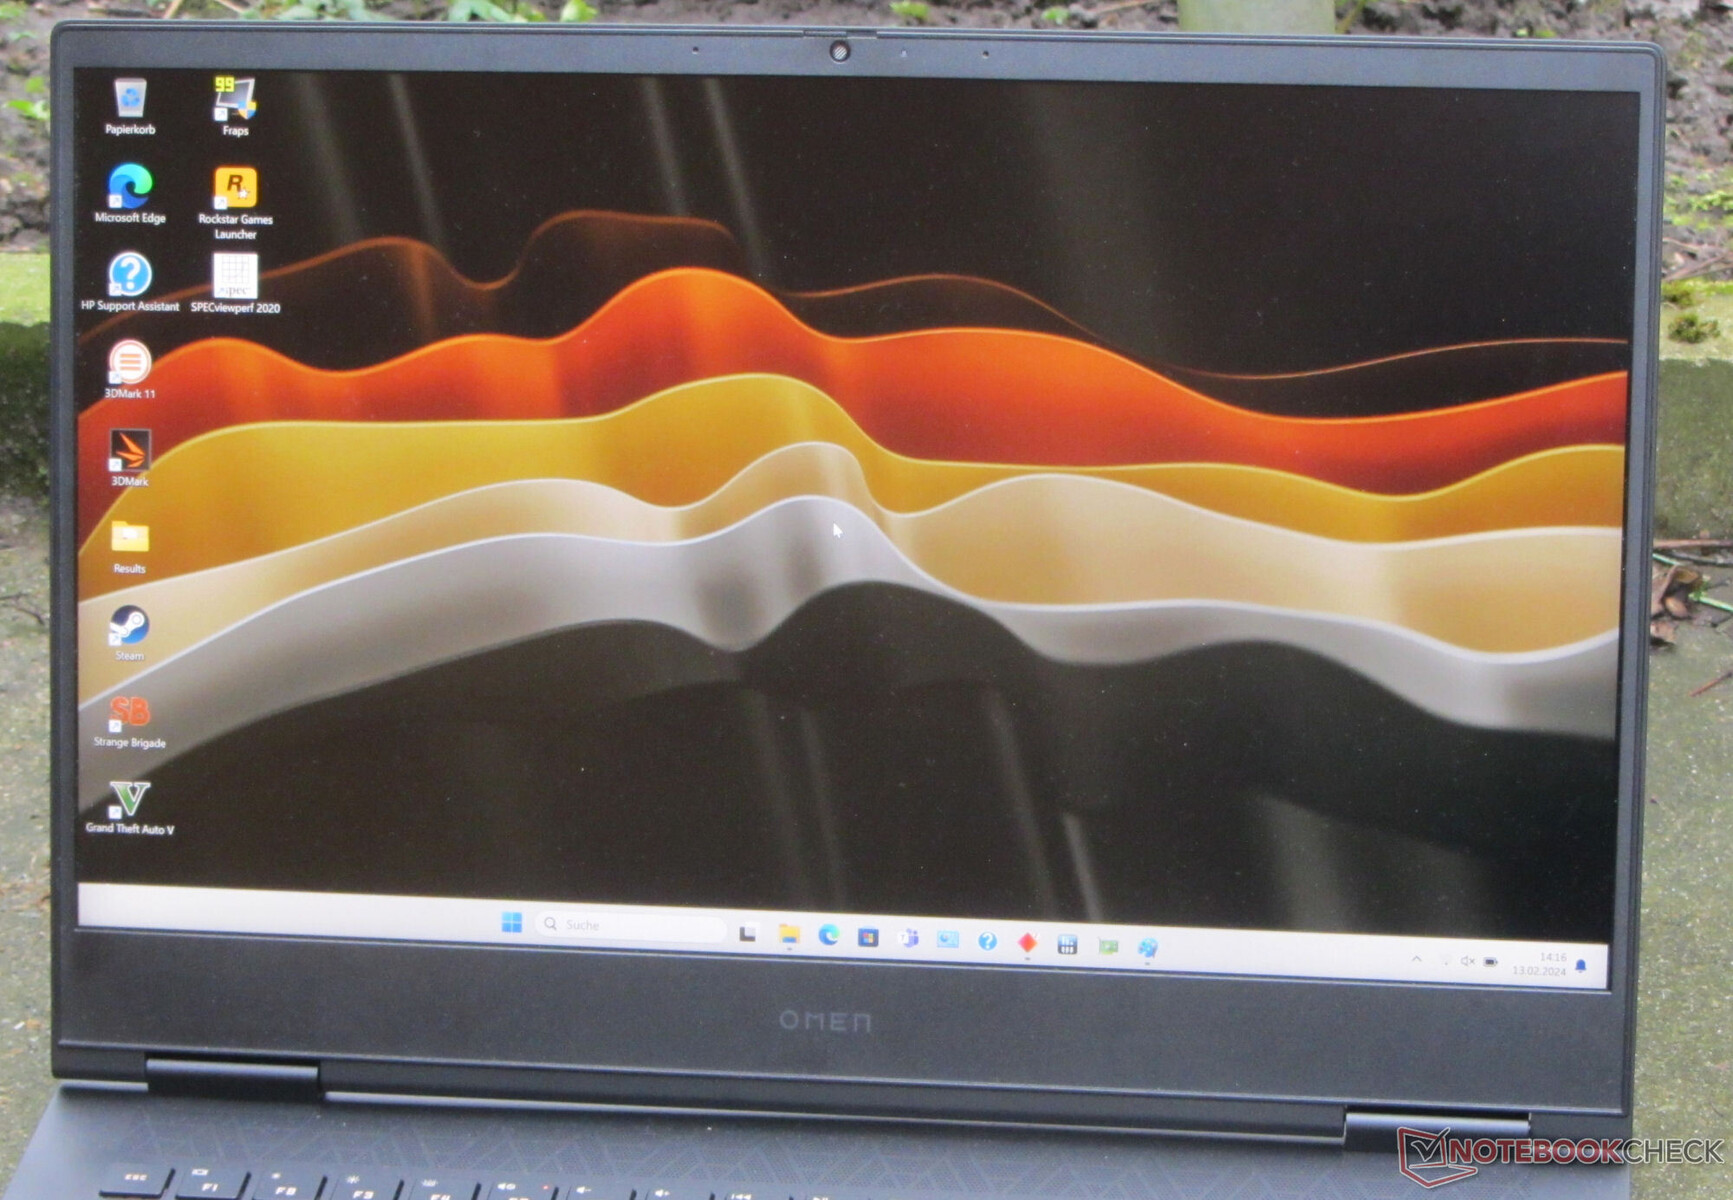
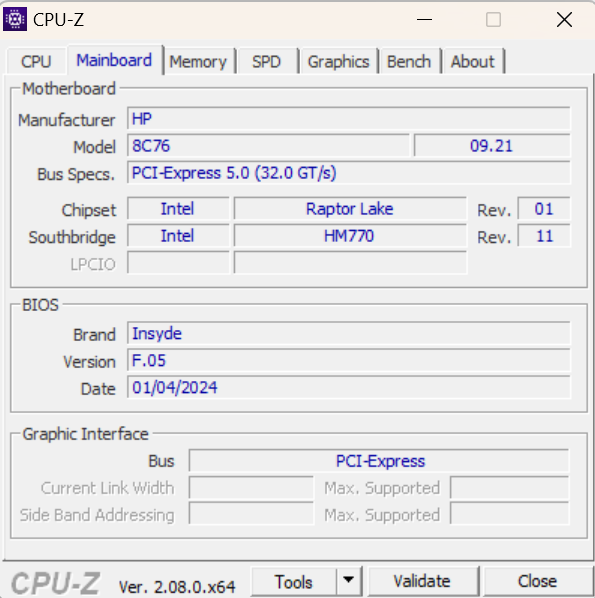
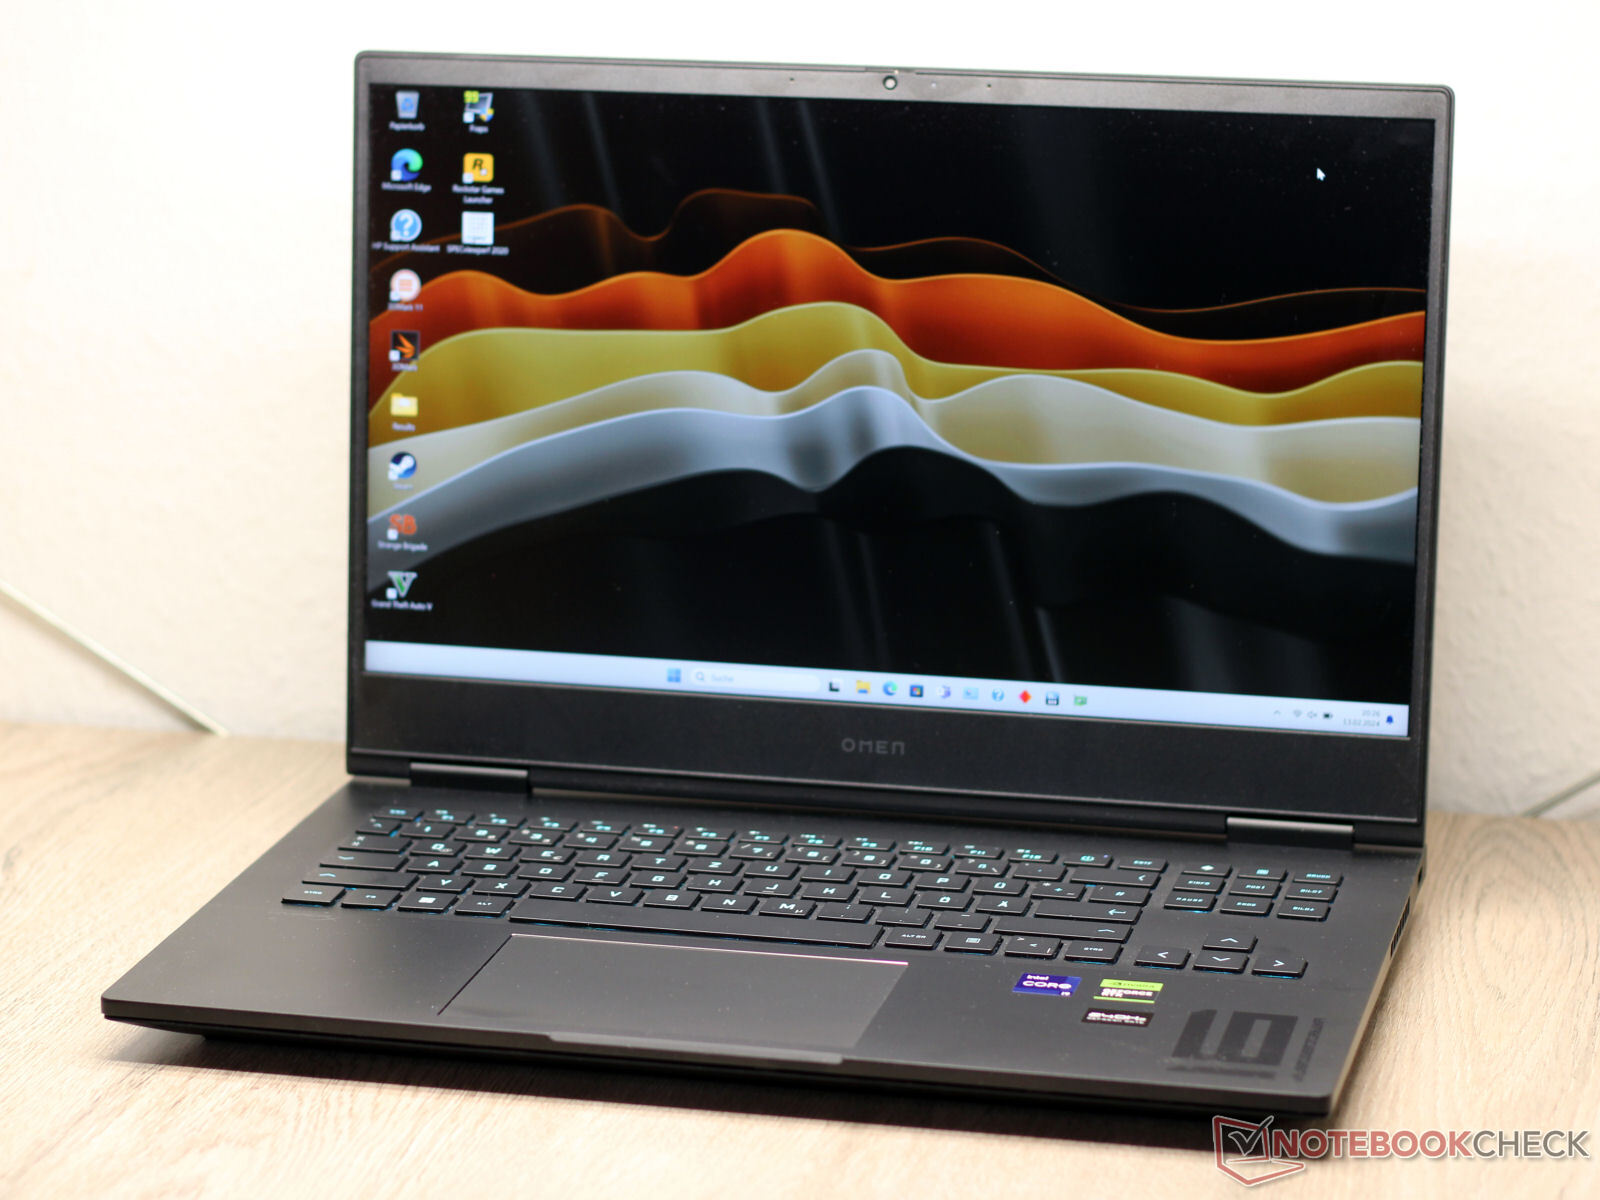
机箱与规格 - 配备 Thunderbolt 4 的惠普笔记本电脑
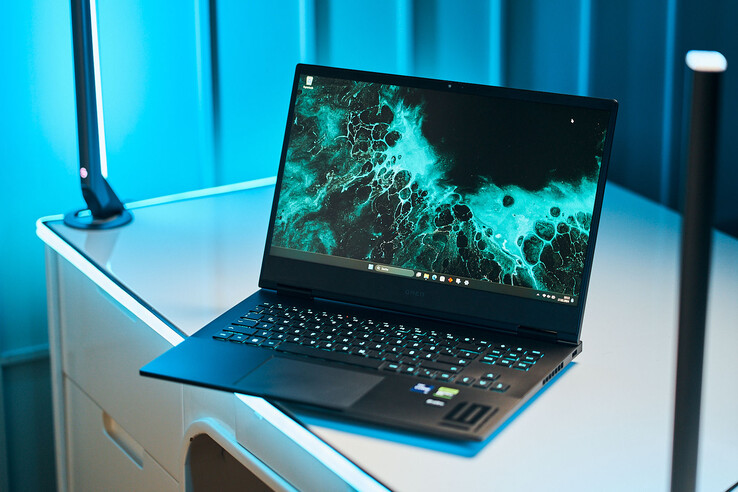
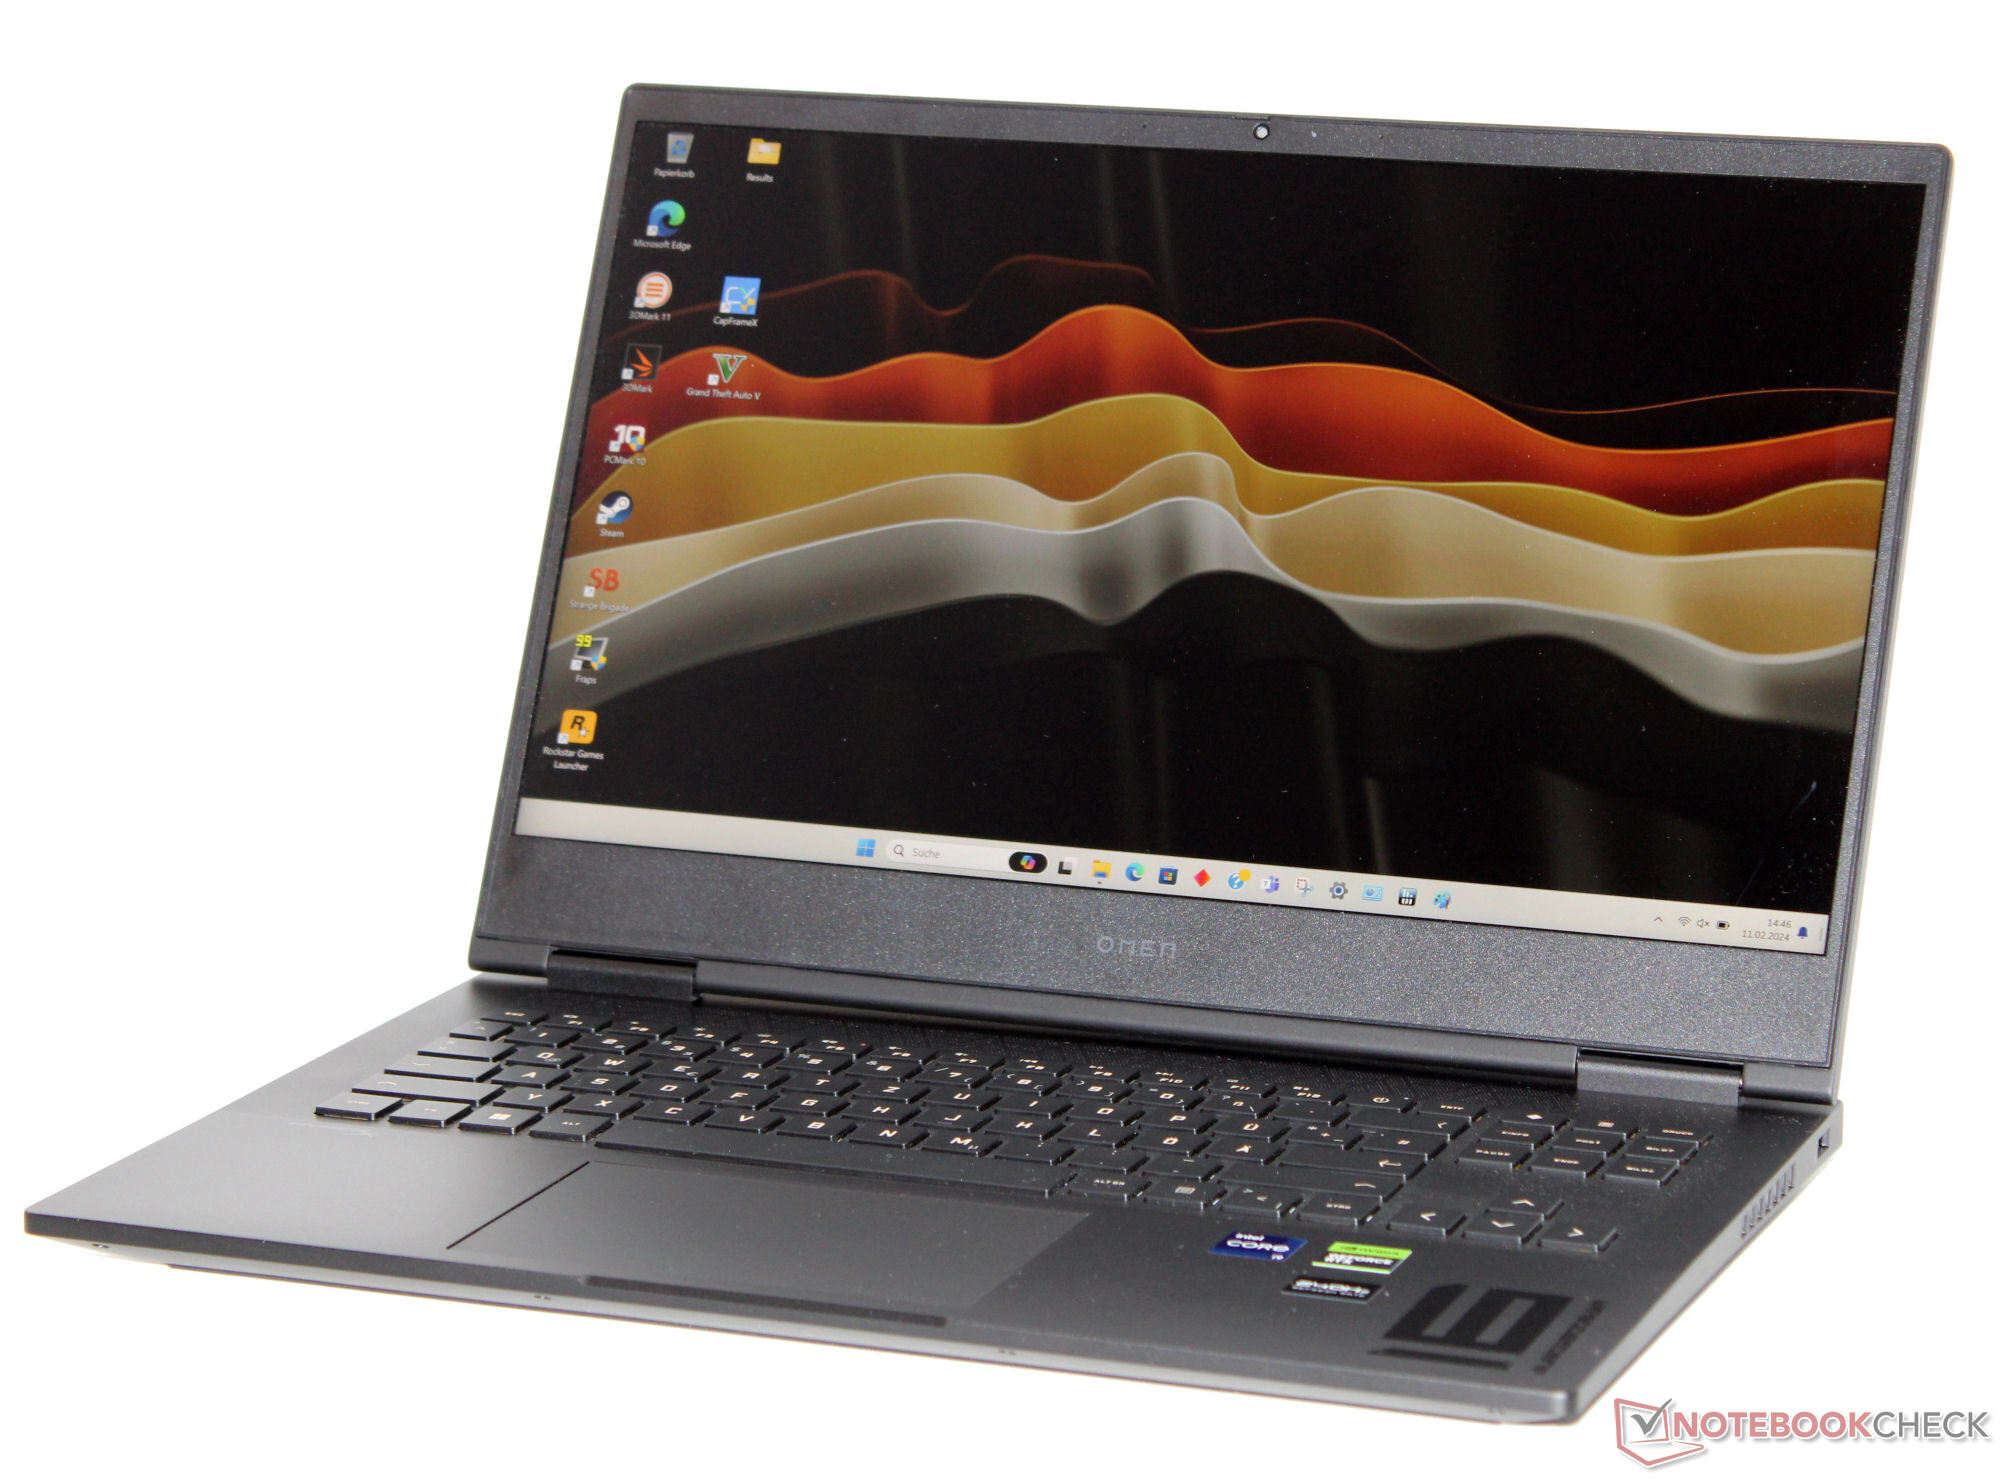
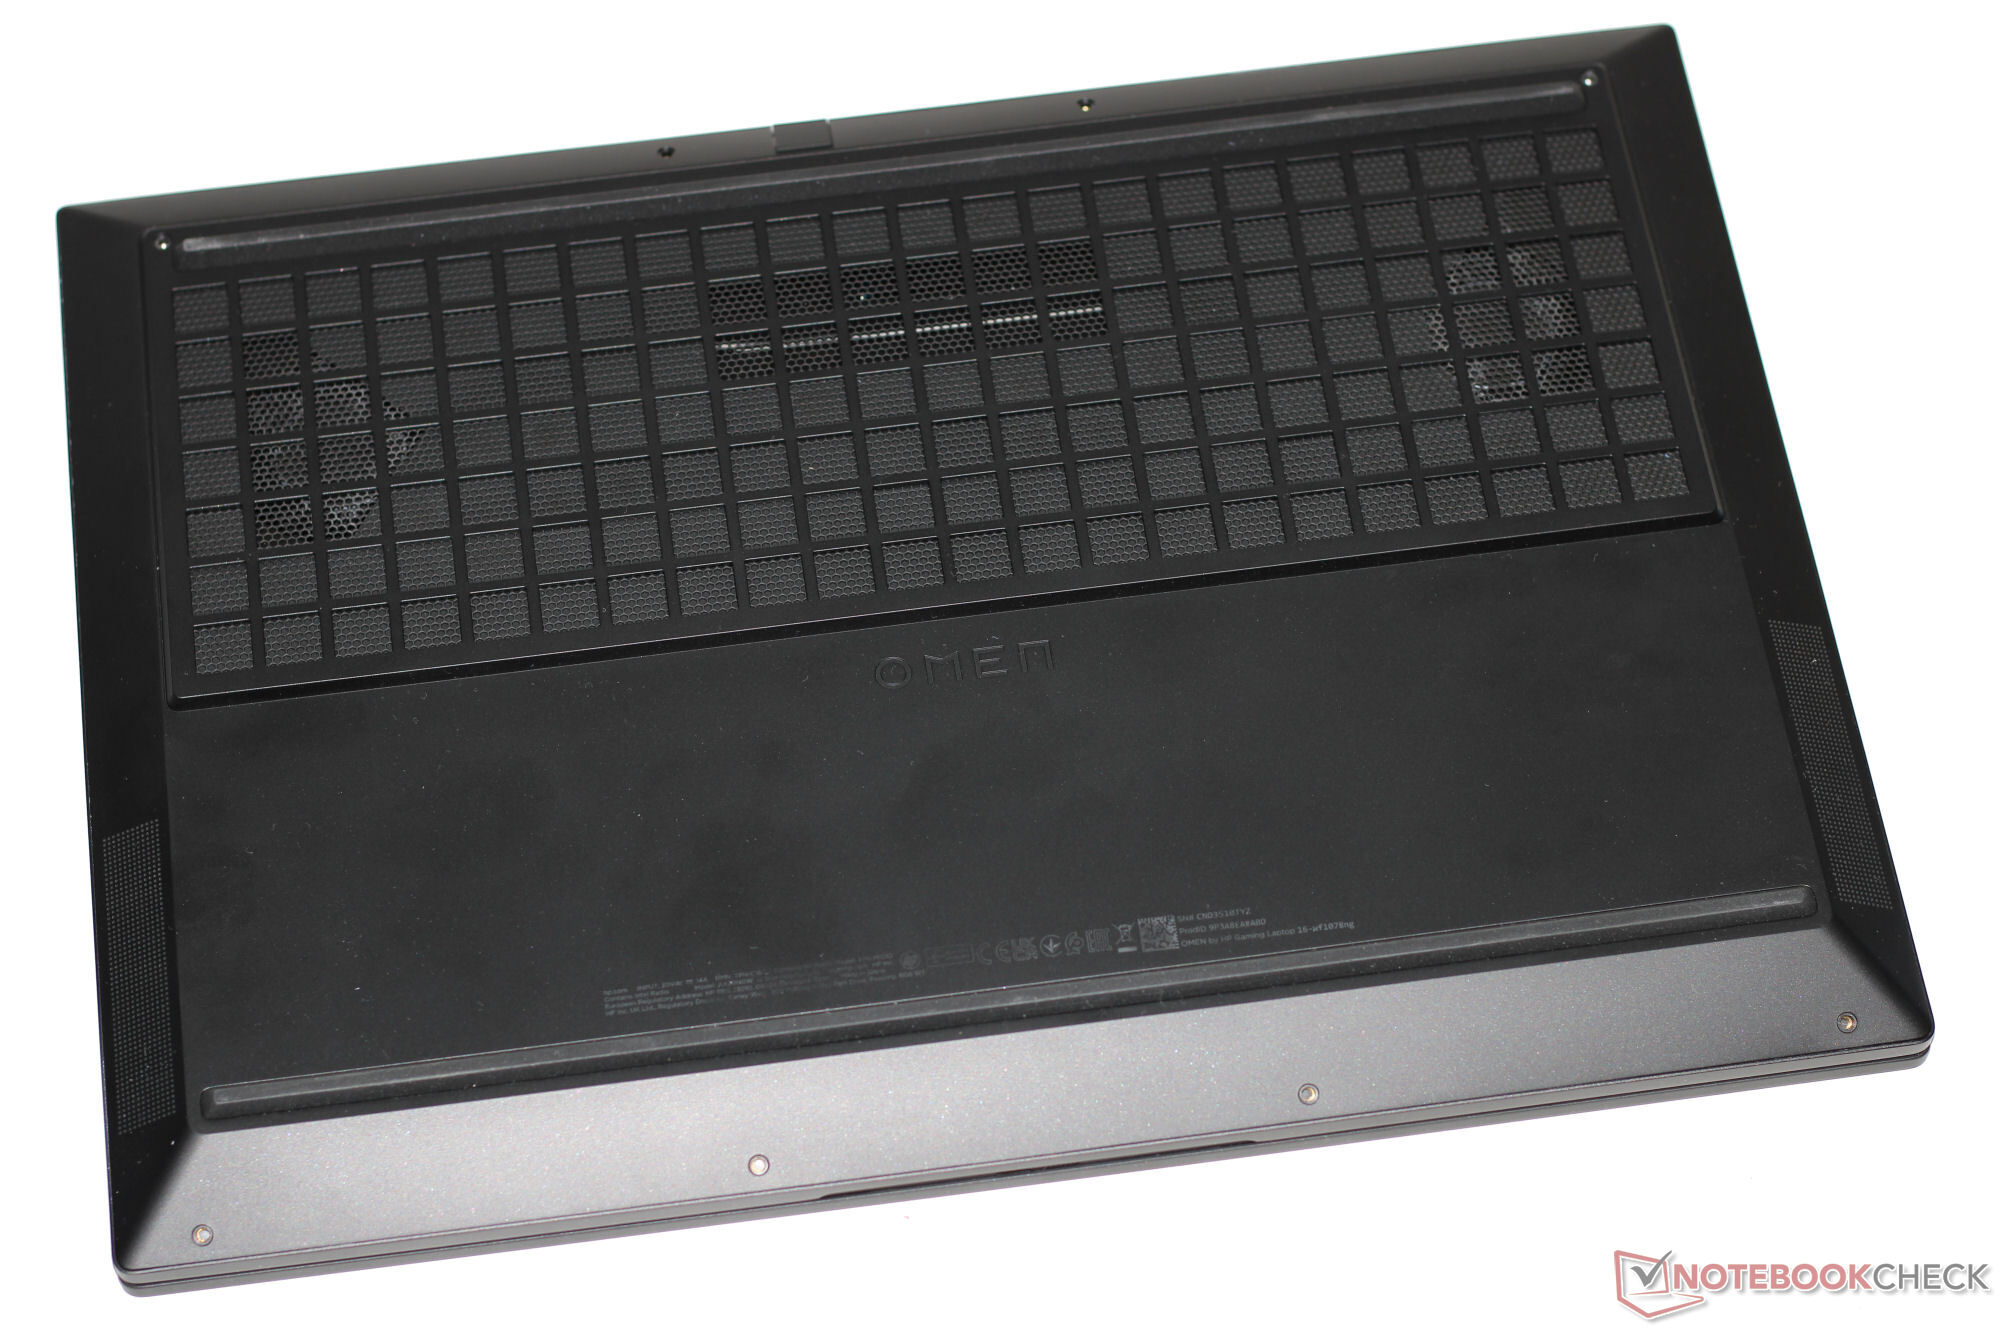
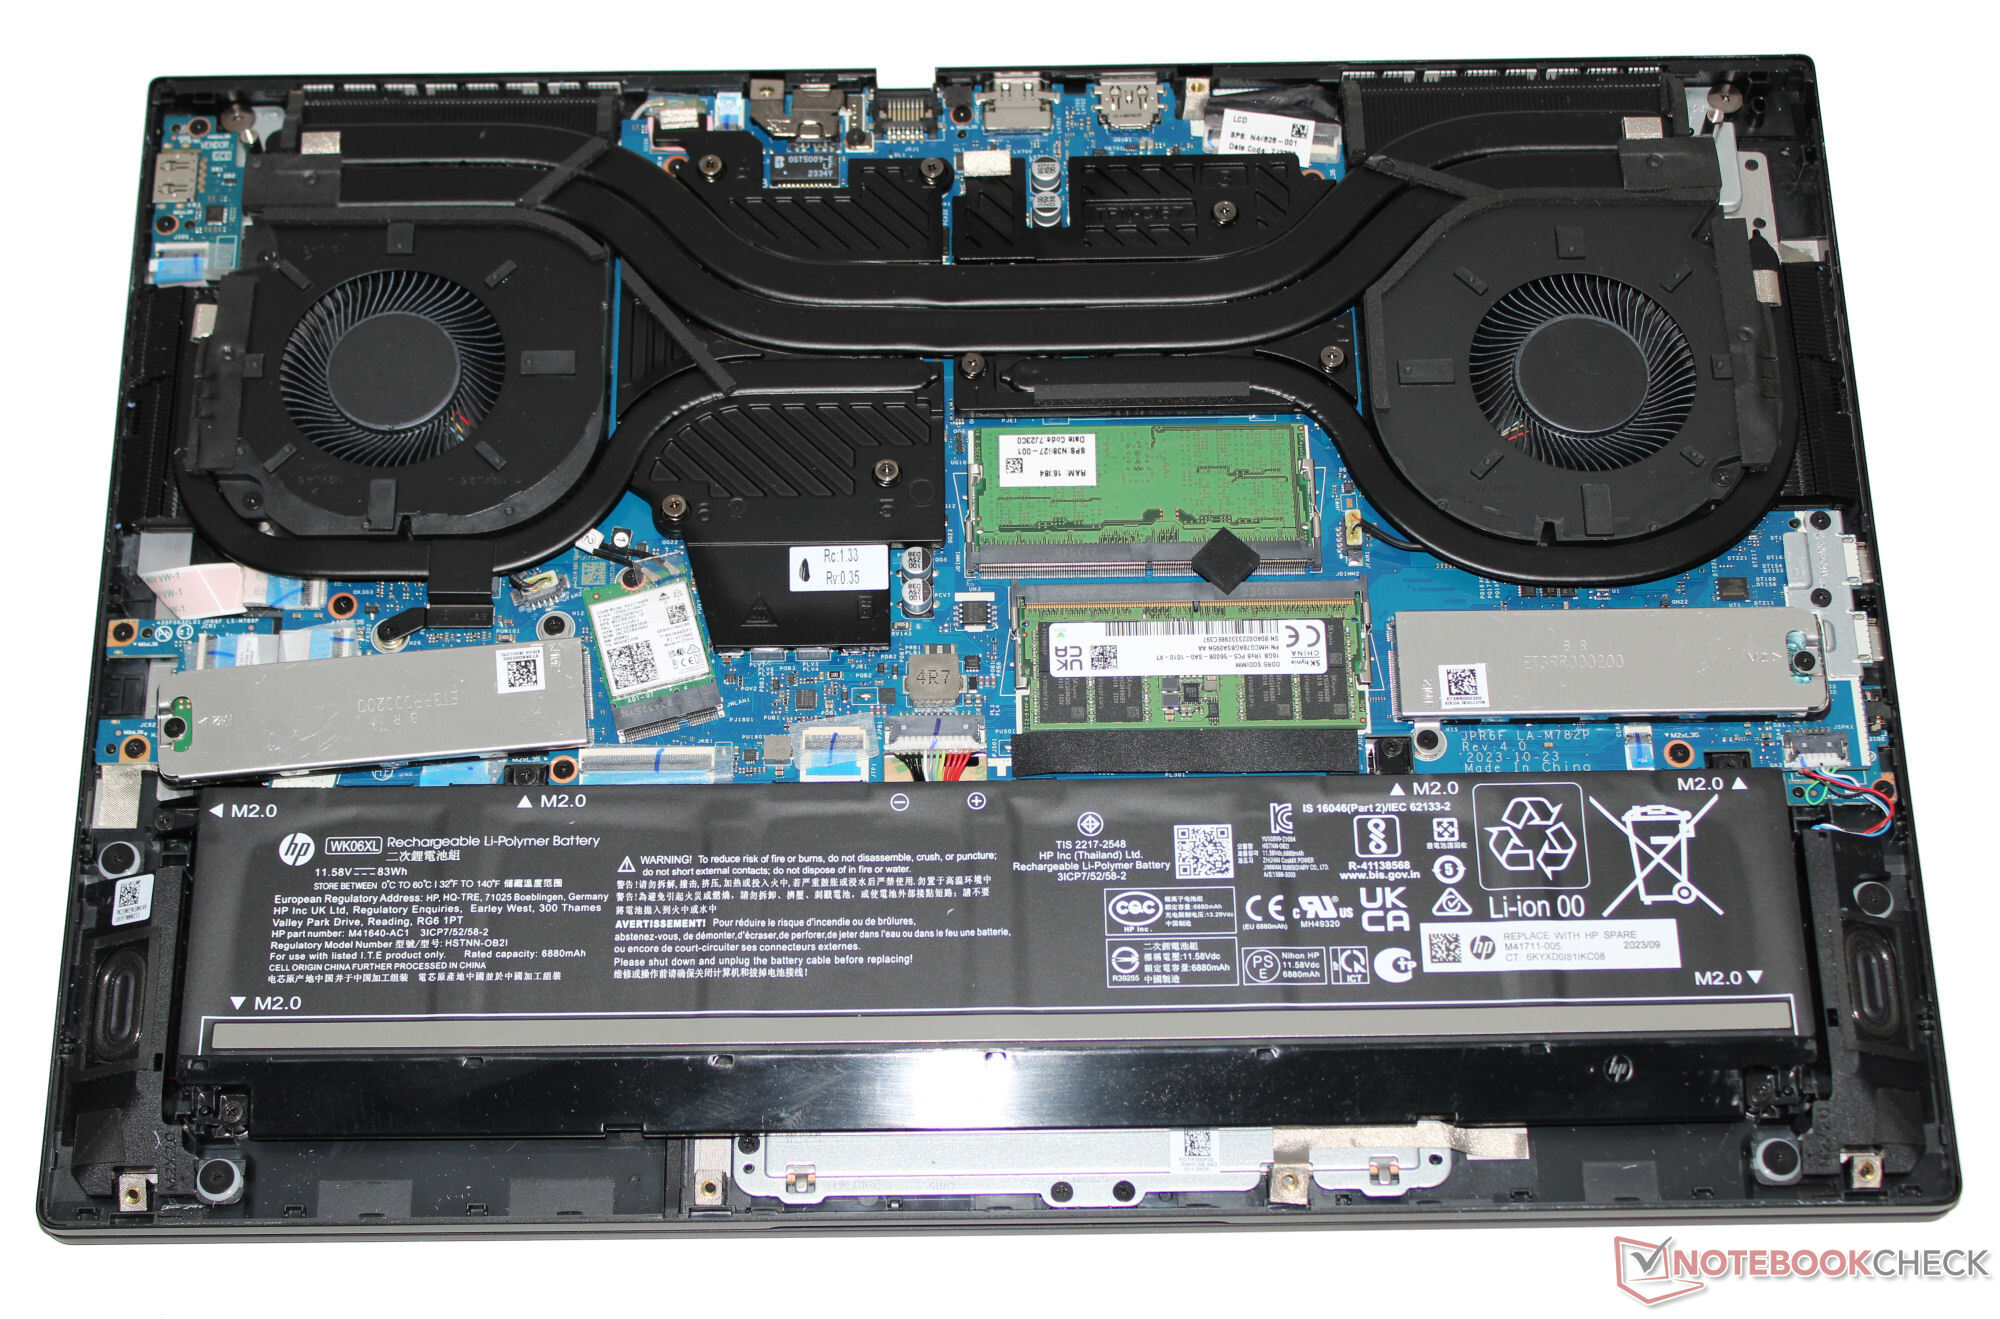
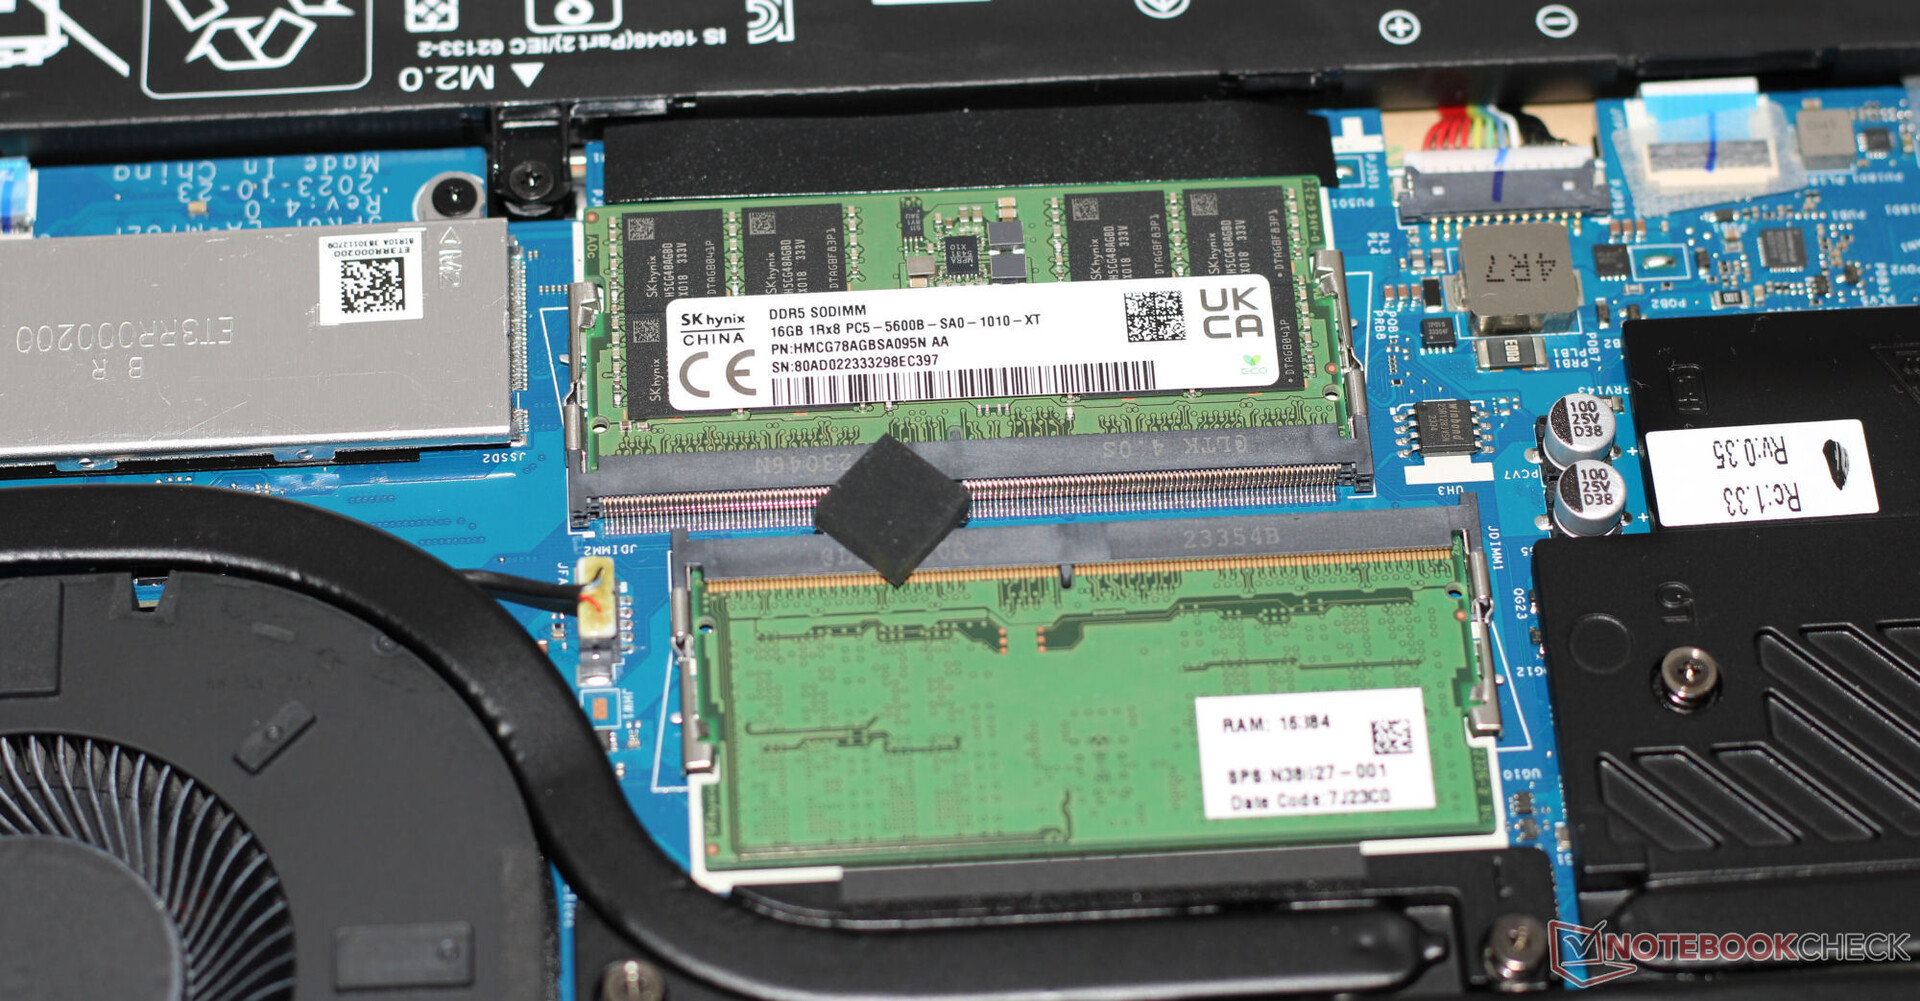
惠普保留了与其前身惠普Omen 16 2023笔记本电脑回顾:145 WGeForce RTX 4080性能 相同的哑黑色机身和光滑表面。塑料盖与铝制底座形成鲜明对比。除键盘照明灯外,机身没有任何引人注目的设计或 LED 元素。取下底盖后,就可以看到电池(旋入式,非粘合式)和其他硬件。
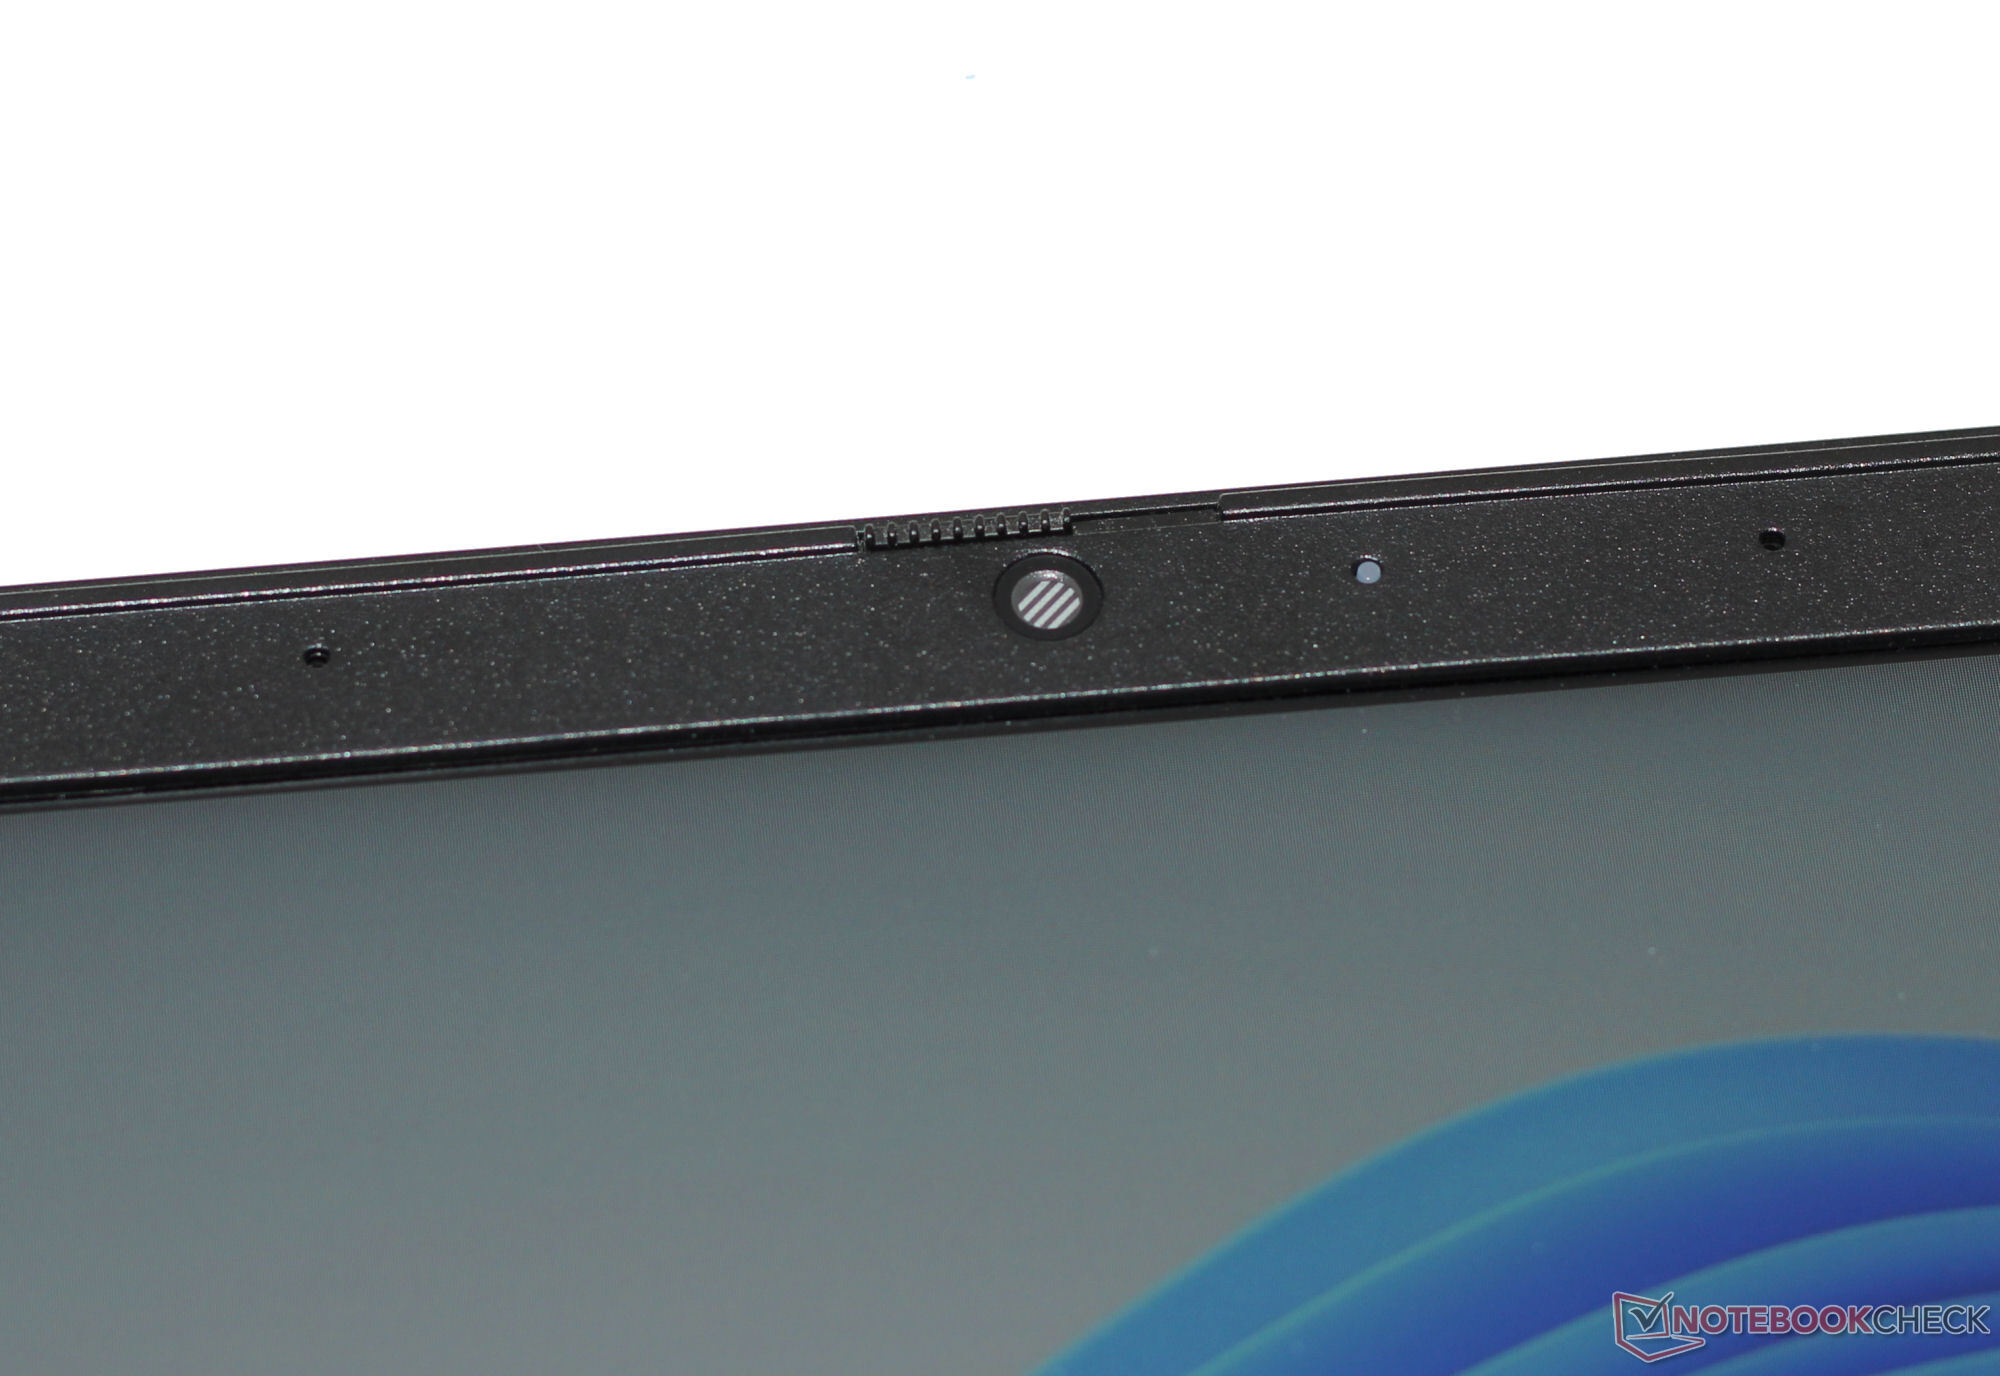
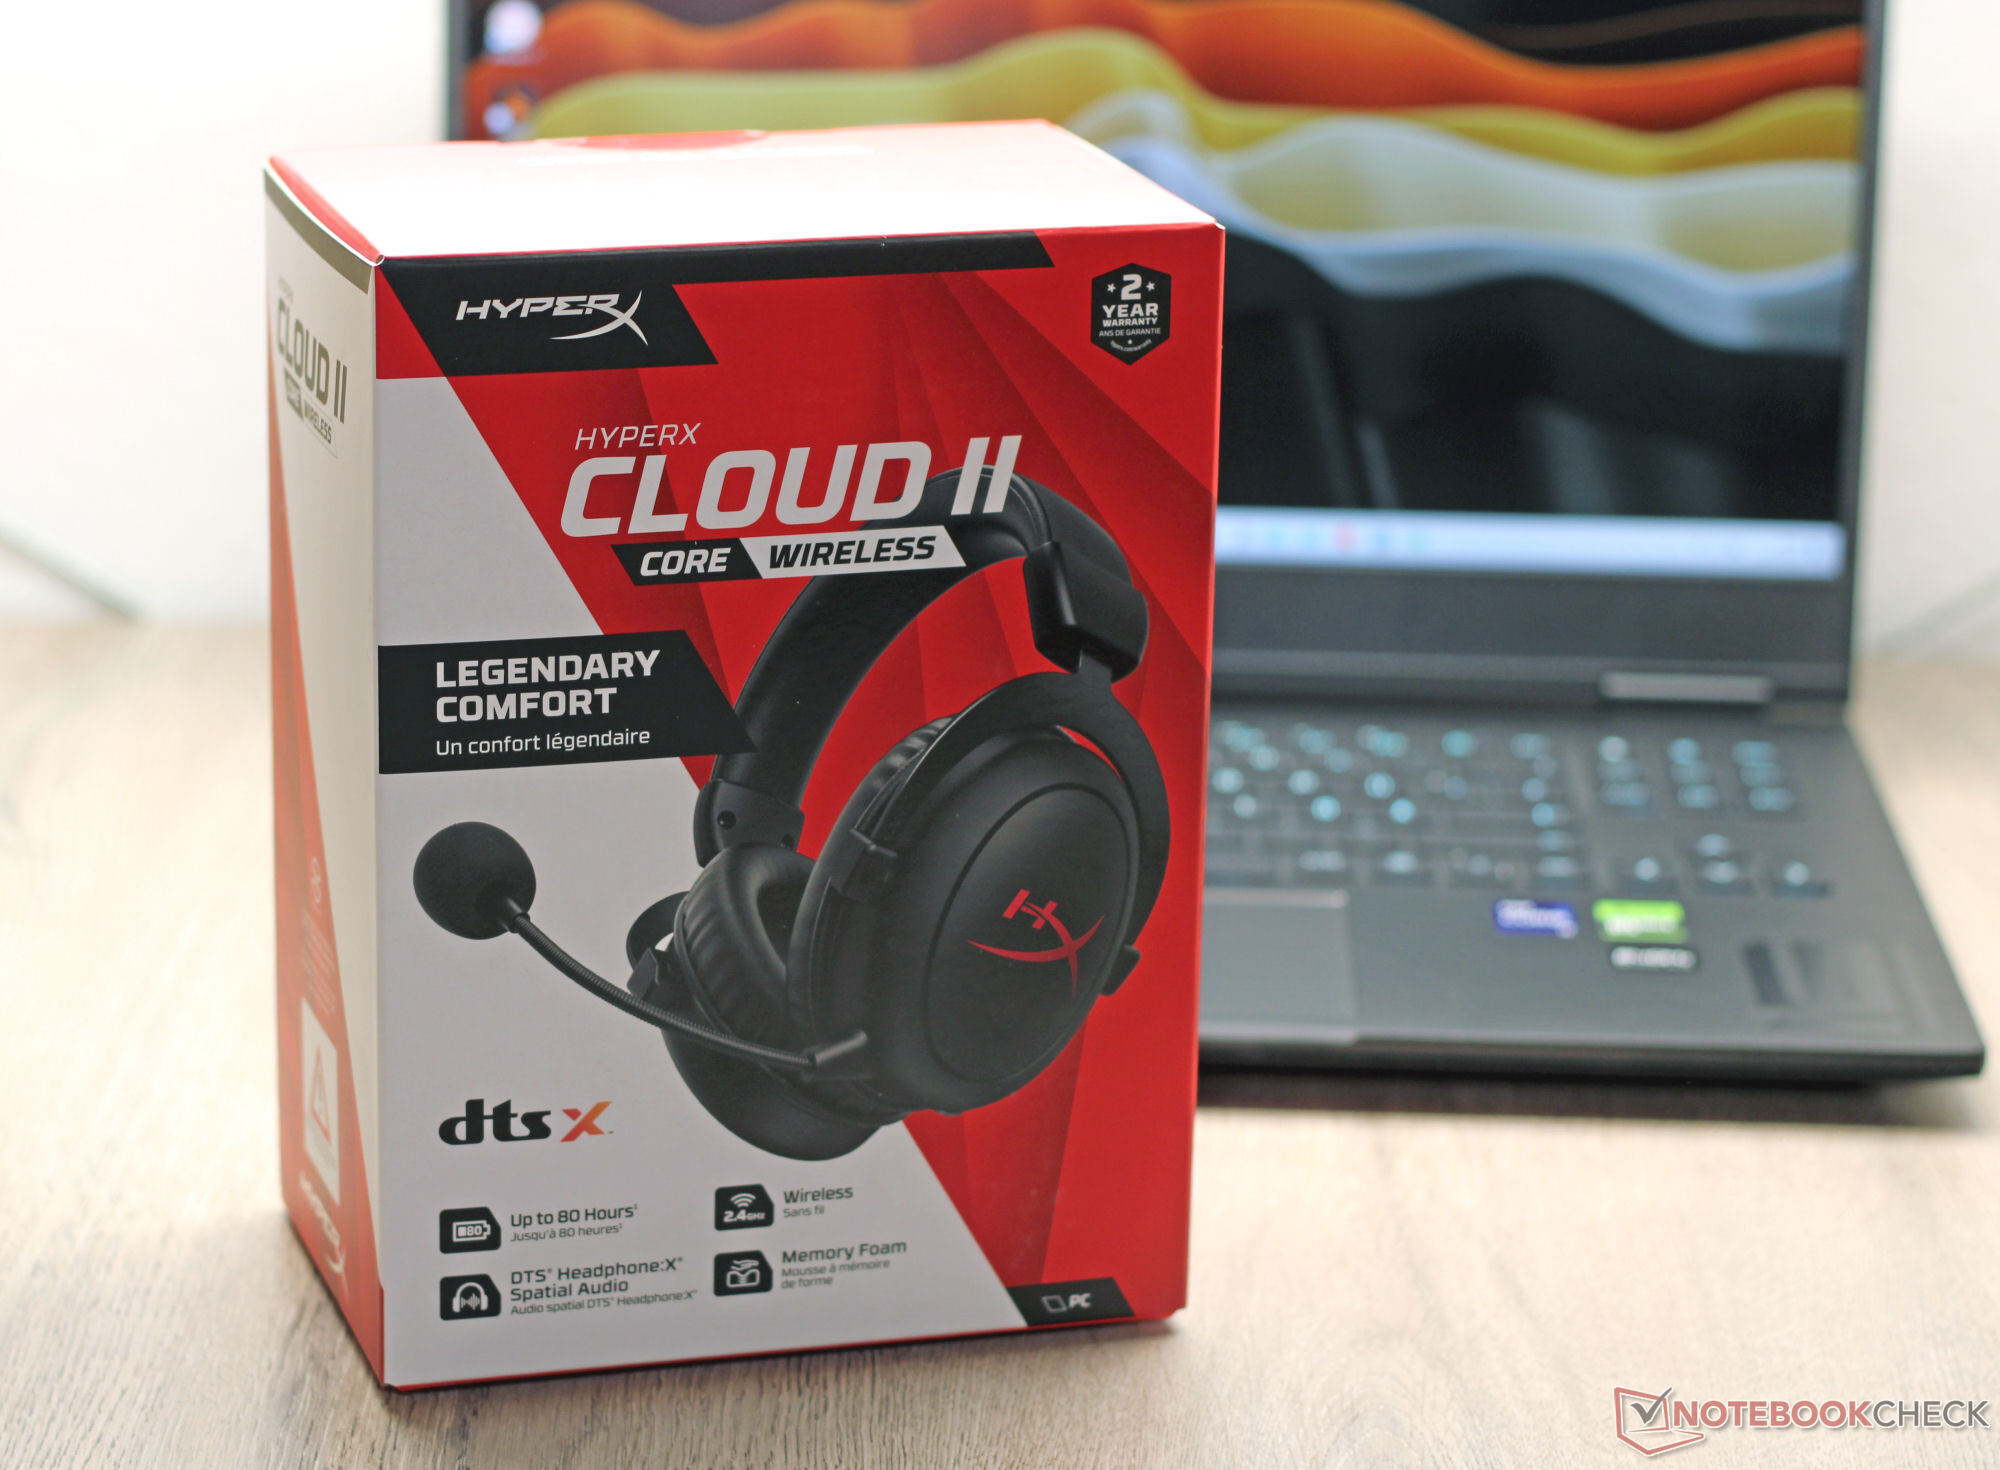
惠普笔记本有两个 USB-A 端口(USB 3.2 Gen 1)和两个 USB-C 端口(Thunderbolt 4/USB4)。后者支持 Power Delivery 并可输出 DisplayPort 信号。总之,Omen 16 有三个视频输出端口(1x HDMI、2x DP)。惠普没有为该设备配备存储卡读卡器。网络摄像头(210 万像素,最大 1,920 x 1,080 像素,带隐私快门)提供标准的图像质量。笔记本电脑随附一个 HyperX Cloud II Core 无线耳机。
Omen 16 配备了英特尔 Wi-Fi 6E AX211 模块,在最佳条件下(周围没有 Wi-Fi 设备,笔记本电脑与服务器电脑之间距离较近)可实现出色的 Wi-Fi 传输速度。有线连接由 Realtek RTL8168/8111 以太网控制器(1 Gbit/s)处理。


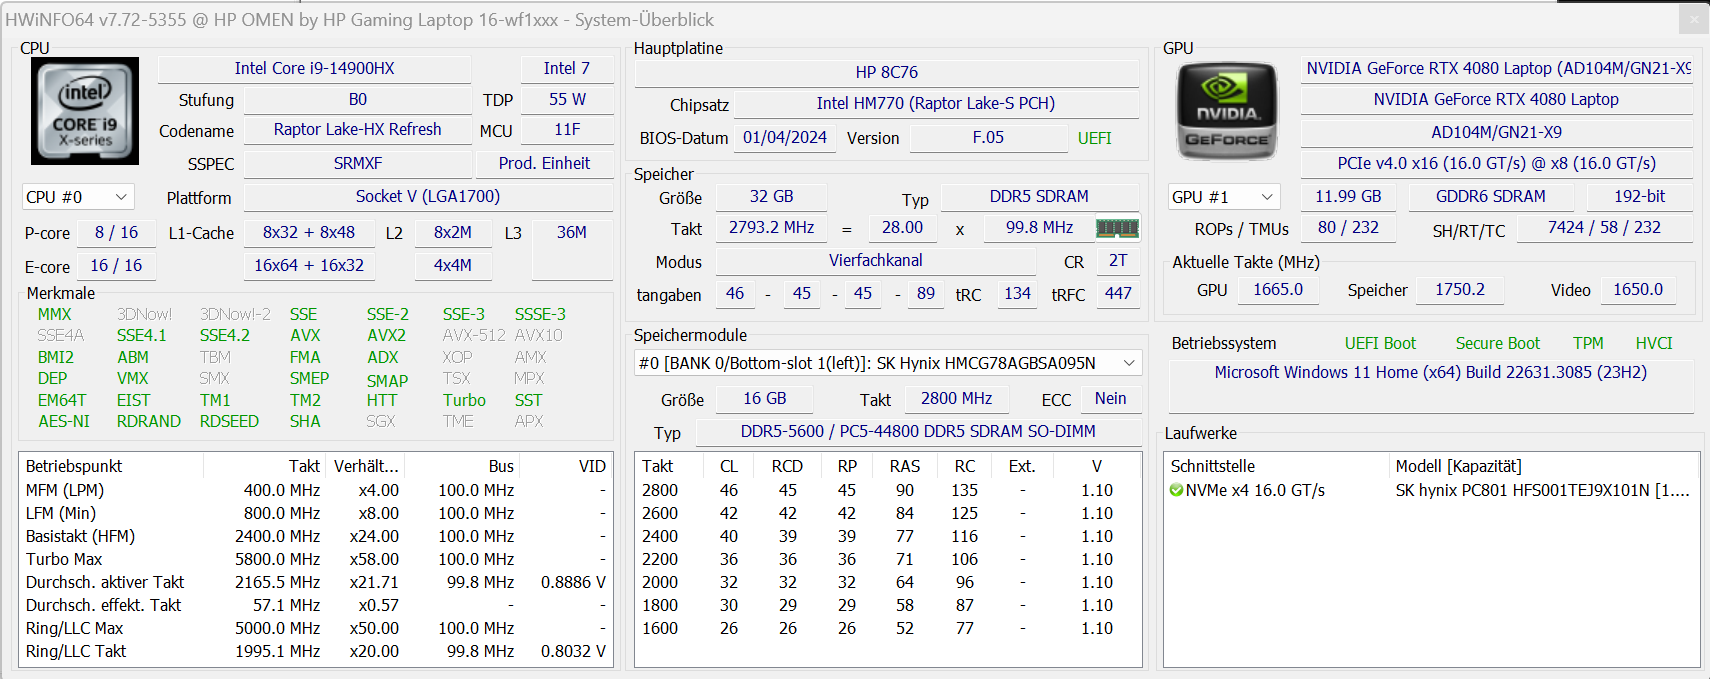
 GeForce RTX 4080 Laptop GPU, i9-14900HX, SK hynix PC801 HFS001TEJ9X101N")
 GeForce RTX 4080 Laptop GPU, i9-14900HX, SK hynix PC801 HFS001TEJ9X101N")
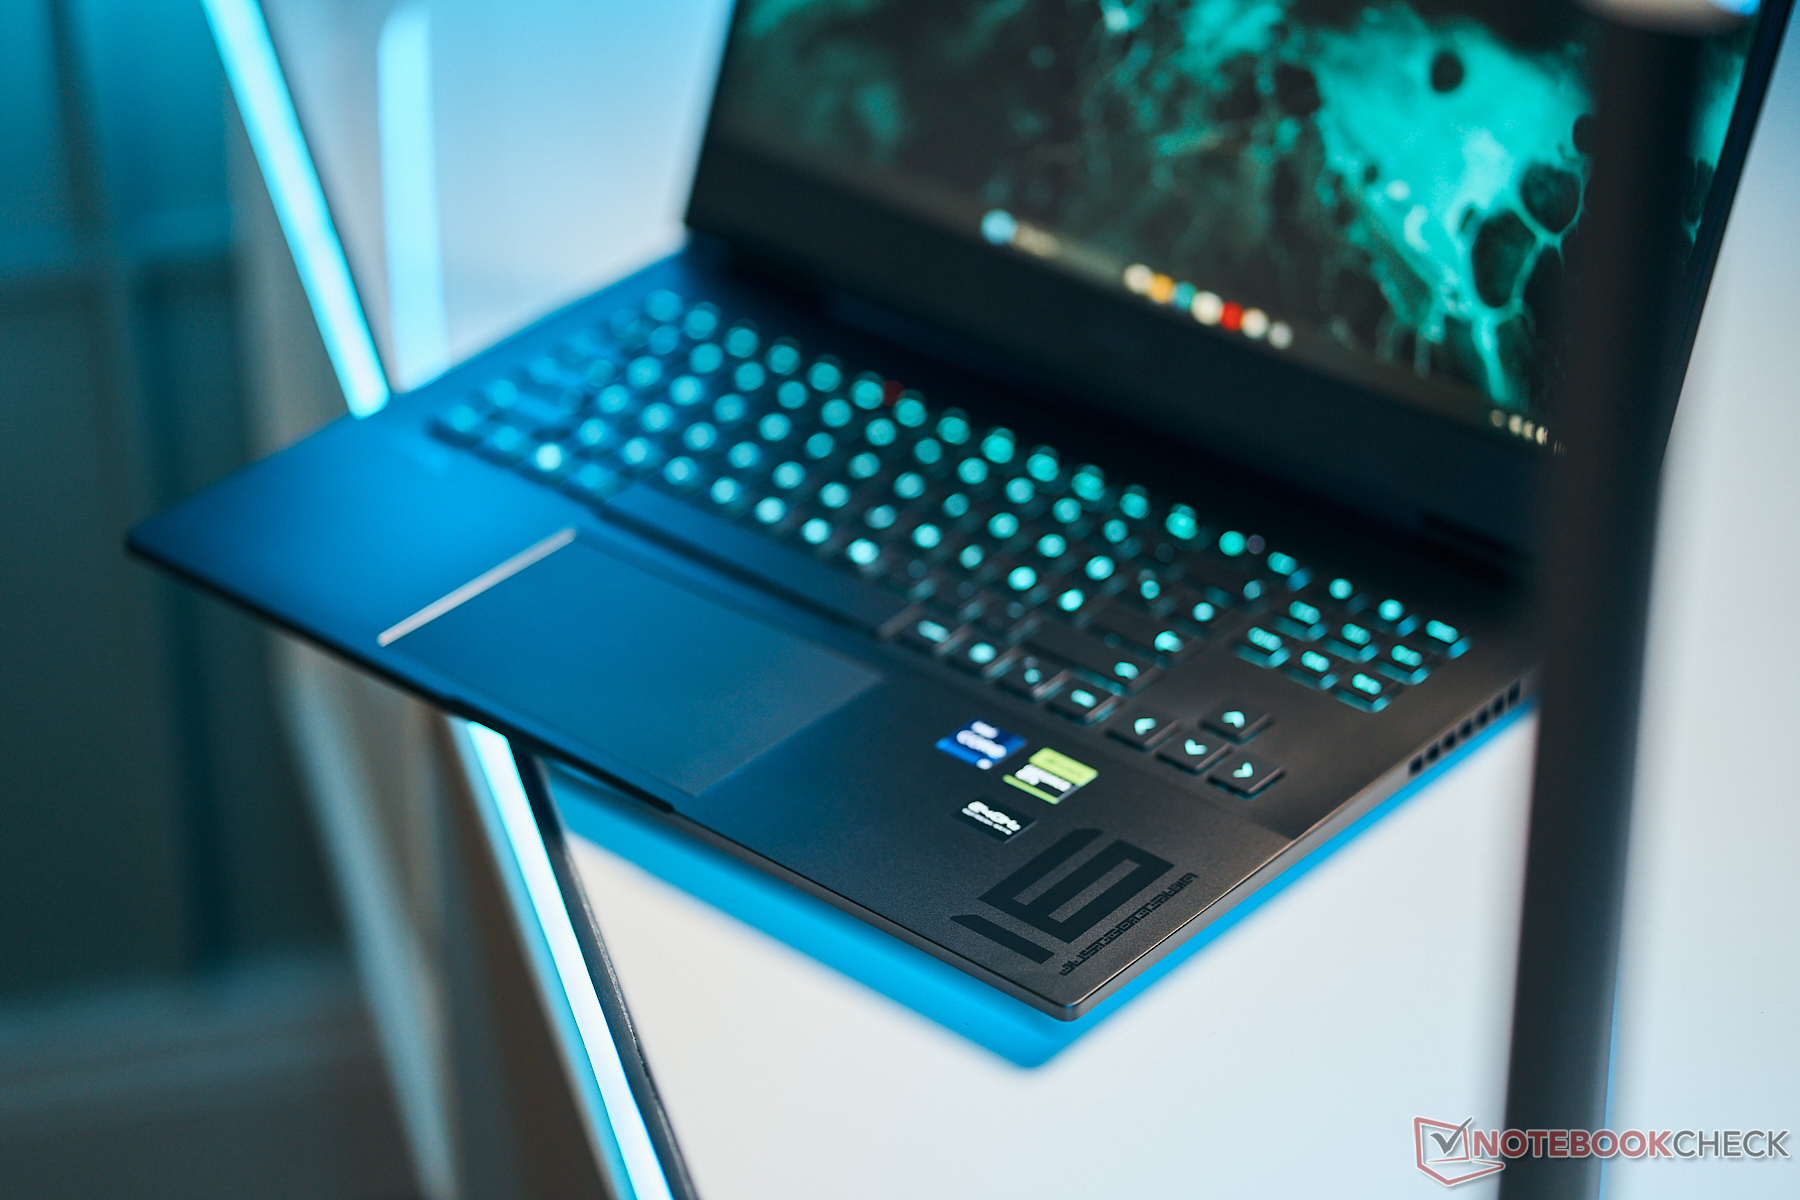
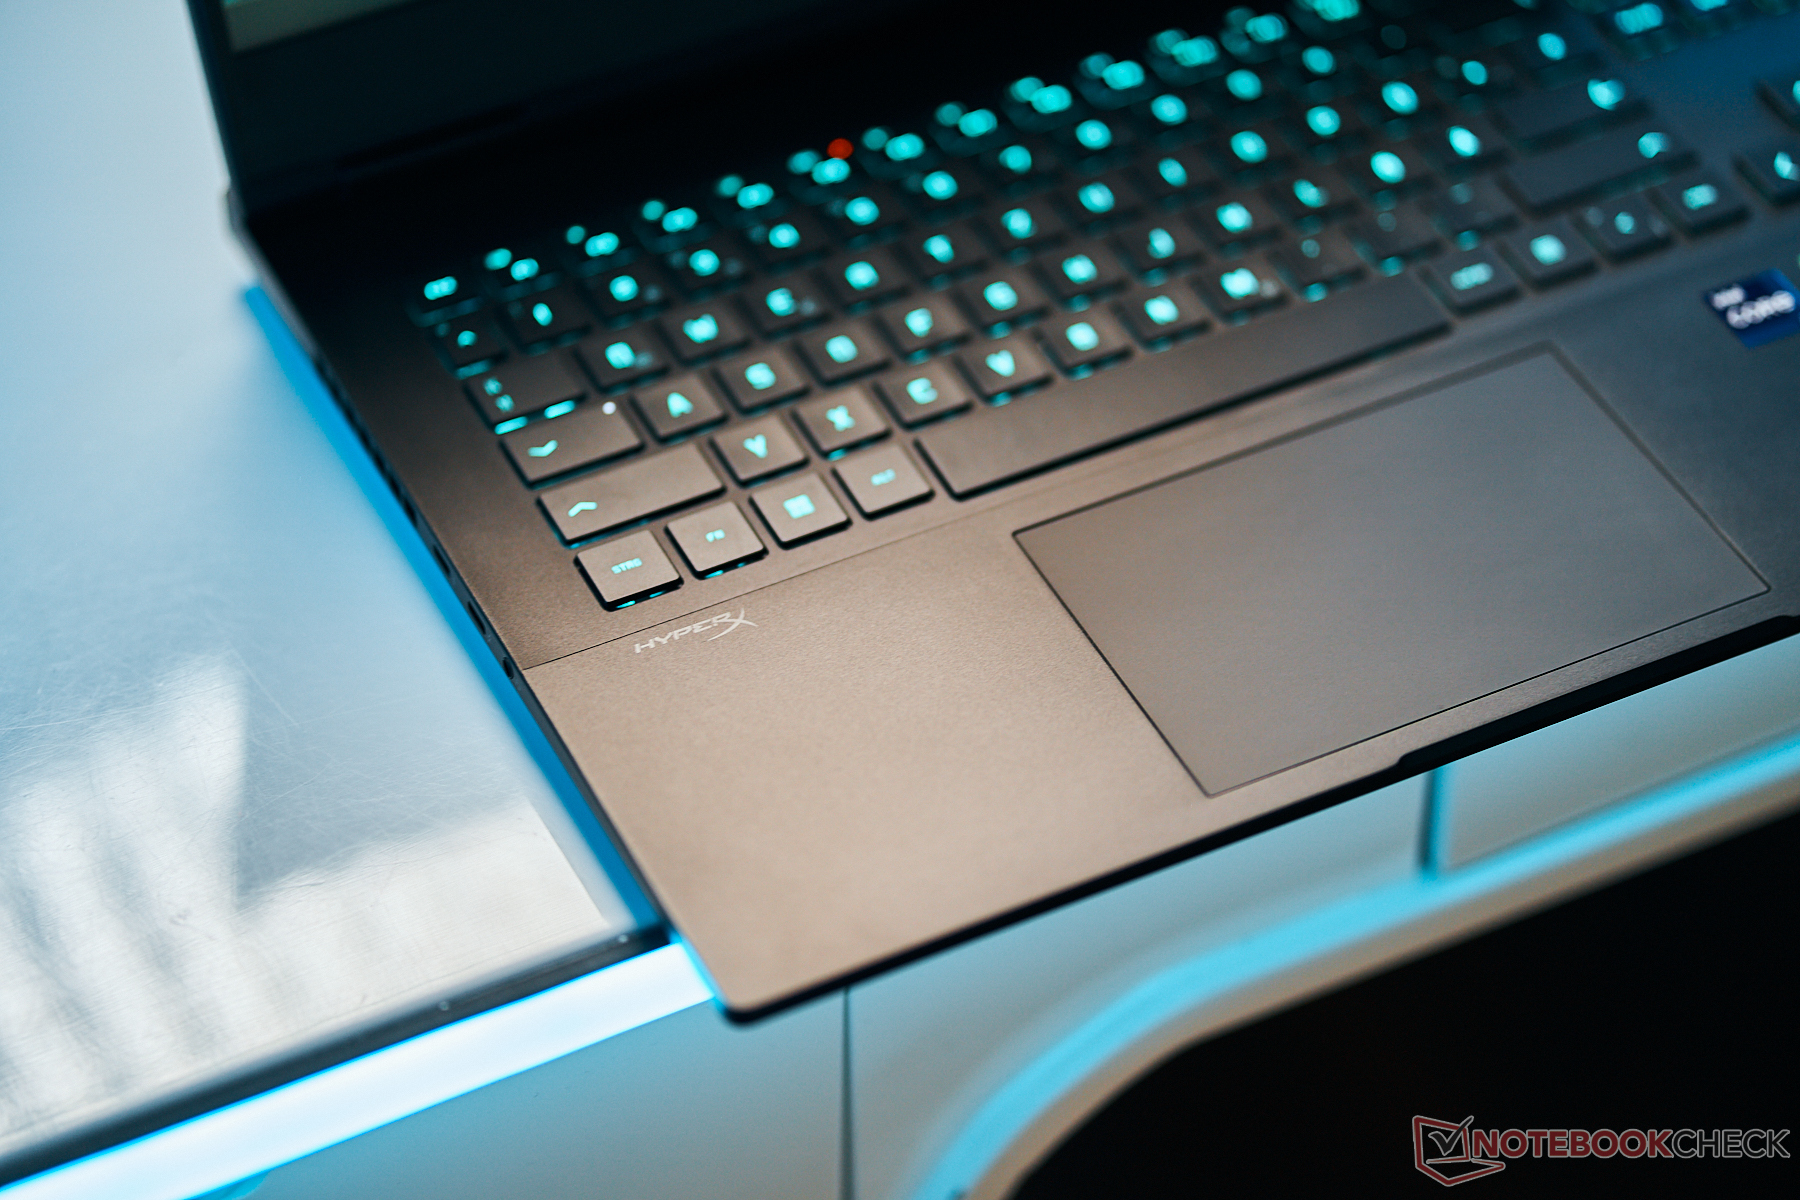
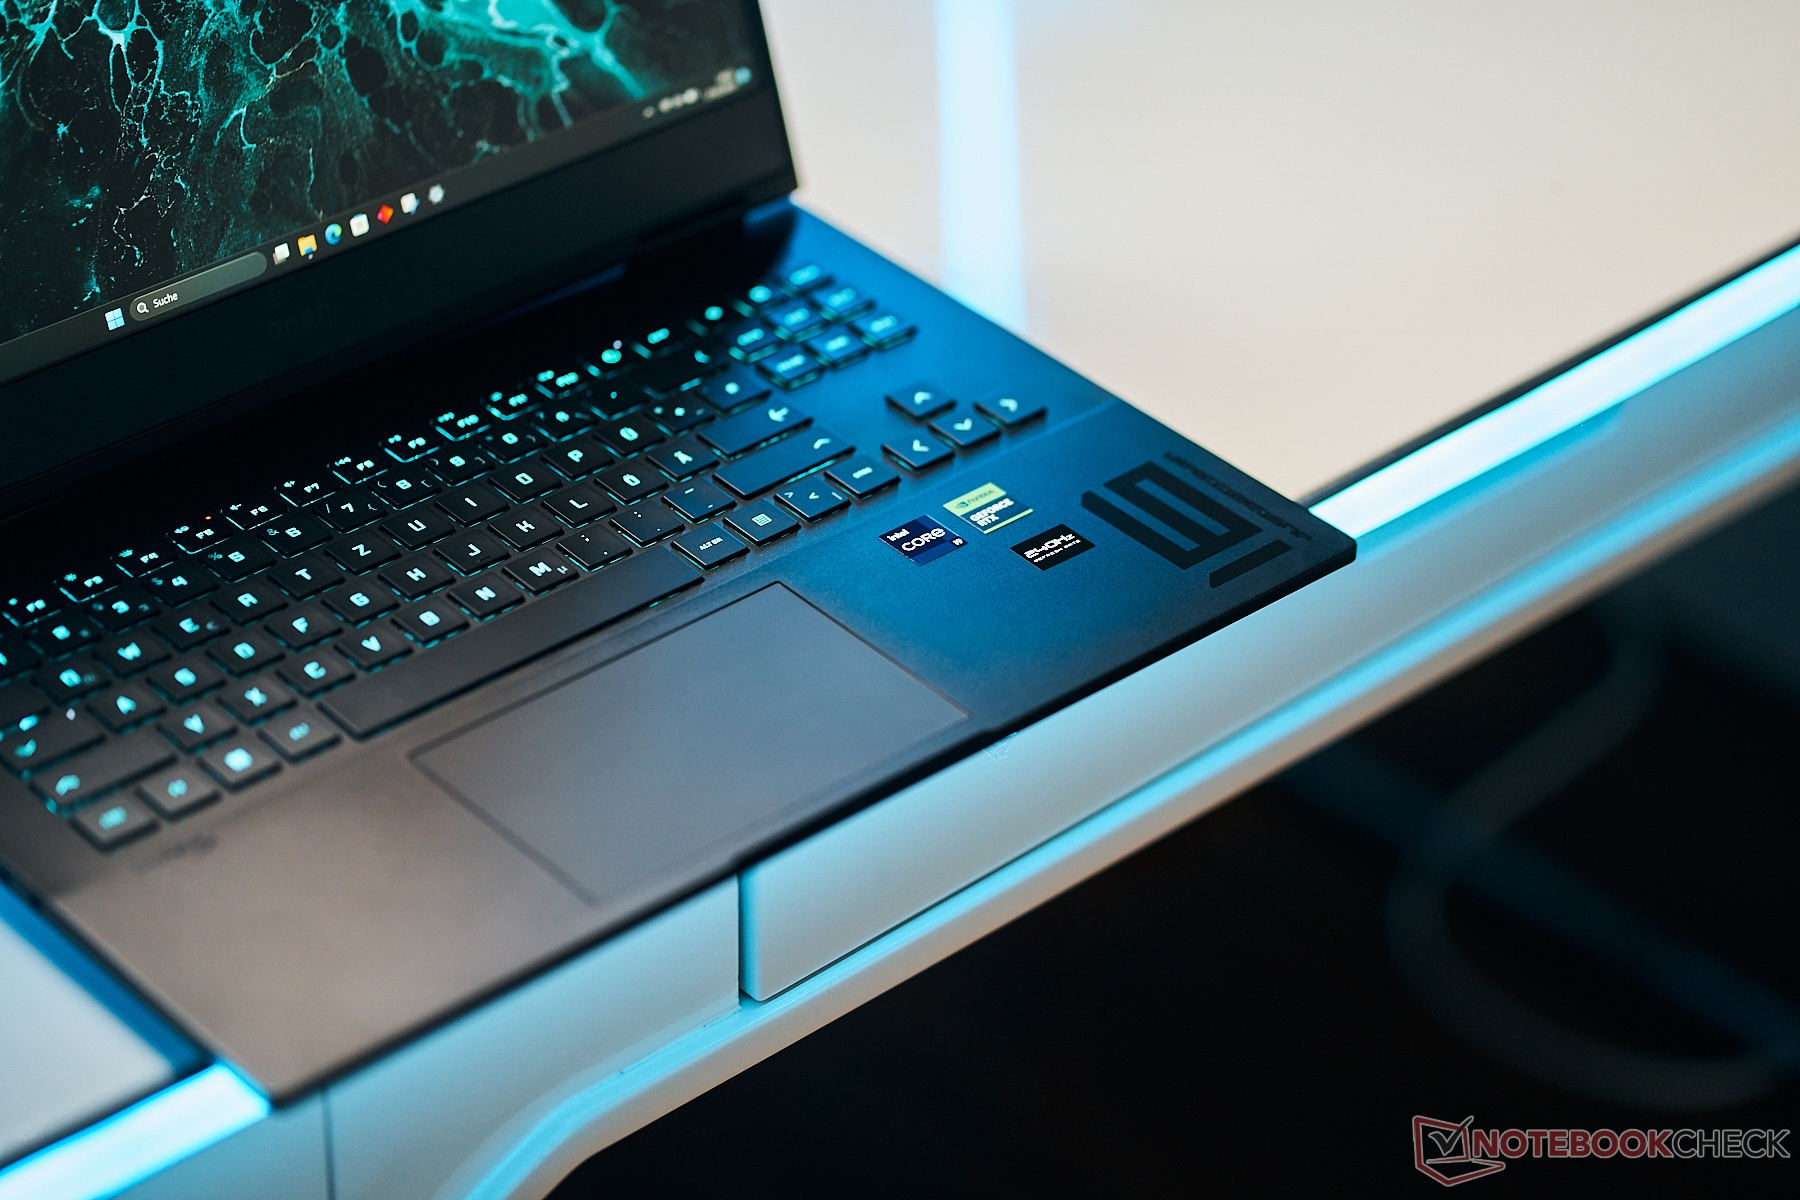
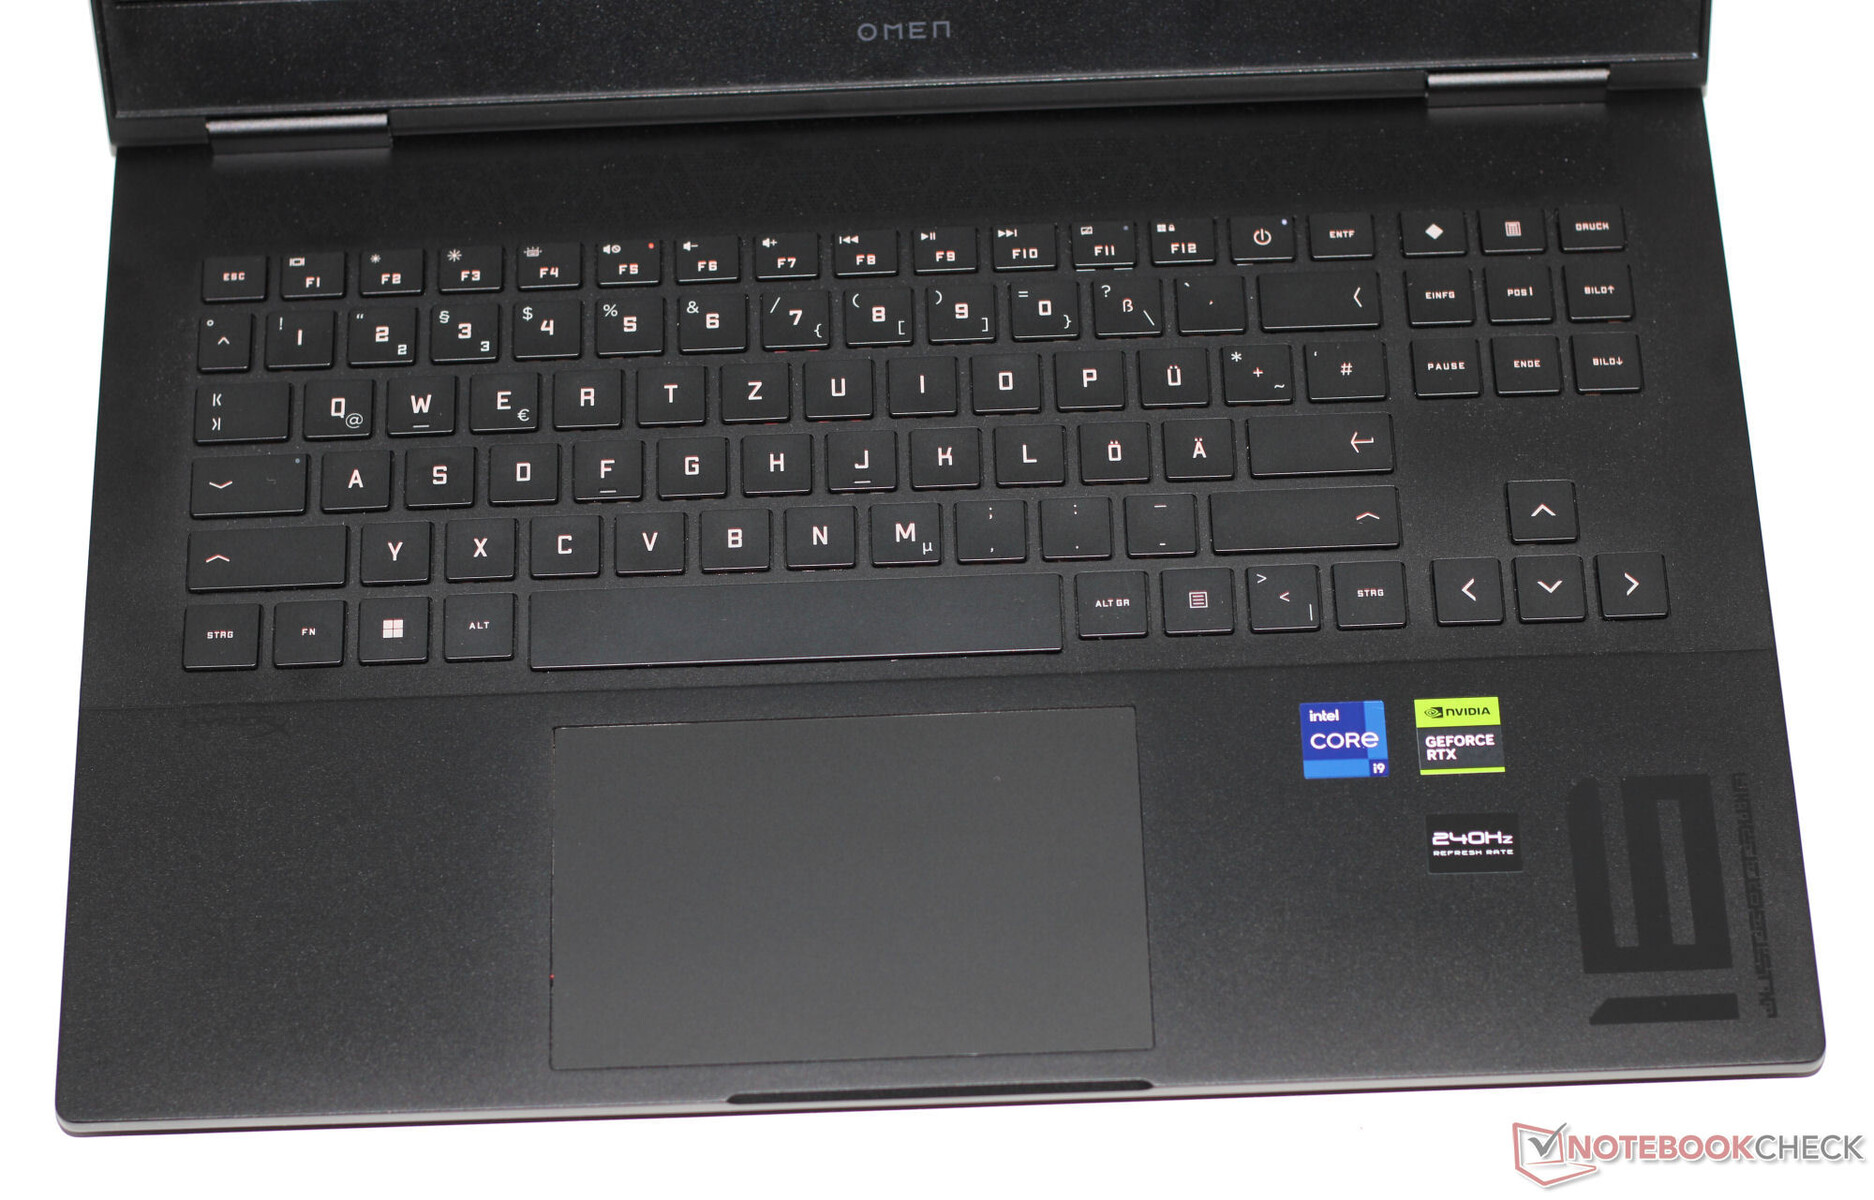
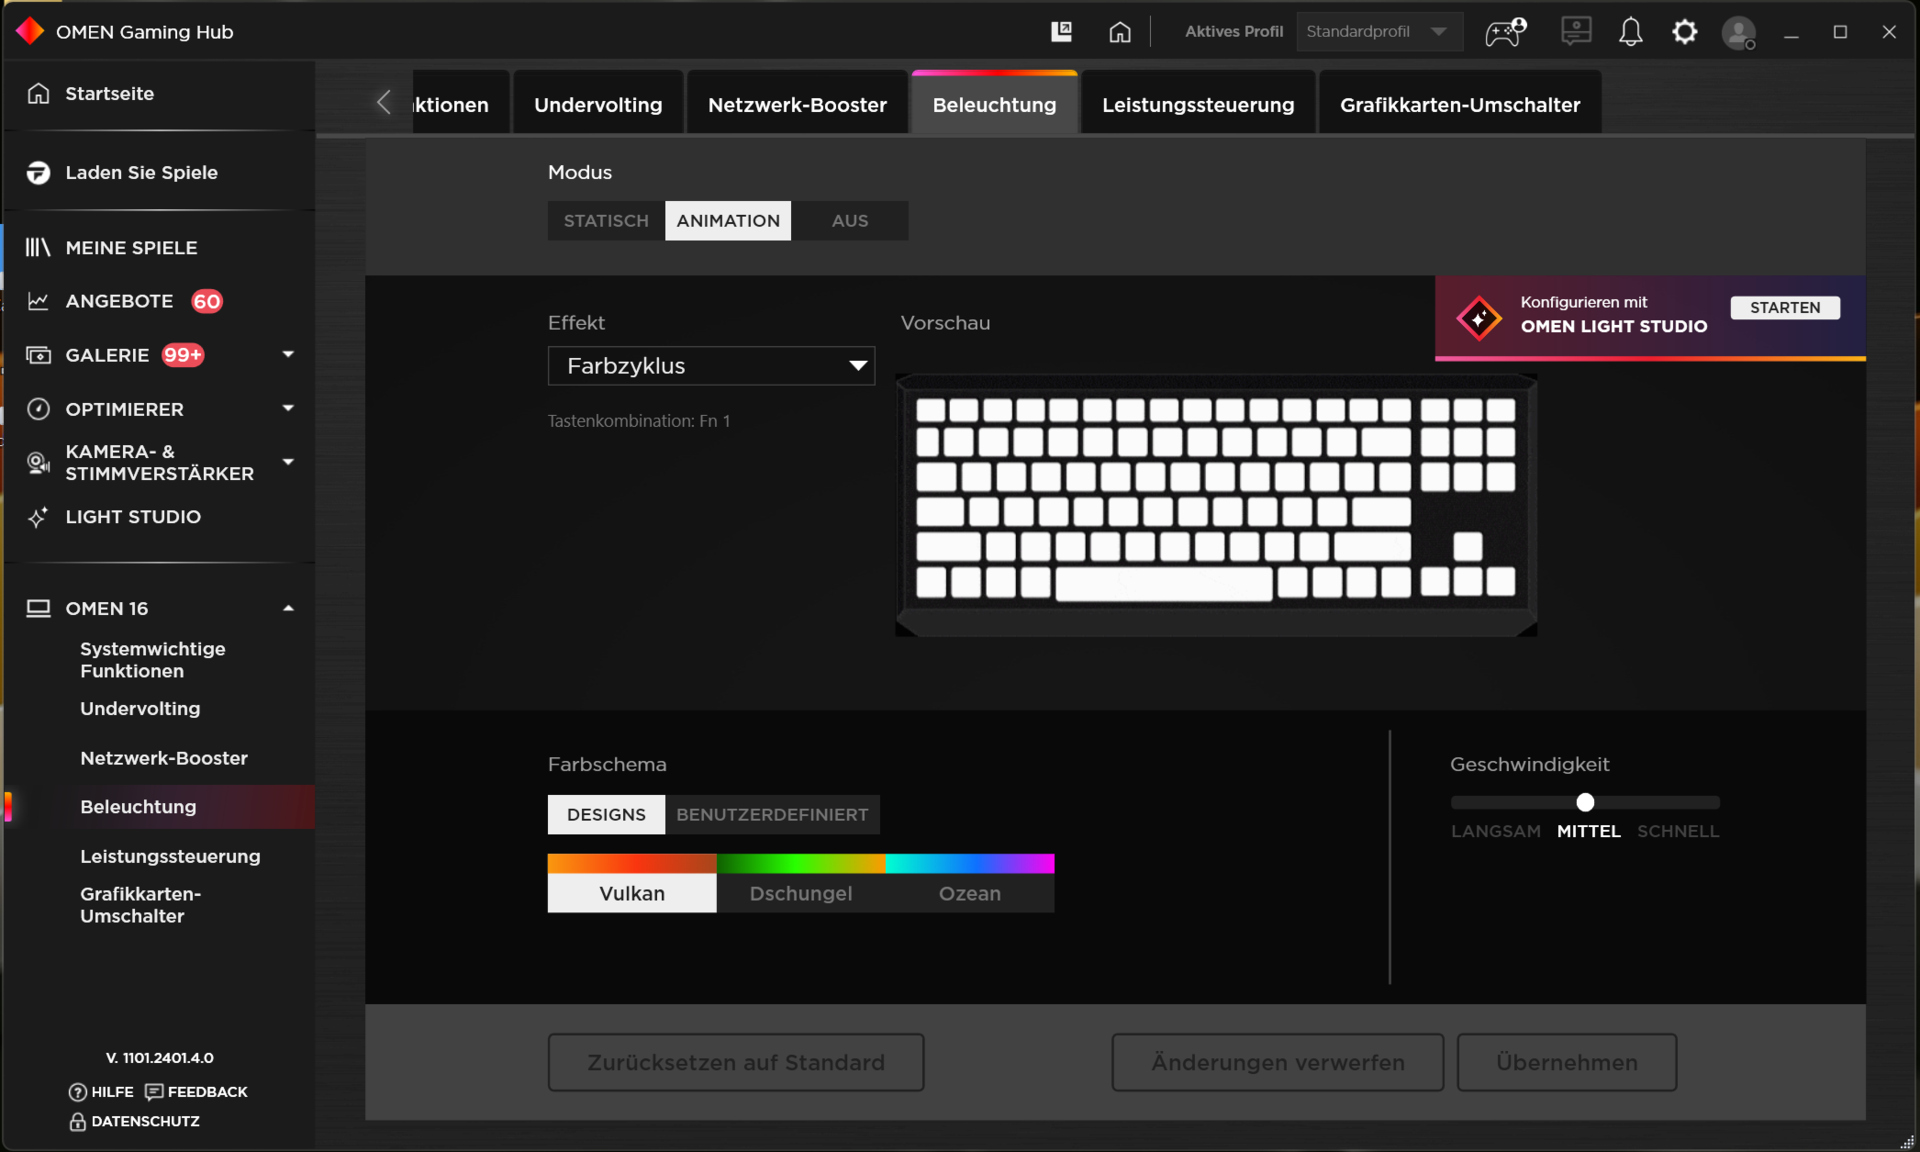
输入设备 - Omen 提供按键 RGB 照明功能
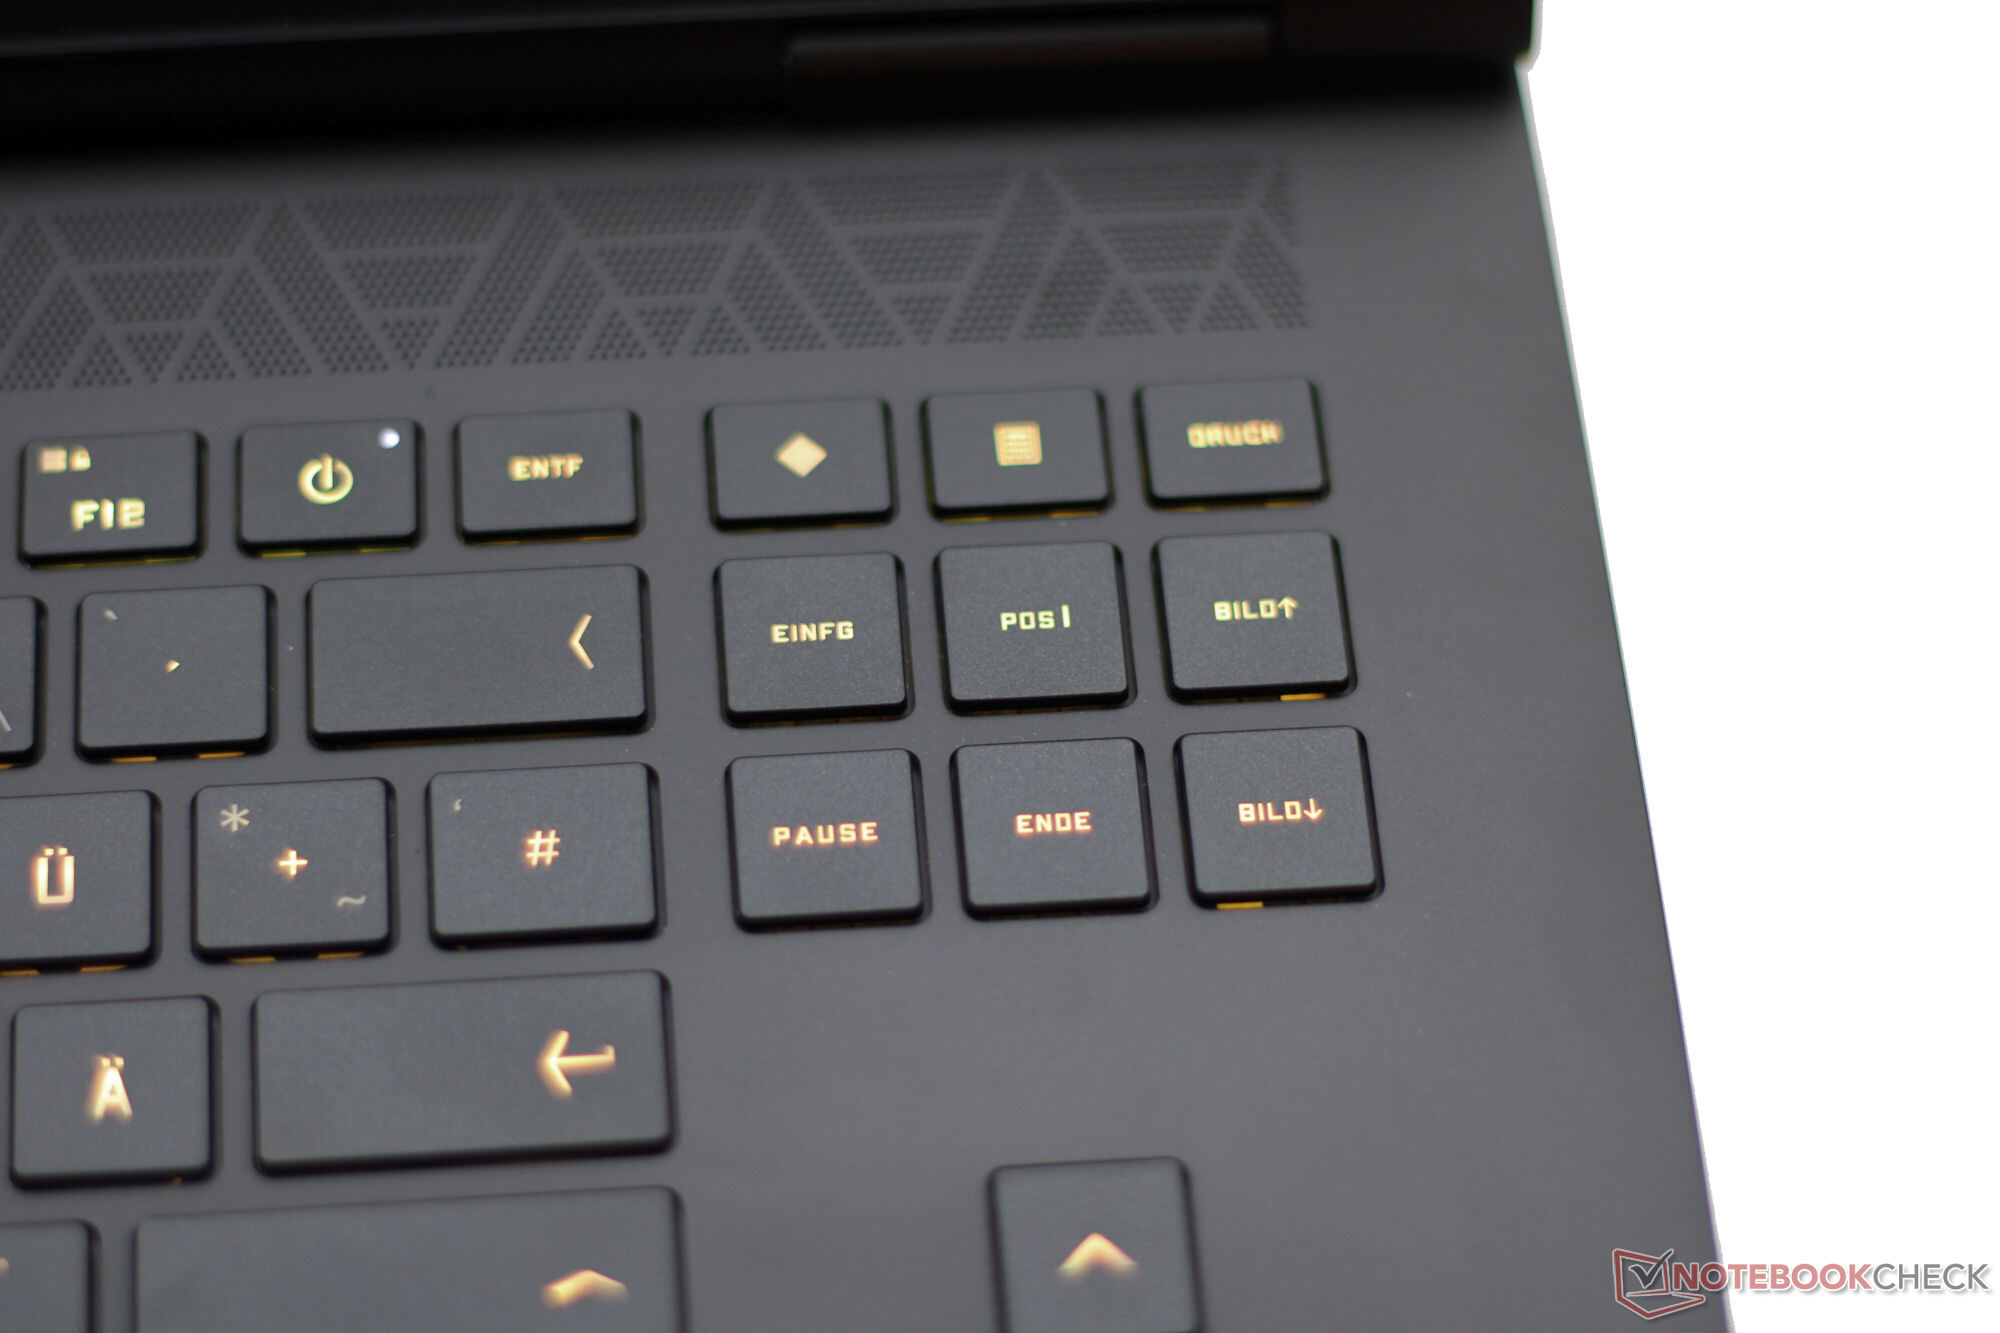
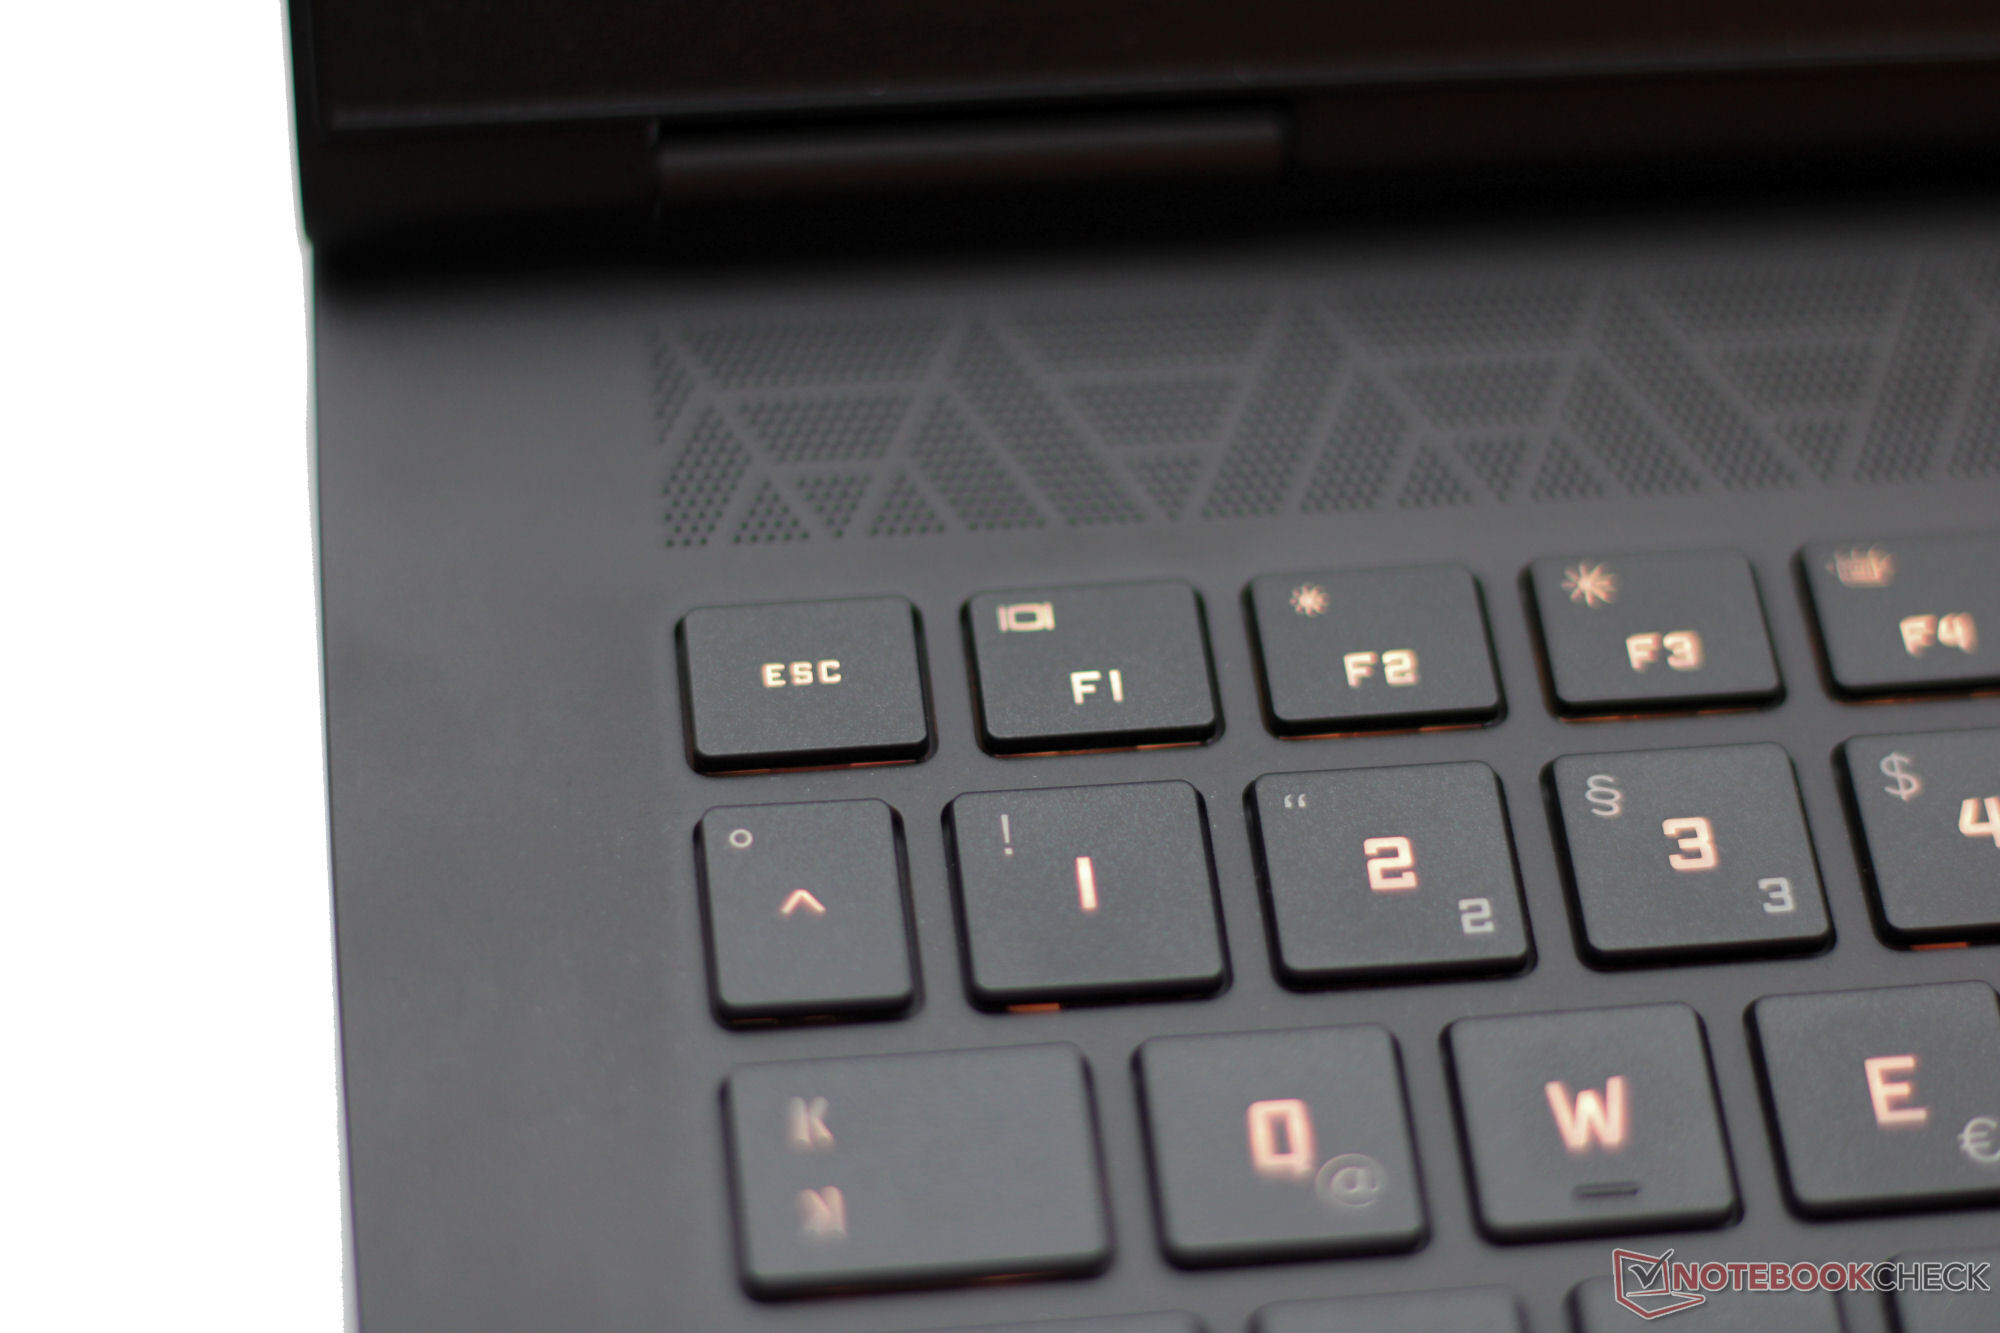
Omen 16 的 RGB 背光 Chiclet 键盘没有数字键盘。通常用于数字键盘的空间现在被控制键和独立的大尺寸方向键占据。凹面按键易于按压,键程适中,驱动点清晰,阻力适中。触摸板尺寸约为 12.5 x 8 厘米(4.9 x 3.1 英寸),行程较短,点击点清晰。
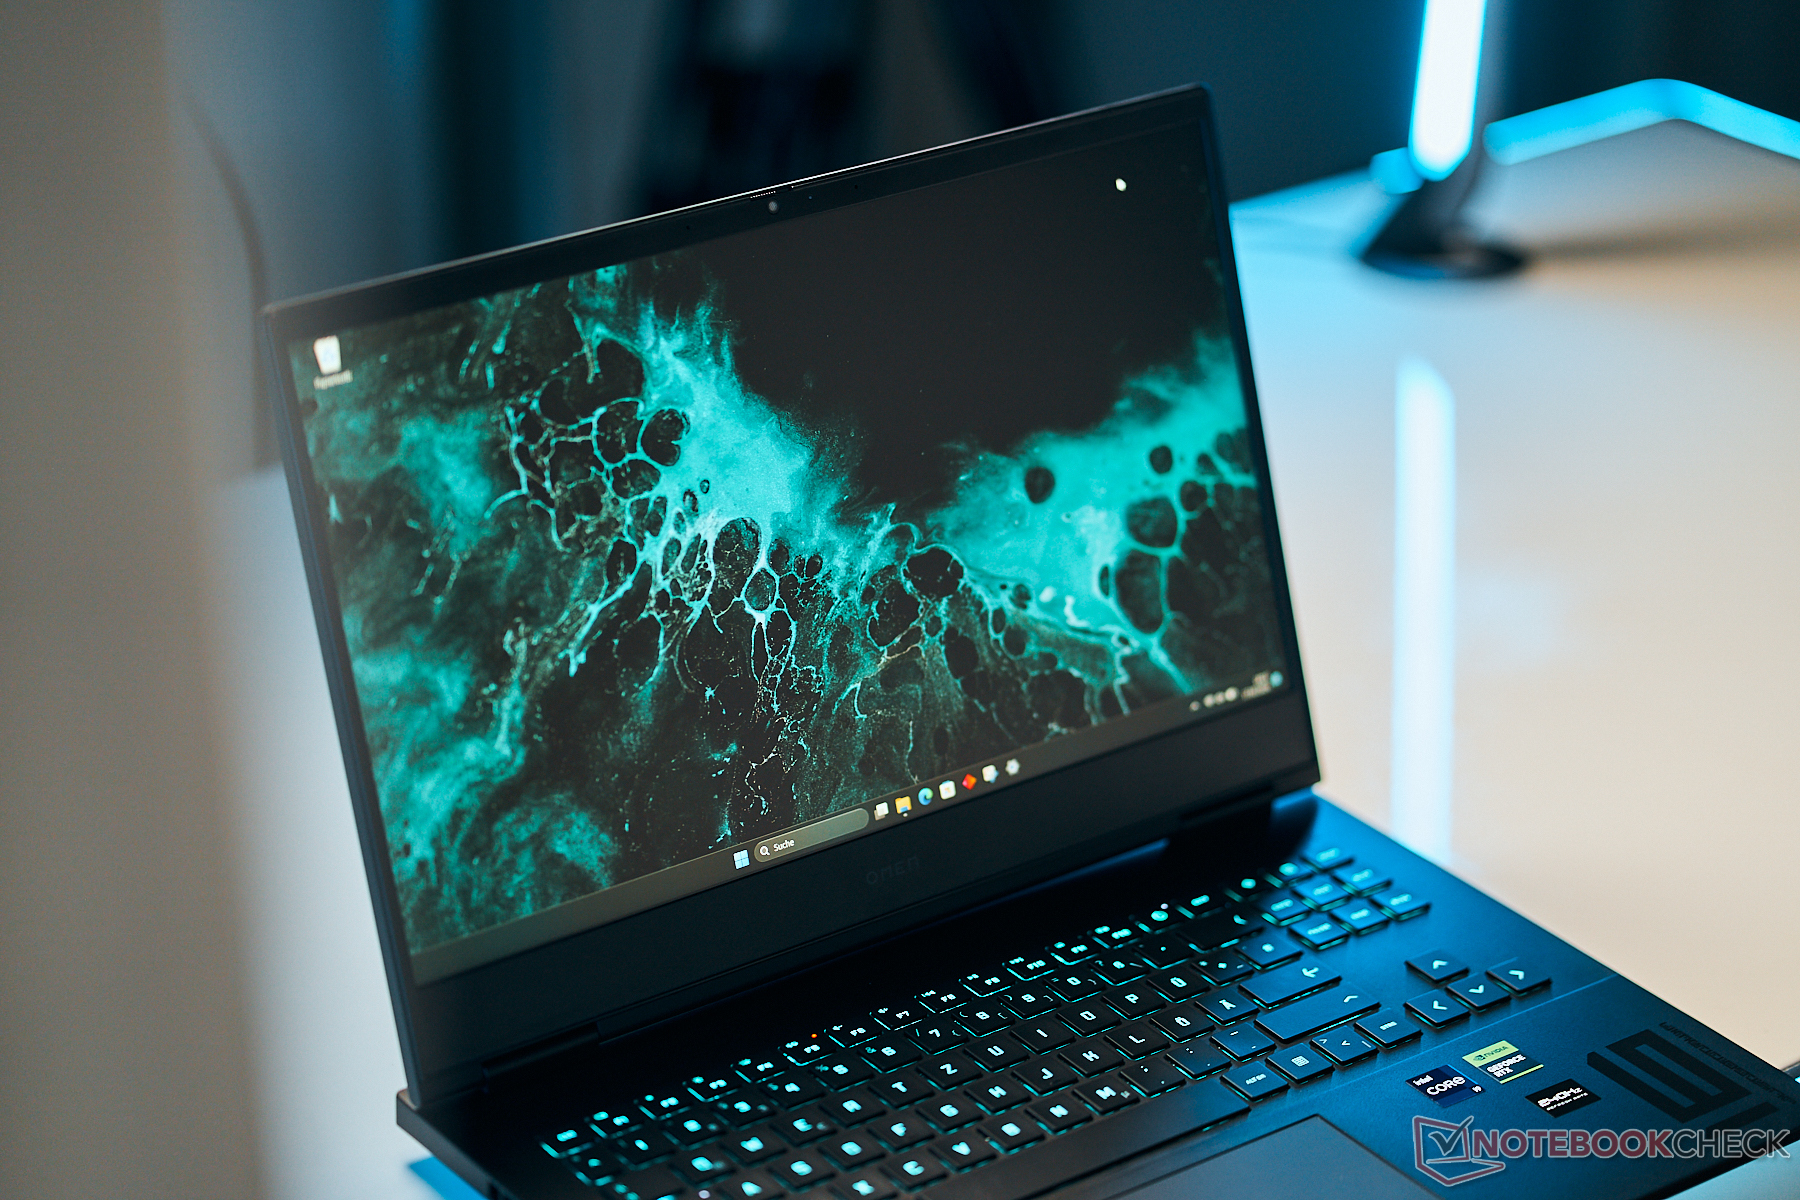
显示屏 - QHD 面板,全面覆盖 sRGB
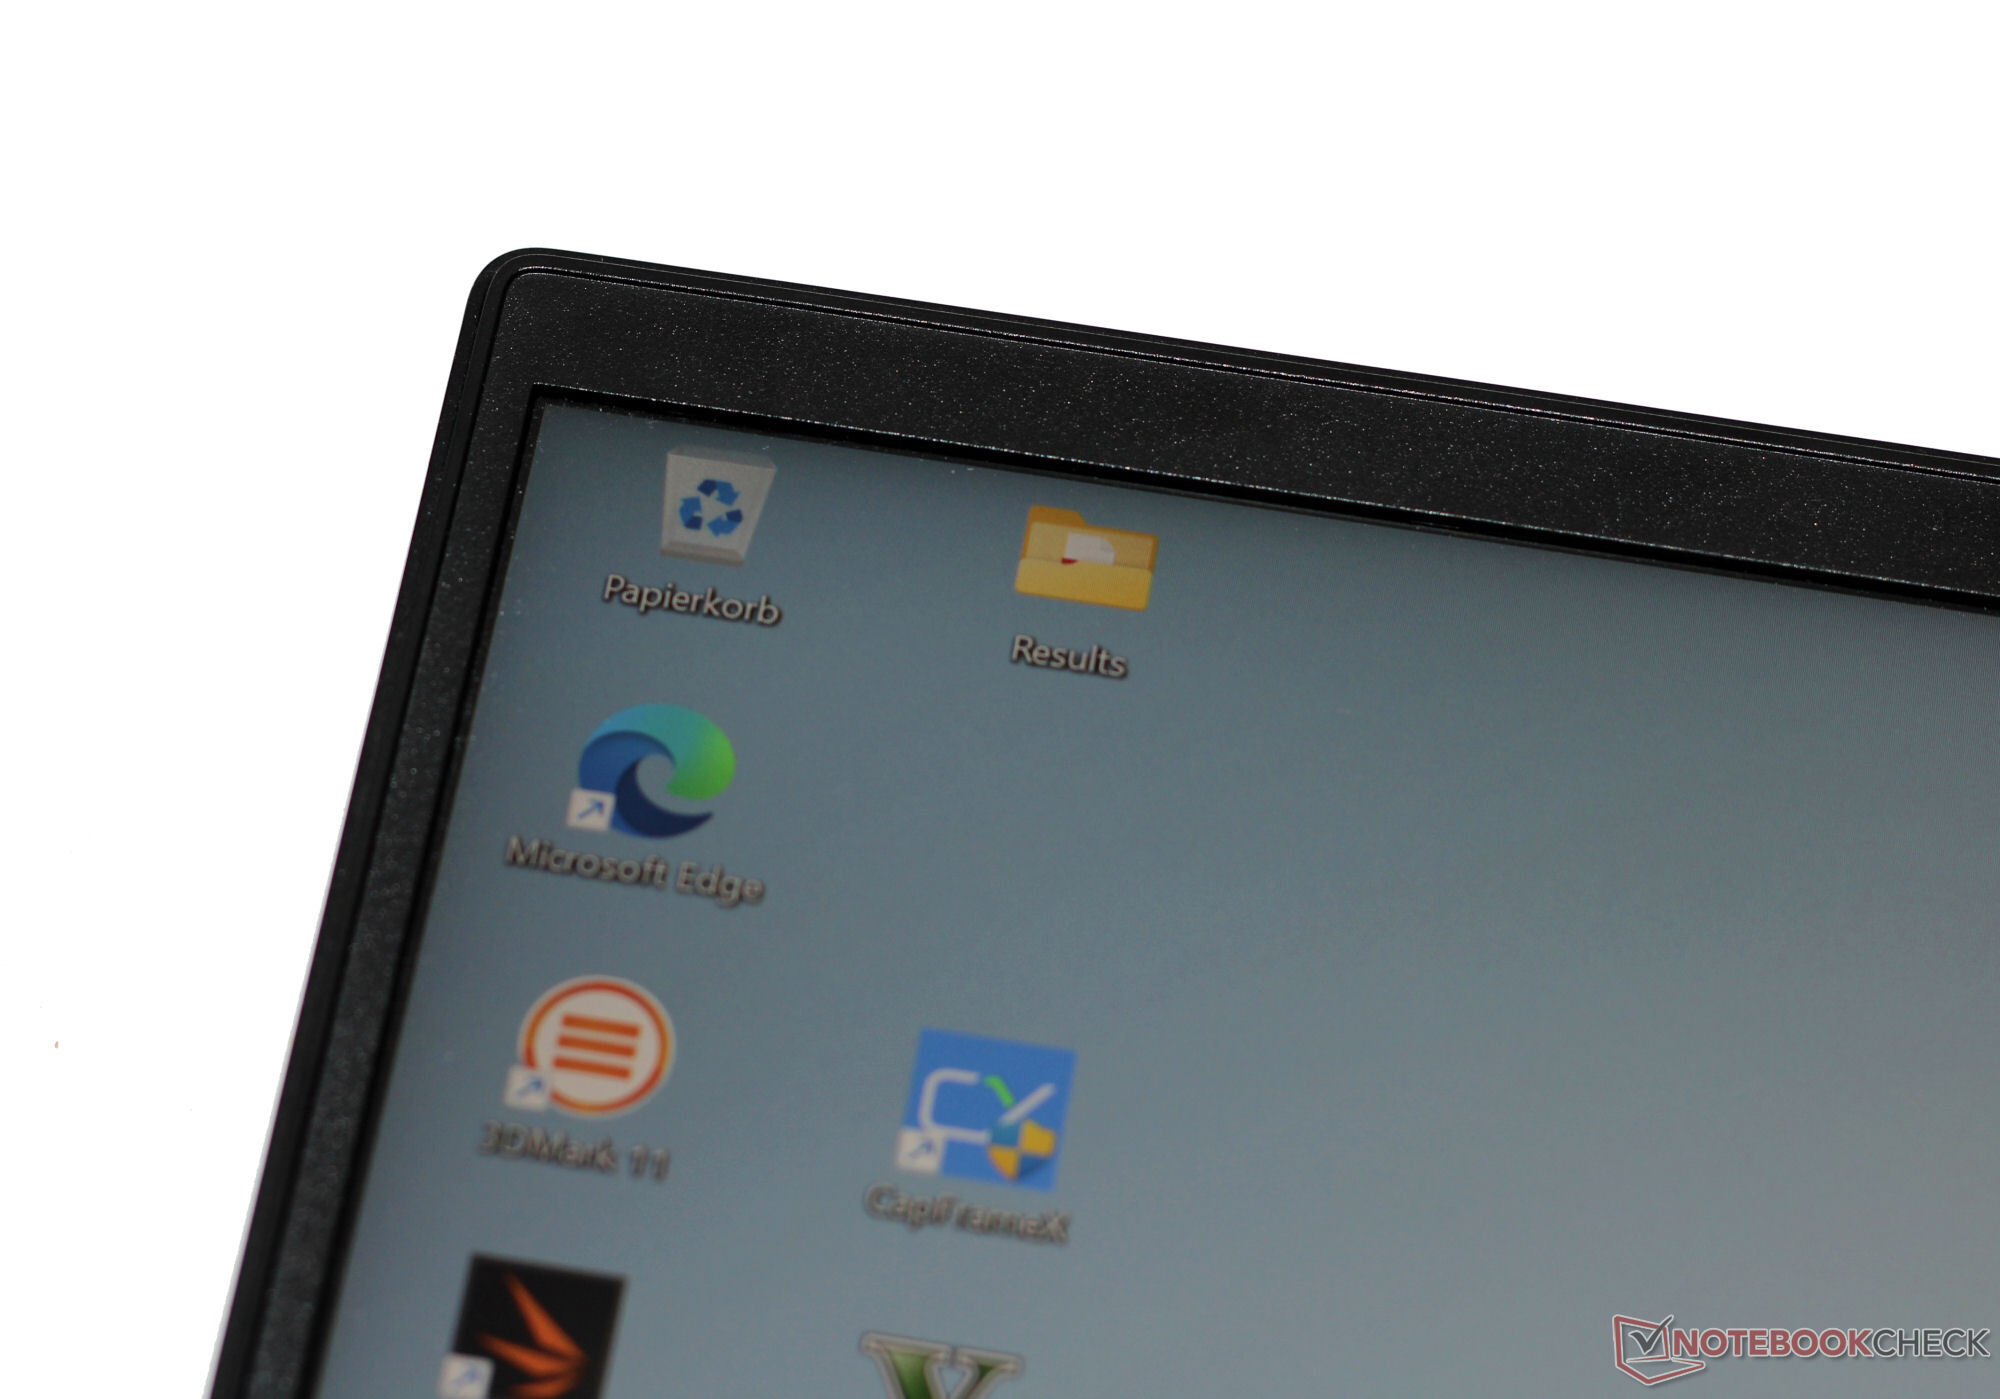
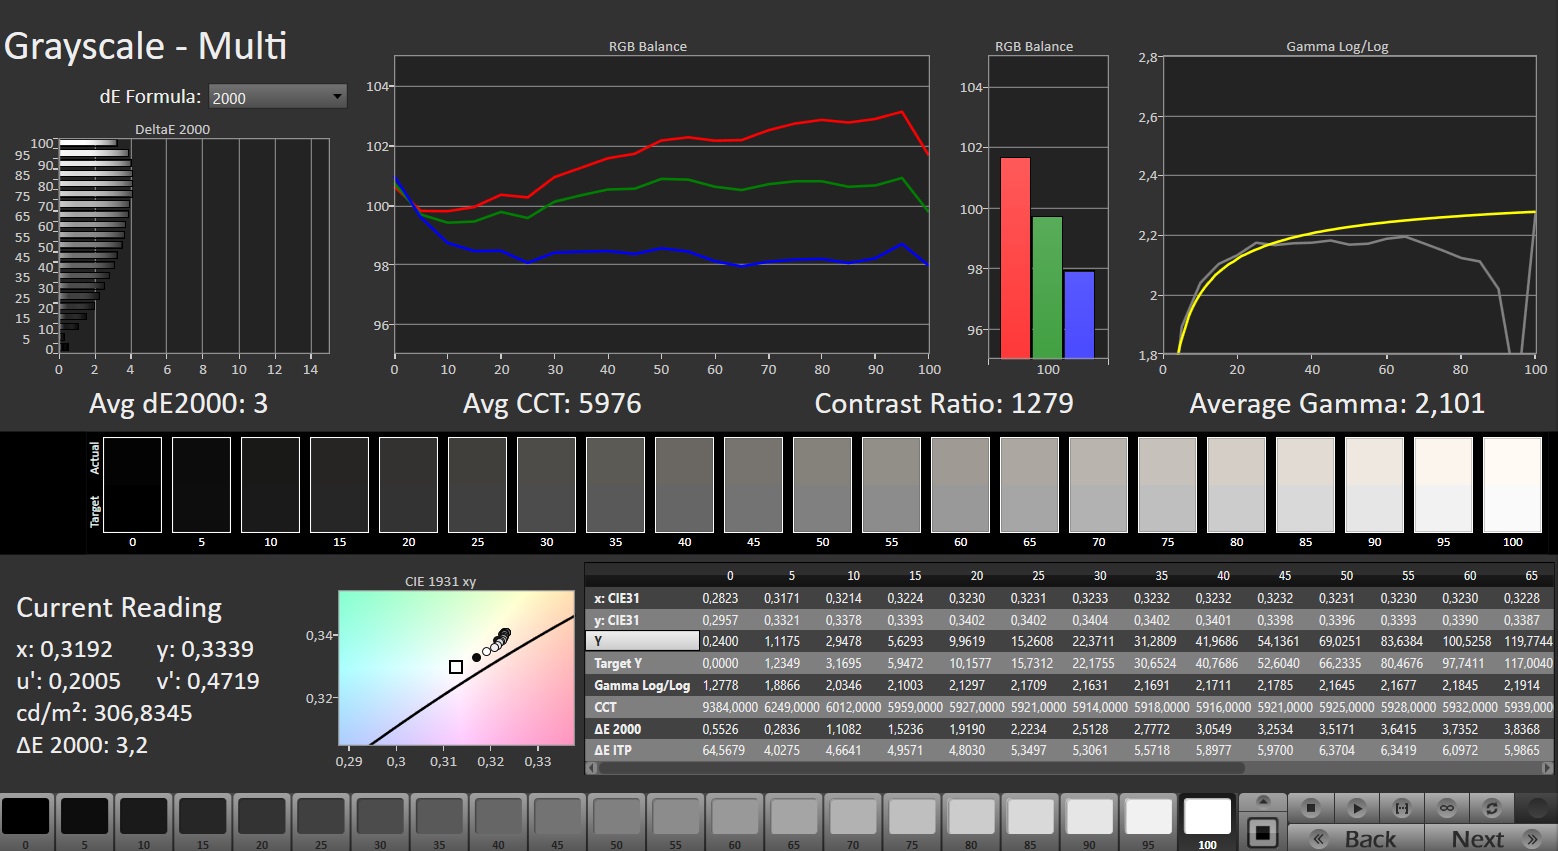
值得称赞的是,这款宽高比为 16:9 的 16.1 英寸 IPS 显示屏(1440p)没有出现 PWM 闪烁,支持 G-Sync,响应时间也很快。虽然显示屏的对比度足够好(大于 1,000:1),但峰值亮度略低于目标水平(大于 300 cd/m²)。

| |||||||||||||||||||||||||
Brightness Distribution: 85 %
Center on Battery: 292 cd/m²
Contrast: 1217:1 (Black: 0.24 cd/m²)
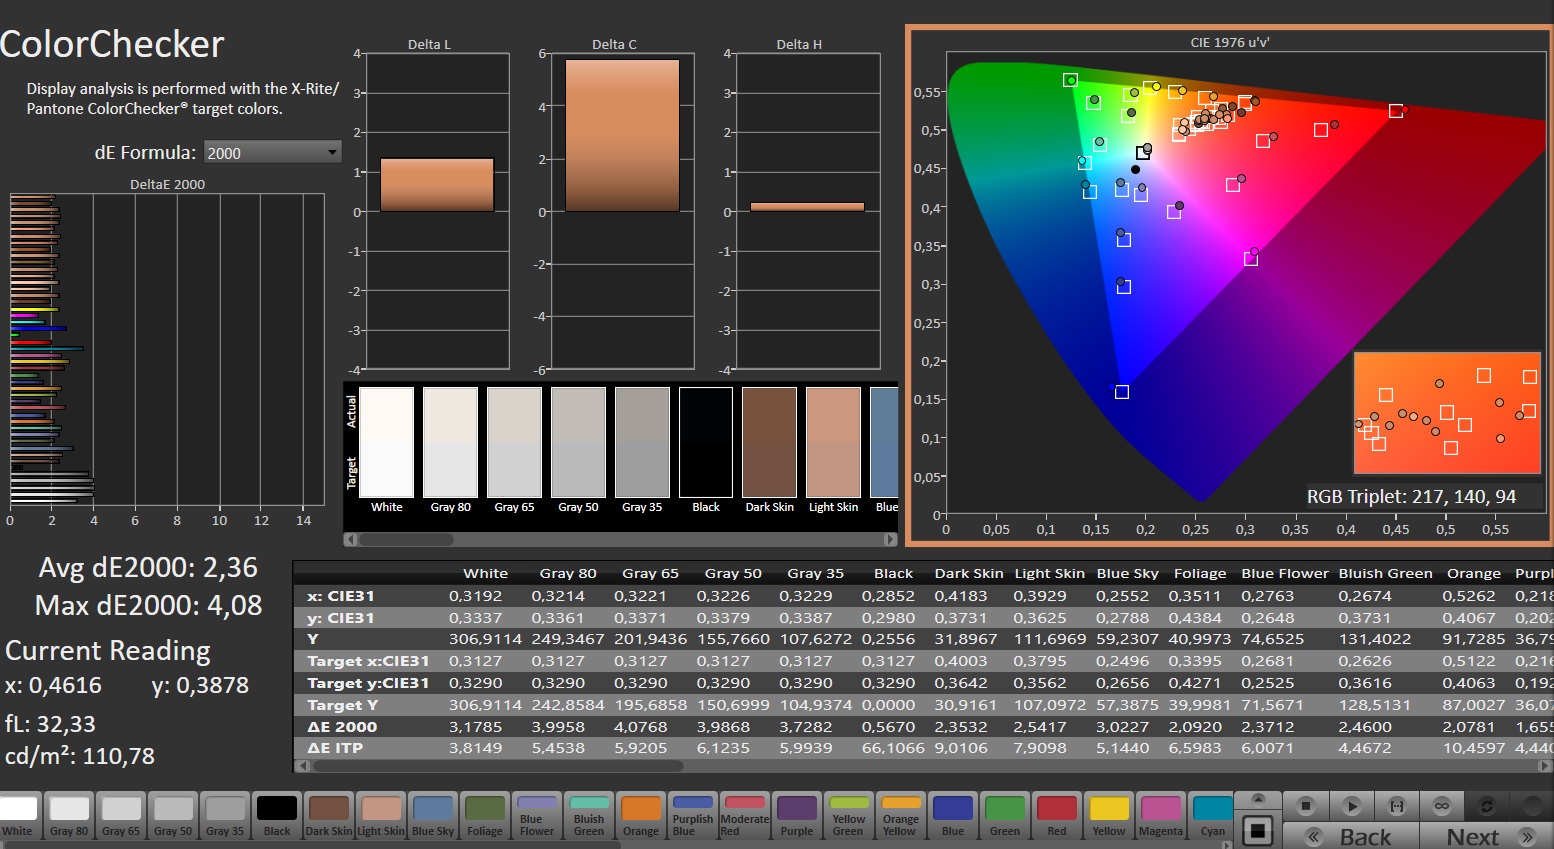
ΔE ColorChecker Calman: 2.36 | ∀{0.5-29.43 Ø4.71}
calibrated: 0.93
ΔE Greyscale Calman: 3 | ∀{0.09-98 Ø4.96}
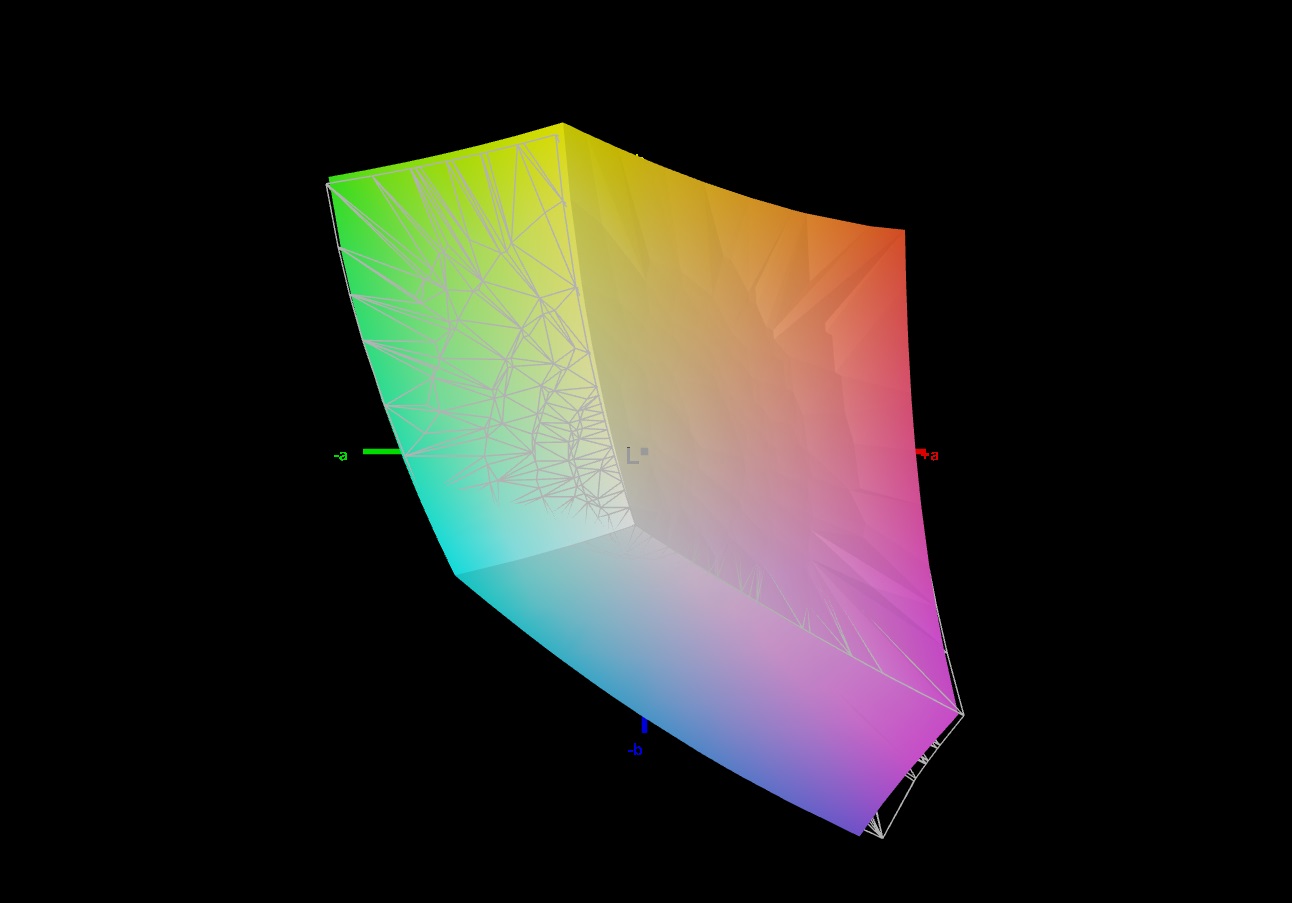
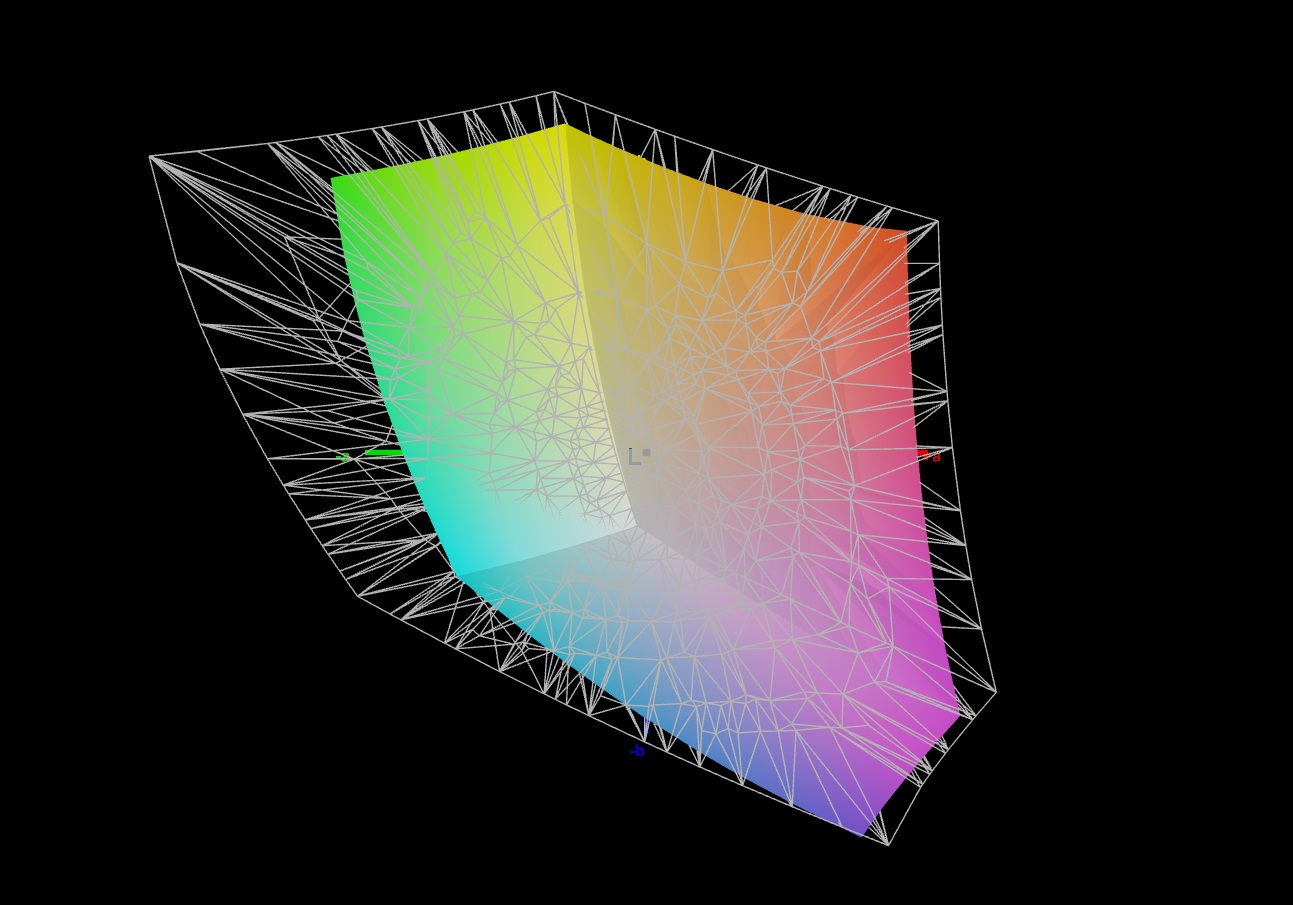
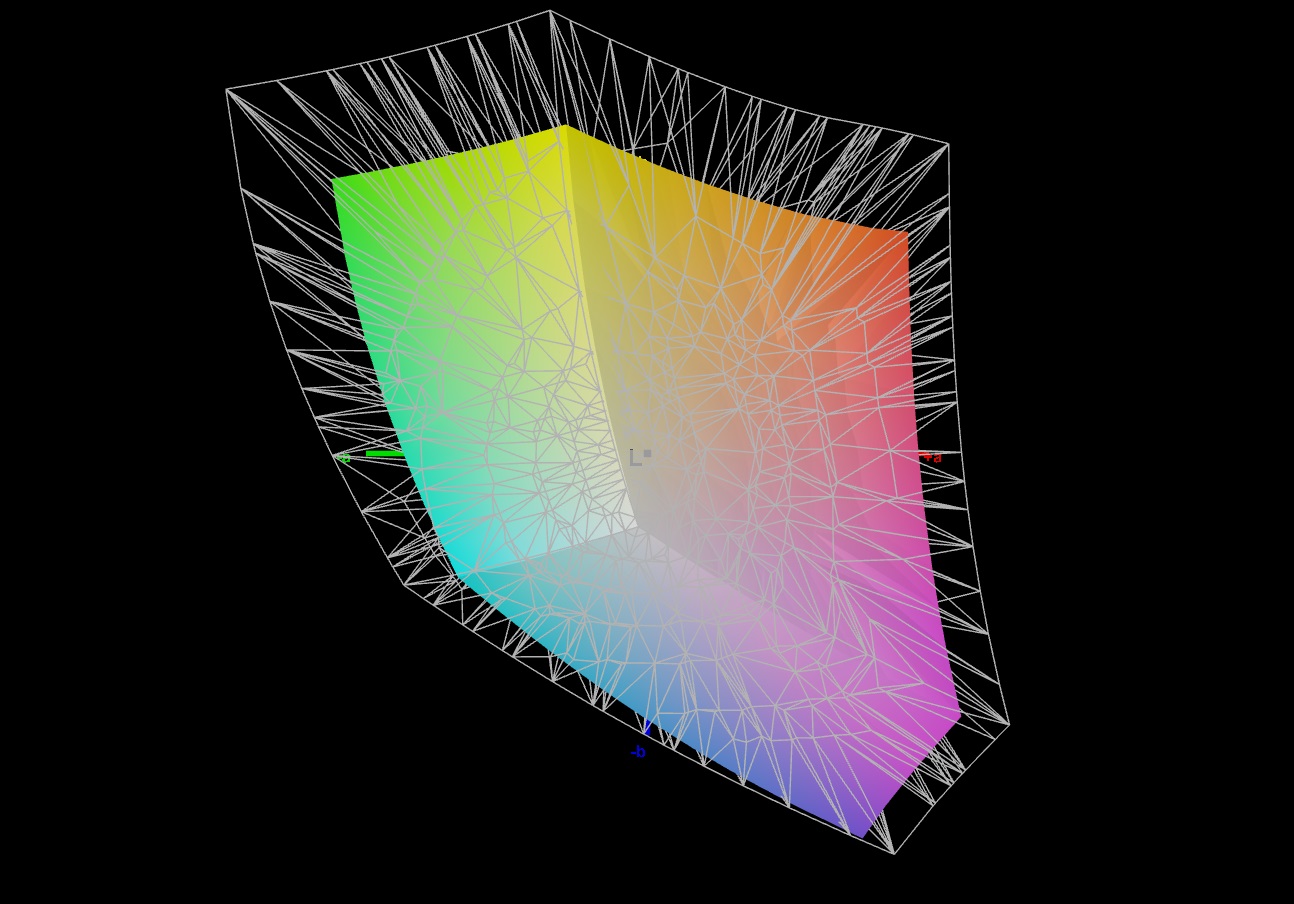
70.6% AdobeRGB 1998 (Argyll 3D)
98.6% sRGB (Argyll 3D)
68.6% Display P3 (Argyll 3D)
Gamma: 2.101
CCT: 5976 K
| HP Omen 16 (2024) BOE BOE0B7D, IPS, 2560x1440, 16.1" | MSI Vector 16 HX A14V Chi Mei N160GME-GTB, IPS, 2560x1600, 16" | Alienware m16 R1 AMD BOE NE16NZ4, IPS, 2560x1600, 16" | Acer Predator Helios 18 N23Q2 AUO45A8 (B180QAN01.2), IPS, 2560x1600, 18" | HP Omen 16-wf000 BOE0B7D, IPS, 2560x1440, 16.1" | |
|---|---|---|---|---|---|
| Display | 20% | 24% | 25% | 1% | |
| Display P3 Coverage (%) | 68.6 | 95.4 39% | 98.6 44% | 99.8 45% | 69 1% |
| sRGB Coverage (%) | 98.6 | 99.7 1% | 99.9 1% | 100 1% | 99.2 1% |
| AdobeRGB 1998 Coverage (%) | 70.6 | 85.4 21% | 88.9 26% | 91.8 30% | 71.2 1% |
| Response Times | 19% | 34% | -23% | 32% | |
| Response Time Grey 50% / Grey 80% * (ms) | 14.1 ? | 5.7 ? 60% | 5.1 ? 64% | 7.6 ? 46% | 4.6 ? 67% |
| Response Time Black / White * (ms) | 9.3 ? | 11.4 ? -23% | 9 ? 3% | 17.8 ? -91% | 9.7 ? -4% |
| PWM Frequency (Hz) | 2509 | ||||
| Screen | -7% | -37% | -27% | 1% | |
| Brightness middle (cd/m²) | 292 | 557.2 91% | 329 13% | 360 23% | 310.9 6% |
| Brightness (cd/m²) | 291 | 506 74% | 317 9% | 355 22% | 296 2% |
| Brightness Distribution (%) | 85 | 83 -2% | 89 5% | 92 8% | 91 7% |
| Black Level * (cd/m²) | 0.24 | 0.41 -71% | 0.32 -33% | 0.21 12% | 0.35 -46% |
| Contrast (:1) | 1217 | 1359 12% | 1028 -16% | 1714 41% | 888 -27% |
| Colorchecker dE 2000 * | 2.36 | 2.91 -23% | 3.71 -57% | 3.82 -62% | 2.18 8% |
| Colorchecker dE 2000 max. * | 4.08 | 5.94 -46% | 7.23 -77% | 7.38 -81% | 3.58 12% |
| Colorchecker dE 2000 calibrated * | 0.93 | 1.63 -75% | 2.82 -203% | 2.24 -141% | 0.52 44% |
| Greyscale dE 2000 * | 3 | 3.8 -27% | 2.2 27% | 5.06 -69% | 2.8 7% |
| Gamma | 2.101 105% | 2.23 99% | 2.3 96% | 2.52 87% | 2.18 101% |
| CCT | 5976 109% | 6408 101% | 6270 104% | 5657 115% | 6002 108% |
| Total Average (Program / Settings) | 11% /
2% | 7% /
-14% | -8% /
-15% | 11% /
6% |
* ... smaller is better
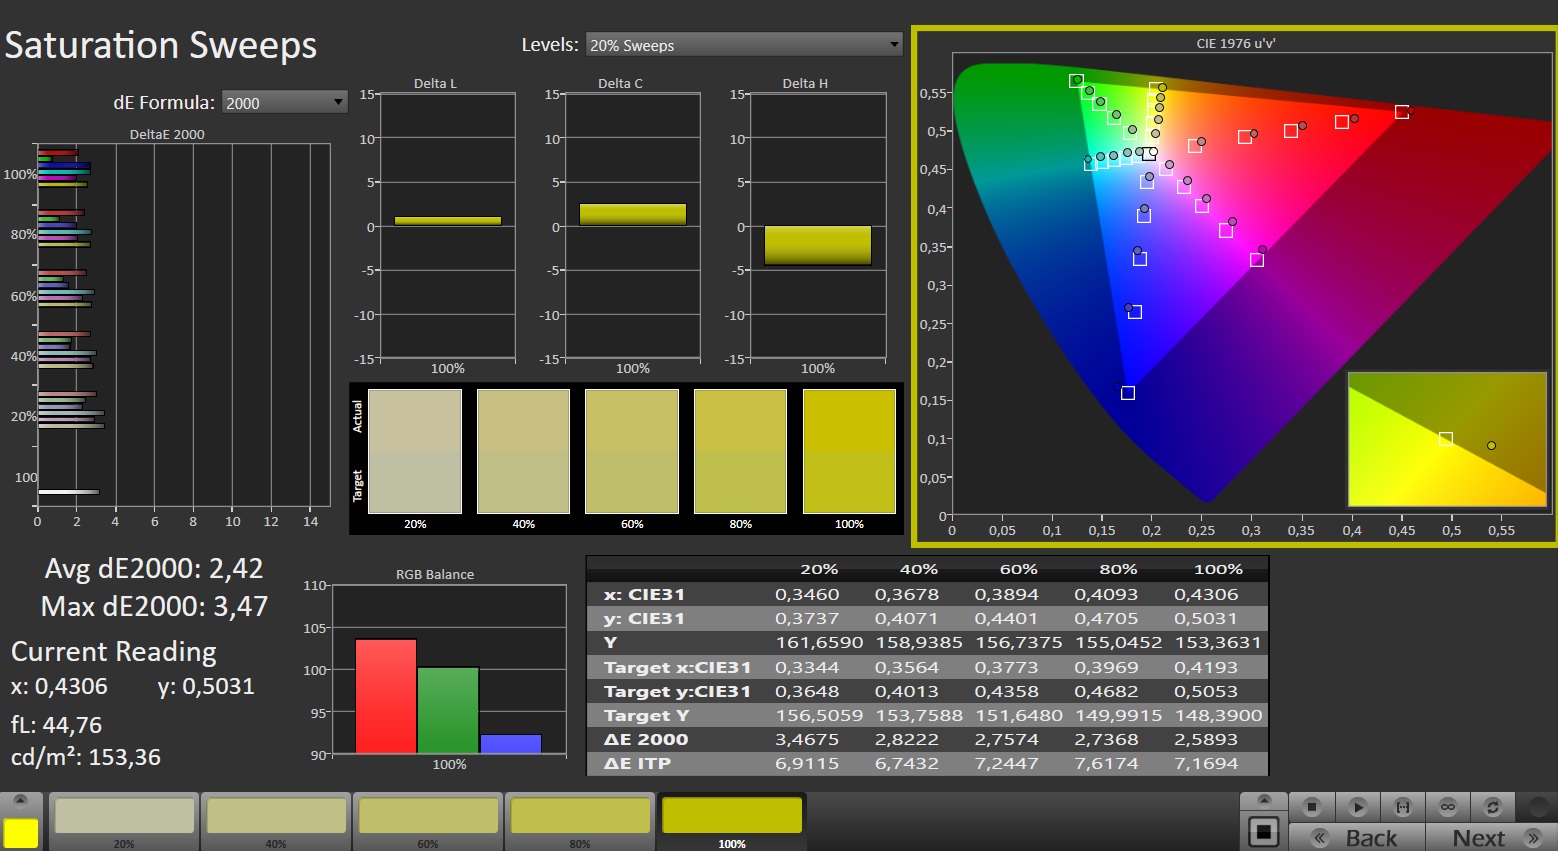
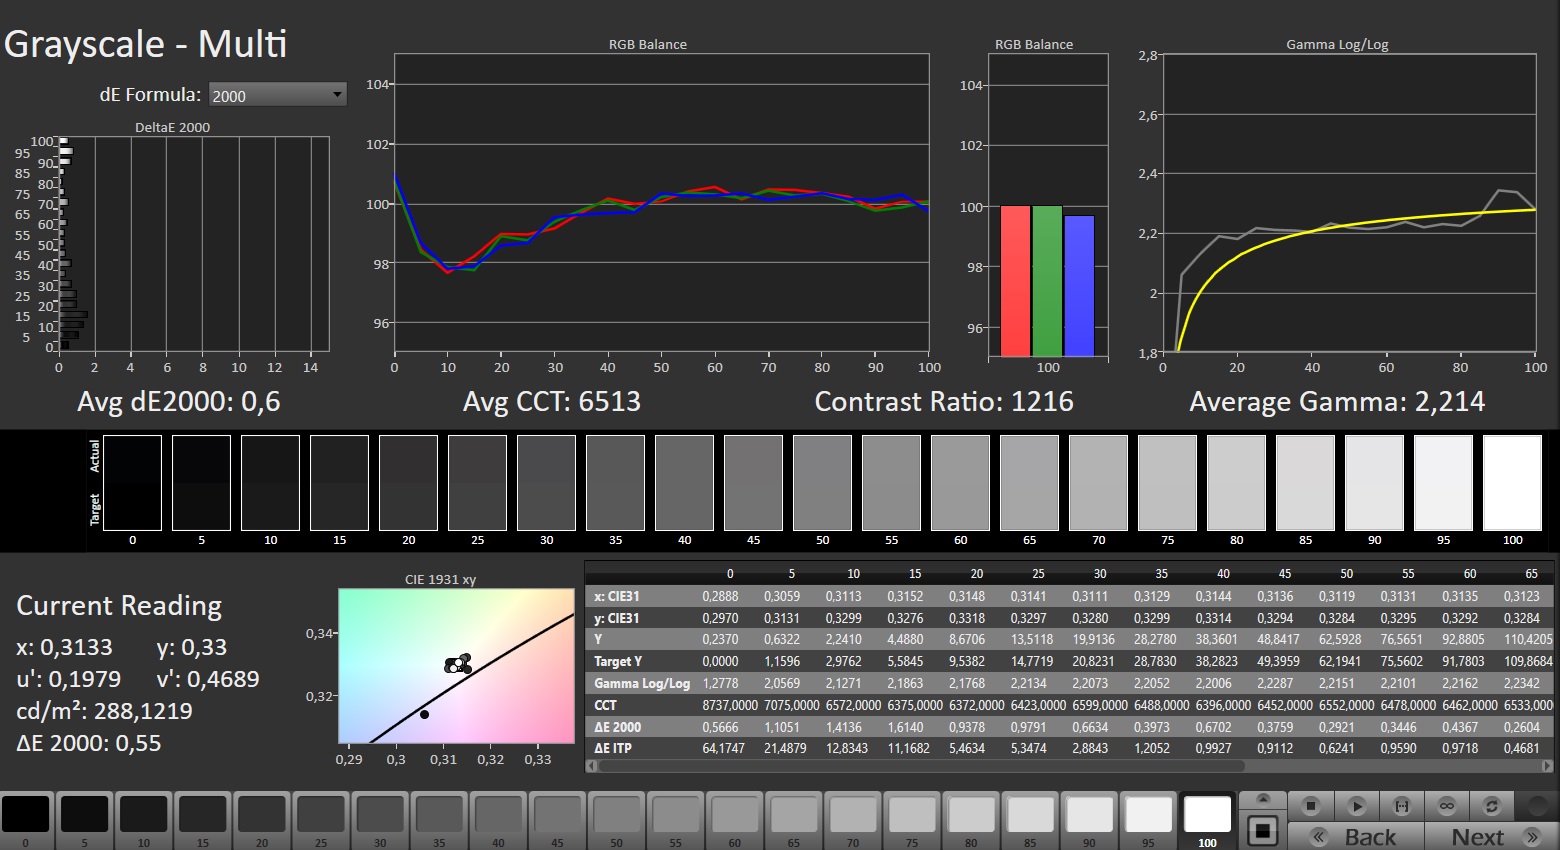
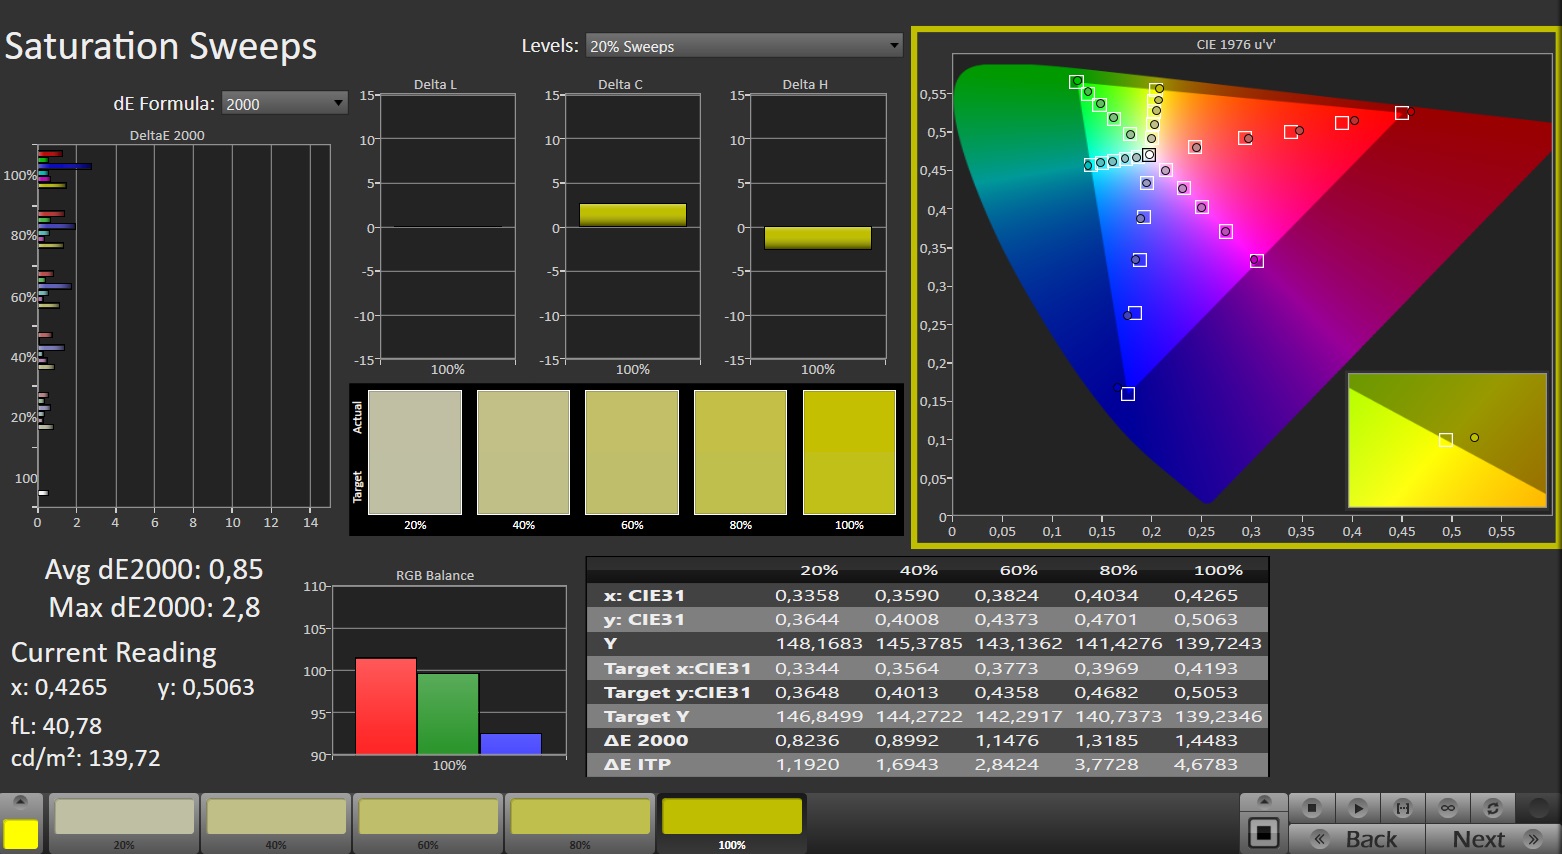
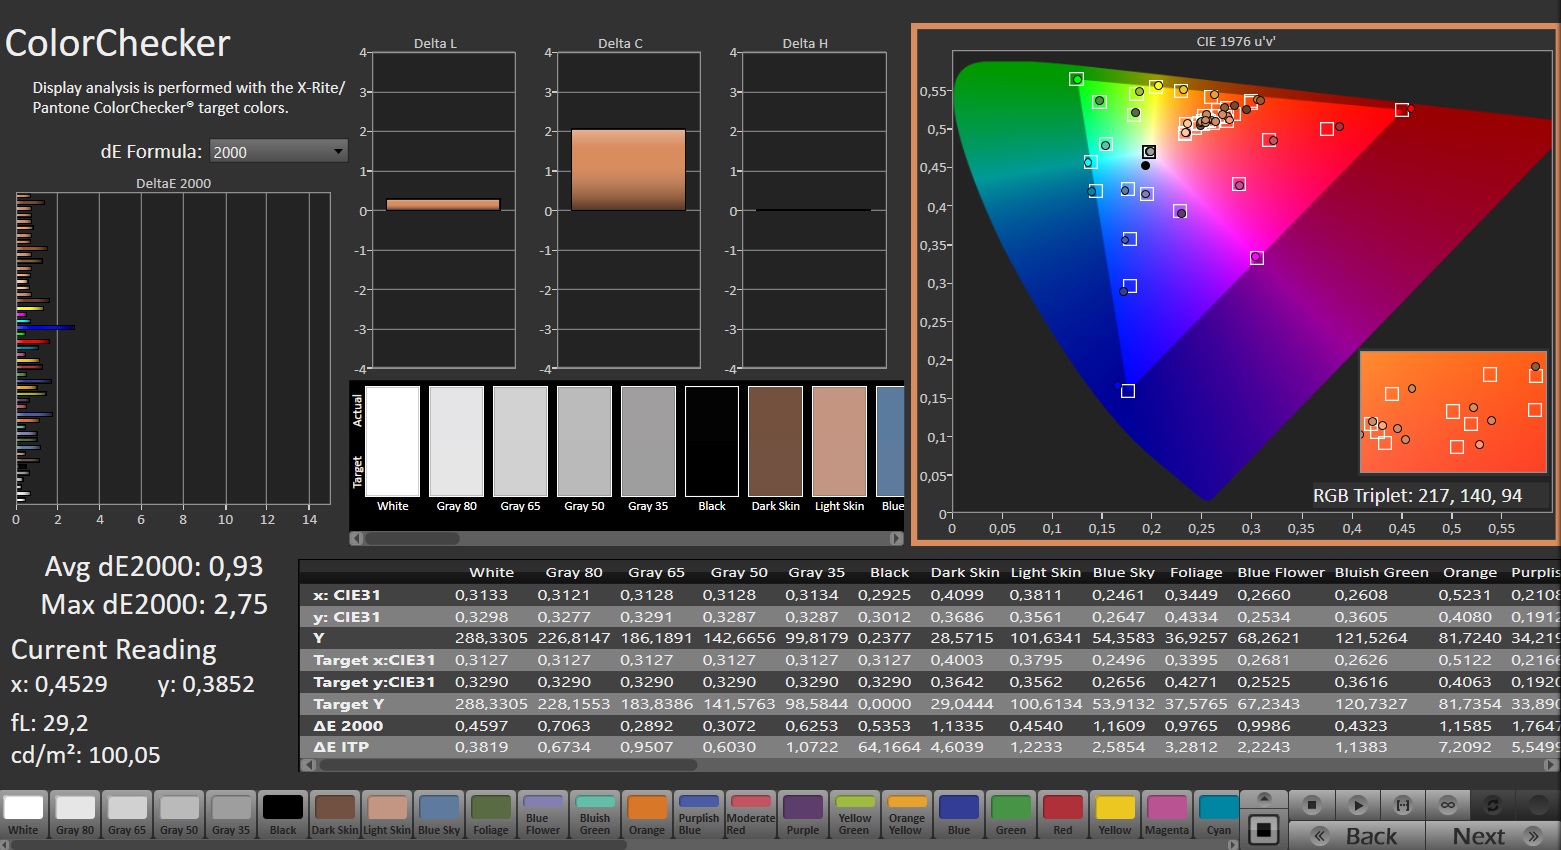
显示器开箱即具有出色的色彩还原能力。平均色差约为 2.4,达到了我们认为的良好水平(Delta E < 3)。对屏幕进行校准后,平均 Delta E 值降至 0.93,灰度更为均衡。该面板可以再现完整的 sRGB 色彩空间,但没有完全覆盖 AdobeRGB 和 DCI-P3。同类产品的显示屏在这方面有更多的优势。
Display Response Times
| ↔ Response Time Black to White | ||
|---|---|---|
| 9.3 ms ... rise ↗ and fall ↘ combined | ↗ 4.6 ms rise | 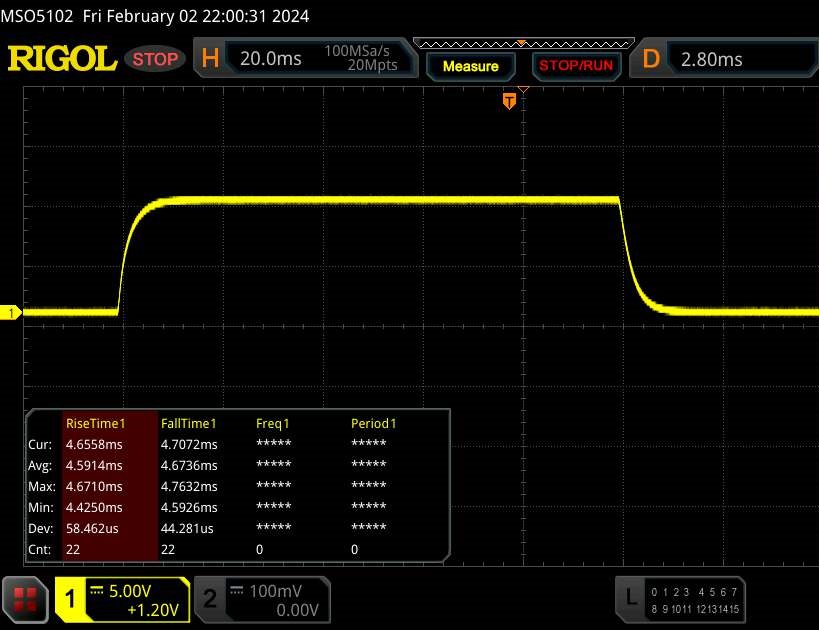 |
| ↘ 4.7 ms fall | ||
| The screen shows fast response rates in our tests and should be suited for gaming. In comparison, all tested devices range from 0.1 (minimum) to 240 (maximum) ms. » 26 % of all devices are better. This means that the measured response time is better than the average of all tested devices (19.8 ms). | ||
| ↔ Response Time 50% Grey to 80% Grey | ||
| 14.1 ms ... rise ↗ and fall ↘ combined | ↗ 6.7 ms rise | 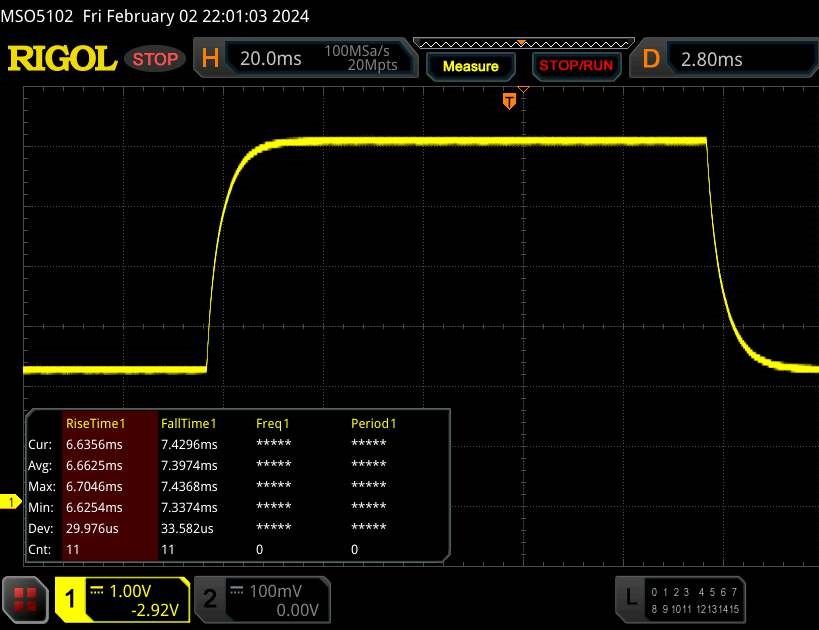 |
| ↘ 7.4 ms fall | ||
| The screen shows good response rates in our tests, but may be too slow for competitive gamers. In comparison, all tested devices range from 0.165 (minimum) to 636 (maximum) ms. » 28 % of all devices are better. This means that the measured response time is better than the average of all tested devices (30.9 ms). | ||
Screen Flickering / PWM (Pulse-Width Modulation)
| Screen flickering / PWM not detected | 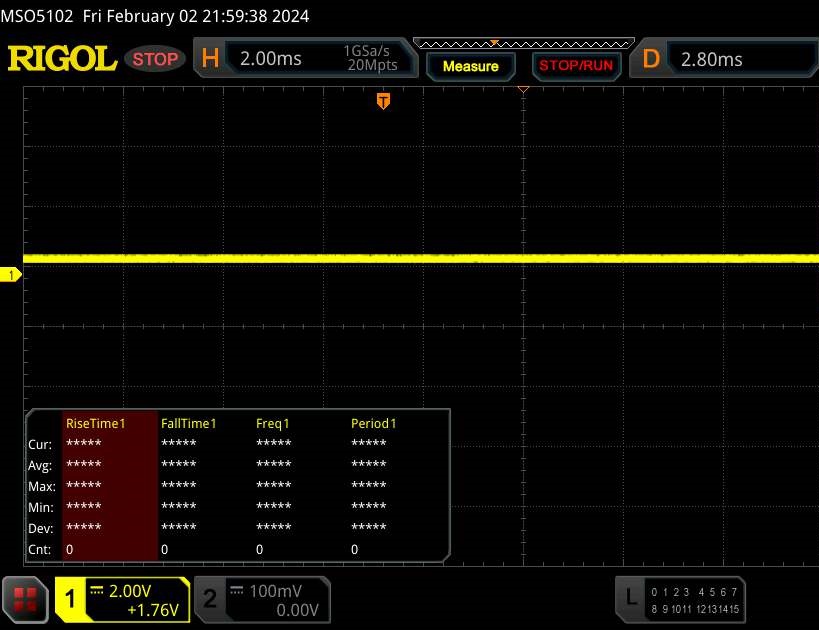 | ||
In comparison: 52 % of all tested devices do not use PWM to dim the display. If PWM was detected, an average of 7744 (minimum: 5 - maximum: 343500) Hz was measured. | |||
广视角意味着 IPS 面板在任何位置都可阅读。如果阳光不太强烈,还可以在户外使用显示屏。
性能 - 由 Raptor Lake 和 Ada Lovelace 提供支持
惠普 Omen 16 是一款 QHD 游戏笔记本电脑,在其他对性能要求较高的应用中同样表现出色。必要的计算能力由 Raptor Lake 和 Ada Lovelace 提供。Omen 机型的价格约为 3,200 欧元(3,446 美元)。更便宜的配置起价仅为 1,900 欧元(2,760 美元)。
测试条件
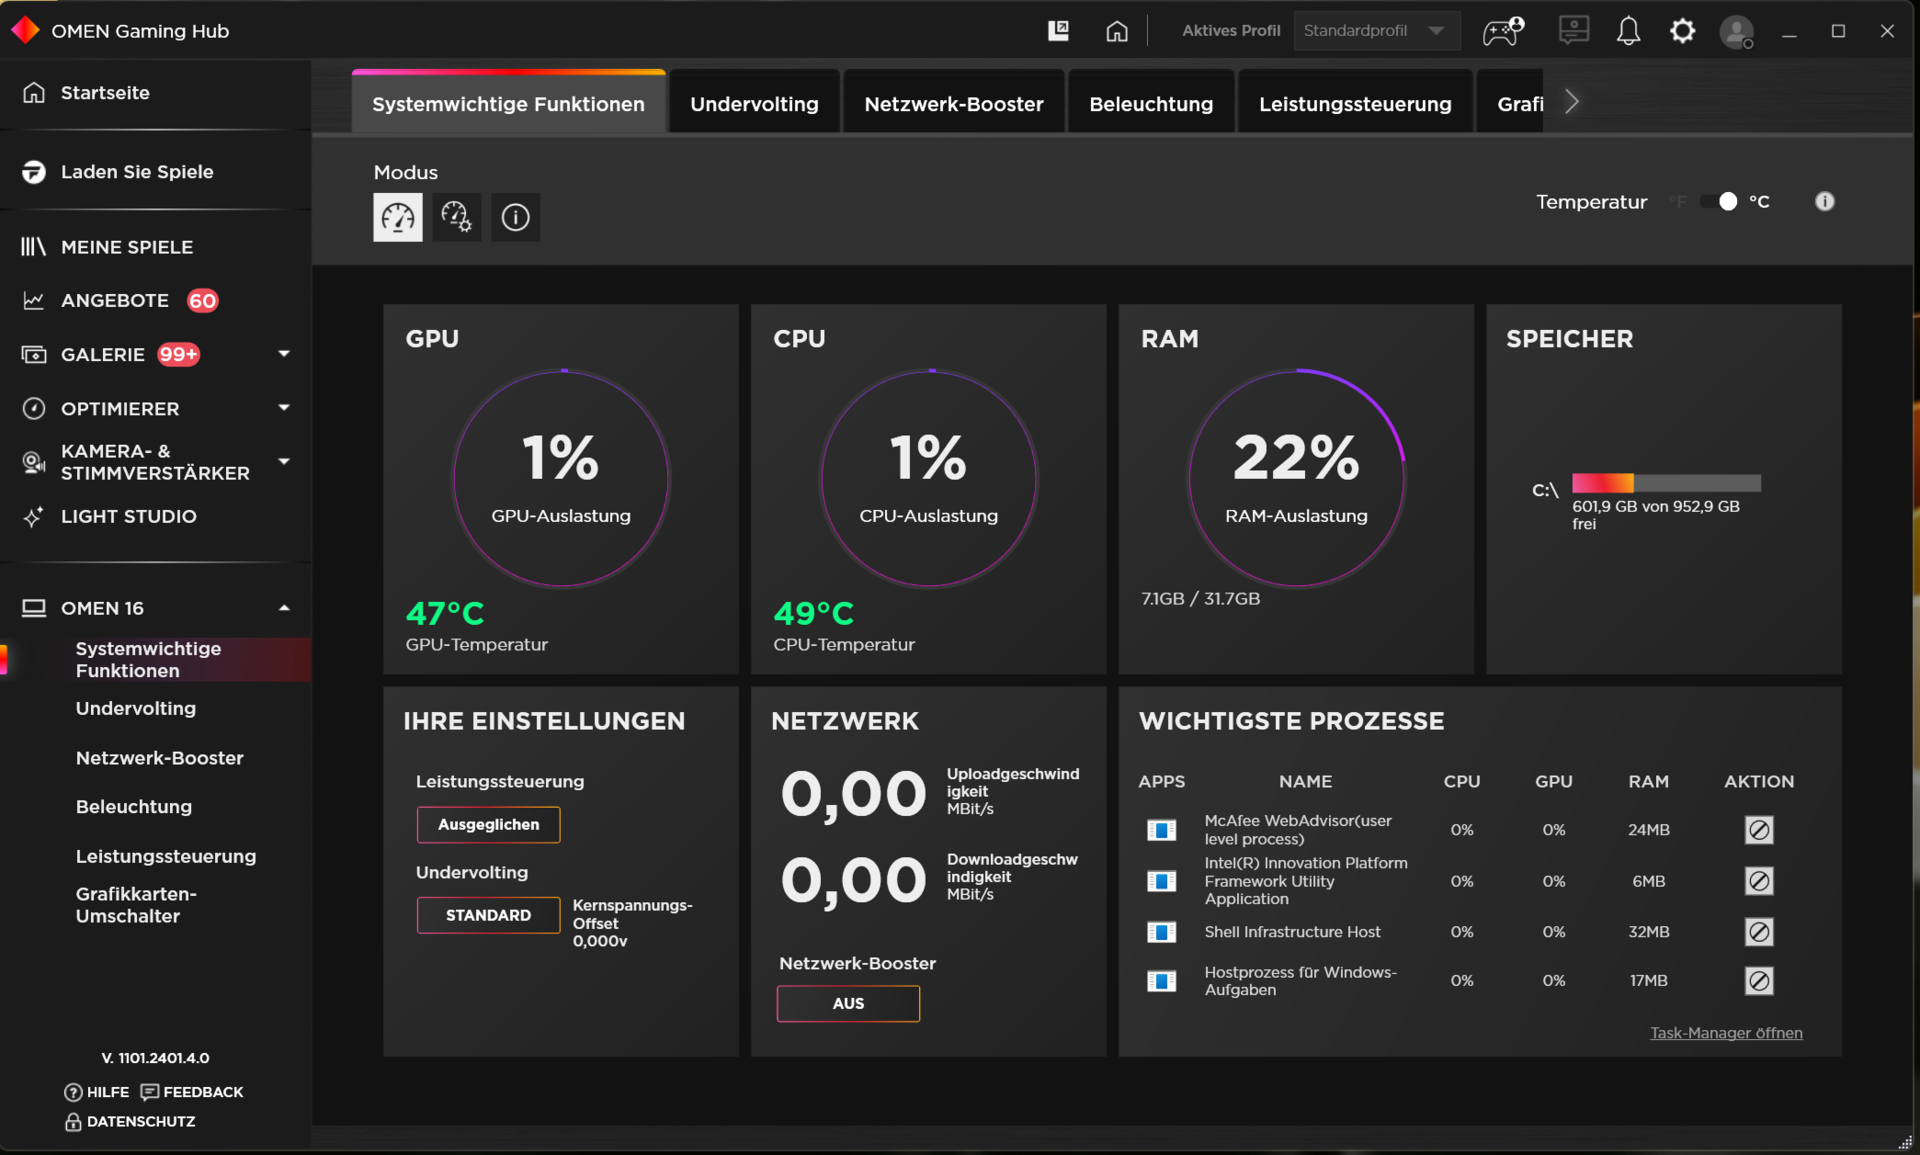
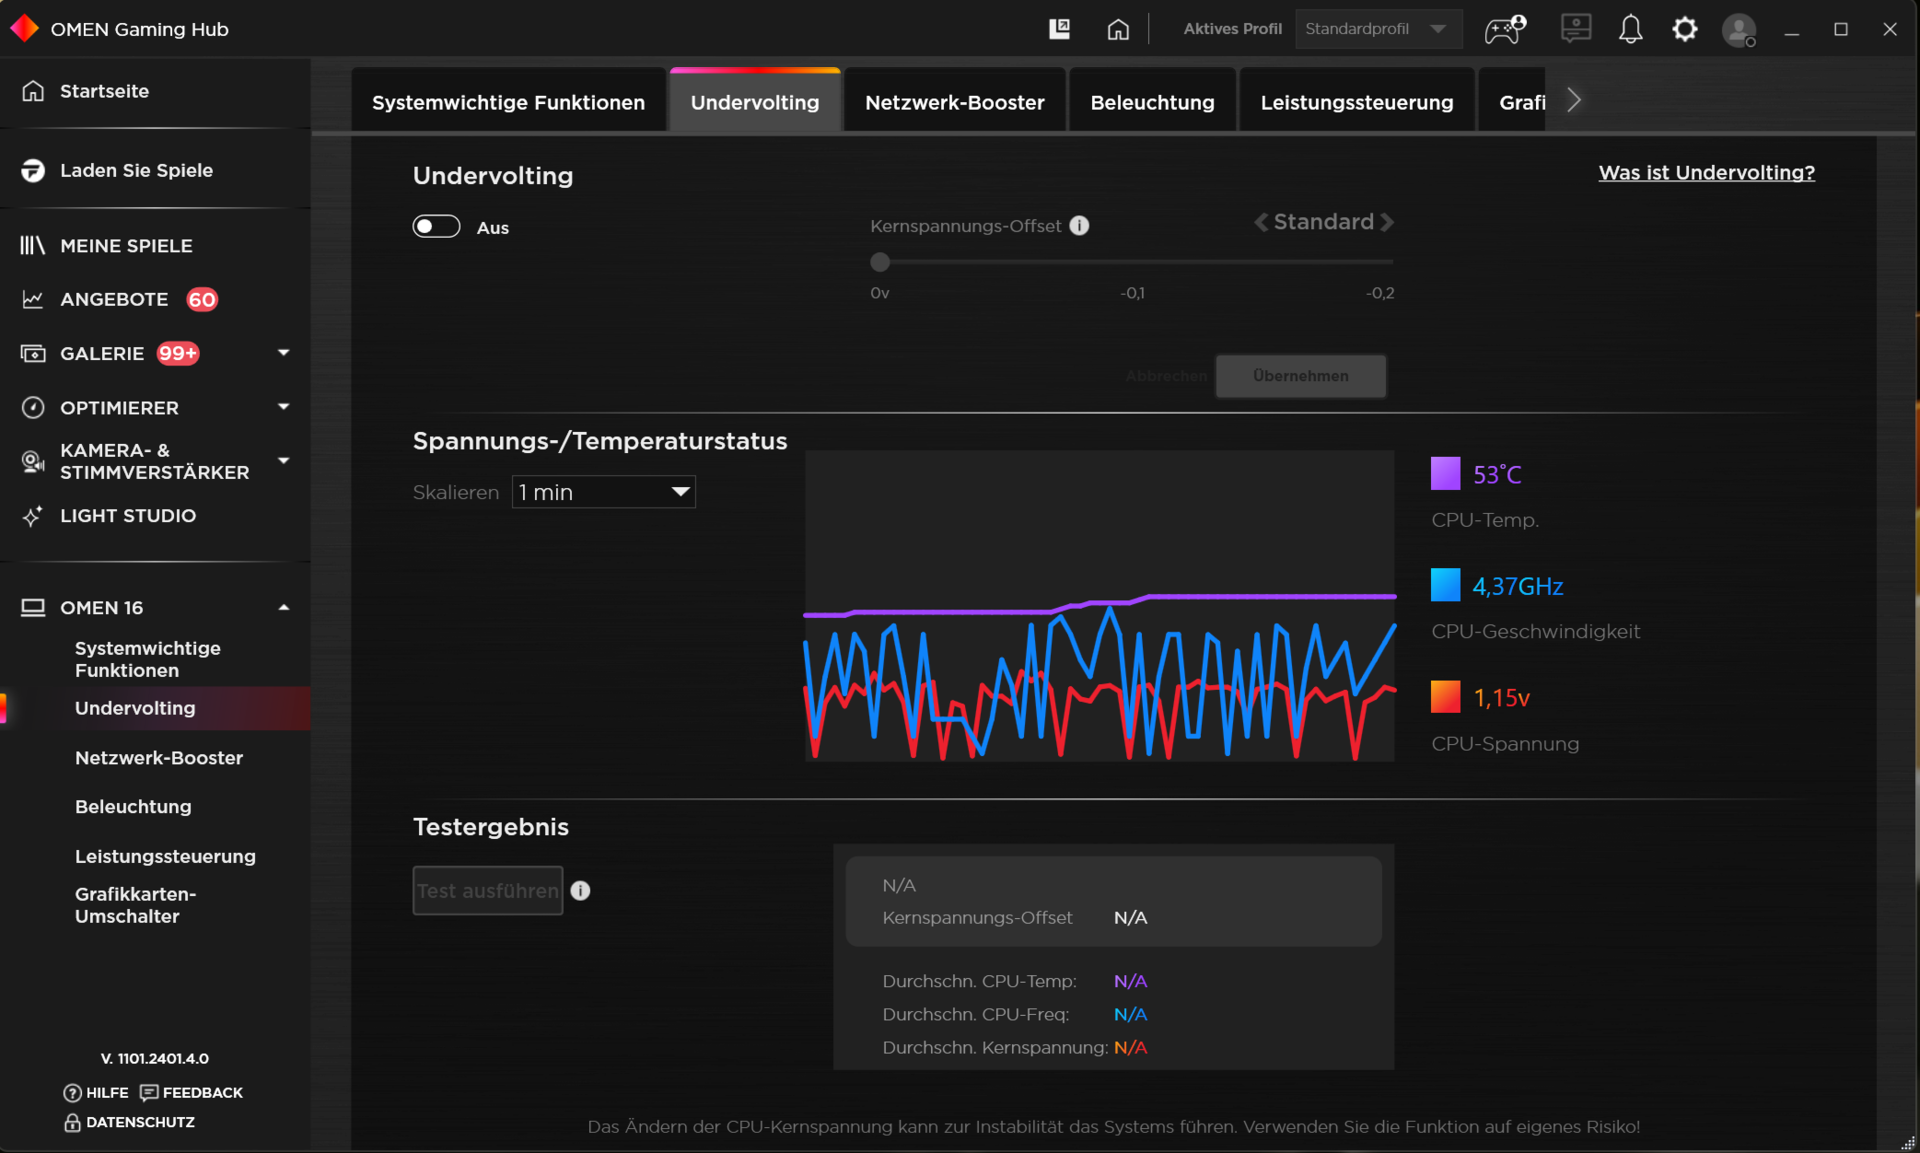
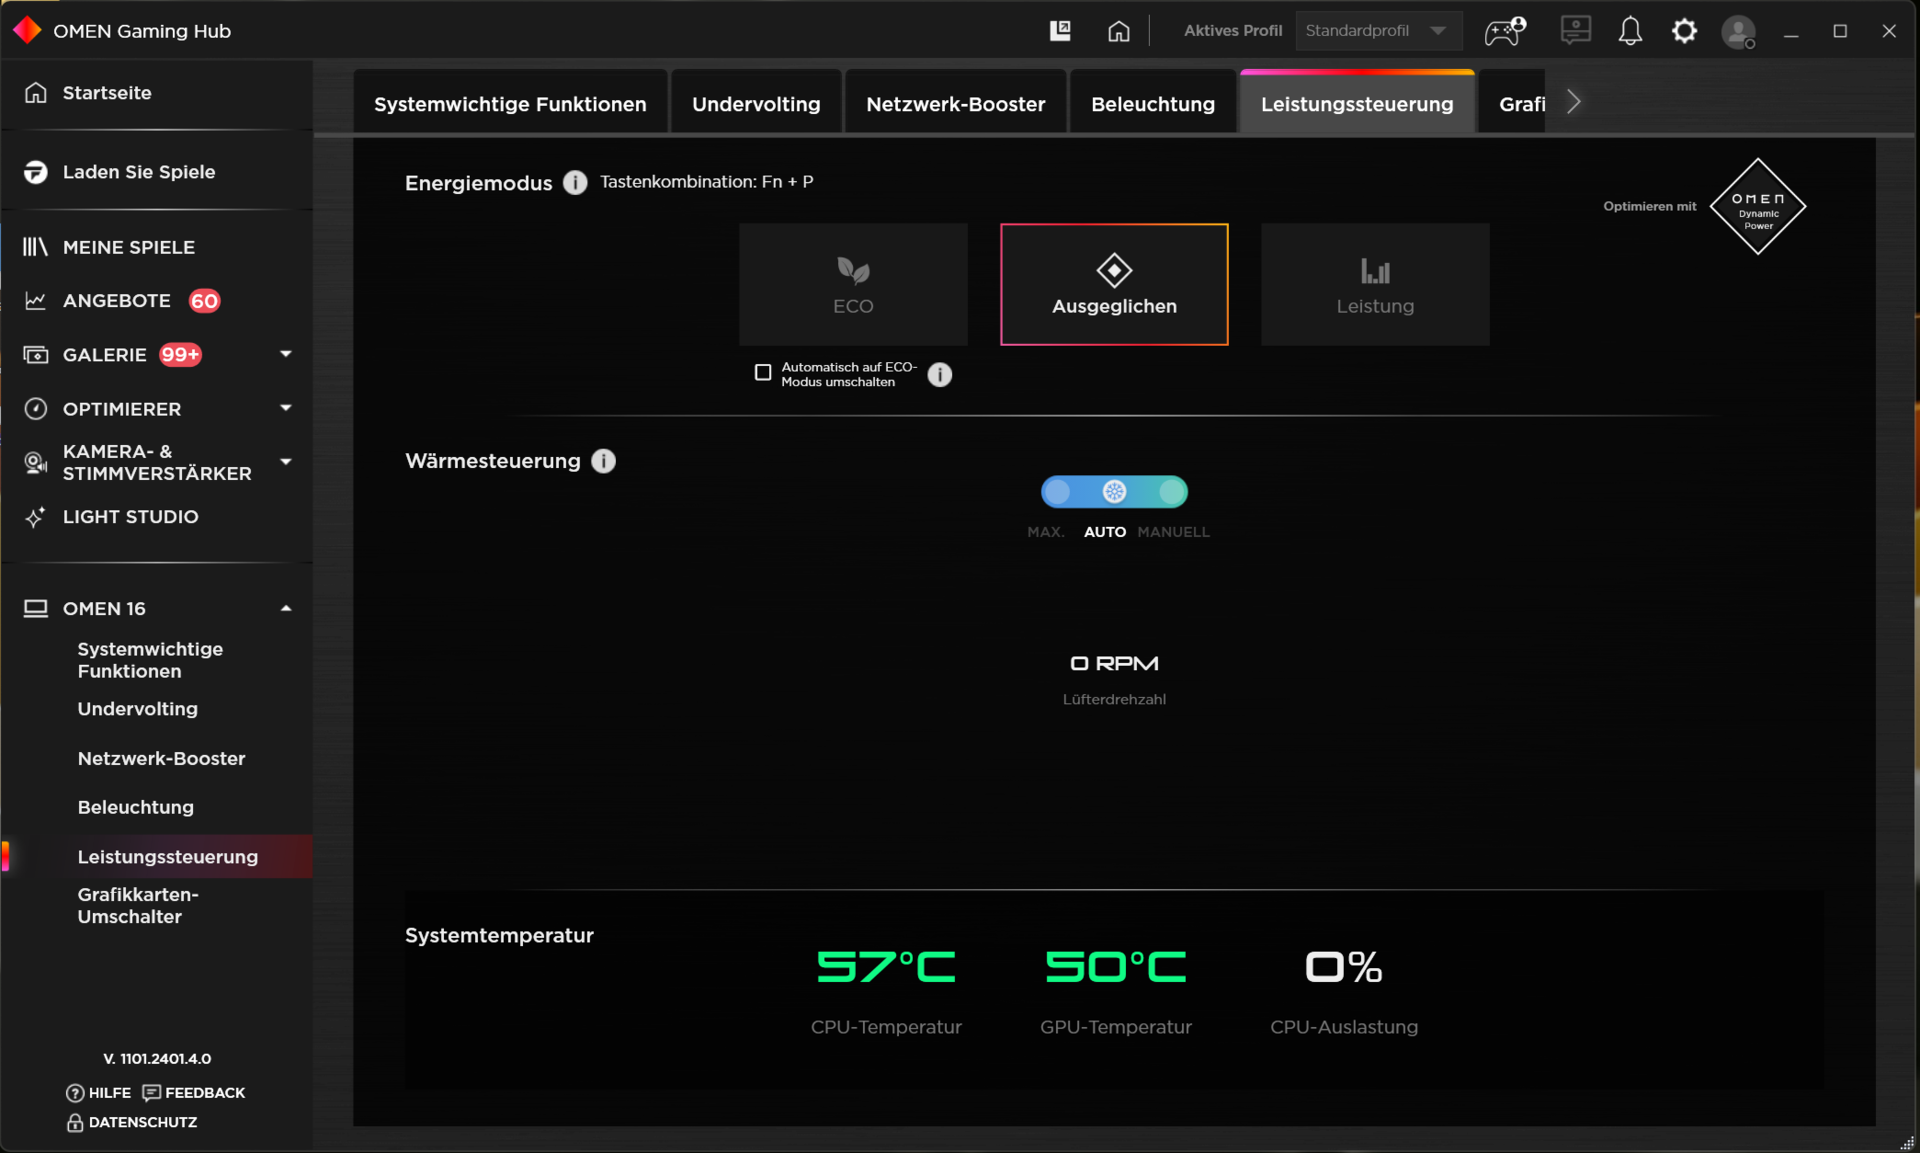
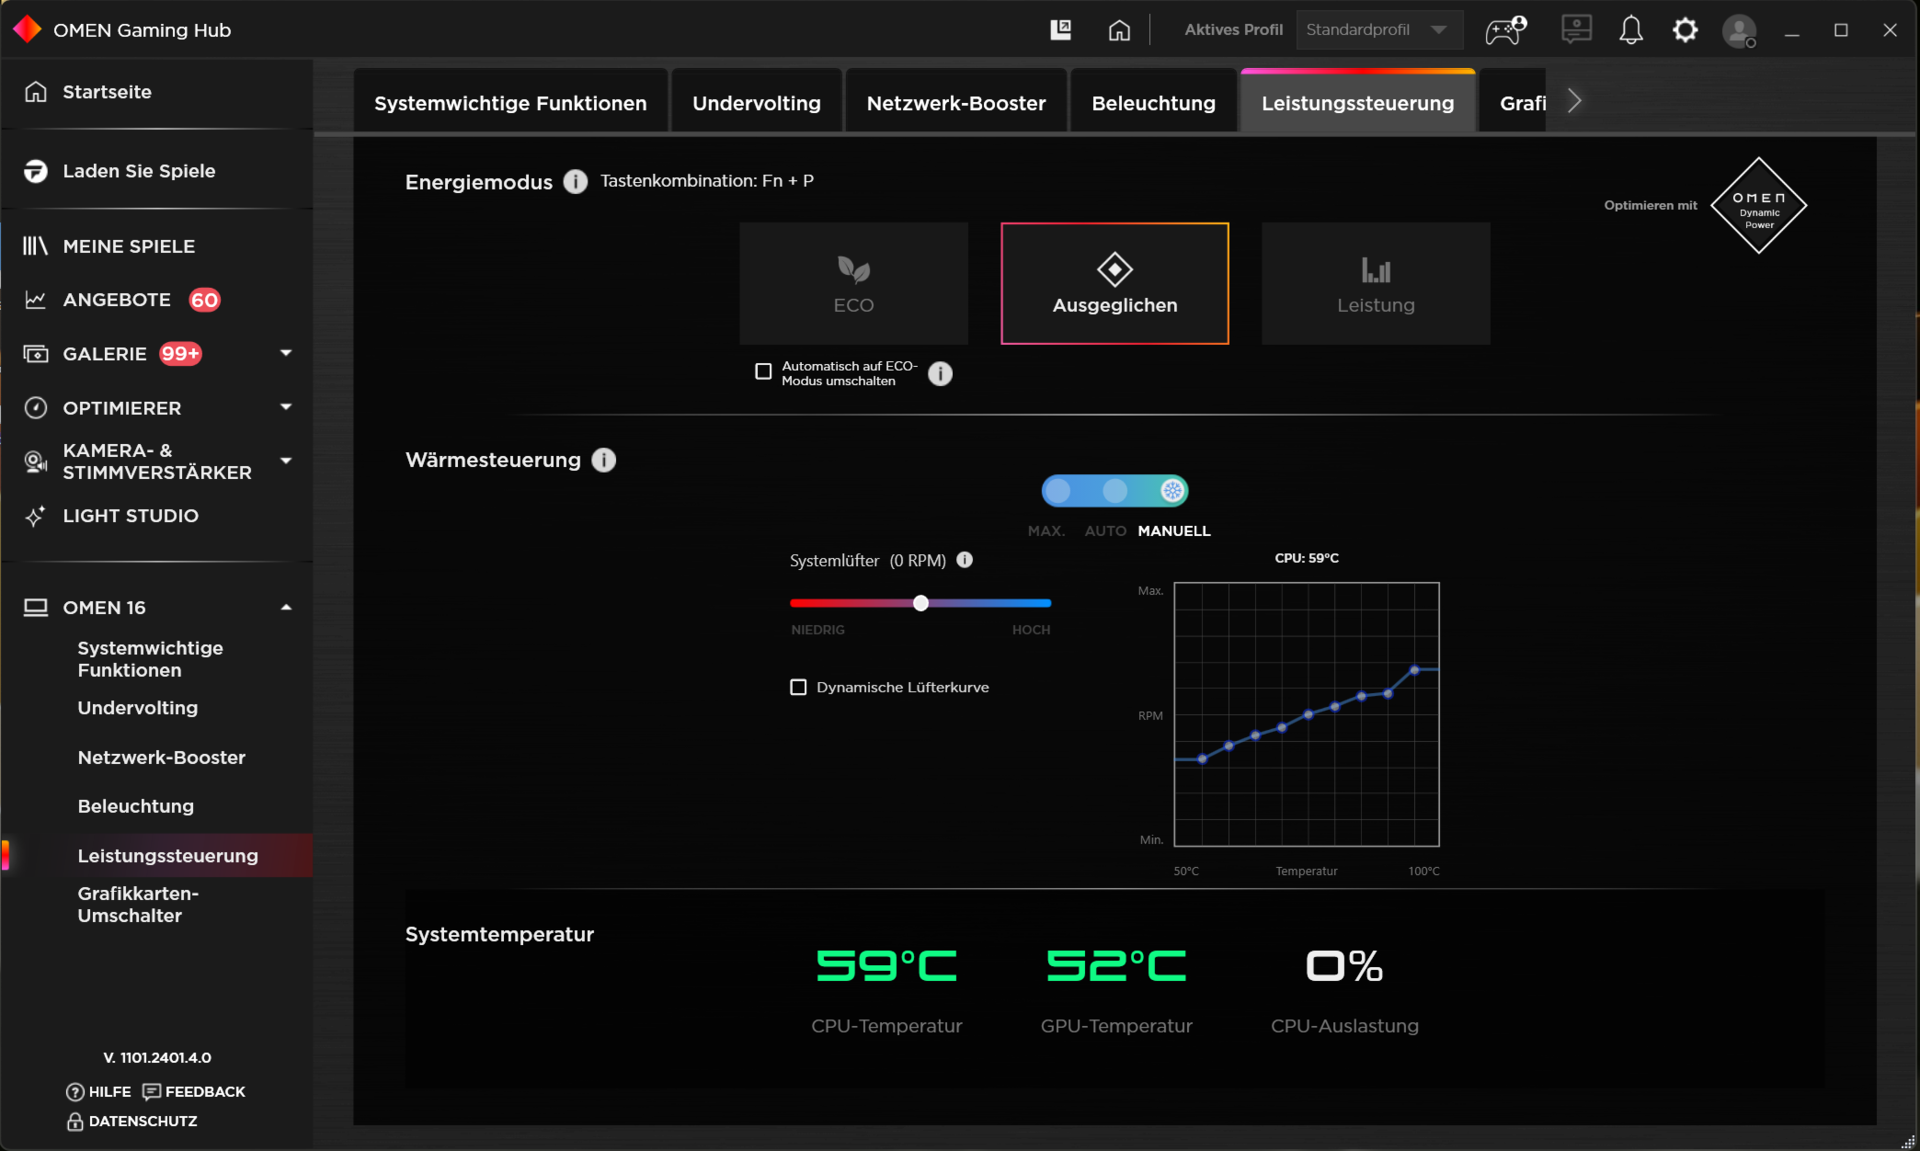
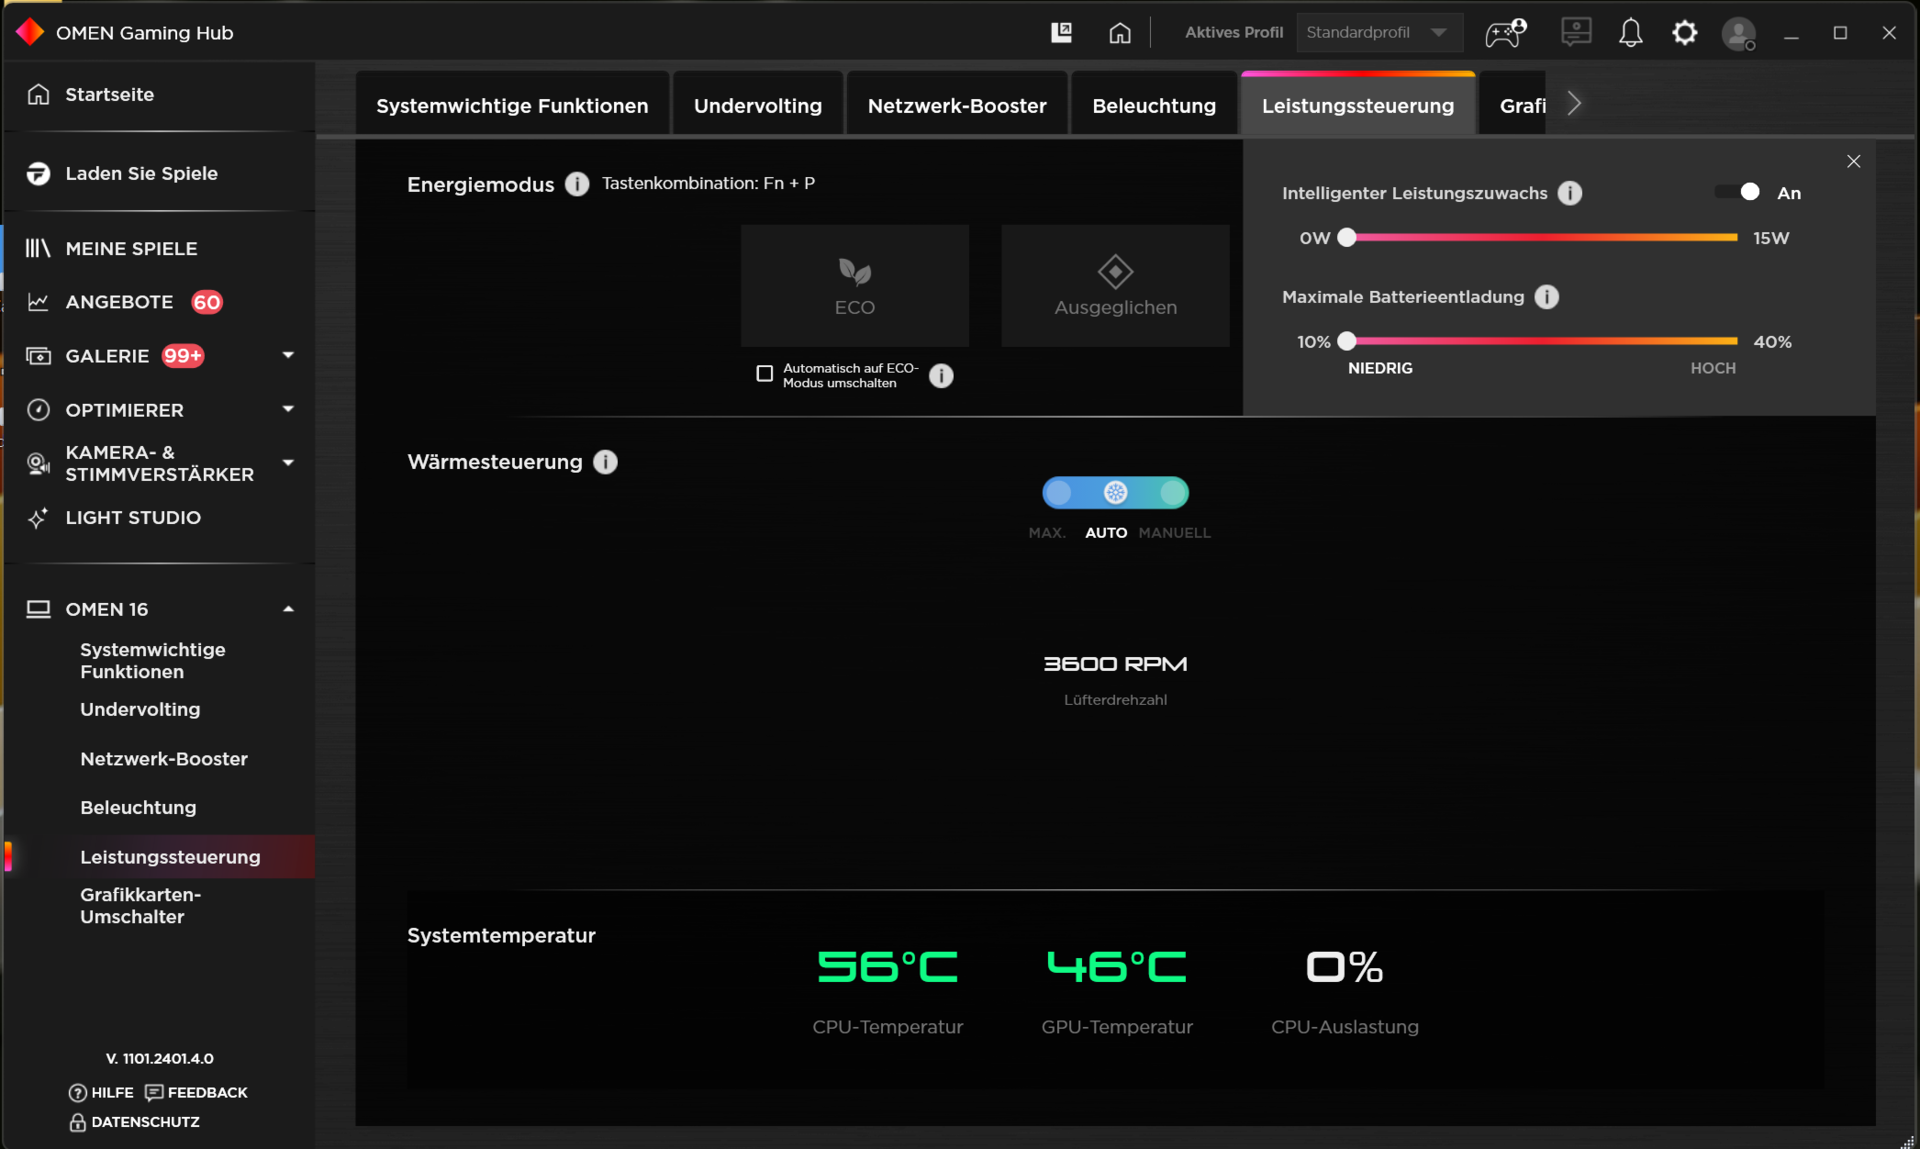
预装的 Omen Gaming Hub 是笔记本电脑的控制中心。除了选择电源模式(见表)外,您还可以使用该软件为 CPU 降压,并指定自定义风扇曲线等。按 Fn + P 组合键还可以在三种惠普专用模式之间快速切换。平衡模式和经济模式分别用于我们的基准测试和电池测试。
| 性能 | 平衡 | ECO | |
|---|---|---|---|
| 功率限制 1 (HWInfo) | 130 瓦 | 130 瓦 | 130 瓦 |
| 功率限制 2 (HWInfo) | 130 瓦 | 130 瓦 | 130 瓦 |
| 噪音 (Witcher 3) | 58 dB(A) | 47 dB(A) | 39 dB(A) |
| 性能 (Witcher 3) | ~ 164 帧/秒 | ~ 142 帧/秒 | 60 帧/秒(锁定) |
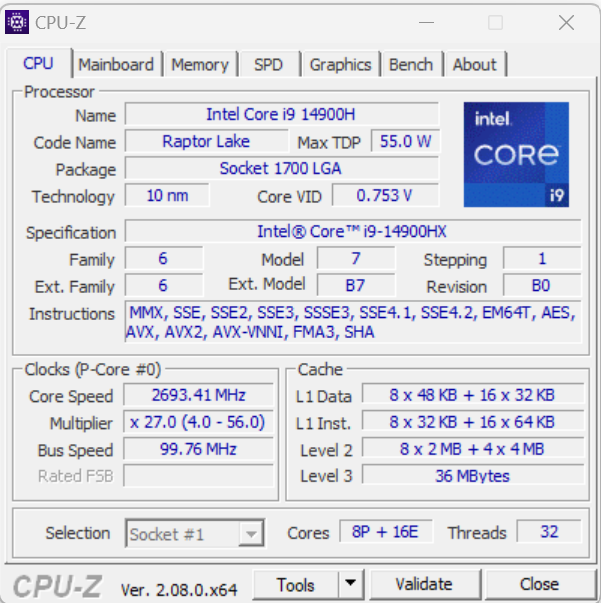
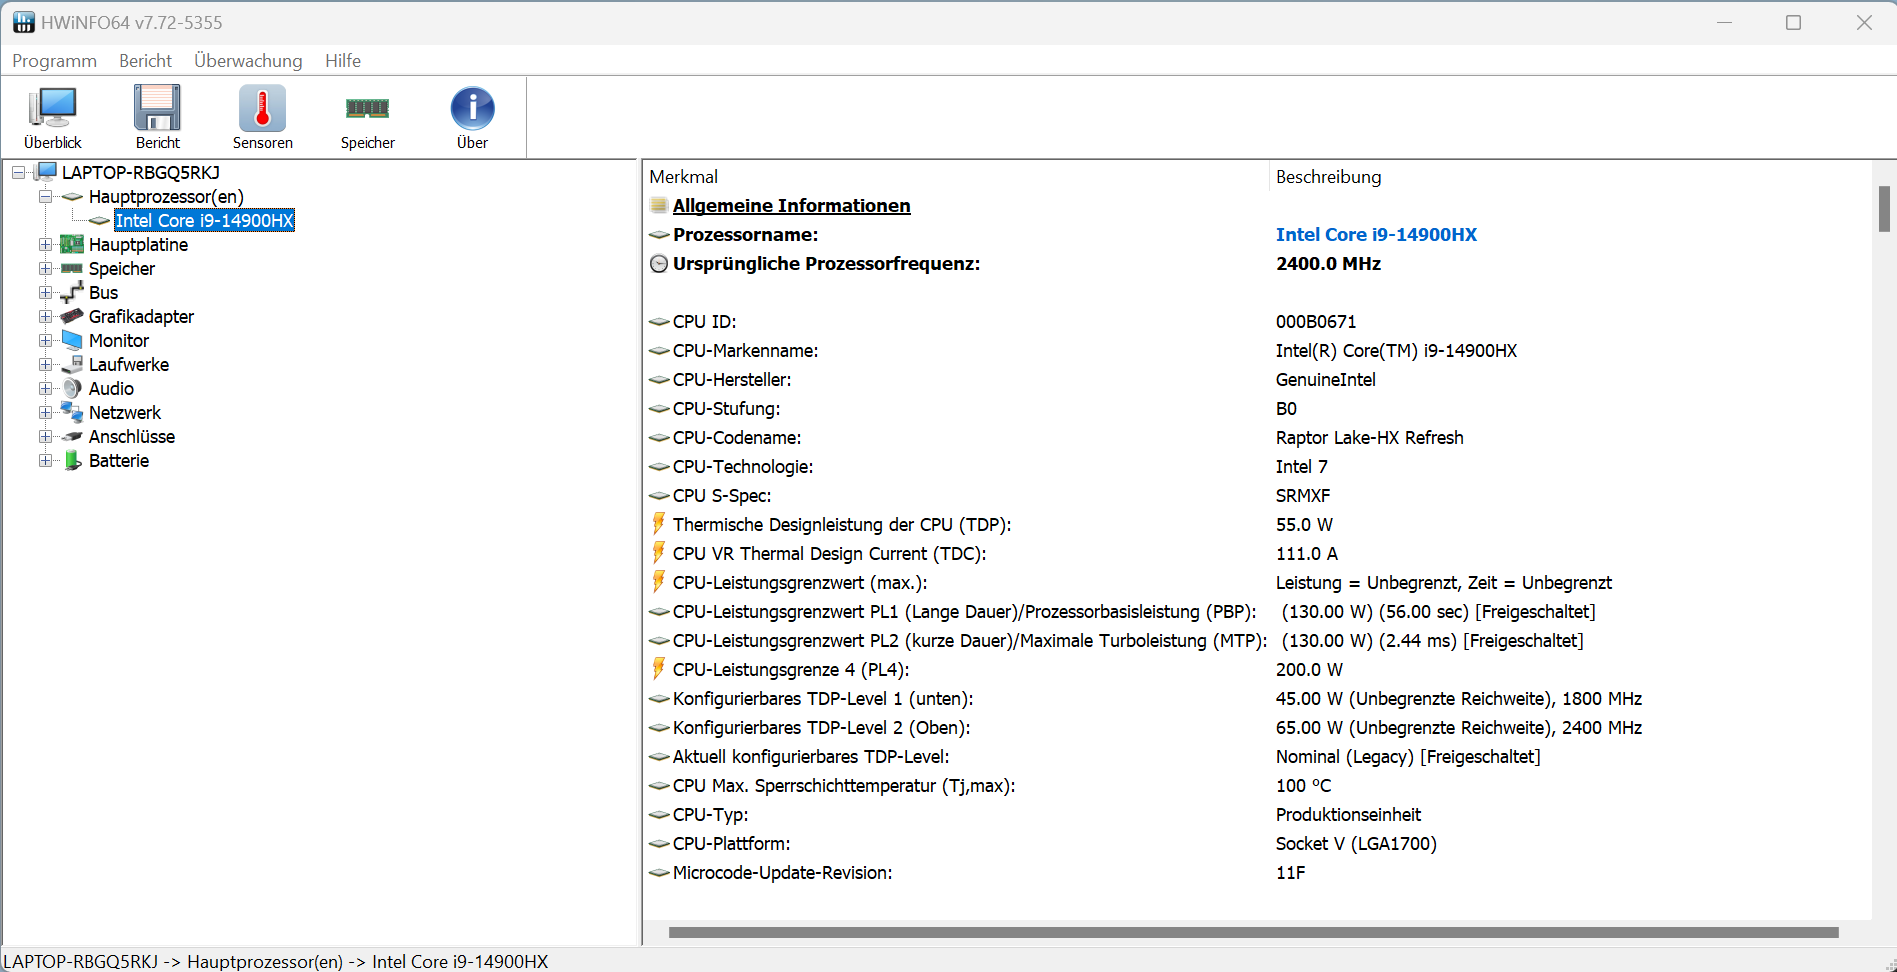
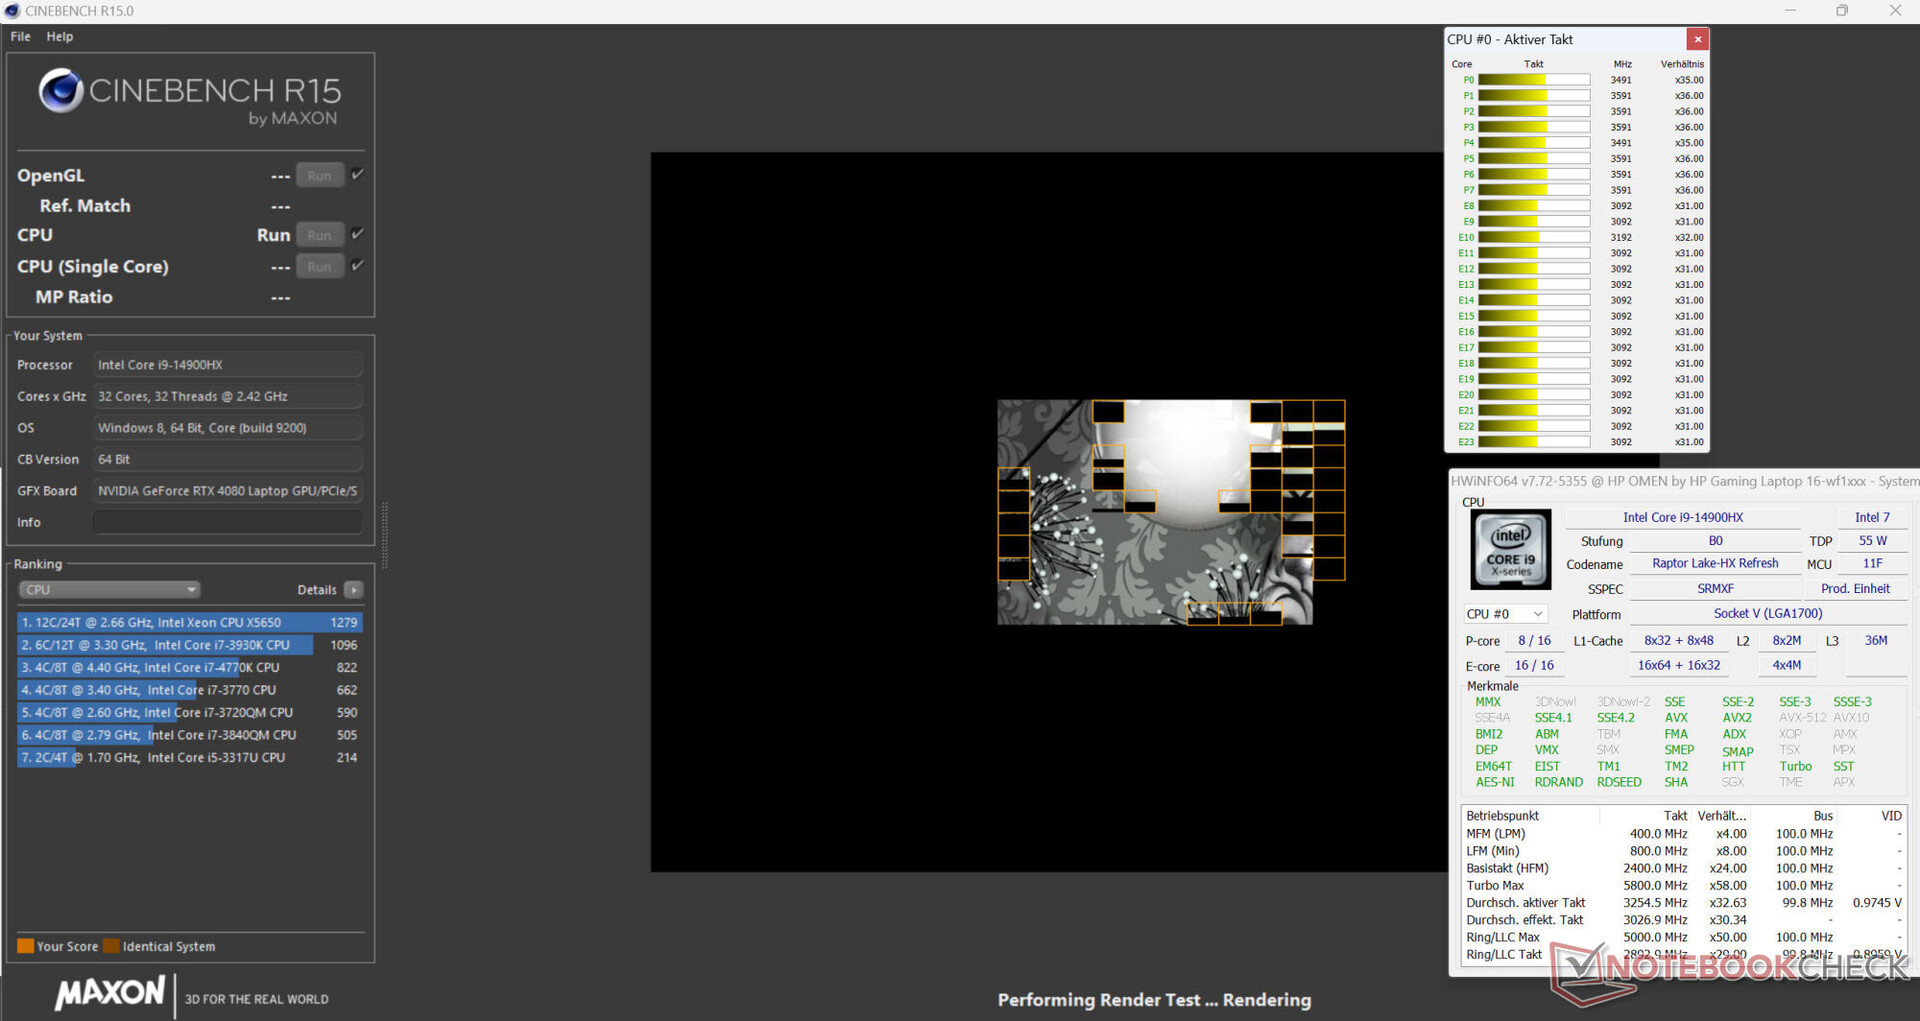
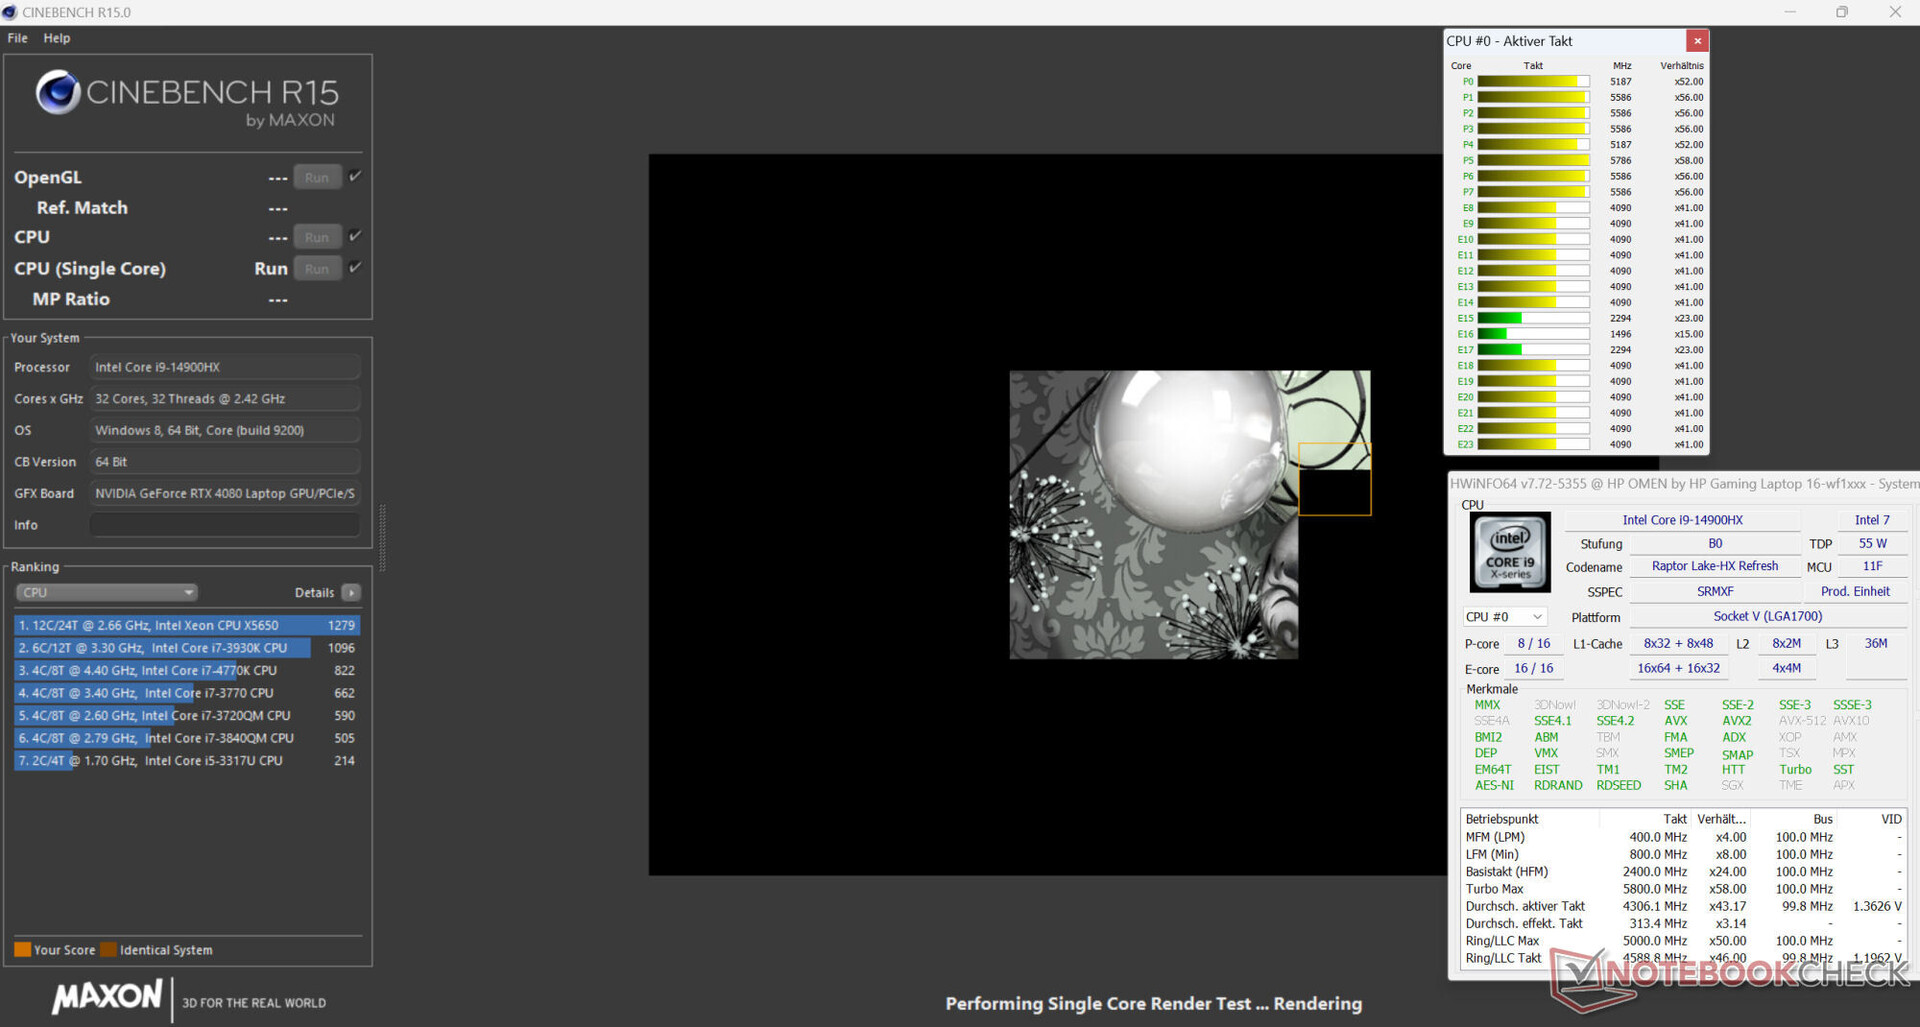
处理器
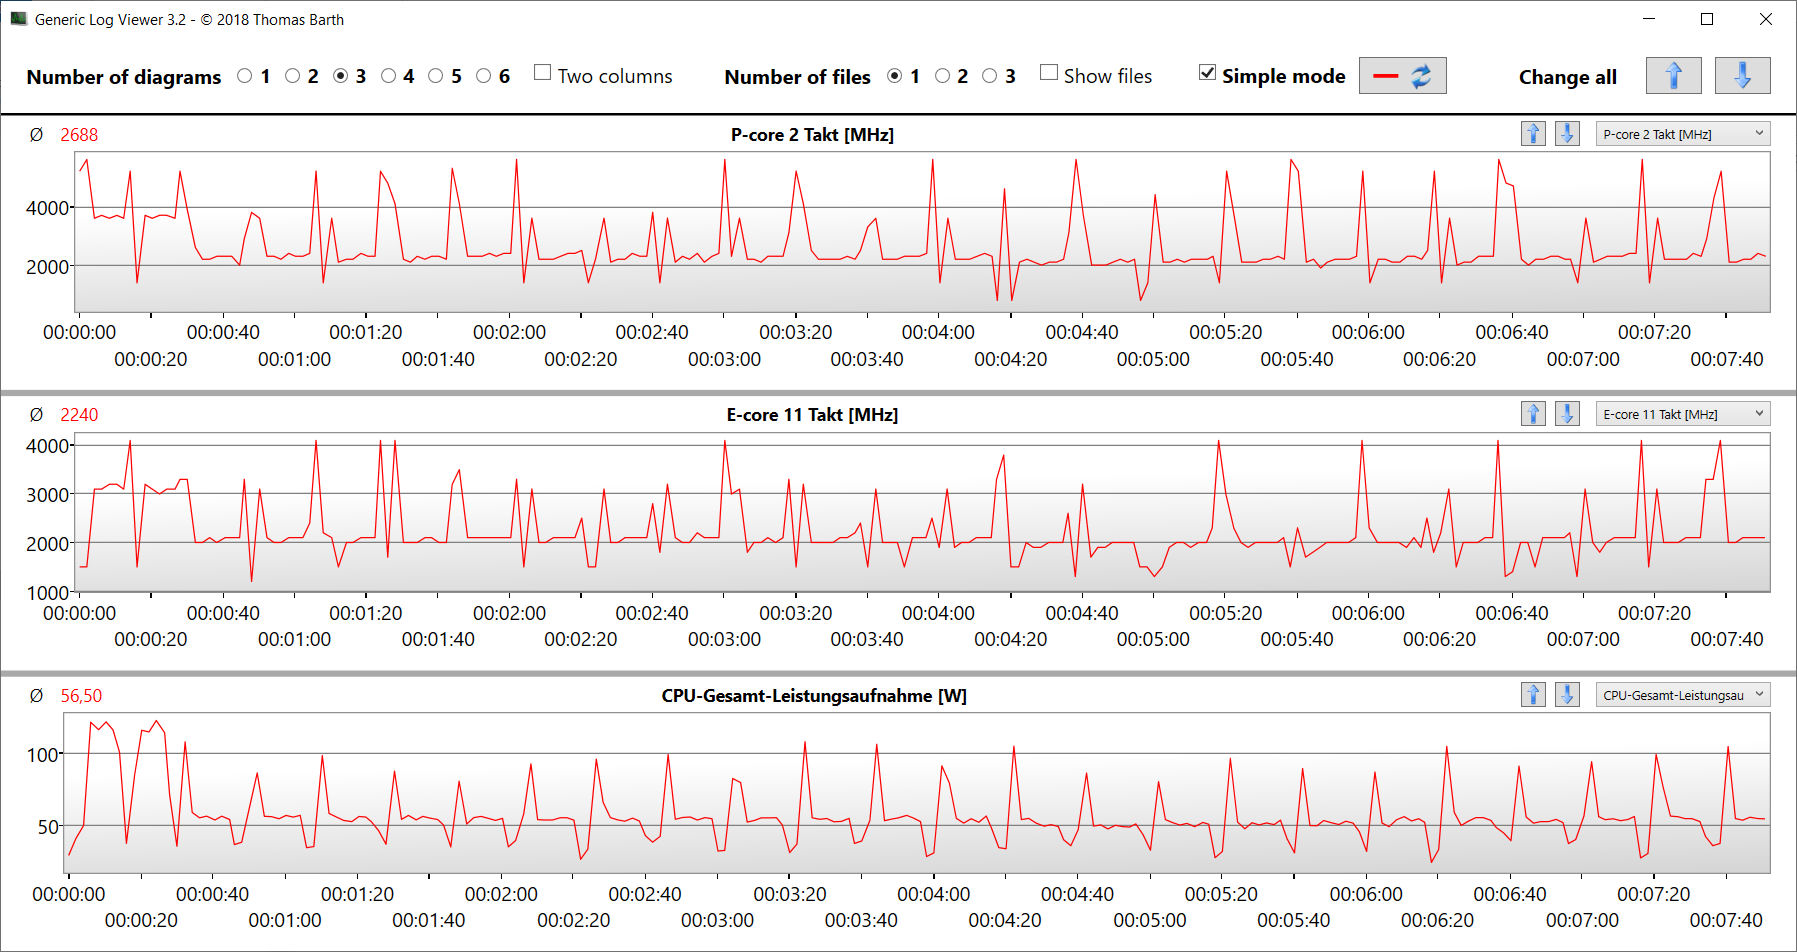
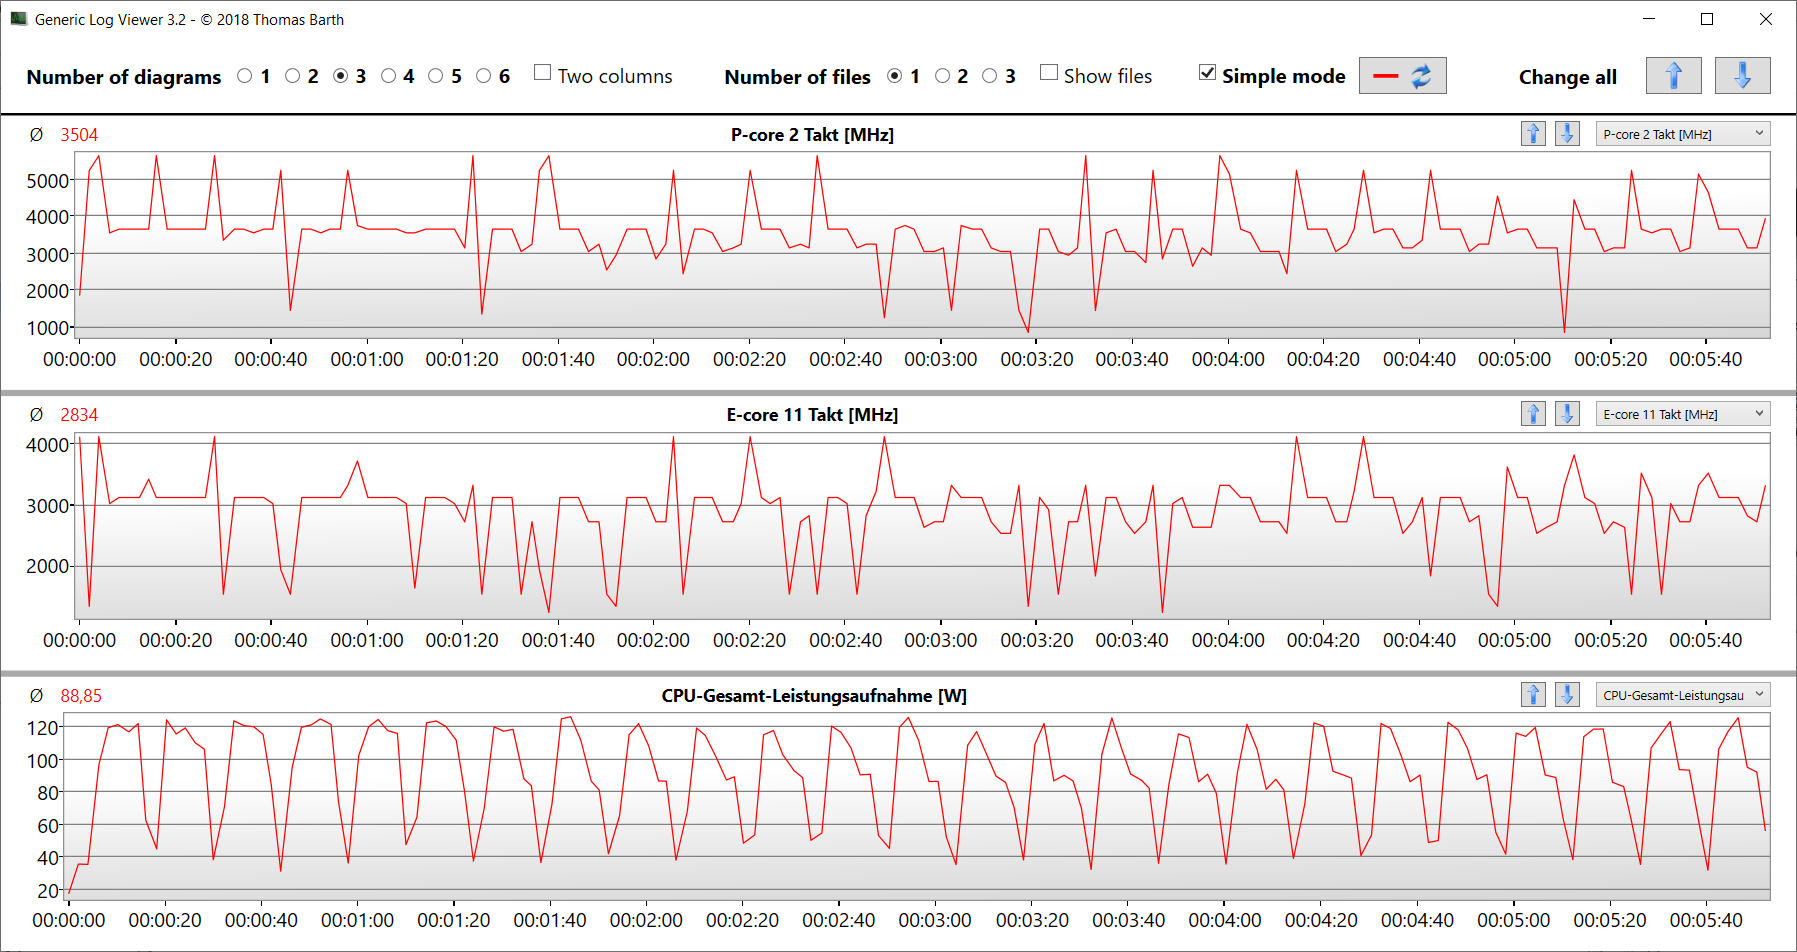
酷睿 i9-14900HX 酷睿 i9-14900HX包含 8 个 P 核和 16 个 E 核,共 32 个线程。P 核心和 E 核心的最大时钟频率分别为 5.8 GHz 和 4.1 GHz。在平衡模式下,基准测试成绩低于 CPU 的平均水平。切换到 "性能 "模式只能带来微弱的提升。
在持续多线程负载(CB15 循环)下,差距进一步拉大。在第四次运行开始时,时钟速度明显下降,然后在测试的剩余时间内保持在一个相对稳定的水平。在性能模式下,时钟速度保持在初始水平。在电池供电情况下,更相关的单线程分数(206 分;CB15)下降幅度小于多线程分数(1,596;CB15)。
请参考我们的 分析有关酷睿 i9 的更多信息。
Cinebench R15 Multi Sustained Load
| CPU Performance rating - Percent | |
| MSI Vector 16 HX A14V | |
| Acer Predator Helios 18 N23Q2 | |
| Average Intel Core i9-14900HX | |
| HP Omen 16 (2024) | |
| HP Omen 16 (2024) | |
| Alienware m16 R1 AMD | |
| Average of class Gaming | |
| HP Omen 16-wf000 -3! | |
| Cinebench R23 | |
| Multi Core | |
| MSI Vector 16 HX A14V | |
| Acer Predator Helios 18 N23Q2 | |
| Average Intel Core i9-14900HX (17078 - 36249, n=37) | |
| Alienware m16 R1 AMD | |
| Average of class Gaming (10488 - 42661, n=104, last 2 years) | |
| HP Omen 16 (2024) | |
| HP Omen 16 (2024) (Leistung) | |
| HP Omen 16-wf000 | |
| Single Core | |
| HP Omen 16 (2024) (Leistung) | |
| HP Omen 16 (2024) | |
| MSI Vector 16 HX A14V | |
| Average Intel Core i9-14900HX (1720 - 2245, n=37) | |
| Acer Predator Helios 18 N23Q2 | |
| Average of class Gaming (1601 - 2415, n=104, last 2 years) | |
| HP Omen 16-wf000 | |
| Alienware m16 R1 AMD | |
| Cinebench R20 | |
| CPU (Multi Core) | |
| MSI Vector 16 HX A14V | |
| Acer Predator Helios 18 N23Q2 | |
| Average Intel Core i9-14900HX (6579 - 13832, n=37) | |
| Alienware m16 R1 AMD | |
| Average of class Gaming (4029 - 16433, n=103, last 2 years) | |
| HP Omen 16 (2024) | |
| HP Omen 16 (2024) (Leistung) | |
| HP Omen 16-wf000 | |
| CPU (Single Core) | |
| HP Omen 16 (2024) (Leistung) | |
| HP Omen 16 (2024) | |
| MSI Vector 16 HX A14V | |
| Average Intel Core i9-14900HX (657 - 859, n=37) | |
| Acer Predator Helios 18 N23Q2 | |
| Average of class Gaming (622 - 913, n=103, last 2 years) | |
| HP Omen 16-wf000 | |
| Alienware m16 R1 AMD | |
| Cinebench R15 | |
| CPU Multi 64Bit | |
| Acer Predator Helios 18 N23Q2 | |
| MSI Vector 16 HX A14V | |
| Average Intel Core i9-14900HX (3263 - 5589, n=38) | |
| Alienware m16 R1 AMD | |
| Average of class Gaming (1578 - 6330, n=102, last 2 years) | |
| HP Omen 16 (2024) (Leistung) | |
| HP Omen 16 (2024) | |
| HP Omen 16-wf000 | |
| CPU Single 64Bit | |
| HP Omen 16 (2024) (Leistung) | |
| HP Omen 16 (2024) | |
| MSI Vector 16 HX A14V | |
| Average Intel Core i9-14900HX (247 - 323, n=37) | |
| Average of class Gaming (188.8 - 350, n=103, last 2 years) | |
| Alienware m16 R1 AMD | |
| Acer Predator Helios 18 N23Q2 | |
| HP Omen 16-wf000 | |
| Blender - v2.79 BMW27 CPU | |
| HP Omen 16 (2024) | |
| Average of class Gaming (79 - 330, n=101, last 2 years) | |
| HP Omen 16 (2024) (Leistung) | |
| Average Intel Core i9-14900HX (91 - 206, n=37) | |
| Alienware m16 R1 AMD | |
| Acer Predator Helios 18 N23Q2 | |
| MSI Vector 16 HX A14V | |
| Geekbench 6.7 | |
| Multi-Core | |
| MSI Vector 16 HX A14V (6.2.1) | |
| Acer Predator Helios 18 N23Q2 | |
| Average Intel Core i9-14900HX (13158 - 19665, n=37) | |
| HP Omen 16 (2024) (6.2.1, Leistung) | |
| HP Omen 16 (2024) (6.2.1) | |
| Average of class Gaming (6625 - 22850, n=103, last 2 years) | |
| Alienware m16 R1 AMD | |
| Single-Core | |
| HP Omen 16 (2024) (6.2.1) | |
| HP Omen 16 (2024) (6.2.1, Leistung) | |
| MSI Vector 16 HX A14V (6.2.1) | |
| Average Intel Core i9-14900HX (2419 - 3129, n=37) | |
| Acer Predator Helios 18 N23Q2 | |
| Average of class Gaming (1982 - 3259, n=103, last 2 years) | |
| Alienware m16 R1 AMD | |
| Geekbench 5.5 | |
| Multi-Core | |
| MSI Vector 16 HX A14V | |
| Acer Predator Helios 18 N23Q2 | |
| Average Intel Core i9-14900HX (8618 - 23194, n=37) | |
| HP Omen 16 (2024) (Leistung) | |
| HP Omen 16 (2024) | |
| Average of class Gaming (6460 - 28263, n=102, last 2 years) | |
| Alienware m16 R1 AMD | |
| HP Omen 16-wf000 | |
| Single-Core | |
| HP Omen 16 (2024) (Leistung) | |
| HP Omen 16 (2024) | |
| MSI Vector 16 HX A14V | |
| Average Intel Core i9-14900HX (1669 - 2210, n=37) | |
| Average of class Gaming (1403 - 2474, n=102, last 2 years) | |
| Acer Predator Helios 18 N23Q2 | |
| Alienware m16 R1 AMD | |
| HP Omen 16-wf000 | |
| HWBOT x265 Benchmark v2.2 - 4k Preset | |
| MSI Vector 16 HX A14V | |
| Acer Predator Helios 18 N23Q2 | |
| Alienware m16 R1 AMD | |
| Average Intel Core i9-14900HX (16.8 - 38.9, n=37) | |
| Average of class Gaming (11.5 - 44.4, n=102, last 2 years) | |
| HP Omen 16 (2024) (Leistung) | |
| HP Omen 16 (2024) | |
| HP Omen 16-wf000 | |
| LibreOffice - 20 Documents To PDF | |
| Average of class Gaming (33.2 - 88.8, n=102, last 2 years) | |
| Acer Predator Helios 18 N23Q2 | |
| MSI Vector 16 HX A14V (6.3.4.2) | |
| HP Omen 16-wf000 | |
| HP Omen 16 (2024) (6.3.4.2) | |
| HP Omen 16 (2024) (6.3.4.2, Leistung) | |
| Average Intel Core i9-14900HX (19 - 85.1, n=37) | |
| Alienware m16 R1 AMD | |
| R Benchmark 2.5 - Overall mean | |
| HP Omen 16-wf000 | |
| Alienware m16 R1 AMD | |
| Average of class Gaming (0.3439 - 0.59, n=102, last 2 years) | |
| Acer Predator Helios 18 N23Q2 | |
| Average Intel Core i9-14900HX (0.3604 - 0.4859, n=37) | |
| MSI Vector 16 HX A14V | |
| HP Omen 16 (2024) (Leistung) | |
| HP Omen 16 (2024) | |
* ... smaller is better
AIDA64: FP32 Ray-Trace | FPU Julia | CPU SHA3 | CPU Queen | FPU SinJulia | FPU Mandel | CPU AES | CPU ZLib | FP64 Ray-Trace | CPU PhotoWorxx
| Performance rating | |
| Alienware m16 R1 AMD | |
| Acer Predator Helios 18 N23Q2 | |
| MSI Vector 16 HX A14V | |
| Average of class Gaming | |
| Average Intel Core i9-14900HX | |
| HP Omen 16 (2024) | |
| HP Omen 16 (2024) | |
| HP Omen 16-wf000 | |
| AIDA64 / FP32 Ray-Trace | |
| Alienware m16 R1 AMD (v6.85.6300) | |
| Average of class Gaming (10227 - 85542, n=102, last 2 years) | |
| MSI Vector 16 HX A14V (v6.92.6600) | |
| Acer Predator Helios 18 N23Q2 (v6.85.6300) | |
| Average Intel Core i9-14900HX (13098 - 33474, n=36) | |
| HP Omen 16 (2024) (v6.92.6600, Leistung) | |
| HP Omen 16-wf000 (v6.85.6300) | |
| HP Omen 16 (2024) (v6.92.6600) | |
| AIDA64 / FPU Julia | |
| Alienware m16 R1 AMD (v6.85.6300) | |
| MSI Vector 16 HX A14V (v6.92.6600) | |
| Average of class Gaming (51376 - 372155, n=102, last 2 years) | |
| Acer Predator Helios 18 N23Q2 (v6.85.6300) | |
| Average Intel Core i9-14900HX (67573 - 166040, n=36) | |
| HP Omen 16 (2024) (v6.92.6600, Leistung) | |
| HP Omen 16-wf000 (v6.85.6300) | |
| HP Omen 16 (2024) (v6.92.6600) | |
| AIDA64 / CPU SHA3 | |
| Alienware m16 R1 AMD (v6.85.6300) | |
| MSI Vector 16 HX A14V (v6.92.6600) | |
| Acer Predator Helios 18 N23Q2 (v6.85.6300) | |
| Average of class Gaming (2180 - 10115, n=102, last 2 years) | |
| Average Intel Core i9-14900HX (3589 - 7979, n=36) | |
| HP Omen 16 (2024) (v6.92.6600, Leistung) | |
| HP Omen 16 (2024) (v6.92.6600) | |
| HP Omen 16-wf000 (v6.85.6300) | |
| AIDA64 / CPU Queen | |
| Alienware m16 R1 AMD (v6.85.6300) | |
| MSI Vector 16 HX A14V (v6.92.6600) | |
| Average Intel Core i9-14900HX (118405 - 148966, n=36) | |
| Acer Predator Helios 18 N23Q2 (v6.85.6300) | |
| HP Omen 16 (2024) (v6.92.6600) | |
| HP Omen 16 (2024) (v6.92.6600, Leistung) | |
| Average of class Gaming (49785 - 173351, n=86, last 2 years) | |
| HP Omen 16-wf000 (v6.85.6300) | |
| AIDA64 / FPU SinJulia | |
| Alienware m16 R1 AMD (v6.85.6300) | |
| MSI Vector 16 HX A14V (v6.92.6600) | |
| Acer Predator Helios 18 N23Q2 (v6.85.6300) | |
| Average Intel Core i9-14900HX (10475 - 18517, n=36) | |
| Average of class Gaming (4424 - 33636, n=102, last 2 years) | |
| HP Omen 16 (2024) (v6.92.6600, Leistung) | |
| HP Omen 16 (2024) (v6.92.6600) | |
| HP Omen 16-wf000 (v6.85.6300) | |
| AIDA64 / FPU Mandel | |
| Alienware m16 R1 AMD (v6.85.6300) | |
| Average of class Gaming (25115 - 196829, n=102, last 2 years) | |
| MSI Vector 16 HX A14V (v6.92.6600) | |
| Acer Predator Helios 18 N23Q2 (v6.85.6300) | |
| Average Intel Core i9-14900HX (32543 - 83662, n=36) | |
| HP Omen 16 (2024) (v6.92.6600, Leistung) | |
| HP Omen 16-wf000 (v6.85.6300) | |
| HP Omen 16 (2024) (v6.92.6600) | |
| AIDA64 / CPU AES | |
| Acer Predator Helios 18 N23Q2 (v6.85.6300) | |
| Average Intel Core i9-14900HX (86964 - 241777, n=36) | |
| MSI Vector 16 HX A14V (v6.92.6600) | |
| HP Omen 16 (2024) (v6.92.6600, Leistung) | |
| Average of class Gaming (39258 - 247074, n=102, last 2 years) | |
| Alienware m16 R1 AMD (v6.85.6300) | |
| HP Omen 16-wf000 (v6.85.6300) | |
| HP Omen 16 (2024) (v6.92.6600) | |
| AIDA64 / CPU ZLib | |
| MSI Vector 16 HX A14V (v6.92.6600) | |
| Acer Predator Helios 18 N23Q2 (v6.85.6300) | |
| Average Intel Core i9-14900HX (1054 - 2292, n=36) | |
| Alienware m16 R1 AMD (v6.85.6300) | |
| HP Omen 16 (2024) (v6.92.6600, Leistung) | |
| Average of class Gaming (574 - 2531, n=102, last 2 years) | |
| HP Omen 16-wf000 (v6.85.6300) | |
| HP Omen 16 (2024) (v6.92.6600) | |
| AIDA64 / FP64 Ray-Trace | |
| Alienware m16 R1 AMD (v6.85.6300) | |
| Average of class Gaming (5509 - 45446, n=102, last 2 years) | |
| MSI Vector 16 HX A14V (v6.92.6600) | |
| Acer Predator Helios 18 N23Q2 (v6.85.6300) | |
| Average Intel Core i9-14900HX (6809 - 18349, n=36) | |
| HP Omen 16 (2024) (v6.92.6600, Leistung) | |
| HP Omen 16-wf000 (v6.85.6300) | |
| HP Omen 16 (2024) (v6.92.6600) | |
| AIDA64 / CPU PhotoWorxx | |
| Acer Predator Helios 18 N23Q2 (v6.85.6300) | |
| HP Omen 16 (2024) (v6.92.6600, Leistung) | |
| HP Omen 16 (2024) (v6.92.6600) | |
| MSI Vector 16 HX A14V (v6.92.6600) | |
| Average Intel Core i9-14900HX (23903 - 54702, n=36) | |
| Average of class Gaming (12271 - 89891, n=102, last 2 years) | |
| HP Omen 16-wf000 (v6.85.6300) | |
| Alienware m16 R1 AMD (v6.85.6300) | |
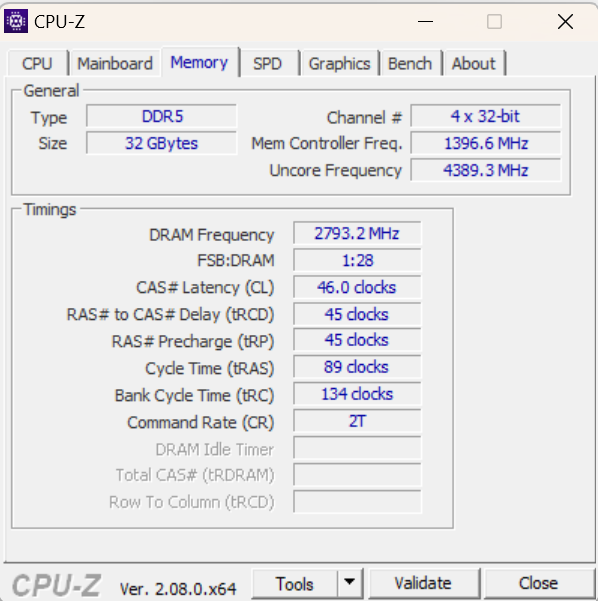
系统性能
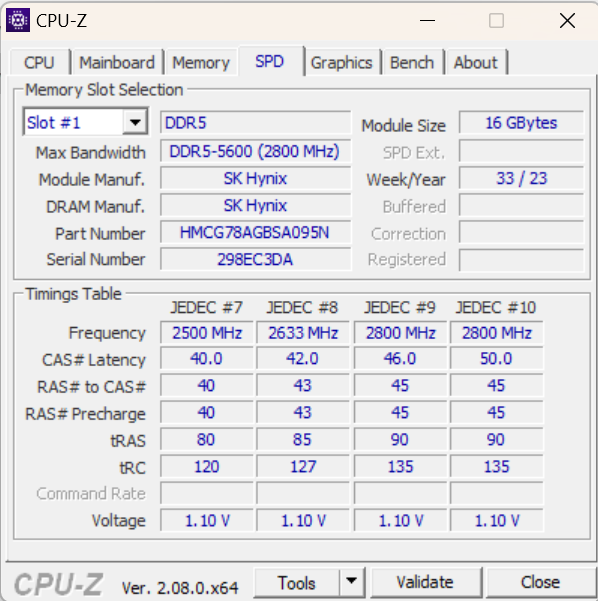
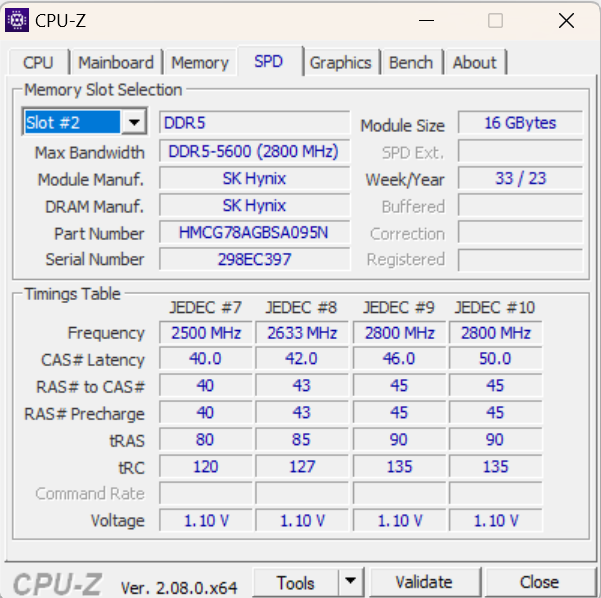
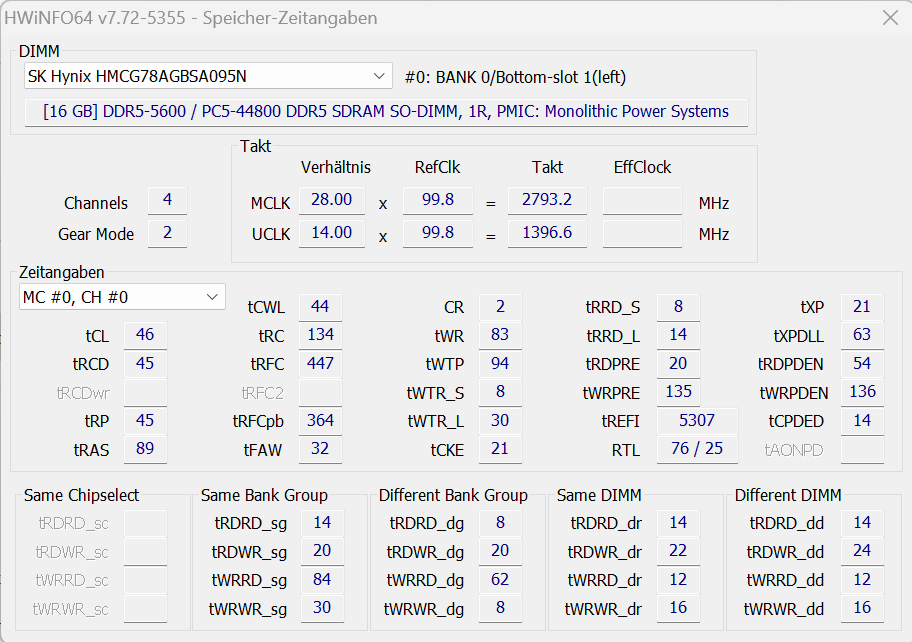
迅捷的系统具有强大的处理能力。硬件能够毫不费力地处理游戏和渲染等工作。内存的传输速度达到了 DDR5-5600 内存的典型水平。
CrossMark: Overall | Productivity | Creativity | Responsiveness
WebXPRT 3: Overall
WebXPRT 4: Overall
Mozilla Kraken 1.1: Total
| PCMark 10 / Score | |
| HP Omen 16 (2024) | |
| Alienware m16 R1 AMD | |
| Average Intel Core i9-14900HX, NVIDIA GeForce RTX 4080 Laptop GPU (7703 - 9223, n=7) | |
| MSI Vector 16 HX A14V | |
| Acer Predator Helios 18 N23Q2 | |
| Average of class Gaming (5828 - 12414, n=93, last 2 years) | |
| HP Omen 16-wf000 | |
| PCMark 10 / Essentials | |
| Average Intel Core i9-14900HX, NVIDIA GeForce RTX 4080 Laptop GPU (11255 - 12600, n=7) | |
| Alienware m16 R1 AMD | |
| MSI Vector 16 HX A14V | |
| HP Omen 16 (2024) | |
| Acer Predator Helios 18 N23Q2 | |
| Average of class Gaming (8810 - 11935, n=97, last 2 years) | |
| HP Omen 16-wf000 | |
| PCMark 10 / Productivity | |
| HP Omen 16 (2024) | |
| Average of class Gaming (6845 - 25323, n=95, last 2 years) | |
| Acer Predator Helios 18 N23Q2 | |
| Alienware m16 R1 AMD | |
| Average Intel Core i9-14900HX, NVIDIA GeForce RTX 4080 Laptop GPU (6662 - 11410, n=7) | |
| MSI Vector 16 HX A14V | |
| HP Omen 16-wf000 | |
| PCMark 10 / Digital Content Creation | |
| MSI Vector 16 HX A14V | |
| Alienware m16 R1 AMD | |
| Average Intel Core i9-14900HX, NVIDIA GeForce RTX 4080 Laptop GPU (14211 - 16246, n=7) | |
| HP Omen 16 (2024) | |
| Acer Predator Helios 18 N23Q2 | |
| Average of class Gaming (7602 - 19954, n=95, last 2 years) | |
| HP Omen 16-wf000 | |
| CrossMark / Overall | |
| HP Omen 16 (2024) | |
| Acer Predator Helios 18 N23Q2 | |
| MSI Vector 16 HX A14V | |
| Average Intel Core i9-14900HX, NVIDIA GeForce RTX 4080 Laptop GPU (1992 - 2334, n=7) | |
| Alienware m16 R1 AMD | |
| Average of class Gaming (1366 - 2409, n=94, last 2 years) | |
| HP Omen 16-wf000 | |
| CrossMark / Productivity | |
| HP Omen 16 (2024) | |
| Acer Predator Helios 18 N23Q2 | |
| MSI Vector 16 HX A14V | |
| Average Intel Core i9-14900HX, NVIDIA GeForce RTX 4080 Laptop GPU (1812 - 2204, n=7) | |
| Alienware m16 R1 AMD | |
| Average of class Gaming (1386 - 2254, n=94, last 2 years) | |
| HP Omen 16-wf000 | |
| CrossMark / Creativity | |
| MSI Vector 16 HX A14V | |
| Acer Predator Helios 18 N23Q2 | |
| Average Intel Core i9-14900HX, NVIDIA GeForce RTX 4080 Laptop GPU (2327 - 2500, n=7) | |
| HP Omen 16 (2024) | |
| Average of class Gaming (1343 - 2786, n=94, last 2 years) | |
| Alienware m16 R1 AMD | |
| HP Omen 16-wf000 | |
| CrossMark / Responsiveness | |
| HP Omen 16 (2024) | |
| Acer Predator Helios 18 N23Q2 | |
| MSI Vector 16 HX A14V | |
| Average Intel Core i9-14900HX, NVIDIA GeForce RTX 4080 Laptop GPU (1520 - 2254, n=7) | |
| Alienware m16 R1 AMD | |
| Average of class Gaming (1226 - 2334, n=94, last 2 years) | |
| HP Omen 16-wf000 | |
| WebXPRT 3 / Overall | |
| Alienware m16 R1 AMD | |
| Average Intel Core i9-14900HX, NVIDIA GeForce RTX 4080 Laptop GPU (310 - 345, n=7) | |
| HP Omen 16 (2024) | |
| MSI Vector 16 HX A14V | |
| Acer Predator Helios 18 N23Q2 | |
| Average of class Gaming (220 - 532, n=98, last 2 years) | |
| HP Omen 16-wf000 | |
| WebXPRT 4 / Overall | |
| Average Intel Core i9-14900HX, NVIDIA GeForce RTX 4080 Laptop GPU (300 - 321, n=7) | |
| HP Omen 16 (2024) | |
| MSI Vector 16 HX A14V | |
| Average of class Gaming (165 - 354, n=98, last 2 years) | |
| Alienware m16 R1 AMD | |
| HP Omen 16-wf000 | |
| Mozilla Kraken 1.1 / Total | |
| HP Omen 16-wf000 | |
| Alienware m16 R1 AMD | |
| Average of class Gaming (391 - 590, n=100, last 2 years) | |
| Acer Predator Helios 18 N23Q2 | |
| MSI Vector 16 HX A14V | |
| Average Intel Core i9-14900HX, NVIDIA GeForce RTX 4080 Laptop GPU (437 - 446, n=7) | |
| HP Omen 16 (2024) | |
* ... smaller is better
| PCMark 10 Score | 8915 points | |
Help | ||
| AIDA64 / Memory Copy | |
| HP Omen 16 (2024) | |
| Acer Predator Helios 18 N23Q2 | |
| MSI Vector 16 HX A14V | |
| Average Intel Core i9-14900HX (38028 - 83392, n=36) | |
| Average of class Gaming (21750 - 129946, n=102, last 2 years) | |
| HP Omen 16-wf000 | |
| Alienware m16 R1 AMD | |
| AIDA64 / Memory Read | |
| HP Omen 16 (2024) | |
| Acer Predator Helios 18 N23Q2 | |
| MSI Vector 16 HX A14V | |
| Average Intel Core i9-14900HX (43306 - 87568, n=36) | |
| Average of class Gaming (22956 - 118858, n=102, last 2 years) | |
| HP Omen 16-wf000 | |
| Alienware m16 R1 AMD | |
| AIDA64 / Memory Write | |
| HP Omen 16 (2024) | |
| MSI Vector 16 HX A14V | |
| Average of class Gaming (22297 - 135096, n=102, last 2 years) | |
| Acer Predator Helios 18 N23Q2 | |
| Average Intel Core i9-14900HX (37146 - 80589, n=36) | |
| HP Omen 16-wf000 | |
| Alienware m16 R1 AMD | |
| AIDA64 / Memory Latency | |
| Average of class Gaming (75.3 - 165.4, n=102, last 2 years) | |
| Alienware m16 R1 AMD | |
| HP Omen 16-wf000 | |
| Average Intel Core i9-14900HX (76.1 - 105, n=36) | |
| HP Omen 16 (2024) | |
| Acer Predator Helios 18 N23Q2 | |
| MSI Vector 16 HX A14V | |
* ... smaller is better
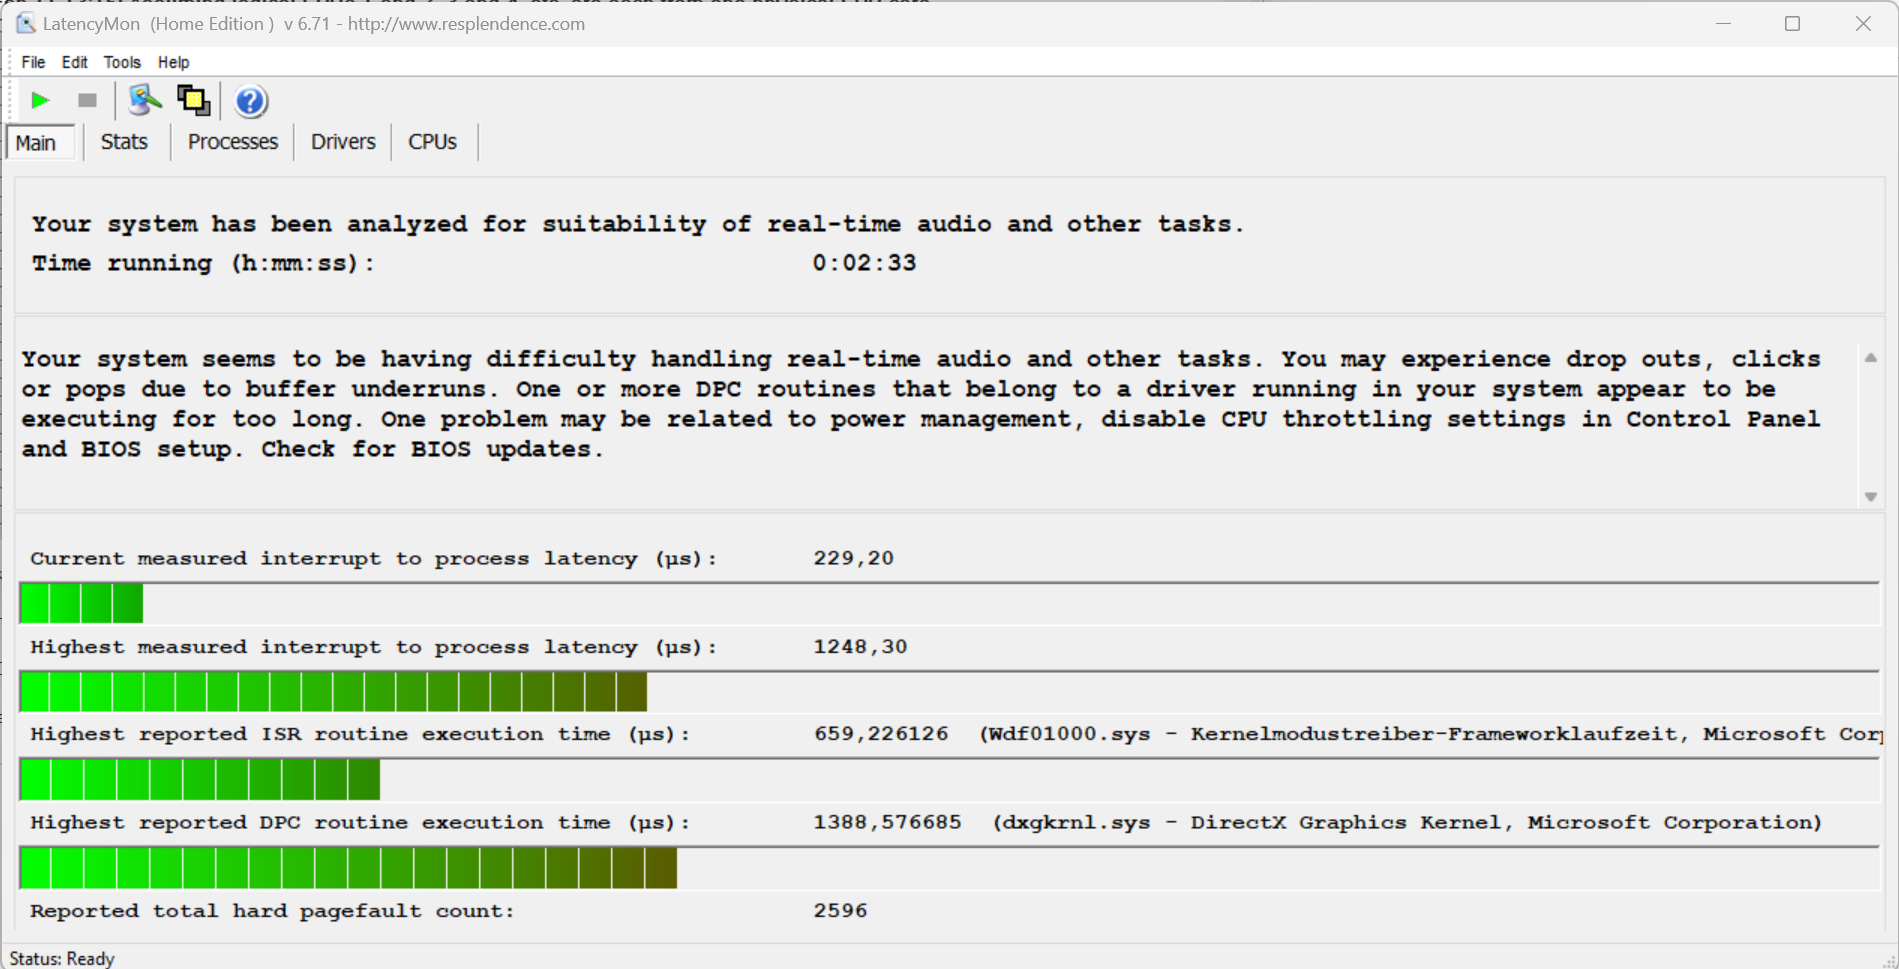
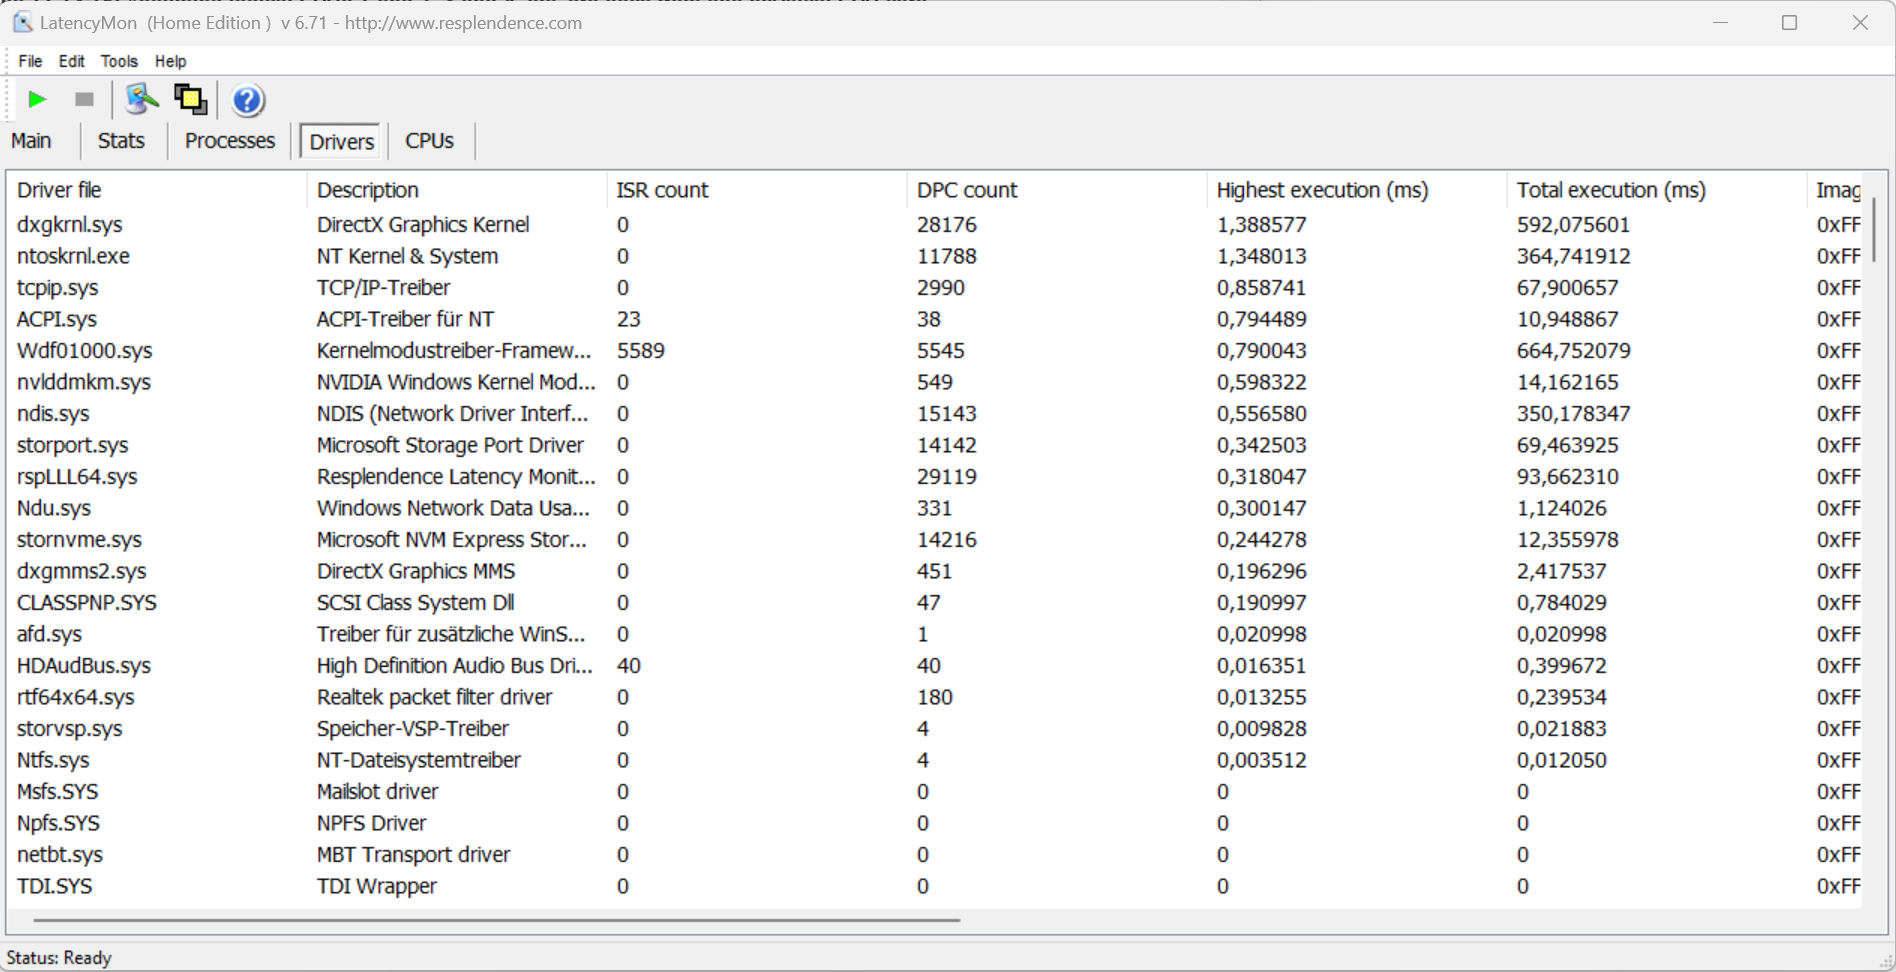
DPC 延迟
我们的标准延迟监控器测试(网上冲浪、4K 视频播放和 Prime95 高负载)发现了一些问题。该系统似乎不适合实时视频和音频编辑。希望未来的软件更新能带来改善。
| DPC Latencies / LatencyMon - interrupt to process latency (max), Web, Youtube, Prime95 | |
| Acer Predator Helios 18 N23Q2 | |
| HP Omen 16-wf000 | |
| Alienware m16 R1 AMD | |
| MSI Vector 16 HX A14V | |
| HP Omen 16 (2024) | |
* ... smaller is better
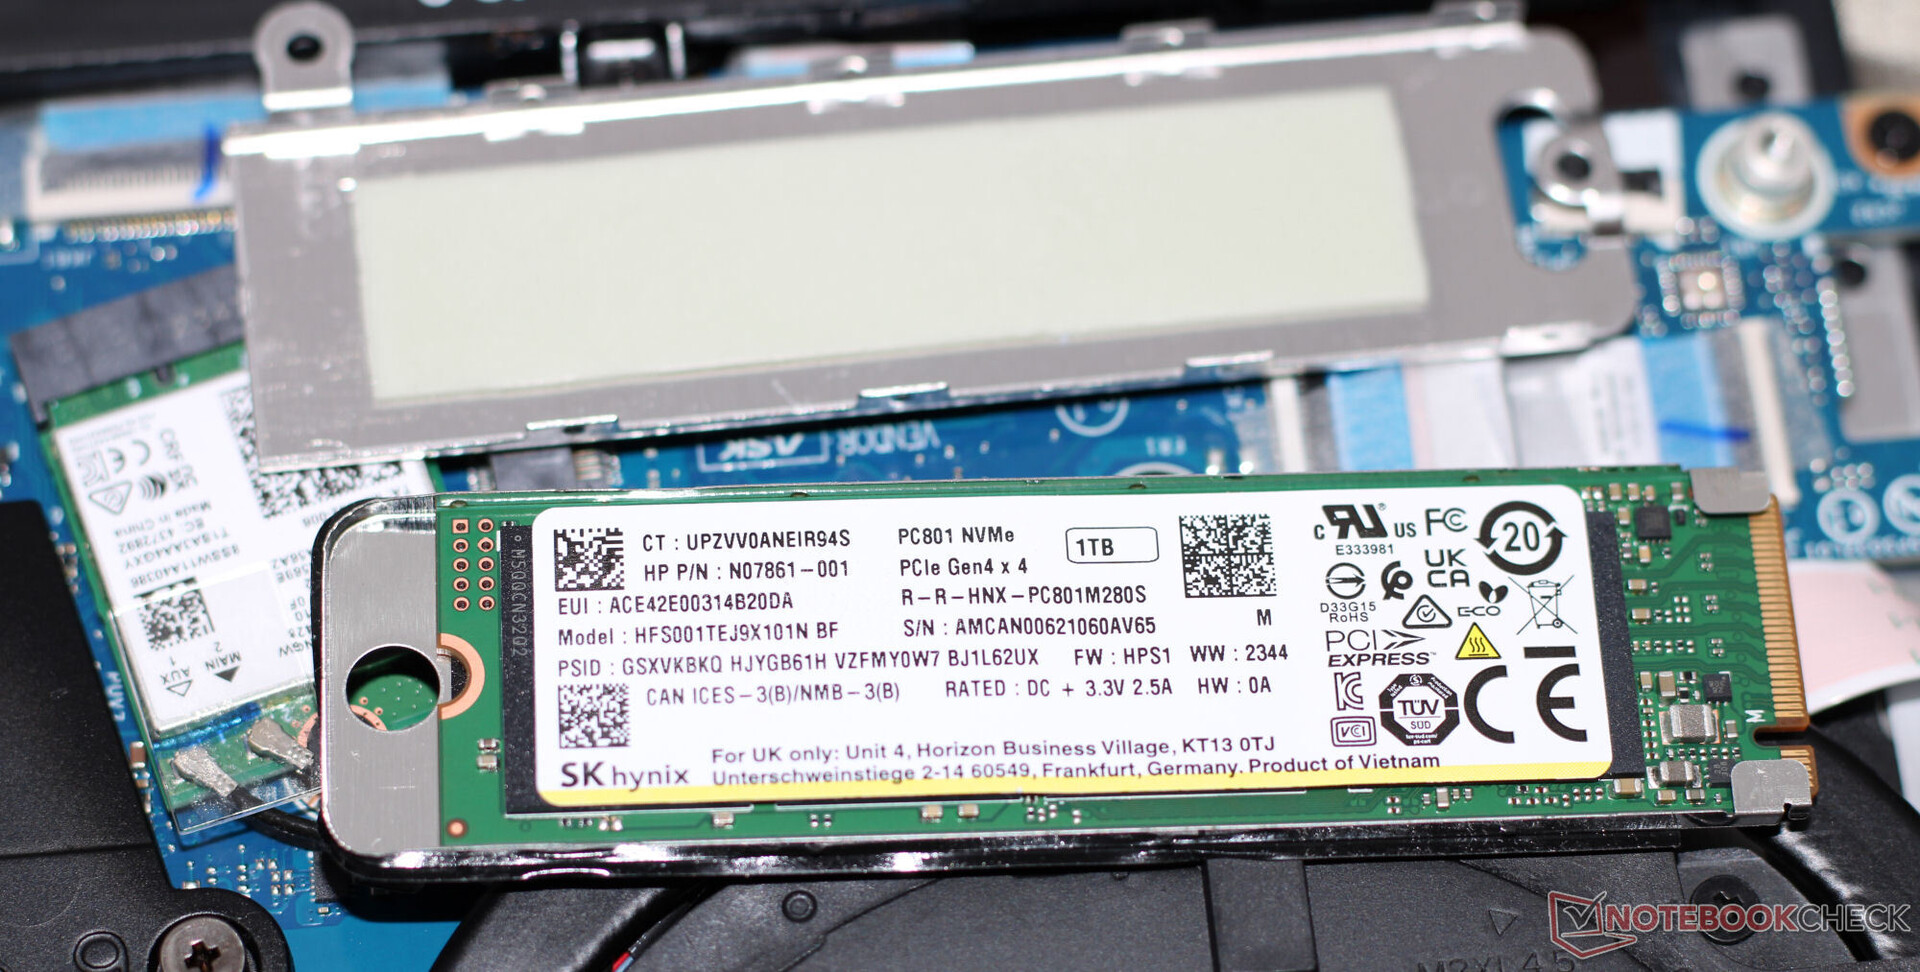
大容量存储器
Omen 16 可容纳两个 PCIe 4.0 M.2-2280 固态硬盘。我们评测设备中的 1 TB SK Hynix 硬盘具有出色的传输速度,而且在测试中没有出现热节流现象。

| Drive Performance rating - Percent | |
| HP Omen 16 (2024) | |
| Acer Predator Helios 18 N23Q2 | |
| Alienware m16 R1 AMD | |
| Average of class Gaming | |
| Average SK hynix PC801 HFS001TEJ9X101N | |
| HP Omen 16-wf000 | |
| MSI Vector 16 HX A14V | |
* ... smaller is better
Sustained Load Read: DiskSpd Read Loop, Queue Depth 8
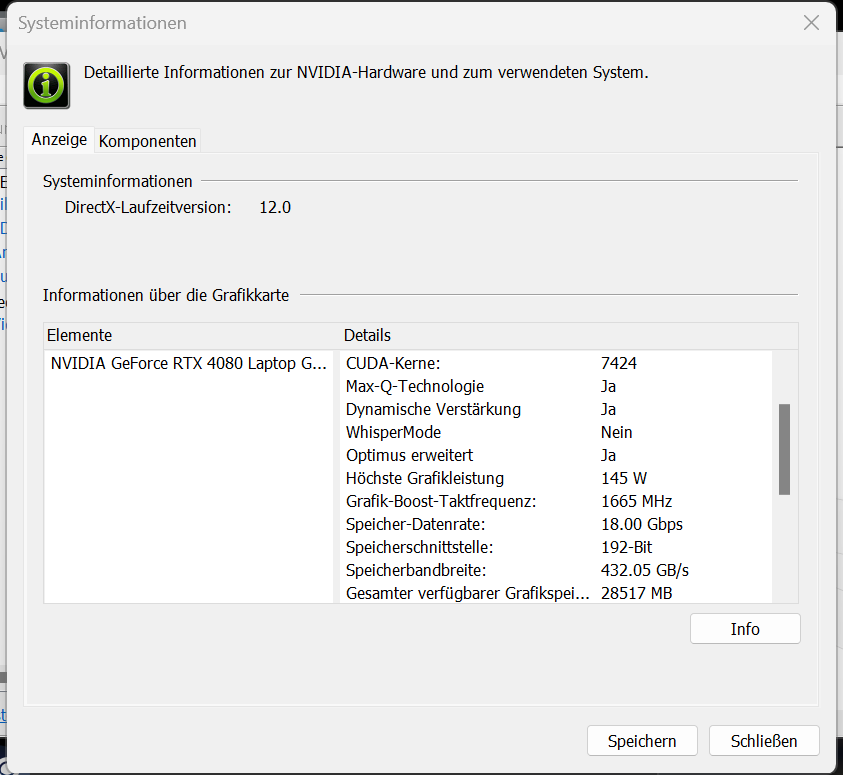
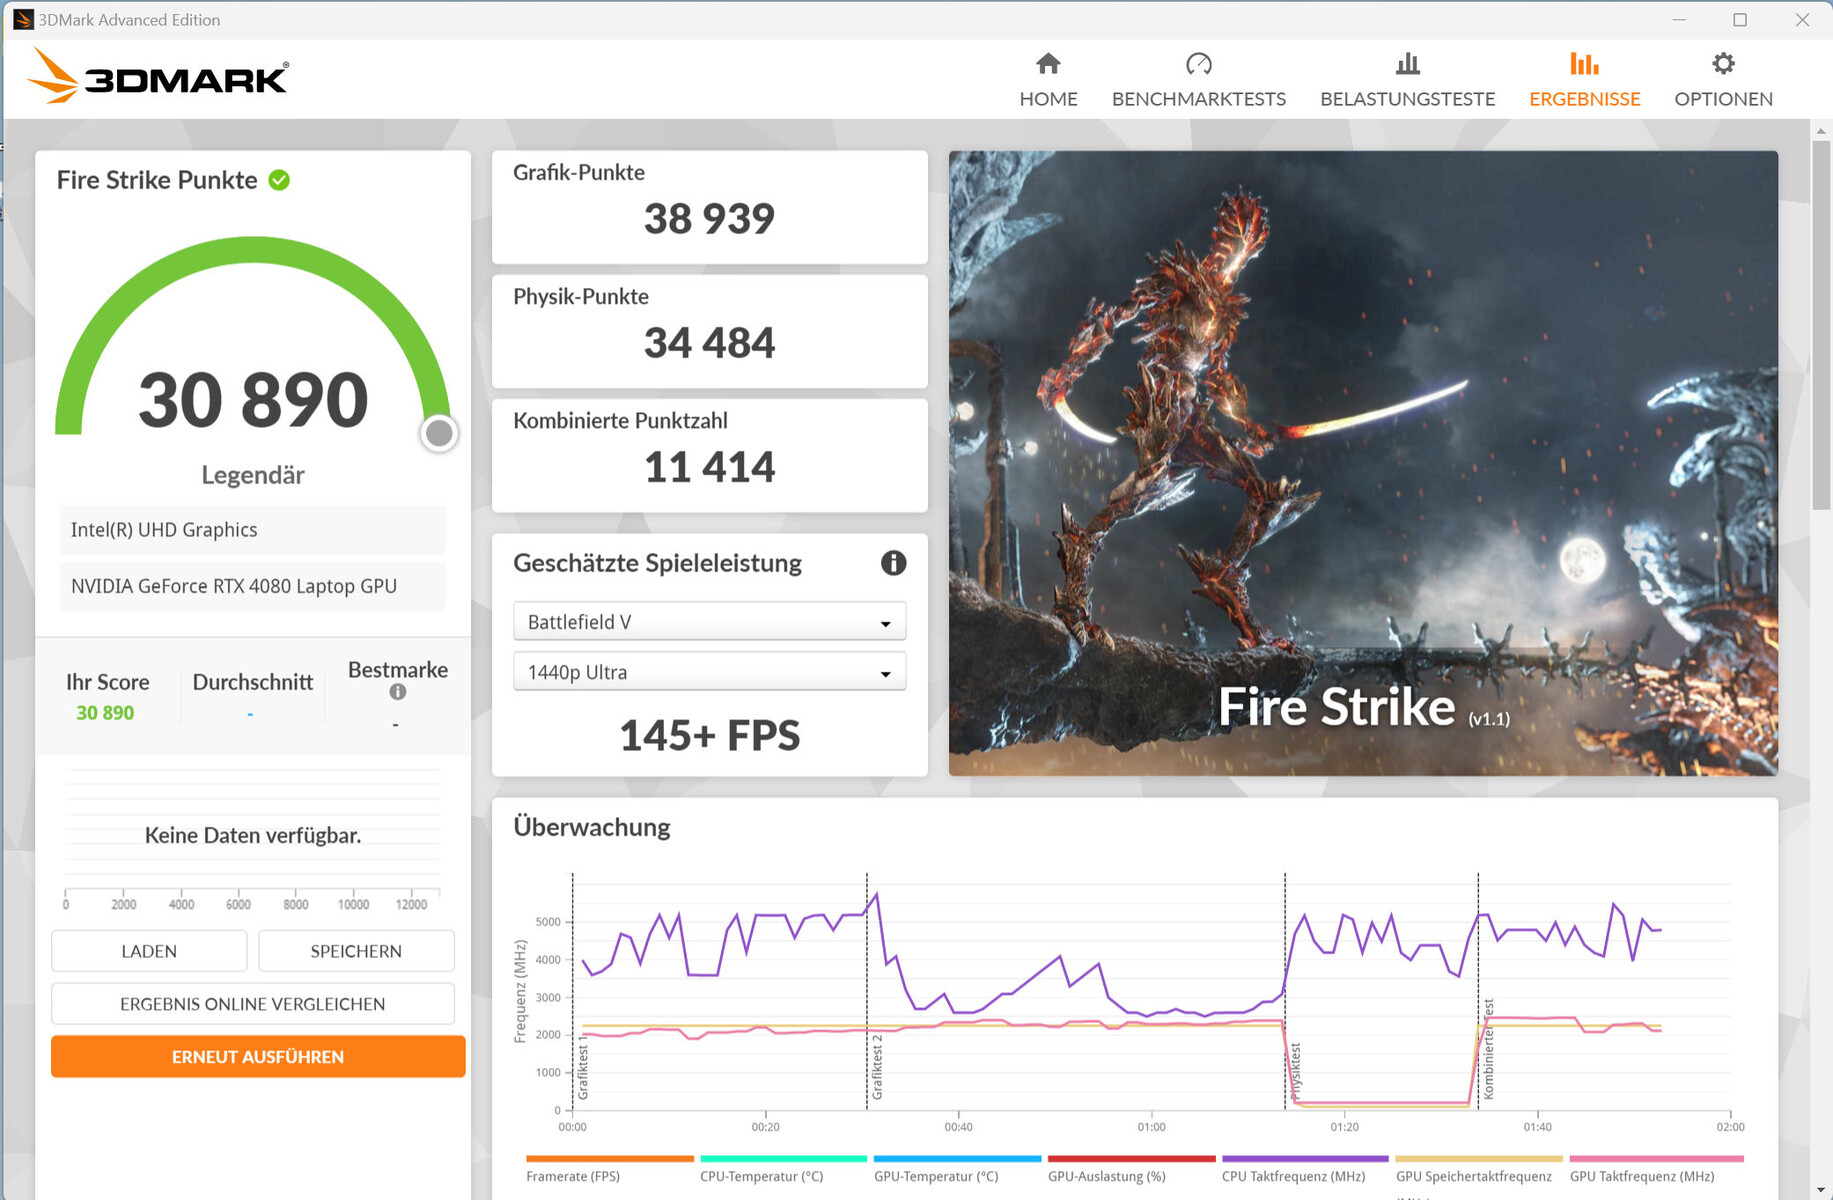
图形卡
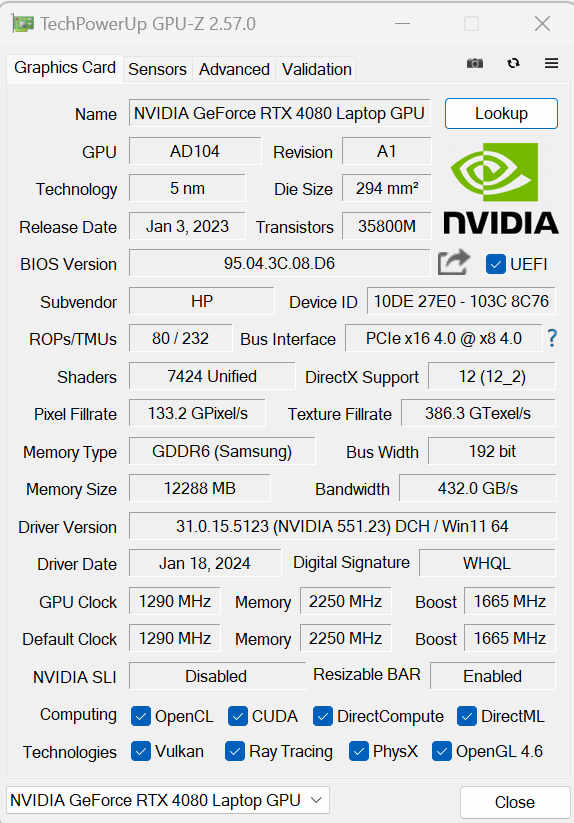
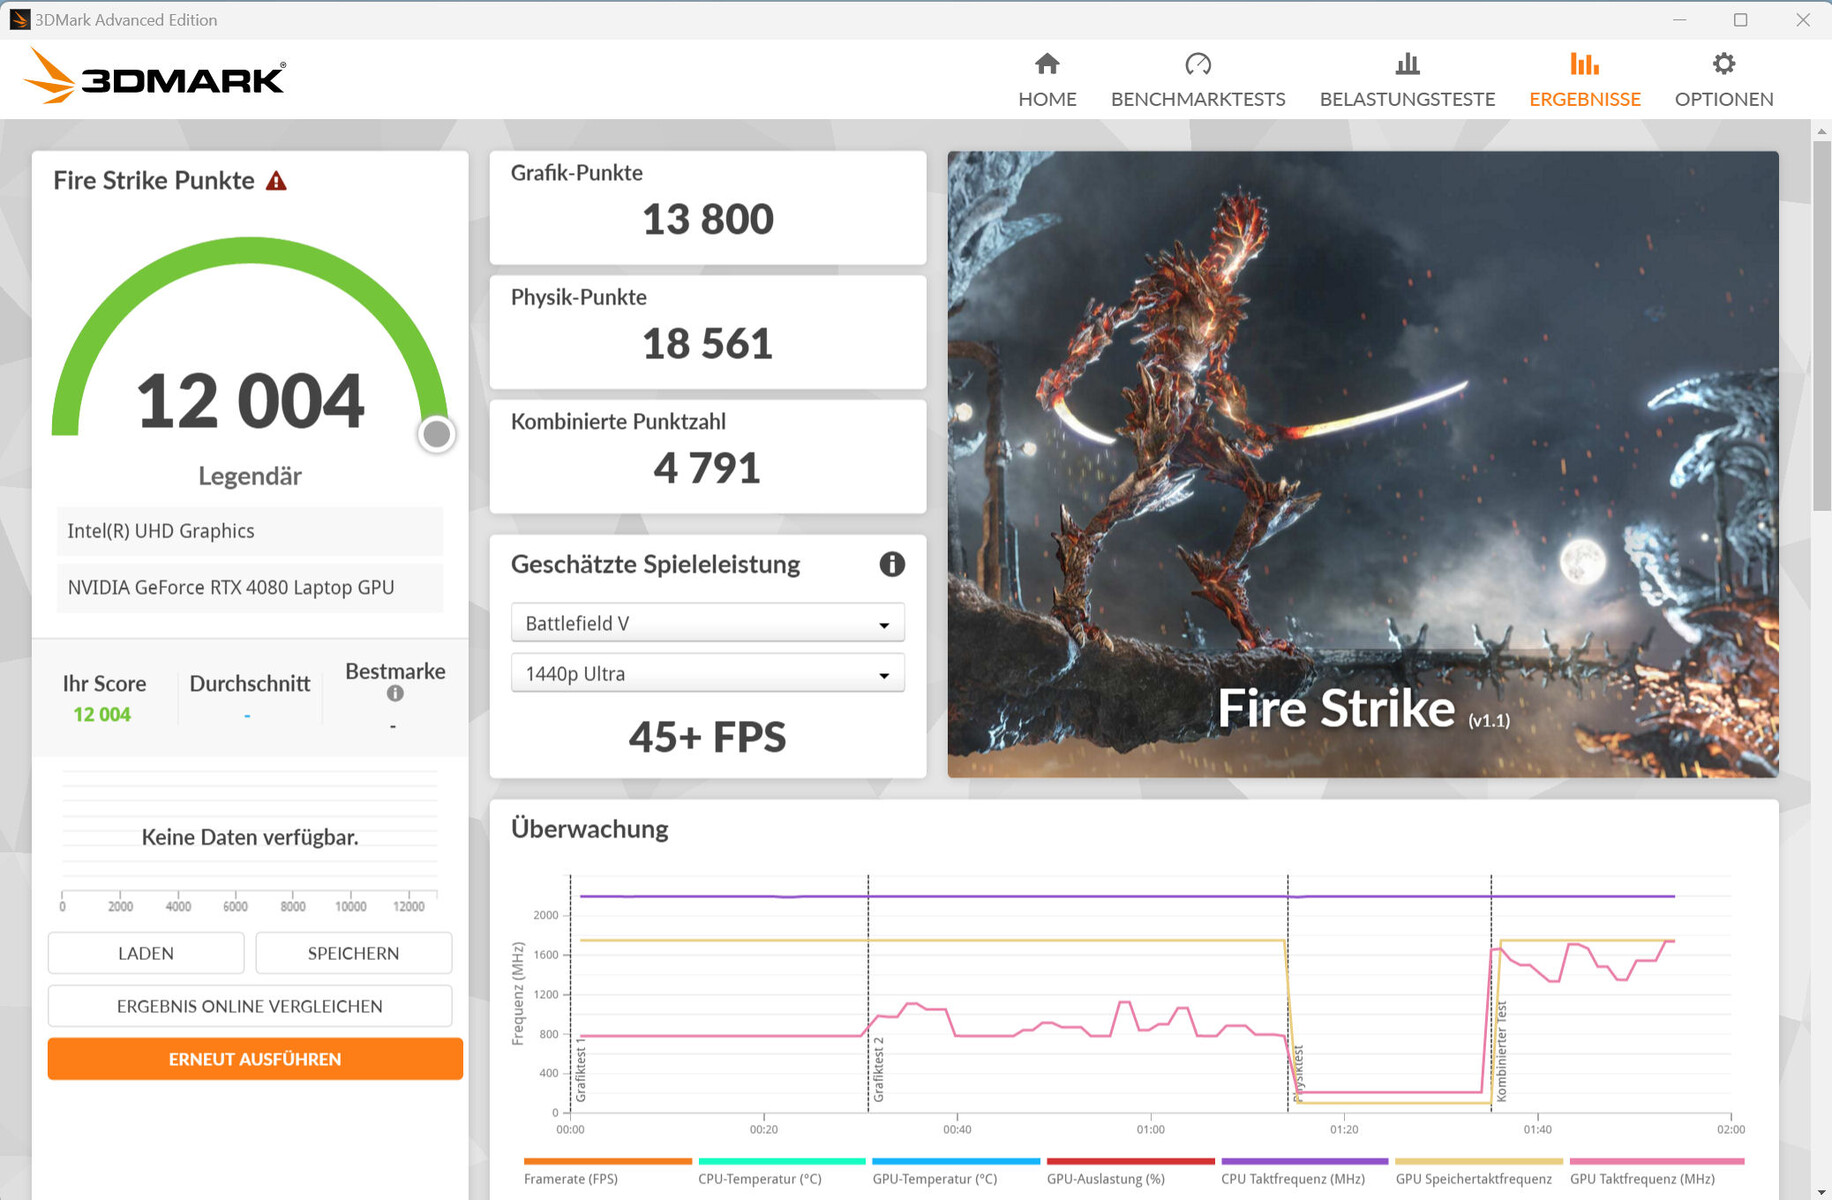
GeForce RTX 4080 拥有 7424 个 CUDA 内核、192 位内存总线和 12288 MB GDDR6 内存。惠普为该显卡设定的 TGP 为 145 瓦,低于 Nvidia 规定的 175 瓦最大 TGP。
Omen 16 的基准测试结果和帧速率低于我们从 RTX 4080 笔记本电脑上看到的平均值。切换到性能模式后,性能有所提升。GPU 可让你在 QHD 分辨率和高至最高设置下进行游戏。在 DLSS 3 和 Frame Generation 的帮助下,还可以在更高分辨率下启用最高设置和额外的光线追踪效果,不过只能在有相应支持的游戏中这样做。


| 3DMark Performance rating - Percent | |
| MSI Vector 16 HX A14V | |
| Alienware m16 R1 AMD | |
| Acer Predator Helios 18 N23Q2 | |
| Average NVIDIA GeForce RTX 4080 Laptop GPU | |
| HP Omen 16-wf000 | |
| HP Omen 16 (2024) | |
| Average of class Gaming | |
| HP Omen 16 (2024) | |
| 3DMark 11 - 1280x720 Performance GPU | |
| MSI Vector 16 HX A14V | |
| Acer Predator Helios 18 N23Q2 | |
| Average NVIDIA GeForce RTX 4080 Laptop GPU (45199 - 63128, n=24) | |
| Alienware m16 R1 AMD | |
| HP Omen 16-wf000 | |
| HP Omen 16 (2024) (Leistung) | |
| Average of class Gaming (21841 - 80022, n=103, last 2 years) | |
| HP Omen 16 (2024) | |
| 3DMark | |
| 1920x1080 Fire Strike Graphics | |
| Alienware m16 R1 AMD | |
| MSI Vector 16 HX A14V | |
| Acer Predator Helios 18 N23Q2 | |
| Average NVIDIA GeForce RTX 4080 Laptop GPU (33058 - 45220, n=23) | |
| Average of class Gaming (18629 - 62849, n=112, last 2 years) | |
| HP Omen 16 (2024) (Leistung) | |
| HP Omen 16-wf000 | |
| HP Omen 16 (2024) | |
| 2560x1440 Time Spy Graphics | |
| MSI Vector 16 HX A14V | |
| Alienware m16 R1 AMD | |
| Acer Predator Helios 18 N23Q2 | |
| Average NVIDIA GeForce RTX 4080 Laptop GPU (13282 - 19663, n=23) | |
| HP Omen 16-wf000 | |
| HP Omen 16 (2024) (Leistung) | |
| Average of class Gaming (6387 - 26212, n=112, last 2 years) | |
| HP Omen 16 (2024) | |
| 3DMark 11 Performance | 35380 points | |
| 3DMark Cloud Gate Standard Score | 51266 points | |
| 3DMark Fire Strike Score | 27191 points | |
| 3DMark Time Spy Score | 13636 points | |
Help | ||
| Blender | |
| v3.3 Classroom OPTIX/RTX | |
| Average of class Gaming (9 - 32, n=103, last 2 years) | |
| HP Omen 16-wf000 (3.3.3) | |
| HP Omen 16 (2024) (3.3.3) | |
| Alienware m16 R1 AMD (3.3.3) | |
| Average NVIDIA GeForce RTX 4080 Laptop GPU (13 - 20, n=22) | |
| Acer Predator Helios 18 N23Q2 (3.3.3) | |
| MSI Vector 16 HX A14V (3.3.3) | |
| HP Omen 16 (2024) (3.3.3, Leistung) | |
| v3.3 Classroom CUDA | |
| Average of class Gaming (15 - 228, n=103, last 2 years) | |
| HP Omen 16 (2024) (3.3.3) | |
| Alienware m16 R1 AMD (3.3.3) | |
| HP Omen 16 (2024) (3.3.3, Leistung) | |
| Average NVIDIA GeForce RTX 4080 Laptop GPU (21 - 28, n=23) | |
| HP Omen 16-wf000 (3.3.3) | |
| MSI Vector 16 HX A14V (3.3.3) | |
| Acer Predator Helios 18 N23Q2 (3.3.3) | |
| v3.3 Classroom CPU | |
| HP Omen 16-wf000 (3.3.3) | |
| HP Omen 16 (2024) (3.3.3) | |
| Average of class Gaming (122 - 565, n=99, last 2 years) | |
| Average NVIDIA GeForce RTX 4080 Laptop GPU (177 - 337, n=23) | |
| HP Omen 16 (2024) (3.3.3, Leistung) | |
| Acer Predator Helios 18 N23Q2 (3.3.3) | |
| Alienware m16 R1 AMD (3.3.3) | |
| MSI Vector 16 HX A14V (3.3.3) | |
| Geekbench 5.5 | |
| OpenCL Score | |
| Alienware m16 R1 AMD | |
| Acer Predator Helios 18 N23Q2 | |
| Average of class Gaming (80702 - 277970, n=98, last 2 years) | |
| Average NVIDIA GeForce RTX 4080 Laptop GPU (146413 - 189320, n=23) | |
| HP Omen 16 (2024) (Leistung) | |
| HP Omen 16-wf000 | |
| MSI Vector 16 HX A14V | |
| HP Omen 16 (2024) | |
| Vulkan Score 5.5 | |
| Average of class Gaming (18857 - 246759, n=72, last 2 years) | |
| HP Omen 16 (2024) (Leistung) | |
| Average NVIDIA GeForce RTX 4080 Laptop GPU (9296 - 122085, n=15) | |
| HP Omen 16 (2024) | |
| HP Omen 16-wf000 | |
| MSI Vector 16 HX A14V | |
| Geekbench 6.7 | |
| GPU Vulkan | |
| HP Omen 16 (2024) (6.2.1, Leistung) | |
| HP Omen 16 (2024) (6.2.1) | |
| Average NVIDIA GeForce RTX 4080 Laptop GPU (104581 - 159261, n=11) | |
| Average of class Gaming (7562 - 244348, n=56, last 2 years) | |
| MSI Vector 16 HX A14V (6.2.1) | |
| GPU OpenCL | |
| Alienware m16 R1 AMD | |
| Acer Predator Helios 18 N23Q2 | |
| HP Omen 16 (2024) (6.2.1, Leistung) | |
| Average NVIDIA GeForce RTX 4080 Laptop GPU (136770 - 181484, n=15) | |
| HP Omen 16 (2024) (6.2.1) | |
| Average of class Gaming (67235 - 253130, n=100, last 2 years) | |
| MSI Vector 16 HX A14V (6.2.1) | |
| V-Ray 5 Benchmark | |
| GPU RTX | |
| Average of class Gaming (1524 - 4363, n=29, last 2 years) | |
| MSI Vector 16 HX A14V (5.0.1) | |
| Alienware m16 R1 AMD (5.0.1) | |
| HP Omen 16 (2024) (5.0.1, Leistung) | |
| HP Omen 16-wf000 (5.0.1) | |
| Average NVIDIA GeForce RTX 4080 Laptop GPU (2128 - 2843, n=17) | |
| HP Omen 16 (2024) (5.0.1) | |
| GPU CUDA | |
| Average of class Gaming (1202 - 3288, n=29, last 2 years) | |
| Alienware m16 R1 AMD (5.0.1) | |
| MSI Vector 16 HX A14V (5.0.1) | |
| HP Omen 16-wf000 (5.0.1) | |
| Average NVIDIA GeForce RTX 4080 Laptop GPU (1647 - 2112, n=17) | |
| HP Omen 16 (2024) (5.0.1, Leistung) | |
| HP Omen 16 (2024) | |
| CPU | |
| Average of class Gaming (5864 - 30302, n=28, last 2 years) | |
| MSI Vector 16 HX A14V (5.0.1) | |
| Alienware m16 R1 AMD (5.0.1) | |
| HP Omen 16 (2024) (5.0.1, Leistung) | |
| Average NVIDIA GeForce RTX 4080 Laptop GPU (11906 - 21823, n=17) | |
| HP Omen 16 (2024) (5.0.1) | |
| HP Omen 16-wf000 (5.0.1) | |
| V-Ray Benchmark Next 4.10 | |
| GPU | |
| Acer Predator Helios 18 N23Q2 (v4.10.07 ) | |
| Average NVIDIA GeForce RTX 4080 Laptop GPU (812 - 1036, n=16) | |
| HP Omen 16 (2024) (v4.10.07, Leistung) | |
| MSI Vector 16 HX A14V (v4.10.07 ) | |
| Average of class Gaming (427 - 1627, n=96, last 2 years) | |
| HP Omen 16 (2024) (v4.10.07 ) | |
| CPU | |
| MSI Vector 16 HX A14V (v4.10.07 ) | |
| Acer Predator Helios 18 N23Q2 (v4.10.07 ) | |
| Average NVIDIA GeForce RTX 4080 Laptop GPU (19636 - 31653, n=16) | |
| Average of class Gaming (10048 - 45327, n=94, last 2 years) | |
| HP Omen 16 (2024) (v4.10.07, Leistung) | |
| HP Omen 16 (2024) (v4.10.07 ) | |
* ... smaller is better
| Performance rating - Percent | |
| Acer Predator Helios 18 N23Q2 | |
| MSI Vector 16 HX A14V | |
| Alienware m16 R1 AMD -1! | |
| HP Omen 16 (2024) | |
| Average NVIDIA GeForce RTX 4080 Laptop GPU | |
| Average of class Gaming | |
| HP Omen 16-wf000 | |
| HP Omen 16 (2024) | |
| The Witcher 3 - 1920x1080 Ultra Graphics & Postprocessing (HBAO+) | |
| Average of class Gaming (104.7 - 240, n=7, last 2 years) | |
| MSI Vector 16 HX A14V | |
| Acer Predator Helios 18 N23Q2 | |
| Alienware m16 R1 AMD | |
| Average NVIDIA GeForce RTX 4080 Laptop GPU (130.4 - 186.1, n=20) | |
| HP Omen 16 (2024) (Leistung) | |
| HP Omen 16-wf000 | |
| HP Omen 16 (2024) | |
| GTA V - 1920x1080 Highest AA:4xMSAA + FX AF:16x | |
| Acer Predator Helios 18 N23Q2 | |
| MSI Vector 16 HX A14V | |
| HP Omen 16 (2024) (Leistung) | |
| Average of class Gaming (67.1 - 186.9, n=90, last 2 years) | |
| Average NVIDIA GeForce RTX 4080 Laptop GPU (102.9 - 152.7, n=21) | |
| HP Omen 16-wf000 | |
| HP Omen 16 (2024) | |
| Final Fantasy XV Benchmark - 1920x1080 High Quality | |
| Acer Predator Helios 18 N23Q2 (1.3) | |
| MSI Vector 16 HX A14V (1.3) | |
| Alienware m16 R1 AMD (1.3) | |
| HP Omen 16 (2024) (1.3, Leistung) | |
| Average NVIDIA GeForce RTX 4080 Laptop GPU (129 - 182.1, n=23) | |
| HP Omen 16-wf000 (1.3) | |
| Average of class Gaming (64.2 - 215, n=91, last 2 years) | |
| HP Omen 16 (2024) (1.3) | |
| Strange Brigade - 1920x1080 ultra AA:ultra AF:16 | |
| Alienware m16 R1 AMD (1.47.22.14 D3D12) | |
| MSI Vector 16 HX A14V (1.47.22.14 D3D12) | |
| Acer Predator Helios 18 N23Q2 (1.47.22.14 D3D12) | |
| Average NVIDIA GeForce RTX 4080 Laptop GPU (239 - 357, n=22) | |
| HP Omen 16 (2024) (1.47.22.14 D3D12, Leistung) | |
| HP Omen 16-wf000 (1.47.22.14 D3D12) | |
| Average of class Gaming (113.6 - 458, n=83, last 2 years) | |
| HP Omen 16 (2024) (1.47.22.14 D3D12) | |
| Dota 2 Reborn - 1920x1080 ultra (3/3) best looking | |
| Acer Predator Helios 18 N23Q2 | |
| MSI Vector 16 HX A14V | |
| HP Omen 16 (2024) (Leistung) | |
| Alienware m16 R1 AMD | |
| Average NVIDIA GeForce RTX 4080 Laptop GPU (133 - 194.7, n=23) | |
| HP Omen 16 (2024) | |
| Average of class Gaming (84.8 - 252, n=104, last 2 years) | |
| HP Omen 16-wf000 | |
| X-Plane 11.11 - 1920x1080 high (fps_test=3) | |
| Acer Predator Helios 18 N23Q2 | |
| HP Omen 16 (2024) (Leistung) | |
| MSI Vector 16 HX A14V | |
| HP Omen 16 (2024) | |
| Average NVIDIA GeForce RTX 4080 Laptop GPU (89.3 - 143.5, n=25) | |
| HP Omen 16-wf000 | |
| Alienware m16 R1 AMD | |
| Average of class Gaming (55.5 - 148.5, n=106, last 2 years) | |
| Enshrouded | |
| 1920x1080 Max. Quality AA:FX | |
| HP Omen 16 (2024) (Leistung) | |
| Average NVIDIA GeForce RTX 4080 Laptop GPU (67.6 - 82.6, n=3) | |
| HP Omen 16 (2024) | |
| Average of class Gaming (n=1last 2 years) | |
| 2560x1440 Max. Quality AA:FX | |
| HP Omen 16 (2024) (Leistung) | |
| Average NVIDIA GeForce RTX 4080 Laptop GPU (52.8 - 64.5, n=3) | |
| HP Omen 16 (2024) | |
| Ready or Not | |
| 2560x1440 Epic Preset | |
| Average NVIDIA GeForce RTX 4080 Laptop GPU (102.1 - 128, n=3) | |
| HP Omen 16 (2024) (Leistung) | |
| HP Omen 16 (2024) | |
| 1920x1080 Epic Preset | |
| Average NVIDIA GeForce RTX 4080 Laptop GPU (118.6 - 202, n=3) | |
| HP Omen 16 (2024) (Leistung) | |
| HP Omen 16 (2024) | |
| Helldivers 2 | |
| 2560x1440 Ultra Preset | |
| Average of class Gaming (81.3 - 140.1, n=5, last 2 years) | |
| HP Omen 16 (2024) (Leistung) | |
| Average NVIDIA GeForce RTX 4080 Laptop GPU (85.7 - 106, n=3) | |
| HP Omen 16 (2024) | |
| 1920x1080 Ultra Preset | |
| HP Omen 16 (2024) (Leistung) | |
| Average NVIDIA GeForce RTX 4080 Laptop GPU (100.8 - 132.3, n=3) | |
| Average of class Gaming (18.4 - 153.8, n=5, last 2 years) | |
| HP Omen 16 (2024) | |
| The Finals | |
| 1920x1080 Epic Preset + Epic RTX Global Illumination | |
| HP Omen 16 (2024) (Leistung) | |
| Average NVIDIA GeForce RTX 4080 Laptop GPU (147.8 - 181.5, n=3) | |
| HP Omen 16 (2024) | |
| 2560x1440 Epic Preset | |
| HP Omen 16 (2024) (Leistung) | |
| Average NVIDIA GeForce RTX 4080 Laptop GPU (104.7 - 128.5, n=3) | |
| HP Omen 16 (2024) | |
| Average of class Gaming (n=1last 2 years) | |
| 1920x1080 Epic Preset | |
| HP Omen 16 (2024) (Leistung) | |
| Average NVIDIA GeForce RTX 4080 Laptop GPU (143.9 - 192.5, n=3) | |
| HP Omen 16 (2024) | |
| Average of class Gaming (n=1last 2 years) | |
Witcher 3 FPS chart
| low | med. | high | ultra | QHD | |
|---|---|---|---|---|---|
| GTA V (2015) | 184.2 | 181.1 | 173.8 | 109.7 | 100 |
| The Witcher 3 (2015) | 485 | 384 | 246 | 142 | 102.5 |
| Dota 2 Reborn (2015) | 215 | 191.6 | 177 | 163.4 | |
| Final Fantasy XV Benchmark (2018) | 183.9 | 152.8 | 129 | 98 | |
| X-Plane 11.11 (2018) | 177.3 | 156.2 | 126.9 | ||
| Strange Brigade (2018) | 382 | 307 | 263 | 239 | 179.5 |
| Cyberpunk 2077 (2023) | 111.3 | 96.4 | 94.1 | 83.9 | 56.2 |
| The Finals (2023) | 188.9 | 179.3 | 170.7 | 143.9 | 104.7 |
| Ready or Not (2023) | 267 | 127.6 | 121.5 | 118.6 | 102.1 |
| Enshrouded (2024) | 103.3 | 90.9 | 77.7 | 67.6 | 52.8 |
| Helldivers 2 (2024) | 110.6 | 110.4 | 103.9 | 100.8 | 85.7 |
排放与电量 - 惠普笔记本电脑的电池续航时间尚可
噪音排放
在平衡模式下,满载噪音高达 47 dB(A)。使用 "性能 "模式时,噪音明显更高,达到 58 dB(A)。在 ECO 模式下,Omen 16 的噪音水平为 39 dB(A),非常舒适,但这是以牺牲性能为代价的。
即使笔记本处于闲置或处理日常任务(如办公和互联网应用)时,风扇也在不停地转动。这是因为惠普在 BIOS 中设置了 "风扇常开 "选项。禁用它可以让两个风扇偶尔停止运转。
Noise level
| Idle |
| 29 / 30 / 31 dB(A) |
| Load |
| 46 / 47 dB(A) |
 | ||
30 dB silent 40 dB(A) audible 50 dB(A) loud |
||
min: | ||
| HP Omen 16 (2024) GeForce RTX 4080 Laptop GPU, i9-14900HX, SK hynix PC801 HFS001TEJ9X101N | MSI Vector 16 HX A14V GeForce RTX 4080 Laptop GPU, i9-14900HX, WD PC SN560 SDDPNQE-1T00 | Alienware m16 R1 AMD GeForce RTX 4080 Laptop GPU, R9 7845HX, Kioxia XG8 KXG80ZNV1T02 | Acer Predator Helios 18 N23Q2 GeForce RTX 4080 Laptop GPU, i9-13900HX, Samsung PM9A1 MZVL22T0HBLB | HP Omen 16-wf000 GeForce RTX 4080 Laptop GPU, i7-13700HX, SK hynix PC801 HFS002TEJ9X101N | |
|---|---|---|---|---|---|
| Noise | -15% | 5% | 4% | -1% | |
| off / environment * (dB) | 25 | 23.2 7% | 22.9 8% | 23 8% | 23 8% |
| Idle Minimum * (dB) | 29 | 33.5 -16% | 22.9 21% | 23 21% | 29.6 -2% |
| Idle Average * (dB) | 30 | 33.5 -12% | 29.7 1% | 23 23% | 29.8 1% |
| Idle Maximum * (dB) | 31 | 33.5 -8% | 29.7 4% | 23 26% | 30.4 2% |
| Load Average * (dB) | 46 | 52.1 -13% | 29.8 35% | 45.26 2% | 33.8 27% |
| Witcher 3 ultra * (dB) | 47 | 62 -32% | 54.7 -16% | 59.82 -27% | 57 -21% |
| Load Maximum * (dB) | 47 | 62 -32% | 54.7 -16% | 59.94 -28% | 58.3 -24% |
* ... smaller is better
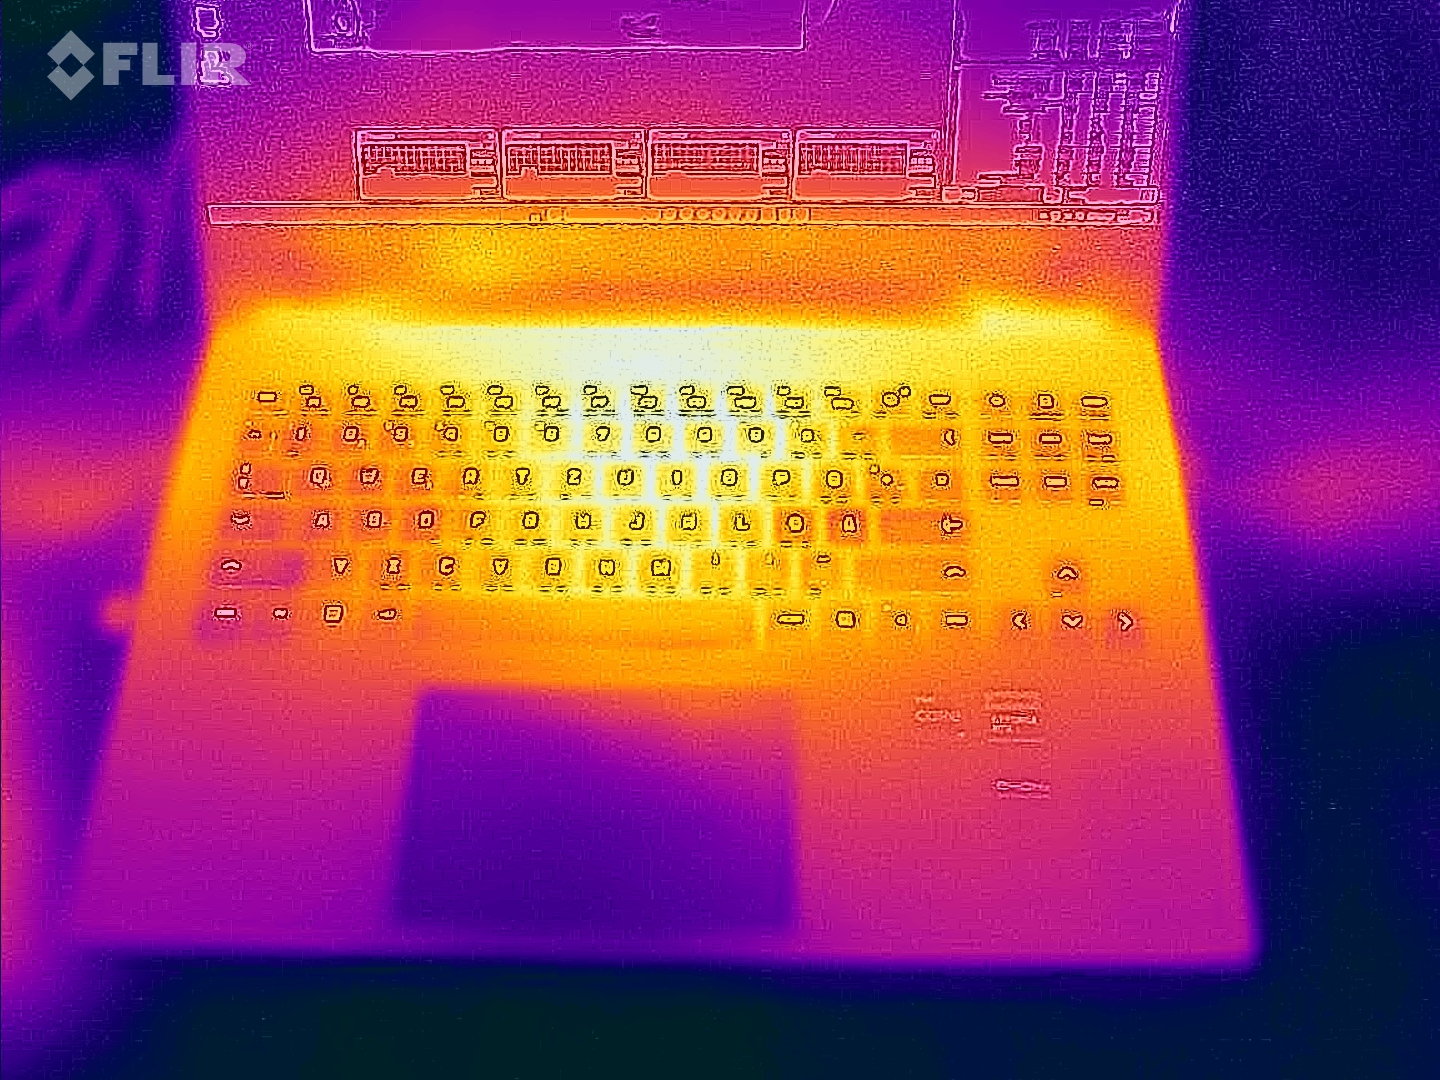
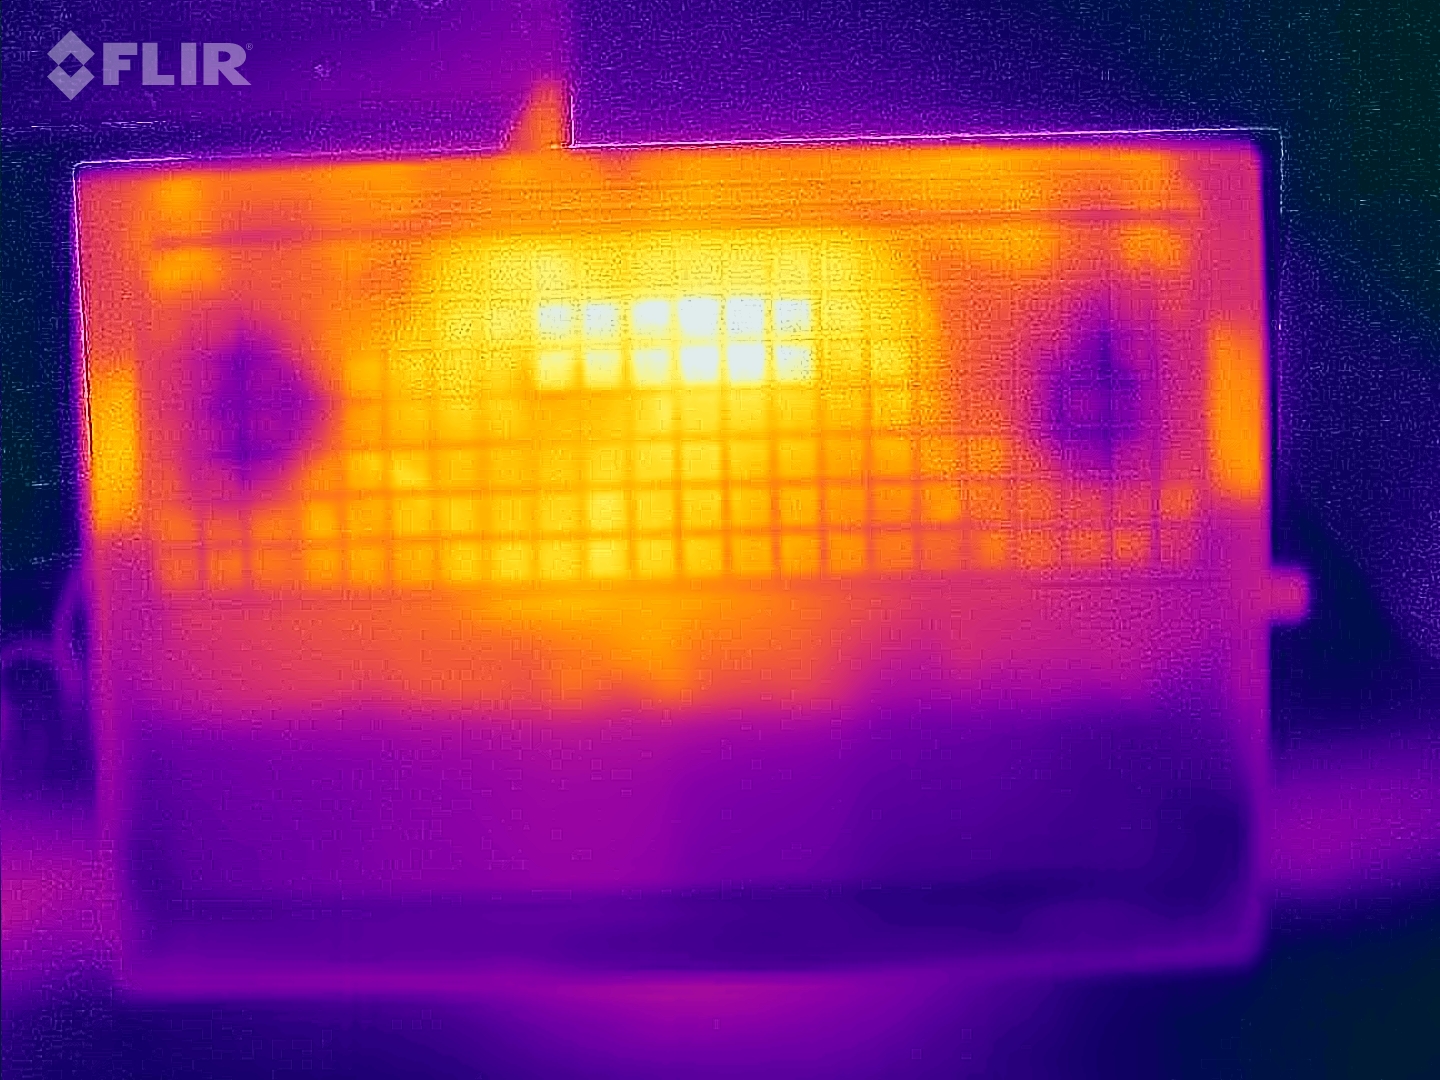
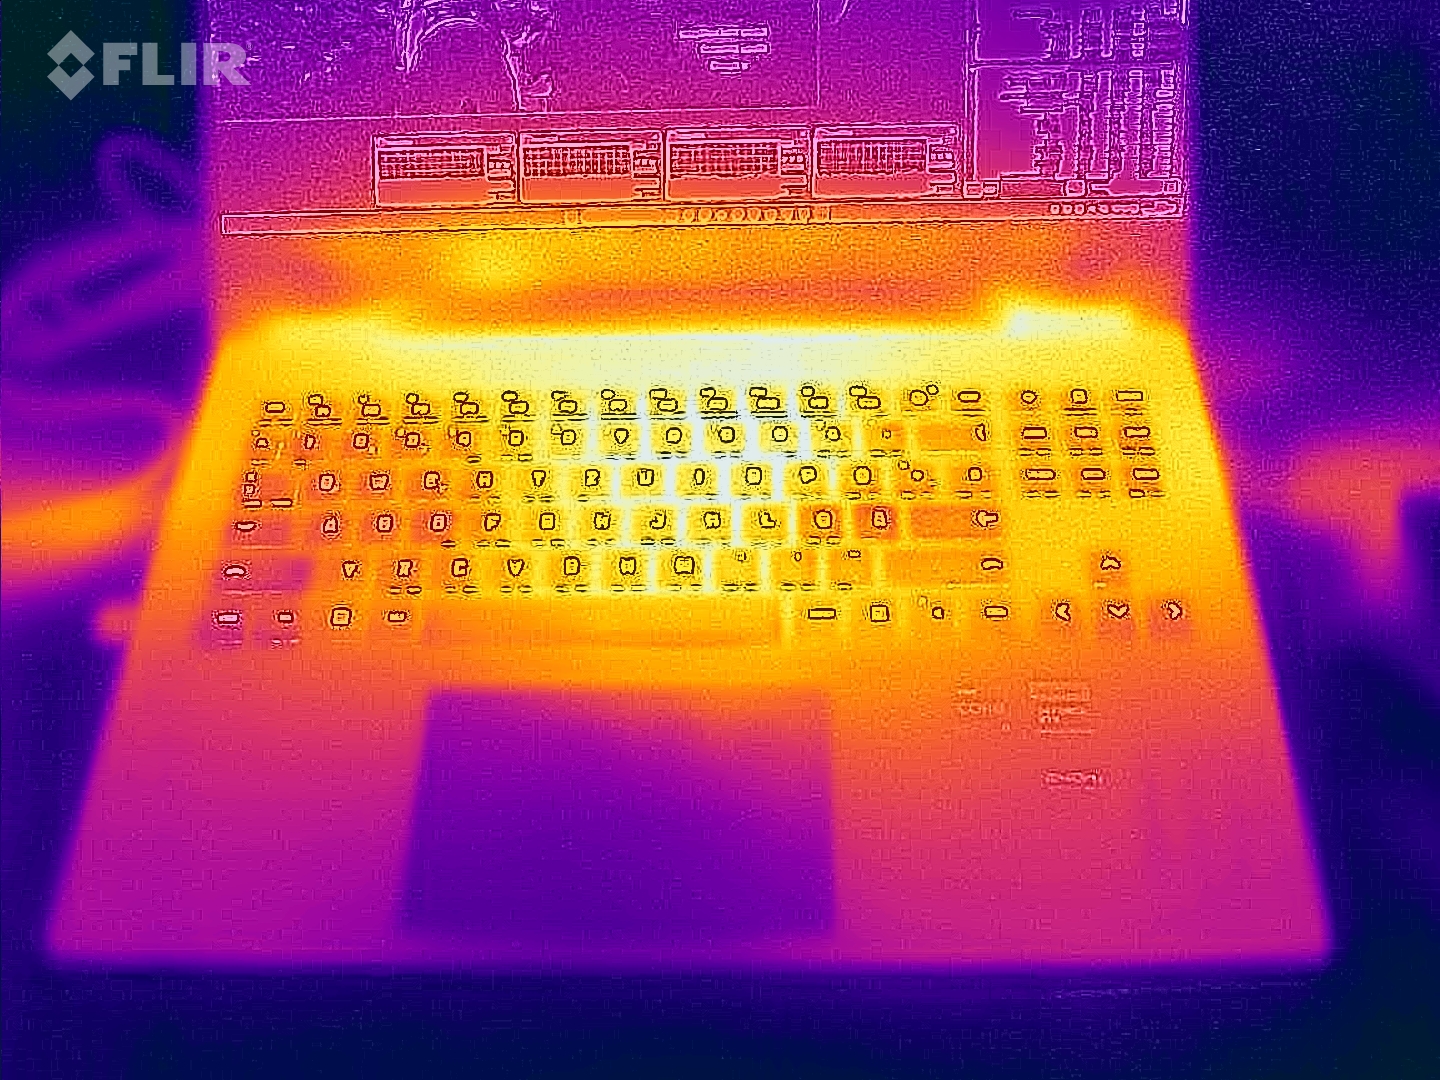
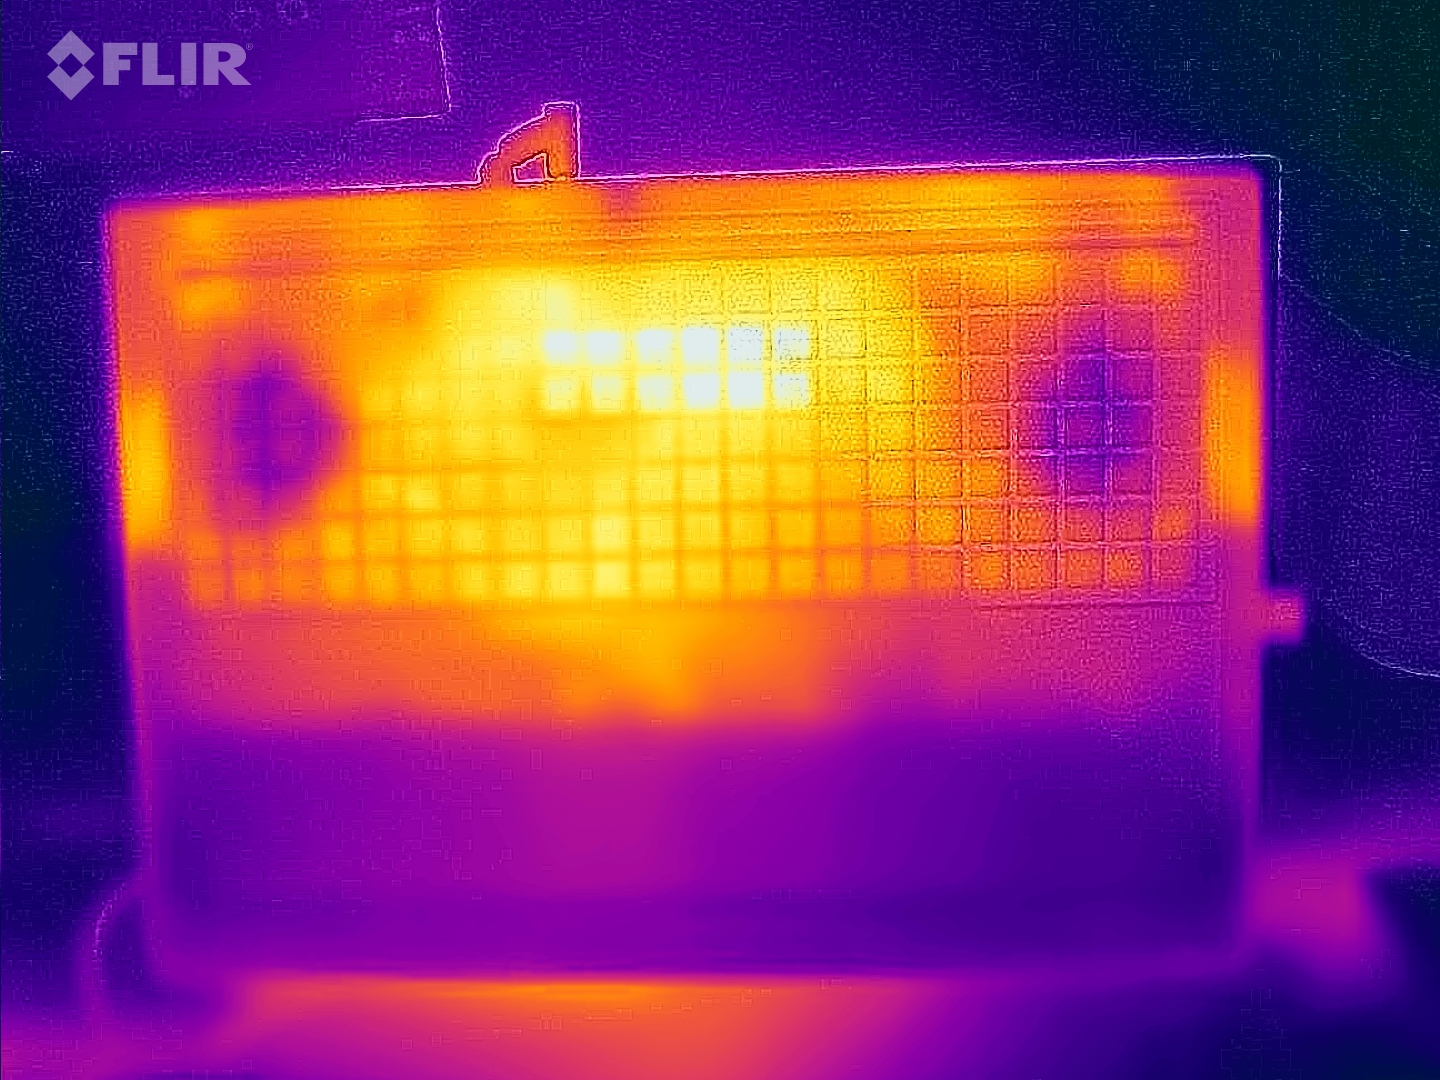
温度
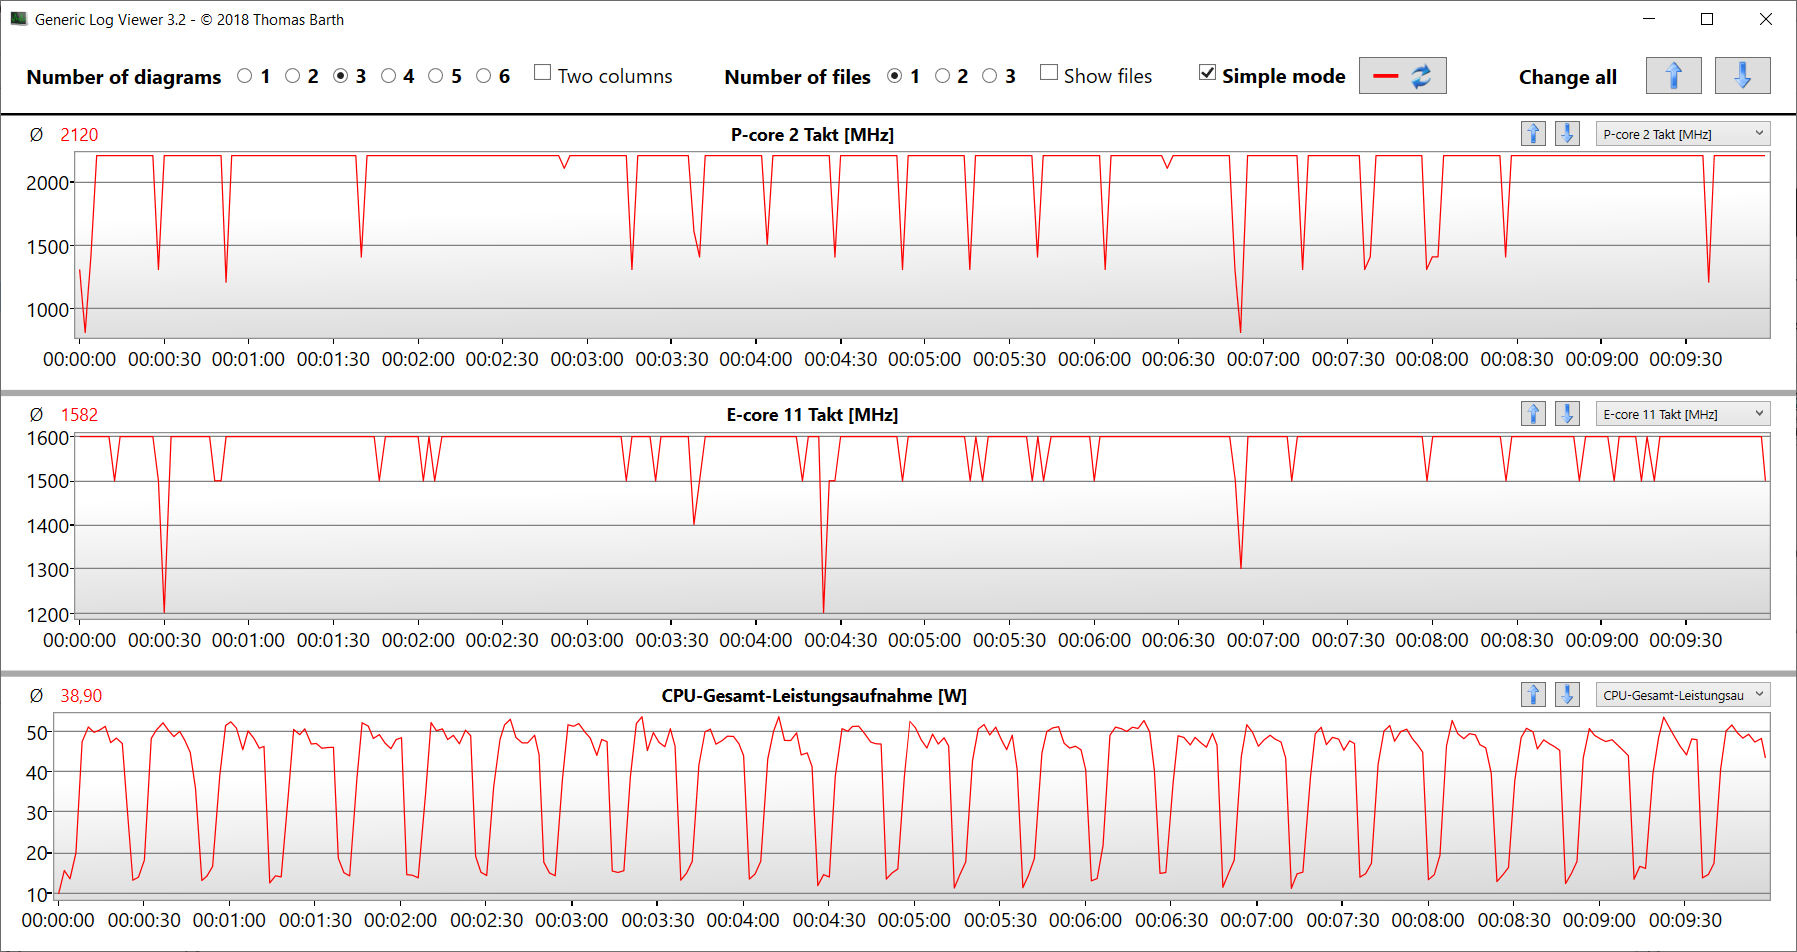
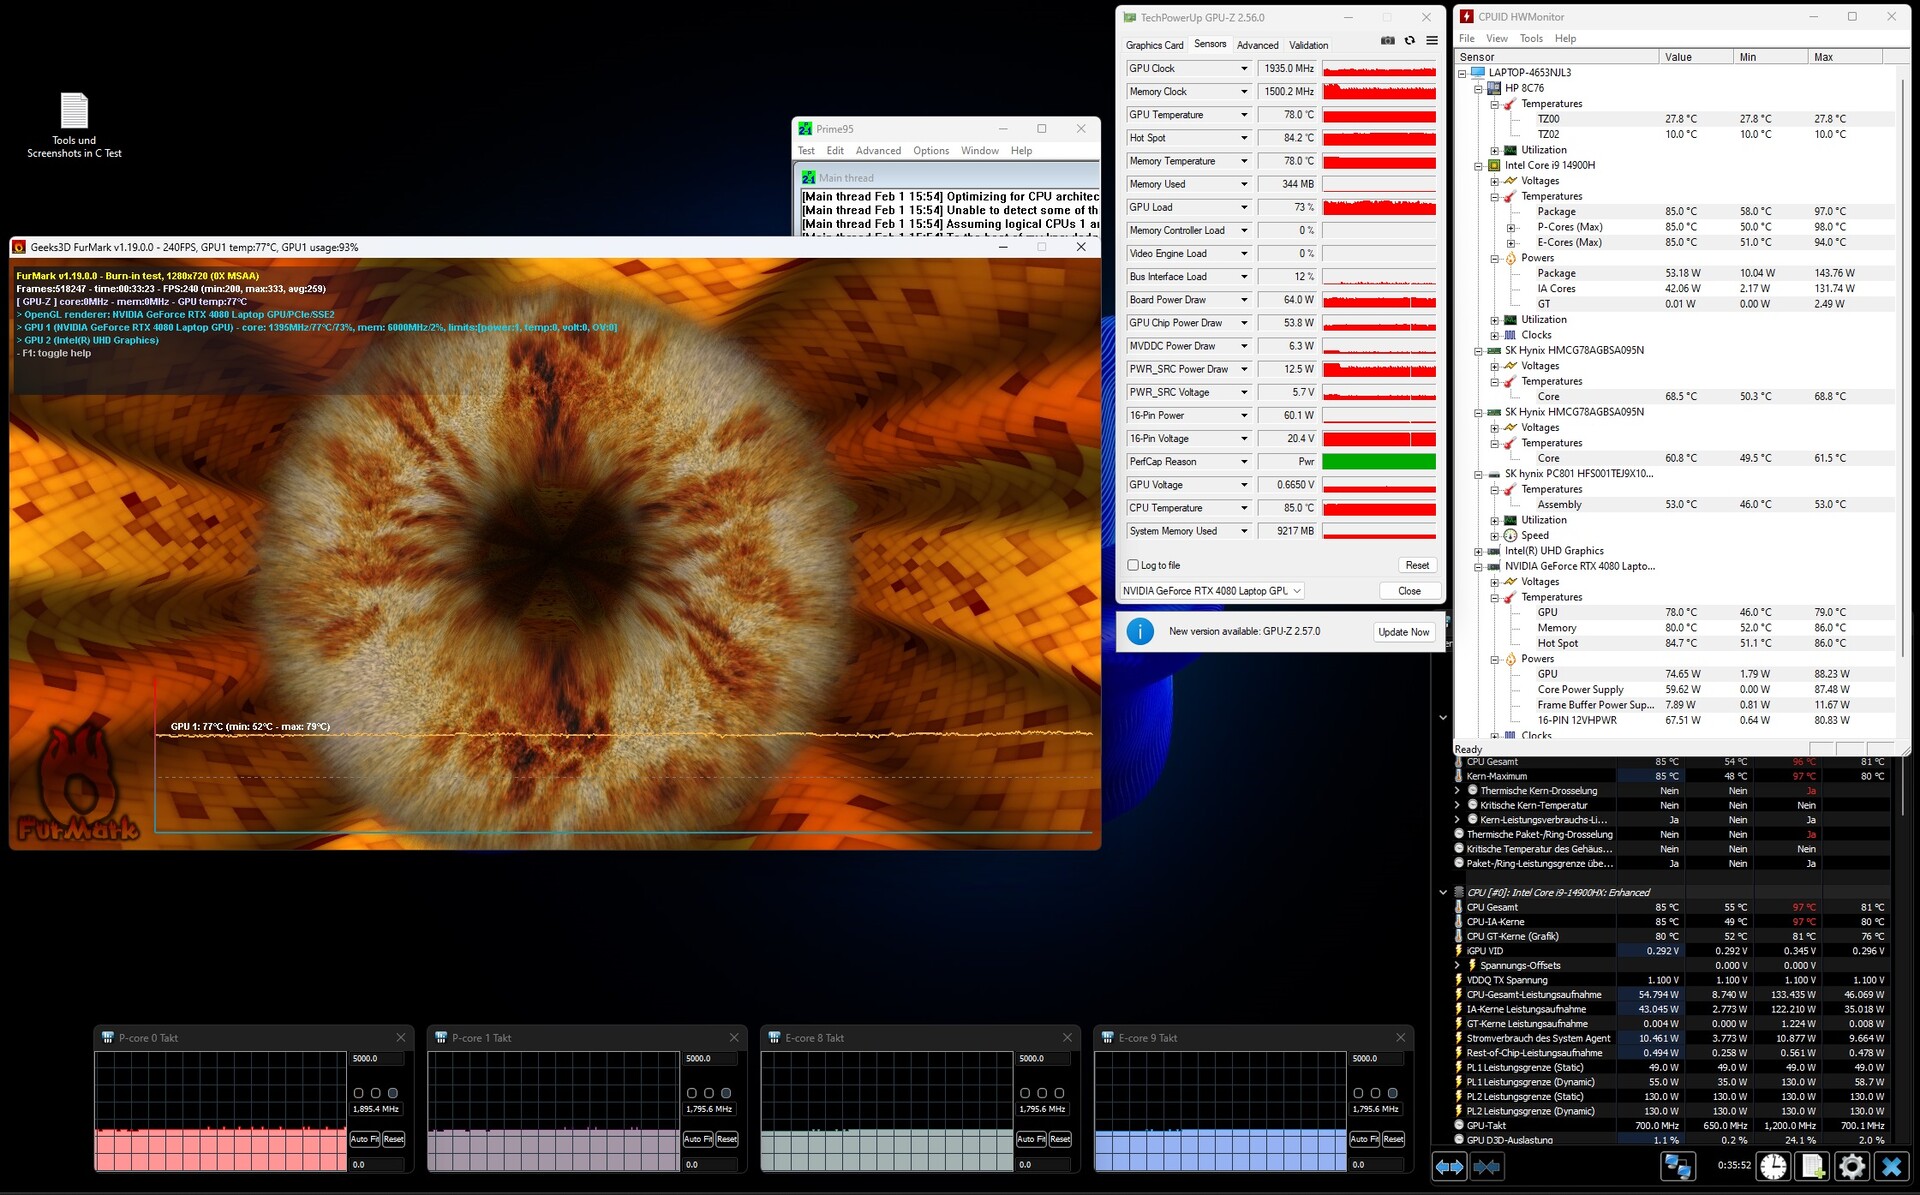
我们的压力测试和Witcher 3 测试导致笔记本电脑温度明显升高,某些地方的皮肤温度超过 50°C (122°F)。不过在日常使用中,温度仍在可接受的范围内。
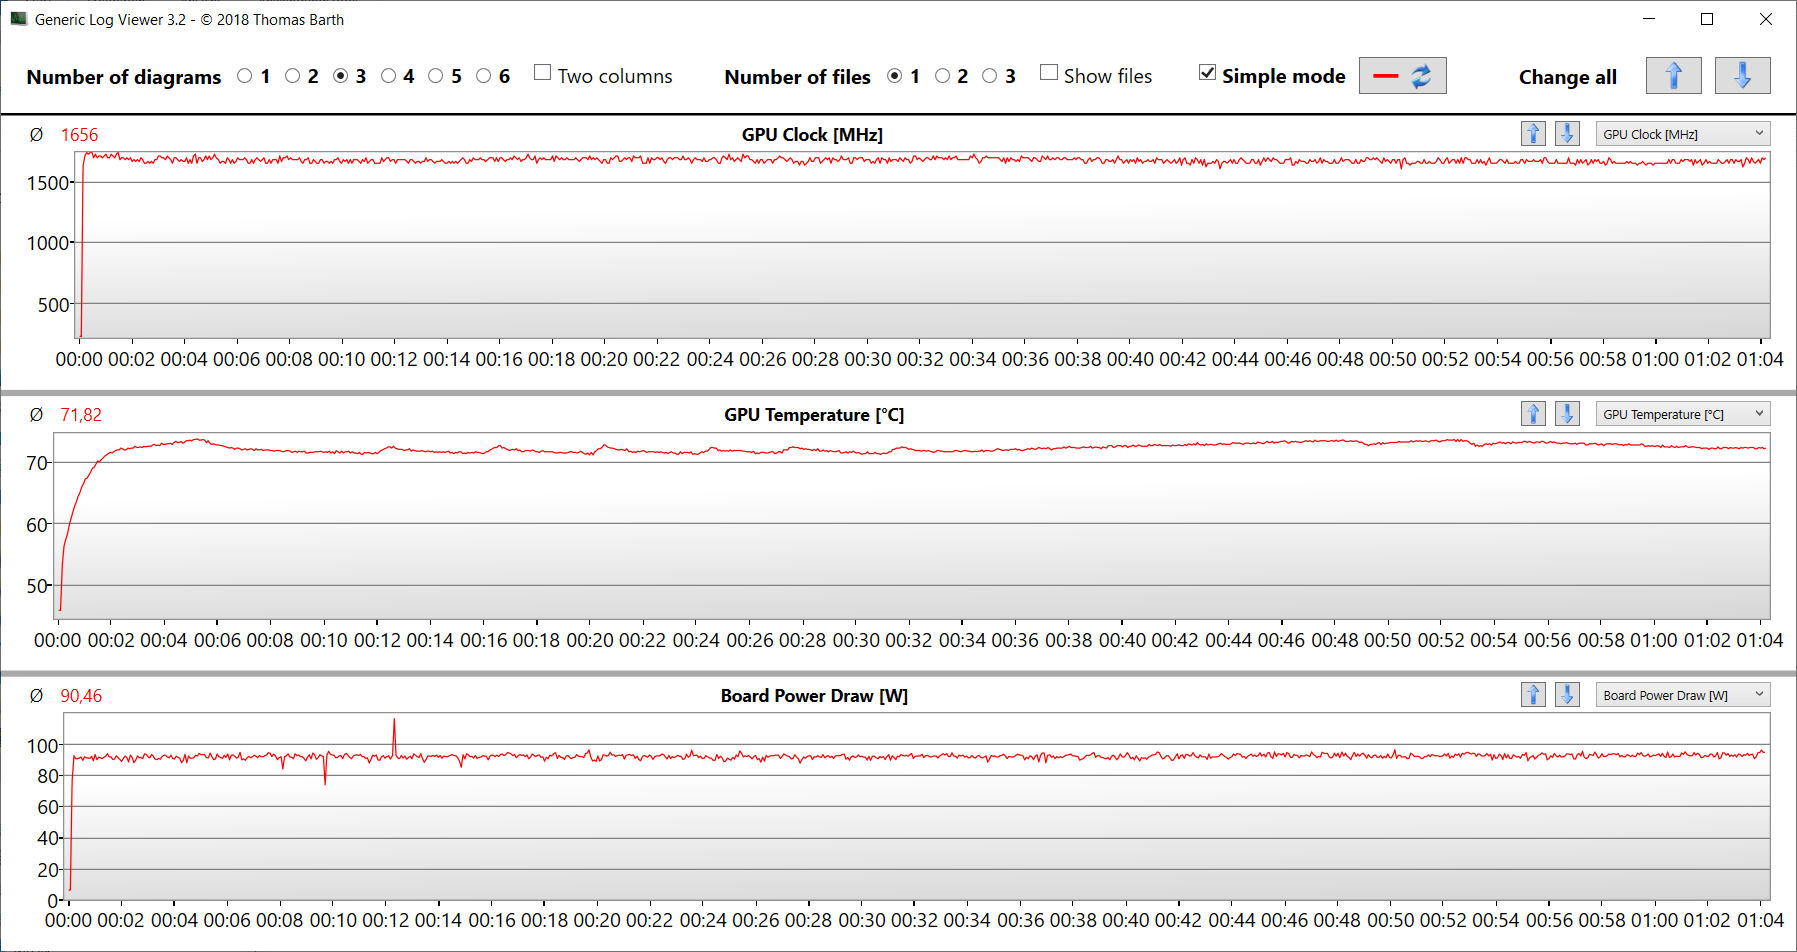
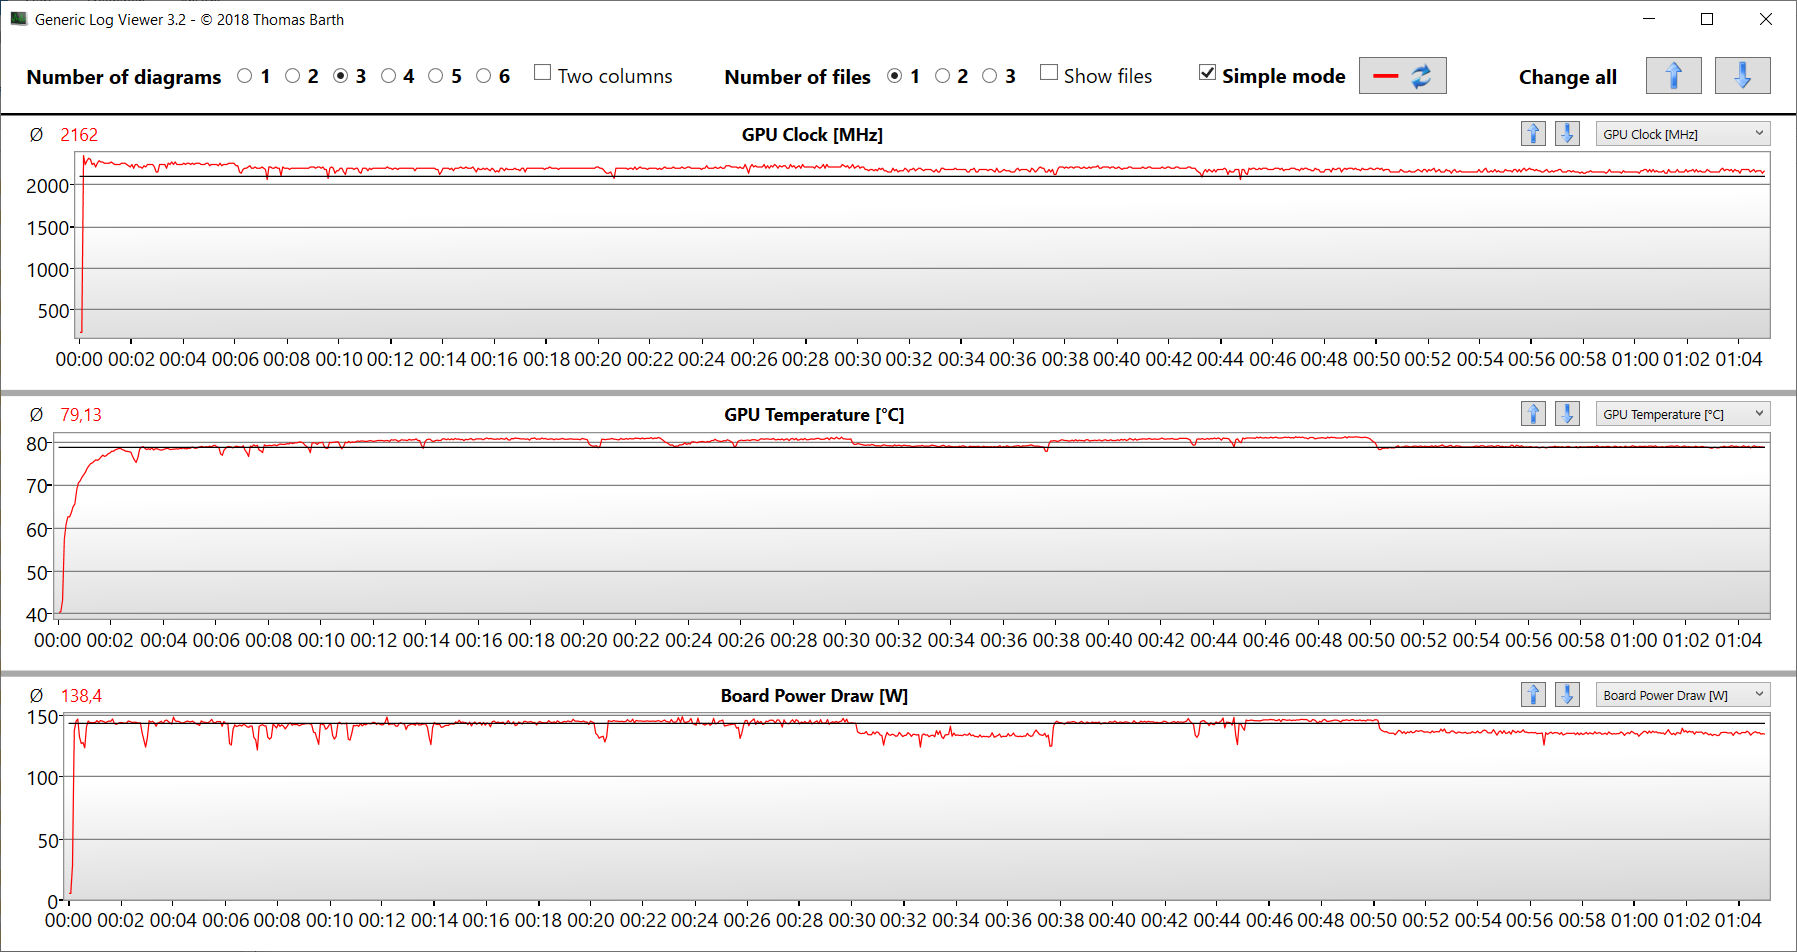
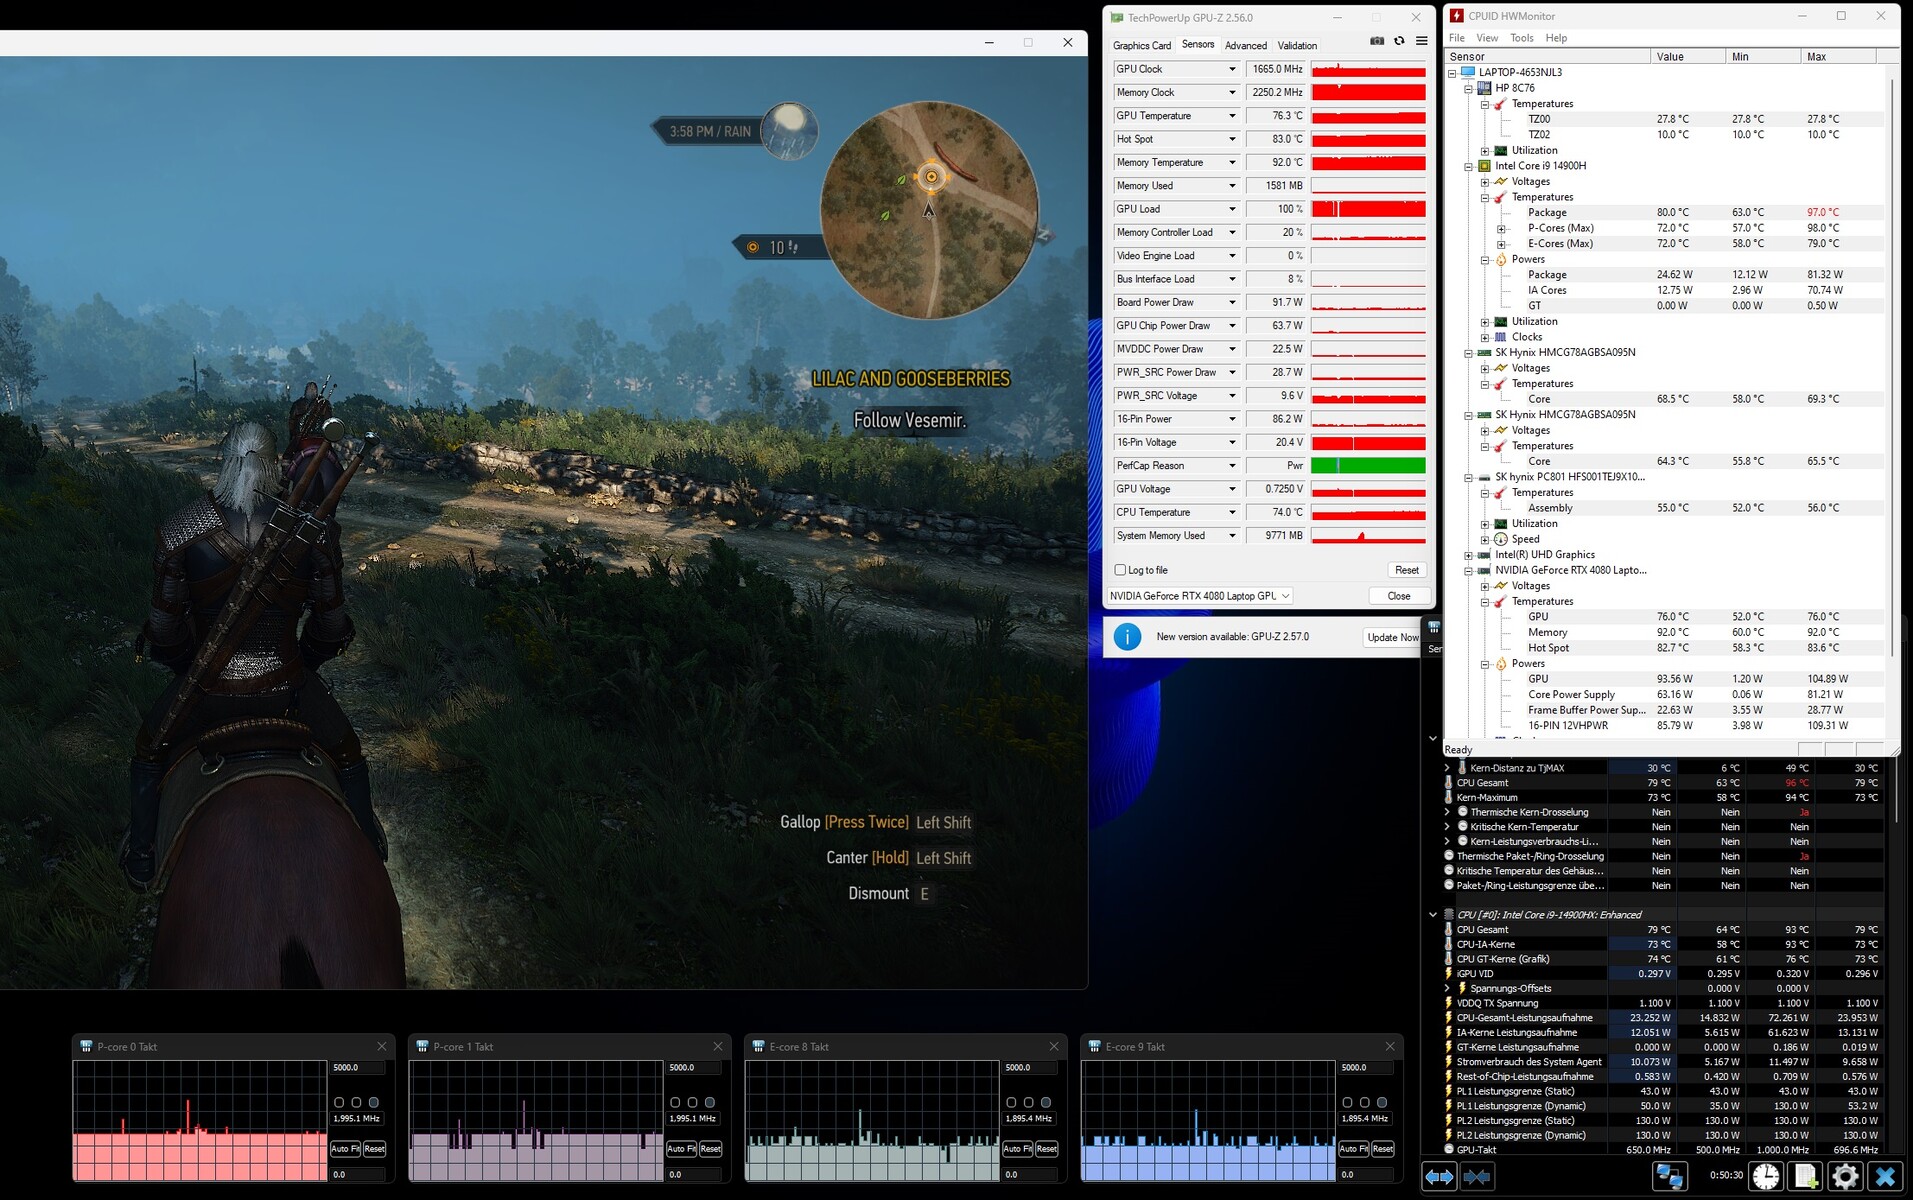
我们的压力测试包括长时间运行 Prime95 和 FurMark,这是一种极端情况,旨在评估系统在满负荷情况下的稳定性。CPU 时钟速度从最初的 3.4 GHz(P)和 2.9 GHz(E)迅速下降到大约 1.8 至 1.9 GHz(P 和 E),然后保持在这一水平。图形处理器的运行速度介于 1.9 和 2 GHz 之间。
(-) The maximum temperature on the upper side is 47 °C / 117 F, compared to the average of 40.4 °C / 105 F, ranging from 21.2 to 68.8 °C for the class Gaming.
(-) The bottom heats up to a maximum of 57 °C / 135 F, compared to the average of 43.2 °C / 110 F
(+) In idle usage, the average temperature for the upper side is 23.9 °C / 75 F, compared to the device average of 33.9 °C / 93 F.
(-) Playing The Witcher 3, the average temperature for the upper side is 39.3 °C / 103 F, compared to the device average of 33.9 °C / 93 F.
(+) The palmrests and touchpad are reaching skin temperature as a maximum (35 °C / 95 F) and are therefore not hot.
(-) The average temperature of the palmrest area of similar devices was 28.8 °C / 83.8 F (-6.2 °C / -11.2 F).
| HP Omen 16 (2024) Intel Core i9-14900HX, NVIDIA GeForce RTX 4080 Laptop GPU | MSI Vector 16 HX A14V Intel Core i9-14900HX, NVIDIA GeForce RTX 4080 Laptop GPU | Alienware m16 R1 AMD AMD Ryzen 9 7845HX, NVIDIA GeForce RTX 4080 Laptop GPU | Acer Predator Helios 18 N23Q2 Intel Core i9-13900HX, NVIDIA GeForce RTX 4080 Laptop GPU | HP Omen 16-wf000 Intel Core i7-13700HX, NVIDIA GeForce RTX 4080 Laptop GPU | |
|---|---|---|---|---|---|
| Heat | 13% | -14% | -15% | -3% | |
| Maximum Upper Side * (°C) | 47 | 36.4 23% | 48 -2% | 35 26% | 45 4% |
| Maximum Bottom * (°C) | 57 | 35.6 38% | 39 32% | 56 2% | 48.8 14% |
| Idle Upper Side * (°C) | 25 | 26.6 -6% | 37 -48% | 34 -36% | 29.2 -17% |
| Idle Bottom * (°C) | 26 | 27 -4% | 36.2 -39% | 39 -50% | 28.8 -11% |
* ... smaller is better
发言人
立体声扬声器整体音效不错,但低音不足。
HP Omen 16 (2024) audio analysis
(±) | speaker loudness is average but good (78 dB)
Bass 100 - 315 Hz
(-) | nearly no bass - on average 15.2% lower than median
(±) | linearity of bass is average (14.3% delta to prev. frequency)
Mids 400 - 2000 Hz
(+) | balanced mids - only 4.8% away from median
(+) | mids are linear (5% delta to prev. frequency)
Highs 2 - 16 kHz
(+) | balanced highs - only 2% away from median
(+) | highs are linear (4.1% delta to prev. frequency)
Overall 100 - 16.000 Hz
(+) | overall sound is linear (14.7% difference to median)
Compared to same class
» 29% of all tested devices in this class were better, 7% similar, 64% worse
» The best had a delta of 6%, average was 18%, worst was 132%
Compared to all devices tested
» 19% of all tested devices were better, 4% similar, 77% worse
» The best had a delta of 4%, average was 23%, worst was 134%
MSI Vector 16 HX A14V audio analysis
(+) | speakers can play relatively loud (85 dB)
Bass 100 - 315 Hz
(±) | reduced bass - on average 12.7% lower than median
(+) | bass is linear (6.8% delta to prev. frequency)
Mids 400 - 2000 Hz
(+) | balanced mids - only 3% away from median
(+) | mids are linear (3.6% delta to prev. frequency)
Highs 2 - 16 kHz
(+) | balanced highs - only 3.1% away from median
(+) | highs are linear (6.7% delta to prev. frequency)
Overall 100 - 16.000 Hz
(+) | overall sound is linear (12.6% difference to median)
Compared to same class
» 16% of all tested devices in this class were better, 4% similar, 81% worse
» The best had a delta of 6%, average was 18%, worst was 132%
Compared to all devices tested
» 11% of all tested devices were better, 3% similar, 86% worse
» The best had a delta of 4%, average was 23%, worst was 134%
耗电量
Omen 16 在耗电方面没有表现出任何问题,耗电水平在内部硬件的正常范围内。在接受Witcher 3 测试和压力测试时,笔记本电脑的耗电量保持稳定。充电器的额定功率为 280 瓦,对于 Omen 来说足够强劲。
| Off / Standby | |
| Idle | |
| Load |
|
Key:
min: | |
Power consumption Witcher 3 / Stress test
Power consumption with external monitor
电池寿命
这款 16 英寸笔记本电脑在实际 Wi-Fi 测试(使用脚本访问网站以模拟负载)中的续航时间为 5 小时 52 分钟--这是一个不错的结果。因此,在我们的比较中,Omen 的电池续航时间是最好的,而且比其前代产品 前代产品了 45 分钟。
Pros
Cons
结论 - 坚固的游戏巨兽
游戏、流媒体和渲染是惠普 Omen 16 擅长的几项功能。处理器 酷睿 i9-14900HX和 GeForce RTX 4080提供了必要的性能,而 1 TB PCIe 4.0 固态硬盘则确保了较短的加载时间。此类笔记本电脑的发热和噪音通常较高。但 Omen 16 通过放弃性能,将它们控制在了适中的水平。
惠普 Omen 16(2024)是一款性能稳定、功能强大的游戏笔记本电脑,注重基本功能。
惠普一反使用 16:10 显示屏的潮流,决定坚持使用 16:9 长宽比。16.1 英寸面板(2560 x 1440 像素、sRGB、IPS、240Hz、G-Sync)整体给人留下了很好的印象。尽管如此,一台售价 3,200 欧元(3,446 美元)的笔记本电脑的显示屏应该在亮度和色彩覆盖方面提供更多。
两个 USB-C 端口(Thunderbolt 4)可以轻松地将笔记本电脑集成到现有的工作站设置中,并提供扩展选项(如外置 GPU、底座)。两个端口均可输出 DisplayPort 信号,并支持 Power Delivery。笔记本电脑的电池续航时间也不错。
微星 微星 Vector 16 HX A14V是 Omen 16 的潜在替代品。在 CPU/GPU 组合相同的情况下,Vector 16 性能更强,显示屏(DCI-P3,16:10)更亮、更鲜艳。不过,Vector 只有一个 Thunderbolt 4 端口,屏幕不支持 G-Sync。
价格和供应情况
在德国,HP Omen 16-wf1078ng 可在Office-Partner.de 和 Otto.de 等零售商处购买。和Otto.de等零售商有售,售价 3,200 欧元(3,446 美元)。您还可以在美国亚马逊网站上找到配备酷睿 i7-13700HX 和 RTX 4060 的低配置机型,售价为1,500 美元。
HP Omen 16 (2024)
- 02/16/2024 v7 (old)
Sascha Mölck
Transparency
The selection of devices to be reviewed is made by our editorial team. The test sample was provided to the author as a loan by the manufacturer or retailer for the purpose of this review. The lender had no influence on this review, nor did the manufacturer receive a copy of this review before publication. There was no obligation to publish this review. As an independent media company, Notebookcheck is not subjected to the authority of manufacturers, retailers or publishers.
This is how Notebookcheck is testing
Every year, Notebookcheck independently reviews hundreds of laptops and smartphones using standardized procedures to ensure that all results are comparable. We have continuously developed our test methods for around 20 years and set industry standards in the process. In our test labs, high-quality measuring equipment is utilized by experienced technicians and editors. These tests involve a multi-stage validation process. Our complex rating system is based on hundreds of well-founded measurements and benchmarks, which maintains objectivity. Further information on our test methods can be found here.
Price comparison

