华硕 ROG Strix Scar 16 (2024) 笔记本电脑评测:炽热性能和迷你 LED 光彩,价格合理
评测")
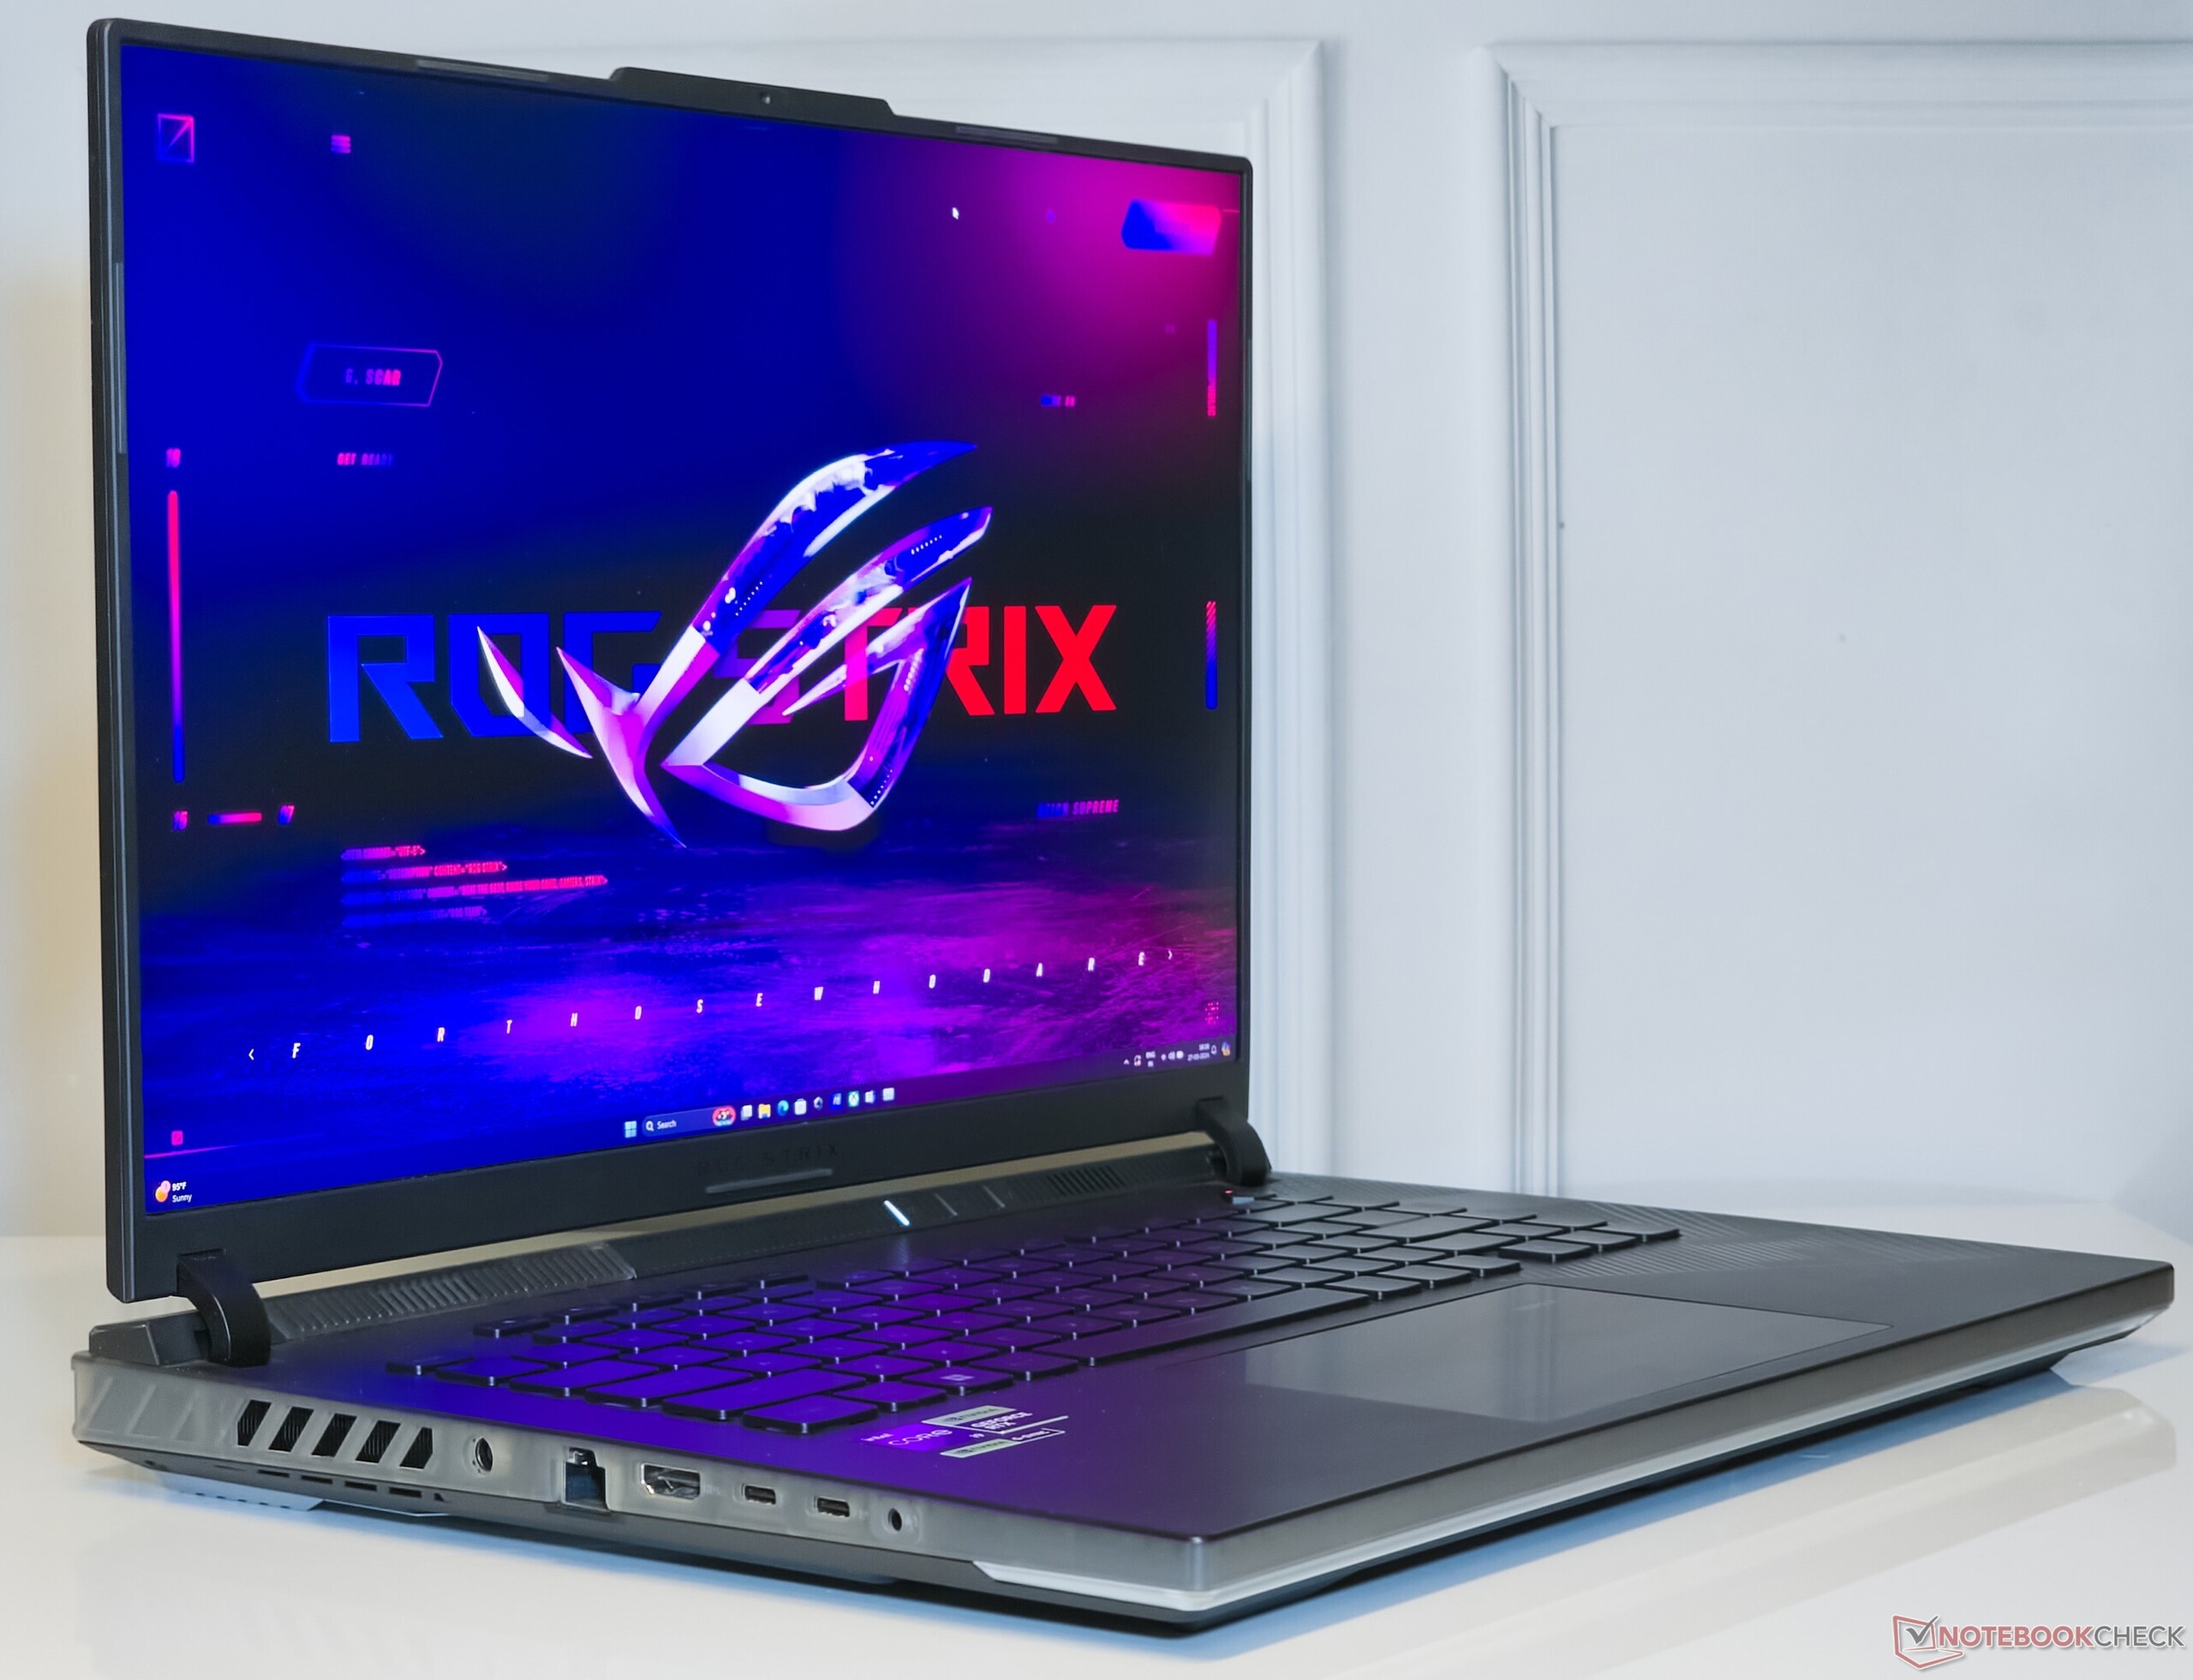
华硕在 CES 2024 上升级了整个笔记本电脑阵容。在 2024 年的游戏产品中,我们评测了 ROG Zephyrus G14, ROG Zephyrus G16和 ROG Strix Scar 18到目前为止。今天,我们来看看全新的 ROG Strix Scar 16。
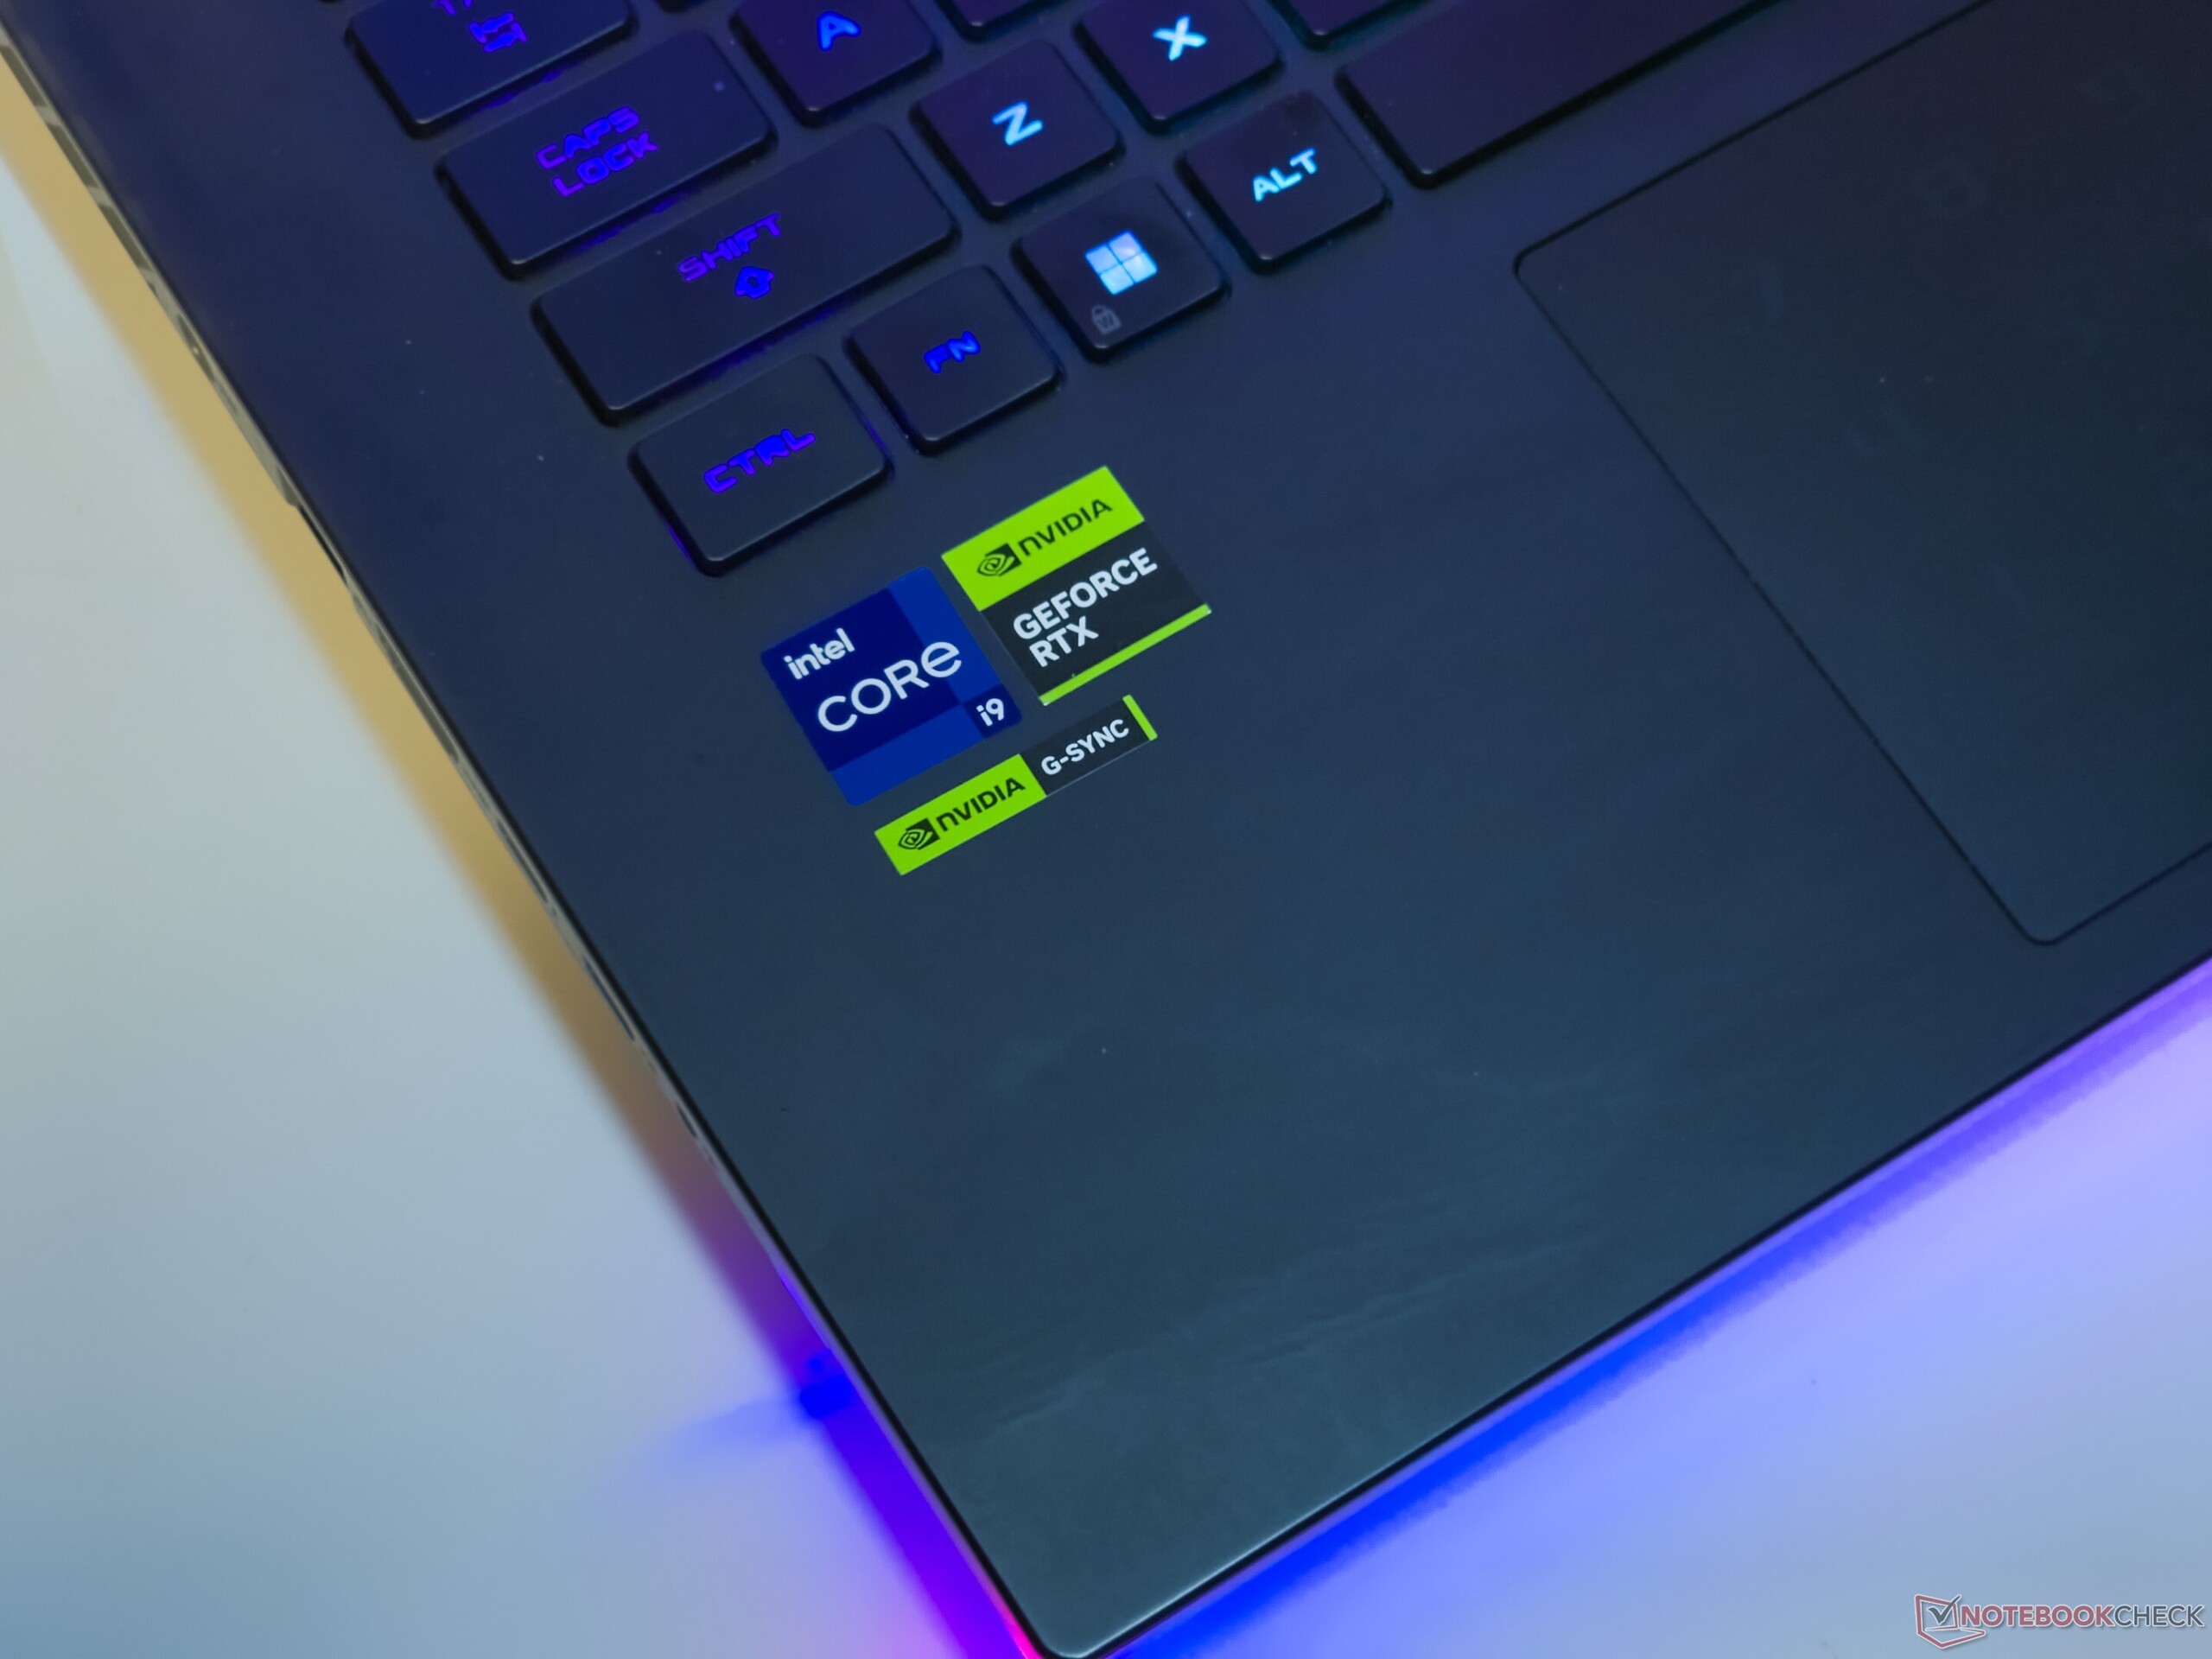
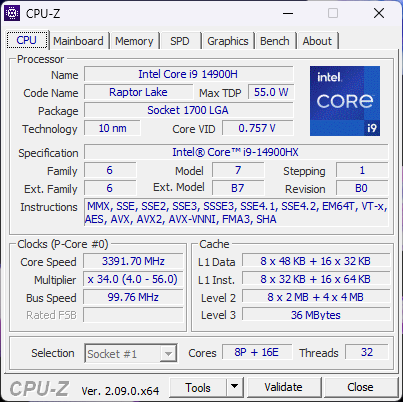
ROG Strix Scar 16 面向高端游戏人群,并配备了必要的硬件。我们的测试设备基于 英特尔酷睿 i9-14900HXRaptor Lake-HX 处理器,辅以 175 W 英伟达GeForce RTX 4080 笔记本电脑 GPU.
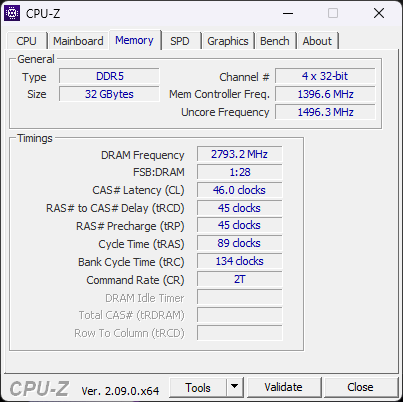
其他令人垂涎的配置还包括 32 GB DDR5-5600 内存、2 TB NVMe SSD 和 QHD+ 240 Hz mini-LED G-Sync 显示屏,这些配置加在一起可以让你的钱包毫不犹豫地掏出 2,89,990 镑(约合 3,473 美元)。
潜在的竞争对手比较
Rating | Date | Model | Weight | Height | Size | Resolution | Price |
|---|---|---|---|---|---|---|---|
| 87.6 % v7 (old) | 04 / 2024 | Asus ROG Strix Scar 16 G634JZR i9-14900HX, GeForce RTX 4080 Laptop GPU | 2.7 kg | 30.4 mm | 16.00" | 2560x1600 | |
| 87.2 % v7 (old) | 08 / 2023 | Asus ROG Strix Scar 17 G733PYV-LL053X R9 7945HX3D, GeForce RTX 4090 Laptop GPU | 2.9 kg | 28.3 mm | 17.30" | 2560x1440 | |
| 88.4 % v7 (old) | 03 / 2023 | Asus ROG Strix G16 G614JZ i9-13980HX, GeForce RTX 4080 Laptop GPU | 2.4 kg | 30.4 mm | 16.00" | 2560x1600 | |
| 89.5 % v7 (old) | 03 / 2024 | Lenovo Legion Pro 7 16IRX9H i9-14900HX, GeForce RTX 4080 Laptop GPU | 2.7 kg | 21.95 mm | 16.00" | 2560x1600 | |
| 86.7 % v7 (old) | 02 / 2024 | HP Omen 16 (2024) i9-14900HX, GeForce RTX 4080 Laptop GPU | 2.4 kg | 23.5 mm | 16.10" | 2560x1440 | |
| 88 % v7 (old) | 02 / 2024 | MSI Vector 16 HX A14V i9-14900HX, GeForce RTX 4080 Laptop GPU | 2.7 kg | 28.55 mm | 16.00" | 2560x1600 | |
| 90.2 % v7 (old) | 03 / 2024 | Alienware m16 R2 Ultra 7 155H, GeForce RTX 4070 Laptop GPU | 2.5 kg | 23.5 mm | 16.00" | 2560x1600 |
底盘主要为塑料材质,有一个半透明的透视窗
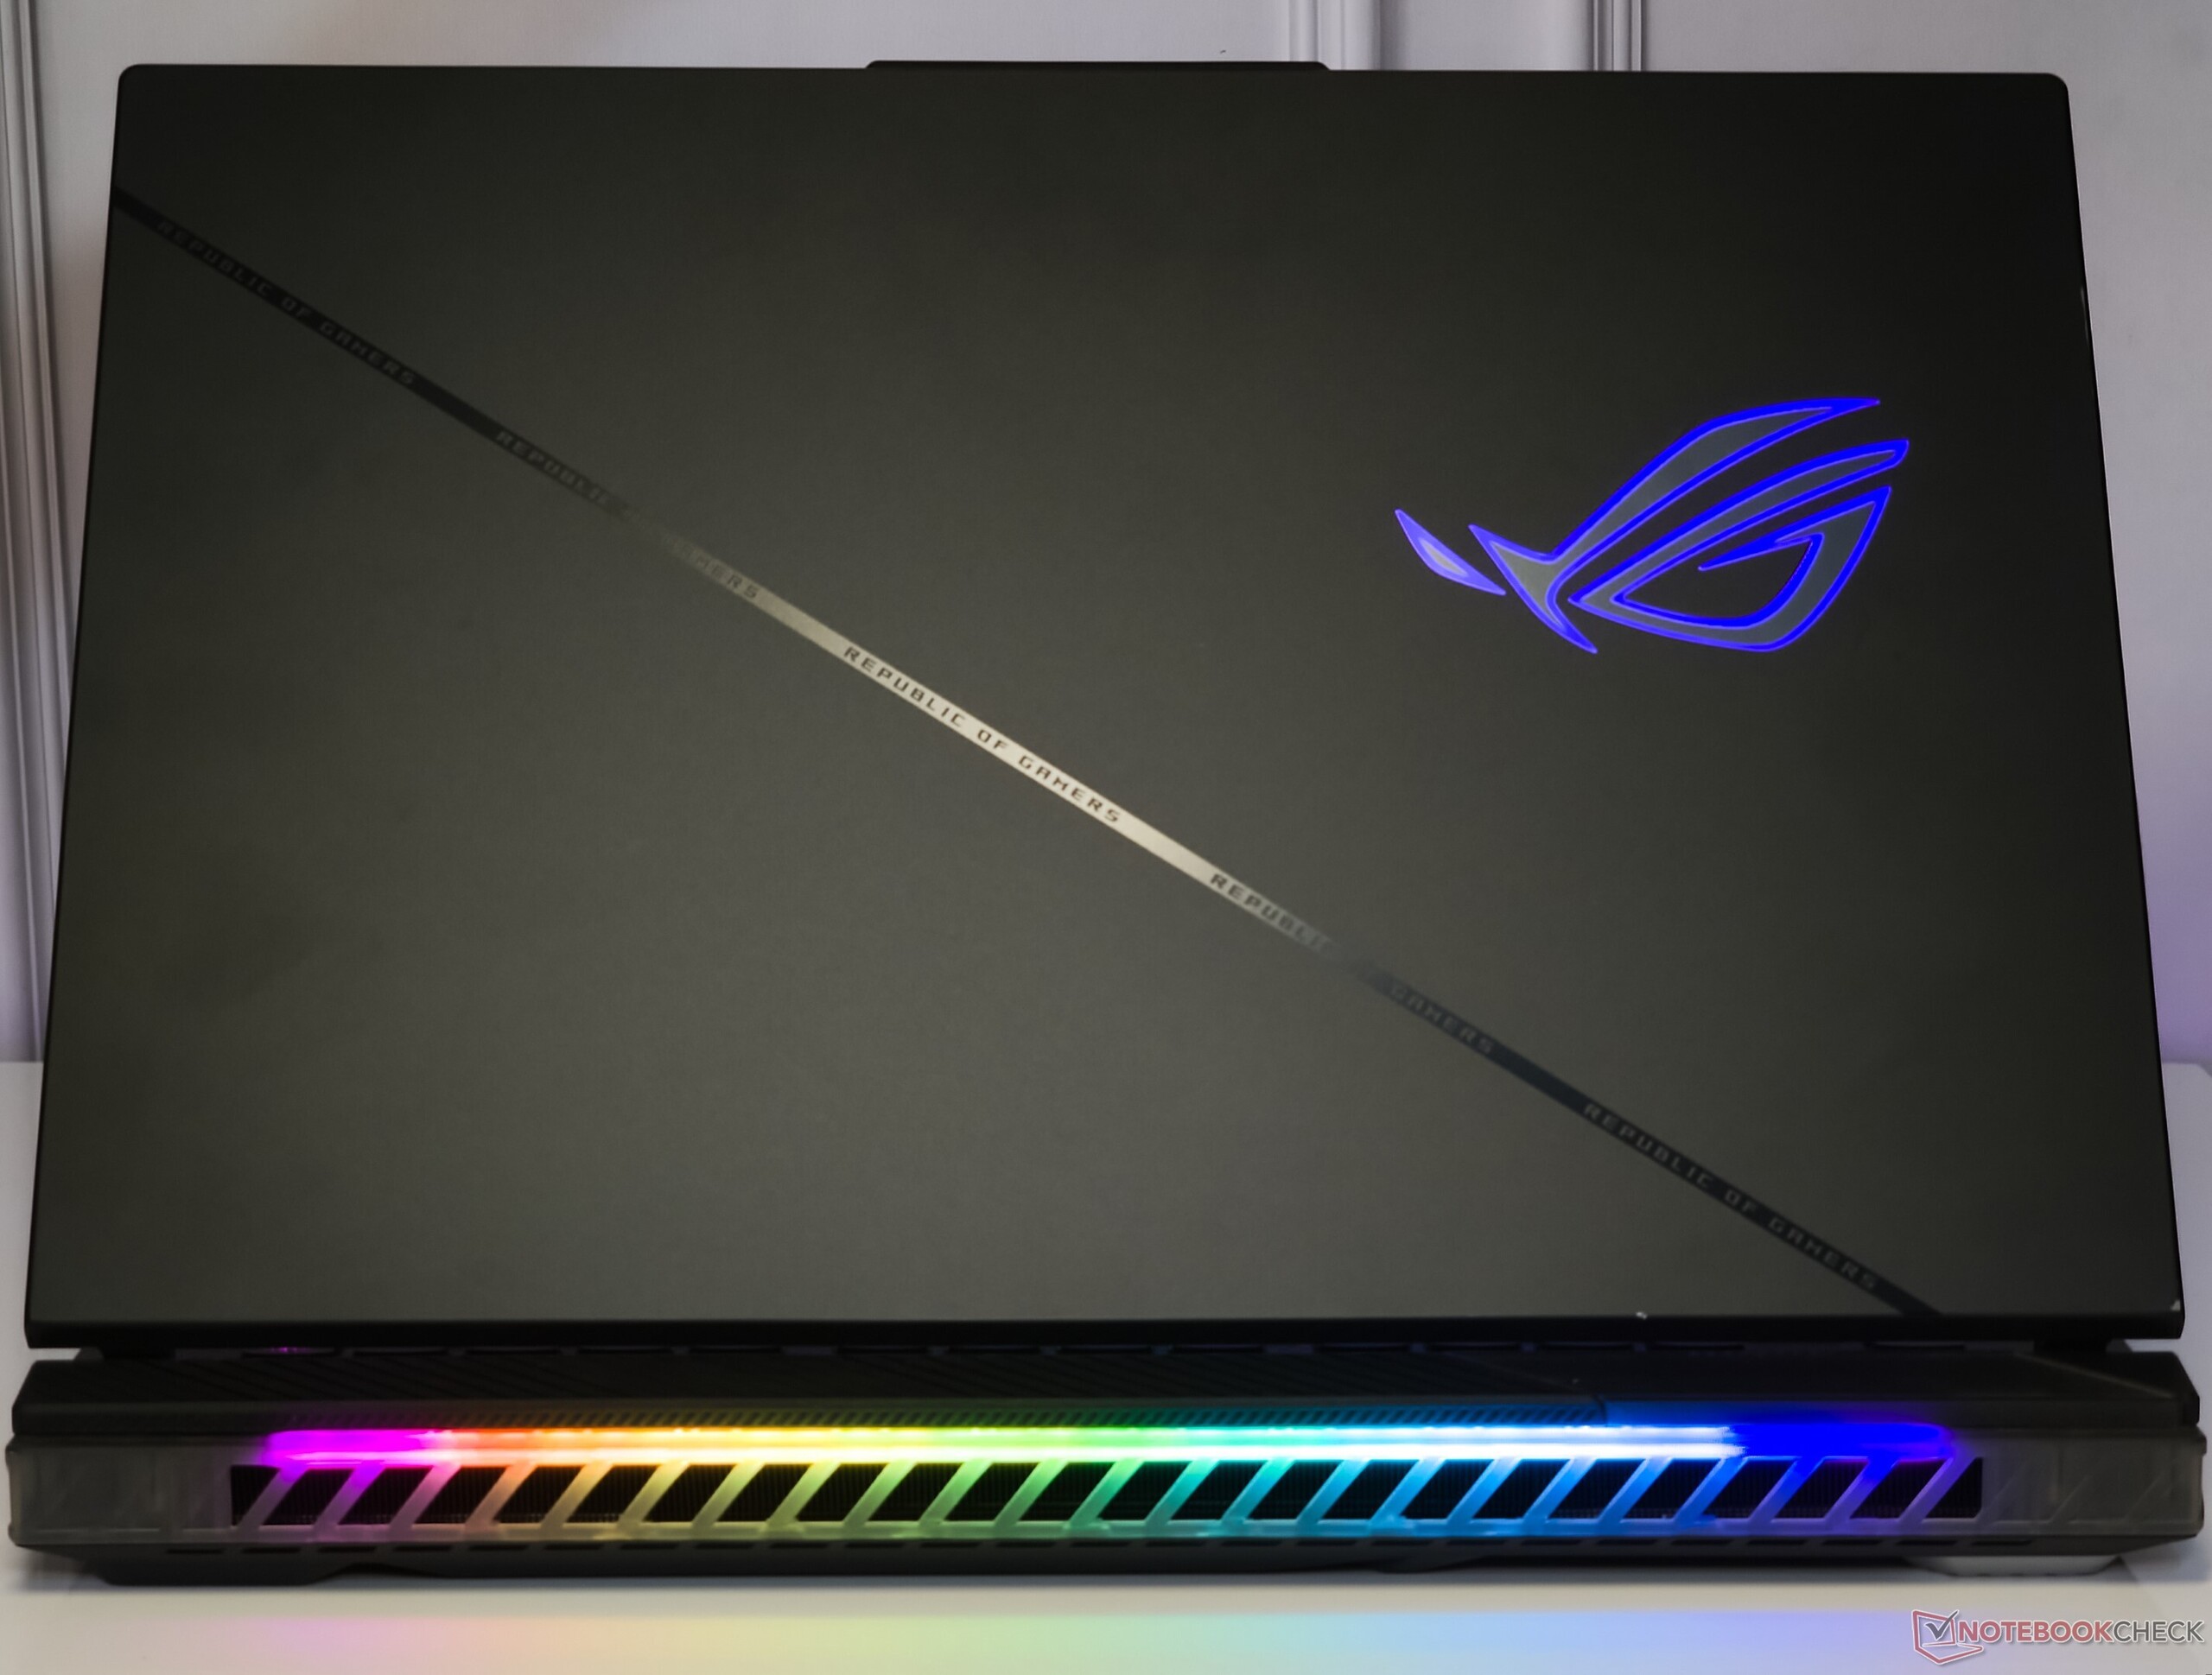
今年的 ROG Strix Scar 16 采用了我们熟悉的设计语言,正如我们之前在 2022 Scar 15但重量增加了 350 克,达到 2.65 千克。
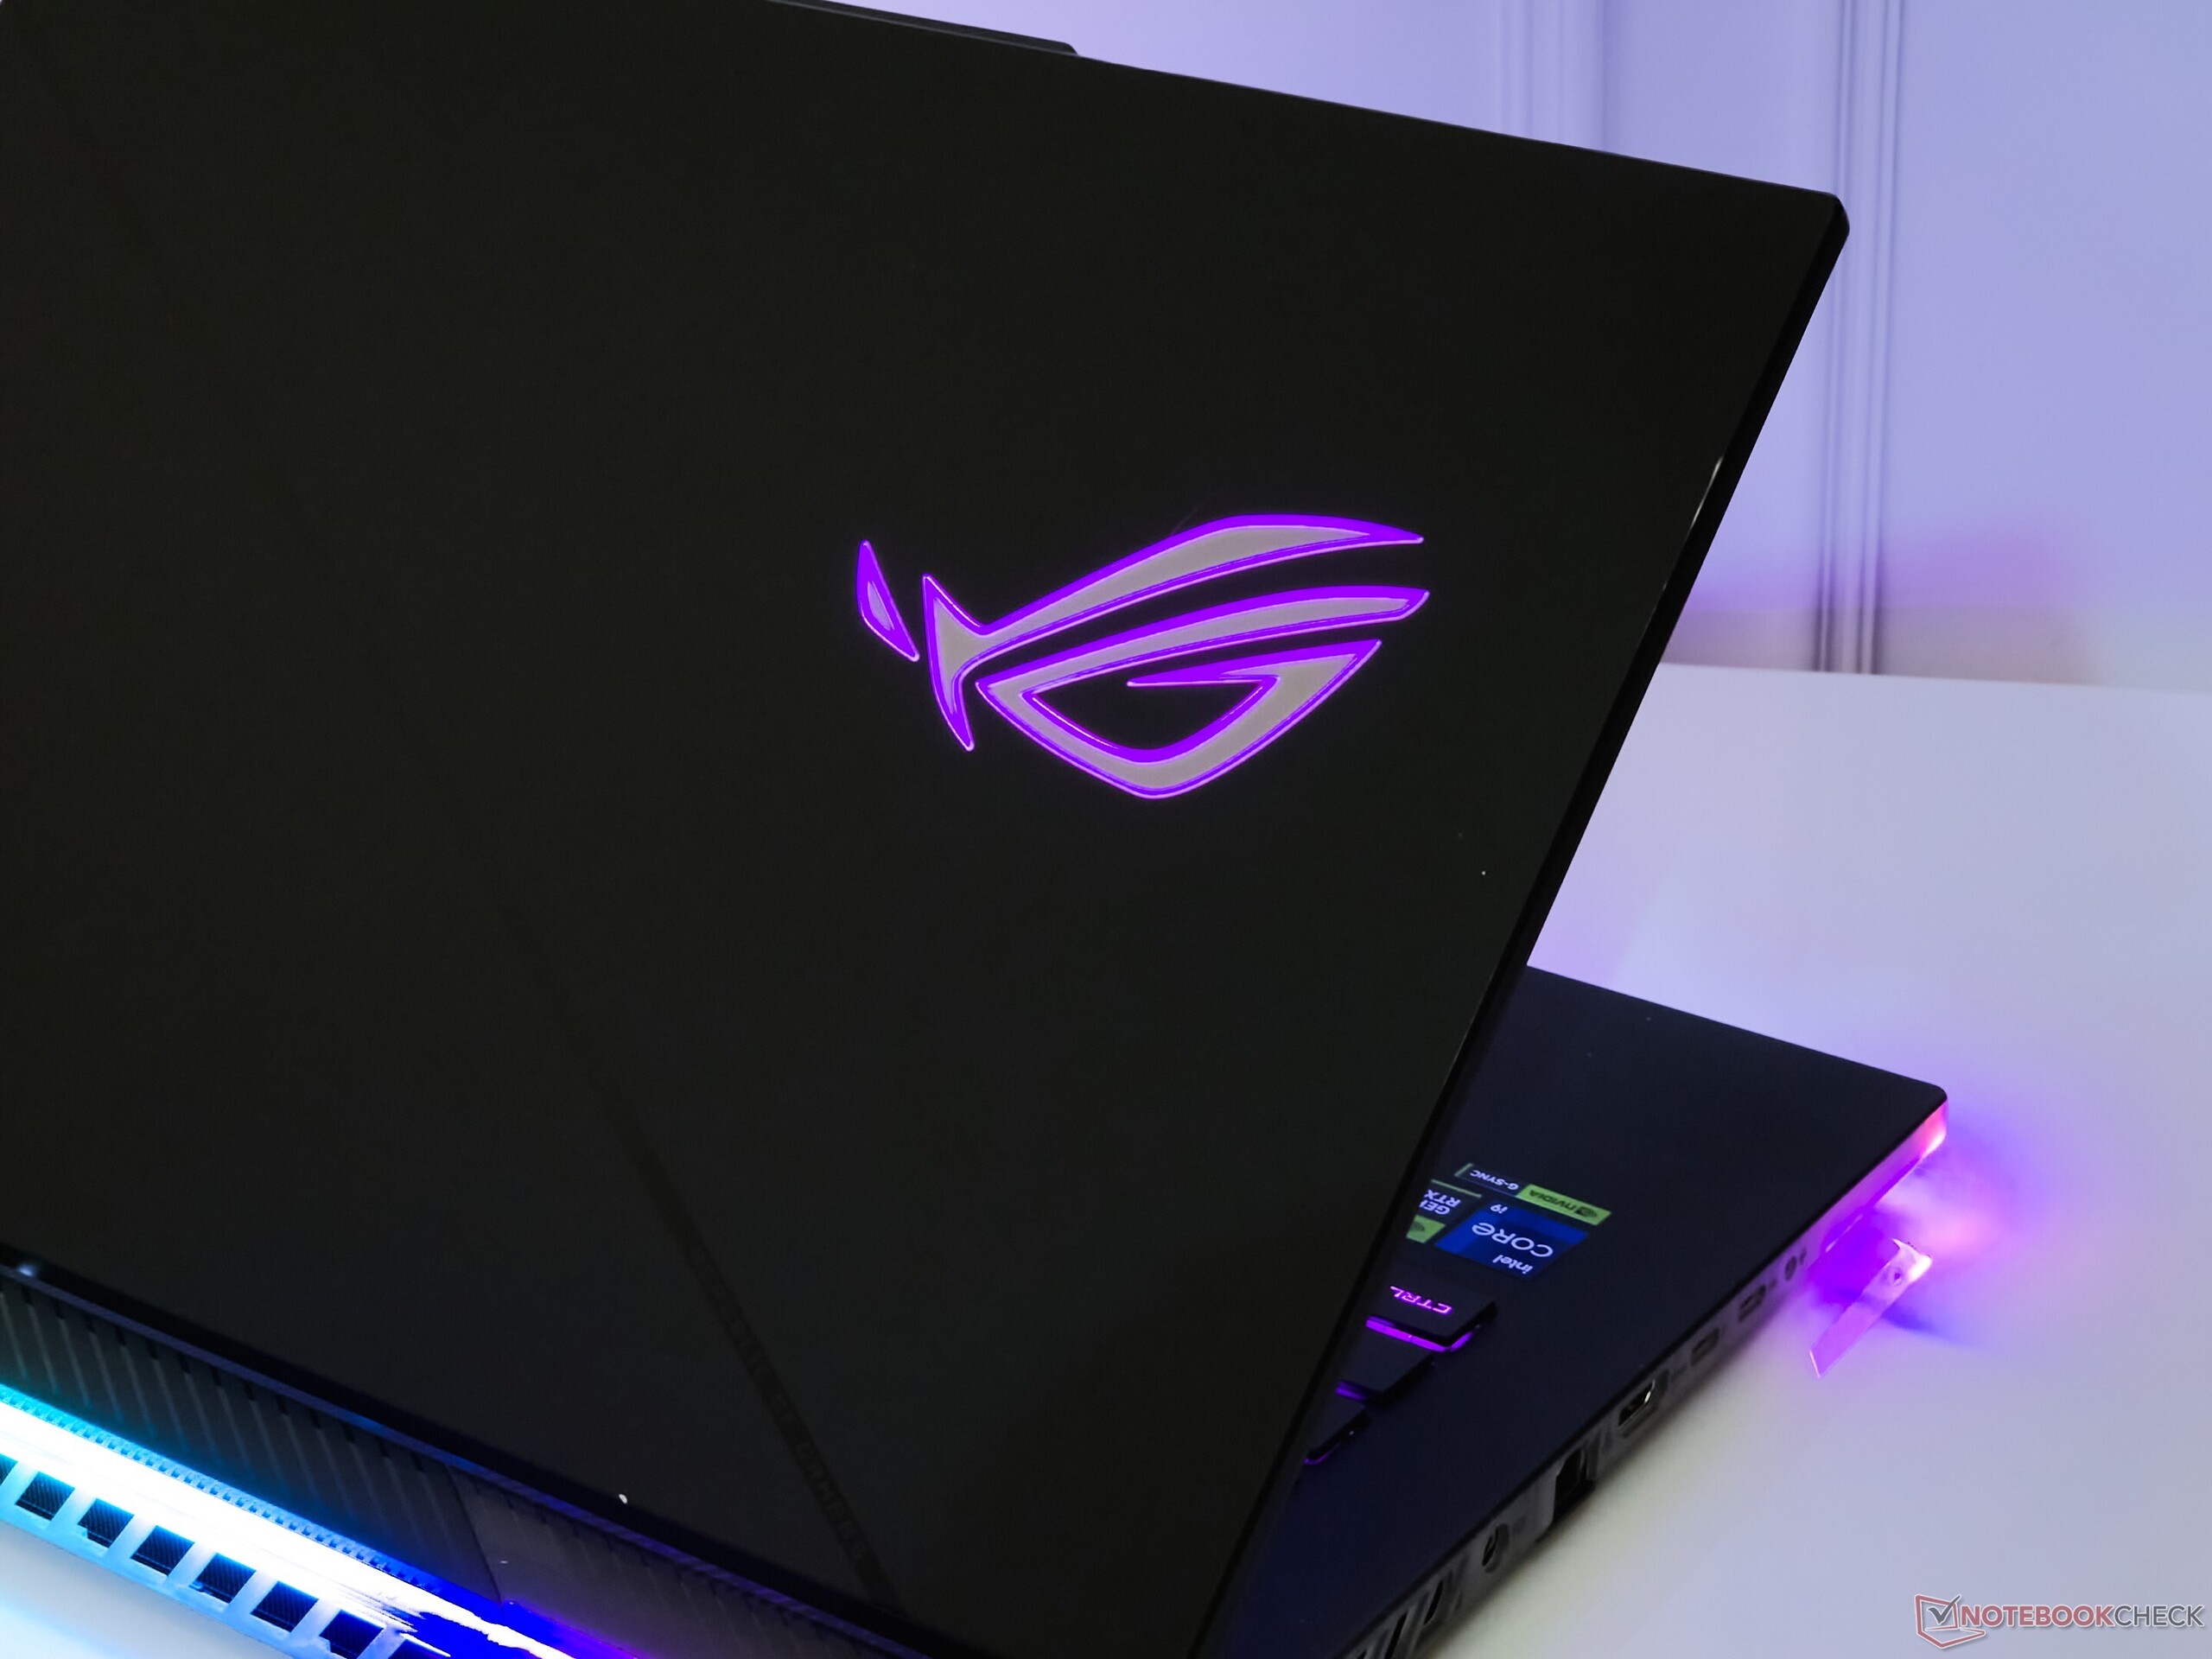
虽然是塑料结构,但机身不会弯曲。磨砂处理的铝制盖子看起来也相当坚固,铰链稳定。
单指就能打开盖子,笔记本电脑不会在桌面上滑动,橡胶底座进一步防止了滑动。
熟悉 Scar 系列的用户会注意到,键盘面板上不再有带有 ROG 徽标的白色斜条纹。
键盘面板的上半部分和以前一样保持半透明状态,让人可以窥探到下面的内部结构。不过,华硕在键盘面板的防指纹和防油污方面做得很少。
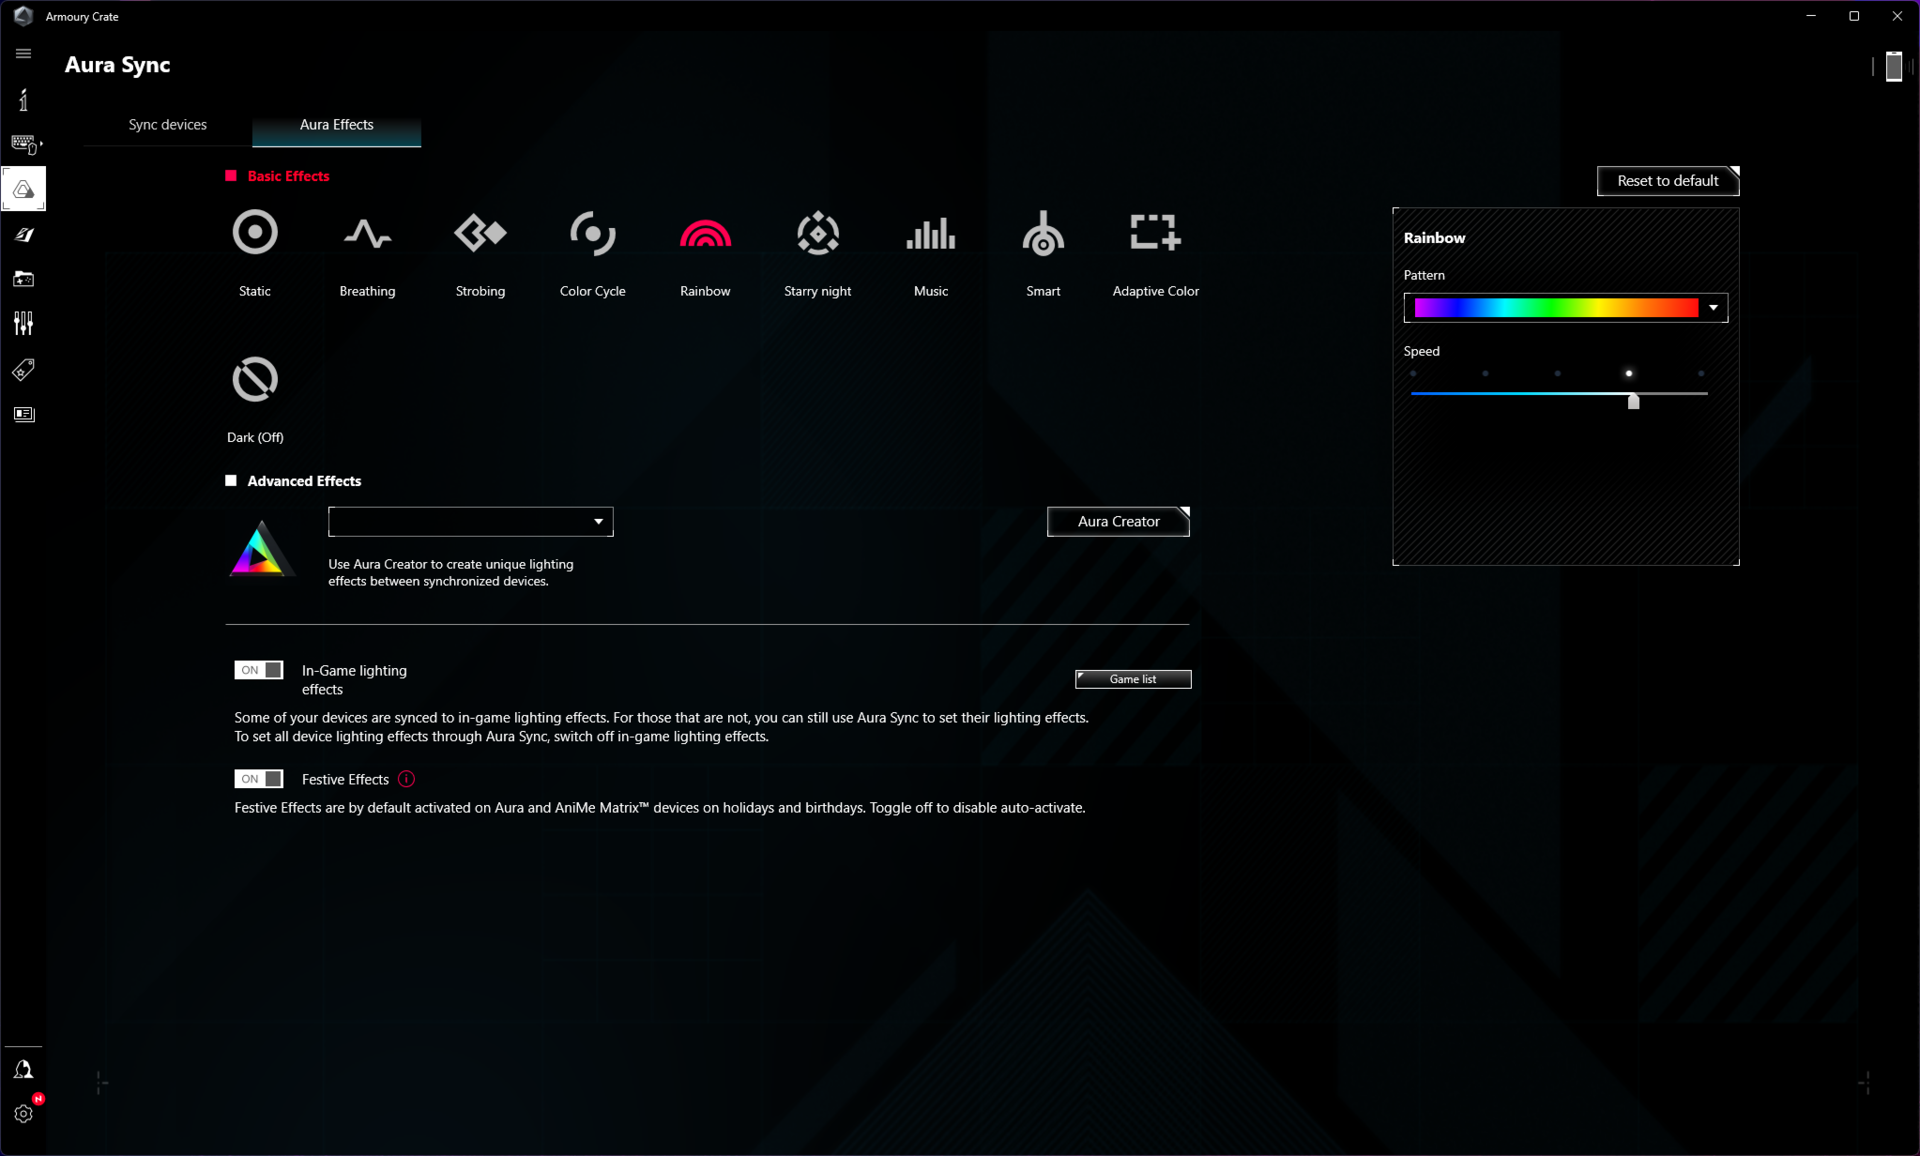
Scar 16 的键盘、底座、后部和 ROG 徽标都采用了 RGB 色彩,可通过 Armory Crate 进行控制和定制。不过,没有明显的方法可以单独点亮这些区域--要么全部采用 RGB,要么全部不采用。
秉承 Scar 的精神,华硕允许您自定义设计和 3D 打印ROG Armor 帽 ,以实现个性化。
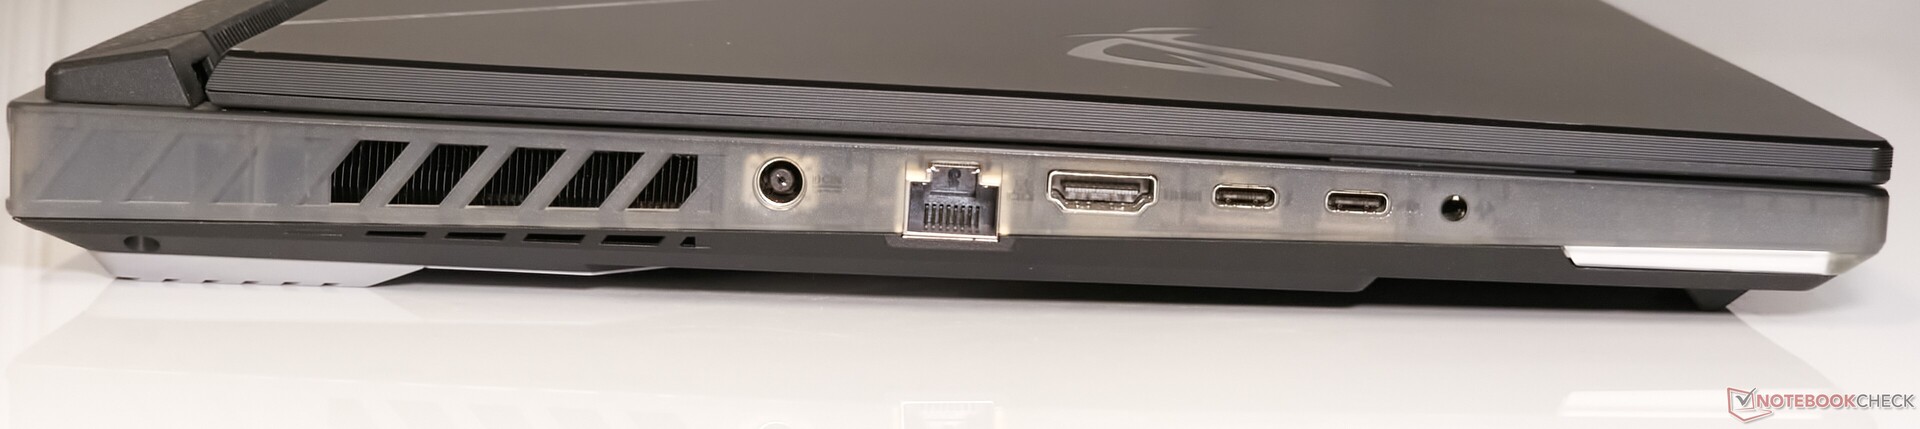
连接性普通的 Wi-Fi 5 和 100 W USB 电源
ROG Strix Scar 16 采用了与去年迭代产品相同的端口布局和功能。华硕不再提供 ROG Keystone,尽管它的实用性值得怀疑,但它一直是 Scar 系列的一大特色。
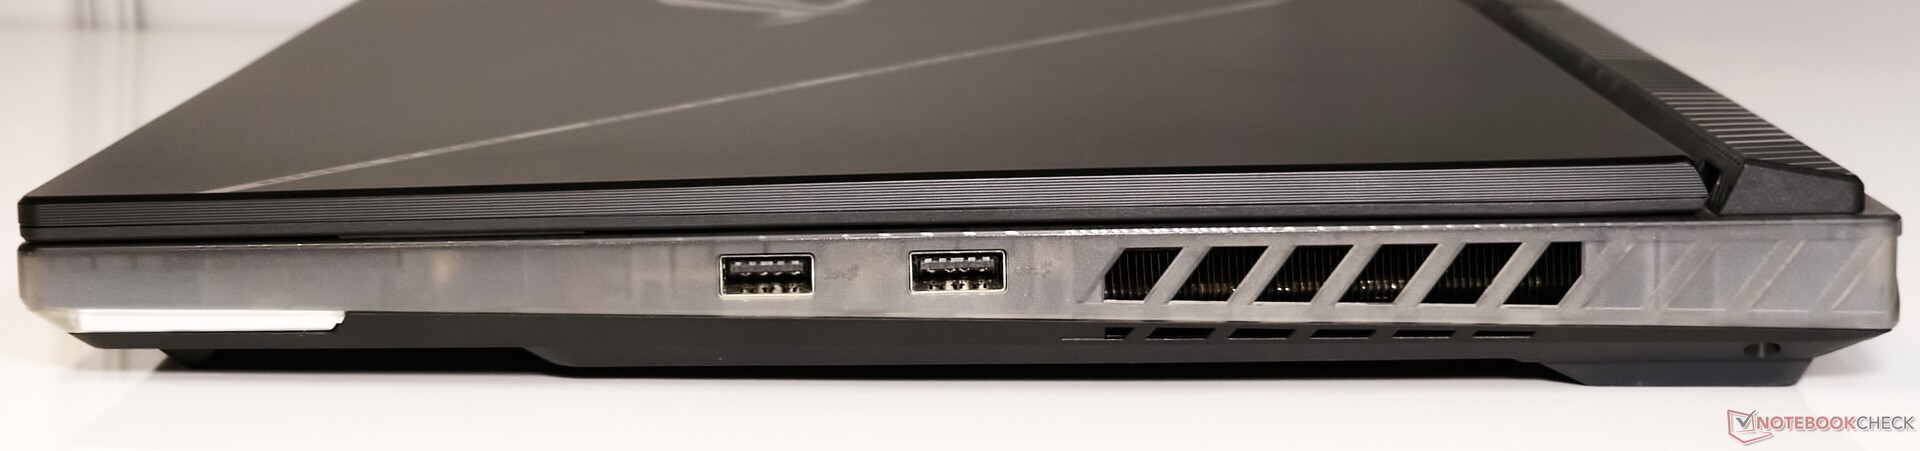
端口分布不均。除了右侧的两个 USB 3.2 Gen2 Type-A 端口外,所有其他端口都位于左侧。不过,这些端口间距适中,在连接多个外设时不会造成任何阻碍。
有两个 USB Type-C 端口,其中一个是 Thunderbolt 4。Thunderbolt 4 端口允许 DisplayPort 1.4 输出,但不能充电。而 USB 3.2 Gen2 Type-C 端口不仅提供 DisplayPort 输出,还能提供 100 W 的功率输出。
机身后部完全用于容纳散热设备,因此没有任何端口。
交流
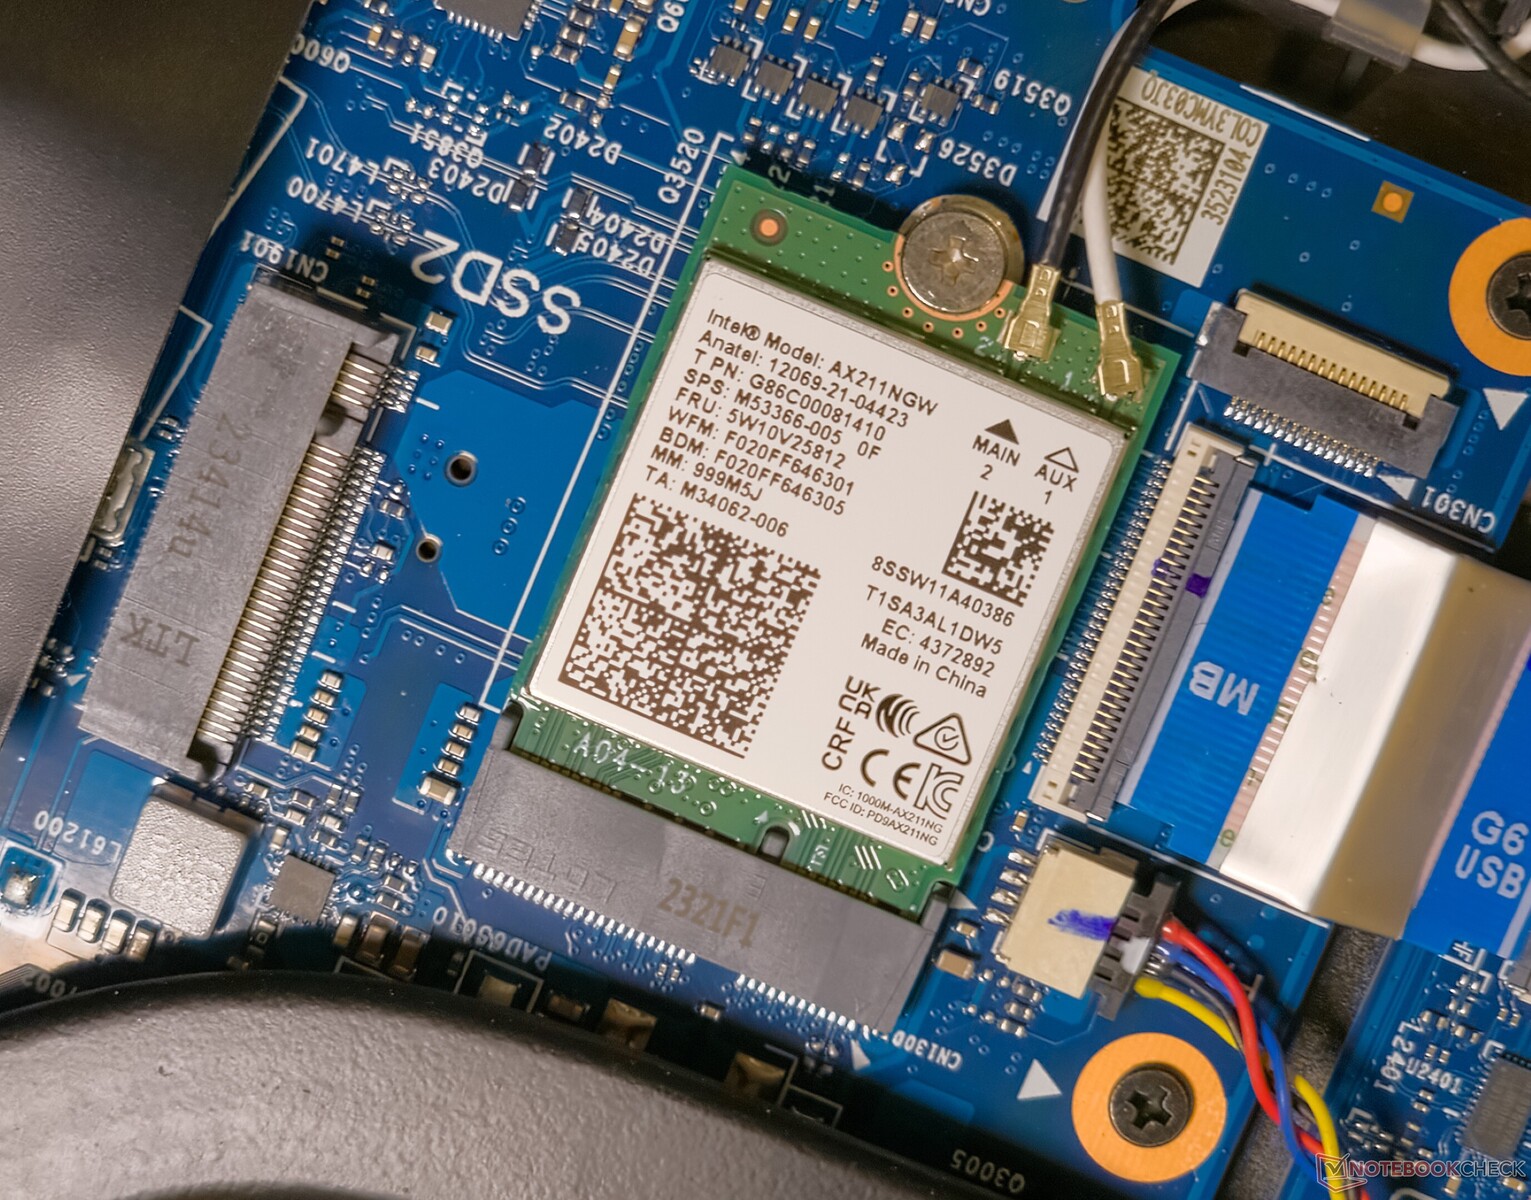
2024 年的笔记本电脑正在慢慢赶上 Wi-Fi 7 的潮流,尽管对该标准的支持要到今年晚些时候 Windows 11 24H2 开始推出时才会到来。因此,Scar 16 只能使用普通的英特尔 Wi-Fi AX211 芯片。
我们使用华硕 ROG Rapture GT-AXE11000 路由器对 Scar 16 进行了测试,结果显示其在 Wi-Fi 5 频段的吞吐量低于同类产品。不过,性能相当稳定,没有出现严重的速度下降。
Wi-Fi 6E 的性能明显更好,发射和接收速度分别高达 1.5 Gbps 和 1.74 Gbps,但我们在发射测试中观察到了瞬间节流现象。
| Networking / iperf3 transmit AXE11000 | |
| Asus ROG Strix G16 G614JZ | |
| HP Omen 16 (2024) | |
| Lenovo Legion Pro 7 16IRX9H | |
| Average of class Gaming (560 - 1862, n=88, last 2 years) | |
| Average Intel Wi-Fi 6E AX211 (64 - 1921, n=276) | |
| Alienware m16 R2 | |
| MSI Vector 16 HX A14V | |
| Asus ROG Strix Scar 16 G634JZR | |
| Networking / iperf3 receive AXE11000 | |
| HP Omen 16 (2024) | |
| Lenovo Legion Pro 7 16IRX9H | |
| Asus ROG Strix G16 G614JZ | |
| Average of class Gaming (680 - 1745, n=88, last 2 years) | |
| Average Intel Wi-Fi 6E AX211 (582 - 1890, n=276) | |
| MSI Vector 16 HX A14V | |
| Alienware m16 R2 | |
| Asus ROG Strix Scar 16 G634JZR | |
| Networking / iperf3 transmit AXE11000 6GHz | |
| Asus ROG Strix Scar 16 G634JZR | |
| Average of class Gaming (723 - 1868, n=36, last 2 years) | |
| MSI Vector 16 HX A14V | |
| Alienware m16 R2 | |
| Average Intel Wi-Fi 6E AX211 (385 - 1851, n=226) | |
| Networking / iperf3 receive AXE11000 6GHz | |
| Asus ROG Strix Scar 16 G634JZR | |
| Average of class Gaming (975 - 1775, n=35, last 2 years) | |
| Average Intel Wi-Fi 6E AX211 (700 - 1857, n=226) | |
| Alienware m16 R2 | |
| MSI Vector 16 HX A14V | |
网络摄像头
Scar 15 配备了外置 ROG Eye 1080p 网络摄像头作为收件箱附件,与之不同的是,Scar 16 只配备了传统的集成式 720p 传感器。
无论如何,它的图像质量并不出众,但偶尔也能满足一两次视频通话的需求。我们观察到蓝色色调的色彩偏差较大,整体清晰度似乎不够。


安全
Scar 16 缺乏任何形式的生物识别验证。TPM 2.0 模块符合 Windows 11 的要求。
配件和保修
包装盒中还包括一个可定制的盔甲帽。除此之外,没有其他配件。
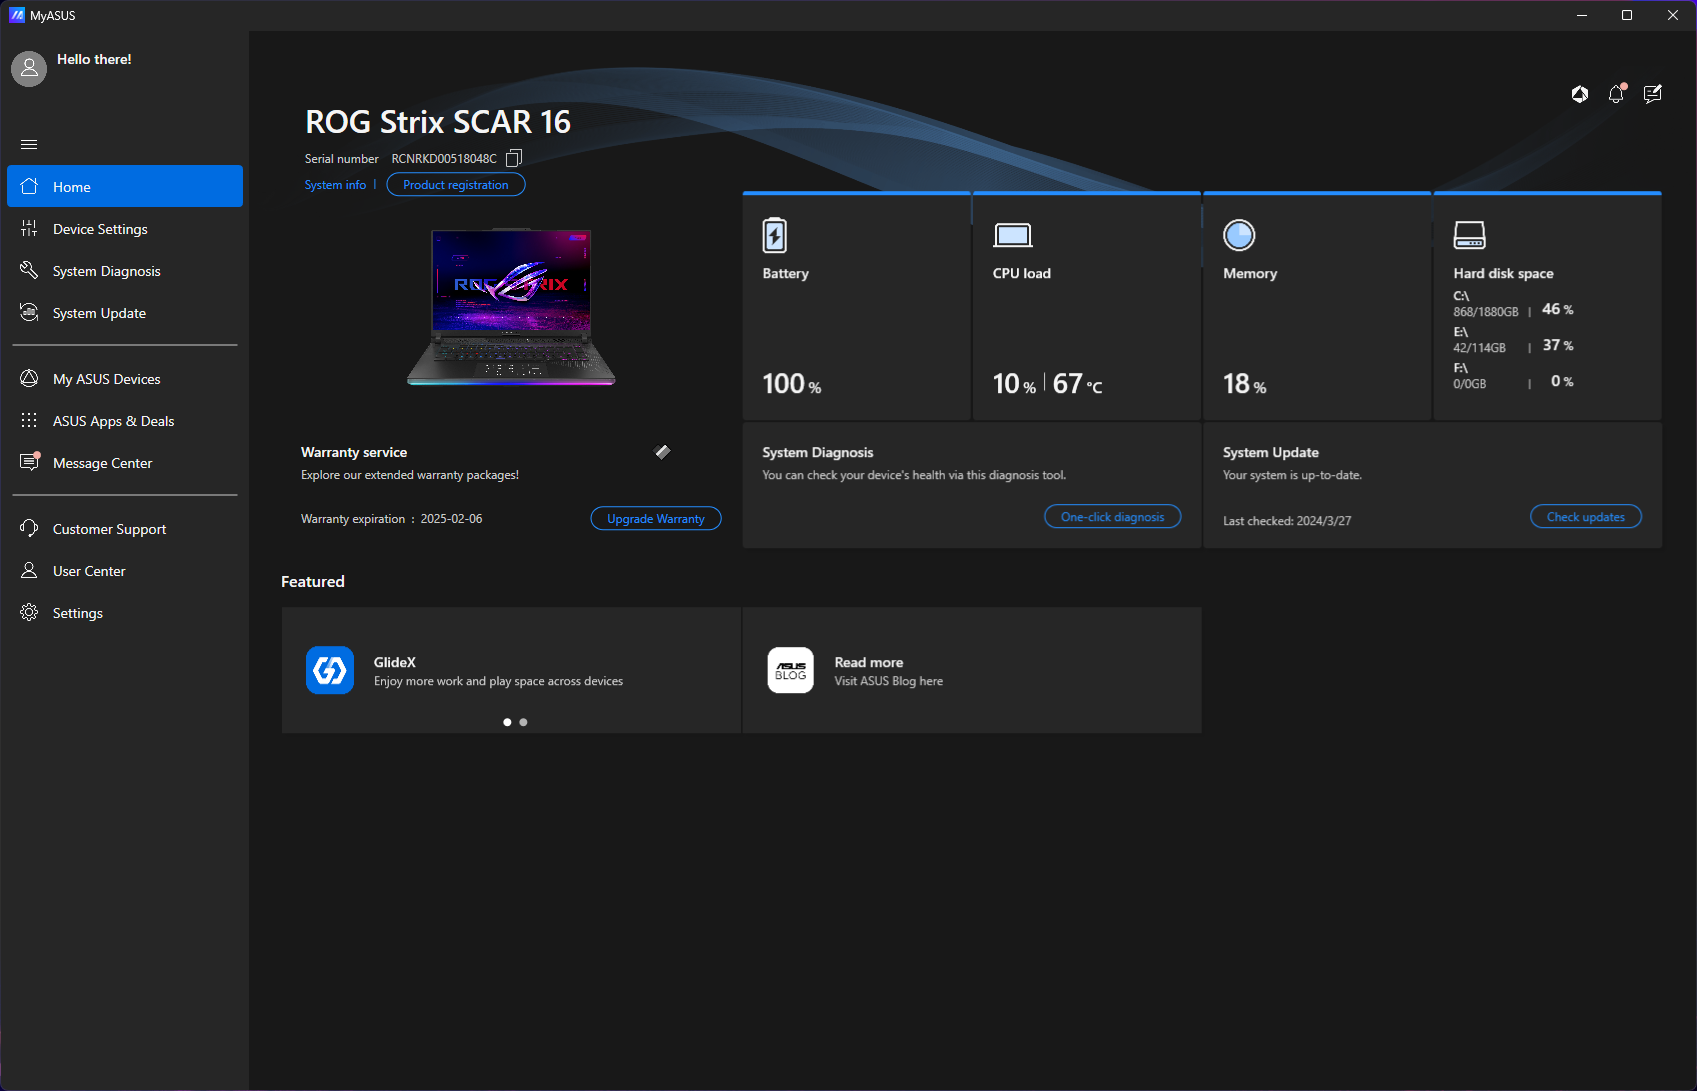
华硕在印度为 Scar 16 提供标准的一年保修服务。购买后 180 天内可通过预装的 MyAsus 应用程序购买延长保修服务。
购买者还可以从多个保修选项中进行选择从一年延长保修的 ₹999(12 美元)到包括两年延长保修和三年意外损坏保护的 ₹4,999(60 美元)不等。
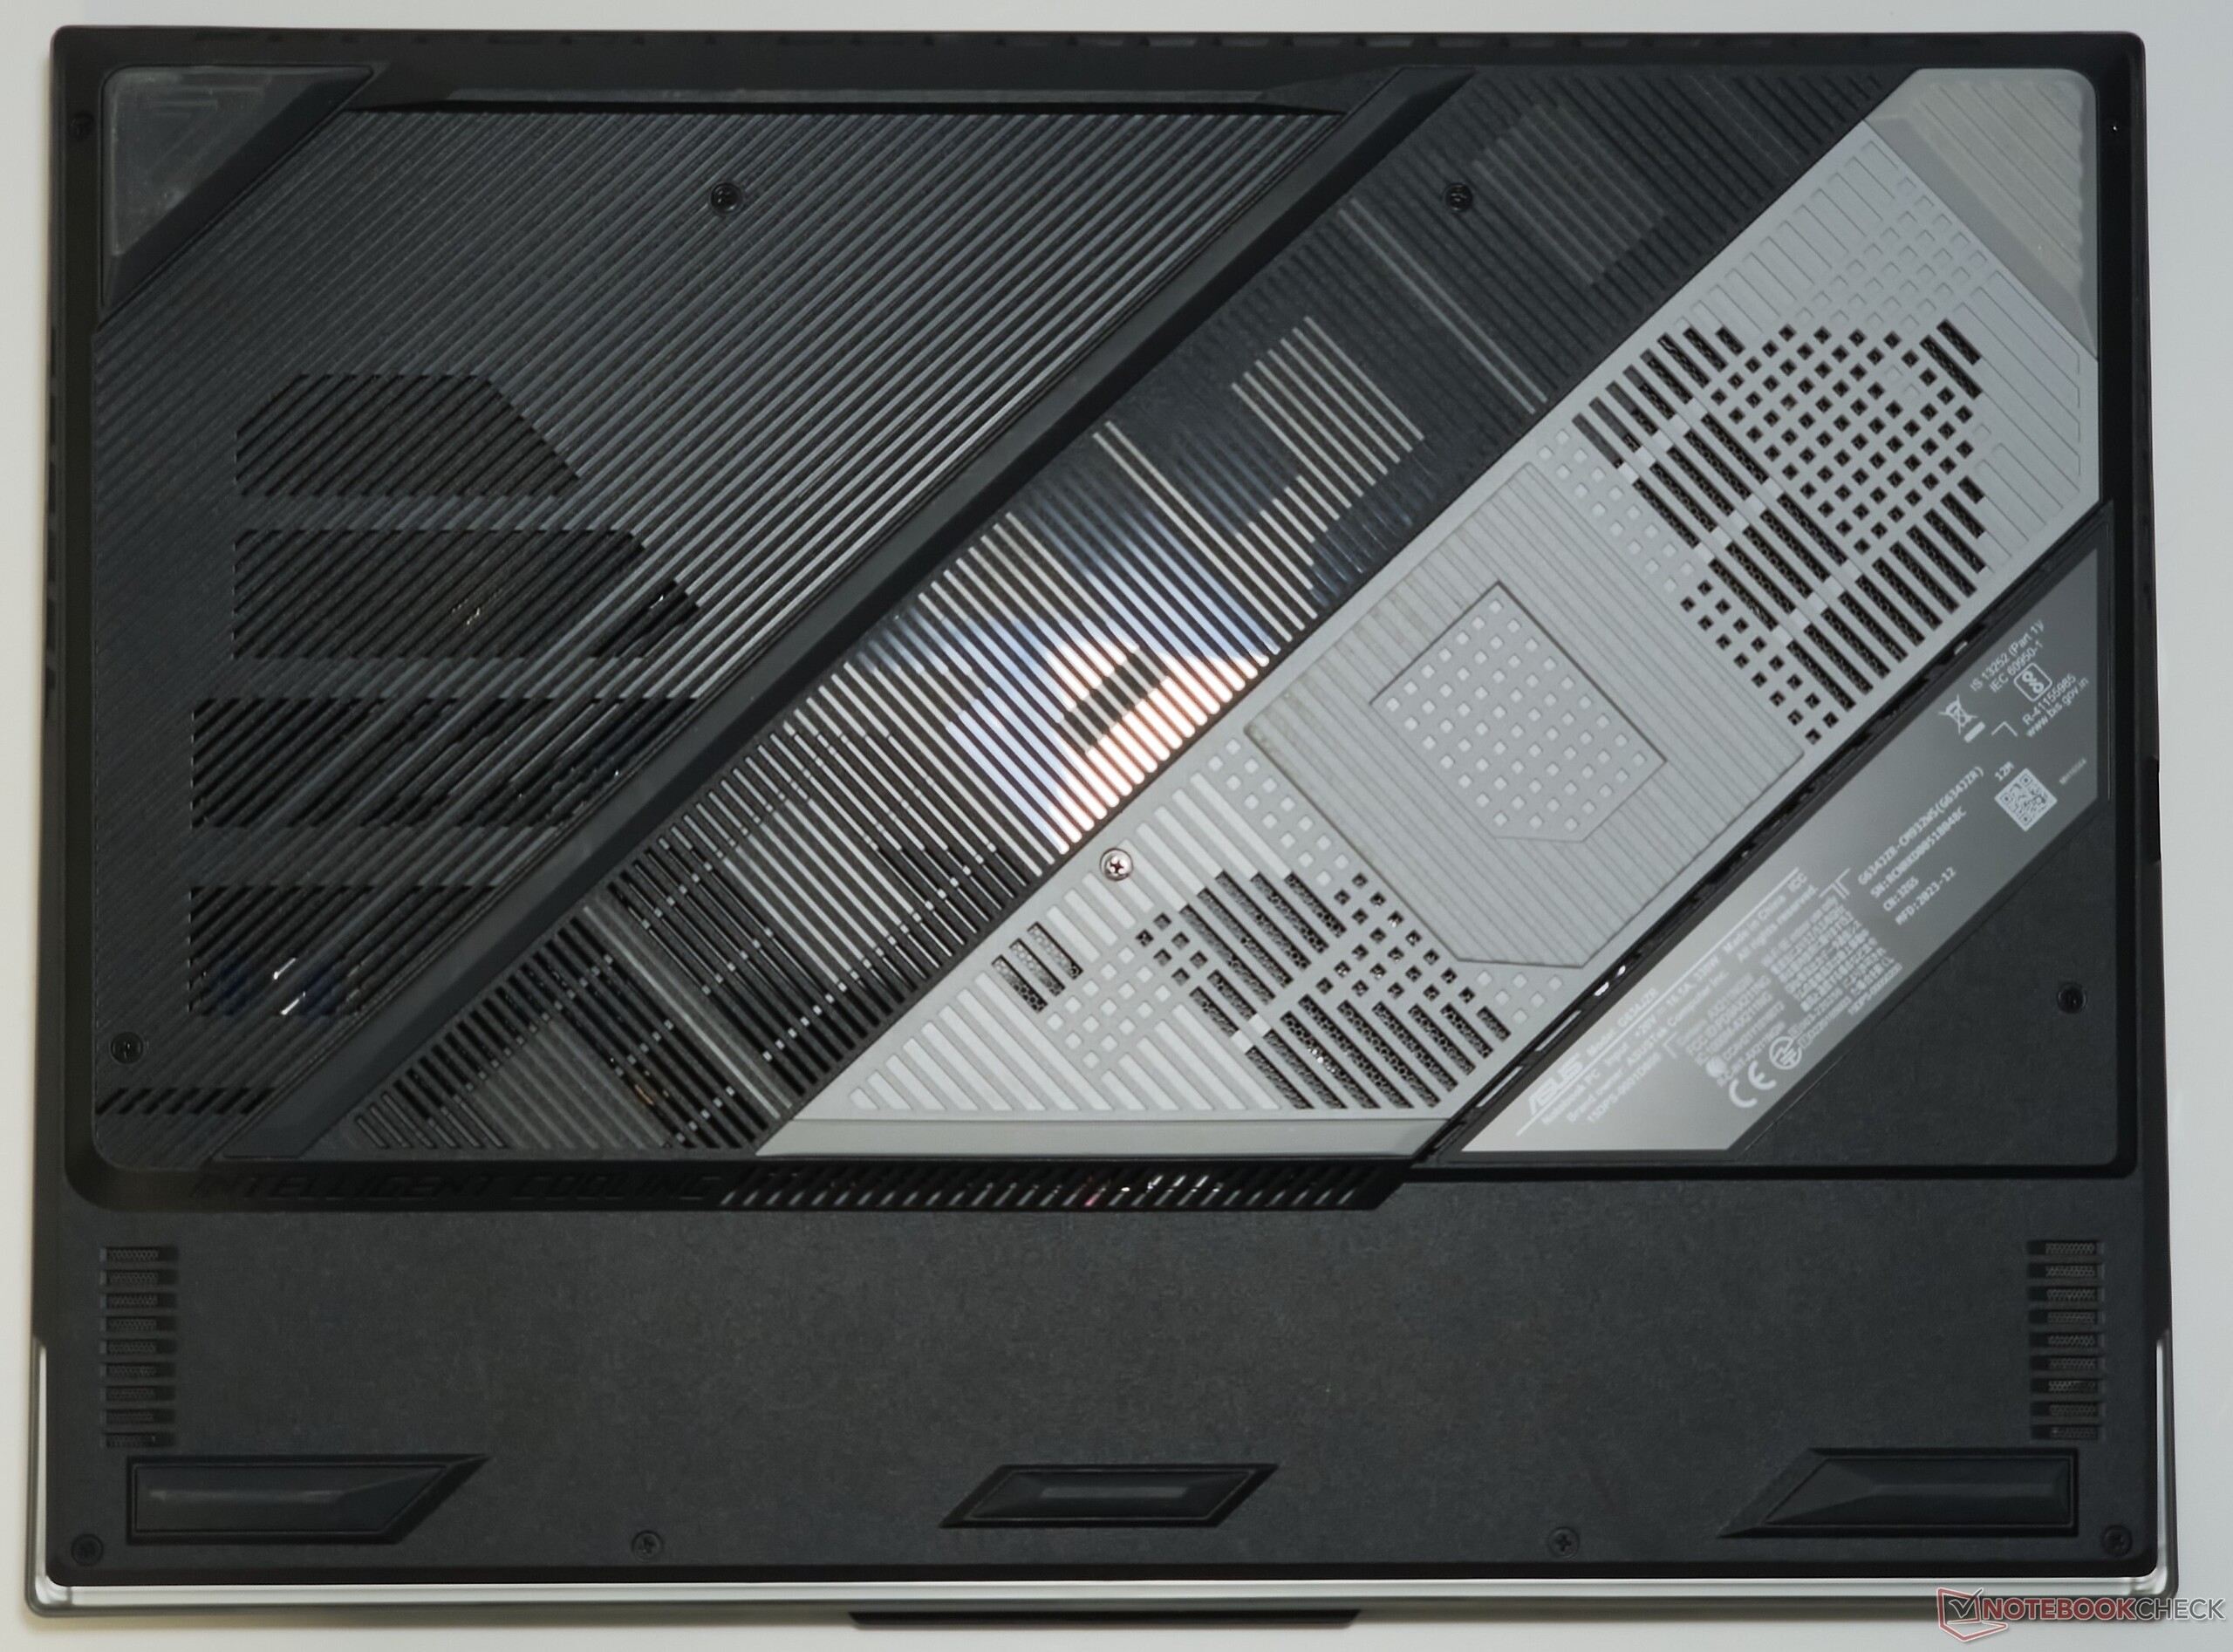
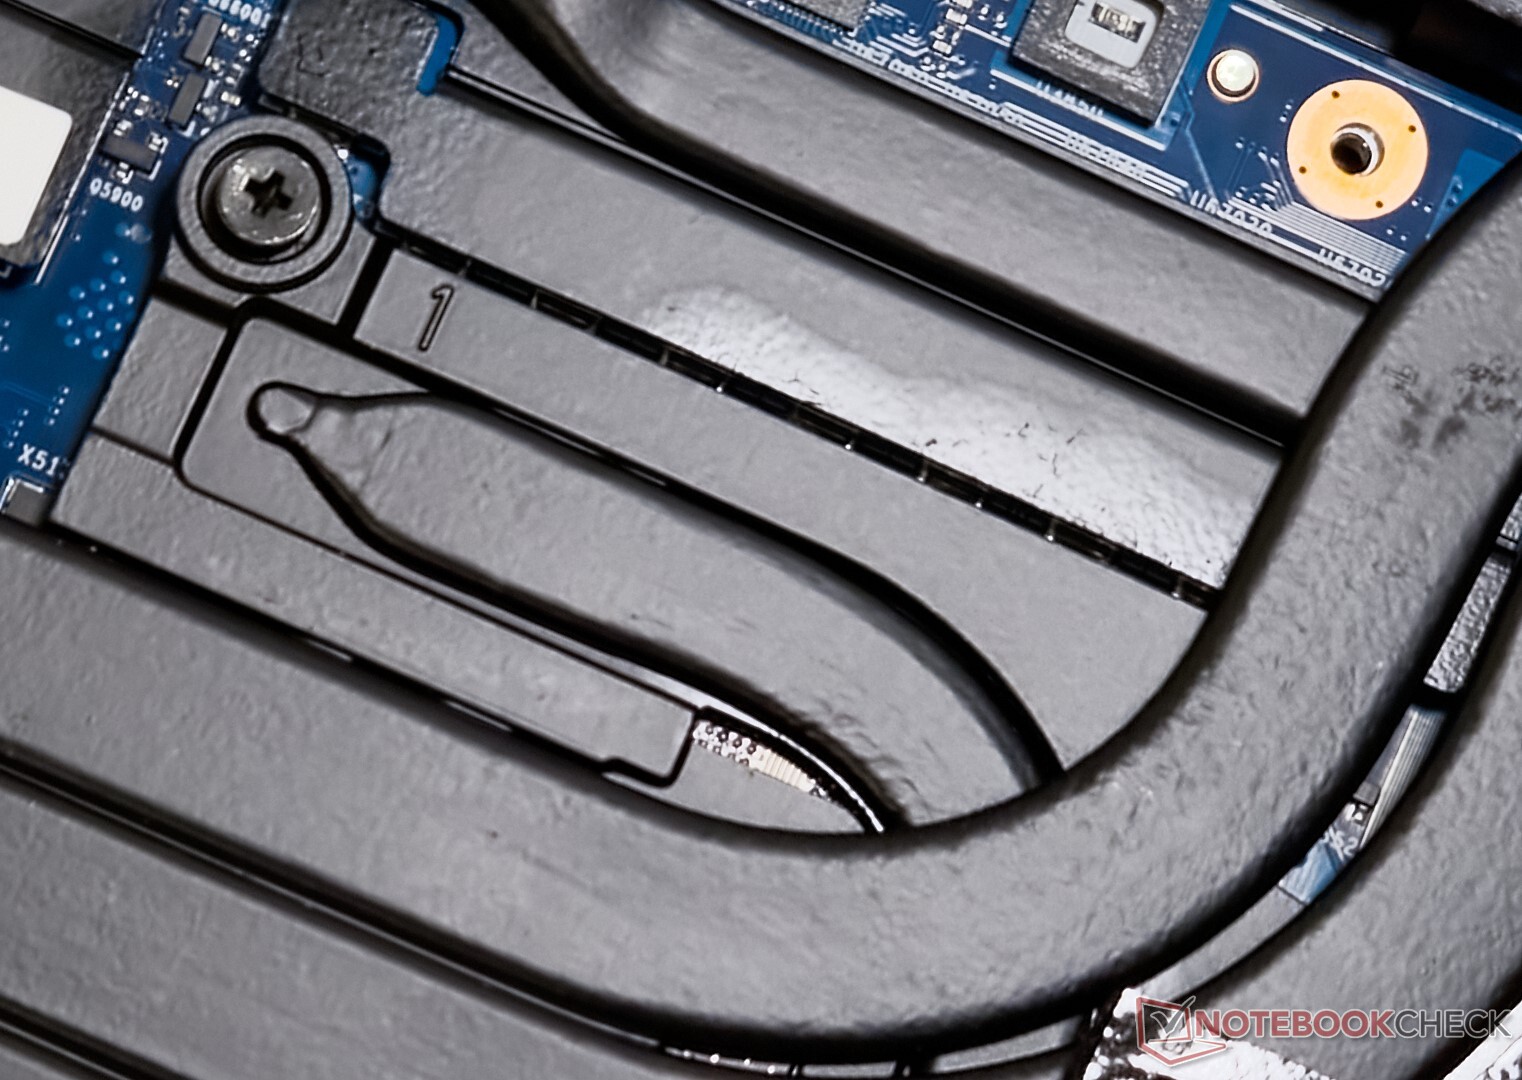
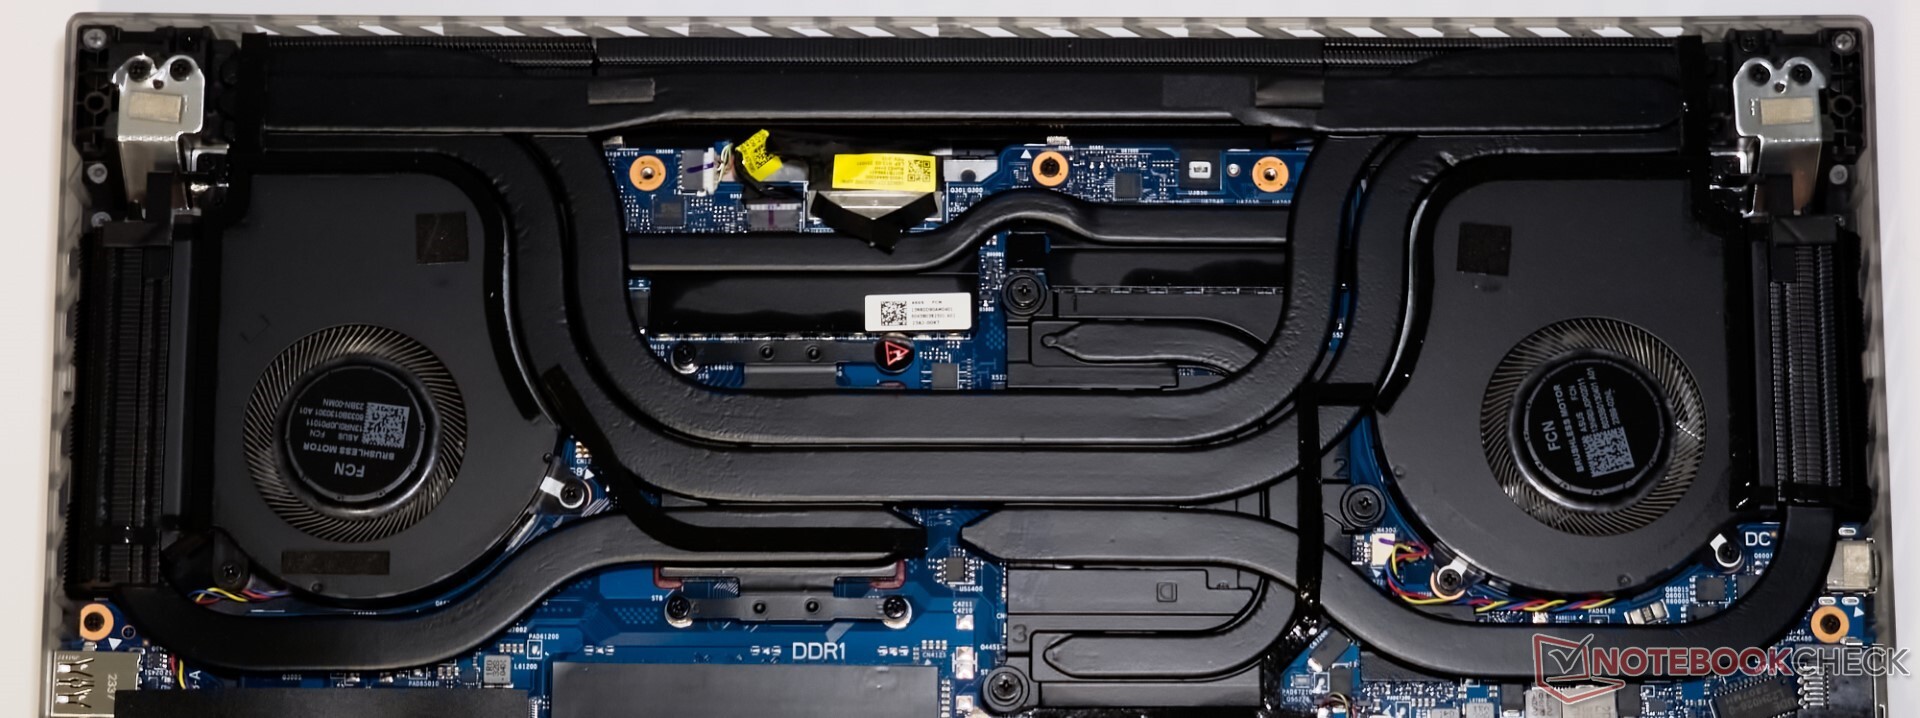
维护
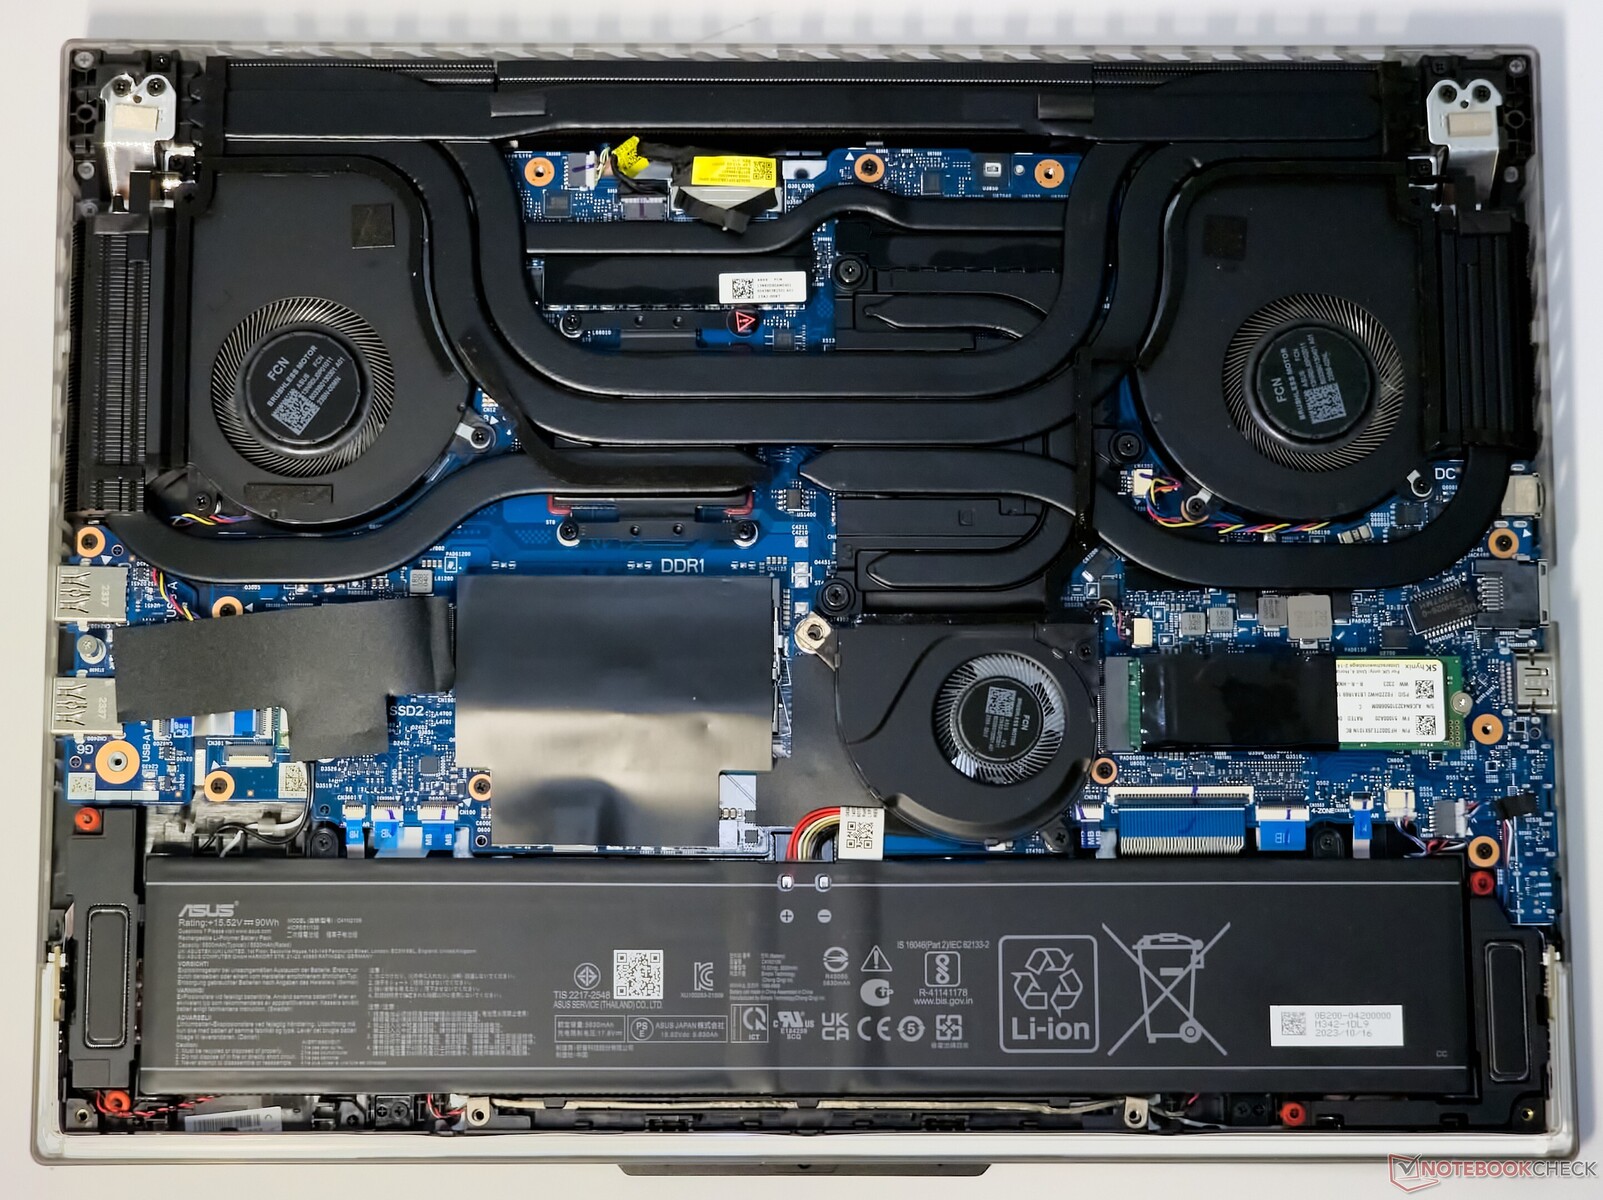
卸下 11 颗 PH0 螺钉,撬开背板,Scar 16 繁杂的内部布局就展现在眼前。主板上的光学传感器起到了安全保护作用,当底板移开时,如果笔记本电脑已经开机,它就会阻止开机或关机。要重新启动,需要放回底板,并将笔记本电脑连接到电源适配器上。
RGB LED 灯带不再是背板的一部分,因此再也不用担心在撬开盖子时脆弱的带状电缆会折断了。
必要时,可以更换内存、固态硬盘和无线局域网卡进行升级。电池也可以拧开更换。
输入设备:便捷的虚拟数字键盘,但 F1-F12 仍未点亮
键盘
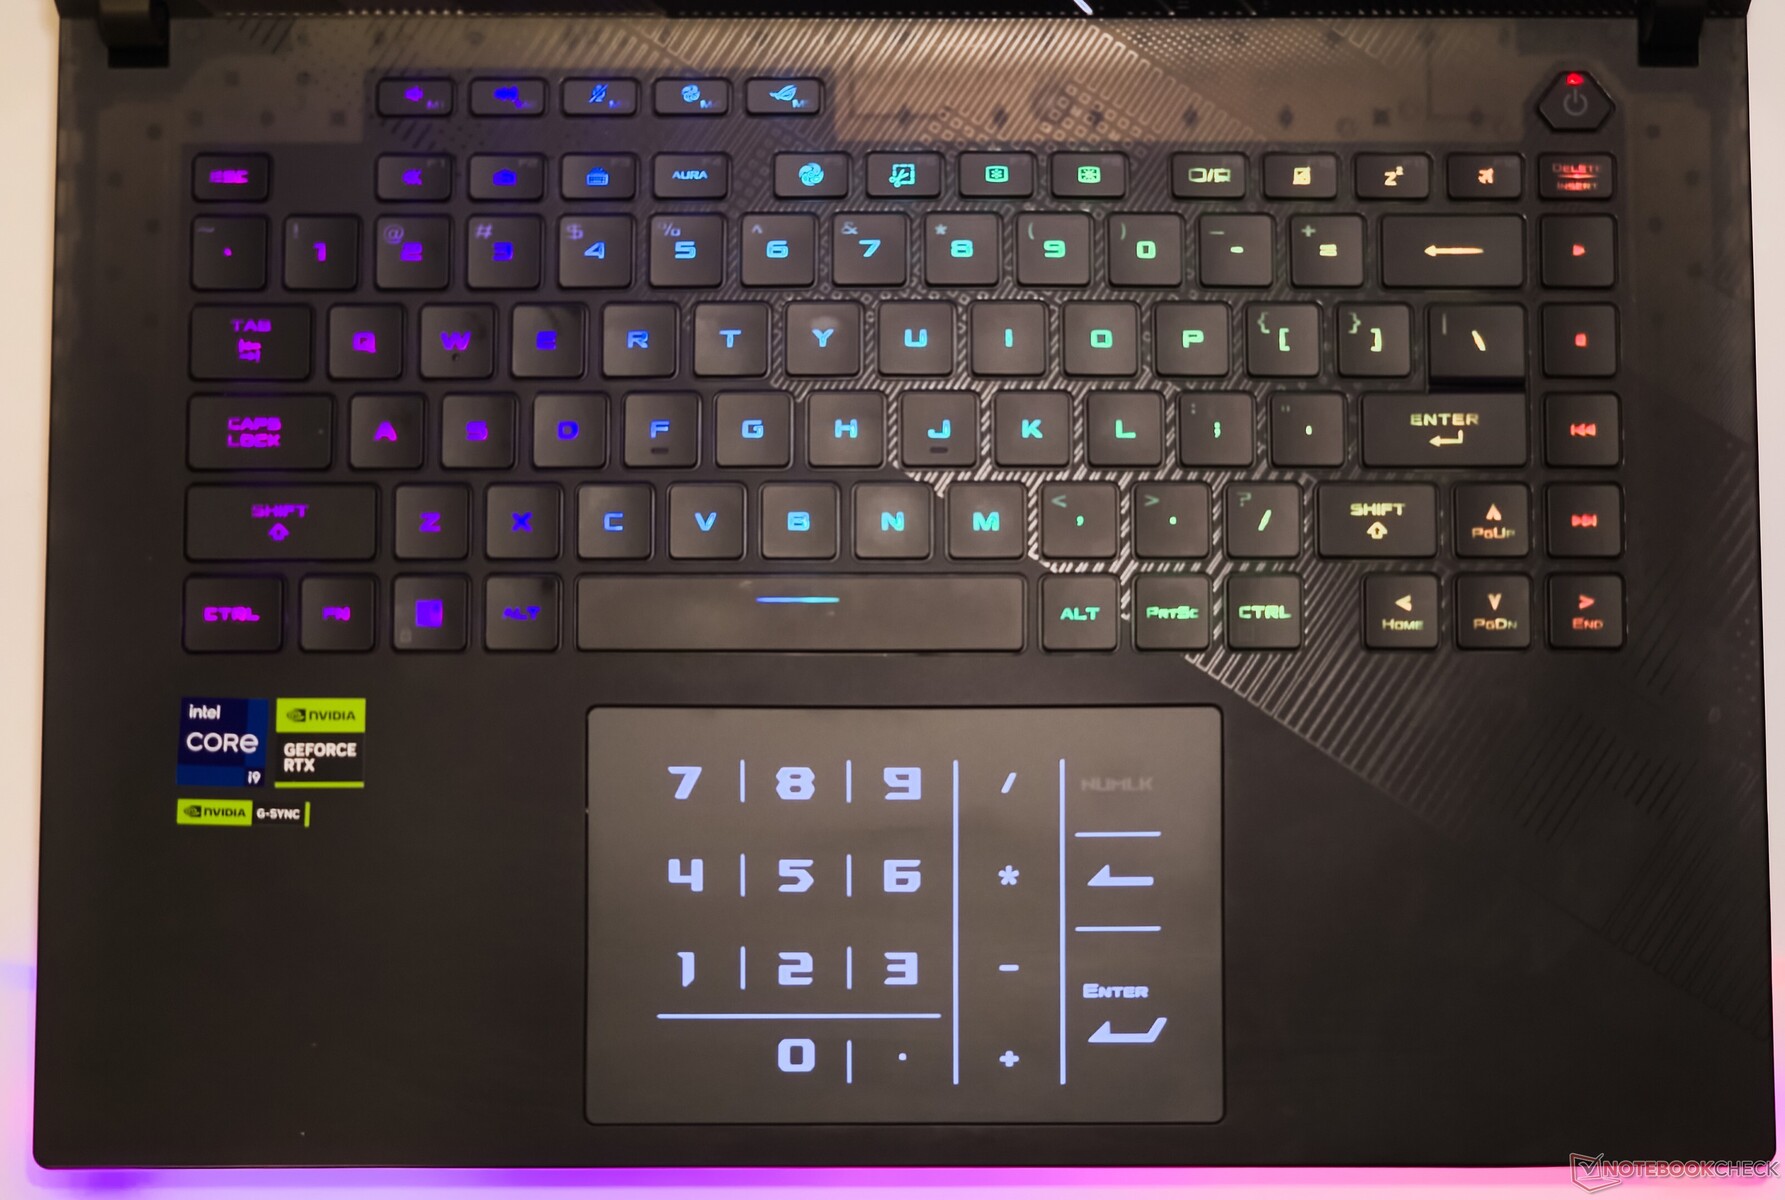
Scar 16 的键盘整体上提供了良好的键入体验,但反馈可能会更清晰。来自非华硕 ROG 笔记本电脑的用户可能需要一些时间来适应右侧较短的 Shift 键和垂直排列的媒体键。
作为 ROG 笔记本电脑的标准配置,顶排可通过 Armory Crate 进行宏功能编程。值得称赞的是,华硕提供了全尺寸方向键。RGB 灯光预设和性能配置文件之间有专门的切换键。
每个按键的 RGB 都可以通过 Armory Crate 进行自定义。不过,F1-F12 字母仍然保持暗色。
触摸板
8.5 厘米 x 13 厘米的触摸板提供流畅的滑动体验,支持 WindowsPrecision 手势。触摸板触感良好,边角点击反应灵敏。
触摸板右上方有一个软 Num 锁定切换键,可弹出一个虚拟数字键盘,满足数字运算的需要。轻扫时可能会意外触发,但一般不会影响正常使用。
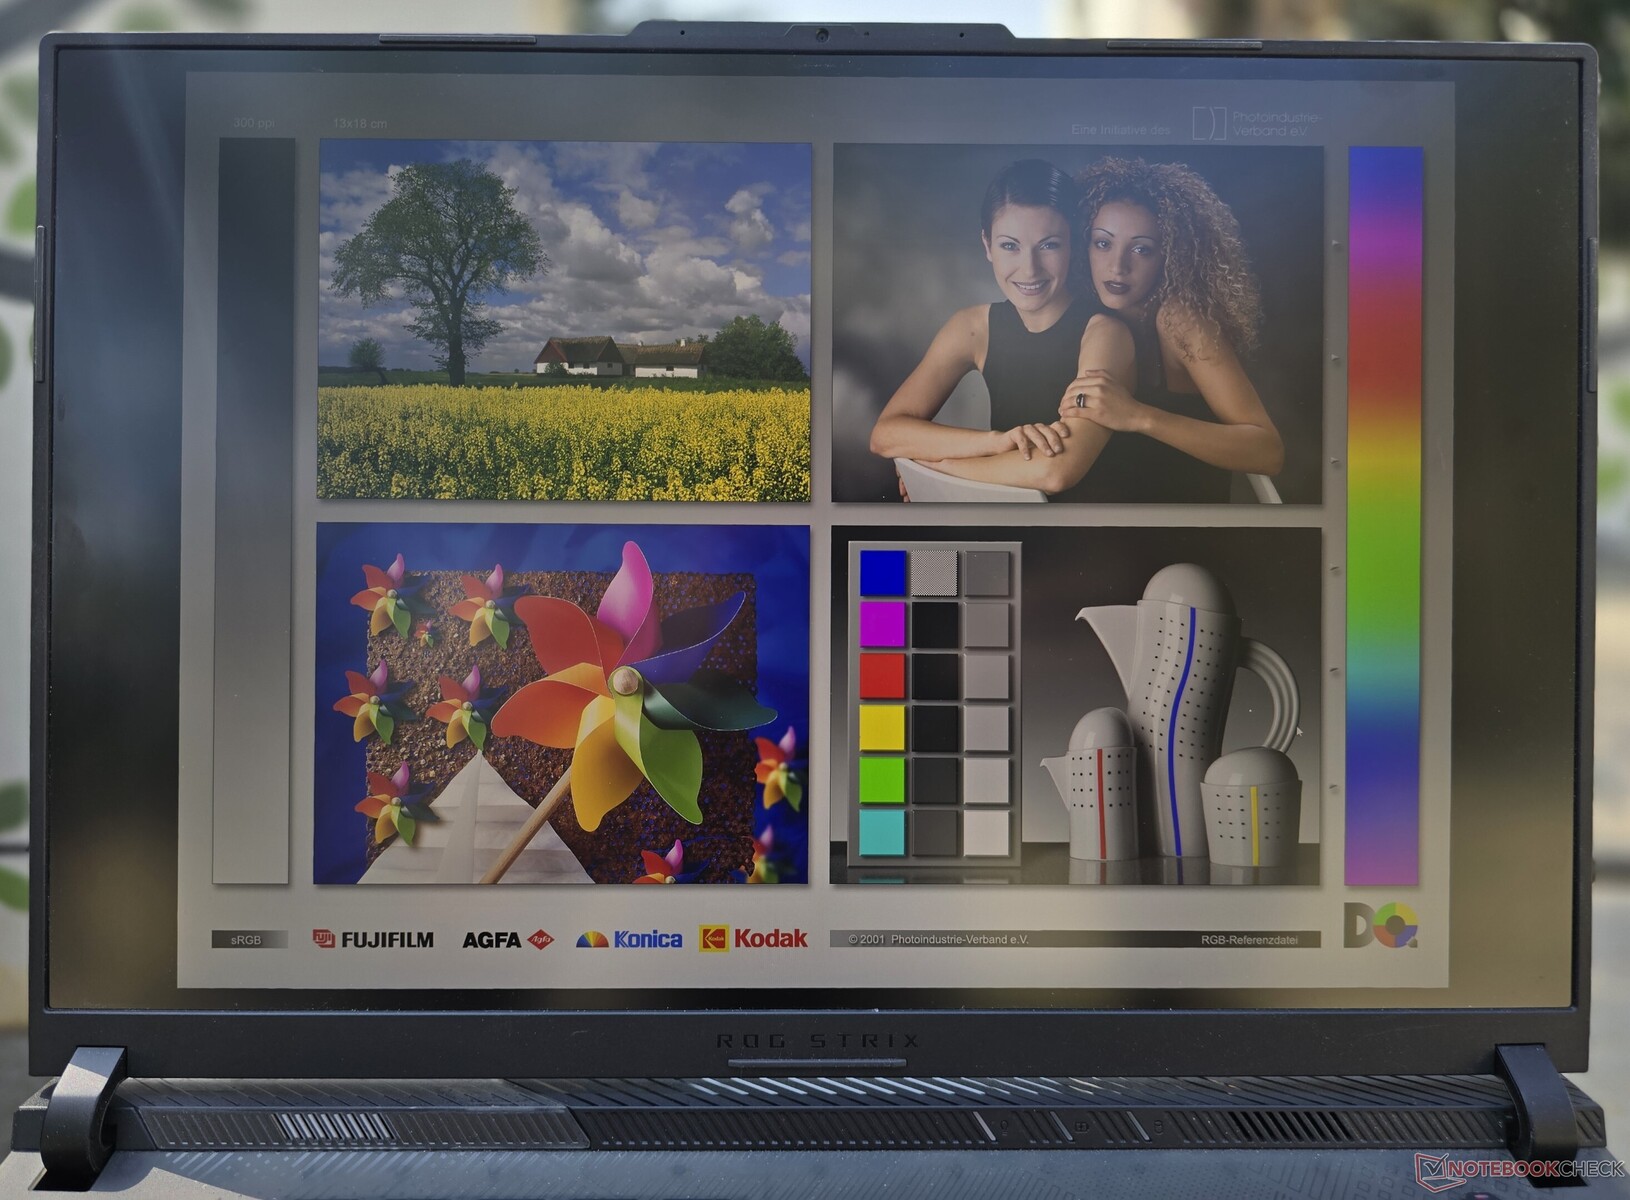
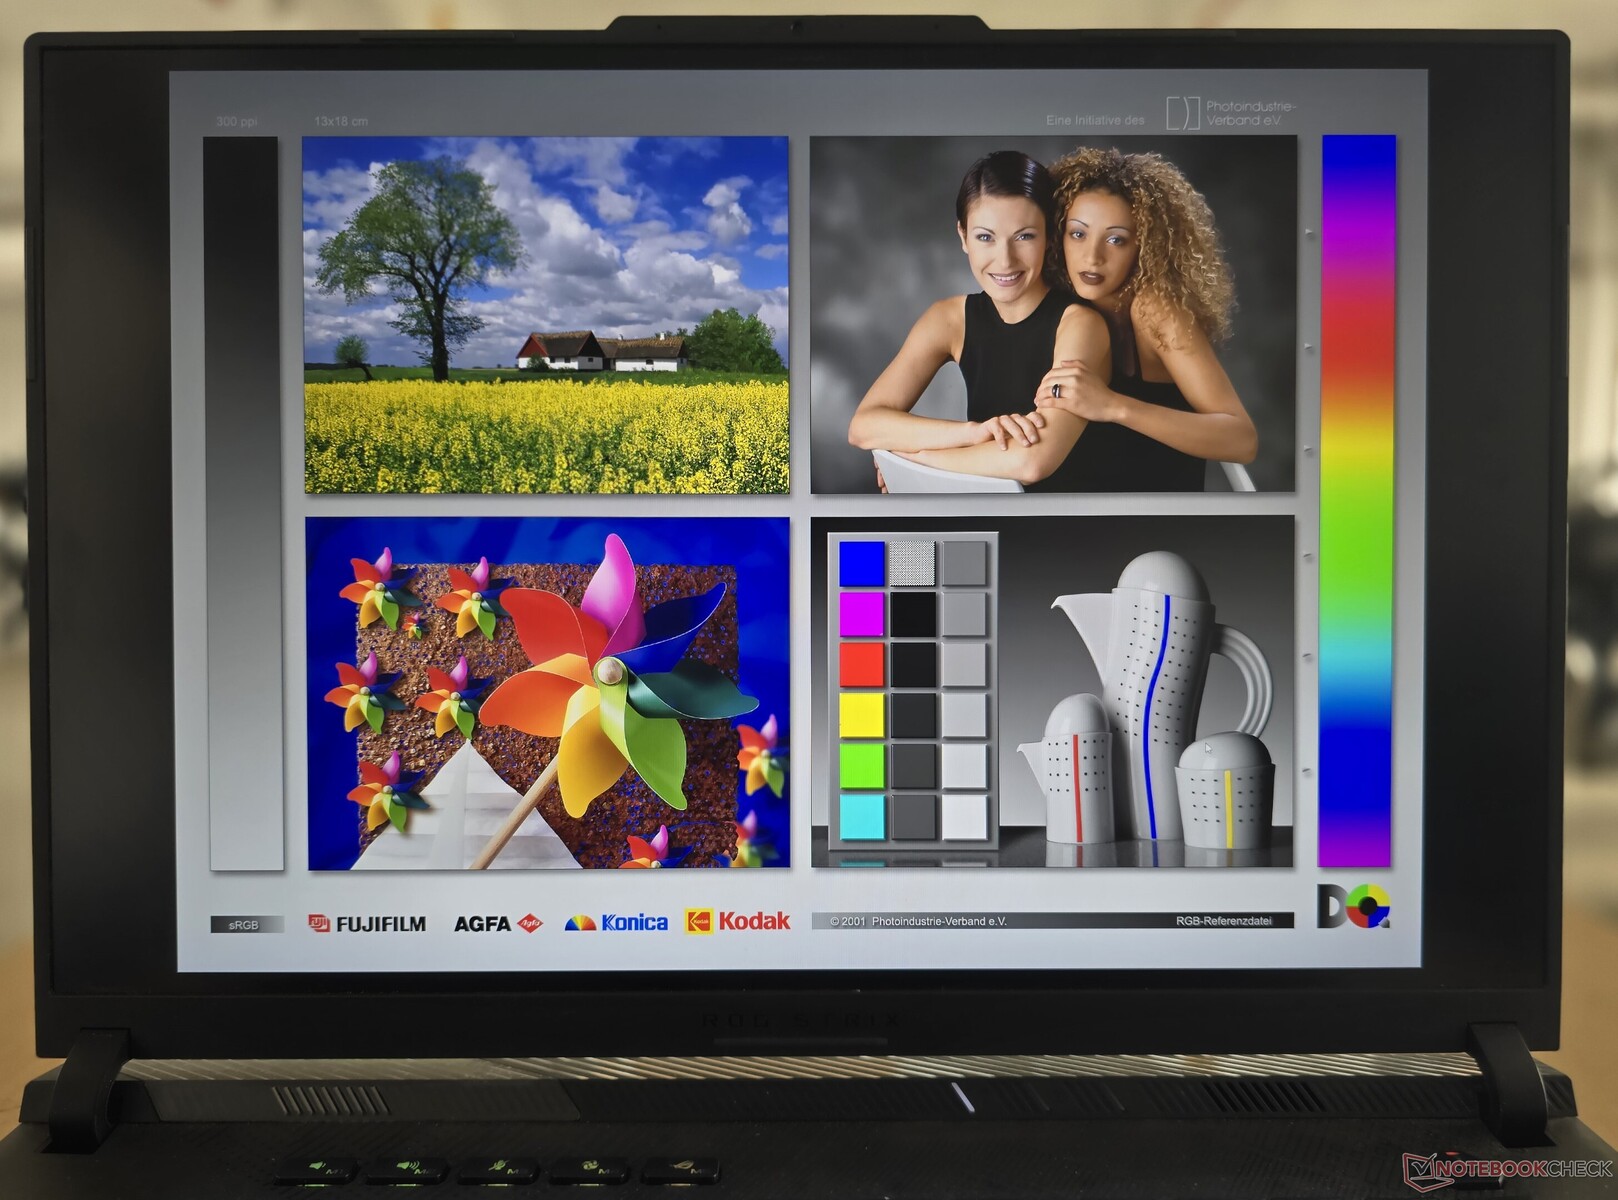
显示屏:高 PWM 240 Hz QHD+ G-Sync HDR 面板
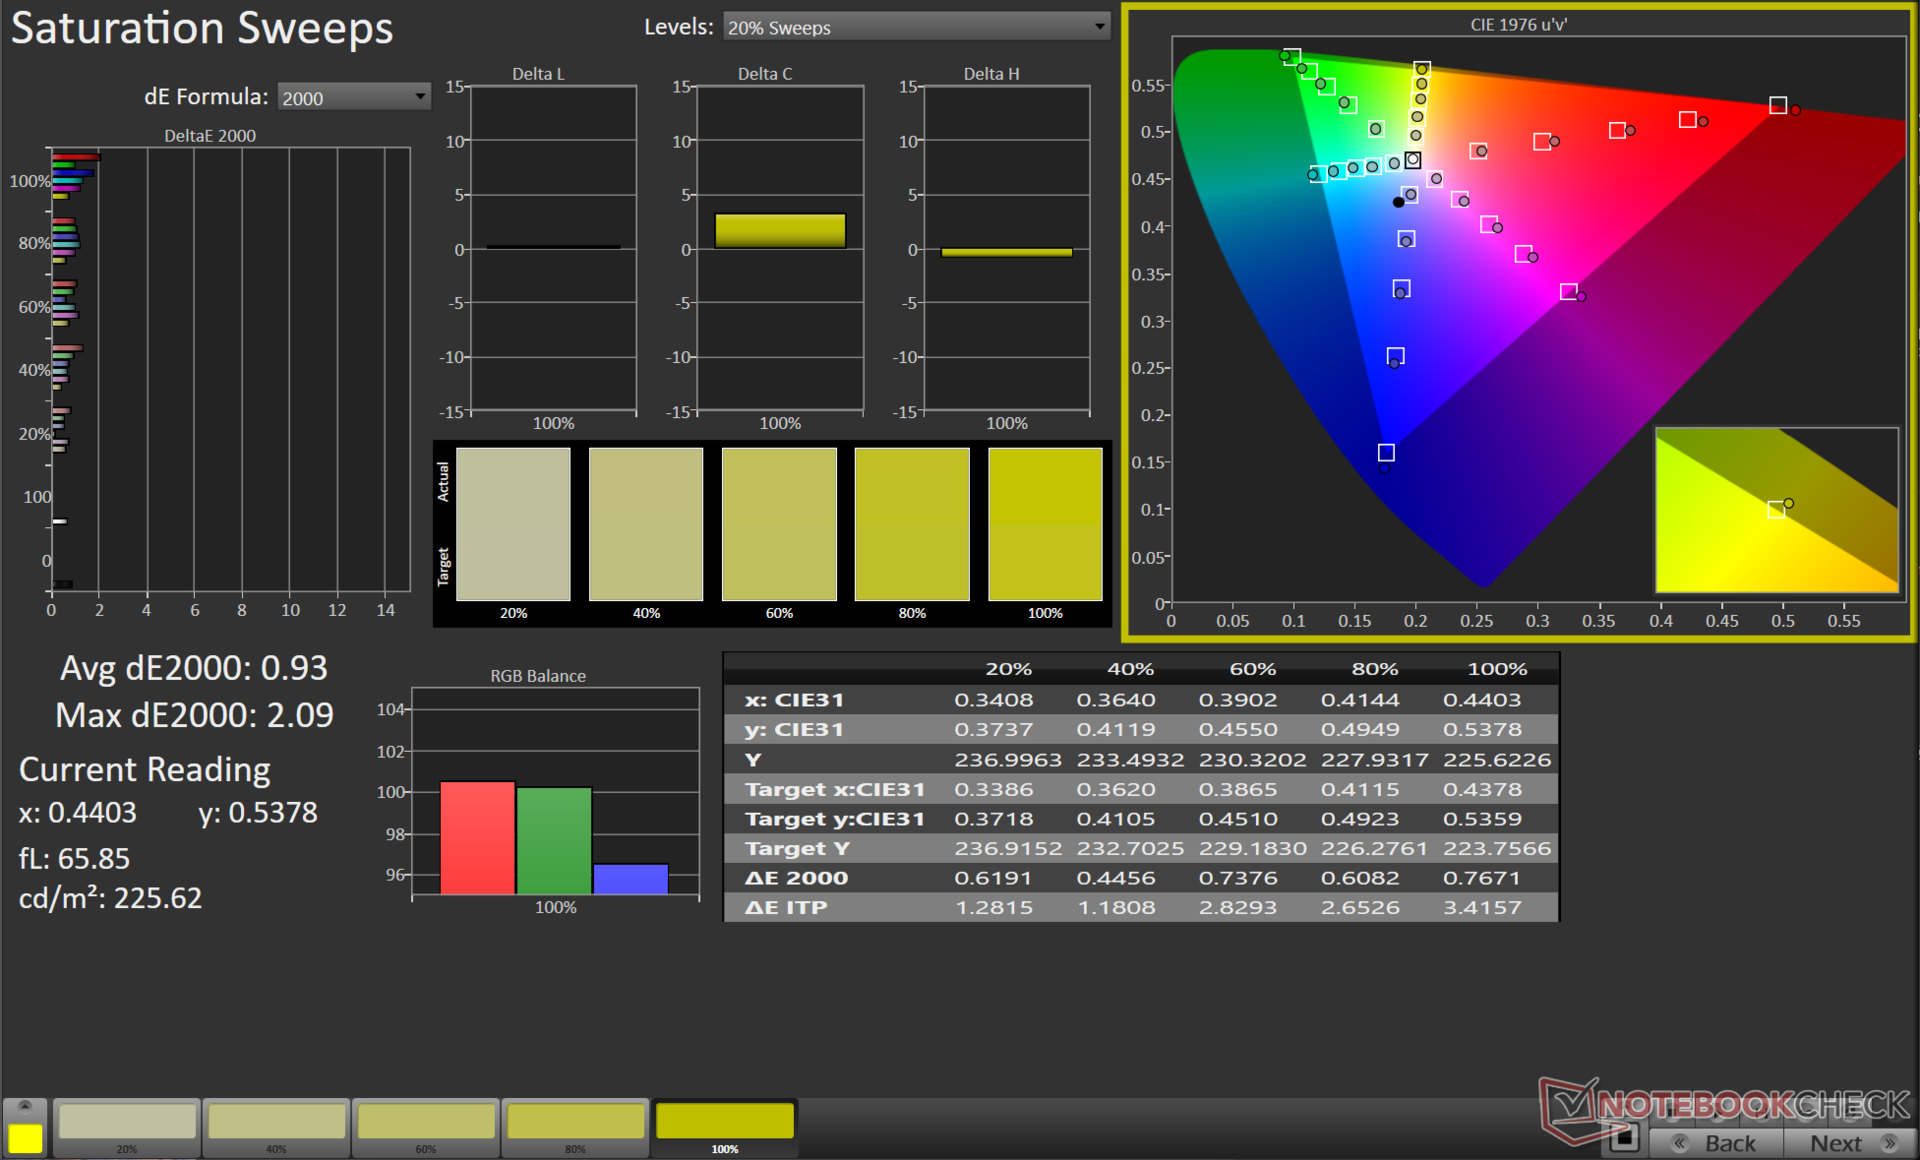
ROG Strix Scar 16 配备了 2560 x 1600 16:10 mini LED "星云 HDR "面板,华硕称其拥有 2048 个调光区。240 Hz 显示屏支持 HDR10、杜比视界(Dolby Vision)、Nvidia G-Sync,还通过了 Pantone 验证。
Armory Crate 允许在单区和多区背光之间切换。前者是默认工作模式,可实现更均匀的照明,从而实现色彩精确的工作流程。
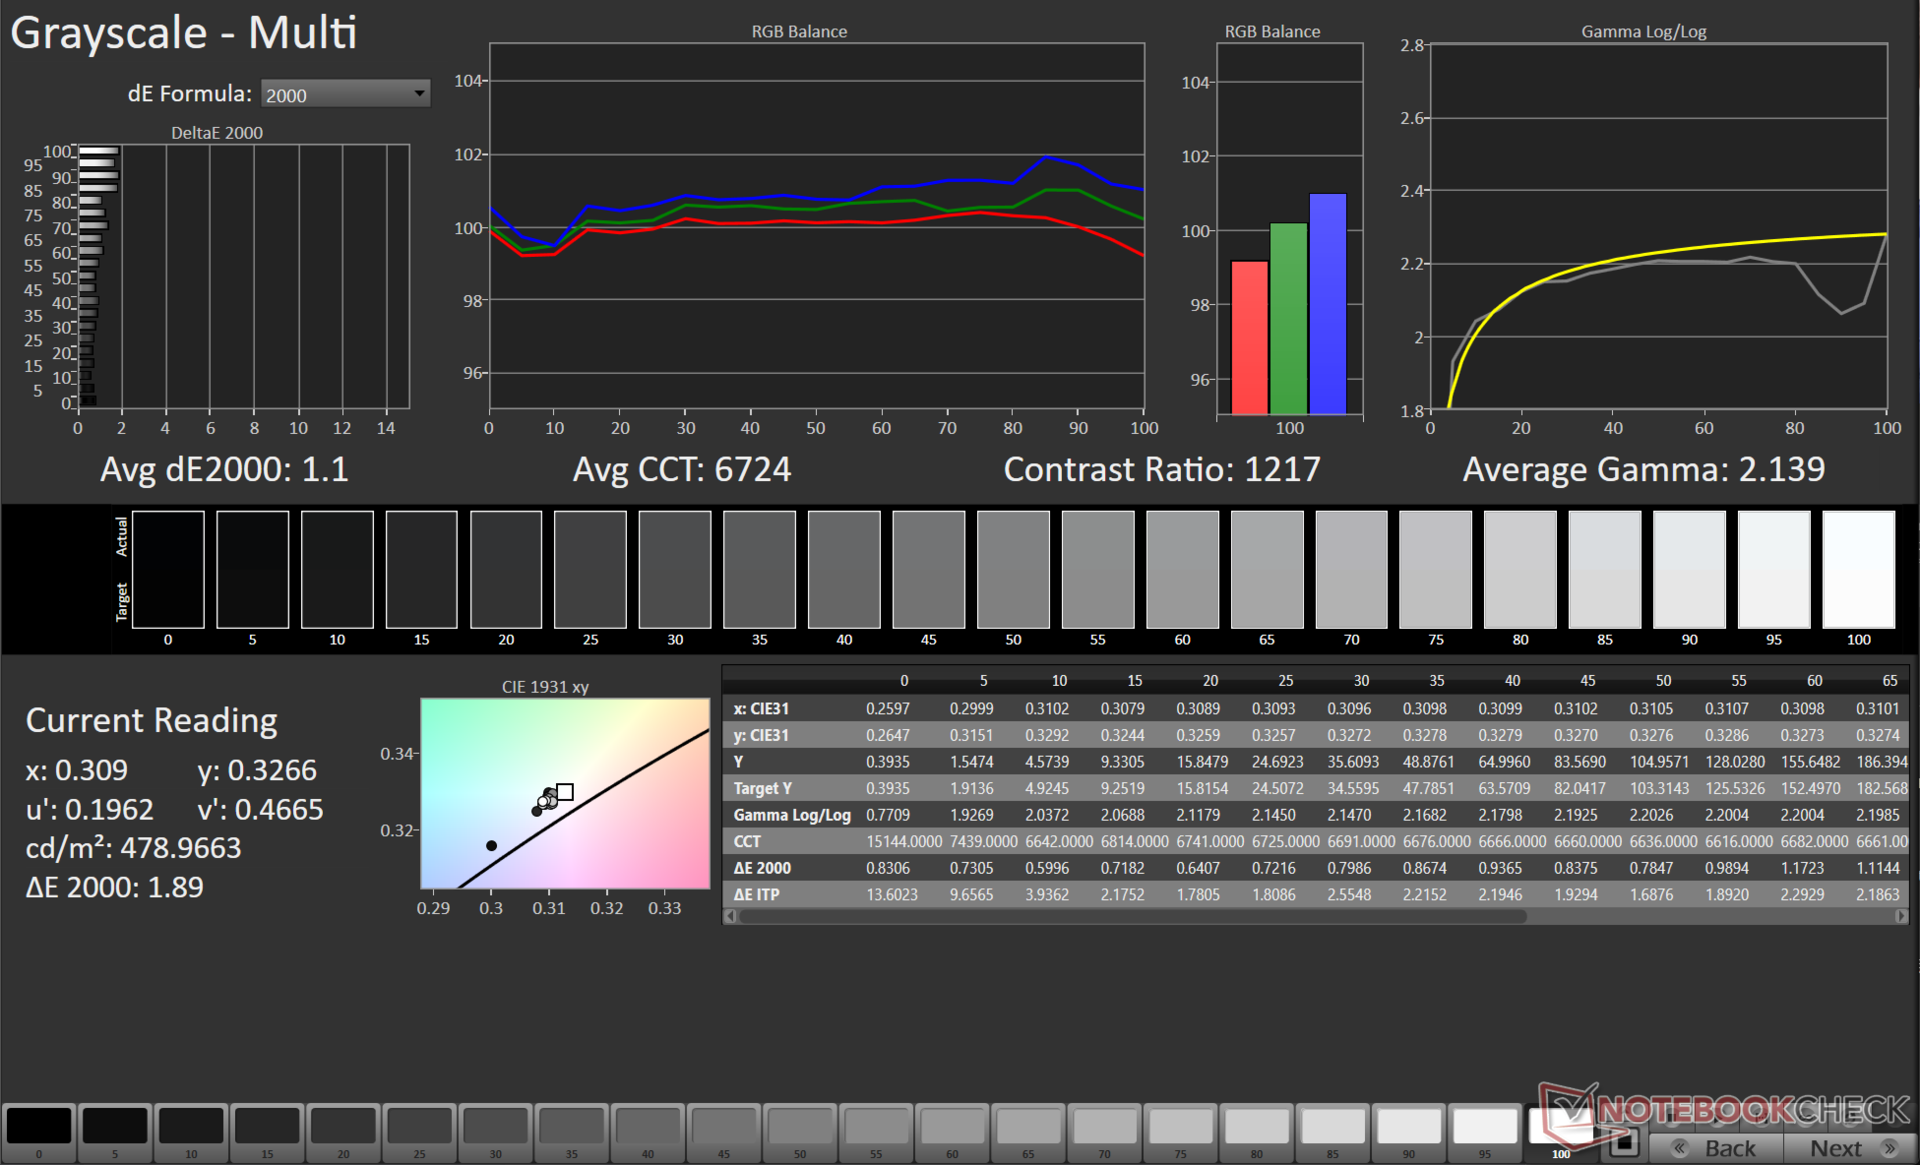
在这种模式下,Scar 16 的显示屏在我们的 SDR 测量中显示出 94% 的亮度分布,峰值亮度为 503 尼特。我们测得的对比度为 1,225:1,表现不错,但如果需要更深的黑色,则需要切换多区开关。
请参考我们的 ROG Scar 18 (2024) 评测我们的 ROG Scar 18(2024)采用了类似的 Nebula HDR mini LED 面板,可提供多区背光的预期值。
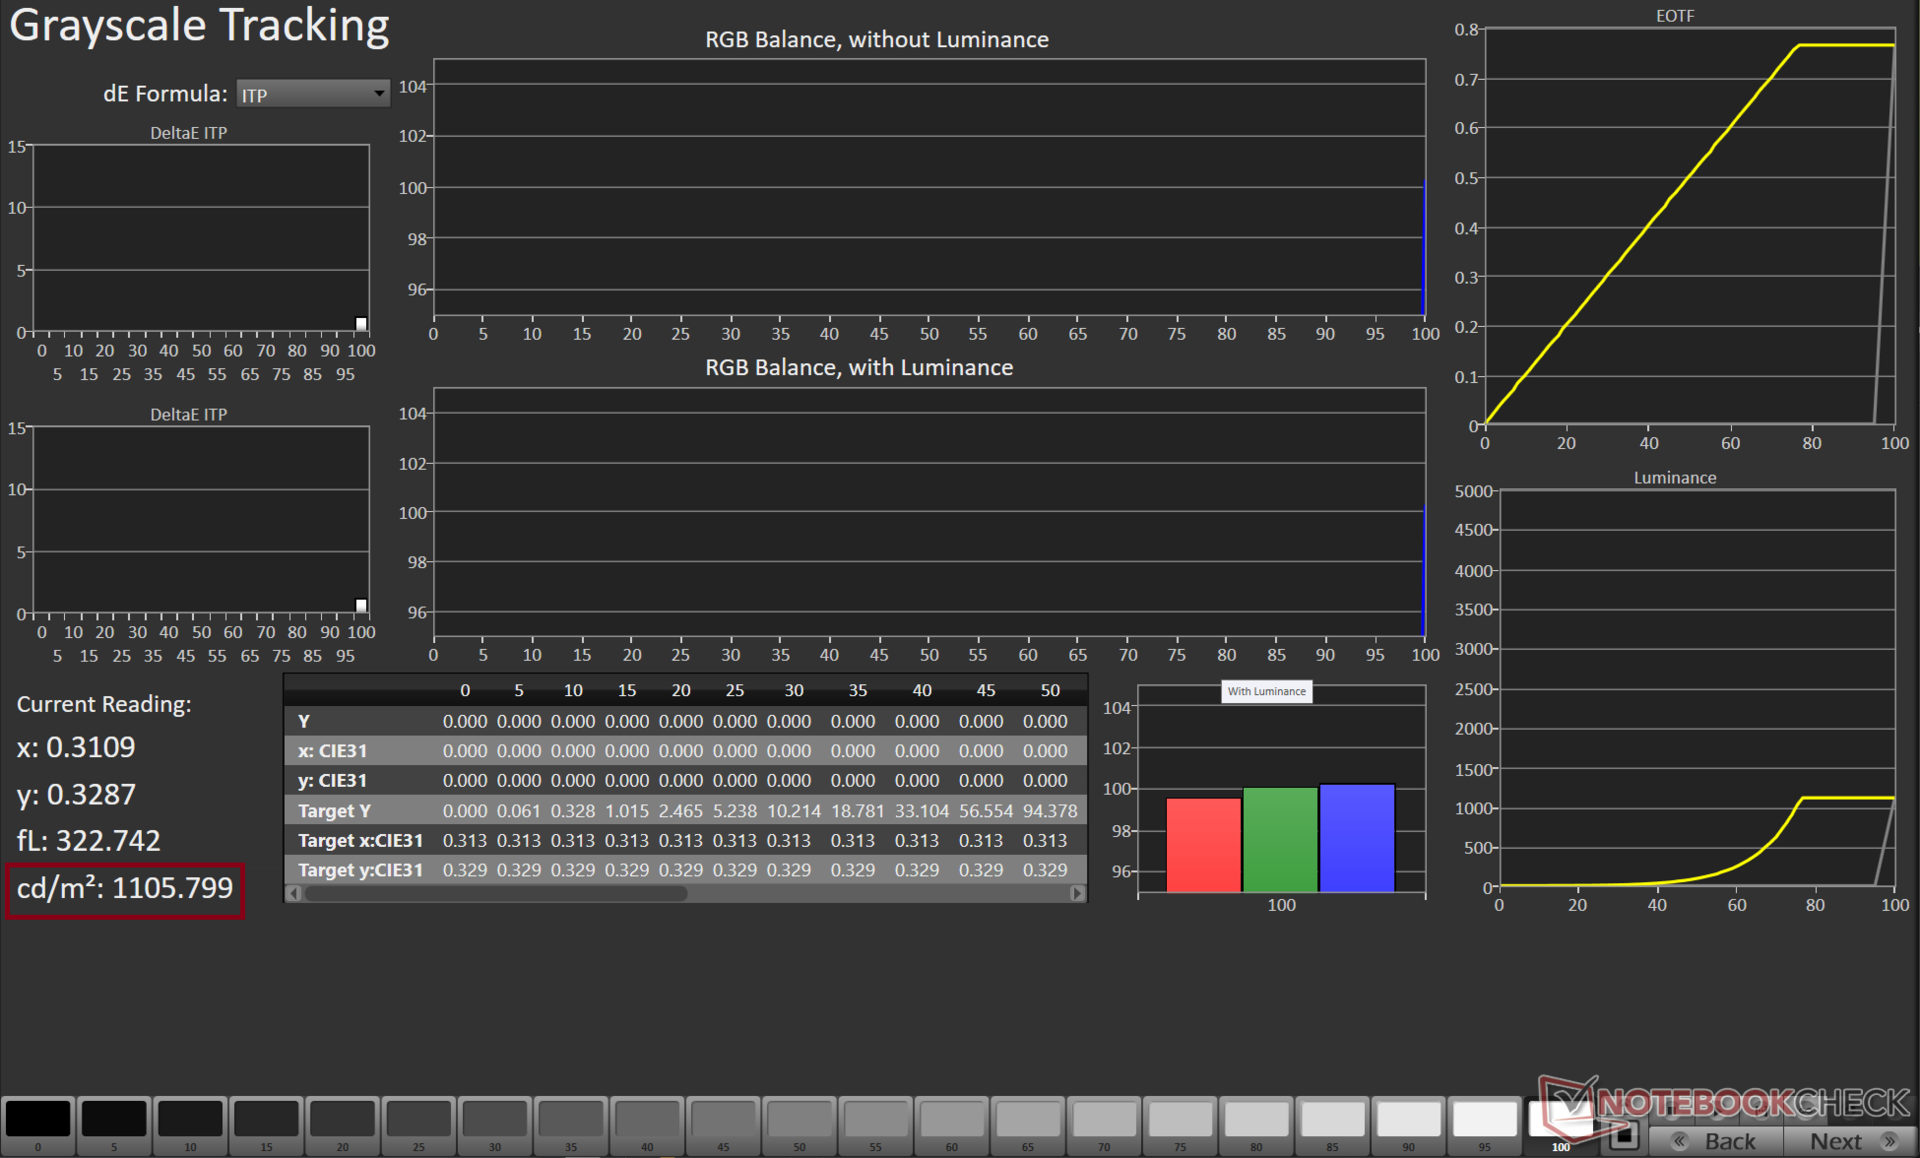
华硕宣传的 HDR 峰值亮度为 1,100 尼特,我们发现在 49% 的窗口尺寸下测量时,这一说法是正确的。
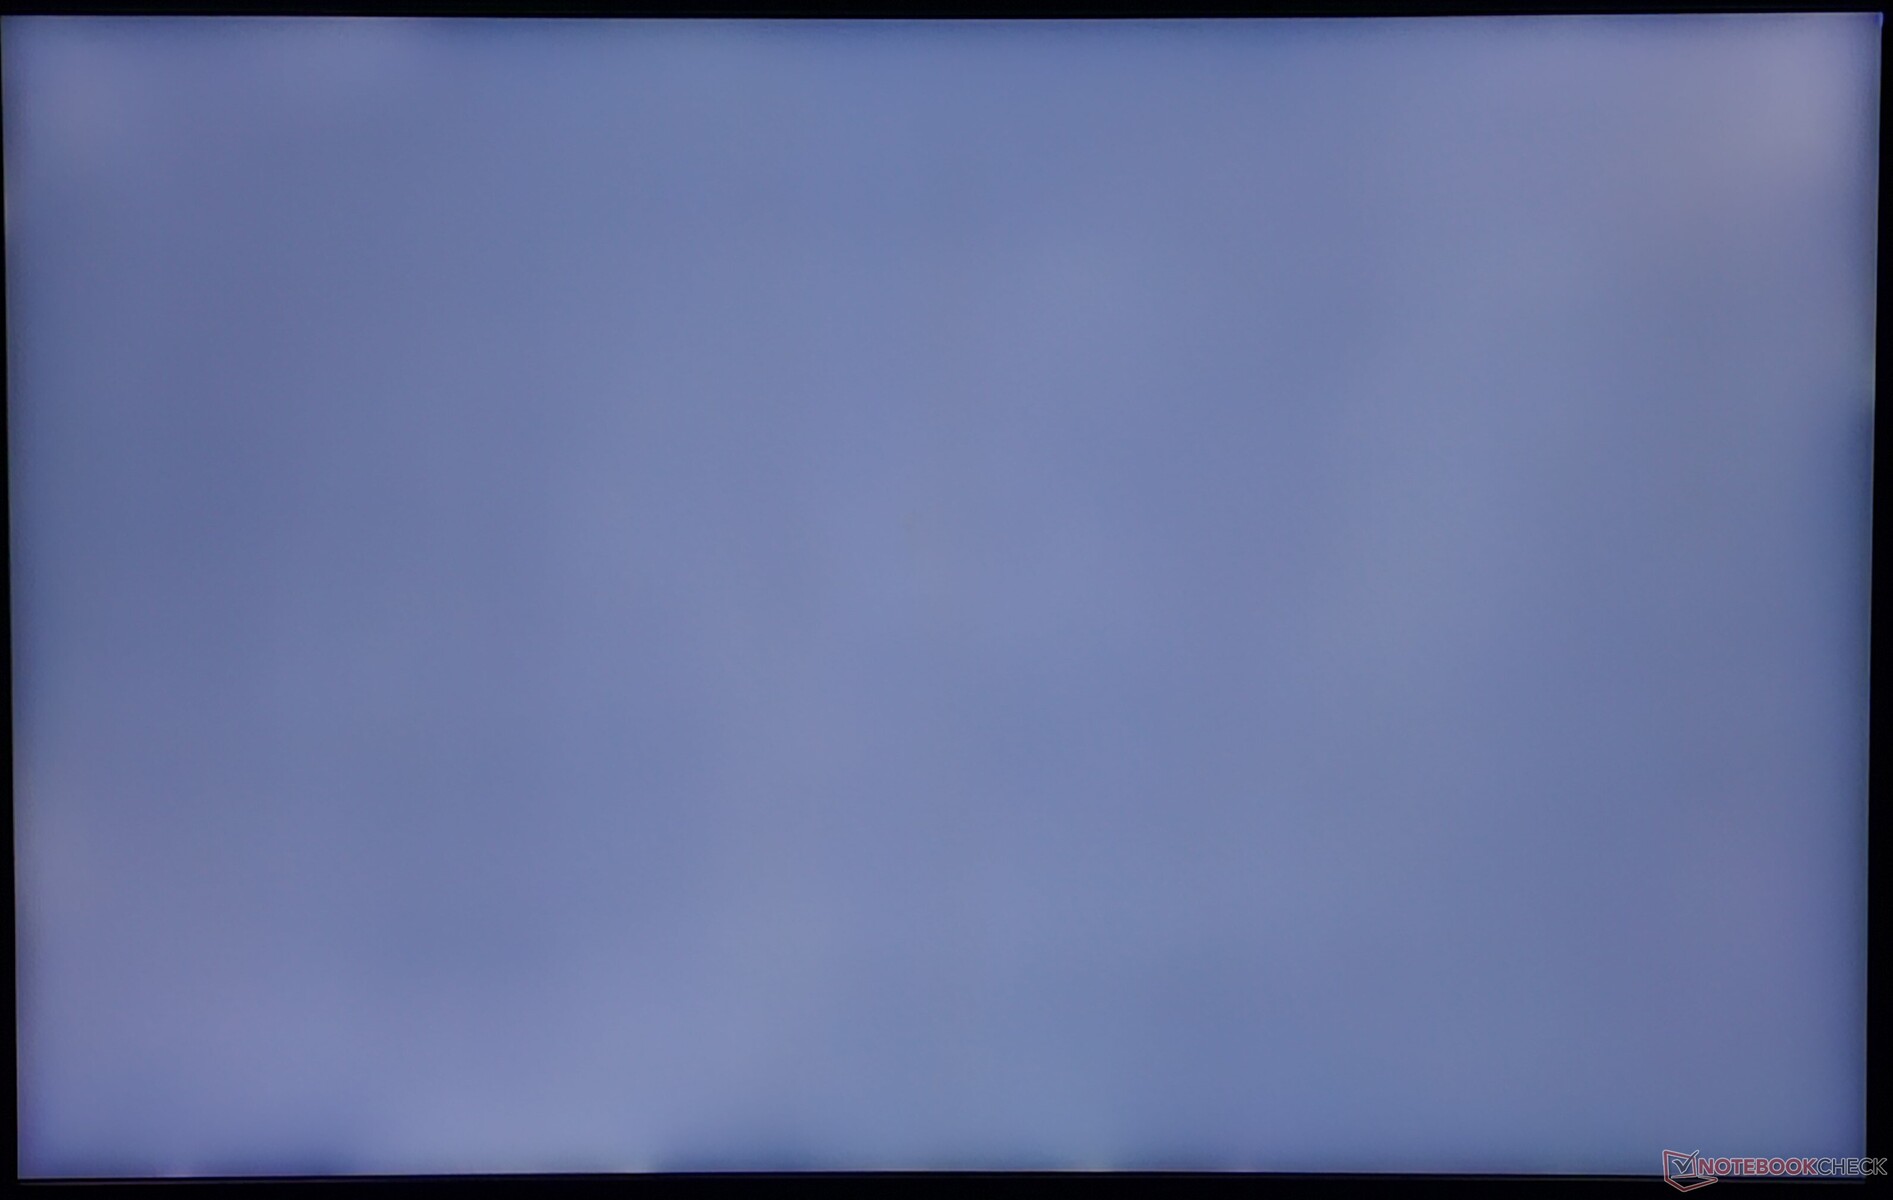
显示屏底部边框的背光出血现象非常轻微。
| |||||||||||||||||||||||||
Brightness Distribution: 94 %
Center on Battery: 291 cd/m²
Contrast: 1225:1 (Black: 0.4 cd/m²)
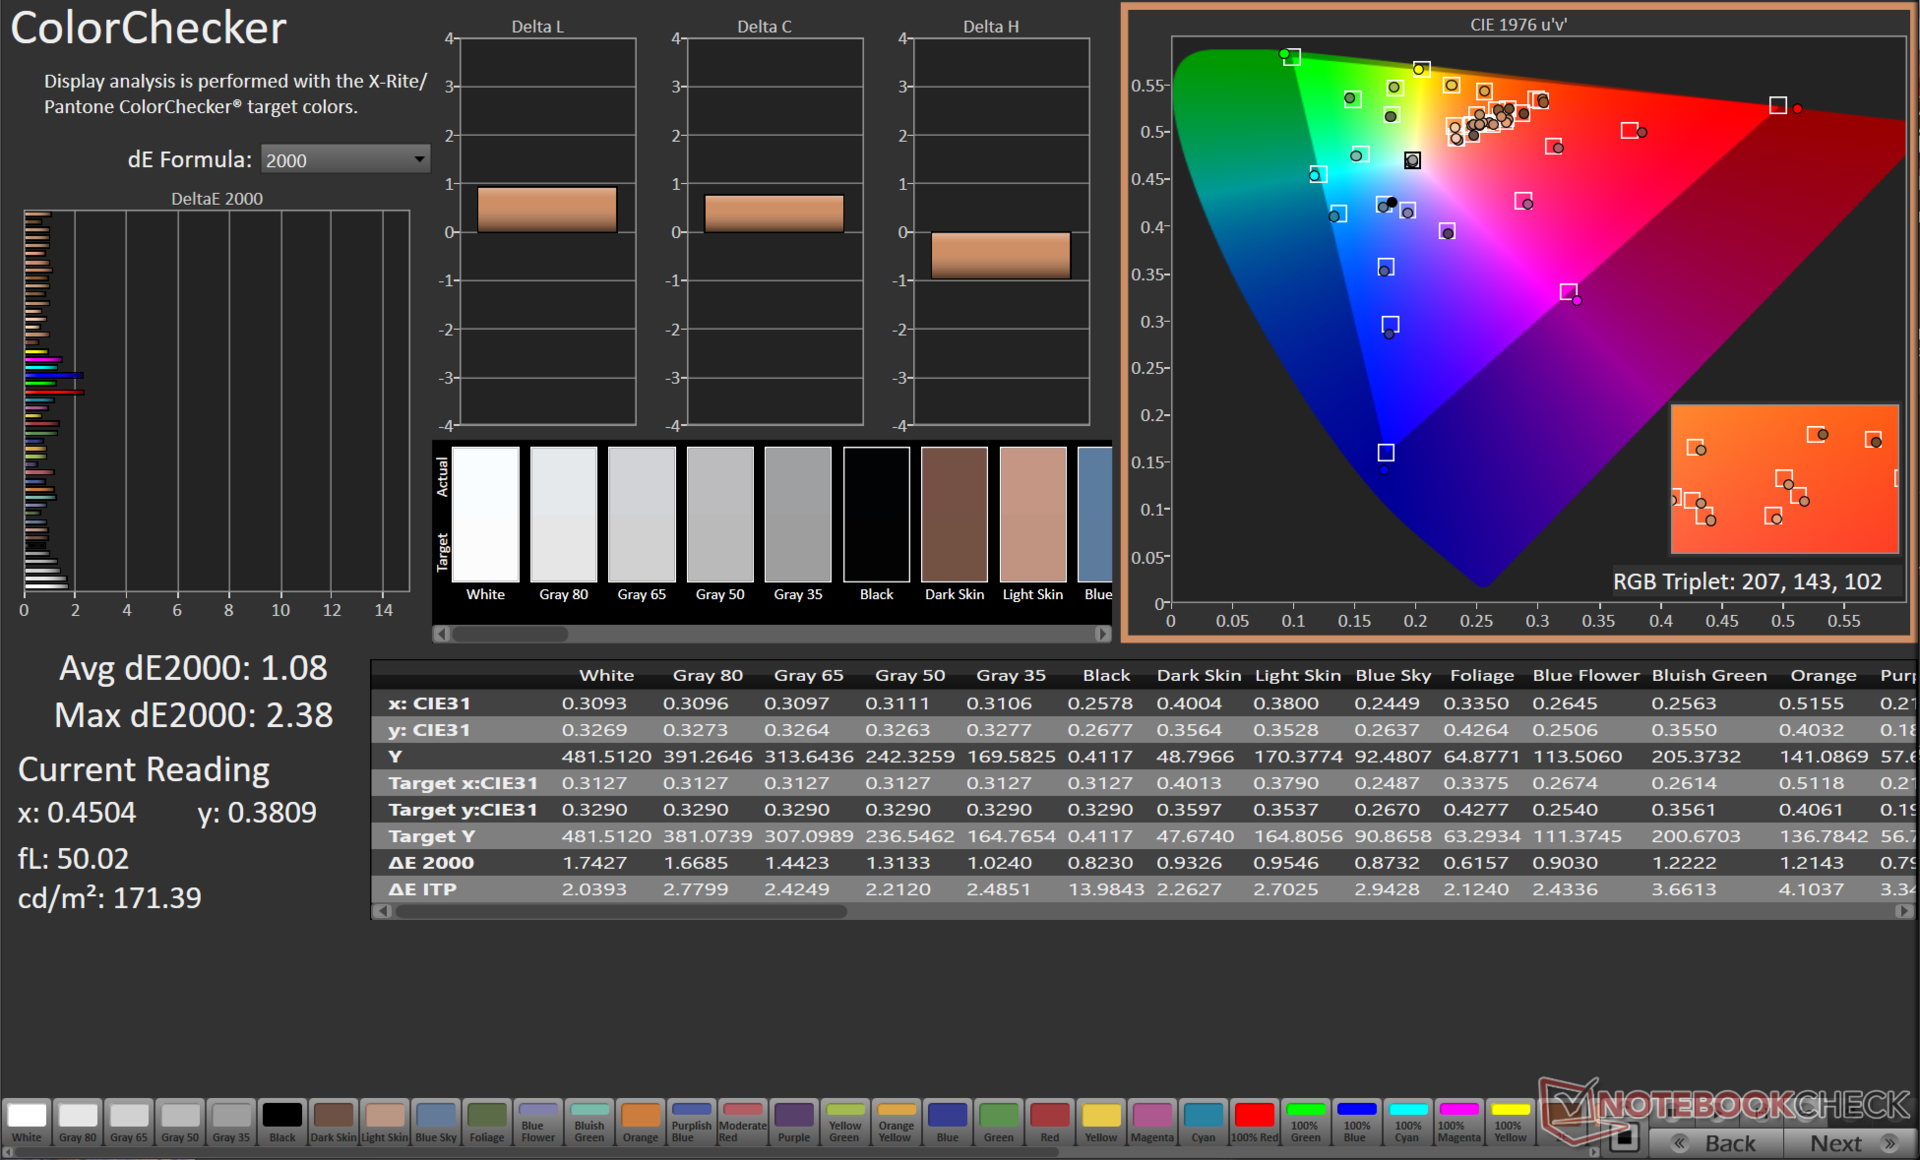
ΔE ColorChecker Calman: 1.08 | ∀{0.5-29.43 Ø4.71}
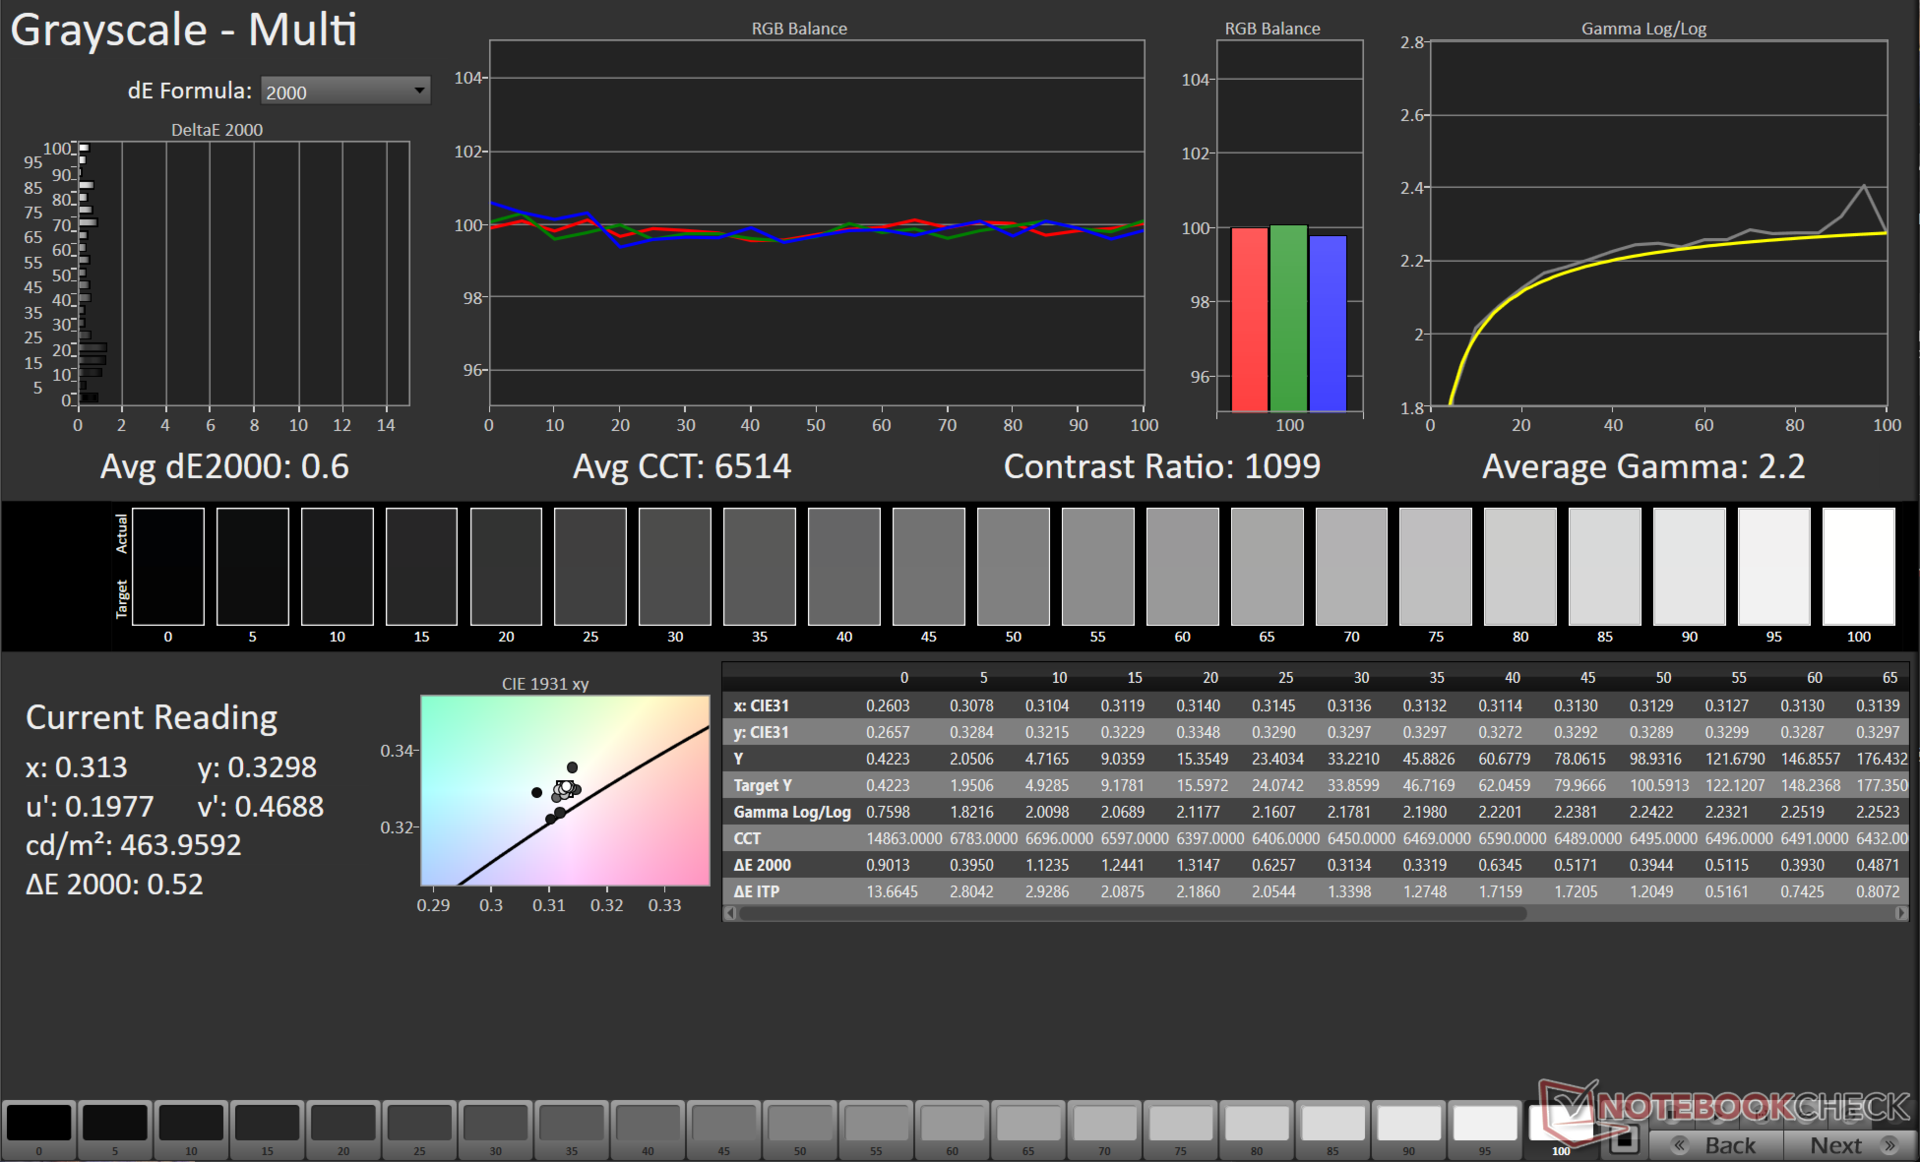
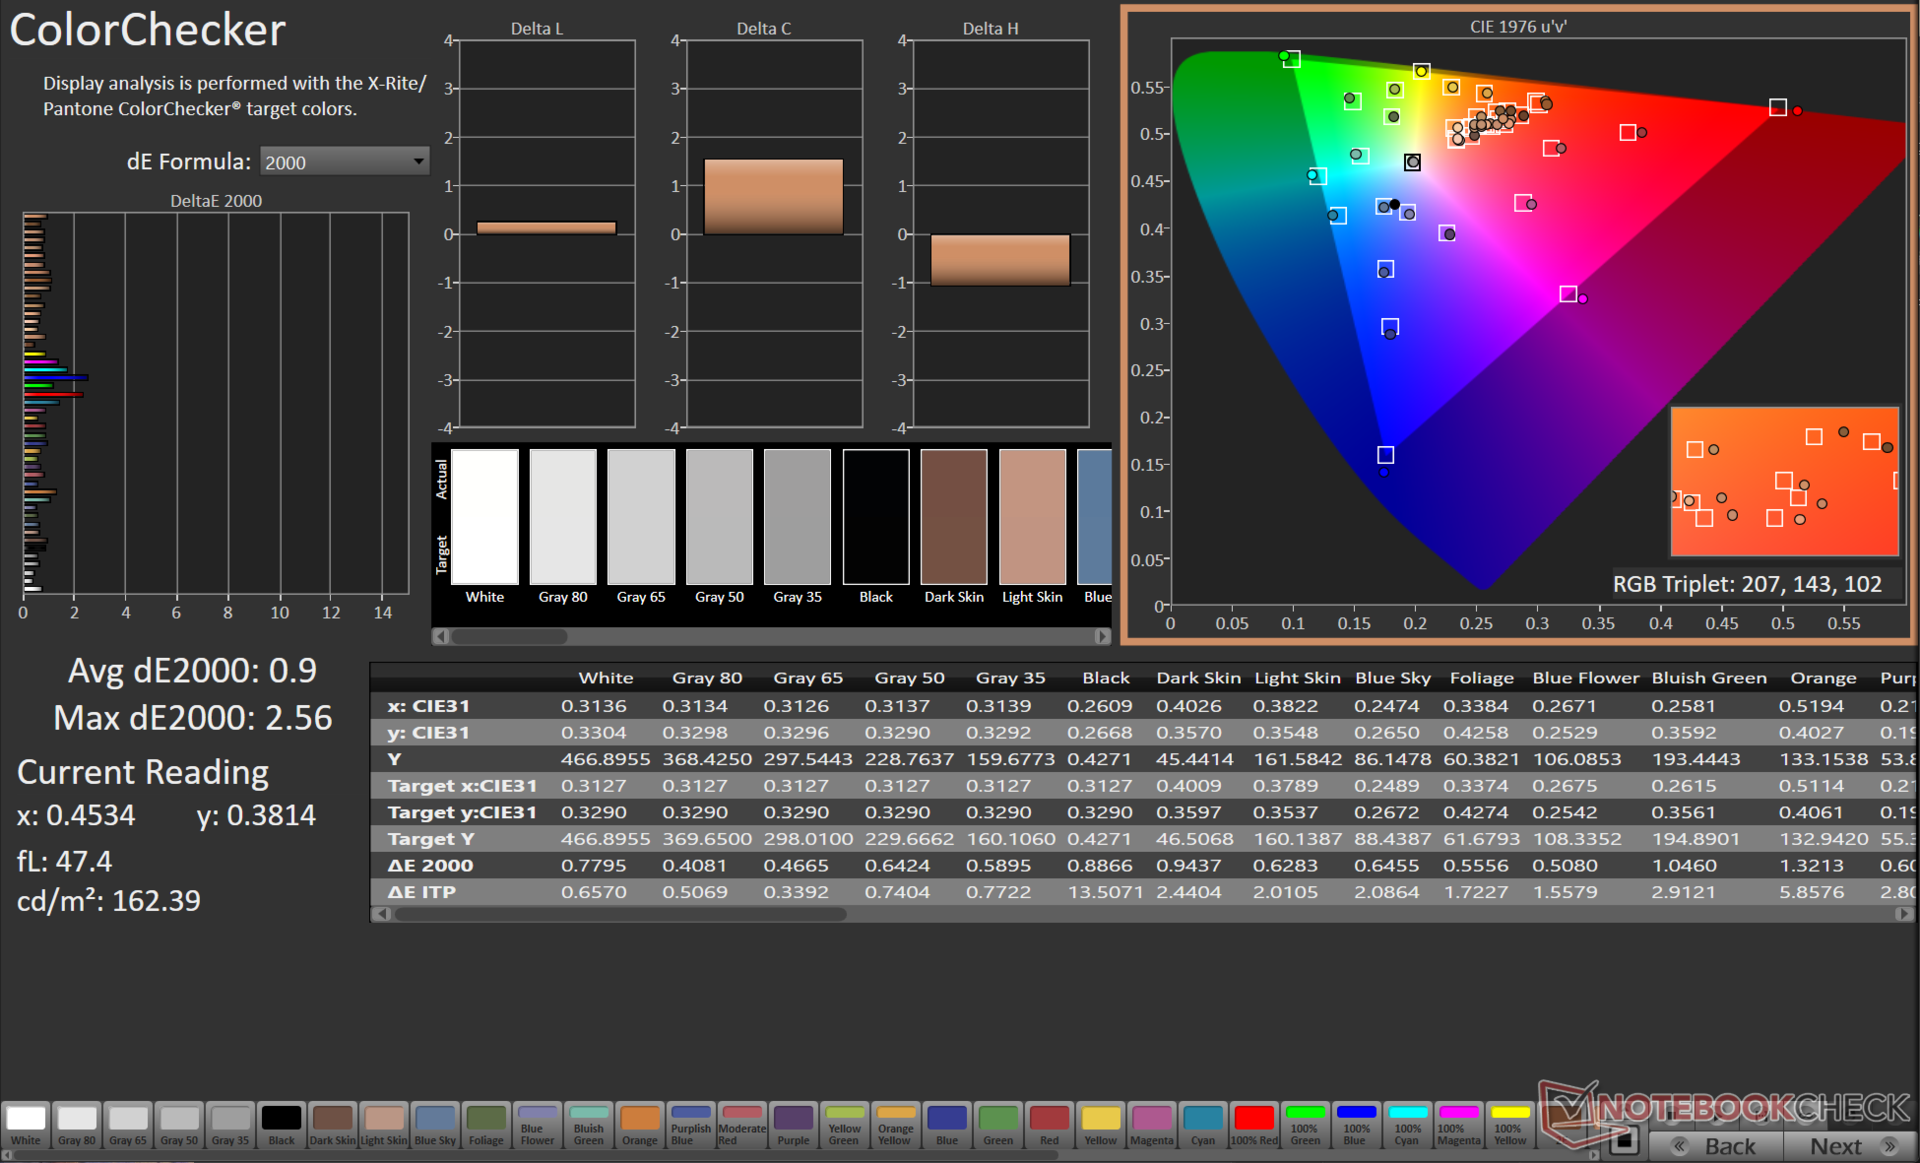
calibrated: 0.9
ΔE Greyscale Calman: 1.1 | ∀{0.09-98 Ø4.96}
90.8% AdobeRGB 1998 (Argyll 3D)
100% sRGB (Argyll 3D)
99.8% Display P3 (Argyll 3D)
Gamma: 2.13
CCT: 6724 K
| Asus ROG Strix Scar 16 G634JZR BOE NE160QDM-NM7, Mini LED, 2560x1600, 16" | Asus ROG Strix G16 G614JZ TL160ADMP03-0, IPS, 2560x1600, 16" | Lenovo Legion Pro 7 16IRX9H BOE CQ NE16QDM-NZB, IPS, 2560x1600, 16" | HP Omen 16 (2024) BOE BOE0B7D, IPS, 2560x1440, 16.1" | MSI Vector 16 HX A14V Chi Mei N160GME-GTB, IPS, 2560x1600, 16" | Alienware m16 R2 BOE NE16NYH, IPS, 2560x1600, 16" | |
|---|---|---|---|---|---|---|
| Display | -3% | -2% | -18% | -3% | -17% | |
| Display P3 Coverage (%) | 99.8 | 97 -3% | 98.5 -1% | 68.6 -31% | 95.4 -4% | 71 -29% |
| sRGB Coverage (%) | 100 | 99.9 0% | 99.9 0% | 98.6 -1% | 99.7 0% | 100 0% |
| AdobeRGB 1998 Coverage (%) | 90.8 | 84.9 -6% | 86.7 -5% | 70.6 -22% | 85.4 -6% | 71.4 -21% |
| Response Times | 18% | -54% | -86% | -12% | 1% | |
| Response Time Grey 50% / Grey 80% * (ms) | 5 ? | 5.1 ? -2% | 12.6 ? -152% | 14.1 ? -182% | 5.7 ? -14% | 5.7 ? -14% |
| Response Time Black / White * (ms) | 10.4 ? | 6.6 ? 37% | 5.8 ? 44% | 9.3 ? 11% | 11.4 ? -10% | 8.7 ? 16% |
| PWM Frequency (Hz) | 2040 ? | |||||
| Screen | -34% | -1% | -46% | -70% | -27% | |
| Brightness middle (cd/m²) | 490 | 470 -4% | 487 -1% | 292 -40% | 557.2 14% | 345.8 -29% |
| Brightness (cd/m²) | 487 | 459 -6% | 460 -6% | 291 -40% | 506 4% | 337 -31% |
| Brightness Distribution (%) | 94 | 93 -1% | 88 -6% | 85 -10% | 83 -12% | 87 -7% |
| Black Level * (cd/m²) | 0.4 | 0.42 -5% | 0.42 -5% | 0.24 40% | 0.41 -2% | 0.3 25% |
| Contrast (:1) | 1225 | 1119 -9% | 1160 -5% | 1217 -1% | 1359 11% | 1153 -6% |
| Colorchecker dE 2000 * | 1.08 | 1.86 -72% | 1.12 -4% | 2.36 -119% | 2.91 -169% | 1.99 -84% |
| Colorchecker dE 2000 max. * | 2.38 | 3.87 -63% | 2.26 5% | 4.08 -71% | 5.94 -150% | 3.52 -48% |
| Colorchecker dE 2000 calibrated * | 0.9 | 0.93 -3% | 0.54 40% | 0.93 -3% | 1.63 -81% | 0.62 31% |
| Greyscale dE 2000 * | 1.1 | 2.7 -145% | 1.4 -27% | 3 -173% | 3.8 -245% | 2.1 -91% |
| Gamma | 2.13 103% | 2.246 98% | 2.242 98% | 2.101 105% | 2.23 99% | 2.32 95% |
| CCT | 6724 97% | 6711 97% | 6809 95% | 5976 109% | 6408 101% | 6369 102% |
| Total Average (Program / Settings) | -6% /
-20% | -19% /
-9% | -50% /
-46% | -28% /
-47% | -14% /
-21% |
* ... smaller is better
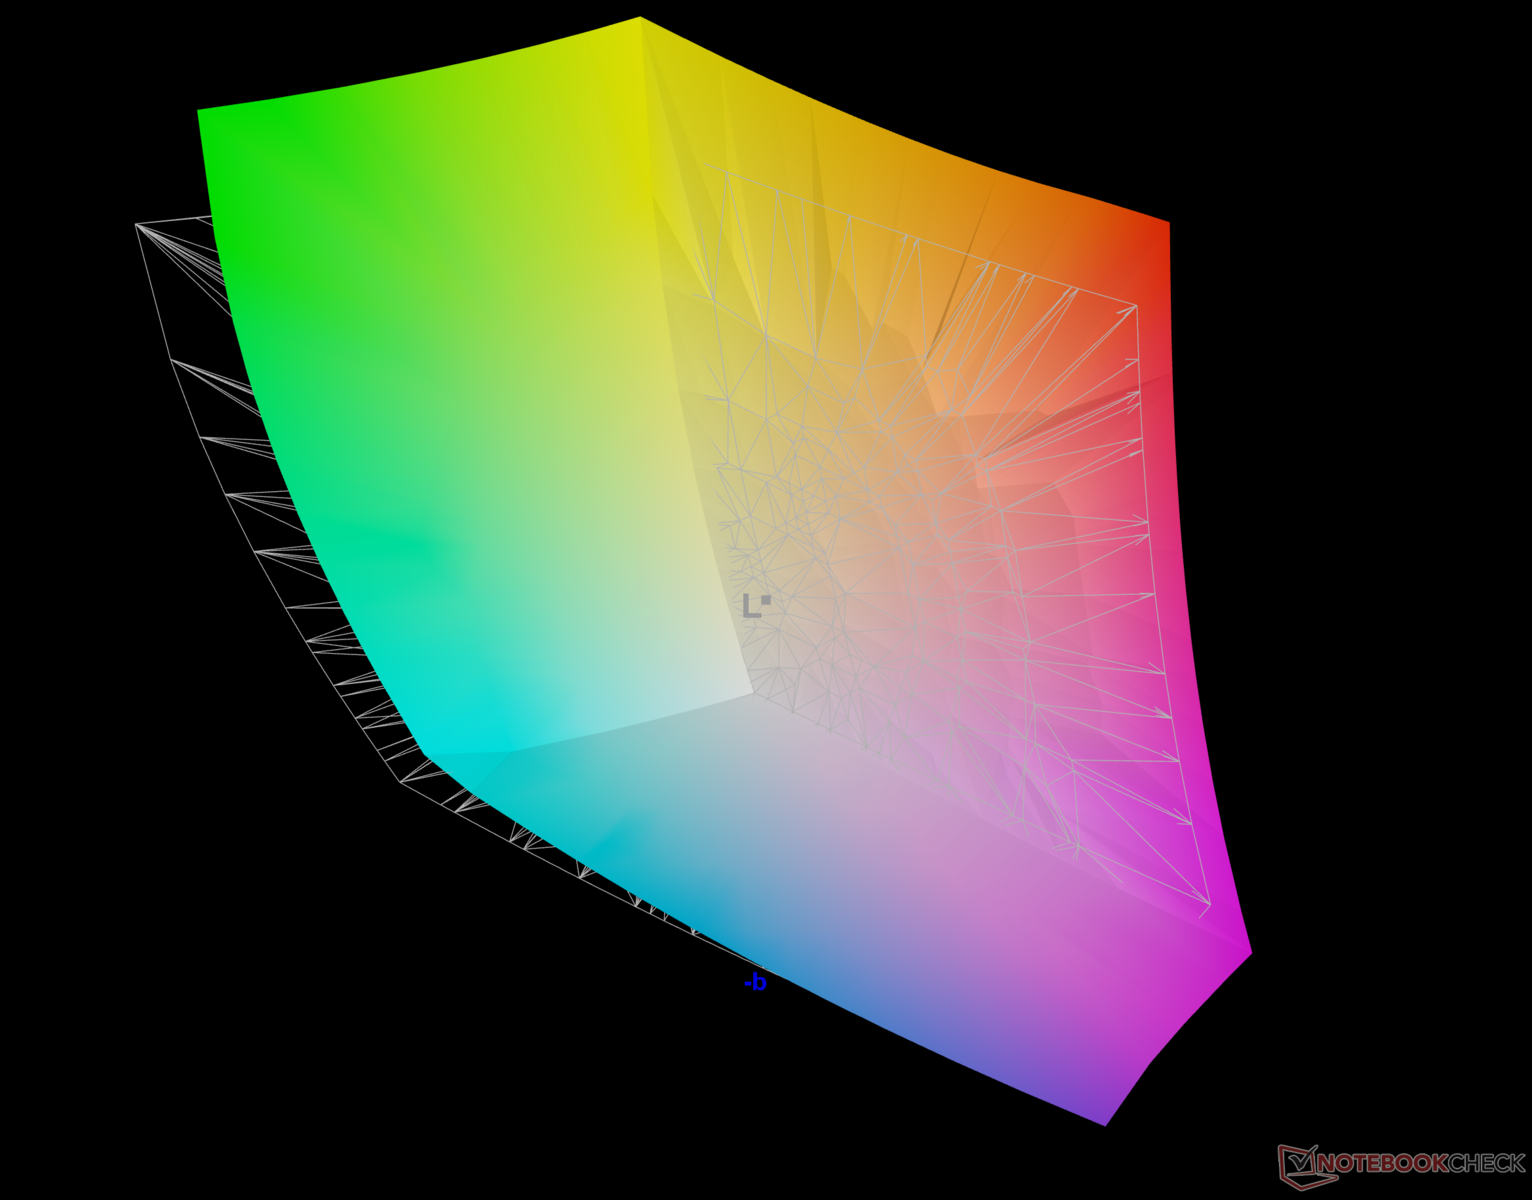
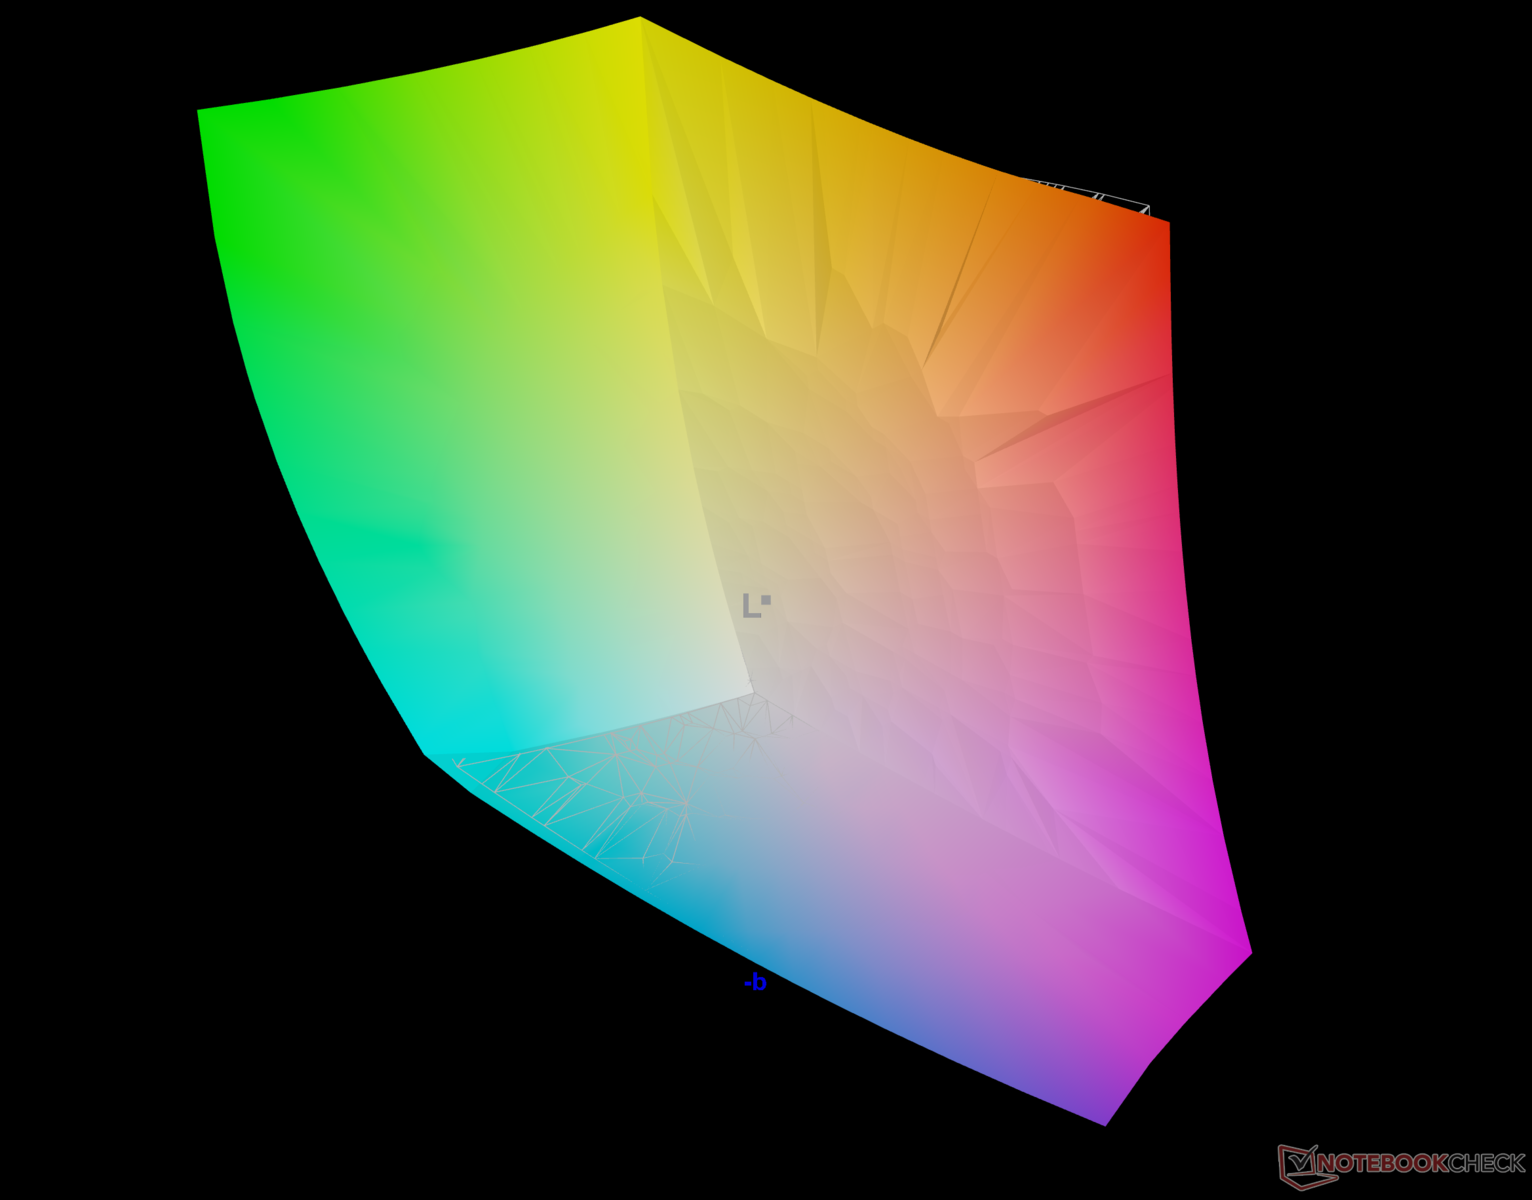
Scar 16 的显示屏完全覆盖了 sRGB 和 Display P3 色彩空间。Adobe RGB 的覆盖率也很高,接近 91%,这使得 Scar 16 非常适合媒体消费和内容创建工作流程。

Scar 16 的显示屏校准良好,灰度和 ColorChecker Delta E 2000 的平均值分别为 1.1 和 1.08。
我们使用 X-Rite i1Basic Pro 3 分光光度计和 Portrait Displays 的 Calman Ultimate 软件在 Display P3 色彩空间中进行了校准,进一步将相应值缩减到 0.6 和 0.9。

Display Response Times
| ↔ Response Time Black to White | ||
|---|---|---|
| 10.4 ms ... rise ↗ and fall ↘ combined | ↗ 3 ms rise |  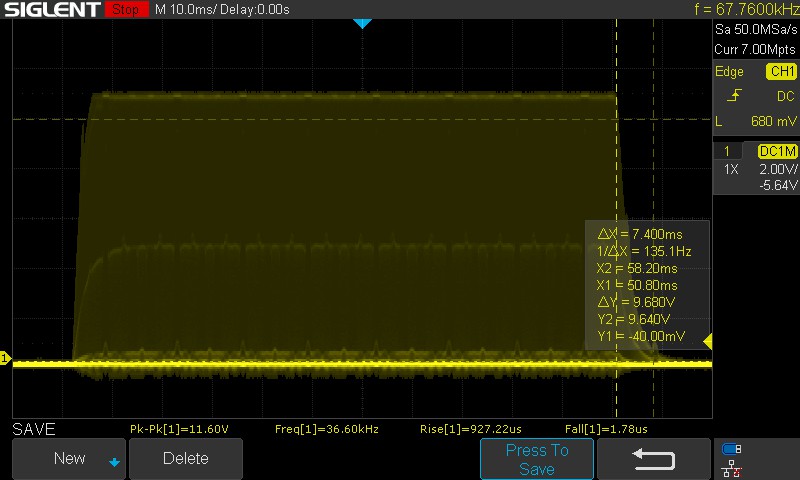 |
| ↘ 7.4 ms fall | ||
| The screen shows good response rates in our tests, but may be too slow for competitive gamers. In comparison, all tested devices range from 0.1 (minimum) to 240 (maximum) ms. » 28 % of all devices are better. This means that the measured response time is better than the average of all tested devices (19.8 ms). | ||
| ↔ Response Time 50% Grey to 80% Grey | ||
| 5 ms ... rise ↗ and fall ↘ combined | ↗ 2 ms rise | 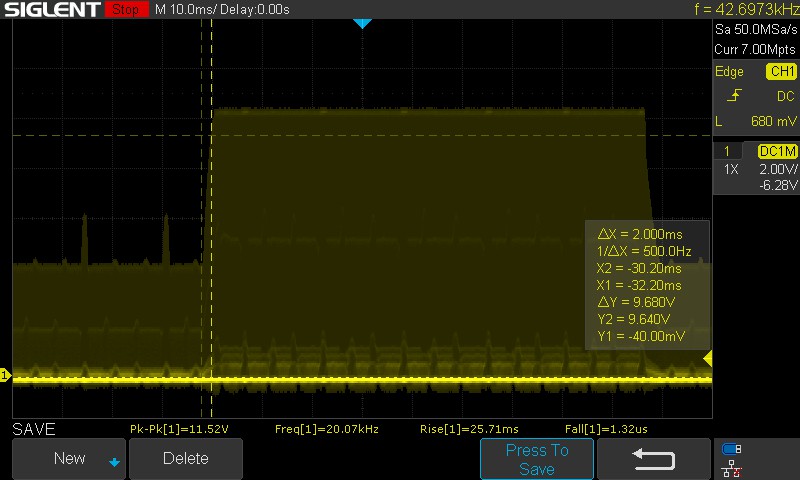 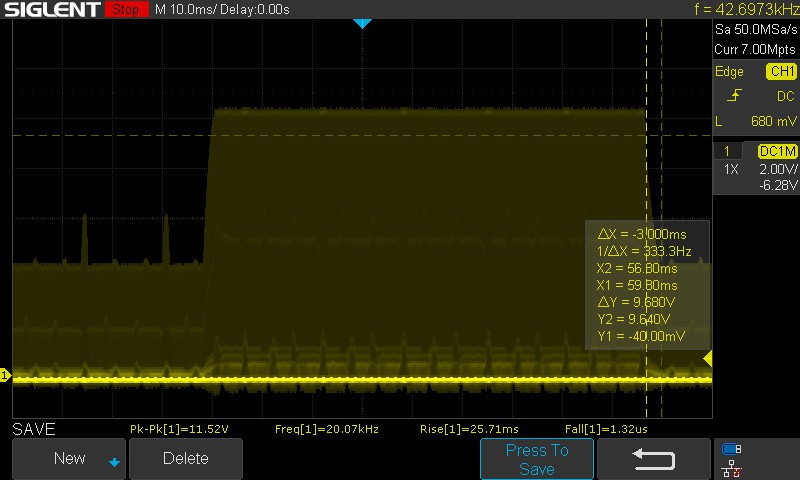 |
| ↘ 3 ms fall | ||
| The screen shows very fast response rates in our tests and should be very well suited for fast-paced gaming. In comparison, all tested devices range from 0.165 (minimum) to 636 (maximum) ms. » 17 % of all devices are better. This means that the measured response time is better than the average of all tested devices (31 ms). | ||
由于微型 LED 面板的背景 PWM,我们不得不手动估算响应时间。对于一款游戏笔记本电脑来说,估计的响应时间似乎还不错。
华硕宣传的响应时间为 3 毫秒,但我们在 50% 灰色到 80% 灰色的转换过程中测得的响应时间为 5 毫秒。没有提供面板超速选项。
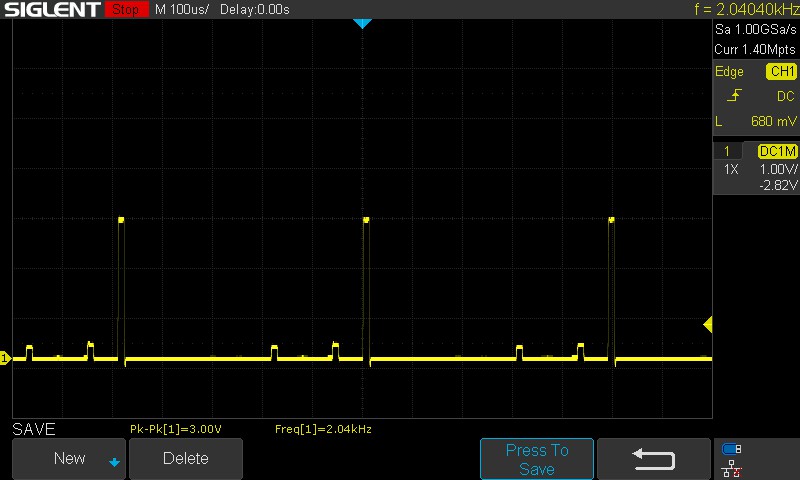
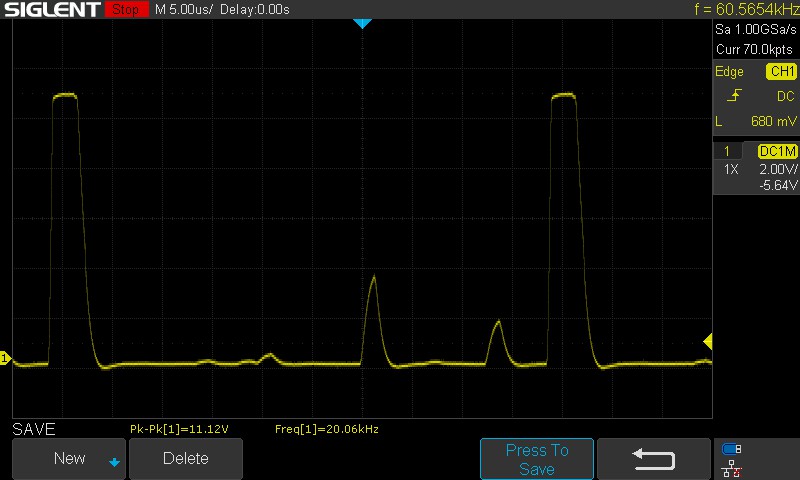
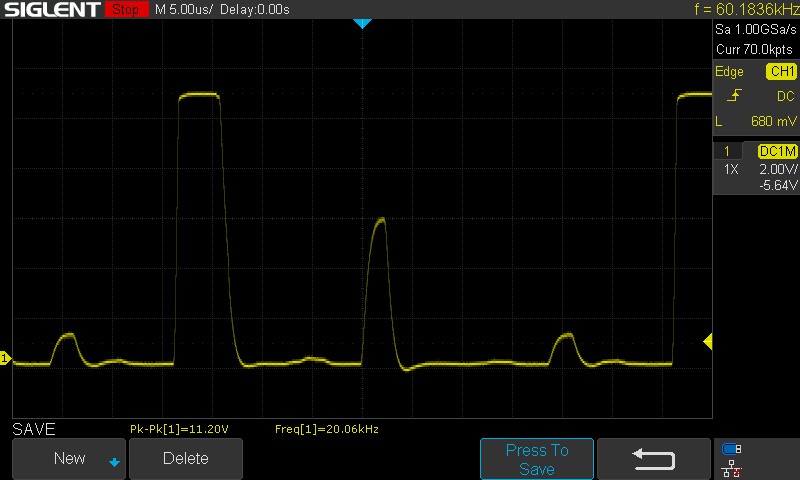
Screen Flickering / PWM (Pulse-Width Modulation)
| Screen flickering / PWM detected | 2040 Hz | ≤ 10 % brightness setting |  |
The display backlight flickers at 2040 Hz (worst case, e.g., utilizing PWM) Flickering detected at a brightness setting of 10 % and below. There should be no flickering or PWM above this brightness setting. The frequency of 2040 Hz is quite high, so most users sensitive to PWM should not notice any flickering. In comparison: 52 % of all tested devices do not use PWM to dim the display. If PWM was detected, an average of 7757 (minimum: 5 - maximum: 343500) Hz was measured. | |||
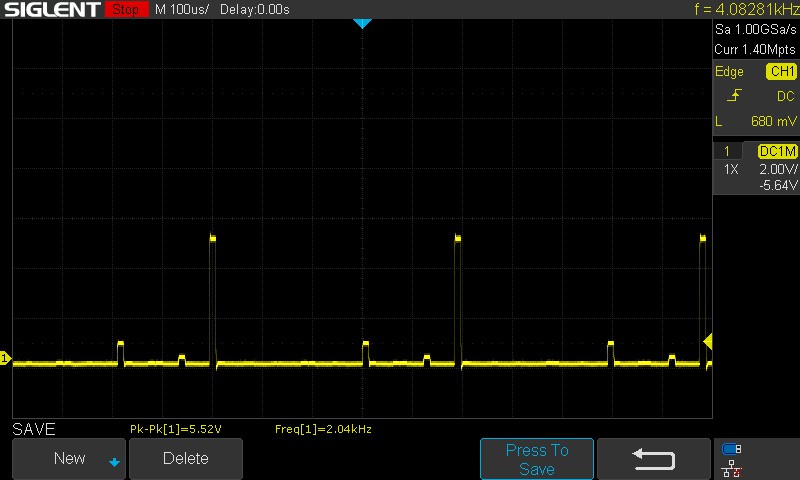
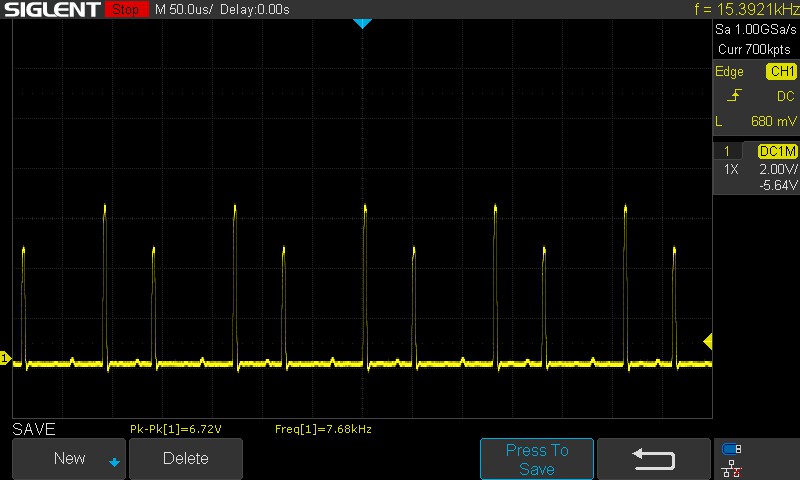
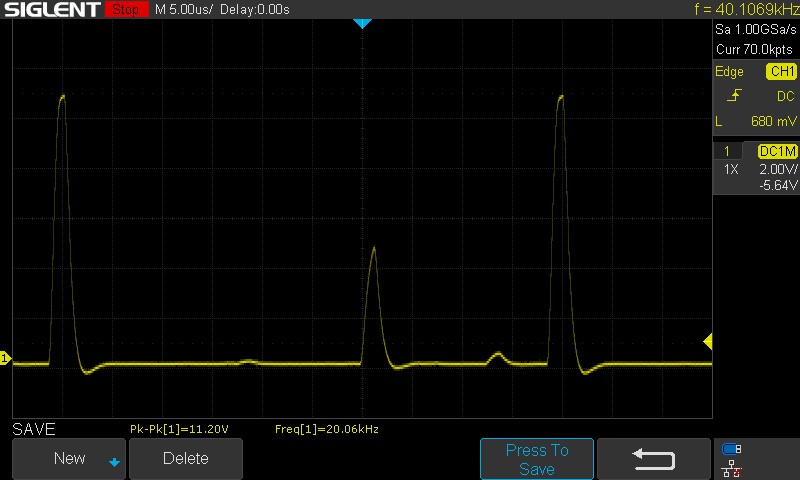
我们记录的 PWM 频率为 2.04 kHZ,Windows 亮度滑块设置为 10%。亮度从 50% 到 100% 时,该值增至 20.06 kHz。测量值相当高,因此即使亮度较低,也不会造成眼睛疲劳。
请参阅我们的文章"为什么 PWM 如此令人头痛"一文了解更多信息。我们还有一个 PWM 排名页面列出了所有评测设备的频率测量值。
室外观看一般没有问题,但眩目的阳光会影响屏幕内容的清晰度。可视角度相当稳定,在极端情况下亮度或色彩信息不会有明显的损失。

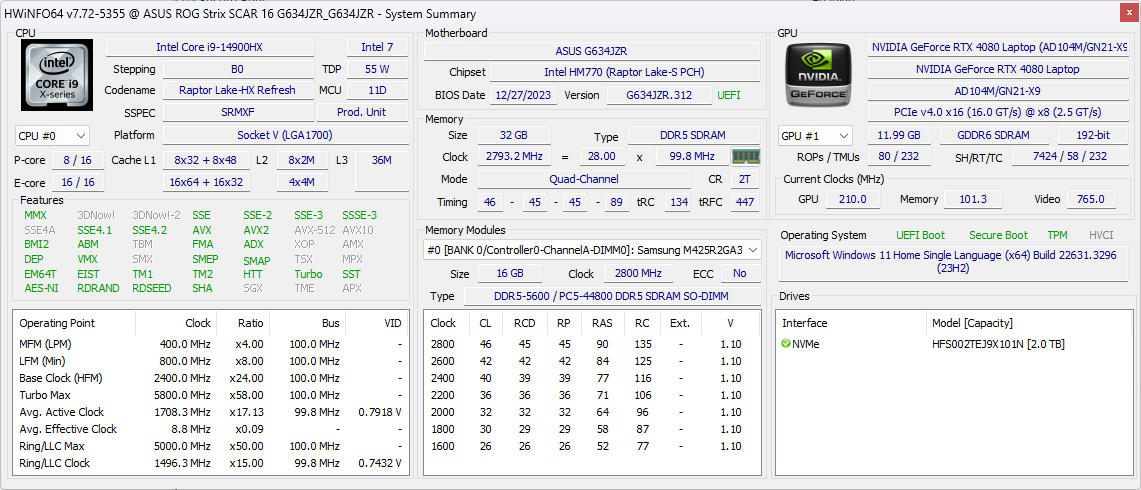
性能:与酷睿 i9-13980HX 相比,酷睿 i9-14900HX 的性能略有提升
华硕提供两种配置的 ROG Strix Scar 16,均配备 英特尔酷睿 i9-14900HX处理器。这两种配置仅在 GPU 上有所不同,可选择 英伟达GeForce RTX 4080和 RTX 4090 笔记本电脑 GPUs.
测试条件
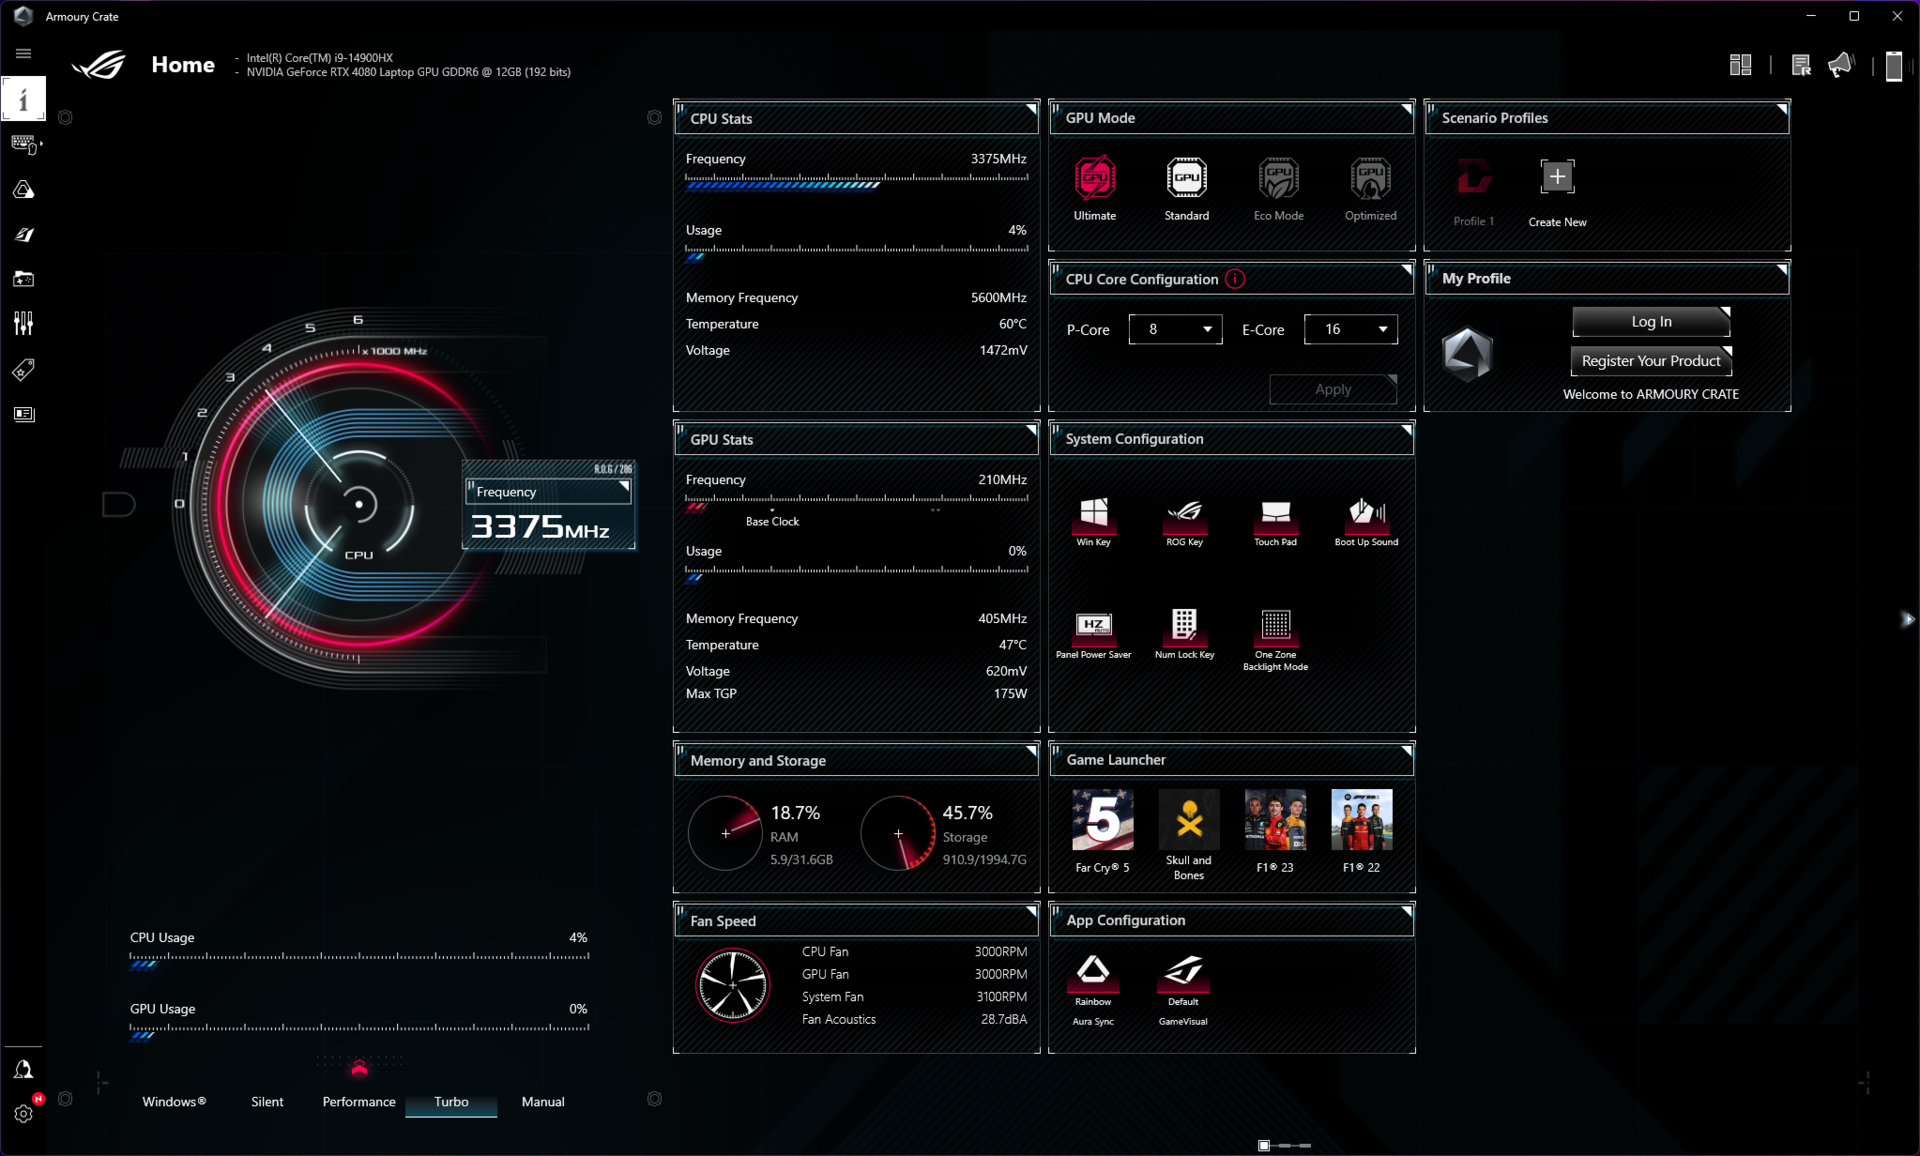
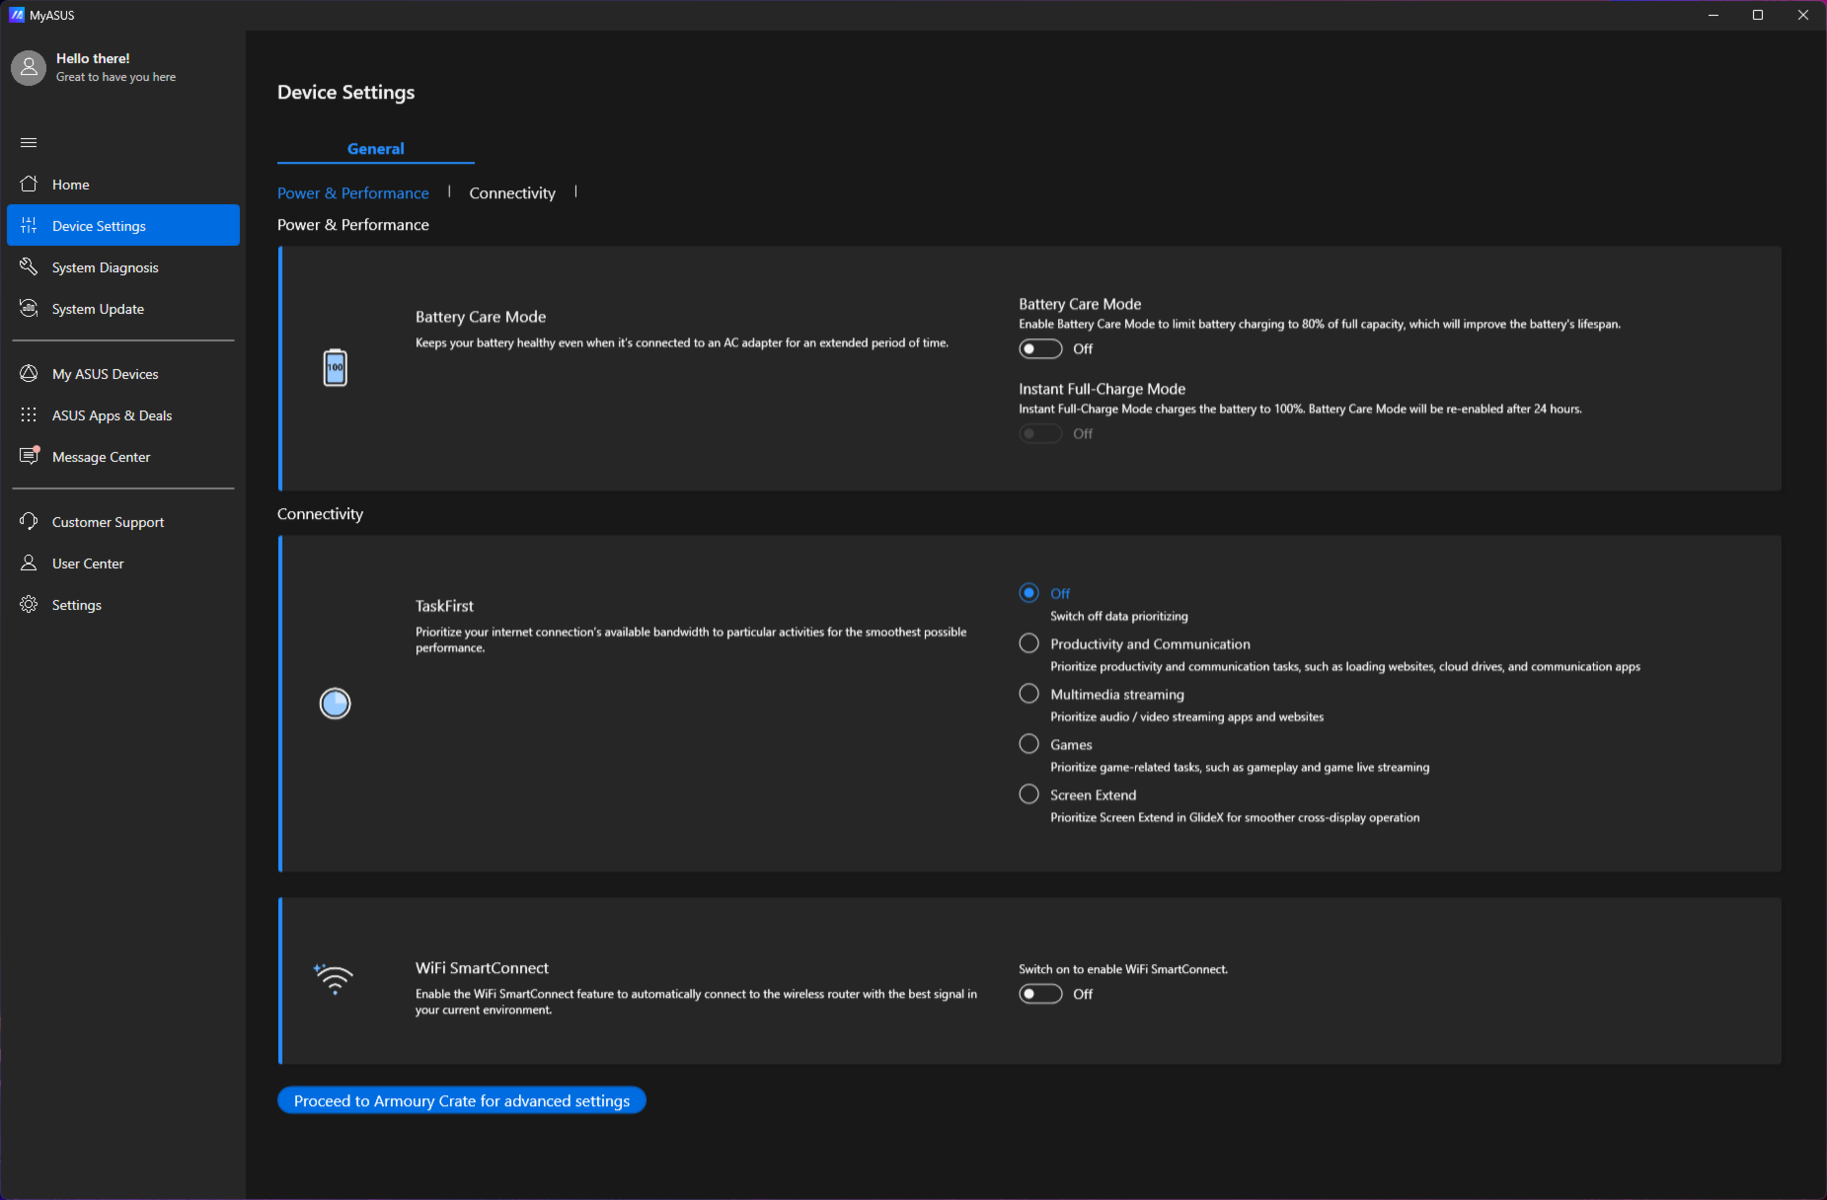
性能调整可通过 Armory Crate 执行。华硕还捆绑了 MyAsus 应用程序,提供系统更新、诊断等辅助功能。
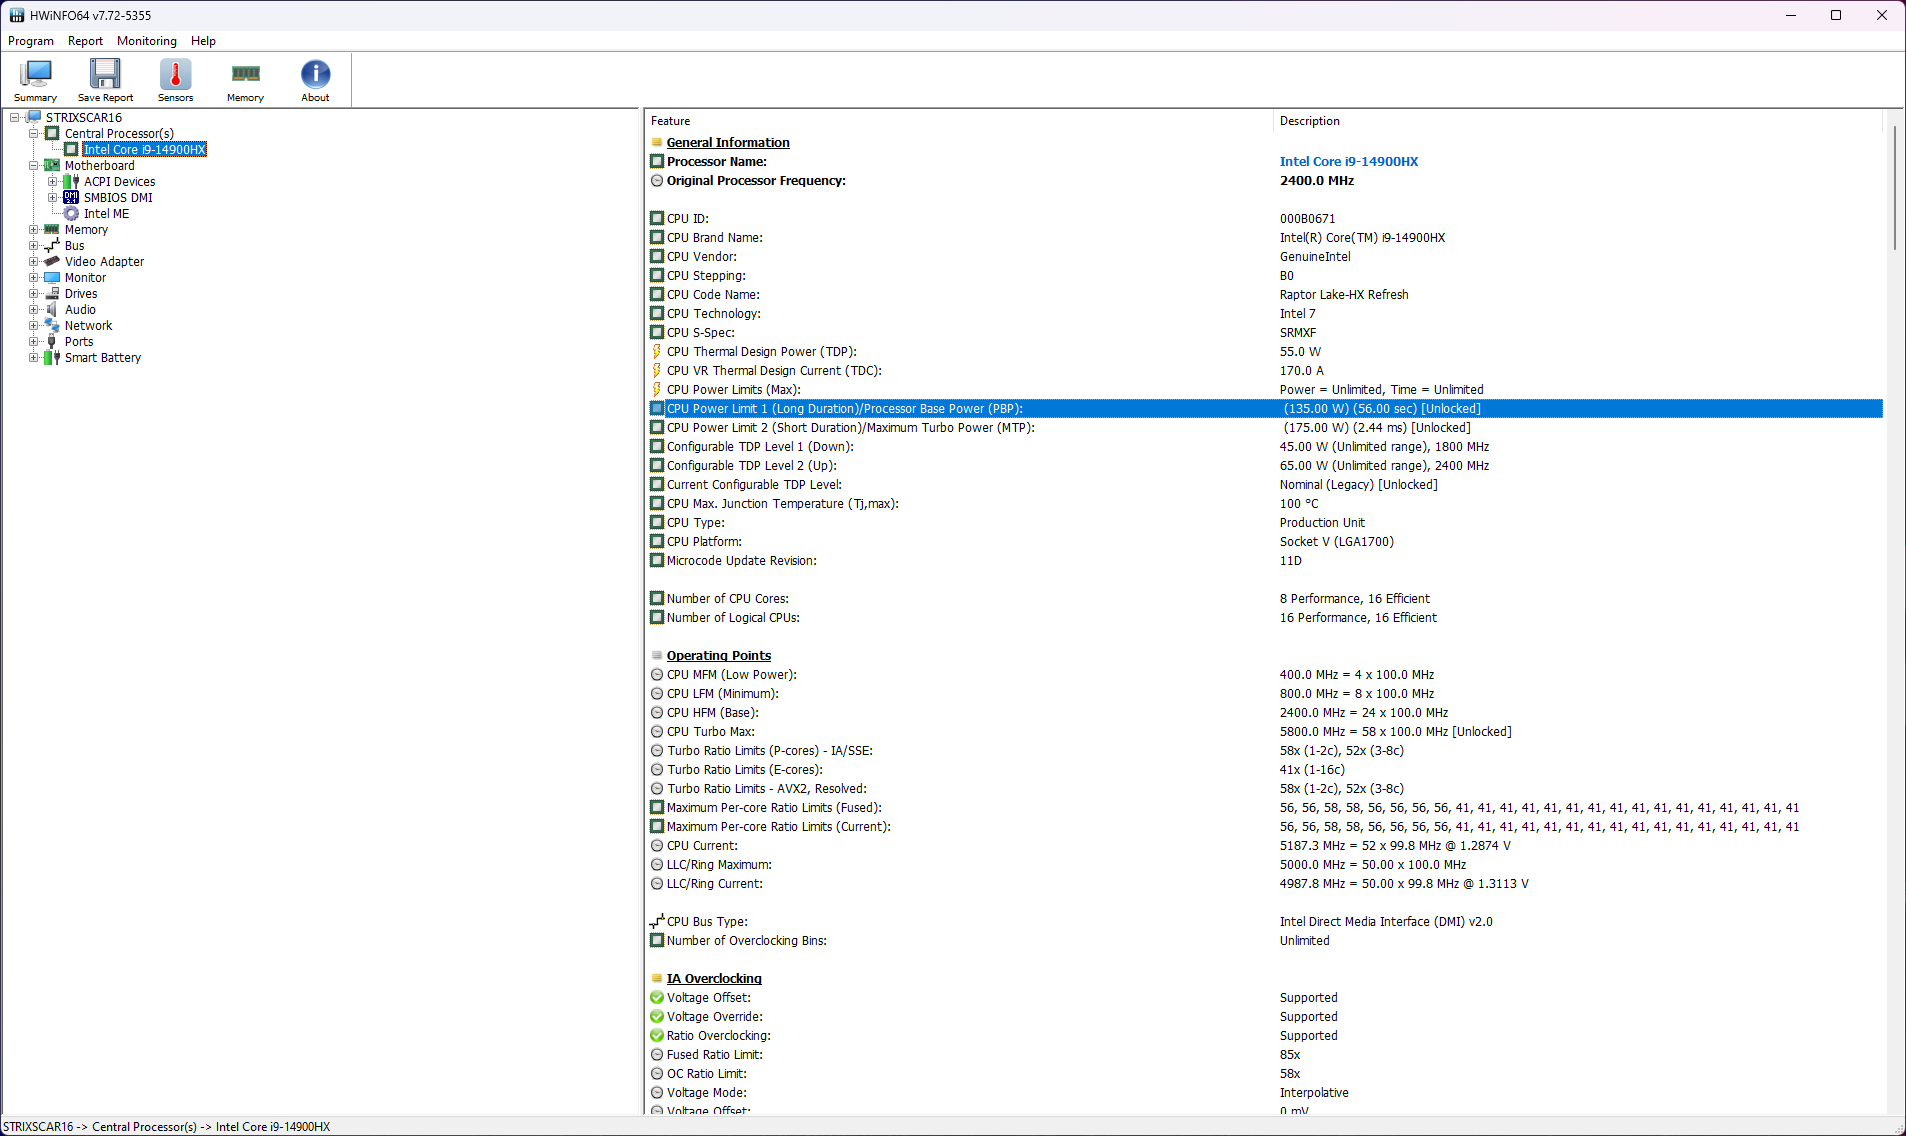
Scar 16 提供三种主要电源配置文件供用户选择:静音、高性能和涡轮增压。也可以使用 Windows 电源计划来代替 Armory Crate 中的电源计划。此外,还有一个手动模式,最多可配置 140 W PL1。
| 性能模式 | PL1 (PBP) / Tau | PL2 (MTP) / Tau | Cinebench R15 Multi score | Cinebench R15 Multi score (30 loop) |
|---|---|---|---|---|
| 静音 | 70 W / 56 s | 100 W / 2.44 ms | 3904 (-15.14%) | 3435 (-20.98%) |
| 性能 | 107 W / 56 s | 120 W / 2.44 ms | 4208 (-8.54%) | 4182 (-3.79%) |
| 涡轮 | 135 W / 56 s | 175 W / 2.44 ms | 4601 (100%) | 4347 (100%) |
支持 Nvidia Advanced Optimus,但华硕也提供了硬件 MUX 模式。我们在 MUX 设置为 RTX 4080 dGPU 的 Turbo 模式下进行了所有基准测试。
电池测试在启用 MSHybrid 的静音模式下进行。
处理器
酷睿 i9-14900HX 几乎与 酷睿 i9-13980HX24 个内核(8P + 16E)和 32 个线程,但主频提升了 5.8 GHz。
第 14 代 Raptor Lake-HX 并非重大升级,与酷睿 i9-13980HX 相比,性能提升幅度在误差范围之内。相比之下,Scar 16 的单核性能与其他酷睿 i9-14900HX 笔记本电脑相当。
不过 微星 Vector 16 HX的多核性能明显占优,因为 PL2 为 184 W。相反,惠普 惠普 Omen 16在这些测试中落后于 Scar 16。
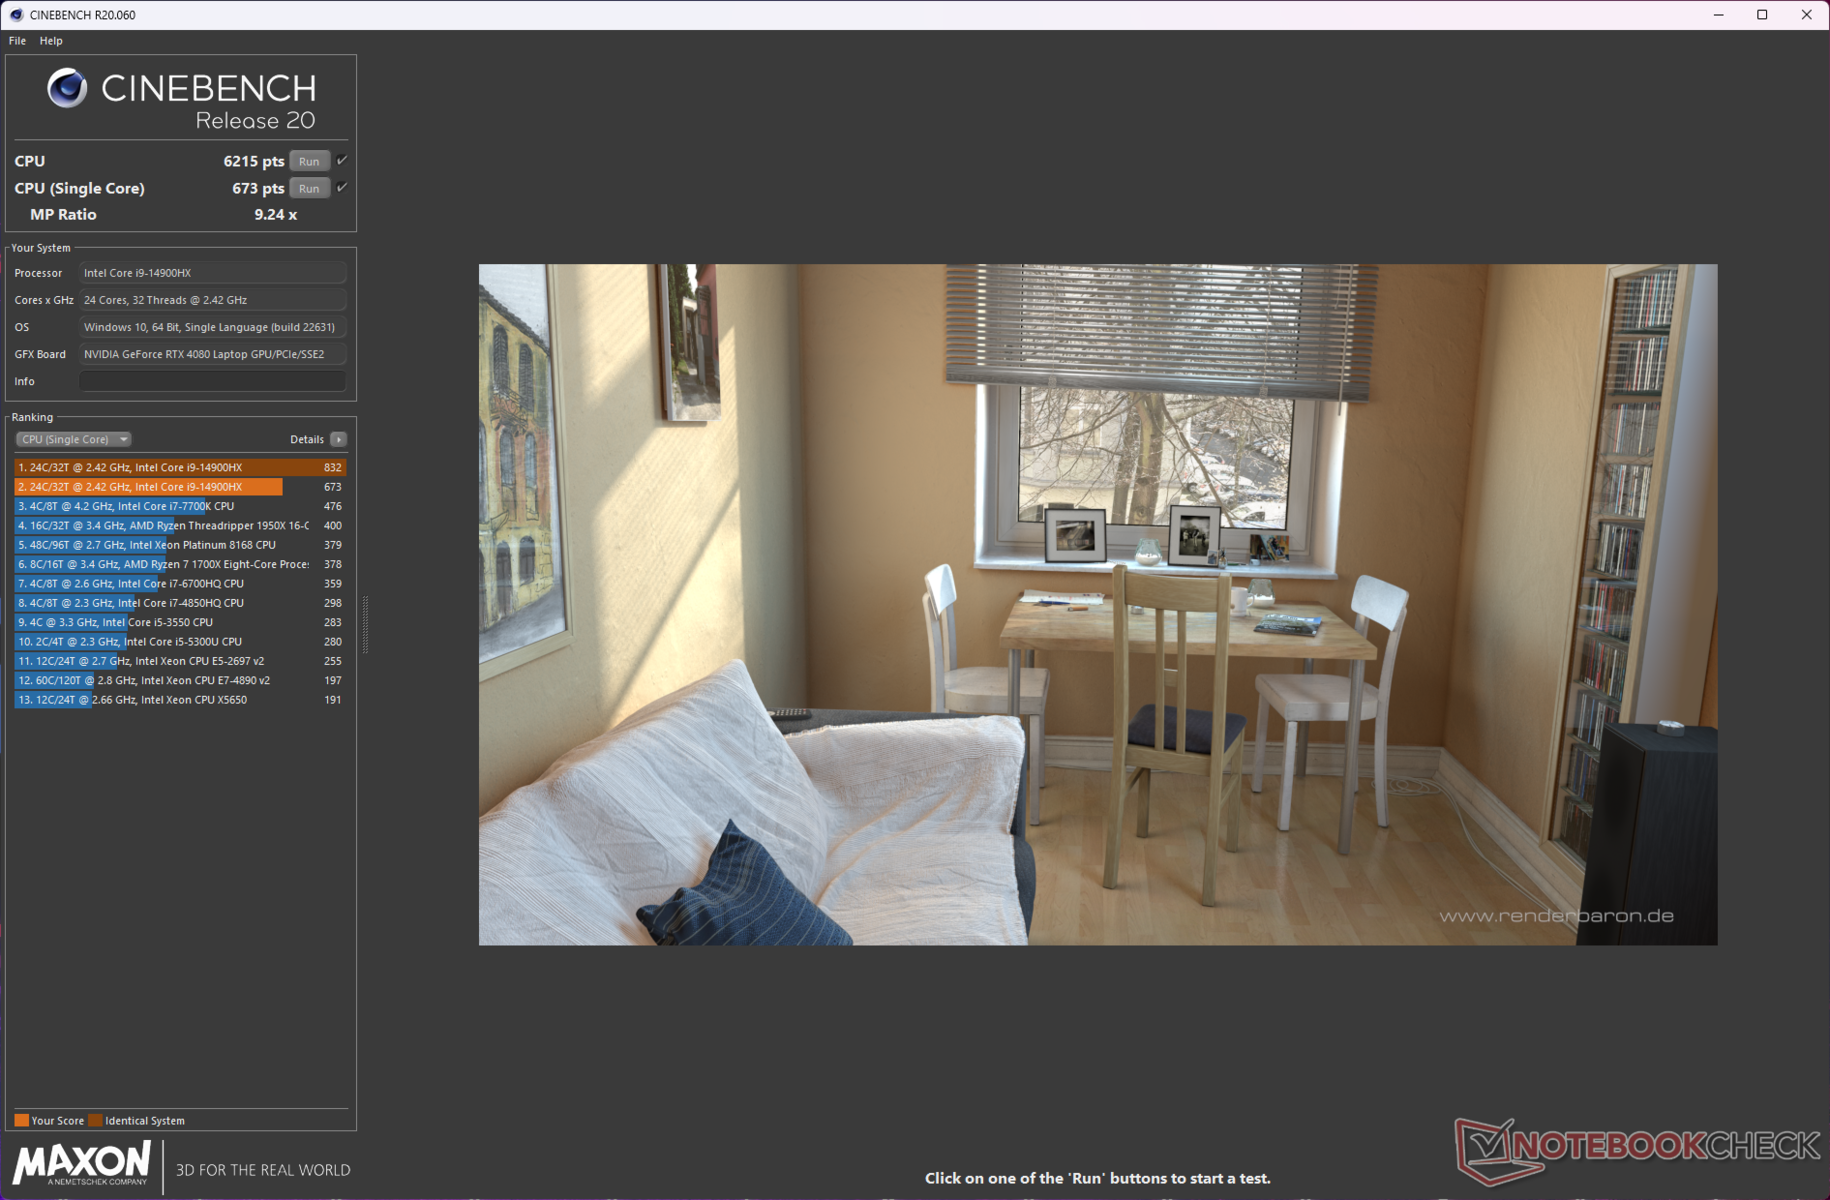
Cinebench R15 Multi Loop
Cinebench R23: Multi Core | Single Core
Cinebench R20: CPU (Multi Core) | CPU (Single Core)
Cinebench R15: CPU Multi 64Bit | CPU Single 64Bit
Blender: v2.79 BMW27 CPU
7-Zip 18.03: 7z b 4 | 7z b 4 -mmt1
Geekbench 6.7: Multi-Core | Single-Core
Geekbench 5.5: Multi-Core | Single-Core
HWBOT x265 Benchmark v2.2: 4k Preset
LibreOffice : 20 Documents To PDF
R Benchmark 2.5: Overall mean
| CPU Performance rating | |
| Lenovo Legion Pro 7 16IRX9H | |
| Asus ROG Strix Scar 17 G733PYV-LL053X | |
| Asus ROG Strix Scar 16 G634JZR | |
| MSI Vector 16 HX A14V | |
| Average Intel Core i9-14900HX | |
| Asus ROG Strix G16 G614JZ -2! | |
| HP Omen 16 (2024) | |
| Average of class Gaming | |
| Alienware m16 R2 -1! | |
| Cinebench R23 / Multi Core | |
| MSI Vector 16 HX A14V | |
| Asus ROG Strix Scar 17 G733PYV-LL053X | |
| Lenovo Legion Pro 7 16IRX9H | |
| Asus ROG Strix Scar 16 G634JZR | |
| Asus ROG Strix G16 G614JZ | |
| Average Intel Core i9-14900HX (17078 - 36249, n=37) | |
| HP Omen 16 (2024) | |
| Average of class Gaming (10488 - 42661, n=107, last 2 years) | |
| Alienware m16 R2 | |
| Cinebench R23 / Single Core | |
| Lenovo Legion Pro 7 16IRX9H | |
| HP Omen 16 (2024) | |
| MSI Vector 16 HX A14V | |
| Asus ROG Strix Scar 16 G634JZR | |
| Average Intel Core i9-14900HX (1720 - 2245, n=37) | |
| Asus ROG Strix G16 G614JZ | |
| Average of class Gaming (1166 - 2415, n=107, last 2 years) | |
| Asus ROG Strix Scar 17 G733PYV-LL053X | |
| Alienware m16 R2 | |
| Cinebench R20 / CPU (Multi Core) | |
| Asus ROG Strix Scar 17 G733PYV-LL053X | |
| Lenovo Legion Pro 7 16IRX9H | |
| MSI Vector 16 HX A14V | |
| Asus ROG Strix Scar 16 G634JZR | |
| Asus ROG Strix G16 G614JZ | |
| Average Intel Core i9-14900HX (6579 - 13832, n=37) | |
| Average of class Gaming (4029 - 16433, n=106, last 2 years) | |
| HP Omen 16 (2024) | |
| Alienware m16 R2 | |
| Cinebench R20 / CPU (Single Core) | |
| HP Omen 16 (2024) | |
| Asus ROG Strix Scar 16 G634JZR | |
| MSI Vector 16 HX A14V | |
| Lenovo Legion Pro 7 16IRX9H | |
| Average Intel Core i9-14900HX (657 - 859, n=37) | |
| Asus ROG Strix G16 G614JZ | |
| Average of class Gaming (442 - 913, n=106, last 2 years) | |
| Asus ROG Strix Scar 17 G733PYV-LL053X | |
| Alienware m16 R2 | |
| Cinebench R15 / CPU Multi 64Bit | |
| Asus ROG Strix Scar 17 G733PYV-LL053X | |
| Asus ROG Strix Scar 16 G634JZR | |
| Asus ROG Strix G16 G614JZ | |
| Asus ROG Strix G16 G614JZ | |
| Lenovo Legion Pro 7 16IRX9H | |
| MSI Vector 16 HX A14V | |
| Average Intel Core i9-14900HX (3263 - 5589, n=38) | |
| Average of class Gaming (1578 - 6330, n=105, last 2 years) | |
| HP Omen 16 (2024) | |
| Alienware m16 R2 | |
| Cinebench R15 / CPU Single 64Bit | |
| Asus ROG Strix Scar 16 G634JZR | |
| Lenovo Legion Pro 7 16IRX9H | |
| Asus ROG Strix Scar 17 G733PYV-LL053X | |
| HP Omen 16 (2024) | |
| MSI Vector 16 HX A14V | |
| Asus ROG Strix G16 G614JZ | |
| Asus ROG Strix G16 G614JZ | |
| Average Intel Core i9-14900HX (247 - 323, n=37) | |
| Average of class Gaming (188.8 - 350, n=106, last 2 years) | |
| Alienware m16 R2 | |
| Blender / v2.79 BMW27 CPU | |
| HP Omen 16 (2024) | |
| Average of class Gaming (79 - 330, n=104, last 2 years) | |
| Average Intel Core i9-14900HX (91 - 206, n=37) | |
| Asus ROG Strix Scar 16 G634JZR | |
| Asus ROG Strix G16 G614JZ | |
| Lenovo Legion Pro 7 16IRX9H | |
| MSI Vector 16 HX A14V | |
| Asus ROG Strix Scar 17 G733PYV-LL053X | |
| 7-Zip 18.03 / 7z b 4 | |
| Asus ROG Strix Scar 17 G733PYV-LL053X | |
| Lenovo Legion Pro 7 16IRX9H | |
| MSI Vector 16 HX A14V | |
| Asus ROG Strix Scar 16 G634JZR | |
| Asus ROG Strix G16 G614JZ | |
| Average Intel Core i9-14900HX (66769 - 136645, n=37) | |
| Average of class Gaming (33491 - 148086, n=105, last 2 years) | |
| HP Omen 16 (2024) | |
| Alienware m16 R2 | |
| 7-Zip 18.03 / 7z b 4 -mmt1 | |
| Asus ROG Strix Scar 17 G733PYV-LL053X | |
| Asus ROG Strix Scar 16 G634JZR | |
| Lenovo Legion Pro 7 16IRX9H | |
| HP Omen 16 (2024) | |
| MSI Vector 16 HX A14V | |
| Average Intel Core i9-14900HX (5452 - 7545, n=37) | |
| Asus ROG Strix G16 G614JZ | |
| Average of class Gaming (4199 - 7436, n=105, last 2 years) | |
| Alienware m16 R2 | |
| Geekbench 6.7 / Multi-Core | |
| Asus ROG Strix Scar 16 G634JZR | |
| Lenovo Legion Pro 7 16IRX9H | |
| MSI Vector 16 HX A14V | |
| Average Intel Core i9-14900HX (13158 - 19665, n=37) | |
| Asus ROG Strix Scar 17 G733PYV-LL053X | |
| HP Omen 16 (2024) | |
| Average of class Gaming (6625 - 22850, n=106, last 2 years) | |
| Alienware m16 R2 | |
| Geekbench 6.7 / Single-Core | |
| HP Omen 16 (2024) | |
| Lenovo Legion Pro 7 16IRX9H | |
| Asus ROG Strix Scar 16 G634JZR | |
| MSI Vector 16 HX A14V | |
| Average Intel Core i9-14900HX (2419 - 3129, n=37) | |
| Asus ROG Strix Scar 17 G733PYV-LL053X | |
| Average of class Gaming (1490 - 3259, n=106, last 2 years) | |
| Alienware m16 R2 | |
| Geekbench 5.5 / Multi-Core | |
| Asus ROG Strix Scar 16 G634JZR | |
| MSI Vector 16 HX A14V | |
| Lenovo Legion Pro 7 16IRX9H | |
| Asus ROG Strix Scar 17 G733PYV-LL053X | |
| Average Intel Core i9-14900HX (8618 - 23194, n=37) | |
| Asus ROG Strix G16 G614JZ | |
| HP Omen 16 (2024) | |
| Average of class Gaming (6460 - 28263, n=105, last 2 years) | |
| Alienware m16 R2 | |
| Geekbench 5.5 / Single-Core | |
| Asus ROG Strix Scar 16 G634JZR | |
| HP Omen 16 (2024) | |
| Asus ROG Strix Scar 17 G733PYV-LL053X | |
| MSI Vector 16 HX A14V | |
| Lenovo Legion Pro 7 16IRX9H | |
| Average Intel Core i9-14900HX (1669 - 2210, n=37) | |
| Average of class Gaming (986 - 2474, n=105, last 2 years) | |
| Asus ROG Strix G16 G614JZ | |
| Alienware m16 R2 | |
| HWBOT x265 Benchmark v2.2 / 4k Preset | |
| Asus ROG Strix Scar 17 G733PYV-LL053X | |
| Lenovo Legion Pro 7 16IRX9H | |
| MSI Vector 16 HX A14V | |
| Asus ROG Strix Scar 16 G634JZR | |
| Asus ROG Strix G16 G614JZ | |
| Average Intel Core i9-14900HX (16.8 - 38.9, n=37) | |
| Average of class Gaming (11.5 - 44.4, n=105, last 2 years) | |
| HP Omen 16 (2024) | |
| Alienware m16 R2 | |
| LibreOffice / 20 Documents To PDF | |
| Alienware m16 R2 | |
| Average of class Gaming (33.2 - 88.8, n=105, last 2 years) | |
| Asus ROG Strix Scar 16 G634JZR | |
| Asus ROG Strix G16 G614JZ | |
| MSI Vector 16 HX A14V | |
| HP Omen 16 (2024) | |
| Average Intel Core i9-14900HX (19 - 85.1, n=37) | |
| Asus ROG Strix Scar 17 G733PYV-LL053X | |
| Lenovo Legion Pro 7 16IRX9H | |
| R Benchmark 2.5 / Overall mean | |
| Alienware m16 R2 | |
| Average of class Gaming (0.3439 - 0.759, n=106, last 2 years) | |
| Asus ROG Strix Scar 17 G733PYV-LL053X | |
| Asus ROG Strix G16 G614JZ | |
| Lenovo Legion Pro 7 16IRX9H | |
| Average Intel Core i9-14900HX (0.3604 - 0.4859, n=37) | |
| MSI Vector 16 HX A14V | |
| HP Omen 16 (2024) | |
| Asus ROG Strix Scar 16 G634JZR | |
* ... smaller is better
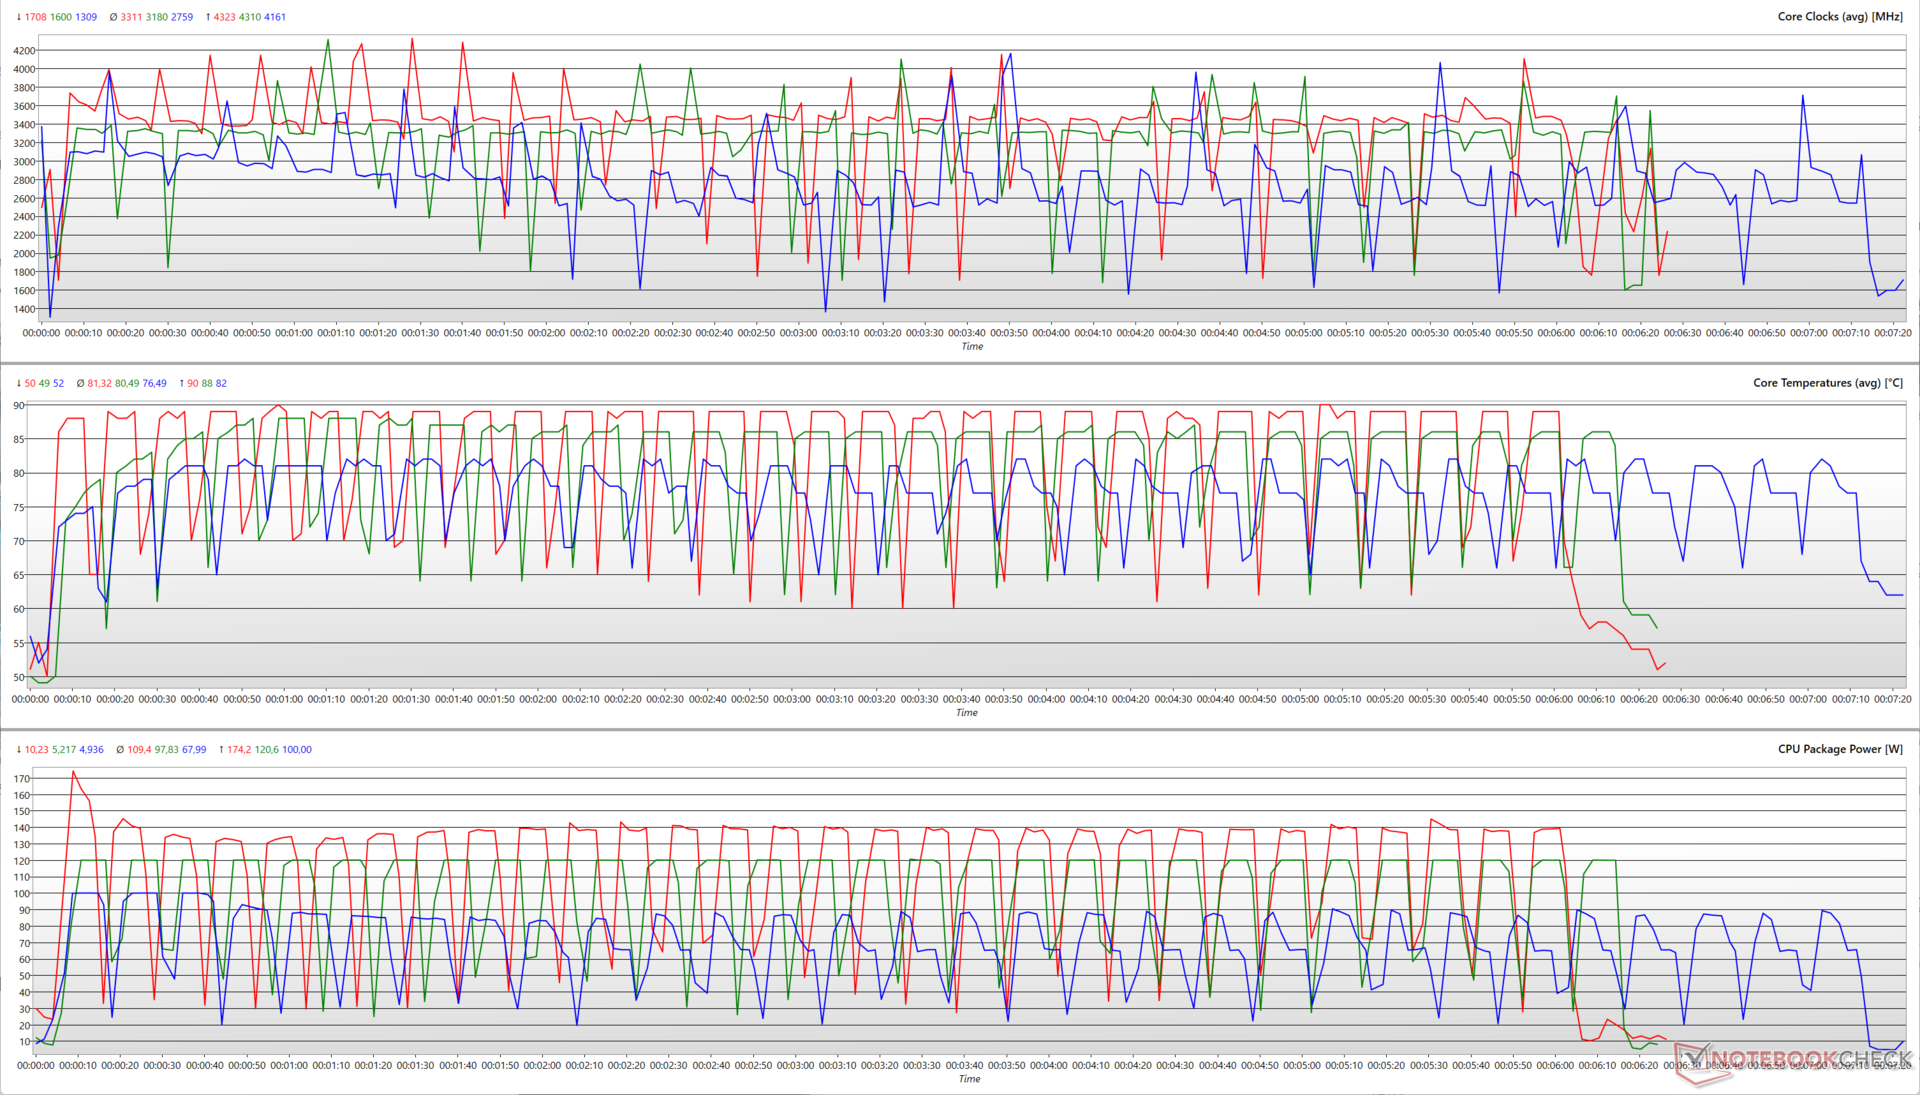
在 Cinebench R15 多核模式下运行 30 个循环后发现,酷睿 i9-14900HX 在每种模式下都能充分利用允许的 PL2 限制。在 Turbo 配置文件中,Core i9-14900HX 能够以 174 W 的功耗达到 4.3 GHz 的提升频率,然后以 109 W 的平均功耗达到 3.3 GHz 的平均频率。
不过,在性能模式下,CPU 也能以 120 W 的功耗达到类似的频率,而平均频率则徘徊在 3.18 GHz,平均封装功耗为 97.8 W。
静音模式下,平均时钟频率为 2.76 GHz,平均封装功耗为 68 W。在该模式下,CPU 的最大提升频率为 4.16 GHz,功耗为 100 W。
Cinebench R20 评分显示,单核和多核电池功耗分别下降了 19.78% 和 46.44%。
AIDA64: FP32 Ray-Trace | FPU Julia | CPU SHA3 | CPU Queen | FPU SinJulia | FPU Mandel | CPU AES | CPU ZLib | FP64 Ray-Trace | CPU PhotoWorxx
| Performance rating | |
| Asus ROG Strix Scar 17 G733PYV-LL053X | |
| MSI Vector 16 HX A14V | |
| Lenovo Legion Pro 7 16IRX9H | |
| Asus ROG Strix Scar 16 G634JZR | |
| Asus ROG Strix G16 G614JZ | |
| Average of class Gaming | |
| Average Intel Core i9-14900HX | |
| HP Omen 16 (2024) | |
| Alienware m16 R2 | |
| AIDA64 / FP32 Ray-Trace | |
| Asus ROG Strix Scar 17 G733PYV-LL053X | |
| Average of class Gaming (10227 - 85542, n=105, last 2 years) | |
| MSI Vector 16 HX A14V | |
| Lenovo Legion Pro 7 16IRX9H | |
| Asus ROG Strix G16 G614JZ | |
| Asus ROG Strix Scar 16 G634JZR | |
| Average Intel Core i9-14900HX (13098 - 33474, n=36) | |
| Alienware m16 R2 | |
| HP Omen 16 (2024) | |
| AIDA64 / FPU Julia | |
| Asus ROG Strix Scar 17 G733PYV-LL053X | |
| MSI Vector 16 HX A14V | |
| Average of class Gaming (51376 - 238426, n=105, last 2 years) | |
| Lenovo Legion Pro 7 16IRX9H | |
| Asus ROG Strix G16 G614JZ | |
| Asus ROG Strix Scar 16 G634JZR | |
| Average Intel Core i9-14900HX (67573 - 166040, n=36) | |
| Alienware m16 R2 | |
| HP Omen 16 (2024) | |
| AIDA64 / CPU SHA3 | |
| Asus ROG Strix Scar 17 G733PYV-LL053X | |
| Lenovo Legion Pro 7 16IRX9H | |
| MSI Vector 16 HX A14V | |
| Asus ROG Strix Scar 16 G634JZR | |
| Asus ROG Strix G16 G614JZ | |
| Average of class Gaming (2180 - 10115, n=105, last 2 years) | |
| Average Intel Core i9-14900HX (3589 - 7979, n=36) | |
| HP Omen 16 (2024) | |
| Alienware m16 R2 | |
| AIDA64 / CPU Queen | |
| Asus ROG Strix Scar 17 G733PYV-LL053X | |
| Asus ROG Strix Scar 16 G634JZR | |
| Lenovo Legion Pro 7 16IRX9H | |
| Asus ROG Strix G16 G614JZ | |
| MSI Vector 16 HX A14V | |
| Average Intel Core i9-14900HX (118405 - 148966, n=36) | |
| HP Omen 16 (2024) | |
| Average of class Gaming (49785 - 173351, n=90, last 2 years) | |
| Alienware m16 R2 | |
| AIDA64 / FPU SinJulia | |
| Asus ROG Strix Scar 17 G733PYV-LL053X | |
| Asus ROG Strix G16 G614JZ | |
| Lenovo Legion Pro 7 16IRX9H | |
| MSI Vector 16 HX A14V | |
| Asus ROG Strix Scar 16 G634JZR | |
| Average Intel Core i9-14900HX (10475 - 18517, n=36) | |
| Average of class Gaming (4424 - 33636, n=105, last 2 years) | |
| HP Omen 16 (2024) | |
| Alienware m16 R2 | |
| AIDA64 / FPU Mandel | |
| Asus ROG Strix Scar 17 G733PYV-LL053X | |
| Average of class Gaming (25115 - 128721, n=105, last 2 years) | |
| MSI Vector 16 HX A14V | |
| Lenovo Legion Pro 7 16IRX9H | |
| Asus ROG Strix G16 G614JZ | |
| Asus ROG Strix Scar 16 G634JZR | |
| Average Intel Core i9-14900HX (32543 - 83662, n=36) | |
| Alienware m16 R2 | |
| HP Omen 16 (2024) | |
| AIDA64 / CPU AES | |
| Asus ROG Strix Scar 17 G733PYV-LL053X | |
| Asus ROG Strix Scar 16 G634JZR | |
| Average Intel Core i9-14900HX (86964 - 241777, n=36) | |
| Lenovo Legion Pro 7 16IRX9H | |
| MSI Vector 16 HX A14V | |
| Asus ROG Strix G16 G614JZ | |
| Average of class Gaming (39258 - 247074, n=105, last 2 years) | |
| HP Omen 16 (2024) | |
| Alienware m16 R2 | |
| AIDA64 / CPU ZLib | |
| Lenovo Legion Pro 7 16IRX9H | |
| MSI Vector 16 HX A14V | |
| Asus ROG Strix Scar 17 G733PYV-LL053X | |
| Asus ROG Strix G16 G614JZ | |
| Asus ROG Strix Scar 16 G634JZR | |
| Average Intel Core i9-14900HX (1054 - 2292, n=36) | |
| Average of class Gaming (574 - 2531, n=105, last 2 years) | |
| HP Omen 16 (2024) | |
| Alienware m16 R2 | |
| AIDA64 / FP64 Ray-Trace | |
| Asus ROG Strix Scar 17 G733PYV-LL053X | |
| Average of class Gaming (5509 - 45446, n=105, last 2 years) | |
| MSI Vector 16 HX A14V | |
| Lenovo Legion Pro 7 16IRX9H | |
| Asus ROG Strix G16 G614JZ | |
| Asus ROG Strix Scar 16 G634JZR | |
| Average Intel Core i9-14900HX (6809 - 18349, n=36) | |
| Alienware m16 R2 | |
| HP Omen 16 (2024) | |
| AIDA64 / CPU PhotoWorxx | |
| Asus ROG Strix Scar 16 G634JZR | |
| HP Omen 16 (2024) | |
| MSI Vector 16 HX A14V | |
| Lenovo Legion Pro 7 16IRX9H | |
| Average Intel Core i9-14900HX (23903 - 54702, n=36) | |
| Average of class Gaming (12271 - 89891, n=105, last 2 years) | |
| Alienware m16 R2 | |
| Asus ROG Strix G16 G614JZ | |
| Asus ROG Strix Scar 17 G733PYV-LL053X | |
更多信息和性能比较,请参阅我们的专栏 英特尔酷睿 i9-14900HX页面。
系统性能
Scar 16 略微落后于 联想Legion Pro 7在 PCMark 10 和 CrossMark 测试中稍逊一筹。尽管如此,这款笔记本电脑在执行日常任务时反应还是相当灵敏的,没有太多工作负载会让它的性能遇到瓶颈。
CrossMark: Overall | Productivity | Creativity | Responsiveness
AIDA64: Memory Copy | Memory Read | Memory Write | Memory Latency
WebXPRT 3: Overall
WebXPRT 4: Overall
Mozilla Kraken 1.1: Total
| PCMark 10 / Score | |
| Asus ROG Strix Scar 17 G733PYV-LL053X | |
| Lenovo Legion Pro 7 16IRX9H | |
| HP Omen 16 (2024) | |
| Average Intel Core i9-14900HX, NVIDIA GeForce RTX 4080 Laptop GPU (7703 - 9223, n=7) | |
| MSI Vector 16 HX A14V | |
| Average of class Gaming (5828 - 12414, n=93, last 2 years) | |
| Alienware m16 R2 | |
| Asus ROG Strix Scar 16 G634JZR | |
| Asus ROG Strix G16 G614JZ | |
| PCMark 10 / Essentials | |
| Asus ROG Strix G16 G614JZ | |
| Lenovo Legion Pro 7 16IRX9H | |
| Average Intel Core i9-14900HX, NVIDIA GeForce RTX 4080 Laptop GPU (11255 - 12600, n=7) | |
| Asus ROG Strix Scar 16 G634JZR | |
| Asus ROG Strix Scar 17 G733PYV-LL053X | |
| MSI Vector 16 HX A14V | |
| HP Omen 16 (2024) | |
| Average of class Gaming (8810 - 11935, n=97, last 2 years) | |
| Alienware m16 R2 | |
| PCMark 10 / Productivity | |
| HP Omen 16 (2024) | |
| Lenovo Legion Pro 7 16IRX9H | |
| Average of class Gaming (6845 - 25323, n=95, last 2 years) | |
| Asus ROG Strix Scar 17 G733PYV-LL053X | |
| Average Intel Core i9-14900HX, NVIDIA GeForce RTX 4080 Laptop GPU (6662 - 11410, n=7) | |
| MSI Vector 16 HX A14V | |
| Alienware m16 R2 | |
| Asus ROG Strix G16 G614JZ | |
| Asus ROG Strix Scar 16 G634JZR | |
| PCMark 10 / Digital Content Creation | |
| Asus ROG Strix Scar 17 G733PYV-LL053X | |
| Asus ROG Strix Scar 16 G634JZR | |
| MSI Vector 16 HX A14V | |
| Average Intel Core i9-14900HX, NVIDIA GeForce RTX 4080 Laptop GPU (14211 - 16246, n=7) | |
| HP Omen 16 (2024) | |
| Lenovo Legion Pro 7 16IRX9H | |
| Average of class Gaming (7602 - 19954, n=95, last 2 years) | |
| Alienware m16 R2 | |
| Asus ROG Strix G16 G614JZ | |
| CrossMark / Overall | |
| Lenovo Legion Pro 7 16IRX9H | |
| HP Omen 16 (2024) | |
| MSI Vector 16 HX A14V | |
| Asus ROG Strix G16 G614JZ | |
| Average Intel Core i9-14900HX, NVIDIA GeForce RTX 4080 Laptop GPU (1992 - 2334, n=7) | |
| Asus ROG Strix Scar 17 G733PYV-LL053X | |
| Asus ROG Strix Scar 16 G634JZR | |
| Average of class Gaming (1366 - 2409, n=94, last 2 years) | |
| Alienware m16 R2 | |
| CrossMark / Productivity | |
| Lenovo Legion Pro 7 16IRX9H | |
| HP Omen 16 (2024) | |
| Asus ROG Strix G16 G614JZ | |
| MSI Vector 16 HX A14V | |
| Average Intel Core i9-14900HX, NVIDIA GeForce RTX 4080 Laptop GPU (1812 - 2204, n=7) | |
| Asus ROG Strix Scar 17 G733PYV-LL053X | |
| Asus ROG Strix Scar 16 G634JZR | |
| Average of class Gaming (1386 - 2254, n=94, last 2 years) | |
| Alienware m16 R2 | |
| CrossMark / Creativity | |
| Lenovo Legion Pro 7 16IRX9H | |
| MSI Vector 16 HX A14V | |
| Asus ROG Strix Scar 17 G733PYV-LL053X | |
| Average Intel Core i9-14900HX, NVIDIA GeForce RTX 4080 Laptop GPU (2327 - 2500, n=7) | |
| Asus ROG Strix G16 G614JZ | |
| HP Omen 16 (2024) | |
| Asus ROG Strix Scar 16 G634JZR | |
| Average of class Gaming (1343 - 2786, n=94, last 2 years) | |
| Alienware m16 R2 | |
| CrossMark / Responsiveness | |
| Lenovo Legion Pro 7 16IRX9H | |
| HP Omen 16 (2024) | |
| Asus ROG Strix G16 G614JZ | |
| MSI Vector 16 HX A14V | |
| Average Intel Core i9-14900HX, NVIDIA GeForce RTX 4080 Laptop GPU (1520 - 2254, n=7) | |
| Asus ROG Strix Scar 16 G634JZR | |
| Average of class Gaming (1226 - 2334, n=94, last 2 years) | |
| Asus ROG Strix Scar 17 G733PYV-LL053X | |
| Alienware m16 R2 | |
| AIDA64 / Memory Copy | |
| HP Omen 16 (2024) | |
| Asus ROG Strix Scar 16 G634JZR | |
| Lenovo Legion Pro 7 16IRX9H | |
| MSI Vector 16 HX A14V | |
| Average Intel Core i9-14900HX, NVIDIA GeForce RTX 4080 Laptop GPU (64612 - 79244, n=8) | |
| Average of class Gaming (21750 - 129946, n=105, last 2 years) | |
| Alienware m16 R2 | |
| Asus ROG Strix G16 G614JZ | |
| Asus ROG Strix Scar 17 G733PYV-LL053X | |
| AIDA64 / Memory Read | |
| Asus ROG Strix Scar 16 G634JZR | |
| HP Omen 16 (2024) | |
| Lenovo Legion Pro 7 16IRX9H | |
| MSI Vector 16 HX A14V | |
| Average Intel Core i9-14900HX, NVIDIA GeForce RTX 4080 Laptop GPU (62535 - 87507, n=8) | |
| Alienware m16 R2 | |
| Average of class Gaming (22956 - 118858, n=105, last 2 years) | |
| Asus ROG Strix G16 G614JZ | |
| Asus ROG Strix Scar 17 G733PYV-LL053X | |
| AIDA64 / Memory Write | |
| HP Omen 16 (2024) | |
| Asus ROG Strix Scar 16 G634JZR | |
| MSI Vector 16 HX A14V | |
| Average of class Gaming (22297 - 135096, n=105, last 2 years) | |
| Average Intel Core i9-14900HX, NVIDIA GeForce RTX 4080 Laptop GPU (60645 - 77715, n=8) | |
| Lenovo Legion Pro 7 16IRX9H | |
| Alienware m16 R2 | |
| Asus ROG Strix G16 G614JZ | |
| Asus ROG Strix Scar 17 G733PYV-LL053X | |
| AIDA64 / Memory Latency | |
| Alienware m16 R2 | |
| Average of class Gaming (75.3 - 259, n=105, last 2 years) | |
| Asus ROG Strix Scar 17 G733PYV-LL053X | |
| Asus ROG Strix G16 G614JZ | |
| HP Omen 16 (2024) | |
| Average Intel Core i9-14900HX, NVIDIA GeForce RTX 4080 Laptop GPU (79.7 - 97.7, n=8) | |
| MSI Vector 16 HX A14V | |
| Asus ROG Strix Scar 16 G634JZR | |
| Lenovo Legion Pro 7 16IRX9H | |
| WebXPRT 3 / Overall | |
| Asus ROG Strix Scar 17 G733PYV-LL053X | |
| Lenovo Legion Pro 7 16IRX9H | |
| Asus ROG Strix G16 G614JZ | |
| Average Intel Core i9-14900HX, NVIDIA GeForce RTX 4080 Laptop GPU (310 - 345, n=7) | |
| HP Omen 16 (2024) | |
| MSI Vector 16 HX A14V | |
| Average of class Gaming (220 - 532, n=98, last 2 years) | |
| Asus ROG Strix Scar 16 G634JZR | |
| Alienware m16 R2 | |
| WebXPRT 4 / Overall | |
| Asus ROG Strix Scar 17 G733PYV-LL053X | |
| Lenovo Legion Pro 7 16IRX9H | |
| Average Intel Core i9-14900HX, NVIDIA GeForce RTX 4080 Laptop GPU (300 - 321, n=7) | |
| Asus ROG Strix G16 G614JZ | |
| HP Omen 16 (2024) | |
| Asus ROG Strix Scar 16 G634JZR | |
| MSI Vector 16 HX A14V | |
| Average of class Gaming (165 - 354, n=98, last 2 years) | |
| Alienware m16 R2 | |
| Mozilla Kraken 1.1 / Total | |
| Alienware m16 R2 | |
| Average of class Gaming (391 - 590, n=100, last 2 years) | |
| Asus ROG Strix G16 G614JZ | |
| MSI Vector 16 HX A14V | |
| Asus ROG Strix Scar 16 G634JZR | |
| Average Intel Core i9-14900HX, NVIDIA GeForce RTX 4080 Laptop GPU (437 - 446, n=7) | |
| Lenovo Legion Pro 7 16IRX9H | |
| HP Omen 16 (2024) | |
| Asus ROG Strix Scar 17 G733PYV-LL053X | |
* ... smaller is better
| PCMark 8 Home Score Accelerated v2 | 5883 points | |
| PCMark 10 Score | 7703 points | |
Help | ||
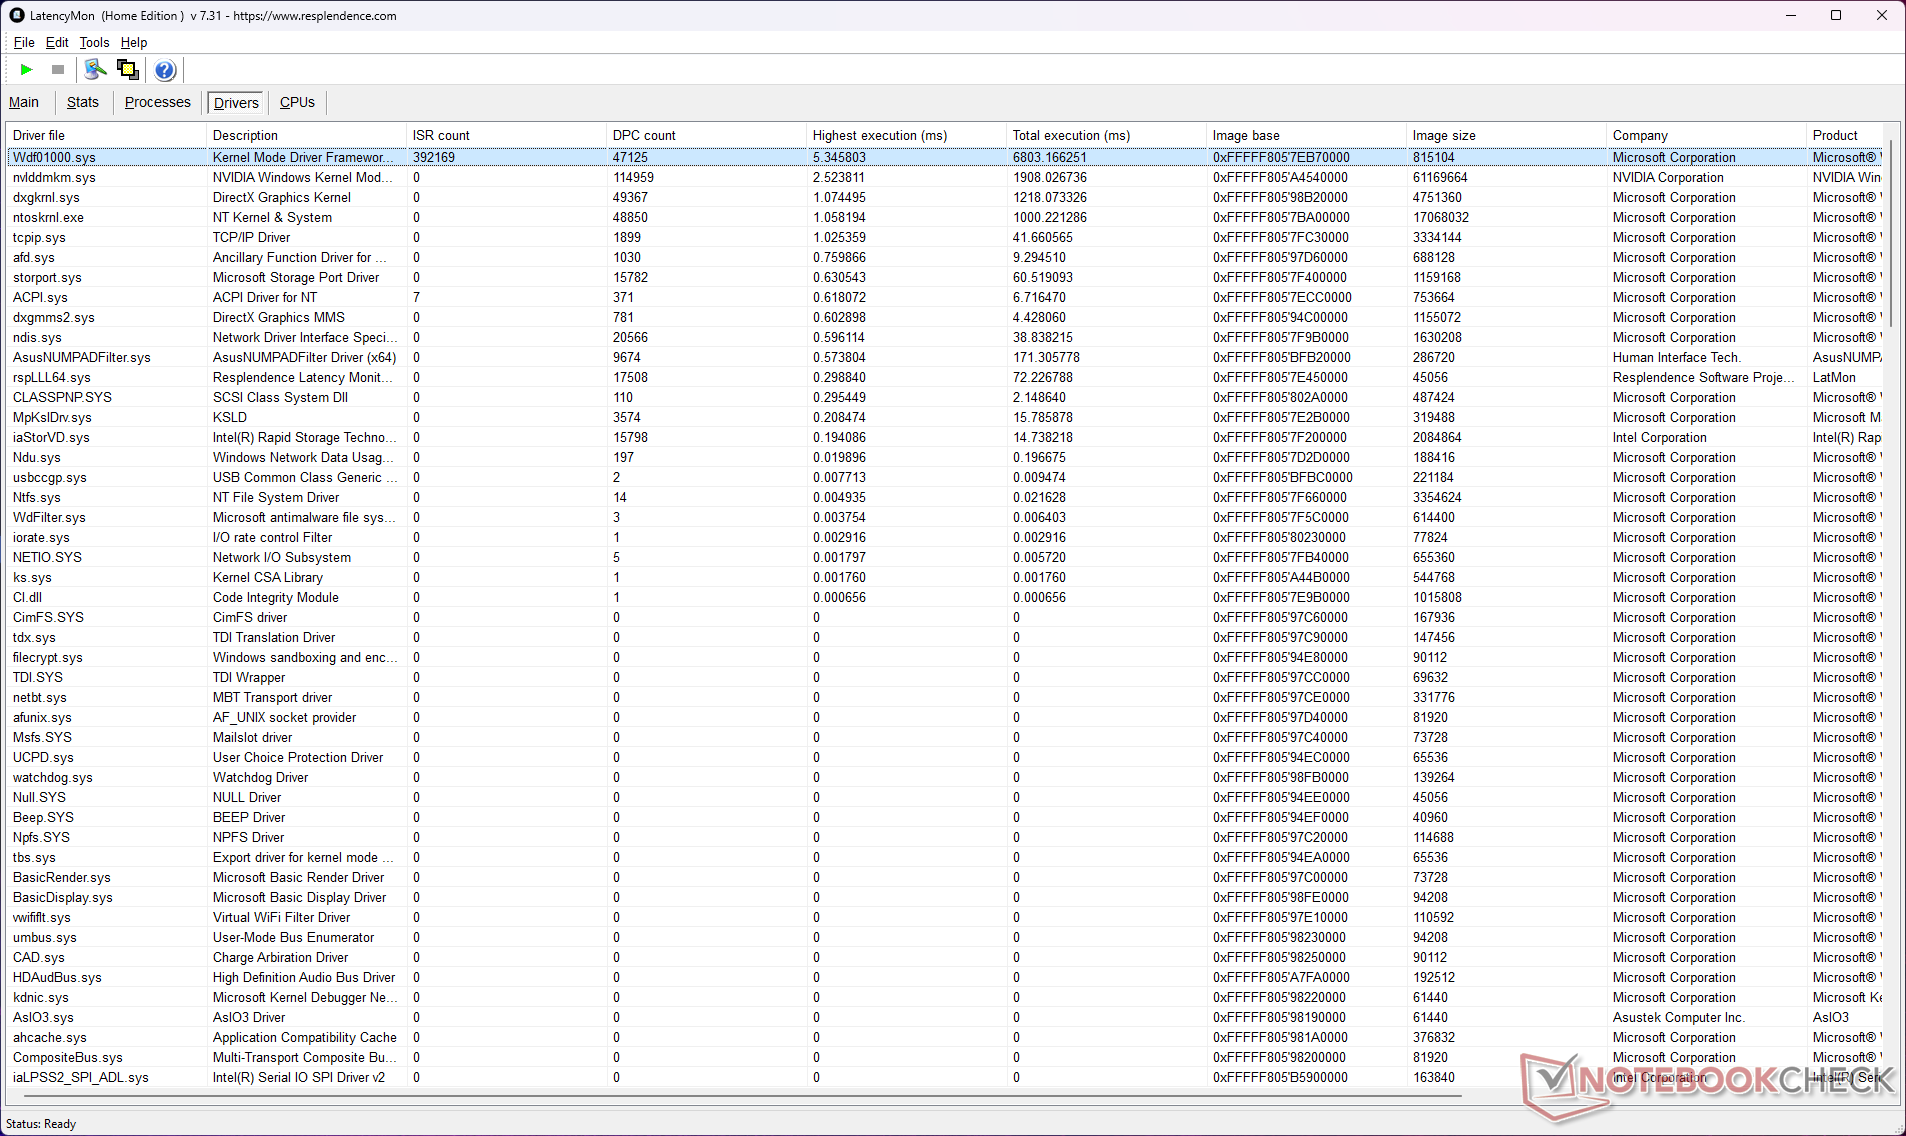
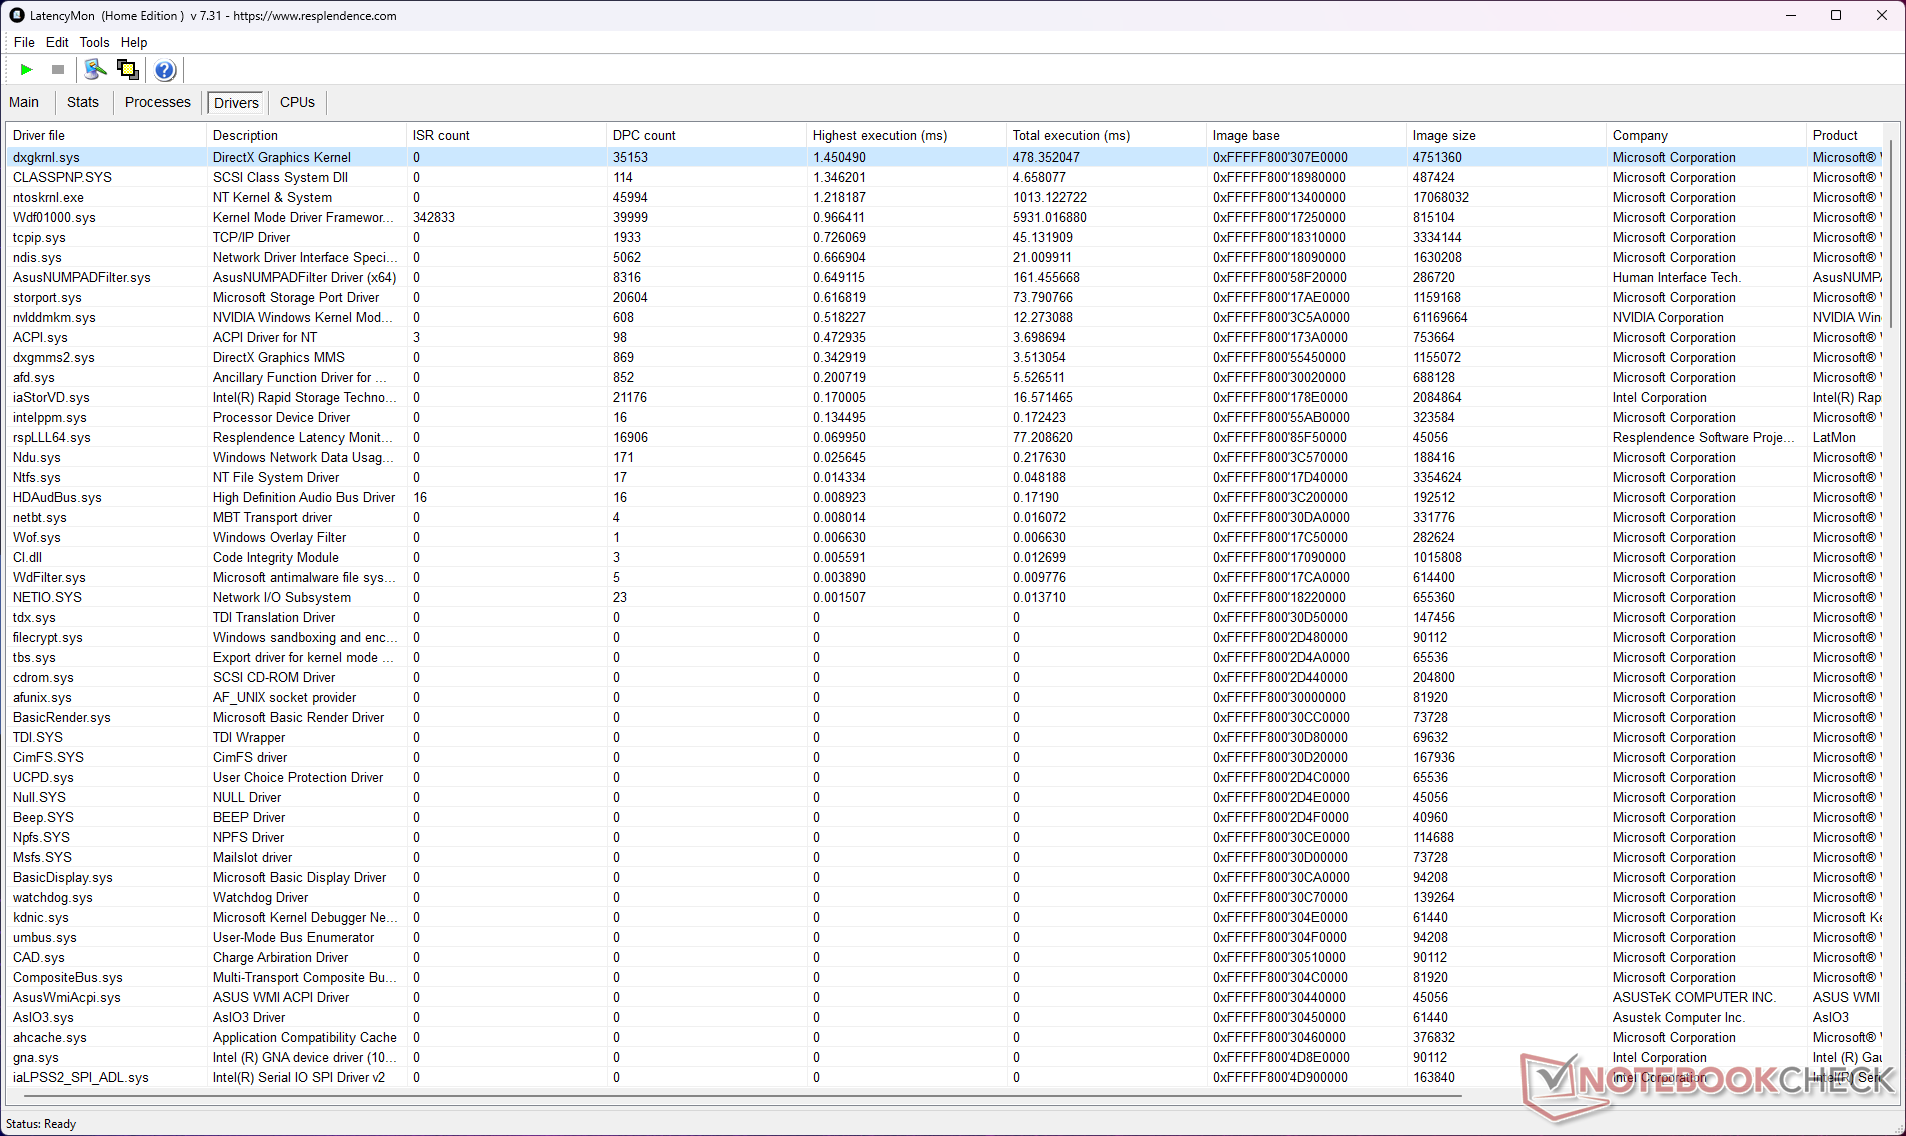
DPC 延迟
启用 dGPU MUX 后,DPC 延迟偏高。切换到 iGPU 后,延迟时间从 5821.30 微秒降至 2333.80 微秒,但这一数值仍然很高。如果使用实时音频或视频编辑工作流,这可能会造成问题。
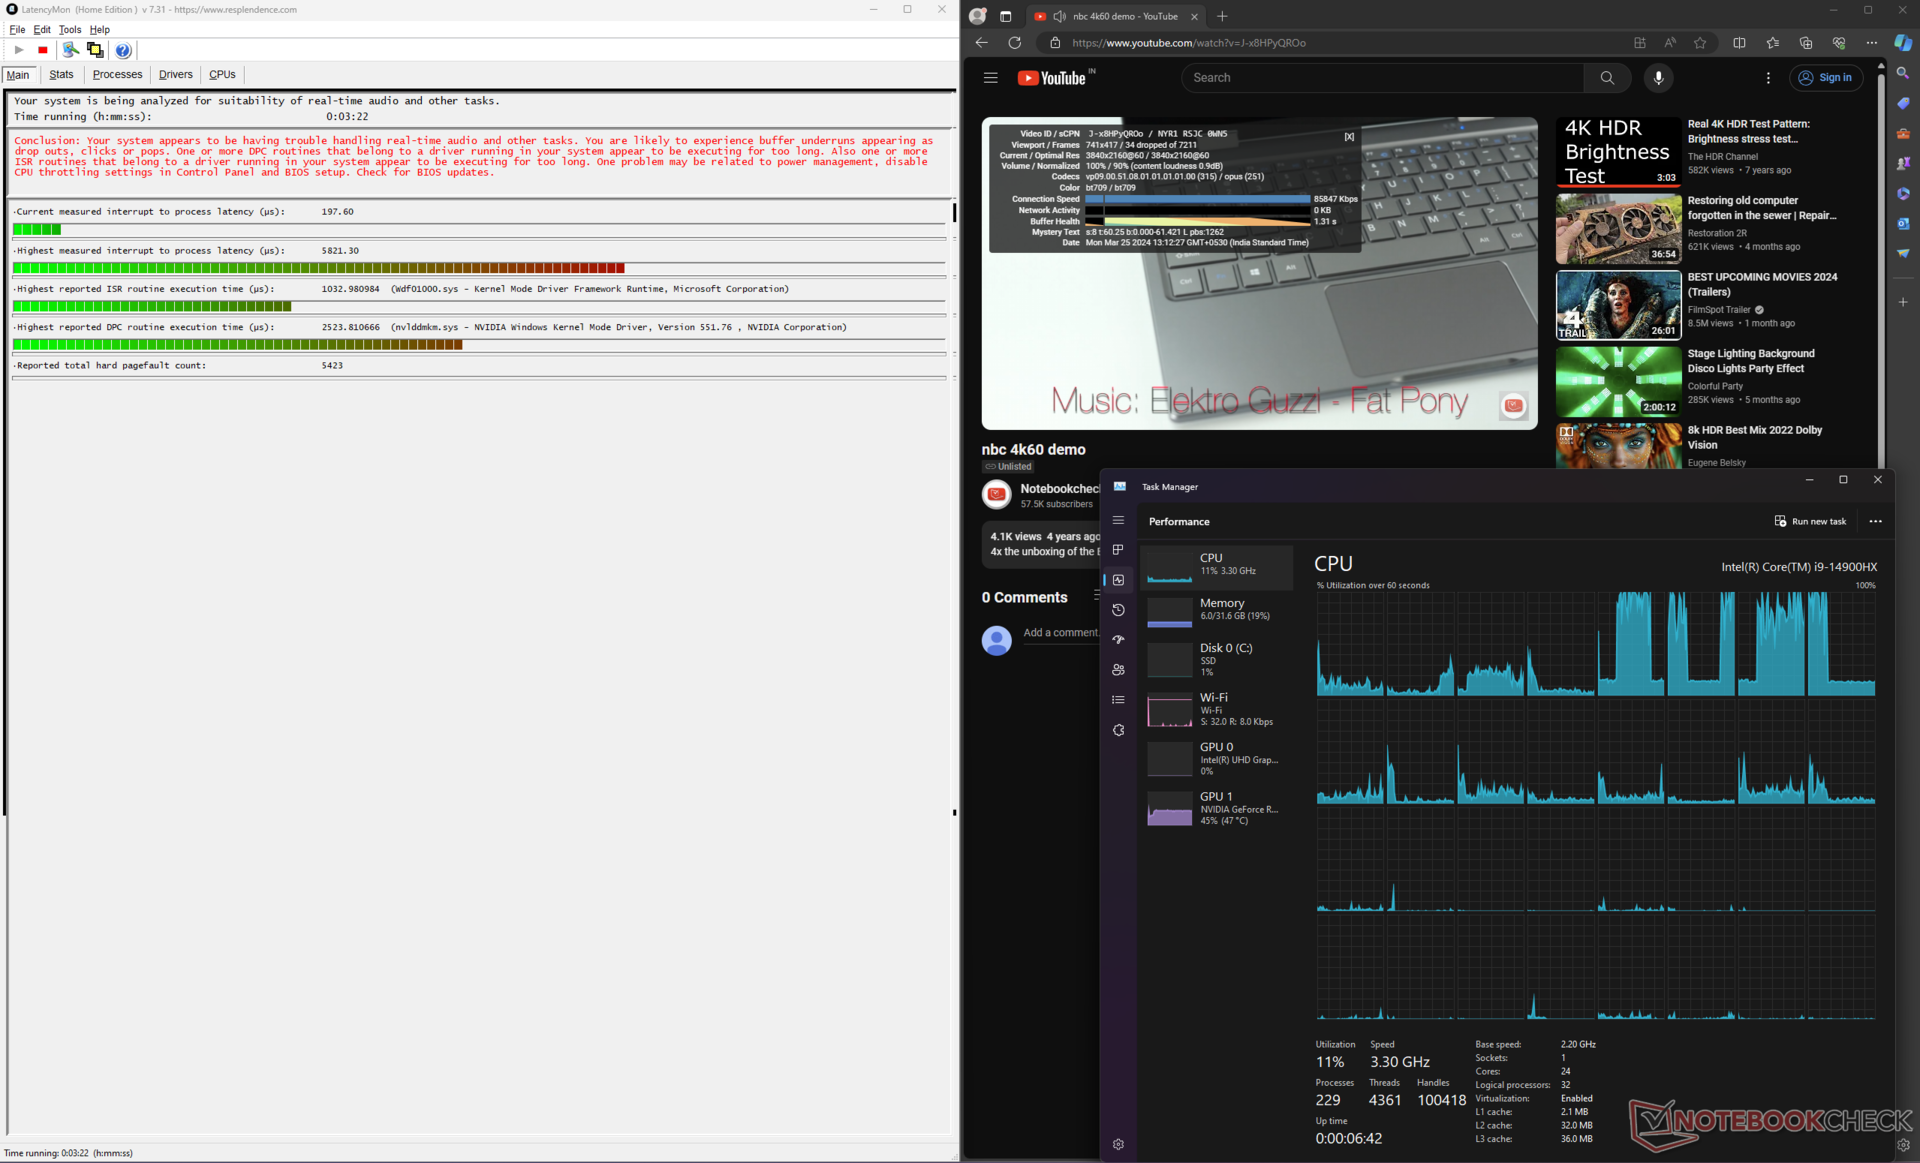
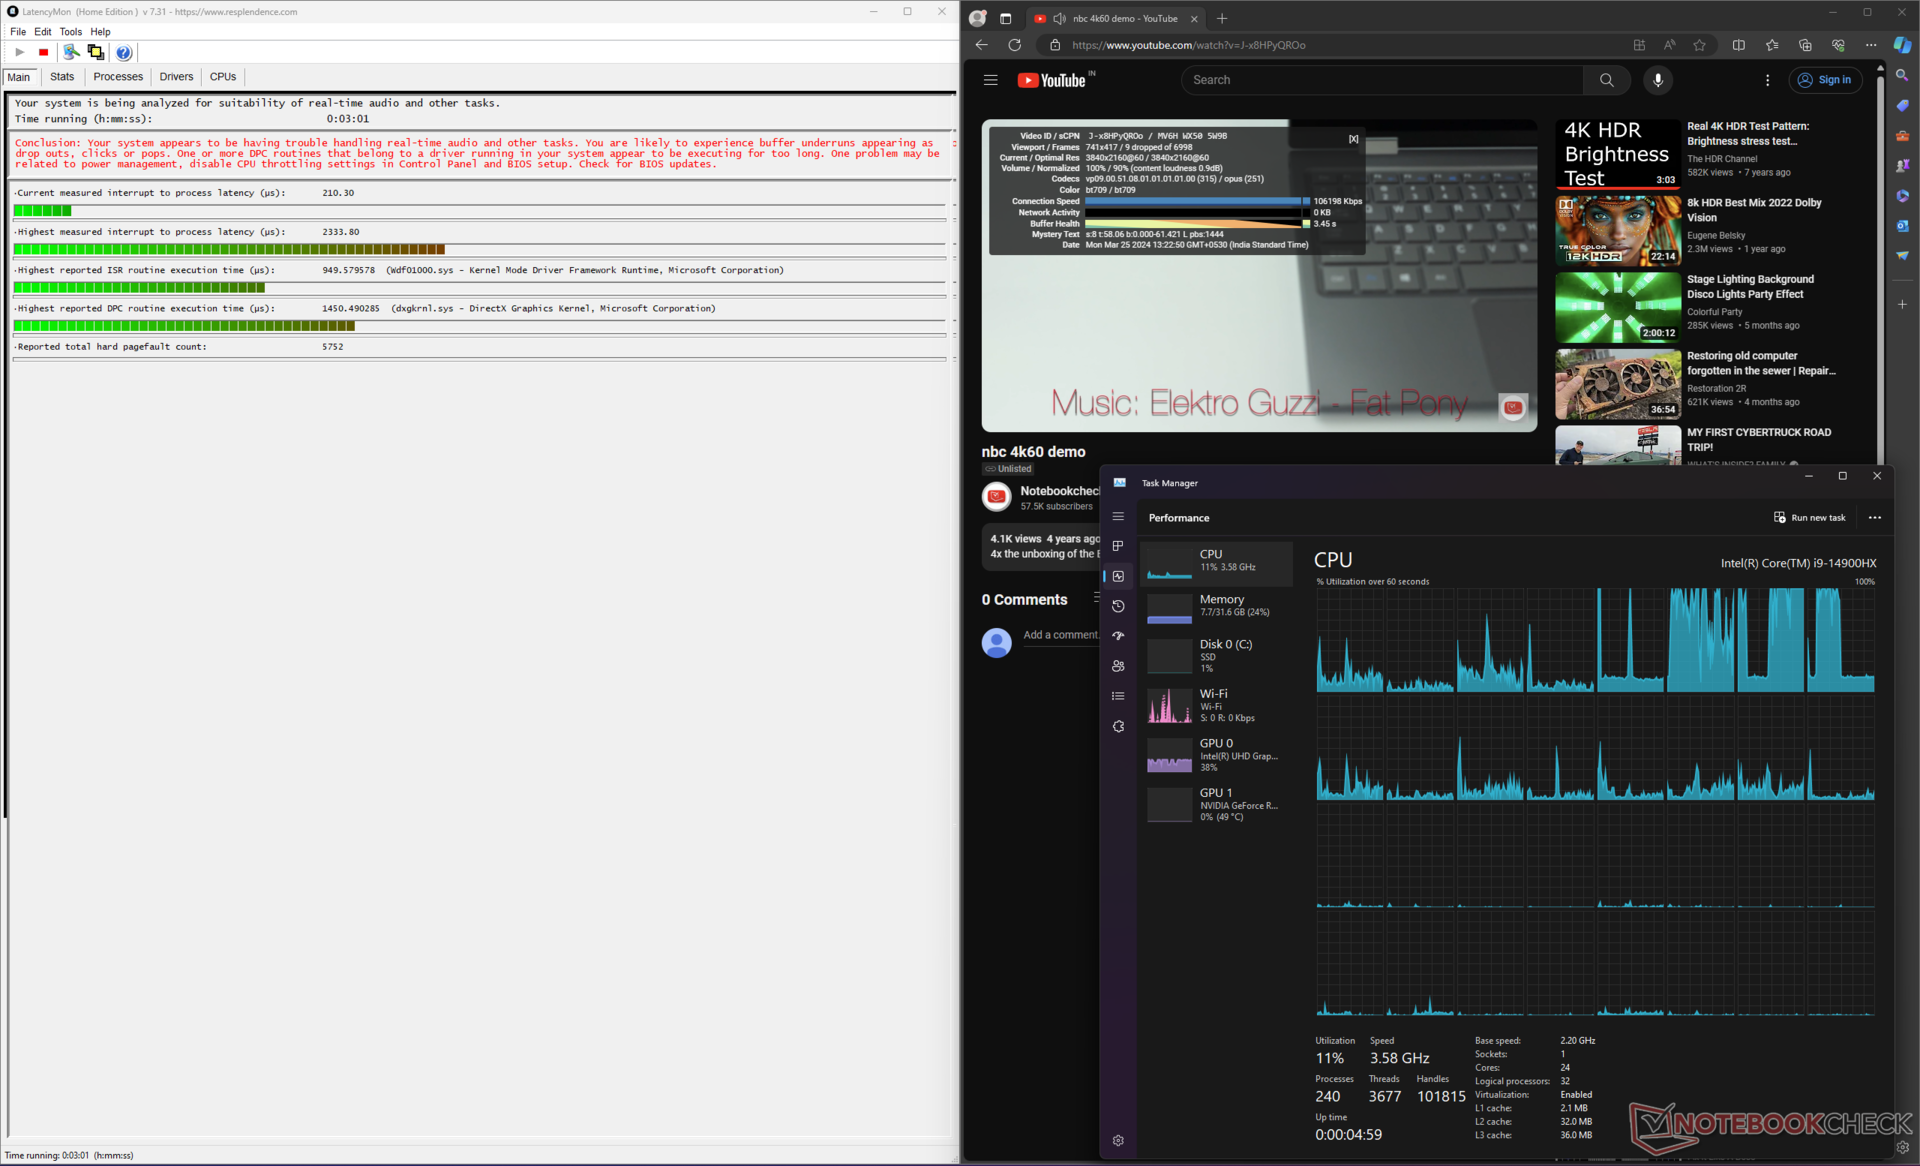
| DPC Latencies / LatencyMon - interrupt to process latency (max), Web, Youtube, Prime95 | |
| Asus ROG Strix Scar 16 G634JZR | |
| Asus ROG Strix G16 G614JZ | |
| Alienware m16 R2 | |
| MSI Vector 16 HX A14V | |
| Lenovo Legion Pro 7 16IRX9H | |
| HP Omen 16 (2024) | |
| Asus ROG Strix Scar 17 G733PYV-LL053X | |
* ... smaller is better
我们的 DPC 延迟排名页面提供了经评测设备的测量延迟概览。
存储设备
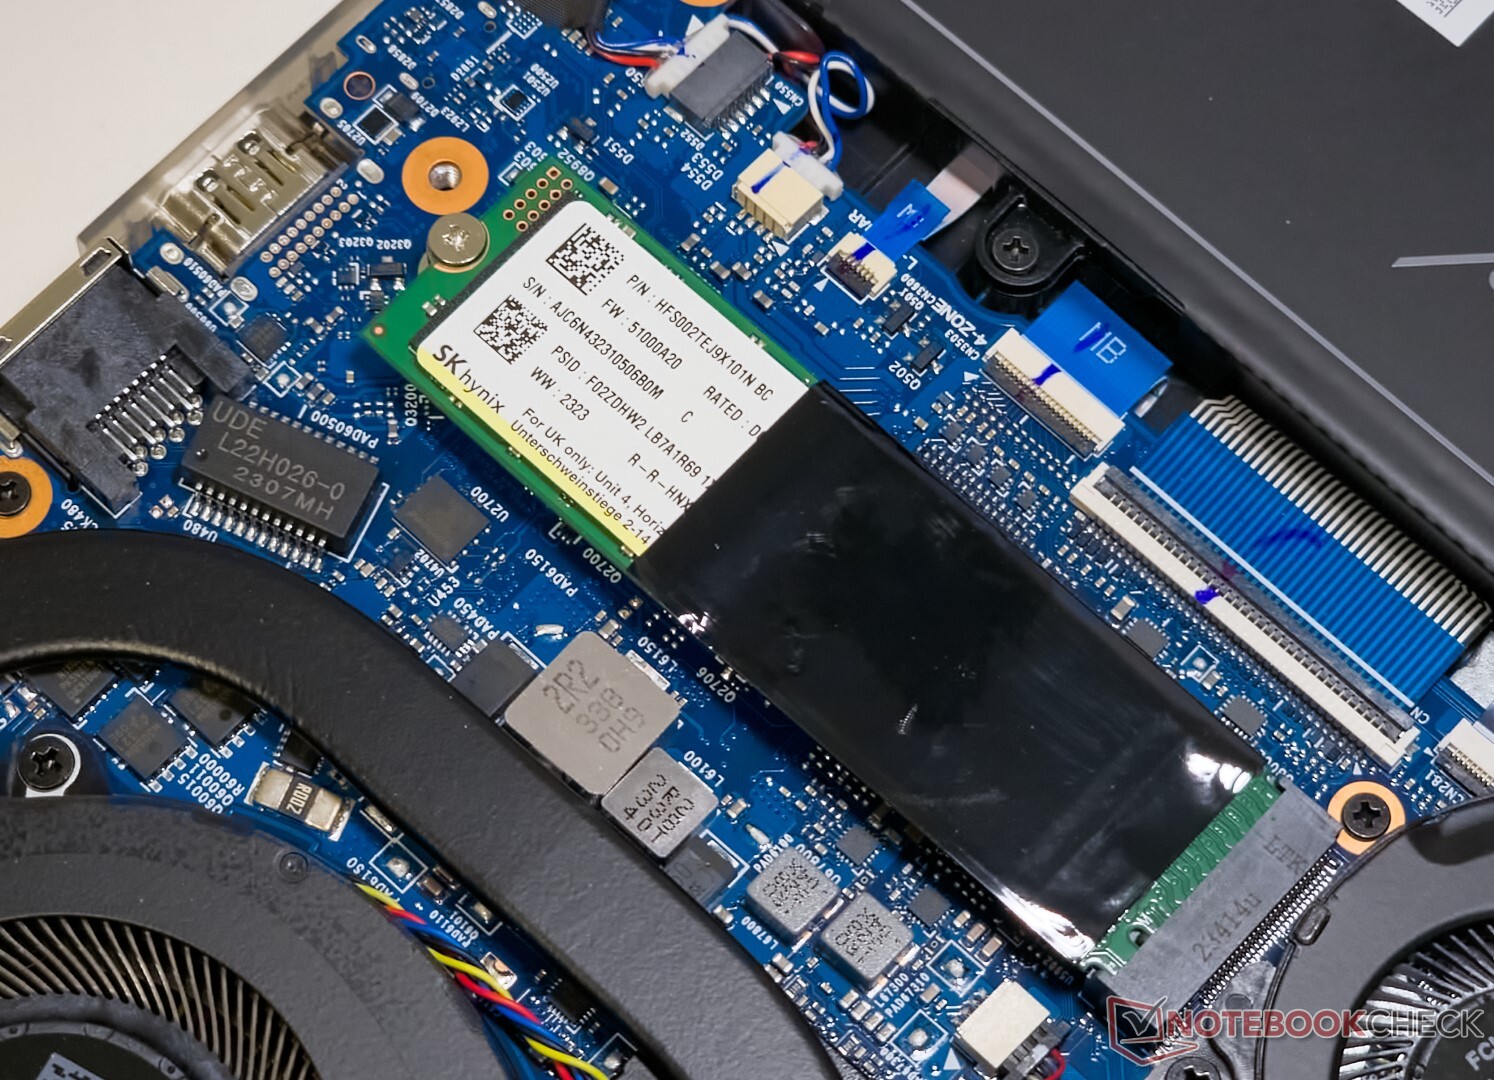
我们的 Scar 16 配备了 Sk hynix PC801 2 TB PCIe Gen 4 NVMe 固态硬盘。
固态硬盘的性能在连续读取和几项 4k 测试中表现不佳,但累计性能与 Alienware m16 R2的三星 PM9A1 不相伯仲。
可通过扩展插槽为另一块 M.2 固态硬盘添加额外的存储空间。不过,它无法安装 2.5 英寸 SATA 硬盘。

* ... smaller is better
磁盘节流DiskSpd 读取循环,队列深度 8
在队列深度为 8 的 DiskSpd 读取循环测试中,硬盘性能在第 14 次运行后下降,但随后保持稳定。
更多存储性能比较,请参阅我们的 固态硬盘和硬盘基准页面。
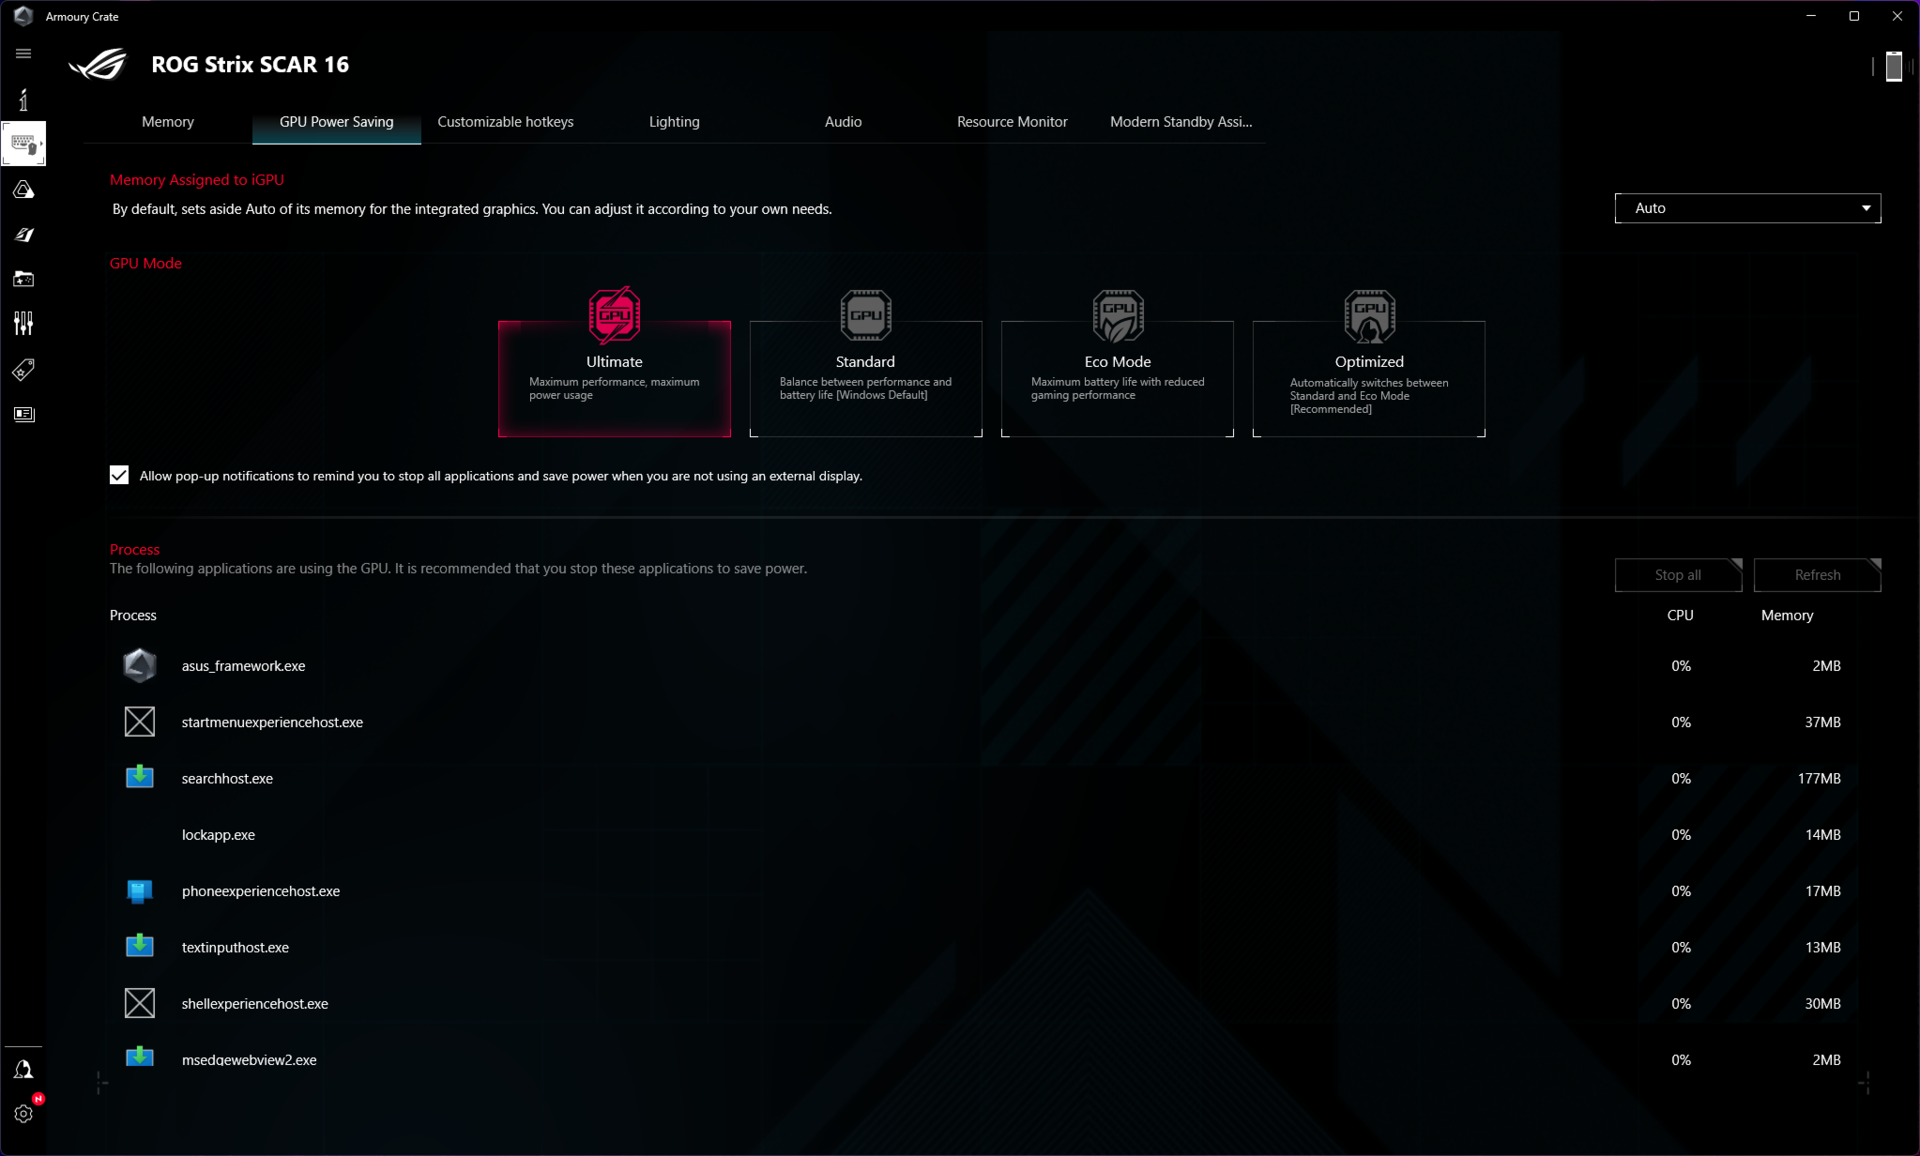
图形处理器性能
Scar 16 配备了 175 W NvidiaGeForce RTX 4080 笔记本图形处理器。整体 3DMark 性能与配备该显卡的其他笔记本电脑相当,但落后联想Legion Pro 7 6%。
配备 140 瓦 RTX 4080 笔记本图形处理器的 HP Omen 16 在 3DMark 累计性能上比 Strix Scar 16 落后 24%,超出预期。
Scar 16 的 RTX 4080 使其仅次于 华硕 ROG Strix Scar 17在 Blender Classroom Optix 中,配备 RTX 4090 笔记本电脑 GPU 的 Scar 16 仅以 15% 的差距落后于华硕 ROG Strix Scar 17,而在 Blender Classroom CUDA 中,这一差距扩大到 18%。
另一方面,在 Blender 教室 CPU 方面,Scar 16 的酷睿 i9-14900HX 与Legion Pro 7 和 Vector 16 HX 相当,但 Scar 17 的酷睿 i9-14900HX 与 Pro 7 和 Vector 16 HX 相当。 AMD Ryzen 9 7945HX3D的渲染速度要快 20%。
| 3DMark 11 Performance | 42772 points | |
| 3DMark Ice Storm Standard Score | 284572 points | |
| 3DMark Cloud Gate Standard Score | 64579 points | |
| 3DMark Fire Strike Score | 32183 points | |
| 3DMark Fire Strike Extreme Score | 21288 points | |
| 3DMark Time Spy Score | 18822 points | |
Help | ||
| Blender / v3.3 Classroom OPTIX/RTX | |
| Alienware m16 R2 | |
| Average of class Gaming (9 - 32, n=106, last 2 years) | |
| HP Omen 16 (2024) | |
| Average NVIDIA GeForce RTX 4080 Laptop GPU (13 - 20, n=22) | |
| Asus ROG Strix G16 G614JZ | |
| MSI Vector 16 HX A14V | |
| Lenovo Legion Pro 7 16IRX9H | |
| Asus ROG Strix Scar 16 G634JZR | |
| Asus ROG Strix Scar 17 G733PYV-LL053X | |
| Blender / v3.3 Classroom CUDA | |
| Alienware m16 R2 | |
| Average of class Gaming (15 - 228, n=106, last 2 years) | |
| HP Omen 16 (2024) | |
| Average NVIDIA GeForce RTX 4080 Laptop GPU (21 - 28, n=23) | |
| Asus ROG Strix G16 G614JZ | |
| MSI Vector 16 HX A14V | |
| Asus ROG Strix Scar 16 G634JZR | |
| Lenovo Legion Pro 7 16IRX9H | |
| Asus ROG Strix Scar 17 G733PYV-LL053X | |
| Blender / v3.3 Classroom CPU | |
| Alienware m16 R2 | |
| HP Omen 16 (2024) | |
| Average of class Gaming (122 - 565, n=102, last 2 years) | |
| Average NVIDIA GeForce RTX 4080 Laptop GPU (177 - 337, n=23) | |
| Asus ROG Strix G16 G614JZ | |
| Asus ROG Strix Scar 16 G634JZR | |
| Lenovo Legion Pro 7 16IRX9H | |
| MSI Vector 16 HX A14V | |
| Asus ROG Strix Scar 17 G733PYV-LL053X | |
* ... smaller is better
游戏性能
Legion Pro 7 和 Strix Scar 16 之间的性能差距在 1080p 超高速游戏的累积性能中消失了。
在 1440p 超高清分辨率下,Scar 16 可以轻松超过 100 fps。在此分辨率下,这款笔记本能以 60 帧/秒的速度运行大多数现代 AAA 级游戏,如果使用升频器,还能达到更高的帧率。
| The Witcher 3 - 1920x1080 Ultra Graphics & Postprocessing (HBAO+) | |
| Asus ROG Strix Scar 17 G733PYV-LL053X | |
| Average of class Gaming (104.7 - 240, n=7, last 2 years) | |
| Lenovo Legion Pro 7 16IRX9H | |
| Asus ROG Strix Scar 16 G634JZR | |
| MSI Vector 16 HX A14V | |
| Asus ROG Strix G16 G614JZ | |
| HP Omen 16 (2024) | |
| Alienware m16 R2 | |
Witcher 3 FPS 图表
Scar 16 的大型散热系统能够确保相对平稳的游戏性能。我们在使用 Scar 16 进行压力测试时没有观察到任何急剧的帧数下降。 在Witcher 3在 1080p 超高清模式下,我们没有发现任何大幅掉帧现象。
| low | med. | high | ultra | QHD | |
|---|---|---|---|---|---|
| GTA V (2015) | 187.3 | 187.1 | 182.6 | 139 | 130.1 |
| The Witcher 3 (2015) | 581 | 513 | 365 | 185.6 | 140.1 |
| Dota 2 Reborn (2015) | 247 | 216 | 192.7 | 177.4 | |
| Final Fantasy XV Benchmark (2018) | 228 | 207 | 178 | 138.1 | |
| X-Plane 11.11 (2018) | 211 | 184.3 | 141.3 | ||
| Far Cry 5 (2018) | 183 | 168 | 164 | 157 | 157 |
| Strange Brigade (2018) | 499 | 402 | 373 | 337 | 240 |
| F1 22 (2022) | 323 | 334 | 287 | 117.1 | 76.6 |
| F1 23 (2023) | 310 | 326 | 295 | 111.3 | 70 |
| Cyberpunk 2077 (2023) | 170.4 | 159.8 | 141.3 | 123.1 | 77.6 |
| Avatar Frontiers of Pandora (2023) | 141.4 | 131.6 | 115.2 | 88.3 | 59.3 |
| Skull & Bones (2024) | 155 | 168 | 144 | 115 | 91 |
请参阅我们专门的 NvidiaGeForce RTX 4080 笔记本电脑 GPU页面,了解更多性能和游戏基准测试。
排放:尽管有 3 个风扇和 7 根热管,但表面温度和噪音仍然很高
系统噪音
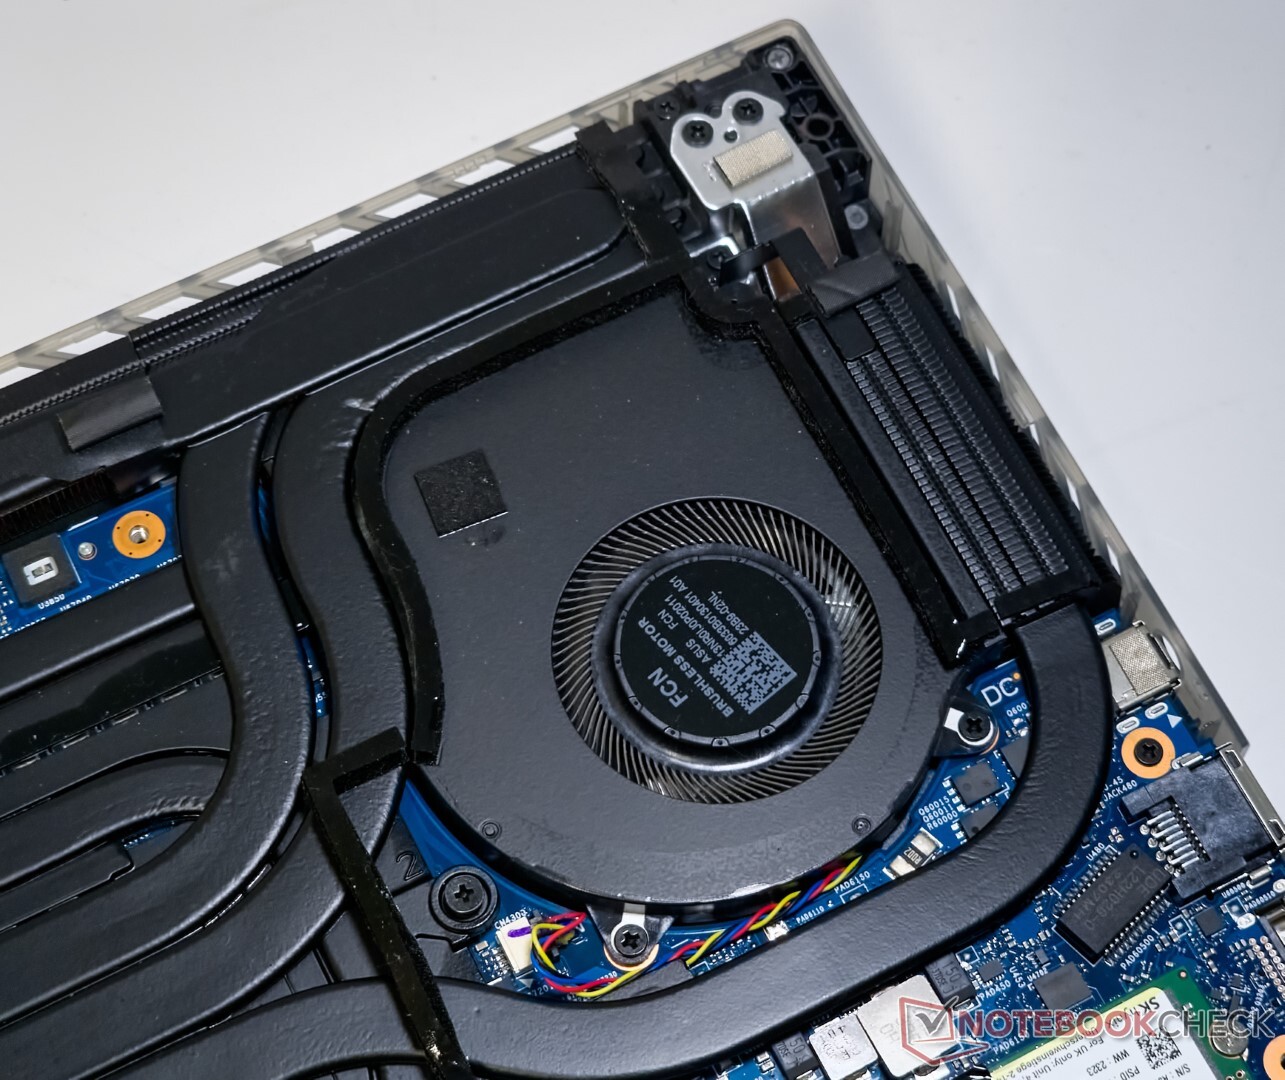
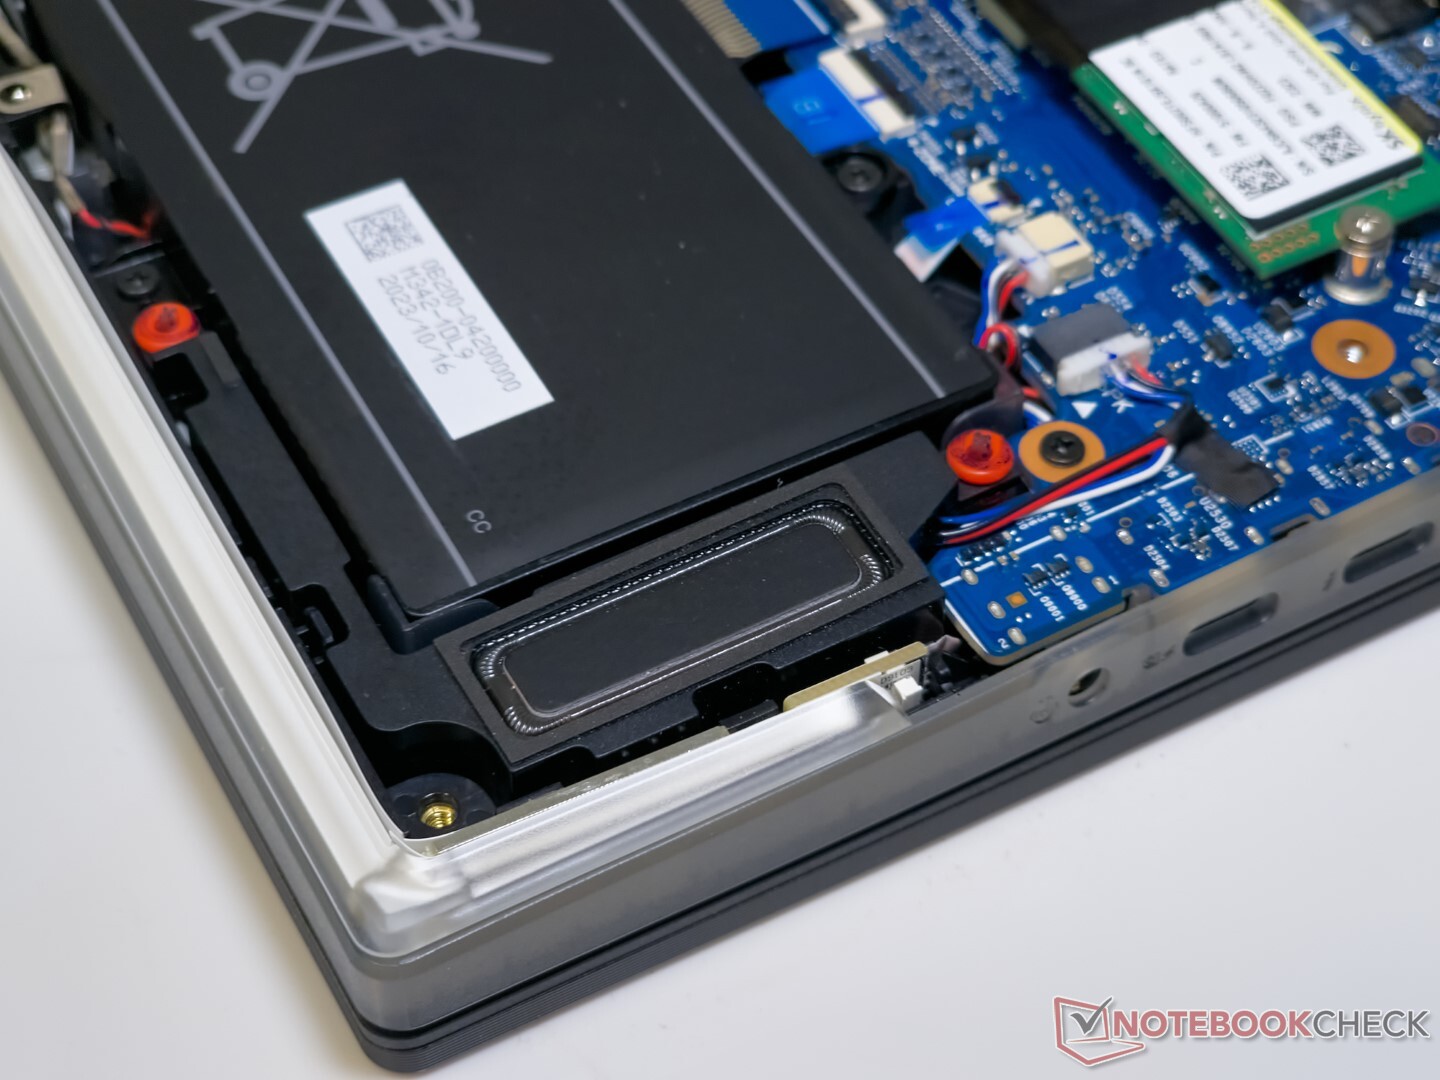
有趣的是,除了连接 CPU 和 GPU 的风扇外,华硕还在 VRAM 上安装了第三个风扇。
Scar 16 似乎并没有对每个电源配置文件中的噪音排放做出硬性限制。因此,在最大负载下,涡轮模式下的风扇噪音可高达 58 db(A)。
性能模式也会产生较高的噪音。静音模式的噪音相对较小,但游戏性能会明显下降。
尽管如此,在静音模式下,风扇在空闲时和不太密集的工作负载(如办公或休闲网页浏览)时是完全关闭的。
Noise level
| Idle |
| 29.75 / 29.75 / 29.75 dB(A) |
| Load |
| 54.85 / 58 dB(A) |
 | ||
30 dB silent 40 dB(A) audible 50 dB(A) loud |
||
min: | ||
| 性能模式 | 空闲 dB(A) | 负载平均 dB(A) | 负载最大 dB(A) | Witcher 3 1080p Ultra dB(A) |
|---|---|---|---|---|
| 静音 | 21.07 | 37.50 | 46.56 | 46.32 / 133 帧/秒 |
| 性能 | 21.07 | 54.03 | 54.02 | 54.08 / 174 帧/秒 |
| Turbo | 29.75 | 54.85 | 58 | 57.75 / 177 fps |
| Asus ROG Strix Scar 16 G634JZR i9-14900HX, GeForce RTX 4080 Laptop GPU | Asus ROG Strix Scar 17 G733PYV-LL053X R9 7945HX3D, GeForce RTX 4090 Laptop GPU | Asus ROG Strix G16 G614JZ i9-13980HX, GeForce RTX 4080 Laptop GPU | Lenovo Legion Pro 7 16IRX9H i9-14900HX, GeForce RTX 4080 Laptop GPU | HP Omen 16 (2024) i9-14900HX, GeForce RTX 4080 Laptop GPU | MSI Vector 16 HX A14V i9-14900HX, GeForce RTX 4080 Laptop GPU | Alienware m16 R2 Ultra 7 155H, GeForce RTX 4070 Laptop GPU | |
|---|---|---|---|---|---|---|---|
| Noise | 3% | 5% | -4% | 5% | -8% | 10% | |
| off / environment * (dB) | 21.07 | 23 -9% | 25 -19% | 24 -14% | 25 -19% | 23.2 -10% | 24.7 -17% |
| Idle Minimum * (dB) | 29.75 | 23 23% | 26 13% | 25 16% | 29 3% | 33.5 -13% | 25.3 15% |
| Idle Average * (dB) | 29.75 | 27.7 7% | 28 6% | 30 -1% | 30 -1% | 33.5 -13% | 25.3 15% |
| Idle Maximum * (dB) | 29.75 | 34.7 -17% | 30 -1% | 45 -51% | 31 -4% | 33.5 -13% | 25.3 15% |
| Load Average * (dB) | 54.85 | 53.4 3% | 48 12% | 50 9% | 46 16% | 52.1 5% | 31.7 42% |
| Witcher 3 ultra * (dB) | 57.8 | 53.4 8% | 49 15% | 54 7% | 47 19% | 62 -7% | 53.8 7% |
| Load Maximum * (dB) | 58 | 53.4 8% | 52 10% | 56 3% | 47 19% | 62 -7% | 62 -7% |
* ... smaller is better
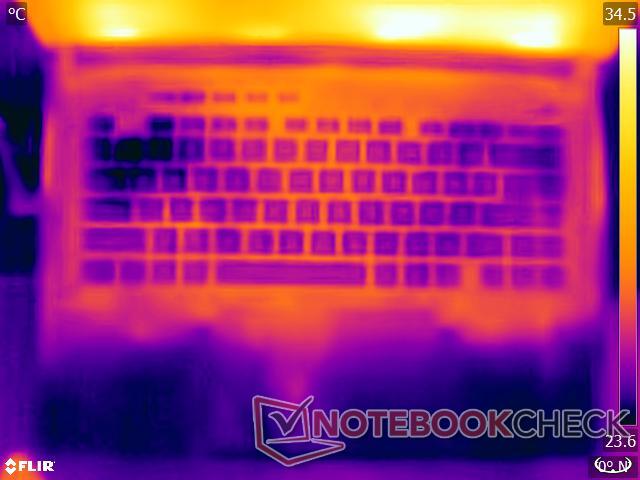
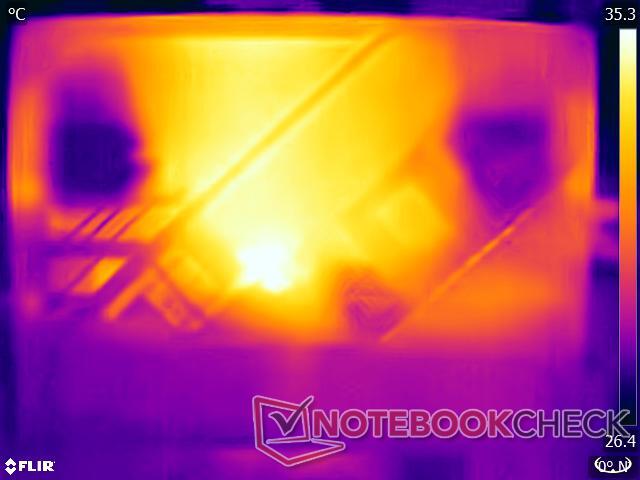
温度
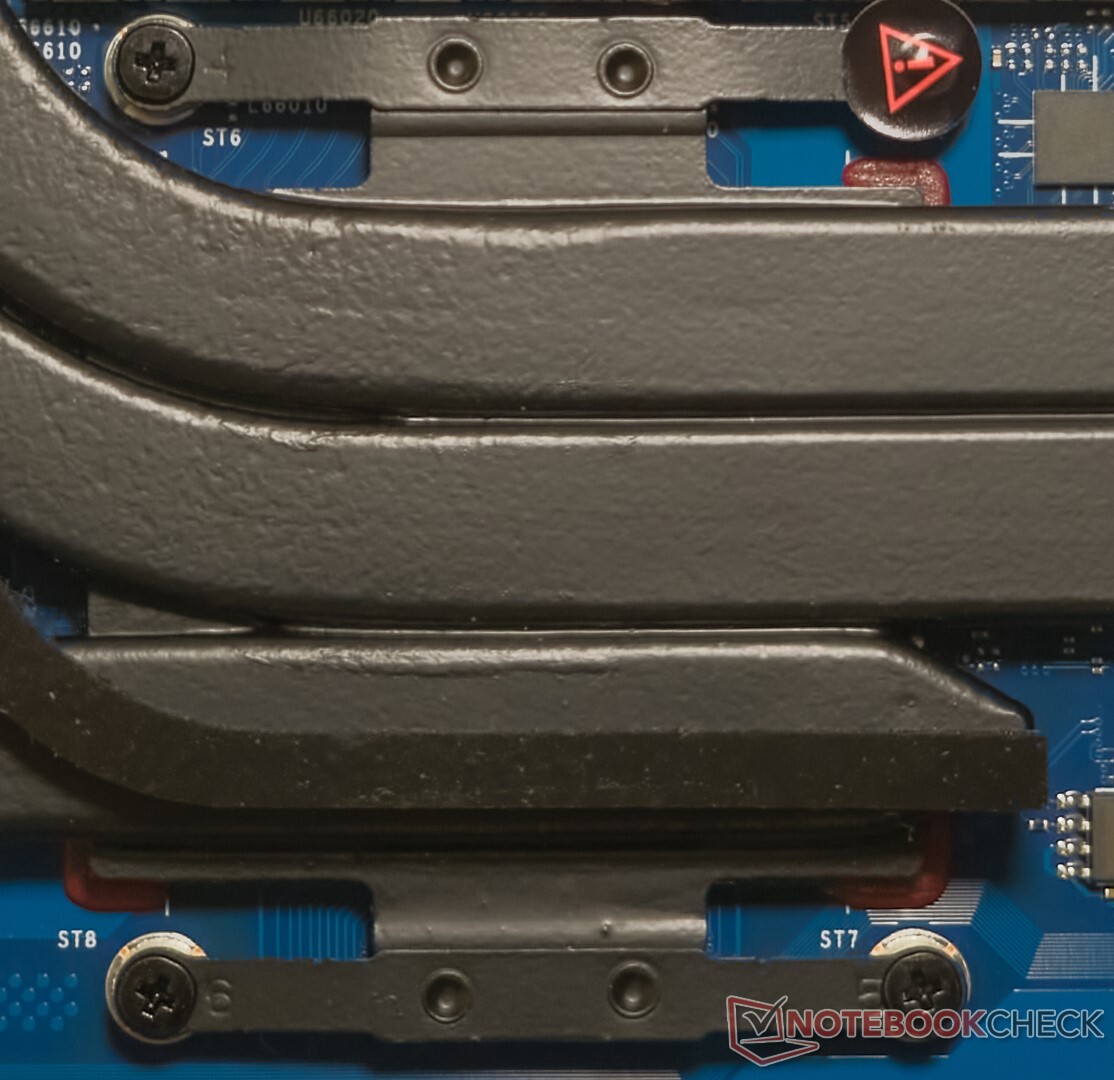
ROG Strix Scar 16 配备了七根热管和三风扇散热系统。这一次,华硕全力为 CPU 和 GPU 使用 Conductonaut Extreme 液态金属。
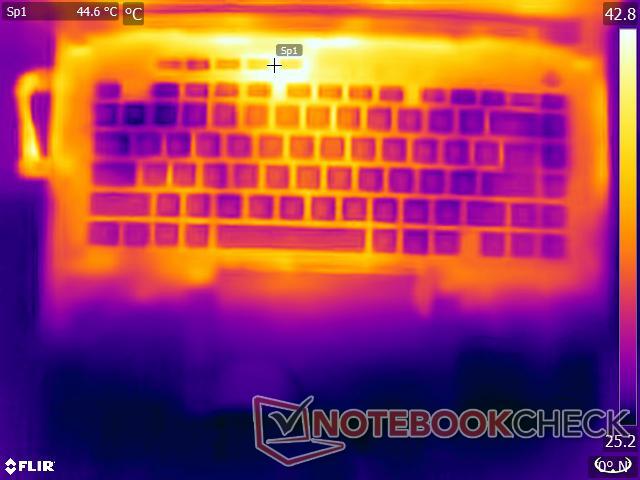
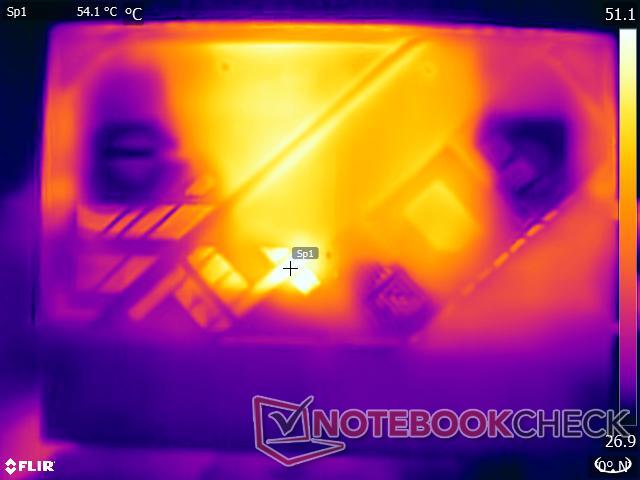
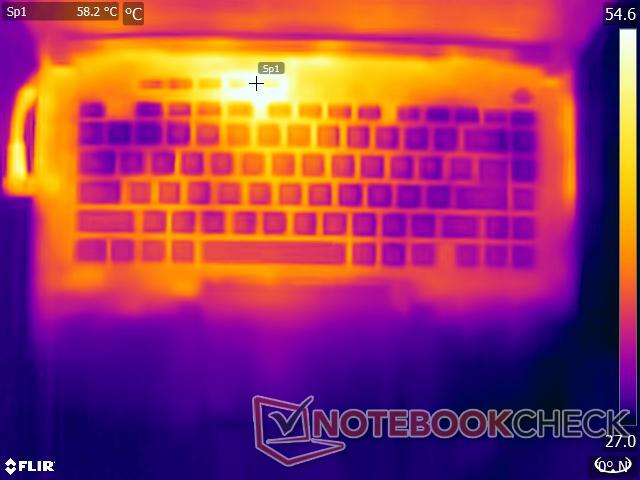
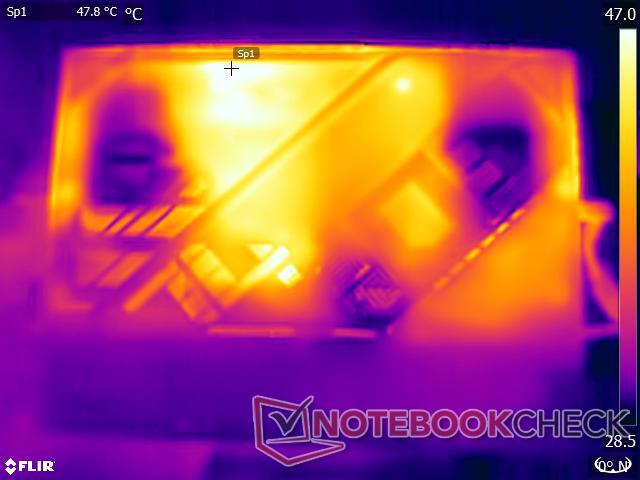
强大的散热设备和三面排风口有助于有效冷却组件,但同时也导致了更高的散热量,负载情况下的高表面温度读数就是证明。
我们在 1080p 超高清《Witcher 3》的压力测试中发现,上侧有几个温度超过 55 °C 的热点。
在实际使用中,考虑到其重量和表面温度,Scar 16 更适合作为桌面机器。尽管如此,如果不承受繁重的工作负荷,在静音模式下将笔记本电脑放在腿上使用也不会造成太大的不适。
(-) The maximum temperature on the upper side is 47.8 °C / 118 F, compared to the average of 40.4 °C / 105 F, ranging from 21.2 to 68.8 °C for the class Gaming.
(-) The bottom heats up to a maximum of 52.2 °C / 126 F, compared to the average of 43.2 °C / 110 F
(+) In idle usage, the average temperature for the upper side is 30.9 °C / 88 F, compared to the device average of 33.9 °C / 93 F.
(-) Playing The Witcher 3, the average temperature for the upper side is 42.9 °C / 109 F, compared to the device average of 33.9 °C / 93 F.
(±) The palmrests and touchpad can get very hot to the touch with a maximum of 39.2 °C / 102.6 F.
(-) The average temperature of the palmrest area of similar devices was 28.8 °C / 83.8 F (-10.4 °C / -18.8 F).
| Asus ROG Strix Scar 16 G634JZR i9-14900HX, GeForce RTX 4080 Laptop GPU | Asus ROG Strix Scar 17 G733PYV-LL053X R9 7945HX3D, GeForce RTX 4090 Laptop GPU | Asus ROG Strix G16 G614JZ i9-13980HX, GeForce RTX 4080 Laptop GPU | Lenovo Legion Pro 7 16IRX9H i9-14900HX, GeForce RTX 4080 Laptop GPU | HP Omen 16 (2024) i9-14900HX, GeForce RTX 4080 Laptop GPU | MSI Vector 16 HX A14V i9-14900HX, GeForce RTX 4080 Laptop GPU | Alienware m16 R2 Ultra 7 155H, GeForce RTX 4070 Laptop GPU | |
|---|---|---|---|---|---|---|---|
| Heat | 15% | -2% | -5% | 9% | 23% | -7% | |
| Maximum Upper Side * (°C) | 47.8 | 40.1 16% | 54 -13% | 46 4% | 47 2% | 36.4 24% | 44.8 6% |
| Maximum Bottom * (°C) | 52.2 | 46.7 11% | 55 -5% | 49 6% | 57 -9% | 35.6 32% | 48 8% |
| Idle Upper Side * (°C) | 32.4 | 26.5 18% | 29 10% | 38 -17% | 25 23% | 26.6 18% | 37.2 -15% |
| Idle Bottom * (°C) | 33 | 27.7 16% | 33 -0% | 37 -12% | 26 21% | 27 18% | 42 -27% |
* ... smaller is better
压力测试
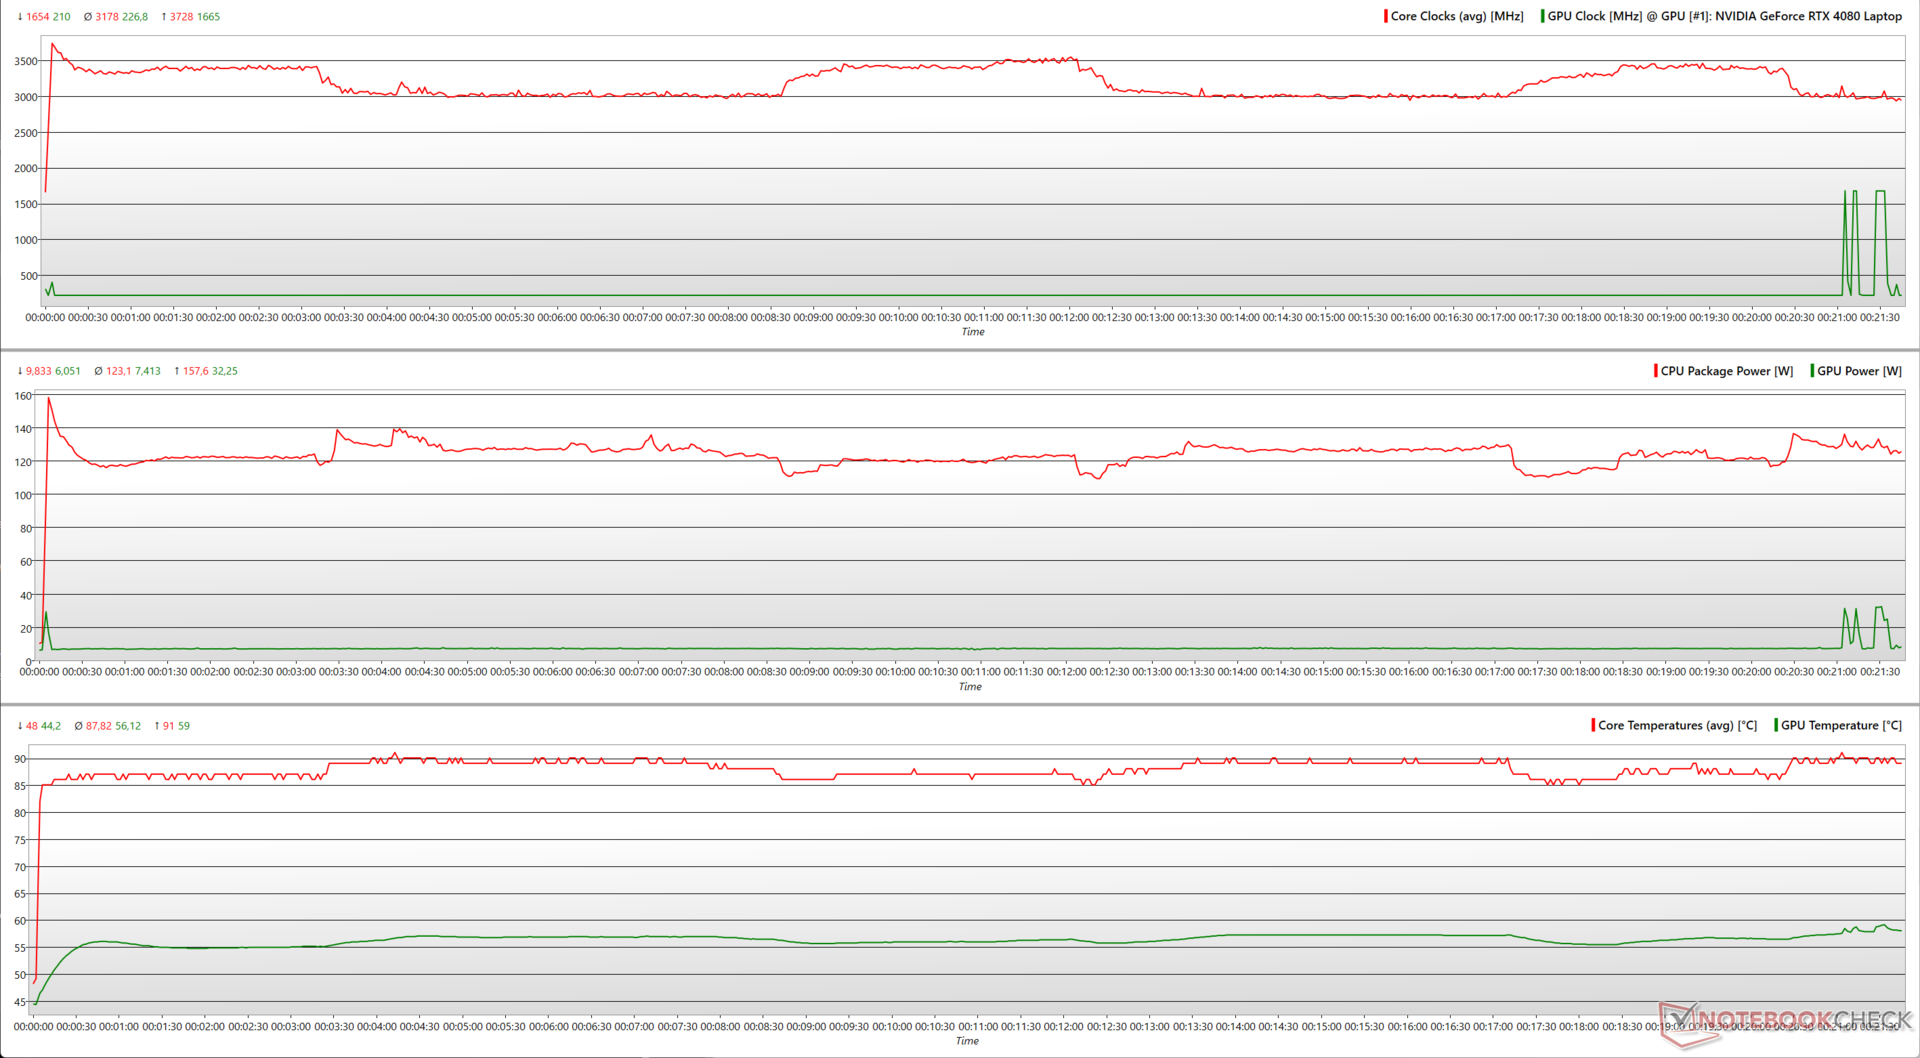
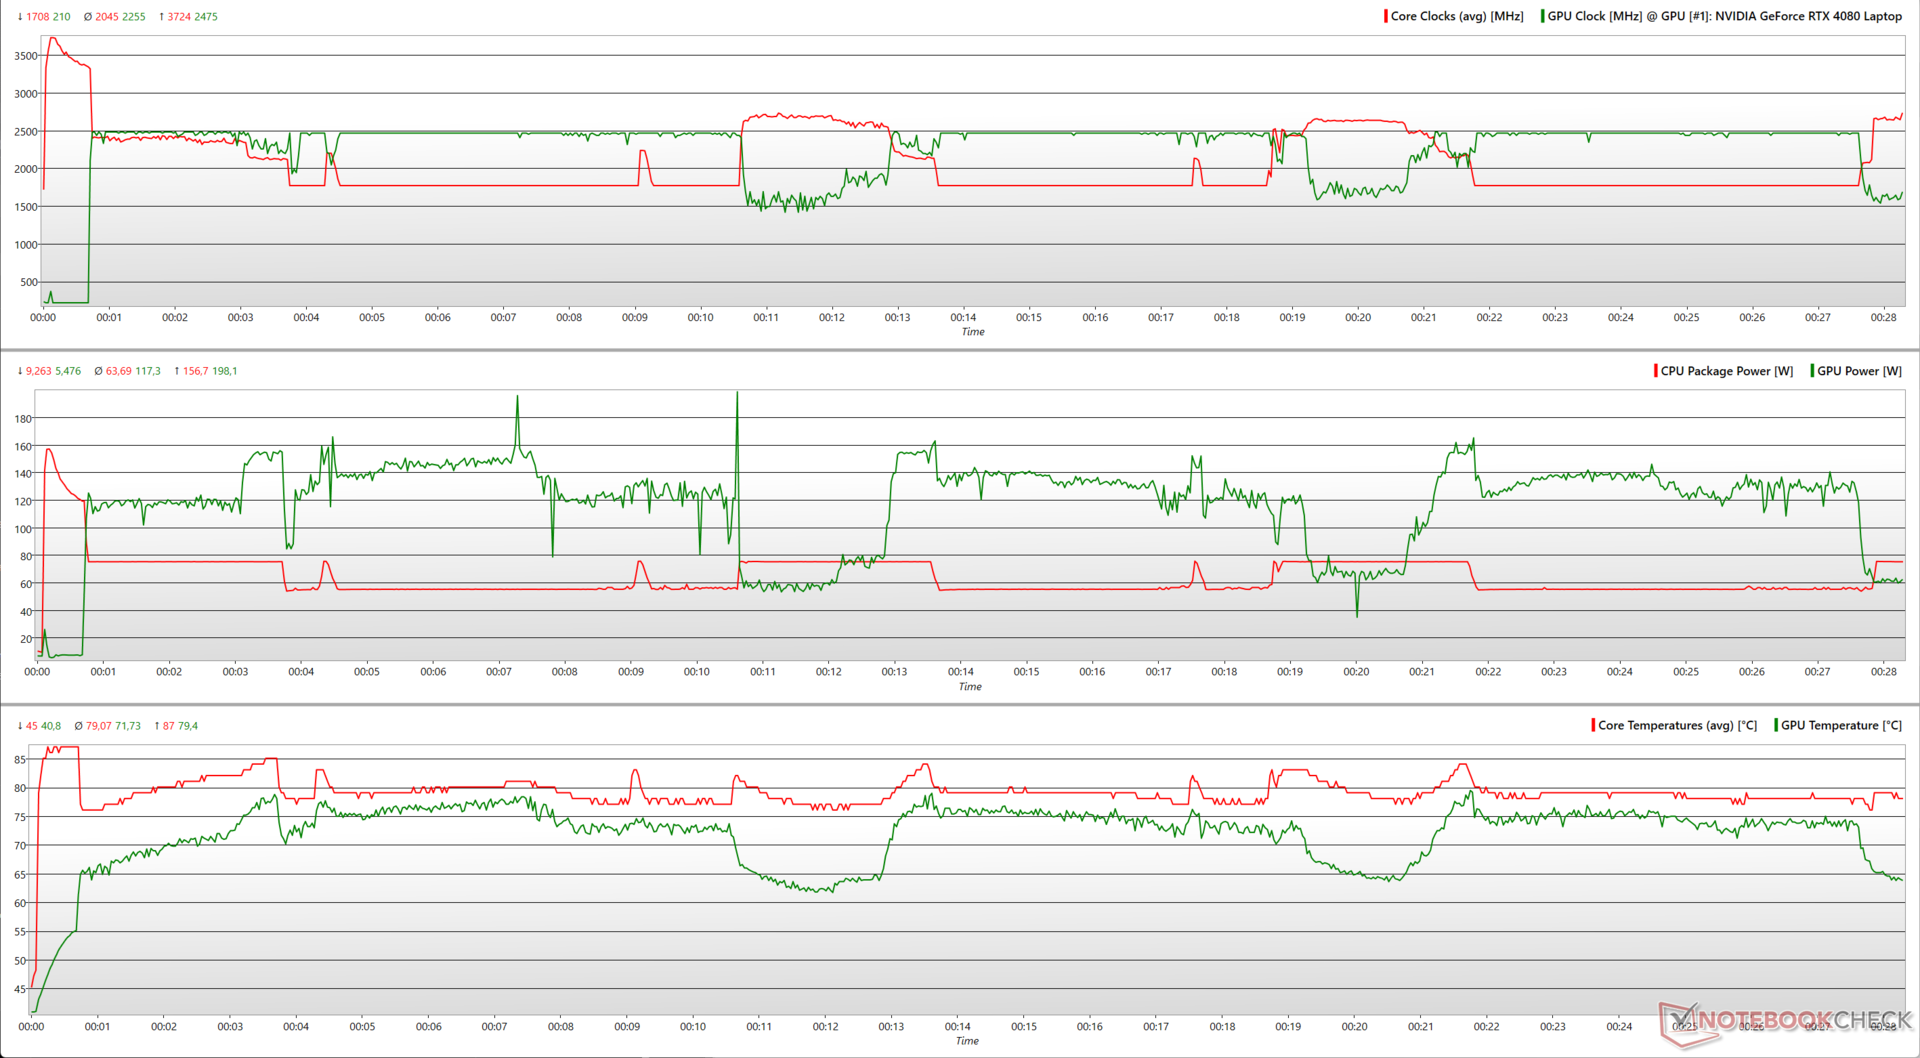
仅通过 Prime95 就地大型 FFT 对 Scar 16 施加压力,Core i9-14900HX 的功耗就高达 158 W,时钟频率峰值为 3.7 GHz,但这并不能维持很长时间。当核心温度达到 90 °C 时,频率降至 3 GHz。当核心温度下降到约 87 ℃ 时,核心频率可得到喘息,并可提升至 3.5 GHz。
加入 FurMark(1280 x 720,无 AA)后,Scar 16 的 RTX 4080 的耗电量瞬间达到 198 W。
不过,我们观察到,CPU 需要调低 GPU 的功耗,反之亦然。
| 压力测试 | CPU 时钟 (GHz) | GPU 时钟 (MHz) | CPU 平均温度 (°C) | GPU 平均温度(°C) |
| 系统空闲 | 1.6 | 210 | 41 | 37.5 |
| Prime95 | 3.0 | 210 | 87 | 56 |
| Prime95 + FurMark | 2.7 | 1,500 | 78 | 70.4 |
| Witcher 3 1080p Ultra | 2.4 | 2,460 | 78 | 80.2 |
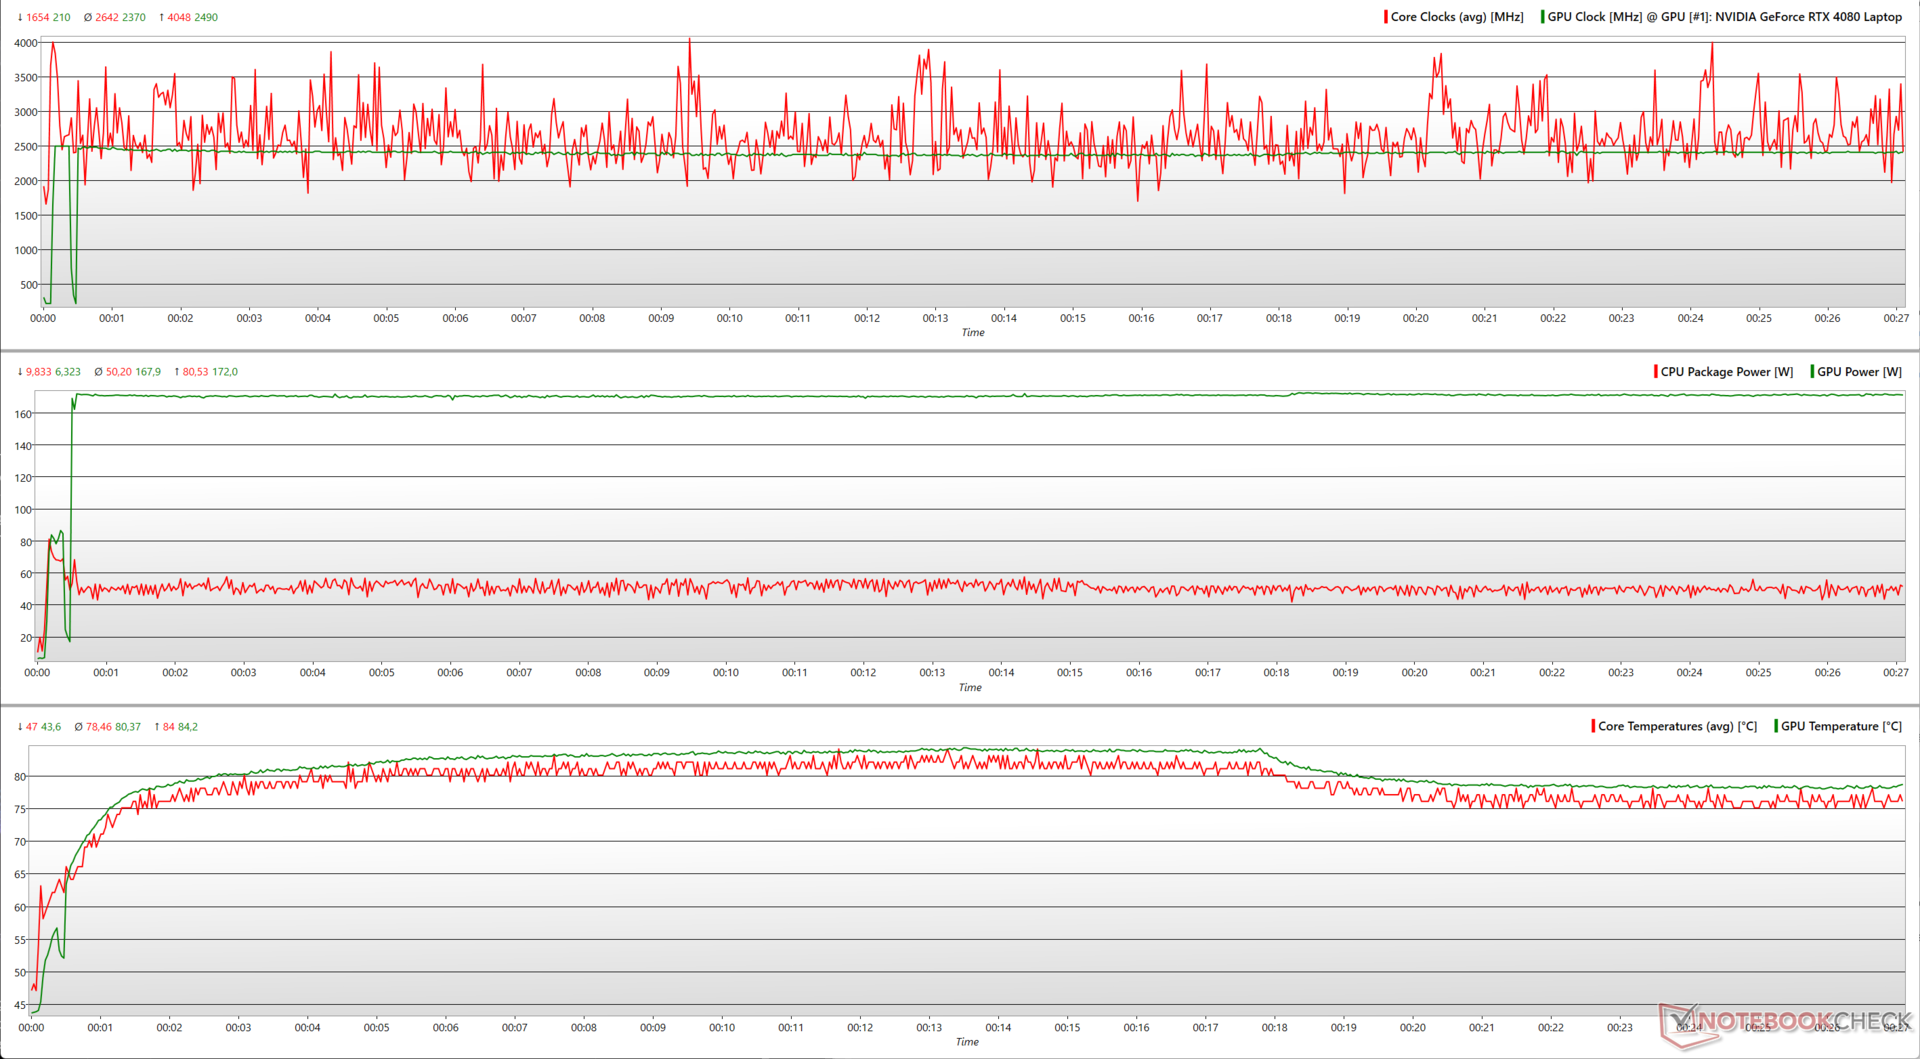
在 1080p 超高清环境下使用 Witcher 3 对 Scar 16 施加压力,可以看到更真实的表现。酷睿 i9-14900HX 的频率有时可提升至 4 GHz,但功耗却高达 81 W。另一方面,RTX 4080 的频率可维持在 2,500 MHz,功耗却始终保持在 ~170 W。
发言人
Scar 16 采用四扬声器阵列,两个高音扬声器靠近盖子底部,两个低音扬声器向下发射。华硕表示支持 Hi-Res Audio 和 Dolby Atmos。
79 db(A)的响度足以满足一般大小房间的需求。低音响应尚可,但考虑到专用低音单元的存在,低音响应可能会更好。中音和高音的还原相当不错。
3.5 毫米组合音频插孔和蓝牙 5.3 的出现意味着用户可以连接功能更强大的外置音频设备。
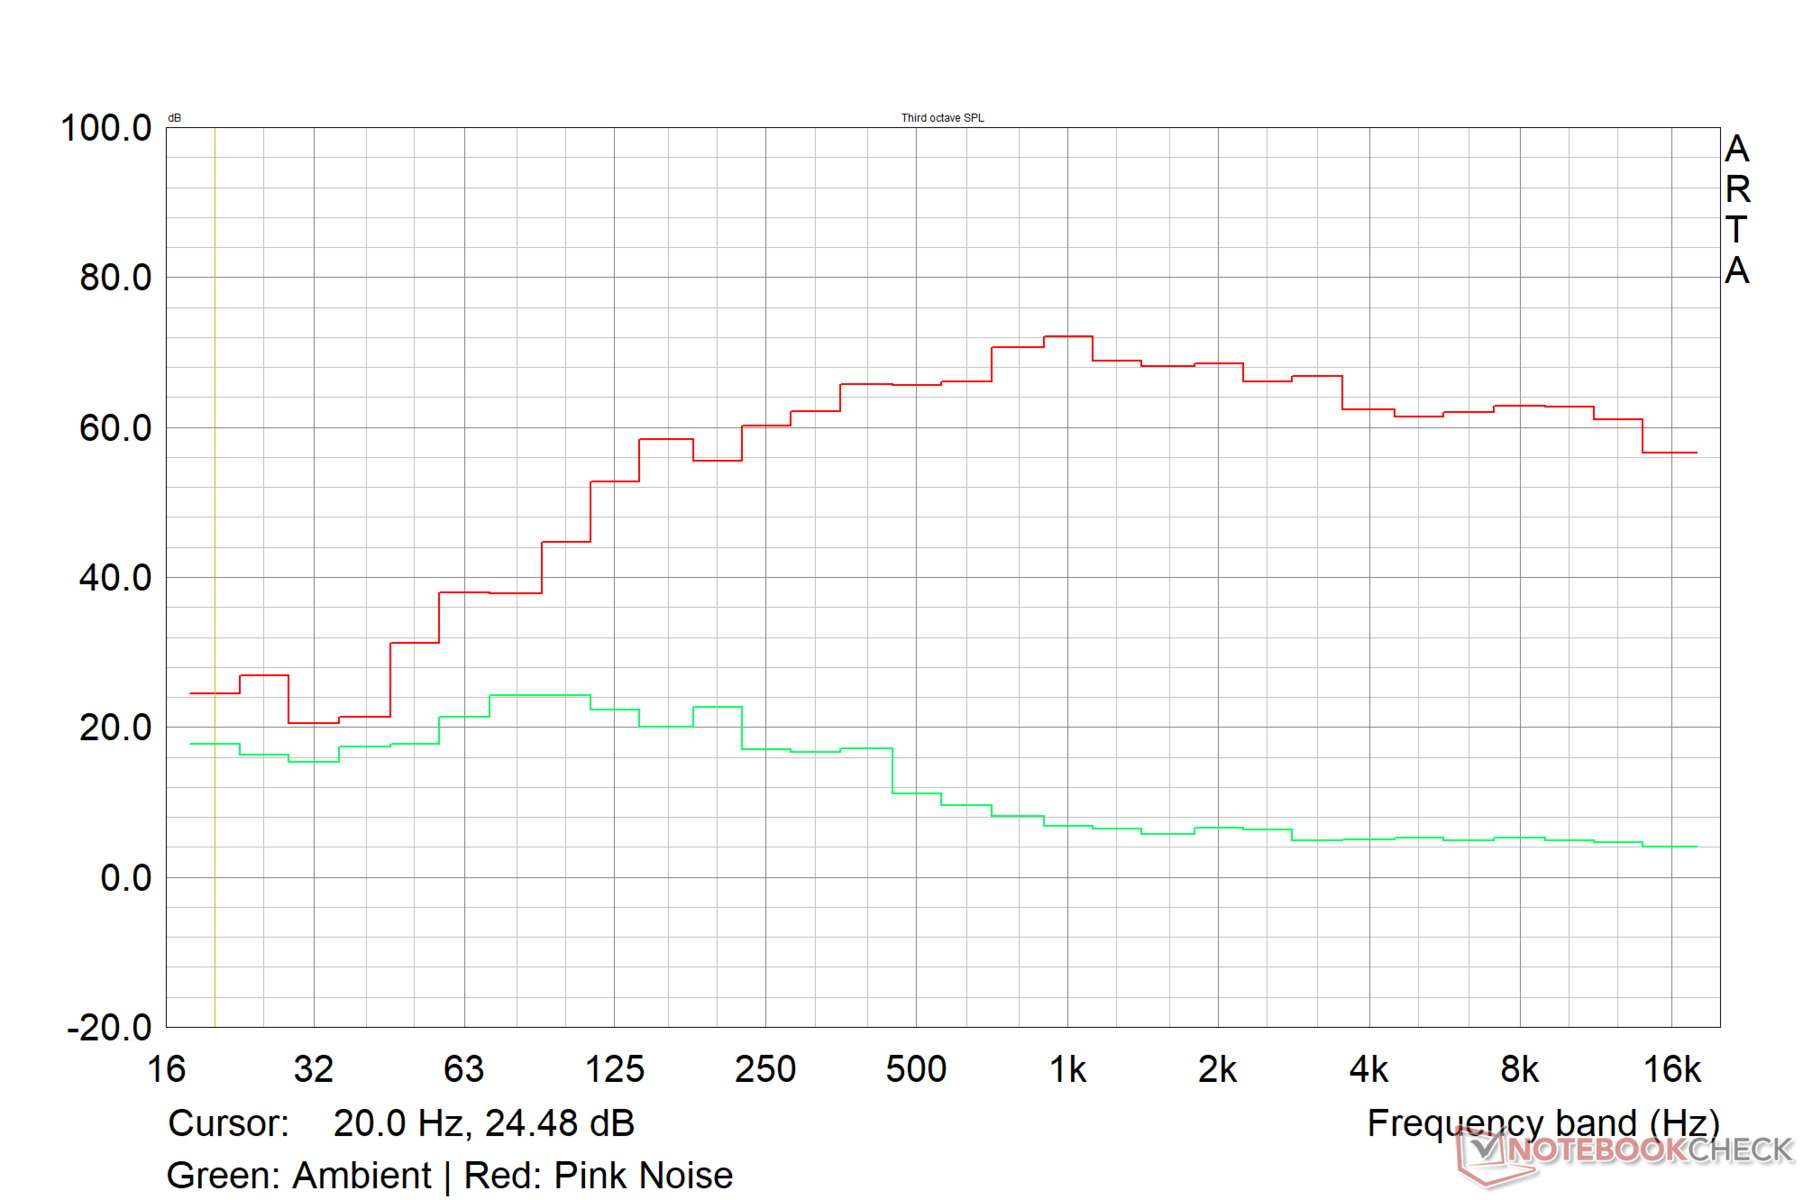
Asus ROG Strix Scar 16 G634JZR audio analysis
(±) | speaker loudness is average but good (79 dB)
Bass 100 - 315 Hz
(±) | reduced bass - on average 7.1% lower than median
(±) | linearity of bass is average (9% delta to prev. frequency)
Mids 400 - 2000 Hz
(±) | higher mids - on average 5.5% higher than median
(+) | mids are linear (3.3% delta to prev. frequency)
Highs 2 - 16 kHz
(+) | balanced highs - only 1.4% away from median
(+) | highs are linear (2.6% delta to prev. frequency)
Overall 100 - 16.000 Hz
(+) | overall sound is linear (9.8% difference to median)
Compared to same class
» 5% of all tested devices in this class were better, 1% similar, 94% worse
» The best had a delta of 6%, average was 18%, worst was 132%
Compared to all devices tested
» 4% of all tested devices were better, 1% similar, 95% worse
» The best had a delta of 4%, average was 23%, worst was 134%
Apple MacBook Pro 16 2021 M1 Pro audio analysis
(+) | speakers can play relatively loud (84.7 dB)
Bass 100 - 315 Hz
(+) | good bass - only 3.8% away from median
(+) | bass is linear (5.2% delta to prev. frequency)
Mids 400 - 2000 Hz
(+) | balanced mids - only 1.3% away from median
(+) | mids are linear (2.1% delta to prev. frequency)
Highs 2 - 16 kHz
(+) | balanced highs - only 1.9% away from median
(+) | highs are linear (2.7% delta to prev. frequency)
Overall 100 - 16.000 Hz
(+) | overall sound is linear (4.6% difference to median)
Compared to same class
» 0% of all tested devices in this class were better, 0% similar, 100% worse
» The best had a delta of 5%, average was 17%, worst was 45%
Compared to all devices tested
» 0% of all tested devices were better, 0% similar, 100% worse
» The best had a delta of 4%, average was 23%, worst was 134%
能源管理:符合机载硬件的预期
耗电量
Scar 16 的功耗略高于 ROG Strix G16酷睿 i9-13980HX。采用类似配置的 Omen 16 由于 CPU 和 GPU 瓦数较低,总体上比 Scar 16 省电约 8%。
Vector 16 HX 的负载功耗相同,但空闲功耗要高得多。
随附的 330 瓦电源适配器可保证笔记本电脑在最大压力下的充足供电。
| Off / Standby | |
| Idle | |
| Load |
|
Key:
min: | |
| Asus ROG Strix Scar 16 G634JZR i9-14900HX, GeForce RTX 4080 Laptop GPU, Mini LED, 2560x1600, 16" | Asus ROG Strix Scar 17 G733PYV-LL053X R9 7945HX3D, GeForce RTX 4090 Laptop GPU, IPS, 2560x1440, 17.3" | Asus ROG Strix G16 G614JZ i9-13980HX, GeForce RTX 4080 Laptop GPU, IPS, 2560x1600, 16" | Lenovo Legion Pro 7 16IRX9H i9-14900HX, GeForce RTX 4080 Laptop GPU, IPS, 2560x1600, 16" | HP Omen 16 (2024) i9-14900HX, GeForce RTX 4080 Laptop GPU, IPS, 2560x1440, 16.1" | MSI Vector 16 HX A14V i9-14900HX, GeForce RTX 4080 Laptop GPU, IPS, 2560x1600, 16" | Alienware m16 R2 Ultra 7 155H, GeForce RTX 4070 Laptop GPU, IPS, 2560x1600, 16" | Average NVIDIA GeForce RTX 4080 Laptop GPU | Average of class Gaming | |
|---|---|---|---|---|---|---|---|---|---|
| Power Consumption | -8% | 3% | -20% | 8% | -16% | 16% | -21% | 0% | |
| Idle Minimum * (Watt) | 10.71 | 15.4 -44% | 10 7% | 16 -49% | 9 16% | 15.8 -48% | 8.1 24% | 16.9 ? -58% | 13 ? -21% |
| Idle Average * (Watt) | 14.75 | 21.6 -46% | 16 -8% | 21 -42% | 16 -8% | 23.3 -58% | 13 12% | 22 ? -49% | 19 ? -29% |
| Idle Maximum * (Watt) | 30 | 22.2 26% | 27 10% | 36 -20% | 35 -17% | 30 -0% | 40.3 -34% | 34.1 ? -14% | 24.6 ? 18% |
| Load Average * (Watt) | 135 | 116.7 14% | 129 4% | 132 2% | 129 4% | 123.9 8% | 79 41% | 117.9 ? 13% | 110.7 ? 18% |
| Witcher 3 ultra * (Watt) | 286 | 262 8% | 247 14% | 267 7% | 150.8 47% | 285 -0% | 188.1 34% | ||
| Load Maximum * (Watt) | 307 | 327.1 -7% | 342 -11% | 360 -17% | 285 7% | 306 -0% | 254.9 17% | 297 ? 3% | 259 ? 16% |
| Cyberpunk 2077 ultra external monitor * (Watt) | 272 |
* ... smaller is better
Power Consumption: The Witcher 3 / Stress test
Power Consumption: External monitor
电池寿命
在启用 MSHybrid 和 60 Hz 刷新率的静音模式下,Scar 16 在 150 尼特亮度的标准 Wi-Fi 网页浏览测试中可持续 7:14 小时。在关闭所有无线电设备、亮度相同的 H.264 1080p 循环测试中,续航时间增至 7.5 小时。
在 150 尼特亮度下玩《TheWitcher 31080p Ultra》时,笔记本电脑只能勉强维持一个小时。
| Asus ROG Strix Scar 16 G634JZR i9-14900HX, GeForce RTX 4080 Laptop GPU, 90 Wh | Asus ROG Strix Scar 17 G733PYV-LL053X R9 7945HX3D, GeForce RTX 4090 Laptop GPU, 90 Wh | Asus ROG Strix G16 G614JZ i9-13980HX, GeForce RTX 4080 Laptop GPU, 90 Wh | Lenovo Legion Pro 7 16IRX9H i9-14900HX, GeForce RTX 4080 Laptop GPU, 99.9 Wh | HP Omen 16 (2024) i9-14900HX, GeForce RTX 4080 Laptop GPU, 83 Wh | MSI Vector 16 HX A14V i9-14900HX, GeForce RTX 4080 Laptop GPU, 90 Wh | Alienware m16 R2 Ultra 7 155H, GeForce RTX 4070 Laptop GPU, 90 Wh | Average of class Gaming | |
|---|---|---|---|---|---|---|---|---|
| Battery runtime | -22% | 29% | -14% | -18% | 16% | 12% | 26% | |
| H.264 (h) | 7.5 | 5 -33% | 8.32 ? 11% | |||||
| WiFi v1.3 (h) | 7.2 | 4.8 -33% | 9.7 35% | 6.2 -14% | 5.9 -18% | 5.5 -24% | 8.1 13% | 7.11 ? -1% |
| Witcher 3 ultra (h) | 1 | |||||||
| Load (h) | 0.9 | 0.9 0% | 1.1 22% | 1.4 56% | 1 11% | 1.502 ? 67% | ||
| Reader / Idle (h) | 10.7 | 12.6 | 8.27 ? |
Pros
Cons
结论发烧级游戏玩家的习惯性迭代升级
华硕坚持使用久经考验的配方,使 Scar 16 有别于竞争对手。从这个意义上说,今年的华硕 ROG Strix Scar 16 与上一代产品相比,只是进化而非革命性的升级。
华硕为 Scar 16 提供了优质的迷你 LED G-Sync HDR 显示屏。240 Hz 的高 PWM 频率显示屏呈现出出色的色彩特性,完全适用于对色彩要求苛刻的工作流程,尽管是在单区背光模式下。遗憾的是,这一点并没有得到很好的证明。
华硕 ROG Strix Scar 16 几乎满足了 2024 年 16 英寸发烧级游戏笔记本电脑的所有要求。然而,它的同类产品却能以更低的价格提供类似的功能和性能。
从性能上看,ROG Strix Scar 16 与其他搭载酷睿 i9-14900HX 和 RTX 4080 的笔记本电脑不相上下。
华硕对散热进行了调整,使 Scar 16 在负载情况下,CPU 和 GPU 的总功率达到 180 W。然而,将笔记本电脑推到如此之高的温度不可避免地会导致表面温度升高和风扇噪音增大。
我们希望能解决的一些问题包括更好的 Wi-Fi 5 性能和两侧更公平的端口分布。此外,在这款机型中加入 1080p 网络摄像头应该不会对 2024 年的华硕造成太大影响。
如果你正在寻找一款 16 英寸的游戏利器,并有 3,00,00 ₹(约合 3,000 美元)的余钱,华硕 ROG Strix Scar 16 几乎完全符合这一要求。不过,它并不是最理想的廉价产品。
LenovoLegion Pro 7 拥有更纤薄的外形、更大的电池(运行时间较低)和更出色的 1080p 网络摄像头,同时在 CPU 方面的表现略胜一筹。
MSI Vector 16 HX 虽然没有增加 RGB 功能和 G-Sync,但价格略低,在大多数方面与 Scar 16 性能相当。
价格和供应情况
在印度,配备 RTX 4080 的华硕 ROG Strix Scar 16 (2024) 的官方售价为 2,89,990 镑,但目前在亚马逊印度网站上的售价为 3,04,490 镑,而RTX 4090 版本的指定售价为 3,29,990 镑。
经测试,配备 1 TB SSD 和 RTX 4080 的 ROG Strix Scar 16 (2024) 在美国亚马逊和美国百思买的售价为 2,900 美元,而RTX 4090版本的售价为 3,625 美元。
Asus ROG Strix Scar 16 G634JZR
- 04/22/2024 v7 (old)
Vaidyanathan Subramaniam
Transparency
The selection of devices to be reviewed is made by our editorial team. The test sample was provided to the author as a loan by the manufacturer or retailer for the purpose of this review. The lender had no influence on this review, nor did the manufacturer receive a copy of this review before publication. There was no obligation to publish this review. As an independent media company, Notebookcheck is not subjected to the authority of manufacturers, retailers or publishers.
This is how Notebookcheck is testing
Every year, Notebookcheck independently reviews hundreds of laptops and smartphones using standardized procedures to ensure that all results are comparable. We have continuously developed our test methods for around 20 years and set industry standards in the process. In our test labs, high-quality measuring equipment is utilized by experienced technicians and editors. These tests involve a multi-stage validation process. Our complex rating system is based on hundreds of well-founded measurements and benchmarks, which maintains objectivity. Further information on our test methods can be found here.
Price comparison

