联想Legion Pro 7 16 (2024) 评测:RTX 4080 笔记本电脑中的佼佼者
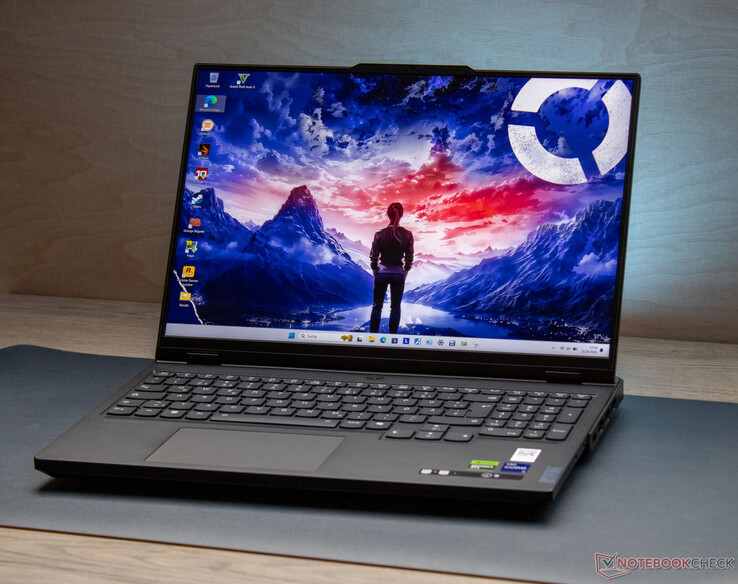
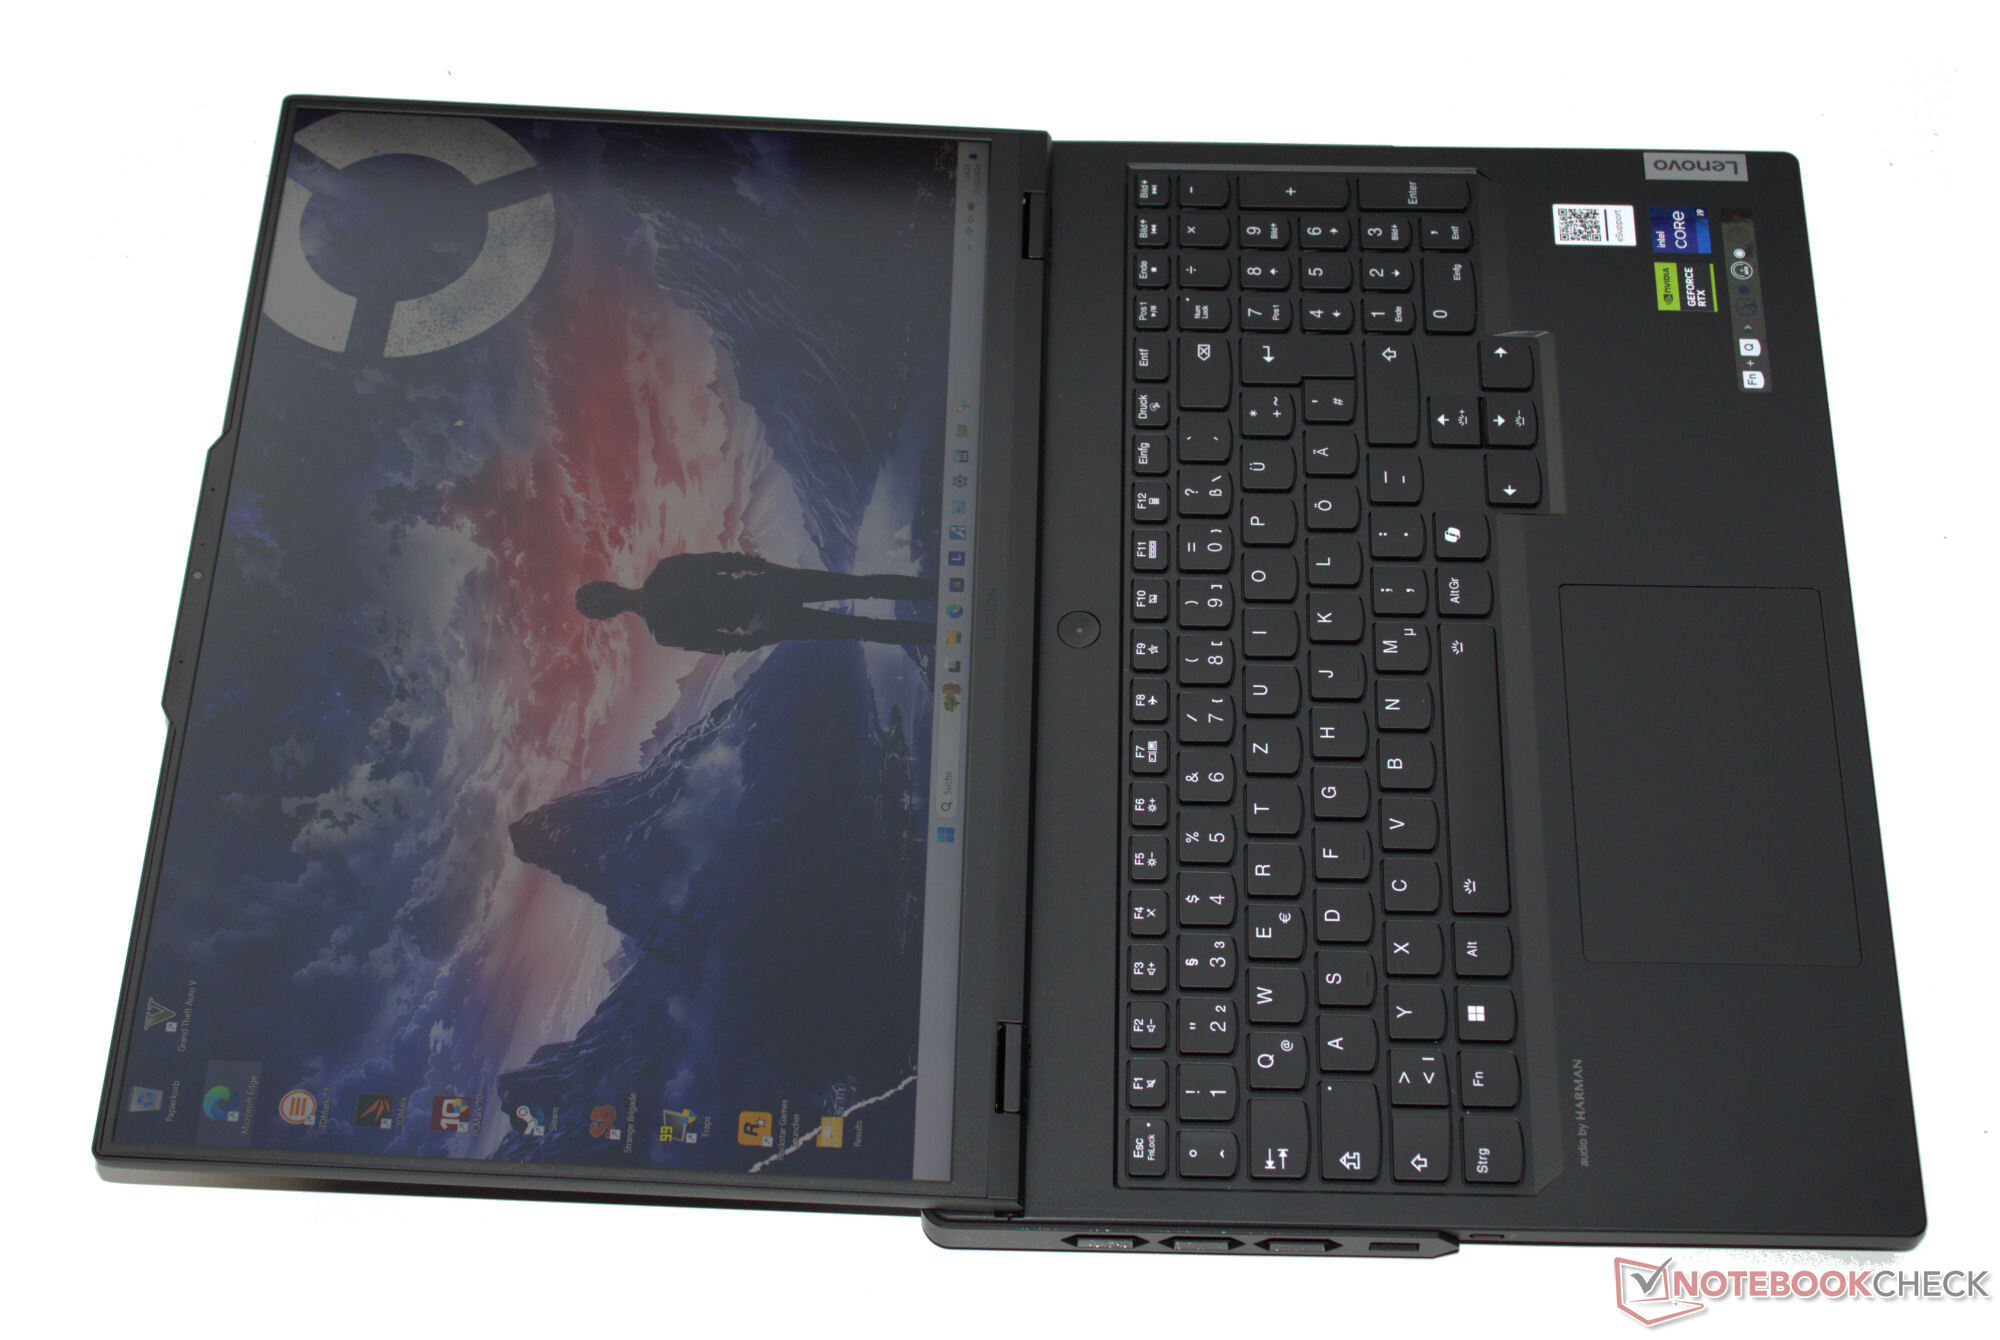
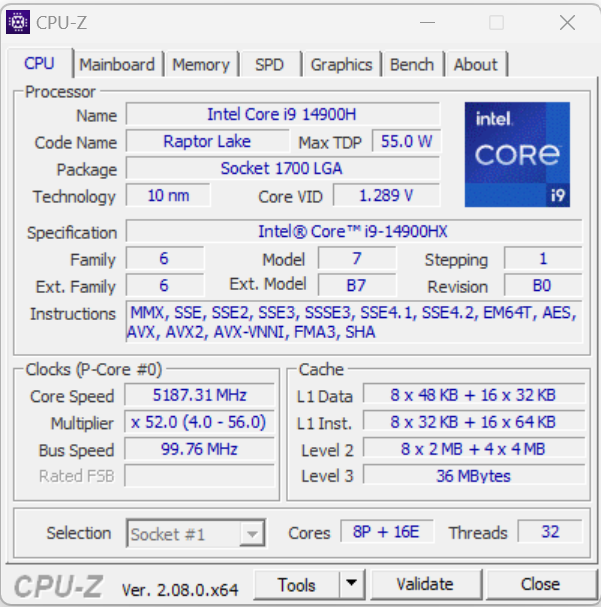
Legion Pro 7 是一款面向游戏玩家和创作者的 16 英寸笔记本电脑,其性能达到了顶级水平。它配备了强大的硬件,包括 酷睿 i9-14900HX, a GeForce RTX 408032 GB 内存,以及色彩精准的 IPS 显示屏(覆盖 DCI-P3、杜比视界、G-Sync),宽高比为 16:10。Legion Pro 的竞争对手包括 微星 Vector 16 HX A14V、 Alienware m16 R1 AMD、惠普 HP Omen 16 (2024).
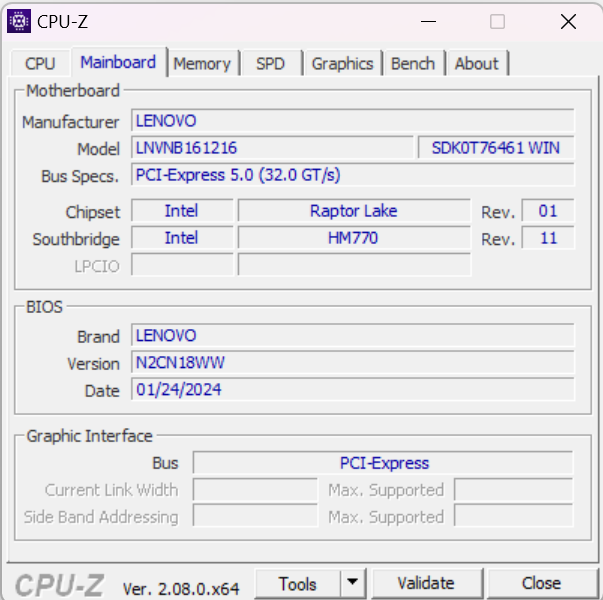
Legion Pro 7 16IRX9H 是继 Legion Pro 7 16IRX8HPro 7 16IRX9H 是 Pro 7 16IRX8H 的后续机型,采用相同的外观设计。请参阅 我们的 16IRX8H 评测了解有关机箱、功能和输入设备的更多详情。
潜在的竞争对手比较
Rating | Date | Model | Weight | Height | Size | Resolution | Price |
|---|---|---|---|---|---|---|---|
| 89.5 % v7 (old) | 03 / 2024 | Lenovo Legion Pro 7 16IRX9H i9-14900HX, GeForce RTX 4080 Laptop GPU | 2.7 kg | 21.95 mm | 16.00" | 2560x1600 | |
| 89.2 % v7 (old) | 08 / 2023 | Alienware m16 R1 AMD R9 7845HX, GeForce RTX 4080 Laptop GPU | 3.1 kg | 25.4 mm | 16.00" | 2560x1600 | |
| 88 % v7 (old) | 02 / 2024 | MSI Vector 16 HX A14V i9-14900HX, GeForce RTX 4080 Laptop GPU | 2.7 kg | 28.55 mm | 16.00" | 2560x1600 | |
| 86.7 % v7 (old) | 02 / 2024 | HP Omen 16 (2024) i9-14900HX, GeForce RTX 4080 Laptop GPU | 2.4 kg | 23.5 mm | 16.10" | 2560x1440 |
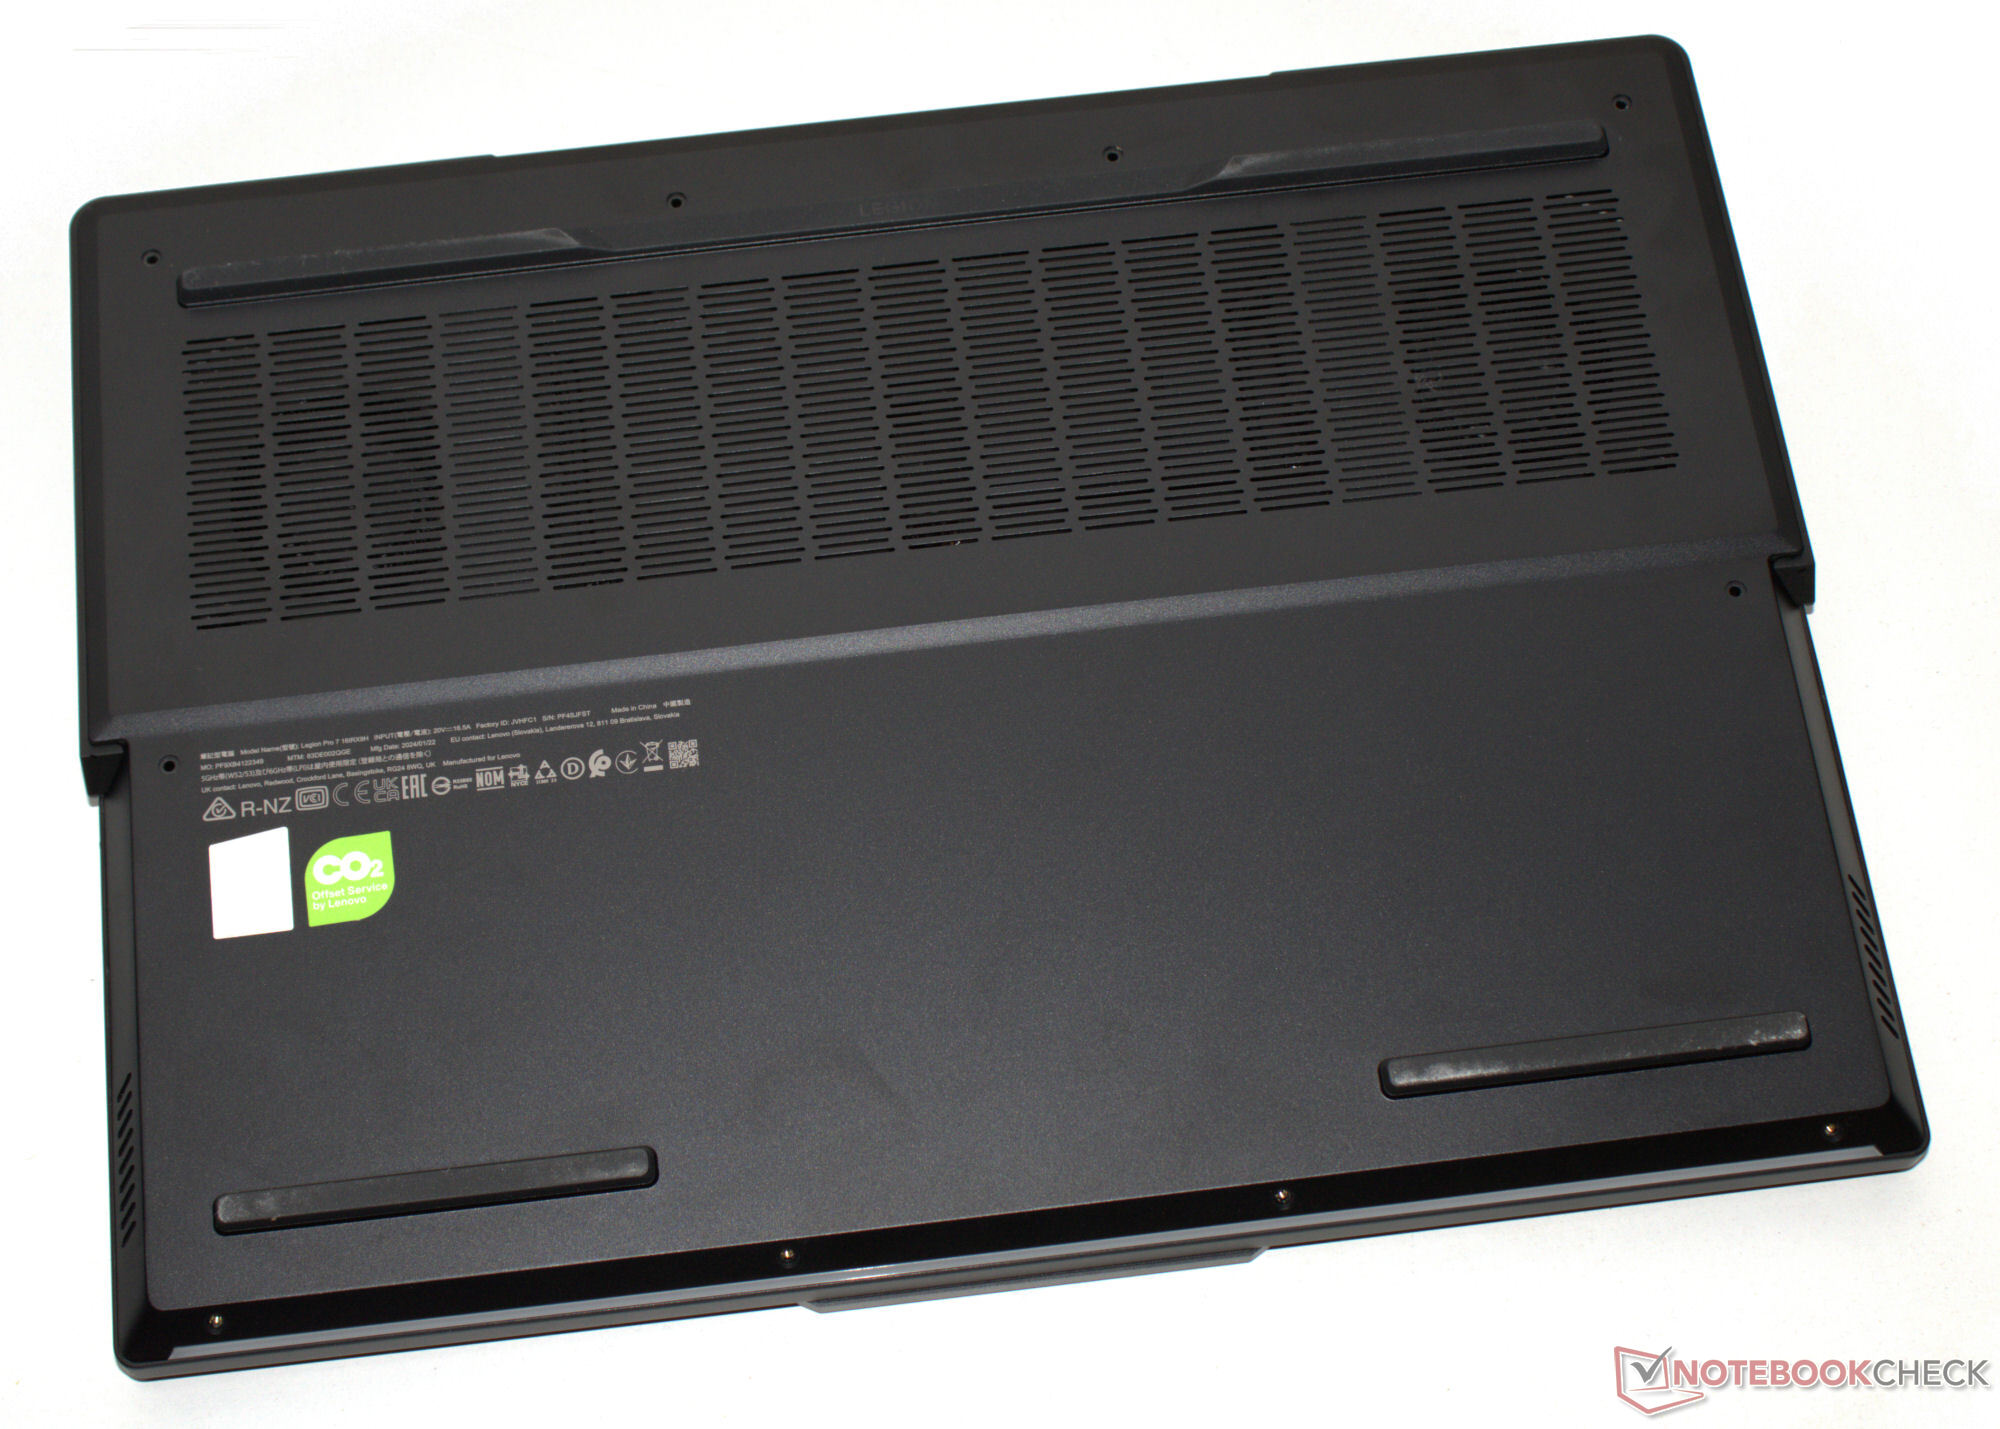
机箱和规格 - 配备雷电 4
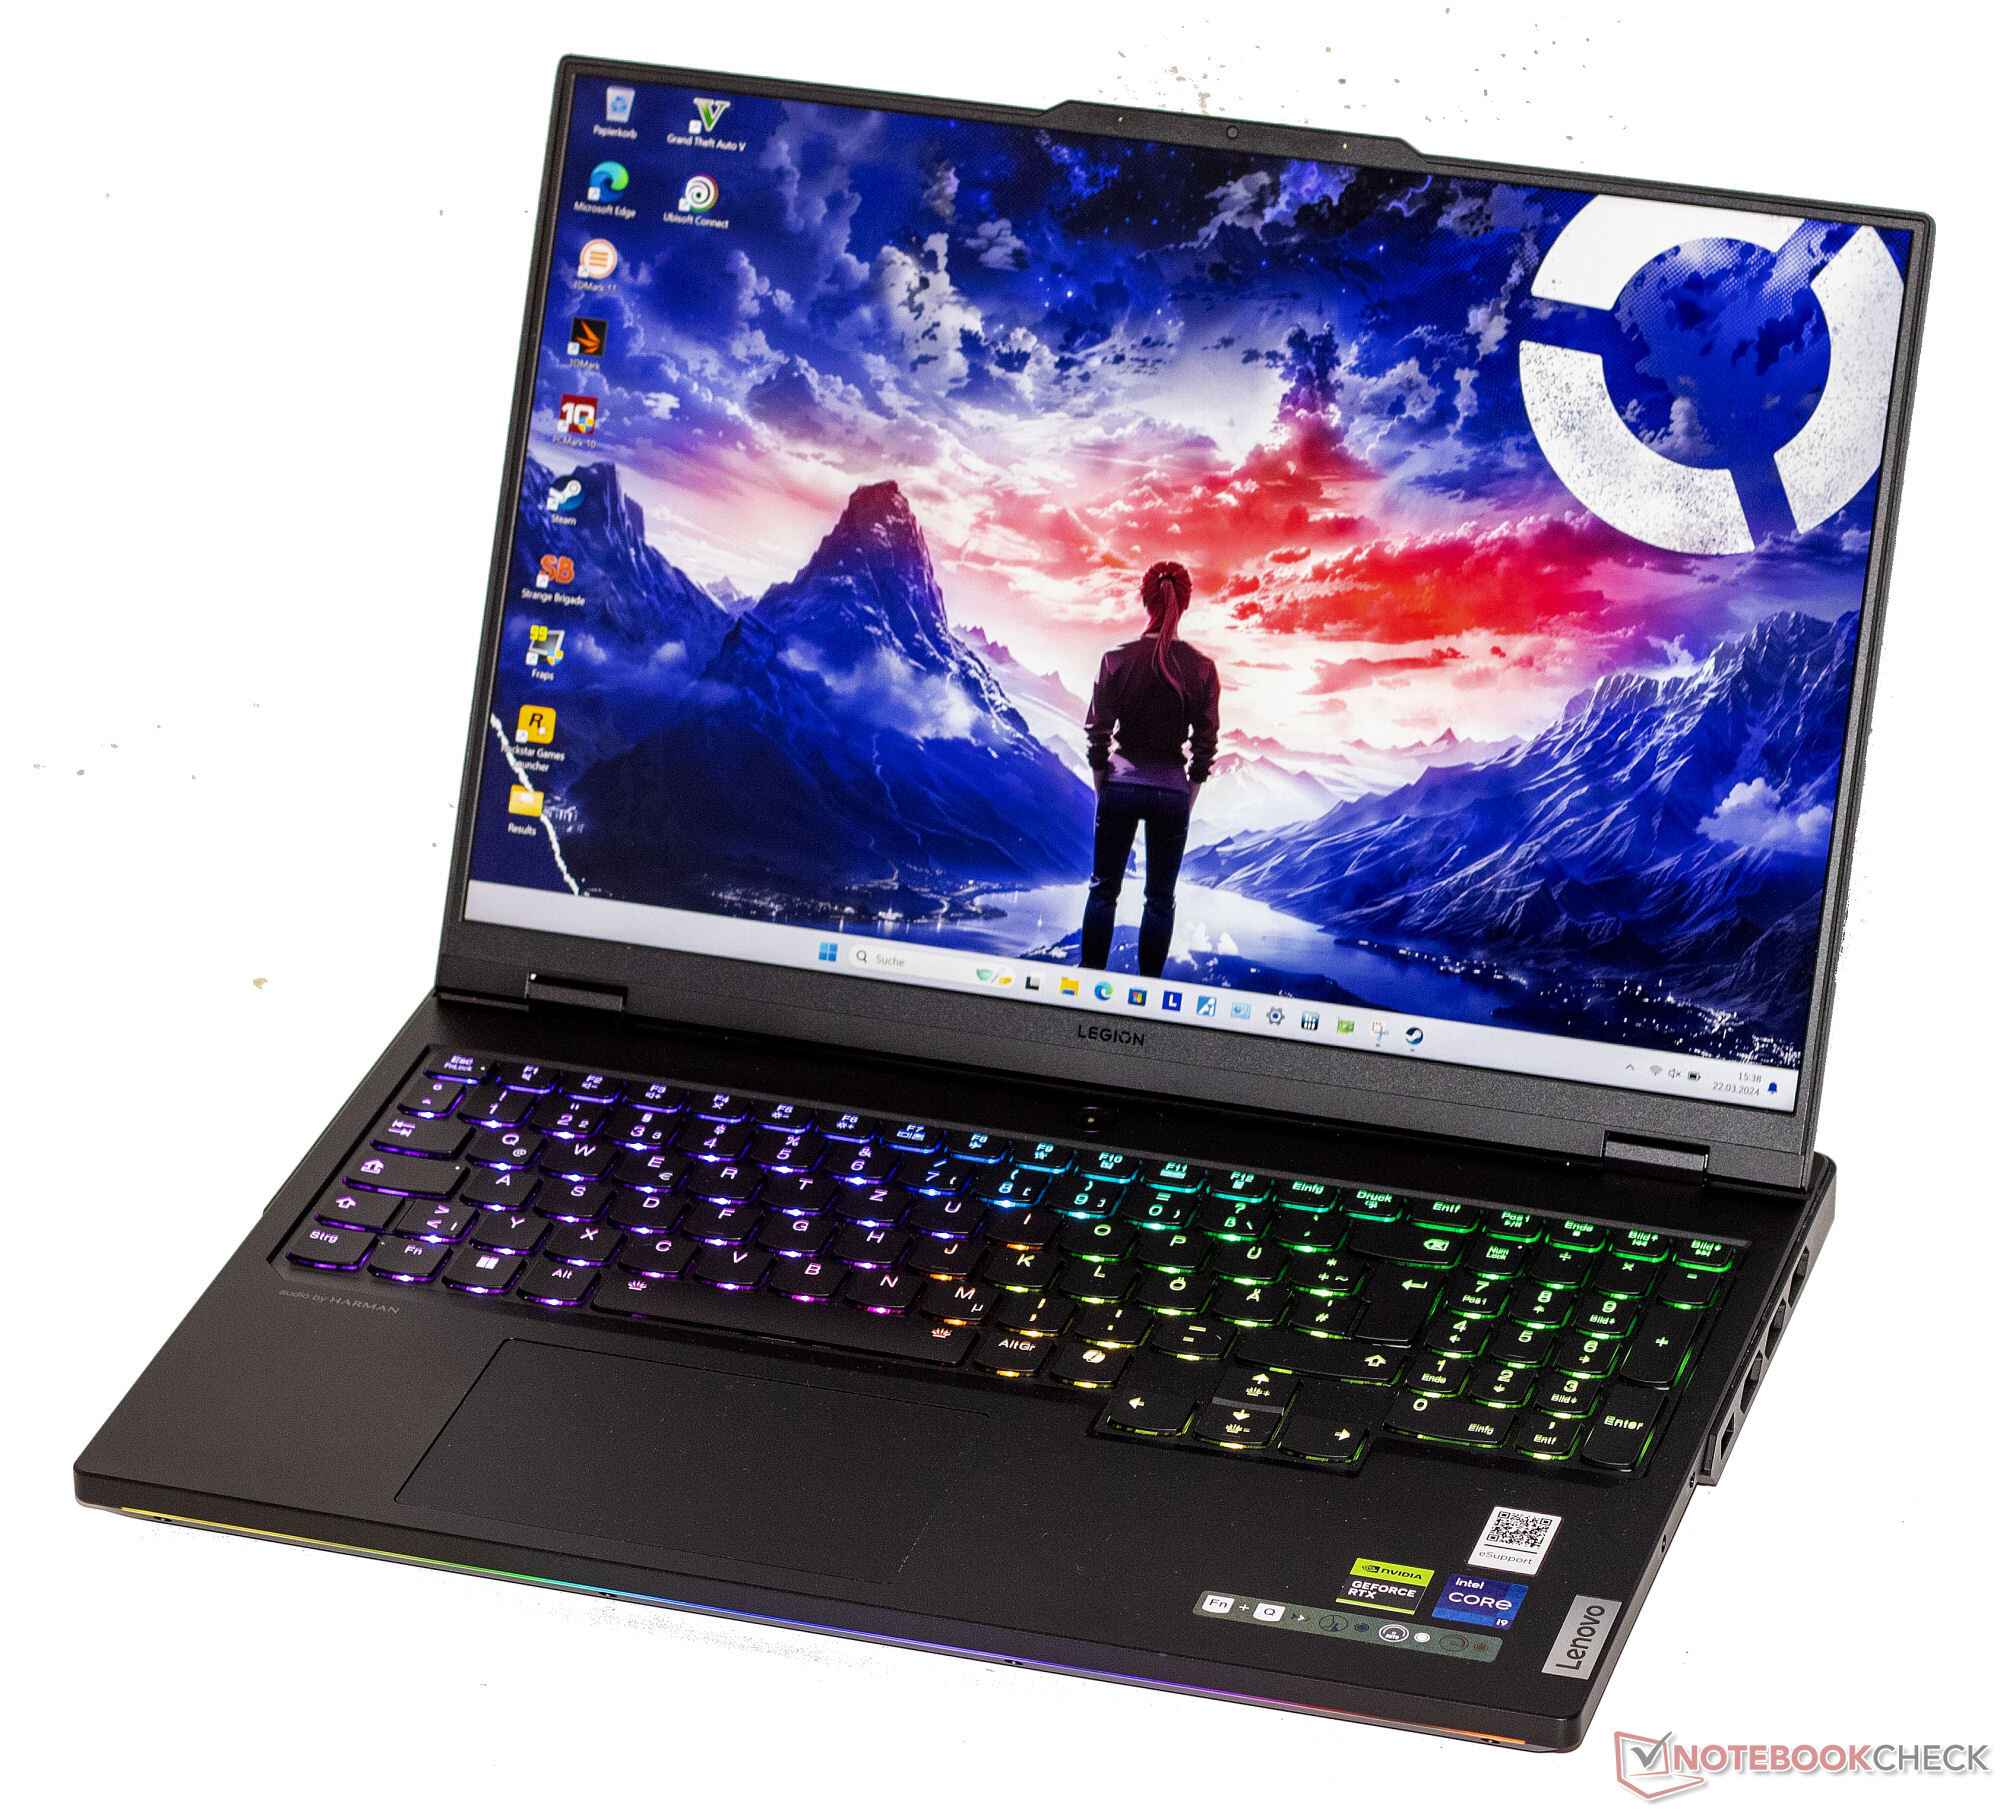
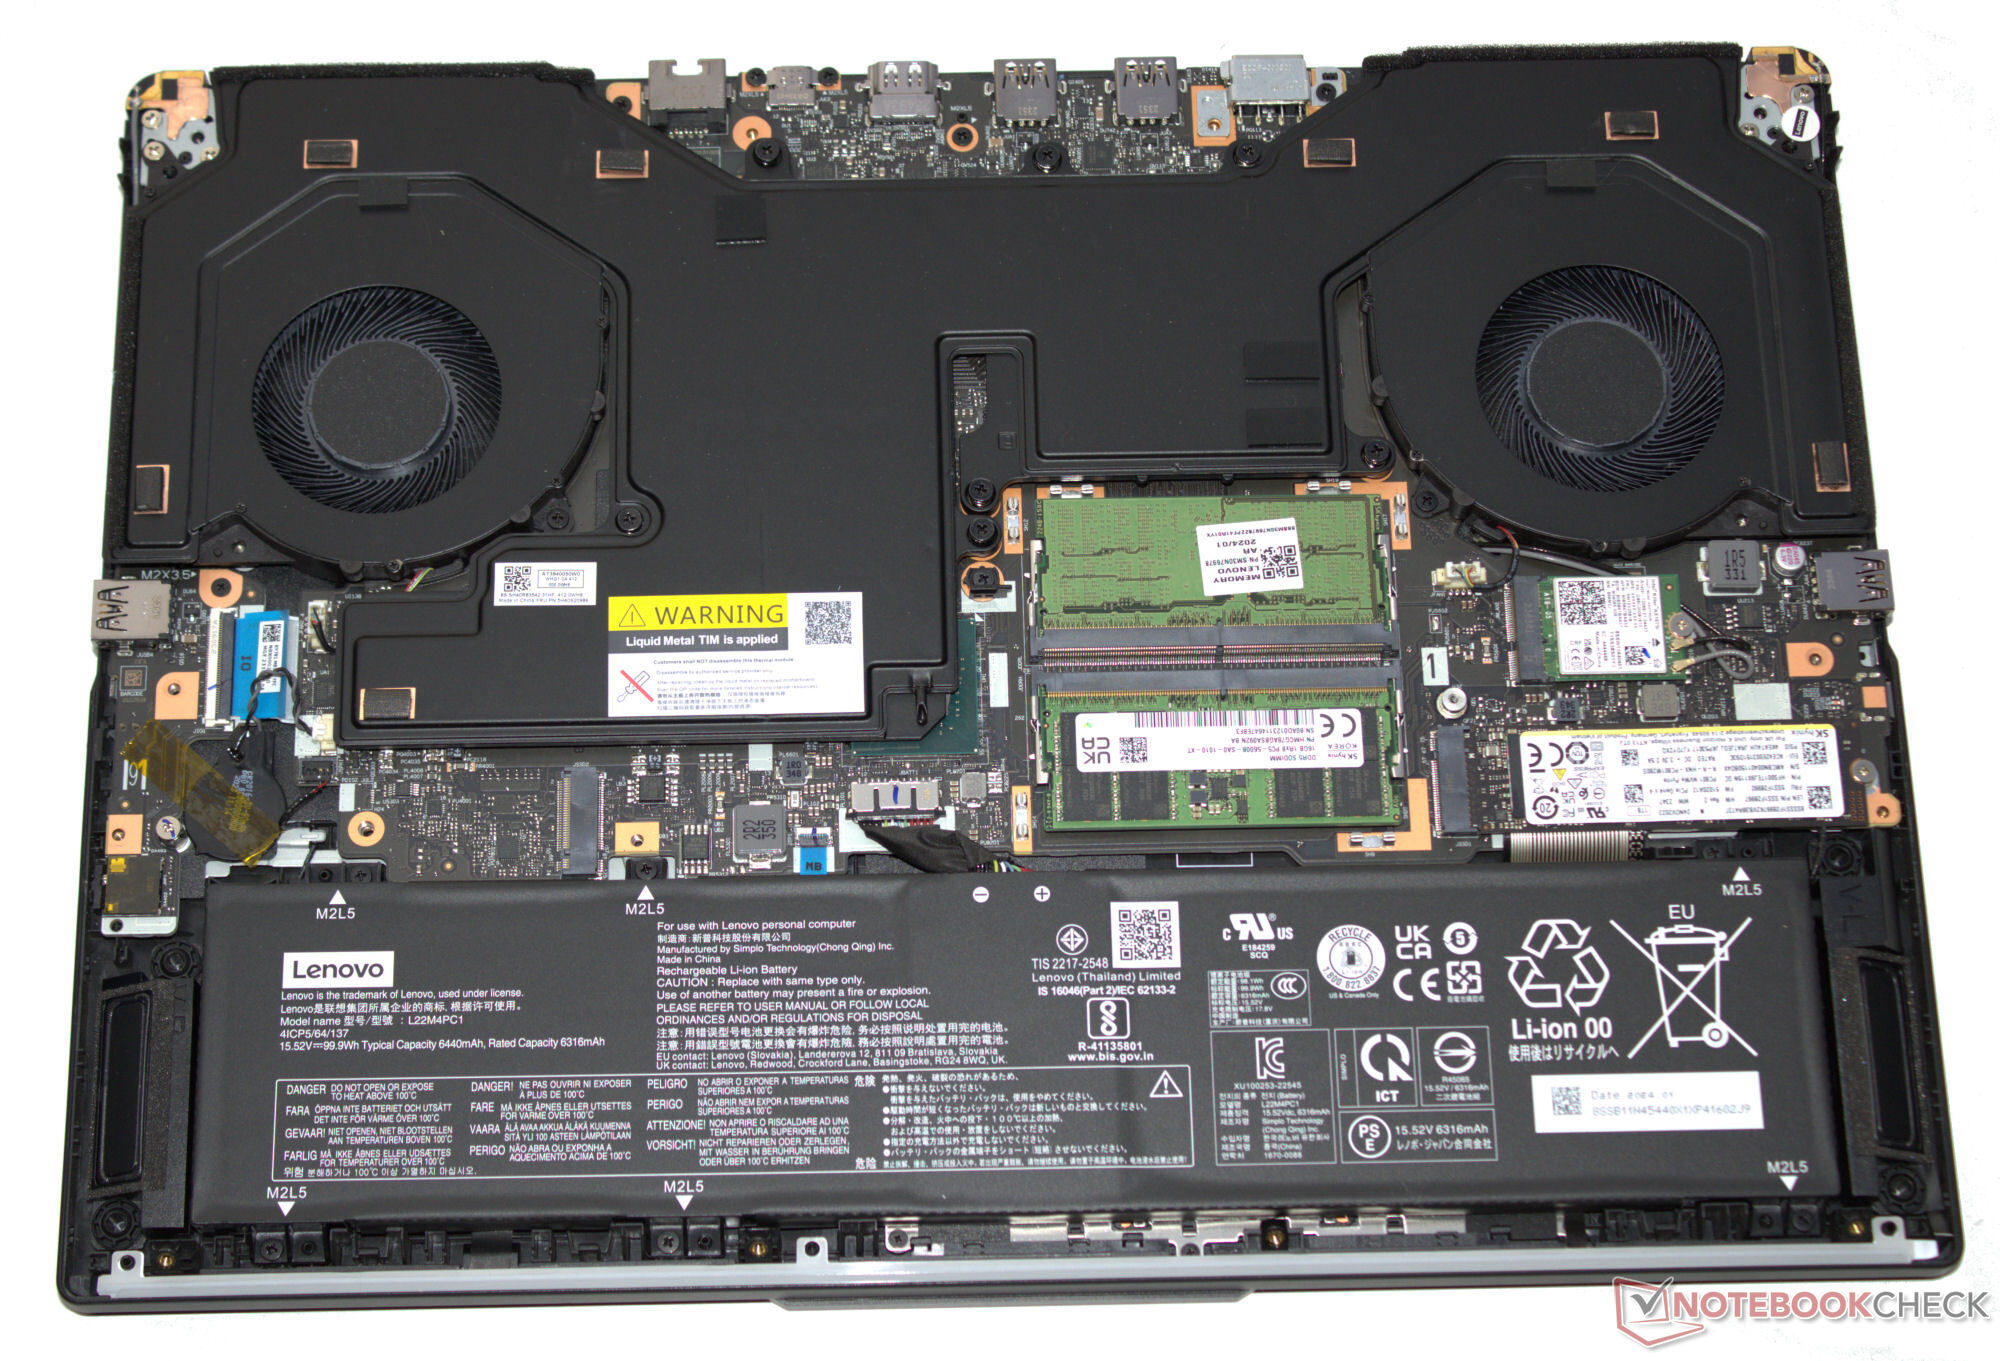
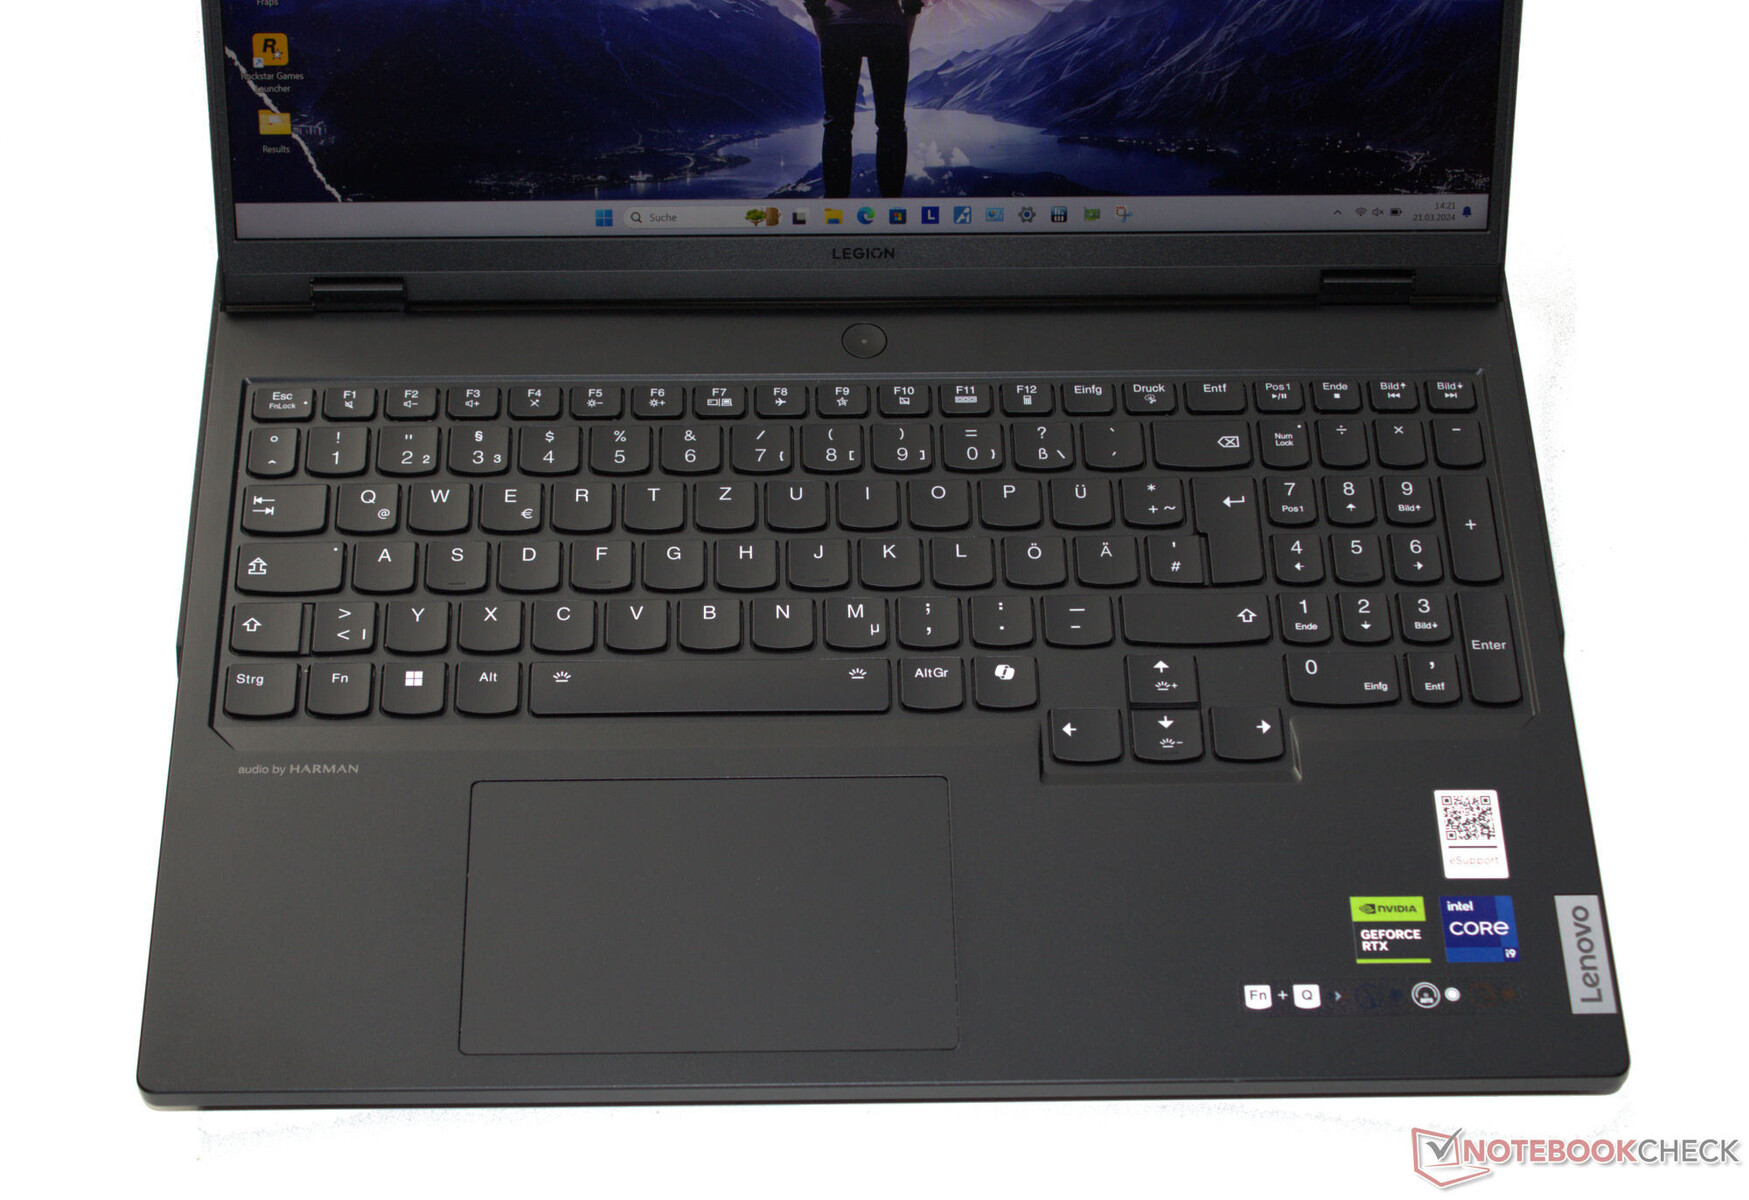
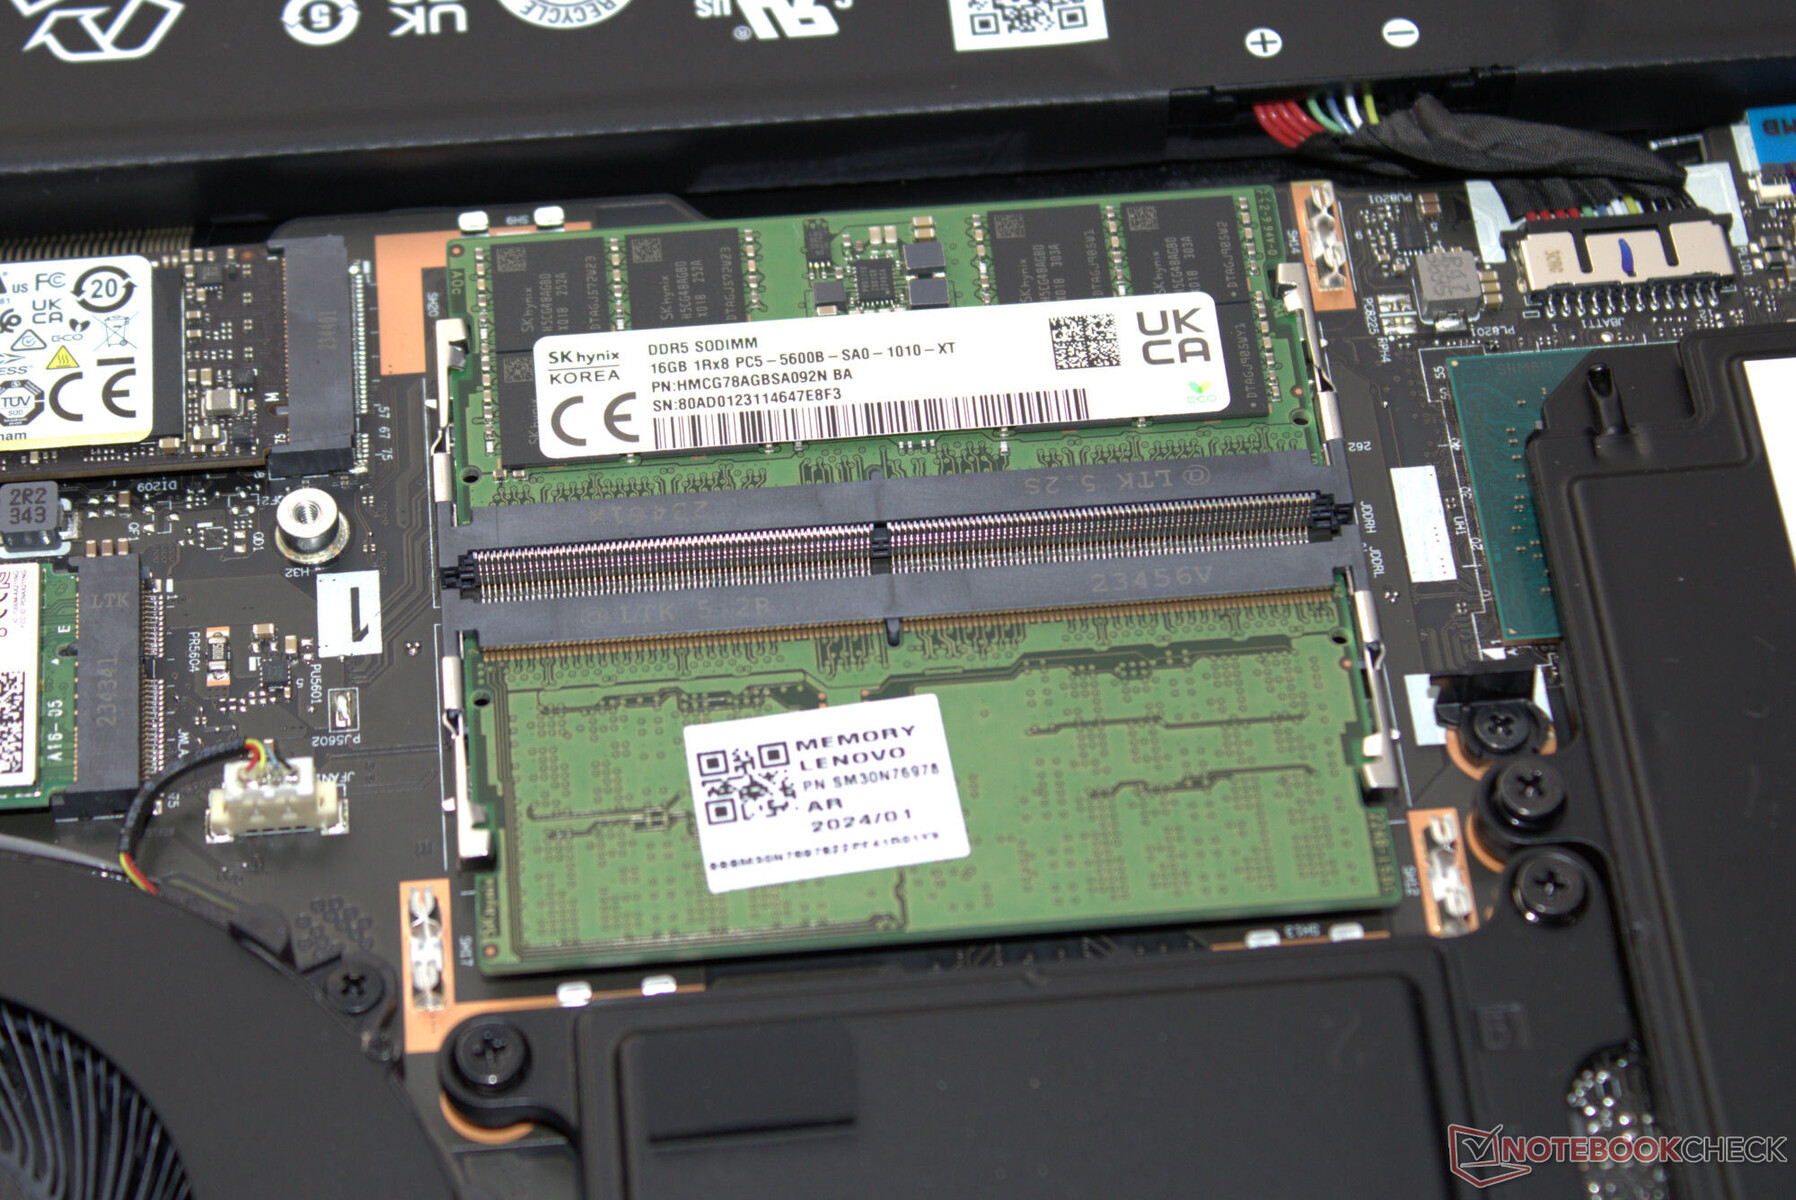
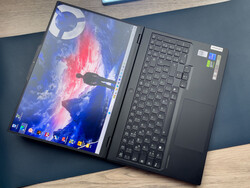
Legion的硬件安装在坚固的哑黑色铝制机箱内,表面光滑。键盘背光和面向用户的 LED 灯带增添了一些色彩。坚固的铰链最大开启角度为 180 度,值得竖起大拇指。取下底盖后,可以看到电池(旋入式,非粘合式)和其他内部结构。
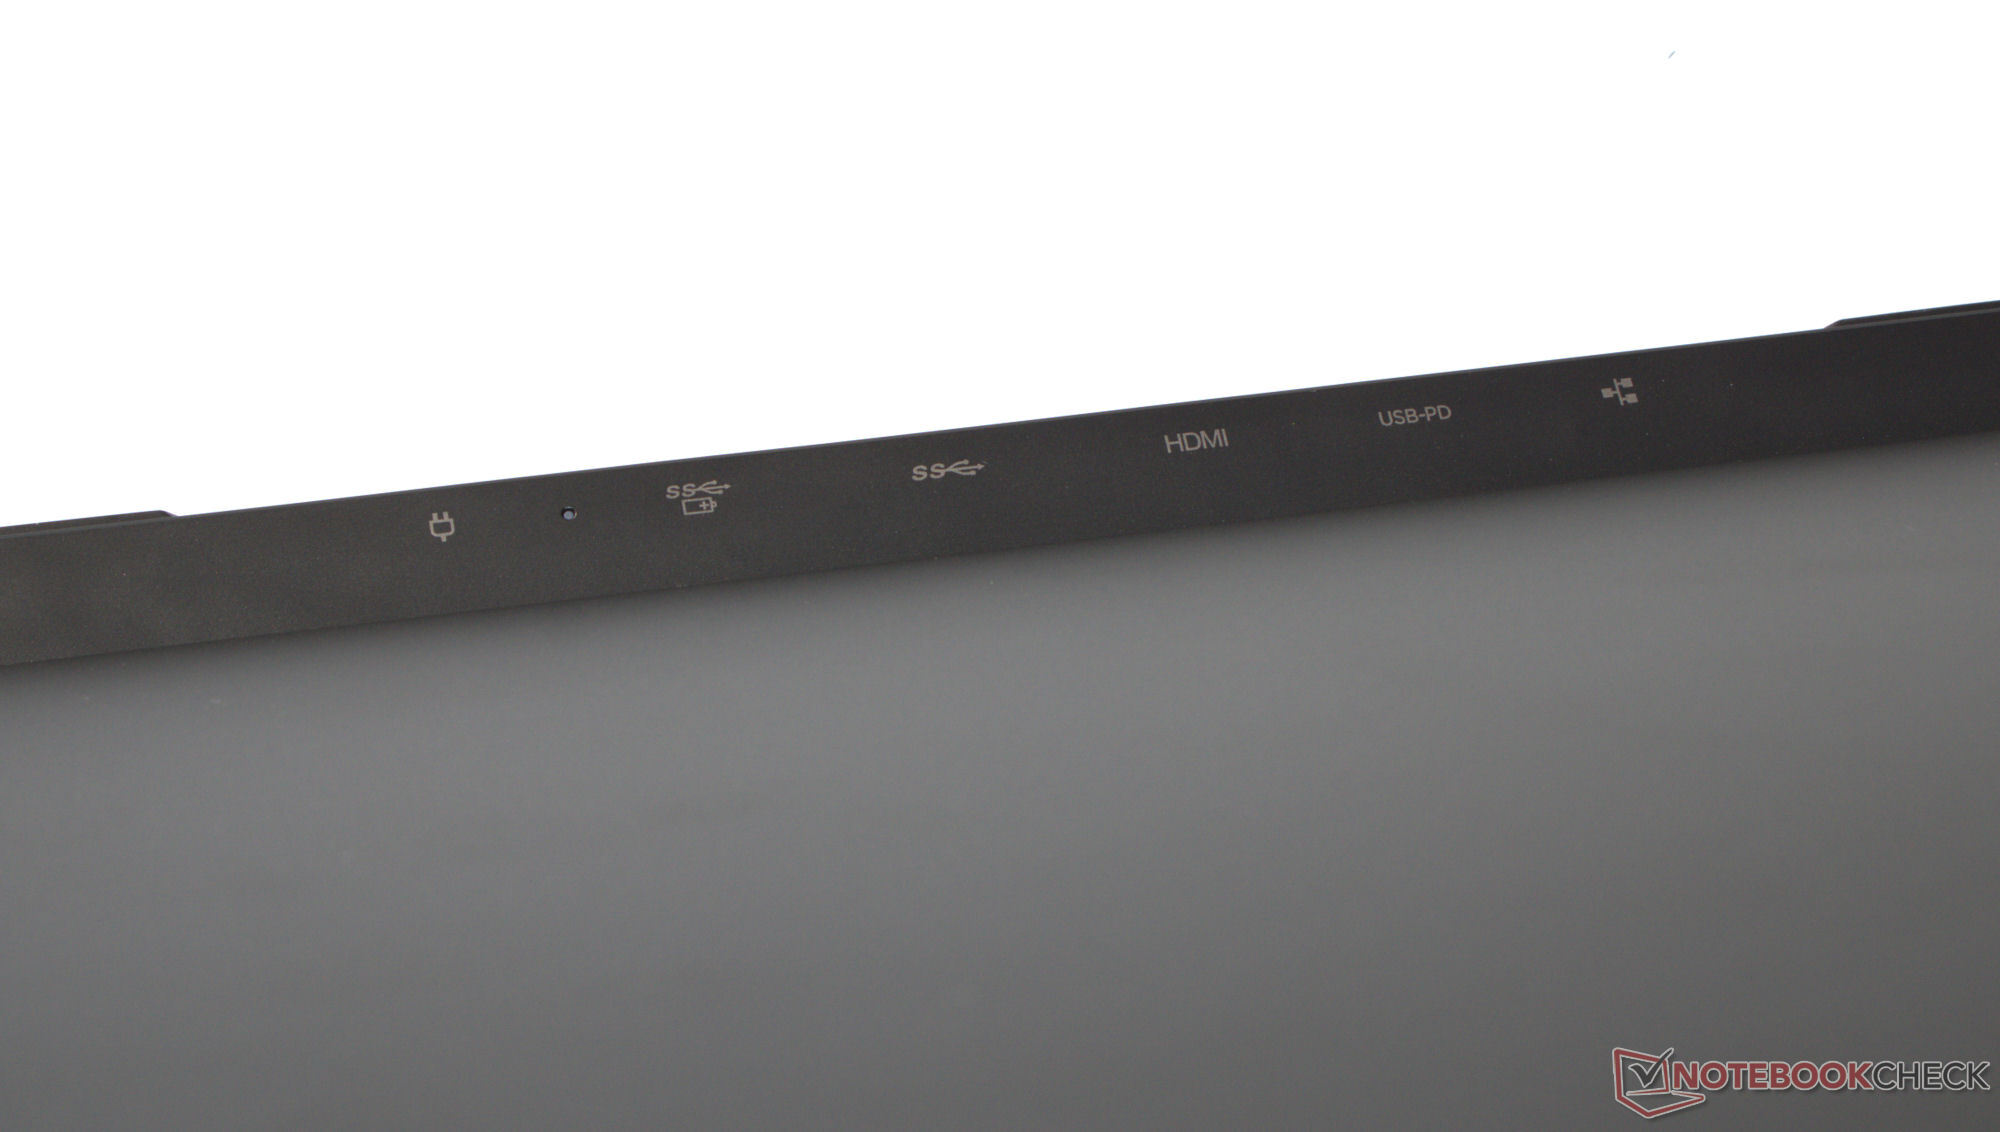
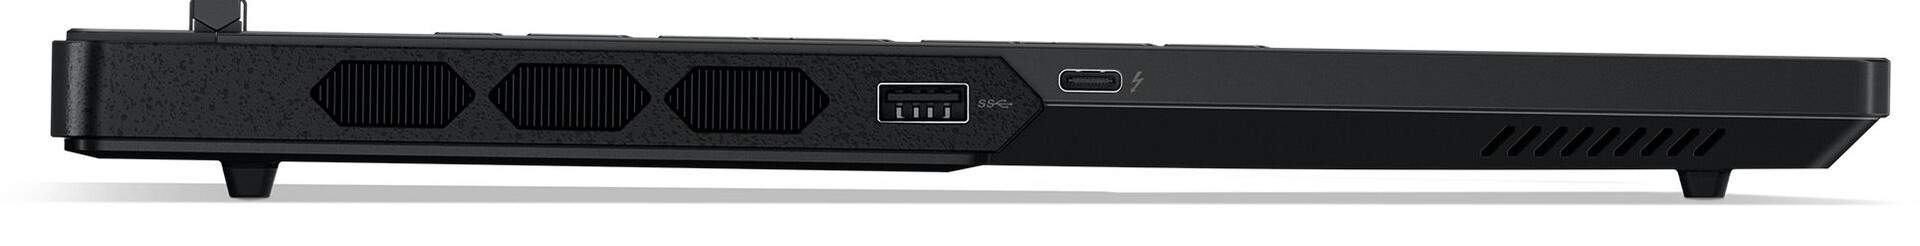
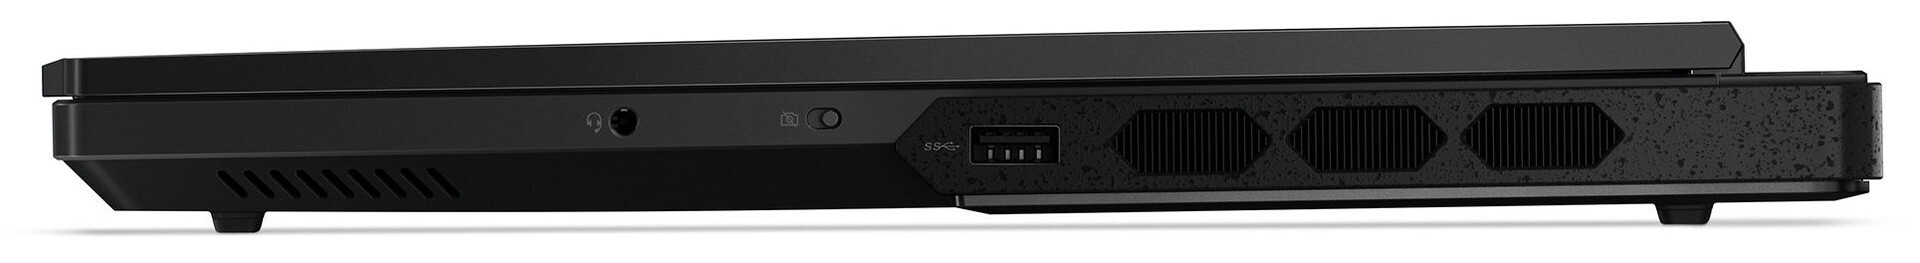
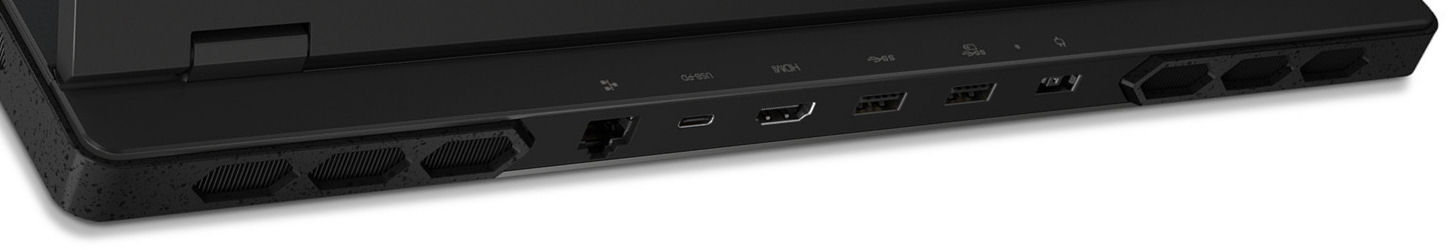
这款笔记本电脑在输入/输出方面也不含糊,配备了四个 USB-A 端口(USB 3.2 Gen 1)和两个 USB-C 端口(1 个 Thunderbolt 4、1 个 USB 3.2 Gen 2;1 个 PD、2 个 DP)。它总共提供三个视频输出(1 个 HDMI、2 个 DP)。210 万像素 1080p 网络摄像头配有隐私快门,效果非常出色。机上没有存储卡读卡器。
在最佳条件下(即附近没有其他 Wi-Fi 设备,笔记本电脑和服务器电脑之间的距离很短),Legion Pro 7 的 Wi-Fi 数据传输率非常高。该笔记本采用了 Killer AX1675i Wi-Fi 6E 芯片(又名英特尔 AX211)。有线连接由 Realtek RTL8168/8111 控制器处理。
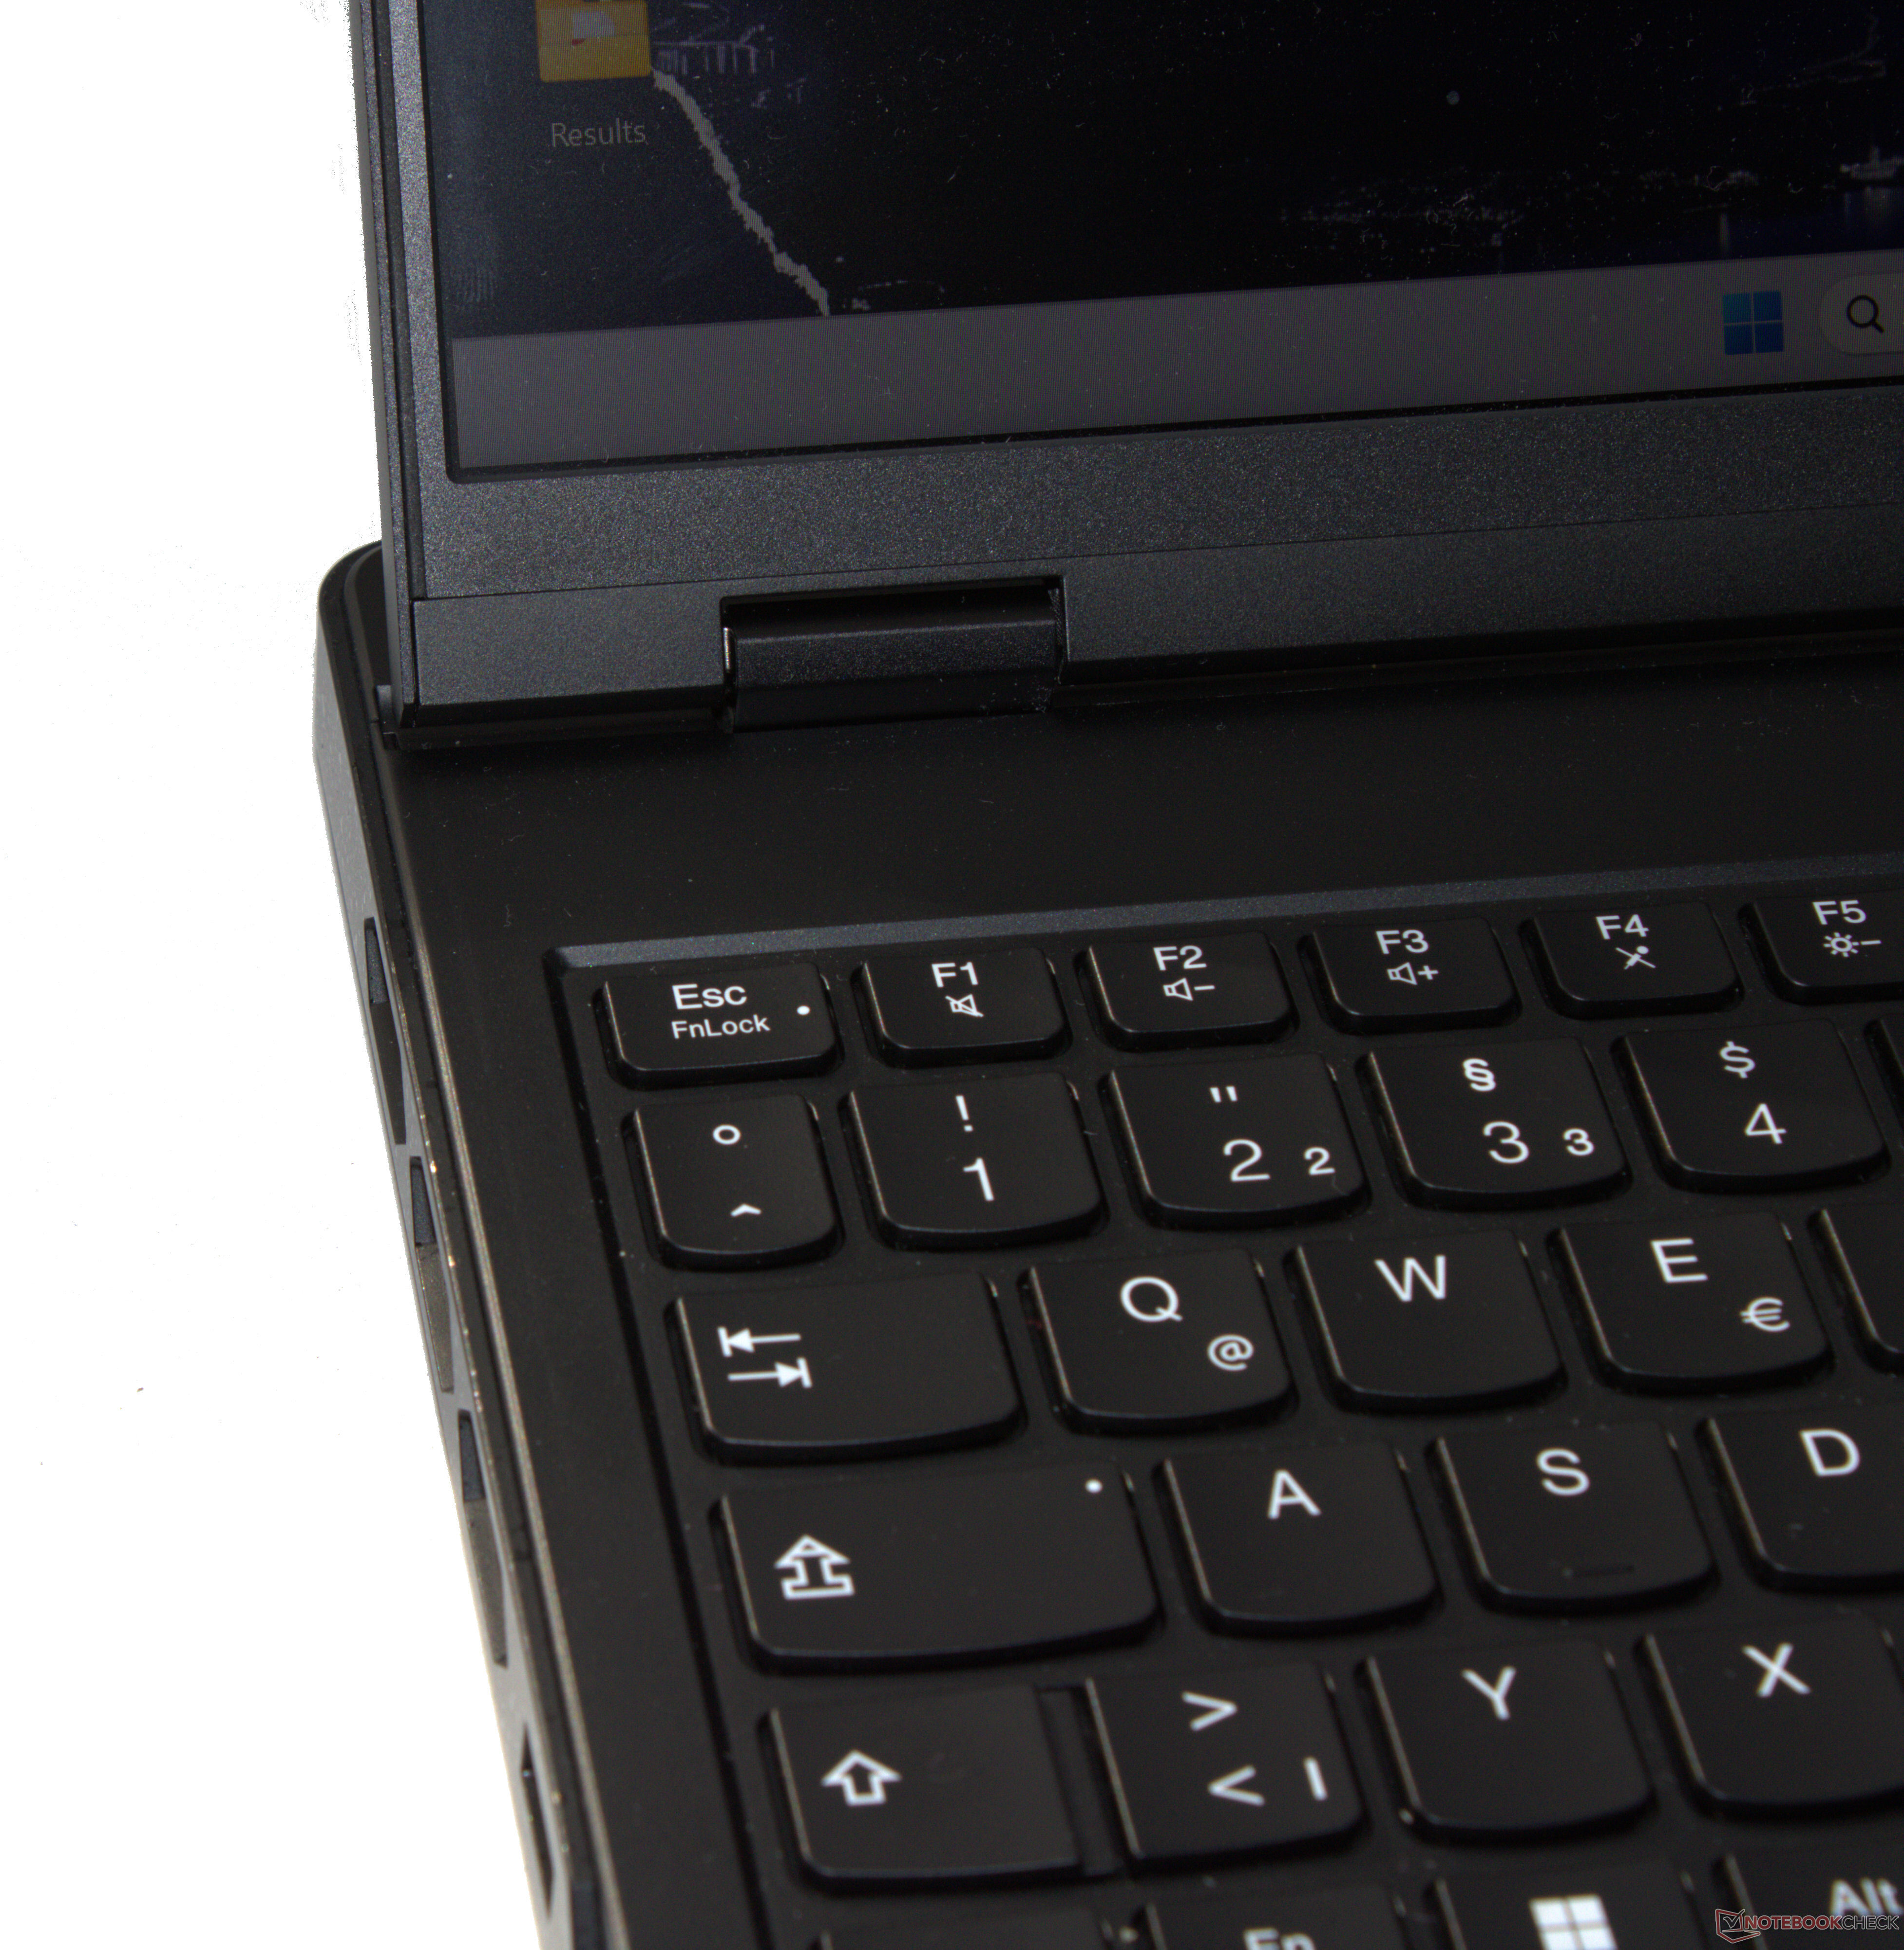
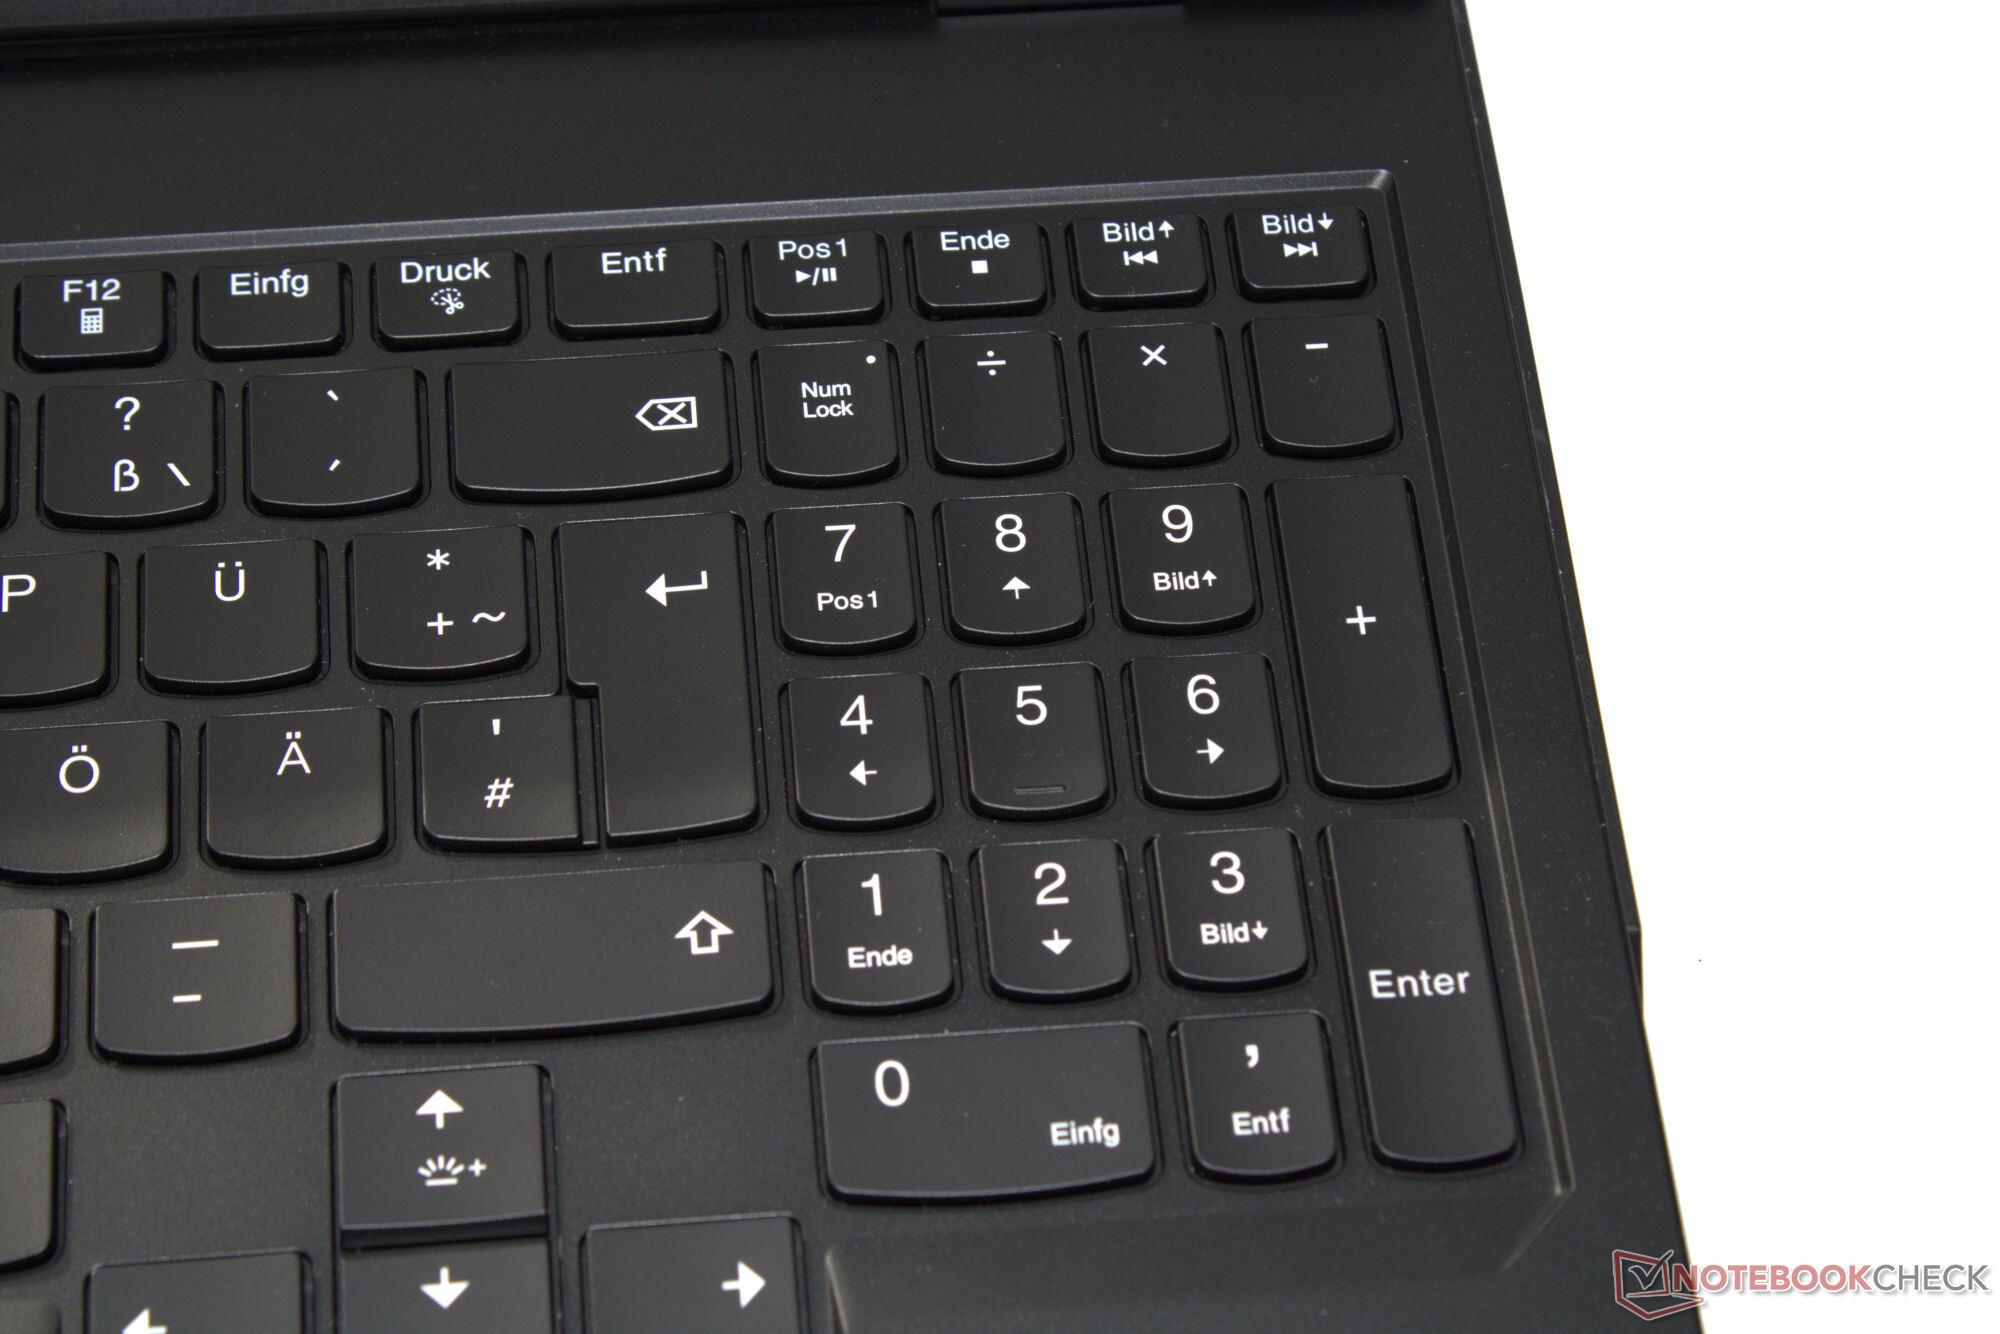
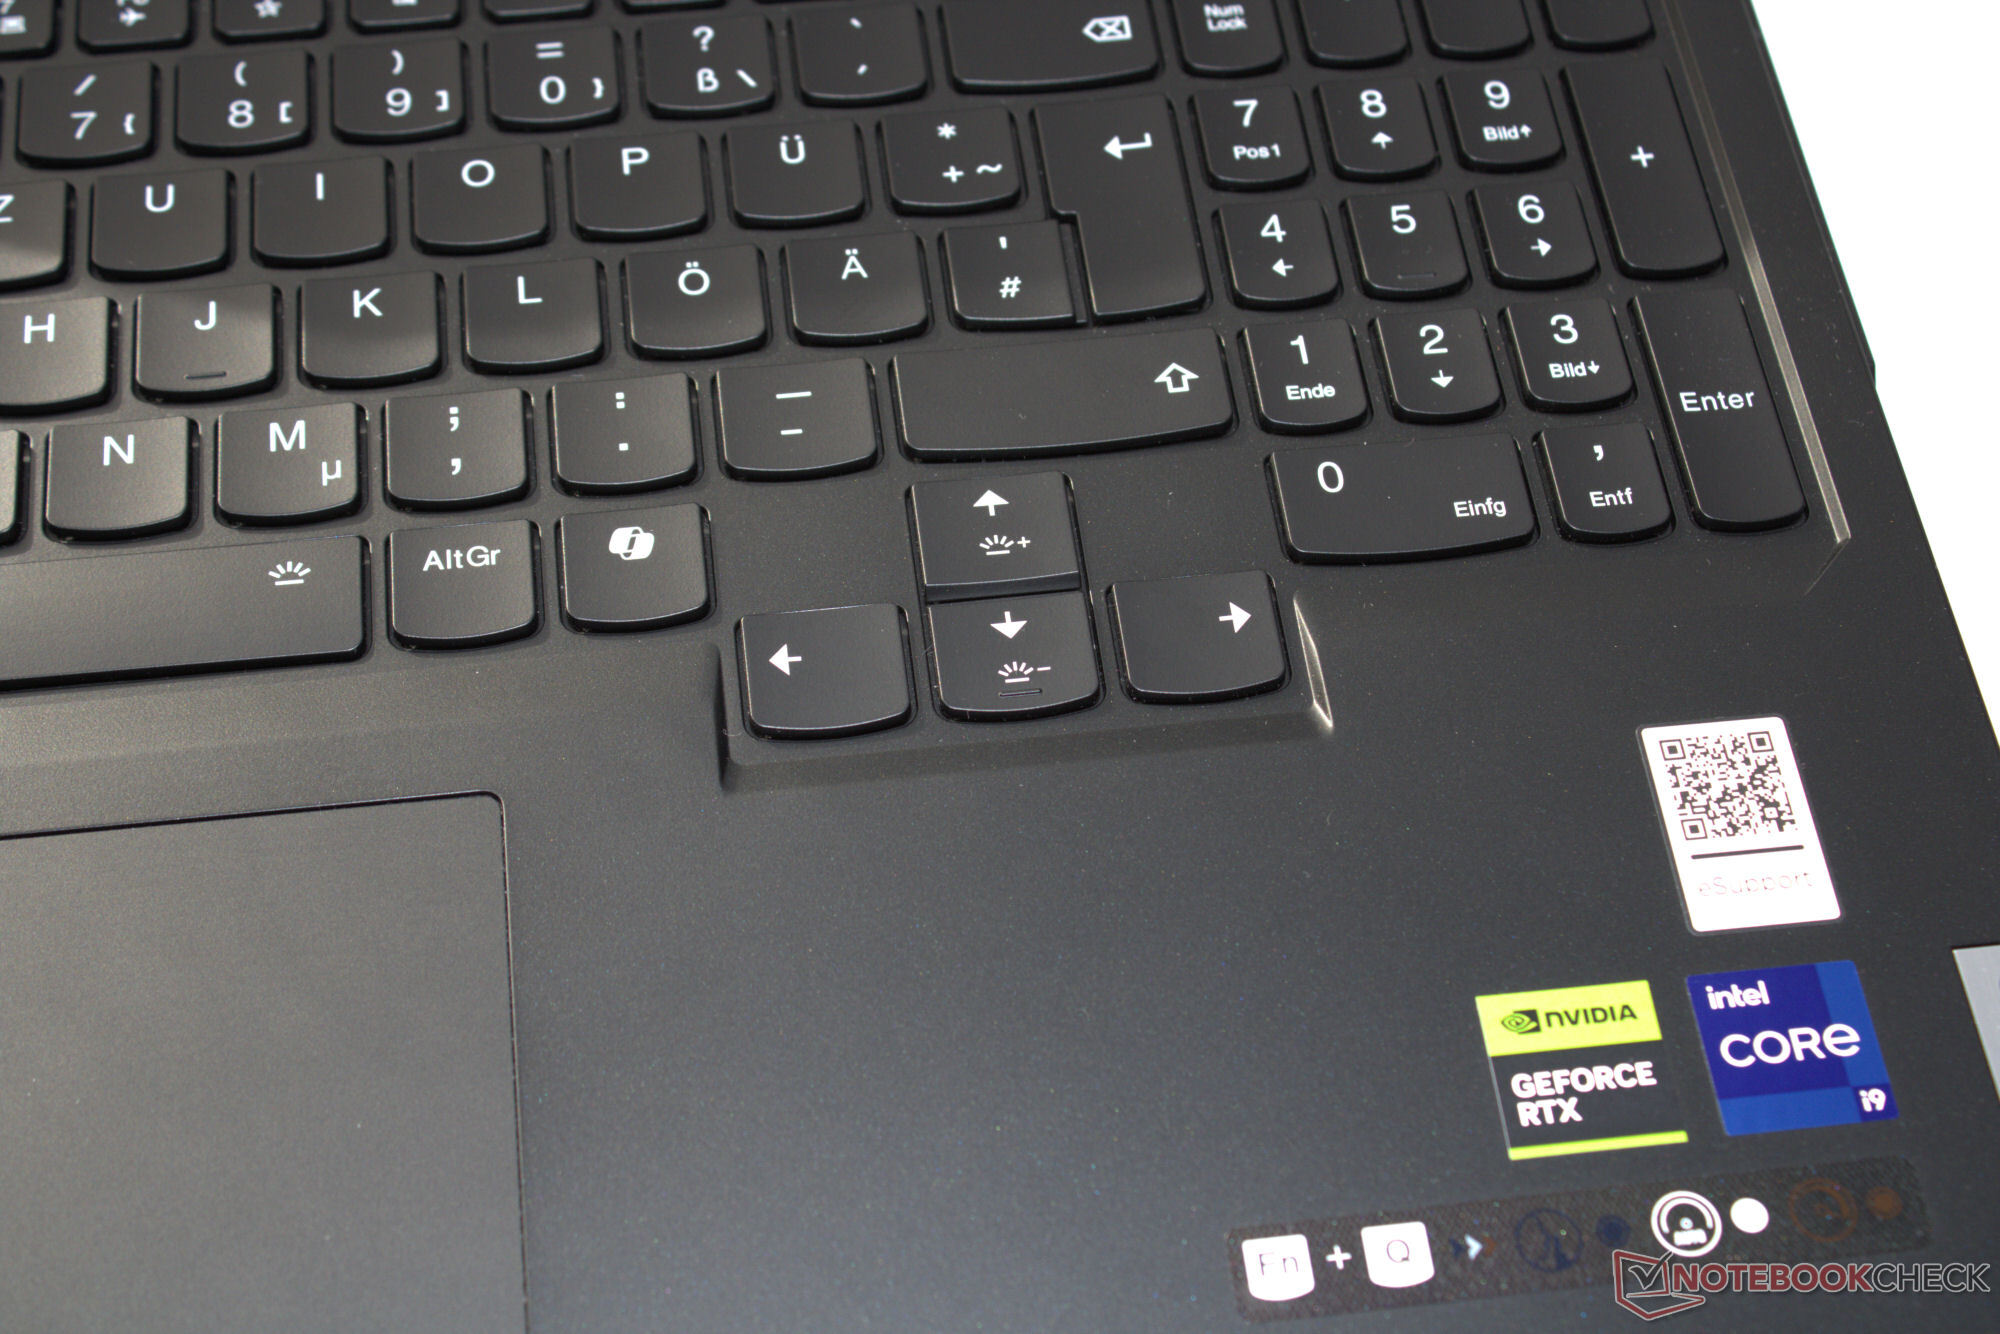


输入设备 - 配备简洁的键盘
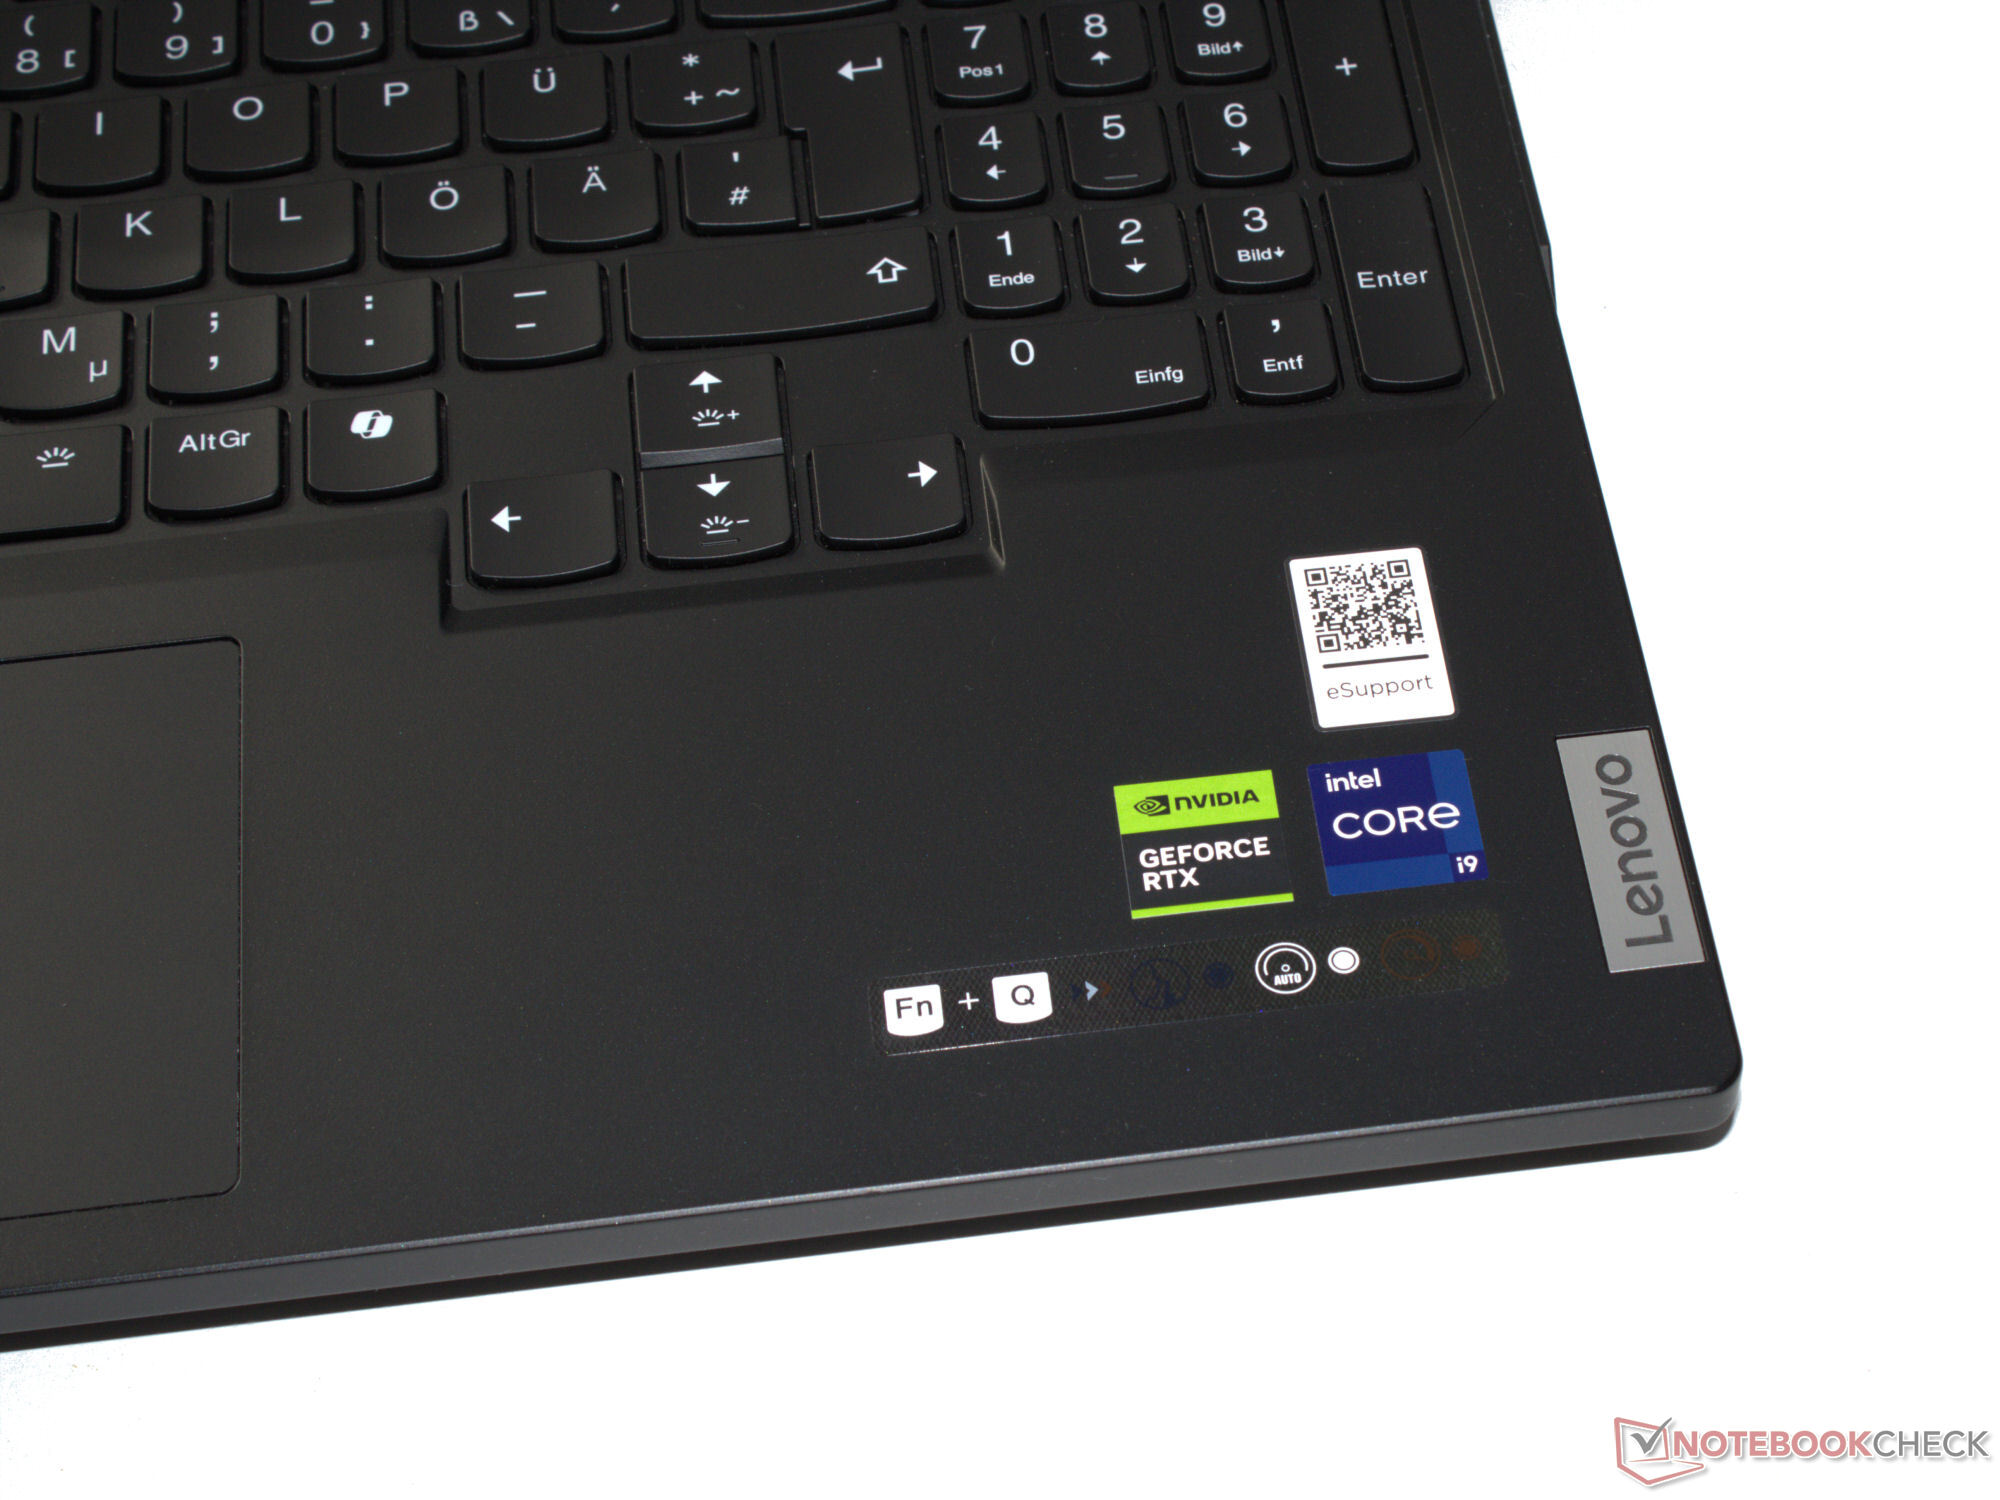
凹面 Chiclet 键带有按键 RGB 灯光,具有令人愉悦的坚硬阻力和清晰的驱动点。键入时键盘会有轻微弯曲,但不会影响键入体验。方向键是全尺寸的。在鼠标控制方面,笔记本配备了支持多点触控的点击板(尺寸约为 12 x 7.5 厘米,或 4.7 x 3.0 英寸),行程较短,点击点清晰。
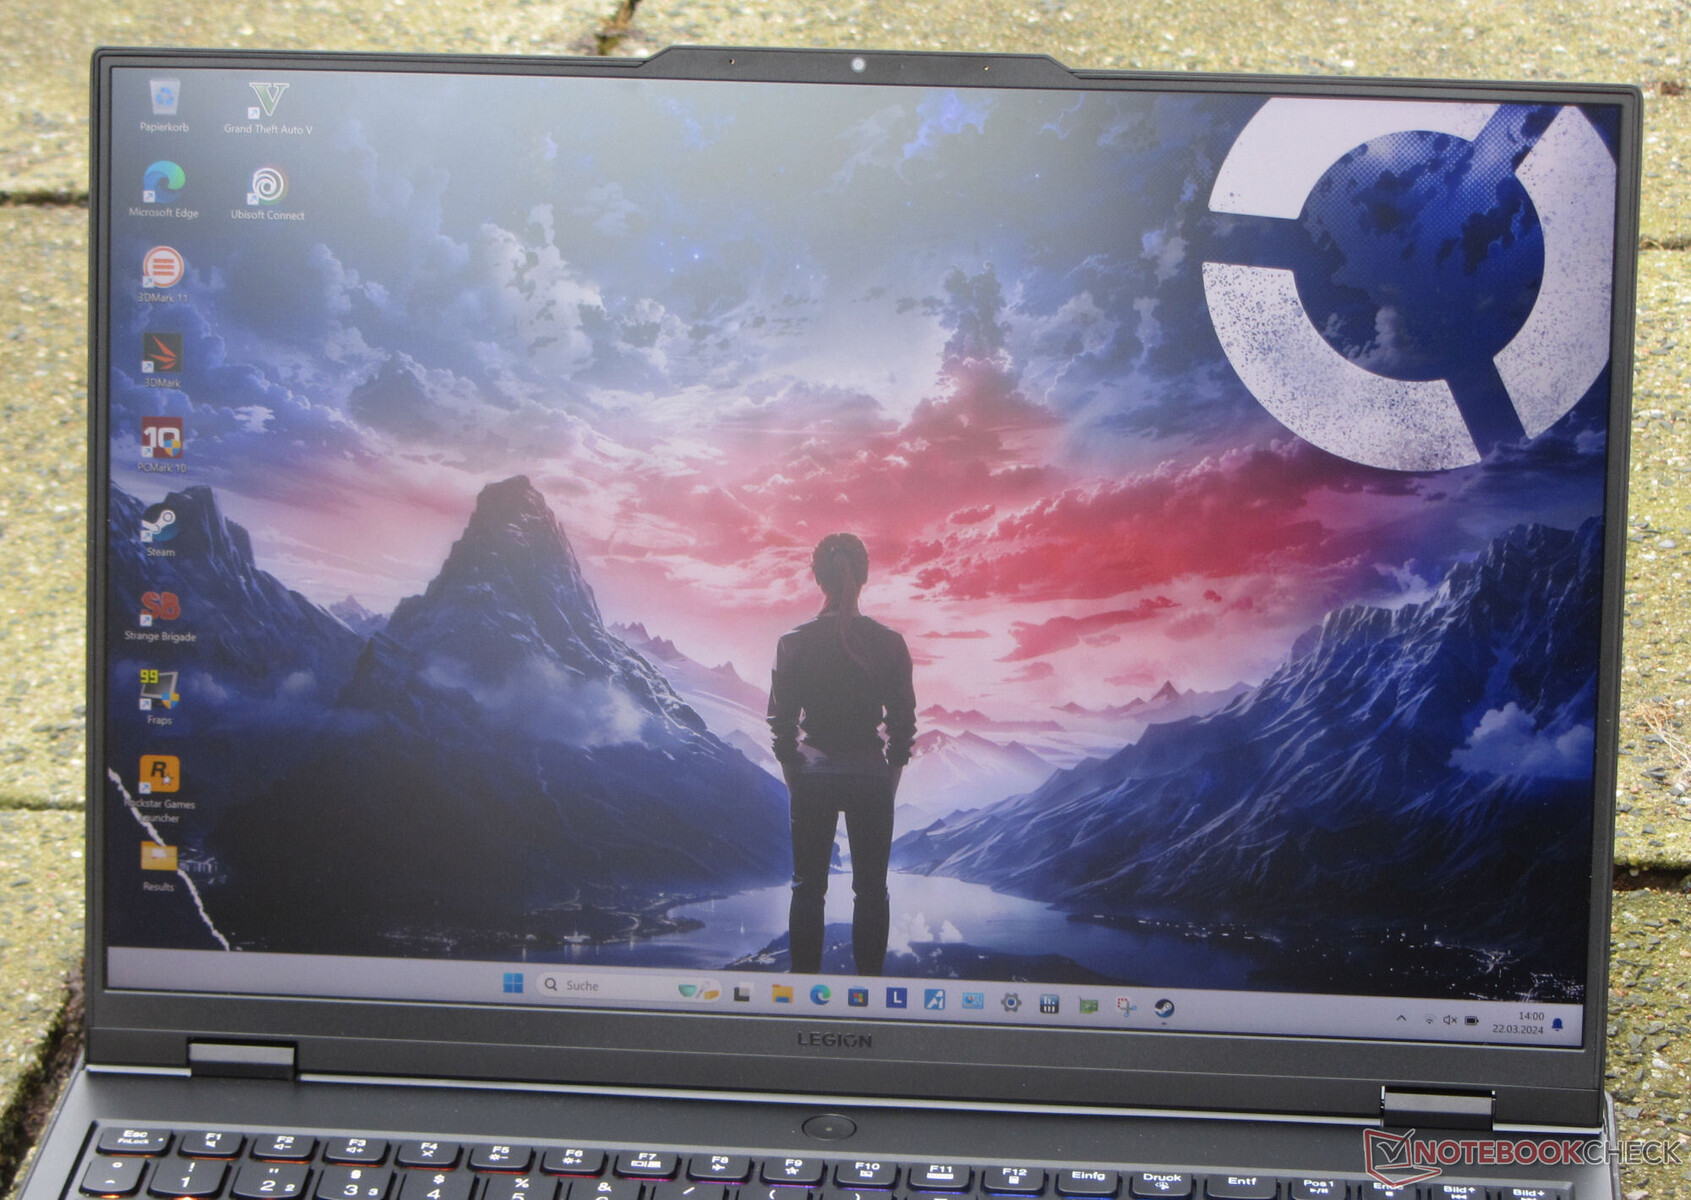
显示屏 - 16:10、DCI-P3、杜比视界
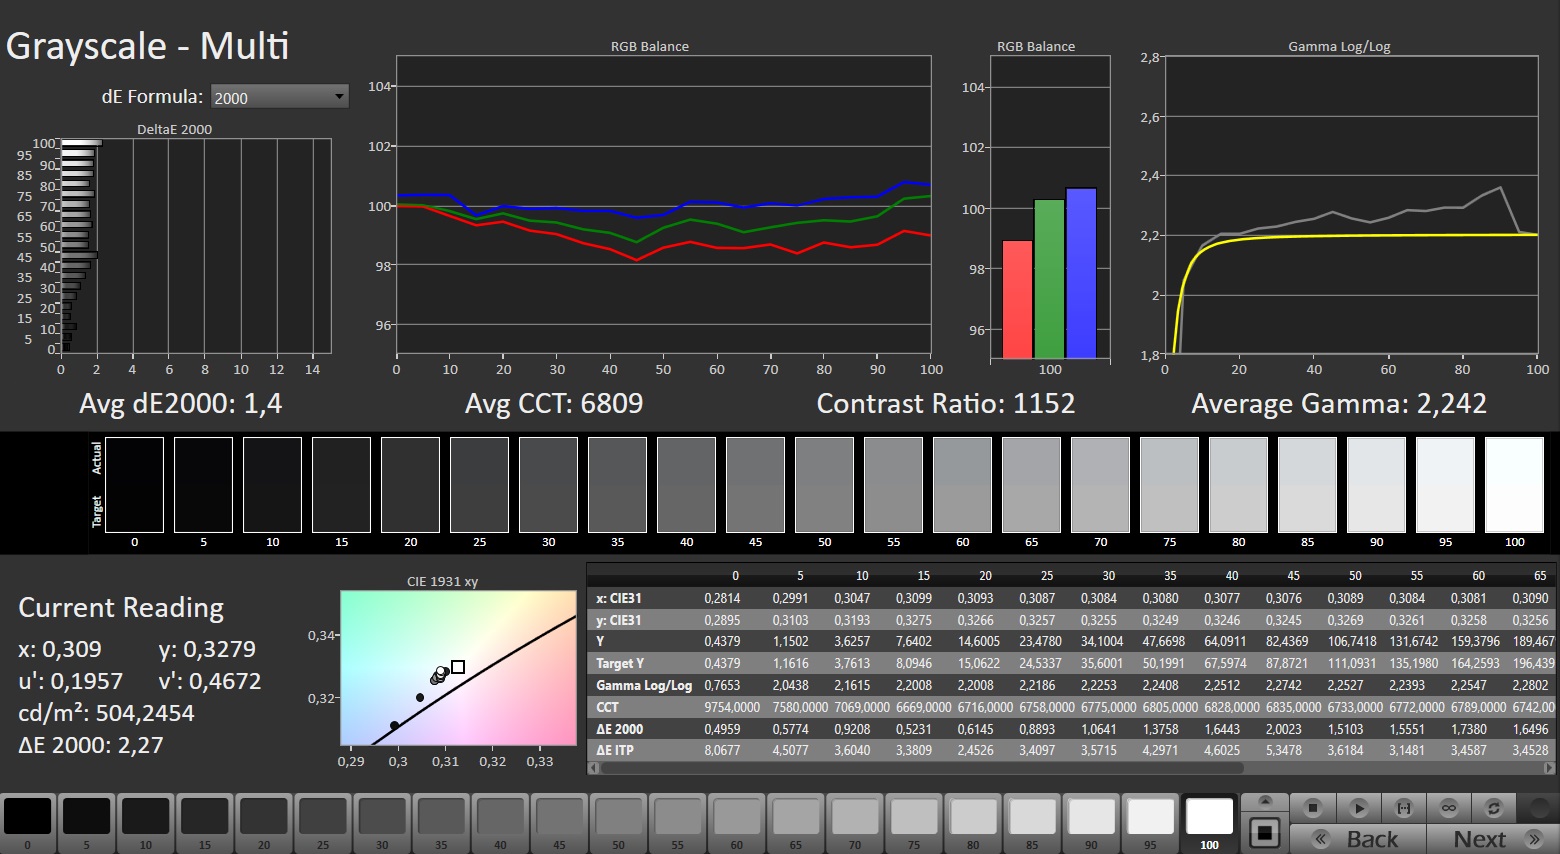
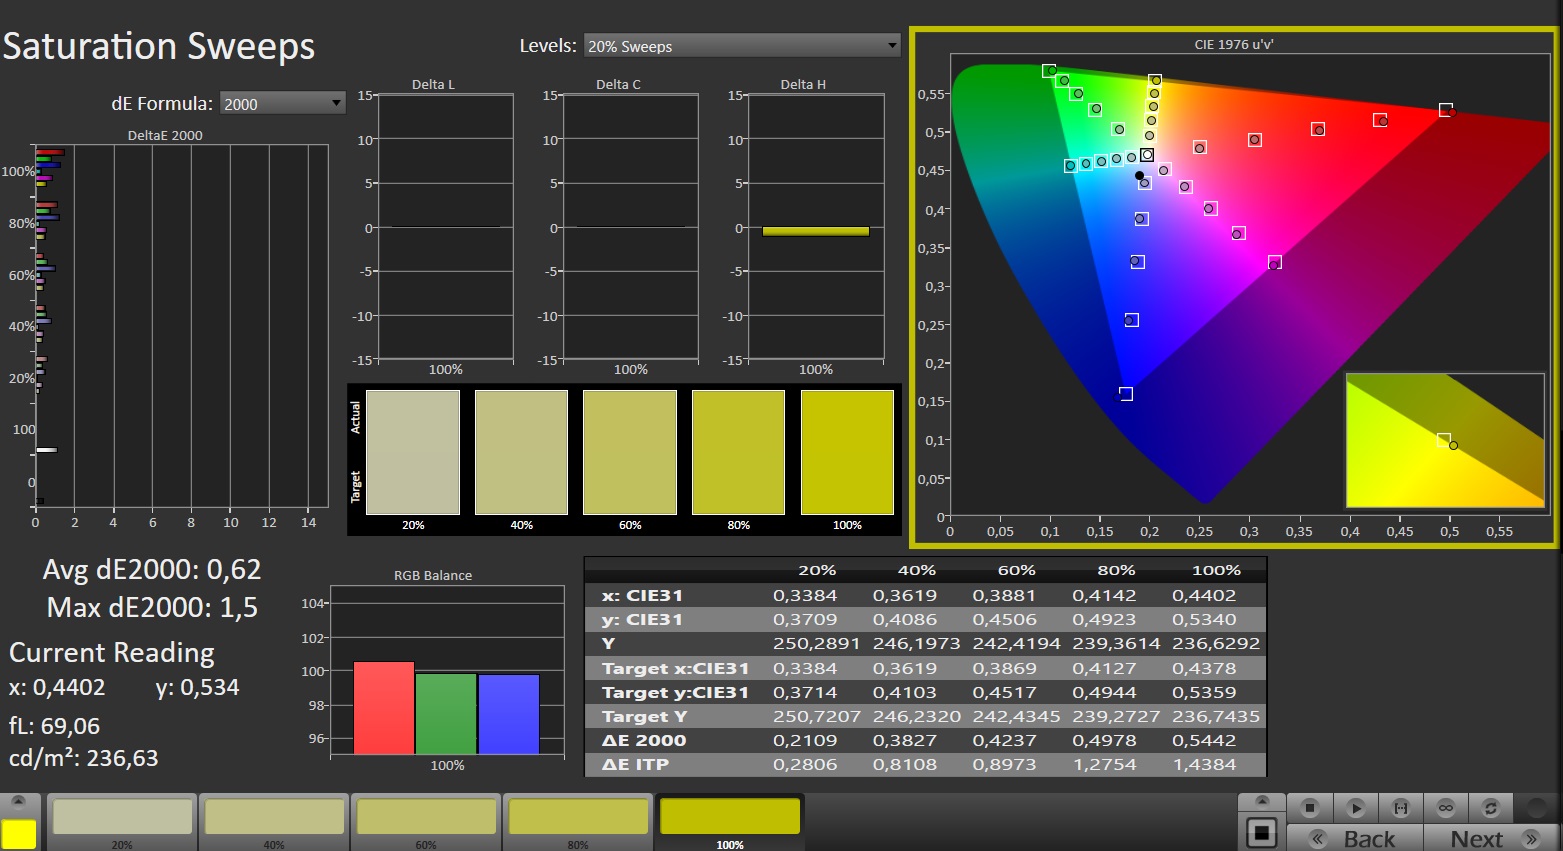
16 英寸哑光 IPS 显示屏(分辨率为 2,560 x 1,600)的宽高比为 16:10,支持 G-Sync、杜比视界、快速响应时间和无 PWM 闪烁。240Hz 面板的亮度和对比度也达到了可被视为良好的水平(分别大于 300 cd/m² 和 1,000:1)。联想没有提供其他显示屏选项。
| |||||||||||||||||||||||||
Brightness Distribution: 88 %
Center on Battery: 487 cd/m²
Contrast: 1160:1 (Black: 0.42 cd/m²)
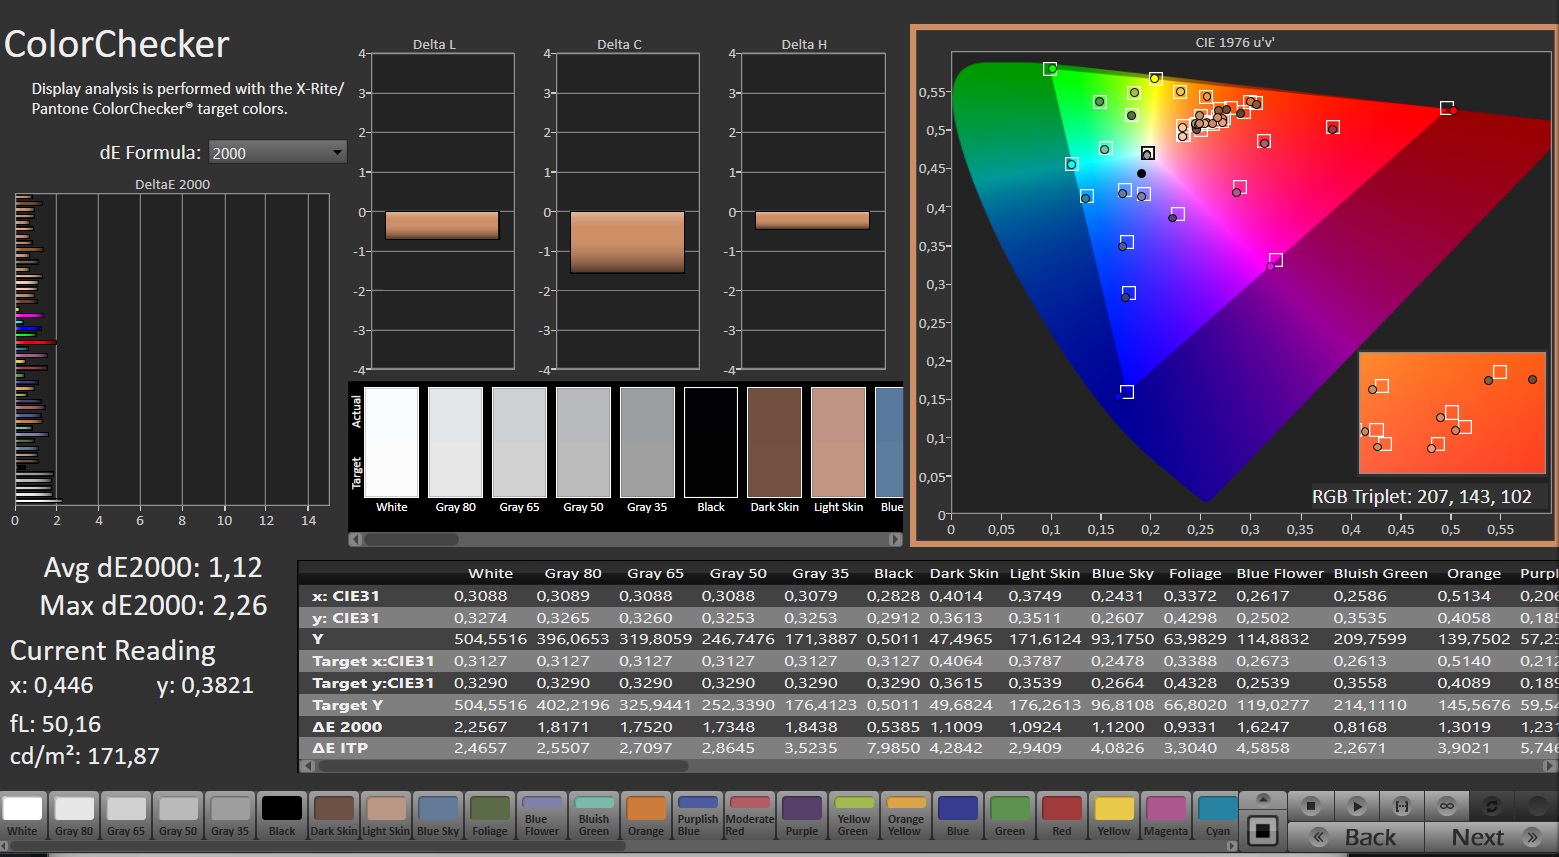
ΔE ColorChecker Calman: 1.12 | ∀{0.5-29.43 Ø4.71}
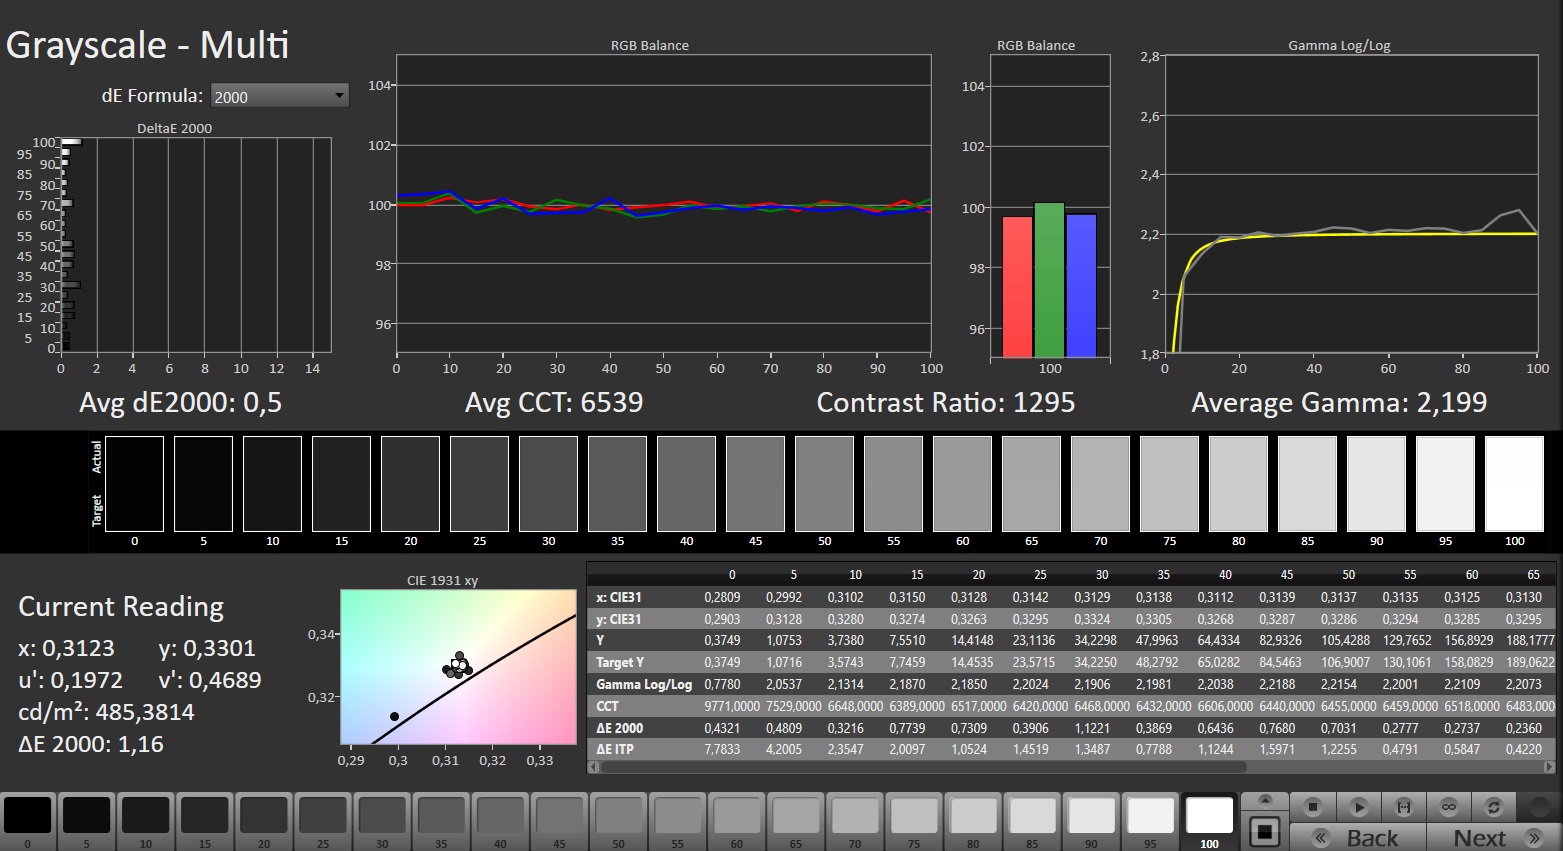
calibrated: 0.54
ΔE Greyscale Calman: 1.4 | ∀{0.09-98 Ø4.96}
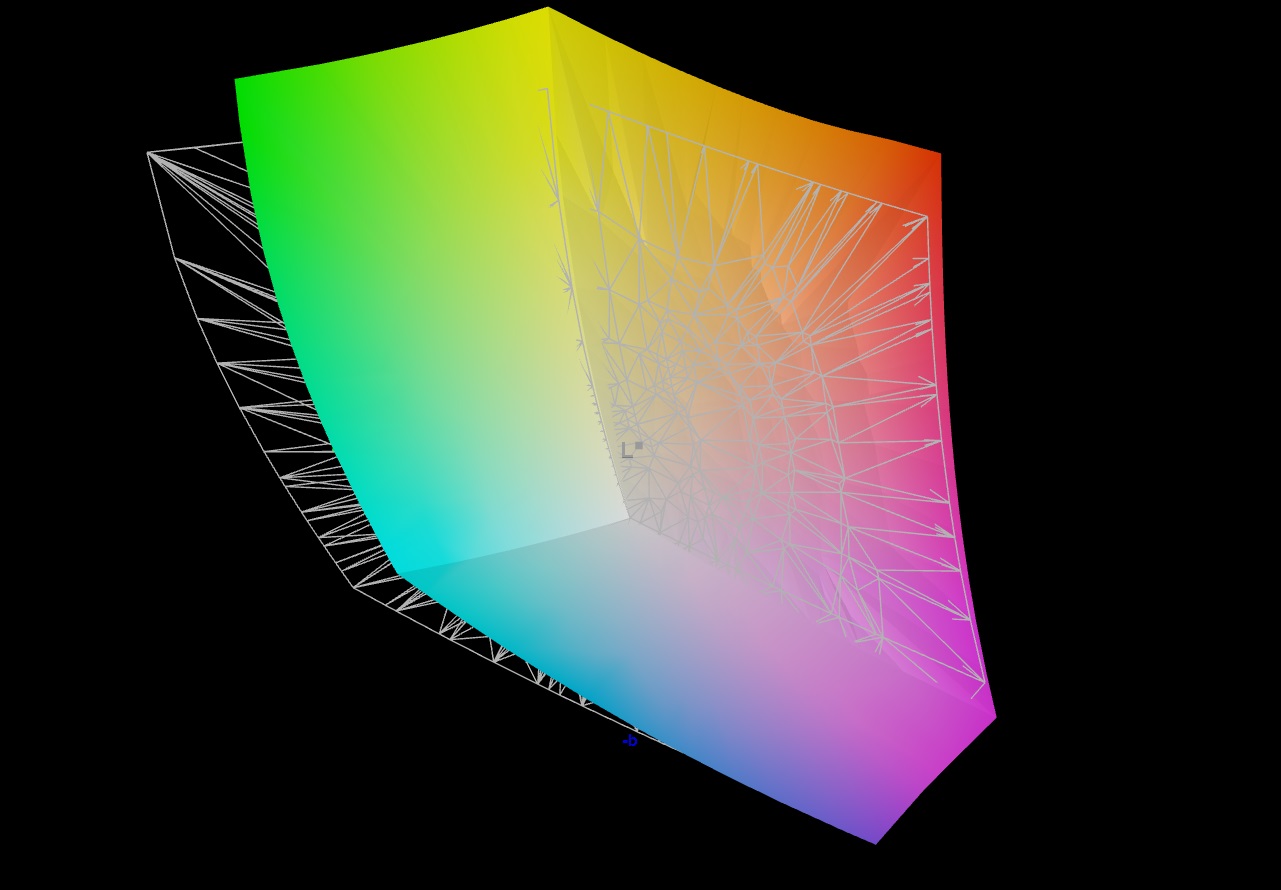
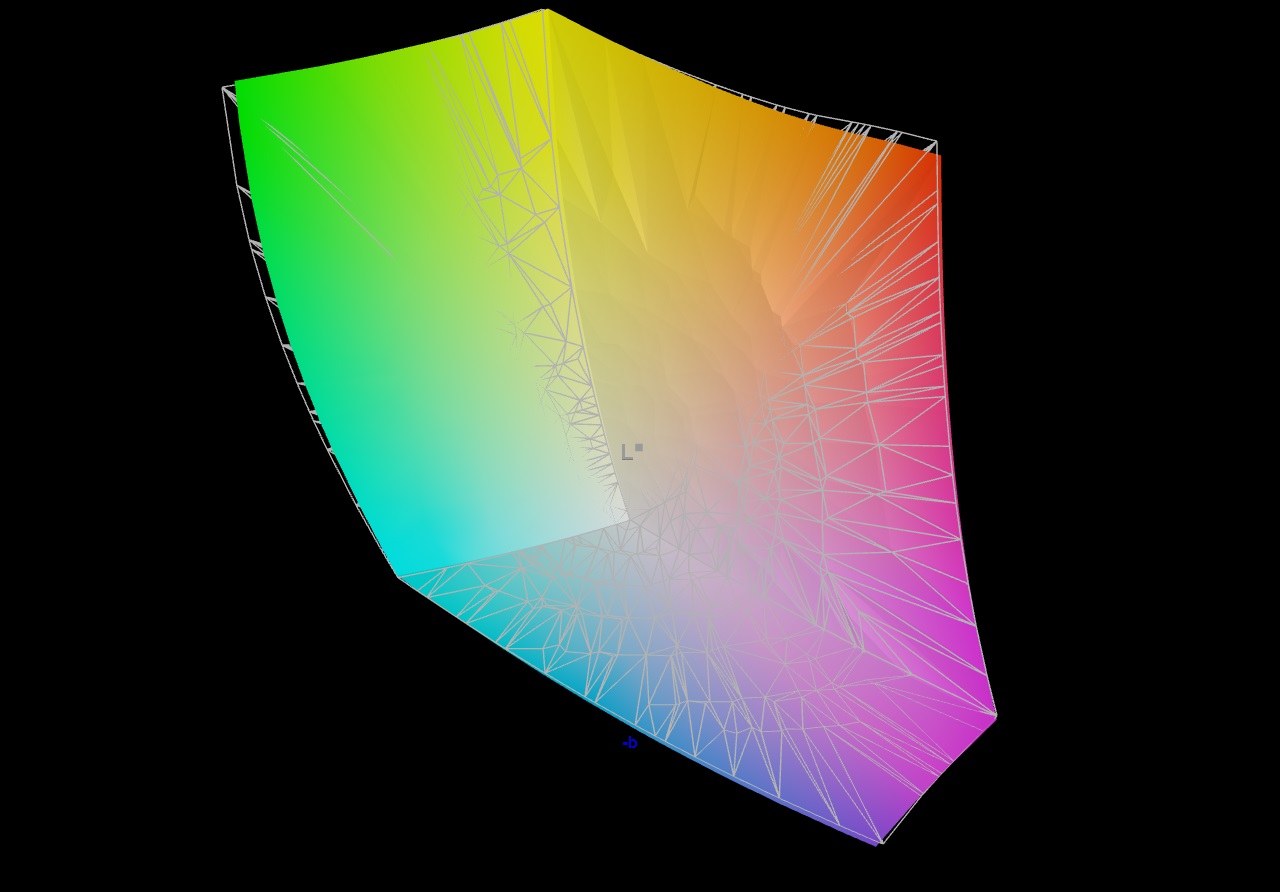
86.7% AdobeRGB 1998 (Argyll 3D)
99.9% sRGB (Argyll 3D)
98.5% Display P3 (Argyll 3D)
Gamma: 2.242
CCT: 6809 K
| Lenovo Legion Pro 7 16IRX9H BOE CQ NE16QDM-NZB, IPS, 2560x1600, 16" | Alienware m16 R1 AMD BOE NE16NZ4, IPS, 2560x1600, 16" | MSI Vector 16 HX A14V Chi Mei N160GME-GTB, IPS, 2560x1600, 16" | HP Omen 16 (2024) BOE BOE0B7D, IPS, 2560x1440, 16.1" | Lenovo Legion Pro 7 16IRX8H MNG007DA2-3 (CSO1628), IPS, 2560x1600, 16" | |
|---|---|---|---|---|---|
| Display | 1% | -1% | -17% | -16% | |
| Display P3 Coverage (%) | 98.5 | 98.6 0% | 95.4 -3% | 68.6 -30% | 69.1 -30% |
| sRGB Coverage (%) | 99.9 | 99.9 0% | 99.7 0% | 98.6 -1% | 99.7 0% |
| AdobeRGB 1998 Coverage (%) | 86.7 | 88.9 3% | 85.4 -1% | 70.6 -19% | 71.2 -18% |
| Response Times | 3% | -21% | -36% | 0% | |
| Response Time Grey 50% / Grey 80% * (ms) | 12.6 ? | 5.1 ? 60% | 5.7 ? 55% | 14.1 ? -12% | 12.3 ? 2% |
| Response Time Black / White * (ms) | 5.8 ? | 9 ? -55% | 11.4 ? -97% | 9.3 ? -60% | 5.9 ? -2% |
| PWM Frequency (Hz) | |||||
| Screen | -109% | -73% | -46% | 3% | |
| Brightness middle (cd/m²) | 487 | 329 -32% | 557.2 14% | 292 -40% | 511 5% |
| Brightness (cd/m²) | 460 | 317 -31% | 506 10% | 291 -37% | 469 2% |
| Brightness Distribution (%) | 88 | 89 1% | 83 -6% | 85 -3% | 86 -2% |
| Black Level * (cd/m²) | 0.42 | 0.32 24% | 0.41 2% | 0.24 43% | 0.4 5% |
| Contrast (:1) | 1160 | 1028 -11% | 1359 17% | 1217 5% | 1278 10% |
| Colorchecker dE 2000 * | 1.12 | 3.71 -231% | 2.91 -160% | 2.36 -111% | 0.95 15% |
| Colorchecker dE 2000 max. * | 2.26 | 7.23 -220% | 5.94 -163% | 4.08 -81% | 2.07 8% |
| Colorchecker dE 2000 calibrated * | 0.54 | 2.82 -422% | 1.63 -202% | 0.93 -72% | 0.91 -69% |
| Greyscale dE 2000 * | 1.4 | 2.2 -57% | 3.8 -171% | 3 -114% | 0.6 57% |
| Gamma | 2.242 98% | 2.3 96% | 2.23 99% | 2.101 105% | 2.176 101% |
| CCT | 6809 95% | 6270 104% | 6408 101% | 5976 109% | 6545 99% |
| Total Average (Program / Settings) | -35% /
-69% | -32% /
-50% | -33% /
-38% | -4% /
-1% |
* ... smaller is better
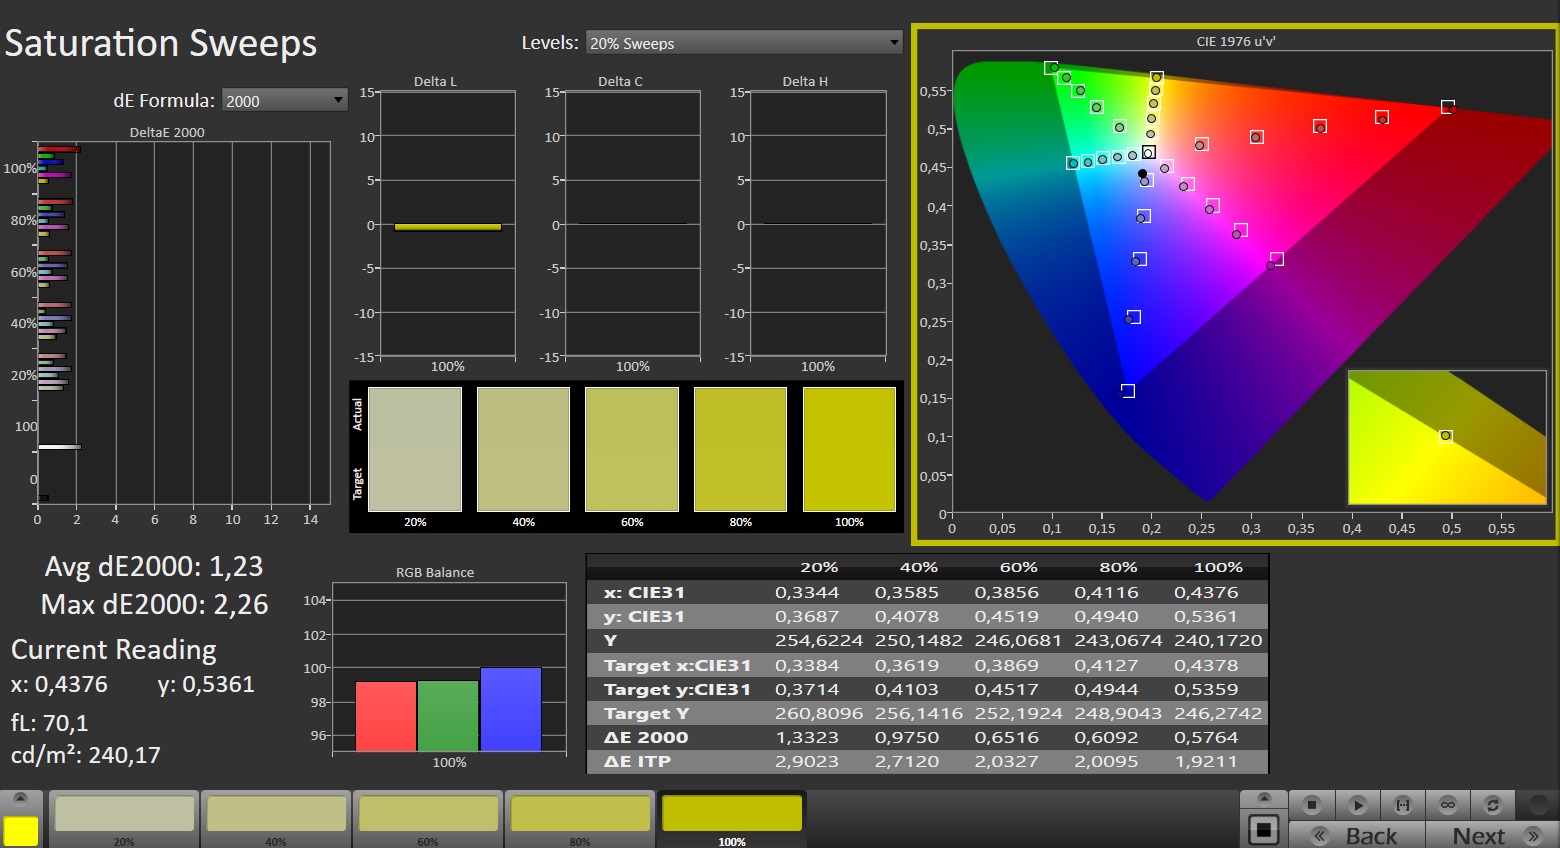
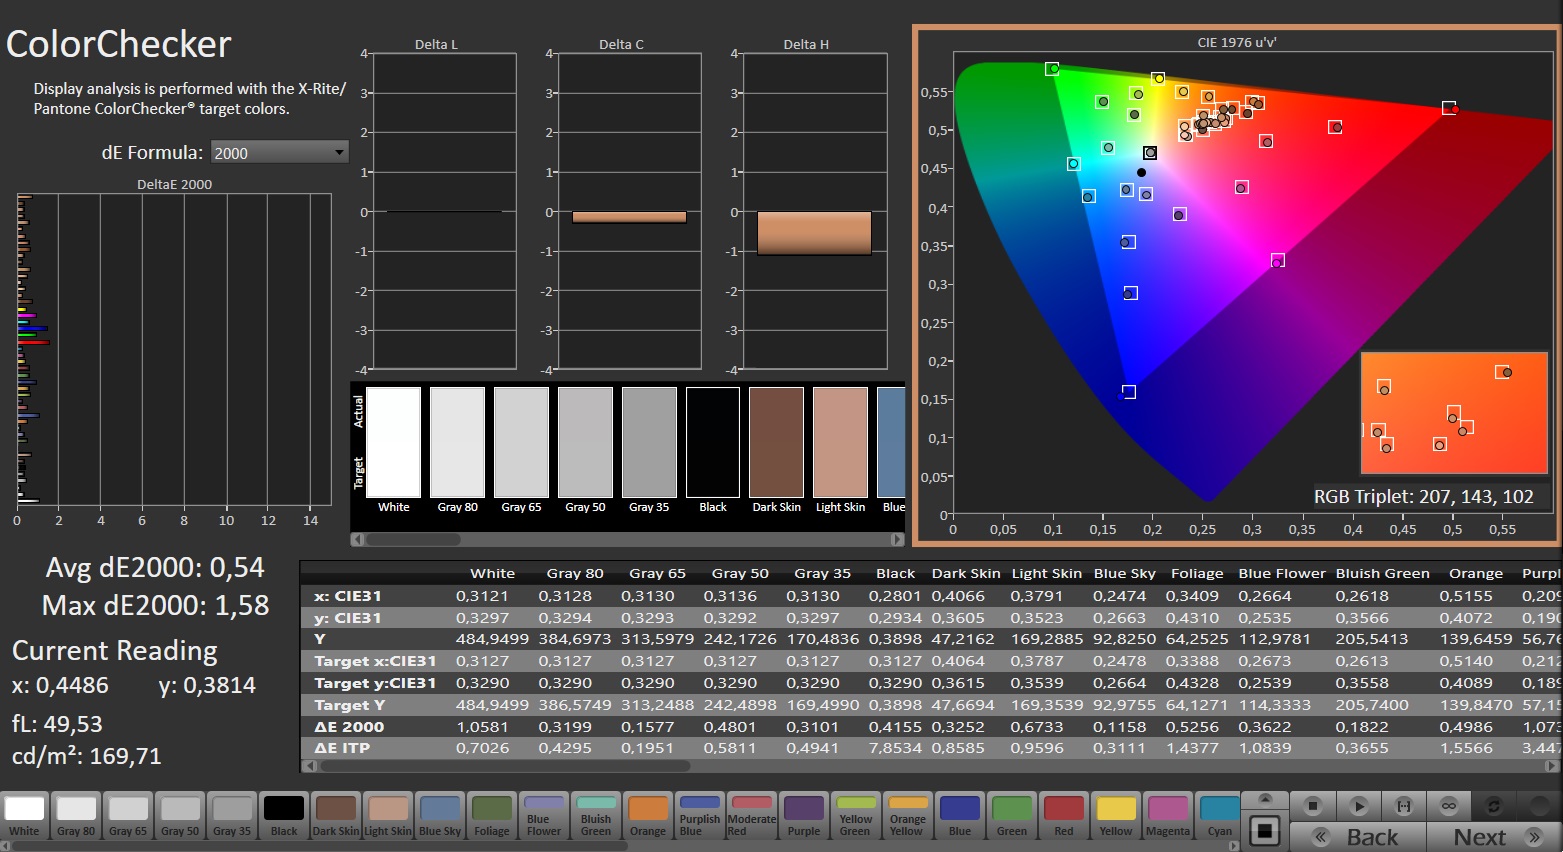
该屏幕开箱即具有极佳的色彩还原能力。它的 Delta E 值约为 1.1,达到了低于 3 的目标水平。校准显示屏后,平均色差降至 0.54,灰度也更加均衡。面板能够完全覆盖 sRGB 和 DCI-P3 色域,但不能覆盖 AdobeRGB 色彩空间。这与大多数同类笔记本电脑的显示屏类似。

Display Response Times
| ↔ Response Time Black to White | ||
|---|---|---|
| 5.8 ms ... rise ↗ and fall ↘ combined | ↗ 2.1 ms rise | 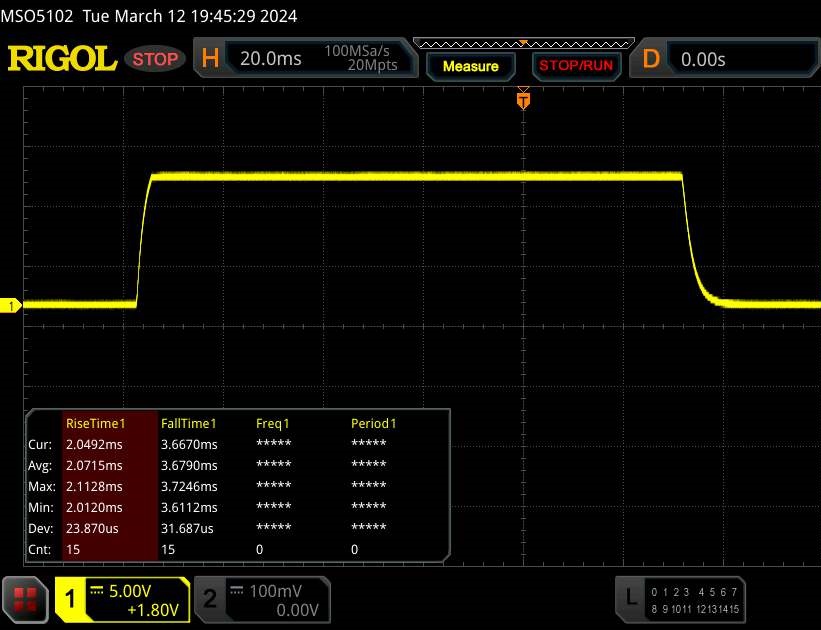 |
| ↘ 3.7 ms fall | ||
| The screen shows very fast response rates in our tests and should be very well suited for fast-paced gaming. In comparison, all tested devices range from 0.1 (minimum) to 240 (maximum) ms. » 18 % of all devices are better. This means that the measured response time is better than the average of all tested devices (19.8 ms). | ||
| ↔ Response Time 50% Grey to 80% Grey | ||
| 12.6 ms ... rise ↗ and fall ↘ combined | ↗ 6 ms rise | 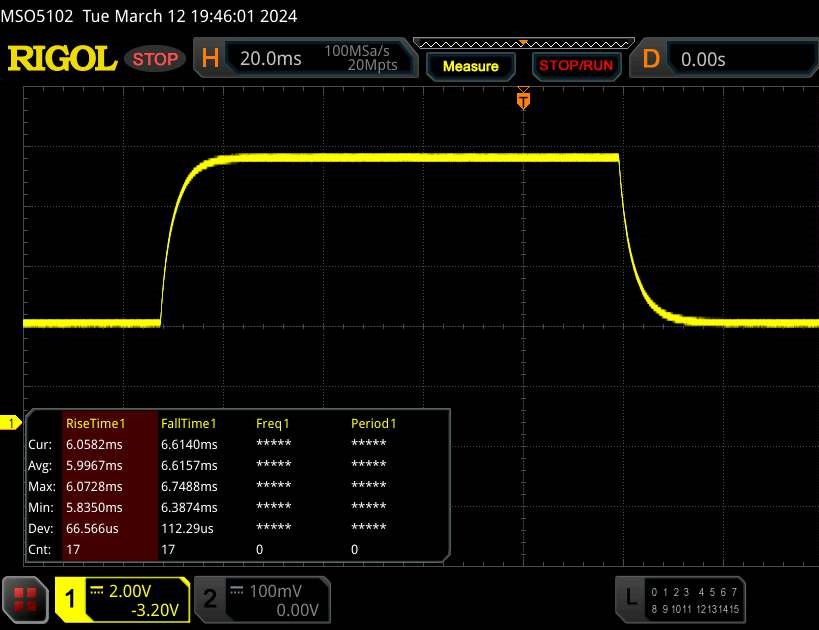 |
| ↘ 6.6 ms fall | ||
| The screen shows good response rates in our tests, but may be too slow for competitive gamers. In comparison, all tested devices range from 0.165 (minimum) to 636 (maximum) ms. » 26 % of all devices are better. This means that the measured response time is better than the average of all tested devices (31 ms). | ||
Screen Flickering / PWM (Pulse-Width Modulation)
| Screen flickering / PWM not detected | 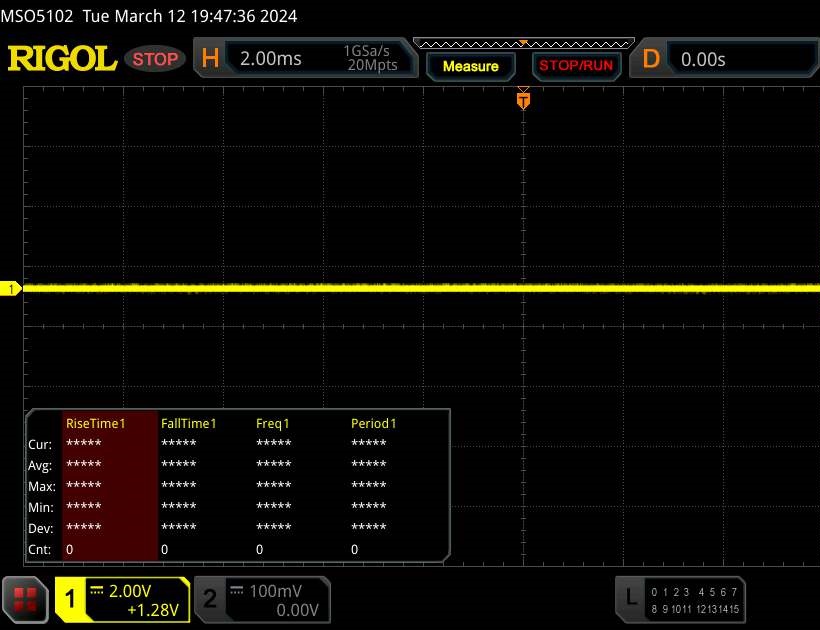 | ||
In comparison: 52 % of all tested devices do not use PWM to dim the display. If PWM was detected, an average of 7747 (minimum: 5 - maximum: 343500) Hz was measured. | |||
IPS 面板视角宽广,从任何位置都可阅读。只要阳光不是太强烈,在户外也可以使用该屏幕。
Leistung - 英特尔和 Nvidia 的高端硬件
联想Legion Pro 7 是一款专为游戏玩家和创作者打造的高性能 16 英寸笔记本电脑。Raptor Lake 和 Ada Lovelace 提供了必要的计算能力。我们的评测机型享受教育折扣,售价略低于 3000 欧元(约合 3245 美元)。在撰写这篇评论时,还没有其他型号。
测试条件
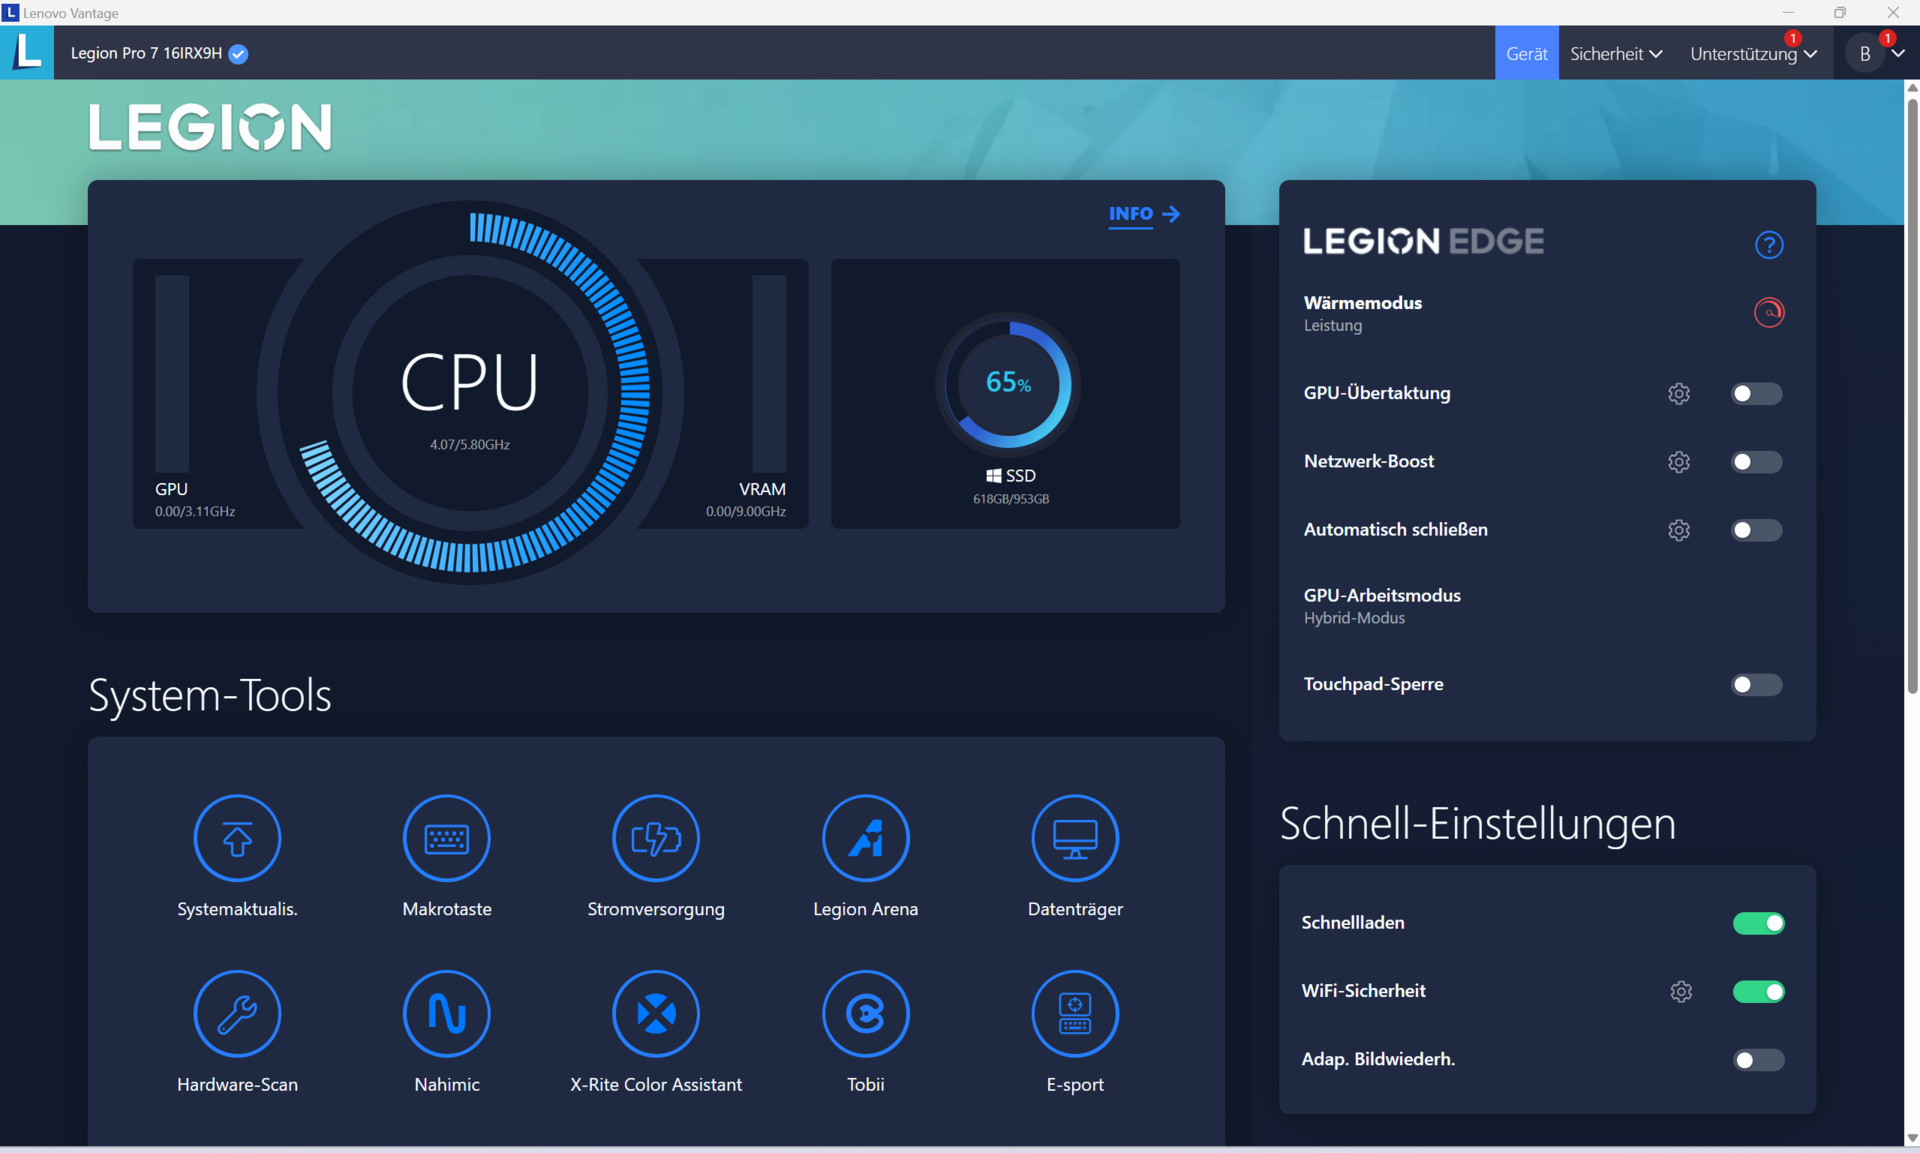
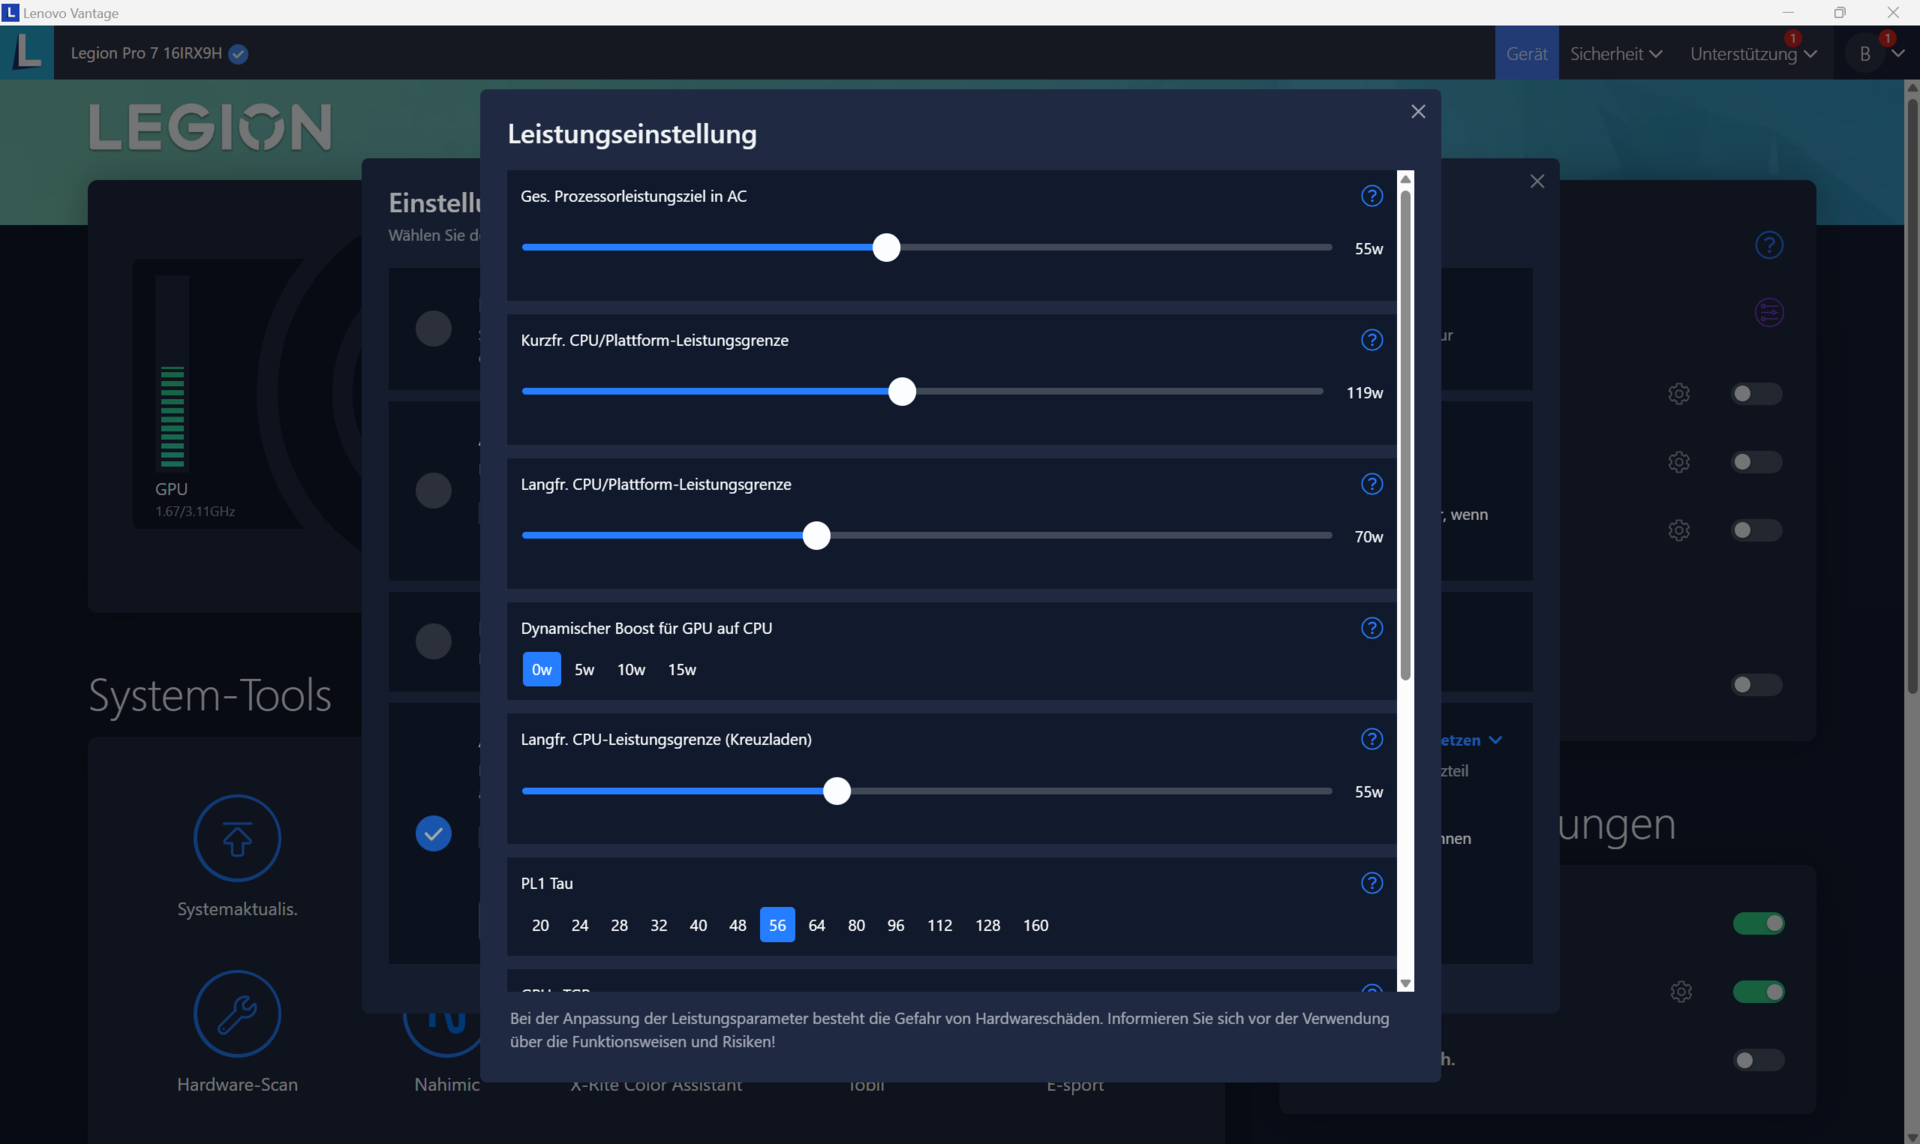
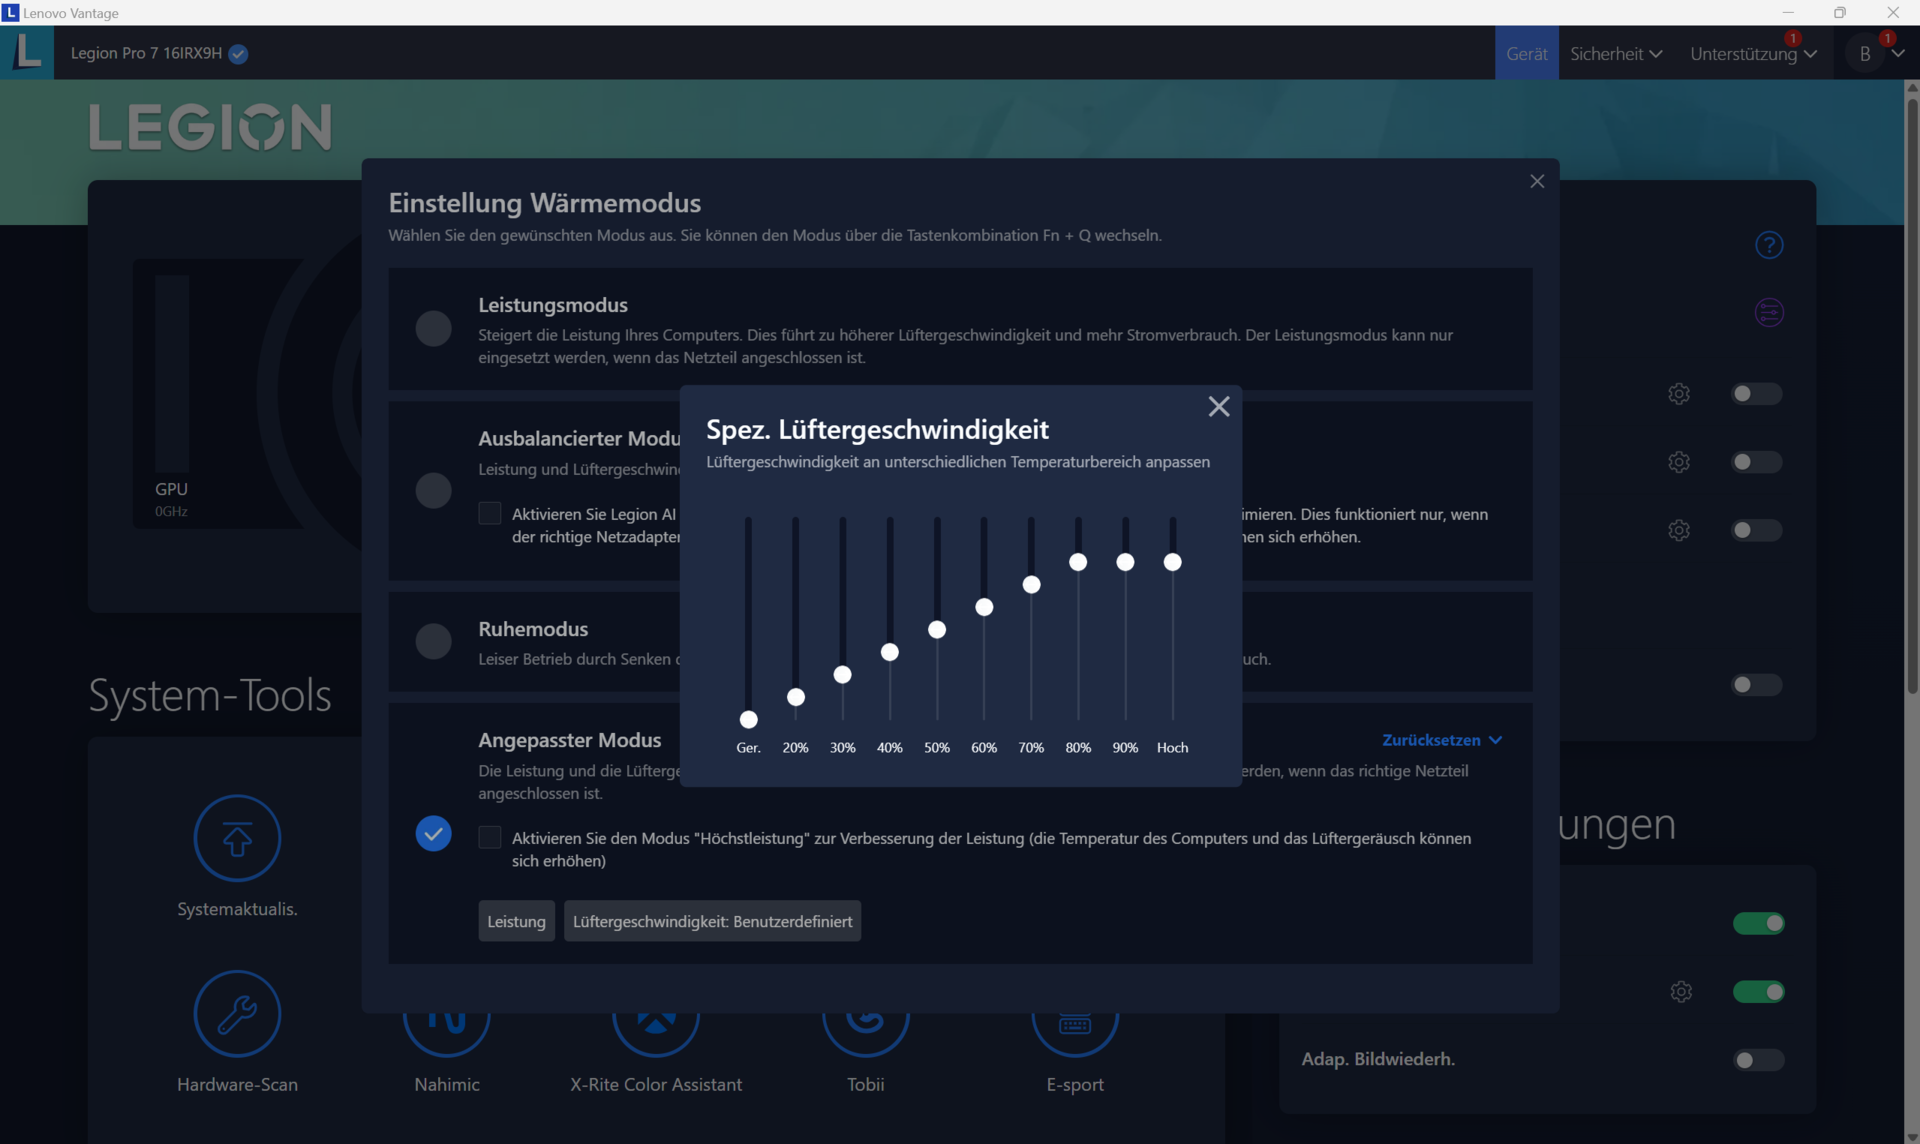
笔记本提供三种特定于制造商的性能模式(见表)。您可以使用 Fn + Q 组合键在它们之间切换。我们在基准测试和电池测试中分别使用了 "性能 "和 "安静 "模式。
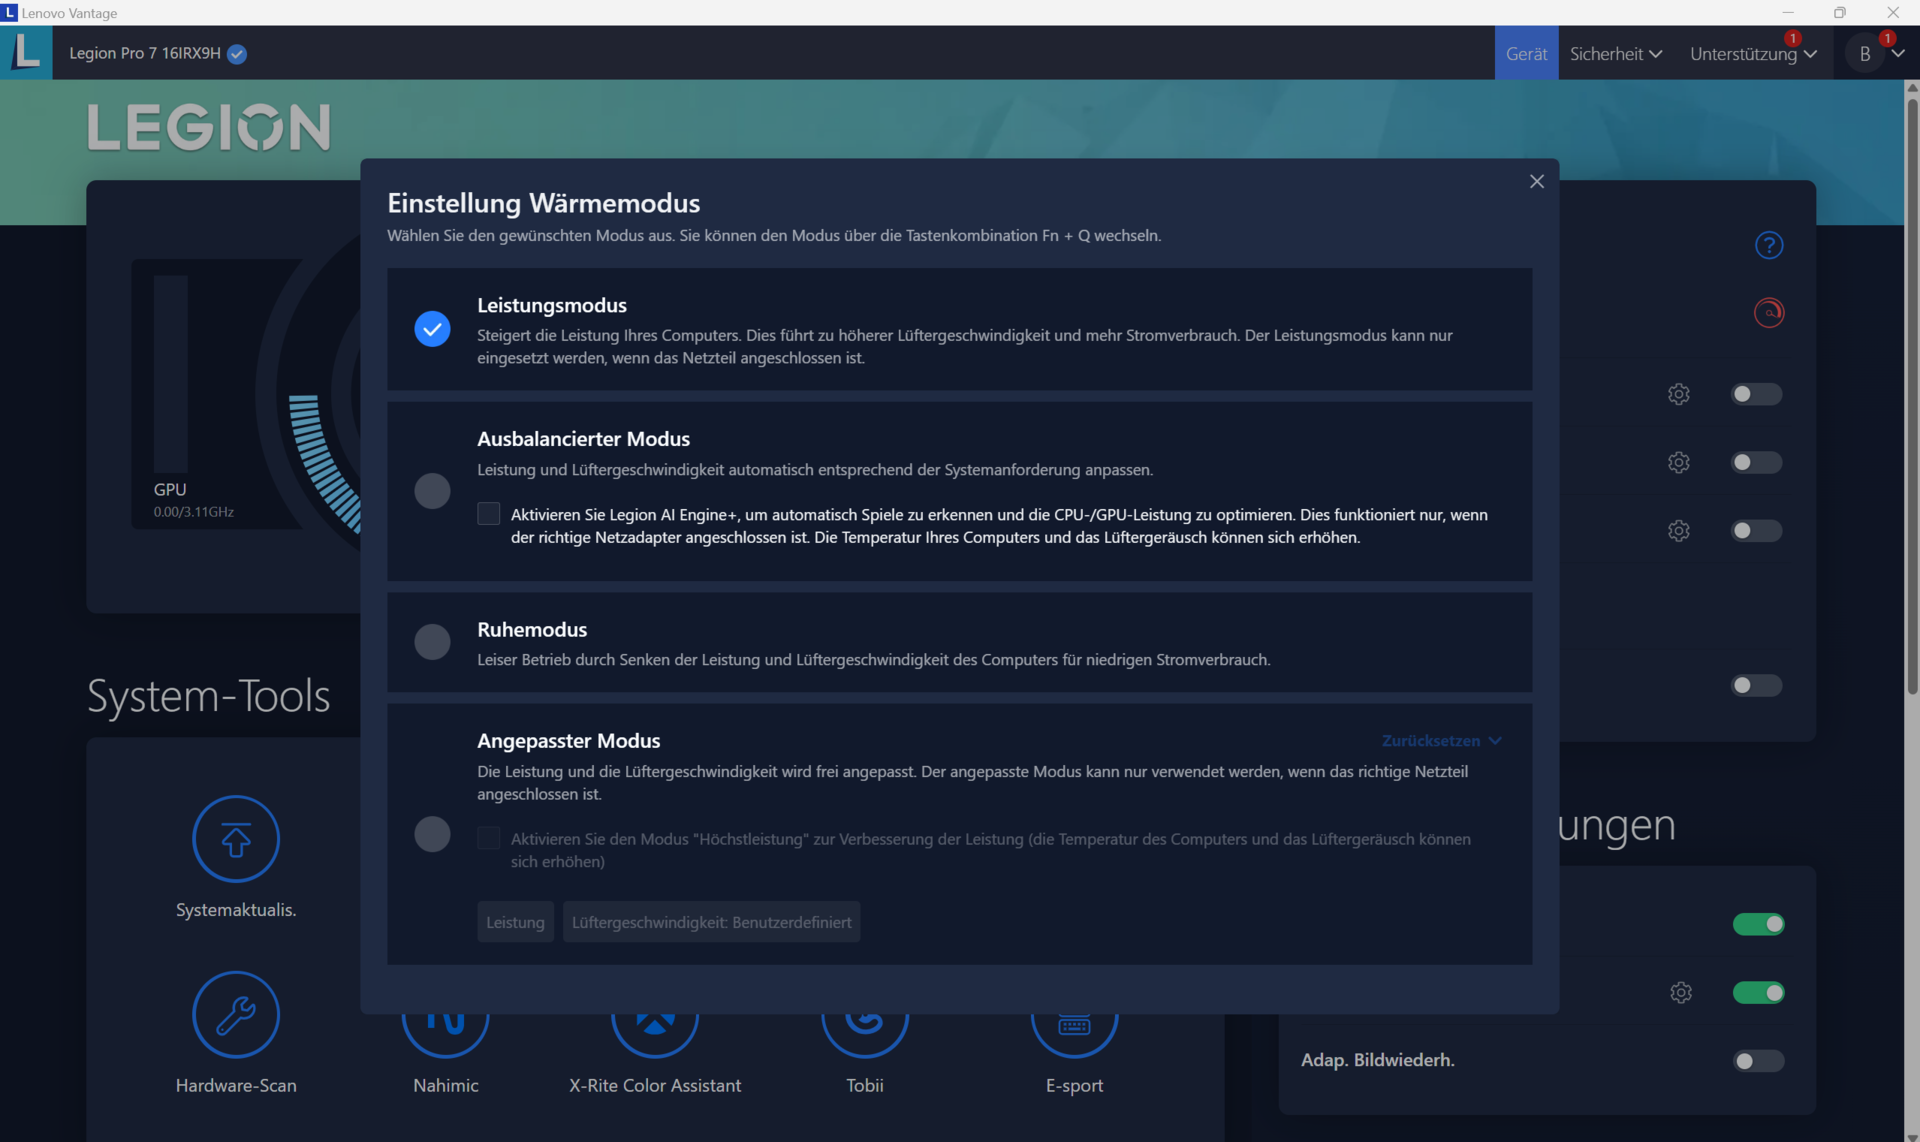
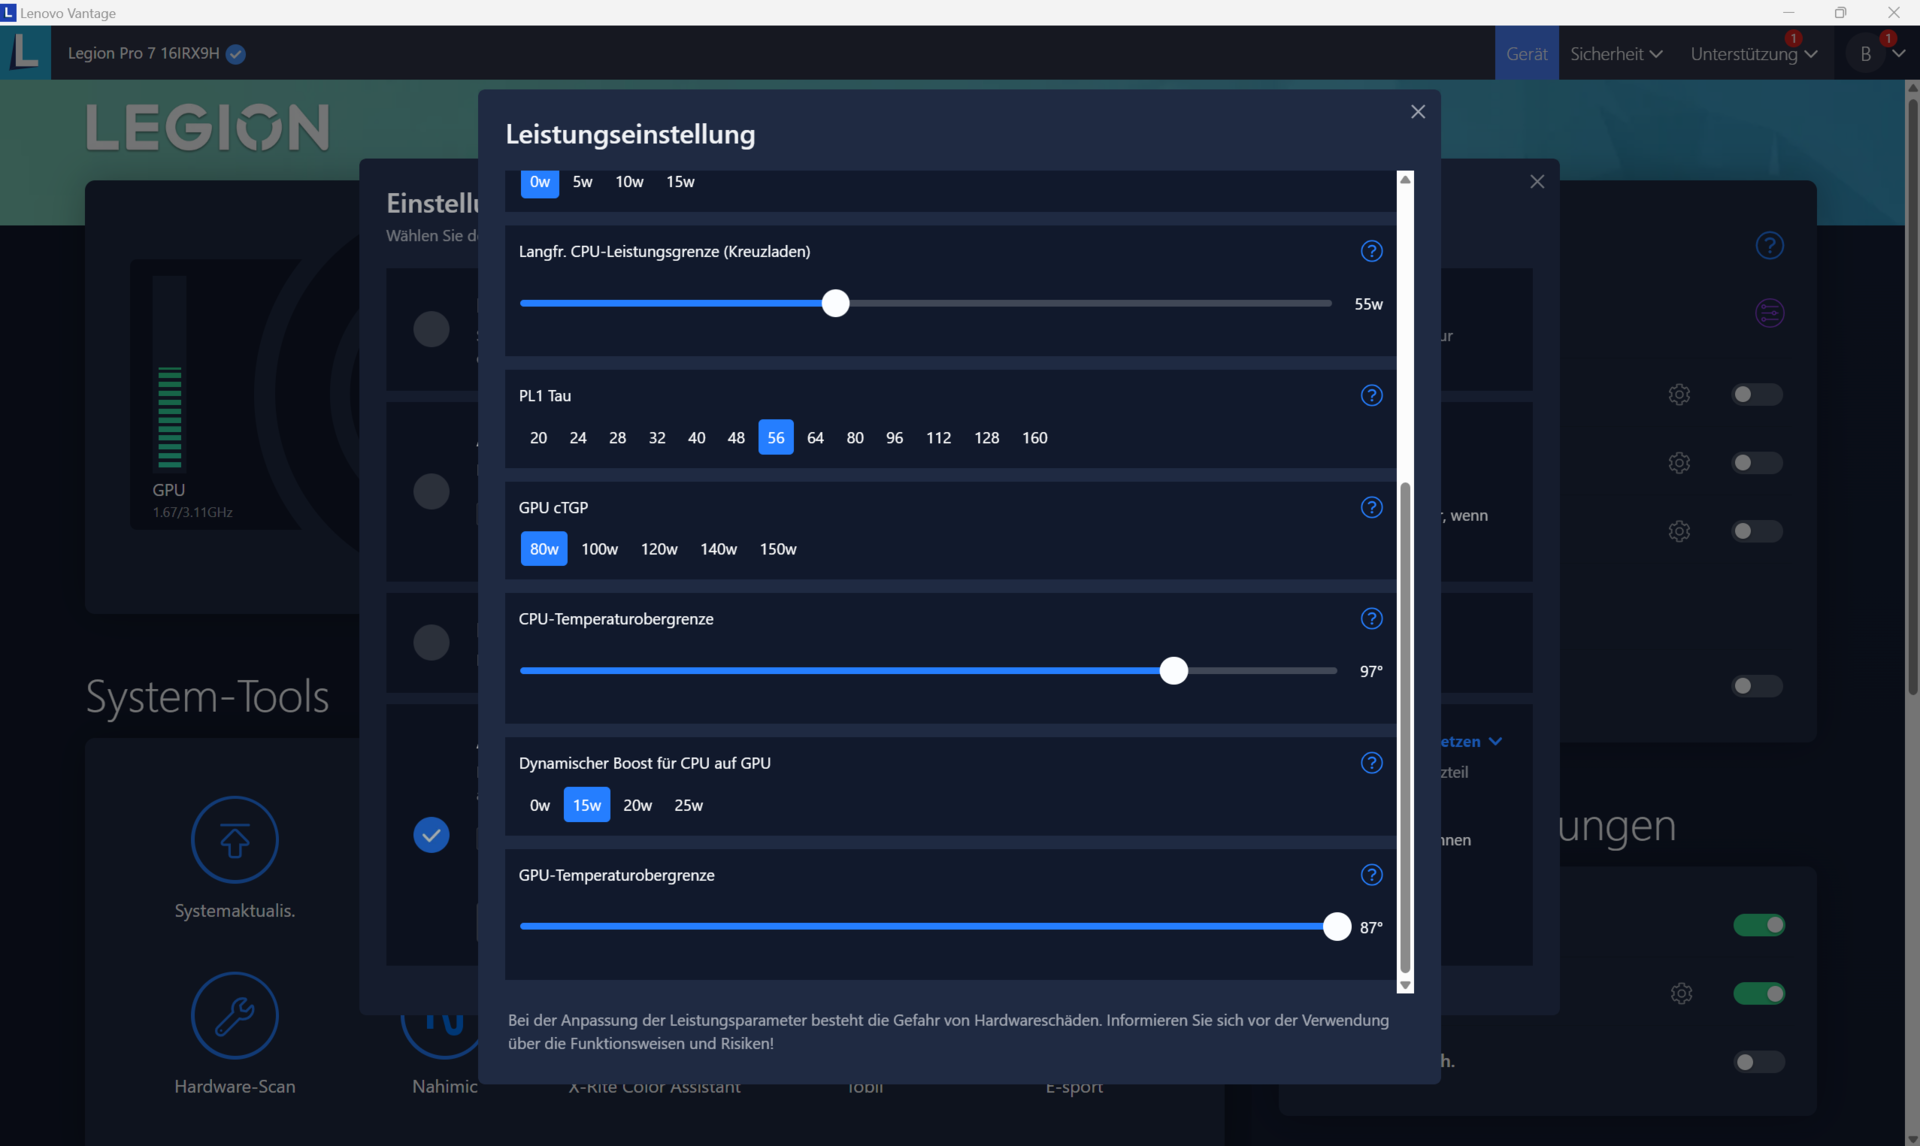
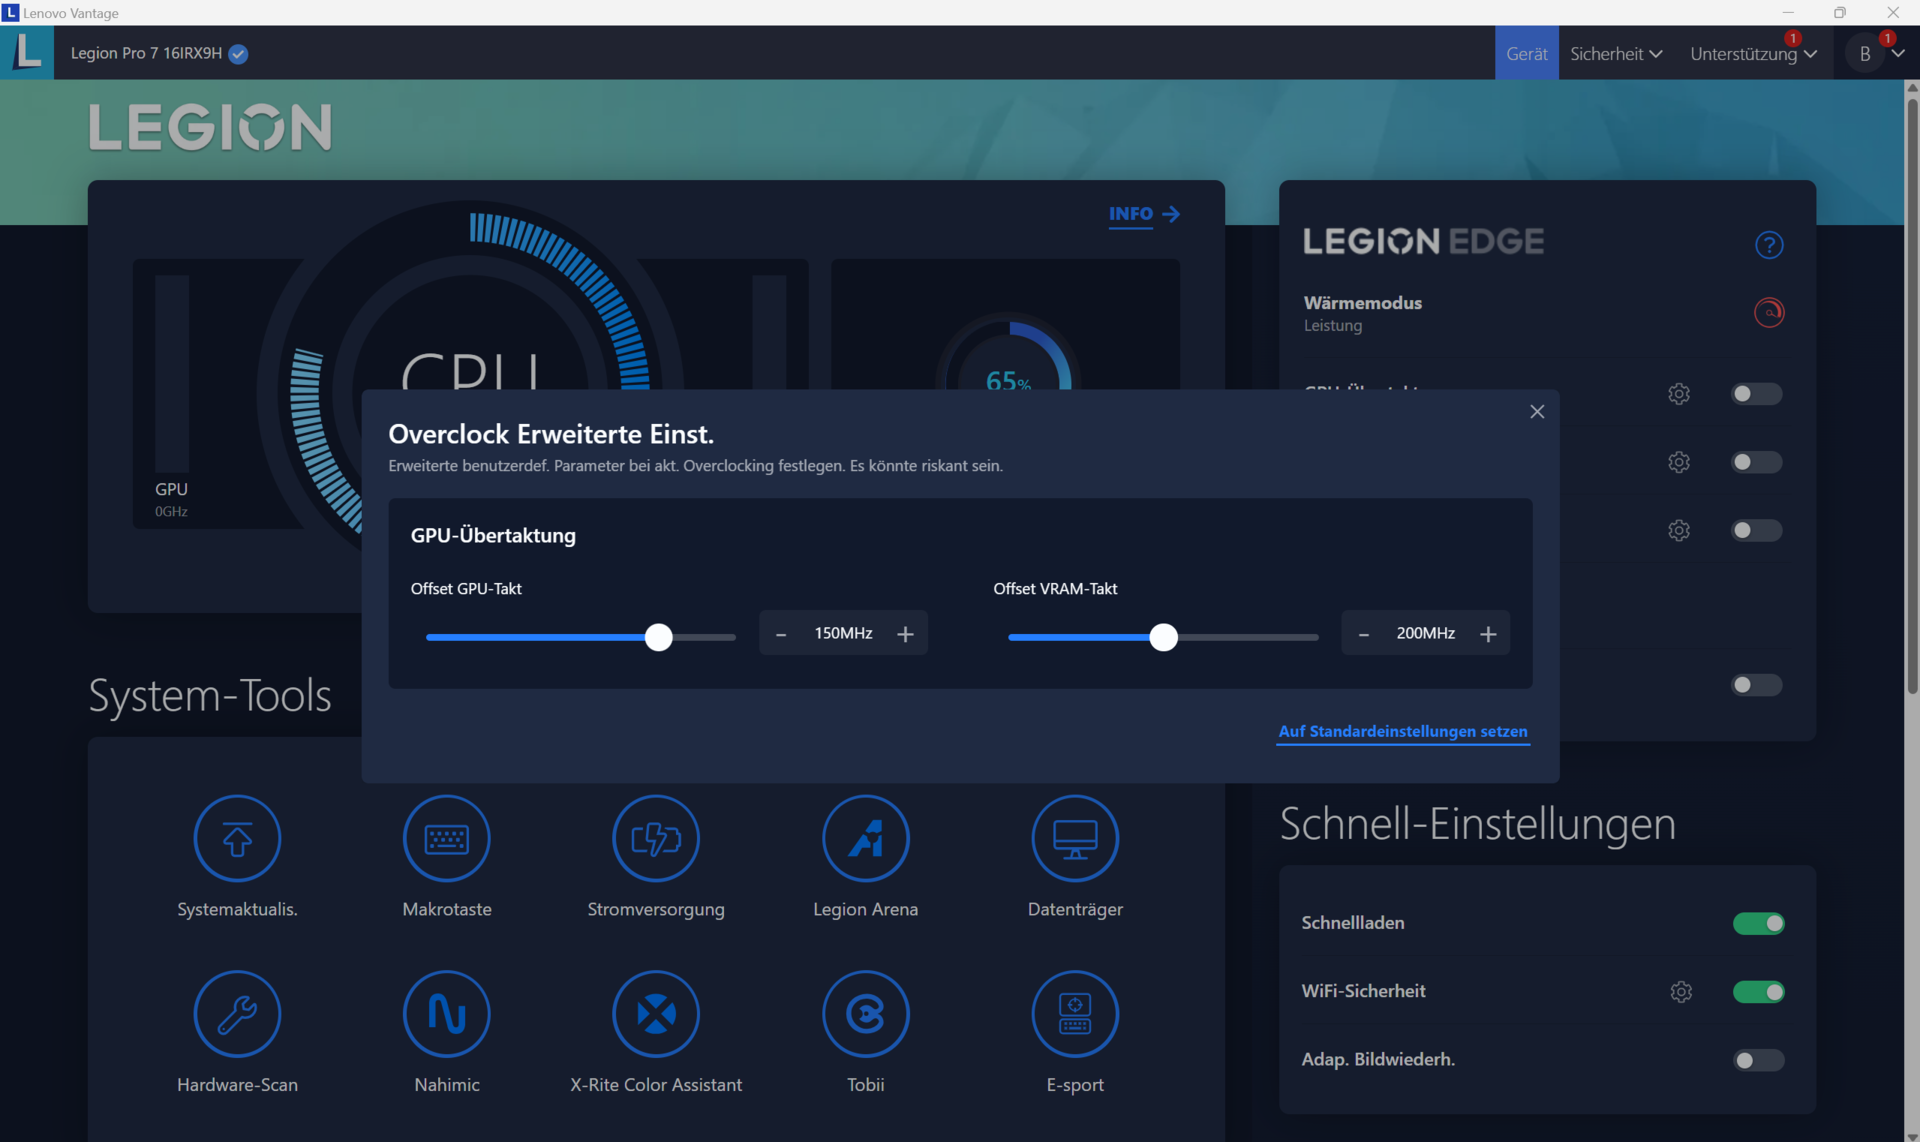
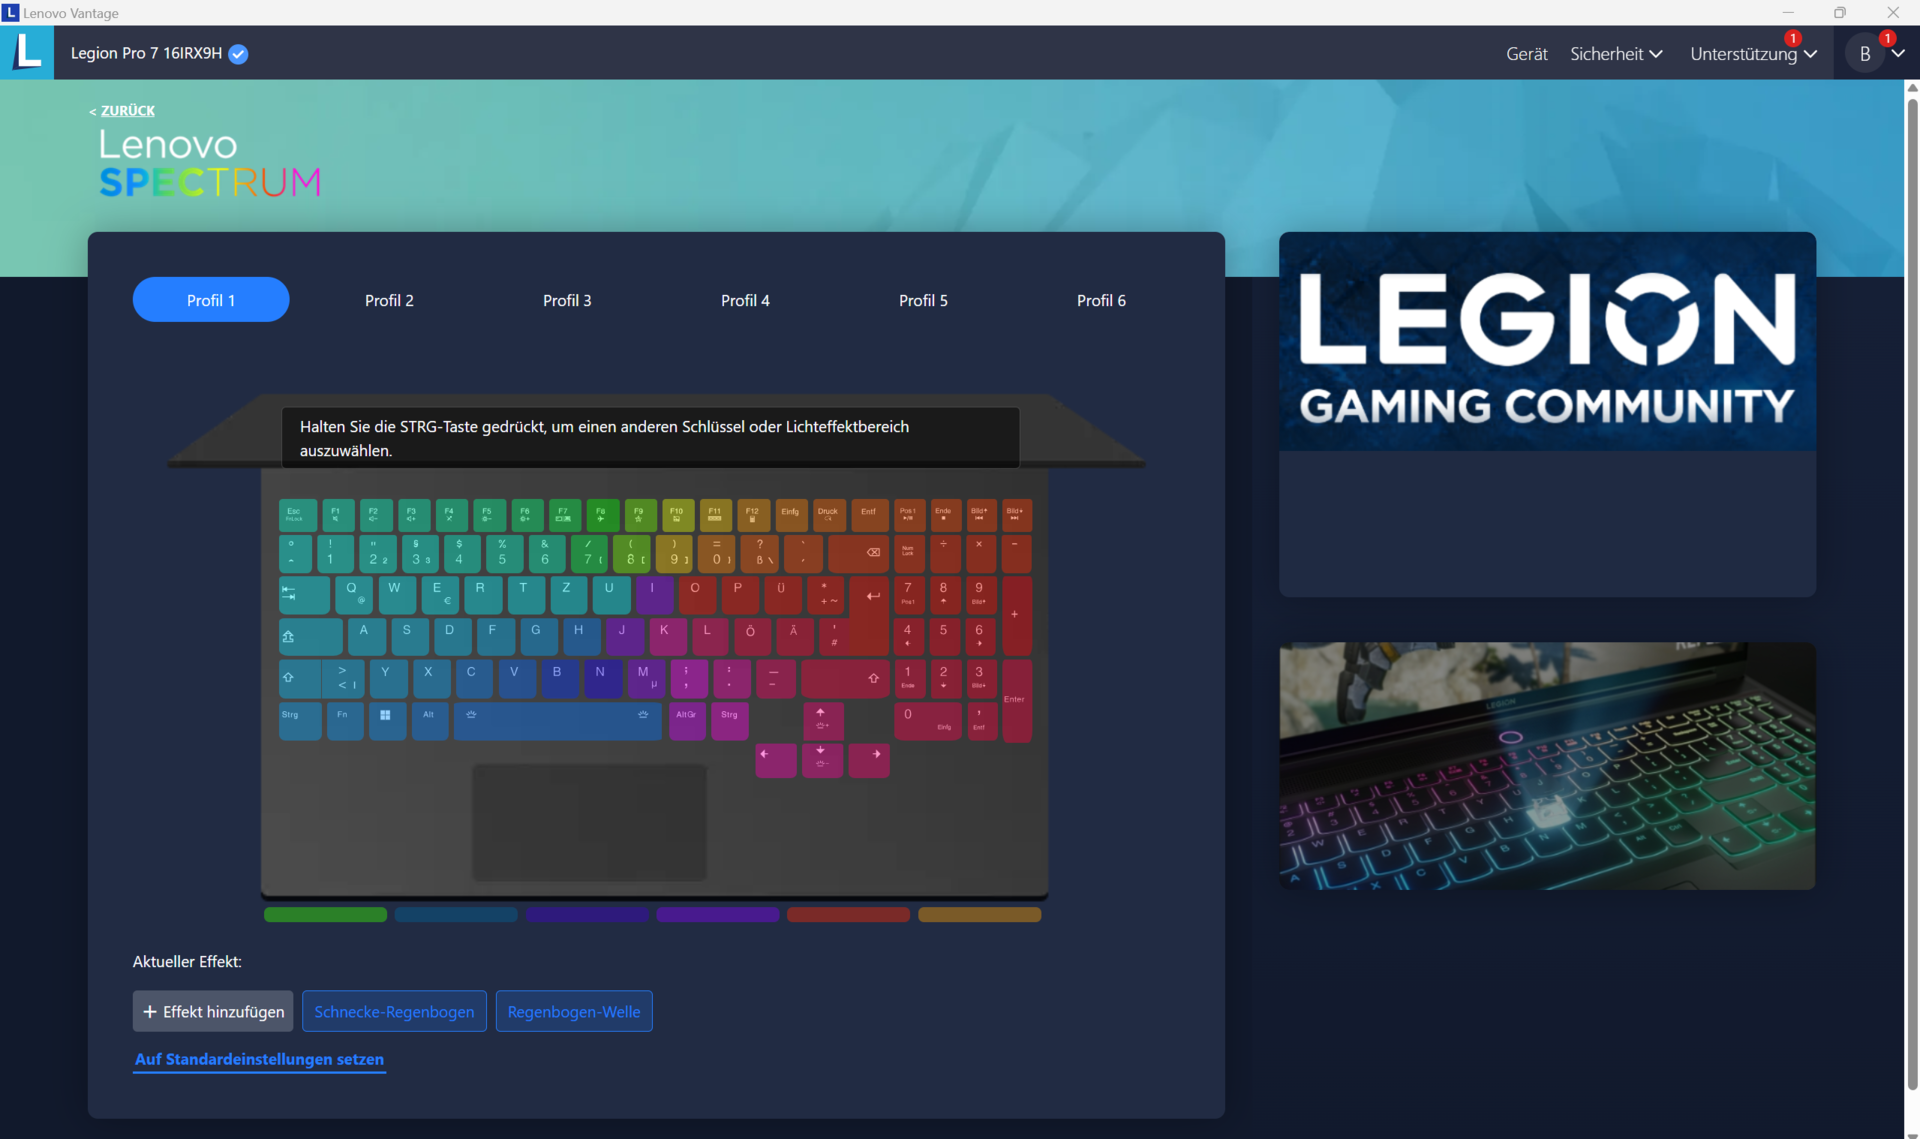
联想 Vantage(笔记本控制中心)还提供第四种模式:自定义模式。在该模式下,您可以指定处理器(功率限制)和显卡(TGP、动态提升和温度限制)的性能设置以及调整风扇速度。此外,还可以根据所选配置文件对 GPU 和显存进行超频。
| 性能模式 | 平衡模式 | 静音模式 | |
|---|---|---|---|
| 功率限制 1 (HWInfo) | 130 瓦 | 80 瓦 | 55 瓦 |
| 功率限制 2 (HWInfo) | 185 瓦 | 119 瓦 | 65 瓦 |
| 噪音 (Witcher 3) | 54 dB(A) | 45 dB(A) | 33 dB(A) |
| 性能 (Witcher 3) | ~184 帧/秒 | ~160 帧/秒 | 40 帧/秒(锁定) |
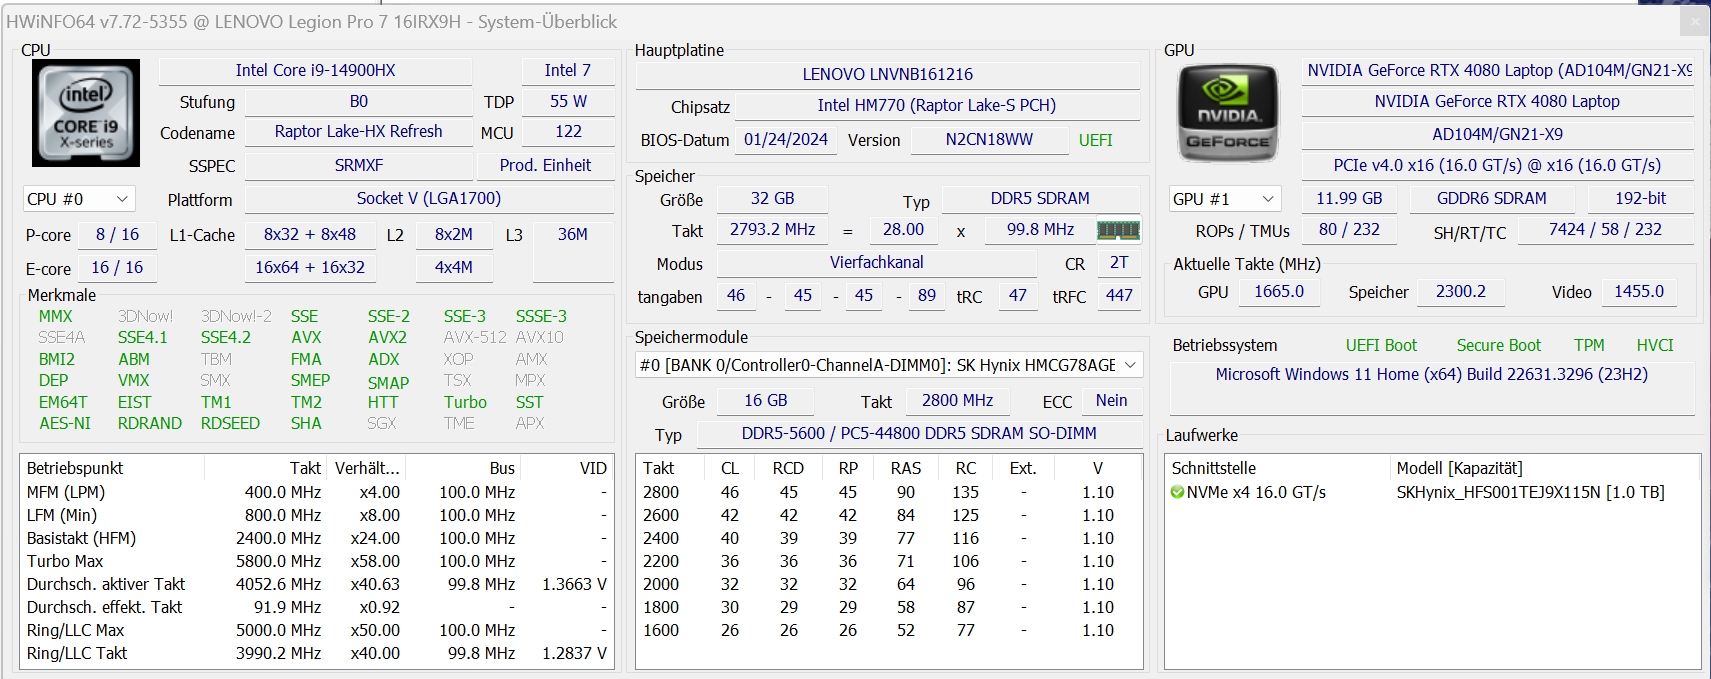
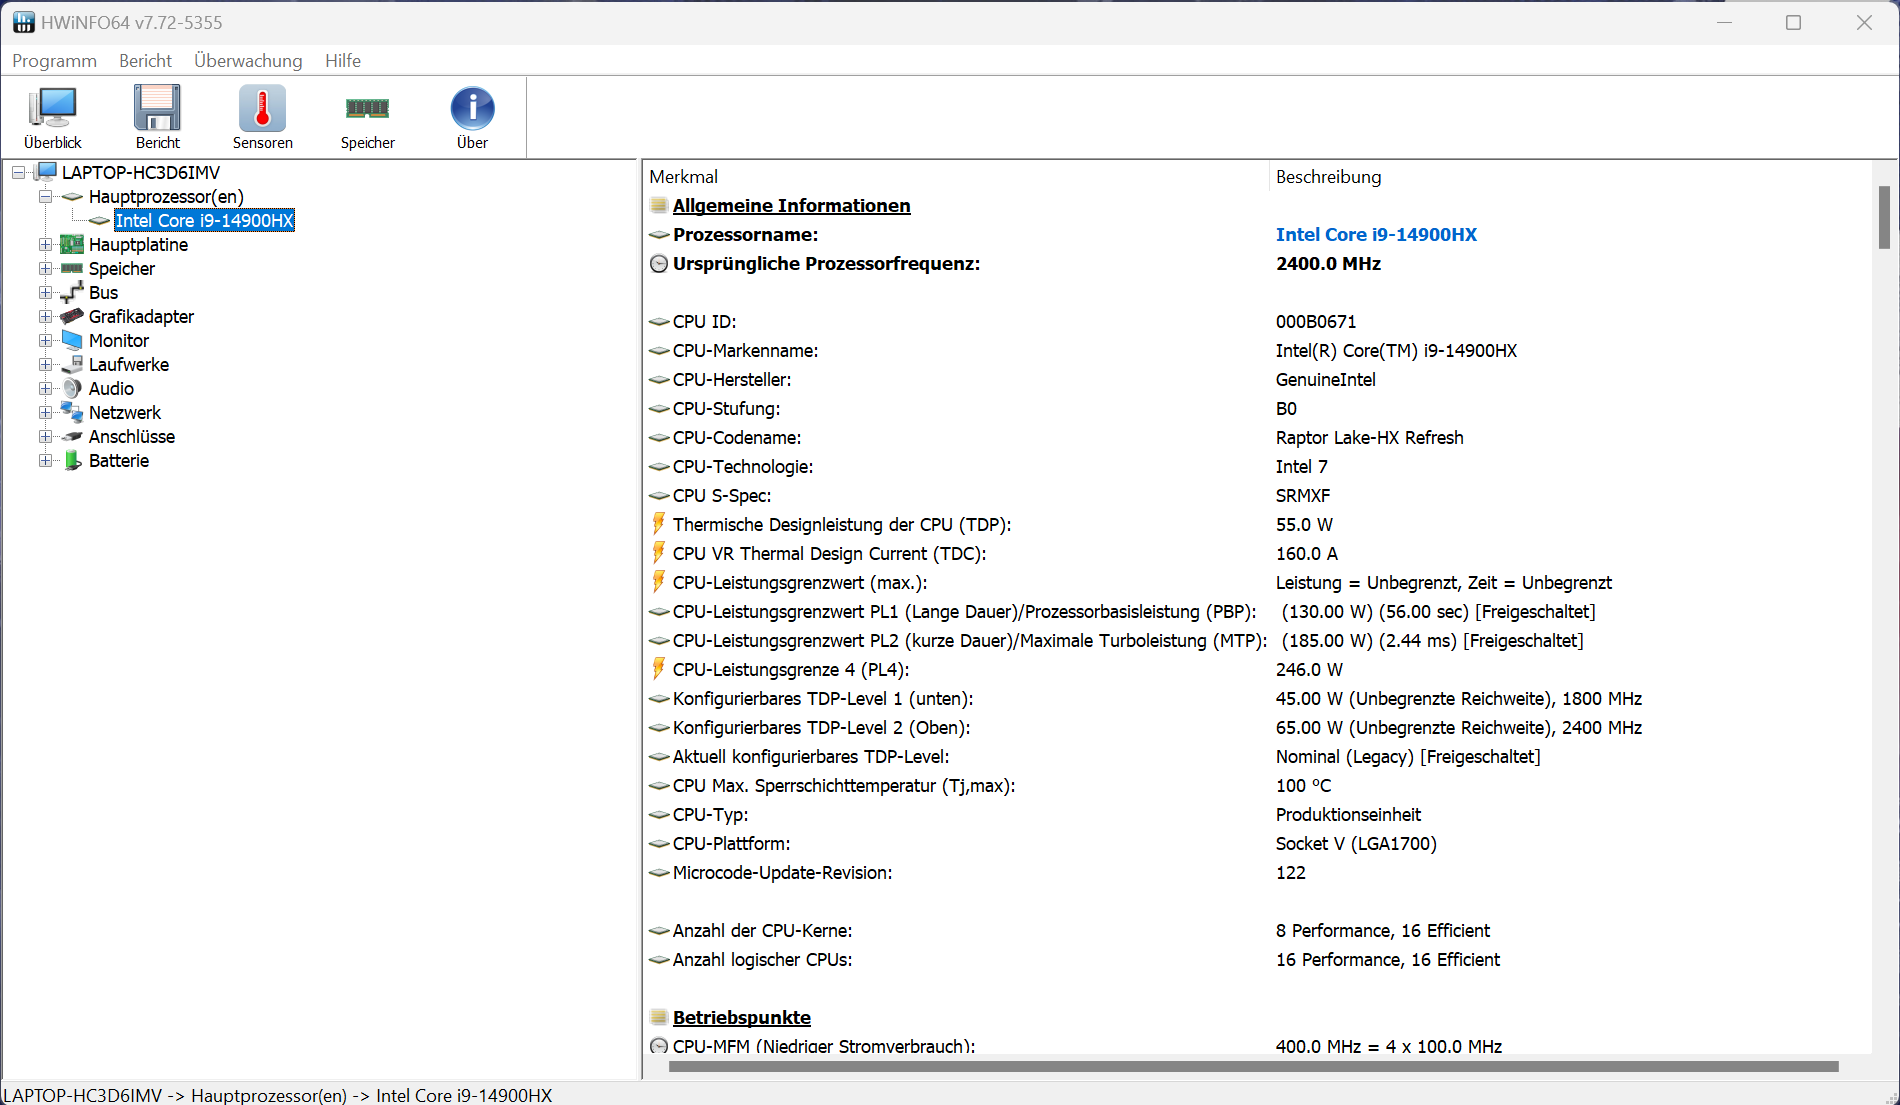
处理器
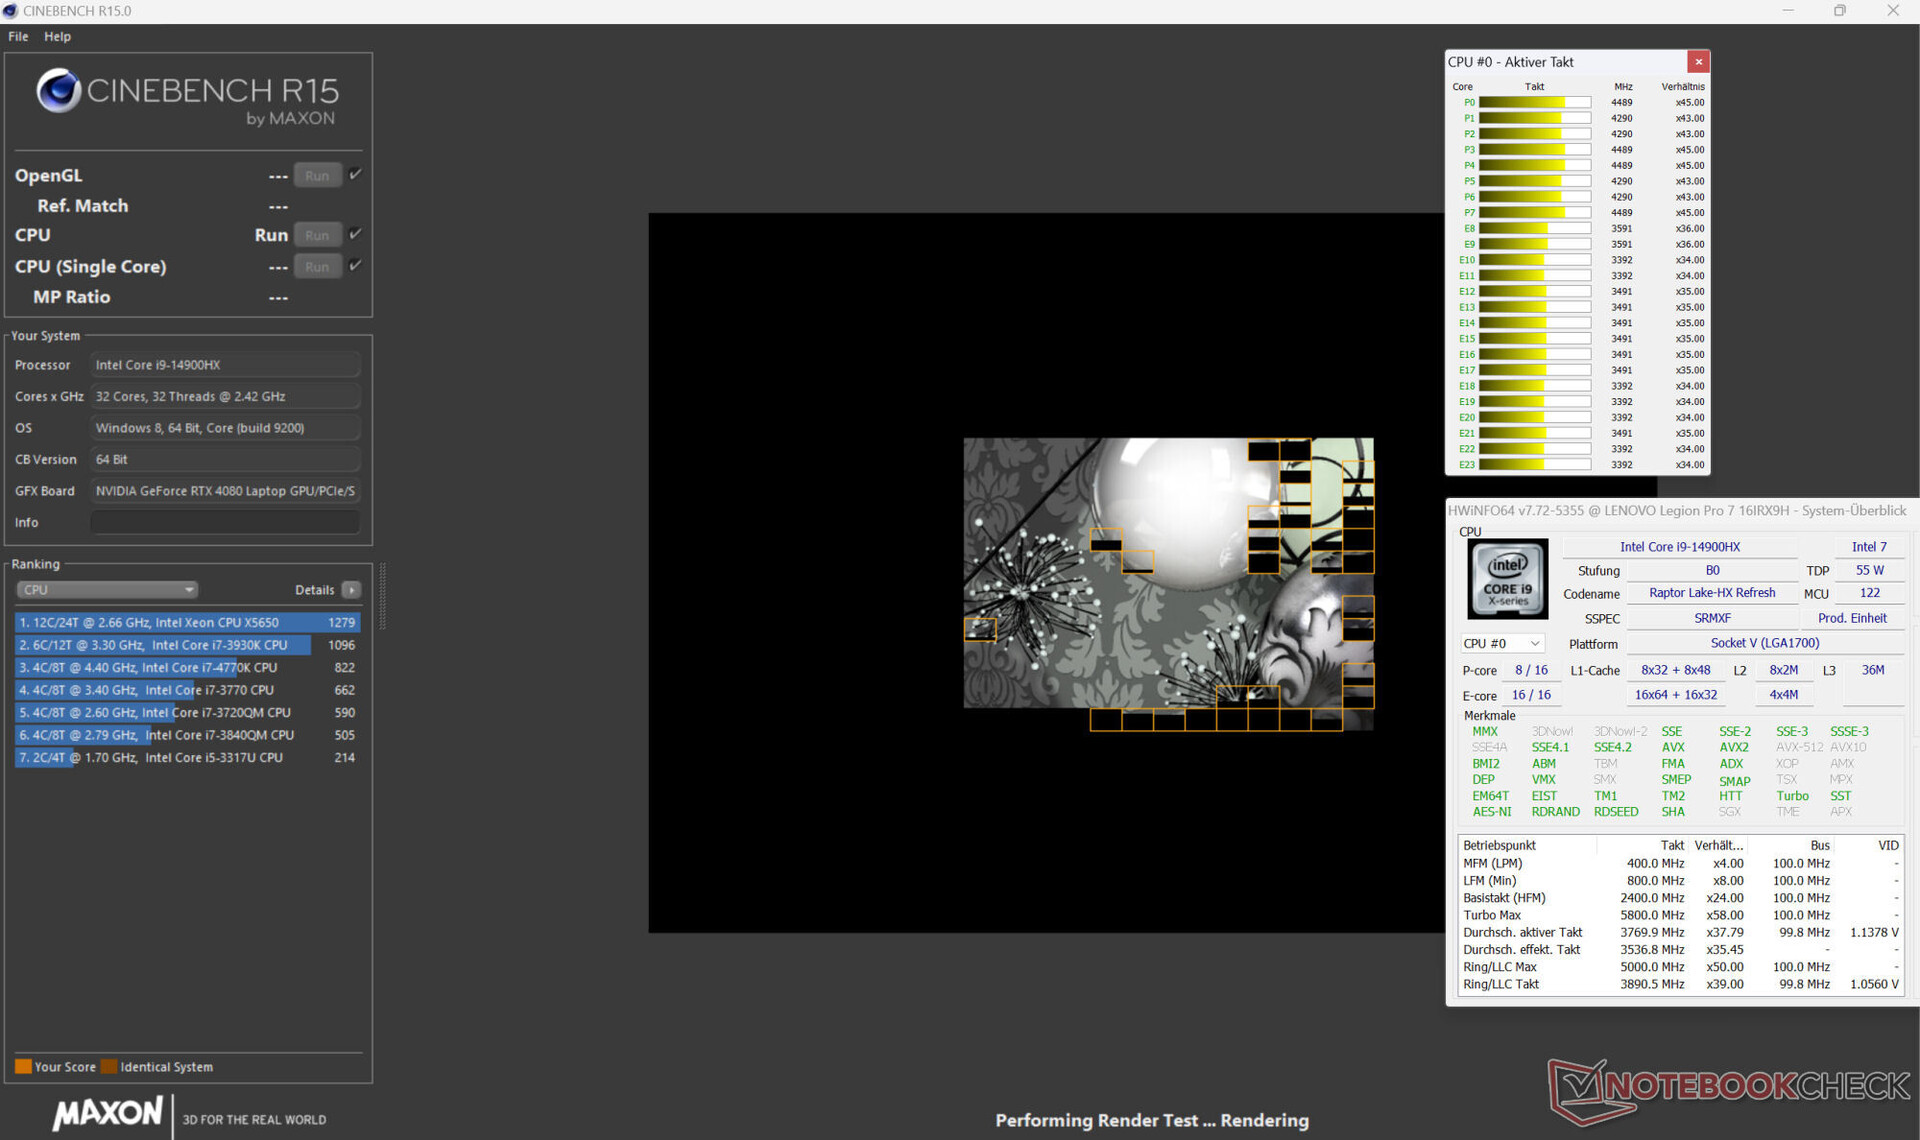
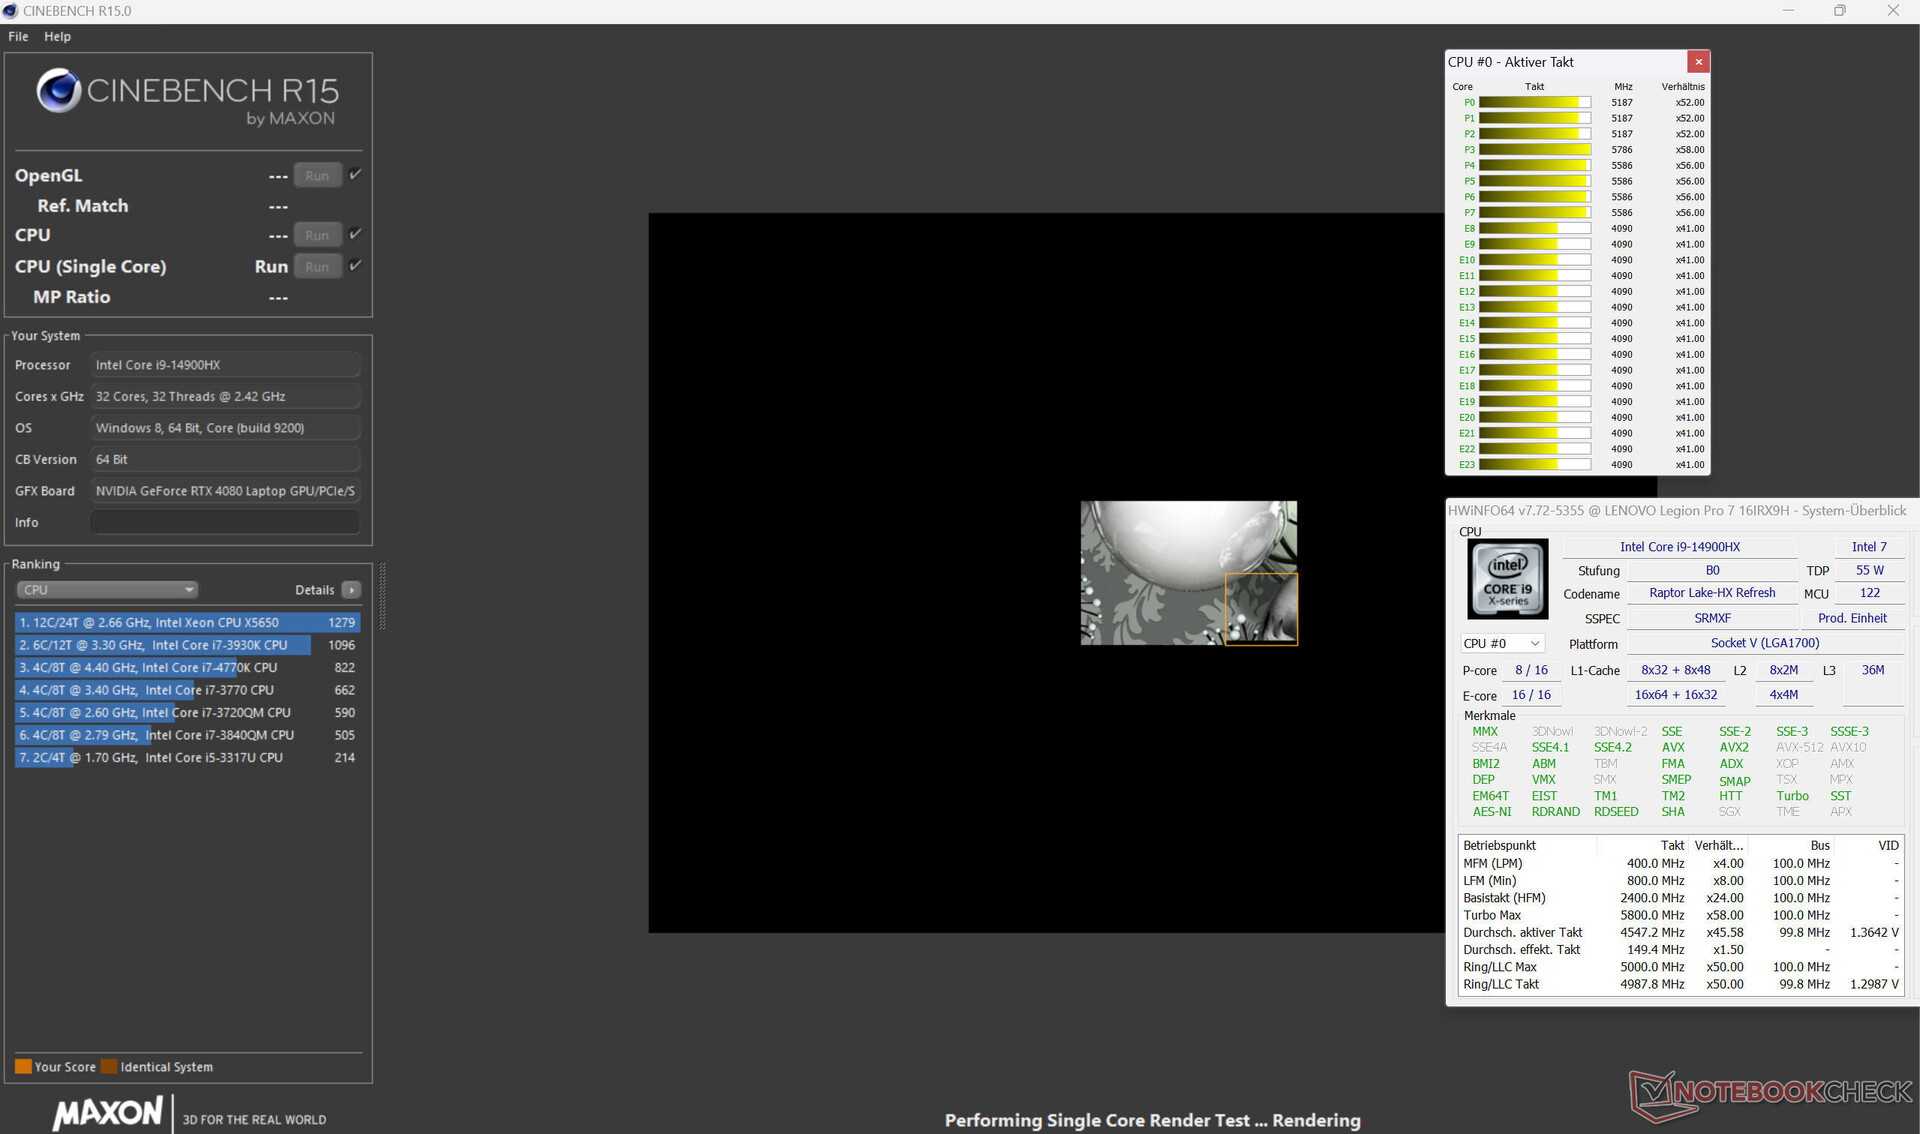
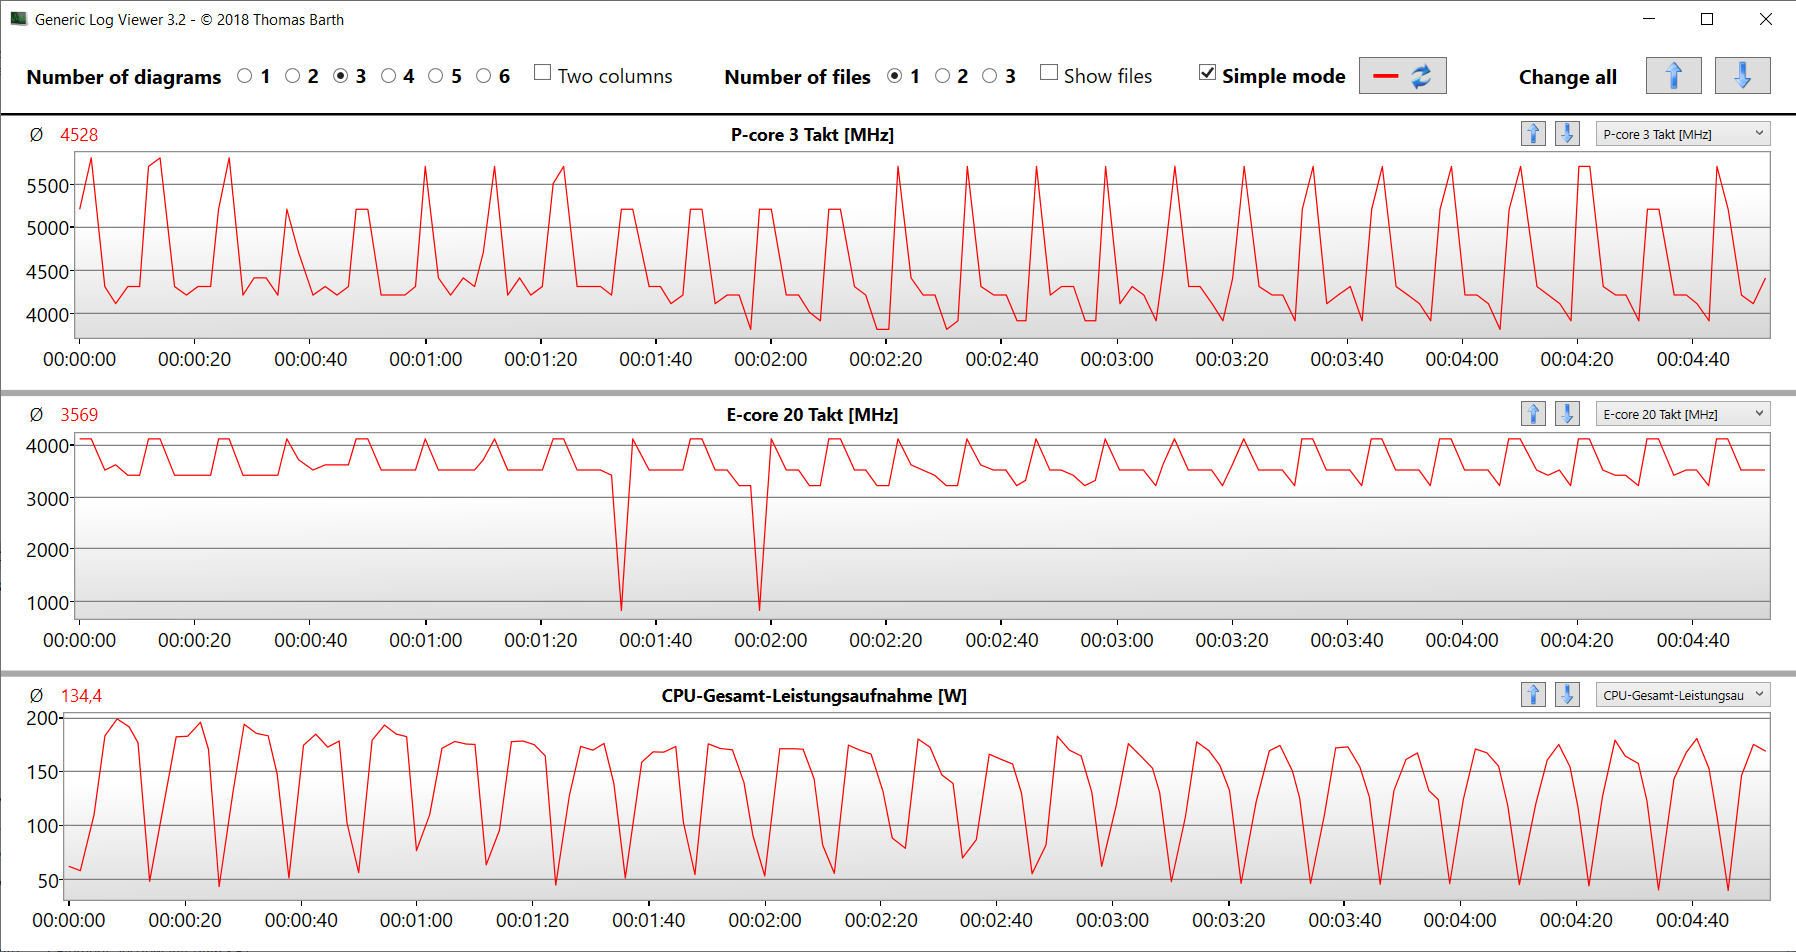
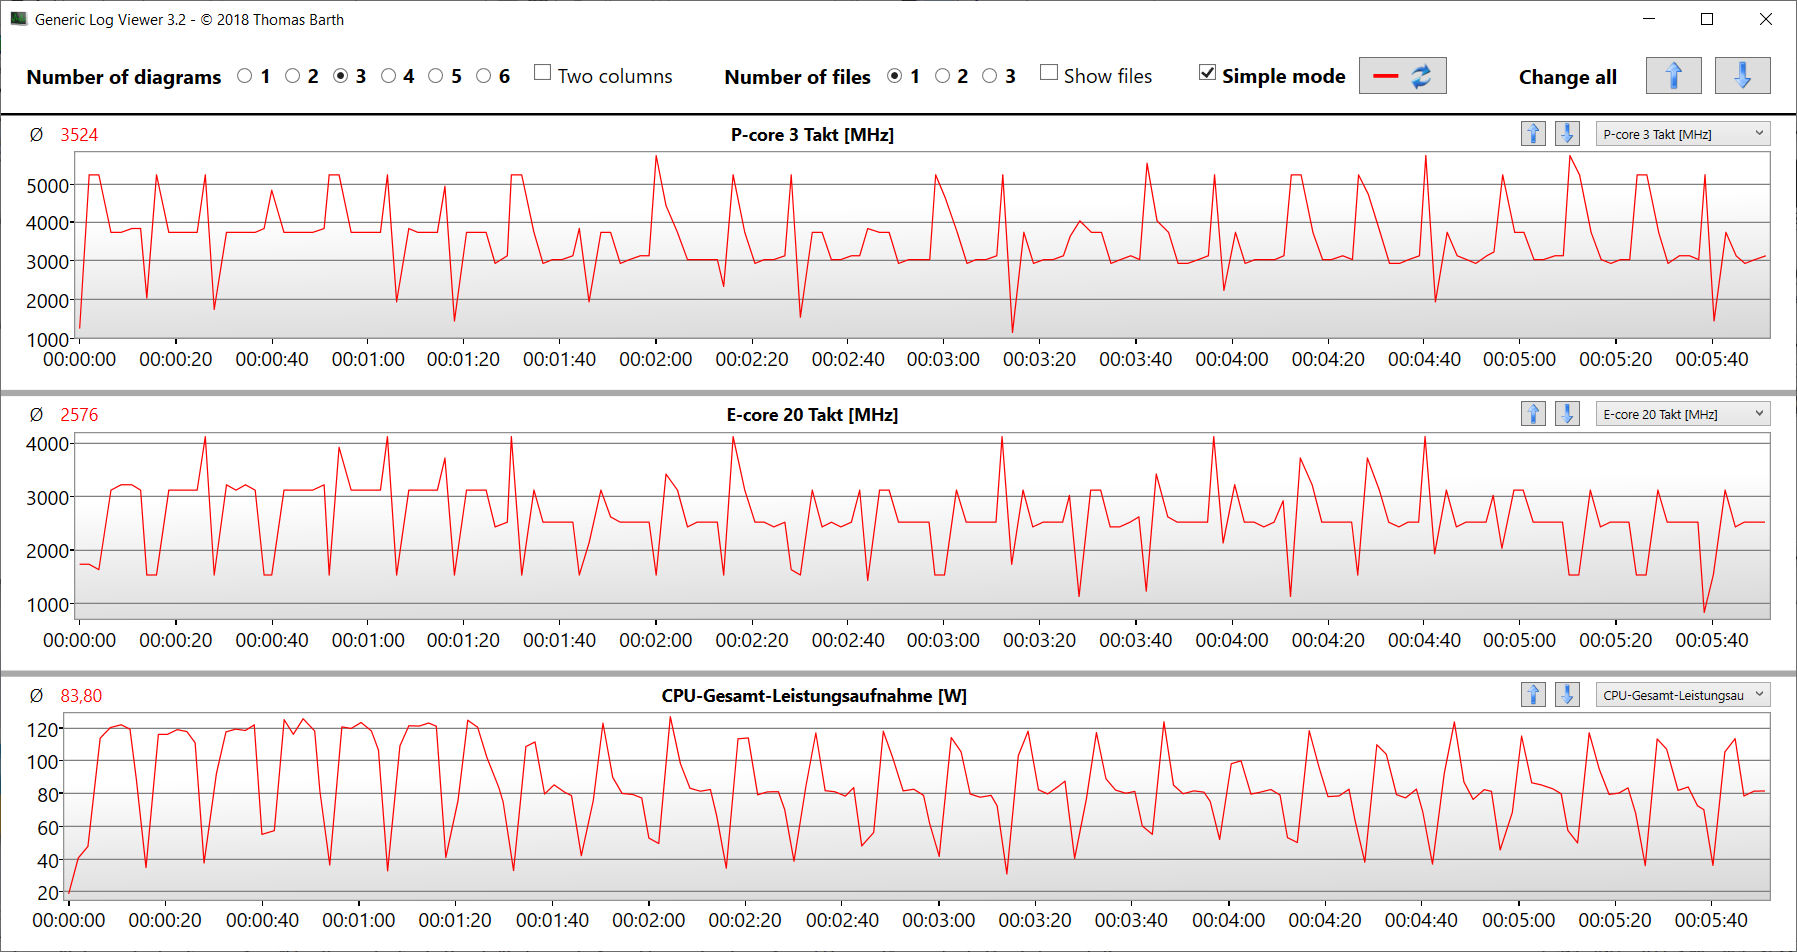
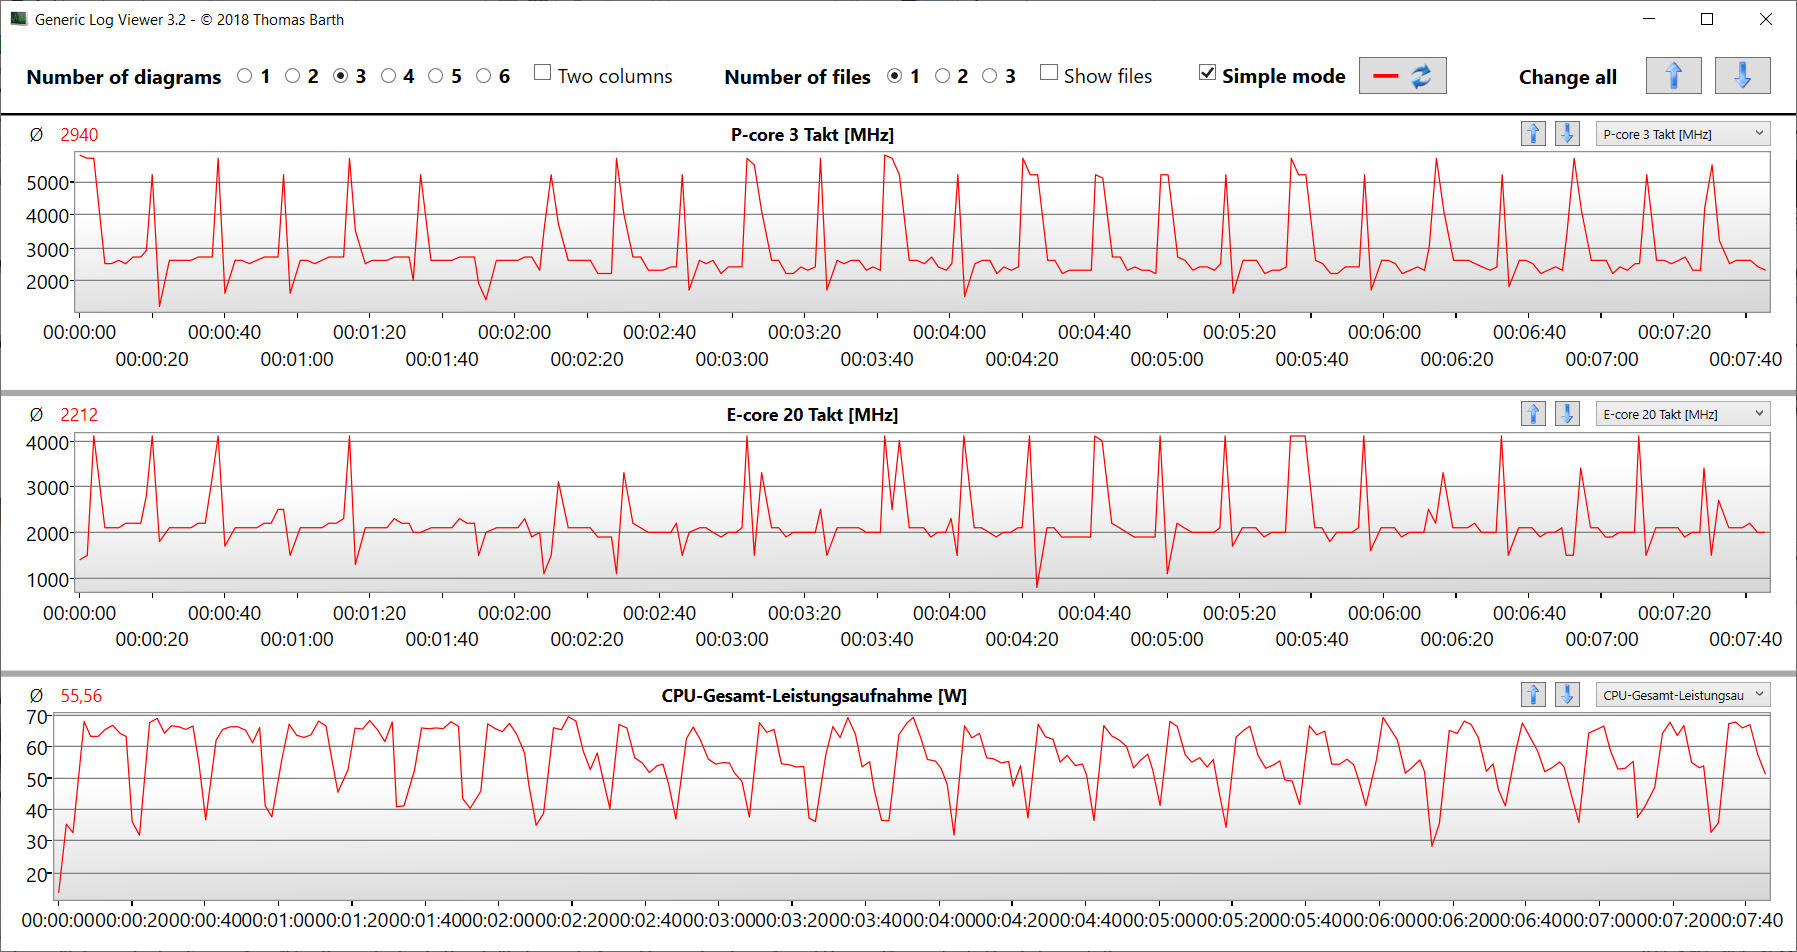
酷睿 i9-14900HX 的 24 个 CPU 内核(8P + 16E = 32 个线程 酷睿 i9-14900HX(Raptor Lake)的峰值时钟频率为 5.8 GHz(P)和 4.1 GHz(E)。该处理器以稳定的高时钟频率处理持续的多线程负载(循环运行 Cinebench 15)。在 "性能 "模式下,获得的基准测试成绩高于 CPU 的平均水平。在电池供电情况下,单线程性能下降不多(CB15 中为 307 分),但多线程性能却大幅下降(CB15 中为 2482 分)。
有关酷睿 i9 的更多信息,请参阅本分析 。
Cinebench R15 Multi Sustained load
* ... smaller is better
AIDA64: FP32 Ray-Trace | FPU Julia | CPU SHA3 | CPU Queen | FPU SinJulia | FPU Mandel | CPU AES | CPU ZLib | FP64 Ray-Trace | CPU PhotoWorxx
| Performance rating | |
| Alienware m16 R1 AMD | |
| MSI Vector 16 HX A14V | |
| Lenovo Legion Pro 7 16IRX9H | |
| Lenovo Legion Pro 7 16IRX8H | |
| Average of class Gaming | |
| Average Intel Core i9-14900HX | |
| HP Omen 16 (2024) | |
| AIDA64 / FP32 Ray-Trace | |
| Alienware m16 R1 AMD | |
| Average of class Gaming (10227 - 85542, n=105, last 2 years) | |
| MSI Vector 16 HX A14V | |
| Lenovo Legion Pro 7 16IRX9H | |
| Lenovo Legion Pro 7 16IRX8H | |
| Average Intel Core i9-14900HX (13098 - 33474, n=36) | |
| HP Omen 16 (2024) | |
| AIDA64 / FPU Julia | |
| Alienware m16 R1 AMD | |
| MSI Vector 16 HX A14V | |
| Average of class Gaming (51376 - 238426, n=105, last 2 years) | |
| Lenovo Legion Pro 7 16IRX9H | |
| Lenovo Legion Pro 7 16IRX8H | |
| Average Intel Core i9-14900HX (67573 - 166040, n=36) | |
| HP Omen 16 (2024) | |
| AIDA64 / CPU SHA3 | |
| Alienware m16 R1 AMD | |
| Lenovo Legion Pro 7 16IRX9H | |
| MSI Vector 16 HX A14V | |
| Lenovo Legion Pro 7 16IRX8H | |
| Average of class Gaming (2180 - 10115, n=105, last 2 years) | |
| Average Intel Core i9-14900HX (3589 - 7979, n=36) | |
| HP Omen 16 (2024) | |
| AIDA64 / CPU Queen | |
| Alienware m16 R1 AMD | |
| Lenovo Legion Pro 7 16IRX9H | |
| MSI Vector 16 HX A14V | |
| Average Intel Core i9-14900HX (118405 - 148966, n=36) | |
| Lenovo Legion Pro 7 16IRX8H | |
| HP Omen 16 (2024) | |
| Average of class Gaming (49785 - 173351, n=90, last 2 years) | |
| AIDA64 / FPU SinJulia | |
| Alienware m16 R1 AMD | |
| Lenovo Legion Pro 7 16IRX9H | |
| MSI Vector 16 HX A14V | |
| Lenovo Legion Pro 7 16IRX8H | |
| Average Intel Core i9-14900HX (10475 - 18517, n=36) | |
| Average of class Gaming (4424 - 33636, n=105, last 2 years) | |
| HP Omen 16 (2024) | |
| AIDA64 / FPU Mandel | |
| Alienware m16 R1 AMD | |
| Average of class Gaming (25115 - 128721, n=105, last 2 years) | |
| MSI Vector 16 HX A14V | |
| Lenovo Legion Pro 7 16IRX9H | |
| Lenovo Legion Pro 7 16IRX8H | |
| Average Intel Core i9-14900HX (32543 - 83662, n=36) | |
| HP Omen 16 (2024) | |
| AIDA64 / CPU AES | |
| Average Intel Core i9-14900HX (86964 - 241777, n=36) | |
| Lenovo Legion Pro 7 16IRX9H | |
| MSI Vector 16 HX A14V | |
| Lenovo Legion Pro 7 16IRX8H | |
| Alienware m16 R1 AMD | |
| Average of class Gaming (39258 - 247074, n=105, last 2 years) | |
| HP Omen 16 (2024) | |
| AIDA64 / CPU ZLib | |
| Lenovo Legion Pro 7 16IRX9H | |
| MSI Vector 16 HX A14V | |
| Lenovo Legion Pro 7 16IRX8H | |
| Average Intel Core i9-14900HX (1054 - 2292, n=36) | |
| Alienware m16 R1 AMD | |
| Average of class Gaming (574 - 2531, n=105, last 2 years) | |
| HP Omen 16 (2024) | |
| AIDA64 / FP64 Ray-Trace | |
| Alienware m16 R1 AMD | |
| Average of class Gaming (5509 - 45446, n=105, last 2 years) | |
| MSI Vector 16 HX A14V | |
| Lenovo Legion Pro 7 16IRX9H | |
| Lenovo Legion Pro 7 16IRX8H | |
| Average Intel Core i9-14900HX (6809 - 18349, n=36) | |
| HP Omen 16 (2024) | |
| AIDA64 / CPU PhotoWorxx | |
| HP Omen 16 (2024) | |
| MSI Vector 16 HX A14V | |
| Lenovo Legion Pro 7 16IRX8H | |
| Lenovo Legion Pro 7 16IRX9H | |
| Average Intel Core i9-14900HX (23903 - 54702, n=36) | |
| Average of class Gaming (12271 - 89891, n=105, last 2 years) | |
| Alienware m16 R1 AMD | |
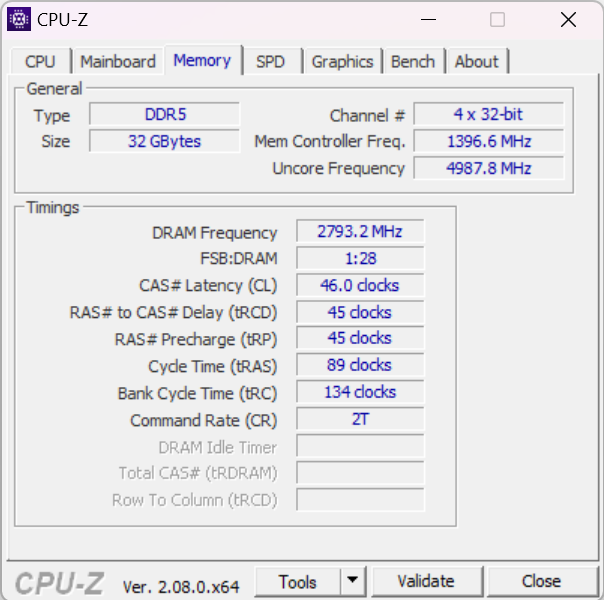
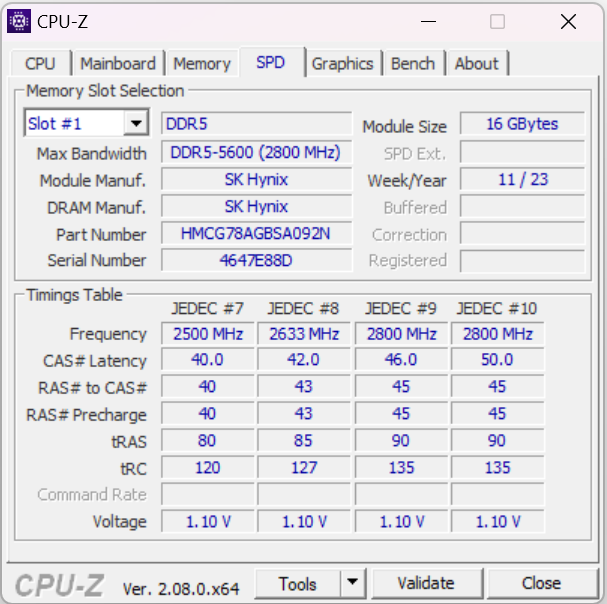
系统性能
运行流畅的系统并不缺乏计算性能。Legion Pro 7 可以毫不费力地处理游戏、流媒体和渲染等工作。内存的传输速率达到了 DDR5-5600 内存的正常水平。
CrossMark: Overall | Productivity | Creativity | Responsiveness
WebXPRT 3: Overall
WebXPRT 4: Overall
Mozilla Kraken 1.1: Total
| PCMark 10 / Score | |
| Lenovo Legion Pro 7 16IRX9H | |
| HP Omen 16 (2024) | |
| Alienware m16 R1 AMD | |
| Average Intel Core i9-14900HX, NVIDIA GeForce RTX 4080 Laptop GPU (7703 - 9223, n=7) | |
| MSI Vector 16 HX A14V | |
| Average of class Gaming (5828 - 12414, n=93, last 2 years) | |
| Lenovo Legion Pro 7 16IRX8H | |
| PCMark 10 / Essentials | |
| Lenovo Legion Pro 7 16IRX9H | |
| Lenovo Legion Pro 7 16IRX8H | |
| Average Intel Core i9-14900HX, NVIDIA GeForce RTX 4080 Laptop GPU (11255 - 12600, n=7) | |
| Alienware m16 R1 AMD | |
| MSI Vector 16 HX A14V | |
| HP Omen 16 (2024) | |
| Average of class Gaming (8810 - 11935, n=97, last 2 years) | |
| PCMark 10 / Productivity | |
| HP Omen 16 (2024) | |
| Lenovo Legion Pro 7 16IRX9H | |
| Average of class Gaming (6845 - 25323, n=95, last 2 years) | |
| Lenovo Legion Pro 7 16IRX8H | |
| Alienware m16 R1 AMD | |
| Average Intel Core i9-14900HX, NVIDIA GeForce RTX 4080 Laptop GPU (6662 - 11410, n=7) | |
| MSI Vector 16 HX A14V | |
| PCMark 10 / Digital Content Creation | |
| MSI Vector 16 HX A14V | |
| Alienware m16 R1 AMD | |
| Average Intel Core i9-14900HX, NVIDIA GeForce RTX 4080 Laptop GPU (14211 - 16246, n=7) | |
| HP Omen 16 (2024) | |
| Lenovo Legion Pro 7 16IRX9H | |
| Average of class Gaming (7602 - 19954, n=95, last 2 years) | |
| Lenovo Legion Pro 7 16IRX8H | |
| CrossMark / Overall | |
| Lenovo Legion Pro 7 16IRX9H | |
| HP Omen 16 (2024) | |
| MSI Vector 16 HX A14V | |
| Average Intel Core i9-14900HX, NVIDIA GeForce RTX 4080 Laptop GPU (1992 - 2334, n=7) | |
| Alienware m16 R1 AMD | |
| Average of class Gaming (1366 - 2409, n=94, last 2 years) | |
| CrossMark / Productivity | |
| Lenovo Legion Pro 7 16IRX9H | |
| HP Omen 16 (2024) | |
| MSI Vector 16 HX A14V | |
| Average Intel Core i9-14900HX, NVIDIA GeForce RTX 4080 Laptop GPU (1812 - 2204, n=7) | |
| Alienware m16 R1 AMD | |
| Average of class Gaming (1386 - 2254, n=94, last 2 years) | |
| CrossMark / Creativity | |
| Lenovo Legion Pro 7 16IRX9H | |
| MSI Vector 16 HX A14V | |
| Average Intel Core i9-14900HX, NVIDIA GeForce RTX 4080 Laptop GPU (2327 - 2500, n=7) | |
| HP Omen 16 (2024) | |
| Average of class Gaming (1343 - 2786, n=94, last 2 years) | |
| Alienware m16 R1 AMD | |
| CrossMark / Responsiveness | |
| Lenovo Legion Pro 7 16IRX9H | |
| HP Omen 16 (2024) | |
| MSI Vector 16 HX A14V | |
| Average Intel Core i9-14900HX, NVIDIA GeForce RTX 4080 Laptop GPU (1520 - 2254, n=7) | |
| Alienware m16 R1 AMD | |
| Average of class Gaming (1226 - 2334, n=94, last 2 years) | |
| WebXPRT 3 / Overall | |
| Lenovo Legion Pro 7 16IRX8H | |
| Lenovo Legion Pro 7 16IRX8H | |
| Alienware m16 R1 AMD | |
| Lenovo Legion Pro 7 16IRX9H | |
| Average Intel Core i9-14900HX, NVIDIA GeForce RTX 4080 Laptop GPU (310 - 345, n=7) | |
| HP Omen 16 (2024) | |
| MSI Vector 16 HX A14V | |
| Average of class Gaming (220 - 532, n=98, last 2 years) | |
| WebXPRT 4 / Overall | |
| Lenovo Legion Pro 7 16IRX9H | |
| Average Intel Core i9-14900HX, NVIDIA GeForce RTX 4080 Laptop GPU (300 - 321, n=7) | |
| HP Omen 16 (2024) | |
| Lenovo Legion Pro 7 16IRX8H | |
| MSI Vector 16 HX A14V | |
| Average of class Gaming (165 - 354, n=98, last 2 years) | |
| Alienware m16 R1 AMD | |
| Mozilla Kraken 1.1 / Total | |
| Alienware m16 R1 AMD | |
| Average of class Gaming (391 - 590, n=100, last 2 years) | |
| Lenovo Legion Pro 7 16IRX8H | |
| Lenovo Legion Pro 7 16IRX8H | |
| MSI Vector 16 HX A14V | |
| Average Intel Core i9-14900HX, NVIDIA GeForce RTX 4080 Laptop GPU (437 - 446, n=7) | |
| Lenovo Legion Pro 7 16IRX9H | |
| HP Omen 16 (2024) | |
* ... smaller is better
| PCMark 10 Score | 8923 points | |
Help | ||
| AIDA64 / Memory Copy | |
| HP Omen 16 (2024) | |
| Lenovo Legion Pro 7 16IRX9H | |
| MSI Vector 16 HX A14V | |
| Average Intel Core i9-14900HX (38028 - 83392, n=36) | |
| Average of class Gaming (21750 - 129946, n=105, last 2 years) | |
| Alienware m16 R1 AMD | |
| AIDA64 / Memory Read | |
| HP Omen 16 (2024) | |
| Lenovo Legion Pro 7 16IRX9H | |
| MSI Vector 16 HX A14V | |
| Average Intel Core i9-14900HX (43306 - 87568, n=36) | |
| Average of class Gaming (22956 - 118858, n=105, last 2 years) | |
| Alienware m16 R1 AMD | |
| AIDA64 / Memory Write | |
| HP Omen 16 (2024) | |
| MSI Vector 16 HX A14V | |
| Average of class Gaming (22297 - 135096, n=105, last 2 years) | |
| Average Intel Core i9-14900HX (37146 - 80589, n=36) | |
| Lenovo Legion Pro 7 16IRX9H | |
| Alienware m16 R1 AMD | |
| AIDA64 / Memory Latency | |
| Average of class Gaming (75.3 - 259, n=105, last 2 years) | |
| Alienware m16 R1 AMD | |
| Average Intel Core i9-14900HX (76.1 - 105, n=36) | |
| HP Omen 16 (2024) | |
| MSI Vector 16 HX A14V | |
| Lenovo Legion Pro 7 16IRX9H | |
* ... smaller is better
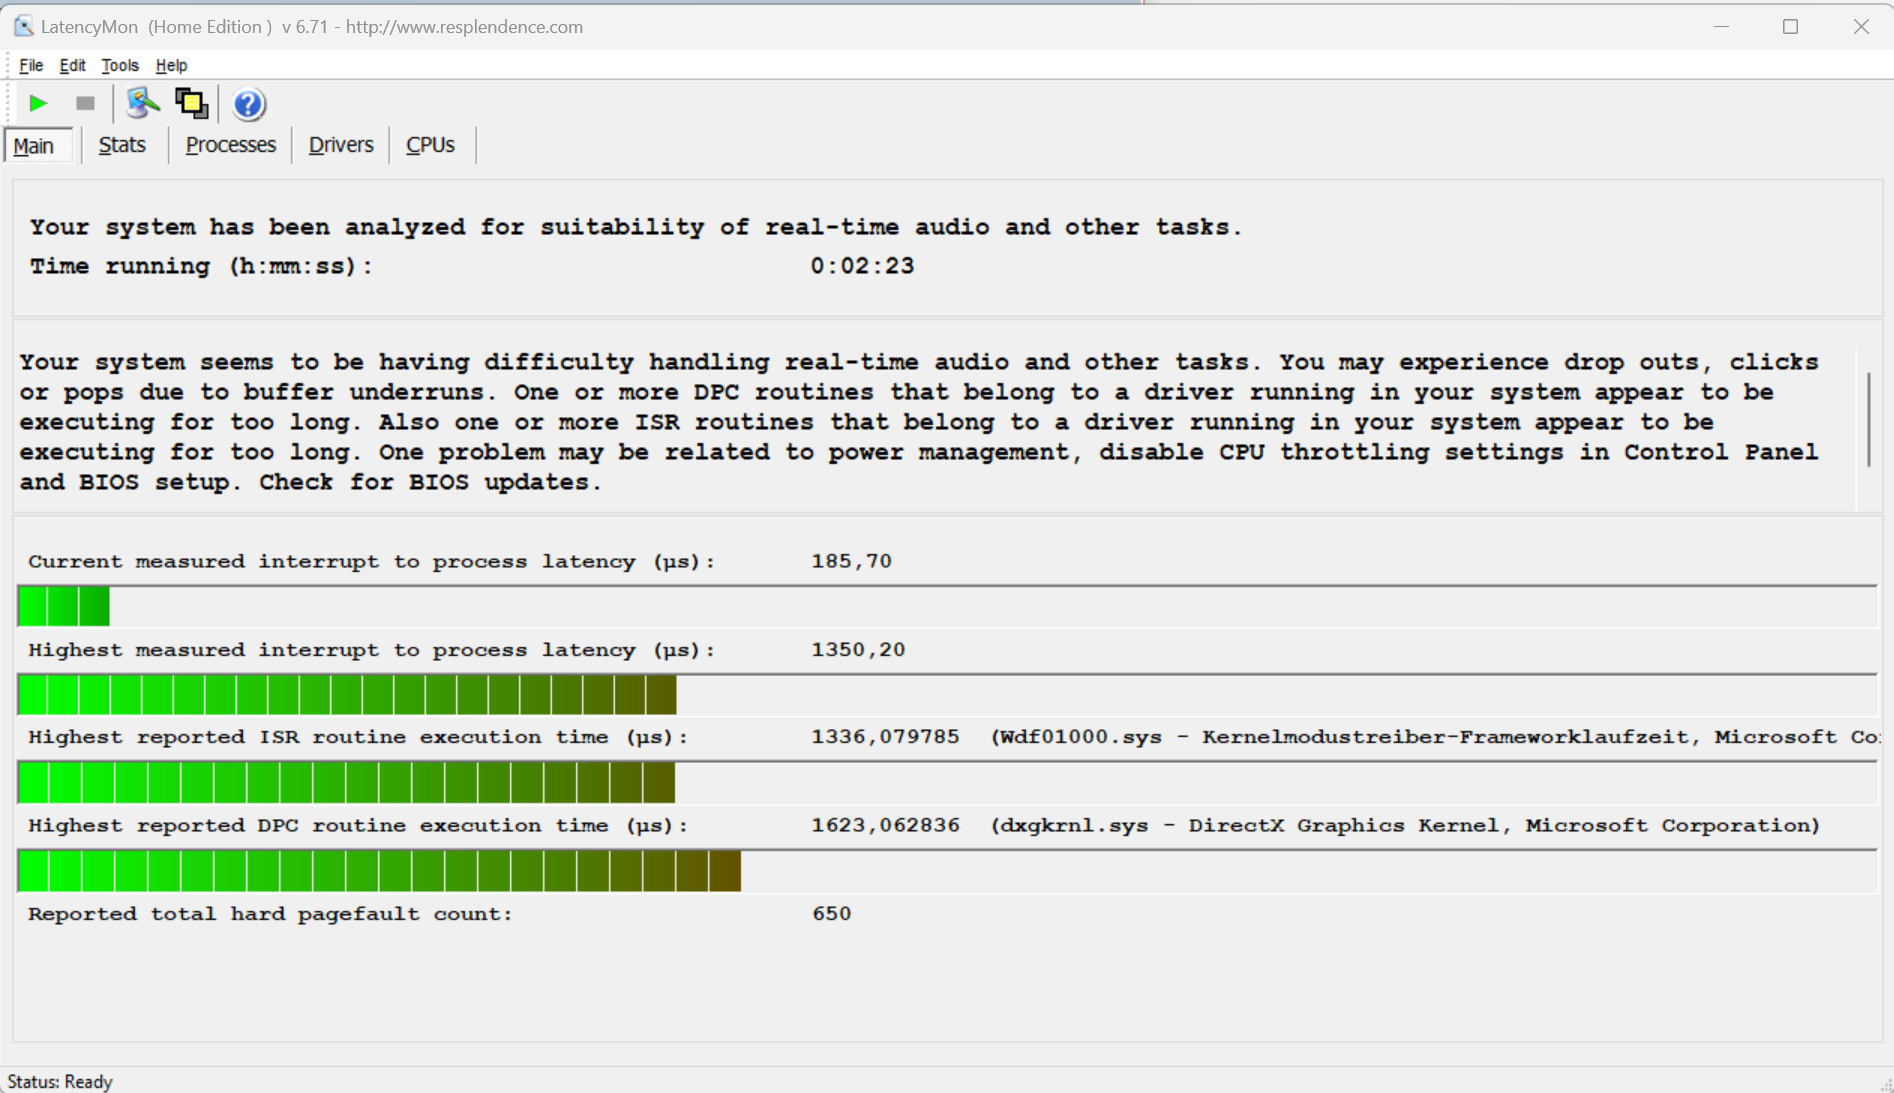
DPC 延迟
延迟监控器在延迟测试中发现了一些问题(网页浏览、4K 视频播放、Prime95 高负载)。该系统似乎不适合实时视频和音频任务。希望未来的软件更新能改善这一状况。
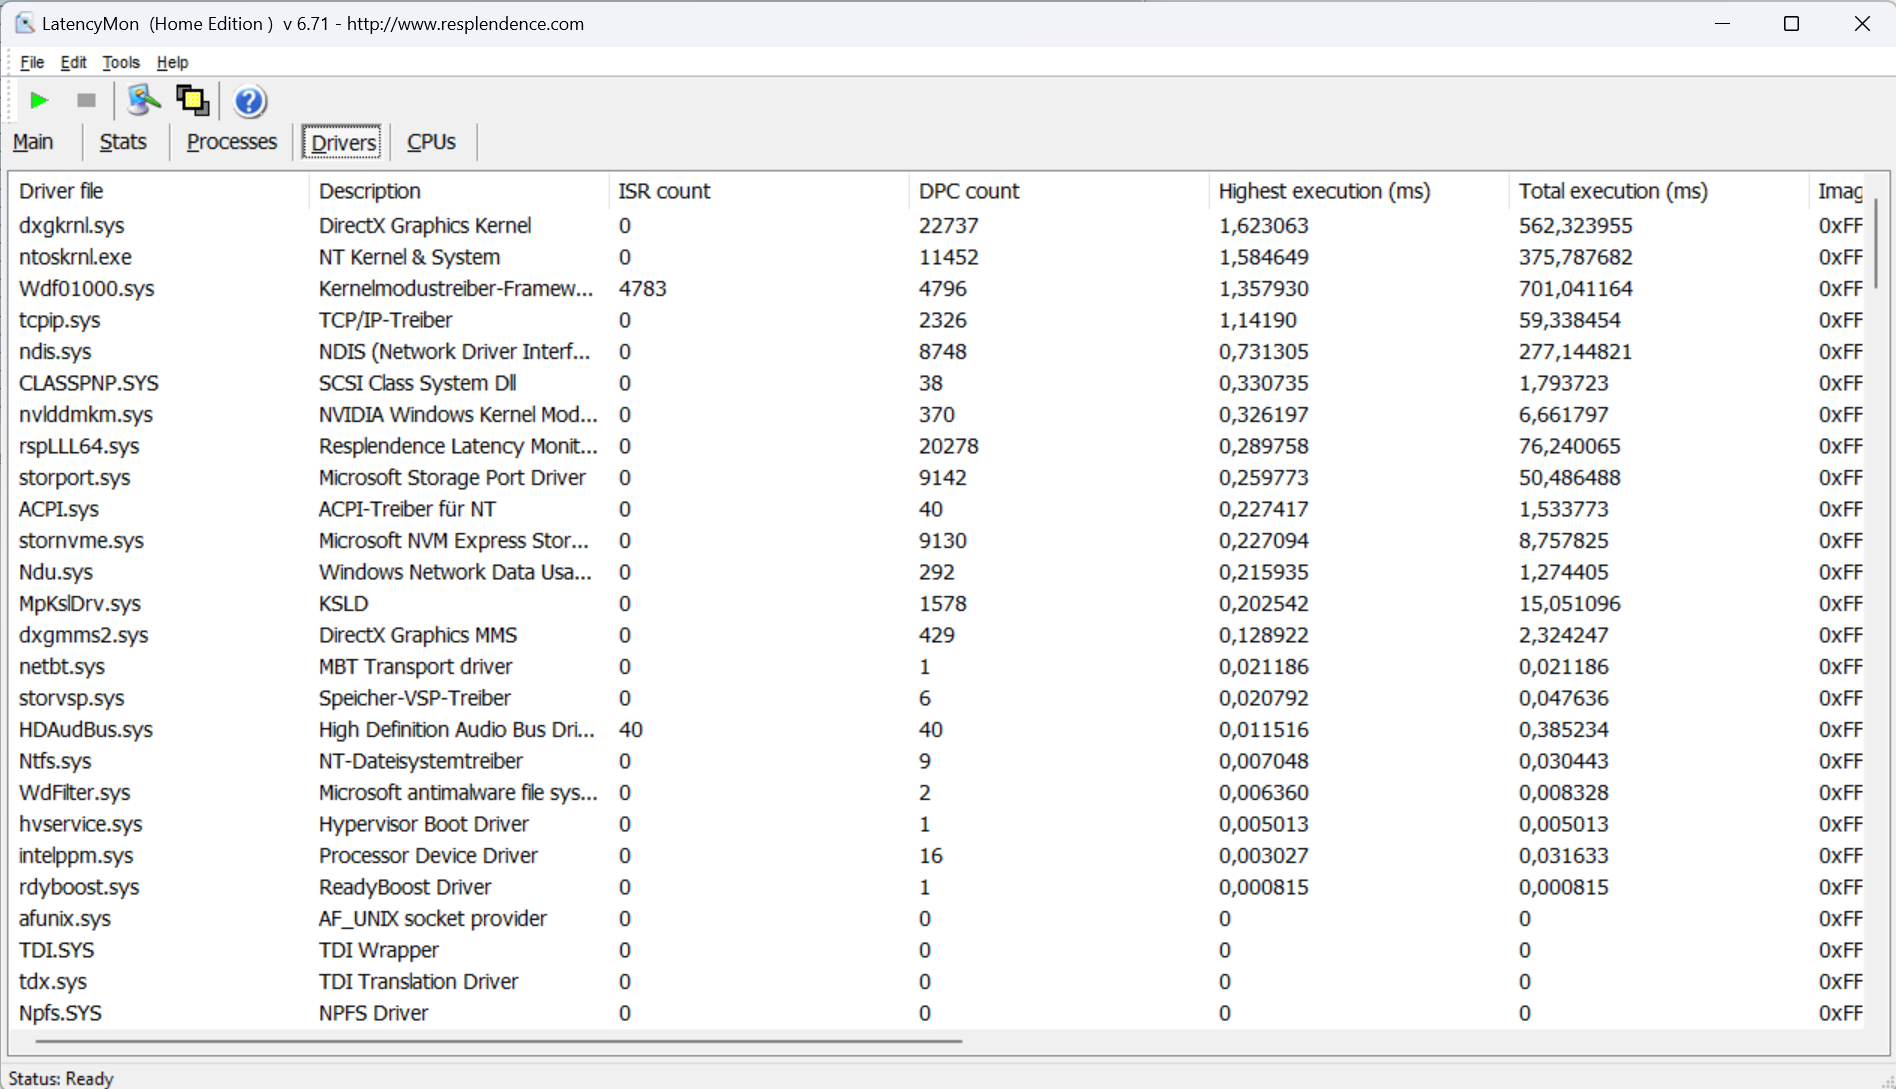
| DPC Latencies / LatencyMon - interrupt to process latency (max), Web, Youtube, Prime95 | |
| Alienware m16 R1 AMD | |
| MSI Vector 16 HX A14V | |
| Lenovo Legion Pro 7 16IRX9H | |
| HP Omen 16 (2024) | |
| Lenovo Legion Pro 7 16IRX8H | |
* ... smaller is better
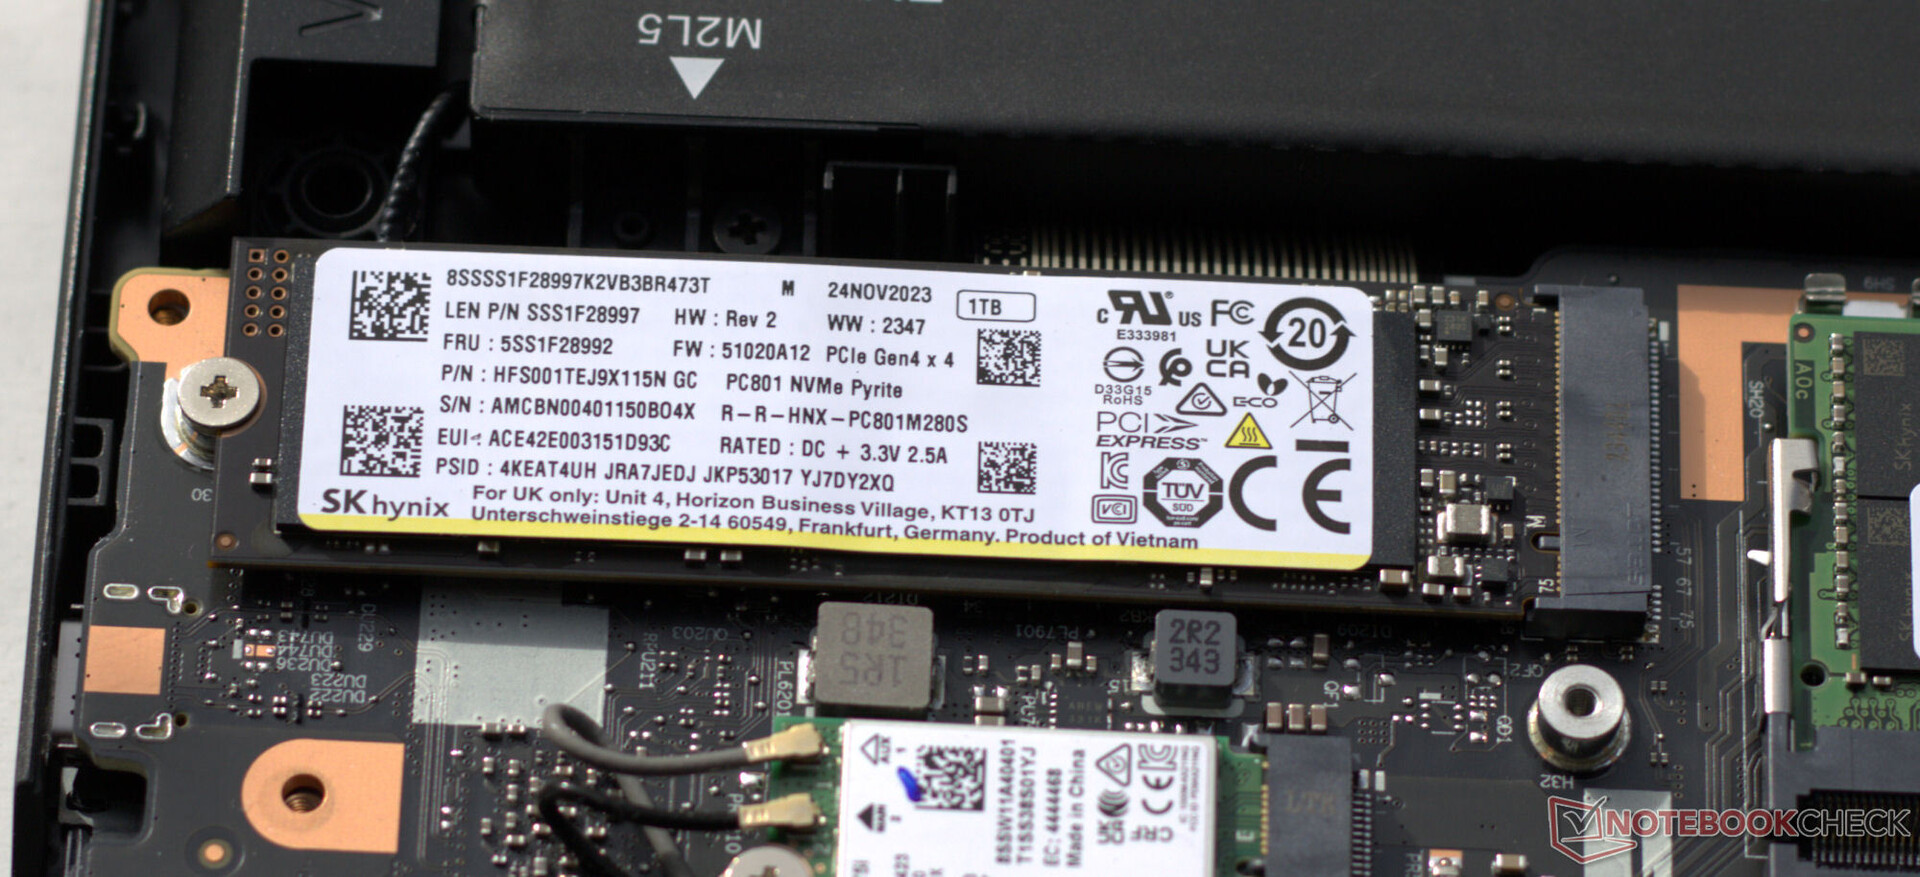
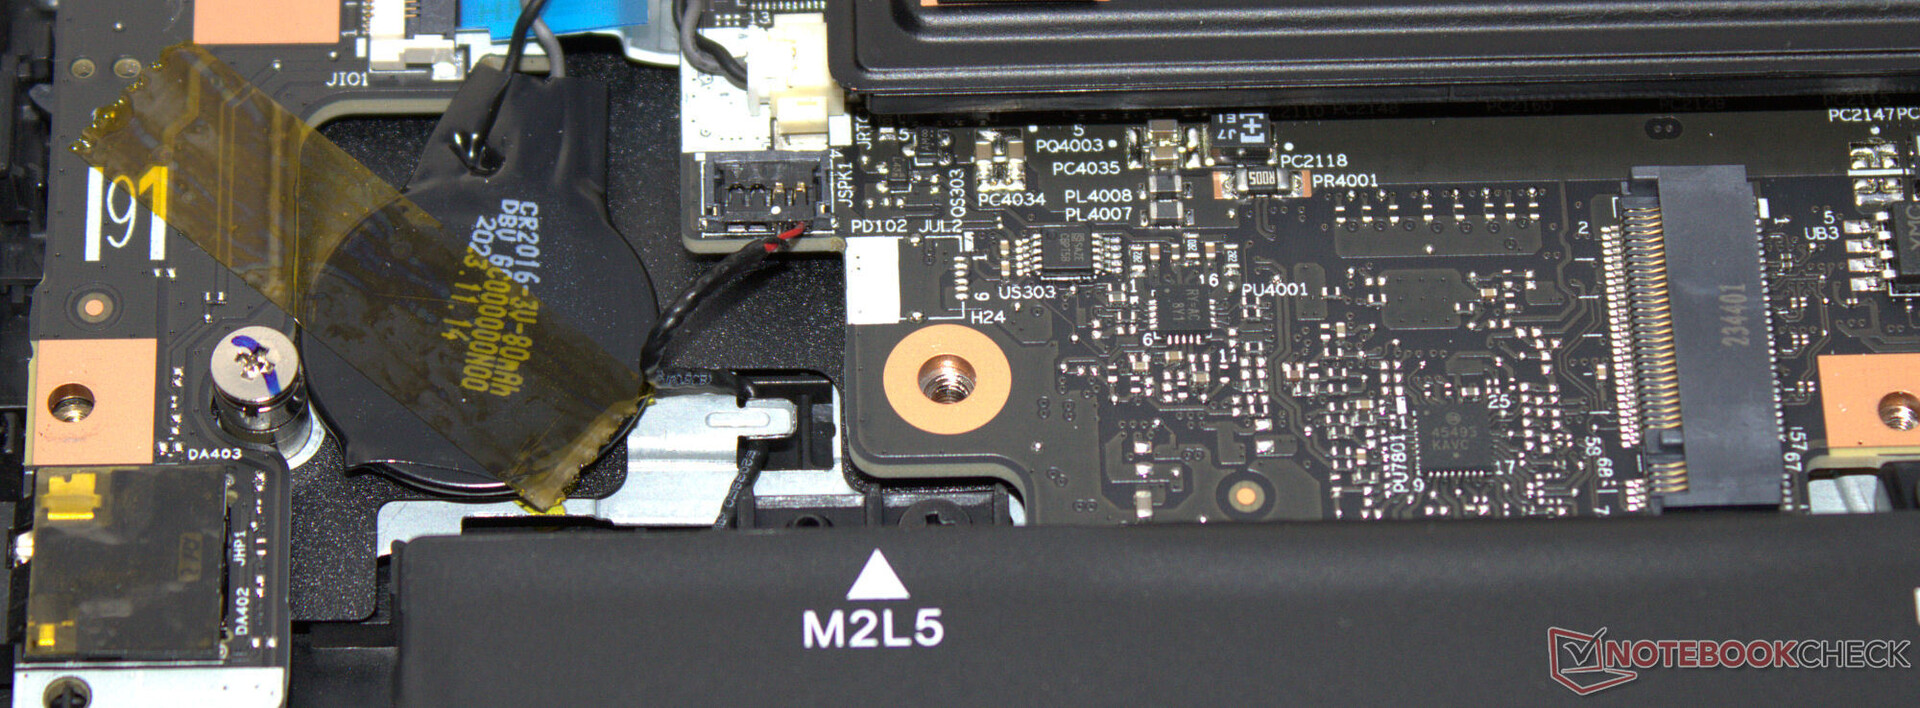
大容量存储器
Legion 可容纳两个 PCIe 4.0 固态硬盘。我们评测设备中的 SK Hynix M.2 2280 SSD(1TB)读写速度极佳。另一个积极的方面是,在我们的测试过程中没有出现热节流现象。

* ... smaller is better
Sustained load Read: DiskSpd Read Loop, Queue Depth 8
图形卡
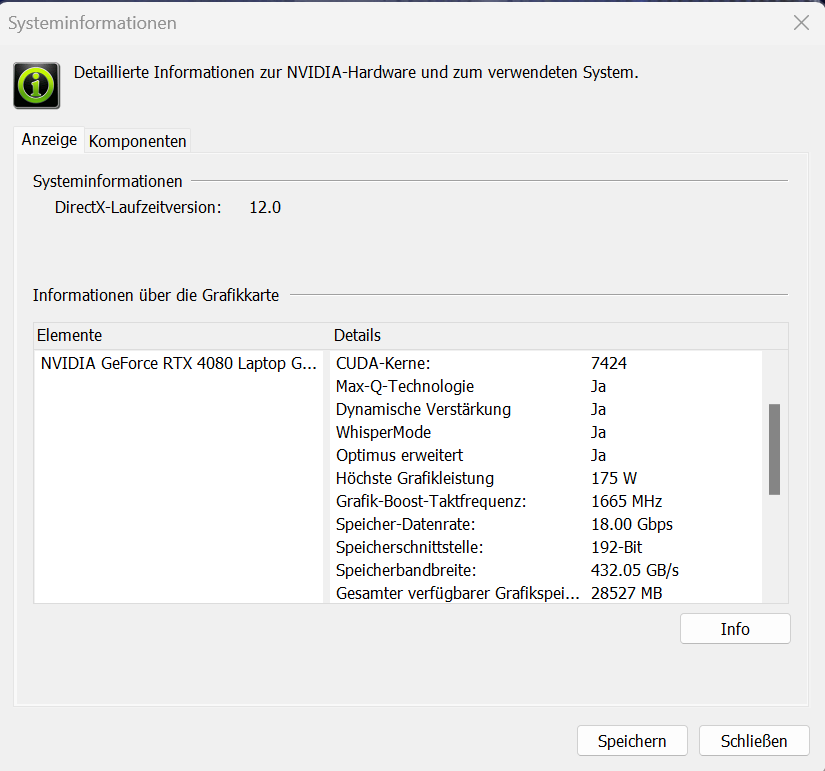
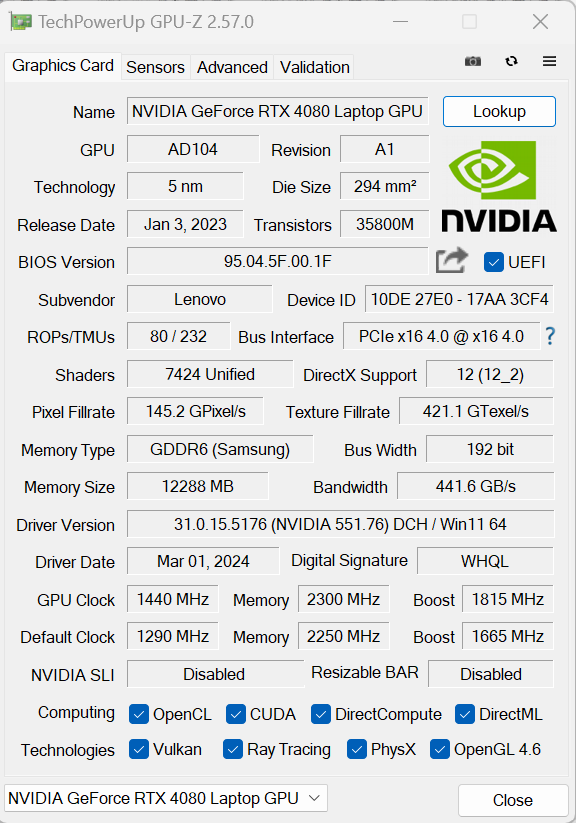
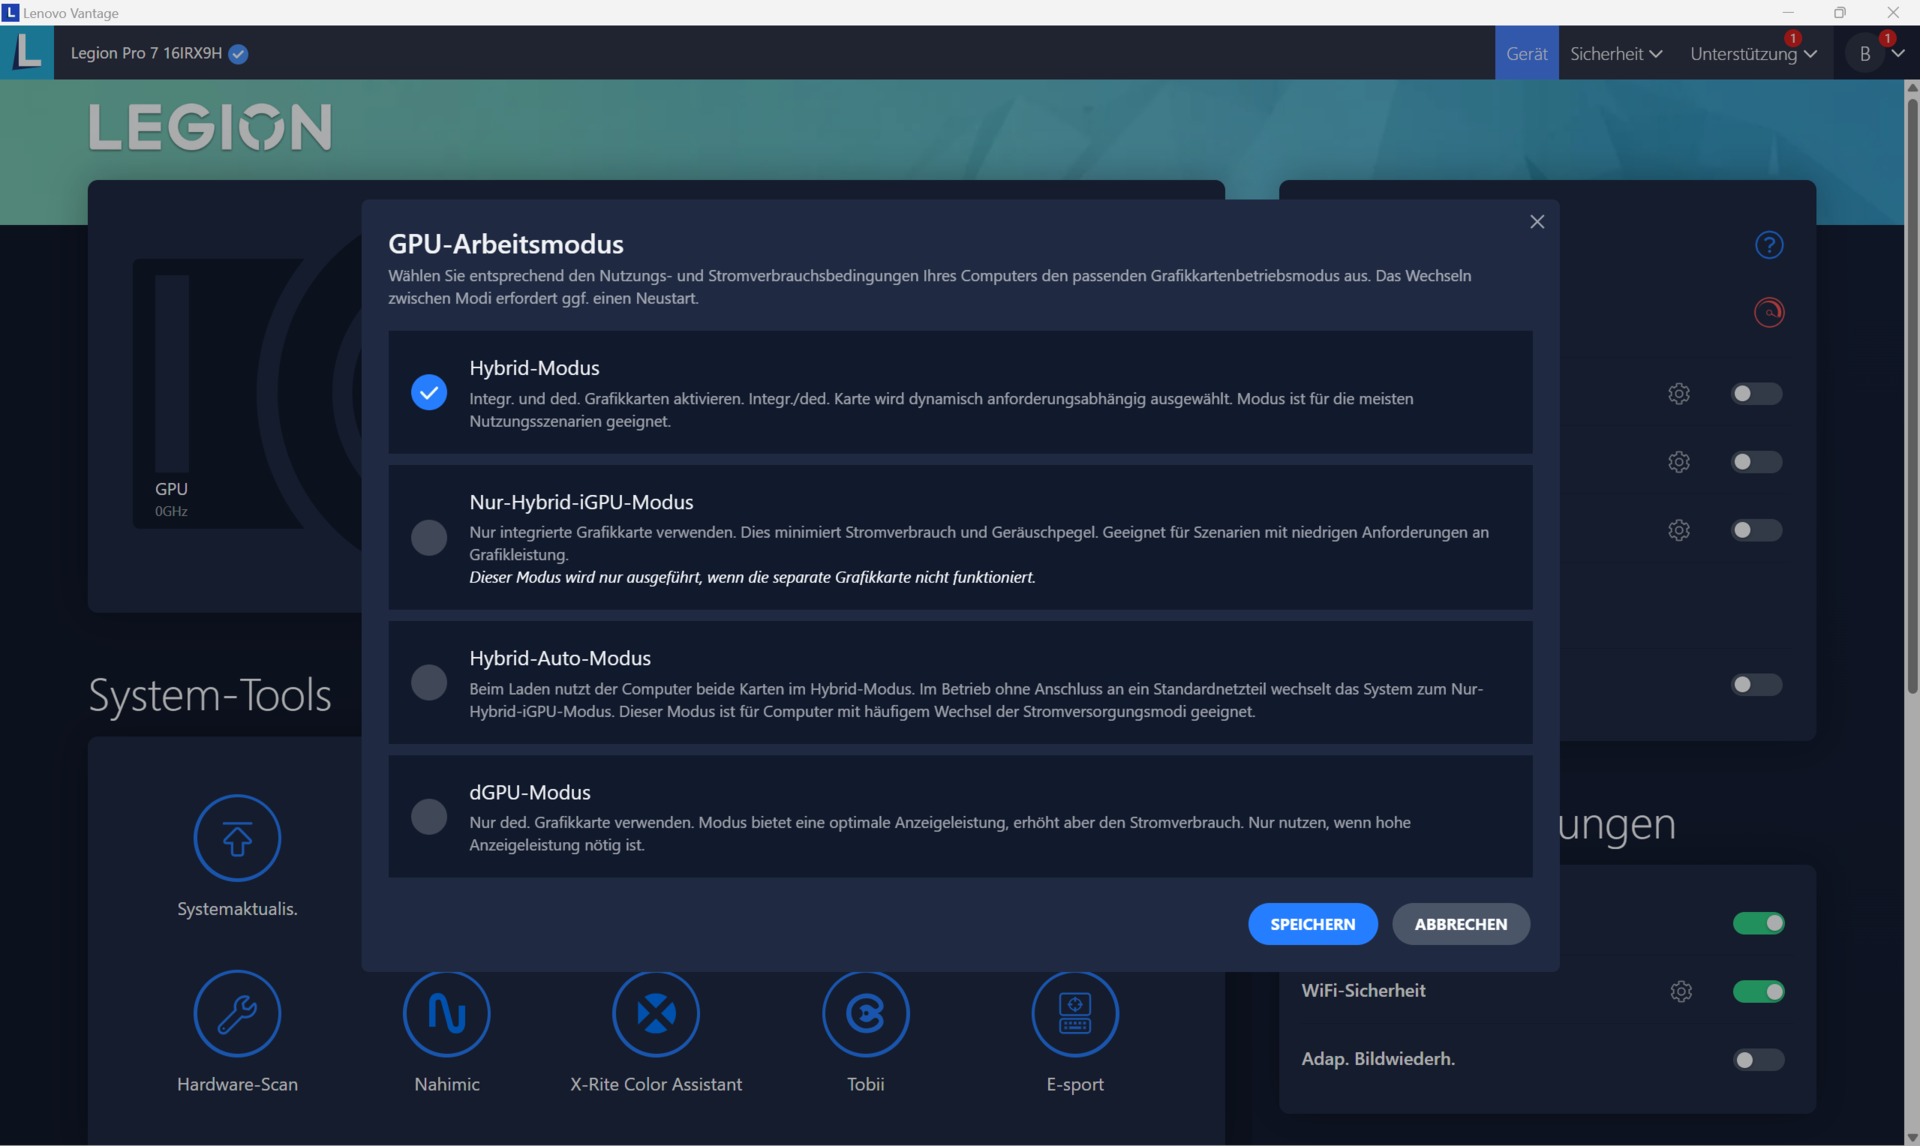
联想为Legion Pro 7 配备了 GeForce RTX 4080(7424 个着色单元、192 位内存总线、12 GB GDDR6、175 瓦),这是目前 Nvidia 移动 GPU 阵容中的第二名。我们在测试中获得的基准分数和帧率都高于 RTX 4080 Laptop 的平均水平。其中一些成绩是我们迄今为止从 RTX 4080 上看到的最好成绩。在纯 dGPU 模式和 Optimus 模式之间切换无需重启;还支持高级 Optimus。
该显卡性能强劲,足以在高至最高设置下运行 QHD 游戏。在 DLSS 3 和 Frame Generation 的帮助下,您还可以在最大设置和启用光线追踪的情况下获得更高分辨率,但仅限于支持这些功能的游戏。
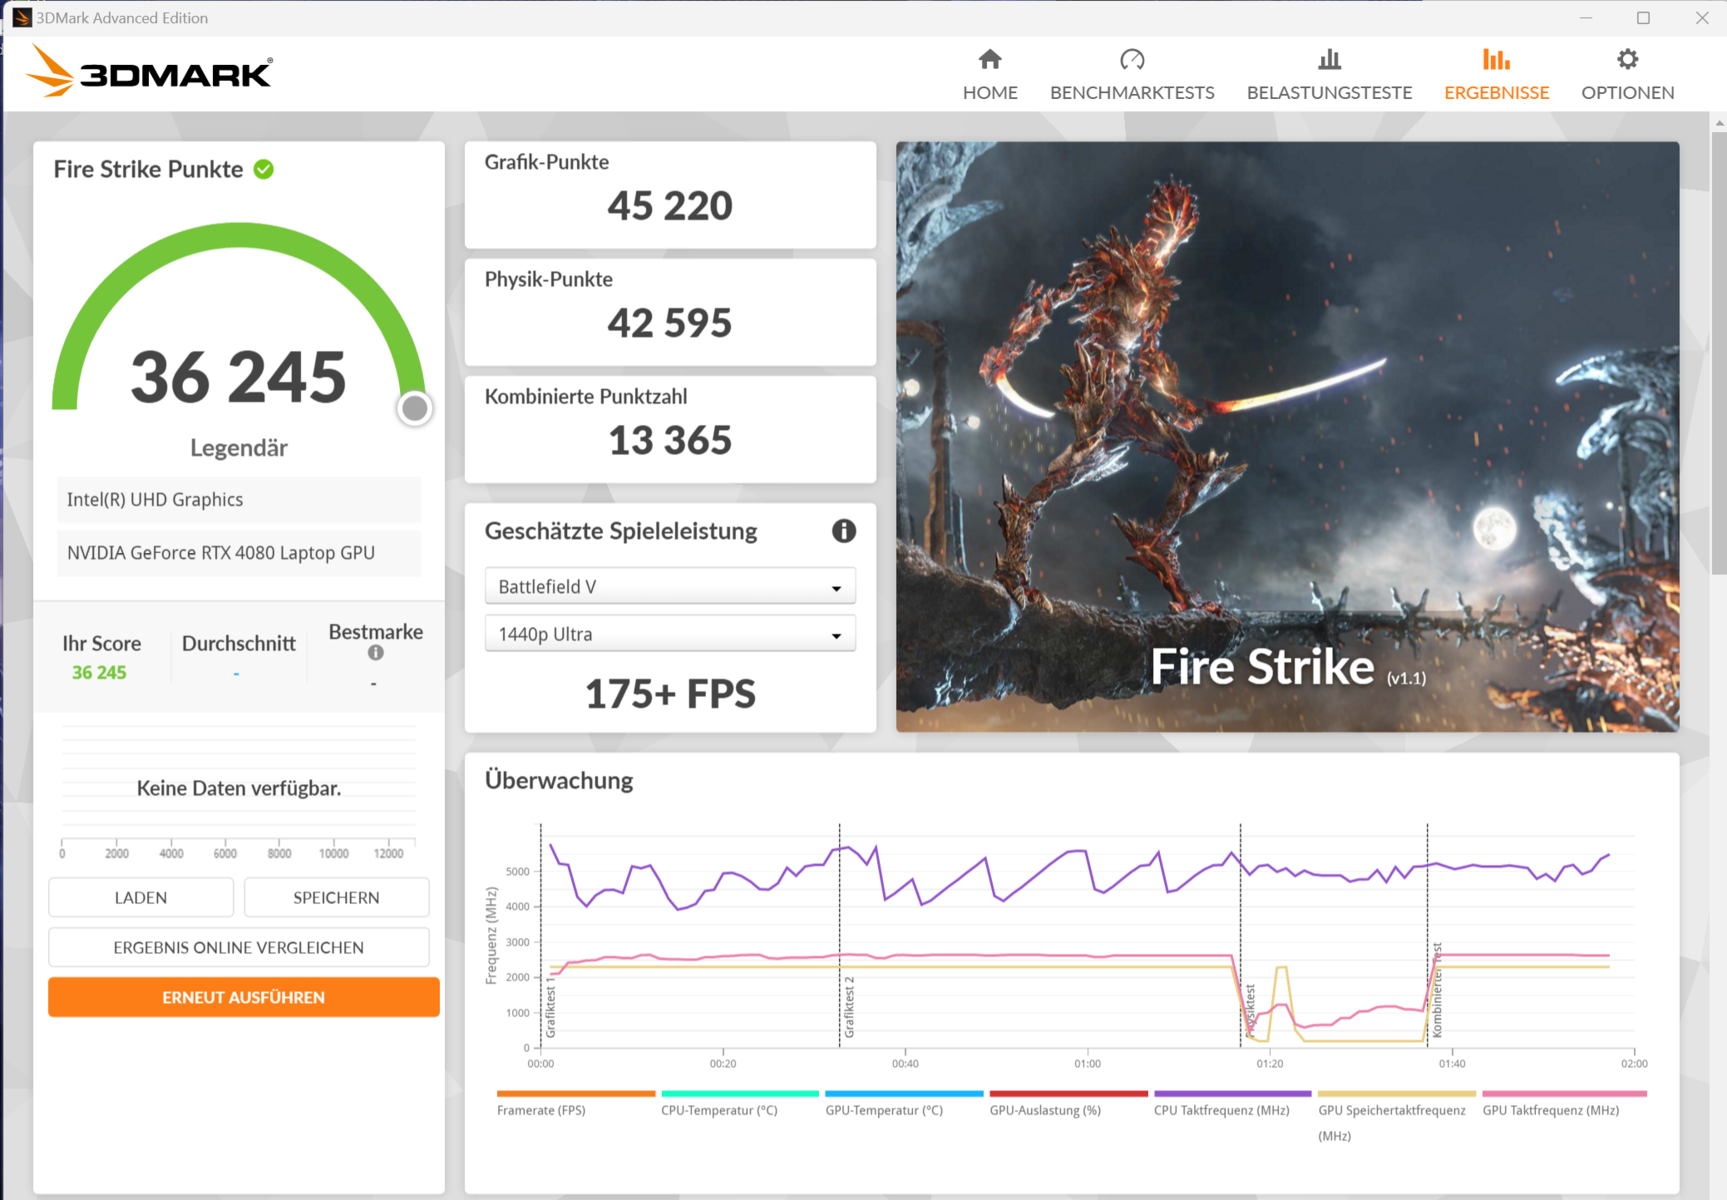
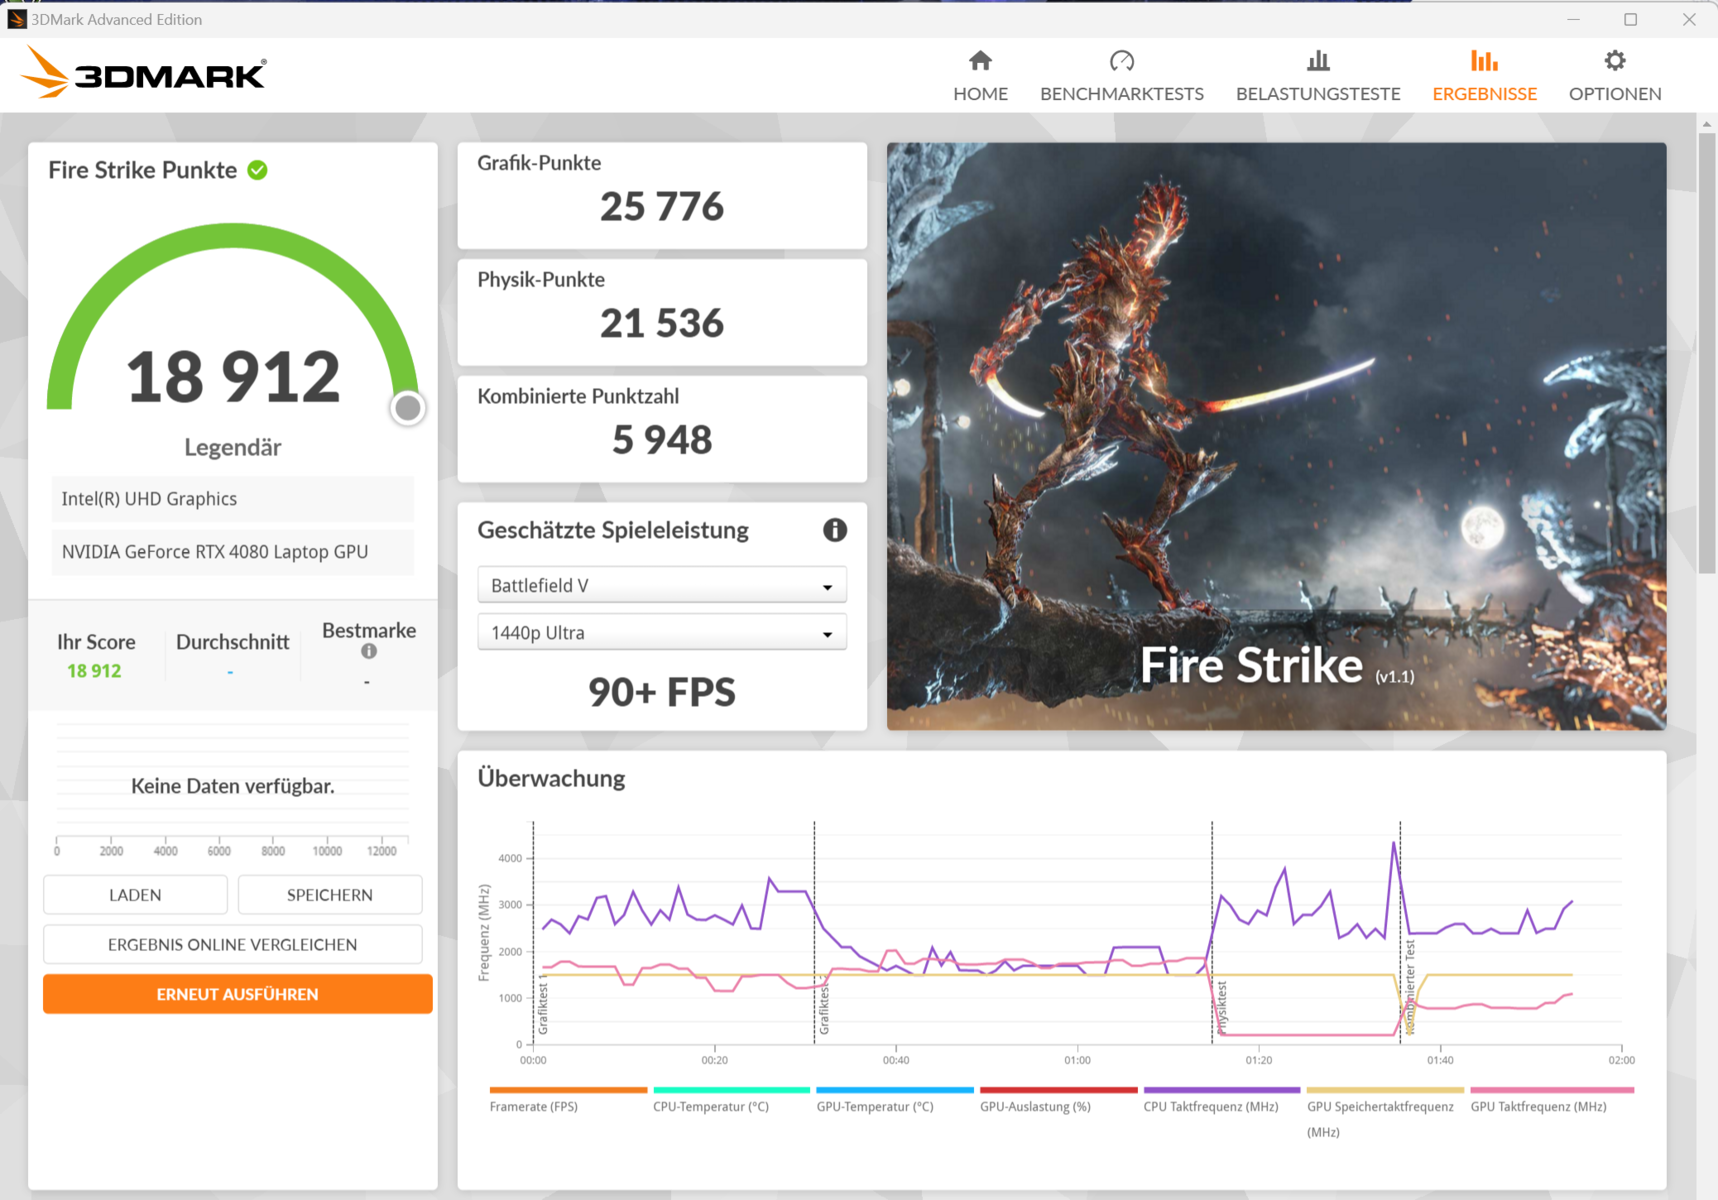
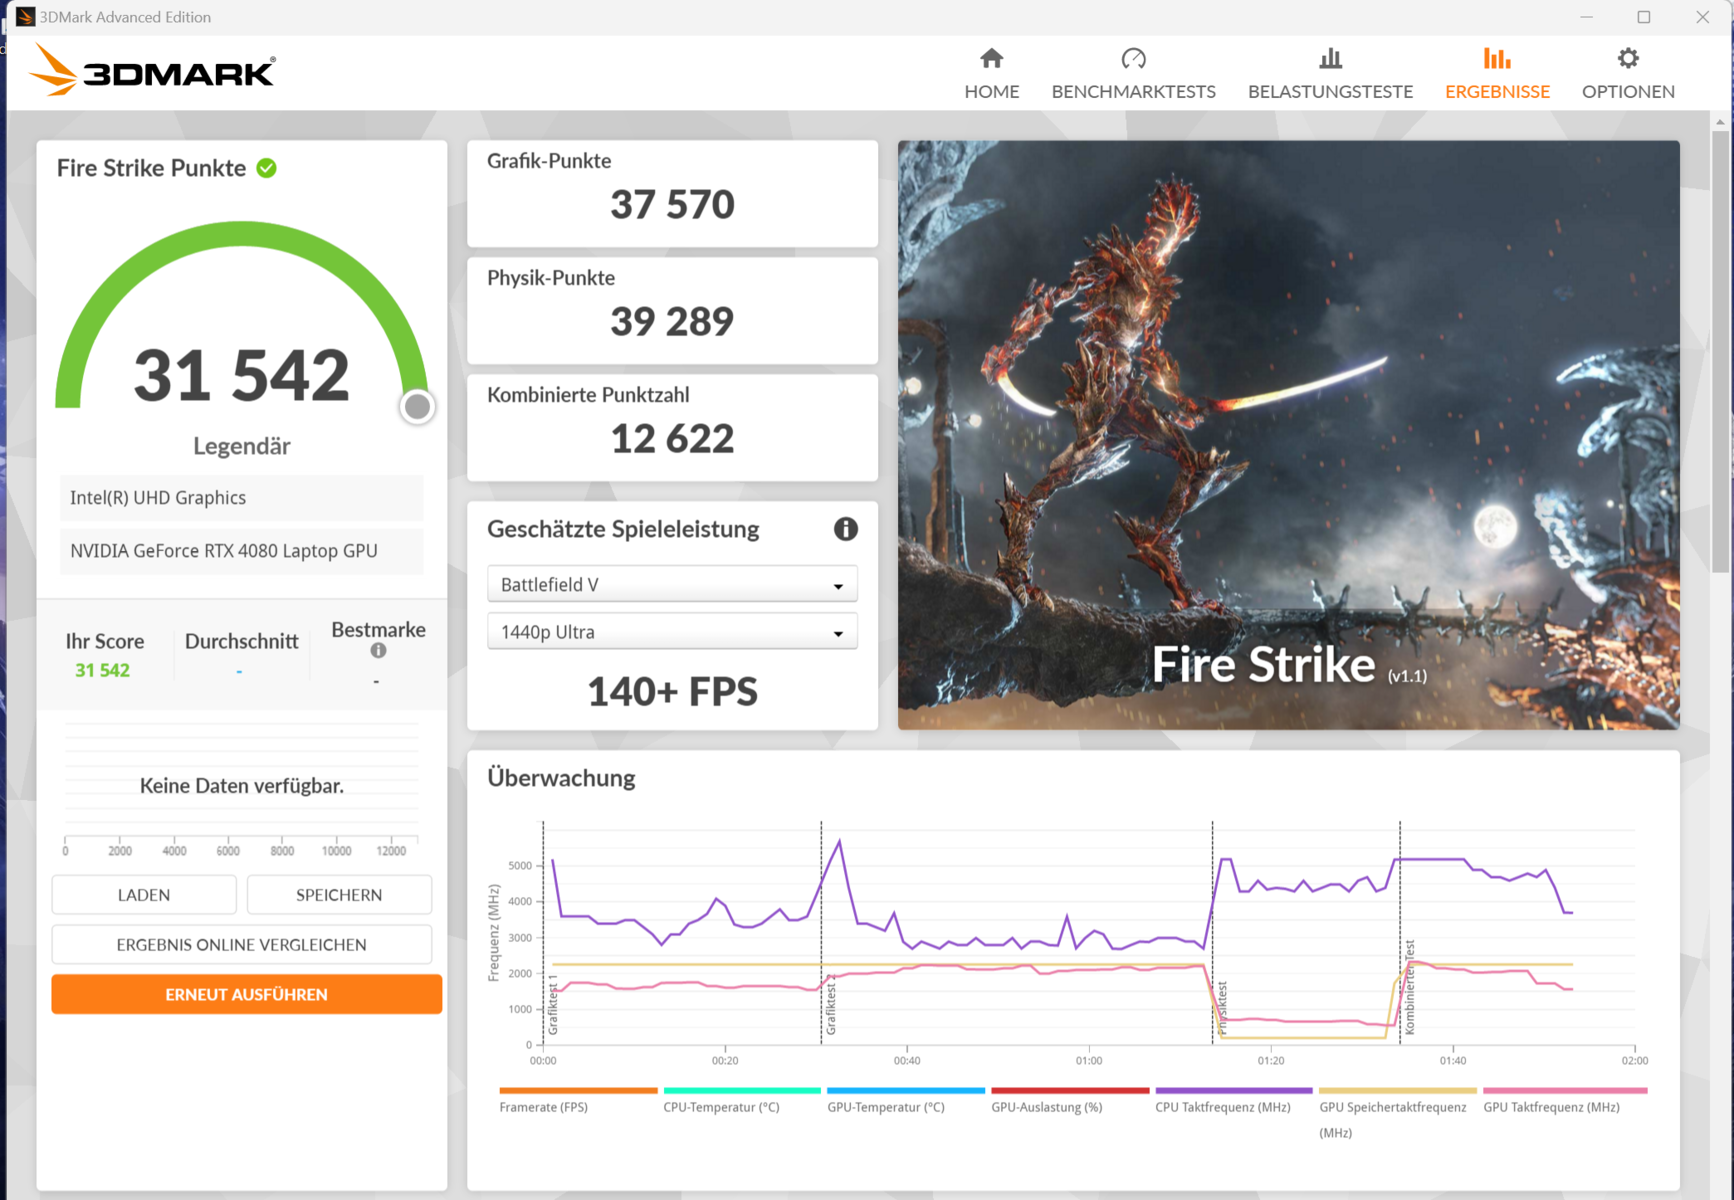
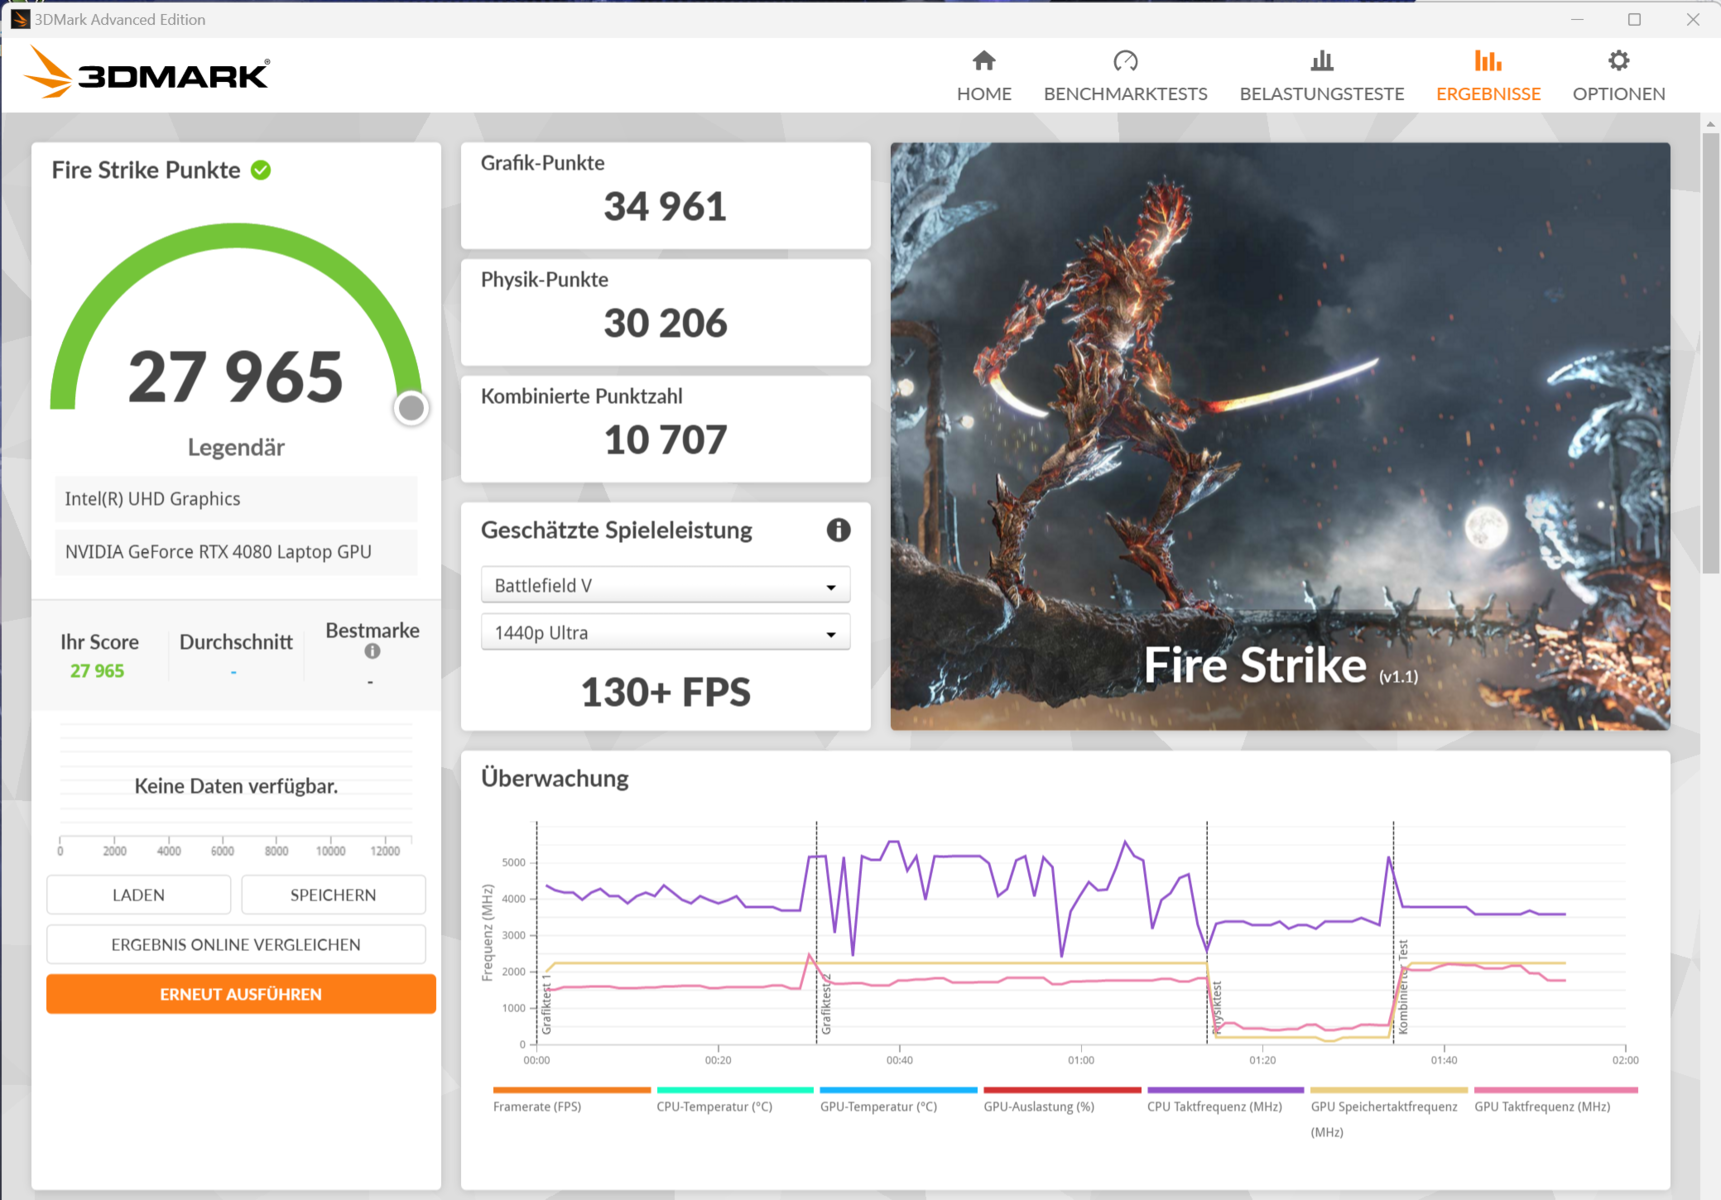
| 3DMark 11 Performance | 46847 points | |
| 3DMark Fire Strike Score | 36245 points | |
| 3DMark Time Spy Score | 19518 points | |
Help | ||
* ... smaller is better
| Performance rating - Percent | |
| Lenovo Legion Pro 7 16IRX9H | |
| MSI Vector 16 HX A14V | |
| Alienware m16 R1 AMD -1! | |
| Average NVIDIA GeForce RTX 4080 Laptop GPU | |
| Average of class Gaming | |
| HP Omen 16 (2024) | |
| The Witcher 3 - 1920x1080 Ultra Graphics & Postprocessing (HBAO+) | |
| Average of class Gaming (104.7 - 240, n=6, last 2 years) | |
| Lenovo Legion Pro 7 16IRX9H | |
| MSI Vector 16 HX A14V | |
| Alienware m16 R1 AMD | |
| Average NVIDIA GeForce RTX 4080 Laptop GPU (130.4 - 186.1, n=20) | |
| HP Omen 16 (2024) | |
| GTA V - 1920x1080 Highest AA:4xMSAA + FX AF:16x | |
| Lenovo Legion Pro 7 16IRX9H | |
| MSI Vector 16 HX A14V | |
| Average of class Gaming (48.3 - 186.9, n=93, last 2 years) | |
| Average NVIDIA GeForce RTX 4080 Laptop GPU (102.9 - 152.7, n=21) | |
| HP Omen 16 (2024) | |
| Final Fantasy XV Benchmark - 1920x1080 High Quality | |
| MSI Vector 16 HX A14V | |
| Lenovo Legion Pro 7 16IRX9H | |
| Alienware m16 R1 AMD | |
| Average NVIDIA GeForce RTX 4080 Laptop GPU (129 - 182.1, n=23) | |
| Average of class Gaming (41 - 215, n=95, last 2 years) | |
| HP Omen 16 (2024) | |
| Strange Brigade - 1920x1080 ultra AA:ultra AF:16 | |
| Alienware m16 R1 AMD | |
| MSI Vector 16 HX A14V | |
| Lenovo Legion Pro 7 16IRX9H | |
| Average NVIDIA GeForce RTX 4080 Laptop GPU (239 - 357, n=22) | |
| Average of class Gaming (76.3 - 456, n=86, last 2 years) | |
| HP Omen 16 (2024) | |
| Dota 2 Reborn - 1920x1080 ultra (3/3) best looking | |
| Lenovo Legion Pro 7 16IRX9H | |
| MSI Vector 16 HX A14V | |
| Alienware m16 R1 AMD | |
| Average NVIDIA GeForce RTX 4080 Laptop GPU (133 - 194.7, n=23) | |
| HP Omen 16 (2024) | |
| Average of class Gaming (84.8 - 248, n=107, last 2 years) | |
| Cyberpunk 2077 | |
| 1920x1080 Ray Tracing Ultra Preset (DLSS off) | |
| Lenovo Legion Pro 7 16IRX9H | |
| MSI Vector 16 HX A14V | |
| Average NVIDIA GeForce RTX 4080 Laptop GPU (43.8 - 67.2, n=12) | |
| Average of class Gaming (19.1 - 84.9, n=36, last 2 years) | |
| HP Omen 16 (2024) | |
| 2560x1440 Ultra Preset (FSR off) | |
| MSI Vector 16 HX A14V | |
| Average of class Gaming (24.8 - 122.8, n=93, last 2 years) | |
| Lenovo Legion Pro 7 16IRX9H | |
| Average NVIDIA GeForce RTX 4080 Laptop GPU (56.2 - 86.3, n=15) | |
| HP Omen 16 (2024) | |
| 1920x1080 Ultra Preset (FSR off) | |
| MSI Vector 16 HX A14V | |
| Lenovo Legion Pro 7 16IRX9H | |
| Average NVIDIA GeForce RTX 4080 Laptop GPU (83.9 - 127.1, n=15) | |
| Average of class Gaming (17.7 - 169.9, n=115, last 2 years) | |
| HP Omen 16 (2024) | |
| 1920x1080 Ultra Preset (FSR2 on) | |
| Average of class Gaming (58 - 173.1, n=7, last 2 years) | |
| Lenovo Legion Pro 7 16IRX9H | |
| MSI Vector 16 HX A14V | |
| Average NVIDIA GeForce RTX 4080 Laptop GPU (94.6 - 128, n=8) | |
| HP Omen 16 (2024) | |
| Call of Duty Modern Warfare 3 2023 - 1920x1080 Extreme Preset | |
| Average NVIDIA GeForce RTX 4080 Laptop GPU (153 - 171, n=3) | |
| Lenovo Legion Pro 7 16IRX9H | |
| Average of class Gaming (27 - 95, n=2, last 2 years) | |
| Skull & Bones | |
| 1920x1080 Ultra High Preset AA:T | |
| Lenovo Legion Pro 7 16IRX9H | |
| Average NVIDIA GeForce RTX 4080 Laptop GPU (96 - 115, n=3) | |
| 2560x1440 Ultra High Preset AA:T | |
| Lenovo Legion Pro 7 16IRX9H | |
| Average NVIDIA GeForce RTX 4080 Laptop GPU (76 - 91, n=3) | |
| Assassin's Creed Mirage | |
| 1920x1080 Ultra High Preset (Adaptive Quality Off) | |
| Lenovo Legion Pro 7 16IRX9H | |
| Average NVIDIA GeForce RTX 4080 Laptop GPU (129 - 157, n=3) | |
| 2560x1440 Ultra High Preset (Adaptive Quality Off) | |
| Lenovo Legion Pro 7 16IRX9H | |
| Average NVIDIA GeForce RTX 4080 Laptop GPU (112 - 136, n=3) | |
| Avatar Frontiers of Pandora | |
| 1920x1080 Ultra Preset AA:T | |
| Average NVIDIA GeForce RTX 4080 Laptop GPU (87 - 97, n=4) | |
| Lenovo Legion Pro 7 16IRX9H | |
| Average of class Gaming (n=1last 2 years) | |
| 2560x1440 Ultra Preset AA:T | |
| Average NVIDIA GeForce RTX 4080 Laptop GPU (59 - 66, n=4) | |
| Lenovo Legion Pro 7 16IRX9H | |
| Average of class Gaming (n=1last 2 years) | |
| Last Epoch | |
| 1920x1080 Ultra Preset AA:T | |
| Lenovo Legion Pro 7 16IRX9H | |
| Average NVIDIA GeForce RTX 4080 Laptop GPU (156.5 - 204, n=2) | |
| Average of class Gaming (n=1last 2 years) | |
| 2560x1440 Ultra Preset AA:T | |
| Lenovo Legion Pro 7 16IRX9H | |
| Average NVIDIA GeForce RTX 4080 Laptop GPU (127.4 - 139, n=2) | |
| Average of class Gaming (n=1last 2 years) | |
| Alone in the Dark | |
| 1920x1080 Cinematic Preset | |
| Lenovo Legion Pro 7 16IRX9H | |
| Average NVIDIA GeForce RTX 4080 Laptop GPU (120 - 176.4, n=2) | |
| 2560x1440 Cinematic Preset | |
| Lenovo Legion Pro 7 16IRX9H | |
| Average NVIDIA GeForce RTX 4080 Laptop GPU (86 - 91.6, n=2) | |
| Horizon Forbidden West | |
| 1920x1080 Very High Preset AA:T | |
| Lenovo Legion Pro 7 16IRX9H | |
| Average NVIDIA GeForce RTX 4080 Laptop GPU (89.2 - 103.5, n=2) | |
| Average of class Gaming (14.7 - 140.3, n=12, last 2 years) | |
| 2560x1440 Very High Preset AA:T | |
| Lenovo Legion Pro 7 16IRX9H | |
| Average NVIDIA GeForce RTX 4080 Laptop GPU (71 - 83.7, n=2) | |
| Average of class Gaming (45.7 - 100.9, n=9, last 2 years) | |
Witcher 3 FPS chart
| low | med. | high | ultra | QHD | |
|---|---|---|---|---|---|
| GTA V (2015) | 187.2 | 186.6 | 186.5 | 152 | 135.3 |
| The Witcher 3 (2015) | 628.4 | 518.3 | 342.2 | 186.1 | 142.6 |
| Dota 2 Reborn (2015) | 229 | 211 | 197.3 | 183.5 | |
| Final Fantasy XV Benchmark (2018) | 232 | 211 | 173.1 | 139.3 | |
| X-Plane 11.11 (2018) | 196.4 | 162.3 | 127.5 | ||
| Strange Brigade (2018) | 538 | 446 | 377 | 339 | 243 |
| Cyberpunk 2077 (2023) | 152.3 | 137.2 | 126.7 | 118.3 | 79.1 |
| Assassin's Creed Mirage (2023) | 208 | 207 | 199 | 157 | 136 |
| Call of Duty Modern Warfare 3 2023 (2023) | 224 | 205 | 164 | 153 | 110 |
| Avatar Frontiers of Pandora (2023) | 141 | 130 | 114 | 89 | 59 |
| Skull & Bones (2024) | 161 | 151 | 135 | 112 | 89 |
| Last Epoch (2024) | 248 | 237 | 229 | 204 | 139 |
| Alone in the Dark (2024) | 249 | 230 | 214 | 176.4 | 91.6 |
| Horizon Forbidden West (2024) | 153.3 | 145.5 | 108.1 | 103.5 | 83.7 |
排放与电源管理 - 联想笔记本电脑可以安静运行
噪音排放
在性能模式下,负载情况下的噪音水平高达 56 dB(A)。平衡模式在噪音和性能之间进行了很好的权衡;静音模式可以让你的神经放松,但会导致性能大幅下降。在闲置和日常使用(如办公应用、互联网浏览)时,笔记本电脑通常很安静,有时甚至是无声的。遗憾的是,我们注意到评测机内部偶尔会发出(轻微的)电子啸叫声。
Noise level
| Idle |
| 25 / 30 / 45 dB(A) |
| Load |
| 50 / 56 dB(A) |
 | ||
30 dB silent 40 dB(A) audible 50 dB(A) loud |
||
min: | ||
| Lenovo Legion Pro 7 16IRX9H i9-14900HX, GeForce RTX 4080 Laptop GPU | Alienware m16 R1 AMD R9 7845HX, GeForce RTX 4080 Laptop GPU | MSI Vector 16 HX A14V i9-14900HX, GeForce RTX 4080 Laptop GPU | HP Omen 16 (2024) i9-14900HX, GeForce RTX 4080 Laptop GPU | Lenovo Legion Pro 7 16IRX8H i9-13900HX, GeForce RTX 4080 Laptop GPU | |
|---|---|---|---|---|---|
| Noise | 13% | -7% | 7% | 4% | |
| off / environment * (dB) | 24 | 22.9 5% | 23.2 3% | 25 -4% | 24 -0% |
| Idle Minimum * (dB) | 25 | 22.9 8% | 33.5 -34% | 29 -16% | 26 -4% |
| Idle Average * (dB) | 30 | 29.7 1% | 33.5 -12% | 30 -0% | 28 7% |
| Idle Maximum * (dB) | 45 | 29.7 34% | 33.5 26% | 31 31% | 34 24% |
| Load Average * (dB) | 50 | 29.8 40% | 52.1 -4% | 46 8% | 47 6% |
| Witcher 3 ultra * (dB) | 54 | 54.7 -1% | 62 -15% | 47 13% | 55 -2% |
| Load Maximum * (dB) | 56 | 54.7 2% | 62 -11% | 47 16% | 56 -0% |
* ... smaller is better
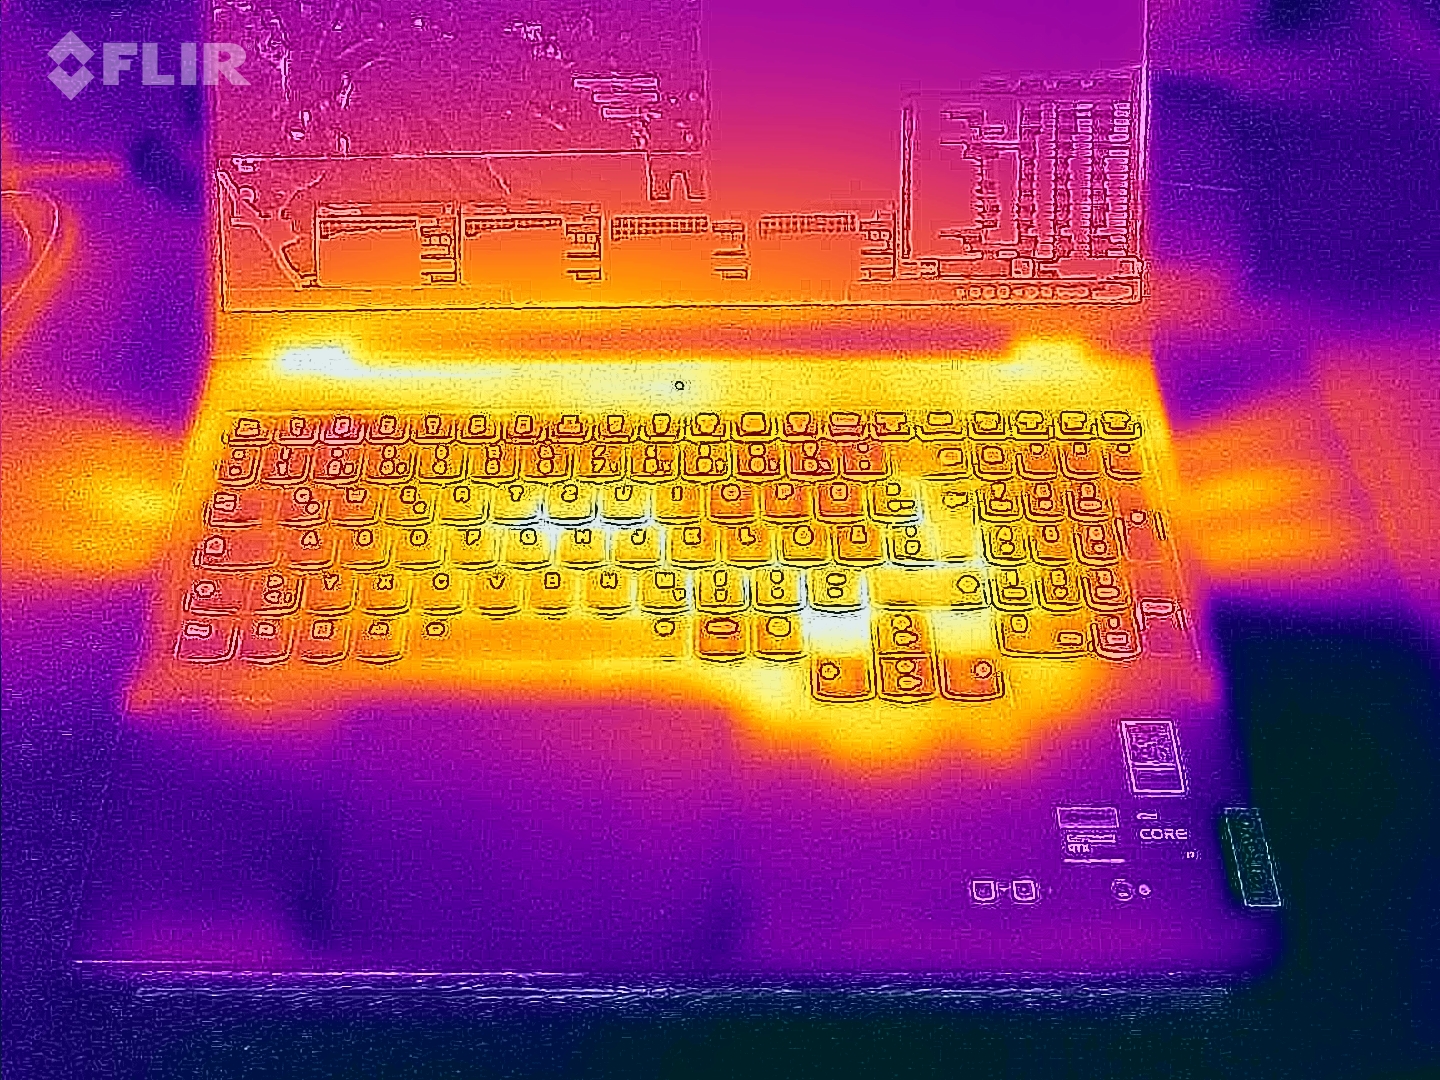
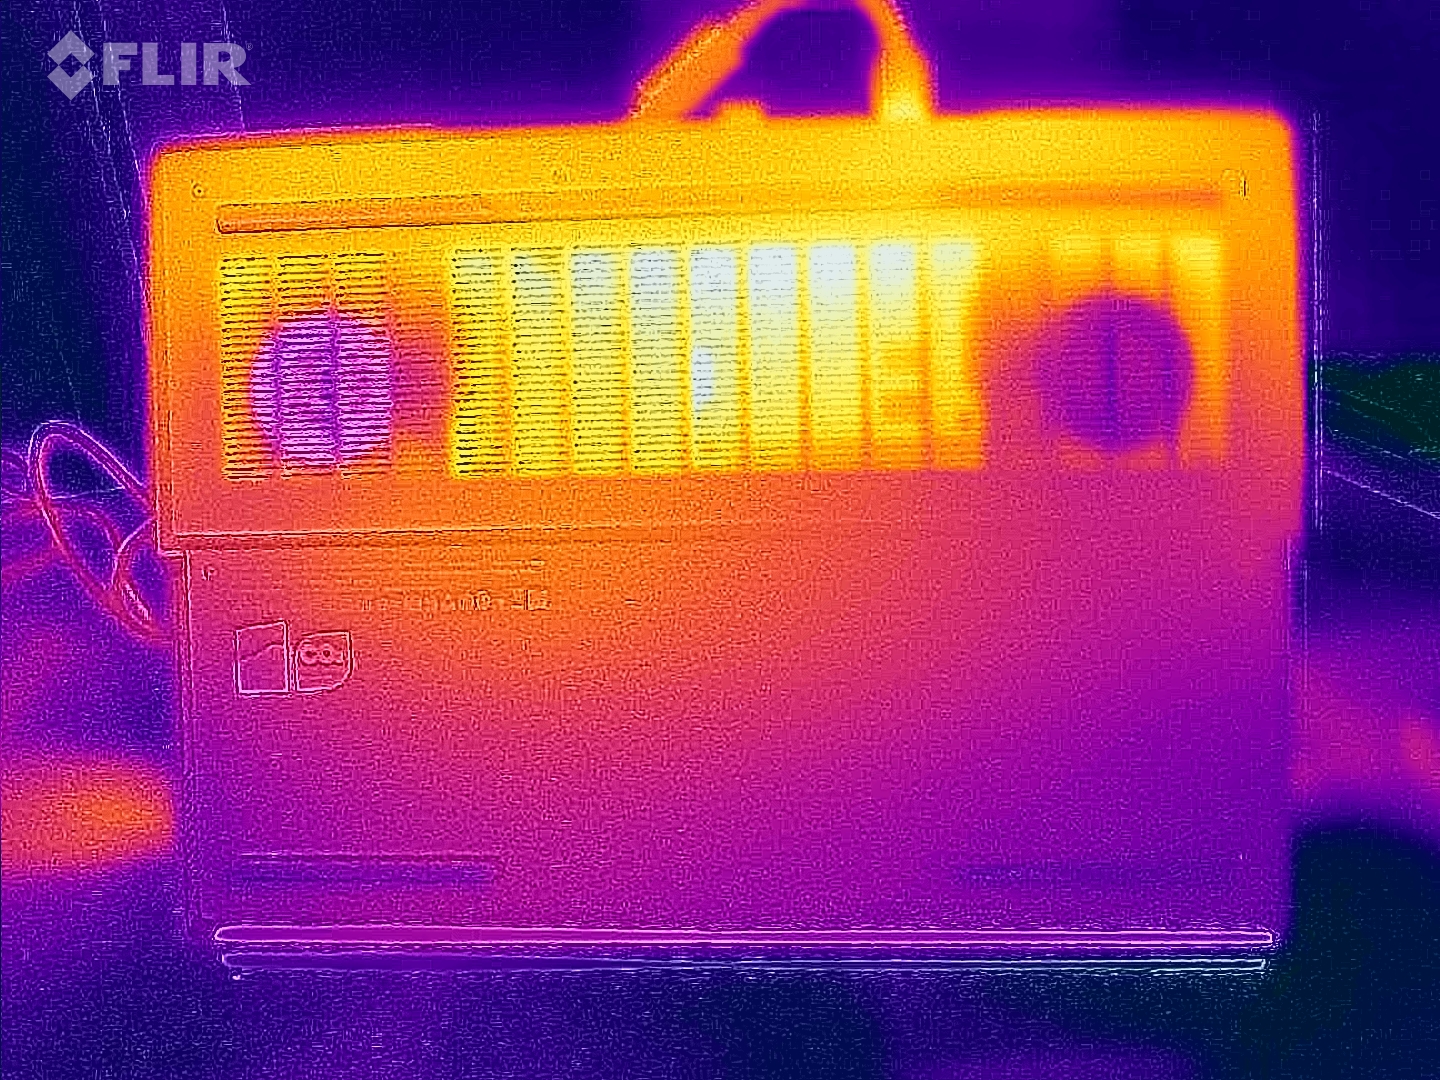
温度
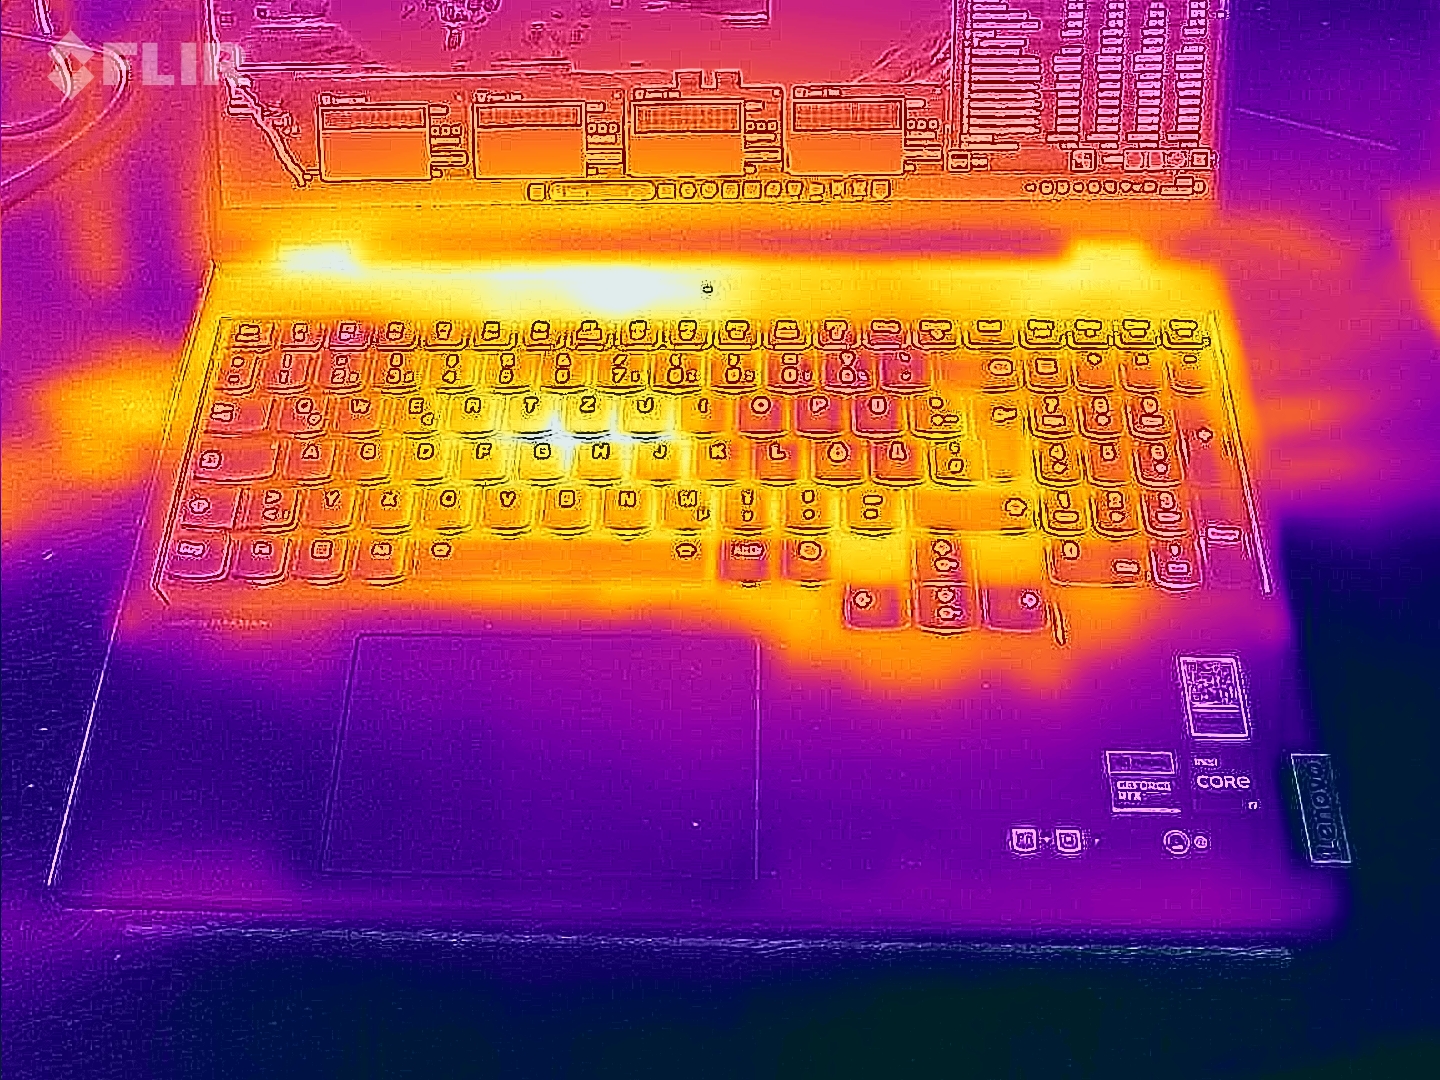
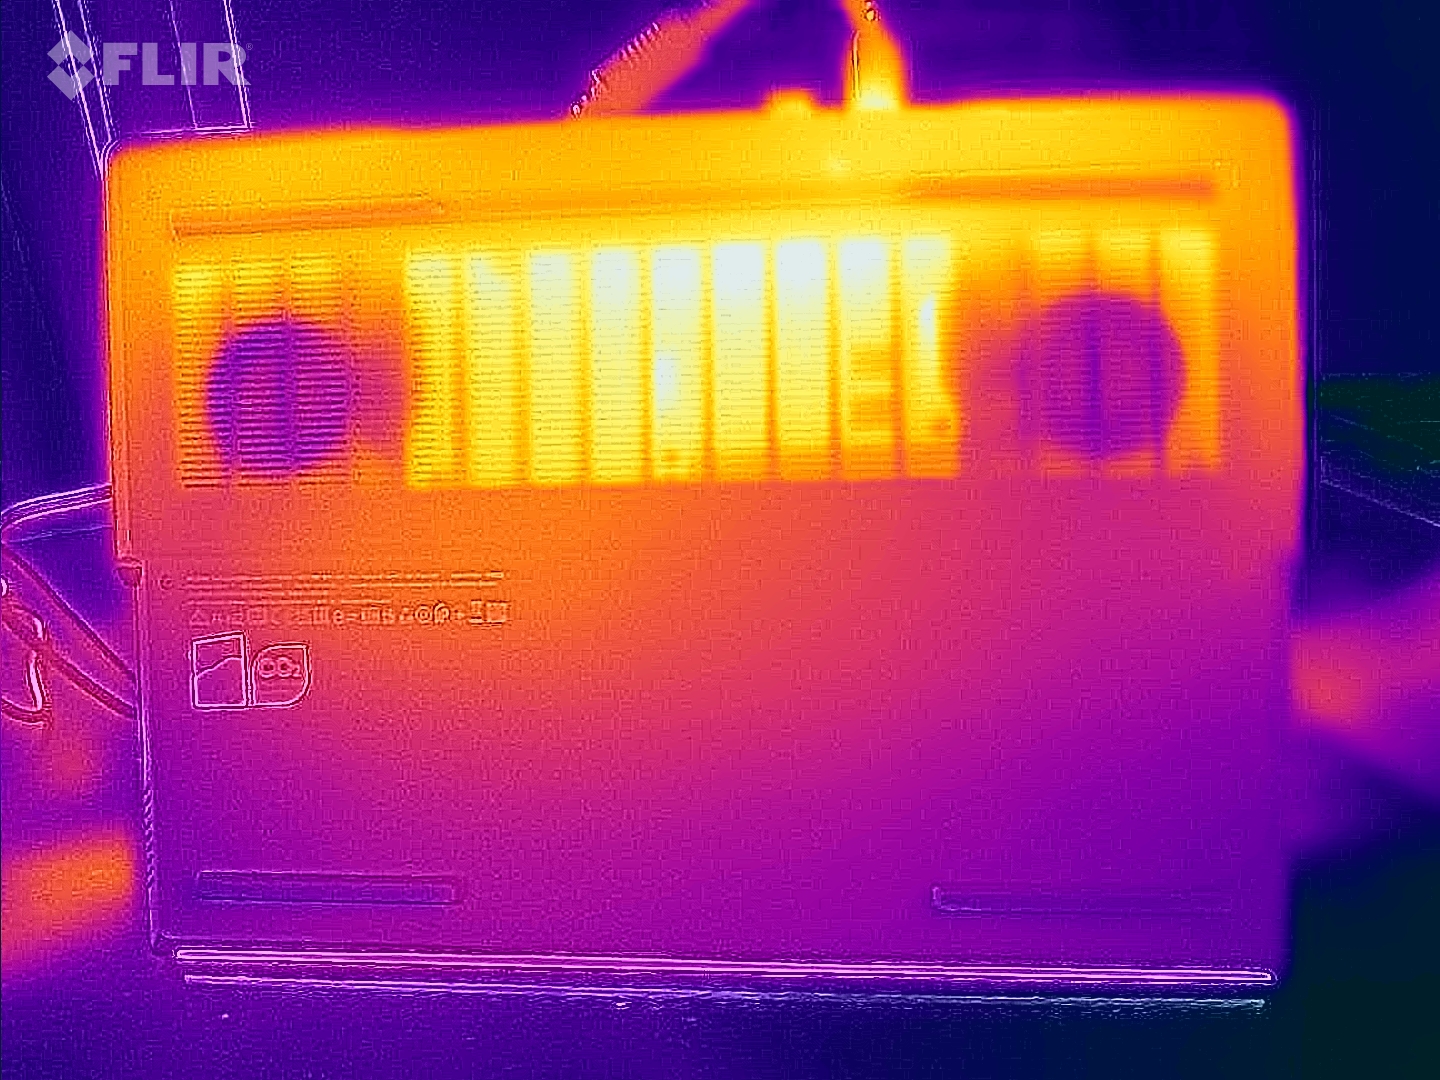
在压力测试和Witcher 3 测试中,笔记本的温度明显升高。机箱上的某些位置甚至超过了 50°C(122°F)。在日常使用(如办公应用和互联网浏览)中,机箱温度保持在舒适的范围内。
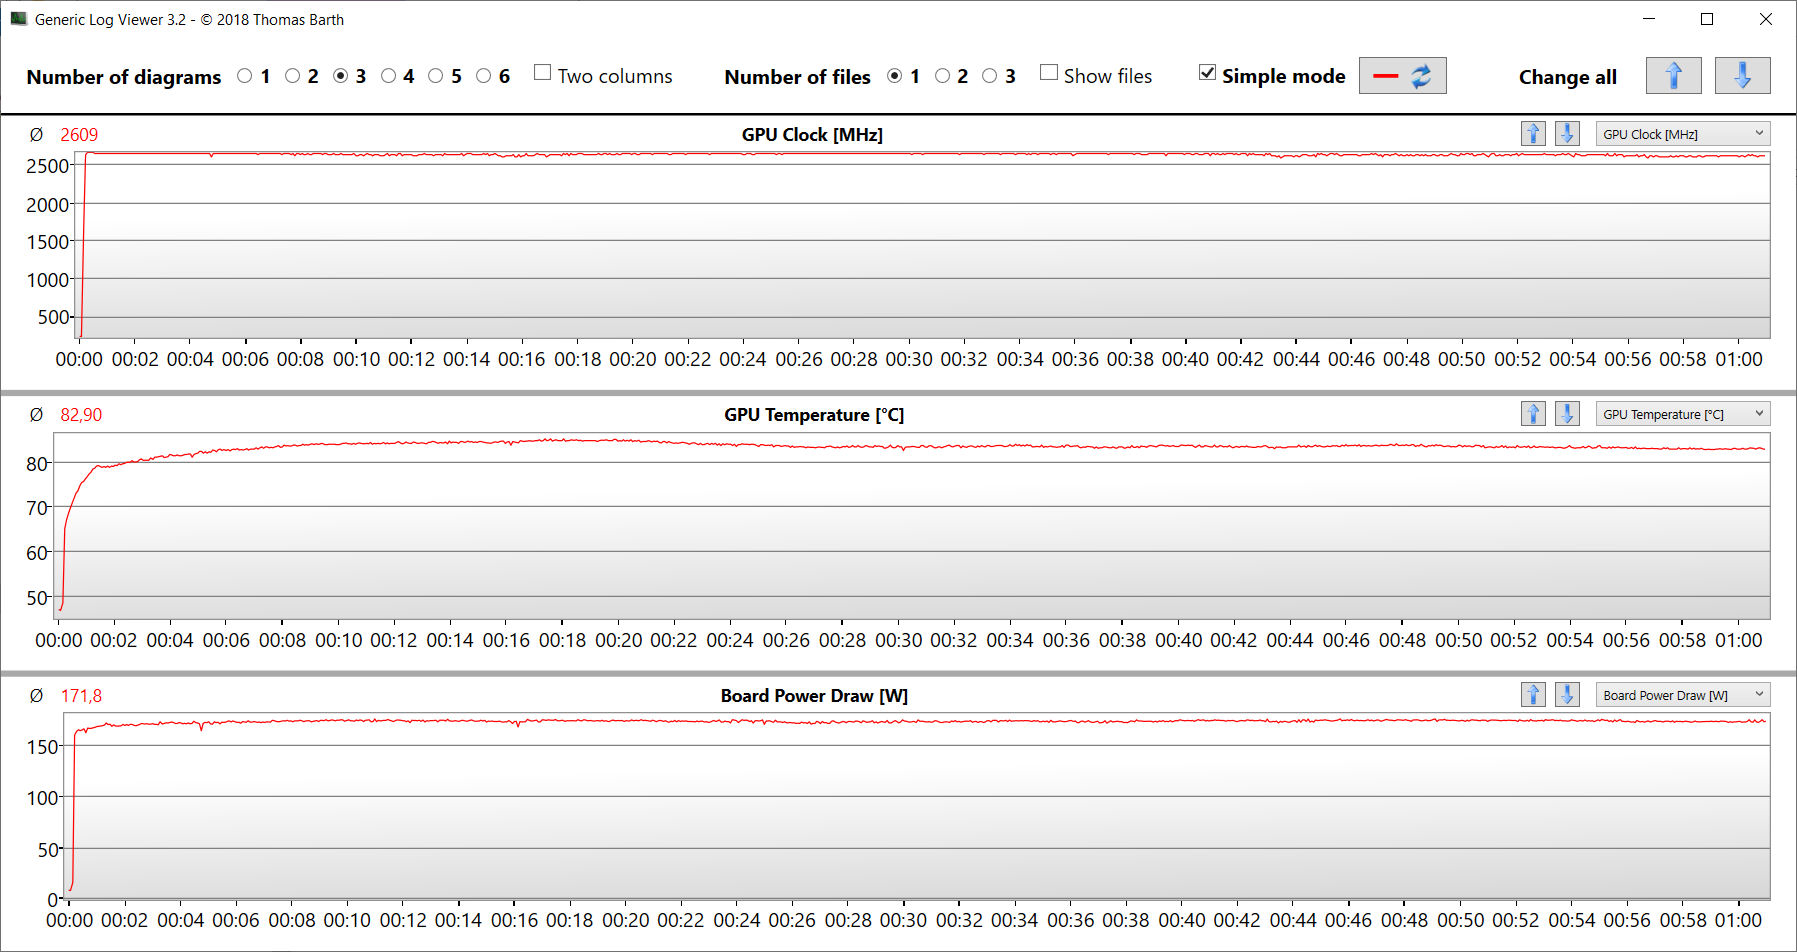
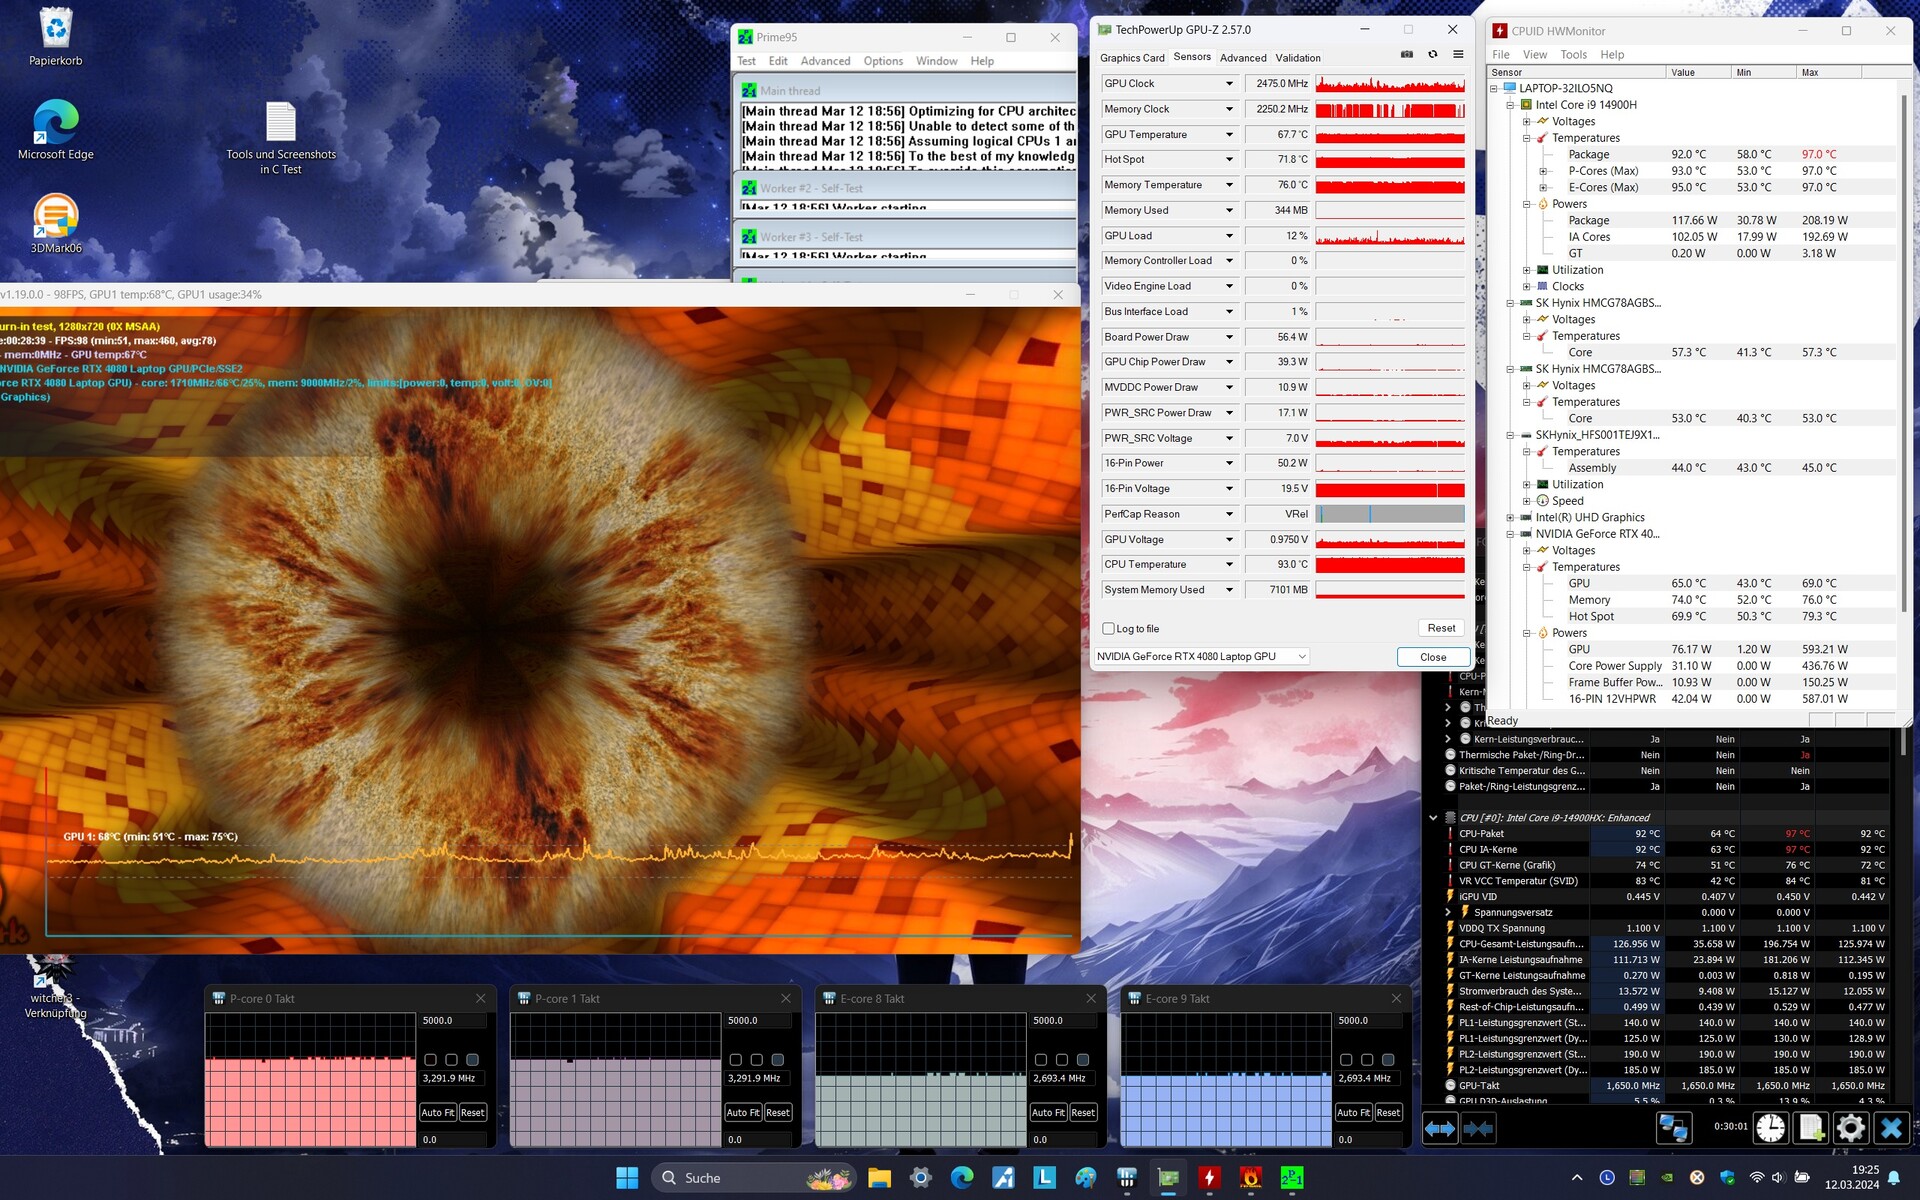
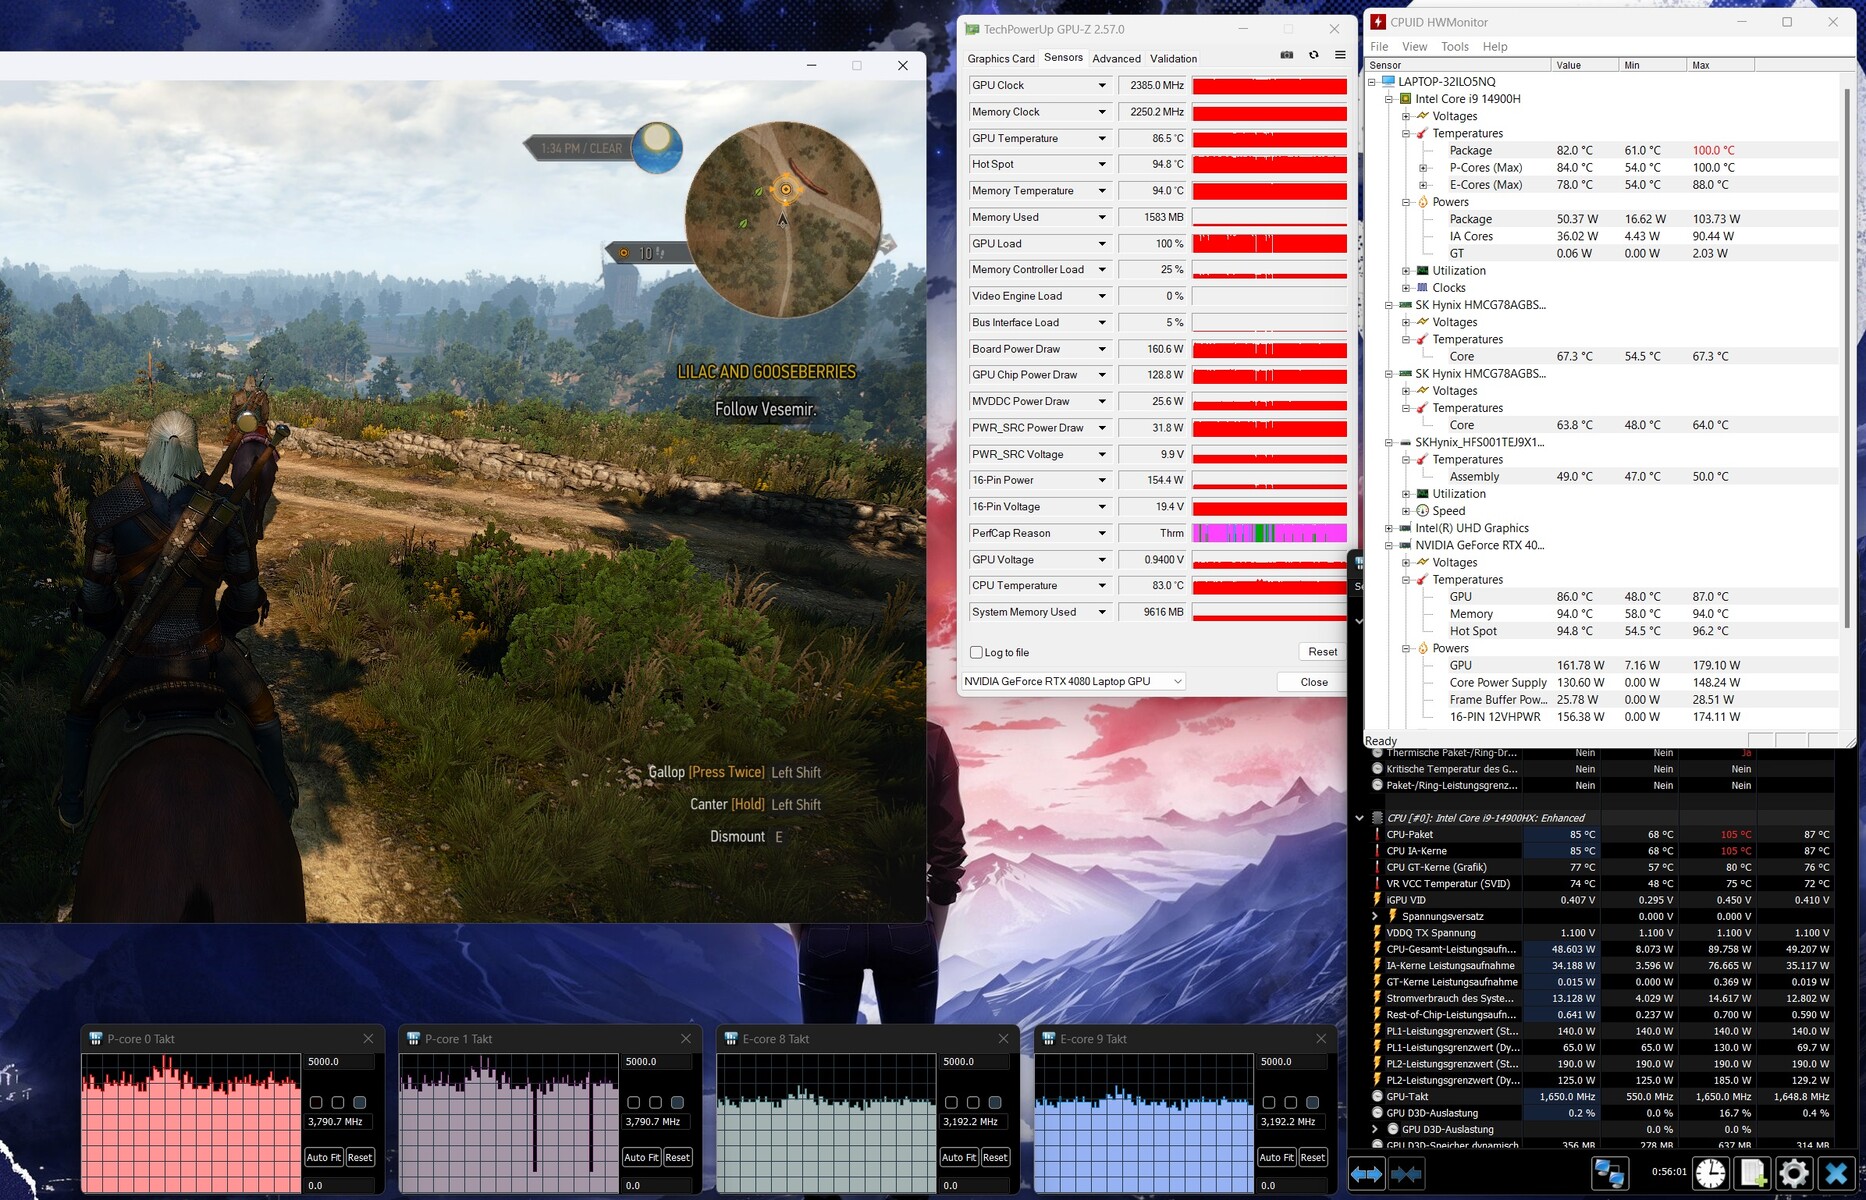
我们的压力测试包括长时间同时运行 Prime95 和 FurMark,旨在确定系统在满负荷情况下的稳定性。在测试过程中,CPU 和 GPU 都能保持较高的时钟速度。
(-) The maximum temperature on the upper side is 46 °C / 115 F, compared to the average of 40.4 °C / 105 F, ranging from 21.2 to 68.8 °C for the class Gaming.
(-) The bottom heats up to a maximum of 49 °C / 120 F, compared to the average of 43.2 °C / 110 F
(±) In idle usage, the average temperature for the upper side is 33.3 °C / 92 F, compared to the device average of 33.9 °C / 93 F.
(-) Playing The Witcher 3, the average temperature for the upper side is 42.7 °C / 109 F, compared to the device average of 33.9 °C / 93 F.
(-) The palmrests and touchpad can get very hot to the touch with a maximum of 40 °C / 104 F.
(-) The average temperature of the palmrest area of similar devices was 28.8 °C / 83.8 F (-11.2 °C / -20.2 F).
| Lenovo Legion Pro 7 16IRX9H i9-14900HX, GeForce RTX 4080 Laptop GPU | Alienware m16 R1 AMD R9 7845HX, GeForce RTX 4080 Laptop GPU | MSI Vector 16 HX A14V i9-14900HX, GeForce RTX 4080 Laptop GPU | HP Omen 16 (2024) i9-14900HX, GeForce RTX 4080 Laptop GPU | Lenovo Legion Pro 7 16IRX8H i9-13900HX, GeForce RTX 4080 Laptop GPU | |
|---|---|---|---|---|---|
| Heat | 5% | 26% | 12% | 1% | |
| Maximum Upper Side * (°C) | 46 | 48 -4% | 36.4 21% | 47 -2% | 48 -4% |
| Maximum Bottom * (°C) | 49 | 39 20% | 35.6 27% | 57 -16% | 49 -0% |
| Idle Upper Side * (°C) | 38 | 37 3% | 26.6 30% | 25 34% | 40 -5% |
| Idle Bottom * (°C) | 37 | 36.2 2% | 27 27% | 26 30% | 33 11% |
* ... smaller is better
发言人
立体声扬声器能产生绝佳的音效。
Lenovo Legion Pro 7 16IRX9H audio analysis
(+) | speakers can play relatively loud (84 dB)
Bass 100 - 315 Hz
(±) | reduced bass - on average 8.9% lower than median
(±) | linearity of bass is average (7.4% delta to prev. frequency)
Mids 400 - 2000 Hz
(+) | balanced mids - only 2.8% away from median
(+) | mids are linear (4% delta to prev. frequency)
Highs 2 - 16 kHz
(+) | balanced highs - only 3% away from median
(+) | highs are linear (5% delta to prev. frequency)
Overall 100 - 16.000 Hz
(+) | overall sound is linear (8.4% difference to median)
Compared to same class
» 2% of all tested devices in this class were better, 1% similar, 97% worse
» The best had a delta of 6%, average was 18%, worst was 132%
Compared to all devices tested
» 2% of all tested devices were better, 1% similar, 97% worse
» The best had a delta of 4%, average was 23%, worst was 134%
HP Omen 16 (2024) audio analysis
(±) | speaker loudness is average but good (78 dB)
Bass 100 - 315 Hz
(-) | nearly no bass - on average 15.2% lower than median
(±) | linearity of bass is average (14.3% delta to prev. frequency)
Mids 400 - 2000 Hz
(+) | balanced mids - only 4.8% away from median
(+) | mids are linear (5% delta to prev. frequency)
Highs 2 - 16 kHz
(+) | balanced highs - only 2% away from median
(+) | highs are linear (4.1% delta to prev. frequency)
Overall 100 - 16.000 Hz
(+) | overall sound is linear (14.7% difference to median)
Compared to same class
» 29% of all tested devices in this class were better, 7% similar, 64% worse
» The best had a delta of 6%, average was 18%, worst was 132%
Compared to all devices tested
» 19% of all tested devices were better, 4% similar, 77% worse
» The best had a delta of 4%, average was 23%, worst was 134%
耗电量
功耗方面没有任何意外。对于内部硬件来说,耗电量处于典型水平。Legion Pro 7 完成了我们的Witcher 3 测试和压力测试,功耗水平保持一致。随附的 330 瓦充电器功率足以满足笔记本电脑的需要。
| Off / Standby | |
| Idle | |
| Load |
|
Key:
min: | |
Power consumption Witcher 3 / Stress test
Power consumption with external monitor
电池寿命
在我们的真实 Wi-Fi 测试中,这款 16 英寸笔记本电脑的续航时间为 6 小时 13 分钟,该测试通过使用脚本访问网站来模拟负载。在我们比较的所有设备中,Legion 的电池续航时间最长。
Pros
Cons
评语--功能强大的高端笔记本电脑

通过Legion Pro 7,联想为游戏玩家和创作者提供了一款强大的 16 英寸笔记本电脑。这款笔记本配备了 16 英寸 QHD+ 显示屏(2560 x 1600 像素、DCI-P3、G-Sync、HDR、240Hz),宽高比为 16:10,适合工作使用。
联想Legion Pro 7 16IRX9H 以合理的价格提供了强大的性能。
GeForce RTX 4080 和Core i9-14900HX 在部分测试中取得了新的最佳成绩--毫无疑问,这两款芯片都能持续全速运行。此类笔记本电脑普遍存在的高发热量和高噪音是无法回避的问题。不过,有一个静音模式可以缓解这一问题,但代价是性能的下降。
两个 USB-C 端口(1 个 Thunderbolt 4 端口、1 个 USB 3.2 Gen 2 端口)可让您更轻松地将笔记本电脑集成到现有的工作设置中,并提供扩展选项(如外置 GPU、底座)。两个端口都能输出 DisplayPort 信号,其中一个甚至支持 Power Delivery。电池续航能力相当不错。
MSI Vector 16 HX A14V 是一款值得考虑的替代产品。它的性能与Legion 相当,但电池续航时间稍差。
价格和供应情况
在欧洲,这里介绍的联想Legion Pro 7 型号的售价为 2,999 欧元(3,245 美元)起Campuspoint.de和Notebooksbilliger.de 的学生和教育工作者特别折扣。
虽然新款Legion Pro 7 尚未在美国上市,但在美国亚马逊网站上可以找到其上一代产品,售价约为 2,490 美元。该机型采用了上一代的酷睿 i9-13900HX,但在其他方面大致相同。
Lenovo Legion Pro 7 16IRX9H
- 03/25/2024 v7 (old)
Sascha Mölck
Transparency
The selection of devices to be reviewed is made by our editorial team. The test sample was provided to the author as a loan by the manufacturer or retailer for the purpose of this review. The lender had no influence on this review, nor did the manufacturer receive a copy of this review before publication. There was no obligation to publish this review. As an independent media company, Notebookcheck is not subjected to the authority of manufacturers, retailers or publishers.
This is how Notebookcheck is testing
Every year, Notebookcheck independently reviews hundreds of laptops and smartphones using standardized procedures to ensure that all results are comparable. We have continuously developed our test methods for around 20 years and set industry standards in the process. In our test labs, high-quality measuring equipment is utilized by experienced technicians and editors. These tests involve a multi-stage validation process. Our complex rating system is based on hundreds of well-founded measurements and benchmarks, which maintains objectivity. Further information on our test methods can be found here.
Price comparison

