华硕ROG Strix G16 G614JZ笔记本电脑回顾。为RTX 4080清除舞台

ROG,即Republic of Gamers,是华硕的高端游戏品牌。其中有三个产品系列。Flow、Zephyrus和Strix,其中只有Strix笔记本电脑是经典游戏笔记本电脑。华硕将Strix产品线进一步细分为ROG Strix和ROG Strix Scar类别。原则上,所有ROG Strix笔记本电脑都有与ROG Strix Scar型号类似的硬件,但设计略显简单。然后,这也是一个角度问题,因为这家台湾制造商的所有游戏笔记本电脑都相当华丽。同时,ROG Strix G和Scar系列的设备已经有点接近了。虽然2022年的Scar型号是用蒸汽室冷却的,但这两个系列的冷却系统现在几乎是相同的。
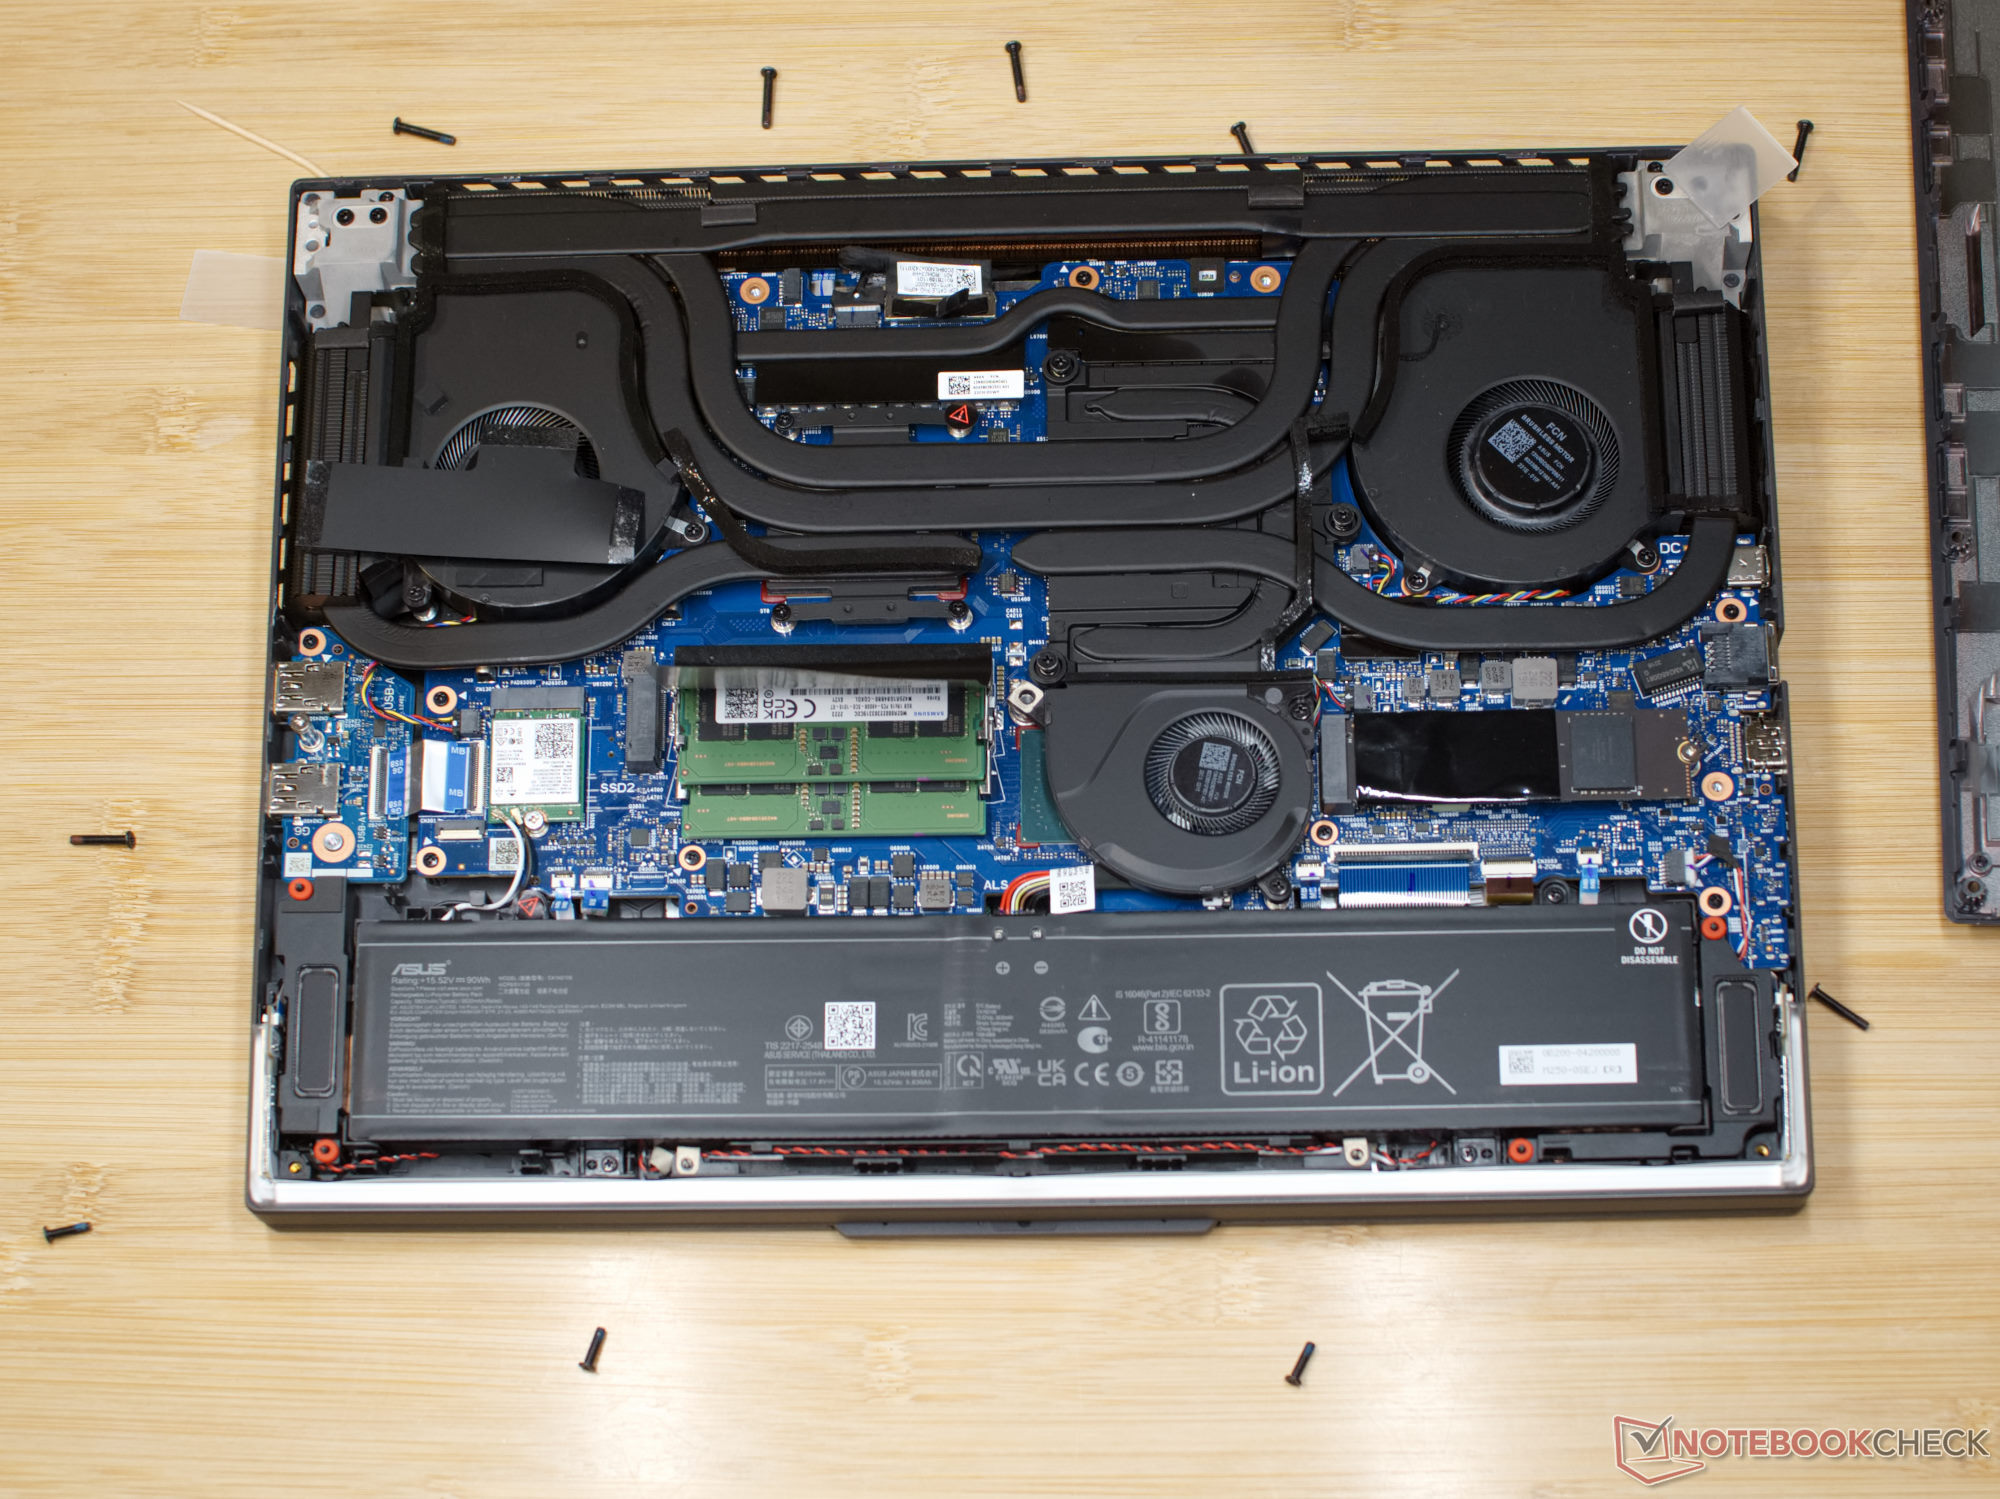
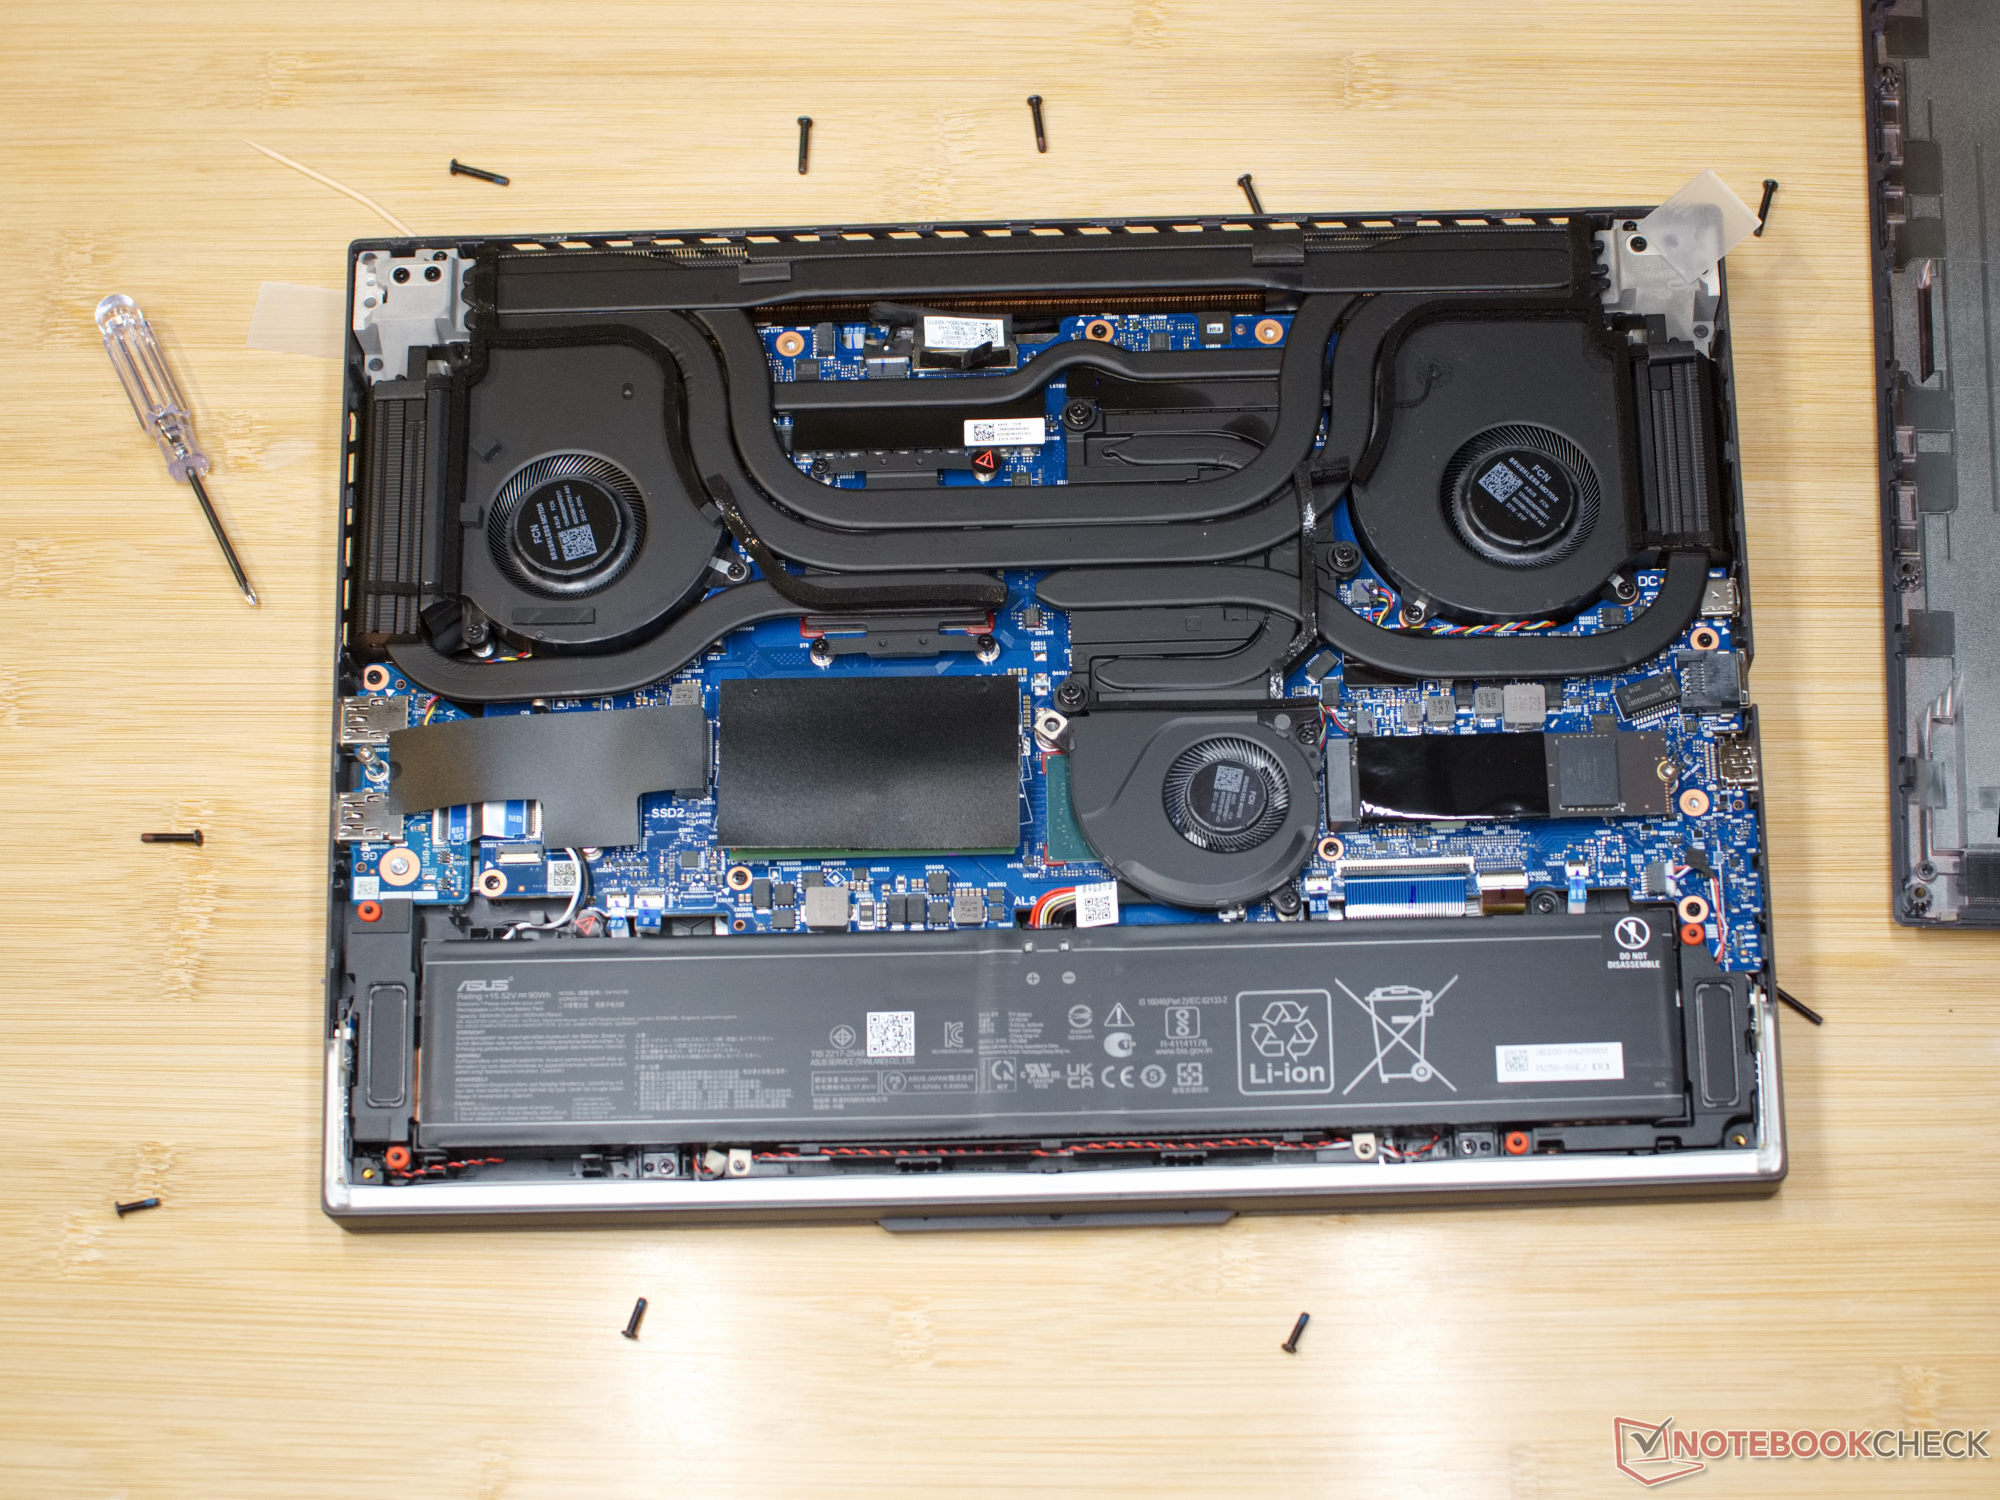
我们的测试设备,其英特尔酷睿i7-13980HX和 NvidiaGeForce RTX 4080是装备最好的设备之一。为了使强大的硬件保持在可容忍的工作温度,华硕安装了一个带有三个风扇的大规模冷却系统。液态金属也确保了良好的散热和长时间的提升。
16英寸游戏笔记本电脑目前风头正劲,因此我们的数据库中有大量规格相似的现役游戏机。我们已经审查了ROG Strix系列最新一代的几款笔记本电脑。这些产品包括 华硕ROG Strix G18和 华硕ROG Strix Scar 18。这两款笔记本电脑有不同的图形芯片,即RTX 4070和RTX 4090,但有类似的冷却系统,几乎相同的主板,因此有类似的功率限制值。这导致不同的Nvidia图形单元之间出现了有趣的比较可能性。
这 联想Legion Pro 7和 Razer Blade 16是与ROG Strix G16处于同一性能级别的16英寸笔记本电脑,尽管这两款笔记本电脑可能更加昂贵。
潜在的竞争对手比较
Rating | Date | Model | Weight | Height | Size | Resolution | Price |
|---|---|---|---|---|---|---|---|
| 88.4 % v7 (old) | 03 / 2023 | Asus ROG Strix G16 G614JZ i9-13980HX, GeForce RTX 4080 Laptop GPU | 2.4 kg | 30.4 mm | 16.00" | 2560x1600 | |
| 88 % v7 (old) | 04 / 2023 | Asus Zephyrus Duo 16 GX650PY-NM006W R9 7945HX, GeForce RTX 4090 Laptop GPU | 2.7 kg | 29.7 mm | 16.00" | 2560x1600 | |
| 89.4 % v7 (old) | 02 / 2023 | Lenovo Legion Pro 7 16IRX8H i9-13900HX, GeForce RTX 4080 Laptop GPU | 2.7 kg | 26 mm | 16.00" | 2560x1600 | |
| 86.2 % v7 (old) | 03 / 2023 | Gigabyte AERO 16 OLED BSF i9-13900H, GeForce RTX 4070 Laptop GPU | 2.1 kg | 18 mm | 16.00" | 3840x2400 | |
| 86.2 % v7 (old) | 02 / 2023 | Asus TUF Gaming A16 FA617 R7 7735HS, Radeon RX 7600S | 2.2 kg | 27 mm | 16.00" | 1920x1200 | |
| 91.2 % v7 (old) | 02 / 2023 | Razer Blade 16 Early 2023 i9-13950HX, GeForce RTX 4080 Laptop GPU | 2.4 kg | 21.99 mm | 16.00" | 2560x1600 | |
| 88.4 % v7 (old) | 04 / 2023 | Asus ROG Strix G17 G713PI R9 7945HX, GeForce RTX 4070 Laptop GPU | 2.8 kg | 30.7 mm | 17.30" | 2560x1440 | |
| 87.4 % v7 (old) | 03 / 2023 | Asus ROG Strix G18 G814JI i7-13650HX, GeForce RTX 4070 Laptop GPU | 3 kg | 31 mm | 18.00" | 2560x1600 | |
| 86.6 % v7 (old) | 02 / 2023 | Asus ROG Strix Scar 18 2023 G834JY-N6005W i9-13980HX, GeForce RTX 4090 Laptop GPU | 3.1 kg | 30.8 mm | 18.00" | 2560x1600 | |
| 86.9 % v7 (old) | 11 / 2022 | Asus ROG Strix Scar 17 SE G733CX-LL014W i9-12950HX, GeForce RTX 3080 Ti Laptop GPU | 2.9 kg | 28.3 mm | 17.30" | 2560x1440 | |
| 85 % v7 (old) | 03 / 2021 | Asus ROG Strix G15 G513QR R9 5900HX, GeForce RTX 3070 Laptop GPU | 2.3 kg | 27.2 mm | 15.60" | 1920x1080 |
案例 - 顶尖的设计,但实施可以改进
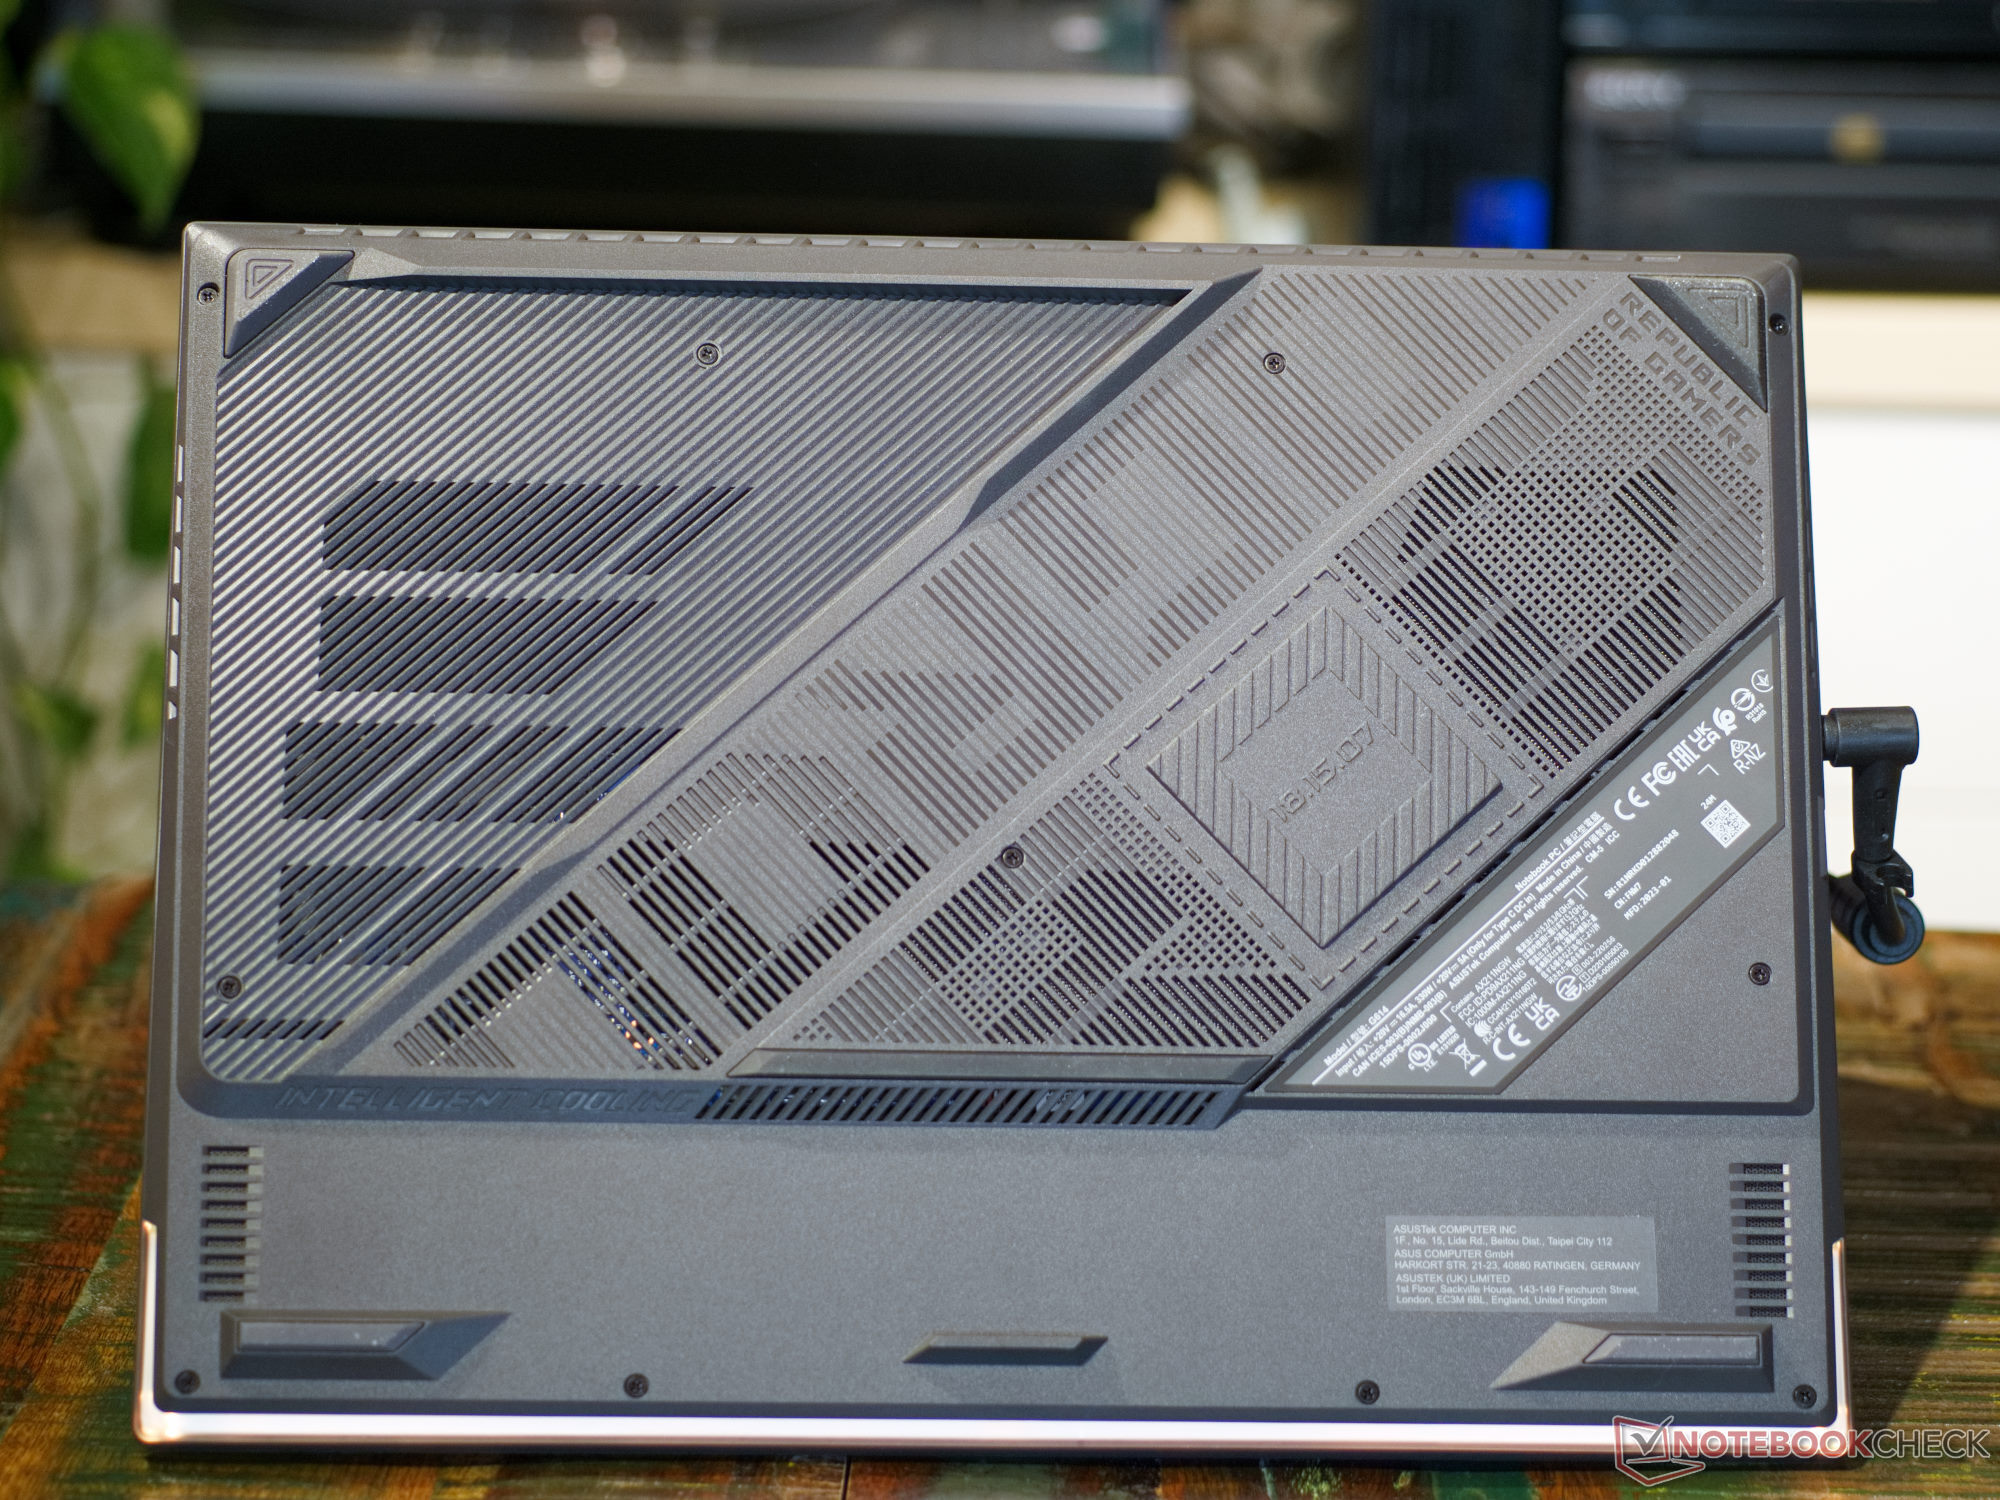
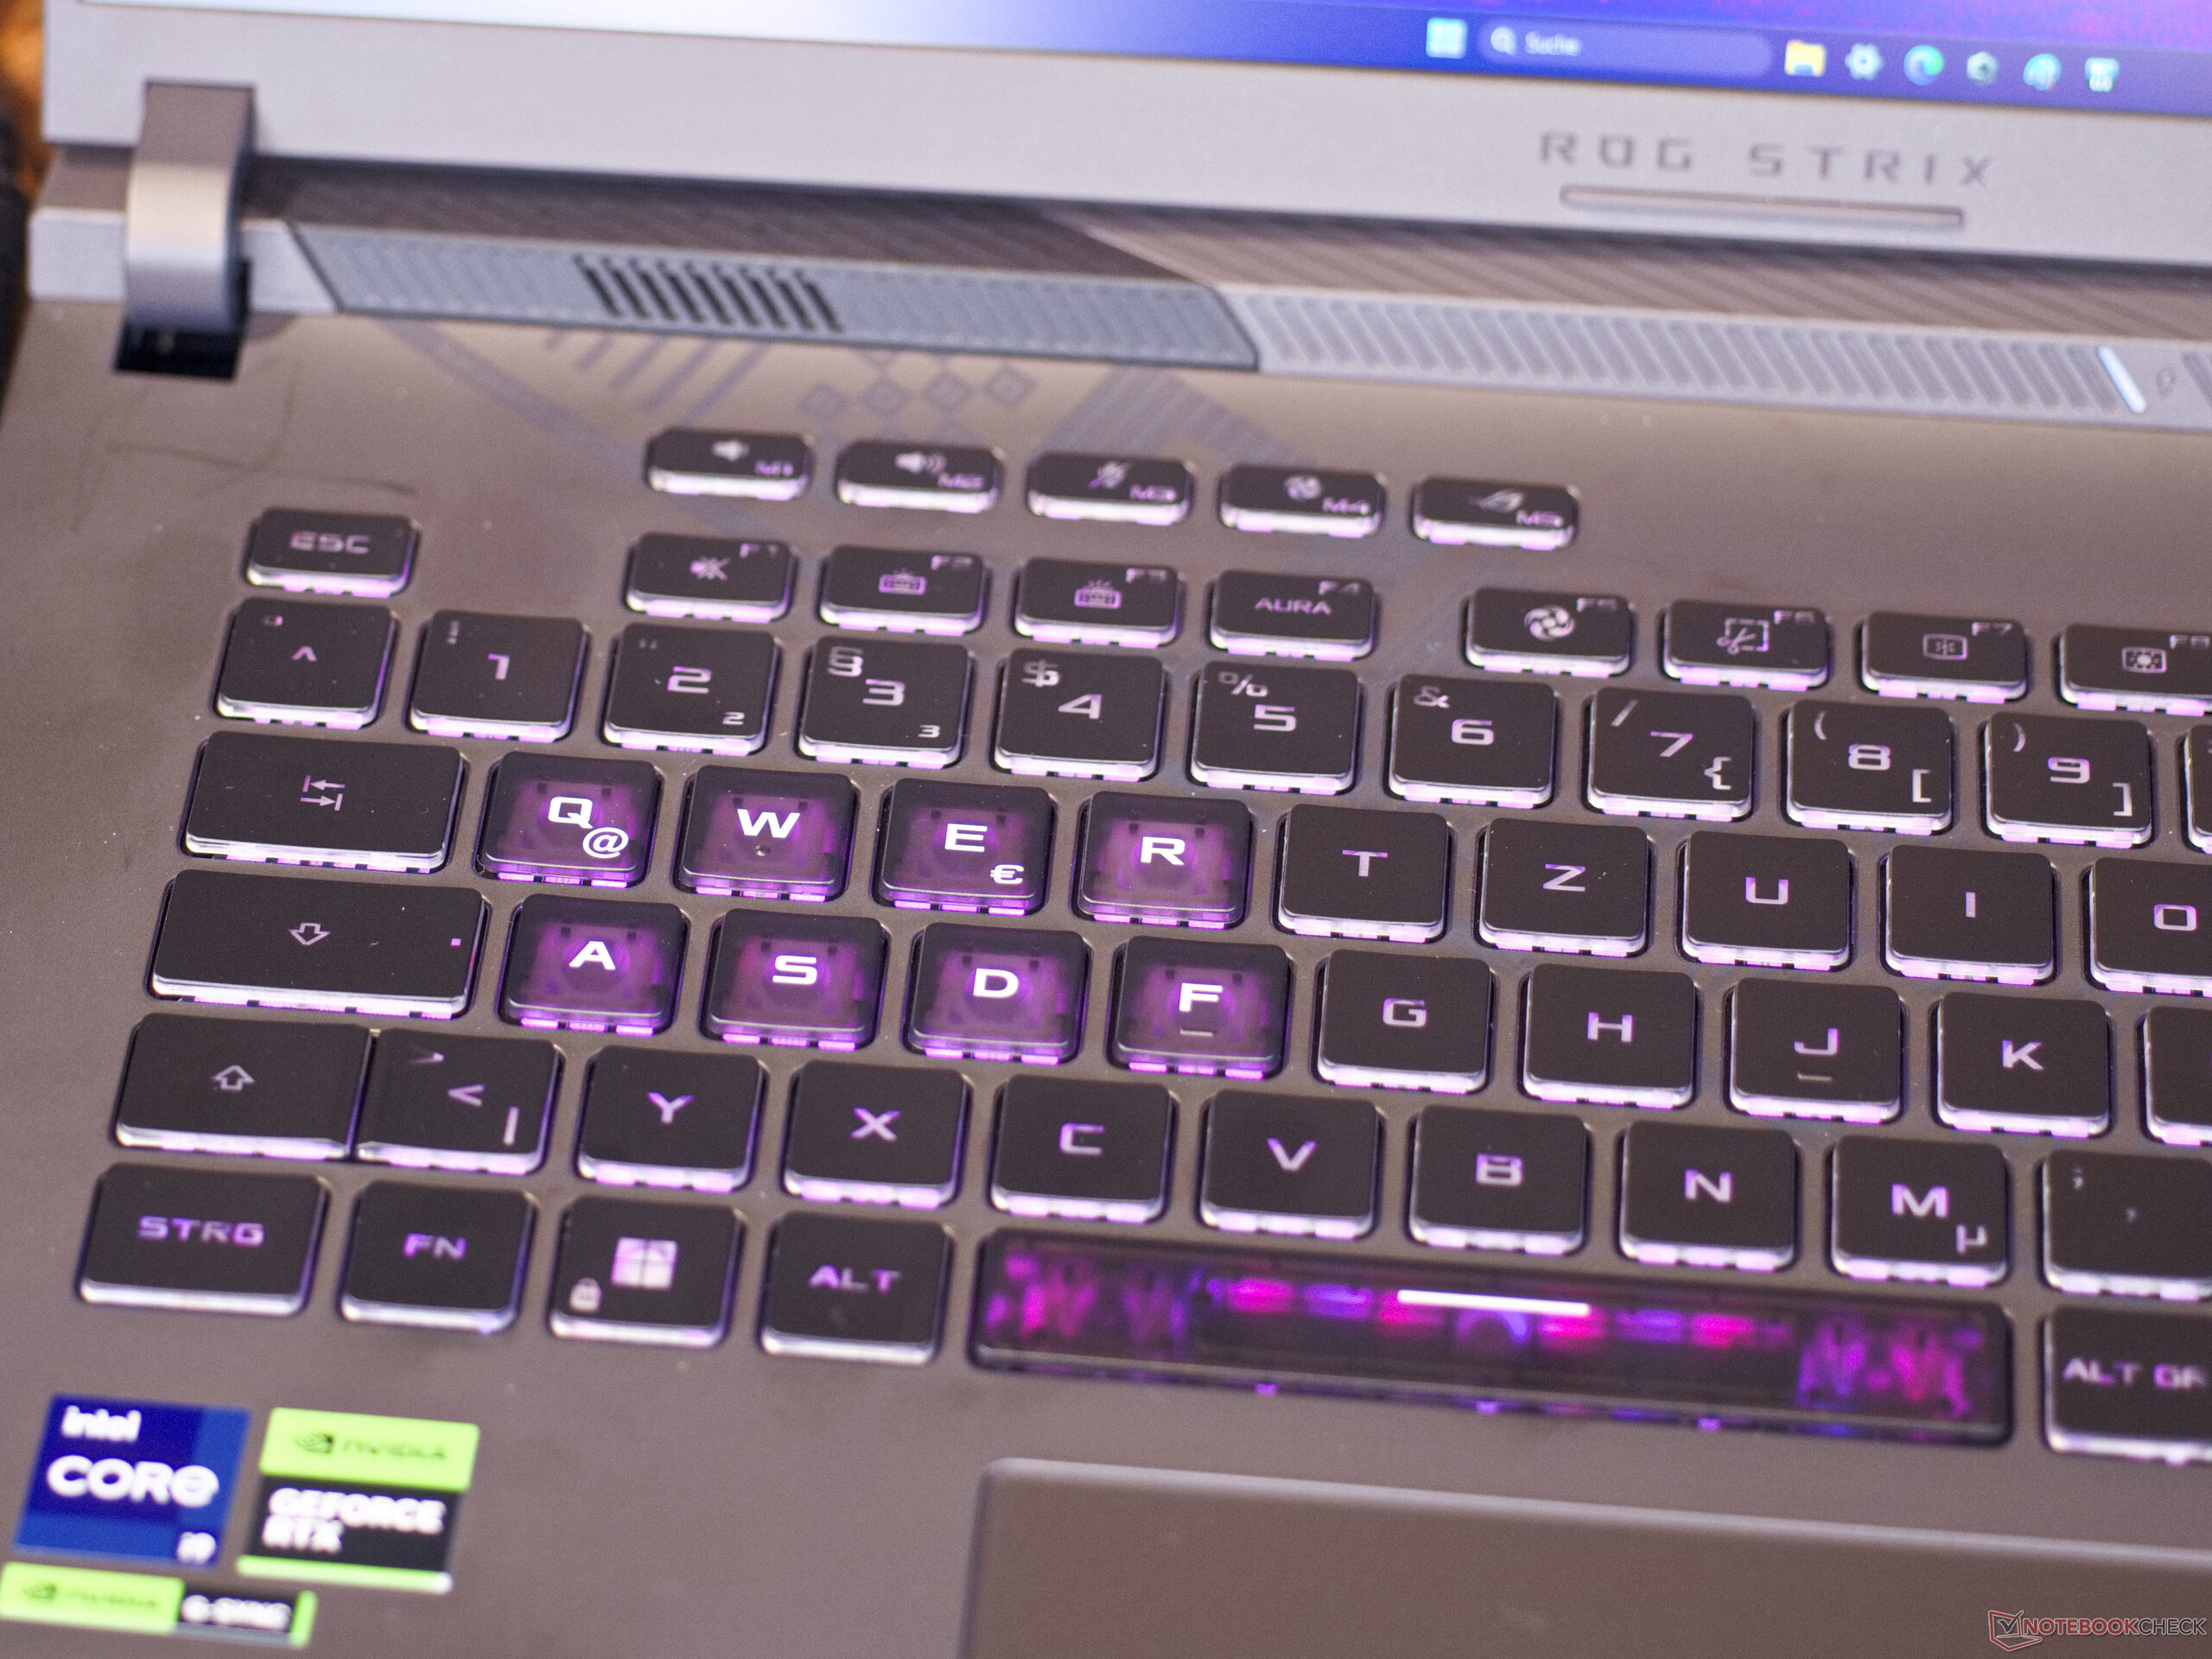
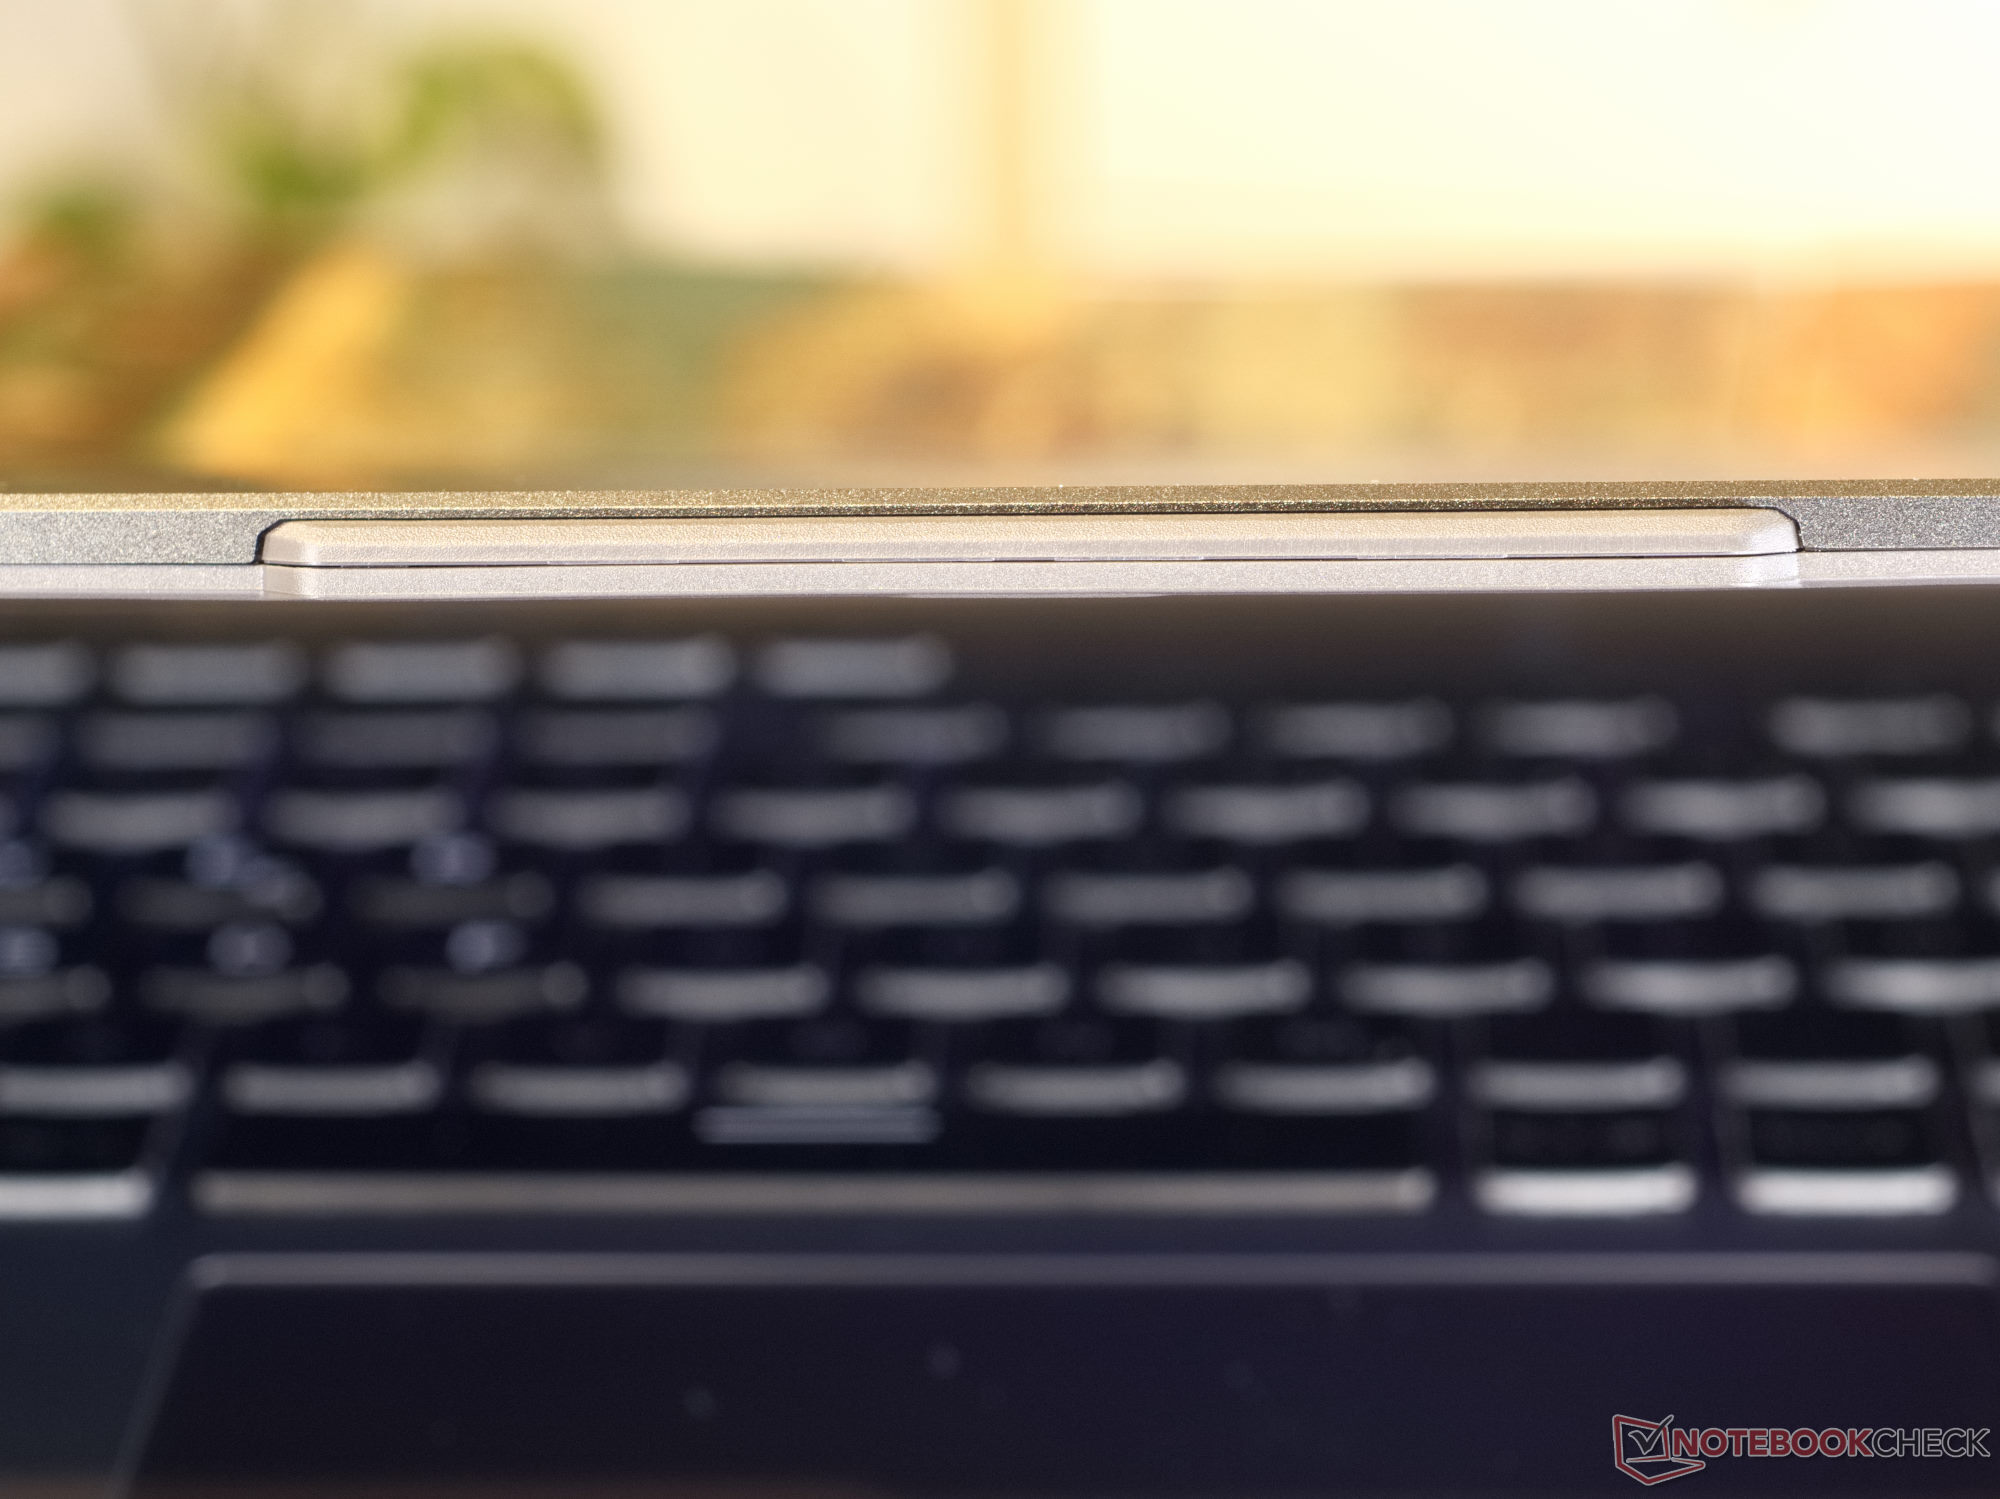
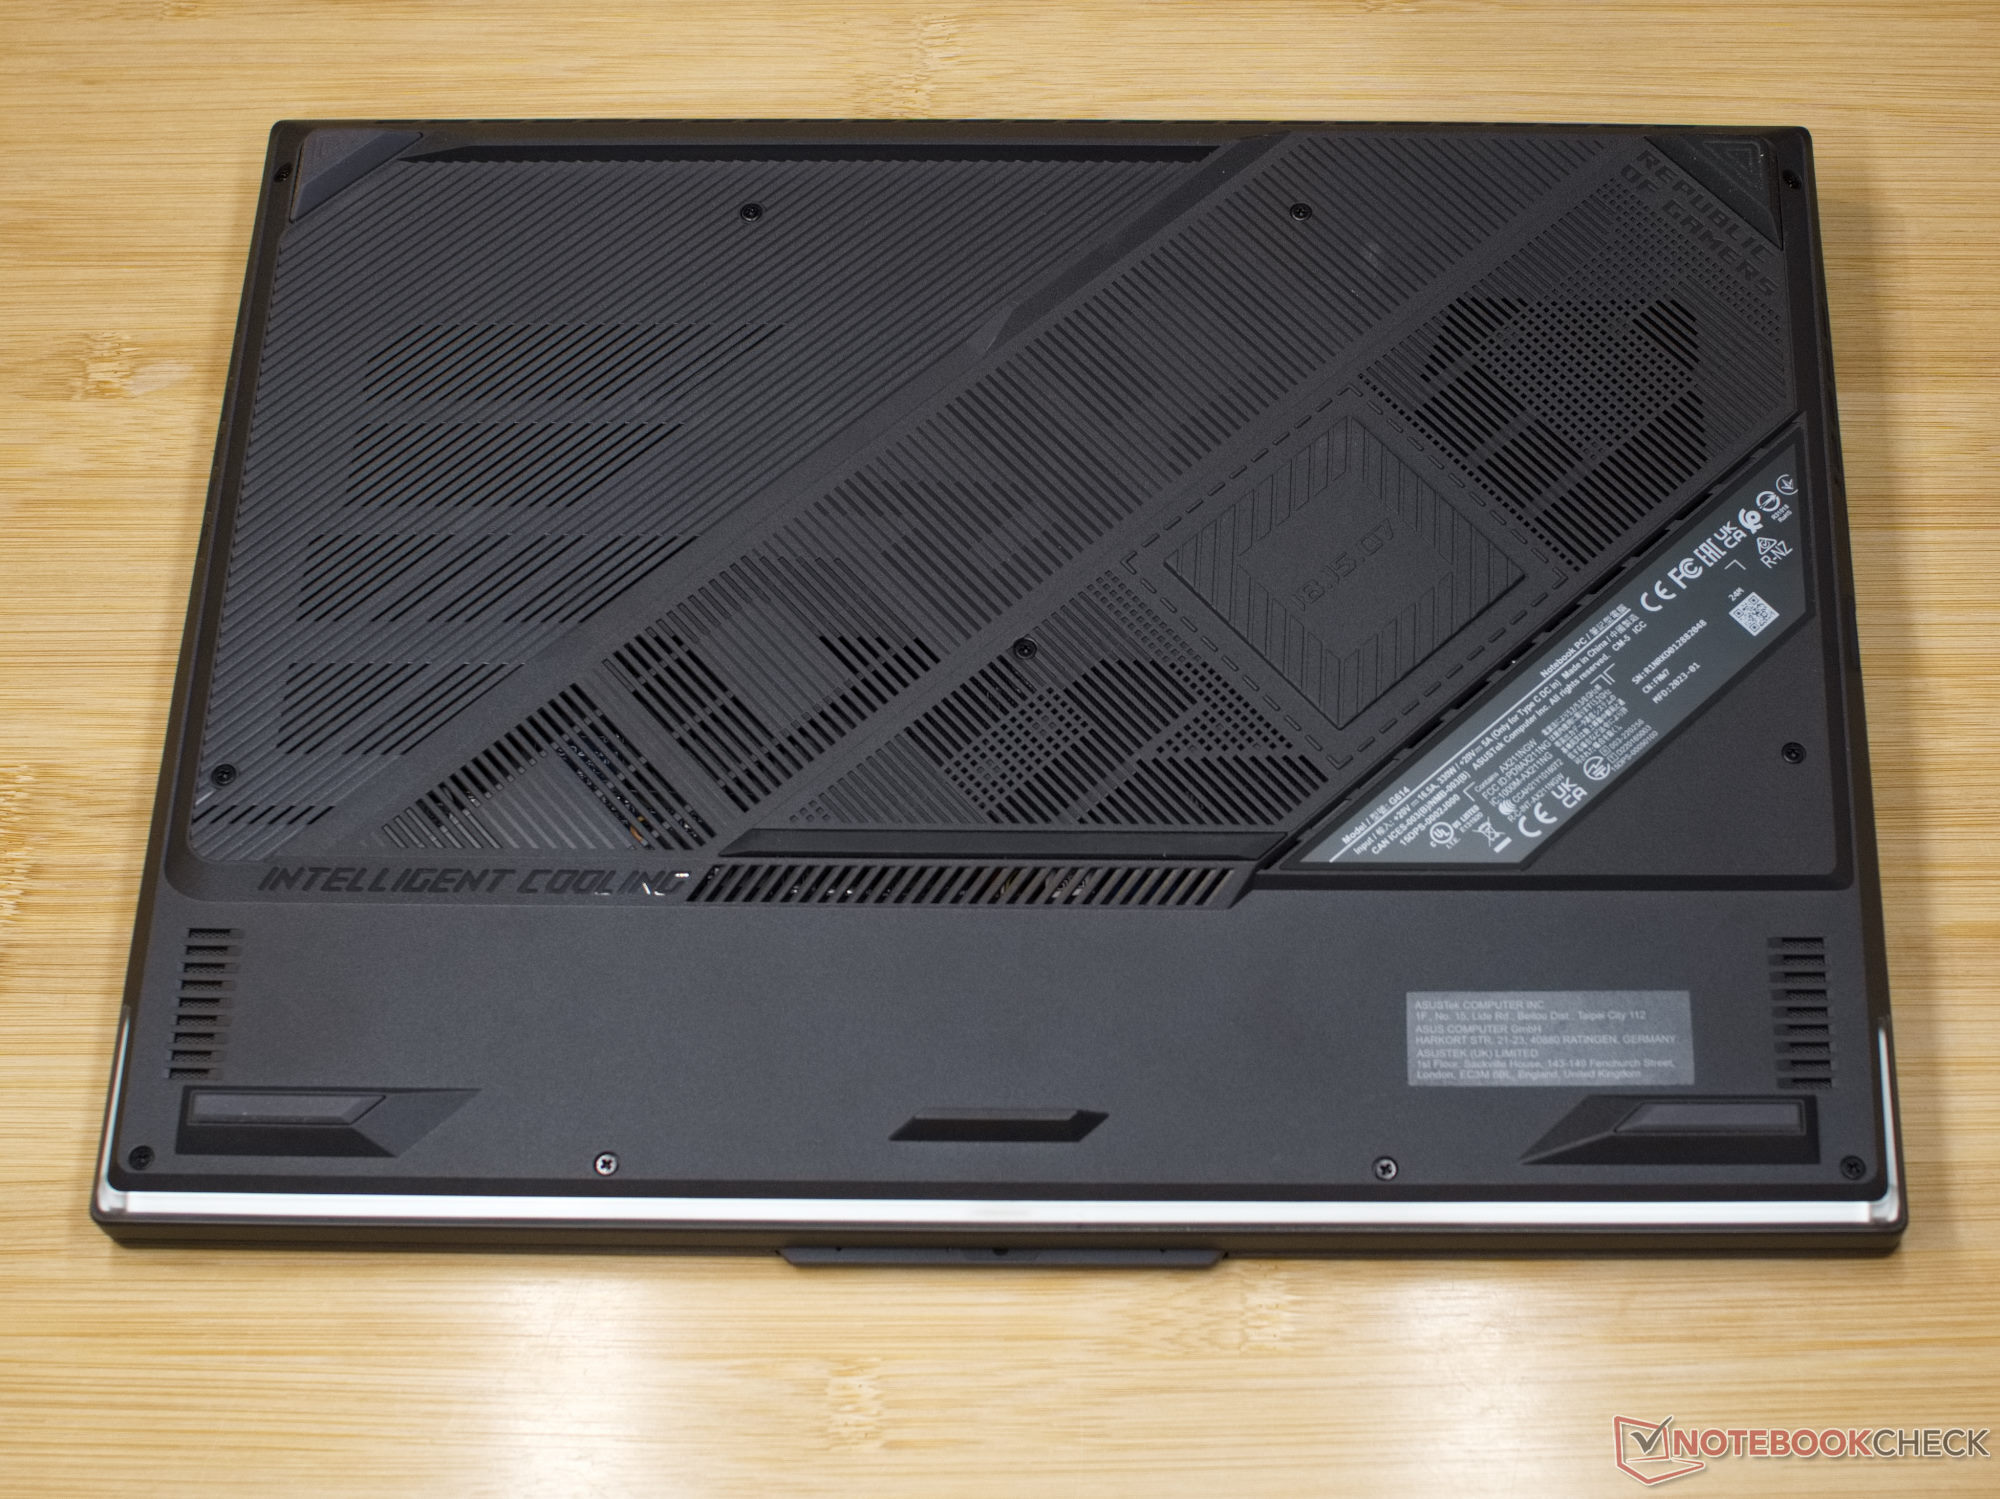
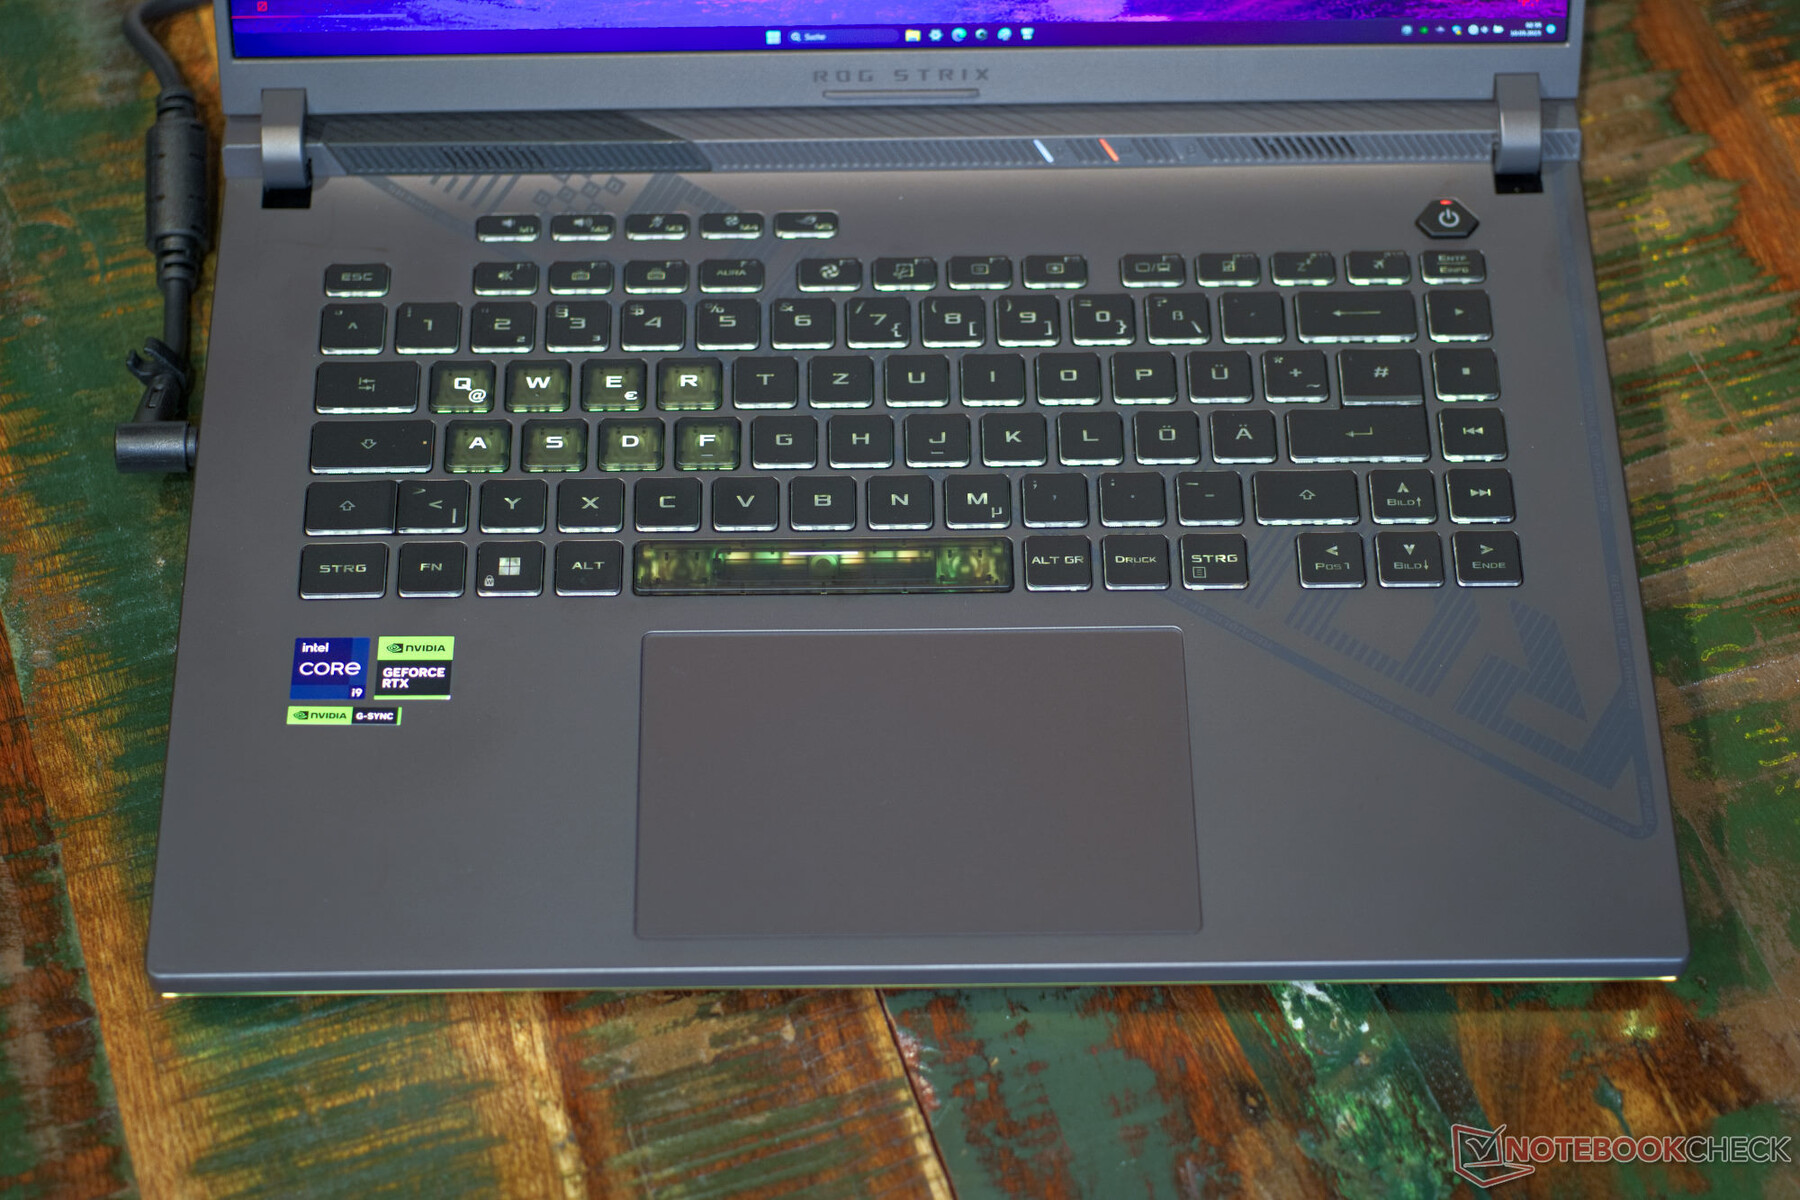
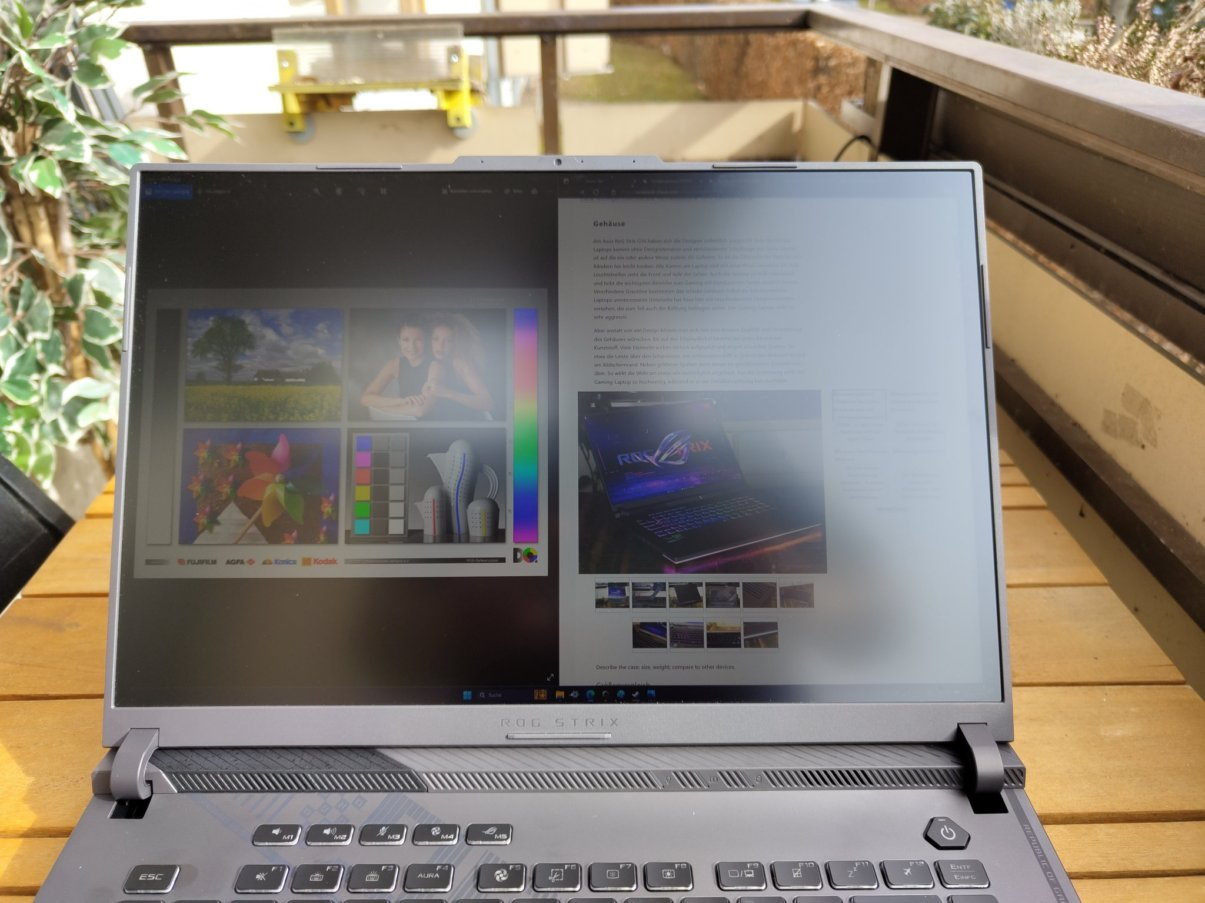
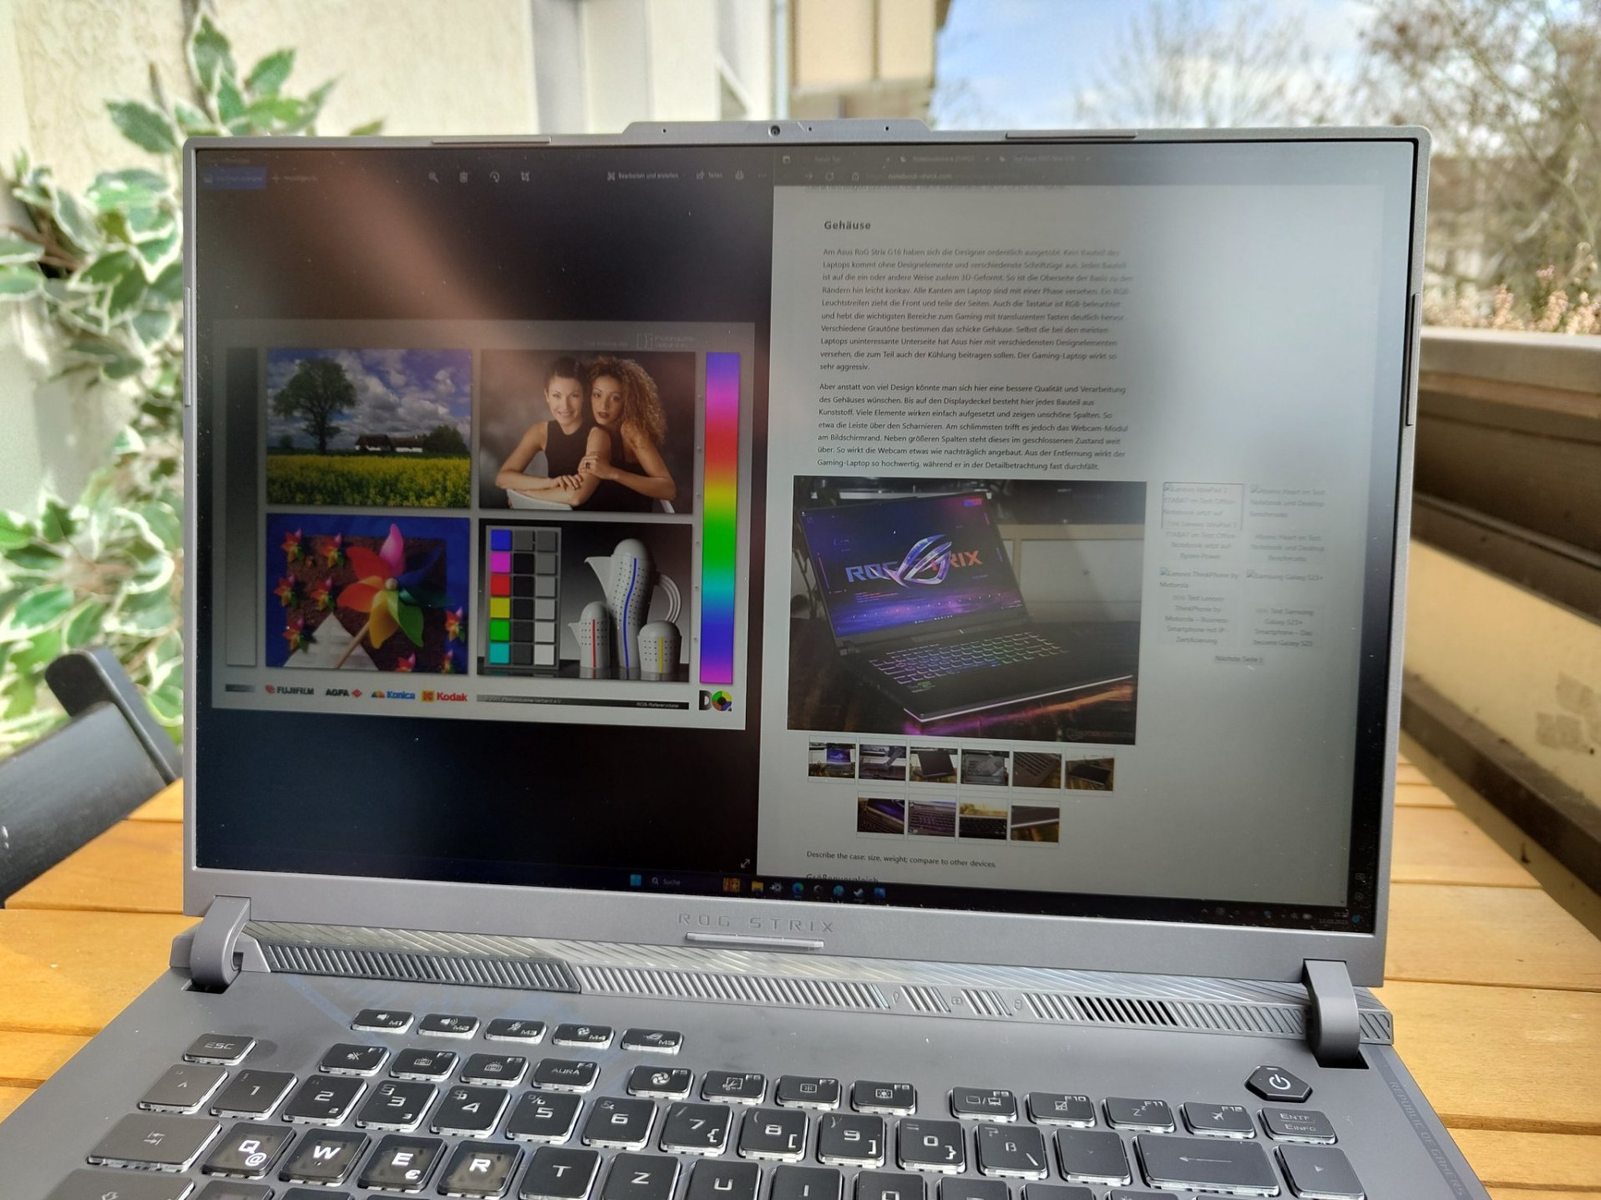
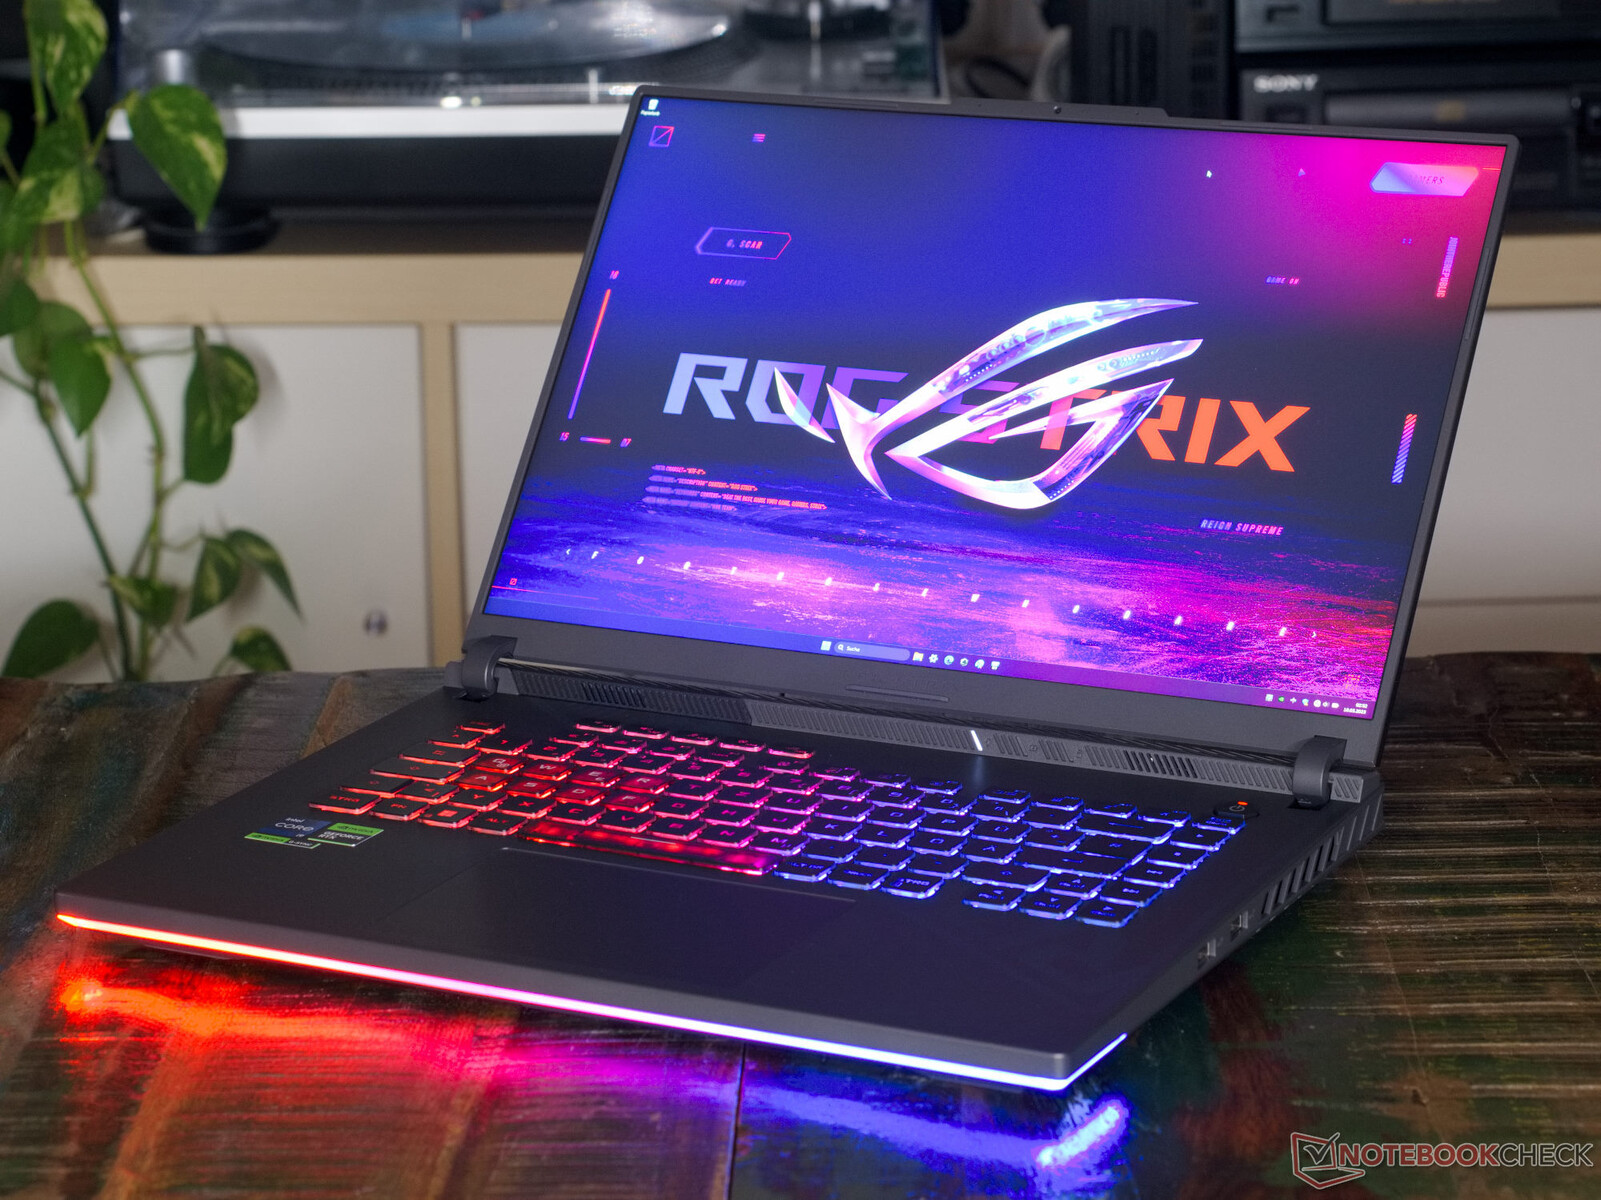
华硕ROG Strix G16的设计师们不遗余力。这款笔记本电脑的任何组件都没有设计或文字元素。每个部件也都以这种或那种方式进行了3D塑形。例如,底座的顶部是略微向边缘凹陷的。正面和部分侧面配有RGB灯带。键盘也是RGB发光的,并通过半透明的按键公开突出了对游戏最重要的区域。各种灰色的阴影定义了这个别致的外壳。华硕甚至还在大多数笔记本中无趣的底部布置了各种设计元素,其中一些也是为了帮助散热。与以前的机型相比,一些端口不得不从笔记本的背面移开,以便为散热让路,因为现在散热器沿着笔记本的整个背面运行。这使散热器的总表面积超过174平方毫米,使这台游戏笔记本看起来非常有侵略性。16:10格式的屏幕可以用一只手打开到130°。铰链相当坚硬,但能稳定地将16英寸(约41厘米)的显示屏固定在任何可以想象的位置。
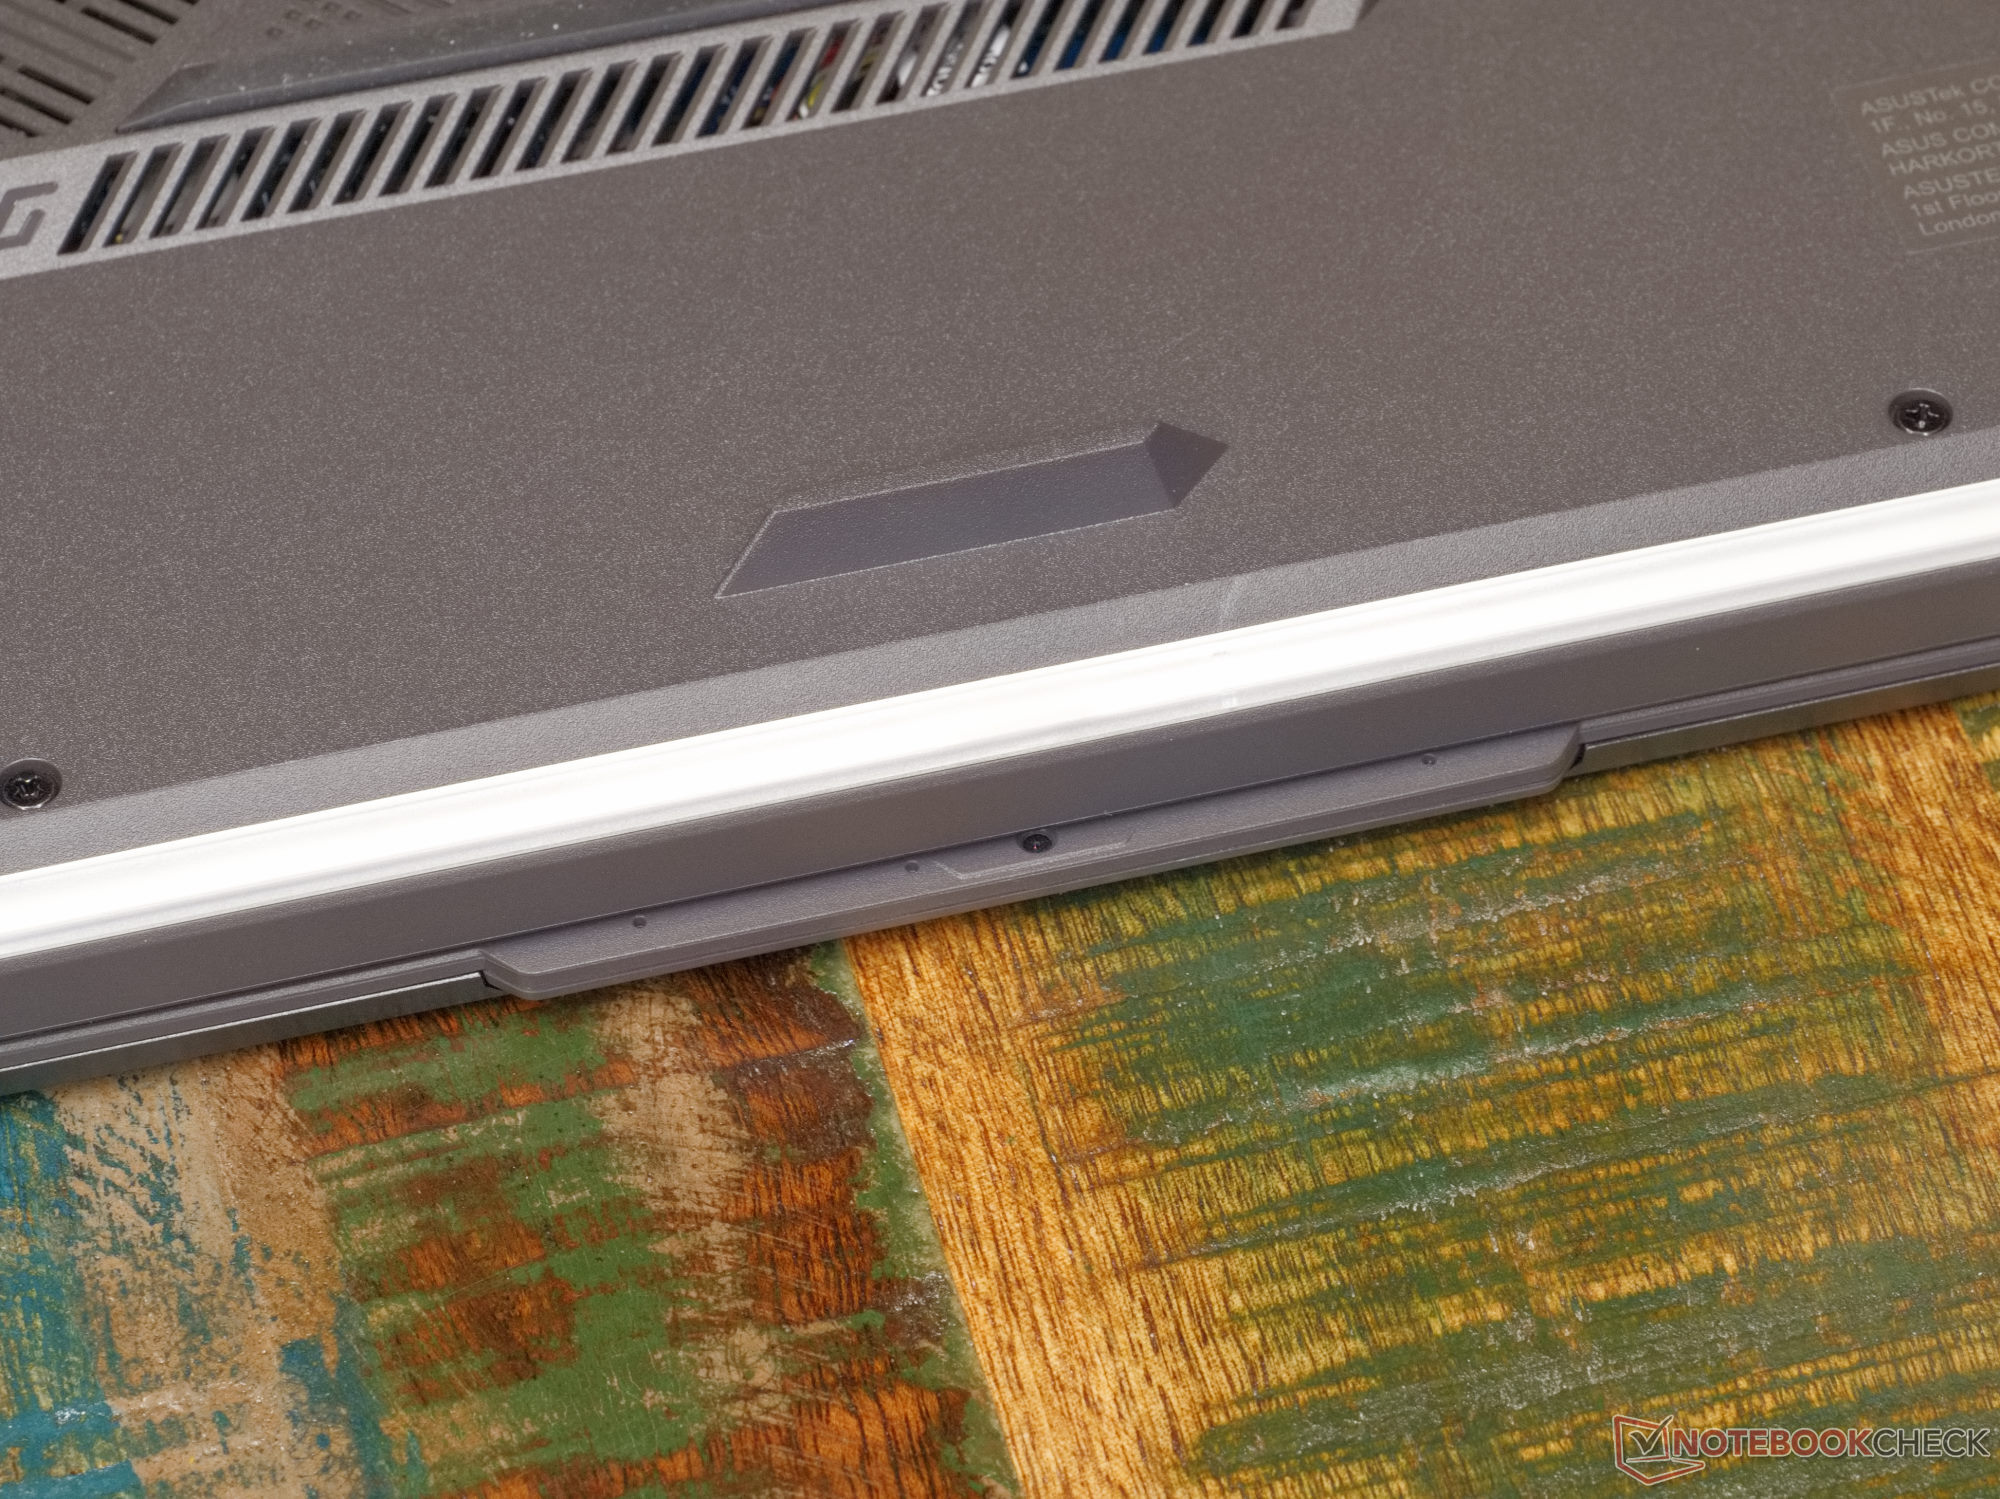
与其说是肆无忌惮的设计,我们倒是希望机箱的质量和做工更好。除了显示屏的盖子,所有部件都是由塑料制成的。许多元素显得过度,有难看的缝隙,如铰链上方的条状物。摄像头模块是受影响最严重的,除了较大的缝隙外,关闭时还会远远地伸出来。这使得网络摄像头看起来好像是在机箱制造完成后被附加上去的。从远处看,这款游戏笔记本看起来质量很高,但仔细观察就会发现其弱点。至少,16英寸的笔记本比18英寸的笔记本更稳定;我们发现ROG Strix G18的基本单元的稳定性很好。ROG Strix G18的基本单元的稳定性是值得批评的。
目前所有的16英寸游戏笔记本电脑在尺寸和重量方面都非常相似。几乎所有机型的重量都在两到三公斤之间,不含电源装置。在我们的测试设备中,电源装置几乎增加了一公斤的重量,所以你不得不拖着一台重约3.3公斤的笔记本电脑。只有Gigabyte AERO 16比我们数据库中的其他16英寸笔记本明显更薄。
设备 - Thunderbolt 4和快速Wi-Fi 6E
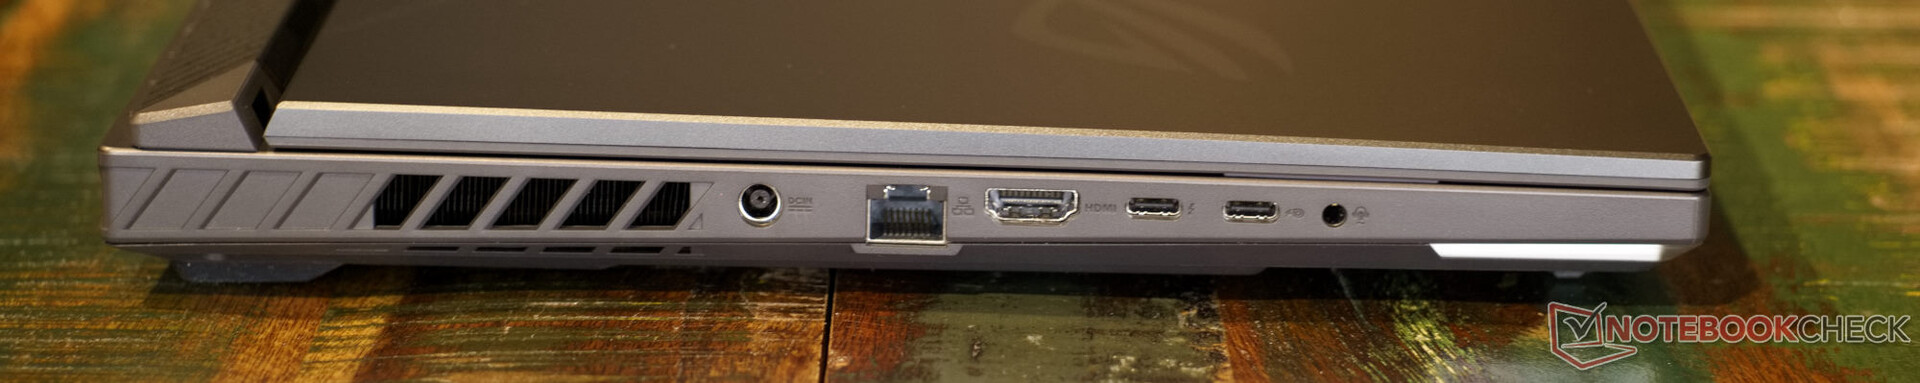
ROG Strix G16的大部分端口都集中在笔记本的左侧。在右边,只有两个USB接口。左边的两个USB Type-C插座分享它们的任务:后面的支持Thunderbolt 4,前面的支持Power Delivery,同时都支持DisplayPort。通过USB-C的供电是相当有限的。笔记本电脑需要20伏的电源输出,最大功率为100瓦。因此,通过USB-C电力传输无法获得笔记本电脑的全部性能。

沟通
英特尔的Wi-Fi 6E AX211模块确保本地网络和华硕游戏笔记本电脑之间的快速连接,因此是最先进的。上传和下载的连接速度略高于平均水平,但我们看到英特尔的WLAN-ax模块的效果更强。
网络摄像头
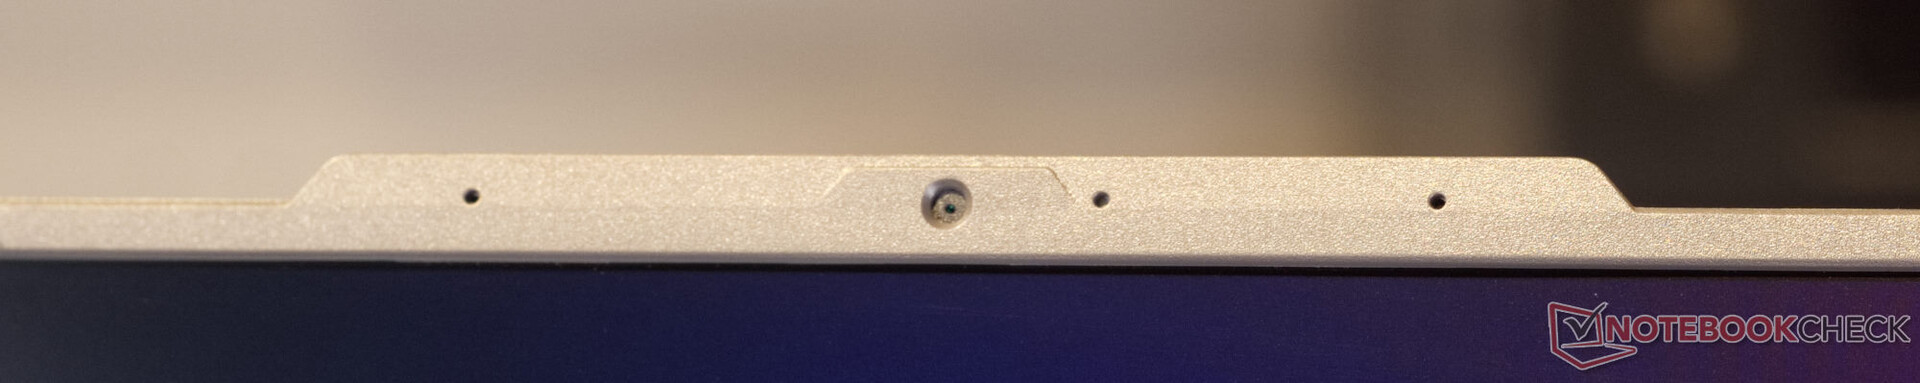
这款笔记本电脑的720p网络摄像头拥有针孔摄像头的图像质量,表现并不出色。只有在光线良好的情况下,图片才有一定的可用性。否则,噪声抑制吞噬了所有的细节。边缘处的细节也非常模糊。至少,网络摄像头旁边的三个麦克风能提供相当好的声音。


安全问题
这里找不到指纹扫描仪或其他安全功能。只有英特尔酷睿i9的安全措施,如TPM 2.0,是可用的。
辅料
这款游戏笔记本除了一个330瓦的电源和一些文件外,并没有带来更多东西。华硕在很大程度上免除了塑料包装,只用保护膜将笔记本包裹起来。
维护
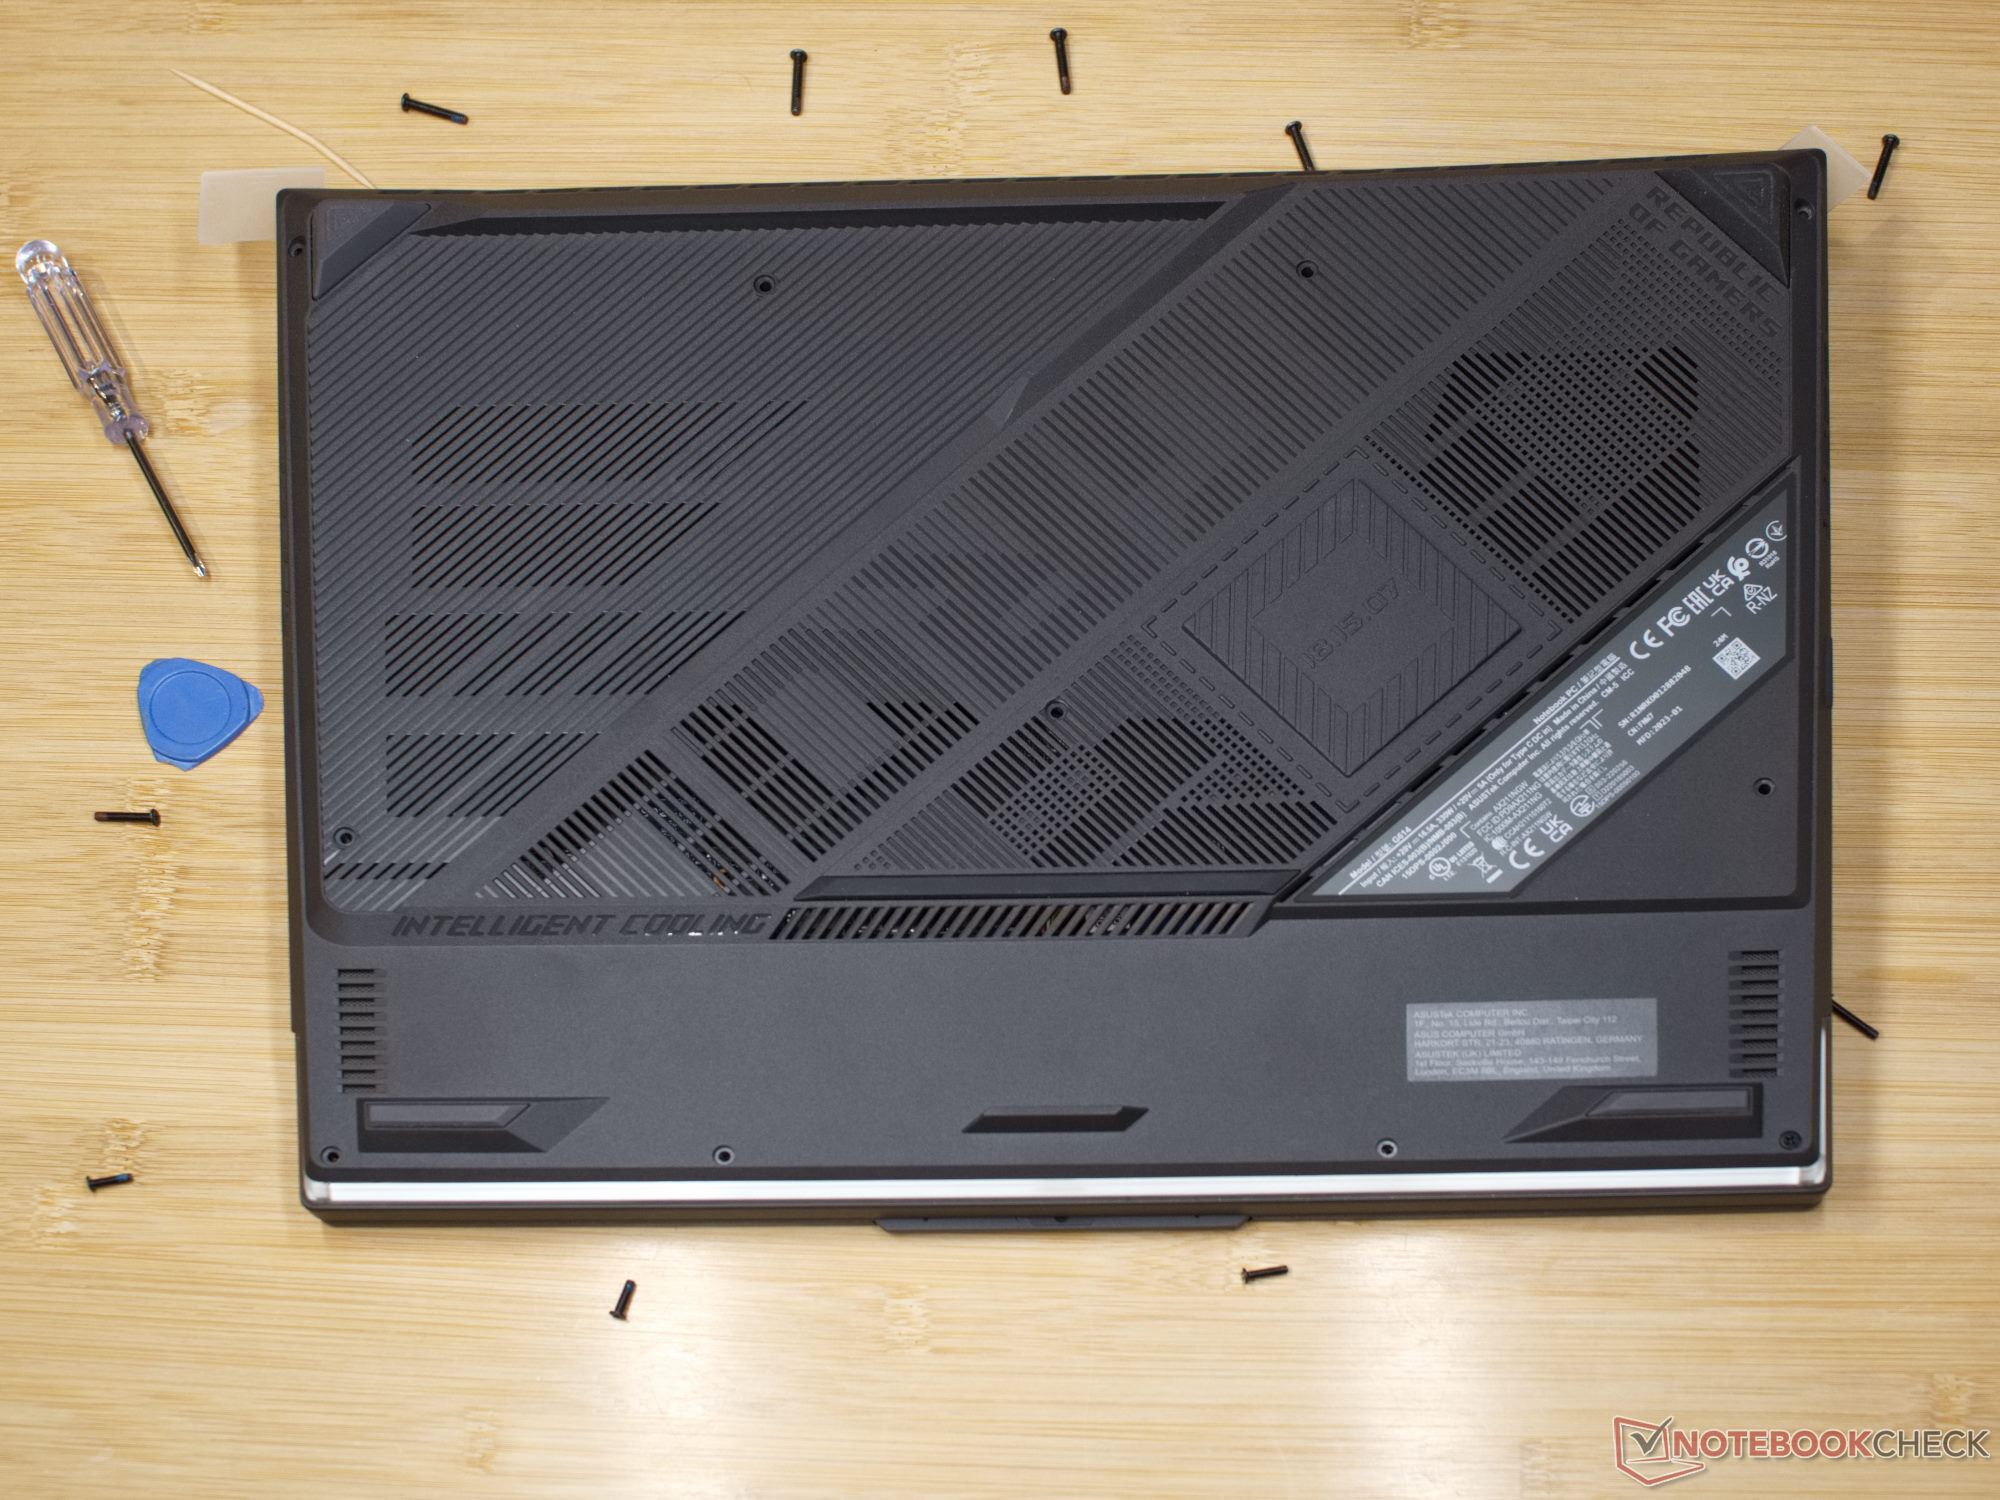
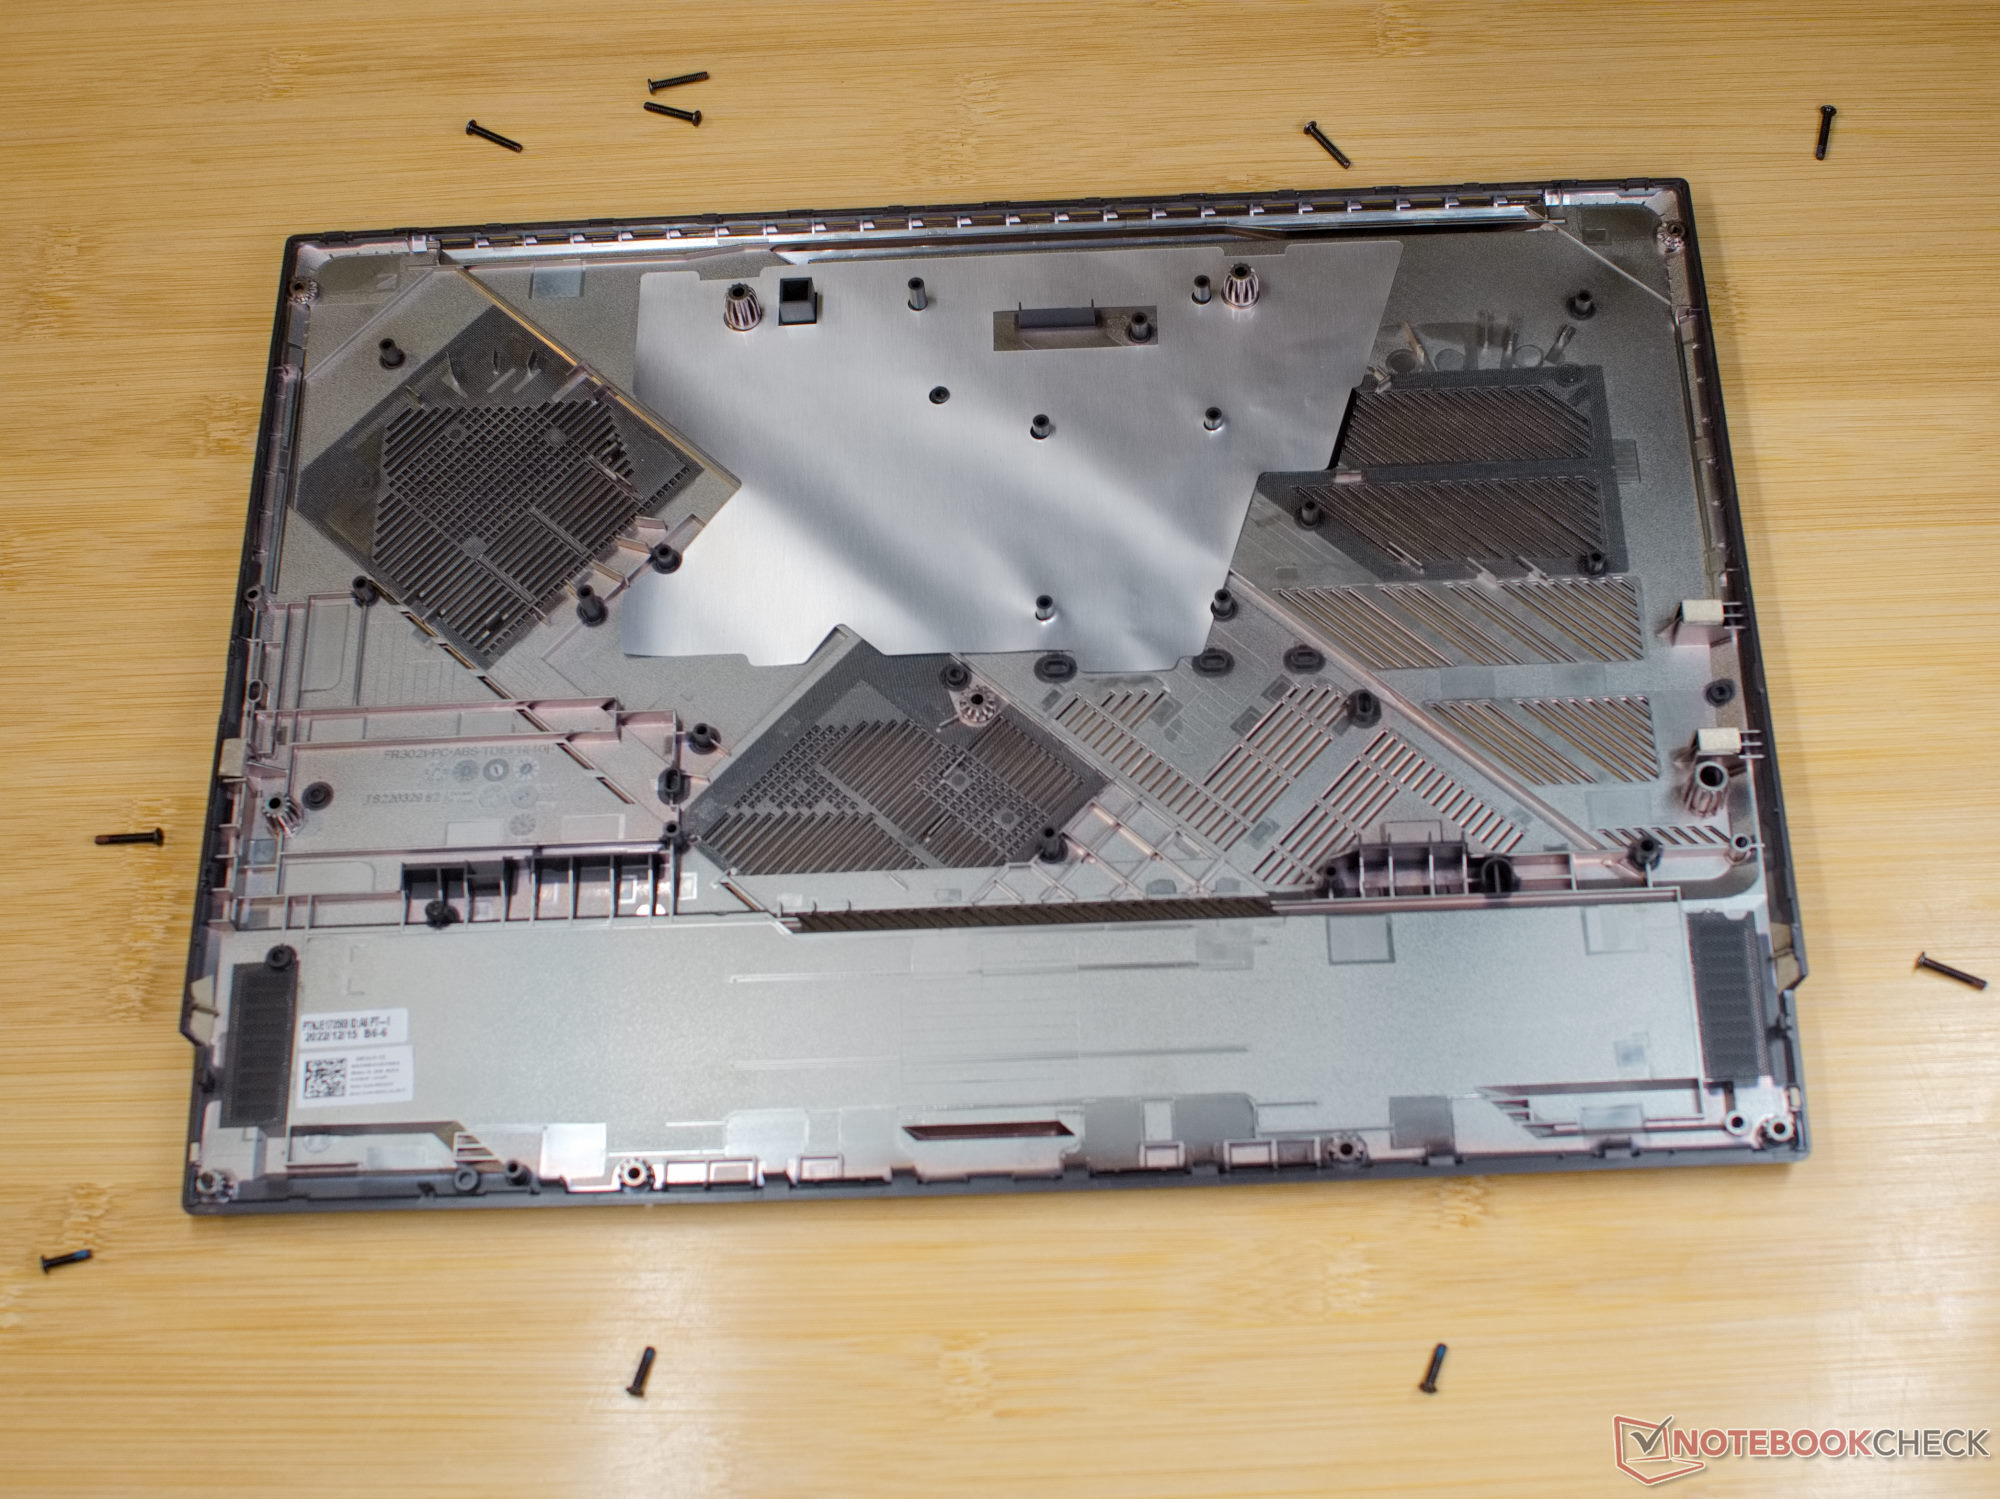
11颗PH1螺丝将游戏笔记本的底板固定在原位。我们建议从笔记本的后面到前面,最后松开前面右边的螺丝。这是因为它有一个锁环,确保盖子的一部分被抬起,因此为塑料开启工具提供了方便。几个夹子将盖子固定住。该工具是用来打开底部四周的。关于如何打开笔记本电脑以及哪些部件可以更换的更详细的信息,见华硕的维修手册.
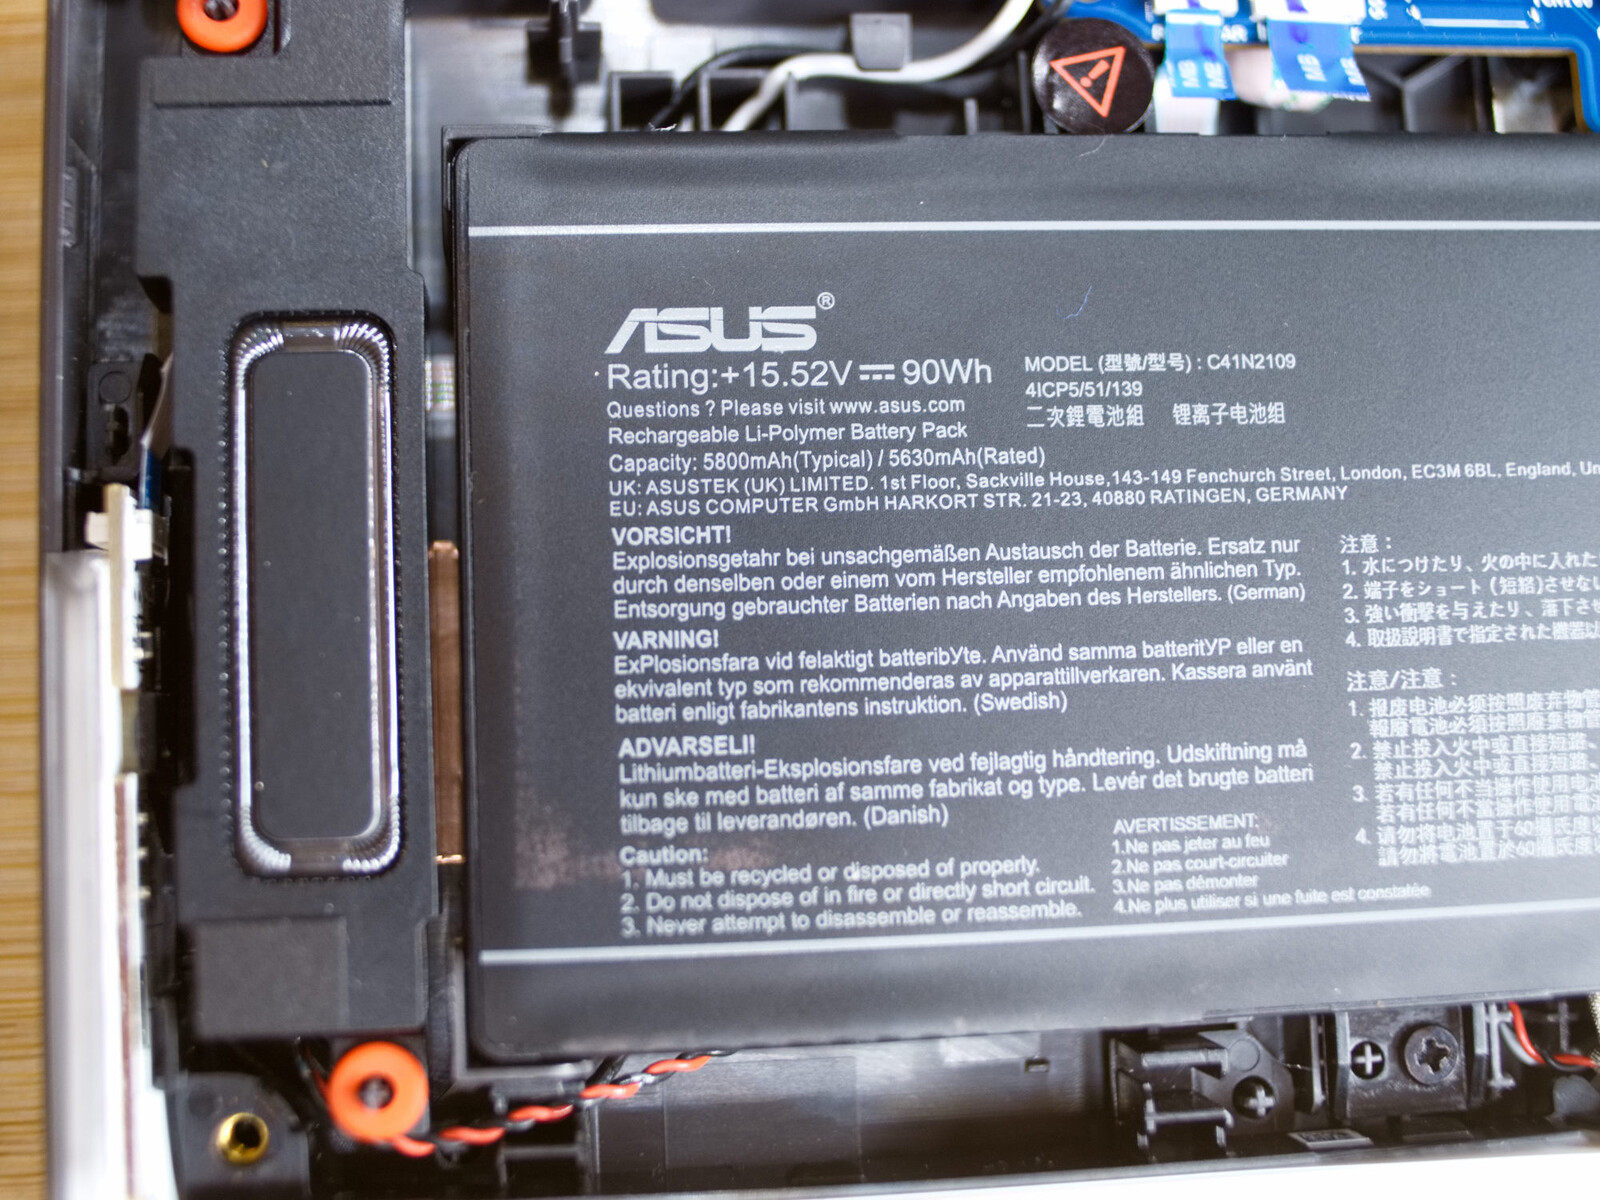
在笔记本电脑内部,我们遇到了一个相当容易维护的设备。我们发现两个内存插槽(都被占用),两个M.2插槽(一个被占用)和可更换的WLAN模块。90瓦时的电池也很容易更换,因为它不是用胶粘的。
担保
华硕在欧洲为ROG Strix G16提供两年的保修。这在其他地区可能有所不同,所以感兴趣的买家应该在购买前仔细检查。
输入设备 - 良好的键盘,但不是机械键盘
键盘
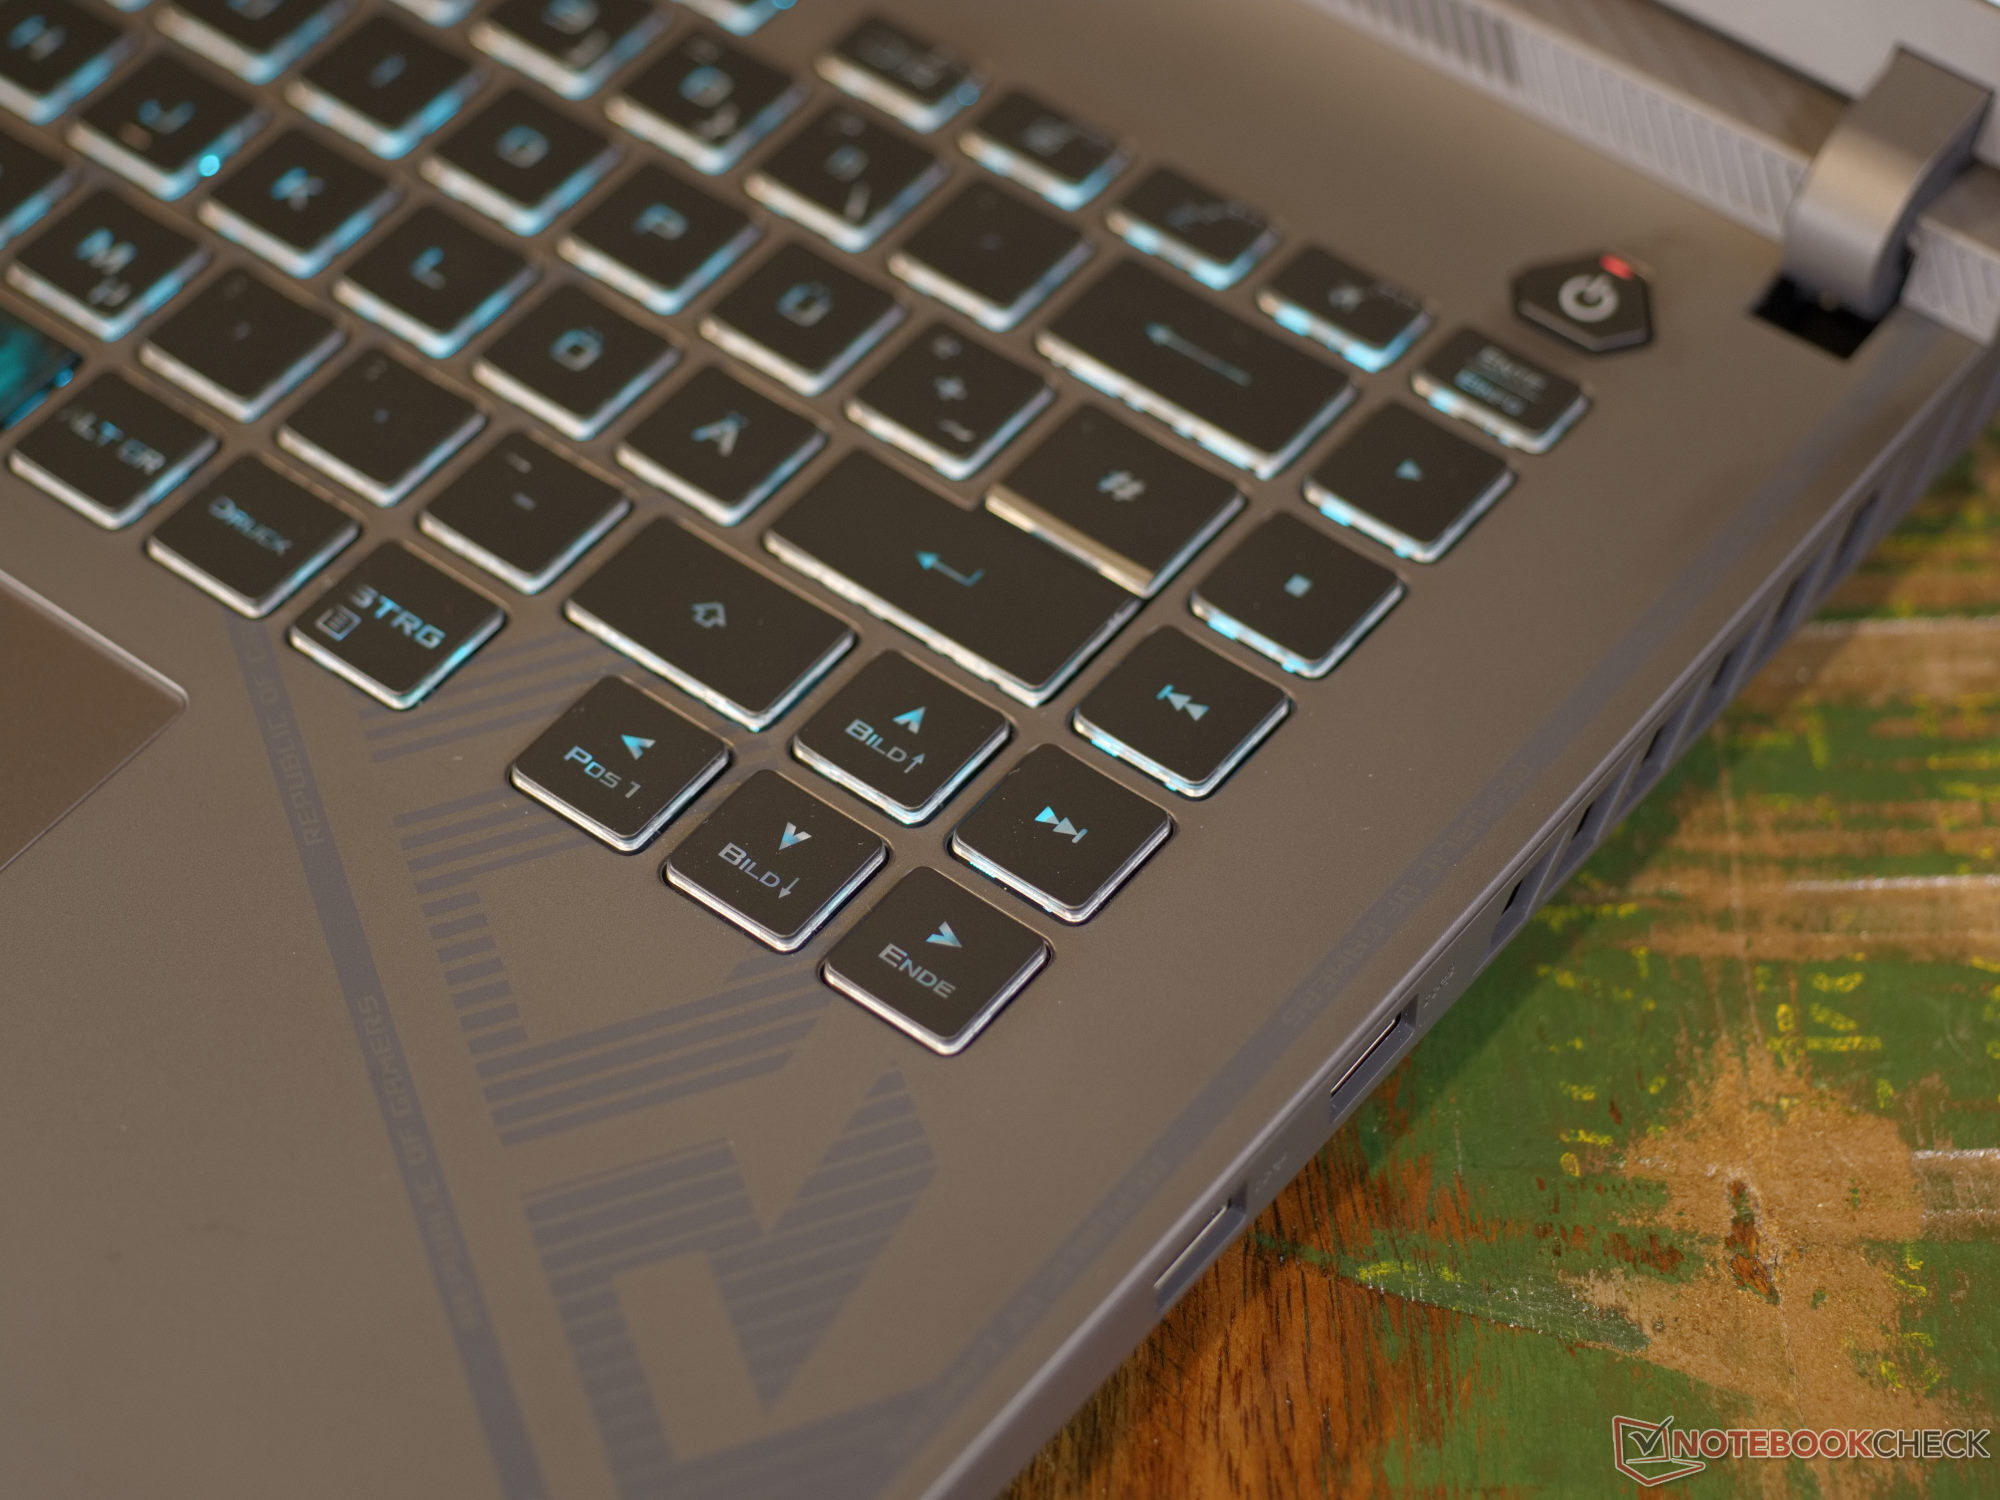
ROG Strix G16配备了一个小键盘,但由于其1.9毫米的键程和体面的触觉反馈,它提供了一个愉快的打字感觉。键盘设计是典型的游戏笔记本电脑,安装了RBG照明。此外,对游戏最重要的按键被突出显示。所有按钮都被设计成全尺寸键,这意味着右侧的方向键相当拥挤。在紧张的时刻,你很容易在这里按错键。笔记本电脑本身会有足够的空间将方向键往下移一点。然而,在输入文本时,你必须习惯于缩短的移位键
在功能键上方还有五个可以分配各种宏的按键。然而,宏键离掌托很远。根据你的手的大小,如果不改变手的位置,就很难够到它们。
触摸板
13×8.5厘米,这款游戏笔记本的点击板大得令人愉快,其位置不应该影响键盘操作。由于它的玻璃表面,它应该能长期保持其丝滑的哑光质地。这具有令人愉快的感觉和良好的滑行特性。点击板本身对所有的输入都有快速而准确的反应,一直到角落里。
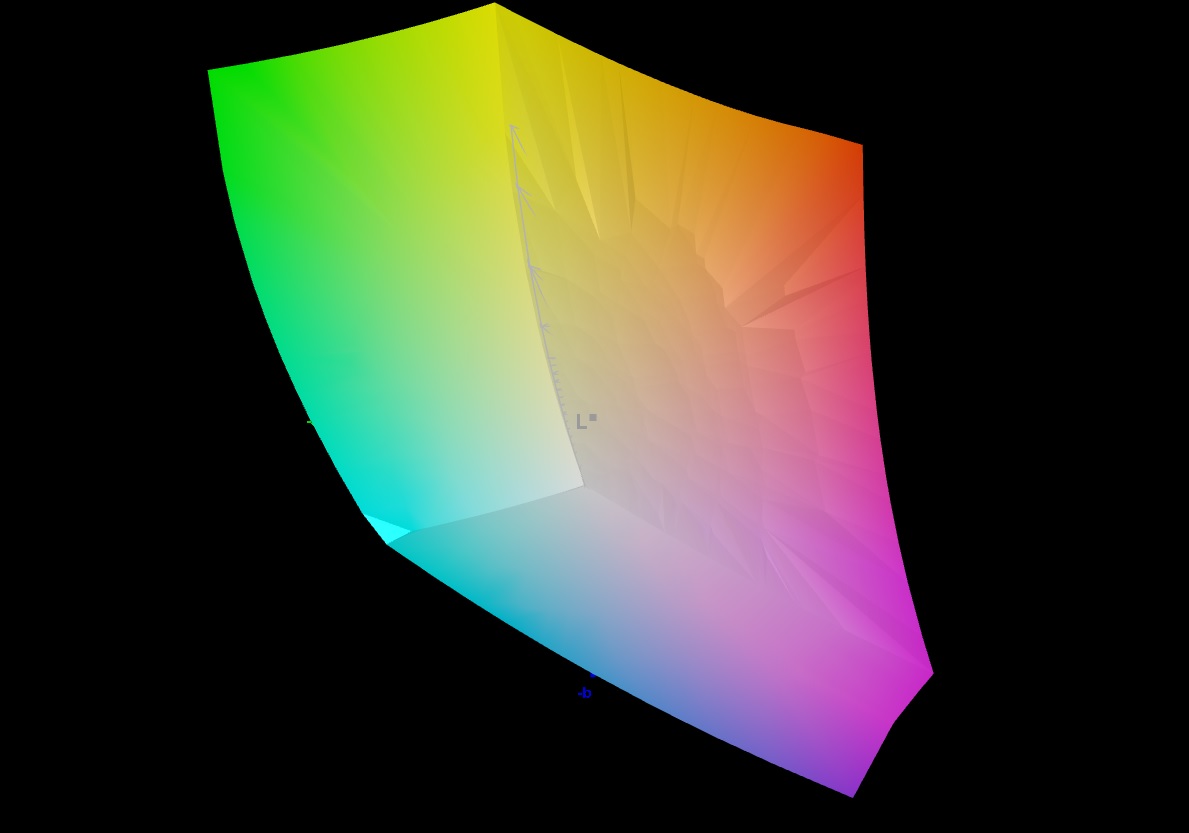
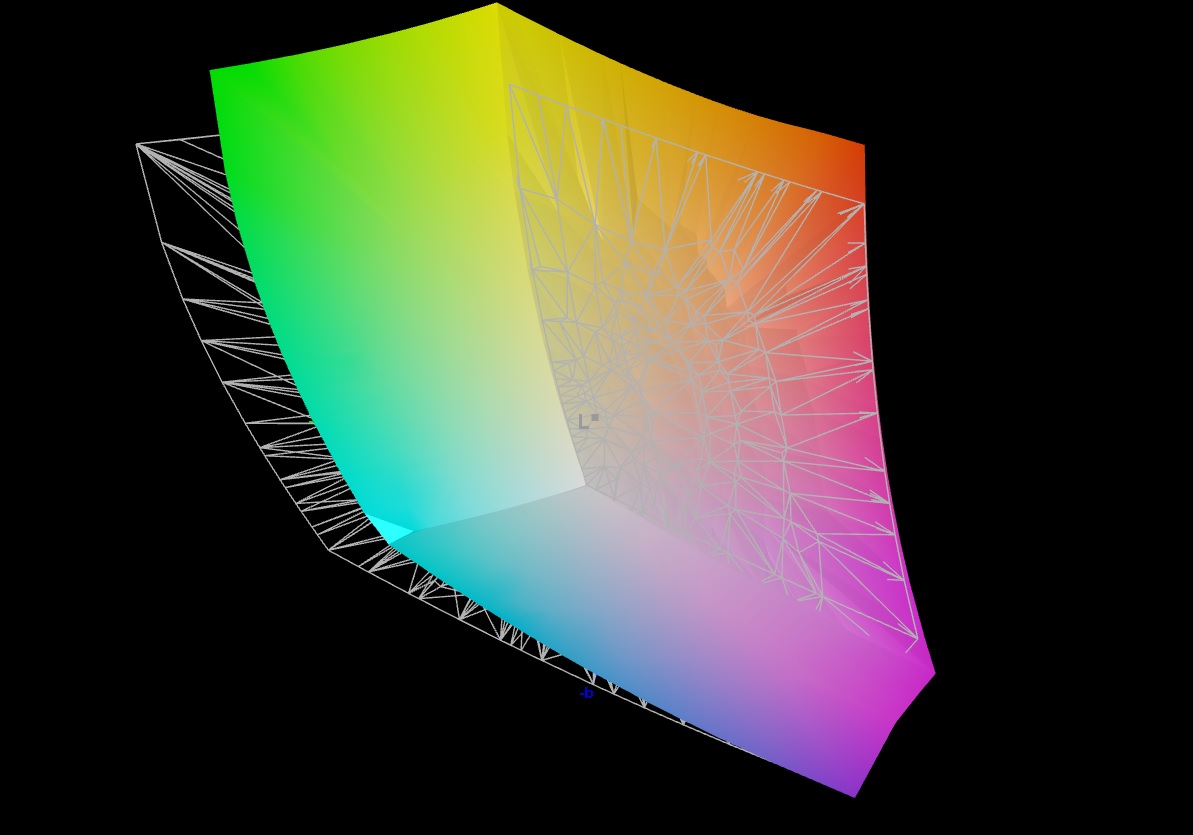
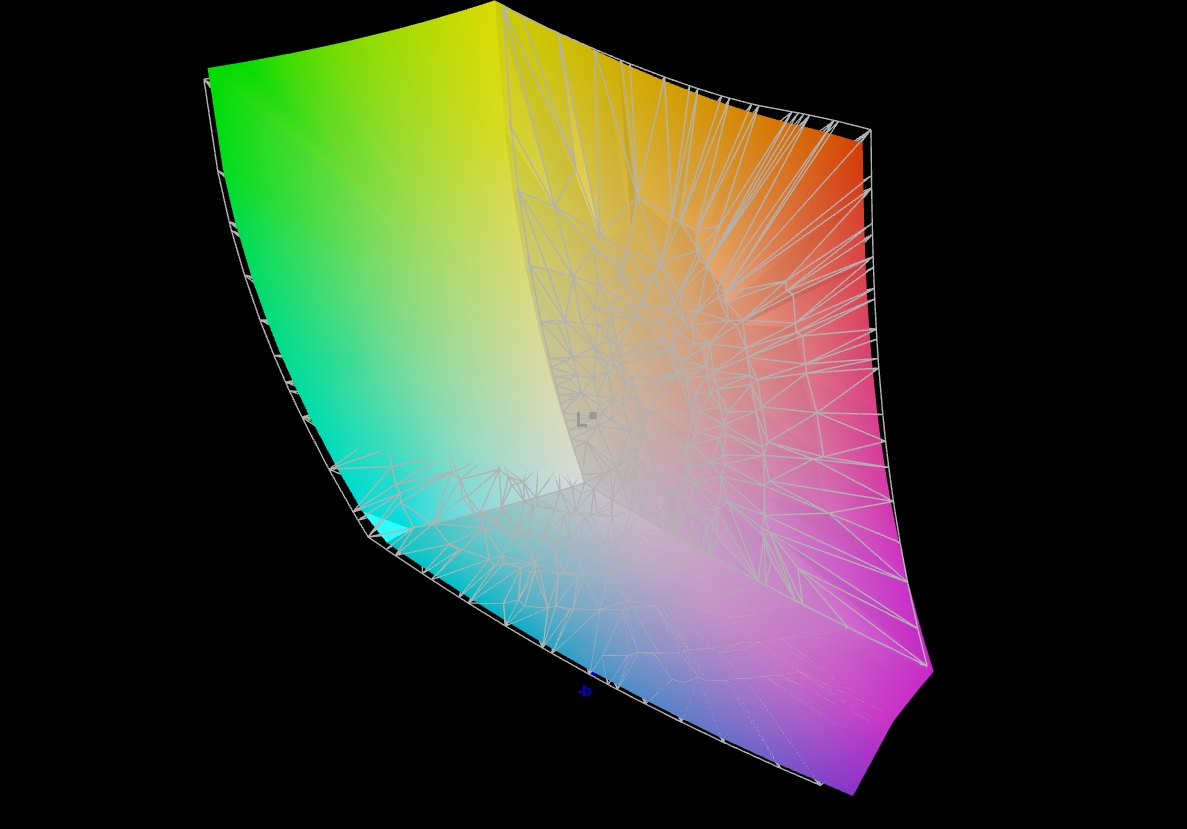
显示屏 - 响应式QHD+,16:10格式
IPS显示屏提供16:10格式的QHD+分辨率,刷新率为240赫兹。然而,该面板并没有达到宣传的3毫秒的响应时间;在某些情况下,该数值甚至翻倍。亮度也没有华硕在数据表中承诺的500 cd/m²那么高。总的来说,我们仍然有一个坚实的显示屏,它具有哑光表面和高DisplayP3色彩空间覆盖率。这里没有发现明显的照明错误。
但有一件事可能会在游戏时被证明是一种困扰。华硕ROG Strix G16的状态LED位于屏幕的正下方,其中存储设备LED在游戏过程中闪烁得相当频繁,令人分心,尤其是在动作密集的游戏中。为了获得身临其境的游戏体验,唯一可以帮助的是一条黑色的胶带。
| |||||||||||||||||||||||||
Brightness Distribution: 93 %
Center on Battery: 470 cd/m²
Contrast: 1119:1 (Black: 0.42 cd/m²)
ΔE ColorChecker Calman: 1.86 | ∀{0.5-29.43 Ø4.72}
calibrated: 0.93
ΔE Greyscale Calman: 2.7 | ∀{0.09-98 Ø4.97}
84.9% AdobeRGB 1998 (Argyll 3D)
99.9% sRGB (Argyll 3D)
97% Display P3 (Argyll 3D)
Gamma: 2.246
CCT: 6711 K
| Asus ROG Strix G16 G614JZ TL160ADMP03-0, IPS, 2560x1600, 16" | Asus Zephyrus Duo 16 GX650PY-NM006W NE160QDM-NM4, MiniLED, 2560x1600, 16" | Lenovo Legion Pro 7 16IRX8H MNG007DA2-3 (CSO1628), IPS, 2560x1600, 16" | Gigabyte AERO 16 OLED BSF Samsung SDC4191 (ATNA60YV09-0, OLED, 3840x2400, 16" | Asus TUF Gaming A16 FA617 NE160WUM-NX2 (BOE0B33), IPS-Level, 1920x1200, 16" | Razer Blade 16 Early 2023 CSOT T3 MNG007DA4-1, IPS, 2560x1600, 16" | |
|---|---|---|---|---|---|---|
| Display | 3% | -15% | 6% | -15% | 3% | |
| Display P3 Coverage (%) | 97 | 99.4 2% | 69.1 -29% | 99.9 3% | 69.4 -28% | 98.5 2% |
| sRGB Coverage (%) | 99.9 | 100 0% | 99.7 0% | 100 0% | 97.8 -2% | 100 0% |
| AdobeRGB 1998 Coverage (%) | 84.9 | 90.8 7% | 71.2 -16% | 96.4 14% | 70.9 -16% | 89.7 6% |
| Response Times | -193% | -65% | 66% | -143% | -56% | |
| Response Time Grey 50% / Grey 80% * (ms) | 5.1 ? | 15.2 ? -198% | 12.3 ? -141% | 2 ? 61% | 17 ? -233% | 6.6 ? -29% |
| Response Time Black / White * (ms) | 6.6 ? | 19 ? -188% | 5.9 ? 11% | 1.98 ? 70% | 10.1 ? -53% | 12 ? -82% |
| PWM Frequency (Hz) | 12000 ? | 60 | ||||
| Screen | 108% | 22% | 117% | 5% | -13% | |
| Brightness middle (cd/m²) | 470 | 712 51% | 511 9% | 389.97 -17% | 308 -34% | 456.8 -3% |
| Brightness (cd/m²) | 459 | 703 53% | 469 2% | 395 -14% | 293 -36% | 437 -5% |
| Brightness Distribution (%) | 93 | 95 2% | 86 -8% | 97 4% | 90 -3% | 83 -11% |
| Black Level * (cd/m²) | 0.42 | 0.07 83% | 0.4 5% | 0.03 93% | 0.23 45% | 0.35 17% |
| Contrast (:1) | 1119 | 10171 809% | 1278 14% | 12999 1062% | 1339 20% | 1305 17% |
| Colorchecker dE 2000 * | 1.86 | 1.7 9% | 0.95 49% | 2 -8% | 1.47 21% | 3.7 -99% |
| Colorchecker dE 2000 max. * | 3.87 | 4 -3% | 2.07 47% | 4.1 -6% | 2.98 23% | 6.42 -66% |
| Colorchecker dE 2000 calibrated * | 0.93 | 1.2 -29% | 0.91 2% | 1.68 -81% | 1.02 -10% | 0.66 29% |
| Greyscale dE 2000 * | 2.7 | 2.8 -4% | 0.6 78% | 2.23 17% | 2.2 19% | 2.6 4% |
| Gamma | 2.246 98% | 2.21 100% | 2.176 101% | 2.41 91% | 2.228 99% | 2.3 96% |
| CCT | 6711 97% | 6978 93% | 6545 99% | 6323 103% | 6228 104% | 6108 106% |
| Total Average (Program / Settings) | -27% /
42% | -19% /
2% | 63% /
86% | -51% /
-21% | -22% /
-16% |
* ... smaller is better
华硕ROG Strix G16在出厂时就配备了一个经过良好校准的显示器。没有一个平均色彩偏差超过2的ΔΕ2000。使用我们信息箱中的ICC配置文件,色彩偏差下降到1的ΔΕ2000以下,但最大值几乎保持不变,只是高于3的ΔΕ2000。
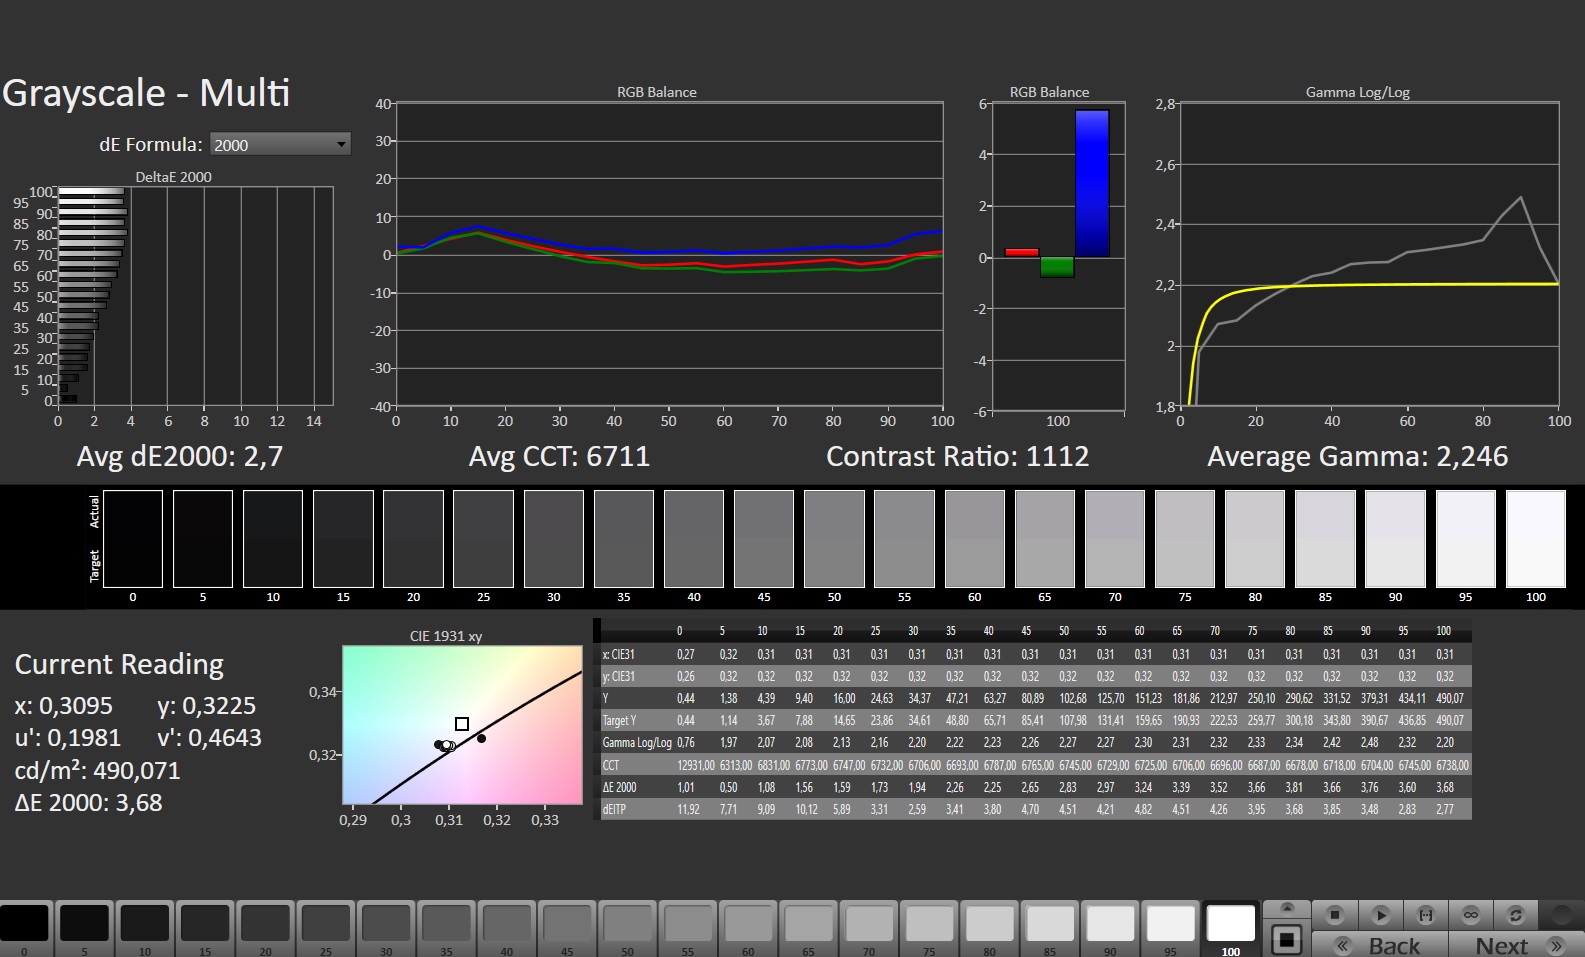


对于电影制片人和电影爱好者来说,DisplayP3色彩空间97%的覆盖率也应该是令人满意的。接近100%的sRGB色彩空间覆盖率通常对游戏来说是足够的。只有少数游戏提供更大色彩空间的选择。只有在AdobeRGB中,屏幕才会有些削弱,其中对摄影师很重要的色彩空间只有85%左右的覆盖率。
Display Response Times
| ↔ Response Time Black to White | ||
|---|---|---|
| 6.6 ms ... rise ↗ and fall ↘ combined | ↗ 2.2 ms rise | 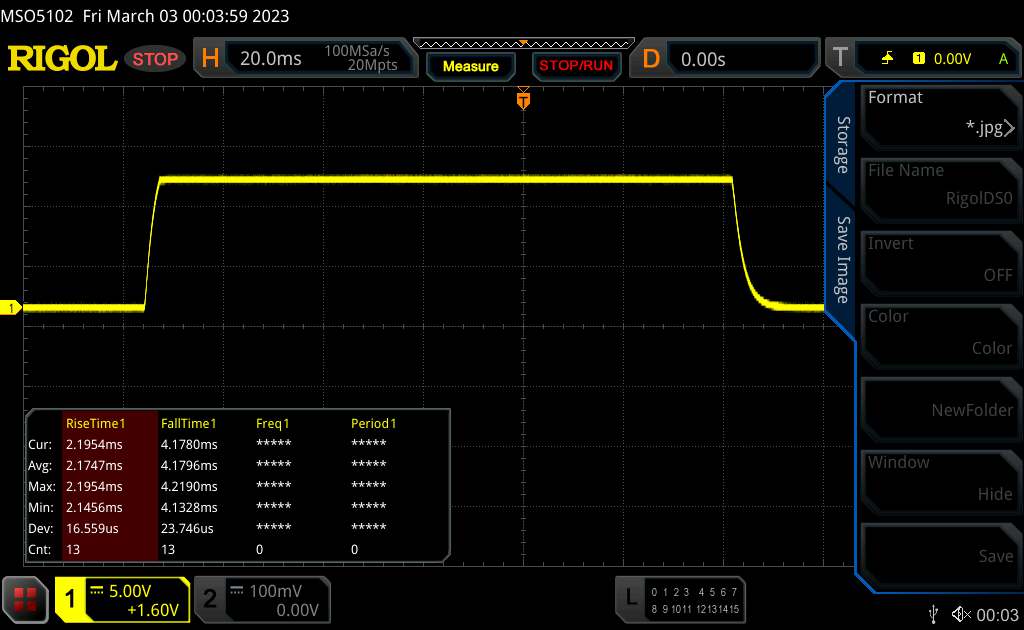 |
| ↘ 4.2 ms fall | ||
| The screen shows very fast response rates in our tests and should be very well suited for fast-paced gaming. In comparison, all tested devices range from 0.1 (minimum) to 240 (maximum) ms. » 21 % of all devices are better. This means that the measured response time is better than the average of all tested devices (19.8 ms). | ||
| ↔ Response Time 50% Grey to 80% Grey | ||
| 5.1 ms ... rise ↗ and fall ↘ combined | ↗ 2.3 ms rise | 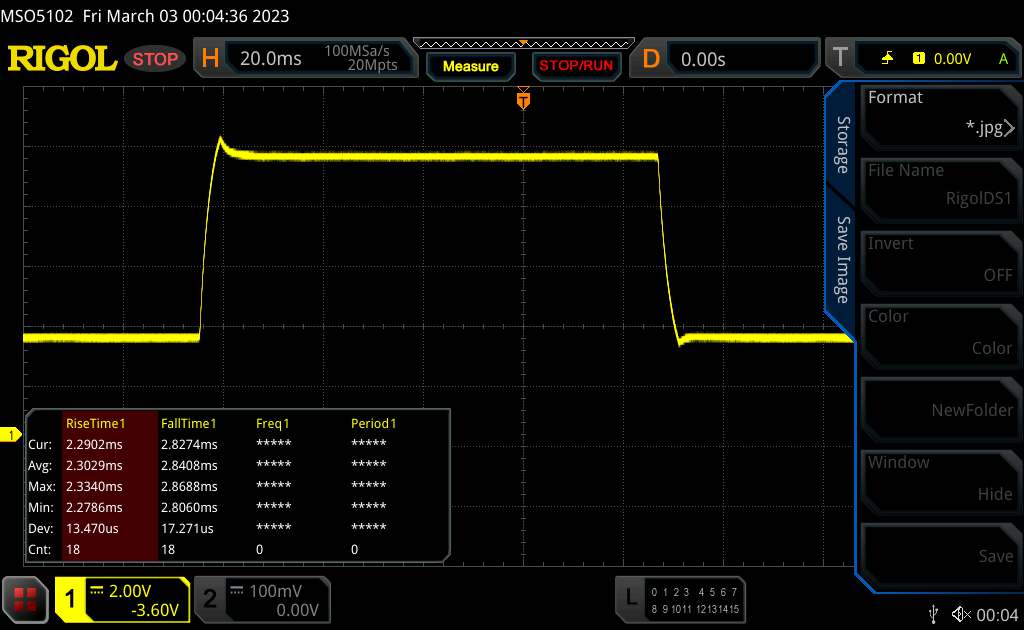 |
| ↘ 2.8 ms fall | ||
| The screen shows very fast response rates in our tests and should be very well suited for fast-paced gaming. In comparison, all tested devices range from 0.165 (minimum) to 636 (maximum) ms. » 17 % of all devices are better. This means that the measured response time is better than the average of all tested devices (31 ms). | ||
Screen Flickering / PWM (Pulse-Width Modulation)
| Screen flickering / PWM not detected | 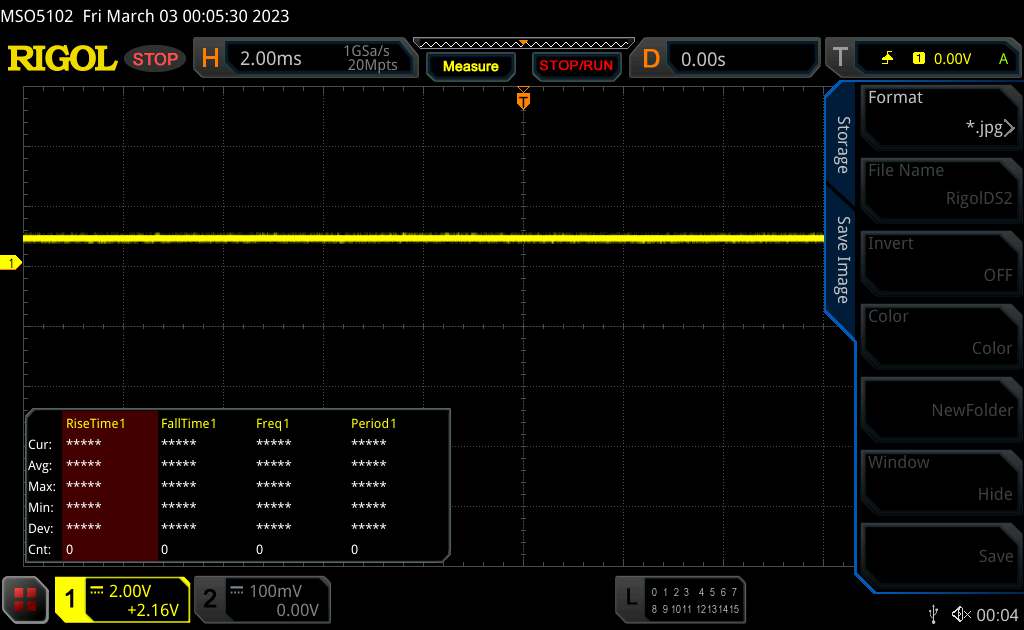 | ||
In comparison: 52 % of all tested devices do not use PWM to dim the display. If PWM was detected, an average of 7769 (minimum: 5 - maximum: 343500) Hz was measured. | |||
470 cd/m²的对比度为1119:1,对于在户外不受限制地使用哑光屏幕来说还不够。如果你看的角度不对,蓝天会反射到屏幕上,使阅读变得困难。幸运的是,华硕ROG Strix G16的屏幕是非常稳定的可视角度。从各个角度看,几乎没有任何明显的亮度和颜色偏差。

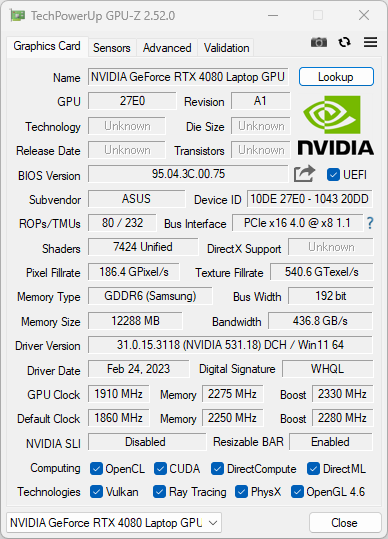
性能 -GeForce RTX 4080的功率最高可达175瓦。
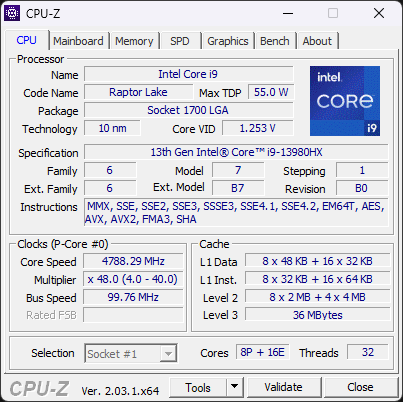
华硕ROG Strix G16有多种配置。顶级配置包括一个 英特尔酷睿i9-13980HX与32GB的DDR5内存和一个 NvidiaGeForce RTX 4080.我们的测试单元是相同的,除了16GB的内存。由于高TDP和TGP值,对游戏几乎没有任何限制。在最高质量设置下,许多当前的标题在ROG Strix上以显示器的原生QHD+分辨率呈现,远远超过60 FPS。
性能控制和测试条件
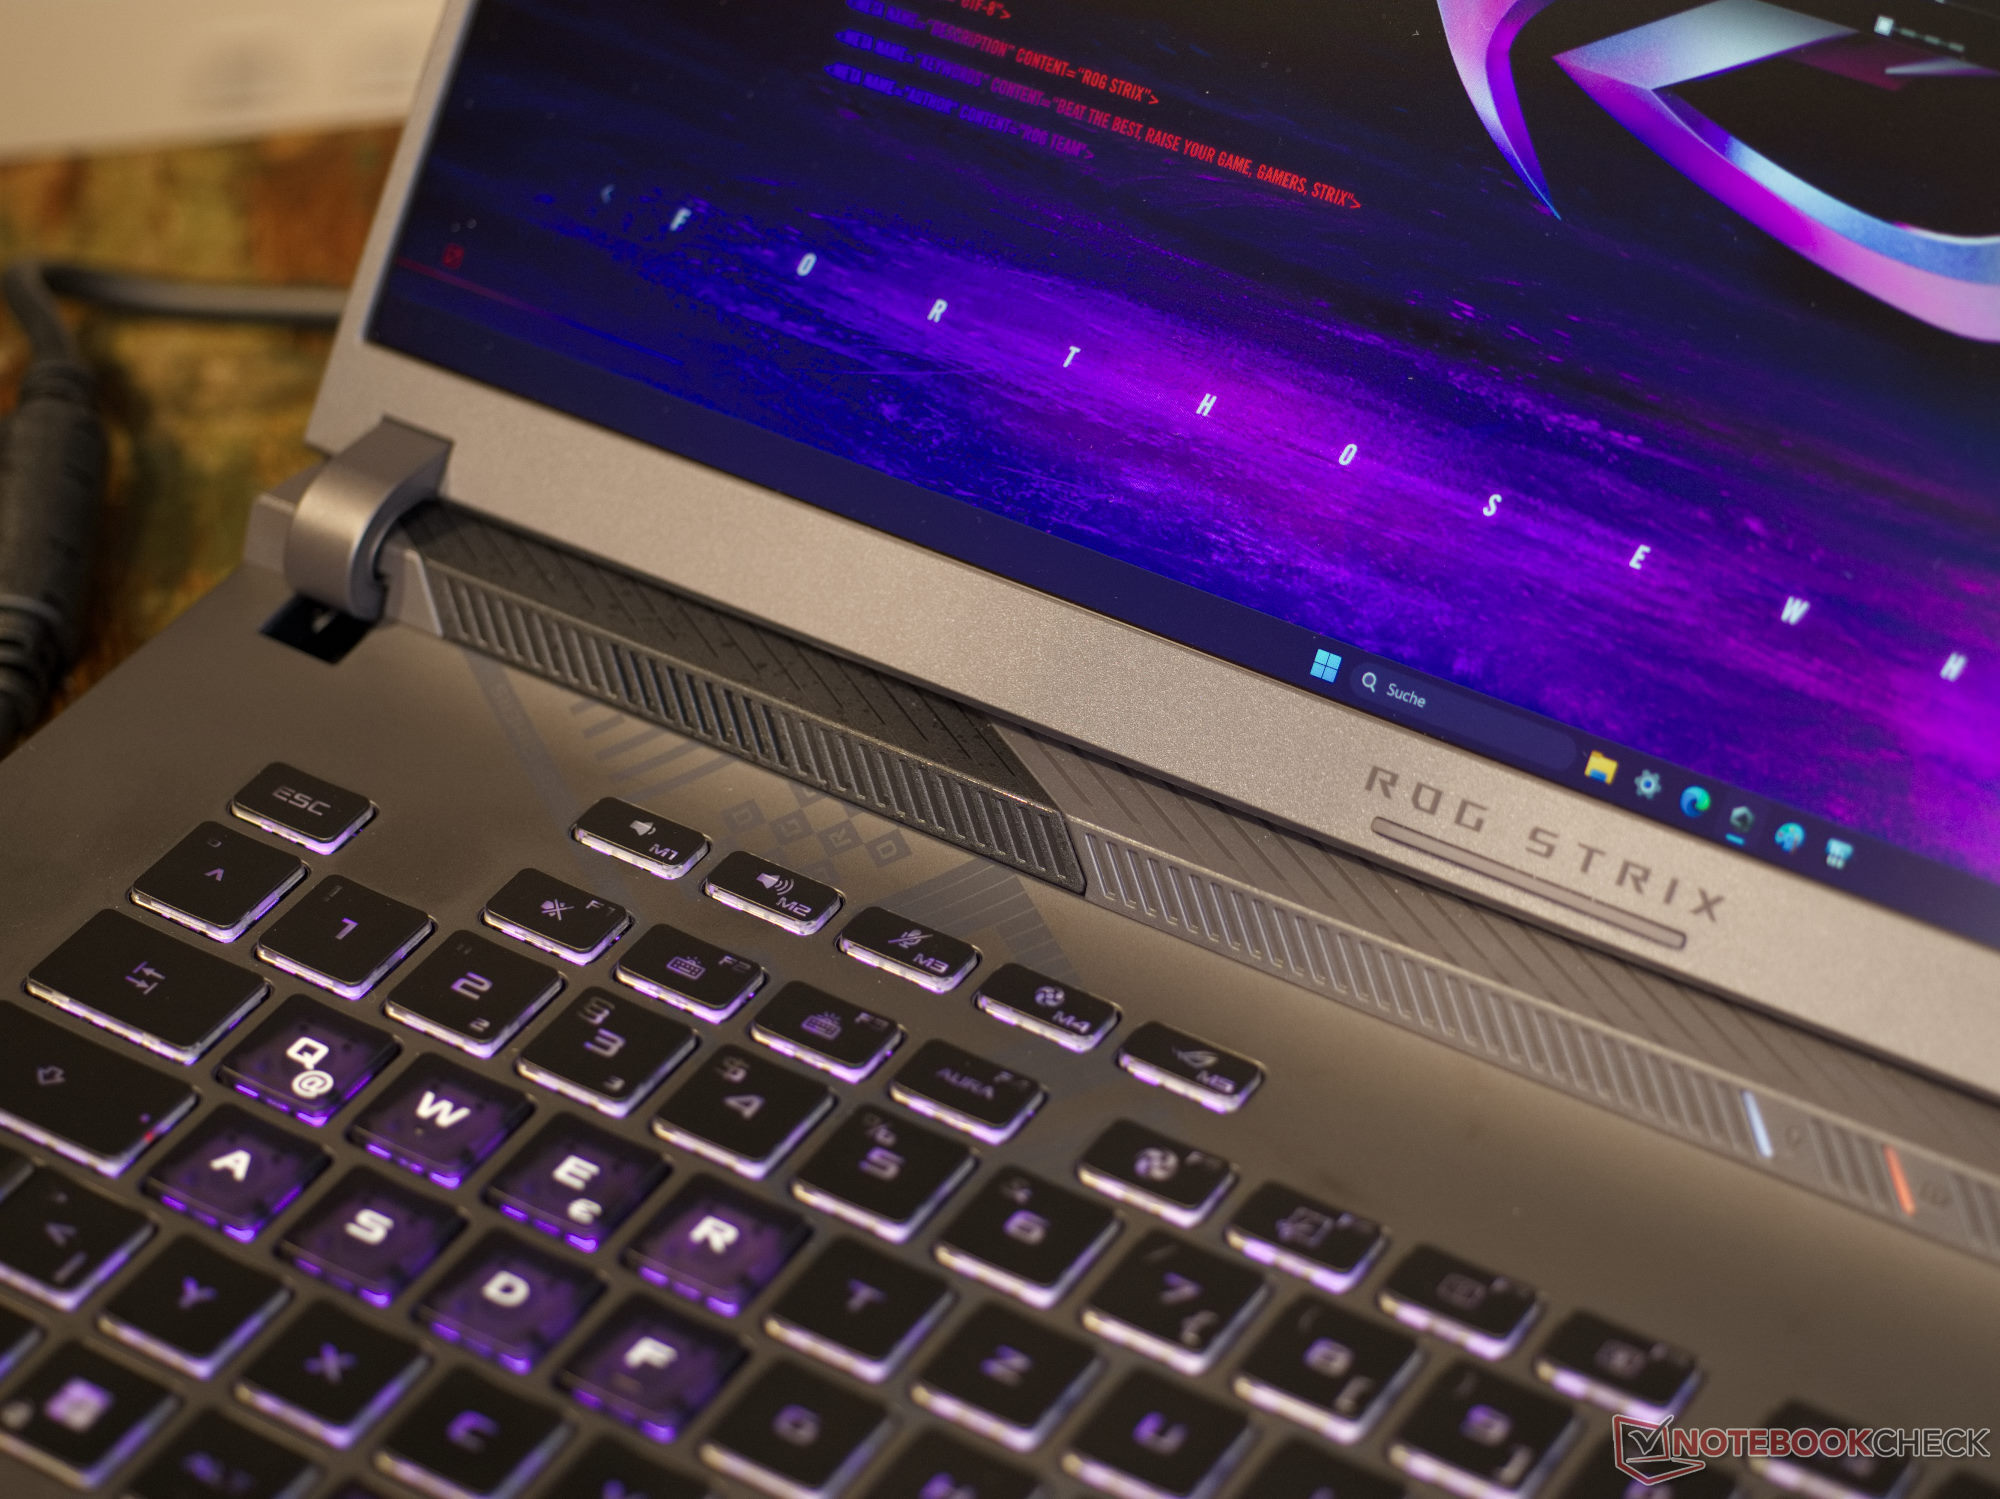
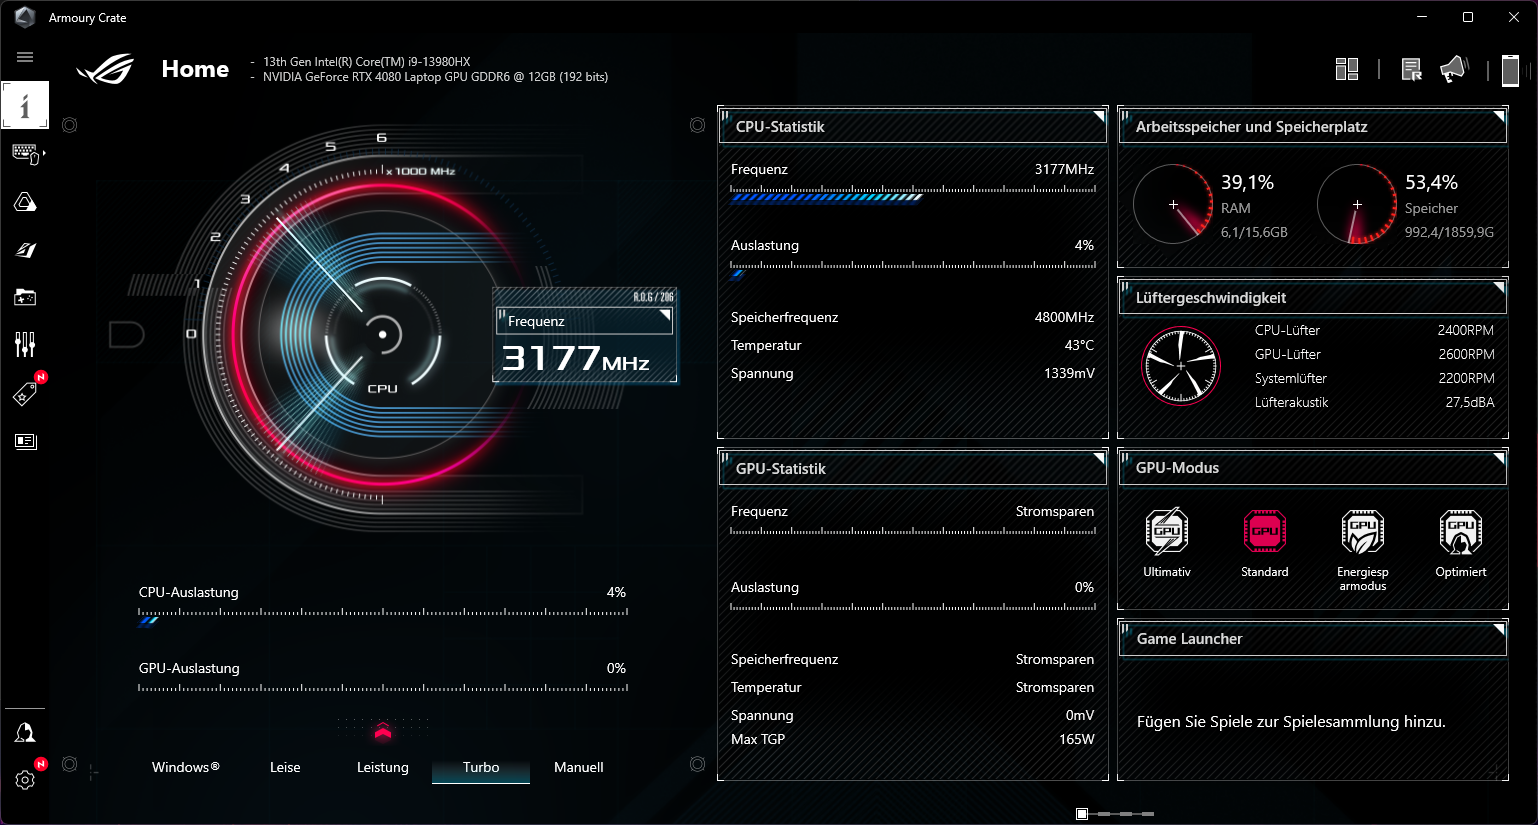
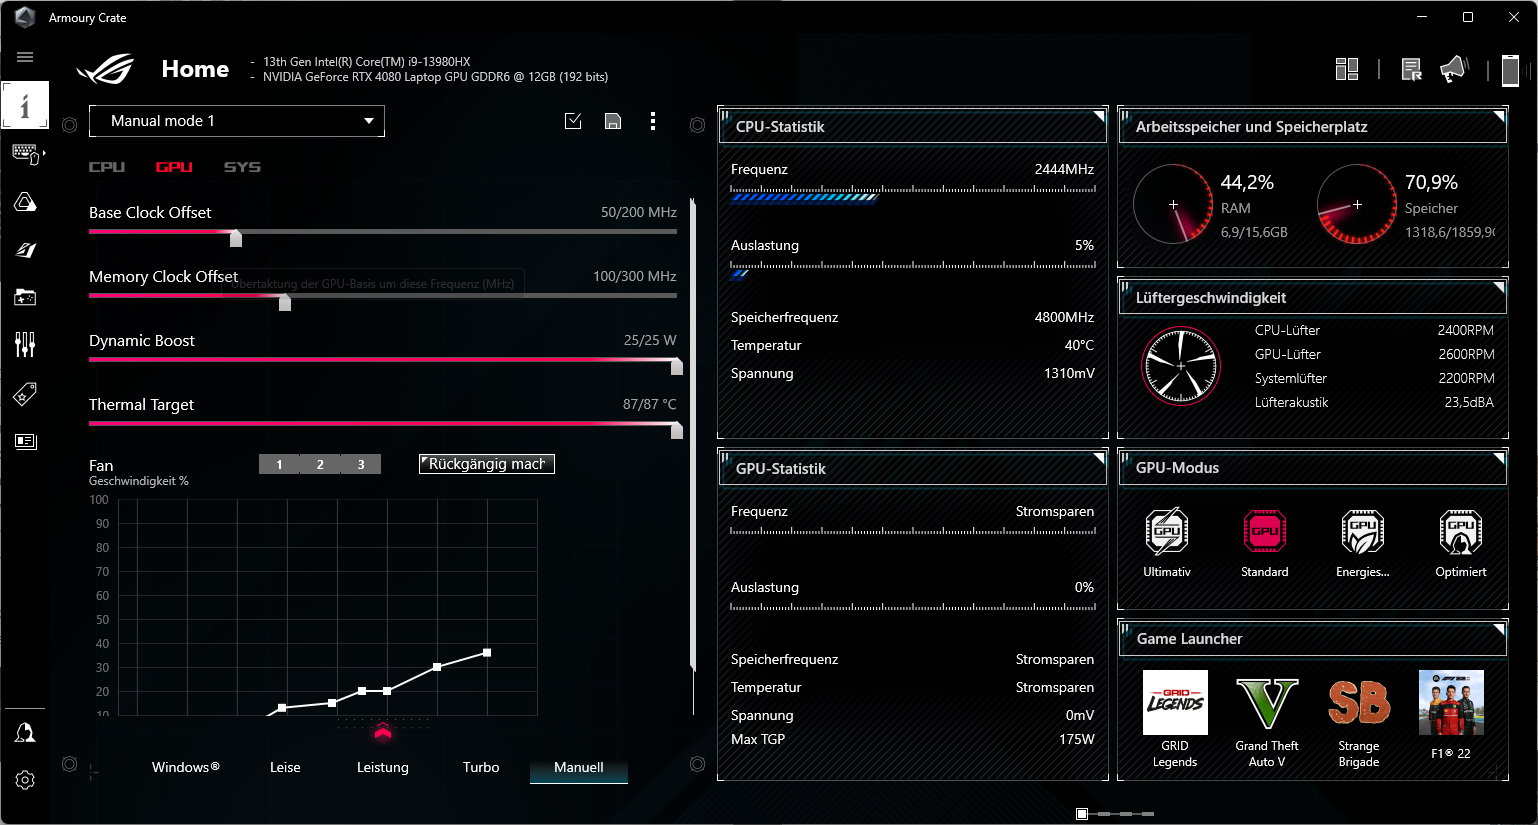
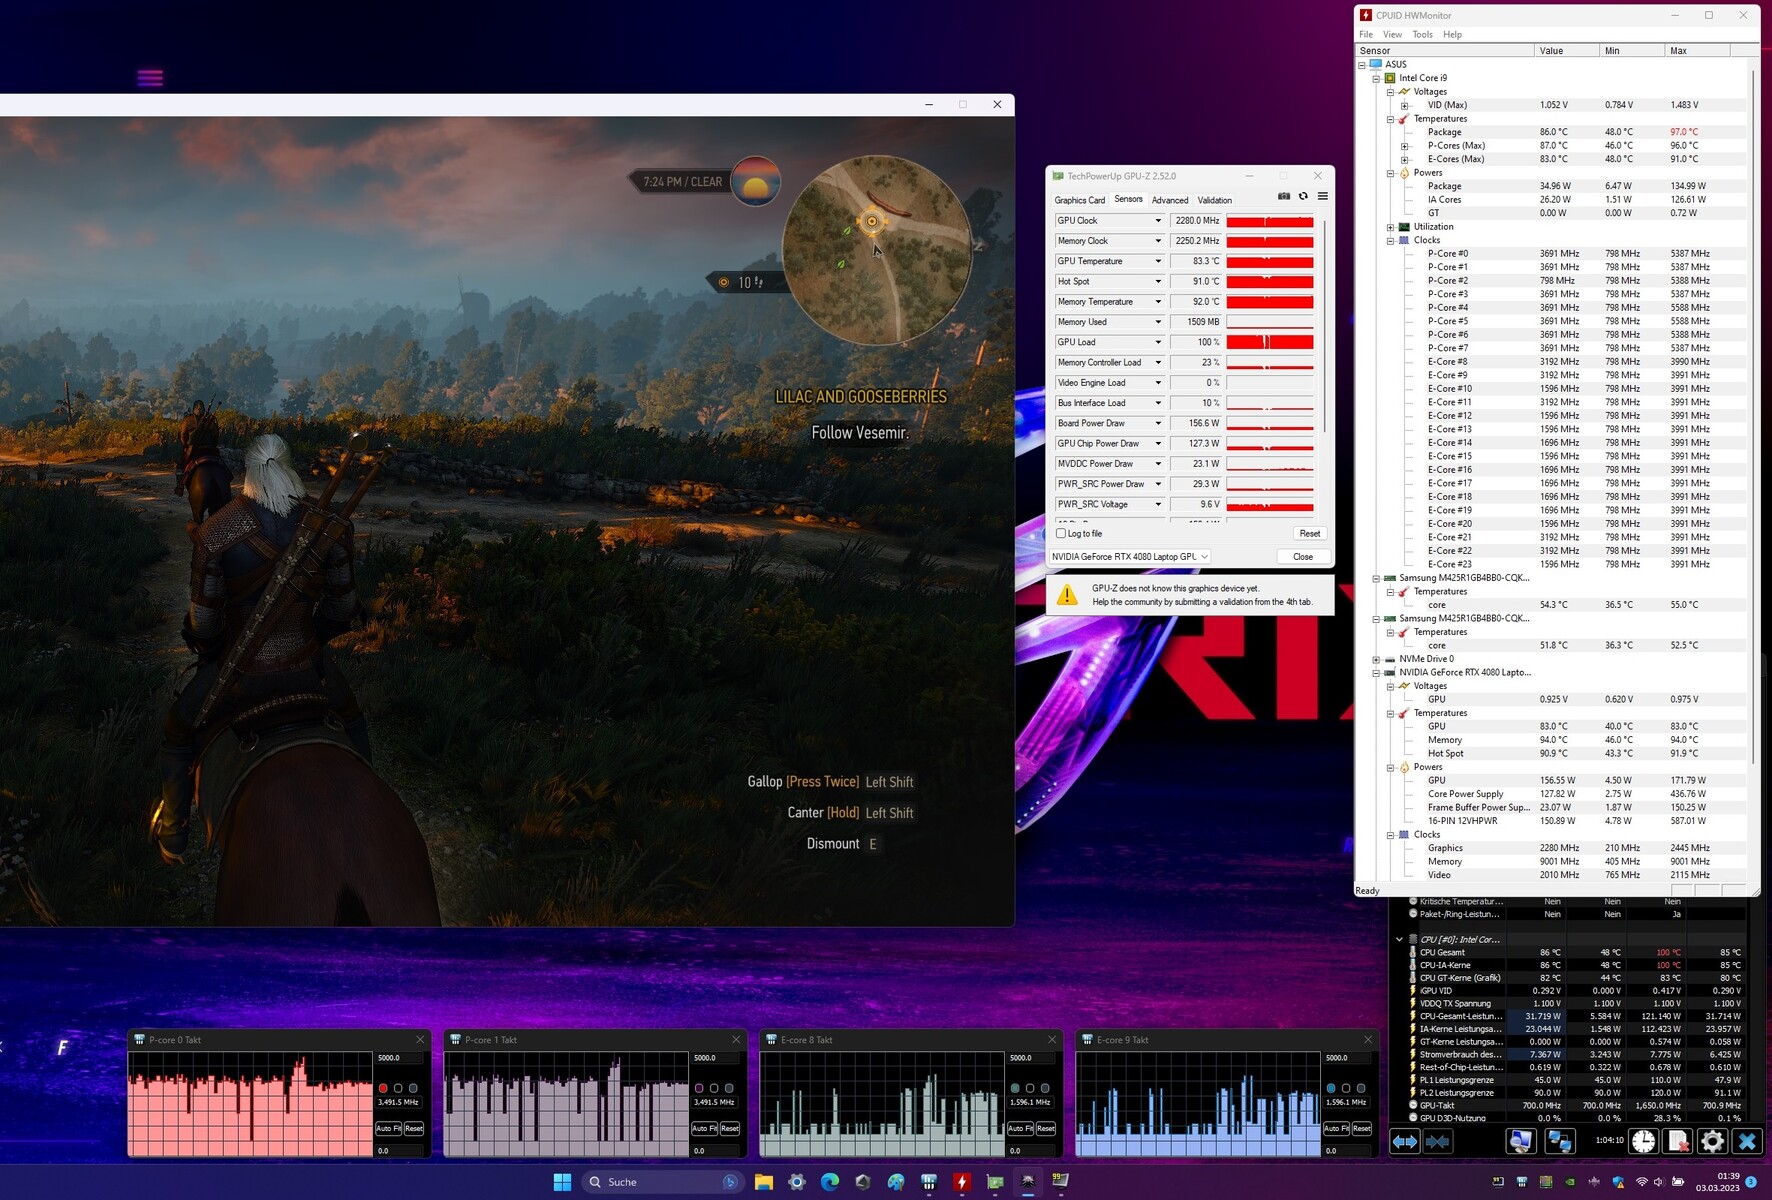
ROG Strix G16的性能可以通过全面的Armory Crate应用来控制。除了性能之外,RGB灯光、显示器和其他功能也在这里配置。有三个预定义的性能配置文件,即静音、性能和涡轮,以及对 RTX 4080.根据GPU模式,有一种混合模式,或在i9的iGPU或Nvidia显卡作为GPU之间进行选择。切换是通过MUX进行的,因此显示器总是直接连接到活动的图形单元。如果需要,用户可以在手动模式下榨出笔记本的所有游戏潜力,并调整各种设置。可以设置风扇曲线、TGP、动态提升、PL1和PL2以及温度限制。即使华硕试图用硬性限制来遏制系统,超频者也会在这里得到他们的金钱回报。至少笔记本电脑的性能可以适应一些游戏的要求。GPU和CPU都没有构成任何性能瓶颈问题。
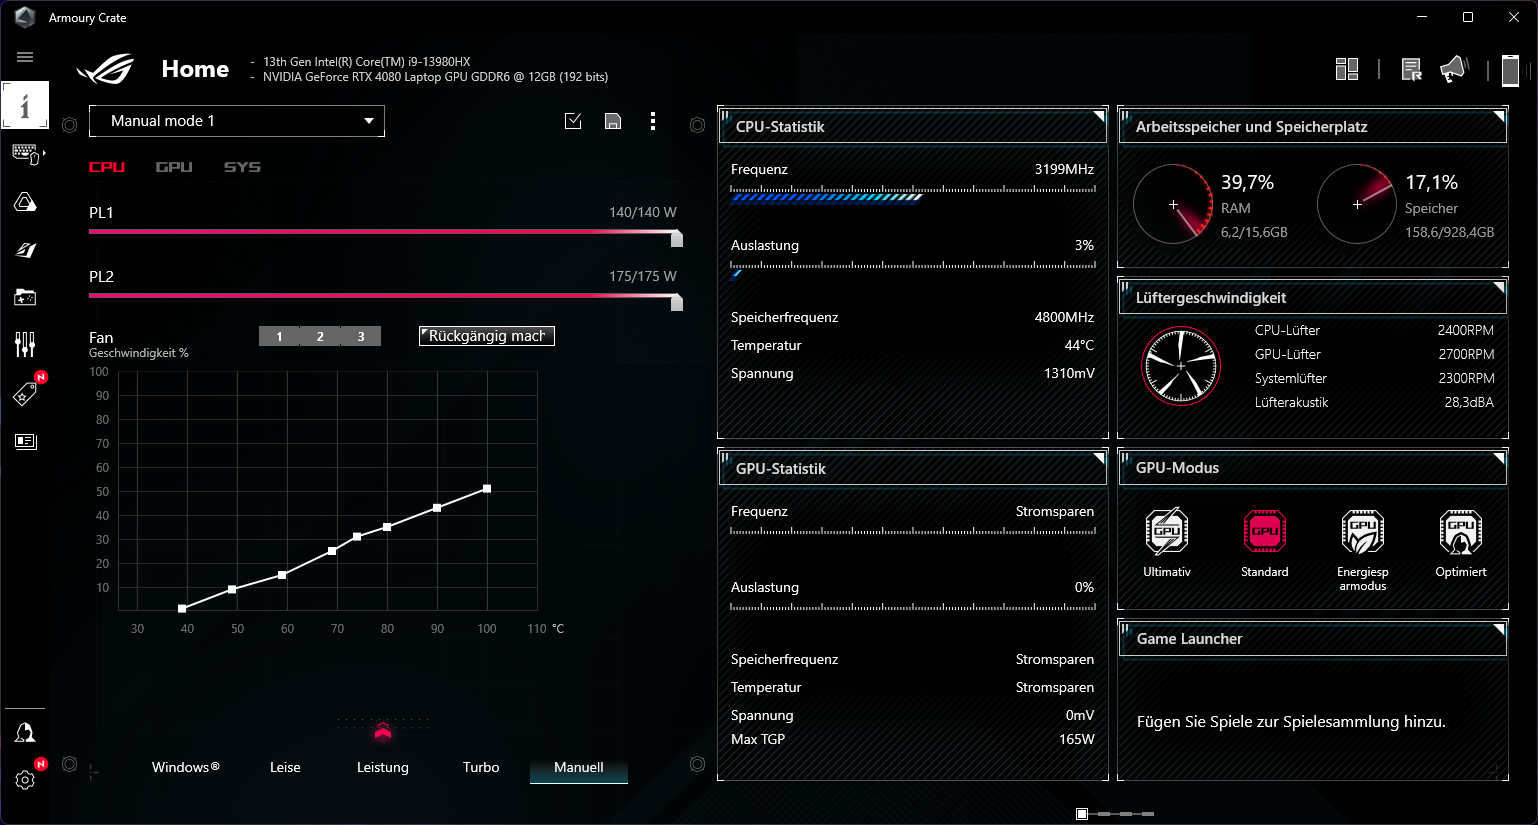
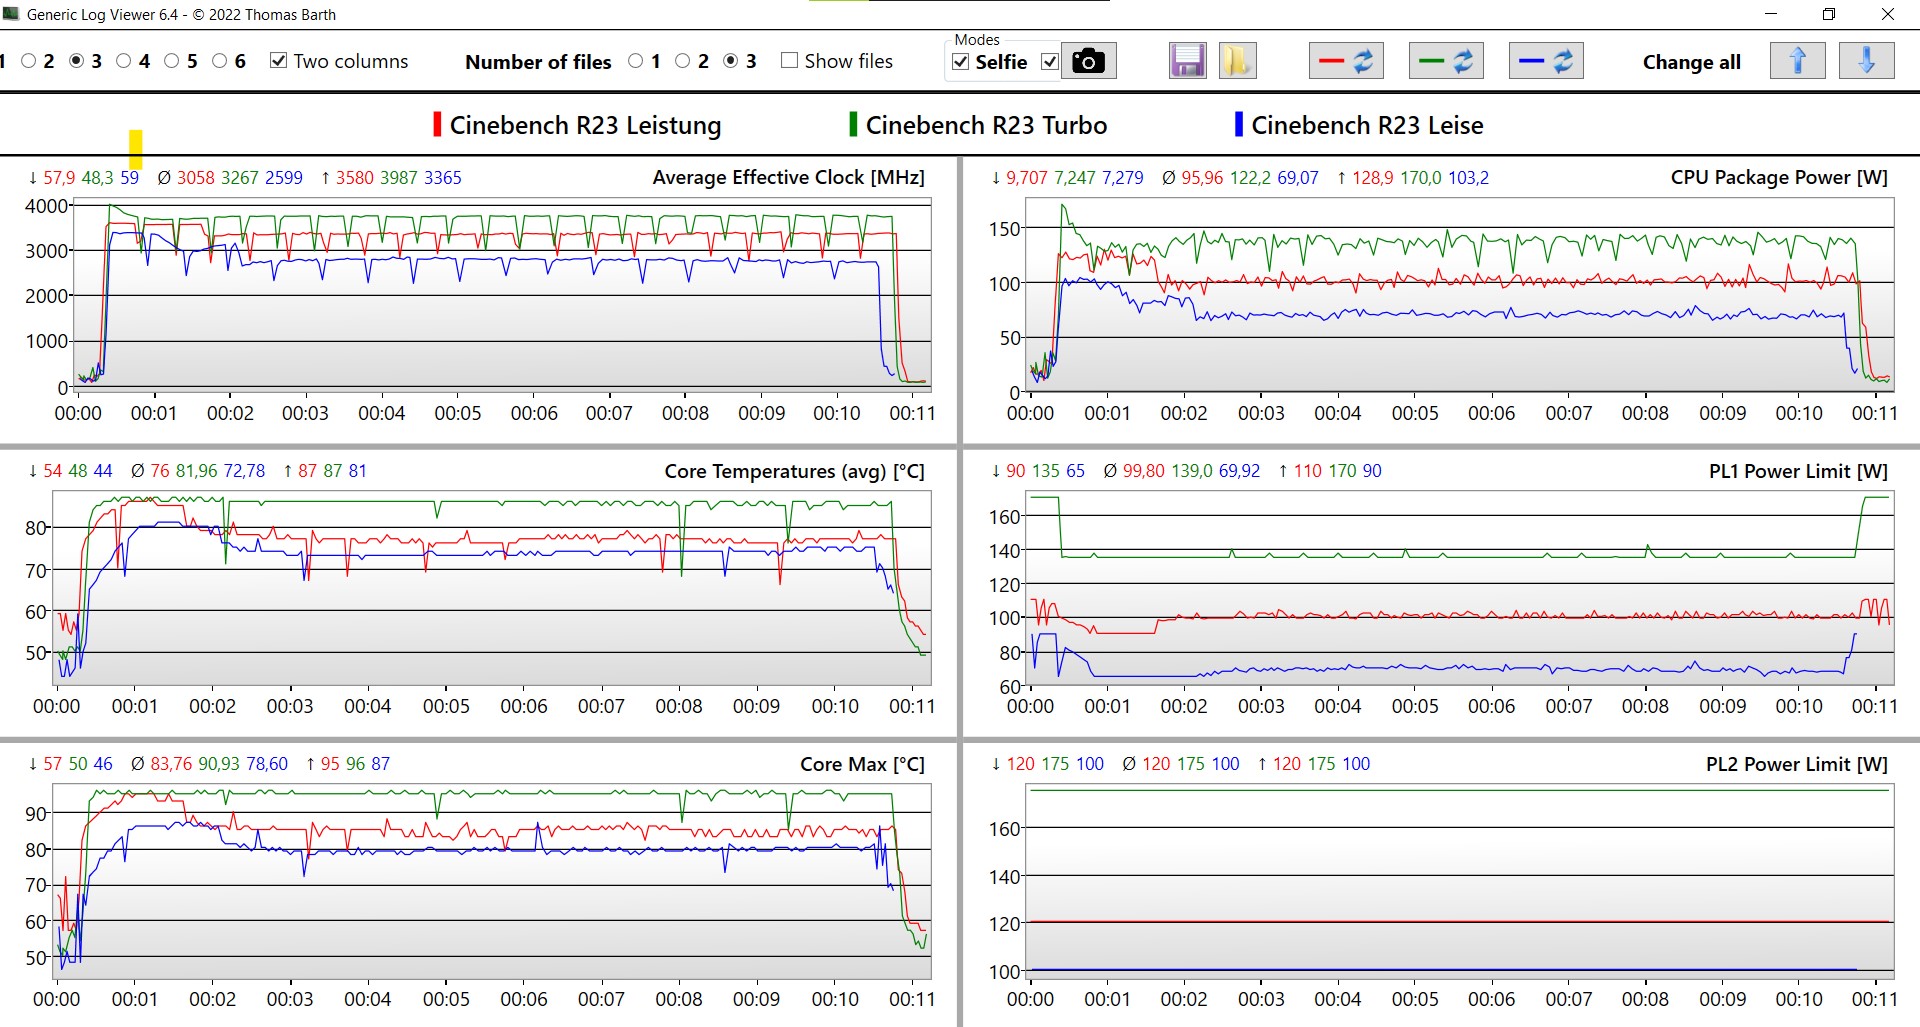
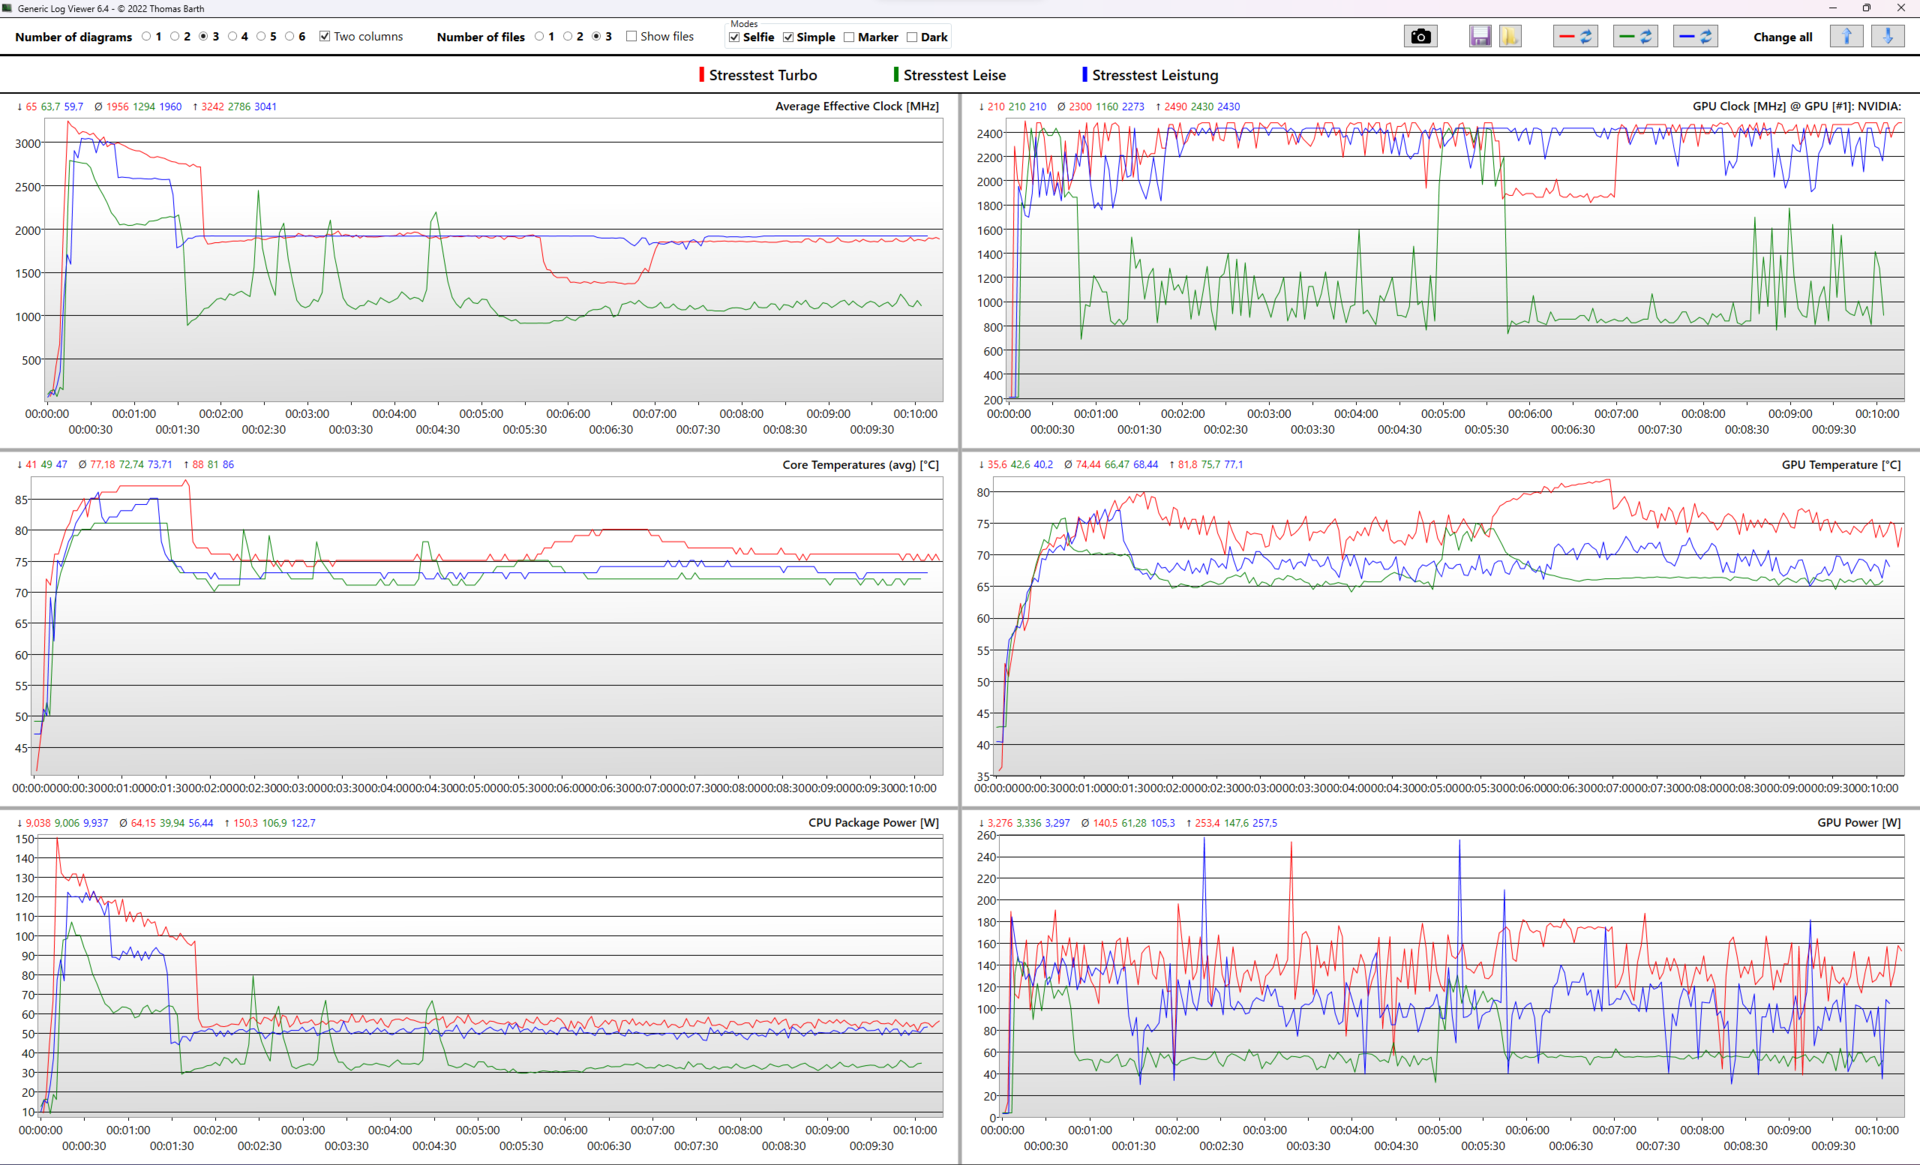
Armory Crate的各种设置可以使TGP和TDP值有相当大的变化。例如,该处理器在涡轮模式下能够长时间提取130瓦,而在静音模式下能够提取约70瓦。在用Prime95和Furmark进行的压力测试中,英特尔酷睿i9和NvidiaGeForce RTX 4080在涡轮模式下的综合输出功率约为210瓦,在静音模式下为95瓦。更精确的数值可以从下面的日志中收集到。仔细观察可以发现,虽然以瓦为单位的硬件性能值偶尔会因工作模式而相差甚远,但处理器和图形芯片的有效时钟速率却相差不远。
另一方面,我们注意到笔记本的噪音排放有很大差异。在静音模式下,三个风扇的运行速度约为40 dB(A)。涡轮模式约为51 dB(A)。由于分贝尺度是对数的,这使ROG Strix G16的感知响度增加了一倍。我们的测量和基准测试主要是在标准GPU模式和性能模式下进行的。
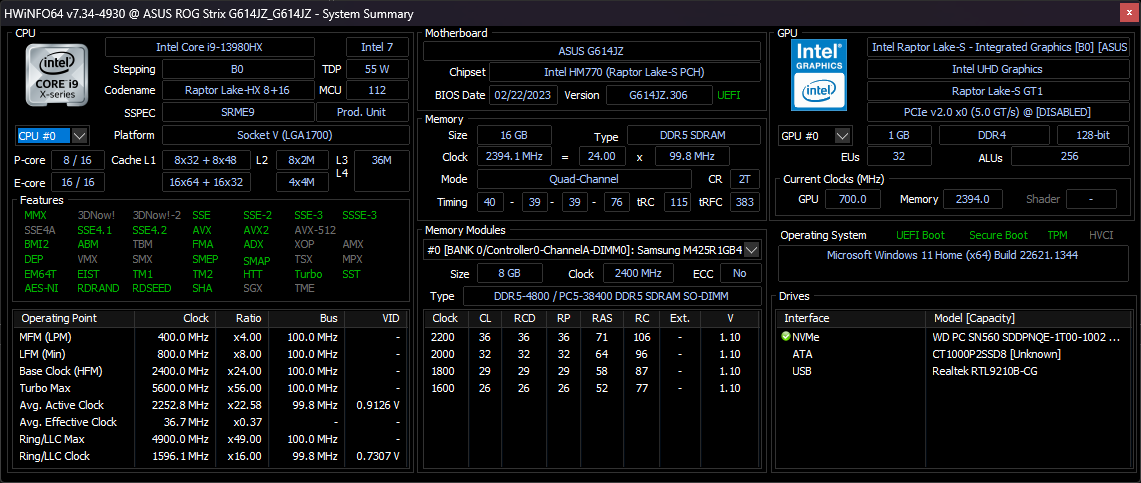
处理器
猛禽湖是英特尔第13代处理器的名称,它带来了 英特尔酷睿i9-13980HX.这款高端CPU是为具有强大冷却能力的大型笔记本设计的。由于有8个P核和16个E核,i9有32个线程。根据HWinfo,华硕游戏笔记本中的CPU运行时远远高于英特尔推荐的TDP值。在涡轮增压模式下,可实现高达130瓦的连续功率。
在性能模式下,风扇在Cinebench R15循环中反复明显地启动得相当晚。这解释了前三次运行后性能急剧下降的原因。然而,此后不久,冷却就稳定下来,处理器能够继续在高水平上工作。性能的急剧下降只发生在这个特定的基准测试中。每次运行后,Cinebench都会重新启动,在两次运行之间给处理器一到三秒的时间来恢复。然而,这也可能导致性能控制对负载情况的延迟反应。在使用Cinebench R23的循环中,我们无法引起性能的急剧下降。在这里,各次运行之间的时间要短一些。在两次超过30,000分的强劲运行后,ROG Strix G16在CB R23循环中保持了10分钟的29,000分左右。在电池模式下,多核性能下降了约30%,达到约20,000分。
总的来说,ROG Strix G16的英特尔酷睿i9是相当强大的。这里的基准测试结果一直是顶级水平。然而,i9无法与华硕Zephyrus Duo 16中的Ryzen 9相比。
Cinebench R15 Multi Sustained Load
Cinebench R23: Multi Core | Single Core
Cinebench R20: CPU (Multi Core) | CPU (Single Core)
Cinebench R15: CPU Multi 64Bit | CPU Single 64Bit
Blender: v2.79 BMW27 CPU
7-Zip 18.03: 7z b 4 | 7z b 4 -mmt1
Geekbench 5.5: Multi-Core | Single-Core
HWBOT x265 Benchmark v2.2: 4k Preset
LibreOffice : 20 Documents To PDF
R Benchmark 2.5: Overall mean
| CPU Performance rating | |
| Asus Zephyrus Duo 16 GX650PY-NM006W | |
| Lenovo Legion Pro 7 16IRX8H | |
| Average Intel Core i9-13980HX | |
| Asus ROG Strix G16 G614JZ | |
| Razer Blade 16 Early 2023 | |
| Average of class Gaming | |
| Gigabyte AERO 16 OLED BSF | |
| Asus TUF Gaming A16 FA617 | |
| Cinebench R23 / Multi Core | |
| Asus Zephyrus Duo 16 GX650PY-NM006W | |
| Average Intel Core i9-13980HX (28301 - 33052, n=11) | |
| Lenovo Legion Pro 7 16IRX8H | |
| Asus ROG Strix G16 G614JZ | |
| Razer Blade 16 Early 2023 | |
| Average of class Gaming (10488 - 40970, n=110, last 2 years) | |
| Gigabyte AERO 16 OLED BSF | |
| Asus TUF Gaming A16 FA617 | |
| Cinebench R23 / Single Core | |
| Asus ROG Strix G16 G614JZ | |
| Average Intel Core i9-13980HX (1825 - 2169, n=9) | |
| Lenovo Legion Pro 7 16IRX8H | |
| Razer Blade 16 Early 2023 | |
| Average of class Gaming (1166 - 2356, n=110, last 2 years) | |
| Asus Zephyrus Duo 16 GX650PY-NM006W | |
| Gigabyte AERO 16 OLED BSF | |
| Asus TUF Gaming A16 FA617 | |
| Cinebench R20 / CPU (Multi Core) | |
| Asus Zephyrus Duo 16 GX650PY-NM006W | |
| Average Intel Core i9-13980HX (10353 - 12437, n=10) | |
| Asus ROG Strix G16 G614JZ | |
| Lenovo Legion Pro 7 16IRX8H | |
| Average of class Gaming (4029 - 16108, n=109, last 2 years) | |
| Razer Blade 16 Early 2023 | |
| Gigabyte AERO 16 OLED BSF | |
| Asus TUF Gaming A16 FA617 | |
| Cinebench R20 / CPU (Single Core) | |
| Asus ROG Strix G16 G614JZ | |
| Average Intel Core i9-13980HX (717 - 825, n=10) | |
| Lenovo Legion Pro 7 16IRX8H | |
| Average of class Gaming (442 - 895, n=109, last 2 years) | |
| Asus Zephyrus Duo 16 GX650PY-NM006W | |
| Razer Blade 16 Early 2023 | |
| Gigabyte AERO 16 OLED BSF | |
| Asus TUF Gaming A16 FA617 | |
| Cinebench R15 / CPU Multi 64Bit | |
| Asus Zephyrus Duo 16 GX650PY-NM006W | |
| Lenovo Legion Pro 7 16IRX8H | |
| Asus ROG Strix G16 G614JZ | |
| Asus ROG Strix G16 G614JZ | |
| Average Intel Core i9-13980HX (4358 - 5172, n=11) | |
| Razer Blade 16 Early 2023 | |
| Average of class Gaming (1578 - 6271, n=108, last 2 years) | |
| Gigabyte AERO 16 OLED BSF | |
| Asus TUF Gaming A16 FA617 | |
| Cinebench R15 / CPU Single 64Bit | |
| Asus Zephyrus Duo 16 GX650PY-NM006W | |
| Asus ROG Strix G16 G614JZ | |
| Asus ROG Strix G16 G614JZ | |
| Average Intel Core i9-13980HX (289 - 312, n=11) | |
| Lenovo Legion Pro 7 16IRX8H | |
| Average of class Gaming (188.8 - 343, n=109, last 2 years) | |
| Razer Blade 16 Early 2023 | |
| Asus TUF Gaming A16 FA617 | |
| Gigabyte AERO 16 OLED BSF | |
| Blender / v2.79 BMW27 CPU | |
| Asus TUF Gaming A16 FA617 | |
| Gigabyte AERO 16 OLED BSF | |
| Average of class Gaming (80 - 330, n=107, last 2 years) | |
| Razer Blade 16 Early 2023 | |
| Average Intel Core i9-13980HX (97 - 136, n=10) | |
| Asus ROG Strix G16 G614JZ | |
| Lenovo Legion Pro 7 16IRX8H | |
| Asus Zephyrus Duo 16 GX650PY-NM006W | |
| 7-Zip 18.03 / 7z b 4 | |
| Asus Zephyrus Duo 16 GX650PY-NM006W | |
| Lenovo Legion Pro 7 16IRX8H | |
| Average Intel Core i9-13980HX (104616 - 129804, n=10) | |
| Asus ROG Strix G16 G614JZ | |
| Razer Blade 16 Early 2023 | |
| Average of class Gaming (33491 - 148086, n=108, last 2 years) | |
| Gigabyte AERO 16 OLED BSF | |
| Asus TUF Gaming A16 FA617 | |
| 7-Zip 18.03 / 7z b 4 -mmt1 | |
| Asus Zephyrus Duo 16 GX650PY-NM006W | |
| Lenovo Legion Pro 7 16IRX8H | |
| Average Intel Core i9-13980HX (6230 - 7163, n=10) | |
| Asus ROG Strix G16 G614JZ | |
| Razer Blade 16 Early 2023 | |
| Average of class Gaming (4199 - 7436, n=108, last 2 years) | |
| Asus TUF Gaming A16 FA617 | |
| Gigabyte AERO 16 OLED BSF | |
| Geekbench 5.5 / Multi-Core | |
| Lenovo Legion Pro 7 16IRX8H | |
| Average Intel Core i9-13980HX (18475 - 22200, n=10) | |
| Asus Zephyrus Duo 16 GX650PY-NM006W | |
| Asus ROG Strix G16 G614JZ | |
| Razer Blade 16 Early 2023 | |
| Average of class Gaming (6460 - 27010, n=108, last 2 years) | |
| Gigabyte AERO 16 OLED BSF | |
| Asus TUF Gaming A16 FA617 | |
| Geekbench 5.5 / Single-Core | |
| Asus Zephyrus Duo 16 GX650PY-NM006W | |
| Average of class Gaming (986 - 2474, n=108, last 2 years) | |
| Average Intel Core i9-13980HX (1796 - 2139, n=10) | |
| Asus ROG Strix G16 G614JZ | |
| Lenovo Legion Pro 7 16IRX8H | |
| Razer Blade 16 Early 2023 | |
| Gigabyte AERO 16 OLED BSF | |
| Asus TUF Gaming A16 FA617 | |
| HWBOT x265 Benchmark v2.2 / 4k Preset | |
| Asus Zephyrus Duo 16 GX650PY-NM006W | |
| Lenovo Legion Pro 7 16IRX8H | |
| Average Intel Core i9-13980HX (27 - 33.4, n=9) | |
| Asus ROG Strix G16 G614JZ | |
| Razer Blade 16 Early 2023 | |
| Average of class Gaming (11.5 - 44.3, n=108, last 2 years) | |
| Gigabyte AERO 16 OLED BSF | |
| Asus TUF Gaming A16 FA617 | |
| LibreOffice / 20 Documents To PDF | |
| Asus Zephyrus Duo 16 GX650PY-NM006W | |
| Asus TUF Gaming A16 FA617 | |
| Gigabyte AERO 16 OLED BSF | |
| Average of class Gaming (19 - 88.8, n=108, last 2 years) | |
| Asus ROG Strix G16 G614JZ | |
| Razer Blade 16 Early 2023 | |
| Lenovo Legion Pro 7 16IRX8H | |
| Average Intel Core i9-13980HX (35 - 51.4, n=10) | |
| R Benchmark 2.5 / Overall mean | |
| Asus TUF Gaming A16 FA617 | |
| Gigabyte AERO 16 OLED BSF | |
| Average of class Gaming (0.3439 - 0.759, n=109, last 2 years) | |
| Razer Blade 16 Early 2023 | |
| Asus Zephyrus Duo 16 GX650PY-NM006W | |
| Lenovo Legion Pro 7 16IRX8H | |
| Average Intel Core i9-13980HX (0.3793 - 0.4462, n=10) | |
| Asus ROG Strix G16 G614JZ | |
* ... smaller is better
AIDA64: FP32 Ray-Trace | FPU Julia | CPU SHA3 | CPU Queen | FPU SinJulia | FPU Mandel | CPU AES | CPU ZLib | FP64 Ray-Trace | CPU PhotoWorxx
| Performance rating | |
| Lenovo Legion Pro 7 16IRX8H | |
| Average Intel Core i9-13980HX | |
| Asus ROG Strix G16 G614JZ | |
| Average of class Gaming | |
| Razer Blade 16 Early 2023 | |
| Gigabyte AERO 16 OLED BSF | |
| Asus TUF Gaming A16 FA617 | |
| AIDA64 / FP32 Ray-Trace | |
| Average of class Gaming (10227 - 85542, n=107, last 2 years) | |
| Asus ROG Strix G16 G614JZ | |
| Lenovo Legion Pro 7 16IRX8H | |
| Average Intel Core i9-13980HX (21332 - 29553, n=9) | |
| Razer Blade 16 Early 2023 | |
| Razer Blade 16 Early 2023 | |
| Razer Blade 16 Early 2023 | |
| Gigabyte AERO 16 OLED BSF | |
| Asus TUF Gaming A16 FA617 | |
| AIDA64 / FPU Julia | |
| Average of class Gaming (51376 - 238426, n=107, last 2 years) | |
| Lenovo Legion Pro 7 16IRX8H | |
| Average Intel Core i9-13980HX (108001 - 148168, n=9) | |
| Asus ROG Strix G16 G614JZ | |
| Razer Blade 16 Early 2023 | |
| Razer Blade 16 Early 2023 | |
| Razer Blade 16 Early 2023 | |
| Asus TUF Gaming A16 FA617 | |
| Gigabyte AERO 16 OLED BSF | |
| AIDA64 / CPU SHA3 | |
| Lenovo Legion Pro 7 16IRX8H | |
| Asus ROG Strix G16 G614JZ | |
| Average Intel Core i9-13980HX (5264 - 7142, n=9) | |
| Razer Blade 16 Early 2023 | |
| Razer Blade 16 Early 2023 | |
| Razer Blade 16 Early 2023 | |
| Average of class Gaming (2180 - 9817, n=107, last 2 years) | |
| Gigabyte AERO 16 OLED BSF | |
| Asus TUF Gaming A16 FA617 | |
| AIDA64 / CPU Queen | |
| Asus ROG Strix G16 G614JZ | |
| Average Intel Core i9-13980HX (126758 - 143409, n=9) | |
| Razer Blade 16 Early 2023 | |
| Razer Blade 16 Early 2023 | |
| Lenovo Legion Pro 7 16IRX8H | |
| Average of class Gaming (49785 - 173351, n=95, last 2 years) | |
| Asus TUF Gaming A16 FA617 | |
| Gigabyte AERO 16 OLED BSF | |
| AIDA64 / FPU SinJulia | |
| Asus ROG Strix G16 G614JZ | |
| Average Intel Core i9-13980HX (13785 - 17117, n=9) | |
| Razer Blade 16 Early 2023 | |
| Razer Blade 16 Early 2023 | |
| Razer Blade 16 Early 2023 | |
| Lenovo Legion Pro 7 16IRX8H | |
| Average of class Gaming (4424 - 33636, n=107, last 2 years) | |
| Asus TUF Gaming A16 FA617 | |
| Gigabyte AERO 16 OLED BSF | |
| AIDA64 / FPU Mandel | |
| Average of class Gaming (25115 - 128721, n=107, last 2 years) | |
| Lenovo Legion Pro 7 16IRX8H | |
| Average Intel Core i9-13980HX (53398 - 73758, n=9) | |
| Asus ROG Strix G16 G614JZ | |
| Razer Blade 16 Early 2023 | |
| Razer Blade 16 Early 2023 | |
| Razer Blade 16 Early 2023 | |
| Asus TUF Gaming A16 FA617 | |
| Gigabyte AERO 16 OLED BSF | |
| AIDA64 / CPU AES | |
| Razer Blade 16 Early 2023 | |
| Razer Blade 16 Early 2023 | |
| Razer Blade 16 Early 2023 | |
| Gigabyte AERO 16 OLED BSF | |
| Asus ROG Strix G16 G614JZ | |
| Lenovo Legion Pro 7 16IRX8H | |
| Average Intel Core i9-13980HX (105169 - 136520, n=9) | |
| Average of class Gaming (39258 - 247074, n=107, last 2 years) | |
| Asus TUF Gaming A16 FA617 | |
| AIDA64 / CPU ZLib | |
| Lenovo Legion Pro 7 16IRX8H | |
| Asus ROG Strix G16 G614JZ | |
| Average Intel Core i9-13980HX (1513 - 2039, n=9) | |
| Razer Blade 16 Early 2023 | |
| Razer Blade 16 Early 2023 | |
| Razer Blade 16 Early 2023 | |
| Average of class Gaming (574 - 2531, n=107, last 2 years) | |
| Gigabyte AERO 16 OLED BSF | |
| Asus TUF Gaming A16 FA617 | |
| AIDA64 / FP64 Ray-Trace | |
| Average of class Gaming (5509 - 45446, n=107, last 2 years) | |
| Lenovo Legion Pro 7 16IRX8H | |
| Asus ROG Strix G16 G614JZ | |
| Average Intel Core i9-13980HX (11431 - 16325, n=9) | |
| Razer Blade 16 Early 2023 | |
| Razer Blade 16 Early 2023 | |
| Razer Blade 16 Early 2023 | |
| Gigabyte AERO 16 OLED BSF | |
| Asus TUF Gaming A16 FA617 | |
| AIDA64 / CPU PhotoWorxx | |
| Razer Blade 16 Early 2023 | |
| Razer Blade 16 Early 2023 | |
| Razer Blade 16 Early 2023 | |
| Lenovo Legion Pro 7 16IRX8H | |
| Average Intel Core i9-13980HX (37069 - 52949, n=9) | |
| Gigabyte AERO 16 OLED BSF | |
| Average of class Gaming (12271 - 89891, n=107, last 2 years) | |
| Asus ROG Strix G16 G614JZ | |
| Asus TUF Gaming A16 FA617 | |
系统性能
在PCMark 10测试中,华硕ROG Strix G16落后于许多具有类似硬件的竞争对手。性能下降发生在生产力子部分,其中考虑到了内存和硬盘驱动器的性能。与目前其他游戏笔记本相比,ROG Strix G16的这两项性能都不理想。然而,我们不能说这里的数值低,因为华硕ROG Strix仍然远远高于一般的游戏笔记本。
当你看到Crossmark以及PCMark 10 Essentials和Content Creation的结果时,你就会明白这款笔记本非常强大:华硕ROG Strix G16配备了所有可能的设备。除了在游戏方面的主要能力外,这款笔记本电脑在日常使用中也是非常通用的。强大的计算硬件确保了较短的加载时间和一个非常灵敏的系统。
CrossMark: Overall | Productivity | Creativity | Responsiveness
| PCMark 10 / Score | |
| Asus Zephyrus Duo 16 GX650PY-NM006W | |
| Asus ROG Strix Scar 18 2023 G834JY-N6005W | |
| Average of class Gaming (5828 - 11574, n=95, last 2 years) | |
| Gigabyte AERO 16 OLED BSF | |
| Razer Blade 16 Early 2023 | |
| Lenovo Legion Pro 7 16IRX8H | |
| Asus TUF Gaming A16 FA617 | |
| Asus ROG Strix G16 G614JZ | |
| Average Intel Core i9-13980HX, NVIDIA GeForce RTX 4080 Laptop GPU (n=1) | |
| Asus ROG Strix G18 G814JI | |
| PCMark 10 / Essentials | |
| Asus Zephyrus Duo 16 GX650PY-NM006W | |
| Asus ROG Strix G16 G614JZ | |
| Average Intel Core i9-13980HX, NVIDIA GeForce RTX 4080 Laptop GPU (n=1) | |
| Lenovo Legion Pro 7 16IRX8H | |
| Gigabyte AERO 16 OLED BSF | |
| Razer Blade 16 Early 2023 | |
| Average of class Gaming (8810 - 12600, n=99, last 2 years) | |
| Asus TUF Gaming A16 FA617 | |
| Asus ROG Strix G18 G814JI | |
| PCMark 10 / Productivity | |
| Asus Zephyrus Duo 16 GX650PY-NM006W | |
| Average of class Gaming (6845 - 21327, n=97, last 2 years) | |
| Lenovo Legion Pro 7 16IRX8H | |
| Asus TUF Gaming A16 FA617 | |
| Gigabyte AERO 16 OLED BSF | |
| Asus ROG Strix G18 G814JI | |
| Razer Blade 16 Early 2023 | |
| Asus ROG Strix G16 G614JZ | |
| Average Intel Core i9-13980HX, NVIDIA GeForce RTX 4080 Laptop GPU (n=1) | |
| PCMark 10 / Digital Content Creation | |
| Razer Blade 16 Early 2023 | |
| Asus Zephyrus Duo 16 GX650PY-NM006W | |
| Average of class Gaming (7602 - 19657, n=97, last 2 years) | |
| Gigabyte AERO 16 OLED BSF | |
| Asus ROG Strix G16 G614JZ | |
| Average Intel Core i9-13980HX, NVIDIA GeForce RTX 4080 Laptop GPU (n=1) | |
| Asus TUF Gaming A16 FA617 | |
| Lenovo Legion Pro 7 16IRX8H | |
| Asus ROG Strix G18 G814JI | |
| CrossMark / Overall | |
| Asus ROG Strix G16 G614JZ | |
| Average Intel Core i9-13980HX, NVIDIA GeForce RTX 4080 Laptop GPU (n=1) | |
| Asus ROG Strix Scar 18 2023 G834JY-N6005W | |
| Asus Zephyrus Duo 16 GX650PY-NM006W | |
| Average of class Gaming (1366 - 2409, n=95, last 2 years) | |
| Gigabyte AERO 16 OLED BSF | |
| Razer Blade 16 Early 2023 | |
| CrossMark / Productivity | |
| Asus ROG Strix G16 G614JZ | |
| Average Intel Core i9-13980HX, NVIDIA GeForce RTX 4080 Laptop GPU (n=1) | |
| Asus Zephyrus Duo 16 GX650PY-NM006W | |
| Asus ROG Strix Scar 18 2023 G834JY-N6005W | |
| Average of class Gaming (1386 - 2254, n=95, last 2 years) | |
| Gigabyte AERO 16 OLED BSF | |
| Razer Blade 16 Early 2023 | |
| CrossMark / Creativity | |
| Asus ROG Strix Scar 18 2023 G834JY-N6005W | |
| Asus ROG Strix G16 G614JZ | |
| Average Intel Core i9-13980HX, NVIDIA GeForce RTX 4080 Laptop GPU (n=1) | |
| Asus Zephyrus Duo 16 GX650PY-NM006W | |
| Average of class Gaming (1343 - 2729, n=95, last 2 years) | |
| Gigabyte AERO 16 OLED BSF | |
| Razer Blade 16 Early 2023 | |
| CrossMark / Responsiveness | |
| Asus ROG Strix G16 G614JZ | |
| Average Intel Core i9-13980HX, NVIDIA GeForce RTX 4080 Laptop GPU (n=1) | |
| Gigabyte AERO 16 OLED BSF | |
| Average of class Gaming (1226 - 2334, n=95, last 2 years) | |
| Asus Zephyrus Duo 16 GX650PY-NM006W | |
| Asus ROG Strix Scar 18 2023 G834JY-N6005W | |
| Razer Blade 16 Early 2023 | |
| PCMark 10 Score | 7223 points | |
Help | ||
| AIDA64 / Memory Copy | |
| Razer Blade 16 Early 2023 | |
| Razer Blade 16 Early 2023 | |
| Razer Blade 16 Early 2023 | |
| Lenovo Legion Pro 7 16IRX8H | |
| Average of class Gaming (21750 - 129946, n=107, last 2 years) | |
| Average Intel Core i9-13980HX (62189 - 80776, n=9) | |
| Asus ROG Strix Scar 18 2023 G834JY-N6005W | |
| Gigabyte AERO 16 OLED BSF | |
| Asus ROG Strix G18 G814JI | |
| Asus ROG Strix G16 G614JZ | |
| Asus TUF Gaming A16 FA617 | |
| AIDA64 / Memory Read | |
| Razer Blade 16 Early 2023 | |
| Razer Blade 16 Early 2023 | |
| Razer Blade 16 Early 2023 | |
| Lenovo Legion Pro 7 16IRX8H | |
| Average Intel Core i9-13980HX (62624 - 89096, n=9) | |
| Asus ROG Strix Scar 18 2023 G834JY-N6005W | |
| Average of class Gaming (22956 - 118858, n=107, last 2 years) | |
| Asus ROG Strix G16 G614JZ | |
| Asus ROG Strix G18 G814JI | |
| Gigabyte AERO 16 OLED BSF | |
| Asus TUF Gaming A16 FA617 | |
| AIDA64 / Memory Write | |
| Razer Blade 16 Early 2023 | |
| Razer Blade 16 Early 2023 | |
| Razer Blade 16 Early 2023 | |
| Average of class Gaming (22297 - 135096, n=107, last 2 years) | |
| Lenovo Legion Pro 7 16IRX8H | |
| Average Intel Core i9-13980HX (59912 - 79917, n=9) | |
| Gigabyte AERO 16 OLED BSF | |
| Asus ROG Strix Scar 18 2023 G834JY-N6005W | |
| Asus ROG Strix G18 G814JI | |
| Asus ROG Strix G16 G614JZ | |
| Asus TUF Gaming A16 FA617 | |
| AIDA64 / Memory Latency | |
| Average of class Gaming (75.3 - 259, n=107, last 2 years) | |
| Razer Blade 16 Early 2023 | |
| Razer Blade 16 Early 2023 | |
| Razer Blade 16 Early 2023 | |
| Gigabyte AERO 16 OLED BSF | |
| Asus ROG Strix Scar 18 2023 G834JY-N6005W | |
| Asus ROG Strix G16 G614JZ | |
| Average Intel Core i9-13980HX (79.4 - 93.2, n=9) | |
| Asus TUF Gaming A16 FA617 | |
| Asus ROG Strix G18 G814JI | |
| Lenovo Legion Pro 7 16IRX8H | |
* ... smaller is better
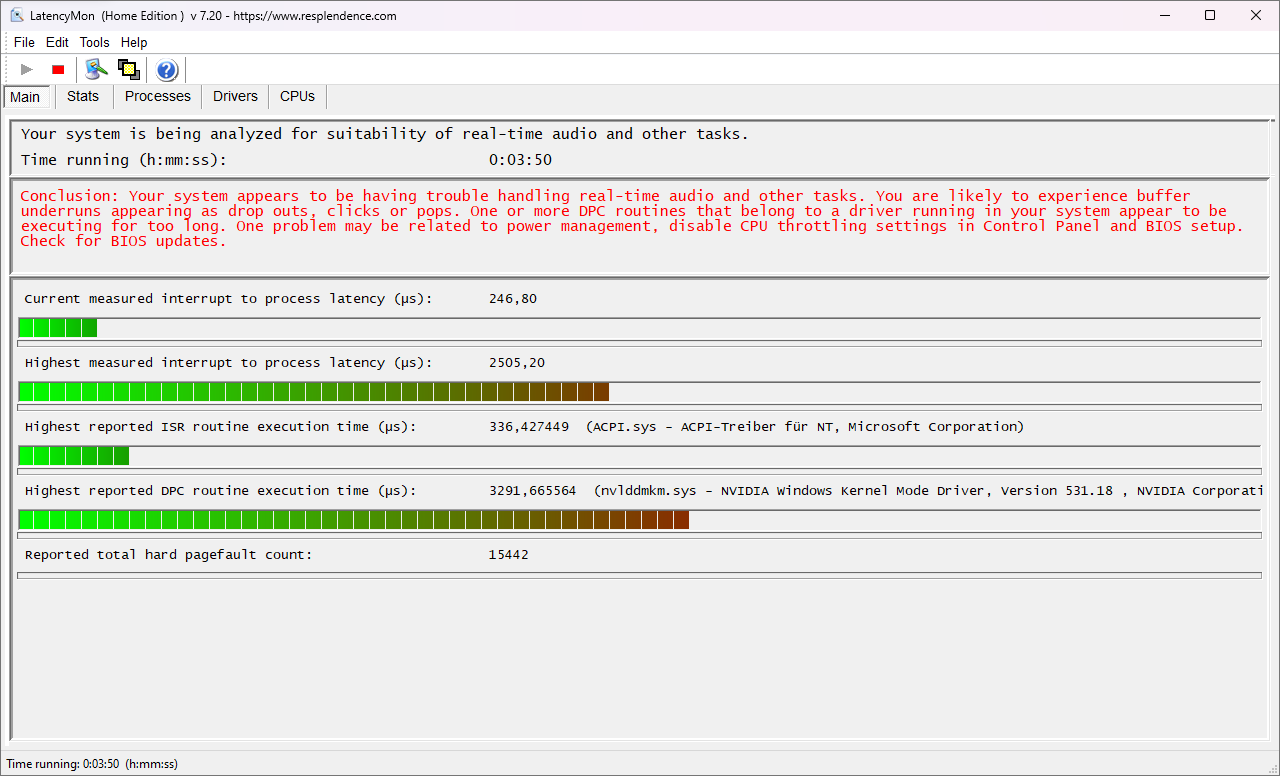
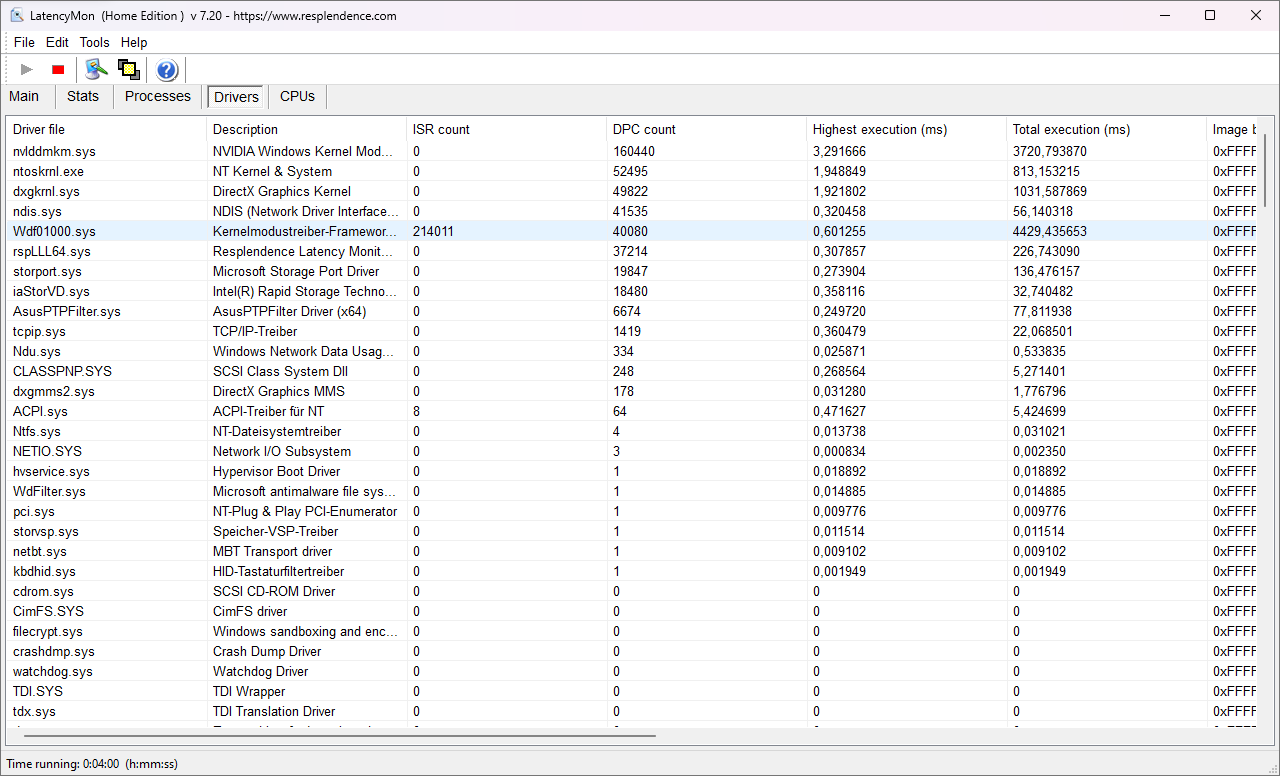
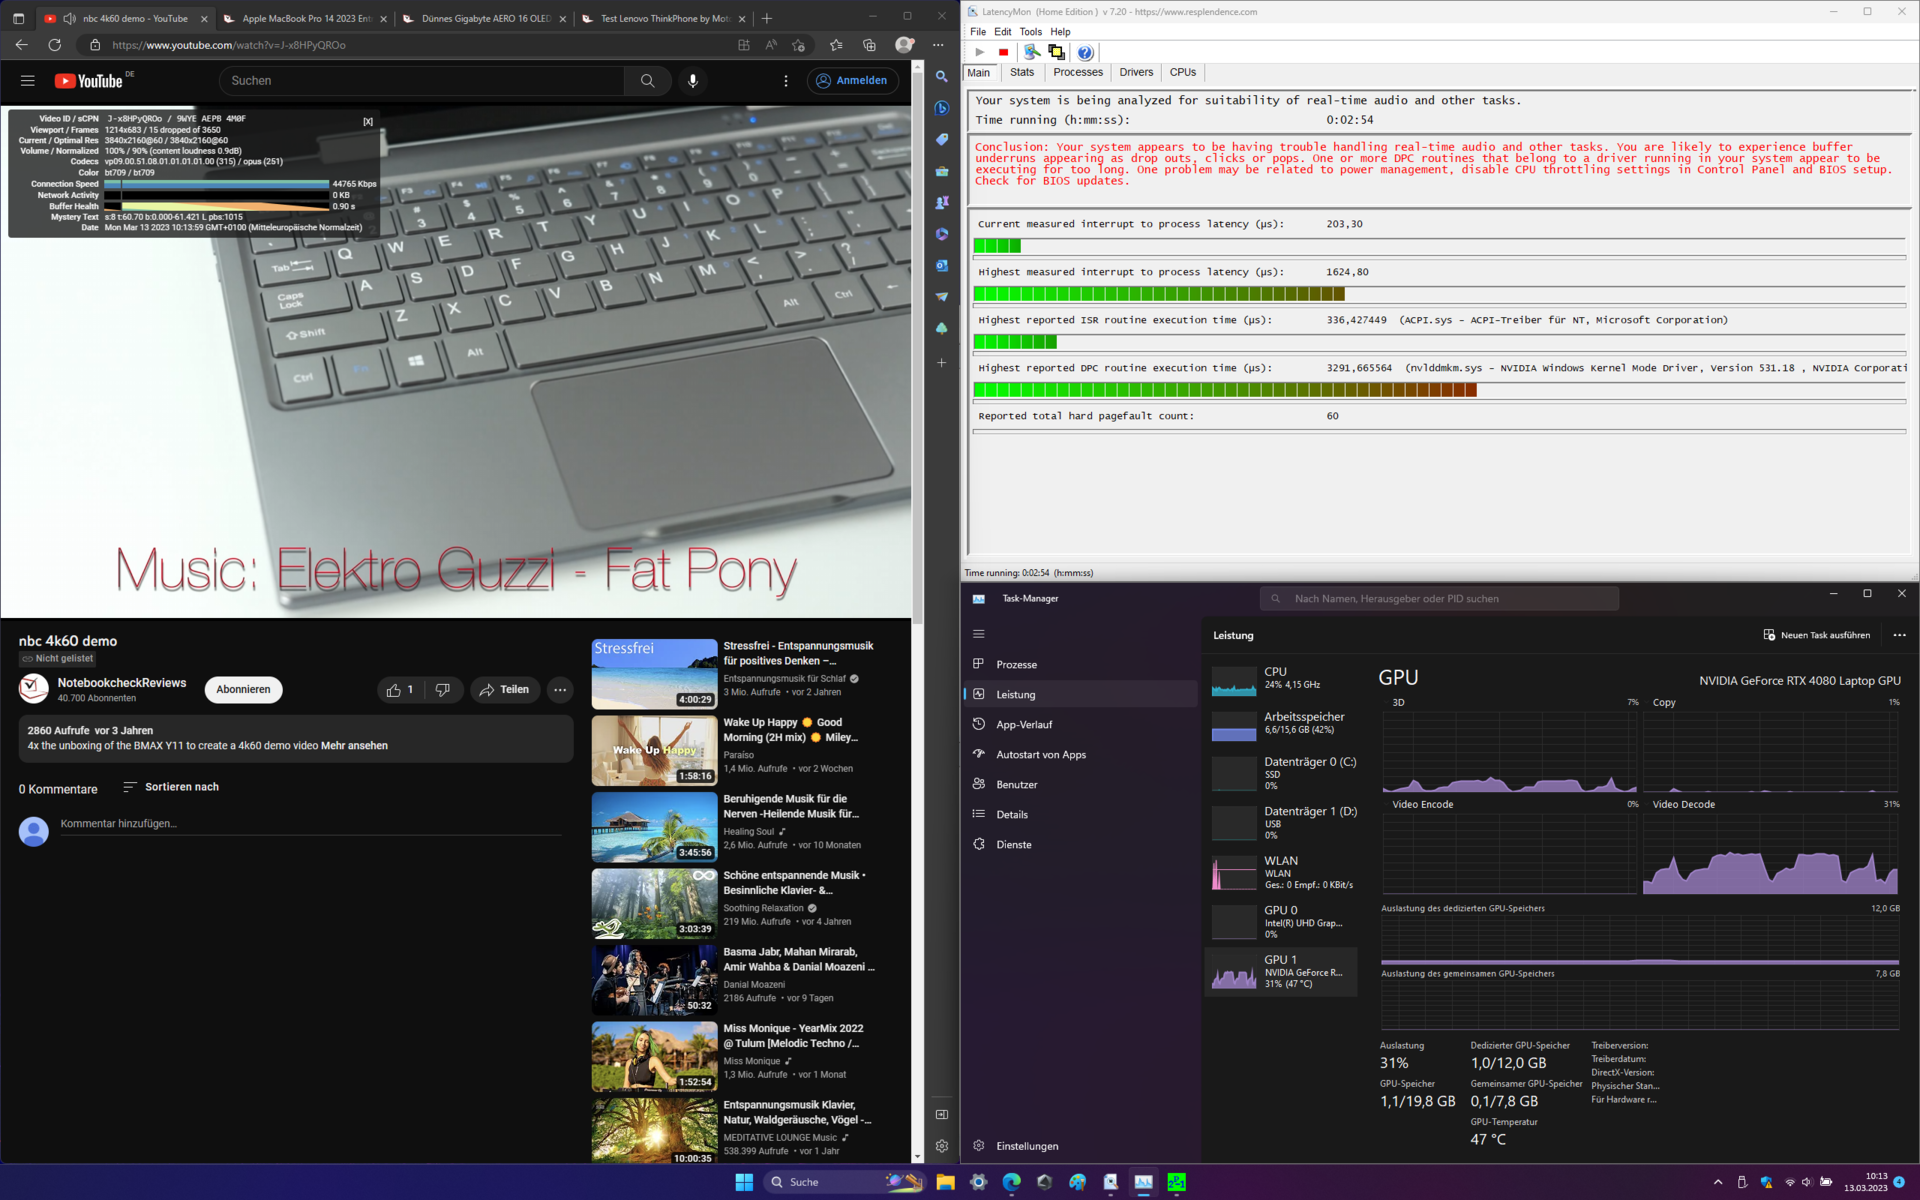
DPC延时
在审查时的当前驱动配置中,ROG Strix G16的DPC延迟相对较高。因此,音频处理等实时应用可能会在这里遇到麻烦。
| DPC Latencies / LatencyMon - interrupt to process latency (max), Web, Youtube, Prime95 | |
| Asus Zephyrus Duo 16 GX650PY-NM006W | |
| Asus ROG Strix G16 G614JZ | |
| Razer Blade 16 Early 2023 | |
| Gigabyte AERO 16 OLED BSF | |
| Lenovo Legion Pro 7 16IRX8H | |
| Asus TUF Gaming A16 FA617 | |
* ... smaller is better
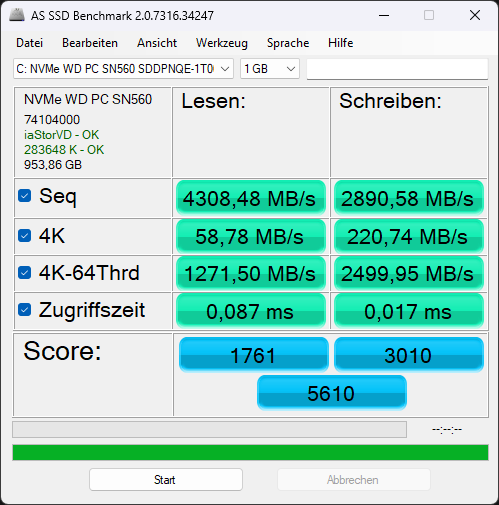
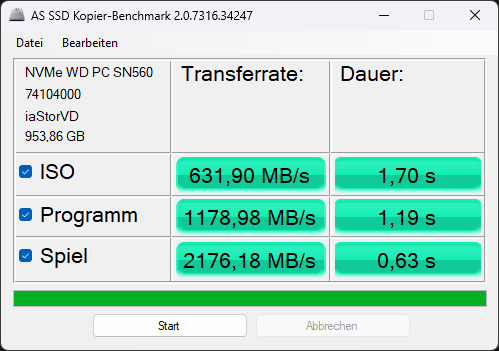
存储设备
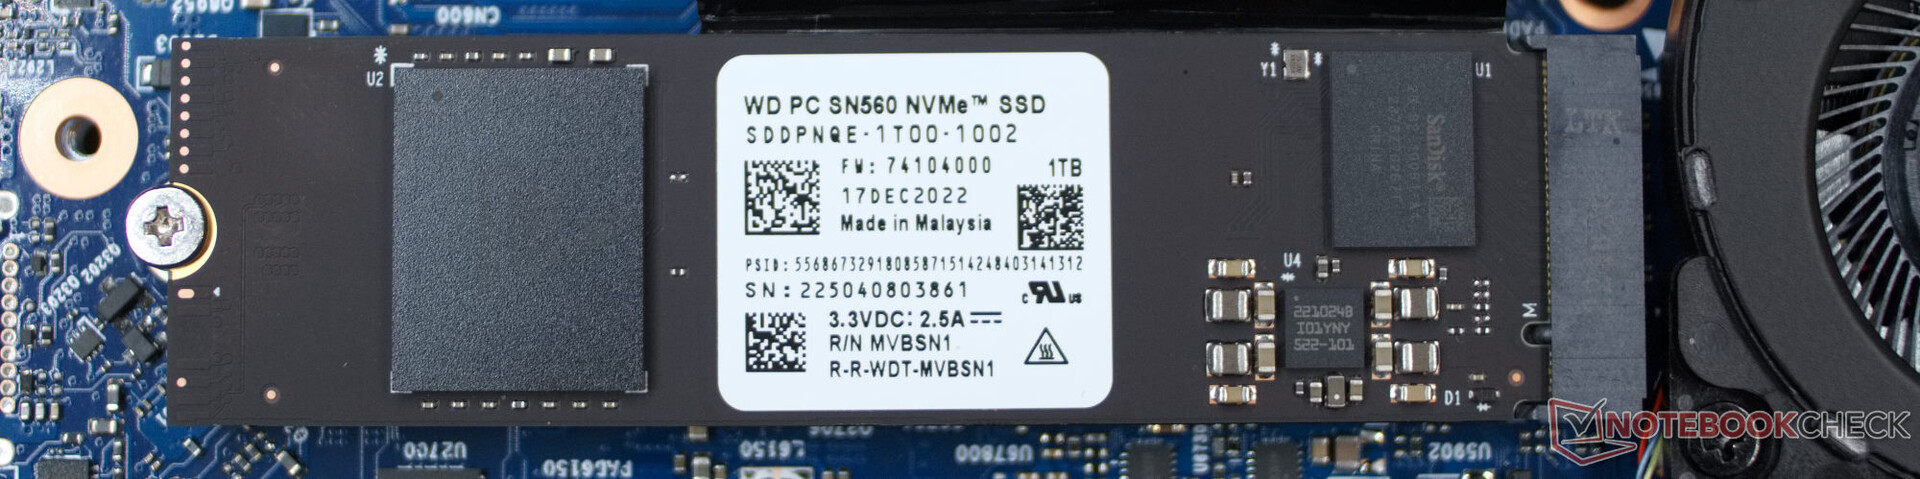
西部数据PC SN560 NVMe固态硬盘的速度其实并不慢,但它还没有完全接近对比领域中其他几款游戏笔记本的极快硬盘。因此,这款固态硬盘不得不在中场休息时占有一席之地。对于华硕ROG Strix G16的性能来说,这只意味着轻微的性能损失,在一些游戏中可能会有稍长的加载时间。

* ... smaller is better
Sustained Read Performance: DiskSpd Read Loop, Queue Depth 8
图形卡
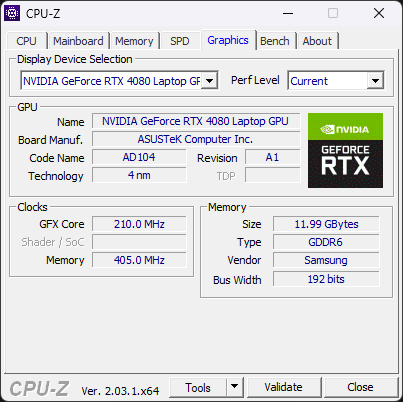
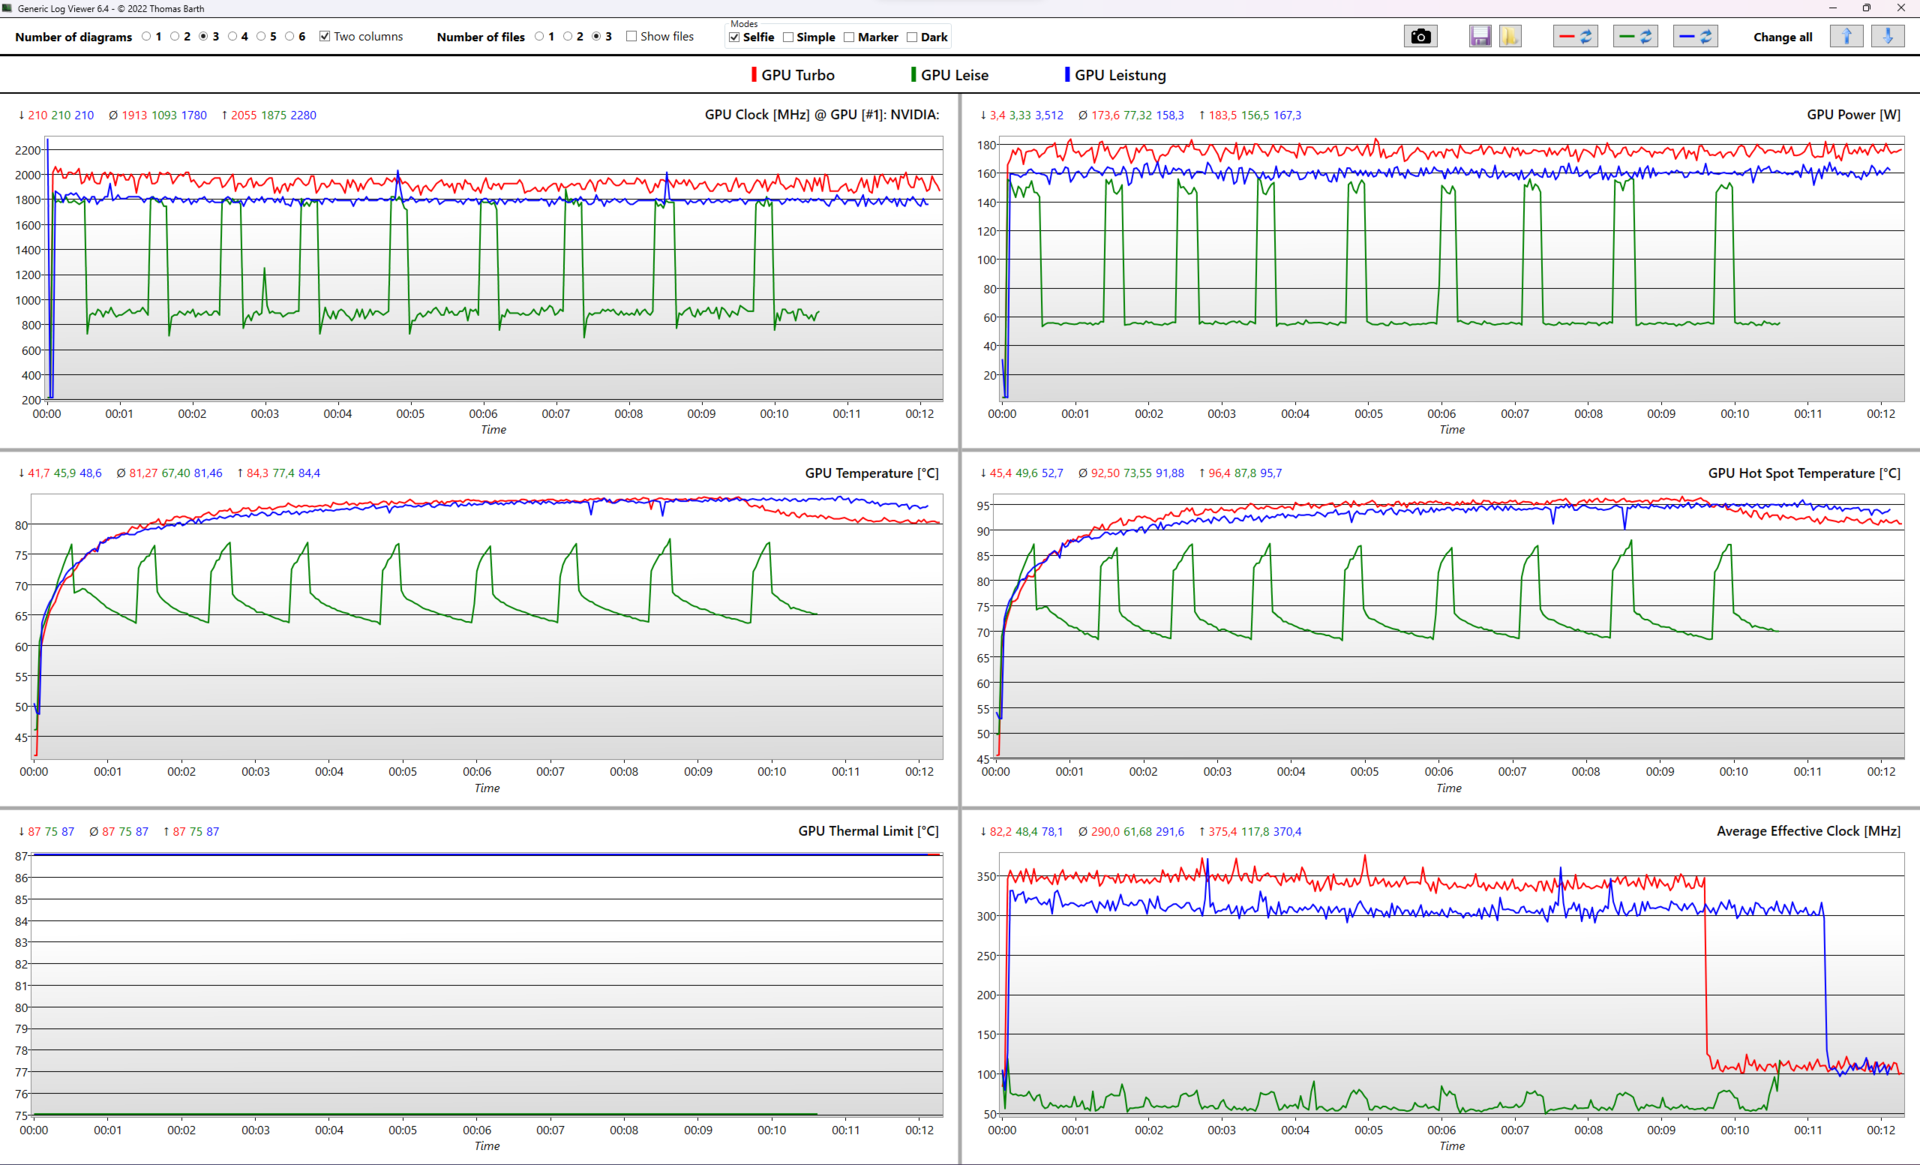
RTX 4080在Nvidia的最新一代显卡中占据第二位。强大的AD104芯片由12GB的GDDR6X内存支持,并提供最多7680个着色器和232个张量核心。华硕还依靠图形芯片的高性能率。在涡轮模式下,RTX 4080能够以约170瓦的功率连续工作。这使Strix G16的图形性能与华硕ROG Strix Scar 18相差无几。然而,这款笔记本的RTX 4090具有类似的冷却效果。因此,在冷却选项和图形性能之间的平衡方面,RTX 4080处于甜蜜点。
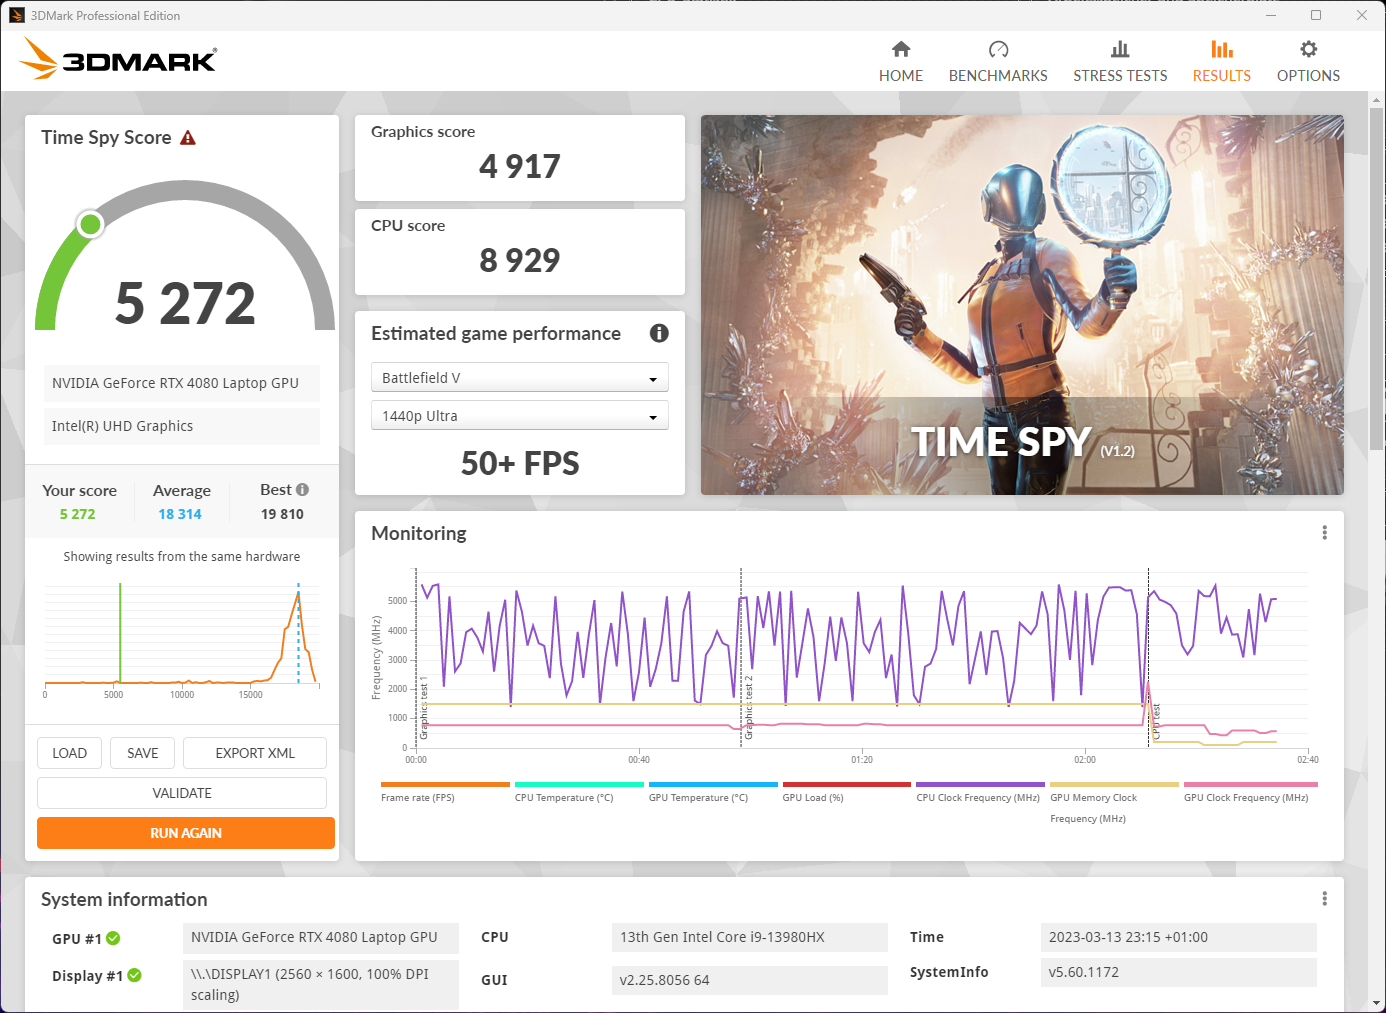
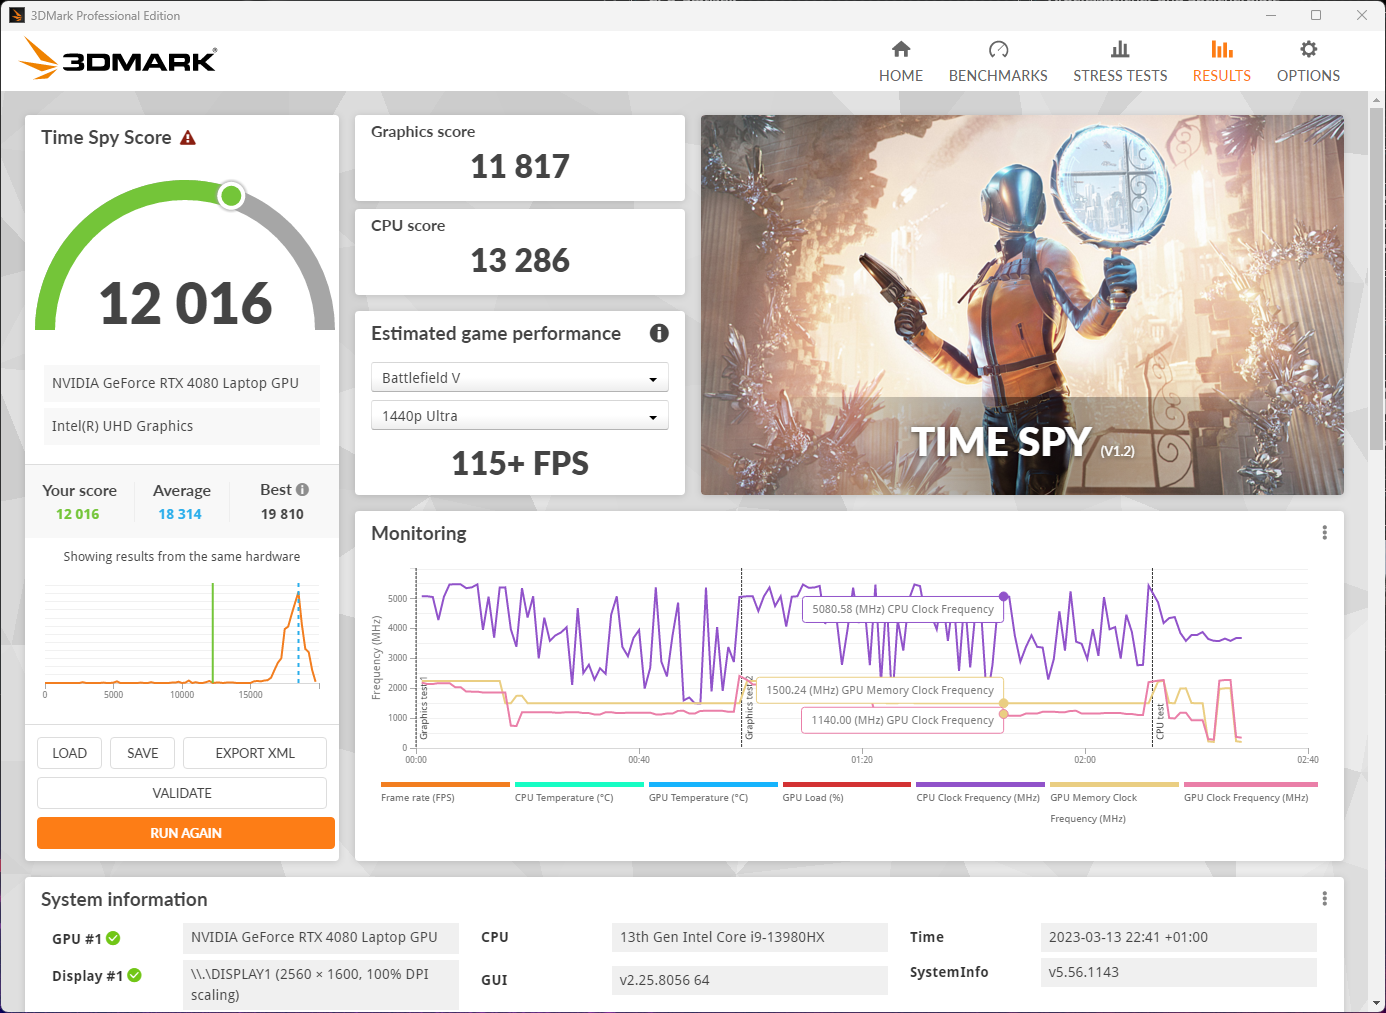
ROG Strix G16在安静模式下的高图形性能也很有趣。在这里,我们可以再次与另一个华硕ROG设备进行直接比较。ROG Strix G18的RTX 4070在激活性能模式的Time Spy 基准测试中达到12111分。G16中的RTX 4080在静音模式下达到了11817分。因此,这款游戏笔记本可以在不牺牲良好图形性能的情况下安静地运行。


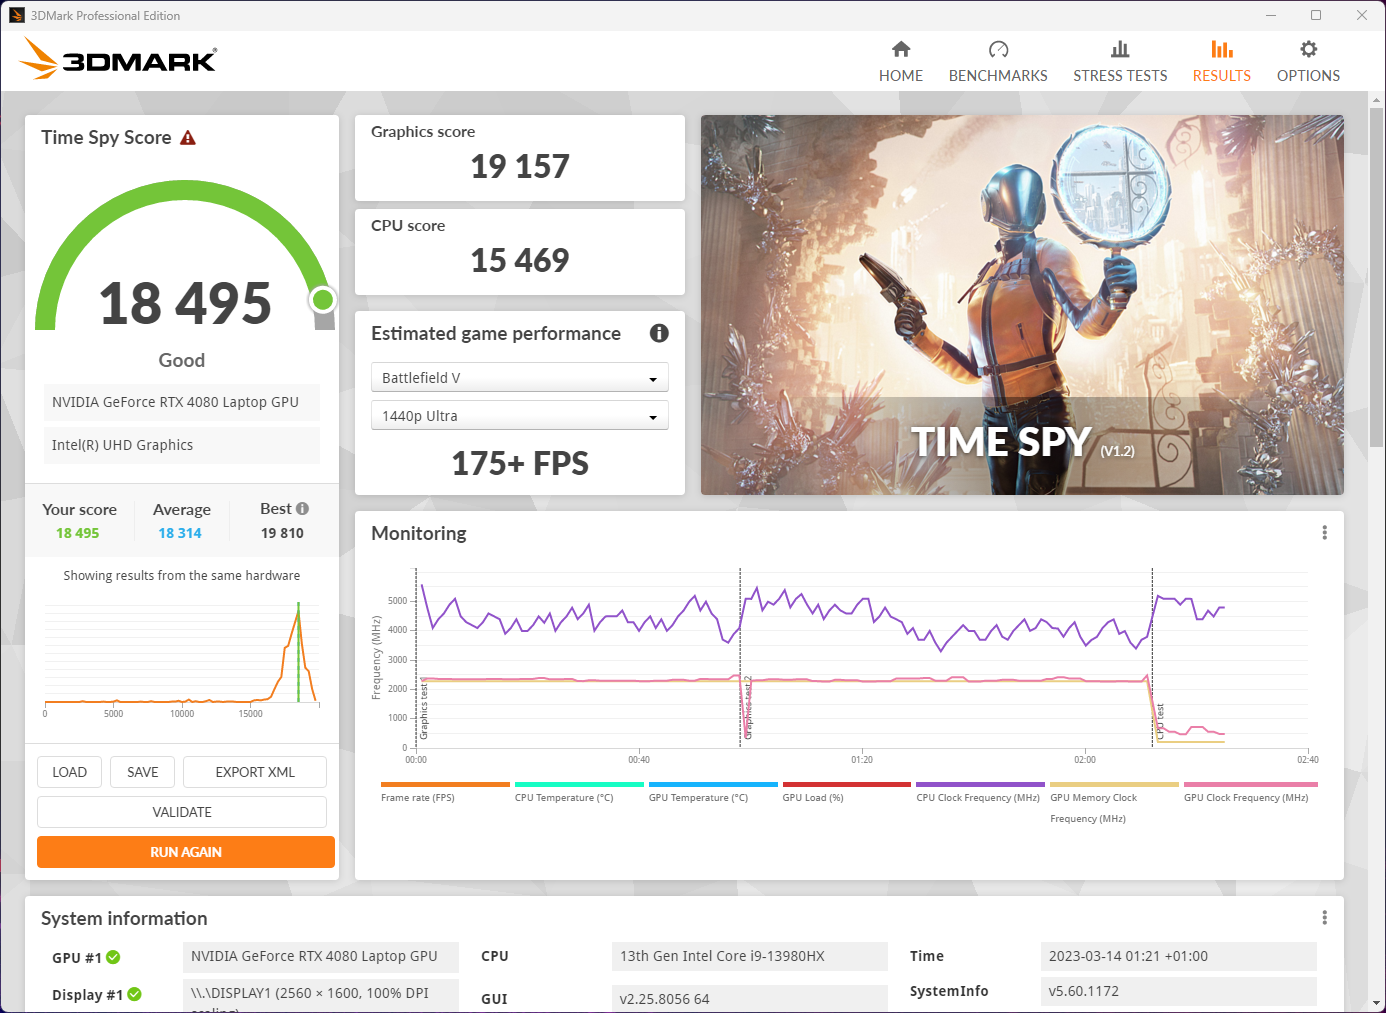
| 3DMark 11 Performance | 44528 points | |
| 3DMark Ice Storm Standard Score | 288532 points | |
| 3DMark Cloud Gate Standard Score | 72794 points | |
| 3DMark Fire Strike Score | 34456 points | |
| 3DMark Time Spy Score | 18495 points | |
Help | ||
* ... smaller is better
游戏性能
得益于RTX 4080充足的图形性能值,即使在最高质量设置和QHD分辨率下,也能在当前许多游戏中实现高帧率(FPS)。该图形芯片还可以很好地处理光线追踪。然而,在2560 × 1600的原始分辨率下,显示器的240赫兹只能在要求不高的游戏中或在降低的质量设置下得到充分利用。
在静音模式下取得强大的结果后,我们没有错过机会,也在这种模式下测试ROG Strix G16的游戏性能。结果是。静音模式适用于游戏。因此,那些不追求最高FPS的人在使用该模式时不应该害羞。在F1 22基准测试中,沉默模式和性能模式之间偶尔只有30 FPS的差异。图形单元也能很好地处理光线追踪,达到72FPS。尽管冷却度较低,但没有一个测试的游戏出现滞后。
| The Witcher 3 - 1920x1080 Ultra Graphics & Postprocessing (HBAO+) | |
| Asus Zephyrus Duo 16 GX650PY-NM006W | |
| Lenovo Legion Pro 7 16IRX8H | |
| Razer Blade 16 Early 2023 | |
| Asus ROG Strix G16 G614JZ | |
| Average of class Gaming (95 - 240, n=8, last 2 years) | |
| Asus ROG Strix G18 G814JI | |
| Gigabyte AERO 16 OLED BSF | |
| Asus TUF Gaming A16 FA617 | |
| Hogwarts Legacy | |
| 1920x1080 Ultra Preset + Full Ray Tracing AA:High T | |
| Average NVIDIA GeForce RTX 4080 Laptop GPU (53 - 66, n=2) | |
| Asus ROG Strix G16 G614JZ | |
| Asus ROG Strix G18 G814JI | |
| 2560x1440 Ultra Preset AA:High T | |
| Asus ROG Strix G16 G614JZ | |
| Average of class Gaming (n=1last 2 years) | |
| Average NVIDIA GeForce RTX 4080 Laptop GPU (76 - 102, n=3) | |
| Asus ROG Strix G18 G814JI | |
| 1920x1080 Ultra Preset AA:High T | |
| Asus ROG Strix G16 G614JZ | |
| Average NVIDIA GeForce RTX 4080 Laptop GPU (108 - 131, n=3) | |
| Average of class Gaming (n=1last 2 years) | |
| Asus ROG Strix G18 G814JI | |
| 1920x1080 High Preset AA:High T | |
| Asus ROG Strix G16 G614JZ | |
| Average NVIDIA GeForce RTX 4080 Laptop GPU (134 - 161.6, n=3) | |
| Asus ROG Strix G18 G814JI | |
| GRID Legends | |
| 2560x1440 Ultra Preset | |
| Asus ROG Strix G16 G614JZ | |
| Average NVIDIA GeForce RTX 4080 Laptop GPU (n=1) | |
| 1920x1080 Ultra Preset | |
| Asus ROG Strix G16 G614JZ | |
| Average NVIDIA GeForce RTX 4080 Laptop GPU (n=1) | |
| 1920x1080 High Preset | |
| Asus ROG Strix G16 G614JZ | |
| Average NVIDIA GeForce RTX 4080 Laptop GPU (n=1) | |
用Witcher 3 进行的长期测试表明,G16可以在长时间内保持其性能。这里的FPS的轻微波动是由于昼夜循环造成的。在其他方面,这改变了游戏中的视觉范围。
Witcher 3 FPS Chart
| low | med. | high | ultra | QHD | 4K | |
|---|---|---|---|---|---|---|
| GTA V (2015) | 186.9 | 186.4 | 183 | 146.1 | 131.4 | |
| The Witcher 3 (2015) | 175 | |||||
| Dota 2 Reborn (2015) | 233 | 205 | 193.9 | 180.7 | 182.6 | |
| Final Fantasy XV Benchmark (2018) | 224 | 201 | 168.1 | 128.3 | 74.2 | |
| X-Plane 11.11 (2018) | 192.2 | 181 | 138.8 | |||
| Strange Brigade (2018) | 497 | 399 | 369 | 338 | 241 | |
| GRID Legends (2022) | 241 | 220 | 199 | 187 | 158 | |
| Cyberpunk 2077 1.6 (2022) | 123.48 | 121.41 | 81.98 | |||
| F1 22 (2022) | 312 | 294 | 263 | 117 | ||
| FIFA 23 (2022) | 165 | 158 | 160 | 155 | ||
| Call of Duty Modern Warfare 2 2022 (2022) | 154 | 145 | 108 | |||
| Hogwarts Legacy (2023) | 207 | 178.5 | 161.6 | 131 | 102 |
排放--ROG Strix也可以是安静的
噪声
ROG Strix G16的三个风扇产生了大量的风,但也产生了相当多的噪音,这取决于功率设置。在52 dB(A)的情况下,风扇淹没了大量的环境噪音,也淹没了来自笔记本的其他种类的噪音,否则就会被听到。如果需要,这款游戏笔记本也可以保持安静,但这并不一定意味着你必须依赖耳机,因为这款笔记本在静音模式下的最大音量为40 dB(A),仍然处于可容忍的范围内,而且仍有足够的功率用于游戏。然而,一个线圈的啸叫声就会变得清晰可闻。每当CPU和GPU在Turbo模式下运行时,你可以听到笔记本的VRM或其他部件发出哔哔声。当打开扬声器进行游戏时,线圈啸叫就不再那么明显了。
Noise level
| Idle |
| 26 / 28 / 30 dB(A) |
| Load |
| 48 / 52 dB(A) |
 | ||
30 dB silent 40 dB(A) audible 50 dB(A) loud |
||
min: | ||
| Asus ROG Strix G16 G614JZ i9-13980HX, GeForce RTX 4080 Laptop GPU | Asus Zephyrus Duo 16 GX650PY-NM006W R9 7945HX, GeForce RTX 4090 Laptop GPU | Lenovo Legion Pro 7 16IRX8H i9-13900HX, GeForce RTX 4080 Laptop GPU | Gigabyte AERO 16 OLED BSF i9-13900H, GeForce RTX 4070 Laptop GPU | Asus TUF Gaming A16 FA617 R7 7735HS, Radeon RX 7600S | Razer Blade 16 Early 2023 i9-13950HX, GeForce RTX 4080 Laptop GPU | |
|---|---|---|---|---|---|---|
| Noise | -4% | -4% | 0% | 6% | 11% | |
| off / environment * (dB) | 25 | 23.9 4% | 24 4% | 23 8% | 24 4% | 23 8% |
| Idle Minimum * (dB) | 26 | 23.9 8% | 26 -0% | 23 12% | 24 8% | 23 12% |
| Idle Average * (dB) | 28 | 32.9 -18% | 28 -0% | 23 18% | 25 11% | 23 18% |
| Idle Maximum * (dB) | 30 | 36.5 -22% | 34 -13% | 33.64 -12% | 28 7% | 23.6 21% |
| Load Average * (dB) | 48 | 42.9 11% | 47 2% | 51.49 -7% | 42 12% | 39 19% |
| Witcher 3 ultra * (dB) | 49 | 51.2 -4% | 55 -12% | 55.27 -13% | 50 -2% | 51.6 -5% |
| Load Maximum * (dB) | 52 | 56 -8% | 56 -8% | 55.24 -6% | 50 4% | 51.3 1% |
* ... smaller is better
温度
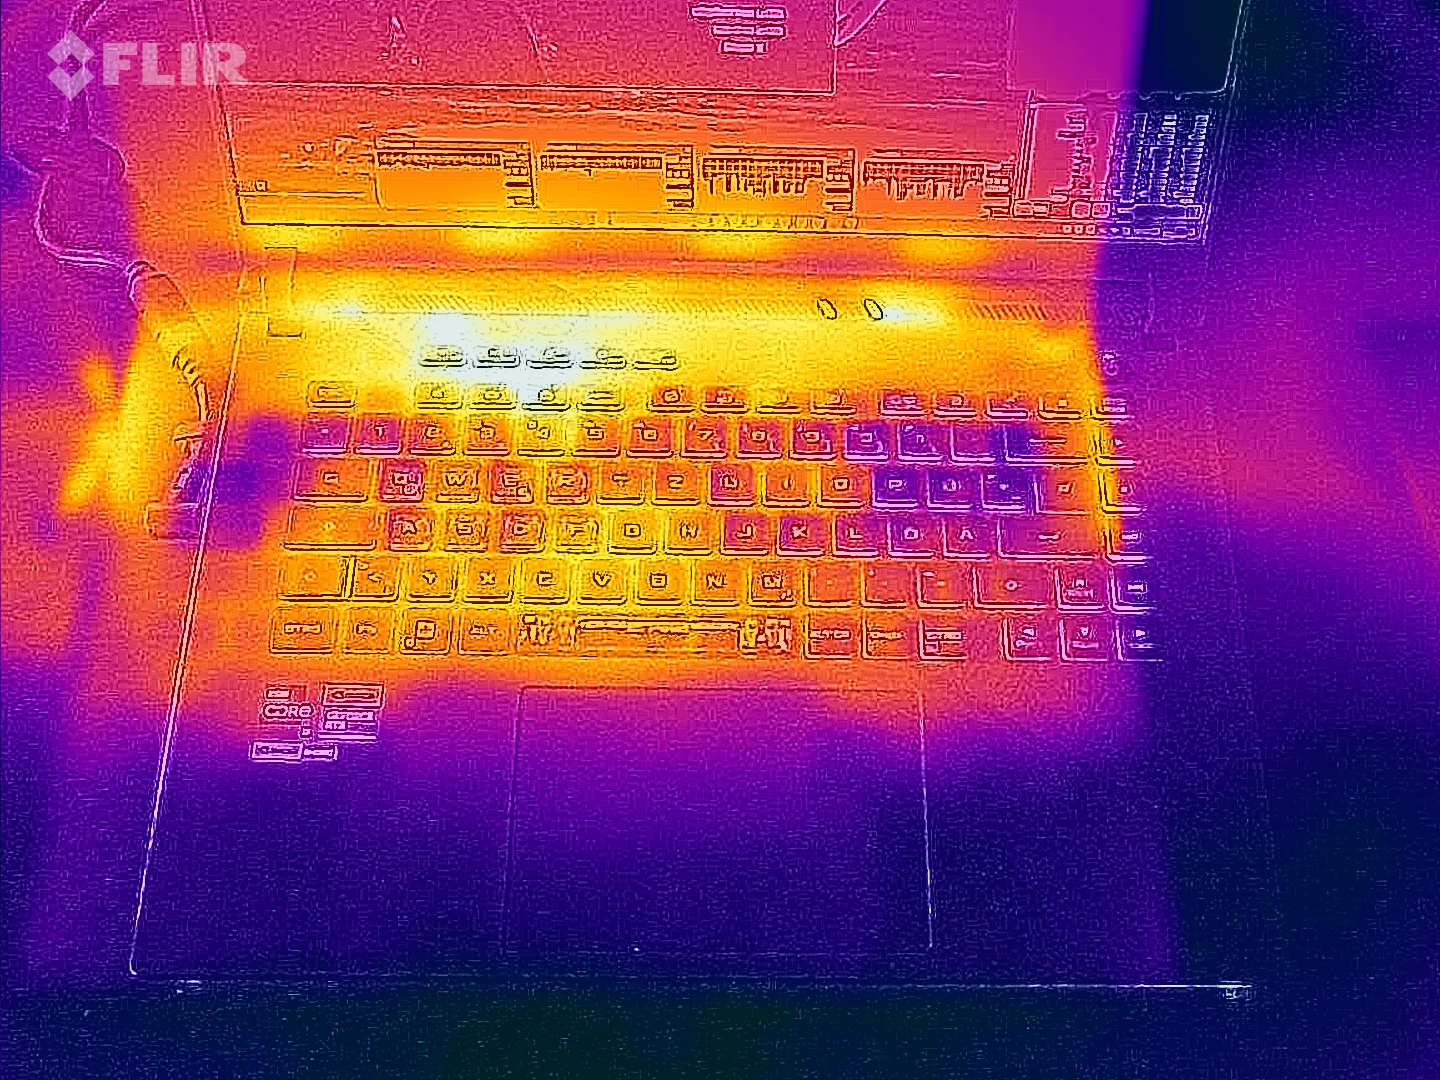
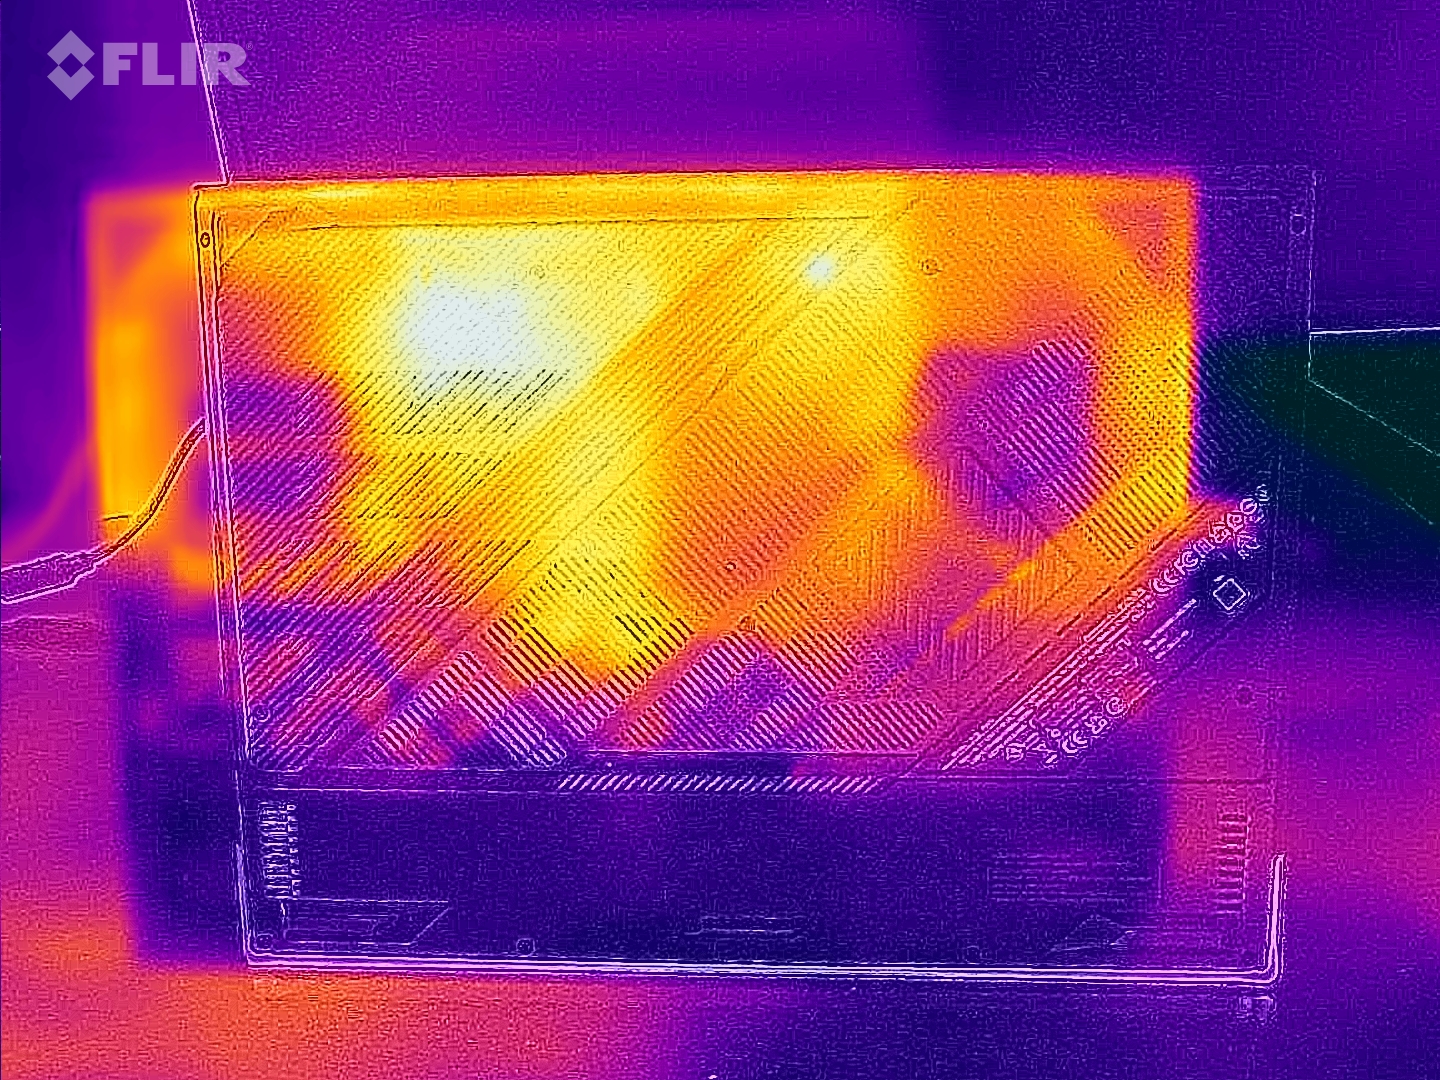
强大的硬件使ROG Strix G16的机箱升温相当快。在游戏过程中,笔记本顶部的温度上升到54℃。幸运的是,该游戏笔记本的风扇位于WASD键的正下方。这里的温度明显下降,所以你在游戏时不会烫伤手指。掌托始终保持凉爽。在游戏时,你应该把笔记本放在一个坚实的表面上。
负荷较低时,情况就不同了。无论是空转、编辑照片和视频,甚至是CAD绘图,ROG Strix G16都不会真正变热。在底面接近30℃的情况下,运行时的热量比负载情况下的热量更容易忍受。
(-) The maximum temperature on the upper side is 54 °C / 129 F, compared to the average of 40.4 °C / 105 F, ranging from 21.2 to 68.8 °C for the class Gaming.
(-) The bottom heats up to a maximum of 55 °C / 131 F, compared to the average of 43.2 °C / 110 F
(+) In idle usage, the average temperature for the upper side is 27.6 °C / 82 F, compared to the device average of 33.9 °C / 93 F.
(-) Playing The Witcher 3, the average temperature for the upper side is 40.1 °C / 104 F, compared to the device average of 33.9 °C / 93 F.
(±) The palmrests and touchpad can get very hot to the touch with a maximum of 38 °C / 100.4 F.
(-) The average temperature of the palmrest area of similar devices was 28.8 °C / 83.8 F (-9.2 °C / -16.6 F).
| Asus ROG Strix G16 G614JZ Intel Core i9-13980HX, NVIDIA GeForce RTX 4080 Laptop GPU | Asus Zephyrus Duo 16 GX650PY-NM006W AMD Ryzen 9 7945HX, NVIDIA GeForce RTX 4090 Laptop GPU | Lenovo Legion Pro 7 16IRX8H Intel Core i9-13900HX, NVIDIA GeForce RTX 4080 Laptop GPU | Gigabyte AERO 16 OLED BSF Intel Core i9-13900H, NVIDIA GeForce RTX 4070 Laptop GPU | Asus TUF Gaming A16 FA617 AMD Ryzen 7 7735HS, AMD Radeon RX 7600S | Razer Blade 16 Early 2023 Intel Core i9-13950HX, NVIDIA GeForce RTX 4080 Laptop GPU | |
|---|---|---|---|---|---|---|
| Heat | 10% | -4% | 23% | -11% | 13% | |
| Maximum Upper Side * (°C) | 54 | 44.2 18% | 48 11% | 41 24% | 54 -0% | 40 26% |
| Maximum Bottom * (°C) | 55 | 46.8 15% | 49 11% | 47 15% | 47 15% | 37.6 32% |
| Idle Upper Side * (°C) | 29 | 29.2 -1% | 40 -38% | 23 21% | 40 -38% | 32.4 -12% |
| Idle Bottom * (°C) | 33 | 30.2 8% | 33 -0% | 23 30% | 40 -21% | 31.4 5% |
* ... smaller is better
压力测试
液态金属和三个风扇与巨大的散热器相结合,应确保温度稳定。在压力测试中,大约8到10分钟后达到平衡状态。从那时起,CPU和GPU的温度在83至88℃之间移动。i9在55瓦左右持续工作,RTX 4080在140瓦左右。GeForce RTX 4080的热点是引人注目的,它明显高于平均水平,几乎达到93℃。在有良好的液态金属冷却的情况下,不应该出现如此高的热点。
发言人
在ROG Strix G16中安装了四个扬声器模块。底座前部的两个朝下的全频驱动器与铰链之间的两个高音扬声器相得益彰。这允许一个良好的声音景观,即使低音有点弱。中音和高音是非常平衡的。在83 dB(A)的最大音量下,扬声器也能淹没游戏笔记本的风扇。耳机在这里可以省去,即使3.5毫米耳机插孔和蓝牙5.2提供了连接外部扬声器和耳机的选择。
Asus ROG Strix G16 G614JZ audio analysis
(+) | speakers can play relatively loud (87 dB)
Bass 100 - 315 Hz
(-) | nearly no bass - on average 16.6% lower than median
(±) | linearity of bass is average (8.7% delta to prev. frequency)
Mids 400 - 2000 Hz
(+) | balanced mids - only 1.9% away from median
(+) | mids are linear (4.1% delta to prev. frequency)
Highs 2 - 16 kHz
(+) | balanced highs - only 3.8% away from median
(+) | highs are linear (6.2% delta to prev. frequency)
Overall 100 - 16.000 Hz
(+) | overall sound is linear (12.2% difference to median)
Compared to same class
» 13% of all tested devices in this class were better, 4% similar, 83% worse
» The best had a delta of 6%, average was 18%, worst was 132%
Compared to all devices tested
» 10% of all tested devices were better, 2% similar, 88% worse
» The best had a delta of 4%, average was 24%, worst was 134%
Lenovo Legion Pro 7 16IRX8H audio analysis
(+) | speakers can play relatively loud (82 dB)
Bass 100 - 315 Hz
(±) | reduced bass - on average 8.9% lower than median
(+) | bass is linear (6.4% delta to prev. frequency)
Mids 400 - 2000 Hz
(+) | balanced mids - only 2.8% away from median
(+) | mids are linear (4.2% delta to prev. frequency)
Highs 2 - 16 kHz
(+) | balanced highs - only 2.5% away from median
(+) | highs are linear (6% delta to prev. frequency)
Overall 100 - 16.000 Hz
(+) | overall sound is linear (9.4% difference to median)
Compared to same class
» 3% of all tested devices in this class were better, 2% similar, 95% worse
» The best had a delta of 6%, average was 18%, worst was 132%
Compared to all devices tested
» 3% of all tested devices were better, 1% similar, 96% worse
» The best had a delta of 4%, average was 24%, worst was 134%
电源管理--90Wh电池和Optimus确保长的电池寿命
消耗功率
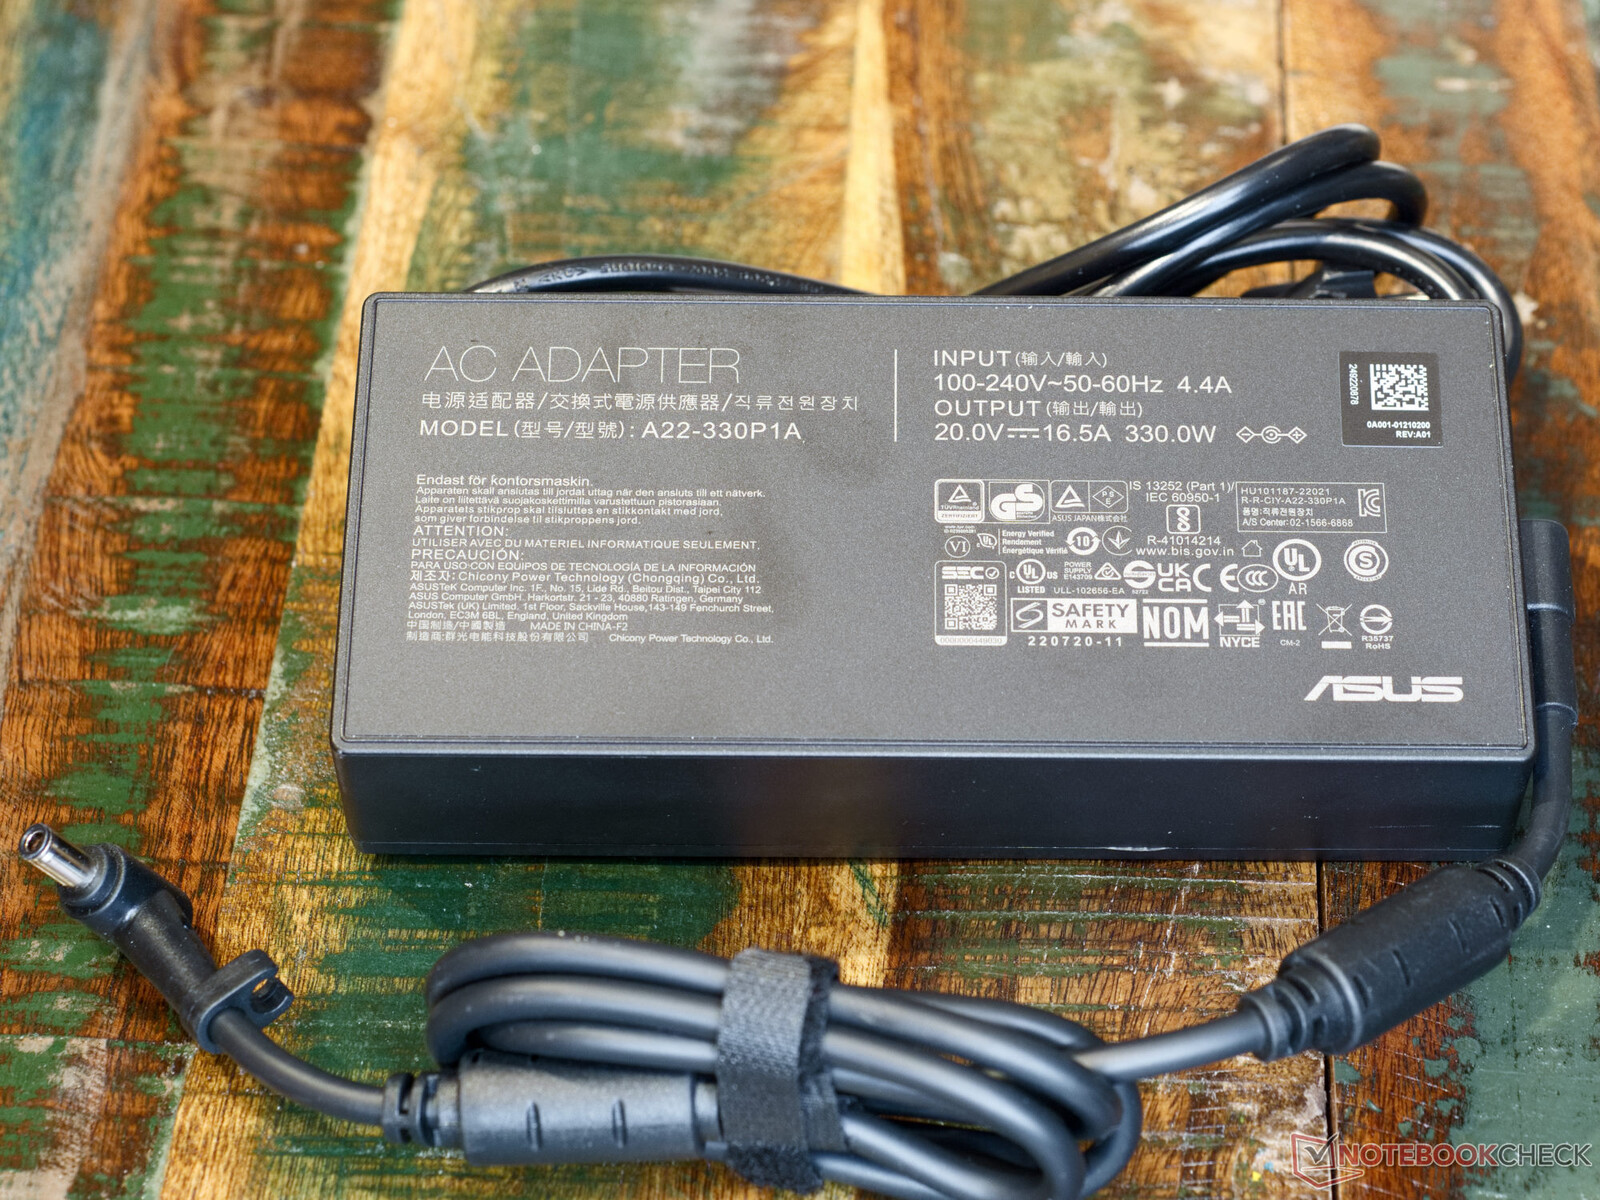
闲置时的功耗为10至20瓦,这款游戏笔记本在可容忍的范围内。然而,这些相对较低的速率只有通过主动图形切换才能达到。在负载情况下,功耗上升到342瓦,这是提升过程中的一个短暂峰值。附带的330瓦的电源应该能够应付这个问题。在更长的时间内,即使在负载下,功耗仍然相当稳定,为260瓦。
| Off / Standby | |
| Idle | |
| Load |
|
Key:
min: | |
| Asus ROG Strix G16 G614JZ i9-13980HX, GeForce RTX 4080 Laptop GPU | Asus Zephyrus Duo 16 GX650PY-NM006W R9 7945HX, GeForce RTX 4090 Laptop GPU | Lenovo Legion Pro 7 16IRX8H i9-13900HX, GeForce RTX 4080 Laptop GPU | Gigabyte AERO 16 OLED BSF i9-13900H, GeForce RTX 4070 Laptop GPU | Asus TUF Gaming A16 FA617 R7 7735HS, Radeon RX 7600S | Razer Blade 16 Early 2023 i9-13950HX, GeForce RTX 4080 Laptop GPU | Average NVIDIA GeForce RTX 4080 Laptop GPU | Average of class Gaming | |
|---|---|---|---|---|---|---|---|---|
| Power Consumption | -32% | -25% | 20% | 34% | -25% | -22% | 0% | |
| Idle Minimum * (Watt) | 10 | 19.2 -92% | 18 -80% | 11.8 -18% | 8 20% | 15.2 -52% | 16.9 ? -69% | 13.2 ? -32% |
| Idle Average * (Watt) | 16 | 29.7 -86% | 24 -50% | 16.1 -1% | 11 31% | 22.8 -43% | 22 ? -38% | 18.9 ? -18% |
| Idle Maximum * (Watt) | 27 | 30.8 -14% | 32 -19% | 17 37% | 16 41% | 49.8 -84% | 34.1 ? -26% | 24.5 ? 9% |
| Load Average * (Watt) | 129 | 126 2% | 130 -1% | 100.6 22% | 97 25% | 121.2 6% | 117.9 ? 9% | 108.8 ? 16% |
| Witcher 3 ultra * (Watt) | 247 | 258 -4% | 260 -5% | 158 36% | 161.5 35% | 242 2% | ||
| Load Maximum * (Watt) | 342 | 330 4% | 320 6% | 192 44% | 168 51% | 273.7 20% | 297 ? 13% | 254 ? 26% |
* ... smaller is better
Power Consumption Witcher 3 / Stress Test
Power Consumption with an external monitor
电池寿命
华硕ROG Strix G16的电池容量为90瓦时,应该能够在离开插座时提供良好的运行时间。然而,在WiFi网络冲浪测试中,这款笔记本在主动切换图形的情况下只达到了9小时以上。只要GeForce RTX 4080被激活,运行时间就会明显下降。在高负荷下,电池在某些情况下只能维持一小时。尽管如此,对于2023年的游戏笔记本来说,电池运行时间仍然是特别好的。
| Asus ROG Strix G16 G614JZ i9-13980HX, GeForce RTX 4080 Laptop GPU, 90 Wh | Asus Zephyrus Duo 16 GX650PY-NM006W R9 7945HX, GeForce RTX 4090 Laptop GPU, 90 Wh | Lenovo Legion Pro 7 16IRX8H i9-13900HX, GeForce RTX 4080 Laptop GPU, 99.9 Wh | Gigabyte AERO 16 OLED BSF i9-13900H, GeForce RTX 4070 Laptop GPU, 88 Wh | Asus TUF Gaming A16 FA617 R7 7735HS, Radeon RX 7600S, 90 Wh | Razer Blade 16 Early 2023 i9-13950HX, GeForce RTX 4080 Laptop GPU, 95.2 Wh | Average of class Gaming | |
|---|---|---|---|---|---|---|---|
| Battery runtime | -34% | 22% | 34% | 31% | -5% | 3% | |
| WiFi v1.3 (h) | 9.7 | 4 -59% | 5.1 -47% | 7.5 -23% | 12.1 25% | 6.1 -37% | 6.96 ? -28% |
| Load (h) | 1.1 | 1 -9% | 2.1 91% | 2.1 91% | 1.5 36% | 1.4 27% | 1.47 ? 34% |
| H.264 (h) | 3.8 | 7.4 | 8.28 ? | ||||
| Reader / Idle (h) | 6.4 | 20.2 | 8.9 | 8.71 ? |
Pros
Cons
结论 - 4080是一个不错的选择
凭借移动的NvidiaGeForce RTX 4080,华硕ROG Stix G16在性能和冷却之间找到了甜蜜点。G16也不必回避与它的所谓更强大的家族成员的直接比较,即 ROG Strix Scar 18它的RTX 4090,因为这两款笔记本电脑的大多数基准测试都非常接近对方。此外,G16的价格应该会便宜很多。根据供应商的情况,这里的价格差异可能几乎达到2000美元。
在2023型号系列中,华硕已经大大拉平了两个高端系列之间的差异。由于省略了Strix Scar设备中的蒸汽室,Scar 18和G16之间的差异几乎完全是外观上的。那些绝对坚持要用半透明机箱的笔记本电脑的人将不得不在他们的口袋里挖得更深。我们最近还回顾了一个 Strix G18配备了 RTX 4070.就像G16一样,这里使用了一个好的屏幕和强大的硬件,具有良好的散热效果。也就是说,16英寸的产品可能是更好的选择,因为它的结构更稳定一些。
抢眼的包装中的强大性能。华硕ROG Strix G16由于其强大的功能,使用起来非常有趣。
有趣的是,ROG Strix G16提供了没有噪音污染的游戏的真正可能性。预先配置的静音模式的得分超过了可玩的FPS和低风扇噪音。不幸的是,这也使G16的线圈啸叫声凸显出来。这种穿透力强的噪音在升压过程中特别容易听到,可能是由电压转换器产生的。
在性能方面,ROG Strix G16与联想Legion Pro 7和Razer Blade 16大致相当,但可能更便宜。然而,这两个竞争对手在外壳质量和连接性方面有优势。这两点也是ROG Strix G16的最大弱点。
价格和可用性
考虑到它最近的发布,配备NvidiaGeForce RTX 4080的华硕ROG Strix G16的全球供应目前是有限的,或者根本没有。在美国,只有配置RTX 4070(,通过亚马逊售价1999.99美元)或RTX 4050(通过华硕ROG网站,售价1799.99美元)似乎是可用的。
带有RTX 4080的型号一旦上市,预计将达到3000美元左右。
价格截止到2023年3月17日,可能会有变化。
Asus ROG Strix G16 G614JZ
- 03/16/2023 v7 (old)
Marc Herter
Transparency
The selection of devices to be reviewed is made by our editorial team. The test sample was provided to the author as a loan by the manufacturer or retailer for the purpose of this review. The lender had no influence on this review, nor did the manufacturer receive a copy of this review before publication. There was no obligation to publish this review. As an independent media company, Notebookcheck is not subjected to the authority of manufacturers, retailers or publishers.
This is how Notebookcheck is testing
Every year, Notebookcheck independently reviews hundreds of laptops and smartphones using standardized procedures to ensure that all results are comparable. We have continuously developed our test methods for around 20 years and set industry standards in the process. In our test labs, high-quality measuring equipment is utilized by experienced technicians and editors. These tests involve a multi-stage validation process. Our complex rating system is based on hundreds of well-founded measurements and benchmarks, which maintains objectivity. Further information on our test methods can be found here.
Price comparison

