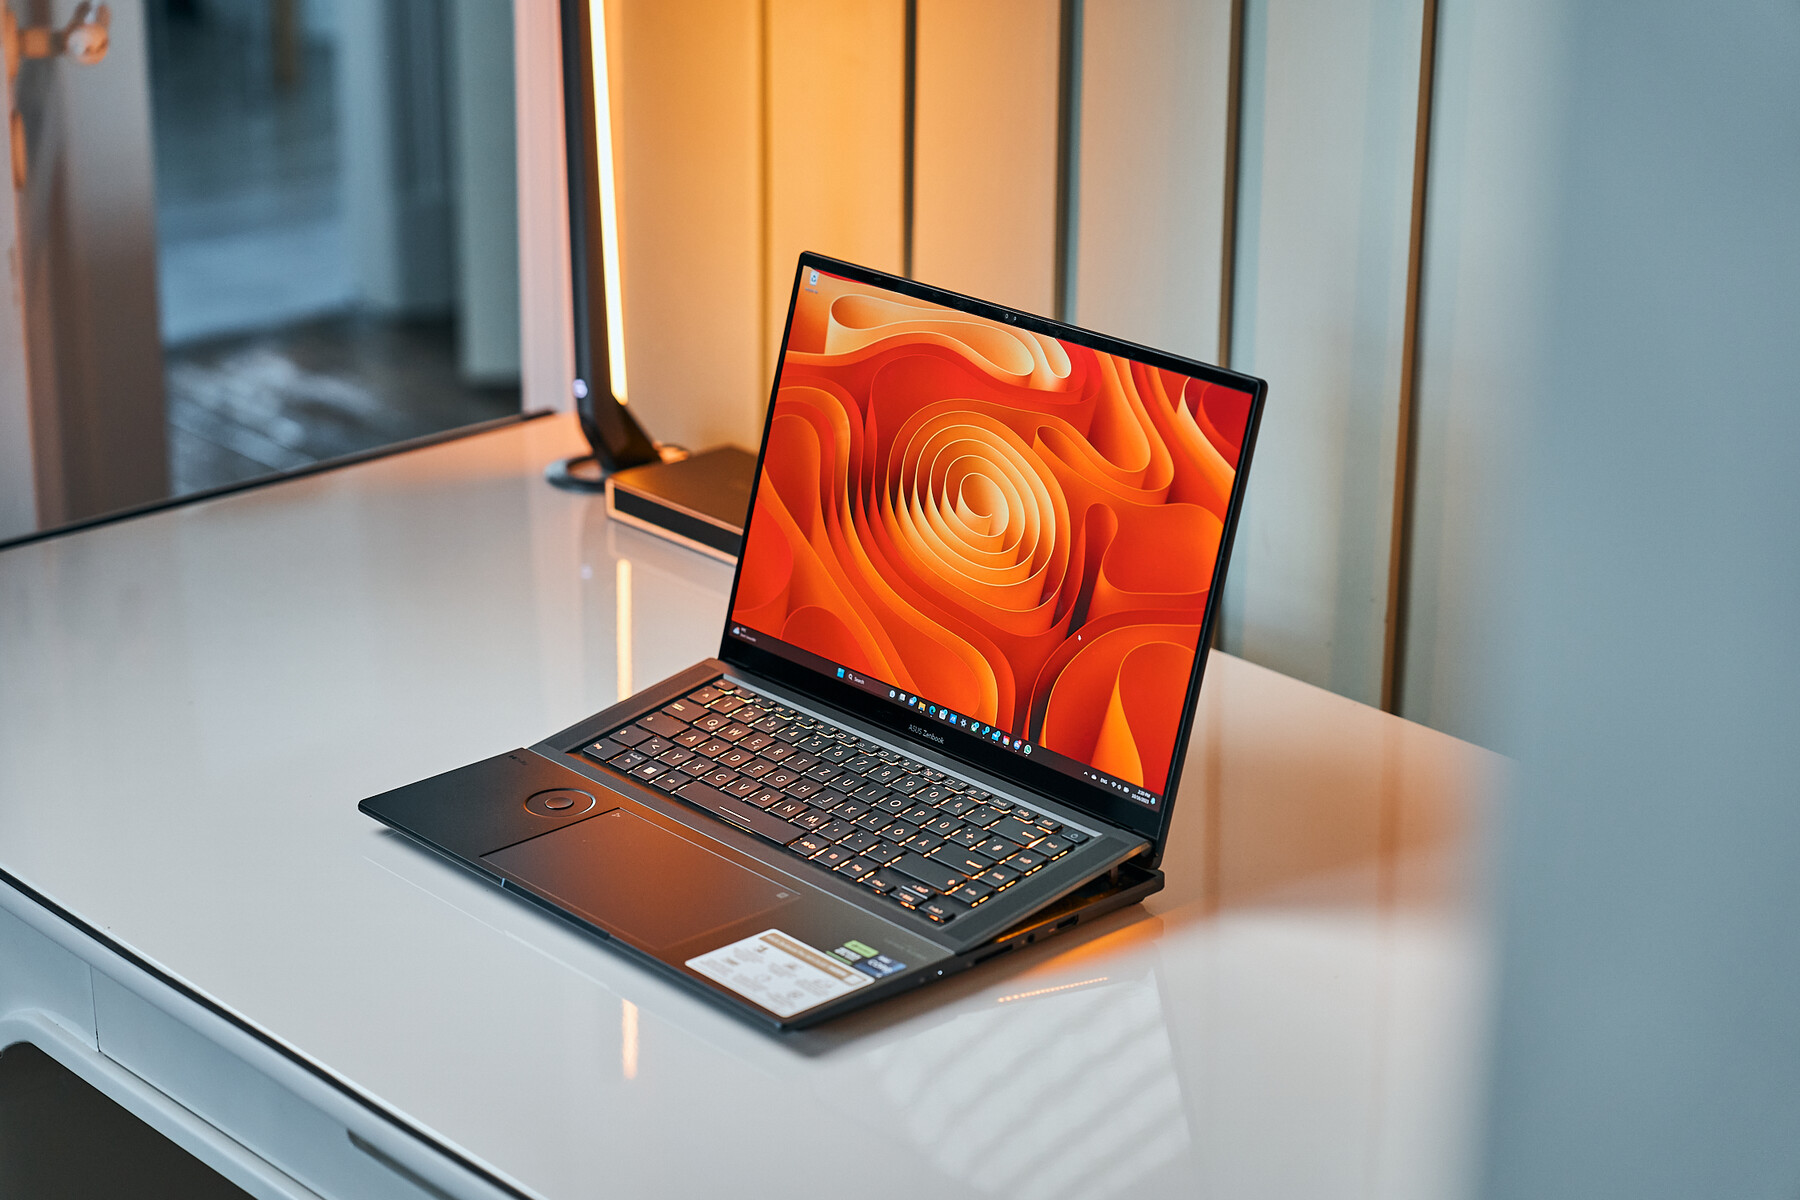
Zenbook Pro 16X (2023) 评测:华硕旗舰机的最强动力

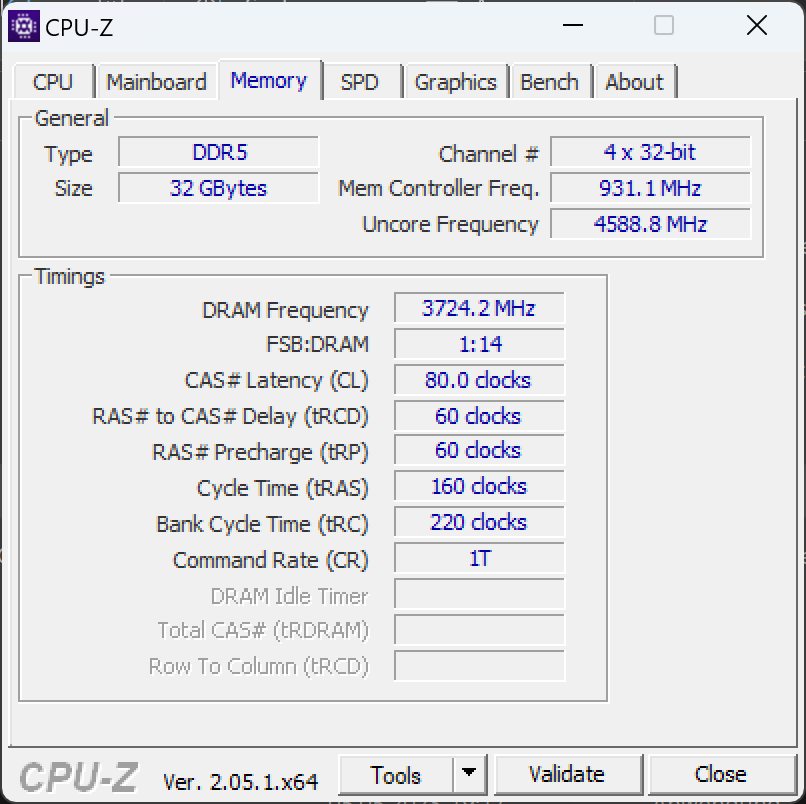
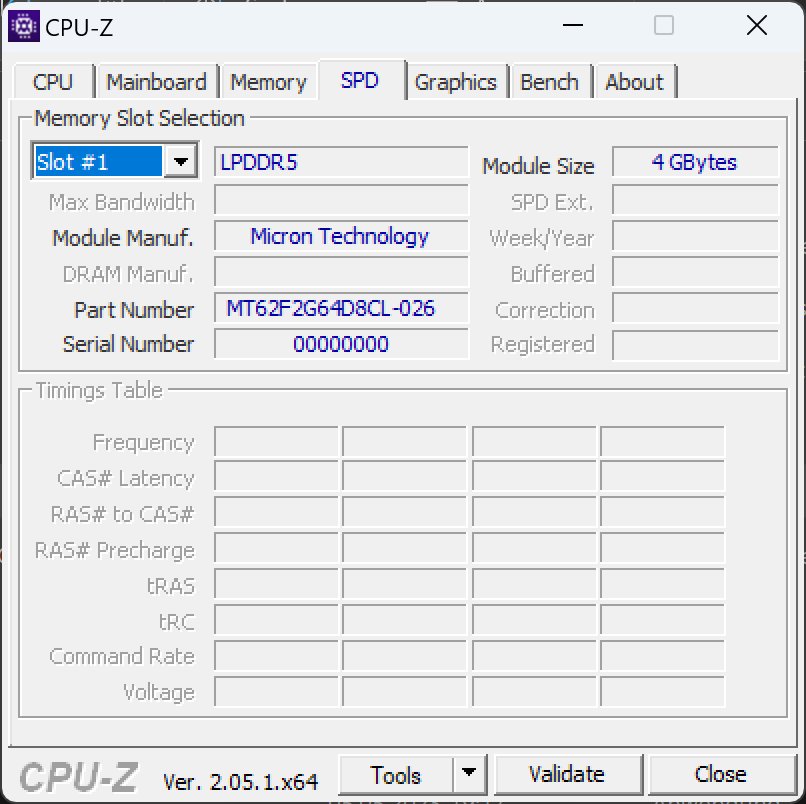
从光学角度看,Zenbook Pro 16X 几乎没有任何变化。 广泛评测而这款笔记本的内部空间则要大得多。虽然稍显薄弱的 RTX 3060去年,性能稍弱的 RTX 3060 备受批评,而现在的 Zenbook 则配备了强大的 英伟达GeForce RTX 4080.新的 CPU 和 LPDDR5 RAM 配置应能确保更快的内存访问速度,因此已经非常强大的 英特尔酷睿 i9-13905H的运行速度会更快。
当然,强大的硬件也需要适当的散热。华硕翻转键盘下的 AAS 冷却系统、3D 蒸汽腔、液态金属和 3D 形 12 V 风扇再次确保了这一点。这使得系统的耗电量高达 200 瓦,而不会产生热量积聚。因此,在某些基准测试中,新款 Zenbook Pro 16X 的性能比上一代产品提高了一倍多。
华硕还对屏幕进行了调整,现在终于提供了 120 Hz OLED 显示屏。这块屏幕开箱即进行了良好的校准,并提供完整的 DisplayP3 和 DCI P3 覆盖范围,这意味着这块强大的屏幕也可能是媒体设计师的绝佳选择。笔输入功能和华硕拨号盘也支持这一理念,后者可用于快速访问创意软件中的众多功能。最后,新款 Zenbook Pro 16X 强大的图形处理能力使它成为那些寻求不那么花哨的笔记本电脑的游戏玩家的兴趣所在。
这里有很多竞争对手可供选择。价格较低的是华硕 ROG Strix G16 G614JZ也配备了 RTX 4080和英特尔酷睿 i9,但没有 OLED 显示屏。取而代之的是一块出色的 IPS 面板。微星 微星隐形 17 Studio A13VH-014同样配备 RTX 4080 的微星 Stealth 17 Studio A13VH-014 在某种程度上更适合创意用途。联想联想Legion Pro 7和 华硕 ROG Zephyrus M16配置更高,都配备了 RTX 4090。
我们还向下比较了联想Legion Slim 7i 16 Gen 8和 华硕 Vivobook Pro 16X,因为它们分别配备了 RTX 4070 和 RTX 4060。当然,去年的 Zenbook Pro 16X也在对比之列。
潜在的竞争对手比较
Rating | Date | Model | Weight | Height | Size | Resolution | Price |
|---|---|---|---|---|---|---|---|
| 90.5 % v7 (old) | 11 / 2023 | Asus Zenbook Pro 16X UX7602BZ-MY005W i9-13905H, GeForce RTX 4080 Laptop GPU | 2.4 kg | 17.8 mm | 16.00" | 3200x2000 | |
| 88.4 % v7 (old) | 12 / 2022 | Asus ZenBook Pro 16X OLED UX7602ZM-ME115W i9-12900H, GeForce RTX 3060 Laptop GPU | 2.4 kg | 19.5 mm | 16.00" | 3840x2400 | |
| 88.4 % v7 (old) | 03 / 2023 | Asus ROG Strix G16 G614JZ i9-13980HX, GeForce RTX 4080 Laptop GPU | 2.4 kg | 30.4 mm | 16.00" | 2560x1600 | |
| 89.4 % v7 (old) | 03 / 2023 | Asus ROG Zephyrus M16 GU604VY-NM042X i9-13900H, GeForce RTX 4090 Laptop GPU | 2.3 kg | 22.9 mm | 16.00" | 2560x1600 | |
| 89.2 % v7 (old) | 04 / 2023 | MSI Stealth 17 Studio A13VH-014 i9-13900H, GeForce RTX 4080 Laptop GPU | 3 kg | 21.3 mm | 17.30" | 3840x2160 | |
| 88.8 % v7 (old) | 06 / 2023 | Lenovo Legion Pro 7 RTX4090 i9-13900HX, GeForce RTX 4090 Laptop GPU | 2.7 kg | 26 mm | 16.00" | 2560x1600 | |
| 90 % v7 (old) | 07 / 2023 | Lenovo Legion Slim 7i 16 Gen 8 i9-13900H, GeForce RTX 4070 Laptop GPU | 2.1 kg | 19.9 mm | 16.00" | 2560x1600 | |
| 86.2 % v7 (old) | 07 / 2023 | Asus Vivobook Pro 16X K6604JV-MX016W i9-13980HX, GeForce RTX 4060 Laptop GPU | 2.1 kg | 22.8 mm | 16.00" | 3200x2000 |
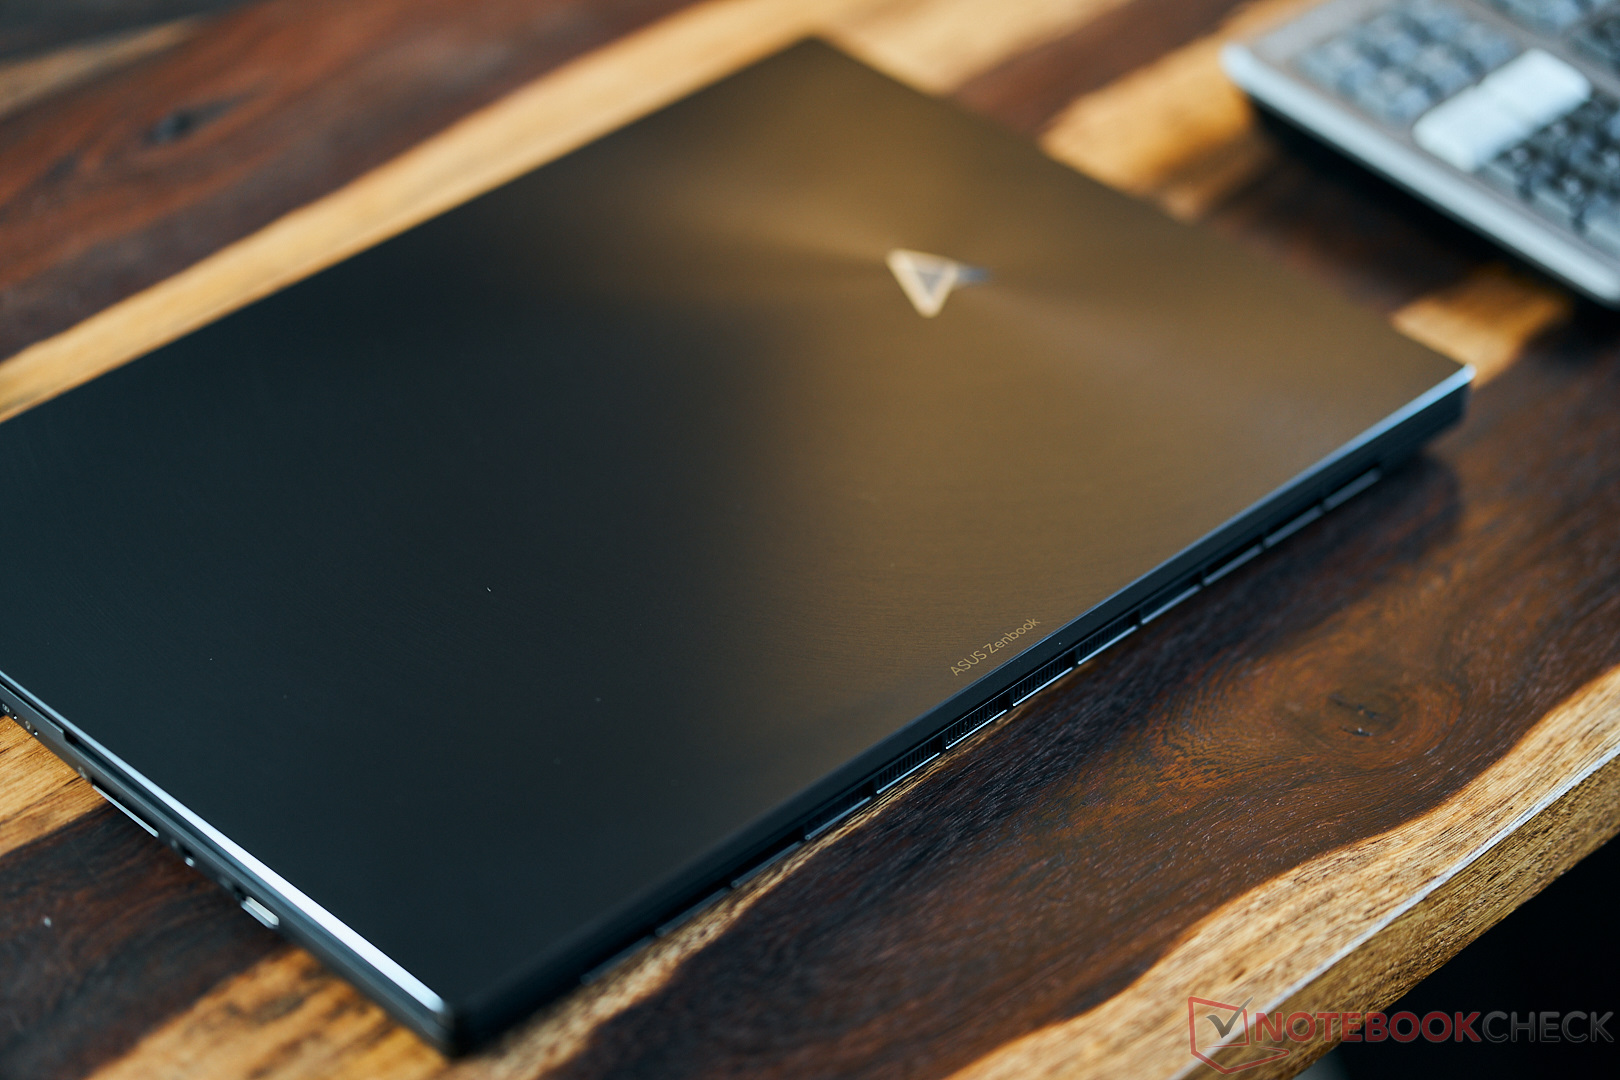
外壳 - 独特的轻金属结构

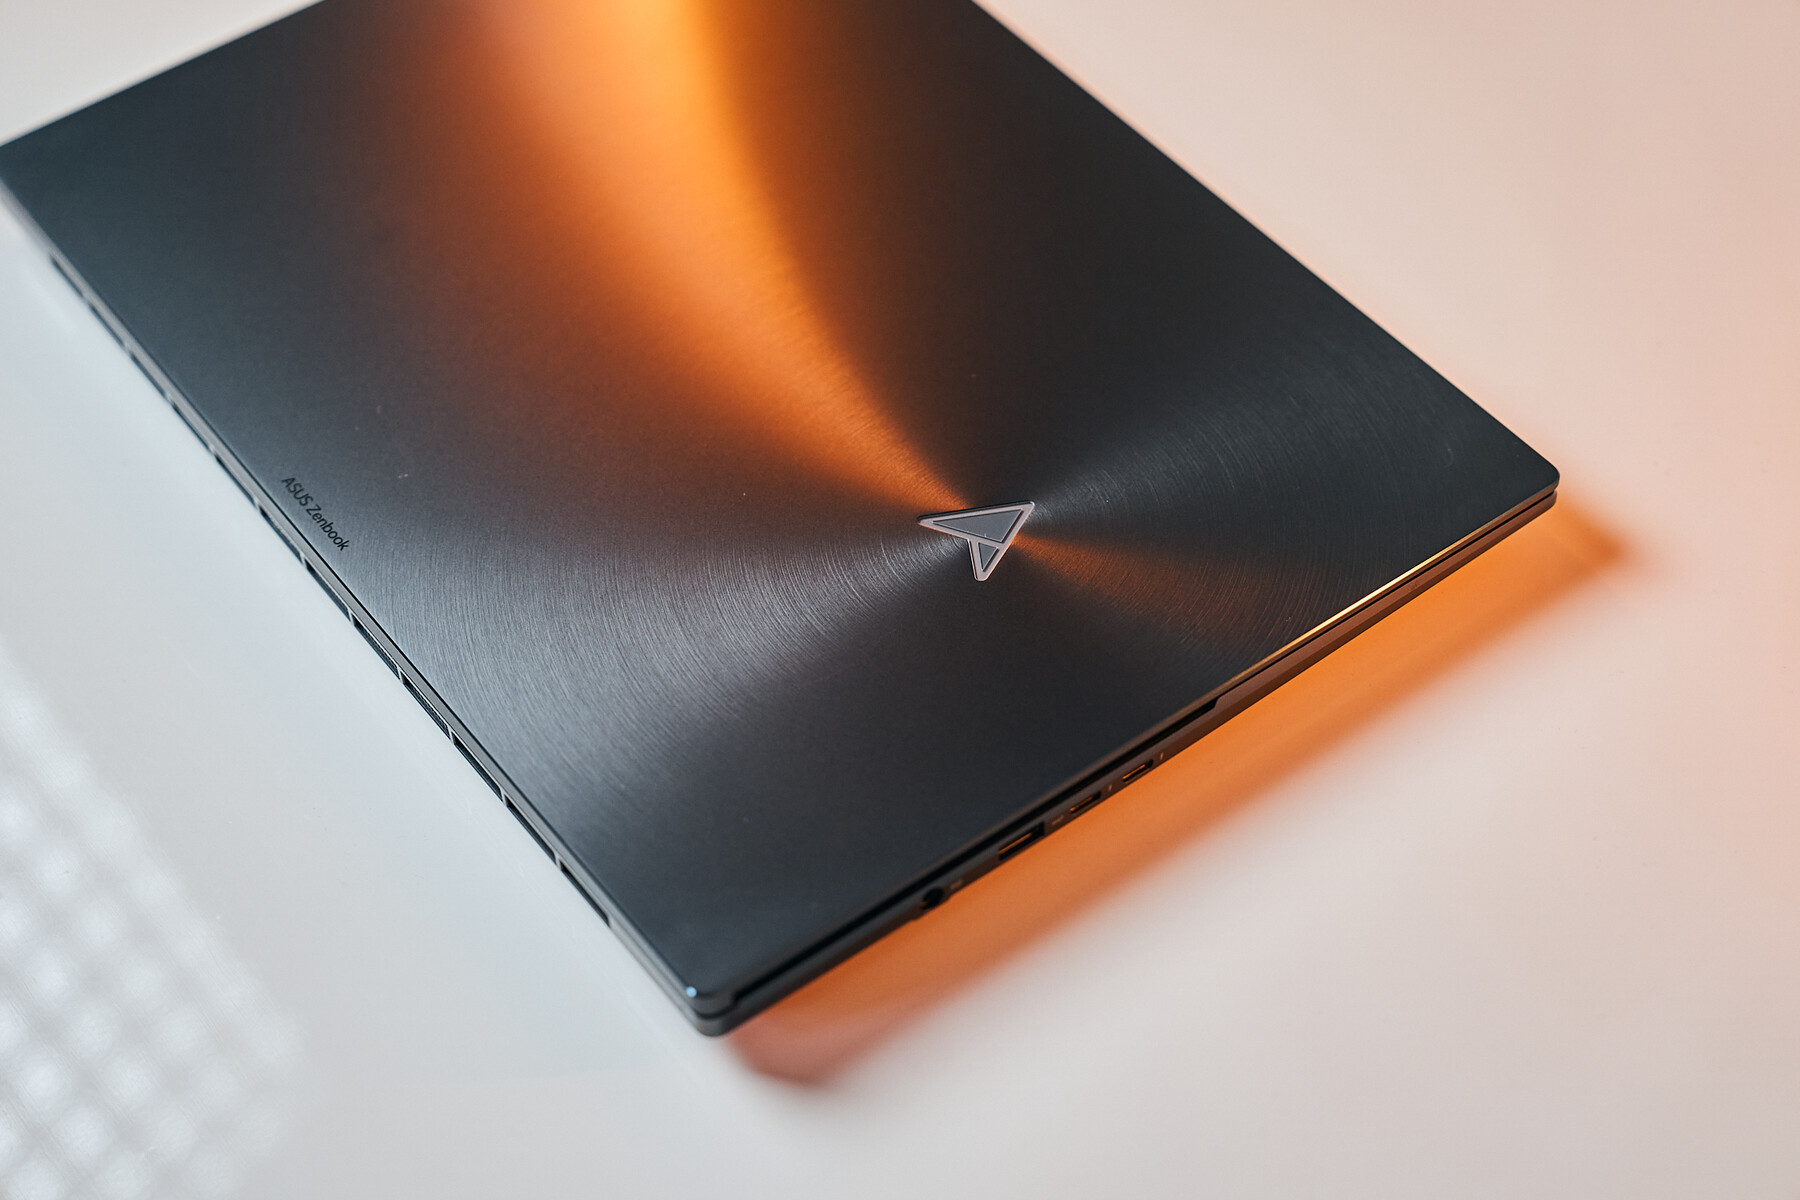
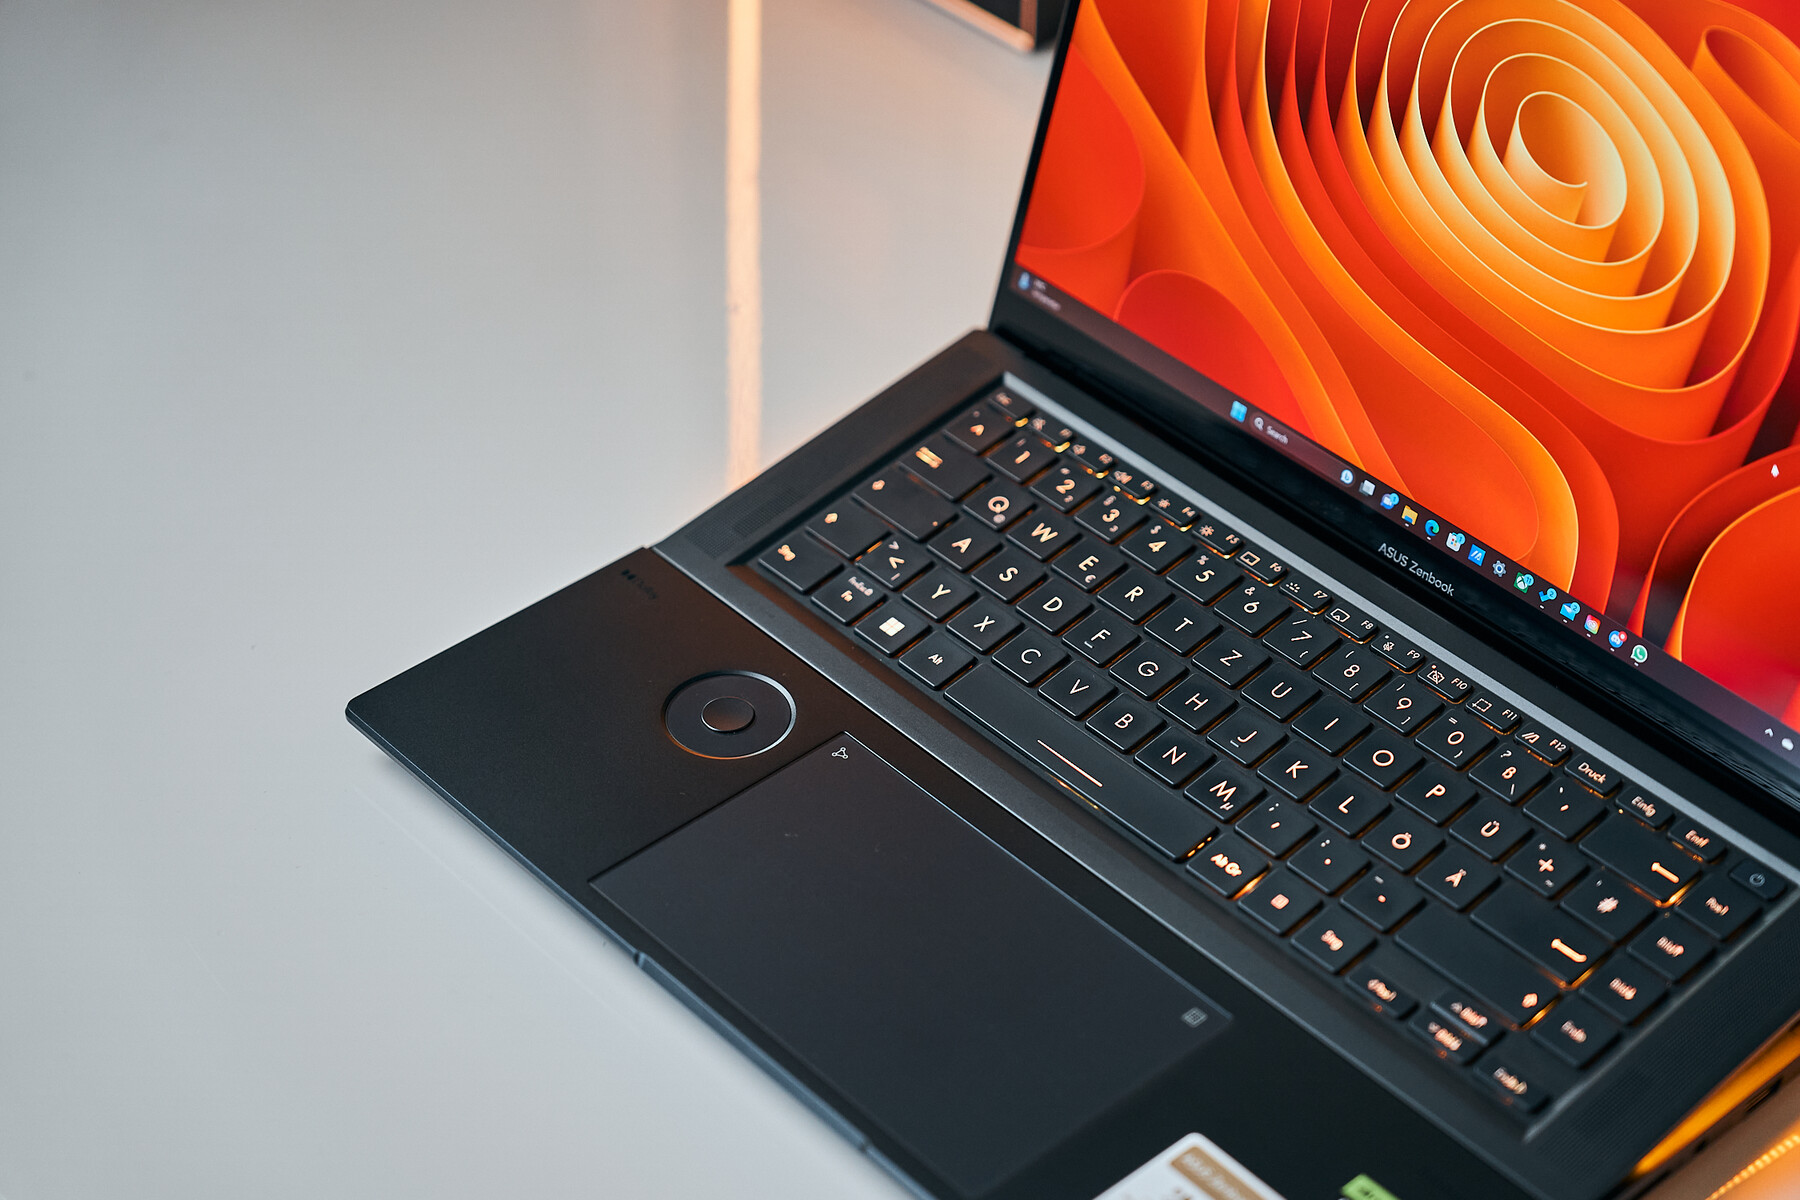
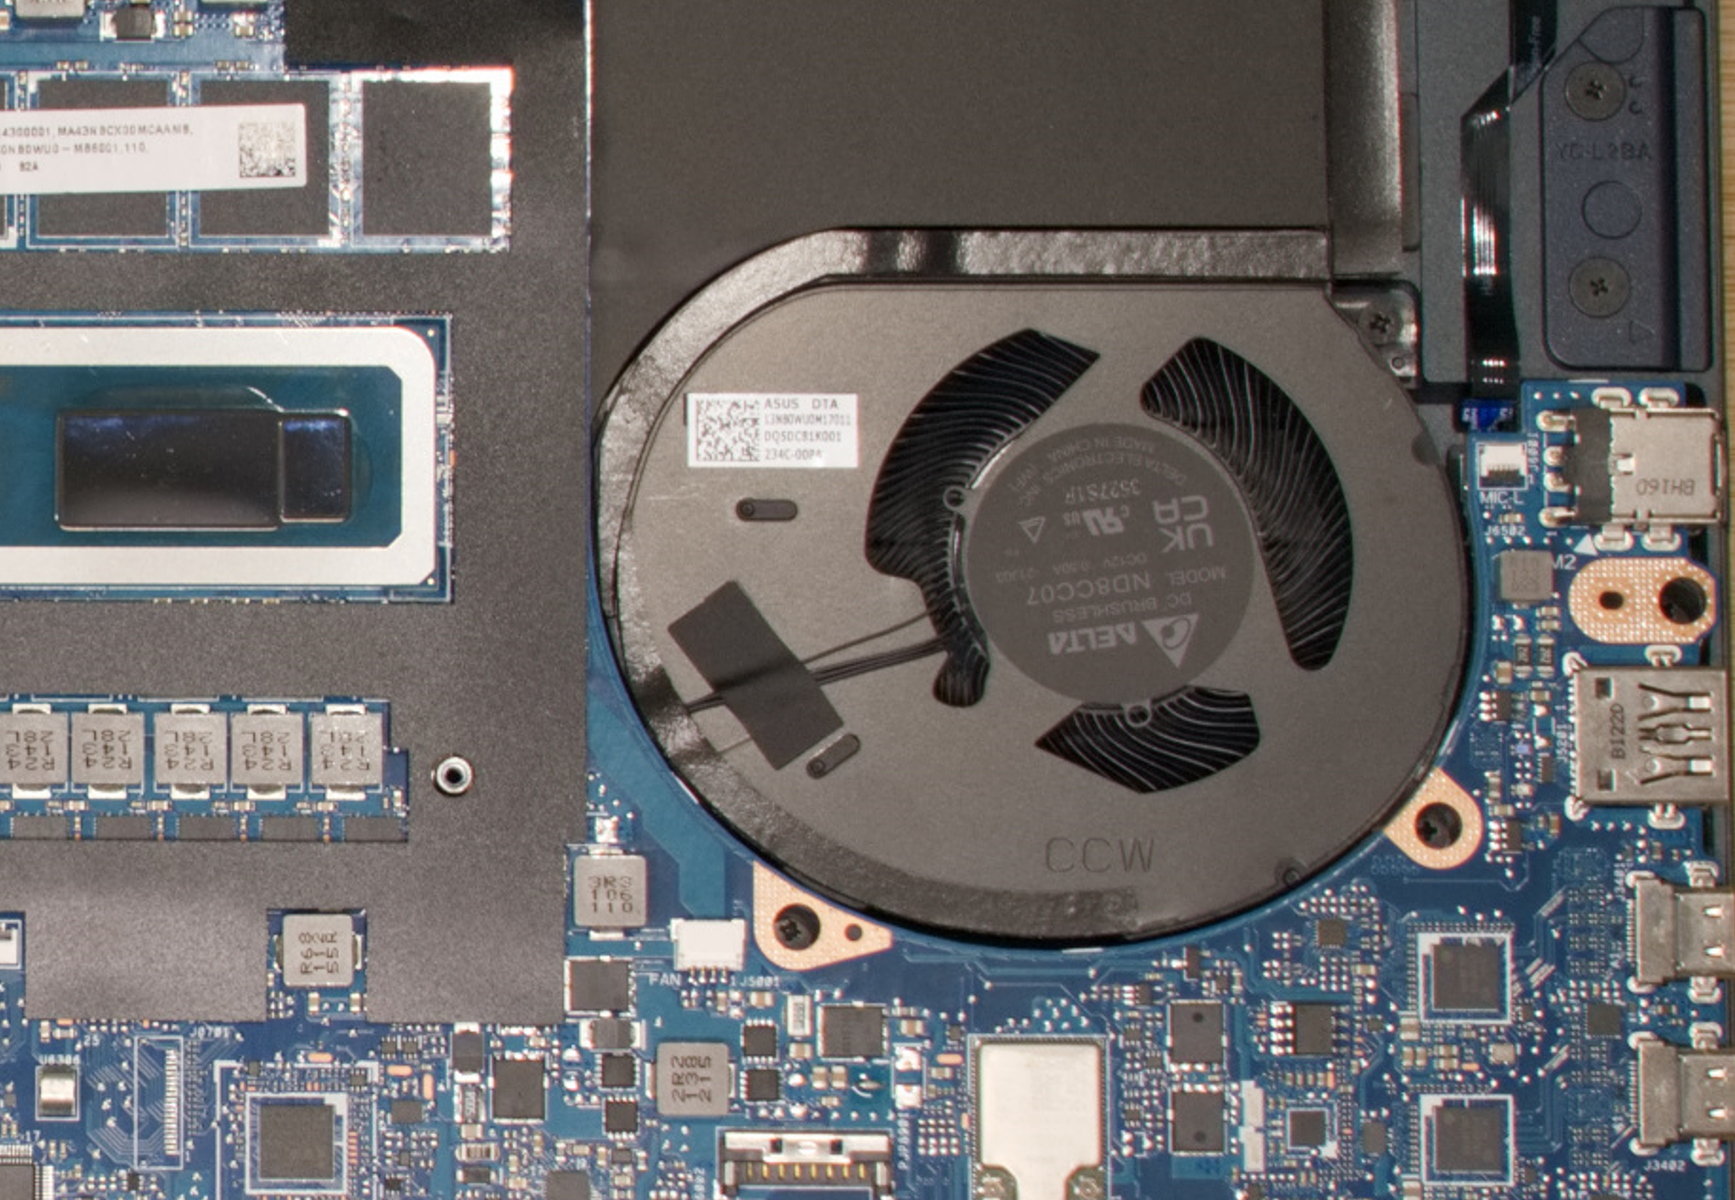
新款 Zenbook Pro 16x 的外壳似乎没有重大变化。顶多是键盘的颜色更加鲜明。我们认为,与上一代产品相比,铰链的稳定性略有提高。尤其是铰链的精心设计,因为当你打开笔记本电脑时,键盘背面会抬高 2 厘米。键盘下方有两个风扇吸入冷空气,华硕称之为 AAS Ultra Cooling。支撑键盘的另一个好处是,由于热硬件和键盘之间没有直接的温度传导,因此键盘依然非常凉爽。
玻璃和金属使 Zenbook Pro 16X 的触感与众不同。只有键盘单元的外壳由塑料制成。总体而言,笔记本电脑手感稳定,扭动时不会发出嘎吱声,做工精良。
谨慎的 RGB 灯光也装饰了这款笔记本电脑。可控 LED 灯位于键盘下方和盖子上的徽标中。按键也可以单独照明。华硕在低调的外观和新潮的 RGB 之间取得了很好的平衡,而这正是引人注目的游戏笔记本电脑所应具备的。
我们的测试设备仅重 2 公斤多一点,在同类产品中处于中间位置。在尺寸和厚度方面,只有 3 千克的微星 Stealth 17 Studio在大多数竞争对手中脱颖而出。不过,说到最薄的设备,联想的 联想Legion Slim和我们的 Zenbook 没有竞争对手。
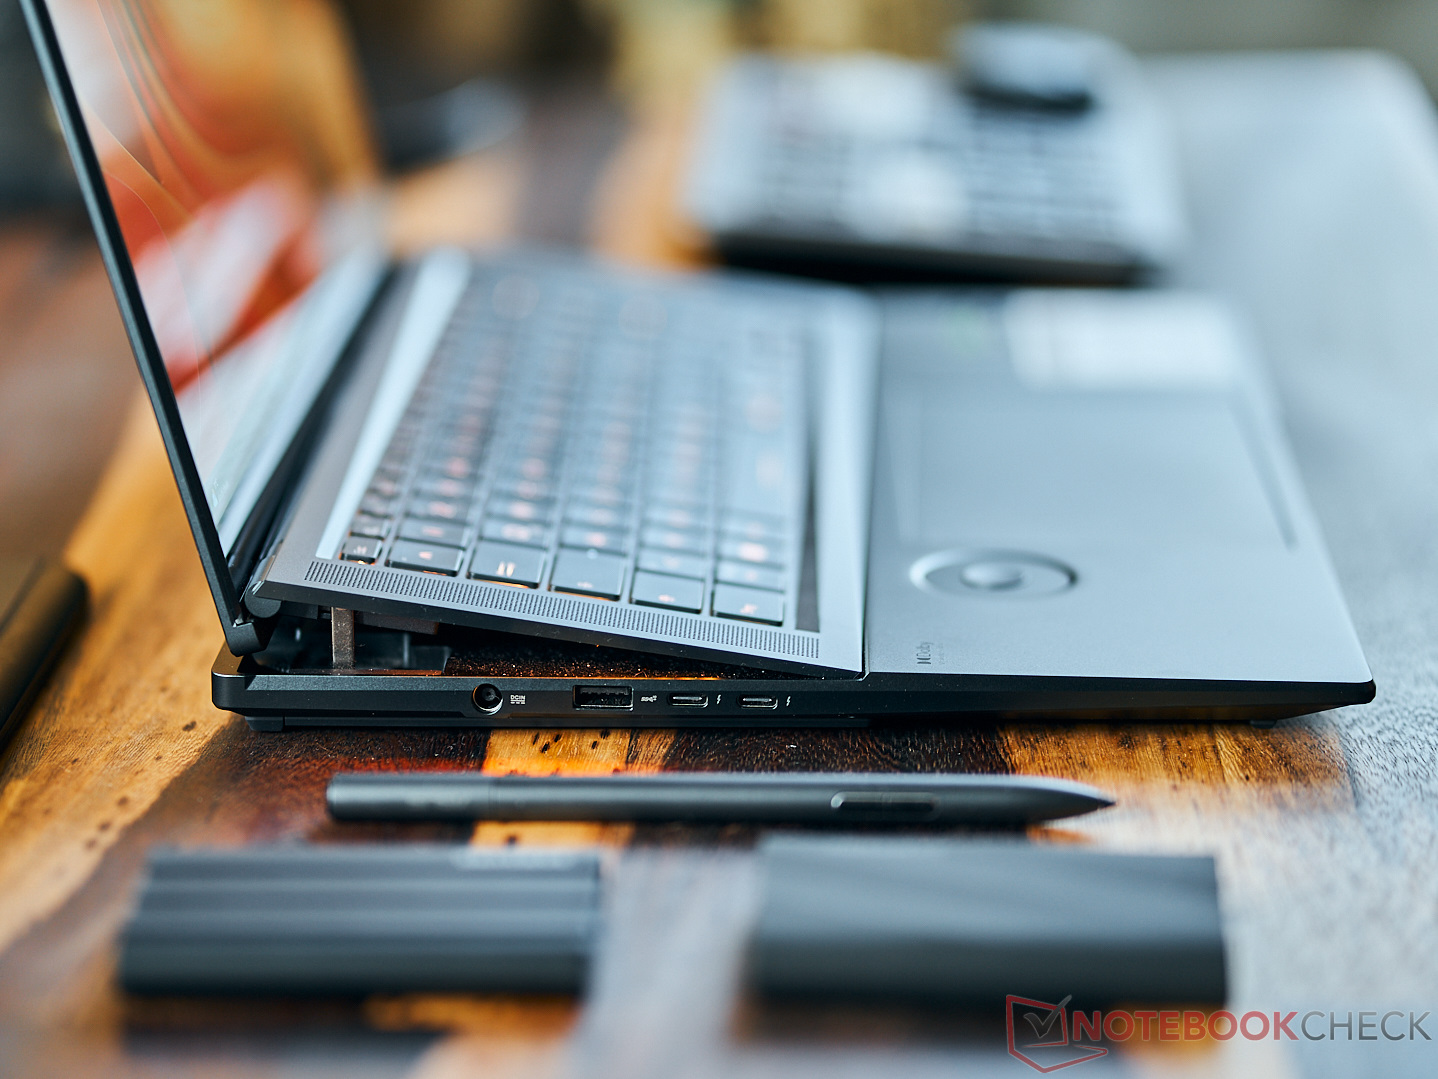
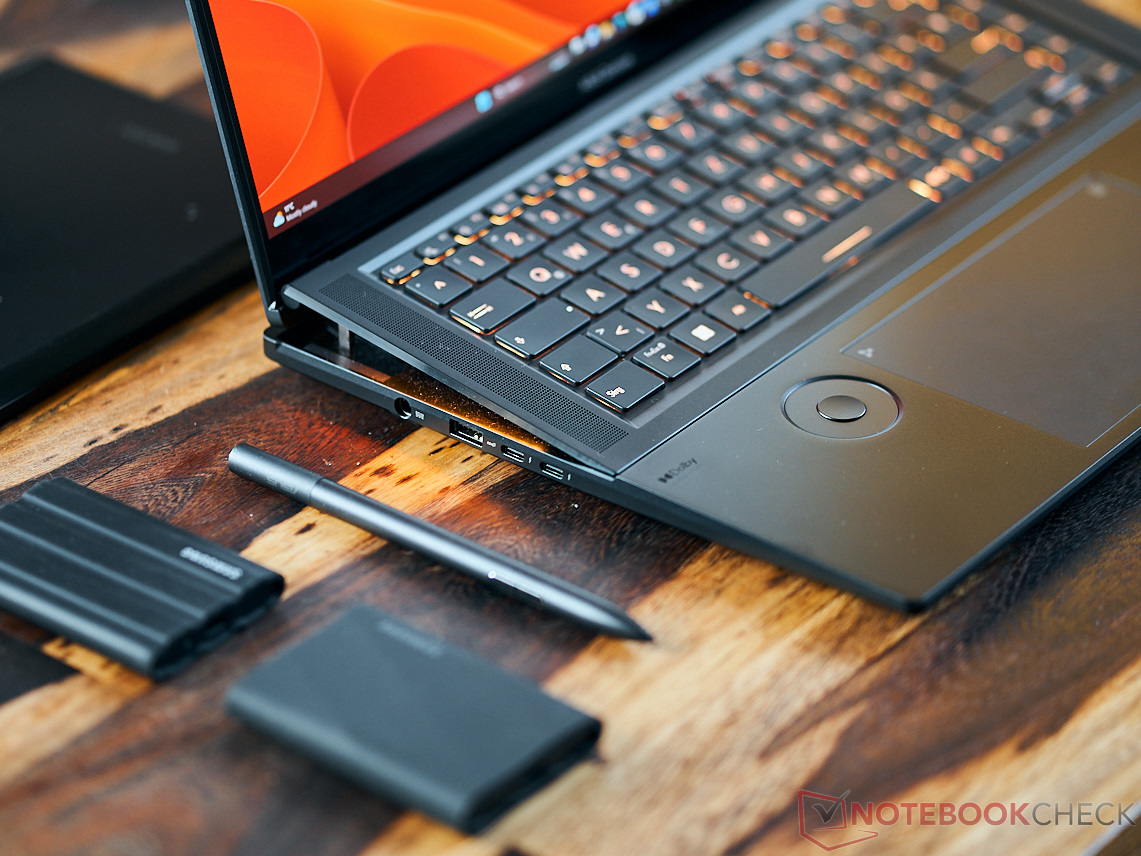
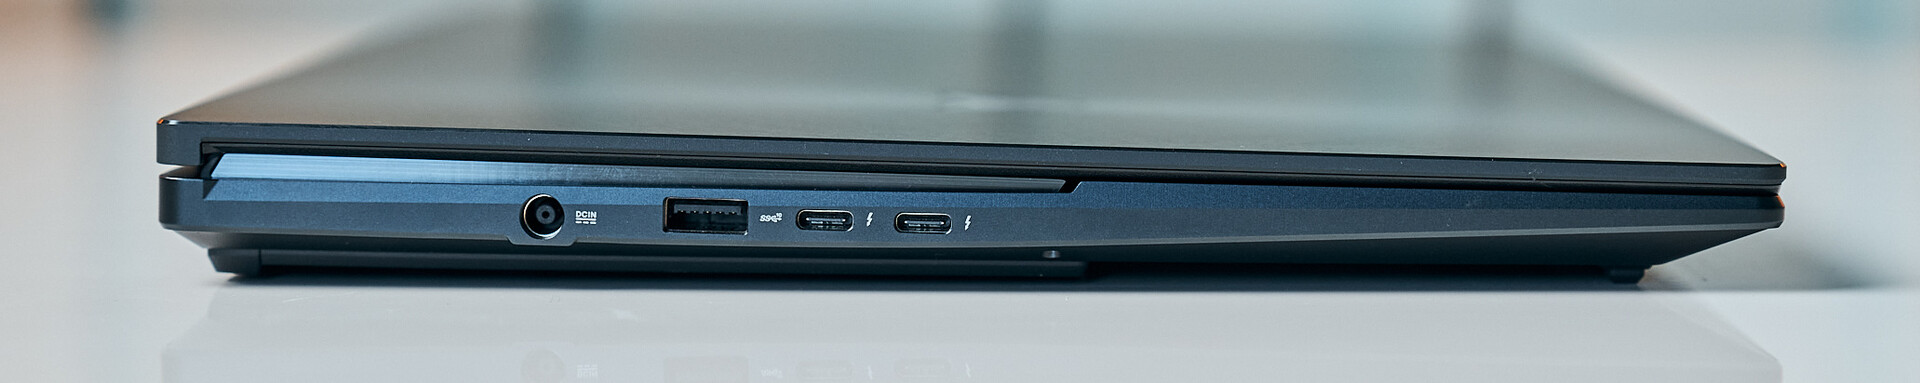
设备 - 尽管有 Thunderbolt 技术,但三个 USB 端口还是太少了。
对前前身的一个诟病就是连接性差。遗憾的是,这一点并没有改变:USB 端口只在笔记本电脑的左侧,而 HDMI 和音频接口以及速度并不快的读卡器则在右侧。
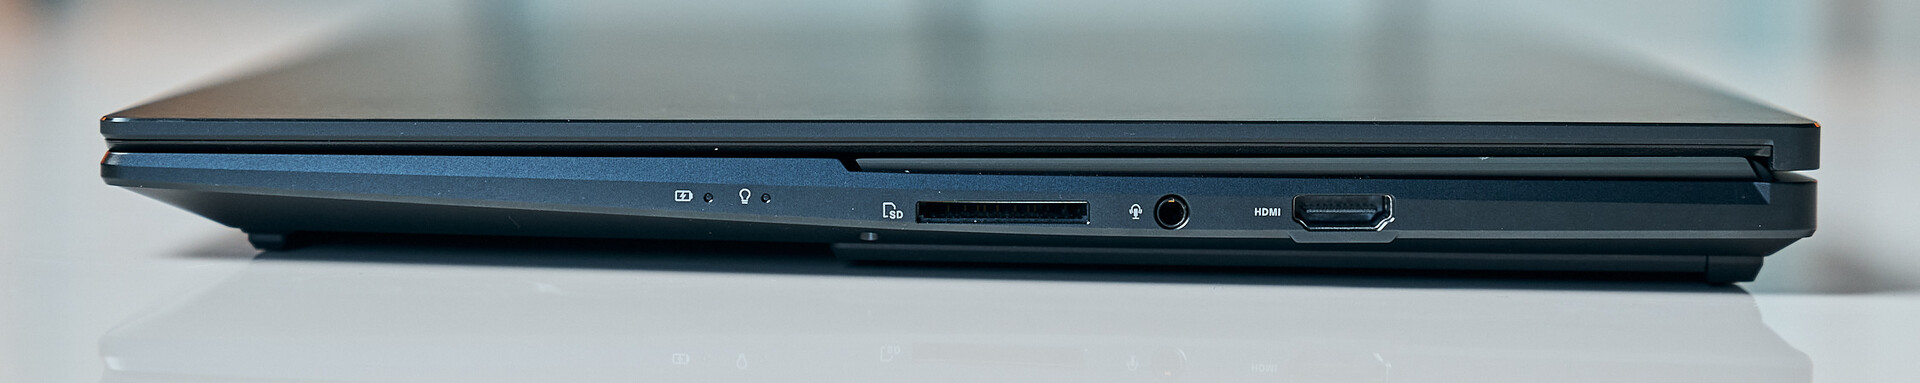
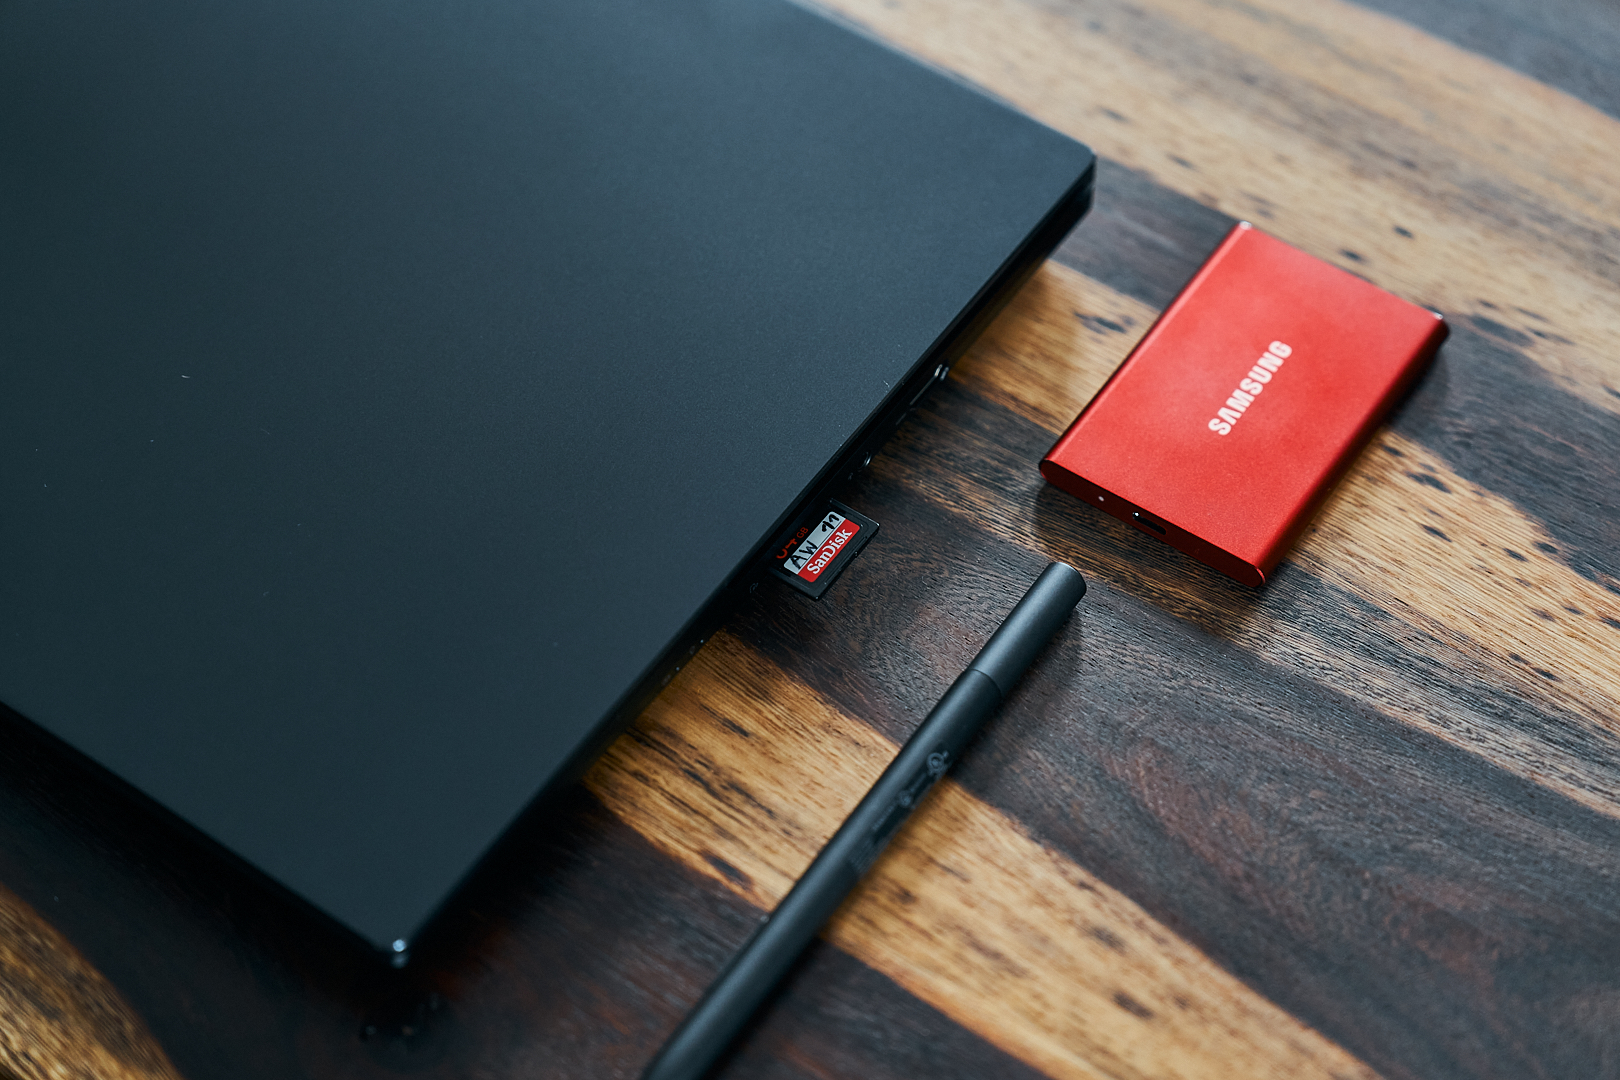
SD 读卡器
在使用 AV PRO microSD 时,传输速度与前代产品相比略有提高,但笔记本电脑的读取速度仍无法达到 100 MB/s。如果我们的 128 GB 存储卡中全部是照片,我们可能需要等待 20 分钟才能完成一次完整的传输。
| SD Card Reader | |
| average JPG Copy Test (av. of 3 runs) | |
| Asus ROG Zephyrus M16 GU604VY-NM042X | |
| Average of class Gaming (20.9 - 210, n=54, last 2 years) | |
| Asus Vivobook Pro 16X K6604JV-MX016W | |
| Asus Zenbook Pro 16X UX7602BZ-MY005W | |
| Lenovo Legion Slim 7i 16 Gen 8 (Toshiba Exceria Pro SDXC 64 GB UHS-II) | |
| Asus ZenBook Pro 16X OLED UX7602ZM-ME115W (AV Pro SD microSD 128 GB V60) | |
| MSI Stealth 17 Studio A13VH-014 | |
| maximum AS SSD Seq Read Test (1GB) | |
| Asus ROG Zephyrus M16 GU604VY-NM042X | |
| Average of class Gaming (25.5 - 261, n=51, last 2 years) | |
| Asus Vivobook Pro 16X K6604JV-MX016W | |
| Lenovo Legion Slim 7i 16 Gen 8 (Toshiba Exceria Pro SDXC 64 GB UHS-II) | |
| Asus Zenbook Pro 16X UX7602BZ-MY005W | |
| Asus ZenBook Pro 16X OLED UX7602ZM-ME115W (AV Pro SD microSD 128 GB V60) | |
| MSI Stealth 17 Studio A13VH-014 | |
交流
尽管有三根 WLAN 天线和一个智能开关,但我们在连接华硕 ROG AX11000 参考路由器时只能看到一般的传输速度。需要稳定网络连接的用户还可以使用随附的 LAN 适配器。
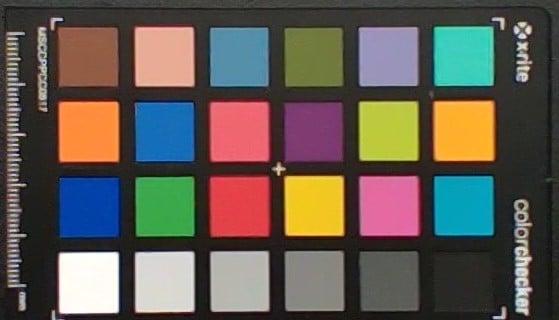
网络摄像头
Zenbook 内置的支持 Windows Hello 的网络摄像头效果相对较好,分辨率为 1920 × 1080。色彩偏差、对比度和清晰度尚可,但并不出众。


安全
Zenbook Pro 16X 配备了指纹扫描仪和面部识别功能。两者都能快速、流畅地工作。现代处理器常用的各种安全功能也一应俱全。TPM 2.0 和 SecureBoot 均已搭载。
配件
除了笔记本电脑和配套的 280 瓦电源外,还包括一个保护套和华硕笔 2.0。还有一条相应的充电线和三个替换笔尖。此外,还提供了一个 RJ45 USB-C 适配器,以便通过线缆将笔记本电脑连接到网络。最后但同样重要的是,Zenbook 的包装也不容忽视--它特别时尚,可用作笔记本电脑支架。
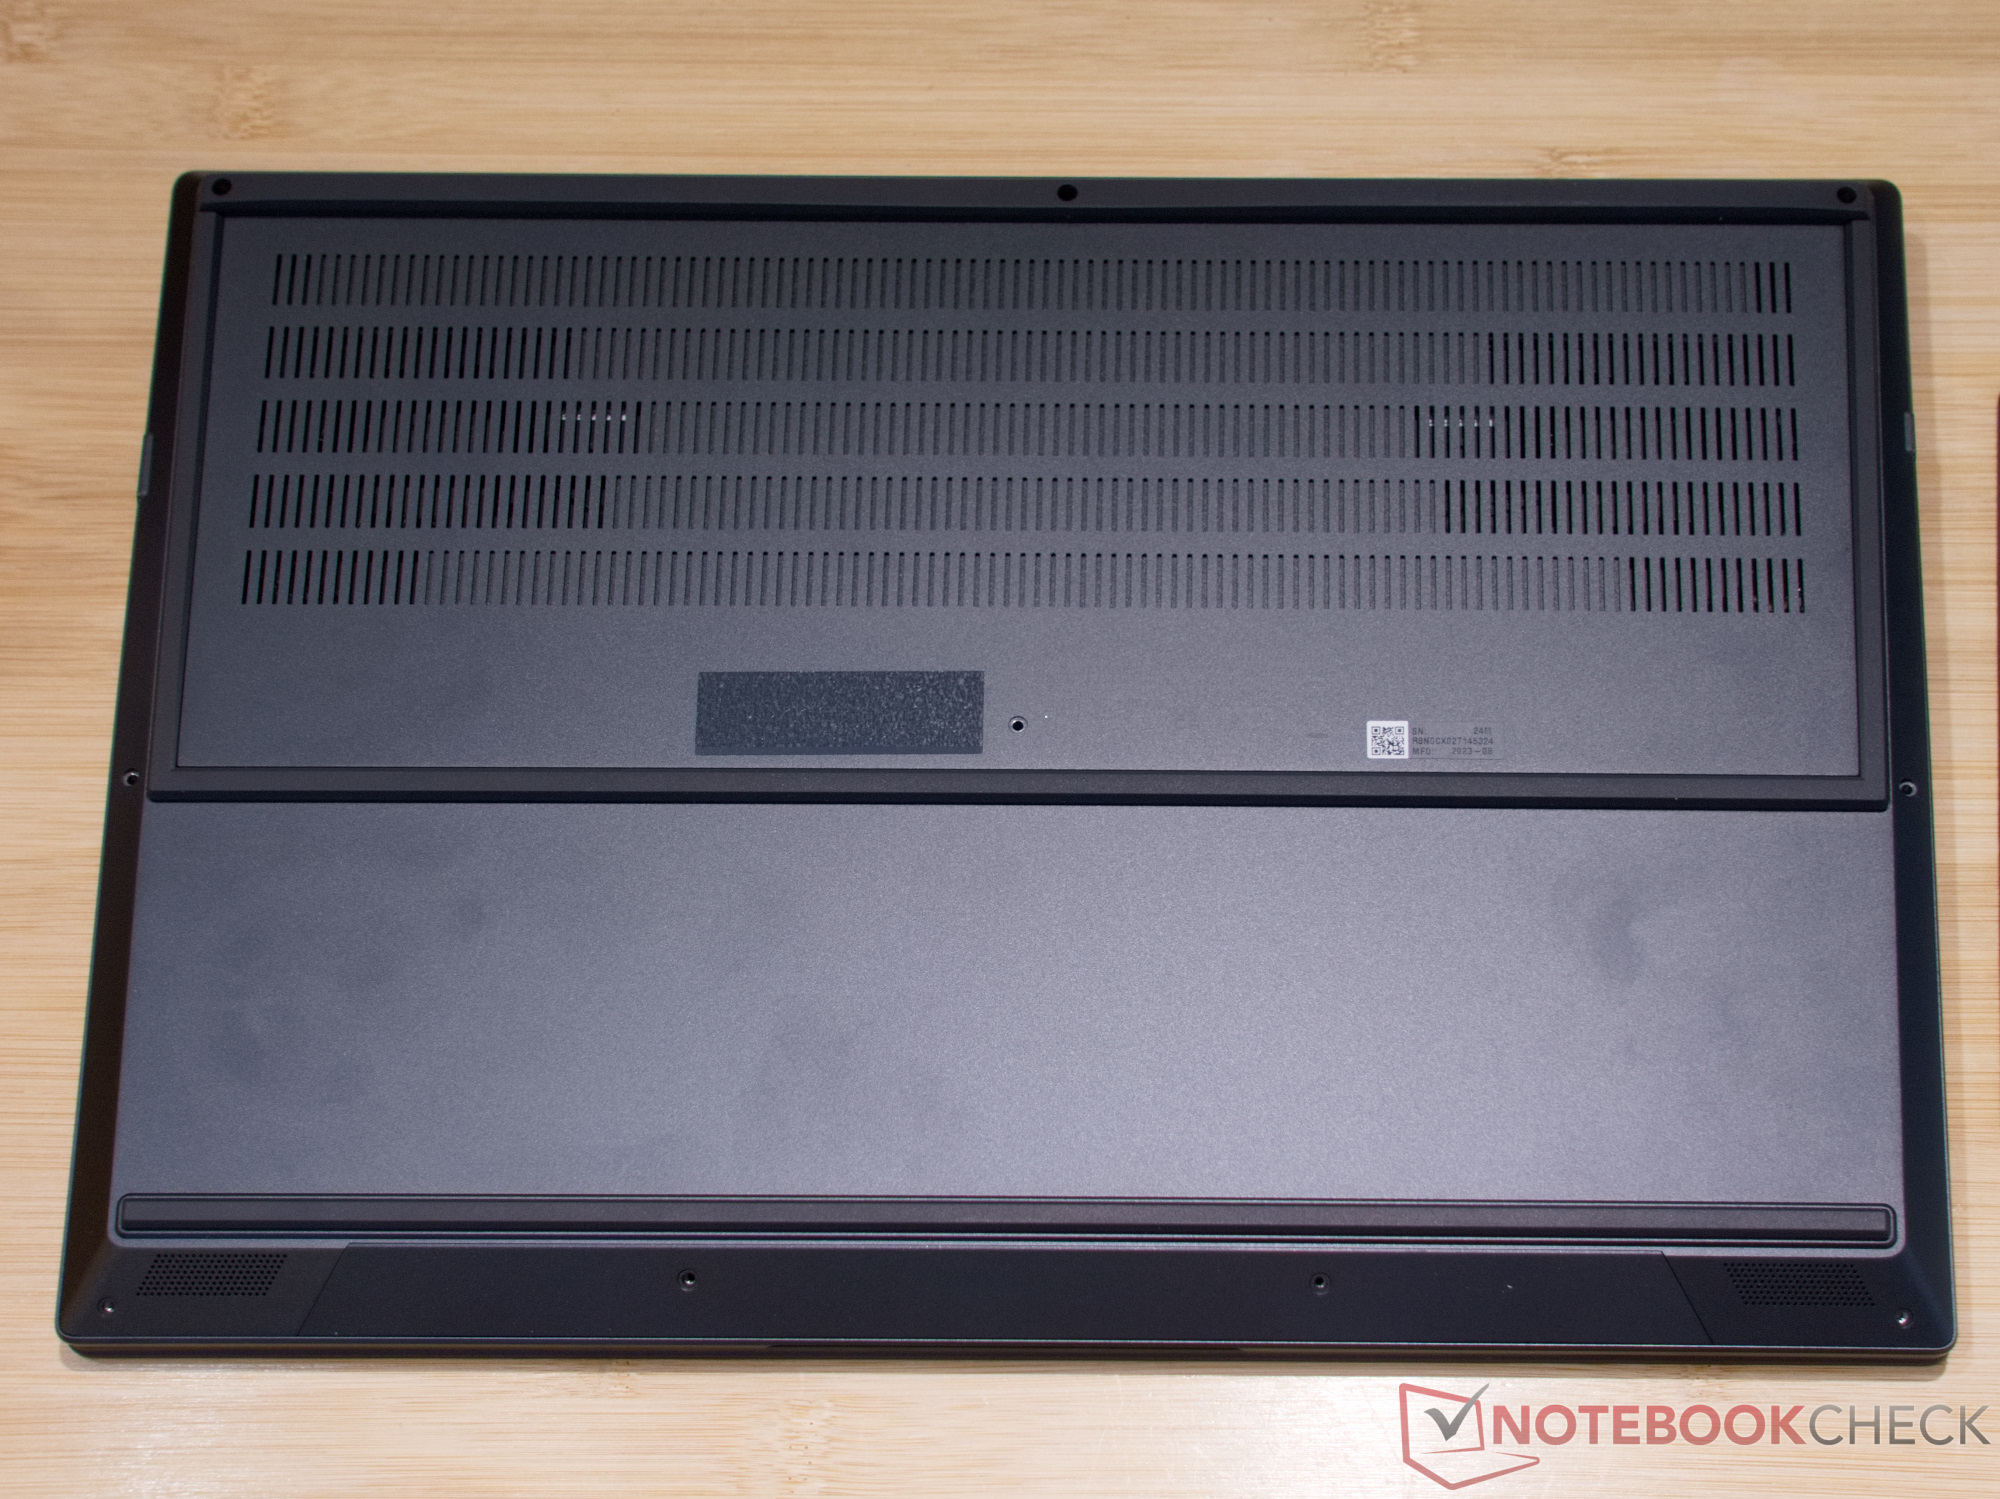
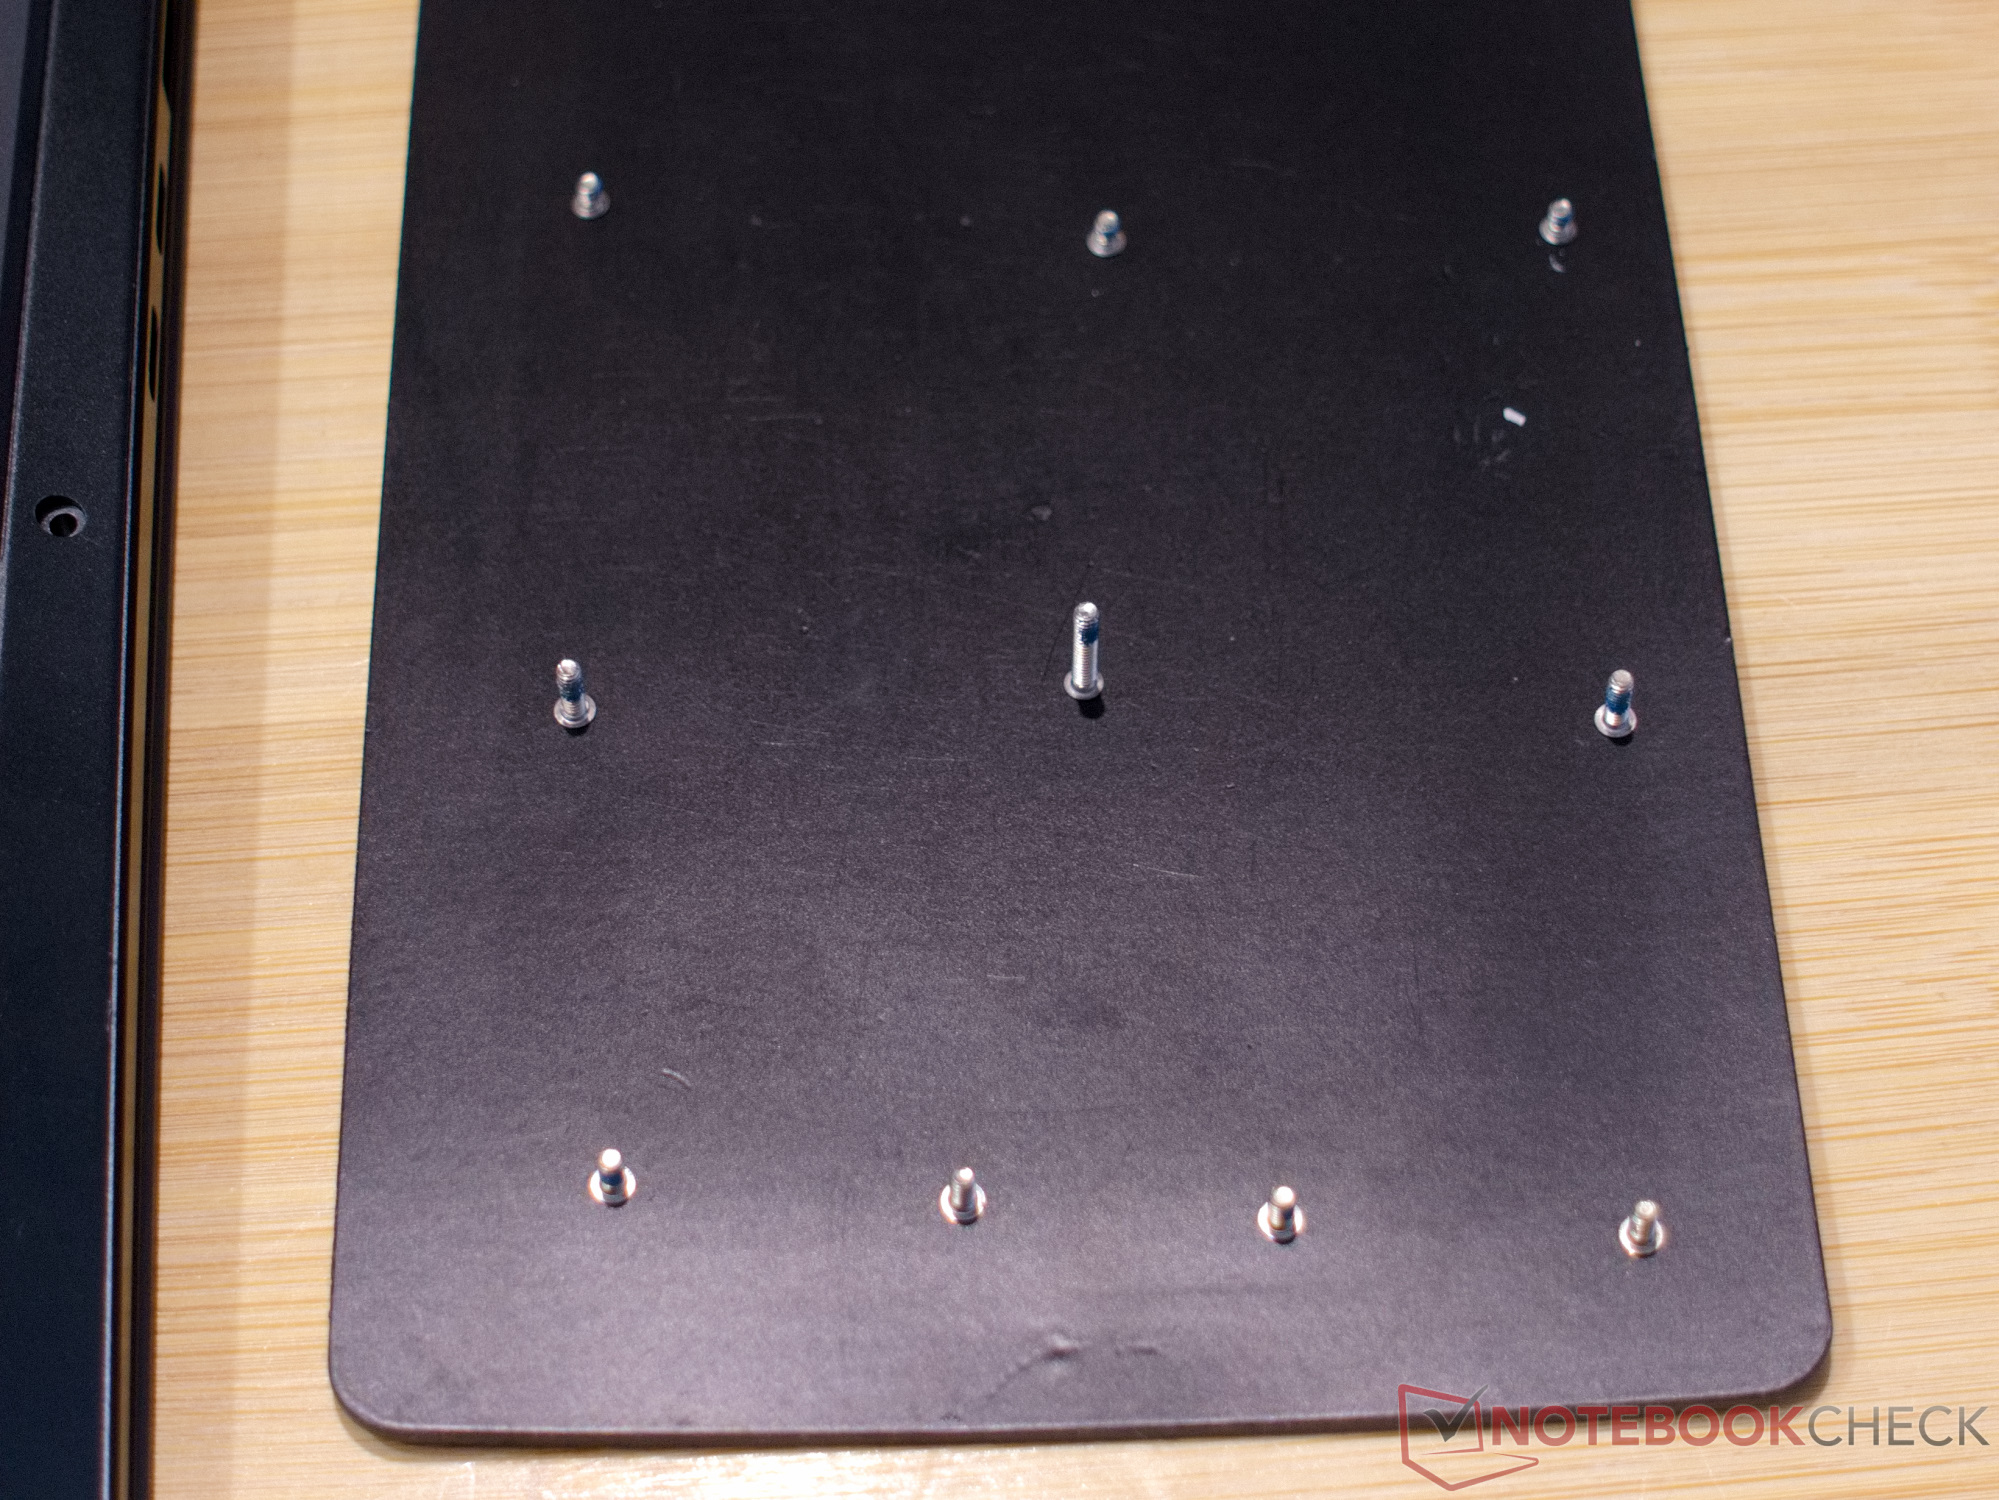
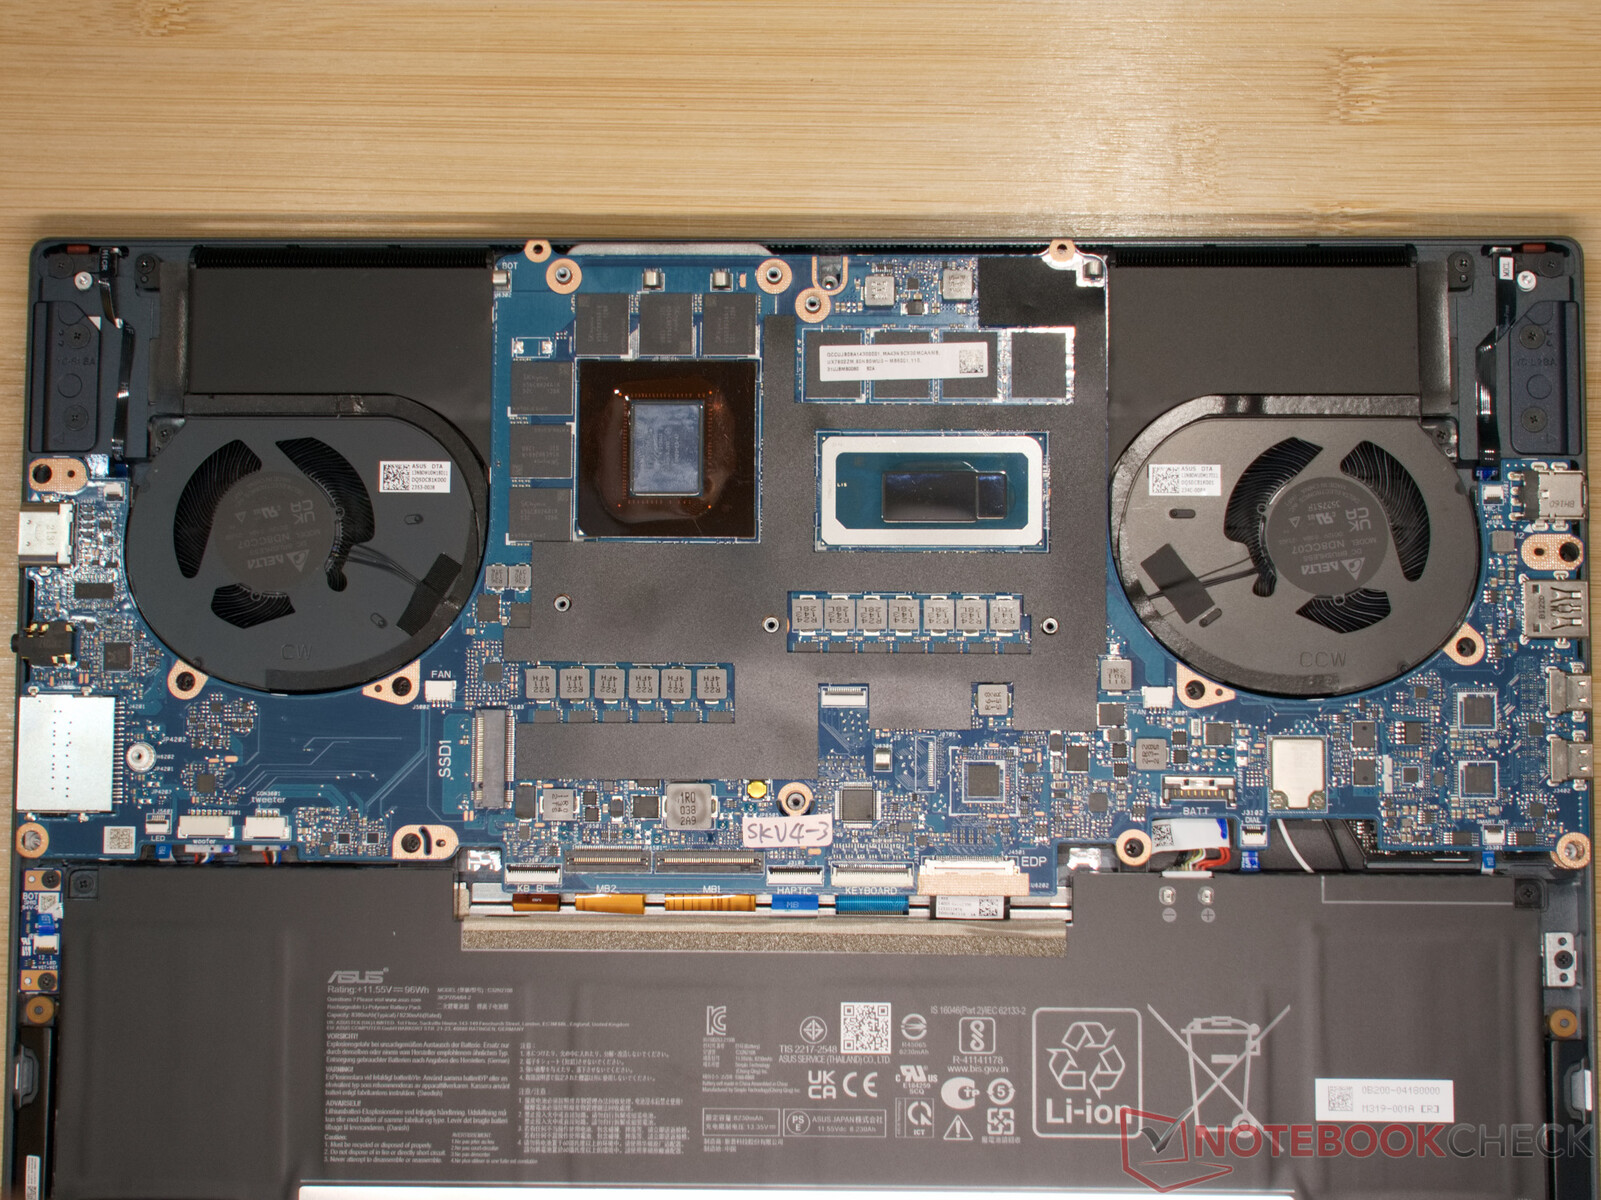
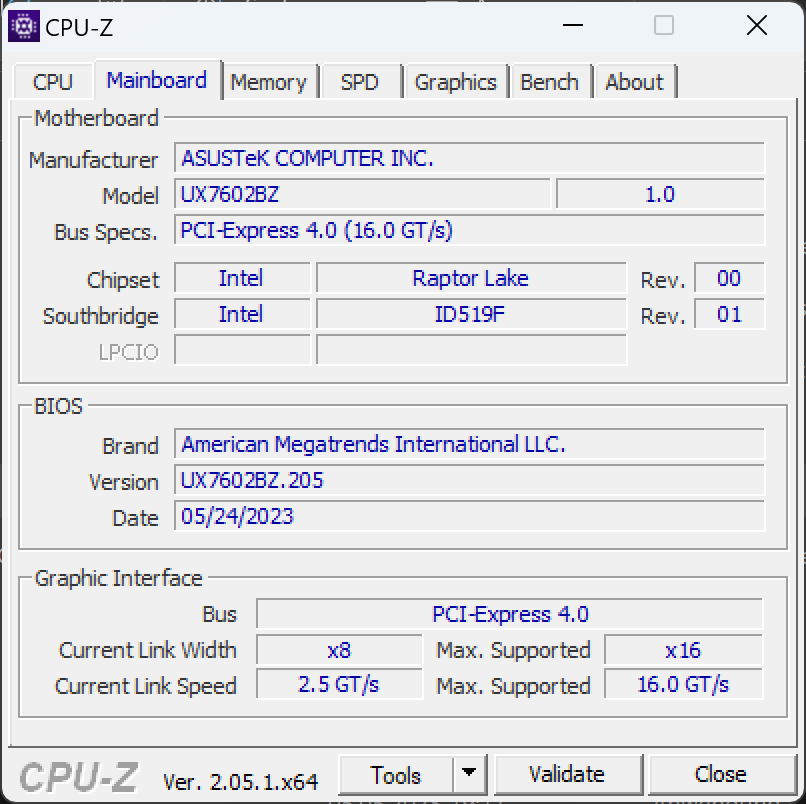
维护
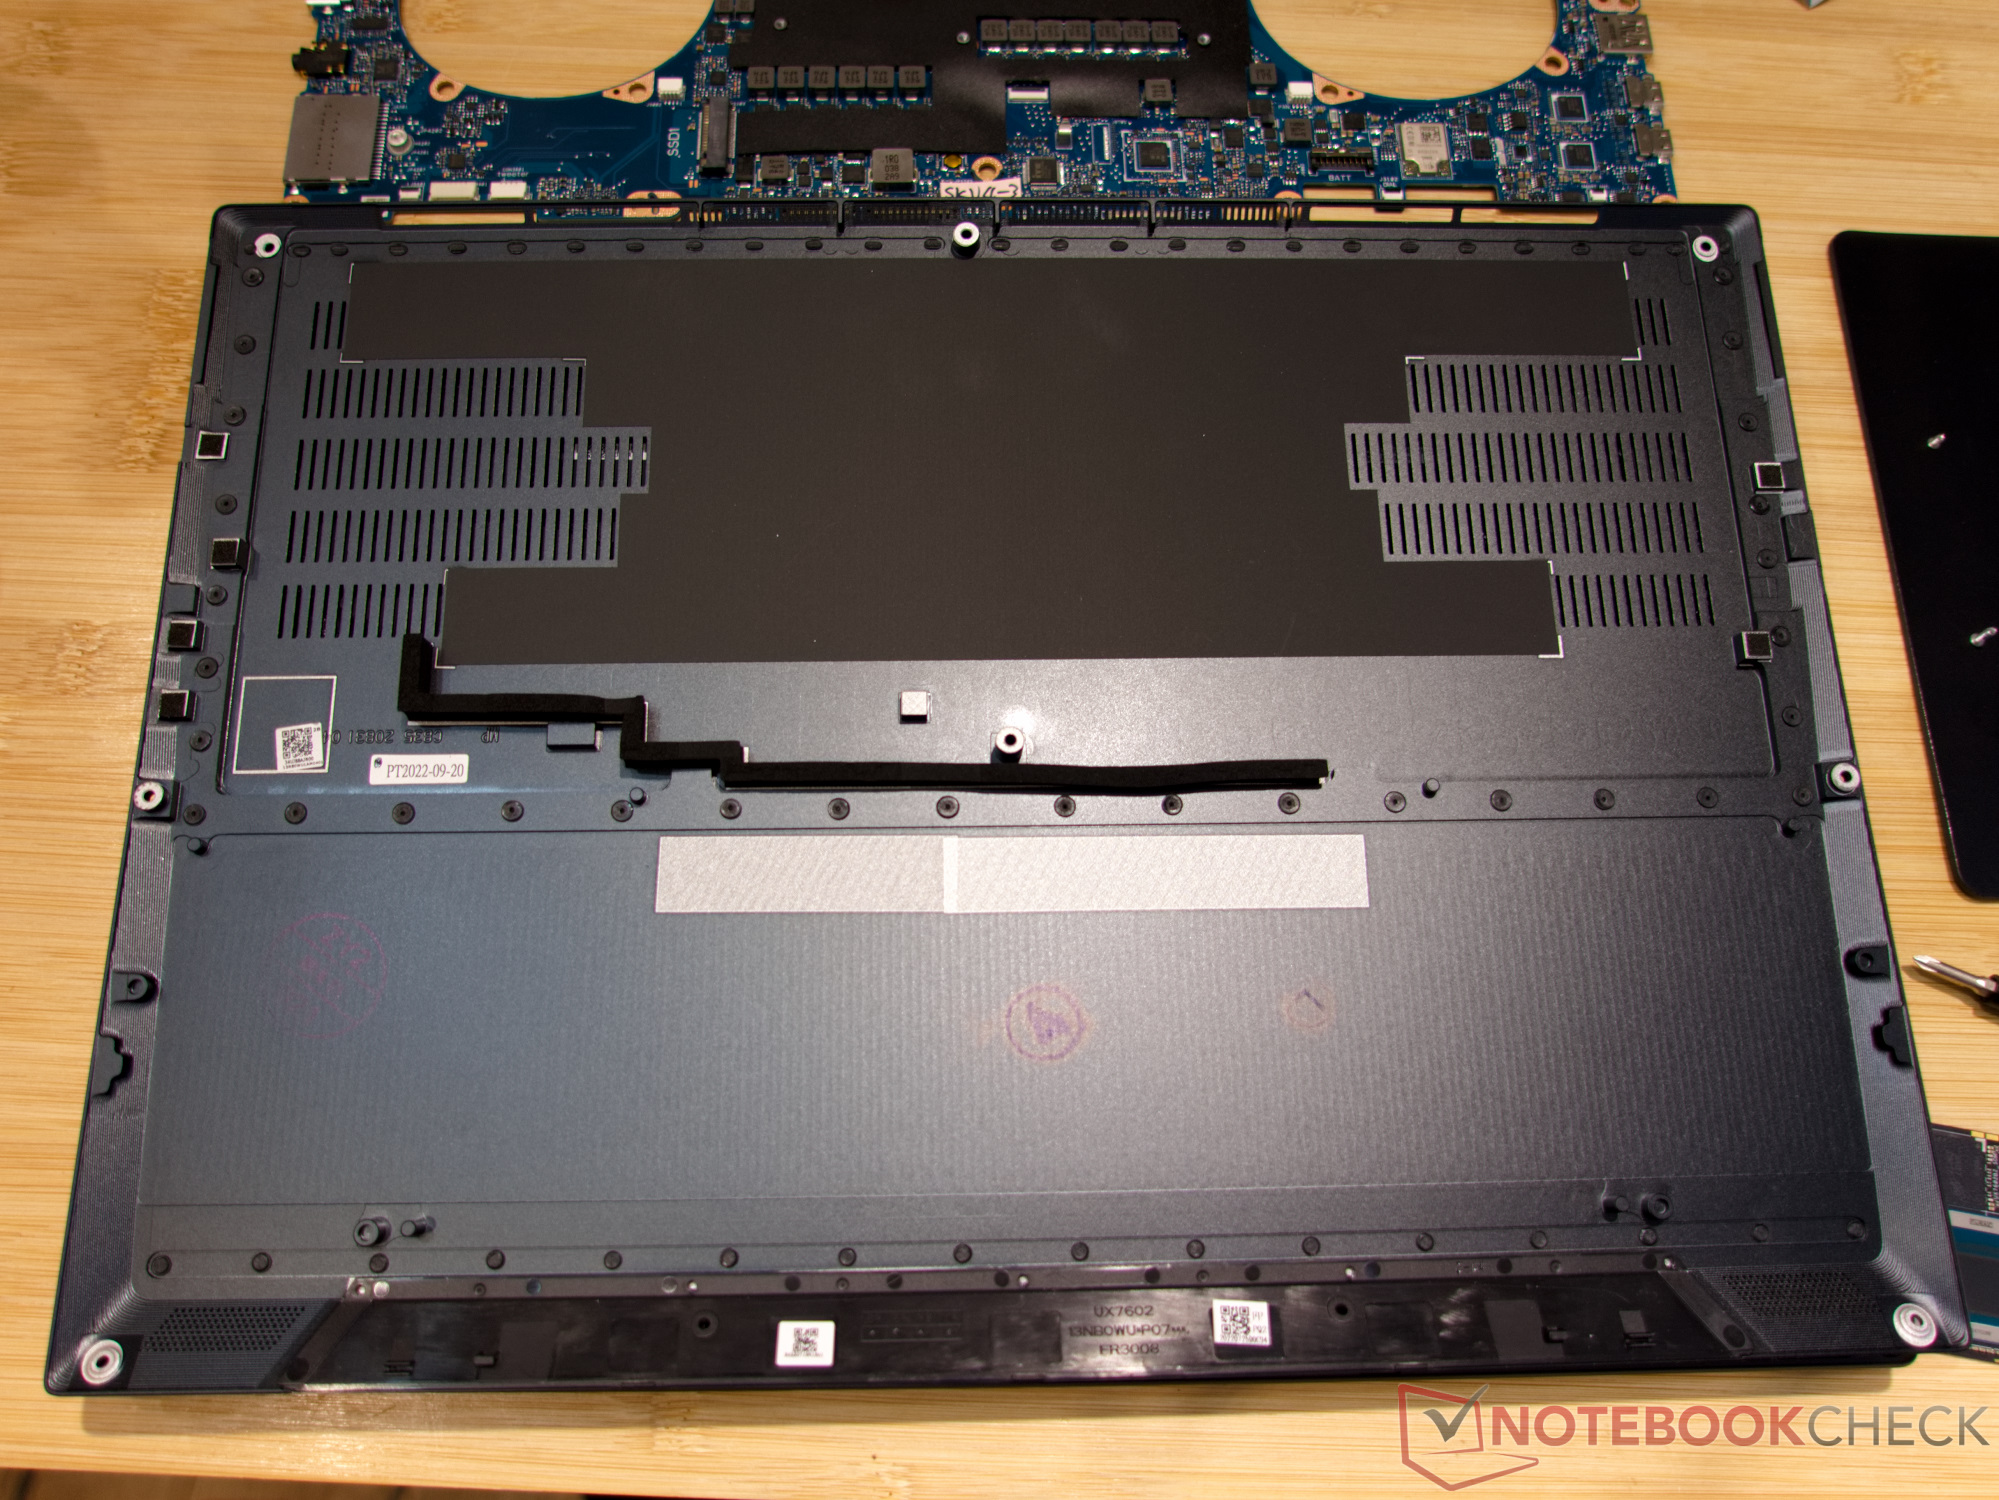
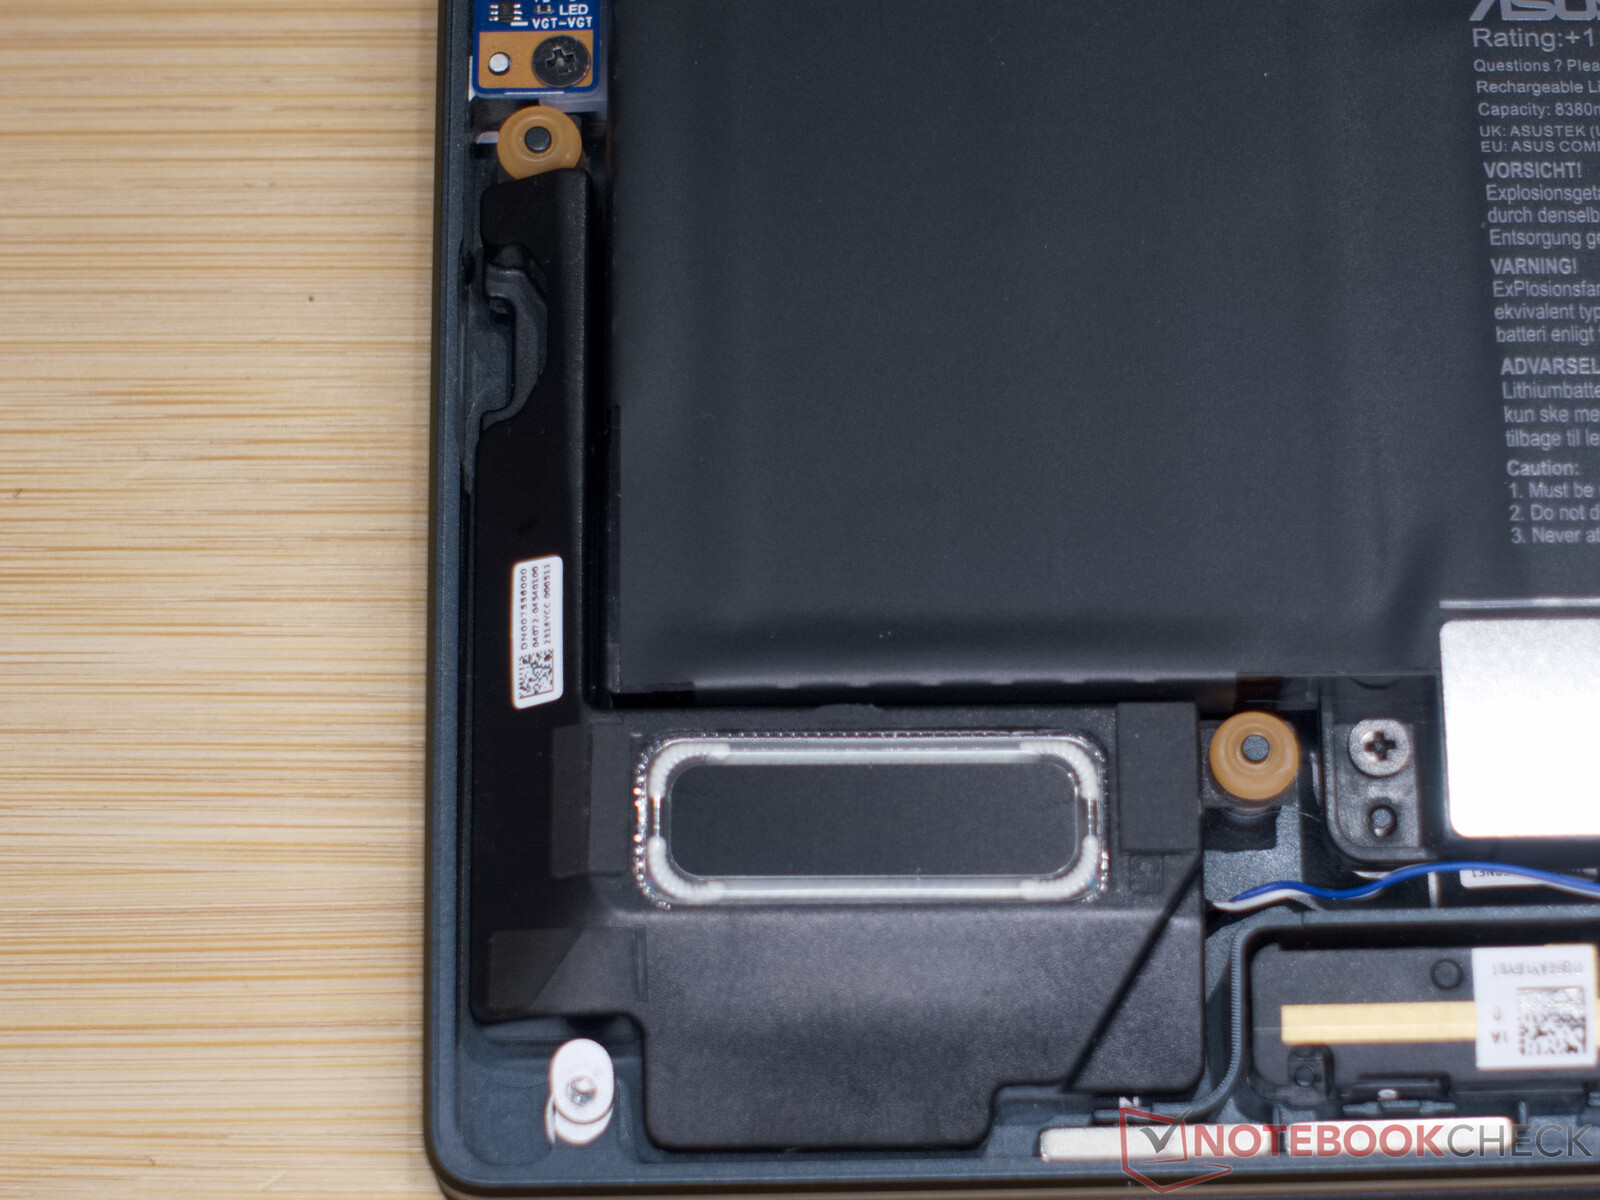
四种不同长度的十颗螺钉将底板牢牢固定。因此,用户在拧下螺丝时应注意各个螺丝的位置。除此之外,要进入笔记本内部并不费力。底板上没有夹子或夹具,不用螺丝也能轻松取下。
内部有一个可更换的固态硬盘,而内存和 WLAN 模块是焊接的。因此,Zenbook 在维修或维护方面并不方便用户使用。
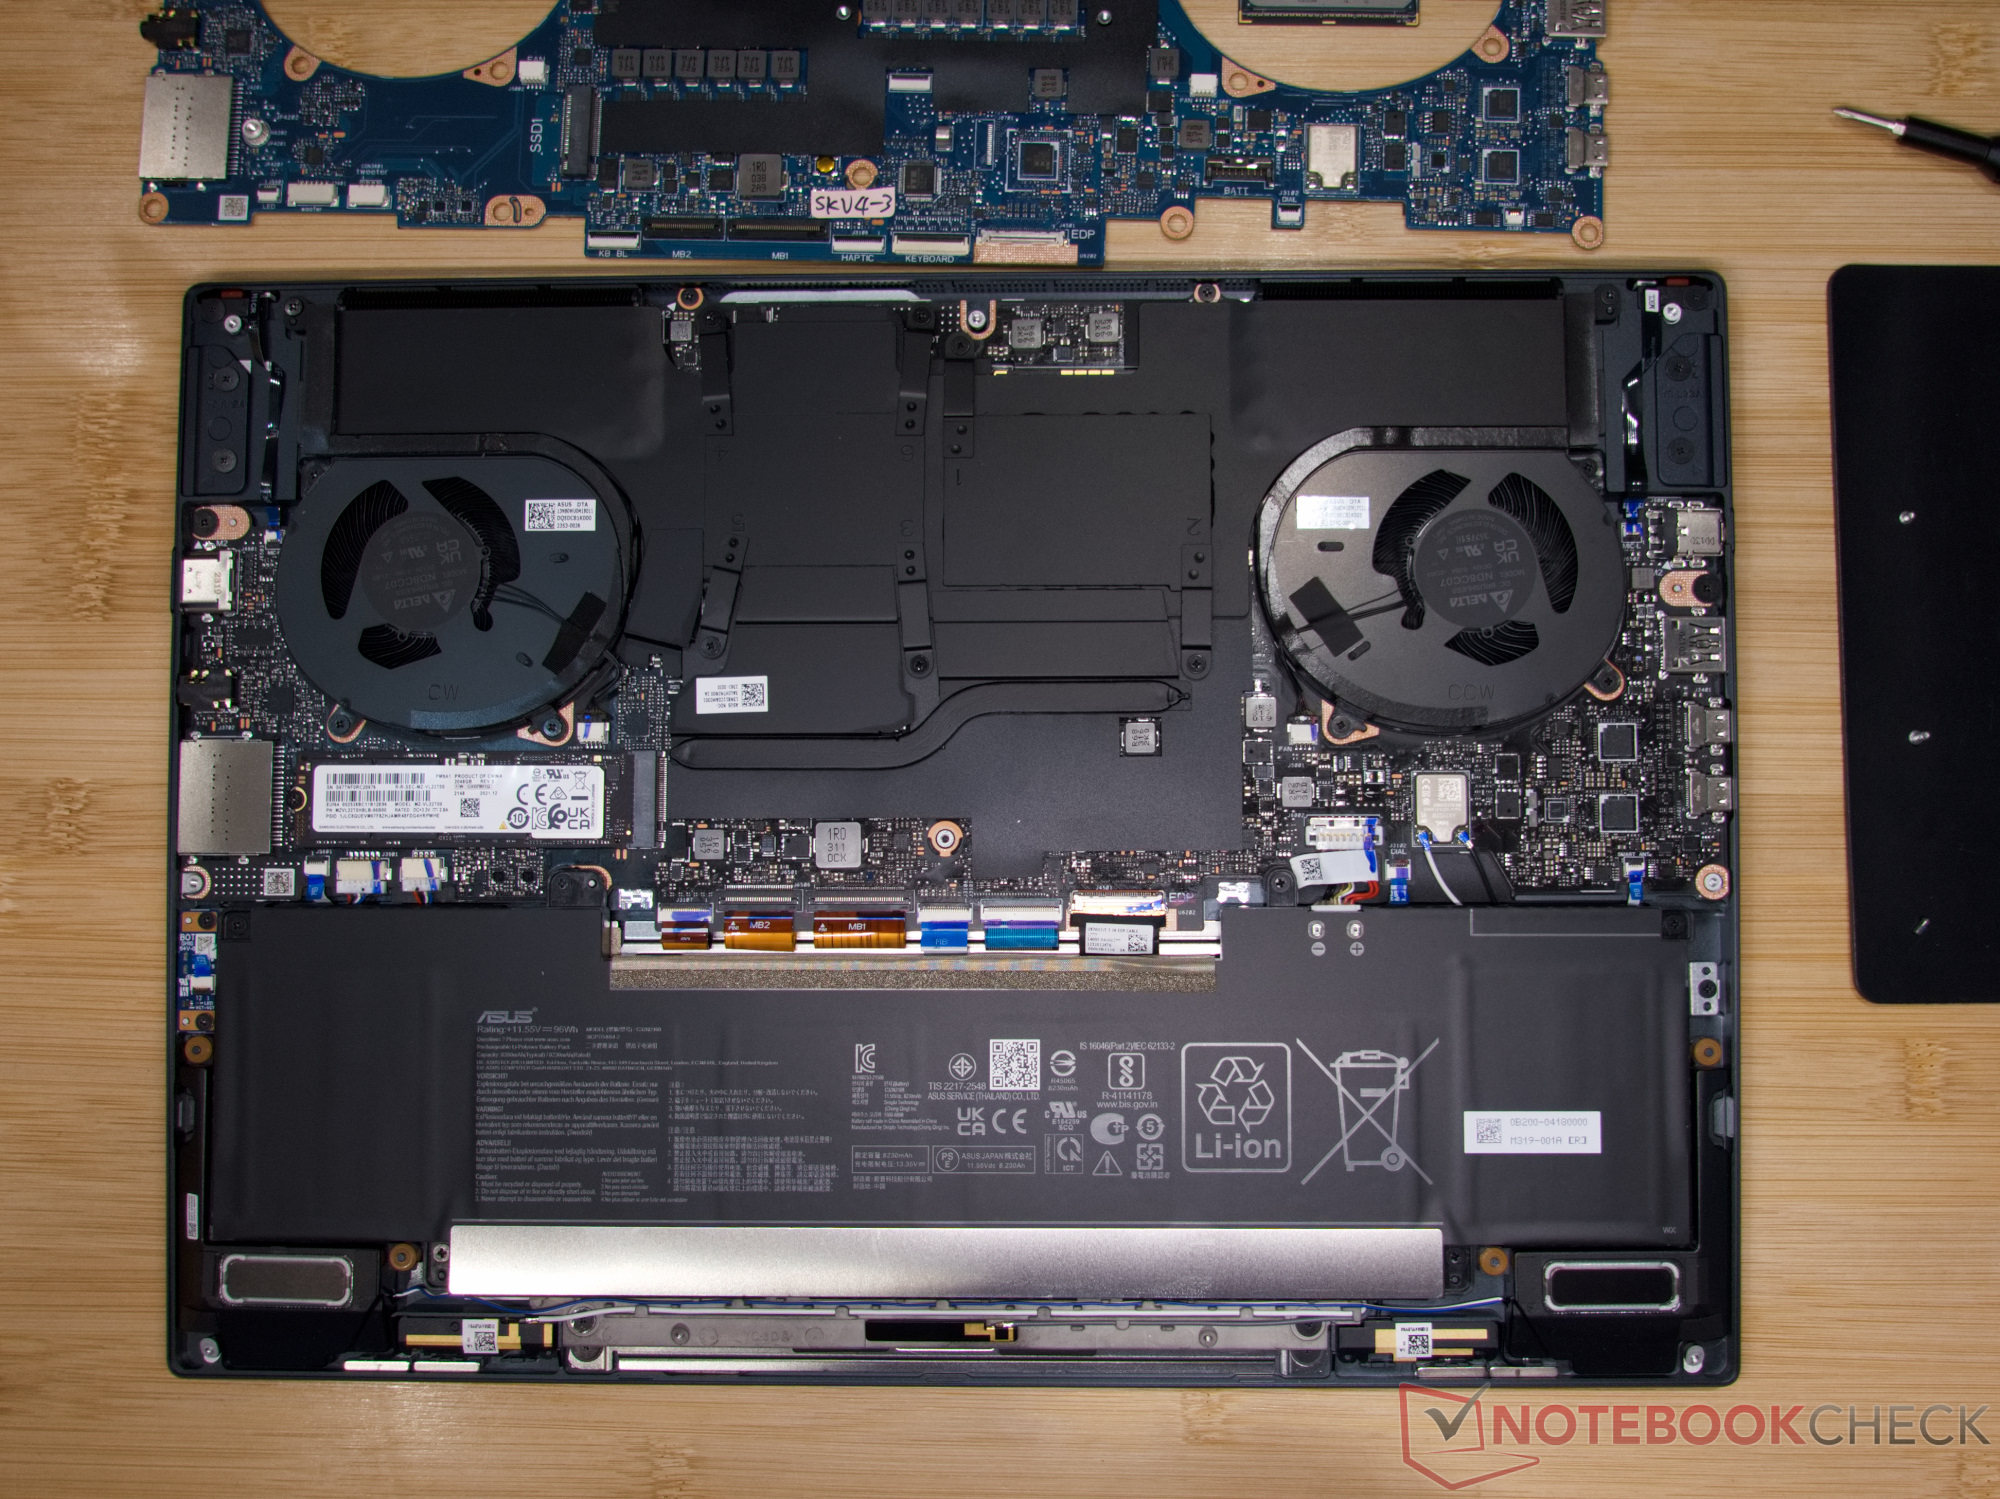
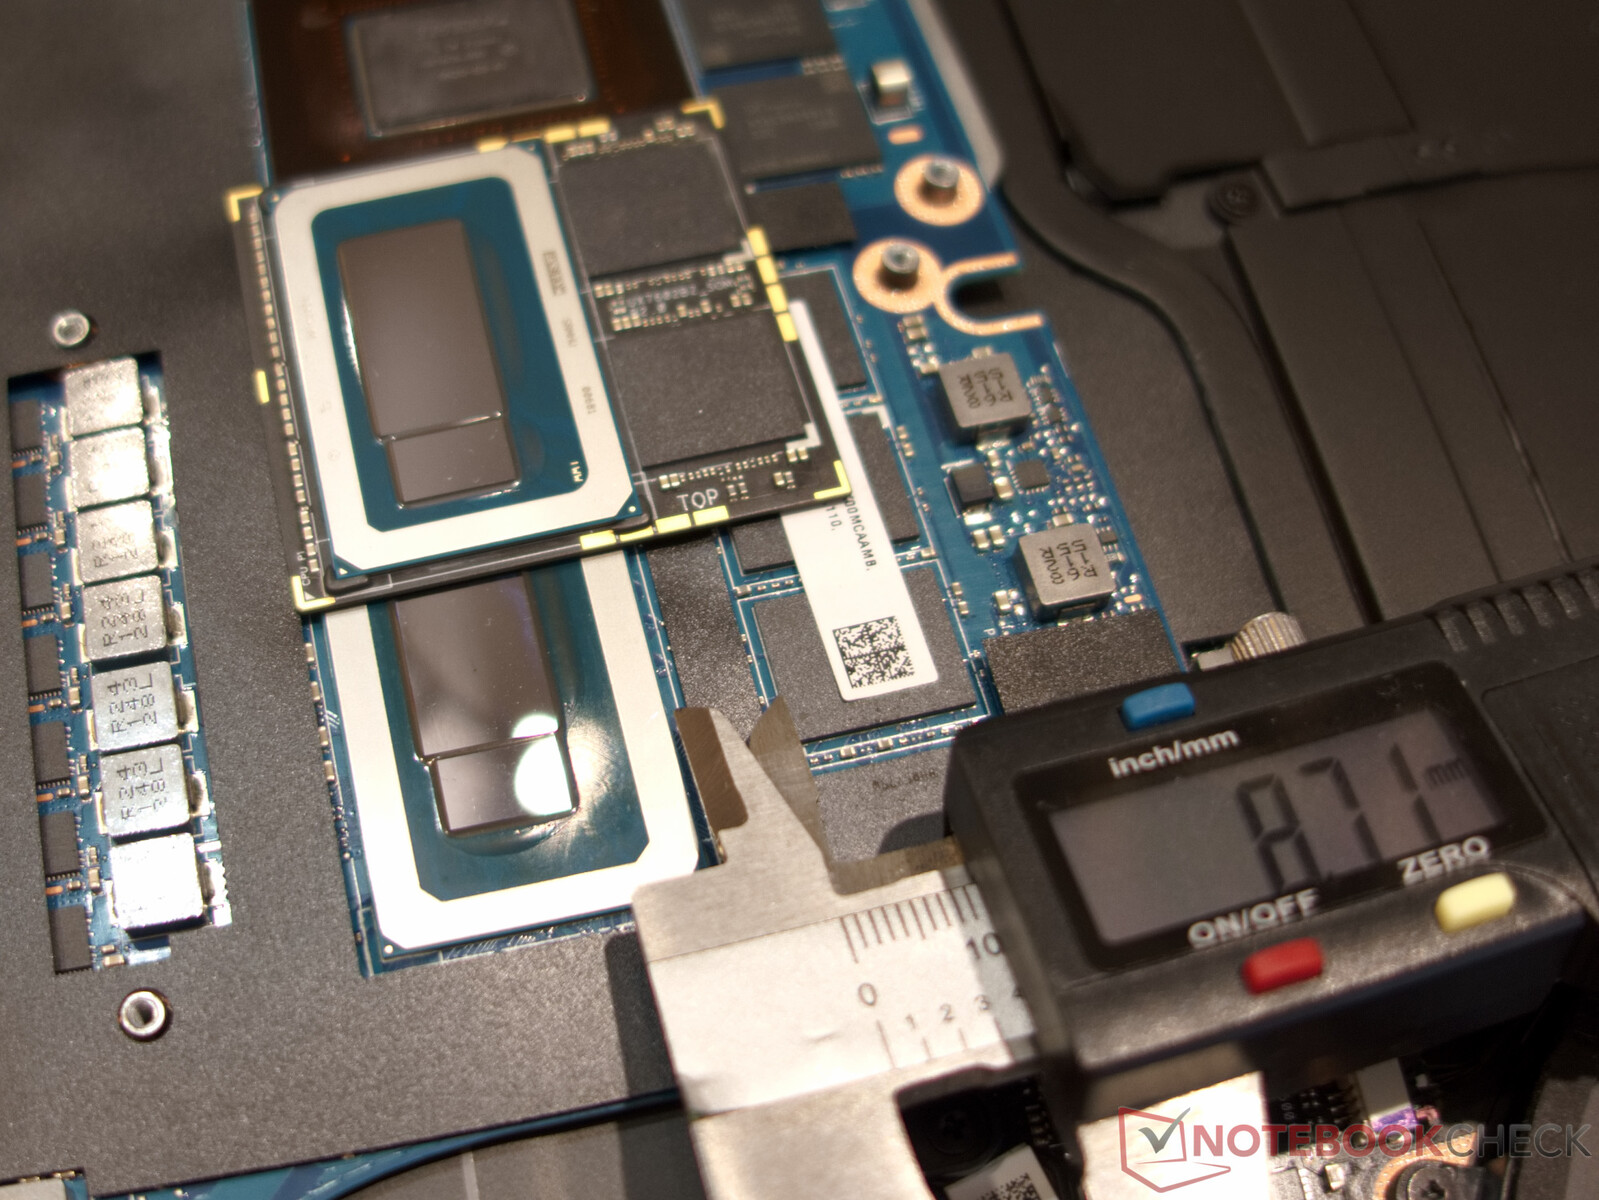
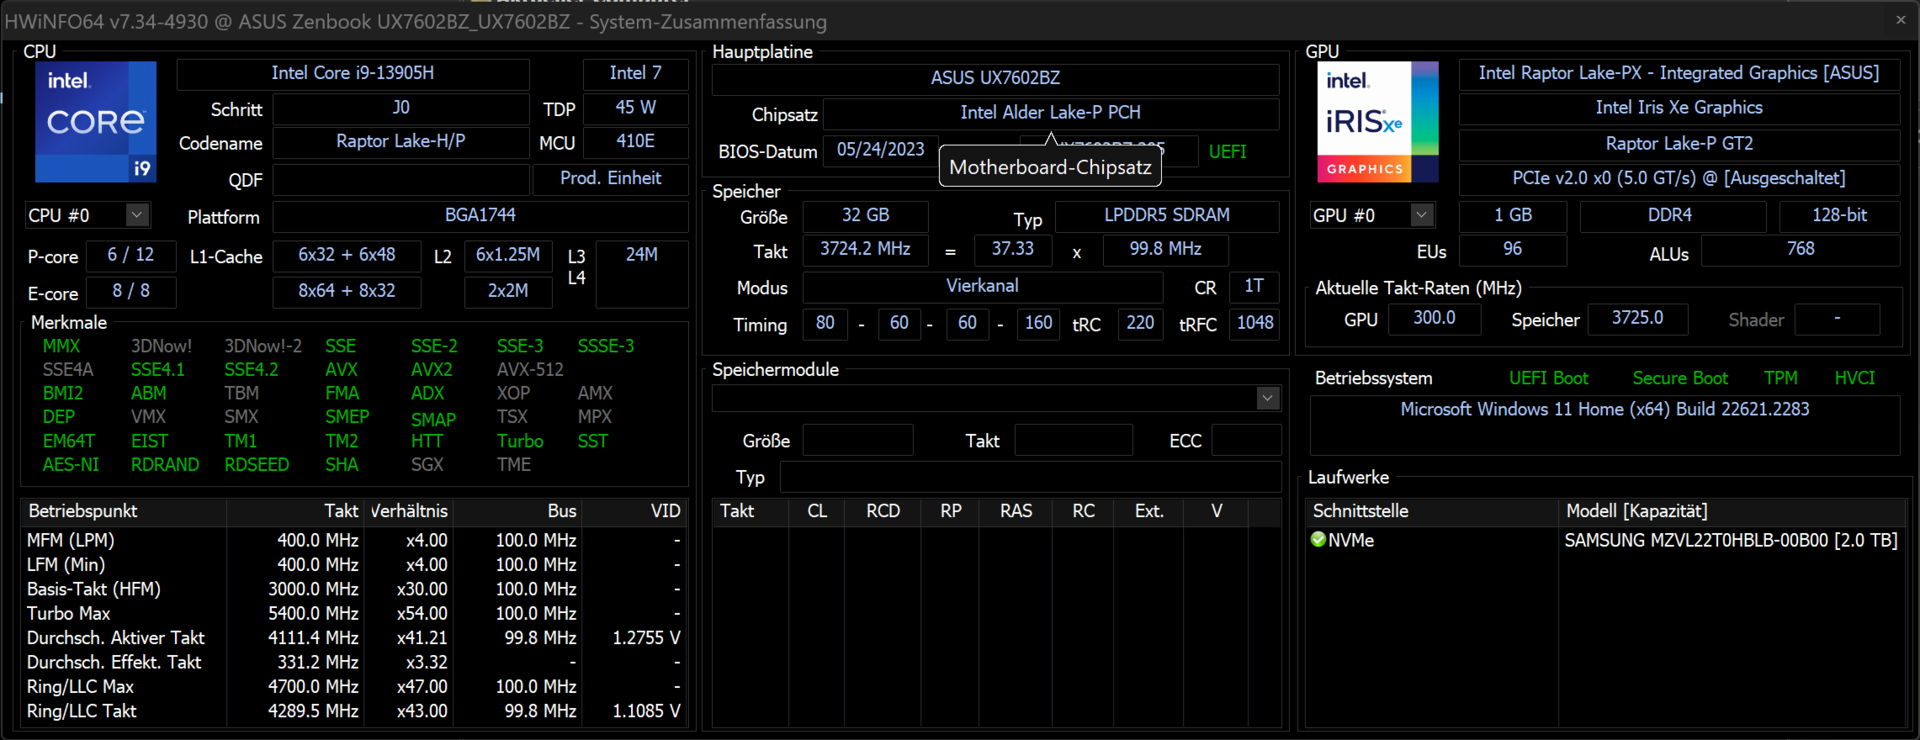
为了比较新旧 Zenbook Pro 16X,华硕给我们寄来了前代产品的主板和采用 SoM 设计、集成 LPDDR5X 内存的处理器模块。因此我们可以看到,在新款 Zenbook Pro 16X 中,内存和 CPU 之间的距离整整缩短了 8 毫米。元件所占表面积的减少也会在一定程度上改善散热性能。不过,最终我们可以说,旧的电路板也可以安装到新的 Zenbook 中。
保修
华硕为在欧洲购买的产品提供 24 个月的保修服务,当然其他地区的保修期可能有所不同,因此建议买家在购买前仔细确认。
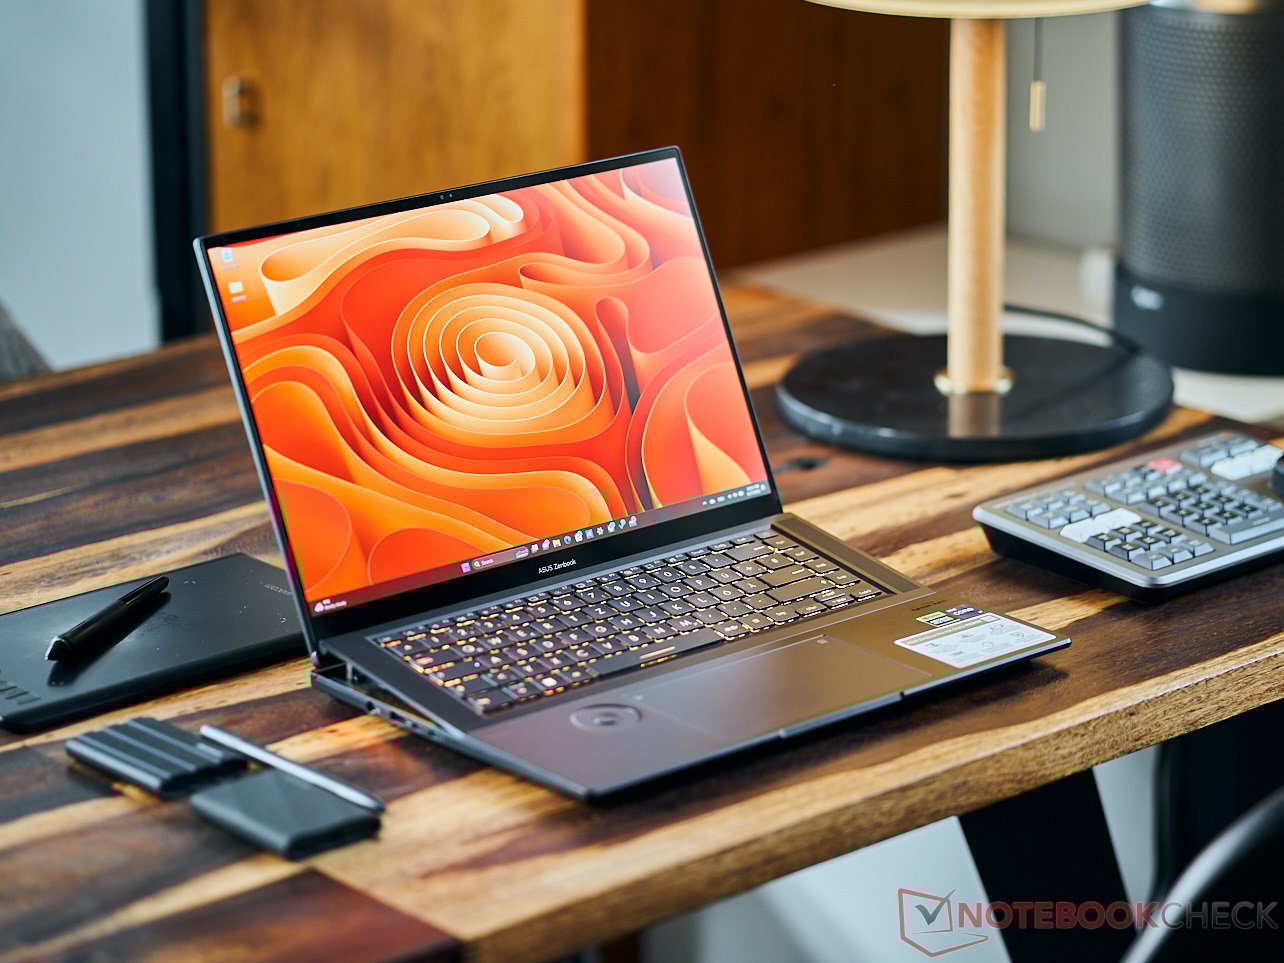
输入设备 - 华硕为 Zenbook 倾尽全力
至多,Zenbook 仍然缺少手势控制输入。除此之外,我们测试设备上的输入方法选择很多,包括键盘、触摸板、触摸屏、华硕拨号盘和华硕笔 2.0。所有输入设备都能正常工作,但我们仍然发现它们有时会相互干扰。
键盘
Zenbook 的 Chiclet 键盘落差约为 1.7 毫米,键程舒适,触觉反馈充分。键盘角度略高,尤其适合输入长篇文字。游戏玩家也会喜欢这款键盘:除了上述优点外,它还提供了 RGB 照明和 N 键翻转功能。
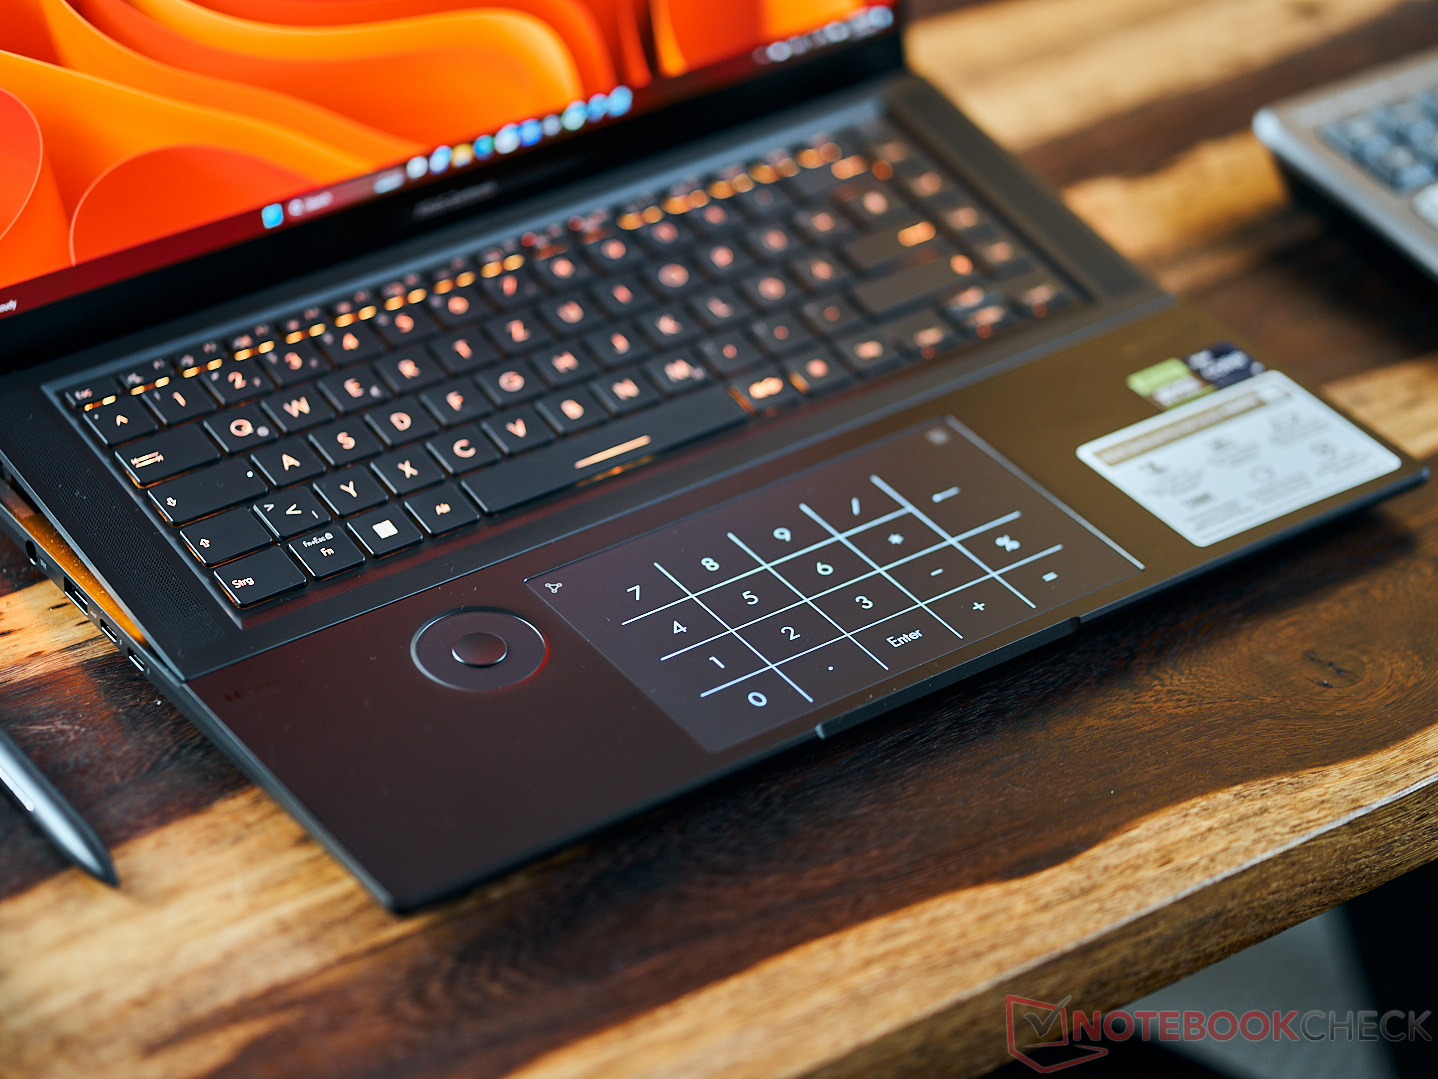
触摸板
Zenbook 的触摸板仍然没有物理按键或按钮。悦耳的 "咔哒 "声是由可配置的触觉电机产生的。尽管如此,或者正因为如此,精确的点击板还是很容易操作的。手指可以在磨砂玻璃表面轻松滑动,但很快就会留下指纹。如果需要,用户还可以在这里显示数字键盘。不过,只有在 Windows 中激活美式键盘布局后才能正常使用。

其他输入选项
随机附带的华硕触控笔 2.0 和华硕 MPPT 2.0 触控笔可以在 Zenbook 的触摸屏上完美地工作。触控笔内置电池,可通过 USB-C 线缆充电。最多可在触摸屏上准确识别十个手指。华硕拨号盘还提供多种功能。不过,与前代产品一样,各个输入设备经常会相互干扰。打字时,你往往会将手放在拨号盘上,这可能会导致输入错误。为了用华硕笔在屏幕上操作,建议用户将手臂放在键盘上,但这样做也不是没有问题。归根结底,对于手写笔来说,屏幕偶尔会过于晃动。
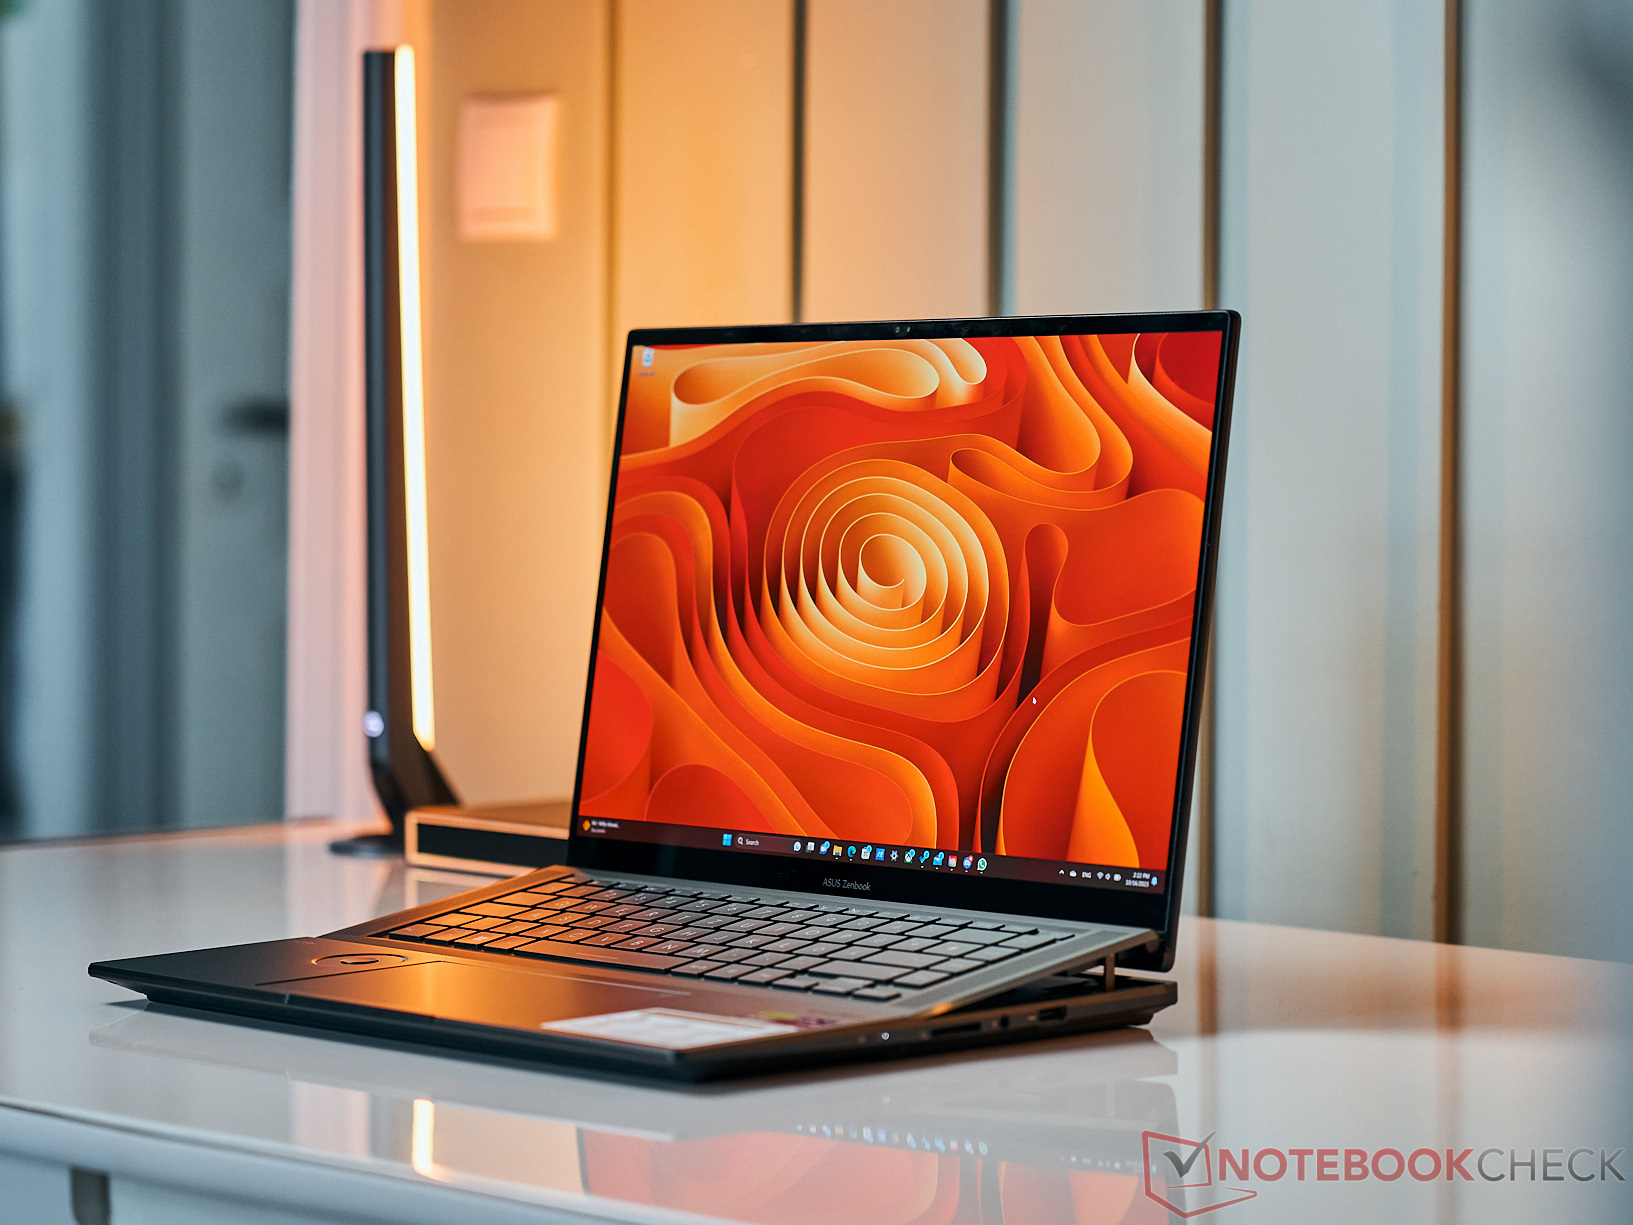
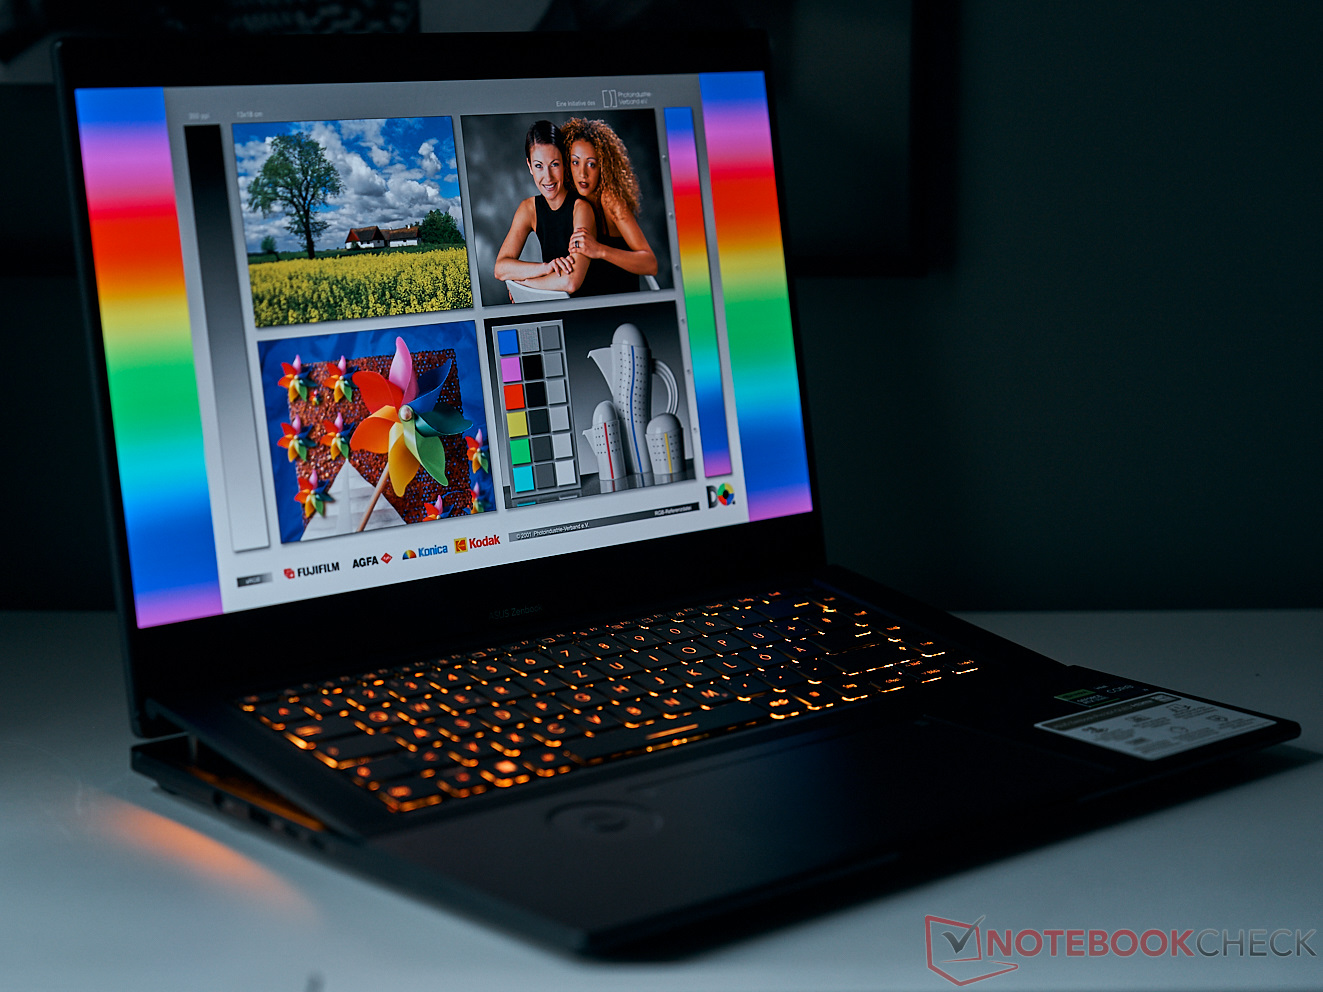
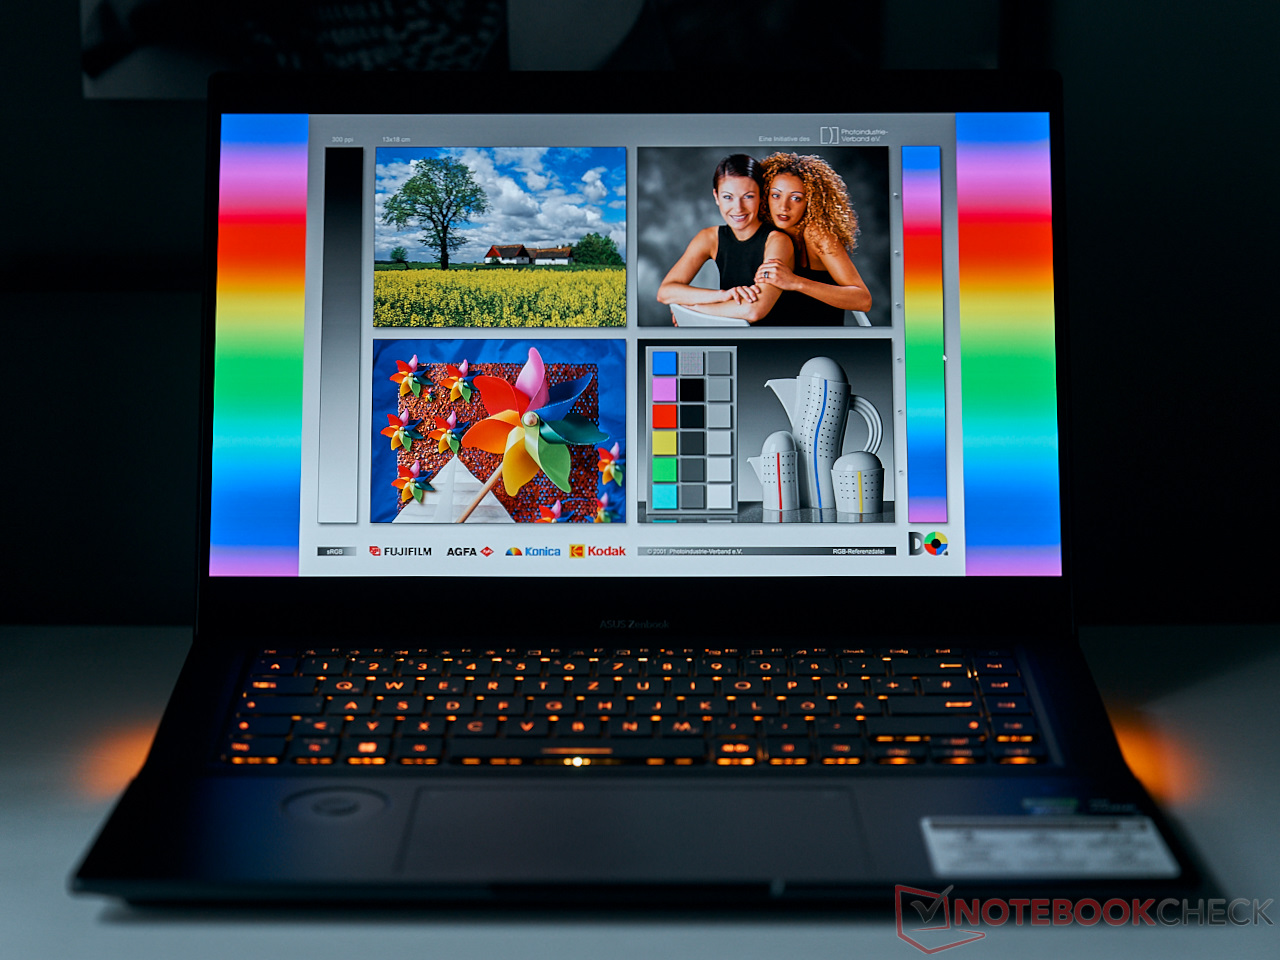
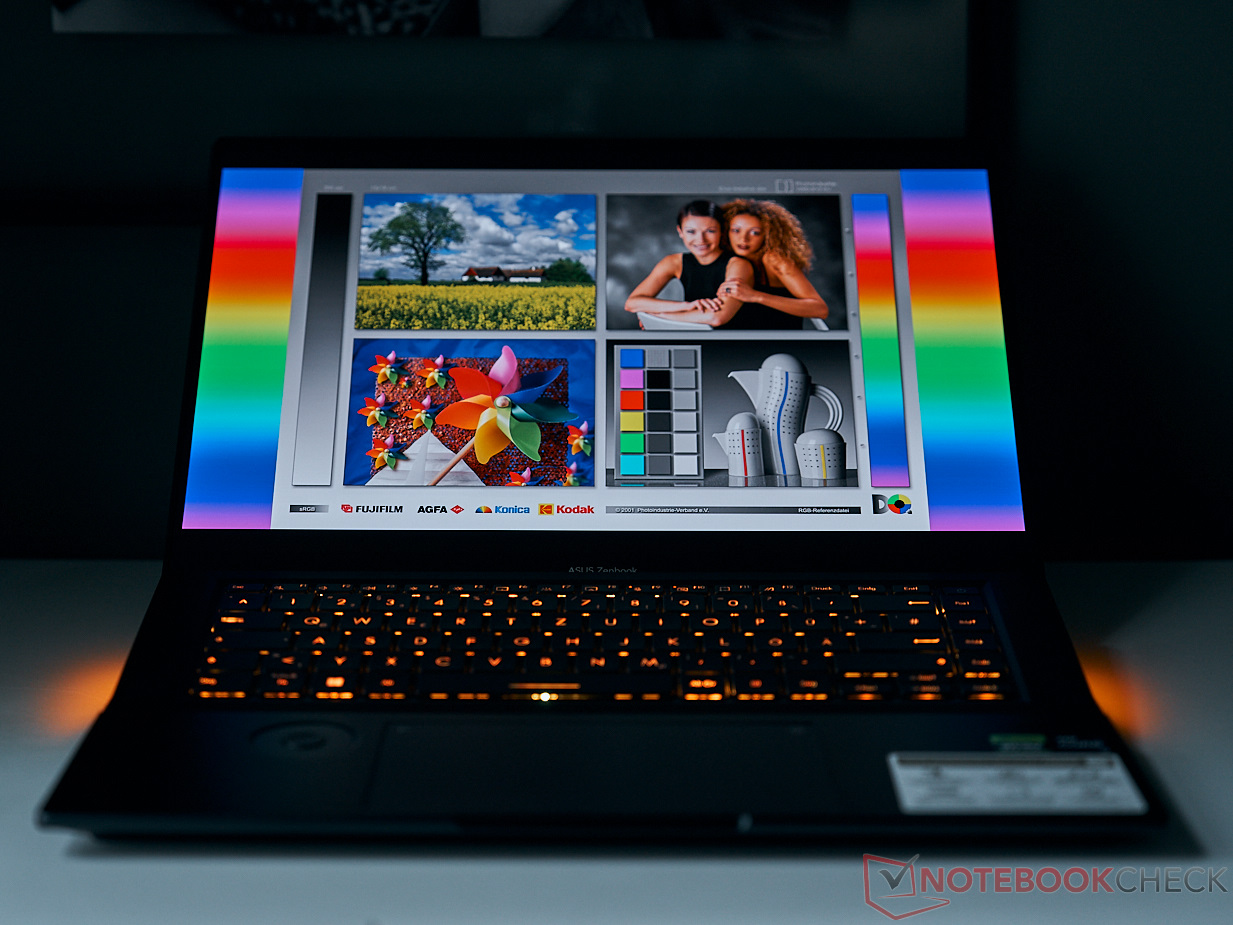
显示屏 - 终于有了 120 赫兹的 OLED 显示屏

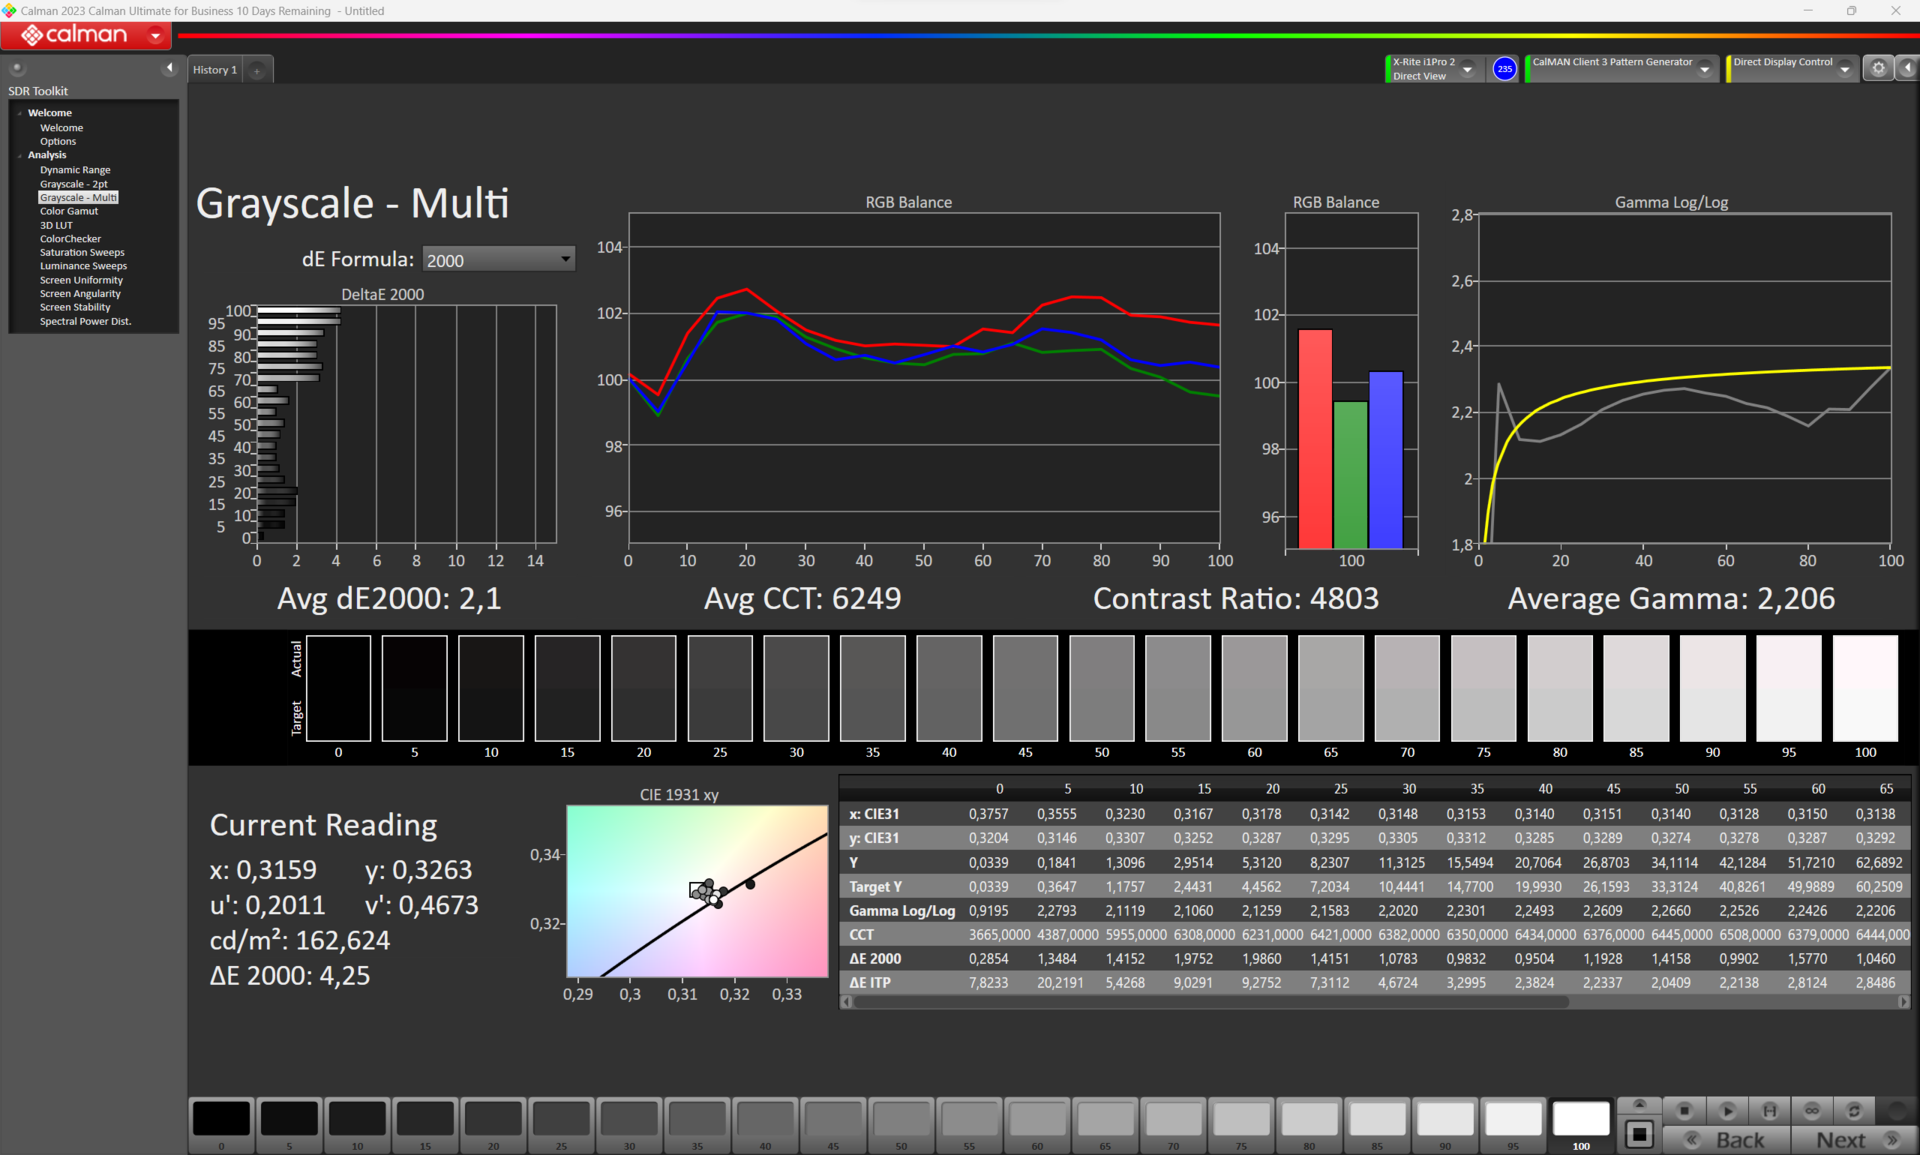
与 前代产品一样、现款 Zenbook 的屏幕通过了 Pantone 认证。亮度约为 350 cd/m²,帧频为 120 Hz。典型的华硕风格是在 MyAsus 应用程序中对屏幕进行各种可选设置。屏幕测试首先在原生模式下进行,然后在 DisplayP3 模式下进行。
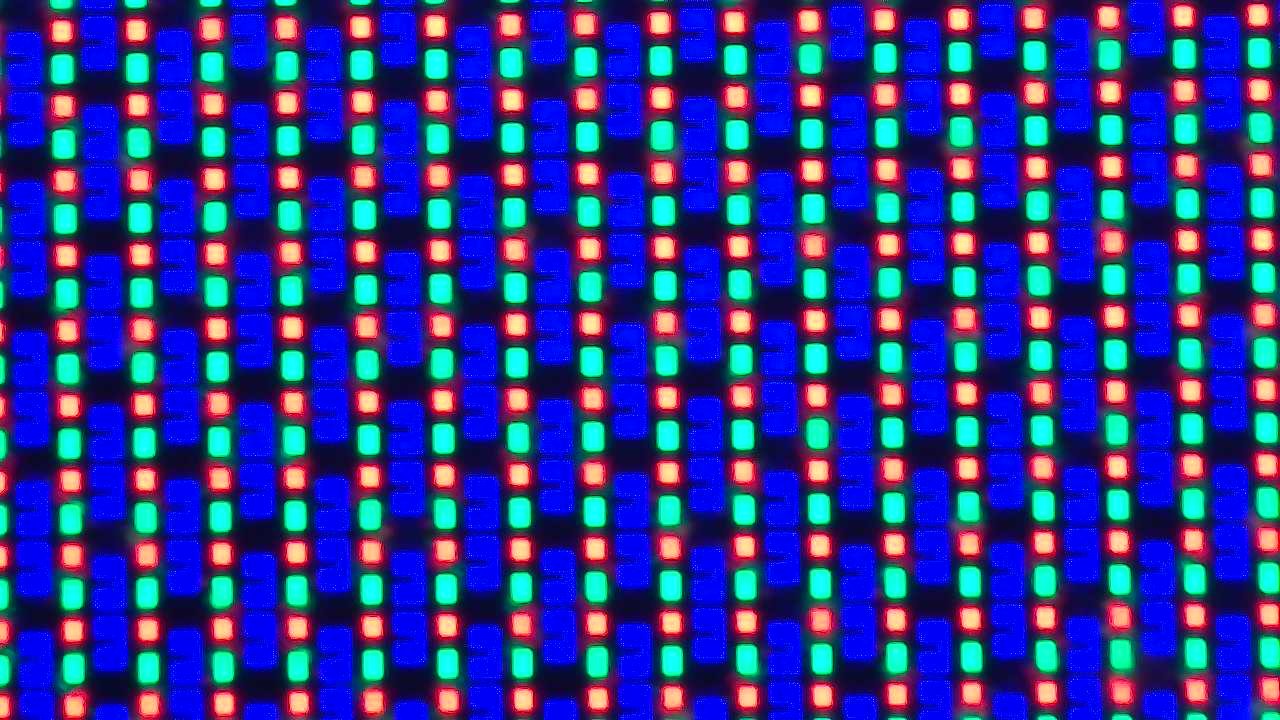
遗憾的是,新款 Zenbook 继承了前代产品的一个缺点:在子像素矩阵中,蓝色子像素之间的距离太远,视力较好的人也能看出缝隙。
| |||||||||||||||||||||||||
Brightness Distribution: 98 %
Center on Battery: 329.66 cd/m²
Contrast: 4740:1 (Black: 0.07 cd/m²)
ΔE ColorChecker Calman: 1.58 | ∀{0.5-29.43 Ø4.71}
calibrated: 6.66
ΔE Greyscale Calman: 4.25 | ∀{0.09-98 Ø4.96}
97.48% AdobeRGB 1998 (Argyll 3D)
100% sRGB (Argyll 3D)
99.93% Display P3 (Argyll 3D)
Gamma: 2.206
CCT: 6249 K
| Asus Zenbook Pro 16X UX7602BZ-MY005W ATNA60BX01-1, OLED, 3200x2000, 16" | Asus ZenBook Pro 16X OLED UX7602ZM-ME115W Samsung SDC415D, OLED, 3840x2400, 16" | Asus ROG Strix G16 G614JZ TL160ADMP03-0, IPS, 2560x1600, 16" | Asus ROG Zephyrus M16 GU604VY-NM042X BOE0B74 (NE160QDM-NM4, IPS, 2560x1600, 16" | MSI Stealth 17 Studio A13VH-014 AUO41A2 B173ZAN06.C, Mini LED, 3840x2160, 17.3" | Lenovo Legion Pro 7 RTX4090 MNG007DA2-3 (CSO1628), IPS, 2560x1600, 16" | Lenovo Legion Slim 7i 16 Gen 8 CSOT T3 MNG007DA2-3, IPS, 2560x1600, 16" | Asus Vivobook Pro 16X K6604JV-MX016W Samsung SDC4178 ATNA60BX01-1, OLED, 3200x2000, 16" | |
|---|---|---|---|---|---|---|---|---|
| Display | -3% | -5% | -3% | -4% | -19% | -19% | -1% | |
| Display P3 Coverage (%) | 99.93 | 99.84 0% | 97 -3% | 99.33 -1% | 92 -8% | 69.5 -30% | 70.4 -30% | 98.4 -2% |
| sRGB Coverage (%) | 100 | 99.99 0% | 99.9 0% | 99.9 0% | 99.1 -1% | 99.8 0% | 99.4 -1% | 99.7 0% |
| AdobeRGB 1998 Coverage (%) | 97.48 | 88.9 -9% | 84.9 -13% | 90.01 -8% | 94.07 -3% | 71.6 -27% | 72.5 -26% | 95.8 -2% |
| Response Times | -22% | -247% | -2455% | -1573% | -405% | -551% | 8% | |
| Response Time Grey 50% / Grey 80% * (ms) | 1.4 ? | 2 ? -43% | 5.1 ? -264% | 50.8 ? -3529% | 46.4 ? -3214% | 10.9 ? -679% | 12 ? -757% | 1.6 ? -14% |
| Response Time Black / White * (ms) | 2 ? | 2 ? -0% | 6.6 ? -230% | 29.6 ? -1380% | 0.62 ? 69% | 4.6 ? -130% | 8.9 ? -345% | 1.4 ? 30% |
| PWM Frequency (Hz) | 250 ? | 59 ? | 12000 | 2400 | 120 ? | |||
| Screen | 11% | -43% | 93% | 52% | -41% | -43% | 20% | |
| Brightness middle (cd/m²) | 331.8 | 346 4% | 470 42% | 634 91% | 397.29 20% | 491 48% | 474.6 43% | 347 5% |
| Brightness (cd/m²) | 334 | 354 6% | 459 37% | 627 88% | 392 17% | 472 41% | 445 33% | 346 4% |
| Brightness Distribution (%) | 98 | 96 -2% | 93 -5% | 92 -6% | 93 -5% | 91 -7% | 86 -12% | 97 -1% |
| Black Level * (cd/m²) | 0.07 | 0.42 -500% | 0.03 57% | 0.02 71% | 0.4 -471% | 0.39 -457% | 0.06 14% | |
| Contrast (:1) | 4740 | 1119 -76% | 21133 346% | 19865 319% | 1228 -74% | 1217 -74% | 5783 22% | |
| Colorchecker dE 2000 * | 1.58 | 2.28 -44% | 1.86 -18% | 0.89 44% | 2.52 -59% | 1.6 -1% | 2.12 -34% | 1.89 -20% |
| Colorchecker dE 2000 max. * | 4.23 | 4.94 -17% | 3.87 9% | 1.79 58% | 3.91 8% | 5.15 -22% | 4.73 -12% | 3.26 23% |
| Colorchecker dE 2000 calibrated * | 6.66 | 2.16 68% | 0.93 86% | 0.91 86% | 2.52 62% | 0.97 85% | 0.57 91% | 1.97 70% |
| Greyscale dE 2000 * | 4.25 | 1.64 61% | 2.7 36% | 1.13 73% | 2.78 35% | 3 29% | 2.8 34% | 1.55 64% |
| Gamma | 2.206 100% | 2.37 93% | 2.246 98% | 2.47 89% | 2.63 84% | 2.211 100% | 2.22 99% | 2.39 92% |
| CCT | 6249 104% | 6384 102% | 6711 97% | 6497 100% | 6412 101% | 6979 93% | 6542 99% | 6458 101% |
| Total Average (Program / Settings) | -5% /
2% | -98% /
-64% | -788% /
-292% | -508% /
-192% | -155% /
-88% | -204% /
-111% | 9% /
14% |
* ... smaller is better
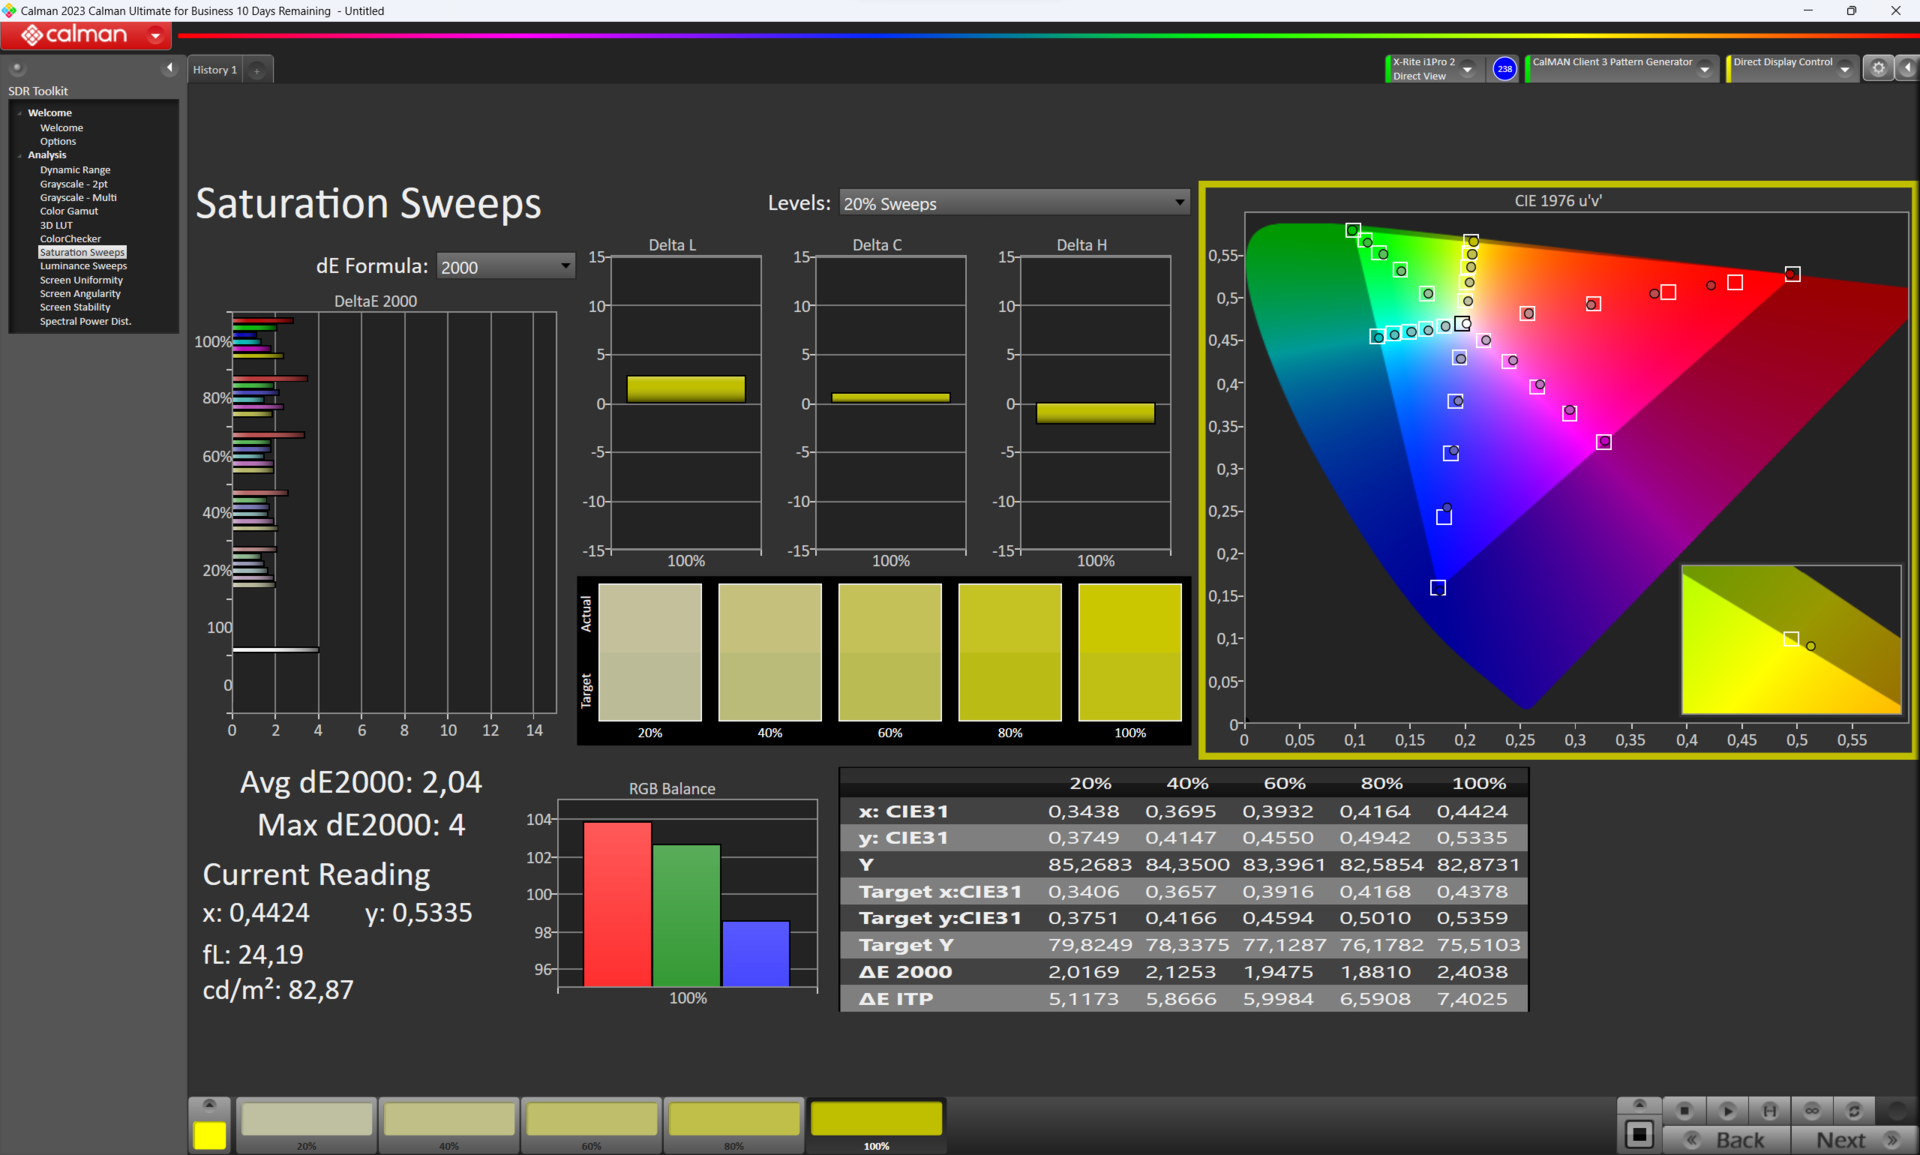
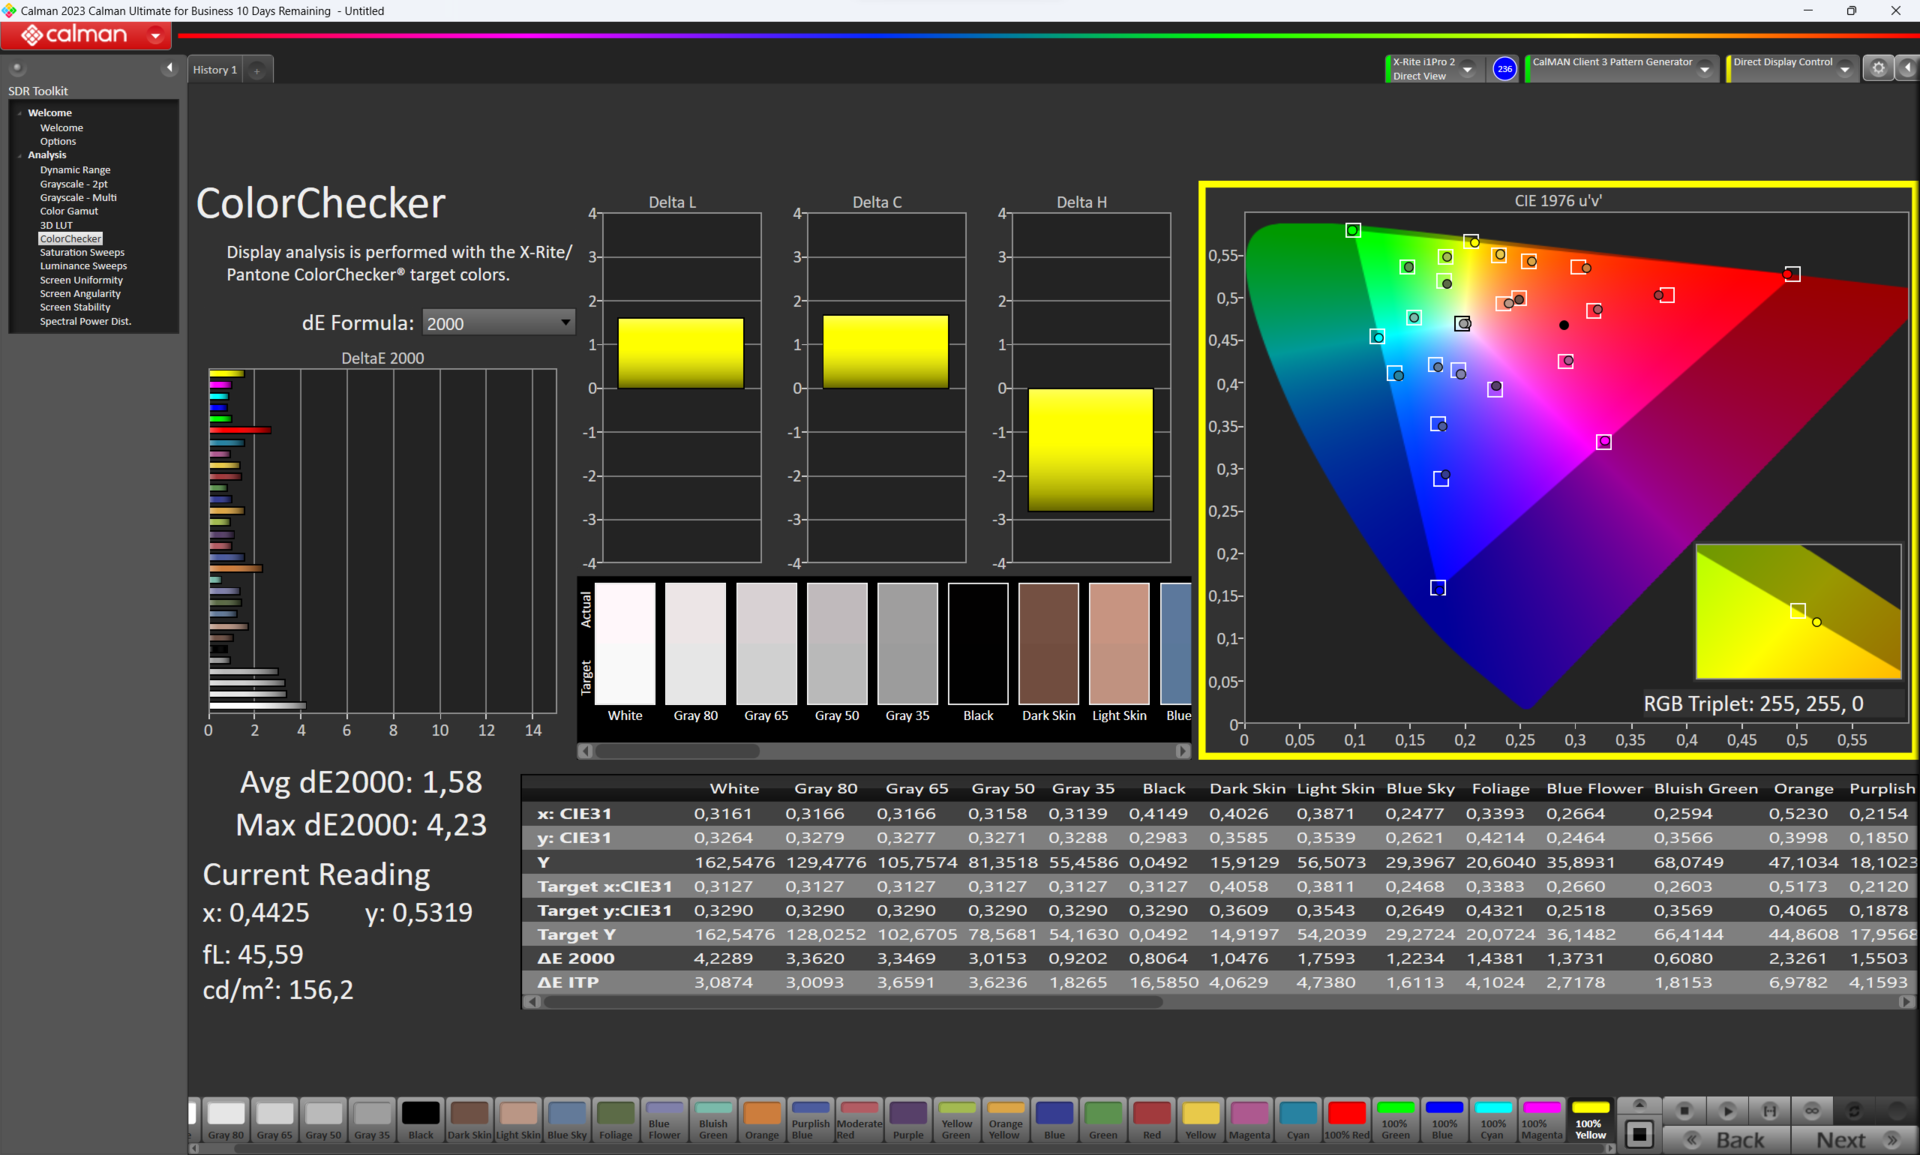
Zenbook 几乎 100% 地覆盖了三个重要的色彩空间,即 AdobeRGB、DisplayP3 和 sRGB。这将使各个领域的创意专业人士受益匪浅。

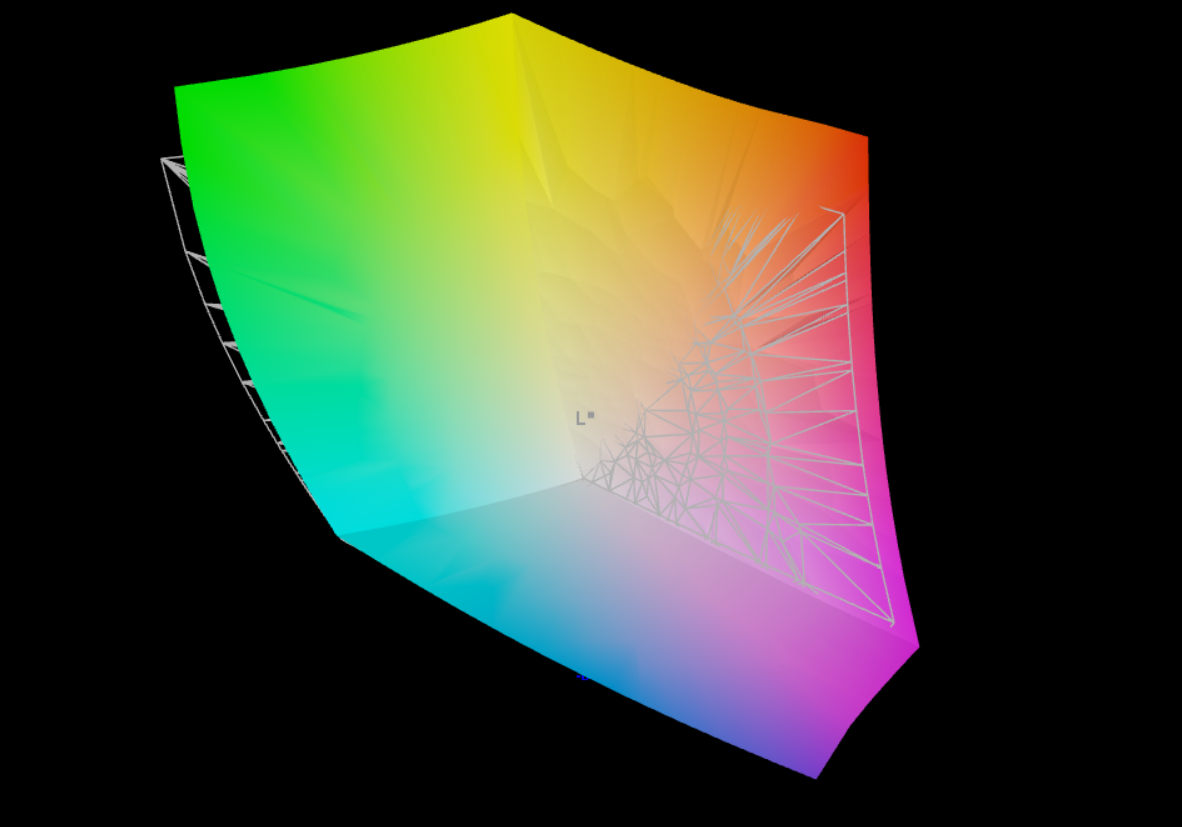
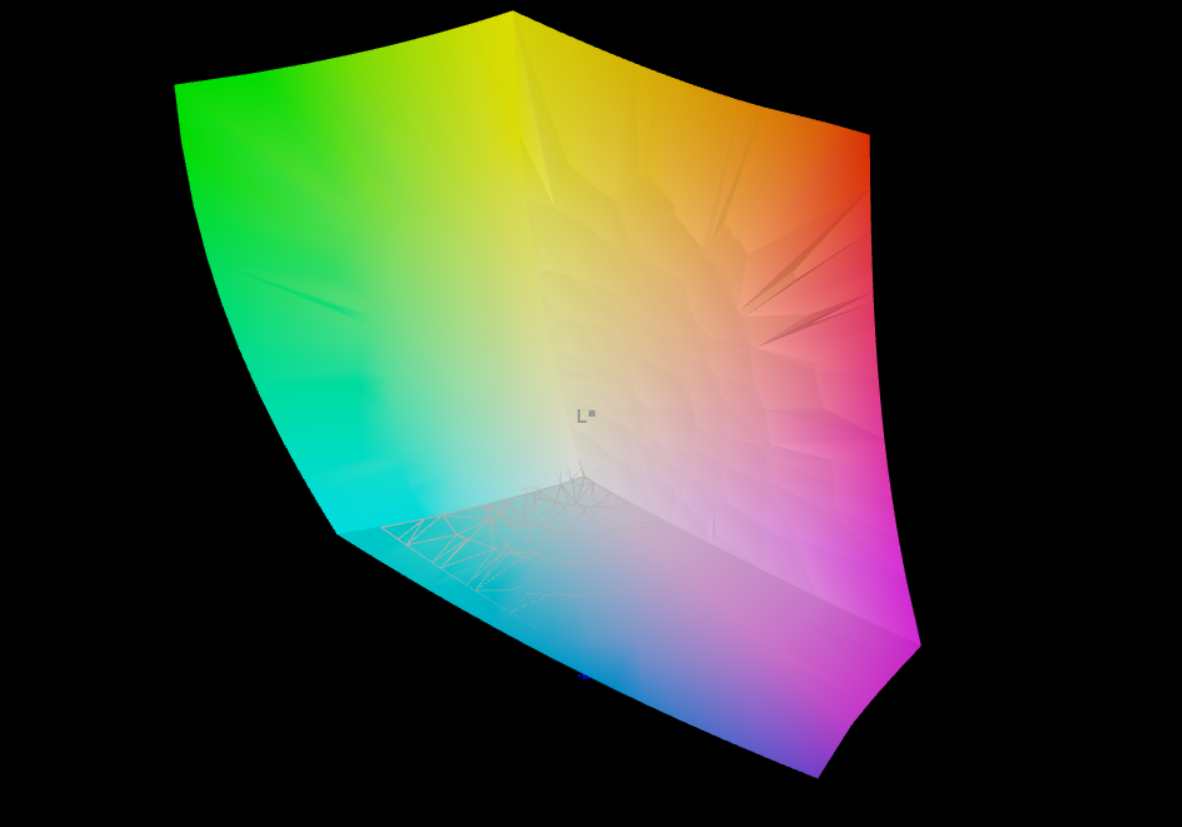
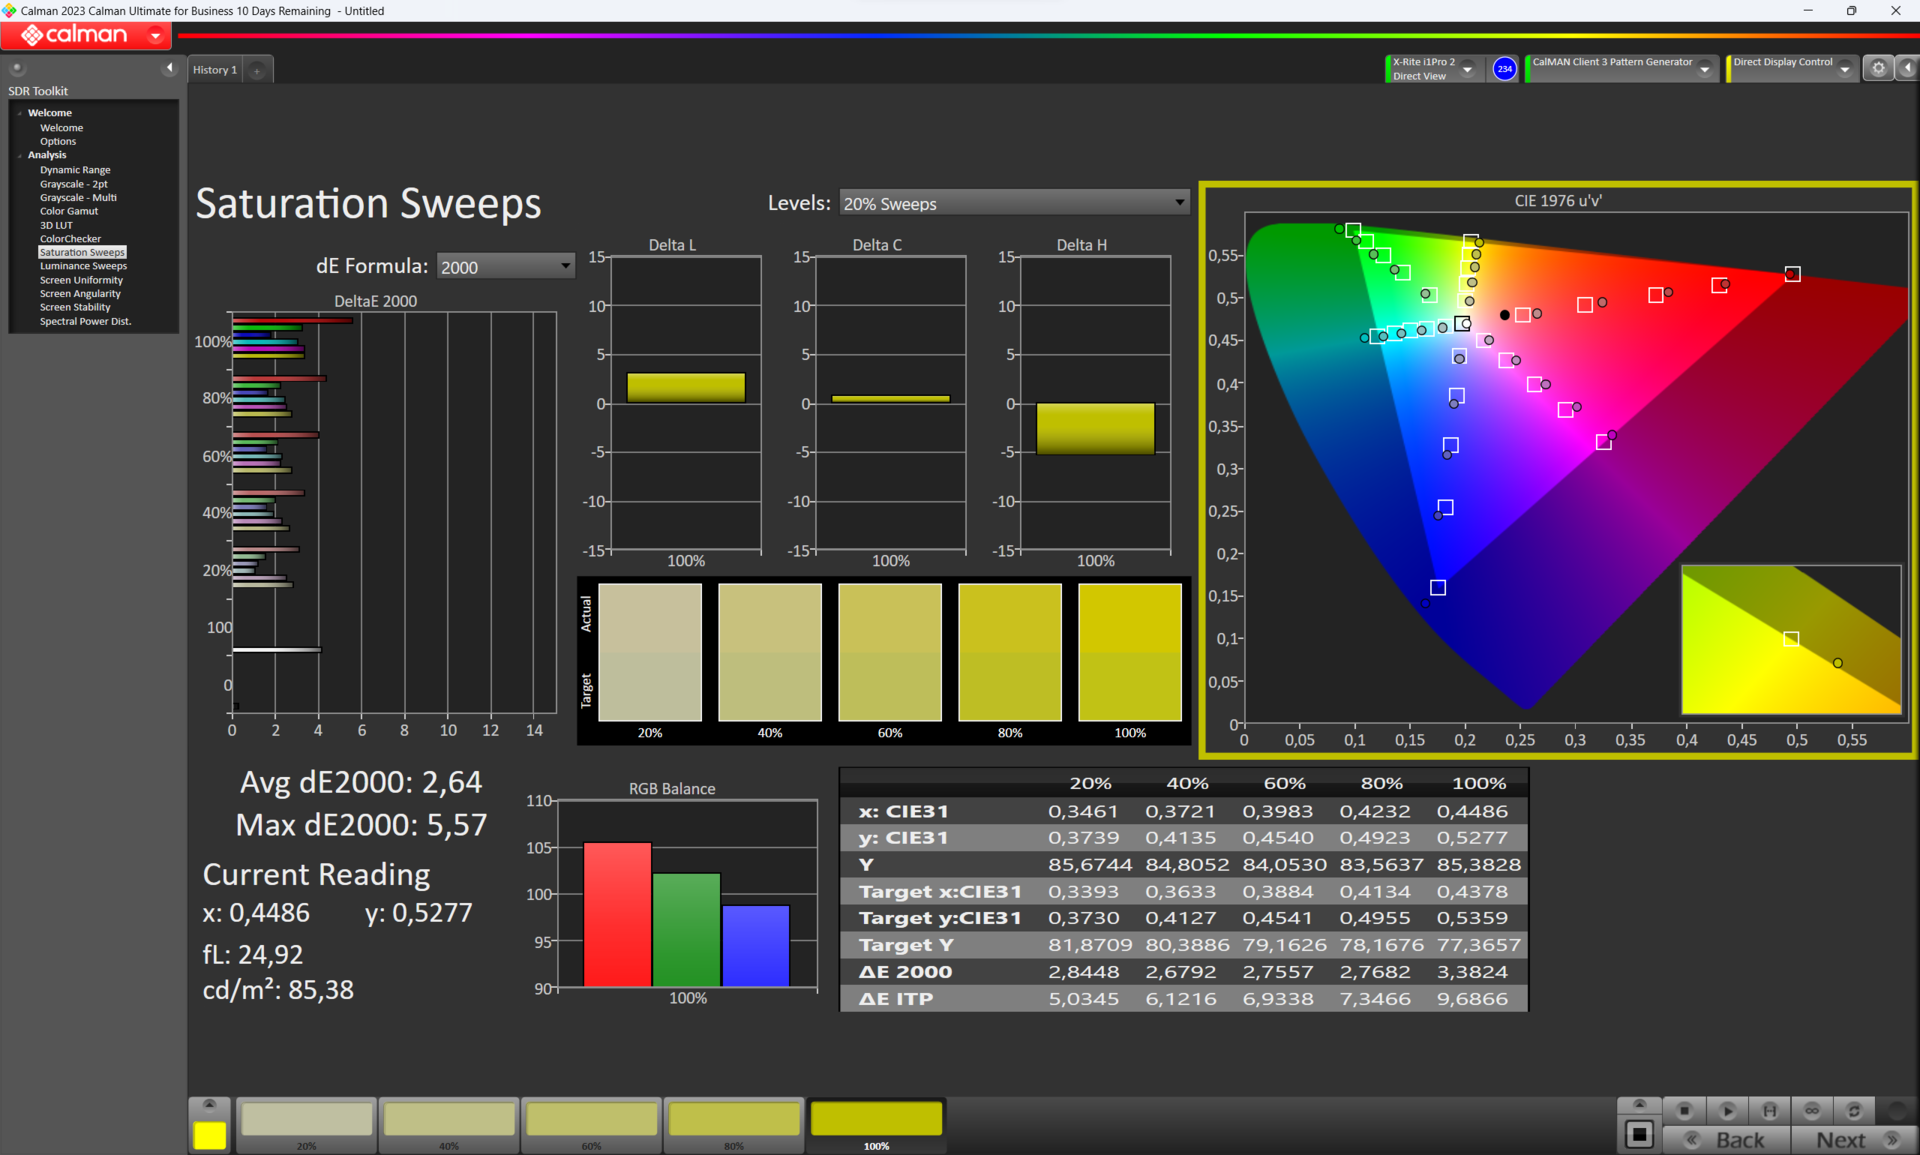
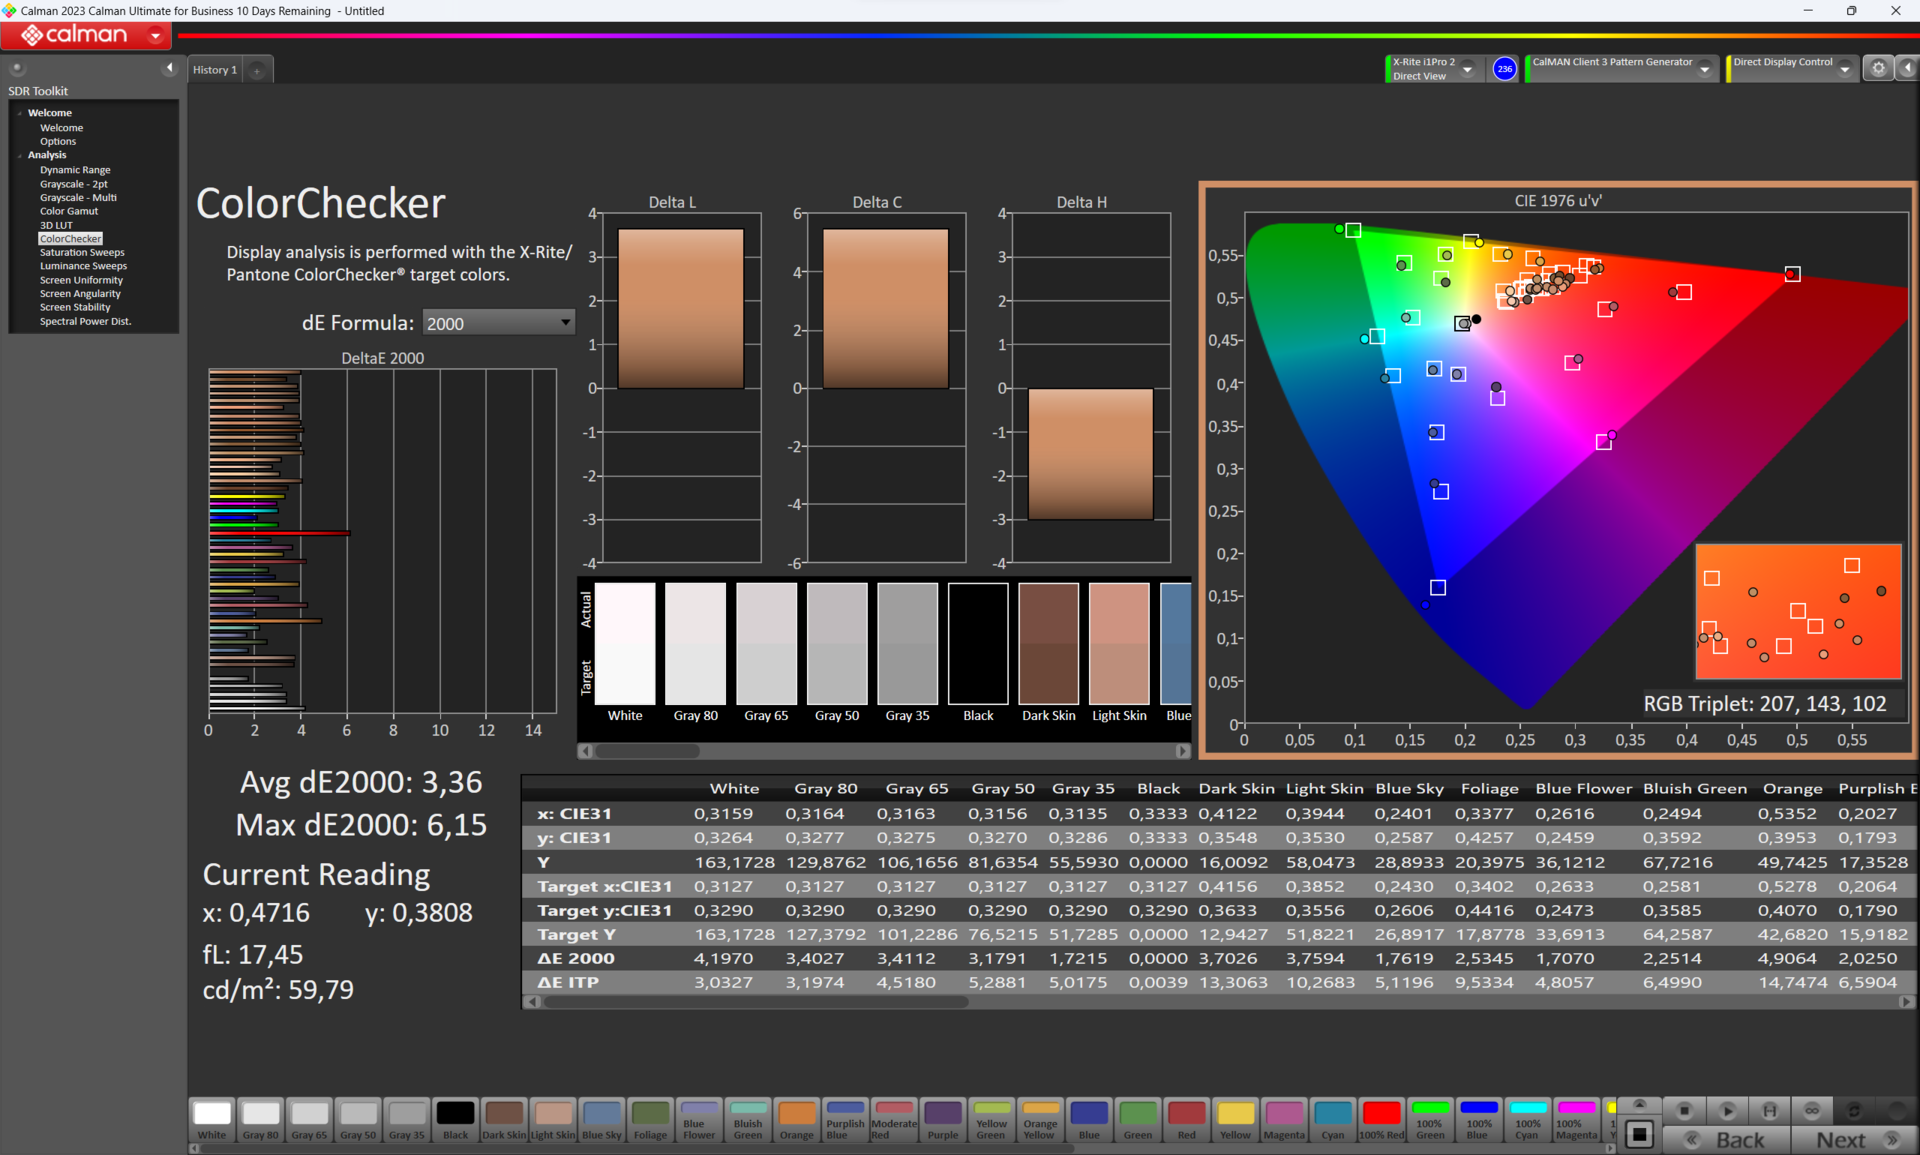
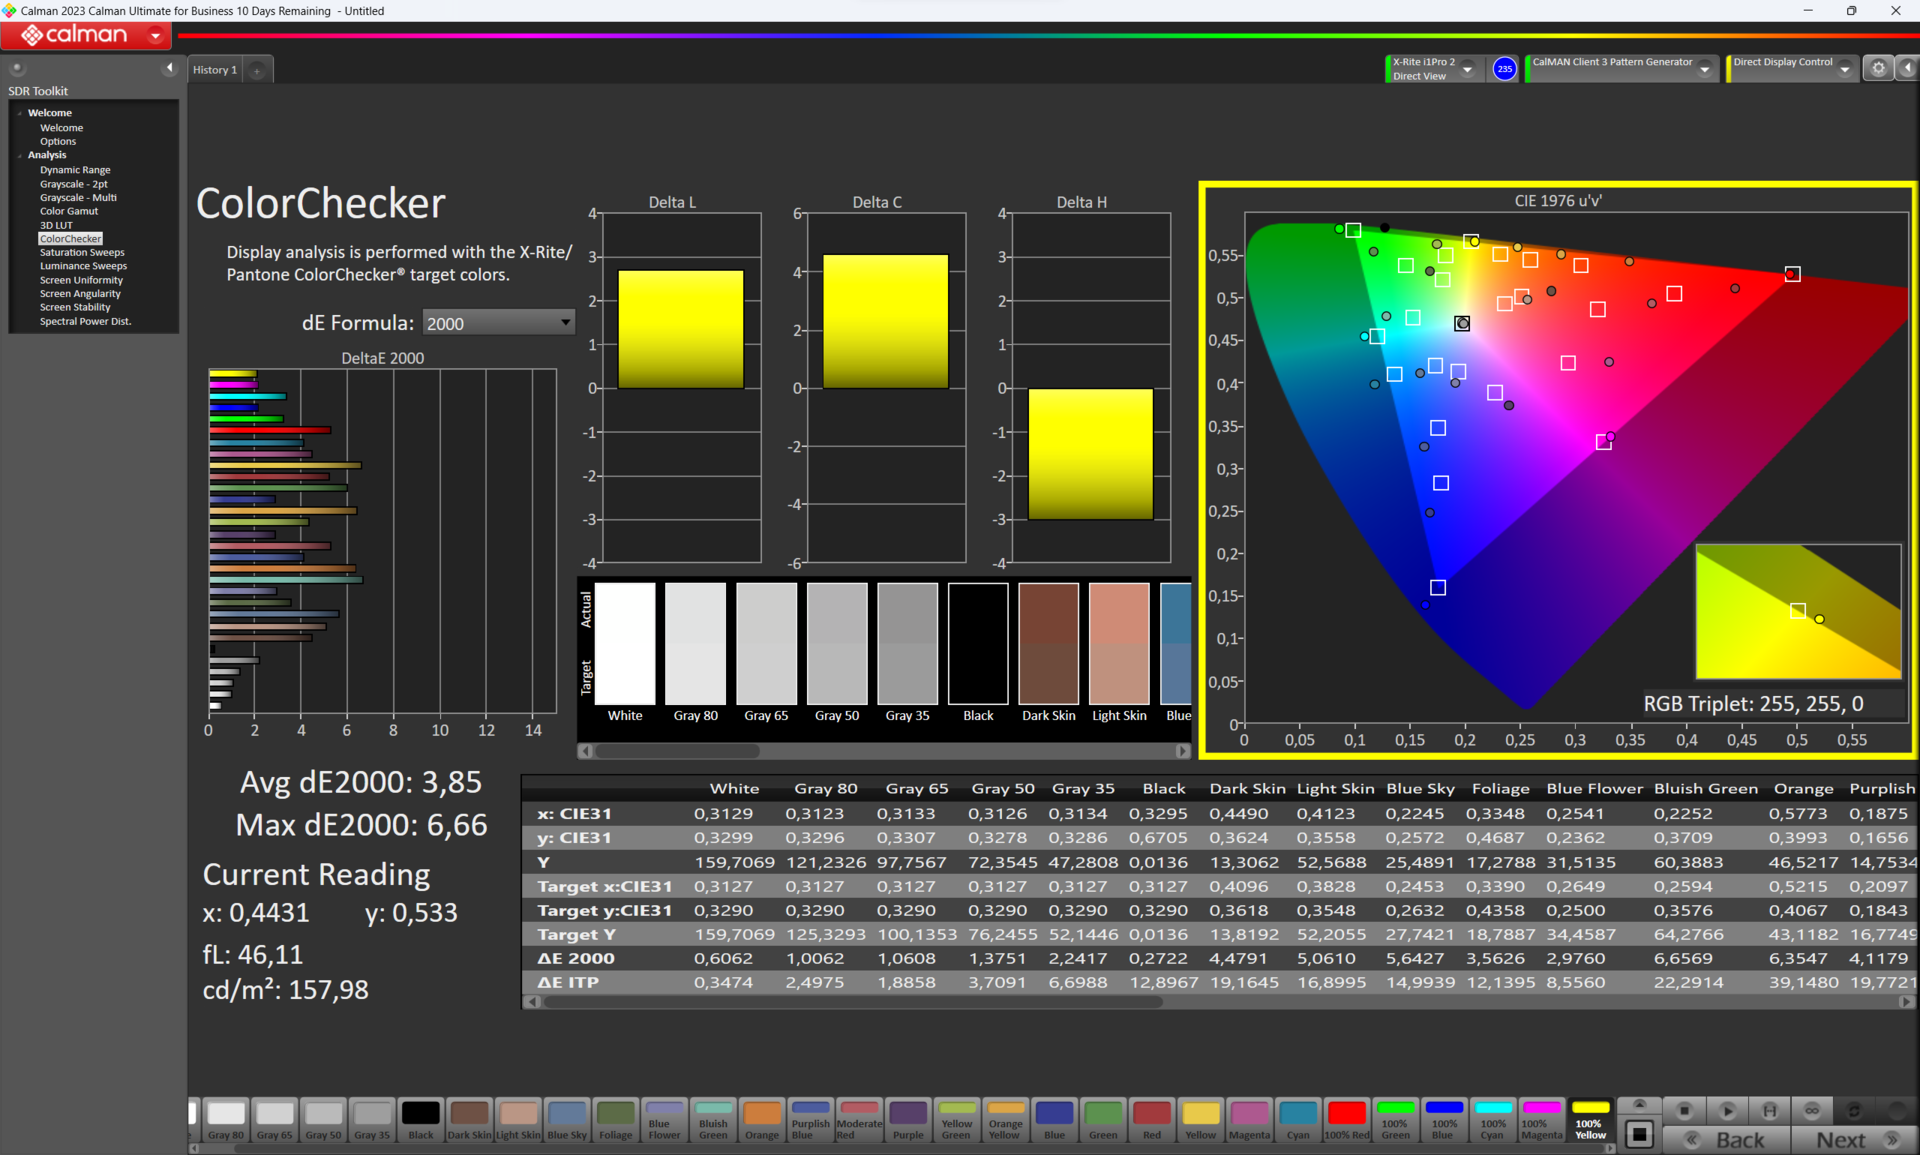
华硕 Zenbook Pro 16X 的不同显示模式可确保准确的色彩表现。在原生模式下,显示屏的平均色彩偏差为 ΔΕ2000 3.36(DisplayP3 目标色彩空间)。华硕的 DisplayP3 预设值确保了在同一色彩空间中仅有ΔΕ2000 1.58 的极低色彩偏差。这意味着即使是受过训练的眼睛也不太可能注意到任何色彩差异。
Display Response Times
| ↔ Response Time Black to White | ||
|---|---|---|
| 2 ms ... rise ↗ and fall ↘ combined | ↗ 1 ms rise |  |
| ↘ 1 ms fall | ||
| The screen shows very fast response rates in our tests and should be very well suited for fast-paced gaming. In comparison, all tested devices range from 0.1 (minimum) to 240 (maximum) ms. » 11 % of all devices are better. This means that the measured response time is better than the average of all tested devices (19.8 ms). | ||
| ↔ Response Time 50% Grey to 80% Grey | ||
| 1.4 ms ... rise ↗ and fall ↘ combined | ↗ 0.6 ms rise |  |
| ↘ 0.8 ms fall | ||
| The screen shows very fast response rates in our tests and should be very well suited for fast-paced gaming. In comparison, all tested devices range from 0.165 (minimum) to 636 (maximum) ms. » 7 % of all devices are better. This means that the measured response time is better than the average of all tested devices (31 ms). | ||
Screen Flickering / PWM (Pulse-Width Modulation)
| Screen flickering / PWM detected | 250 Hz | ≤ 100 % brightness setting |  |
The display backlight flickers at 250 Hz (worst case, e.g., utilizing PWM) Flickering detected at a brightness setting of 100 % and below. There should be no flickering or PWM above this brightness setting. The frequency of 250 Hz is relatively low, so sensitive users will likely notice flickering and experience eyestrain at the stated brightness setting and below. In comparison: 52 % of all tested devices do not use PWM to dim the display. If PWM was detected, an average of 7754 (minimum: 5 - maximum: 343500) Hz was measured. | |||


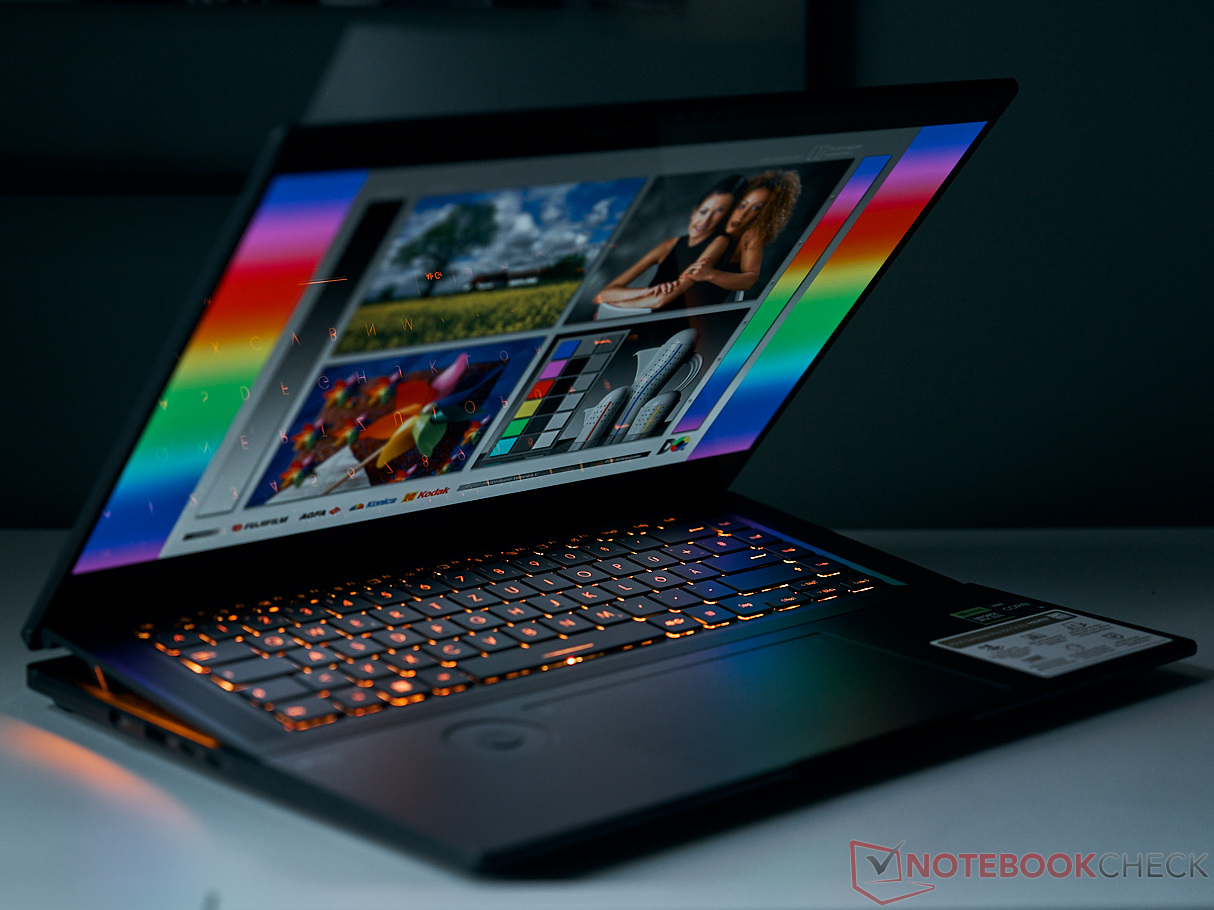
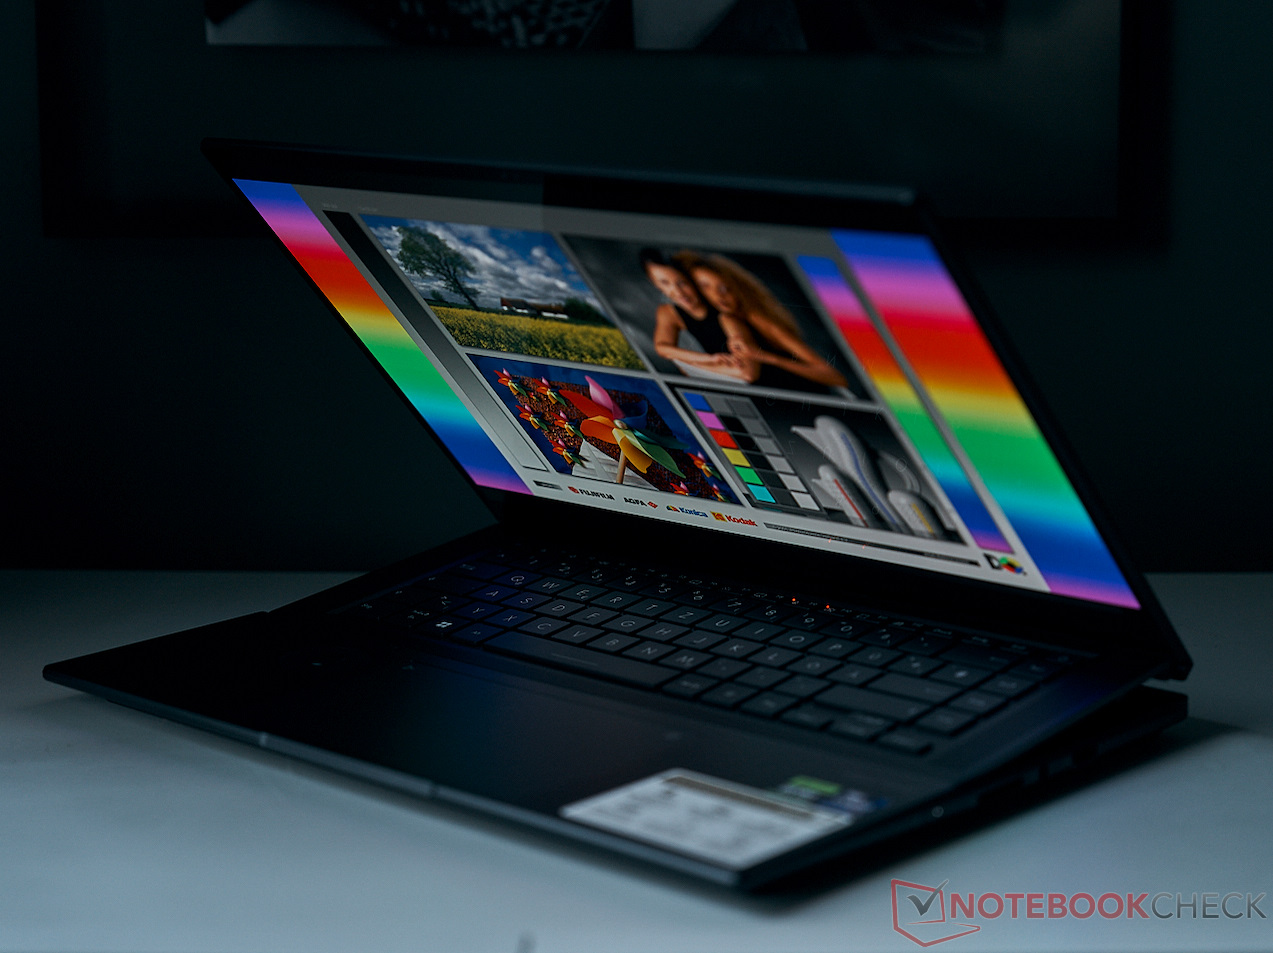
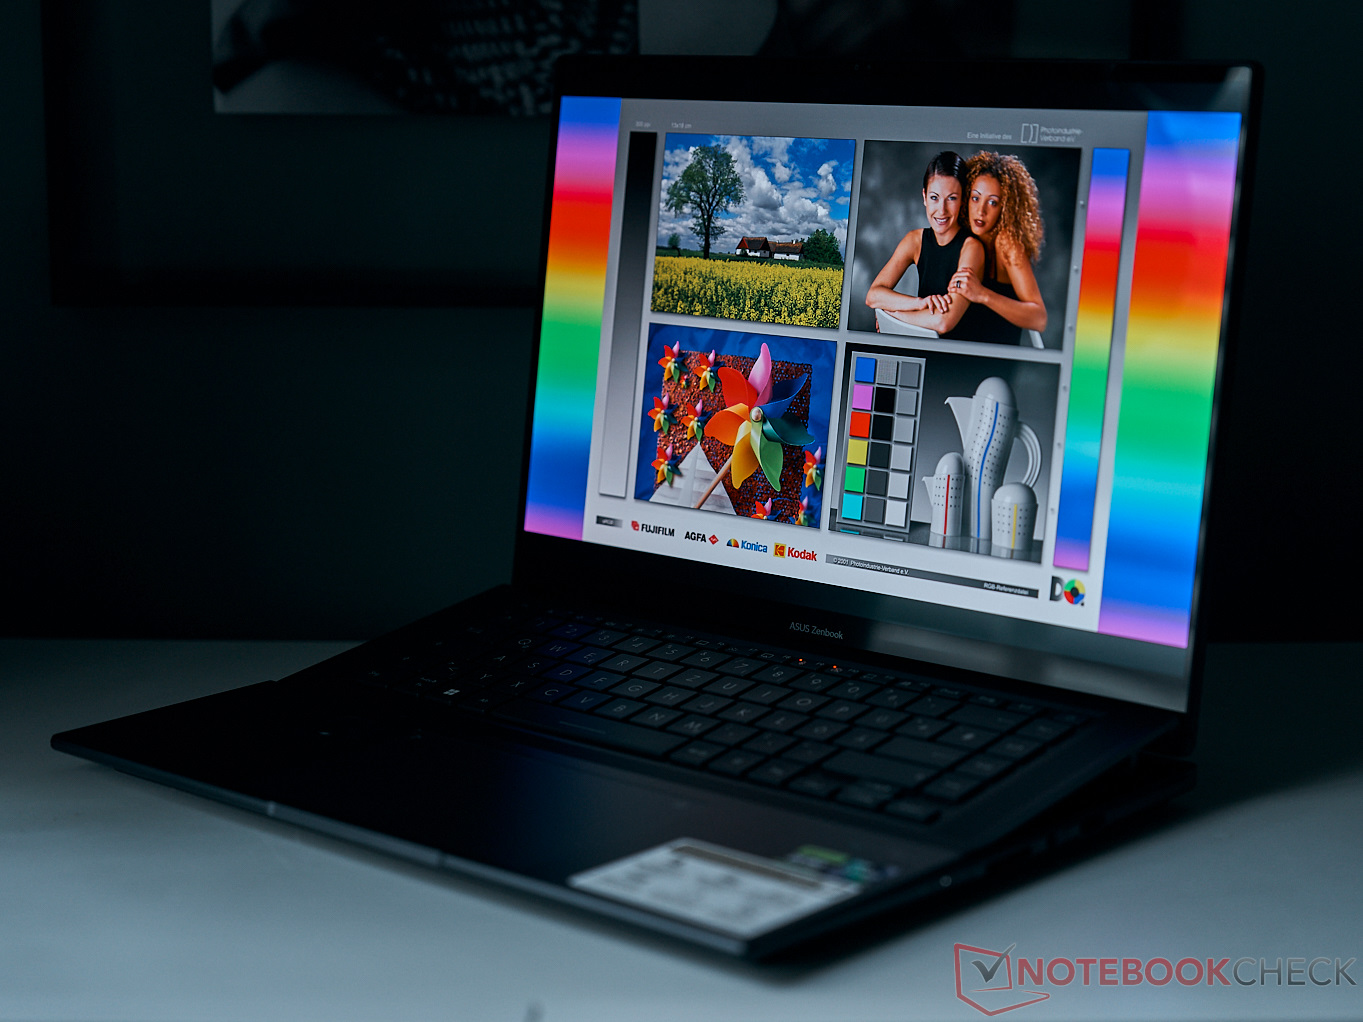
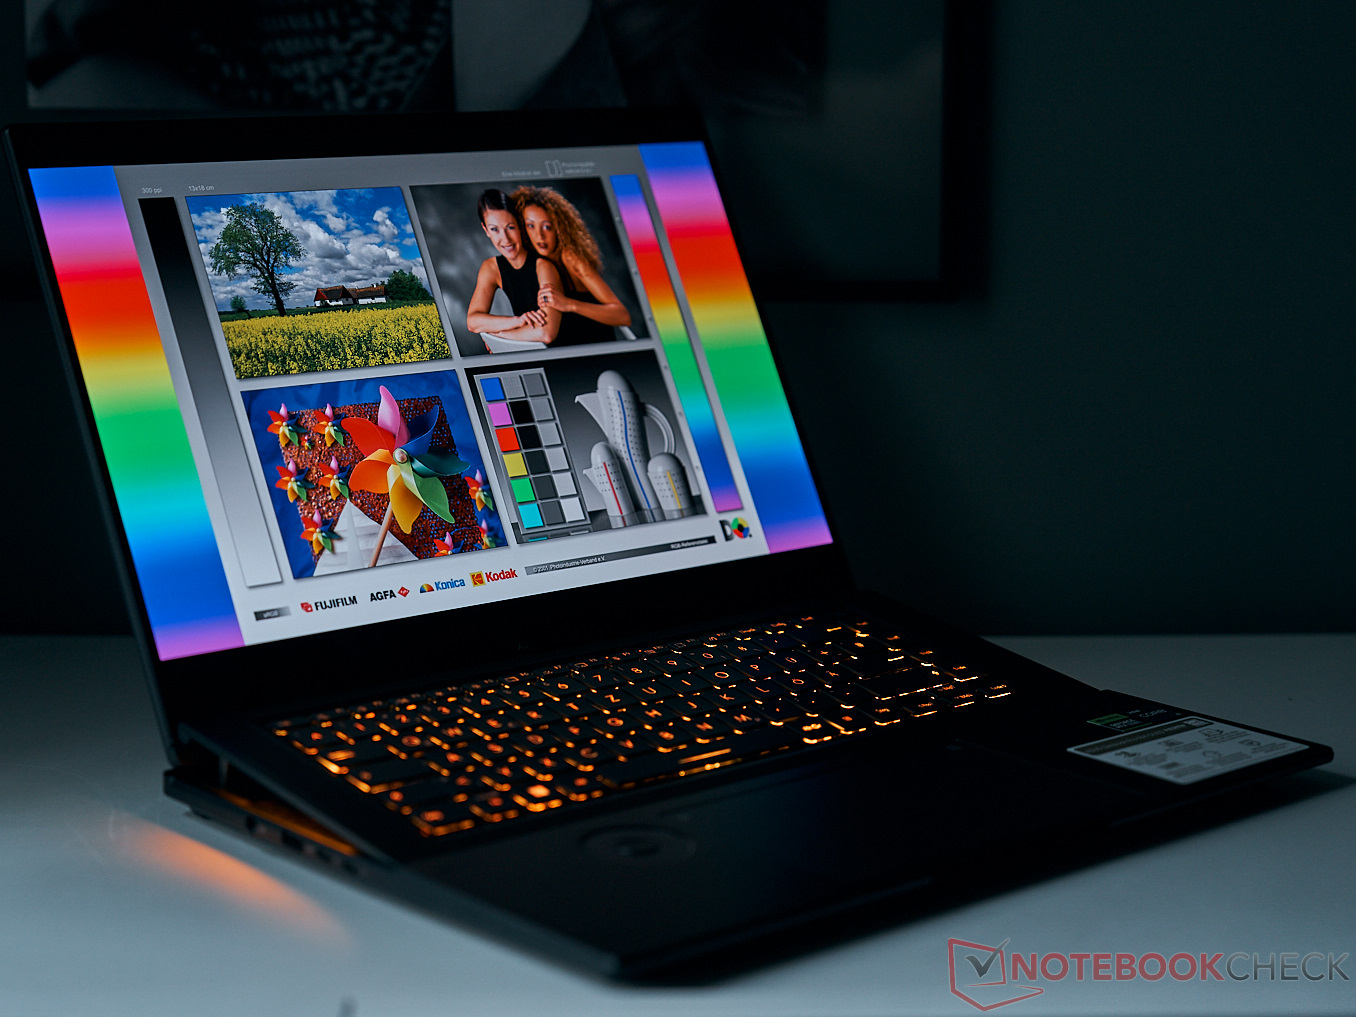
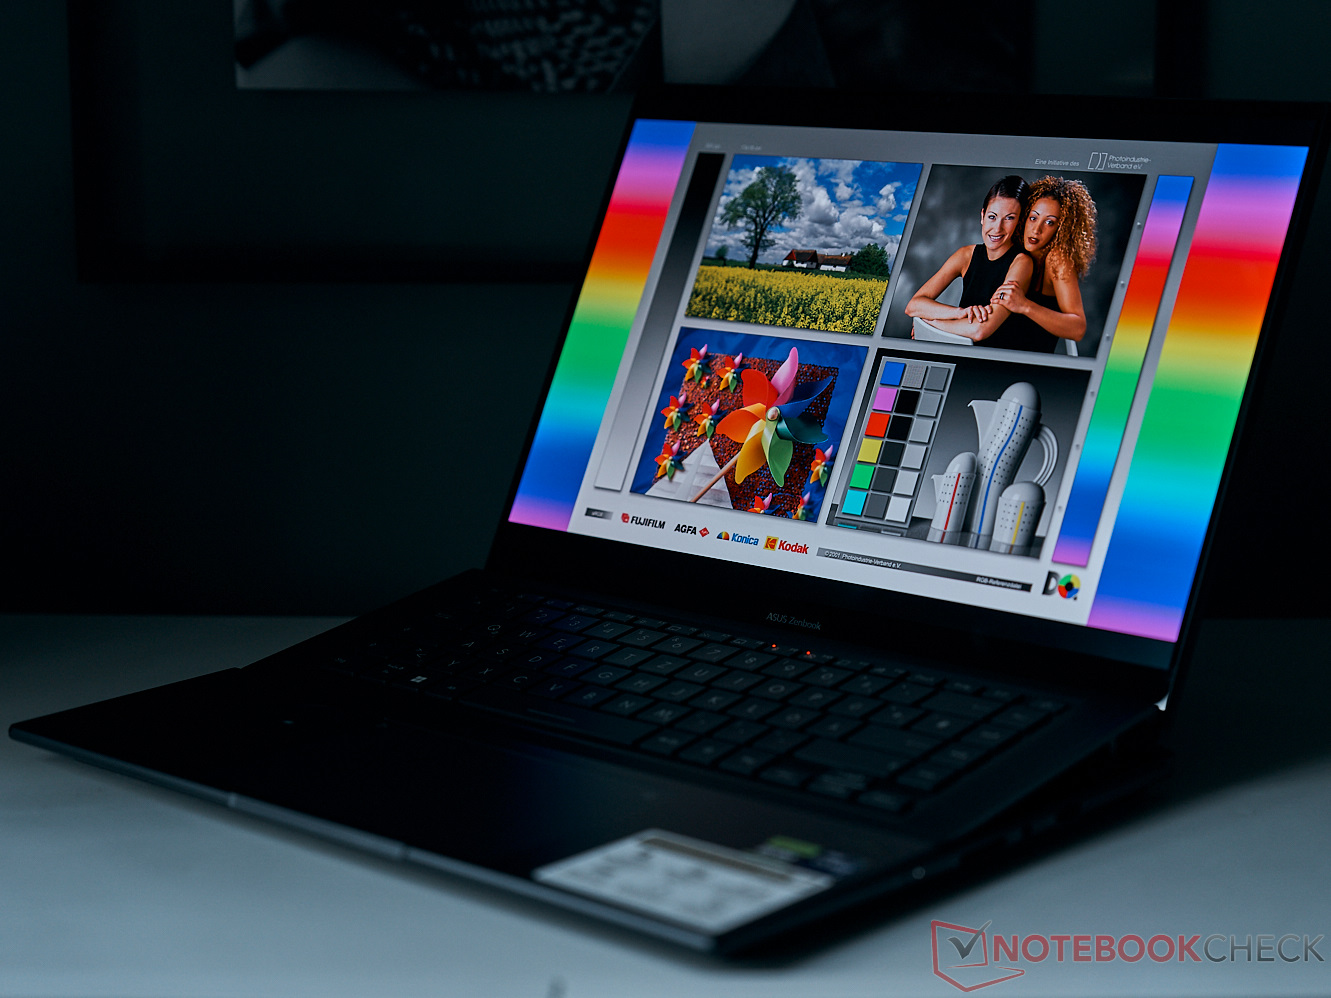
由于 OLED 显示屏具有良好的视角稳定性,因此即使在室外,也总能找到一个比较容易阅读的角度。但反光表面会带来一些问题,所以最好找个阴凉的地方。正如我们拍摄的视角照片所示,即使是键盘照明有时也足以在屏幕上产生清晰的反光。

性能 - 游戏笔记本电脑级别
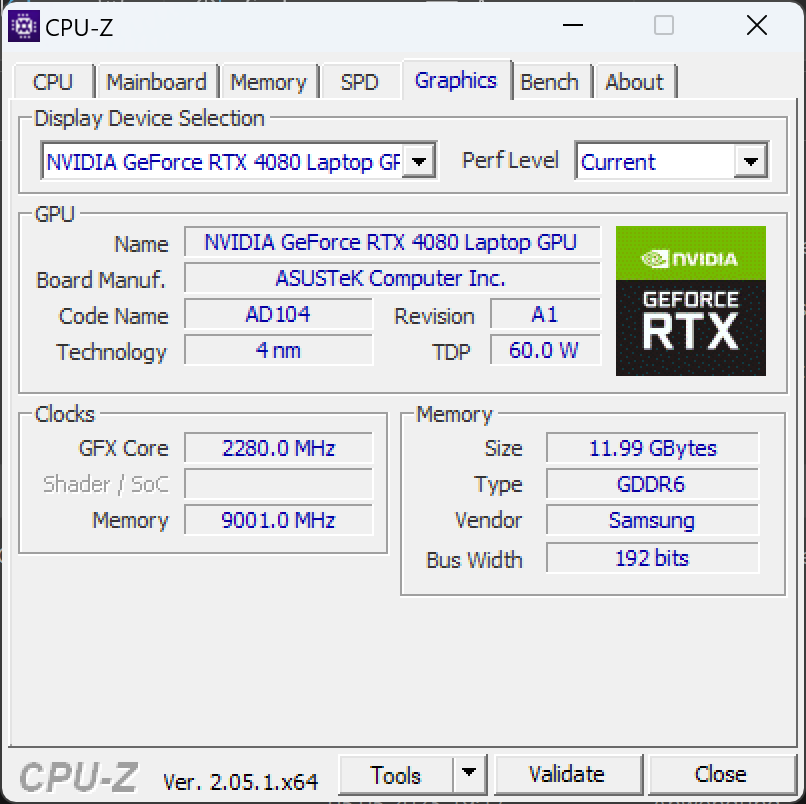
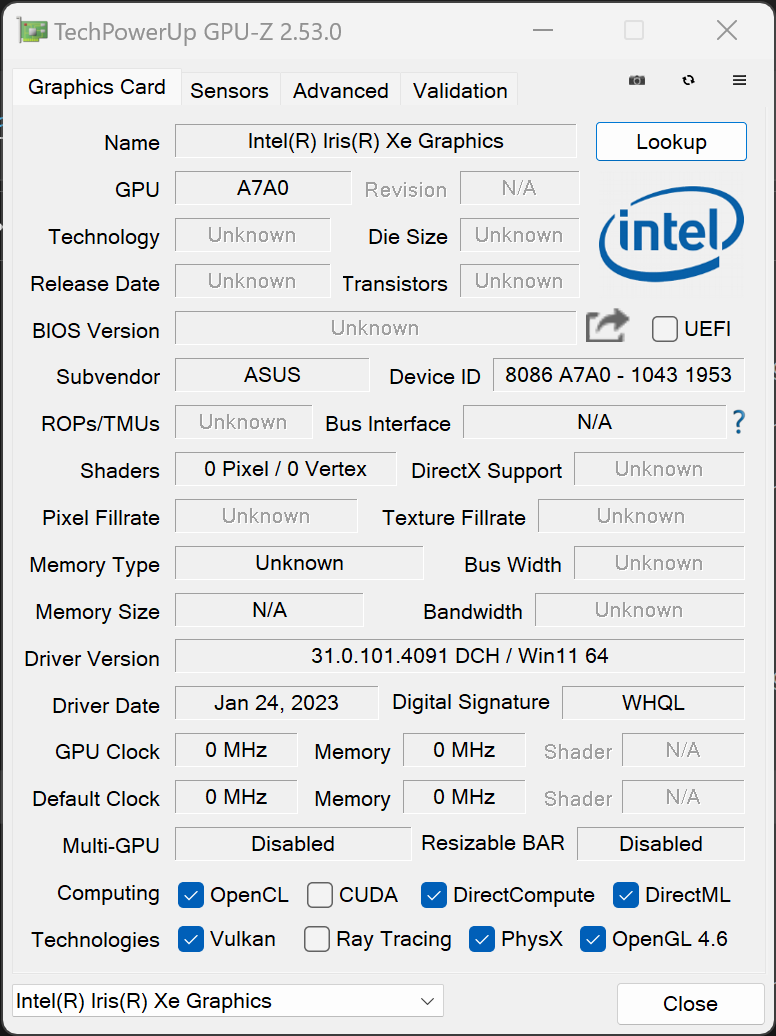
配备 NvidiaGeForce RTX 4080和 英特尔酷睿 i9-13905H今年的 Zenbook 在硬件方面有了显著提升。这款笔记本电脑的目标用户显然是内容创作者、游戏玩家和其他依赖超强硬件的用户。这款笔记本电脑的两颗芯片的功率超过 170 瓦,可以很好地协同工作。
测试条件
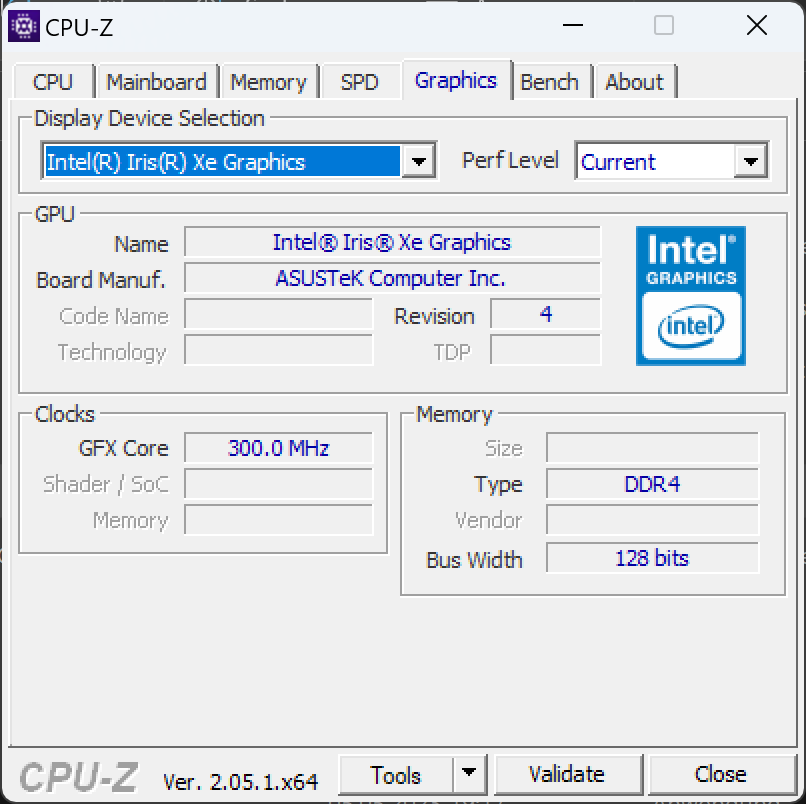
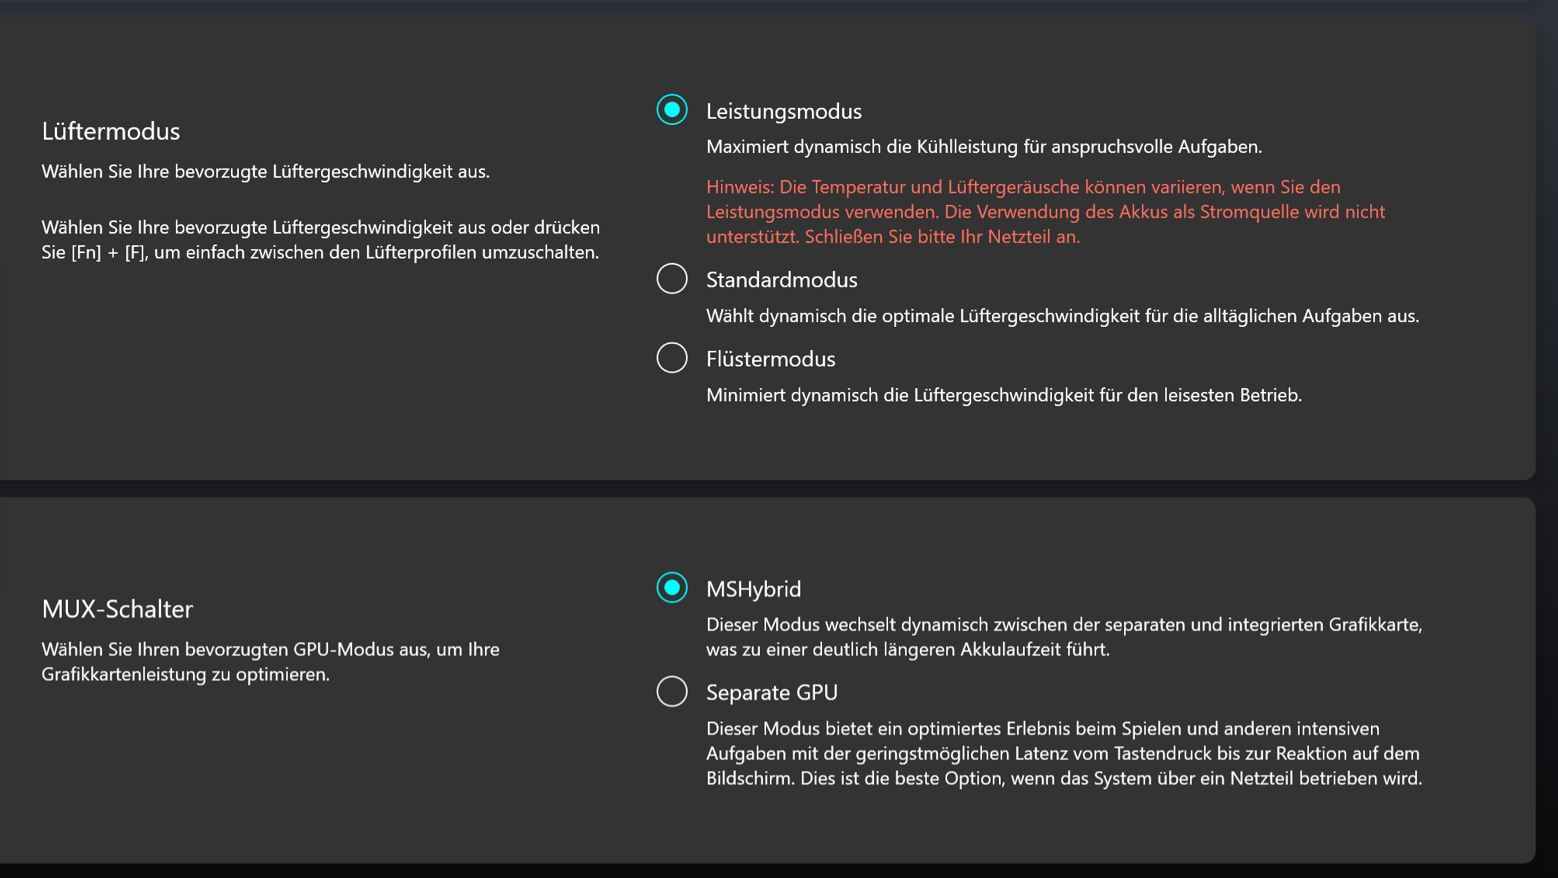
通过 MyAsus 应用程序可以切换三种不同的电源配置文件。我们决定使用 "性能 "模式,以便对硬件进行测试。不过,为了确保笔记本电脑在使用电池时尽可能经济,MSHybrid(混合动力)模式对两个显卡单元都保持激活状态。这样,Zenbook 就可以将RTX 4080用于要求不高的任务。在电池模式下,性能 模式不可用;笔记本电脑会自动切换到标准模式。
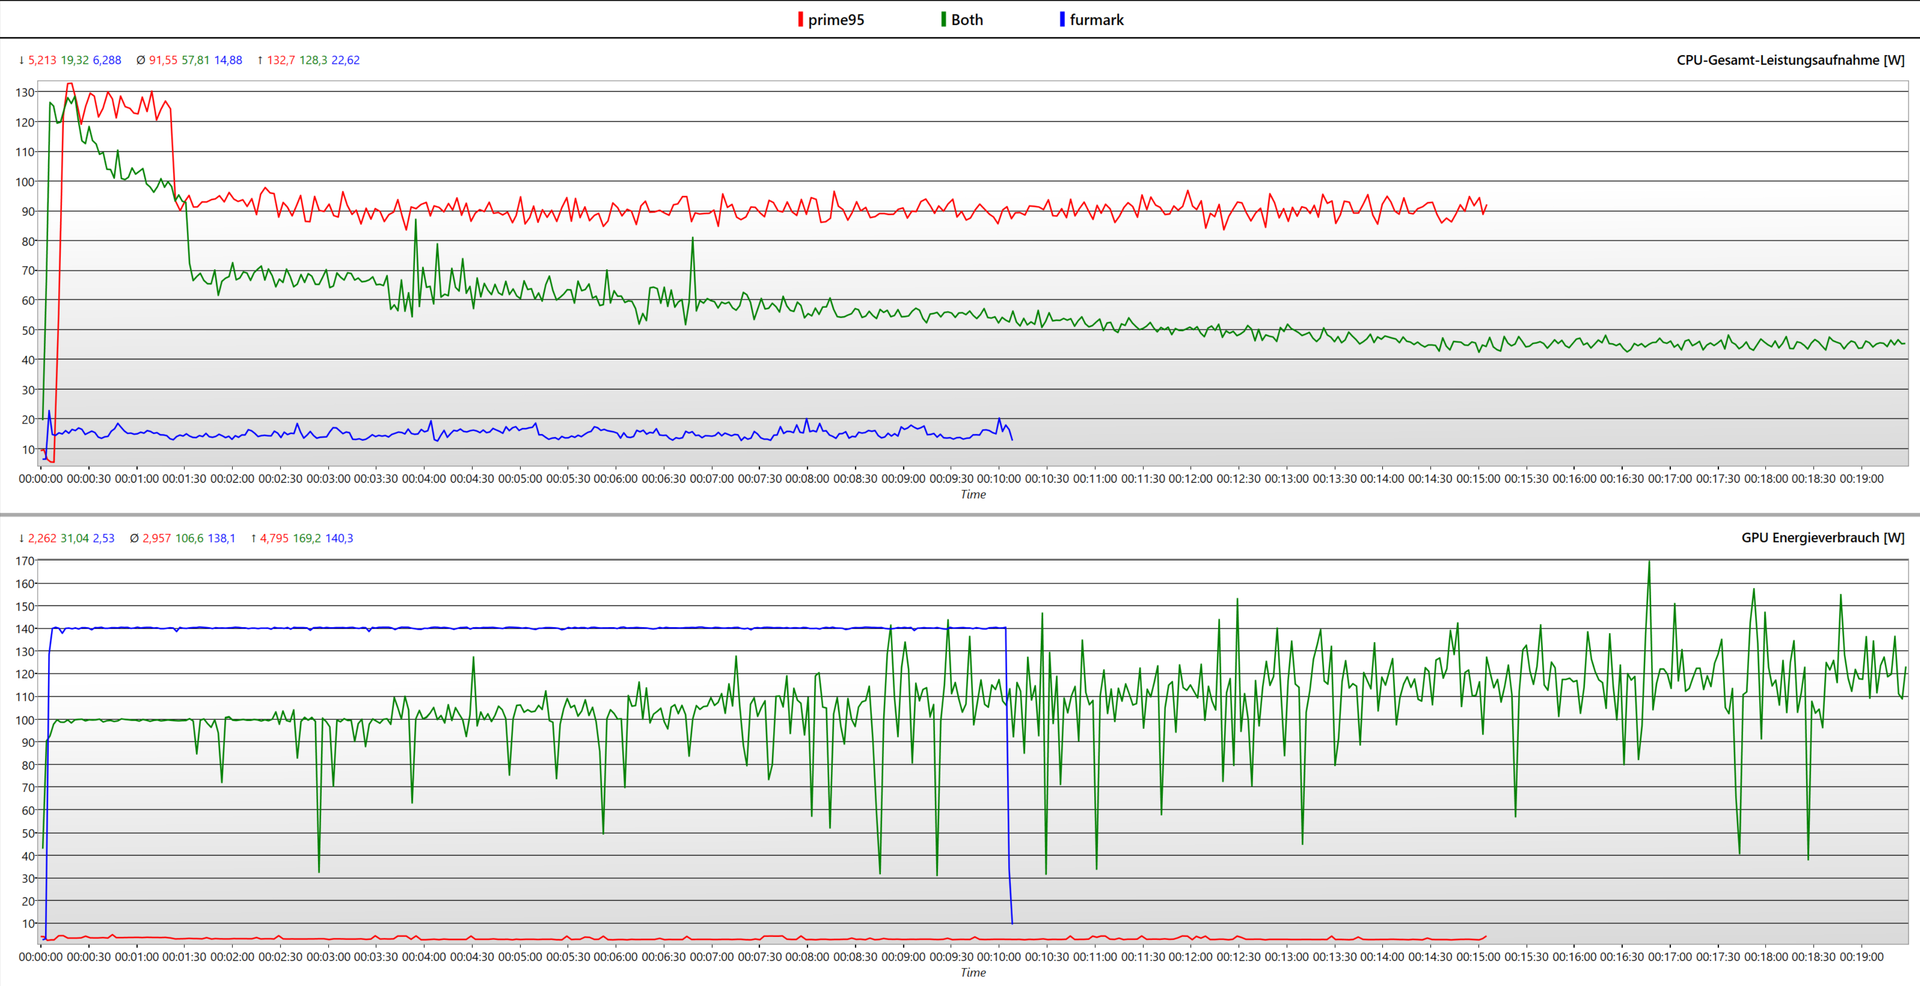
......(英文 RTX 4080的最大运行功耗始终为 140 瓦。英特尔酷睿 i9 的 PL2 为 130 瓦,PL1 为 90 瓦。在 Prime95 和 Furmark 压力测试中,我们看到处理器的持续运行功耗为 45 瓦,图形芯片为 117 瓦。
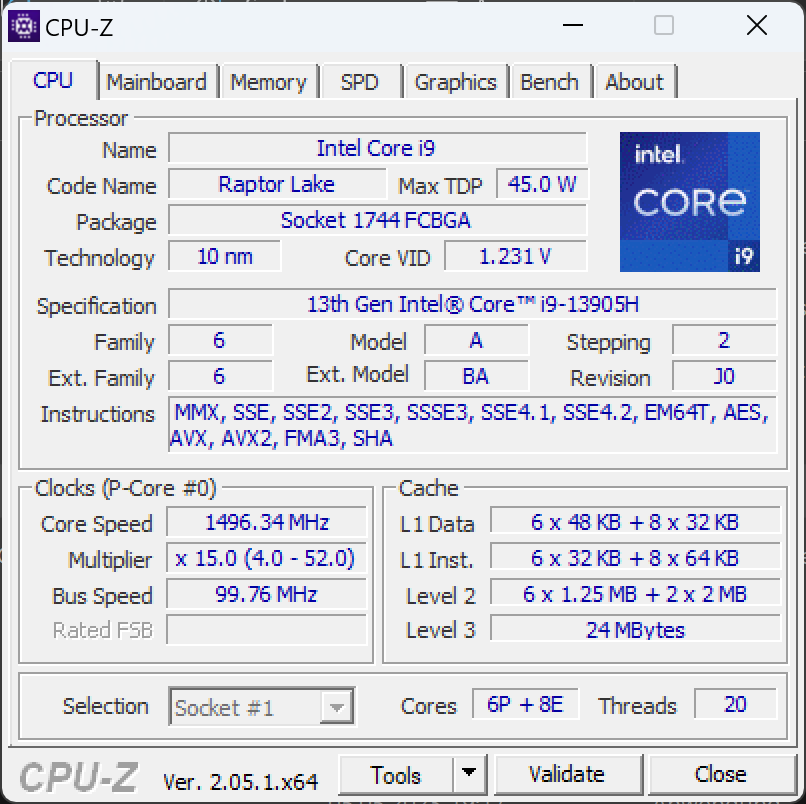
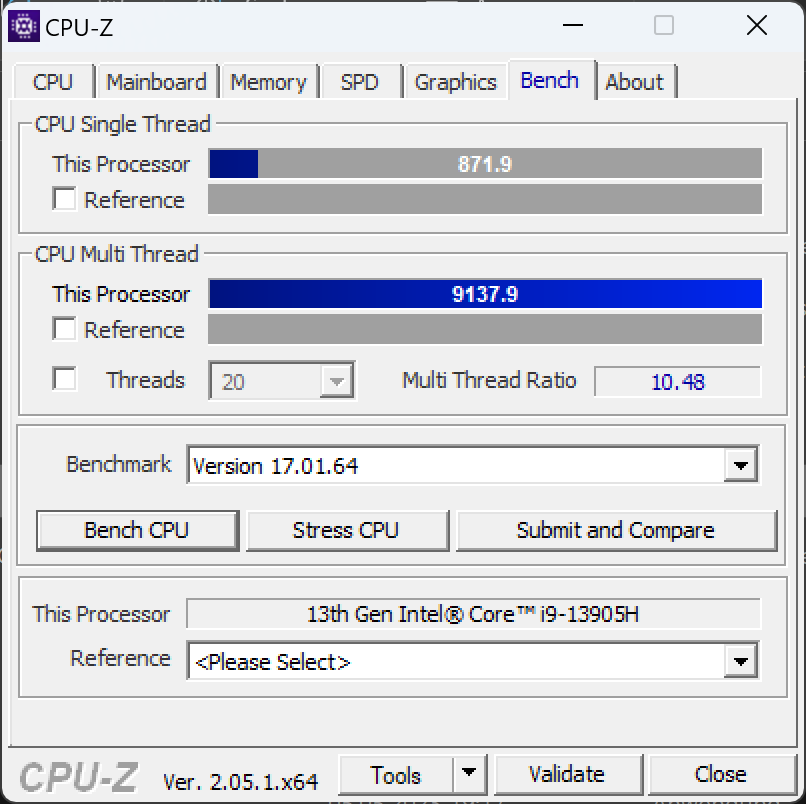
处理器
拥有 14 个内核英特尔酷睿 i9-13905H有 20 个线程。这意味着有 6 个 P 核心和 8 个 E 核心在高性能水平上工作。Zenbook 在性能方面处于领先地位,但竞争对手的设备也很强劲。争夺第一位置的是 联想Legion Pro 7和 华硕 ROG Strix G16以及更便宜的 华硕 Vivobook Pro 16X。目前的 Zenbook Pro 16X 与前代产品相比,性能优势并不明显。 在处理器性能方面在处理器性能方面,目前的 Zenbook Pro 16X 与前代产品相比并没有明显的性能优势。 酷睿 i9-13905H和 酷睿 i9-12900H的原始性能值过于接近。尽管如此,英特尔还是进行了一些优化,因此 Aida64 的通用基准测试显示了不同的情况。目前的机型在这里明显脱颖而出,仅次于上述三款竞争对手的设备。
在我们的基准测试中,最突出的一点是 Zenbook 并没有真正使用风扇。在 Cinebench R23 多核测试中,风扇很晚才开始工作,而在 Cinebench R15 循环测试中,只有在多次运行后才能获得最高分。在此过程中可能会损失一些性能。不过,在较短的负载高峰期和日常使用中,华硕笔记本电脑经常保持非常安静或完全静音。
Cinebench R15 Multi Sustained Load
Cinebench R23: Multi Core | Single Core
Cinebench R20: CPU (Multi Core) | CPU (Single Core)
Cinebench R15: CPU Multi 64Bit | CPU Single 64Bit
Blender: v2.79 BMW27 CPU
7-Zip 18.03: 7z b 4 | 7z b 4 -mmt1
Geekbench 5.5: Multi-Core | Single-Core
HWBOT x265 Benchmark v2.2: 4k Preset
LibreOffice : 20 Documents To PDF
R Benchmark 2.5: Overall mean
| CPU Performance rating | |
| Lenovo Legion Pro 7 RTX4090 | |
| Asus ROG Strix G16 G614JZ | |
| Asus Vivobook Pro 16X K6604JV-MX016W | |
| Average of class Gaming | |
| Lenovo Legion Slim 7i 16 Gen 8 -1! | |
| Asus ROG Zephyrus M16 GU604VY-NM042X | |
| MSI Stealth 17 Studio A13VH-014 | |
| Asus Zenbook Pro 16X UX7602BZ-MY005W | |
| Average Intel Core i9-13905H | |
| Asus ZenBook Pro 16X OLED UX7602ZM-ME115W | |
| Cinebench R23 / Multi Core | |
| Lenovo Legion Pro 7 RTX4090 | |
| Asus ROG Strix G16 G614JZ | |
| Asus Vivobook Pro 16X K6604JV-MX016W | |
| Average of class Gaming (10488 - 42661, n=107, last 2 years) | |
| MSI Stealth 17 Studio A13VH-014 | |
| Asus Zenbook Pro 16X UX7602BZ-MY005W | |
| Lenovo Legion Slim 7i 16 Gen 8 | |
| Asus ROG Zephyrus M16 GU604VY-NM042X | |
| Average Intel Core i9-13905H (17880 - 20237, n=3) | |
| Asus ZenBook Pro 16X OLED UX7602ZM-ME115W | |
| Cinebench R23 / Single Core | |
| Asus ROG Strix G16 G614JZ | |
| Lenovo Legion Pro 7 RTX4090 | |
| Asus Zenbook Pro 16X UX7602BZ-MY005W | |
| Lenovo Legion Slim 7i 16 Gen 8 | |
| Average of class Gaming (1166 - 2415, n=107, last 2 years) | |
| Asus ROG Zephyrus M16 GU604VY-NM042X | |
| Average Intel Core i9-13905H (1652 - 2030, n=3) | |
| Asus Vivobook Pro 16X K6604JV-MX016W | |
| Asus ZenBook Pro 16X OLED UX7602ZM-ME115W | |
| MSI Stealth 17 Studio A13VH-014 | |
| Cinebench R20 / CPU (Multi Core) | |
| Lenovo Legion Pro 7 RTX4090 | |
| Asus ROG Strix G16 G614JZ | |
| Asus Vivobook Pro 16X K6604JV-MX016W | |
| Average of class Gaming (4029 - 16433, n=106, last 2 years) | |
| MSI Stealth 17 Studio A13VH-014 | |
| Lenovo Legion Slim 7i 16 Gen 8 | |
| Asus ROG Zephyrus M16 GU604VY-NM042X | |
| Asus Zenbook Pro 16X UX7602BZ-MY005W | |
| Average Intel Core i9-13905H (6462 - 7469, n=3) | |
| Asus ZenBook Pro 16X OLED UX7602ZM-ME115W | |
| Cinebench R20 / CPU (Single Core) | |
| Asus ROG Strix G16 G614JZ | |
| Lenovo Legion Pro 7 RTX4090 | |
| Average of class Gaming (442 - 913, n=106, last 2 years) | |
| Lenovo Legion Slim 7i 16 Gen 8 | |
| Asus ROG Zephyrus M16 GU604VY-NM042X | |
| Asus Vivobook Pro 16X K6604JV-MX016W | |
| Asus ZenBook Pro 16X OLED UX7602ZM-ME115W | |
| Average Intel Core i9-13905H (622 - 775, n=3) | |
| MSI Stealth 17 Studio A13VH-014 | |
| Asus Zenbook Pro 16X UX7602BZ-MY005W | |
| Cinebench R15 / CPU Multi 64Bit | |
| Asus ROG Strix G16 G614JZ | |
| Asus ROG Strix G16 G614JZ | |
| Asus Vivobook Pro 16X K6604JV-MX016W | |
| Lenovo Legion Pro 7 RTX4090 | |
| Average of class Gaming (1578 - 6330, n=105, last 2 years) | |
| Asus ROG Zephyrus M16 GU604VY-NM042X | |
| MSI Stealth 17 Studio A13VH-014 | |
| Lenovo Legion Slim 7i 16 Gen 8 | |
| Asus Zenbook Pro 16X UX7602BZ-MY005W | |
| Average Intel Core i9-13905H (2676 - 2931, n=3) | |
| Asus ZenBook Pro 16X OLED UX7602ZM-ME115W | |
| Blender / v2.79 BMW27 CPU | |
| Asus ZenBook Pro 16X OLED UX7602ZM-ME115W | |
| Average Intel Core i9-13905H (163 - 178, n=3) | |
| Asus ROG Zephyrus M16 GU604VY-NM042X | |
| MSI Stealth 17 Studio A13VH-014 | |
| Asus Zenbook Pro 16X UX7602BZ-MY005W | |
| Average of class Gaming (79 - 330, n=104, last 2 years) | |
| Asus Vivobook Pro 16X K6604JV-MX016W | |
| Asus ROG Strix G16 G614JZ | |
| Lenovo Legion Pro 7 RTX4090 | |
| 7-Zip 18.03 / 7z b 4 -mmt1 | |
| Asus Vivobook Pro 16X K6604JV-MX016W | |
| Lenovo Legion Pro 7 RTX4090 | |
| Asus ROG Strix G16 G614JZ | |
| Average of class Gaming (4199 - 7436, n=105, last 2 years) | |
| Lenovo Legion Slim 7i 16 Gen 8 | |
| Asus ROG Zephyrus M16 GU604VY-NM042X | |
| MSI Stealth 17 Studio A13VH-014 | |
| Asus ZenBook Pro 16X OLED UX7602ZM-ME115W | |
| Asus Zenbook Pro 16X UX7602BZ-MY005W | |
| Average Intel Core i9-13905H (4871 - 6069, n=3) | |
| Geekbench 5.5 / Multi-Core | |
| Lenovo Legion Pro 7 RTX4090 | |
| Asus ROG Strix G16 G614JZ | |
| Asus Vivobook Pro 16X K6604JV-MX016W | |
| Average of class Gaming (6460 - 28263, n=105, last 2 years) | |
| Asus ROG Zephyrus M16 GU604VY-NM042X | |
| Average Intel Core i9-13905H (13661 - 14999, n=3) | |
| MSI Stealth 17 Studio A13VH-014 | |
| Asus Zenbook Pro 16X UX7602BZ-MY005W | |
| Asus ZenBook Pro 16X OLED UX7602ZM-ME115W | |
| Lenovo Legion Slim 7i 16 Gen 8 | |
| Geekbench 5.5 / Single-Core | |
| Average of class Gaming (986 - 2474, n=105, last 2 years) | |
| Asus ROG Strix G16 G614JZ | |
| MSI Stealth 17 Studio A13VH-014 | |
| Lenovo Legion Pro 7 RTX4090 | |
| Asus Vivobook Pro 16X K6604JV-MX016W | |
| Asus ROG Zephyrus M16 GU604VY-NM042X | |
| Lenovo Legion Slim 7i 16 Gen 8 | |
| Asus ZenBook Pro 16X OLED UX7602ZM-ME115W | |
| Average Intel Core i9-13905H (1672 - 1966, n=3) | |
| Asus Zenbook Pro 16X UX7602BZ-MY005W | |
| HWBOT x265 Benchmark v2.2 / 4k Preset | |
| Lenovo Legion Pro 7 RTX4090 | |
| Asus ROG Strix G16 G614JZ | |
| Average of class Gaming (11.5 - 44.4, n=105, last 2 years) | |
| Asus Vivobook Pro 16X K6604JV-MX016W | |
| MSI Stealth 17 Studio A13VH-014 | |
| Asus ROG Zephyrus M16 GU604VY-NM042X | |
| Lenovo Legion Slim 7i 16 Gen 8 | |
| Average Intel Core i9-13905H (20.5 - 22.9, n=3) | |
| Asus Zenbook Pro 16X UX7602BZ-MY005W | |
| Asus ZenBook Pro 16X OLED UX7602ZM-ME115W | |
| LibreOffice / 20 Documents To PDF | |
| Average Intel Core i9-13905H (42.8 - 94.8, n=3) | |
| MSI Stealth 17 Studio A13VH-014 | |
| Asus Vivobook Pro 16X K6604JV-MX016W | |
| Asus ROG Zephyrus M16 GU604VY-NM042X | |
| Average of class Gaming (33.2 - 88.8, n=105, last 2 years) | |
| Asus ROG Strix G16 G614JZ | |
| Asus Zenbook Pro 16X UX7602BZ-MY005W | |
| Lenovo Legion Pro 7 RTX4090 | |
| Asus ZenBook Pro 16X OLED UX7602ZM-ME115W | |
| Lenovo Legion Slim 7i 16 Gen 8 | |
| R Benchmark 2.5 / Overall mean | |
| Asus Zenbook Pro 16X UX7602BZ-MY005W | |
| Average Intel Core i9-13905H (0.4178 - 0.4974, n=3) | |
| Asus ZenBook Pro 16X OLED UX7602ZM-ME115W | |
| MSI Stealth 17 Studio A13VH-014 | |
| Average of class Gaming (0.3439 - 0.759, n=106, last 2 years) | |
| Lenovo Legion Slim 7i 16 Gen 8 | |
| Asus ROG Zephyrus M16 GU604VY-NM042X | |
| Asus Vivobook Pro 16X K6604JV-MX016W | |
| Lenovo Legion Pro 7 RTX4090 | |
| Asus ROG Strix G16 G614JZ | |
* ... smaller is better
AIDA64: FP32 Ray-Trace | FPU Julia | CPU SHA3 | CPU Queen | FPU SinJulia | FPU Mandel | CPU AES | CPU ZLib | FP64 Ray-Trace | CPU PhotoWorxx
| Performance rating | |
| Lenovo Legion Pro 7 RTX4090 | |
| Asus ROG Strix G16 G614JZ | |
| Average of class Gaming | |
| Asus Vivobook Pro 16X K6604JV-MX016W | |
| Asus Zenbook Pro 16X UX7602BZ-MY005W | |
| Asus ROG Zephyrus M16 GU604VY-NM042X | |
| MSI Stealth 17 Studio A13VH-014 | |
| Average Intel Core i9-13905H | |
| Lenovo Legion Slim 7i 16 Gen 8 | |
| Asus ZenBook Pro 16X OLED UX7602ZM-ME115W | |
| AIDA64 / FP32 Ray-Trace | |
| Average of class Gaming (10227 - 85542, n=105, last 2 years) | |
| Asus ROG Strix G16 G614JZ | |
| Lenovo Legion Pro 7 RTX4090 | |
| Asus Vivobook Pro 16X K6604JV-MX016W | |
| Asus Zenbook Pro 16X UX7602BZ-MY005W | |
| MSI Stealth 17 Studio A13VH-014 | |
| Asus ROG Zephyrus M16 GU604VY-NM042X | |
| Average Intel Core i9-13905H (17642 - 19900, n=3) | |
| Lenovo Legion Slim 7i 16 Gen 8 | |
| Asus ZenBook Pro 16X OLED UX7602ZM-ME115W | |
| AIDA64 / FPU SinJulia | |
| Asus ROG Strix G16 G614JZ | |
| Lenovo Legion Pro 7 RTX4090 | |
| Average of class Gaming (4424 - 33636, n=105, last 2 years) | |
| Asus Vivobook Pro 16X K6604JV-MX016W | |
| Asus ROG Zephyrus M16 GU604VY-NM042X | |
| Lenovo Legion Slim 7i 16 Gen 8 | |
| Average Intel Core i9-13905H (10478 - 11328, n=3) | |
| MSI Stealth 17 Studio A13VH-014 | |
| Asus Zenbook Pro 16X UX7602BZ-MY005W | |
| Asus ZenBook Pro 16X OLED UX7602ZM-ME115W | |
| AIDA64 / FP64 Ray-Trace | |
| Average of class Gaming (5509 - 45446, n=105, last 2 years) | |
| Asus ROG Strix G16 G614JZ | |
| Lenovo Legion Pro 7 RTX4090 | |
| Asus Vivobook Pro 16X K6604JV-MX016W | |
| Asus Zenbook Pro 16X UX7602BZ-MY005W | |
| MSI Stealth 17 Studio A13VH-014 | |
| Asus ROG Zephyrus M16 GU604VY-NM042X | |
| Average Intel Core i9-13905H (9483 - 10804, n=3) | |
| Lenovo Legion Slim 7i 16 Gen 8 | |
| Asus ZenBook Pro 16X OLED UX7602ZM-ME115W | |
| AIDA64 / CPU PhotoWorxx | |
| Asus Zenbook Pro 16X UX7602BZ-MY005W | |
| Average Intel Core i9-13905H (51720 - 60161, n=3) | |
| Lenovo Legion Pro 7 RTX4090 | |
| MSI Stealth 17 Studio A13VH-014 | |
| Asus ROG Zephyrus M16 GU604VY-NM042X | |
| Asus ZenBook Pro 16X OLED UX7602ZM-ME115W | |
| Average of class Gaming (12271 - 89891, n=105, last 2 years) | |
| Asus Vivobook Pro 16X K6604JV-MX016W | |
| Asus ROG Strix G16 G614JZ | |
| Lenovo Legion Slim 7i 16 Gen 8 | |
系统性能
新款 Zenbook Pro 16X 配备了更强大的显卡和至少相当的处理器,因此在 PCMark 10 和 CrossMark 基准测试中的表现应该远远好于前代产品。我们还期待它在 AIDA64 内存基准测试中取得明显领先。但是,尽管内存芯片的路径缩短了,内存延迟却几乎没有降低。只有内存的写入和复制速度明显受益于新的 SoM 设计。
结果表明,RTX 4080 在数字内容创建子领域的得分显著提高。与前代产品相比,PCMark10 中其他子区域的分数也有小幅提升。与华硕 ROG Zephyrus M16或 联想Legion Pro 7的 RTX 4090显示,在这些基准测试中,名义上更强的显卡几乎没有任何优势。18 毫米薄的封闭式机箱似乎很难影响笔记本的极限性能,但另一个因素确实如此:Zenbook Pro 16X 的风扇和电源控制对负载变化的反应非常缓慢。这一事实在长期的 Cinebench R15 测试中已经显现出来。预热 "系统偶尔会比刚启动的笔记本电脑性能更高。不过,这终究是小题大做,因为华硕 Zenbook Pro 16X 是一款性能极高的笔记本电脑,可以轻松处理 PhotoShop 或 Premiere Pro。
CrossMark: Overall | Productivity | Creativity | Responsiveness
WebXPRT 4: Overall
| PCMark 10 / Score | |
| Lenovo Legion Slim 7i 16 Gen 8 | |
| Average of class Gaming (5828 - 12414, n=93, last 2 years) | |
| Asus ROG Zephyrus M16 GU604VY-NM042X | |
| Lenovo Legion Pro 7 RTX4090 | |
| Asus Zenbook Pro 16X UX7602BZ-MY005W | |
| Average Intel Core i9-13905H, NVIDIA GeForce RTX 4080 Laptop GPU (n=1) | |
| MSI Stealth 17 Studio A13VH-014 | |
| Asus ZenBook Pro 16X OLED UX7602ZM-ME115W | |
| Asus ROG Strix G16 G614JZ | |
| Asus Vivobook Pro 16X K6604JV-MX016W | |
| PCMark 10 / Essentials | |
| Asus ROG Strix G16 G614JZ | |
| Asus ROG Zephyrus M16 GU604VY-NM042X | |
| Asus Zenbook Pro 16X UX7602BZ-MY005W | |
| Average Intel Core i9-13905H, NVIDIA GeForce RTX 4080 Laptop GPU (n=1) | |
| Lenovo Legion Slim 7i 16 Gen 8 | |
| Lenovo Legion Pro 7 RTX4090 | |
| Asus ZenBook Pro 16X OLED UX7602ZM-ME115W | |
| Average of class Gaming (8810 - 11935, n=97, last 2 years) | |
| Asus Vivobook Pro 16X K6604JV-MX016W | |
| MSI Stealth 17 Studio A13VH-014 | |
| PCMark 10 / Productivity | |
| Average of class Gaming (6845 - 25323, n=95, last 2 years) | |
| Asus ROG Zephyrus M16 GU604VY-NM042X | |
| Lenovo Legion Slim 7i 16 Gen 8 | |
| Asus Zenbook Pro 16X UX7602BZ-MY005W | |
| Average Intel Core i9-13905H, NVIDIA GeForce RTX 4080 Laptop GPU (n=1) | |
| Asus ZenBook Pro 16X OLED UX7602ZM-ME115W | |
| MSI Stealth 17 Studio A13VH-014 | |
| Lenovo Legion Pro 7 RTX4090 | |
| Asus Vivobook Pro 16X K6604JV-MX016W | |
| Asus ROG Strix G16 G614JZ | |
| PCMark 10 / Digital Content Creation | |
| Lenovo Legion Pro 7 RTX4090 | |
| Average of class Gaming (7602 - 19954, n=95, last 2 years) | |
| Lenovo Legion Slim 7i 16 Gen 8 | |
| Asus Zenbook Pro 16X UX7602BZ-MY005W | |
| Average Intel Core i9-13905H, NVIDIA GeForce RTX 4080 Laptop GPU (n=1) | |
| Asus ROG Zephyrus M16 GU604VY-NM042X | |
| MSI Stealth 17 Studio A13VH-014 | |
| Asus ROG Strix G16 G614JZ | |
| Asus ZenBook Pro 16X OLED UX7602ZM-ME115W | |
| Asus Vivobook Pro 16X K6604JV-MX016W | |
| CrossMark / Overall | |
| Asus ROG Strix G16 G614JZ | |
| Asus Vivobook Pro 16X K6604JV-MX016W | |
| Asus Zenbook Pro 16X UX7602BZ-MY005W | |
| Average Intel Core i9-13905H, NVIDIA GeForce RTX 4080 Laptop GPU (n=1) | |
| Average of class Gaming (1366 - 2409, n=94, last 2 years) | |
| Lenovo Legion Slim 7i 16 Gen 8 | |
| Asus ROG Zephyrus M16 GU604VY-NM042X | |
| Asus ZenBook Pro 16X OLED UX7602ZM-ME115W | |
| MSI Stealth 17 Studio A13VH-014 | |
| CrossMark / Productivity | |
| Asus ROG Strix G16 G614JZ | |
| Asus Vivobook Pro 16X K6604JV-MX016W | |
| Lenovo Legion Slim 7i 16 Gen 8 | |
| Average of class Gaming (1386 - 2254, n=94, last 2 years) | |
| Asus ROG Zephyrus M16 GU604VY-NM042X | |
| Asus Zenbook Pro 16X UX7602BZ-MY005W | |
| Average Intel Core i9-13905H, NVIDIA GeForce RTX 4080 Laptop GPU (n=1) | |
| Asus ZenBook Pro 16X OLED UX7602ZM-ME115W | |
| MSI Stealth 17 Studio A13VH-014 | |
| CrossMark / Creativity | |
| Asus ROG Strix G16 G614JZ | |
| Asus Vivobook Pro 16X K6604JV-MX016W | |
| Asus Zenbook Pro 16X UX7602BZ-MY005W | |
| Average Intel Core i9-13905H, NVIDIA GeForce RTX 4080 Laptop GPU (n=1) | |
| Average of class Gaming (1343 - 2786, n=94, last 2 years) | |
| Asus ROG Zephyrus M16 GU604VY-NM042X | |
| Lenovo Legion Slim 7i 16 Gen 8 | |
| Asus ZenBook Pro 16X OLED UX7602ZM-ME115W | |
| MSI Stealth 17 Studio A13VH-014 | |
| CrossMark / Responsiveness | |
| Asus ROG Strix G16 G614JZ | |
| Lenovo Legion Slim 7i 16 Gen 8 | |
| Average of class Gaming (1226 - 2334, n=94, last 2 years) | |
| Asus ROG Zephyrus M16 GU604VY-NM042X | |
| Asus Vivobook Pro 16X K6604JV-MX016W | |
| Asus Zenbook Pro 16X UX7602BZ-MY005W | |
| Average Intel Core i9-13905H, NVIDIA GeForce RTX 4080 Laptop GPU (n=1) | |
| MSI Stealth 17 Studio A13VH-014 | |
| Asus ZenBook Pro 16X OLED UX7602ZM-ME115W | |
| WebXPRT 4 / Overall | |
| Asus ROG Strix G16 G614JZ | |
| Asus ROG Zephyrus M16 GU604VY-NM042X | |
| Lenovo Legion Slim 7i 16 Gen 8 | |
| Average of class Gaming (165 - 354, n=98, last 2 years) | |
| Lenovo Legion Pro 7 RTX4090 | |
| Asus ZenBook Pro 16X OLED UX7602ZM-ME115W | |
| Asus Vivobook Pro 16X K6604JV-MX016W | |
| Asus Zenbook Pro 16X UX7602BZ-MY005W | |
| Average Intel Core i9-13905H, NVIDIA GeForce RTX 4080 Laptop GPU (n=1) | |
| MSI Stealth 17 Studio A13VH-014 | |
| PCMark 10 Score | 8033 points | |
Help | ||
| AIDA64 / Memory Write | |
| Asus Zenbook Pro 16X UX7602BZ-MY005W | |
| Average Intel Core i9-13905H (89545 - 103259, n=3) | |
| Lenovo Legion Pro 7 RTX4090 | |
| Average of class Gaming (22297 - 135096, n=105, last 2 years) | |
| MSI Stealth 17 Studio A13VH-014 | |
| Asus ROG Zephyrus M16 GU604VY-NM042X | |
| Asus Vivobook Pro 16X K6604JV-MX016W | |
| Asus ZenBook Pro 16X OLED UX7602ZM-ME115W | |
| Asus ROG Strix G16 G614JZ | |
| Lenovo Legion Slim 7i 16 Gen 8 | |
| AIDA64 / Memory Latency | |
| Average Intel Core i9-13905H (101.4 - 134.8, n=3) | |
| Asus ZenBook Pro 16X OLED UX7602ZM-ME115W | |
| Average of class Gaming (75.3 - 259, n=105, last 2 years) | |
| Asus Zenbook Pro 16X UX7602BZ-MY005W | |
| MSI Stealth 17 Studio A13VH-014 | |
| Asus Vivobook Pro 16X K6604JV-MX016W | |
| Asus ROG Zephyrus M16 GU604VY-NM042X | |
| Asus ROG Strix G16 G614JZ | |
| Lenovo Legion Pro 7 RTX4090 | |
| Lenovo Legion Slim 7i 16 Gen 8 | |
* ... smaller is better
DPC 延迟
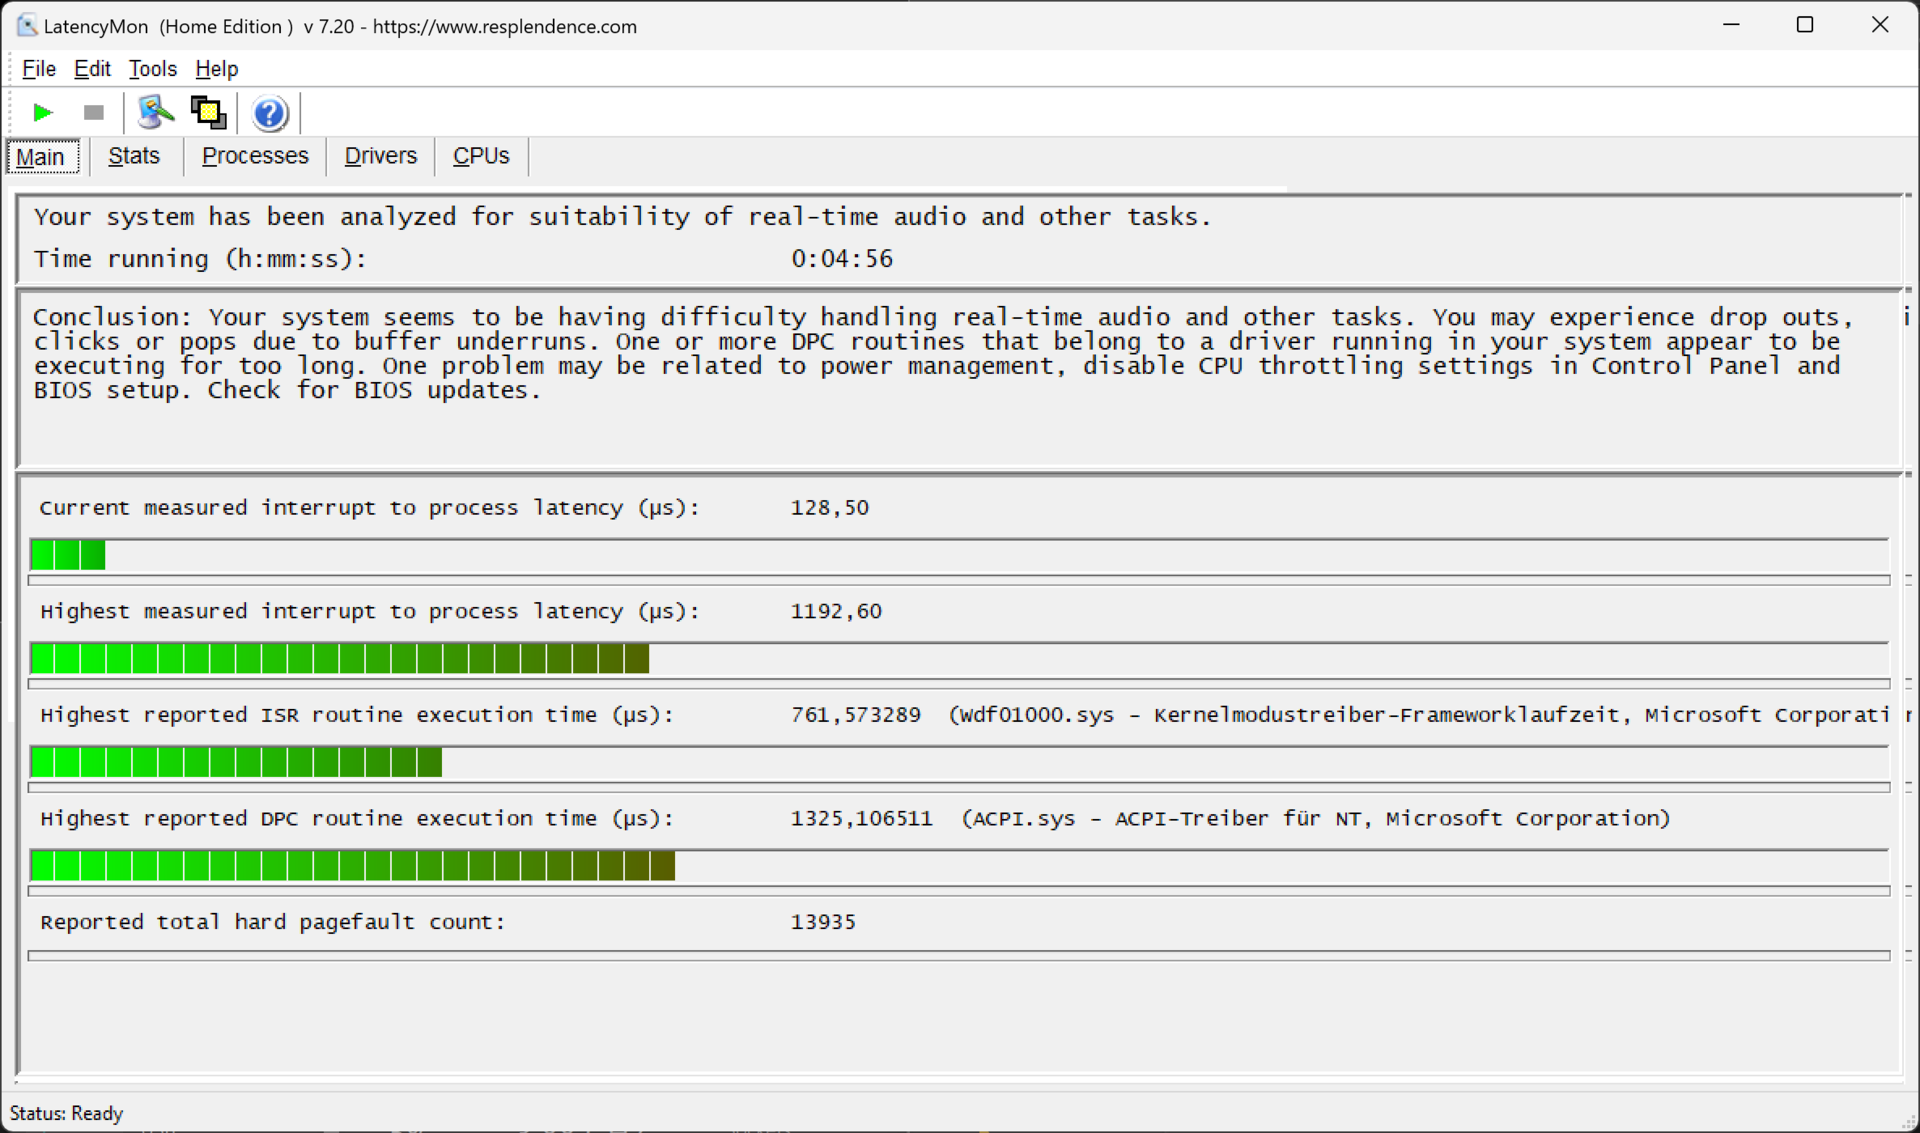
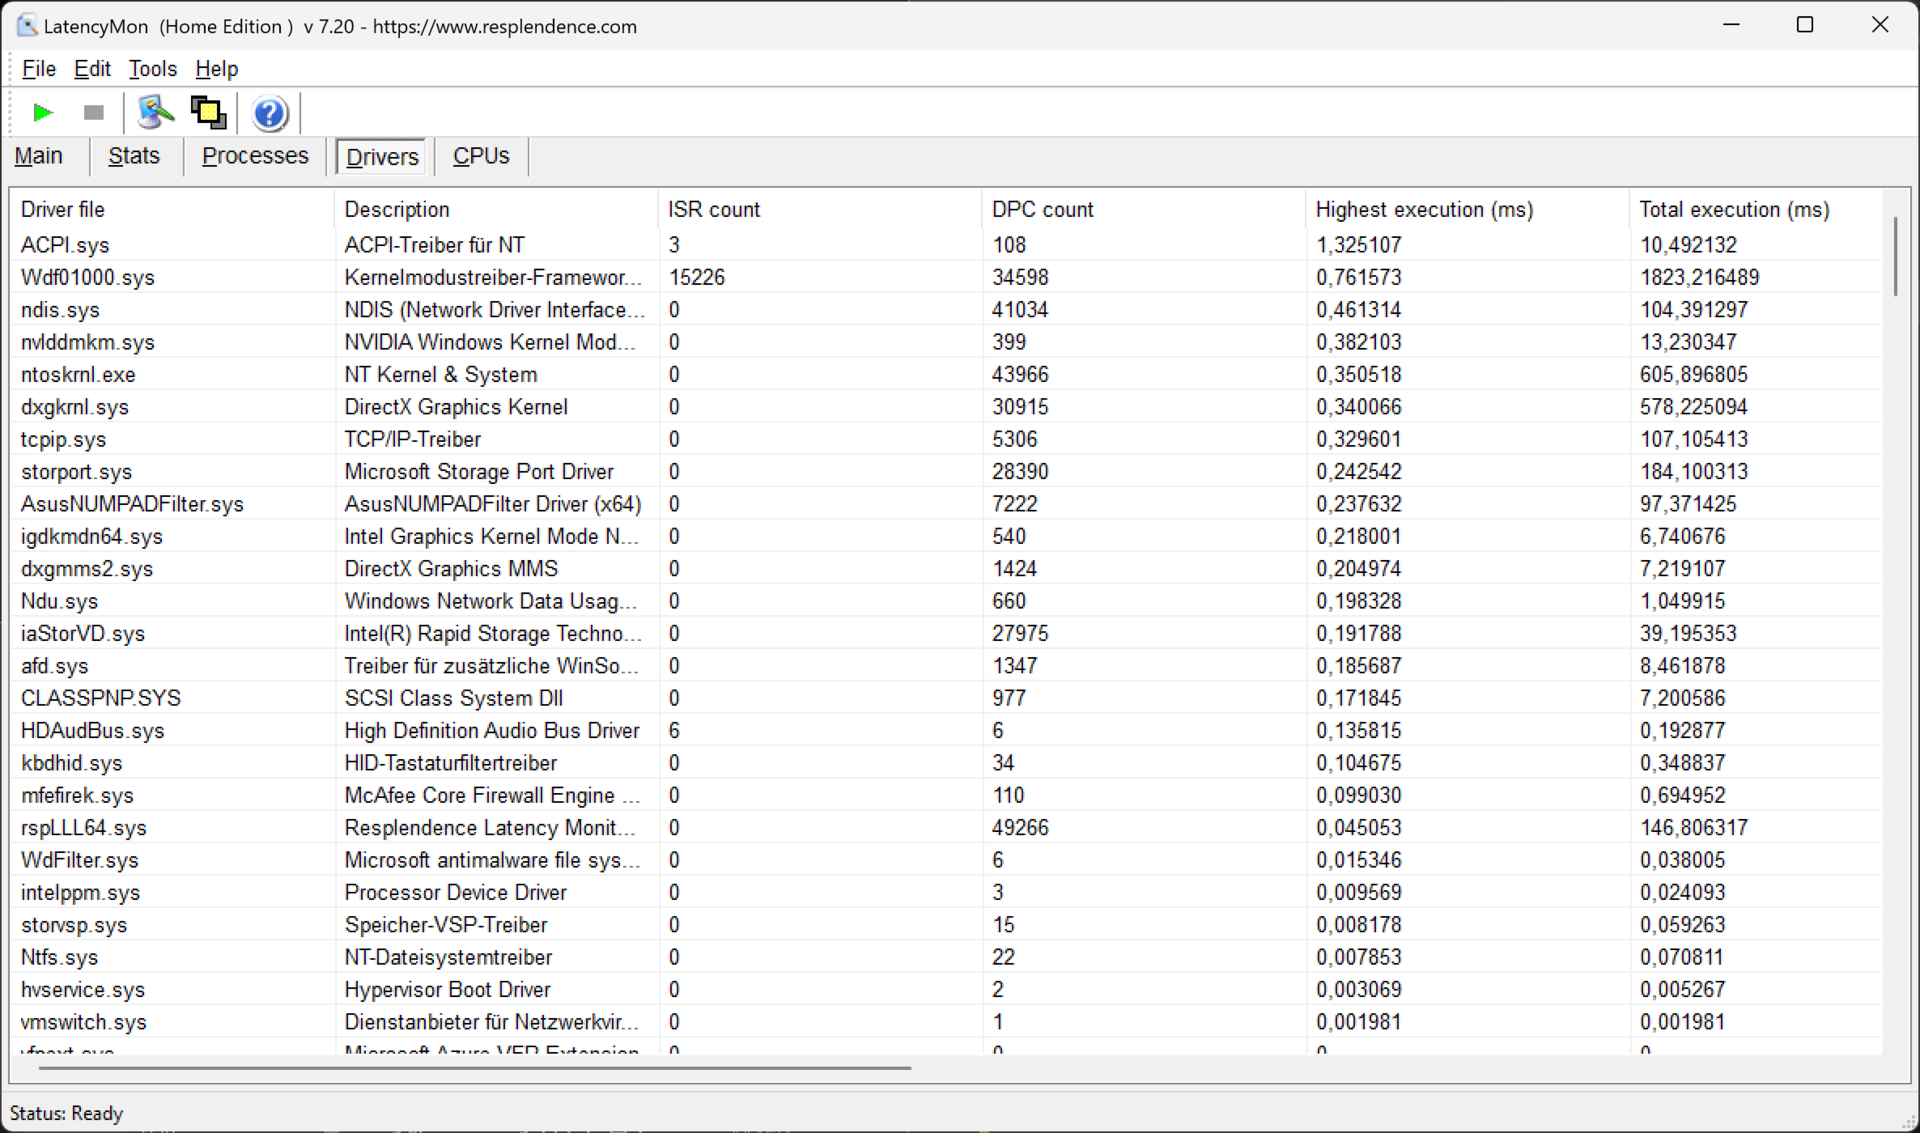
在延迟方面,与竞争对手相比,Zenbook Pro 16X 的表现相当不错。但是,即使是 1164 µs,LatencyMon 仍然指出实时应用程序可能会出现问题。归根结底,当前的驱动程序配置和设备固件对 DPC 延迟起着决定性作用。通过更新,两者都可能发生重大变化。
| DPC Latencies / LatencyMon - interrupt to process latency (max), Web, Youtube, Prime95 | |
| Lenovo Legion Pro 7 RTX4090 | |
| Lenovo Legion Slim 7i 16 Gen 8 | |
| Asus ROG Zephyrus M16 GU604VY-NM042X | |
| MSI Stealth 17 Studio A13VH-014 | |
| Asus ROG Strix G16 G614JZ | |
| Asus Vivobook Pro 16X K6604JV-MX016W | |
| Asus Zenbook Pro 16X UX7602BZ-MY005W | |
| Asus ZenBook Pro 16X OLED UX7602ZM-ME115W | |
* ... smaller is better
存储设备
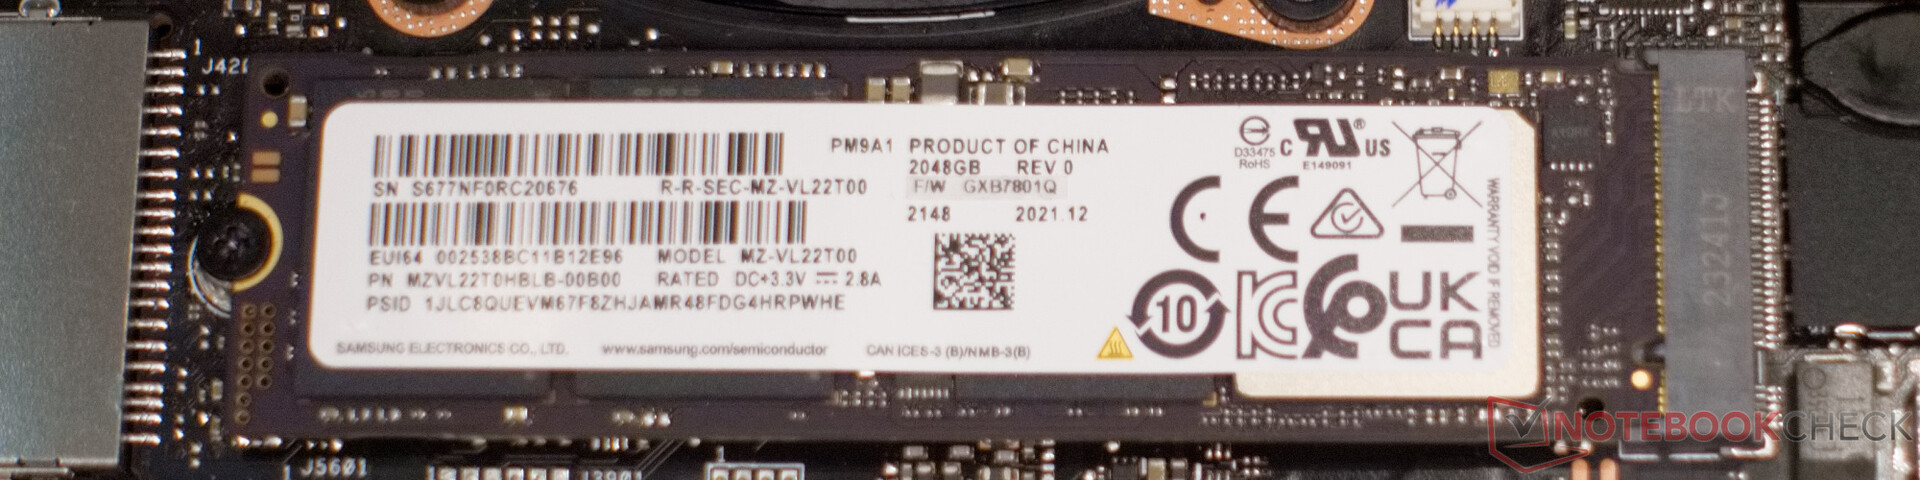
从原理上讲,三星 PM9A1 是一款功能强大的 NVMe 固态硬盘。我们的测试设备安装了一个容量为 2 TB 的模块。在我们的测试中,所有读取和写入速度都不错,尽管我们注意到 4K 写入速度与其他笔记本电脑相比略有下降。在顺序读取和写入方面,固态硬盘的表现也非常出色,没有出现任何掉速现象。

* ... smaller is better
Sustained read performance: DiskSpd Read Loop, Queue Depth 8
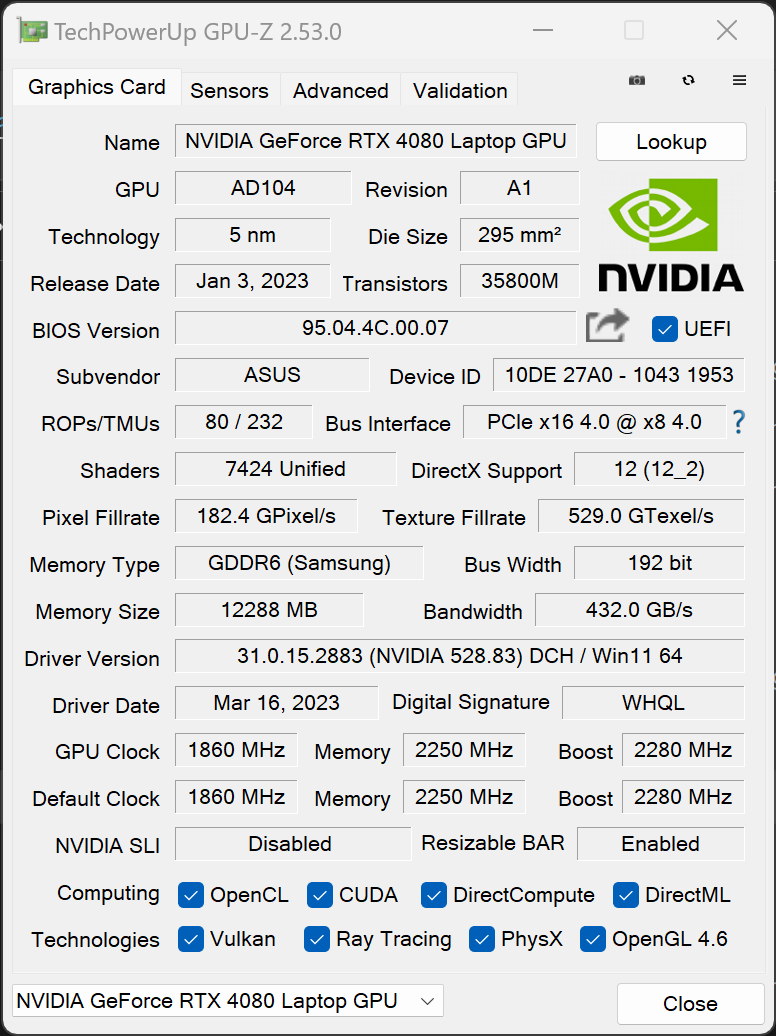
图形卡
......(英文 RTX 4080华硕 Zenbook Pro 16X 提供 12GB GDDR6X 内存。这意味着,该显卡比 RTX 3060 更适合视频编辑。 RTX 3060的 前代产品得益于高达 140 瓦的电源,图形芯片的性能明显处于其性能频谱的上限。Nvidia 为该芯片提供了高达 150 瓦的电源,这在我们的 3DMark、Blender 和 PugetBench 基准测试中也很明显。Zenbook 在所有应用中都取得了高分。在某些情况下,它甚至与 RTX 4090的 华硕 ROG Zephyrus M16。只有 联想Legion Pro 7和华硕 ROG Strix G16才真正在测试中脱颖而出。
我们对前一代产品最强烈的批评之一已经通过功能更强大的图形芯片而消除了。Nvidia RTX 4080 是一个可靠的选择,也适合在 3200 × 2000 的原生显示分辨率下进行游戏。
| 3DMark 11 Performance | 42771 points | |
| 3DMark Cloud Gate Standard Score | 61442 points | |
| 3DMark Fire Strike Score | 31314 points | |
| 3DMark Time Spy Score | 16666 points | |
Help | ||
* ... smaller is better
| Premiere Pro PugetBench - Overall Score 0.98 | |
| Asus Zenbook Pro 16X UX7602BZ-MY005W | |
| Apple MacBook Pro 16 2023 M3 Max | |
| Apple MacBook Pro 14 2023 M3 | |
游戏性能
Witcher 3 FPS chart
| low | med. | high | ultra | QHD | 4K DLSS | 4K | |
|---|---|---|---|---|---|---|---|
| GTA V (2015) | 184.4 | 184.2 | 180.2 | 132.1 | 115.3 | 159.7 | |
| The Witcher 3 (2015) | 172.4 | 131.4 | 114.2 | ||||
| Dota 2 Reborn (2015) | 176.2 | 152.4 | 146 | 138.3 | 138.7 | ||
| Final Fantasy XV Benchmark (2018) | 201 | 180.1 | 152.9 | 123.3 | |||
| X-Plane 11.11 (2018) | 138.1 | 122.3 | 95.3 | 82.8 | |||
| Strange Brigade (2018) | 444 | 349 | 324 | 297 | 221 | 144.3 | |
| Shadow of the Tomb Raider (2018) | 176 | 142 | 79 | ||||
| Far Cry 6 (2021) | 130 | 110 | 70 | ||||
| Tiny Tina's Wonderlands (2022) | 144.93 | 105.29 | 55.65 | ||||
| Call of Duty Modern Warfare 2 2022 (2022) | 148 | 108 | 65 | ||||
| F1 23 (2023) | 236 | 238 | 227 | 90.8 | 60 | 65.1 | |
| Cyberpunk 2077 (2023) | 109.17 | 71.31 | 30.89 | ||||
| Alan Wake 2 (2023) | 76.7 | 66.8 | 34.3 | 34.9 |
排放 - Zenbook 可根据要求实现低噪音
噪音
在轻度至中度负载情况下,Zenbook 仍能保持非常舒适的噪音水平。在 15 厘米的距离内,我们测得的噪音仅为 38 分贝(A)。在标准 模式下,笔记本电脑满载时的噪音为 41 dB(A),但并不刺耳。只有在性能 模式下,风扇才会全速运转,并产生高达 51 dB(A) 的噪音。在所有转速范围内都能听到中频和低频,因此背景噪音更像是一种悦耳的嘶嘶声。
Noise level
| Idle |
| 24.9 / 24.9 / 24.9 dB(A) |
| Load |
| 38 / 51 dB(A) |
 | ||
30 dB silent 40 dB(A) audible 50 dB(A) loud |
||
min: | ||
| Asus Zenbook Pro 16X UX7602BZ-MY005W GeForce RTX 4080 Laptop GPU, i9-13905H, Samsung PM9A1 MZVL22T0HBLB | Asus ZenBook Pro 16X OLED UX7602ZM-ME115W GeForce RTX 3060 Laptop GPU, i9-12900H, Samsung PM9A1 MZVL21T0HCLR | Asus ROG Strix G16 G614JZ GeForce RTX 4080 Laptop GPU, i9-13980HX, WD PC SN560 SDDPNQE-1T00 | Asus ROG Zephyrus M16 GU604VY-NM042X GeForce RTX 4090 Laptop GPU, i9-13900H, Samsung PM9A1 MZVL22T0HBLB | MSI Stealth 17 Studio A13VH-014 GeForce RTX 4080 Laptop GPU, i9-13900H, Samsung PM9A1 MZVL22T0HBLB | Lenovo Legion Pro 7 RTX4090 GeForce RTX 4090 Laptop GPU, i9-13900HX, Samsung PM9A1 MZVL21T0HCLR | Lenovo Legion Slim 7i 16 Gen 8 GeForce RTX 4070 Laptop GPU, i9-13900H, Samsung PM9A1 MZVL21T0HCLR | Asus Vivobook Pro 16X K6604JV-MX016W GeForce RTX 4060 Laptop GPU, i9-13980HX, Solidigm P41 Plus SSDPFKNU010TZ | |
|---|---|---|---|---|---|---|---|---|
| Noise | -8% | -11% | -10% | 5% | -20% | 6% | -14% | |
| off / environment * (dB) | 24.9 | 26 -4% | 25 -0% | 24 4% | 24 4% | 25 -0% | 22.8 8% | 25.2 -1% |
| Idle Minimum * (dB) | 24.9 | 26 -4% | 26 -4% | 24 4% | 24 4% | 28 -12% | 23.6 5% | 26.6 -7% |
| Idle Average * (dB) | 24.9 | 26 -4% | 28 -12% | 29.96 -20% | 24 4% | 30 -20% | 23.6 5% | 26.6 -7% |
| Idle Maximum * (dB) | 24.9 | 26 -4% | 30 -20% | 34.27 -38% | 24 4% | 38 -53% | 25.7 -3% | 29.2 -17% |
| Load Average * (dB) | 38 | 48 -26% | 48 -26% | 35.89 6% | 34.49 9% | 48 -26% | 27.6 27% | 53.4 -41% |
| Load Maximum * (dB) | 51 | 54.6 -7% | 52 -2% | 57.54 -13% | 49.66 3% | 55 -8% | 54.4 -7% | 56.9 -12% |
| Witcher 3 ultra * (dB) | 49 | 57.5 | 48.29 | 53 | 54.4 |
* ... smaller is better
温度
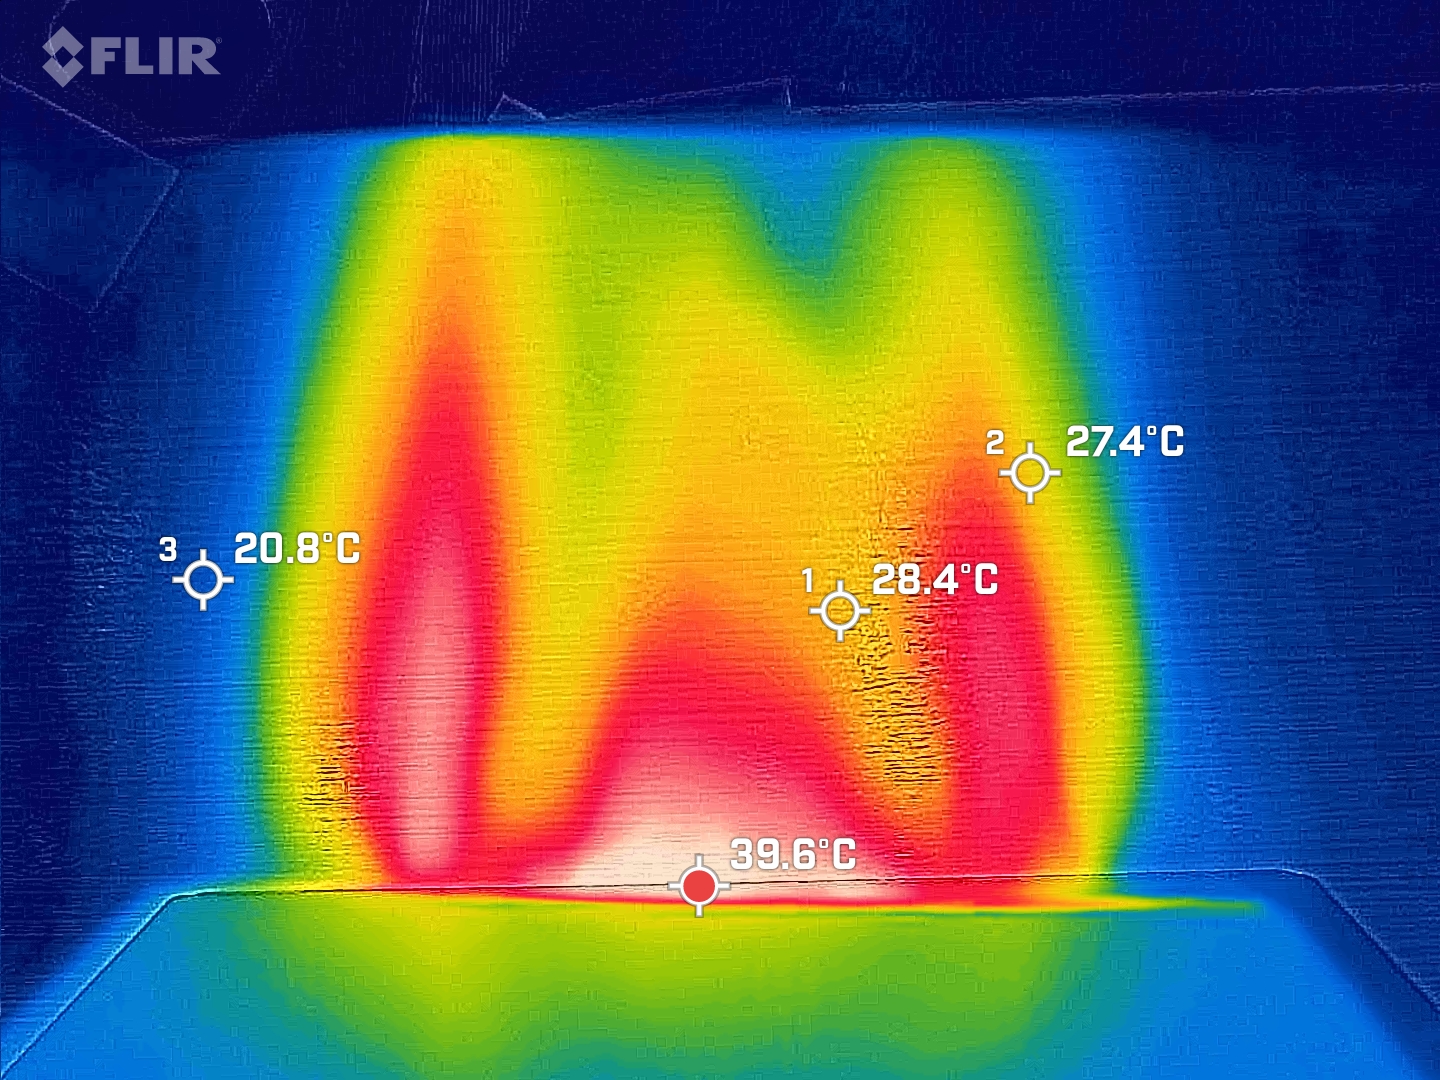
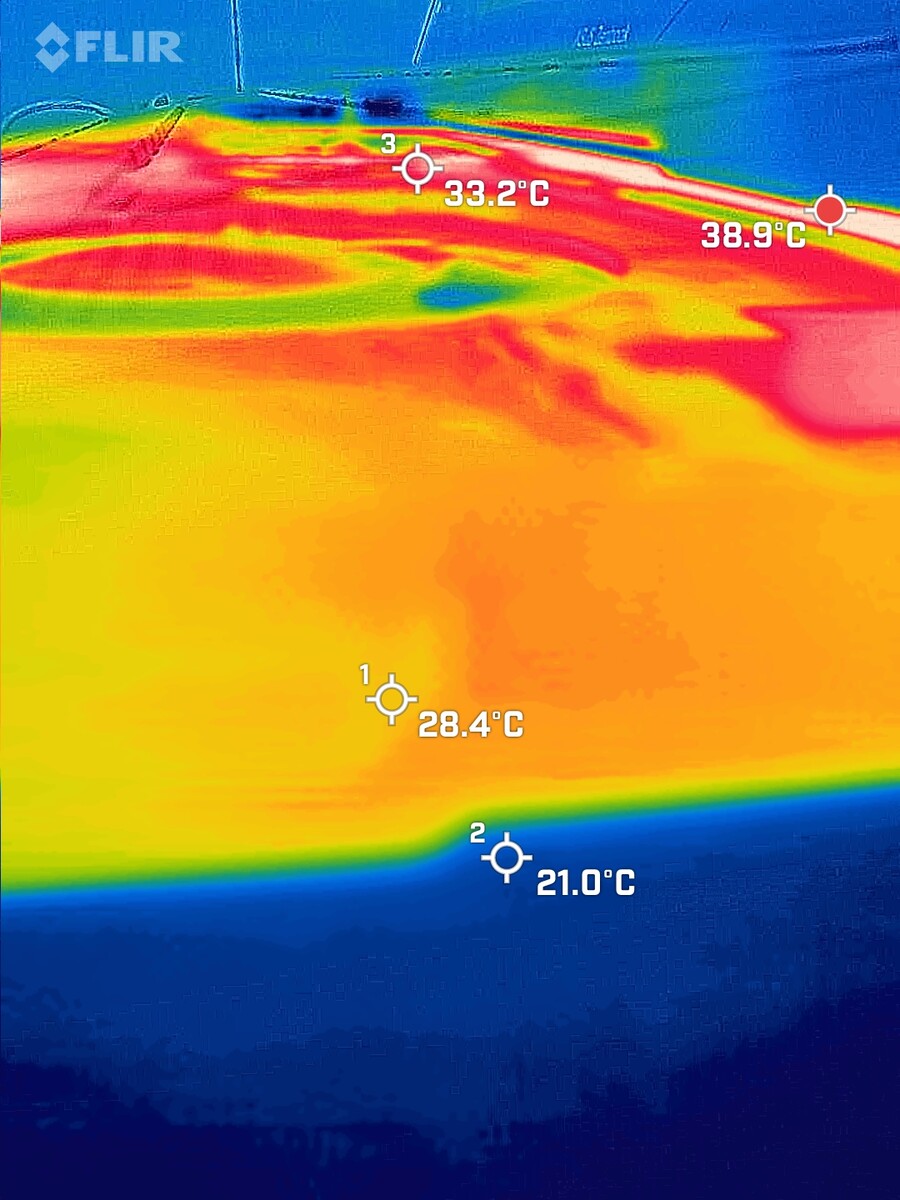
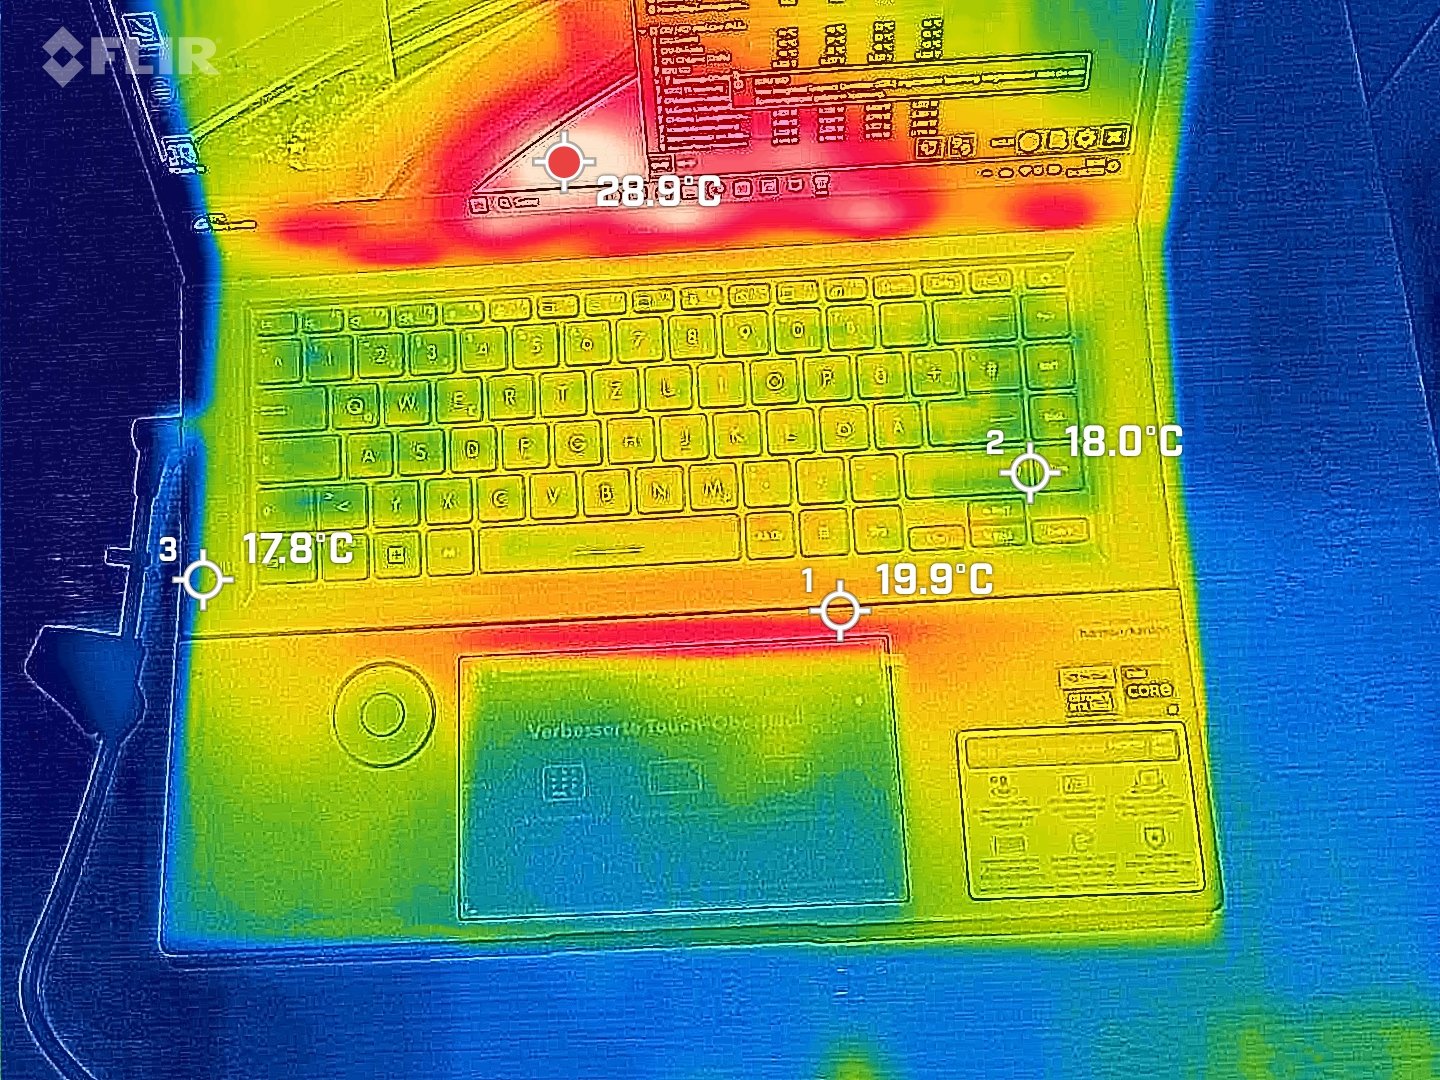
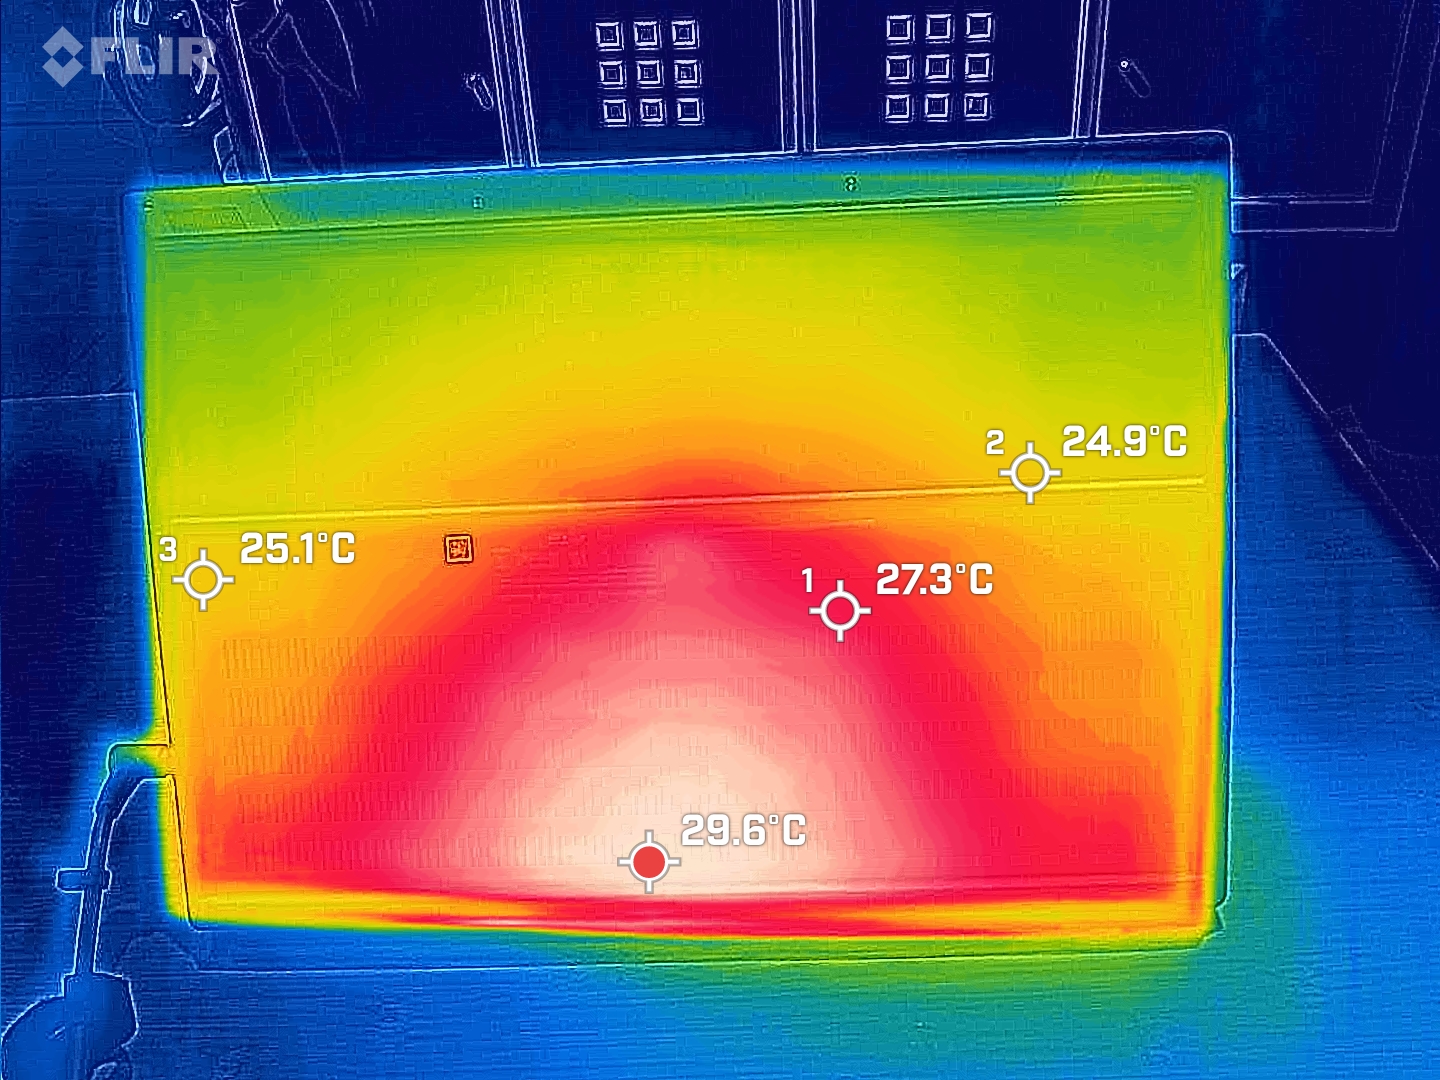
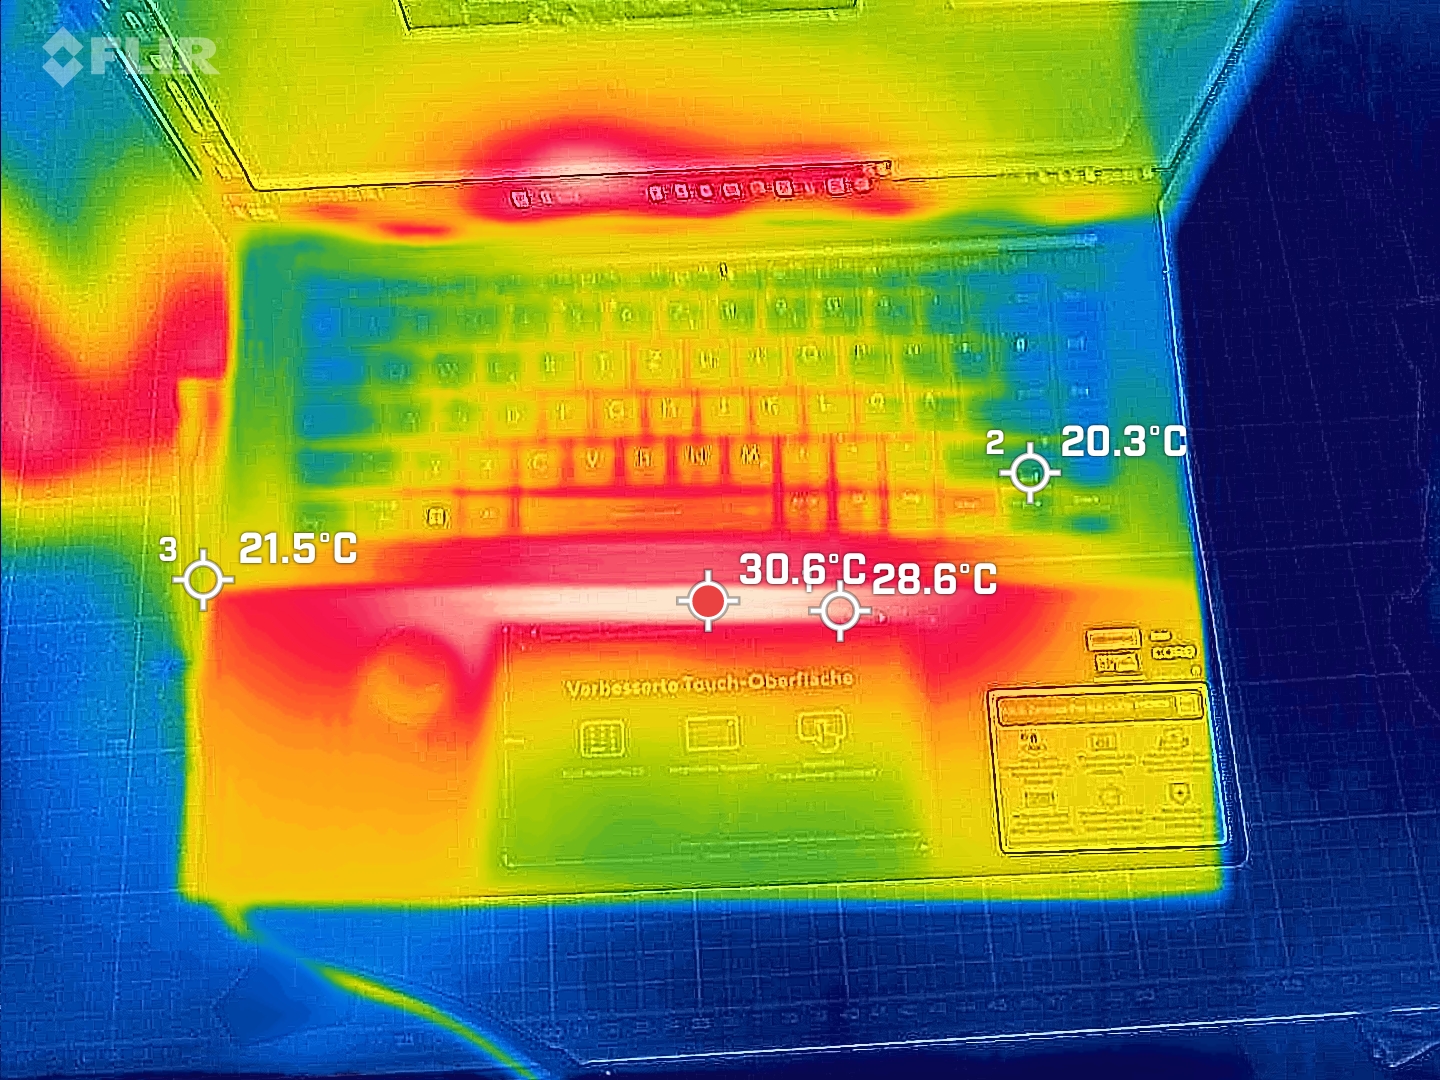
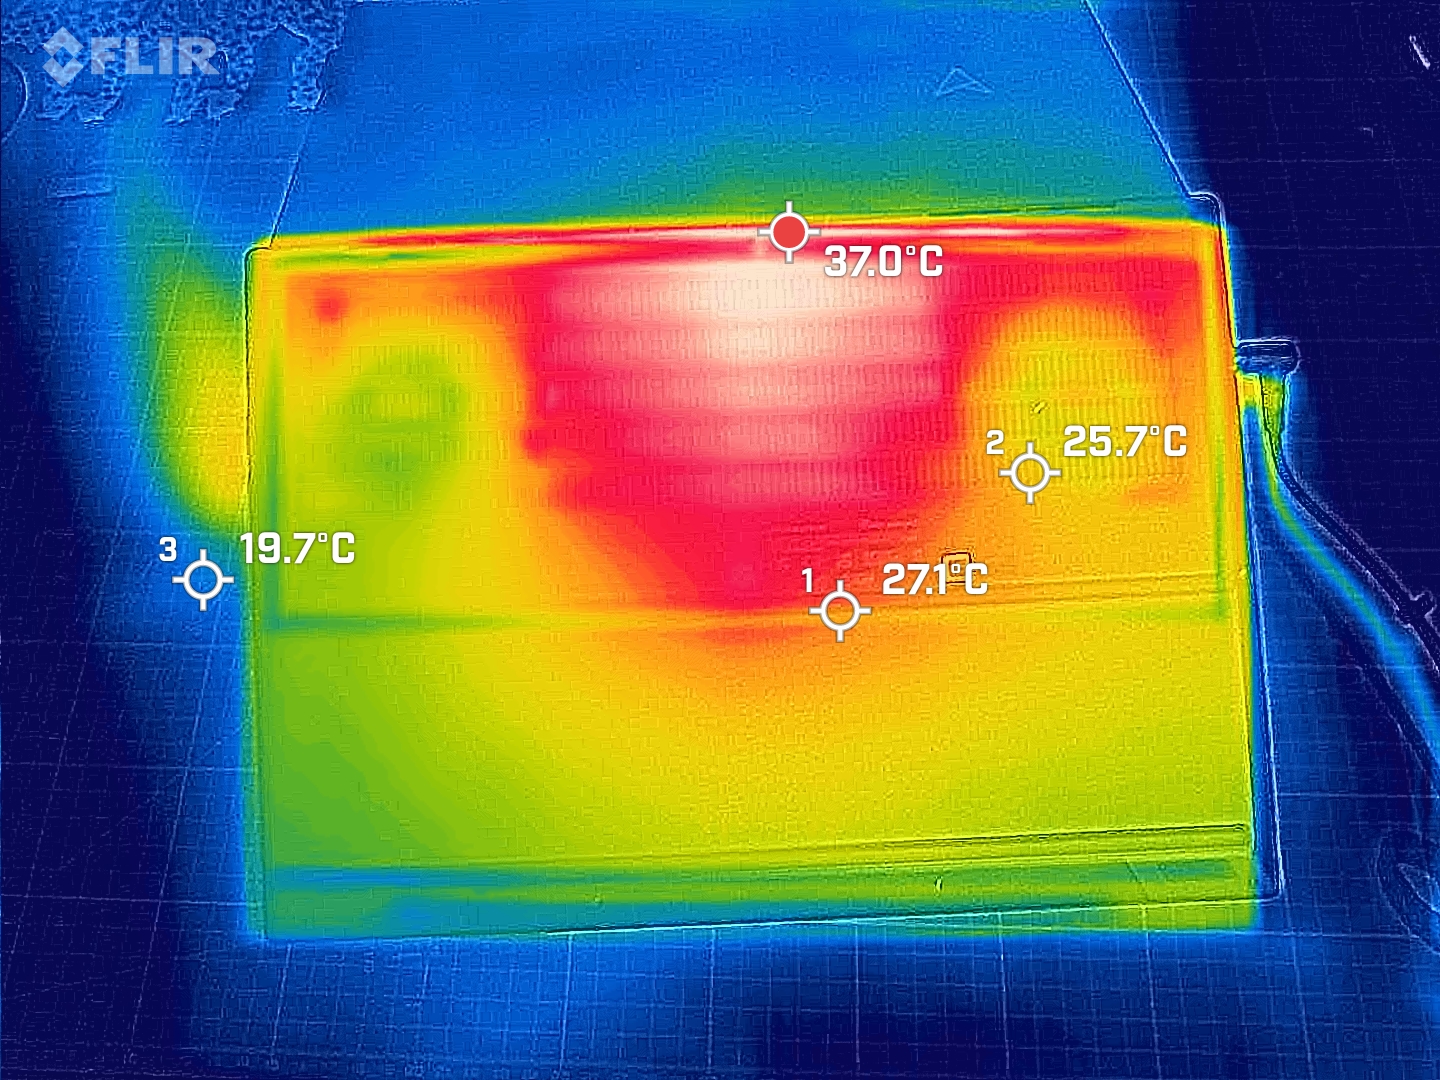
Zenbook Pro 16X 特别明显的一点是,笔记本电脑对周围环境的散热比对自身的散热更重要。笔记本电脑的散热系统非常强大,在我们的压力测试中,笔记本电脑机箱的最高温度为 36 °C,比机箱后部出风口后的桌面温度还要低 3 度。热图像还清楚地显示了 Zenbook 两个风扇的强劲性能。
在我们的测试中,笔记本表面也基本保持低温。尤其是键盘,由于与硬件之间有缝隙,几乎可以达到环境温度。使用 Flir One Pro 对键盘下方进行窥探时,确实发现了温度较高的区域,但即使在缝隙中,我们测得的最高温度也只有 39 °C。因此,尽管插座的功率高达 200 瓦,Zenbook 仍然出奇地凉爽。
(+) The maximum temperature on the upper side is 28.2 °C / 83 F, compared to the average of 40.4 °C / 105 F, ranging from 21.2 to 68.8 °C for the class Gaming.
(+) The bottom heats up to a maximum of 35.1 °C / 95 F, compared to the average of 43.2 °C / 110 F
(+) In idle usage, the average temperature for the upper side is 22.8 °C / 73 F, compared to the device average of 33.9 °C / 93 F.
(+) The palmrests and touchpad are cooler than skin temperature with a maximum of 26.1 °C / 79 F and are therefore cool to the touch.
(+) The average temperature of the palmrest area of similar devices was 28.8 °C / 83.8 F (+2.7 °C / 4.8 F).
| Asus Zenbook Pro 16X UX7602BZ-MY005W Intel Core i9-13905H, NVIDIA GeForce RTX 4080 Laptop GPU | Asus ZenBook Pro 16X OLED UX7602ZM-ME115W Intel Core i9-12900H, NVIDIA GeForce RTX 3060 Laptop GPU | Asus ROG Strix G16 G614JZ Intel Core i9-13980HX, NVIDIA GeForce RTX 4080 Laptop GPU | Asus ROG Zephyrus M16 GU604VY-NM042X Intel Core i9-13900H, NVIDIA GeForce RTX 4090 Laptop GPU | MSI Stealth 17 Studio A13VH-014 Intel Core i9-13900H, NVIDIA GeForce RTX 4080 Laptop GPU | Lenovo Legion Pro 7 RTX4090 Intel Core i9-13900HX, NVIDIA GeForce RTX 4090 Laptop GPU | Lenovo Legion Slim 7i 16 Gen 8 Intel Core i9-13900H, NVIDIA GeForce RTX 4070 Laptop GPU | Asus Vivobook Pro 16X K6604JV-MX016W Intel Core i9-13980HX, NVIDIA GeForce RTX 4060 Laptop GPU | |
|---|---|---|---|---|---|---|---|---|
| Heat | -22% | -45% | -36% | -38% | -51% | -35% | -39% | |
| Maximum Upper Side * (°C) | 28.2 | 32 -13% | 54 -91% | 50 -77% | 47 -67% | 53 -88% | 49.8 -77% | 39.7 -41% |
| Maximum Bottom * (°C) | 35.1 | 41.6 -19% | 55 -57% | 58 -65% | 54 -54% | 59 -68% | 48.8 -39% | 60 -71% |
| Idle Upper Side * (°C) | 24.6 | 32.6 -33% | 29 -18% | 26 -6% | 30 -22% | 34 -38% | 29.4 -20% | 30.9 -26% |
| Idle Bottom * (°C) | 29.4 | 36 -22% | 33 -12% | 28 5% | 32 -9% | 32 -9% | 30 -2% | 34.7 -18% |
* ... smaller is better
压力测试
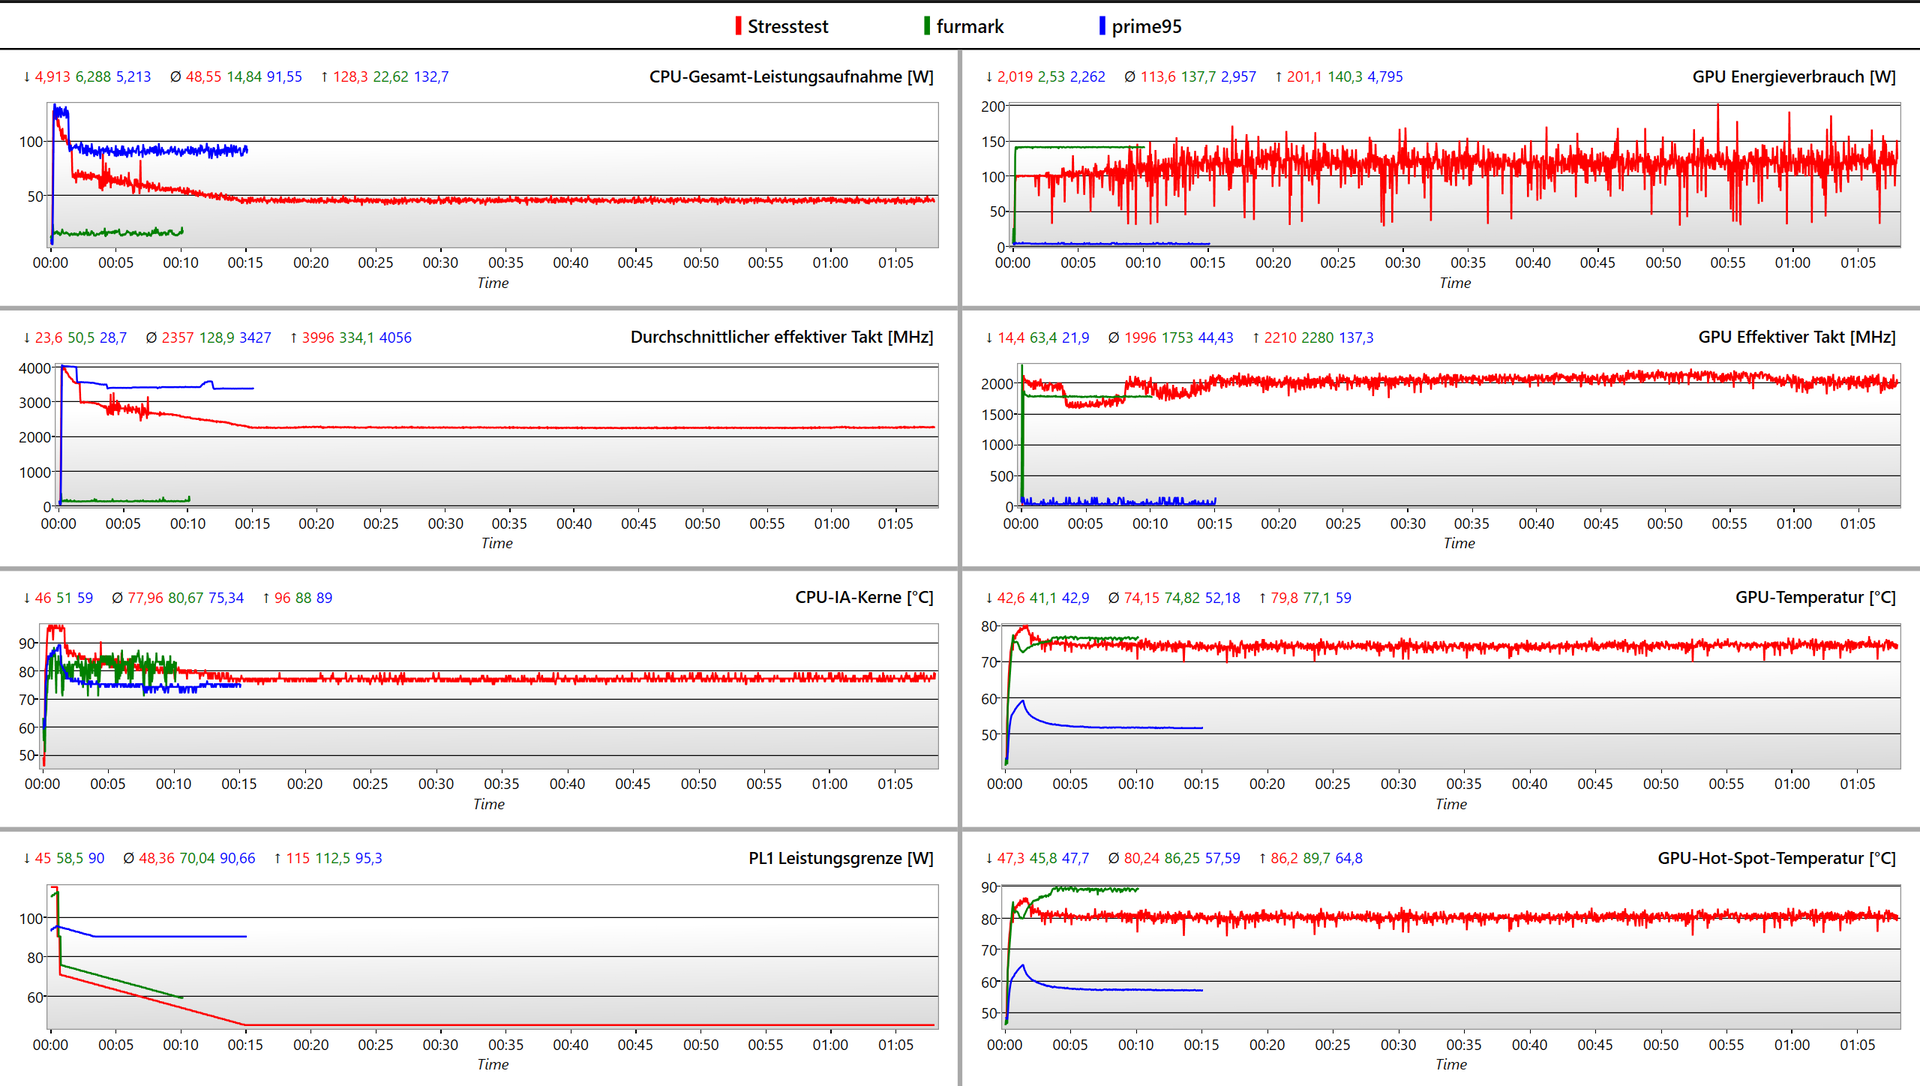
虽然在单项 Prime95 或 Furmark 压力测试中可以相对较快地达到平衡,但在这两项基准测试中,Zenbook 将性能从 CPU 转移到 GPU 的速度相当缓慢。处理器英特尔酷睿 i9-13905H处于提升模式的时间将近两分钟。仅在 Prime95 中,功率就约为 125 瓦;如果同时运行 Furmark,升压功率会从 126 瓦降至 100 瓦。在同时运行两个程序的压力测试中,两分钟后达到了初始平衡,处理器为 70 瓦,RTX 4080 为 100 瓦。但是,在接下来的 12 分钟内,性能继续逐渐发生变化,CPU 性能下降了约 25 瓦,而 GPU 性能则上升到平均 120 瓦。
在所有测试中,CPU 和 GPU 的温度都保持在 75 °C 左右。测试NvidiaGeForce RTX 4080在 Furmark 压力测试中的热点温度略高,达到 90 °C,这让我们感到有些不适。在特殊情况下,如果只有显卡长时间处于完全受压状态,性能可能会受到轻微影响。
发言人
Zenbook Pro 16X 有四个扬声器模块,共六个驱动器。高音扬声器位于键盘的左右两侧,两个全频扬声器则分别位于底座。整体音质非常全面。Zenbook 的音量约为 88 dB(A),声音也相当响亮,与 MacBook Pro 16 相比毫不逊色。
Asus Zenbook Pro 16X UX7602BZ-MY005W audio analysis
(+) | speakers can play relatively loud (88.5 dB)
Bass 100 - 315 Hz
(±) | reduced bass - on average 9.8% lower than median
(±) | linearity of bass is average (7.7% delta to prev. frequency)
Mids 400 - 2000 Hz
(+) | balanced mids - only 1.6% away from median
(+) | mids are linear (4.5% delta to prev. frequency)
Highs 2 - 16 kHz
(+) | balanced highs - only 2.1% away from median
(+) | highs are linear (3.3% delta to prev. frequency)
Overall 100 - 16.000 Hz
(+) | overall sound is linear (8.1% difference to median)
Compared to same class
» 1% of all tested devices in this class were better, 1% similar, 98% worse
» The best had a delta of 6%, average was 18%, worst was 132%
Compared to all devices tested
» 2% of all tested devices were better, 1% similar, 98% worse
» The best had a delta of 4%, average was 23%, worst was 134%
Apple MacBook Pro 16 2021 M1 Pro audio analysis
(+) | speakers can play relatively loud (84.7 dB)
Bass 100 - 315 Hz
(+) | good bass - only 3.8% away from median
(+) | bass is linear (5.2% delta to prev. frequency)
Mids 400 - 2000 Hz
(+) | balanced mids - only 1.3% away from median
(+) | mids are linear (2.1% delta to prev. frequency)
Highs 2 - 16 kHz
(+) | balanced highs - only 1.9% away from median
(+) | highs are linear (2.7% delta to prev. frequency)
Overall 100 - 16.000 Hz
(+) | overall sound is linear (4.6% difference to median)
Compared to same class
» 0% of all tested devices in this class were better, 0% similar, 100% worse
» The best had a delta of 5%, average was 17%, worst was 45%
Compared to all devices tested
» 0% of all tested devices were better, 0% similar, 100% worse
» The best had a delta of 4%, average was 23%, worst was 134%
能源管理 - 功能强大的硬件需要高能量输入
耗电量
华硕为 Zenbook Pro 16X 配备了 280 瓦的电源。这是有道理的,我们很快就在能耗测量中发现了这一点。在压力测试中,这款笔记本的耗电量高达 262 瓦。在满载情况下,笔记本的功耗始终保持在 200 瓦左右。从所提供的计算能力来看,这是完全合适的。
对比结果还表明,Zenbook 在空闲模式和低负载时也相当经济。
| Off / Standby | |
| Idle | |
| Load |
|
Key:
min: | |
| Asus Zenbook Pro 16X UX7602BZ-MY005W i9-13905H, GeForce RTX 4080 Laptop GPU, Samsung PM9A1 MZVL22T0HBLB, OLED, 3200x2000, 16" | Asus ZenBook Pro 16X OLED UX7602ZM-ME115W i9-12900H, GeForce RTX 3060 Laptop GPU, Samsung PM9A1 MZVL21T0HCLR, OLED, 3840x2400, 16" | Asus ROG Strix G16 G614JZ i9-13980HX, GeForce RTX 4080 Laptop GPU, WD PC SN560 SDDPNQE-1T00, IPS, 2560x1600, 16" | Asus ROG Zephyrus M16 GU604VY-NM042X i9-13900H, GeForce RTX 4090 Laptop GPU, Samsung PM9A1 MZVL22T0HBLB, IPS, 2560x1600, 16" | MSI Stealth 17 Studio A13VH-014 i9-13900H, GeForce RTX 4080 Laptop GPU, Samsung PM9A1 MZVL22T0HBLB, Mini LED, 3840x2160, 17.3" | Lenovo Legion Pro 7 RTX4090 i9-13900HX, GeForce RTX 4090 Laptop GPU, Samsung PM9A1 MZVL21T0HCLR, IPS, 2560x1600, 16" | Lenovo Legion Slim 7i 16 Gen 8 i9-13900H, GeForce RTX 4070 Laptop GPU, Samsung PM9A1 MZVL21T0HCLR, IPS, 2560x1600, 16" | Asus Vivobook Pro 16X K6604JV-MX016W i9-13980HX, GeForce RTX 4060 Laptop GPU, Solidigm P41 Plus SSDPFKNU010TZ, OLED, 3200x2000, 16" | Average NVIDIA GeForce RTX 4080 Laptop GPU | Average of class Gaming | |
|---|---|---|---|---|---|---|---|---|---|---|
| Power Consumption | 4% | -28% | -44% | -11% | -69% | -59% | -17% | -55% | -28% | |
| Idle Minimum * (Watt) | 9 | 11.1 -23% | 10 -11% | 20 -122% | 13.9 -54% | 20 -122% | 22 -144% | 13.8 -53% | 16.9 ? -88% | 13 ? -44% |
| Idle Average * (Watt) | 11.9 | 11.4 4% | 16 -34% | 24 -102% | 20 -68% | 25 -110% | 29 -144% | 16 -34% | 22 ? -85% | 19 ? -60% |
| Idle Maximum * (Watt) | 20.5 | 14.4 30% | 27 -32% | 25 -22% | 20.6 -0% | 35 -71% | 39.5 -93% | 19 7% | 34.1 ? -66% | 24.6 ? -20% |
| Load Average * (Watt) | 93.5 | 137.4 -47% | 129 -38% | 107 -14% | 77 18% | 136 -45% | 98.7 -6% | 147 -57% | 117.9 ? -26% | 110.7 ? -18% |
| Witcher 3 ultra * (Watt) | 195.7 | 136 31% | 247 -26% | 208 -6% | 162 17% | 282 -44% | 171.8 12% | 147.8 24% | ||
| Load Maximum * (Watt) | 267 | 197 26% | 342 -28% | 267 -0% | 216 19% | 320 -20% | 213.2 20% | 244 9% | 297 ? -11% | 259 ? 3% |
* ... smaller is better
Power consumption Witcher 3 / Stress test
Power consumption with an external monitor
电池寿命
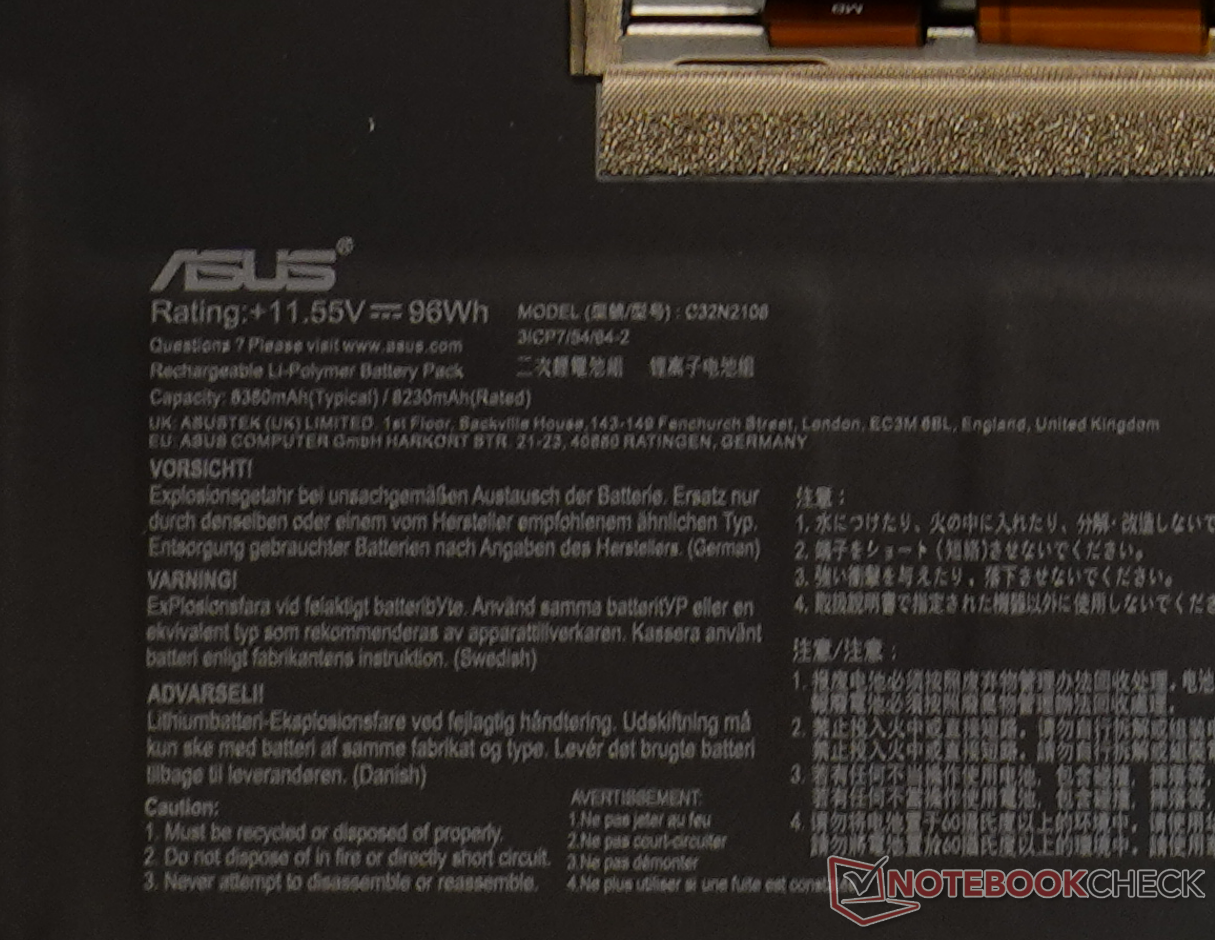
Zenbook 安装了 96 Wh 电池,其部件编号甚至与其前代产品相同。 在我们的在我们的 WiFi 网上冲浪测试中,运行时间减少了一个小时。只有在闲置状态下,新款 Zenbook 的续航时间才会比上一代产品稍长。虽然你不可能在没有电源的情况下工作一整天,但至少与竞争对手相比,Zenbook 的续航时间更长。如果您不需要在旅途中使用笔记本电脑的全部电量,您至少可以使用一个较小的电源或一个相应的电源箱,这要归功于 USB-PD。
| Asus Zenbook Pro 16X UX7602BZ-MY005W i9-13905H, GeForce RTX 4080 Laptop GPU, 96 Wh | Asus ZenBook Pro 16X OLED UX7602ZM-ME115W i9-12900H, GeForce RTX 3060 Laptop GPU, 96 Wh | Asus ROG Strix G16 G614JZ i9-13980HX, GeForce RTX 4080 Laptop GPU, 90 Wh | Asus ROG Zephyrus M16 GU604VY-NM042X i9-13900H, GeForce RTX 4090 Laptop GPU, 90 Wh | MSI Stealth 17 Studio A13VH-014 i9-13900H, GeForce RTX 4080 Laptop GPU, 99 Wh | Lenovo Legion Pro 7 RTX4090 i9-13900HX, GeForce RTX 4090 Laptop GPU, 99.9 Wh | Lenovo Legion Slim 7i 16 Gen 8 i9-13900H, GeForce RTX 4070 Laptop GPU, 99.9 Wh | Asus Vivobook Pro 16X K6604JV-MX016W i9-13980HX, GeForce RTX 4060 Laptop GPU, 90 Wh | Average of class Gaming | |
|---|---|---|---|---|---|---|---|---|---|
| Battery runtime | 6% | -16% | -13% | -31% | -35% | -56% | -28% | -28% | |
| Reader / Idle (h) | 13 | 12.7 -2% | 5.1 -61% | 8.27 ? -36% | |||||
| WiFi v1.3 (h) | 7.9 | 8.9 13% | 9.7 23% | 4.3 -46% | 5.6 -29% | 5.1 -35% | 4.4 -44% | 6.5 -18% | 7.11 ? -10% |
| Load (h) | 2.4 | 2.6 8% | 1.1 -54% | 2.9 21% | 1.6 -33% | 0.9 -62% | 1.5 -37% | 1.502 ? -37% | |
| H.264 (h) | 4.8 | 5.6 | 5.3 | 8.32 ? | |||||
| Witcher 3 ultra (h) | 2.6 |
Pros
Cons
评价--几乎毫不妥协的表现
对于前代产品,我们有一个明确的说法:高性能,但浪费了潜力。华硕在这方面做出了巨大的改进。新款 Zenbook Pro 16X 性能更强、更安静,无需回避专用工作站和游戏玩家。它的体积也相对小巧,我们的测试设备是迄今为止我们评测过的最好的 Zenbook。它似乎同样适合内容创作者和游戏玩家,或者任何希望拥有一款功能强大而又纤薄的笔记本电脑的人。不过,去年的一些批评意见依然存在:华硕大大放松了电源控制,但风扇仍然很晚才启动,这意味着浪费了一点启动时间。尽管如此,与联想Legion Slim 7i 或微星 Stealth 等游戏设备相比,Zenbook 显然不落下风。
全新的 Zenbook Pro 16X 可以被称为旗舰产品。华硕展示了薄至 18 毫米的机身所能带来的震撼。
去年,我们曾批评过 Zenbook 的一些小毛病,遗憾的是,这些毛病在现在的机型上依然存在。笔记本电脑的输入方法仍然过多,有时会相互干扰。蓝色子像素之间的缝隙也依然明显。连接性可以更广泛一些,最终,在一些人看来,高昂的购买价格也值得批评。
OLED、AAS散热和超薄机身不能成为唯一的购买标准,因为华硕 ROG Strix G16 和联想Legion Slim 7i 16 拥有相似的功能,而且价格都低于 1000 美元。当然,Zenbook 的输入选择更多,机身的金属质感也更强,但对于所有不想或不需要使用 Zenbook 全部功能的人来说,价格差异仍然显得过大。另一方面,对于那些需要强大的显卡、出色的(触摸)屏幕,或许还需要笔输入和华硕拨号盘的用户来说,Zenbook 也是无可替代的。
价格和供应情况
Zenbook Pro 16X 目前有两种配置。较弱配置配备了 NvidiaGeForce RTX 4070、32 LPDDR5X 内存和 1 TB,可通过newgg 购买,价格为 2699.99 美元。.较强的配置包括 RTX 4080、32 GB 内存和 2 TB,在 Adorama 的售价为3,394.00 美元。.
Asus Zenbook Pro 16X UX7602BZ-MY005W
- 11/09/2023 v7 (old)
Marc Herter/ Alex Wätzel
Transparency
The selection of devices to be reviewed is made by our editorial team. The test sample was provided to the author as a loan by the manufacturer or retailer for the purpose of this review. The lender had no influence on this review, nor did the manufacturer receive a copy of this review before publication. There was no obligation to publish this review. As an independent media company, Notebookcheck is not subjected to the authority of manufacturers, retailers or publishers.
This is how Notebookcheck is testing
Every year, Notebookcheck independently reviews hundreds of laptops and smartphones using standardized procedures to ensure that all results are comparable. We have continuously developed our test methods for around 20 years and set industry standards in the process. In our test labs, high-quality measuring equipment is utilized by experienced technicians and editors. These tests involve a multi-stage validation process. Our complex rating system is based on hundreds of well-founded measurements and benchmarks, which maintains objectivity. Further information on our test methods can be found here.
Price comparison

