英特尔酷睿i9-13900HK性能首次亮相:艾丽华x16 R1笔记本电脑评测

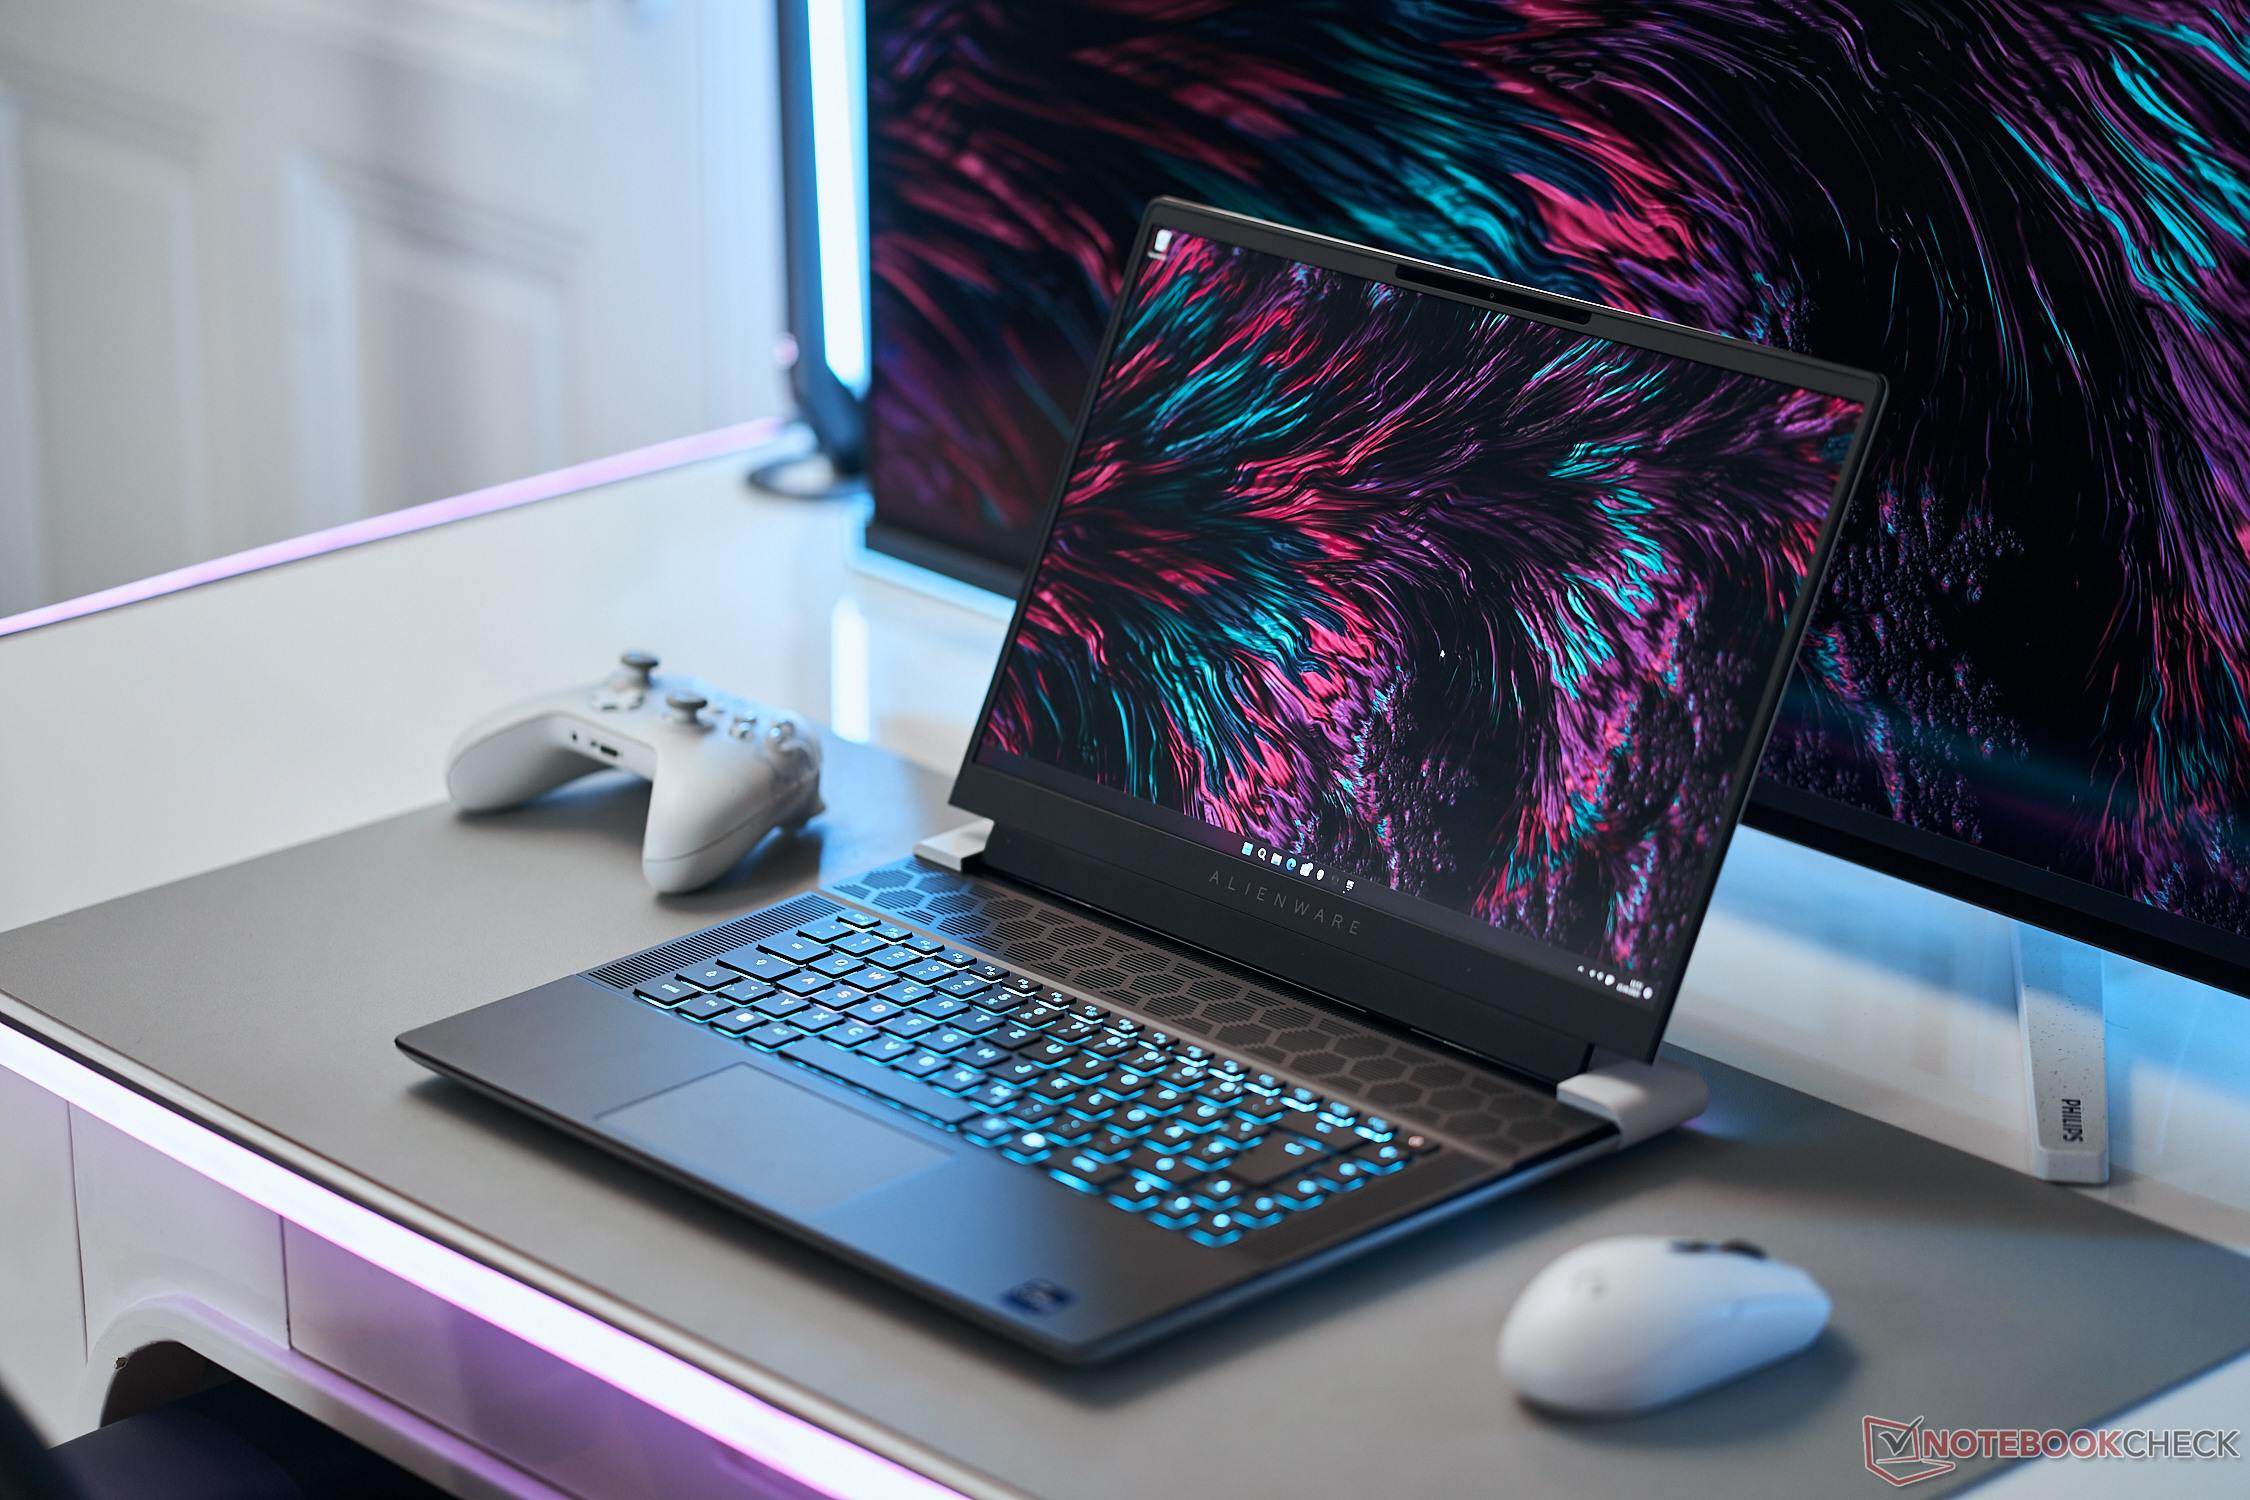
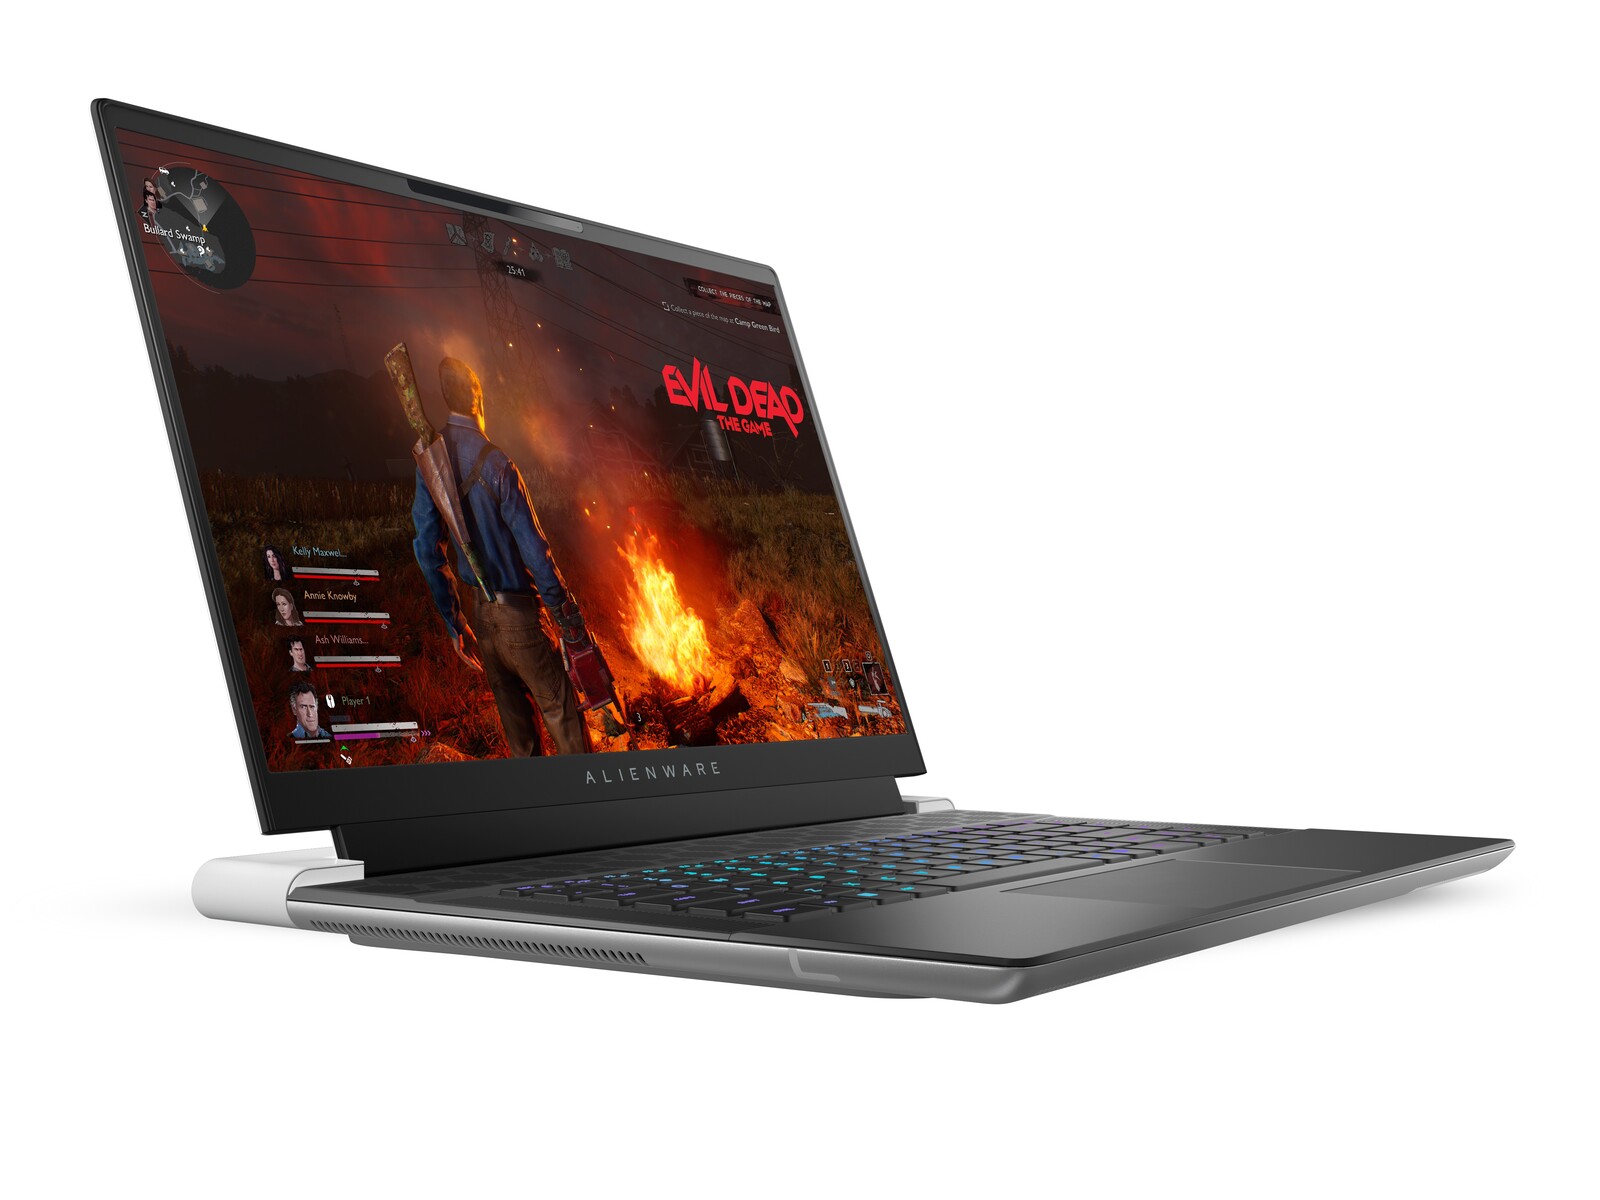
在2023年的CES上亮相的,Alienware x16 R1是继我们尚未评测的更厚更强大的Alienware m16之后该家族的第二款16英寸机型。这两款机型是对现有 14英寸, 15英寸, 17英寸和 18英寸市场上已有的Alienware选项。
我们的测试装置是一个更高端的配置,配备了第13代猛禽湖酷睿i9-13900HK CPU、GeForce RTX 4080 GPU和16.0英寸2560 x 1600 240 Hz IPS显示屏,价格约为3350美元。
更便宜或更昂贵的配置,从酷睿i7-13620H、1200p显示屏和RTX 4050 GPU到RTX 4090,价格从2200美元到超过4000美元。
Alienware x16 R1的替代品包括其他16英寸游戏笔记本电脑,如联想Legion Pro 7 ,华硕ROG Zephyrus M16 ,Razer Blade 16 ,或HP Omen 16 。在过去的几年里,这种特殊的尺寸类别已经越来越受欢迎。
更多戴尔评论:
潜在的竞争对手比较
Rating | Date | Model | Weight | Height | Size | Resolution | Price |
|---|---|---|---|---|---|---|---|
| 88.4 % v7 (old) | 06 / 2023 | Alienware x16 R1 i9-13900HK, GeForce RTX 4080 Laptop GPU | 2.6 kg | 18.57 mm | 16.00" | 2560x1600 | |
| 88.8 % v7 (old) | 06 / 2023 | Lenovo Legion Pro 7 RTX4090 i9-13900HX, GeForce RTX 4090 Laptop GPU | 2.7 kg | 26 mm | 16.00" | 2560x1600 | |
| 89.4 % v7 (old) | 03 / 2023 | Asus ROG Zephyrus M16 GU604VY-NM042X i9-13900H, GeForce RTX 4090 Laptop GPU | 2.3 kg | 22.9 mm | 16.00" | 2560x1600 | |
| 91.2 % v7 (old) | 02 / 2023 | Razer Blade 16 Early 2023 i9-13950HX, GeForce RTX 4080 Laptop GPU | 2.4 kg | 21.99 mm | 16.00" | 2560x1600 | |
| 86.1 % v7 (old) | 10 / 2022 | Dell G16 7620 i7-12700H, GeForce RTX 3060 Laptop GPU | 2.6 kg | 26.9 mm | 16.00" | 2560x1600 | |
| 86.1 % v7 (old) | 01 / 2023 | Alienware m17 R5 (R9 6900HX, RX 6850M XT) R9 6900HX, Radeon RX 6850M XT | 3.4 kg | 26.7 mm | 17.00" | 3840x2160 |
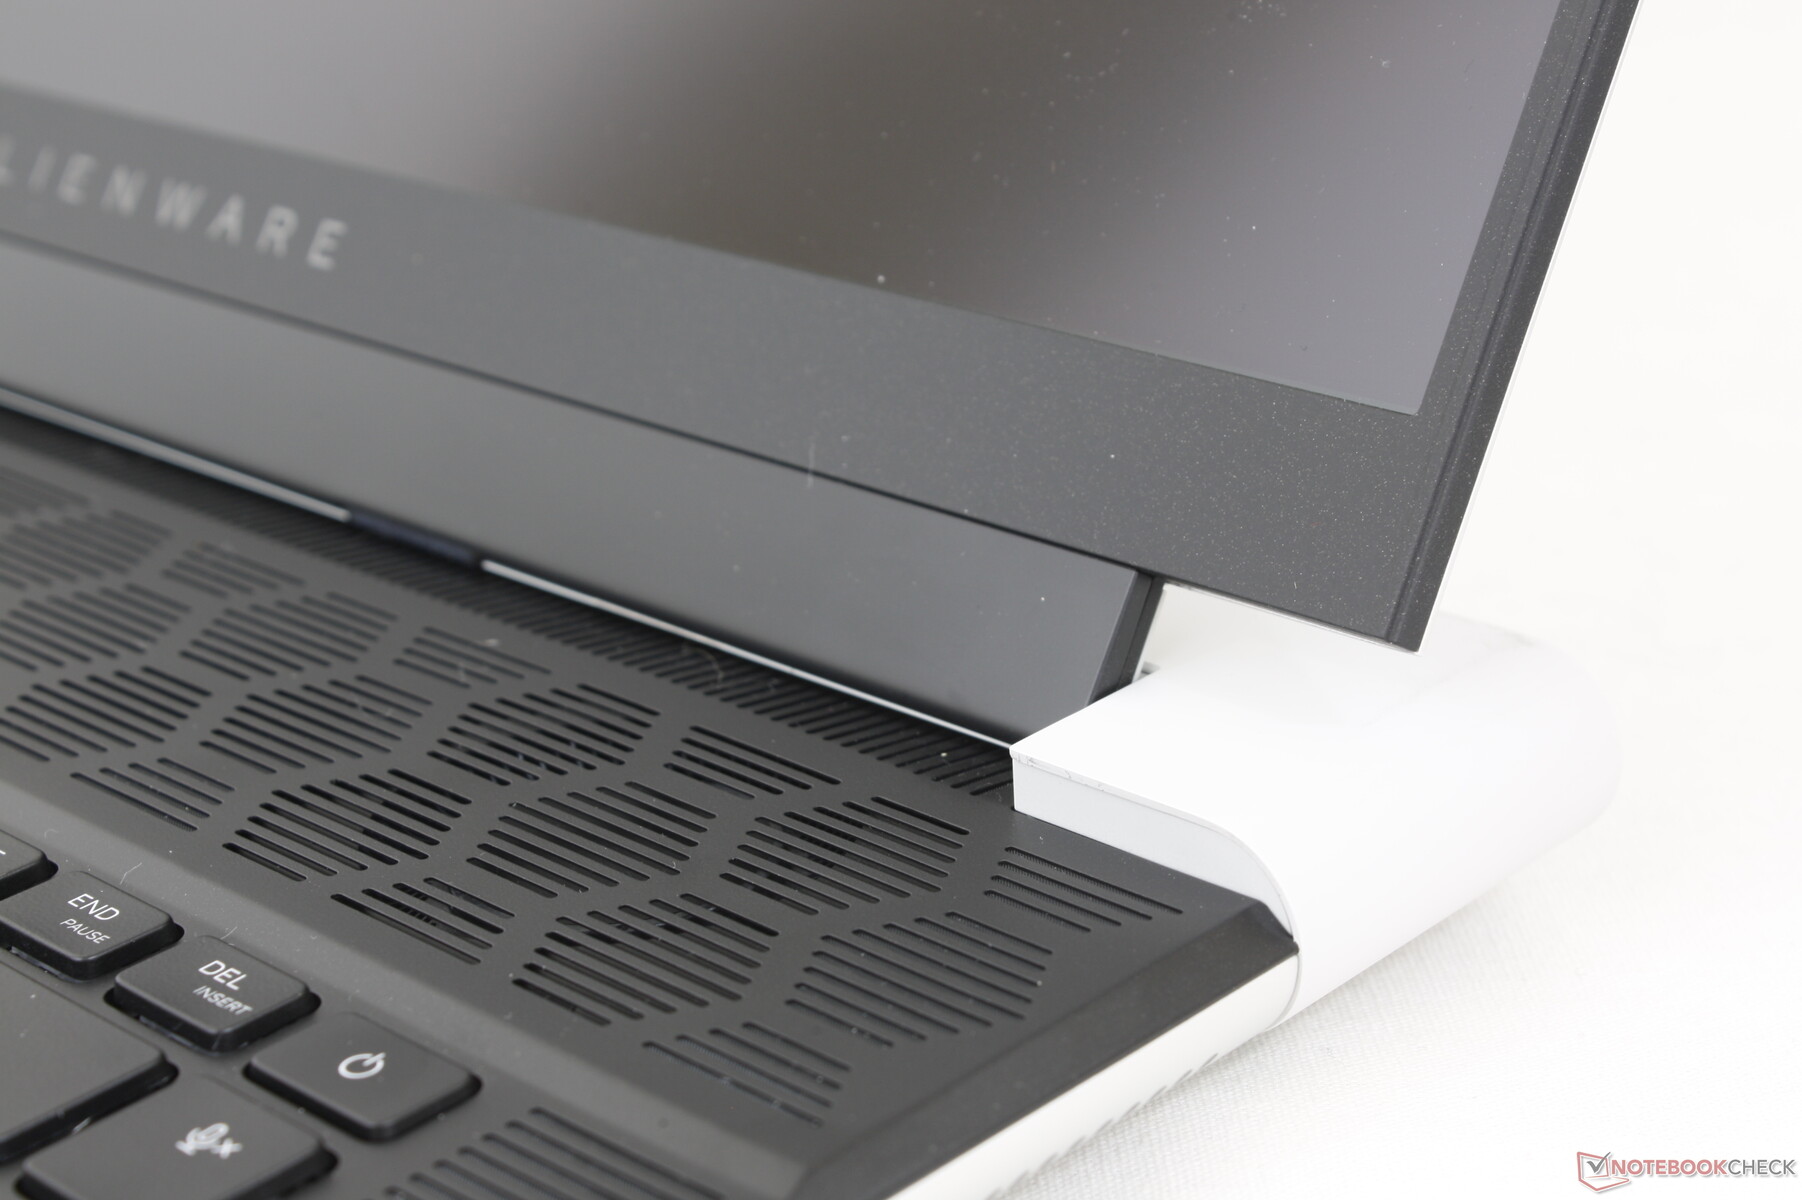
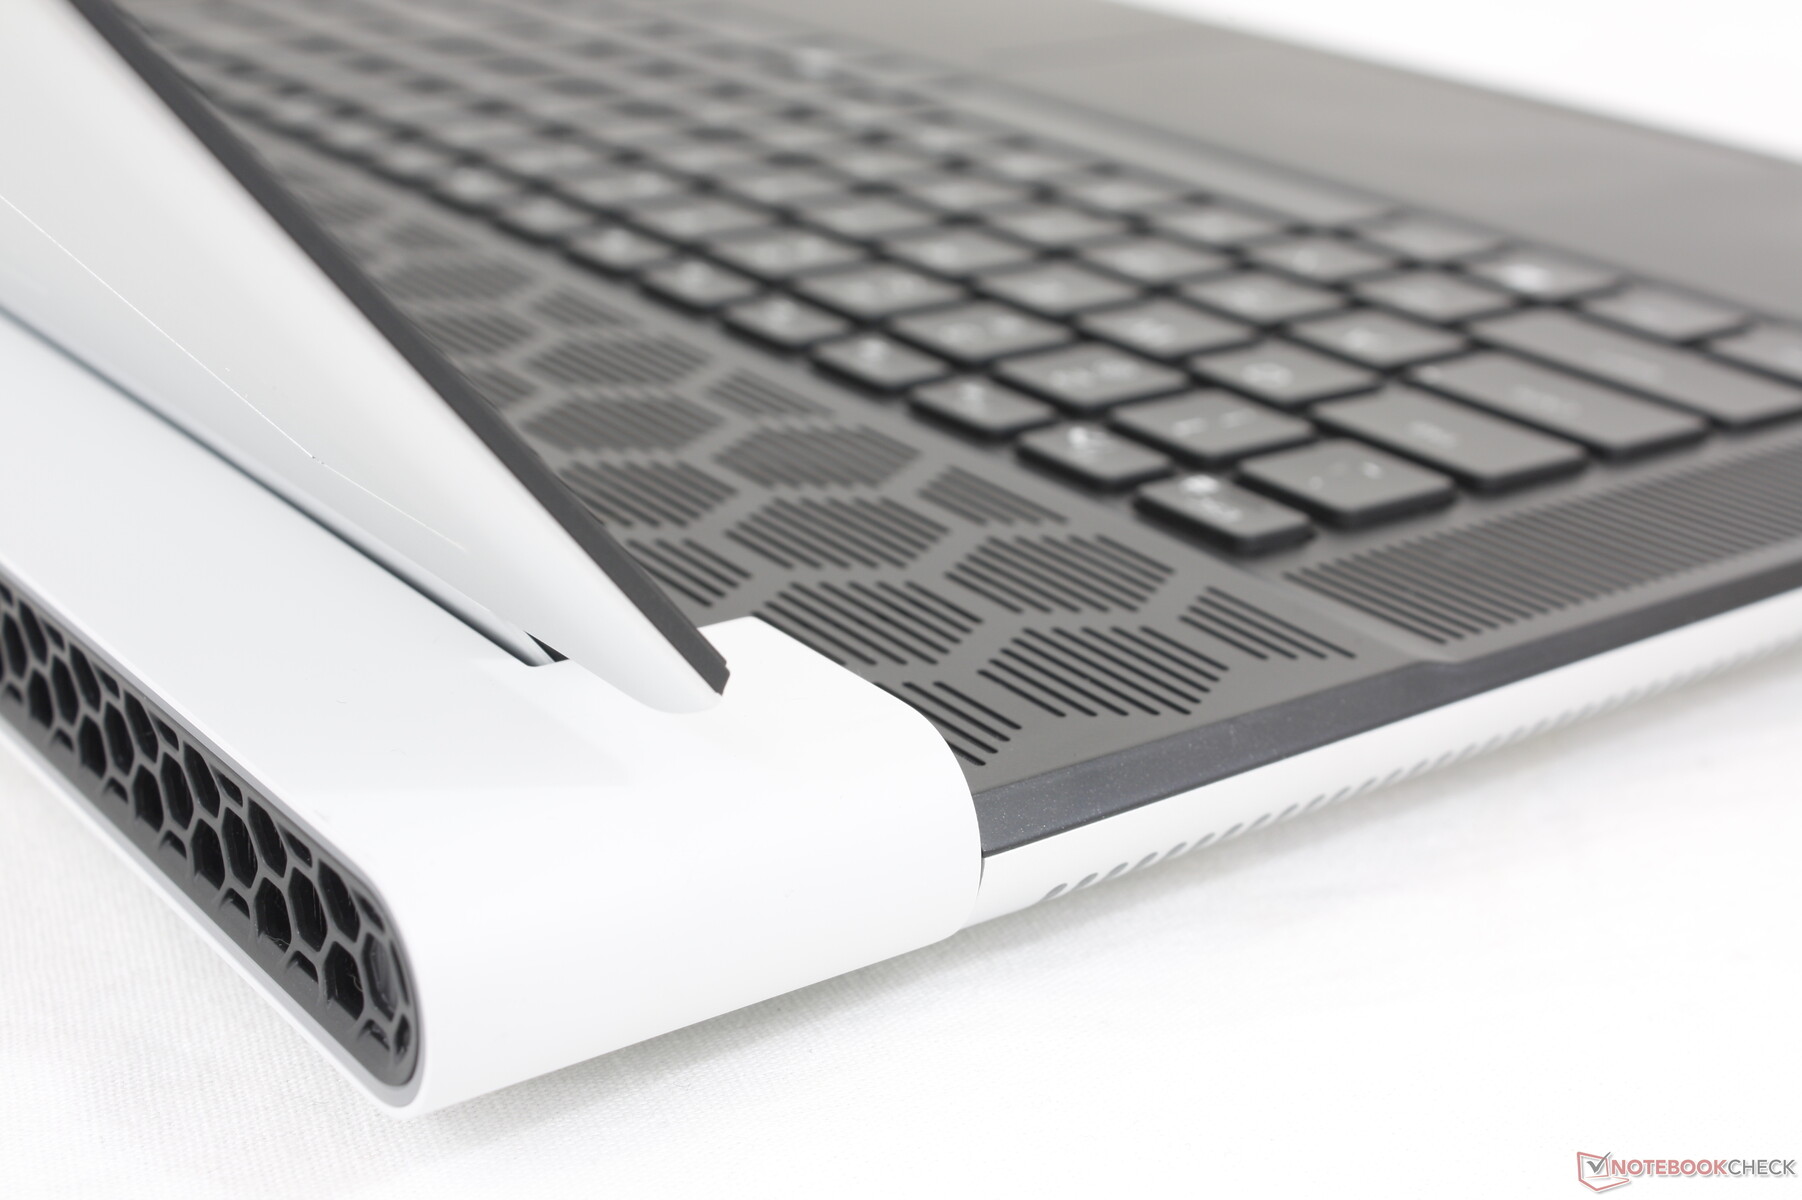
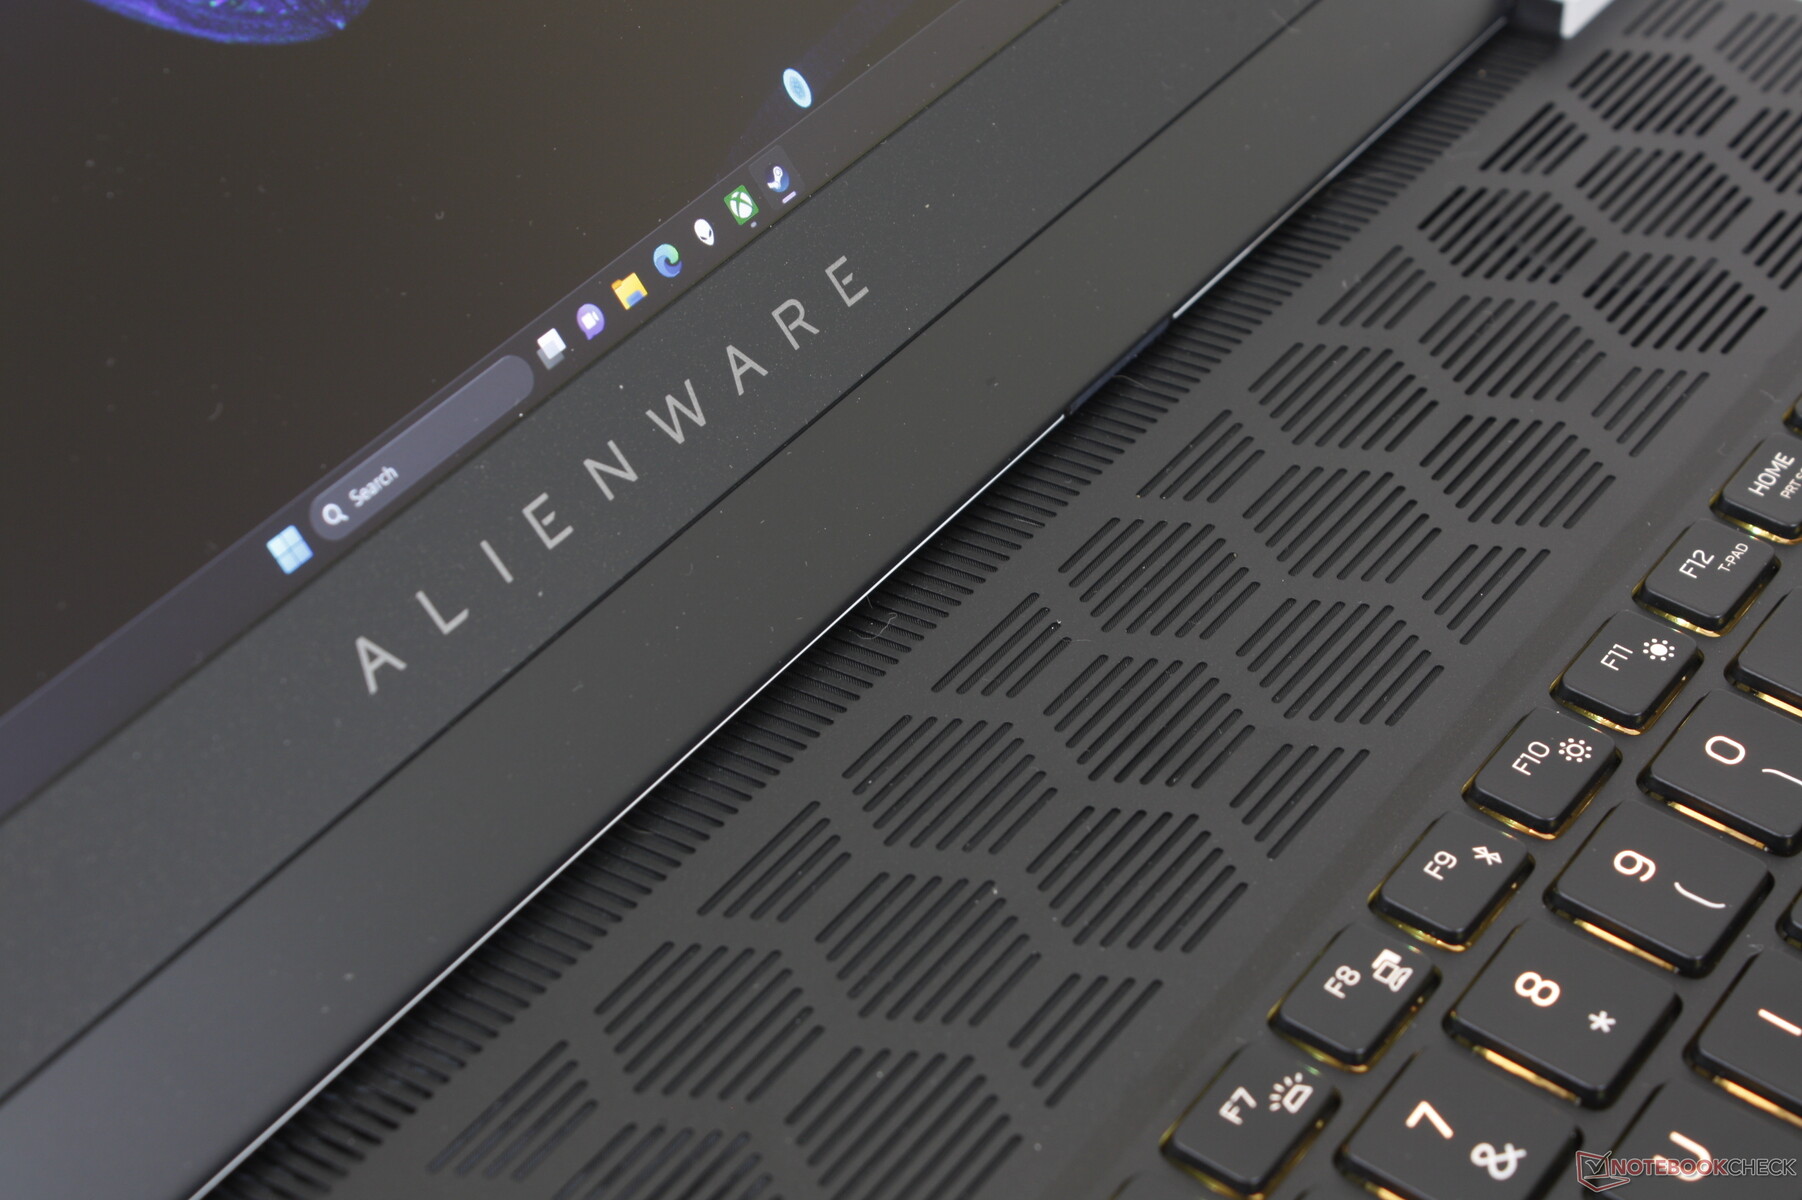
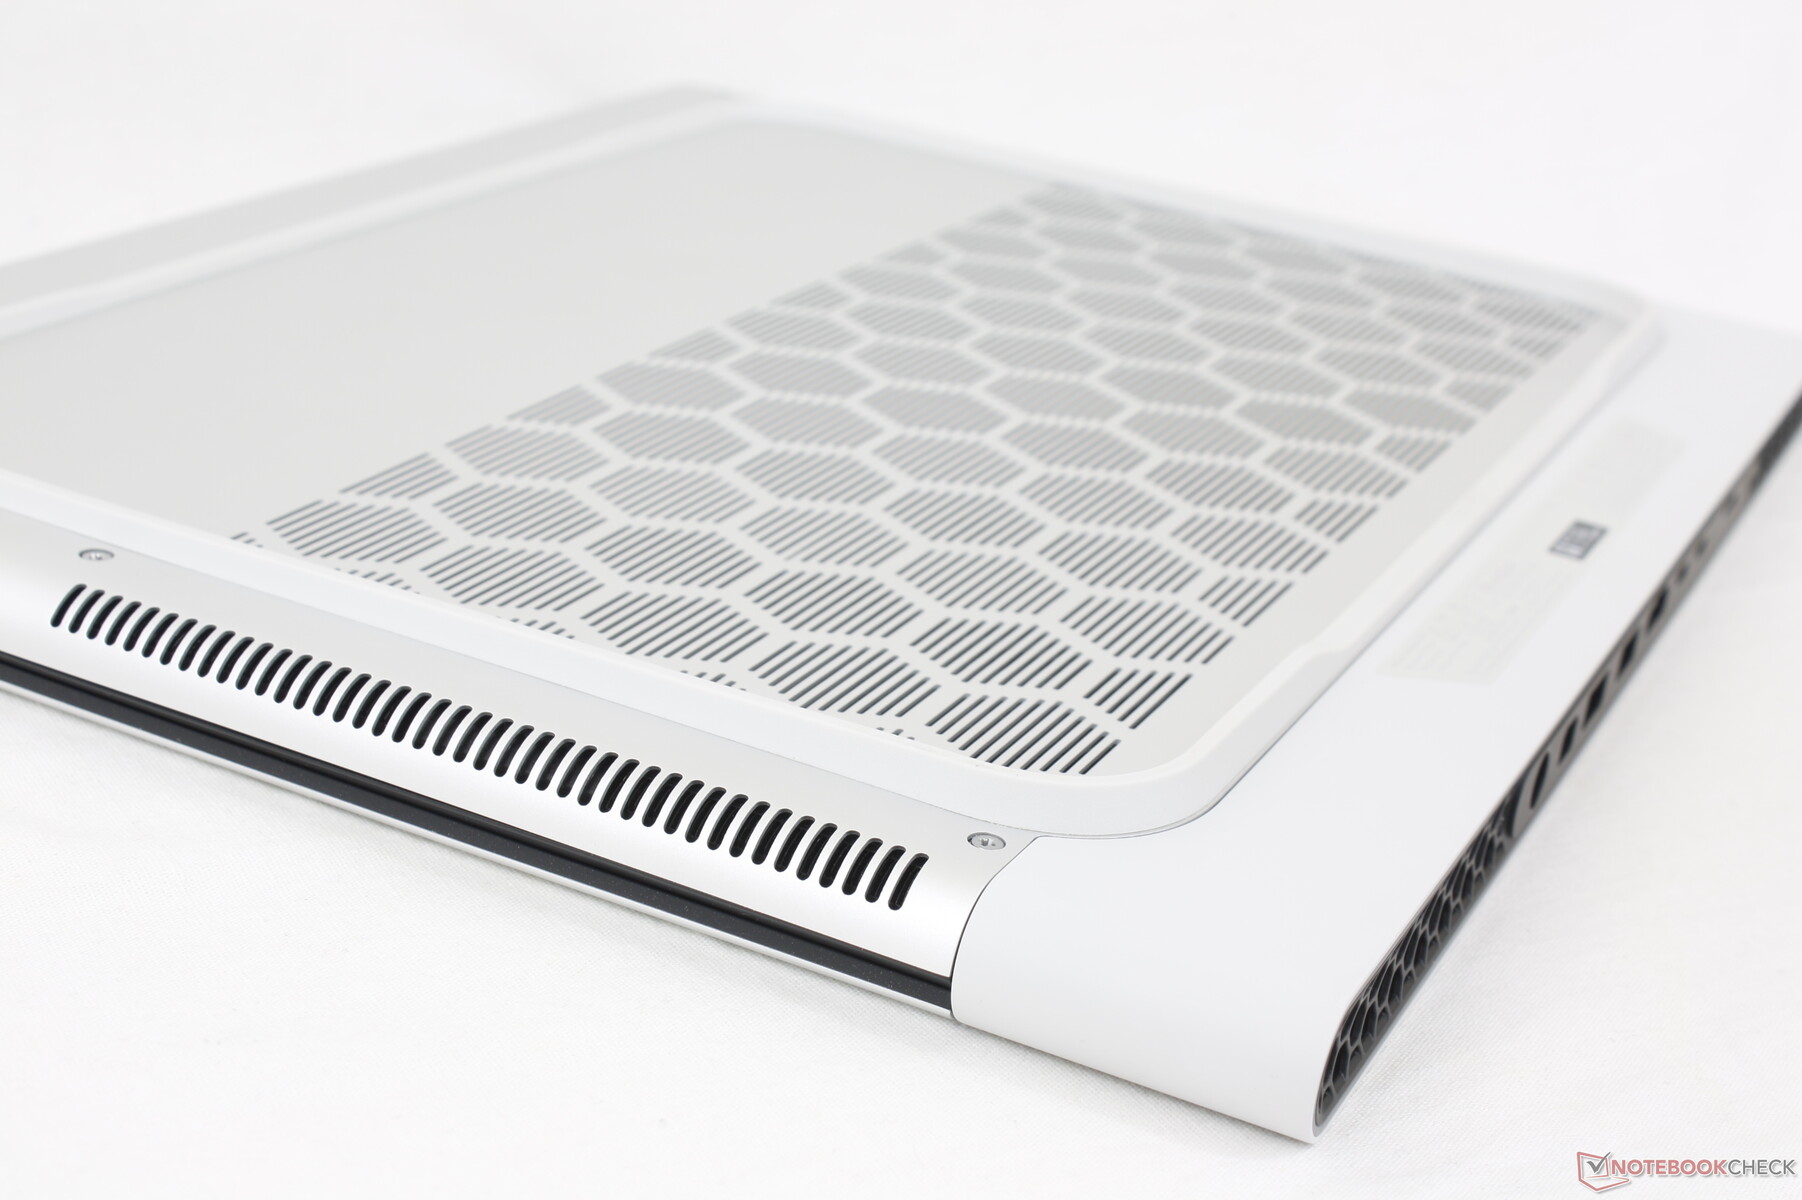
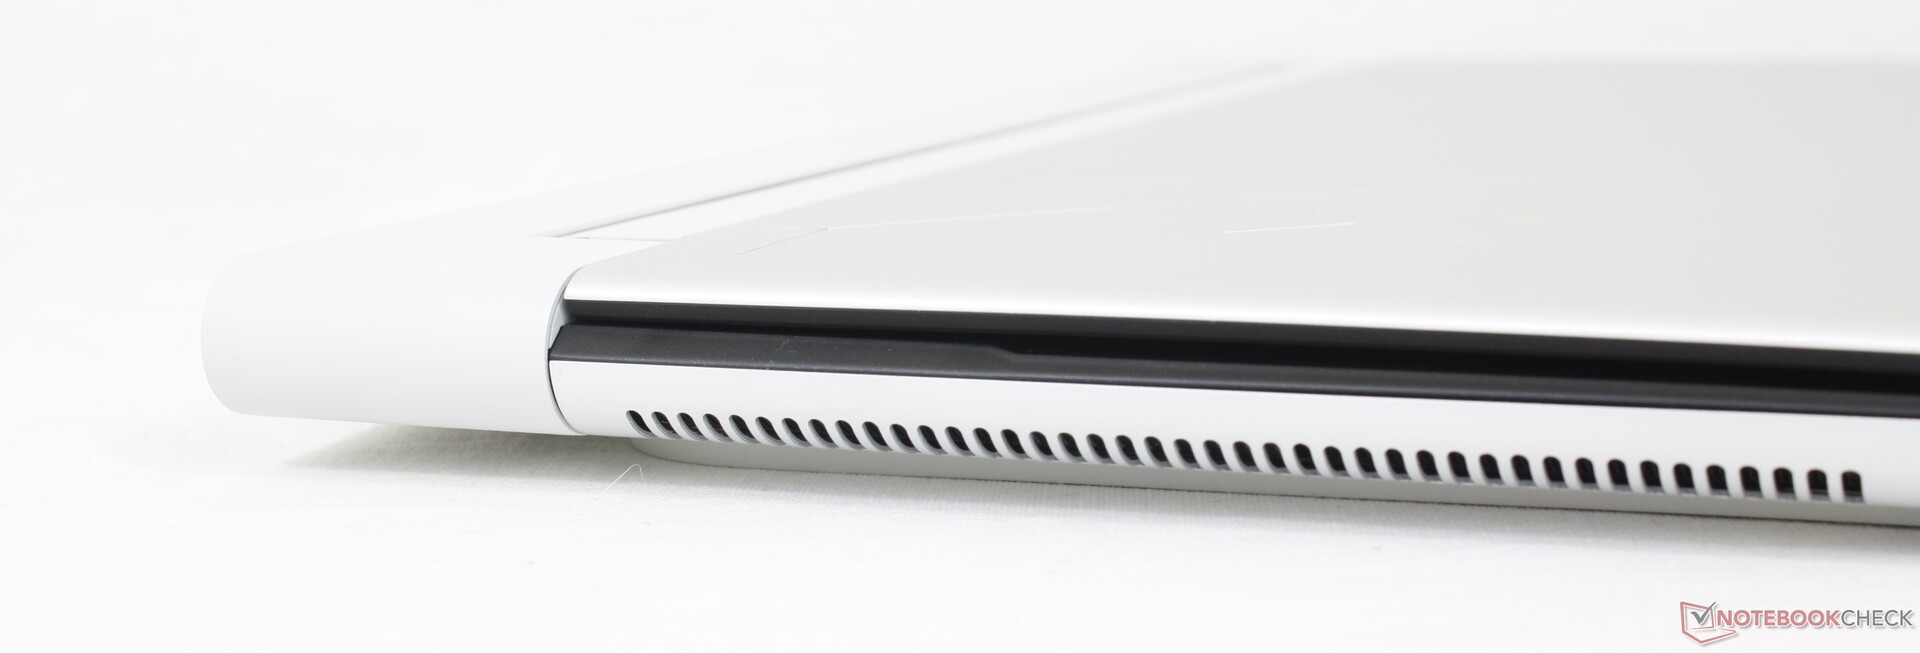
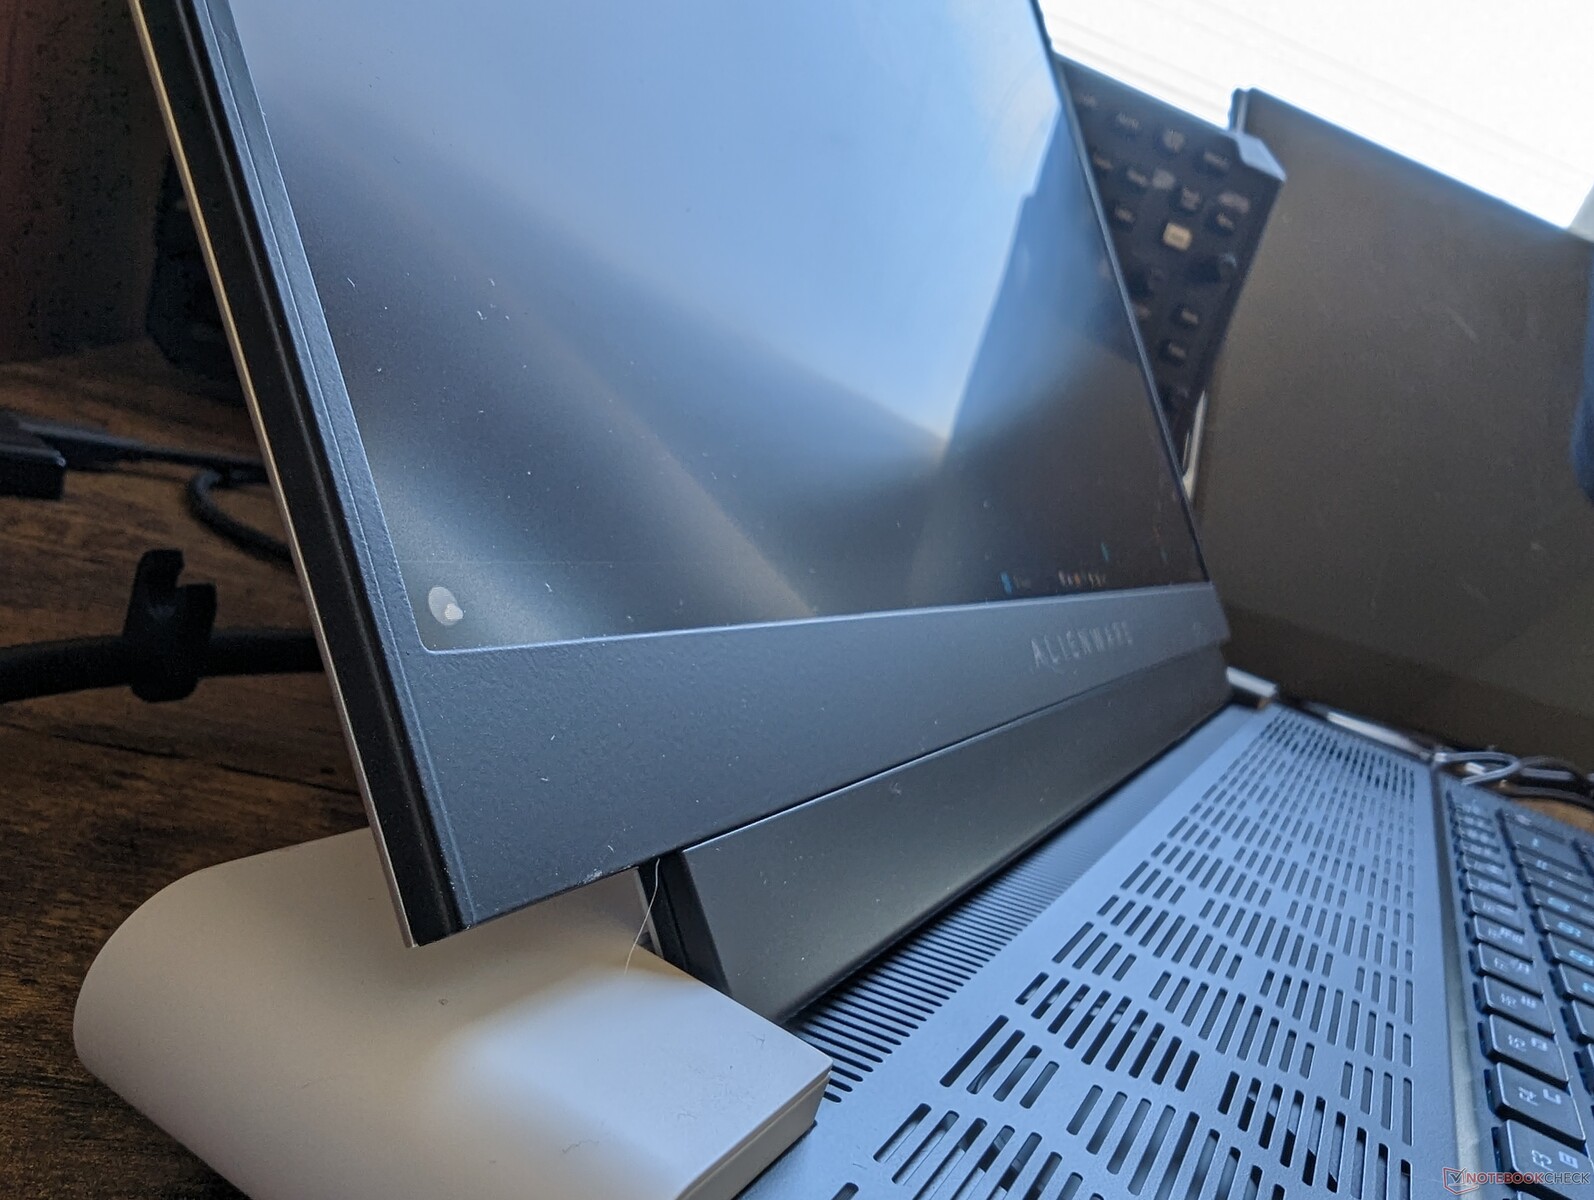
外壳--与众不同的Alienware
这款机箱有很多共同点,与 众多的共同点。和X17 R2有很多共同点,因为它们都采用了传奇3的设计语言。黑白双色、阳极氧化铝和镁合金以及沿后部的RGB环有助于在视觉上将Alienware系列与其他游戏笔记本的海洋区分开来。它是否比竞争机型更有吸引力或更受欢迎,取决于用户的偏好。
底盘的刚性非常好,特别是在底座周围,扭曲和翘曲的情况降到了最低。然而,盖子和铰链并不像我们希望的那样坚硬,当与华硕Strix Scar系列上较硬的显示器相比 华硕Strix Scar系列或刀锋16上的显示器相比,我们并不希望有那么大的刚性。
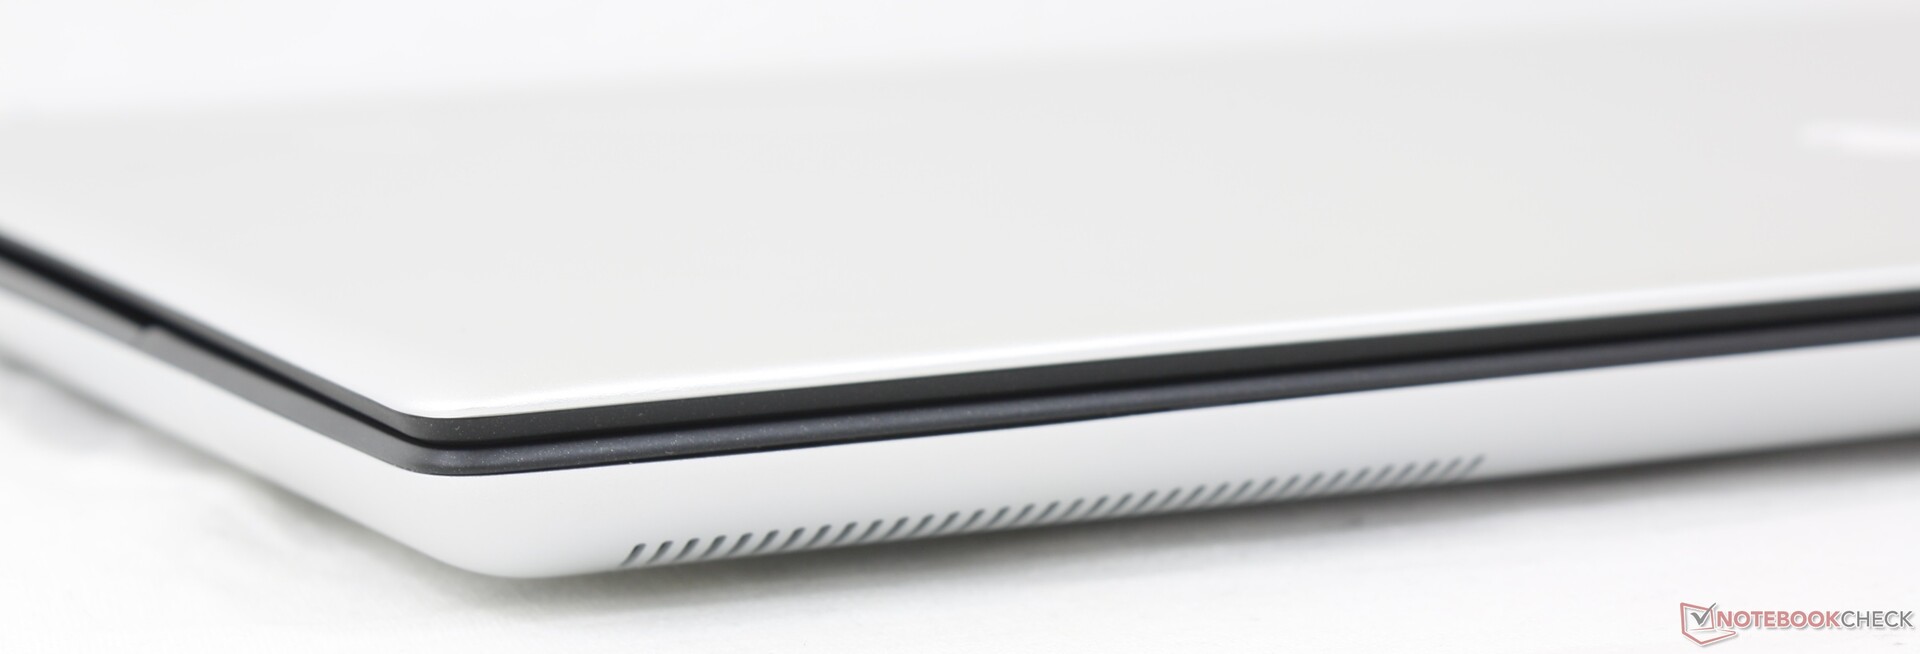
在19毫米以下,Alienware x16是市场上最薄的16英寸游戏笔记本电脑之一,甚至比Razer Blade 16还要薄。不幸的是,该系统更宽更长,占地面积更大,因此其整体体积并不比许多竞争对手小。例如,Alienware比Blade 16薄了近4毫米,但它的长度超过了40毫米,并因此重了约200克。
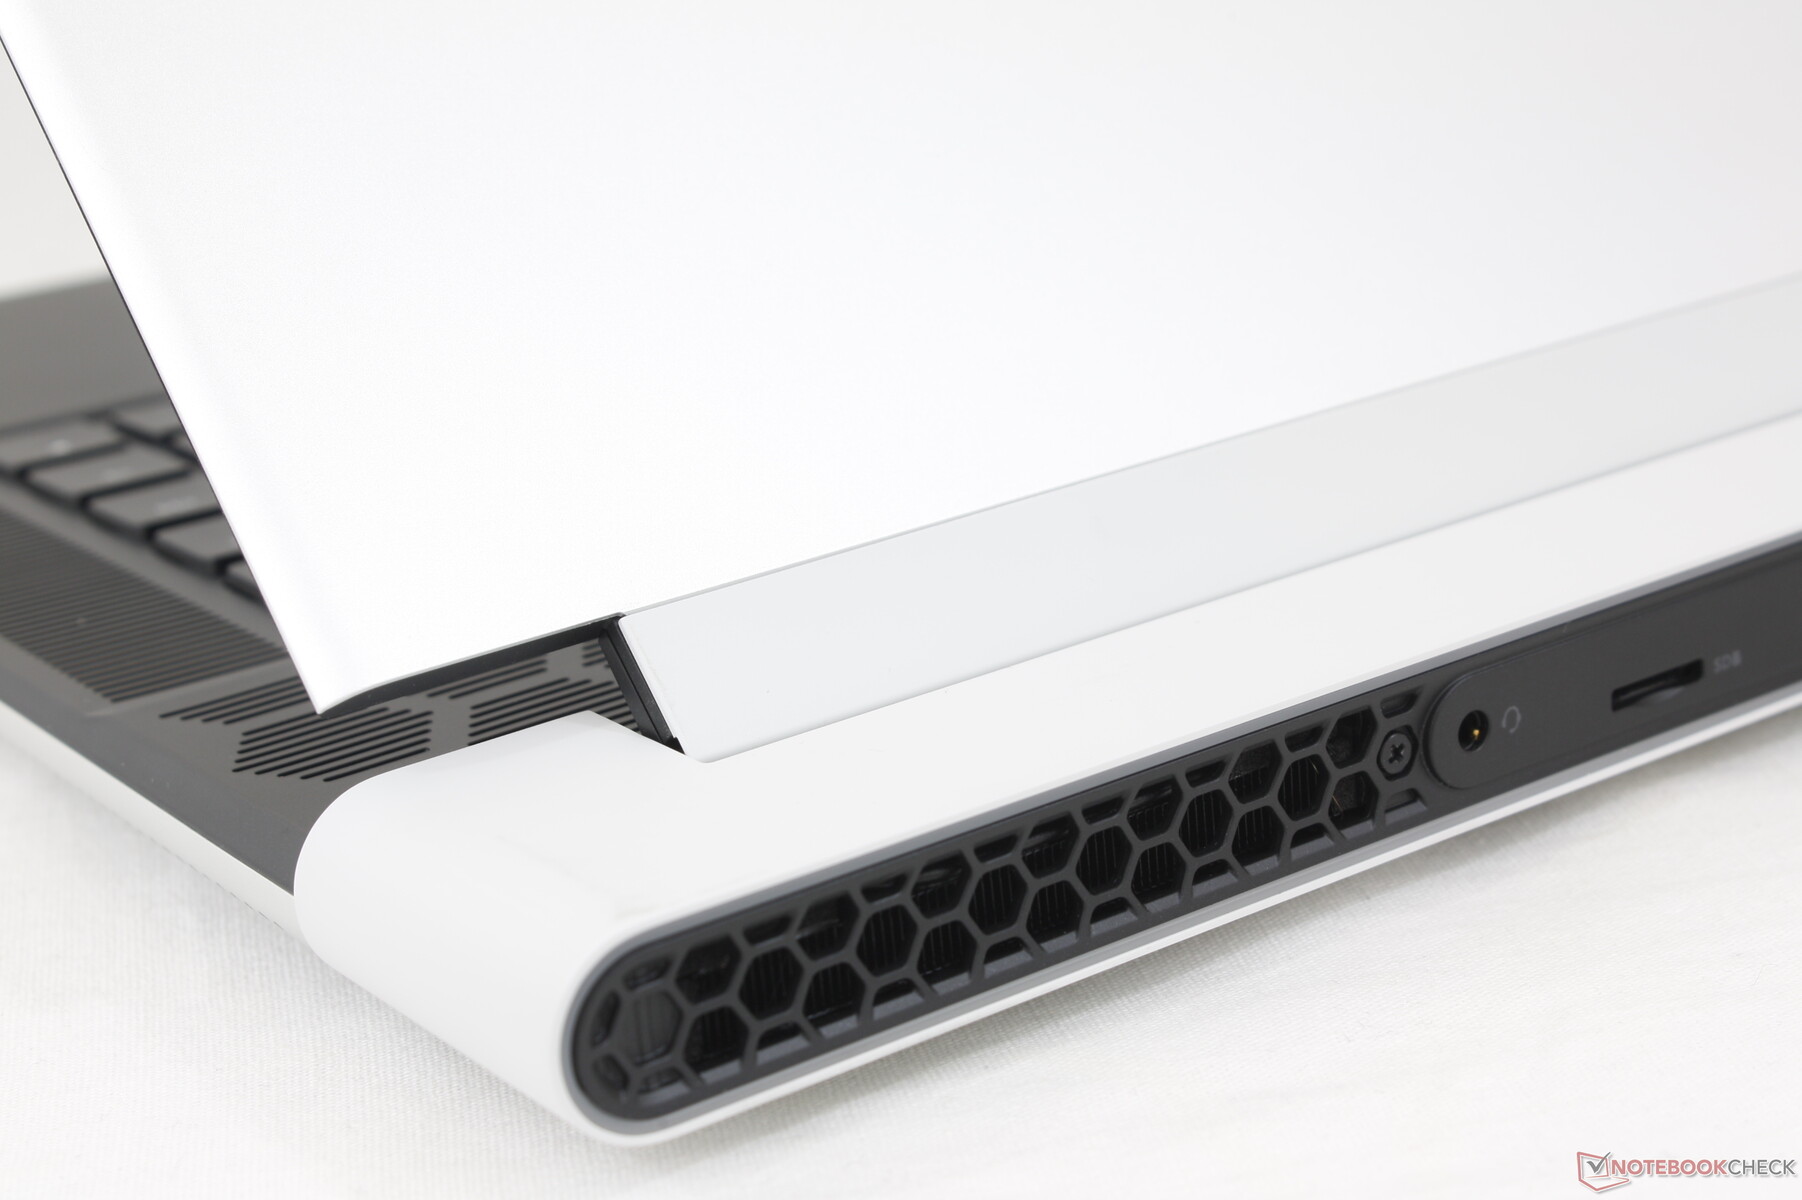
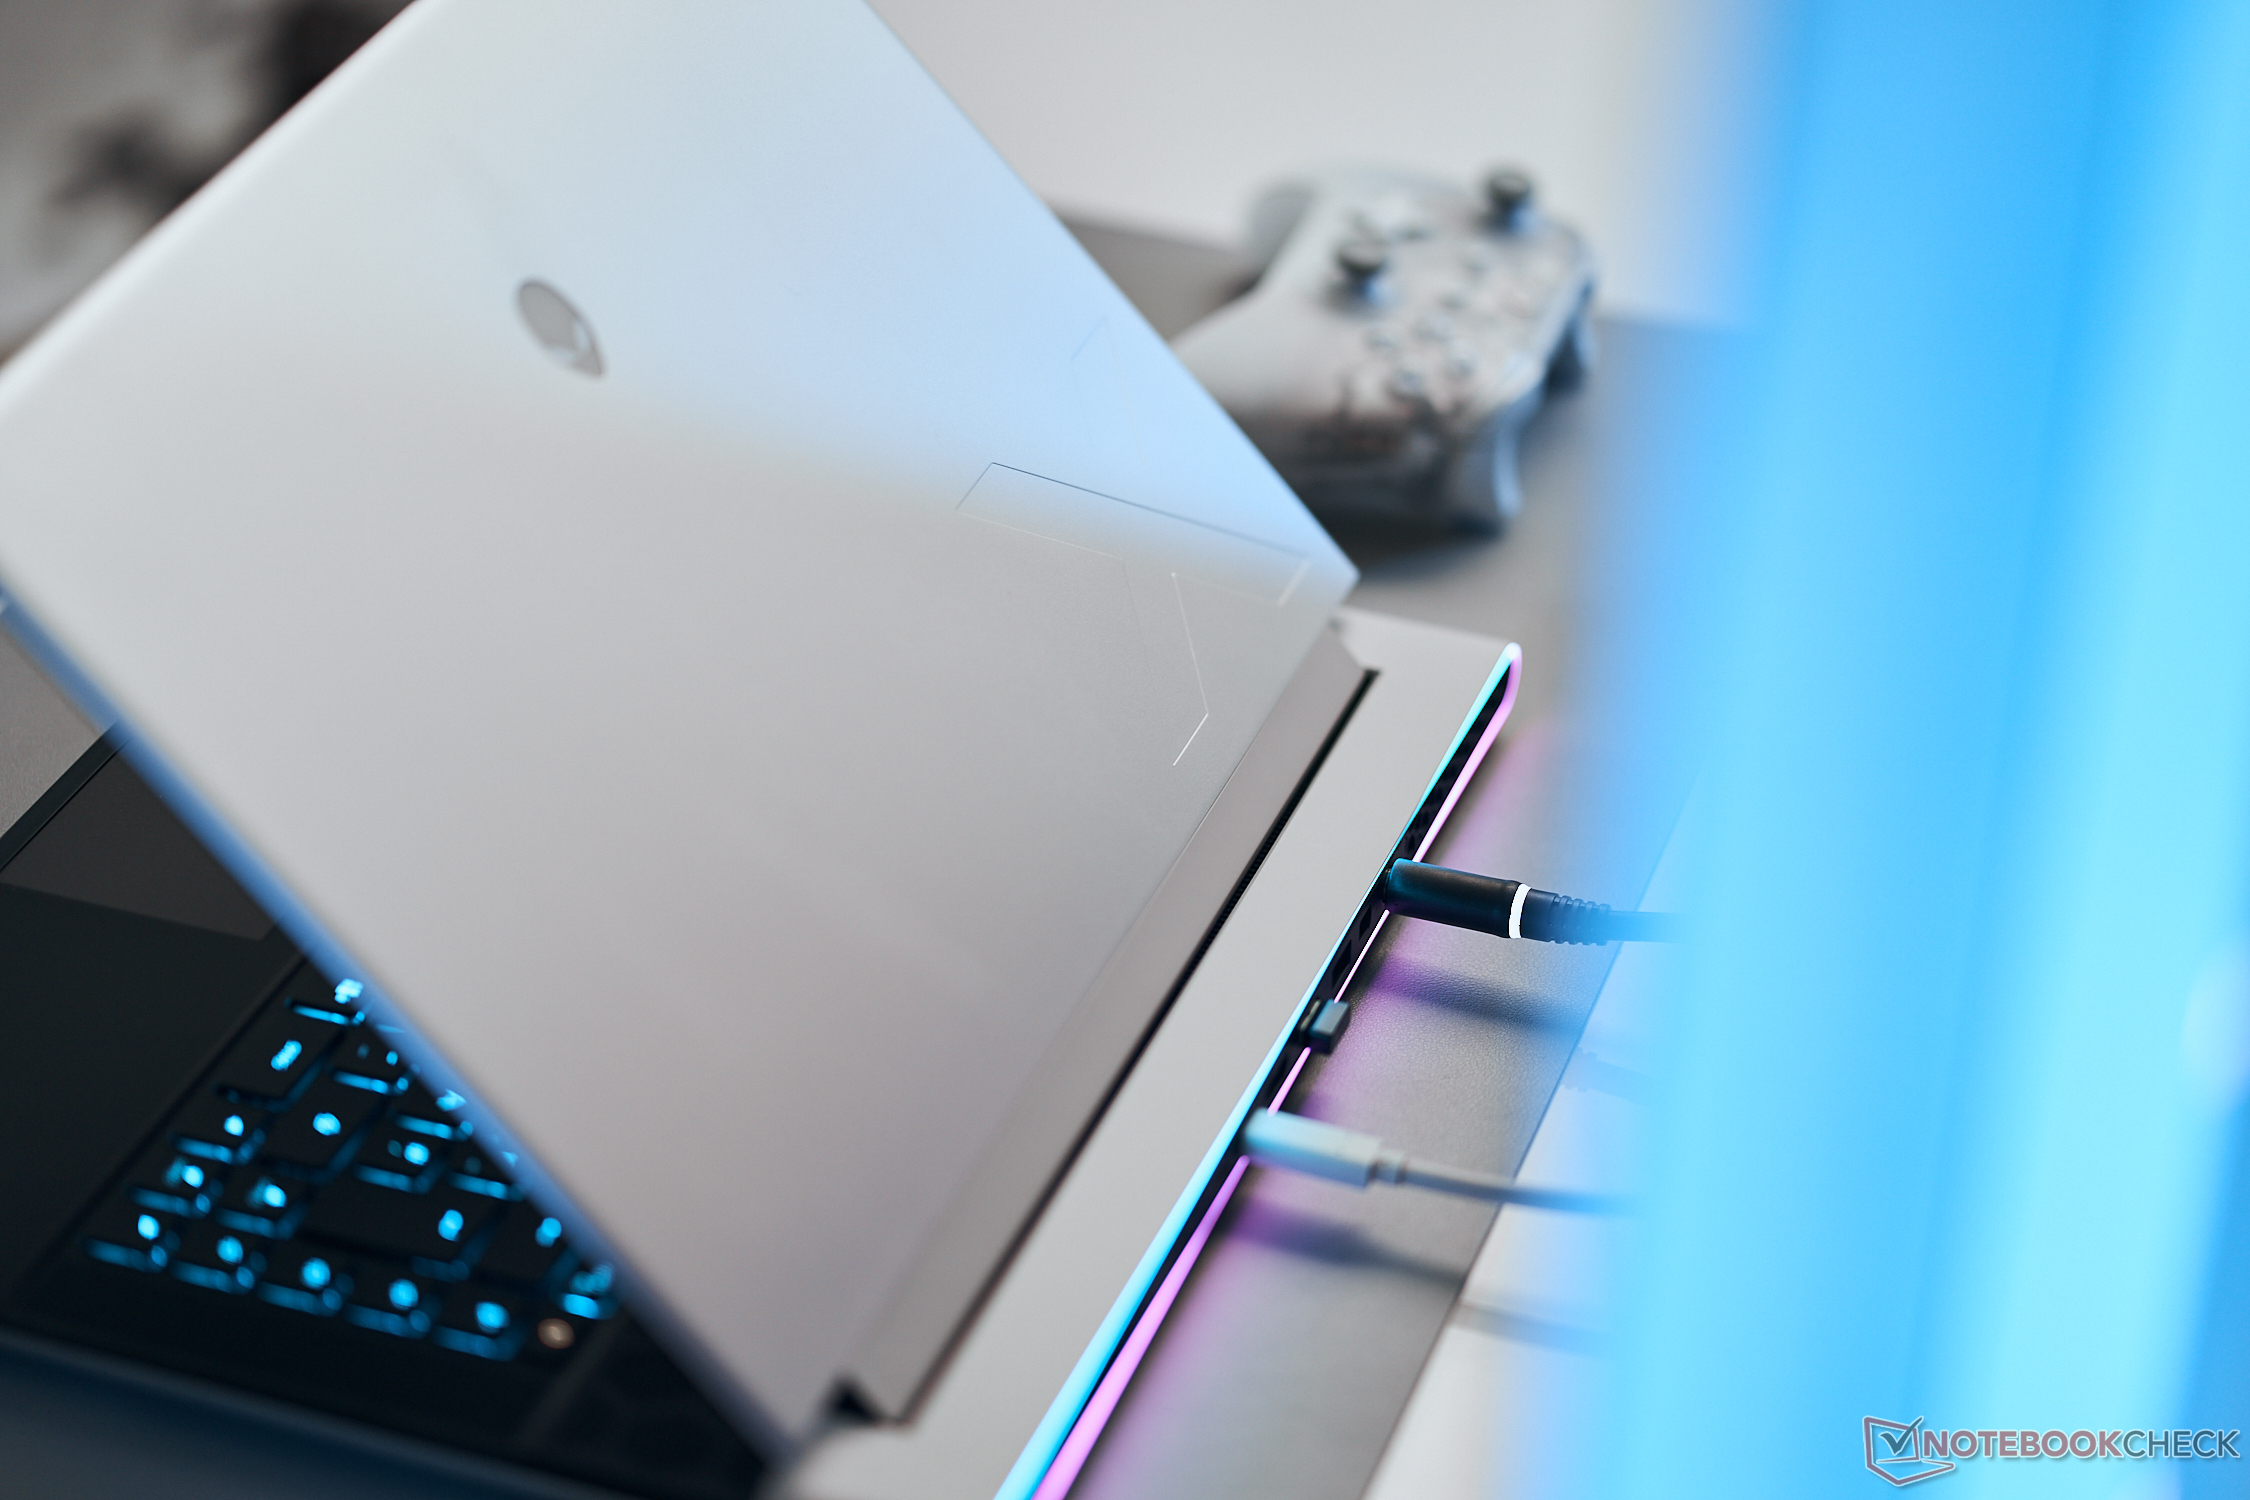
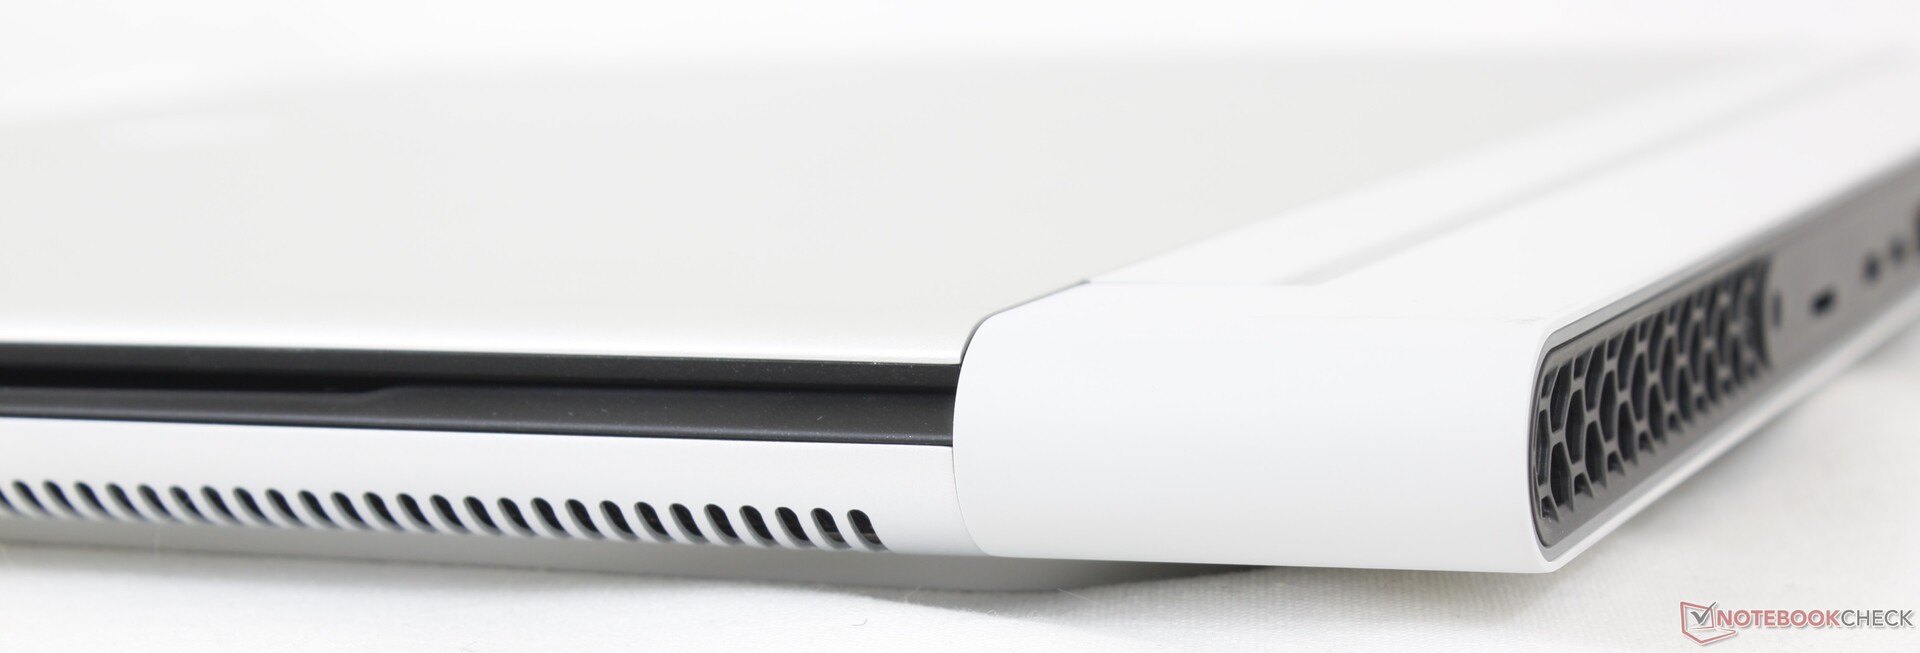
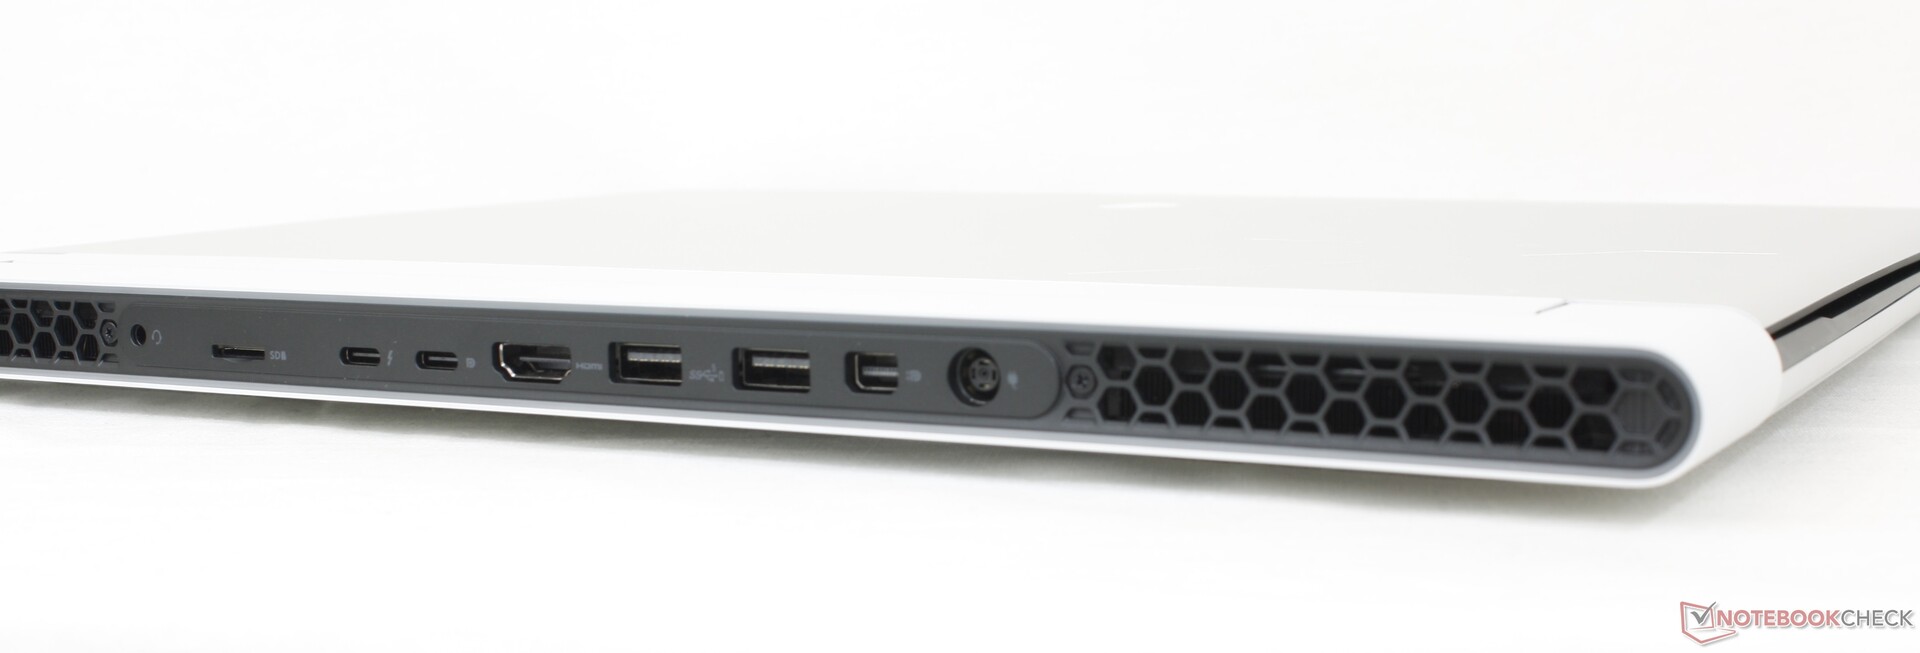
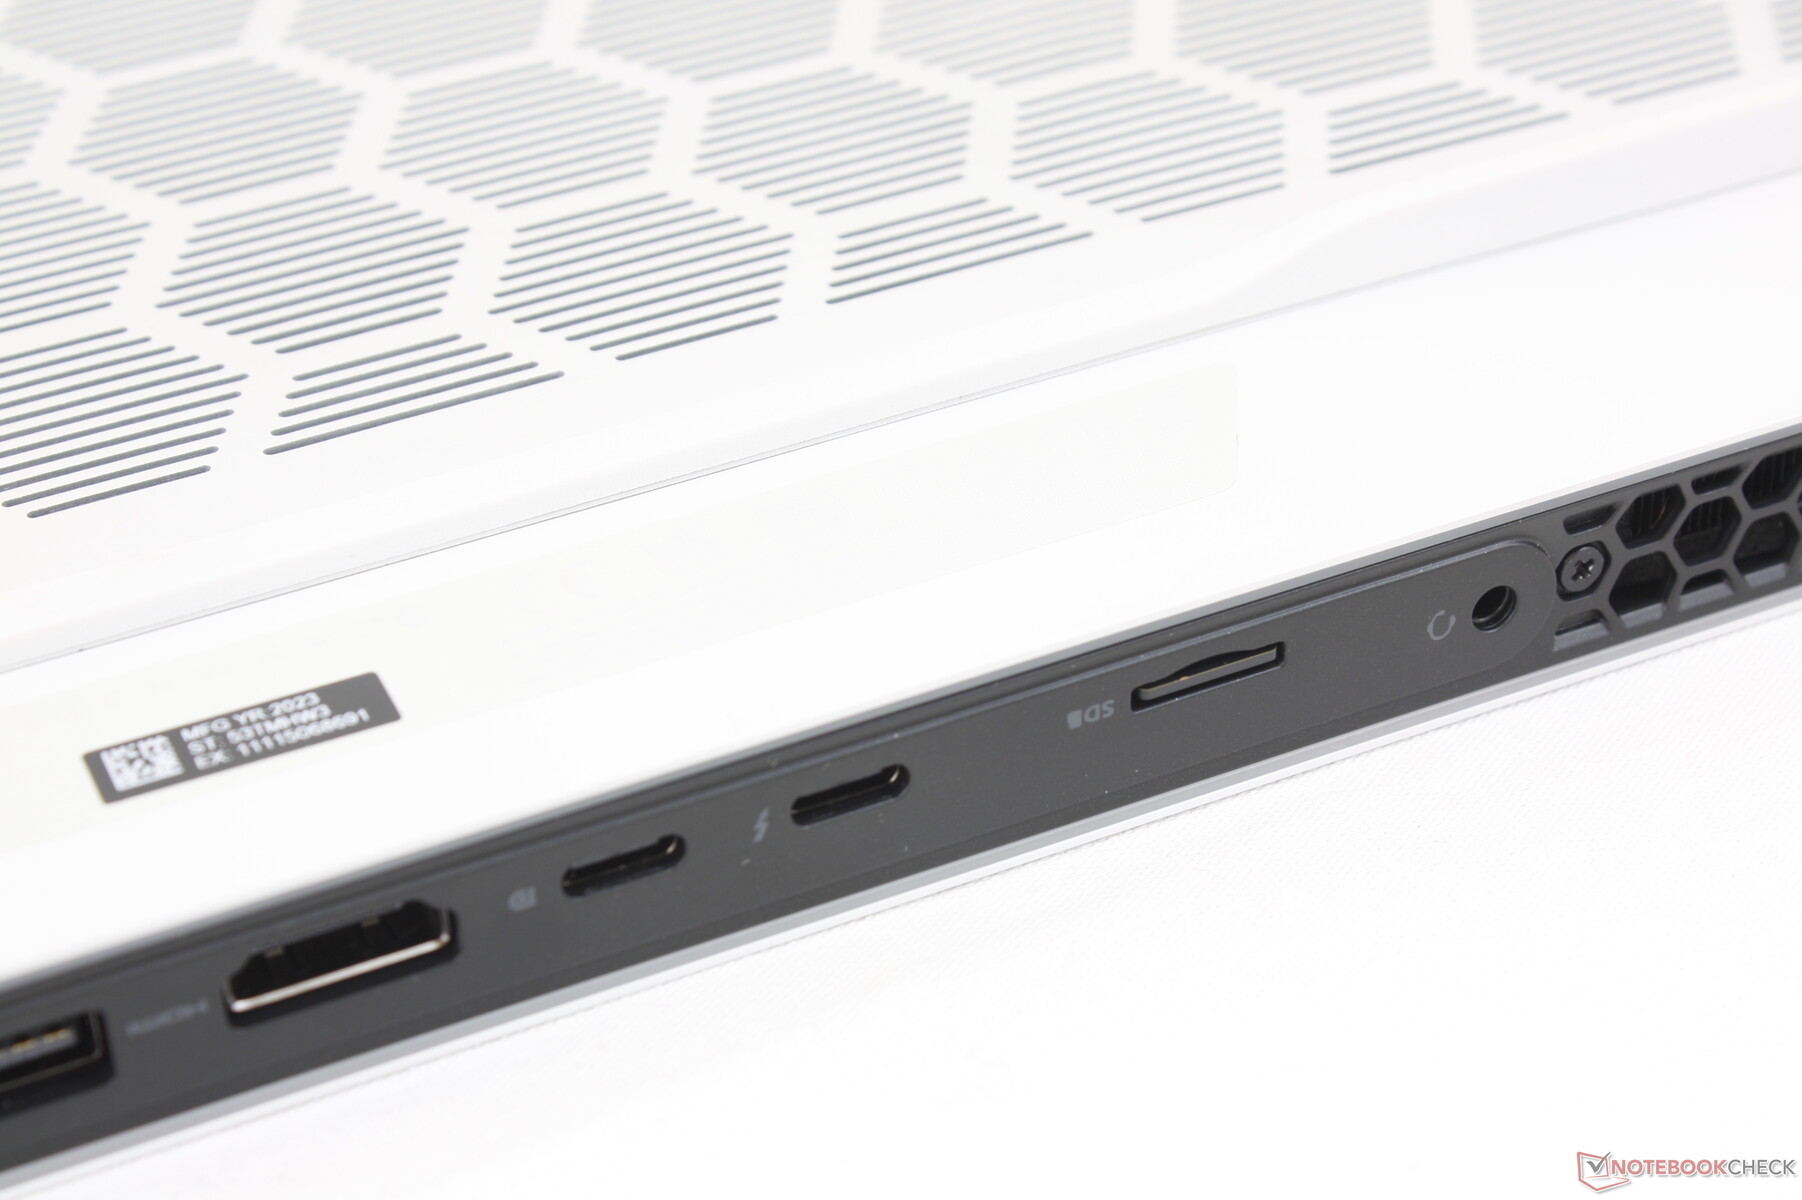
连接性 - 侧面没有任何东西
所有的端口都在后面,这既是一种祝福也是一种麻烦。一方面,没有任何侧面的端口意味着没有难看的或分散注意力的电缆。另一方面,端口的位置并不理想,特别是对于常用的USB端口。
请记住,两个USB-C端口中只有一个支持Thunderbolt 4。
SD卡阅读器
AS SSD报告的连续读取率为256.1 MB/s,而在实际测试中,用我们的UHS-II MicroSD测试卡传输1GB的照片,即使经过多次重试,速度也会慢很多,只有57 MB/s。
与大多数其他笔记本电脑不同的是,MicroSD读卡器是沿着机箱的后部而不是两侧。
| SD Card Reader | |
| average JPG Copy Test (av. of 3 runs) | |
| Asus ROG Zephyrus M16 GU604VY-NM042X | |
| Razer Blade 16 Early 2023 (AV PRO microSD 128 GB V60) | |
| Alienware x16 R1 (AV PRO microSD 128 GB V60) | |
| maximum AS SSD Seq Read Test (1GB) | |
| Alienware x16 R1 (AV PRO microSD 128 GB V60) | |
| Razer Blade 16 Early 2023 (AV PRO microSD 128 GB V60) | |
| Asus ROG Zephyrus M16 GU604VY-NM042X | |
沟通
| Networking | |
| iperf3 transmit AXE11000 | |
| Lenovo Legion Pro 7 16IRX8H | |
| Razer Blade 16 Early 2023 | |
| Alienware x16 R1 | |
| Alienware m17 R5 (R9 6900HX, RX 6850M XT) | |
| Dell G16 7620 | |
| iperf3 receive AXE11000 | |
| Lenovo Legion Pro 7 16IRX8H | |
| Razer Blade 16 Early 2023 | |
| Alienware x16 R1 | |
| Dell G16 7620 | |
| Alienware m17 R5 (R9 6900HX, RX 6850M XT) | |
| iperf3 transmit AXE11000 6GHz | |
| Asus ROG Zephyrus M16 GU604VY-NM042X | |
| Razer Blade 16 Early 2023 | |
| Alienware x16 R1 | |
| iperf3 receive AXE11000 6GHz | |
| Asus ROG Zephyrus M16 GU604VY-NM042X | |
| Razer Blade 16 Early 2023 | |
| Alienware x16 R1 | |
网络摄像头
一个200万像素的网络摄像头是标准配置,同时支持红外线的你好。不过,根本没有隐私快门。


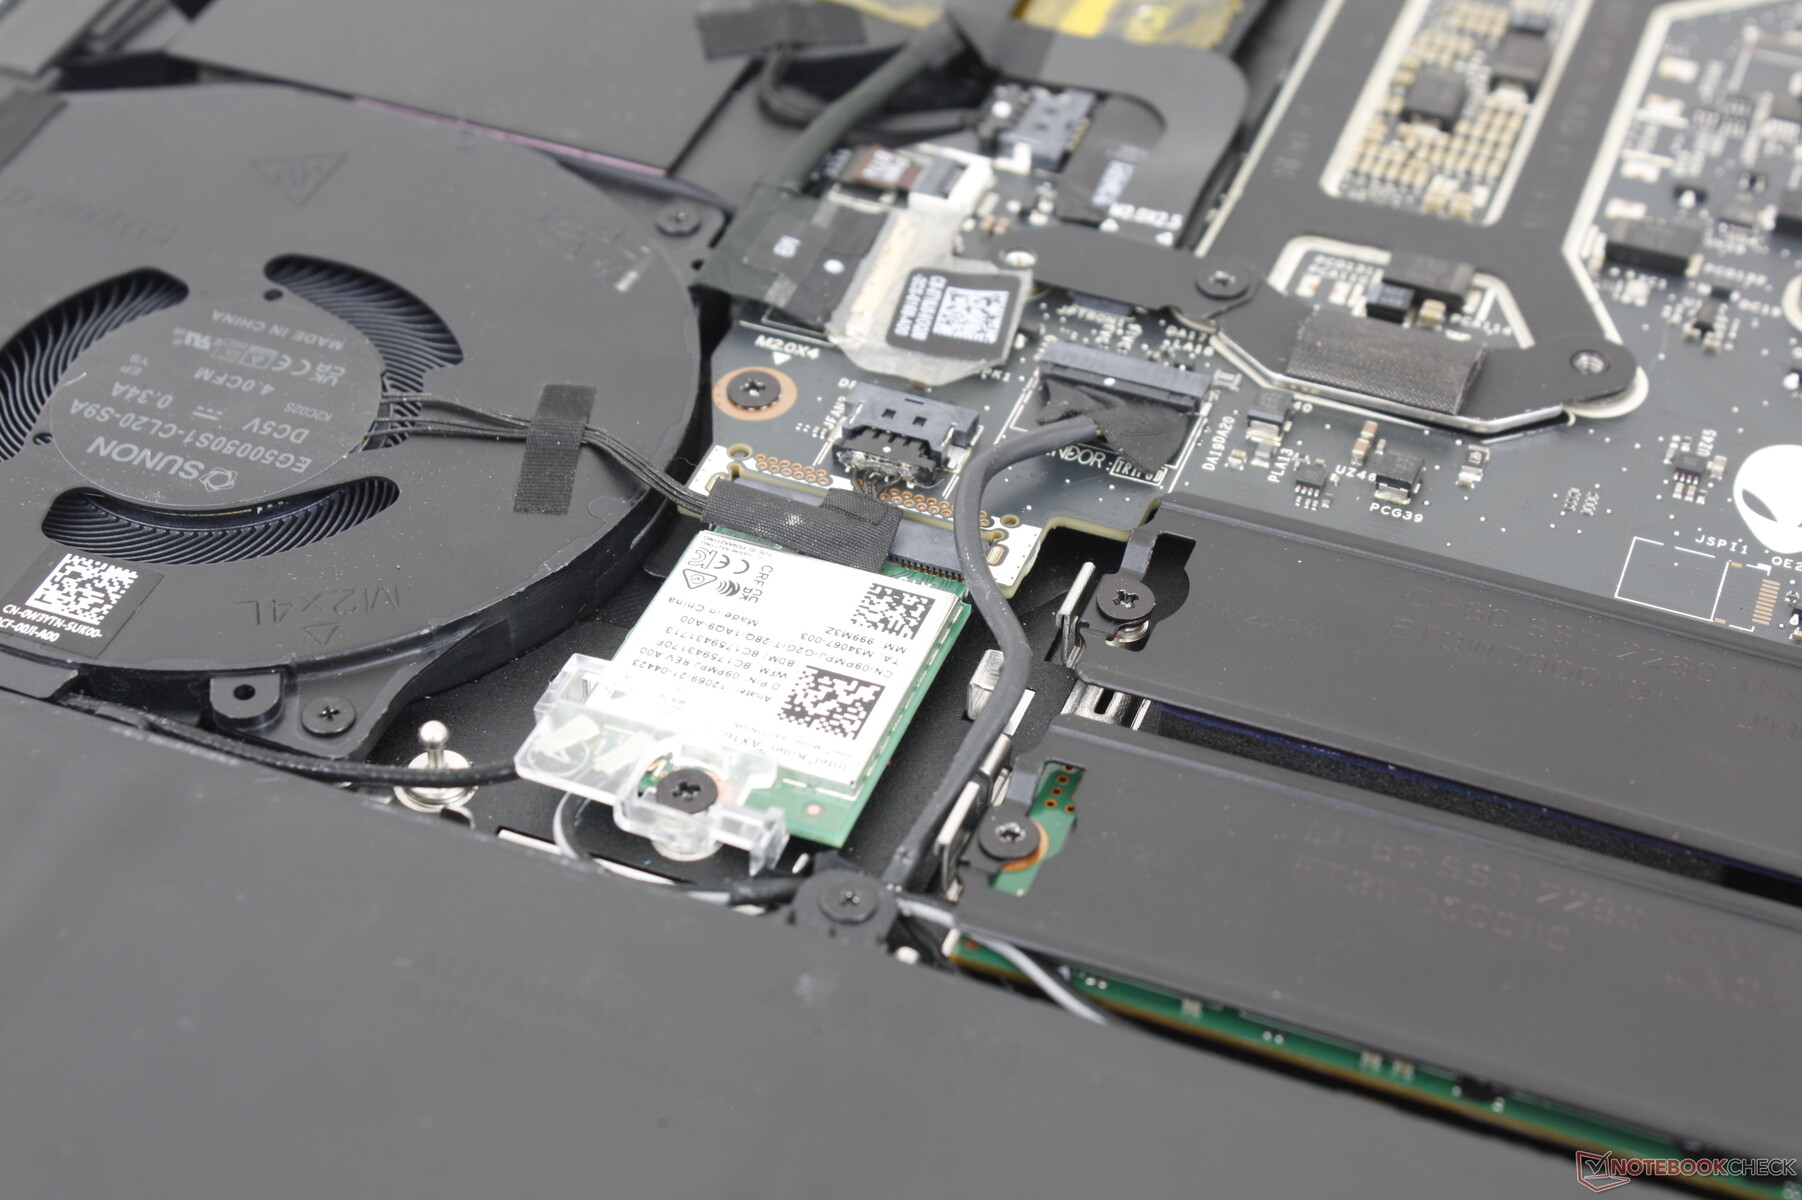
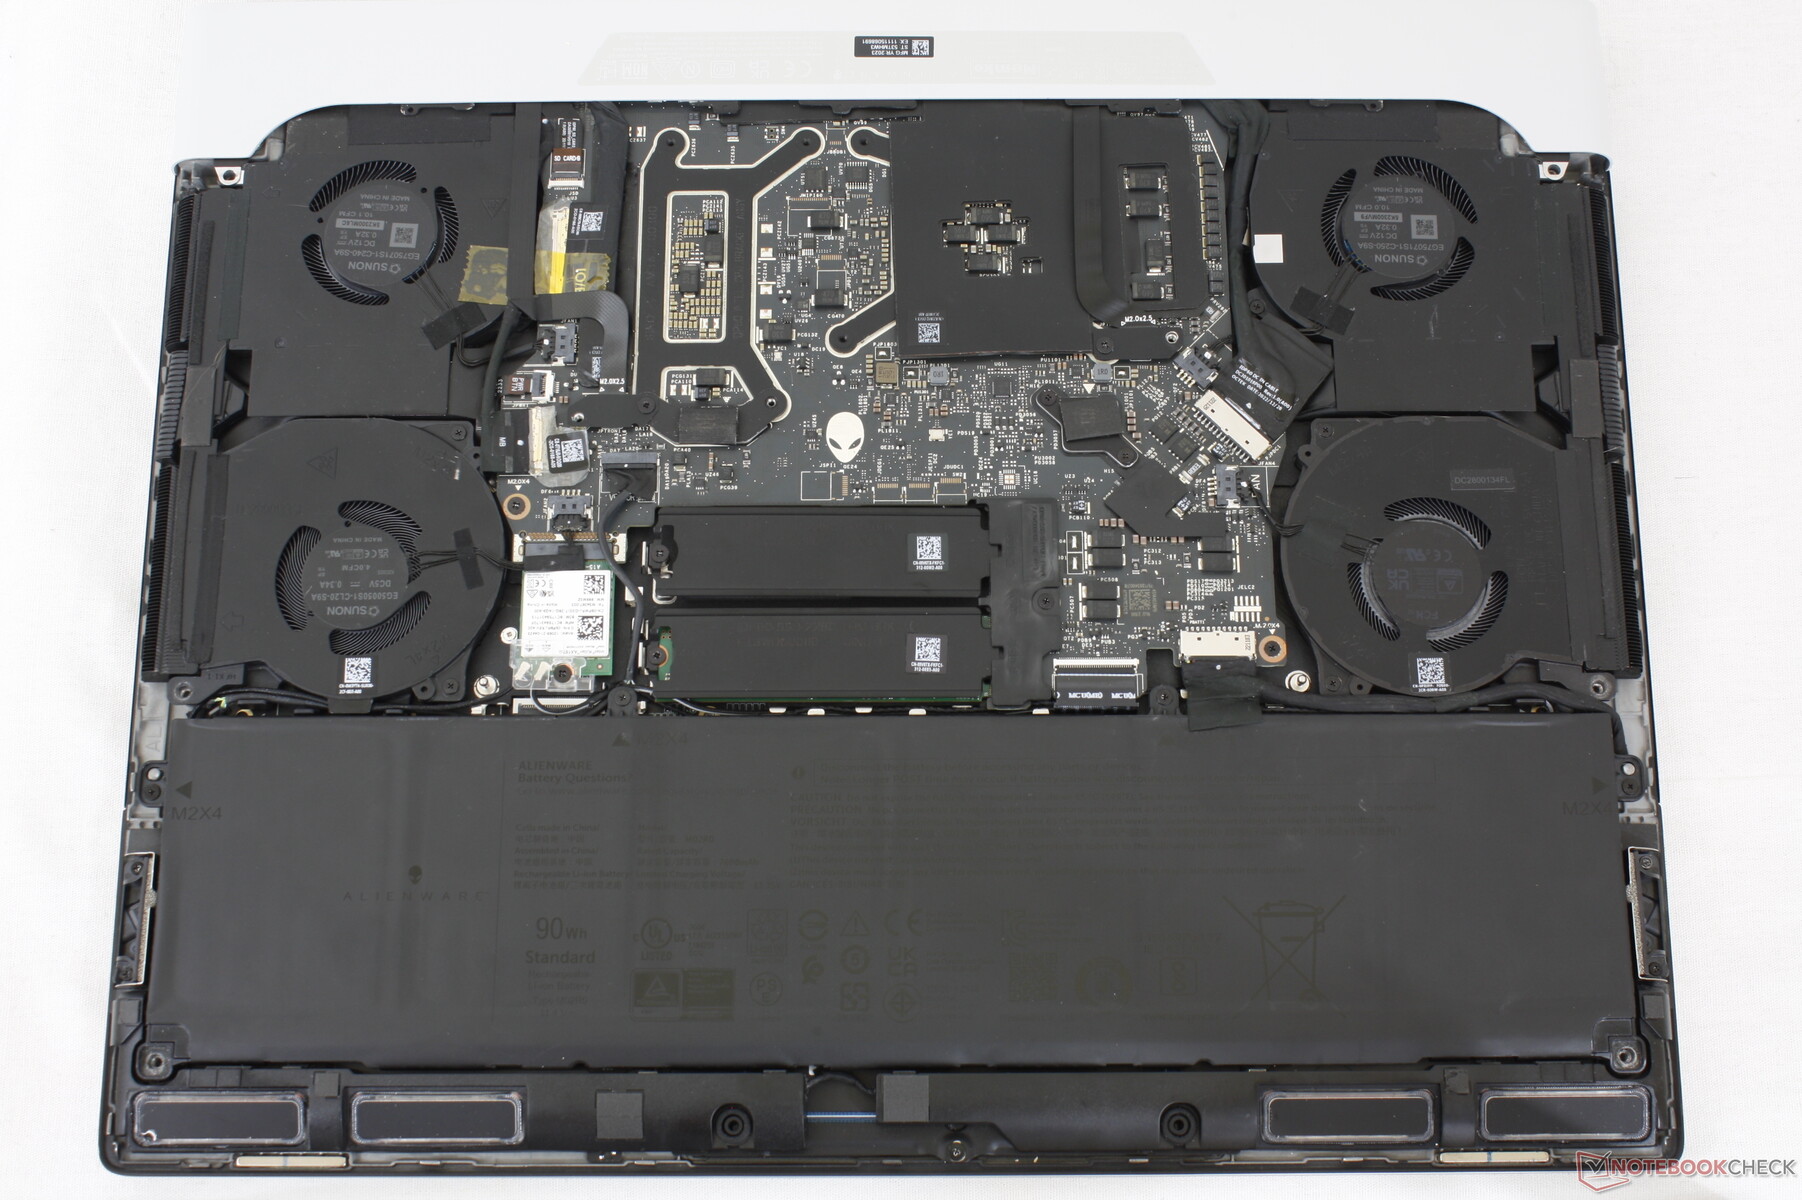
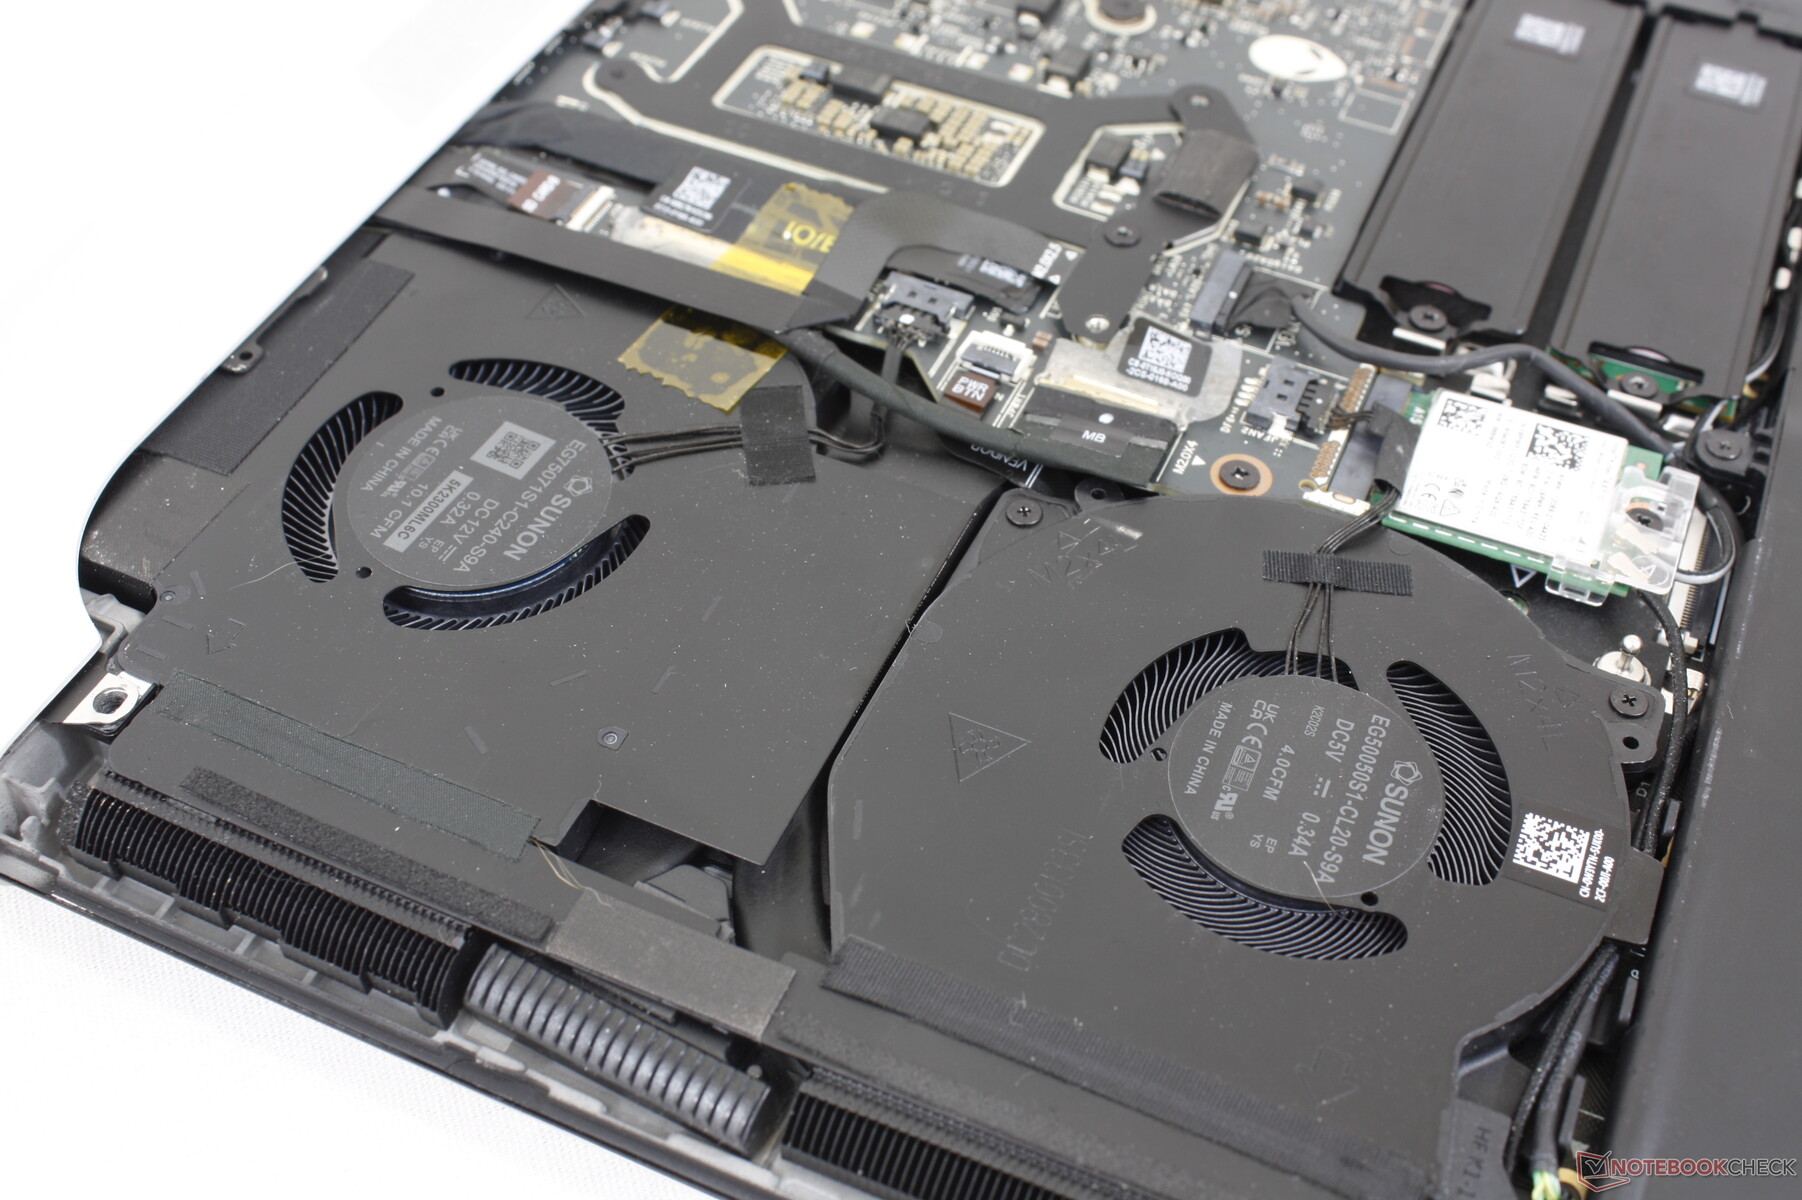
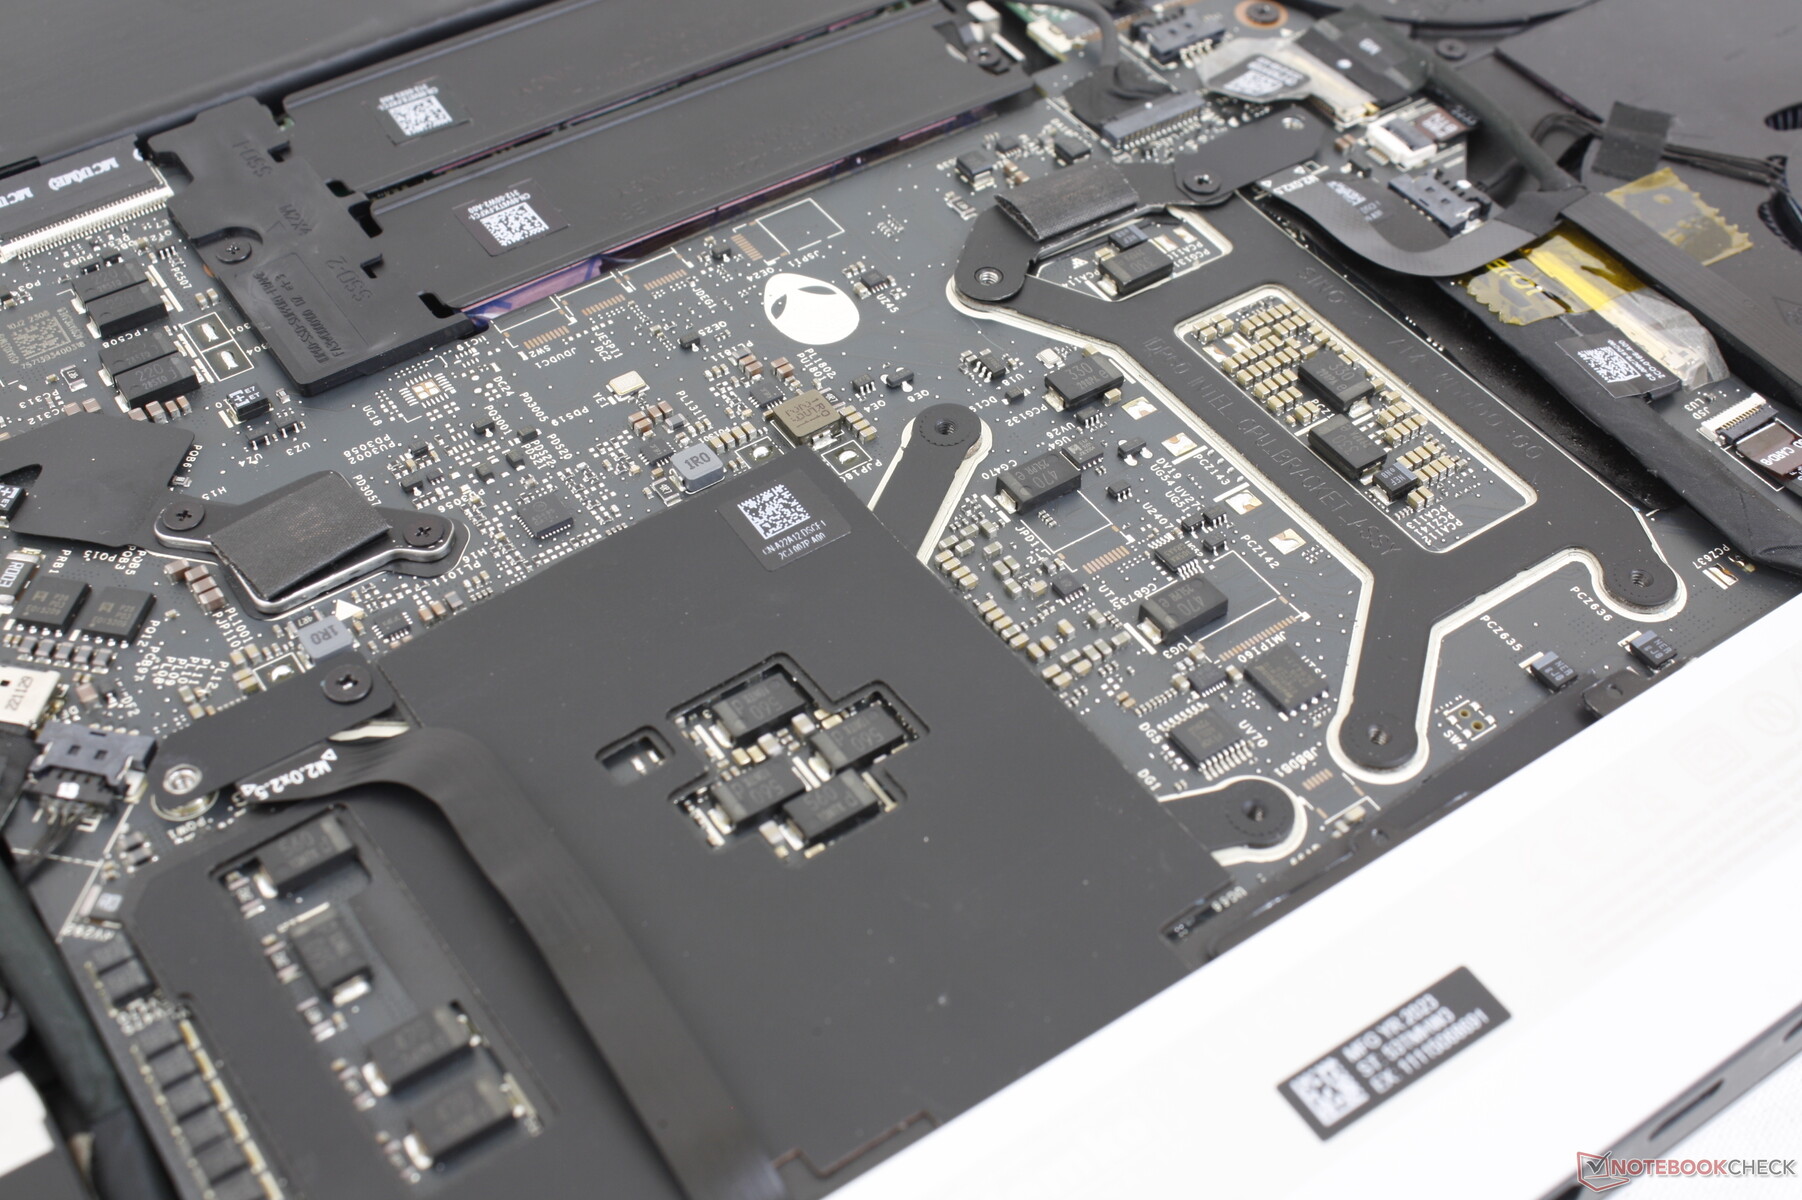
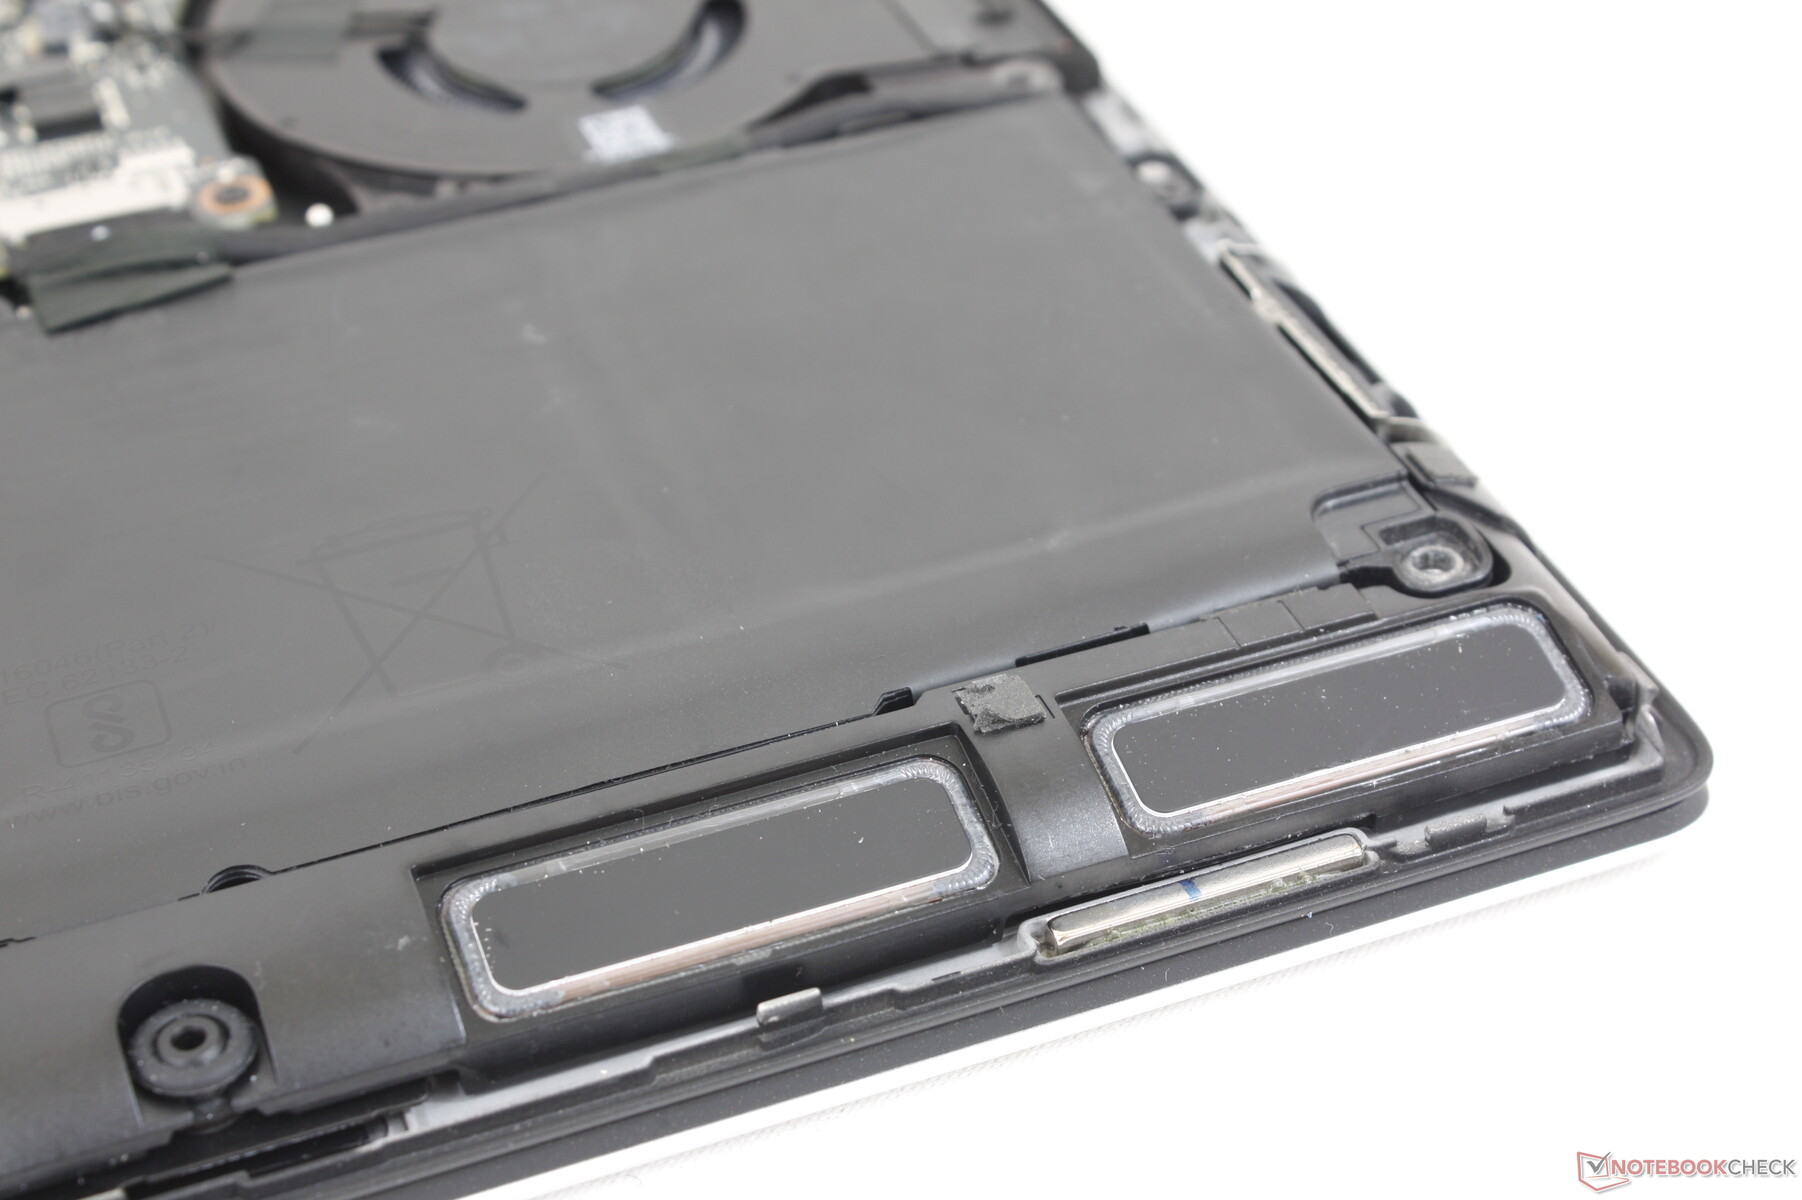
维护
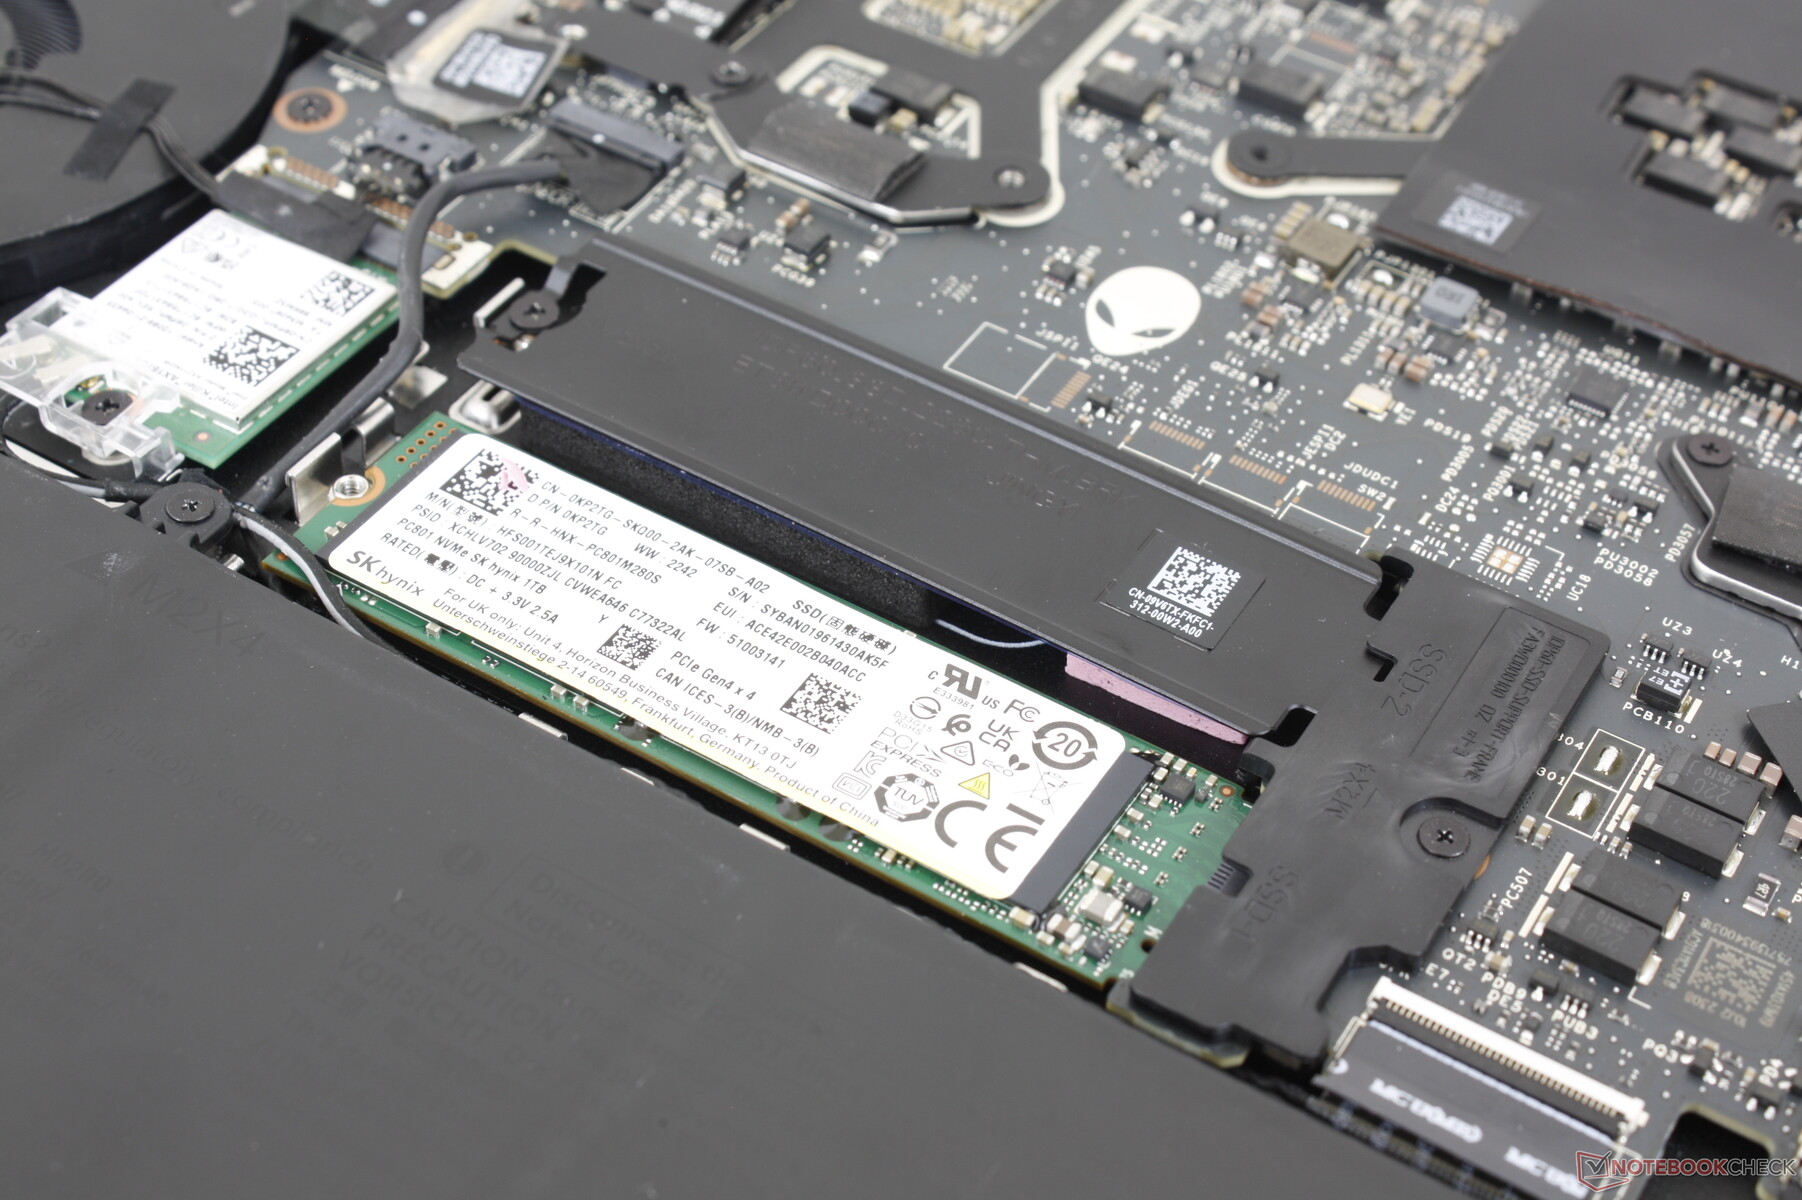
底部面板仅由六个十字螺丝固定,便于拆卸。用户可以直接接触到两个M.2 2280 SSD插槽、电池和可拆卸的WLAN模块。
配件和保修
除了交流电适配器和文件外,盒子里没有其他额外的东西。如果在美国购买,通常有一年的制造商有限保修。
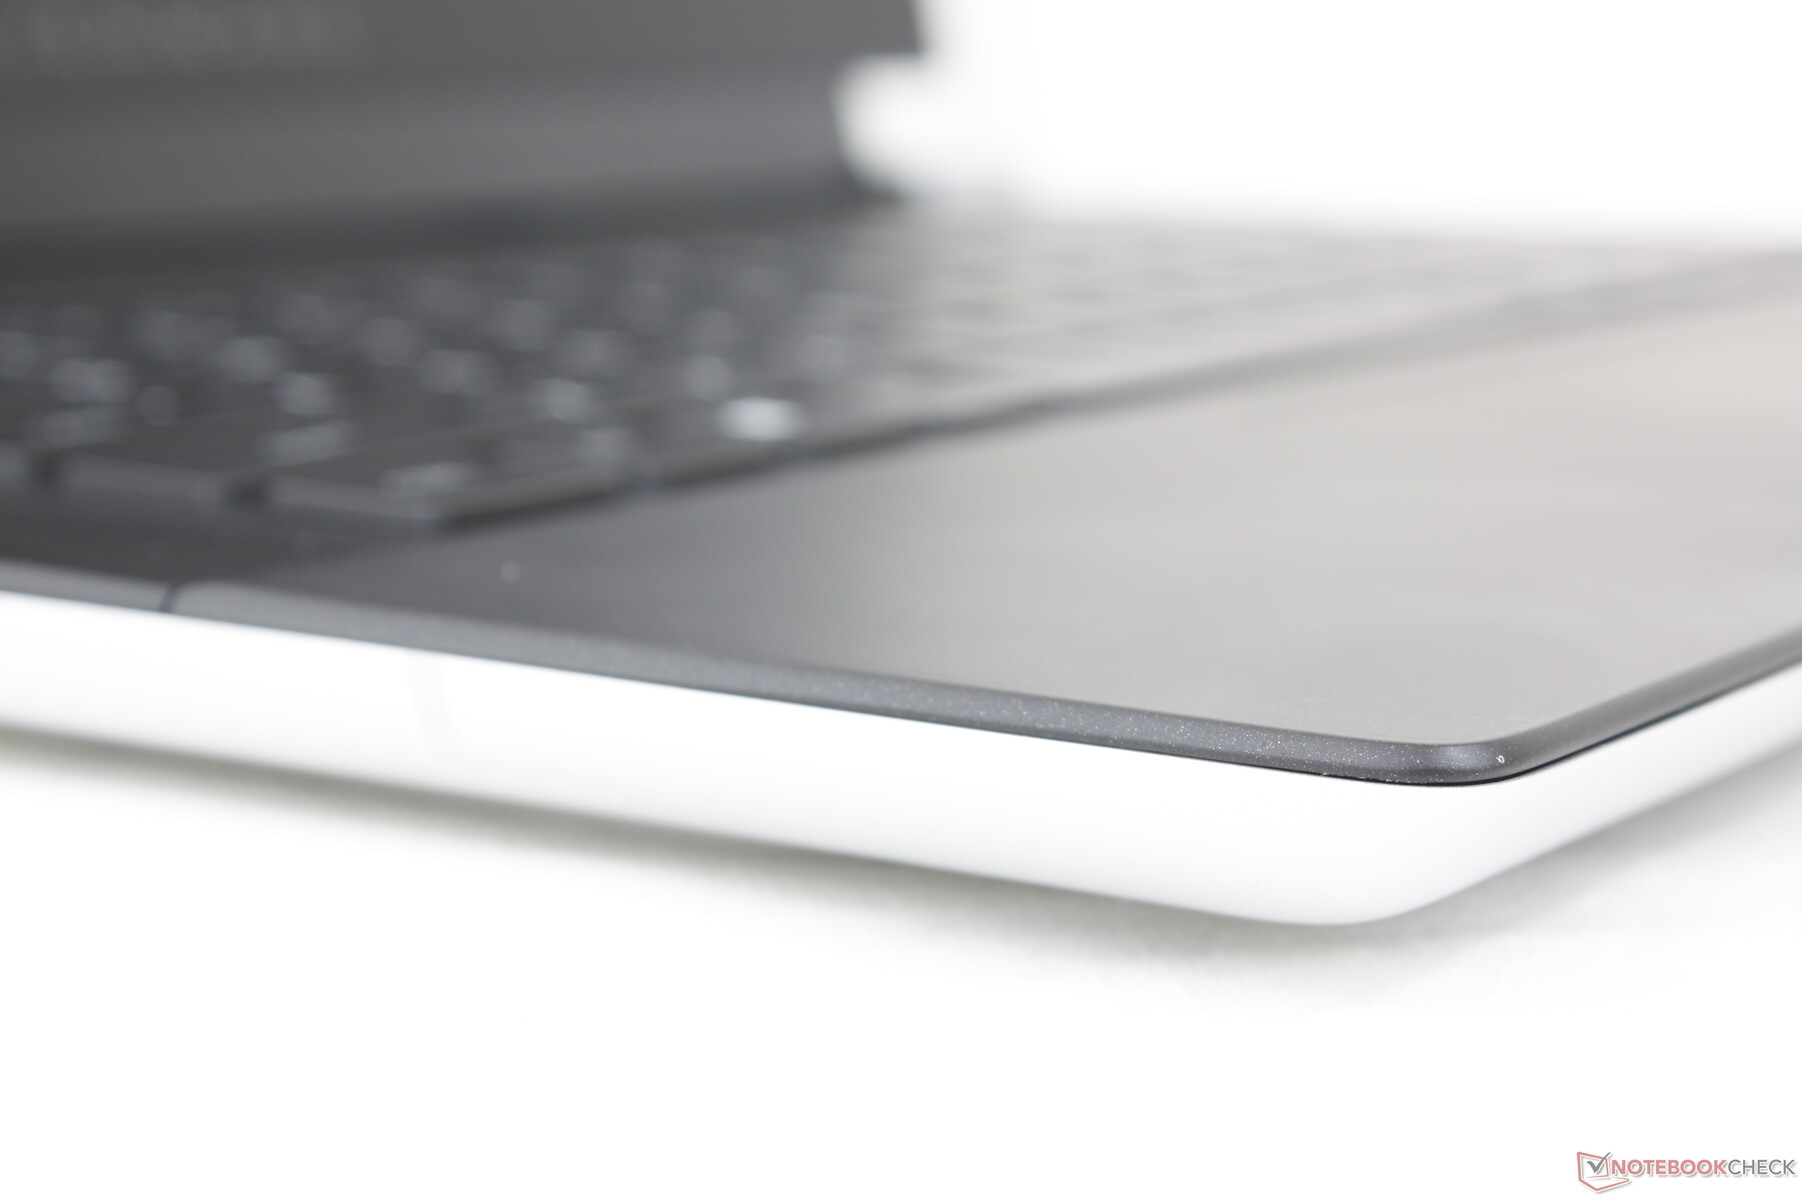
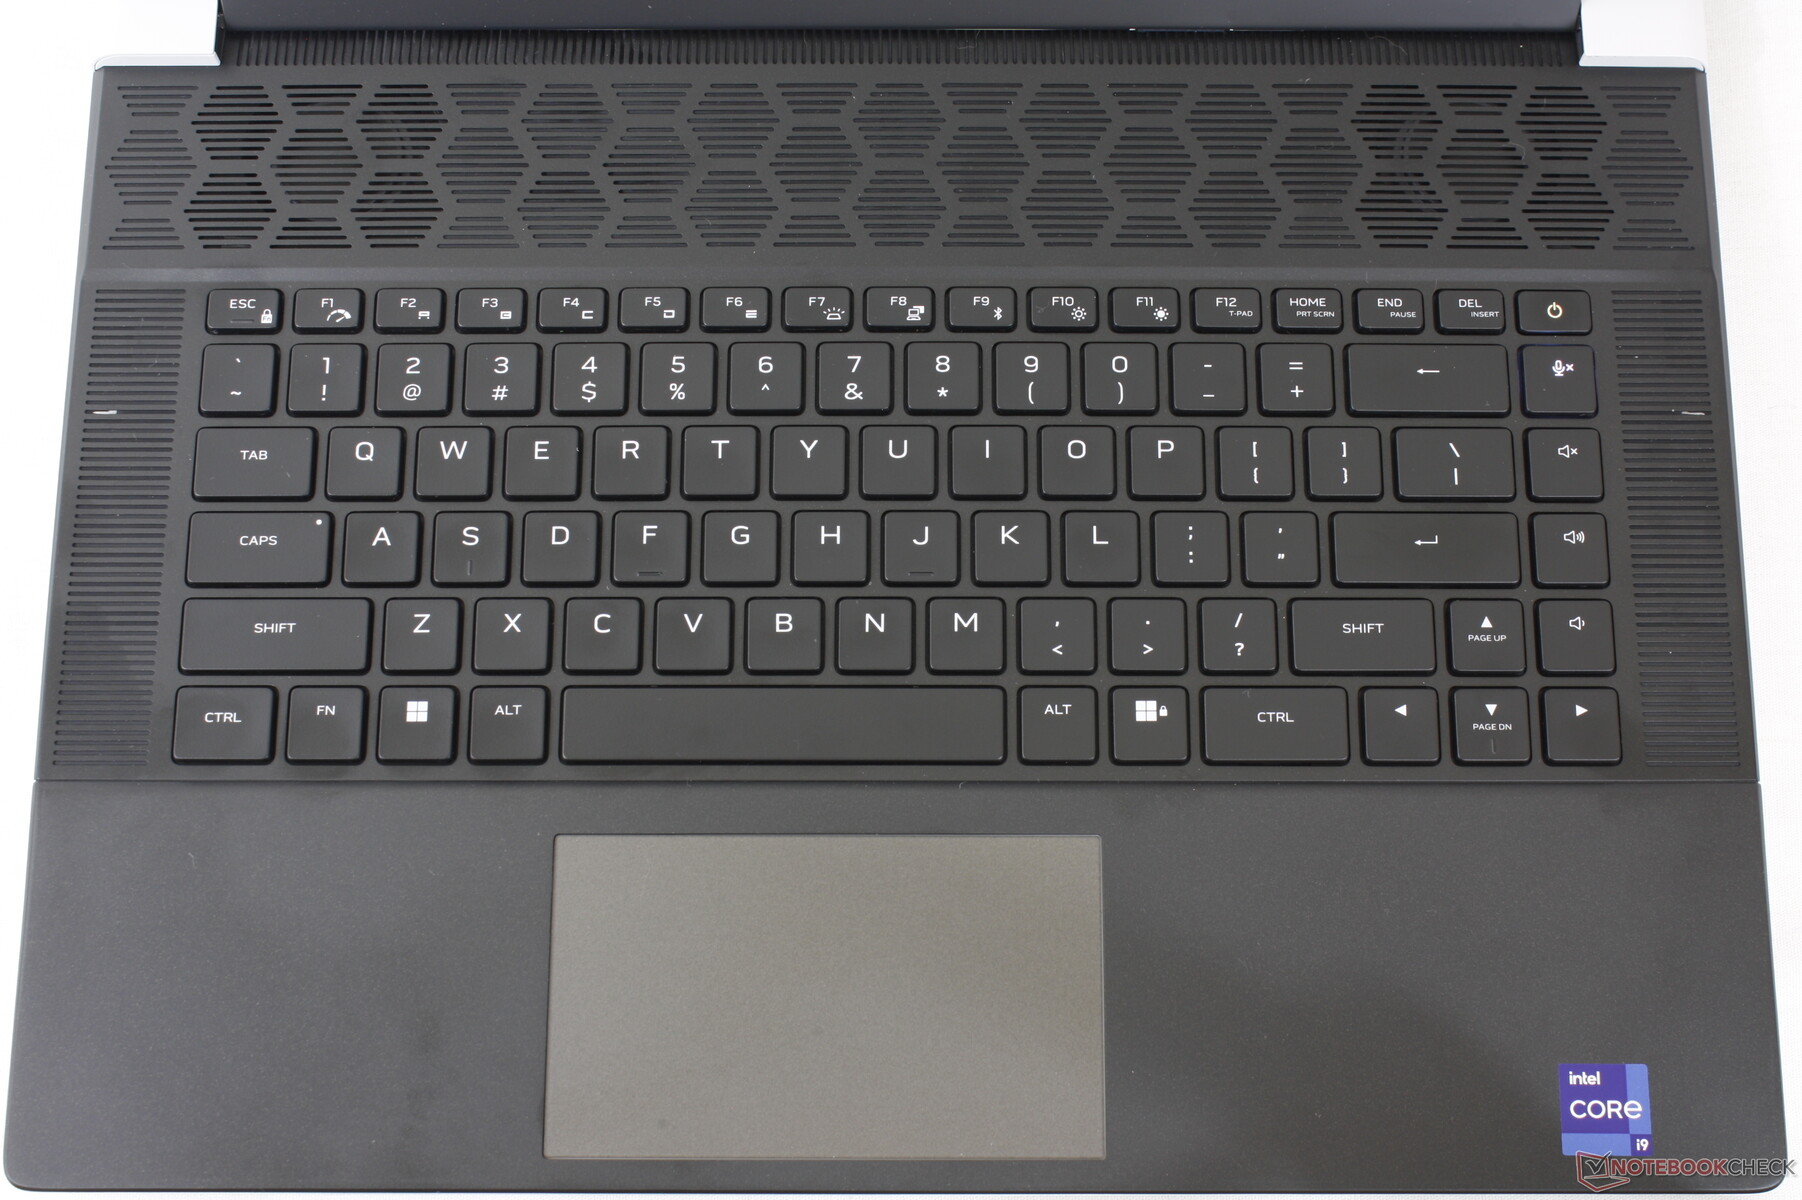
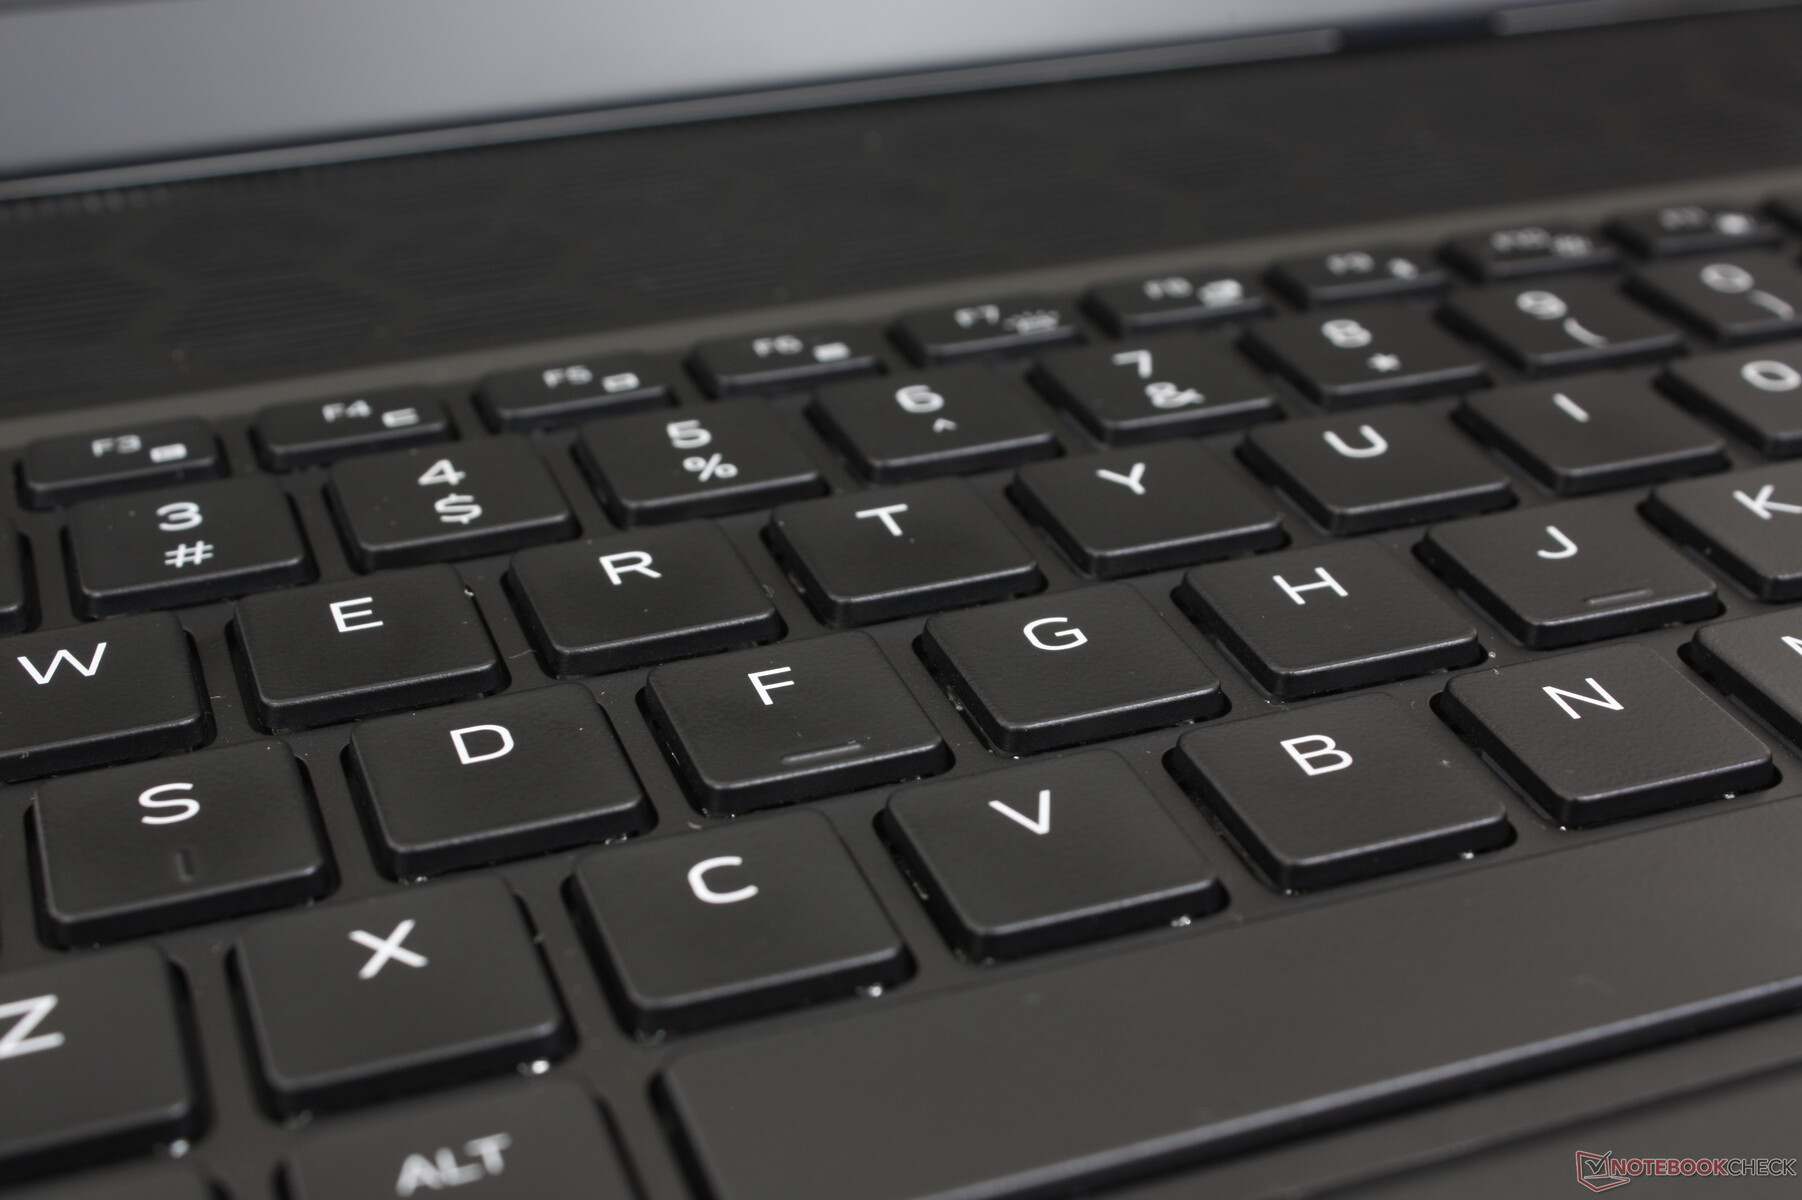
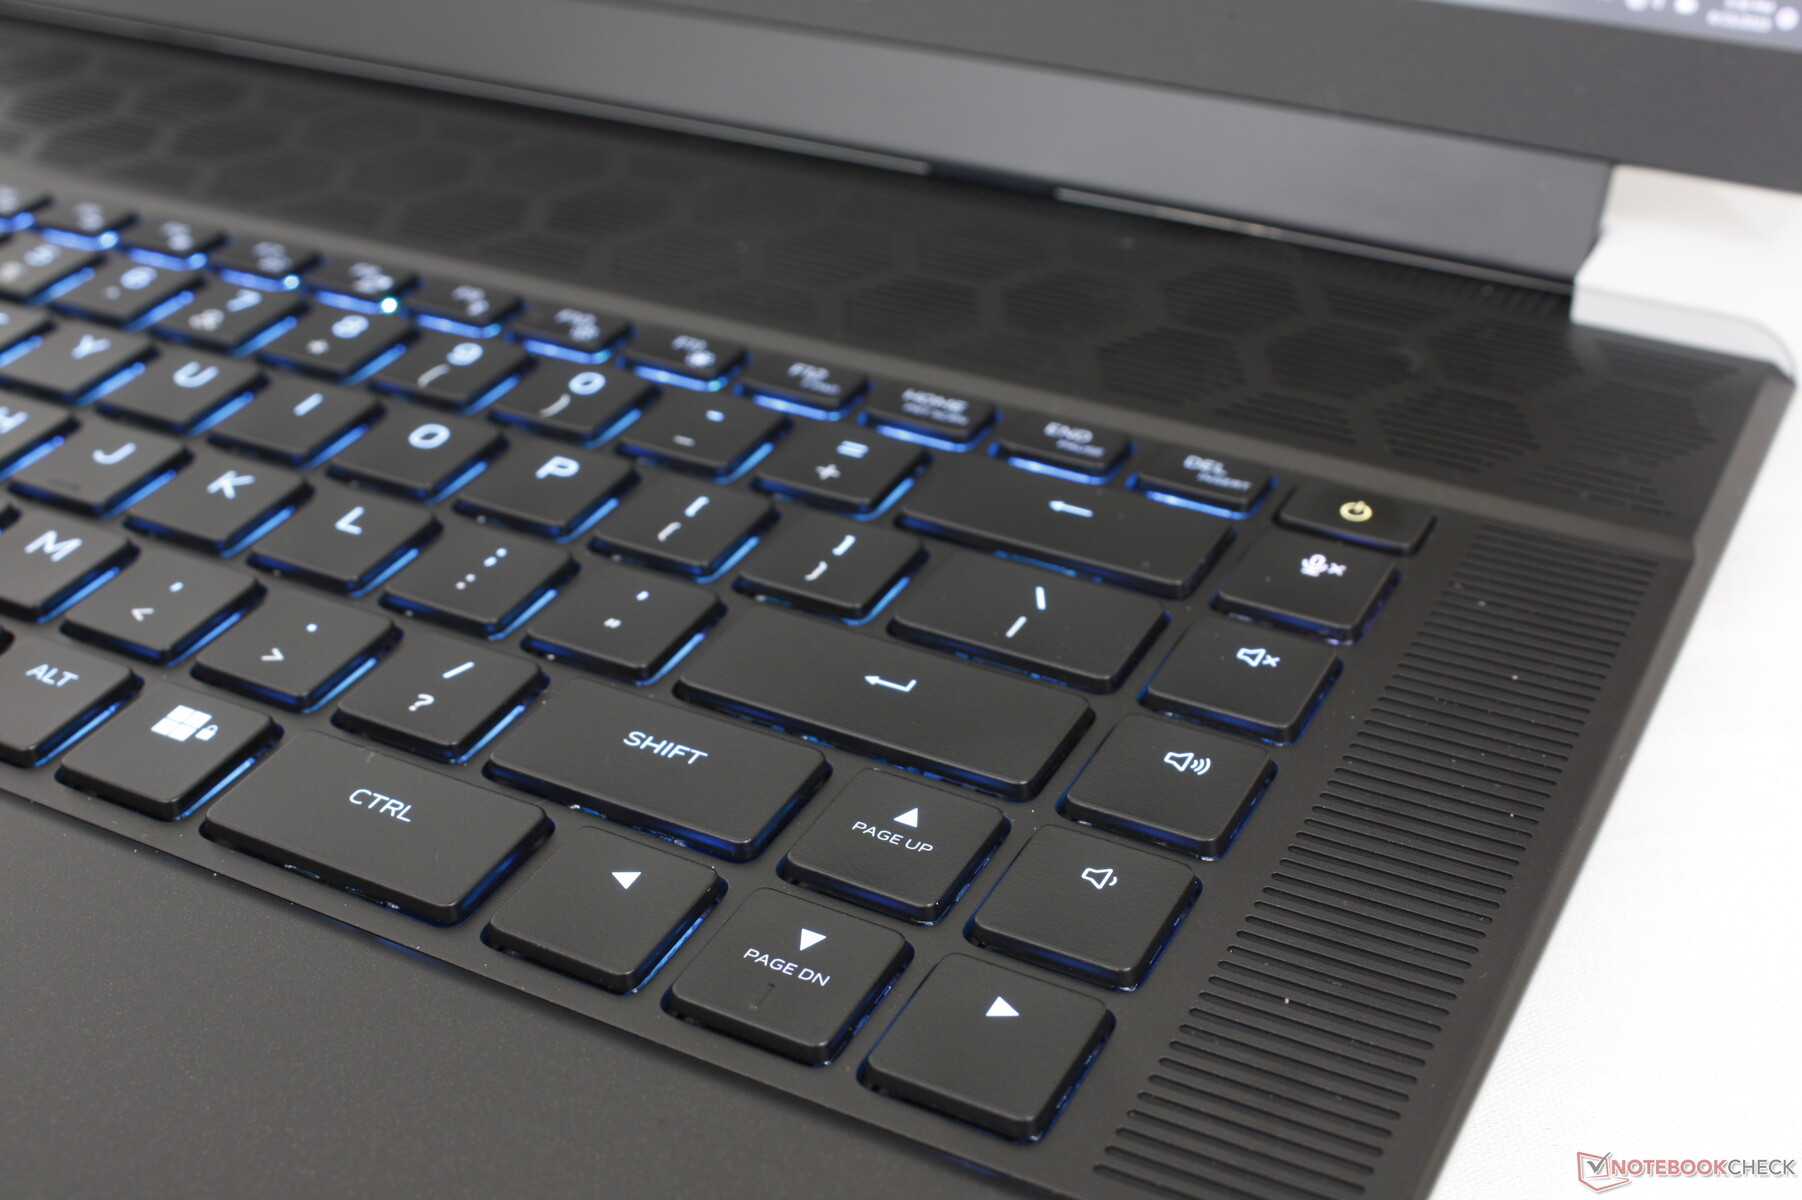
输入设备--机械键响亮而自豪
键盘
戴尔提供了两种键盘选择:标准的膜基键和CherryMX超低调键,每个键都有RGB照明。我们的测试装置配备了后者,与大多数其他游戏笔记本上的膜基键相比,打字体验是夜以继日的。1.8毫米的键程比更典型的1.5毫米的键程更深,反馈更牢固,点击的感觉也更令人满意。它很难回到像Razer Blade 16这样的打字机上。 Razer Blade 16习惯了Alienware x16的CherryMX按键后,很难再回到像Razer Blade 16这样的键盘上打字。
当然,主要的缺点是机械按键的声音明显大了很多。因此,如果你打算在教室或狭窄的宿舍等对噪音敏感的环境中使用笔记本电脑,你可能要考虑标准的非机械选项。
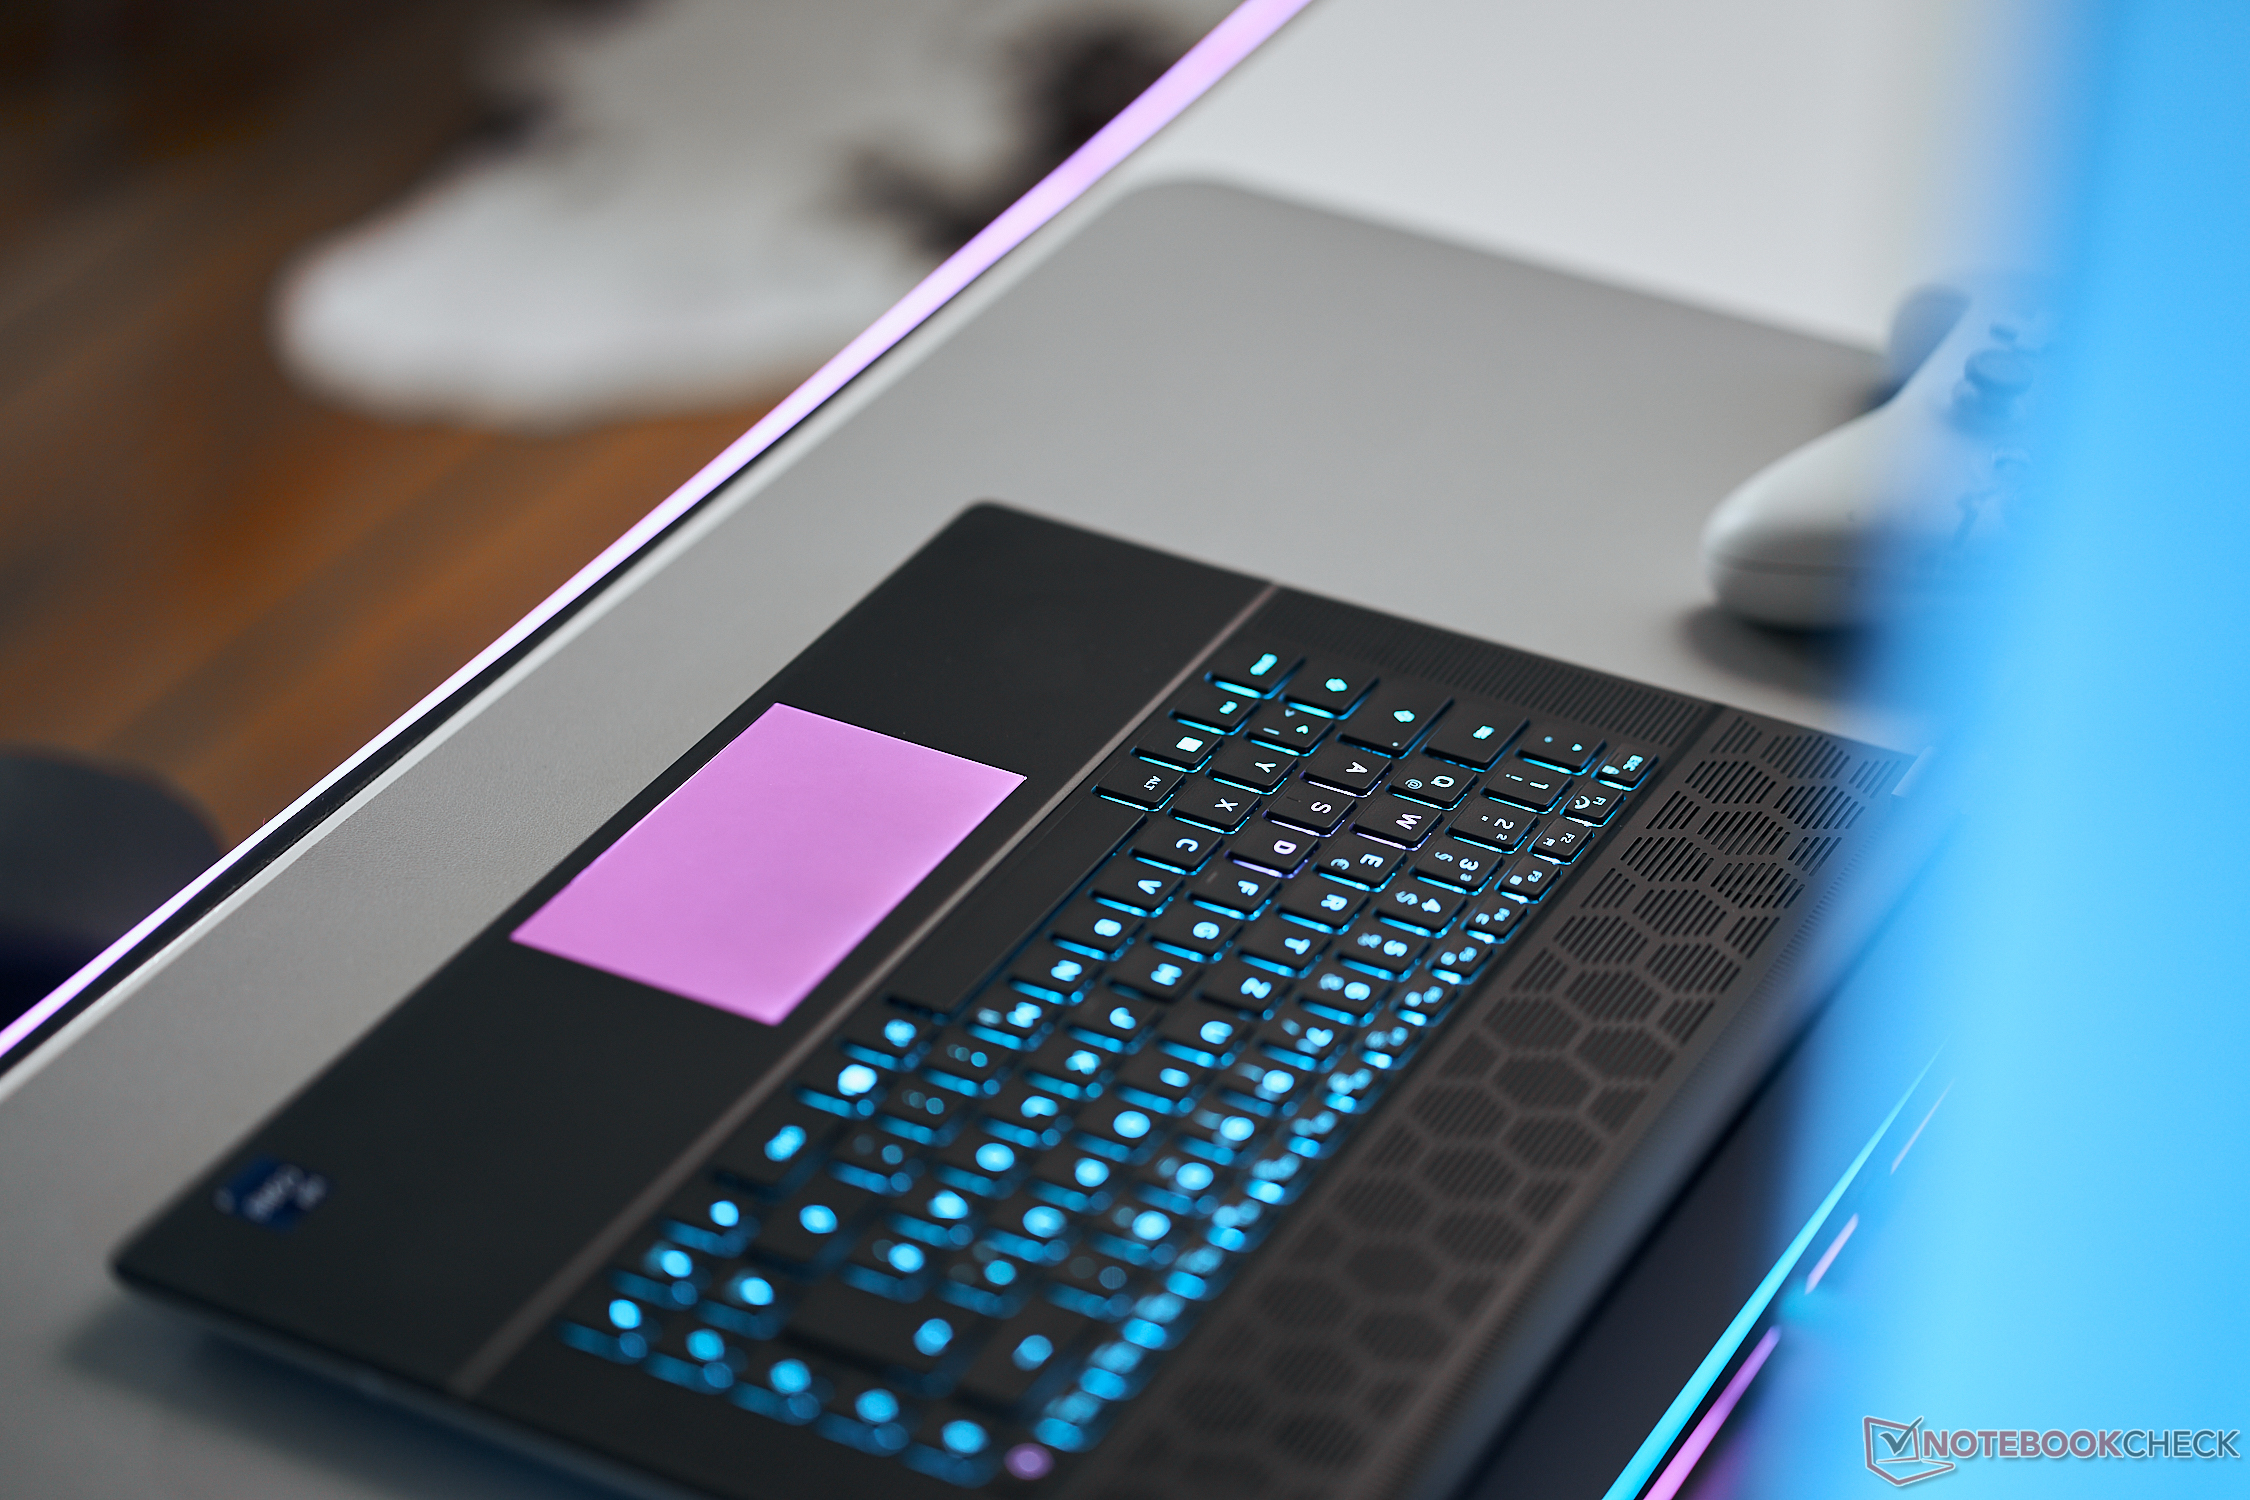
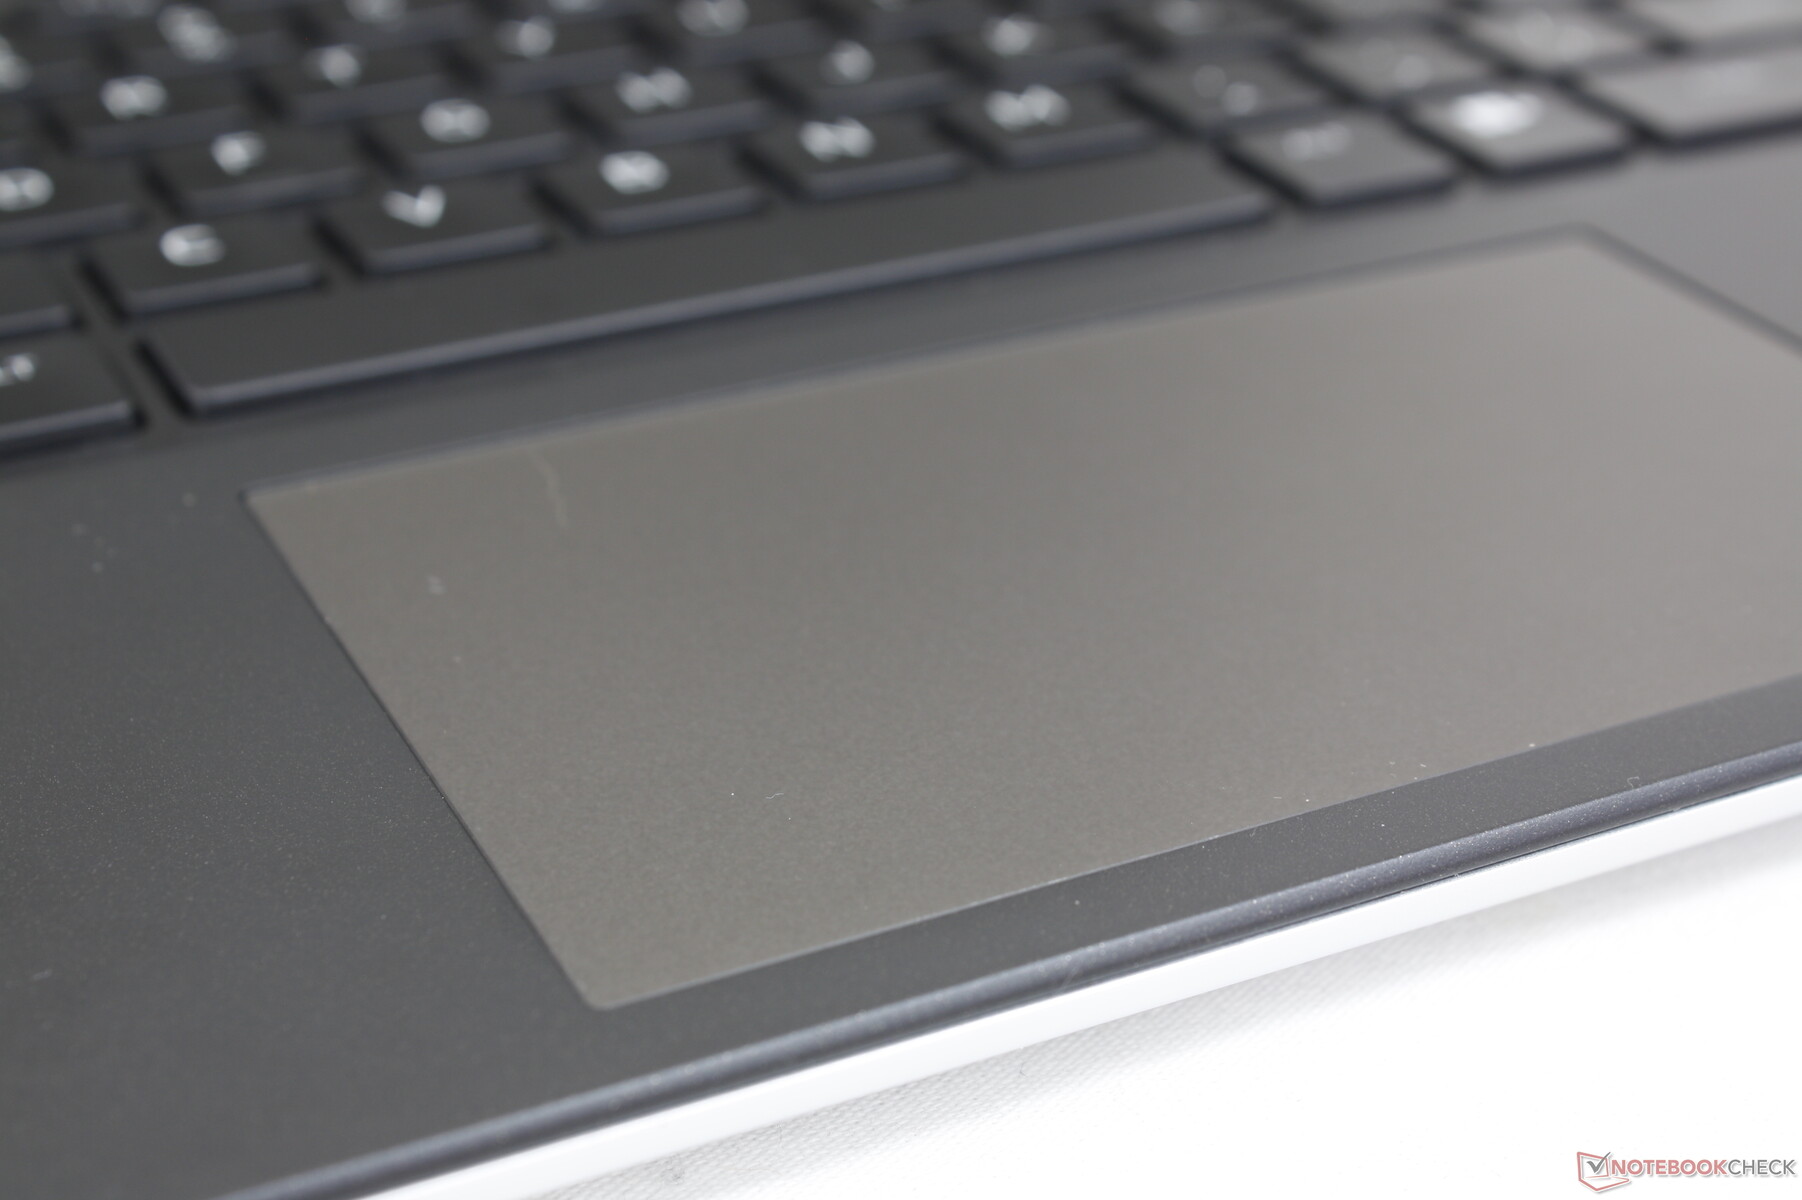
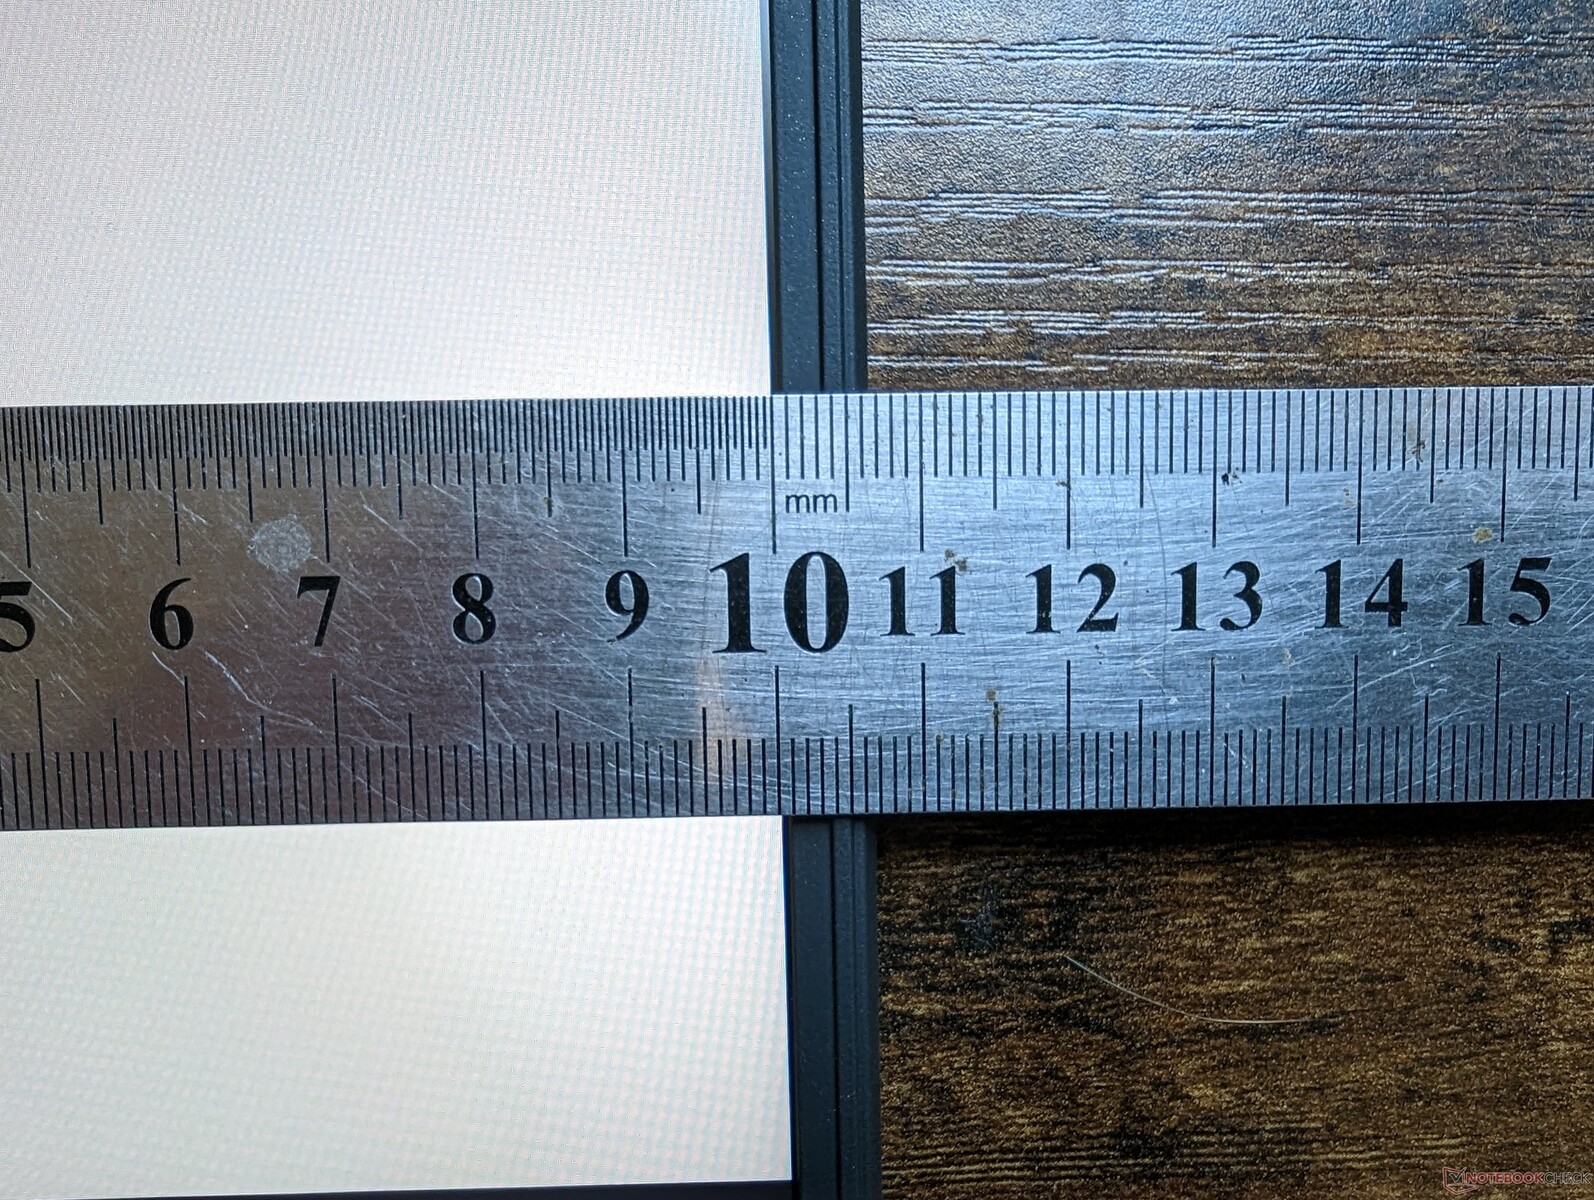
触摸板
点击板是16英寸游戏笔记本电脑中最小的之一,只有11.2 x 6.5厘米,而Blade 16和Pro 5的点击板分别为17 x 9.7厘米和12 x 7.5厘米。 Legion Pro 5 16的尺寸更小。较小的尺寸是由于大型冷却解决方案和通风格栅沿着系统的后半部分占据了更多的空间。滑动很顺畅,在以较慢速度移动时只有轻微的粘连,以获得更准确的点击。
点击时的反馈很轻,而且很浅,没有令人满意的感觉。基于这一点和较小的表面积,很明显,戴尔希望大多数用户都能准备好USB鼠标。
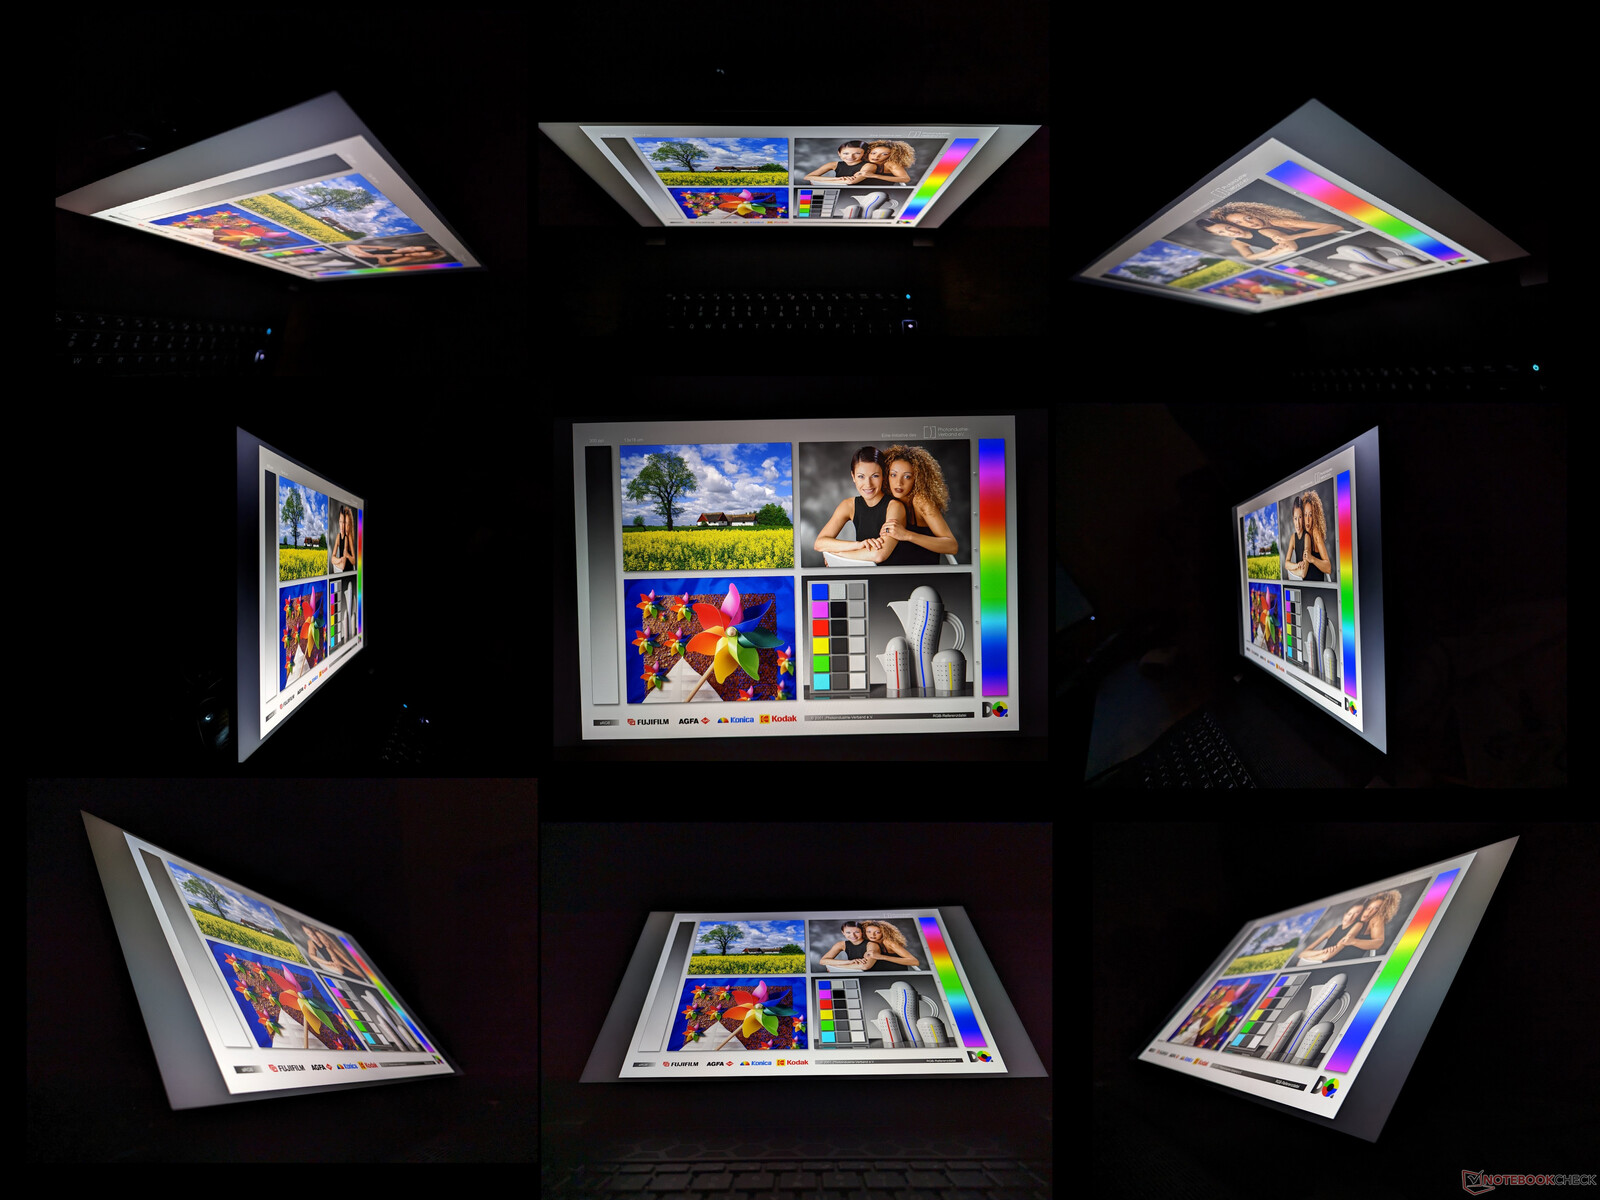
显示 - 没有坏的选择
有三种显示方式可供选择,我们的测量结果只反映了黑体字的选项:
- 2560 x 1600, 165 Hz, 3 ms, 100% sRGB, G-Sync
- 1920 x 1200, 480 Hz, 3 ms, 100% DCI-P3, G-Sync
- 2560 x 1600, 240 Hz, 3 ms, 100% DCI-P3, G-Sync
当然没有坏的或 "错误的 "面板,因为所有的面板都适合于游戏的目的,它们具有快速刷新率和快速响应时间。也就是说,我们配置的1600p240面板是大多数用户的甜蜜点,因为1200p480选项牺牲了分辨率,1600p165选项的颜色较浅。观赏体验与Blade 16相当,同时在色彩范围方面优于戴尔G16 和联想Legion Pro 7 16。
| |||||||||||||||||||||||||
Brightness Distribution: 89 %
Center on Battery: 302.2 cd/m²
Contrast: 1162:1 (Black: 0.26 cd/m²)
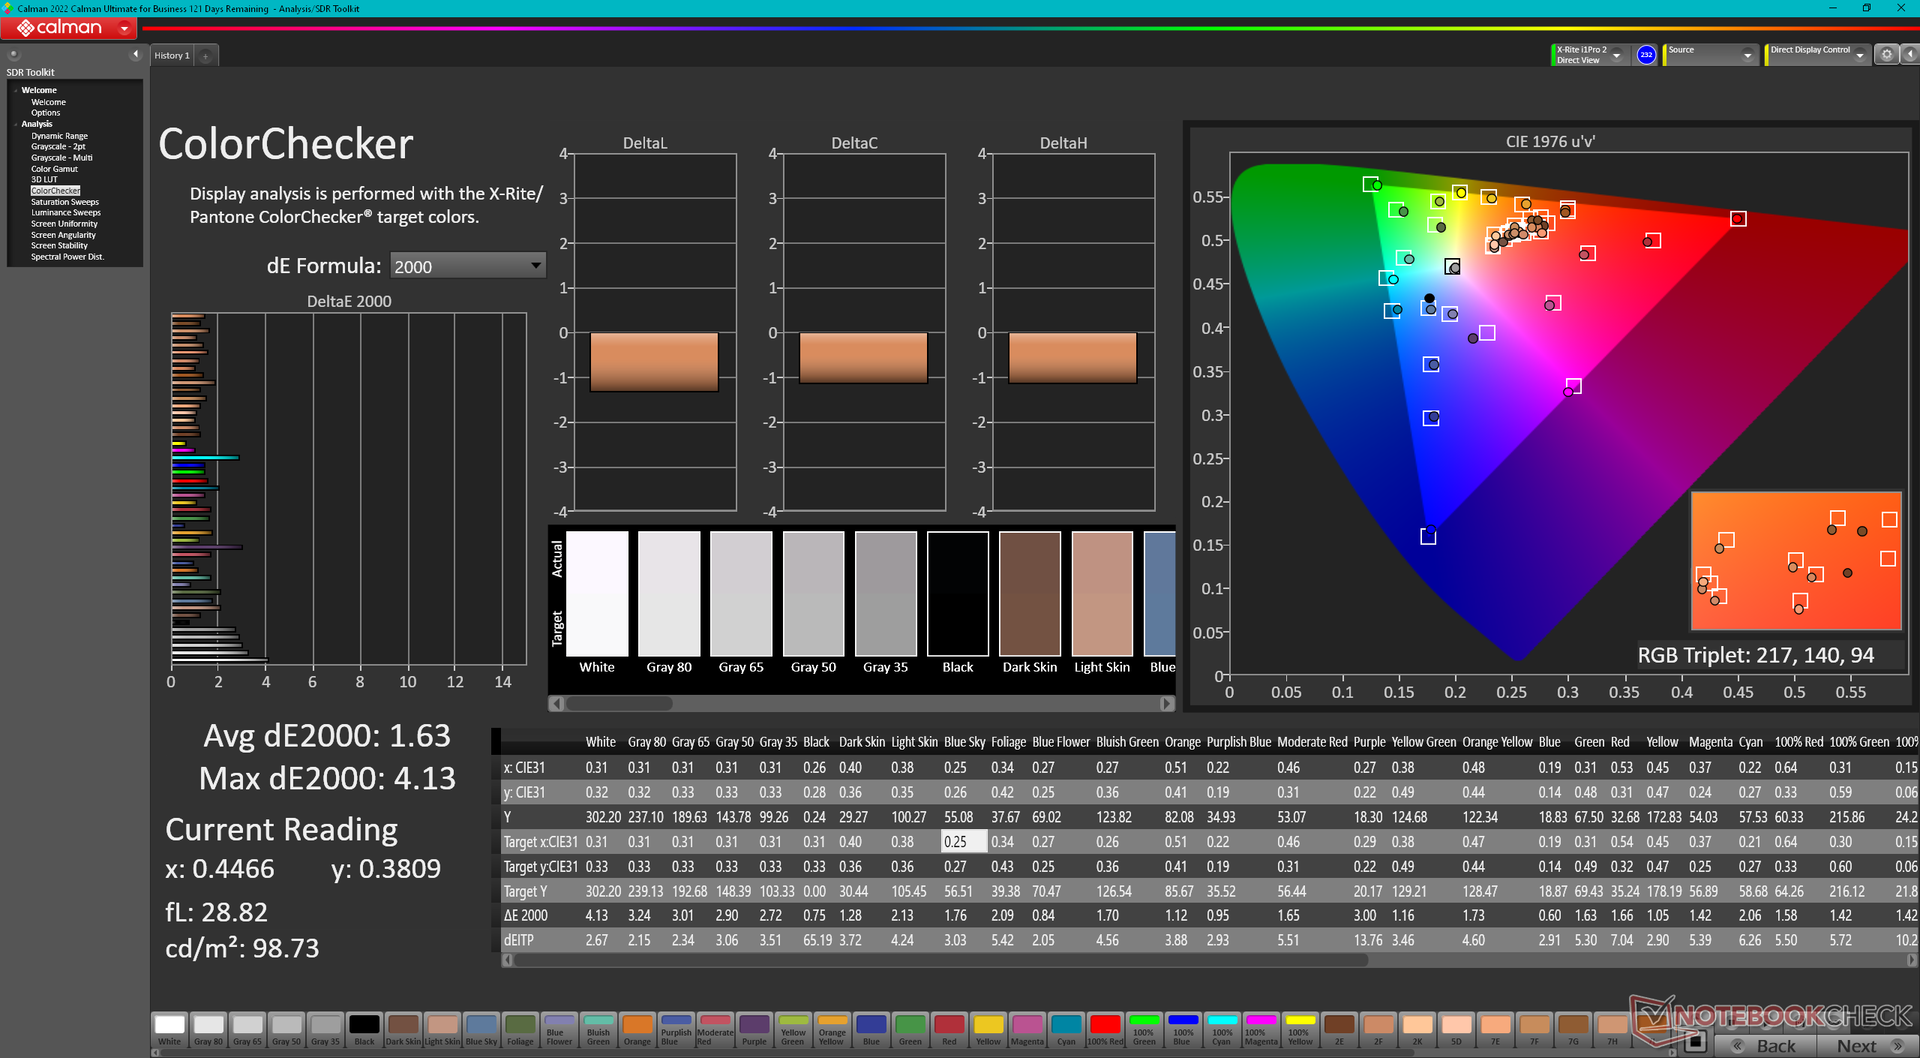
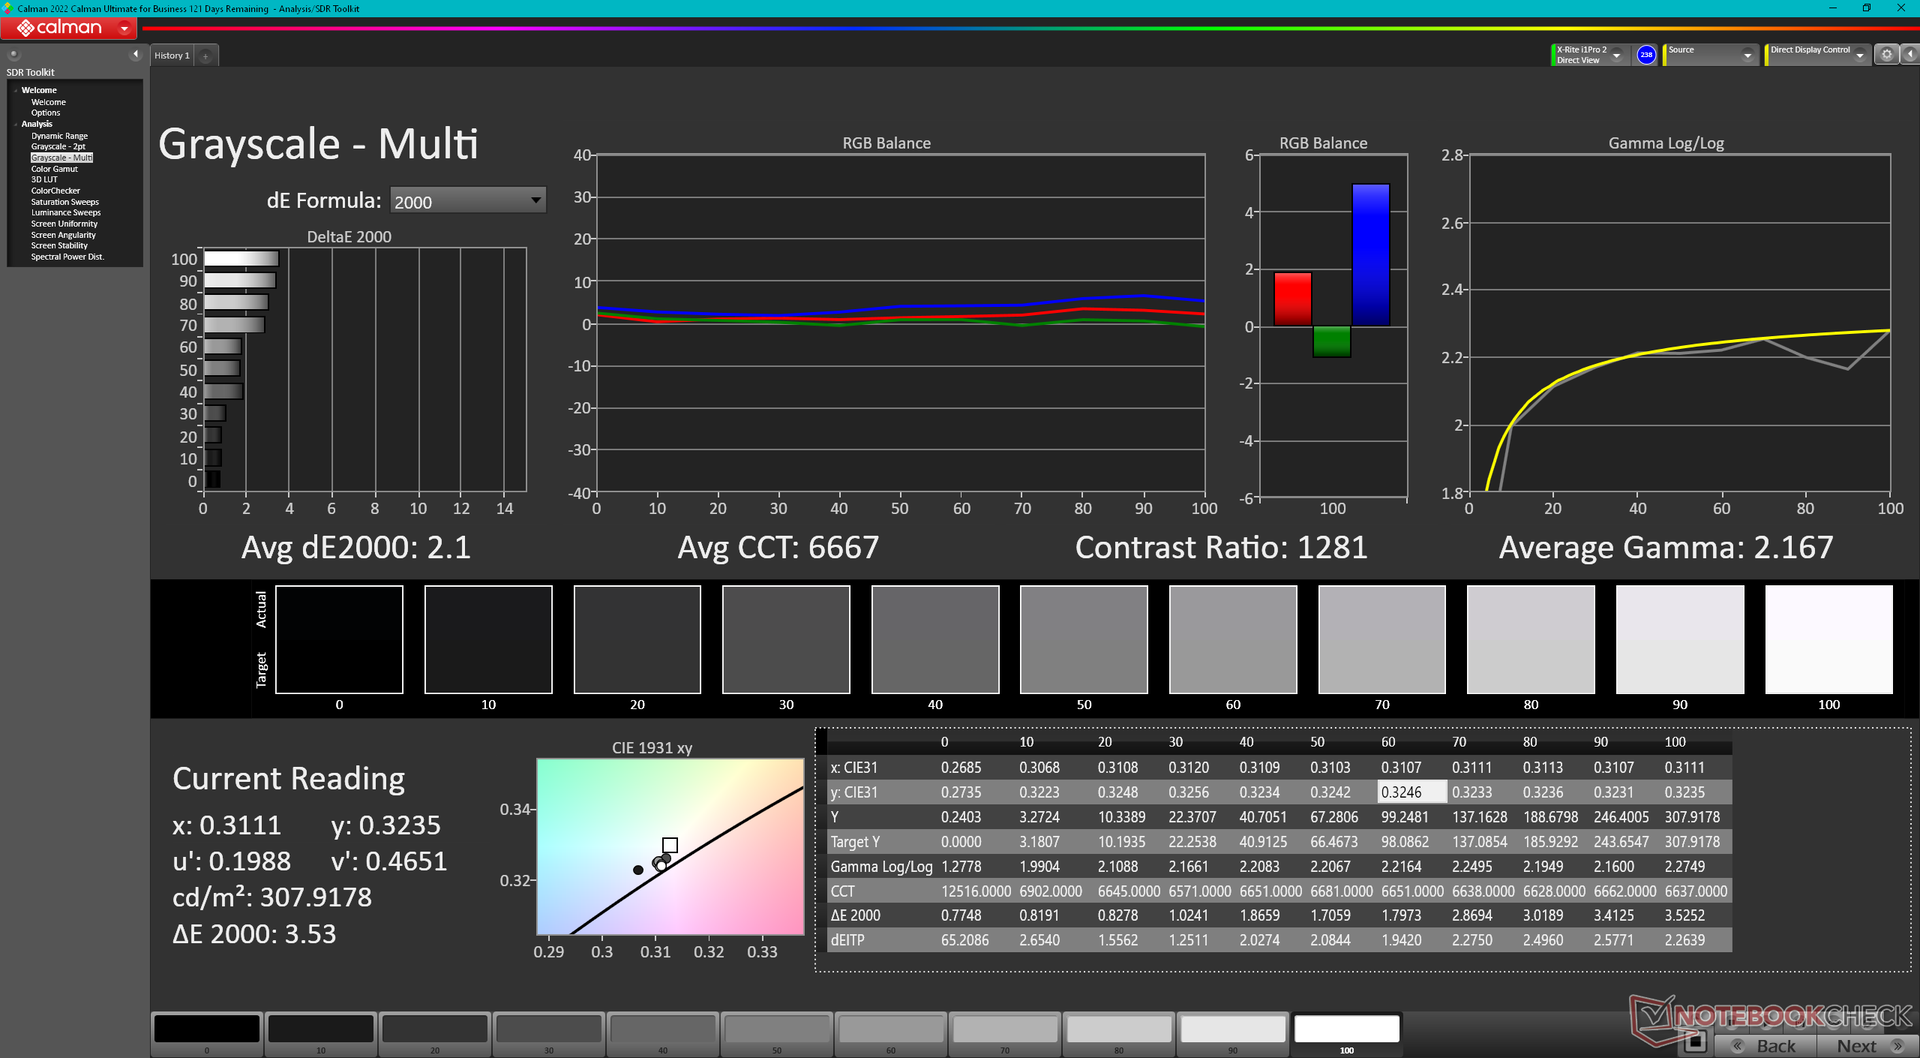
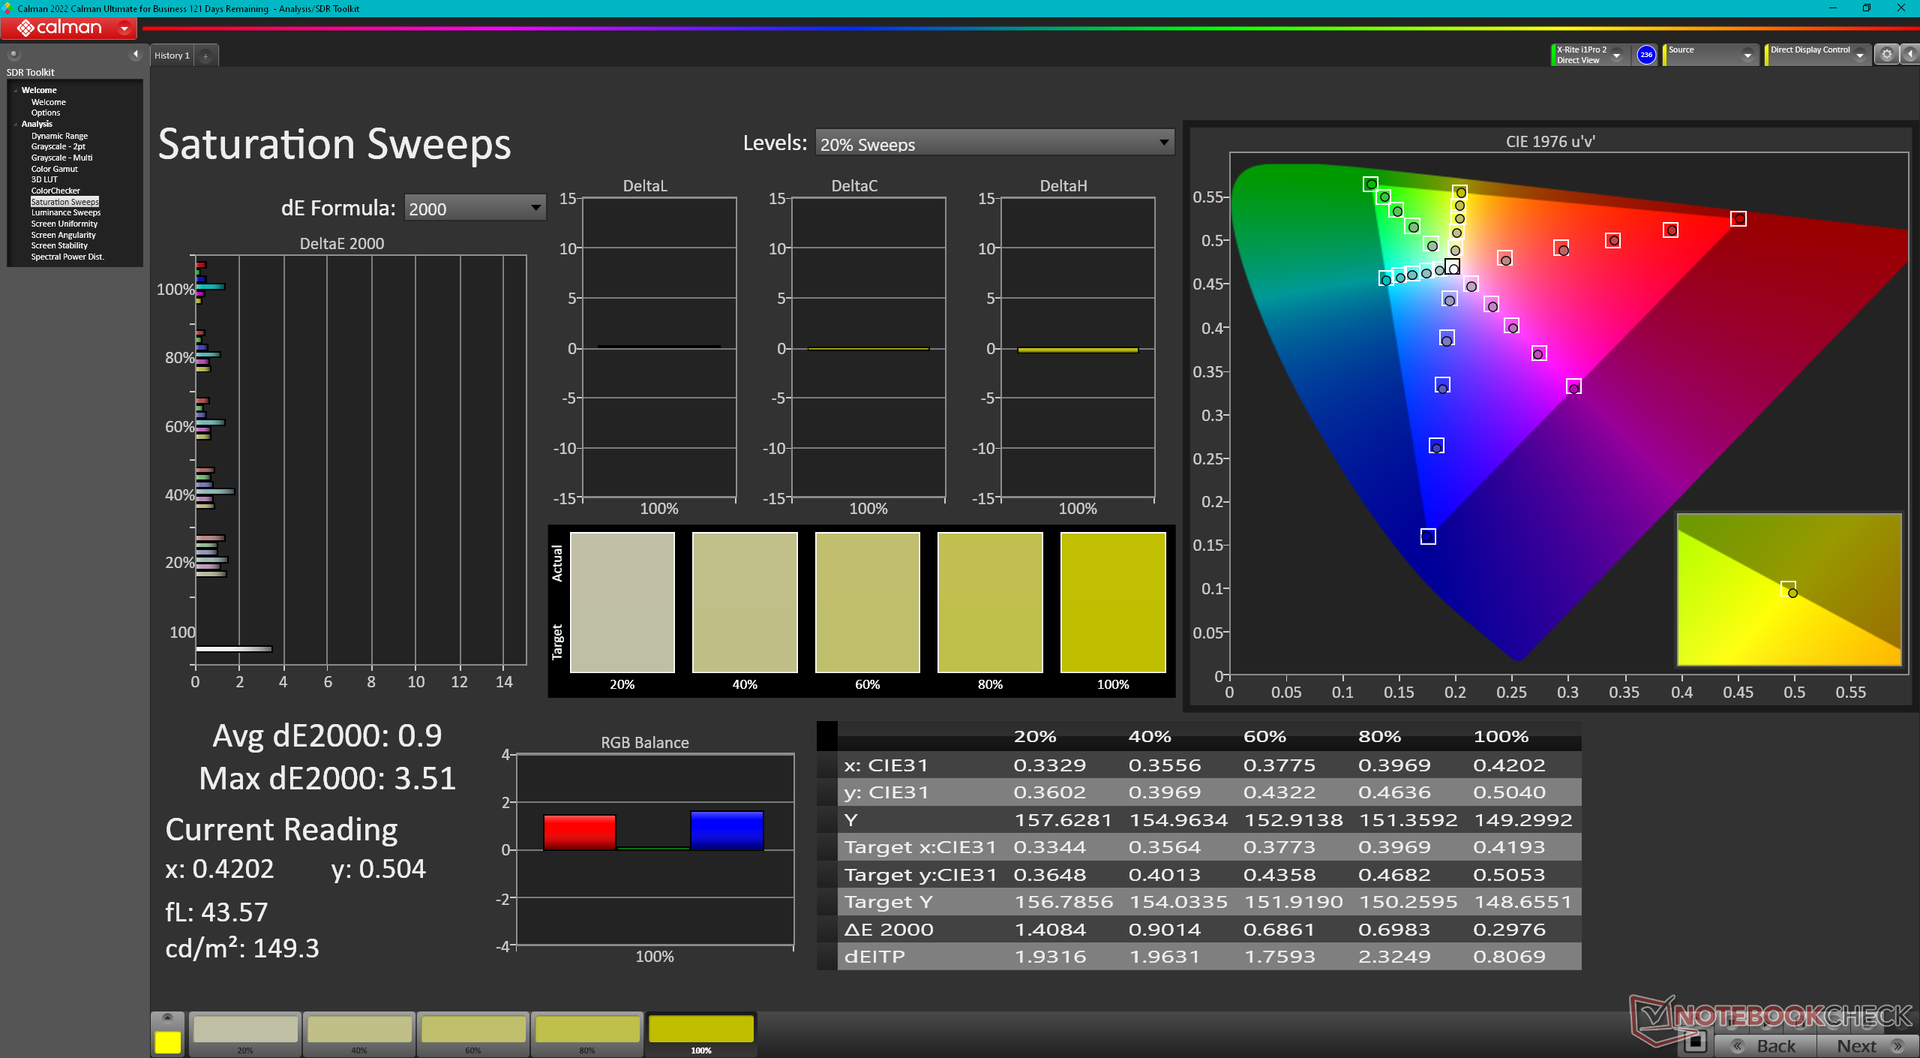
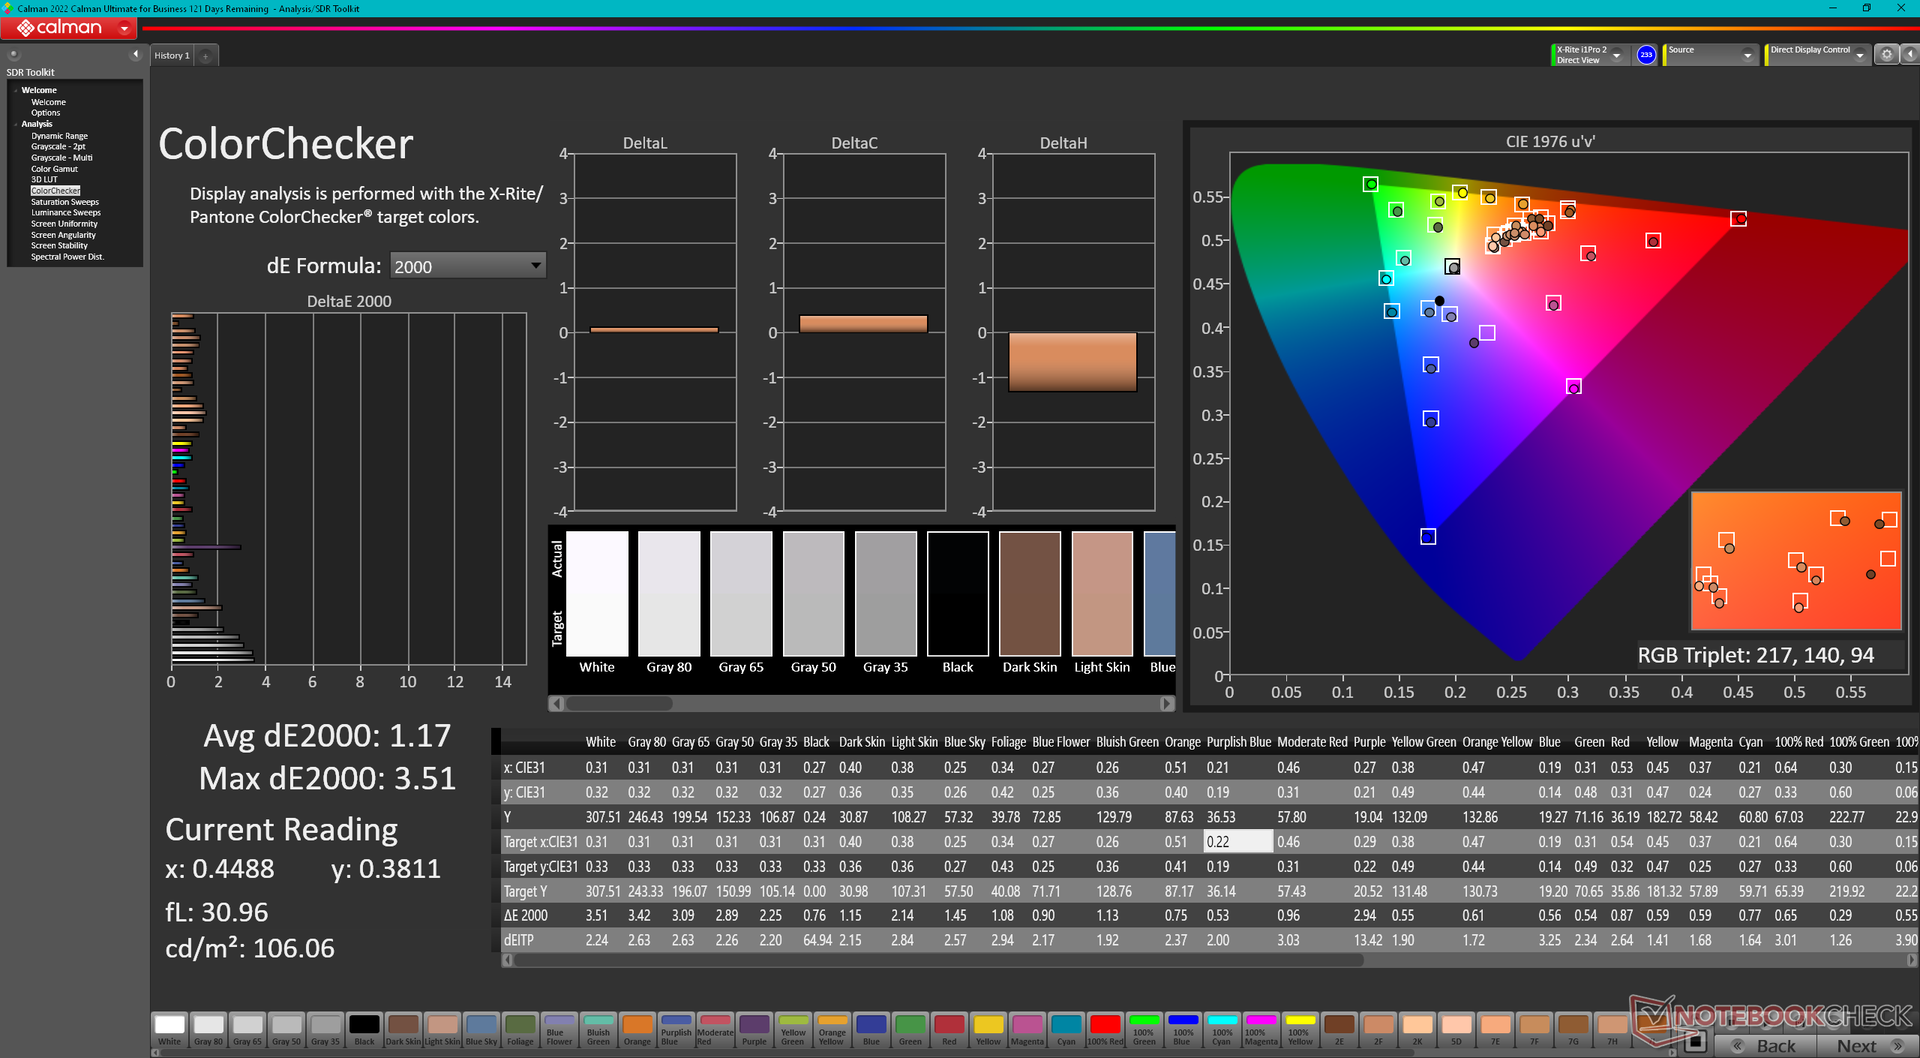
ΔE ColorChecker Calman: 1.63 | ∀{0.5-29.43 Ø4.71}
calibrated: 1.17
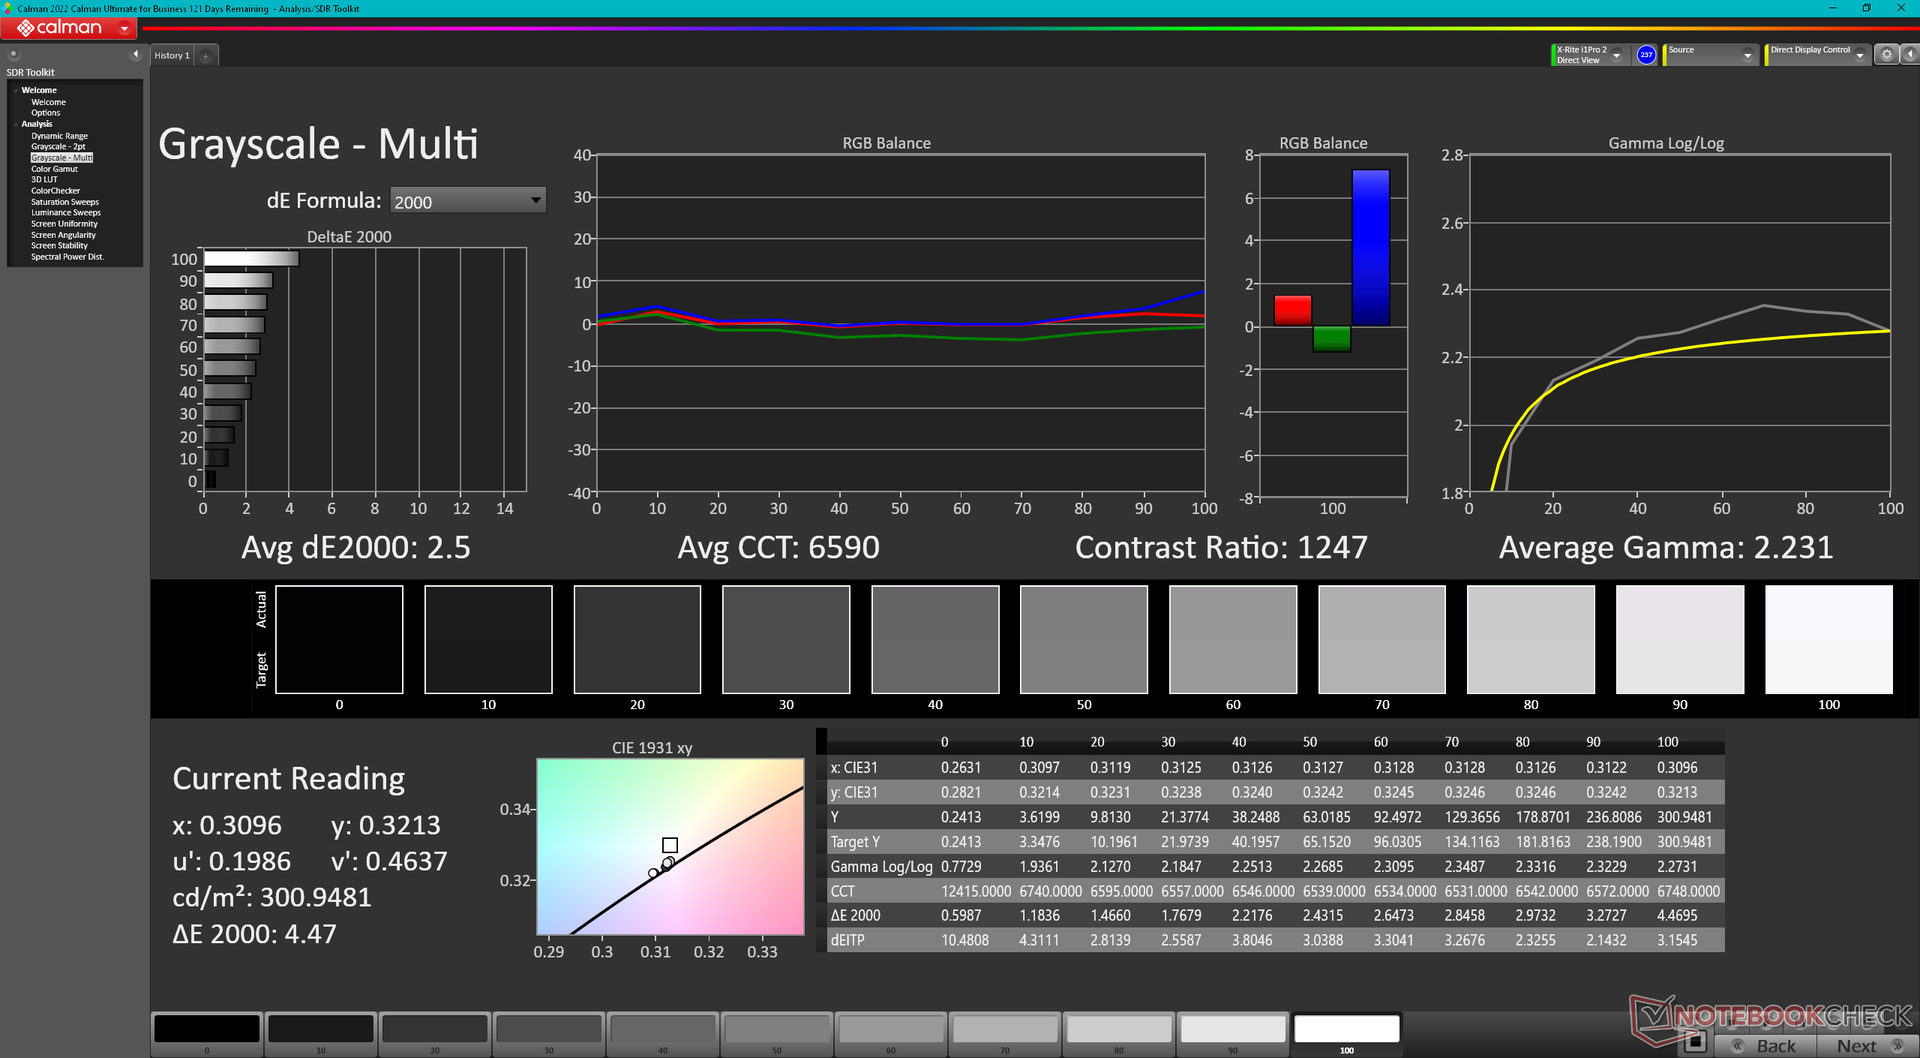
ΔE Greyscale Calman: 2.5 | ∀{0.09-98 Ø4.96}
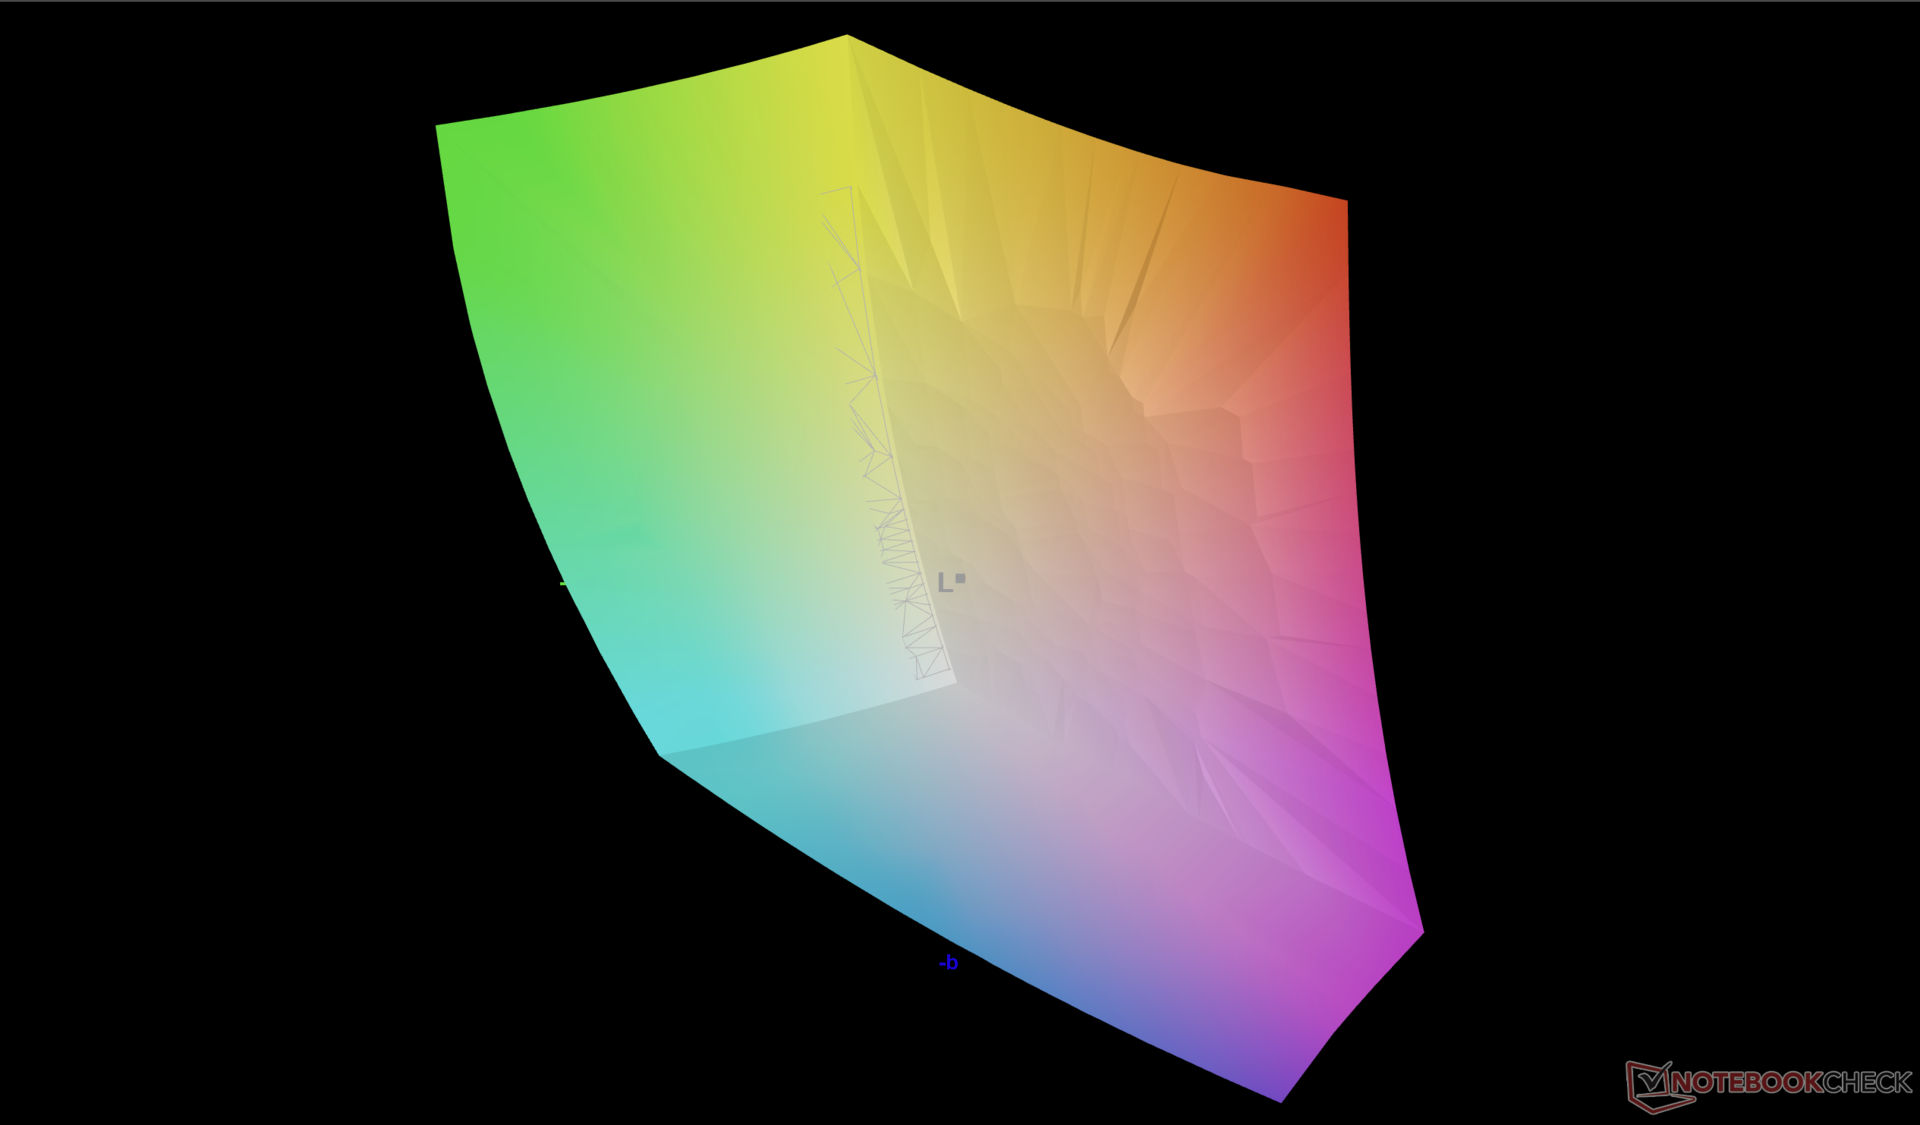
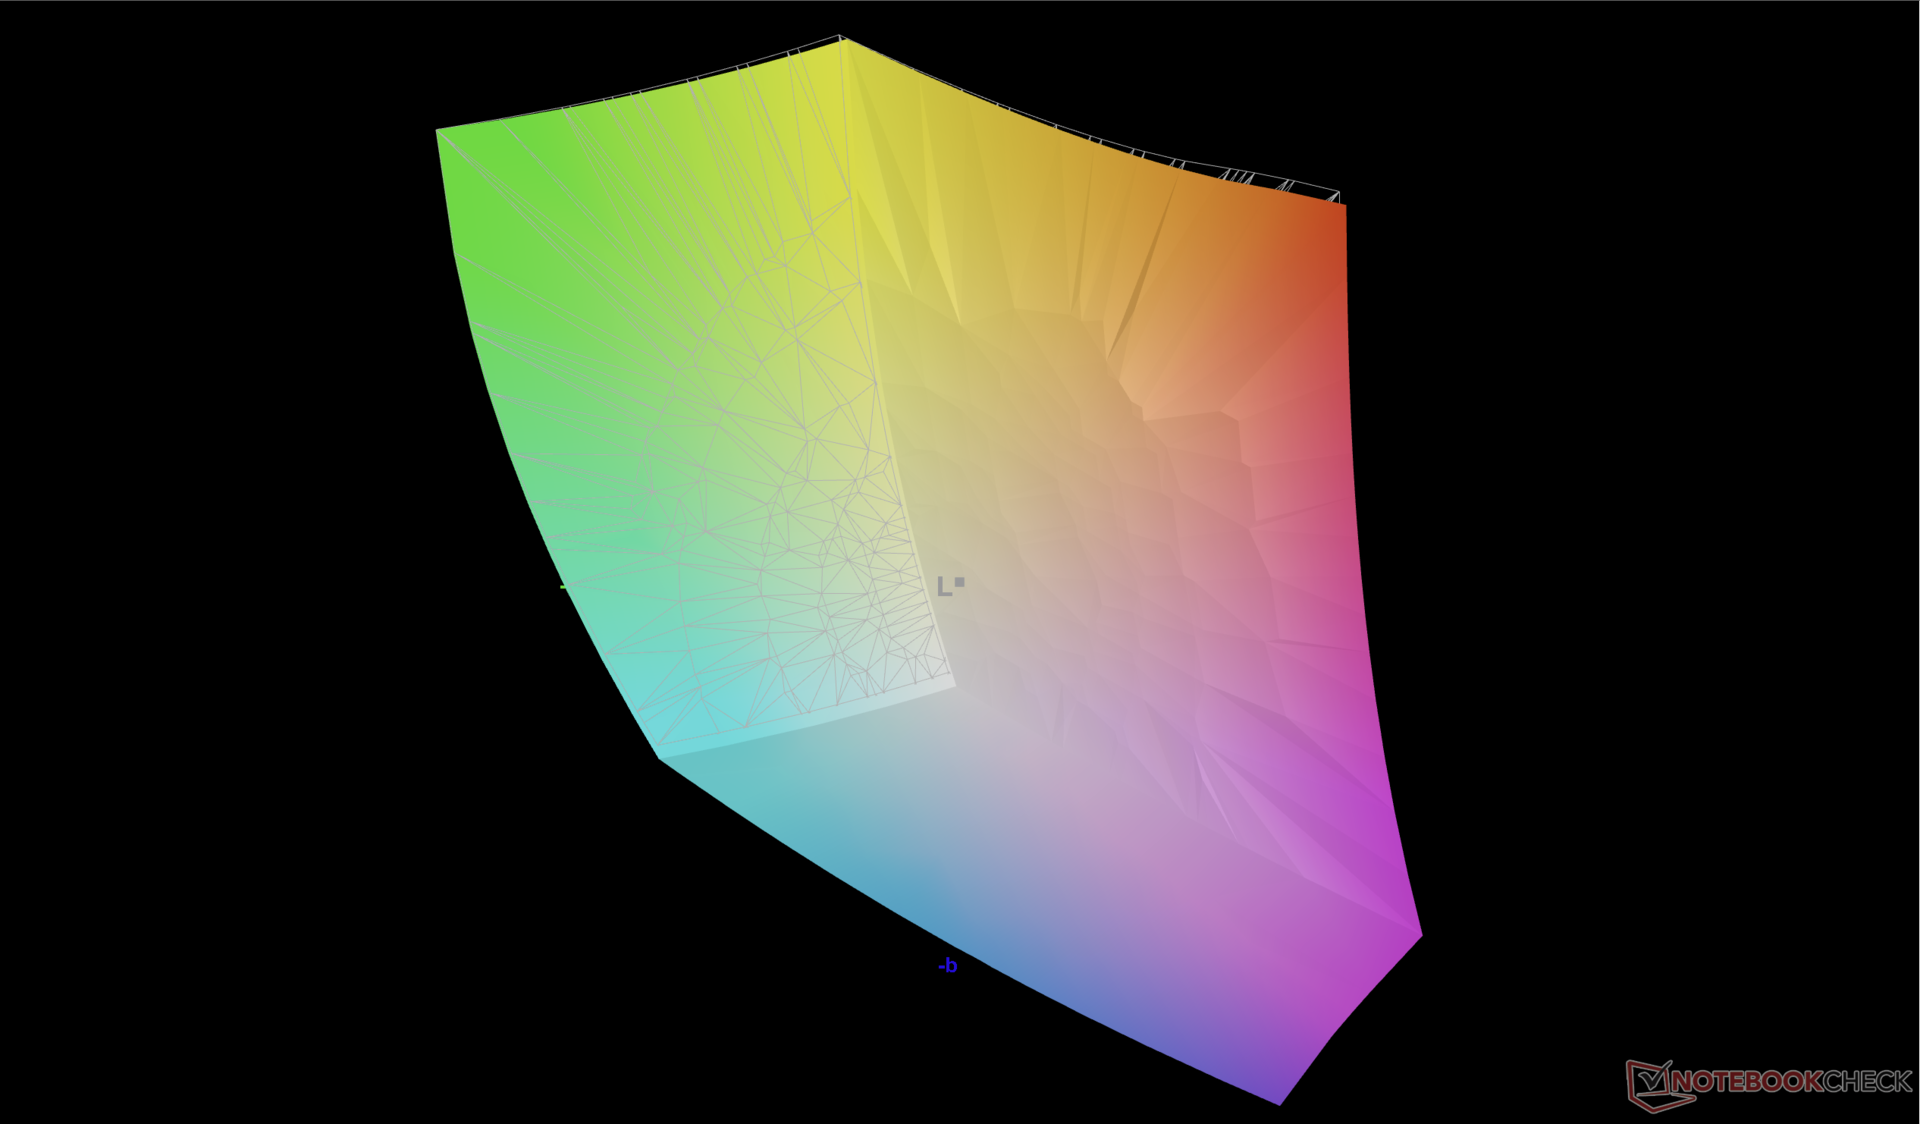
88.6% AdobeRGB 1998 (Argyll 3D)
100% sRGB (Argyll 3D)
99.2% Display P3 (Argyll 3D)
Gamma: 2.23
CCT: 6590 K
| Alienware x16 R1 BOE NE16NZ4, IPS, 2560x1600, 16" | Asus ROG Zephyrus M16 GU604VY-NM042X BOE0B74 (NE160QDM-NM4, IPS, 2560x1600, 16" | Razer Blade 16 Early 2023 CSOT T3 MNG007DA4-1, IPS, 2560x1600, 16" | Dell G16 7620 BOE NE16QDM, IPS, 2560x1600, 16" | Alienware m17 R5 (R9 6900HX, RX 6850M XT) AU Optronics AUODBA3, IPS, 3840x2160, 17" | Lenovo Legion Pro 7 16IRX8H MNG007DA2-3 (CSO1628), IPS, 2560x1600, 16" | |
|---|---|---|---|---|---|---|
| Display | 1% | 0% | -18% | -1% | -17% | |
| Display P3 Coverage (%) | 99.2 | 99.33 0% | 98.5 -1% | 68.3 -31% | 97.2 -2% | 69.1 -30% |
| sRGB Coverage (%) | 100 | 99.9 0% | 100 0% | 98 -2% | 99.6 0% | 99.7 0% |
| AdobeRGB 1998 Coverage (%) | 88.6 | 90.01 2% | 89.7 1% | 70.5 -20% | 88.4 0% | 71.2 -20% |
| Response Times | -542% | -23% | -35% | -118% | -49% | |
| Response Time Grey 50% / Grey 80% * (ms) | 5.1 ? | 50.8 ? -896% | 6.6 ? -29% | 8.6 ? -69% | 16.4 ? -222% | 12.3 ? -141% |
| Response Time Black / White * (ms) | 10.3 ? | 29.6 ? -187% | 12 ? -17% | 10.4 ? -1% | 11.6 ? -13% | 5.9 ? 43% |
| PWM Frequency (Hz) | 12000 | |||||
| Screen | 247% | -8% | -4% | -80% | 31% | |
| Brightness middle (cd/m²) | 302.2 | 634 110% | 456.8 51% | 369.4 22% | 484 60% | 511 69% |
| Brightness (cd/m²) | 285 | 627 120% | 437 53% | 348 22% | 449 58% | 469 65% |
| Brightness Distribution (%) | 89 | 92 3% | 83 -7% | 83 -7% | 87 -2% | 86 -3% |
| Black Level * (cd/m²) | 0.26 | 0.03 88% | 0.35 -35% | 0.32 -23% | 0.55 -112% | 0.4 -54% |
| Contrast (:1) | 1162 | 21133 1719% | 1305 12% | 1154 -1% | 880 -24% | 1278 10% |
| Colorchecker dE 2000 * | 1.63 | 0.89 45% | 3.7 -127% | 1.78 -9% | 4.8 -194% | 0.95 42% |
| Colorchecker dE 2000 max. * | 4.13 | 1.79 57% | 6.42 -55% | 4.41 -7% | 7.48 -81% | 2.07 50% |
| Colorchecker dE 2000 calibrated * | 1.17 | 0.91 22% | 0.66 44% | 1.22 -4% | 4.74 -305% | 0.91 22% |
| Greyscale dE 2000 * | 2.5 | 1.13 55% | 2.6 -4% | 3.2 -28% | 5.5 -120% | 0.6 76% |
| Gamma | 2.23 99% | 2.47 89% | 2.3 96% | 2.2 100% | 2.42 91% | 2.176 101% |
| CCT | 6590 99% | 6497 100% | 6108 106% | 6750 96% | 6148 106% | 6545 99% |
| Total Average (Program / Settings) | -98% /
81% | -10% /
-8% | -19% /
-11% | -66% /
-68% | -12% /
9% |
* ... smaller is better
该显示器在开箱后就得到了很好的校准,平均灰度和色彩deltaE值分别为2.5和1.63。试图用我们的X-Rite色度计进一步校准显示器,只会带来非常小的收益,因此没有必要进行终端用户校准。

Display Response Times
| ↔ Response Time Black to White | ||
|---|---|---|
| 10.3 ms ... rise ↗ and fall ↘ combined | ↗ 5.4 ms rise | 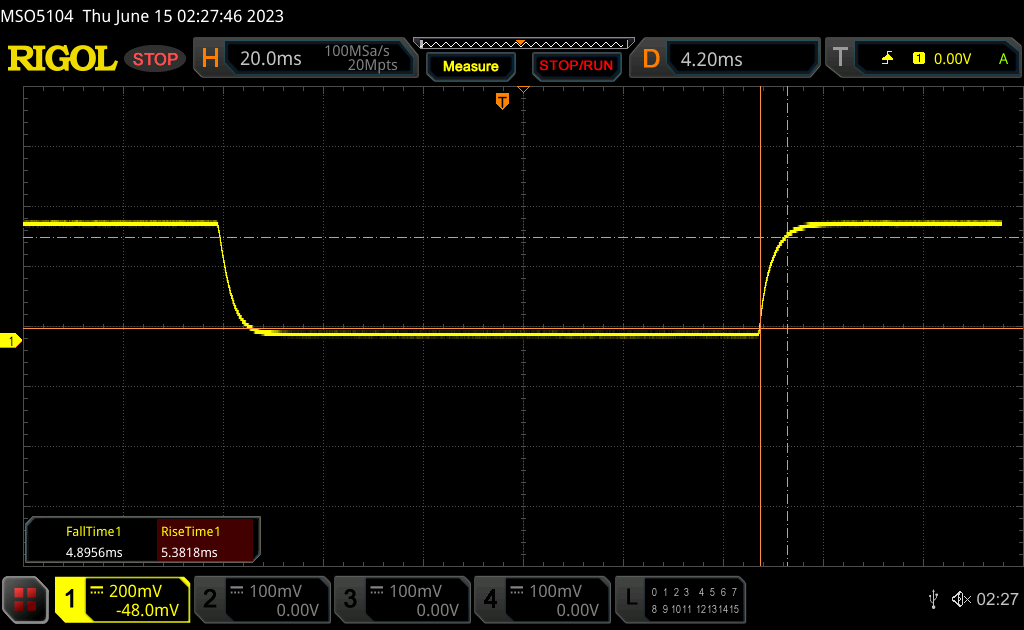 |
| ↘ 4.9 ms fall | ||
| The screen shows good response rates in our tests, but may be too slow for competitive gamers. In comparison, all tested devices range from 0.1 (minimum) to 240 (maximum) ms. » 28 % of all devices are better. This means that the measured response time is better than the average of all tested devices (19.8 ms). | ||
| ↔ Response Time 50% Grey to 80% Grey | ||
| 5.1 ms ... rise ↗ and fall ↘ combined | ↗ 2.4 ms rise | 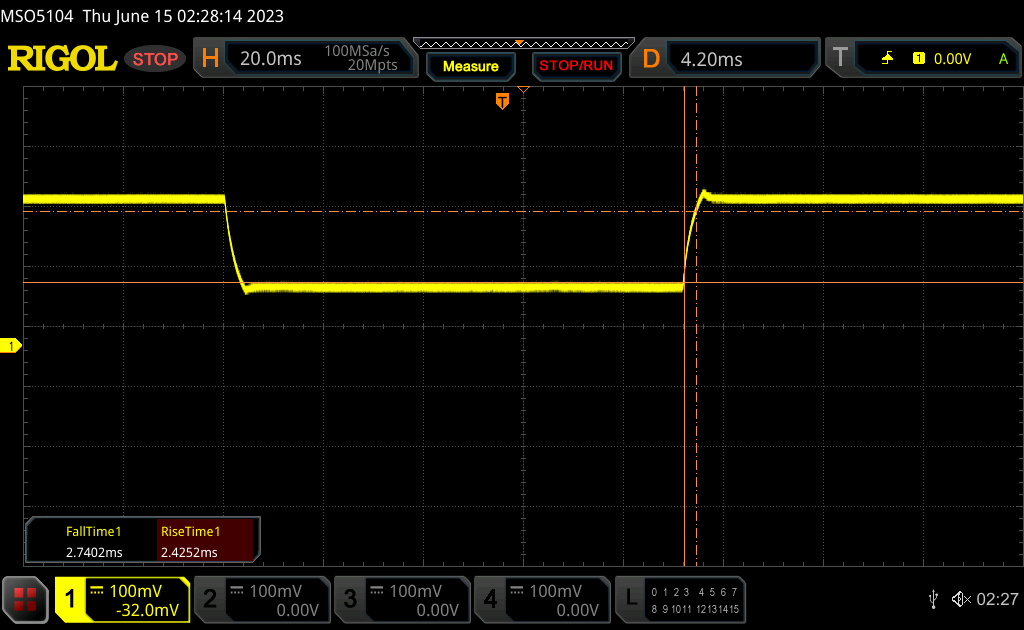 |
| ↘ 2.7 ms fall | ||
| The screen shows very fast response rates in our tests and should be very well suited for fast-paced gaming. In comparison, all tested devices range from 0.165 (minimum) to 636 (maximum) ms. » 17 % of all devices are better. This means that the measured response time is better than the average of all tested devices (31 ms). | ||
Screen Flickering / PWM (Pulse-Width Modulation)
| Screen flickering / PWM not detected | 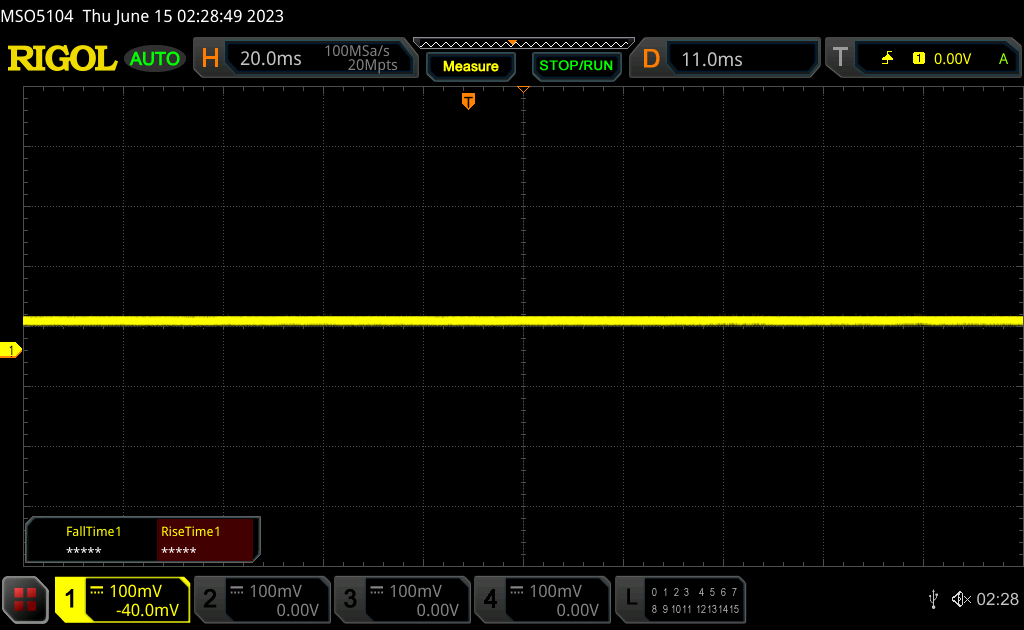 | ||
In comparison: 52 % of all tested devices do not use PWM to dim the display. If PWM was detected, an average of 7757 (minimum: 5 - maximum: 343500) Hz was measured. | |||
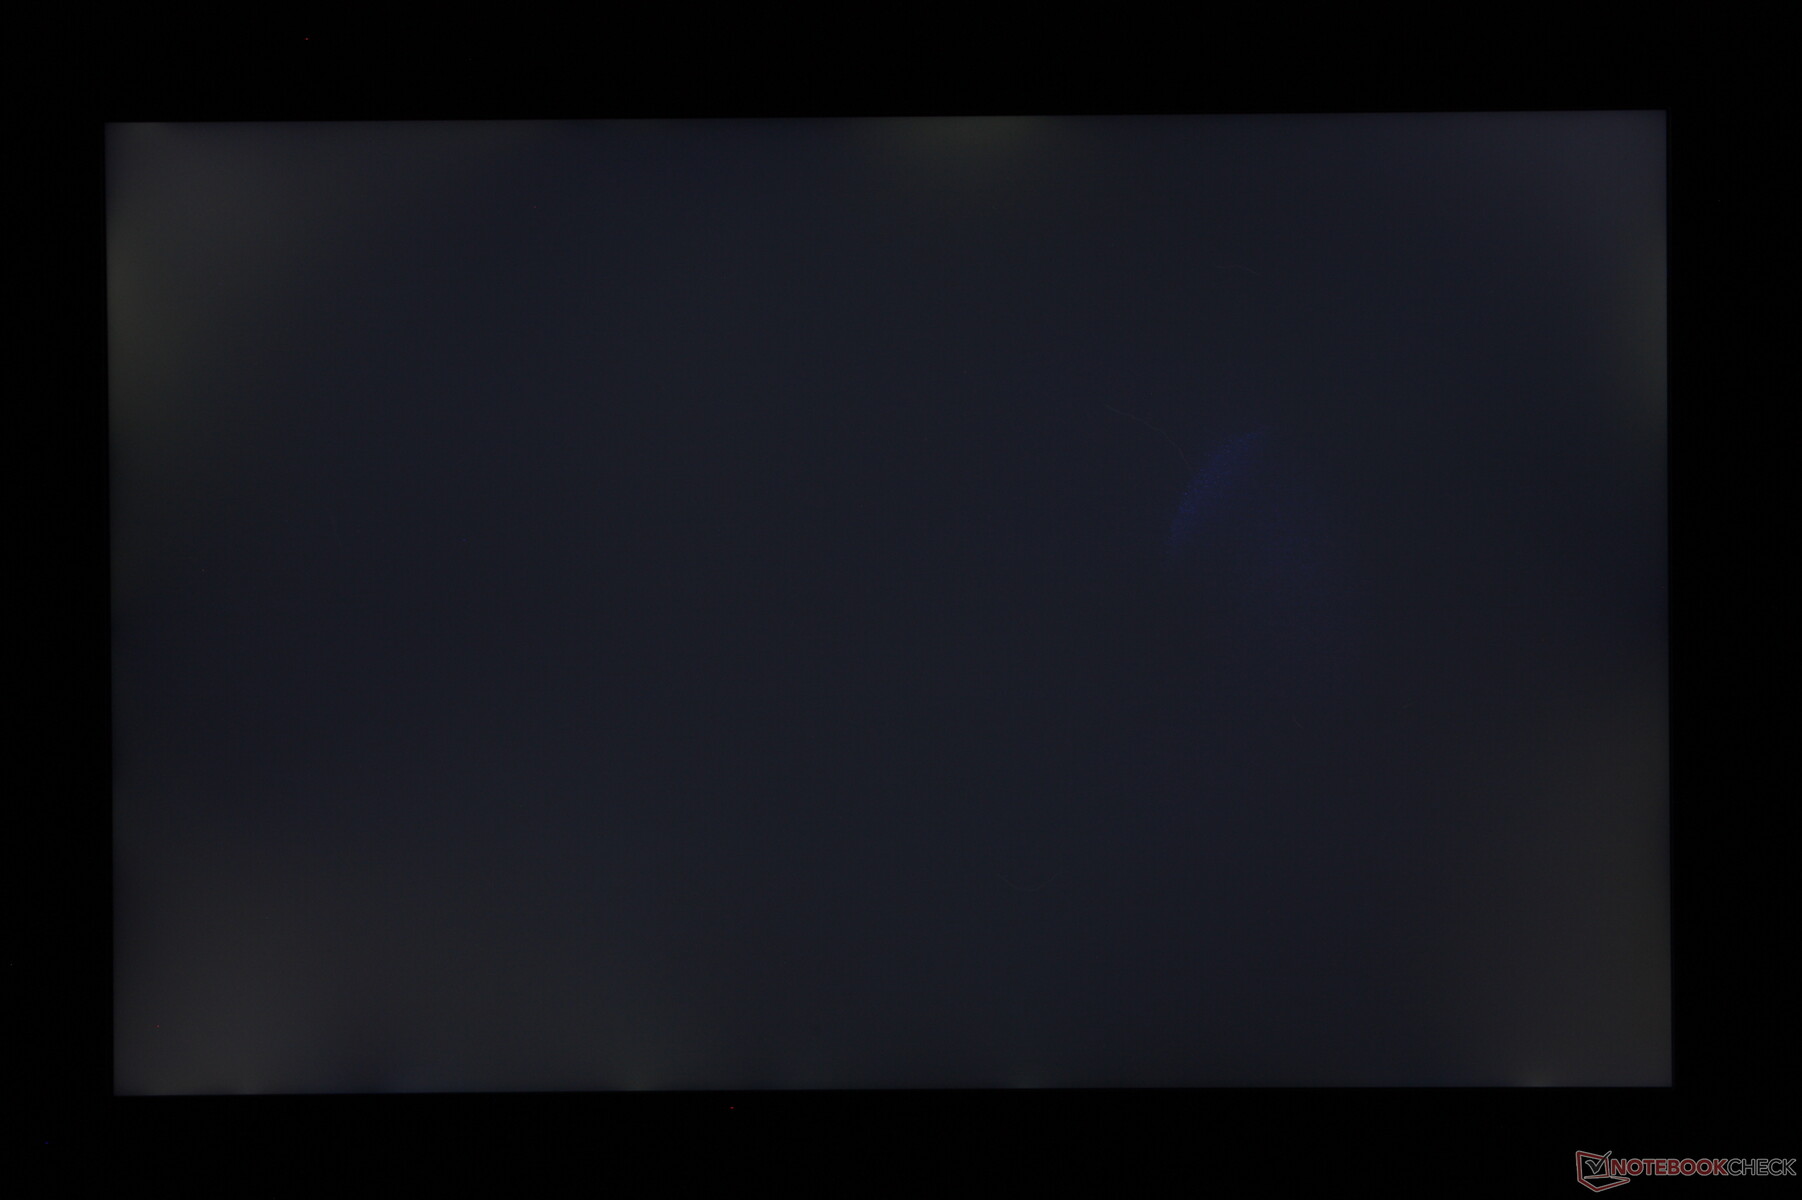
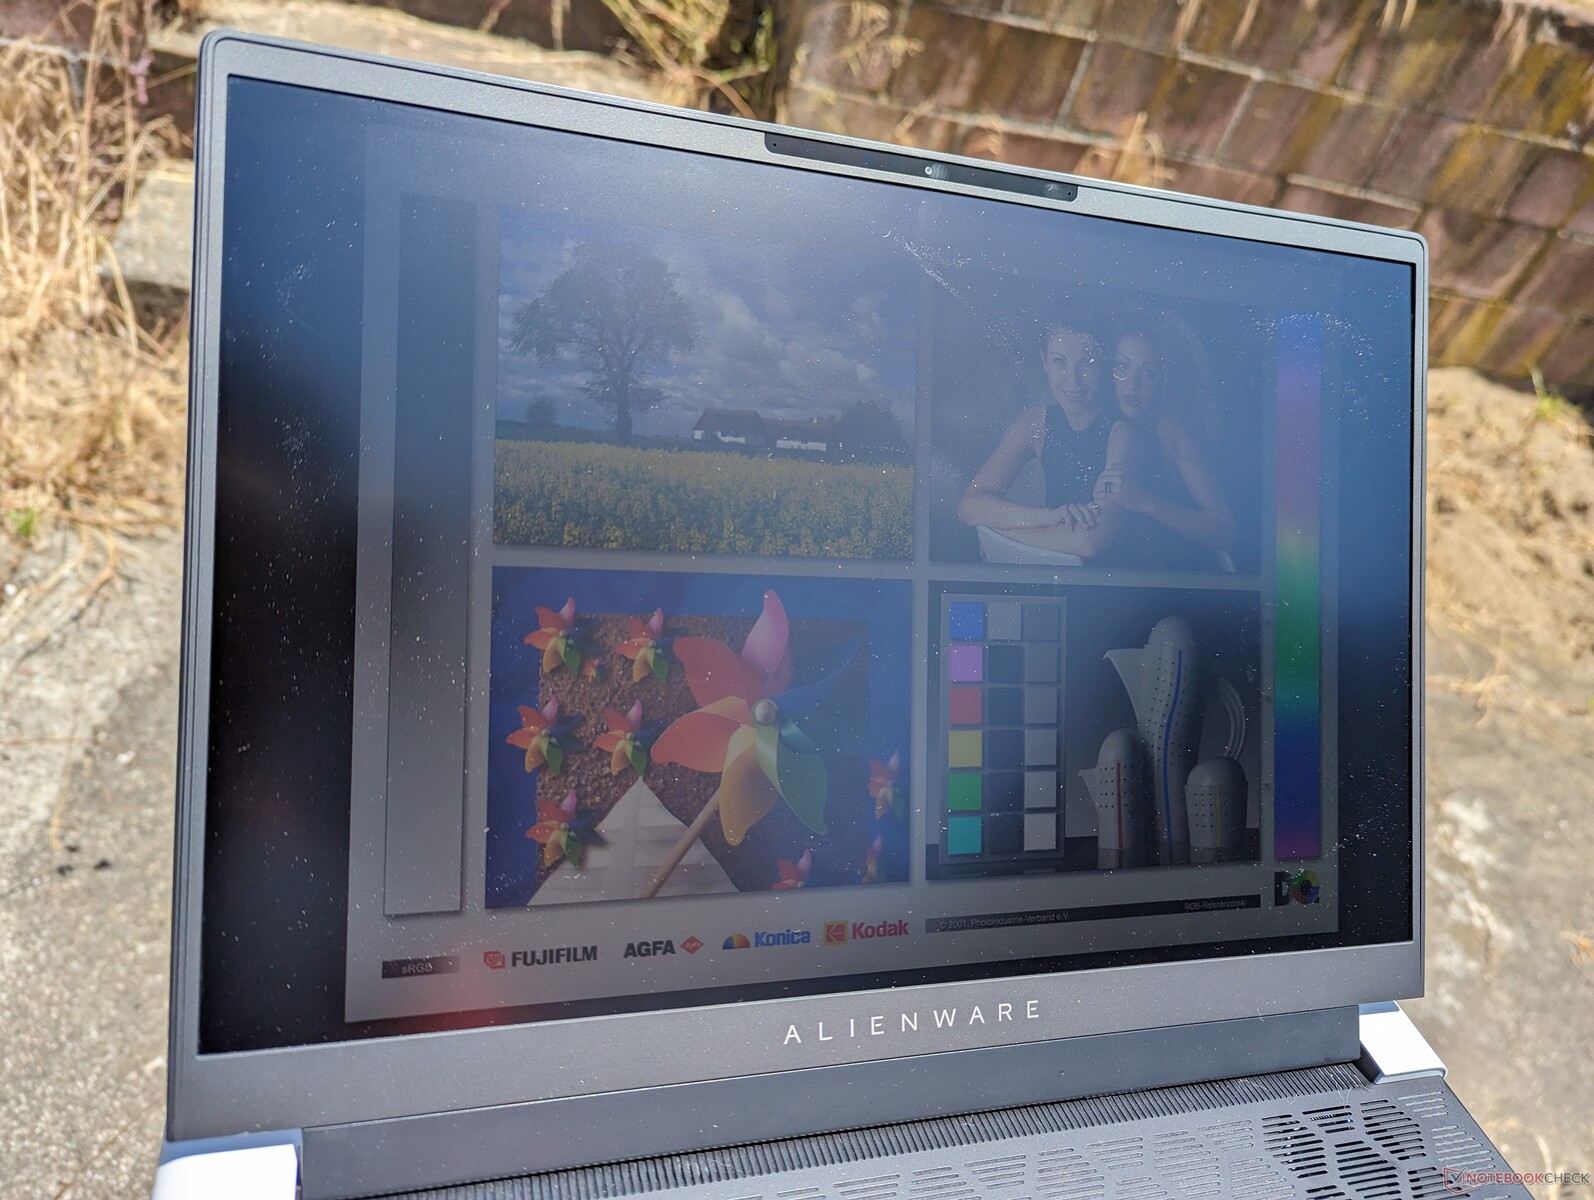
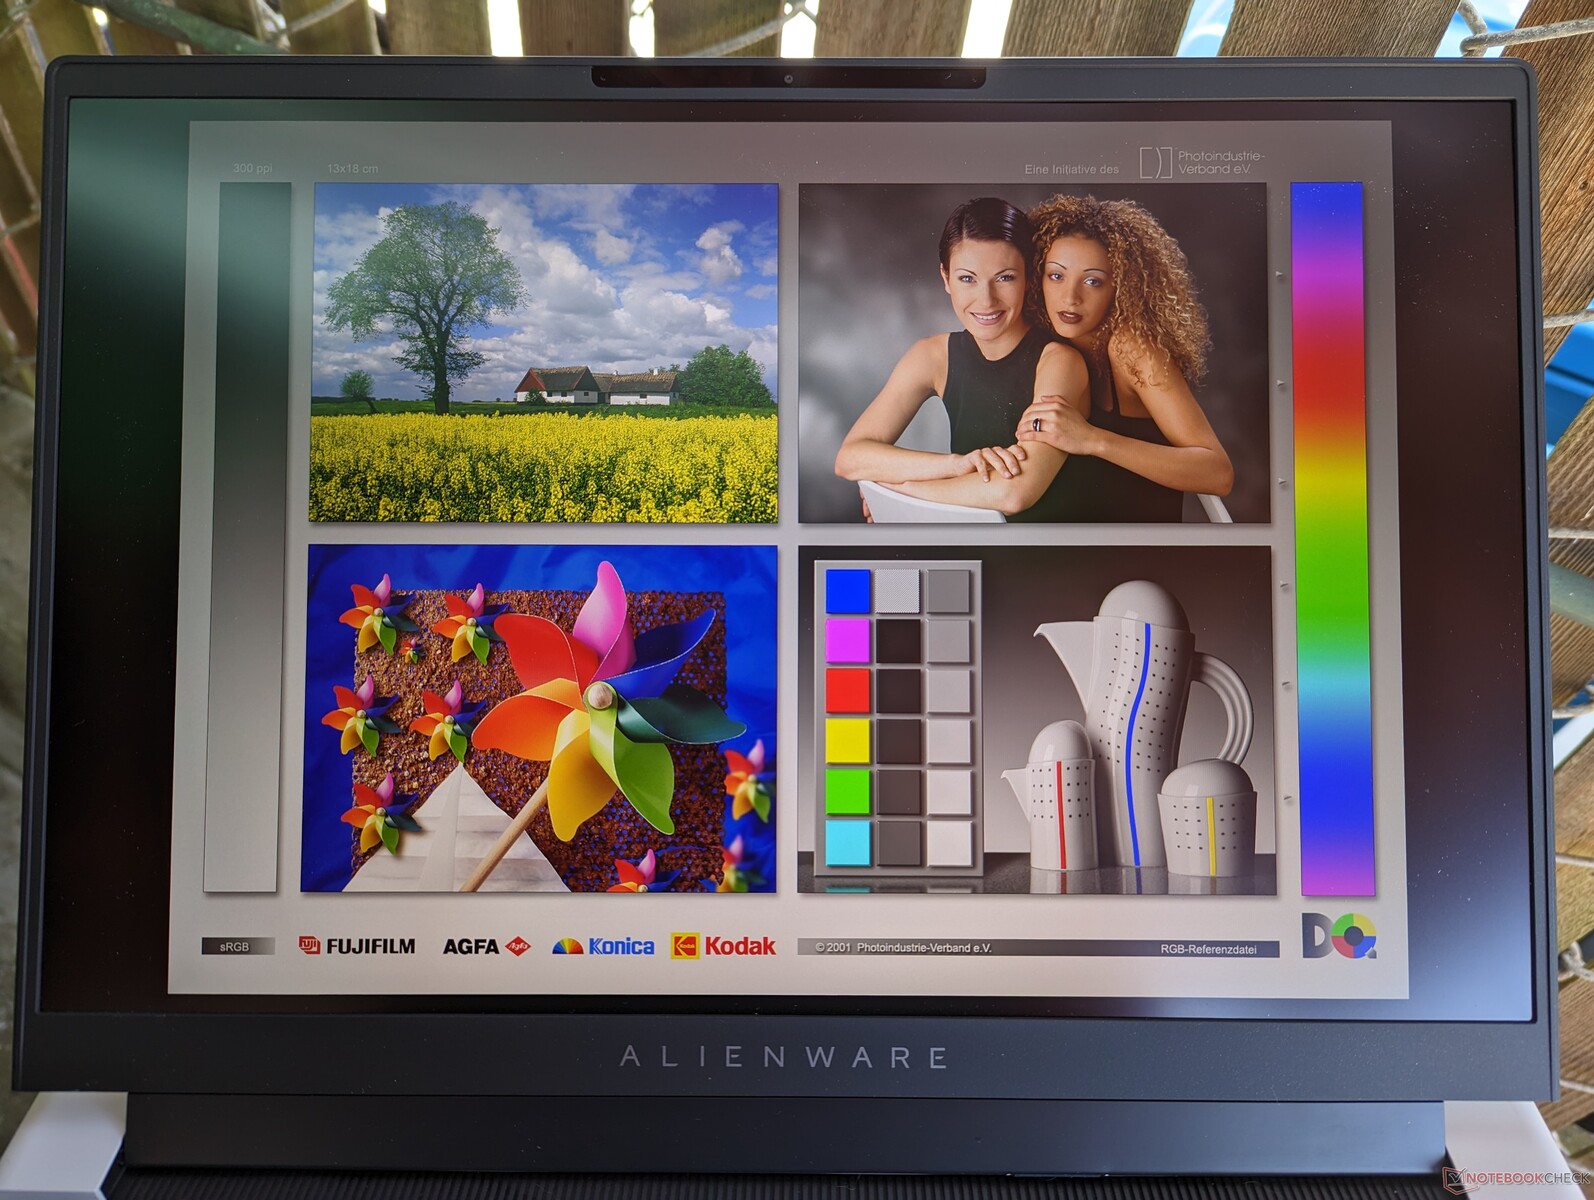
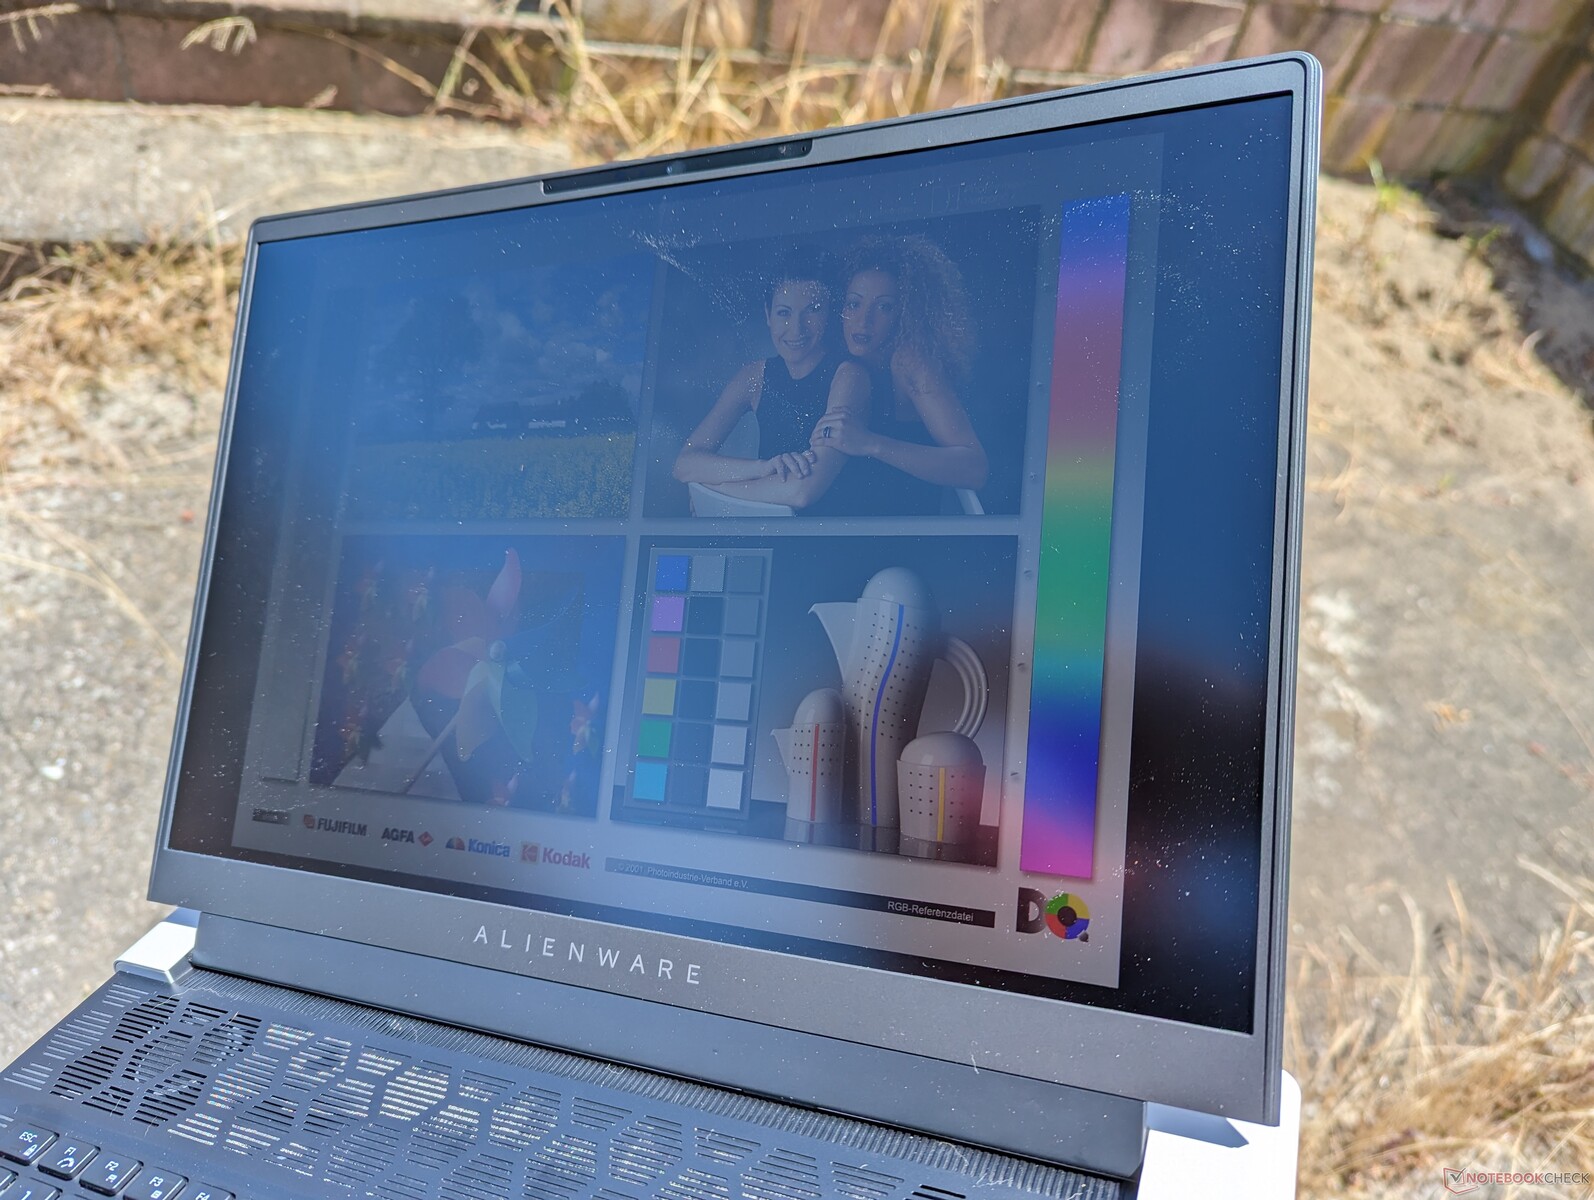
户外能见度不如其他16英寸游戏笔记本,如Zephyrus M16,Blade 16,或Legion Pro 7 16,因为Alienware的显示屏明显更暗。再加上相对较大的占地面积,Alienware x16 R1绝对不是一台适合户外使用的笔记本电脑,尽管它的机箱设计很薄。
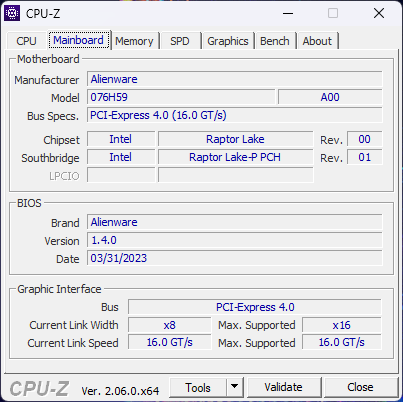
性能 - 我的CPU,令人印象深刻的GPU
测试条件
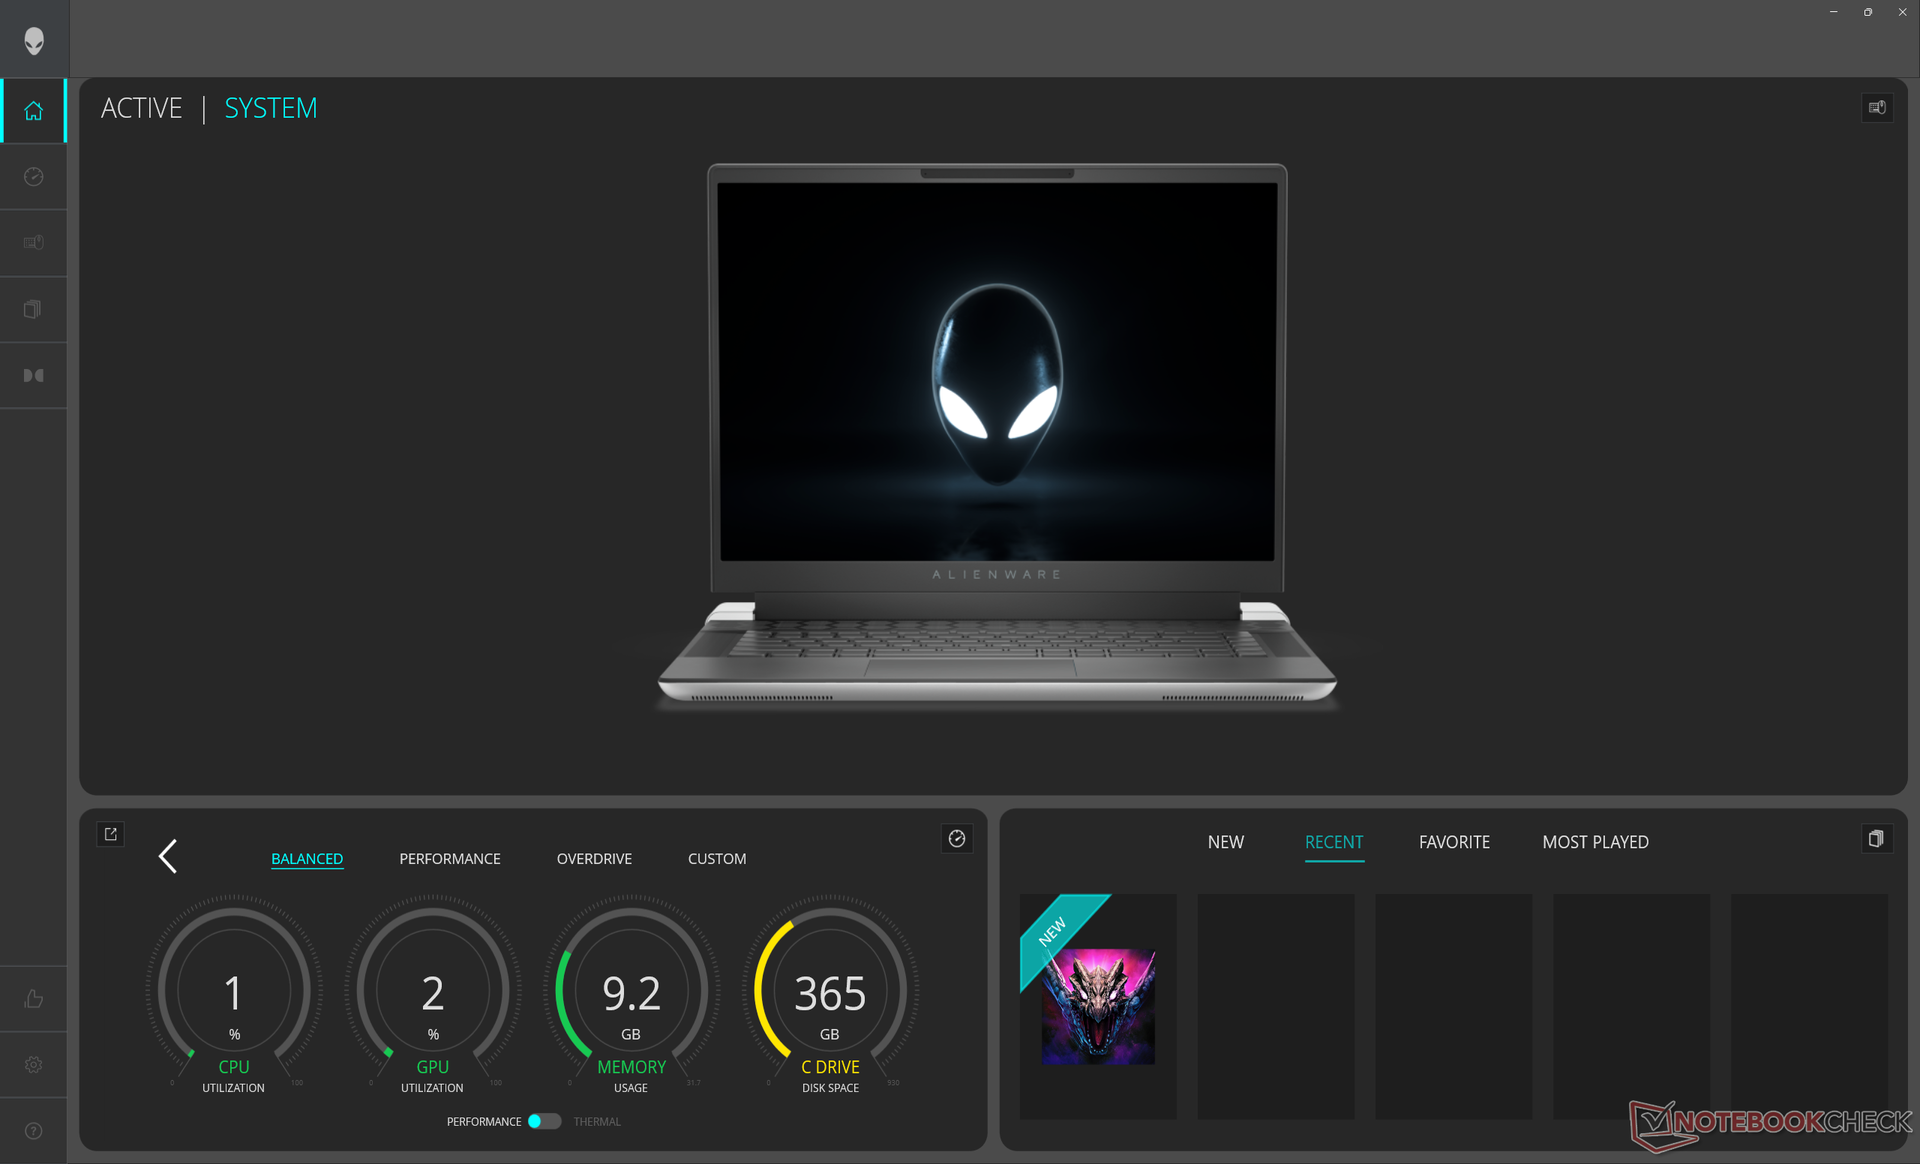
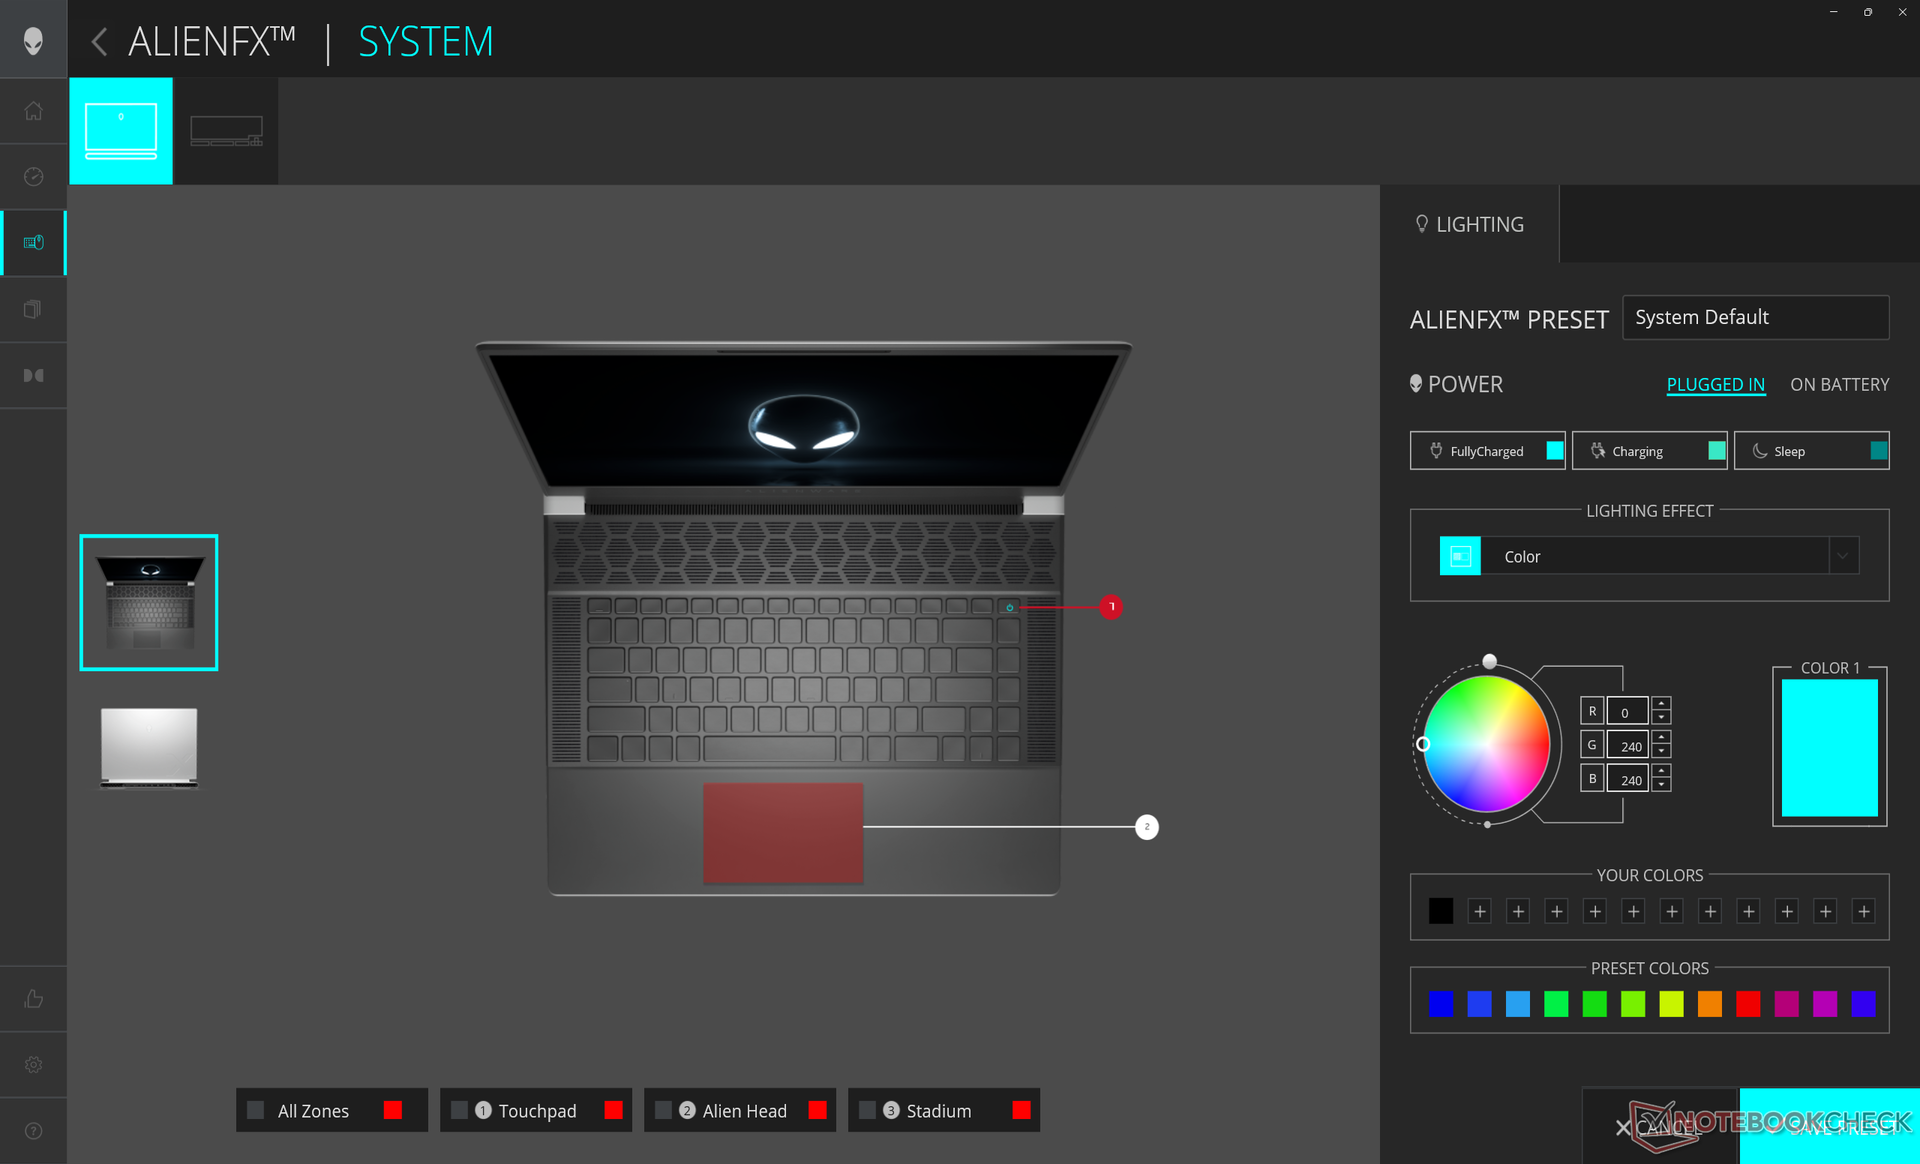
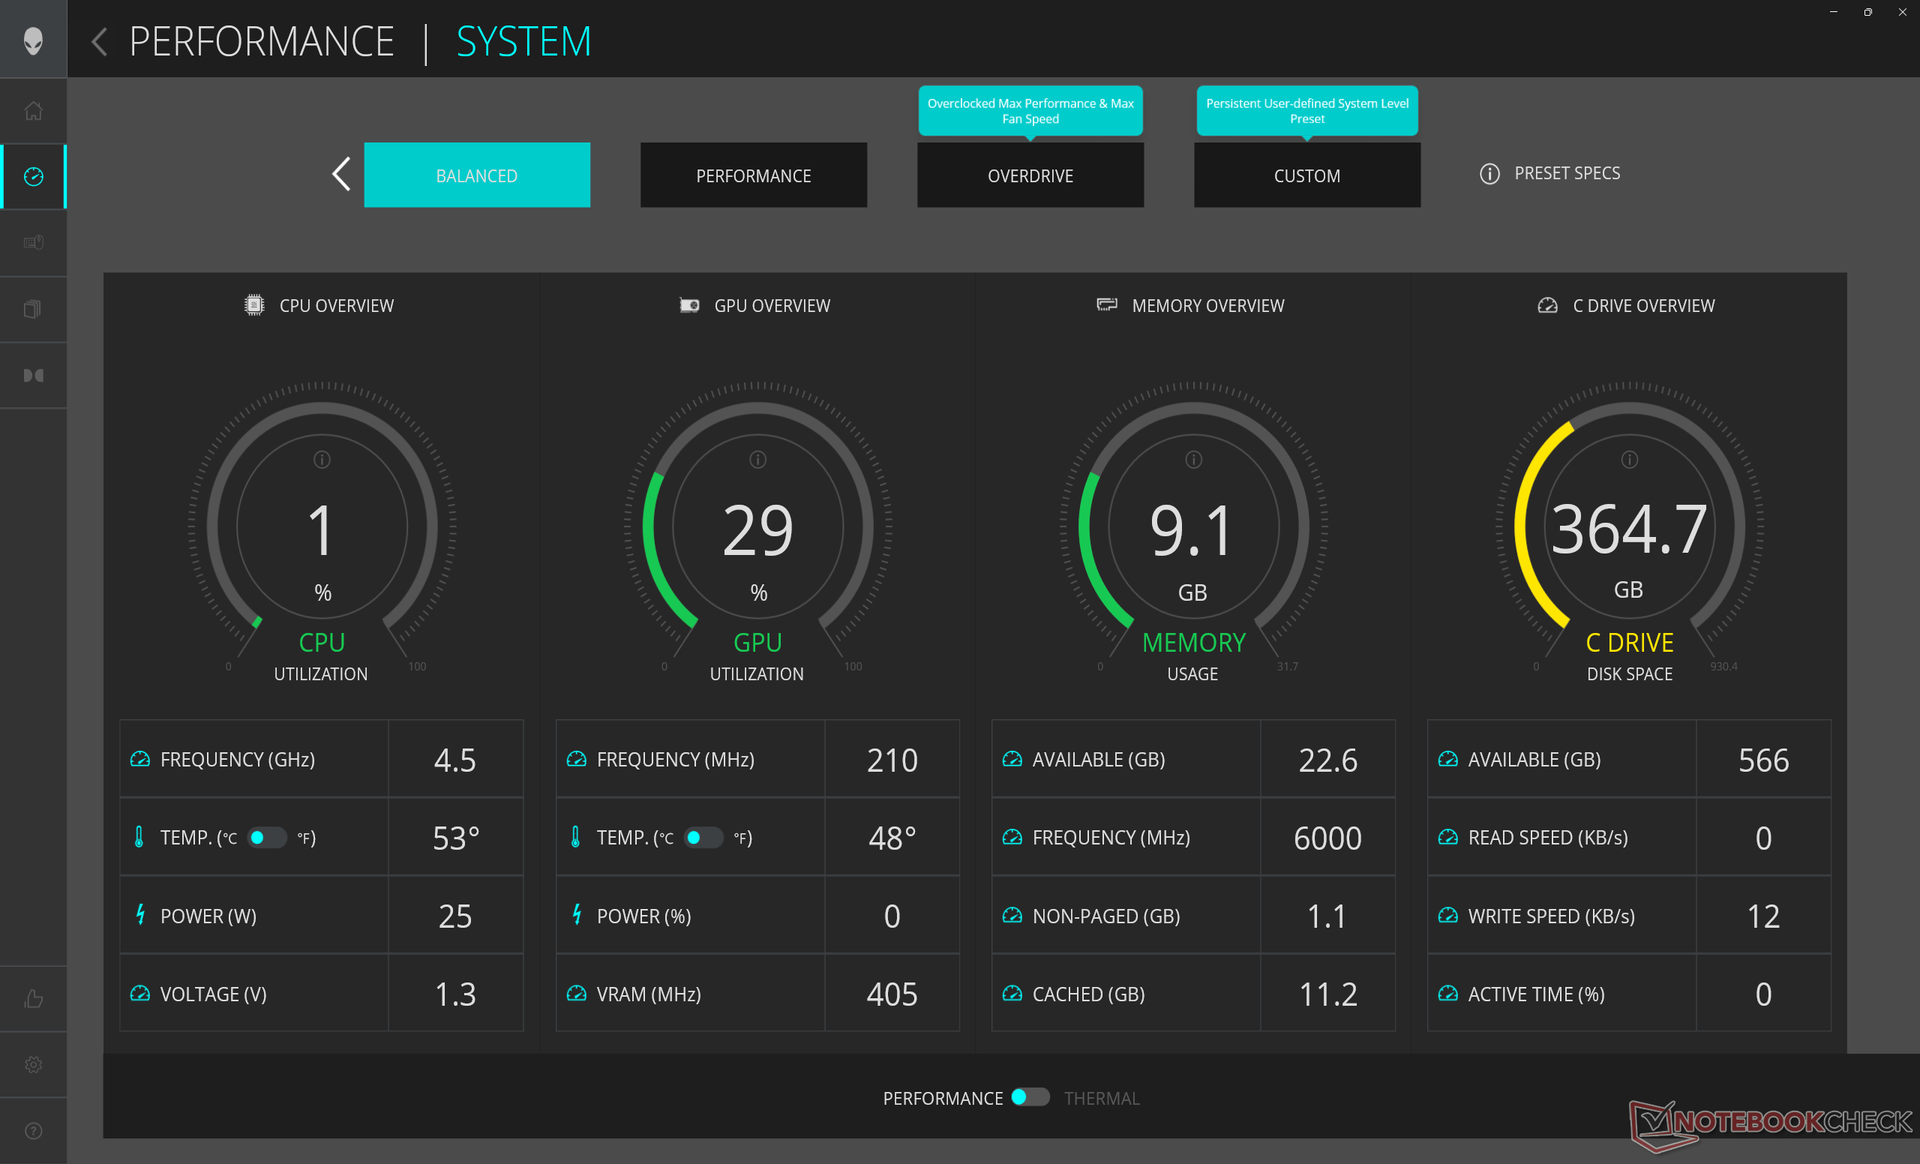
在运行以下基准测试之前,我们通过Alienware指挥中心(ACC)将我们的设备设置为超速模式,并通过Windows设置为高性能模式。我们还确保通过Nvidia控制面板将图形设置为dGPU模式,而不是Optimus。令人讨厌的是,ACC的电源配置文件没有与Windows同步,因此有可能激活冲突的配置文件(即,一个设置为节能模式,另一个设置为性能模式)。
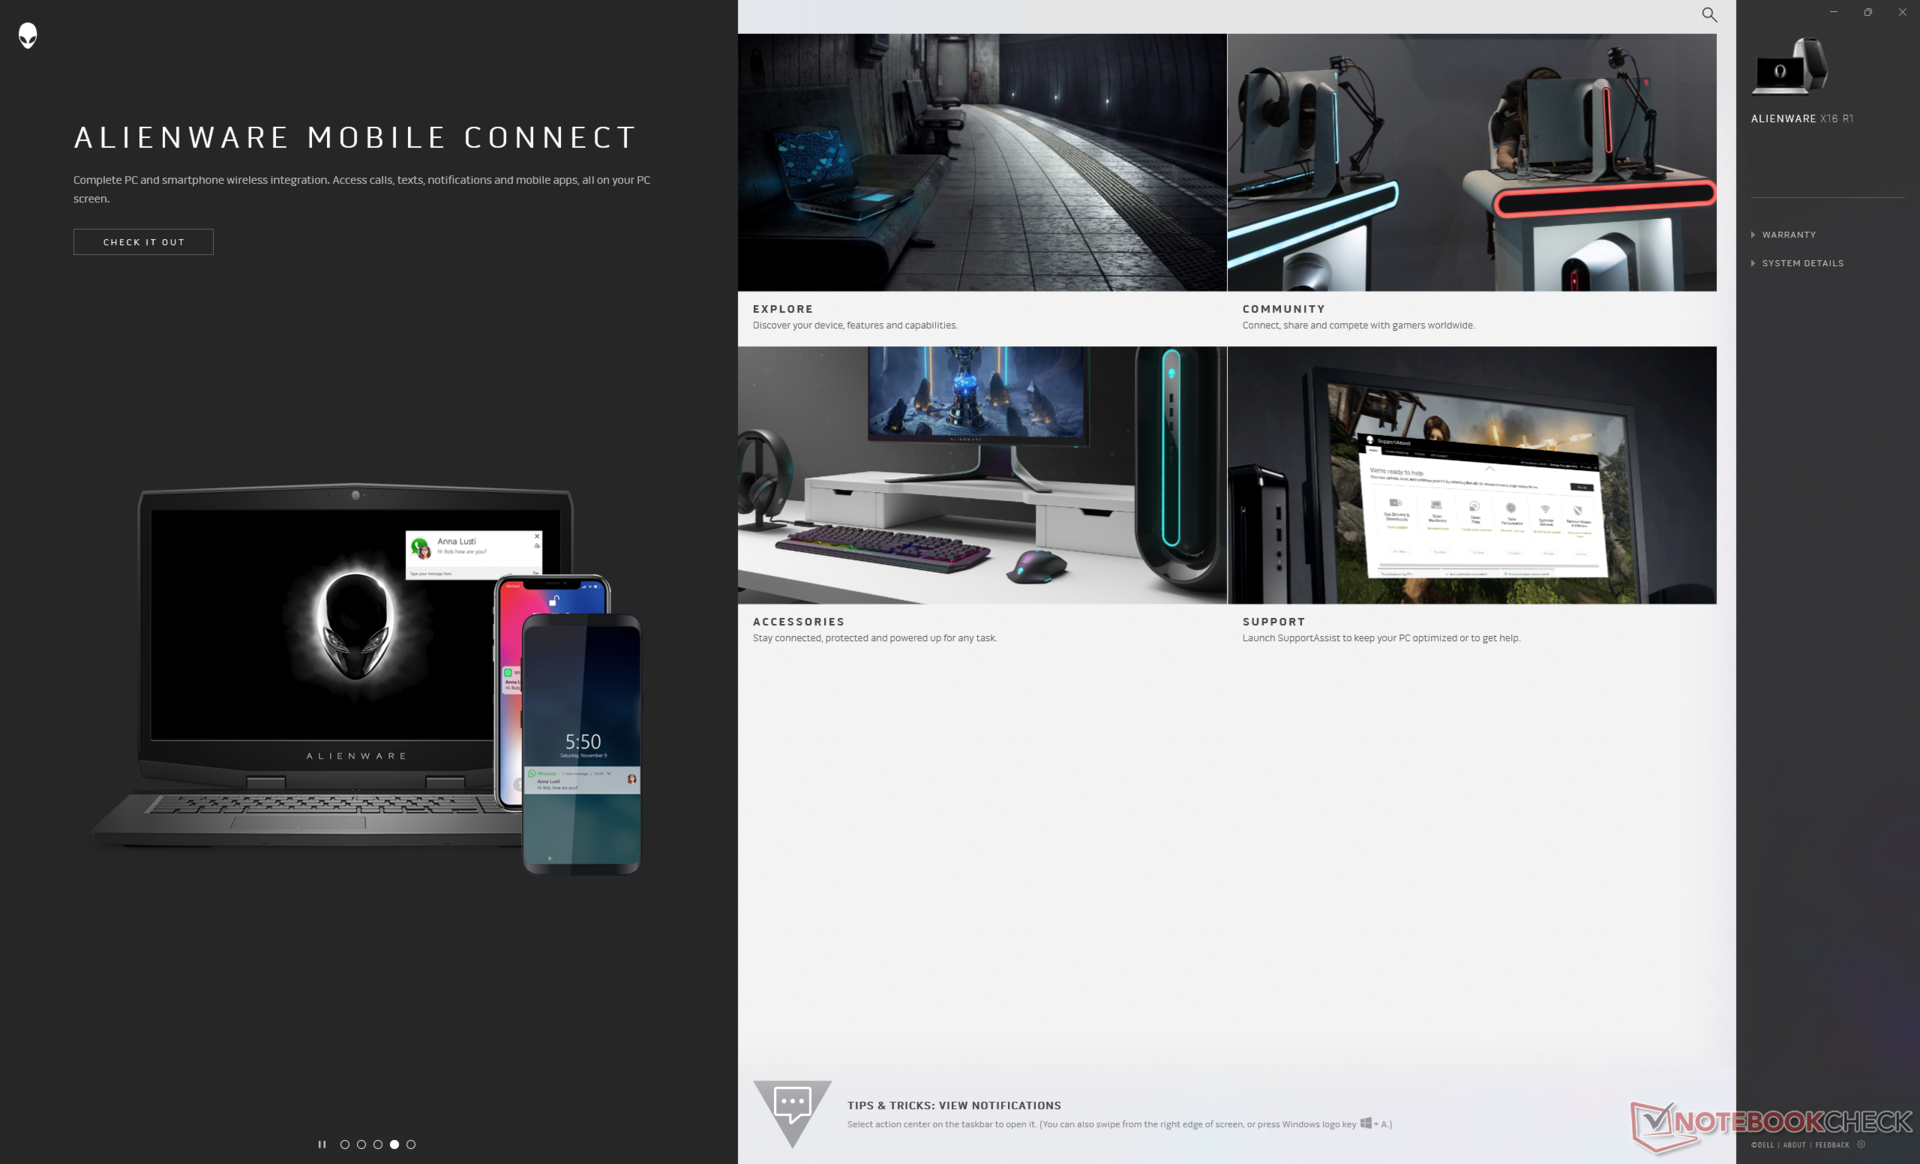
ACC不应与My Alienware相混淆。前者是系统生命体征、RGB设置、电源配置文件和游戏设置的控制中心,而后者是戴尔支持、移动连接和可选配件的枢纽。
所有SKU都支持高级优化或MUX。请记住,如果只设置为dGPU模式,G-Sync对内部显示器是有效的。
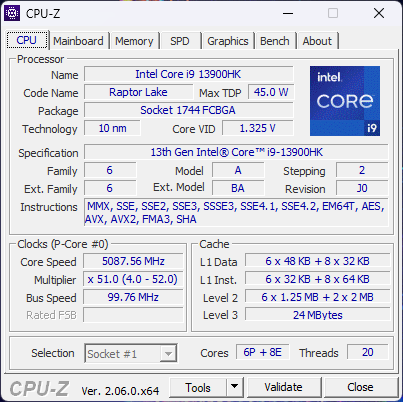
处理器
值得注意的是,该模型的最大功率为 酷睿i9-13900HK而不是 酷睿i9-13900HX后者可以提供50%至60%的多线程性能。因此,我们的酷睿i7-13900HK的整体性能几乎与价格较低的 酷睿i9-13900H并可与竞争性的 Ryzen 7 7745HX.如果想获得更快的性能,玩家可能要考虑更厚的Alienware m16或联想Legion Pro 7,因为它们可以配置Core i7-13900HX。
降级到价格较低的 i7-13620H或 i7-13700H根据我们对微星Katana 17的使用情况,预计对处理器性能的影响约为15%至20%。微星Katana 17和 戴尔XPS 17 9730.
Cinebench R15 Multi Loop
Cinebench R20: CPU (Multi Core) | CPU (Single Core)
Cinebench R23: Multi Core | Single Core
Cinebench R15: CPU Multi 64Bit | CPU Single 64Bit
Blender: v2.79 BMW27 CPU
7-Zip 18.03: 7z b 4 | 7z b 4 -mmt1
Geekbench 5.5: Multi-Core | Single-Core
HWBOT x265 Benchmark v2.2: 4k Preset
LibreOffice : 20 Documents To PDF
R Benchmark 2.5: Overall mean
* ... smaller is better
AIDA64: FP32 Ray-Trace | FPU Julia | CPU SHA3 | CPU Queen | FPU SinJulia | FPU Mandel | CPU AES | CPU ZLib | FP64 Ray-Trace | CPU PhotoWorxx
| Performance rating | |
| Lenovo Legion Pro 7 RTX4090 | |
| Razer Blade 16 Early 2023 | |
| Asus ROG Zephyrus M16 GU604VY-NM042X | |
| Alienware x16 R1 | |
| Alienware m17 R5 (R9 6900HX, RX 6850M XT) | |
| Dell G16 7620 | |
| Average Intel Core i9-13900HK | |
| AIDA64 / CPU Queen | |
| Lenovo Legion Pro 7 RTX4090 | |
| Razer Blade 16 Early 2023 | |
| Razer Blade 16 Early 2023 | |
| Asus ROG Zephyrus M16 GU604VY-NM042X | |
| Alienware x16 R1 | |
| Alienware m17 R5 (R9 6900HX, RX 6850M XT) | |
| Dell G16 7620 | |
| Average Intel Core i9-13900HK (75615 - 118166, n=4) | |
系统性能
CrossMark: Overall | Productivity | Creativity | Responsiveness
| PCMark 10 / Score | |
| Alienware x16 R1 | |
| Average Intel Core i9-13900HK, NVIDIA GeForce RTX 4080 Laptop GPU (n=1) | |
| Asus ROG Zephyrus M16 GU604VY-NM042X | |
| Lenovo Legion Pro 7 RTX4090 | |
| Razer Blade 16 Early 2023 | |
| Alienware m17 R5 (R9 6900HX, RX 6850M XT) | |
| Dell G16 7620 | |
| PCMark 10 / Essentials | |
| Asus ROG Zephyrus M16 GU604VY-NM042X | |
| Alienware x16 R1 | |
| Average Intel Core i9-13900HK, NVIDIA GeForce RTX 4080 Laptop GPU (n=1) | |
| Lenovo Legion Pro 7 RTX4090 | |
| Razer Blade 16 Early 2023 | |
| Dell G16 7620 | |
| Alienware m17 R5 (R9 6900HX, RX 6850M XT) | |
| PCMark 10 / Productivity | |
| Asus ROG Zephyrus M16 GU604VY-NM042X | |
| Alienware x16 R1 | |
| Average Intel Core i9-13900HK, NVIDIA GeForce RTX 4080 Laptop GPU (n=1) | |
| Alienware m17 R5 (R9 6900HX, RX 6850M XT) | |
| Lenovo Legion Pro 7 RTX4090 | |
| Dell G16 7620 | |
| Razer Blade 16 Early 2023 | |
| PCMark 10 / Digital Content Creation | |
| Lenovo Legion Pro 7 RTX4090 | |
| Razer Blade 16 Early 2023 | |
| Alienware x16 R1 | |
| Average Intel Core i9-13900HK, NVIDIA GeForce RTX 4080 Laptop GPU (n=1) | |
| Asus ROG Zephyrus M16 GU604VY-NM042X | |
| Alienware m17 R5 (R9 6900HX, RX 6850M XT) | |
| Dell G16 7620 | |
| CrossMark / Overall | |
| Asus ROG Zephyrus M16 GU604VY-NM042X | |
| Alienware x16 R1 | |
| Average Intel Core i9-13900HK, NVIDIA GeForce RTX 4080 Laptop GPU (n=1) | |
| Dell G16 7620 | |
| Alienware m17 R5 (R9 6900HX, RX 6850M XT) | |
| Razer Blade 16 Early 2023 | |
| CrossMark / Productivity | |
| Asus ROG Zephyrus M16 GU604VY-NM042X | |
| Alienware x16 R1 | |
| Average Intel Core i9-13900HK, NVIDIA GeForce RTX 4080 Laptop GPU (n=1) | |
| Dell G16 7620 | |
| Alienware m17 R5 (R9 6900HX, RX 6850M XT) | |
| Razer Blade 16 Early 2023 | |
| CrossMark / Creativity | |
| Asus ROG Zephyrus M16 GU604VY-NM042X | |
| Alienware x16 R1 | |
| Average Intel Core i9-13900HK, NVIDIA GeForce RTX 4080 Laptop GPU (n=1) | |
| Dell G16 7620 | |
| Razer Blade 16 Early 2023 | |
| Alienware m17 R5 (R9 6900HX, RX 6850M XT) | |
| CrossMark / Responsiveness | |
| Alienware x16 R1 | |
| Average Intel Core i9-13900HK, NVIDIA GeForce RTX 4080 Laptop GPU (n=1) | |
| Asus ROG Zephyrus M16 GU604VY-NM042X | |
| Dell G16 7620 | |
| Razer Blade 16 Early 2023 | |
| Alienware m17 R5 (R9 6900HX, RX 6850M XT) | |
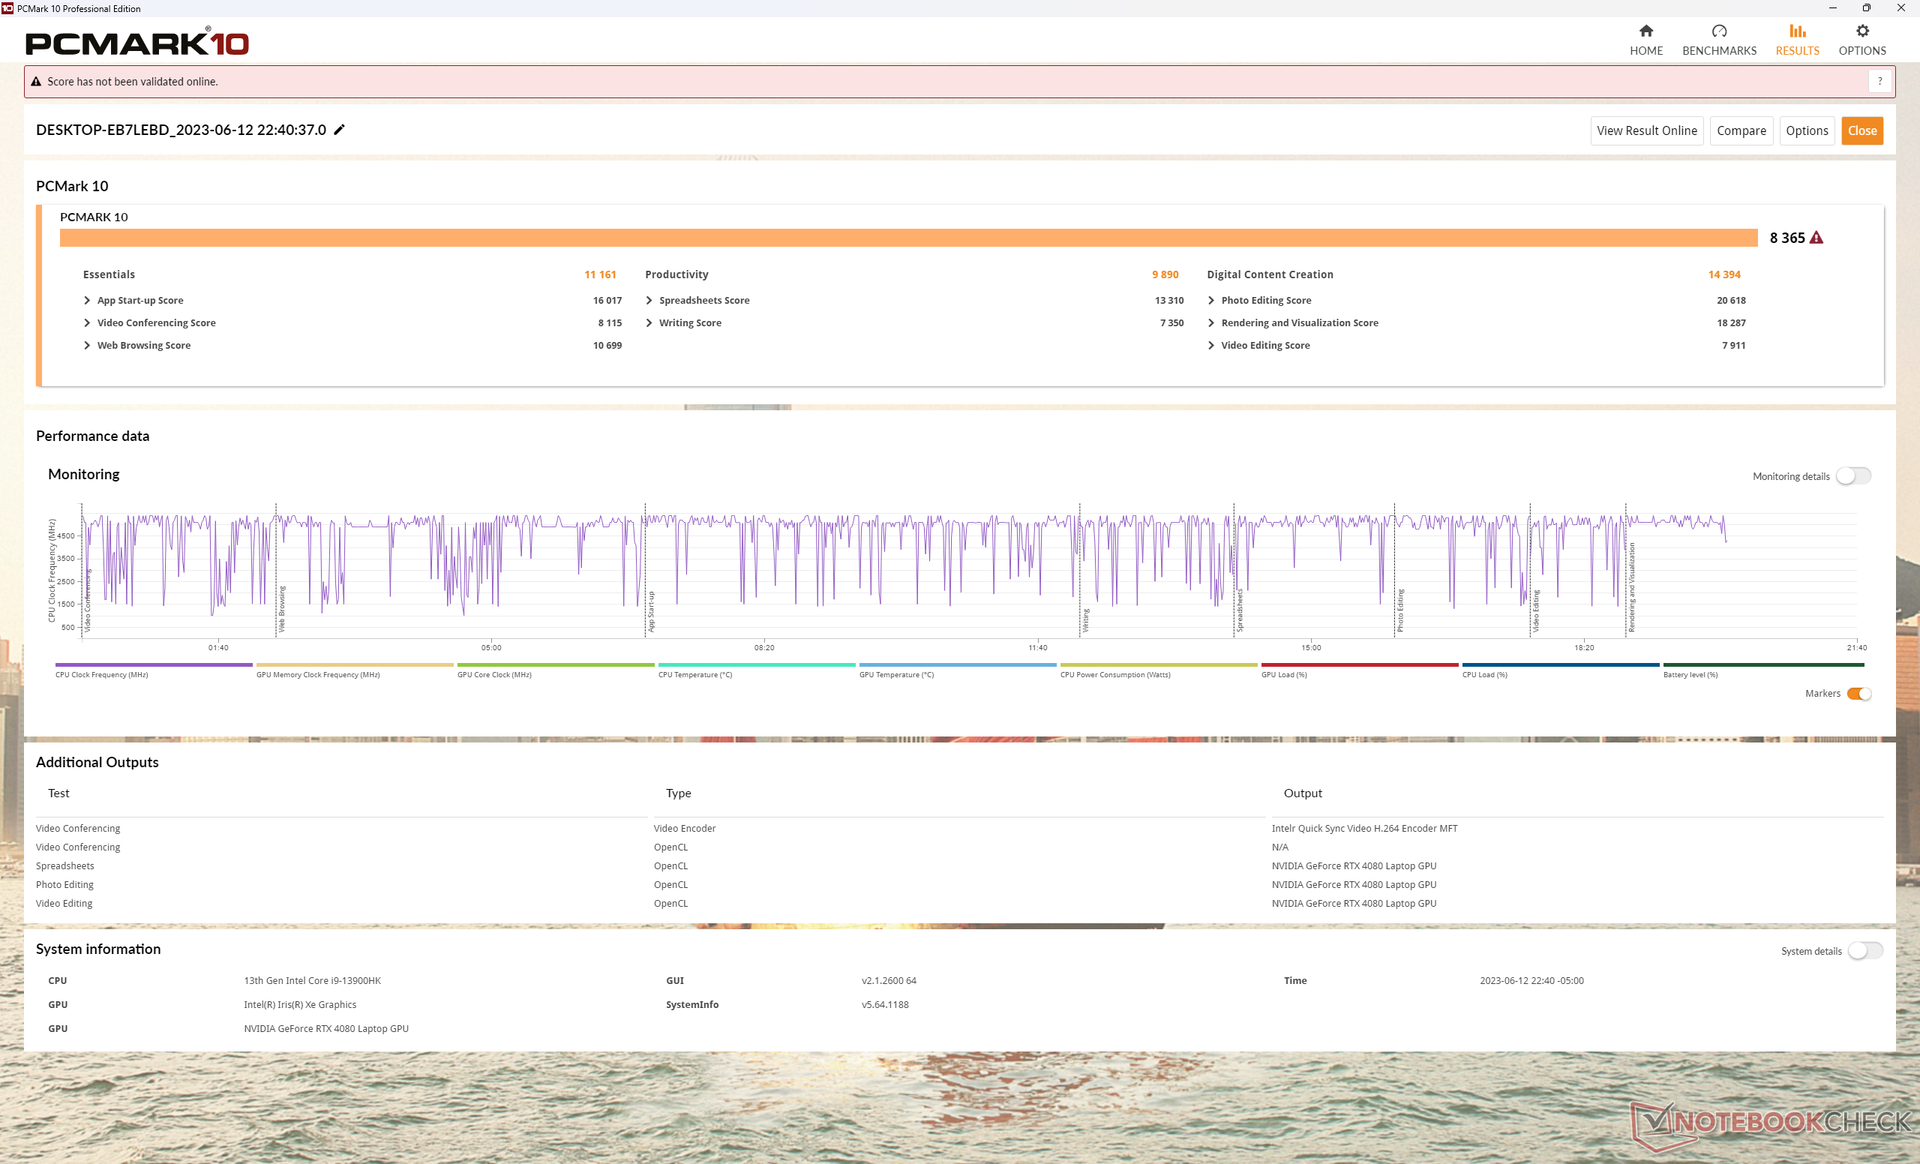
| PCMark 10 Score | 8365 points | |
Help | ||
| AIDA64 / Memory Latency | |
| Alienware x16 R1 | |
| Dell G16 7620 | |
| Razer Blade 16 Early 2023 | |
| Razer Blade 16 Early 2023 | |
| Razer Blade 16 Early 2023 | |
| Average Intel Core i9-13900HK (83 - 115.3, n=4) | |
| Alienware m17 R5 (R9 6900HX, RX 6850M XT) | |
| Asus ROG Zephyrus M16 GU604VY-NM042X | |
| Lenovo Legion Pro 7 RTX4090 | |
* ... smaller is better
DPC延时
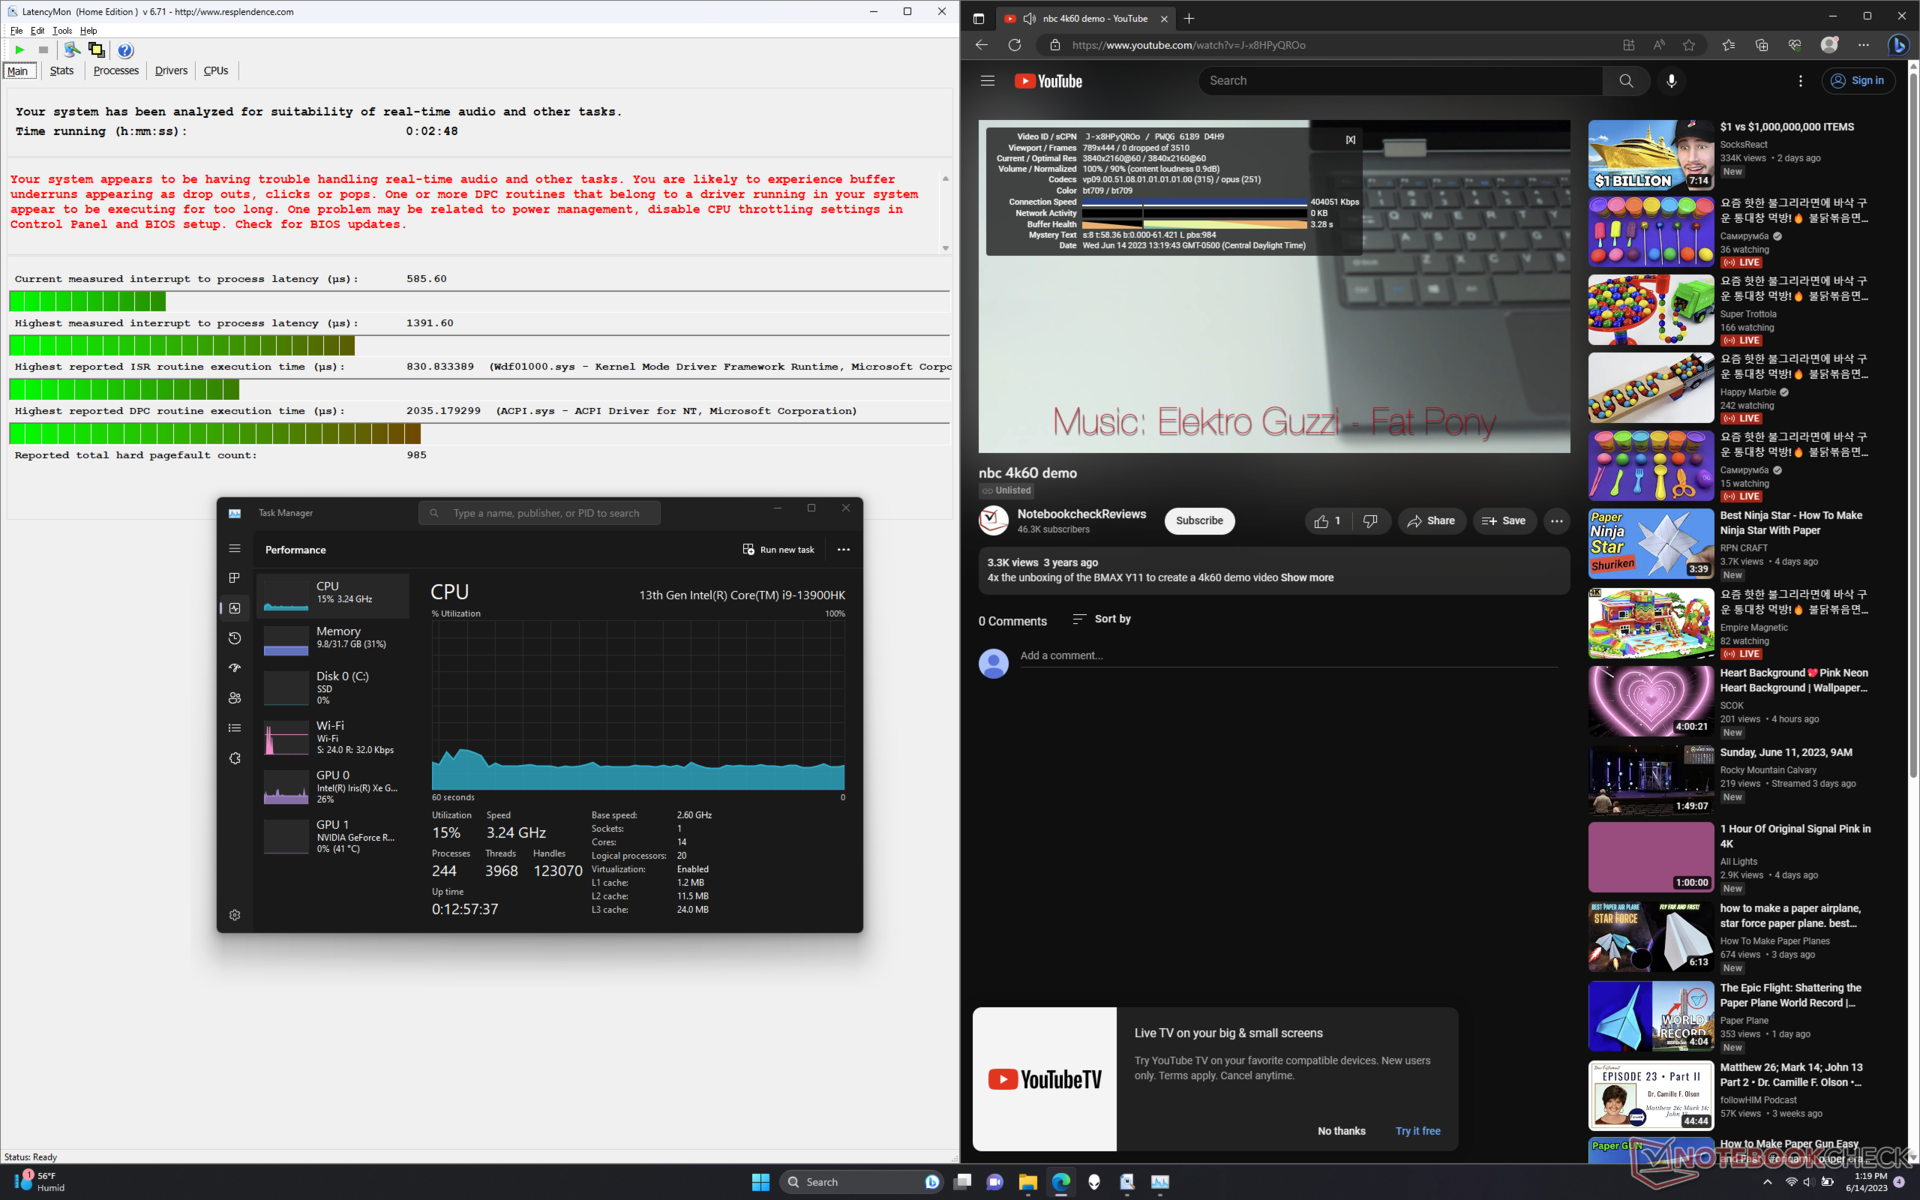
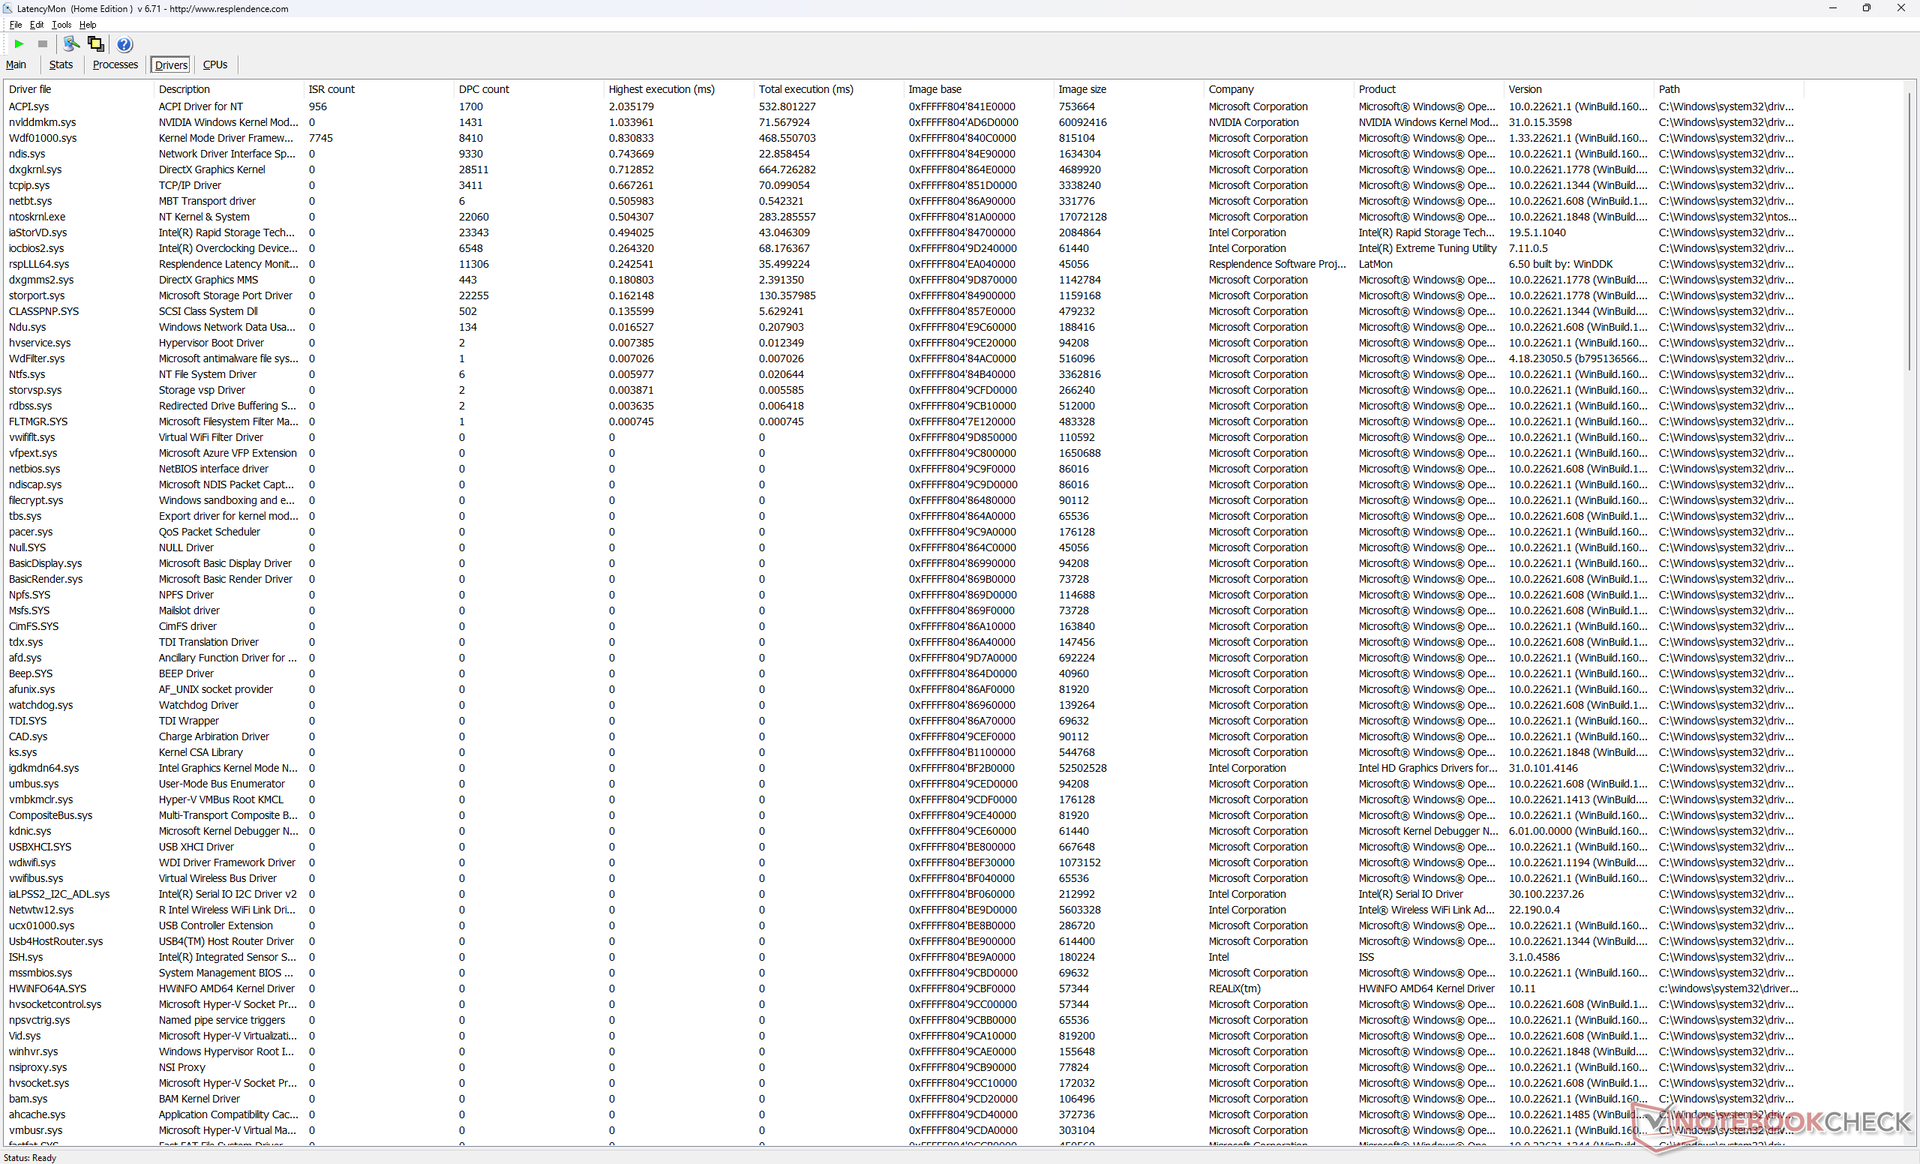
LatencyMon显示了在打开我们主页的多个浏览器标签时的DPC问题。在60 FPS的情况下,4K视频播放是完美的,没有掉帧。
| DPC Latencies / LatencyMon - interrupt to process latency (max), Web, Youtube, Prime95 | |
| Lenovo Legion Pro 7 RTX4090 | |
| Asus ROG Zephyrus M16 GU604VY-NM042X | |
| Razer Blade 16 Early 2023 | |
| Alienware x16 R1 | |
| Alienware m17 R5 (R9 6900HX, RX 6850M XT) | |
| Dell G16 7620 | |
* ... smaller is better
存储设备
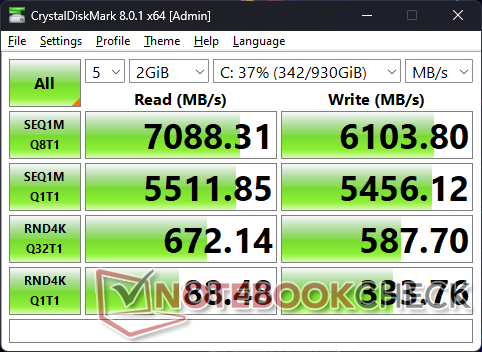
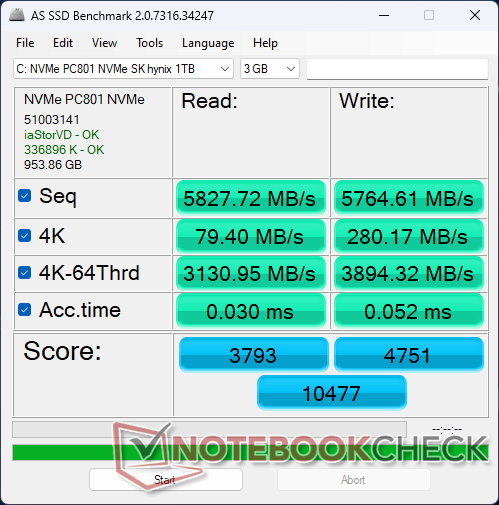
PCIe4 x4 SK Hynix PC801驱动器在我们的设备中可以达到高达7100 MB/s的读取速率,与流行的三星PM9A1相当。不幸的是,该硬盘在长时间内保持其最大传输率方面存在问题,可能是由于冷却不足。例如,在循环运行DiskSpd时,如下图所示,在进入压力测试几分钟后,读取率会降至3400MB/s。重复测试后,结果没有改善。

| Drive Performance rating - Percent | |
| Alienware x16 R1 | |
| Lenovo Legion Pro 7 RTX4090 | |
| Dell G16 7620 | |
| Asus ROG Zephyrus M16 GU604VY-NM042X | |
| Razer Blade 16 Early 2023 | |
| Alienware m17 R5 (R9 6900HX, RX 6850M XT) | |
* ... smaller is better
Disk Throttling: DiskSpd Read Loop, Queue Depth 8
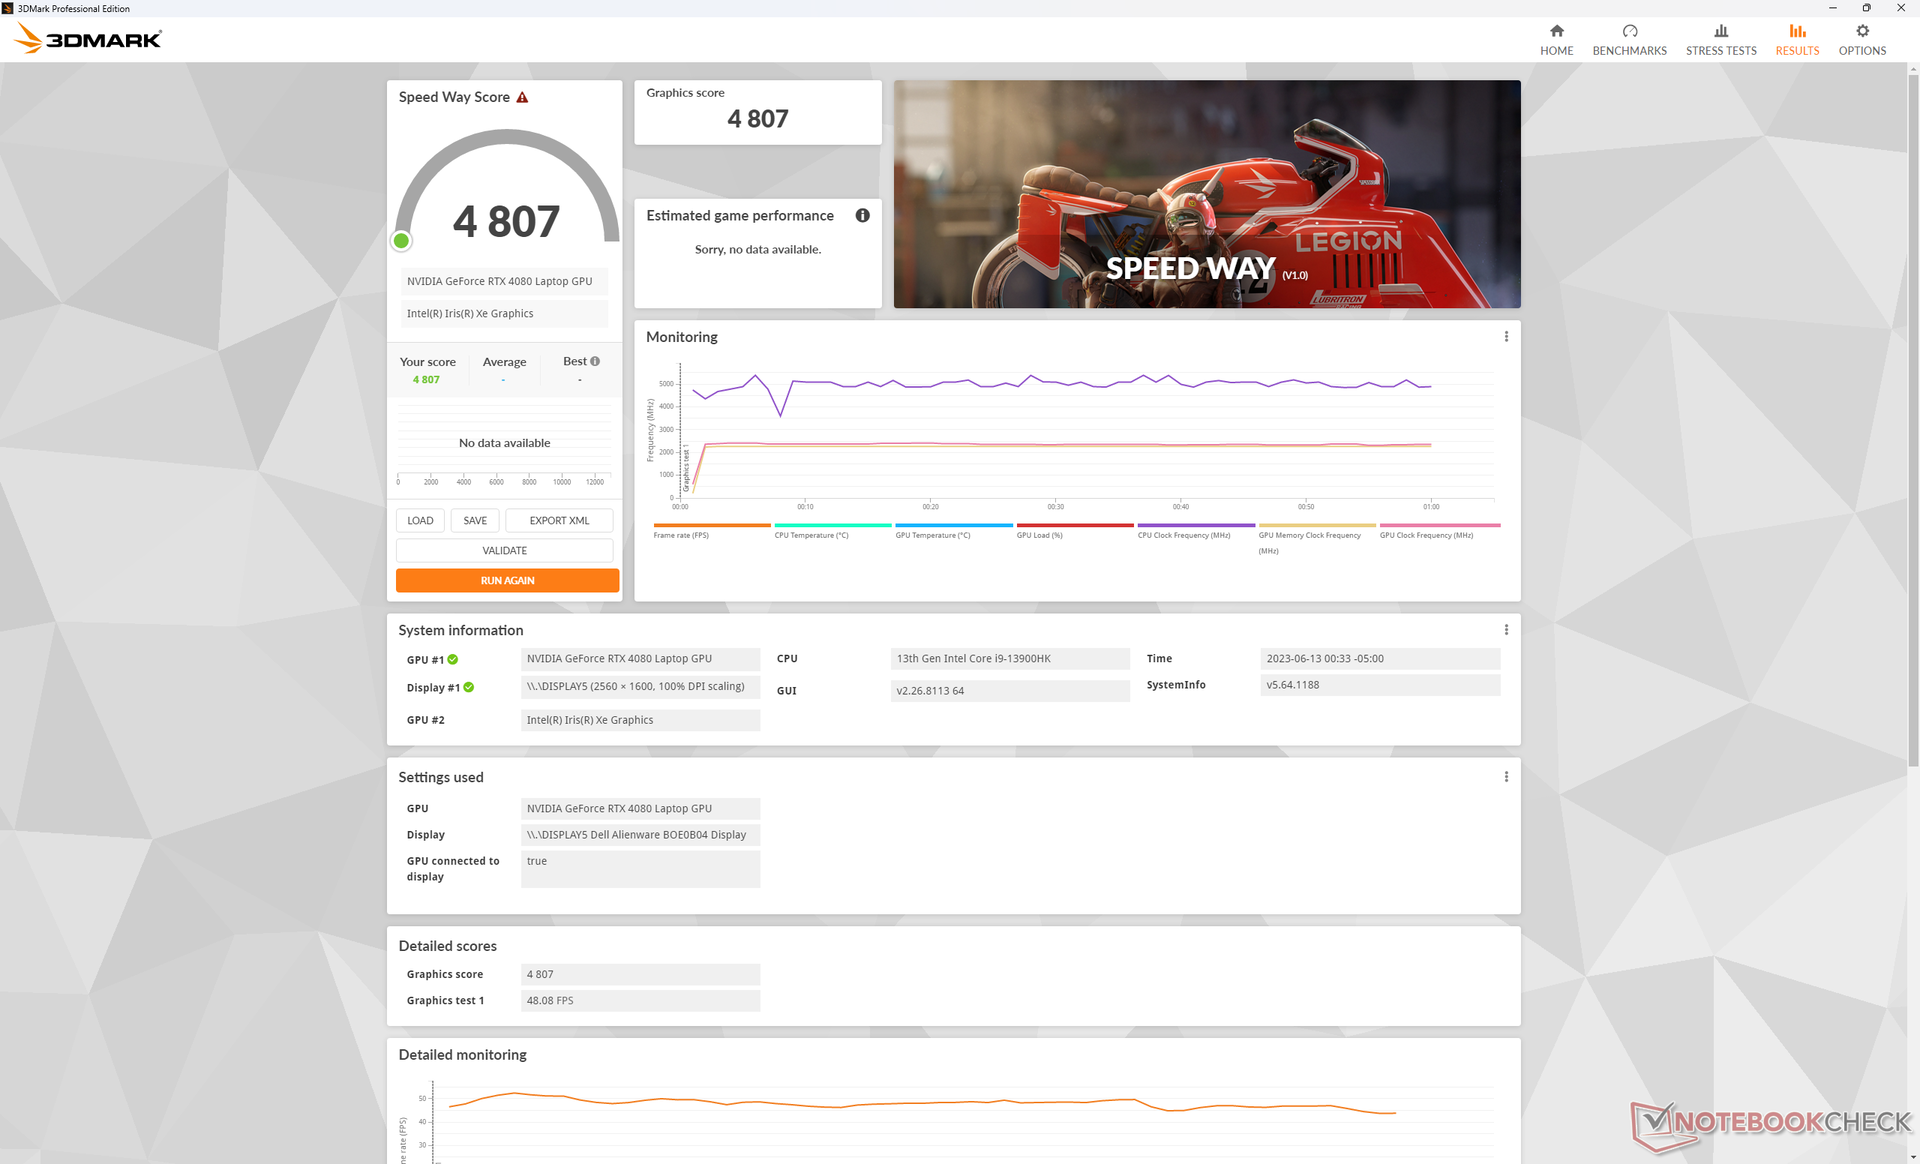
GPU性能 - 175 WGeForce RTX 4080
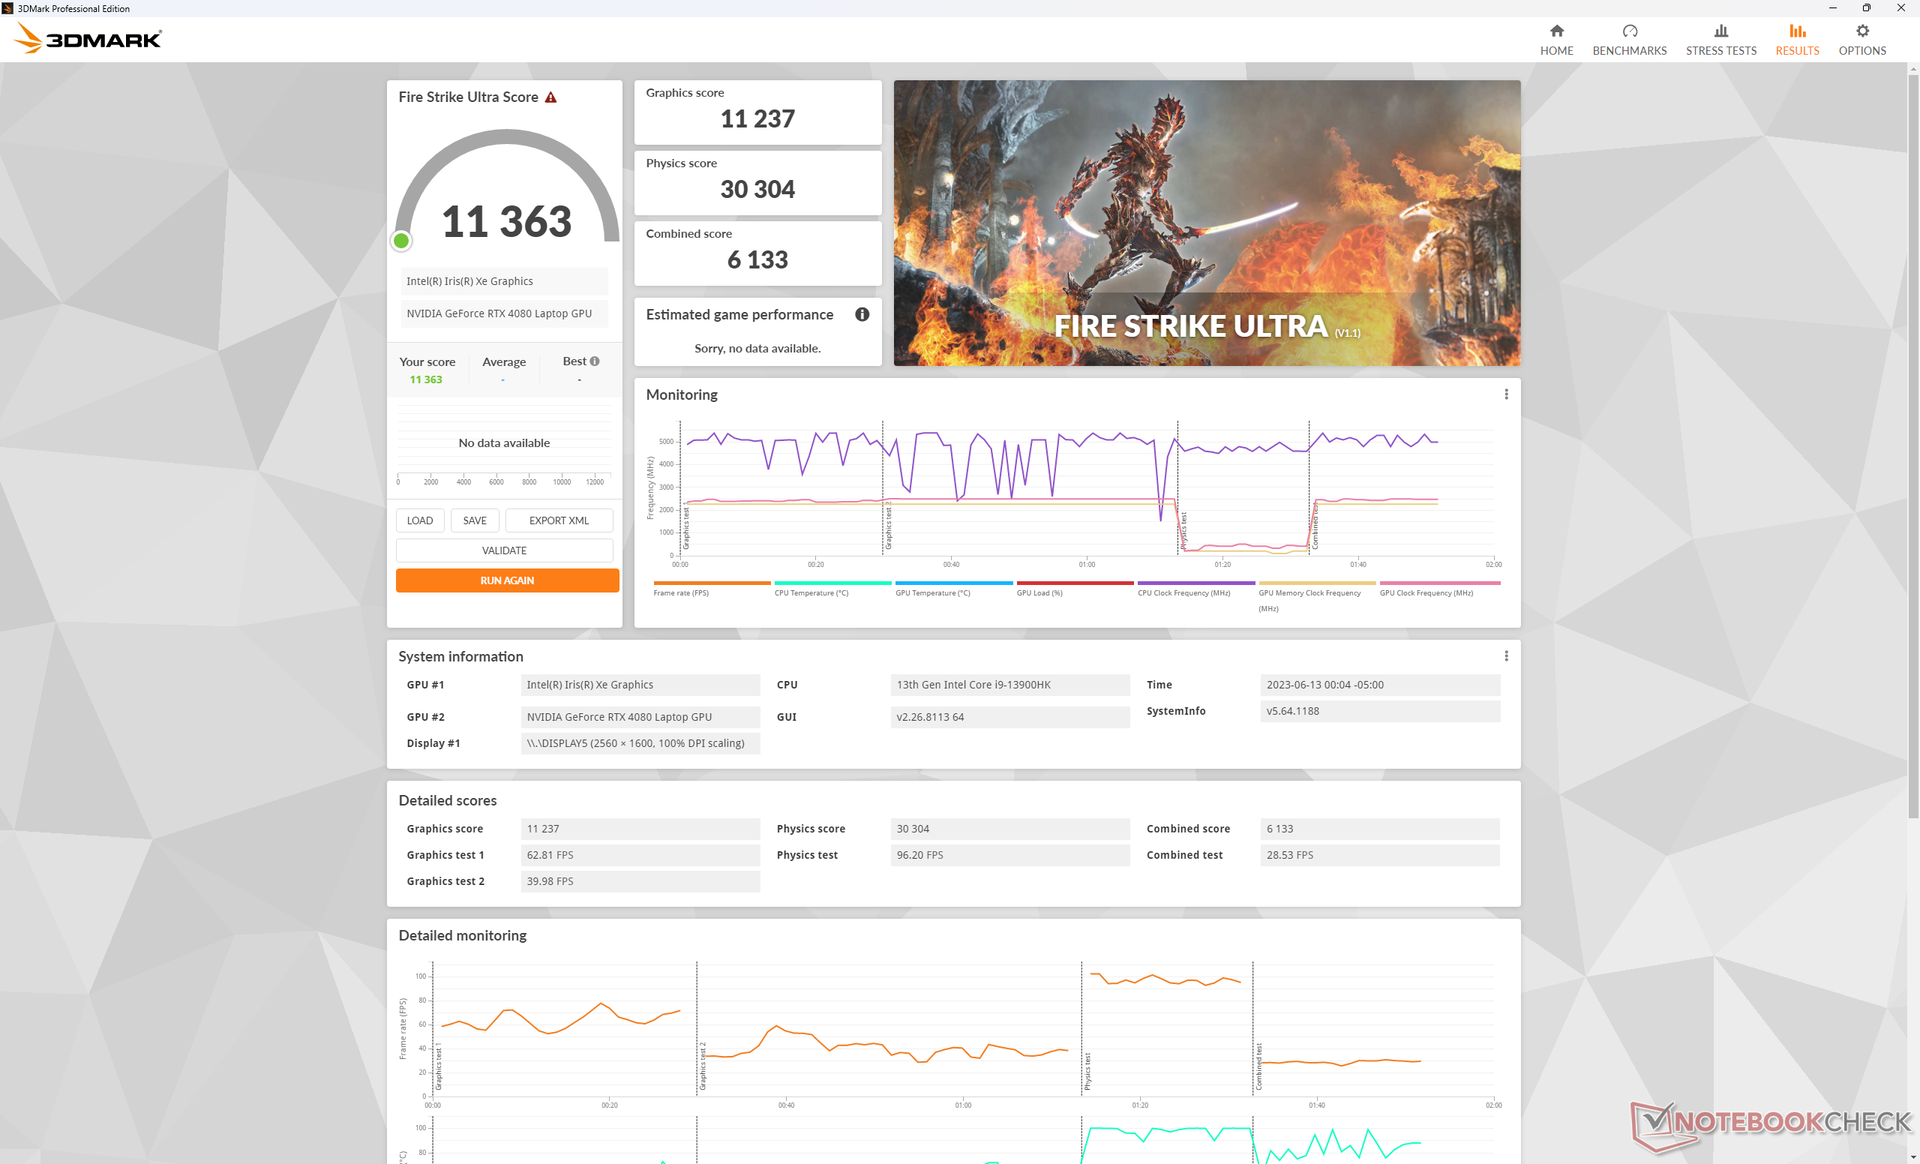
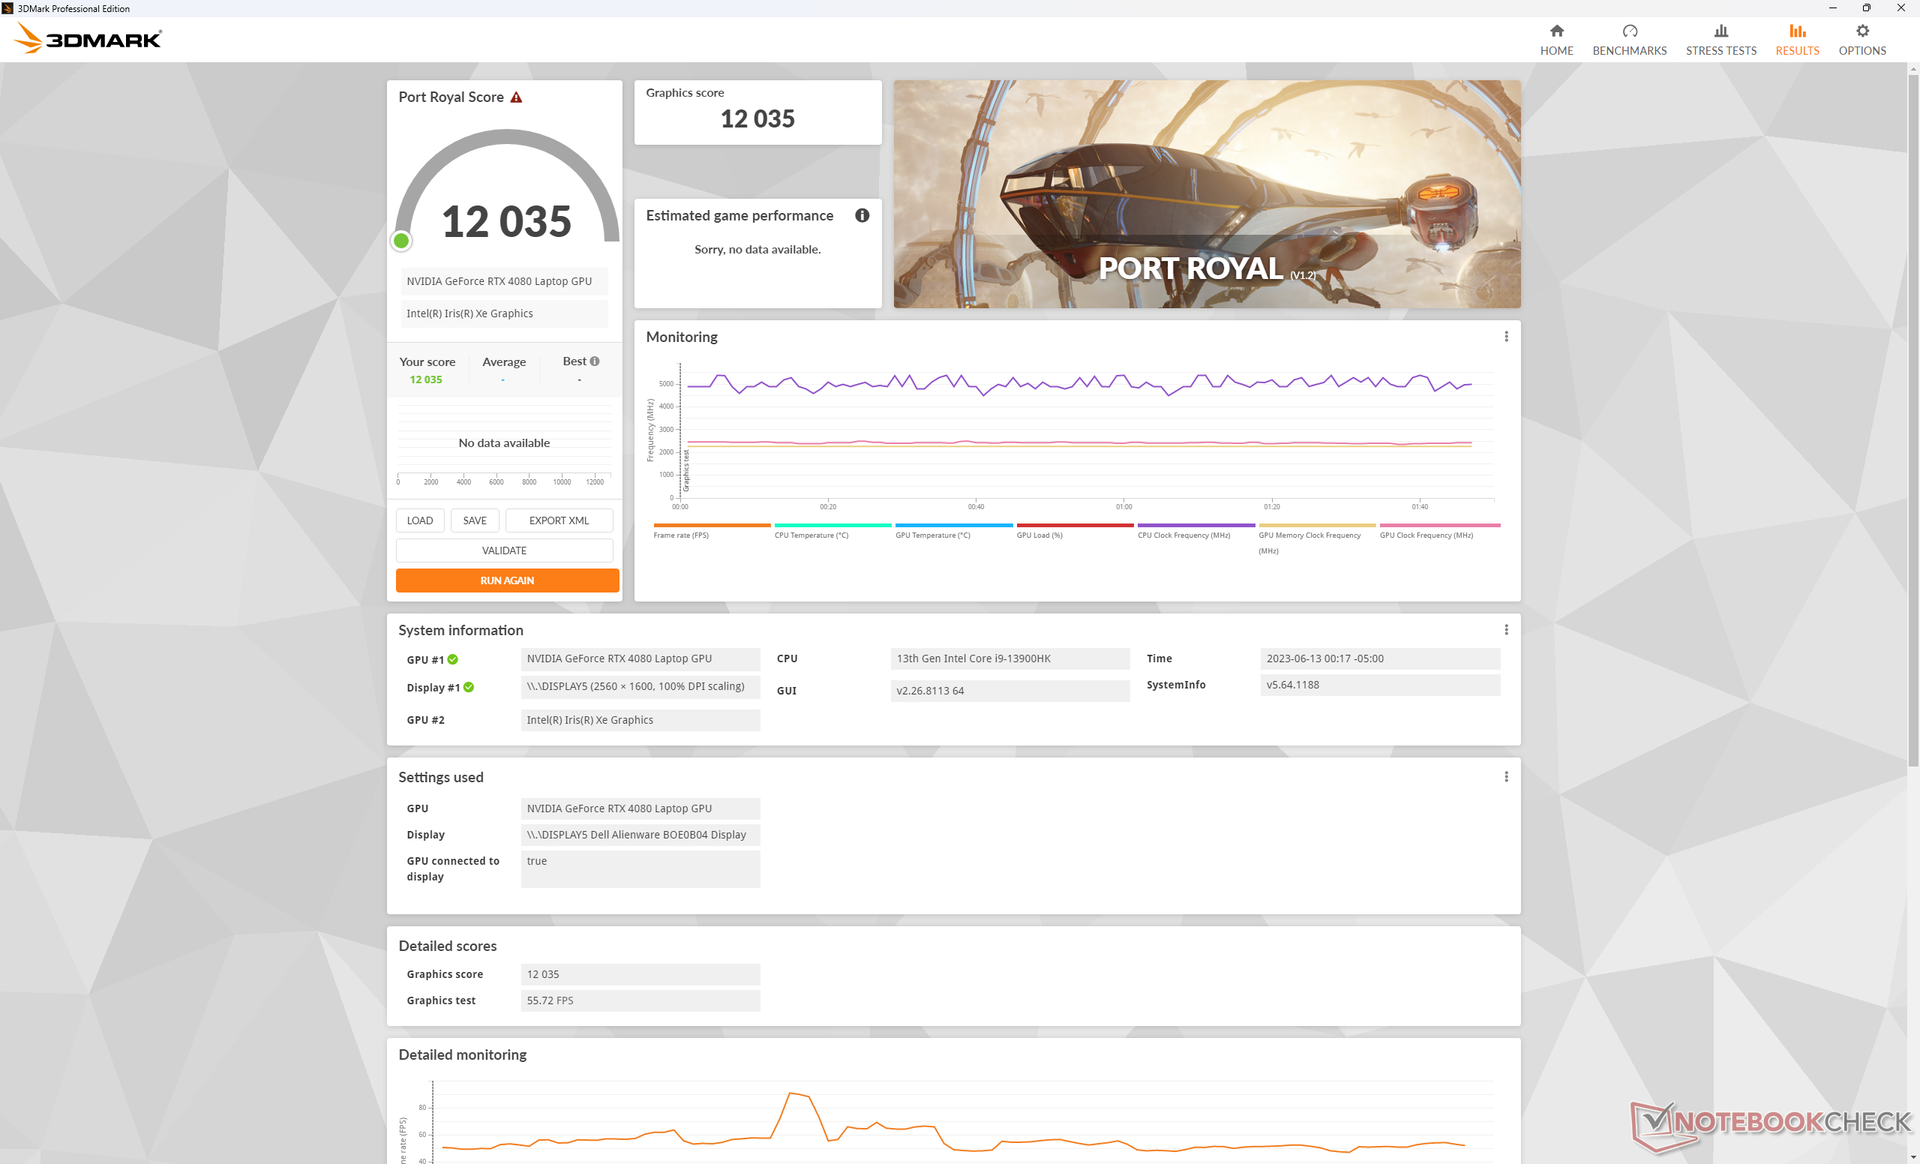
的 GeForce RTX 4080我们的Alienware x16比我们数据库中配备相同RTX 4080 GPU的普通笔记本电脑快5%到10%。这个优势可能看起来不大,但它足以推动该系统成为你能买到的最快的RTX 4080游戏笔记本电脑之一。3DMark的结果只在10%以内。 RTX 4090中的华硕Zephyrus Duo 16,比如说。
有趣的是,如下表所示,在更安静的性能和平衡模式下运行,而不是在最高的超速模式下运行时,3DMark的分数只下降了几个百分点。这对于下面的压力测试和系统噪音部分来说是很重要的。
降级到 RTX 4070选项预计将影响性能达30%至35%,而升级到RTX 4090预计将提高性能约10%。
| 电源配置文件设置 | Fire Strike 物理得分 | Fire Strike GPU得分 | Fire Strike 综合得分 |
| 超速 | 29857 | 43478 | 13071 |
| 表现 | 27890 (-7%) | 43605 (-0%) | 12961 (-1%) |
| 平衡性 | 28704 (-4%) | 41909 (-4%) | 12476 (-5%) |
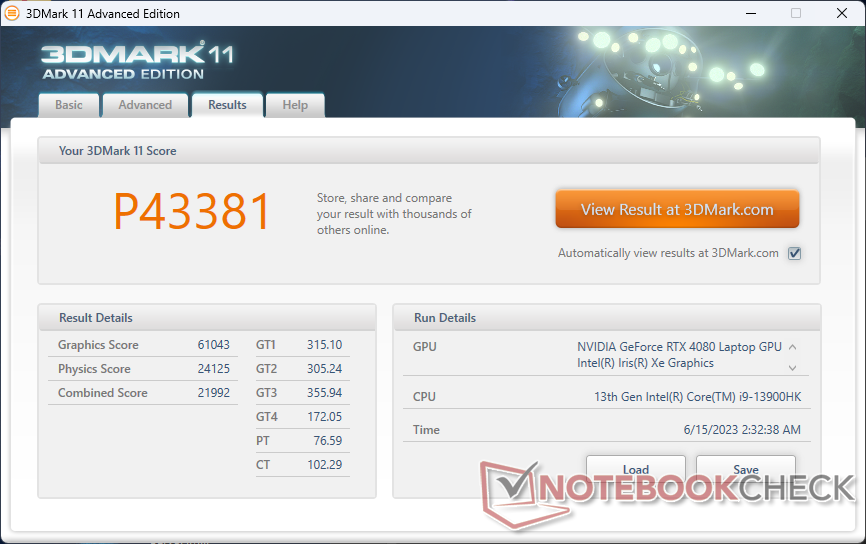
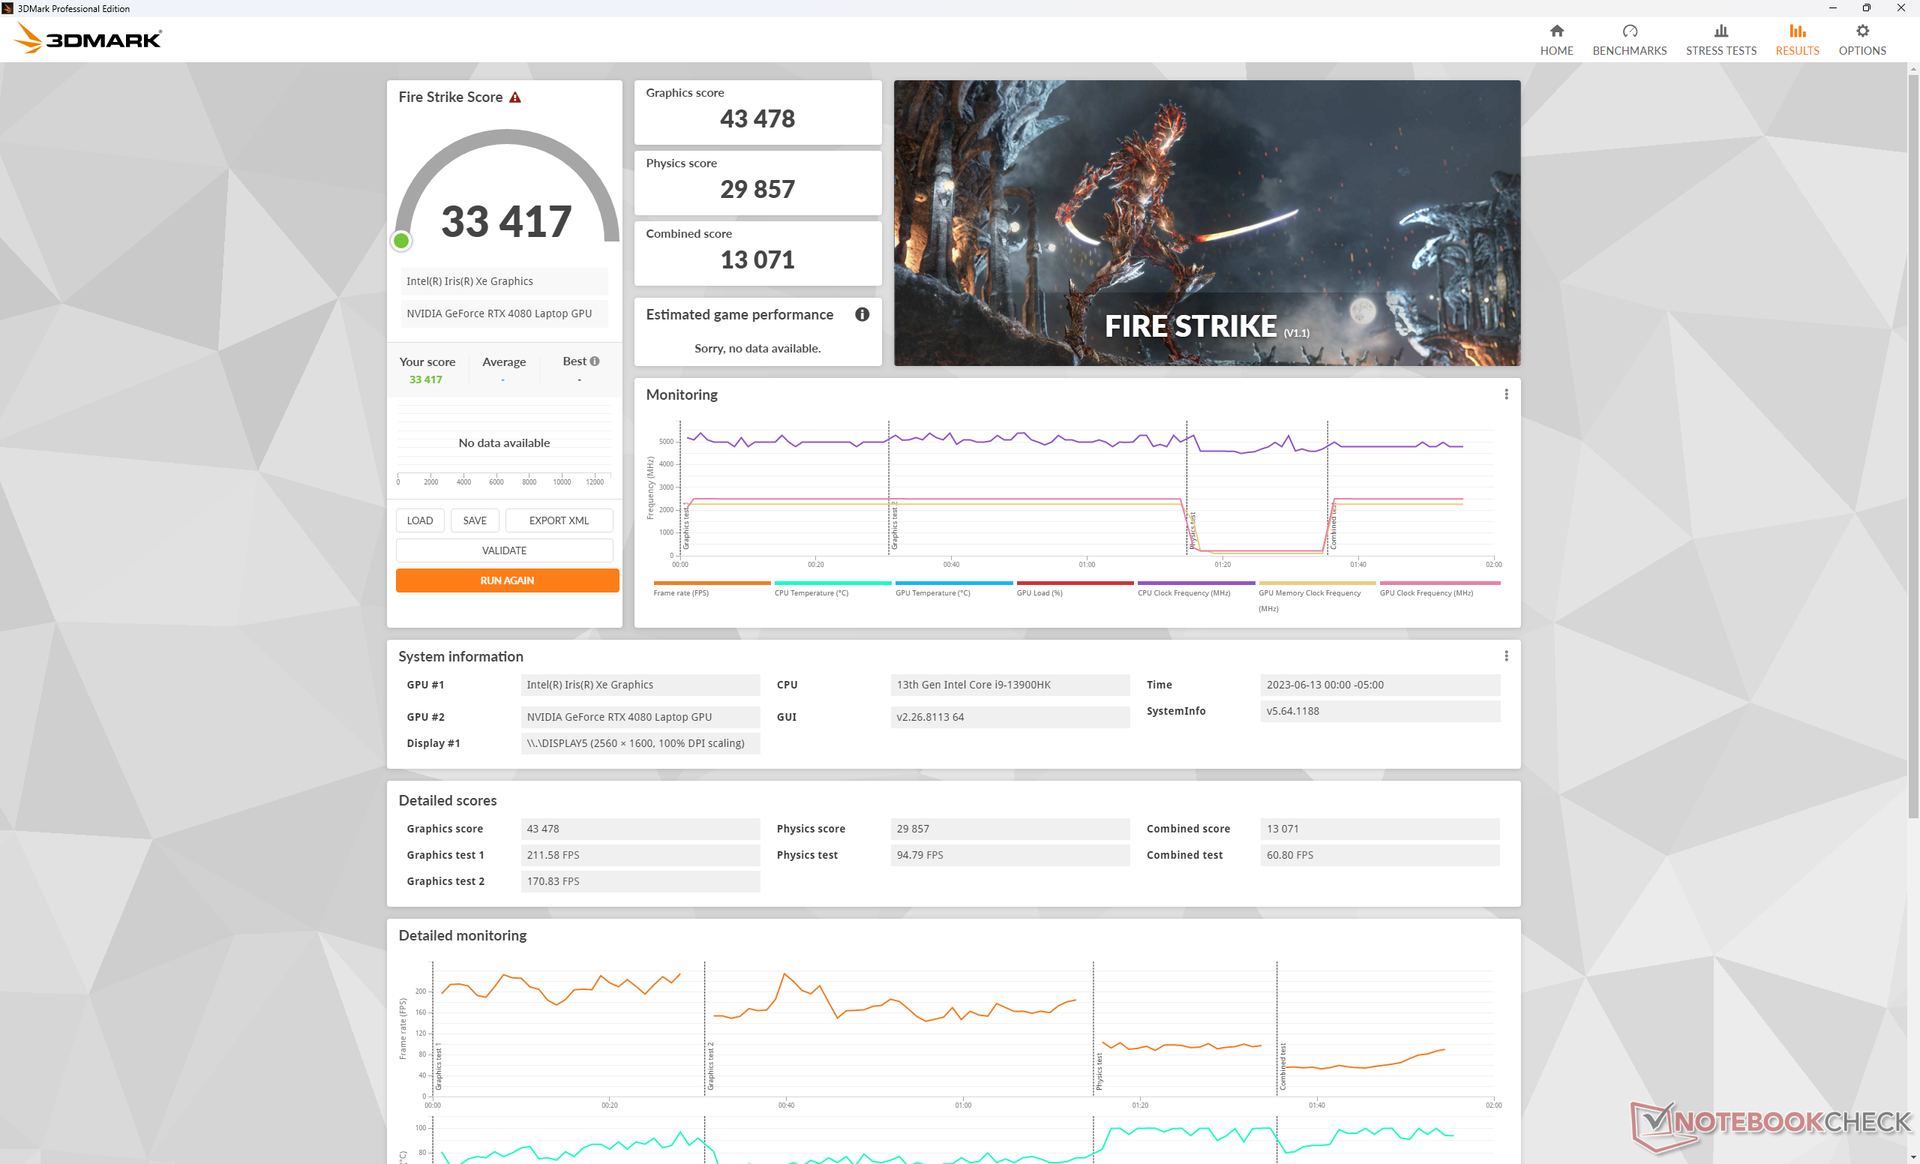
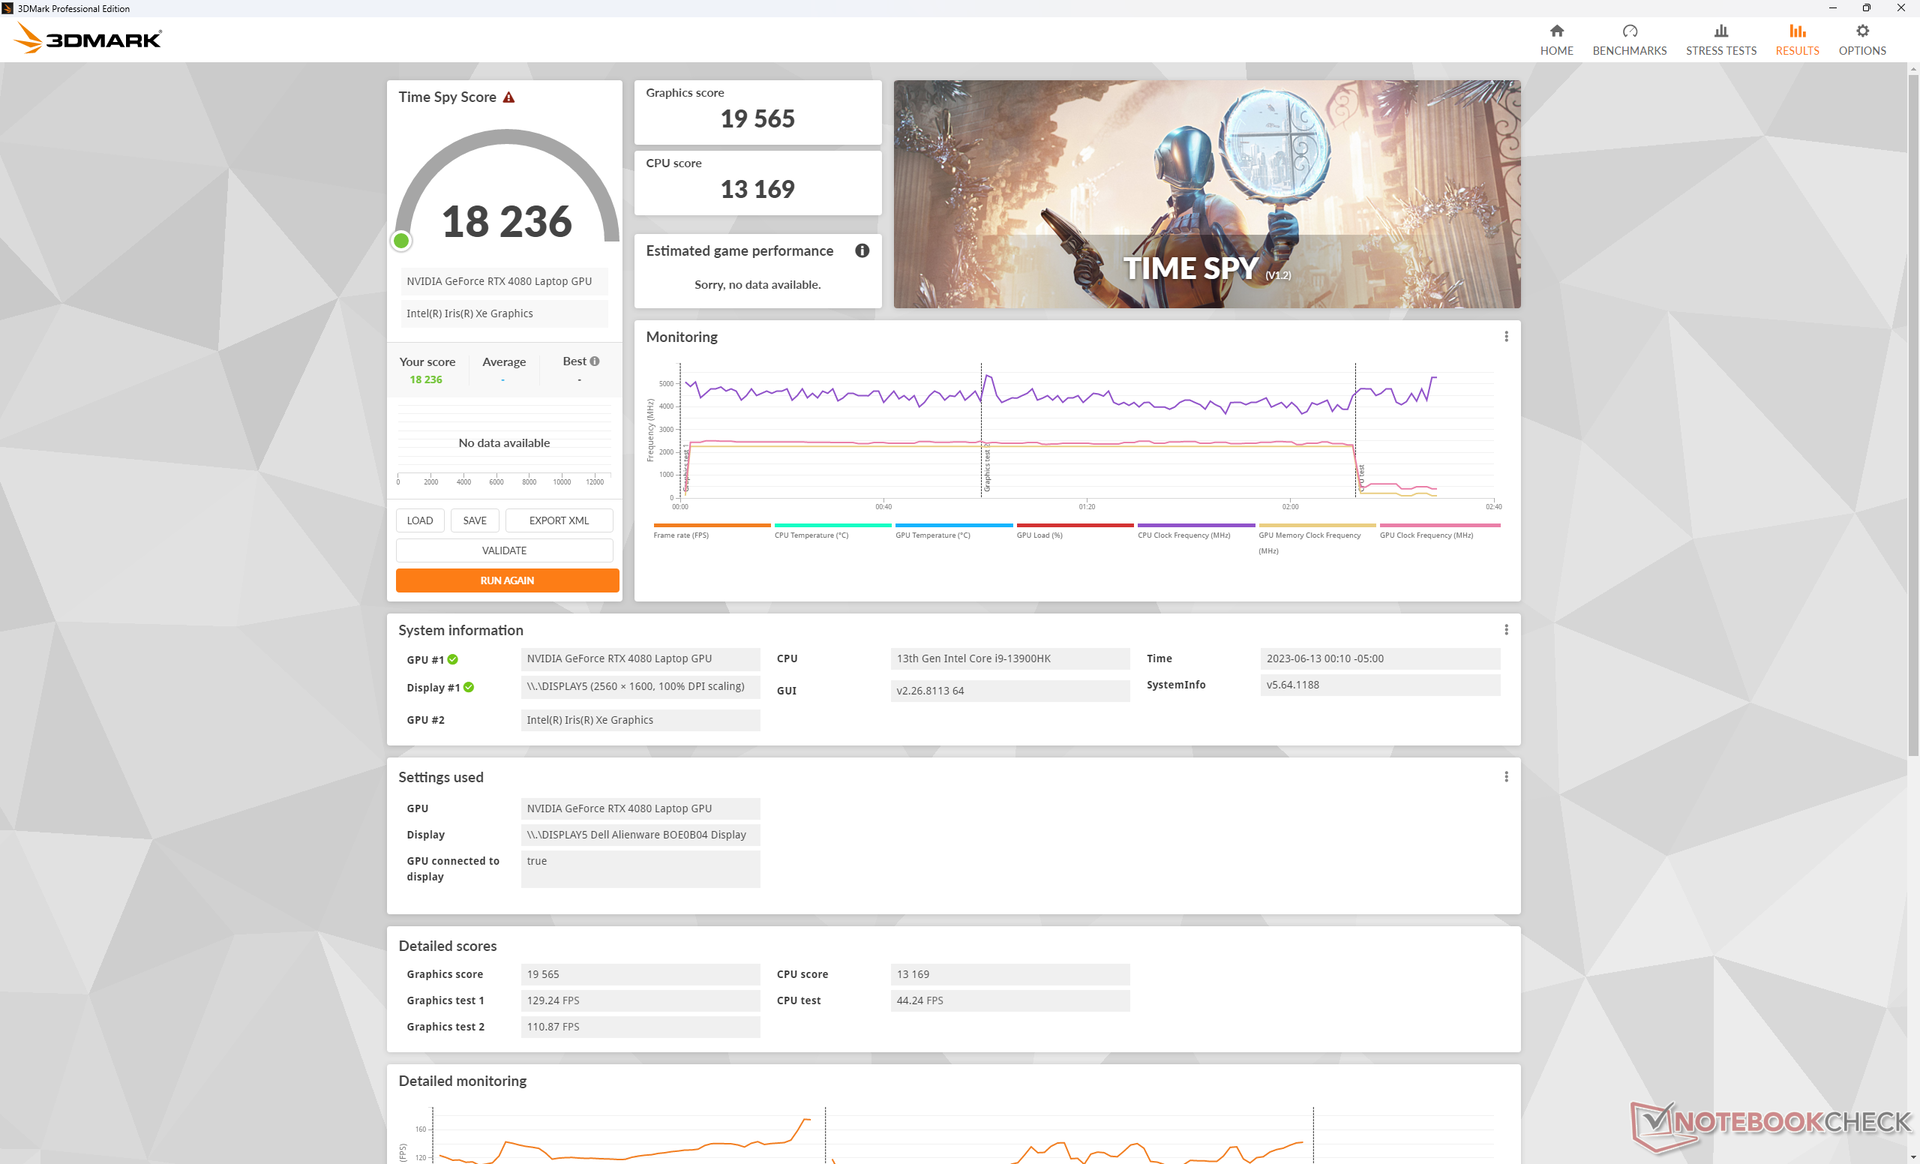
| 3DMark 11 Performance | 43381 points | |
| 3DMark Fire Strike Score | 33417 points | |
| 3DMark Time Spy Score | 18236 points | |
Help | ||
* ... smaller is better
游戏性能
所有的游戏都可以在原生QHD+分辨率下进行,帧率稳定在60FPS或以上。甚至4K游戏也可以在外部显示器上进行,大多数设置为高至最大值,包括Returnal 和F122。然而,对于三位数的帧率,你会想启用DLSS 2或DLSS 3,以更好地利用显示器的高刷新率。
Witcher 3 FPS Chart
| low | med. | high | ultra | QHD | 4K | |
|---|---|---|---|---|---|---|
| GTA V (2015) | 185.8 | 180.4 | 176.4 | 120.3 | 115.4 | 142.9 |
| The Witcher 3 (2015) | 425.6 | 352.7 | 306.5 | 160.2 | 115 | |
| Dota 2 Reborn (2015) | 178.8 | 164 | 159.7 | 146.8 | 129.4 | |
| Final Fantasy XV Benchmark (2018) | 211 | 195.5 | 164.2 | 132.4 | 76.2 | |
| X-Plane 11.11 (2018) | 145.3 | 134.5 | 104.2 | 90.5 | ||
| Strange Brigade (2018) | 469 | 373 | 350 | 325 | 237 | 120.5 |
| Shadow of the Tomb Raider (2018) | 165 | 143 | 84 | |||
| Far Cry 6 (2021) | 121 | 112 | 73 | |||
| Cyberpunk 2077 1.6 (2022) | 158 | 150.9 | 141.2 | 133.6 | 84.4 | 38.5 |
| Tiny Tina's Wonderlands (2022) | 256.6 | 217.3 | 183.3 | 156.4 | 111.1 | 58.6 |
| F1 22 (2022) | 265 | 259 | 244 | 110 | 79 | 39 |
| Call of Duty Modern Warfare 2 2022 (2022) | 139 | 110 | 67 | |||
| Returnal (2023) | 116 | 117 | 114 | 109 | 79 | 43 |
排放
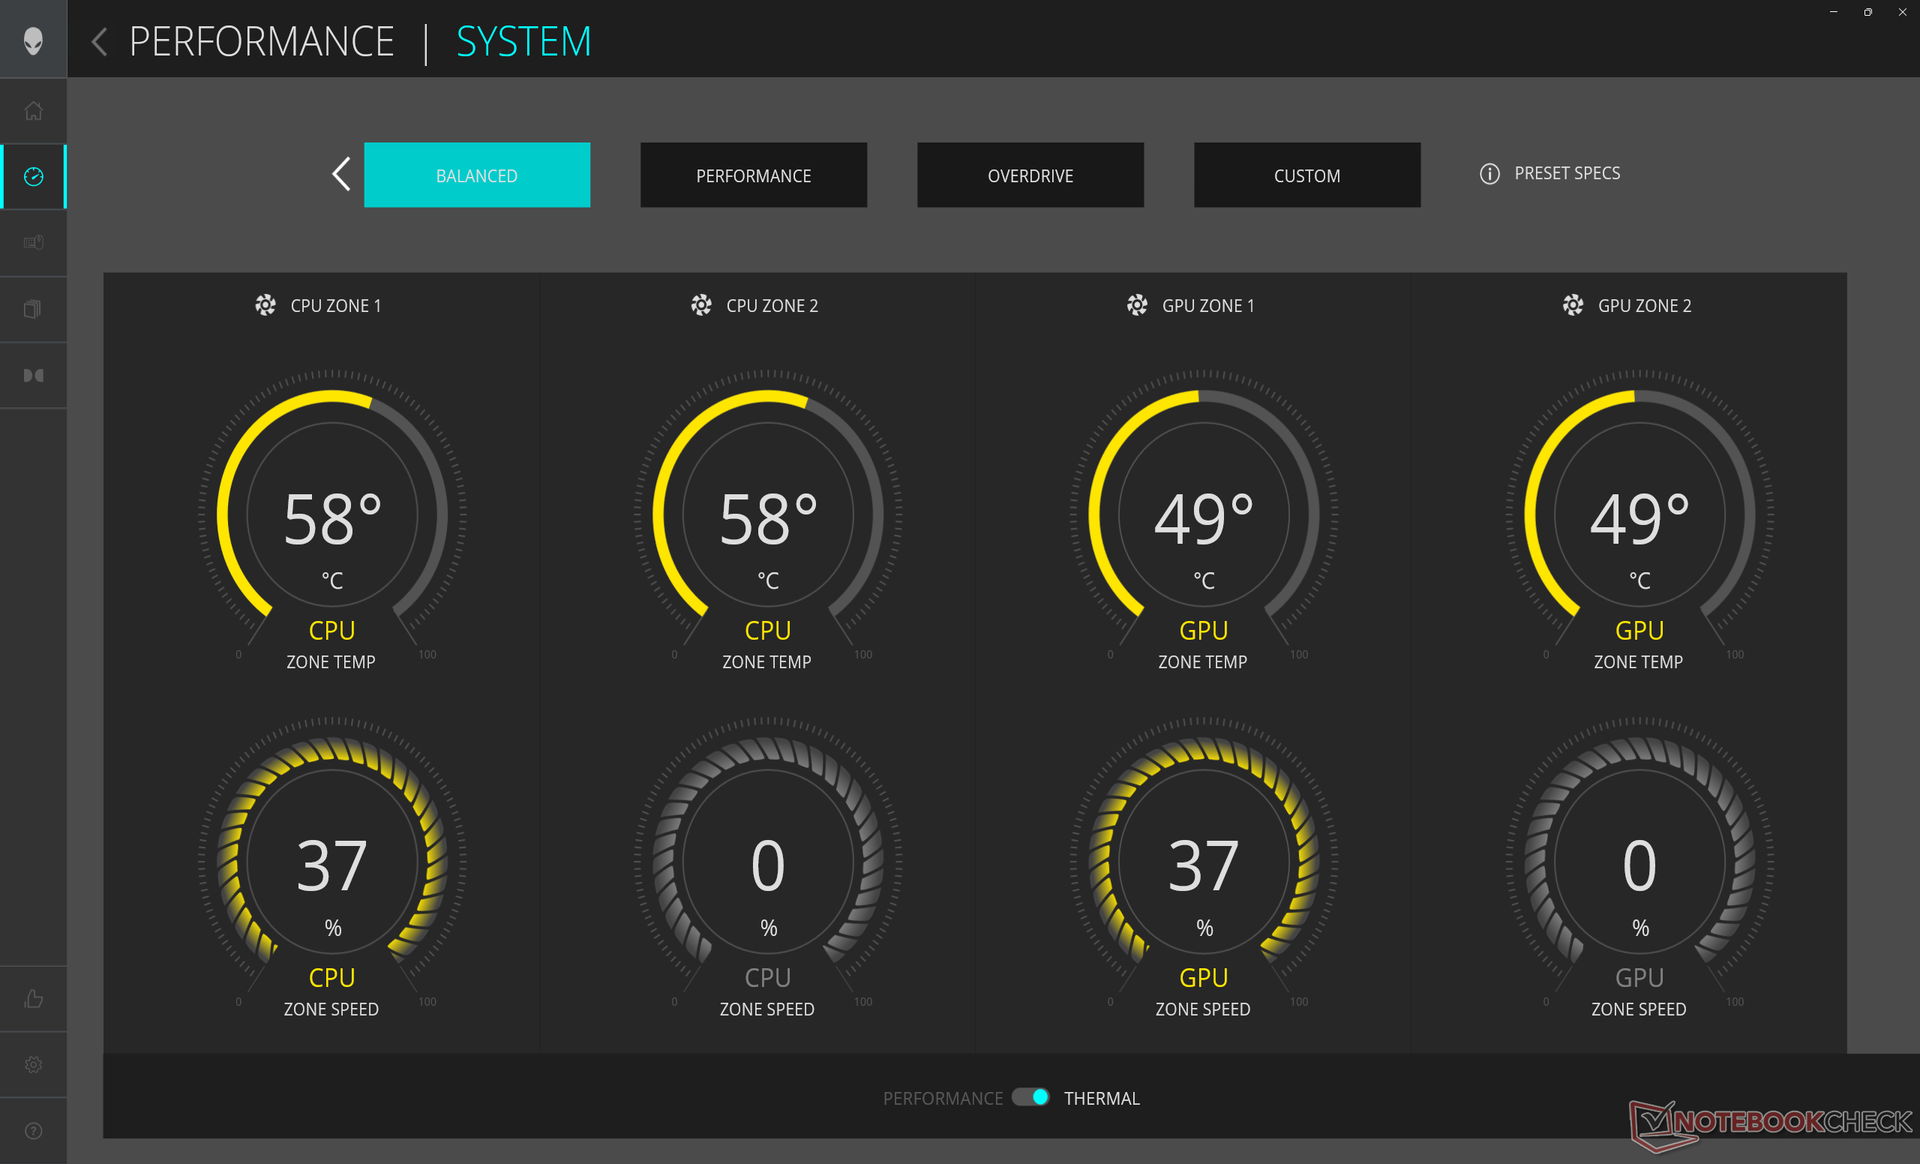
系统噪音--大量的电源配置文件选项
风扇噪音与ACC电源配置文件设置直接相关。如果不玩游戏,建议将ACC设置为平衡模式或静音模式,因为在性能模式或超速模式下,风扇的脉冲频率会更高。
运行 Witcher 3在性能模式和超速模式下,风扇的噪音分别为50 dB(A)和55 dB(A)。由于性能模式和超速模式之间的帧率损失最小,正如我们在上面的GPU性能部分所提到的,当设置为性能模式时,你可以有一个明显更安静的游戏体验。在平衡模式下,风扇噪音会更加安静,而不会对帧率产生明显影响。当然,50多分贝(A)仍然非常响亮,但这仍然是联想Legion Pro 7或Razer Blade 16等竞争机型上的一个常见范围。
Noise level
| Idle |
| 23.1 / 25.8 / 25.8 dB(A) |
| Load |
| 39.3 / 54.8 dB(A) |
 | ||
30 dB silent 40 dB(A) audible 50 dB(A) loud |
||
min: | ||
| Alienware x16 R1 GeForce RTX 4080 Laptop GPU, i9-13900HK, SK hynix PC801 HFS001TEJ9X101N | Lenovo Legion Pro 7 RTX4090 GeForce RTX 4090 Laptop GPU, i9-13900HX, Samsung PM9A1 MZVL21T0HCLR | Asus ROG Zephyrus M16 GU604VY-NM042X GeForce RTX 4090 Laptop GPU, i9-13900H, Samsung PM9A1 MZVL22T0HBLB | Razer Blade 16 Early 2023 GeForce RTX 4080 Laptop GPU, i9-13950HX, SSSTC CA6-8D1024 | Dell G16 7620 GeForce RTX 3060 Laptop GPU, i7-12700H, WDC PC SN810 512GB | Alienware m17 R5 (R9 6900HX, RX 6850M XT) Radeon RX 6850M XT, R9 6900HX, SSSTC CA6-8D1024 | |
|---|---|---|---|---|---|---|
| Noise | -17% | -10% | 3% | -2% | 2% | |
| off / environment * (dB) | 22.7 | 25 -10% | 24 -6% | 23 -1% | 23.2 -2% | 23 -1% |
| Idle Minimum * (dB) | 23.1 | 28 -21% | 24 -4% | 23 -0% | 28.3 -23% | 23 -0% |
| Idle Average * (dB) | 25.8 | 30 -16% | 29.96 -16% | 23 11% | 28.8 -12% | 28.11 -9% |
| Idle Maximum * (dB) | 25.8 | 38 -47% | 34.27 -33% | 23.6 9% | 28.9 -12% | 28.11 -9% |
| Load Average * (dB) | 39.3 | 48 -22% | 35.89 9% | 39 1% | 32.4 18% | 30.62 22% |
| Witcher 3 ultra * (dB) | 49.9 | 53 -6% | 57.5 -15% | 51.6 -3% | 48.3 3% | 49.75 -0% |
| Load Maximum * (dB) | 54.8 | 55 -0% | 57.54 -5% | 51.3 6% | 48.1 12% | 50.17 8% |
* ... smaller is better
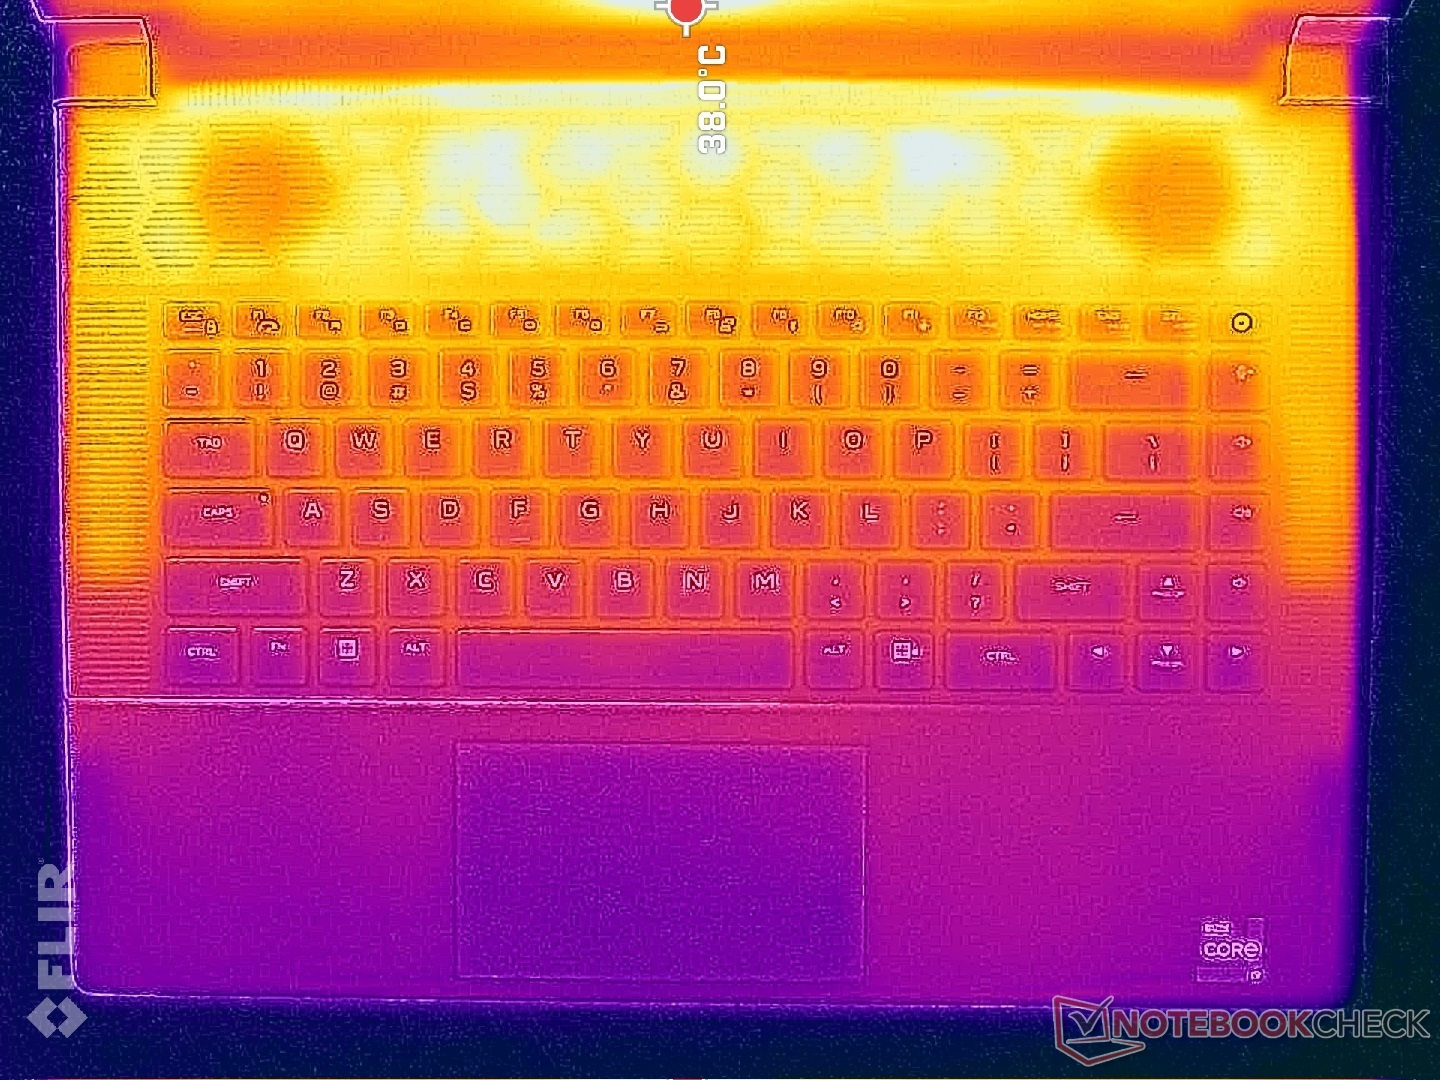
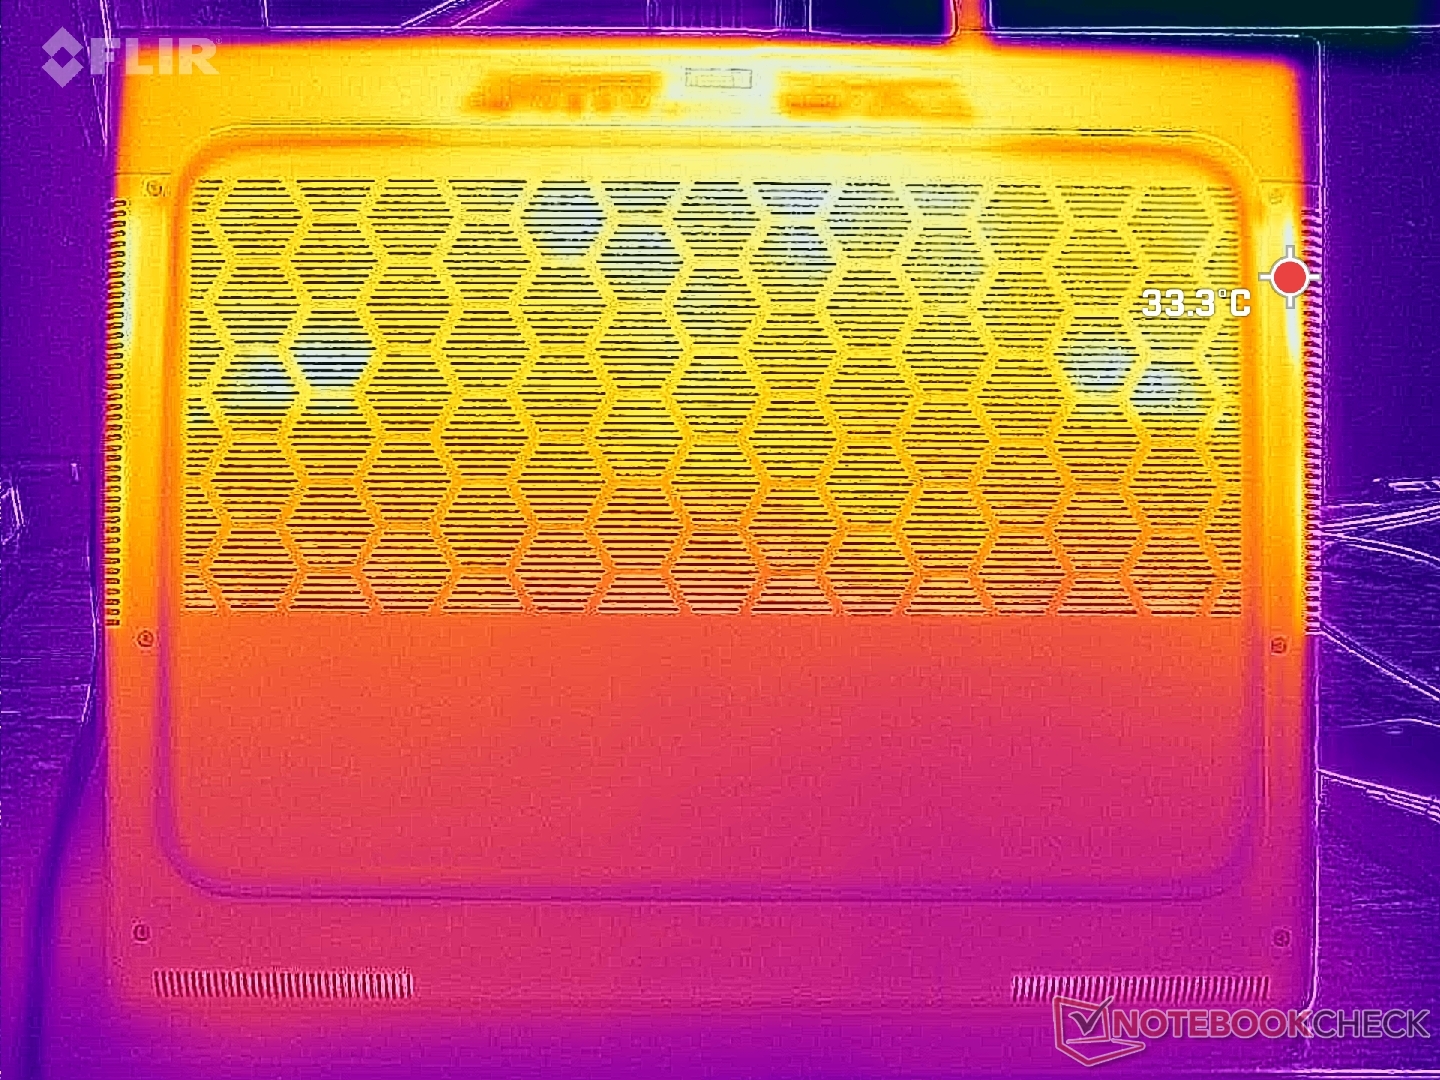
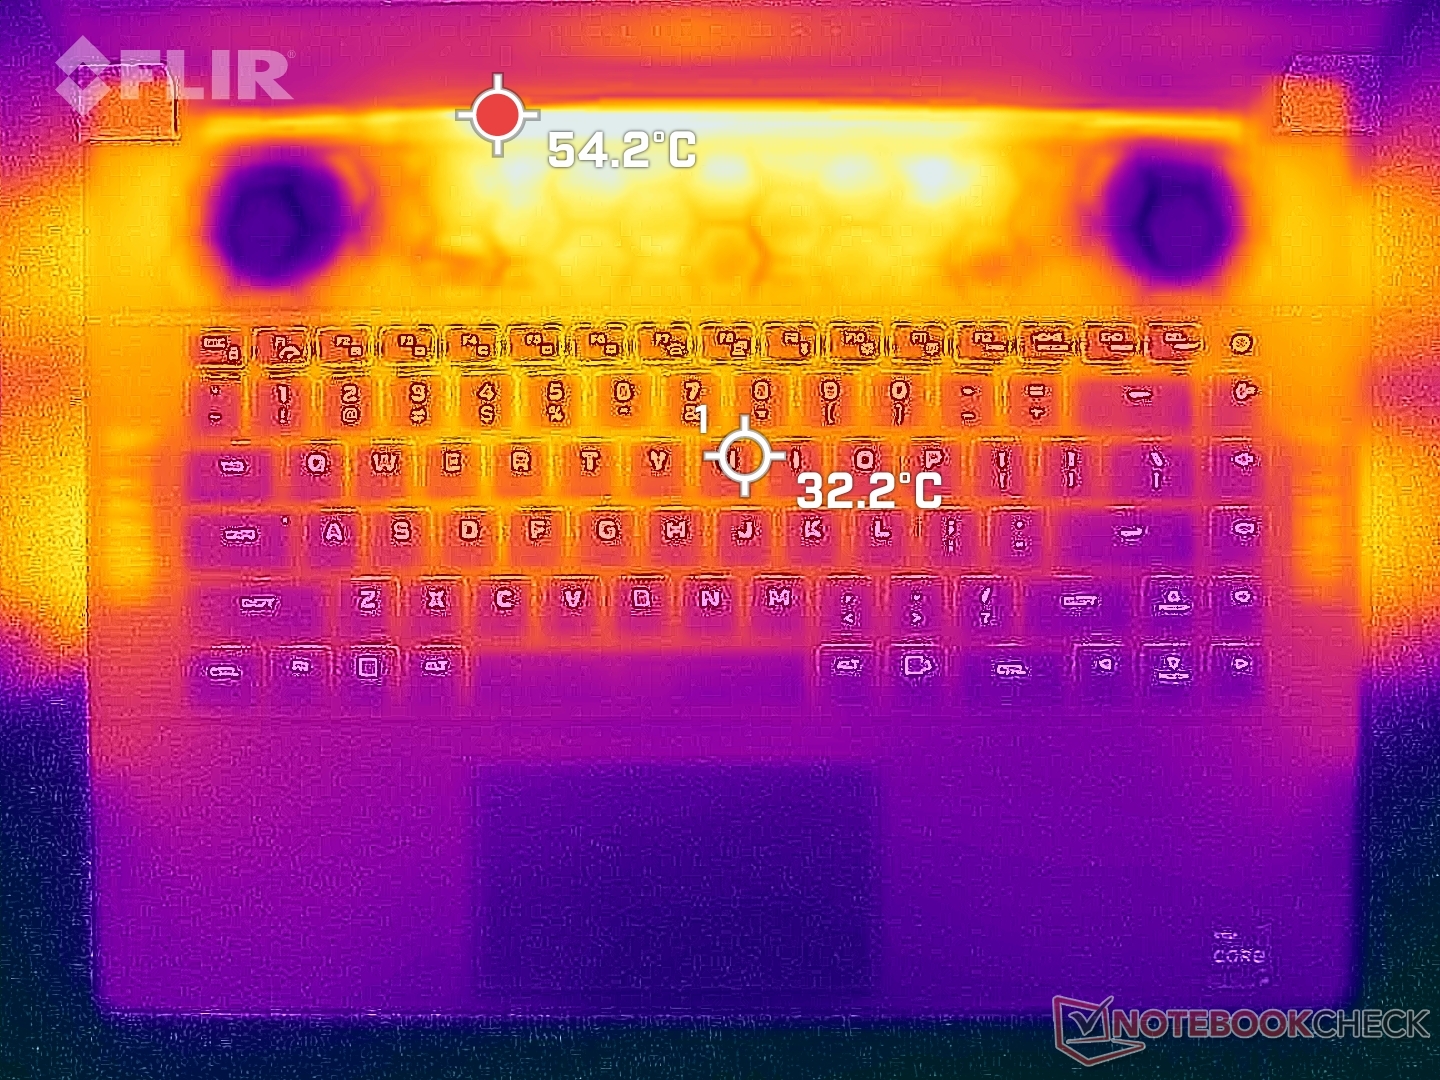
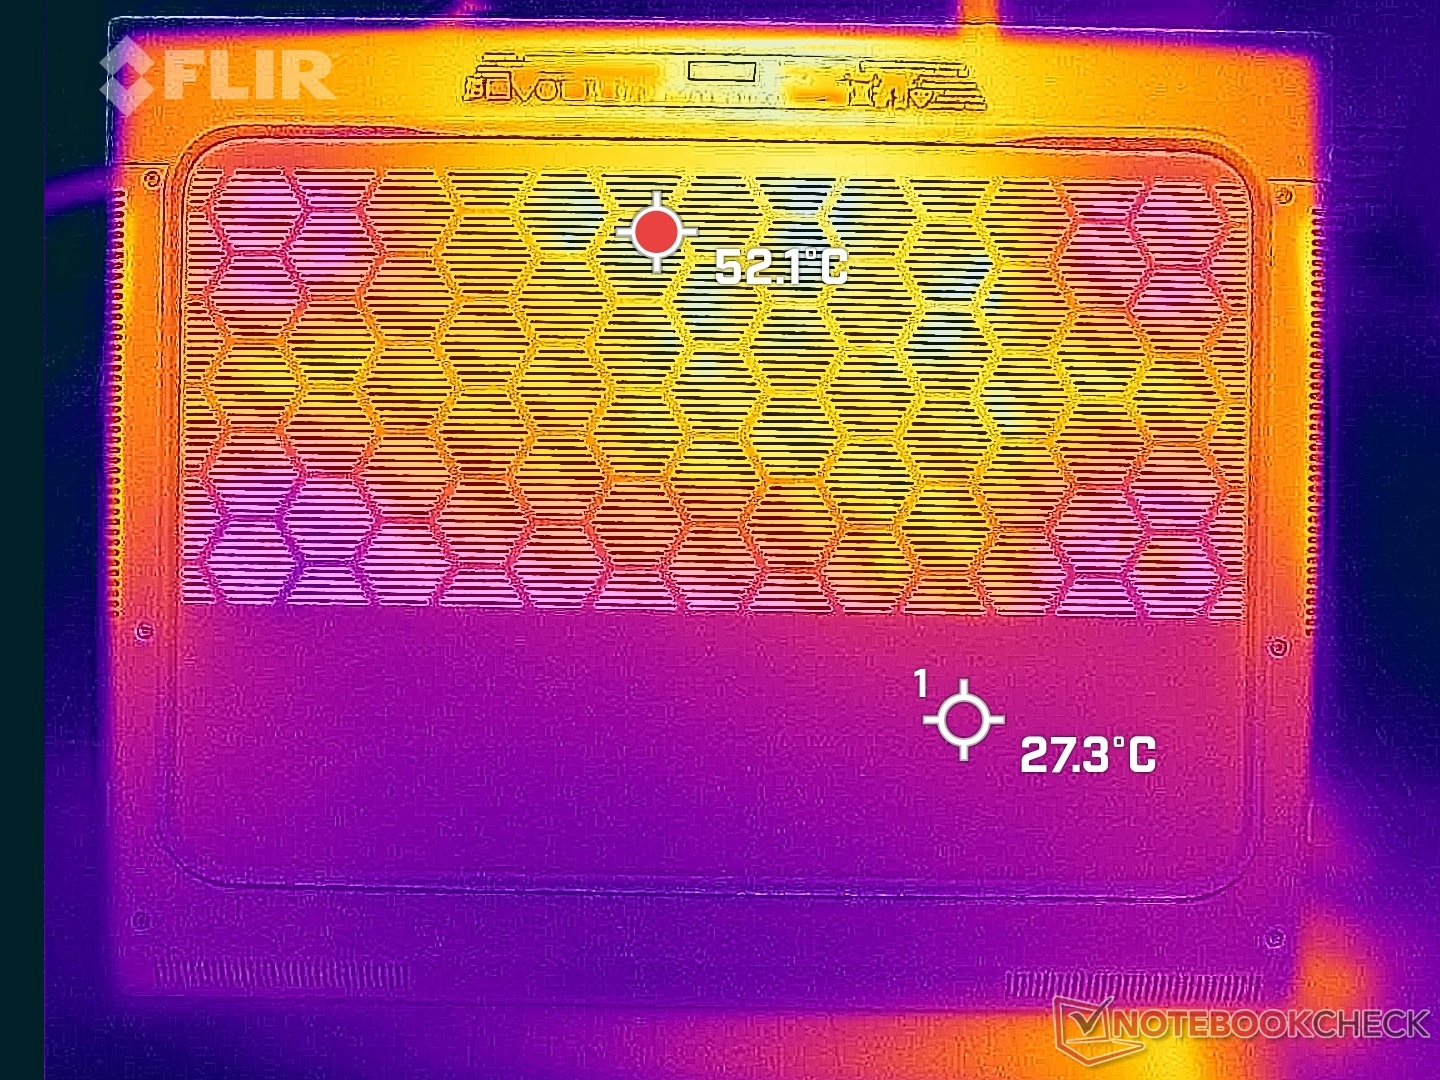
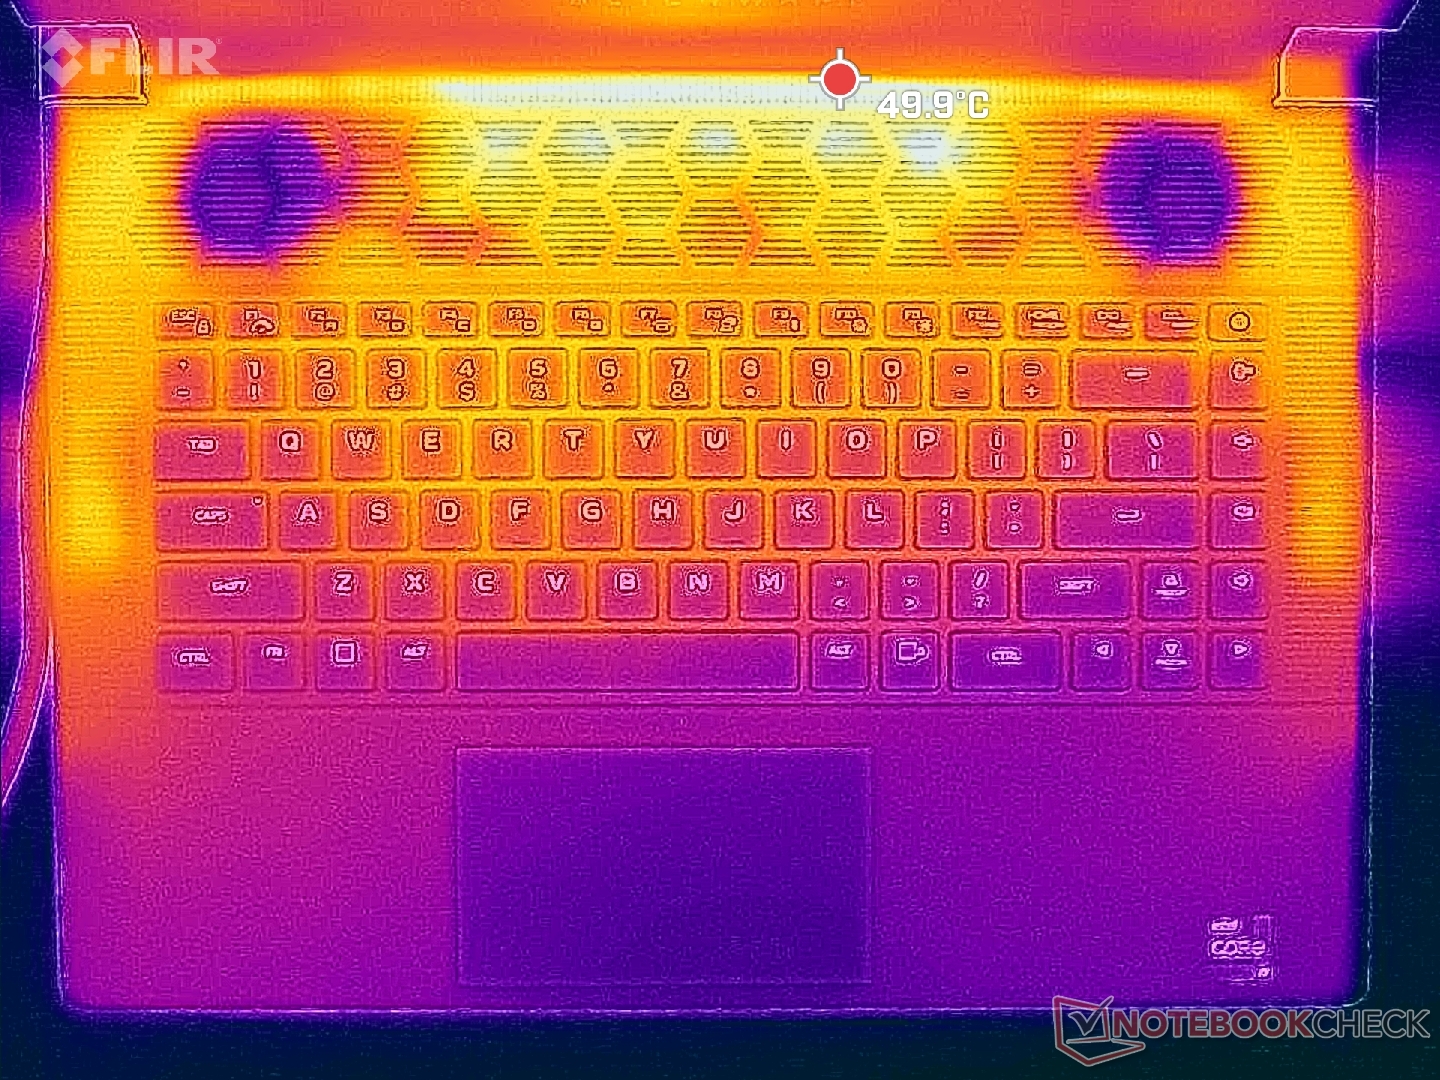
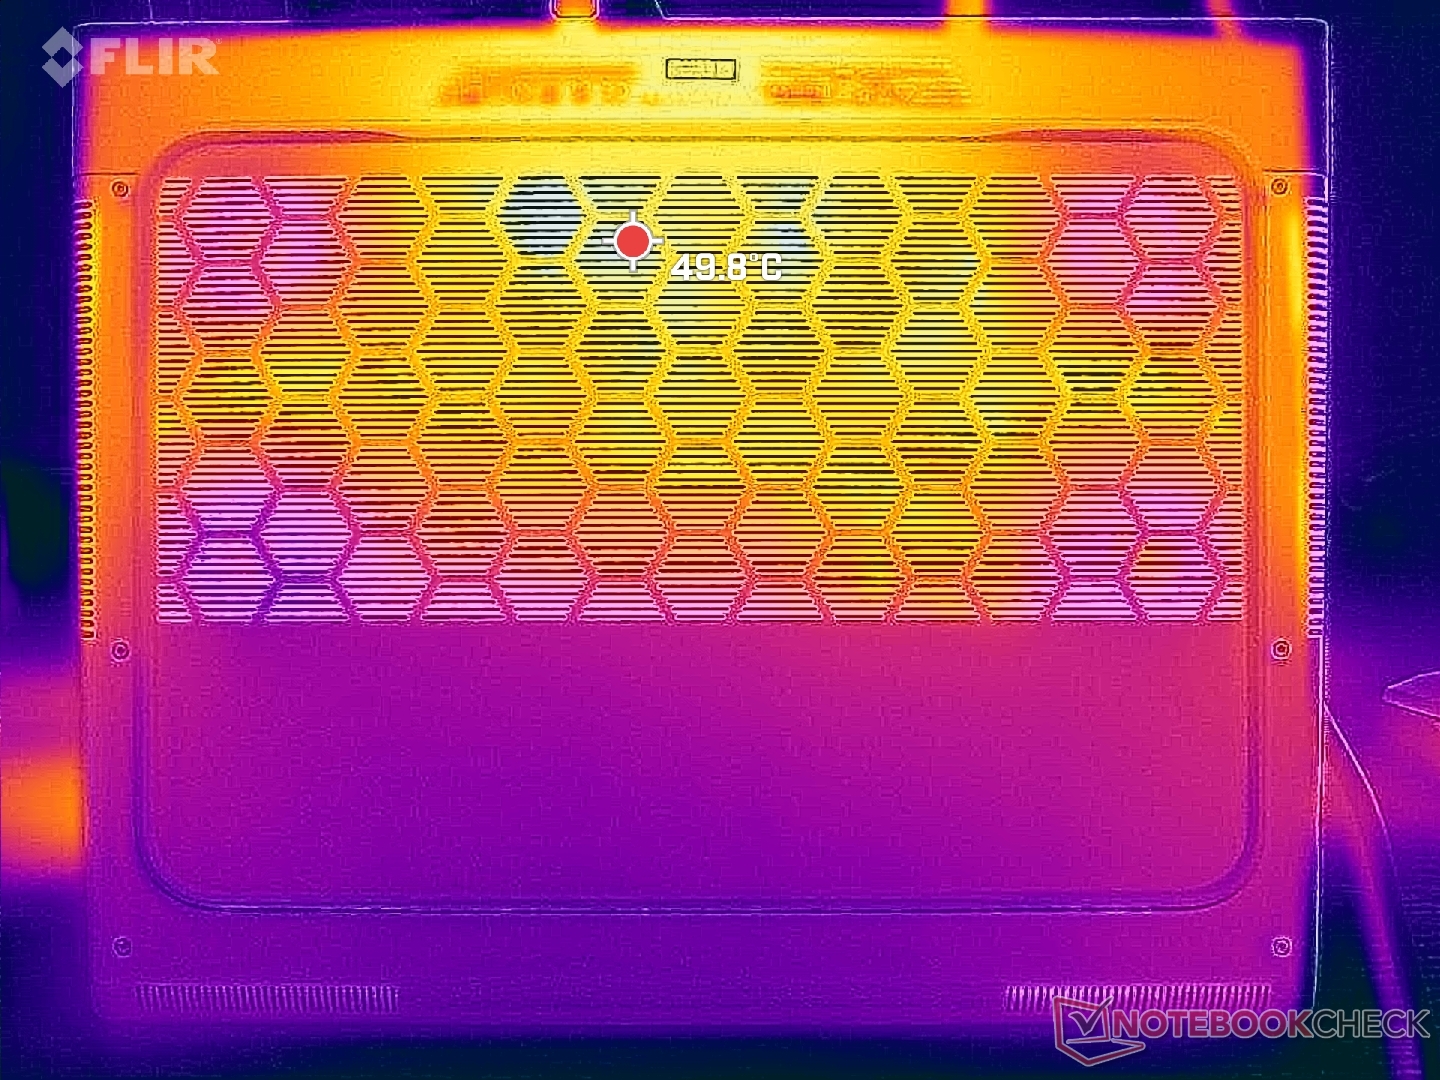
温度
由于薄型设计,表面温度可能非常高。热点在顶部和底部可以达到约50摄氏度,而Blade 16只有40摄氏度。值得庆幸的是,这些热点都在后面,远离掌托。
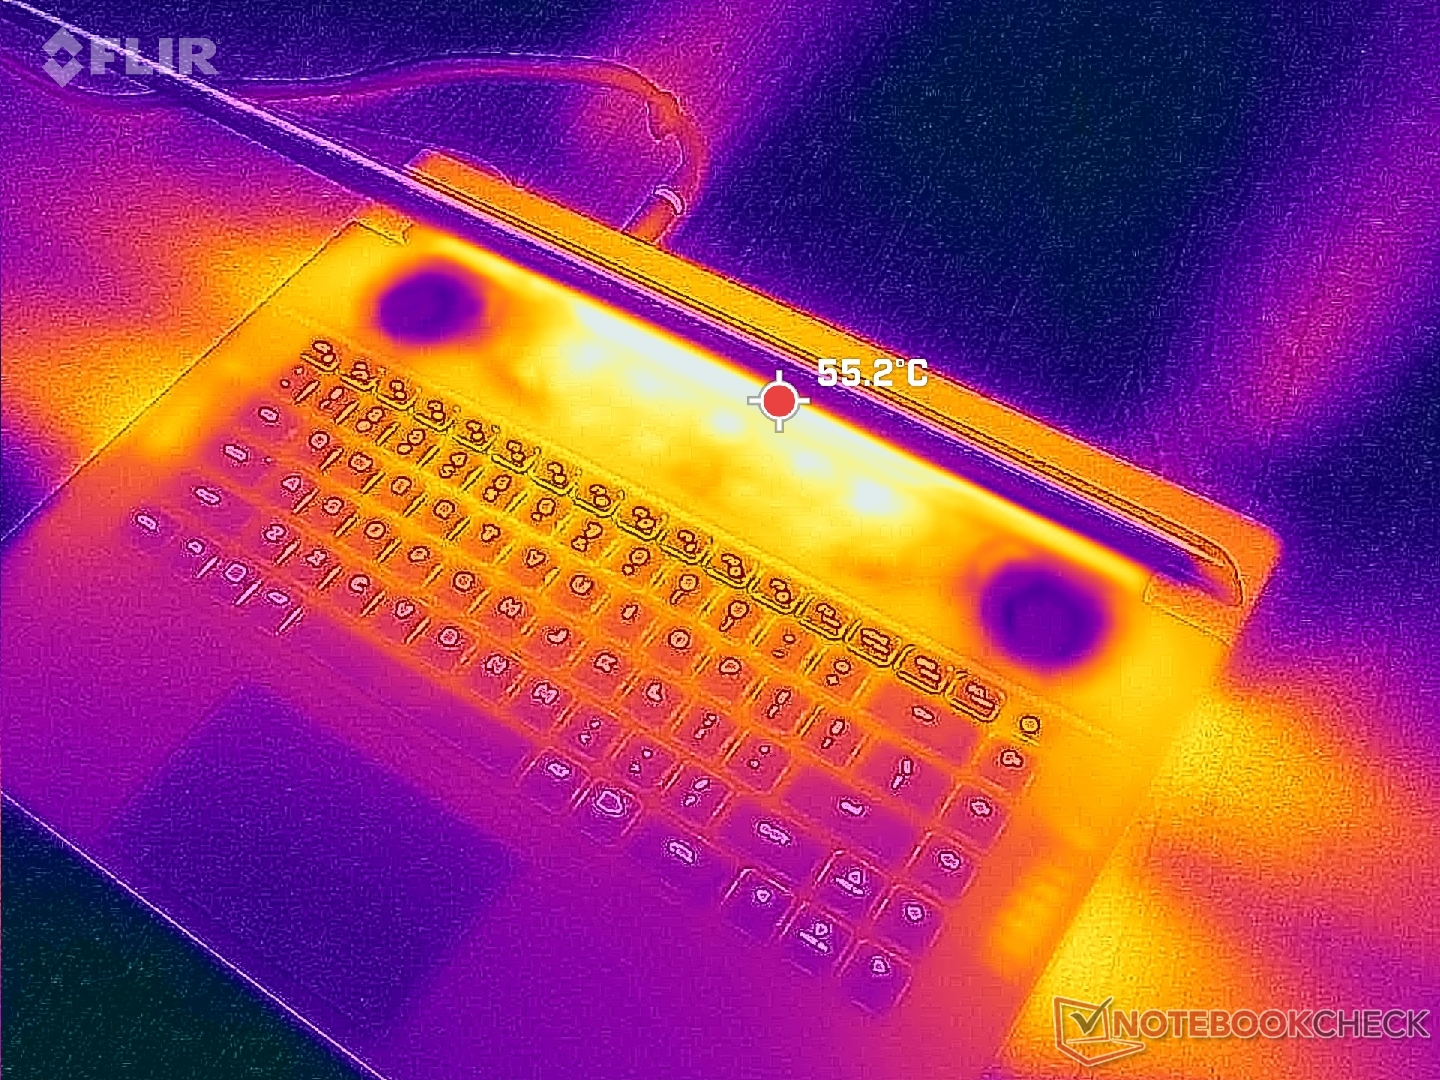
(-) The maximum temperature on the upper side is 47.2 °C / 117 F, compared to the average of 40.4 °C / 105 F, ranging from 21.2 to 68.8 °C for the class Gaming.
(-) The bottom heats up to a maximum of 47.8 °C / 118 F, compared to the average of 43.2 °C / 110 F
(+) In idle usage, the average temperature for the upper side is 30.8 °C / 87 F, compared to the device average of 33.9 °C / 93 F.
(±) Playing The Witcher 3, the average temperature for the upper side is 38 °C / 100 F, compared to the device average of 33.9 °C / 93 F.
(+) The palmrests and touchpad are cooler than skin temperature with a maximum of 30.6 °C / 87.1 F and are therefore cool to the touch.
(±) The average temperature of the palmrest area of similar devices was 28.8 °C / 83.8 F (-1.8 °C / -3.3 F).
| Alienware x16 R1 Intel Core i9-13900HK, NVIDIA GeForce RTX 4080 Laptop GPU | Lenovo Legion Pro 7 RTX4090 Intel Core i9-13900HX, NVIDIA GeForce RTX 4090 Laptop GPU | Asus ROG Zephyrus M16 GU604VY-NM042X Intel Core i9-13900H, NVIDIA GeForce RTX 4090 Laptop GPU | Razer Blade 16 Early 2023 Intel Core i9-13950HX, NVIDIA GeForce RTX 4080 Laptop GPU | Dell G16 7620 Intel Core i7-12700H, NVIDIA GeForce RTX 3060 Laptop GPU | Alienware m17 R5 (R9 6900HX, RX 6850M XT) AMD Ryzen 9 6900HX, AMD Radeon RX 6850M XT | |
|---|---|---|---|---|---|---|
| Heat | -4% | 6% | 15% | 14% | 2% | |
| Maximum Upper Side * (°C) | 47.2 | 53 -12% | 50 -6% | 40 15% | 47.6 -1% | 53 -12% |
| Maximum Bottom * (°C) | 47.8 | 59 -23% | 58 -21% | 37.6 21% | 54 -13% | 56 -17% |
| Idle Upper Side * (°C) | 36.8 | 34 8% | 26 29% | 32.4 12% | 23 37% | 30 18% |
| Idle Bottom * (°C) | 35.8 | 32 11% | 28 22% | 31.4 12% | 24.6 31% | 29 19% |
* ... smaller is better
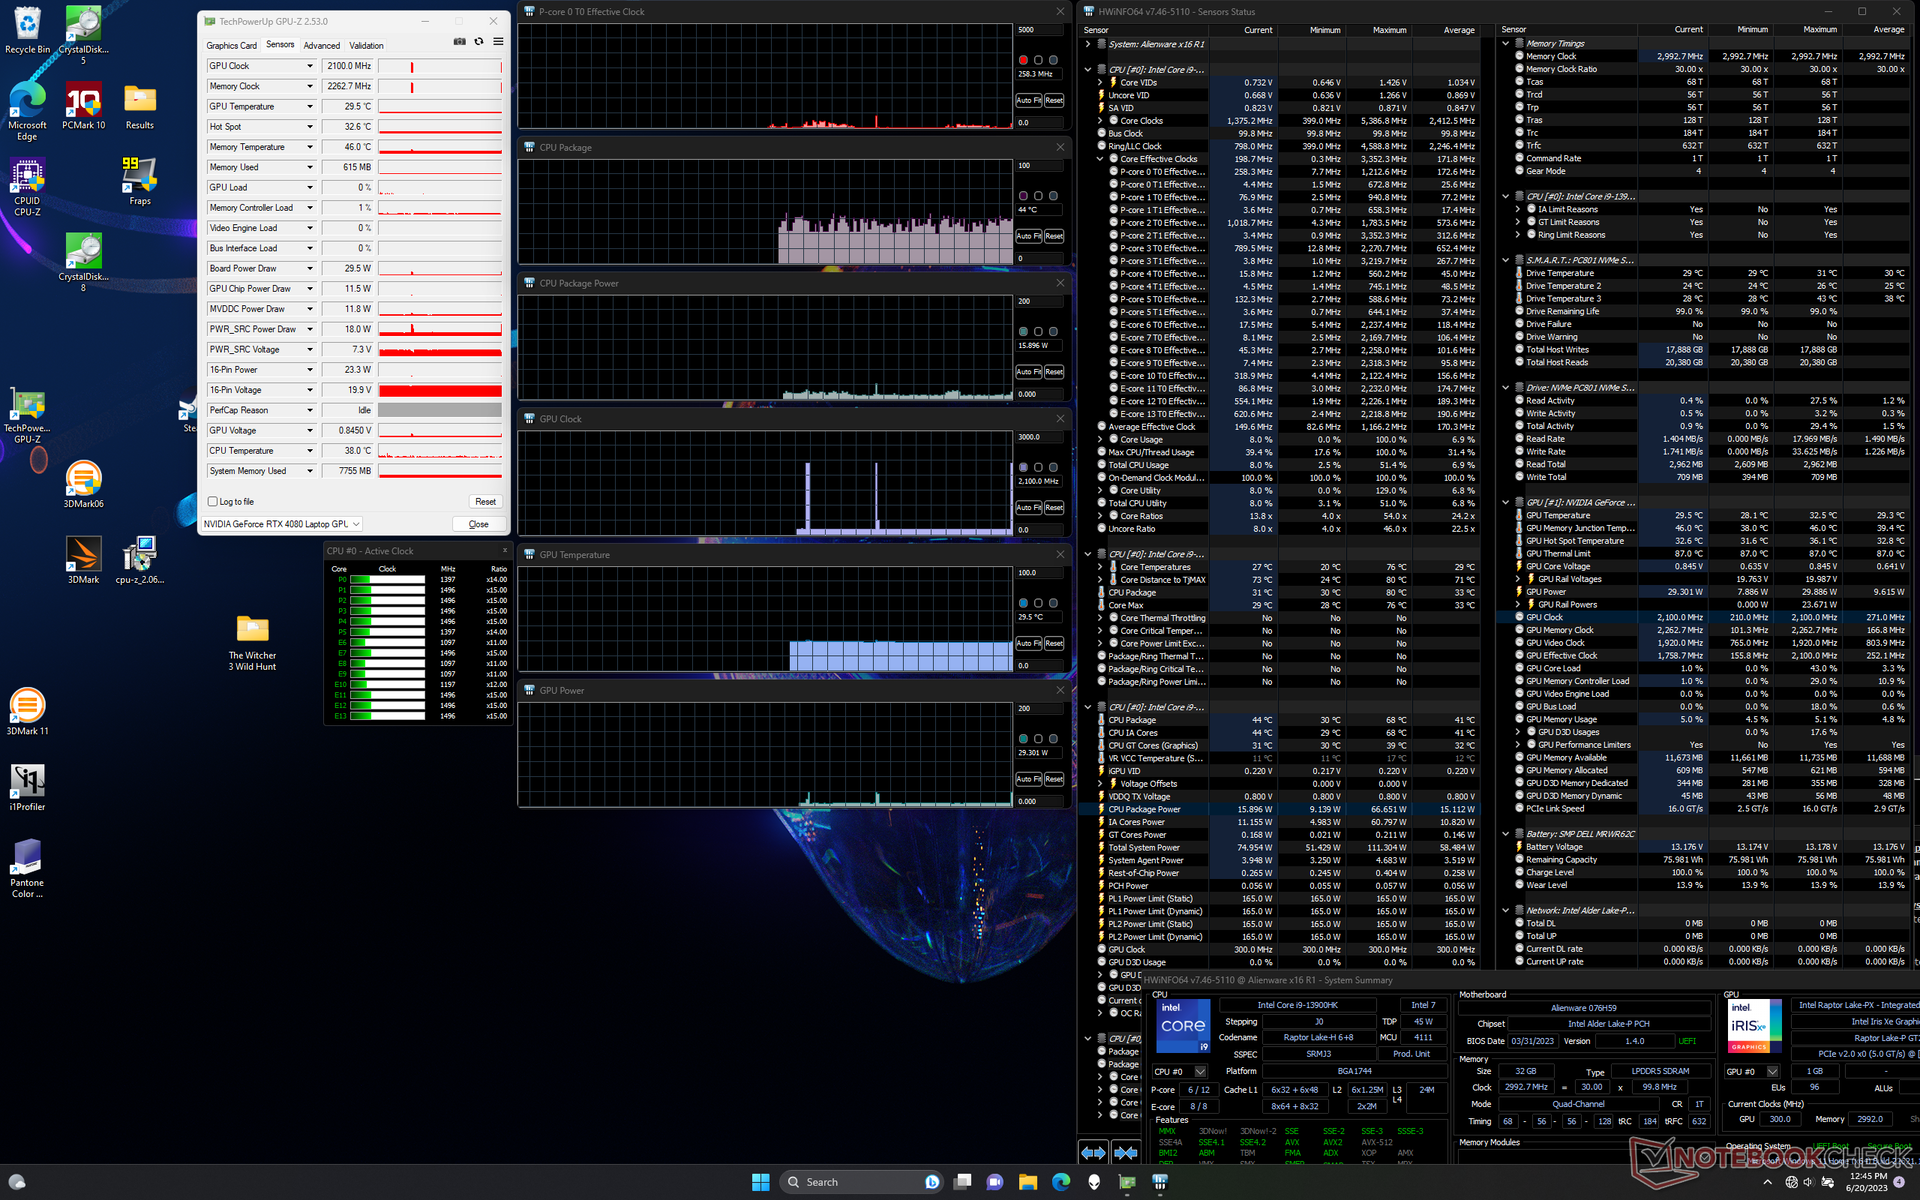
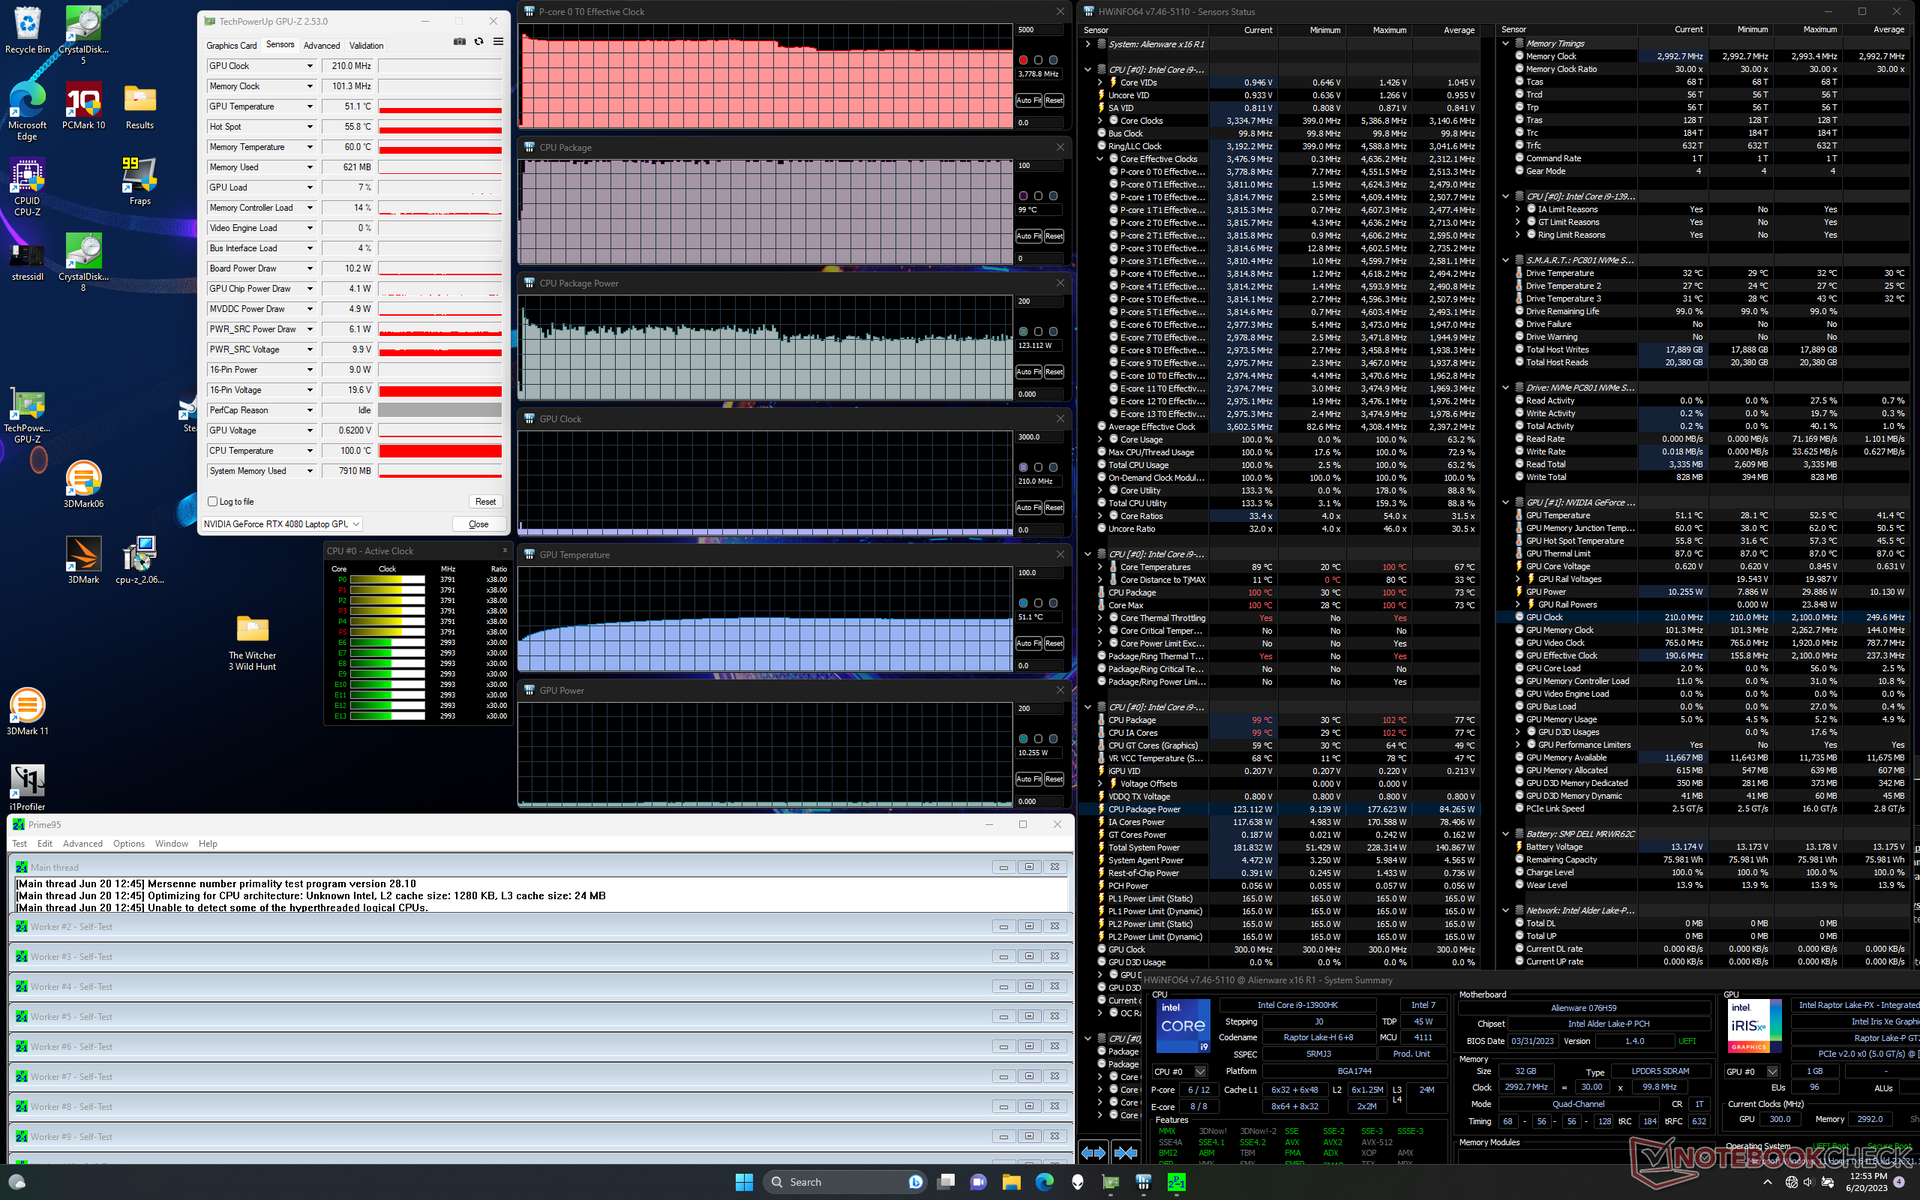
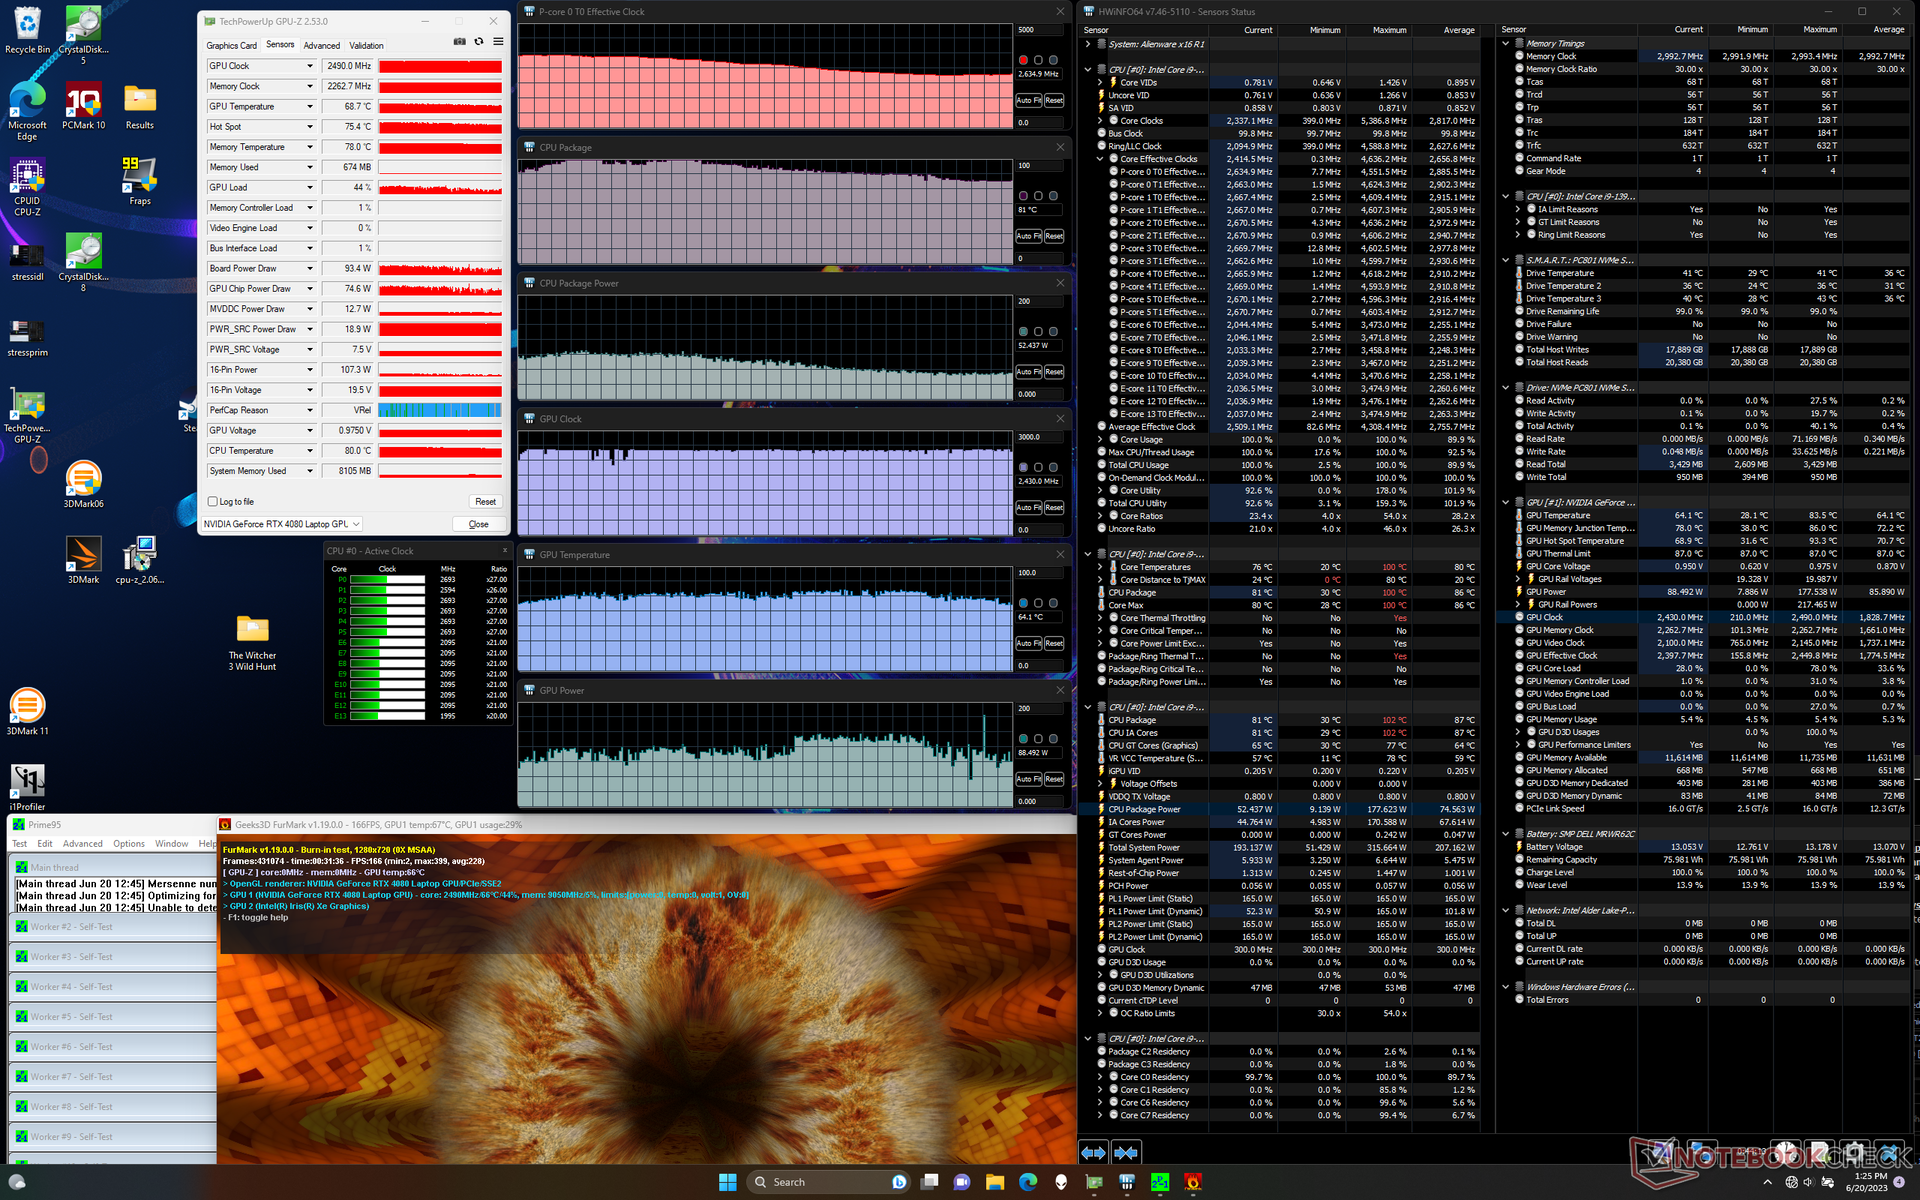
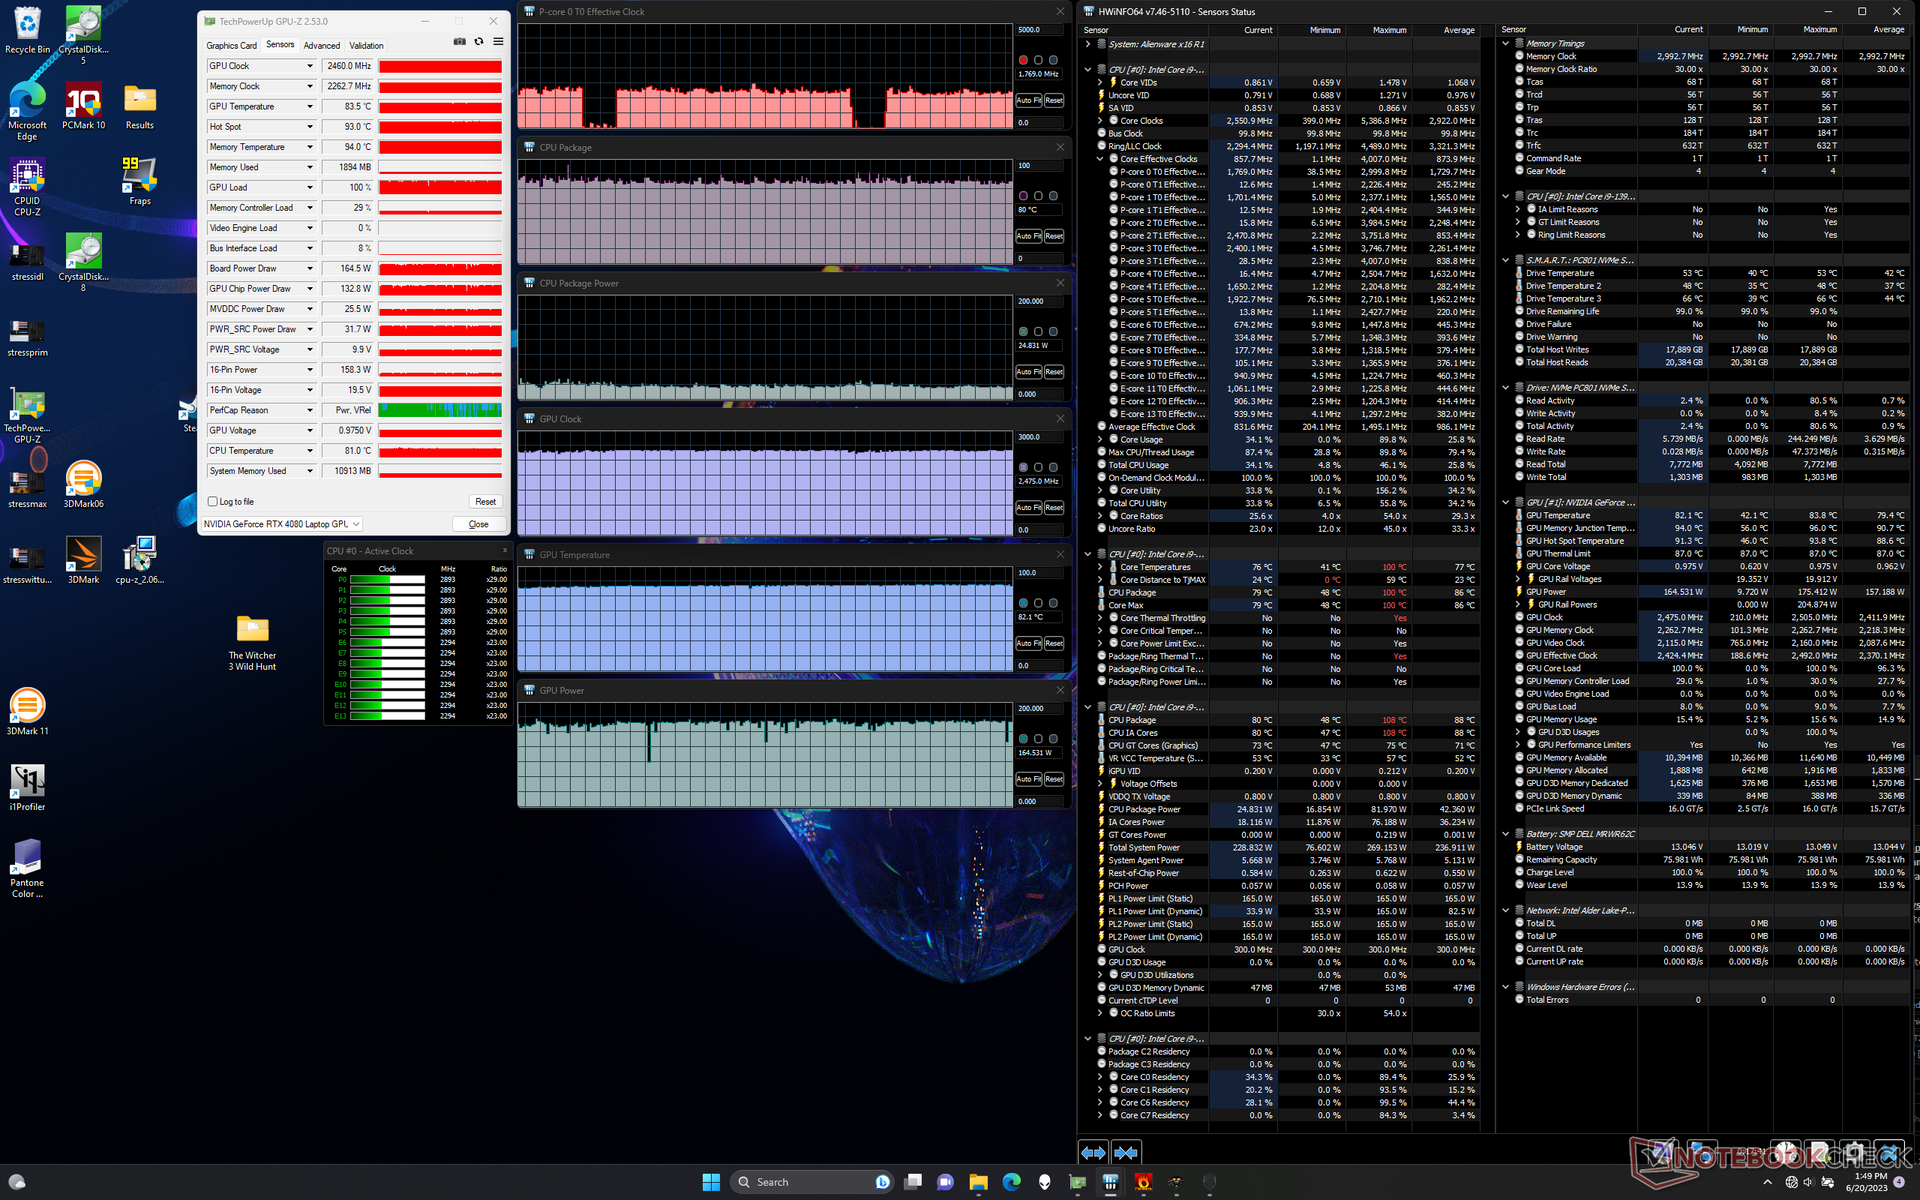
压力测试
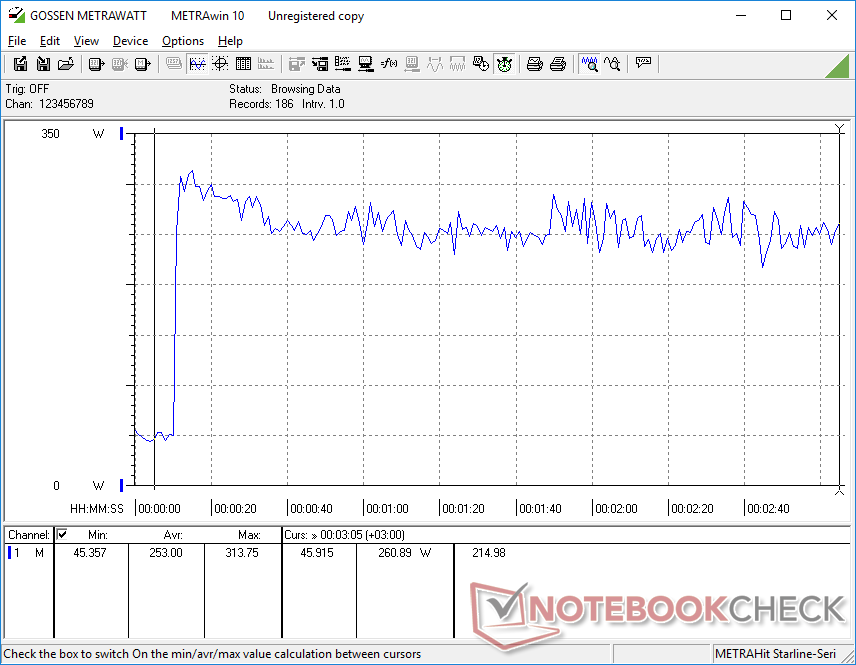
在启动Prime95压力时,CPU时钟频率、电路板功耗和核心温度将分别飙升至4.5 GHz、178 W和99 C。仅仅几分钟后,CPU将最终稳定在3.8 GHz、123 W和99 C。核心温度如此之高,很明显,为了维持最高的Turbo Boost时钟速率,该处理器正在将冷却解决方案推向极限。例如,在Blade 16上重复同样的测试,将导致更冷的稳定核心温度为82℃。
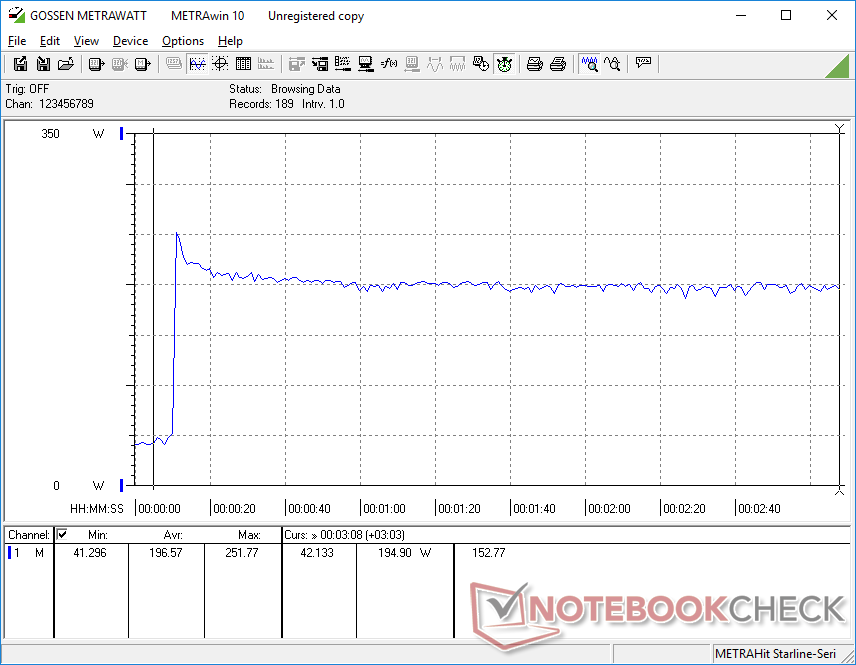
当在Overdrive模式下运行Witcher 3 ,代表典型的游戏负载,GPU将稳定在166W左右,而目标是175W。有趣的是,在Balanced模式下,主板功耗将勉强下降到161W,如下图所示,与Overdrive模式相比,风扇噪音明显更小,代表非常微小的性能损失。因此,用户可以考虑在平衡模式下进行游戏,而不是在更响亮的性能或超速模式下。

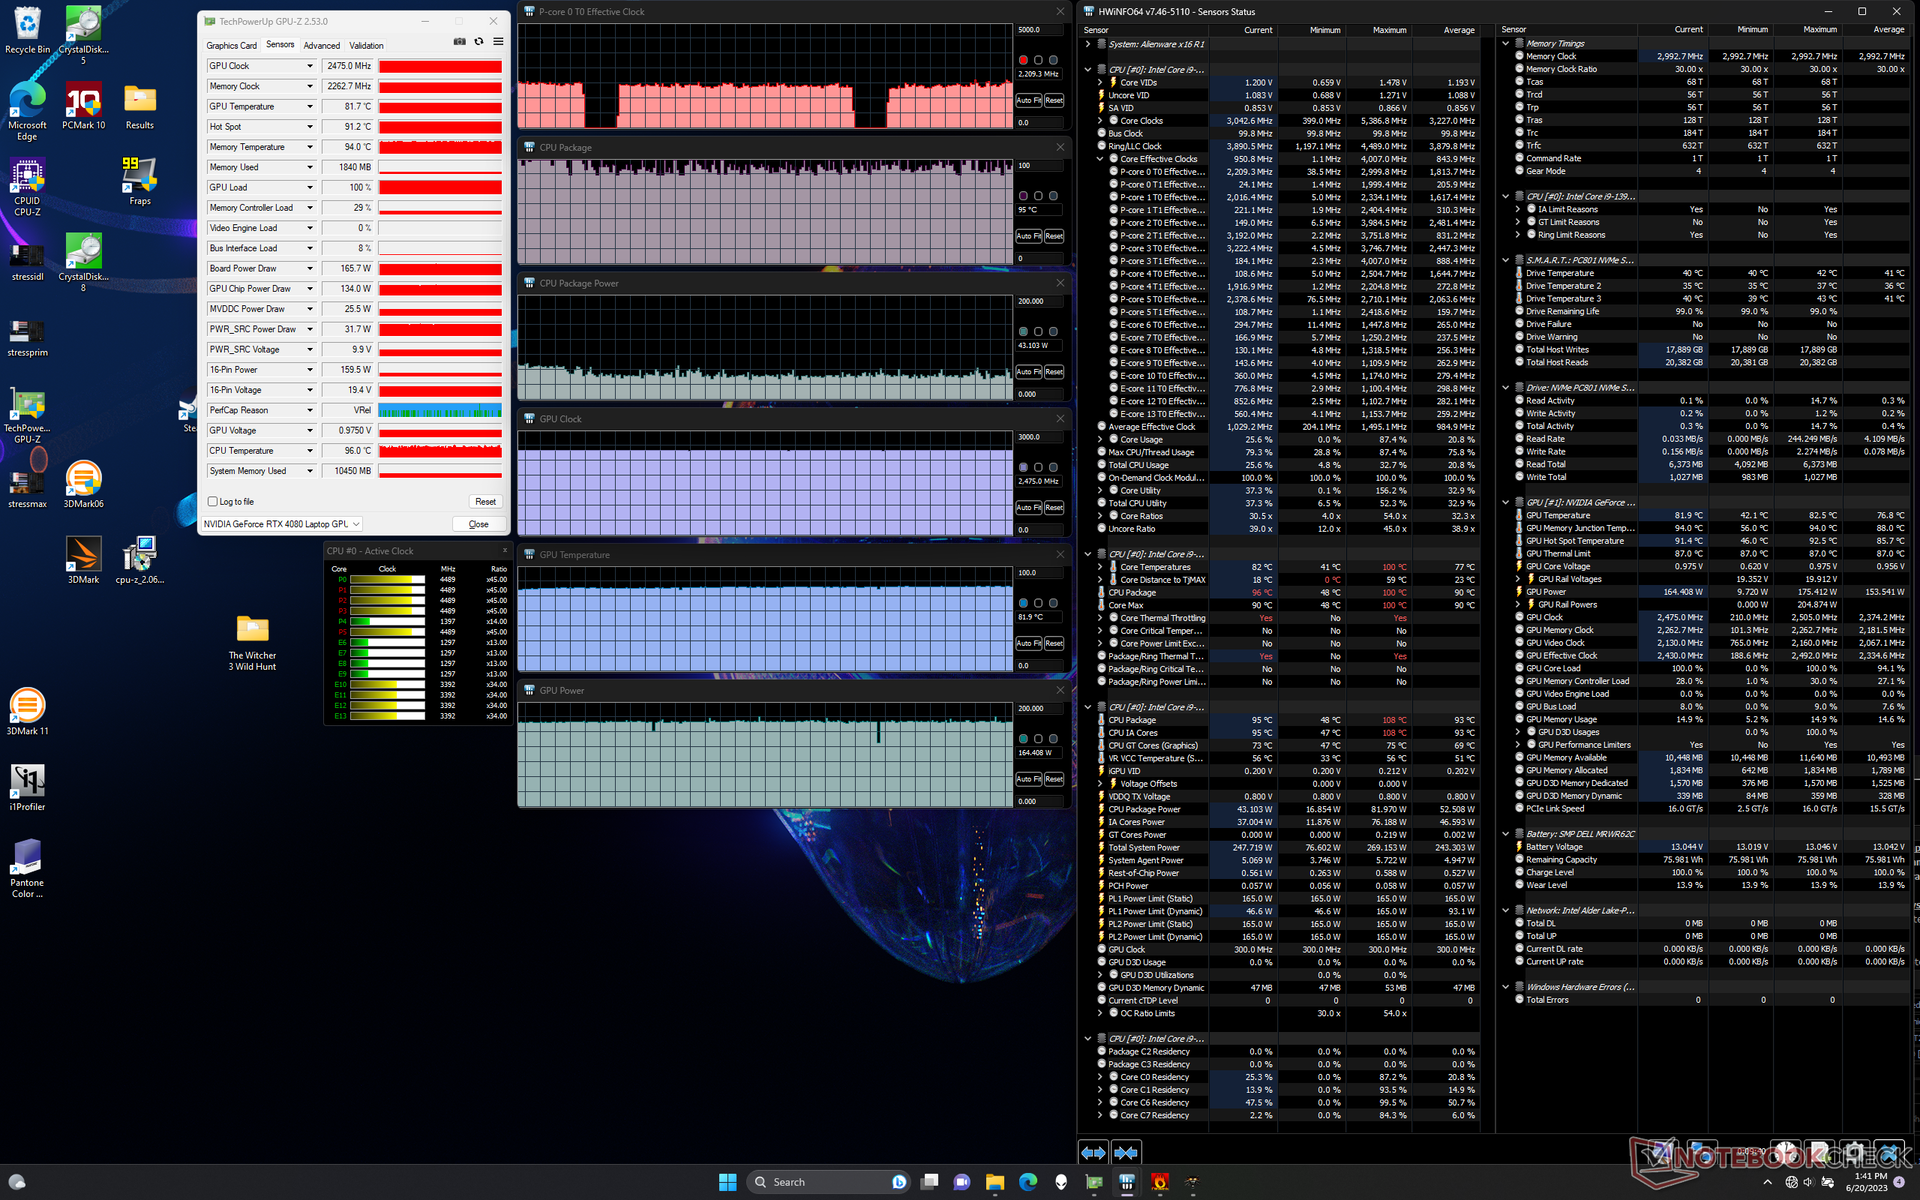
| CPU时钟(GHz) | GPU时钟(MHz) | CPU平均温度(℃) | GPU平均温度(℃) | |
| 系统空闲 | -- | -- | 44 | 30 |
| Prime95压力 | 3.8 | -- | 99 | 51 |
| Prime95 + FurMark 压力 | 2.5 - 3.6 | 2475 | 82 - 100 | 72 - 77 |
| Witcher 3 压力(平衡模式) | ~1.8 | 2460 | 81 | 85 |
| Witcher 3 压力(性能模式) | ~1.8 | 2460 | 80 | 82 |
| Witcher 3 压力(超速模式) | ~2.2 | 2475 | 95 | 82 |
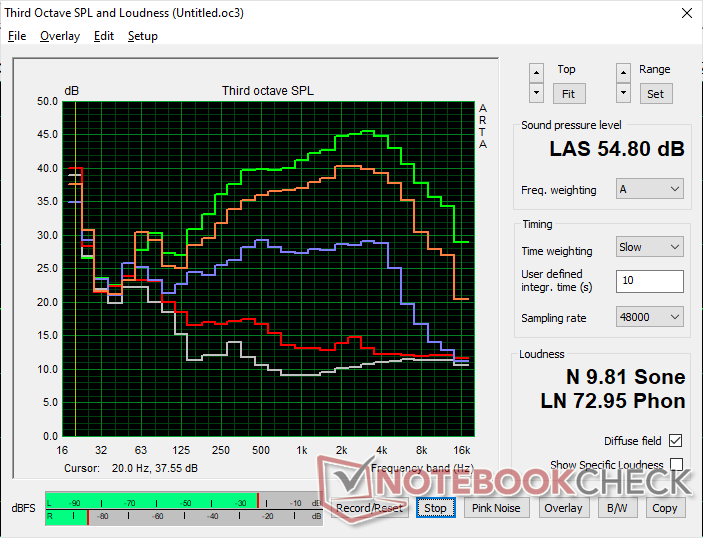
发言人
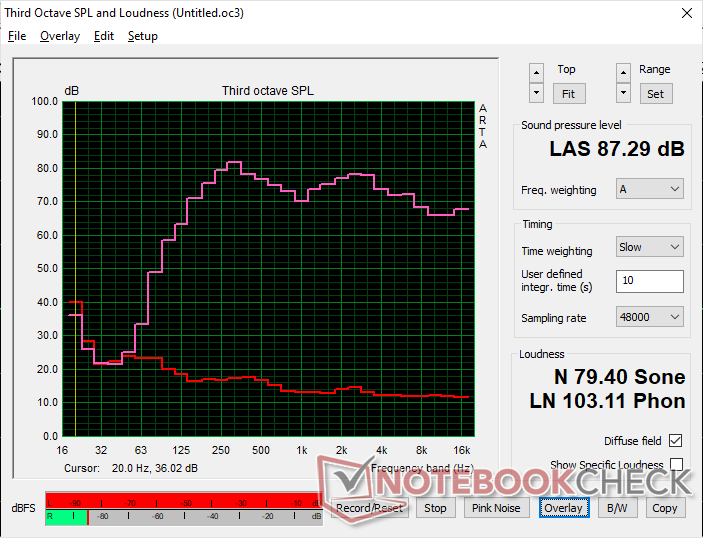
Alienware x16 R1 audio analysis
(+) | speakers can play relatively loud (87.3 dB)
Bass 100 - 315 Hz
(±) | reduced bass - on average 7.3% lower than median
(±) | linearity of bass is average (9.1% delta to prev. frequency)
Mids 400 - 2000 Hz
(+) | balanced mids - only 2.2% away from median
(+) | mids are linear (3.8% delta to prev. frequency)
Highs 2 - 16 kHz
(+) | balanced highs - only 3.6% away from median
(+) | highs are linear (3.3% delta to prev. frequency)
Overall 100 - 16.000 Hz
(+) | overall sound is linear (7.9% difference to median)
Compared to same class
» 1% of all tested devices in this class were better, 1% similar, 98% worse
» The best had a delta of 6%, average was 18%, worst was 132%
Compared to all devices tested
» 2% of all tested devices were better, 1% similar, 98% worse
» The best had a delta of 4%, average was 23%, worst was 134%
Apple MacBook Pro 16 2021 M1 Pro audio analysis
(+) | speakers can play relatively loud (84.7 dB)
Bass 100 - 315 Hz
(+) | good bass - only 3.8% away from median
(+) | bass is linear (5.2% delta to prev. frequency)
Mids 400 - 2000 Hz
(+) | balanced mids - only 1.3% away from median
(+) | mids are linear (2.1% delta to prev. frequency)
Highs 2 - 16 kHz
(+) | balanced highs - only 1.9% away from median
(+) | highs are linear (2.7% delta to prev. frequency)
Overall 100 - 16.000 Hz
(+) | overall sound is linear (4.6% difference to median)
Compared to same class
» 0% of all tested devices in this class were better, 0% similar, 100% worse
» The best had a delta of 5%, average was 17%, worst was 45%
Compared to all devices tested
» 0% of all tested devices were better, 0% similar, 100% worse
» The best had a delta of 4%, average was 23%, worst was 134%
能源管理
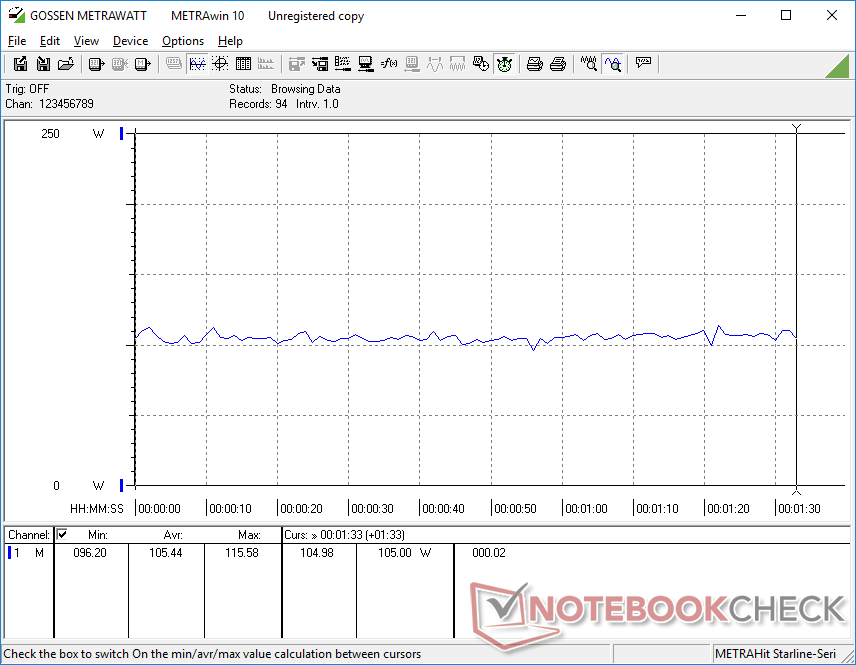
耗电量 - 如预期的那样高
根据电源配置文件、GPU和亮度设置,在桌面上空转时的功耗在25W和50W之间。这个范围甚至在该类别中也是偏高的,因为其他16英寸机型,如Razer Blade 16或 其他16英寸机型,如Razer Blade 16或Alienware m17在类似的最低功率设置下,可以达到15W。
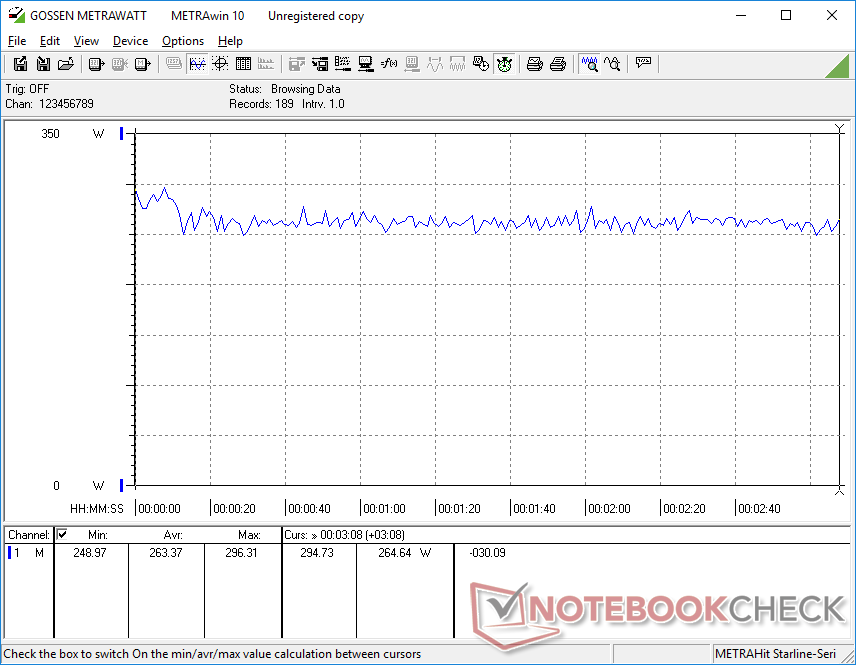
游戏需要大约263瓦,这在华硕ROG Strix G16和微星GE78 HX之间。 微星GE78 HX每个人都有相同的RTX 4080 GPU。也许更值得注意的是,搭载RTX 4090的 华硕ROG Zephyrus M16消耗的电力减少20%,而提供的图形性能与我们的RTX 4080供电的Alienware大致相同。
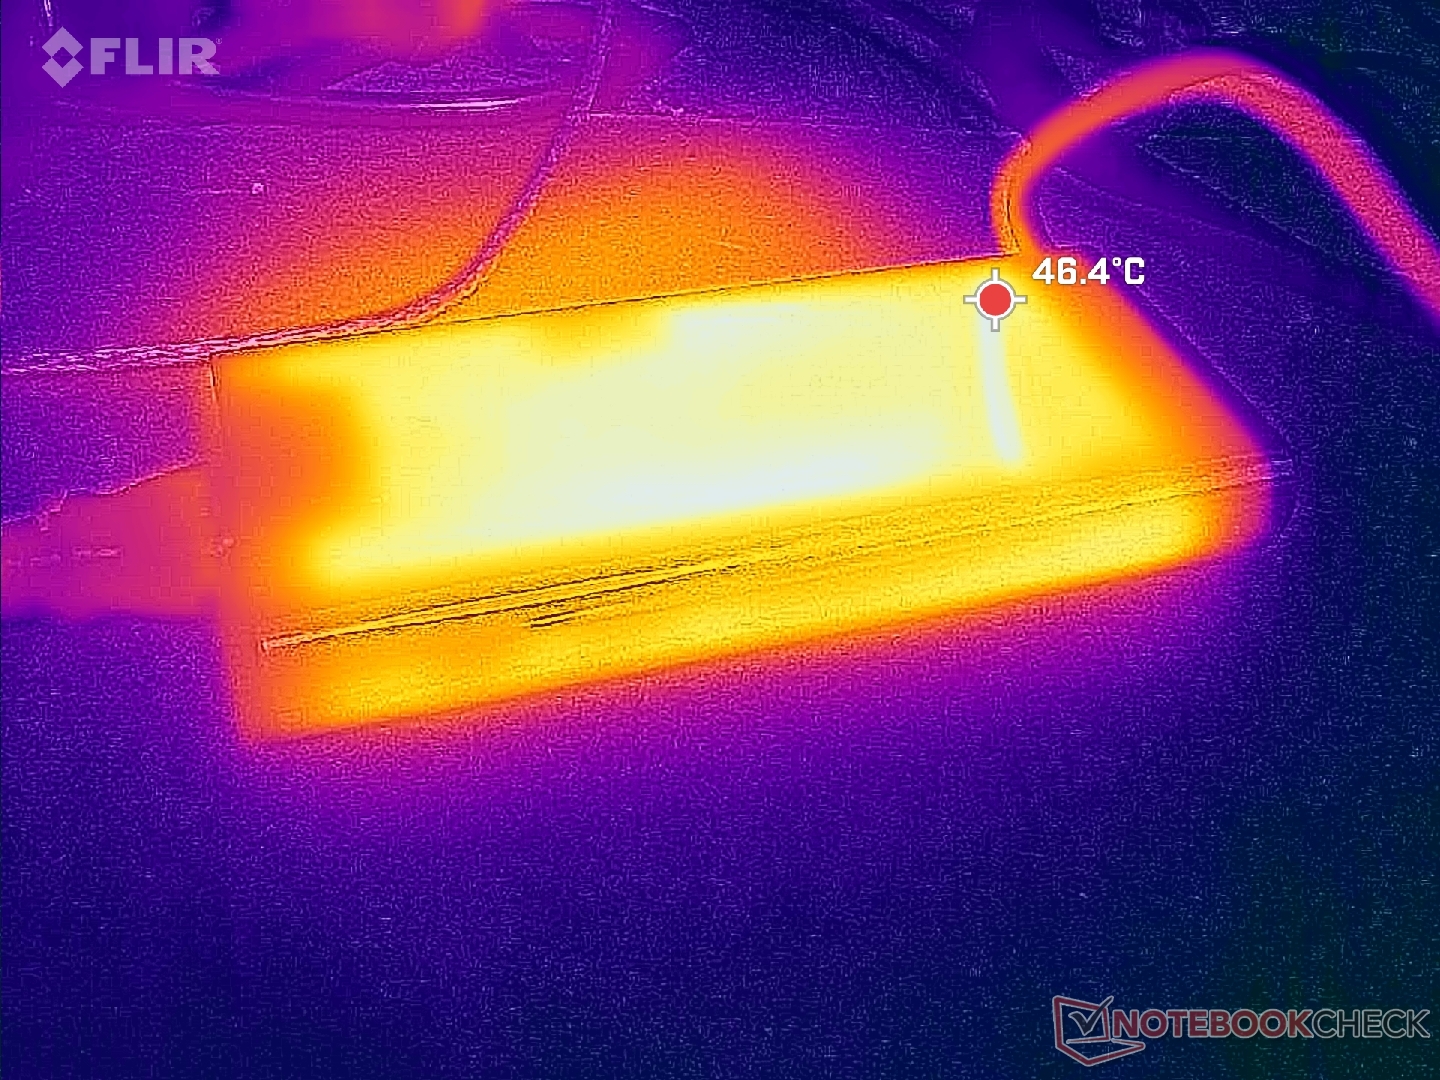
我们能够从中型(约18.3 x 8.6 x 2.6厘米)的330瓦交流适配器测量到,当CPU和GPU都处于100%的利用率时,最大临时消耗为313瓦。在运行如此苛刻的负载时,充电速度会变慢。
| Off / Standby | |
| Idle | |
| Load |
|
Key:
min: | |
| Alienware x16 R1 i9-13900HK, GeForce RTX 4080 Laptop GPU, SK hynix PC801 HFS001TEJ9X101N, IPS, 2560x1600, 16" | Lenovo Legion Pro 7 RTX4090 i9-13900HX, GeForce RTX 4090 Laptop GPU, Samsung PM9A1 MZVL21T0HCLR, IPS, 2560x1600, 16" | Asus ROG Zephyrus M16 GU604VY-NM042X i9-13900H, GeForce RTX 4090 Laptop GPU, Samsung PM9A1 MZVL22T0HBLB, IPS, 2560x1600, 16" | Razer Blade 16 Early 2023 i9-13950HX, GeForce RTX 4080 Laptop GPU, SSSTC CA6-8D1024, IPS, 2560x1600, 16" | Dell G16 7620 i7-12700H, GeForce RTX 3060 Laptop GPU, WDC PC SN810 512GB, IPS, 2560x1600, 16" | Alienware m17 R5 (R9 6900HX, RX 6850M XT) R9 6900HX, Radeon RX 6850M XT, SSSTC CA6-8D1024, IPS, 3840x2160, 17" | |
|---|---|---|---|---|---|---|
| Power Consumption | 5% | 21% | 12% | 30% | 33% | |
| Idle Minimum * (Watt) | 25.2 | 20 21% | 20 21% | 15.2 40% | 14.4 43% | 13 48% |
| Idle Average * (Watt) | 29.9 | 25 16% | 24 20% | 22.8 24% | 17.8 40% | 16.5 45% |
| Idle Maximum * (Watt) | 49.8 | 35 30% | 25 50% | 49.8 -0% | 31.5 37% | 17 66% |
| Load Average * (Watt) | 105.4 | 136 -29% | 107 -2% | 121.2 -15% | 101.2 4% | 93 12% |
| Witcher 3 ultra * (Watt) | 263 | 282 -7% | 208 21% | 242 8% | 176.9 33% | 239 9% |
| Load Maximum * (Watt) | 313.8 | 320 -2% | 267 15% | 273.7 13% | 242.9 23% | 251 20% |
* ... smaller is better
Power Consumption Witcher 3 / Stresstest
Power Consumption external Monitor
电池寿命
在我们的WLAN浏览测试中,即使ACC设置为电池模式,系统设置为iGPU Optimus模式,我们也只能获得2.5小时的运行时间。重复测试的结果是类似的数字。我们并不期望游戏笔记本有很长的运行时间,但与竞争平台相比,这仍然要短得多。戴尔声称浏览时间超过7小时,我们只能在最低亮度设置下的桌面空转时获得。结果是不寻常的,因为我们的Alienware x17在同样的WLAN测试中,其持续时间是Alienware x16的两倍。
使用附带的交流适配器,从空电到满电大约需要两个小时。该系统也可以通过USB-C适配器进行充电,包括XPS型号中的130W适配器。
| Alienware x16 R1 i9-13900HK, GeForce RTX 4080 Laptop GPU, 90 Wh | Asus ROG Zephyrus M16 GU604VY-NM042X i9-13900H, GeForce RTX 4090 Laptop GPU, 90 Wh | Razer Blade 16 Early 2023 i9-13950HX, GeForce RTX 4080 Laptop GPU, 95.2 Wh | Dell G16 7620 i7-12700H, GeForce RTX 3060 Laptop GPU, 84 Wh | Alienware m17 R5 (R9 6900HX, RX 6850M XT) R9 6900HX, Radeon RX 6850M XT, 97 Wh | Lenovo Legion Pro 7 16IRX8H i9-13900HX, GeForce RTX 4080 Laptop GPU, 99.9 Wh | |
|---|---|---|---|---|---|---|
| Battery runtime | 193% | 89% | 32% | 125% | 97% | |
| Reader / Idle (h) | 7.3 | 8.9 22% | 7.1 -3% | 6.4 -12% | ||
| WiFi v1.3 (h) | 2.5 | 4.3 72% | 6.1 144% | 5 100% | 4.8 92% | 5.1 104% |
| Load (h) | 0.7 | 2.9 314% | 1.4 100% | 0.7 0% | 1.8 157% | 2.1 200% |
| H.264 (h) | 4.8 | 4.9 |
Pros
Cons
评语--成功地实现了对薄度和图形的追求
人们普遍认为,笔记本电脑的性能与薄度成反比。Alienware x16挑战了这一点,它是同尺寸类别中最薄的产品之一,同时仍然超过了主要竞争对手,如 Razer Blade 16, 华硕ROG Strix G16,或 HP Omen 17在图形性能方面。令人印象深刻的是,鉴于其超薄的外形,该模型能够挤进175瓦的GeForce RTX GPU。
如果你想最大限度地提高GPU性能,同时最大限度地减少厚度,那么Alienware x16应该是你清单上的首选。
不过,也有几个缺点,其中一些是Alienware x16所特有的。首先,它的超薄并不意味着它的超小或超轻,因为该系统在长度和宽度方面都非常大,以弥补较薄的Z高度。其次,沿着两侧缺乏任何端口,每次连接显示器或配件都会有点麻烦。最后是 酷睿i9-13900HK与上一代产品相比只提供了微小的改进酷睿i9-12900H因为它的性能远不及酷睿i9-13900HX这款处理器在更厚的Alienware m16上可用,而在Alienware x16上则没有。为了最大限度地提高GPU性能,在占地面积、端口定位和CPU性能方面的让步可能是必要的。
Alienware x16 R1
- 06/22/2023 v7 (old)
Allen Ngo
Transparency
The selection of devices to be reviewed is made by our editorial team. The test sample was provided to the author as a loan by the manufacturer or retailer for the purpose of this review. The lender had no influence on this review, nor did the manufacturer receive a copy of this review before publication. There was no obligation to publish this review. As an independent media company, Notebookcheck is not subjected to the authority of manufacturers, retailers or publishers.
This is how Notebookcheck is testing
Every year, Notebookcheck independently reviews hundreds of laptops and smartphones using standardized procedures to ensure that all results are comparable. We have continuously developed our test methods for around 20 years and set industry standards in the process. In our test labs, high-quality measuring equipment is utilized by experienced technicians and editors. These tests involve a multi-stage validation process. Our complex rating system is based on hundreds of well-founded measurements and benchmarks, which maintains objectivity. Further information on our test methods can be found here.
Price comparison

