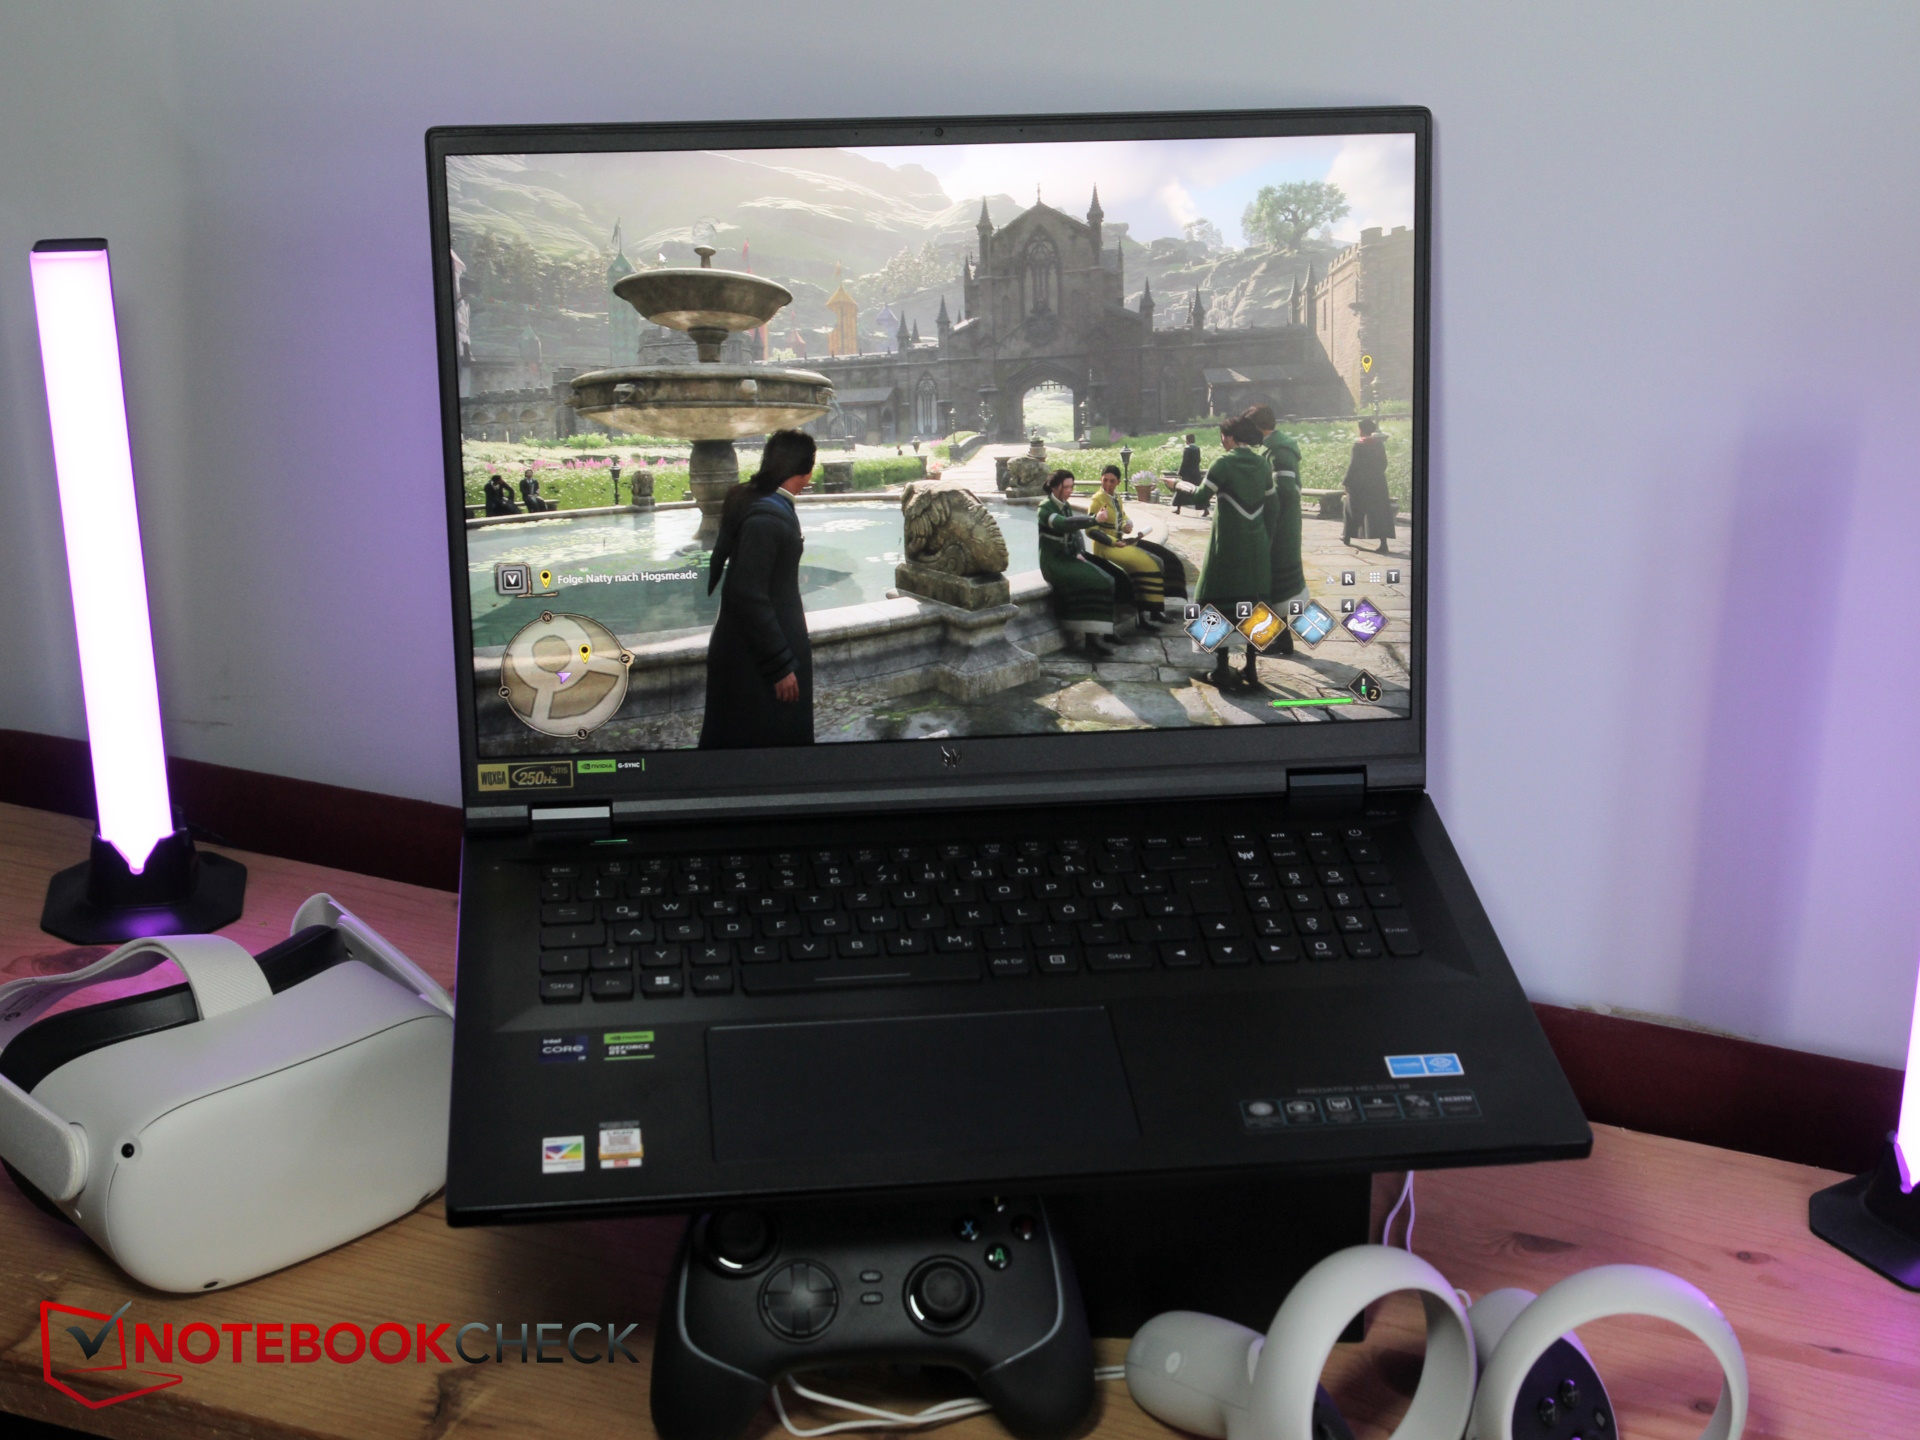
宏碁掠夺者 Helios 18 笔记本电脑评测:配备 MiniLED 显示屏的 RTX 4080 玩家,亮度超过 1,000 尼特
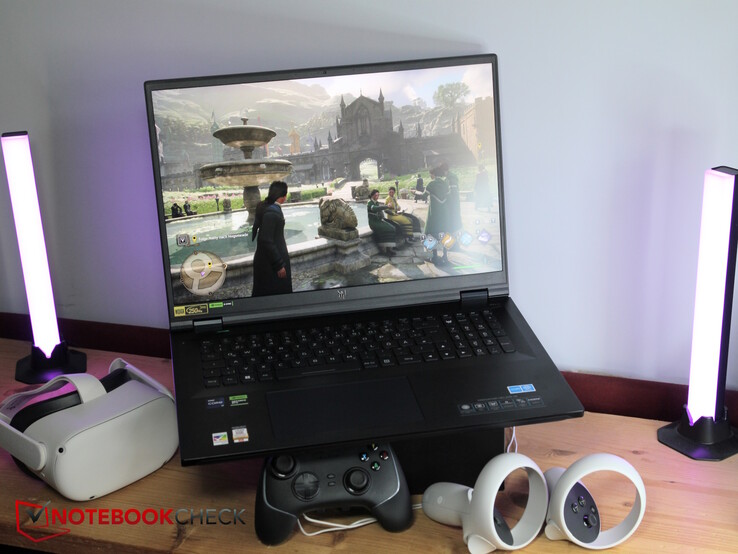
......(英文RTX 4060配备 宏碁掠夺者 Helios 16在我们 7 月份的评测中获得了 90% 的高分。现在,我们来看看搭载英特尔 HX 处理器、RTX 4080 的 18 英寸高端机型。 RTX 4080和 MiniLED 显示屏的 18 英寸高端机型。
为了便于比较,我们使用了其他 18 英寸游戏本以及规格相似的 17 英寸游戏本,因为在我们对 18 英寸笔记本电脑的评测中,Predator Helios 18 是第一款配备 RTX 4080 的笔记本电脑。竞争对手包括微星 Raider GE78 HX 13VH以及 惠普预兆 17、 Alienware m18 R1,华硕 华硕 ROG Strix G18 G814JI和 雷蛇刀锋 18.
潜在的竞争对手比较
Rating | Date | Model | Weight | Height | Size | Resolution | Price |
|---|---|---|---|---|---|---|---|
| 88.3 % v7 (old) | 10 / 2023 | Acer Predator Helios 18 N23Q2 i9-13900HX, GeForce RTX 4080 Laptop GPU | 3.2 kg | 29.15 mm | 18.00" | 2560x1600 | |
| 88.3 % v7 (old) | 03 / 2023 | MSI GE78HX 13VH-070US i9-13950HX, GeForce RTX 4080 Laptop GPU | 3 kg | 23 mm | 17.00" | 2560x1600 | |
| 85.4 % v7 (old) | 03 / 2023 | HP Omen 17-ck2097ng i9-13900HX, GeForce RTX 4080 Laptop GPU | 2.8 kg | 27 mm | 17.30" | 2560x1440 | |
| 90.7 % v7 (old) | 04 / 2023 | Alienware m18 R1 i9-13980HX, GeForce RTX 4090 Laptop GPU | 3.9 kg | 26.7 mm | 18.00" | 1920x1200 | |
| 87.4 % v7 (old) | 03 / 2023 | Asus ROG Strix G18 G814JI i7-13650HX, GeForce RTX 4070 Laptop GPU | 3 kg | 31 mm | 18.00" | 2560x1600 | |
| 91.4 % v7 (old) | 02 / 2023 | Razer Blade 18 RTX 4070 i9-13950HX, GeForce RTX 4070 Laptop GPU | 3 kg | 21.9 mm | 18.00" | 2560x1600 |
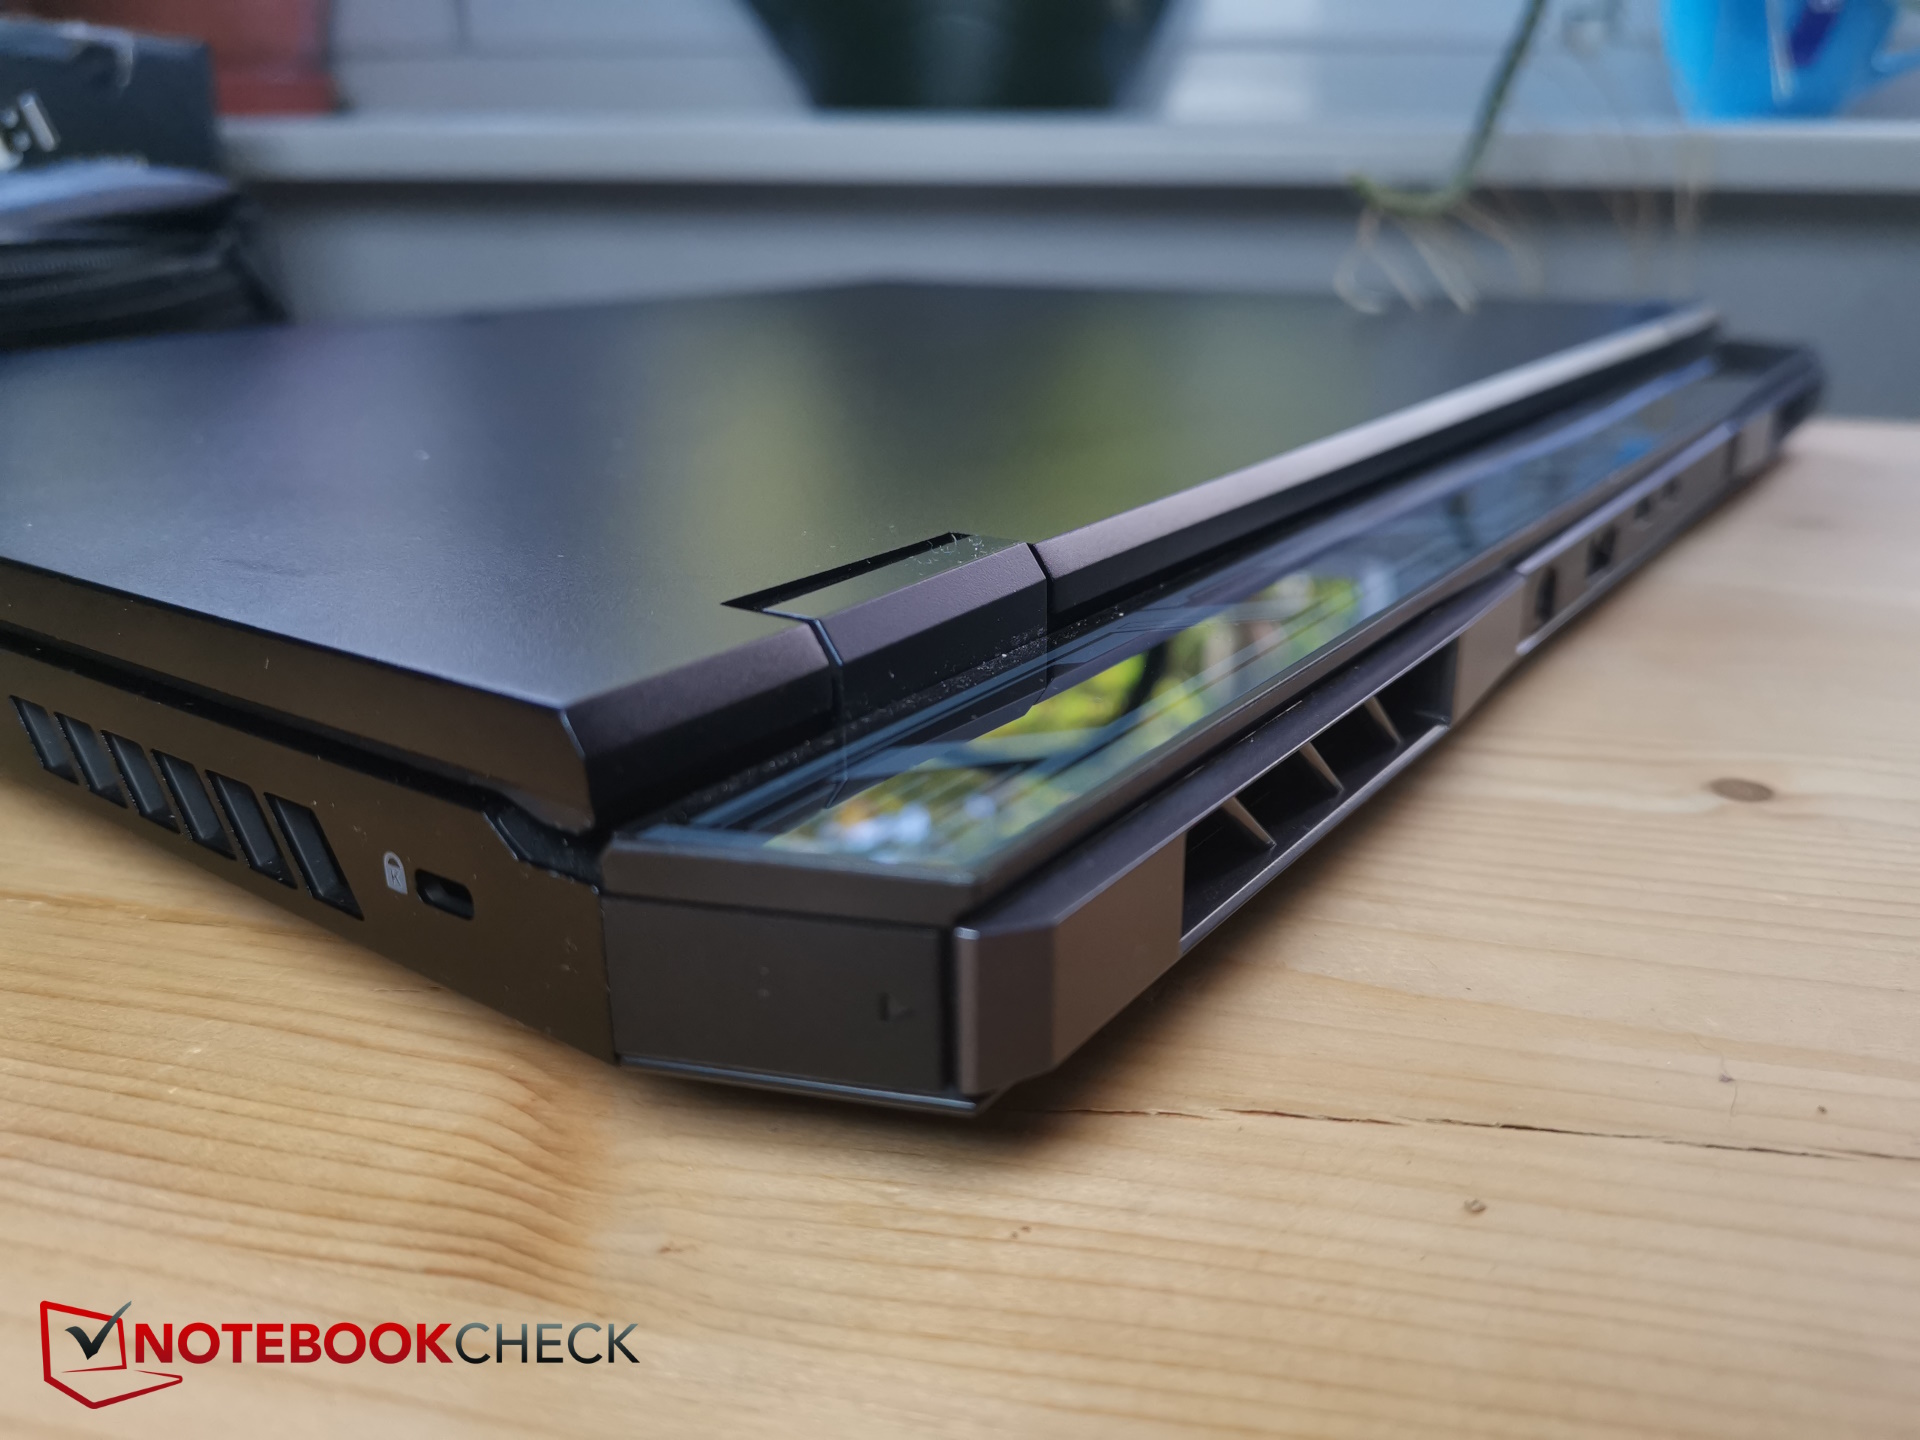
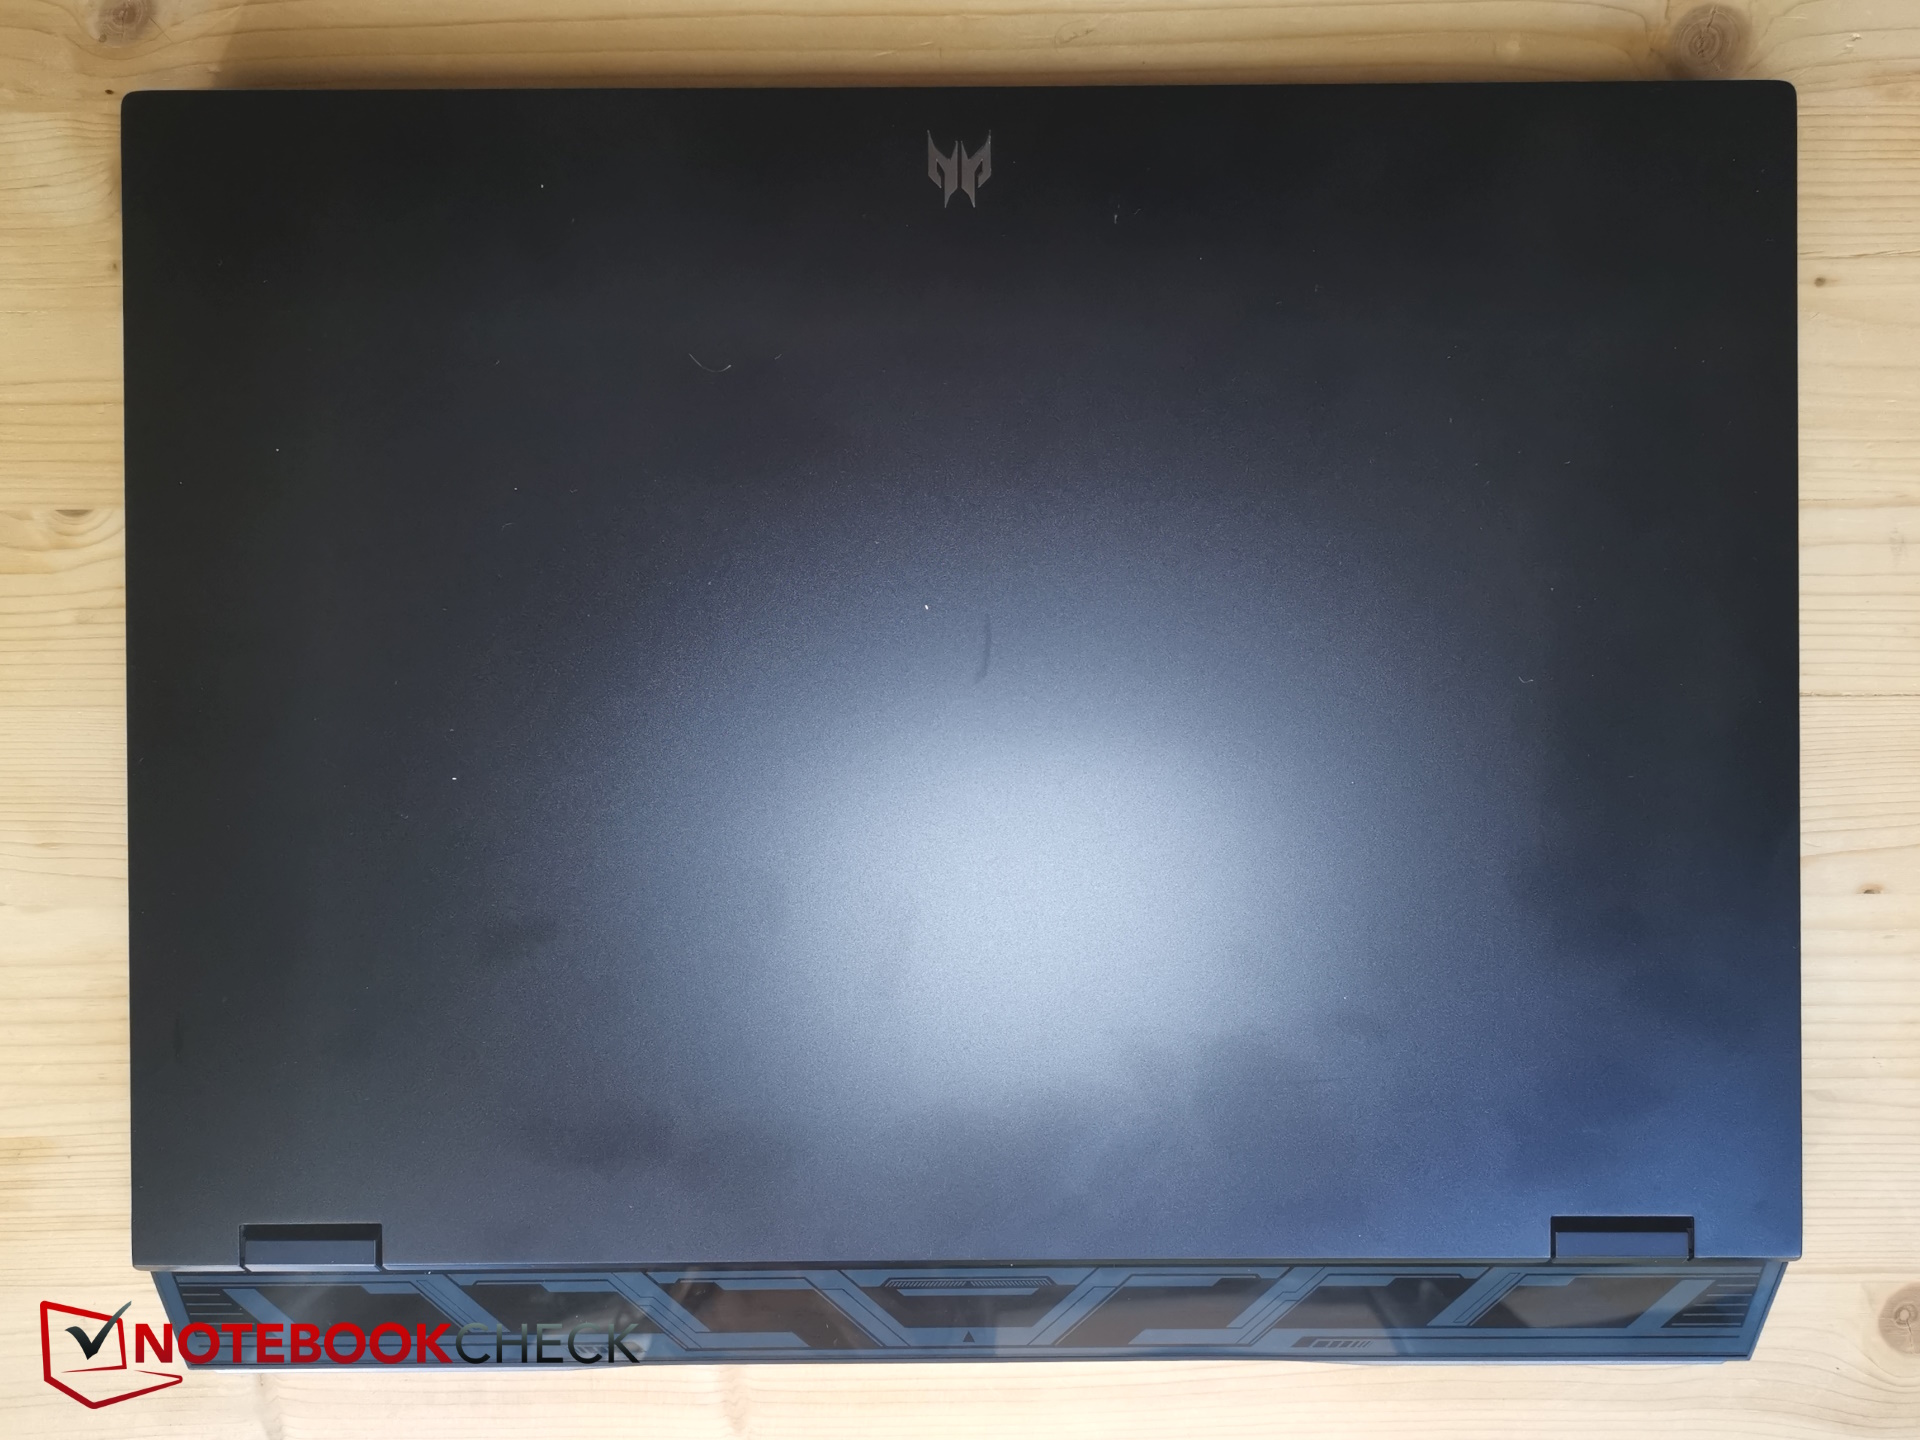
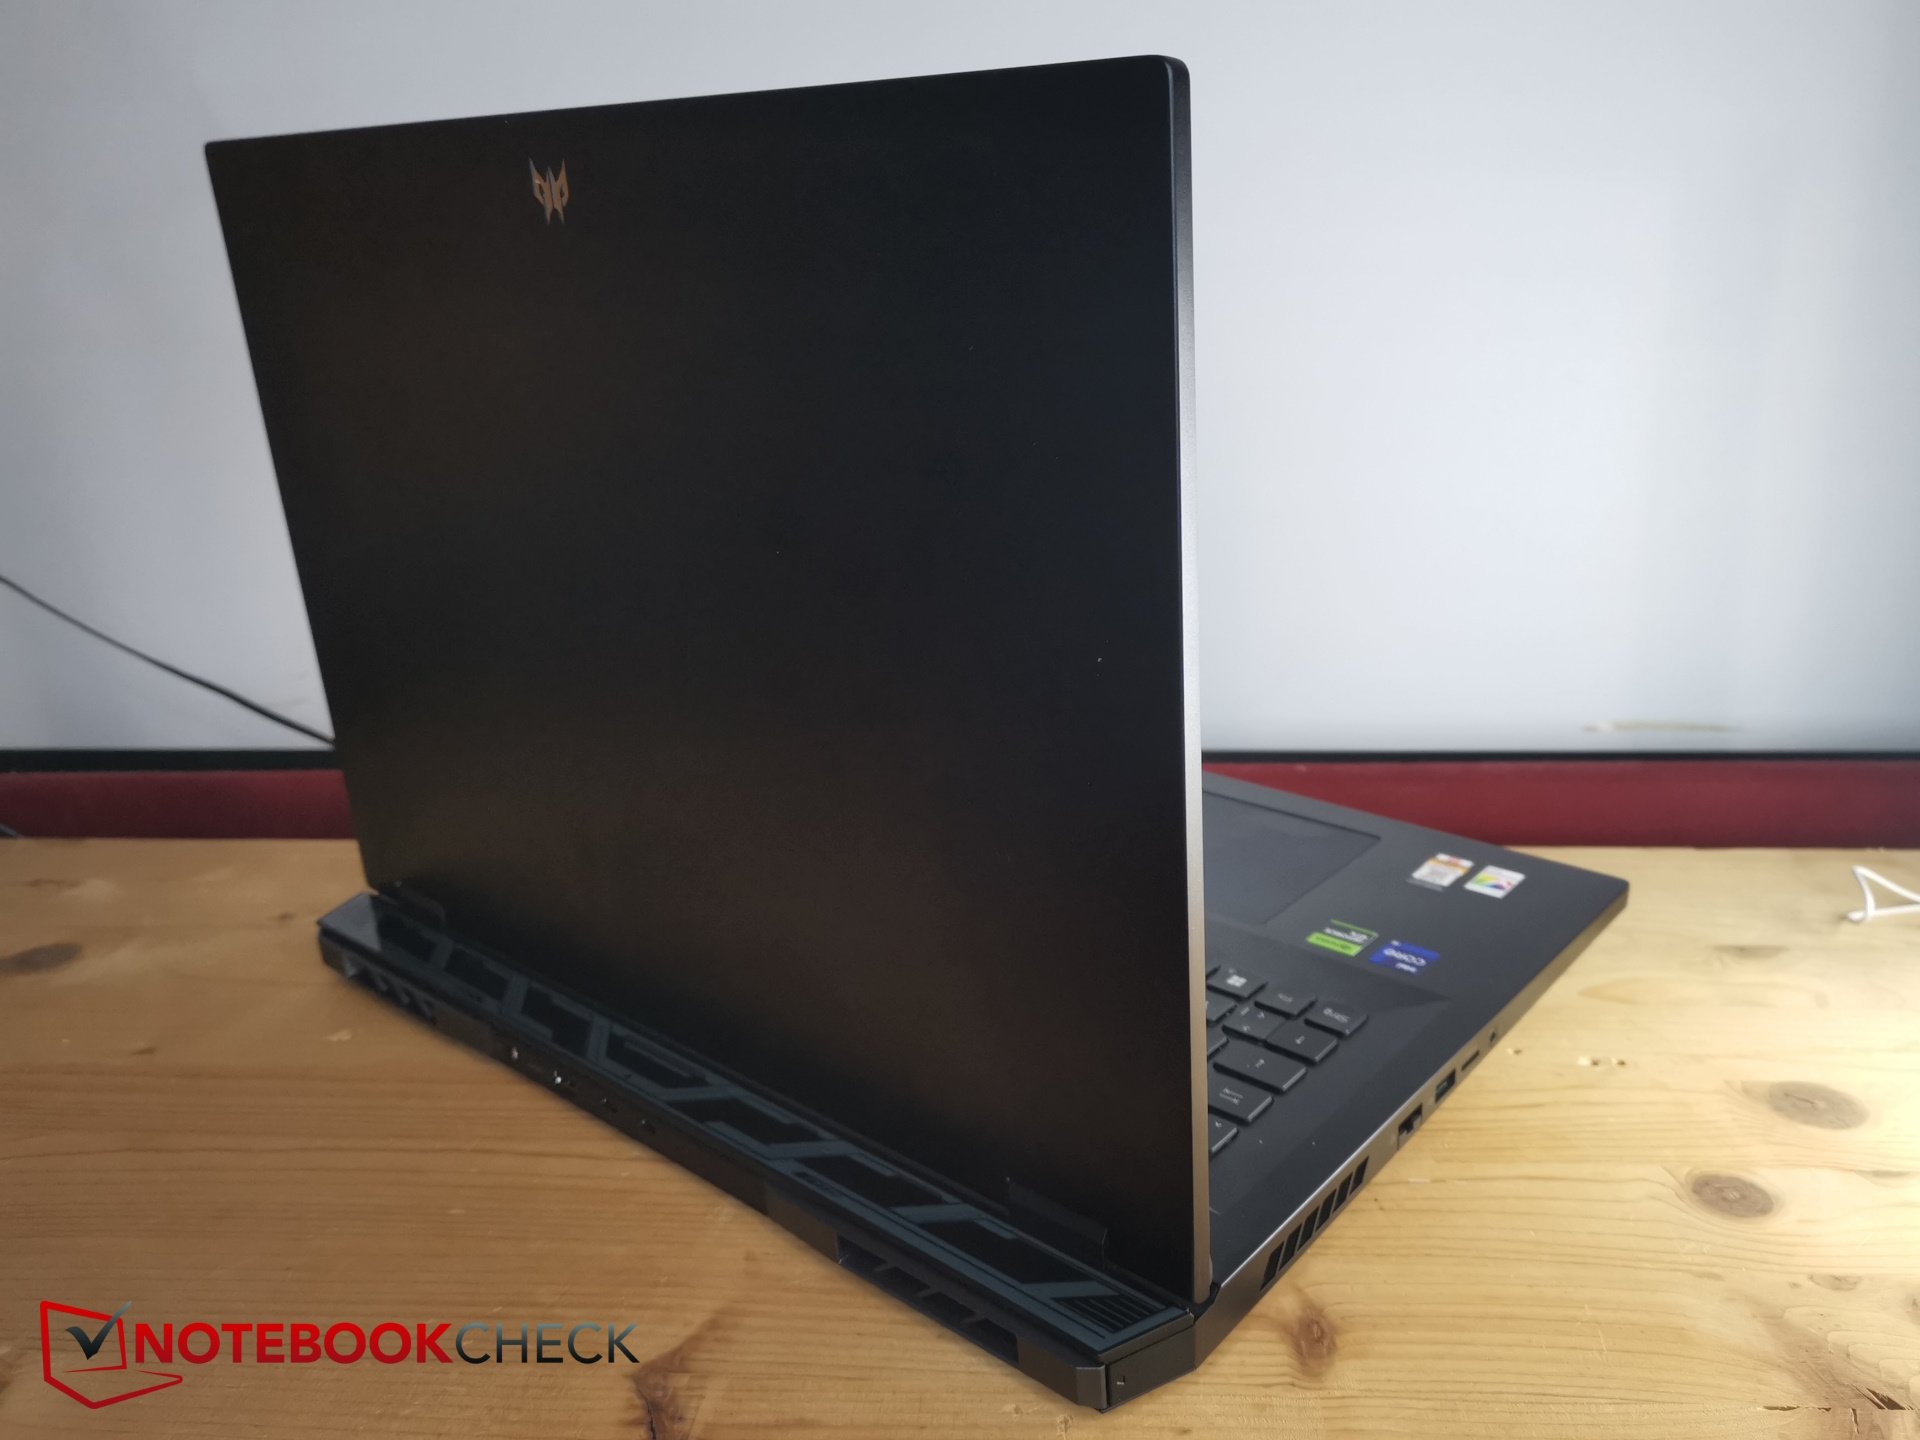
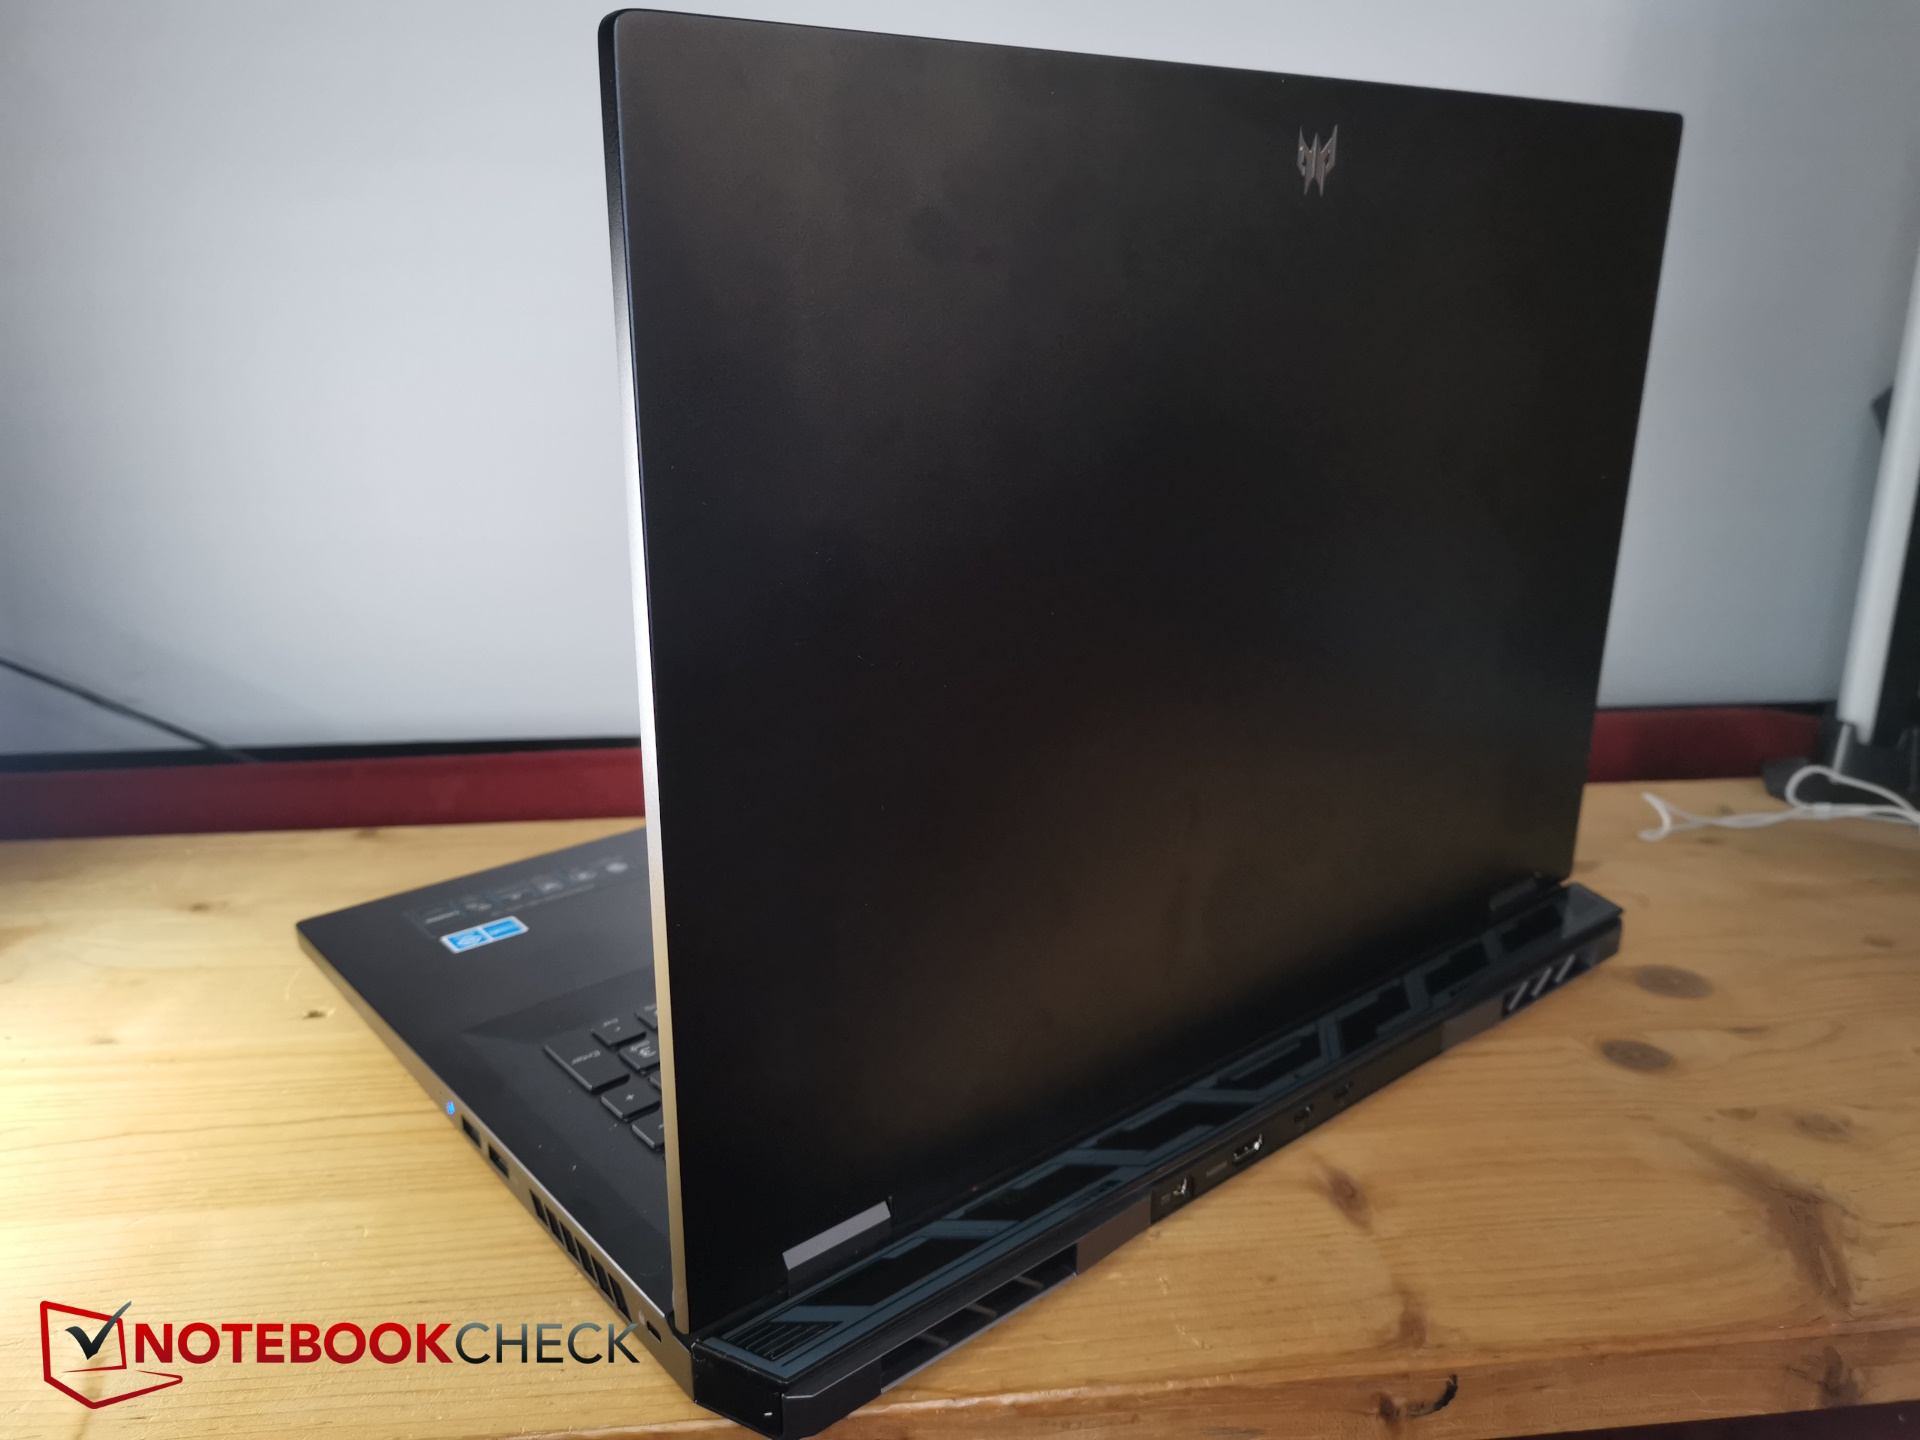
机箱 - 宏碁掠夺者黑色铝合金机箱
宏碁将 Helios 18 设计成深色,几乎不显眼的黑色。但该设备并没有试图掩盖其游戏属性,显示屏盖子上的小 Predator 标志和背面突出的冷却系统就是其特征。
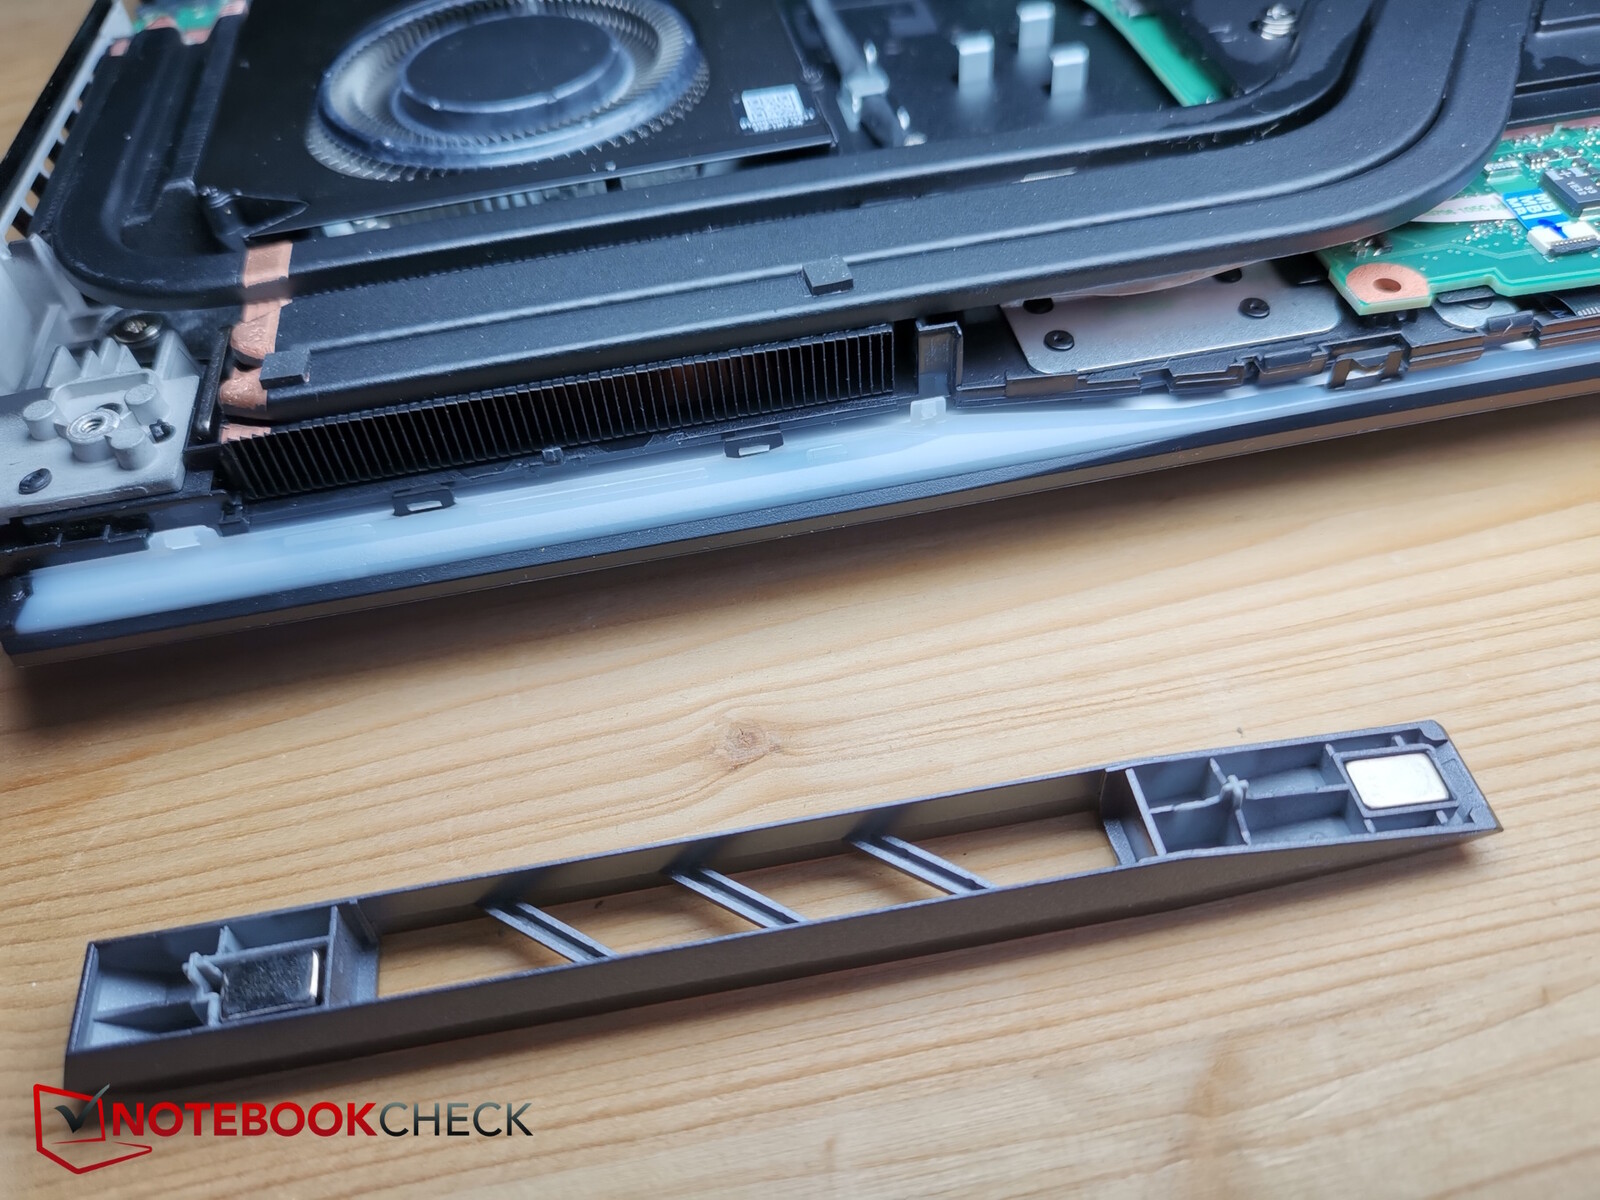
做工无可挑剔:缝隙微乎其微。机身后部的出风口甚至还可以定制--宏碁(Acer)还为其配备了一对通风栅栏,可以通过 3D 打印机进一步定制。
显示屏盖和底座由铝制成,而显示屏边缘、后部冷却装置和笔记本底部则由塑料制成。金属材质为 Helios 18 提供了良好的刚性,在受到扭转应力时不会出现吱吱作响或裂缝。不过,这里很容易积聚指纹,而且尽管采用了金属材质,底座的上侧还是会被硌得有点疼,即使在打字时也是如此。但这并不影响使用,因为它的表面很大。
与 18 英寸竞争产品相比,Helios 18 在尺寸上处于中间位置。Alienware m18 稍大,华硕 ROG Strix G18 较小。后者稍厚,而 Alienware m18 更薄。在重量方面,Alien 显然更重,G18 稍轻。
17 英寸游戏机部分更小,也更薄。
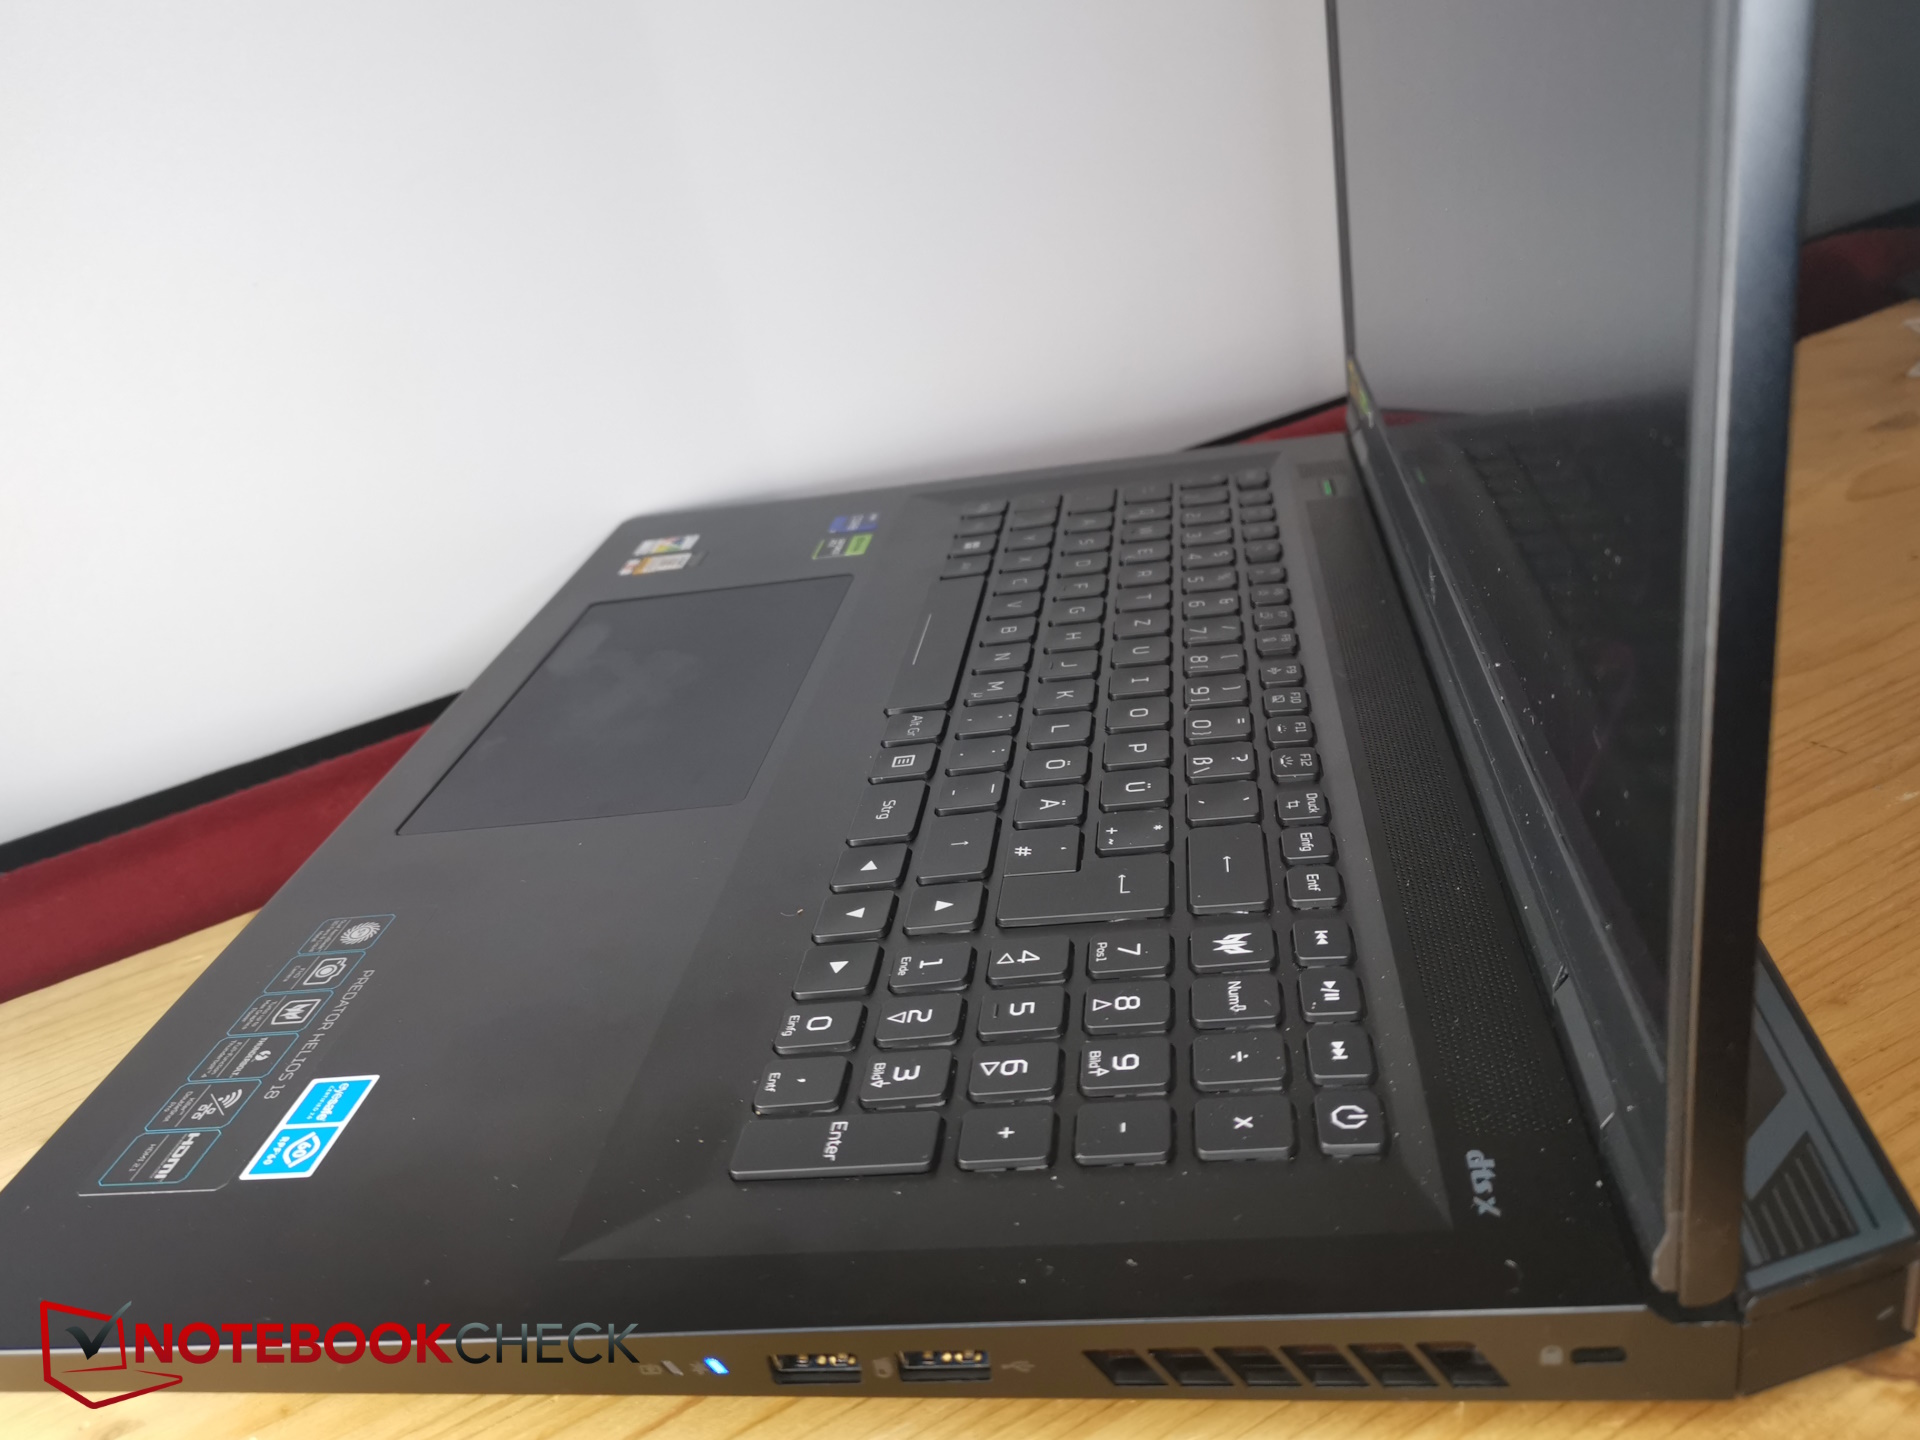
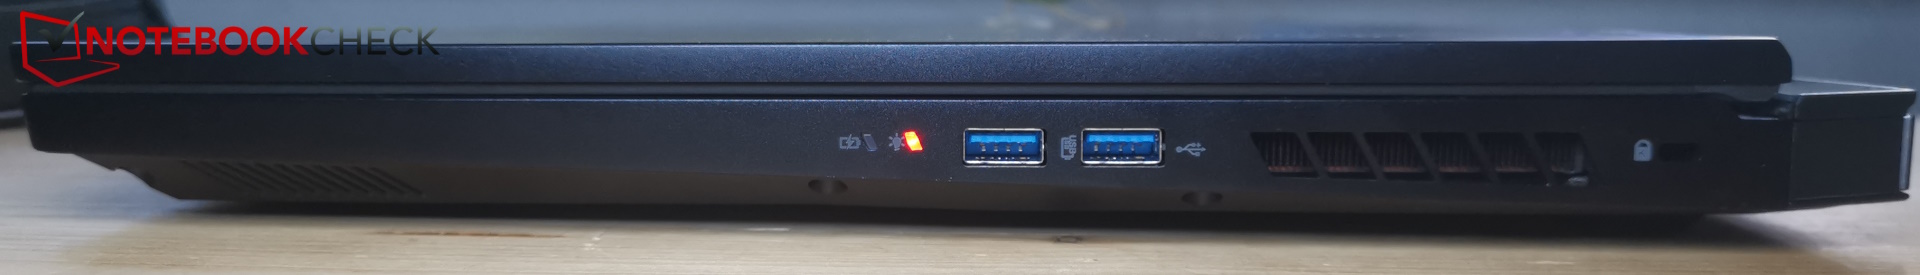
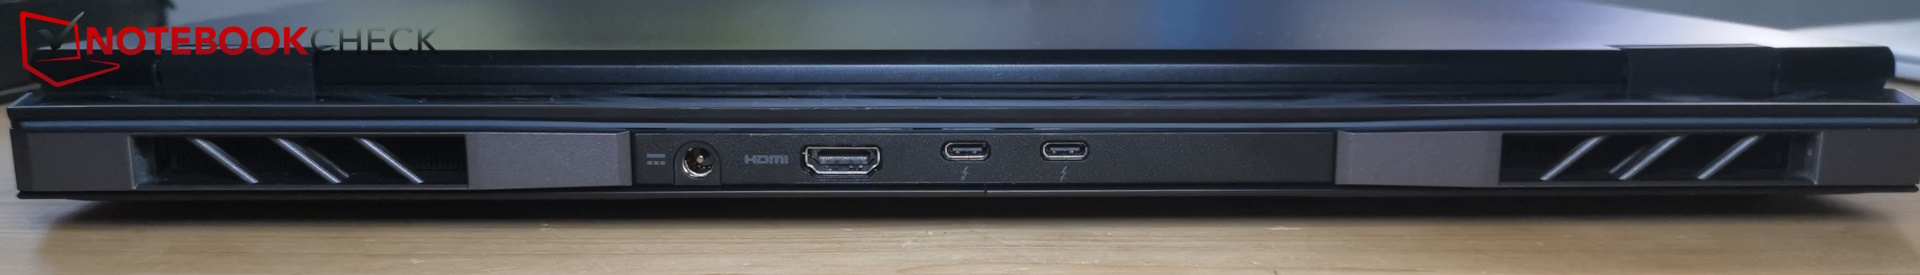
装备 - 2x Thunderbolt 4,安装在捕食者赫利俄斯号上
Helios 18 配备了所有必要的端口。机上有两个 USB-C 形式的 Thunderbolt 4 端口。只有 PowerDelivery 不可用。SD 读卡器 "仅 "接受 MicroSD 卡。
端口分布在三面,不过背面仍有空间,可以轻松容纳左侧众多端口中的一个。我们更倾向于将 LAN 端口放在背面,而将日益重要的 USB-C 端口之一放在侧面。
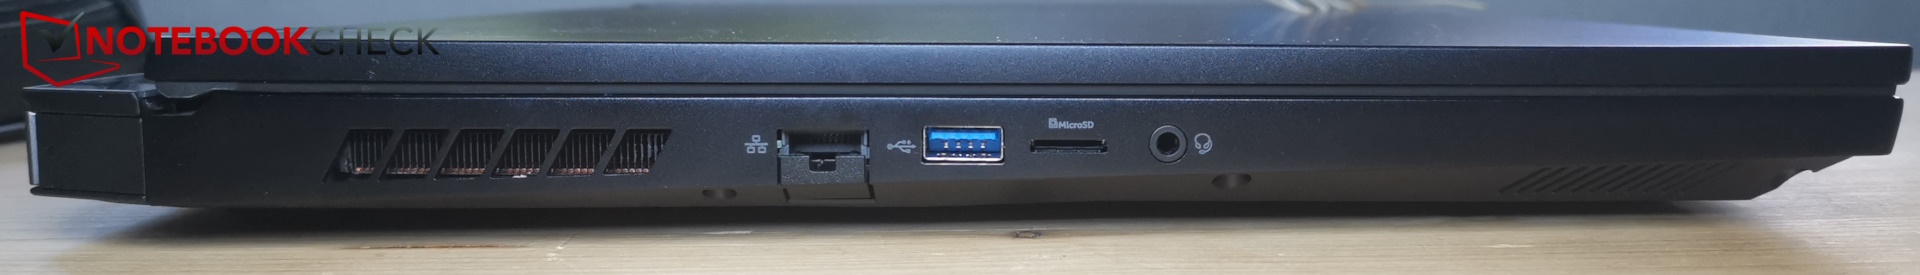
SD 读卡器
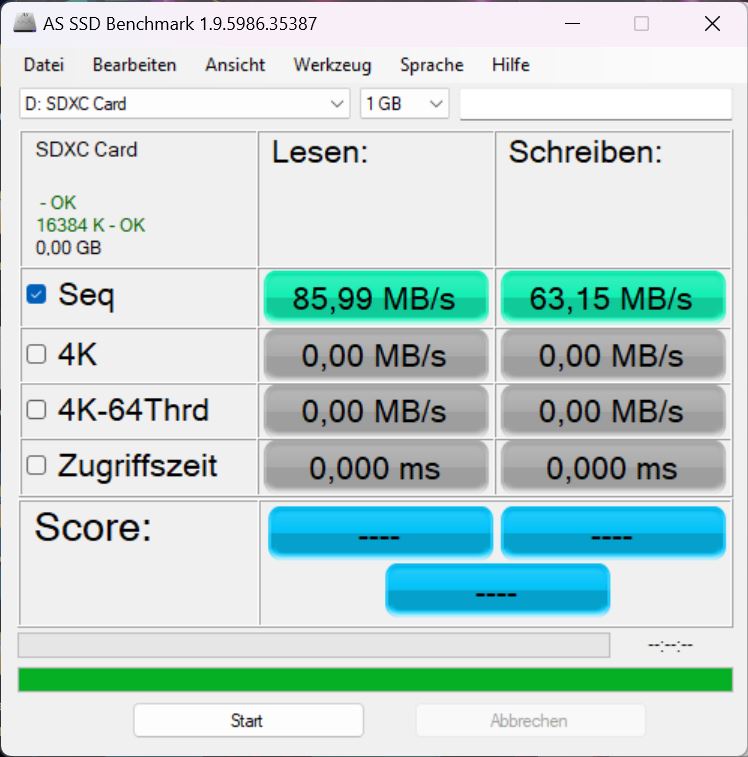
插入的 microSD 卡滑动到位,不会突出。事实证明,插入 AV PRO microSD 128 GB V60 时有些麻烦,因为必须向内推入比平齐位置稍远一些的位置才能将其锁定和分离。
读卡器的速度属于中等水平,并不突出。 刀锋 18或 Alienware m18的读卡器要快得多。
| SD Card Reader | |
| average JPG Copy Test (av. of 3 runs) | |
| Razer Blade 18 RTX 4070 (Angelibird AV Pro V60) | |
| Alienware m18 R1 (Angelibird AV Pro V60) | |
| Average of class Gaming (20.9 - 210, n=54, last 2 years) | |
| HP Omen 17-ck2097ng (AV PRO microSD 128 GB V60) | |
| Acer Predator Helios 18 N23Q2 | |
| MSI GE78HX 13VH-070US (Angelibird AV Pro V60) | |
| maximum AS SSD Seq Read Test (1GB) | |
| Alienware m18 R1 (Angelibird AV Pro V60) | |
| Razer Blade 18 RTX 4070 (Angelibird AV Pro V60) | |
| Average of class Gaming (25.5 - 261, n=51, last 2 years) | |
| MSI GE78HX 13VH-070US (Angelibird AV Pro V60) | |
| Acer Predator Helios 18 N23Q2 | |
| HP Omen 17-ck2097ng (AV PRO microSD 128 GB V60) | |
交流
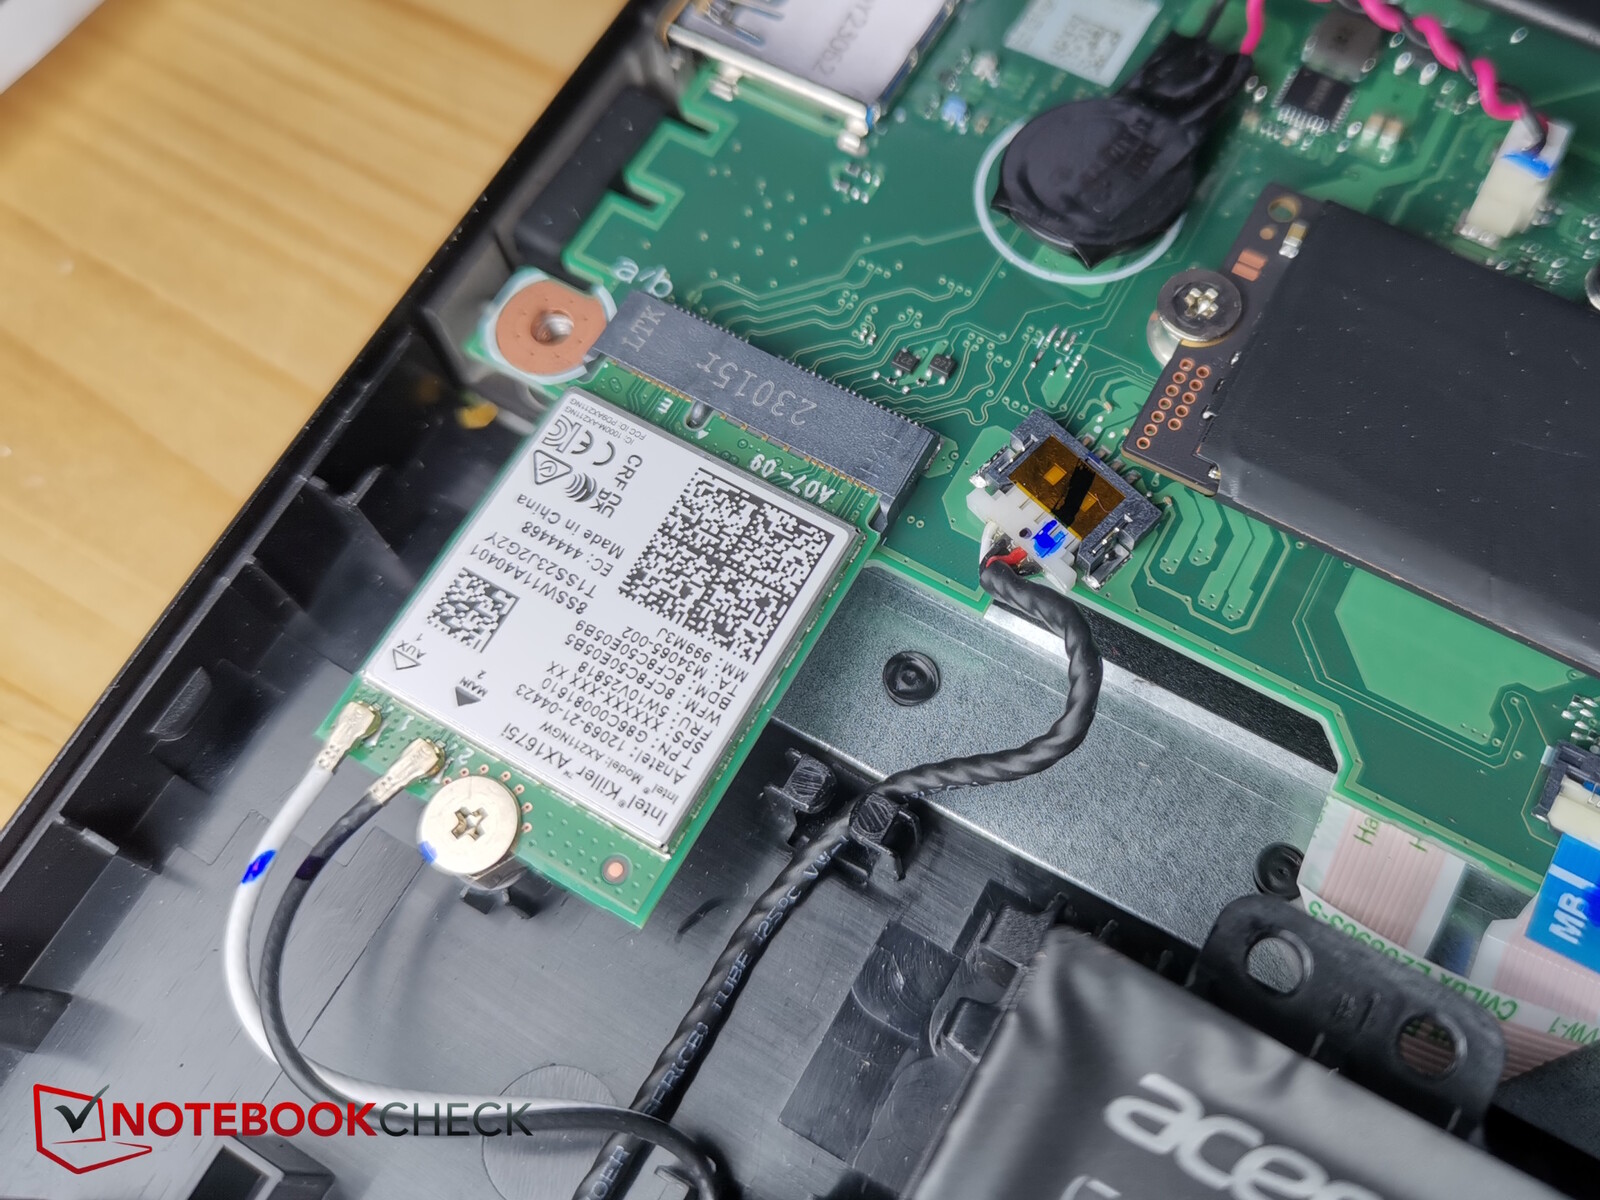
宏碁使用 Killer WiFi 6E AX1675i WiFi 模块,该模块在 6 GHz 模式下支持 6E,可确保约 1.5 Mbps 的良好传输速率。在 5 GHz 网络中,传输速率要慢得多,约为 900 Mbit/s。
事实证明,传输速率非常稳定。
网络摄像头
相机可拍摄全高清照片和视频。质量可以接受:色彩偏差保持在限制范围内。蓝色色调的偏差最大。


安全
板载 TPM 和钢锁连接。但没有指纹传感器。
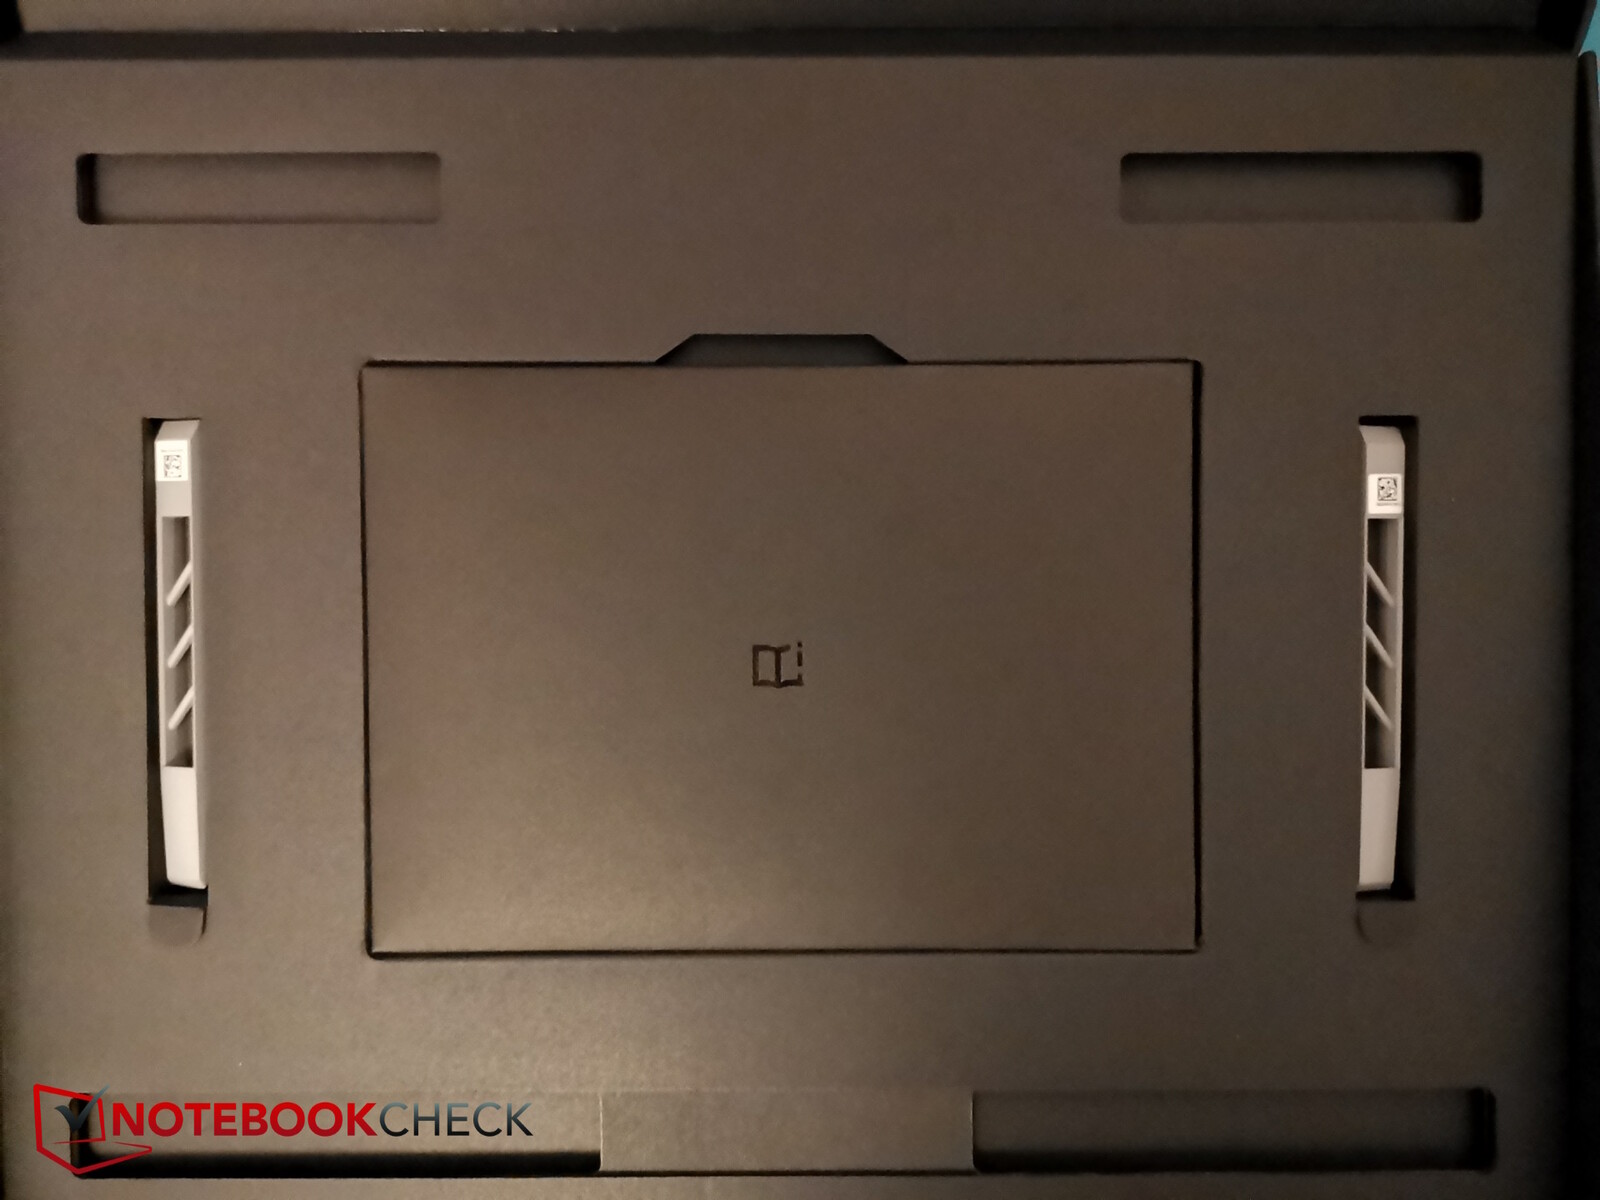
配件和保修
除笔记本电脑、电源和常规文件外,交货范围还包括一对用于 Helios 18 背面的风扇罩。
宏碁在德国提供 24 个月的标准保修。在其他国家可能会有所不同,因此潜在买家在购买前应仔细确认。
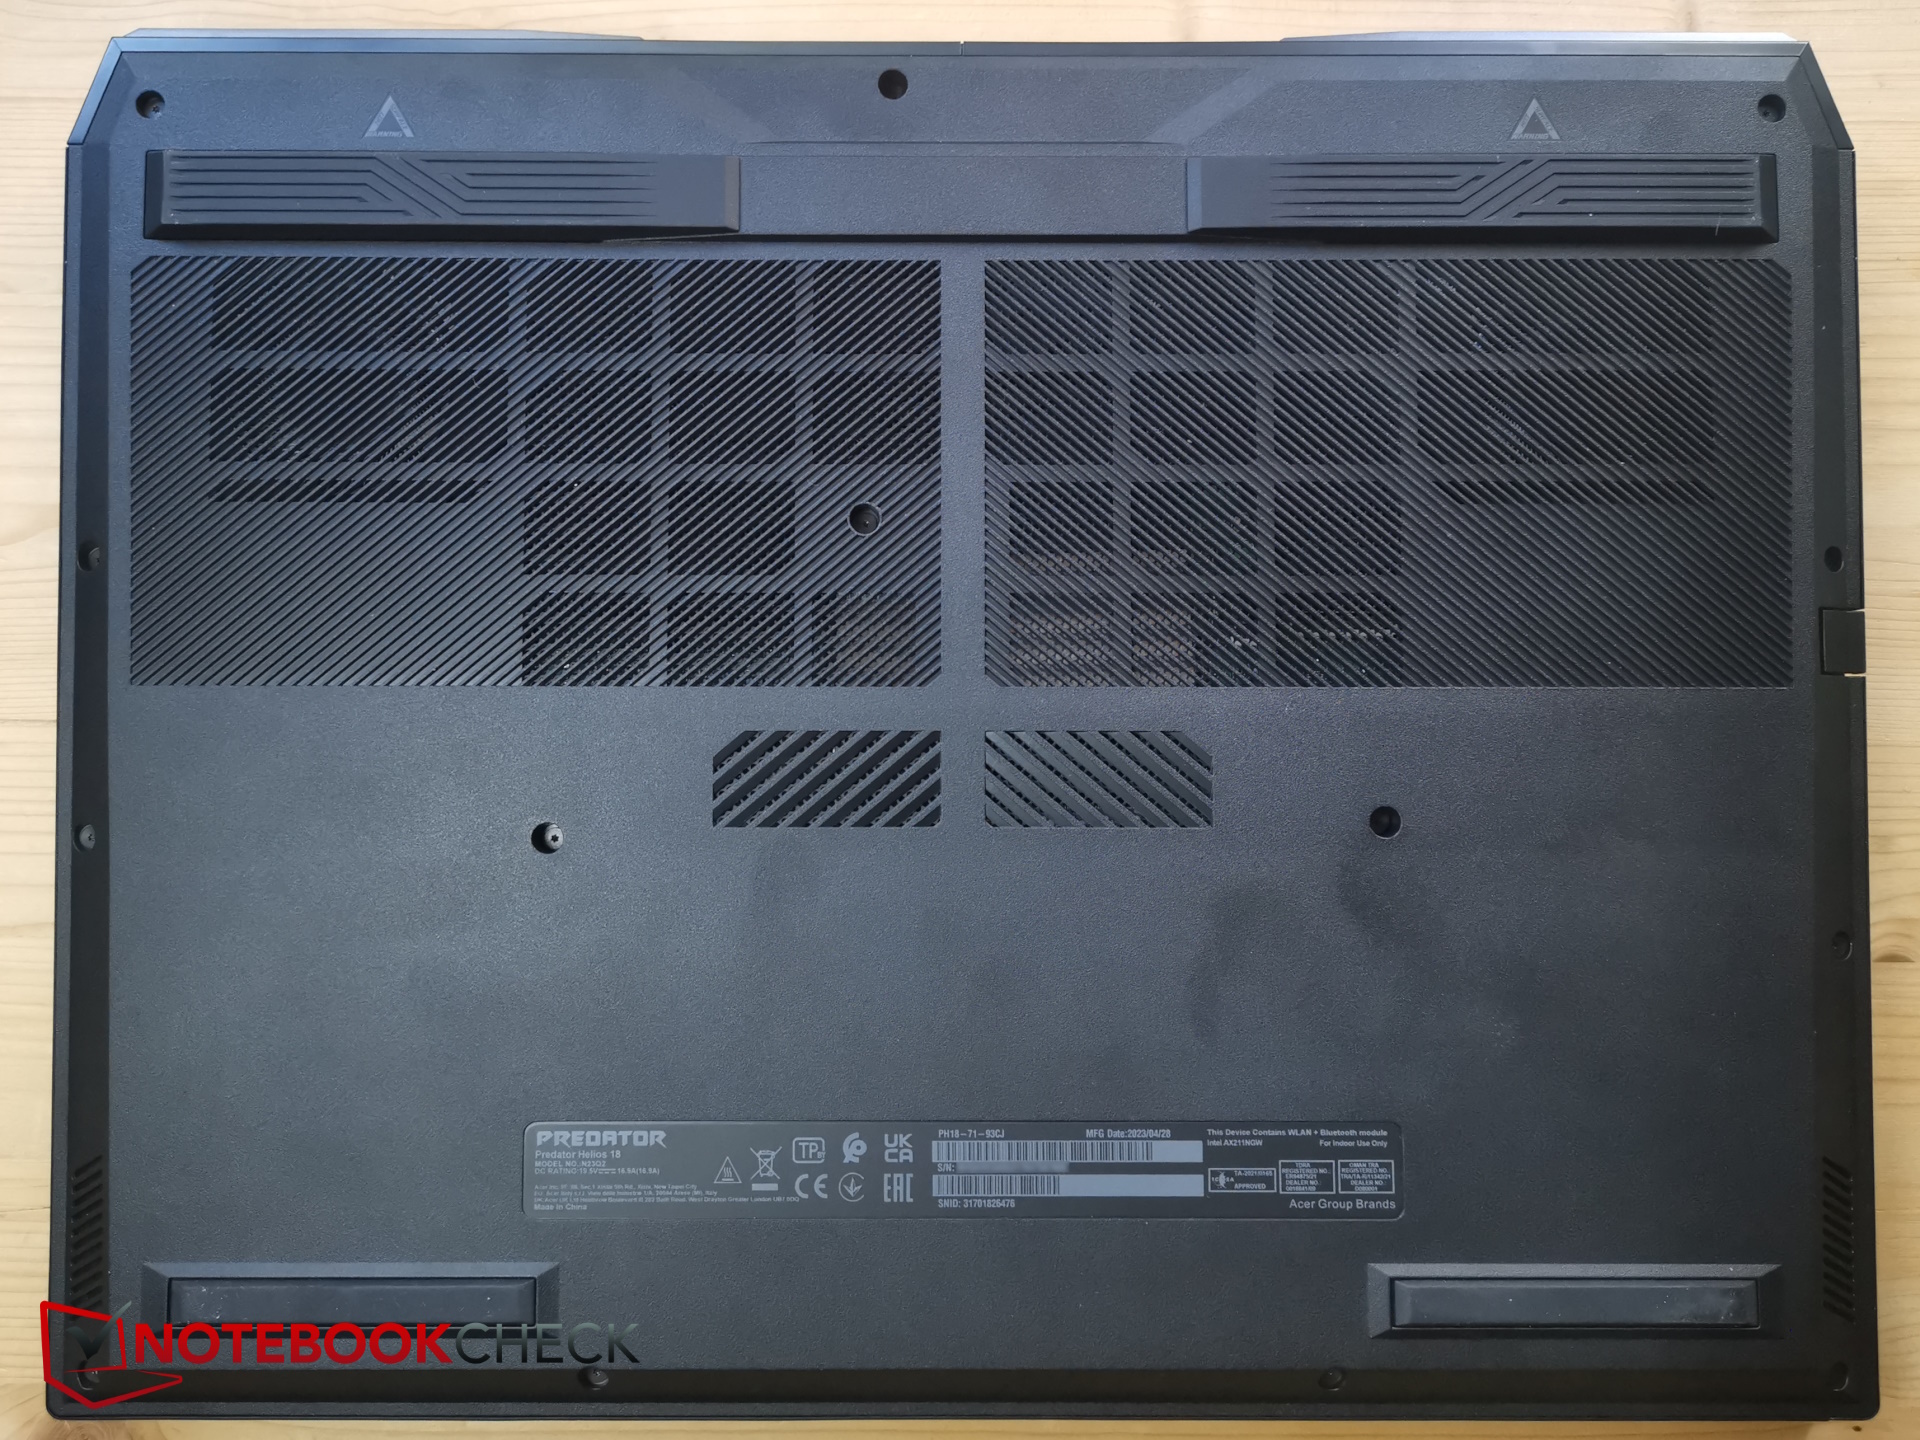
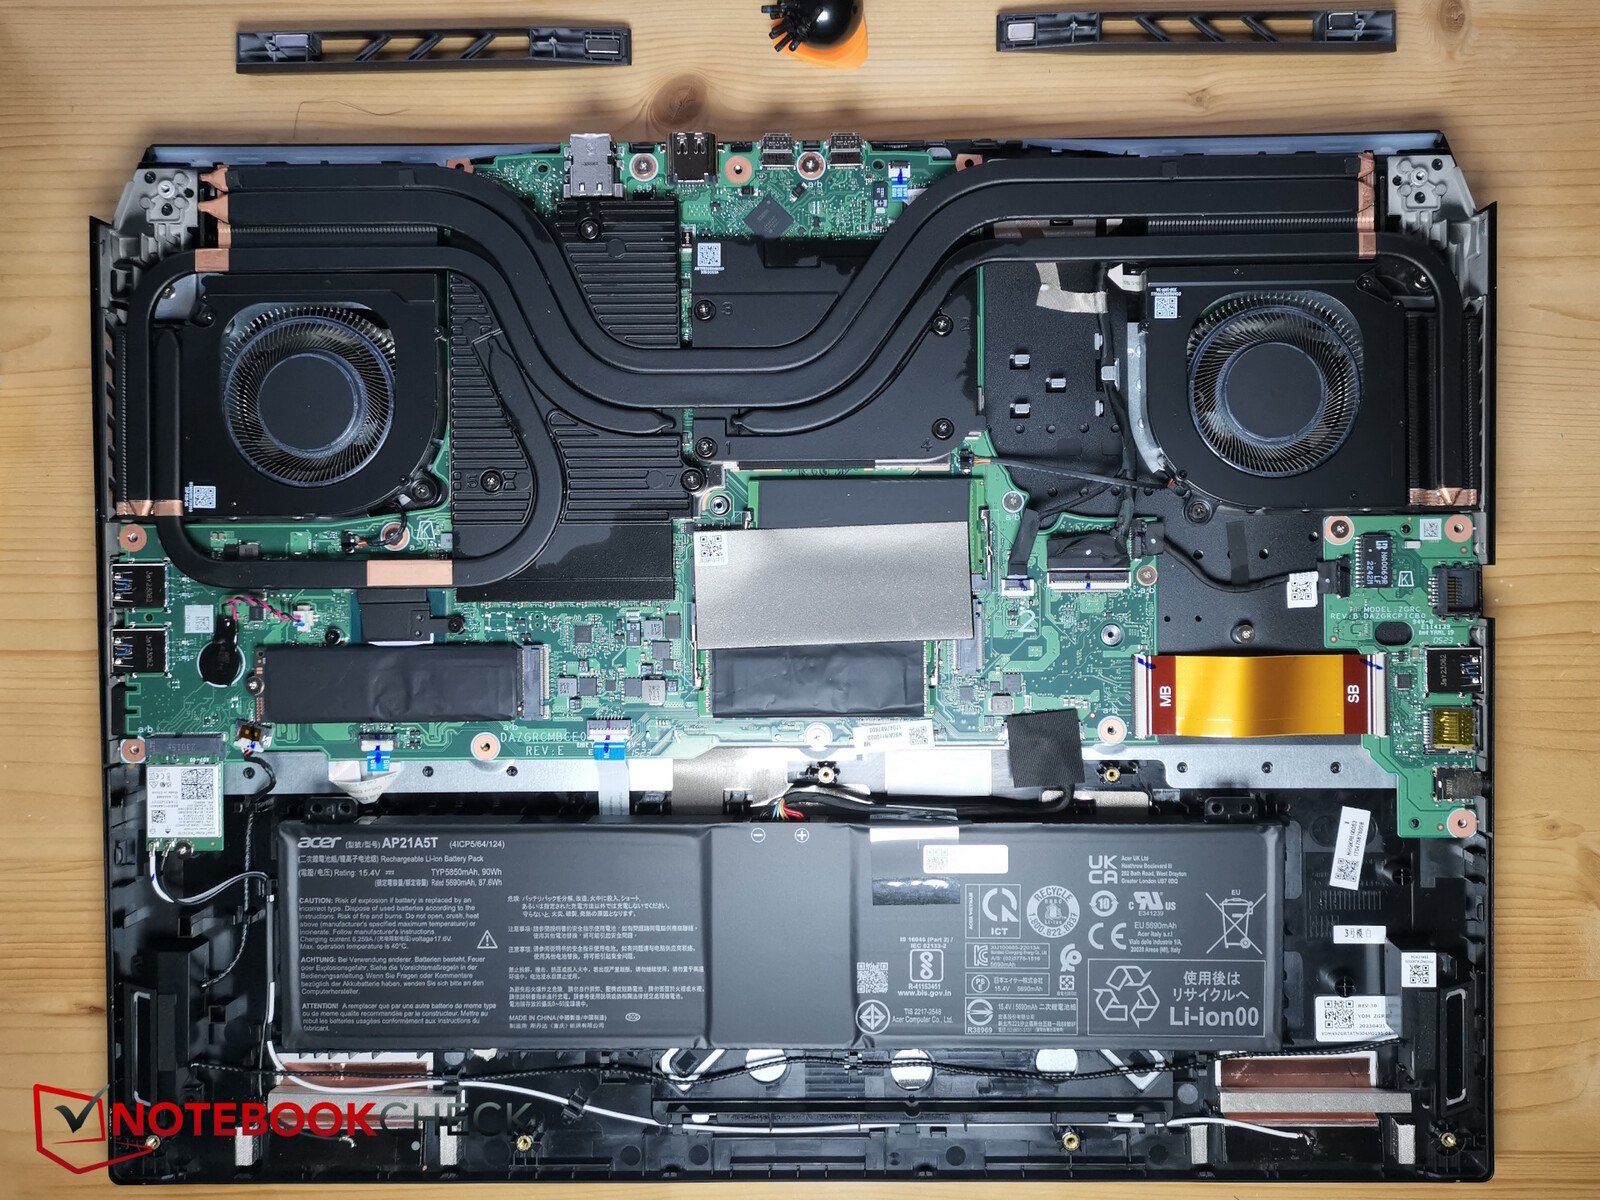
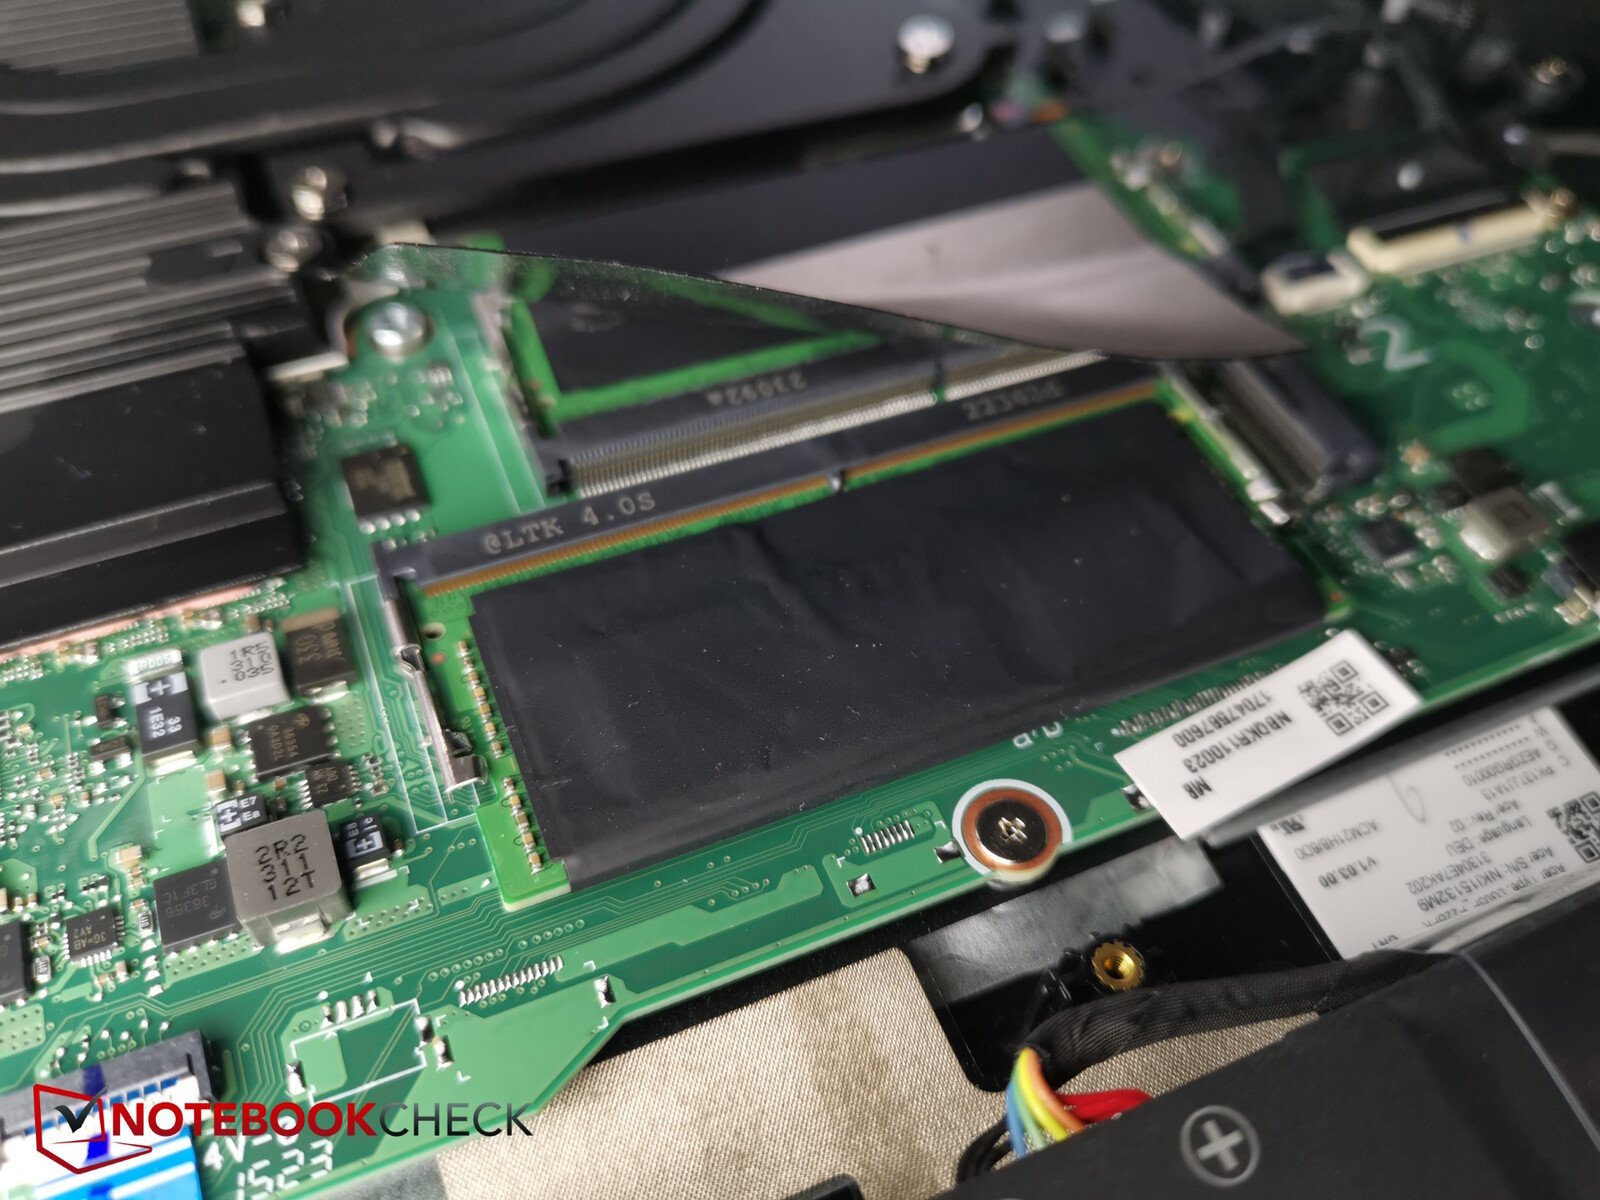
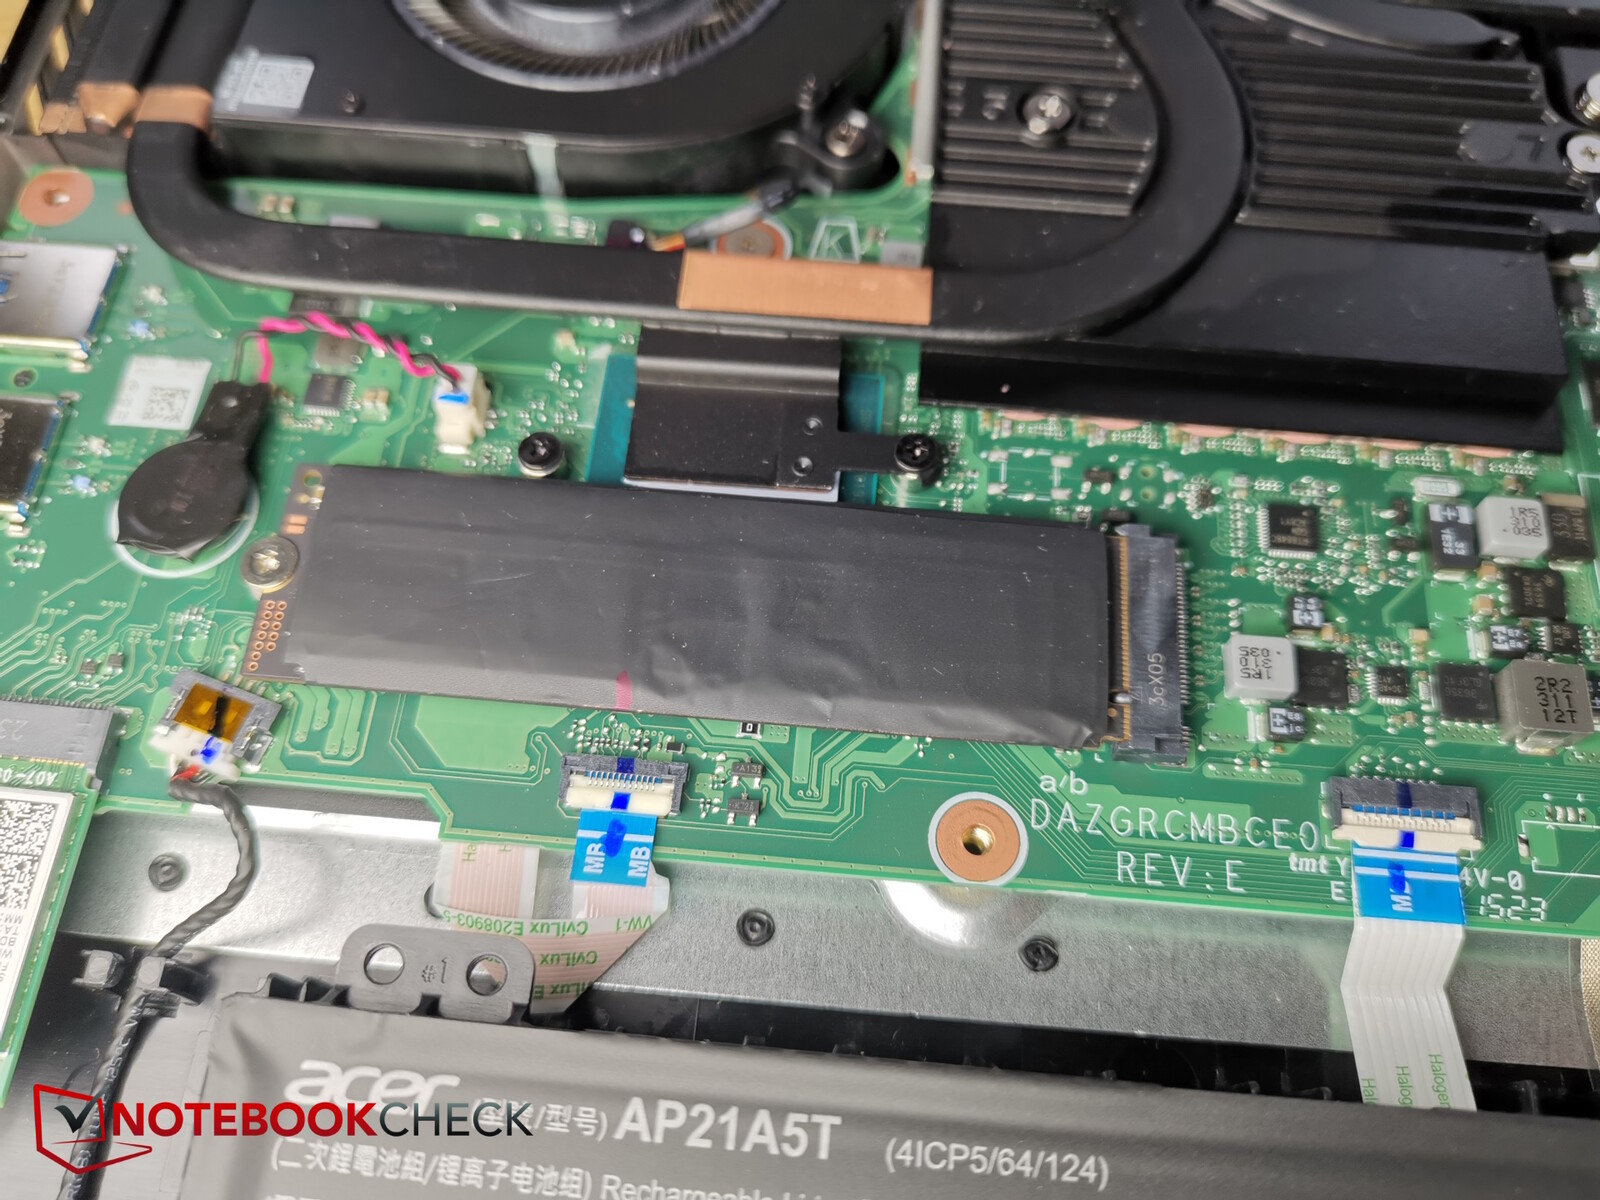
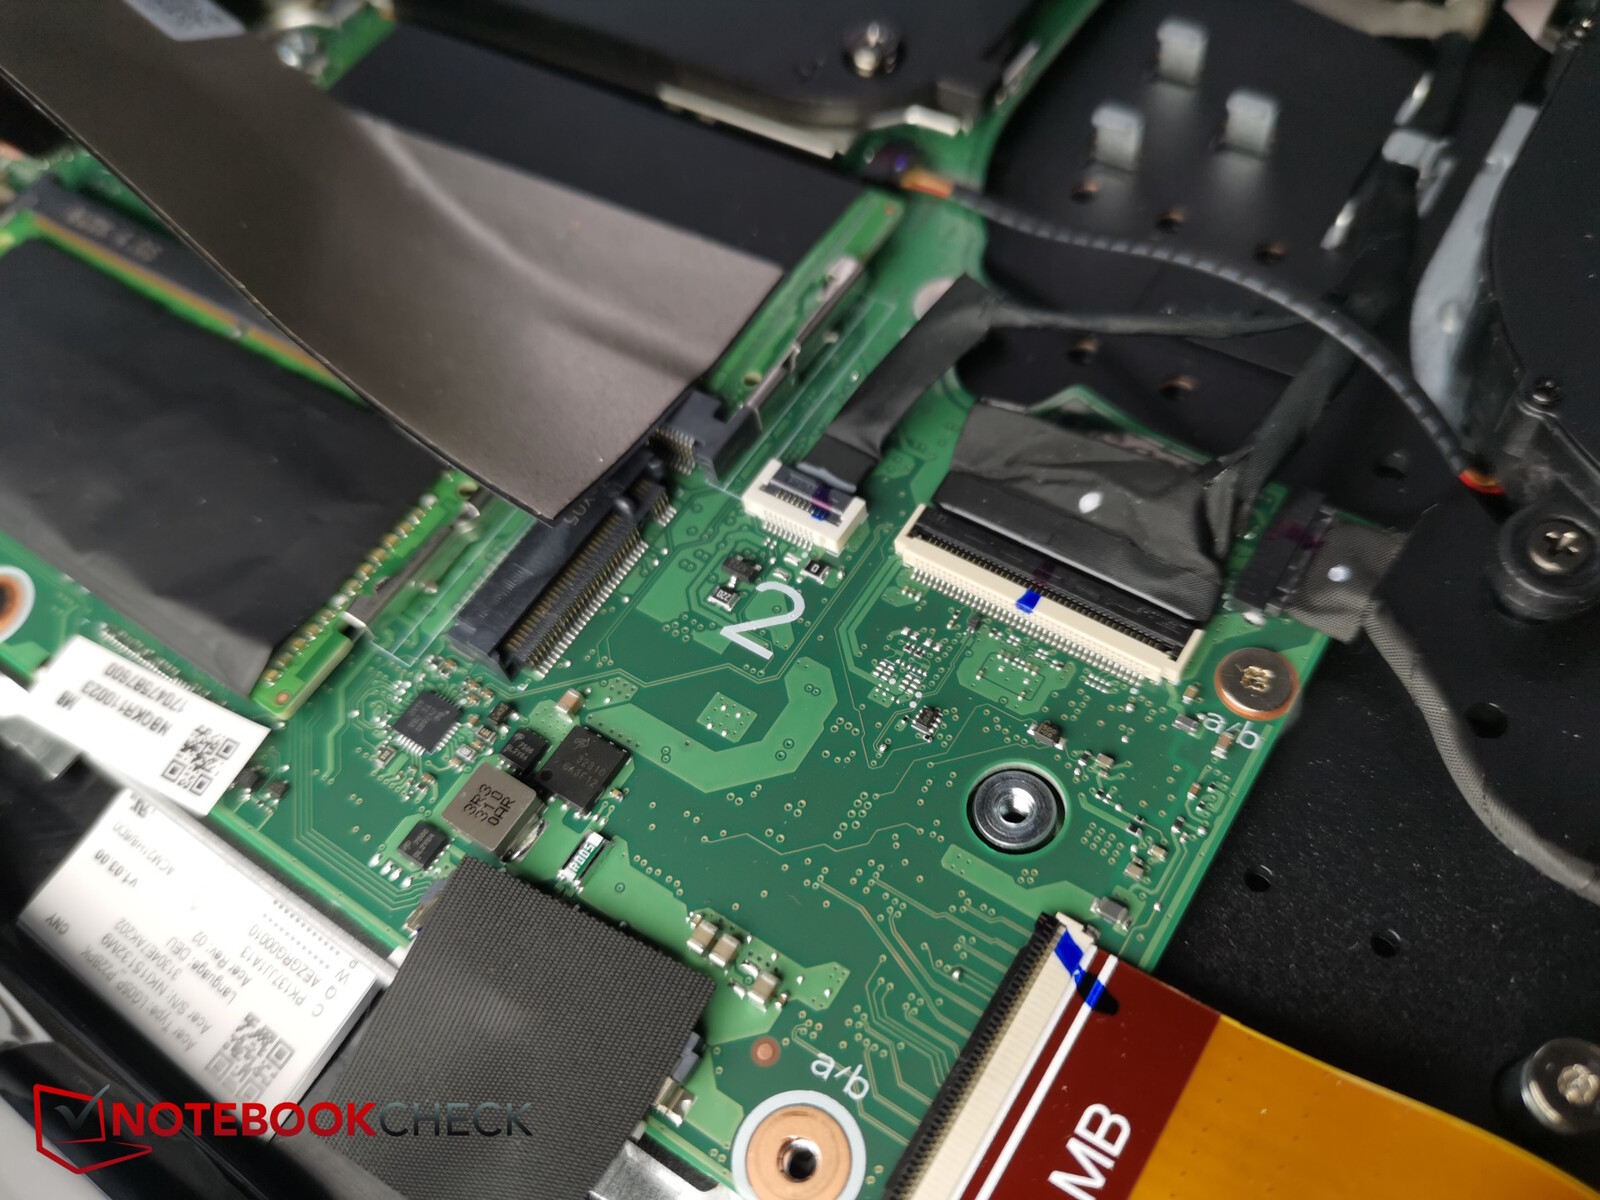
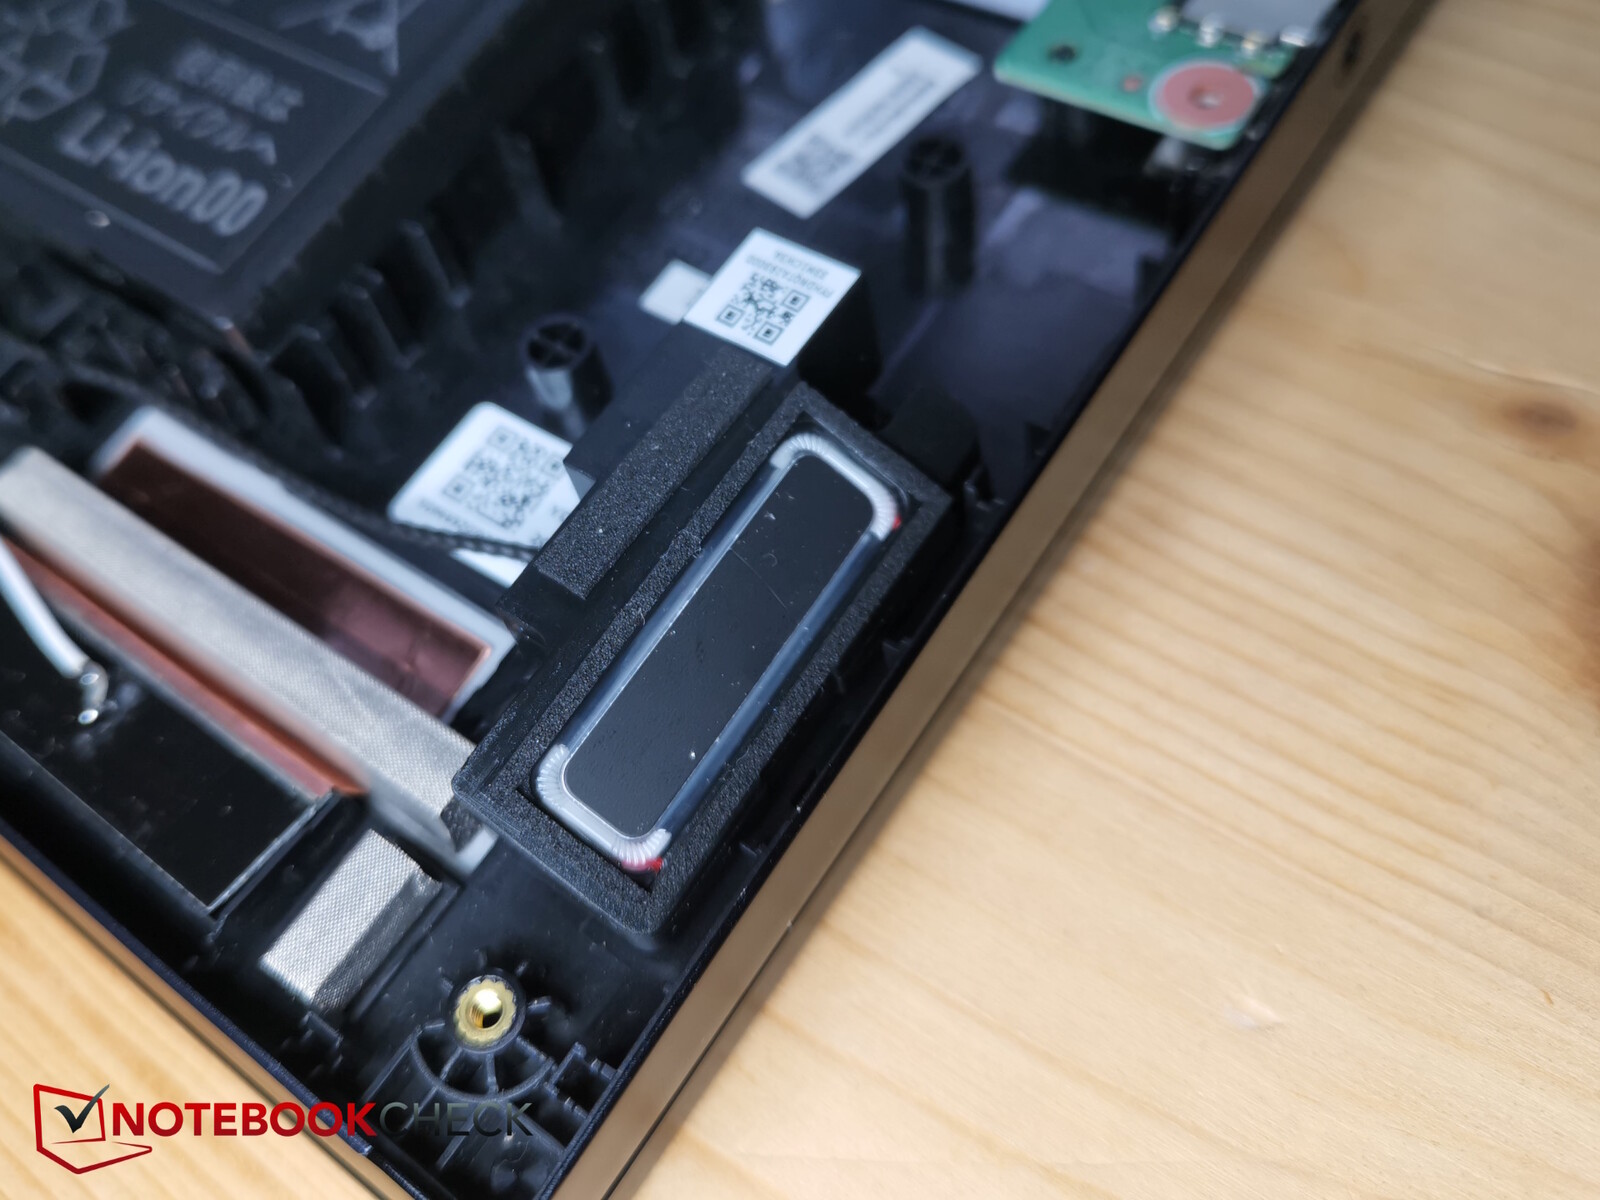
维护
打开 Helios 18 并不那么容易,因为夹具很紧,铝制底座也很坚固,但还是可以打开的。首先,必须拧松 14 颗相同大小的 Torx 螺钉。之后,最好用窄边塑料工具从正面四角撬开背面。
。
进入宏碁掠夺者后,用户可以接触到风扇、电池、固态硬盘(外加第二个插槽)、内存插槽和 WiFi 模块。
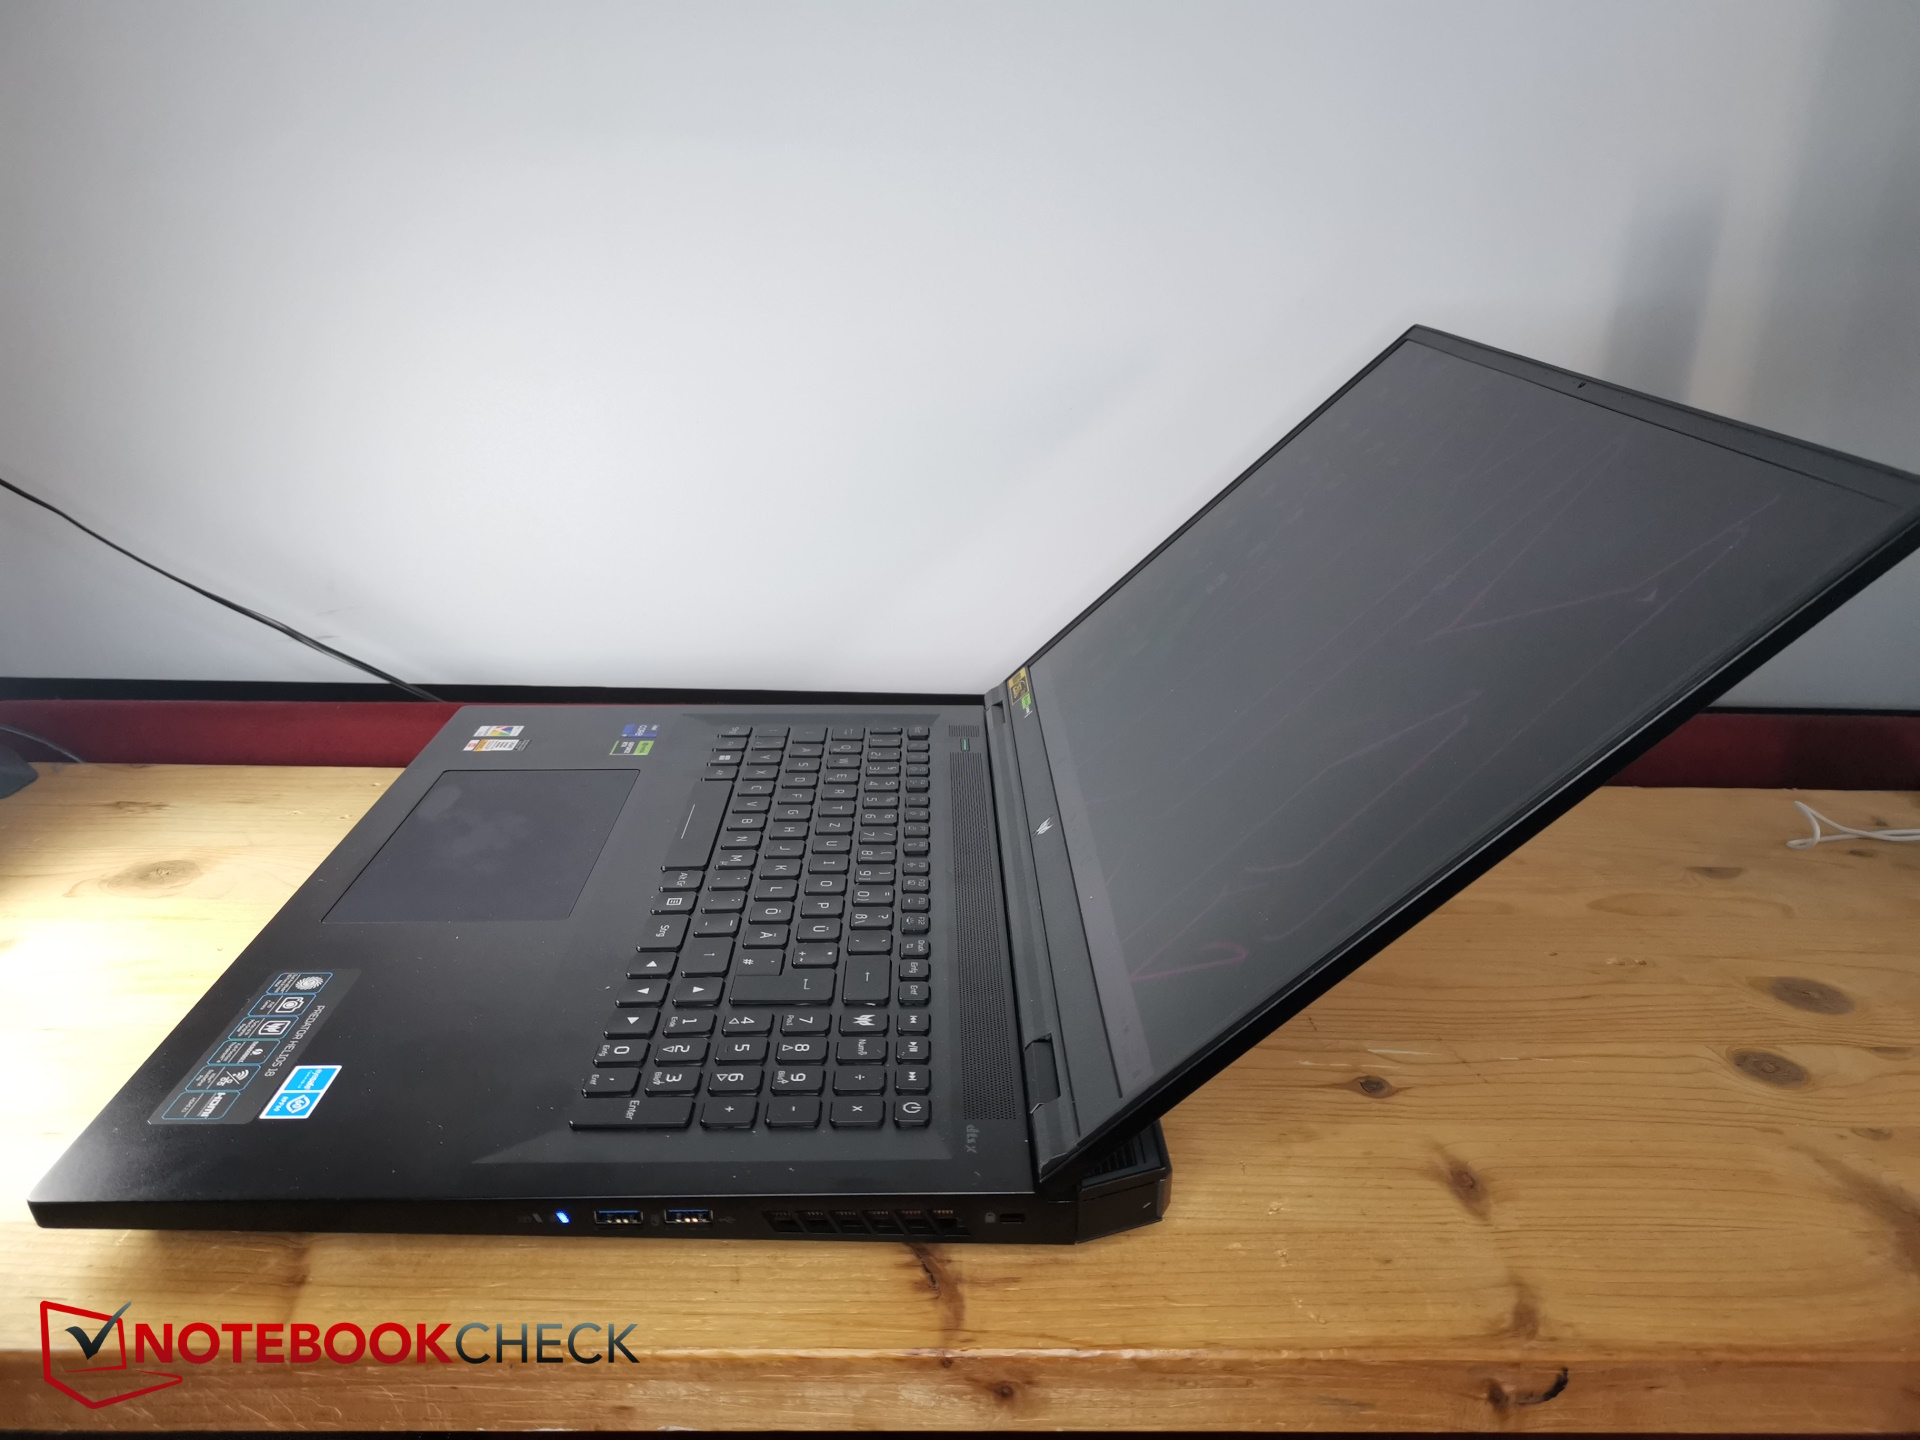
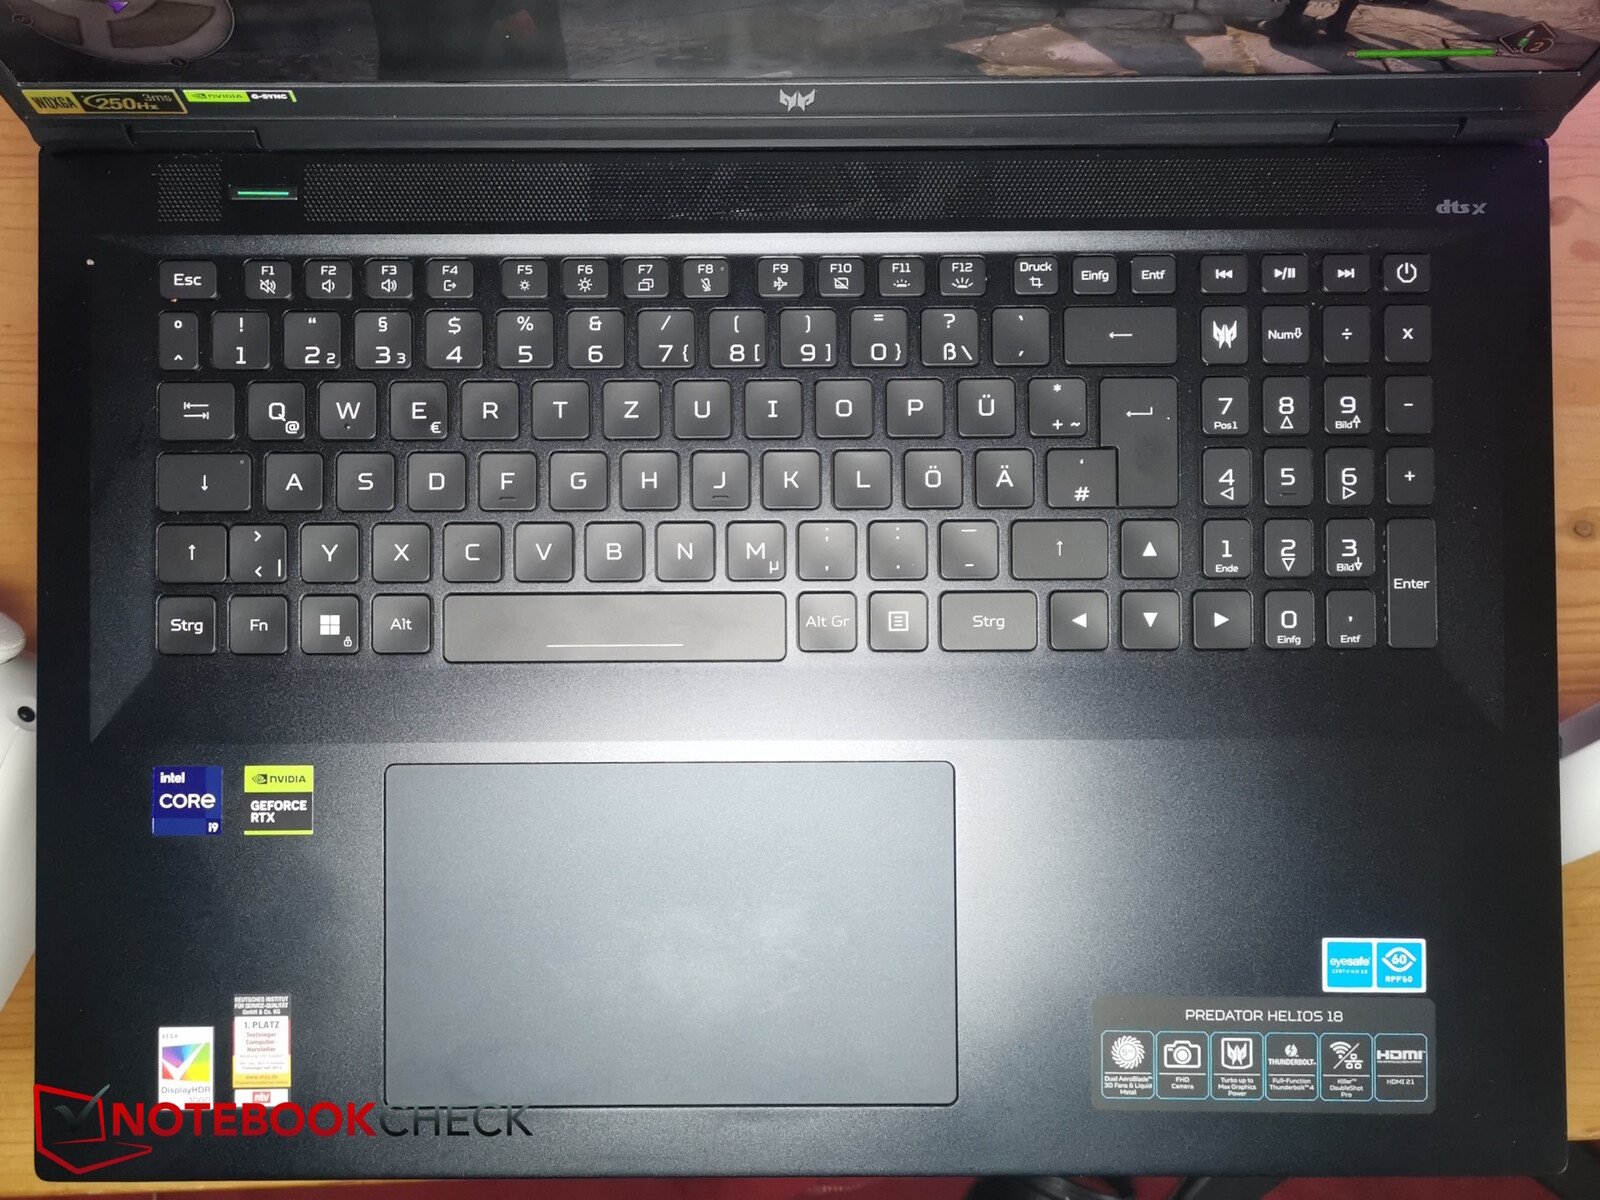
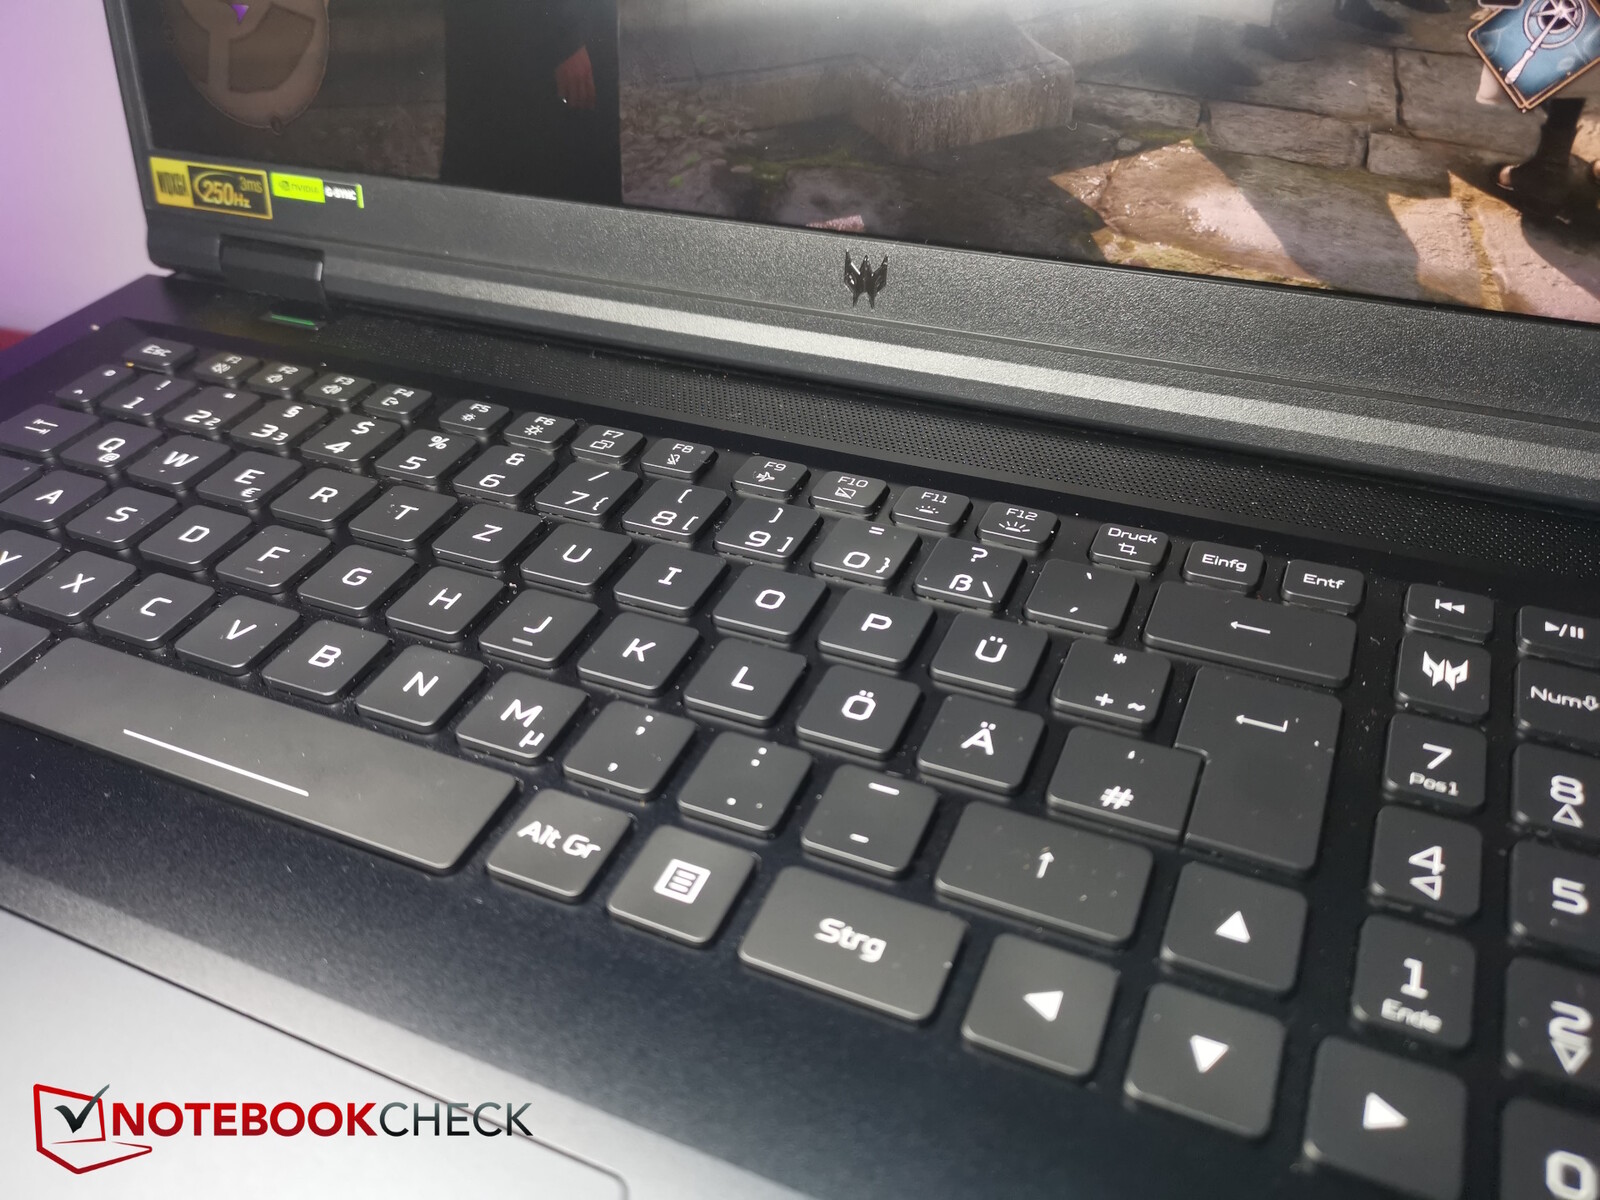
输入设备 - 按键也采用 MiniLED
键盘
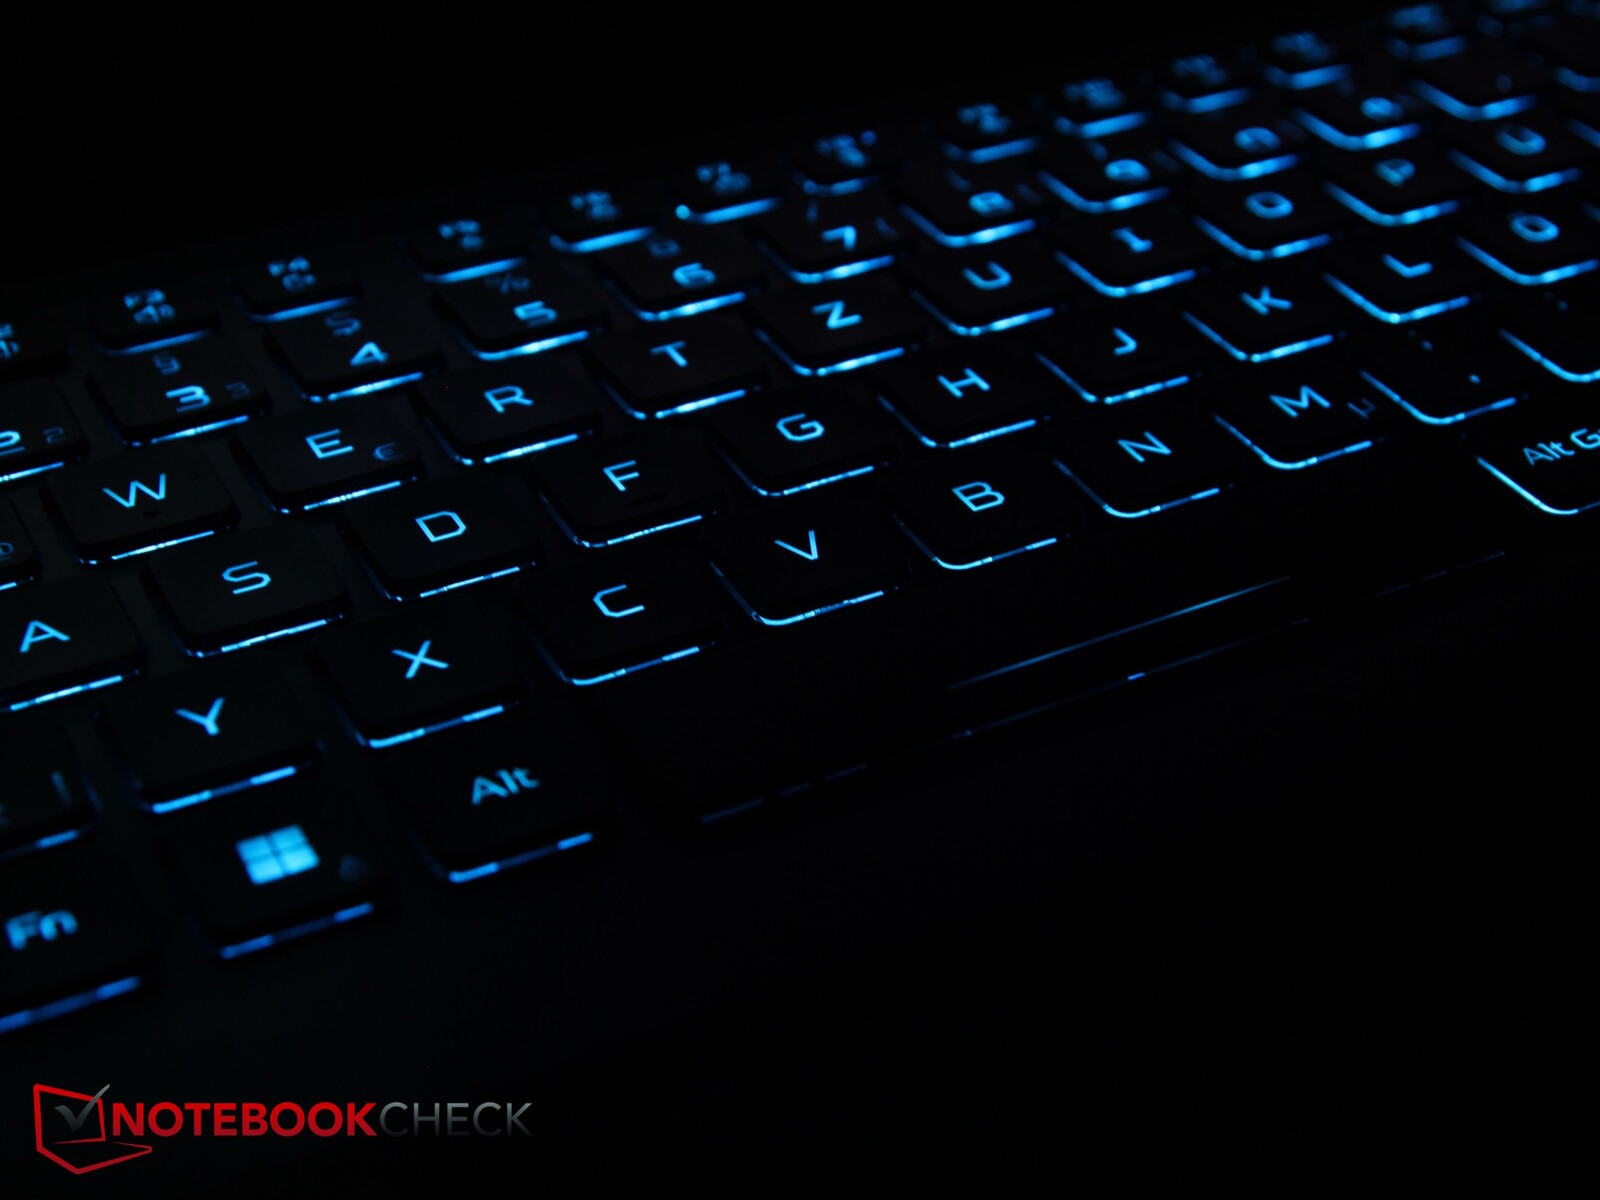
Predator 的布局非常整洁,包括全尺寸方向键、右侧的数字键盘以及用于调用 Predator Sense 软件和切换性能模式的额外按键。
。
按键尺寸为 1.5 x 1.5 毫米,键程适中,反馈明显,但可能会更硬一些。打字噪音适中,打字速度很快。
据宏碁称,RGB 按键背光通过 MiniLED 实现,就像显示屏一样,可分四级调节。
触摸板
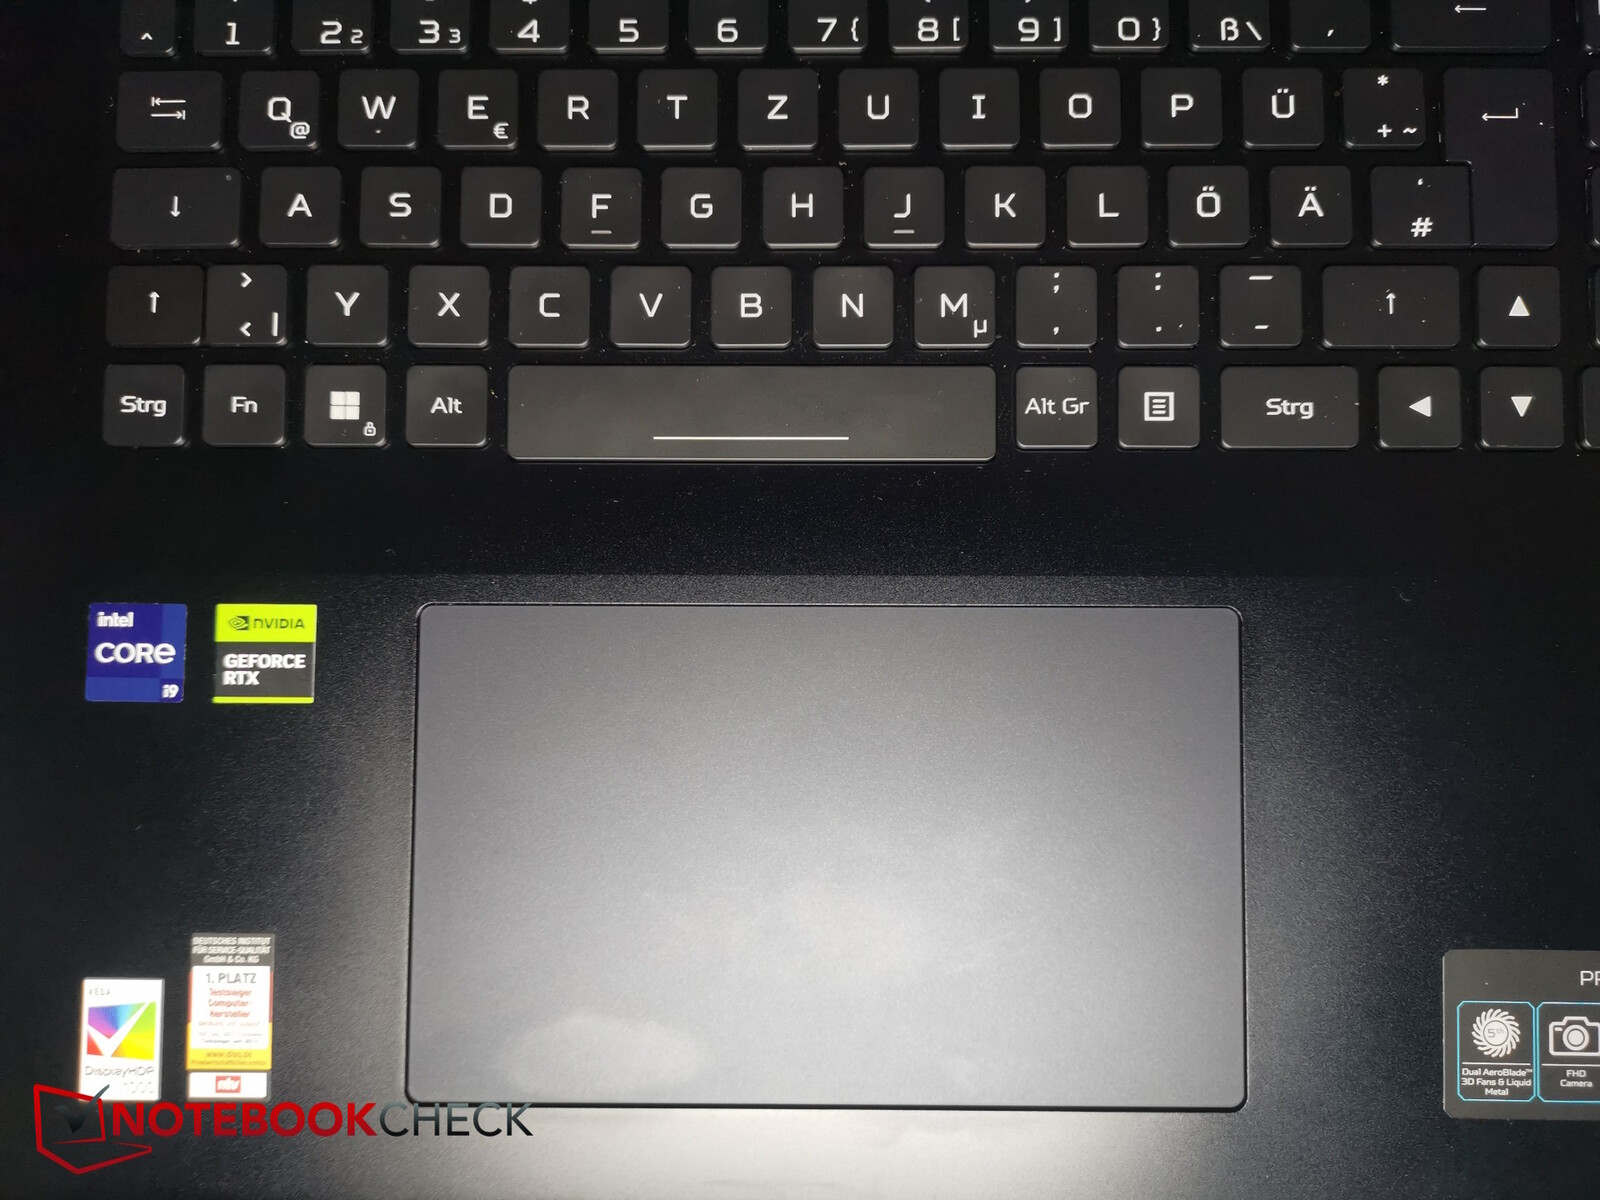
18 英寸触摸板非常大(约 15.2 x 9.1 厘米),滑动性能非常好,几乎不会出现卡顿现象。
集成的点击按钮非常安静,行程极短,但触发可靠,反馈良好。
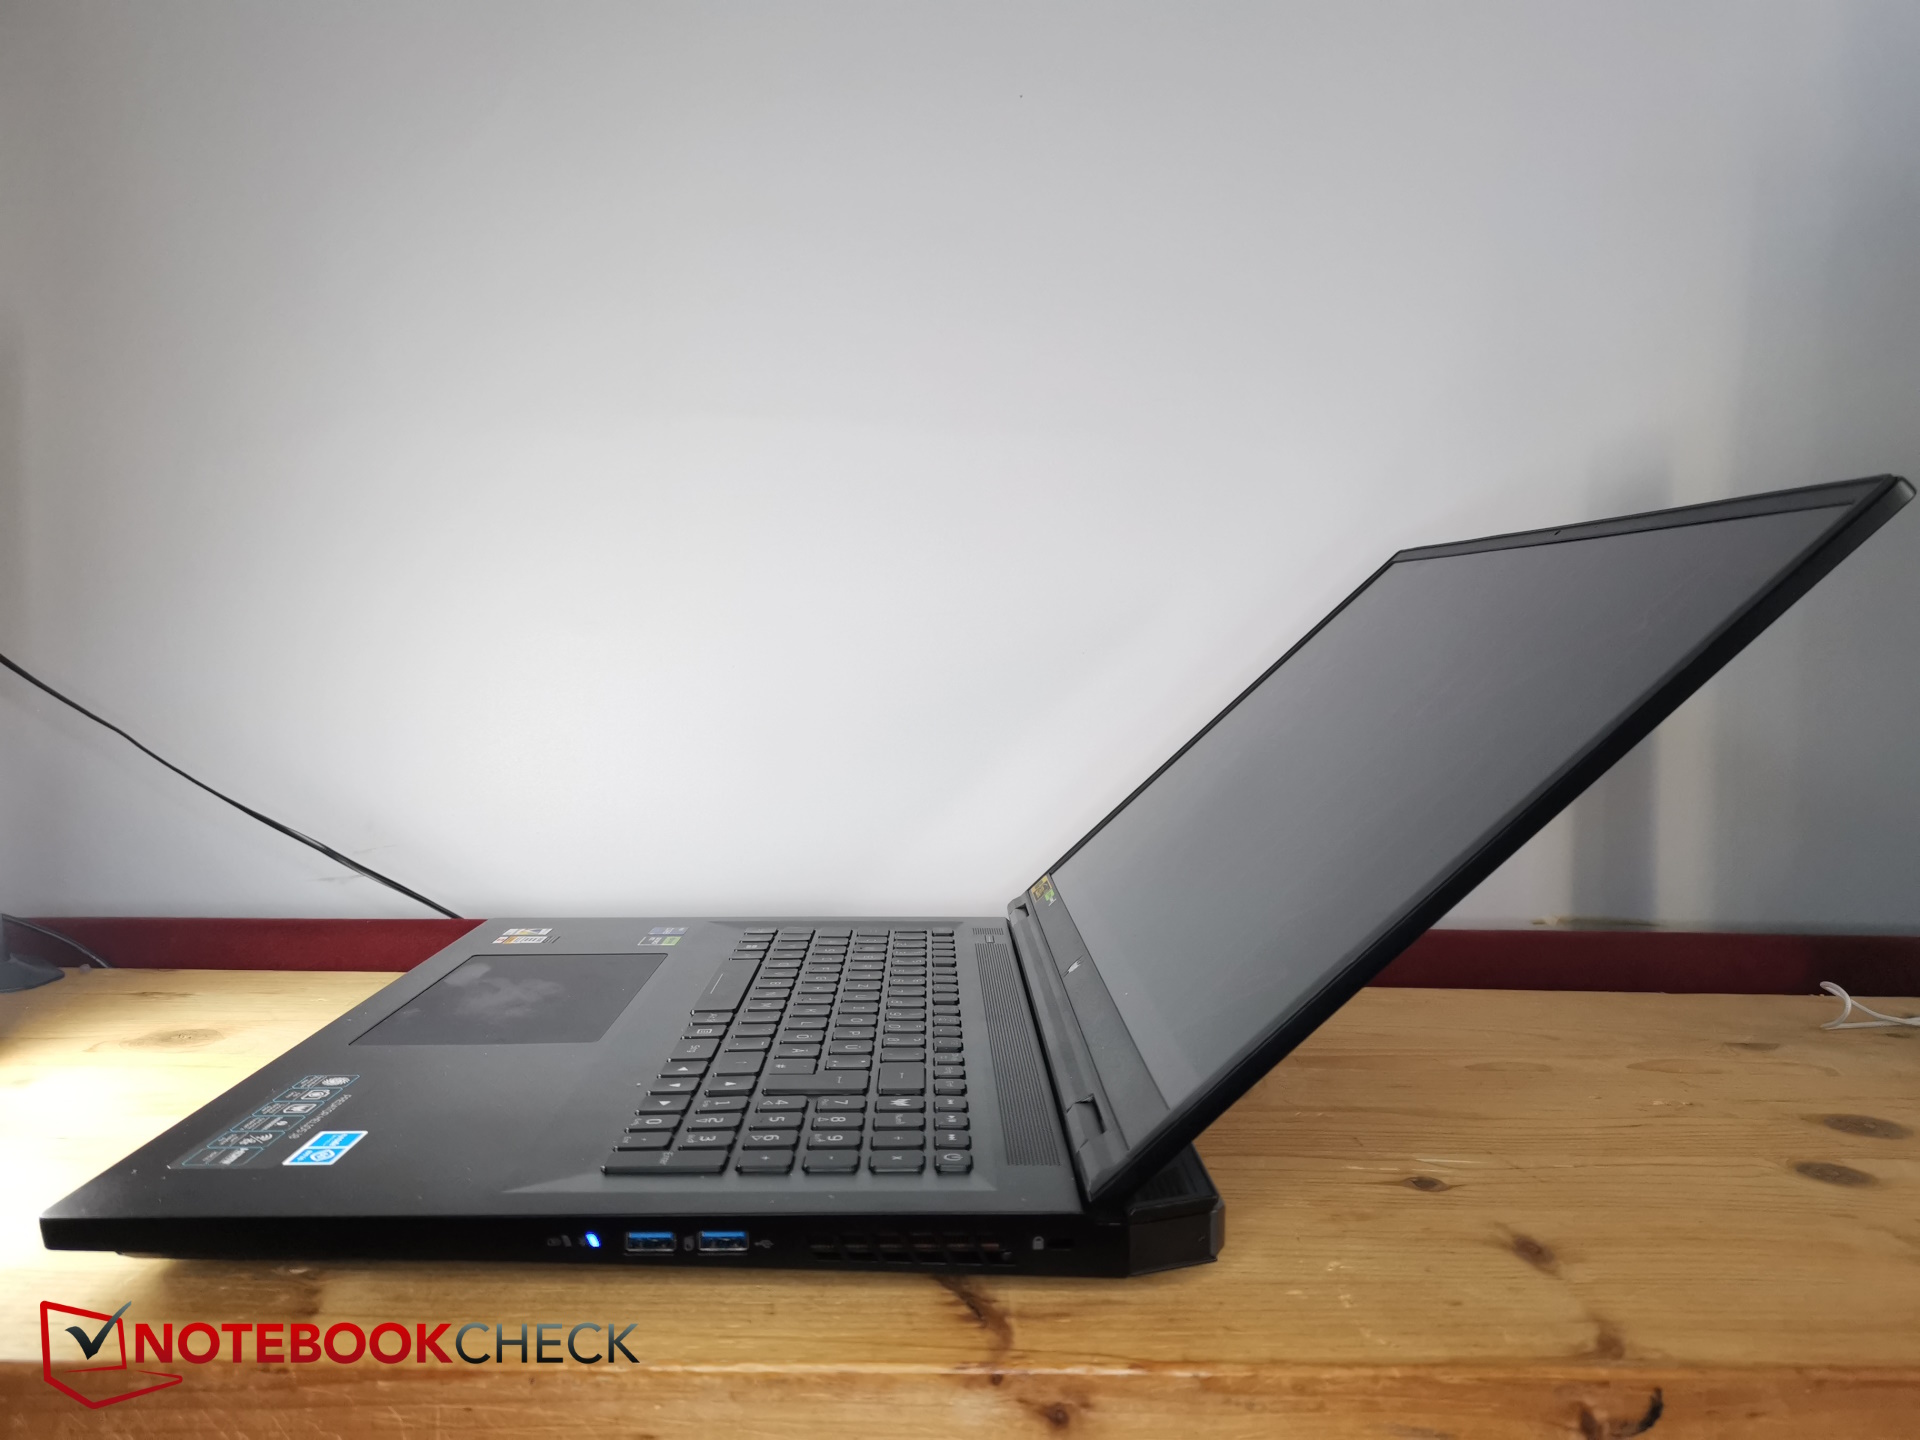
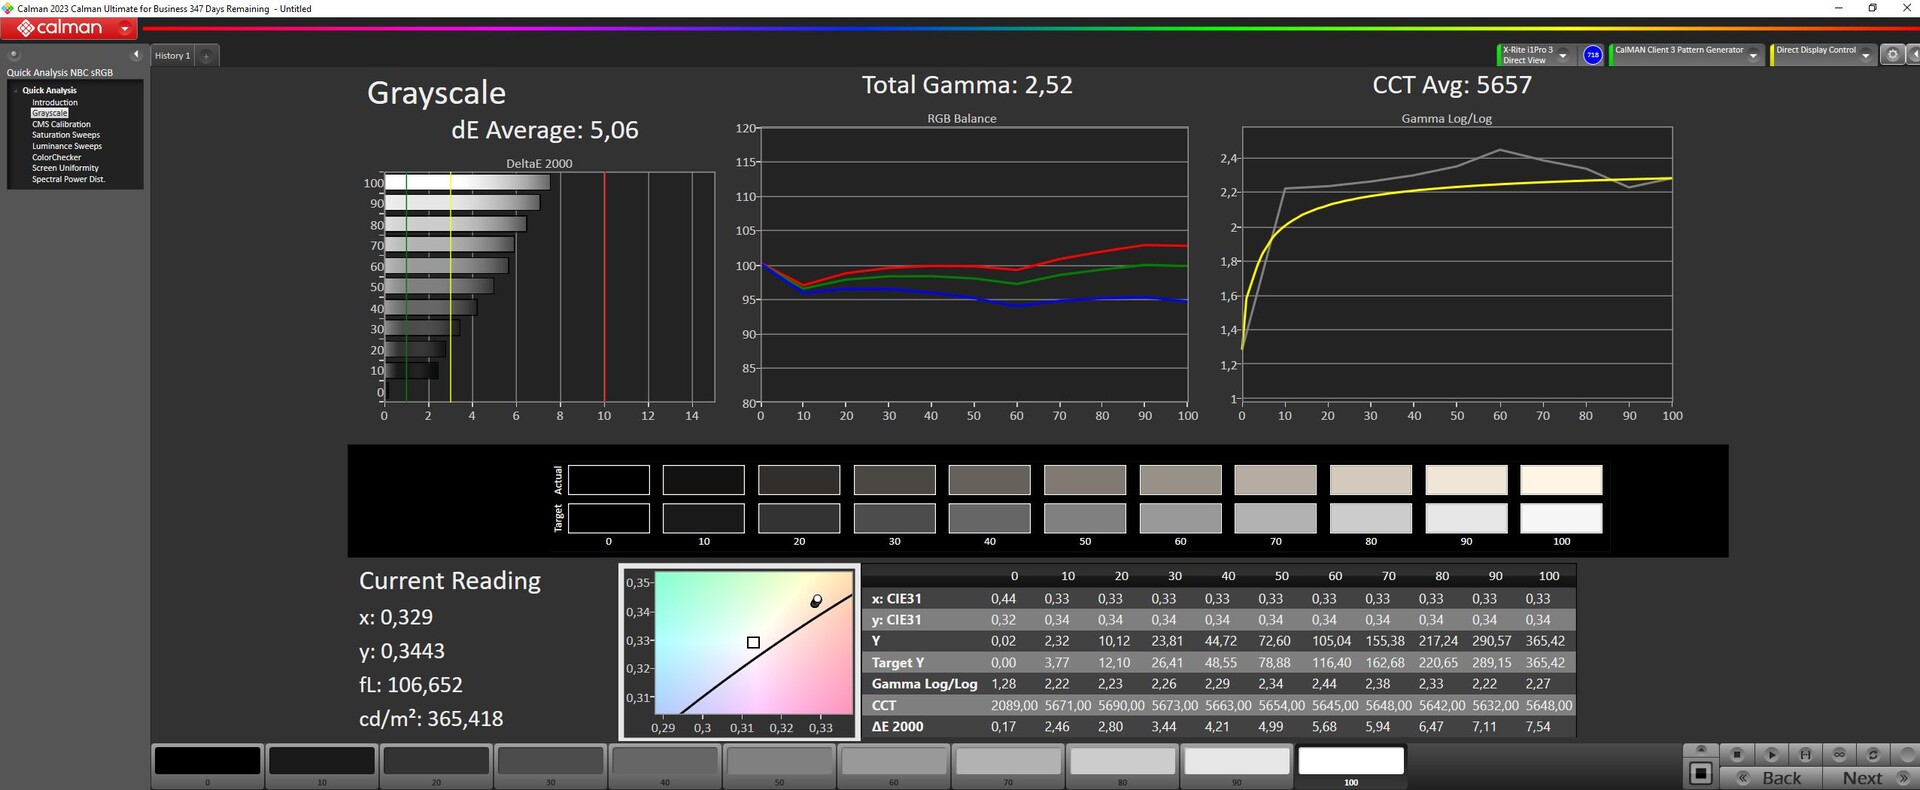
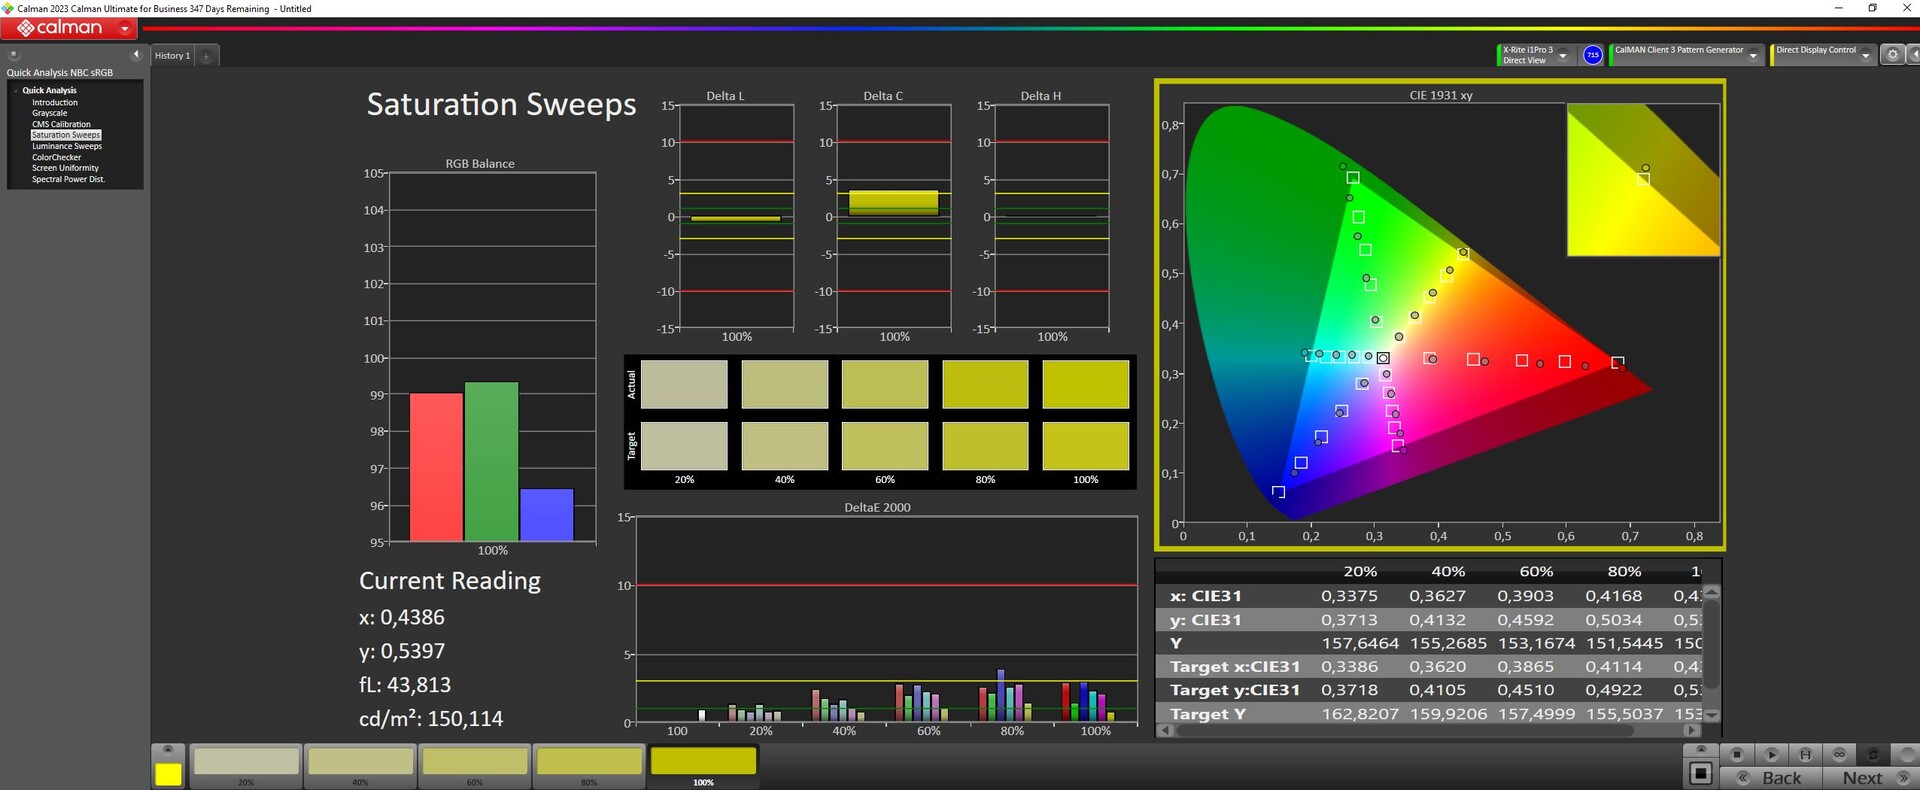
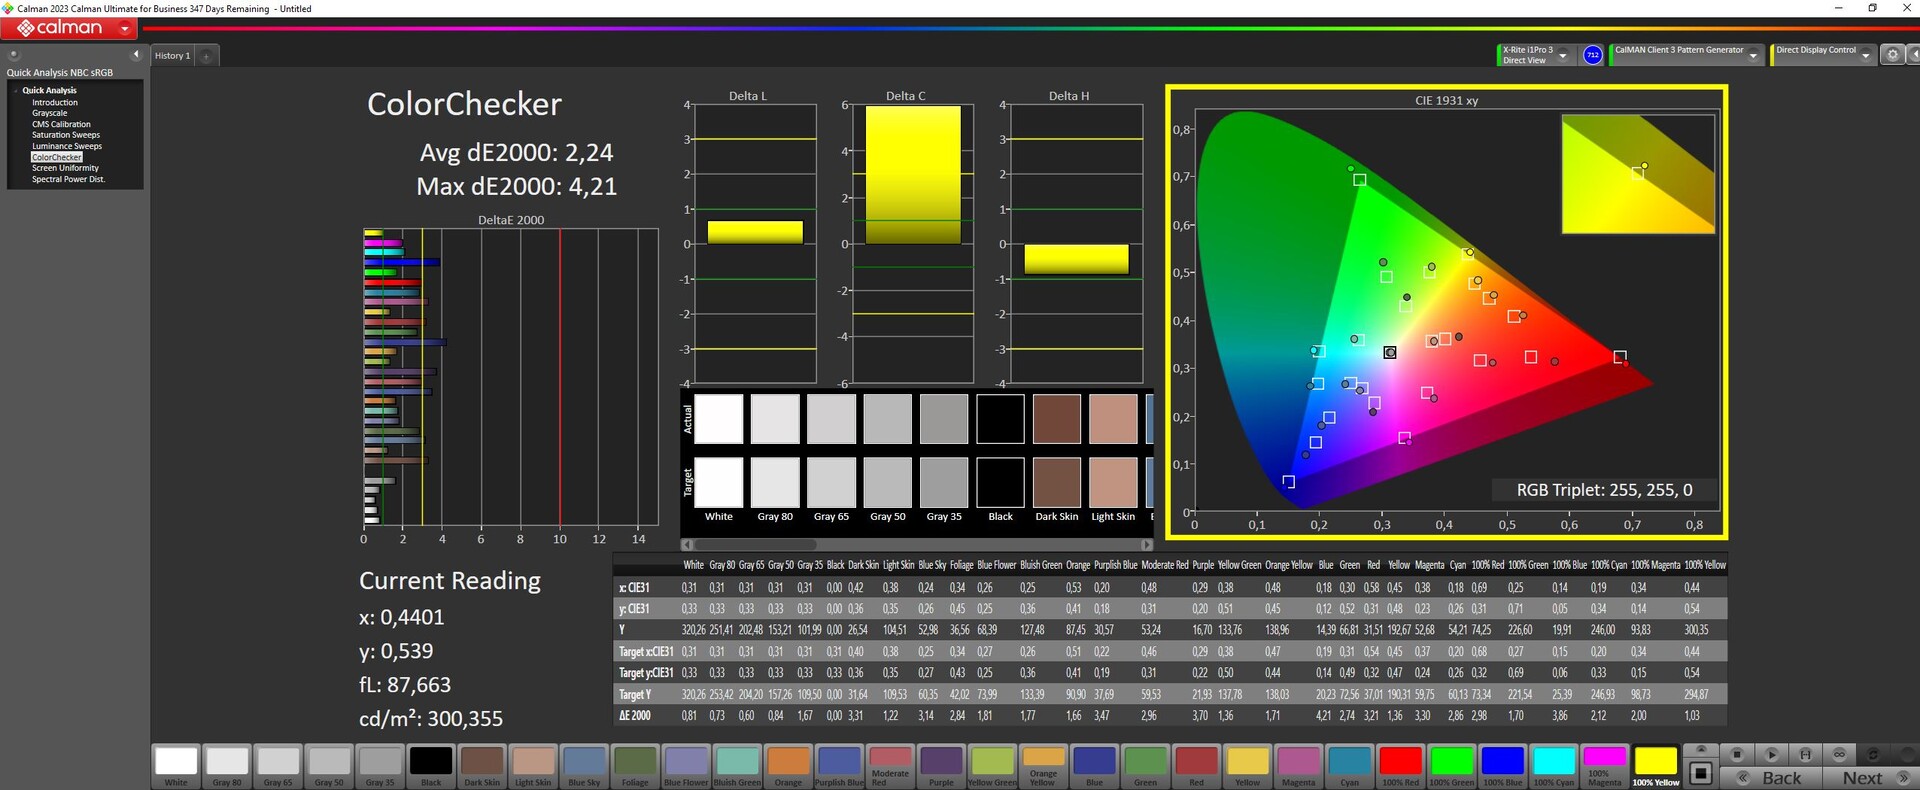
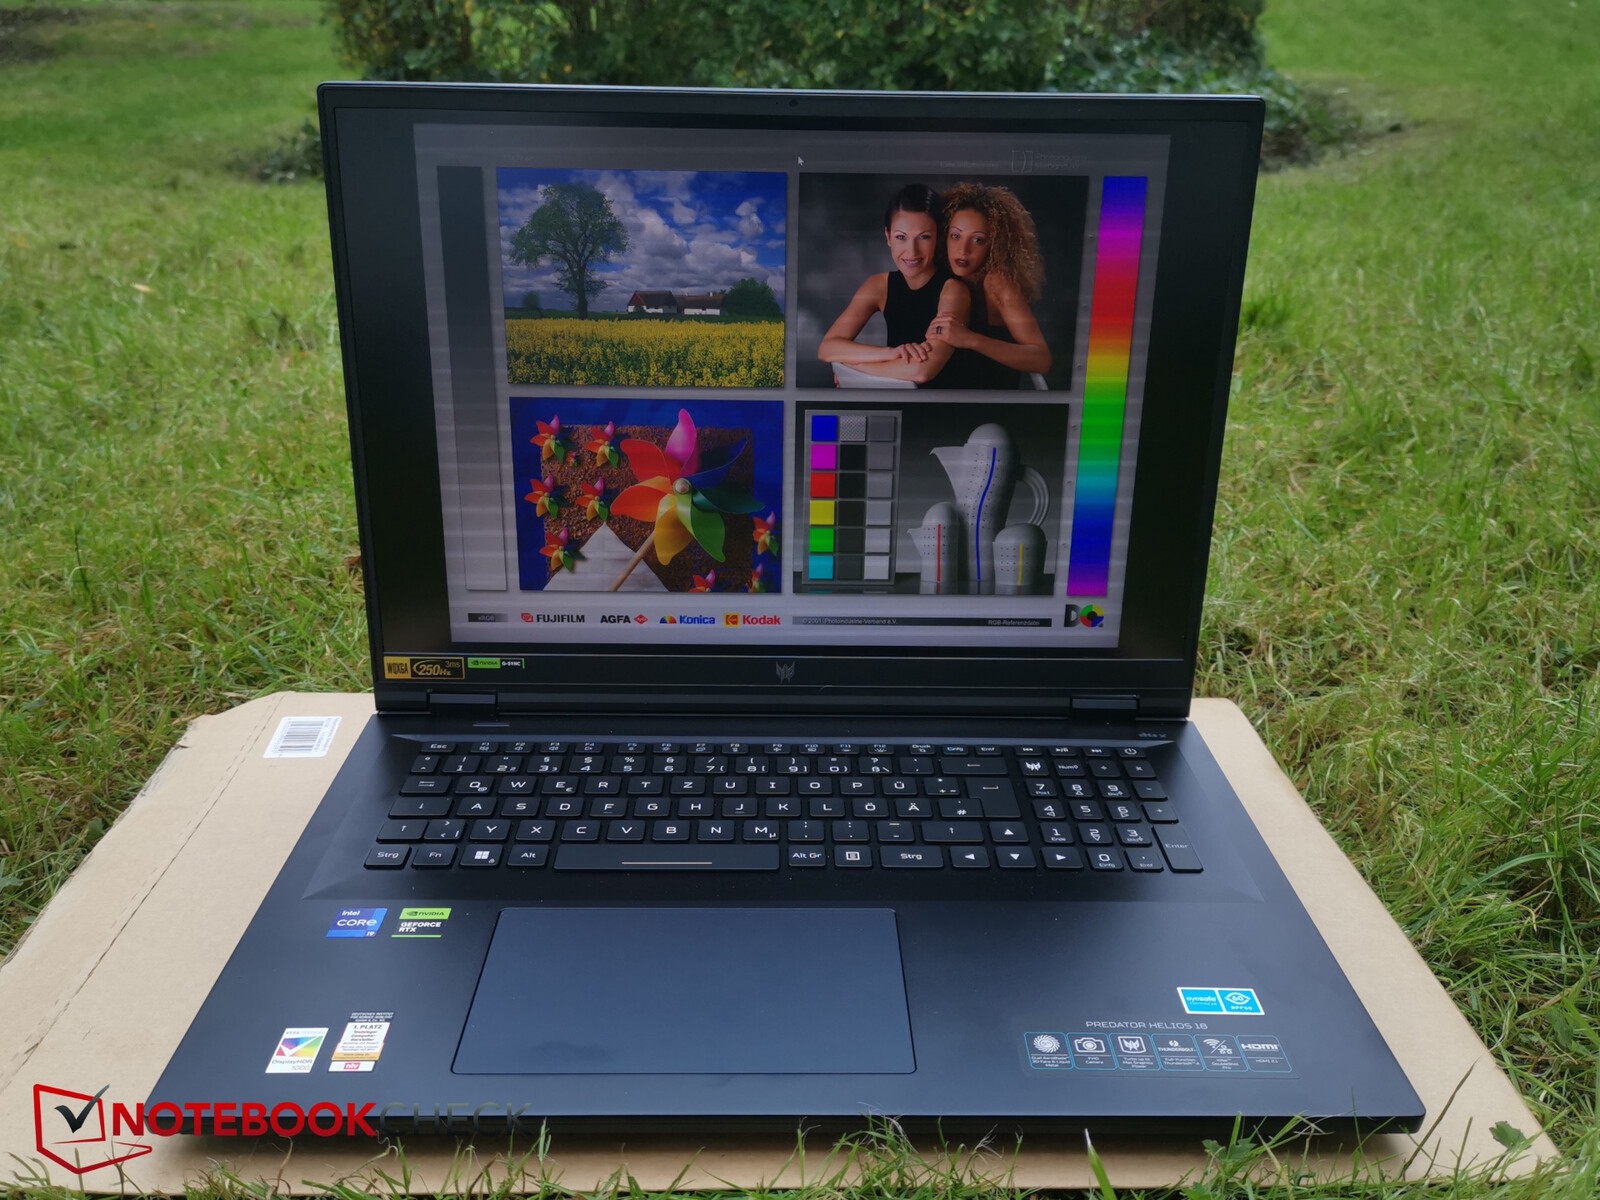
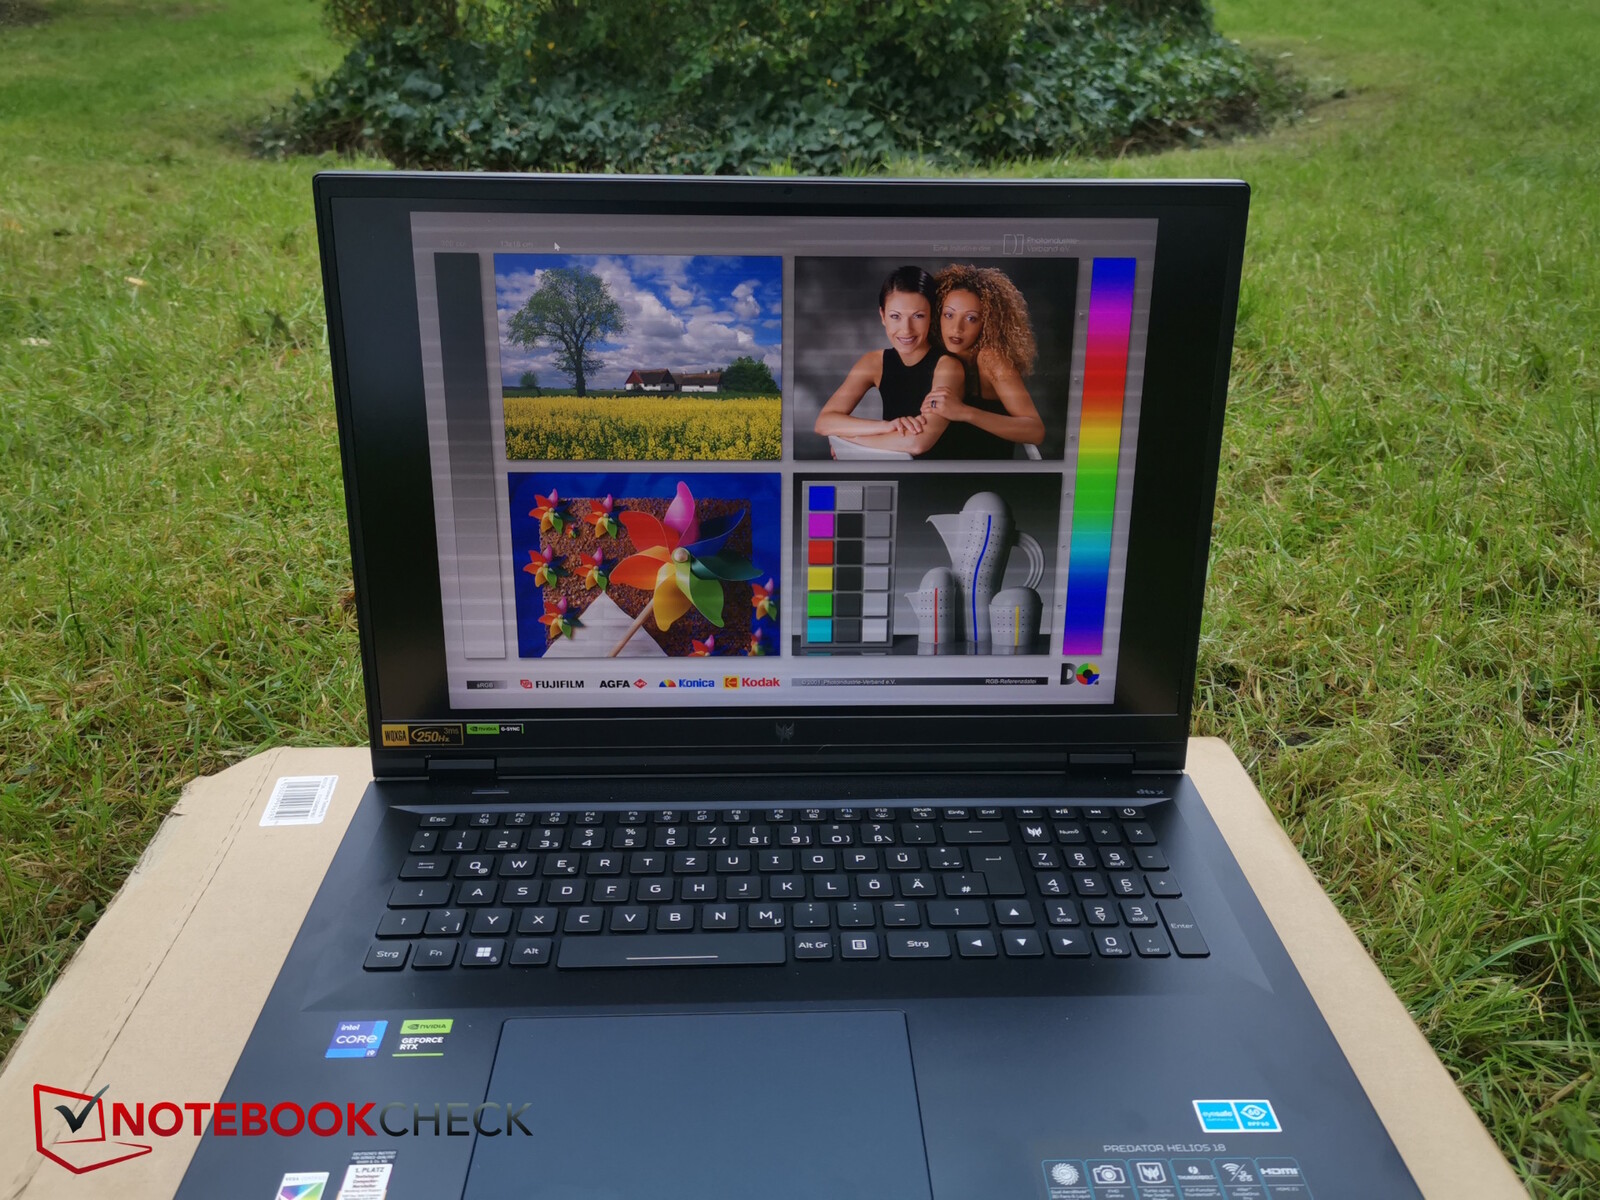
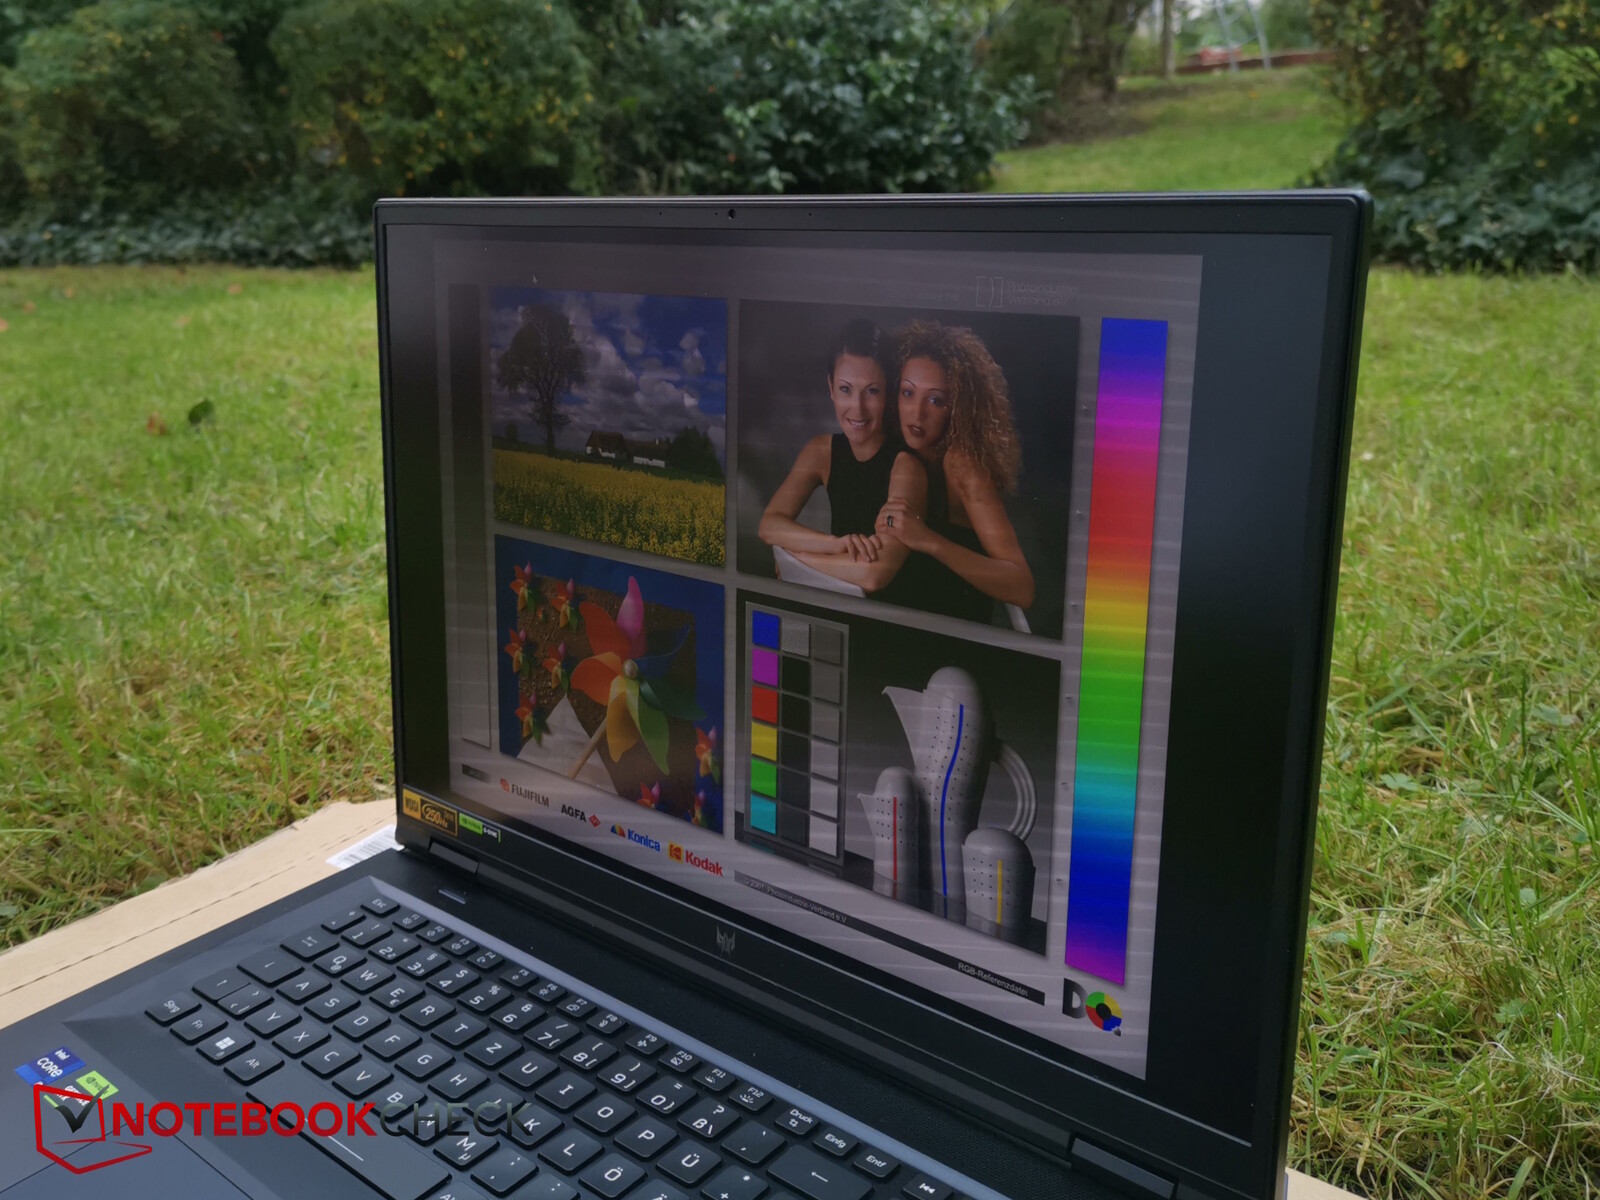
显示屏 - MiniLED,亮度超过 1,000 尼特
Helios 18 可选配频率为 250 Hz 的 MiniLED 显示屏,我们的测试设备也安装了这种显示屏。在这里看不到光晕,黑色浓郁,没有任何恼人的光伪,对比度也相应良好。
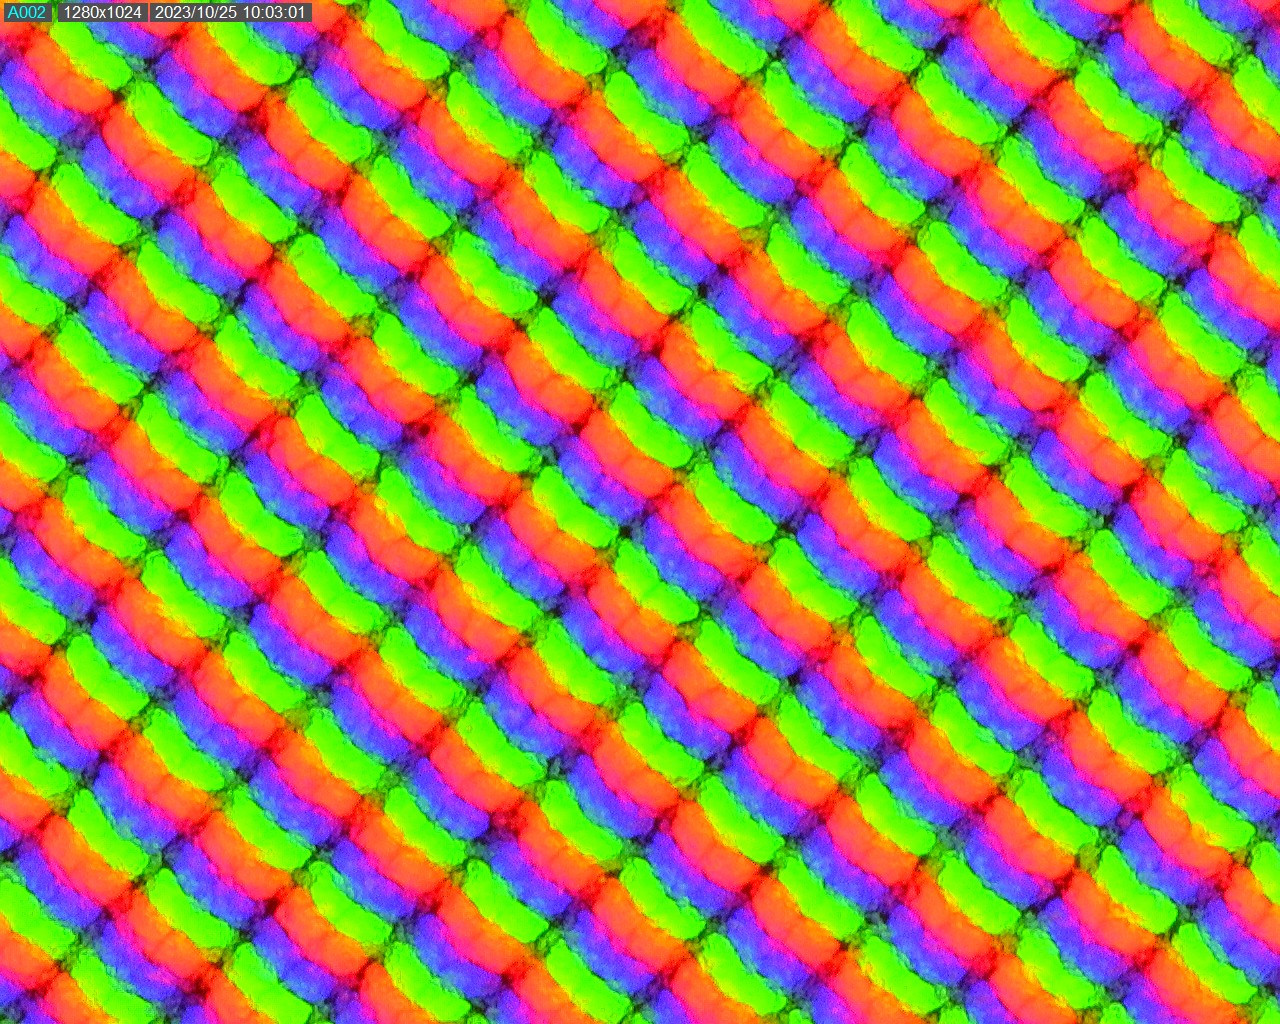
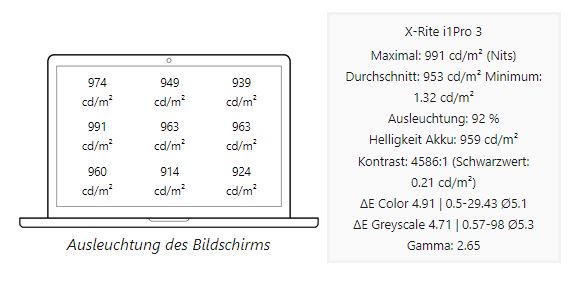
在普通 SDR 模式下,友达光电的面板能达到约 350 尼特的亮度。不过,在 HDR 模式下,屏幕的亮度更高。在这里,我们测得的峰值亮度超过 1100 尼特!两种情况下的亮度都达到了 92%。
HDR 模式下的照明
Illumination in SDR mode
| |||||||||||||||||||||||||
Brightness Distribution: 92 %
Center on Battery: 359 cd/m²
Contrast: 1714:1 (Black: 0.21 cd/m²)
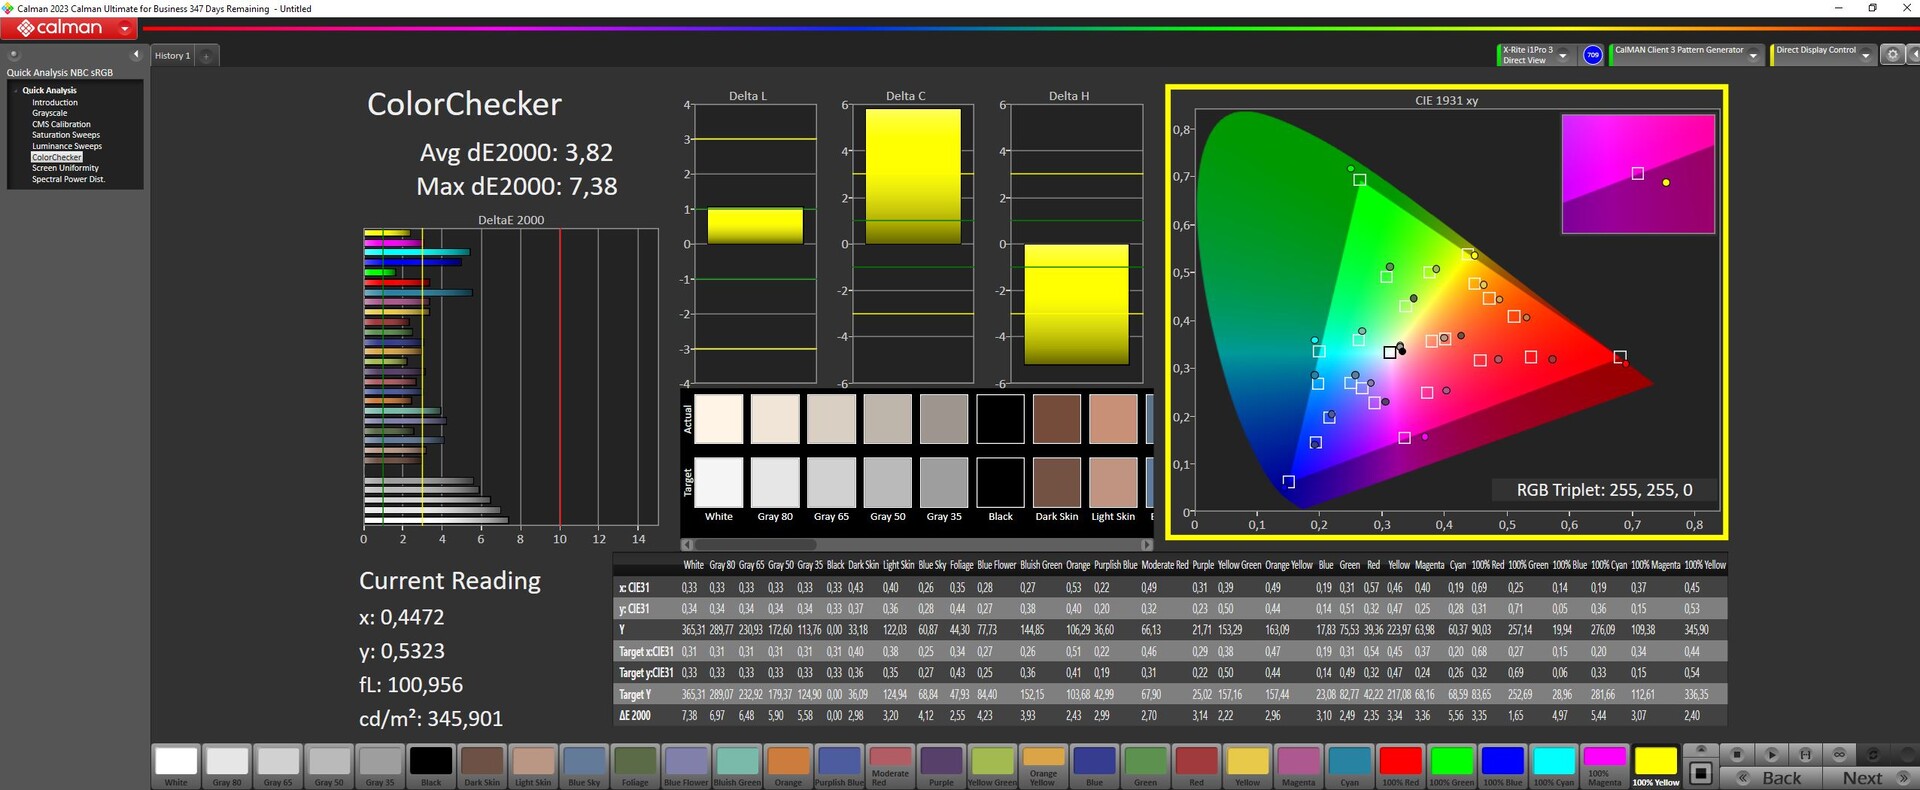
ΔE ColorChecker Calman: 3.82 | ∀{0.5-29.43 Ø4.71}
calibrated: 2.24
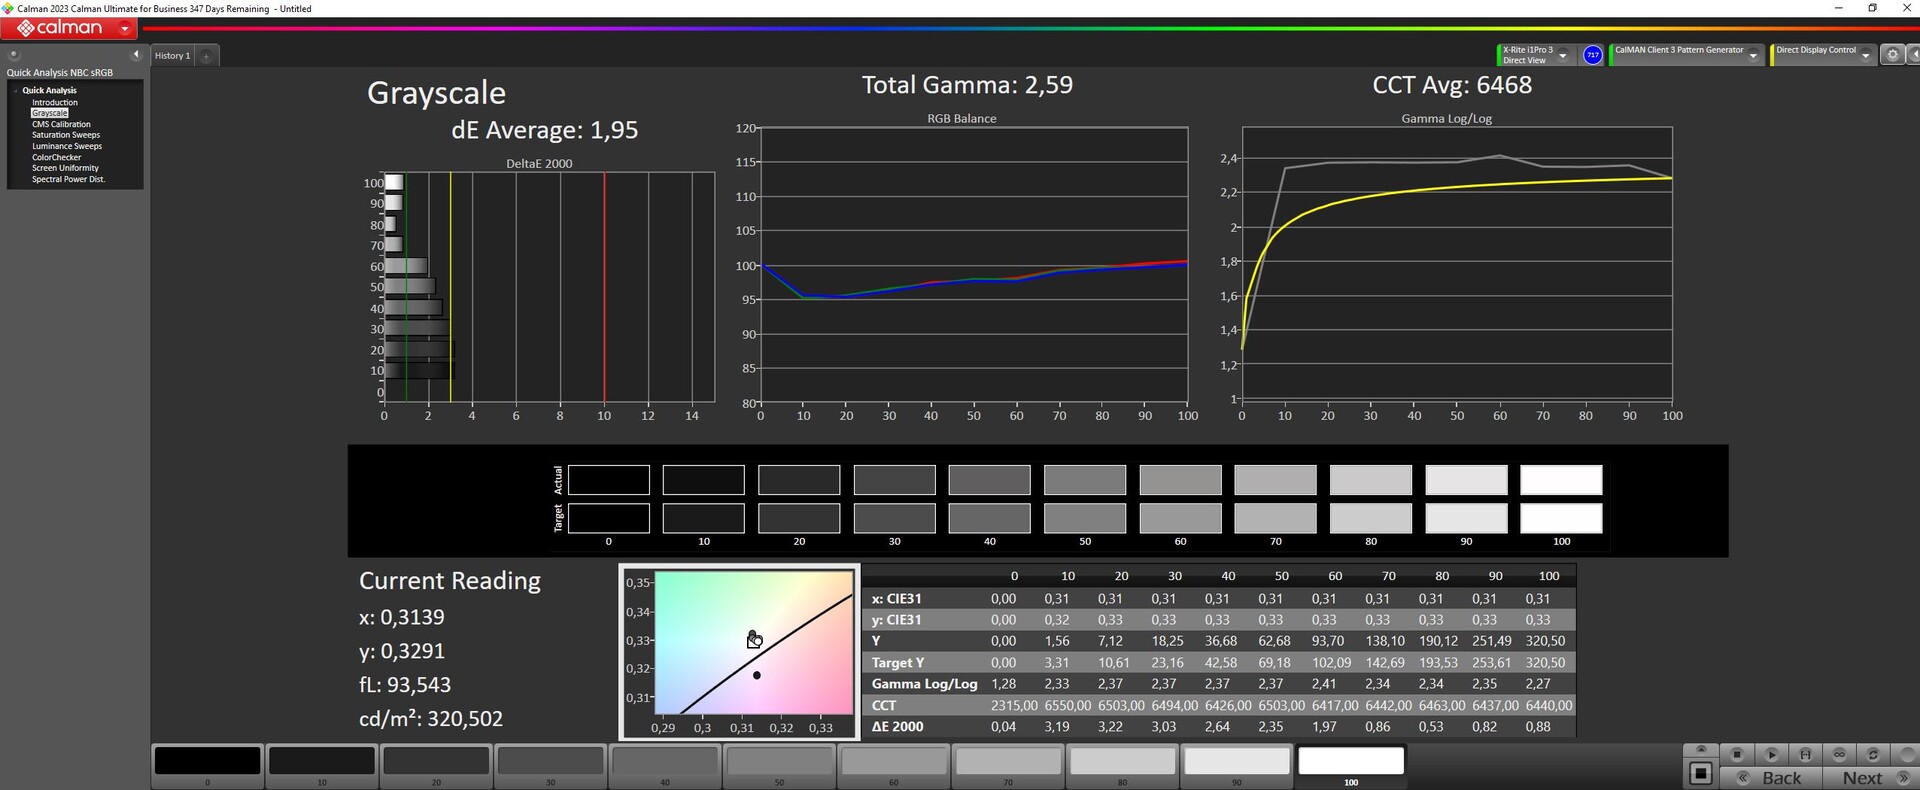
ΔE Greyscale Calman: 5.06 | ∀{0.09-98 Ø4.96}
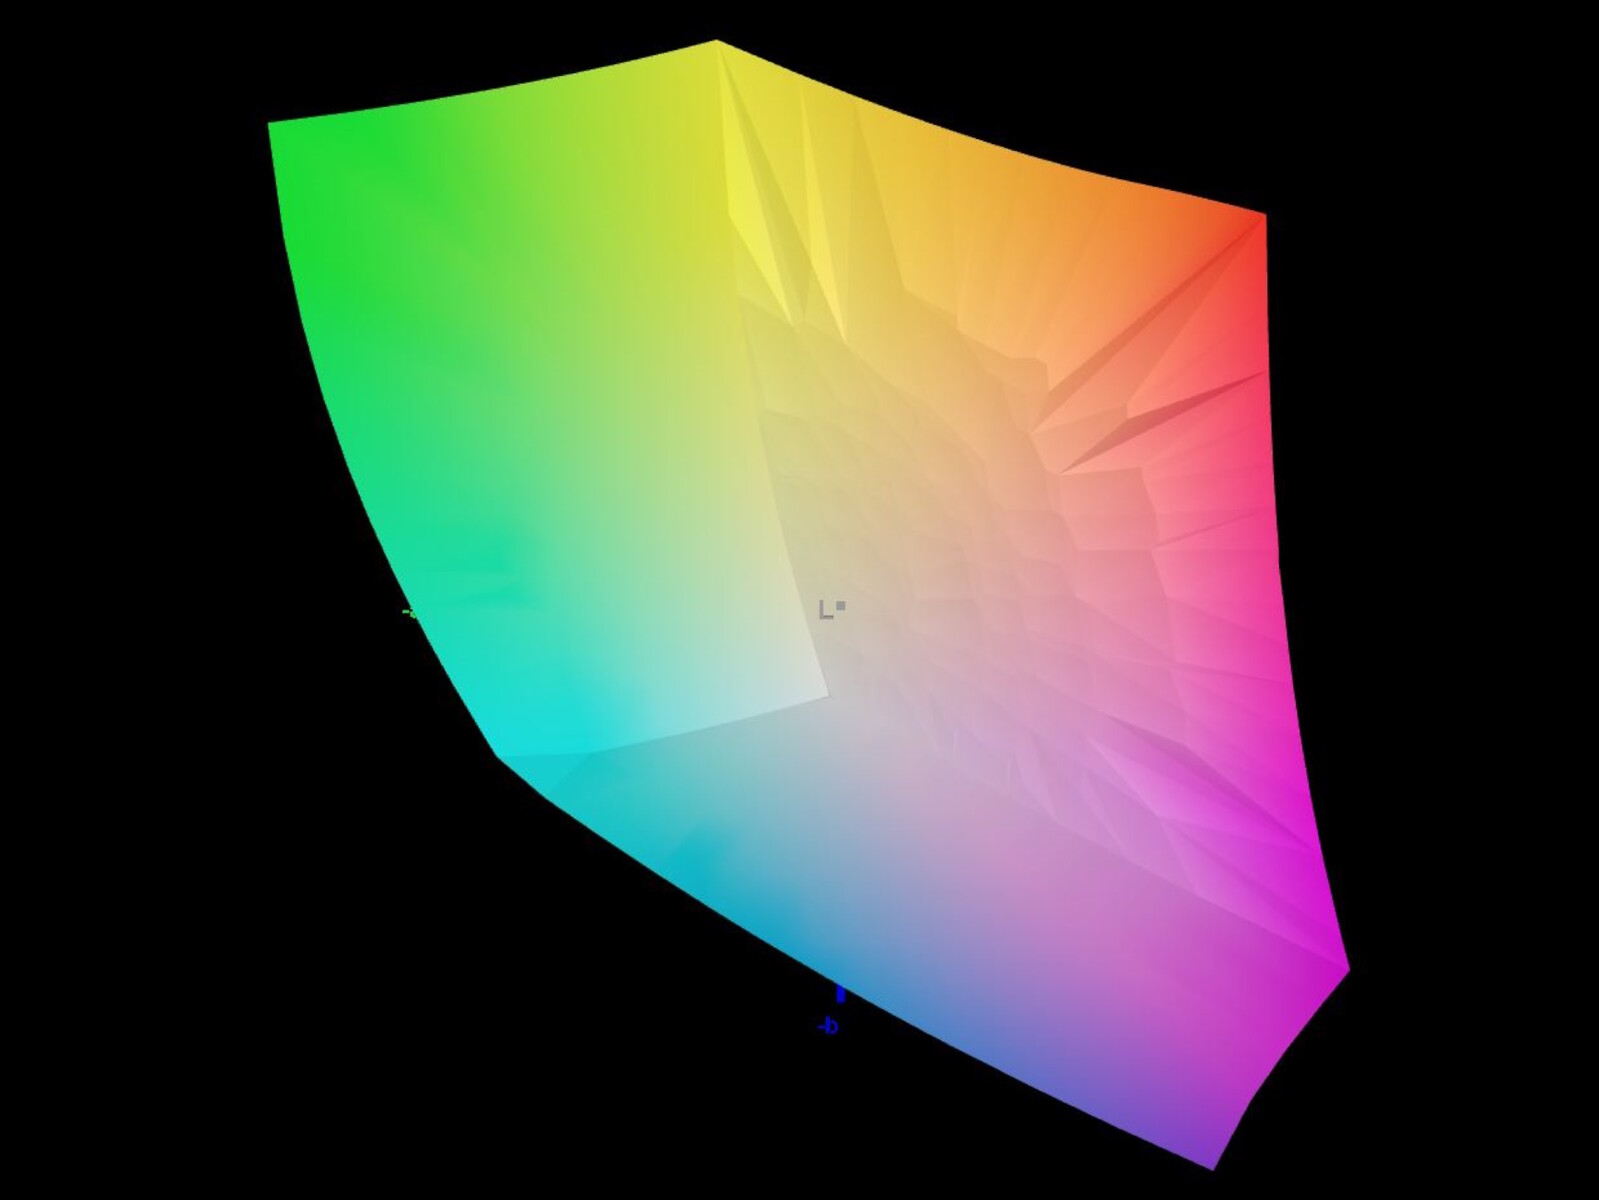
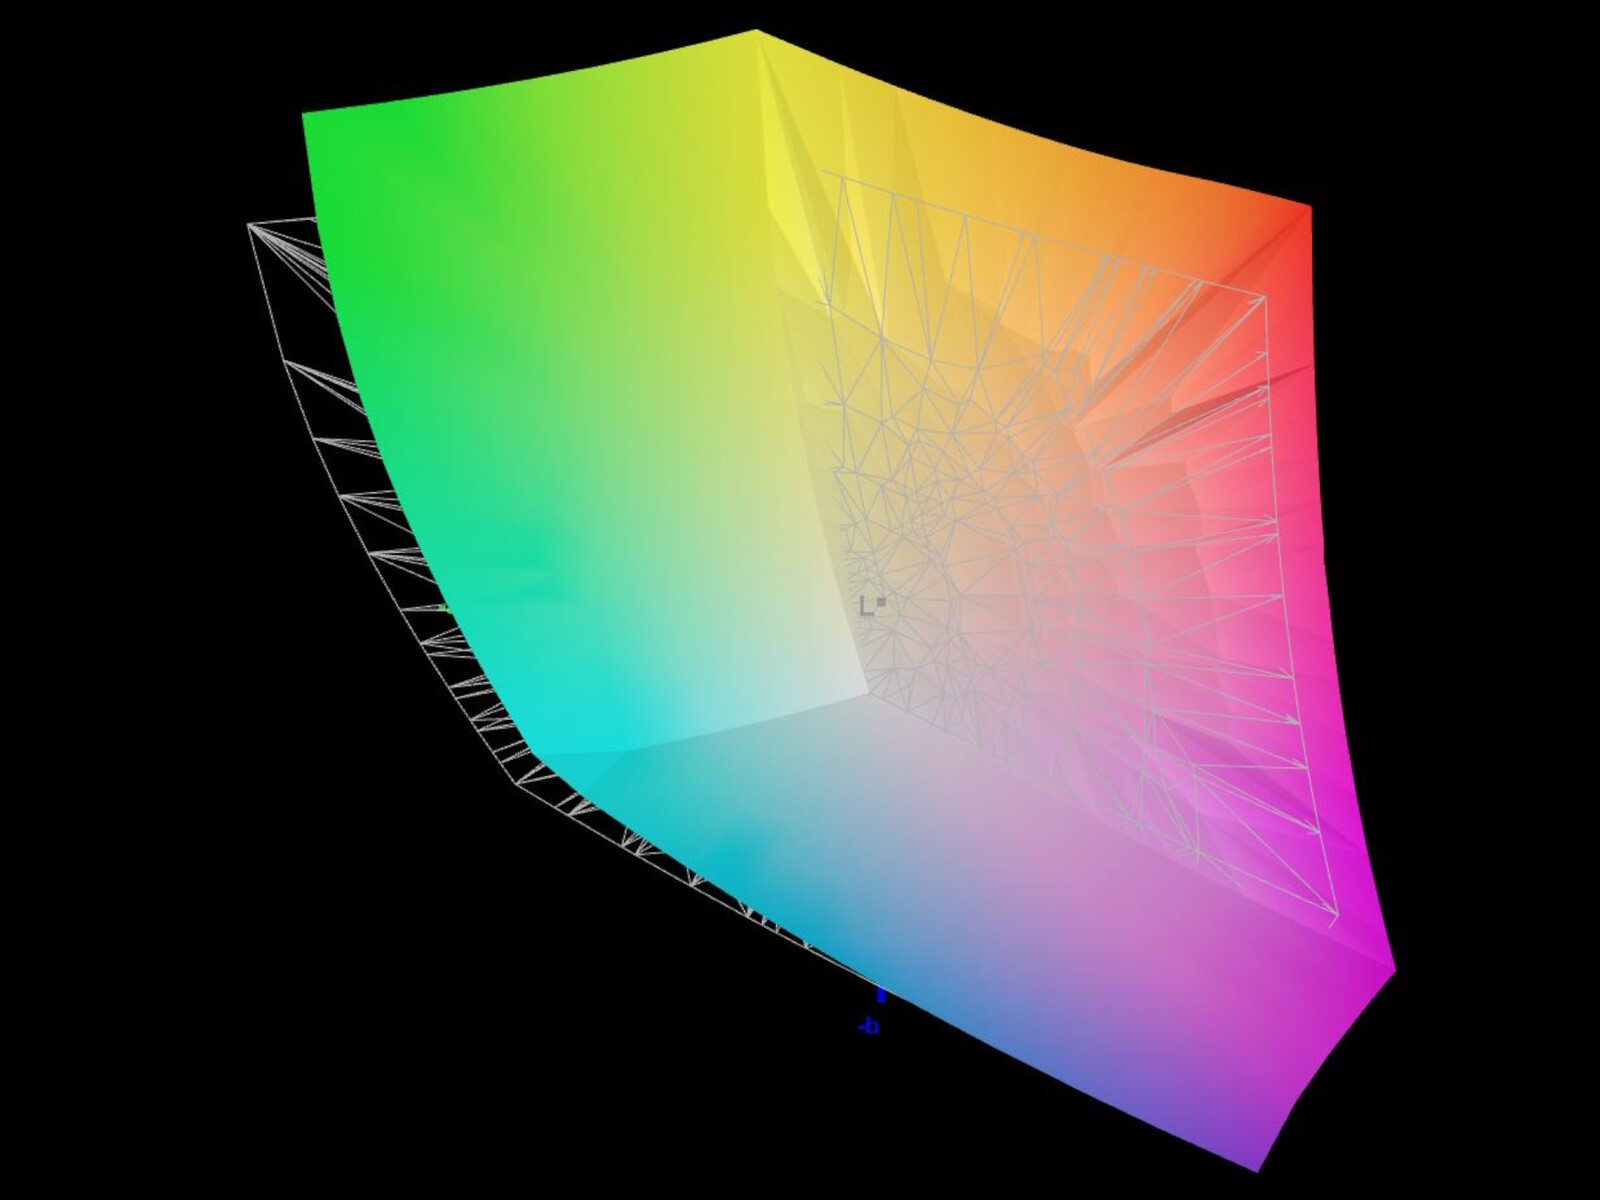
91.8% AdobeRGB 1998 (Argyll 3D)
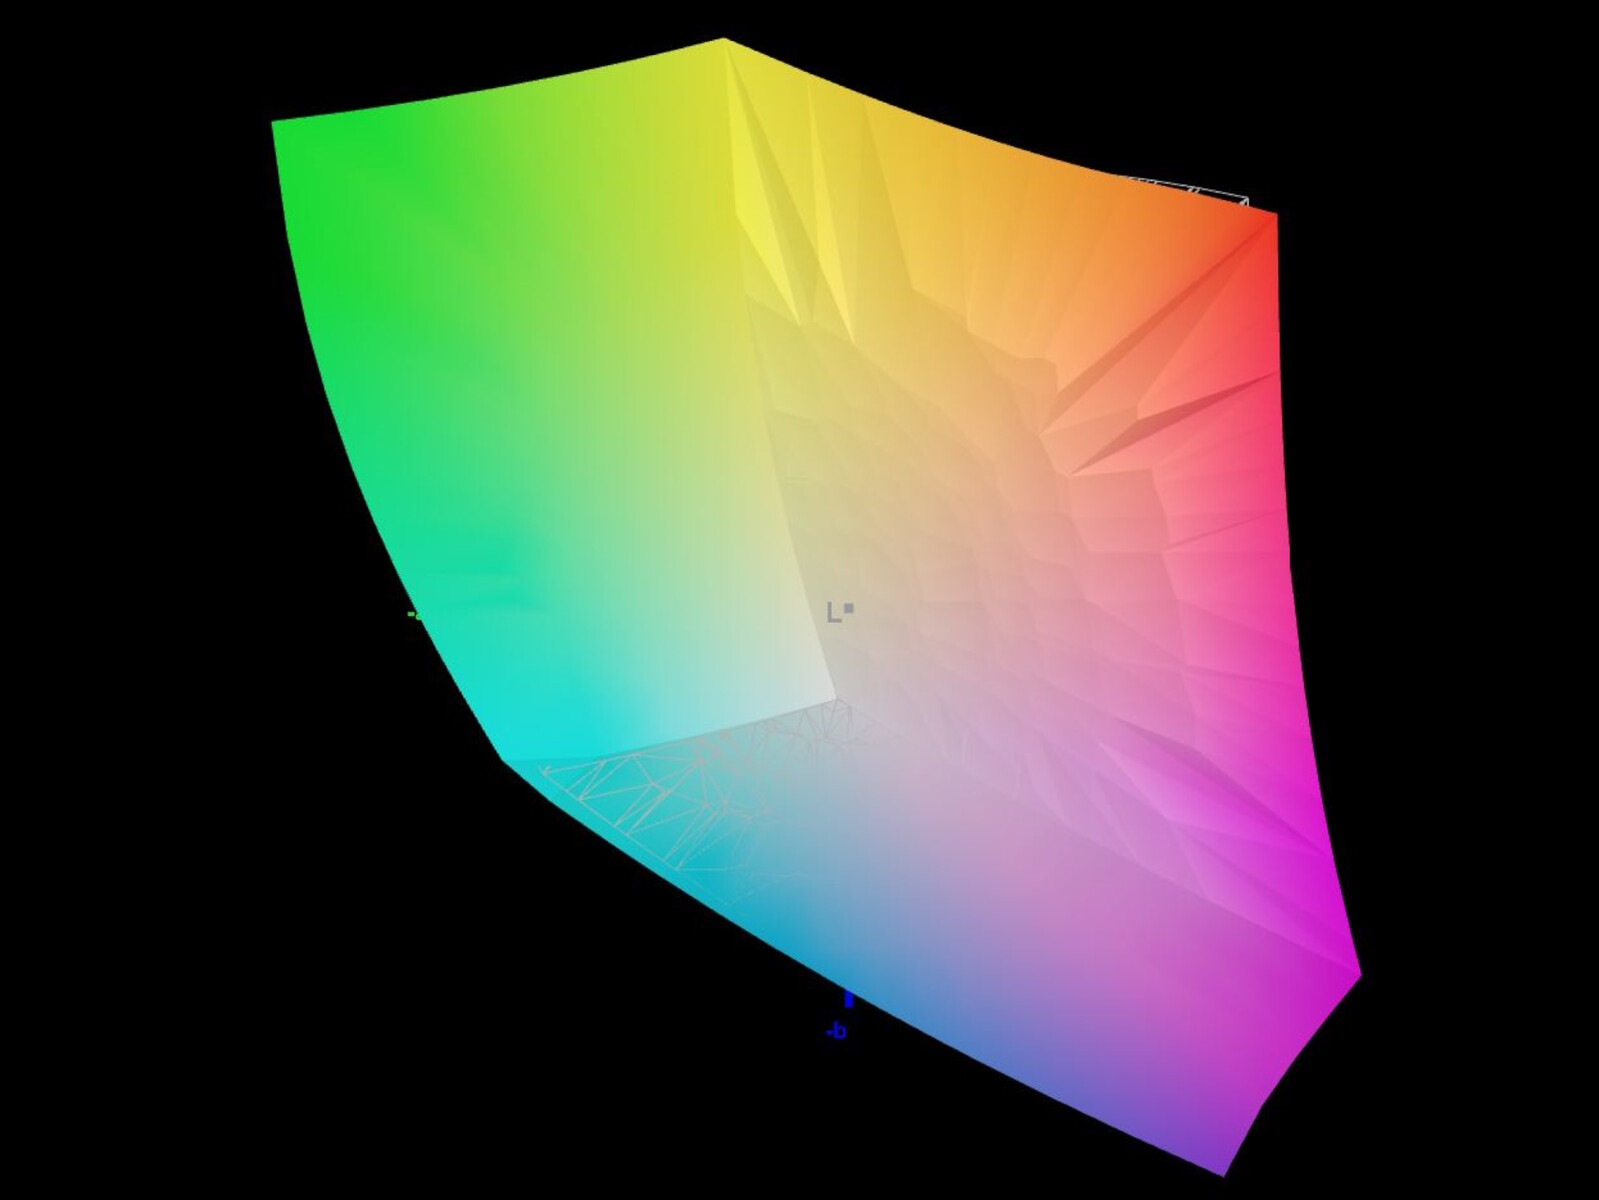
100% sRGB (Argyll 3D)
99.8% Display P3 (Argyll 3D)
Gamma: 2.52
CCT: 5657 K
| Acer Predator Helios 18 N23Q2 AUO45A8 (B180QAN01.2), IPS, 2560x1600, 18" | MSI GE78HX 13VH-070US AU Optronics B170QAN01.2, IPS, 2560x1600, 17" | HP Omen 17-ck2097ng BOE BOE09BF, IPS, 2560x1440, 17.3" | Alienware m18 R1 Chi Mei 180JME, IPS, 1920x1200, 18" | Asus ROG Strix G18 G814JI NE180QDM-NZ2 (BOE0B35), IPS, 2560x1600, 18" | Razer Blade 18 RTX 4070 AU Optronics B180QAN01.0, IPS, 2560x1600, 18" | |
|---|---|---|---|---|---|---|
| Display | -3% | -19% | -1% | -3% | -3% | |
| Display P3 Coverage (%) | 99.8 | 97.6 -2% | 67.4 -32% | 97.7 -2% | 98.1 -2% | 96.9 -3% |
| sRGB Coverage (%) | 100 | 99.9 0% | 97.6 -2% | 100 0% | 99.9 0% | 99.8 0% |
| AdobeRGB 1998 Coverage (%) | 91.8 | 86.5 -6% | 69.6 -24% | 89.8 -2% | 85.6 -7% | 85.3 -7% |
| Response Times | 55% | -28% | 53% | 38% | 50% | |
| Response Time Grey 50% / Grey 80% * (ms) | 7.6 ? | 4.2 ? 45% | 15.6 ? -105% | 3 ? 61% | 5.6 ? 26% | 4.2 ? 45% |
| Response Time Black / White * (ms) | 17.8 ? | 6.4 ? 64% | 8.9 ? 50% | 9.9 ? 44% | 9 ? 49% | 8 ? 55% |
| PWM Frequency (Hz) | 2509 | |||||
| Screen | -17% | 13% | 20% | 8% | -3% | |
| Brightness middle (cd/m²) | 360 | 398.6 11% | 371 3% | 372.8 4% | 471 31% | 549.6 53% |
| Brightness (cd/m²) | 355 | 384 8% | 350 -1% | 367 3% | 422 19% | 524 48% |
| Brightness Distribution (%) | 92 | 89 -3% | 90 -2% | 97 5% | 83 -10% | 89 -3% |
| Black Level * (cd/m²) | 0.21 | 0.46 -119% | 0.32 -52% | 0.32 -52% | 0.47 -124% | 0.53 -152% |
| Contrast (:1) | 1714 | 867 -49% | 1159 -32% | 1165 -32% | 1002 -42% | 1037 -39% |
| Colorchecker dE 2000 * | 3.82 | 4.05 -6% | 1.74 54% | 1.92 50% | 2.05 46% | 3.32 13% |
| Colorchecker dE 2000 max. * | 7.38 | 8.68 -18% | 3.59 51% | 3.65 51% | 4.15 44% | 6.63 10% |
| Colorchecker dE 2000 calibrated * | 2.24 | 1.02 54% | 1.01 55% | 0.51 77% | 0.8 64% | 2.7 -21% |
| Greyscale dE 2000 * | 5.06 | 6.5 -28% | 2.8 45% | 1.5 70% | 2.8 45% | 2 60% |
| Gamma | 2.52 87% | 2.11 104% | 2.19 100% | 2.34 94% | 2.204 100% | 2.29 96% |
| CCT | 5657 115% | 7518 86% | 6474 100% | 6607 98% | 7122 91% | 6319 103% |
| Total Average (Program / Settings) | 12% /
-4% | -11% /
1% | 24% /
20% | 14% /
10% | 15% /
4% |
* ... smaller is better
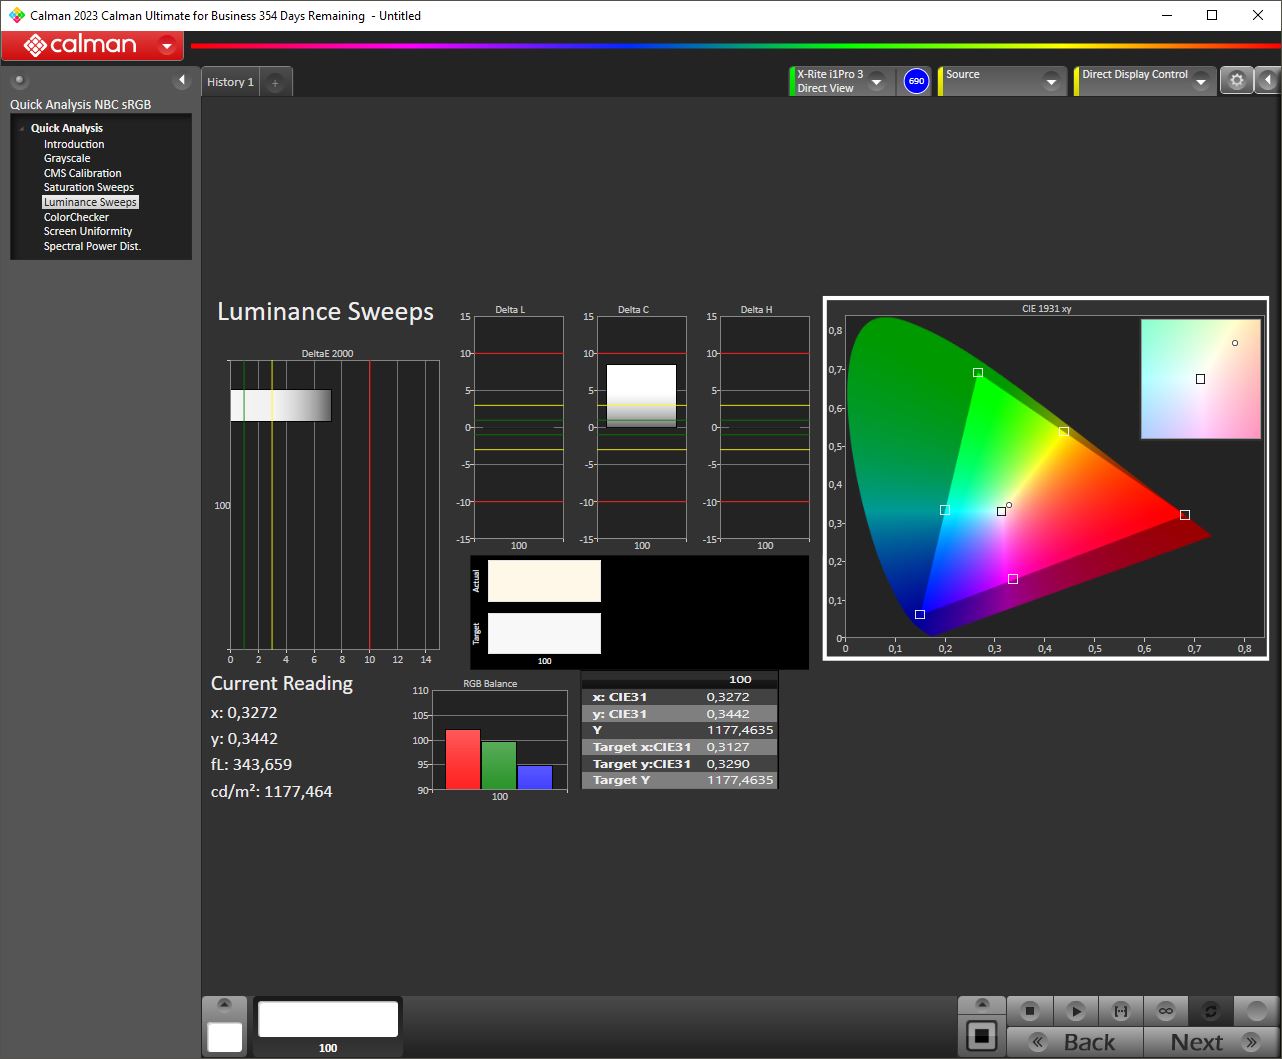
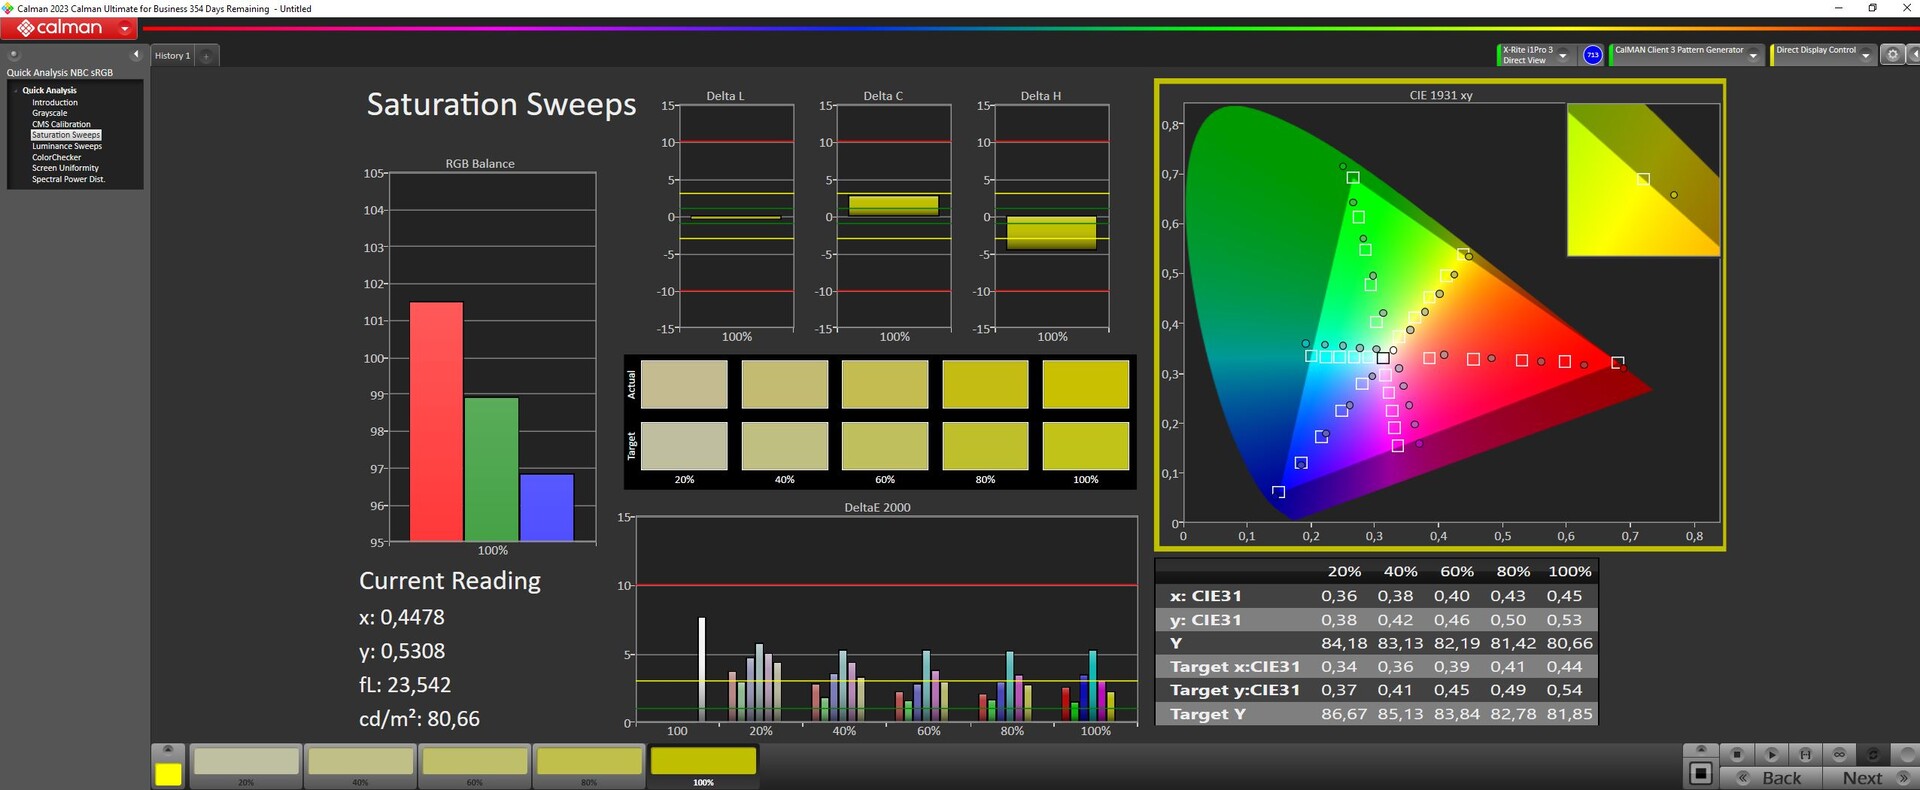
我们根据 P3 色彩空间进行了测量。显示器几乎完全覆盖了 sRGB 和 DisplayP3。AdobeRGB 的覆盖率为 92%。得益于 P3 色彩空间,明亮、高对比度的屏幕也适用于图像和视频编辑。
然而,开箱后,显示器的色彩和灰度的 DeltaE 值超过了重要的 3。我们的手动校准改善了色彩偏差,并将 DeltaE 值降至临界值以下。将亮度降至 160 尼特也能带来进一步的改善。我们的校准 icc 文件可在上面免费下载。
Display Response Times
| ↔ Response Time Black to White | ||
|---|---|---|
| 17.8 ms ... rise ↗ and fall ↘ combined | ↗ 15.6 ms rise | 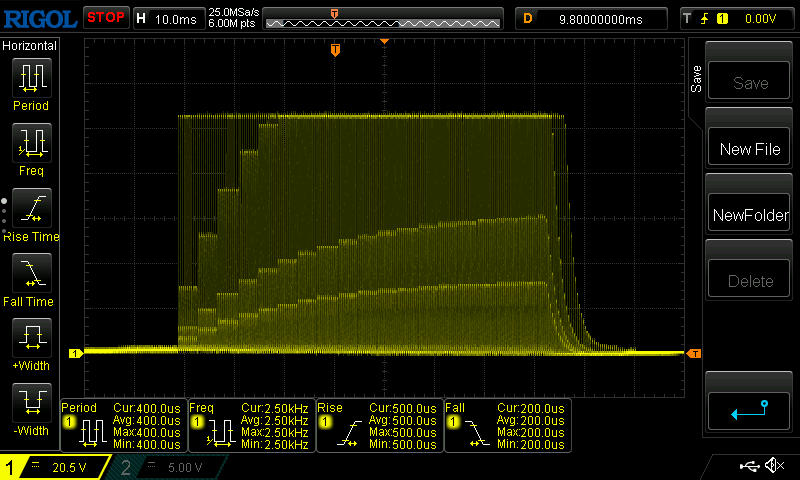 |
| ↘ 2.2 ms fall | ||
| The screen shows good response rates in our tests, but may be too slow for competitive gamers. In comparison, all tested devices range from 0.1 (minimum) to 240 (maximum) ms. » 40 % of all devices are better. This means that the measured response time is better than the average of all tested devices (19.8 ms). | ||
| ↔ Response Time 50% Grey to 80% Grey | ||
| 7.6 ms ... rise ↗ and fall ↘ combined | ↗ 4.4 ms rise | 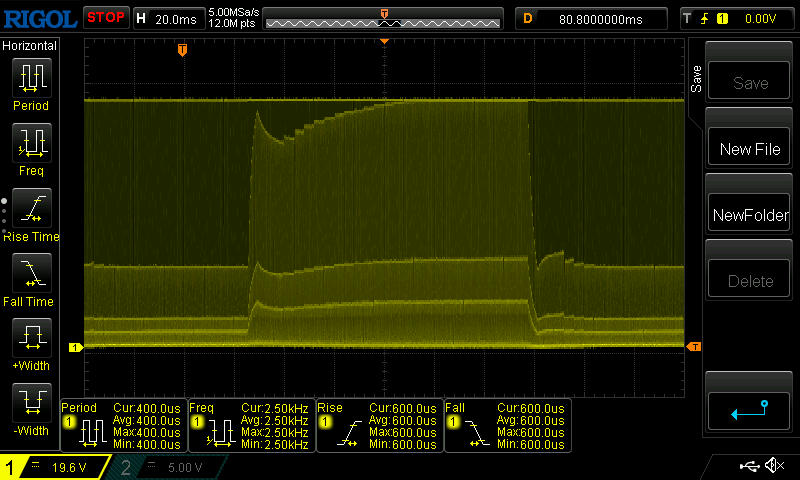 |
| ↘ 3.2 ms fall | ||
| The screen shows very fast response rates in our tests and should be very well suited for fast-paced gaming. In comparison, all tested devices range from 0.165 (minimum) to 636 (maximum) ms. » 20 % of all devices are better. This means that the measured response time is better than the average of all tested devices (31 ms). | ||
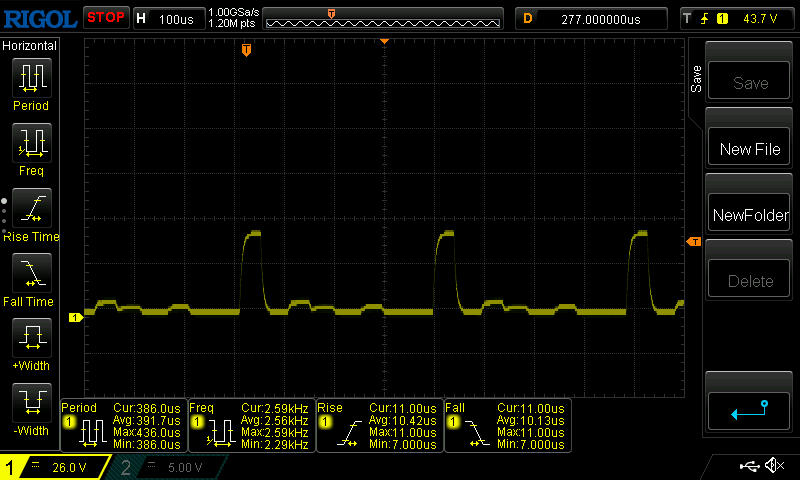
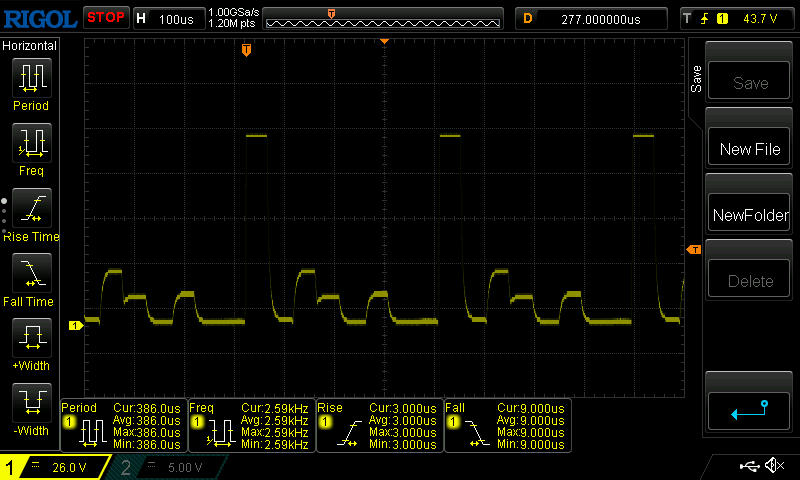
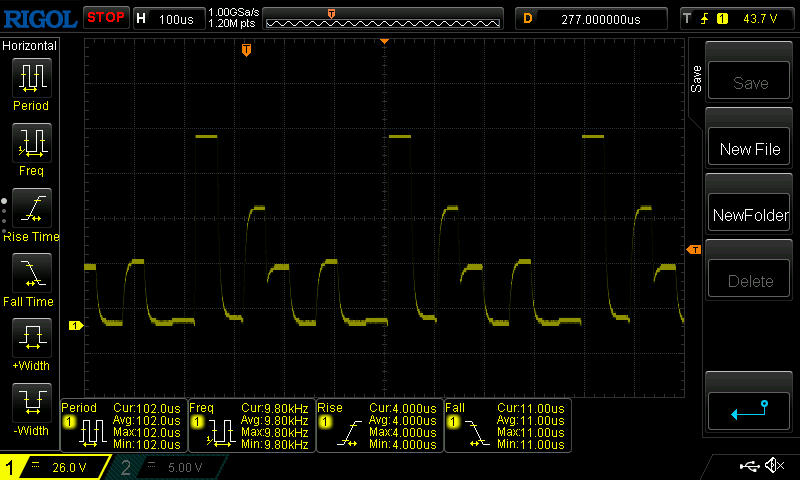
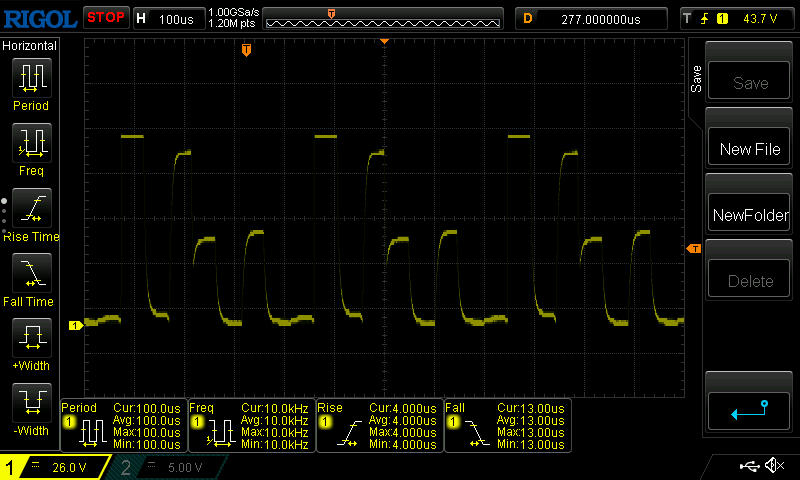
Screen Flickering / PWM (Pulse-Width Modulation)
| Screen flickering / PWM detected | 2509 Hz | 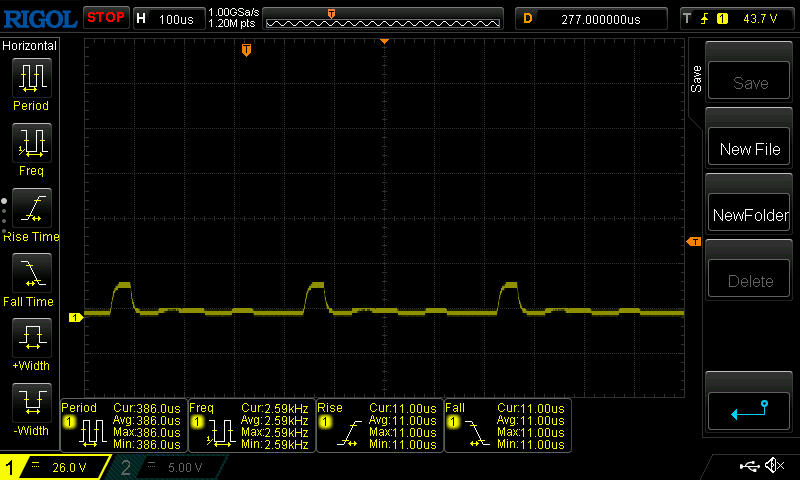 | |
The display backlight flickers at 2509 Hz (worst case, e.g., utilizing PWM) . The frequency of 2509 Hz is quite high, so most users sensitive to PWM should not notice any flickering. In comparison: 52 % of all tested devices do not use PWM to dim the display. If PWM was detected, an average of 7757 (minimum: 5 - maximum: 343500) Hz was measured. | |||
PWM 用于显示器的亮度控制。在最低亮度时,频率最低,约为 2.5 kHz,但仍然足够高,不会对敏感的人造成问题。
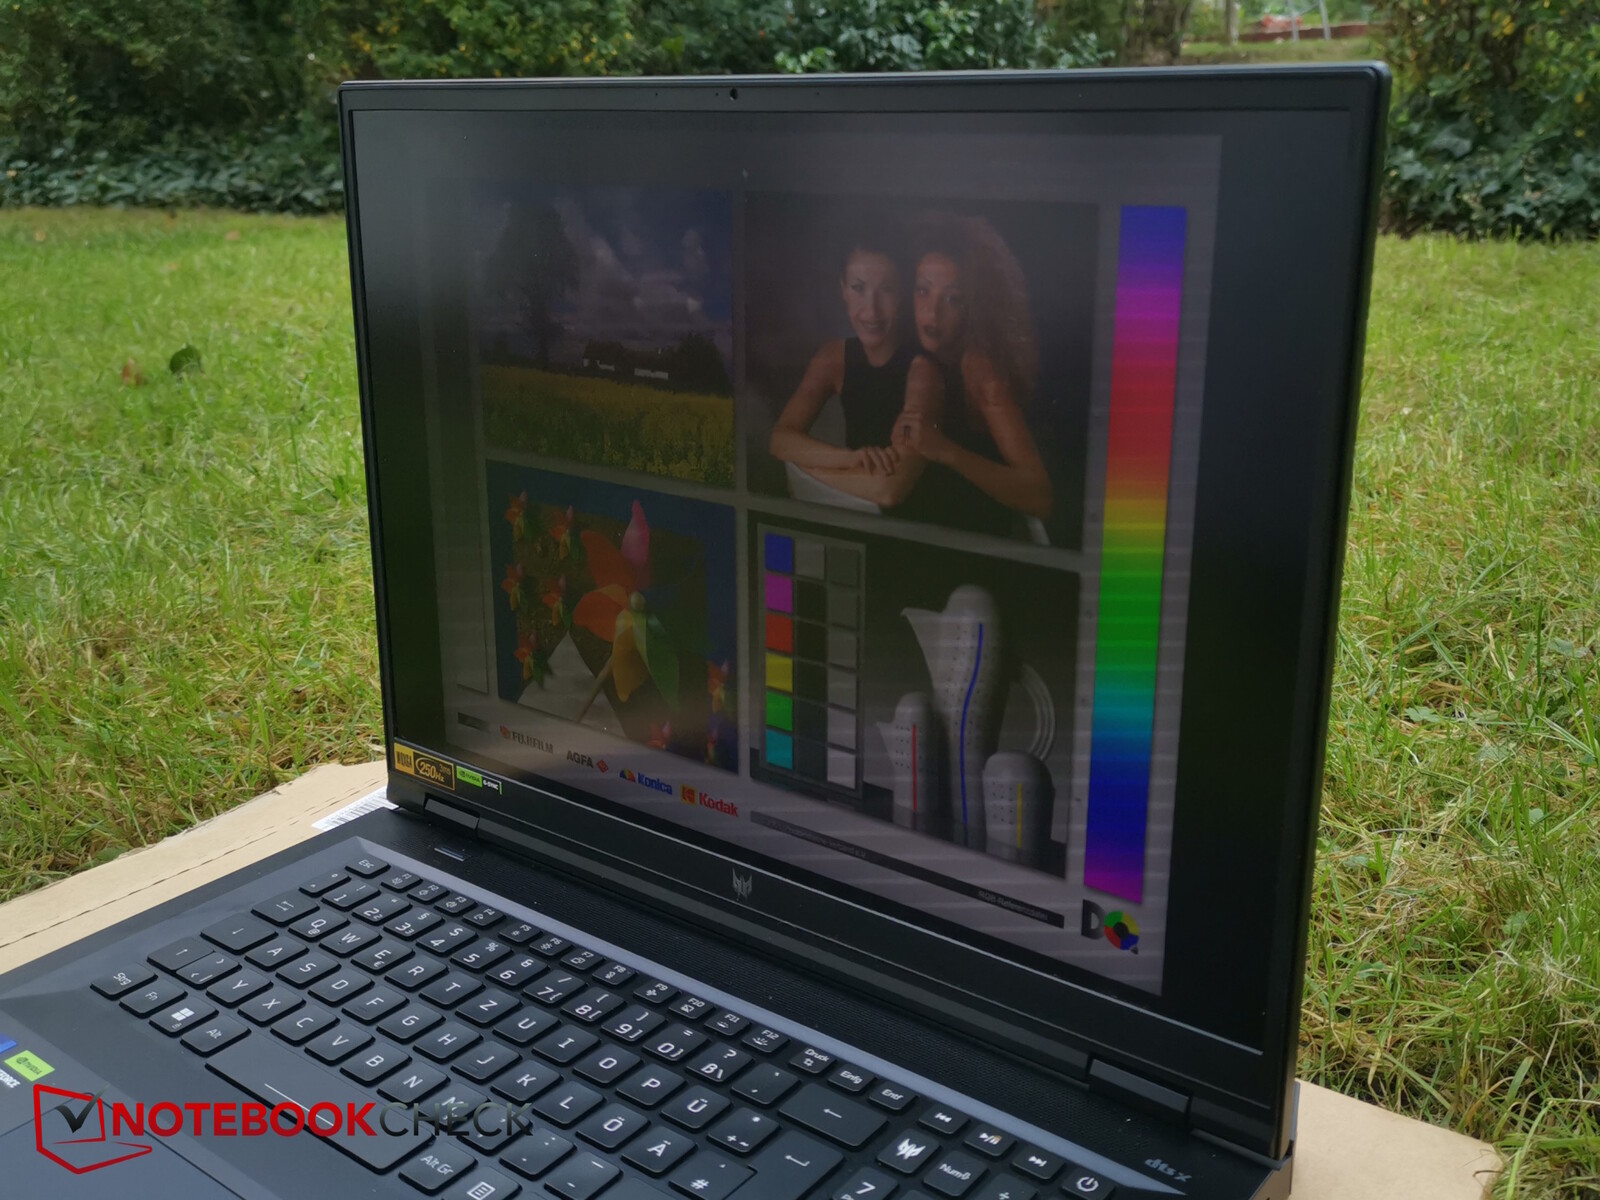
在户外,不妨将屏幕设置为 HDR,使其更加明亮。在阴暗处,内容依然清晰可见。

性能 - HX CPU 和 RTX 4080
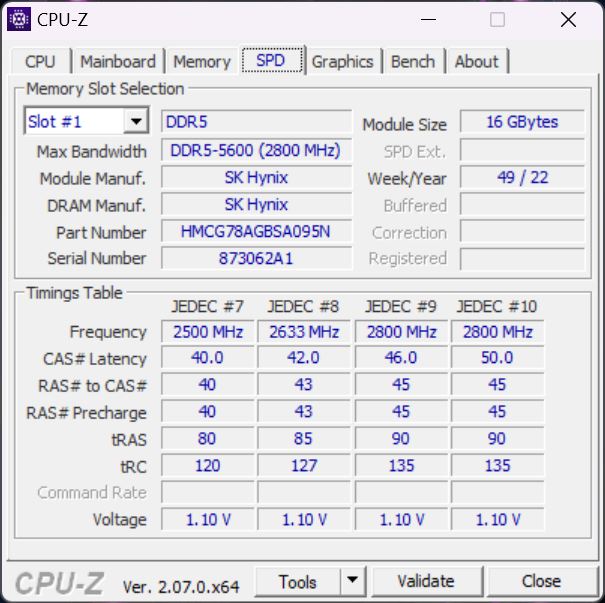
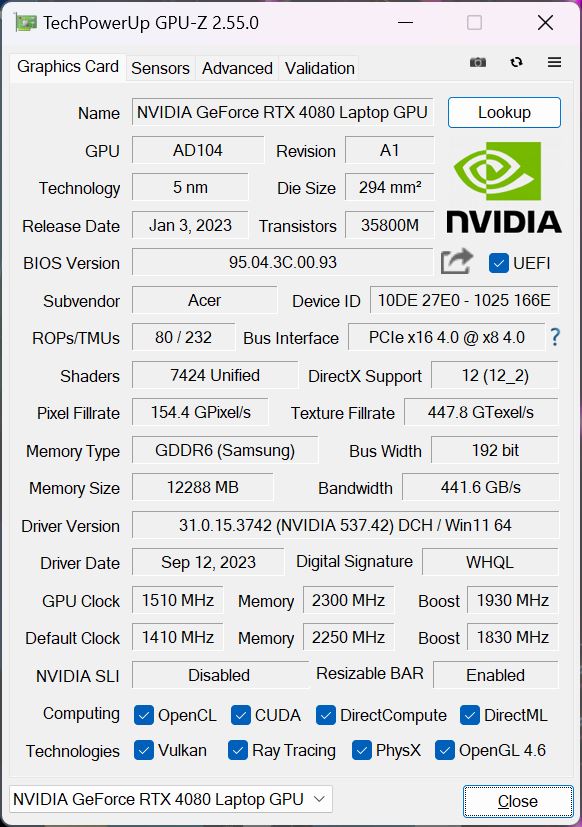
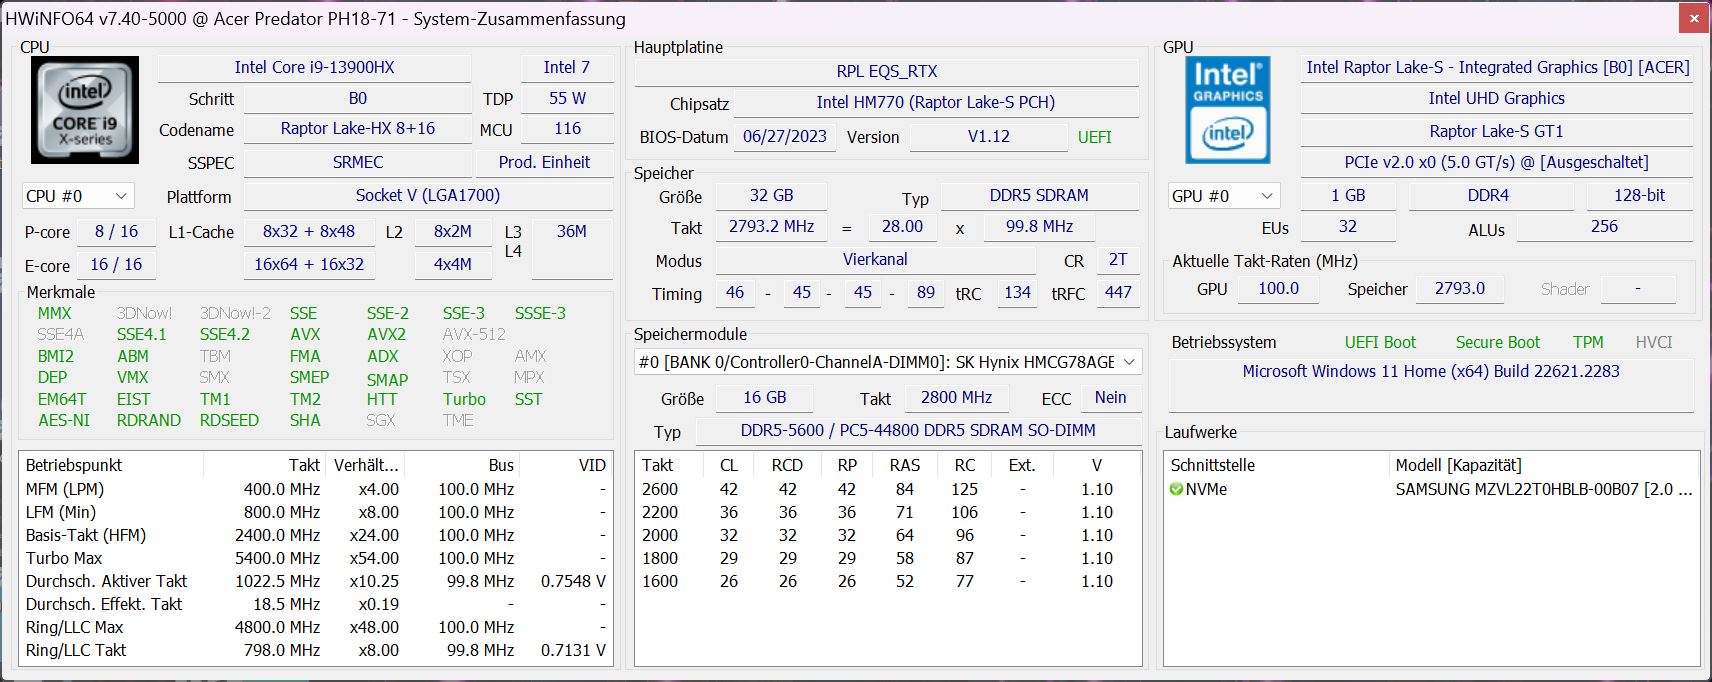
配备英特尔酷睿 i9-13900HX和 GeForce RTX 4080 笔记本电脑 GPU再加上 32 GB 内存和 18 英寸 MiniLED 显示屏,我们就拥有了一台功能极其强大的台式机替代品和高端游戏机,即使在原生 WQXGA 分辨率下,也能流畅呈现当前所有游戏。
得益于良好的显示效果,这款笔记本电脑还可以作为创意人士的工作站。
测试条件
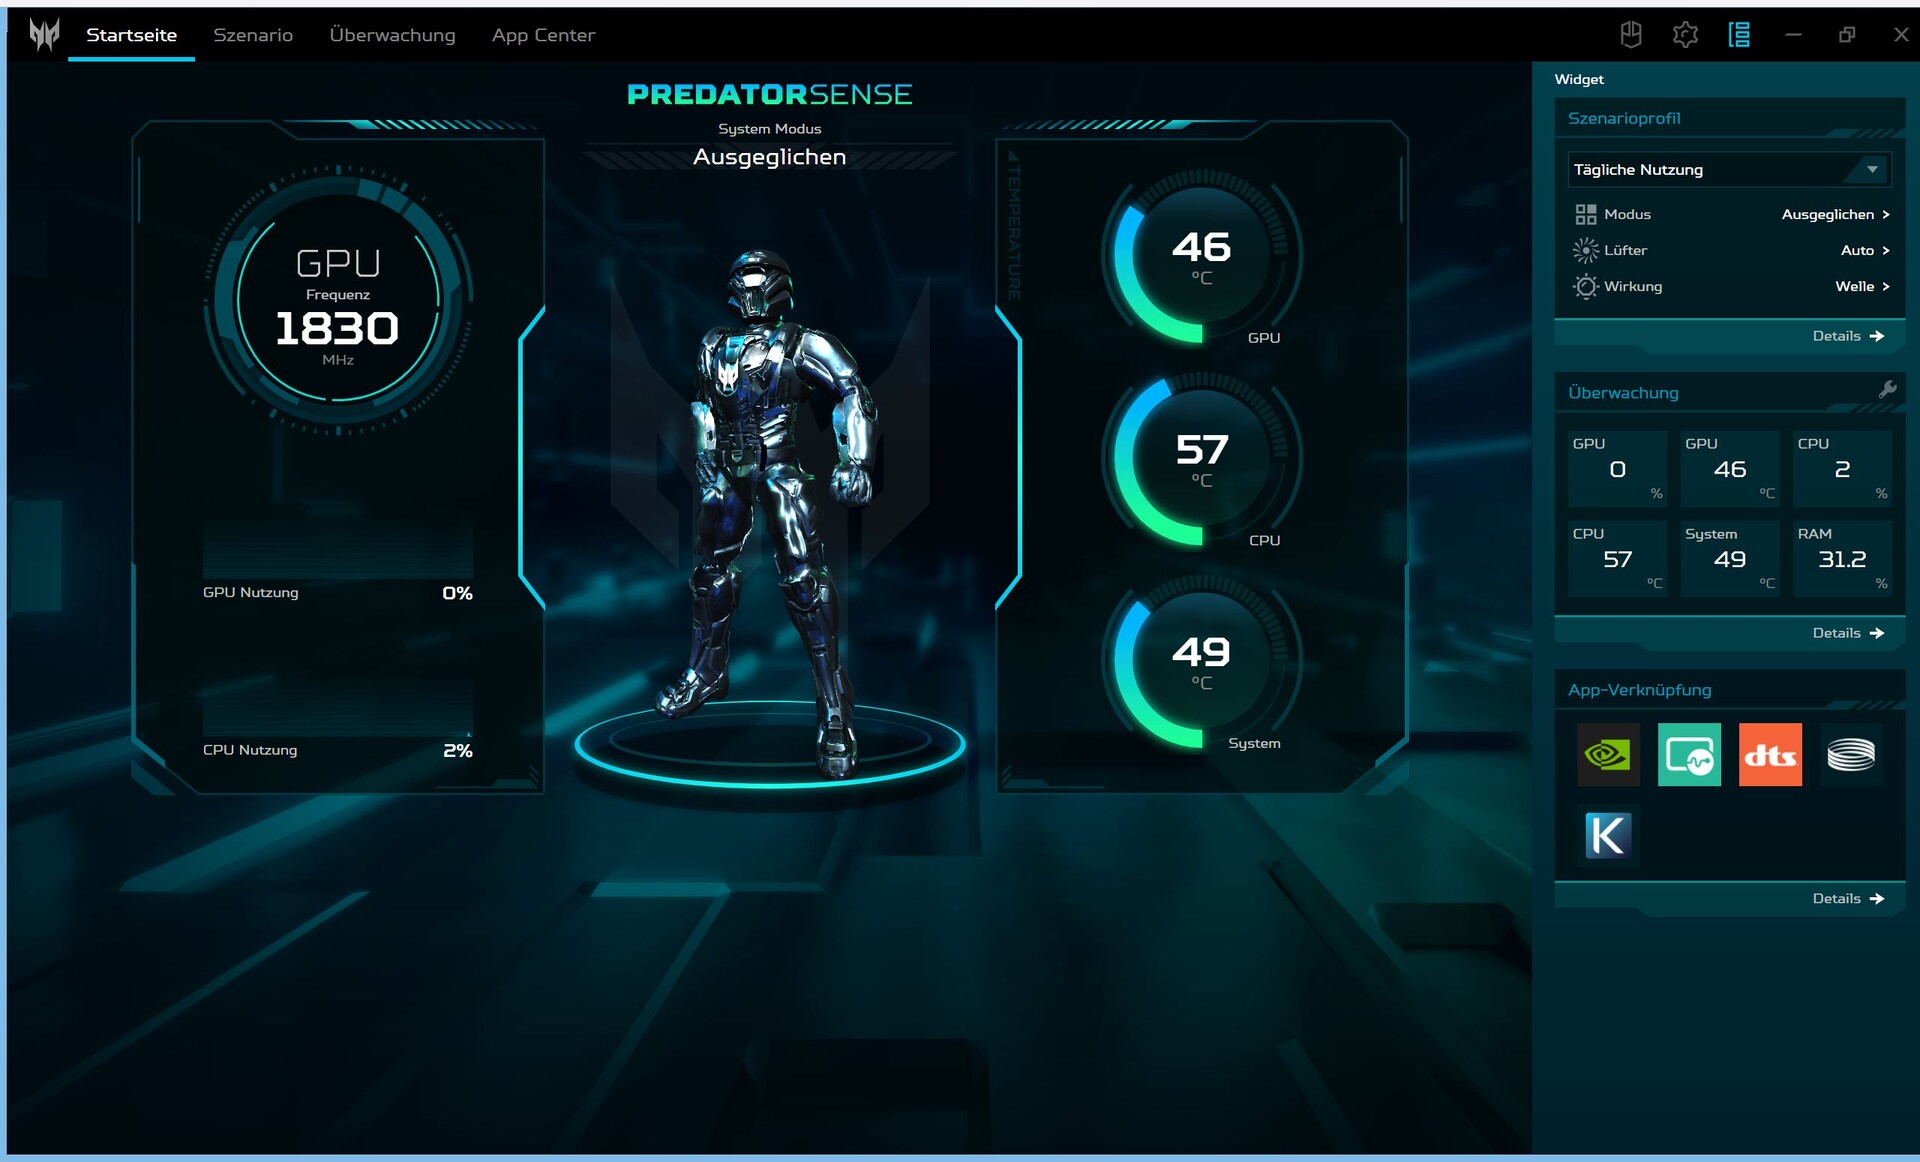
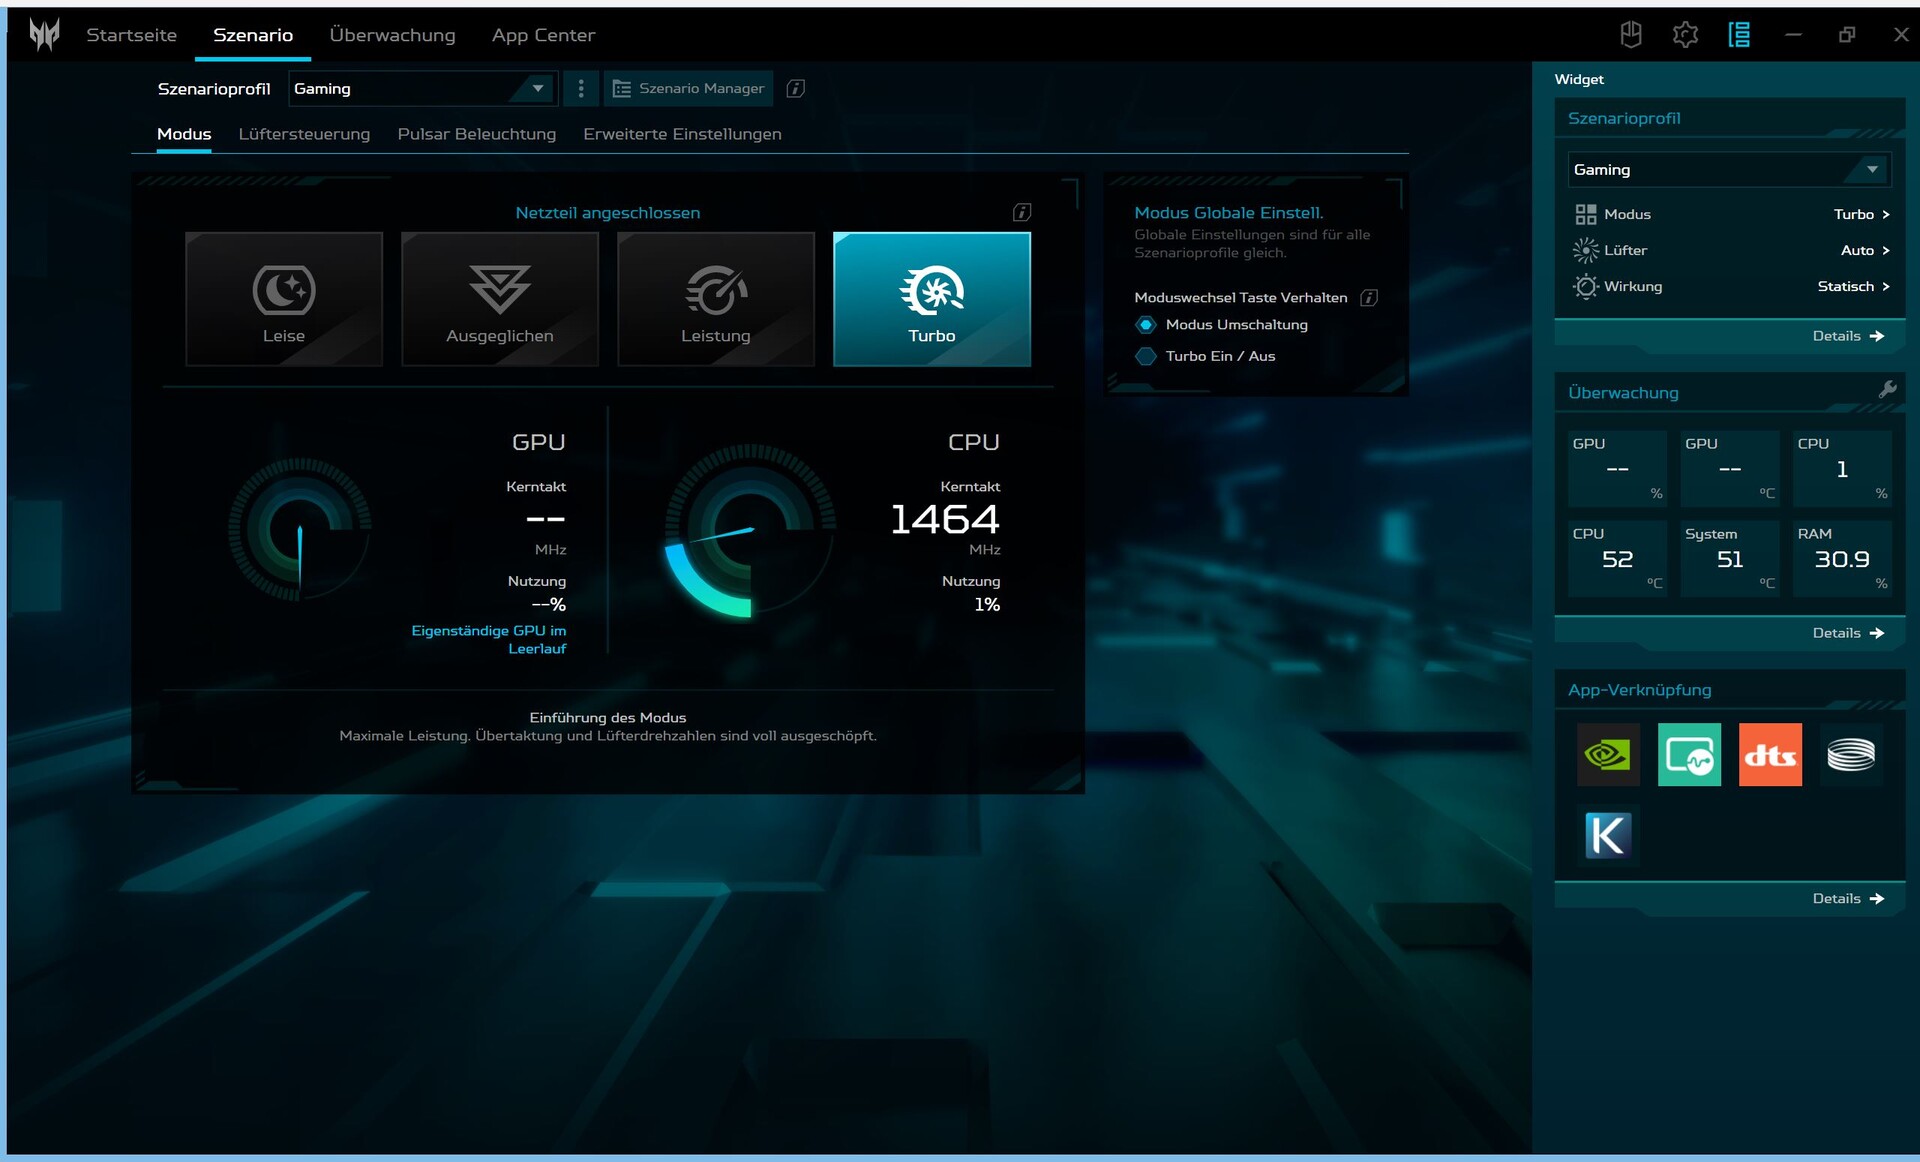
宏碁在游戏笔记本电脑上安装了 Predator Sense 软件。在这里可以自定义四种性能模式(Eco、Balanced、Performance、Turbo)以及其他选项(如键盘照明)。该软件相当清晰,但提供的(手动)设置远不及同类设备。例如,我们缺少 GPU 切换选项和手动调整性能参数的设置。
遗憾的是,宏碁还安装了 McAfee 或 Acer Care 等其他软件,这些软件更多的是提供支持。此外,我们还收到了宏碁主动发来的广告。有一次,我们甚至收到了主动要求安装 Opera 浏览器的请求。这种通过制造商强制软件进行的强制广告确实令人讨厌,而且不幸的是,这种情况正变得越来越频繁。 联想在 LOQ 16点击 Sense 中的 "Planet9 "游戏中心会触发 Cookie 请求,其中包括恼人的各种 "合法利益 "按钮,如果用户希望退出,则必须单独取消选择所有这些按钮。
我们主要使用Turbo 模式来获得最佳基准测试结果,但我们也列出了其他模式的相关信息。

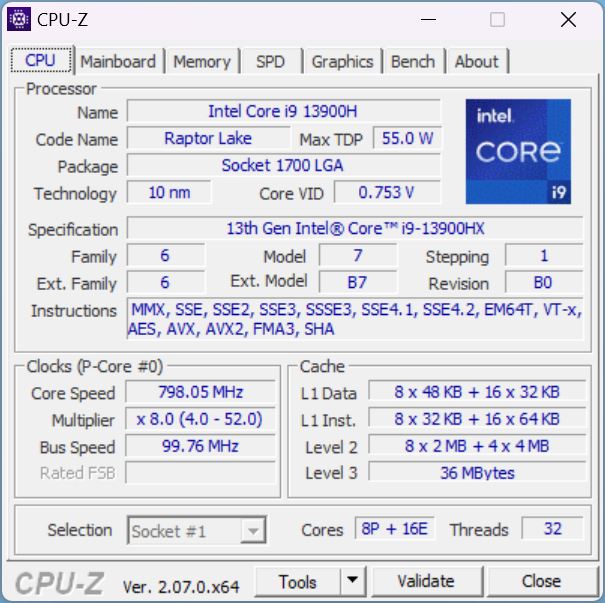
处理器
英特尔酷睿 i9-13900HX是 Raptor-Lake 系列中真正的高端 CPU。它可以通过 8 个 P 核心(包括超线程)和 16 个 E 核心运行 32 个线程。其核心的基本时钟频率为 1.6 GHz(E 核心)和 2.2 GHz(P 核心),单核涡轮增压频率可达 3.9 - 5.4 GHz。
在 Cinebench R15 环路(CB15 环路)中,Helios 的性能表现强劲,尤其是性能稳定。微星 GE78HX和Alienware m18 R1CPU 性能稍强的i9-13950HX和 i9-13980HX采用相同 CPU 的 HP Omen 可轻松超越 Helios,而采用 H 而非 HX CPU 的竞争设备也是如此。
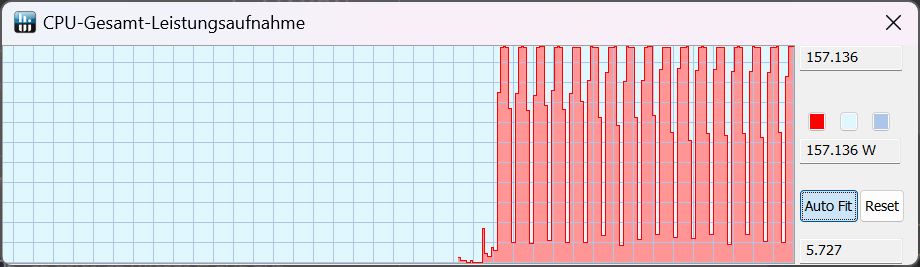
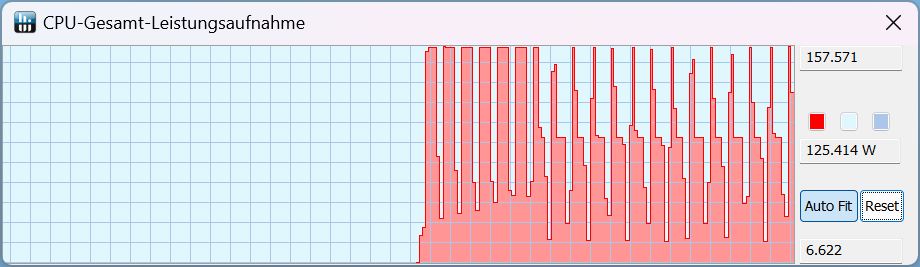
我们在下表列出了在 CB15 循环中每种性能模式下达到的所有 TDP 值。在电池模式下,您仍然可以选择平衡 模式和环保 模式。在这两种模式下,TDP 仍为 25 W,CB15 得分为 1300 分左右,降幅超过 70%!因此,两种模式在性能上并无实际差别。
| TDP/Performance mode | Turbo | Performance | Balanced | Silent | Battery Balanced | Battery Silent |
|---|---|---|---|---|---|---|
| CB15 开始 | 157 | 157 | 157 | 157 | 25 | 25 |
| 后来的 CB15 历史 | 157 | 125 | 85 | 25 | 55 | 25 |
Cinebench R15 Multi Sustained Load
Cinebench R23: Multi Core | Single Core
Cinebench R20: CPU (Multi Core) | CPU (Single Core)
Cinebench R15: CPU Multi 64Bit | CPU Single 64Bit
Blender: v2.79 BMW27 CPU
7-Zip 18.03: 7z b 4 | 7z b 4 -mmt1
Geekbench 5.5: Multi-Core | Single-Core
HWBOT x265 Benchmark v2.2: 4k Preset
LibreOffice : 20 Documents To PDF
R Benchmark 2.5: Overall mean
| CPU Performance rating | |
| MSI GE78HX 13VH-070US | |
| Alienware m18 R1 | |
| Acer Predator Helios 18 N23Q2 | |
| Razer Blade 18 RTX 4070 | |
| Average Intel Core i9-13900HX | |
| HP Omen 17-ck2097ng | |
| Average of class Gaming | |
| Asus ROG Strix G18 G814JI | |
| Cinebench R23 / Multi Core | |
| MSI GE78HX 13VH-070US | |
| Alienware m18 R1 | |
| Acer Predator Helios 18 N23Q2 | |
| Razer Blade 18 RTX 4070 | |
| Average Intel Core i9-13900HX (24270 - 32623, n=23) | |
| HP Omen 17-ck2097ng | |
| Average of class Gaming (10488 - 42661, n=107, last 2 years) | |
| Asus ROG Strix G18 G814JI | |
| Cinebench R23 / Single Core | |
| MSI GE78HX 13VH-070US | |
| Alienware m18 R1 | |
| HP Omen 17-ck2097ng | |
| Acer Predator Helios 18 N23Q2 | |
| Razer Blade 18 RTX 4070 | |
| Average Intel Core i9-13900HX (1867 - 2105, n=20) | |
| Average of class Gaming (1166 - 2415, n=107, last 2 years) | |
| Asus ROG Strix G18 G814JI | |
| Cinebench R20 / CPU (Multi Core) | |
| MSI GE78HX 13VH-070US | |
| Alienware m18 R1 | |
| Acer Predator Helios 18 N23Q2 | |
| Razer Blade 18 RTX 4070 | |
| Average Intel Core i9-13900HX (9152 - 12541, n=21) | |
| Average of class Gaming (4029 - 16433, n=106, last 2 years) | |
| HP Omen 17-ck2097ng | |
| Asus ROG Strix G18 G814JI | |
| Cinebench R20 / CPU (Single Core) | |
| Alienware m18 R1 | |
| HP Omen 17-ck2097ng | |
| Acer Predator Helios 18 N23Q2 | |
| MSI GE78HX 13VH-070US | |
| Razer Blade 18 RTX 4070 | |
| Average Intel Core i9-13900HX (722 - 810, n=21) | |
| Average of class Gaming (442 - 913, n=106, last 2 years) | |
| Asus ROG Strix G18 G814JI | |
| Cinebench R15 / CPU Multi 64Bit | |
| MSI GE78HX 13VH-070US | |
| Alienware m18 R1 | |
| Acer Predator Helios 18 N23Q2 | |
| Average Intel Core i9-13900HX (3913 - 4970, n=22) | |
| Razer Blade 18 RTX 4070 | |
| HP Omen 17-ck2097ng | |
| Average of class Gaming (1578 - 6330, n=105, last 2 years) | |
| Asus ROG Strix G18 G814JI | |
| Cinebench R15 / CPU Single 64Bit | |
| MSI GE78HX 13VH-070US | |
| Alienware m18 R1 | |
| HP Omen 17-ck2097ng | |
| Razer Blade 18 RTX 4070 | |
| Average of class Gaming (188.8 - 350, n=106, last 2 years) | |
| Acer Predator Helios 18 N23Q2 | |
| Average Intel Core i9-13900HX (247 - 304, n=22) | |
| Asus ROG Strix G18 G814JI | |
| Blender / v2.79 BMW27 CPU | |
| Asus ROG Strix G18 G814JI | |
| HP Omen 17-ck2097ng | |
| Average of class Gaming (79 - 330, n=104, last 2 years) | |
| Average Intel Core i9-13900HX (101 - 153, n=22) | |
| Razer Blade 18 RTX 4070 | |
| Acer Predator Helios 18 N23Q2 | |
| MSI GE78HX 13VH-070US | |
| Alienware m18 R1 | |
| 7-Zip 18.03 / 7z b 4 | |
| Alienware m18 R1 | |
| MSI GE78HX 13VH-070US | |
| Acer Predator Helios 18 N23Q2 | |
| Razer Blade 18 RTX 4070 | |
| Average Intel Core i9-13900HX (90675 - 127283, n=21) | |
| HP Omen 17-ck2097ng | |
| Average of class Gaming (33491 - 148086, n=105, last 2 years) | |
| Asus ROG Strix G18 G814JI | |
| 7-Zip 18.03 / 7z b 4 -mmt1 | |
| MSI GE78HX 13VH-070US | |
| Acer Predator Helios 18 N23Q2 | |
| HP Omen 17-ck2097ng | |
| Alienware m18 R1 | |
| Razer Blade 18 RTX 4070 | |
| Average Intel Core i9-13900HX (6340 - 7177, n=21) | |
| Average of class Gaming (4199 - 7436, n=105, last 2 years) | |
| Asus ROG Strix G18 G814JI | |
| Geekbench 5.5 / Multi-Core | |
| Alienware m18 R1 | |
| MSI GE78HX 13VH-070US | |
| Acer Predator Helios 18 N23Q2 | |
| HP Omen 17-ck2097ng | |
| Razer Blade 18 RTX 4070 | |
| Average Intel Core i9-13900HX (17614 - 21075, n=22) | |
| Average of class Gaming (6460 - 28263, n=105, last 2 years) | |
| Asus ROG Strix G18 G814JI | |
| Geekbench 5.5 / Single-Core | |
| MSI GE78HX 13VH-070US | |
| HP Omen 17-ck2097ng | |
| Alienware m18 R1 | |
| Average of class Gaming (986 - 2474, n=105, last 2 years) | |
| Acer Predator Helios 18 N23Q2 | |
| Razer Blade 18 RTX 4070 | |
| Average Intel Core i9-13900HX (1345 - 2093, n=22) | |
| Asus ROG Strix G18 G814JI | |
| HWBOT x265 Benchmark v2.2 / 4k Preset | |
| MSI GE78HX 13VH-070US | |
| Alienware m18 R1 | |
| Razer Blade 18 RTX 4070 | |
| Acer Predator Helios 18 N23Q2 | |
| Average Intel Core i9-13900HX (23.5 - 34.4, n=22) | |
| Average of class Gaming (11.5 - 44.4, n=105, last 2 years) | |
| HP Omen 17-ck2097ng | |
| Asus ROG Strix G18 G814JI | |
| LibreOffice / 20 Documents To PDF | |
| Asus ROG Strix G18 G814JI | |
| Average of class Gaming (33.2 - 88.8, n=105, last 2 years) | |
| Acer Predator Helios 18 N23Q2 | |
| MSI GE78HX 13VH-070US | |
| Alienware m18 R1 | |
| HP Omen 17-ck2097ng | |
| Razer Blade 18 RTX 4070 | |
| Average Intel Core i9-13900HX (32.8 - 51.1, n=21) | |
| R Benchmark 2.5 / Overall mean | |
| Asus ROG Strix G18 G814JI | |
| Average of class Gaming (0.3439 - 0.759, n=106, last 2 years) | |
| Average Intel Core i9-13900HX (0.375 - 0.4564, n=22) | |
| Acer Predator Helios 18 N23Q2 | |
| Razer Blade 18 RTX 4070 | |
| Alienware m18 R1 | |
| HP Omen 17-ck2097ng | |
| MSI GE78HX 13VH-070US | |
* ... smaller is better
AIDA64: FP32 Ray-Trace | FPU Julia | CPU SHA3 | CPU Queen | FPU SinJulia | FPU Mandel | CPU AES | CPU ZLib | FP64 Ray-Trace | CPU PhotoWorxx
| Performance rating | |
| Alienware m18 R1 | |
| Acer Predator Helios 18 N23Q2 | |
| MSI GE78HX 13VH-070US | |
| Average of class Gaming | |
| Razer Blade 18 RTX 4070 | |
| Average Intel Core i9-13900HX | |
| HP Omen 17-ck2097ng | |
| Asus ROG Strix G18 G814JI | |
| AIDA64 / FP32 Ray-Trace | |
| Average of class Gaming (10227 - 85542, n=105, last 2 years) | |
| Alienware m18 R1 | |
| MSI GE78HX 13VH-070US | |
| Acer Predator Helios 18 N23Q2 | |
| Razer Blade 18 RTX 4070 | |
| Average Intel Core i9-13900HX (17589 - 27615, n=22) | |
| Asus ROG Strix G18 G814JI | |
| HP Omen 17-ck2097ng | |
| AIDA64 / FPU Julia | |
| Alienware m18 R1 | |
| MSI GE78HX 13VH-070US | |
| Average of class Gaming (51376 - 238426, n=105, last 2 years) | |
| Acer Predator Helios 18 N23Q2 | |
| Razer Blade 18 RTX 4070 | |
| Average Intel Core i9-13900HX (88686 - 137015, n=22) | |
| Asus ROG Strix G18 G814JI | |
| HP Omen 17-ck2097ng | |
| AIDA64 / CPU SHA3 | |
| Alienware m18 R1 | |
| MSI GE78HX 13VH-070US | |
| Acer Predator Helios 18 N23Q2 | |
| Average of class Gaming (2180 - 10115, n=105, last 2 years) | |
| Razer Blade 18 RTX 4070 | |
| Average Intel Core i9-13900HX (4362 - 7029, n=22) | |
| Asus ROG Strix G18 G814JI | |
| HP Omen 17-ck2097ng | |
| AIDA64 / CPU Queen | |
| Alienware m18 R1 | |
| MSI GE78HX 13VH-070US | |
| Razer Blade 18 RTX 4070 | |
| Acer Predator Helios 18 N23Q2 | |
| HP Omen 17-ck2097ng | |
| Average Intel Core i9-13900HX (125644 - 141385, n=22) | |
| Average of class Gaming (49785 - 173351, n=90, last 2 years) | |
| Asus ROG Strix G18 G814JI | |
| AIDA64 / FPU SinJulia | |
| MSI GE78HX 13VH-070US | |
| Alienware m18 R1 | |
| Razer Blade 18 RTX 4070 | |
| Acer Predator Helios 18 N23Q2 | |
| Average Intel Core i9-13900HX (12334 - 17179, n=22) | |
| Average of class Gaming (4424 - 33636, n=105, last 2 years) | |
| HP Omen 17-ck2097ng | |
| Asus ROG Strix G18 G814JI | |
| AIDA64 / FPU Mandel | |
| Alienware m18 R1 | |
| Average of class Gaming (25115 - 128721, n=105, last 2 years) | |
| MSI GE78HX 13VH-070US | |
| Acer Predator Helios 18 N23Q2 | |
| Razer Blade 18 RTX 4070 | |
| Average Intel Core i9-13900HX (43850 - 69202, n=22) | |
| Asus ROG Strix G18 G814JI | |
| HP Omen 17-ck2097ng | |
| AIDA64 / CPU AES | |
| Acer Predator Helios 18 N23Q2 | |
| Average Intel Core i9-13900HX (89413 - 237881, n=22) | |
| Alienware m18 R1 | |
| MSI GE78HX 13VH-070US | |
| Razer Blade 18 RTX 4070 | |
| Average of class Gaming (39258 - 247074, n=105, last 2 years) | |
| HP Omen 17-ck2097ng | |
| Asus ROG Strix G18 G814JI | |
| AIDA64 / CPU ZLib | |
| MSI GE78HX 13VH-070US | |
| Alienware m18 R1 | |
| Acer Predator Helios 18 N23Q2 | |
| Razer Blade 18 RTX 4070 | |
| Average Intel Core i9-13900HX (1284 - 1958, n=22) | |
| Average of class Gaming (574 - 2531, n=105, last 2 years) | |
| HP Omen 17-ck2097ng | |
| Asus ROG Strix G18 G814JI | |
| AIDA64 / FP64 Ray-Trace | |
| Average of class Gaming (5509 - 45446, n=105, last 2 years) | |
| Alienware m18 R1 | |
| MSI GE78HX 13VH-070US | |
| Acer Predator Helios 18 N23Q2 | |
| Razer Blade 18 RTX 4070 | |
| Average Intel Core i9-13900HX (9481 - 15279, n=22) | |
| Asus ROG Strix G18 G814JI | |
| HP Omen 17-ck2097ng | |
| AIDA64 / CPU PhotoWorxx | |
| Alienware m18 R1 | |
| HP Omen 17-ck2097ng | |
| Acer Predator Helios 18 N23Q2 | |
| MSI GE78HX 13VH-070US | |
| Razer Blade 18 RTX 4070 | |
| Average Intel Core i9-13900HX (42994 - 51994, n=22) | |
| Average of class Gaming (12271 - 89891, n=105, last 2 years) | |
| Asus ROG Strix G18 G814JI | |
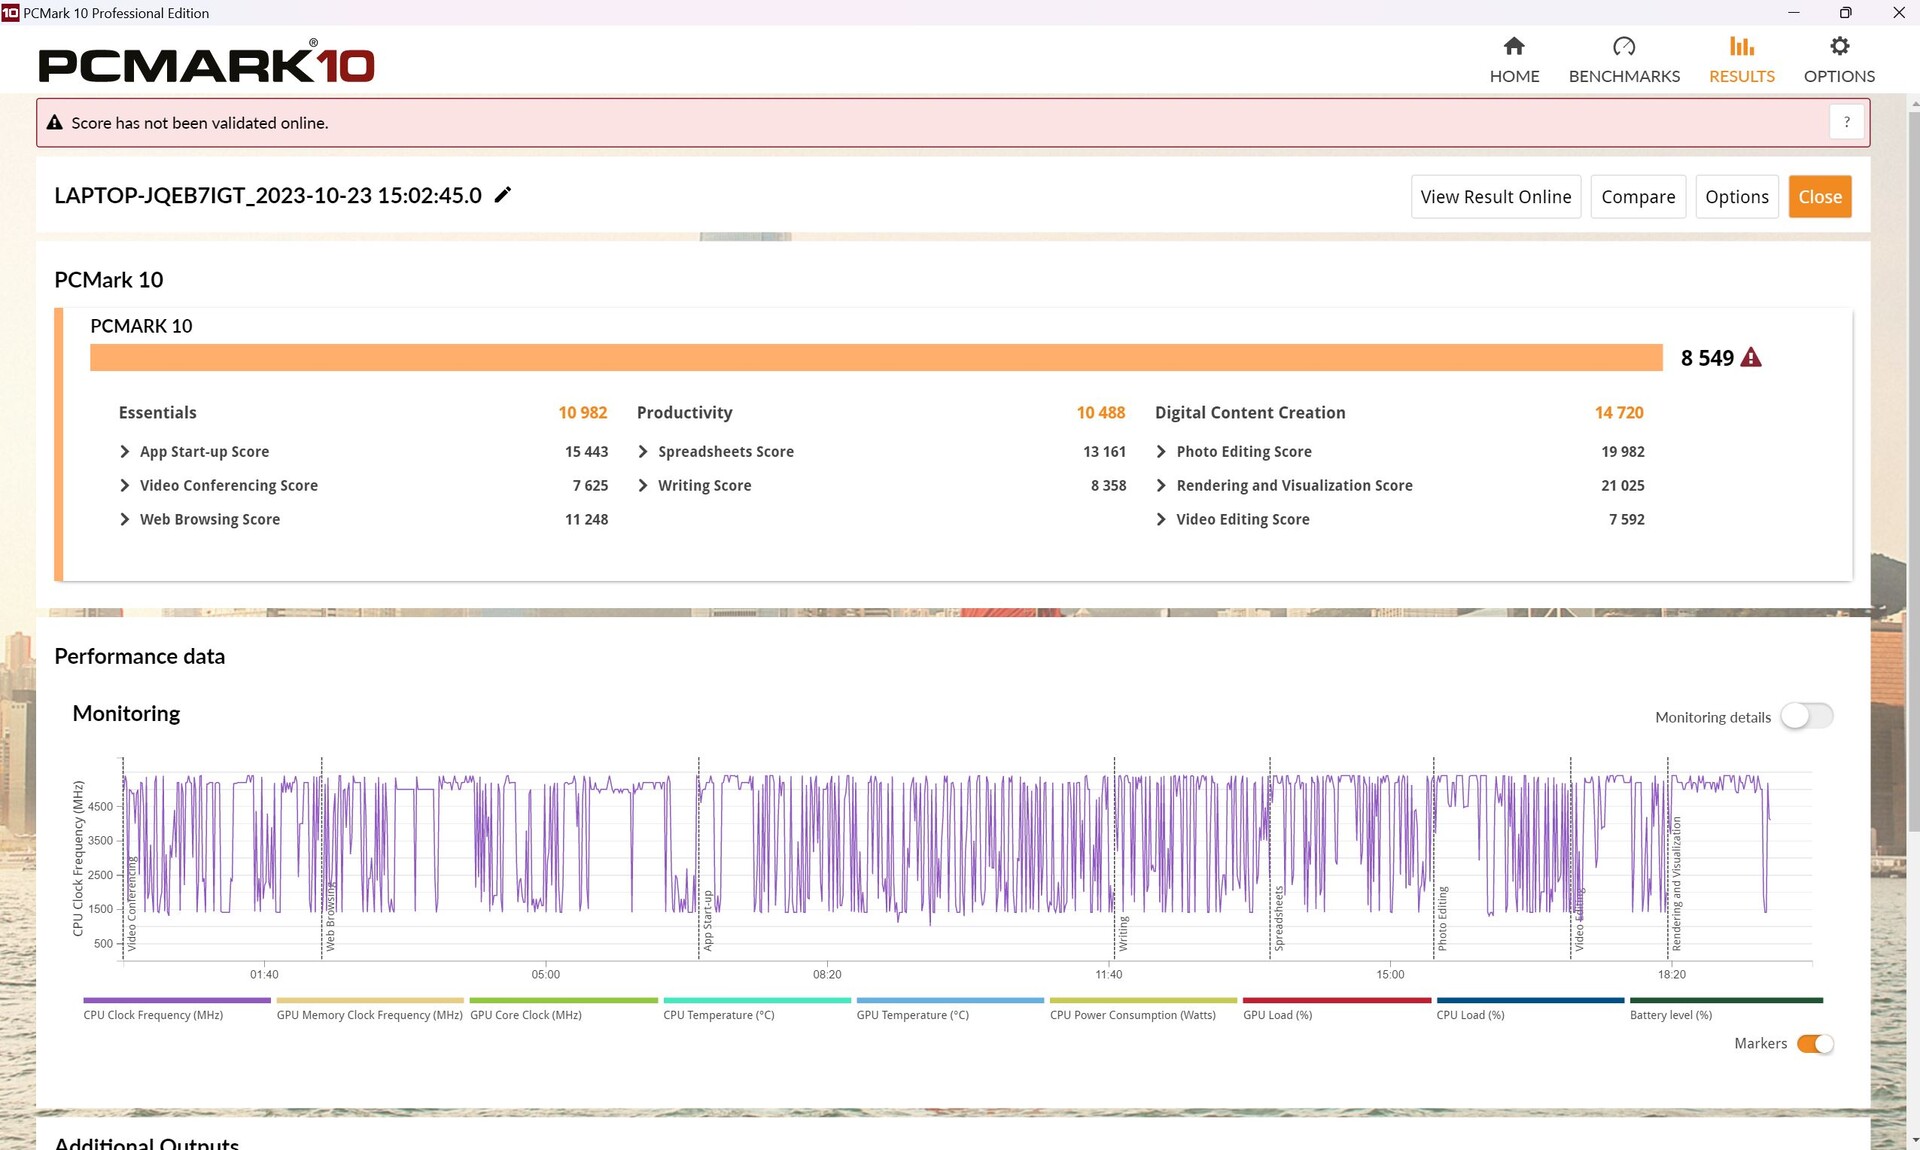
系统性能
与 CPU 性能一样,Helios 也只是略微落后于微星 GE78HX和Alienware m18 R1.
大多数应用程序主观感觉都很流畅。只有图形切换(Advanced Optimus)是笔记本电脑一直存在的问题。有关此问题和延迟问题的更多信息,请参阅以下章节。
CrossMark: Overall | Productivity | Creativity | Responsiveness
| PCMark 10 / Score | |
| MSI GE78HX 13VH-070US | |
| Alienware m18 R1 | |
| Acer Predator Helios 18 N23Q2 | |
| Average of class Gaming (5828 - 12414, n=93, last 2 years) | |
| Average Intel Core i9-13900HX, NVIDIA GeForce RTX 4080 Laptop GPU (7609 - 8549, n=3) | |
| Razer Blade 18 RTX 4070 | |
| HP Omen 17-ck2097ng | |
| Asus ROG Strix G18 G814JI | |
| PCMark 10 / Essentials | |
| HP Omen 17-ck2097ng | |
| Razer Blade 18 RTX 4070 | |
| Average Intel Core i9-13900HX, NVIDIA GeForce RTX 4080 Laptop GPU (10982 - 11824, n=3) | |
| MSI GE78HX 13VH-070US | |
| Alienware m18 R1 | |
| Acer Predator Helios 18 N23Q2 | |
| Average of class Gaming (8810 - 11935, n=97, last 2 years) | |
| Asus ROG Strix G18 G814JI | |
| PCMark 10 / Productivity | |
| Average of class Gaming (6845 - 25323, n=95, last 2 years) | |
| Acer Predator Helios 18 N23Q2 | |
| MSI GE78HX 13VH-070US | |
| Average Intel Core i9-13900HX, NVIDIA GeForce RTX 4080 Laptop GPU (9976 - 10788, n=3) | |
| Alienware m18 R1 | |
| HP Omen 17-ck2097ng | |
| Razer Blade 18 RTX 4070 | |
| Asus ROG Strix G18 G814JI | |
| PCMark 10 / Digital Content Creation | |
| Alienware m18 R1 | |
| MSI GE78HX 13VH-070US | |
| Acer Predator Helios 18 N23Q2 | |
| Average of class Gaming (7602 - 19954, n=95, last 2 years) | |
| Average Intel Core i9-13900HX, NVIDIA GeForce RTX 4080 Laptop GPU (10135 - 14720, n=3) | |
| Razer Blade 18 RTX 4070 | |
| HP Omen 17-ck2097ng | |
| Asus ROG Strix G18 G814JI | |
| CrossMark / Overall | |
| Acer Predator Helios 18 N23Q2 | |
| Alienware m18 R1 | |
| Razer Blade 18 RTX 4070 | |
| Average Intel Core i9-13900HX, NVIDIA GeForce RTX 4080 Laptop GPU (1991 - 2194, n=2) | |
| HP Omen 17-ck2097ng | |
| Average of class Gaming (1366 - 2409, n=94, last 2 years) | |
| MSI GE78HX 13VH-070US | |
| CrossMark / Productivity | |
| Acer Predator Helios 18 N23Q2 | |
| Alienware m18 R1 | |
| Razer Blade 18 RTX 4070 | |
| Average Intel Core i9-13900HX, NVIDIA GeForce RTX 4080 Laptop GPU (1828 - 2059, n=2) | |
| Average of class Gaming (1386 - 2254, n=94, last 2 years) | |
| MSI GE78HX 13VH-070US | |
| HP Omen 17-ck2097ng | |
| CrossMark / Creativity | |
| Alienware m18 R1 | |
| Acer Predator Helios 18 N23Q2 | |
| Razer Blade 18 RTX 4070 | |
| Average Intel Core i9-13900HX, NVIDIA GeForce RTX 4080 Laptop GPU (2239 - 2411, n=2) | |
| Average of class Gaming (1343 - 2786, n=94, last 2 years) | |
| HP Omen 17-ck2097ng | |
| MSI GE78HX 13VH-070US | |
| CrossMark / Responsiveness | |
| Acer Predator Helios 18 N23Q2 | |
| Alienware m18 R1 | |
| Average Intel Core i9-13900HX, NVIDIA GeForce RTX 4080 Laptop GPU (1808 - 1998, n=2) | |
| Razer Blade 18 RTX 4070 | |
| HP Omen 17-ck2097ng | |
| Average of class Gaming (1226 - 2334, n=94, last 2 years) | |
| MSI GE78HX 13VH-070US | |
| PCMark 10 Score | 8549 points | |
Help | ||
| AIDA64 / Memory Copy | |
| Alienware m18 R1 | |
| Acer Predator Helios 18 N23Q2 | |
| HP Omen 17-ck2097ng | |
| MSI GE78HX 13VH-070US | |
| Razer Blade 18 RTX 4070 | |
| Average Intel Core i9-13900HX (67716 - 79193, n=22) | |
| Average of class Gaming (21750 - 129946, n=105, last 2 years) | |
| Asus ROG Strix G18 G814JI | |
| AIDA64 / Memory Read | |
| Alienware m18 R1 | |
| Acer Predator Helios 18 N23Q2 | |
| HP Omen 17-ck2097ng | |
| Razer Blade 18 RTX 4070 | |
| MSI GE78HX 13VH-070US | |
| Average Intel Core i9-13900HX (73998 - 88462, n=22) | |
| Average of class Gaming (22956 - 118858, n=105, last 2 years) | |
| Asus ROG Strix G18 G814JI | |
| AIDA64 / Memory Write | |
| Alienware m18 R1 | |
| HP Omen 17-ck2097ng | |
| MSI GE78HX 13VH-070US | |
| Average of class Gaming (22297 - 135096, n=105, last 2 years) | |
| Razer Blade 18 RTX 4070 | |
| Acer Predator Helios 18 N23Q2 | |
| Average Intel Core i9-13900HX (65472 - 77045, n=22) | |
| Asus ROG Strix G18 G814JI | |
| AIDA64 / Memory Latency | |
| Average of class Gaming (75.3 - 259, n=105, last 2 years) | |
| Average Intel Core i9-13900HX (75.3 - 91.1, n=22) | |
| HP Omen 17-ck2097ng | |
| Razer Blade 18 RTX 4070 | |
| MSI GE78HX 13VH-070US | |
| Asus ROG Strix G18 G814JI | |
| Acer Predator Helios 18 N23Q2 | |
| Alienware m18 R1 | |
* ... smaller is better
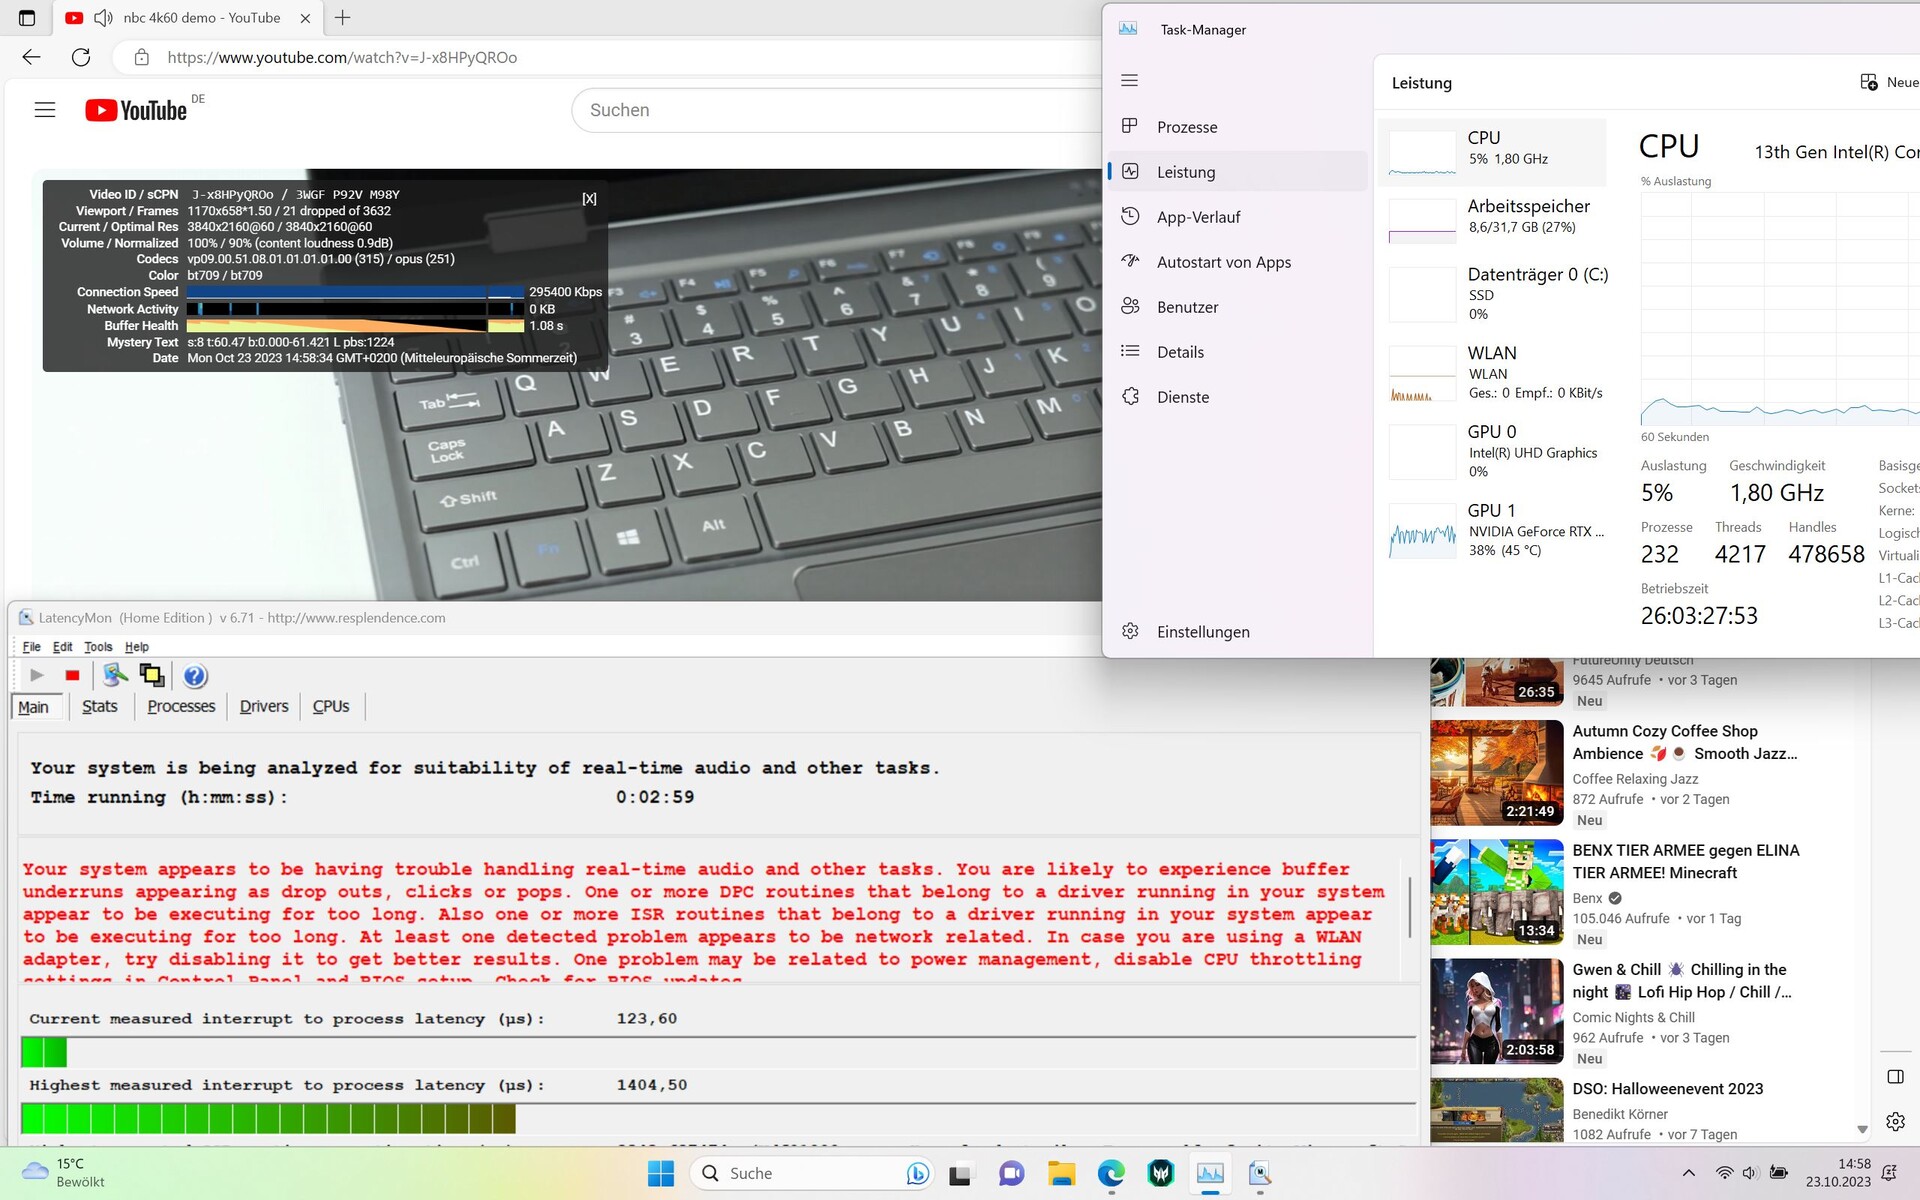
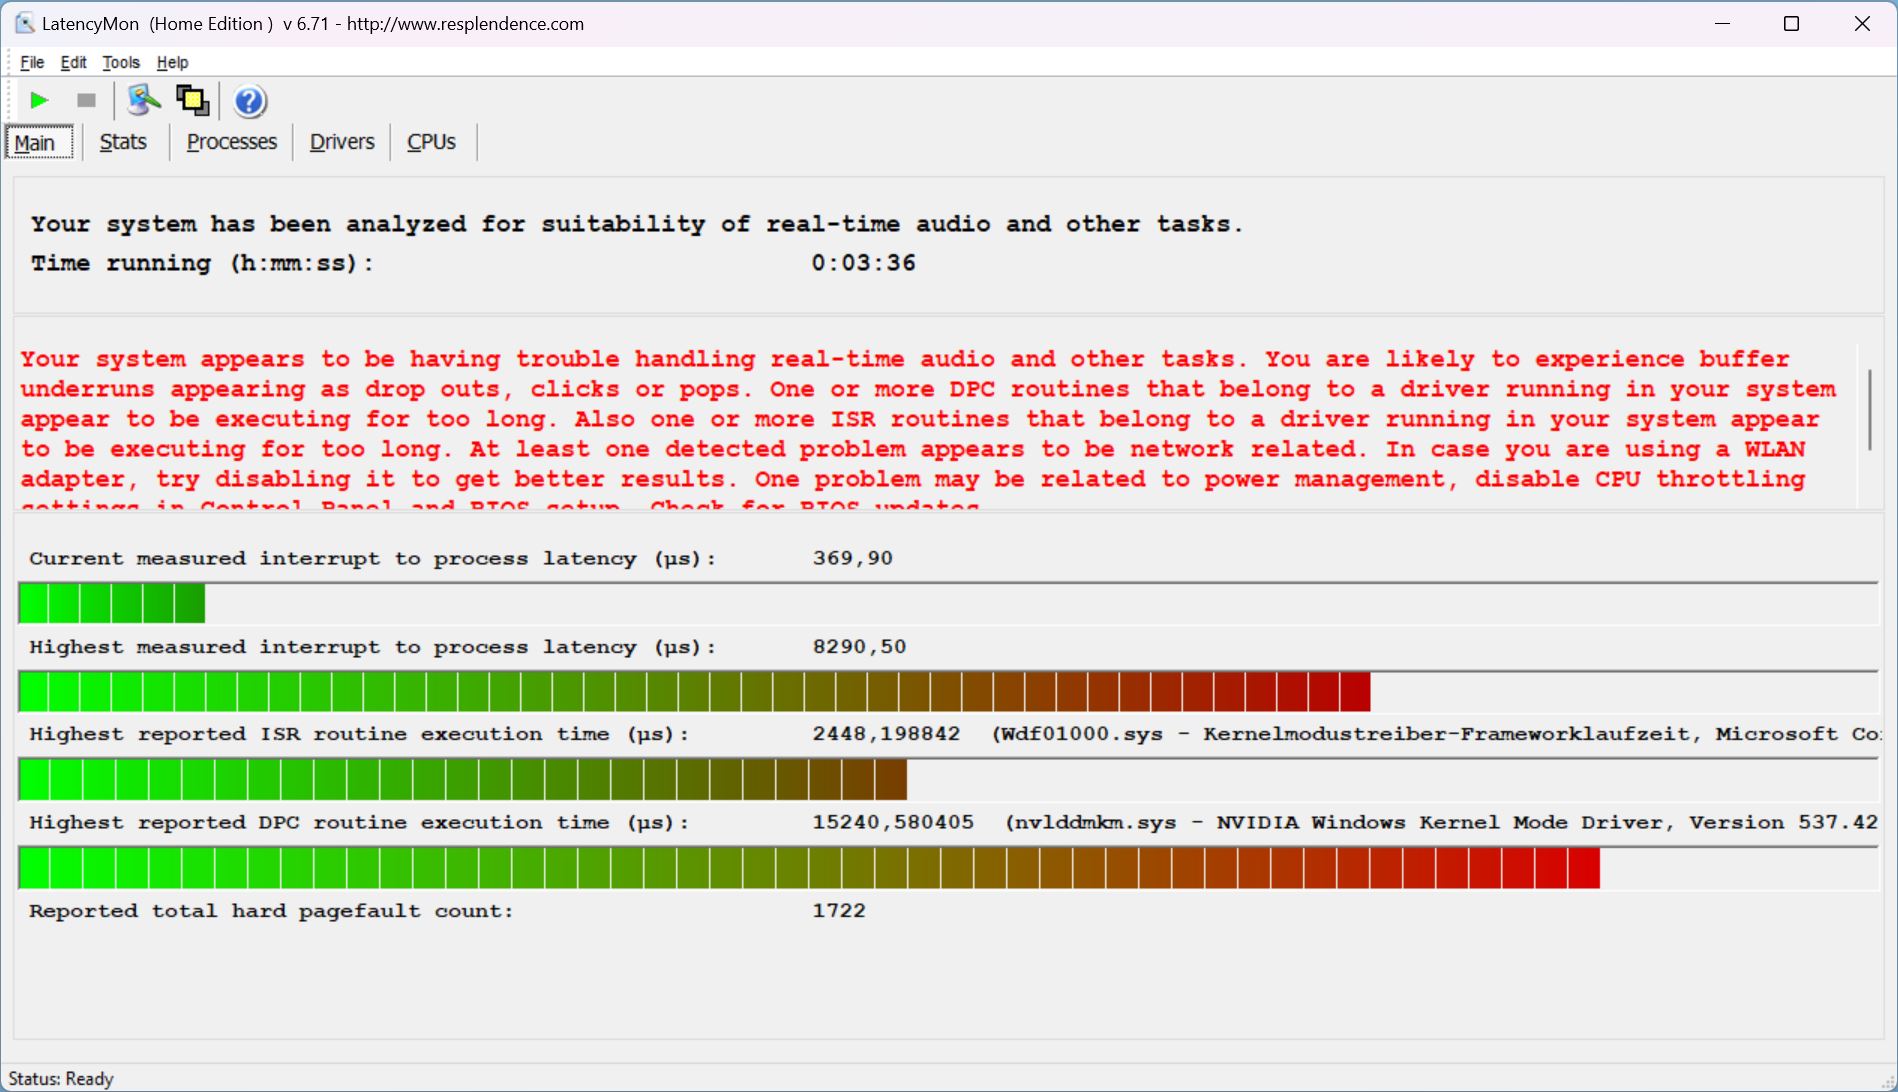
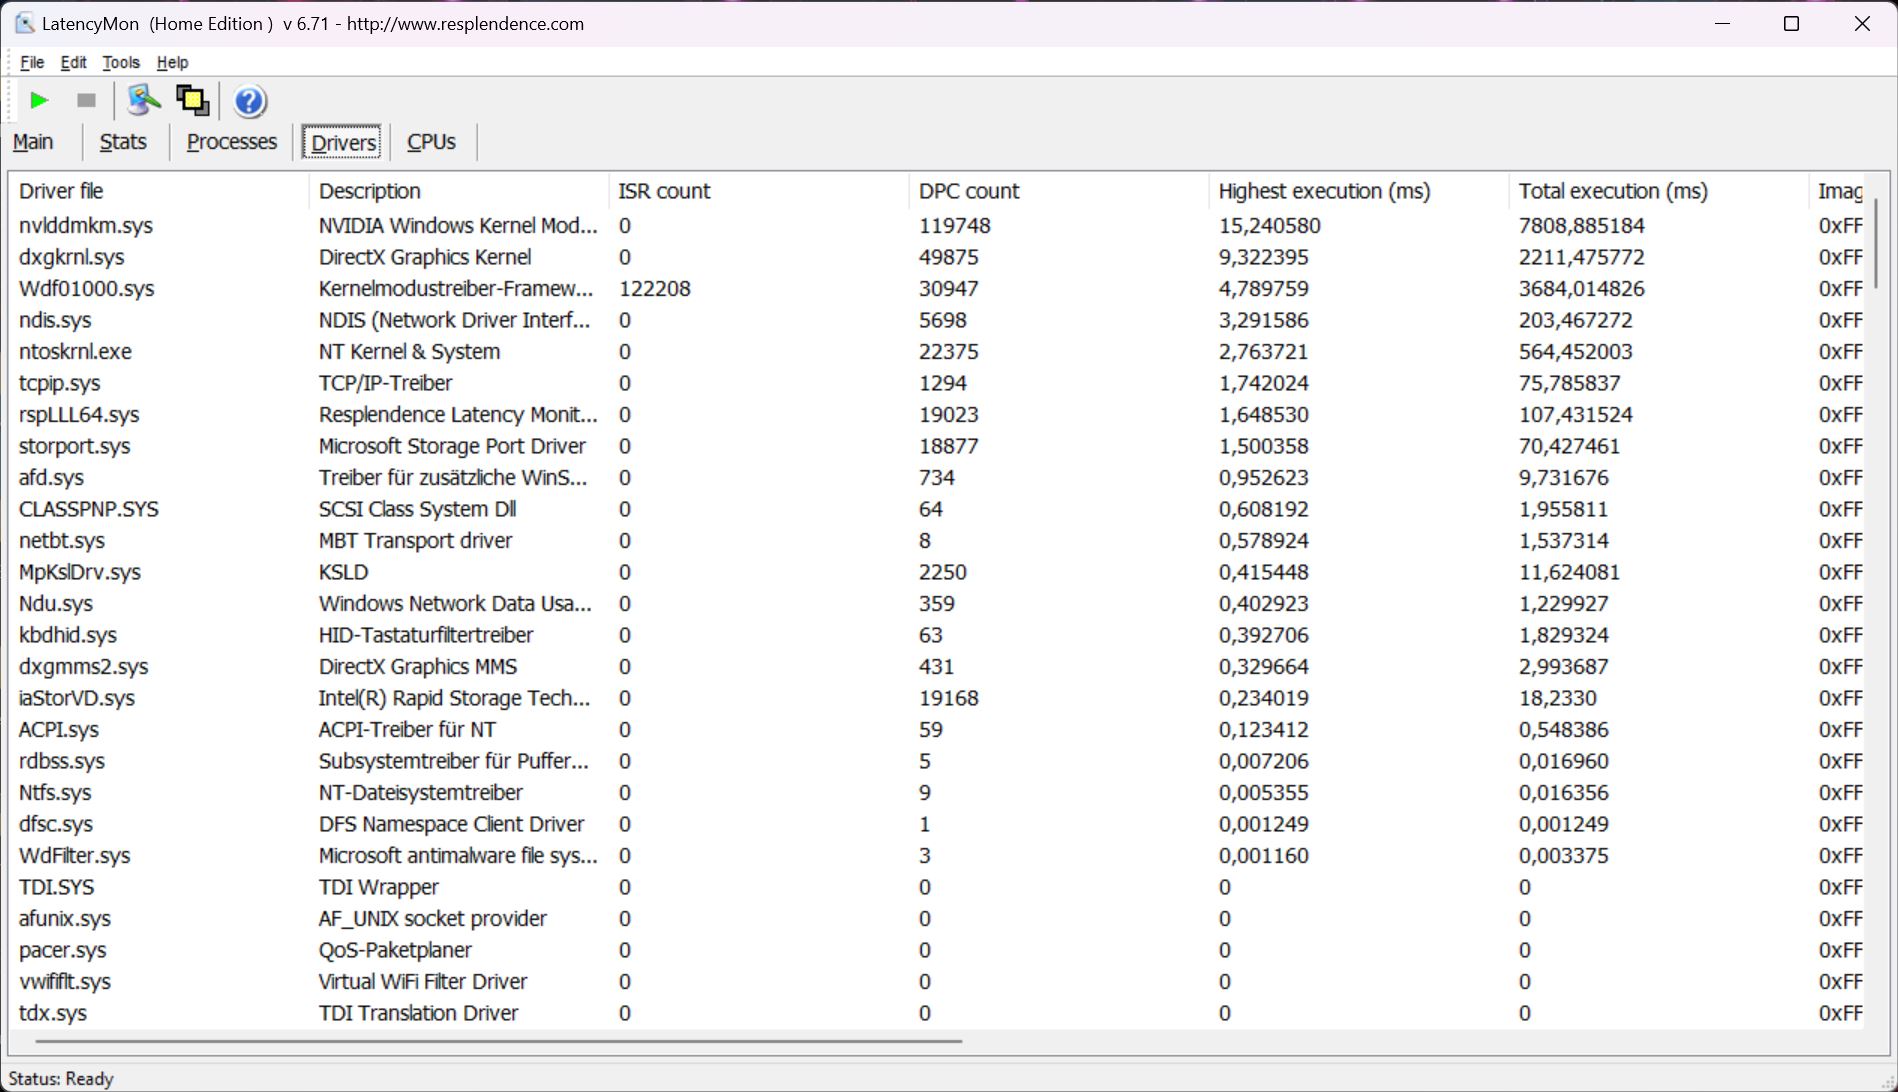
DPC 延迟
正如 LatencyMon 显示的那样,在当前驱动程序状态下,笔记本电脑存在严重的延迟问题。在平衡 模式下,打开浏览器或移动桌面窗口时会出现延迟。在我们的网站上打开多个浏览器标签时,延迟会增加,即使播放 4K/60 fps 的 YouTube 视频,也会出现整整 18 个跳帧。宏碁需要改进驱动程序。不过,竞争对手的笔记本电脑也存在类似问题。
| DPC Latencies / LatencyMon - interrupt to process latency (max), Web, Youtube, Prime95 | |
| Acer Predator Helios 18 N23Q2 | |
| MSI GE78HX 13VH-070US | |
| Alienware m18 R1 | |
| HP Omen 17-ck2097ng | |
| Razer Blade 18 RTX 4070 | |
| Asus ROG Strix G18 G814JI | |
* ... smaller is better
存储设备
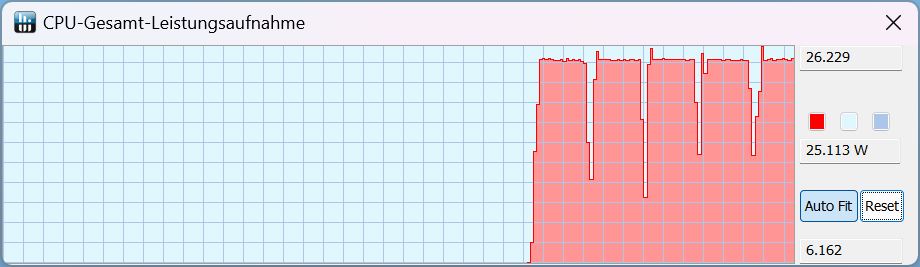
Helios 18 配备了三星 PM9A1,它是我们 "固态硬盘最佳列表 "中速度最快的固态硬盘之一。最佳固态硬盘列表中速度最快的固态硬盘之一。遗憾的是,PM9A1 在 Predator 上的表现并不理想,如下图所示,它的性能很快就被削弱了。我们稍后重复了同样的测试,得到的结果也是一样,因为我们对其性能的急剧下降感到惊讶。在之前评测过的 掠夺者 Helios 16.

* ... smaller is better
Sustained Read Performance: DiskSpd Read Loop, Queue Depth 8
图片
......(英文 RTX 4080是 2023 年初推出的高端 GPU。在 Helios 18 中,它的最大功耗为 175 W,包括动态提升功耗。
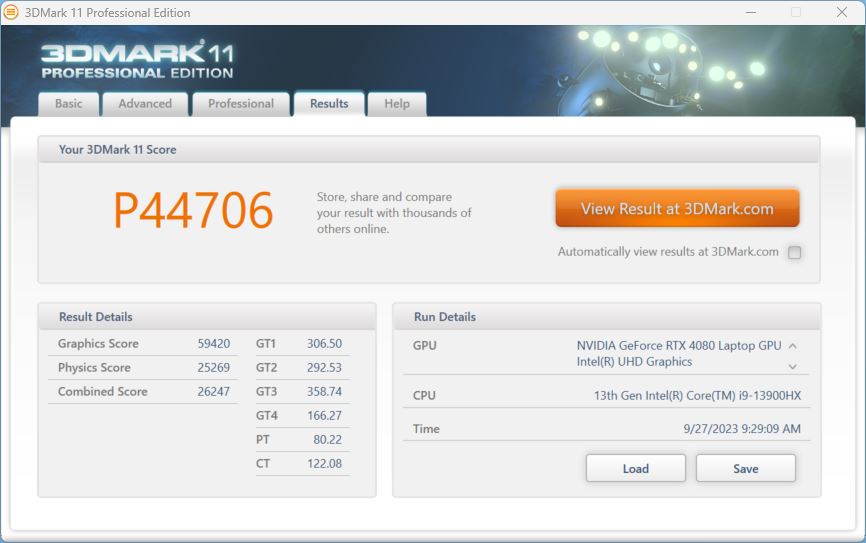
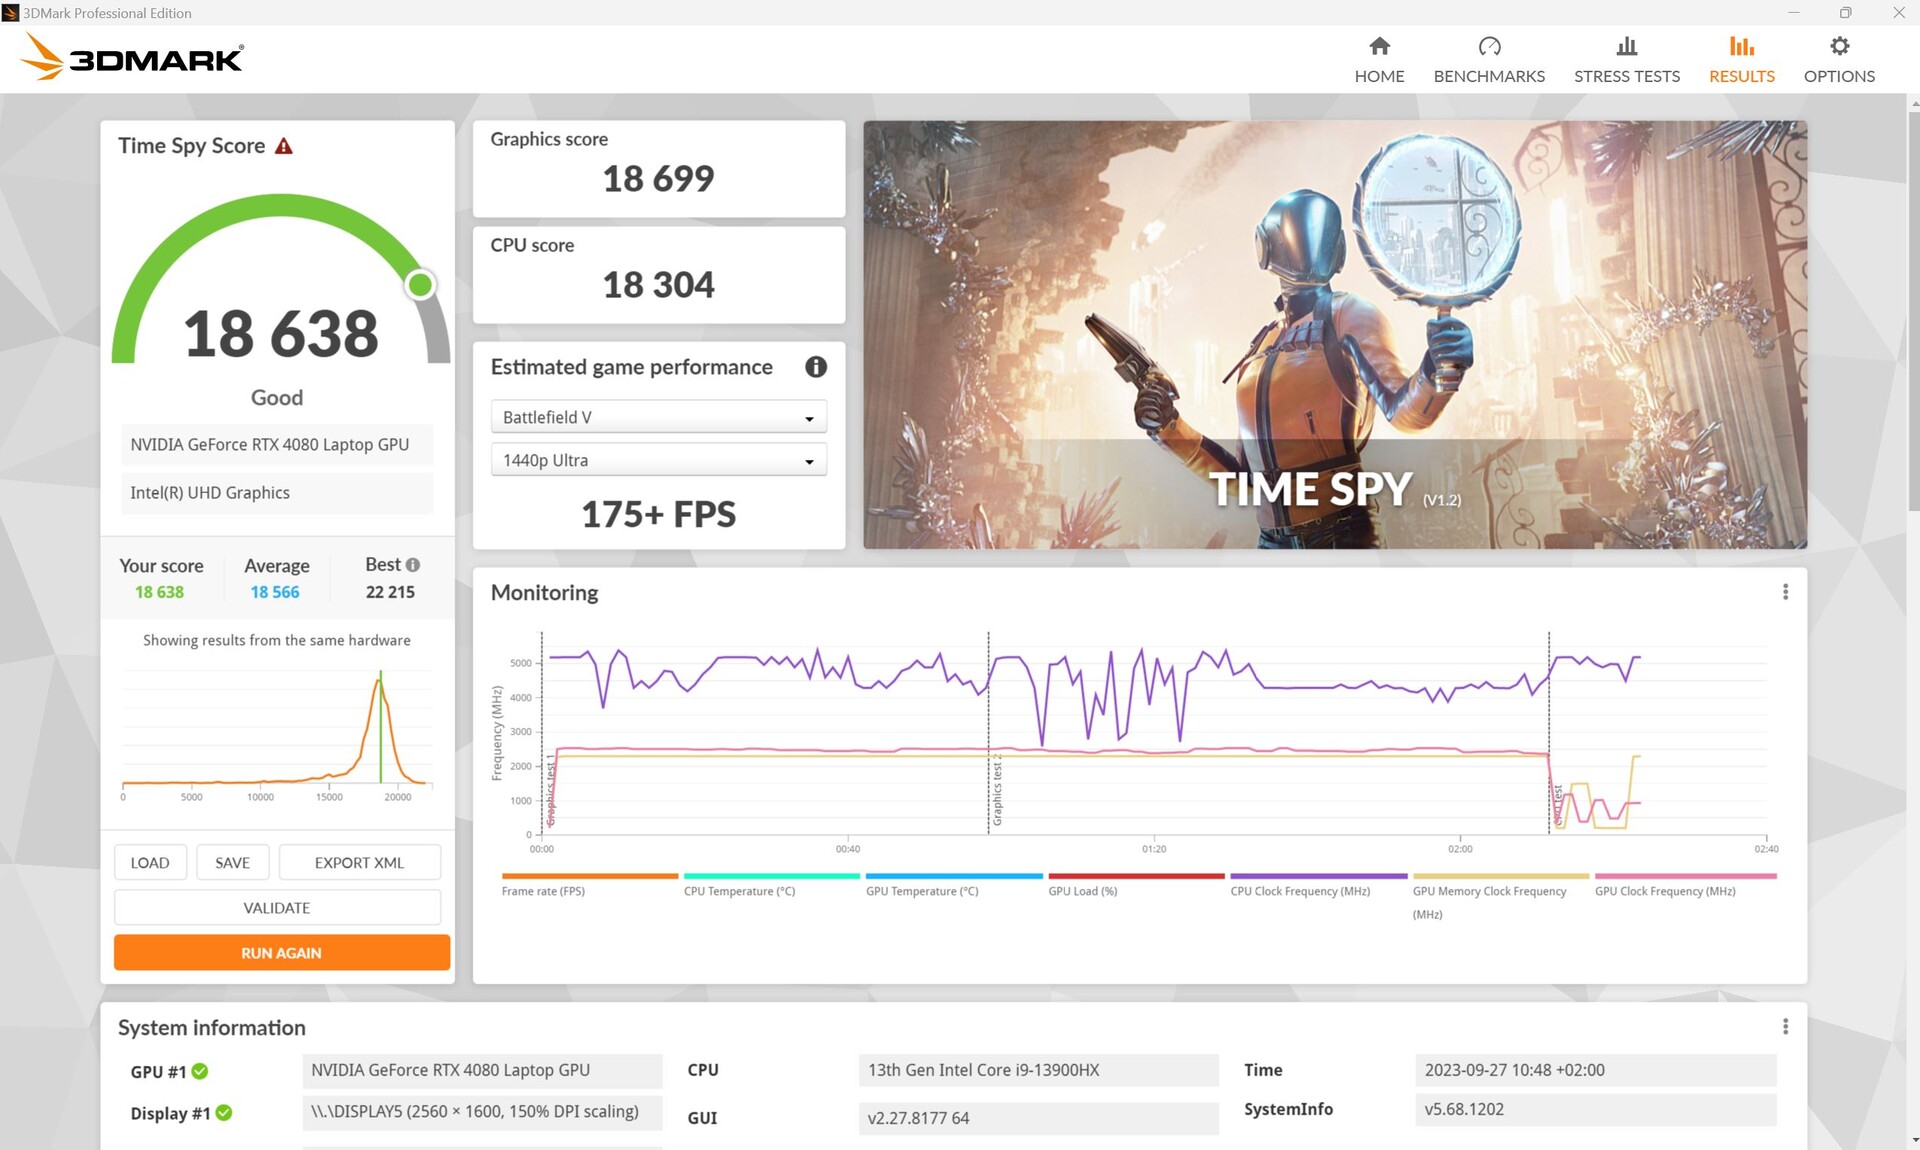
在合成 3DMark 测试中,Helios 以微弱优势超过了 微星 GE78HX以微弱优势首次超越了采用相同 GPU 的微星 GE78HX。RTX 4080 的性能比我们数据库中配备相同 GPU 的所有笔记本电脑的平均性能高出约 10%。
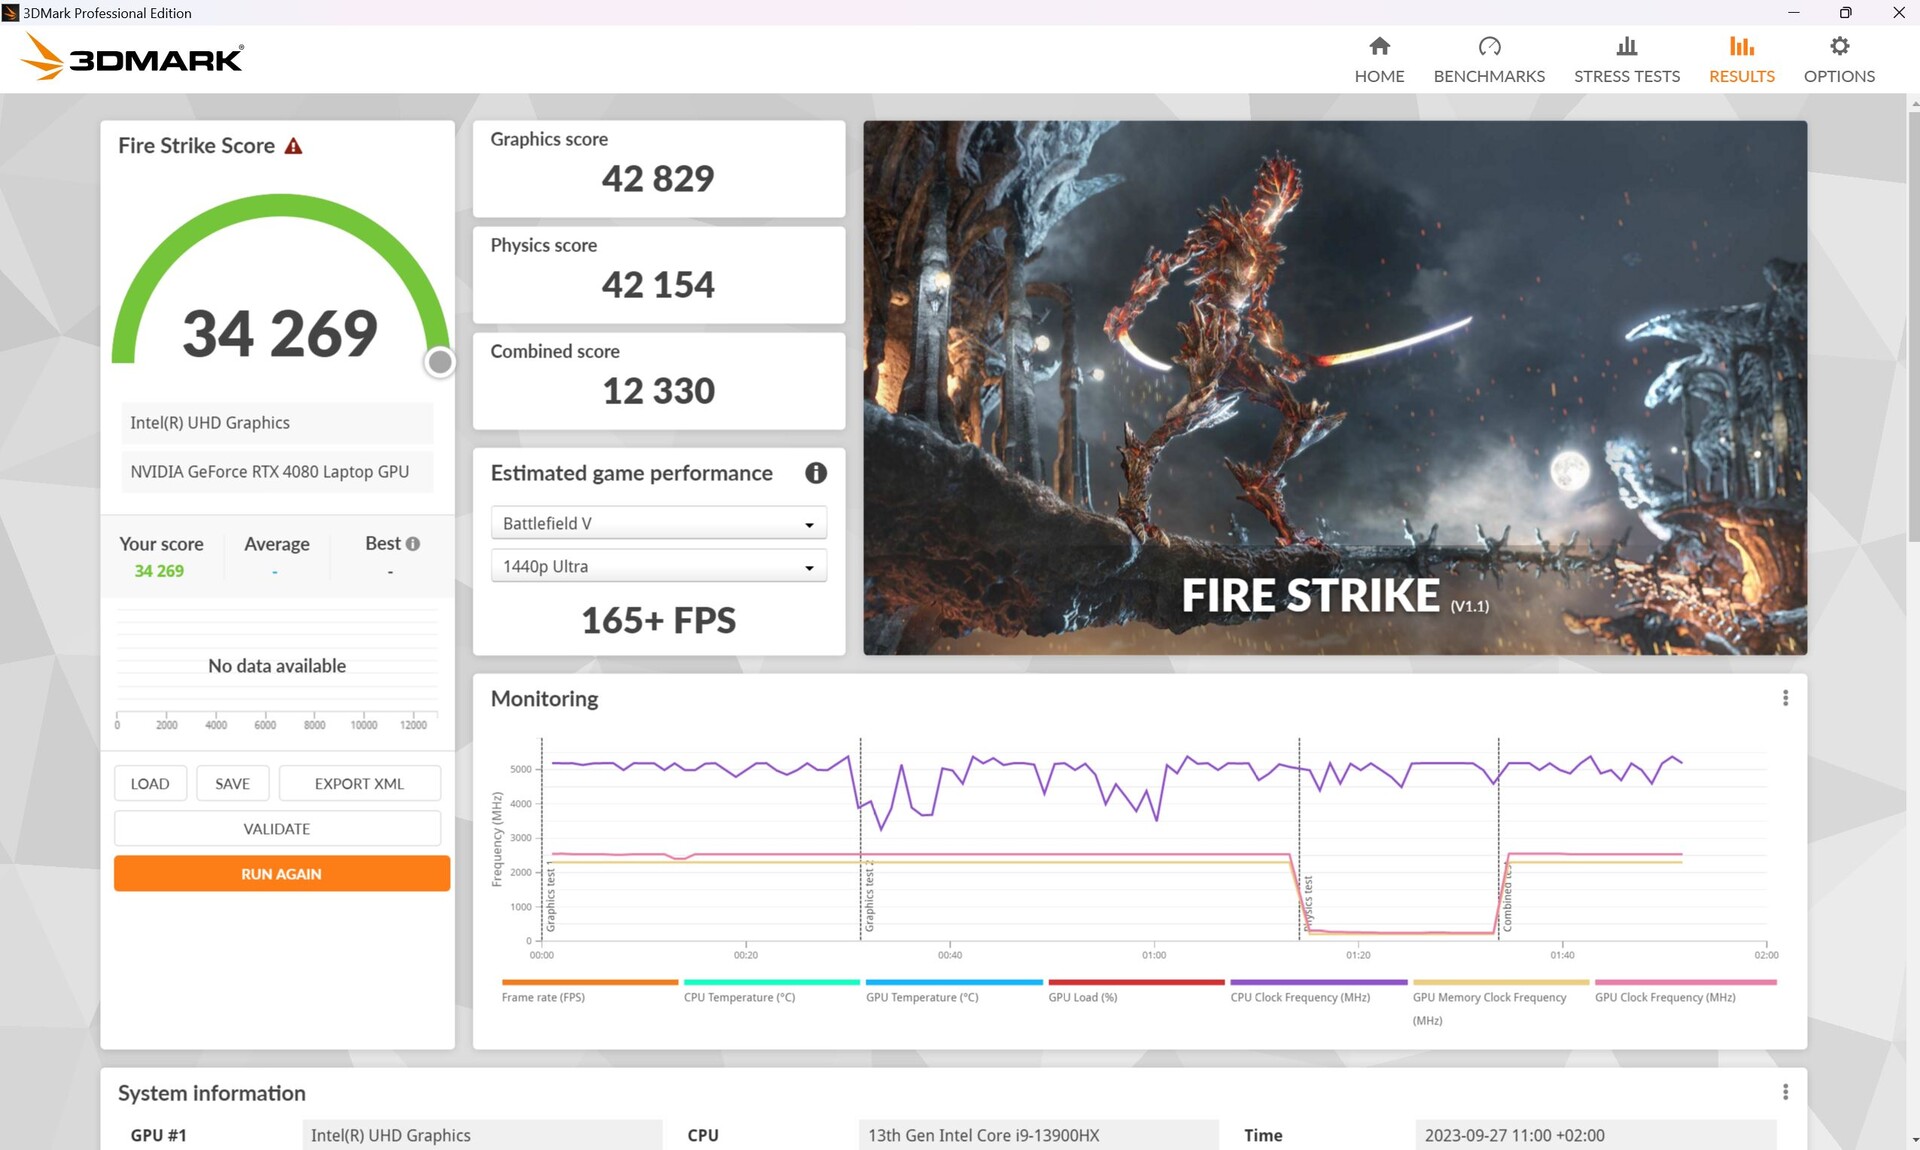
离开插座后,Predator 仍能在Fire Strike 中获得 6897 个图形点,下降了 84%!
| 3DMark Performance rating - Percent | |
| Alienware m18 R1 -1! | |
| Acer Predator Helios 18 N23Q2 | |
| MSI GE78HX 13VH-070US -1! | |
| Average NVIDIA GeForce RTX 4080 Laptop GPU | |
| Average of class Gaming | |
| HP Omen 17-ck2097ng | |
| Asus ROG Strix G18 G814JI | |
| Razer Blade 18 RTX 4070 -1! | |
| 3DMark 11 Performance | 44706 points | |
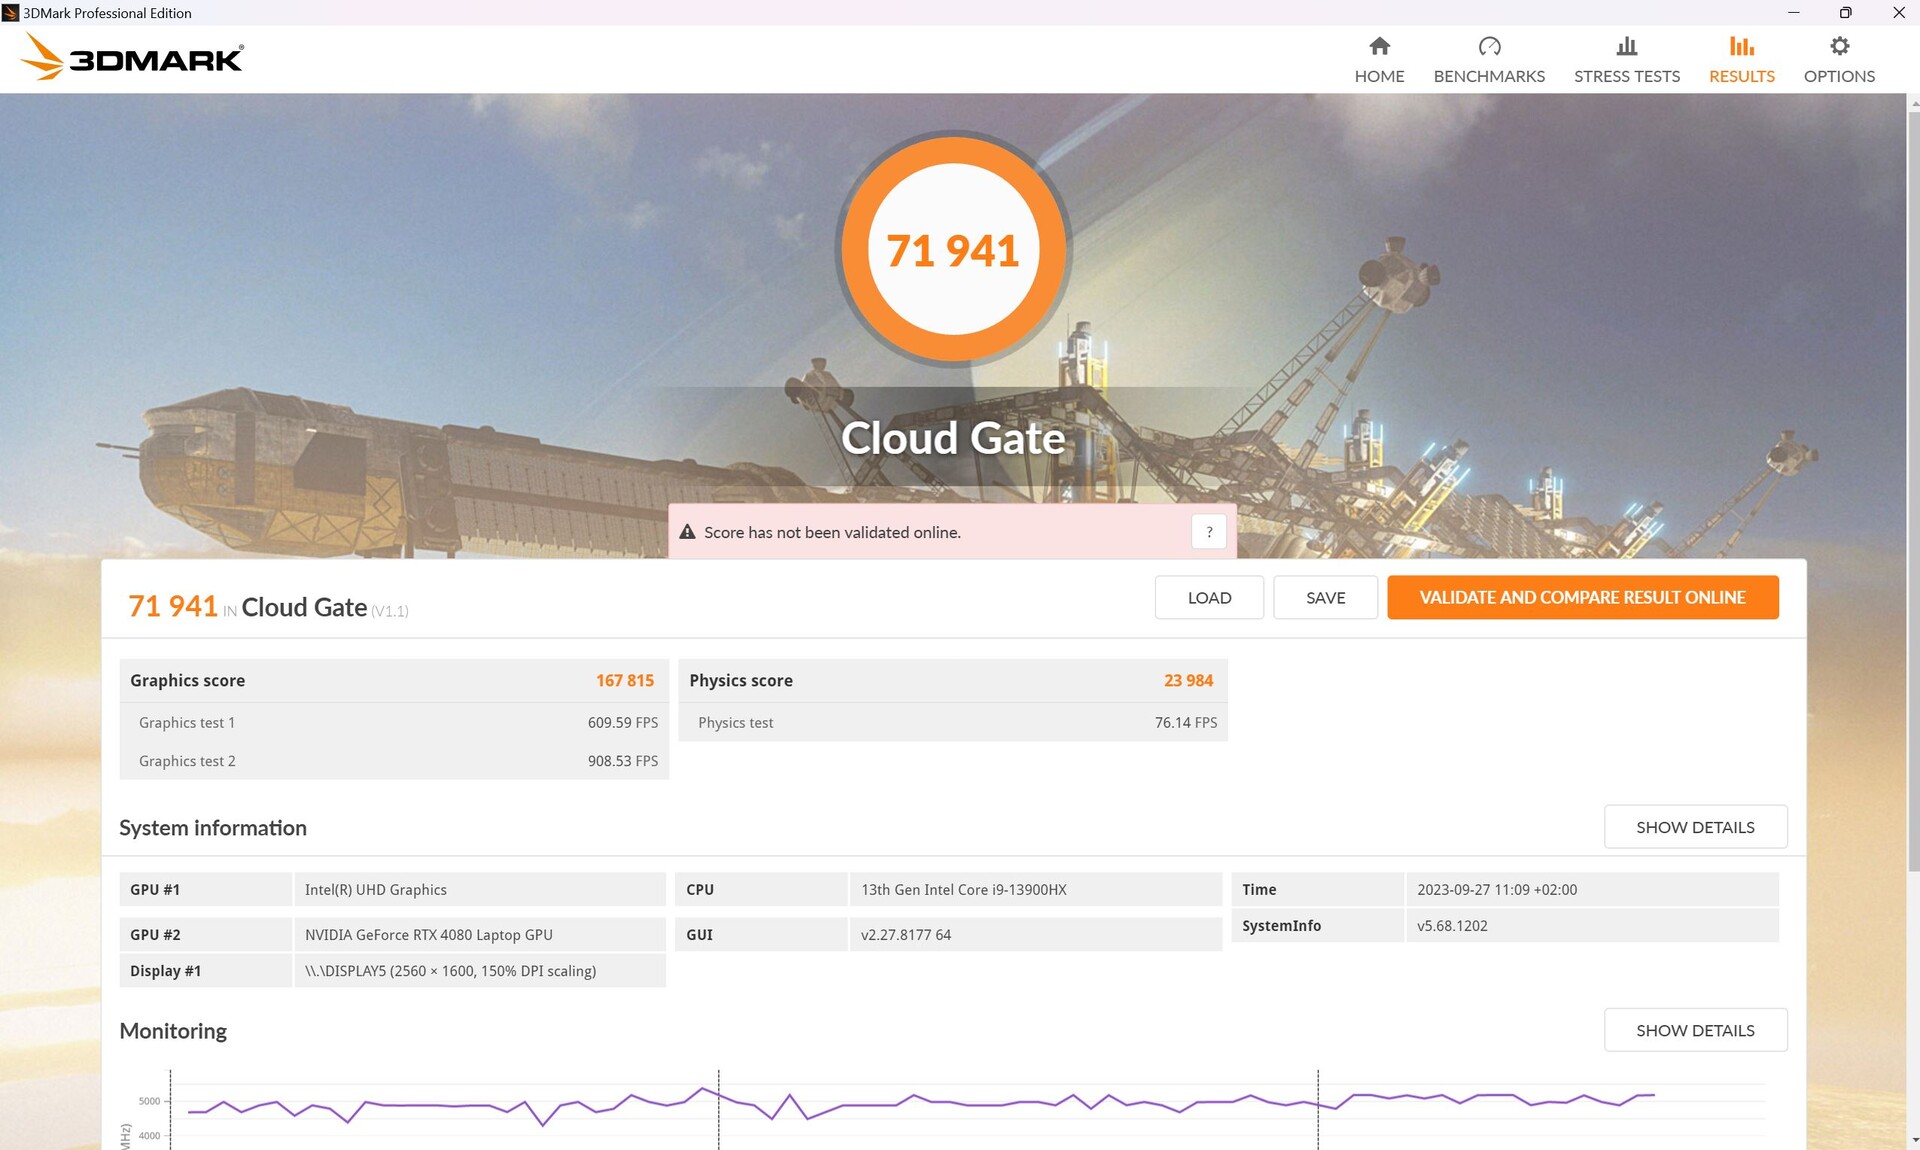
| 3DMark Cloud Gate Standard Score | 71941 points | |
| 3DMark Fire Strike Score | 34269 points | |
| 3DMark Time Spy Score | 18638 points | |
Help | ||
* ... smaller is better
游戏性能
Helios 18 还以微弱优势超过了微星 GE78HX在游戏方面,但两者最终都不相上下。Alienware m18 R1配备了 RTX 4090快约 7%;在Witcher 3 中差距最大,为 +22%,而我们的 Predator 甚至在《GTA V》中遥遥领先。
| Performance rating - Percent | |
| Alienware m18 R1 | |
| Acer Predator Helios 18 N23Q2 | |
| Average of class Gaming | |
| HP Omen 17-ck2097ng | |
| MSI GE78HX 13VH-070US | |
| Razer Blade 18 RTX 4070 | |
| Asus ROG Strix G18 G814JI | |
| The Witcher 3 - 1920x1080 Ultra Graphics & Postprocessing (HBAO+) | |
| Alienware m18 R1 | |
| Average of class Gaming (104.7 - 240, n=7, last 2 years) | |
| MSI GE78HX 13VH-070US | |
| Acer Predator Helios 18 N23Q2 | |
| HP Omen 17-ck2097ng | |
| Asus ROG Strix G18 G814JI | |
| Razer Blade 18 RTX 4070 | |
| GTA V - 1920x1080 Highest AA:4xMSAA + FX AF:16x | |
| Acer Predator Helios 18 N23Q2 | |
| Alienware m18 R1 | |
| Average of class Gaming (48.3 - 186.9, n=94, last 2 years) | |
| Razer Blade 18 RTX 4070 | |
| HP Omen 17-ck2097ng | |
| Asus ROG Strix G18 G814JI | |
| MSI GE78HX 13VH-070US | |
| Final Fantasy XV Benchmark - 1920x1080 High Quality | |
| Alienware m18 R1 | |
| Acer Predator Helios 18 N23Q2 | |
| Average of class Gaming (41 - 215, n=95, last 2 years) | |
| MSI GE78HX 13VH-070US | |
| HP Omen 17-ck2097ng | |
| Asus ROG Strix G18 G814JI | |
| Razer Blade 18 RTX 4070 | |
| Strange Brigade - 1920x1080 ultra AA:ultra AF:16 | |
| Alienware m18 R1 | |
| Acer Predator Helios 18 N23Q2 | |
| Average of class Gaming (76.3 - 458, n=87, last 2 years) | |
| HP Omen 17-ck2097ng | |
| MSI GE78HX 13VH-070US | |
| Asus ROG Strix G18 G814JI | |
| Razer Blade 18 RTX 4070 | |
| Dota 2 Reborn - 1920x1080 ultra (3/3) best looking | |
| Alienware m18 R1 | |
| Acer Predator Helios 18 N23Q2 | |
| Razer Blade 18 RTX 4070 | |
| HP Omen 17-ck2097ng | |
| Asus ROG Strix G18 G814JI | |
| Average of class Gaming (84.8 - 248, n=107, last 2 years) | |
| MSI GE78HX 13VH-070US | |
| The Witcher 3 | |
| 1920x1080 High Graphics & Postprocessing (Nvidia HairWorks Off) | |
| Alienware m18 R1 | |
| MSI GE78HX 13VH-070US | |
| Average of class Gaming (341 - 404, n=2, last 2 years) | |
| Acer Predator Helios 18 N23Q2 | |
| Average NVIDIA GeForce RTX 4080 Laptop GPU (246 - 385, n=14) | |
| HP Omen 17-ck2097ng | |
| Razer Blade 18 RTX 4070 | |
| Asus ROG Strix G18 G814JI | |
| 1920x1080 Ultra Graphics & Postprocessing (HBAO+) | |
| Alienware m18 R1 | |
| Average of class Gaming (104.7 - 240, n=7, last 2 years) | |
| MSI GE78HX 13VH-070US | |
| Acer Predator Helios 18 N23Q2 | |
| Average NVIDIA GeForce RTX 4080 Laptop GPU (130.4 - 186.1, n=20) | |
| HP Omen 17-ck2097ng | |
| Asus ROG Strix G18 G814JI | |
| Razer Blade 18 RTX 4070 | |
| Hogwarts Legacy | |
| 1920x1080 Ultra Preset AA:High T | |
| Average NVIDIA GeForce RTX 4080 Laptop GPU (108 - 131, n=3) | |
| Average of class Gaming (n=1last 2 years) | |
| Acer Predator Helios 18 N23Q2 | |
| Asus ROG Strix G18 G814JI | |
| 2560x1440 Ultra Preset AA:High T | |
| Average of class Gaming (n=1last 2 years) | |
| Average NVIDIA GeForce RTX 4080 Laptop GPU (76 - 102, n=3) | |
| Acer Predator Helios 18 N23Q2 | |
| Asus ROG Strix G18 G814JI | |
| 1920x1080 Ultra Preset + Full Ray Tracing AA:High T | |
| Acer Predator Helios 18 N23Q2 | |
| Average NVIDIA GeForce RTX 4080 Laptop GPU (53 - 66, n=2) | |
| Asus ROG Strix G18 G814JI | |
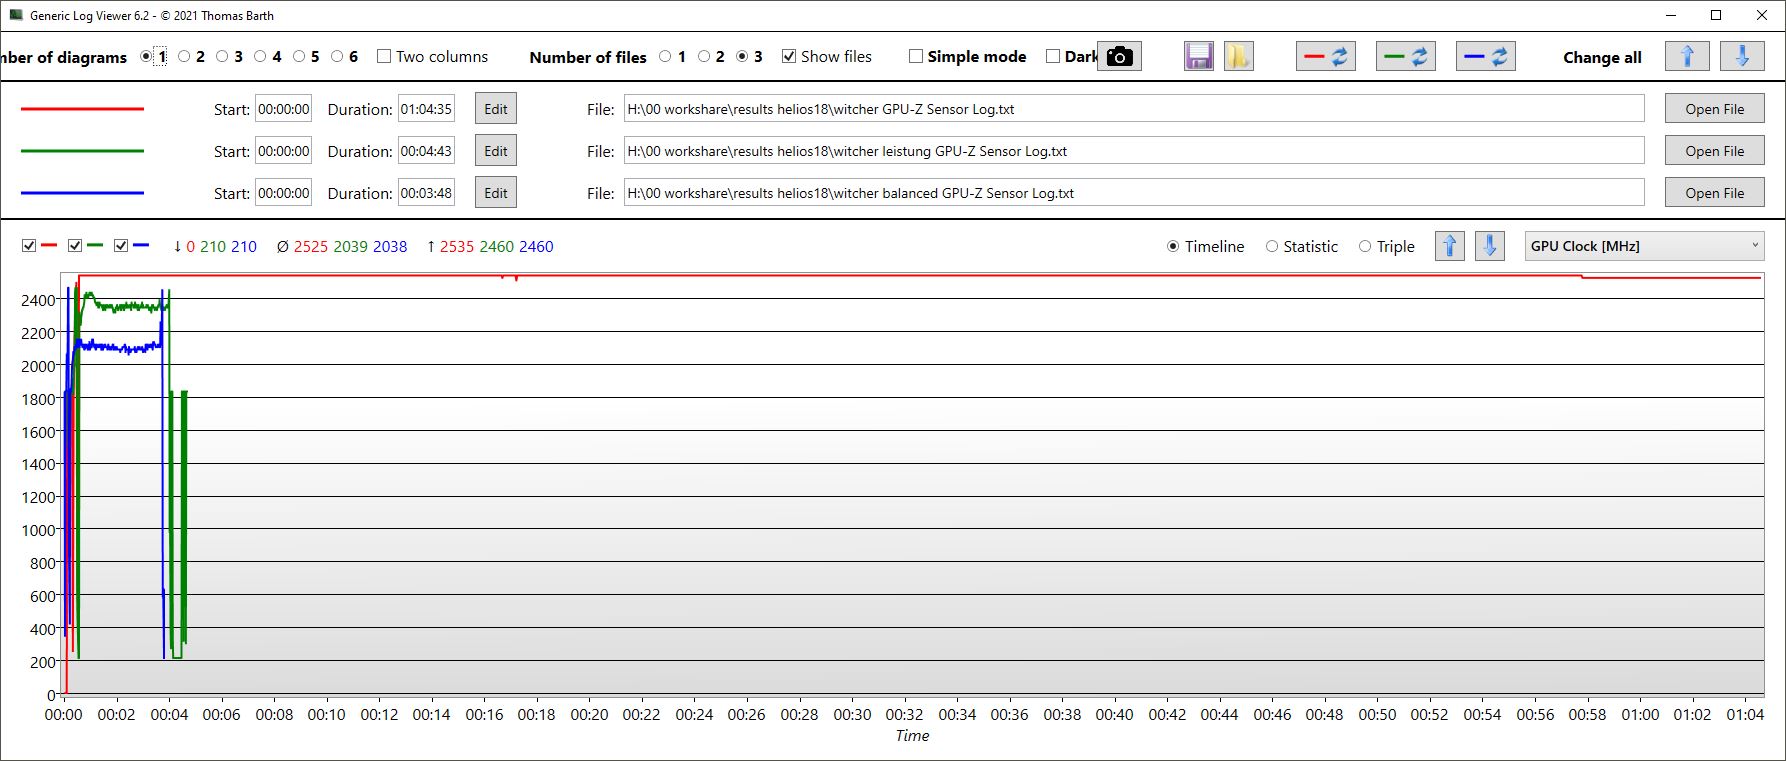
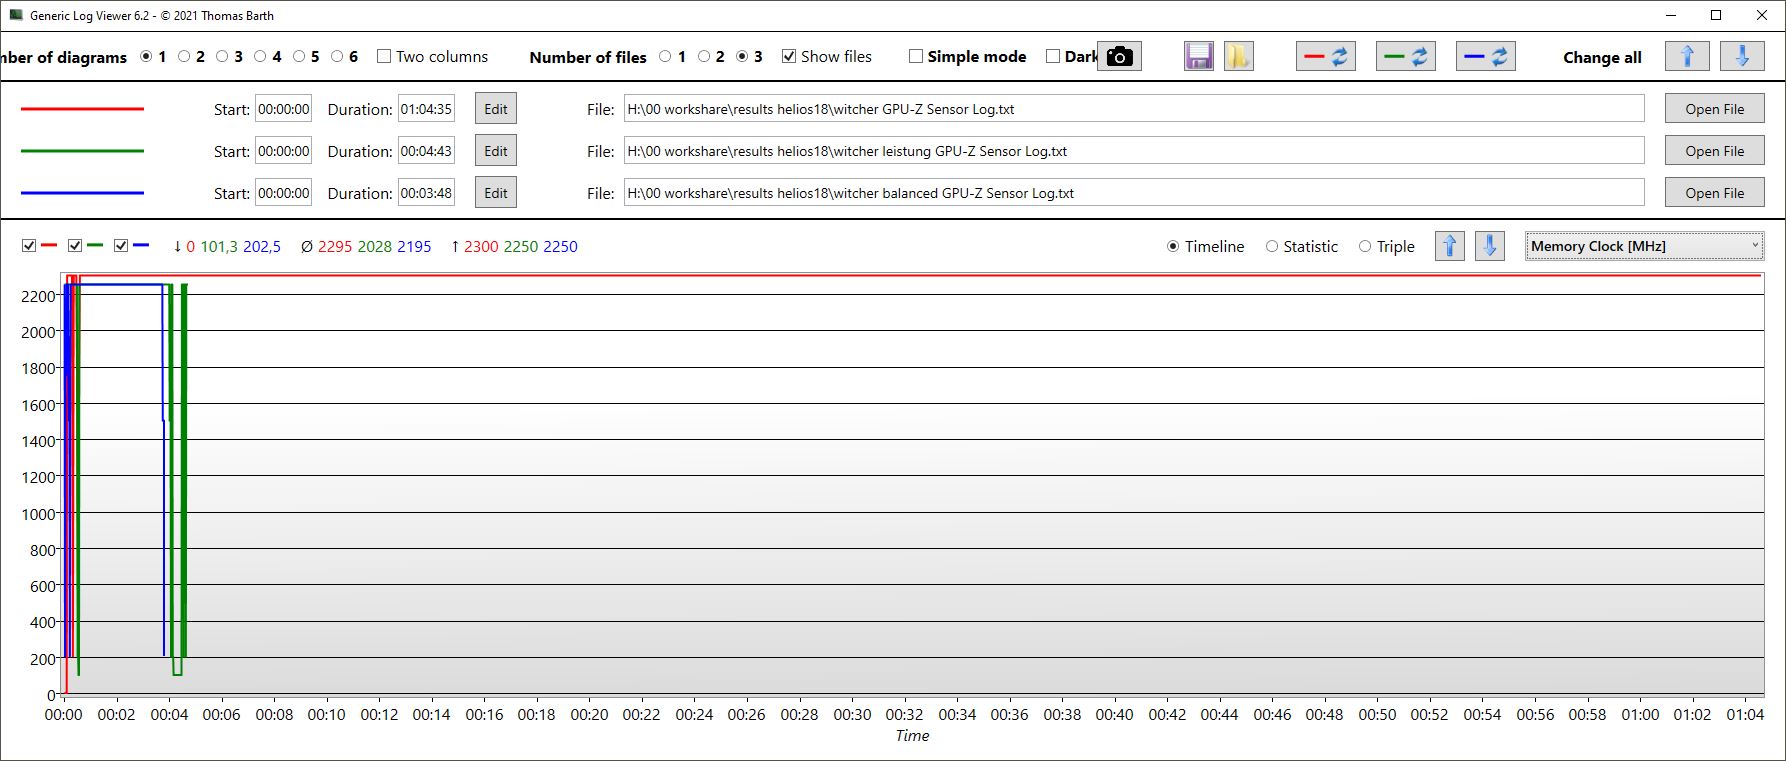
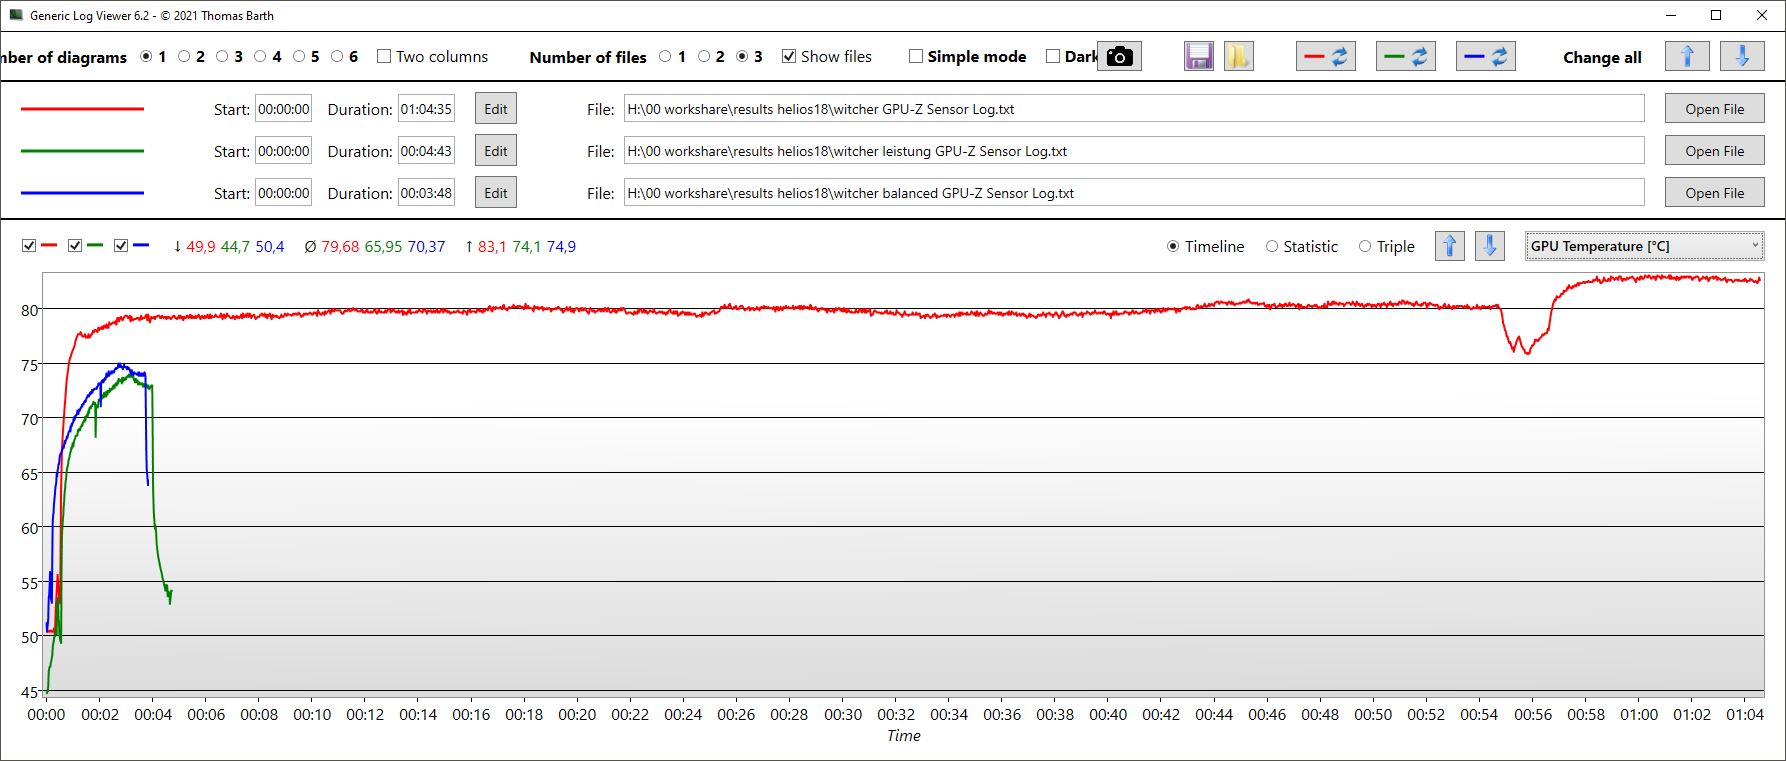
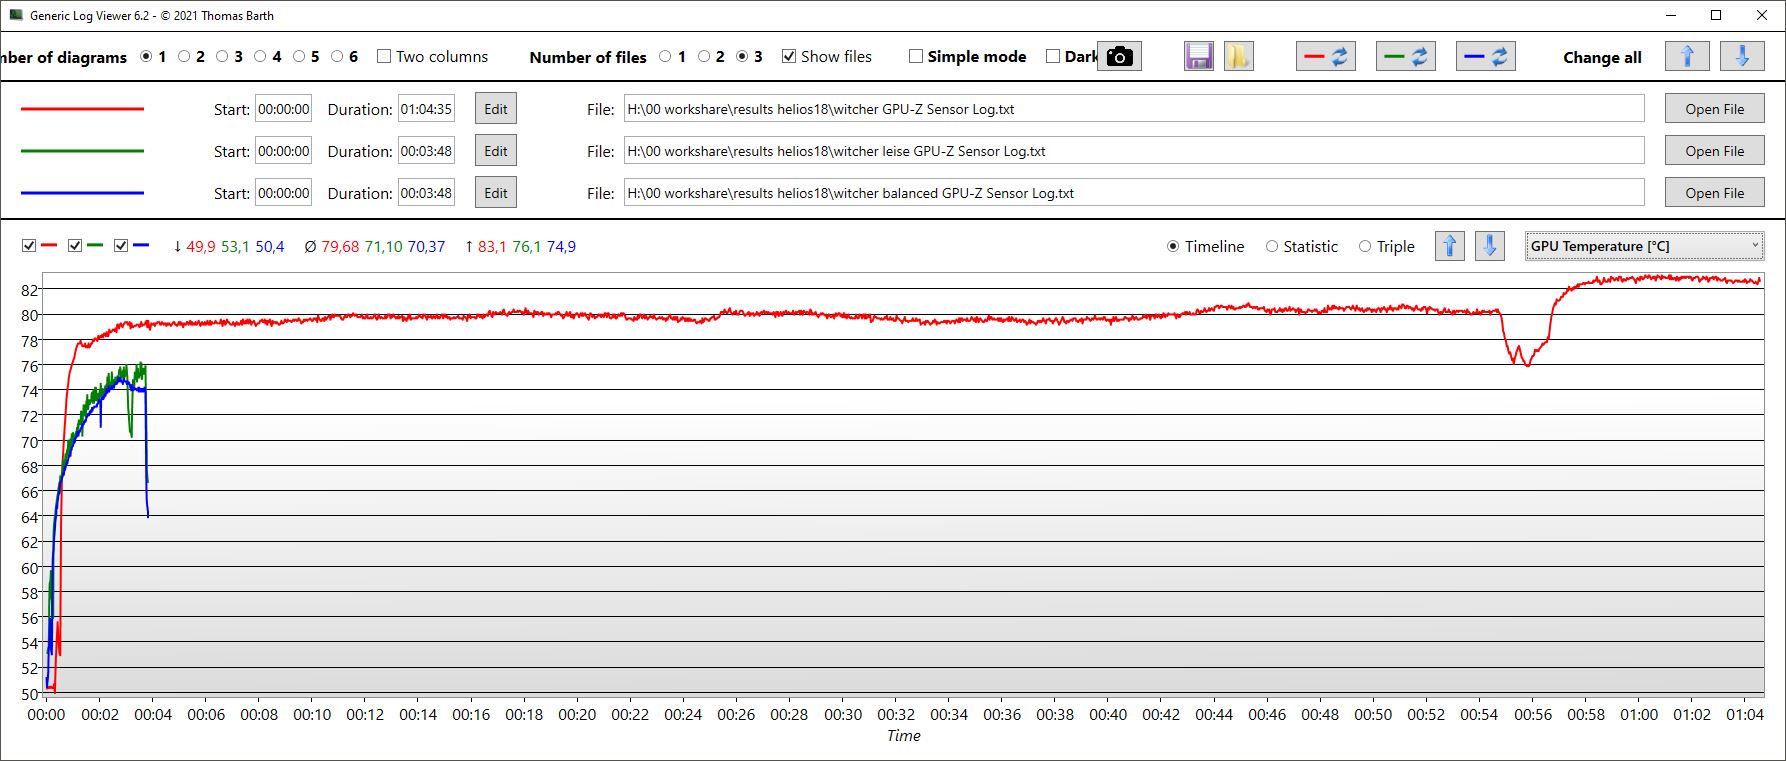
在一个小时的时间里,Witcher 3 ,帧率保持相当稳定;轻微的波动是由于游戏中典型的昼夜循环造成的。
与 CPU 基准测试不同的是,平衡 模式和静音 模式在游戏时有明显区别。后者正如其名,非常安静,而且耗电量更低。Witcher 3 Ultra 各性能模式下的帧频、耗电量和音量表可在以下 "排放/温度"部分找到。
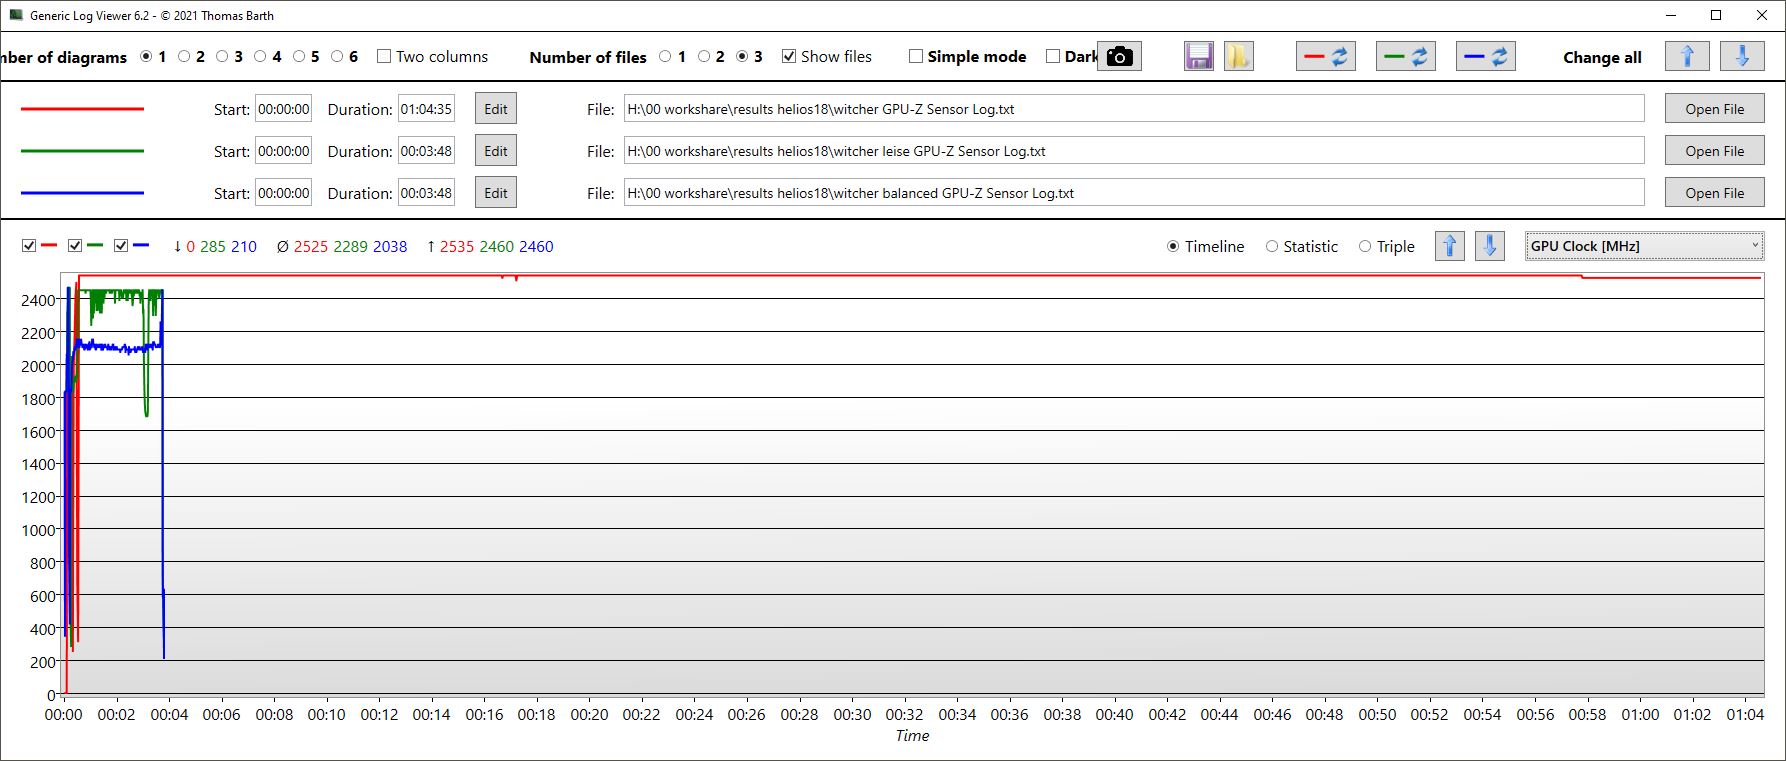
有趣的是,静音 模式下 GPU 时钟略高于平衡模式,但内存时钟明显降低,功耗也更低。

Witcher 3 FPS chart
| low | med. | high | ultra | QHD | 4K | |
|---|---|---|---|---|---|---|
| GTA V (2015) | 187.3 | 187.6 | 186.7 | 152.7 | 140.7 | |
| The Witcher 3 (2015) | 642 | 568 | 368 | 175 | 153 | |
| Dota 2 Reborn (2015) | 234 | 211 | 202 | 186.4 | 131 | |
| Final Fantasy XV Benchmark (2018) | 234 | 225 | 182.1 | 136.6 | 79.4 | |
| X-Plane 11.11 (2018) | 199 | 183.5 | 139.5 | 143.7 | ||
| Far Cry 5 (2018) | 199 | 175 | 168 | 158 | 155 | |
| Strange Brigade (2018) | 562 | 448 | 382 | 339 | 238 | |
| Call of Duty Modern Warfare 2 2022 (2022) | 167 | 124 | ||||
| Hogwarts Legacy (2023) | 173 | 157 | 134 | 108 | 81 | |
| F1 23 (2023) | 329 | 329 | 304 | 111 | 73 | |
| Cyberpunk 2077 (2023) | 127.13 | 77.03 | ||||
| Alan Wake 2 (2023) | 100.7 | 71 |
排放 - Helios 18 在涡轮增压时声音很大
噪音
风扇噪音自然在很大程度上取决于所选的性能模式。在涡轮增压 模式下,负载背景噪声非常大;我们测得的最大噪音略低于 60 分贝,使其成为比较领域中噪音最大的设备。在Alienware配备 RTX 4090 的 Alienware 仍然更安静,只有微星的噪音与之相当。在最大音量下,机箱甚至开始轻微震动。因此,我们建议使用性能 模式或更低的模式。在前者下,您只需放弃 3% 至 5% 的性能(Witcher 3 ),但音量会降低近 10 分贝!
至少,Helios 18 可以根据负载情况很好地调节风扇,在中等负载下不会立即向用户释放全音量。不过,游戏时风扇转速并不是恒定的,而是周期性波动,有时声音较大,有时声音较小 (Witcher 3)。
其他性能模式可以大大降低噪音水平,请参见下表。
| 参数/性能模式 | Turbo | 性能 | 平衡 | 静音 |
|---|---|---|---|---|
| fps | 176 | 171 | 157 | 100 |
| 音量(分贝) | 59.82 | 50.74 | 40.77 | 32.36 |
| 消耗功率(瓦) | 289 | 227 | 182 | 153 |
Noise level
| Idle |
| 23 / 23 / 23 dB(A) |
| Load |
| 45.26 / 59.94 dB(A) |
 | ||
30 dB silent 40 dB(A) audible 50 dB(A) loud |
||
min: | ||
| Acer Predator Helios 18 N23Q2 GeForce RTX 4080 Laptop GPU, i9-13900HX, Samsung PM9A1 MZVL22T0HBLB | MSI GE78HX 13VH-070US GeForce RTX 4080 Laptop GPU, i9-13950HX, Samsung PM9A1 MZVL22T0HBLB | HP Omen 17-ck2097ng GeForce RTX 4080 Laptop GPU, i9-13900HX, SK hynix PC801 HFS001TEJ9X101N | Alienware m18 R1 GeForce RTX 4090 Laptop GPU, i9-13980HX, SK hynix PC801 HFS001TEJ9X101N | Asus ROG Strix G18 G814JI GeForce RTX 4070 Laptop GPU, i7-13650HX, Micron 2400 MTFDKBA1T0QFM | Razer Blade 18 RTX 4070 GeForce RTX 4070 Laptop GPU, i9-13950HX, SSSTC CA6-8D1024 | |
|---|---|---|---|---|---|---|
| Noise | -6% | -11% | 6% | -2% | 3% | |
| off / environment * (dB) | 23 | 23.4 -2% | 24 -4% | 22.8 1% | 25 -9% | 23.5 -2% |
| Idle Minimum * (dB) | 23 | 24.2 -5% | 31 -35% | 23 -0% | 26 -13% | 23.8 -3% |
| Idle Average * (dB) | 23 | 25.6 -11% | 32 -39% | 23 -0% | 28 -22% | 23.8 -3% |
| Idle Maximum * (dB) | 23 | 31 -35% | 33 -43% | 23 -0% | 29 -26% | 26.8 -17% |
| Load Average * (dB) | 45.26 | 43.3 4% | 45 1% | 35.6 21% | 41 9% | 37.3 18% |
| Witcher 3 ultra * (dB) | 59.82 | 56.3 6% | 45 25% | 51.3 14% | 44 26% | 48 20% |
| Load Maximum * (dB) | 59.94 | 59.1 1% | 50 17% | 56.7 5% | 46 23% | 53.5 11% |
* ... smaller is better
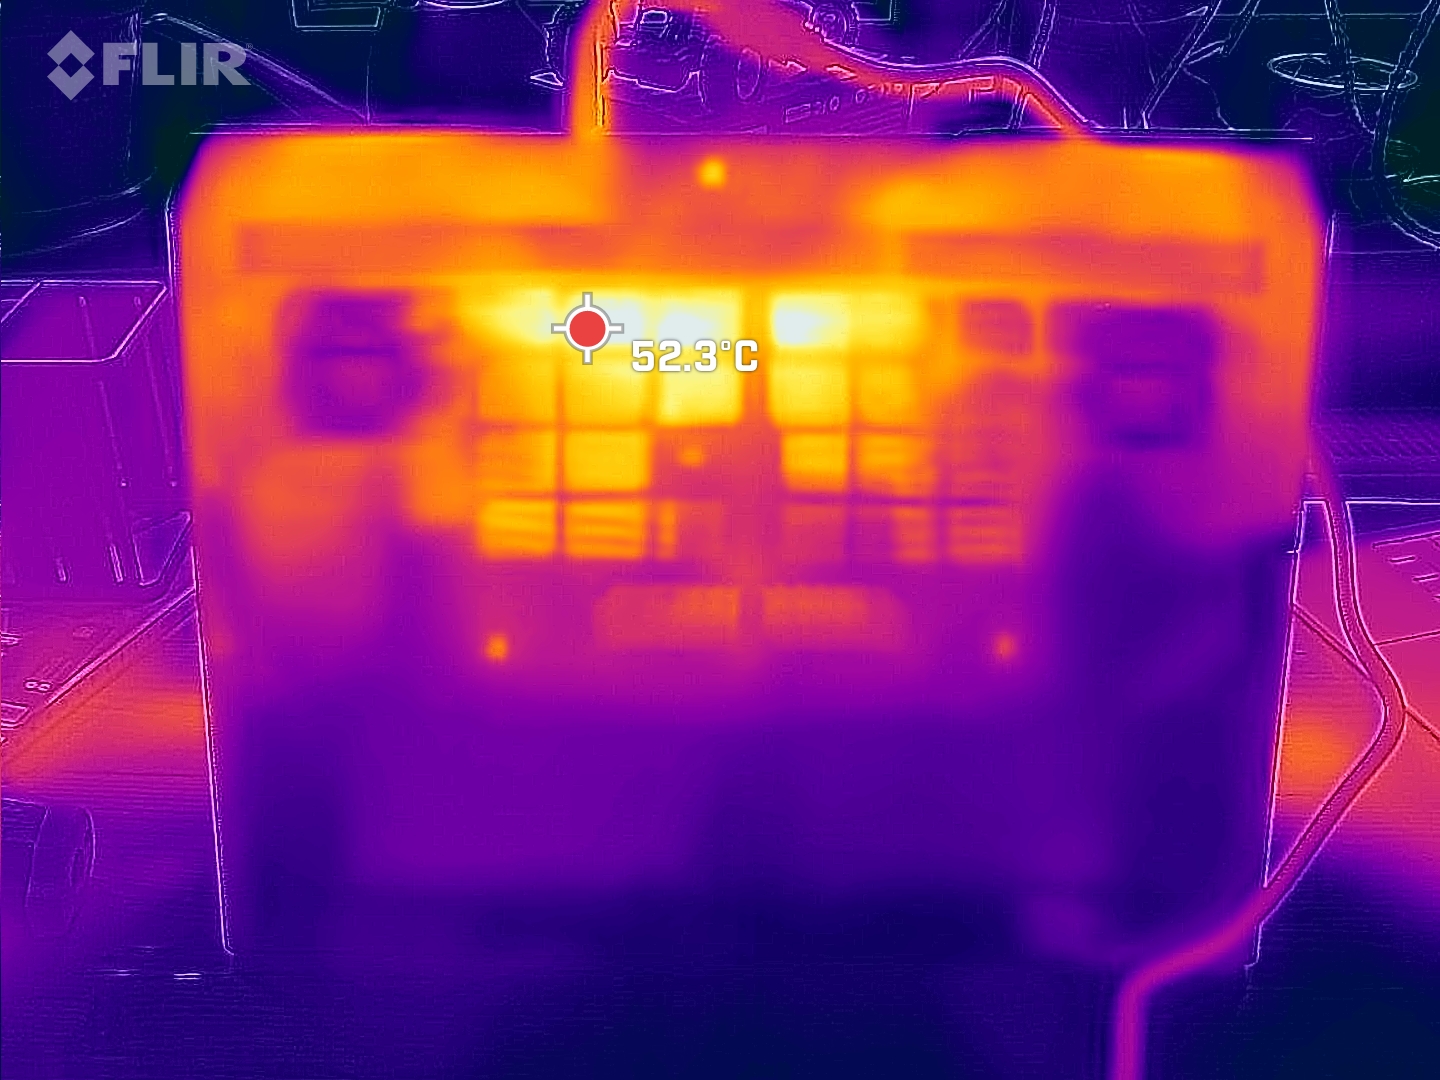
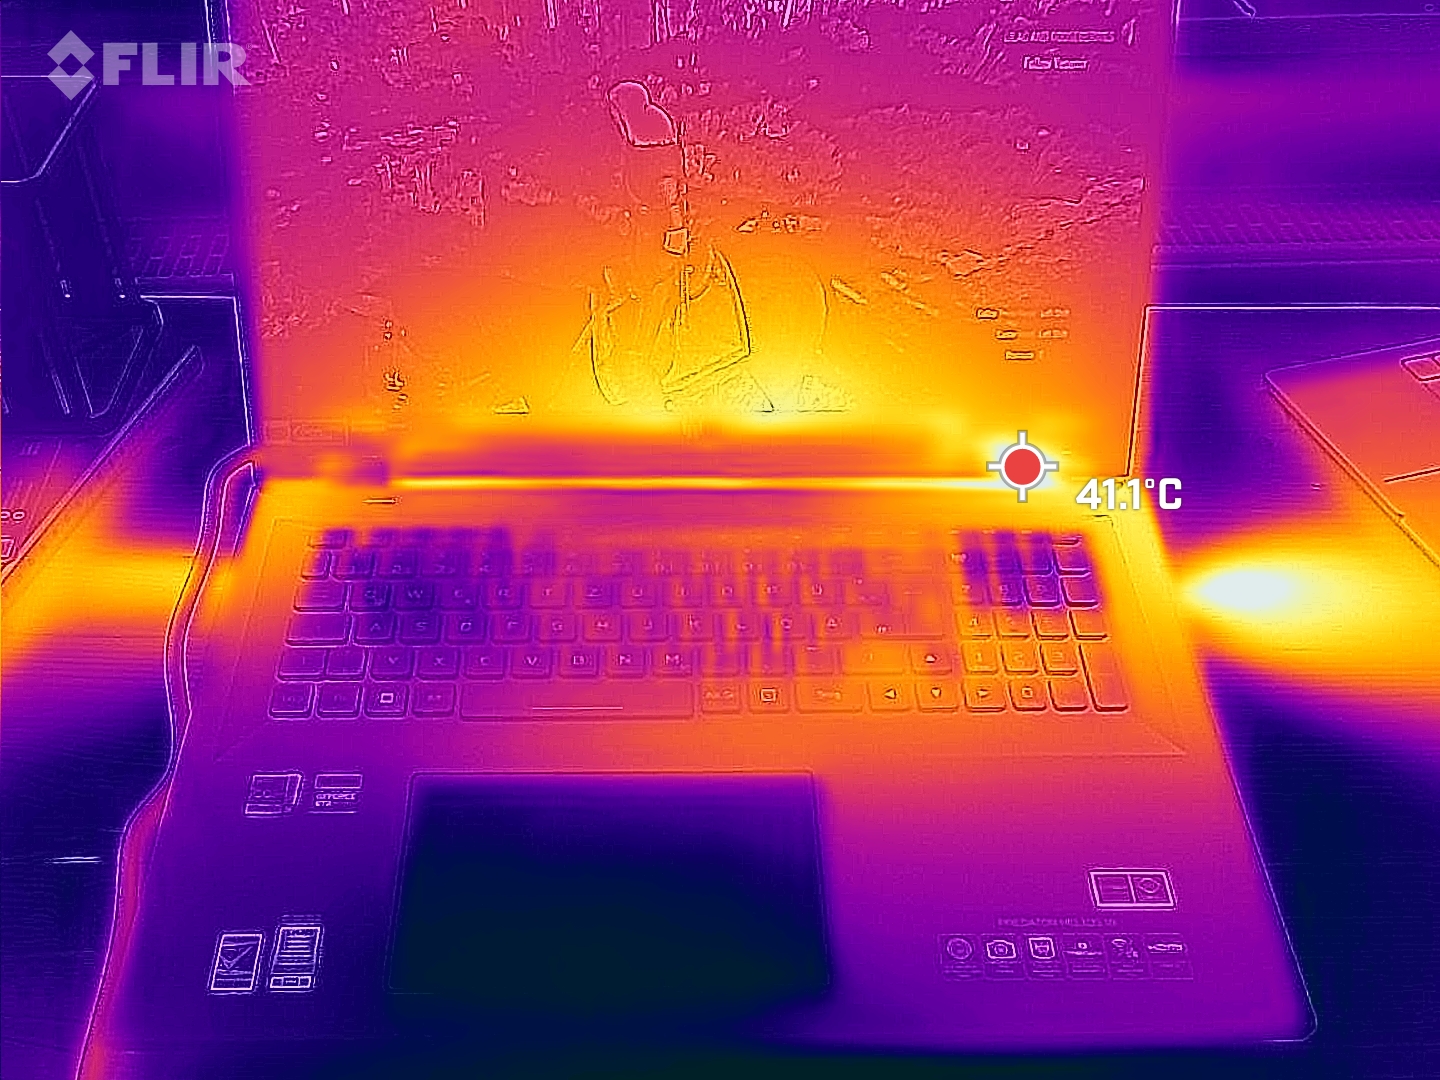
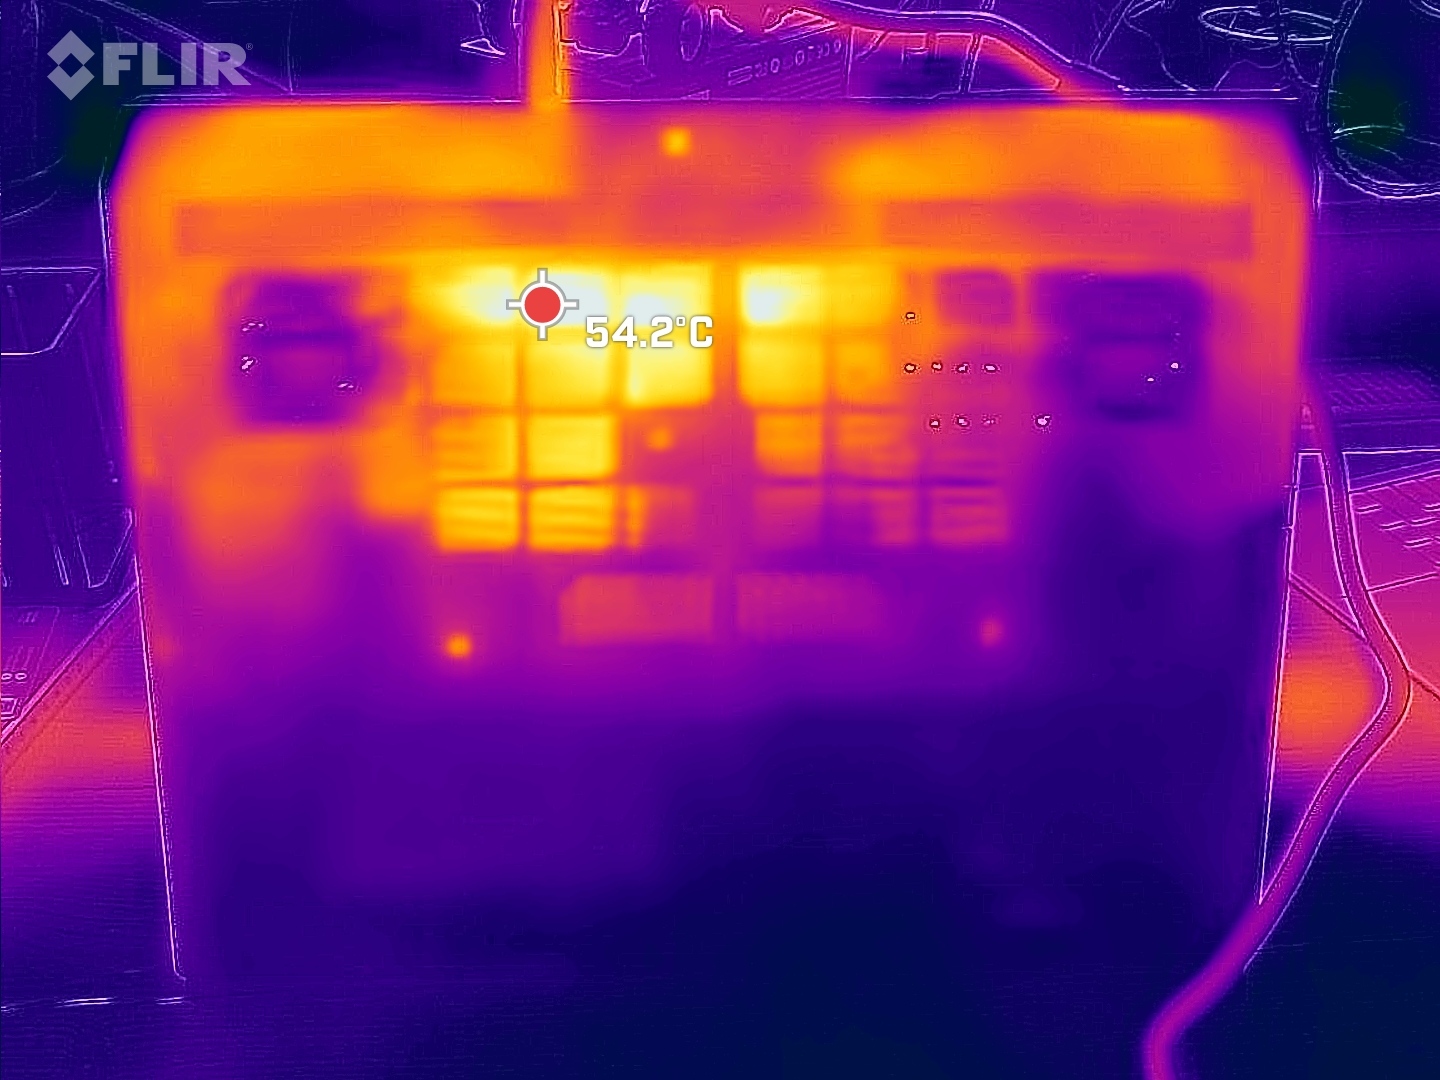
温度
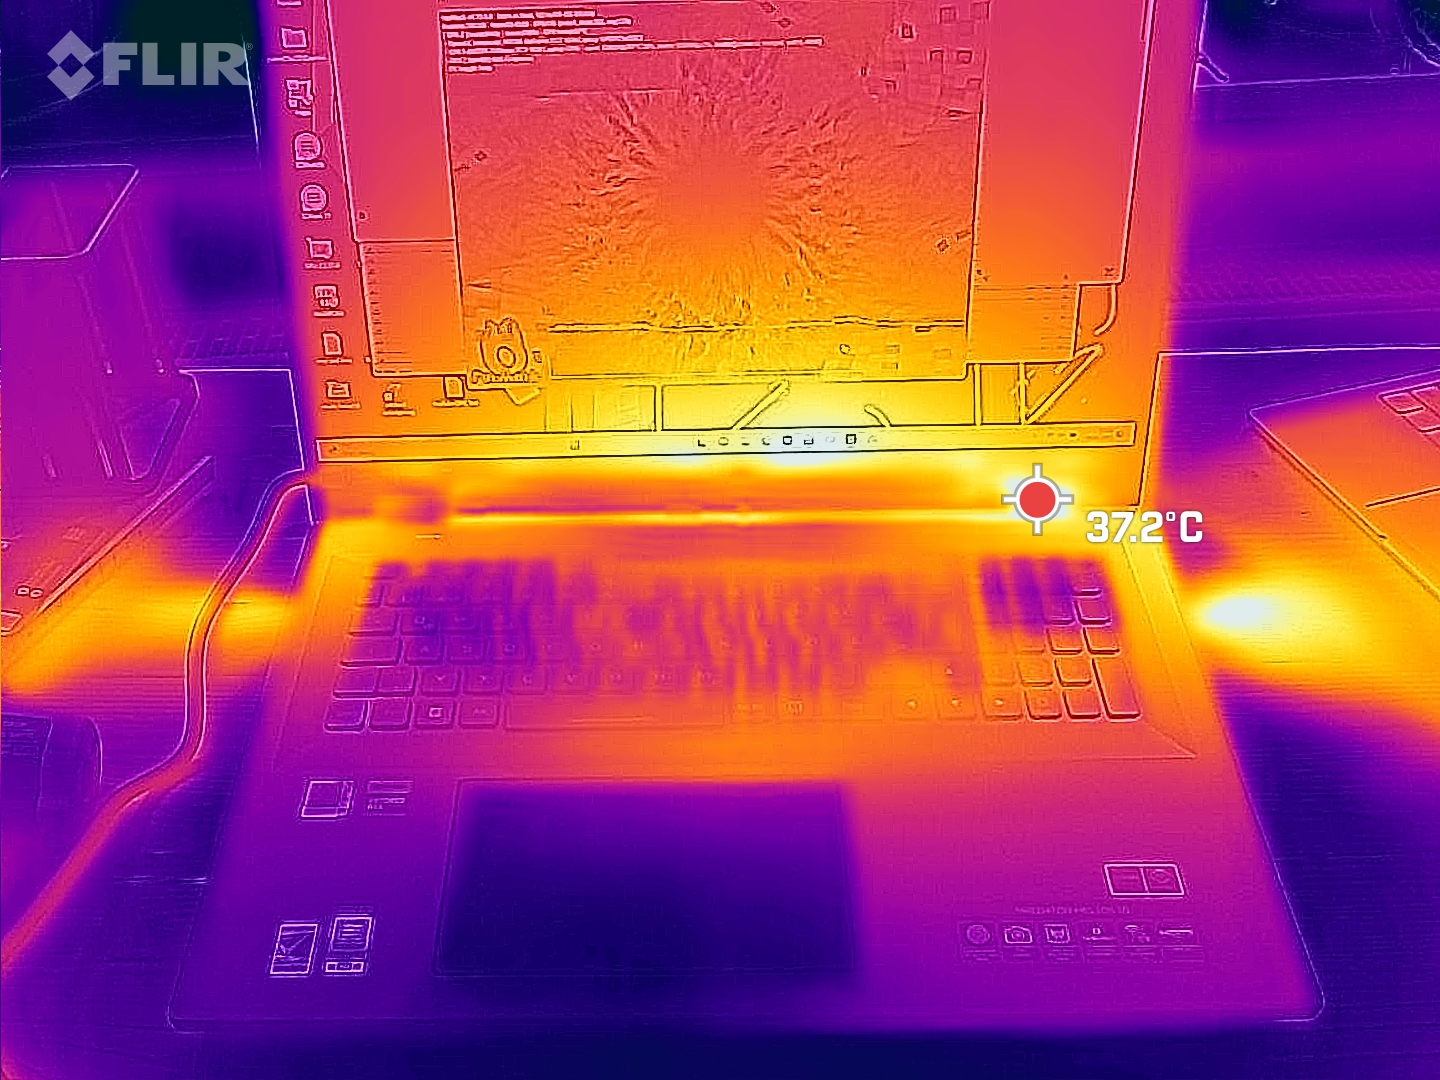
表面温度表明,大风扇也有积极的一面。Helios 18 仅有选择性地发热(底部中央和显示屏左侧),除此之外几乎没有其他异常低温。例如,在玩了一个小时的游戏后,左侧掌托会感觉非常凉。这一方面说明风扇配置过高,另一方面也说明热量分布不均。
(+) The maximum temperature on the upper side is 35 °C / 95 F, compared to the average of 40.4 °C / 105 F, ranging from 21.2 to 68.8 °C for the class Gaming.
(-) The bottom heats up to a maximum of 56 °C / 133 F, compared to the average of 43.2 °C / 110 F
(+) In idle usage, the average temperature for the upper side is 31.1 °C / 88 F, compared to the device average of 33.9 °C / 93 F.
(+) Playing The Witcher 3, the average temperature for the upper side is 30.7 °C / 87 F, compared to the device average of 33.9 °C / 93 F.
(+) The palmrests and touchpad are cooler than skin temperature with a maximum of 29 °C / 84.2 F and are therefore cool to the touch.
(±) The average temperature of the palmrest area of similar devices was 28.8 °C / 83.8 F (-0.2 °C / -0.4 F).
| Acer Predator Helios 18 N23Q2 Intel Core i9-13900HX, NVIDIA GeForce RTX 4080 Laptop GPU | MSI GE78HX 13VH-070US Intel Core i9-13950HX, NVIDIA GeForce RTX 4080 Laptop GPU | HP Omen 17-ck2097ng Intel Core i9-13900HX, NVIDIA GeForce RTX 4080 Laptop GPU | Alienware m18 R1 Intel Core i9-13980HX, NVIDIA GeForce RTX 4090 Laptop GPU | Asus ROG Strix G18 G814JI Intel Core i7-13650HX, NVIDIA GeForce RTX 4070 Laptop GPU | Razer Blade 18 RTX 4070 Intel Core i9-13950HX, NVIDIA GeForce RTX 4070 Laptop GPU | |
|---|---|---|---|---|---|---|
| Heat | 11% | 14% | 17% | 7% | 11% | |
| Maximum Upper Side * (°C) | 35 | 37.4 -7% | 41 -17% | 39 -11% | 45 -29% | 39.2 -12% |
| Maximum Bottom * (°C) | 56 | 45 20% | 51 9% | 36.4 35% | 47 16% | 35.6 36% |
| Idle Upper Side * (°C) | 34 | 29.8 12% | 24 29% | 29.2 14% | 28 18% | 31.8 6% |
| Idle Bottom * (°C) | 39 | 32.4 17% | 25 36% | 27.8 29% | 31 21% | 33.2 15% |
* ... smaller is better
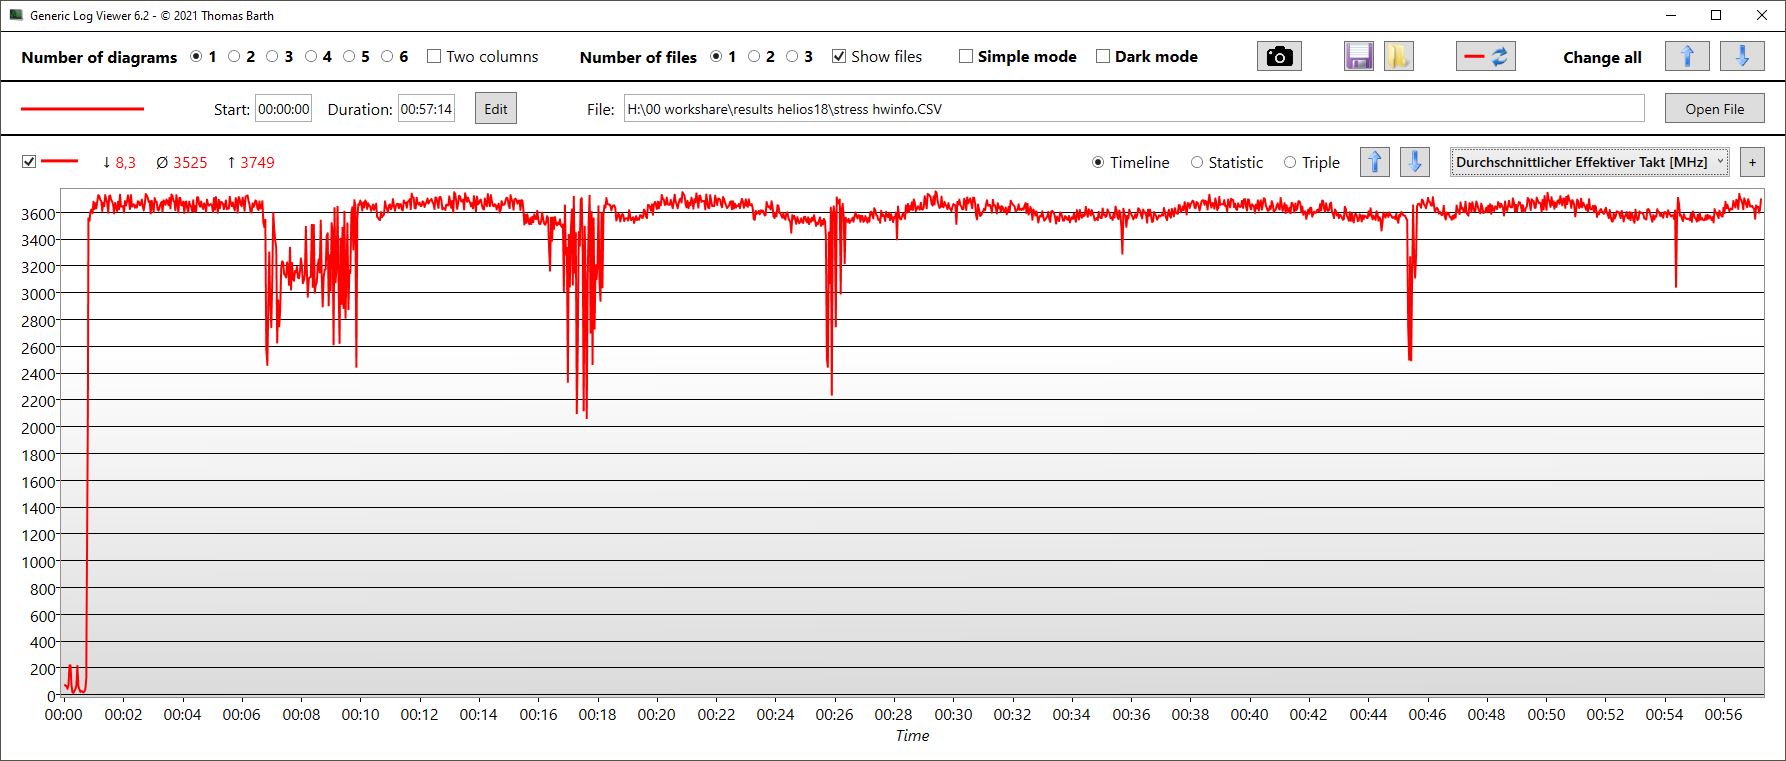
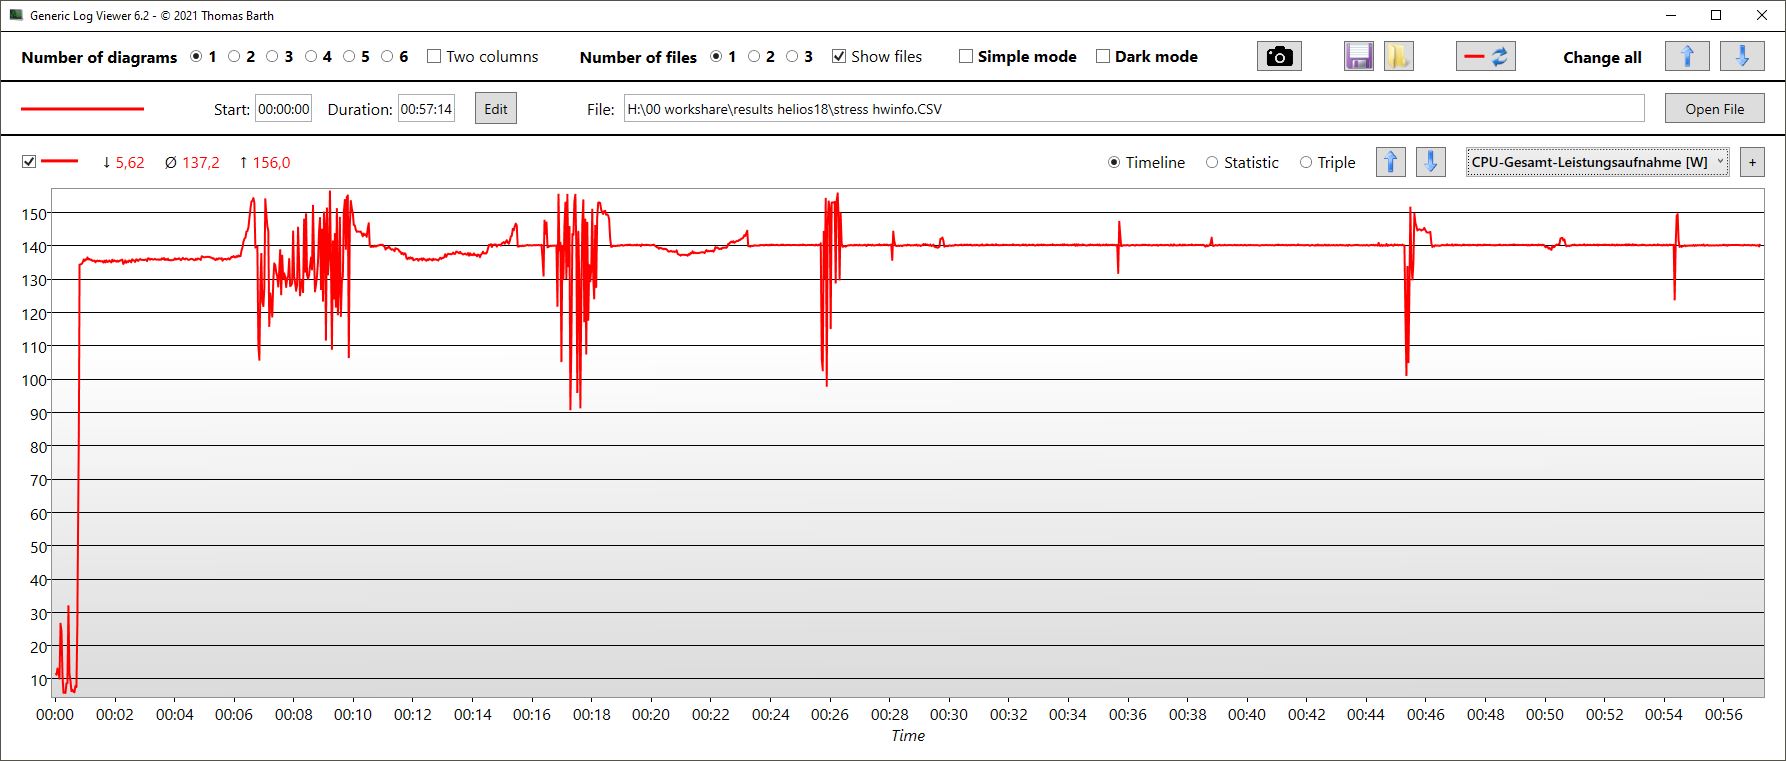
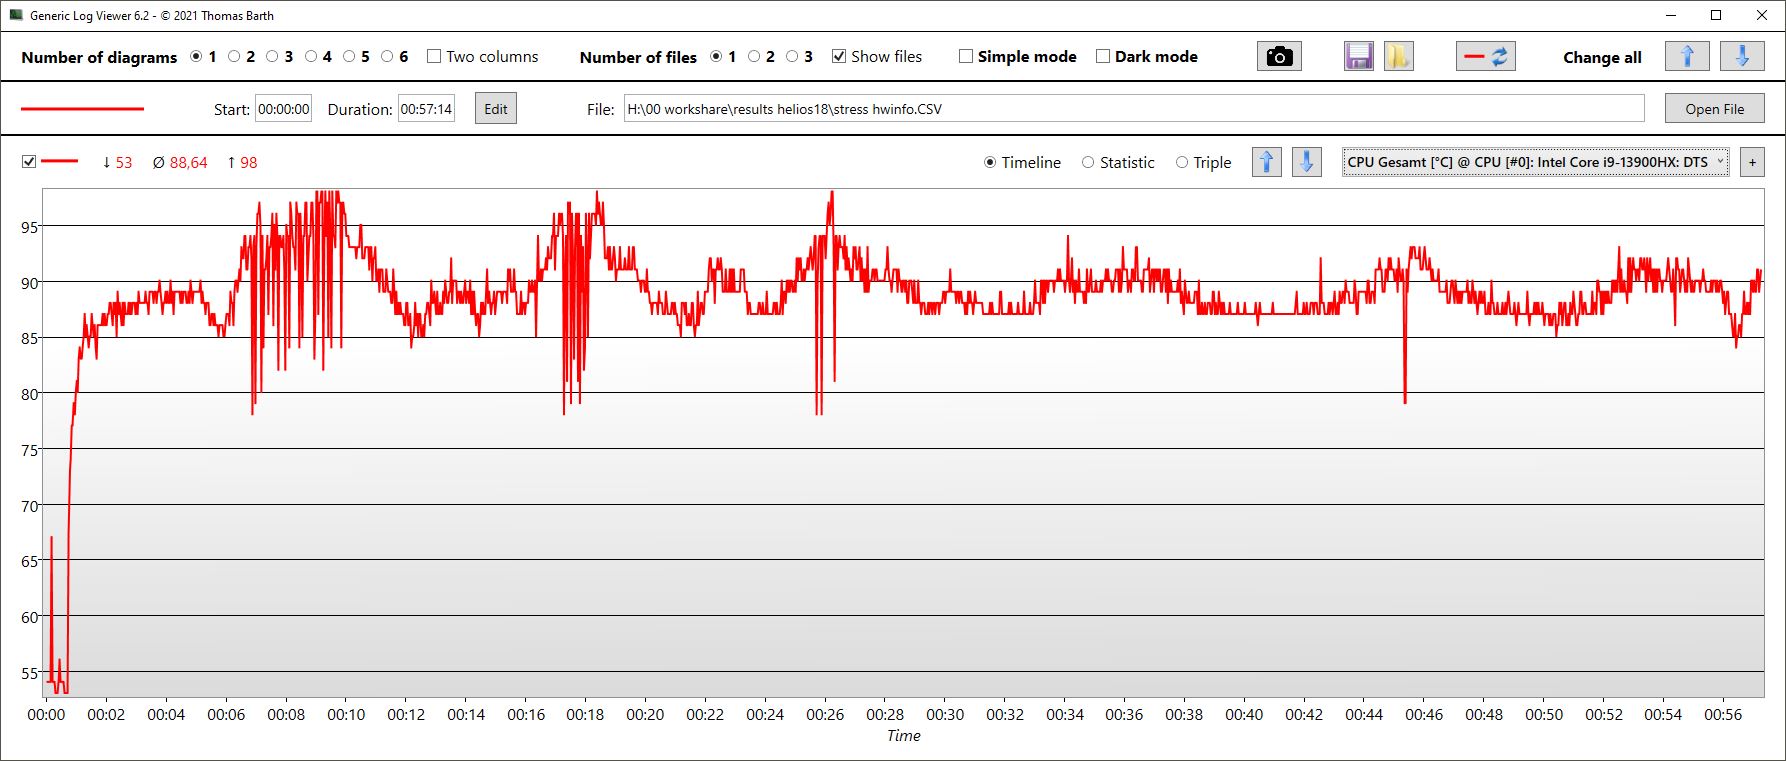
压力测试
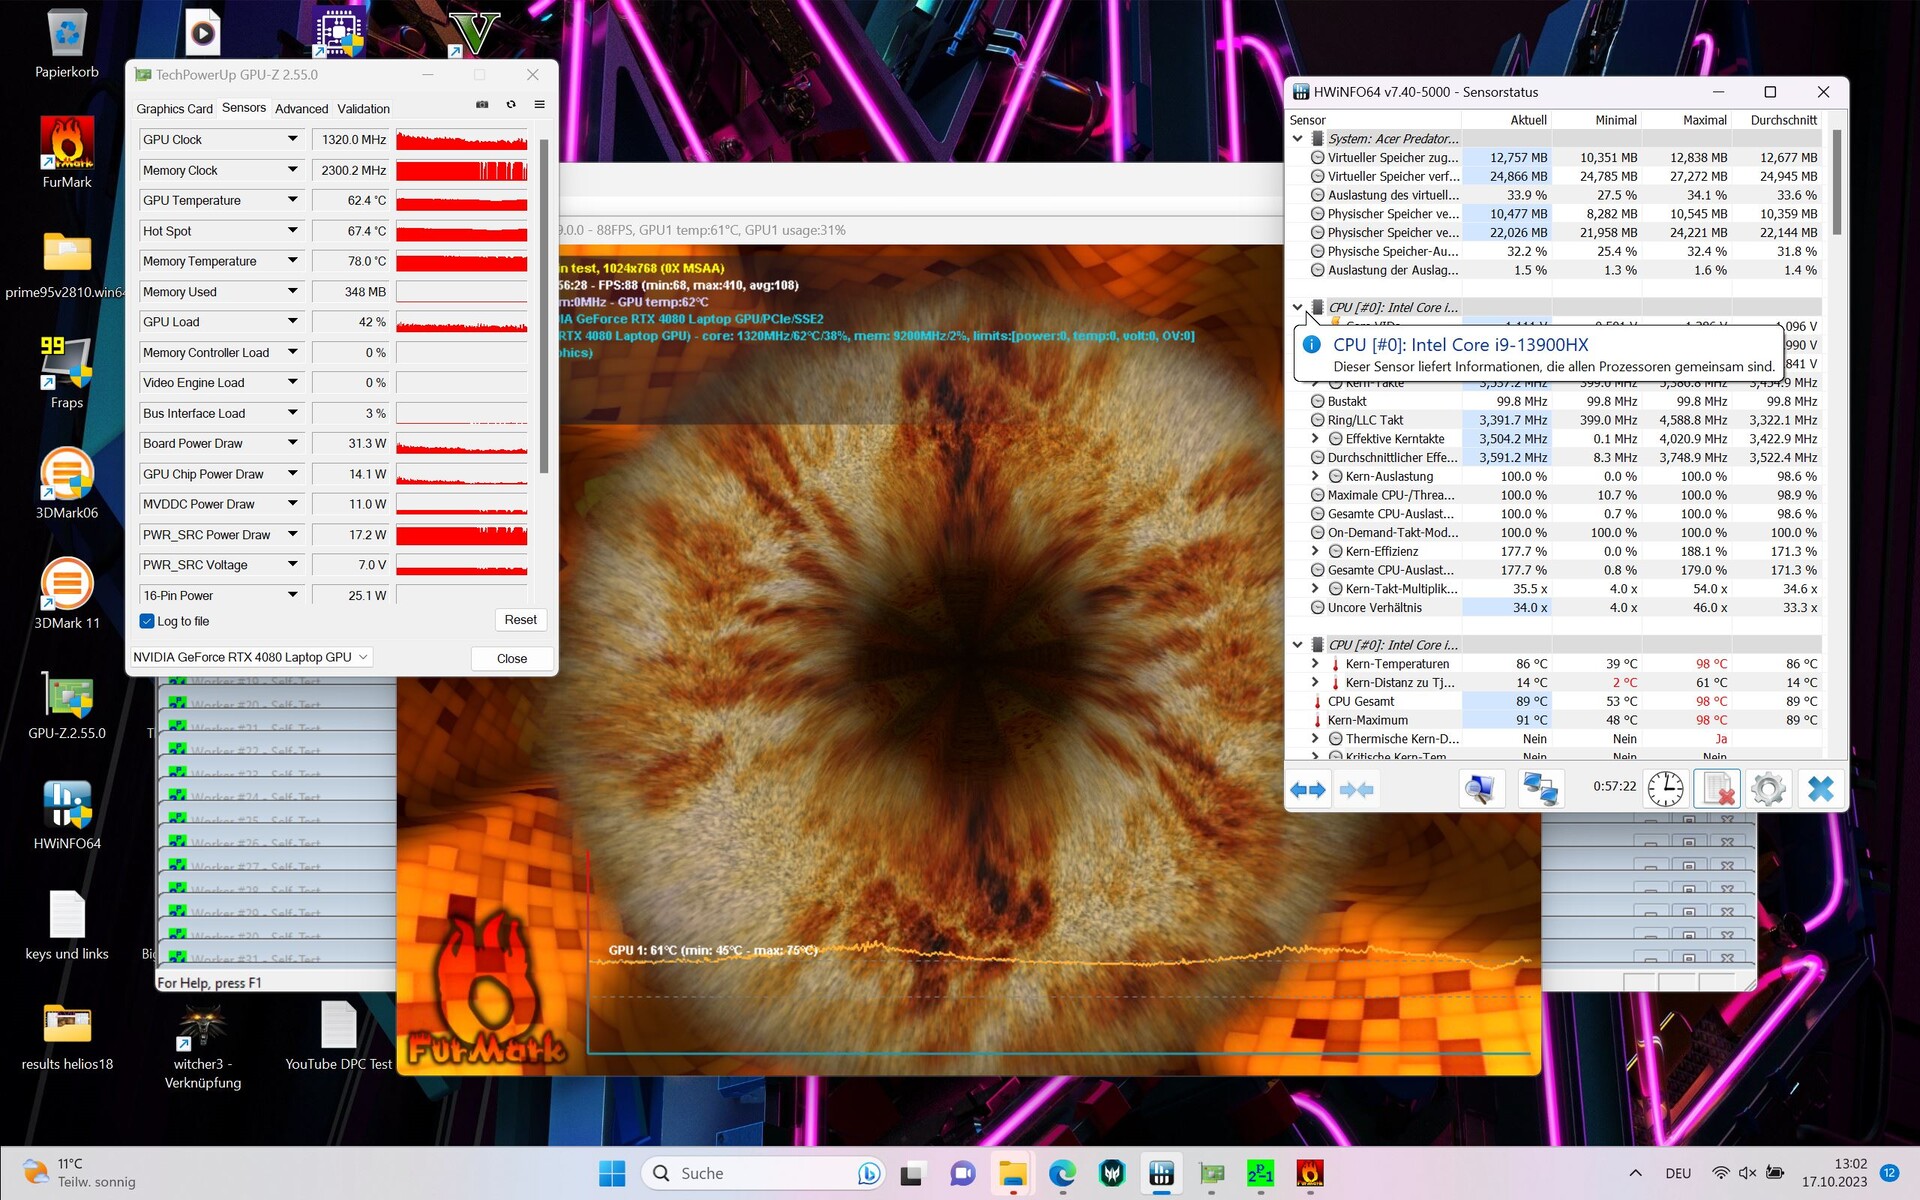
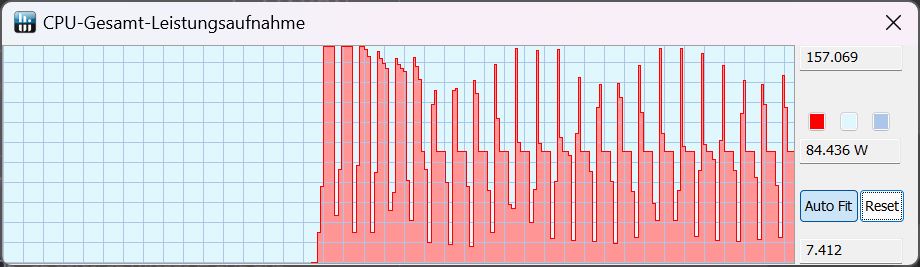
启动压力测试后,Predator 的 CPU 性能保持相对稳定,核心频率始终在 3.4 至 3.6 GHz 之间。在功耗和核心温度方面,总是会有一些小的波动。CPU 核心温度最高可达 98 °C,但平均温度为 89 °C。CPU 功耗峰值为 156 W,平均为 137 W。
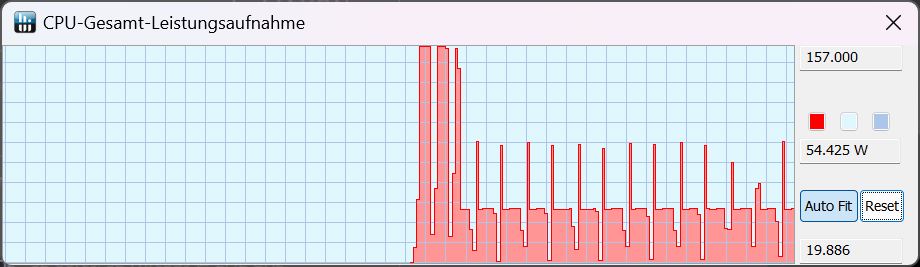
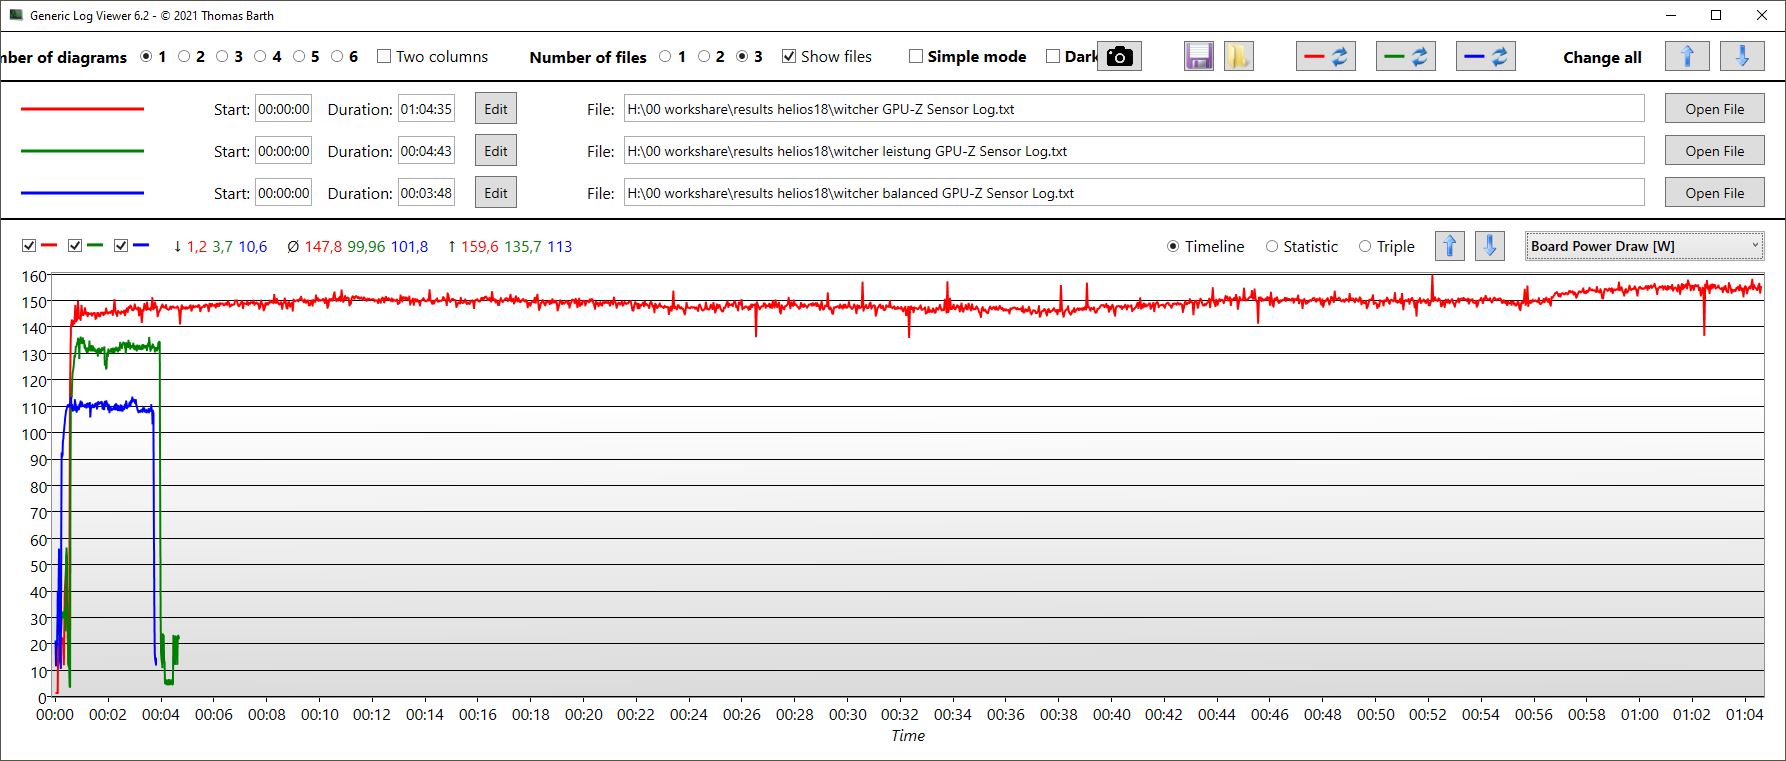
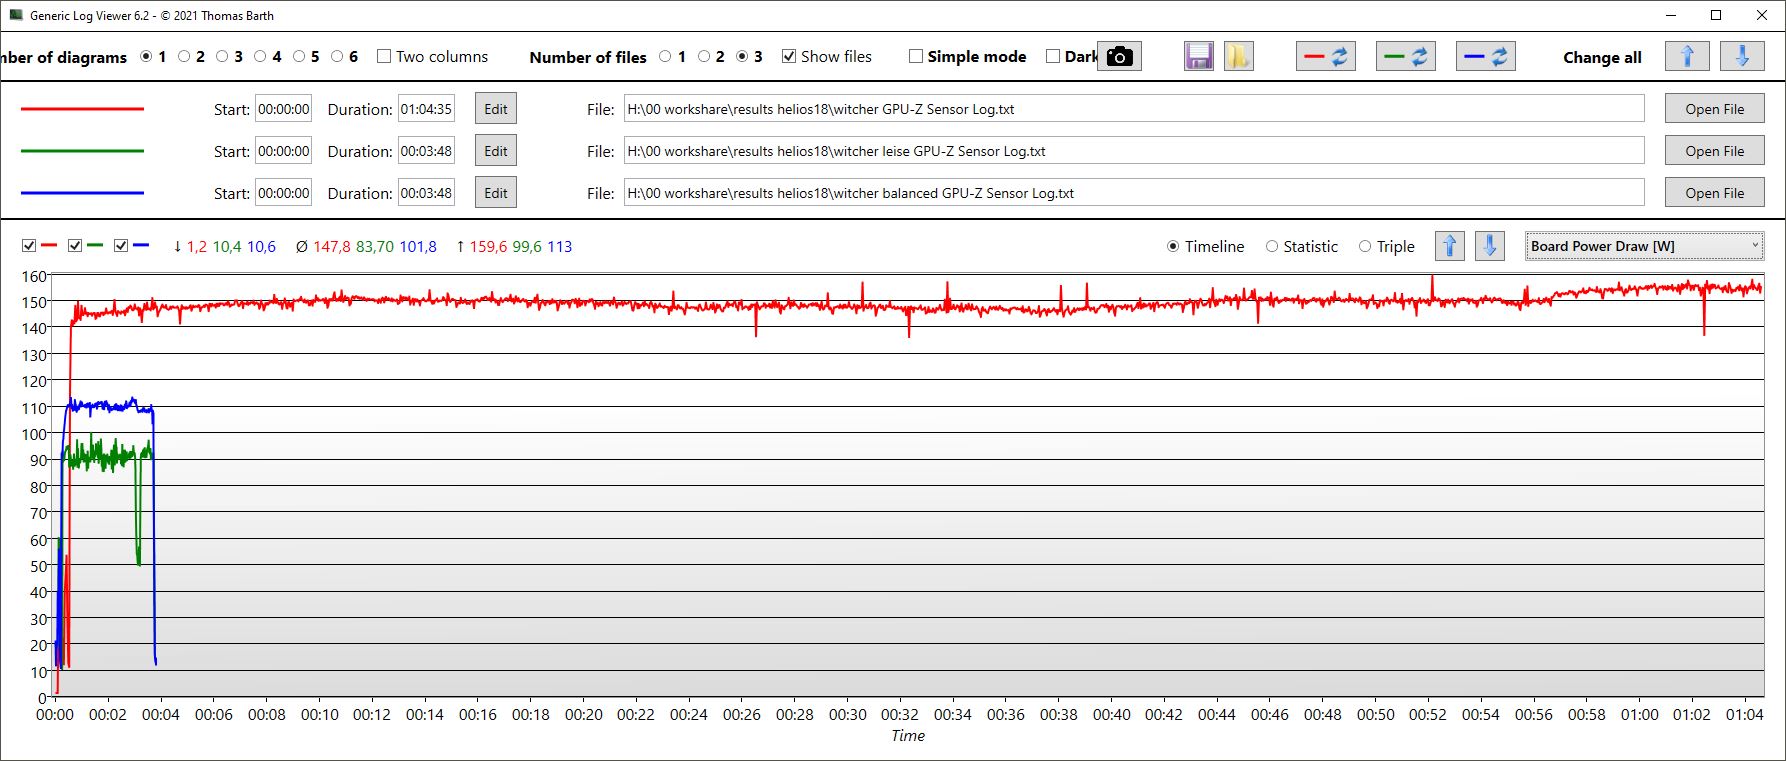
GPU 的性能波动曲线则不那么稳定。时钟频率周期性地达到 2.5 GHz 的最大值,曲线谷值约为 1.2 GHz。与此同时,我们还测量到在 2.3 GHz 的恒定内存时钟频率下,有几分之一秒的时间自发降至 200 MHz。GPU 温度也在波动,但平均温度仅为 64 °C,最高温度为 76 °C。功耗在 25 W 和 90 至 100 W 之间波动。
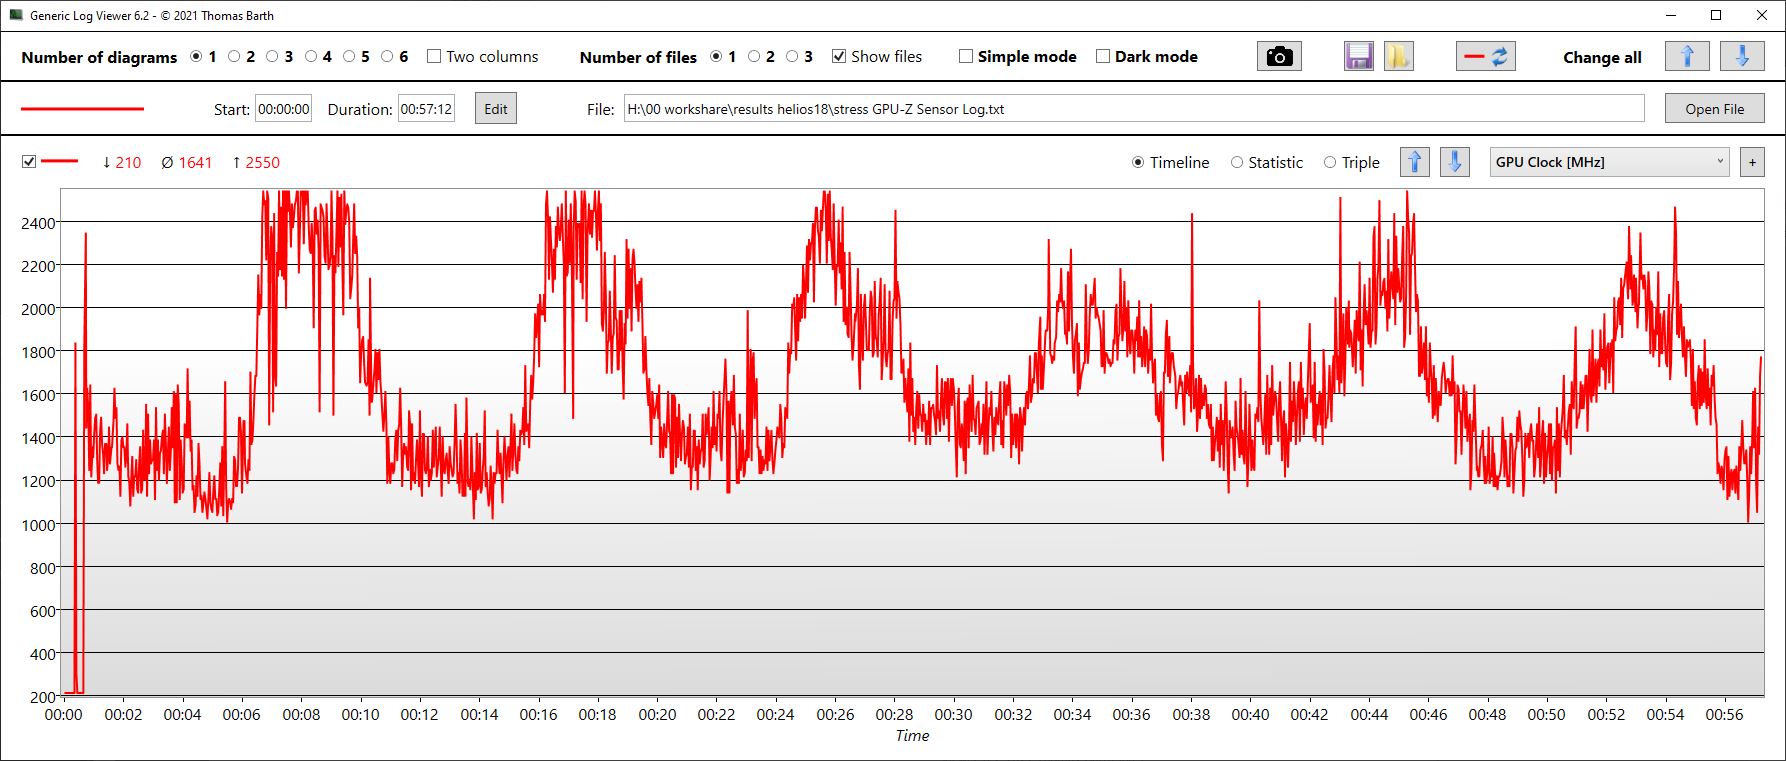
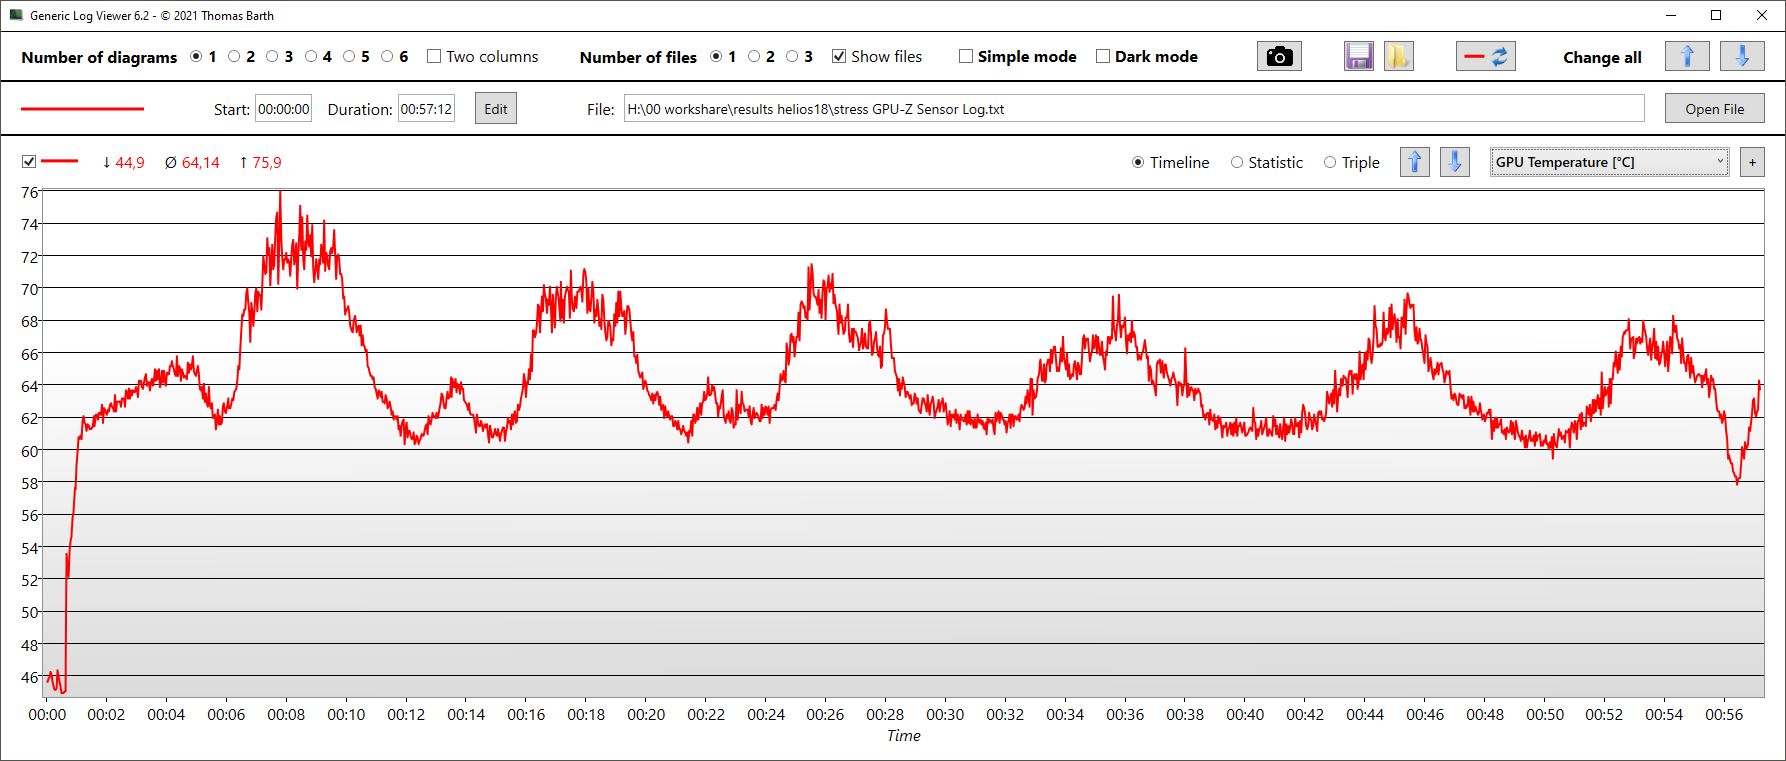
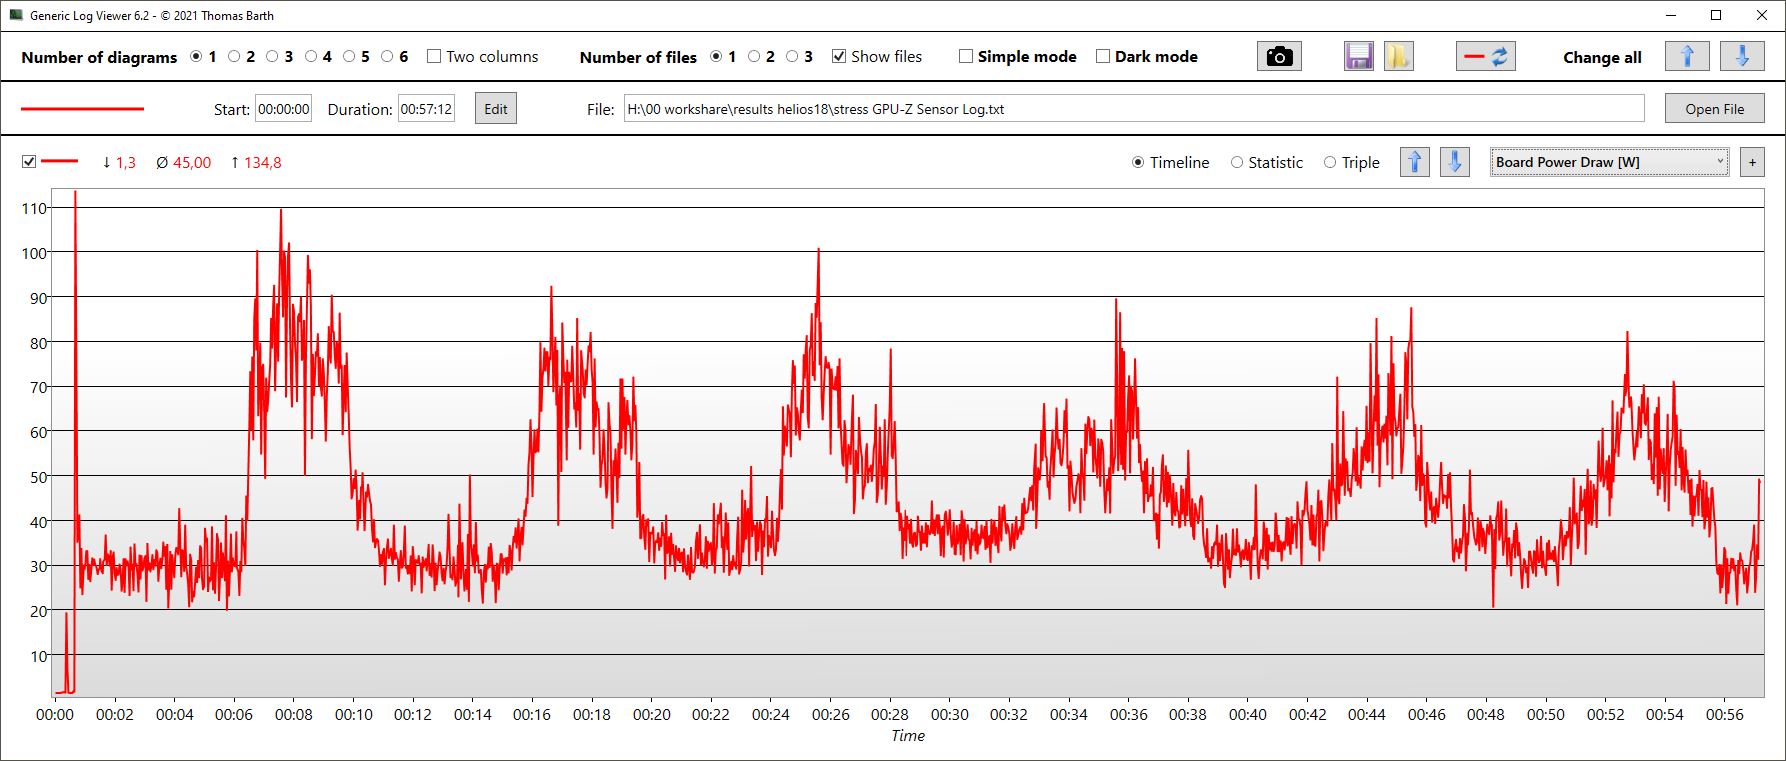
| CPU 时钟 (GHz) | GPU 时钟 (MHz) | CPU 平均温度 (°C) | GPU 平均温度(°C) | |
| Prime95 + FurMark Stress | 3,5 | 1.640 | 89 | 64 |
| Witcher 3 压力 | 527 | 2.525 | 88.5 | 80 |
发言人
扬声器的音量相当大,但也仅此而已。声音尖锐,低音几乎不存在,甚至中音和高音也不是特别平衡。我们本以为音质会更好,尤其是对于这么大的笔记本电脑。
外接音频设备可通过组合式耳机插孔等连接。无论如何,在大音量Turbo 模式下播放时,耳机是必不可少的。
Acer Predator Helios 18 N23Q2 audio analysis
(+) | speakers can play relatively loud (82.74 dB)
Bass 100 - 315 Hz
(-) | nearly no bass - on average 17.6% lower than median
(±) | linearity of bass is average (9.8% delta to prev. frequency)
Mids 400 - 2000 Hz
(±) | higher mids - on average 9.1% higher than median
(±) | linearity of mids is average (8.8% delta to prev. frequency)
Highs 2 - 16 kHz
(±) | higher highs - on average 5.3% higher than median
(+) | highs are linear (6.4% delta to prev. frequency)
Overall 100 - 16.000 Hz
(±) | linearity of overall sound is average (20.3% difference to median)
Compared to same class
» 72% of all tested devices in this class were better, 6% similar, 23% worse
» The best had a delta of 6%, average was 18%, worst was 132%
Compared to all devices tested
» 53% of all tested devices were better, 8% similar, 39% worse
» The best had a delta of 4%, average was 23%, worst was 134%
Apple MacBook Pro 16 2021 M1 Pro audio analysis
(+) | speakers can play relatively loud (84.7 dB)
Bass 100 - 315 Hz
(+) | good bass - only 3.8% away from median
(+) | bass is linear (5.2% delta to prev. frequency)
Mids 400 - 2000 Hz
(+) | balanced mids - only 1.3% away from median
(+) | mids are linear (2.1% delta to prev. frequency)
Highs 2 - 16 kHz
(+) | balanced highs - only 1.9% away from median
(+) | highs are linear (2.7% delta to prev. frequency)
Overall 100 - 16.000 Hz
(+) | overall sound is linear (4.6% difference to median)
Compared to same class
» 0% of all tested devices in this class were better, 0% similar, 100% worse
» The best had a delta of 5%, average was 17%, worst was 45%
Compared to all devices tested
» 0% of all tested devices were better, 0% similar, 100% worse
» The best had a delta of 4%, average was 23%, worst was 134%
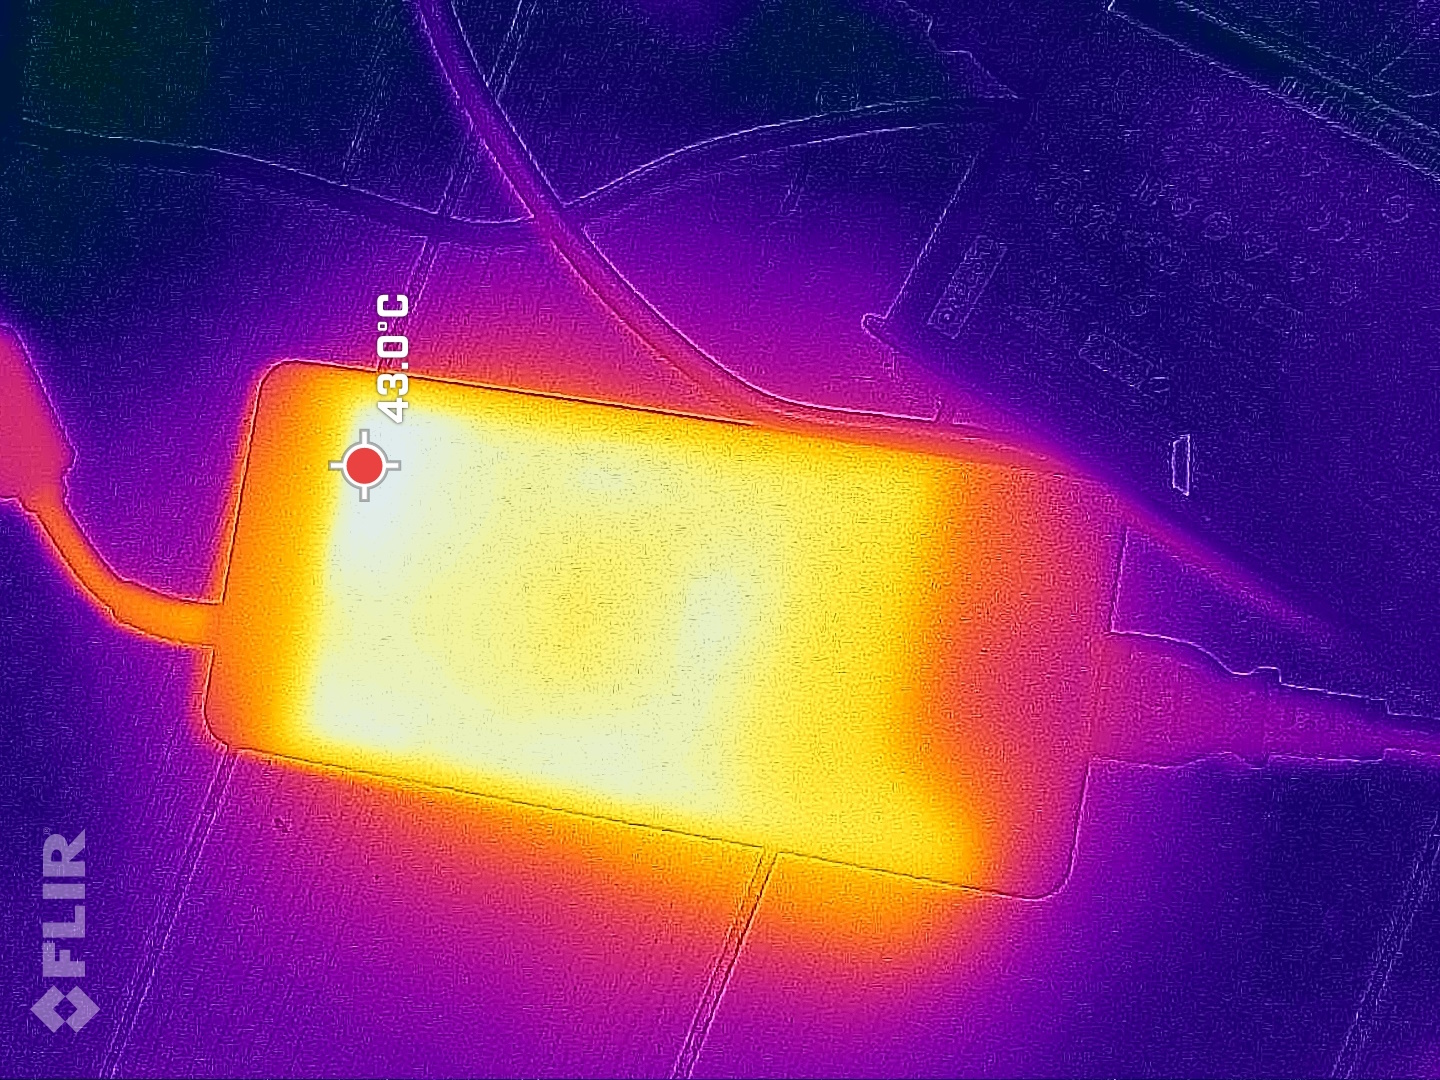
电源管理 - 消耗量和运行时间符合预期
耗电量
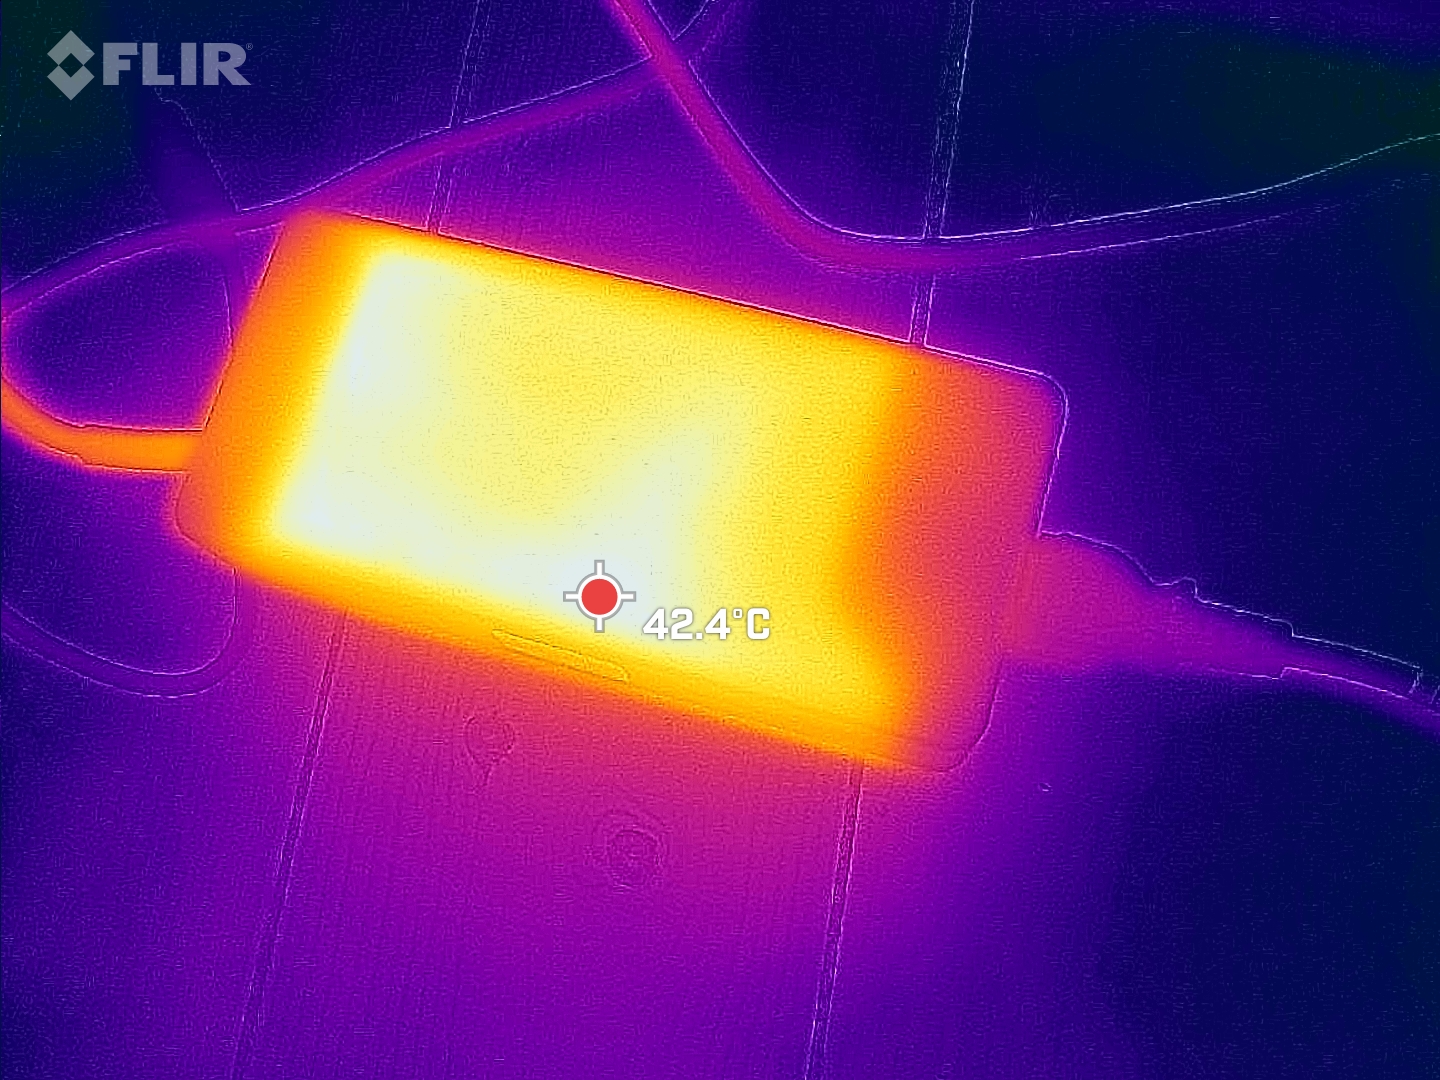
没有人会指望 HX CPU 和 RTX 4080 能够省钱,因此 Helios 18 的表现并不令人意外。它在闲置时相当节俭,但在游戏时,它的需求几乎与性能大致相同的微星 GE78HX。只有 319 W 的短期最大功耗高于微星。大而重的 Chicony 电源额定功率为 330 W,即使在要求苛刻的情况下,也能随时为掠夺者提供足够的电力。
| Off / Standby | |
| Idle | |
| Load |
|
Key:
min: | |
| Acer Predator Helios 18 N23Q2 i9-13900HX, GeForce RTX 4080 Laptop GPU, Samsung PM9A1 MZVL22T0HBLB, IPS, 2560x1600, 18" | MSI GE78HX 13VH-070US i9-13950HX, GeForce RTX 4080 Laptop GPU, Samsung PM9A1 MZVL22T0HBLB, IPS, 2560x1600, 17" | HP Omen 17-ck2097ng i9-13900HX, GeForce RTX 4080 Laptop GPU, SK hynix PC801 HFS001TEJ9X101N, IPS, 2560x1440, 17.3" | Alienware m18 R1 i9-13980HX, GeForce RTX 4090 Laptop GPU, SK hynix PC801 HFS001TEJ9X101N, IPS, 1920x1200, 18" | Asus ROG Strix G18 G814JI i7-13650HX, GeForce RTX 4070 Laptop GPU, Micron 2400 MTFDKBA1T0QFM, IPS, 2560x1600, 18" | Razer Blade 18 RTX 4070 i9-13950HX, GeForce RTX 4070 Laptop GPU, SSSTC CA6-8D1024, IPS, 2560x1600, 18" | Average NVIDIA GeForce RTX 4080 Laptop GPU | Average of class Gaming | |
|---|---|---|---|---|---|---|---|---|
| Power Consumption | -13% | -1% | -47% | 20% | -37% | -14% | 7% | |
| Idle Minimum * (Watt) | 16 | 16.1 -1% | 16 -0% | 21.6 -35% | 8 50% | 24.5 -53% | 16.9 ? -6% | 13 ? 19% |
| Idle Average * (Watt) | 19 | 24 -26% | 20 -5% | 25.2 -33% | 15 21% | 34.1 -79% | 22 ? -16% | 19 ? -0% |
| Idle Maximum * (Watt) | 21.3 | 34 -60% | 26 -22% | 56.7 -166% | 26 -22% | 47.7 -124% | 34.1 ? -60% | 24.6 ? -15% |
| Load Average * (Watt) | 124 | 123.6 -0% | 135 -9% | 164.1 -32% | 102 18% | 140 -13% | 117.9 ? 5% | 110.7 ? 11% |
| Witcher 3 ultra * (Watt) | 289 | 286 1% | 215 26% | 311 -8% | 178.6 38% | 202 30% | ||
| Load Maximum * (Watt) | 319 | 285.7 10% | 299 6% | 338.9 -6% | 267 16% | 261 18% | 297 ? 7% | 259 ? 19% |
* ... smaller is better
Power consumption Witcher 3 / Stress test
Power consumption with an external monitor
电池寿命
宏碁安装了 90 Wh 的电池,而微星和 Alienware 则分别安装了 99 Wh 和 97 Wh 的电池。在电池模式下,用户一定要使用 SDR 模式显示,否则 1000 HDR 尼特会更快地耗尽电池。
在降低亮度至 150 尼特的情况下,Helios 18 在 WiFi 和视频测试中的续航时间为 4.5 至近 5 小时。微星的续航时间稍长,Alienware 在 WiFi 测试中的续航时间也差不多。
| Acer Predator Helios 18 N23Q2 i9-13900HX, GeForce RTX 4080 Laptop GPU, 90 Wh | MSI GE78HX 13VH-070US i9-13950HX, GeForce RTX 4080 Laptop GPU, 99 Wh | HP Omen 17-ck2097ng i9-13900HX, GeForce RTX 4080 Laptop GPU, 83 Wh | Alienware m18 R1 i9-13980HX, GeForce RTX 4090 Laptop GPU, 97 Wh | Asus ROG Strix G18 G814JI i7-13650HX, GeForce RTX 4070 Laptop GPU, 90 Wh | Razer Blade 18 RTX 4070 i9-13950HX, GeForce RTX 4070 Laptop GPU, 91.7 Wh | Average of class Gaming | |
|---|---|---|---|---|---|---|---|
| Battery runtime | 14% | -20% | -31% | 28% | -17% | 41% | |
| H.264 (h) | 4.8 | 3.7 -23% | 8.32 ? 73% | ||||
| WiFi v1.3 (h) | 4.4 | 6.1 39% | 3.6 -18% | 4.3 -2% | 8.1 84% | 4 -9% | 7.11 ? 62% |
| Load (h) | 1.7 | 1.5 -12% | 1.4 -18% | 0.7 -59% | 1.2 -29% | 1.3 -24% | 1.502 ? -12% |
| Reader / Idle (h) | 7.3 | 4.2 | 5.6 | 11.7 | 7 | 8.27 ? |
Pros
Cons
结论 - 强劲的游戏玩家,具有优化散热的潜力

这款游戏本在性能方面没有任何弱点。CPU 和 GPU 的性能均略高于我们数据库中相同配置的普通笔记本电脑。此外,它还配备了明亮、高对比度的 MiniLED 显示屏,做工和功能也令人印象深刻。
与搭载 RTX 4060 的 Helios 16 相比,搭载要求更高的 RTX 4080 的 Helios 18 的弱点显而易见:散热系统在Turbo 模式下噪音很大,其他方面似乎也没有优化。虽然笔记本电脑的大部分区域仍然异常凉爽,但热点仍然是同类产品中最热的。与此同时,理论上强大的固态硬盘模式也会很快出现节流。我们建议在更安静的 "性能 "模式下运行笔记本电脑。
宏碁掠夺者 Helios 18 是一台性能强劲的庞然大物,但噪音较大的散热系统需要优化。
迄今为止,我们只评测过 GPU 较弱的 18 英寸竞争对手,因此推荐替代产品并不容易。就性能而言,17 英寸 微星 Raider GE78HX可以跟上,但显示屏较弱。
价格和供应情况
在美国,宏碁掠夺者 Helios 18 的 RTX 4080 配置似乎供不应求。百思买的 RTX 4070 和 4060 配置报价分别为1999.99 美元和1699.99 美元。
价格截至 2023 年 10 月 27 日,可能会有变动。
Acer Predator Helios 18 N23Q2
- 10/25/2023 v7 (old)
Christian Hintze
Transparency
The selection of devices to be reviewed is made by our editorial team. The test sample was provided to the author as a loan by the manufacturer or retailer for the purpose of this review. The lender had no influence on this review, nor did the manufacturer receive a copy of this review before publication. There was no obligation to publish this review. As an independent media company, Notebookcheck is not subjected to the authority of manufacturers, retailers or publishers.
This is how Notebookcheck is testing
Every year, Notebookcheck independently reviews hundreds of laptops and smartphones using standardized procedures to ensure that all results are comparable. We have continuously developed our test methods for around 20 years and set industry standards in the process. In our test labs, high-quality measuring equipment is utilized by experienced technicians and editors. These tests involve a multi-stage validation process. Our complex rating system is based on hundreds of well-founded measurements and benchmarks, which maintains objectivity. Further information on our test methods can be found here.
Price comparison

