移动GeForce RTX 4080首次亮相。Razer Blade 16 Early 2023笔记本电脑评测
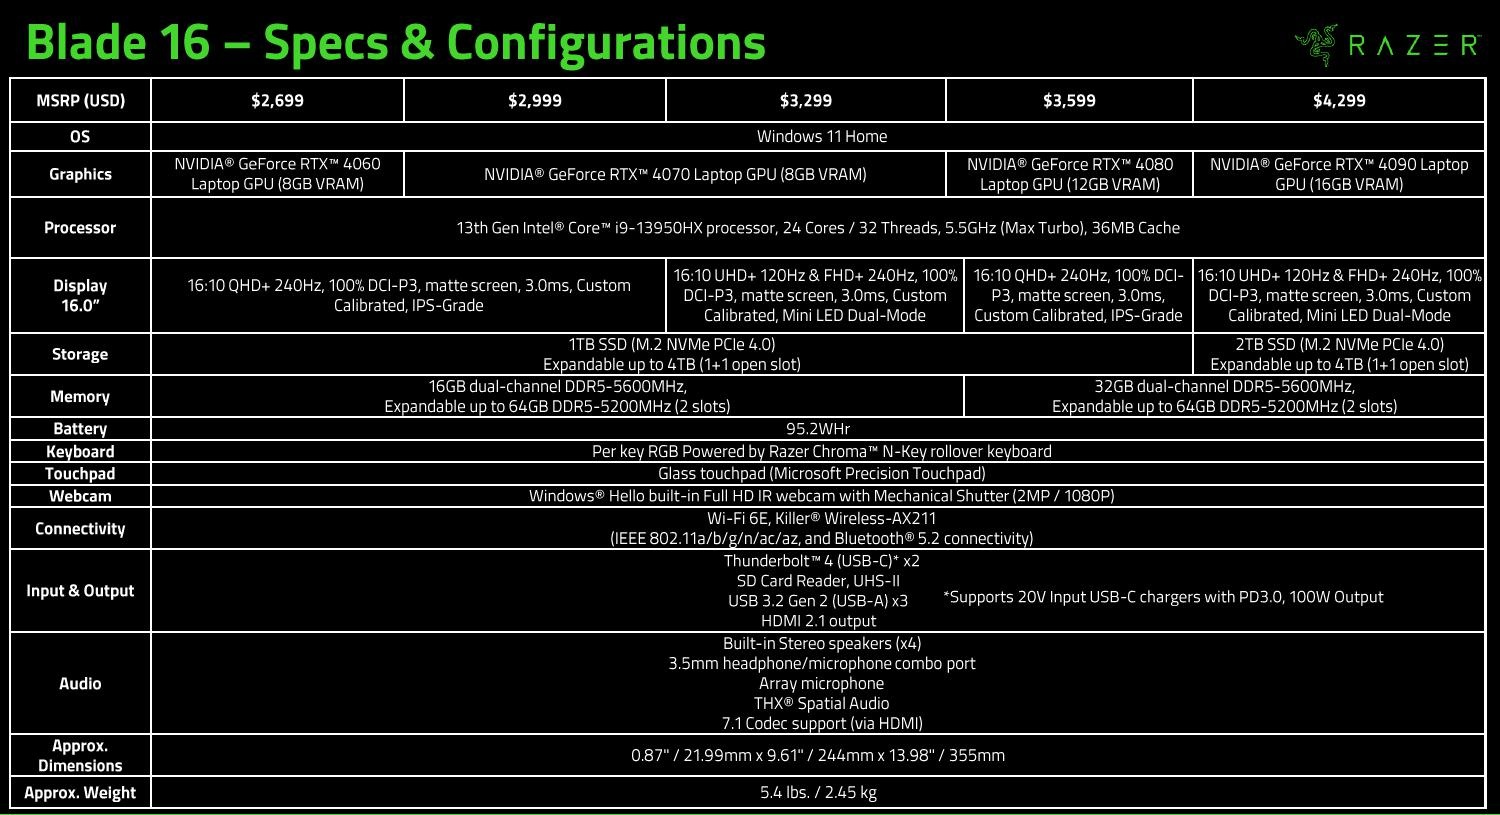
2023年的刀片16是刀片系列的第一个16英寸型号。它的推出恰逢移动英特尔第13代猛禽湖CPU和移动NvidiaGeForce RTX 40 Ada Lovelace GPU的推出。作为与其他刀锋机型一样的高端游戏机,刀锋16占据了15.6英寸刀锋15和17.3英寸刀锋17之间日益流行的16:10 16英寸空间。
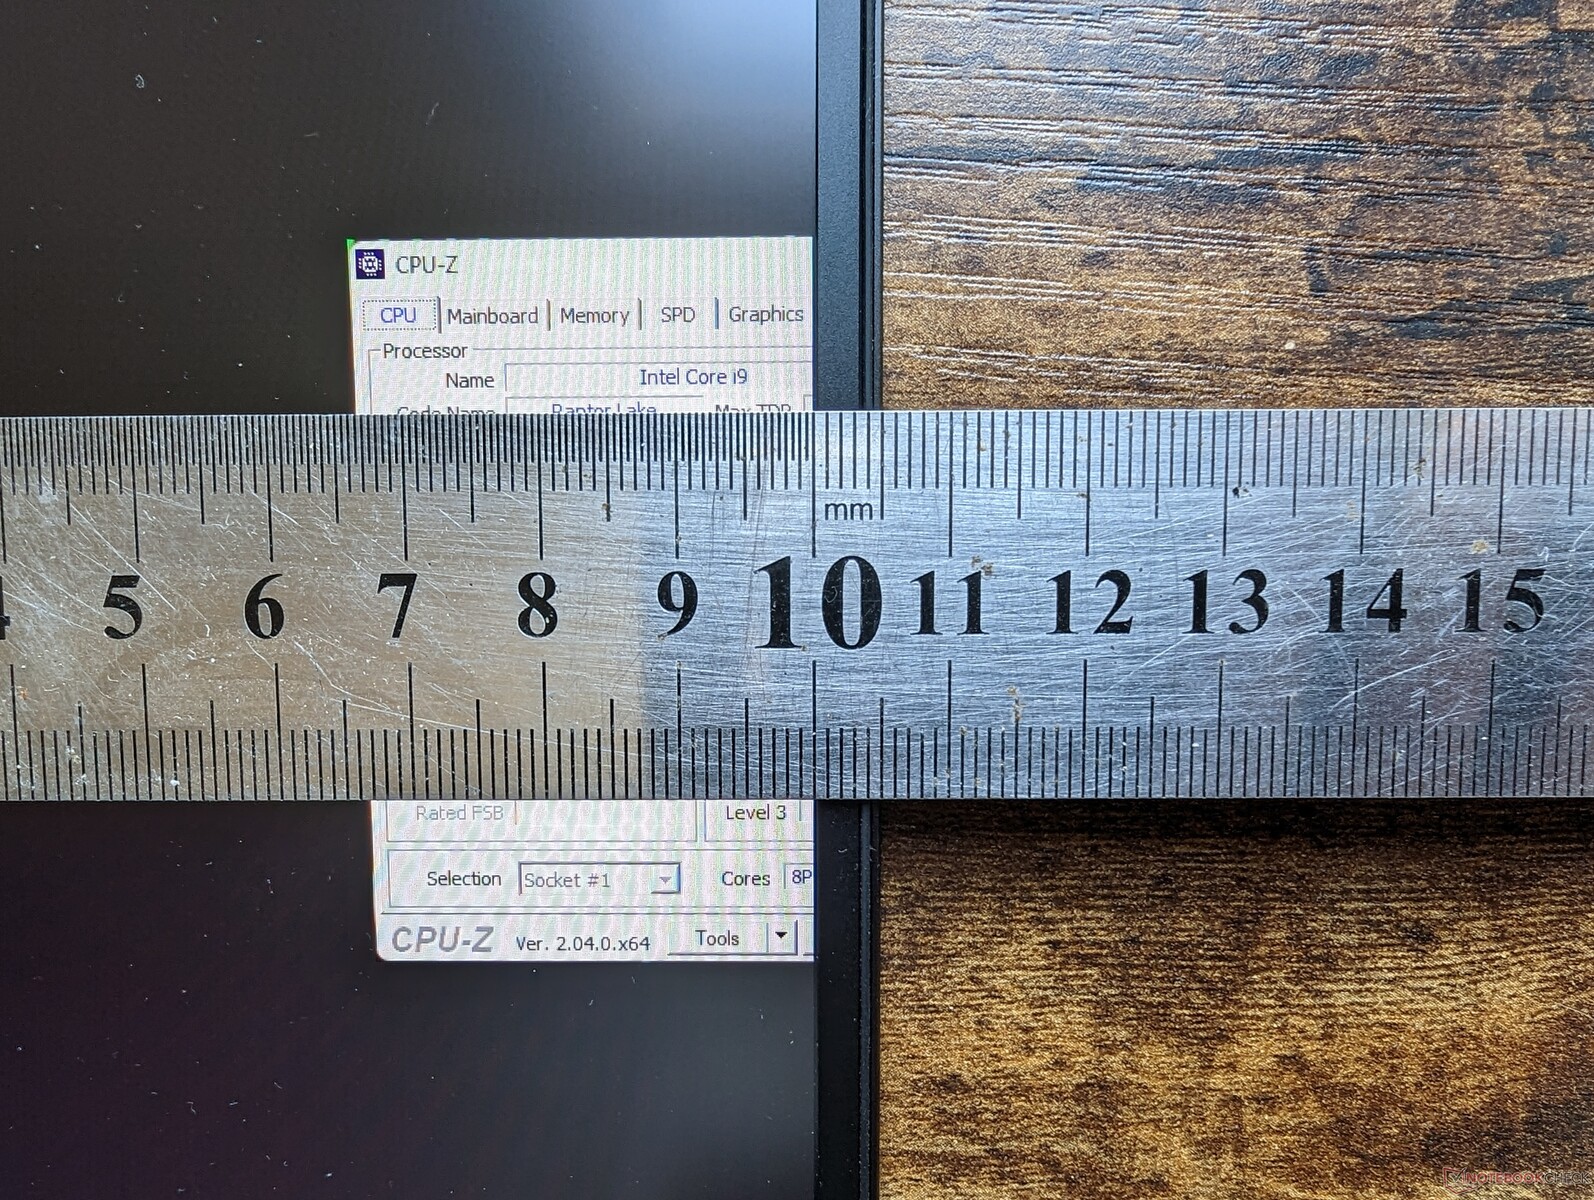
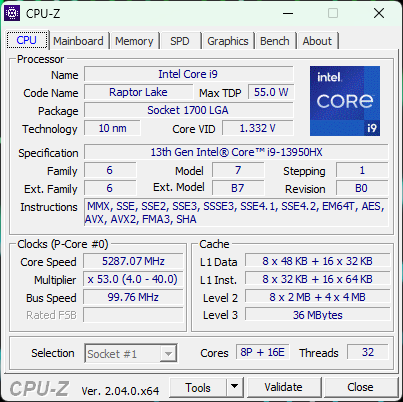
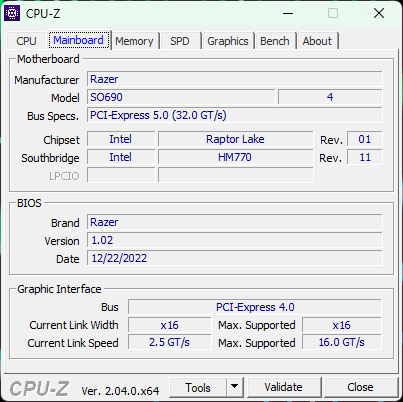
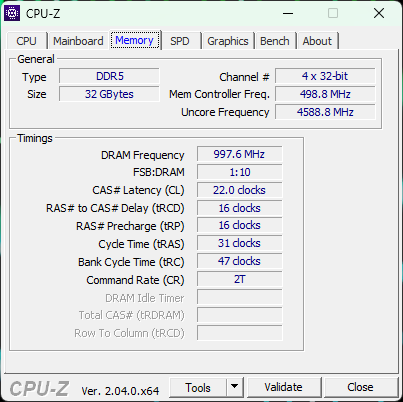
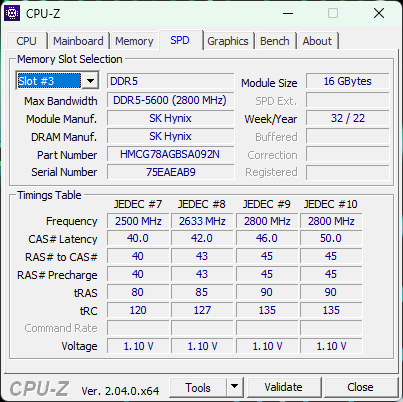
我们的审查单位是一个高端SKU,配备了 酷睿i9-13950HXCPU。 GeForce RTX 4080GPU,快速的32GB DDR5-5600内存,以及240Hz QHD+显示屏,零售价约为3600美元。还有一个更高端的SKU,配备相同的CPU,但有更高级的4K UHD+迷你LED显示屏和RTX 4090 GPU,售价4300美元。其他选项将在未来提供,详见下表。
刀片16的替代品包括16英寸的 联想Legion S7 16ARHA7,戴尔Alienware x16。 华硕ROG Zephyrus Duo 16,以及 HP Omen 16.截至目前,微星还没有宣布16英寸游戏笔记本电脑。
更多Razer评论。
潜在的竞争对手比较
Rating | Date | Model | Weight | Height | Size | Resolution | Price |
|---|---|---|---|---|---|---|---|
| 91.2 % v7 (old) | 02 / 2023 | Razer Blade 16 Early 2023 i9-13950HX, GeForce RTX 4080 Laptop GPU | 2.4 kg | 21.99 mm | 16.00" | 2560x1600 | |
| 88.3 % v7 (old) | 05 / 2022 | Razer Blade 15 Advanced Model Early 2022 i7-12800H, GeForce RTX 3080 Ti Laptop GPU | 2.1 kg | 16.99 mm | 15.60" | 1920x1080 | |
| 89.3 % v7 (old) | 01 / 2023 | Lenovo Legion S7 16ARHA7 R9 6900HX, Radeon RX 6800S | 2.2 kg | 16.9 mm | 16.00" | 2560x1600 | |
| 86.1 % v7 (old) | 10 / 2022 | Dell G16 7620 i7-12700H, GeForce RTX 3060 Laptop GPU | 2.6 kg | 26.9 mm | 16.00" | 2560x1600 | |
| 88.2 % v7 (old) | 05 / 2022 | Asus ROG Zephyrus Duo 16 GX650RX R9 6900HX, GeForce RTX 3080 Ti Laptop GPU | 2.6 kg | 20.5 mm | 16.00" | 3840x2400 | |
| 86.4 % v7 (old) | 12 / 2022 | HP Omen 16-n0033dx R7 6800H, Radeon RX 6650M | 2.4 kg | 22.6 mm | 16.10" | 1920x1080 |
案例 - 刀片13、14、15、17、18和现在的16
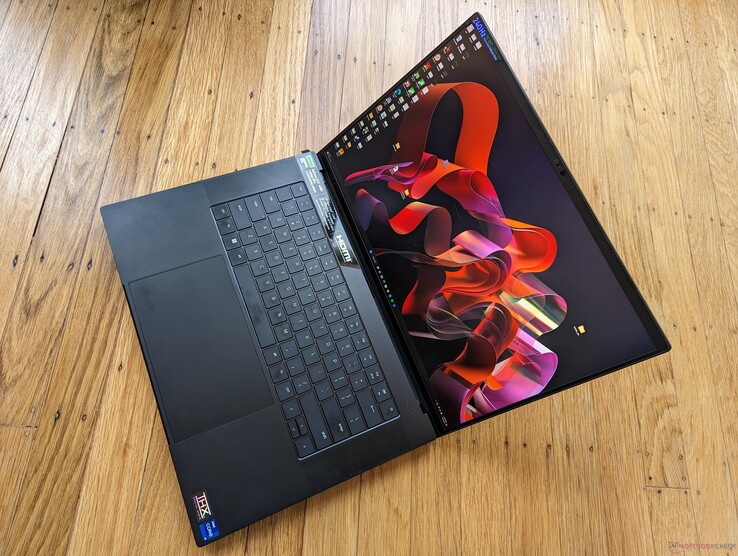
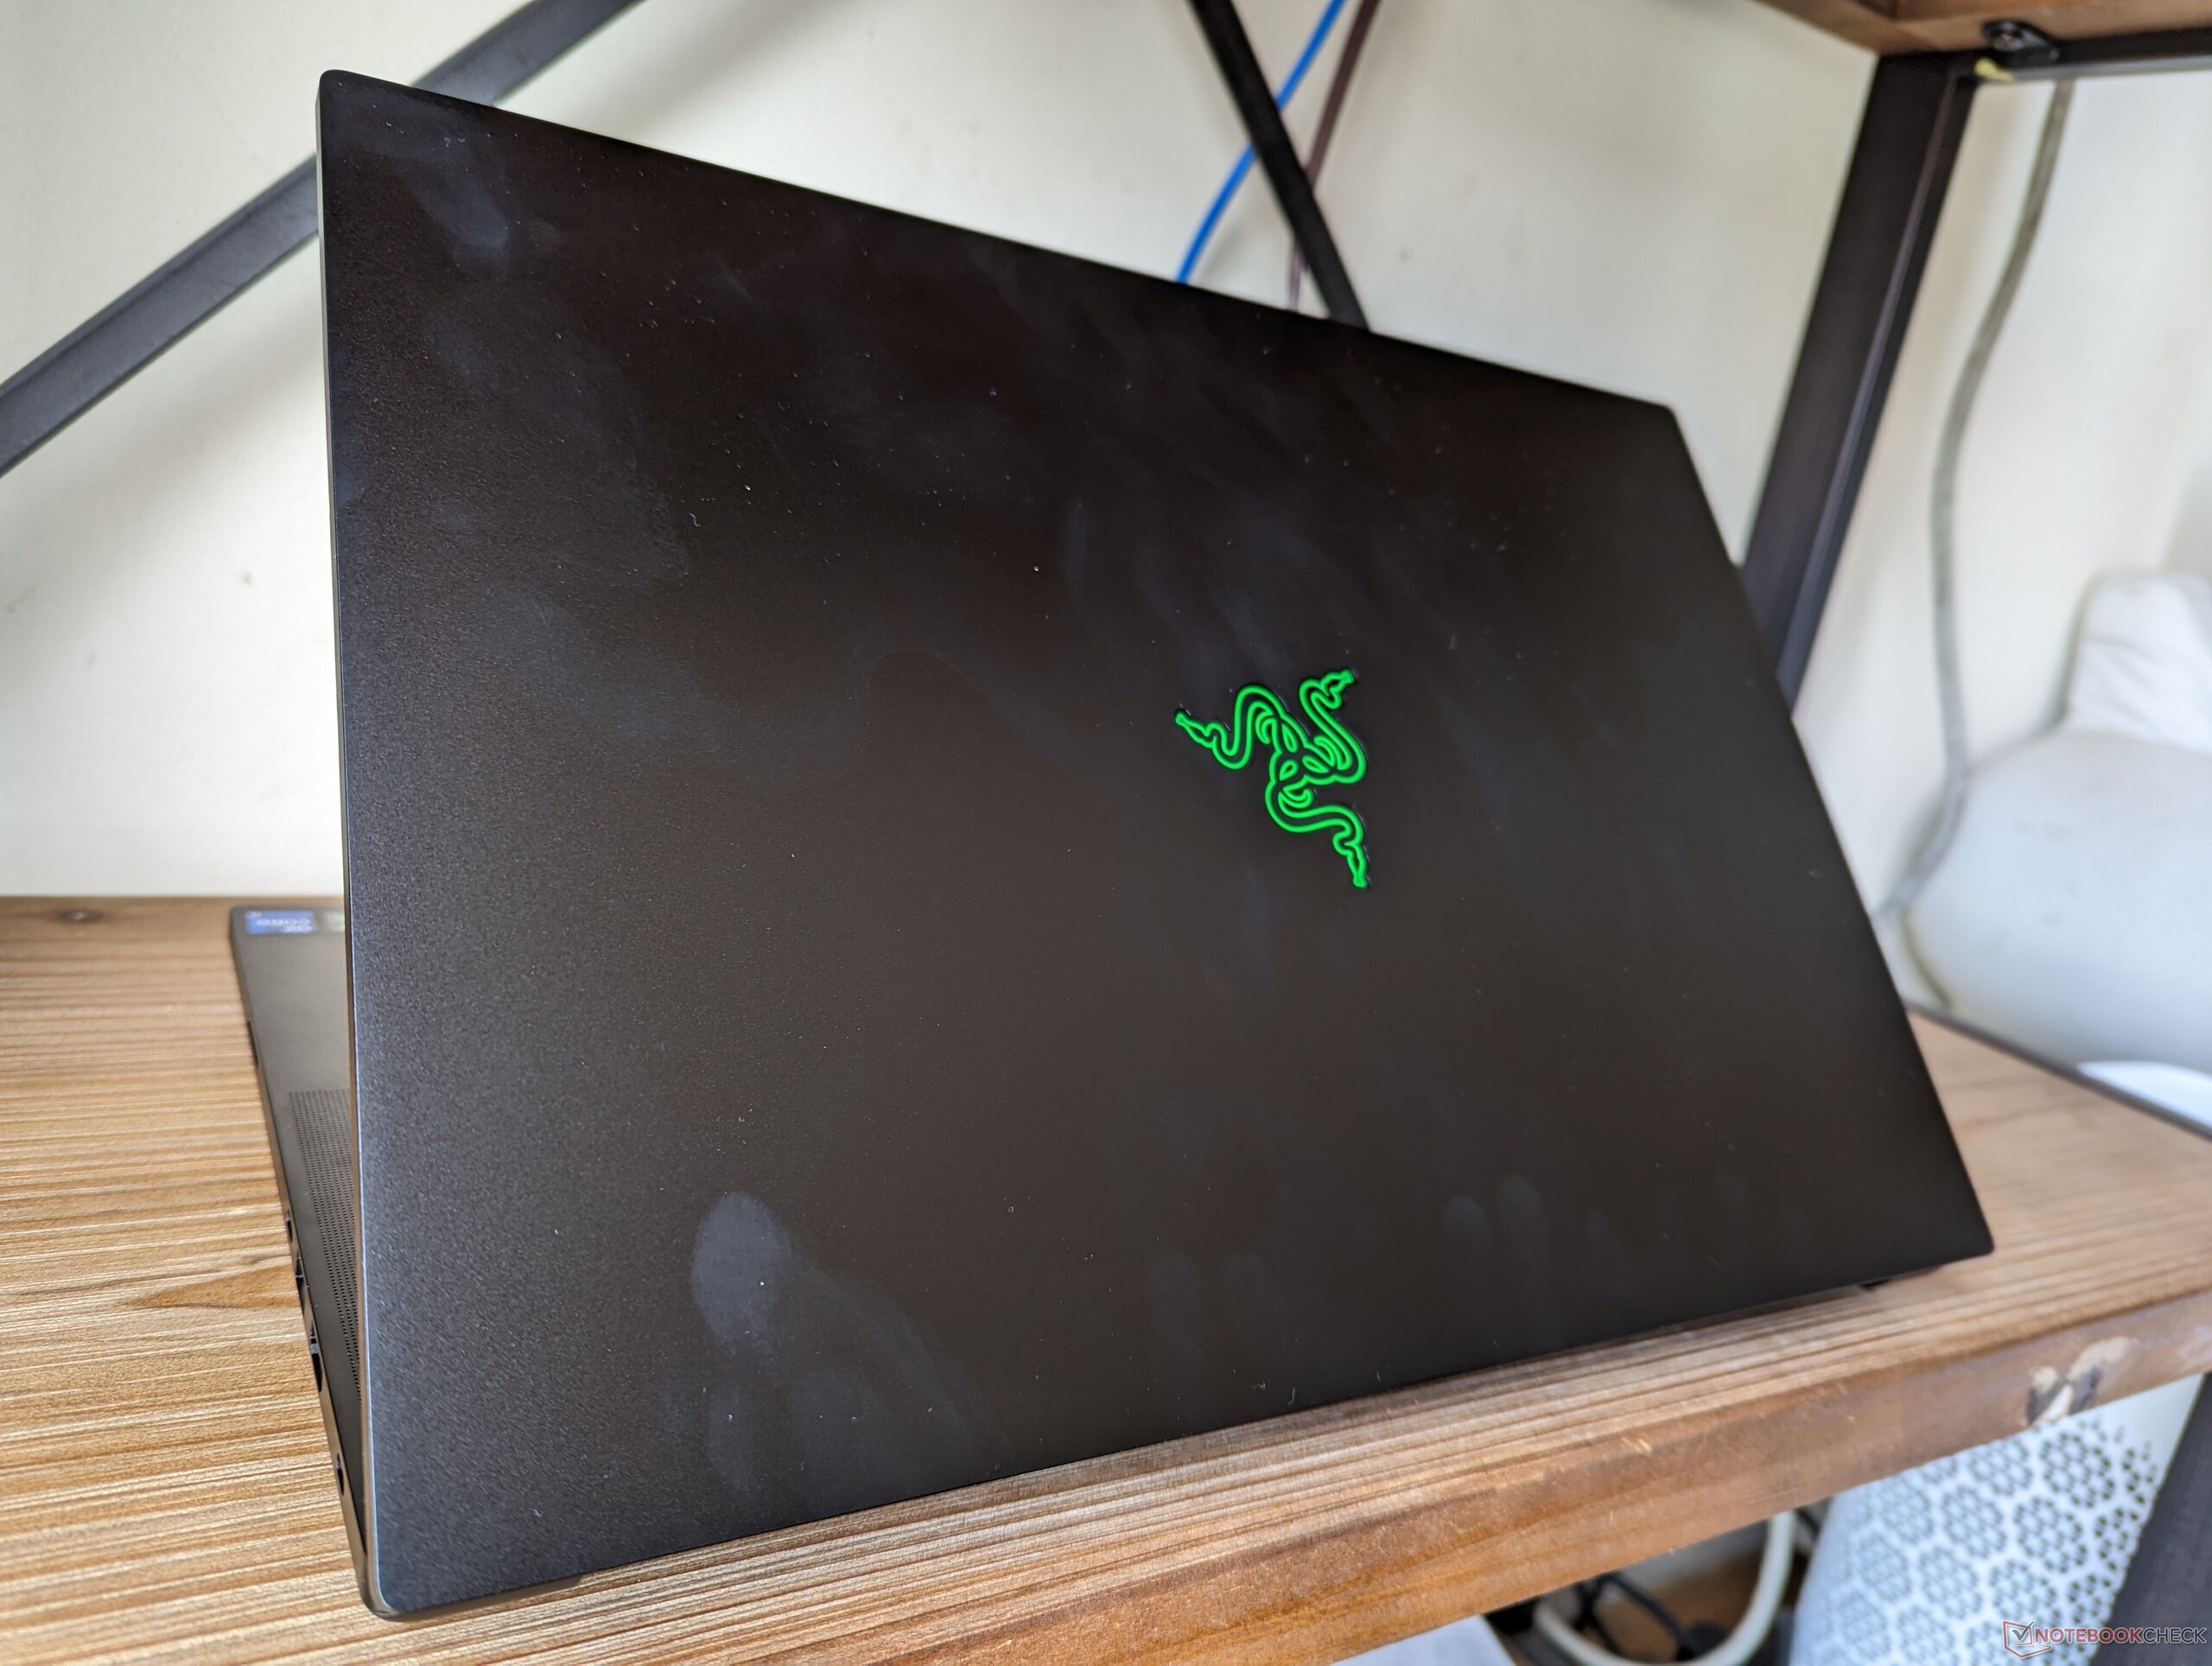
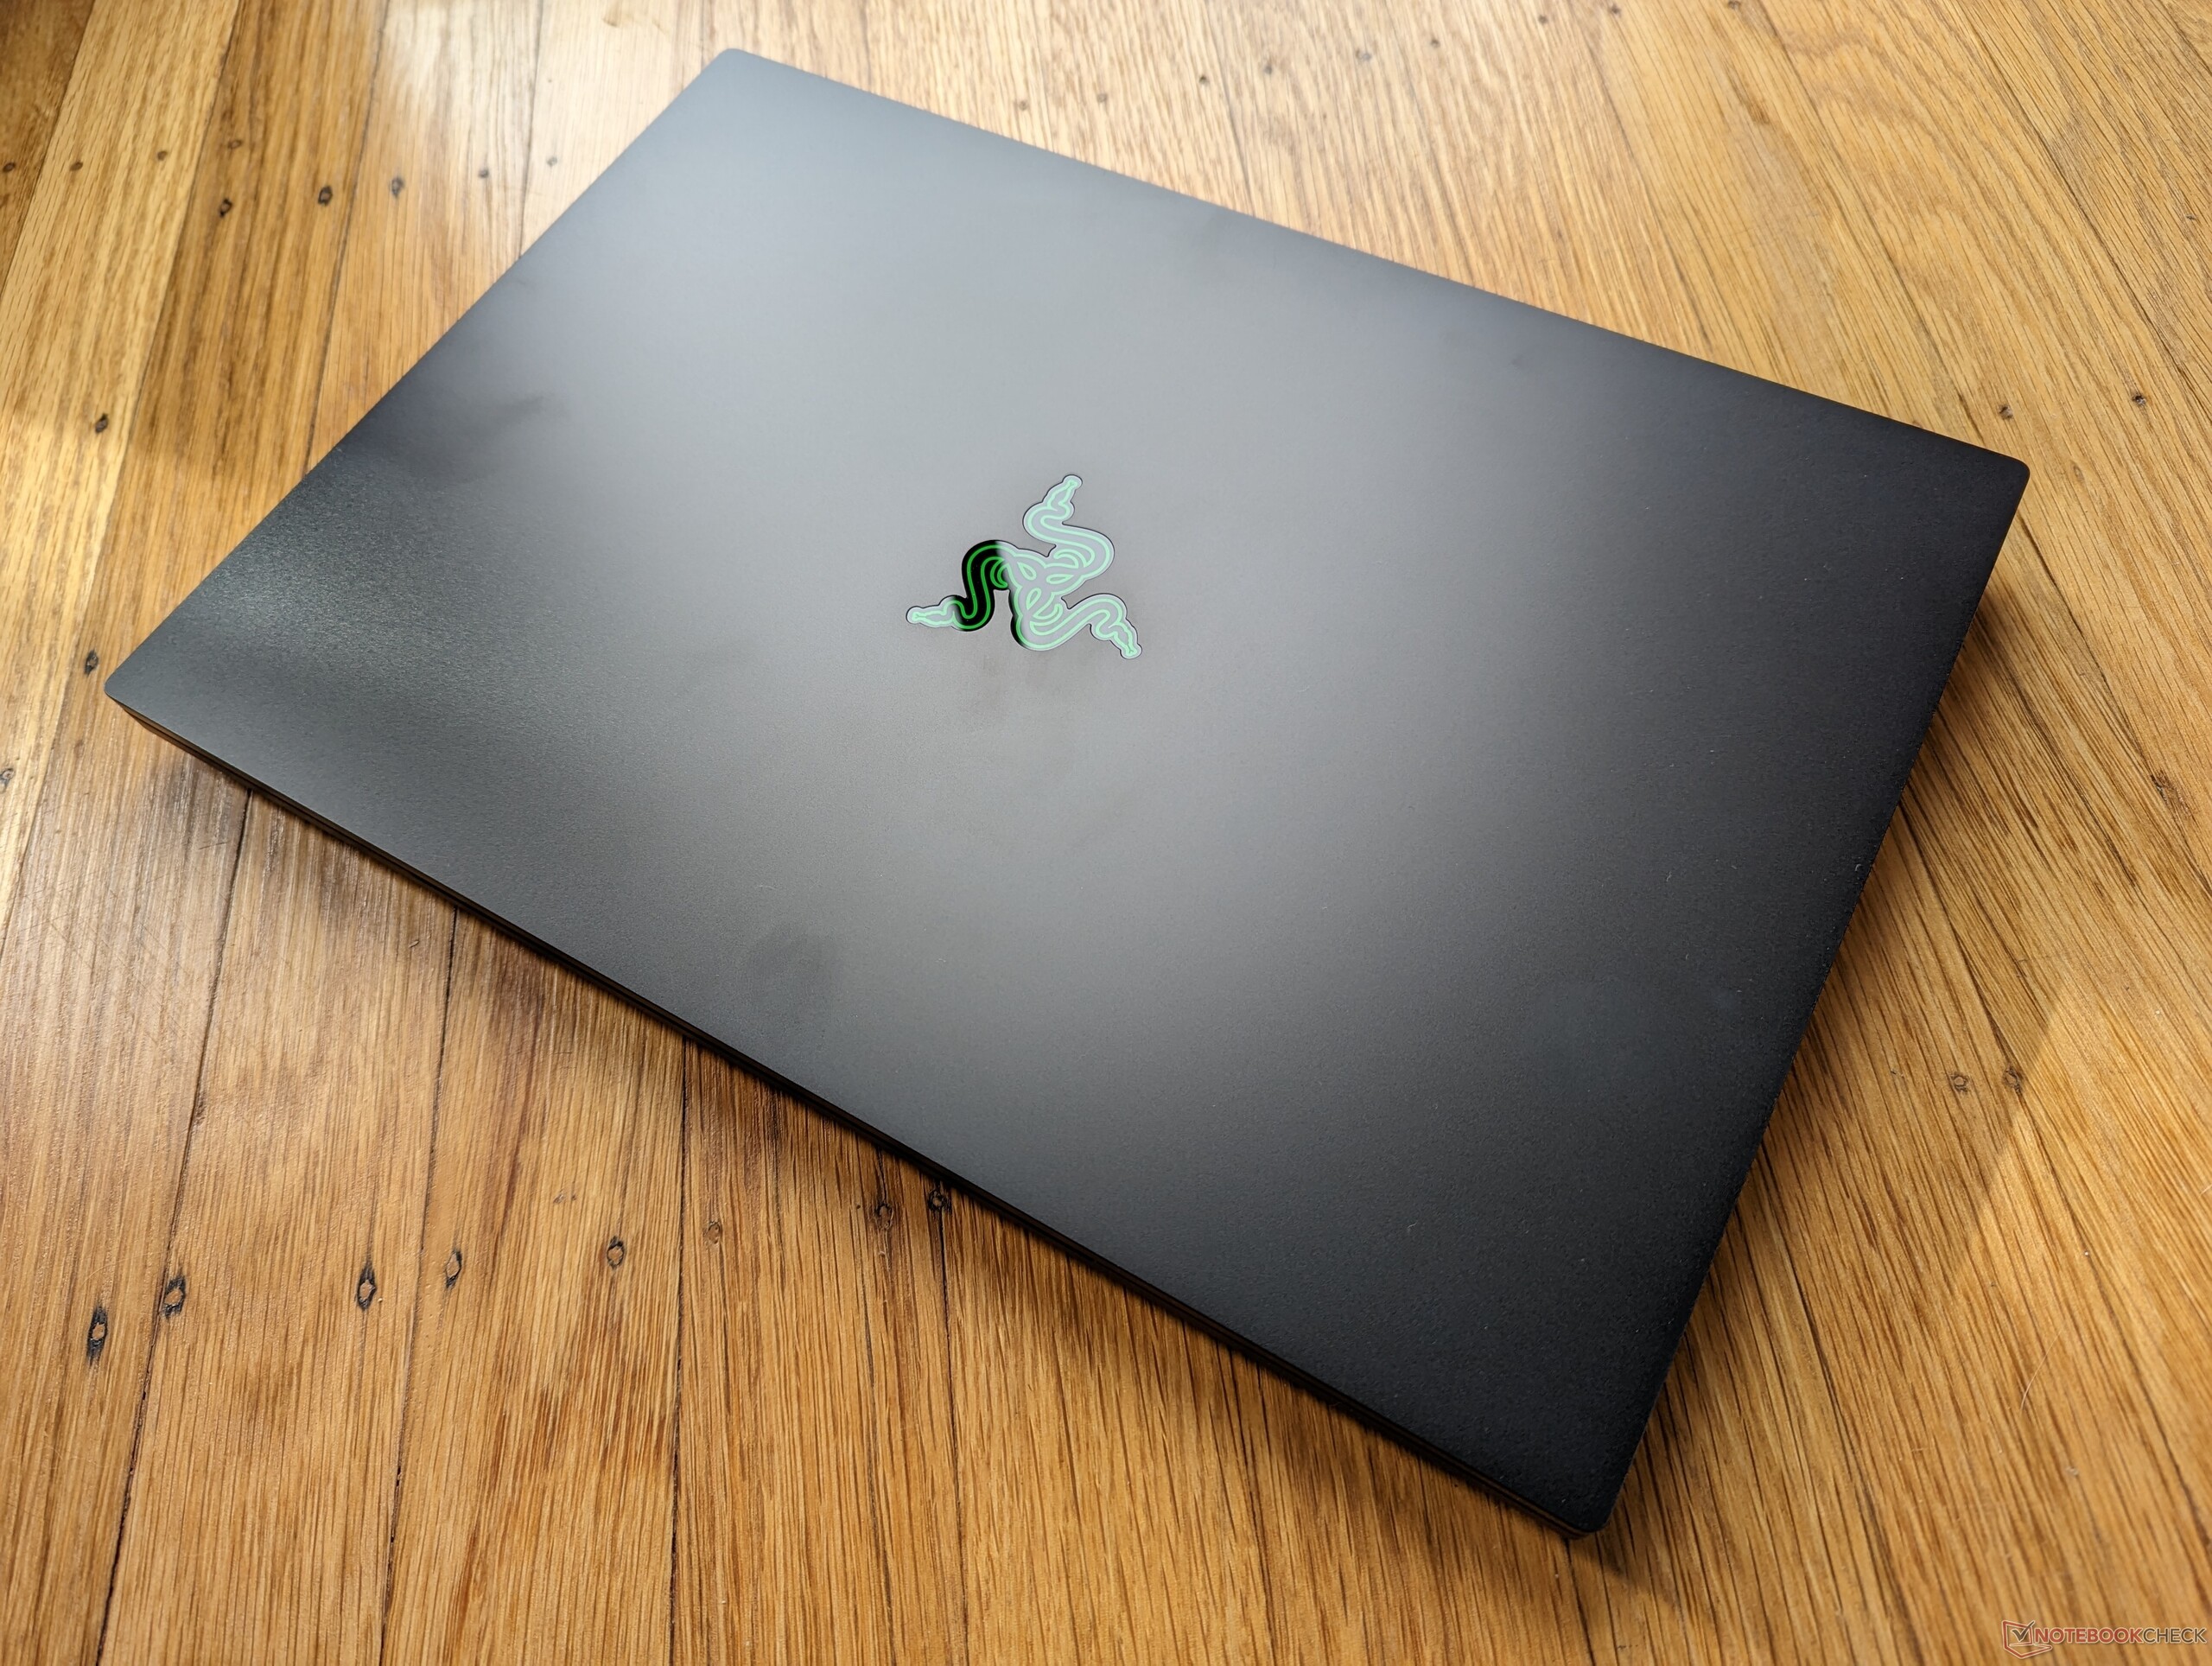
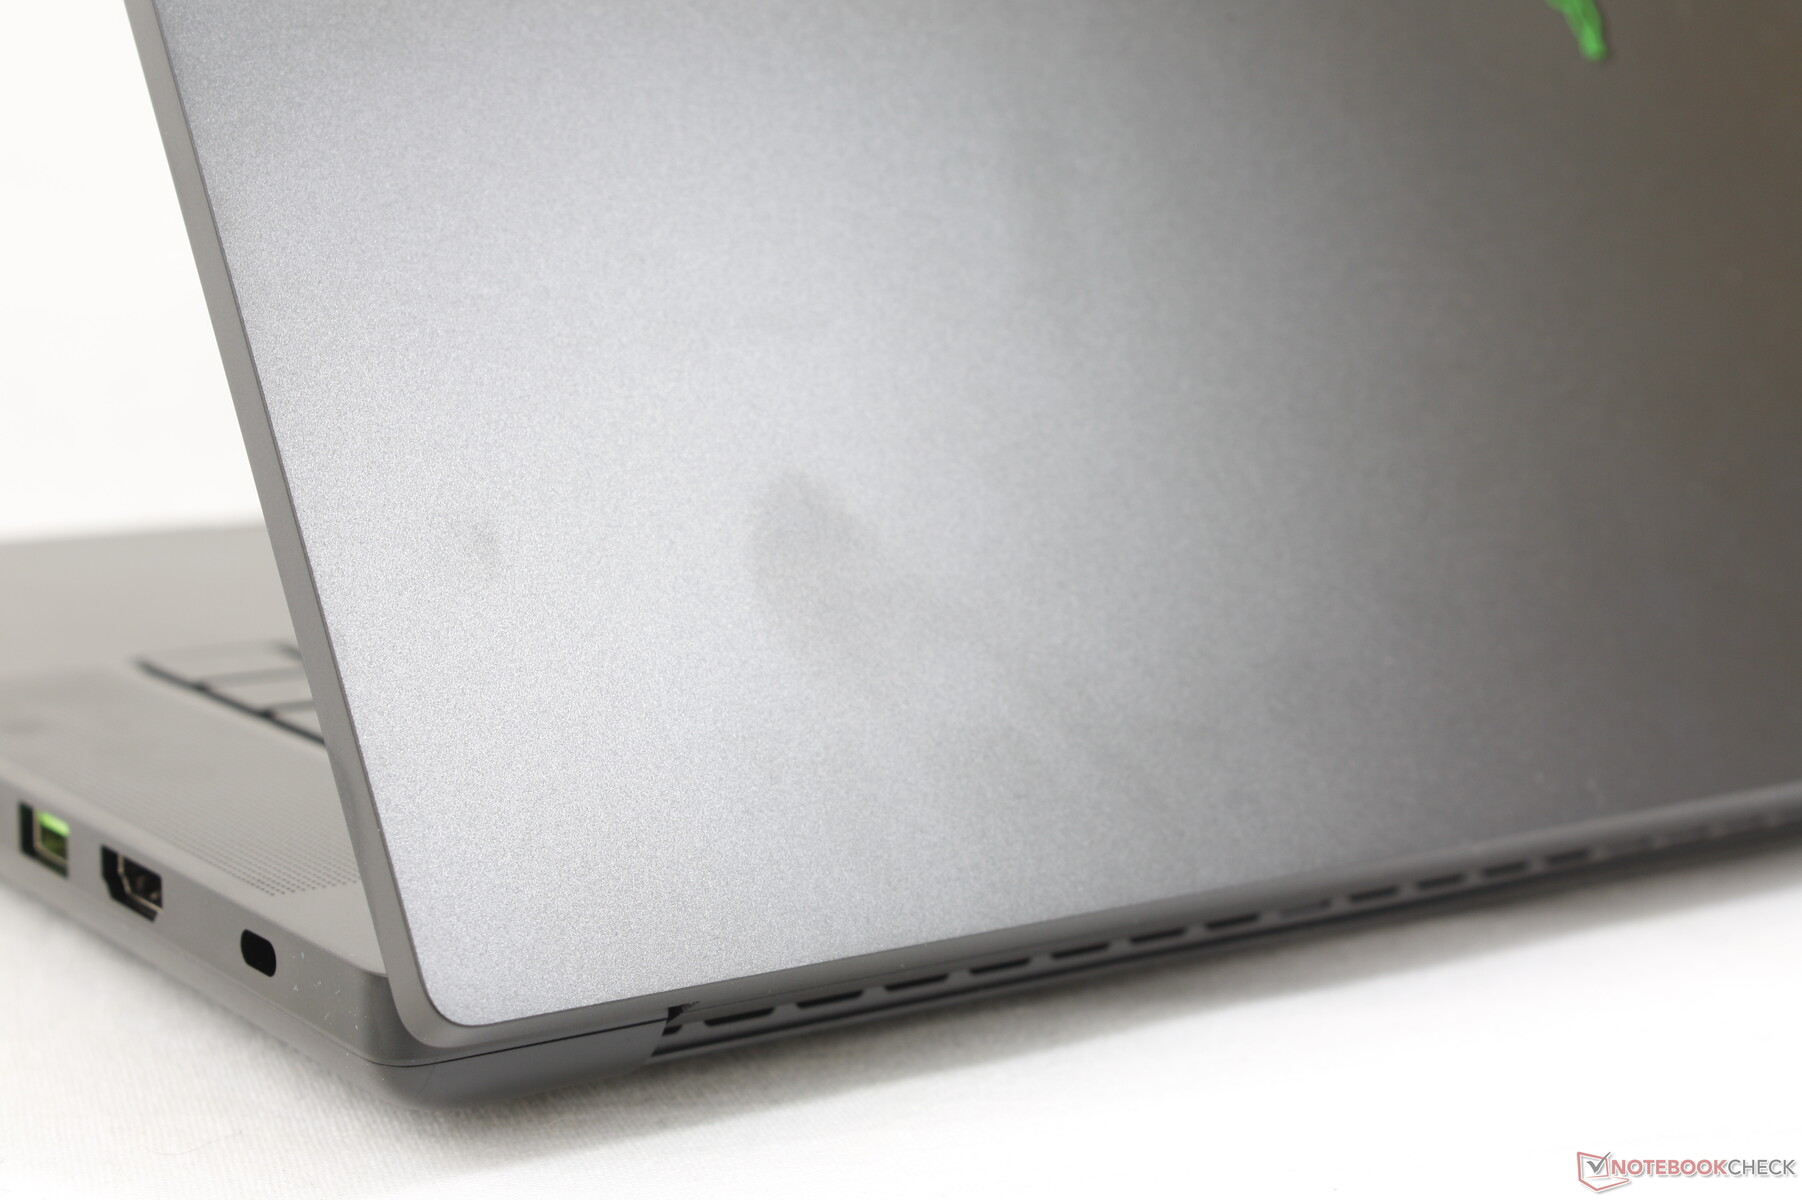
雷蛇很少偏离可识别的刀片设计,刀片16也不例外。如果你曾经操作过Blade Stealth 13、Blade 14、Blade 15或2019年或更新的Blade 17,那么你已经对Blade 16的外观和感觉有了非常好的了解。它仍然是刚性和极简主义方面最强的设计之一,也是迄今为止所有Windows笔记本电脑中最 "像MacBook "的。
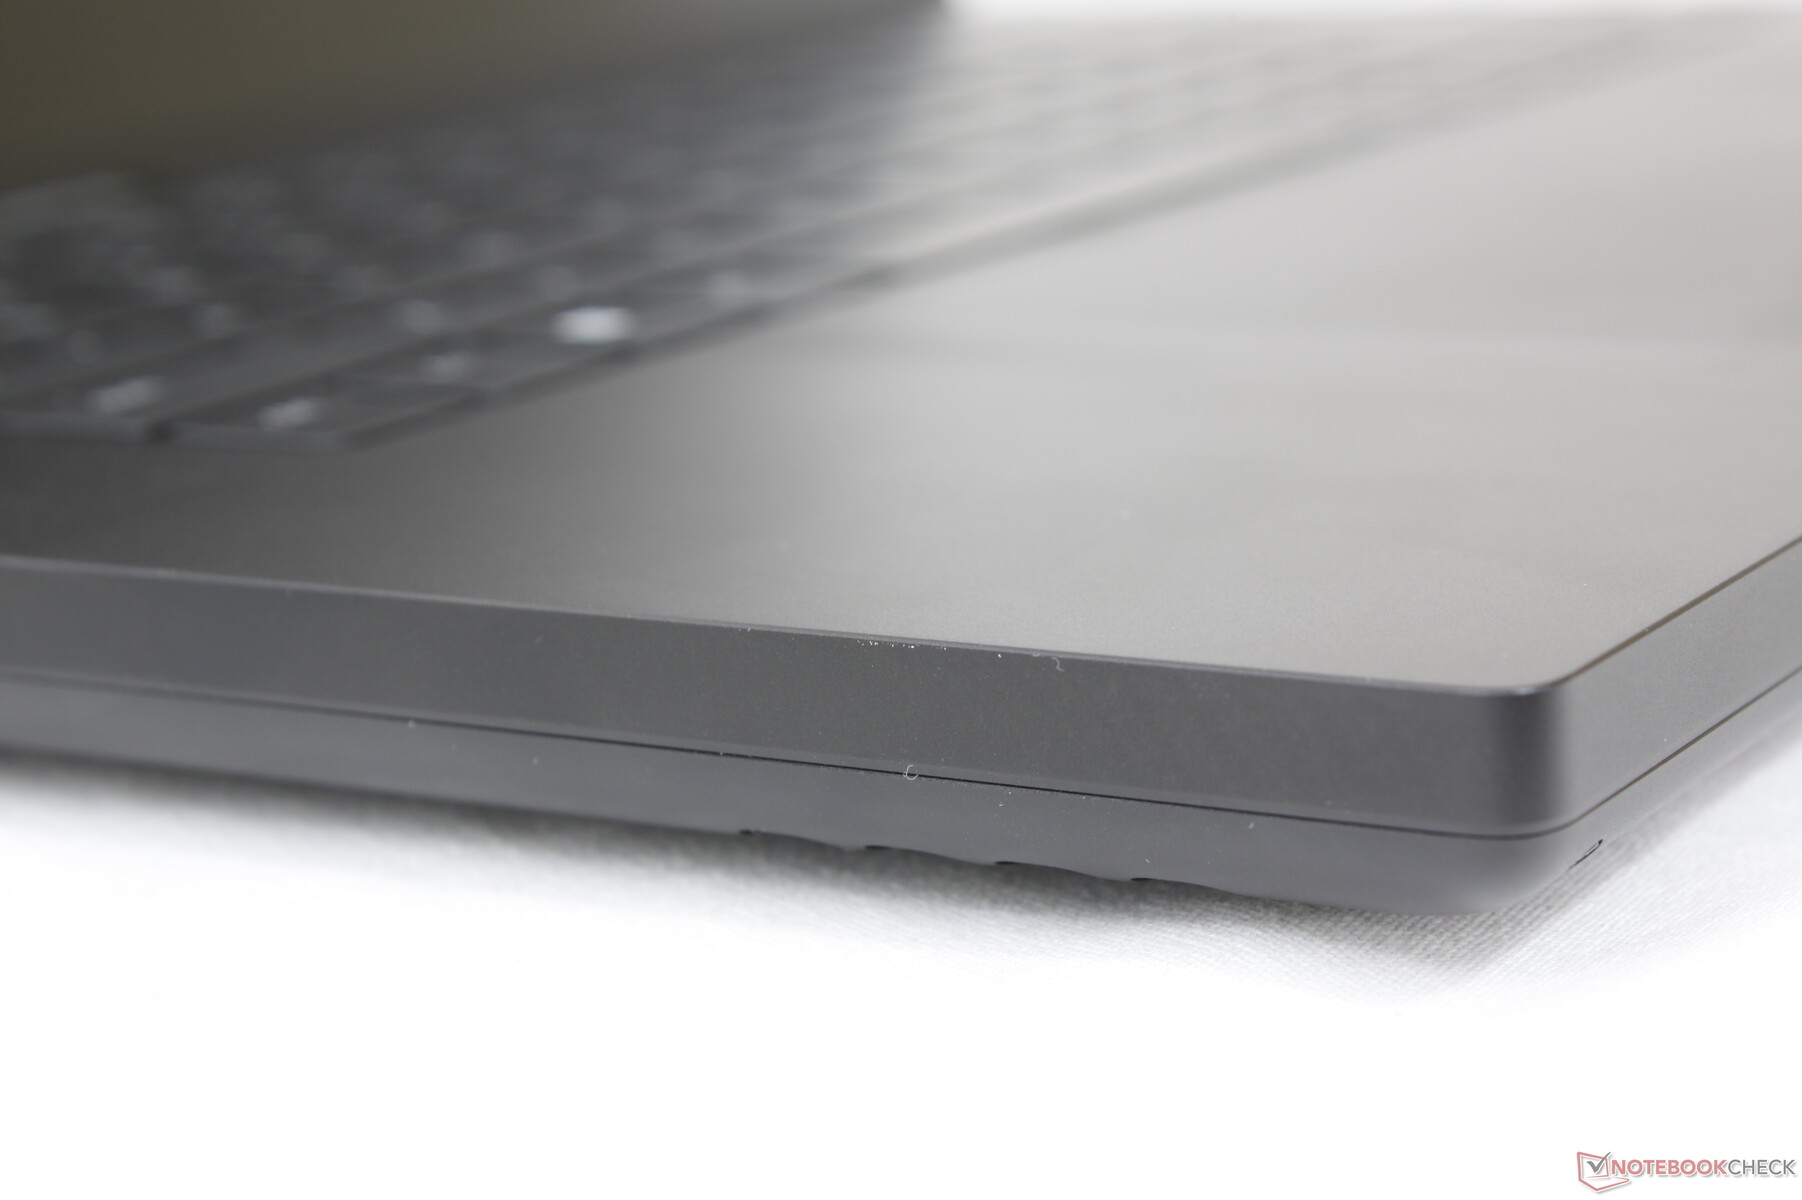
尽管如此,机箱有一个值得注意的更新,在其他任何一款Blade机型上都没有发现,这与显示屏底部明显变薄的下巴边框有关。例如,刀片14和刀片15的下巴边框明显比刀片16厚。因此,刀锋16的屏占比更高,达到89%,而且对于16英寸的外形尺寸来说,其占地面积相对较小。除此以外,该设计保留了雷蛇粉丝所欣赏的刀锋精神和熟悉感。
值得庆幸的是,刀锋16在尺寸和重量上平均比刀锋15更接近。 刀片17 正如我们下面的对比图所示。即便如此,它还是明显比Blade 15大。厚度和重量分别增加了5毫米和300克,甚至比Blade 17更厚。它仍然设法比竞争者的惠普Omen 16或联想Legion S7 16由于前述的高屏占比,它仍然能够比竞争对手惠普Omen 16或联想S7 16小。
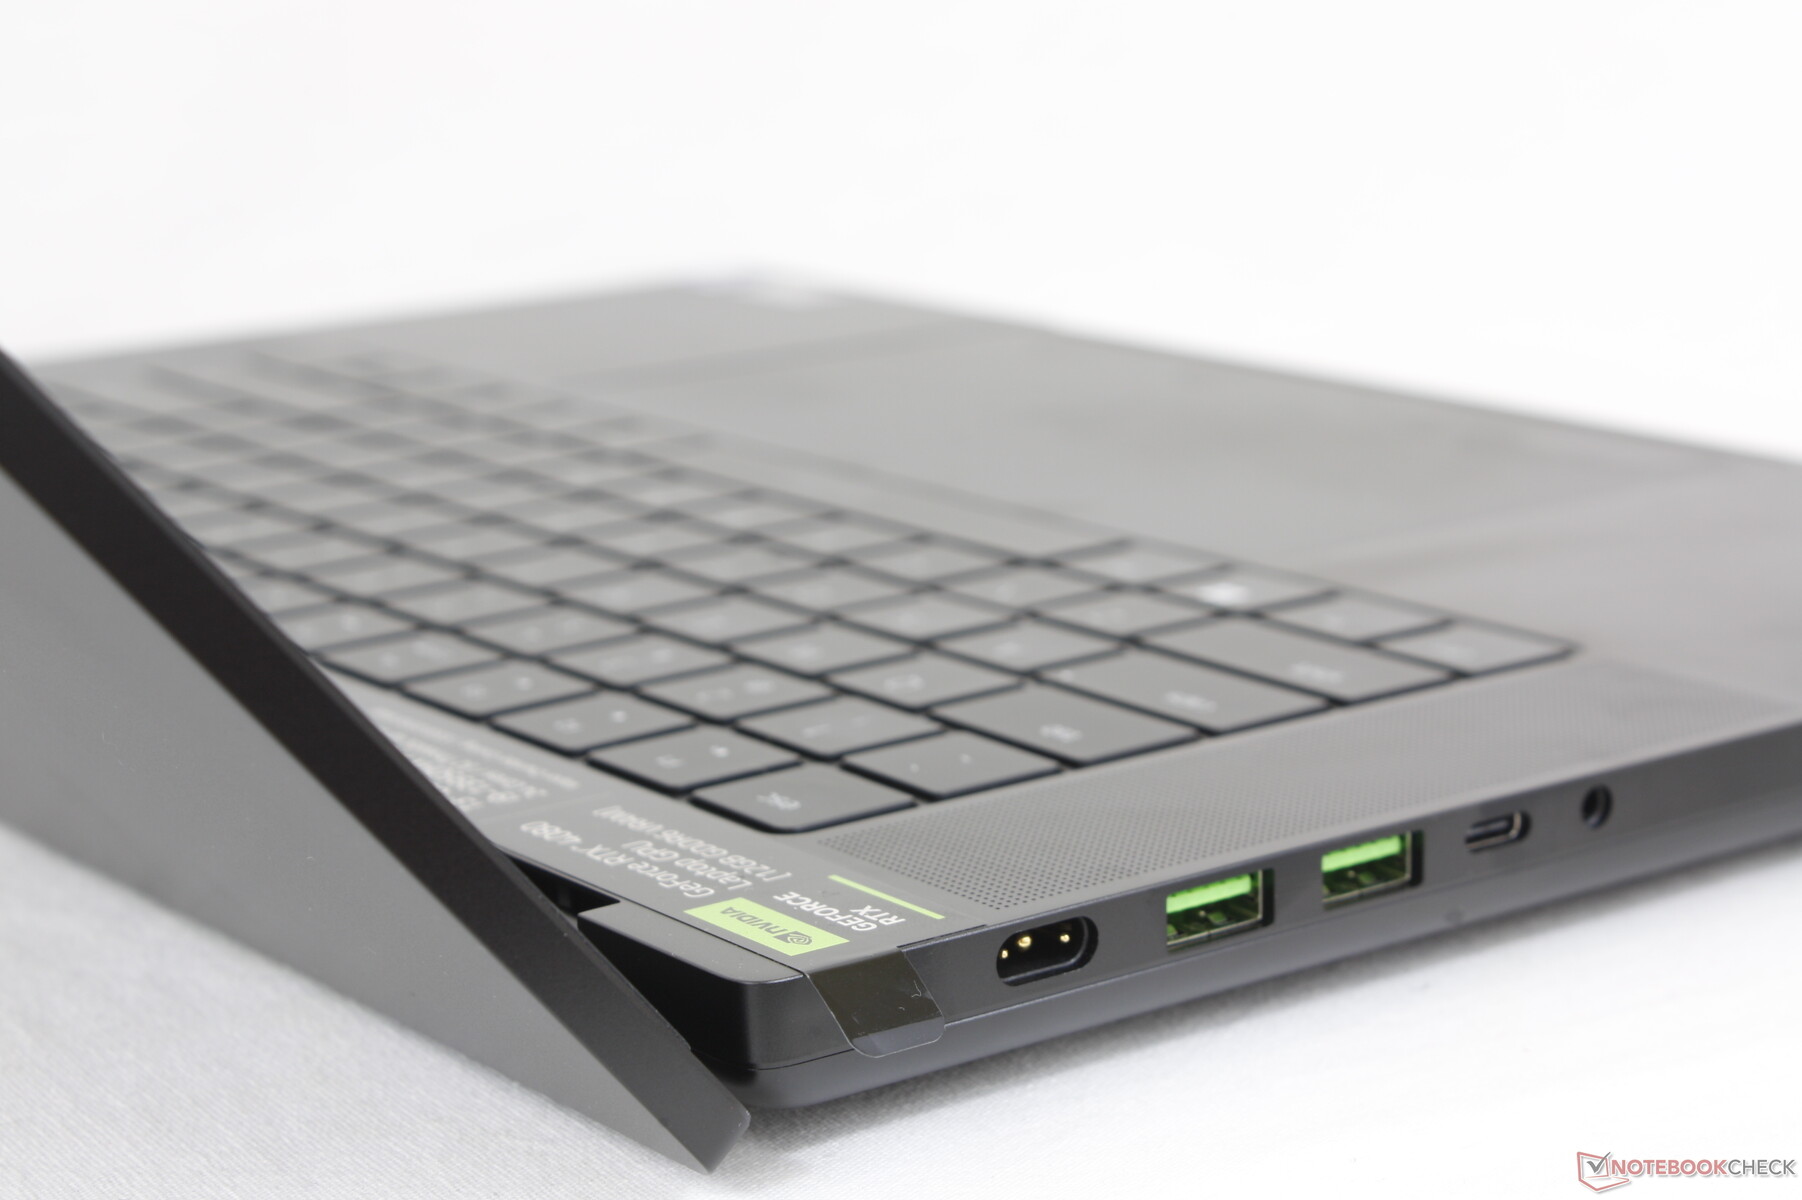
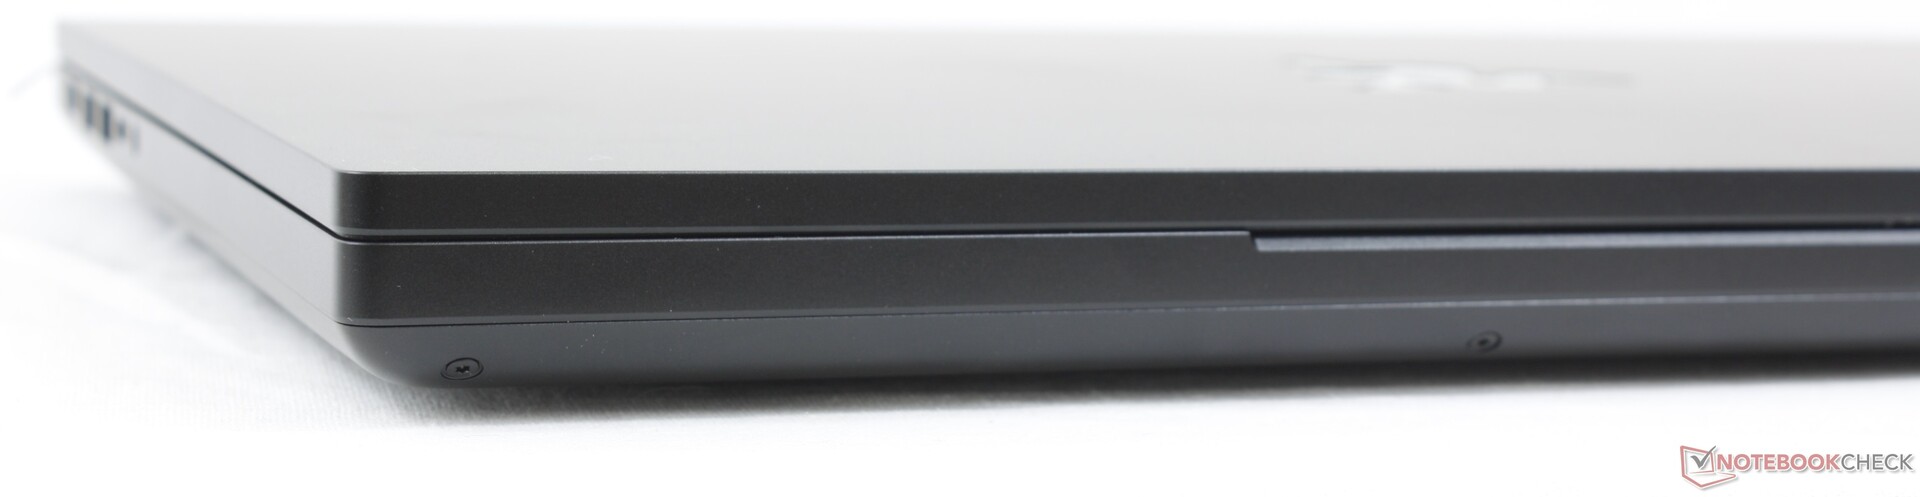
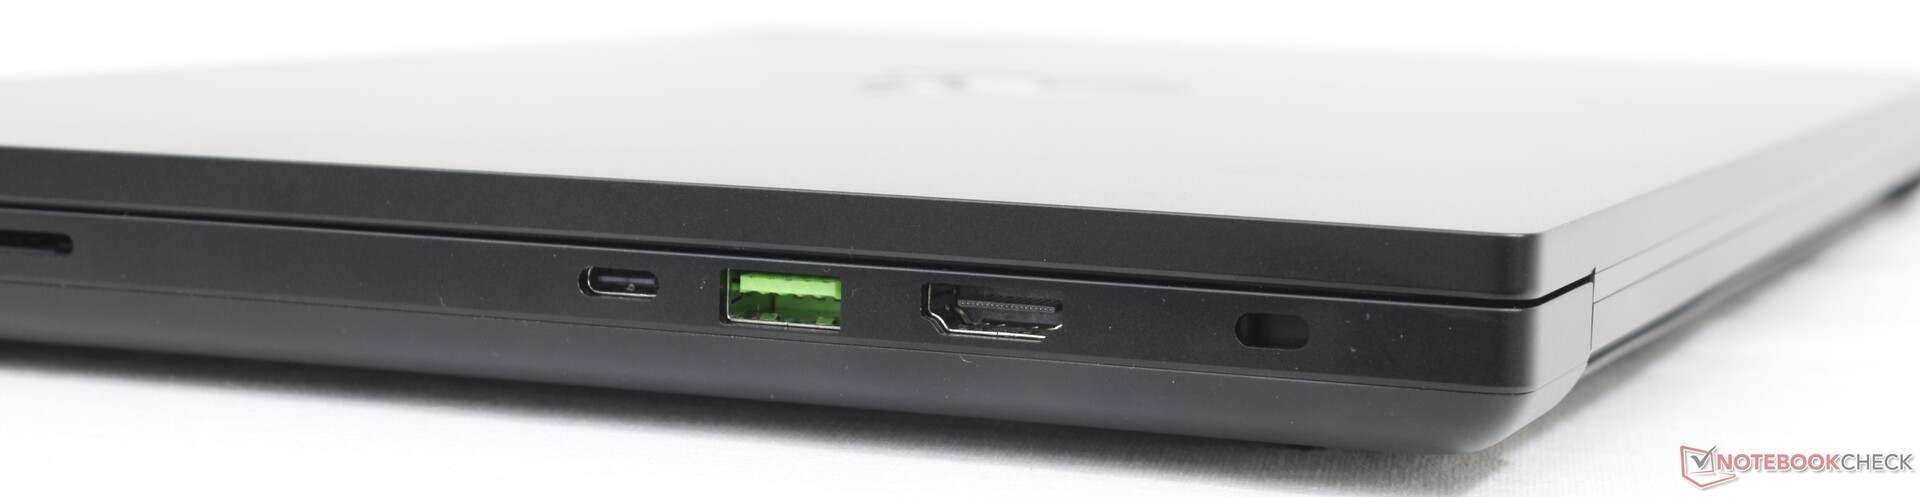
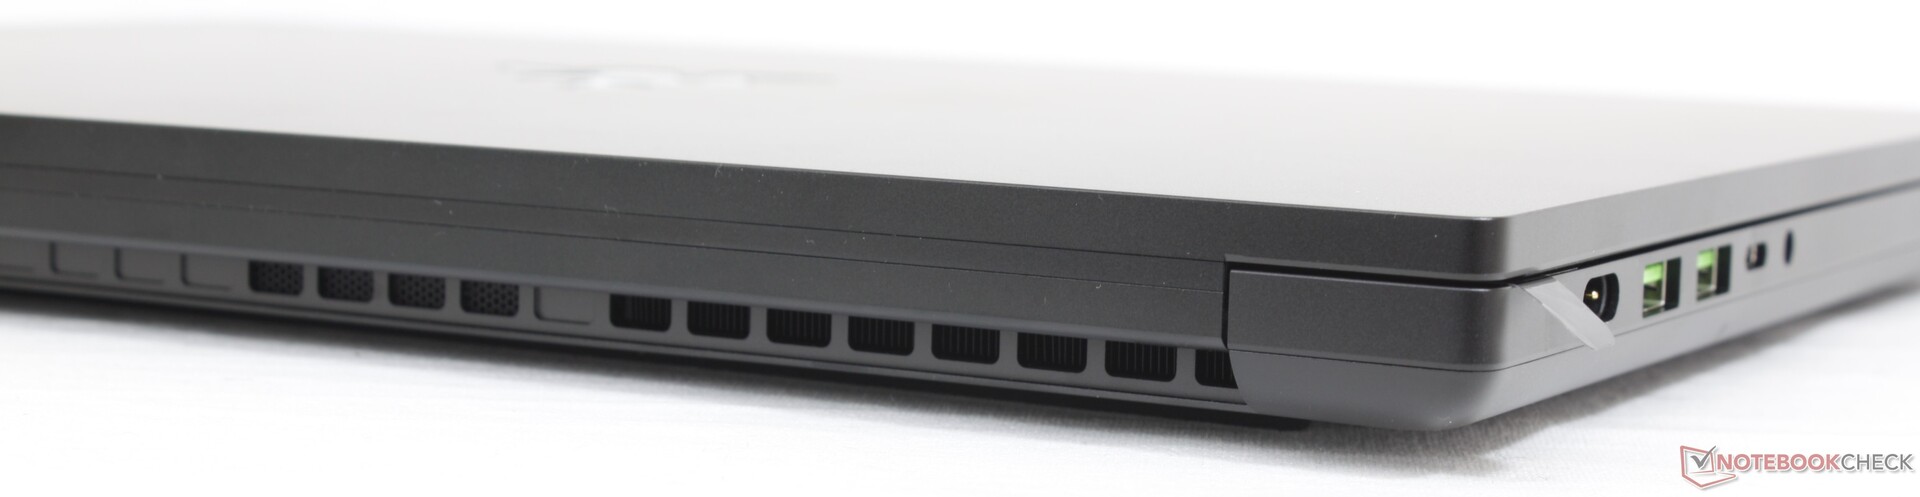
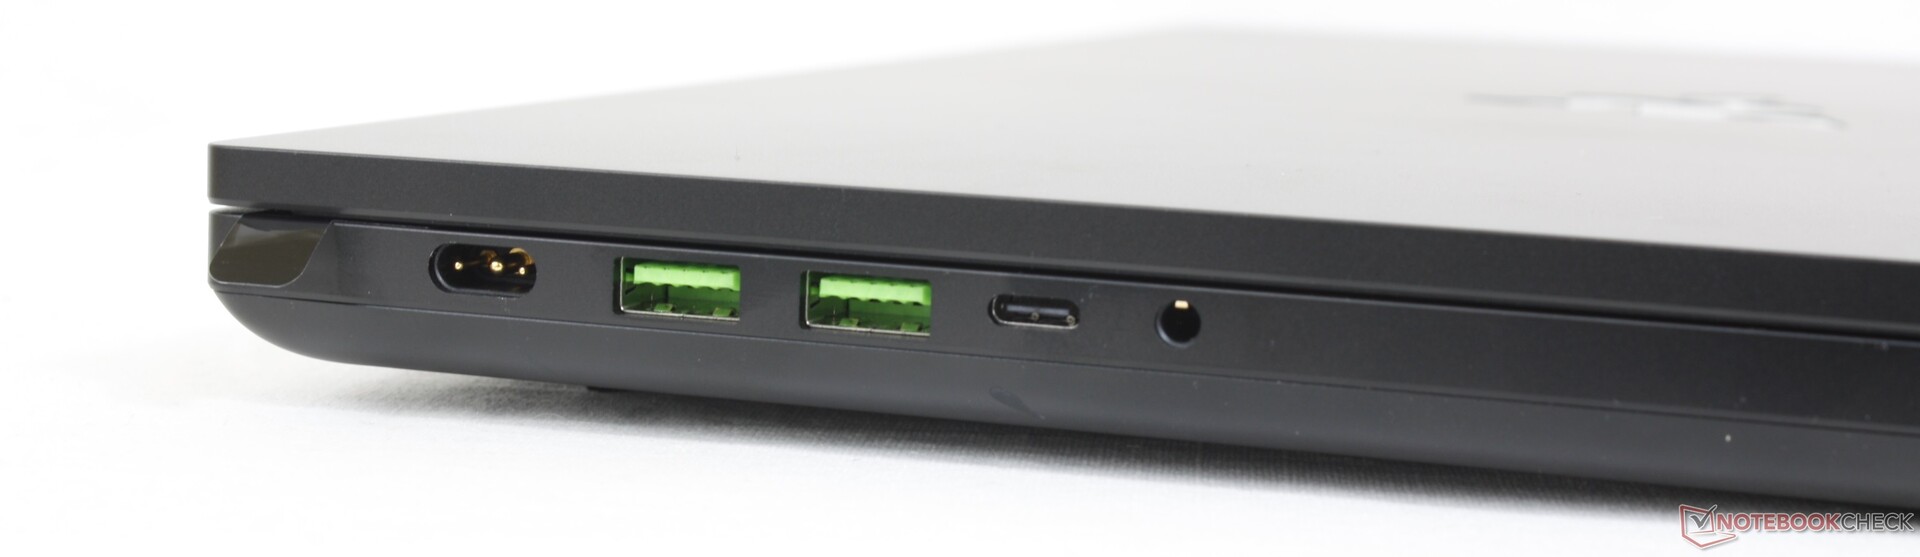
连接性 - 支持Thunderbolt 4
刀片15高级型上的所有端口在刀片16上都已回归。希望获得专用RJ-45端口的用户将不得不升级到更大的刀片17,或考虑使用旧的 刀片15基本型号.请记住,Thunderbolt设备只支持右侧边缘的USB-C端口,不支持左侧。
雷蛇已经确认,Blade 16与去年的Blade 15和Blade 17交流适配器兼容,但由于Blade 16对电源的要求更高,性能和/或充电可能会更慢。
SD卡阅读器
Razer保留了Blade 15和Blade 17系列的集成SD卡读卡器。传输速率大约比联想Legion S7 16、惠普Omen 16,甚至是微星GE67 HX上的读卡器快2倍。 微星GE67 HX.
| SD Card Reader | |
| average JPG Copy Test (av. of 3 runs) | |
| Razer Blade 15 Advanced Model Early 2022 (AV PRO microSD 128 GB V60) | |
| Asus ROG Zephyrus Duo 16 GX650RX (AV PRO microSD 128 GB V60) | |
| Razer Blade 17 (i7-12800H, RTX 3070 Ti) | |
| Razer Blade 16 Early 2023 (AV PRO microSD 128 GB V60) | |
| Lenovo Legion S7 16ARHA7 (AV PRO microSD 128 GB V60) | |
| MSI GE67 HX 12UGS (Toshiba Exceria Pro SDXC 64 GB UHS-II) | |
| HP Omen 16-n0033dx (AV PRO microSD 128 GB V60) | |
| maximum AS SSD Seq Read Test (1GB) | |
| Razer Blade 16 Early 2023 (AV PRO microSD 128 GB V60) | |
| Razer Blade 17 (i7-12800H, RTX 3070 Ti) | |
| Asus ROG Zephyrus Duo 16 GX650RX (AV PRO microSD 128 GB V60) | |
| Lenovo Legion S7 16ARHA7 (AV PRO microSD 128 GB V60) | |
| HP Omen 16-n0033dx (AV PRO microSD 128 GB V60) | |
| MSI GE67 HX 12UGS (Toshiba Exceria Pro SDXC 64 GB UHS-II) | |
沟通
英特尔AX211是6GHz Wi-Fi 6E和蓝牙5.2连接的标准配置。当与我们的华硕AXE11000路由器配对时,我们没有遇到任何性能问题。
| Networking | |
| iperf3 receive AXE11000 6GHz | |
| Razer Blade 16 Early 2023 | |
| Lenovo Legion S7 16ARHA7 | |
| HP Omen 16-n0033dx | |
| iperf3 receive AXE11000 | |
| Razer Blade 15 Advanced Model Early 2022 | |
| Asus ROG Zephyrus Duo 16 GX650RX | |
| HP Omen 16-n0033dx | |
| Razer Blade 16 Early 2023 | |
| Dell G16 7620 | |
| iperf3 transmit AXE11000 | |
| Asus ROG Zephyrus Duo 16 GX650RX | |
| Razer Blade 15 Advanced Model Early 2022 | |
| HP Omen 16-n0033dx | |
| Razer Blade 16 Early 2023 | |
| Dell G16 7620 | |
| iperf3 transmit AXE11000 6GHz | |
| Lenovo Legion S7 16ARHA7 | |
| HP Omen 16-n0033dx | |
| Razer Blade 16 Early 2023 | |
网络摄像头
网络摄像头似乎与Blade 17上的200万像素传感器相同。虽然我们对游戏笔记本的网络摄像头不抱太大希望,但没有看到快门或关闭开关以保护隐私,还是令人失望。相比之下,微星的游戏机型提供了一个一键式杀毒开关,以电动方式禁用摄像头。至少有一个红外传感器用于支持你好。


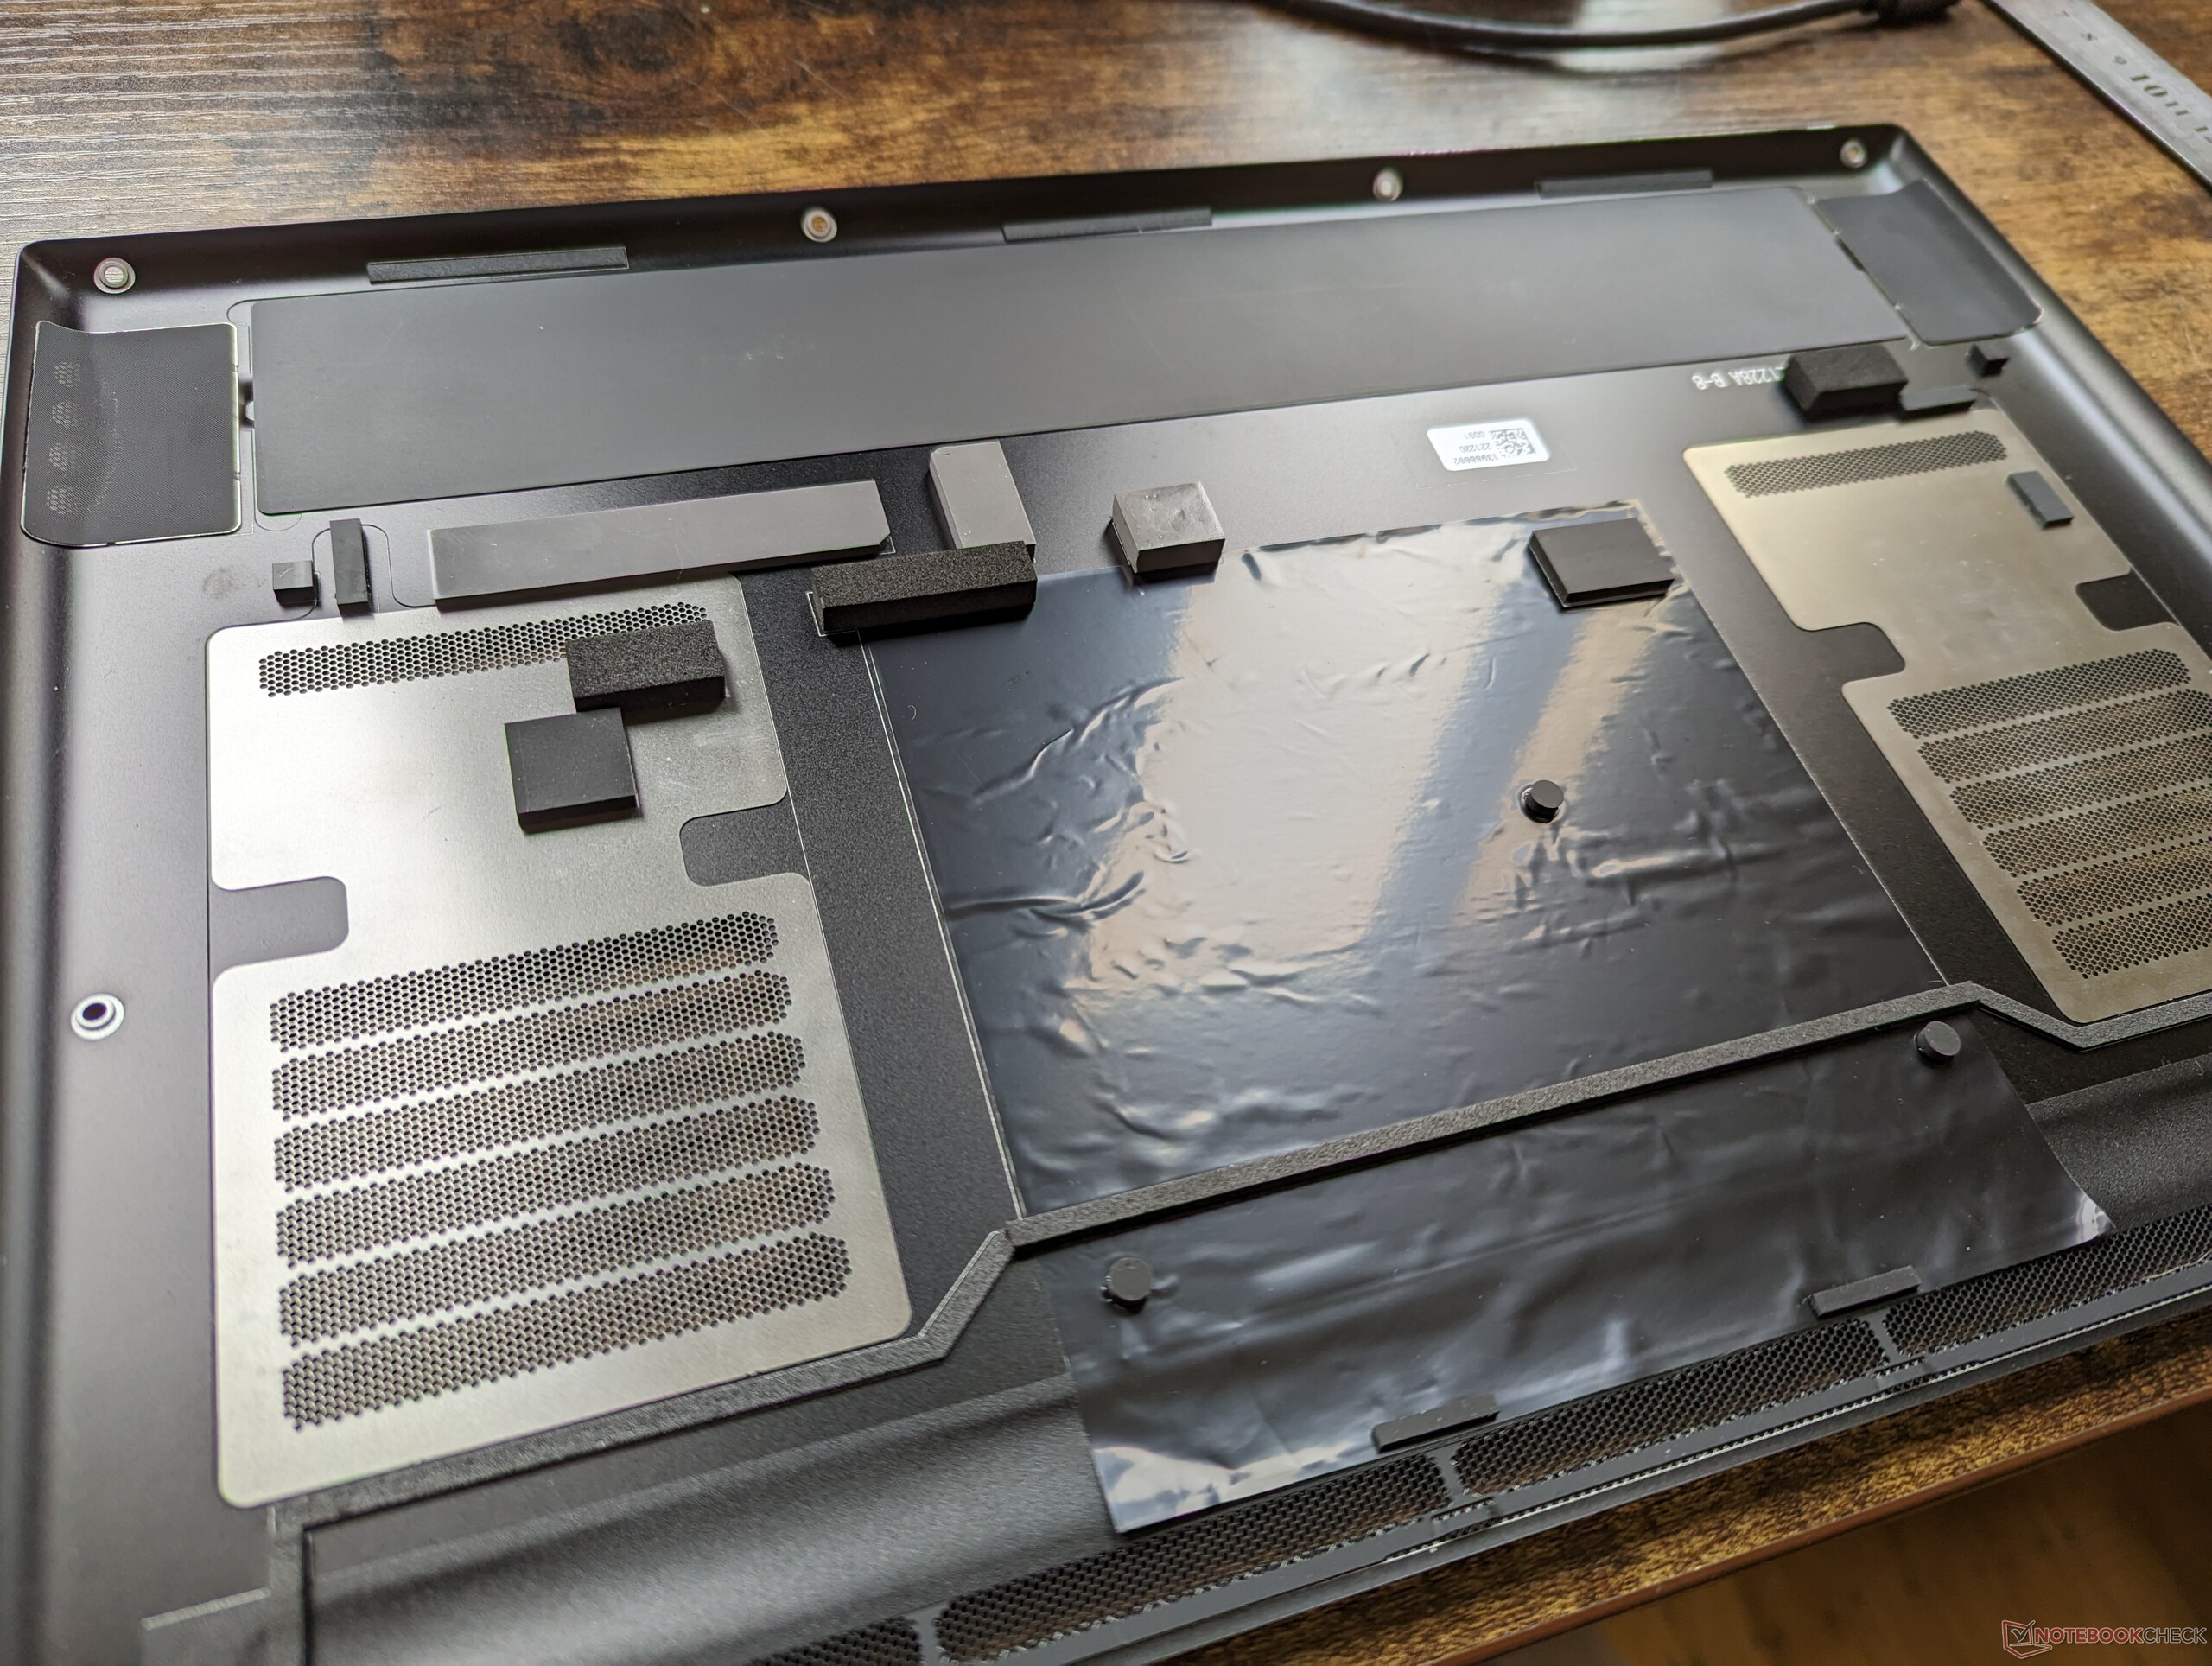
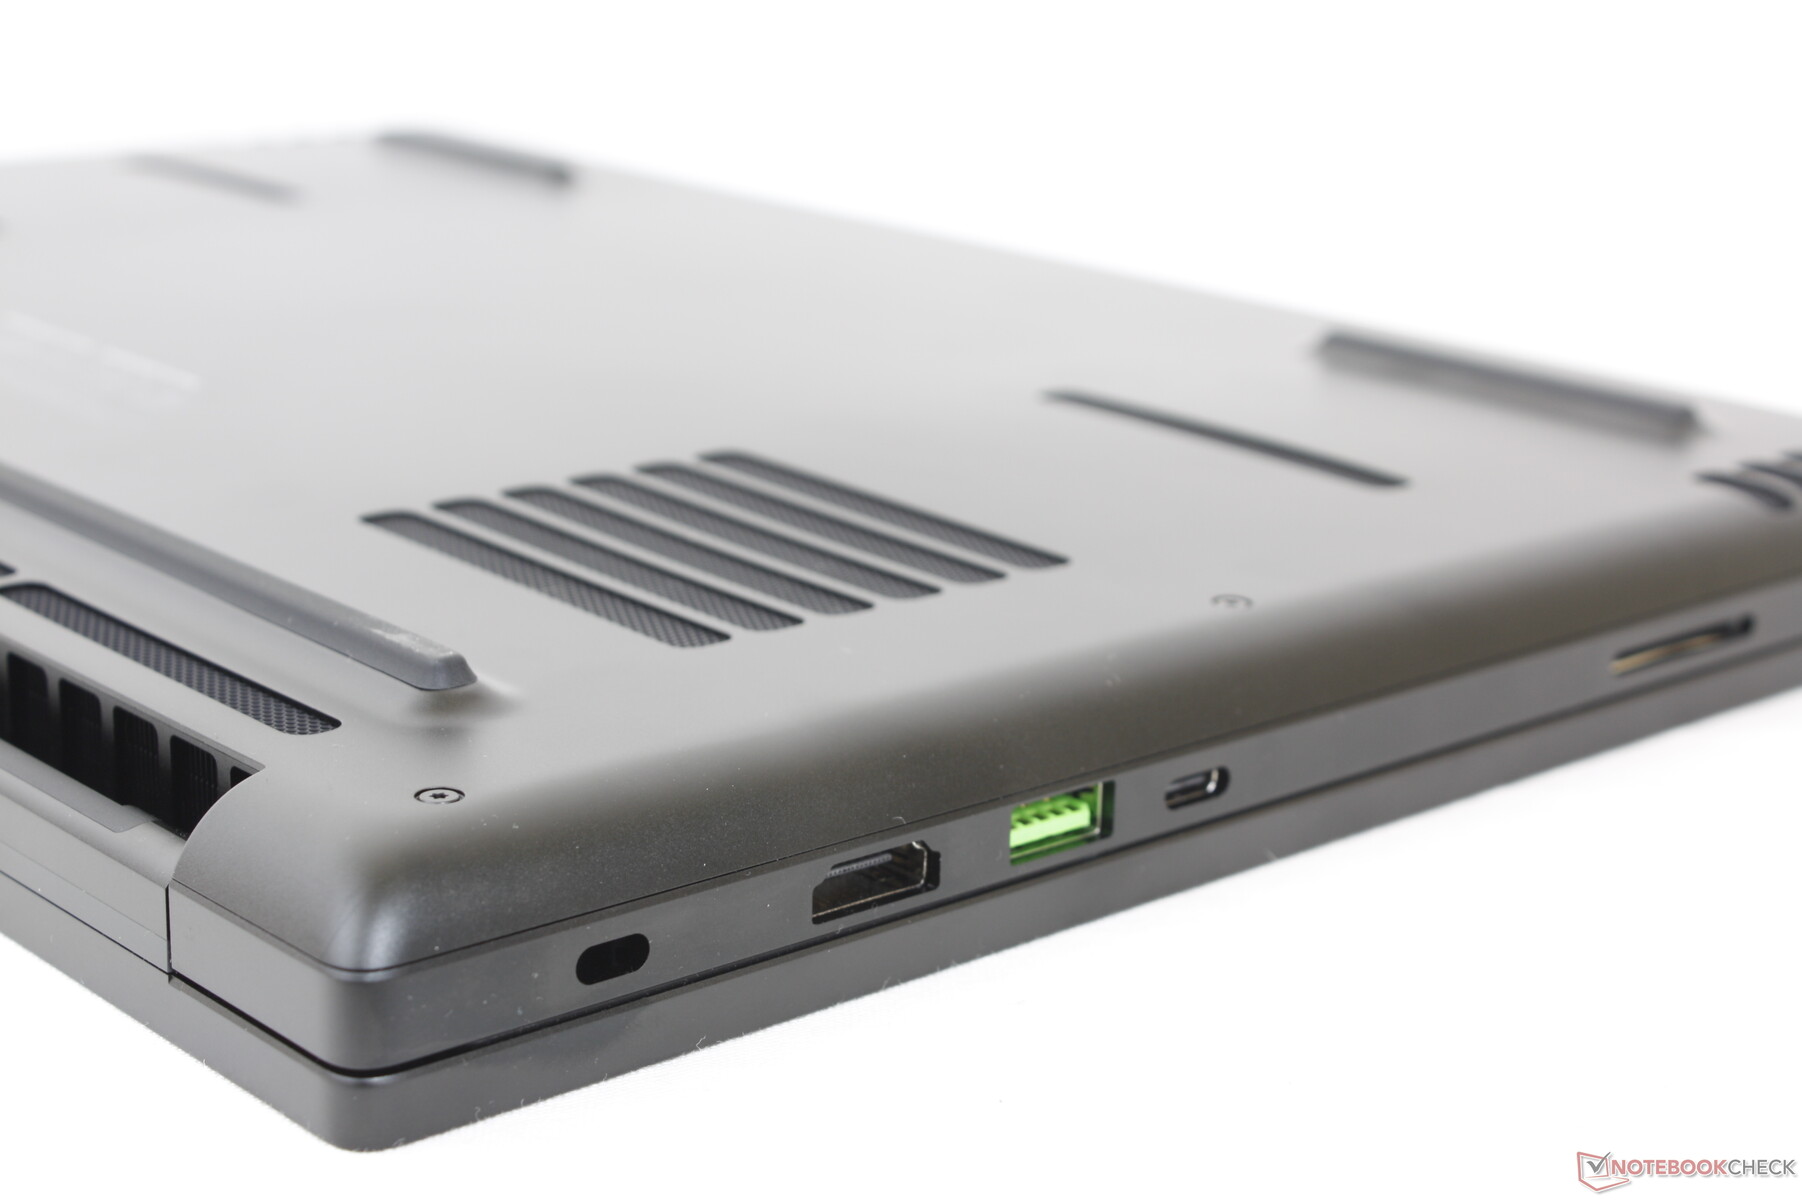
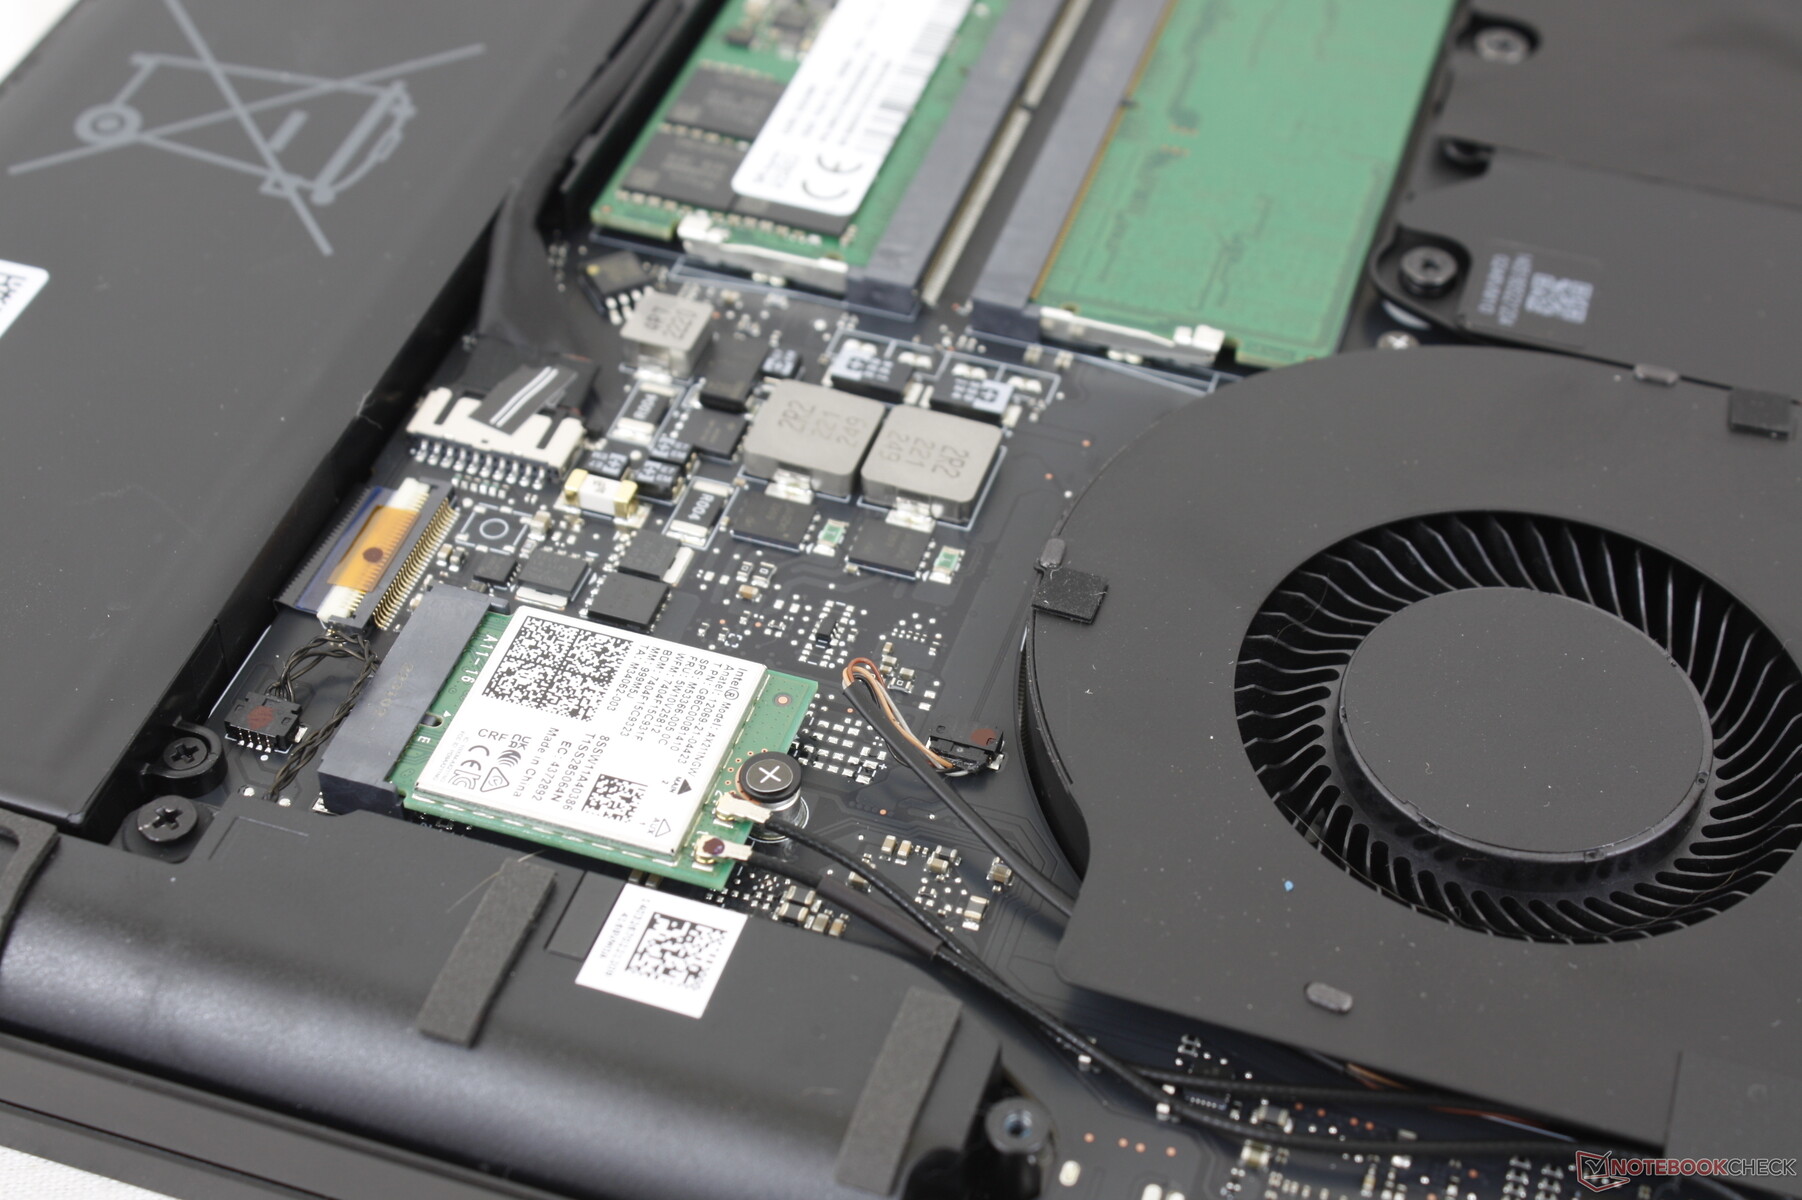
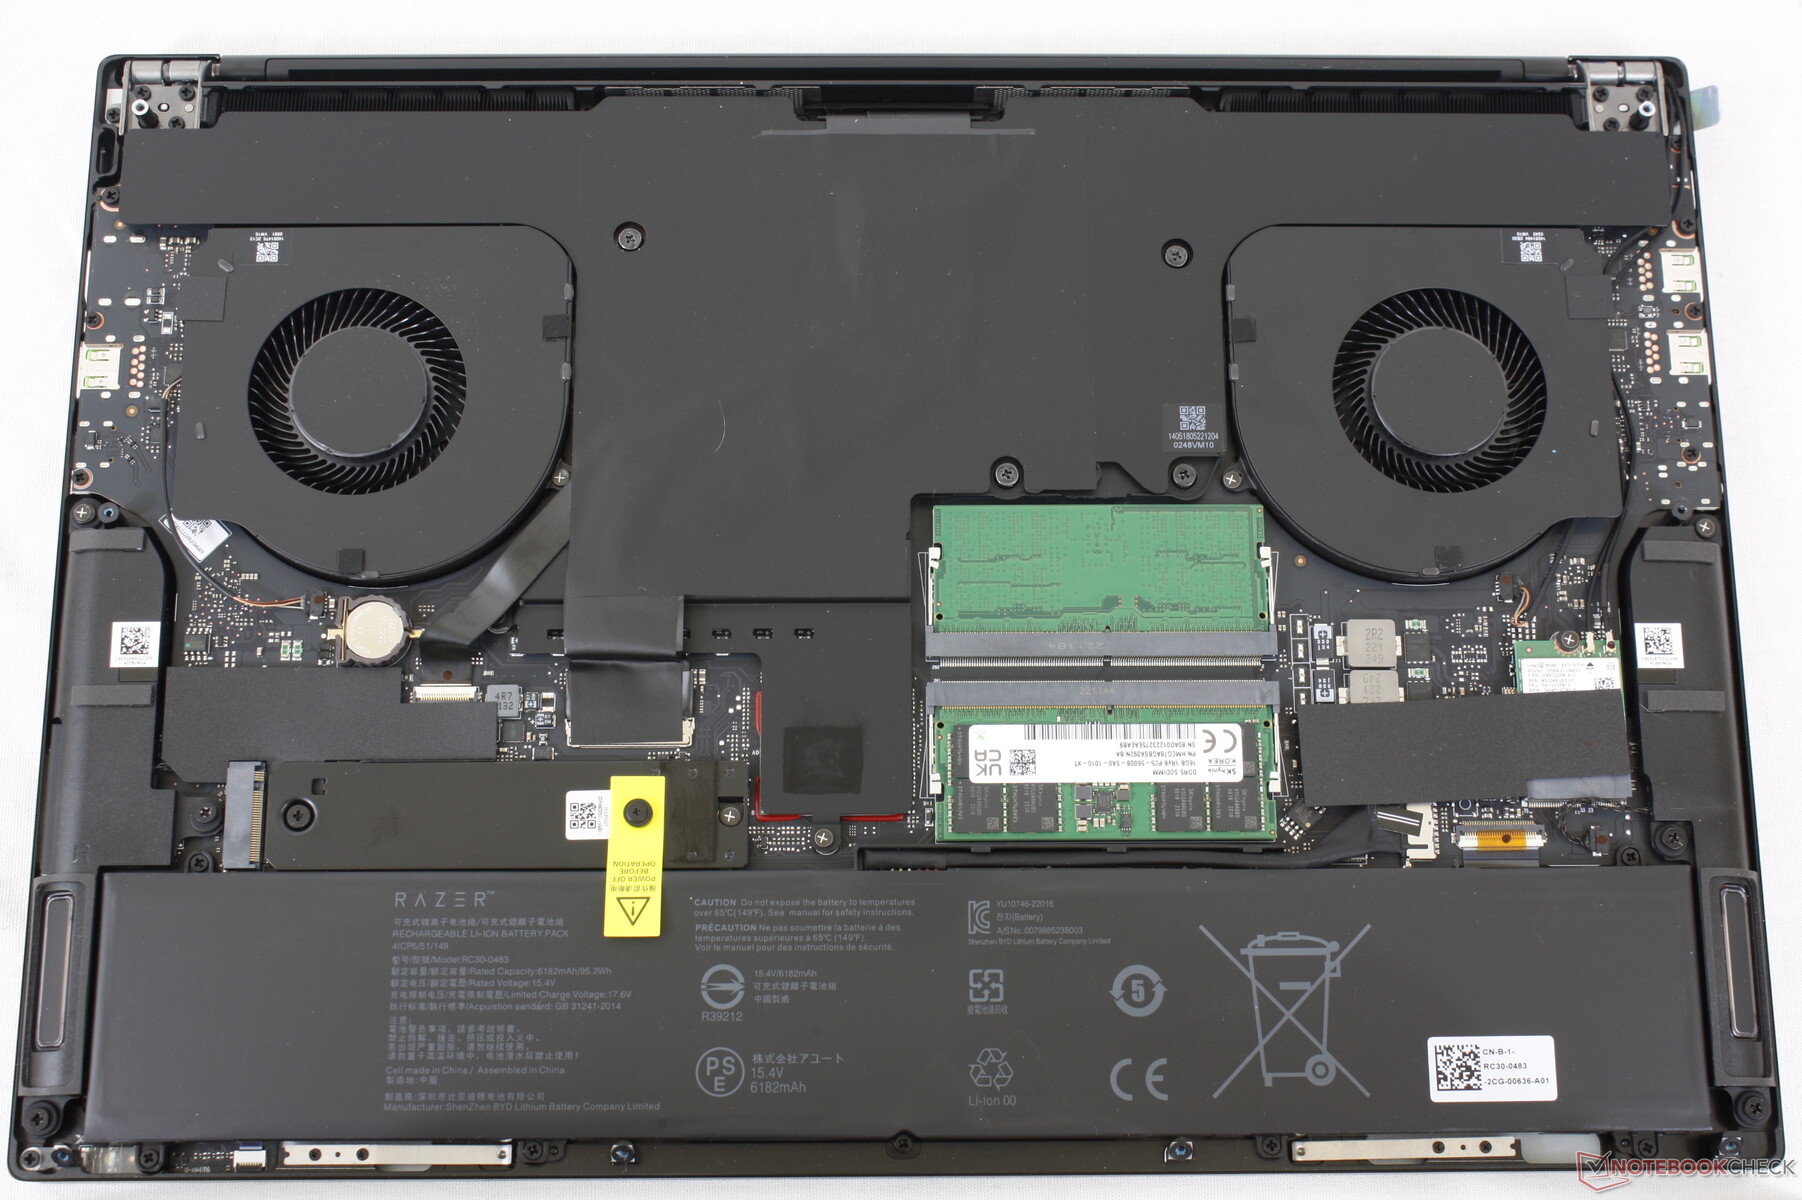
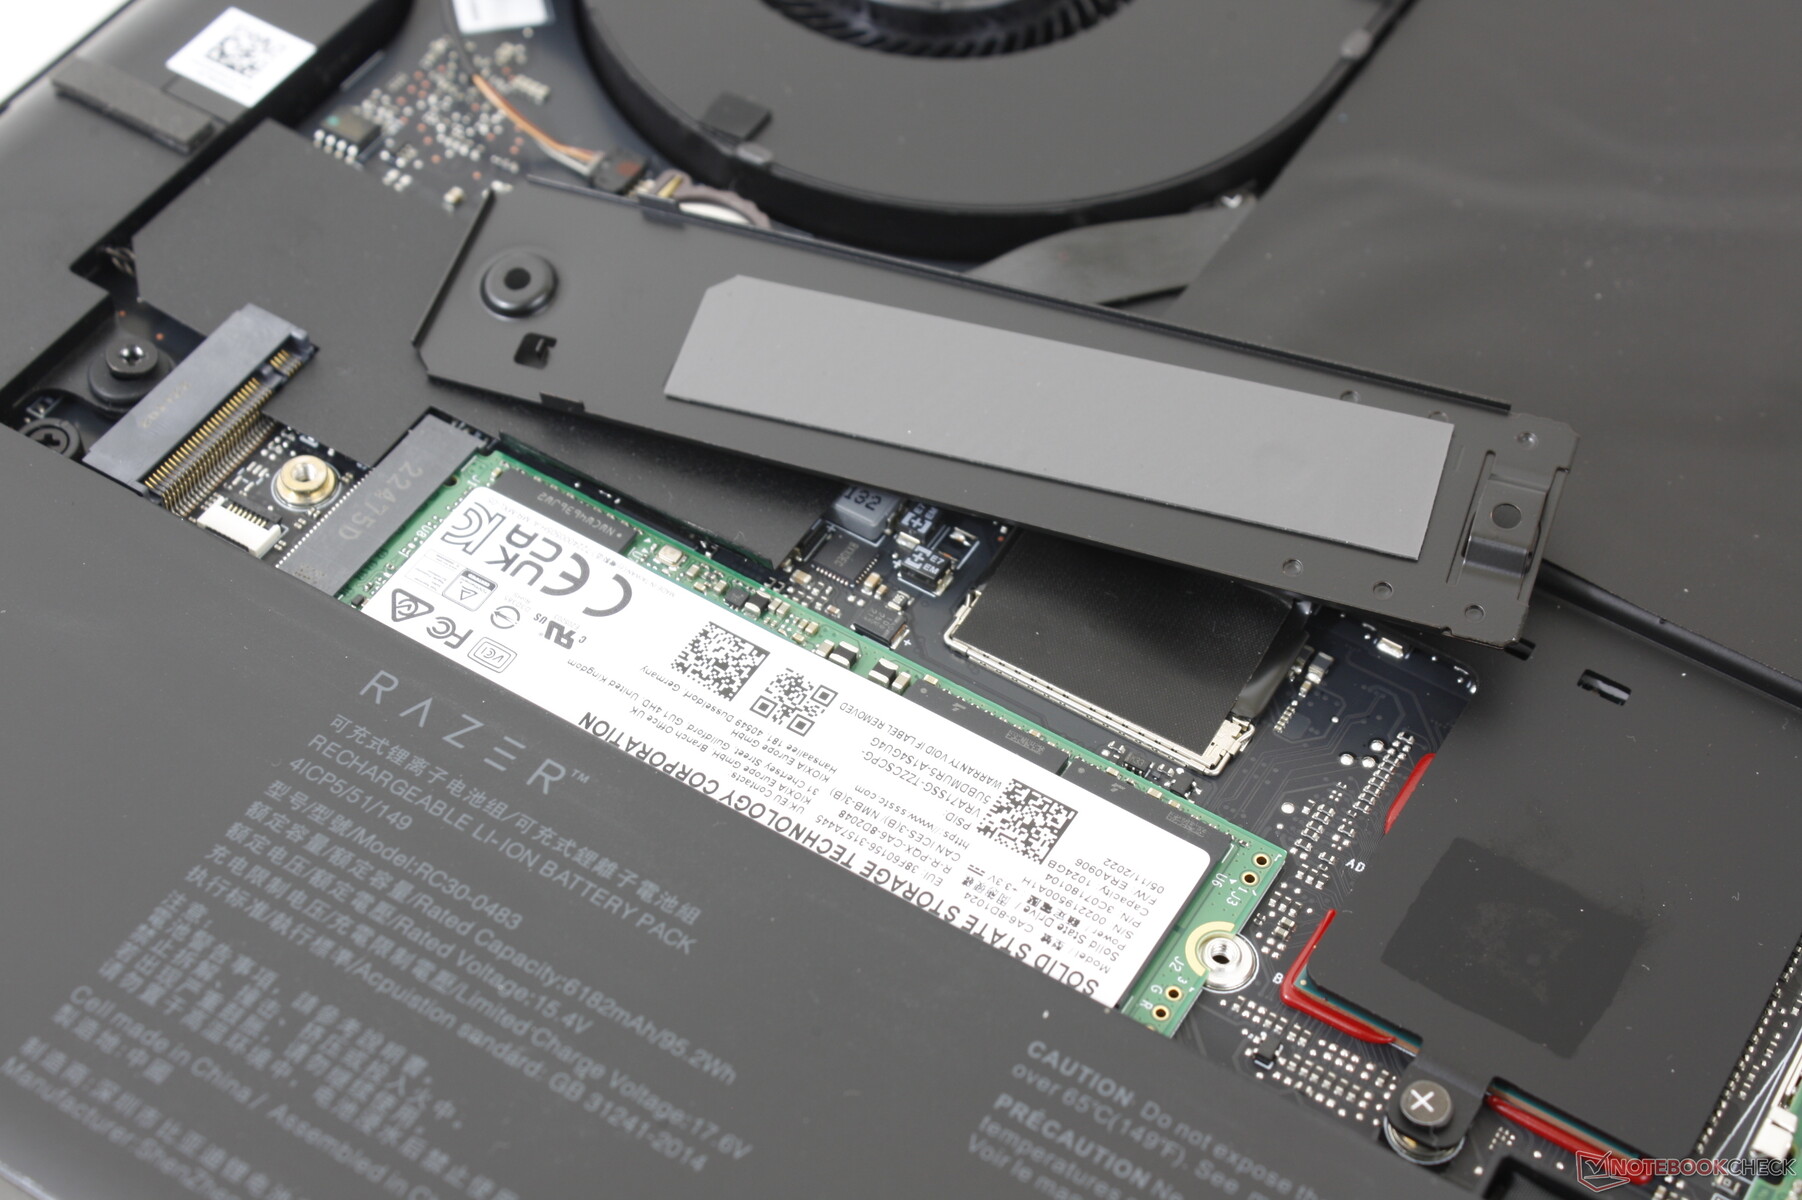
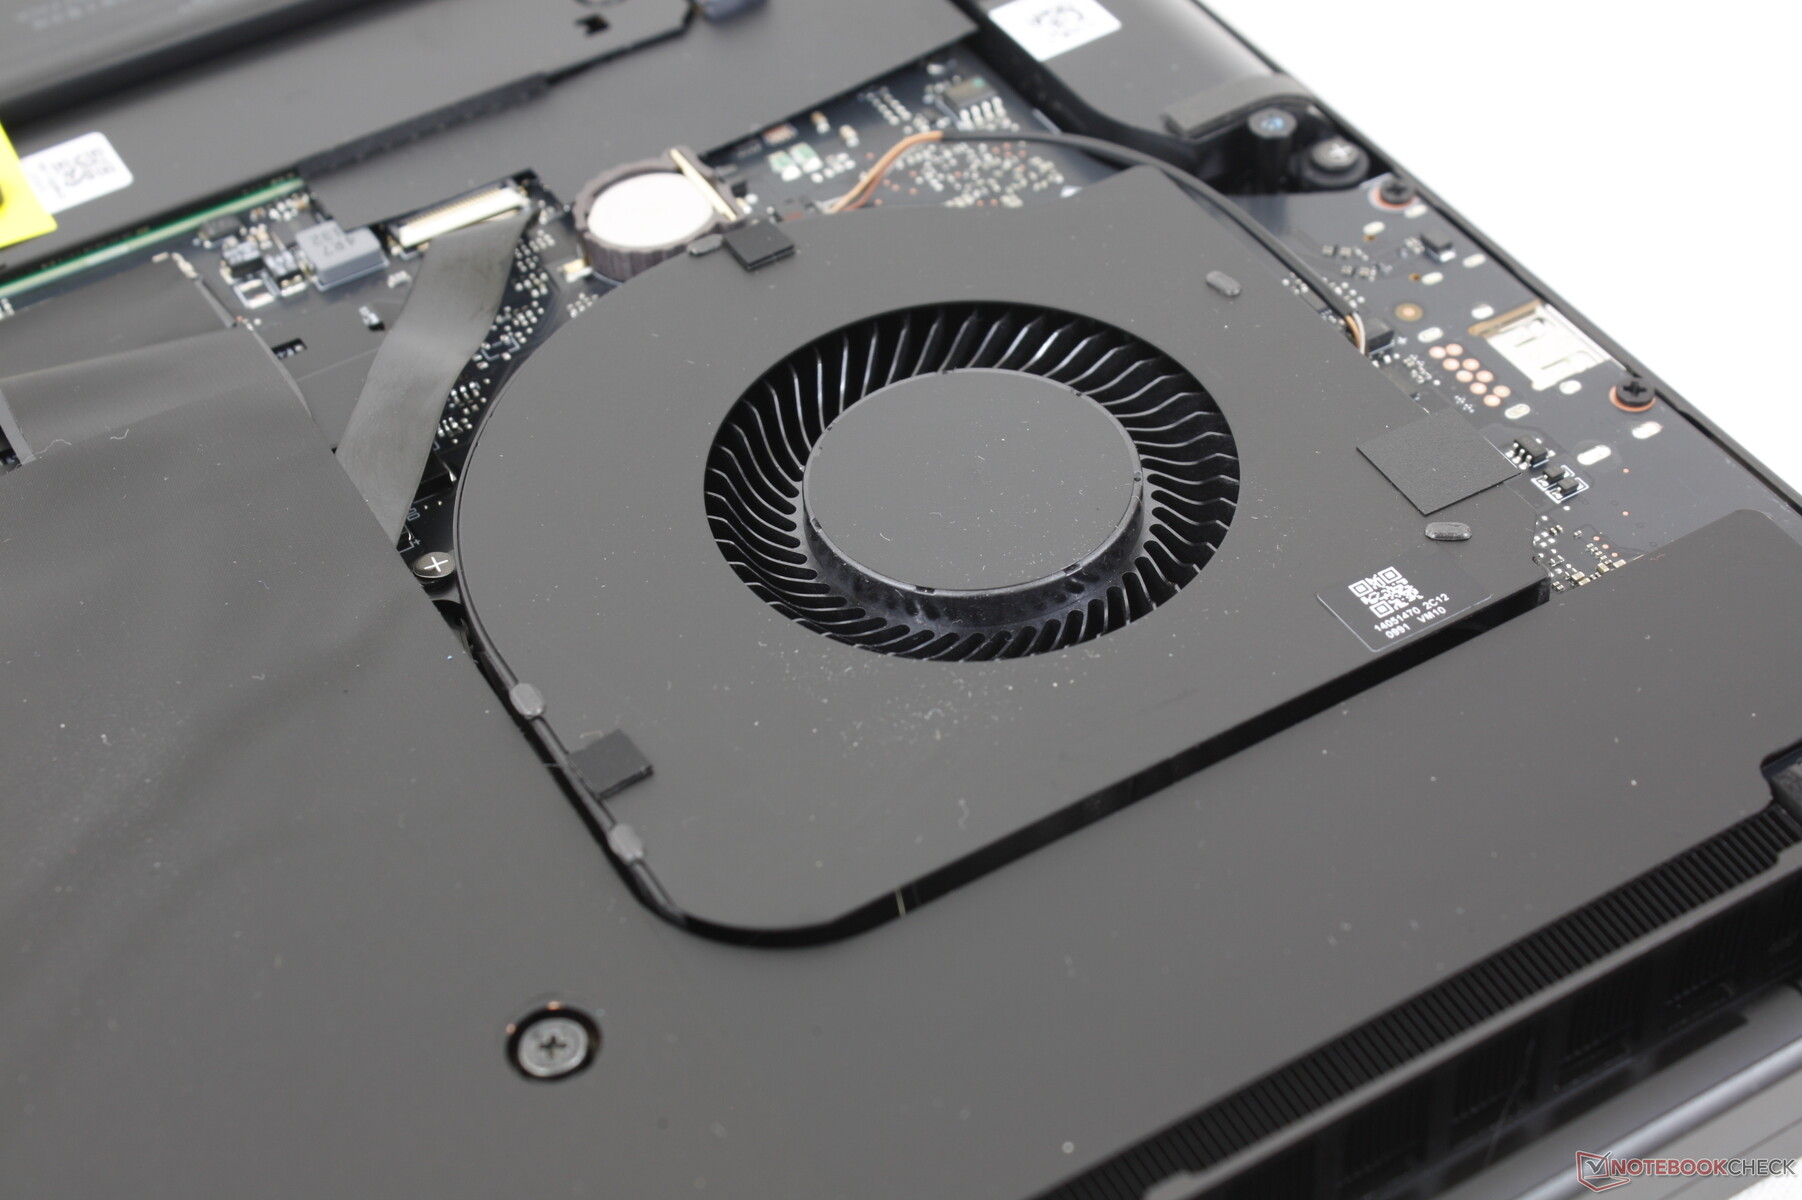
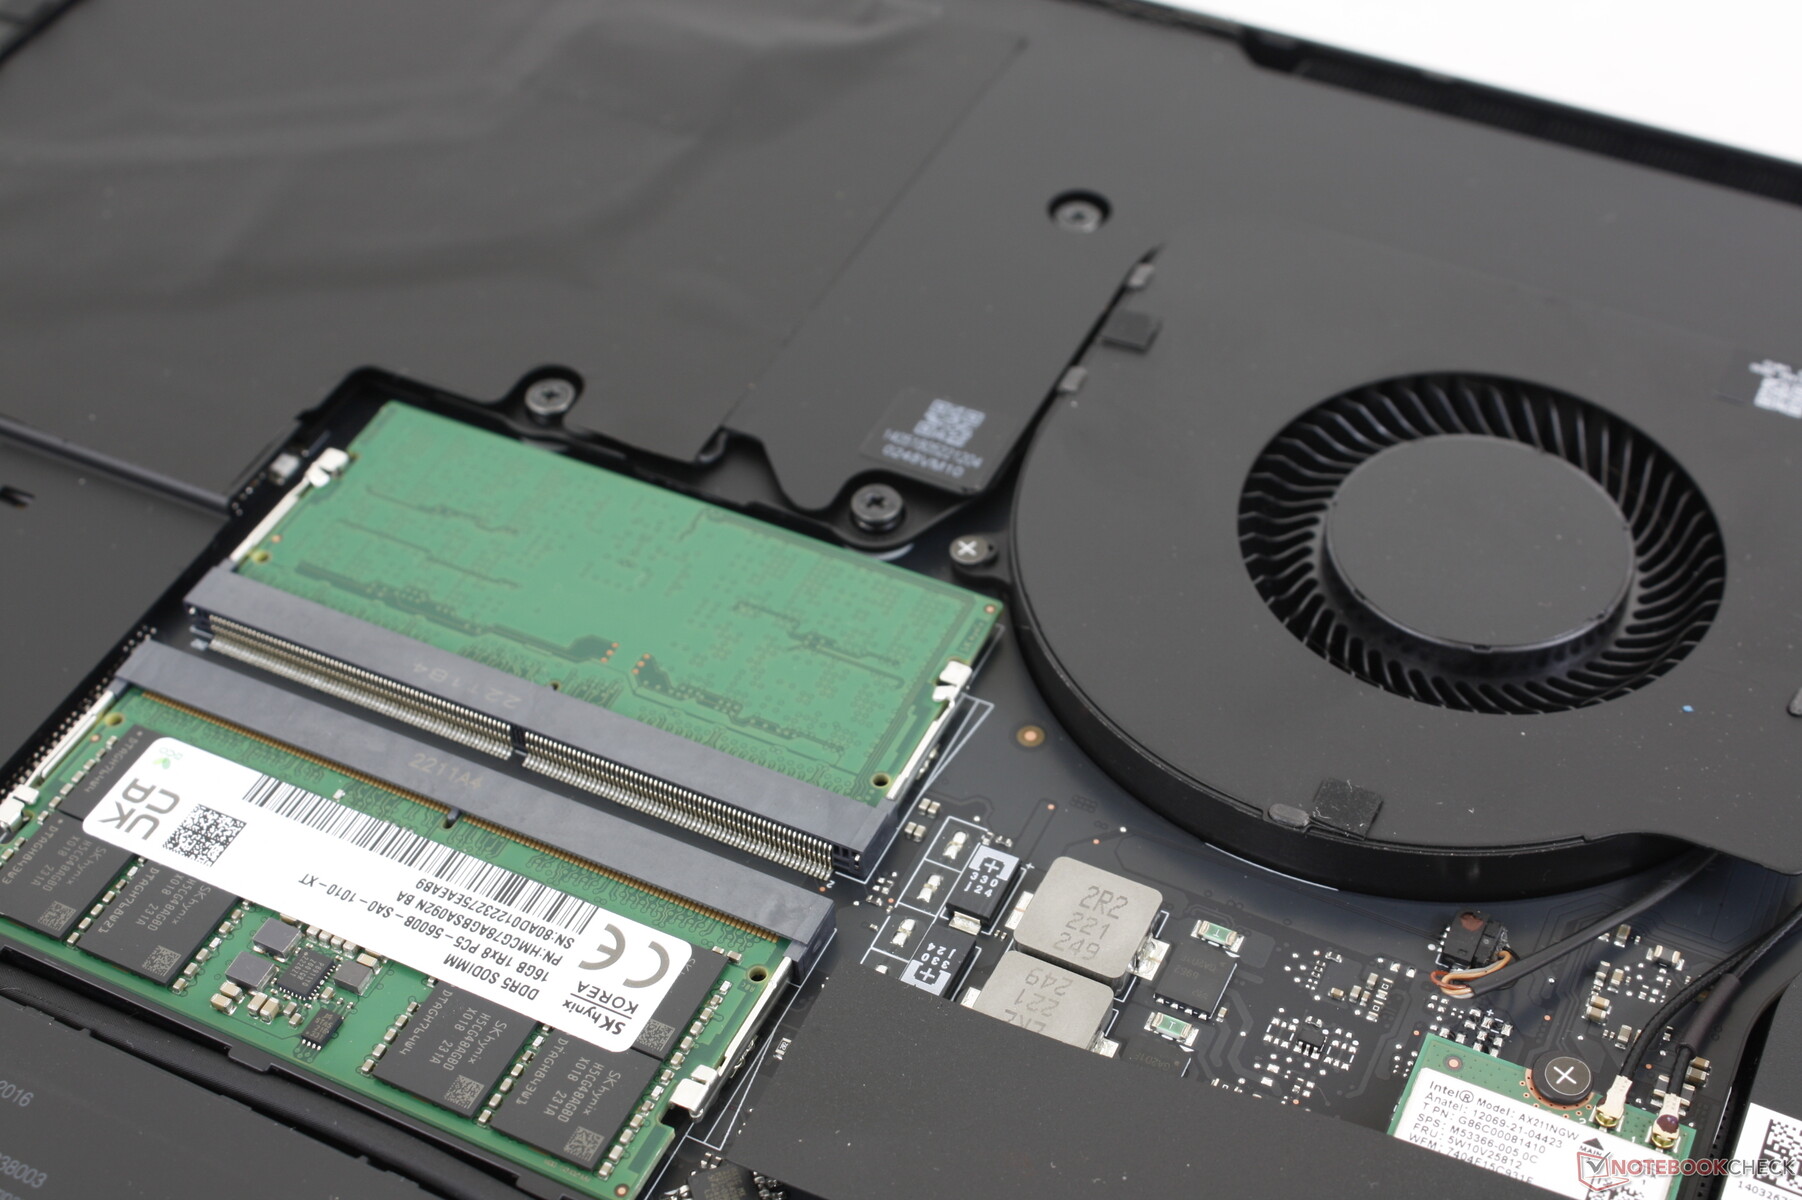
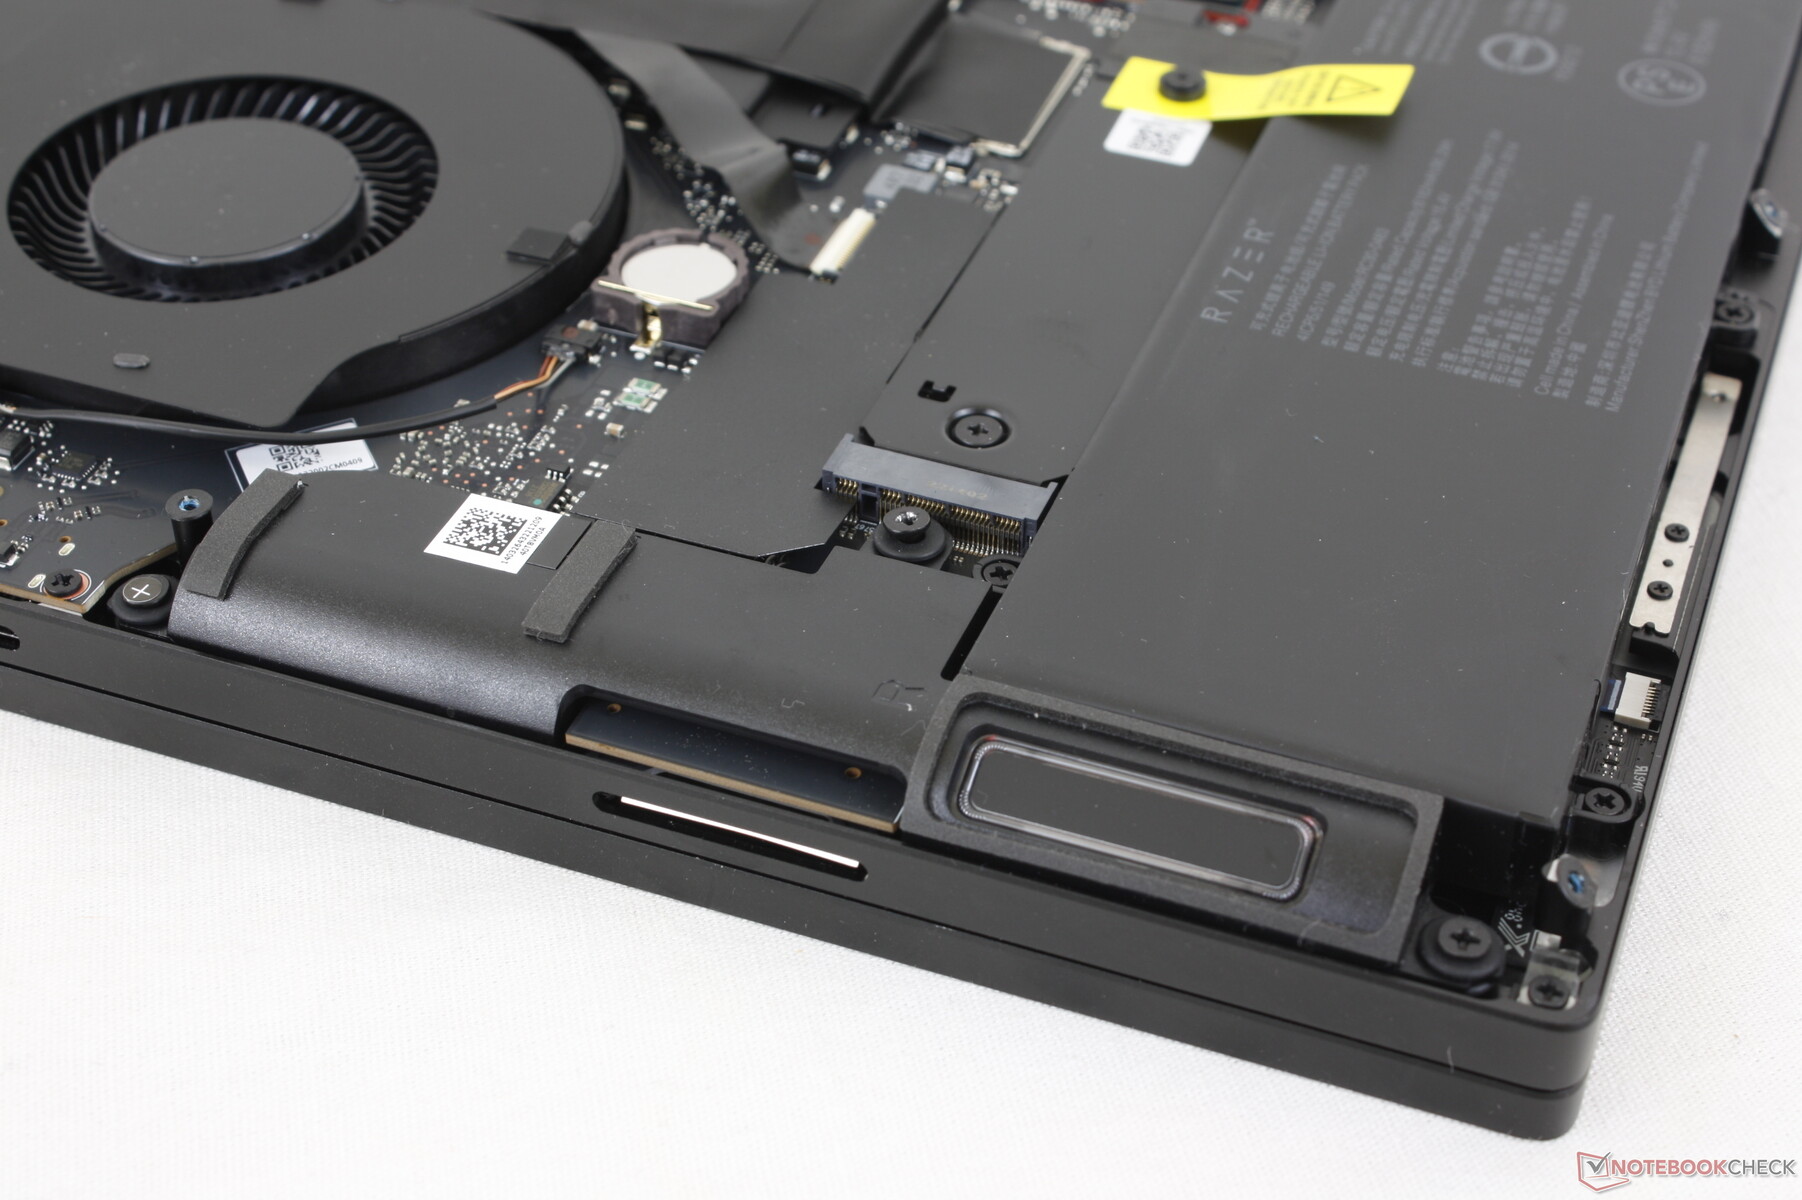
维护
底部面板由八个T5 Torx螺钉固定,便于维修。用户可以直接接触到2个DDR5 SODIMM插槽、2个M.2 2280 SSD插槽、两个电池和WLAN模块。最多可以安装64GB的RAM,但RAM的性能上限为5200MHz,而如果安装32GB或更低的RAM,则为5600MHz。这个性能上限是由于 SODIMM接口的限制.
配件和保修
零售包装盒中除了交流电适配器或文件之外没有任何额外的东西--甚至没有一块天鹅绒擦拭布。如果在美国购买,则适用一年的有限制造商。
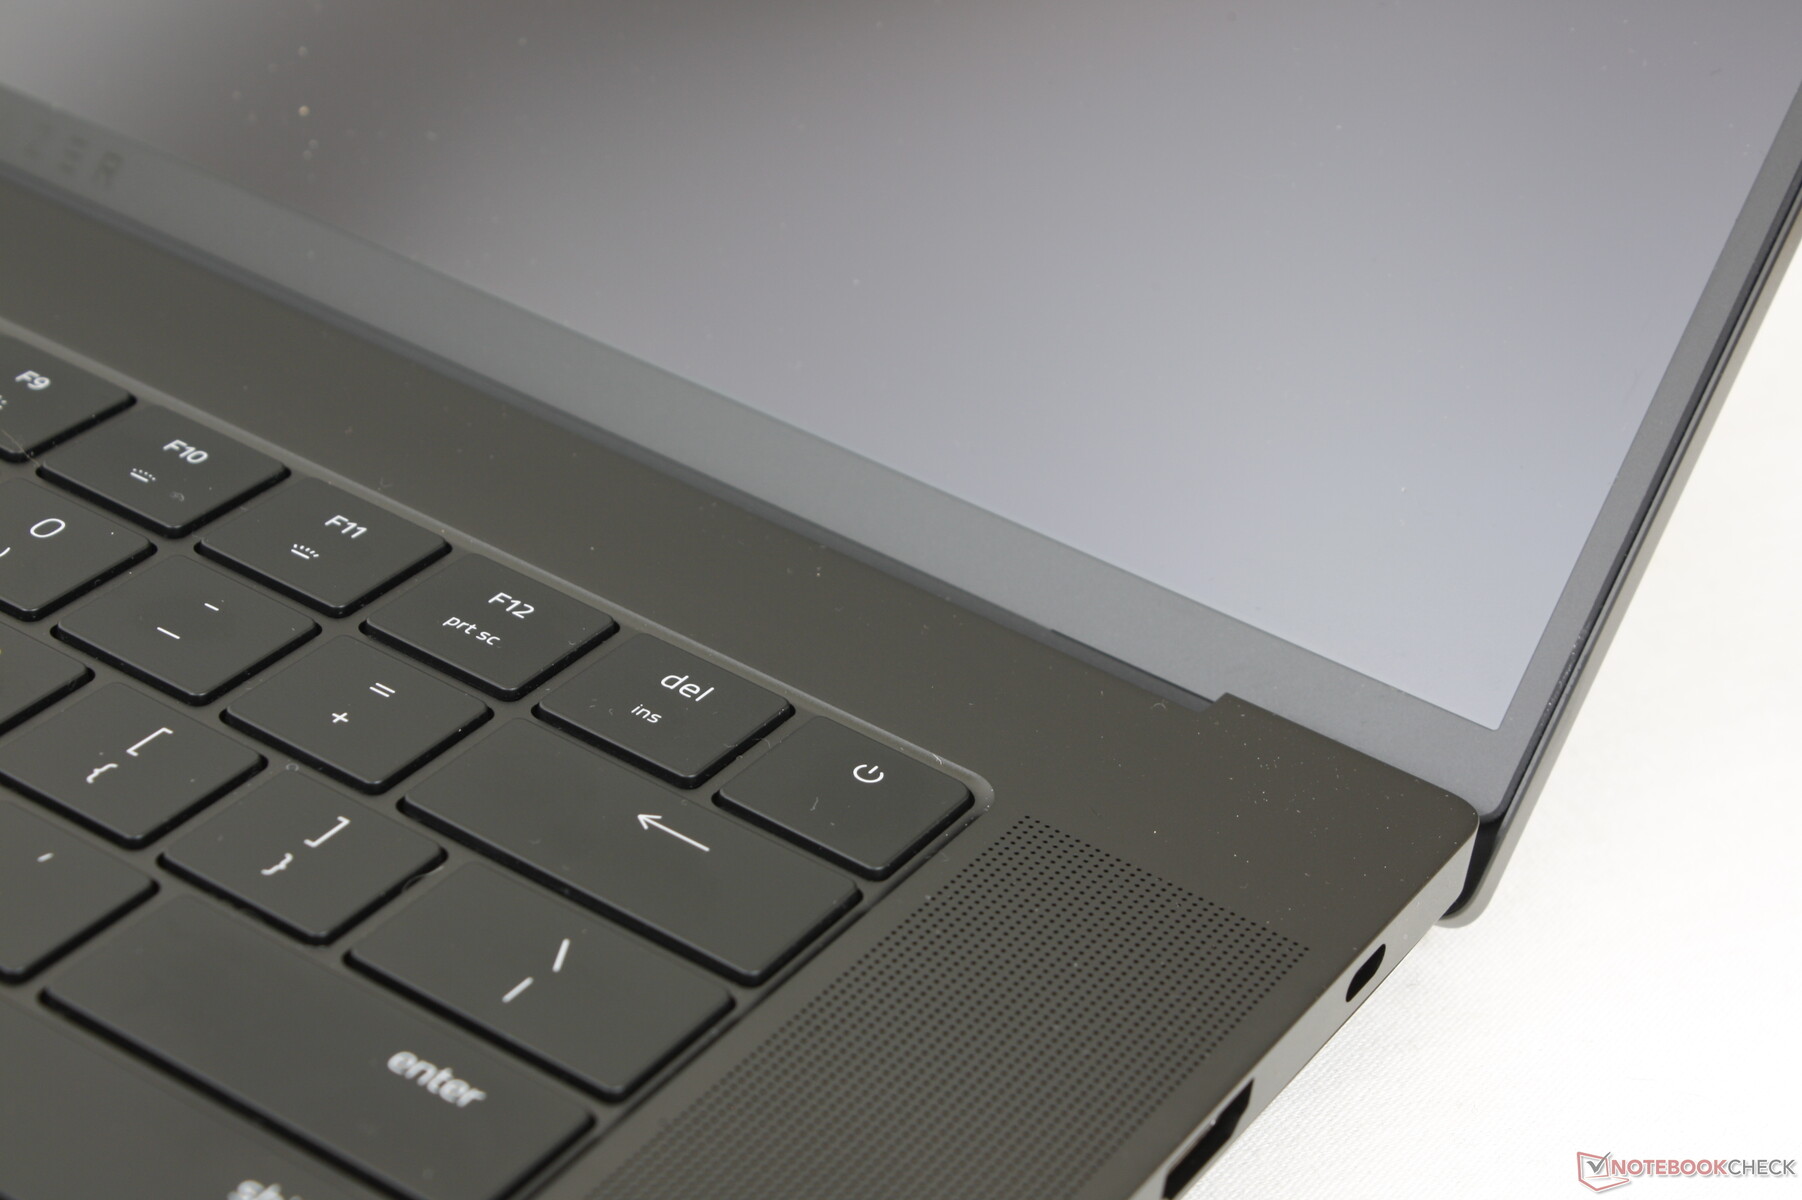
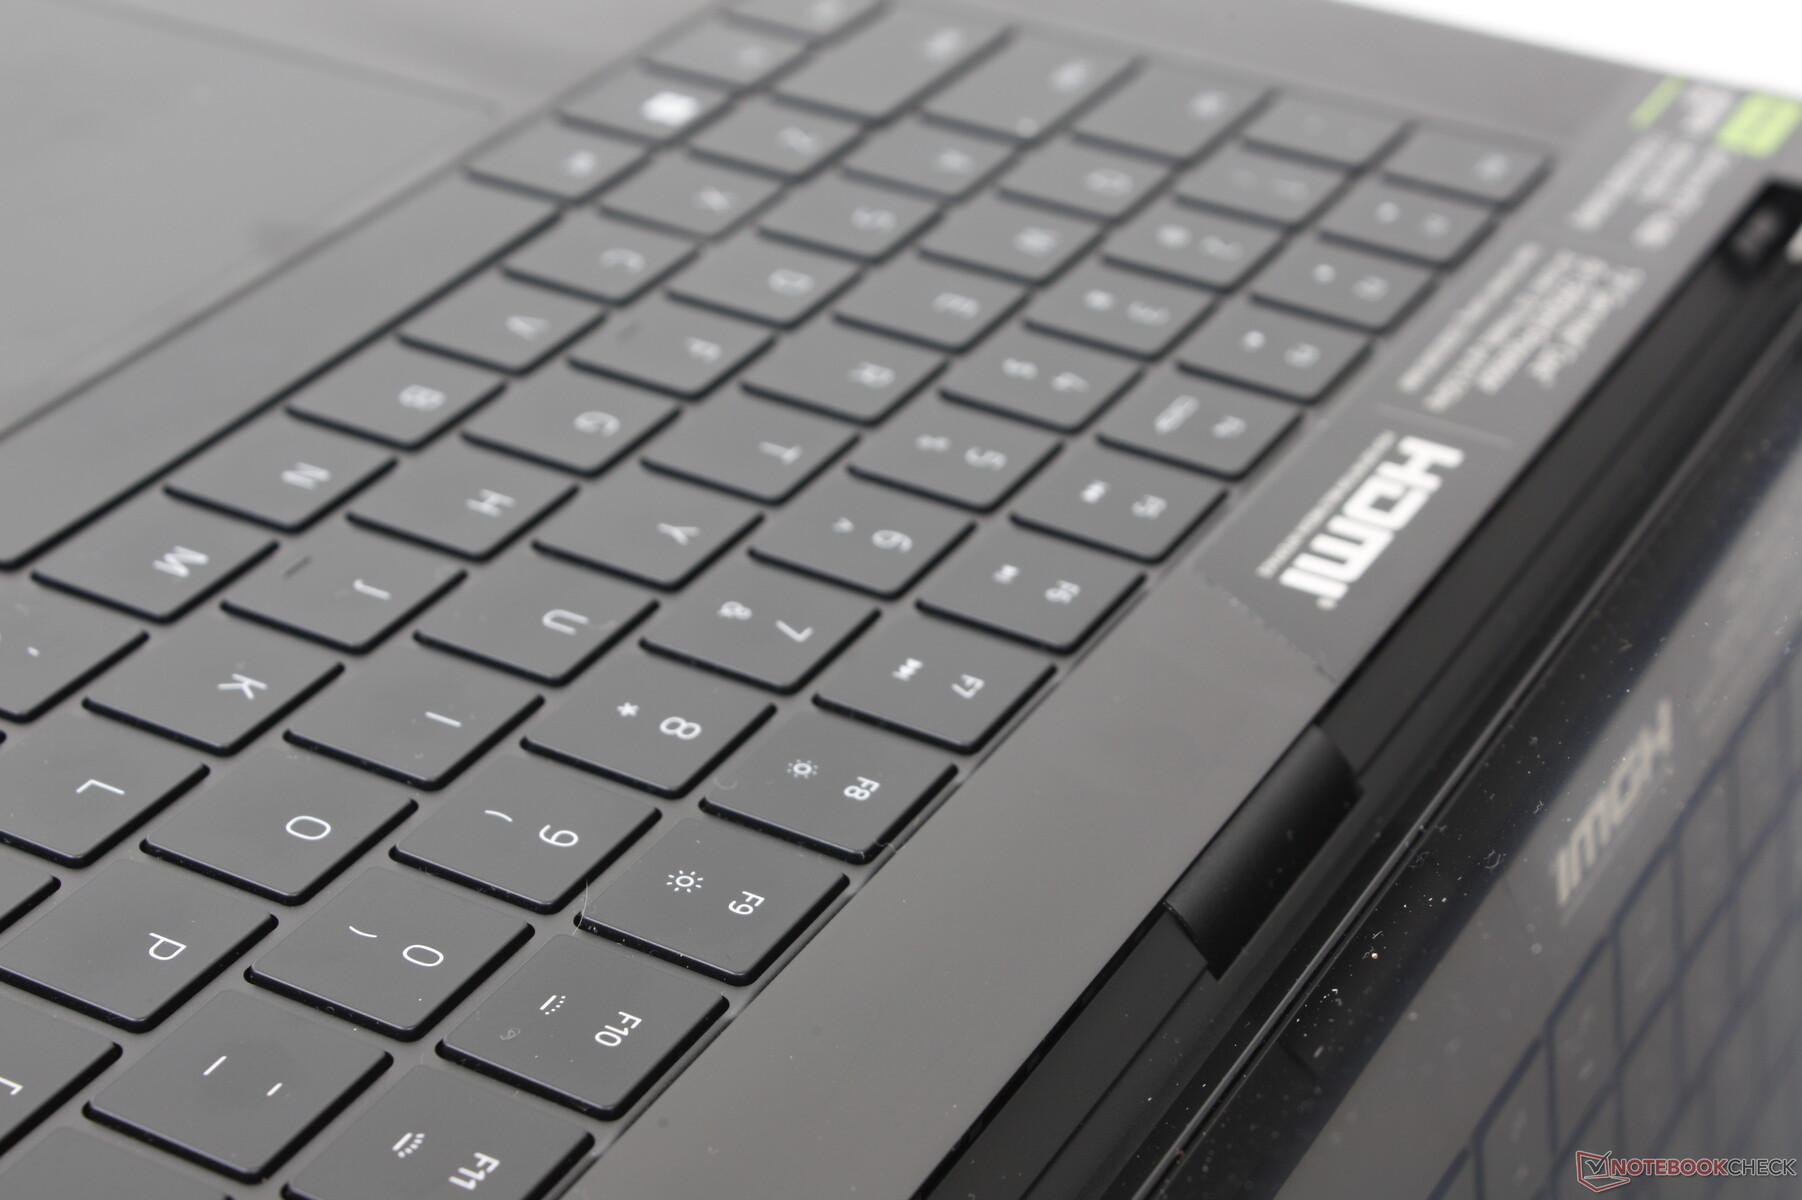
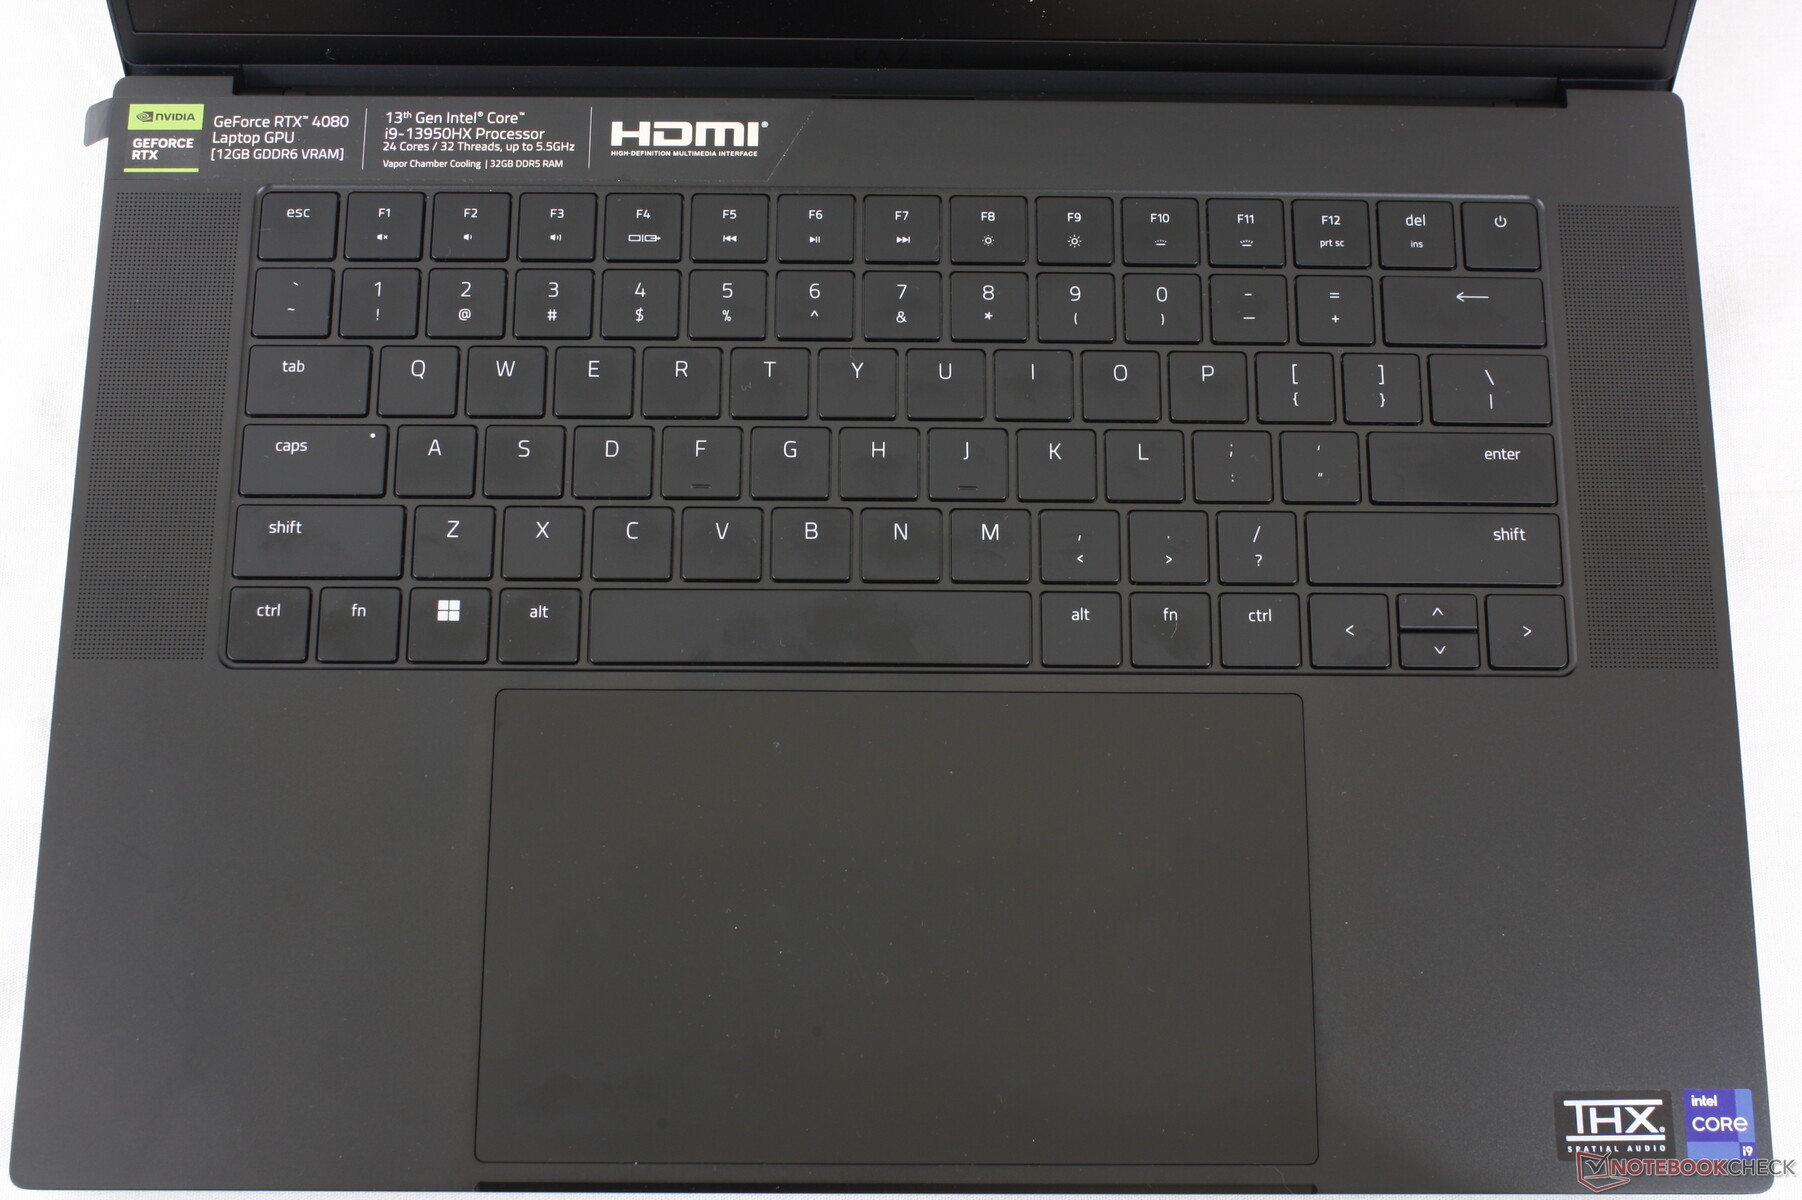
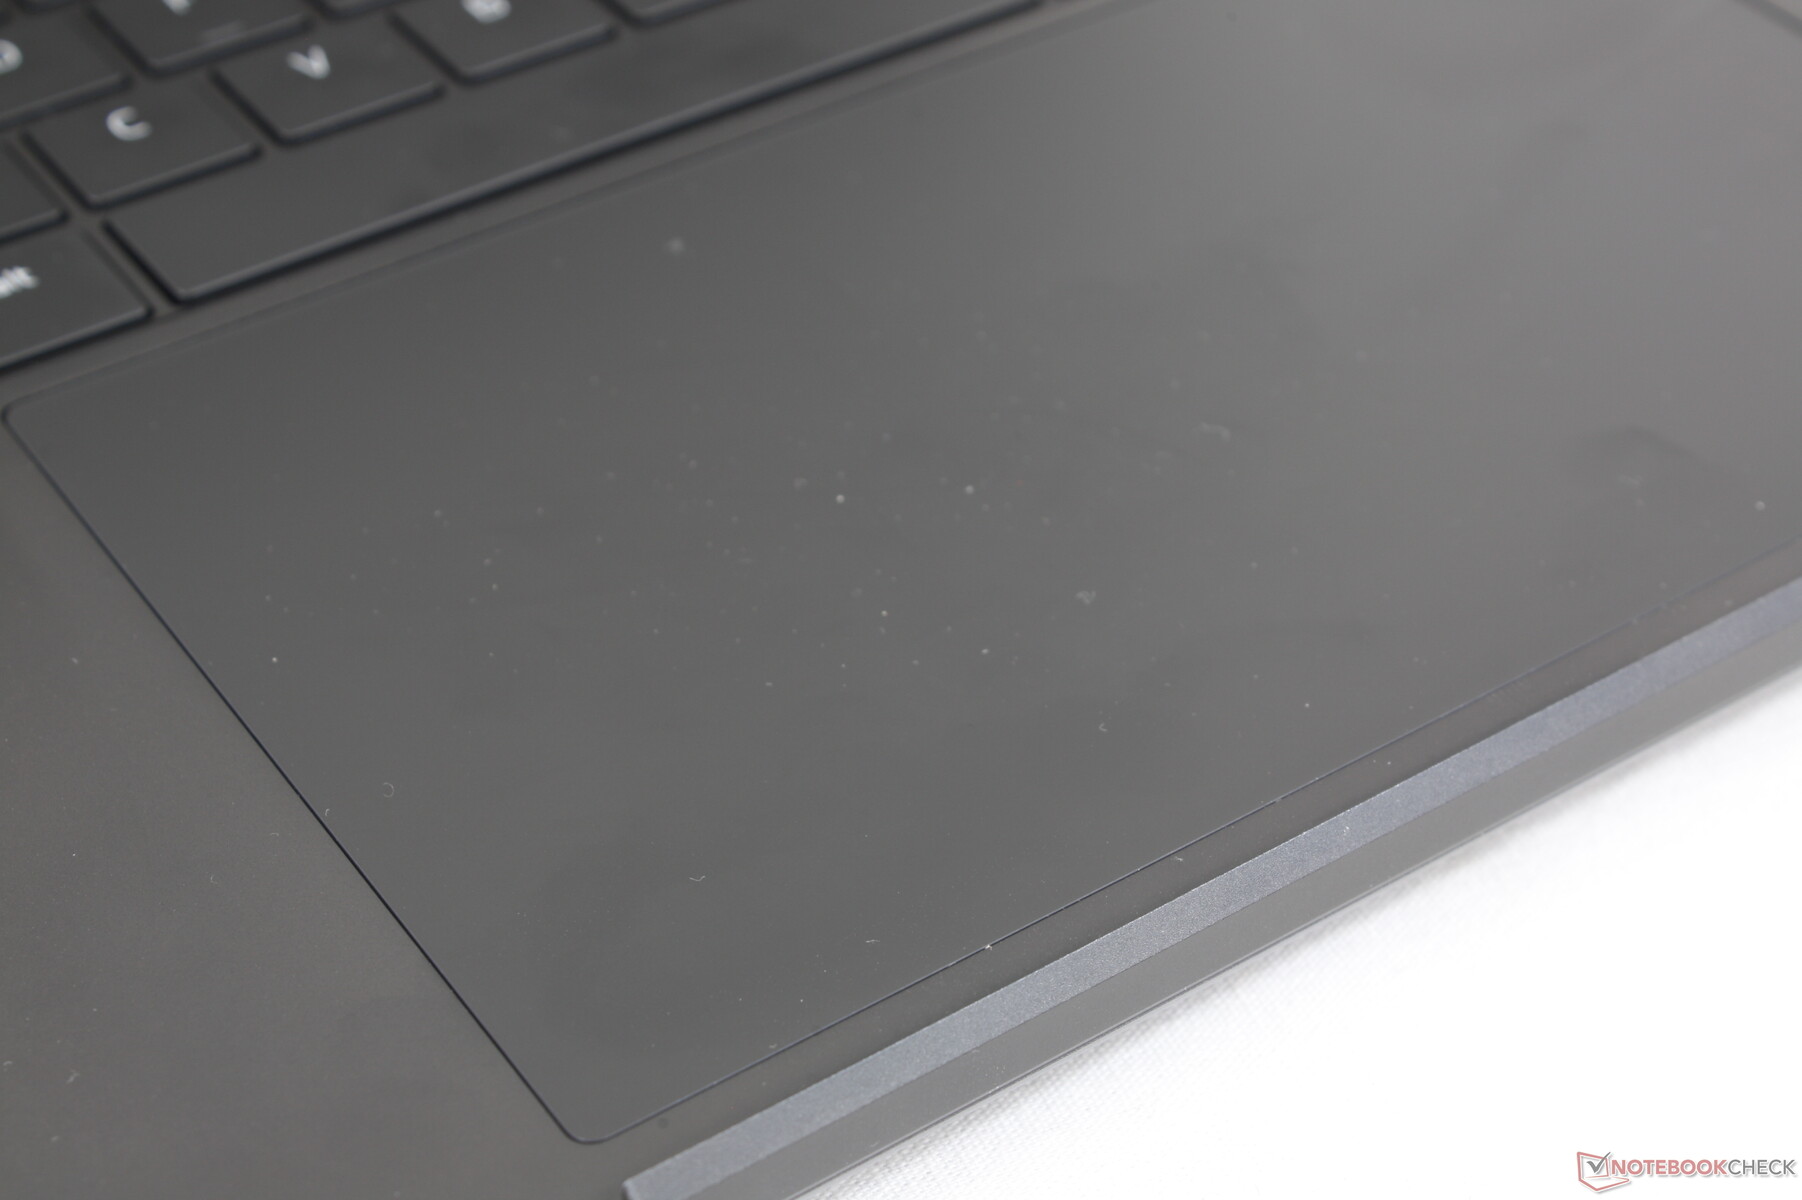
输入设备 - 更大的点击板
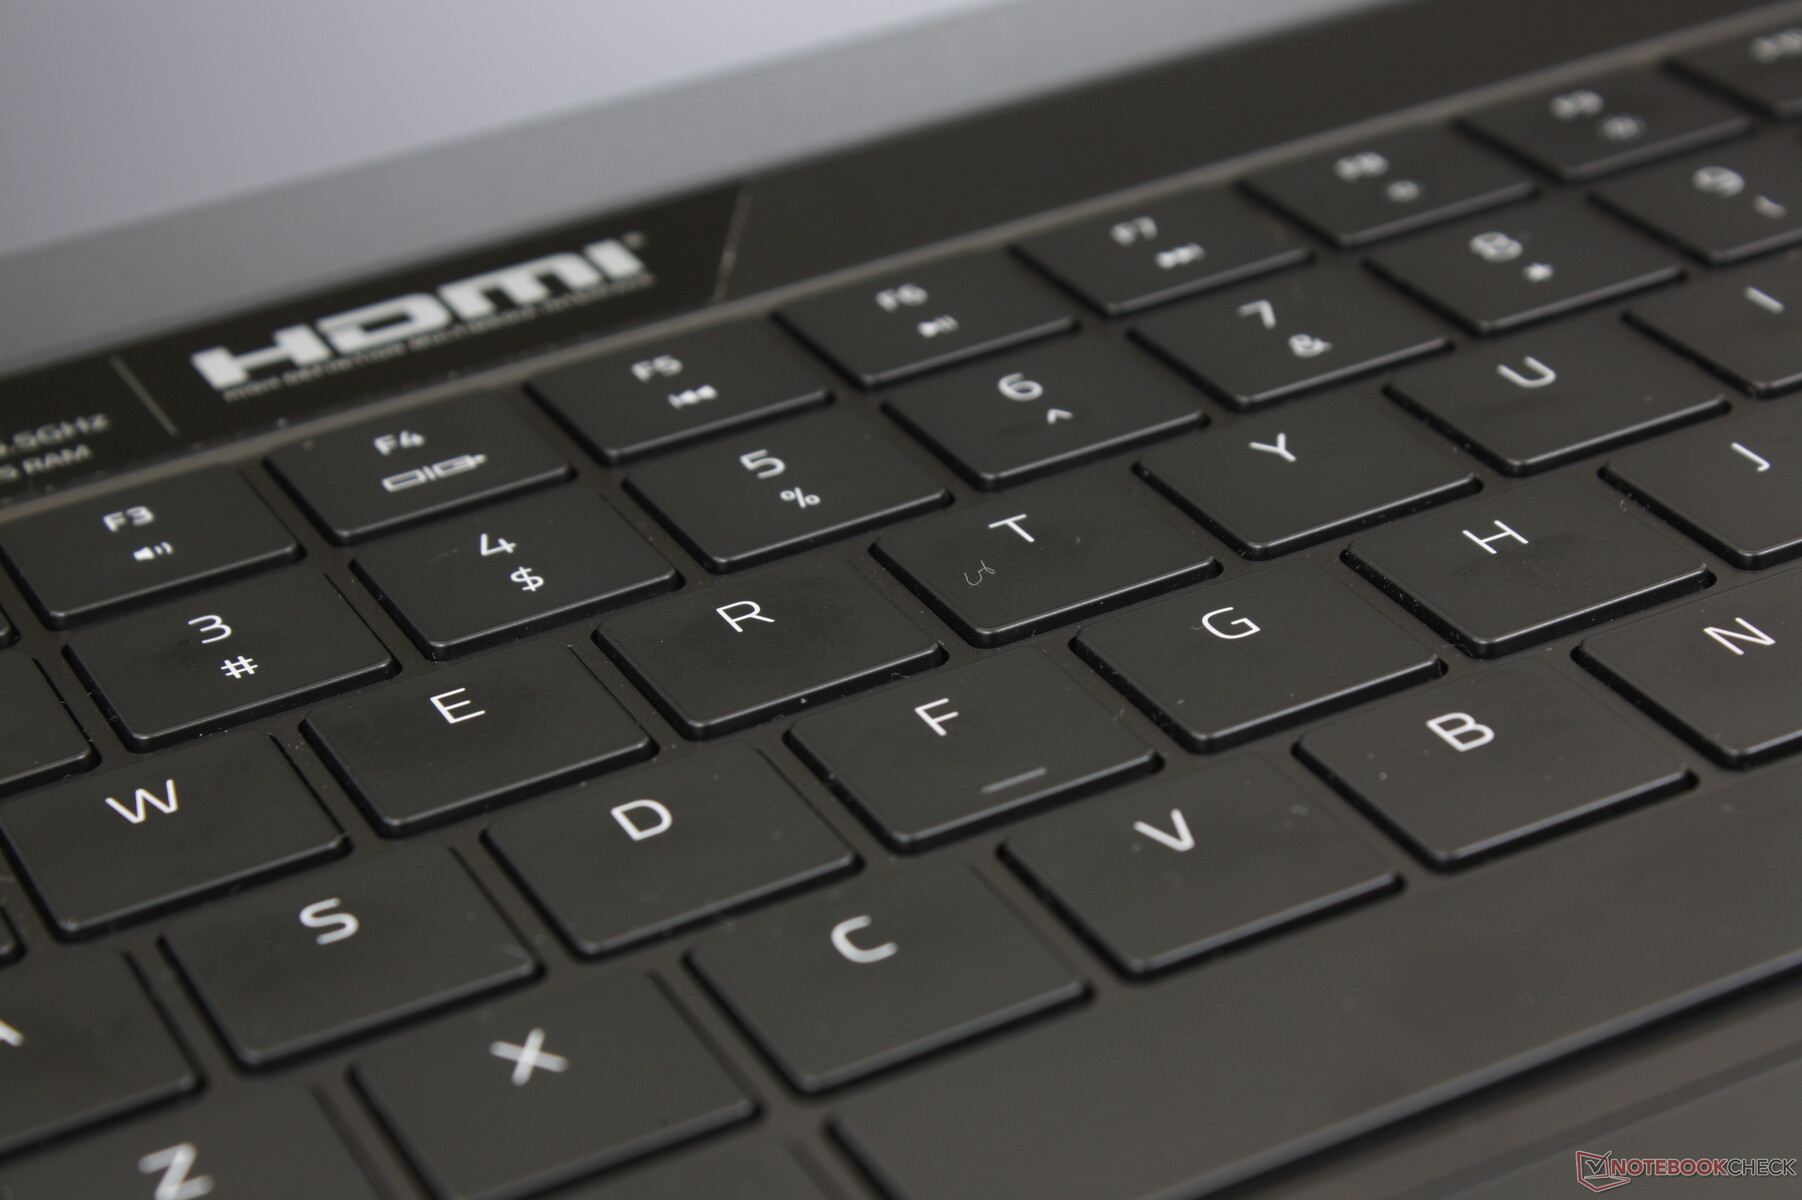
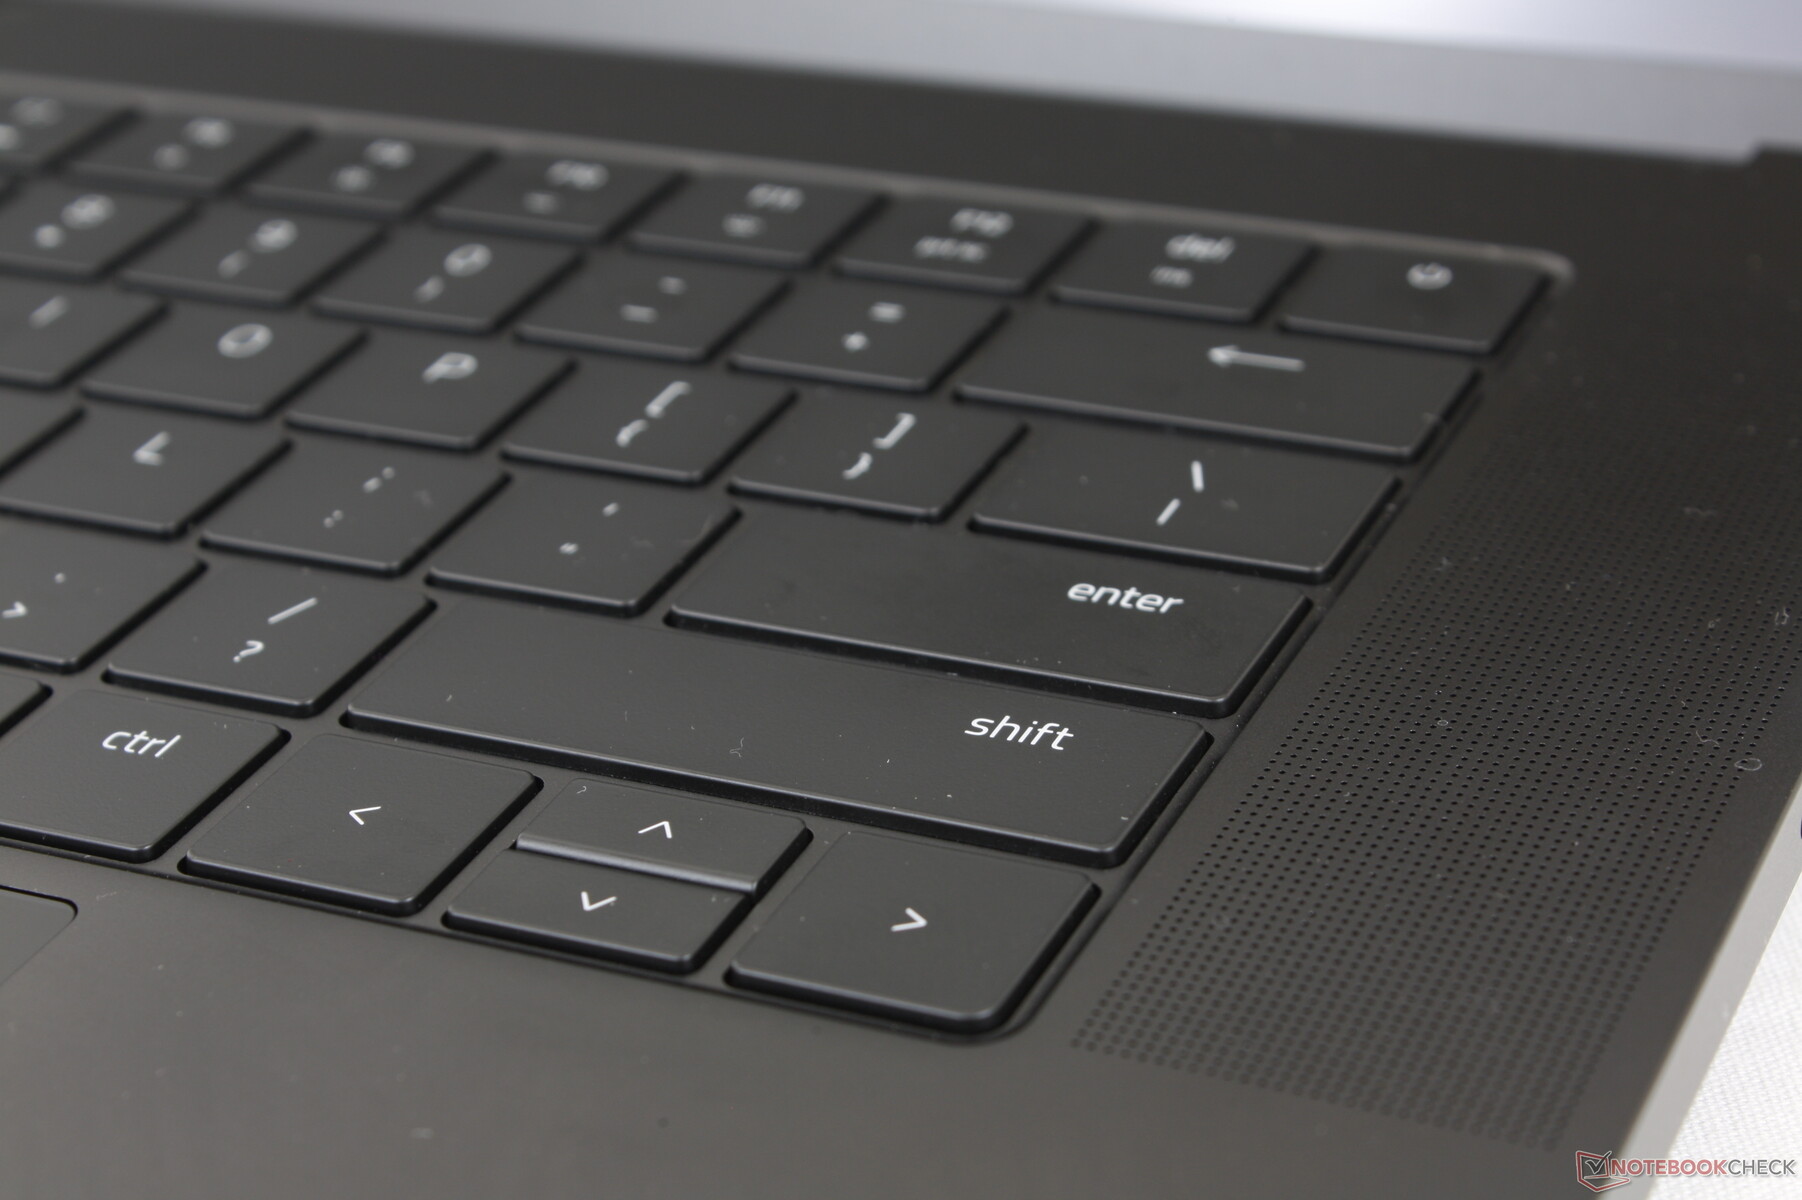
键盘
键盘仍然与 2022年刀片15到键的大小、行程、字体和每个键的RGB照明。Razer已经在2021年和2022年的Blade 15型号之间加长了Shift键,所以Blade 16也继承了这一变化。不过,如果能看到一个支持指纹的电源键,那就更好了。
较早的Blade 15机型采用了光学按键开关,但在最新的Blade机型上,这一功能几乎消失了。
触摸板
当Razer推出更大的17.3英寸的 刀片Pro或Blade 17时,我们惊讶地发现其点击板的尺寸与较小的15.6英寸Blade 15完全相同。对于Blade 16,制造商终于将表面积从Blade 15/17的13 x 8厘米提高到了17 x 9.7厘米的超级宽敞的面积。因此,光标控制和多点触摸输入更容易,但点击时的反馈仍然是海绵状的,类似于现有的刀片型号或 戴尔XPS 15/17.如果你觉得Blade 15或17的点击板反馈太软,那么Blade 16的点击板感觉不会有什么不同。
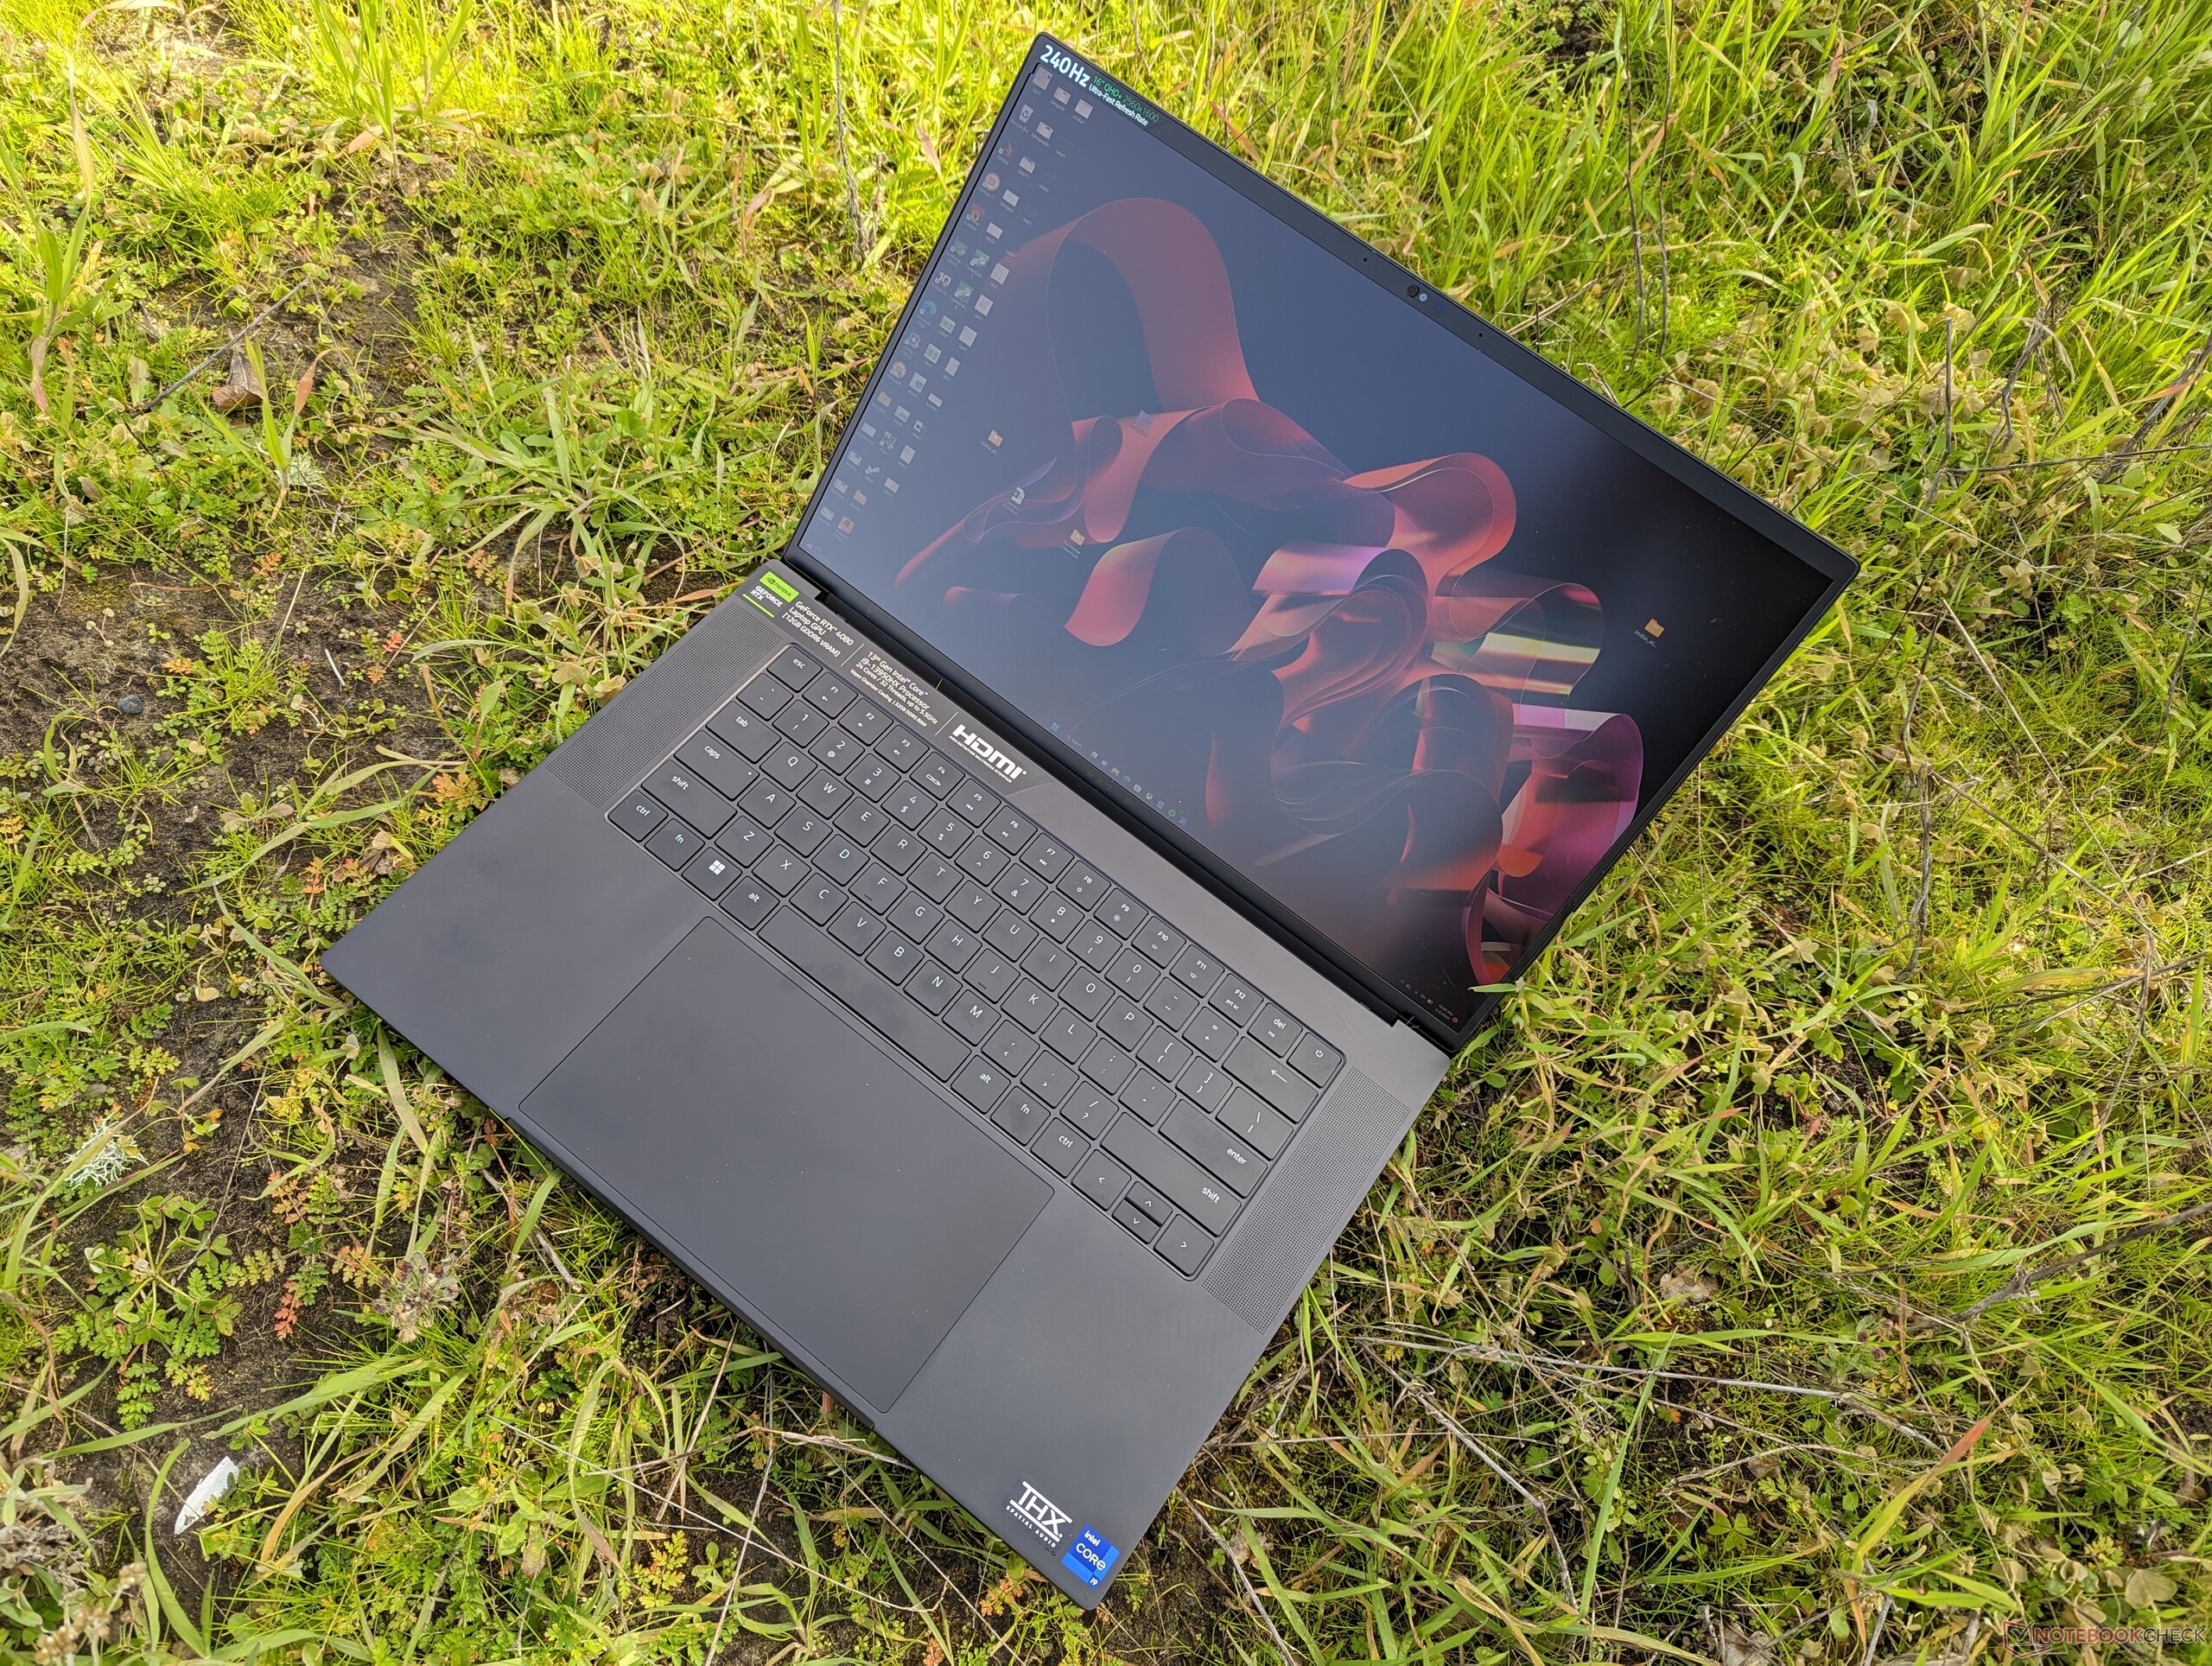
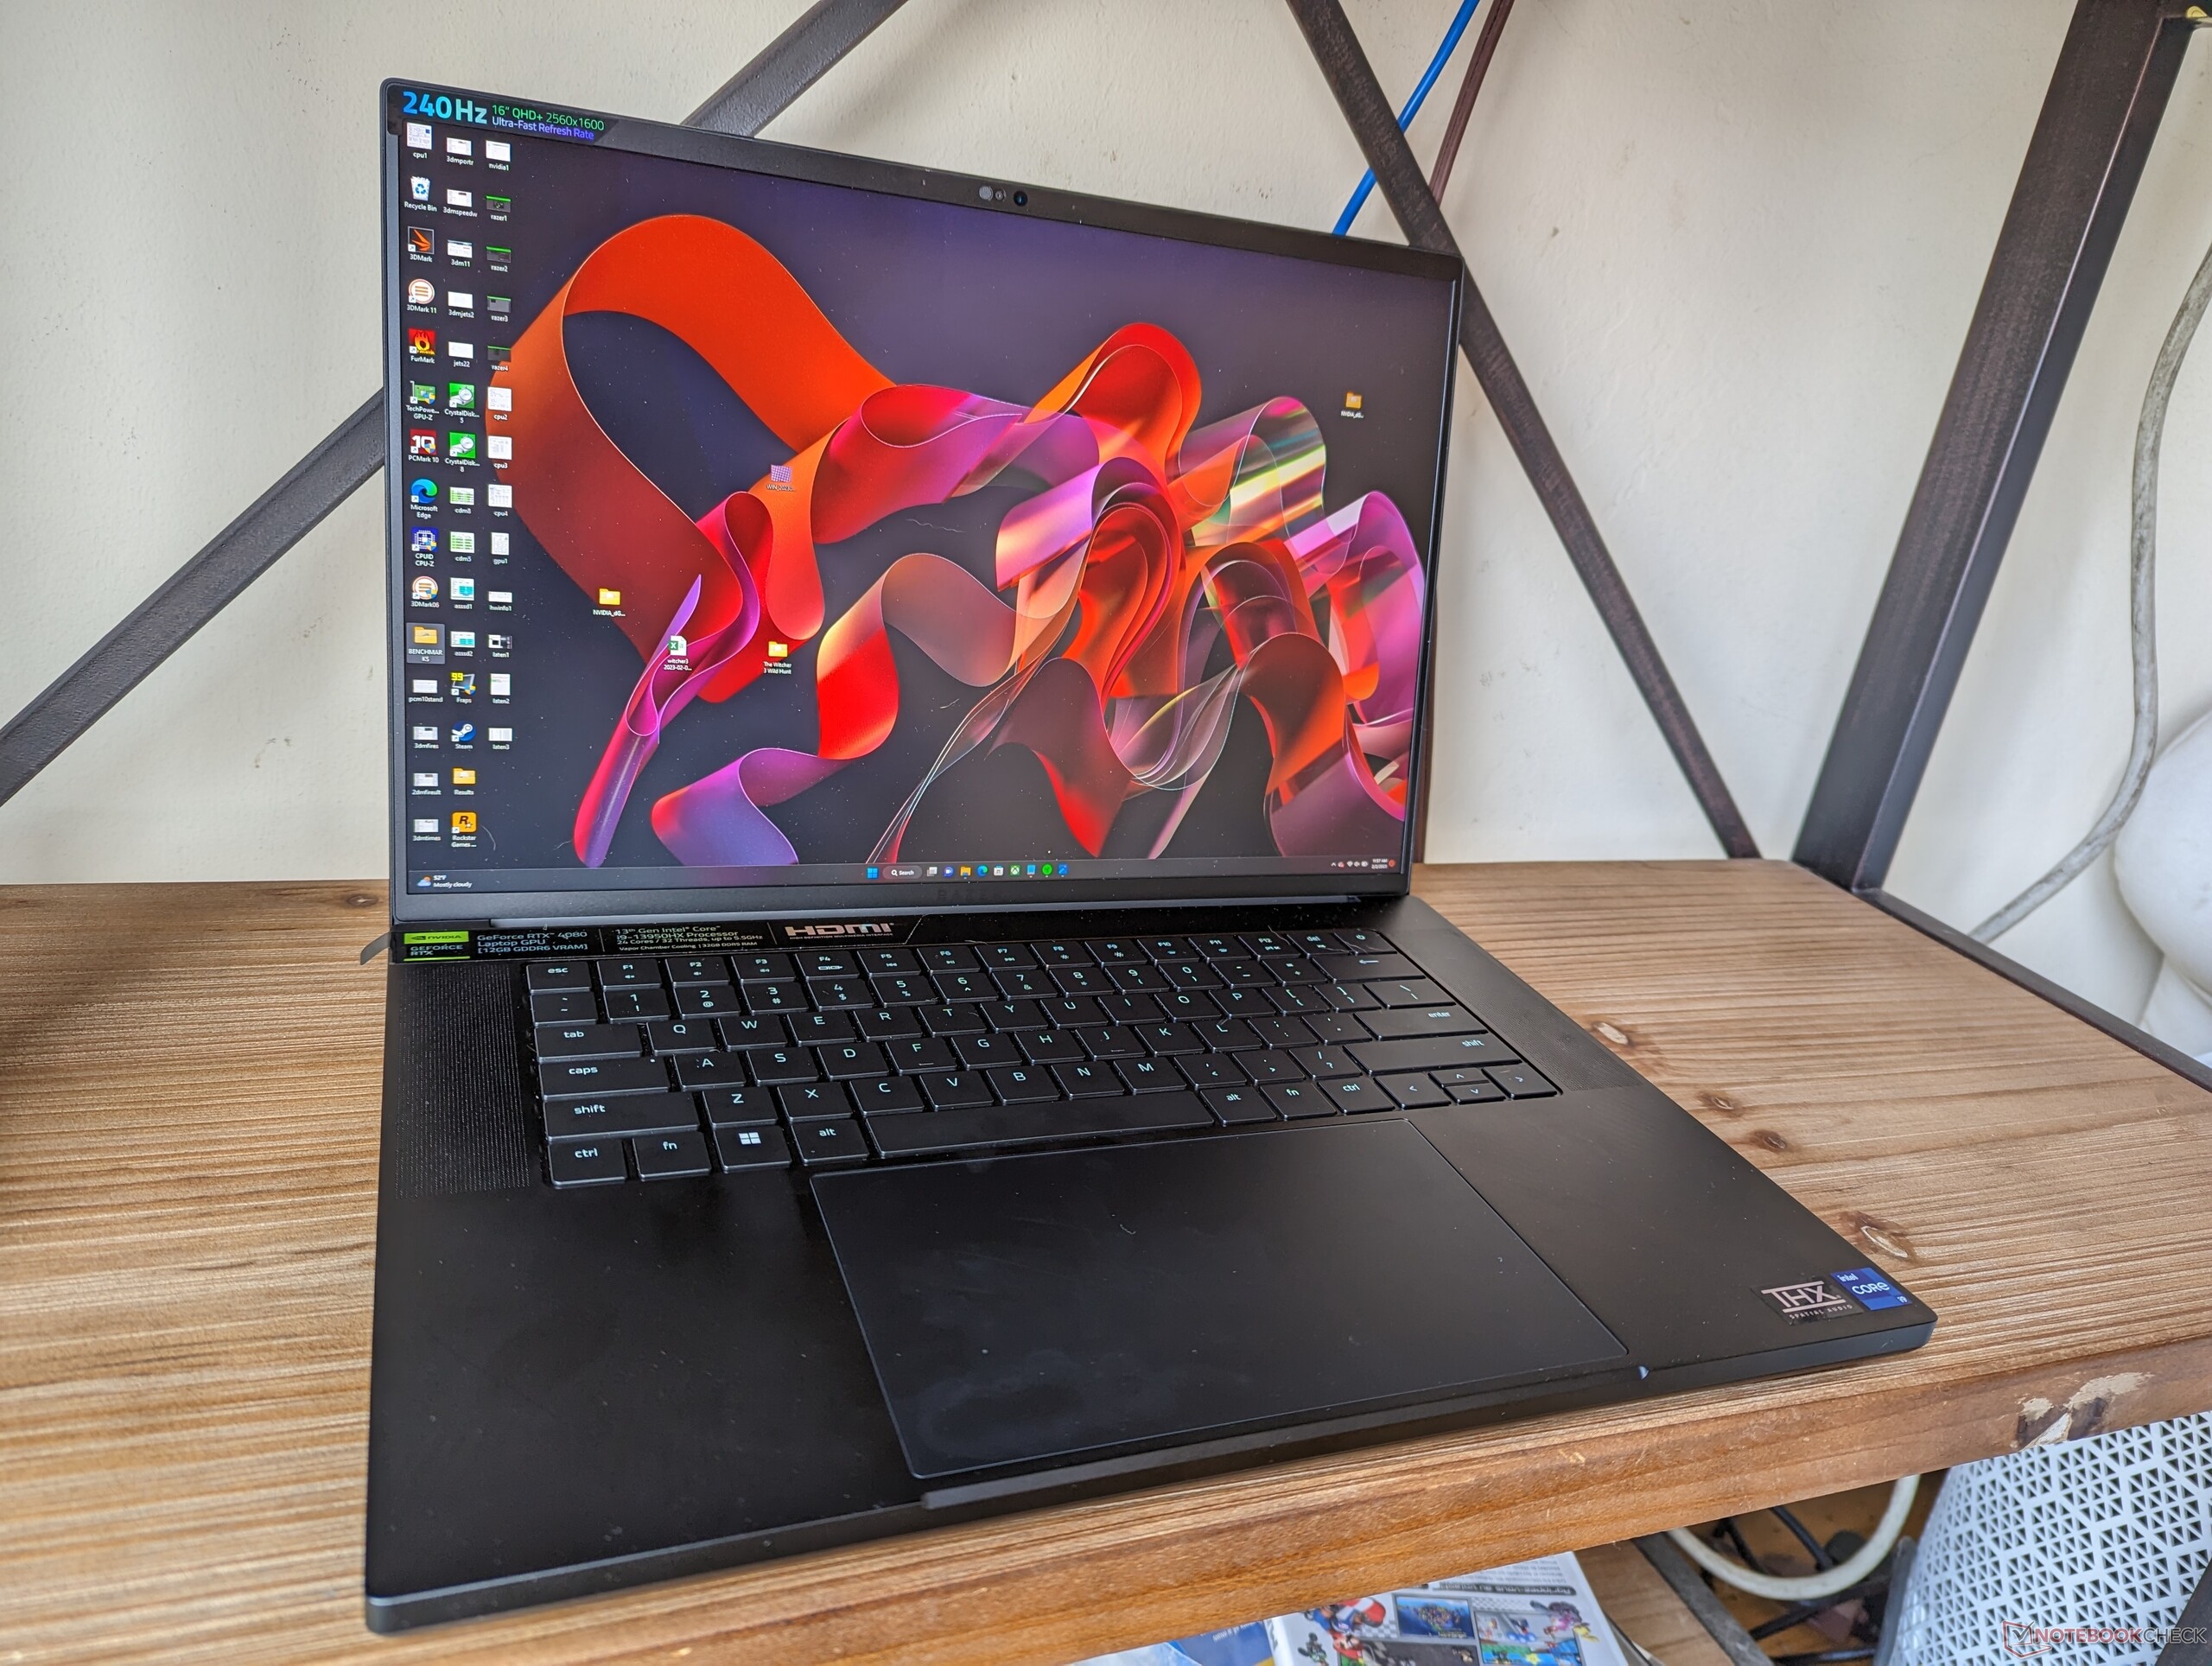
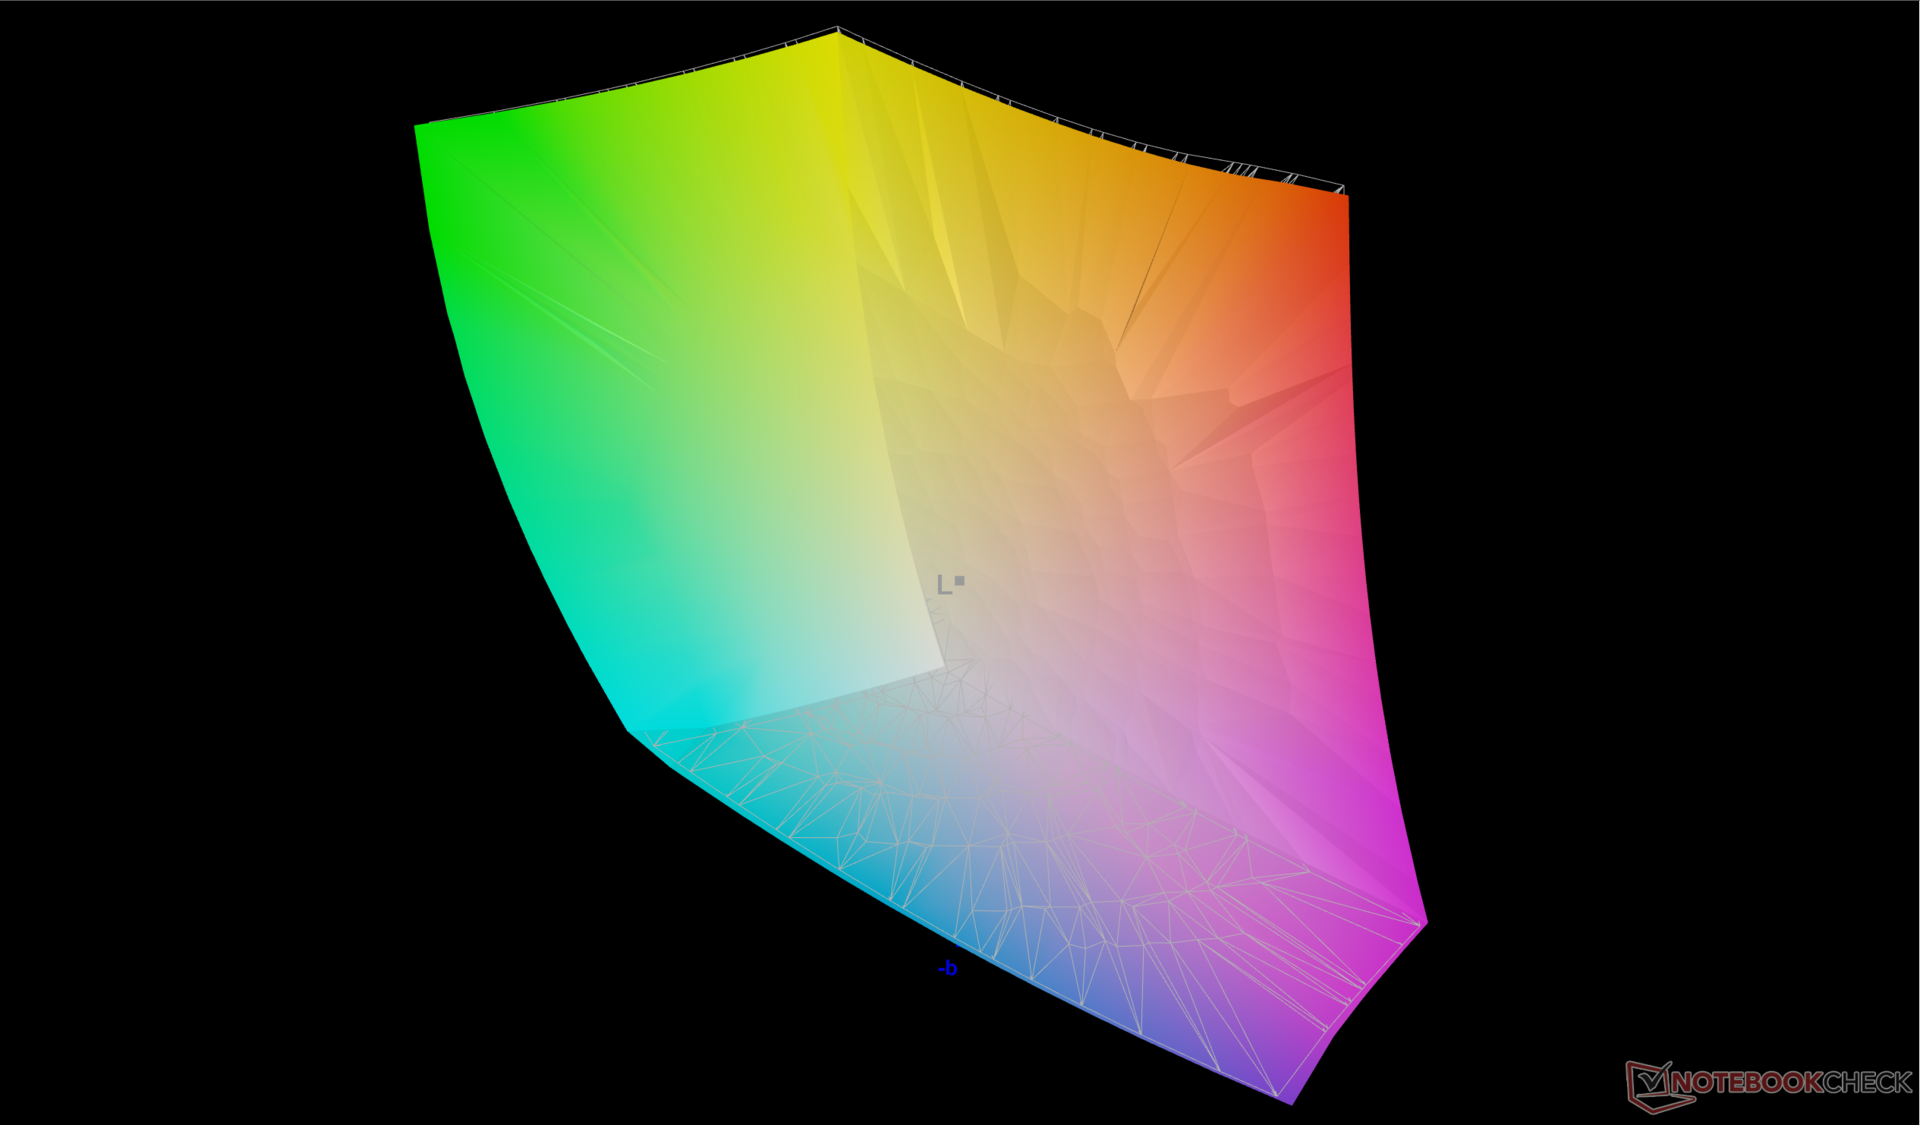
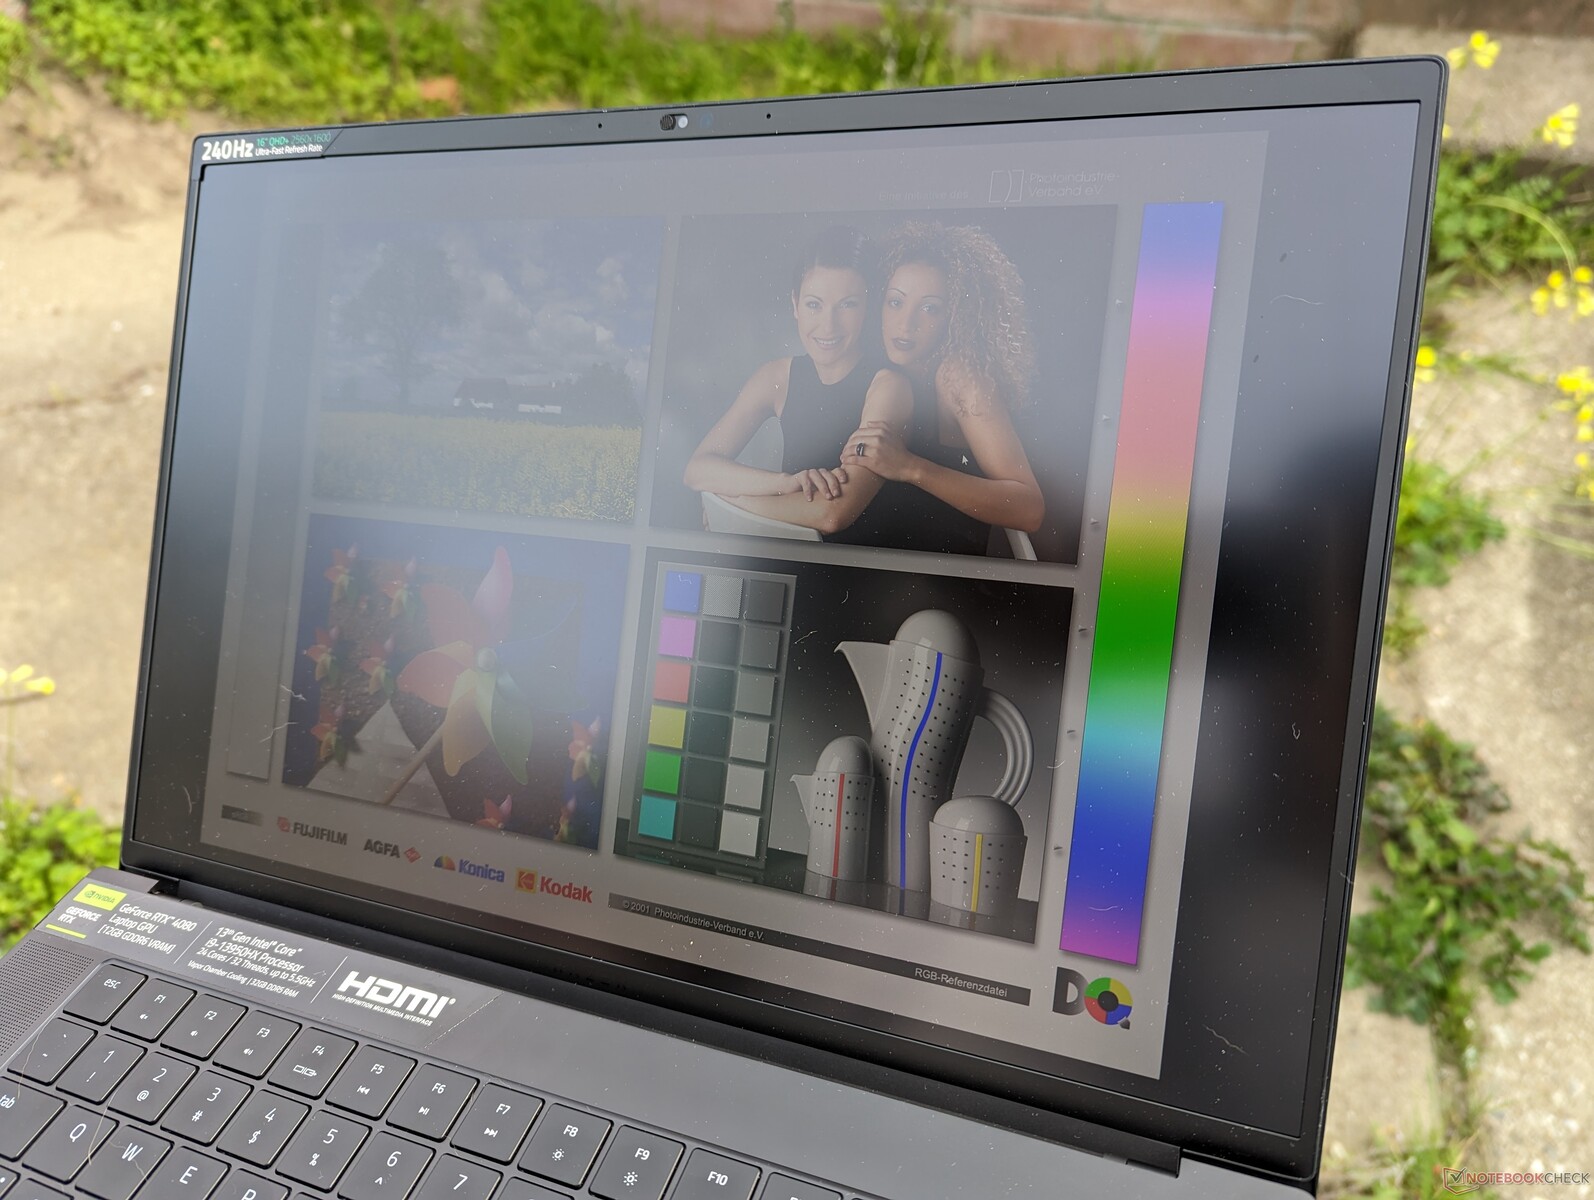
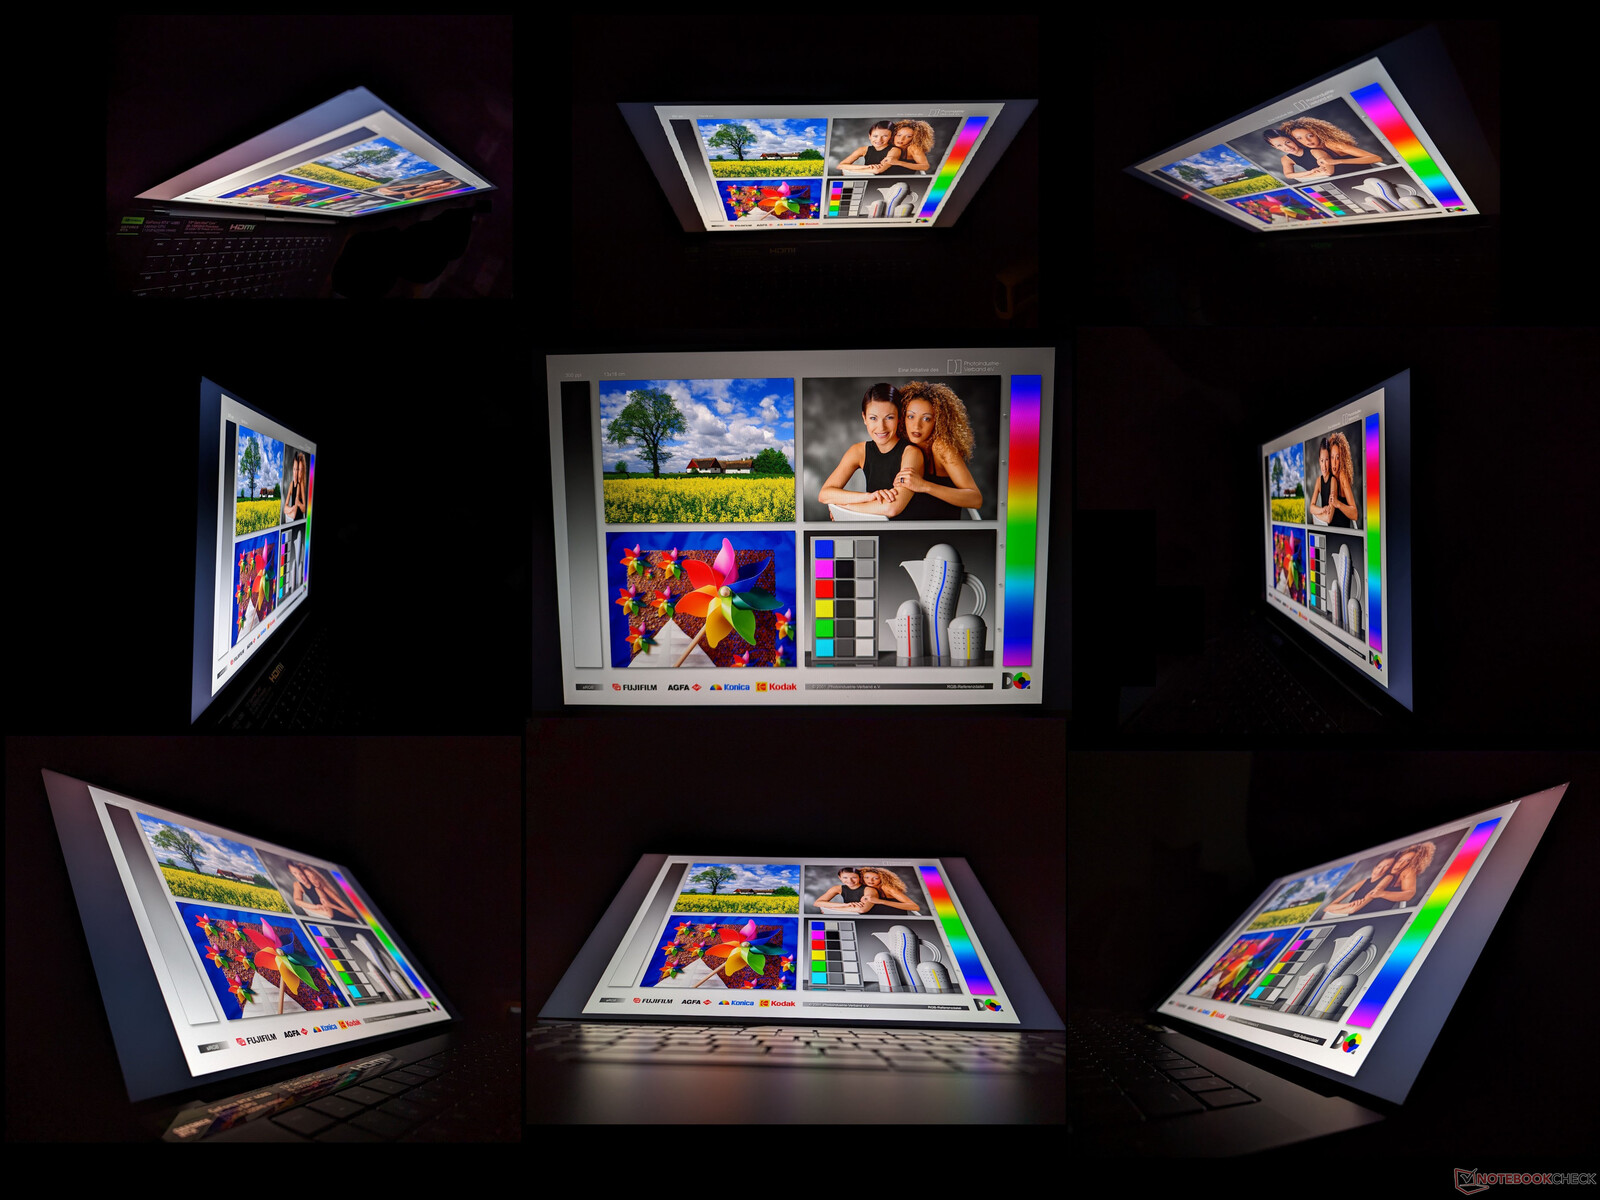
显示屏 - IPS, 240 Hz, QHD+, 16:10, 全AdobeRGB
有两种选择,都是哑光的,并在工厂进行了校准。
- QHD+, 240 Hz, 100% DCI-P3, IPS
- 双模式(UHD+@120 Hz或FHD+@240 Hz),100% DCI-P3,迷你LED
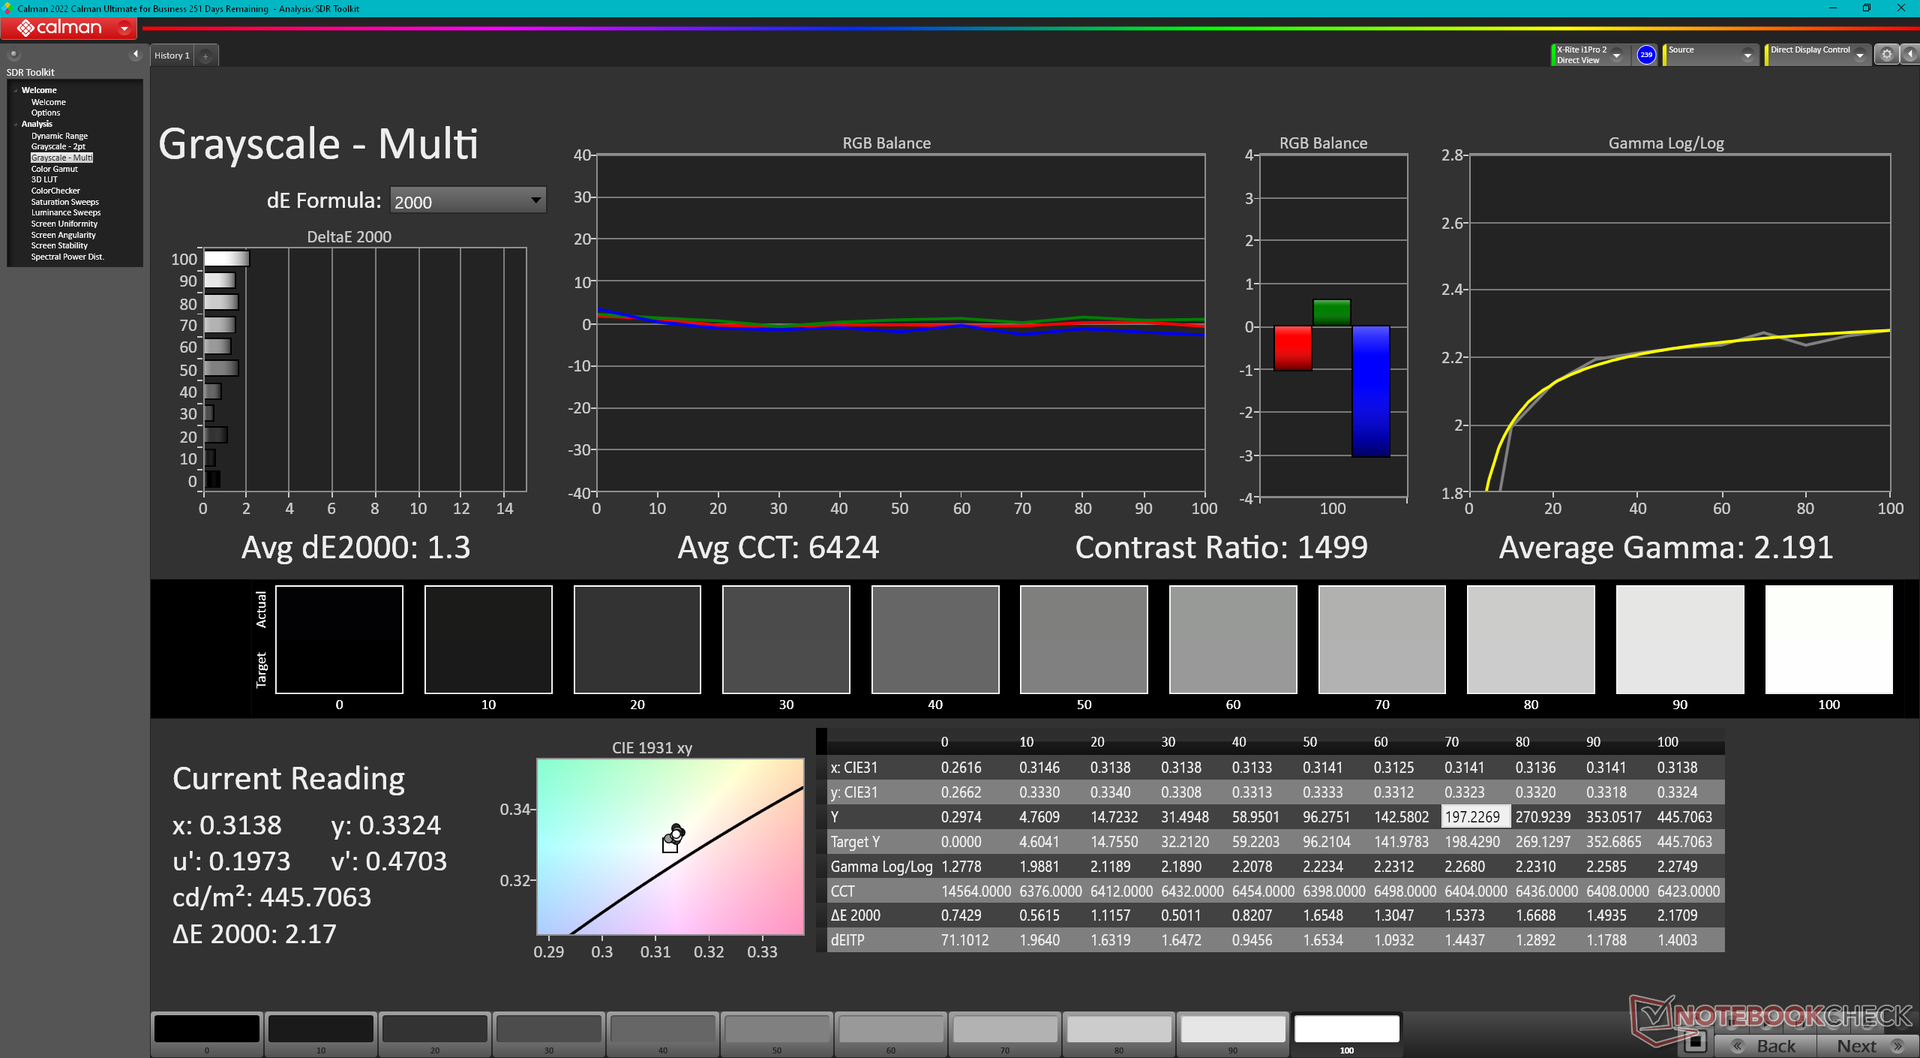
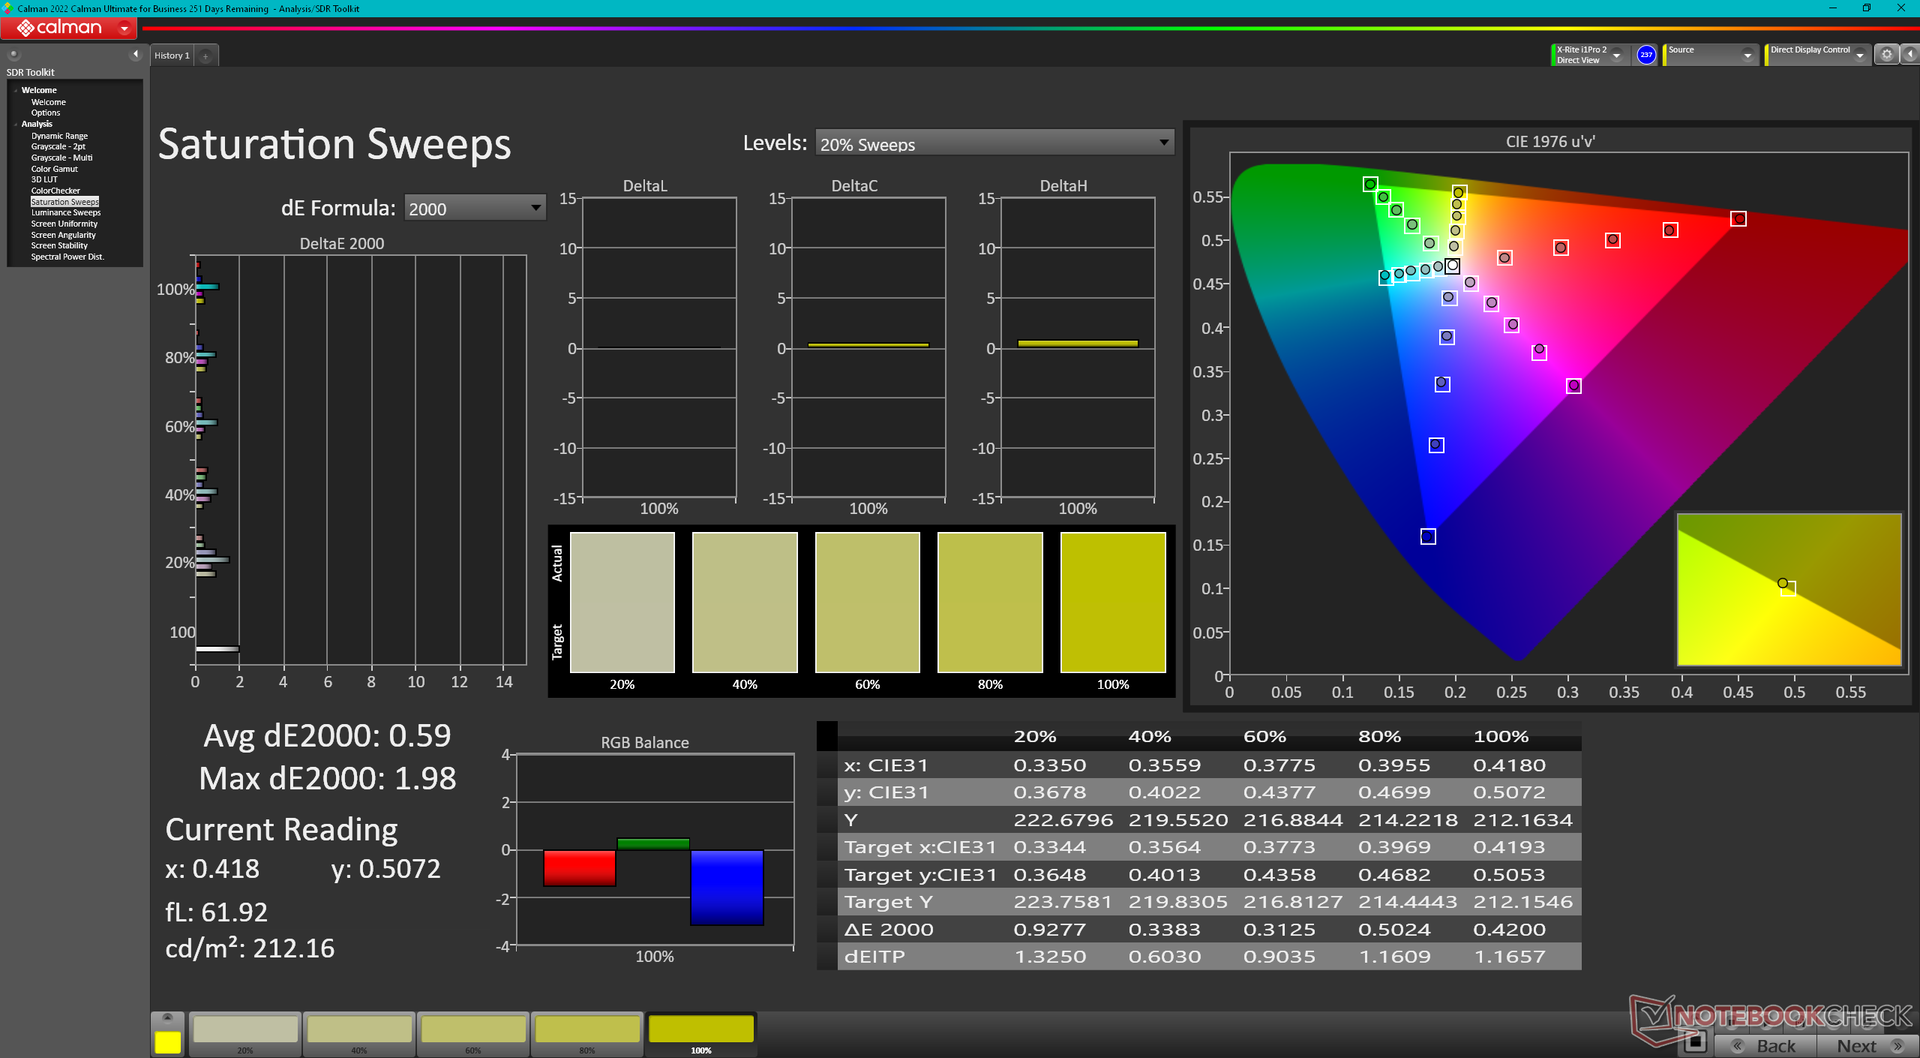
我们下面的测量结果只反映了上面加粗的选项。刀锋16是第一款配备240赫兹QHD+ IPS显示屏的16英寸笔记本电脑,提供全DCI-P3色彩和快速黑白响应时间。其他16英寸面板也有全P3色彩,但它们都是UHD+或OLED,原始刷新率较慢。这种特殊的面板对于游戏和图形编辑都很出色,我们希望在不久的将来能在更多的创造者或工作室类型的笔记本电脑上看到它。
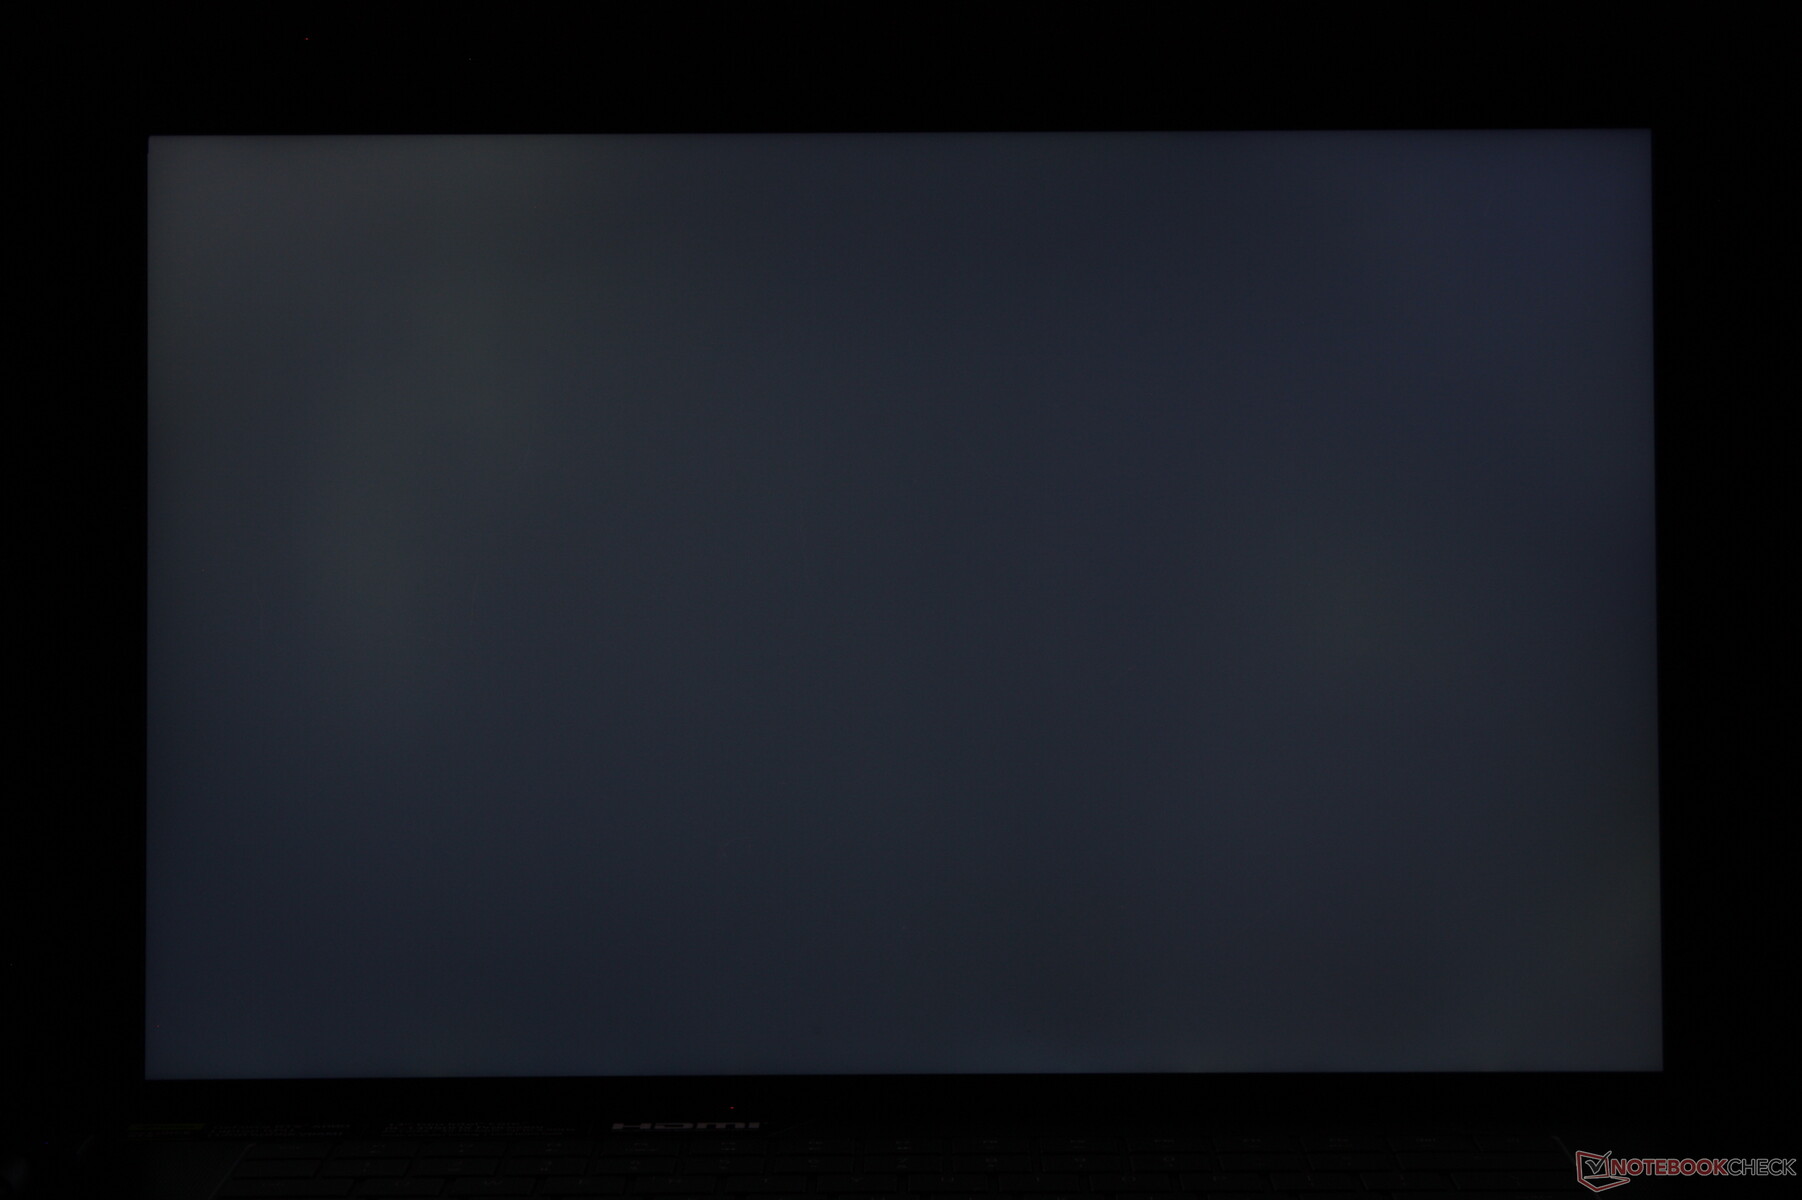
考虑到高昂的售价,我们的设备上的亮度分布可能会更好。屏幕的下半部分比上半部分更暗,亮度分布只有83%。升级到迷你LED SKU可能会解决这个小问题,但Blade 16已经很贵了。

| |||||||||||||||||||||||||
Brightness Distribution: 83 %
Center on Battery: 456.8 cd/m²
Contrast: 1305:1 (Black: 0.35 cd/m²)
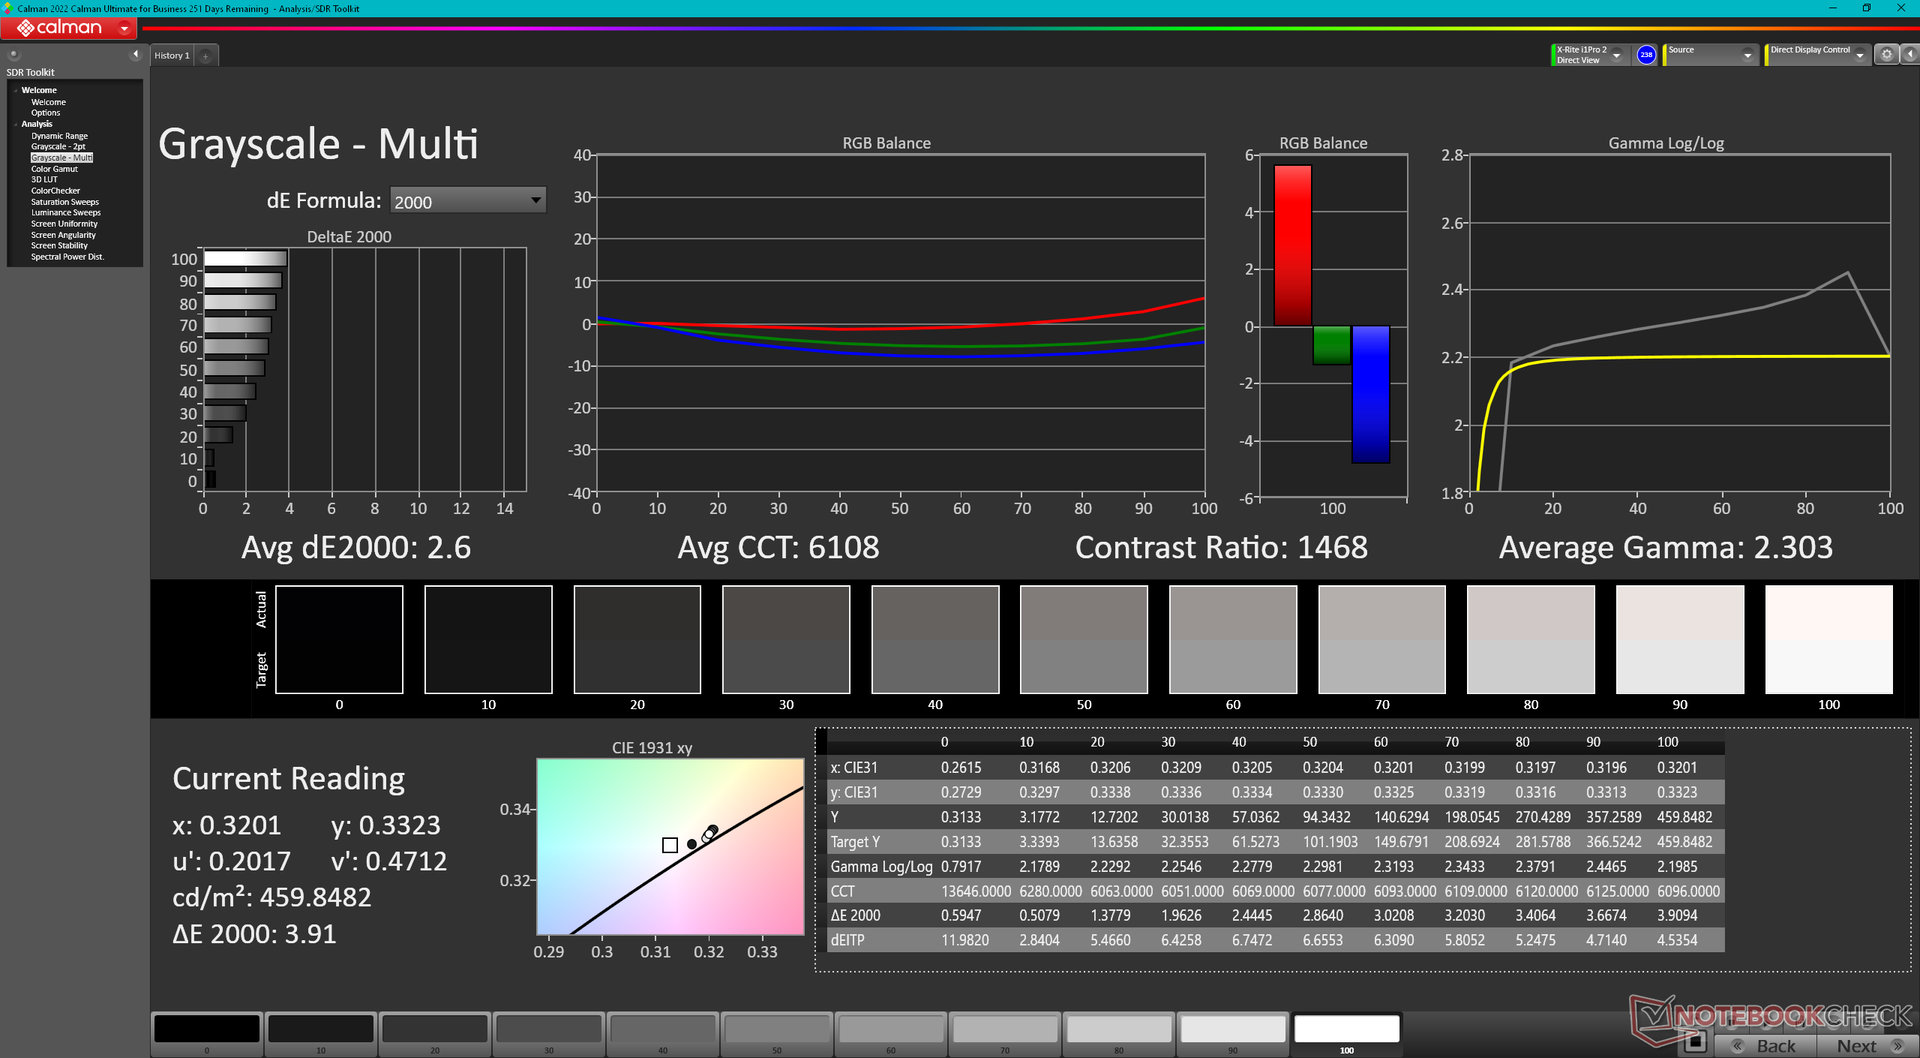
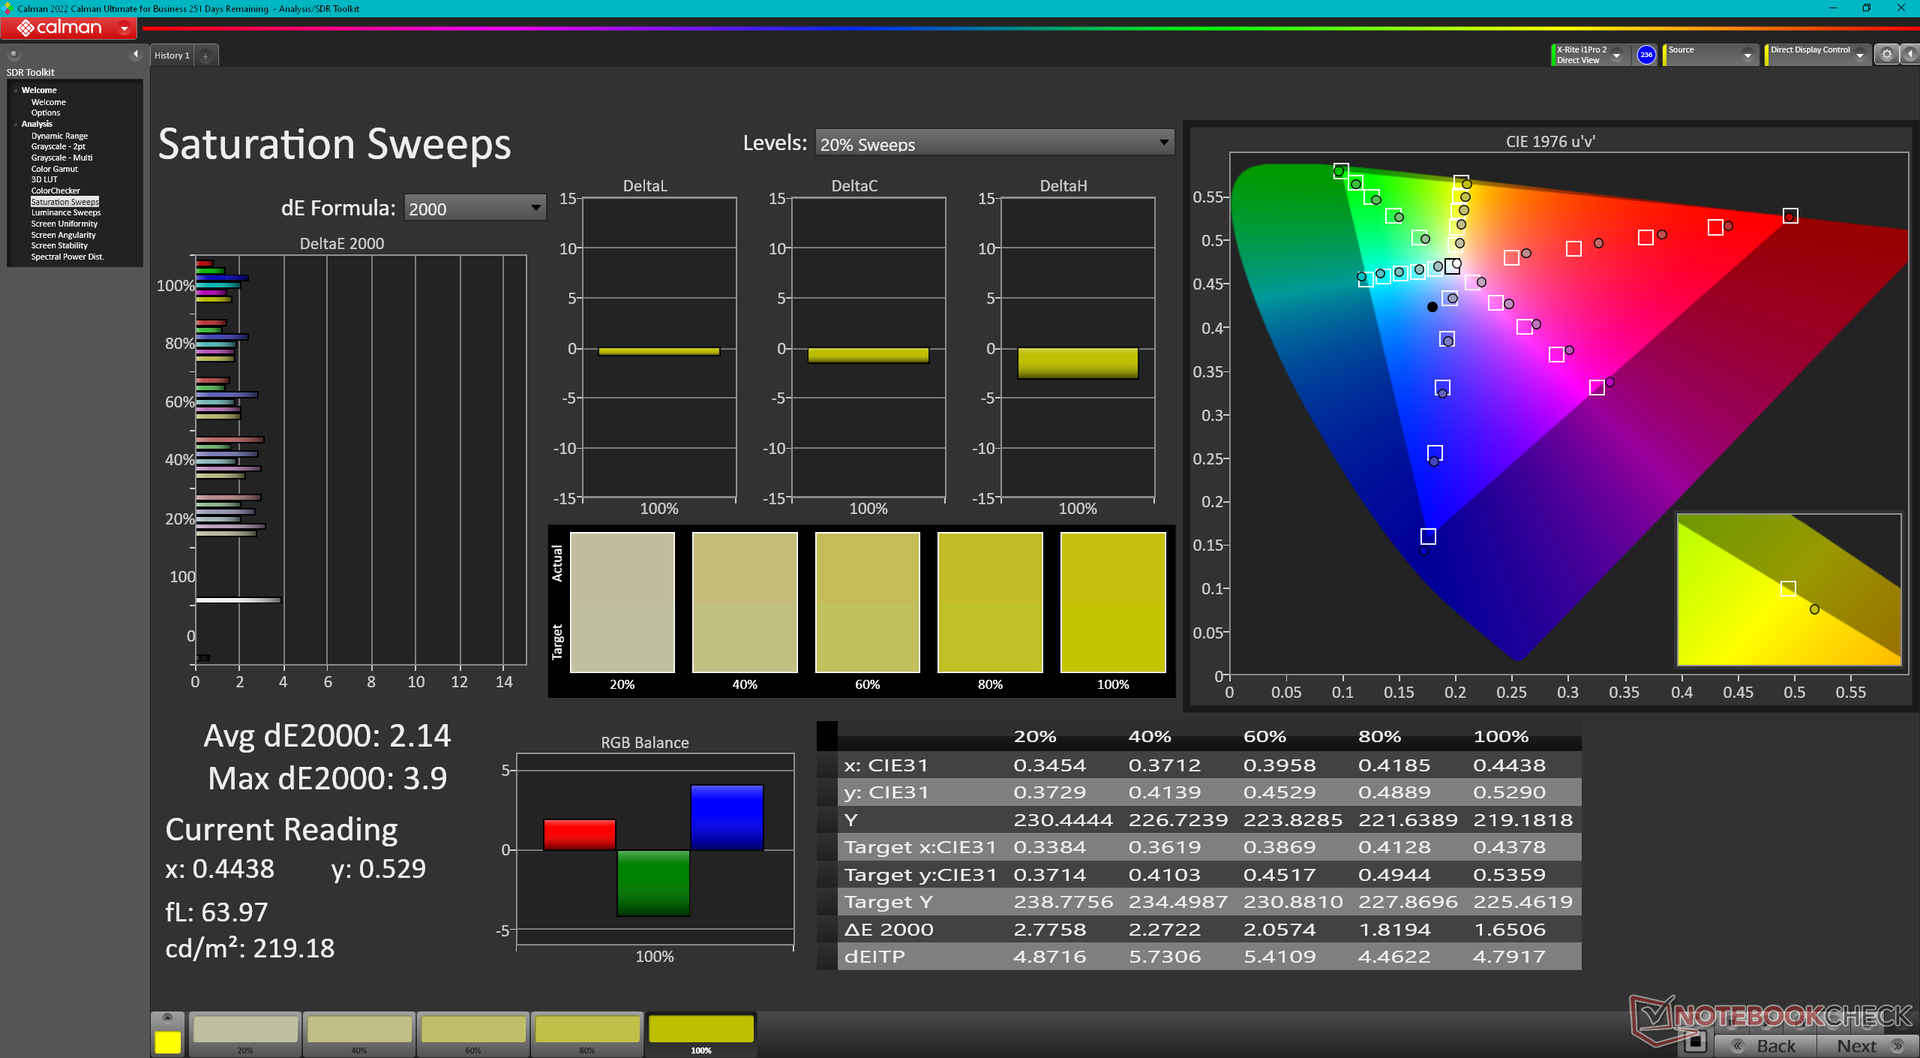
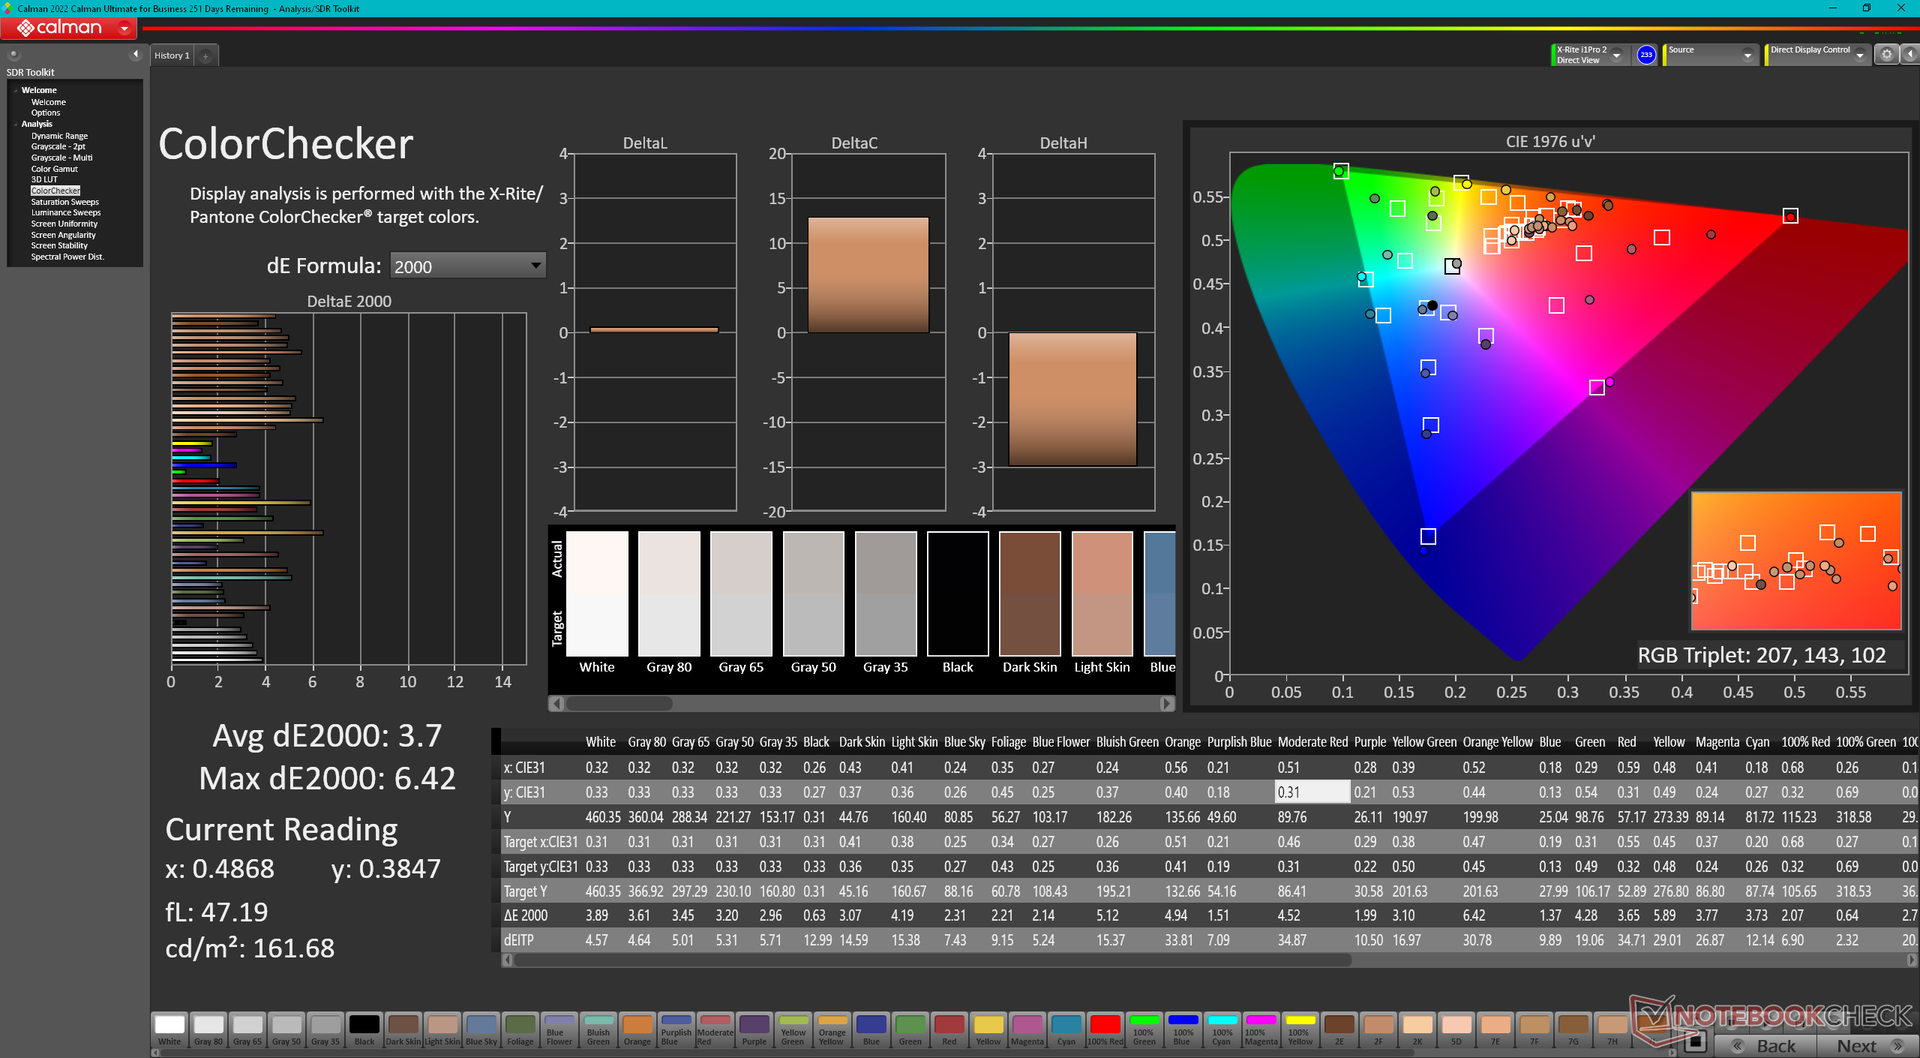
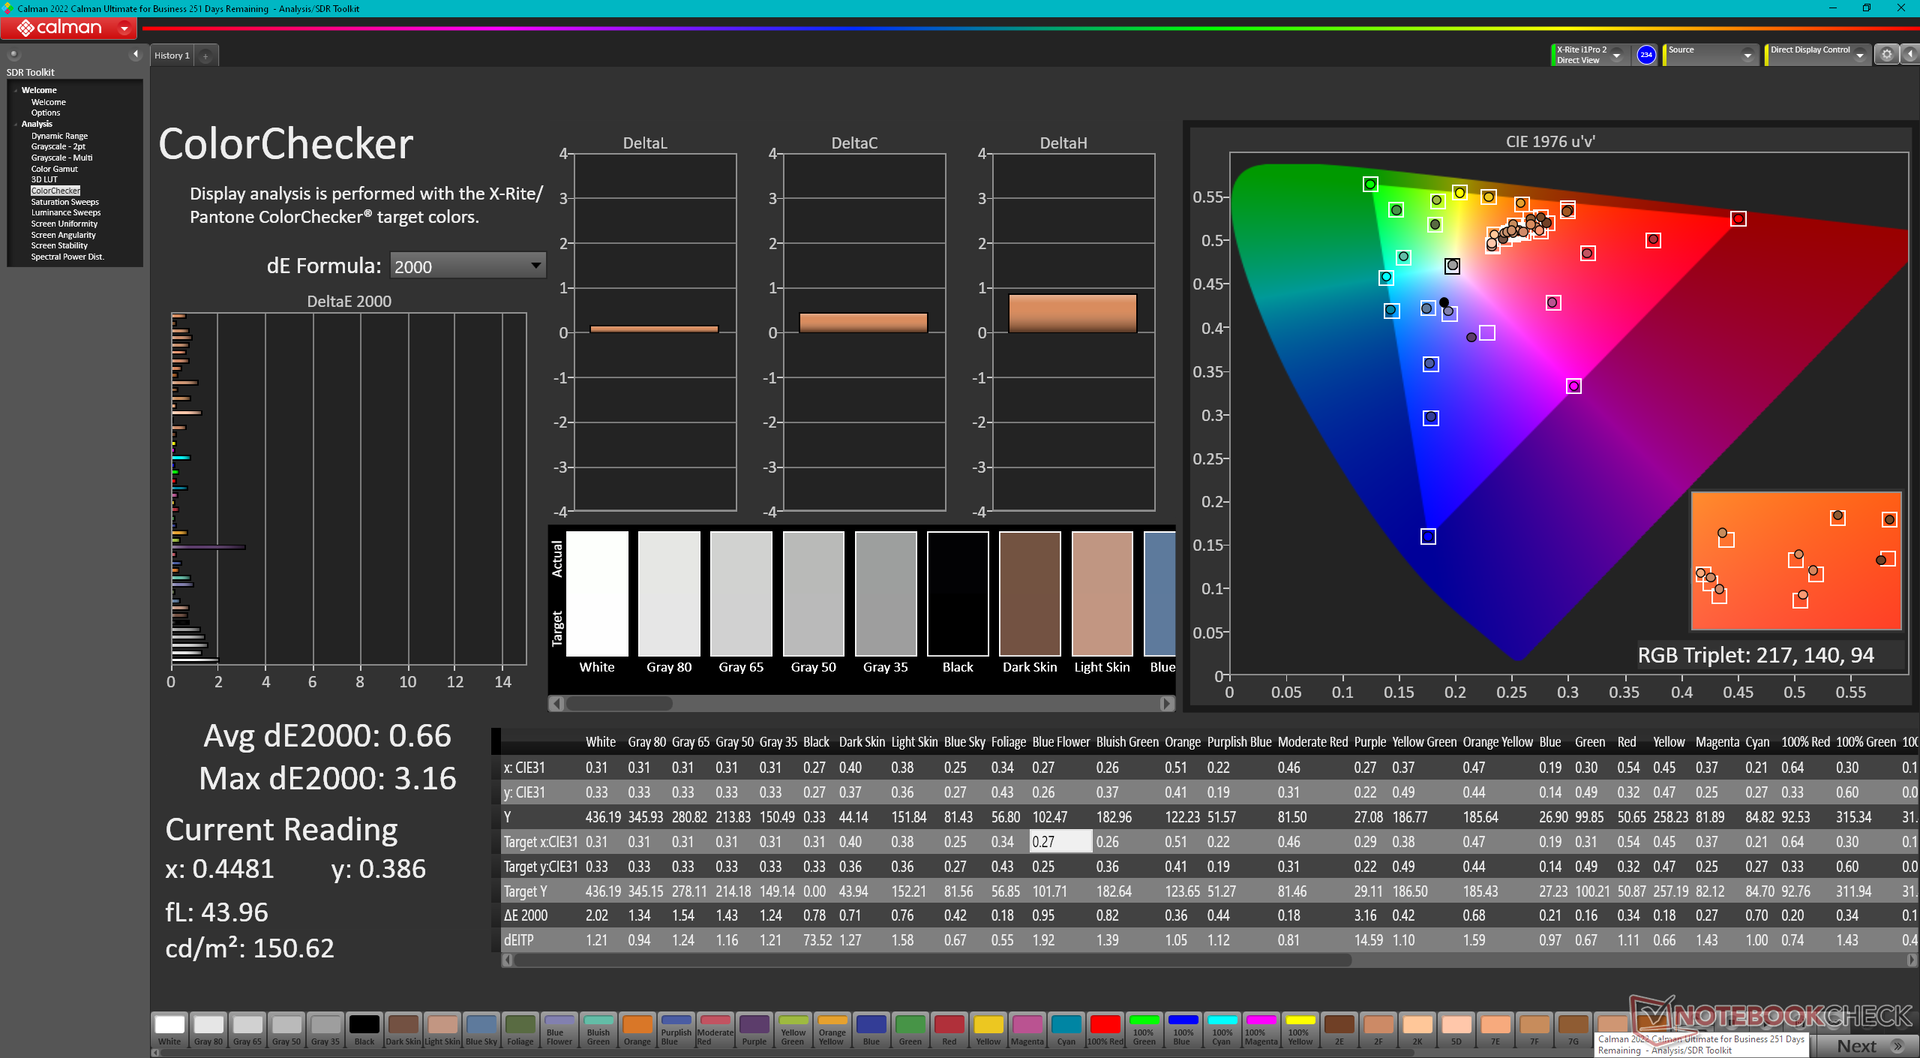
ΔE ColorChecker Argyll: 1.6 (Display P3) Calman: 3.7 | ∀{0.5-29.43 Ø4.71}
calibrated: 0.66
ΔE Greyscale Calman: 2.6 | ∀{0.09-98 Ø4.96}
89.7% AdobeRGB 1998 (Argyll 3D)
100% sRGB (Argyll 3D)
98.5% Display P3 (Argyll 3D)
Gamma: 2.3, Argyll: 98.5
CCT: 6108 K, Argyll: 6626 K
| Razer Blade 16 Early 2023 CSOT T3 MNG007DA4-1, IPS, 2560x1600, 16" | Razer Blade 15 Advanced Model Early 2022 TL156VDXP02-0, IPS, 1920x1080, 15.6" | Lenovo Legion S7 16ARHA7 BOE CQ NE160QDM-NY1, IPS, 2560x1600, 16" | Dell G16 7620 BOE NE16QDM, IPS, 2560x1600, 16" | Asus ROG Zephyrus Duo 16 GX650RX BOE NE160QAM-NX1, IPS-Level, 3840x2400, 16" | HP Omen 16-n0033dx BOE0AAE, IPS, 1920x1080, 16.1" | |
|---|---|---|---|---|---|---|
| Display | -25% | -17% | -18% | -2% | -14% | |
| Display P3 Coverage (%) | 98.5 | 65.3 -34% | 69.8 -29% | 68.3 -31% | 98 -1% | 74.4 -24% |
| sRGB Coverage (%) | 100 | 85.1 -15% | 98.1 -2% | 98 -2% | 99.9 0% | 99.2 -1% |
| AdobeRGB 1998 Coverage (%) | 89.7 | 67.4 -25% | 71.9 -20% | 70.5 -21% | 86.3 -4% | 73.4 -18% |
| Response Times | 24% | -30% | -9% | -34% | -80% | |
| Response Time Grey 50% / Grey 80% * (ms) | 6.6 ? | 4.3 ? 35% | 10 ? -52% | 8.6 ? -30% | 14.6 ? -121% | 17.6 ? -167% |
| Response Time Black / White * (ms) | 12 ? | 10.5 ? 12% | 12.8 ? -7% | 10.4 ? 13% | 5.6 ? 53% | 11.2 ? 7% |
| PWM Frequency (Hz) | ||||||
| Screen | 16% | 9% | -7% | -21% | -28% | |
| Brightness middle (cd/m²) | 456.8 | 330 -28% | 492.4 8% | 369.4 -19% | 459 0% | 373.3 -18% |
| Brightness (cd/m²) | 437 | 315 -28% | 471 8% | 348 -20% | 434 -1% | 361 -17% |
| Brightness Distribution (%) | 83 | 89 7% | 90 8% | 83 0% | 88 6% | 79 -5% |
| Black Level * (cd/m²) | 0.35 | 0.24 31% | 0.4 -14% | 0.32 9% | 0.44 -26% | 0.44 -26% |
| Contrast (:1) | 1305 | 1375 5% | 1231 -6% | 1154 -12% | 1043 -20% | 848 -35% |
| Colorchecker dE 2000 * | 3.7 | 1.47 60% | 1.9 49% | 1.78 52% | 2.97 20% | 2.12 43% |
| Colorchecker dE 2000 max. * | 6.42 | 2.73 57% | 3.81 41% | 4.41 31% | 8.13 -27% | 5.62 12% |
| Colorchecker dE 2000 calibrated * | 0.66 | 0.63 5% | 0.99 -50% | 1.22 -85% | 1.03 -56% | 2.06 -212% |
| Greyscale dE 2000 * | 2.6 | 1.8 31% | 1.7 35% | 3.2 -23% | 4.9 -88% | 2.5 4% |
| Gamma | 2.3 96% | 2.282 96% | 2.36 93% | 2.2 100% | 2.235 98% | 2.3 96% |
| CCT | 6108 106% | 6499 100% | 6497 100% | 6750 96% | 6775 96% | 6408 101% |
| Total Average (Program / Settings) | 5% /
8% | -13% /
-2% | -11% /
-10% | -19% /
-19% | -41% /
-33% |
* ... smaller is better
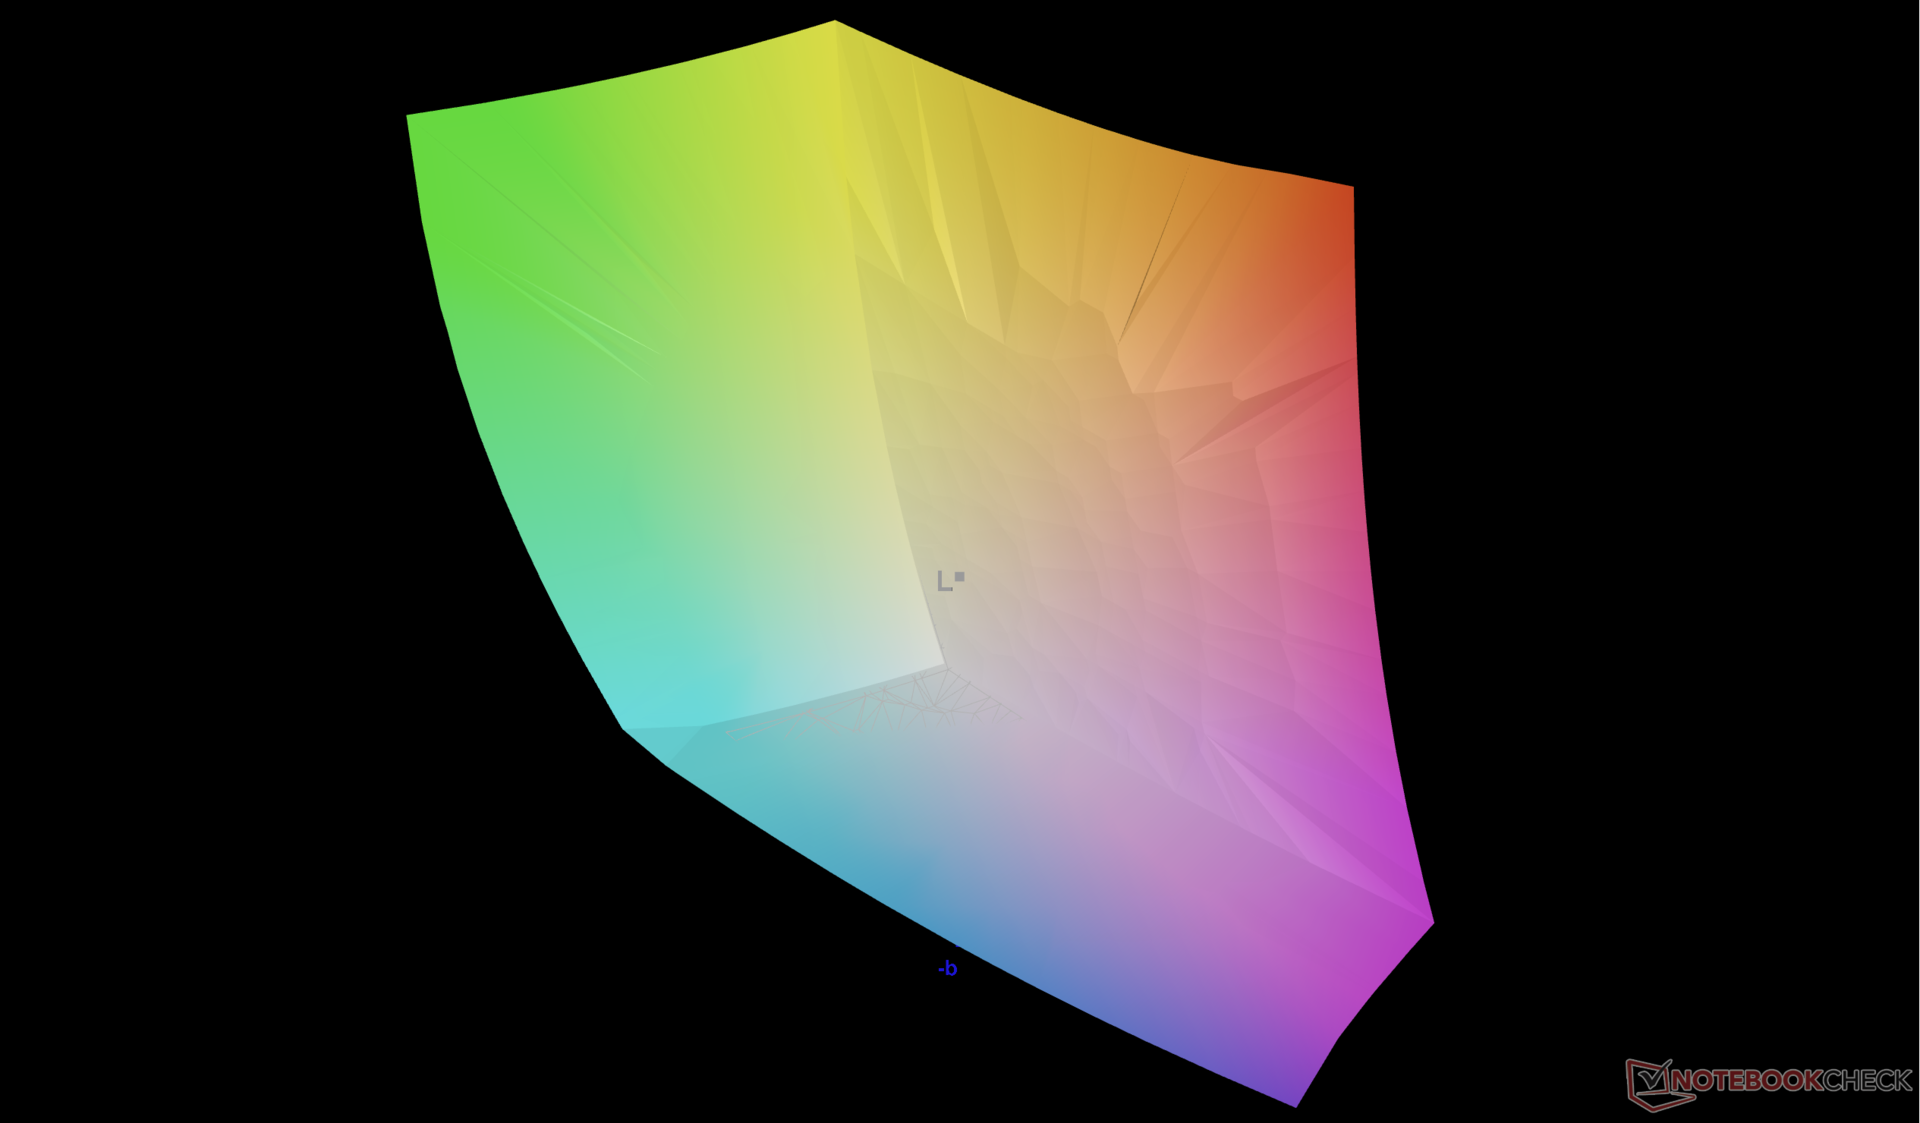
我们的X-Rite色度计可以确认完整的DCI-P3色彩,但466尼特的最大亮度比制造商宣传的500尼特还差。然而,在任何终端用户校准之前,平均灰度和色彩deltaE值都很低,分别只有2.6和3.7。
Display Response Times
| ↔ Response Time Black to White | ||
|---|---|---|
| 12 ms ... rise ↗ and fall ↘ combined | ↗ 6.8 ms rise | 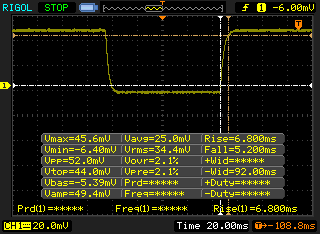 |
| ↘ 5.2 ms fall | ||
| The screen shows good response rates in our tests, but may be too slow for competitive gamers. In comparison, all tested devices range from 0.1 (minimum) to 240 (maximum) ms. » 32 % of all devices are better. This means that the measured response time is better than the average of all tested devices (19.8 ms). | ||
| ↔ Response Time 50% Grey to 80% Grey | ||
| 6.6 ms ... rise ↗ and fall ↘ combined | ↗ 3.4 ms rise | 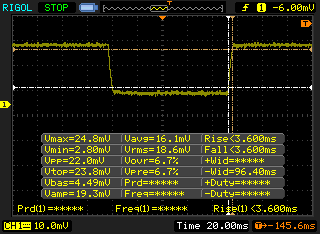 |
| ↘ 3.2 ms fall | ||
| The screen shows very fast response rates in our tests and should be very well suited for fast-paced gaming. In comparison, all tested devices range from 0.165 (minimum) to 636 (maximum) ms. » 20 % of all devices are better. This means that the measured response time is better than the average of all tested devices (31 ms). | ||
Screen Flickering / PWM (Pulse-Width Modulation)
| Screen flickering / PWM not detected | 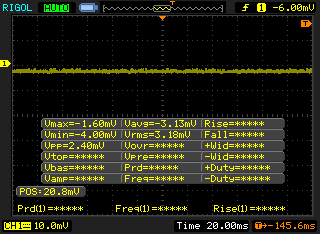 | ||
In comparison: 52 % of all tested devices do not use PWM to dim the display. If PWM was detected, an average of 7757 (minimum: 5 - maximum: 343500) Hz was measured. | |||
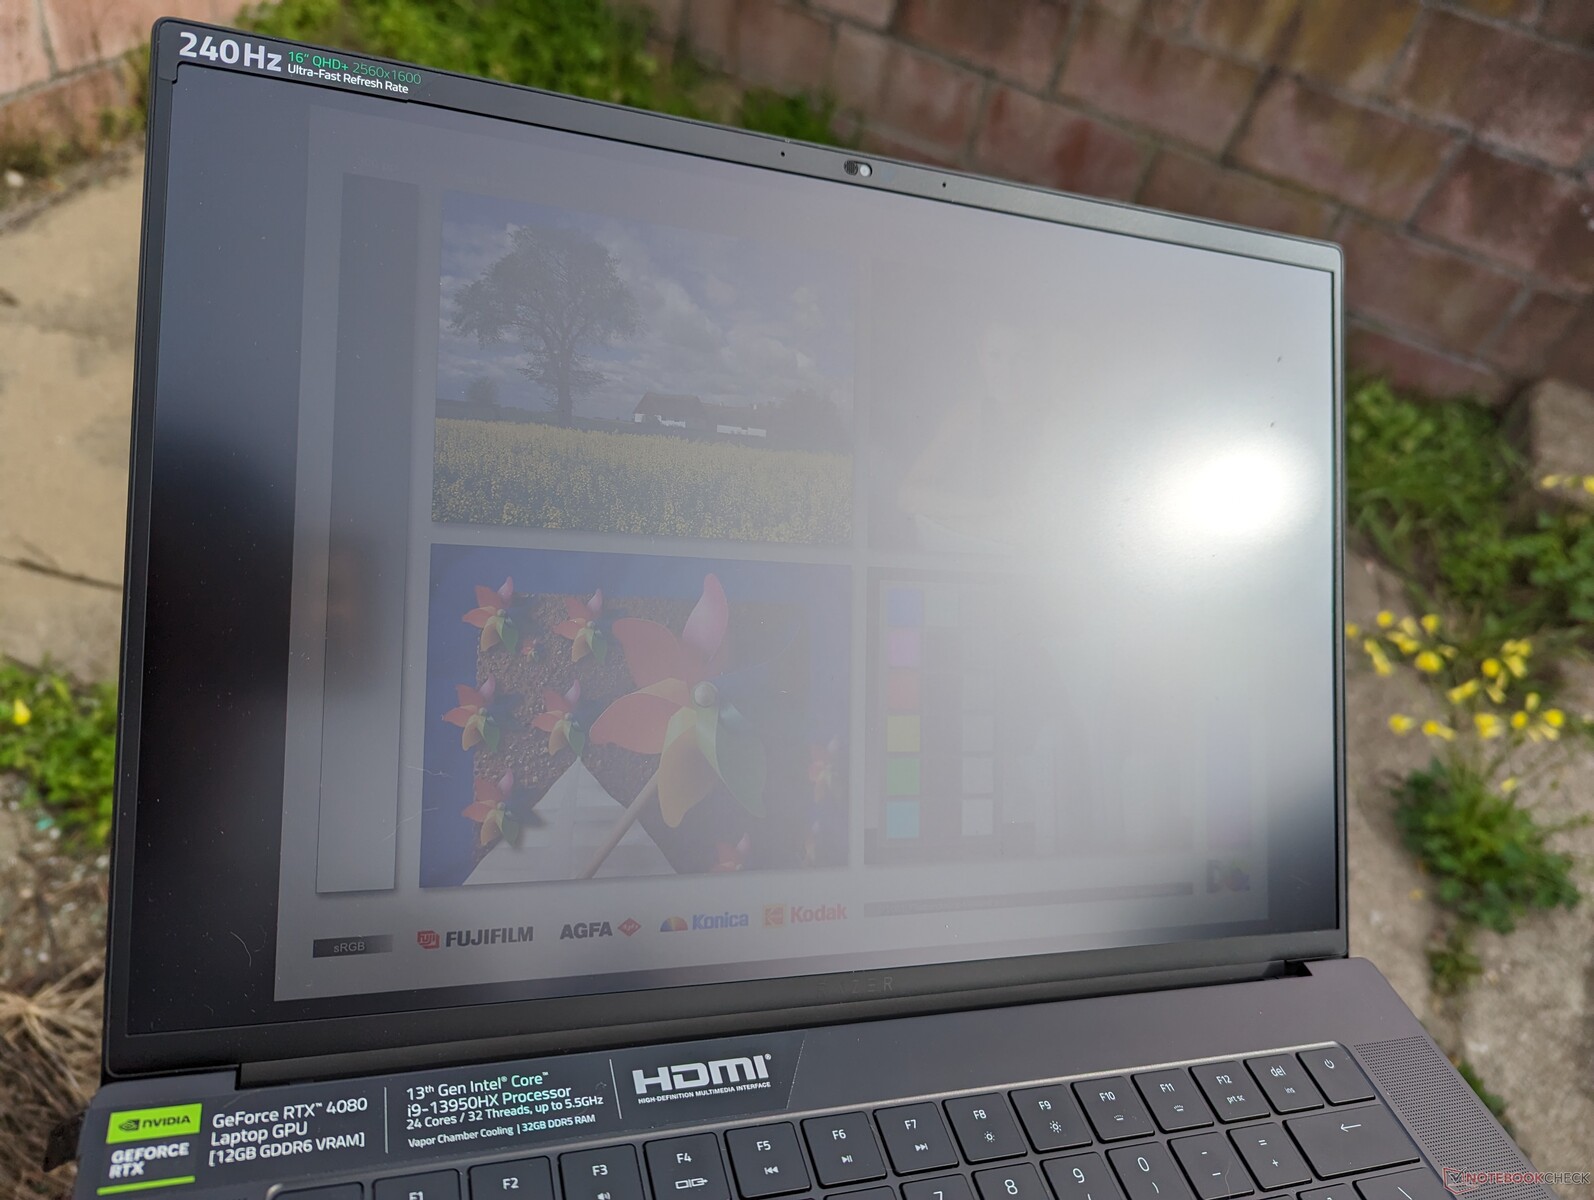
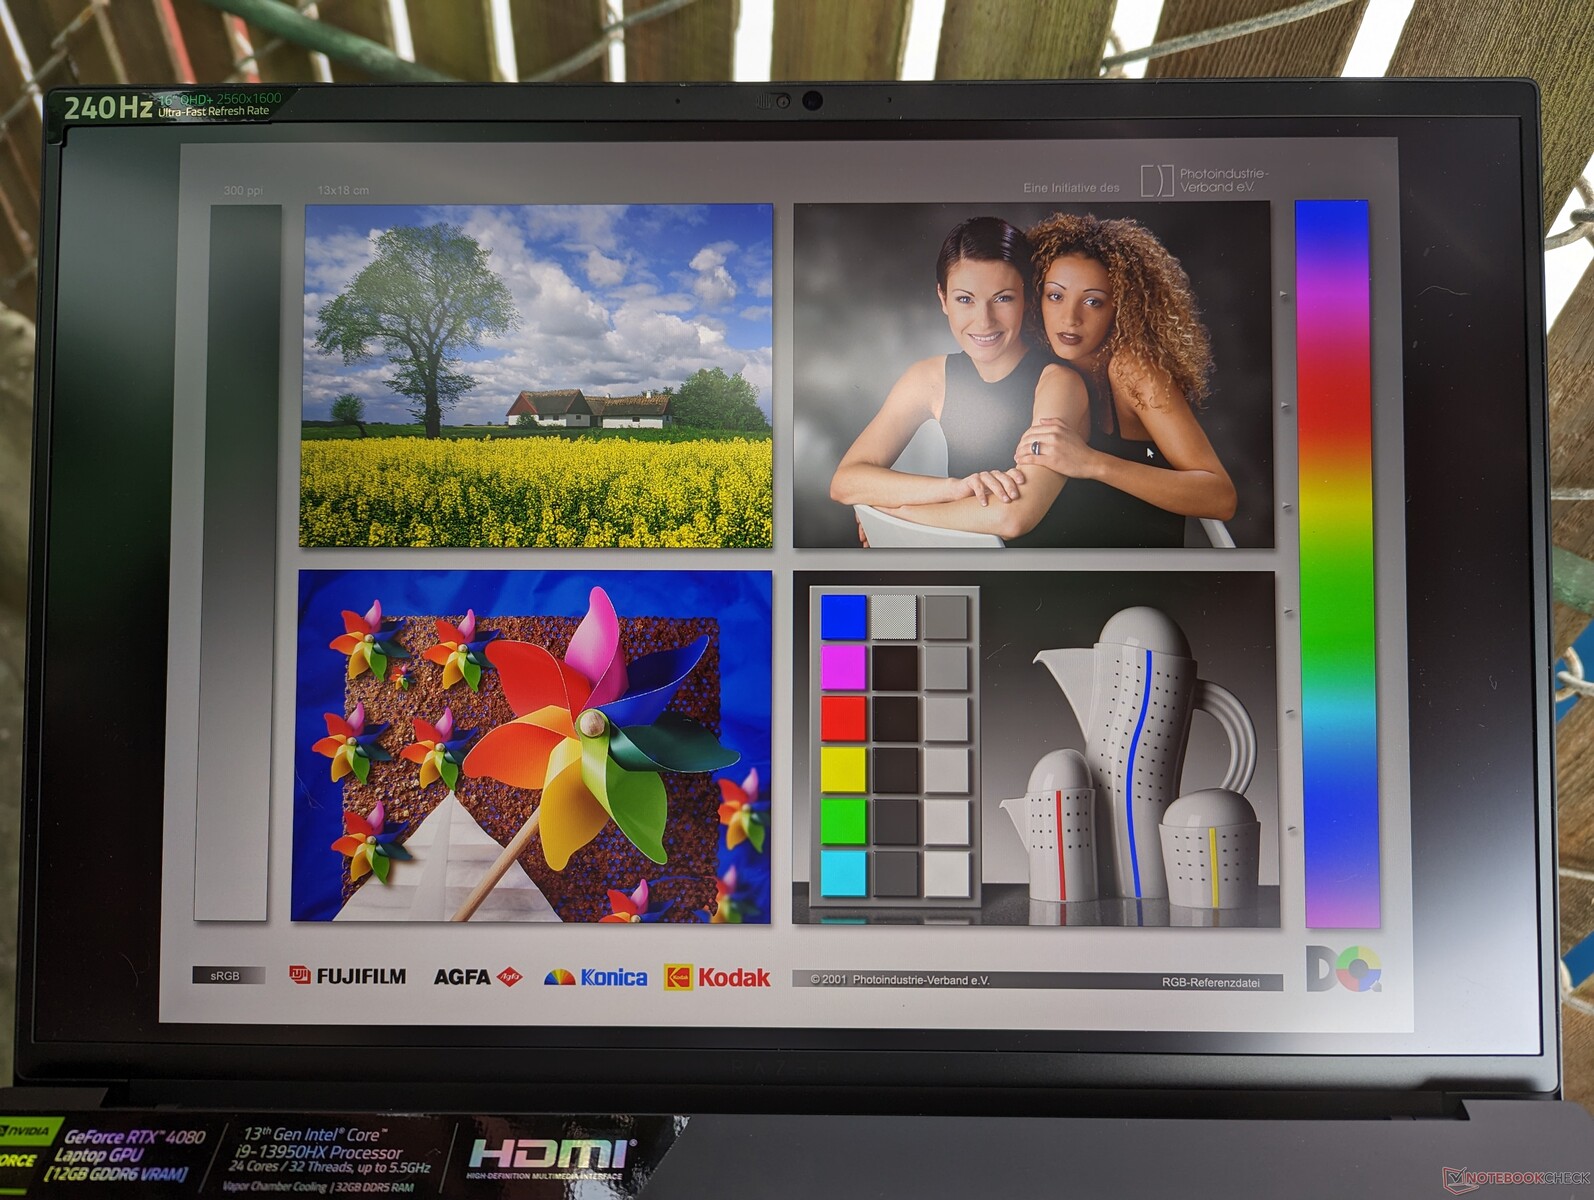
如果在阴凉处,户外能见度还不错,因为更亮的条件会冲淡屏幕。450尼特的显示屏比Blade 15或Omen 16的1080p面板更亮,同时与Zephyrus Duo 16和联想Legion S7 16的UHD+和QHD+显示屏相当。相比之下,更便宜的游戏笔记本往往最多平均为300尼特左右。
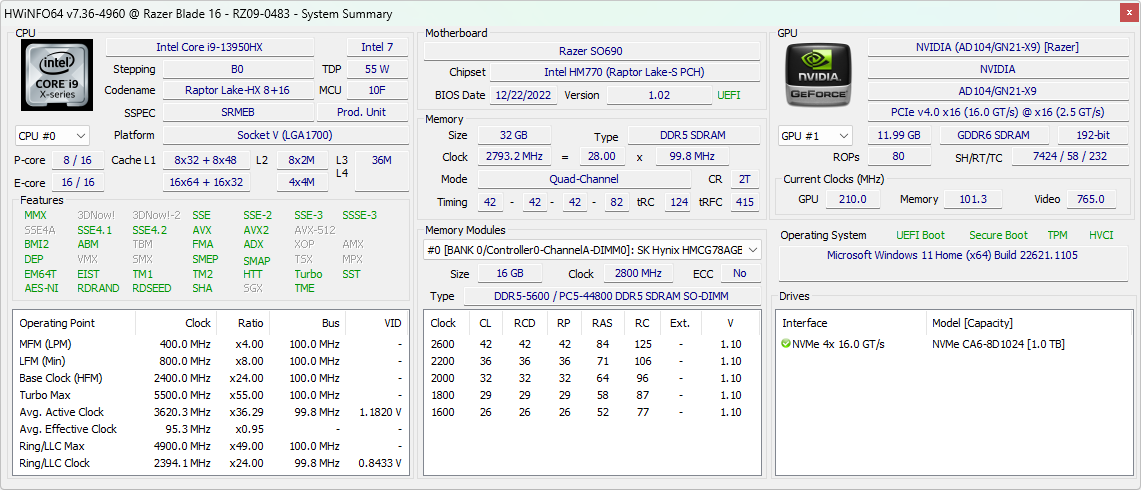
性能--第13代英特尔+Nvidia Ada Lovelace
测试条件
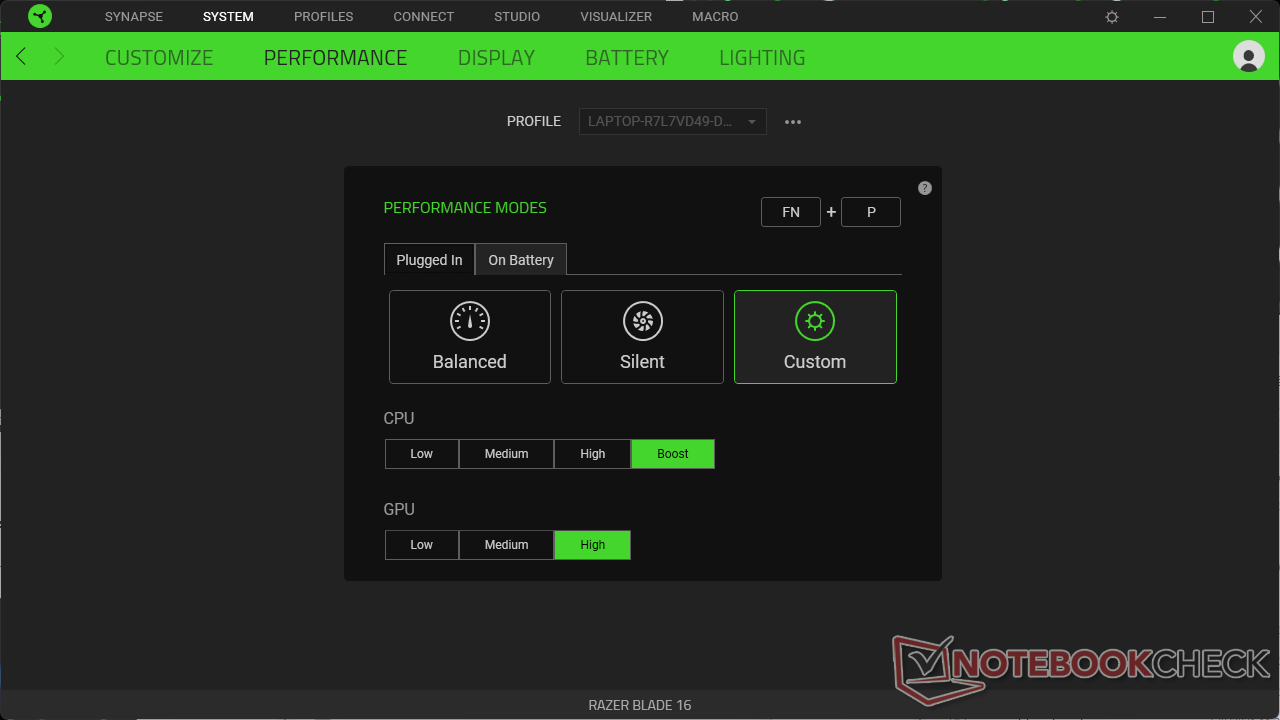
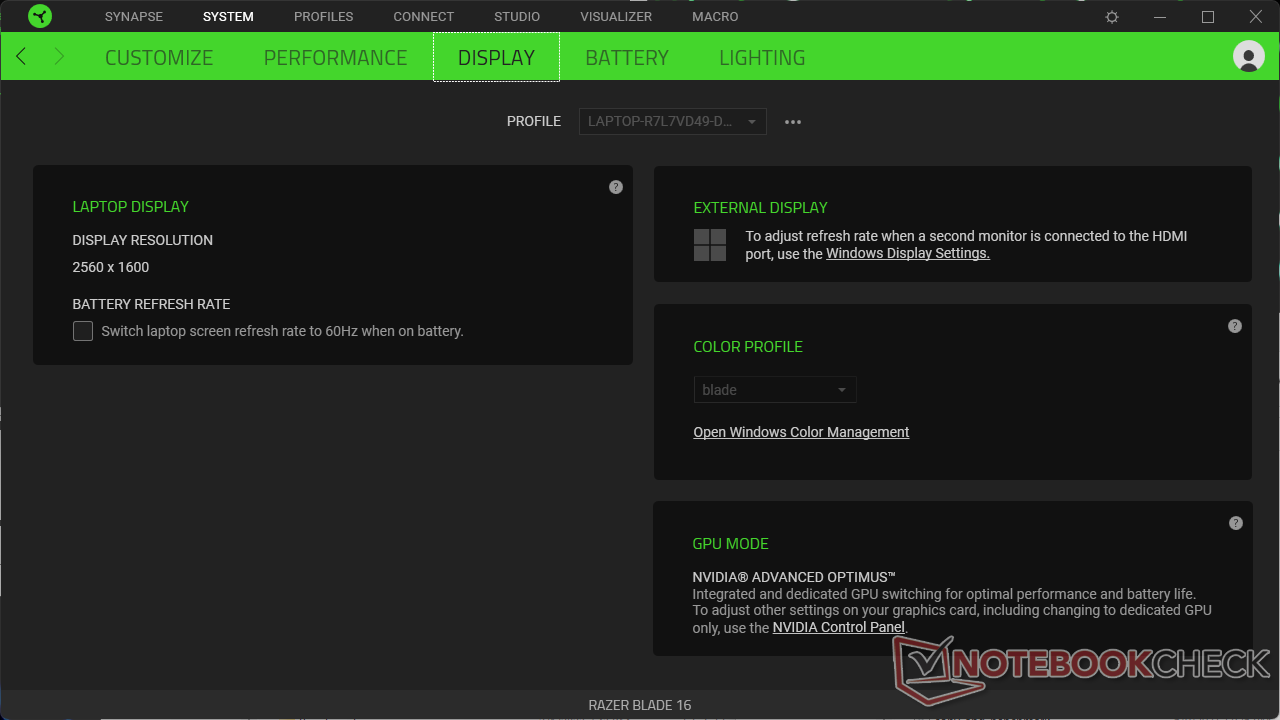
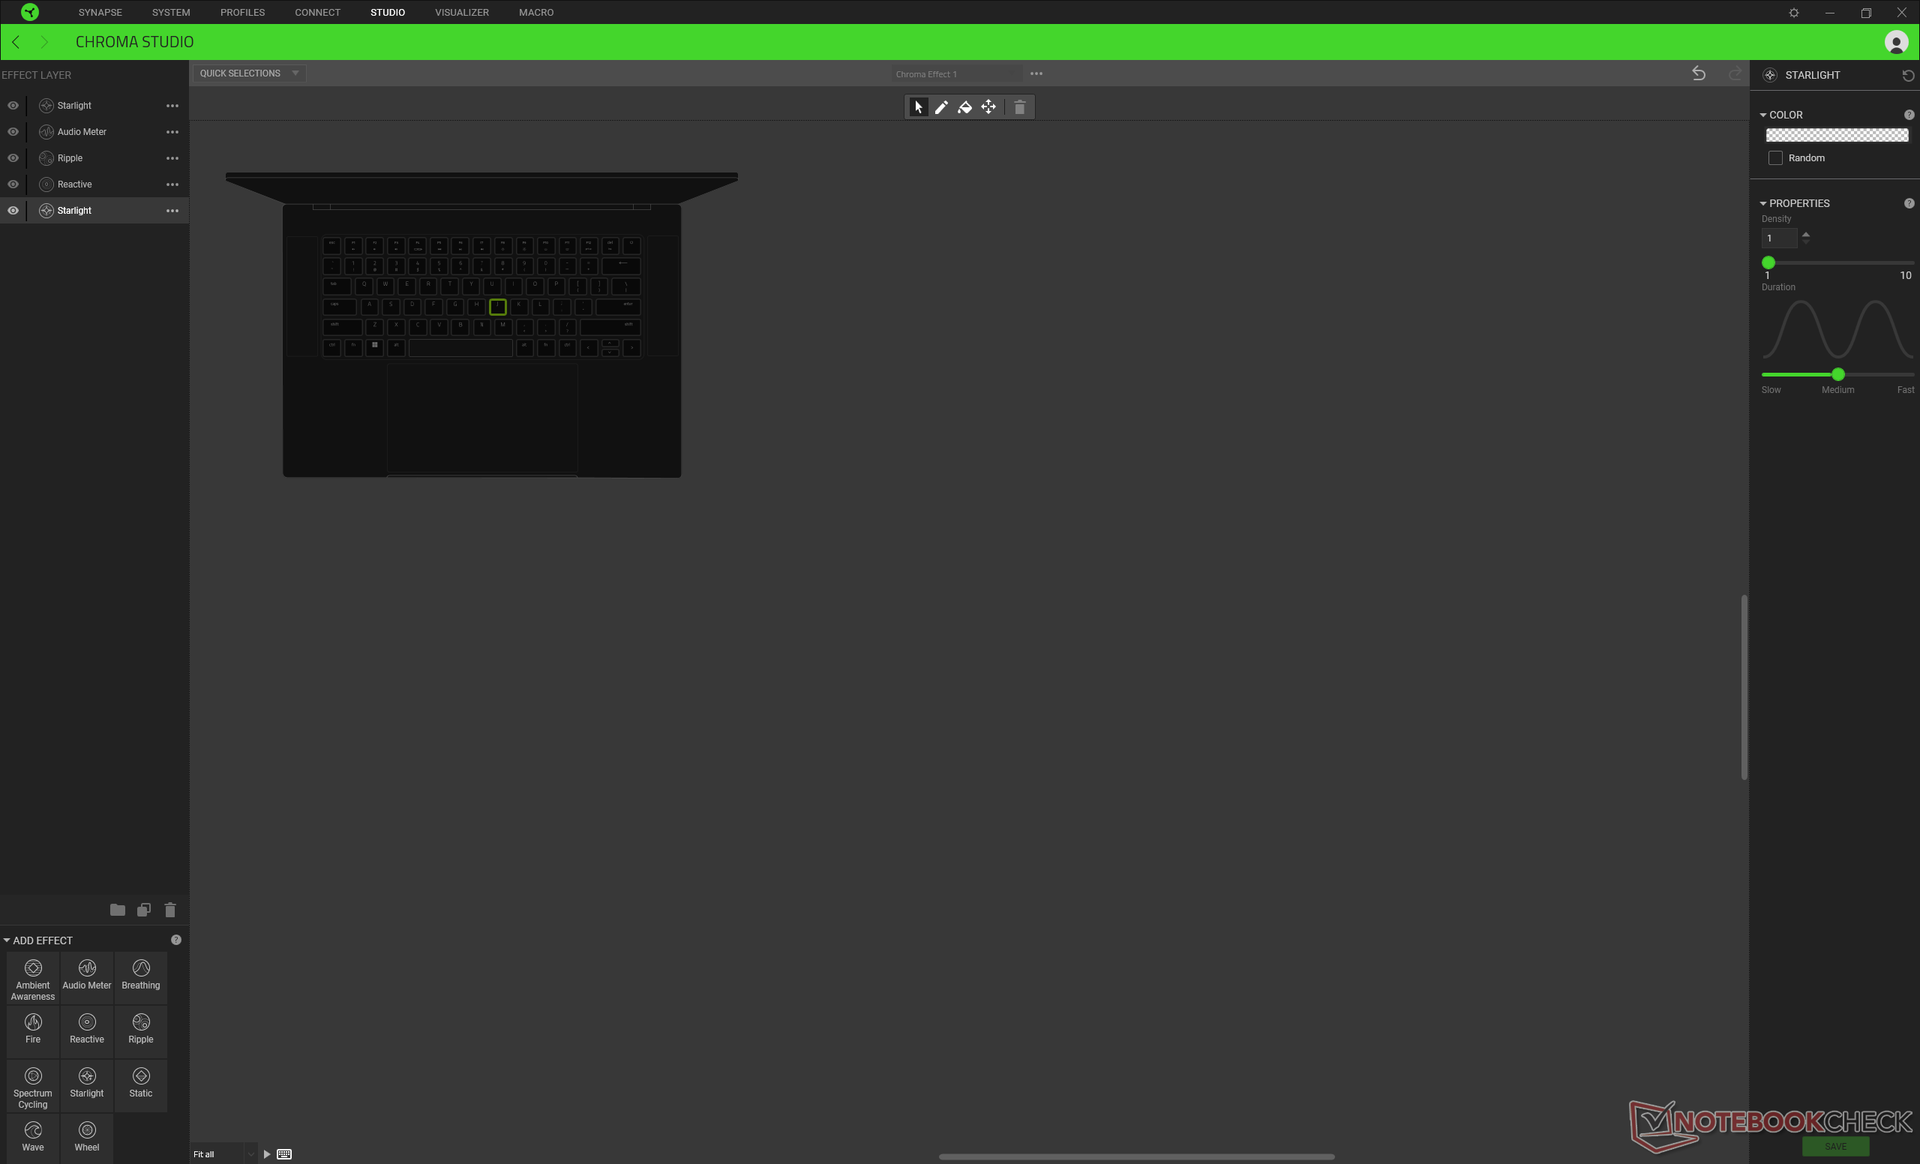
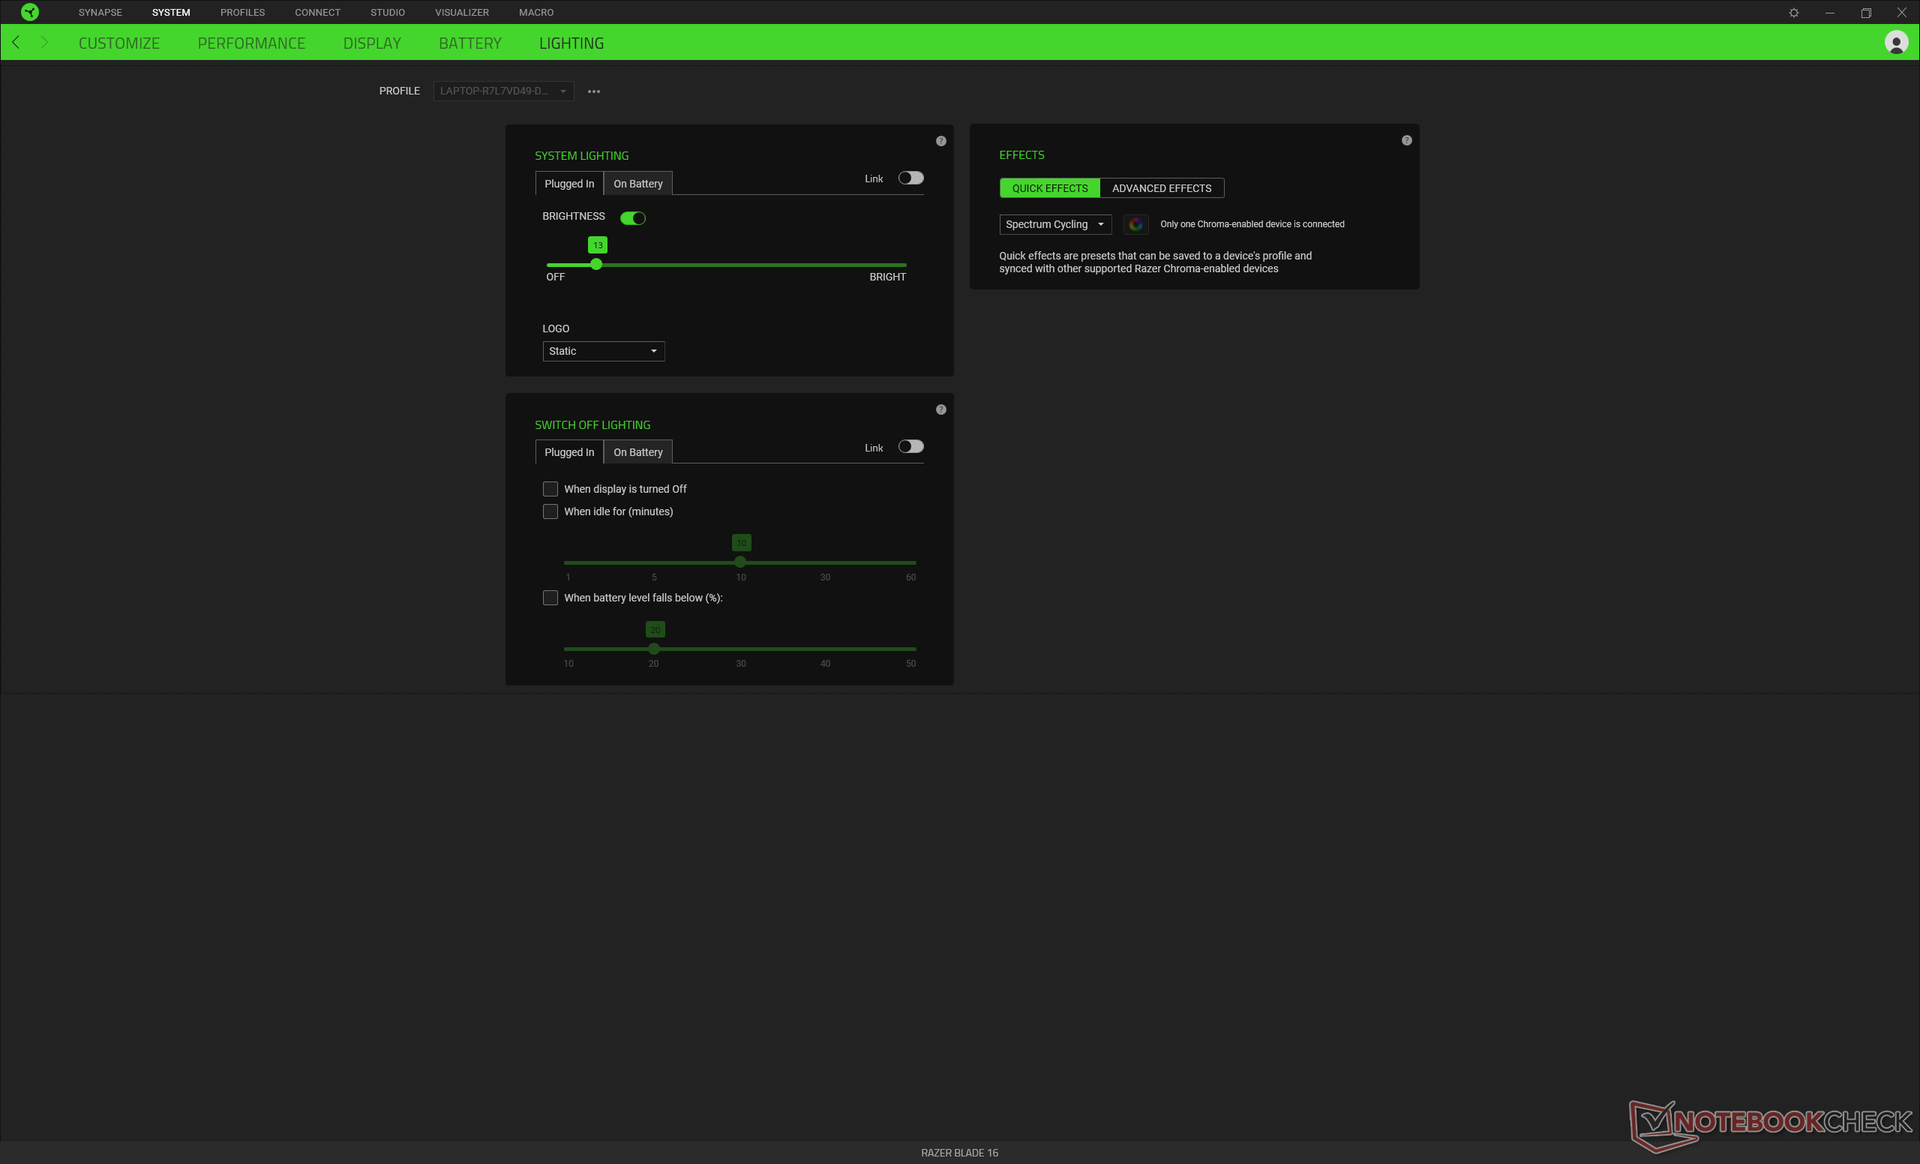
在运行以下任何基准测试之前,我们通过Windows将我们的设备设置为性能模式,并通过Nvidia控制面板设置为dGPU模式。我们还确保将Razer Synapse配置文件设置为自定义,将CPU和GPU分别设置为Boost和High,这应该是可用的最快设置。建议用户熟悉Synapse,因为它是Razer设置的中心枢纽,正如下面几张截图所示。
高级优化的标准意味着用户可以通过Nvidia控制面板在Optimus和独立显卡之间即时切换,而不需要软重启。支持G-Sync,尽管只是在dGPU模式下。请记住,如果连接了任何外部显示器,Optimus模式必须始终处于启用状态。
处理器
我们的第13代 酷睿i9-13950HX比上一代的冠军产品快了约30%。 酷睿i9-12900HX.在循环运行CineBench R15 xT时,性能的可持续性也很好,正如我们下面的对比图所示。结果明显快于任何2022年或更早的Blade 15或Blade 17,特别是因为2022年的Blade 15有一个性能严重不足的 酷睿i7-12800H.
另一方面,单线程性能在各代中一直保持平稳。你的应用程序将不得不利用尽可能多的核心和线程,以充分利用第13代CPU的优势。
AMD目前最快的移动CPU,Zen 3+Ryzen 9 6900HX ,在多线程应用中几乎比我们的Core i9-13950HX慢2倍。今年晚些时候推出的移动Zen 4 ,因为它将与移动Raptor Lake系列直接竞争,所以所有的目光都将聚焦于
此。Cinebench R15 Multi Loop
Cinebench R23: Multi Core | Single Core
Cinebench R20: CPU (Multi Core) | CPU (Single Core)
Cinebench R15: CPU Multi 64Bit | CPU Single 64Bit
Blender: v2.79 BMW27 CPU
7-Zip 18.03: 7z b 4 | 7z b 4 -mmt1
Geekbench 5.5: Multi-Core | Single-Core
HWBOT x265 Benchmark v2.2: 4k Preset
LibreOffice : 20 Documents To PDF
R Benchmark 2.5: Overall mean
* ... smaller is better
AIDA64: FP32 Ray-Trace | FPU Julia | CPU SHA3 | CPU Queen | FPU SinJulia | FPU Mandel | CPU AES | CPU ZLib | FP64 Ray-Trace | CPU PhotoWorxx
系统性能
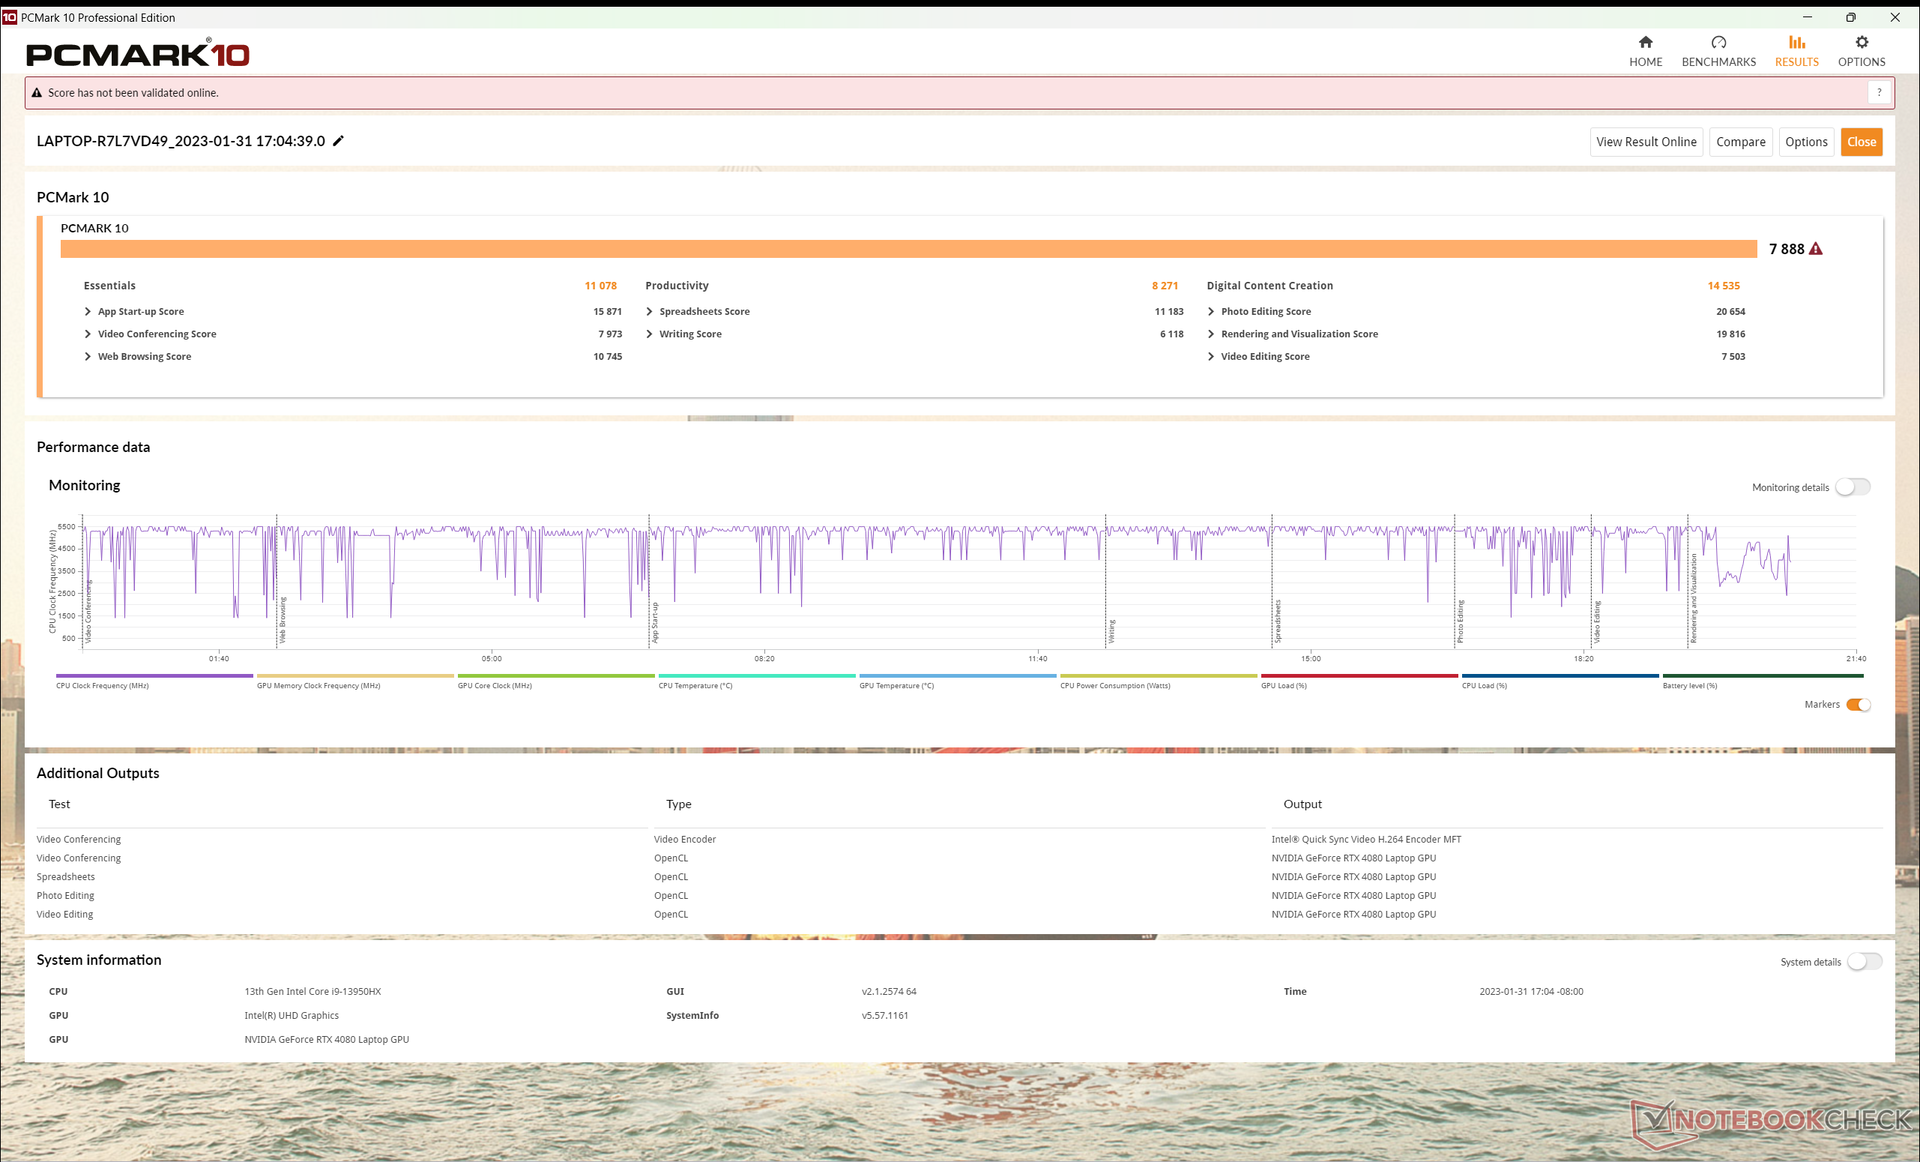
PCMark 10得分平均高于前几代Blade机型,即使差异很小。采用更快的三星PM9A1的游戏笔记本,如 微星GE67 HX可能仍有优势,特别是在生产力分测试中。
CrossMark: Overall | Productivity | Creativity | Responsiveness
| PCMark 10 Score | 7888 points | |
Help | ||
| AIDA64 / Memory Copy | |
| Razer Blade 16 Early 2023 | |
| Razer Blade 16 Early 2023 | |
| Razer Blade 16 Early 2023 | |
| Average Intel Core i9-13950HX (61938 - 78813, n=9) | |
| Average of class Gaming (21750 - 129946, n=105, last 2 years) | |
| Razer Blade 15 Advanced Model Early 2022 | |
| Dell G16 7620 | |
| Asus ROG Zephyrus Duo 16 GX650RX | |
| MSI GE67 HX 12UGS | |
| Lenovo Legion S7 16ARHA7 | |
| HP Omen 16-n0033dx | |
| Razer Blade 17 (i7-12800H, RTX 3070 Ti) | |
| AIDA64 / Memory Read | |
| Razer Blade 16 Early 2023 | |
| Razer Blade 16 Early 2023 | |
| Razer Blade 16 Early 2023 | |
| Average Intel Core i9-13950HX (62368 - 86831, n=9) | |
| Average of class Gaming (22956 - 118858, n=105, last 2 years) | |
| Dell G16 7620 | |
| Razer Blade 15 Advanced Model Early 2022 | |
| MSI GE67 HX 12UGS | |
| Razer Blade 17 (i7-12800H, RTX 3070 Ti) | |
| Asus ROG Zephyrus Duo 16 GX650RX | |
| Lenovo Legion S7 16ARHA7 | |
| HP Omen 16-n0033dx | |
| AIDA64 / Memory Write | |
| Razer Blade 16 Early 2023 | |
| Razer Blade 16 Early 2023 | |
| Razer Blade 16 Early 2023 | |
| Average of class Gaming (22297 - 135096, n=105, last 2 years) | |
| Average Intel Core i9-13950HX (59501 - 80441, n=9) | |
| Razer Blade 15 Advanced Model Early 2022 | |
| MSI GE67 HX 12UGS | |
| Asus ROG Zephyrus Duo 16 GX650RX | |
| Dell G16 7620 | |
| Lenovo Legion S7 16ARHA7 | |
| HP Omen 16-n0033dx | |
| Razer Blade 17 (i7-12800H, RTX 3070 Ti) | |
| AIDA64 / Memory Latency | |
| Average of class Gaming (75.3 - 259, n=105, last 2 years) | |
| Dell G16 7620 | |
| Razer Blade 16 Early 2023 | |
| Razer Blade 16 Early 2023 | |
| Razer Blade 16 Early 2023 | |
| MSI GE67 HX 12UGS | |
| Razer Blade 15 Advanced Model Early 2022 | |
| Asus ROG Zephyrus Duo 16 GX650RX | |
| Average Intel Core i9-13950HX (84.4 - 99.5, n=9) | |
| HP Omen 16-n0033dx | |
| Lenovo Legion S7 16ARHA7 | |
| Razer Blade 17 (i7-12800H, RTX 3070 Ti) | |
* ... smaller is better
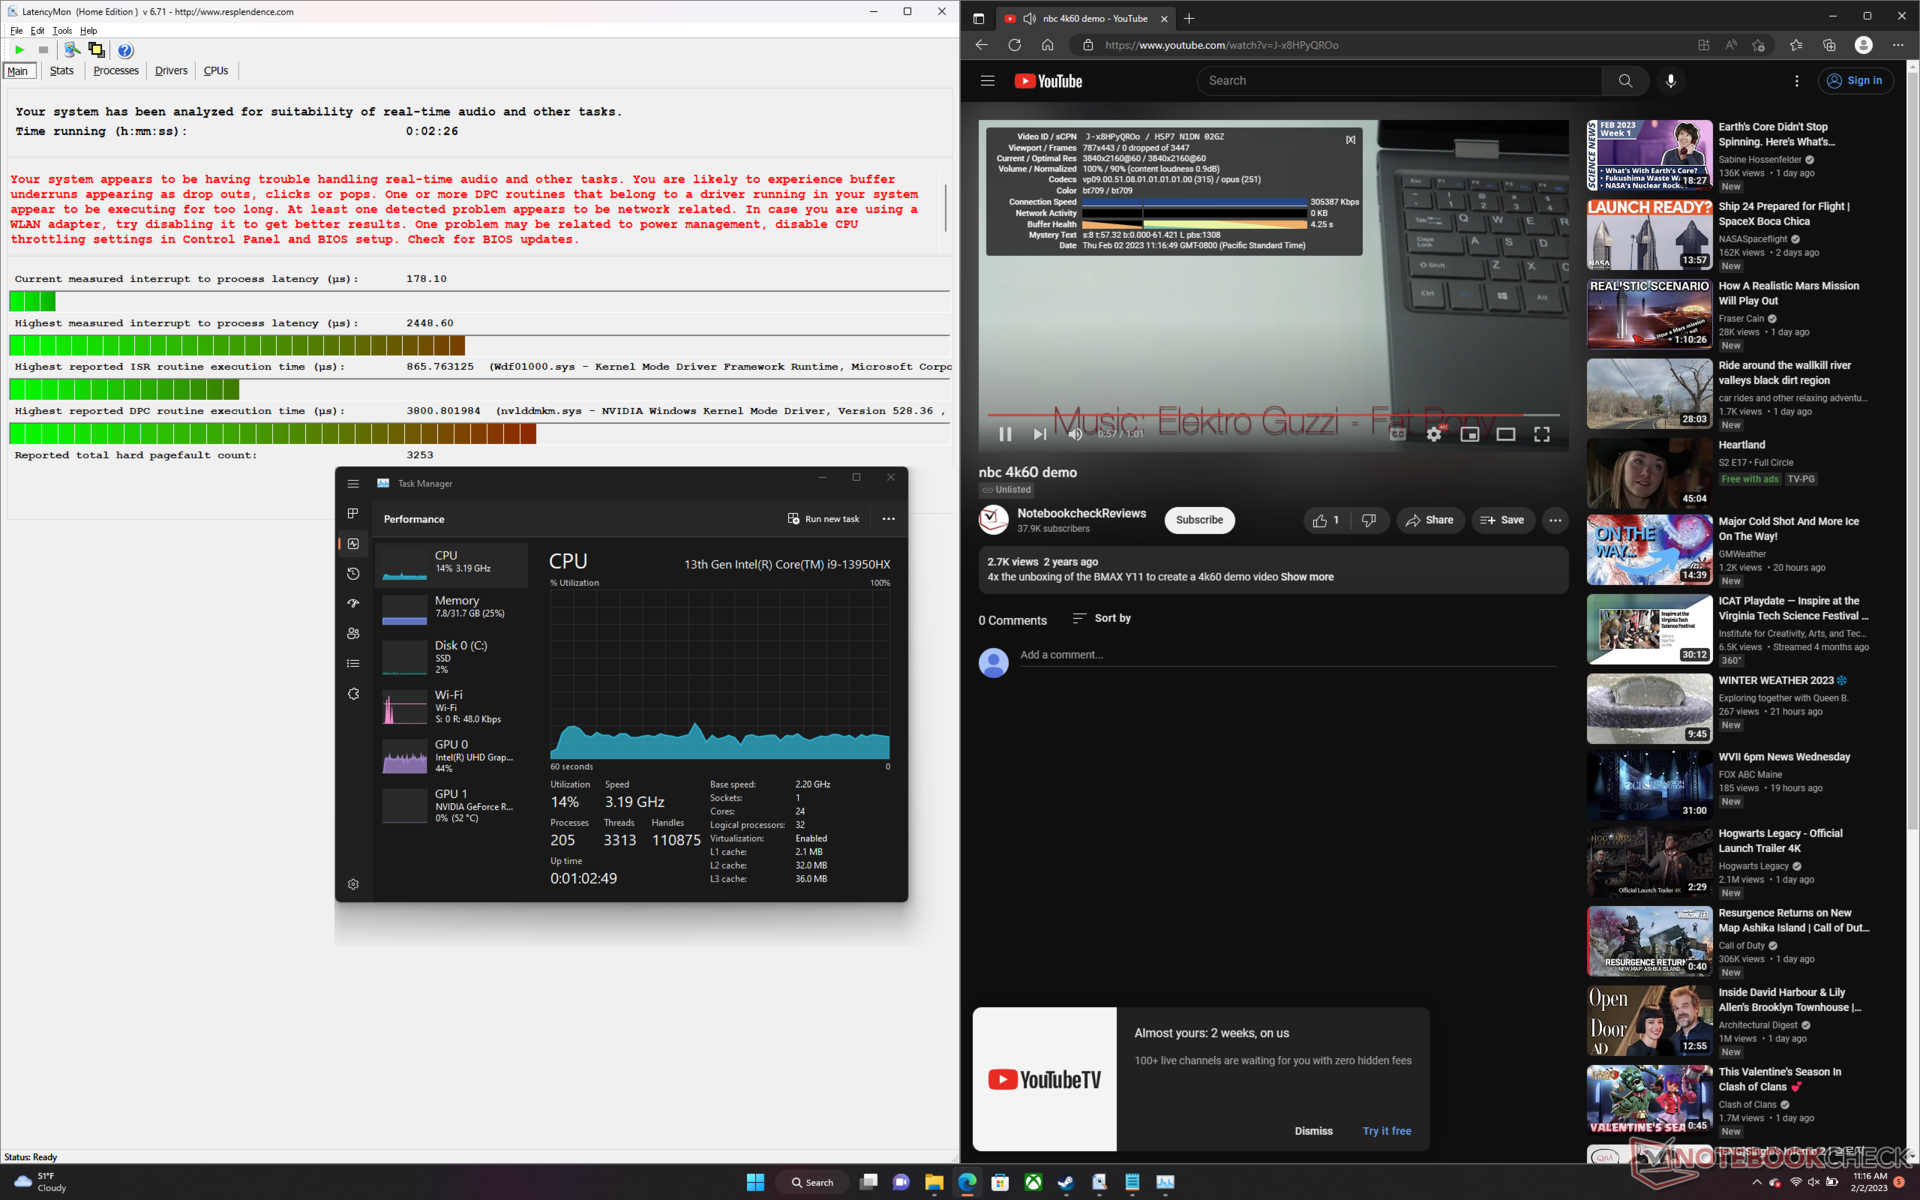
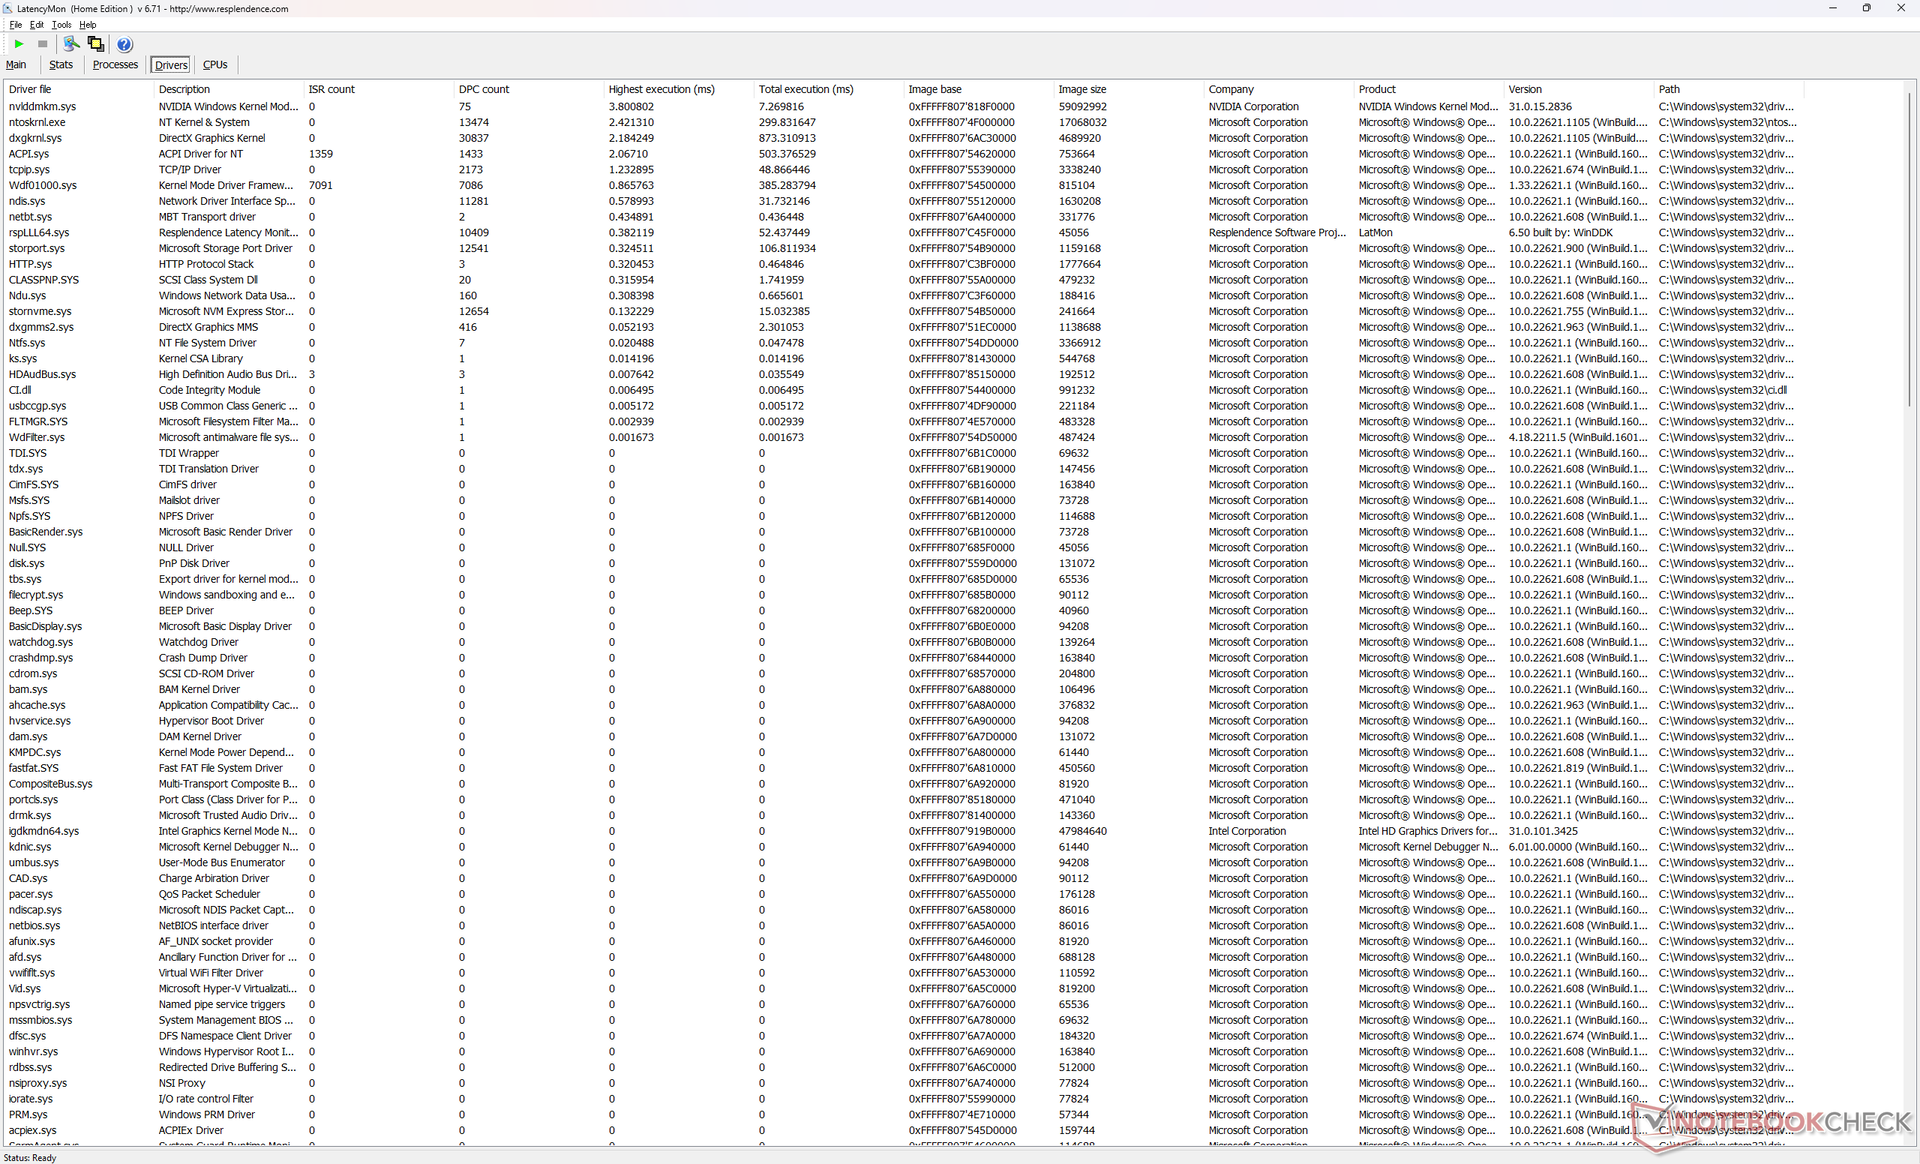
DPC延时
LatencyMon显示了在我们的主页上打开多个浏览器标签时的DPC问题。在60 FPS的情况下,4K视频播放很流畅,没有任何掉帧。
| DPC Latencies / LatencyMon - interrupt to process latency (max), Web, Youtube, Prime95 | |
| Razer Blade 15 Advanced Model Early 2022 | |
| Razer Blade 16 Early 2023 | |
| MSI GE67 HX 12UGS | |
| HP Omen 16-n0033dx | |
| Lenovo Legion S7 16ARHA7 | |
| Dell G16 7620 | |
| Razer Blade 17 (i7-12800H, RTX 3070 Ti) | |
| Asus ROG Zephyrus Duo 16 GX650RX | |
* ... smaller is better
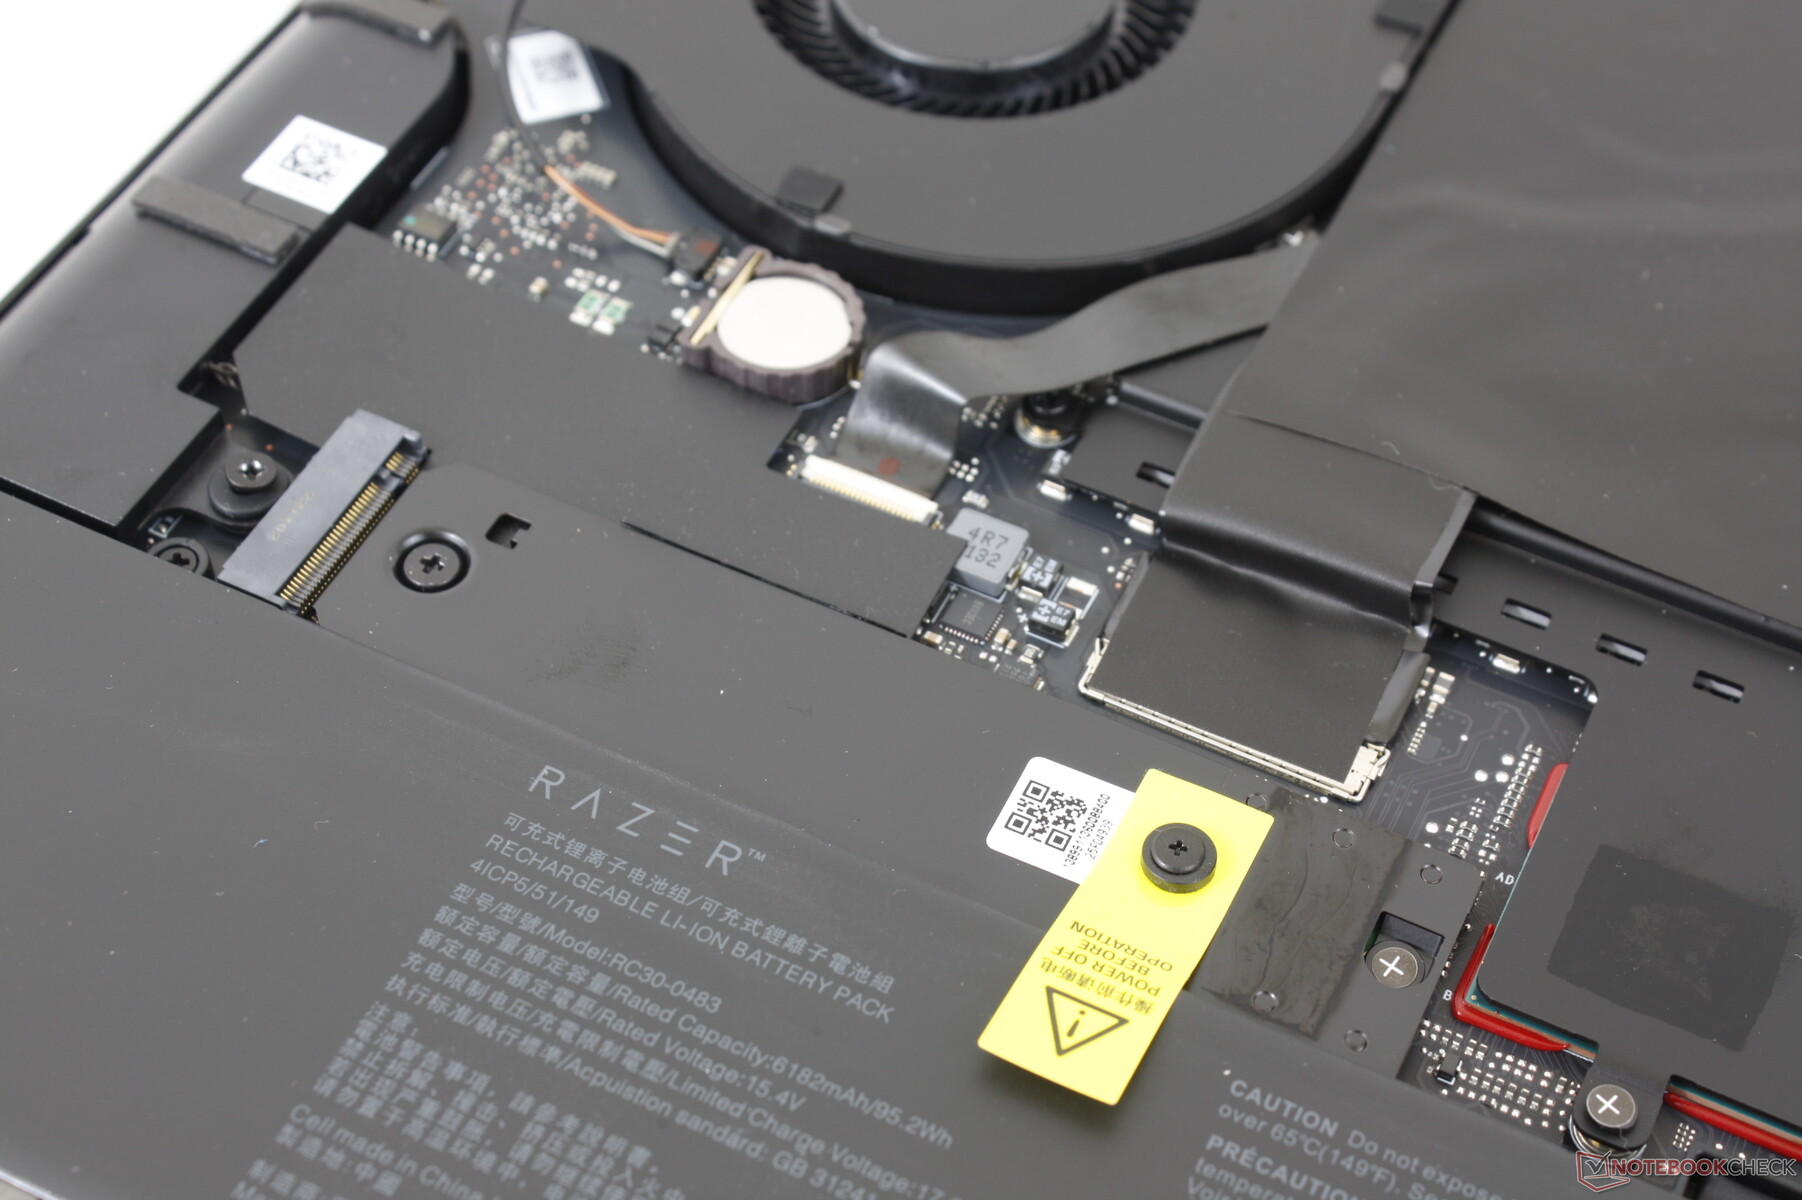
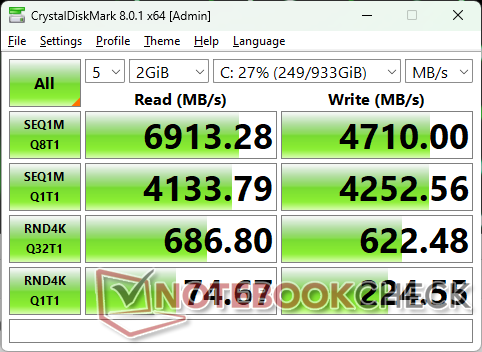
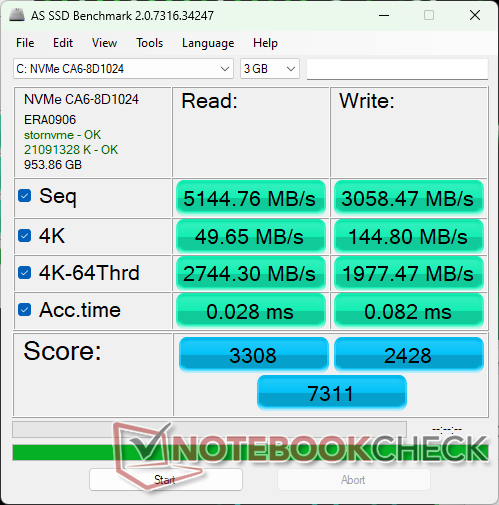
存储设备 - 最多支持2个PCIe4固态硬盘
我们的Blade 16设备配备了相同的1 TB SSSTC CA6-8D1024驱动器,与2021和 2022年刀片15机型。尽管在我们的测试中,连续传输率仍然非常好,高达6900MB/s,但其对较小的SEQ Q8 T1工作负载的读写率却落后于竞争对手的三星PM9A1。雷蛇仍在运送装有三星驱动器的Blade 17设备,因此,目前Blade 16的出货量可能会携带两家制造商的SSD。
与Blade 15和Blade 17一样,最多支持两个内部M.2固态硬盘。然而,在Blade 16上,Razer将两个驱动器堆叠在一起,为其他组件保留主板空间,如更大的电池容量和冷却解决方案。

* ... smaller is better
Disk Throttling: DiskSpd Read Loop, Queue Depth 8
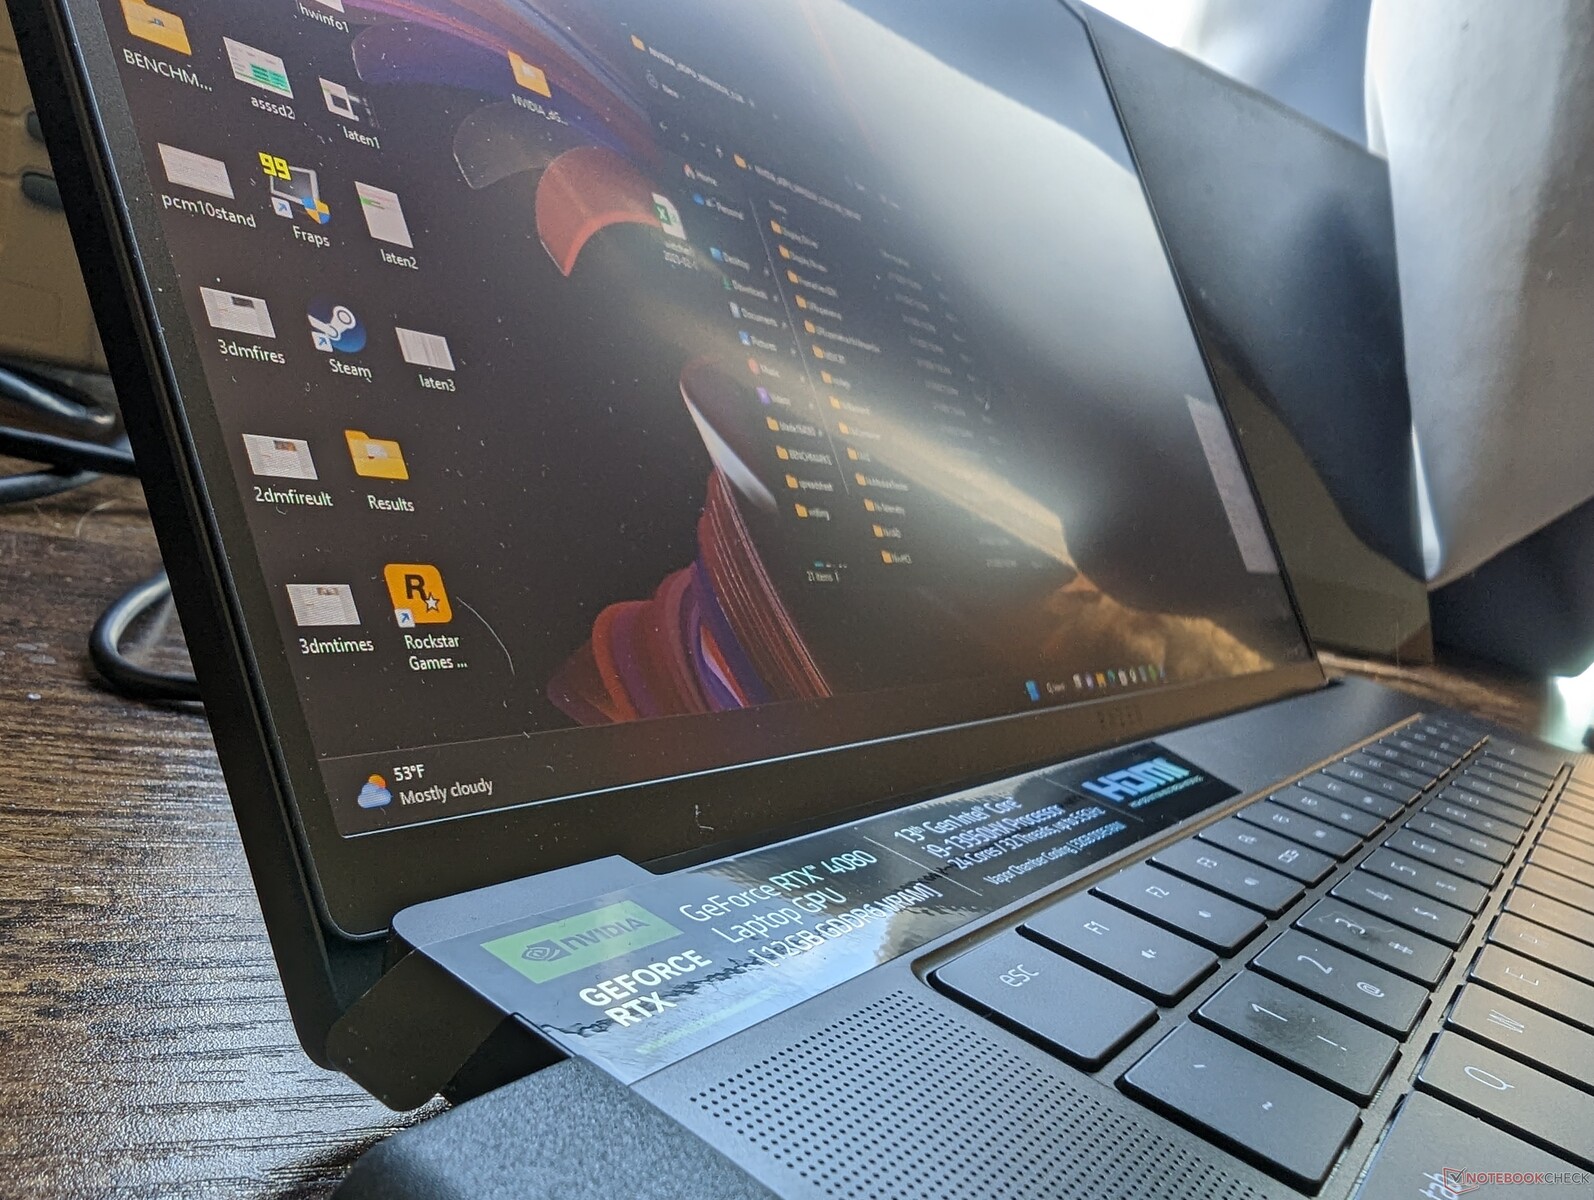
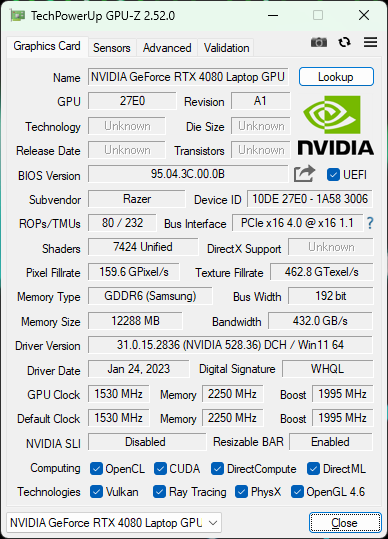
GPU性能 - 175 W TGPGeForce RTX 4080
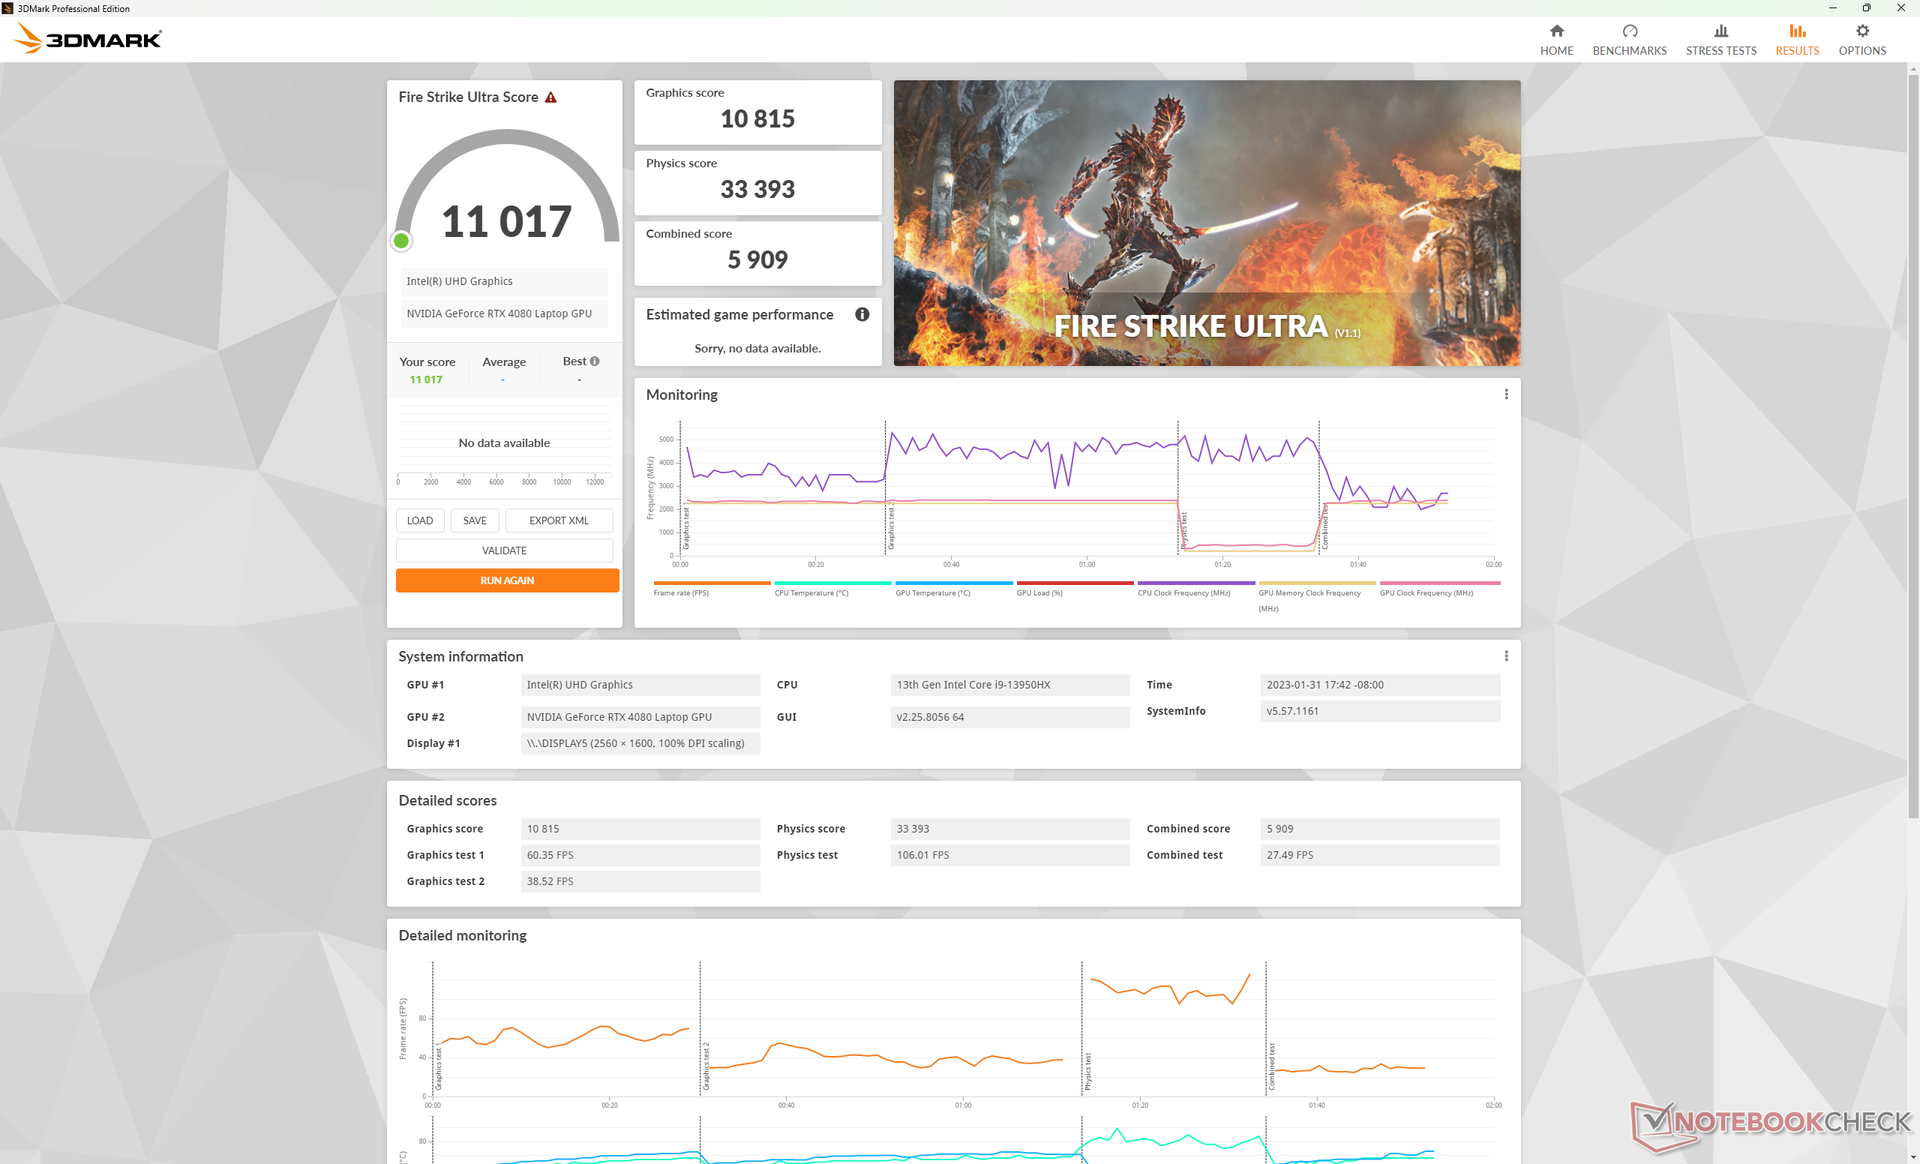
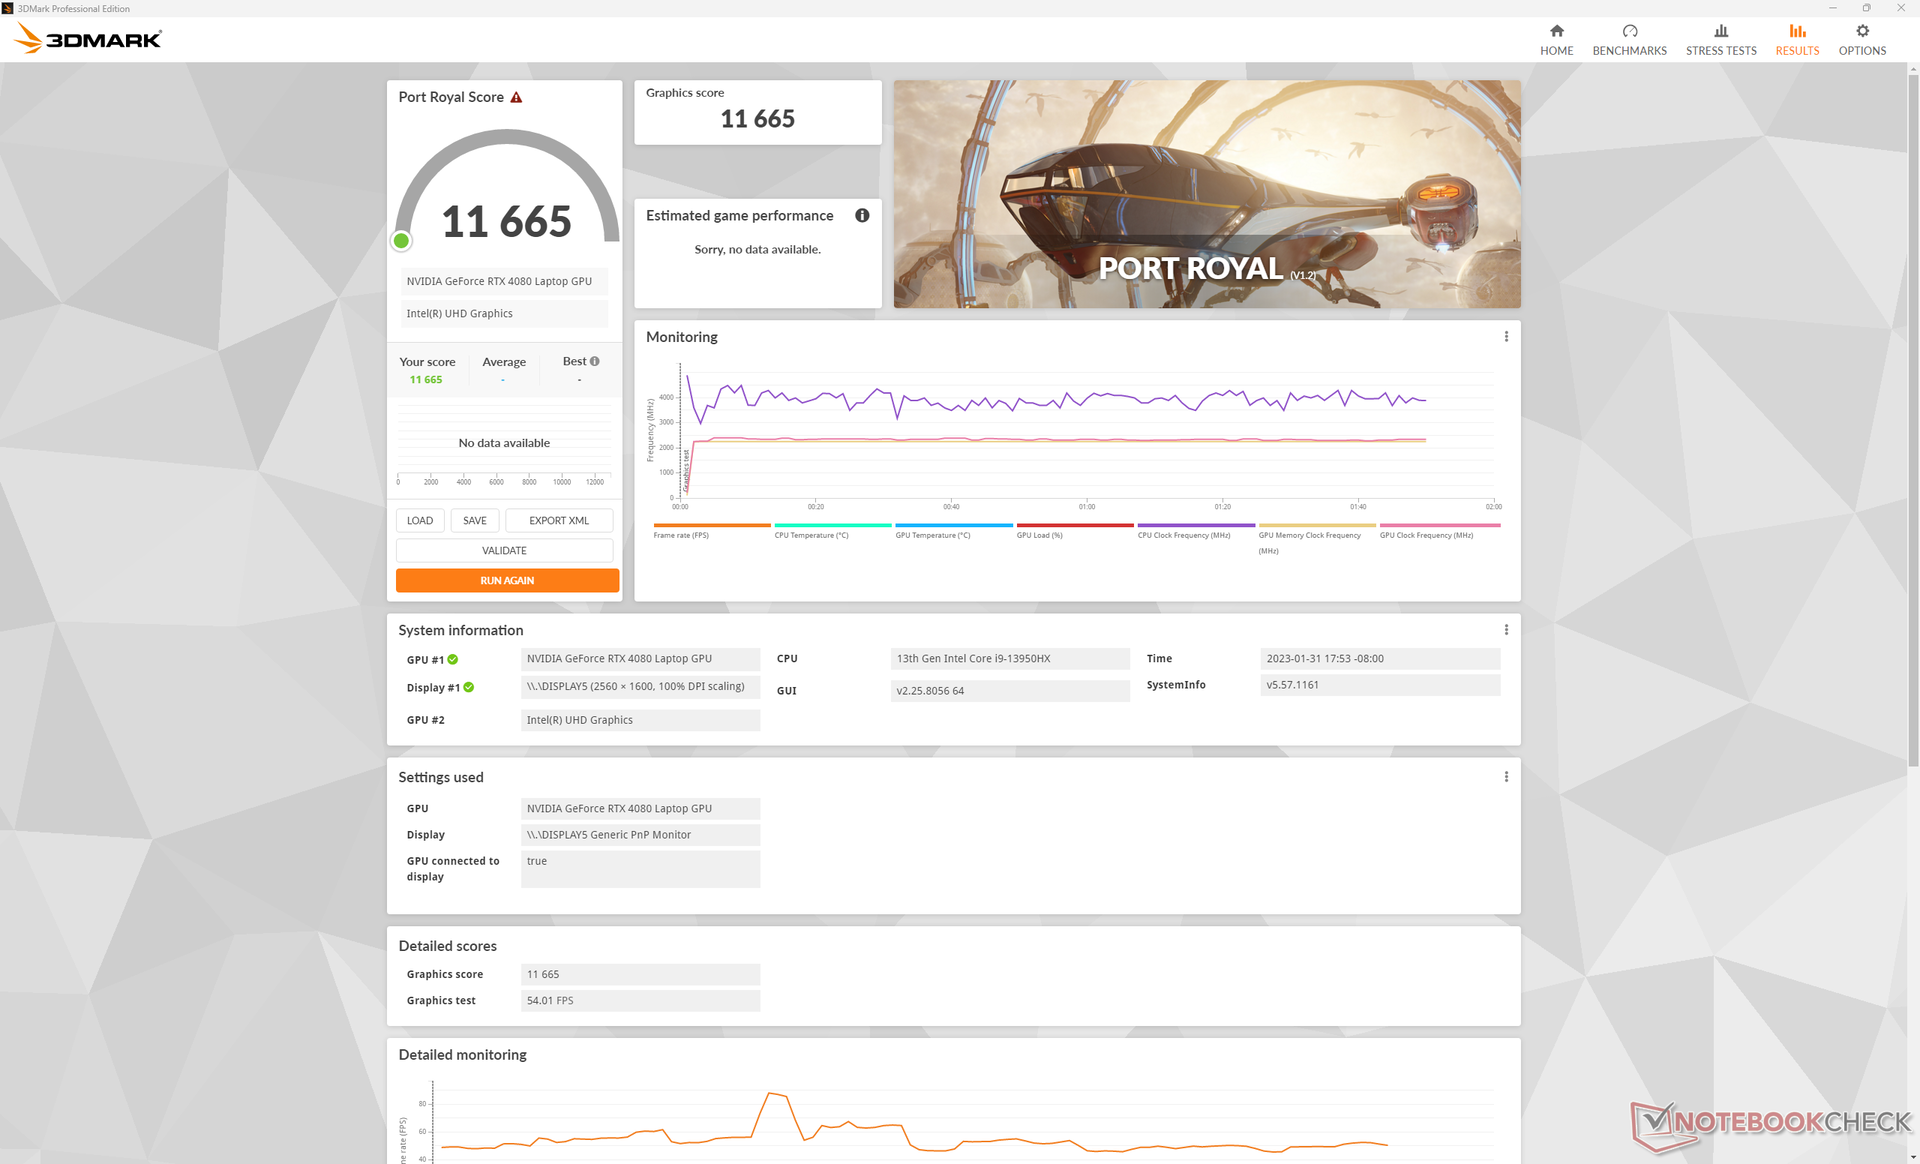
原始图形性能比上一代产品大约快30%至50%。 移动RTX 3080 Ti这与Nvidia声称的40%的基因改进相吻合。性能优势还包括光线追踪的潜力,皇家港的得分比大多数基于安培的游戏笔记本快1.5倍到2.5倍。移动GeForce RTX 4080确实是在两年的移动GeForce 30选择之后的一次代际飞跃。
如果游戏支持DLSS 3.0,性能甚至会快2到3倍。我们下面测试的游戏是在没有DLSS的情况下运行的,以便进行更公平的世代比较,但强烈建议启用DLSS 3.0,因为它所带来的轻微伪影或输入延迟被帧率的提升所掩盖。请参阅我们的专门网页 移动GeForce RTX 4080和 4090 以了解关于GeForce 40系列的更多基准测试和信息。更多的游戏将在接下来的几周内进行基准测试和添加。不幸的是,截至目前,许多流行的游戏不支持DLSS 3.0,包括《堡垒之夜》 和《Elden Ring》。
尽管移动RTX 4080令人印象深刻,但它仍然落后于我们的 桌面GeForce RTX 4080参考的35%到40%。因此,用户可以期待移动RTX 4080的性能更像一个 桌面RTX 3080相反,当DLSS 3.0被禁用时。
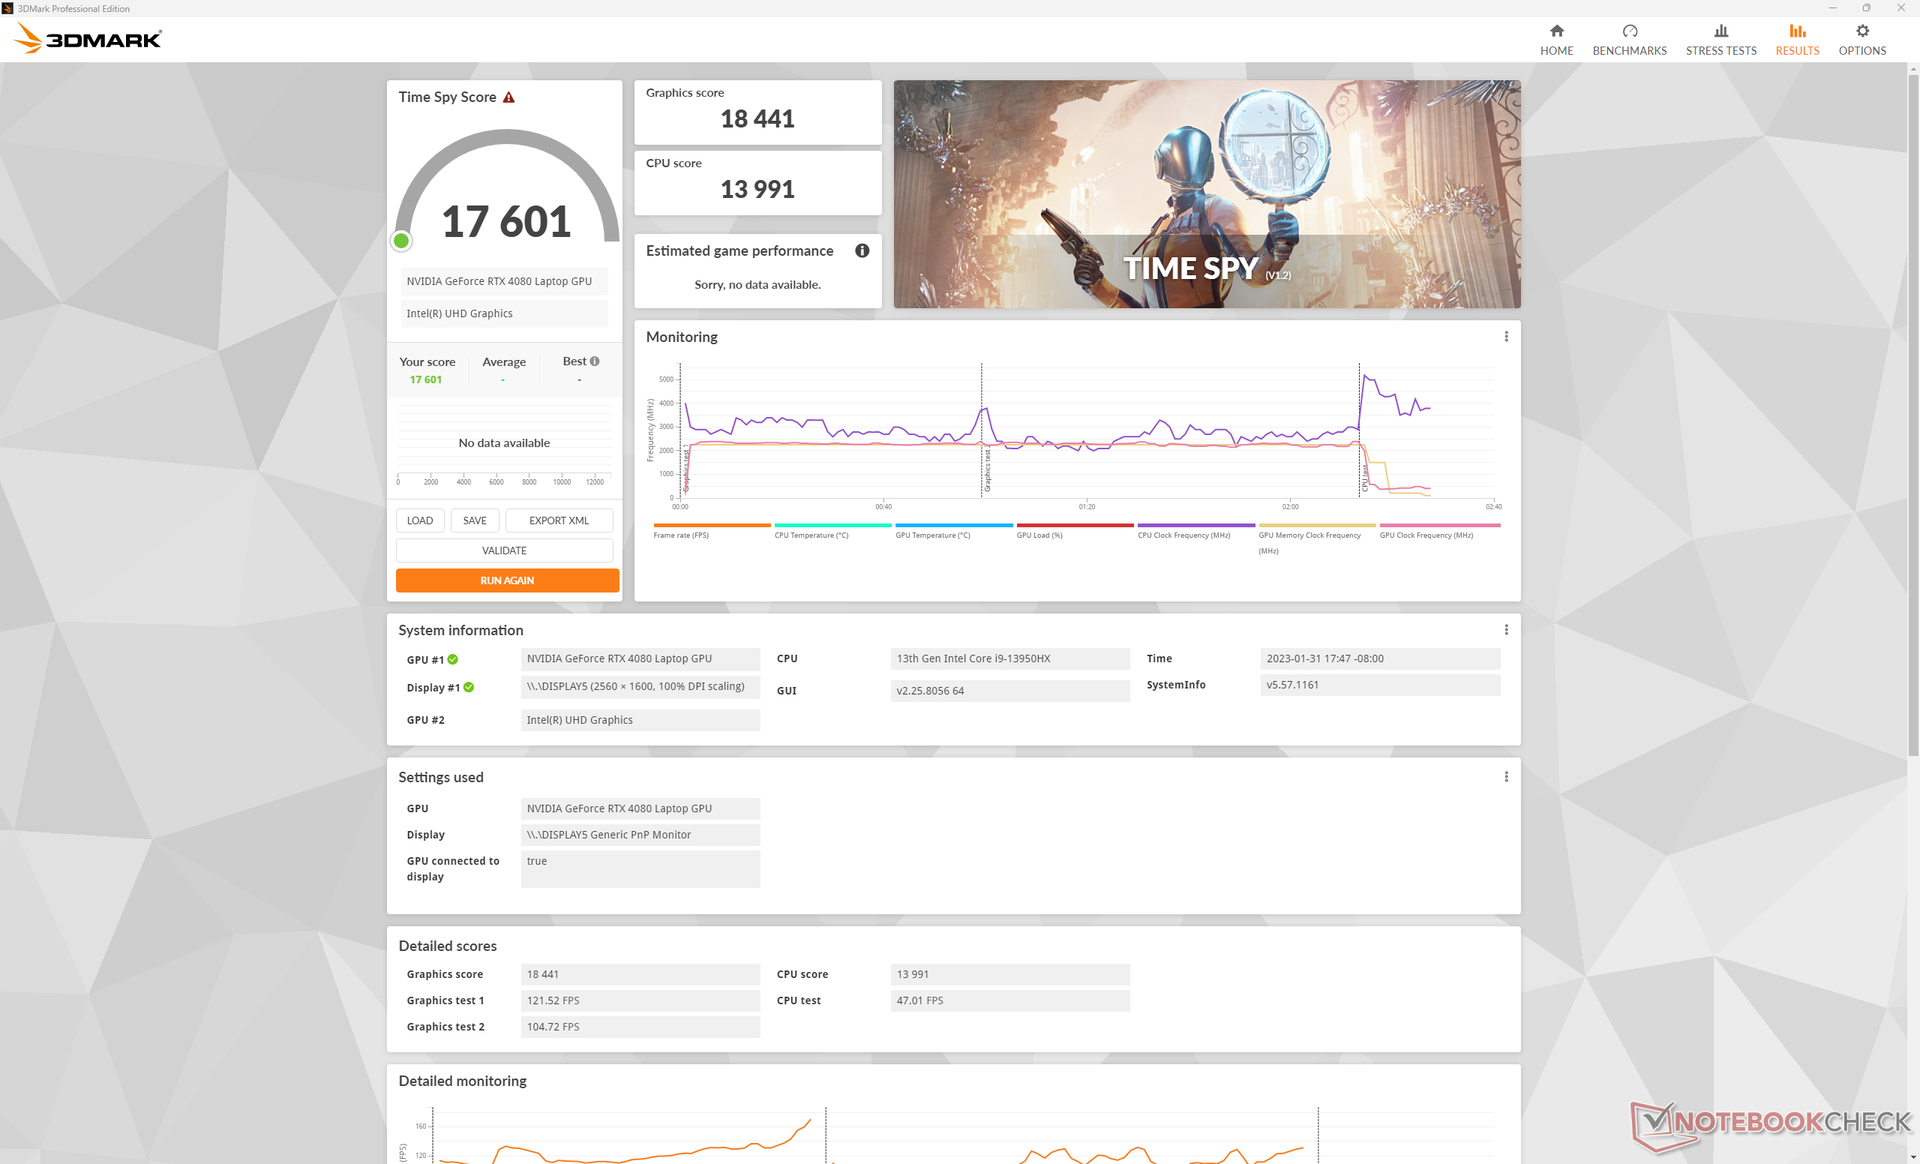
根据Time Spy ,在平衡模式而不是性能模式下运行Blade 16将影响图形性能10%。
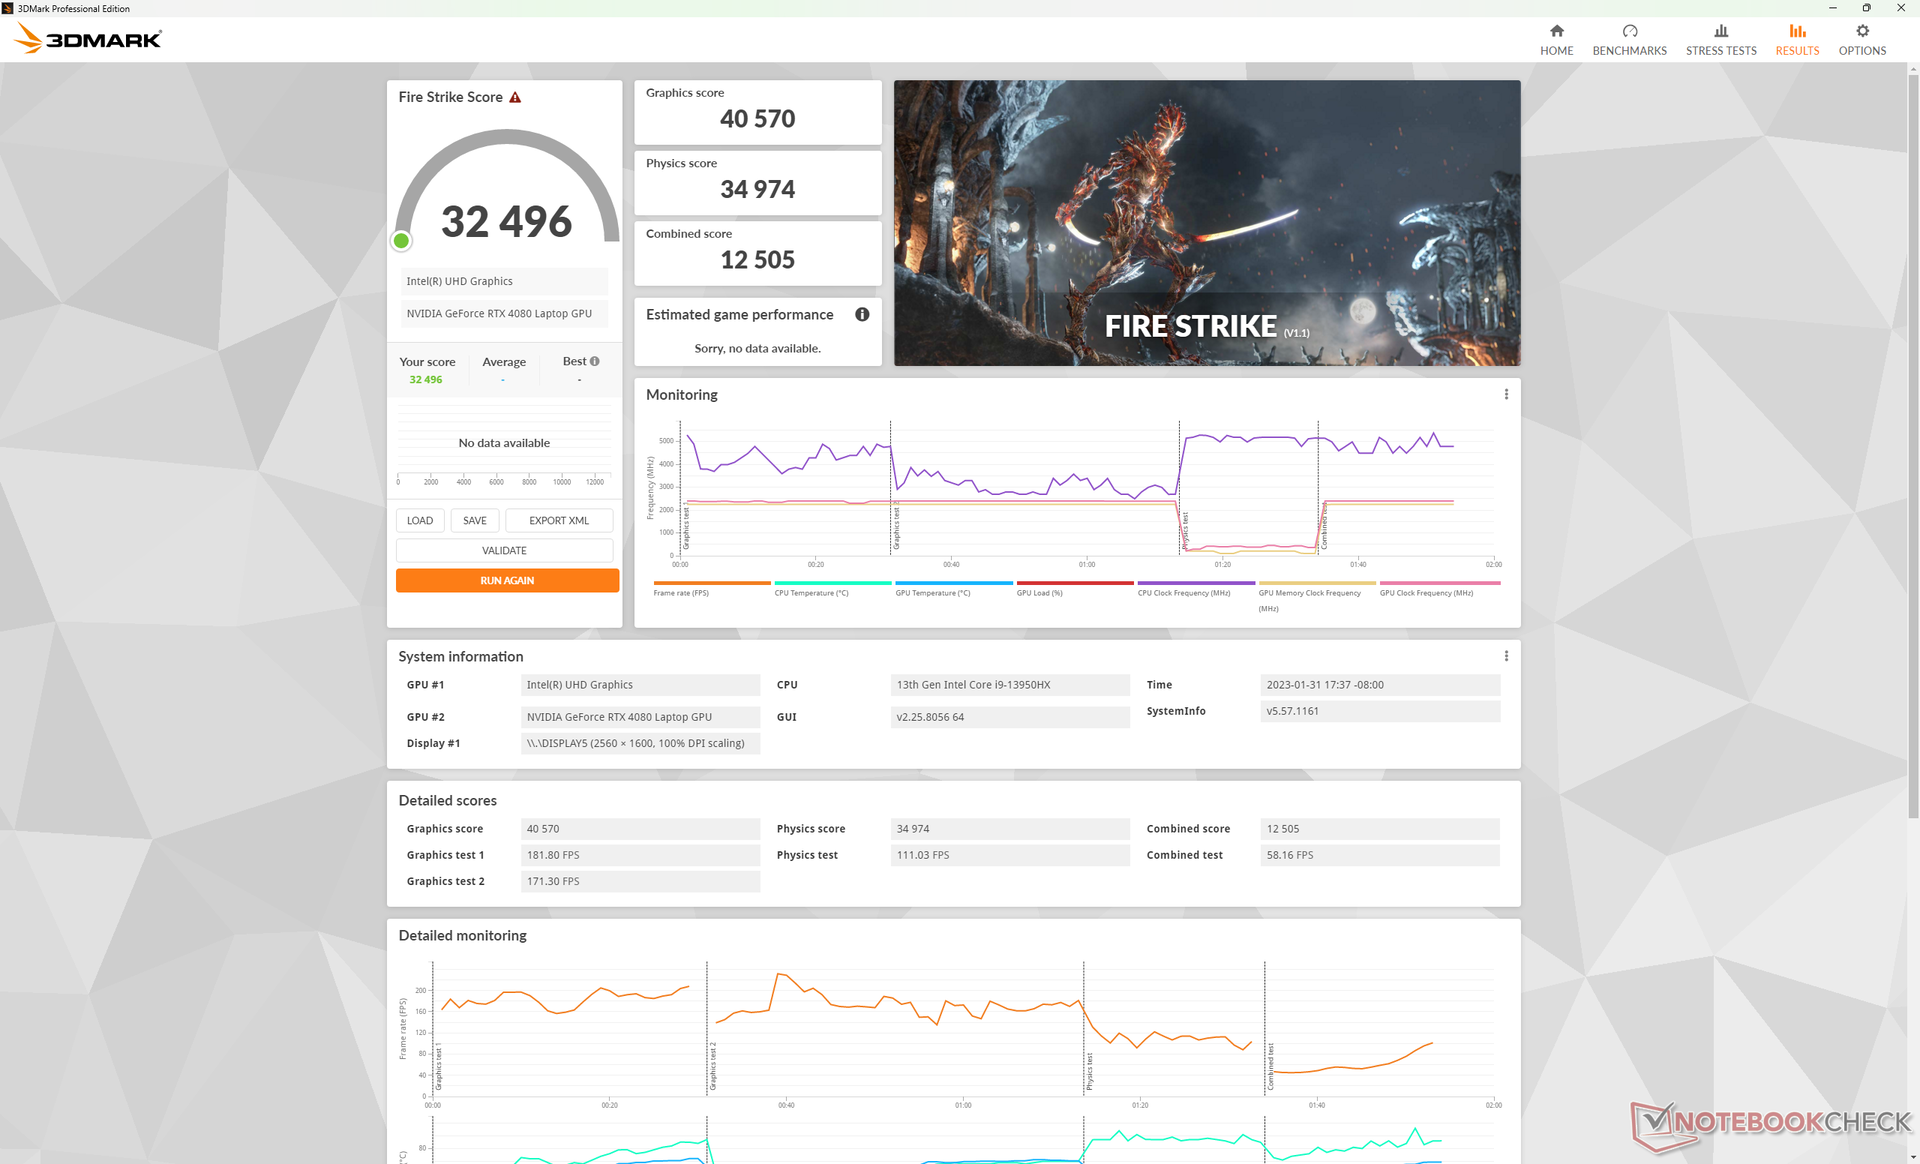

| 3DMark 11 Performance | 41542 points | |
| 3DMark Fire Strike Score | 32496 points | |
| 3DMark Time Spy Score | 17601 points | |
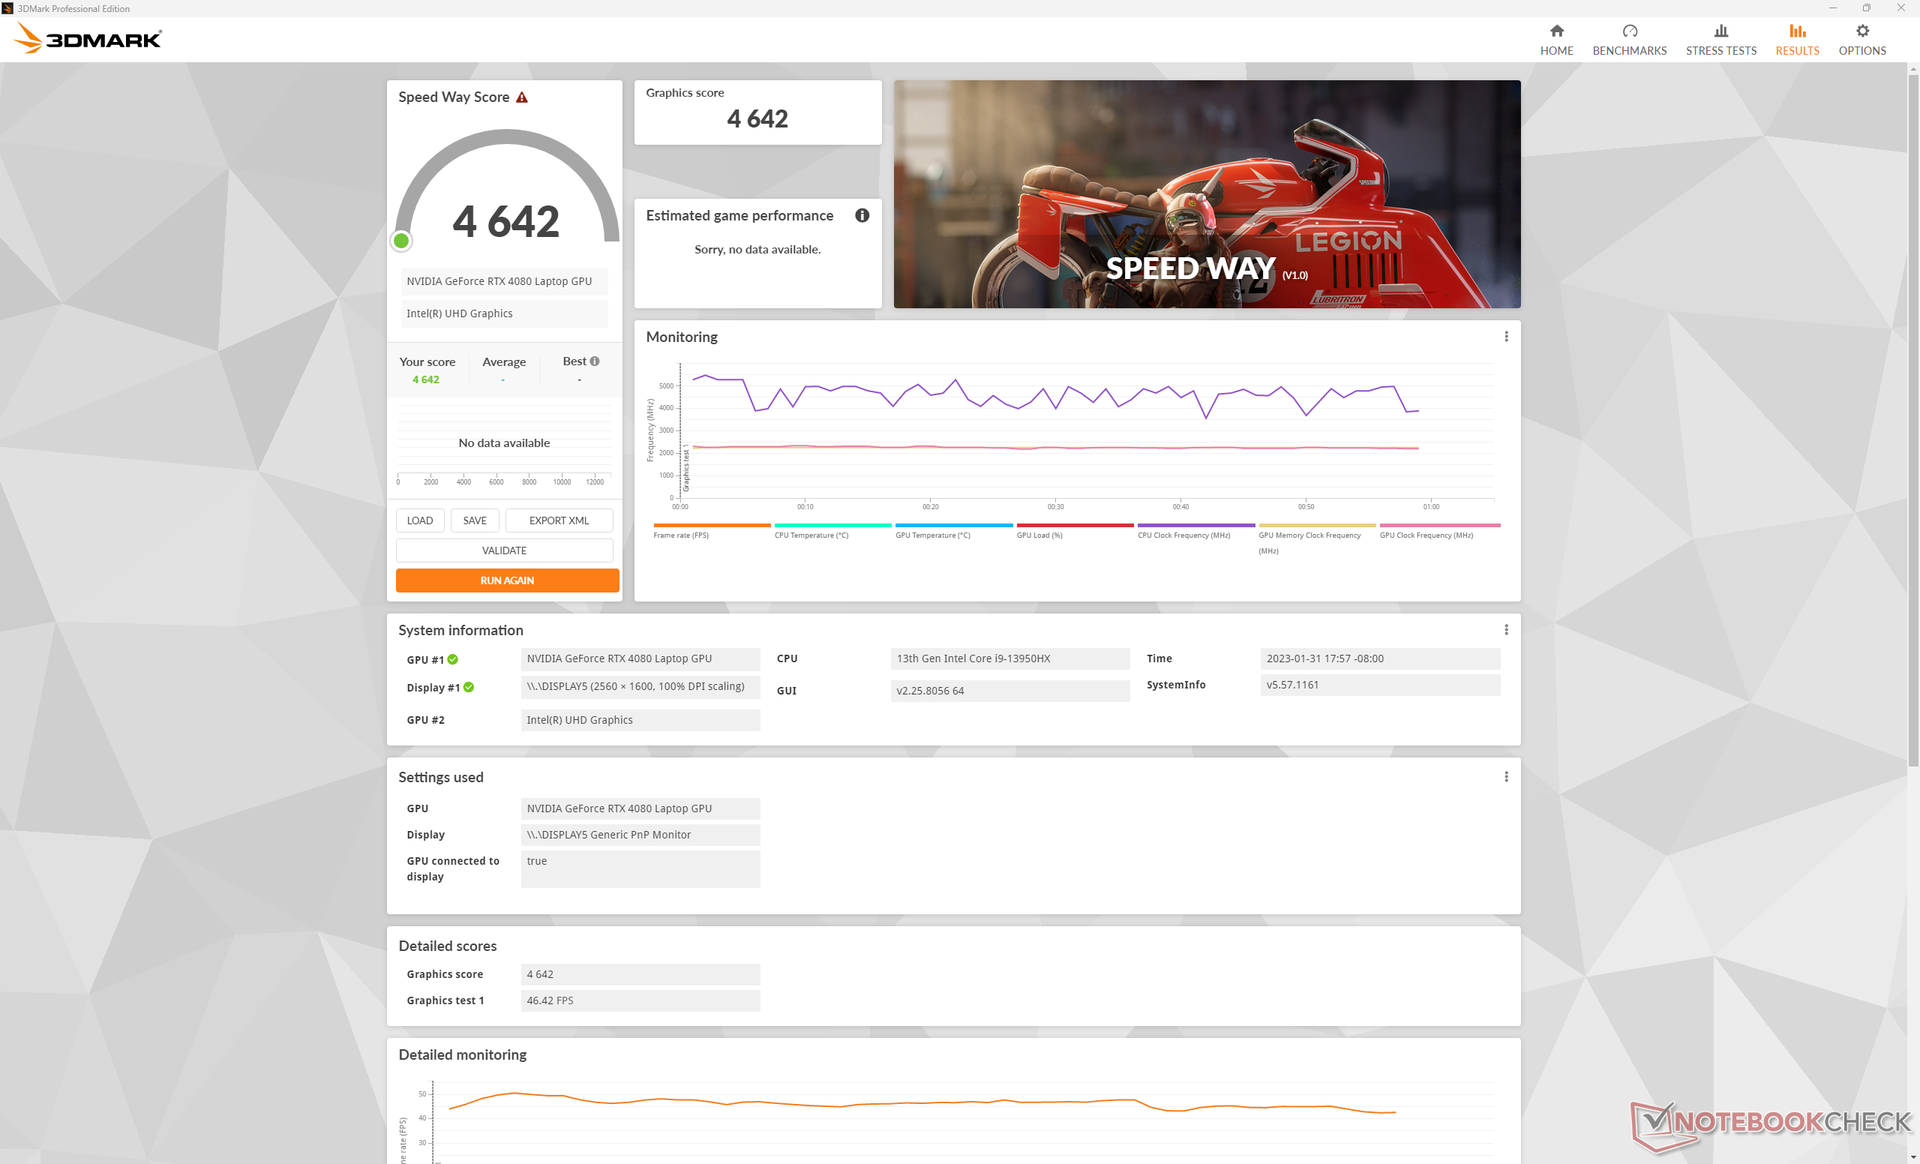
| 3DMark Steel Nomad Score | 4021 points | |
| 3DMark Steel Nomad Light Score | 16652 points | |
Help | ||
* ... smaller is better
在Witcher 3 1080p Ultra上空转显示,随着时间的推移,性能没有明显下降或节流。Time Spy 的压力测试运行将导致最终得分达到98.5%。
Witcher 3 FPS Chart
| low | med. | high | ultra | QHD DLSS | QHD FSR | QHD | 4K DLSS | 4K FSR | 4K | |
|---|---|---|---|---|---|---|---|---|---|---|
| GTA V (2015) | 186.6 | 185.2 | 183.4 | 140.7 | 125.2 | 143.7 | ||||
| The Witcher 3 (2015) | 609.6 | 462.7 | 353.5 | 176.8 | 120.6 | |||||
| Dota 2 Reborn (2015) | 218 | 204 | 196 | 194.7 | 176.7 | |||||
| Final Fantasy XV Benchmark (2018) | 195.8 | 184.1 | 157.8 | 120.1 | 74.1 | |||||
| X-Plane 11.11 (2018) | 201 | 177.7 | 137 | 117.5 | ||||||
| Strange Brigade (2018) | 438 | 365 | 351 | 323 | 237 | 122.3 | ||||
| Shadow of the Tomb Raider (2018) | 228 | 201 | 196 | 176 | 154 | 84 | ||||
| Metro Exodus (2019) | 197 | 170.4 | 145 | 121.7 | 102 | 67 | ||||
| Control (2019) | 239.1 | 204.7 | 157 | 102 | 50.1 | |||||
| Borderlands 3 (2019) | 207.7 | 176.6 | 158.1 | 133.5 | 108.7 | 59.8 | ||||
| Valorant (2020) | 336 | |||||||||
| Horizon Zero Dawn (2020) | 128 | 112 | ||||||||
| Mafia Definitive Edition (2020) | 280.3 | 184 | 171.3 | 121.6 | 70.4 | |||||
| Watch Dogs Legion (2020) | 140 | 129 | 121 | 110 | 93 | 56 | ||||
| Far Cry 6 (2021) | 181 | 149 | 134 | 125 | 115 | 71 | ||||
| Dying Light 2 (2022) | 184.1 | 160.4 | 140.9 | 97.8 | 48.6 | |||||
| Cyberpunk 2077 1.6 (2022) | 121.1 | 118.1 | 113.8 | 106.2 | 81.2 | 40 | ||||
| Ghostwire Tokyo (2022) | 198.7 | 159.6 | 154 | 145 | 135.9 | 73.1 | ||||
| The Callisto Protocol (2022) | 177.8 | 159.8 | 119.9 | 120.4 | 93.1 | 55.3 | ||||
| Baldur's Gate 3 (2023) | 168.3 | 160 | 121.9 | 120.5 | 66.7 | |||||
| Cyberpunk 2077 (2023) | 110 | 93.6 | 80.6 | 44.4 | 36.2 | 35 | ||||
| Alan Wake 2 (2023) | 66.9 | 37 | ||||||||
| Skull & Bones (2024) | 50 | |||||||||
| Horizon Forbidden West (2024) | 56.1 | 54.8 | 39.5 | |||||||
| F1 24 (2024) | 226 | 236 | 251 | 117.7 | 118.8 | 92.5 | 76.3 | 65 | 38.8 | |
| Black Myth: Wukong (2024) | 110 | 89 | 71 | 42 | 47 | 31 | 33 | 18 | ||
| Star Wars Outlaws (2024) | 84.3 | 81.5 | 74.1 | 64.4 | 59.1 | 47.7 | 35.8 | 20.5 | ||
| Call of Duty Black Ops 6 (2024) | 107 | 100 | 65 | 62 | ||||||
| Stalker 2 (2024) | 63.1 | 50.3 | 30.9 | |||||||
| Marvel Rivals (2024) | 145 | 120 | 88 | 74 | 56 | |||||
| Indiana Jones and the Great Circle (2024) | 96.4 | 80.3 | 51 | |||||||
| Kingdom Come Deliverance 2 (2025) | 92.3 | 92.3 | 71.2 | |||||||
| Monster Hunter Wilds (2025) | 63.3 | 62 | 54.8 | 48 | 34.4 | |||||
| Civilization 7 (2025) | 155.1 | 117.3 | 105.8 | 50.2 | ||||||
| Assassin's Creed Shadows (2025) | 69 | 50 | 52 | 44 | 41 | 32 | ||||
| Doom: The Dark Ages (2025) | 112.5 | 102.8 | 94.6 | 93.8 | 86.6 | 65.4 | 51.9 | 53.1 | 34.7 | |
| F1 25 (2025) | 172.5 | 171.9 | 44.2 | 46.1 | 26.5 | 24.2 | 12.2 | |||
| Borderlands 4 (2025) | 58.5 | 30.5 | 46.1 | 26.2 | ||||||
| Battlefield 6 (2025) | 128.9 | 121.9 | 115.1 | 103.8 | 113.8 | 75.5 | 70.1 | 53.7 | ||
| The Outer Worlds 2 (2025) | 83.7 | 79.7 | 73.6 | 61.1 | 31.1 | 43.4 | ||||
| ARC Raiders (2025) | 88.4 | 89.4 | 68.1 | |||||||
| Anno 117: Pax Romana (2025) | 79.8 | 48.2 | 35.2 | |||||||
| Call of Duty Black Ops 7 (2025) | 58 | 56 | 38 | |||||||
| Resident Evil Requiem (2026) | 66.6 | 46.1 | 21.6 | |||||||
| Death Stranding 2 (2026) | 72.1 | 80 | 60.3 | 37.9 | ||||||
| Crimson Desert (2026) | 104.2 | 88.7 | 76.2 | 69 | 68.1 | 59.3 | 48 | 35.9 | ||
| Pragmata (2026) | 114 | 97.9 | 81 | 64.8 | 44.2 | |||||
| War Thunder (2026) | 304 | 127 | 88.6 | 37.9 | ||||||
| Forza Horizon 6 (2026) | 91 | 78 | 59 | 58 | 44 | 37 | 27 | |||
| 007 First Light (2026) | 78.6 | 69.6 | 55.9 | 51.8 | 28.3 |
排放--仍然相当响亮
系统噪音
风扇噪音取决于Synapse的功率配置。例如,在平衡模式下进行游戏时,风扇噪音最高只有42 dB(A),而在性能模式下进行游戏则为51.6 dB(A)。因此,用户可能想考虑在平衡模式下进行游戏,而不是性能模式,尽管如上所述,这会对图形性能产生轻微的影响。
总的来说,风扇的噪音行为更类似于 刀片17而不是Blade 15,这是不幸的,因为Blade 15是更安静的机器。微星微星GE67 HX在类似的条件下,甚至比Blade 16还要响亮。
建议在浏览网页或流媒体时,在安静或省电模式下运行,这样内部风扇将保持较长时间的安静。如果不这样做,如果设置为平衡模式或更高的模式,它们往往会提前和大声脉冲。例如,当在平衡模式下运行3DMark 06时,风扇噪音会在基准测试的早期稳步增加到39 dB(A),而在联想S7上只有31 dB(A)。联想Legion S7 16.
Noise level
| Idle |
| 23 / 23 / 23.6 dB(A) |
| Load |
| 39 / 51.3 dB(A) |
 | ||
30 dB silent 40 dB(A) audible 50 dB(A) loud |
||
min: | ||
| Razer Blade 16 Early 2023 GeForce RTX 4080 Laptop GPU, i9-13950HX, SSSTC CA6-8D1024 | Razer Blade 15 Advanced Model Early 2022 GeForce RTX 3080 Ti Laptop GPU, i7-12800H, Samsung PM9A1 MZVL21T0HCLR | Lenovo Legion S7 16ARHA7 Radeon RX 6800S, R9 6900HX, SK Hynix HFS001TEJ9X115N | Dell G16 7620 GeForce RTX 3060 Laptop GPU, i7-12700H, WDC PC SN810 512GB | Asus ROG Zephyrus Duo 16 GX650RX GeForce RTX 3080 Ti Laptop GPU, R9 6900HX, 2x Samsung SSD 980 Pro 2TB MZ-V8P2T0 (RAID 0) | HP Omen 16-n0033dx Radeon RX 6650M, R7 6800H, Samsung PM9A1 MZVL21T0HCLR | MSI GE67 HX 12UGS GeForce RTX 3070 Ti Laptop GPU, i7-12800HX, Samsung PM9A1 MZVL21T0HCLR | Razer Blade 17 (i7-12800H, RTX 3070 Ti) GeForce RTX 3070 Ti Laptop GPU, i7-12800H, Samsung PM9A1 MZVL21T0HCLR | |
|---|---|---|---|---|---|---|---|---|
| Noise | -5% | 3% | -6% | -9% | -9% | -4% | 2% | |
| off / environment * (dB) | 23 | 26 -13% | 23.1 -0% | 23.2 -1% | 26 -13% | 24.2 -5% | 22.7 1% | 23 -0% |
| Idle Minimum * (dB) | 23 | 26 -13% | 23.1 -0% | 28.3 -23% | 26 -13% | 27.4 -19% | 22.9 -0% | 23 -0% |
| Idle Average * (dB) | 23 | 27 -17% | 23.1 -0% | 28.8 -25% | 27 -17% | 27.4 -19% | 22.9 -0% | 23 -0% |
| Idle Maximum * (dB) | 23.6 | 29 -23% | 23.1 2% | 28.9 -22% | 29 -23% | 28.9 -22% | 22.9 3% | 23 3% |
| Load Average * (dB) | 39 | 37 5% | 31.4 19% | 32.4 17% | 41 -5% | 32.3 17% | 44.4 -14% | 36.92 5% |
| Witcher 3 ultra * (dB) | 51.6 | 44 15% | 51.4 -0% | 48.3 6% | 48 7% | 54.1 -5% | 55.7 -8% | 50 3% |
| Load Maximum * (dB) | 51.3 | 45 12% | 51.2 -0% | 48.1 6% | 50 3% | 57.6 -12% | 57.4 -12% | 50 3% |
* ... smaller is better
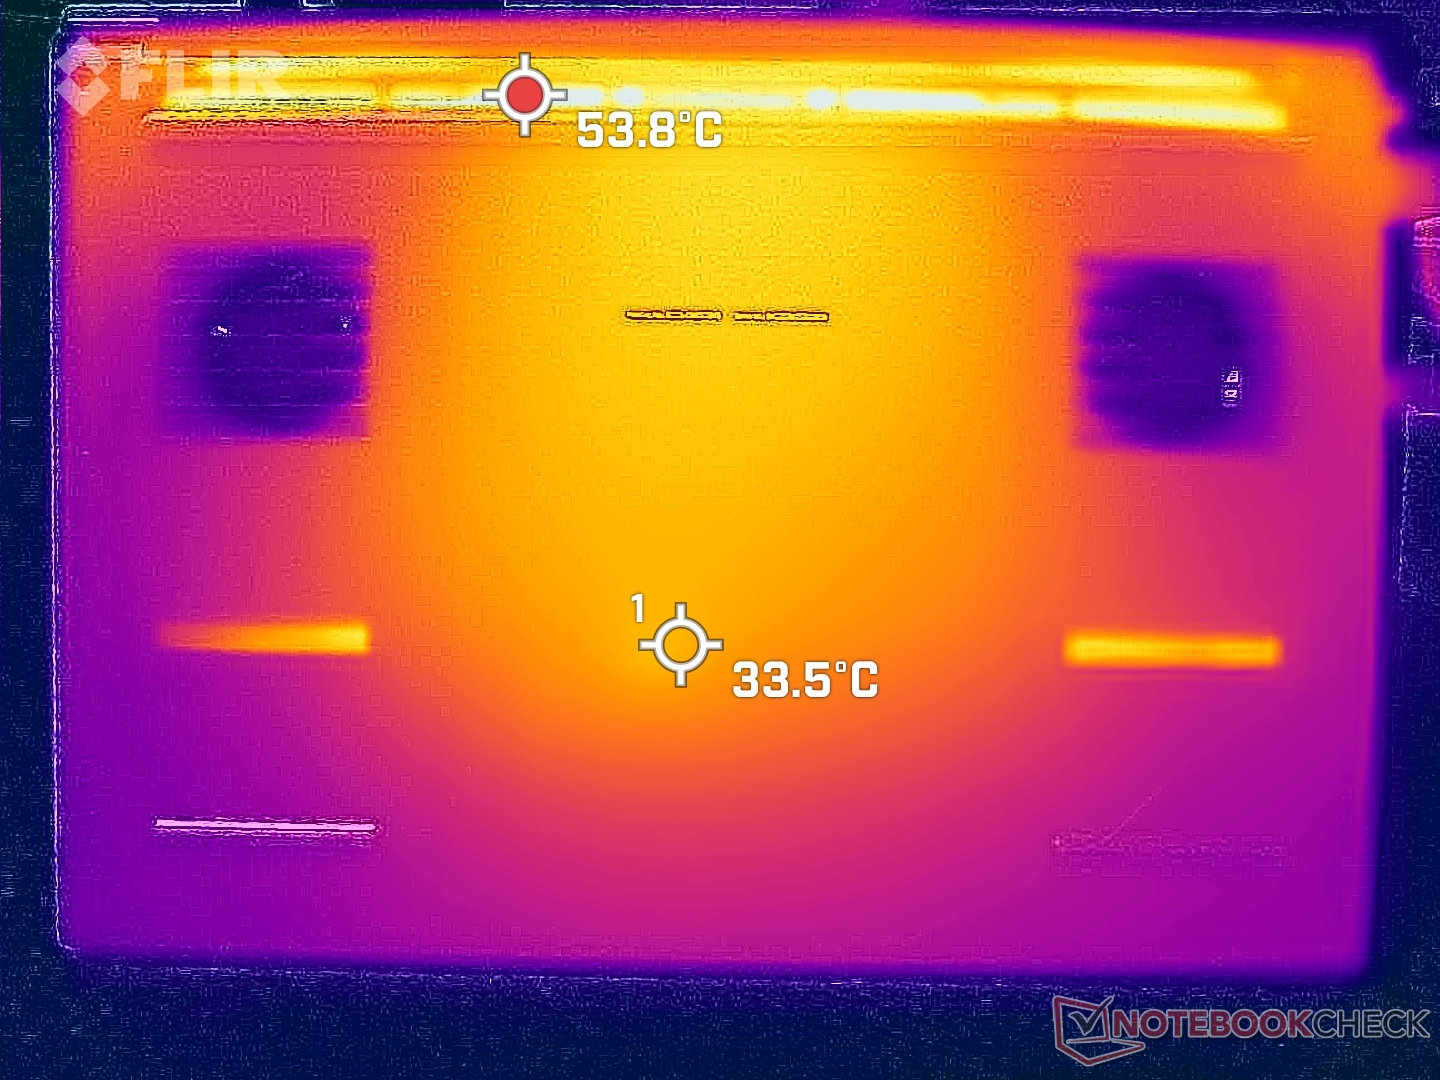
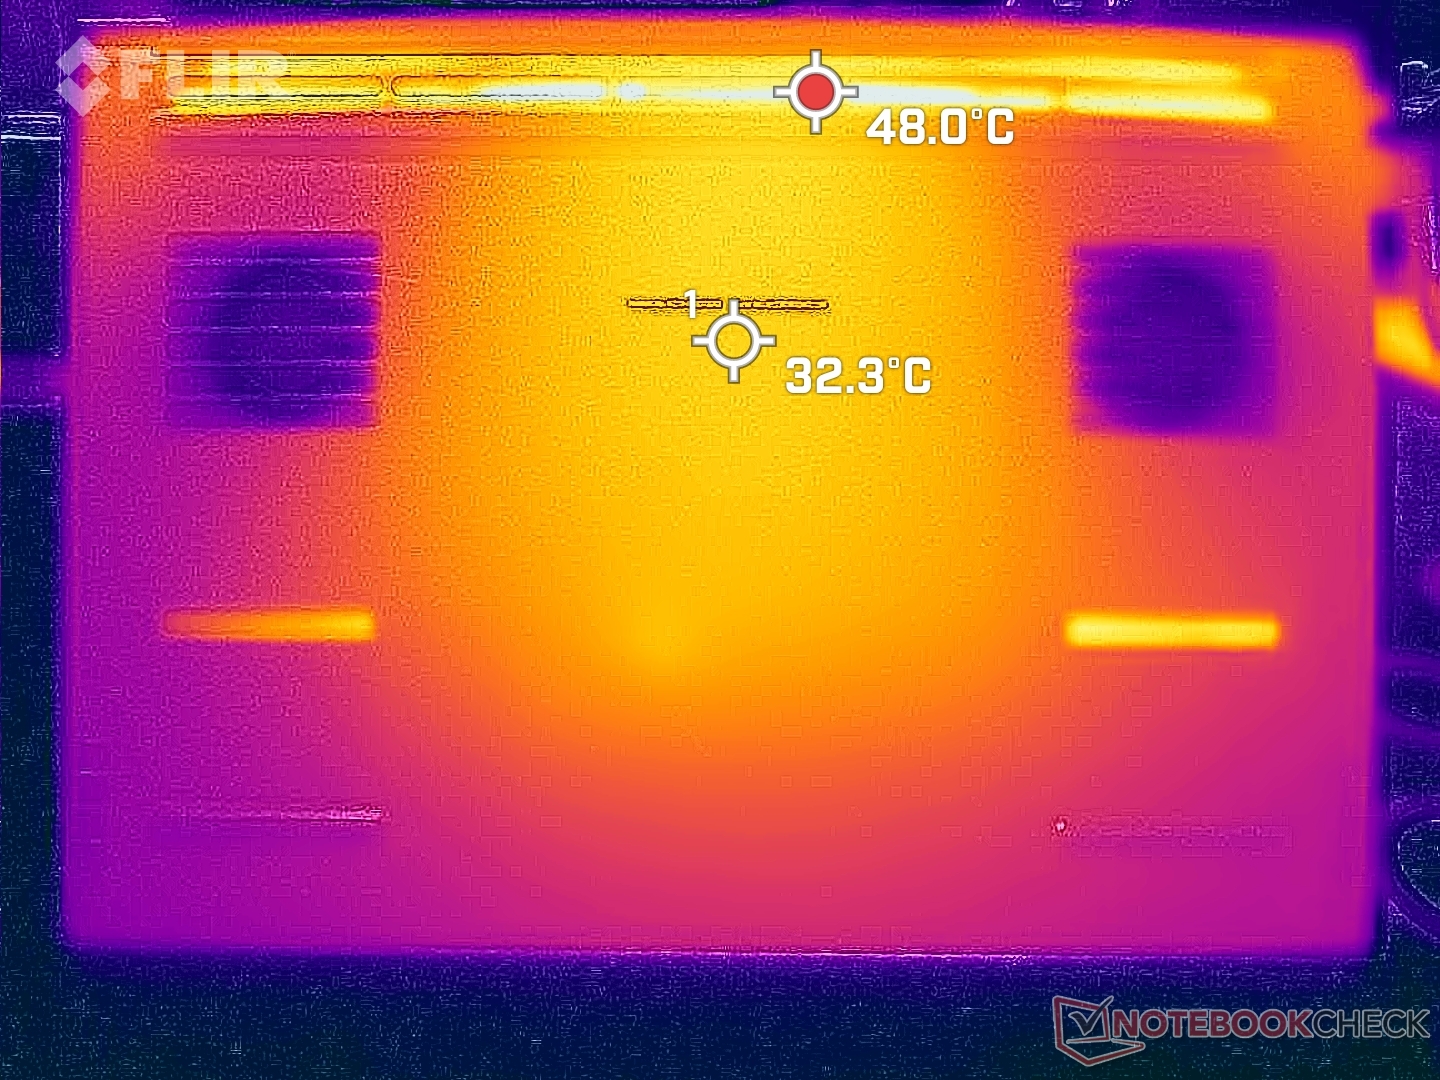
温度
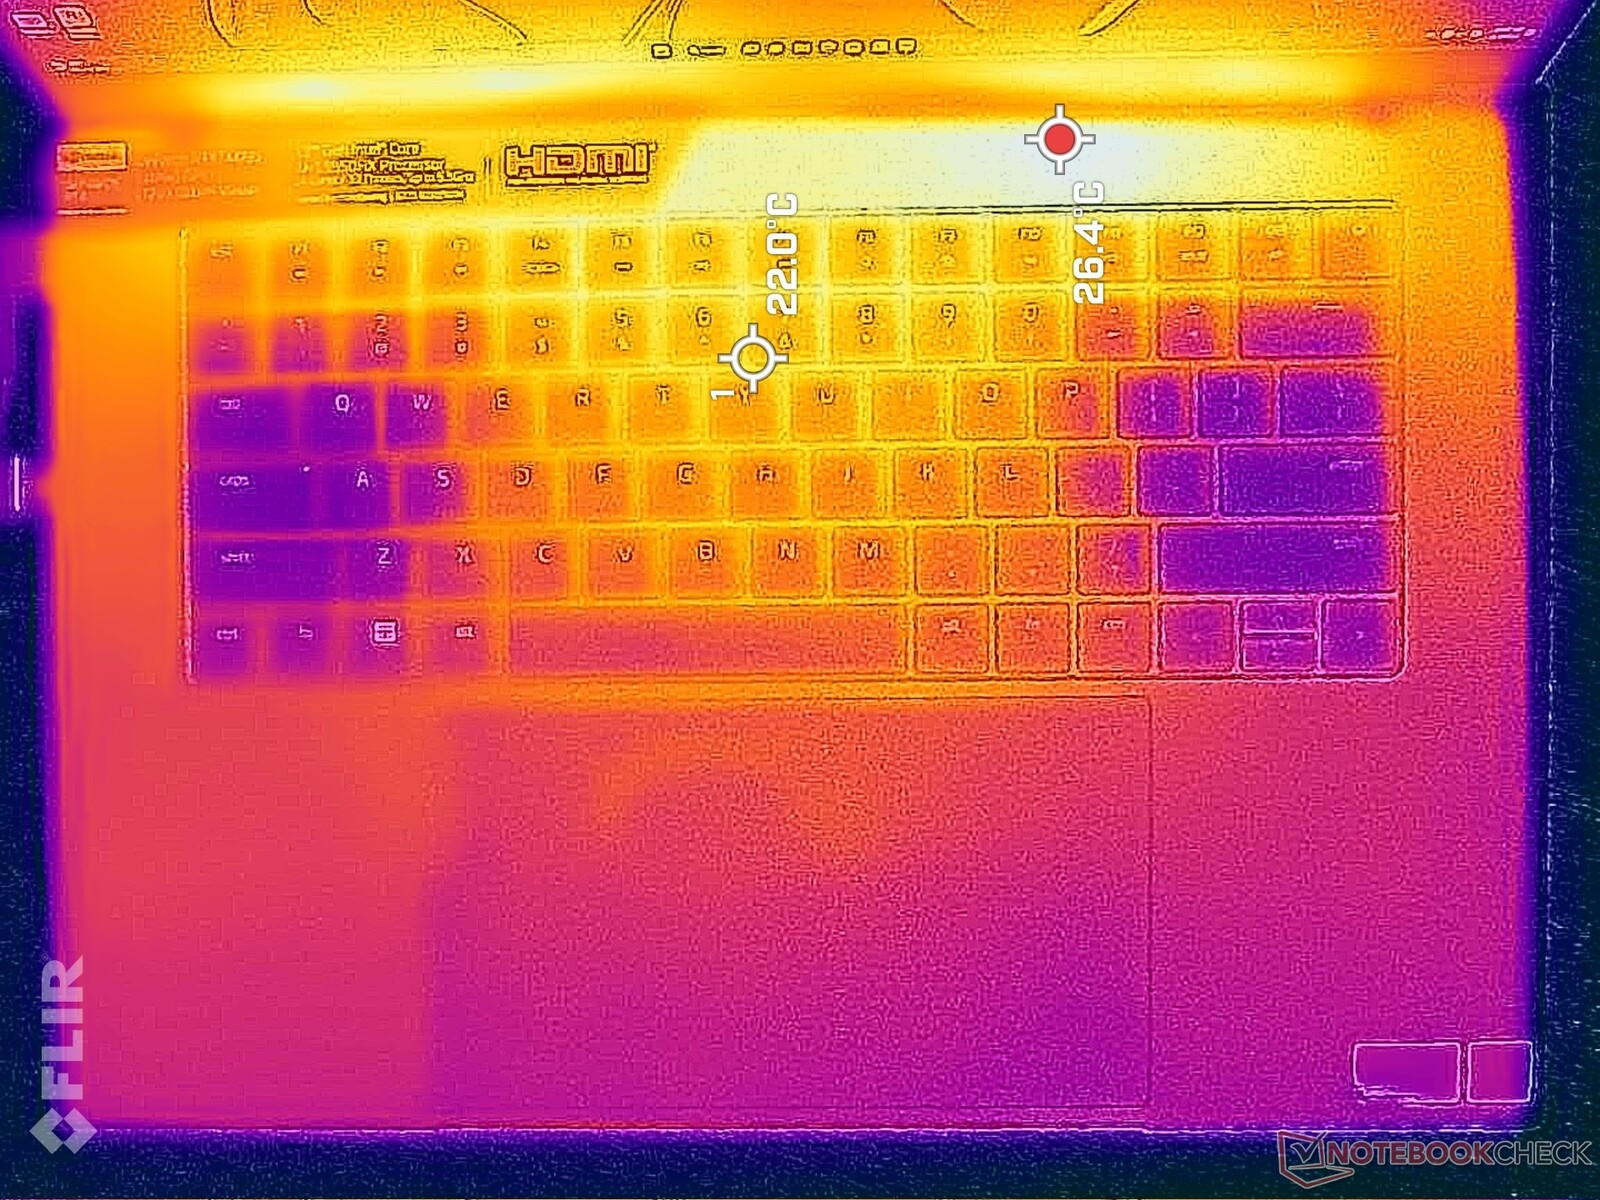
在空转或运行要求不高的负载时,表面温度比预期的要高,而在游戏时则比预期的要低。例如,在桌面上空转时,顶部和底部的热点可高达32摄氏度,而桌面上只有21摄氏度至24摄氏度。 联想Legion Slim 7 16.这可以部分归因于Blade 16的惰性风扇导致了更高的表面温度。
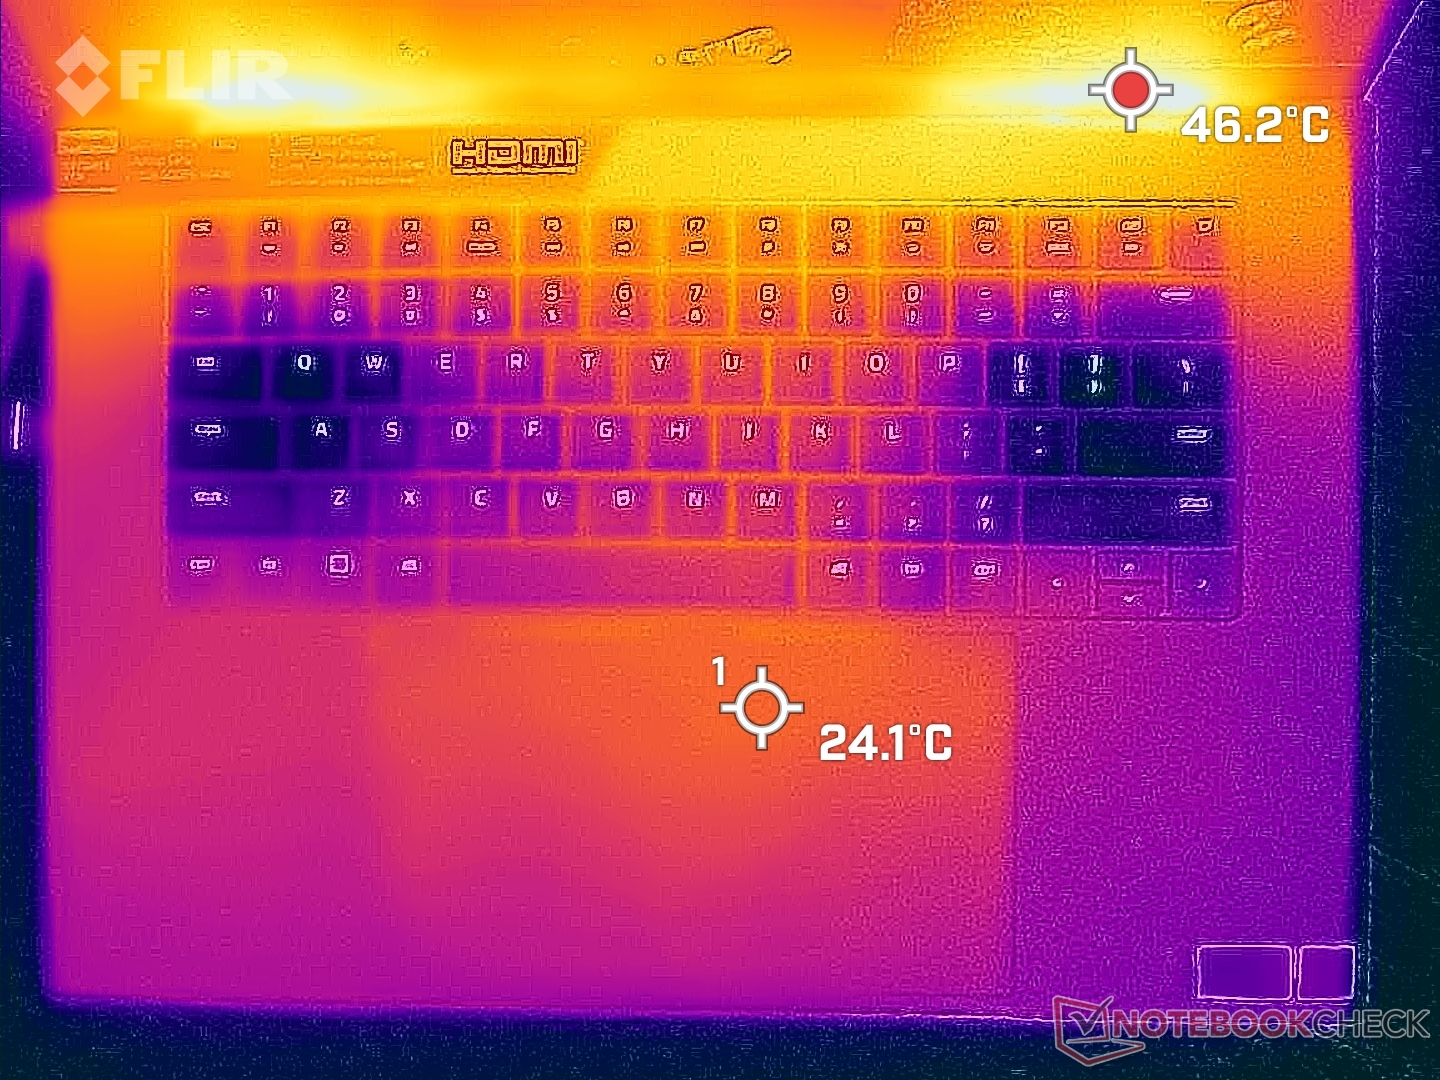
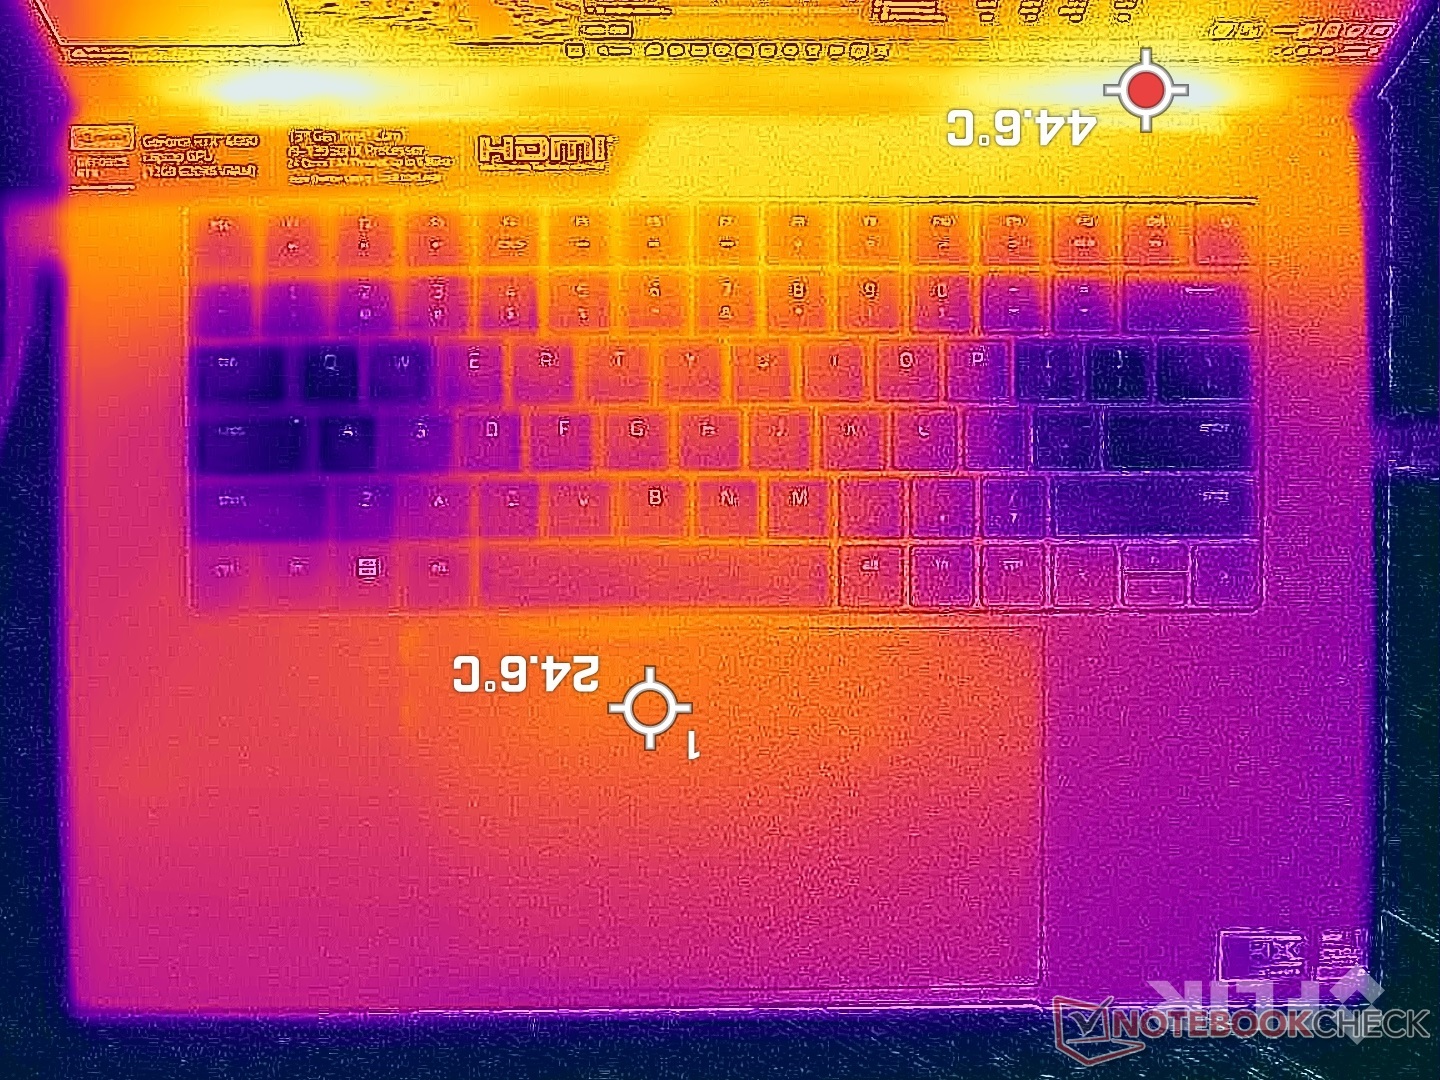
在游戏时,考虑到纤细的全金属机箱和高性能,表面温度相对较低,特别是在键盘甲板上。键盘中心在长时间运行时仅达到31摄氏度,而键盘上的温度为39摄氏度。 Witcher 3与上述联想的39摄氏度相比。无论屏幕上的负载如何,我们的手或手指都不会感到不舒服的温度。
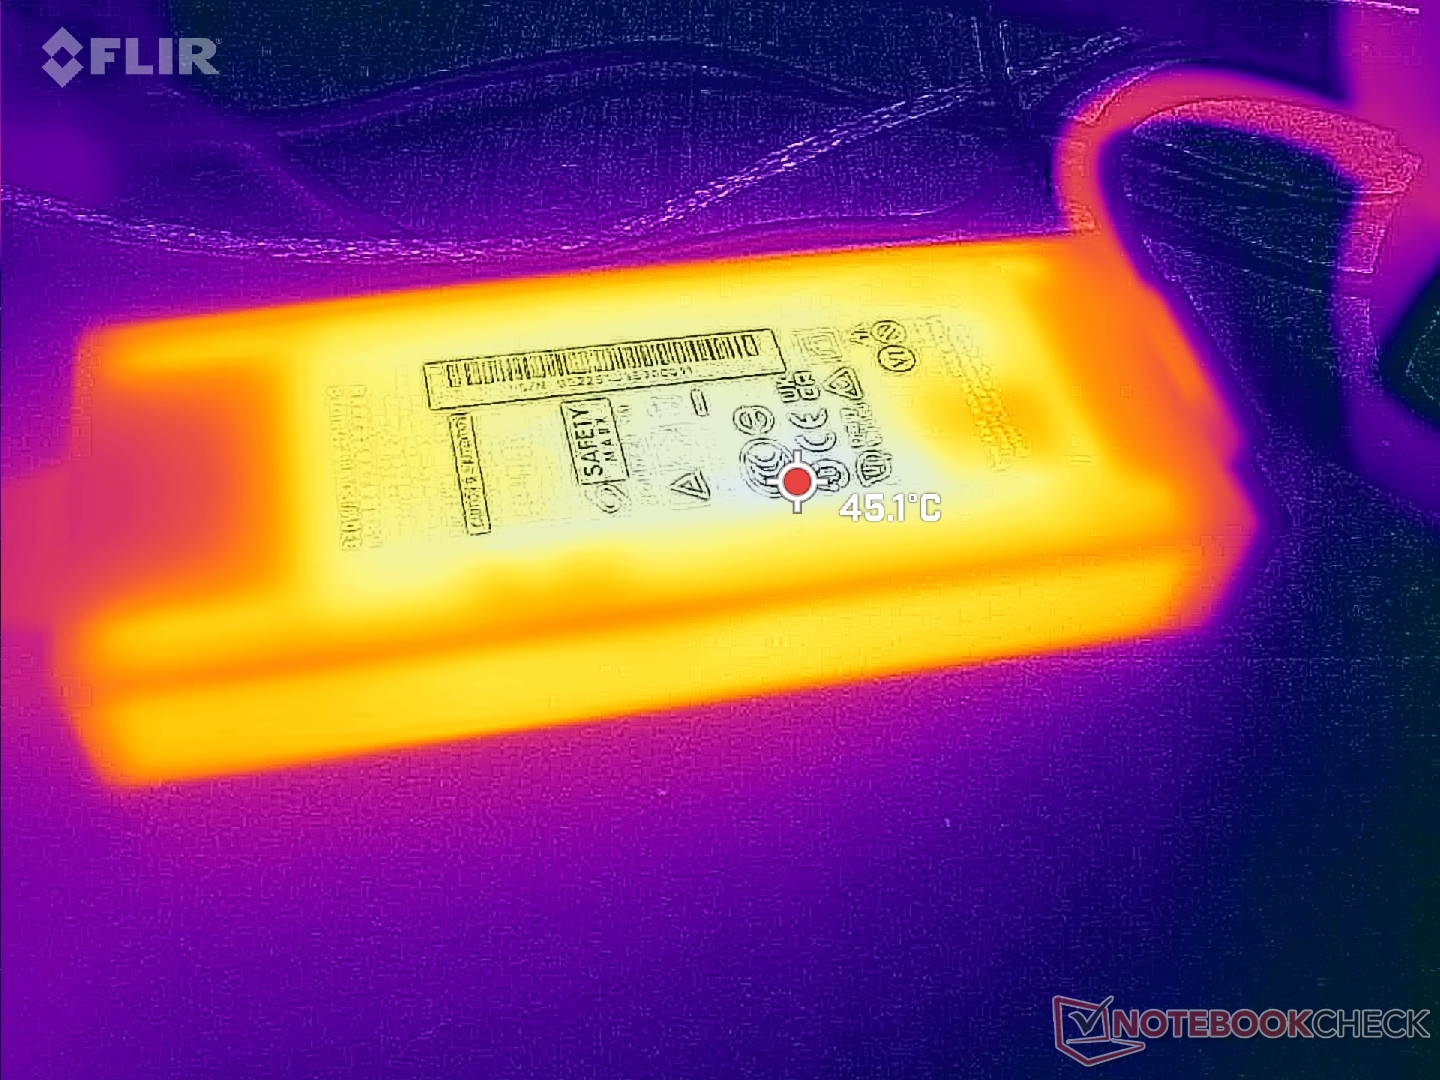
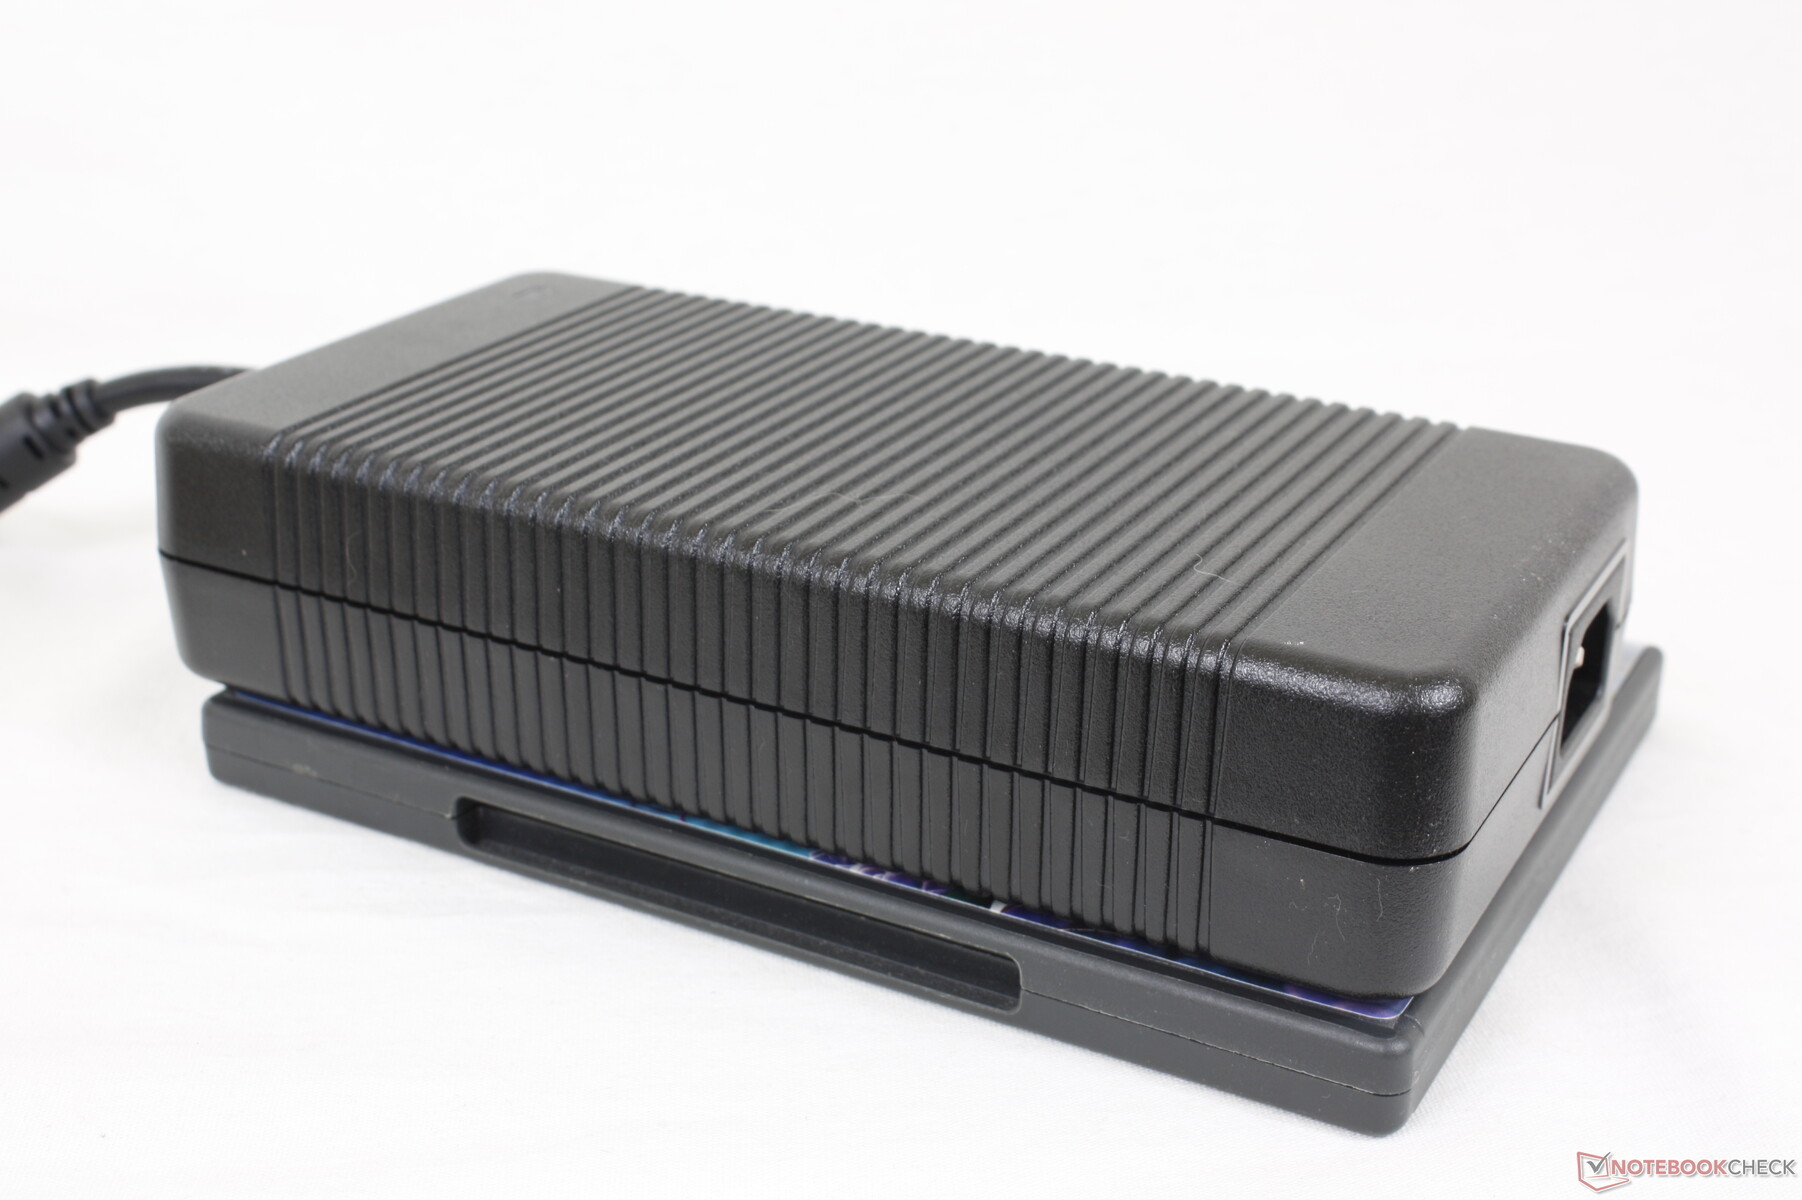
值得一提的是,新的GaN适配器的运行温度比旧的Blade交流适配器要低得多,在旧的交流适配器上 60摄氏度或更热的的表面温度是常见的,在负载下。
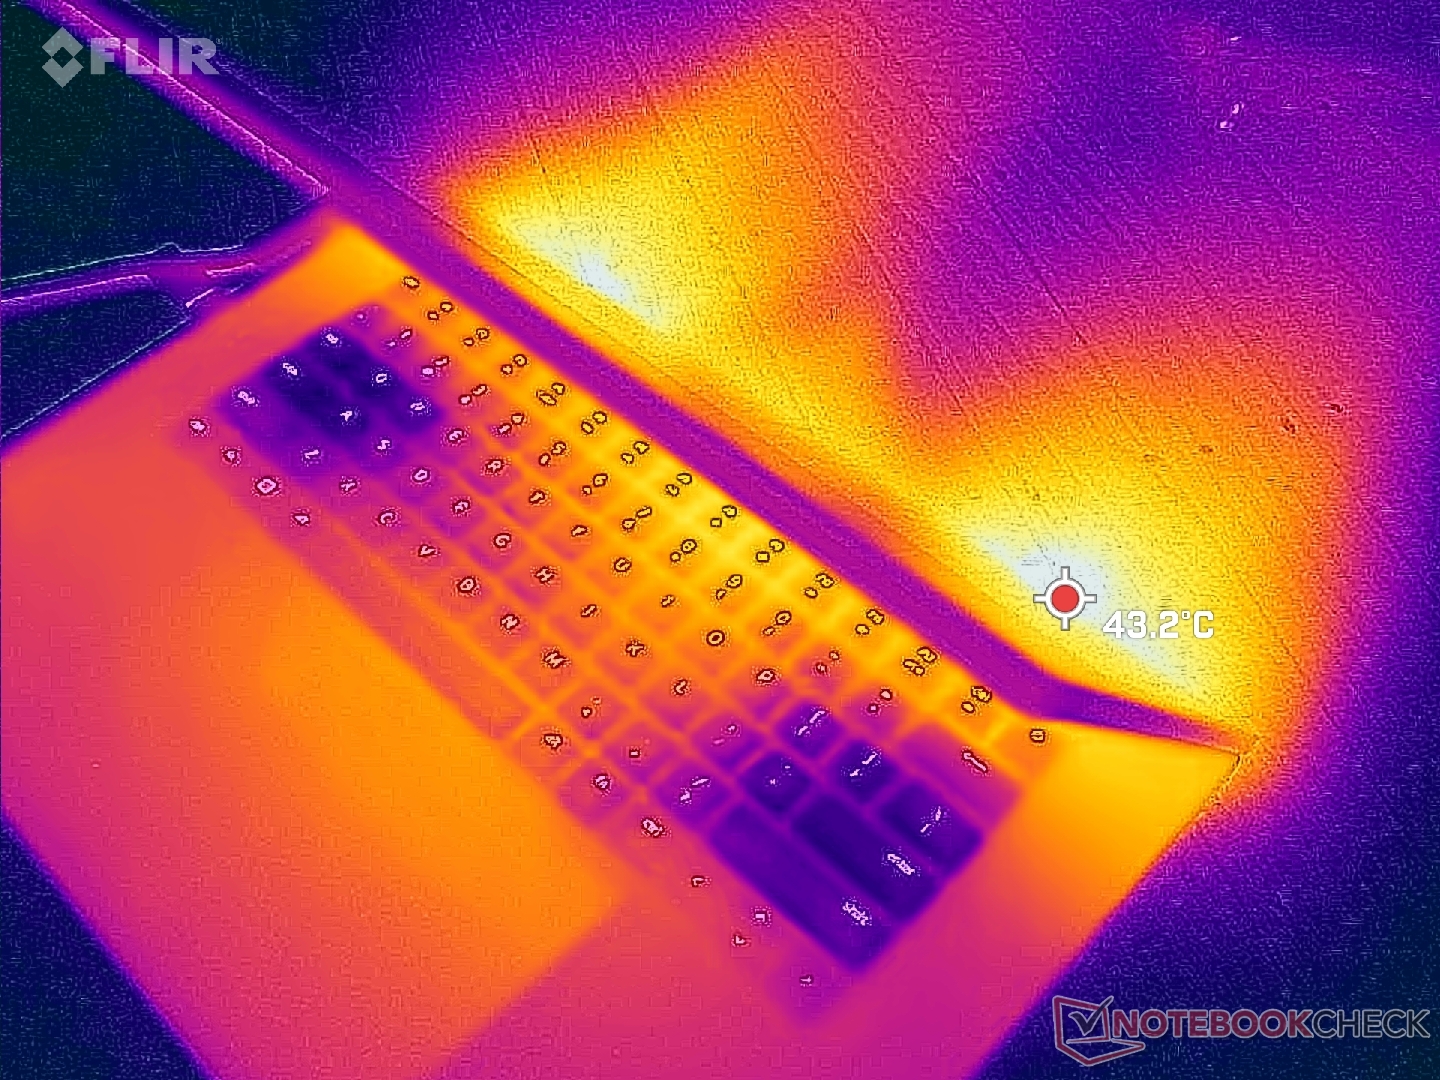
(±) The maximum temperature on the upper side is 40 °C / 104 F, compared to the average of 40.4 °C / 105 F, ranging from 21.2 to 68.8 °C for the class Gaming.
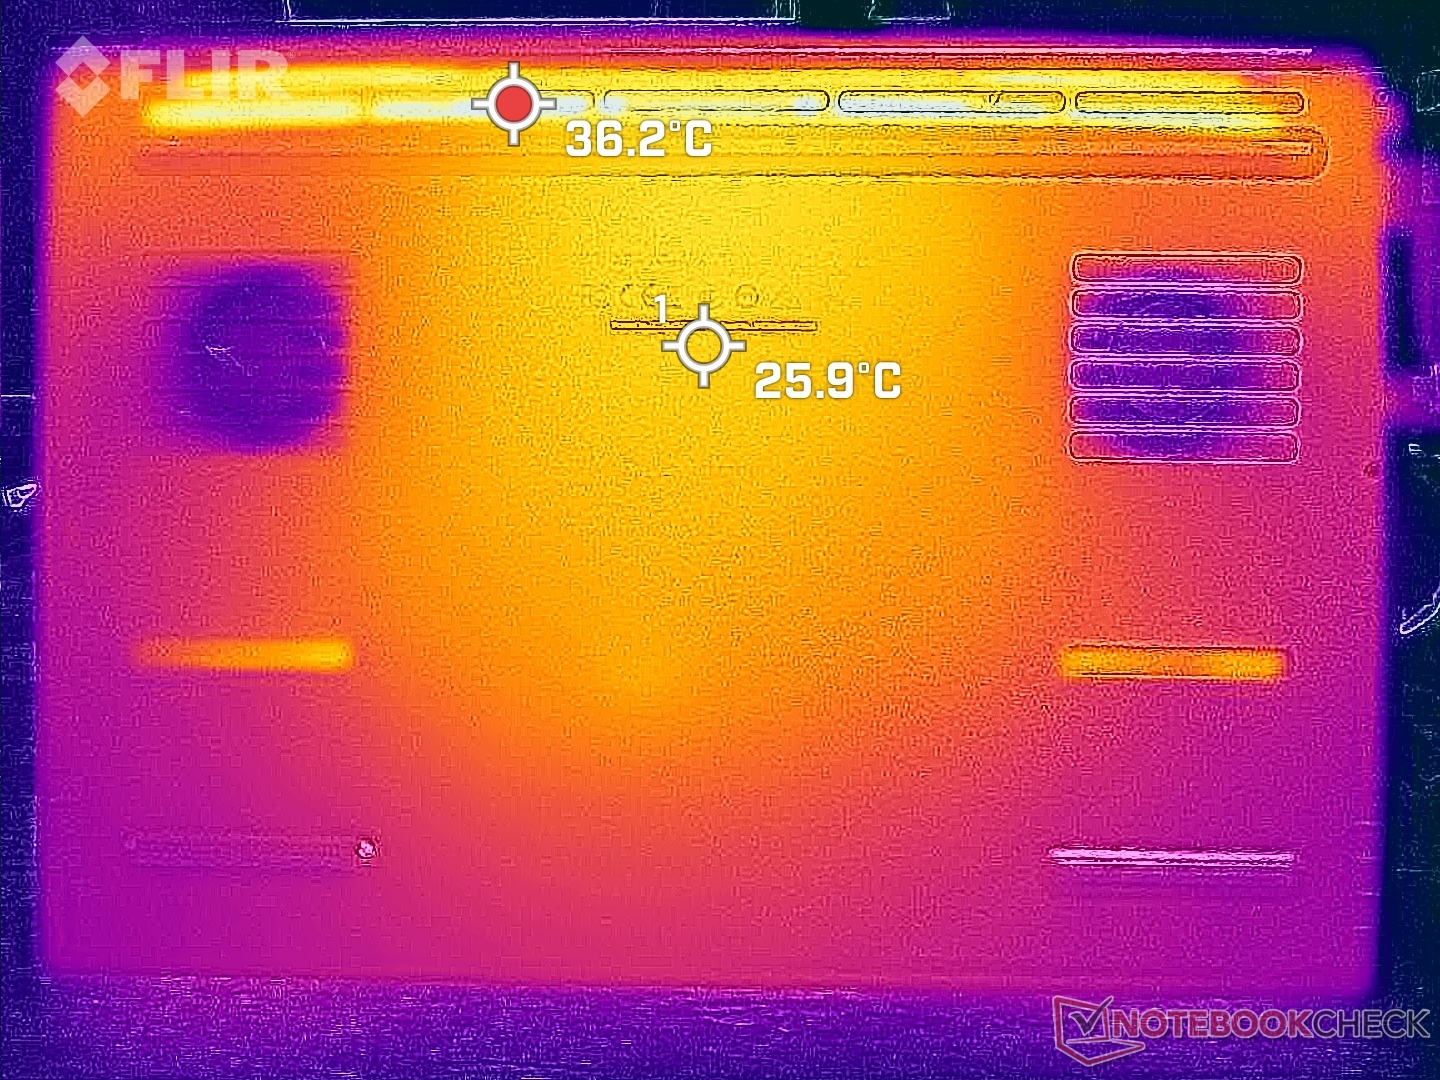
(+) The bottom heats up to a maximum of 37.6 °C / 100 F, compared to the average of 43.2 °C / 110 F
(+) In idle usage, the average temperature for the upper side is 27.3 °C / 81 F, compared to the device average of 33.9 °C / 93 F.
(+) Playing The Witcher 3, the average temperature for the upper side is 31.8 °C / 89 F, compared to the device average of 33.9 °C / 93 F.
(+) The palmrests and touchpad are cooler than skin temperature with a maximum of 30 °C / 86 F and are therefore cool to the touch.
(±) The average temperature of the palmrest area of similar devices was 28.8 °C / 83.8 F (-1.2 °C / -2.2 F).
| Razer Blade 16 Early 2023 Intel Core i9-13950HX, NVIDIA GeForce RTX 4080 Laptop GPU | Razer Blade 15 Advanced Model Early 2022 Intel Core i7-12800H, NVIDIA GeForce RTX 3080 Ti Laptop GPU | Lenovo Legion S7 16ARHA7 AMD Ryzen 9 6900HX, AMD Radeon RX 6800S | Dell G16 7620 Intel Core i7-12700H, NVIDIA GeForce RTX 3060 Laptop GPU | Asus ROG Zephyrus Duo 16 GX650RX AMD Ryzen 9 6900HX, NVIDIA GeForce RTX 3080 Ti Laptop GPU | HP Omen 16-n0033dx AMD Ryzen 7 6800H, AMD Radeon RX 6650M | MSI GE67 HX 12UGS Intel Core i7-12800HX, NVIDIA GeForce RTX 3070 Ti Laptop GPU | |
|---|---|---|---|---|---|---|---|
| Heat | -27% | -5% | -3% | -13% | -4% | 6% | |
| Maximum Upper Side * (°C) | 40 | 53 -33% | 46.6 -17% | 47.6 -19% | 45 -13% | 41.2 -3% | 34.4 14% |
| Maximum Bottom * (°C) | 37.6 | 53 -41% | 50.8 -35% | 54 -44% | 50 -33% | 53.2 -41% | 42 -12% |
| Idle Upper Side * (°C) | 32.4 | 36 -11% | 26.4 19% | 23 29% | 33 -2% | 26.4 19% | 24 26% |
| Idle Bottom * (°C) | 31.4 | 38 -21% | 27.2 13% | 24.6 22% | 33 -5% | 27.8 11% | 33.2 -6% |
* ... smaller is better
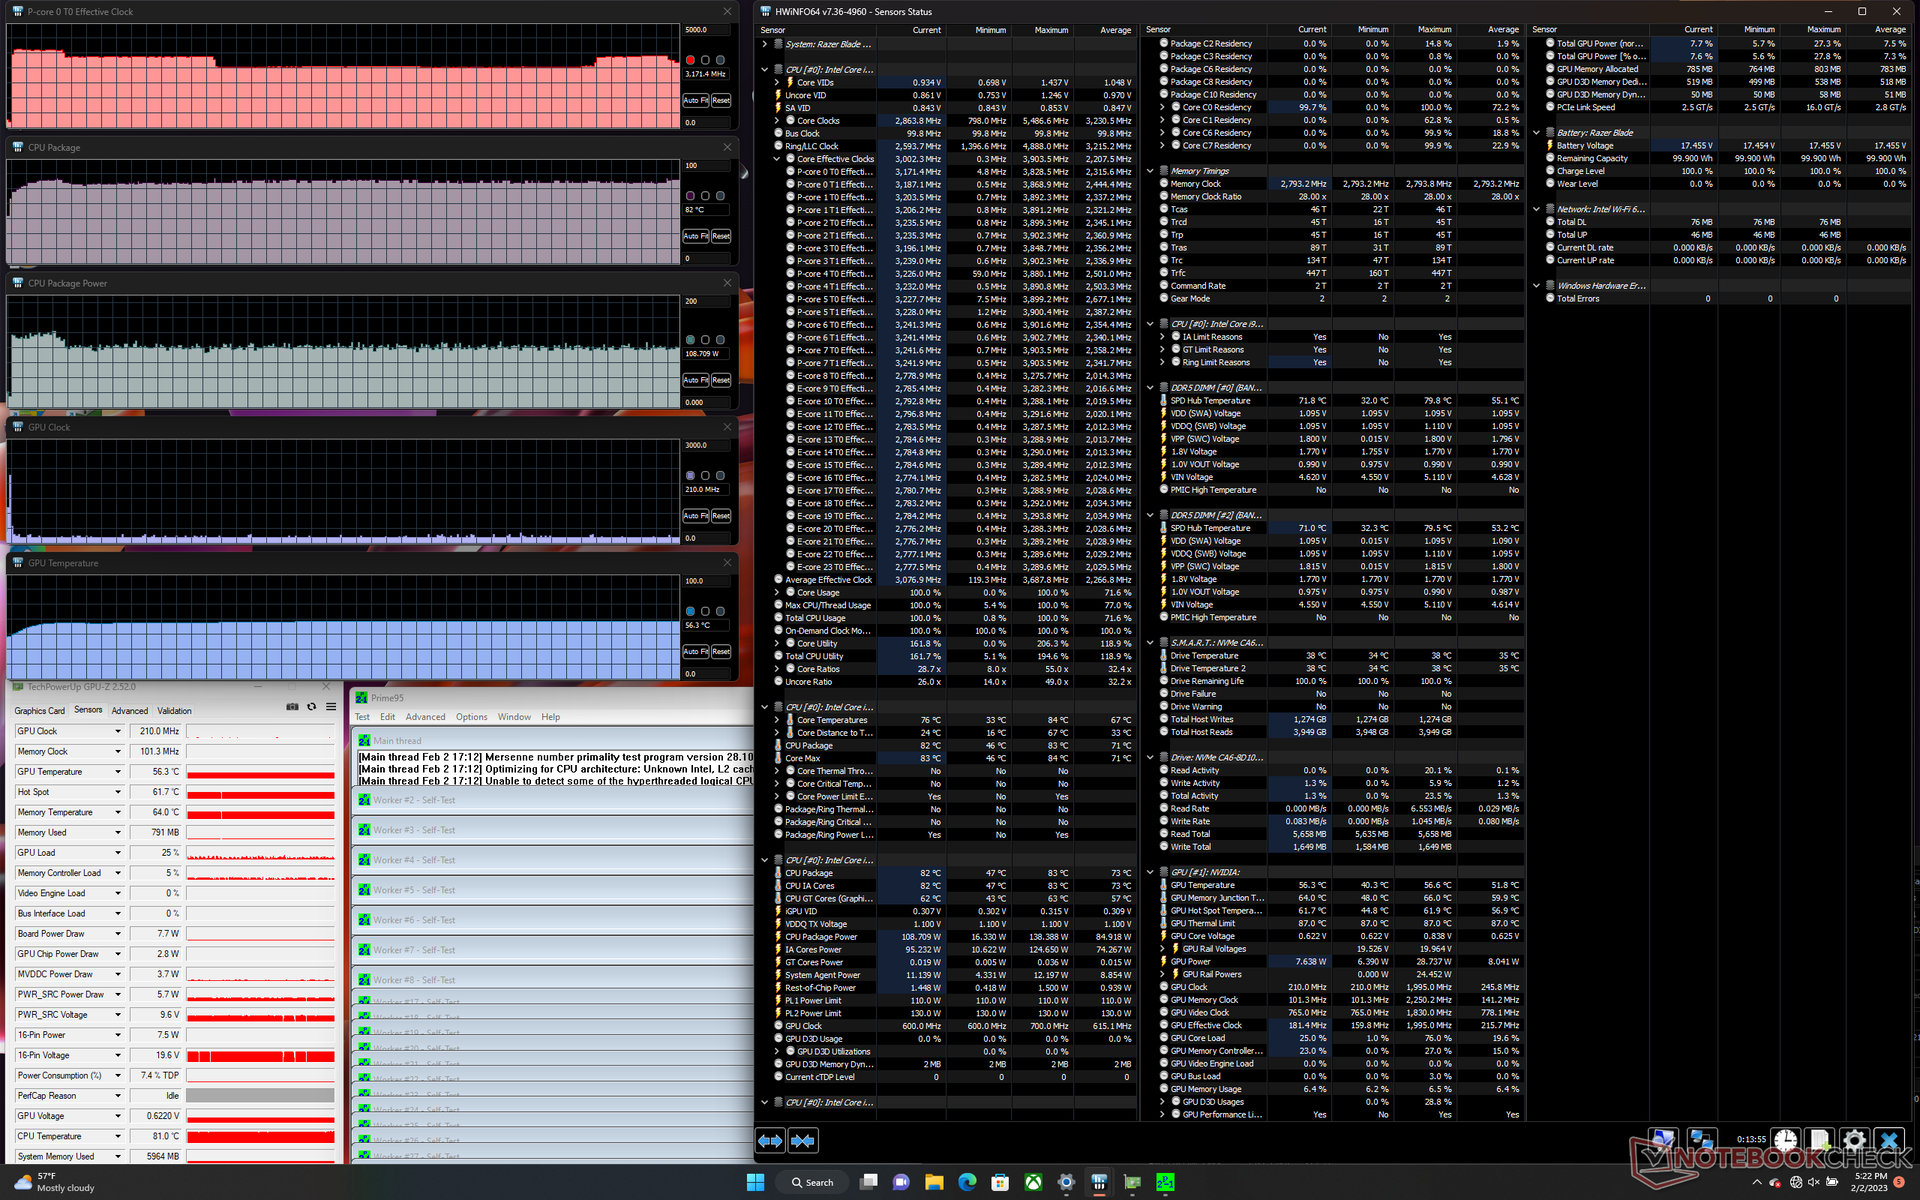
压力测试
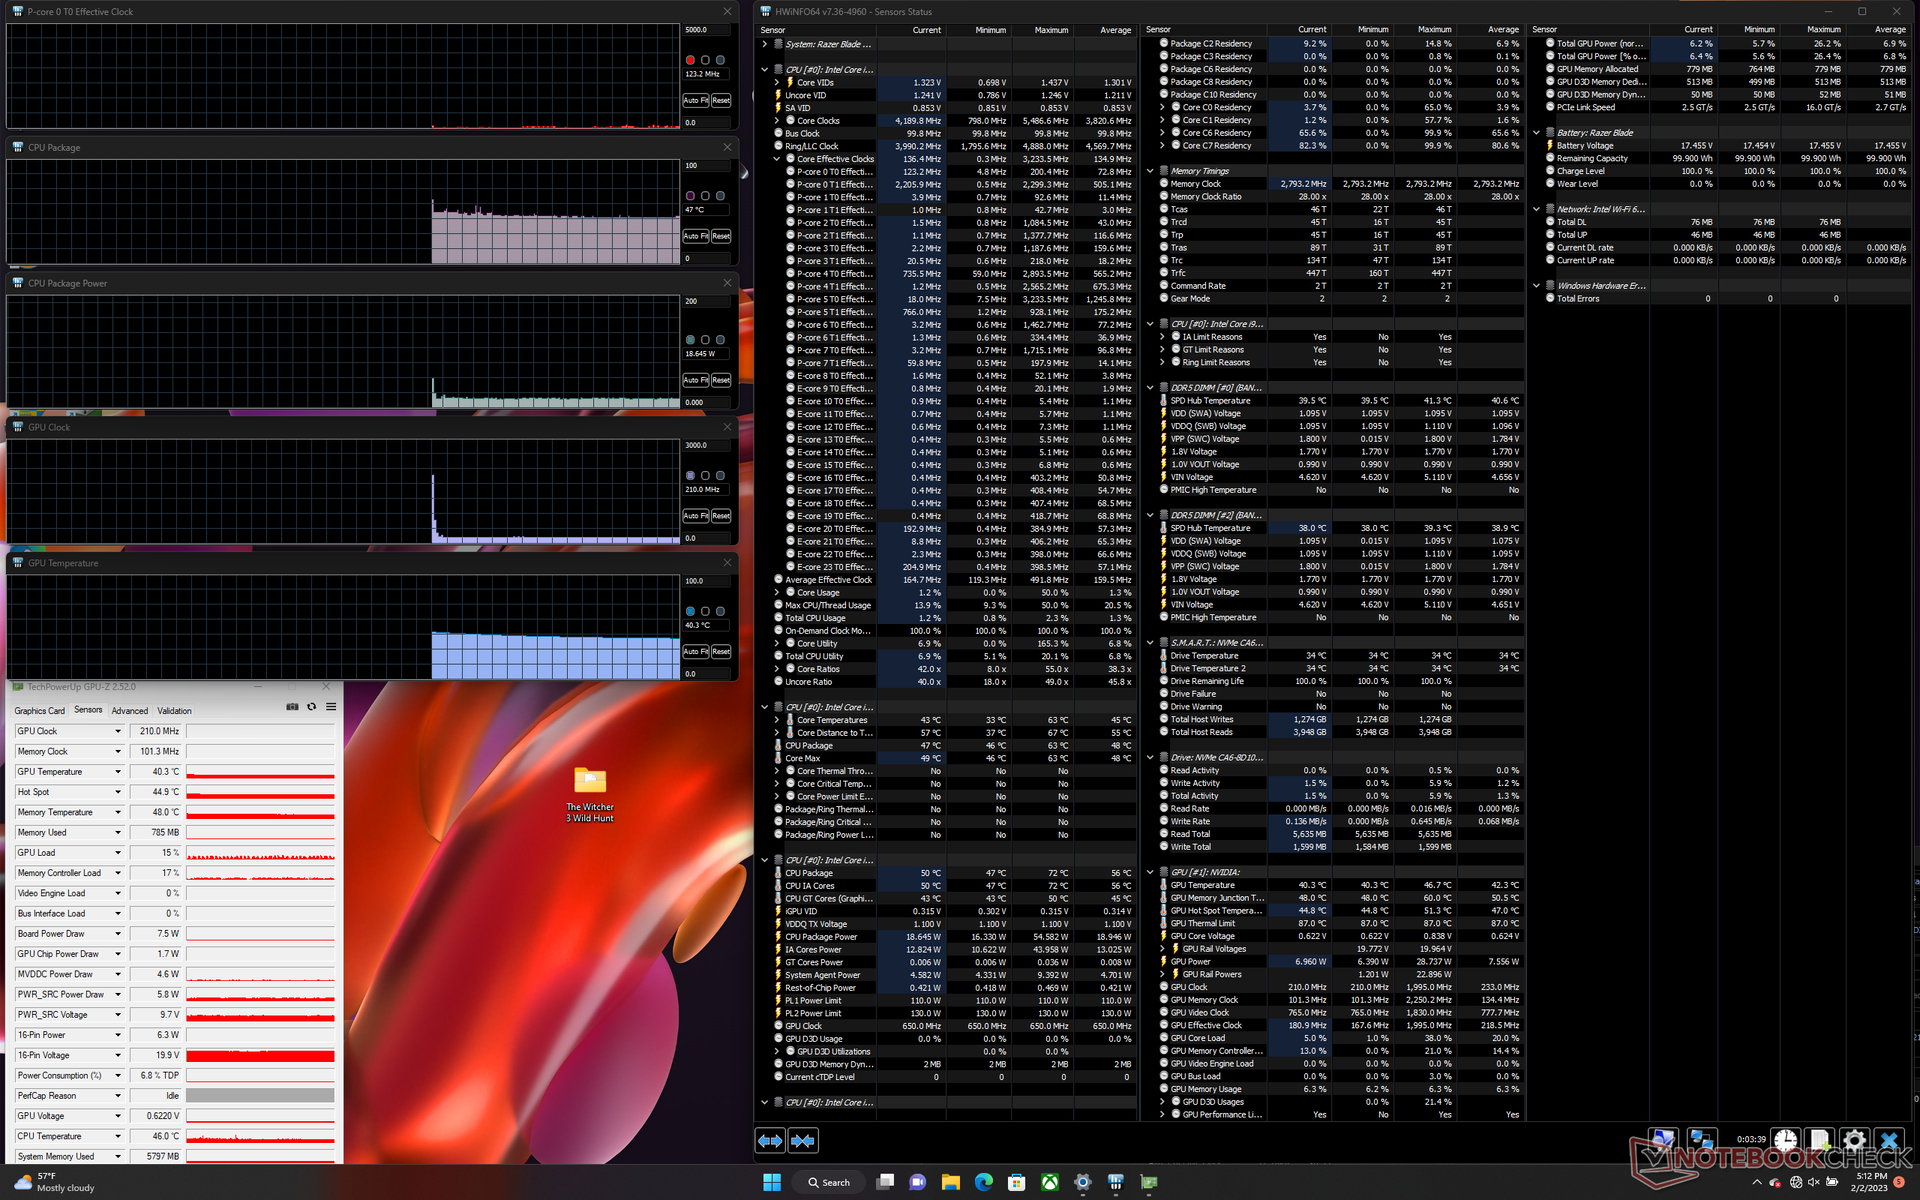
当在Prime95下受压时,CPU会在50秒内提升到3.8GHz和138W,然后下降并稳定在~3.1GHz、108W和82C。因此,即使在最高性能设置下,最大涡轮增压也只是暂时的。在搭载酷睿i7-12800HX的微星GE67 HX上重复这一测试。 微星GE67 HX将导致更高的时钟频率和更高的核心温度,分别为~3.6 GHz和87 C。
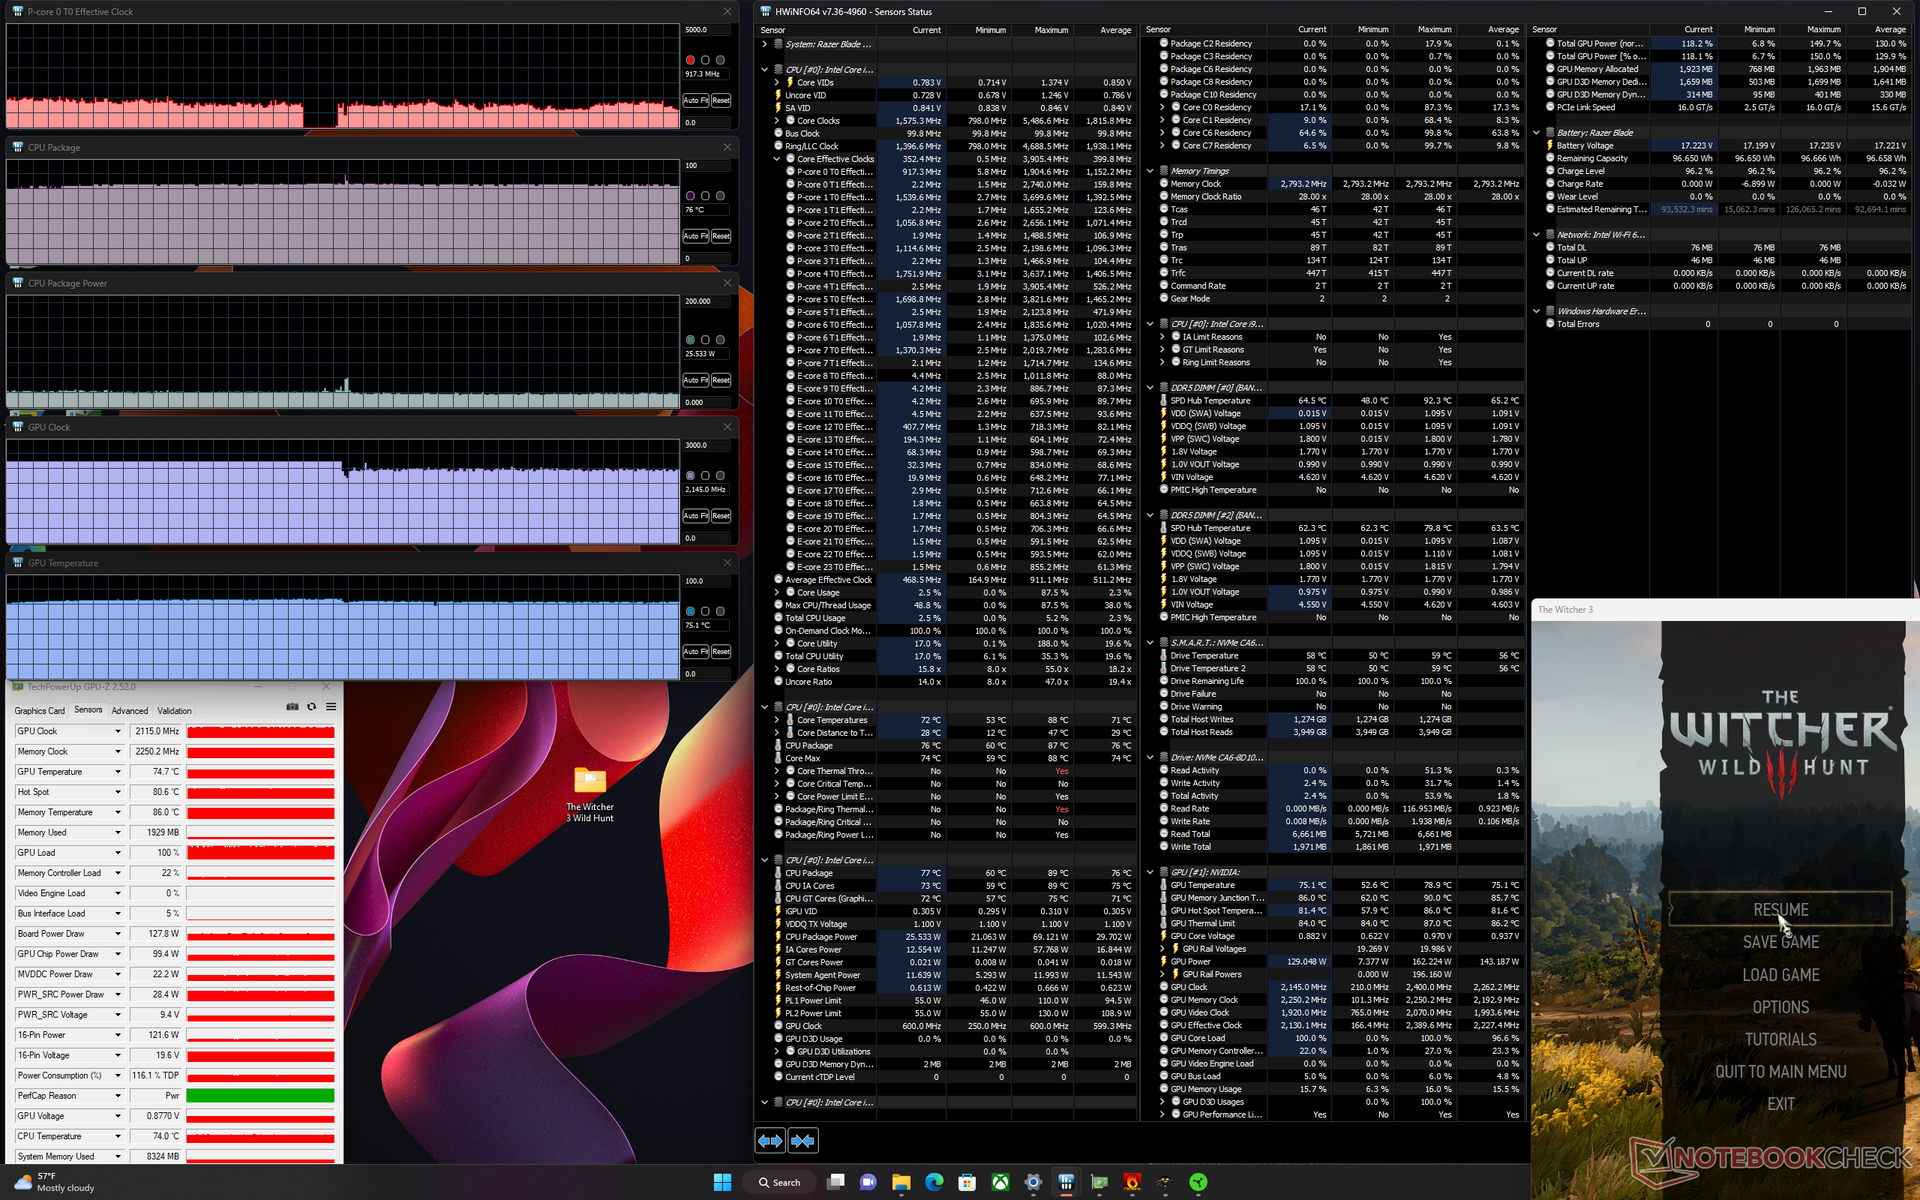
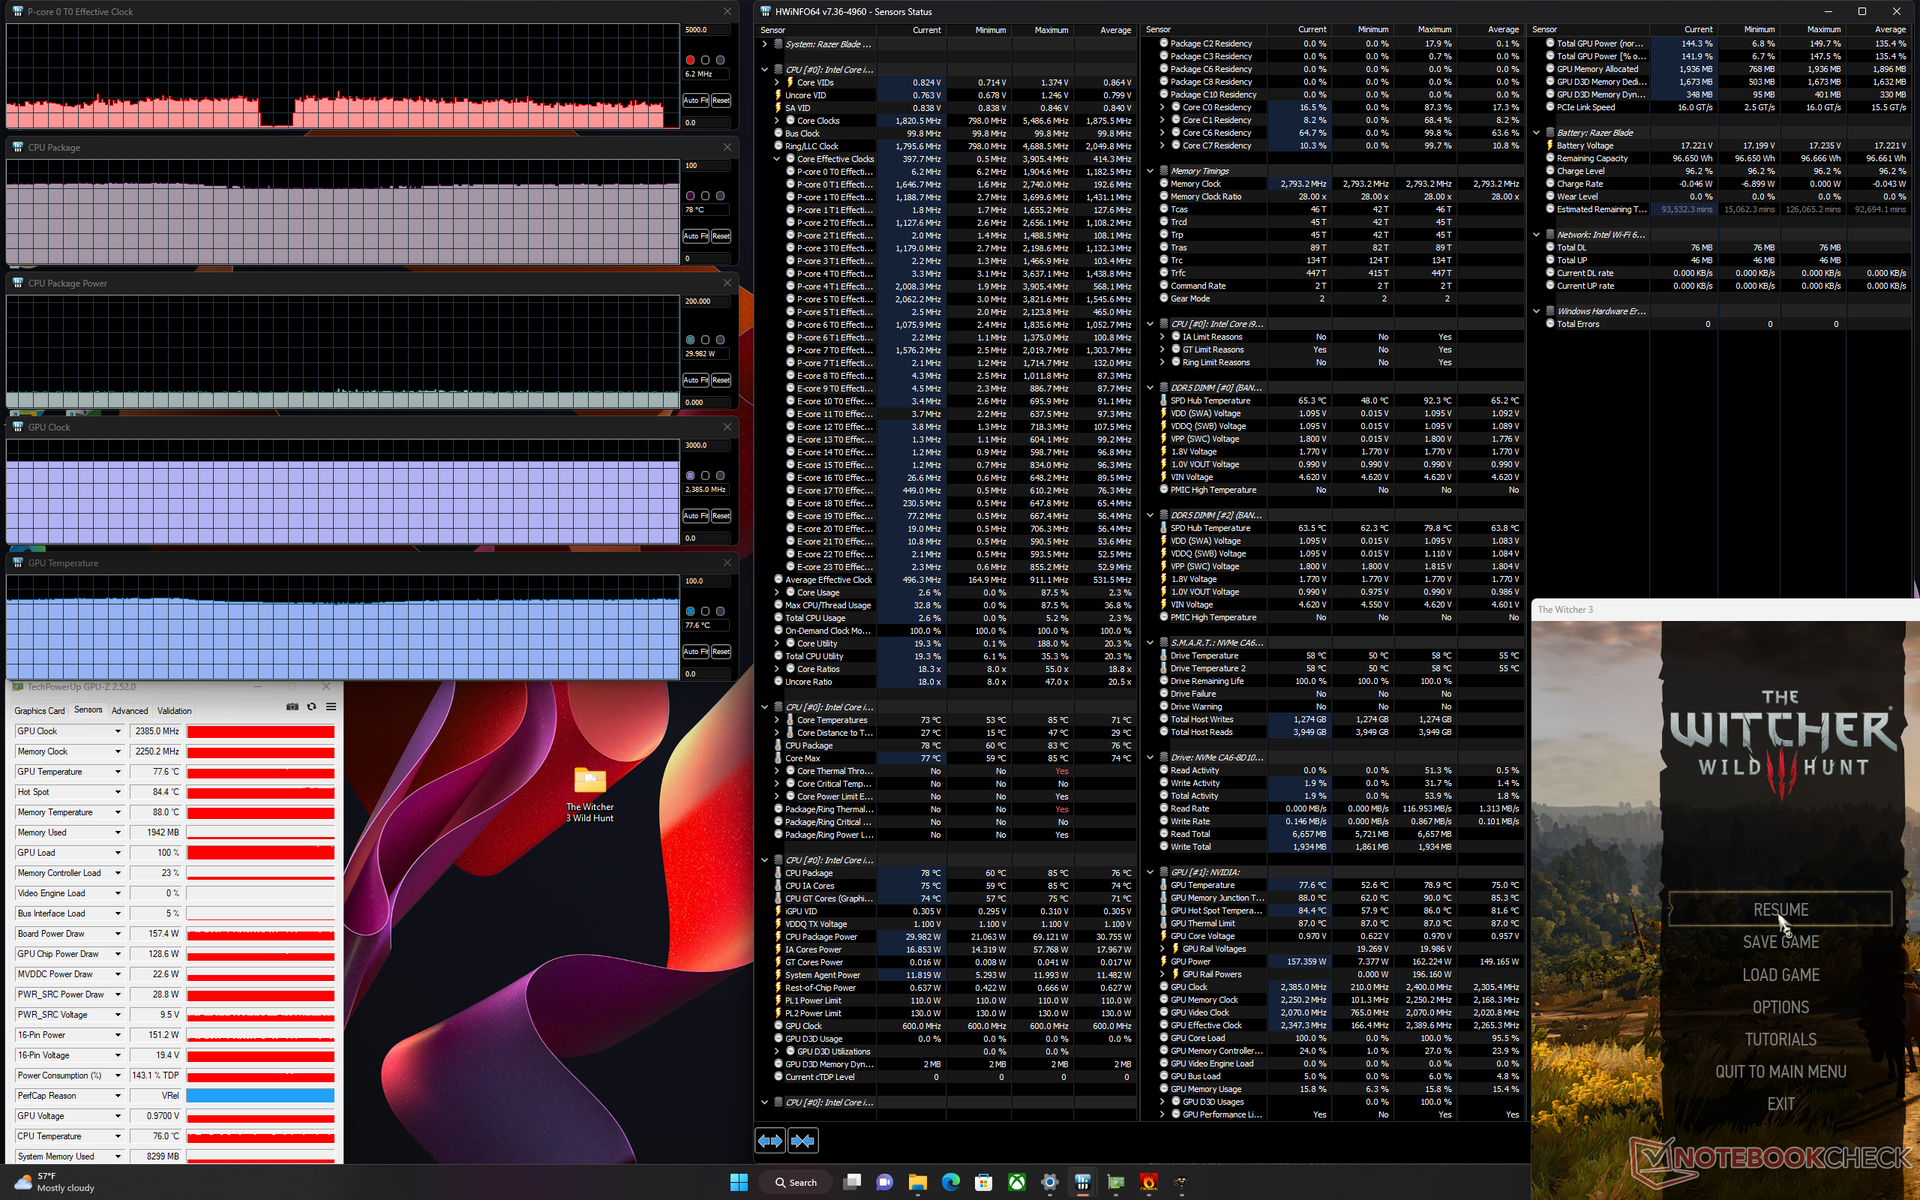
运行 Witcher 3在性能模式下运行将导致稳定的GPU时钟速率、内存时钟、主板功耗和核心温度分别为2385 MHz、2250 MHz、157 W和78 C,而平衡模式将使GPU时钟速率、主板功耗和核心温度分别下降到2115 MHz、128 W和75 C。因此,用户必须记住通过Synapse启用自定义性能模式,并忍受更响亮的最大风扇噪音上限,如果他们希望以最高潜力运行GPU。这些电源配置文件之间的性能差异与我们上述的GPU性能观察相吻合。
重复上面的 Witcher 3测试 2022年刀片15与110 W RTX 3080 Ti重复上述测试将导致较慢的GPU时钟速率和较低的核心温度,分别为1455 MHz和67 C。刀锋16可能会更快,但在这个过程中肯定会更热,要求更高。
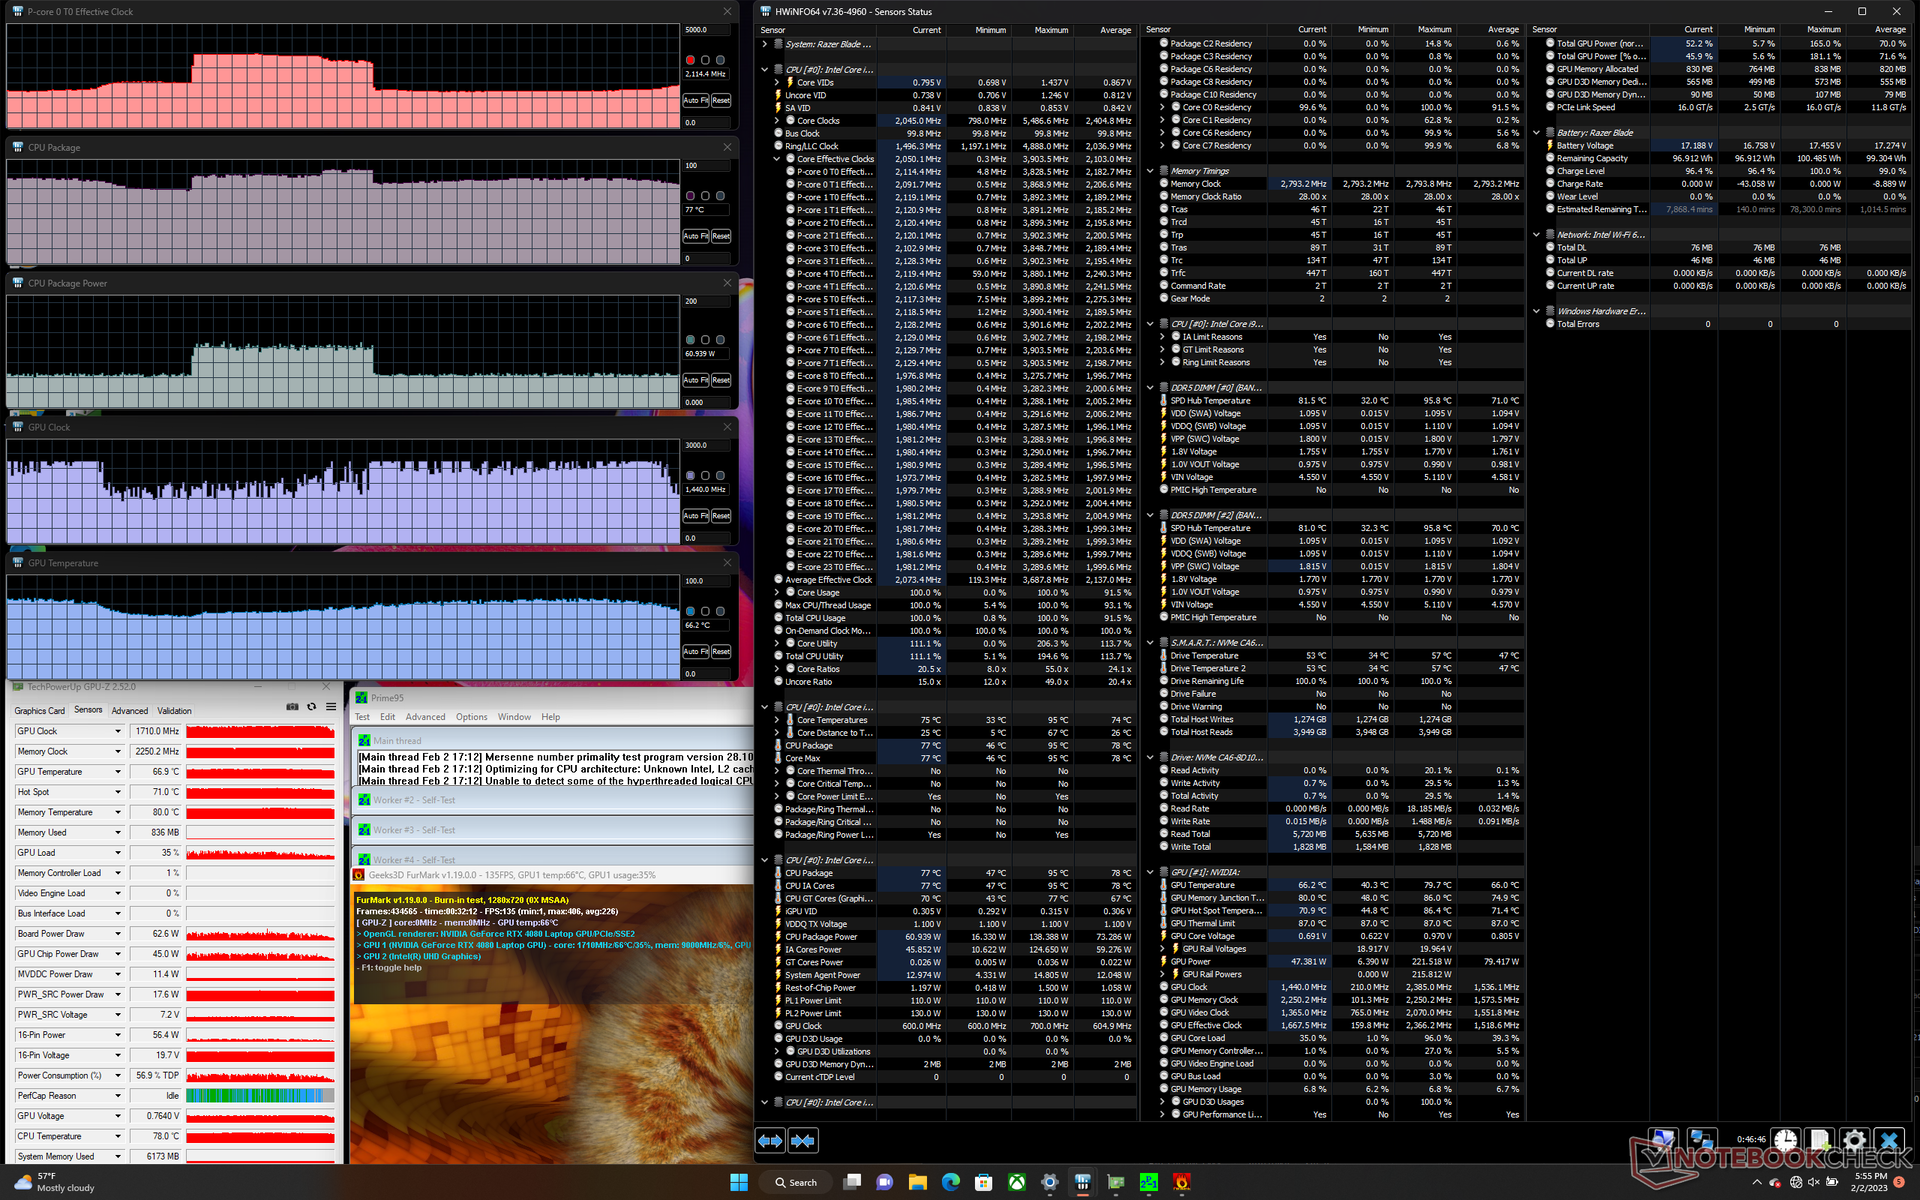
尽管Razer宣传的TGP峰值为175W,但我们在运行高要求的游戏时只能记录到157W和162W之间的最大稳定范围。看看未来的GeForce RTX 4080笔记本电脑在这方面如何比较将是很有趣的,因为Blade 16只是我们的第一台。
用电池供电运行限制了性能。在电池上进行的Time Spy 测试将返回物理和图形分数,分别为8611和8085分,而在主电源上则为13991和18441分。
| CPU时钟(GHz) | GPU时钟(MHz) | CPU平均温度(℃) | GPU平均温度(℃) | |
| 系统空闲 | -- | -- | 47 | 40 |
| Prime95压力 | 3.0 - 3.5 | -- | 82 | 56 |
| Prime95 + FurMark 压力 | ~2.1 | ~1440 - 2357 | 77 - 95 | 62 - 80 |
| Witcher 3 压力(平衡状况) | ~1.0 | 2115 | 76 | 75 |
| Witcher 3 (业绩概况) | ~1.3 | 2385 | 78 | 78 |
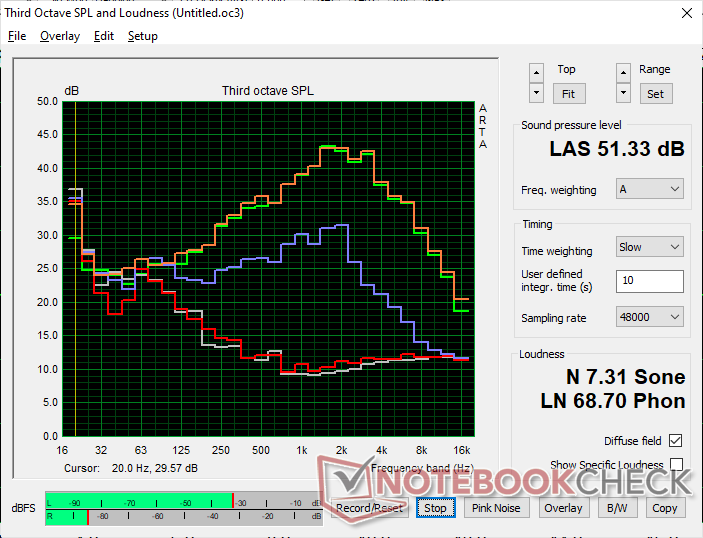
发言人
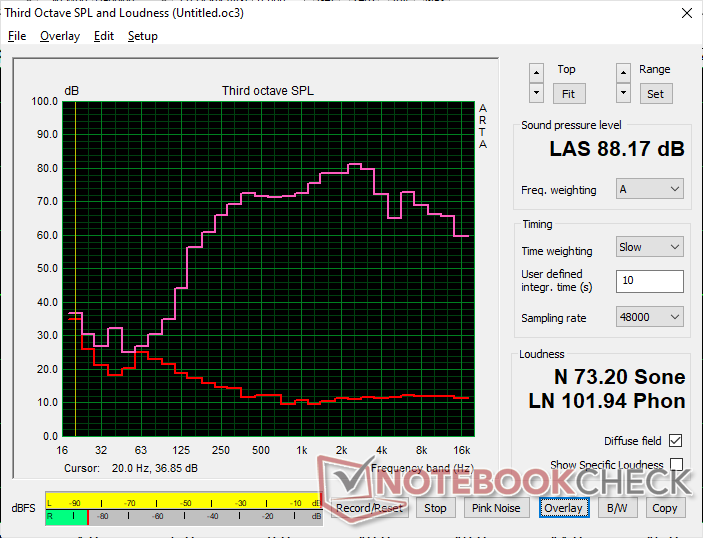
Razer Blade 16 Early 2023 audio analysis
(+) | speakers can play relatively loud (88.2 dB)
Bass 100 - 315 Hz
(-) | nearly no bass - on average 16.4% lower than median
(±) | linearity of bass is average (10.8% delta to prev. frequency)
Mids 400 - 2000 Hz
(+) | balanced mids - only 2.5% away from median
(+) | mids are linear (2.4% delta to prev. frequency)
Highs 2 - 16 kHz
(+) | balanced highs - only 4.9% away from median
(±) | linearity of highs is average (7.9% delta to prev. frequency)
Overall 100 - 16.000 Hz
(+) | overall sound is linear (12.6% difference to median)
Compared to same class
» 16% of all tested devices in this class were better, 4% similar, 81% worse
» The best had a delta of 6%, average was 18%, worst was 132%
Compared to all devices tested
» 11% of all tested devices were better, 3% similar, 86% worse
» The best had a delta of 4%, average was 23%, worst was 134%
Apple MacBook Pro 16 2021 M1 Pro audio analysis
(+) | speakers can play relatively loud (84.7 dB)
Bass 100 - 315 Hz
(+) | good bass - only 3.8% away from median
(+) | bass is linear (5.2% delta to prev. frequency)
Mids 400 - 2000 Hz
(+) | balanced mids - only 1.3% away from median
(+) | mids are linear (2.1% delta to prev. frequency)
Highs 2 - 16 kHz
(+) | balanced highs - only 1.9% away from median
(+) | highs are linear (2.7% delta to prev. frequency)
Overall 100 - 16.000 Hz
(+) | overall sound is linear (4.6% difference to median)
Compared to same class
» 0% of all tested devices in this class were better, 0% similar, 100% worse
» The best had a delta of 5%, average was 17%, worst was 45%
Compared to all devices tested
» 0% of all tested devices were better, 0% similar, 100% worse
» The best had a delta of 4%, average was 23%, worst was 134%
能源管理--比以前更有要求
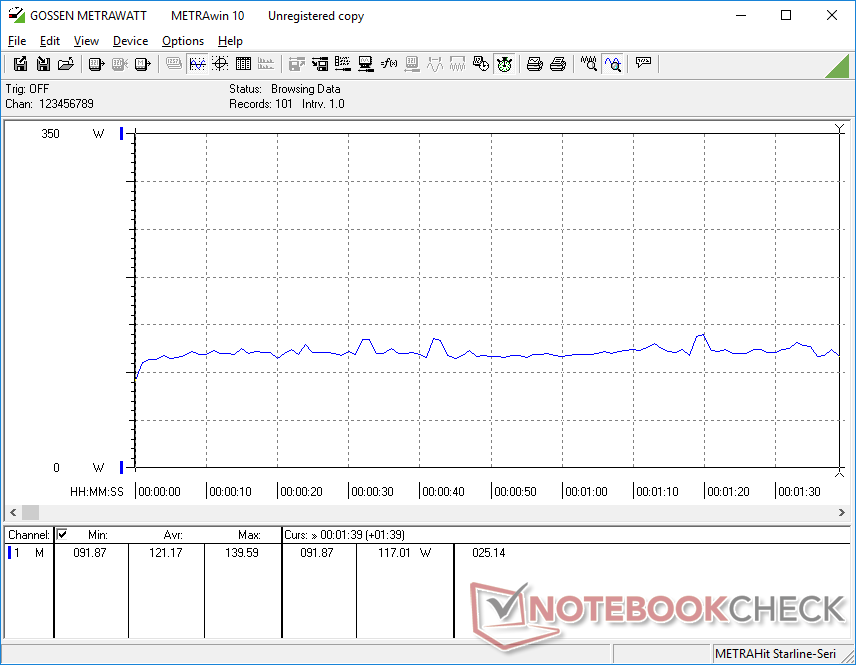
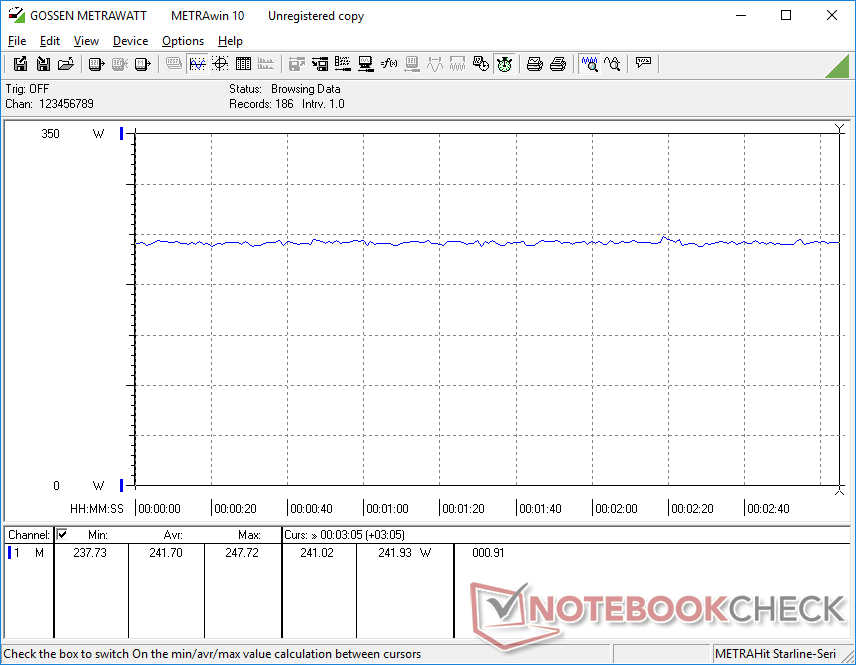
消耗功率
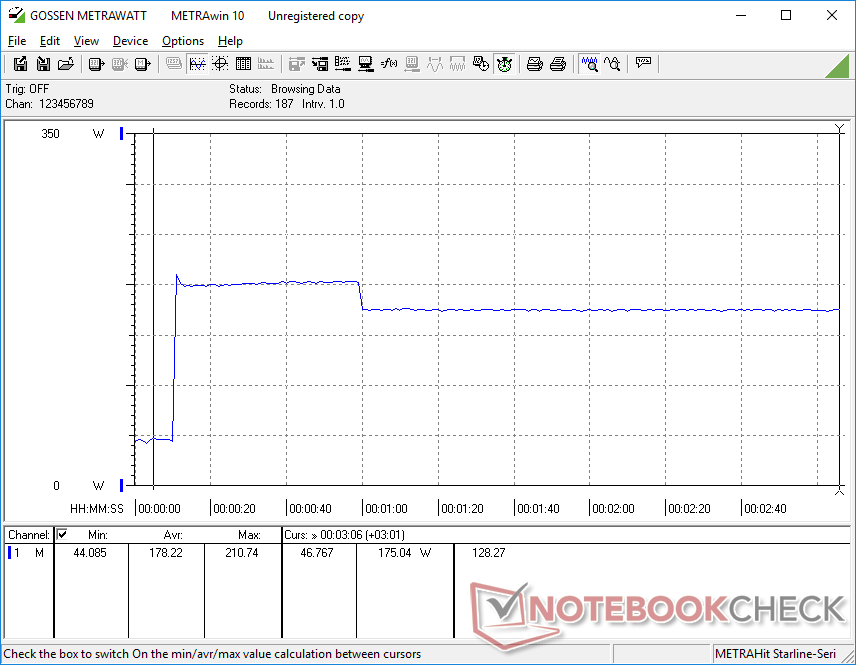
所有这些额外的性能并不是免费的,因为耗电量是任何刀片型号中最高的一些。例如,在性能dGPU模式下,在最大亮度设置下,桌面上的空闲时间将需要近50W,而去年的Blade 15只有一半。如果运行要求不高的负载,强烈建议将系统拨到Optimus模式,因为它可以将空转功耗降低到仅为15瓦至23瓦。
当运行 Witcher 3代表典型的游戏负载时,功耗将比采用RTX 3080 Ti和第12代酷睿i9-12900H的2022年刀片17高大约5%。值得庆幸的是,原始图形功率基因对基因的40%提升,足以弥补功耗的轻微增加。尽管如此,Blade 16仍然明显比大多数其他基于安培的游戏笔记本电脑要求更高,包括 华硕ROG Zephyrus Duo 16或 2022年的Razer Blade 15以高达60%的幅度。
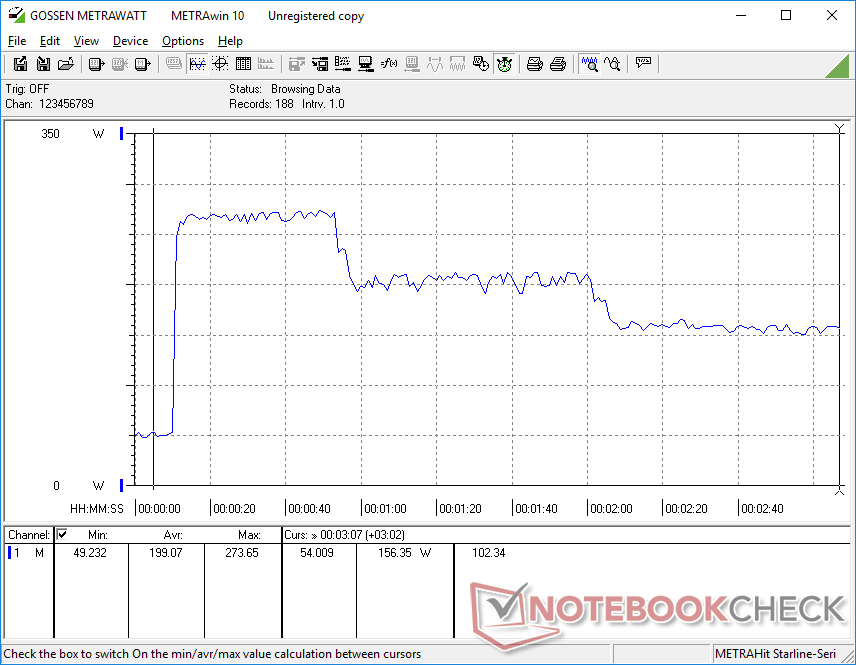
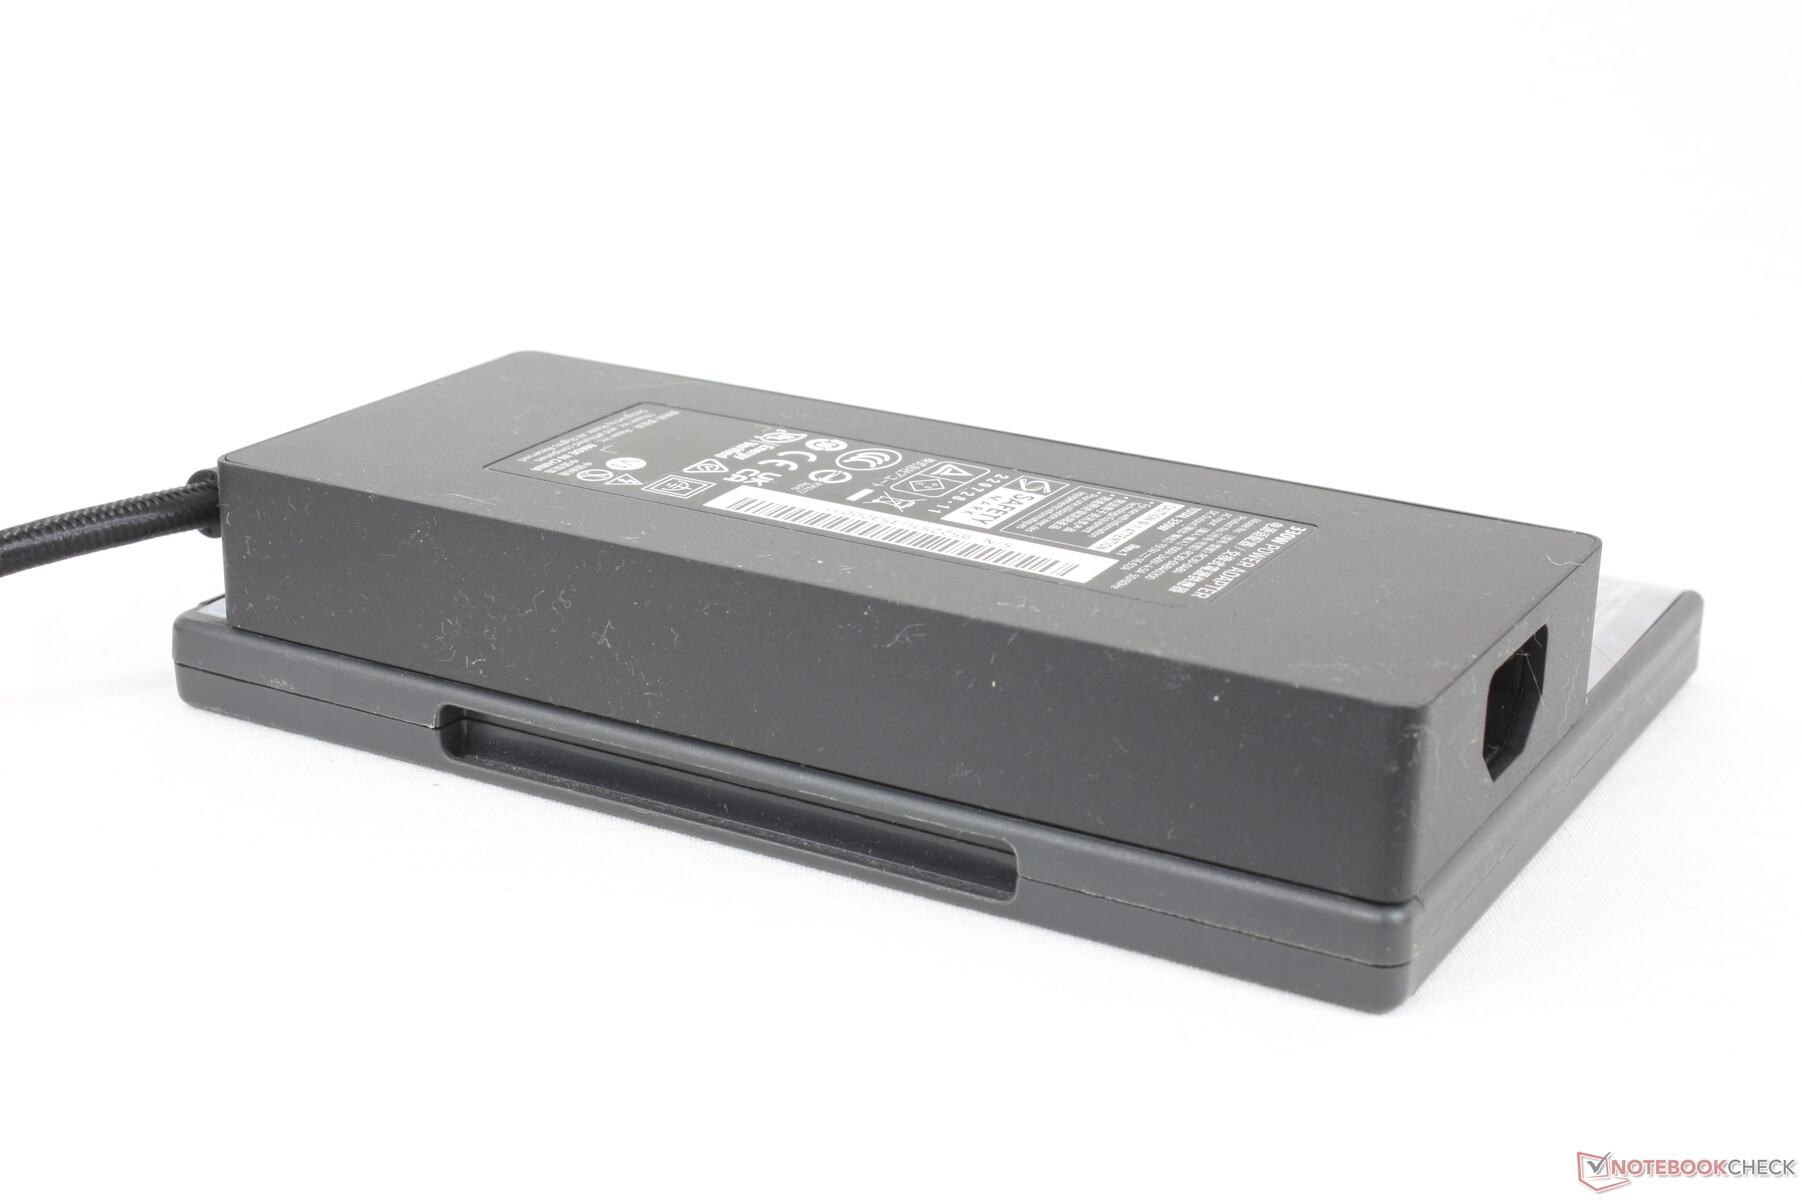
当同时启动Prime95和FurMark时,我们能够记录到274W的临时最大电流。附带的330 W GaN交流适配器(18 x 7.5 x 2.5厘米)比旧的230 W和280 W的略大,但相对于其他330 W交流适配器来说,它更紧凑。例如,微星GE67 HX的330 W适配器,体积更大,为20 x 9.8 x 4.3厘米。
| Off / Standby | |
| Idle | |
| Load |
|
Key:
min: | |
| Razer Blade 16 Early 2023 i9-13950HX, GeForce RTX 4080 Laptop GPU, SSSTC CA6-8D1024, IPS, 2560x1600, 16" | Razer Blade 15 Advanced Model Early 2022 i7-12800H, GeForce RTX 3080 Ti Laptop GPU, Samsung PM9A1 MZVL21T0HCLR, IPS, 1920x1080, 15.6" | Lenovo Legion S7 16ARHA7 R9 6900HX, Radeon RX 6800S, SK Hynix HFS001TEJ9X115N, IPS, 2560x1600, 16" | Dell G16 7620 i7-12700H, GeForce RTX 3060 Laptop GPU, WDC PC SN810 512GB, IPS, 2560x1600, 16" | Asus ROG Zephyrus Duo 16 GX650RX R9 6900HX, GeForce RTX 3080 Ti Laptop GPU, 2x Samsung SSD 980 Pro 2TB MZ-V8P2T0 (RAID 0), IPS-Level, 3840x2400, 16" | HP Omen 16-n0033dx R7 6800H, Radeon RX 6650M, Samsung PM9A1 MZVL21T0HCLR, IPS, 1920x1080, 16.1" | MSI GE67 HX 12UGS i7-12800HX, GeForce RTX 3070 Ti Laptop GPU, Samsung PM9A1 MZVL21T0HCLR, OLED, 1920x1080, 15.6" | |
|---|---|---|---|---|---|---|---|
| Power Consumption | 23% | 36% | 20% | 9% | 36% | 11% | |
| Idle Minimum * (Watt) | 15.2 | 17 -12% | 8.8 42% | 14.4 5% | 19 -25% | 7.9 48% | 16.1 -6% |
| Idle Average * (Watt) | 22.8 | 19 17% | 14.7 36% | 17.8 22% | 24 -5% | 11.5 50% | 17.1 25% |
| Idle Maximum * (Watt) | 49.8 | 25 50% | 19.8 60% | 31.5 37% | 31 38% | 18.3 63% | 26.6 47% |
| Load Average * (Watt) | 121.2 | 108 11% | 85.3 30% | 101.2 17% | 104 14% | 88.1 27% | 116.3 4% |
| Witcher 3 ultra * (Watt) | 242 | 150 38% | 167.5 31% | 176.9 27% | 186.5 23% | 206 15% | 237 2% |
| Load Maximum * (Watt) | 273.7 | 179 35% | 230.7 16% | 242.9 11% | 256 6% | 246.4 10% | 291.1 -6% |
* ... smaller is better
Power Consumption Witcher 3 / Stresstest
Power Consumption external Monitor
电池寿命
刀片16的电池容量为95Wh,比刀片15(80Wh)甚至刀片17(82Wh)的电池都要大。预计WLAN运行时间将延长1至2小时,总时间约为6小时。
用附带的交流适配器从空电到满电大约需要1小时45分钟。该系统还可以用USB-C适配器充电,尽管速度要慢得多。
| Razer Blade 16 Early 2023 i9-13950HX, GeForce RTX 4080 Laptop GPU, 95.2 Wh | Razer Blade 15 Advanced Model Early 2022 i7-12800H, GeForce RTX 3080 Ti Laptop GPU, 80 Wh | Lenovo Legion S7 16ARHA7 R9 6900HX, Radeon RX 6800S, 71 Wh | Dell G16 7620 i7-12700H, GeForce RTX 3060 Laptop GPU, 84 Wh | Asus ROG Zephyrus Duo 16 GX650RX R9 6900HX, GeForce RTX 3080 Ti Laptop GPU, 90 Wh | HP Omen 16-n0033dx R7 6800H, Radeon RX 6650M, 68 Wh | MSI GE67 HX 12UGS i7-12800HX, GeForce RTX 3070 Ti Laptop GPU, 99.9 Wh | |
|---|---|---|---|---|---|---|---|
| Battery runtime | 5% | 2% | -29% | 13% | 2% | 12% | |
| Reader / Idle (h) | 8.9 | 8.1 -9% | 7.1 -20% | 12.5 40% | 10 12% | 8.4 -6% | |
| WiFi v1.3 (h) | 6.1 | 4.9 -20% | 6.2 2% | 5 -18% | 7.8 28% | 7 15% | 5.6 -8% |
| Load (h) | 1.4 | 2 43% | 0.7 -50% | 1 -29% | 1.1 -21% | 2.1 50% | |
| H.264 (h) | 5.9 | 9.3 |
Pros
Cons
结论 - 一个更好的,但更大的刀片
作为Razer的第一款16英寸刀片,Blade 16检查了所有正确的盒子,包括CPU性能、GPU性能和无可挑剔的Razer设计。175瓦的GPU尤其令人印象深刻,因为去年的替代品如 Legion Slim 7 16或 Omen 16相比之下,它的GPU功率更低~100W。尽管如此,来自竞争厂商的机型一旦适当更新,采用类似的第13代英特尔CPU和GeForce 40 GPU选项,应该会有更好的表现。即将推出的 即将推出的Alienware x16是迄今为止最有希望成为新刀片的竞争者。
新的330瓦GaN交流适配器也值得称赞,因为其他制造商的交流适配器仍然要大得多。经常旅行的人绝对可以欣赏雷蛇的这一优势。
刀锋16及其超薄的AC适配器在性能和便携性方面的平衡比迄今为止任何其他16英寸游戏笔记本电脑都要好。然而,其较厚的设计可能会鼓励一些用户等待更新的Blade 15来代替。
也许最明显的对性能提升的妥协是更高的功耗和更厚的外形。刀锋16在游戏时比大多数现有的12代+RTX 3080笔记本电脑明显耗费更多的电力,因此更高容量的330瓦交流适配器是必要的。由此产生的更高的冷却需求使Blade 16成为迄今为止该系列中最厚的型号,甚至包括Blade 17 。考虑到16英寸的外形因素,它仍然是一个时尚的设计,但它肯定不像Blade 15 那样紧凑或便携。
其他缺点相对较小,如海绵状的点击板、响亮的风扇和缺乏网络摄像头快门,因为这些都是许多游戏笔记本电脑的正常情况。
至于移动GeForce RTX 4080,它可以令人印象深刻,也可以令人失望,这取决于你的观点。从笔记本电脑的角度来看,它比移动RTX 3080有了可观的飞跃,特别是在启用DLSS 3.0的情况下。然而,从桌面角度来看,它比RTX 4080慢得多,甚至比移动RTX 3080和桌面RTX 3080还要慢。由于移动和桌面显卡之间的性能差距越来越大,Nvidia可能要考虑为其移动GeForce 系列重新引入 "M "后缀。
Razer Blade 16 Early 2023
- 02/06/2023 v7 (old)
Allen Ngo
Transparency
The selection of devices to be reviewed is made by our editorial team. The test sample was provided to the author as a loan by the manufacturer or retailer for the purpose of this review. The lender had no influence on this review, nor did the manufacturer receive a copy of this review before publication. There was no obligation to publish this review. As an independent media company, Notebookcheck is not subjected to the authority of manufacturers, retailers or publishers.
This is how Notebookcheck is testing
Every year, Notebookcheck independently reviews hundreds of laptops and smartphones using standardized procedures to ensure that all results are comparable. We have continuously developed our test methods for around 20 years and set industry standards in the process. In our test labs, high-quality measuring equipment is utilized by experienced technicians and editors. These tests involve a multi-stage validation process. Our complex rating system is based on hundreds of well-founded measurements and benchmarks, which maintains objectivity. Further information on our test methods can be found here.
Price comparison

