微星 Vector 16 HX 笔记本电脑评测:泰坦性能而非泰坦价格

微星 Vector 16 HX 不会与已停产的Maingear Vector 混淆,它继承了去年的 GP68,引入了新的第 14 代英特尔 Raptor Lake-HX CPU 选项,并对老化的 15.6 英寸GP66 机箱设计进行了修改。该机型与MSI Claw 和 Titan 18 HX 等一系列其他产品一起在今年早些时候的 CES 2024 上首次亮相。
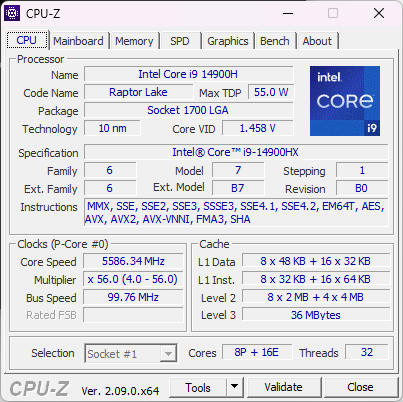
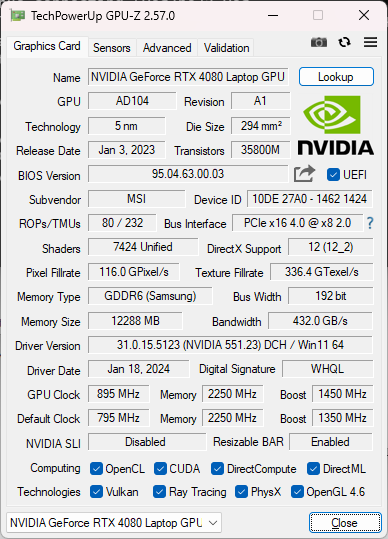
我们的评测机是一款高端配置,配备酷睿 i9-14900HX CPU、175
GeForce RTX 4080 GPU 和 1600p 240 Hz IPS 显示屏,零售价约为 2700 美元。其他配置有 RTX 4090、4070 或 4060 图形处理器和 1200p 144 Hz 显示屏,但目前所有选项都包含相同的酷睿 i9-14900HX CPU。Vector 16 HX 的替代产品包括其他中高端 16 英寸游戏笔记本电脑,如 联想Legion 5i 16,华硕 TUF Gaming A16, Alienware m16 R1或 HP Omen 16.
更多微星评论:
潜在的竞争对手比较
Rating | Date | Model | Weight | Height | Size | Resolution | Price |
|---|---|---|---|---|---|---|---|
| 88 % v7 (old) | 02 / 2024 | MSI Vector 16 HX A14V i9-14900HX, GeForce RTX 4080 Laptop GPU | 2.7 kg | 28.55 mm | 16.00" | 2560x1600 | |
| 86.9 % v7 (old) | 03 / 2022 | MSI Vector GP66 12UGS i9-12900H, GeForce RTX 3070 Ti Laptop GPU | 2.3 kg | 23.4 mm | 15.60" | 1920x1080 | |
| 89.1 % v7 (old) | 02 / 2024 | Lenovo Legion 5 16IRX G9 i7-14650HX, GeForce RTX 4060 Laptop GPU | 2.4 kg | 25.2 mm | 16.00" | 2560x1600 | |
| 85.1 % v7 (old) | 09 / 2023 | HP Victus 16-r0077ng i7-13700H, GeForce RTX 4070 Laptop GPU | 2.4 kg | 24 mm | 16.10" | 1920x1080 | |
| 86.9 % v7 (old) | 06 / 2023 | Asus TUF Gaming A16 FA617XS R9 7940HS, Radeon RX 7600S | 2.2 kg | 22.1 mm | 16.00" | 1920x1200 | |
| 86.1 % v7 (old) | 10 / 2022 | Dell G16 7620 i7-12700H, GeForce RTX 3060 Laptop GPU | 2.6 kg | 26.9 mm | 16.00" | 2560x1600 |
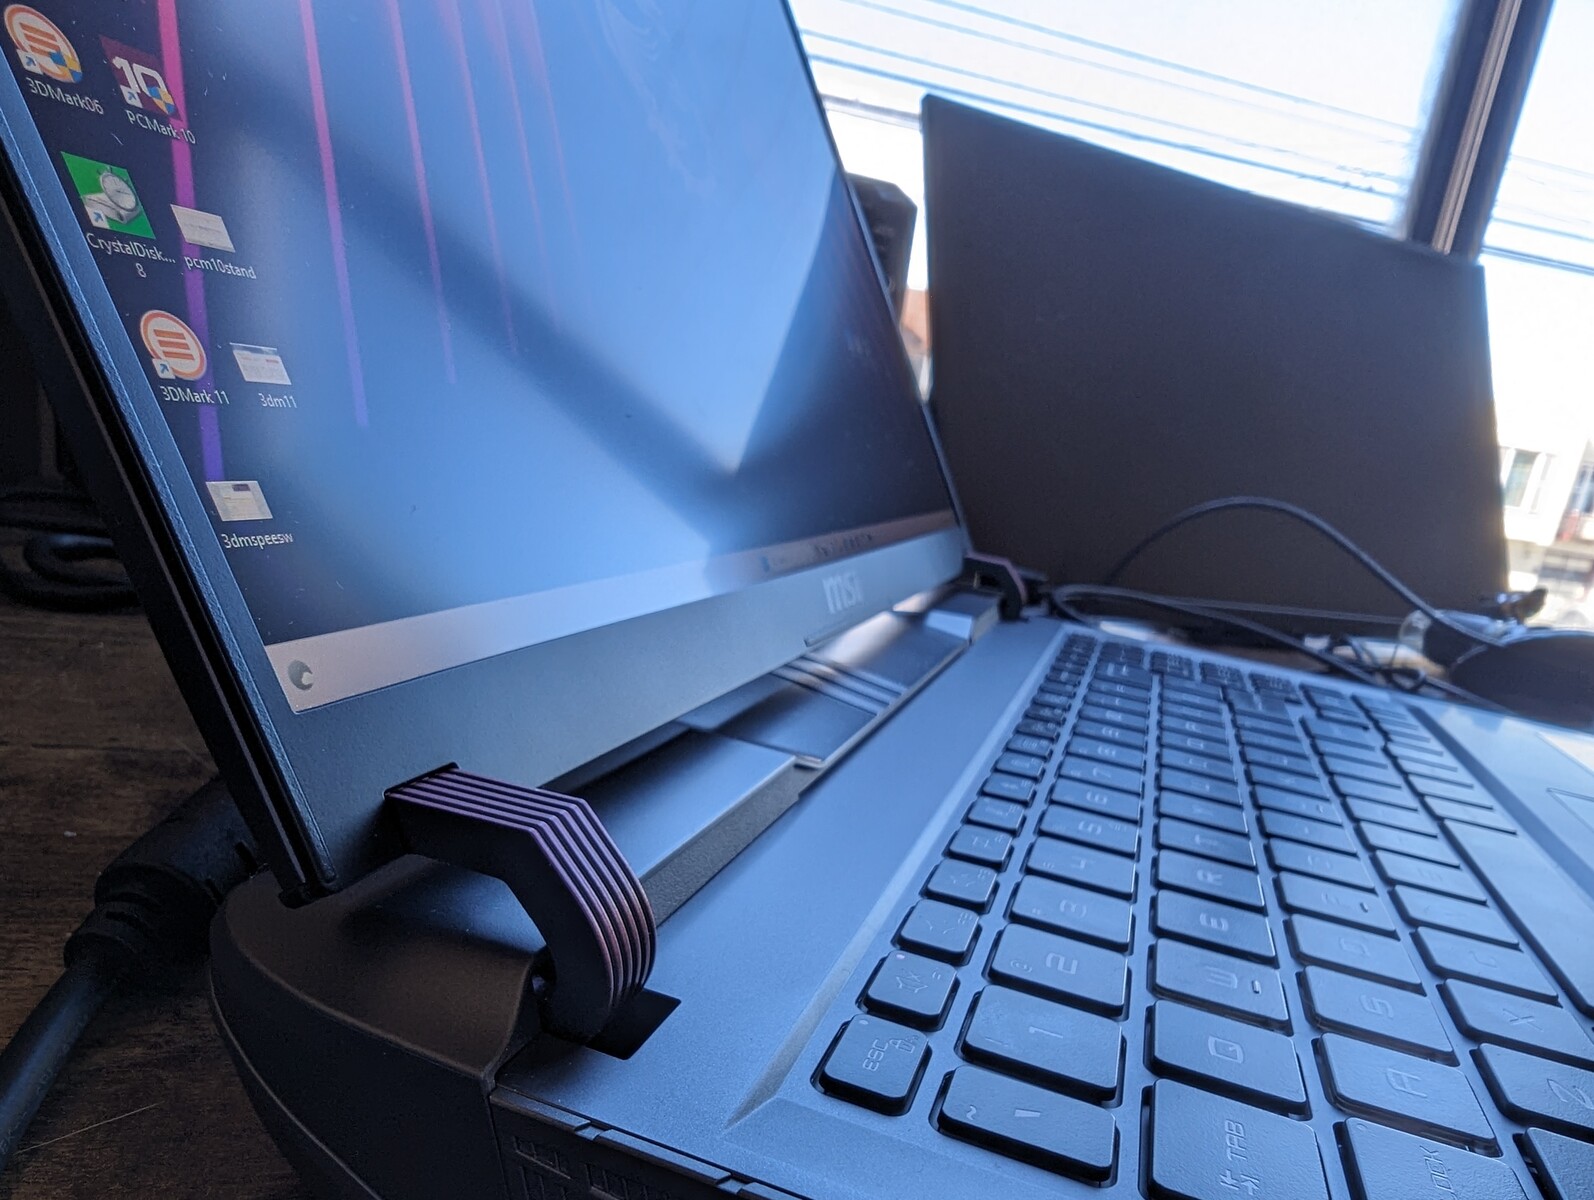
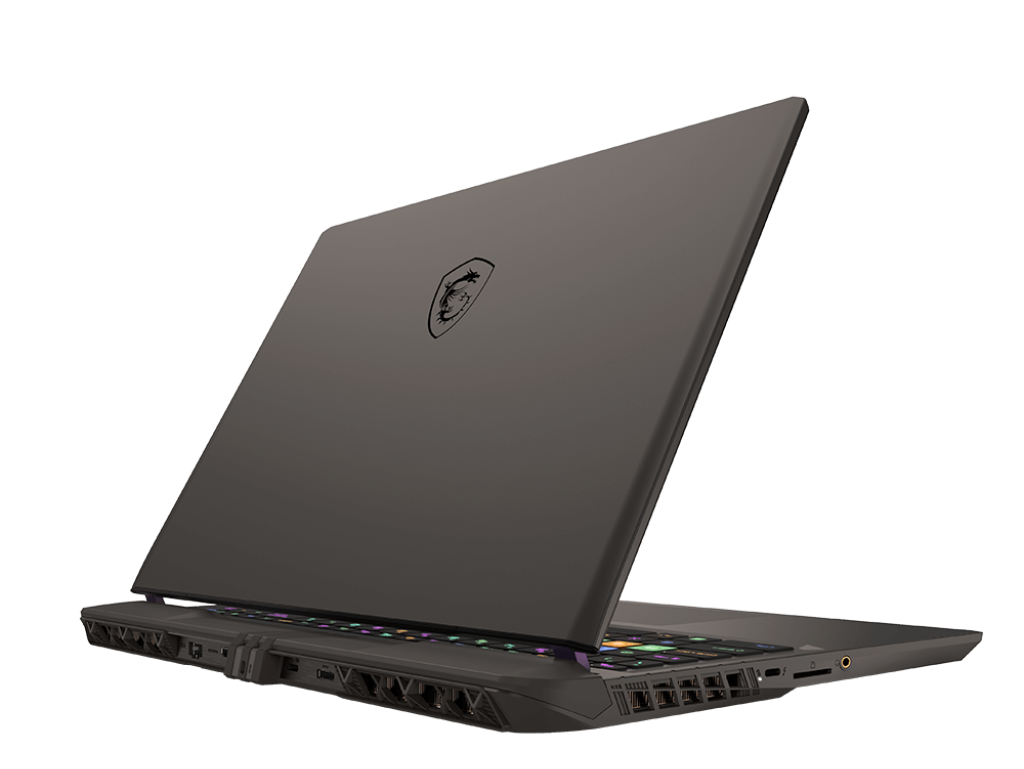
机箱 - 功能强大,但并不华丽
除了金属合金外盖外,大部分底座都是塑料材质,与价格更高的泰坦 HX 相比,奢华感稍逊一筹。Vector 系列并不是顶级产品,但考虑到约 2000 美元的售价,我们对它的期望还是比较高的。它的键盘面板和底板缺乏像 Razer Blade 16 或 Alienware m16 R1.
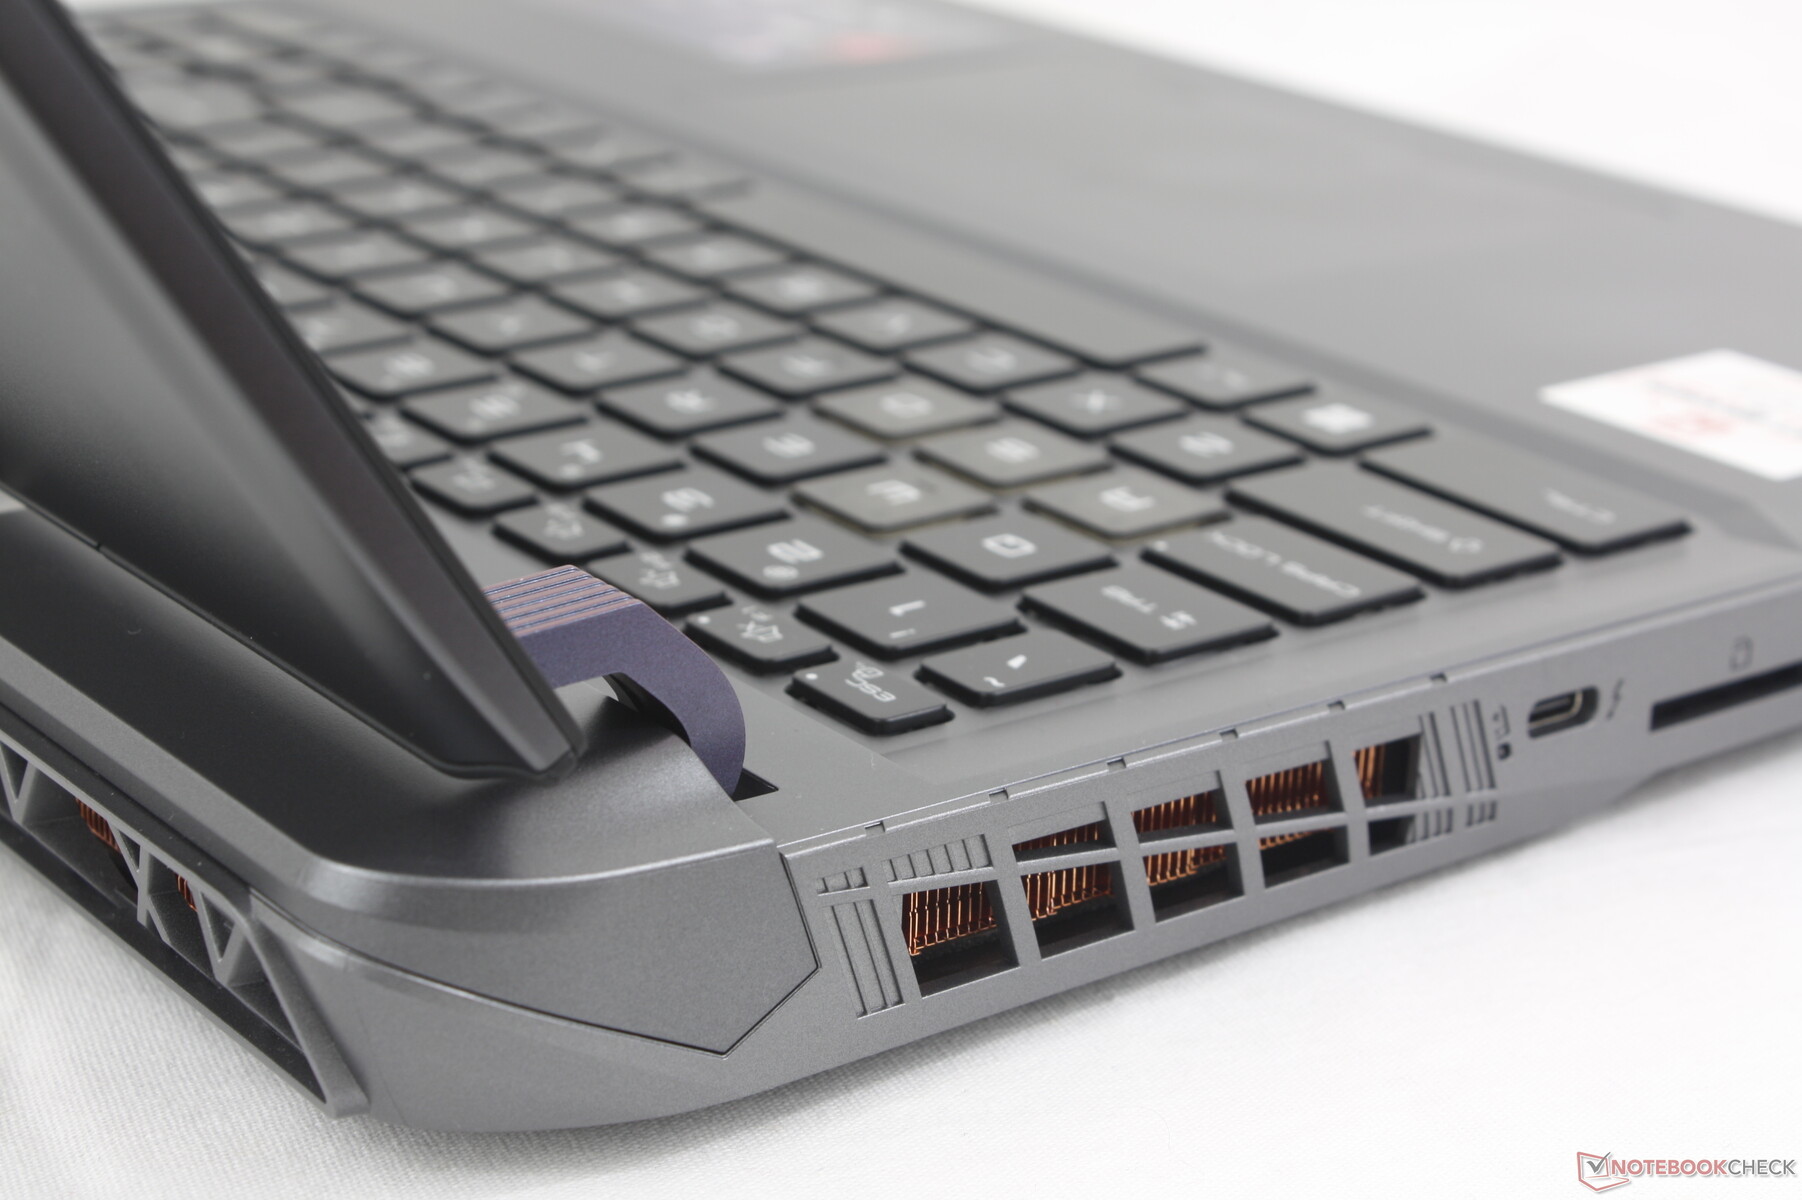
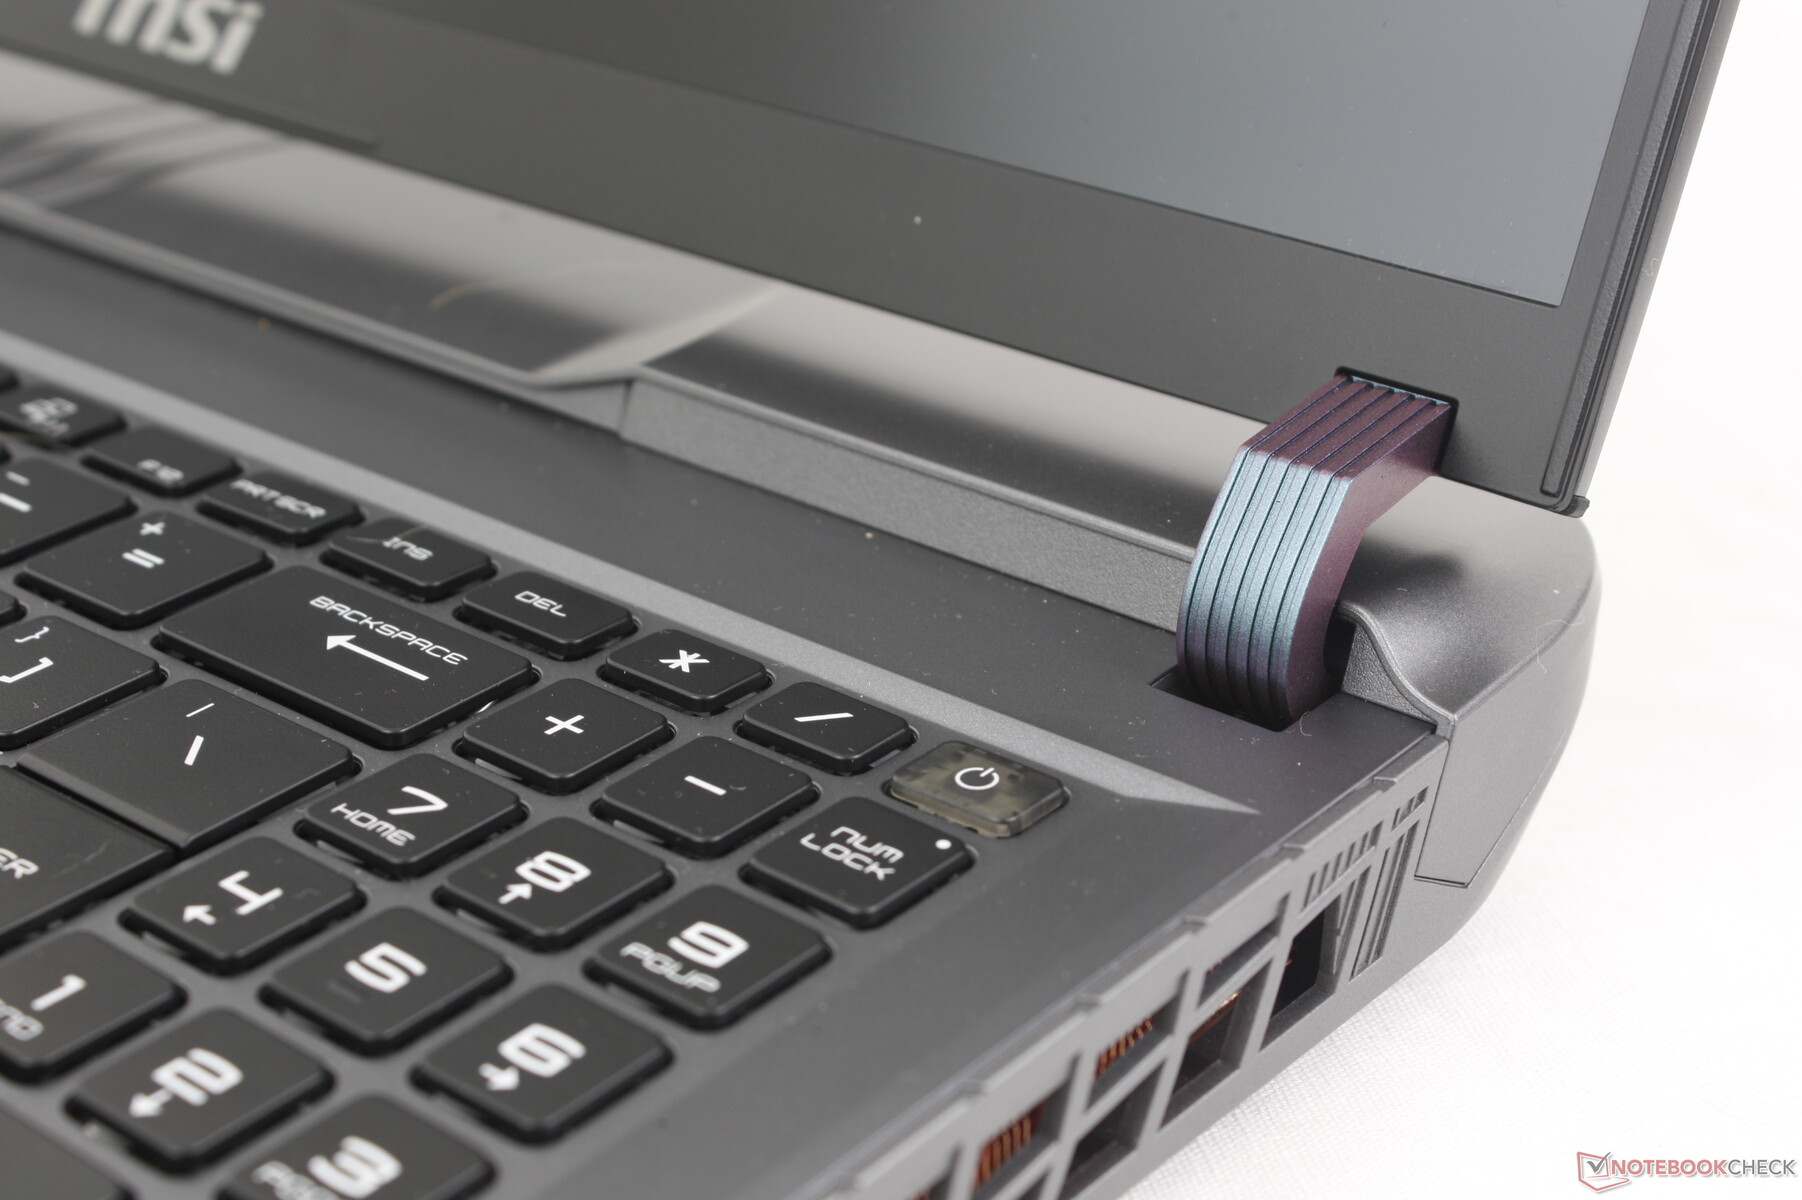
幸运的是,机箱的刚性从上到下都非常出色,包括盖子,而其他笔记本电脑的盖子刚性往往明显较弱。特别是重新设计的铰链现在比以前更大、更坚固,让人不禁想起华硕 Strix Scar 17 的铰链。 华硕 Strix Scar 17.不过,铰链的弧度限制了显示屏的最大打开角度,只能达到 130 度。
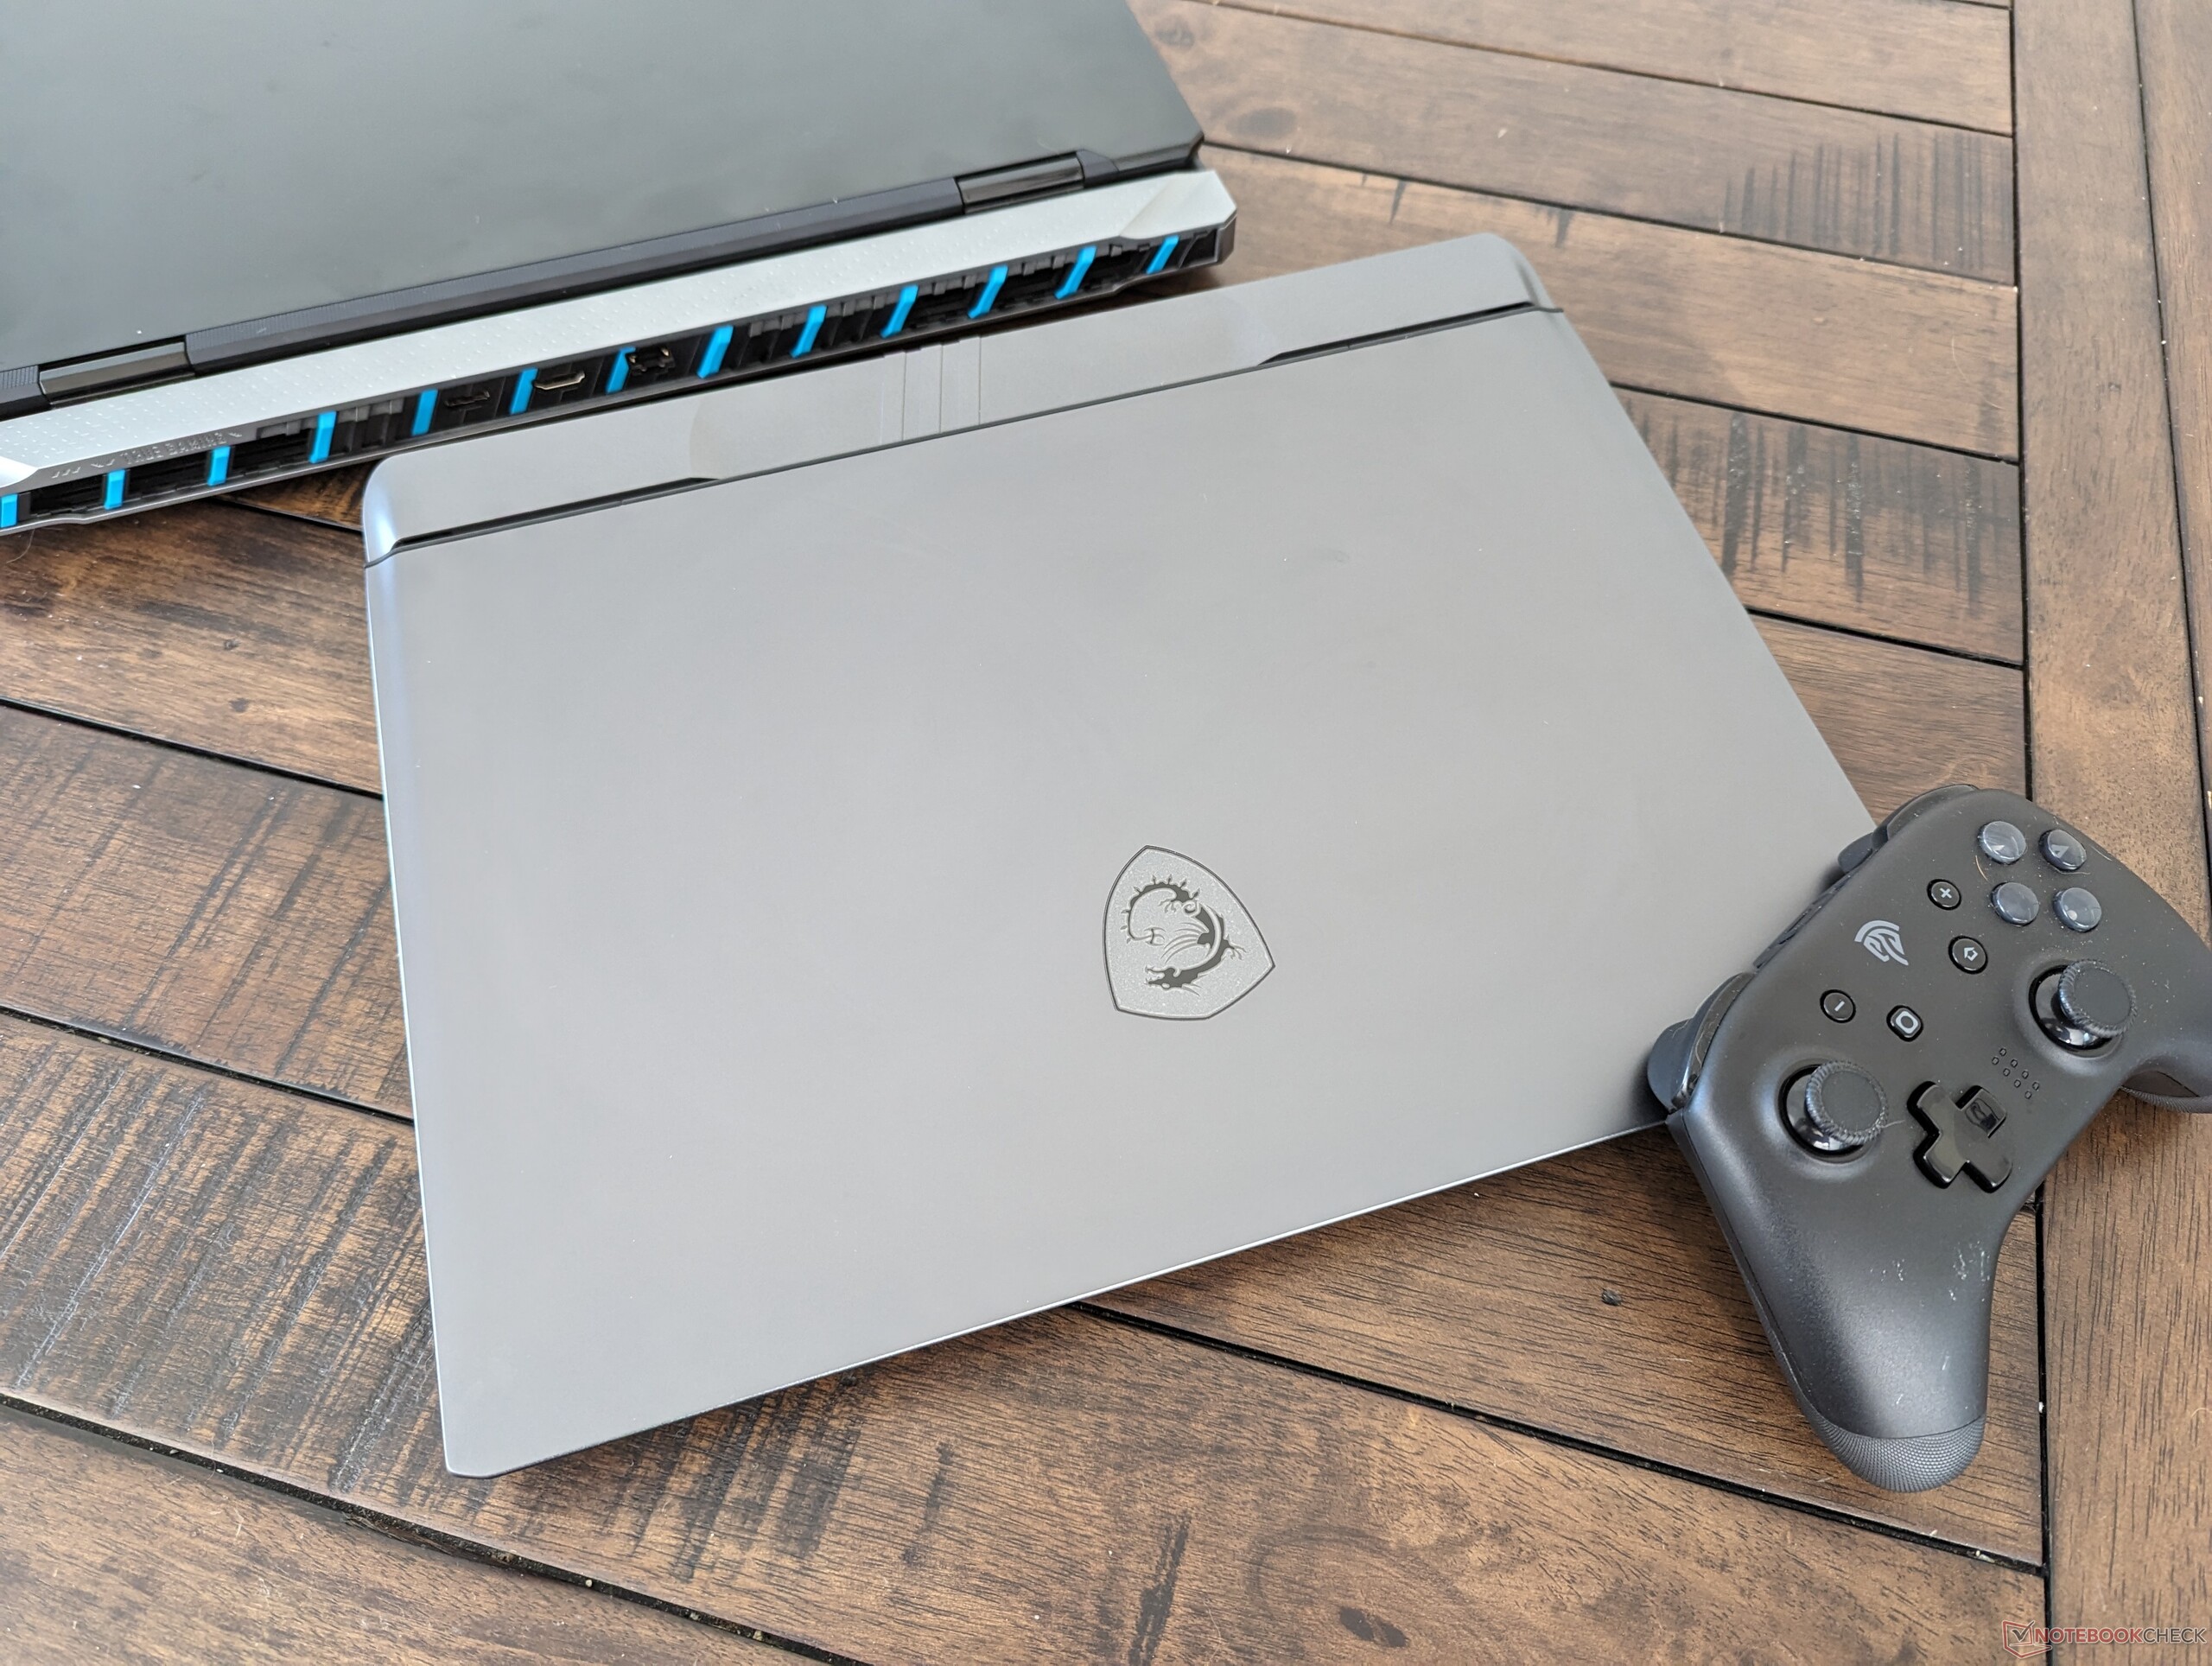
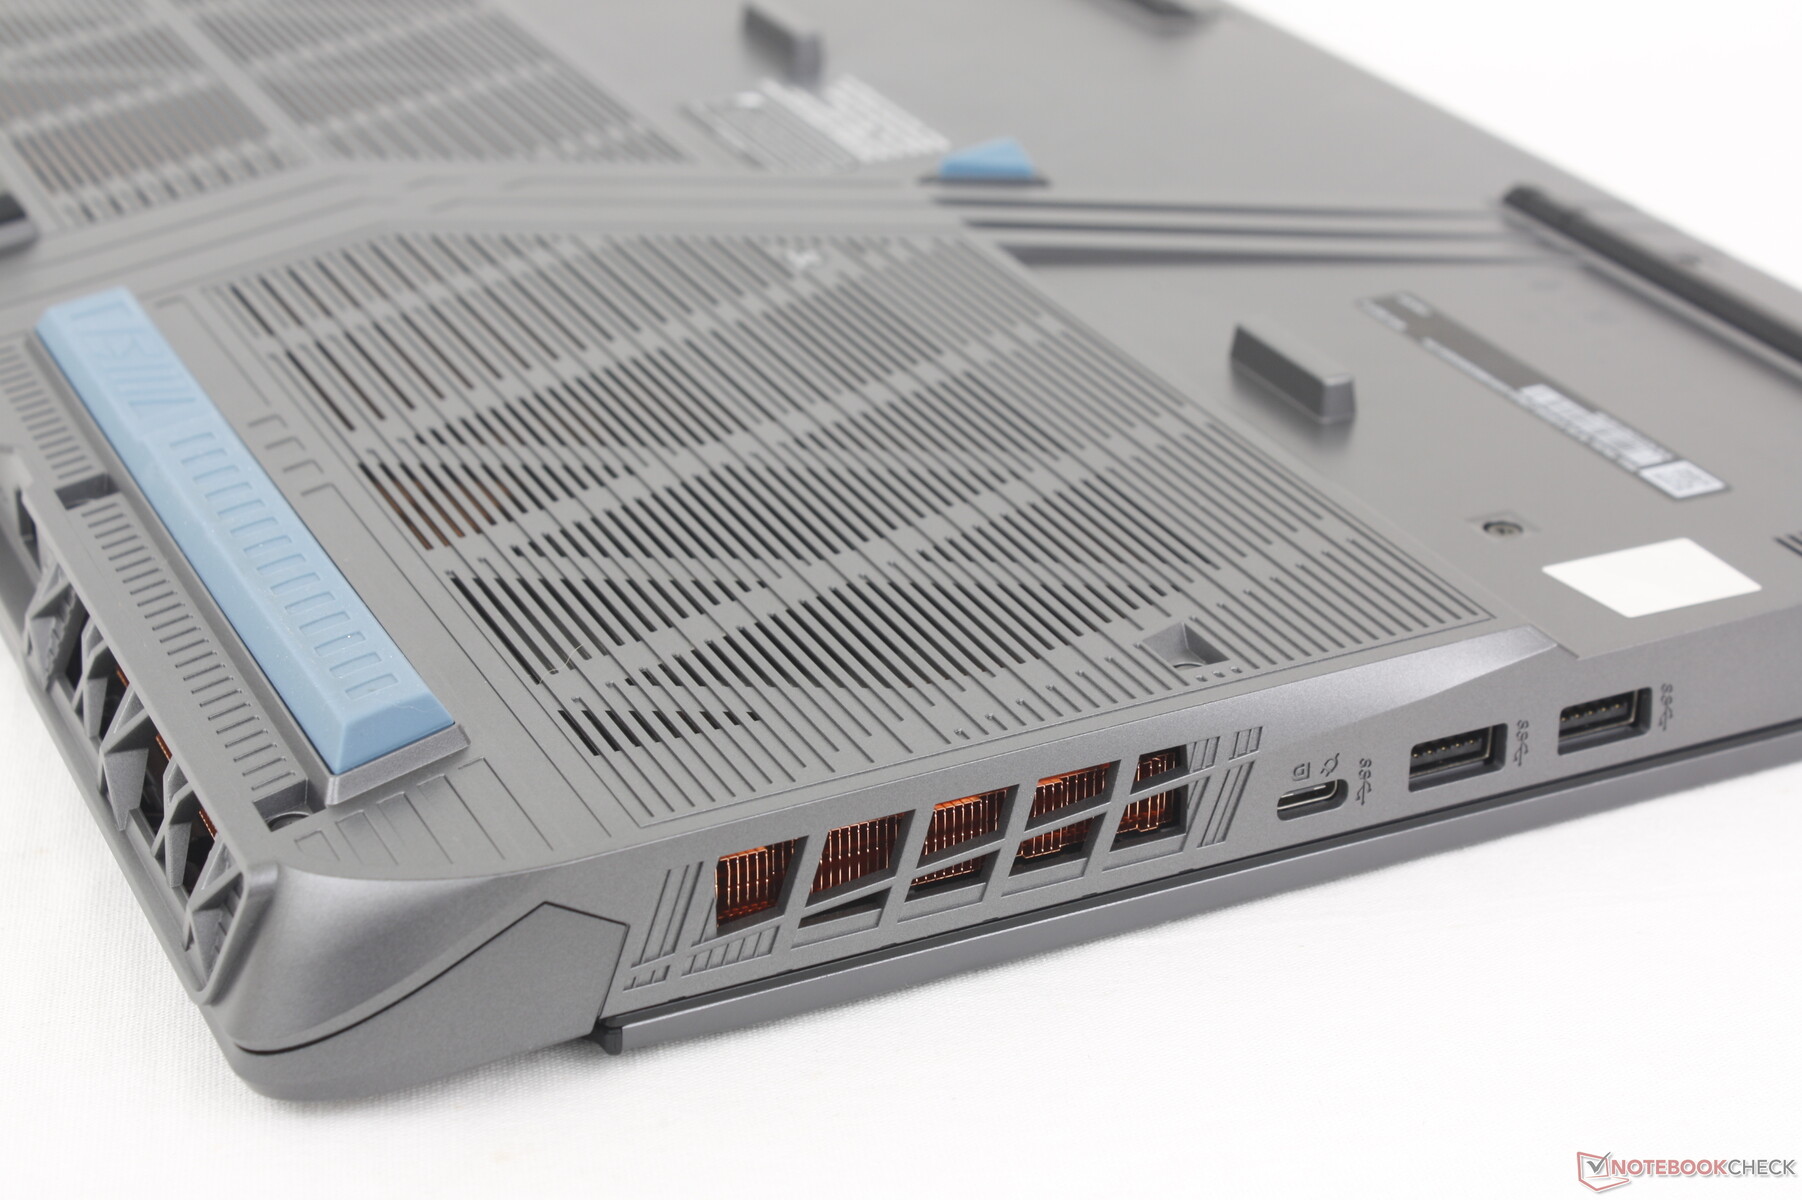
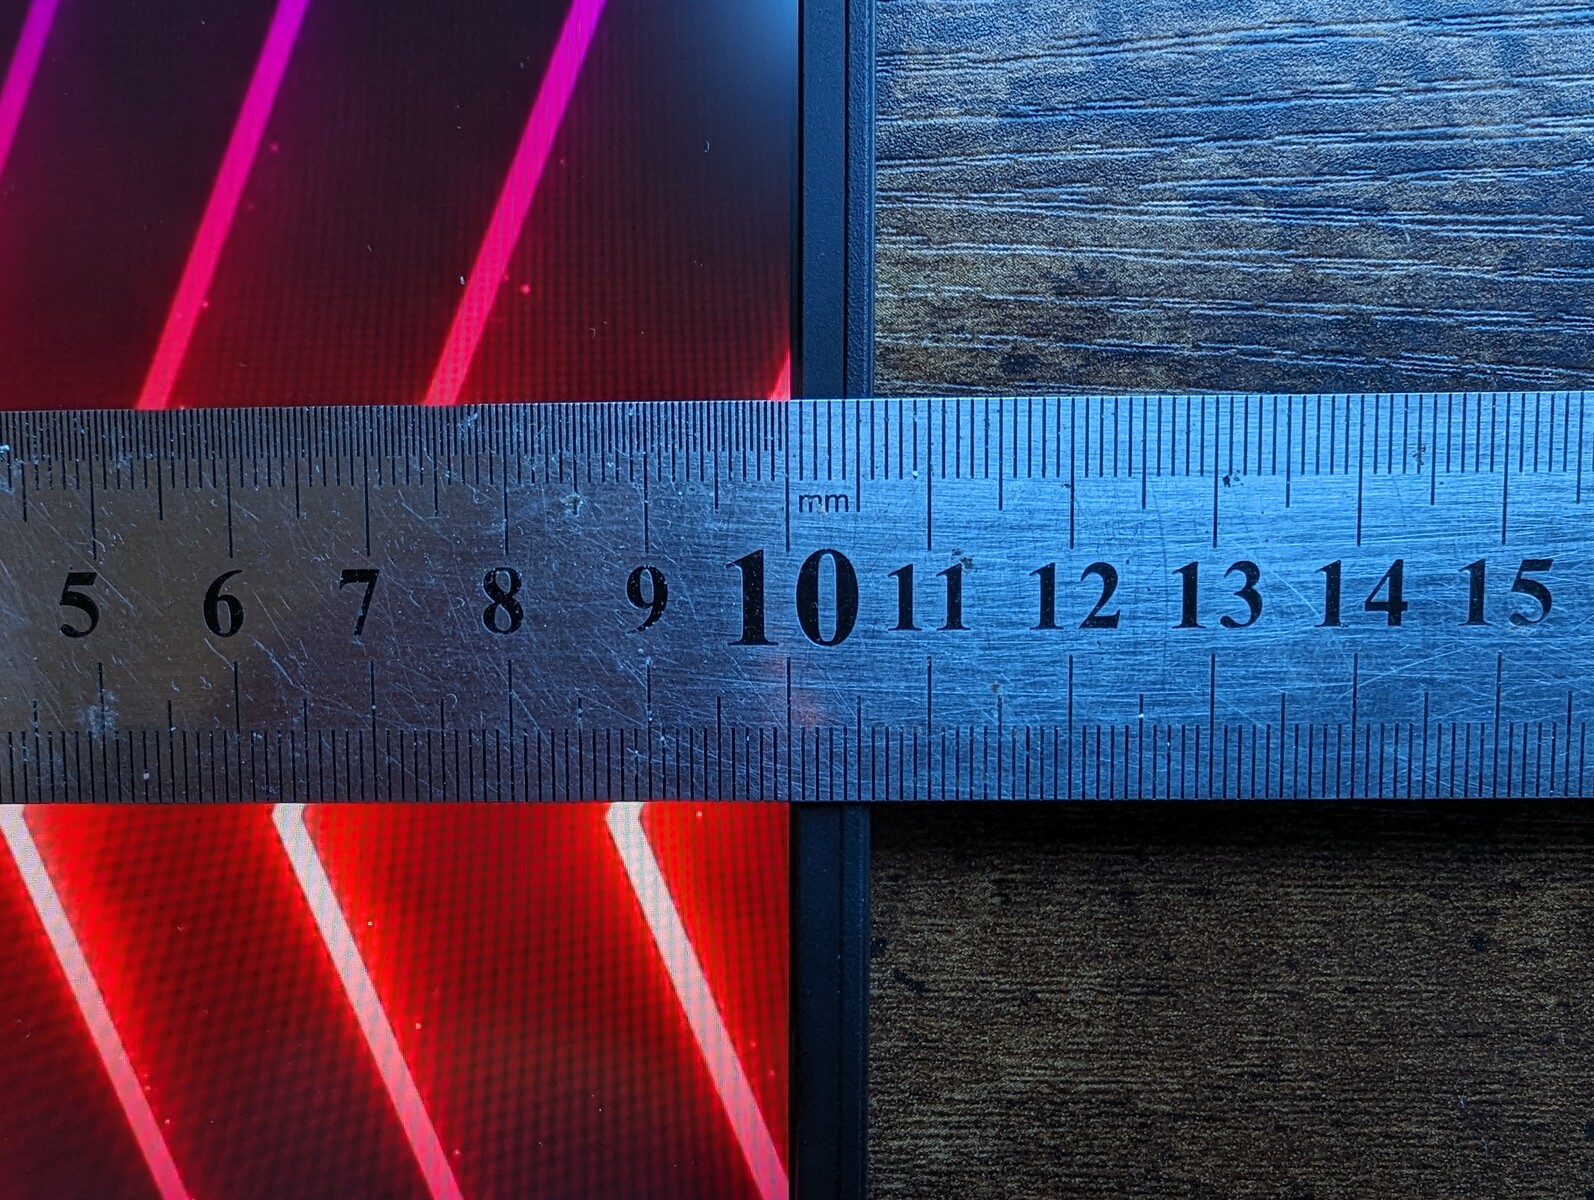
Vector 16 HX 是一款大型笔记本电脑,这一点毋庸置疑。与其他大多数 16 英寸机型相比,其 175 W 的 TGP 目标(与 CPU 结合使用时为 240 W)需要更强的冷却解决方案和更大的机箱设计。微星甚至比去年的 戴尔 G16 7620已经相当大了。值得庆幸的是,它不像 18 英寸的 Razer Blade 18 或 华硕 ROG Strix Scar 18,但它也不完全便携。
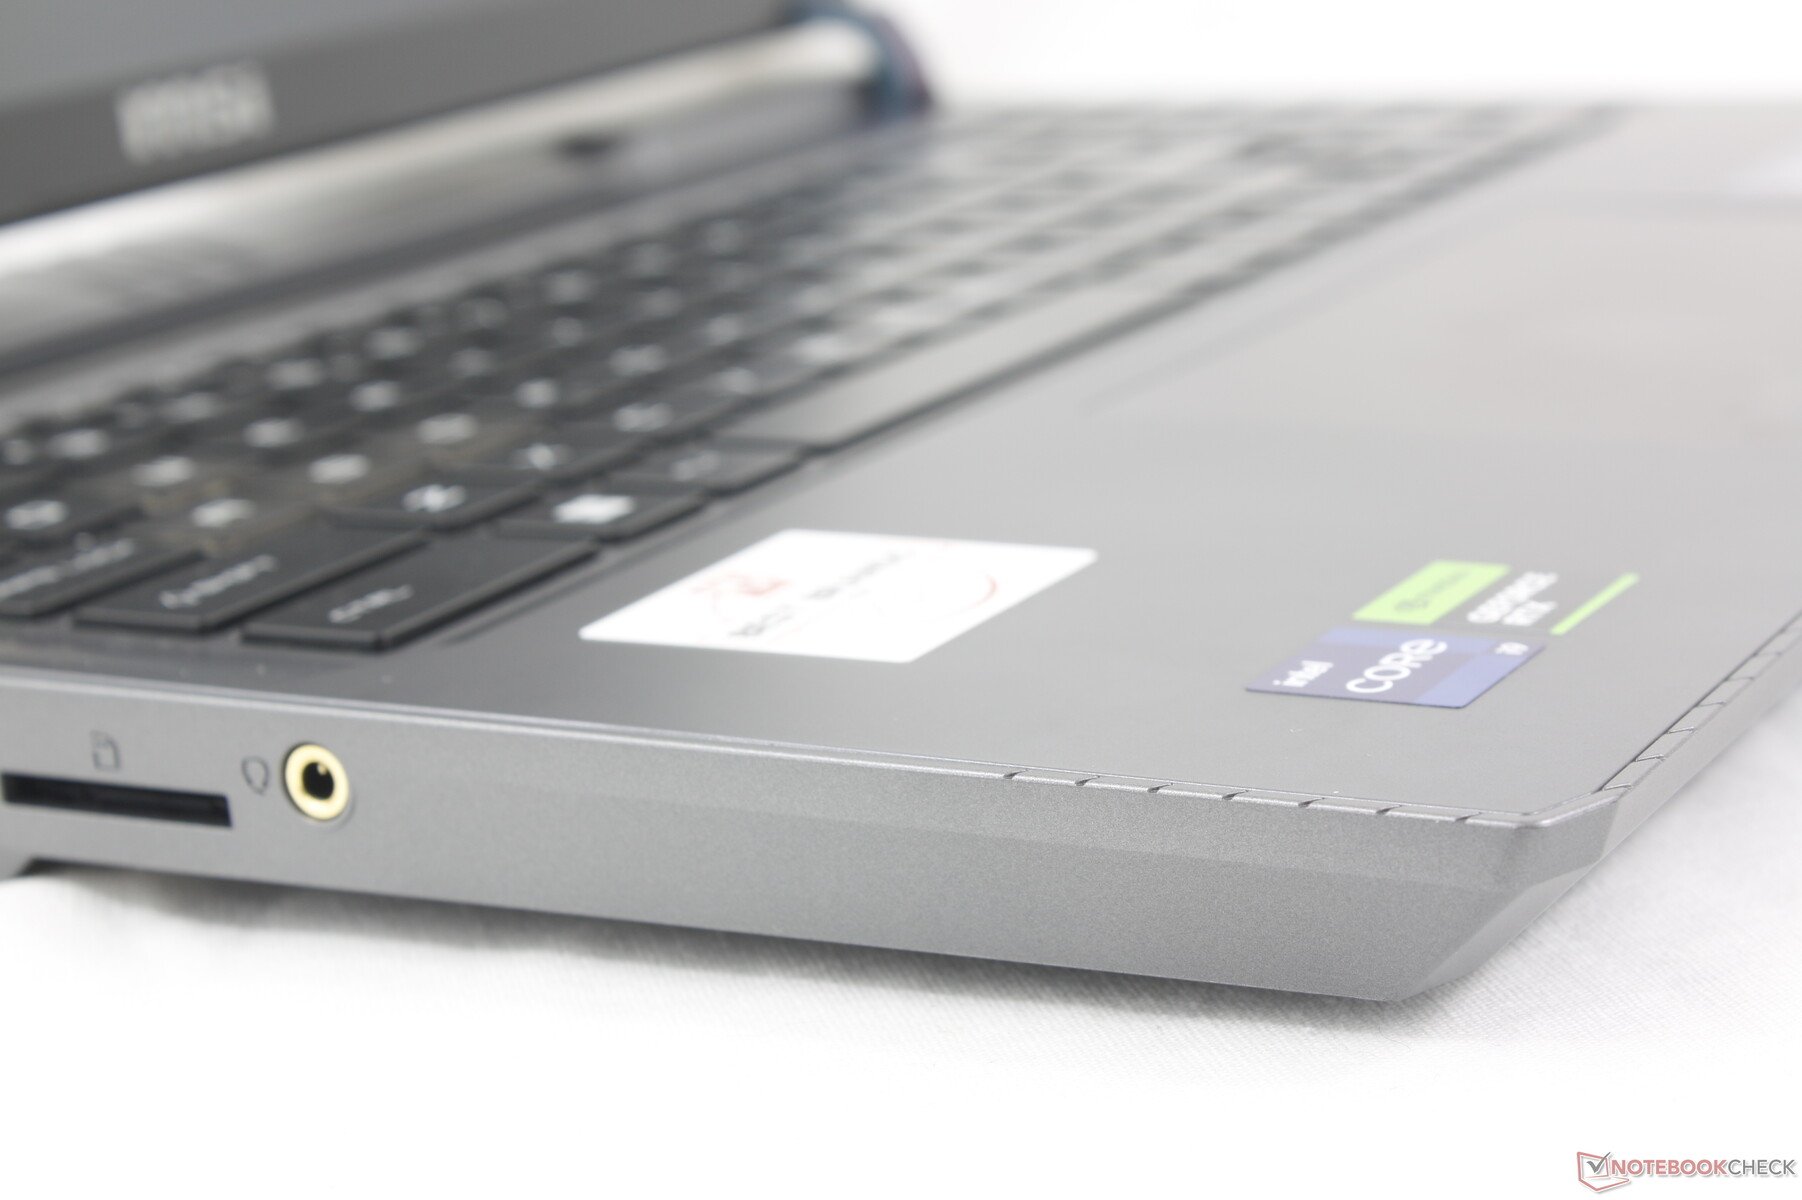
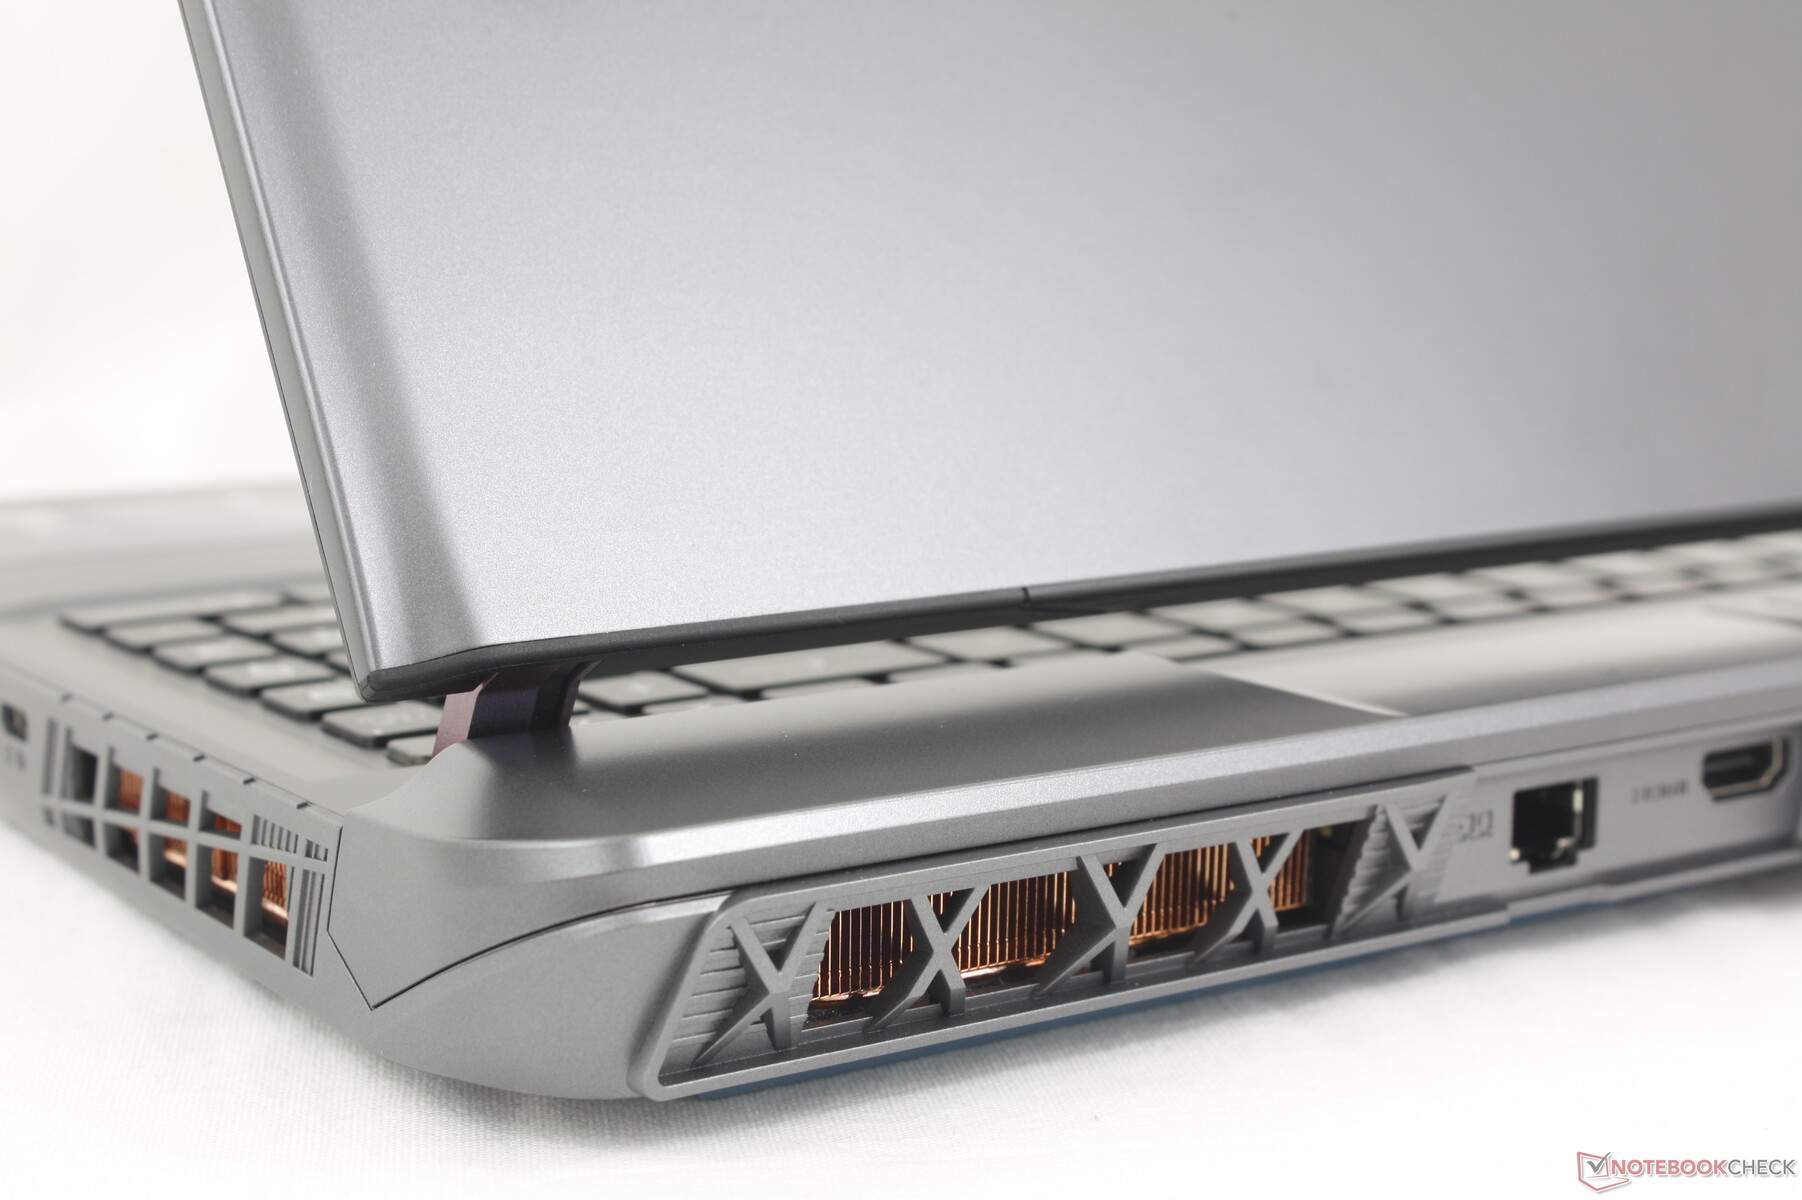
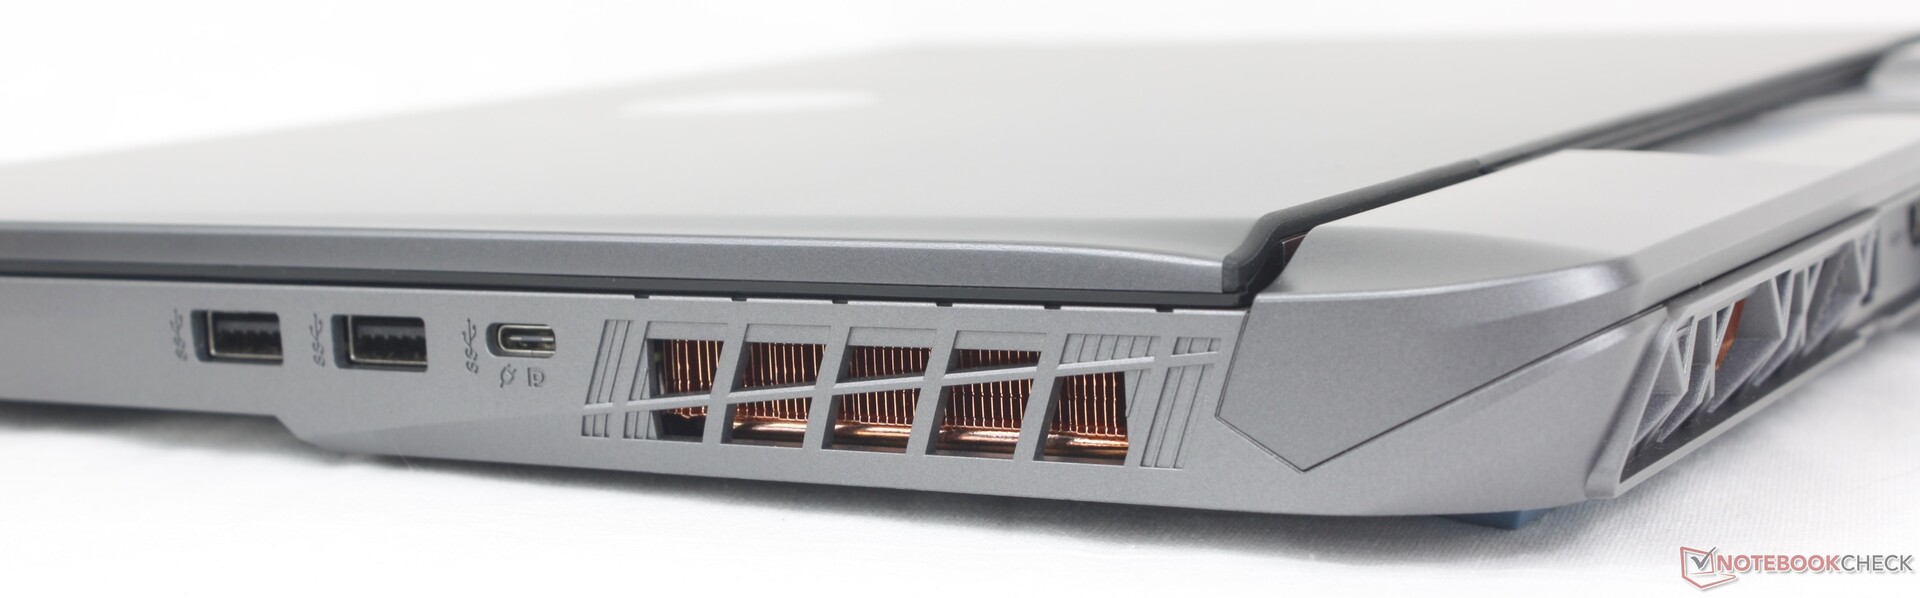
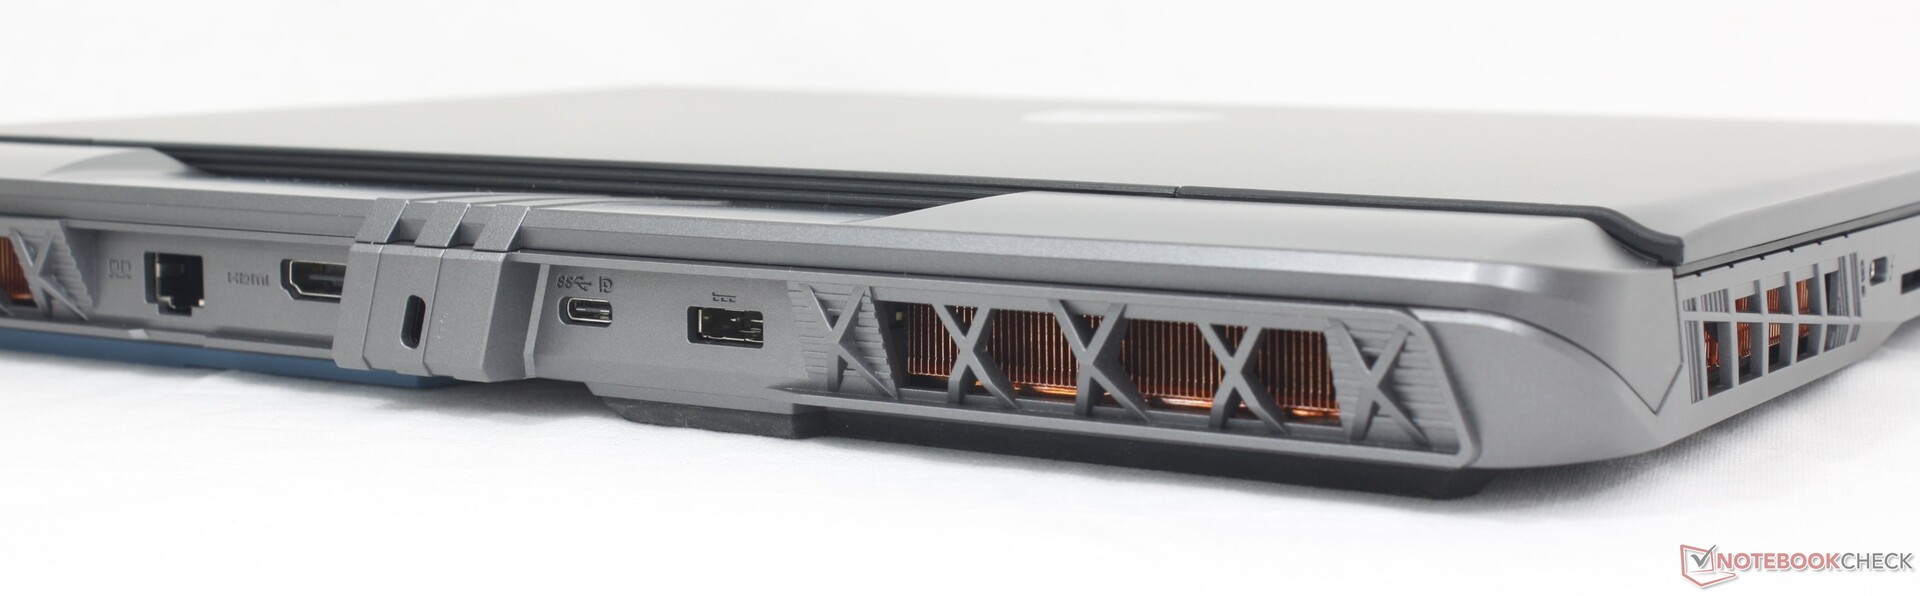
连接性
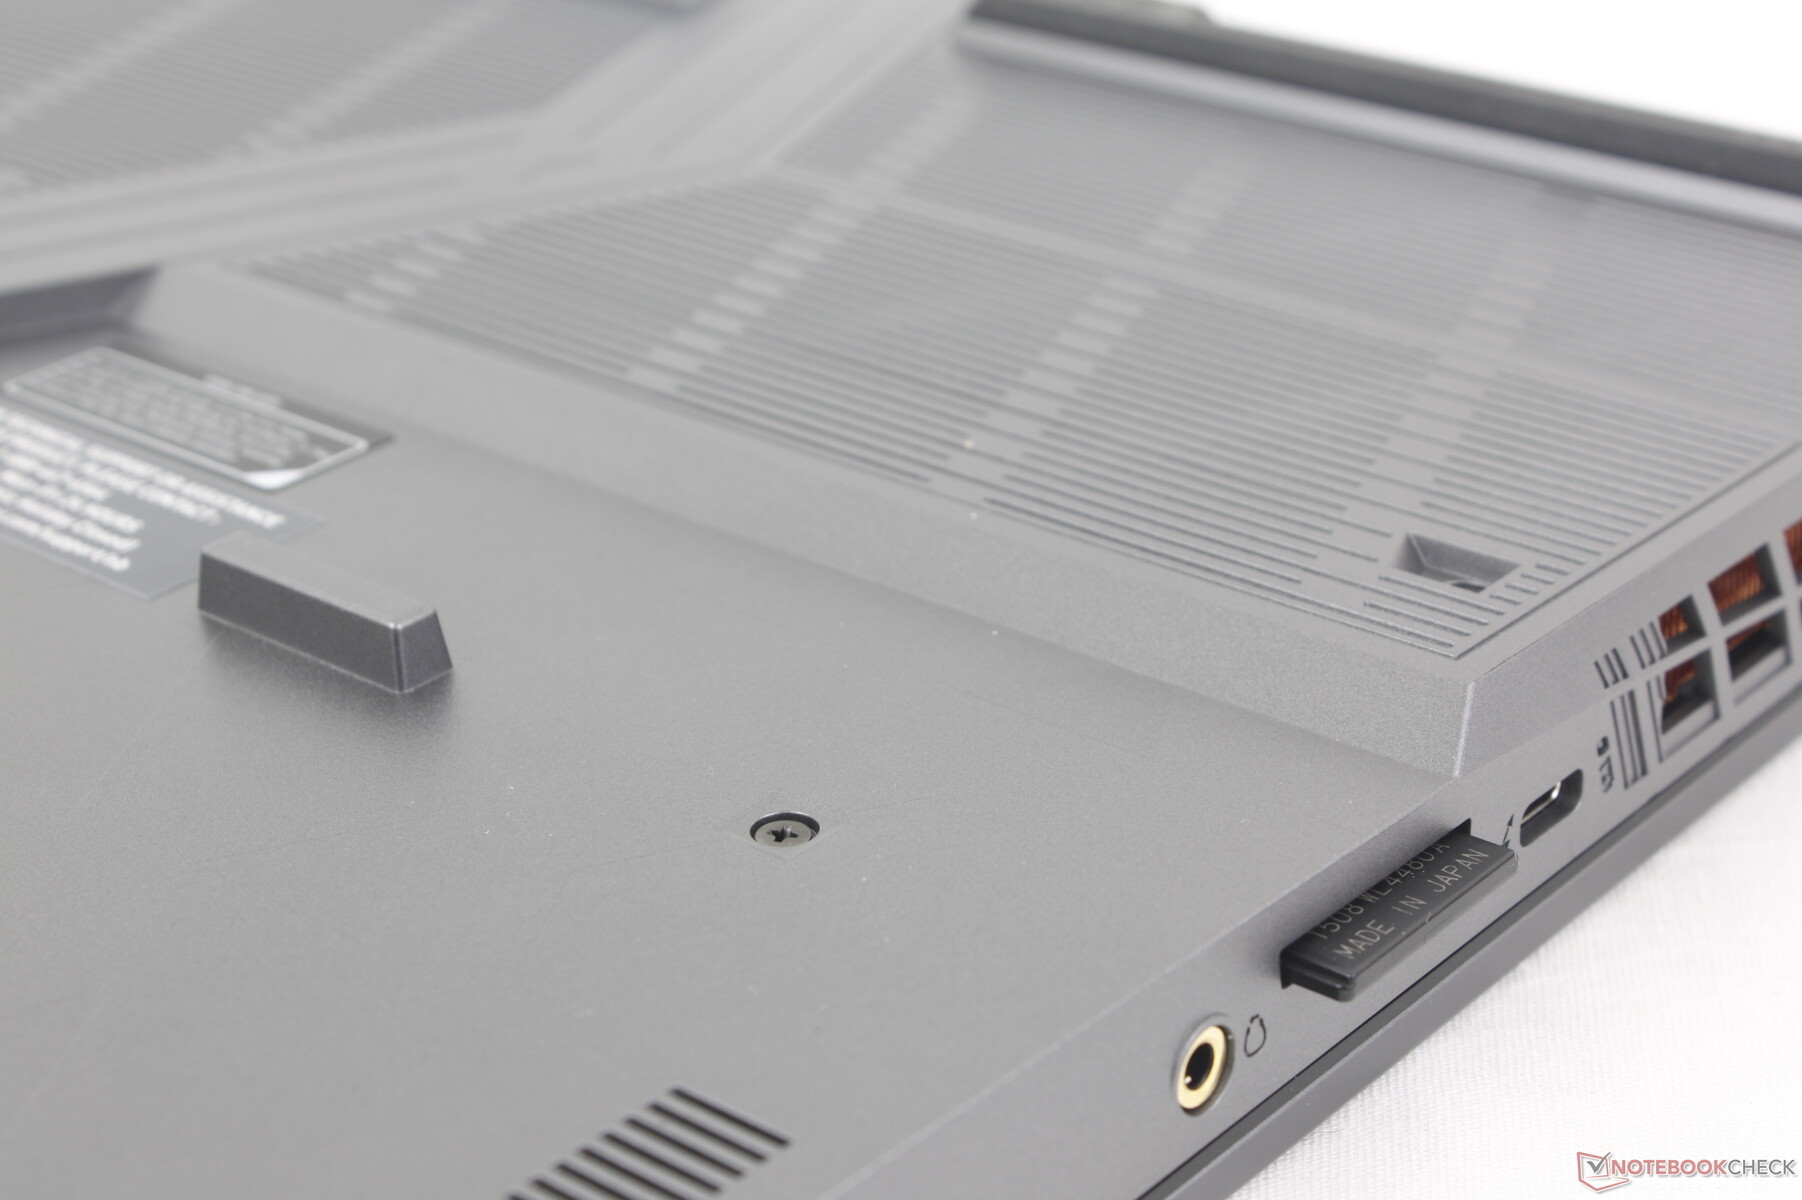
与 GP66 相比,微星修改了端口。Vector 16 HX 新增了 SD 读卡器和额外的 USB-C 端口,并支持 Thunderbolt。不过,作为回报,新款机型减少了 USB-A 端口,并放弃了专用的迷你 DisplayPort。与戴尔 G16 或 华硕 TUF Gaming A16等竞争对手相比,它们的 USB-C 端口更少或没有 SD 读卡器。
请注意,尽管它们的交流适配器尺寸可能不同,但交流适配器端口与 Titan 18 HX 上的端口完全相同。
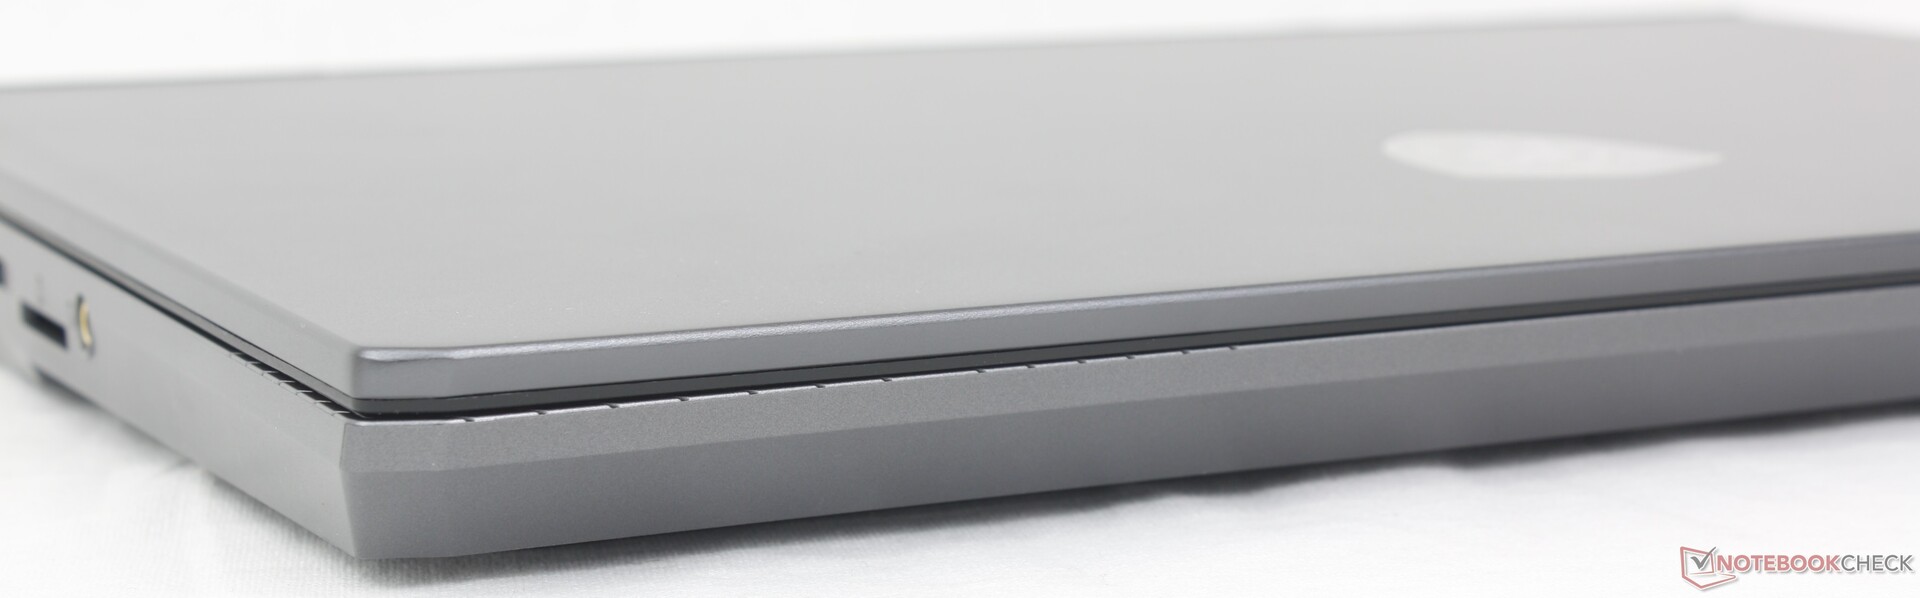
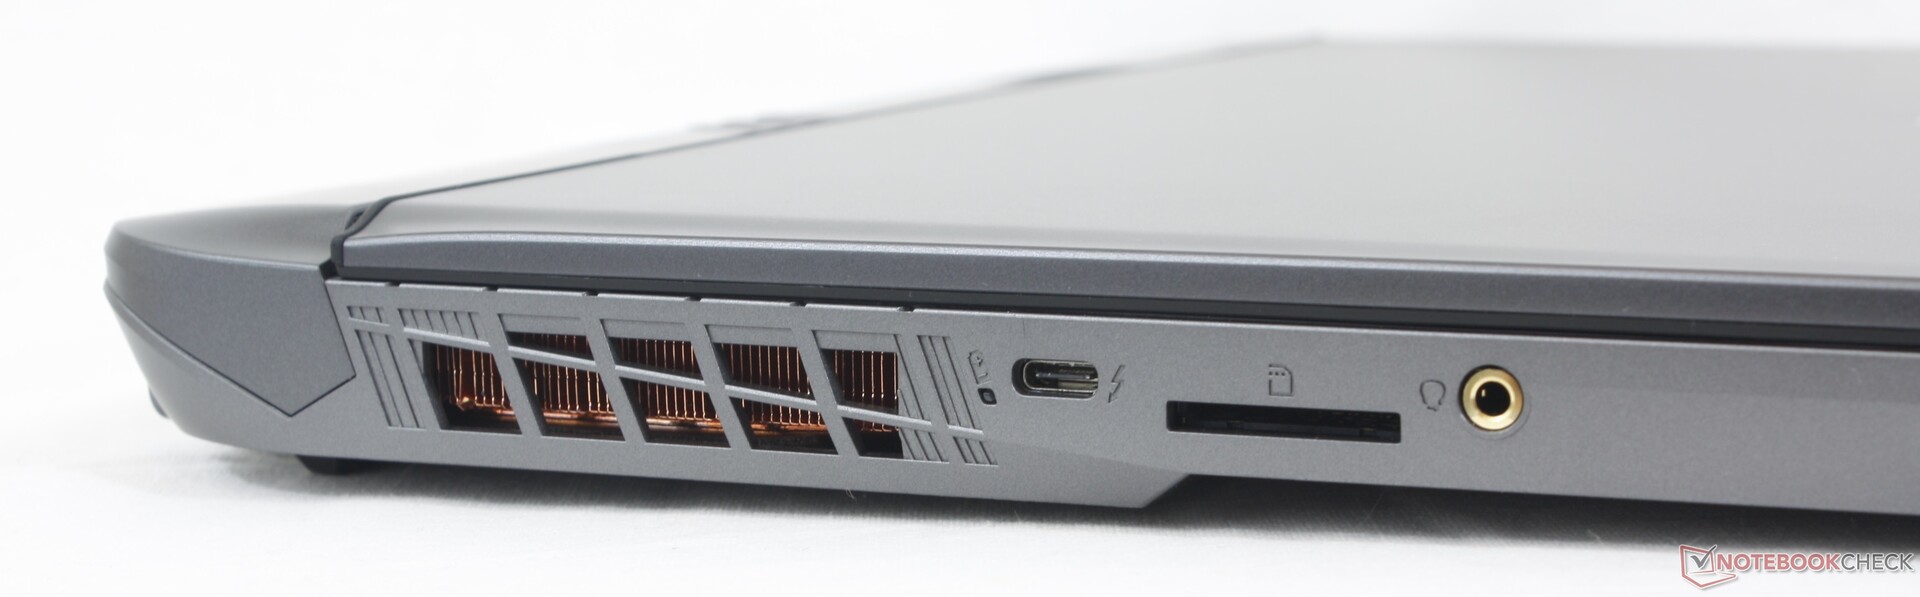
SD 读卡器
集成 SD 读卡器的传输速率约为 90 MB/s,比新款笔记本上的读卡器快 2 到 3 倍。 联想Legion 5 16.不过,微星的读卡器不是弹簧式的,因此插入的 SD 卡很难用较大的手指取出。
| SD Card Reader | |
| average JPG Copy Test (av. of 3 runs) | |
| MSI Vector 16 HX A14V (Toshiba Exceria Pro SDXC 64 GB UHS-II) | |
| Lenovo Legion 5 16IRX G9 | |
| maximum AS SSD Seq Read Test (1GB) | |
| MSI Vector 16 HX A14V (Toshiba Exceria Pro SDXC 64 GB UHS-II) | |
| Lenovo Legion 5 16IRX G9 | |
交流
Killer BE1750x 兼容 Wi-Fi 7 和蓝牙 5.4,尽管 Wi-Fi 7 路由器尚未成为主流。因此,它的加入更多是为了面向未来,因为现在大多数用户都没有 Wi-Fi 7 路由器。不过,与华硕 AXE11000 Wi-Fi 6E 测试路由器配对时,传输速率还是稳定可靠的。
| Networking | |
| iperf3 transmit AX12 | |
| MSI Vector GP66 12UGS | |
| iperf3 receive AX12 | |
| MSI Vector GP66 12UGS | |
| iperf3 transmit AXE11000 | |
| Lenovo Legion 5 16IRX G9 | |
| MSI Vector 16 HX A14V | |
| Dell G16 7620 | |
| Asus TUF Gaming A16 FA617XS | |
| HP Victus 16-r0077ng | |
| iperf3 receive AXE11000 | |
| Lenovo Legion 5 16IRX G9 | |
| MSI Vector 16 HX A14V | |
| Dell G16 7620 | |
| Asus TUF Gaming A16 FA617XS | |
| HP Victus 16-r0077ng | |
| iperf3 transmit AXE11000 6GHz | |
| MSI Vector 16 HX A14V | |
| iperf3 receive AXE11000 6GHz | |
| MSI Vector 16 HX A14V | |
网络摄像头
由于 Vector 并非为频繁召开视频会议而设计,因此其集成的网络摄像头只有区区 100 万像素。该摄像头也不支持红外线,但至少包含一个用于保护隐私的物理快门。


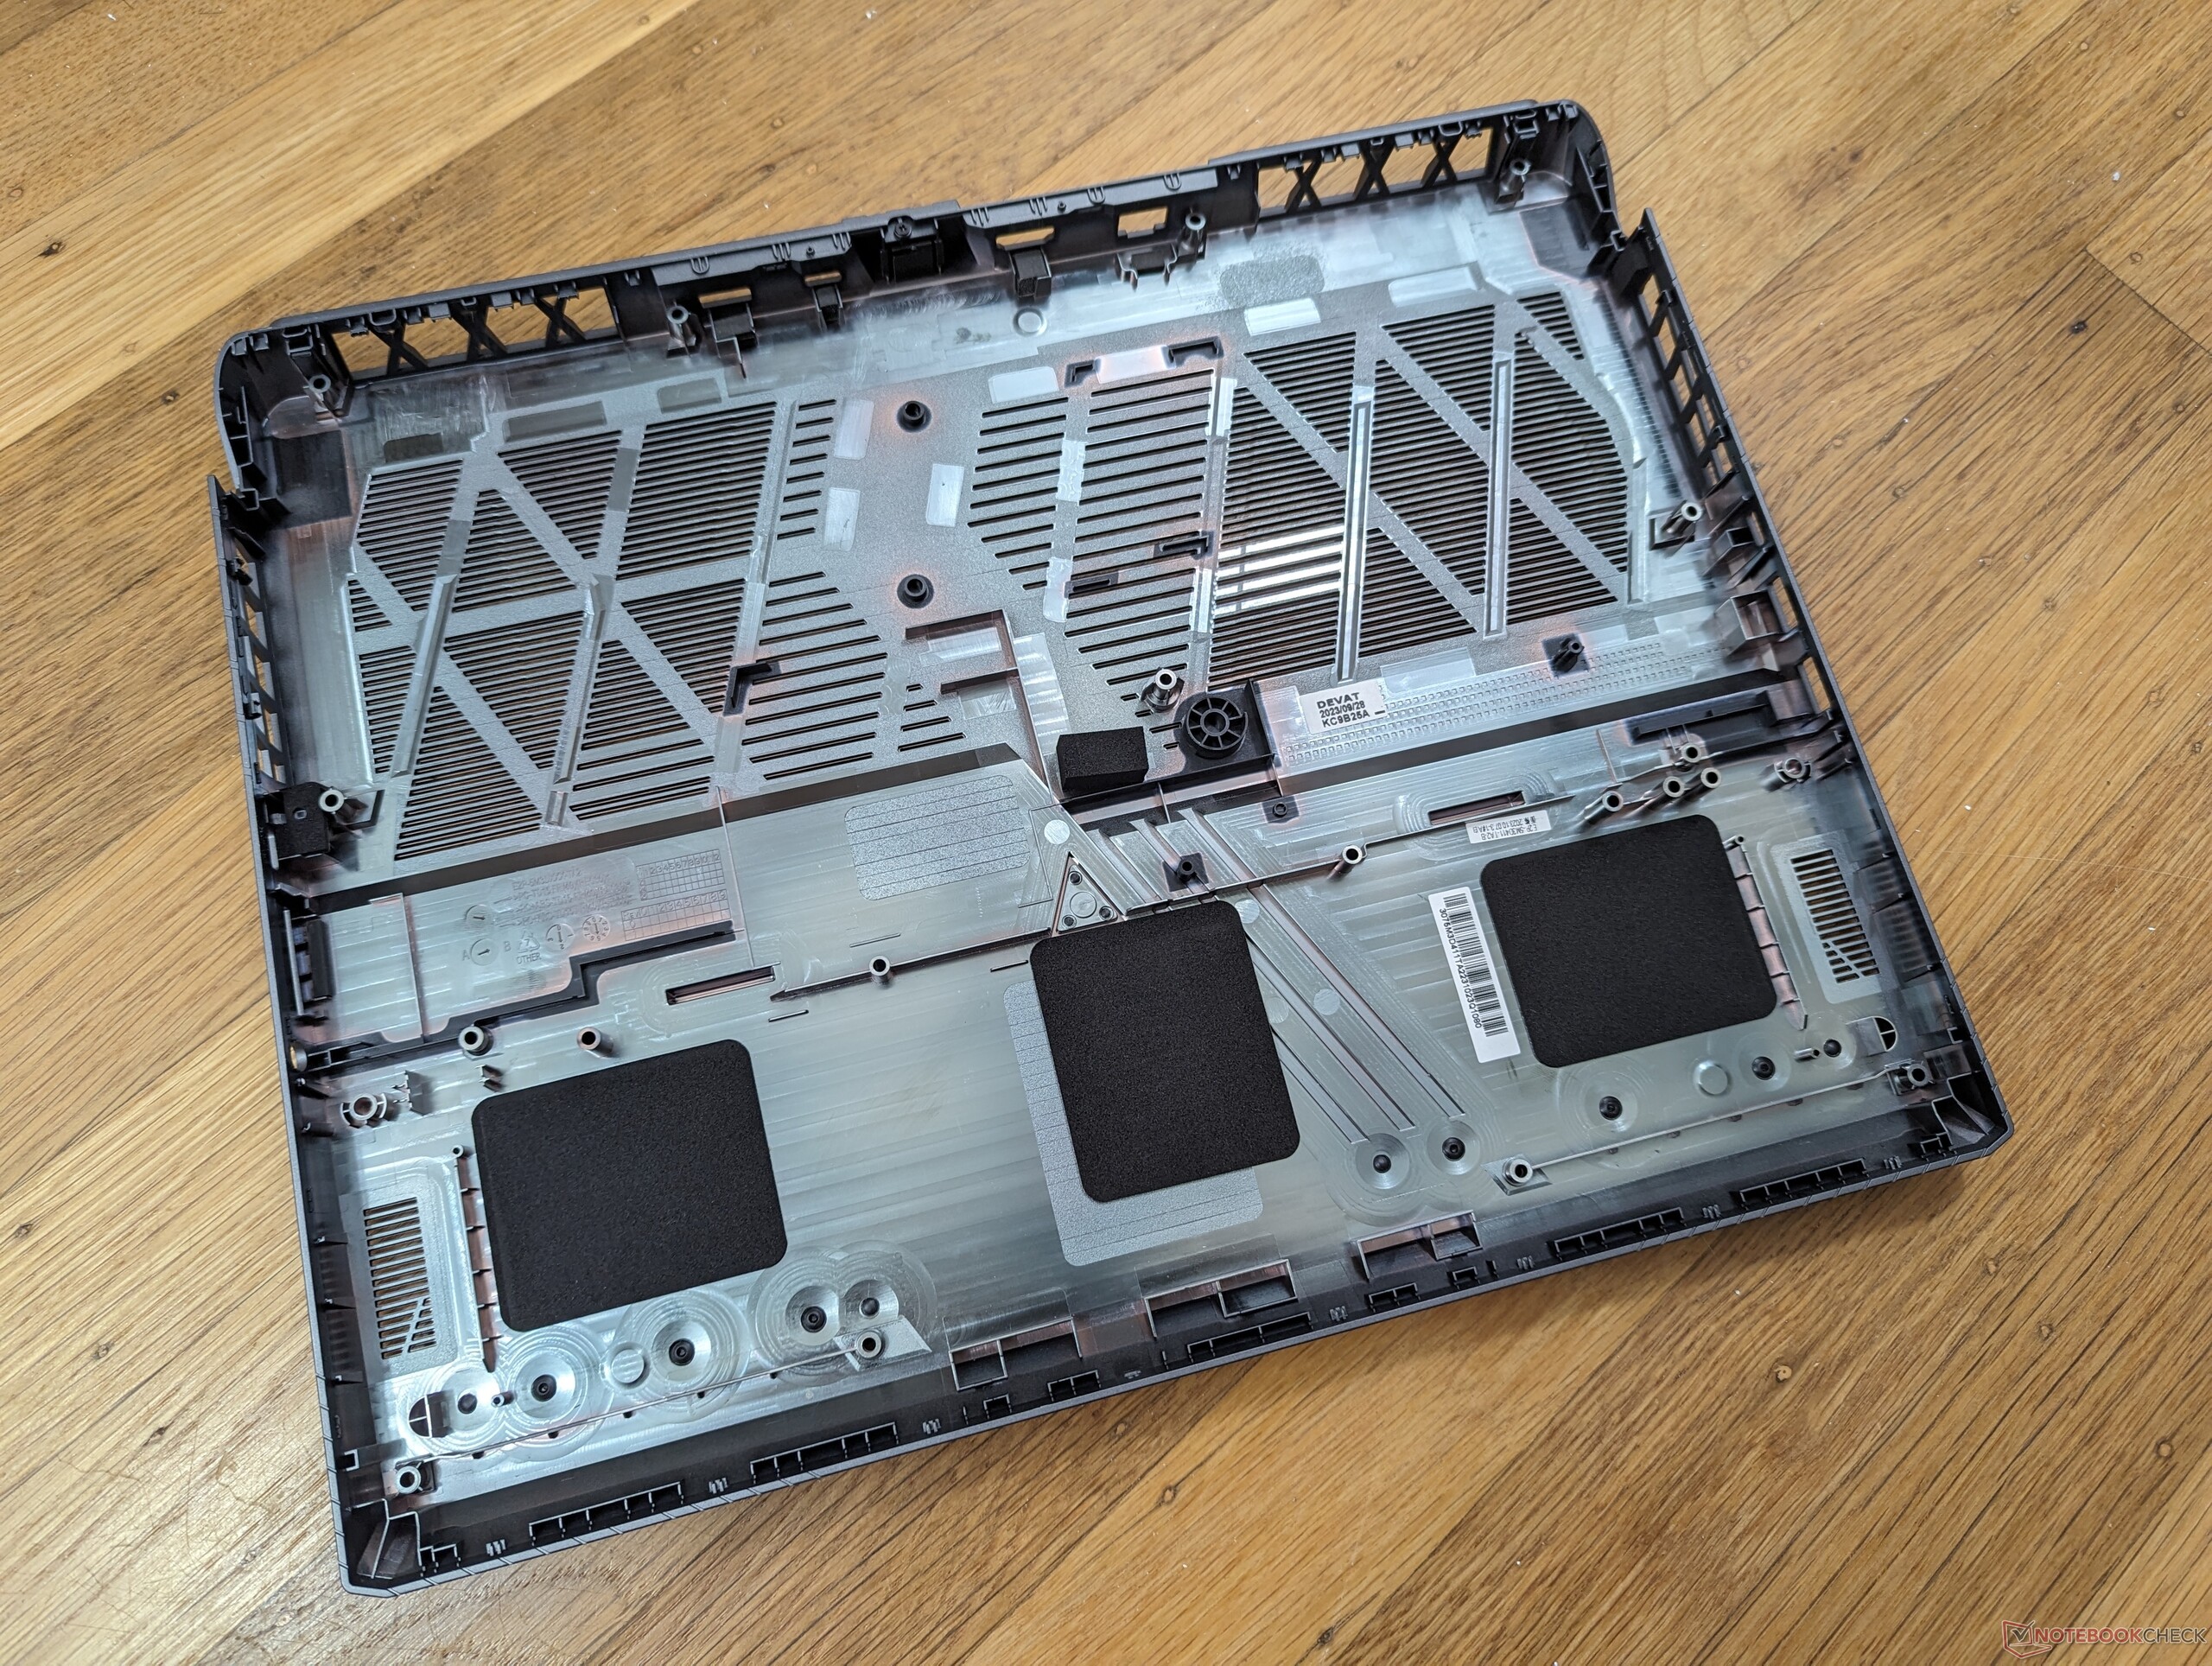
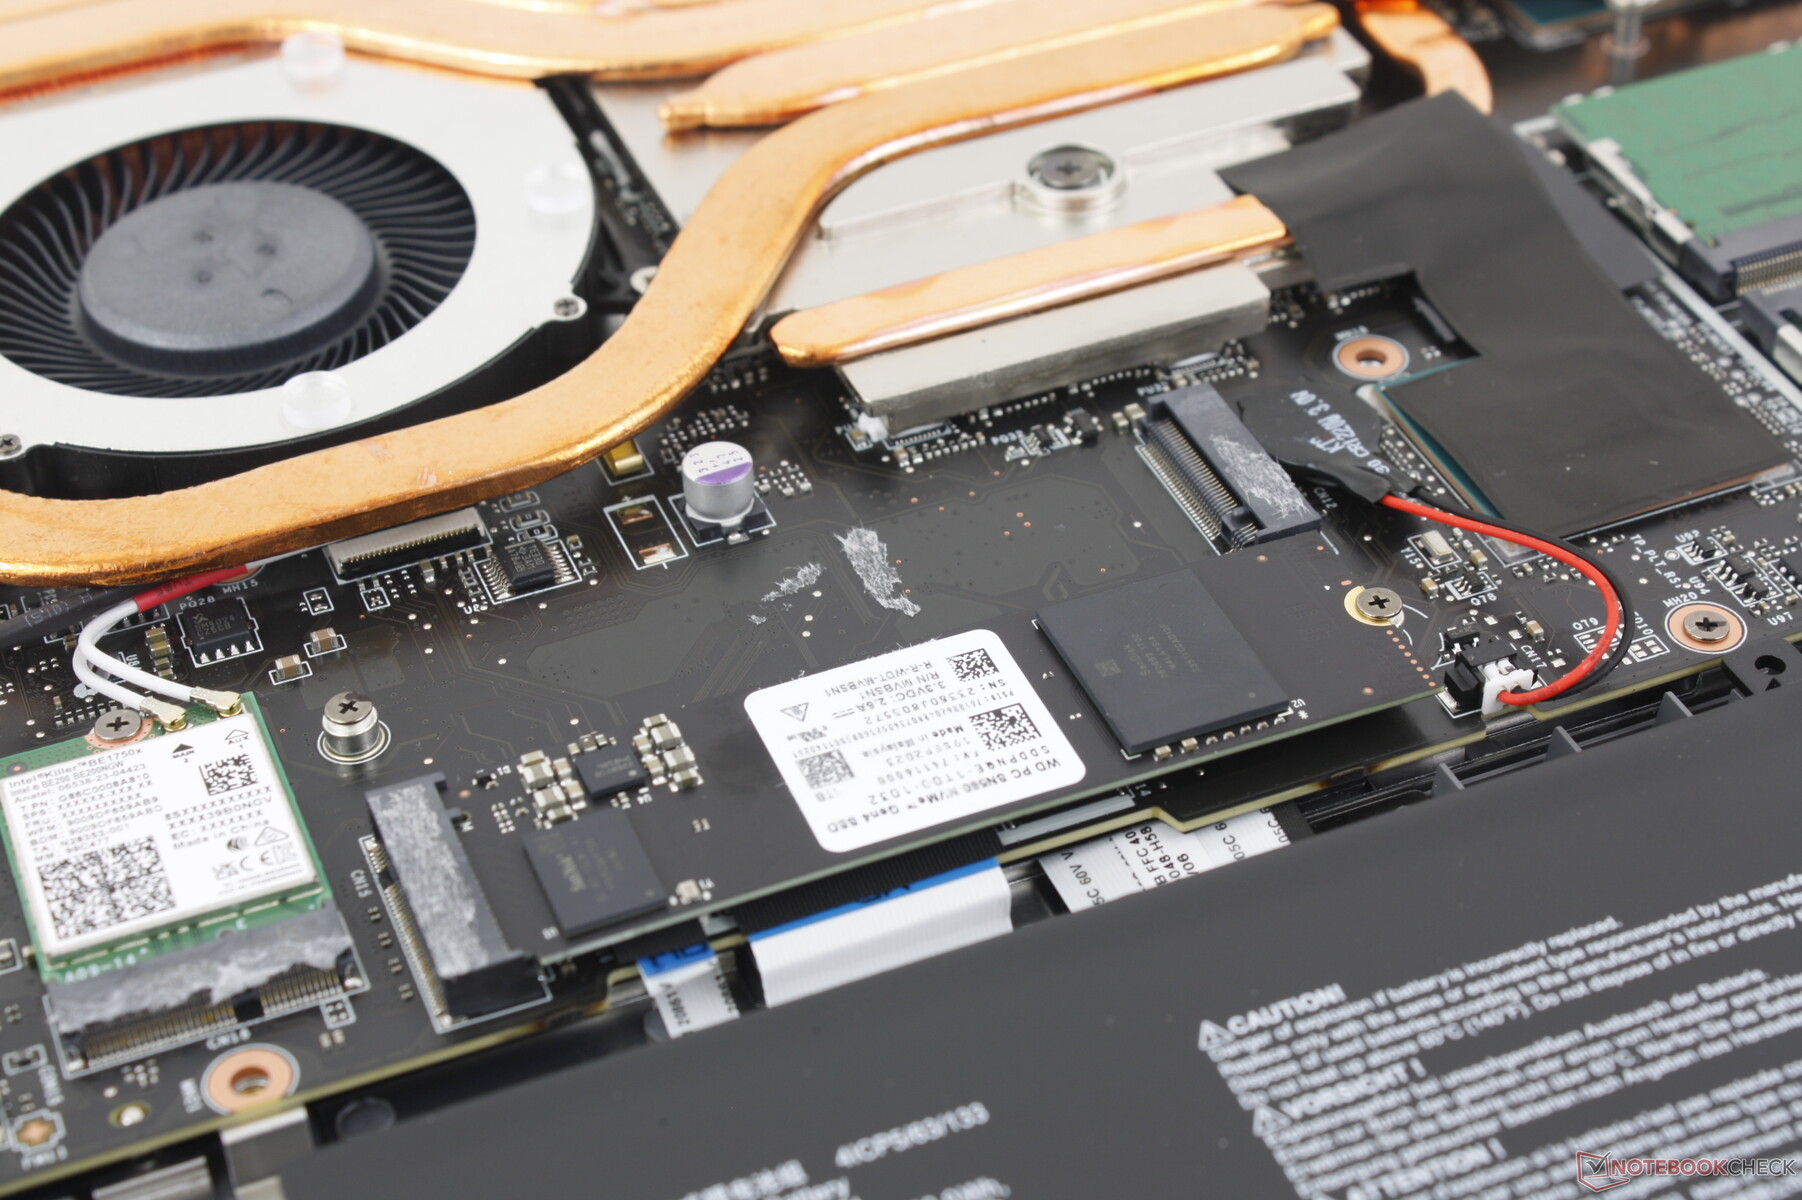
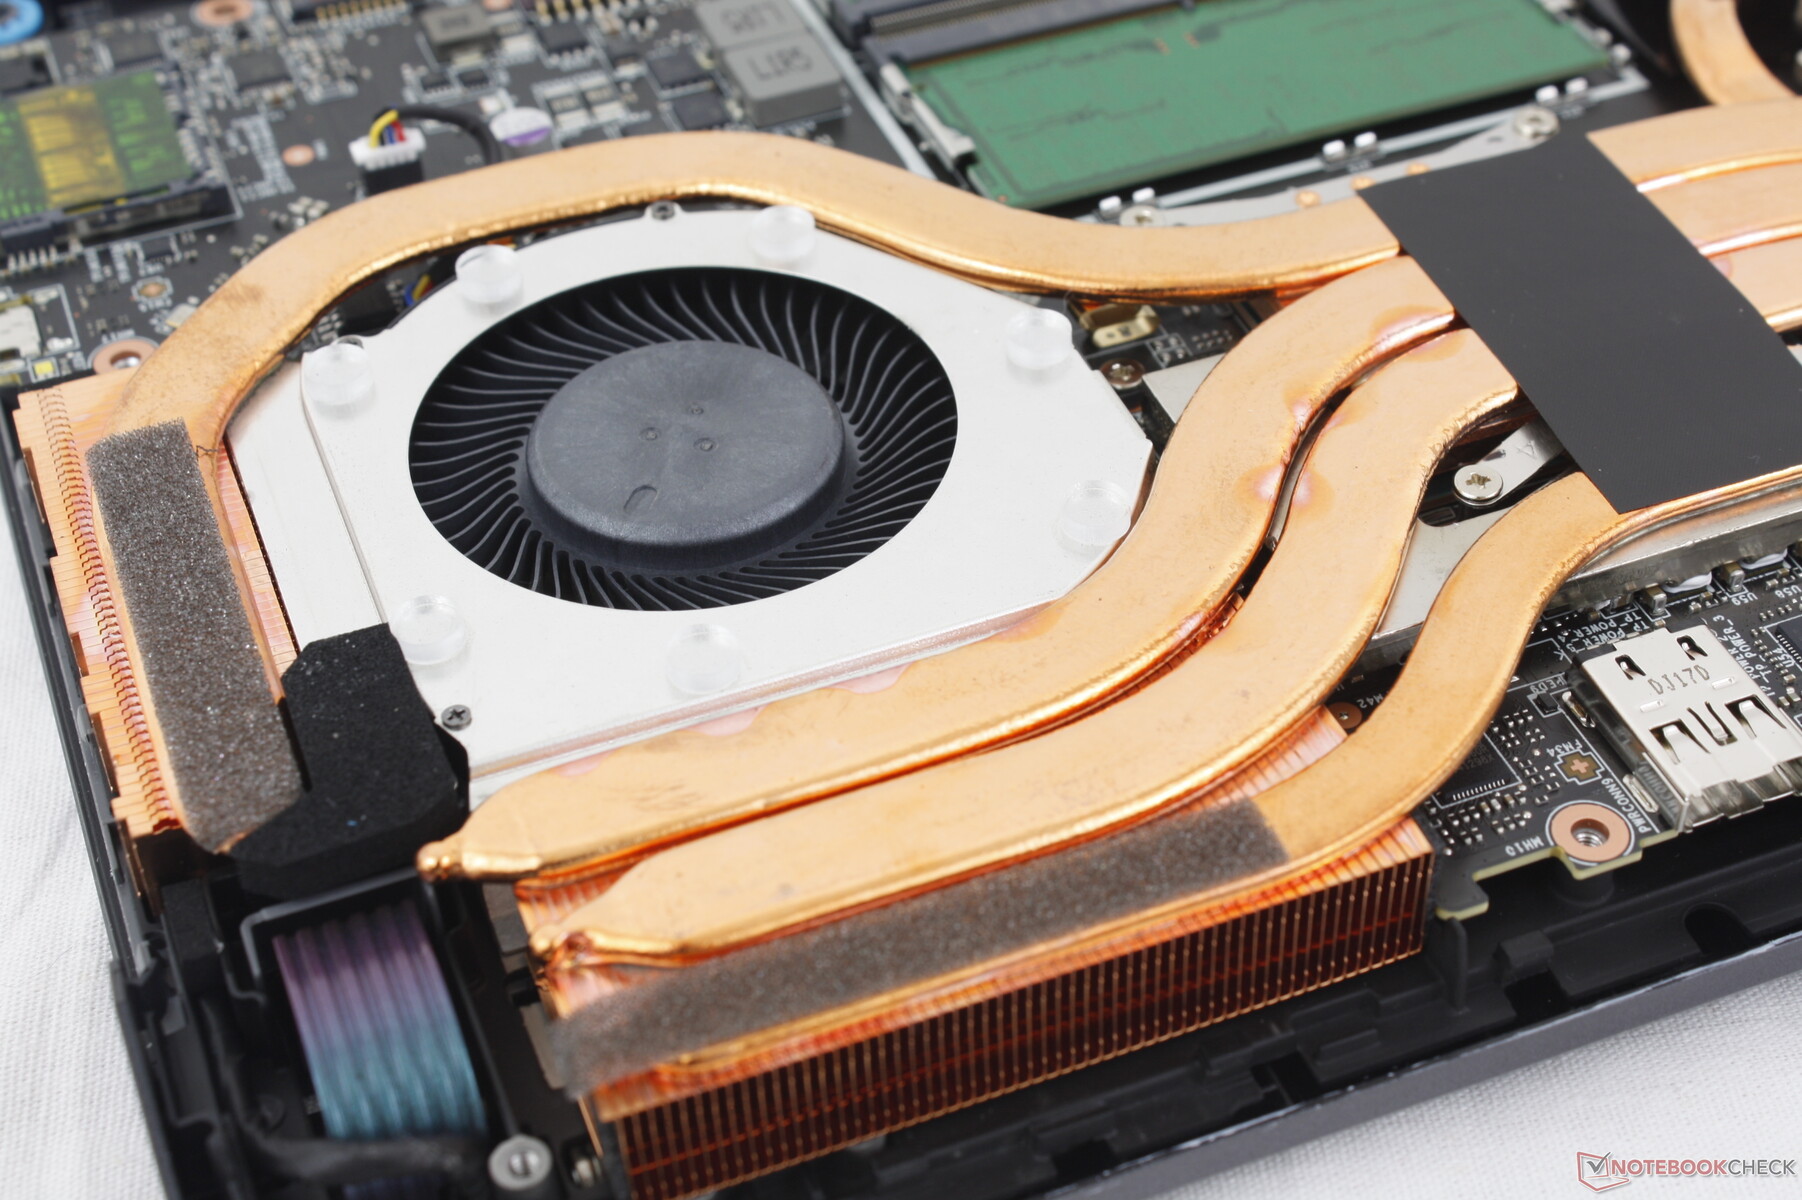
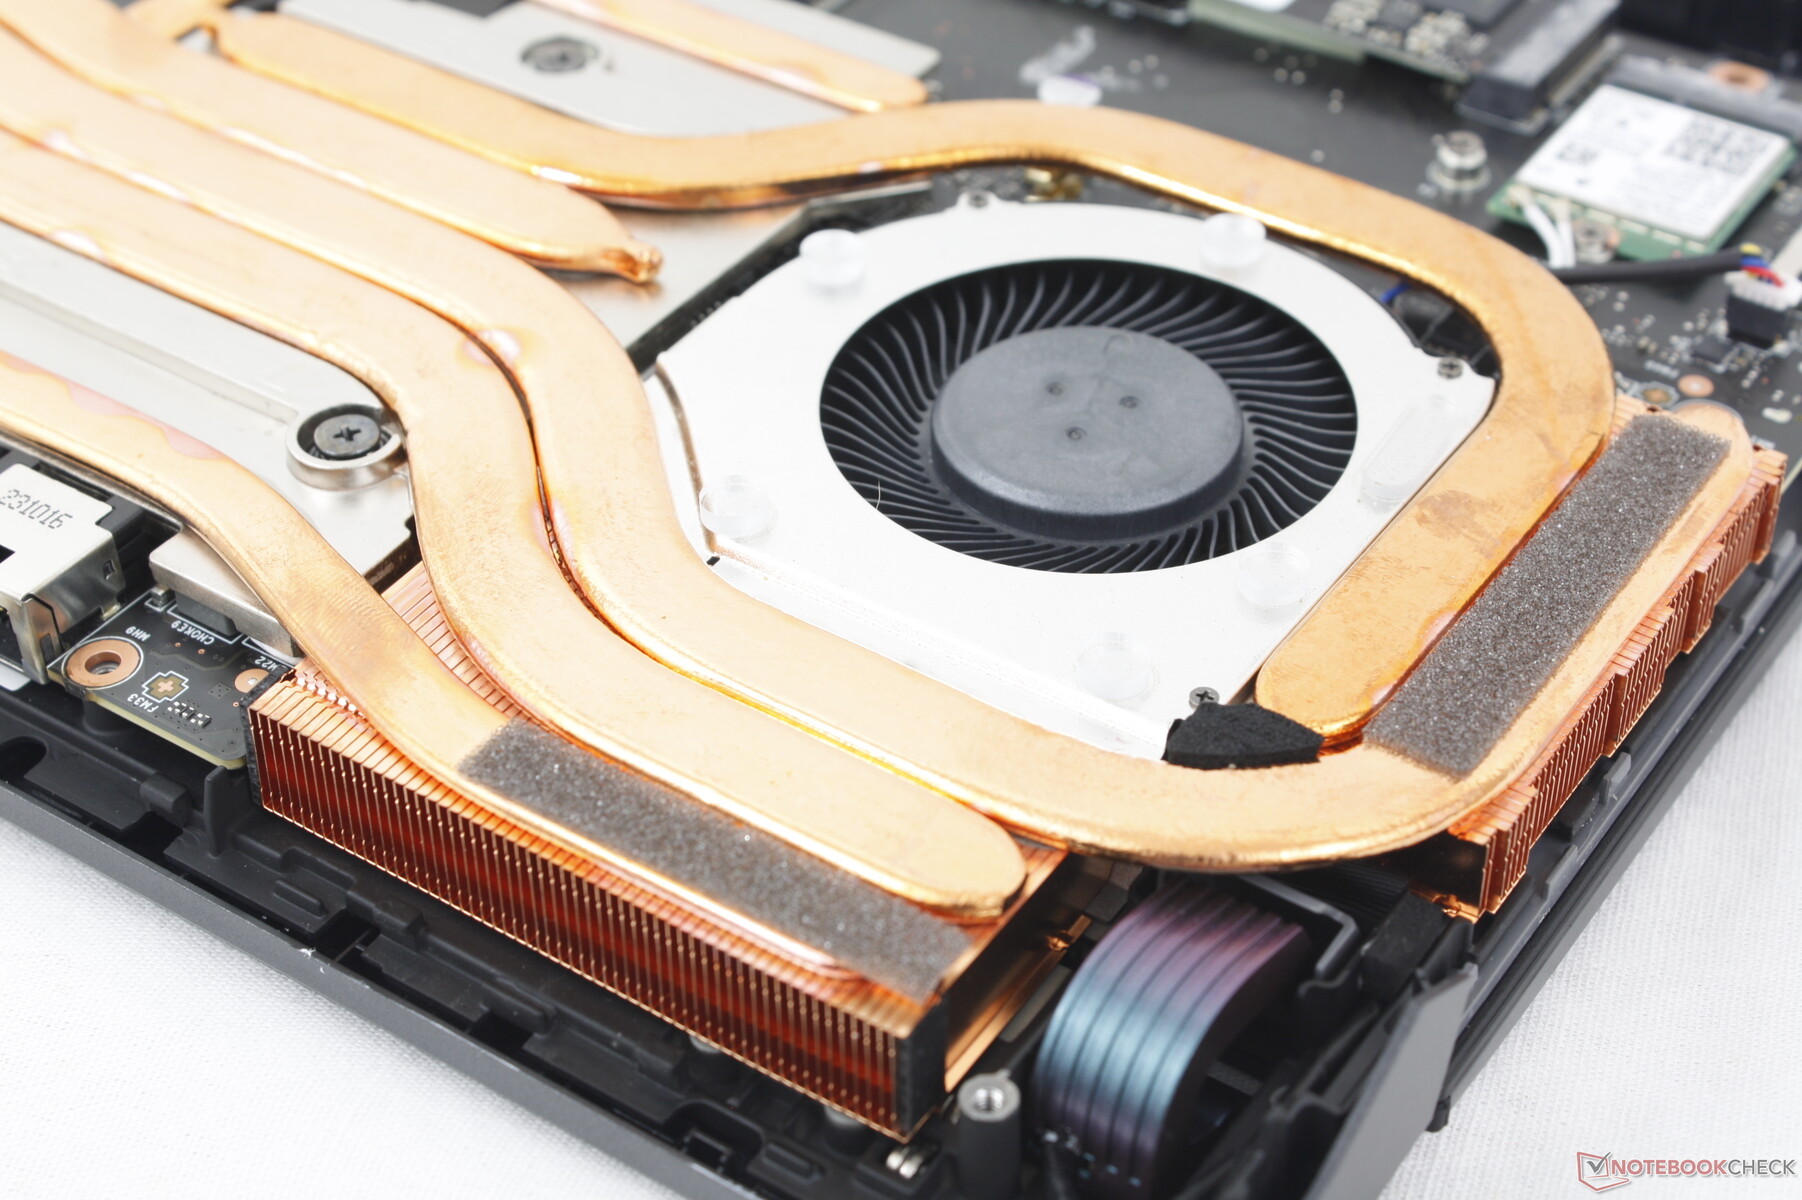
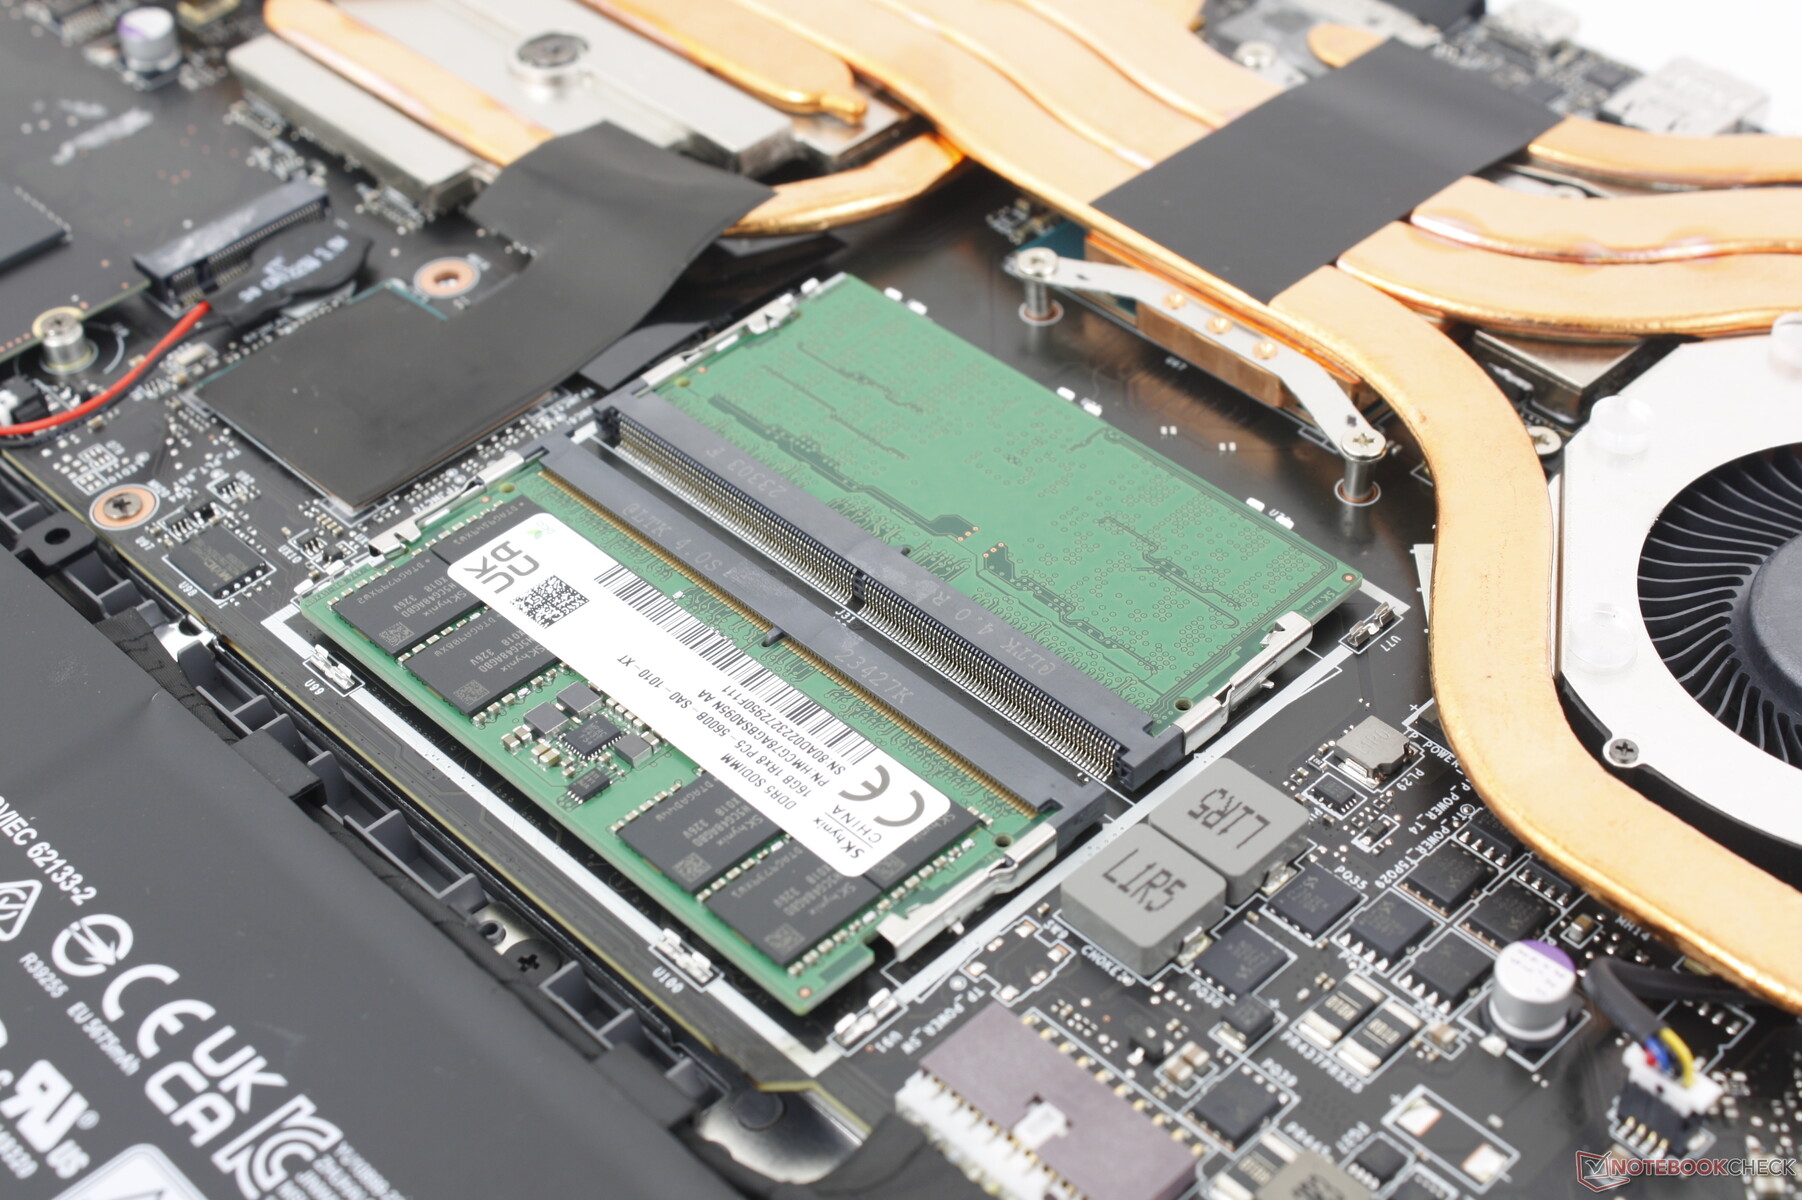
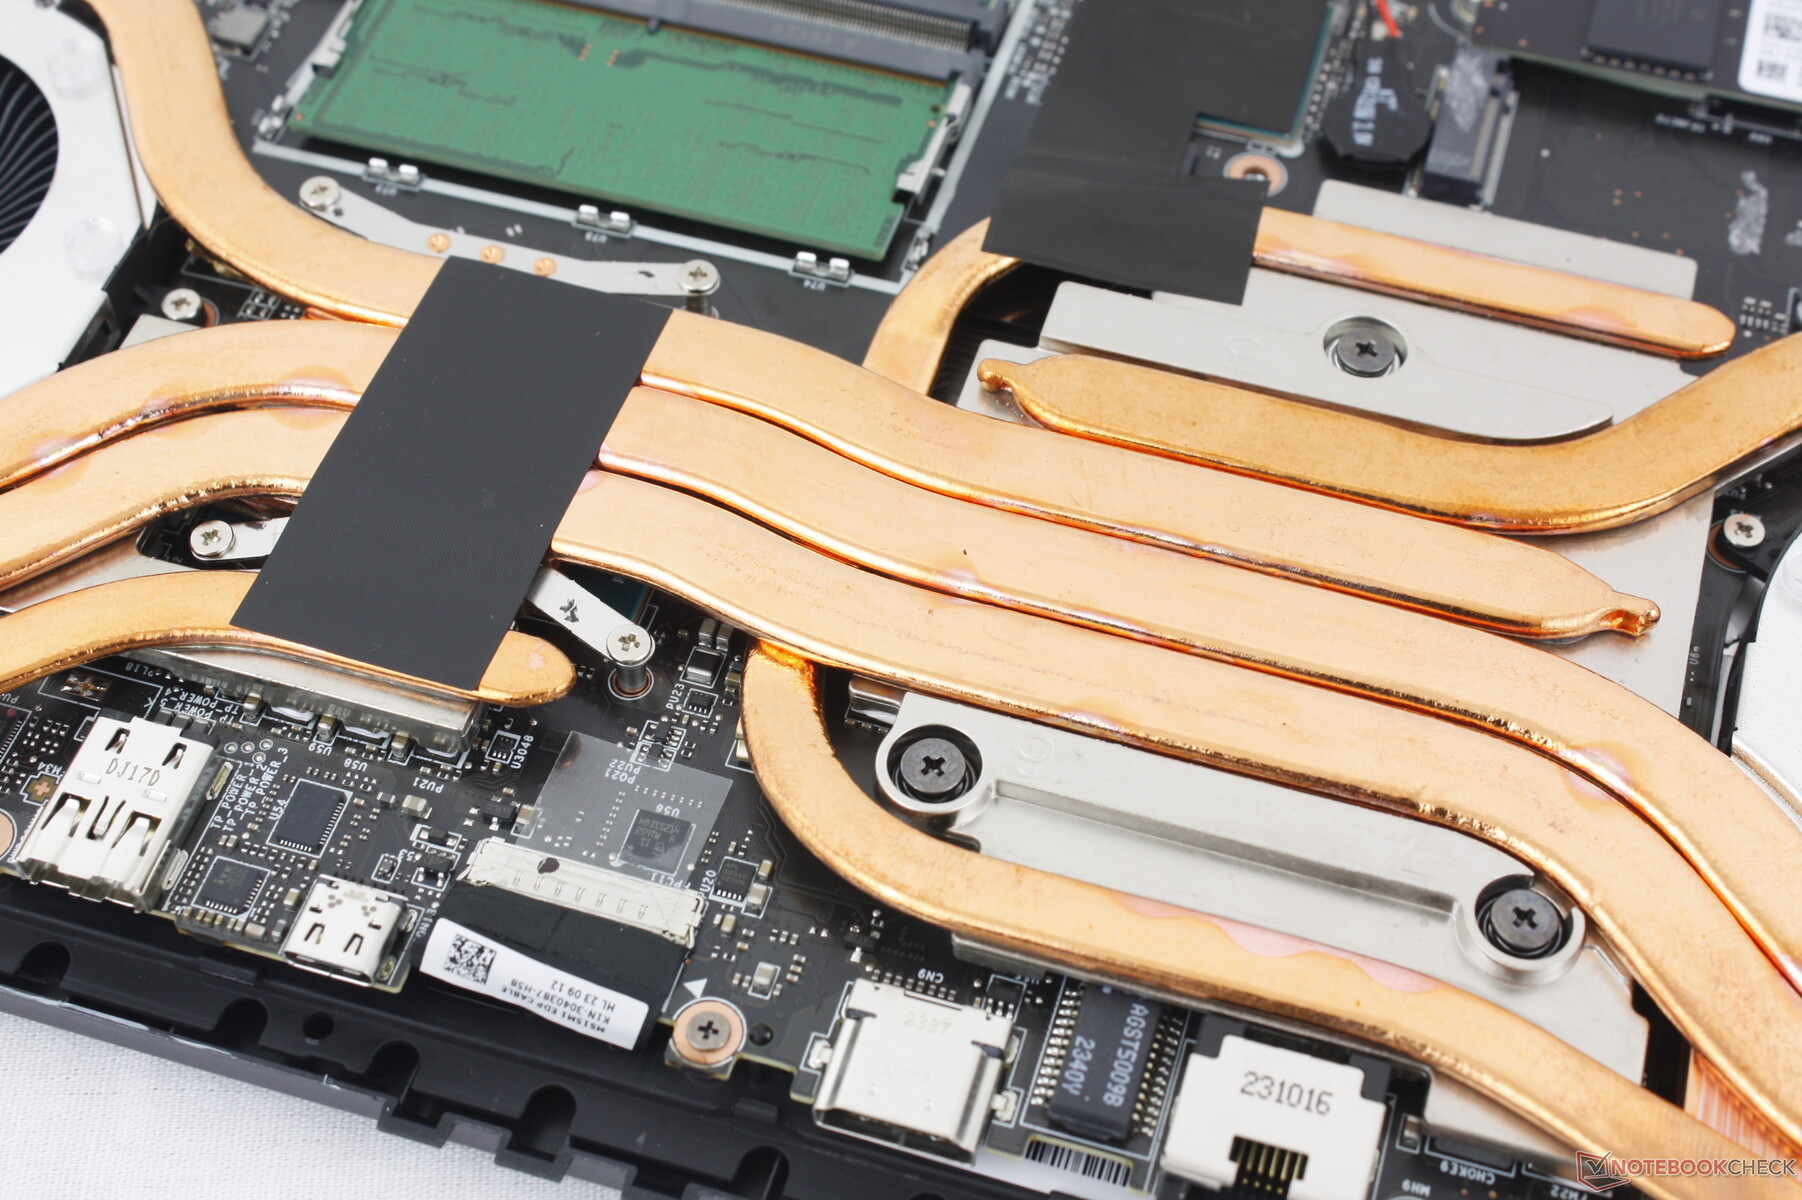
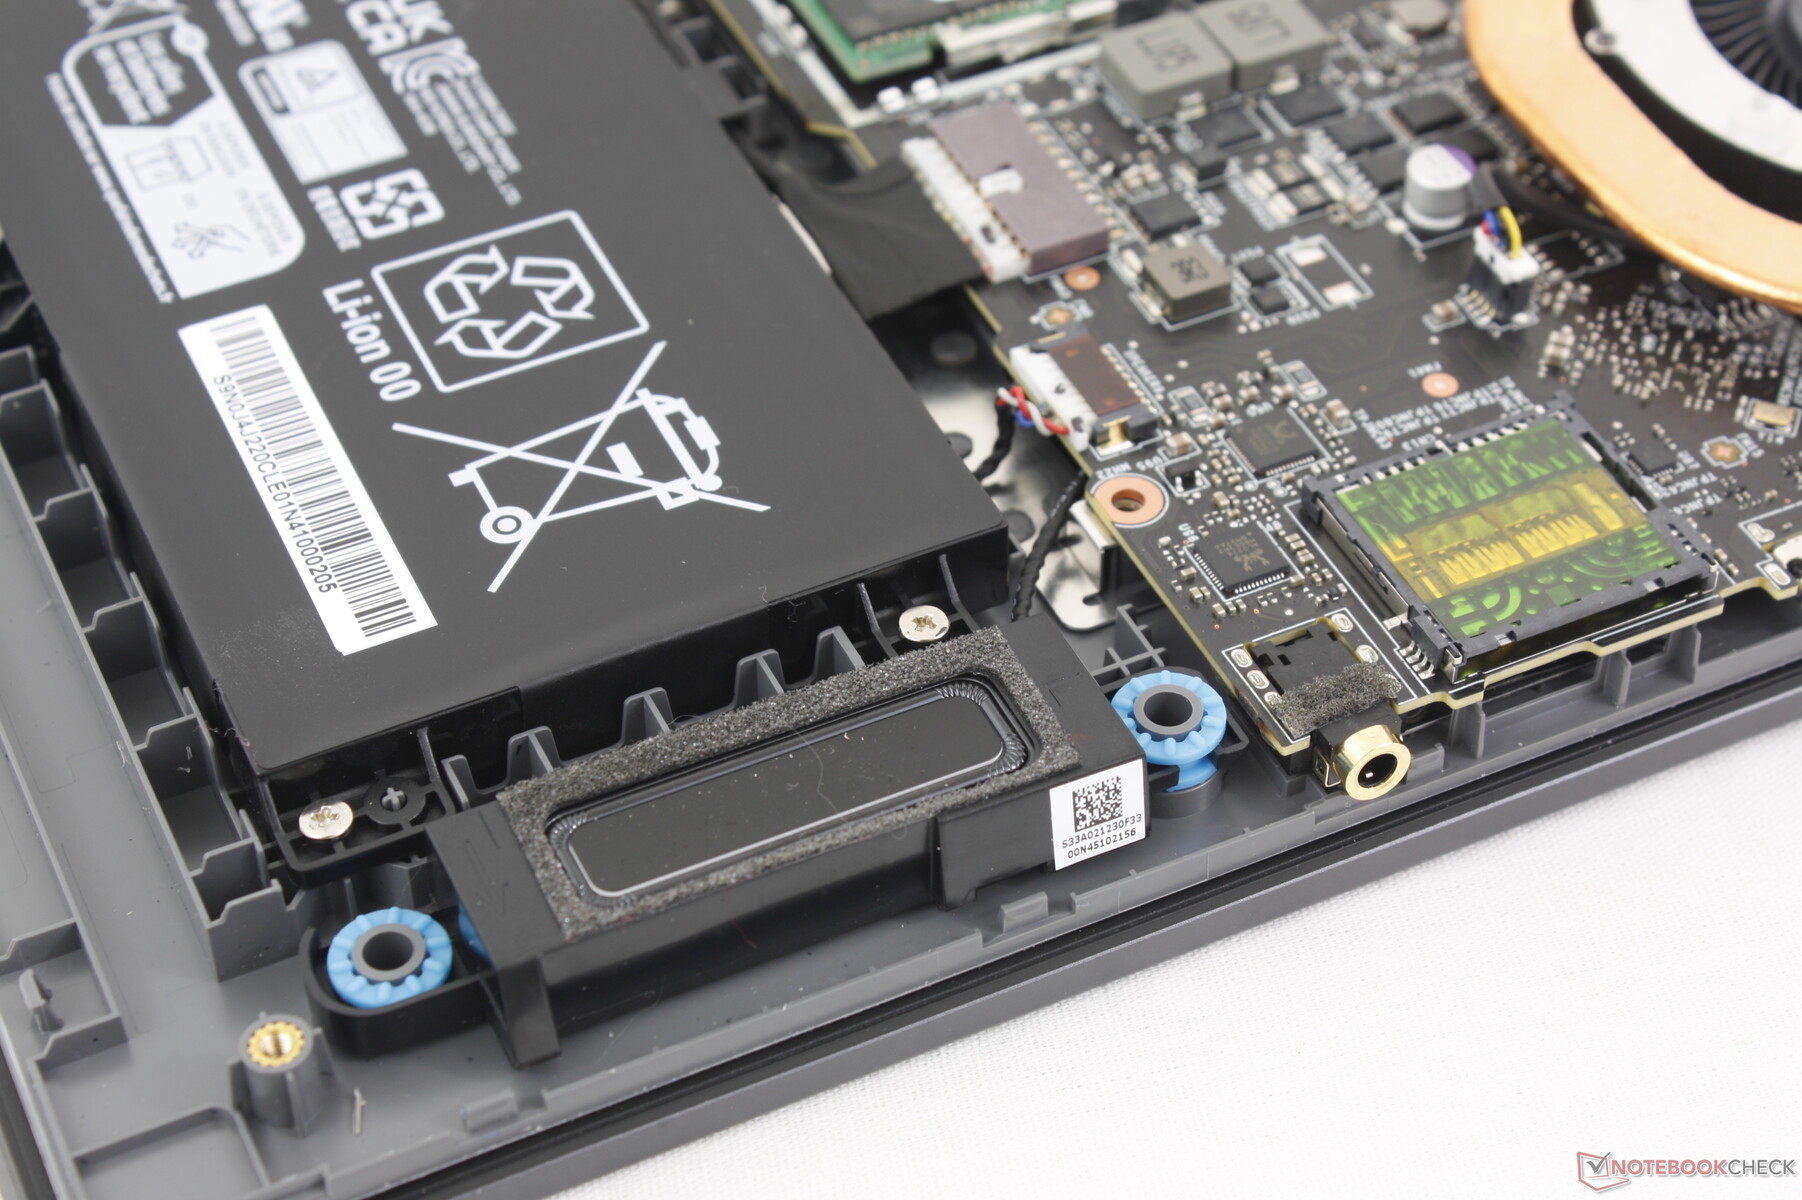
维护
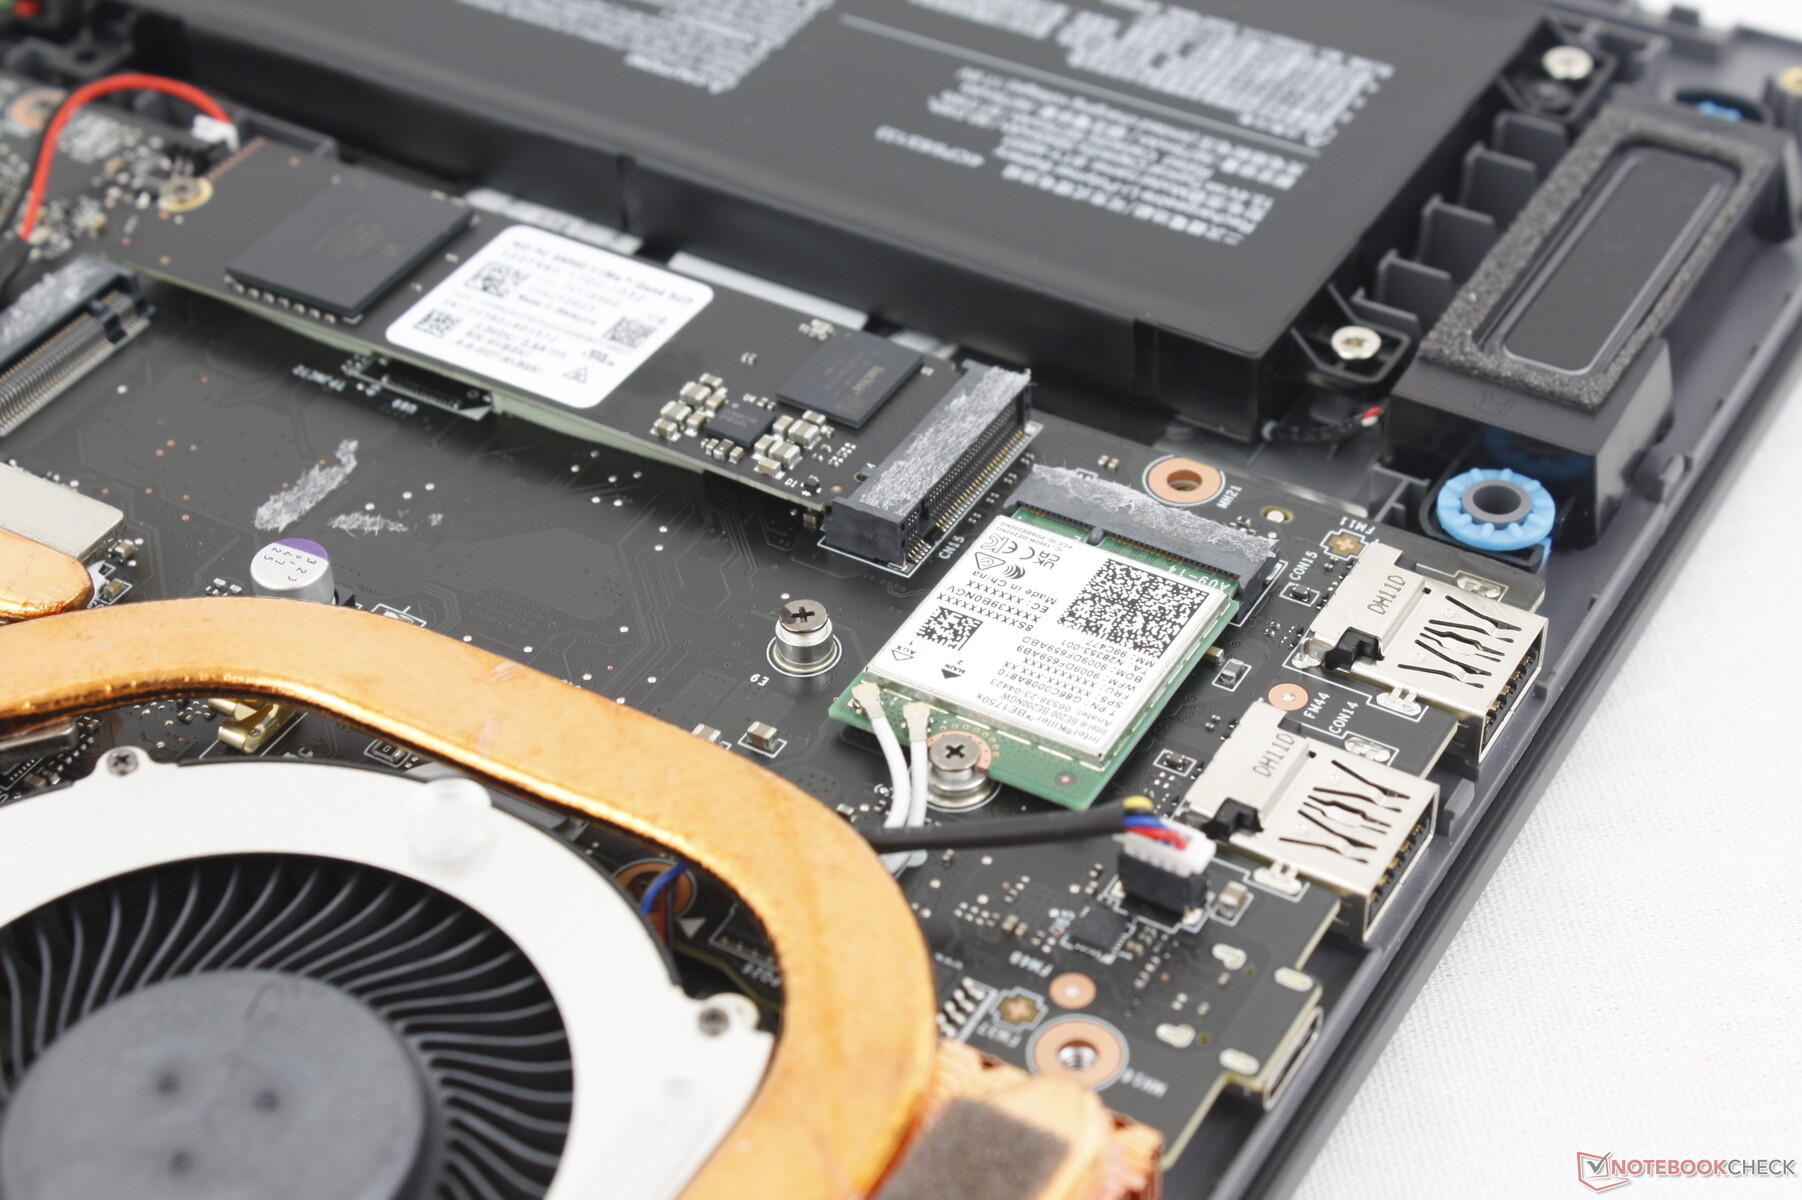
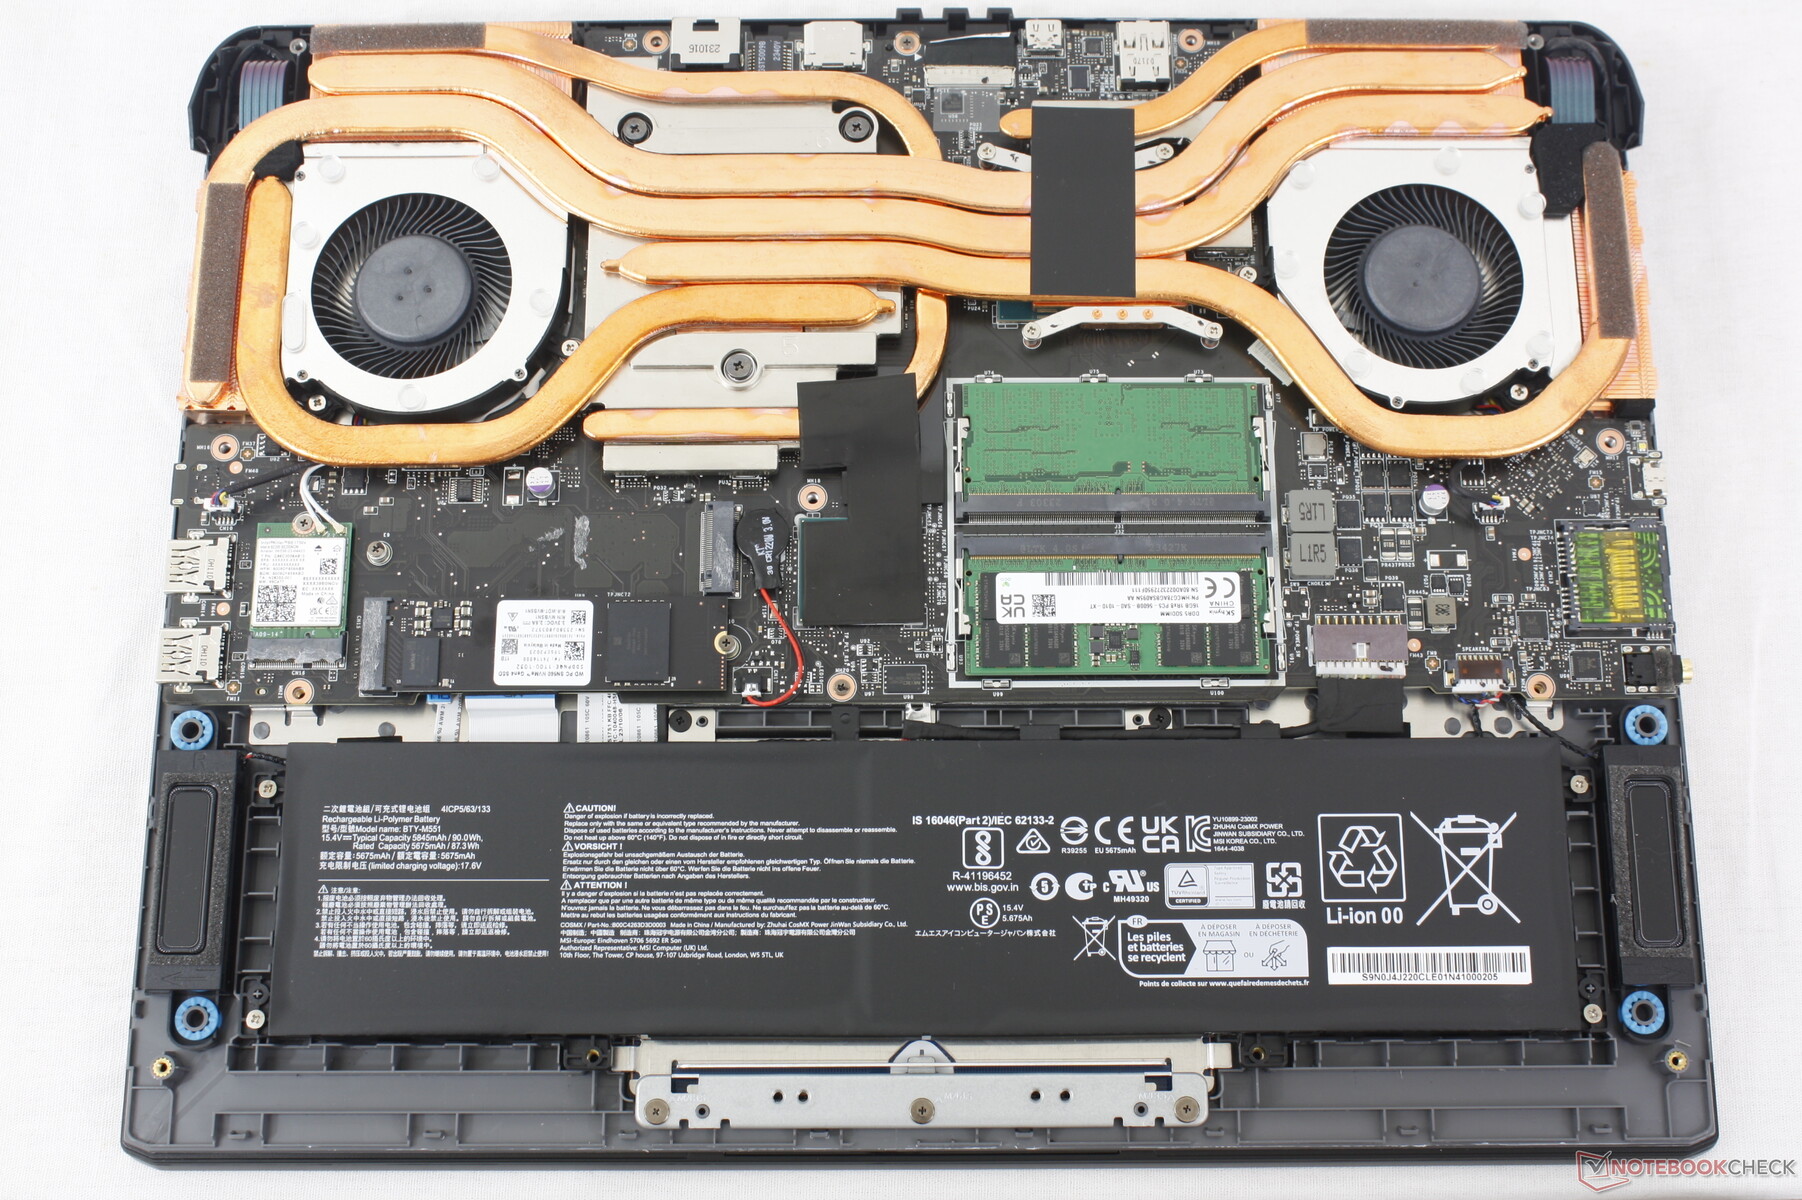
底部面板由 13 颗十字螺丝固定。遗憾的是,拆卸面板非常困难,因为边缘和拐角处有明显的弧度,拆卸过程非常麻烦。相比之下,雷蛇 雷蛇刀锋 16的底板要平整得多,闩锁也更少,更容易拆卸。在维修 Vector 16 HX 时,建议使用平边。
进入机箱后,用户可以看到 2 个 M.2 存储托架、2 个 SODIMM 插槽、电池和 WLAN 模块,就像旧版 Vector GP66 设计一样。
配件和保修
包装盒内除了交流适配器和文件外,没有其他附件。如果在美国购买,制造商通常提供一年有限保修。
输入设备 - 简单实用
键盘
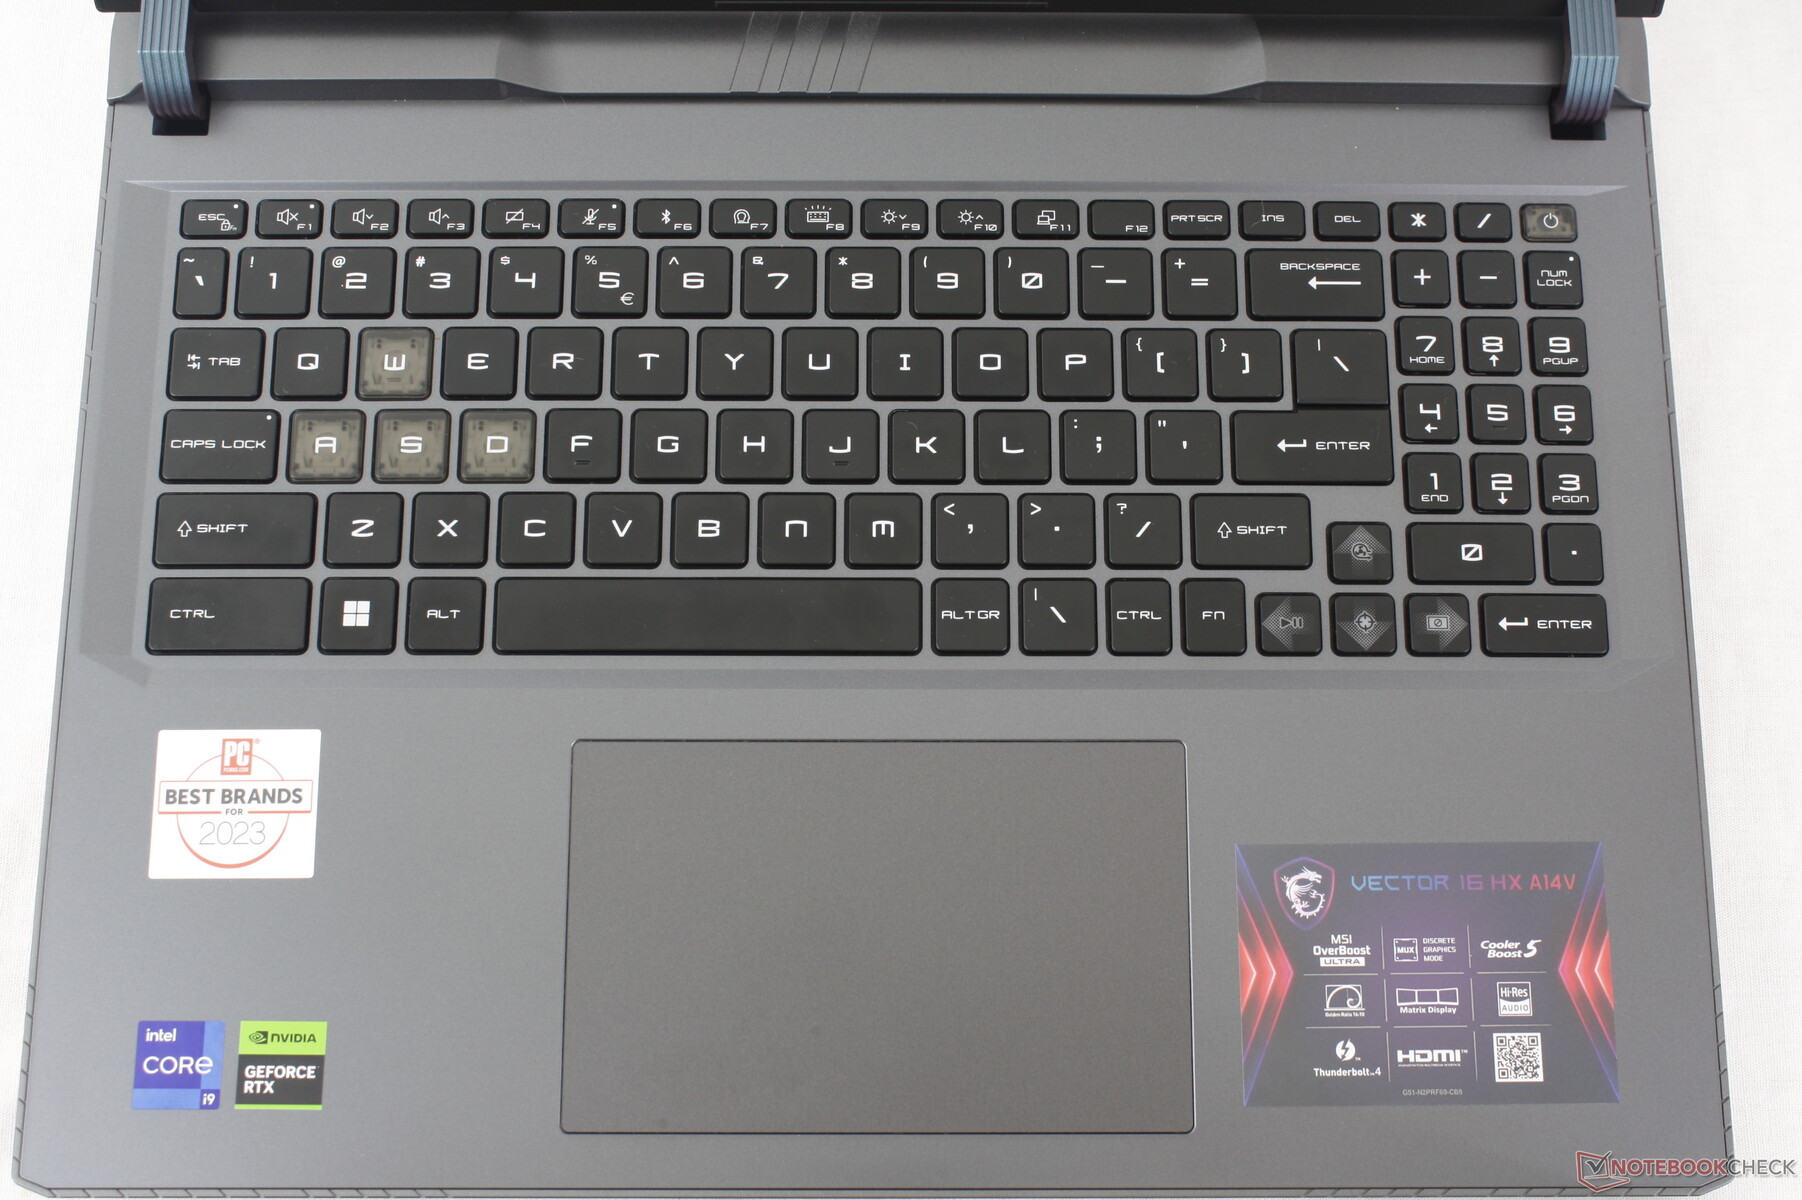
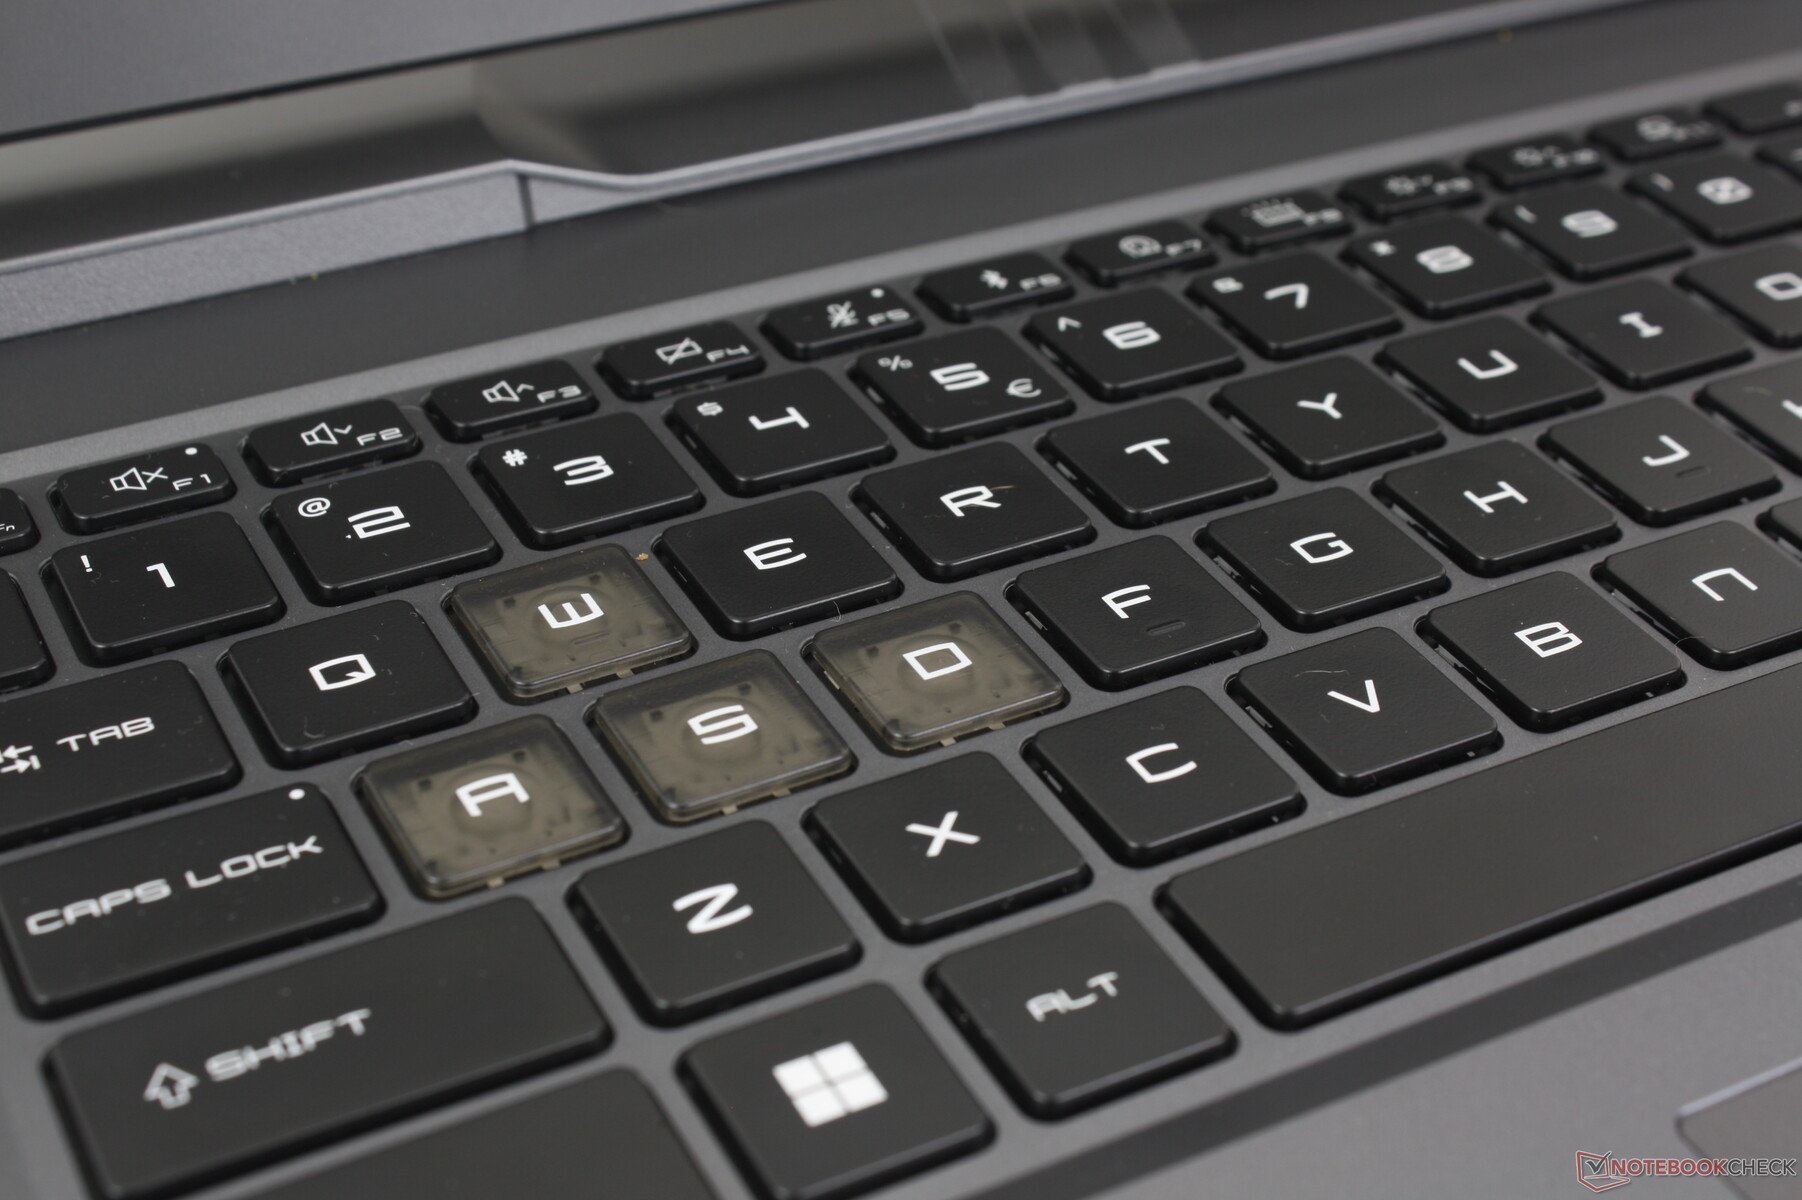
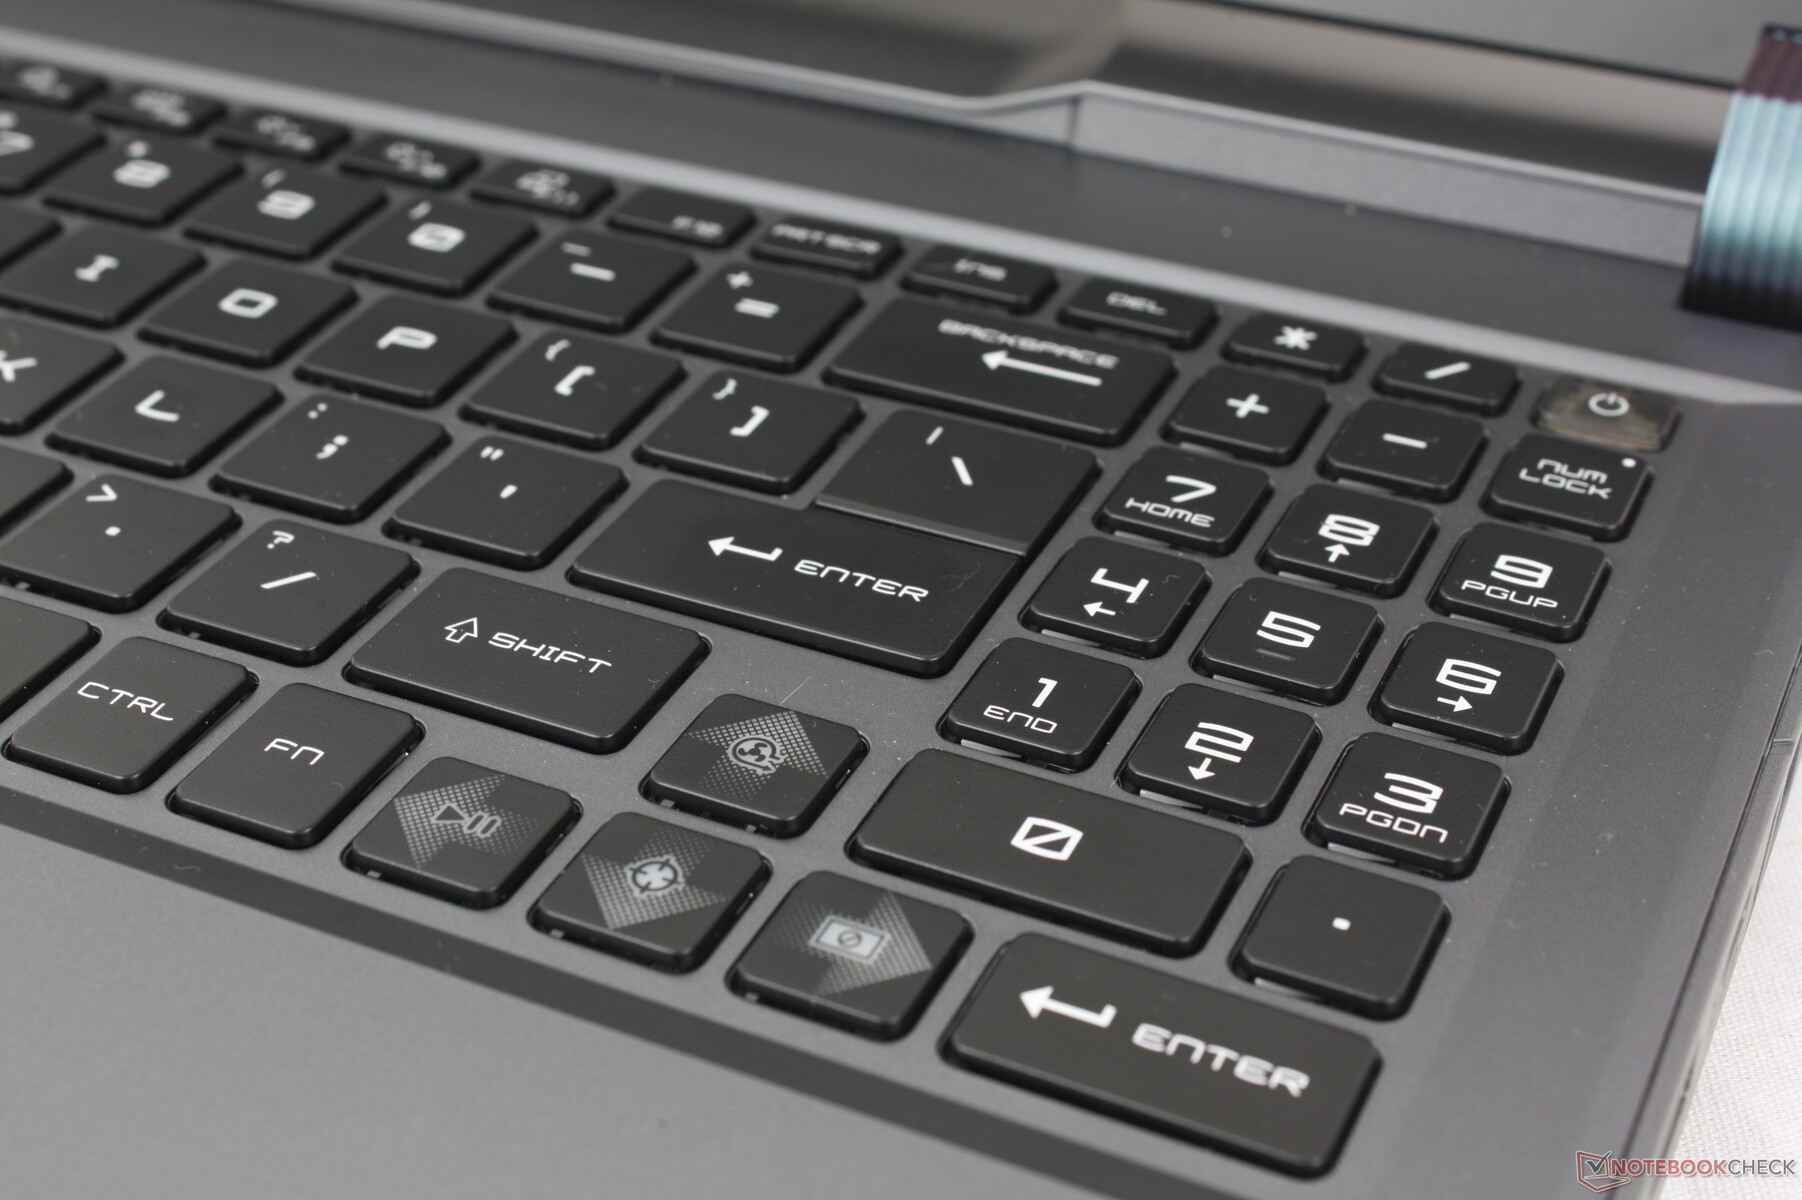
与旧版 Vector GP66 相比,微星改进了键盘布局。 Vector GP66设计。现在,GP66 上笨拙的 Fn/Ctrl 键被适当地分开了,而且还有一个新的数字键盘,而许多其他游戏笔记本电脑通常会完全省略数字键盘。遗憾的是,方向键比以前更小了,而窄小的数字键盘使用起来也不是很舒服。因此,与更大更舒适的 QWERTY 键相比,它们的使用感觉就像是事后才想到的。
每个按键都标配了 RGB 灯光,可照亮所有按键和符号。
触摸板
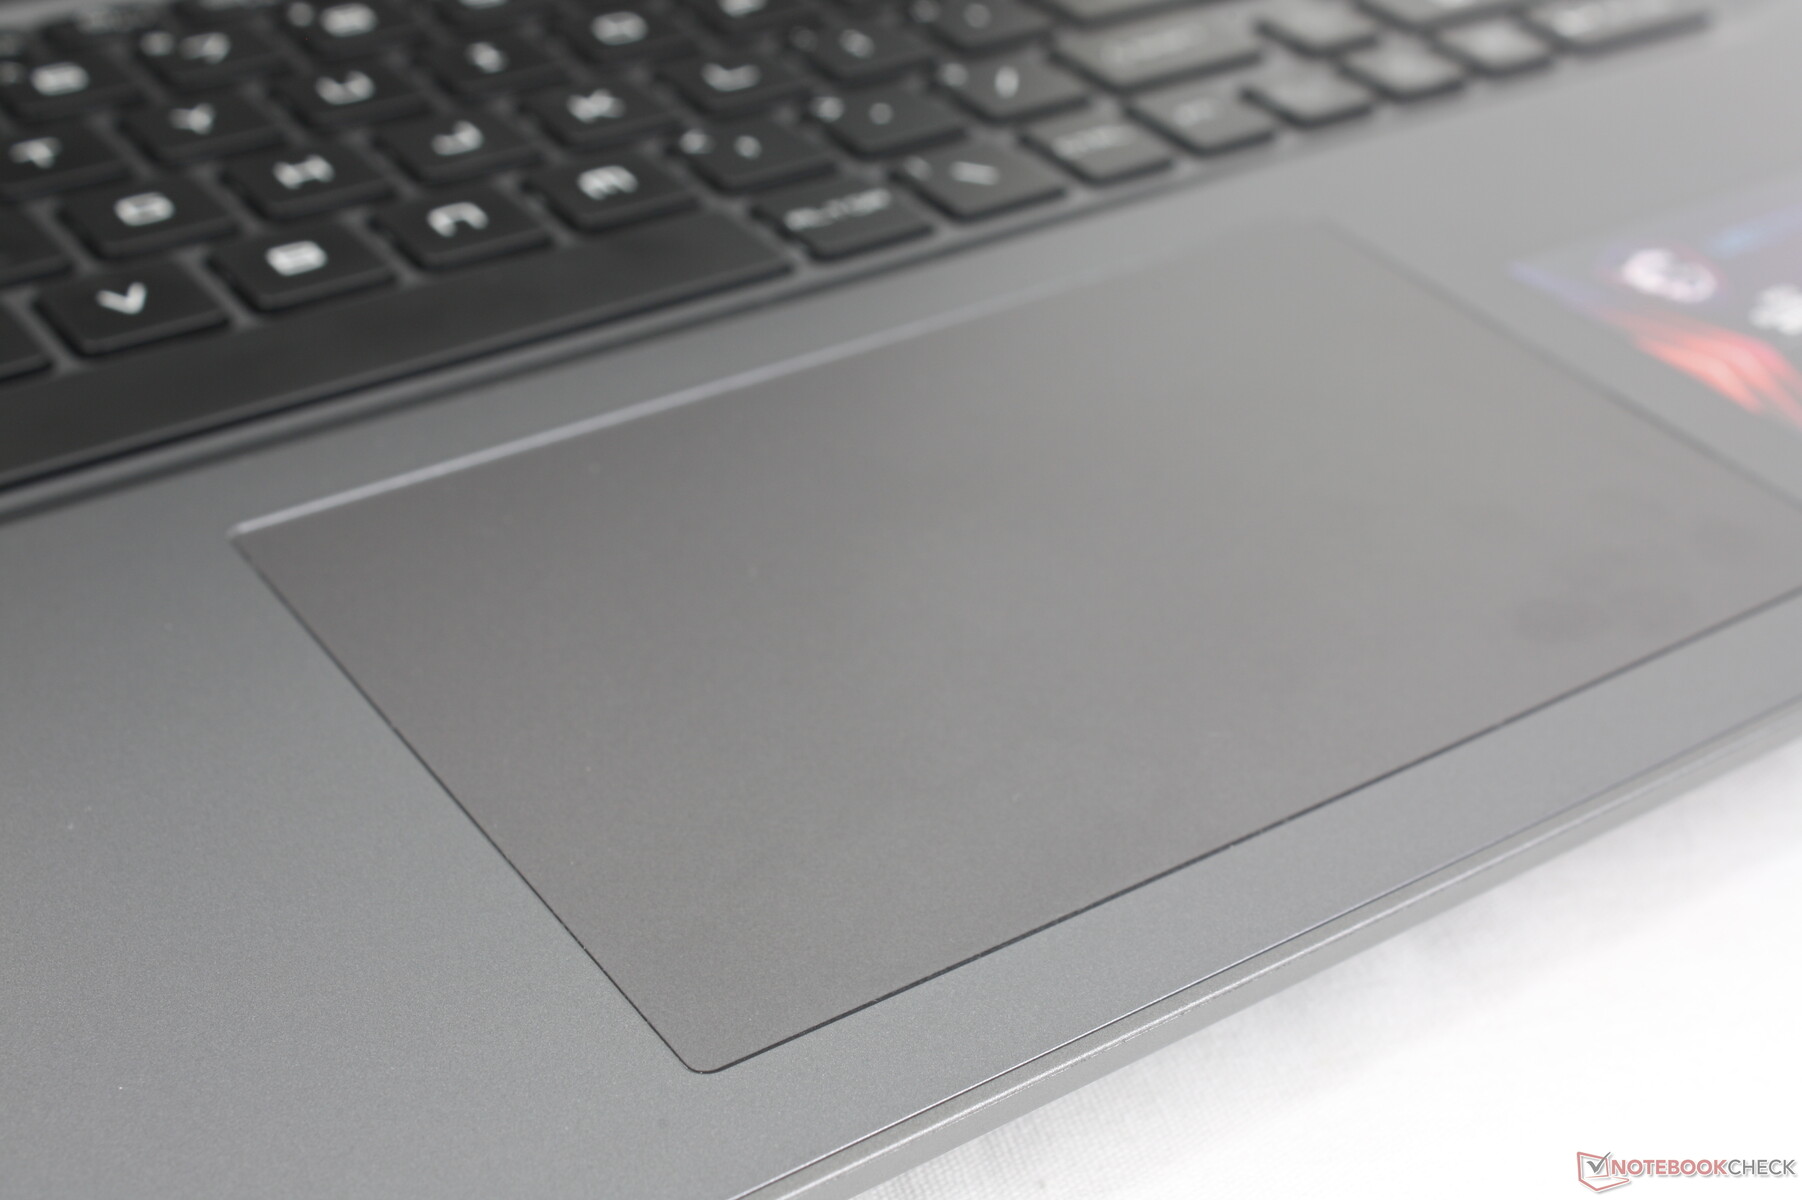
点击板的尺寸约为 13.2 x 8.2 厘米,比戴尔 G16 7620(10.5 x 6 厘米)和旧款 Vector GP66(10.5 x 6.5 厘米)宽敞。滑动非常流畅,只有在低速滑行时才会有轻微的粘滞感。按下时的反馈也相当有力,尽管发出的咔哒声相对较小。游戏笔记本电脑上的触控板通常都不尽如人意,但我们很高兴在 Vector 16 HX 上看到了一个半成品的触控板。
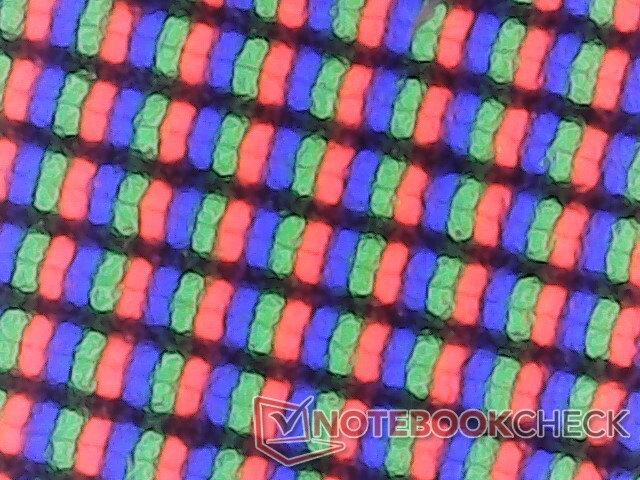
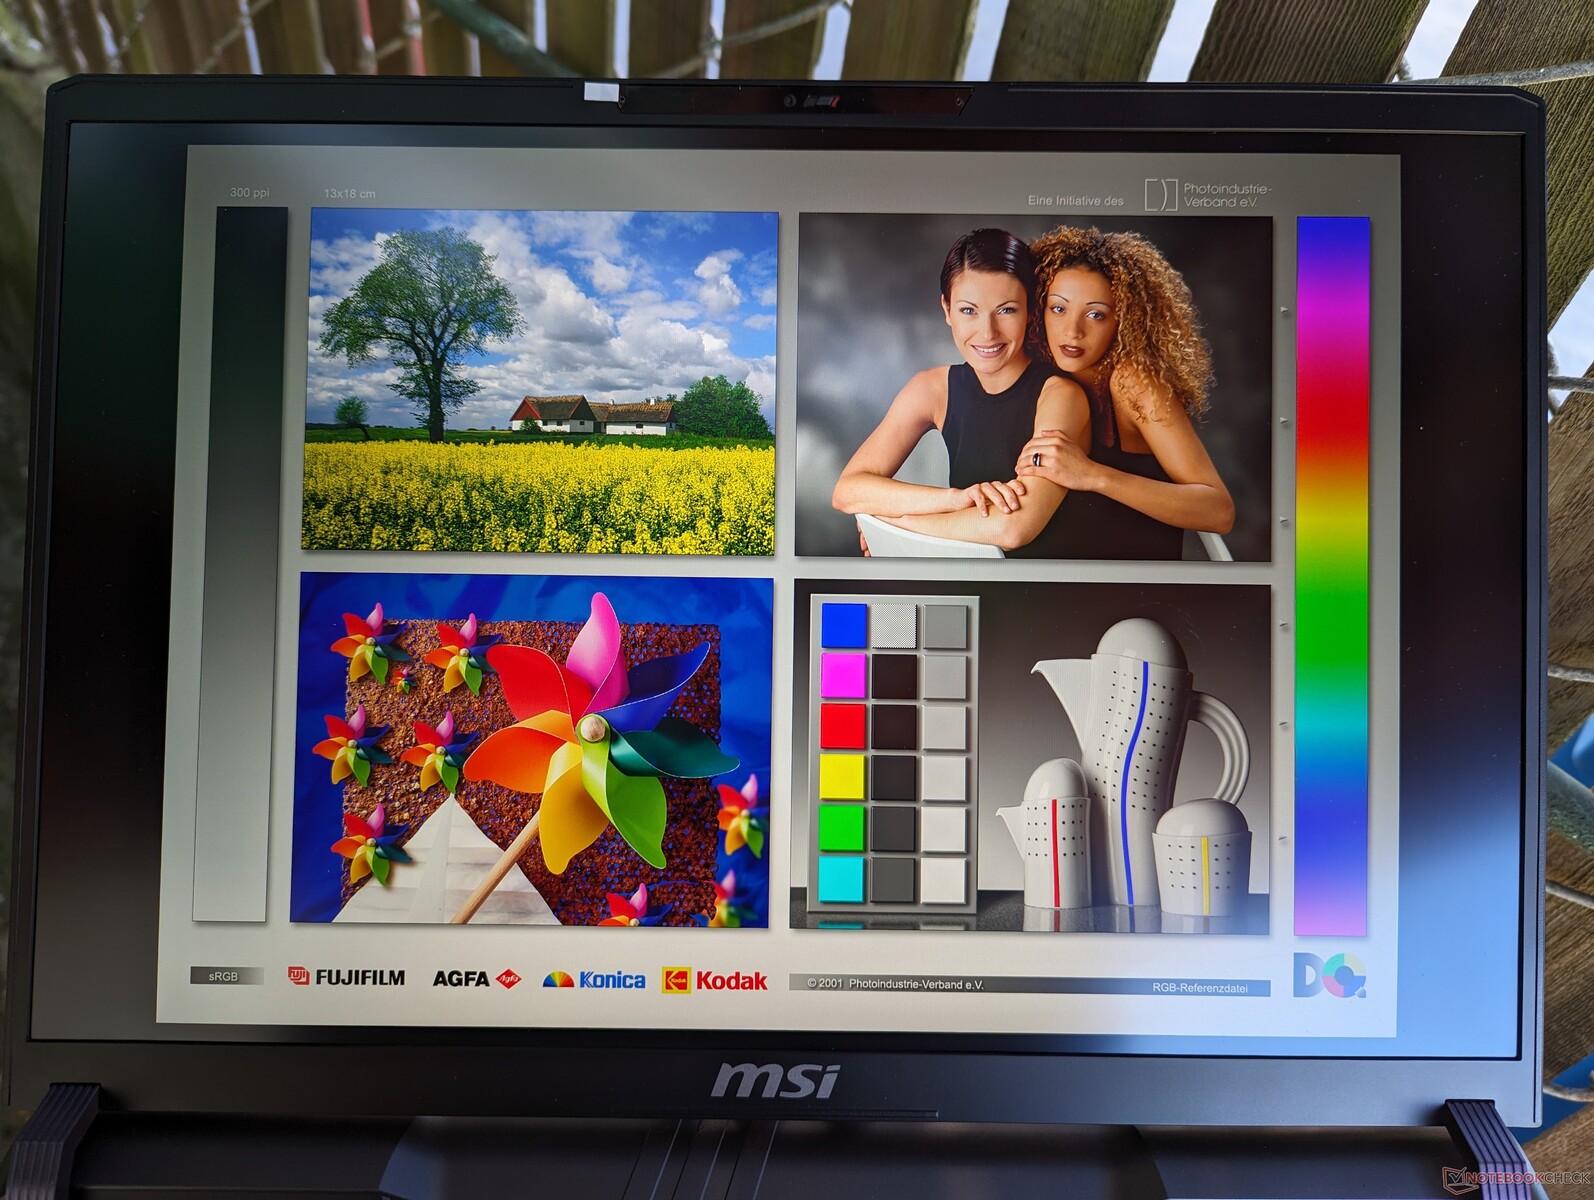
显示屏 - 全 IPS,无 G-Sync
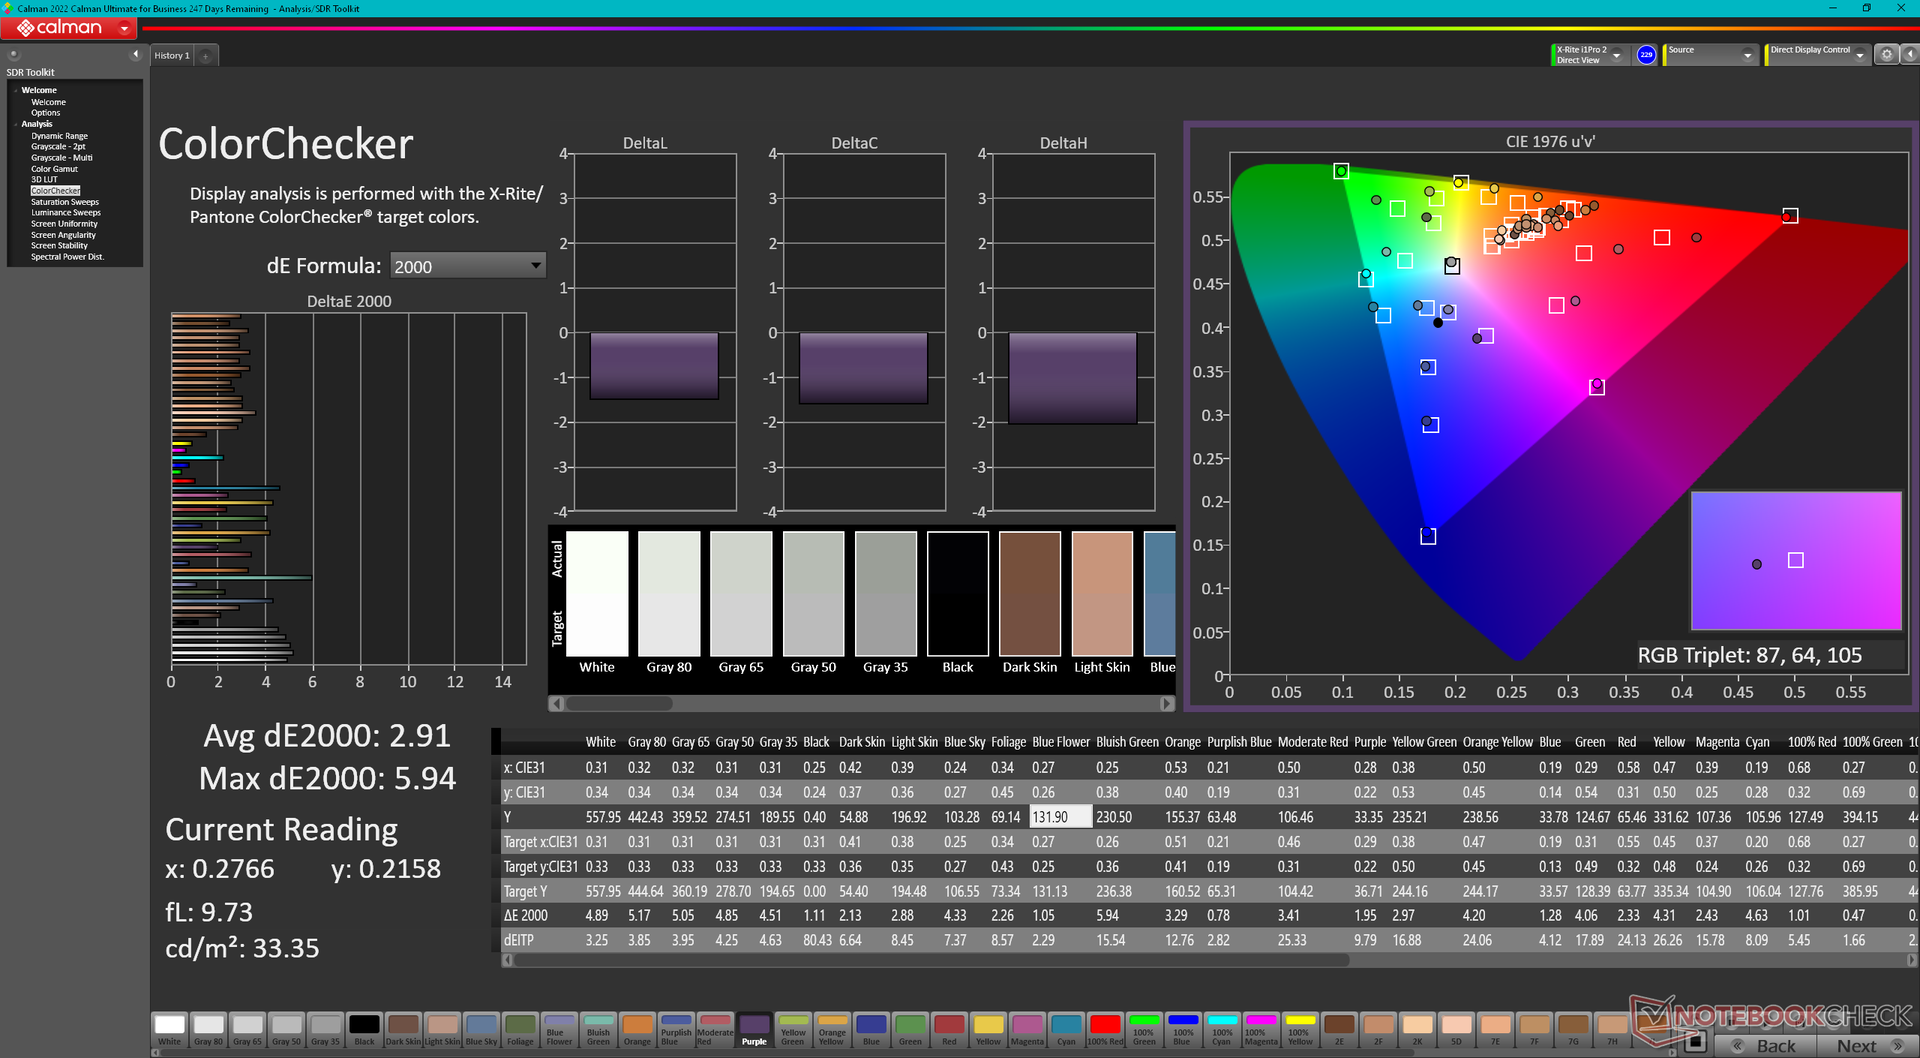
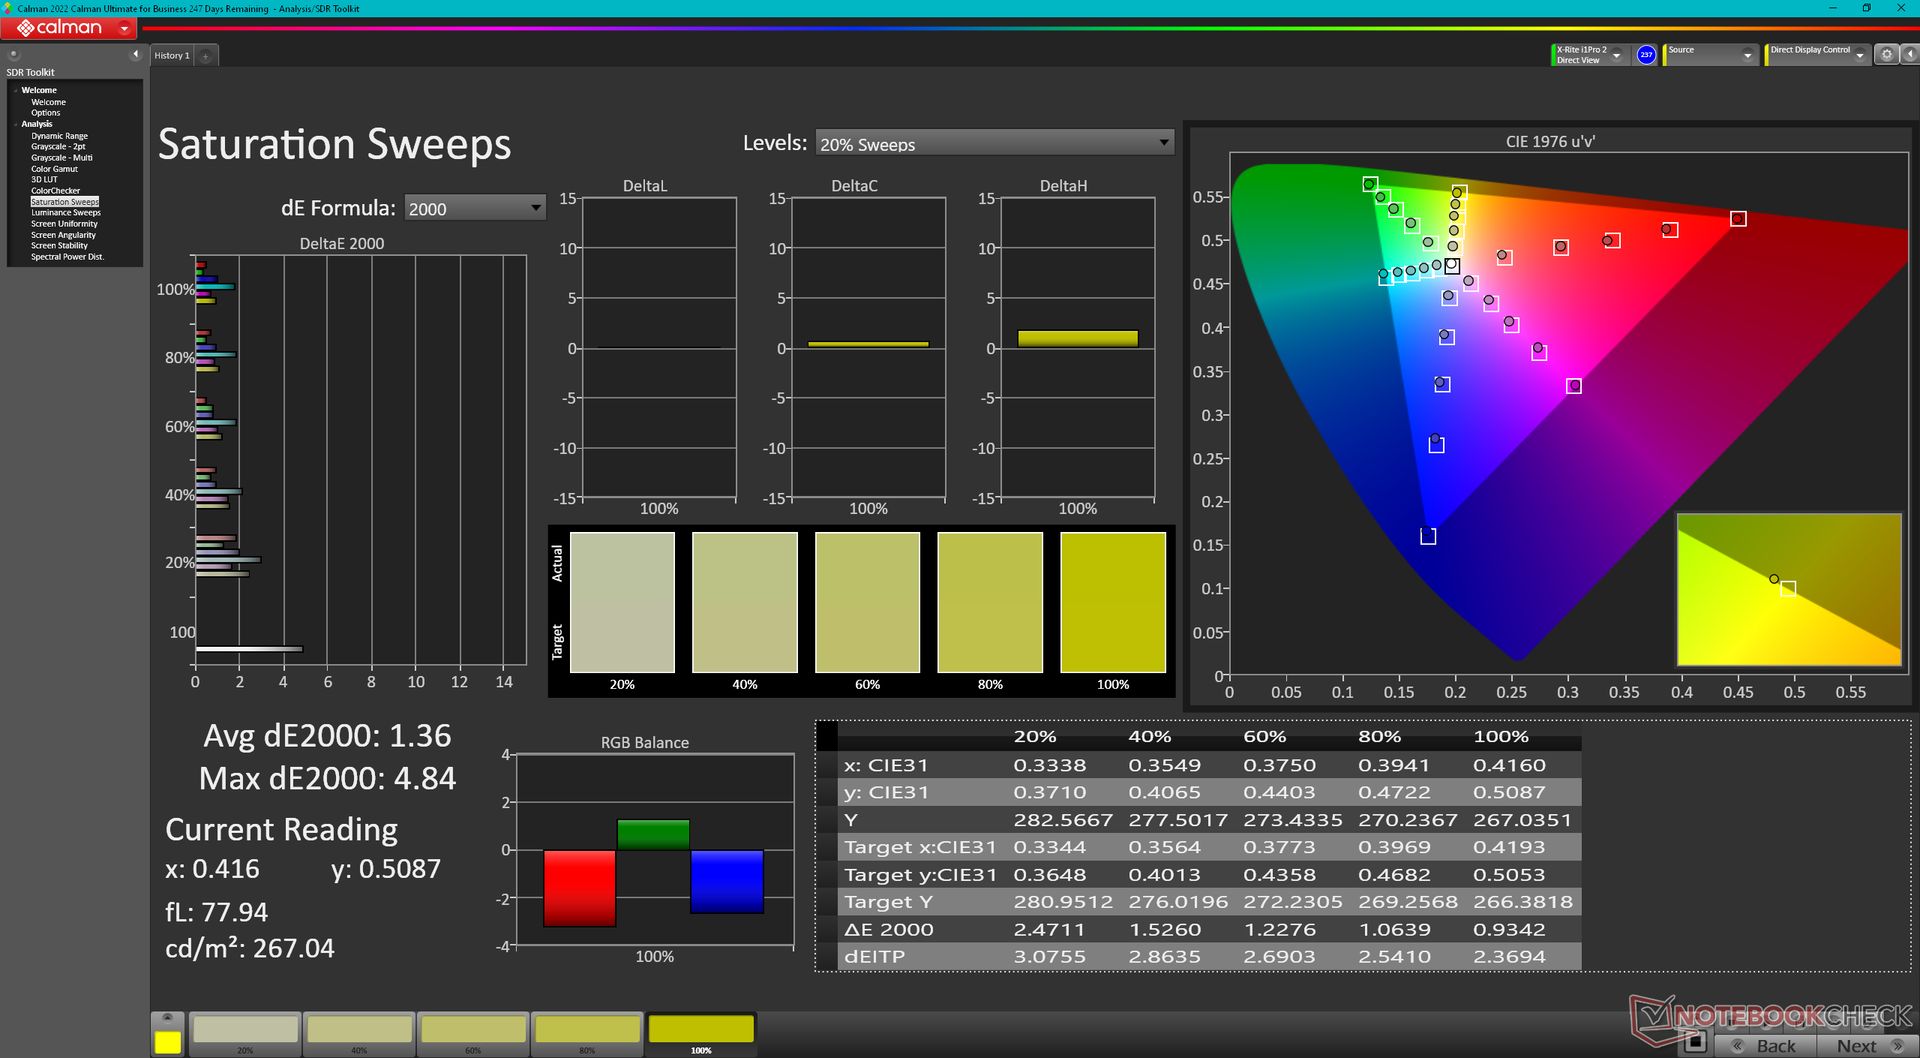
这是我们数据库中第一套配备高端奇美 N160GME-GTB 面板的系统。它的特性与 NE160QDM-NZ3 非常相似。 联想Legion 5 16但有一个显著的改进:全面覆盖 DCI-P3,而不仅仅是 sRGB。除此之外,用户还可以期待与联想机器相同的 240 Hz 快速原生刷新率、~1300:1 对比度和快速响应时间。
值得注意的是,目前所有配置的 Vector 16 HX 都没有 G-Sync。刷新率也固定为 60 Hz 或 240 Hz,而可变刷新率的面板正变得越来越常见。
请记住,在亮度、色彩等方面,价格较低的 1200p 144 Hz 配置可能与我们的 1600p 240 Hz 配置具有不同的属性。
| |||||||||||||||||||||||||
Brightness Distribution: 83 %
Center on Battery: 557.2 cd/m²
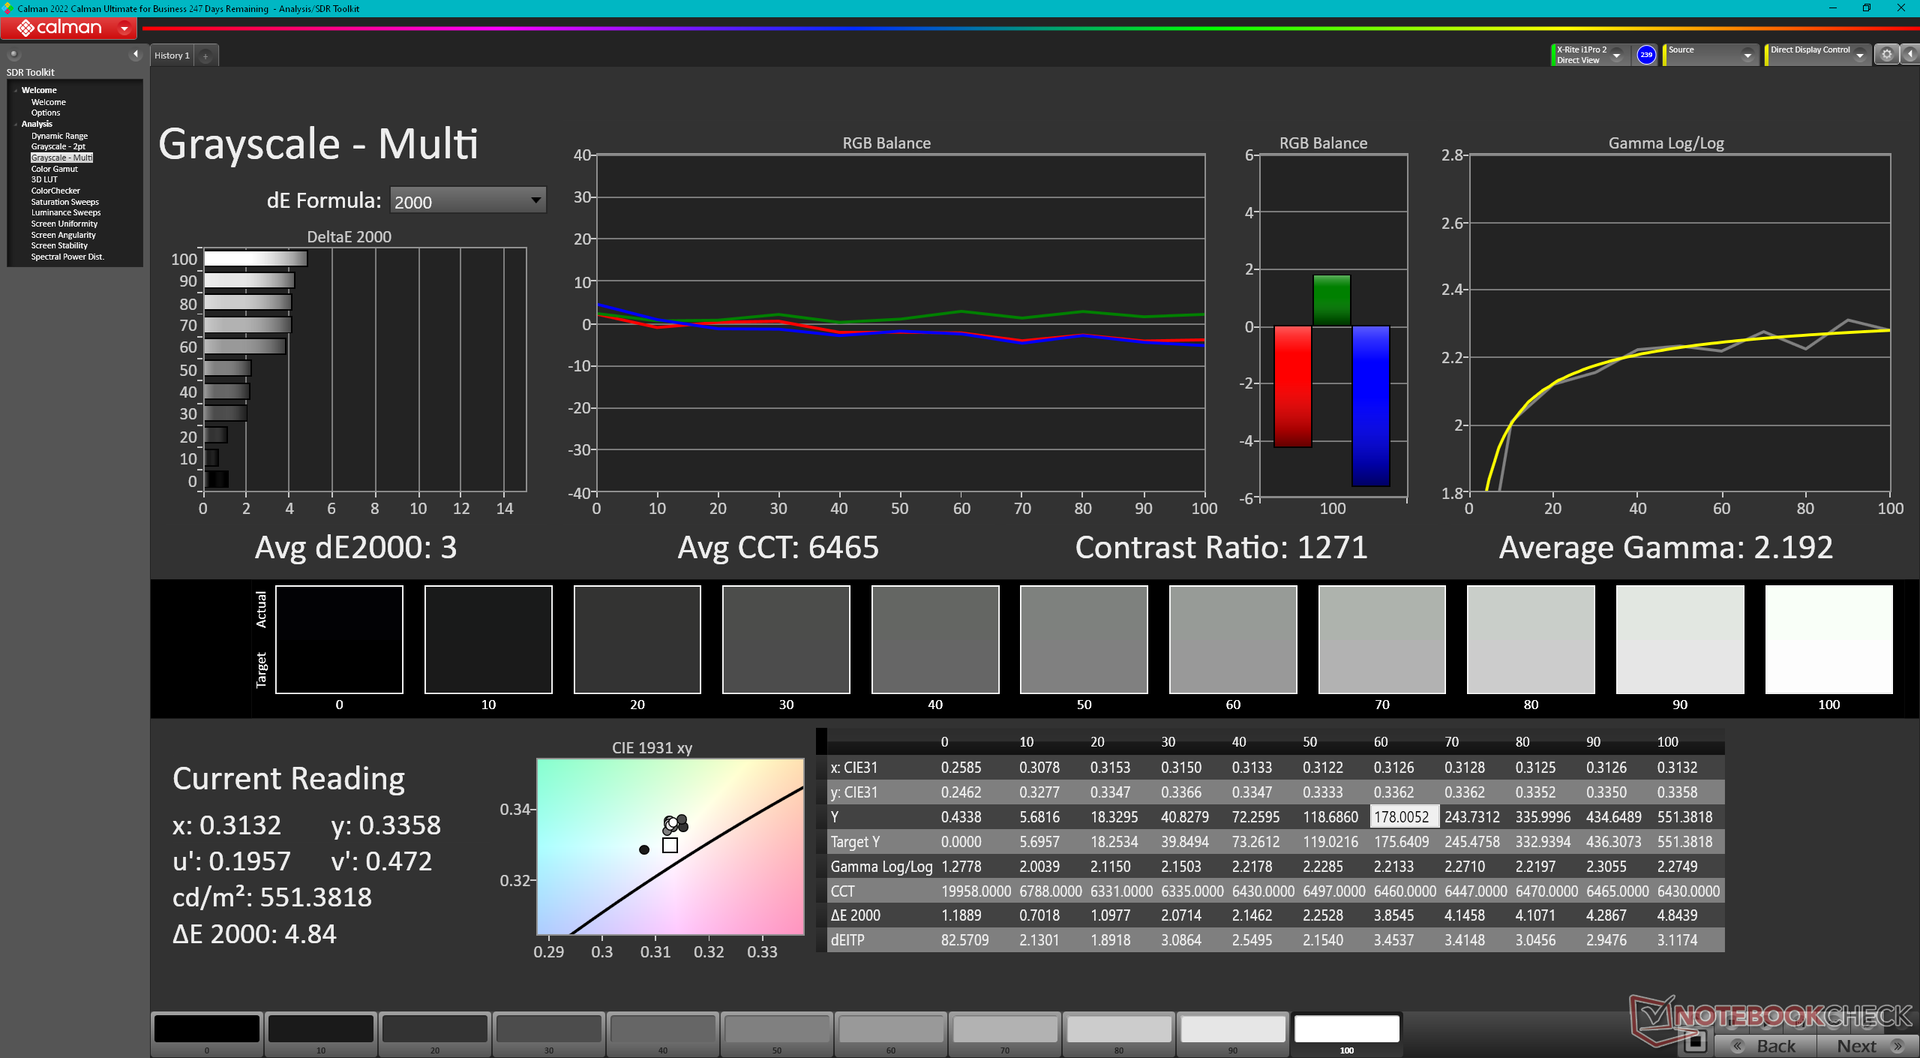
Contrast: 1359:1 (Black: 0.41 cd/m²)
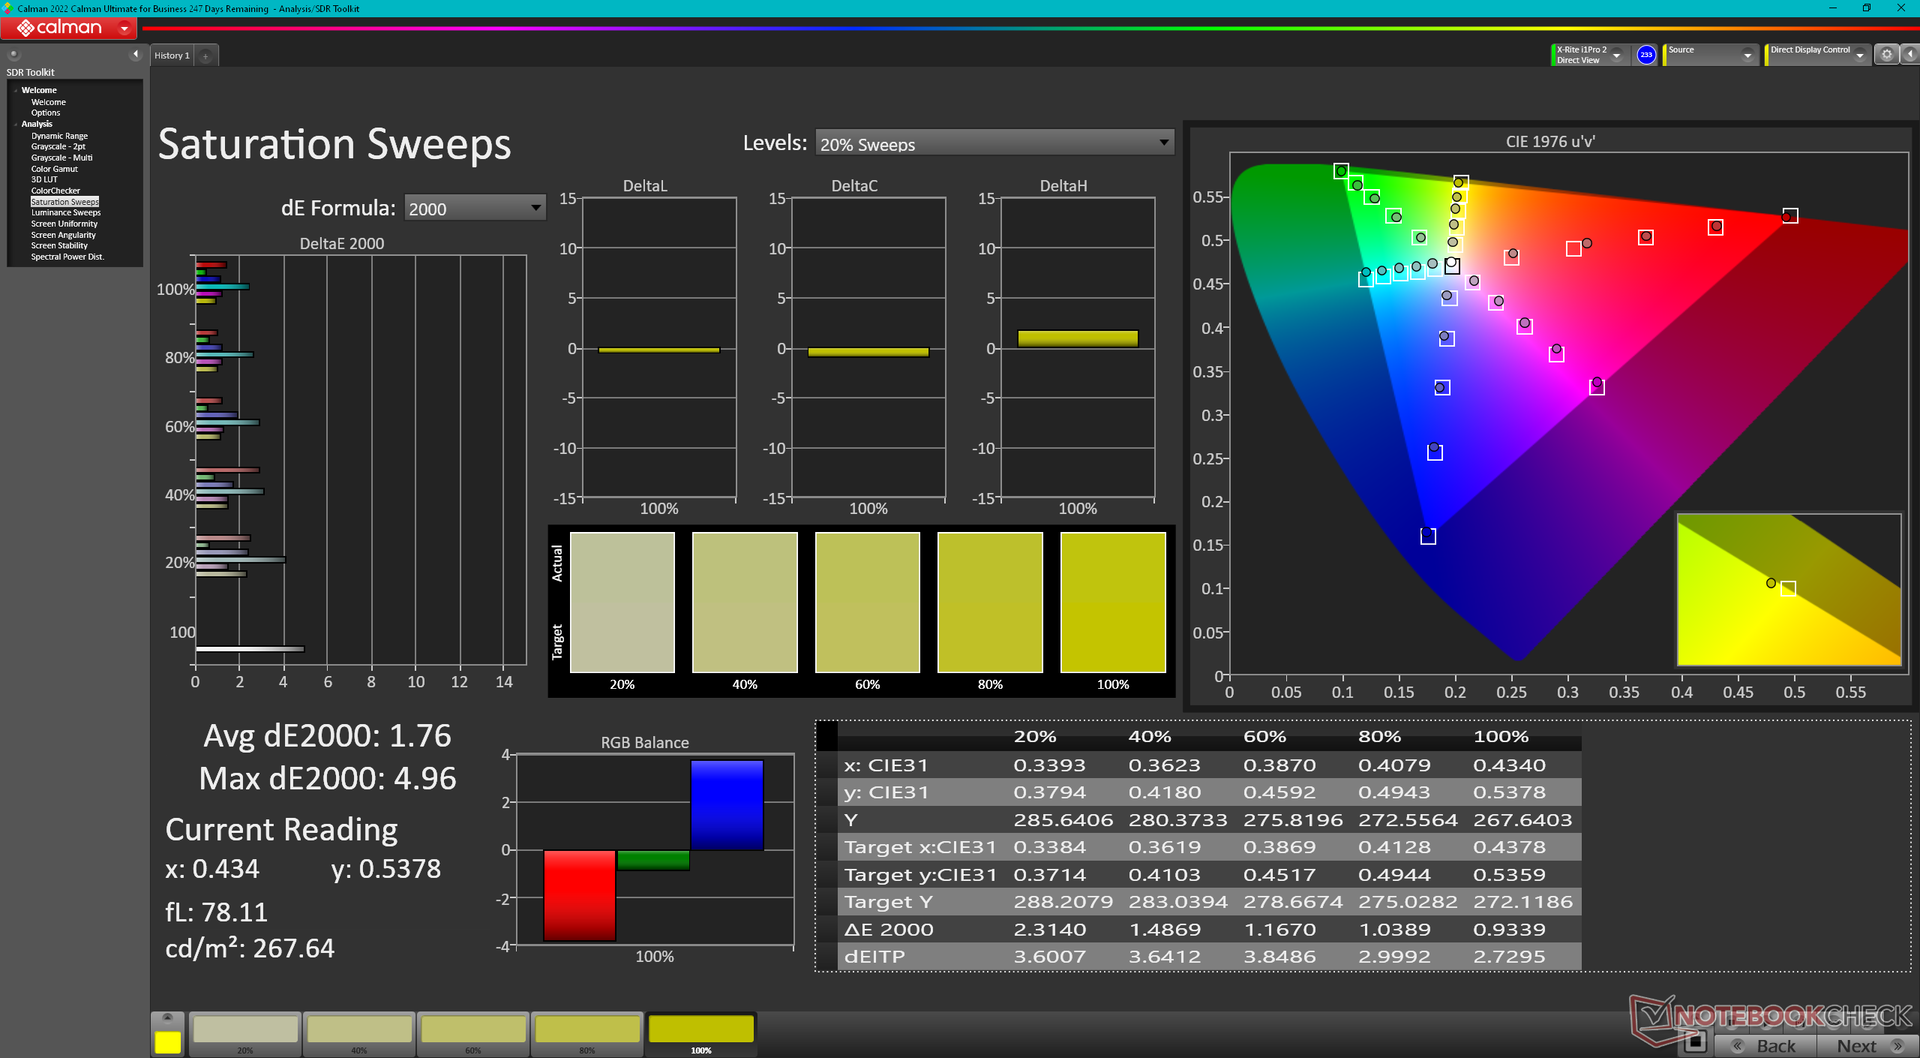
ΔE ColorChecker Calman: 2.91 | ∀{0.5-29.43 Ø4.71}
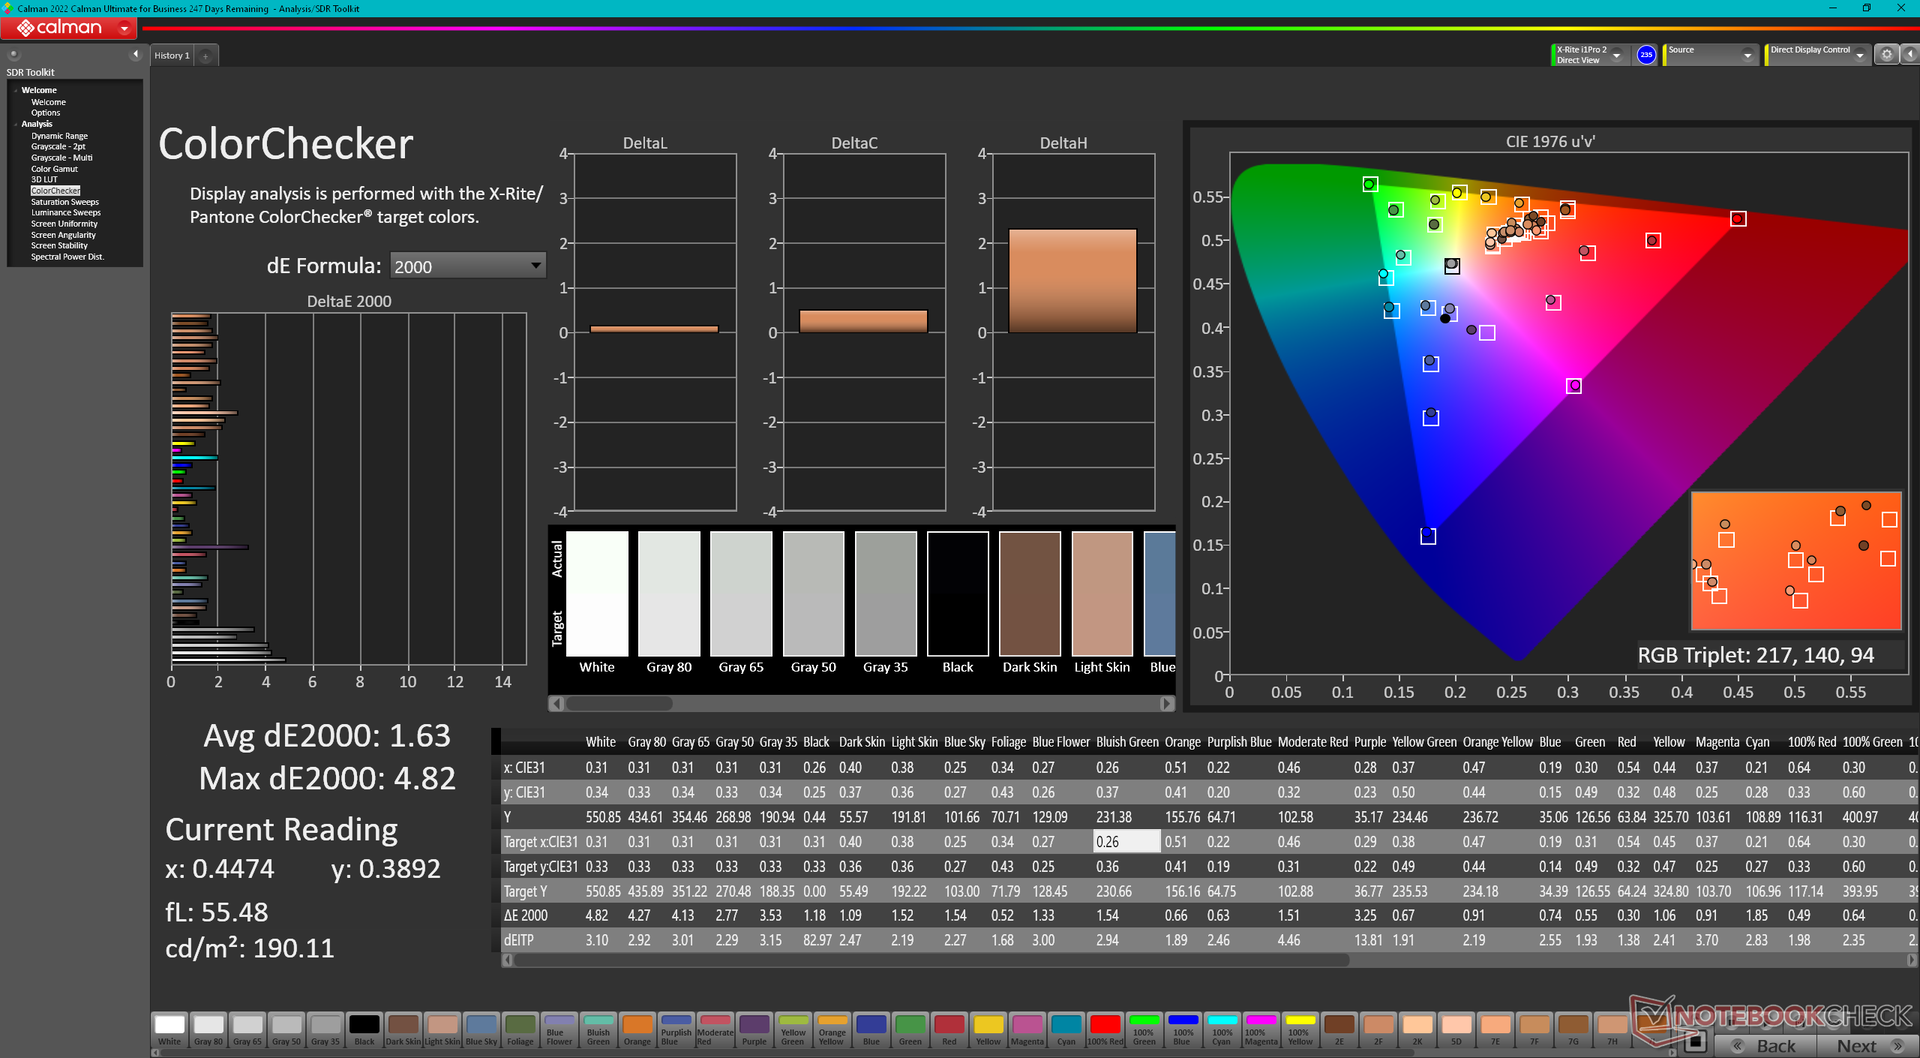
calibrated: 1.63
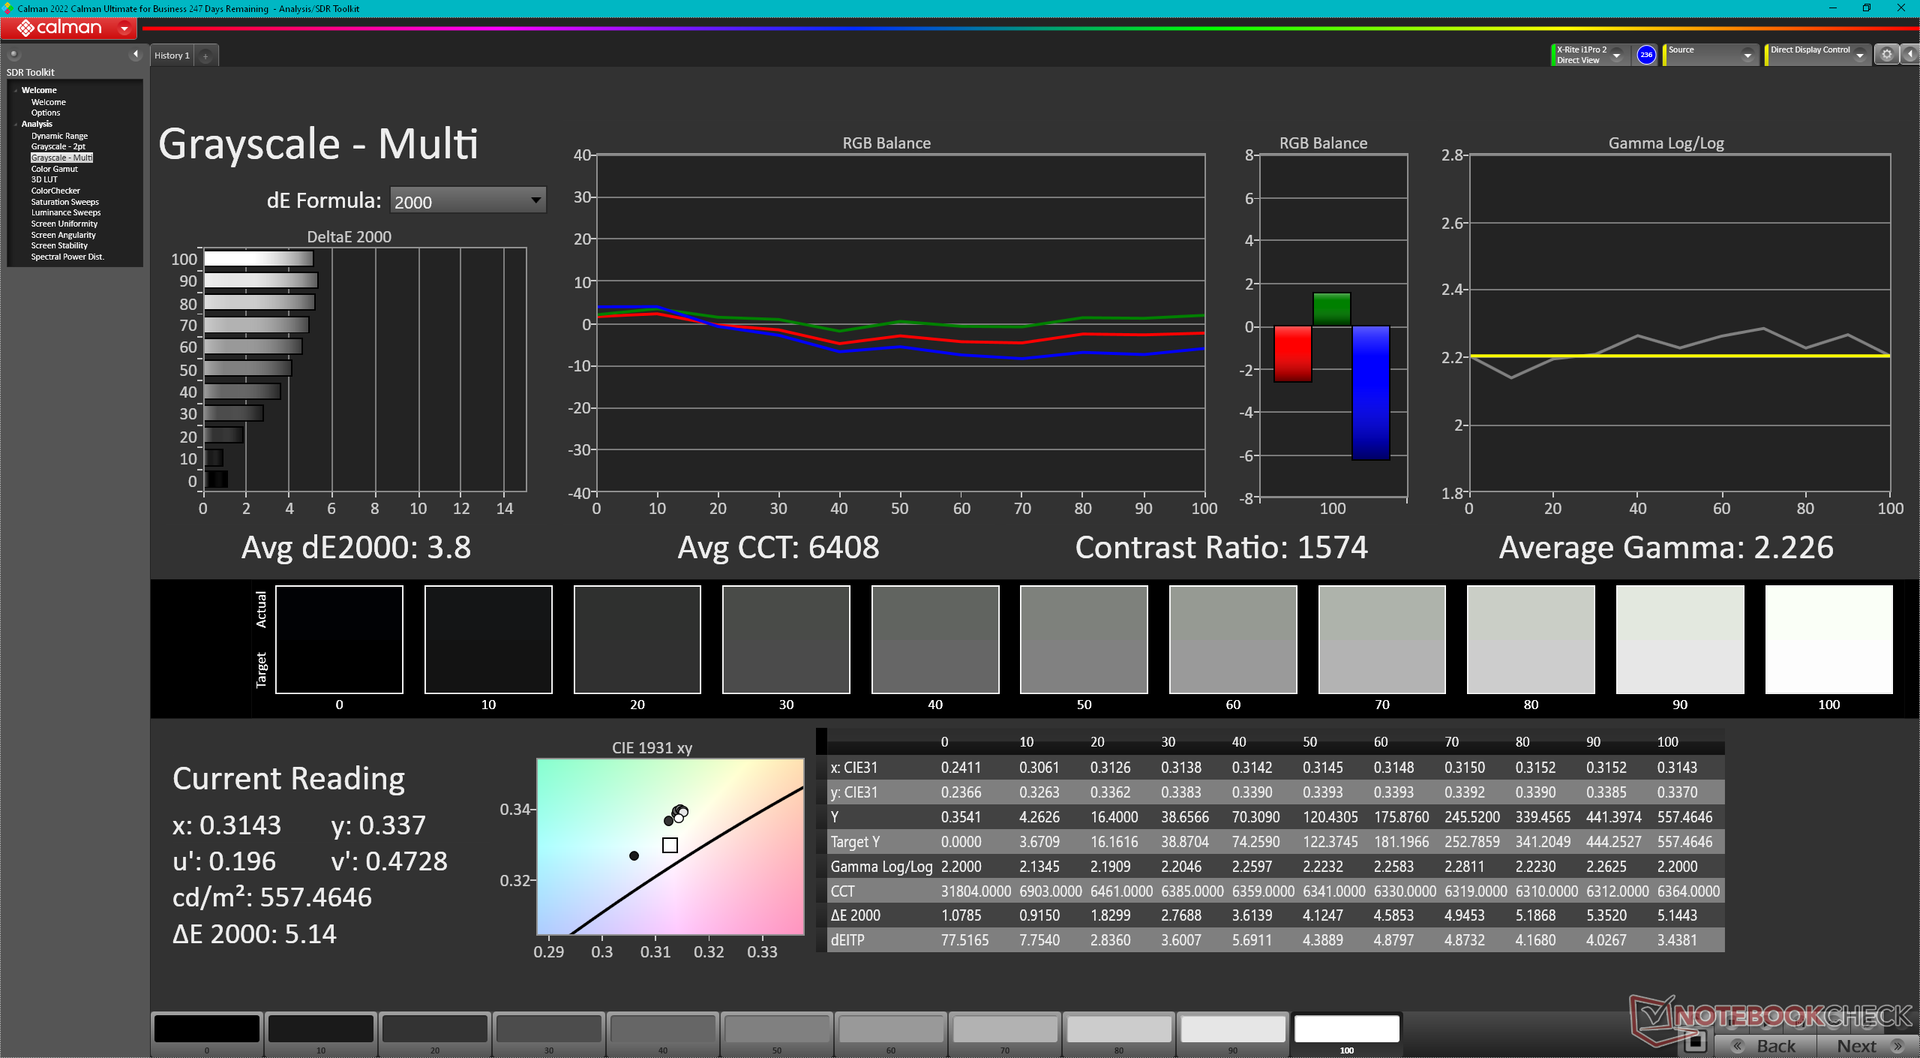
ΔE Greyscale Calman: 3.8 | ∀{0.09-98 Ø4.96}
85.4% AdobeRGB 1998 (Argyll 3D)
99.7% sRGB (Argyll 3D)
95.4% Display P3 (Argyll 3D)
Gamma: 2.23
CCT: 6408 K
| MSI Vector 16 HX A14V Chi Mei N160GME-GTB, IPS, 2560x1600, 16" | MSI Vector GP66 12UGS BOE NE156FHM-NZ3, IPS, 1920x1080, 15.6" | Lenovo Legion 5 16IRX G9 NE160QDM-NZ3, IPS, 2560x1600, 16" | HP Victus 16-r0077ng CMN162D, IPS, 1920x1080, 16.1" | Asus TUF Gaming A16 FA617XS BOE NE160WUM-NX2, IPS, 1920x1200, 16" | Dell G16 7620 BOE NE16QDM, IPS, 2560x1600, 16" | |
|---|---|---|---|---|---|---|
| Display | -14% | -12% | -17% | -15% | -16% | |
| Display P3 Coverage (%) | 95.4 | 70.1 -27% | 72.4 -24% | 66.7 -30% | 69.3 -27% | 68.3 -28% |
| sRGB Coverage (%) | 99.7 | 99.5 0% | 100 0% | 98 -2% | 97.3 -2% | 98 -2% |
| AdobeRGB 1998 Coverage (%) | 85.4 | 72.1 -16% | 74.1 -13% | 69 -19% | 70.7 -17% | 70.5 -17% |
| Response Times | 7% | -48% | -53% | -81% | -21% | |
| Response Time Grey 50% / Grey 80% * (ms) | 5.7 ? | 5.8 ? -2% | 12.5 ? -119% | 13.3 ? -133% | 15.6 ? -174% | 8.6 ? -51% |
| Response Time Black / White * (ms) | 11.4 ? | 9.6 ? 16% | 8.7 ? 24% | 8.2 ? 28% | 10 ? 12% | 10.4 ? 9% |
| PWM Frequency (Hz) | ||||||
| Screen | -3% | 29% | 17% | 13% | 5% | |
| Brightness middle (cd/m²) | 557.2 | 353.1 -37% | 526 -6% | 308 -45% | 301 -46% | 369.4 -34% |
| Brightness (cd/m²) | 506 | 325 -36% | 500 -1% | 285 -44% | 294 -42% | 348 -31% |
| Brightness Distribution (%) | 83 | 85 2% | 87 5% | 85 2% | 94 13% | 83 0% |
| Black Level * (cd/m²) | 0.41 | 0.38 7% | 0.33 20% | 0.25 39% | 0.21 49% | 0.32 22% |
| Contrast (:1) | 1359 | 929 -32% | 1594 17% | 1232 -9% | 1433 5% | 1154 -15% |
| Colorchecker dE 2000 * | 2.91 | 2.24 23% | 1.2 59% | 1.3 55% | 1.79 38% | 1.78 39% |
| Colorchecker dE 2000 max. * | 5.94 | 5 16% | 2.1 65% | 2.76 54% | 3.48 41% | 4.41 26% |
| Colorchecker dE 2000 calibrated * | 1.63 | 1.02 37% | 1 39% | 0.92 44% | 1.2 26% | 1.22 25% |
| Greyscale dE 2000 * | 3.8 | 4 -5% | 1.3 66% | 1.7 55% | 2.5 34% | 3.2 16% |
| Gamma | 2.23 99% | 2.24 98% | 2.23 99% | 2.167 102% | 2.265 97% | 2.2 100% |
| CCT | 6408 101% | 6864 95% | 6391 102% | 6767 96% | 6157 106% | 6750 96% |
| Total Average (Program / Settings) | -3% /
-4% | -10% /
9% | -18% /
-0% | -28% /
-6% | -11% /
-3% |
* ... smaller is better
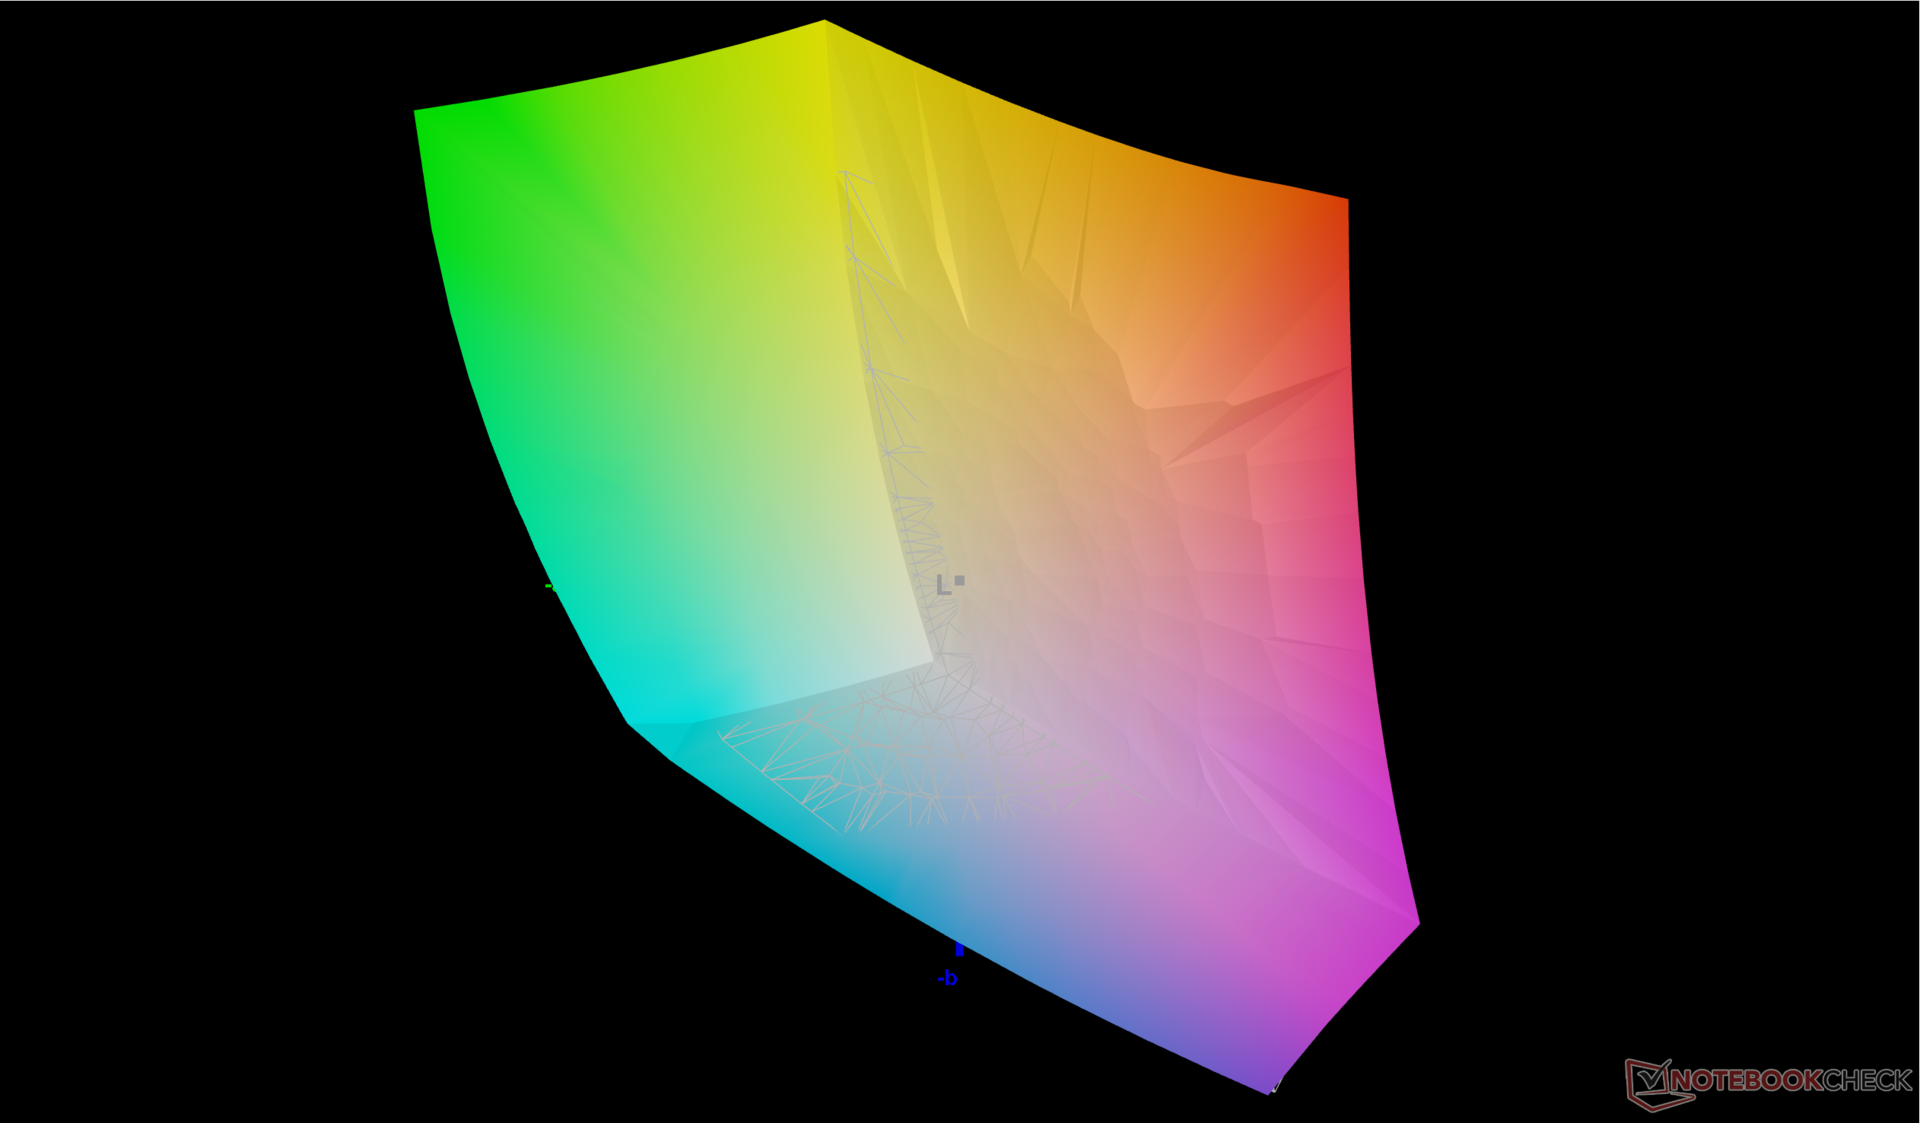
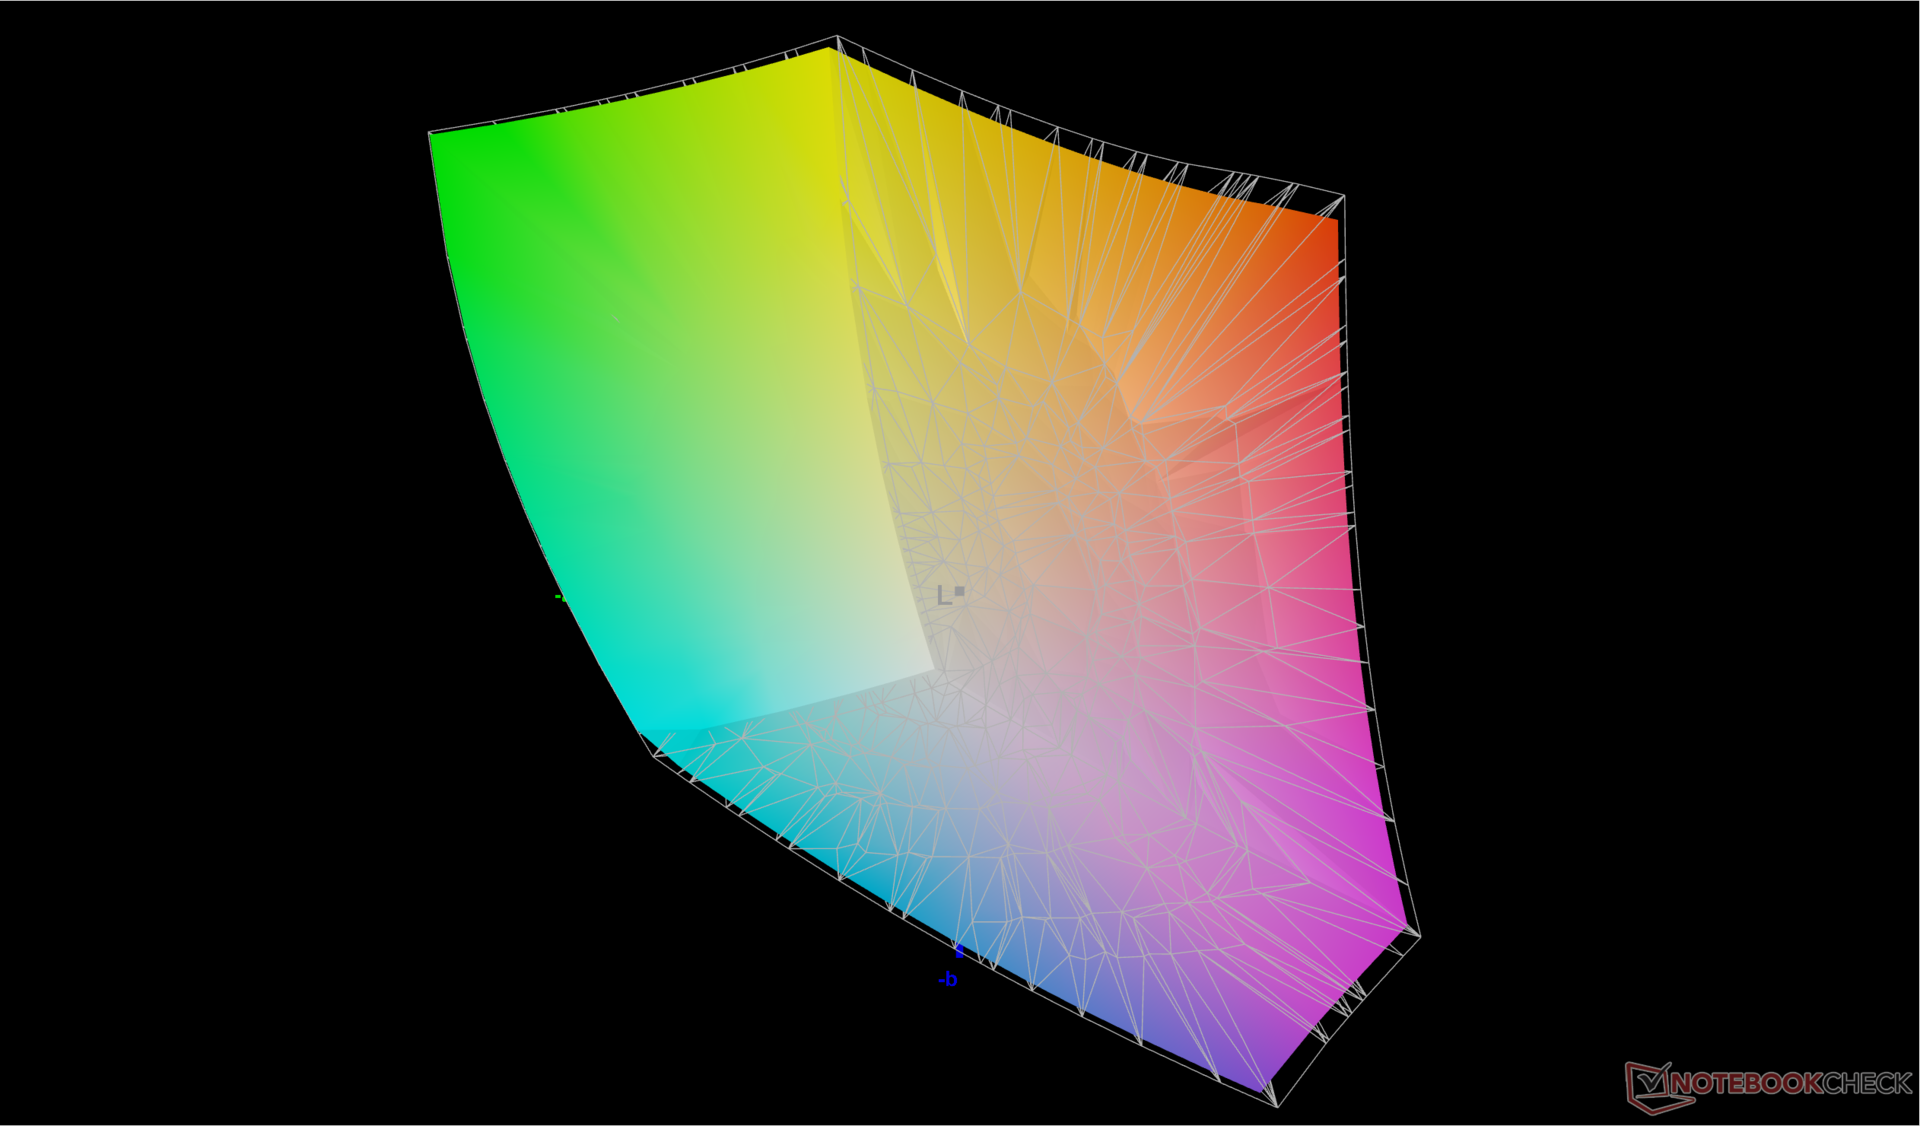
虽然显示屏没有经过预校准,但其色彩已经相对准确。与 P3 标准相比,平均灰度和色彩 deltaE 值分别仅为 3.8 和 2.91。我们的校准 ICM 配置文件免费提供,可提高精确度,使其更接近 deltaE <2 的标准。
Display Response Times
| ↔ Response Time Black to White | ||
|---|---|---|
| 11.4 ms ... rise ↗ and fall ↘ combined | ↗ 6.5 ms rise | 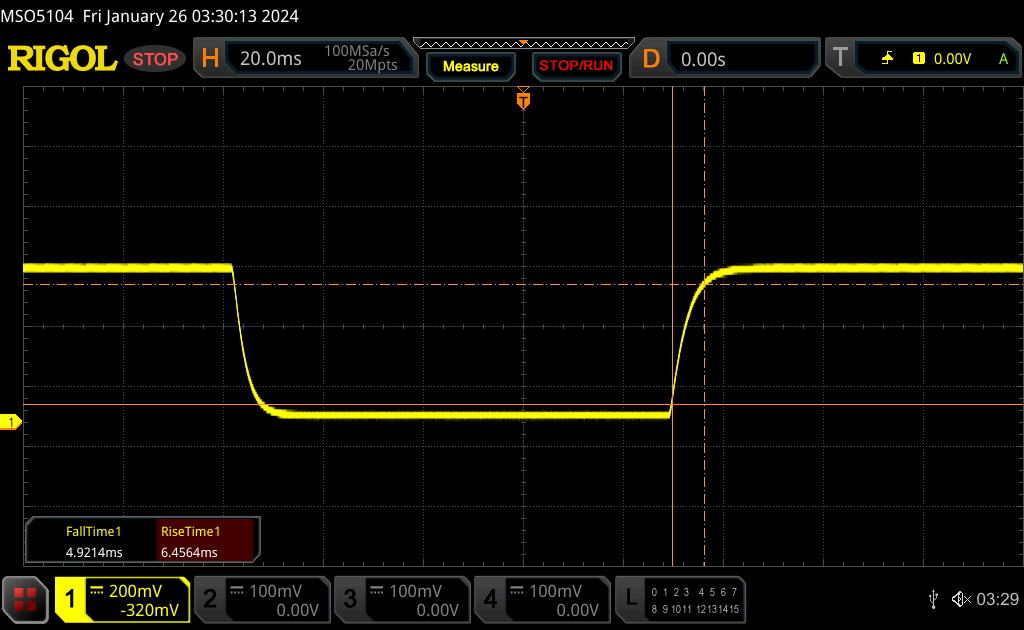 |
| ↘ 4.9 ms fall | ||
| The screen shows good response rates in our tests, but may be too slow for competitive gamers. In comparison, all tested devices range from 0.1 (minimum) to 240 (maximum) ms. » 31 % of all devices are better. This means that the measured response time is better than the average of all tested devices (19.8 ms). | ||
| ↔ Response Time 50% Grey to 80% Grey | ||
| 5.7 ms ... rise ↗ and fall ↘ combined | ↗ 2.8 ms rise | 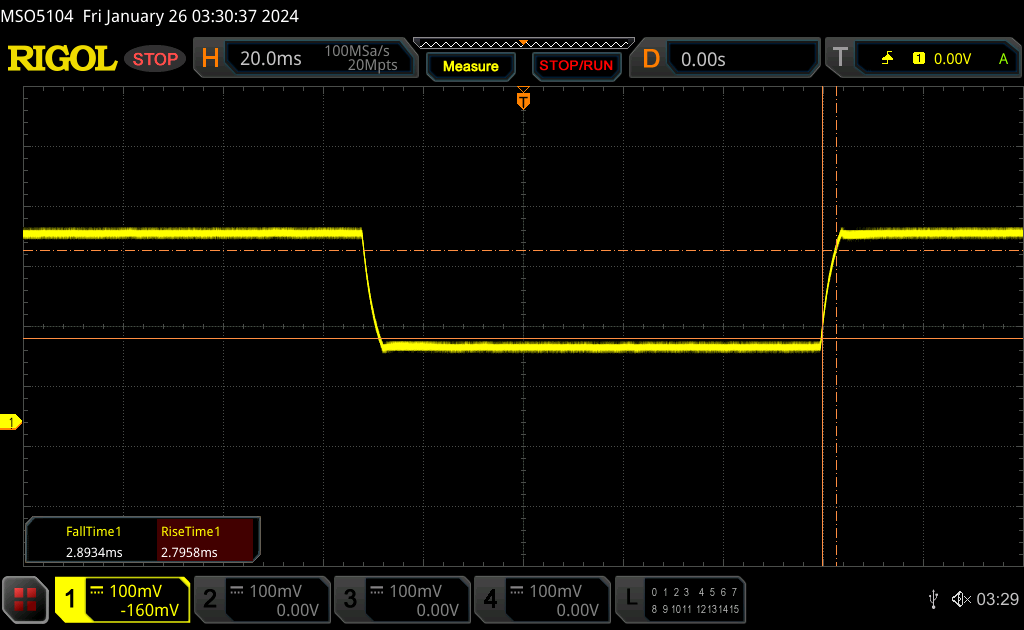 |
| ↘ 2.9 ms fall | ||
| The screen shows very fast response rates in our tests and should be very well suited for fast-paced gaming. In comparison, all tested devices range from 0.165 (minimum) to 636 (maximum) ms. » 18 % of all devices are better. This means that the measured response time is better than the average of all tested devices (31 ms). | ||
Screen Flickering / PWM (Pulse-Width Modulation)
| Screen flickering / PWM not detected | 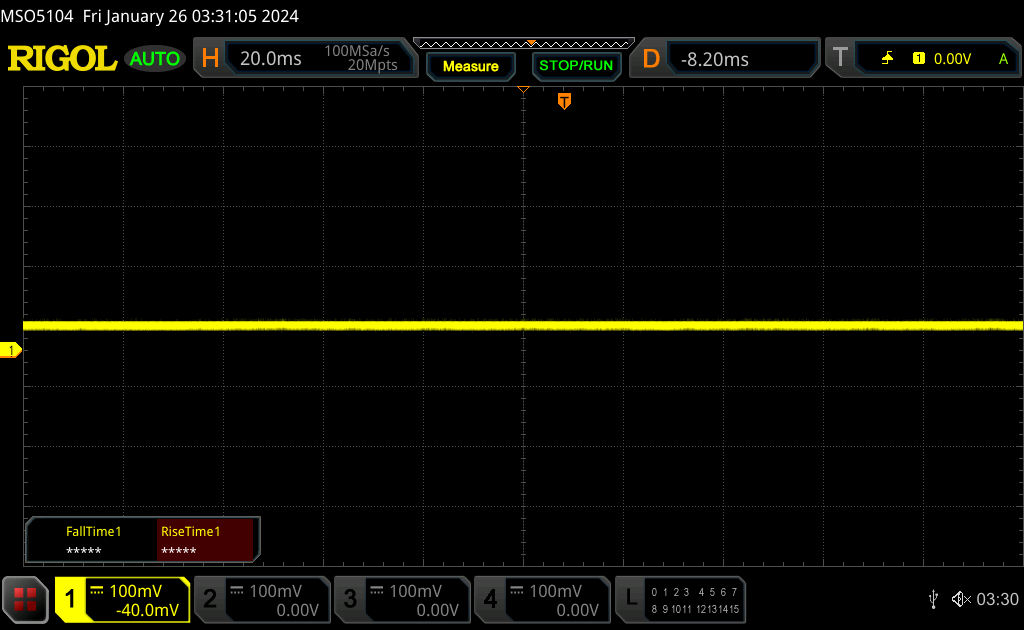 | ||
In comparison: 52 % of all tested devices do not use PWM to dim the display. If PWM was detected, an average of 7757 (minimum: 5 - maximum: 343500) Hz was measured. | |||
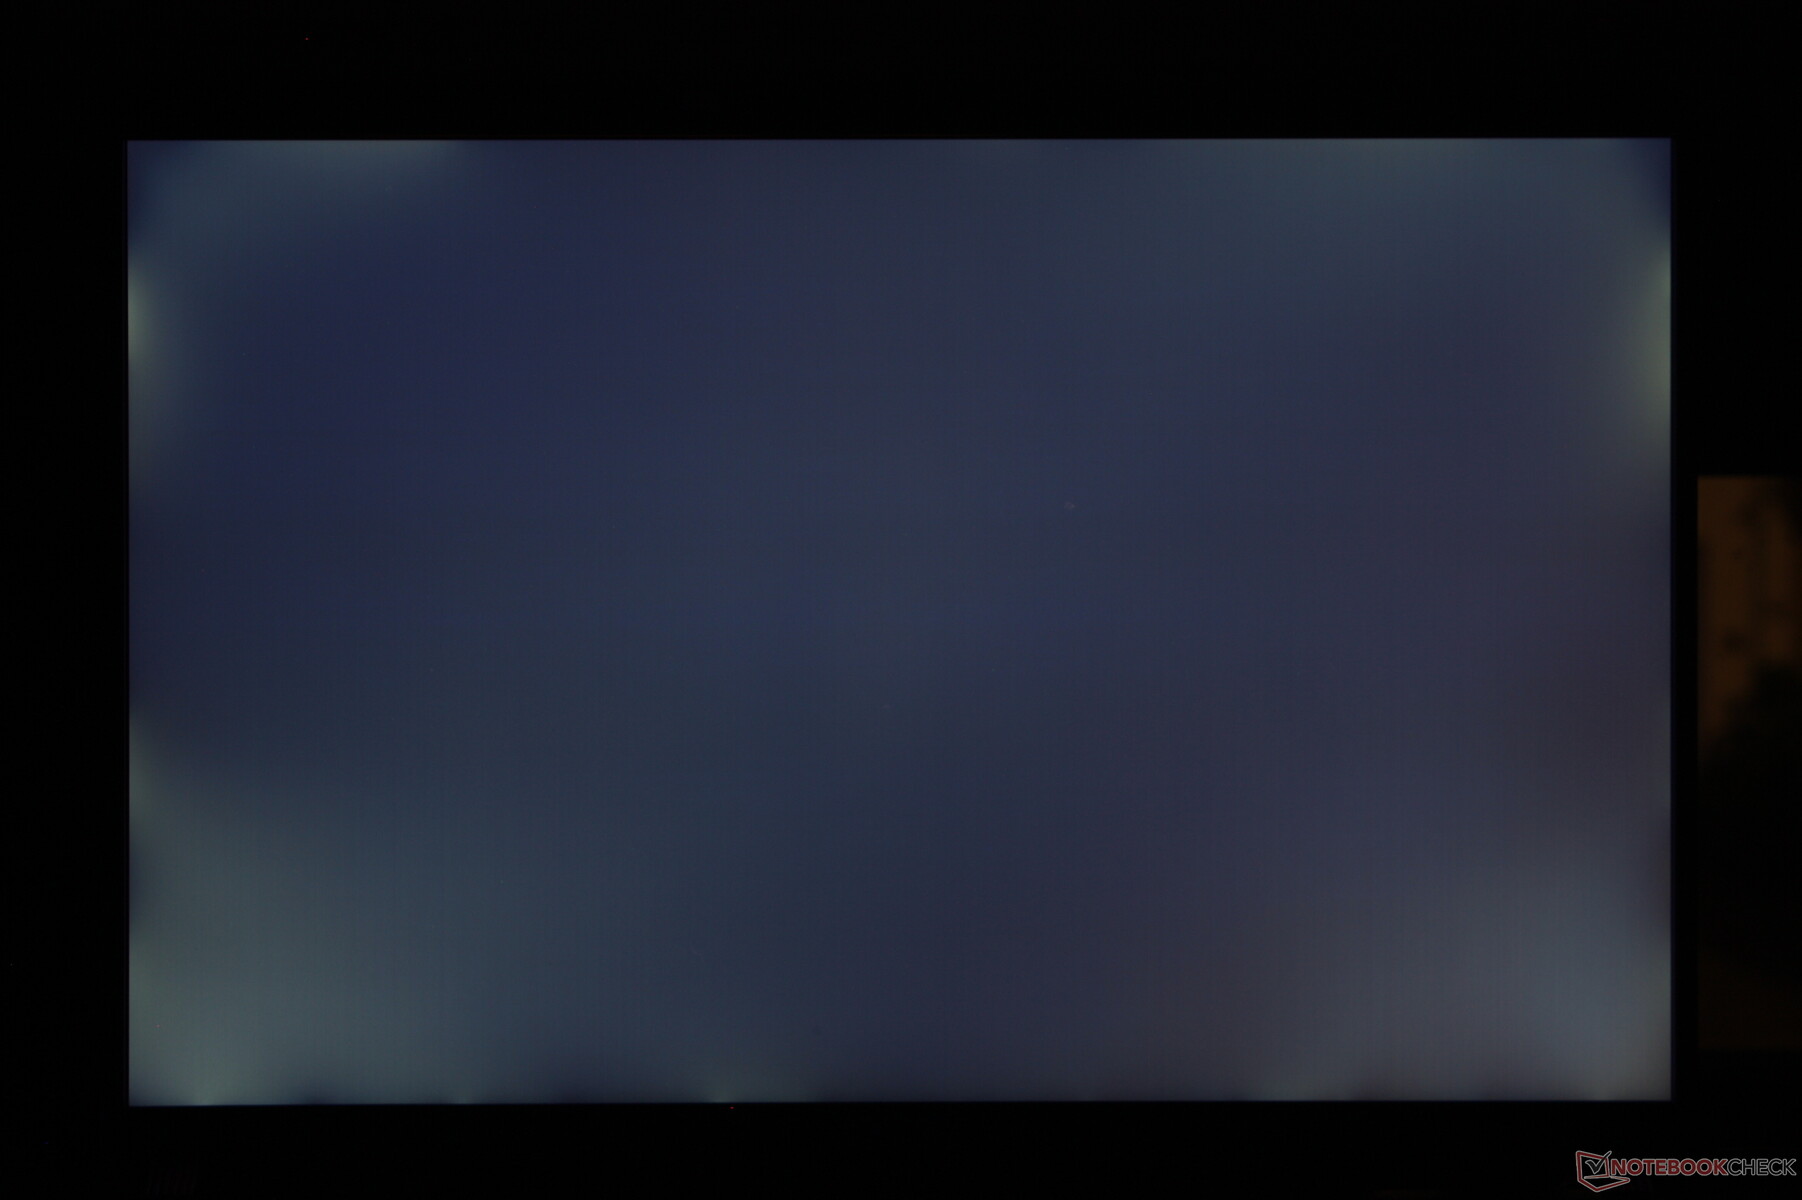
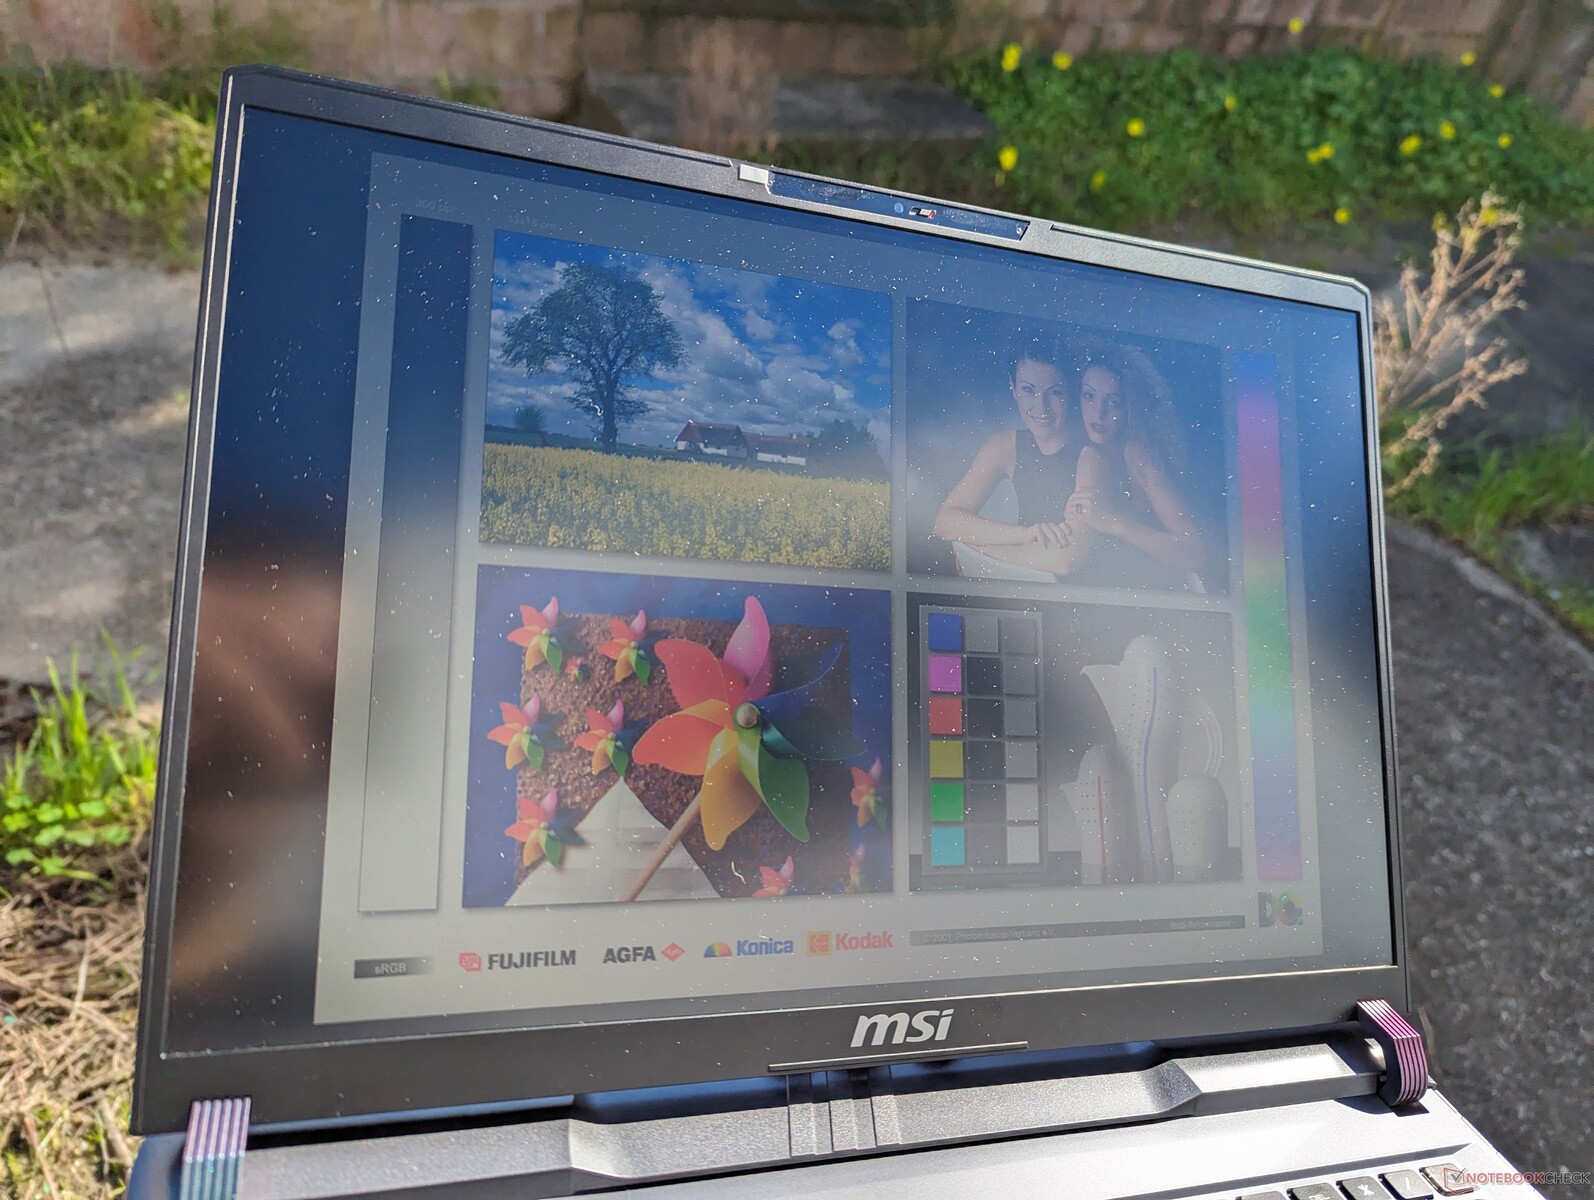
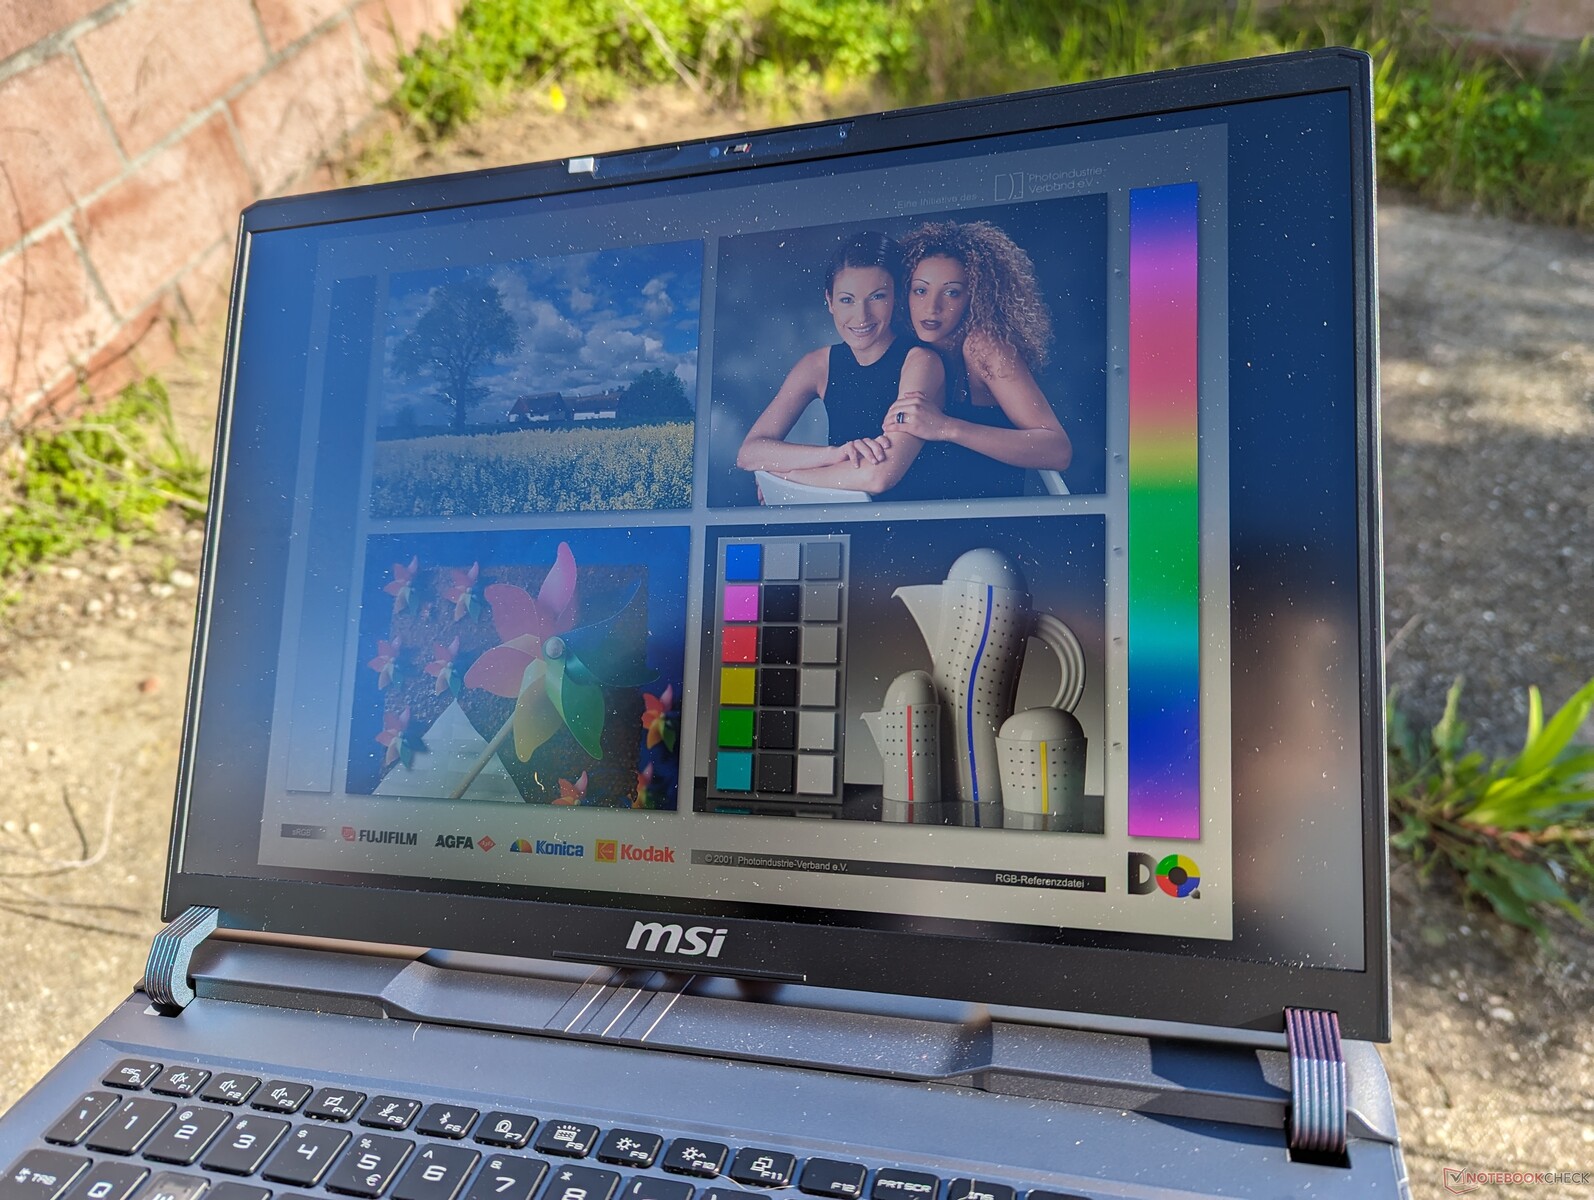
这款亚光显示屏的亮度在 IPS 面板中相对较高,约为 550 尼特,而惠普 Victus 1600 的亮度仅为 300 尼特。 惠普 Victus 16或华硕 TUF Gaming A16 只有 300 尼特。在阴凉处可视性尚可,但在室外较明亮的环境下,屏幕仍然过于暗淡。
性能
测试条件
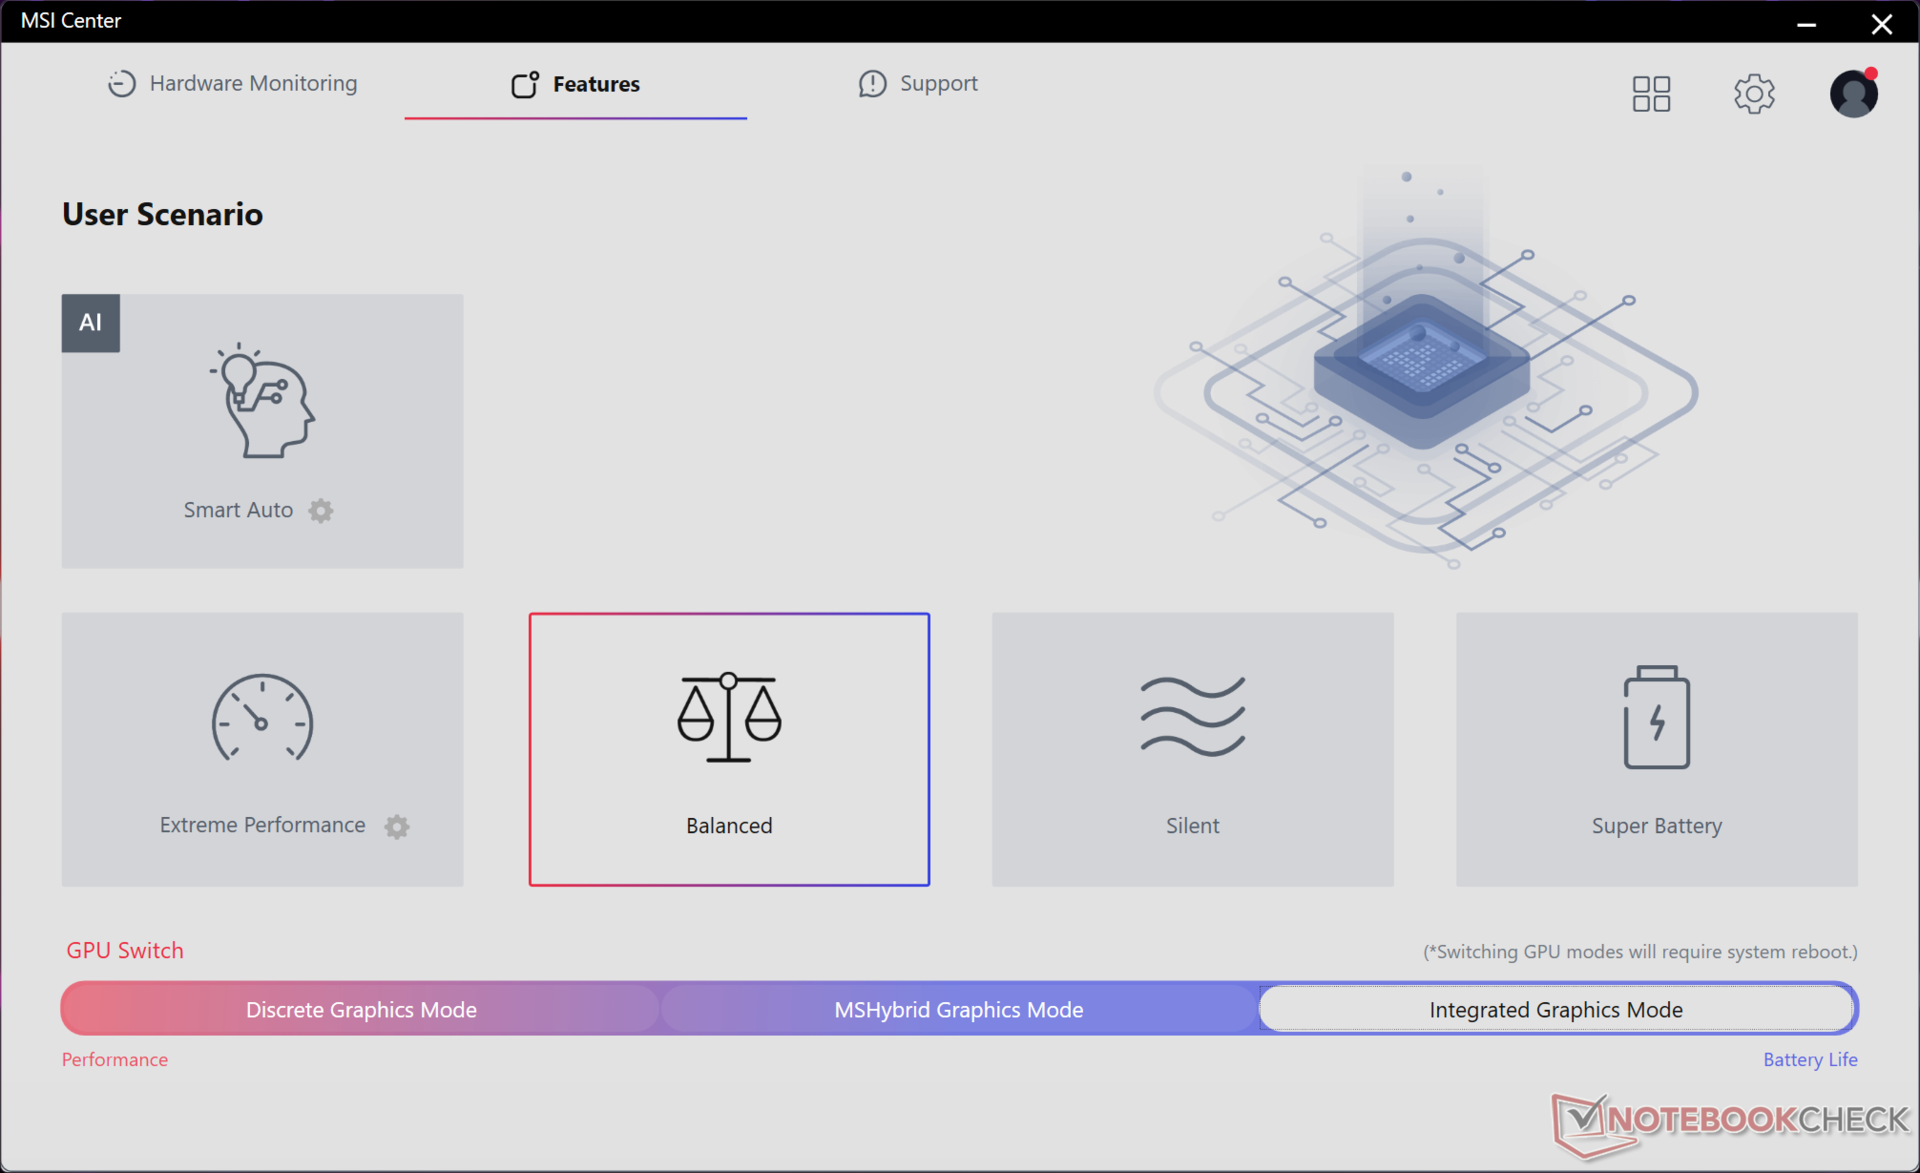
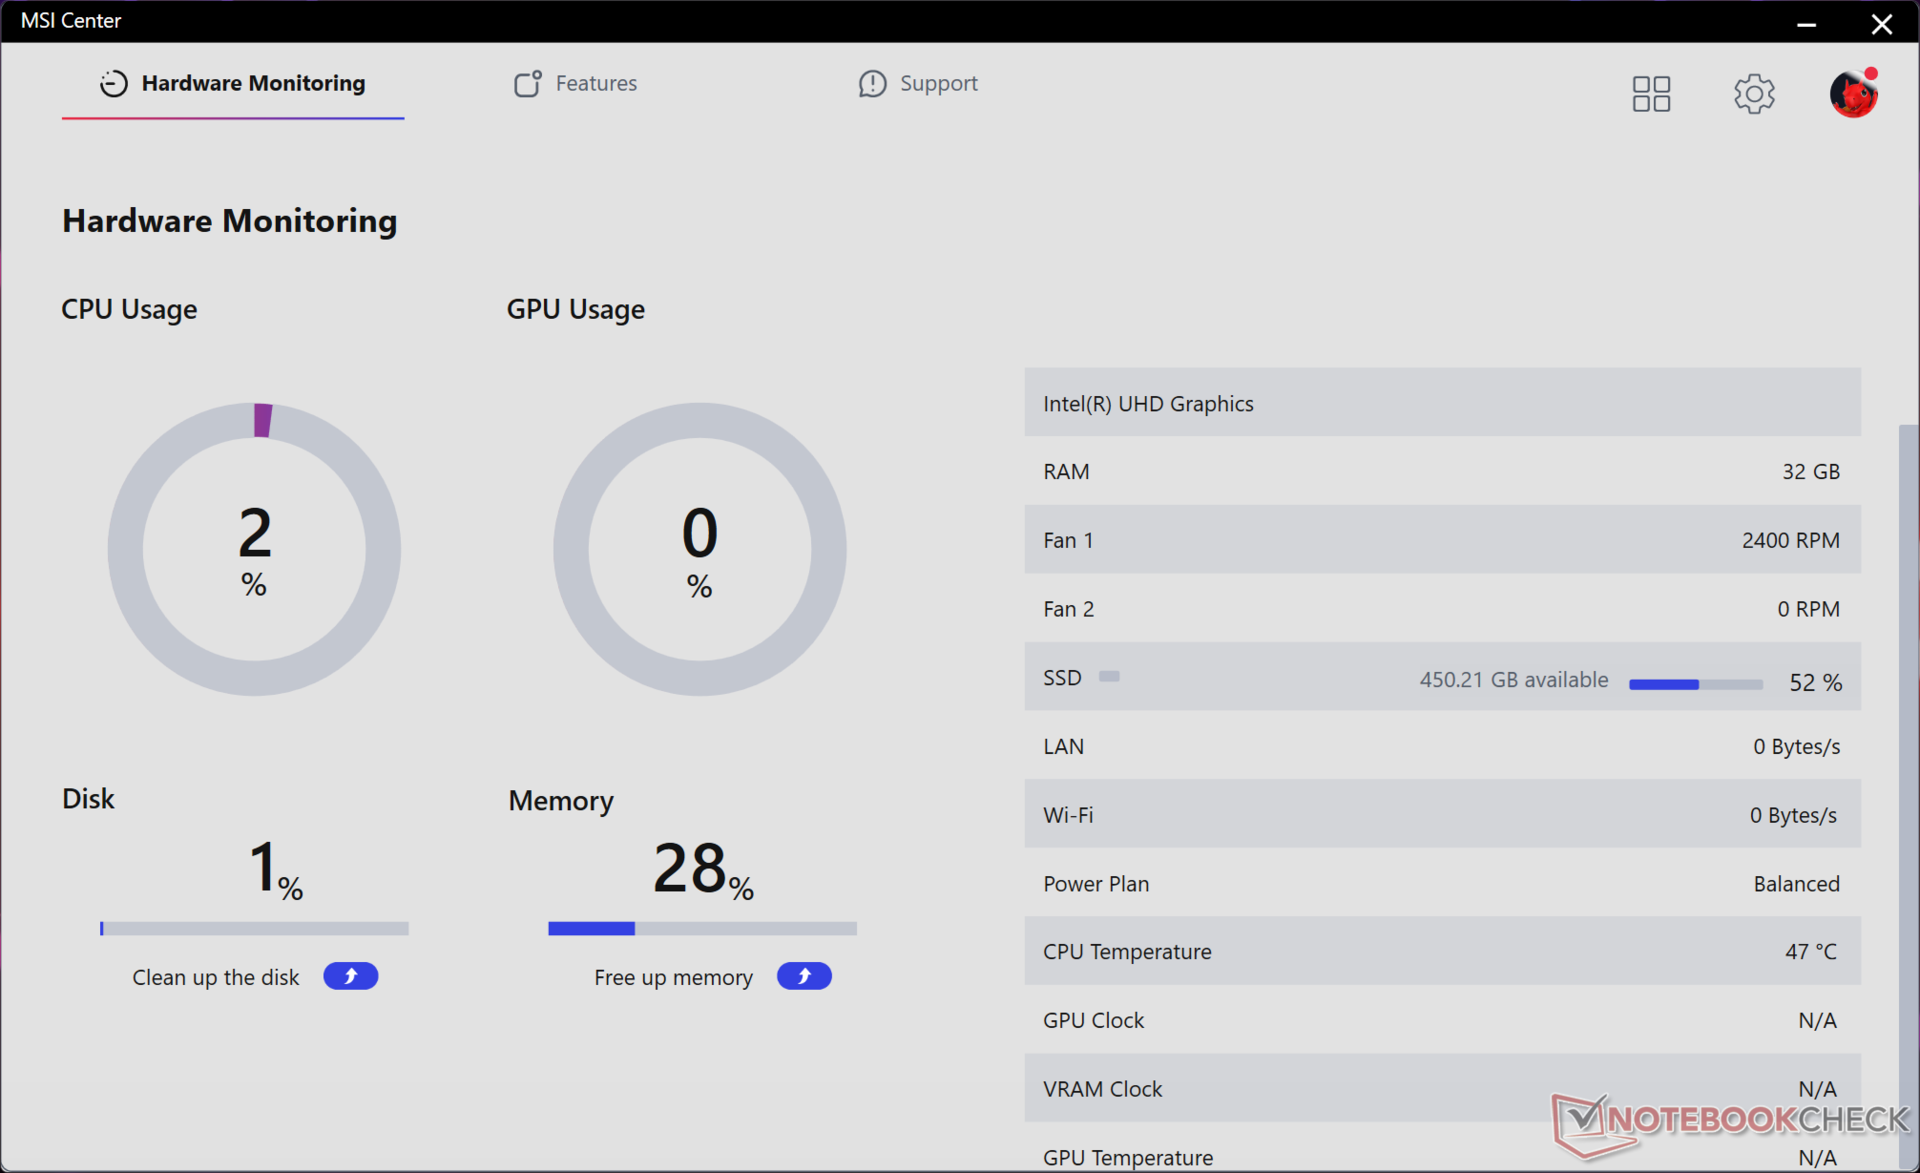
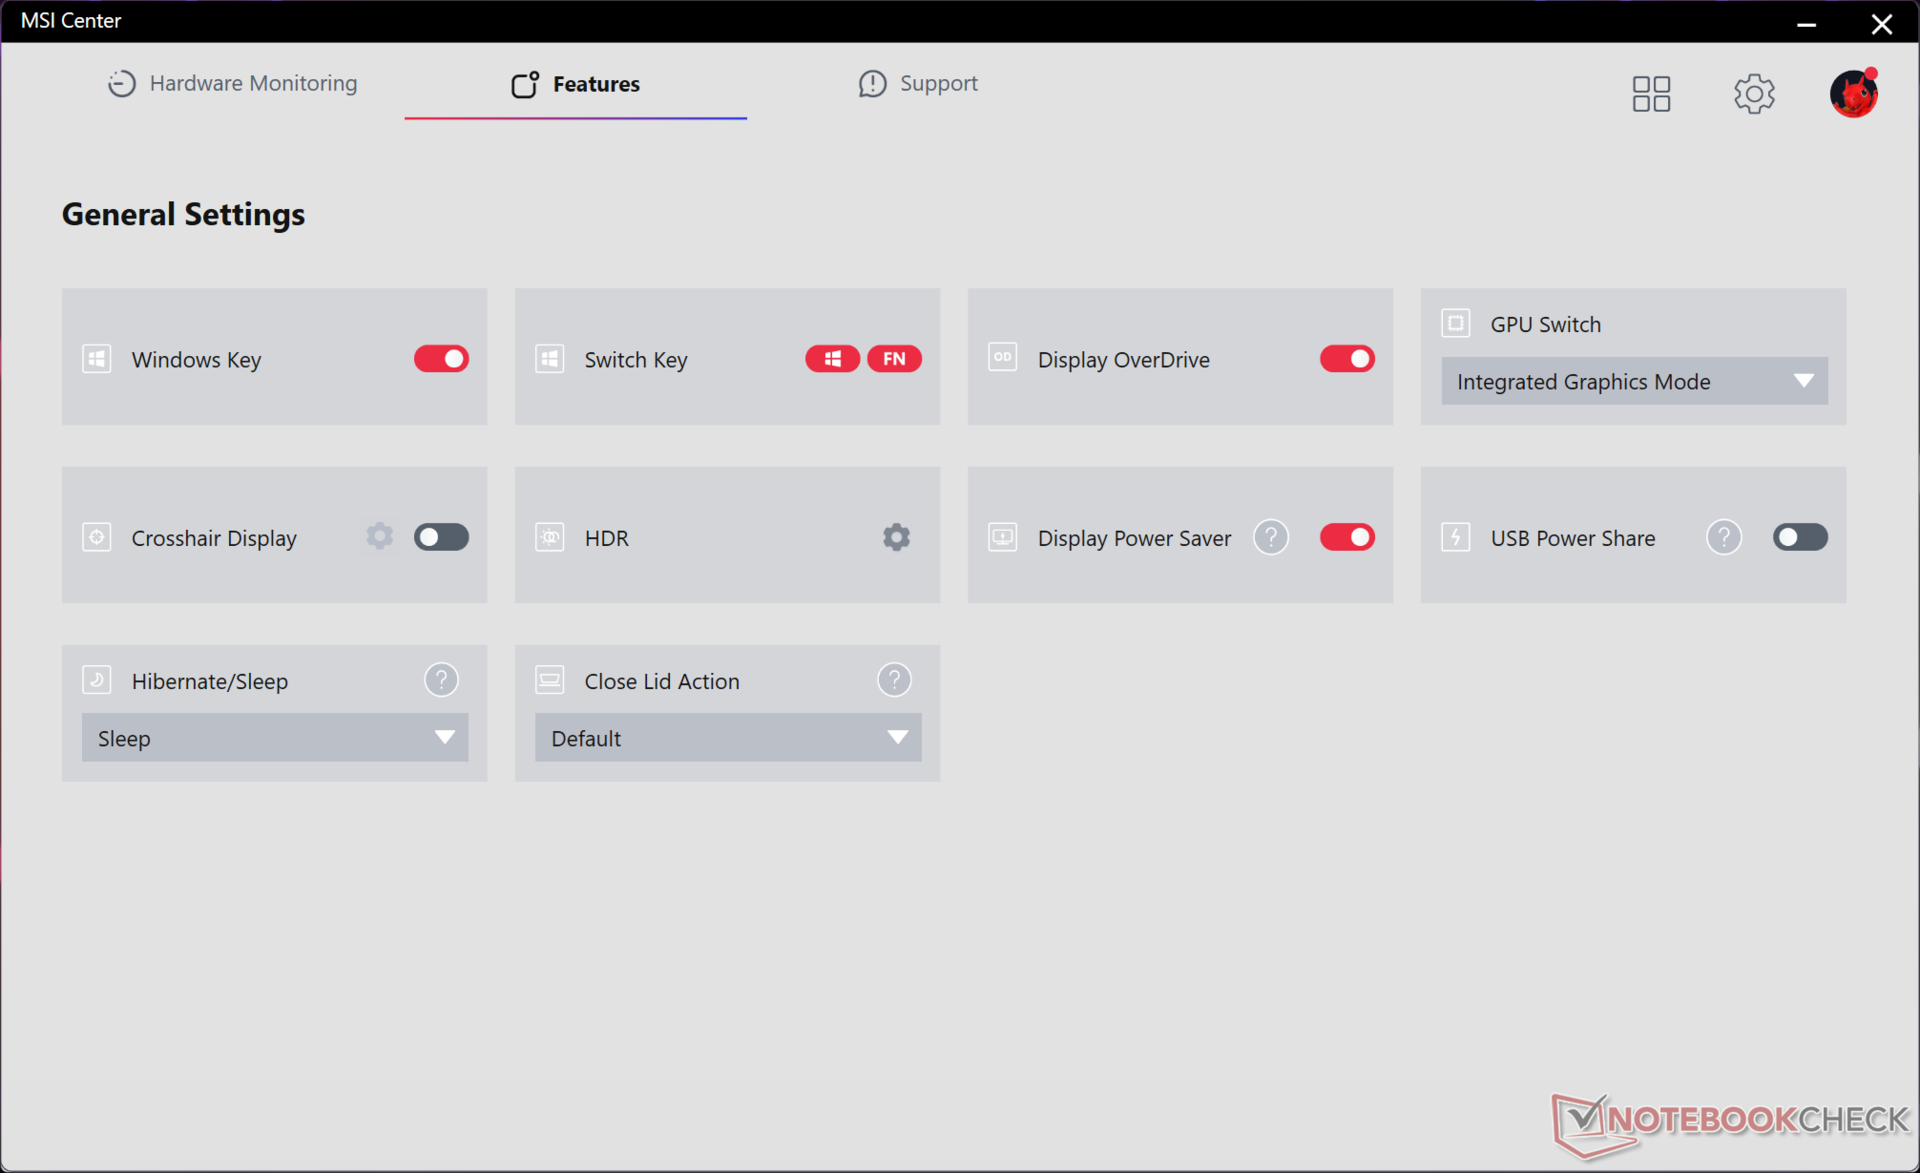
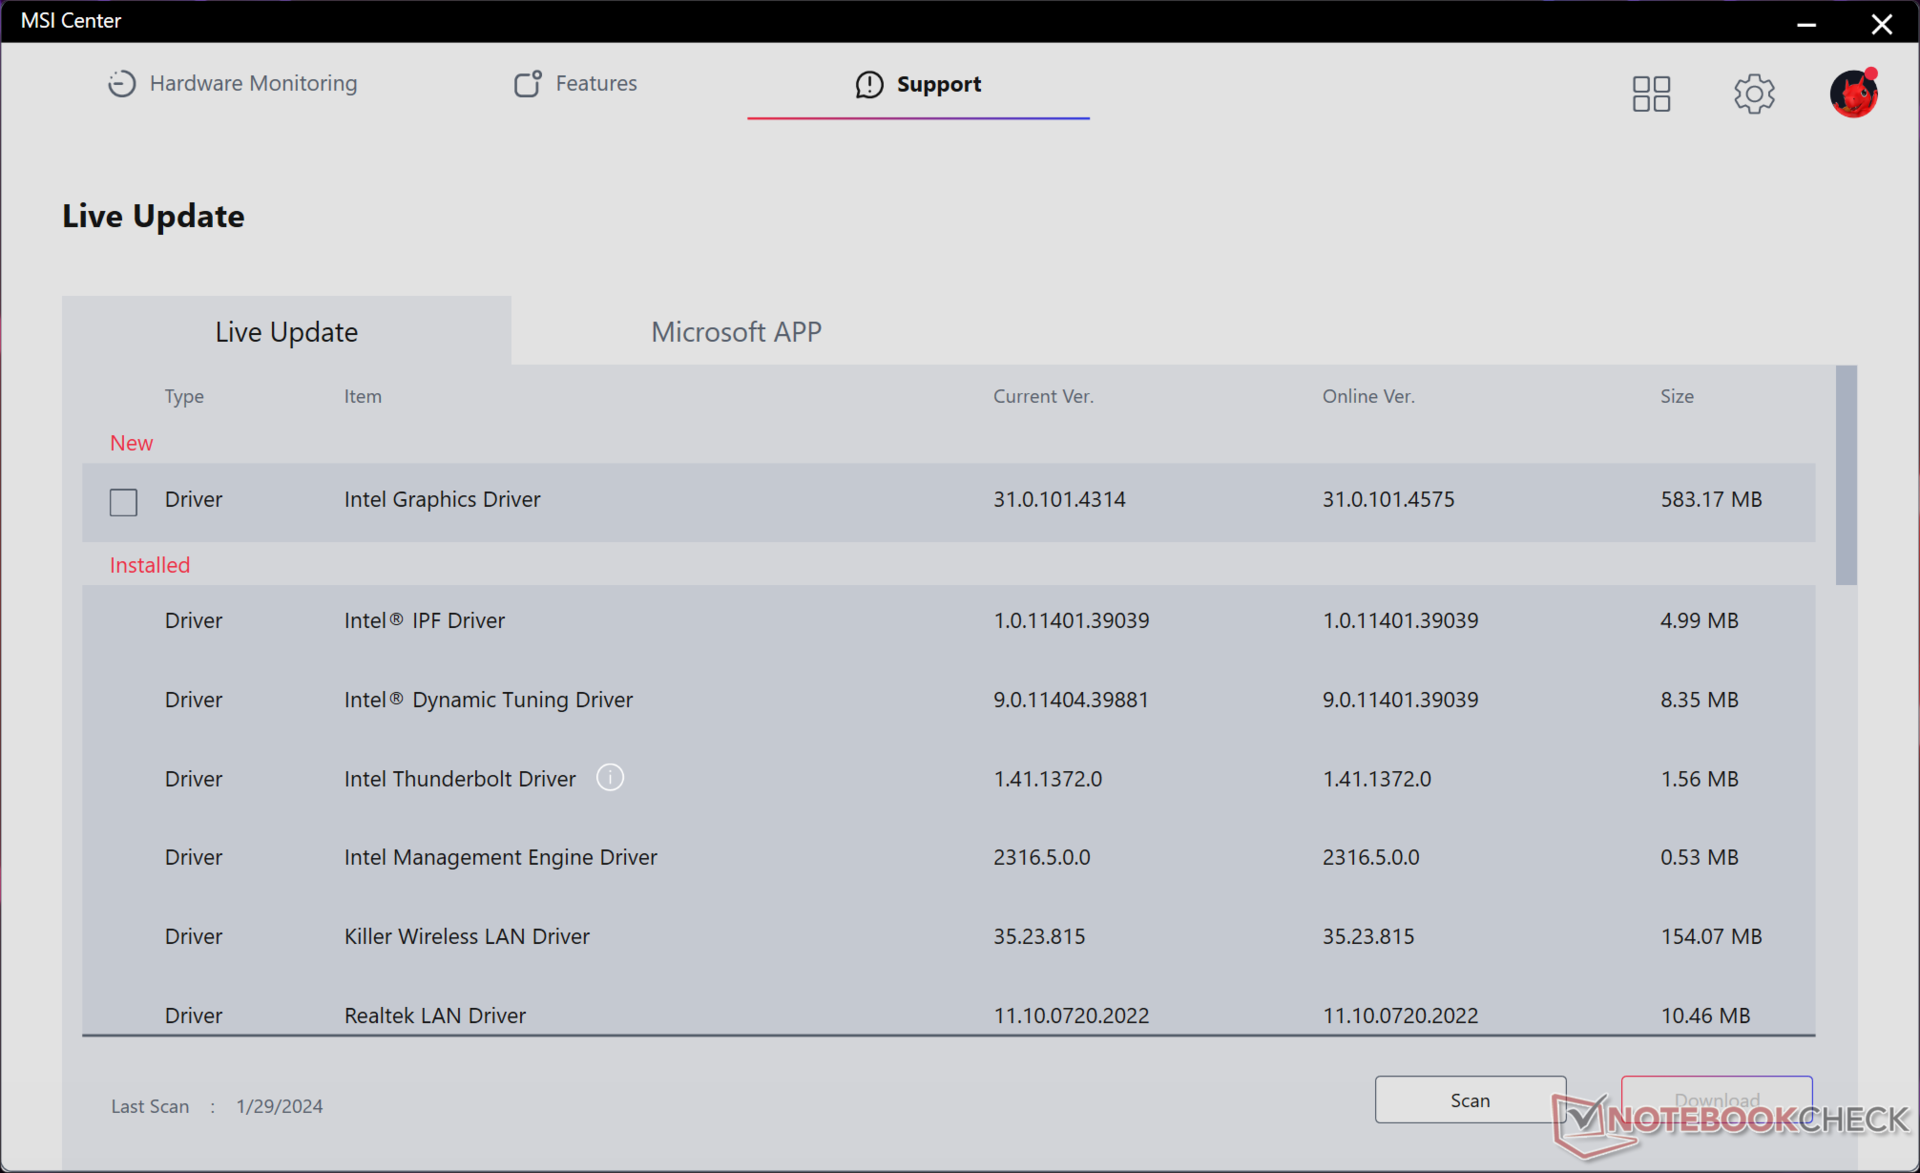
在运行以下基准测试之前,我们将设备设置为 dGPU 模式和激活 Cooler Boost 的极致性能模式。用户应该熟悉预装的微星中心软件,因为它是系统更新、系统状态、切换功能、调整 MUX 设置和电源配置文件的中心。在 dGPU 和 iGPU 模式之间切换需要重新启动,这比普通的冷启动耗时更长。
处理器
与我们在 Titan 18 HX 上发现的情况一样,我们发现 酷睿 i9-14900HX只是比上一代 酷睿 i9-13980HX最多提升 10%。因此,其同比优势只是微不足道,尤其是因为第 14 代 Raptor Lake-HX 更新系列缺少第 14 代 Meteor Lake 系列的全新专用 NPU。当然,酷睿 i9-13980HX 是 2023 年最快的移动 CPU 之一,因此酷睿 i9-14900HX 也绝对不逊色。从第 12 代或更早的英特尔游戏笔记本电脑升级而来的用户应该仍能看到性能的显著提升。
Cinebench R15 Multi Loop
Cinebench R23: Multi Core | Single Core
Cinebench R20: CPU (Multi Core) | CPU (Single Core)
Cinebench R15: CPU Multi 64Bit | CPU Single 64Bit
Blender: v2.79 BMW27 CPU
7-Zip 18.03: 7z b 4 | 7z b 4 -mmt1
Geekbench 6.7: Multi-Core | Single-Core
Geekbench 5.5: Multi-Core | Single-Core
HWBOT x265 Benchmark v2.2: 4k Preset
LibreOffice : 20 Documents To PDF
R Benchmark 2.5: Overall mean
| CPU Performance rating | |
| MSI Vector 16 HX A14V | |
| Asus Zephyrus Duo 16 GX650PY-NM006W -2! | |
| Average Intel Core i9-14900HX | |
| Alienware m16 R1 AMD | |
| Lenovo Legion 5 16IRX G9 | |
| Alienware m16 R1 Intel | |
| Lenovo Legion Pro 5 16ARX8 -2! | |
| Asus TUF Gaming A16 FA617XS -2! | |
| MSI Vector GP66 12UGS -2! | |
| Lenovo Legion Slim 7 16APH8 | |
| Lenovo LOQ 16IRH8 | |
| Dell G16 7620 -2! | |
| HP Victus 16-r0077ng | |
| Geekbench 6.7 / Multi-Core | |
| MSI Vector 16 HX A14V | |
| Average Intel Core i9-14900HX (13158 - 19665, n=37) | |
| Lenovo Legion 5 16IRX G9 | |
| Alienware m16 R1 Intel | |
| Lenovo LOQ 16IRH8 | |
| Lenovo Legion Slim 7 16APH8 | |
| Alienware m16 R1 AMD | |
| HP Victus 16-r0077ng | |
| Geekbench 6.7 / Single-Core | |
| MSI Vector 16 HX A14V | |
| Average Intel Core i9-14900HX (2419 - 3129, n=37) | |
| Lenovo Legion 5 16IRX G9 | |
| Alienware m16 R1 AMD | |
| Alienware m16 R1 Intel | |
| Lenovo Legion Slim 7 16APH8 | |
| Lenovo LOQ 16IRH8 | |
| HP Victus 16-r0077ng | |
Cinebench R23: Multi Core | Single Core
Cinebench R20: CPU (Multi Core) | CPU (Single Core)
Cinebench R15: CPU Multi 64Bit | CPU Single 64Bit
Blender: v2.79 BMW27 CPU
7-Zip 18.03: 7z b 4 | 7z b 4 -mmt1
Geekbench 6.7: Multi-Core | Single-Core
Geekbench 5.5: Multi-Core | Single-Core
HWBOT x265 Benchmark v2.2: 4k Preset
LibreOffice : 20 Documents To PDF
R Benchmark 2.5: Overall mean
* ... smaller is better
AIDA64: FP32 Ray-Trace | FPU Julia | CPU SHA3 | CPU Queen | FPU SinJulia | FPU Mandel | CPU AES | CPU ZLib | FP64 Ray-Trace | CPU PhotoWorxx
| Performance rating | |
| MSI Vector 16 HX A14V | |
| Average Intel Core i9-14900HX | |
| Asus TUF Gaming A16 FA617XS | |
| Lenovo Legion 5 16IRX G9 | |
| Dell G16 7620 | |
| HP Victus 16-r0077ng | |
| MSI Vector GP66 12UGS | |
| AIDA64 / FP32 Ray-Trace | |
| MSI Vector 16 HX A14V | |
| Asus TUF Gaming A16 FA617XS | |
| Average Intel Core i9-14900HX (13098 - 33474, n=36) | |
| Lenovo Legion 5 16IRX G9 | |
| Dell G16 7620 | |
| HP Victus 16-r0077ng | |
| MSI Vector GP66 12UGS | |
| AIDA64 / FPU Julia | |
| MSI Vector 16 HX A14V | |
| Average Intel Core i9-14900HX (67573 - 166040, n=36) | |
| Asus TUF Gaming A16 FA617XS | |
| Lenovo Legion 5 16IRX G9 | |
| Dell G16 7620 | |
| HP Victus 16-r0077ng | |
| MSI Vector GP66 12UGS | |
| AIDA64 / CPU SHA3 | |
| MSI Vector 16 HX A14V | |
| Average Intel Core i9-14900HX (3589 - 7979, n=36) | |
| Asus TUF Gaming A16 FA617XS | |
| Lenovo Legion 5 16IRX G9 | |
| Dell G16 7620 | |
| HP Victus 16-r0077ng | |
| MSI Vector GP66 12UGS | |
| AIDA64 / CPU Queen | |
| MSI Vector 16 HX A14V | |
| Average Intel Core i9-14900HX (118405 - 148966, n=36) | |
| Asus TUF Gaming A16 FA617XS | |
| MSI Vector GP66 12UGS | |
| Dell G16 7620 | |
| Lenovo Legion 5 16IRX G9 | |
| HP Victus 16-r0077ng | |
| AIDA64 / FPU SinJulia | |
| MSI Vector 16 HX A14V | |
| Asus TUF Gaming A16 FA617XS | |
| Average Intel Core i9-14900HX (10475 - 18517, n=36) | |
| Lenovo Legion 5 16IRX G9 | |
| Dell G16 7620 | |
| MSI Vector GP66 12UGS | |
| HP Victus 16-r0077ng | |
| AIDA64 / FPU Mandel | |
| MSI Vector 16 HX A14V | |
| Asus TUF Gaming A16 FA617XS | |
| Average Intel Core i9-14900HX (32543 - 83662, n=36) | |
| Lenovo Legion 5 16IRX G9 | |
| HP Victus 16-r0077ng | |
| Dell G16 7620 | |
| MSI Vector GP66 12UGS | |
| AIDA64 / CPU AES | |
| Average Intel Core i9-14900HX (86964 - 241777, n=36) | |
| MSI Vector 16 HX A14V | |
| MSI Vector GP66 12UGS | |
| Lenovo Legion 5 16IRX G9 | |
| Asus TUF Gaming A16 FA617XS | |
| Dell G16 7620 | |
| HP Victus 16-r0077ng | |
| AIDA64 / CPU ZLib | |
| MSI Vector 16 HX A14V | |
| Average Intel Core i9-14900HX (1054 - 2292, n=36) | |
| Lenovo Legion 5 16IRX G9 | |
| Asus TUF Gaming A16 FA617XS | |
| MSI Vector GP66 12UGS | |
| Dell G16 7620 | |
| HP Victus 16-r0077ng | |
| AIDA64 / FP64 Ray-Trace | |
| MSI Vector 16 HX A14V | |
| Asus TUF Gaming A16 FA617XS | |
| Average Intel Core i9-14900HX (6809 - 18349, n=36) | |
| Lenovo Legion 5 16IRX G9 | |
| Dell G16 7620 | |
| HP Victus 16-r0077ng | |
| MSI Vector GP66 12UGS | |
| AIDA64 / CPU PhotoWorxx | |
| MSI Vector 16 HX A14V | |
| Average Intel Core i9-14900HX (23903 - 54702, n=36) | |
| HP Victus 16-r0077ng | |
| Dell G16 7620 | |
| Lenovo Legion 5 16IRX G9 | |
| Asus TUF Gaming A16 FA617XS | |
| MSI Vector GP66 12UGS | |
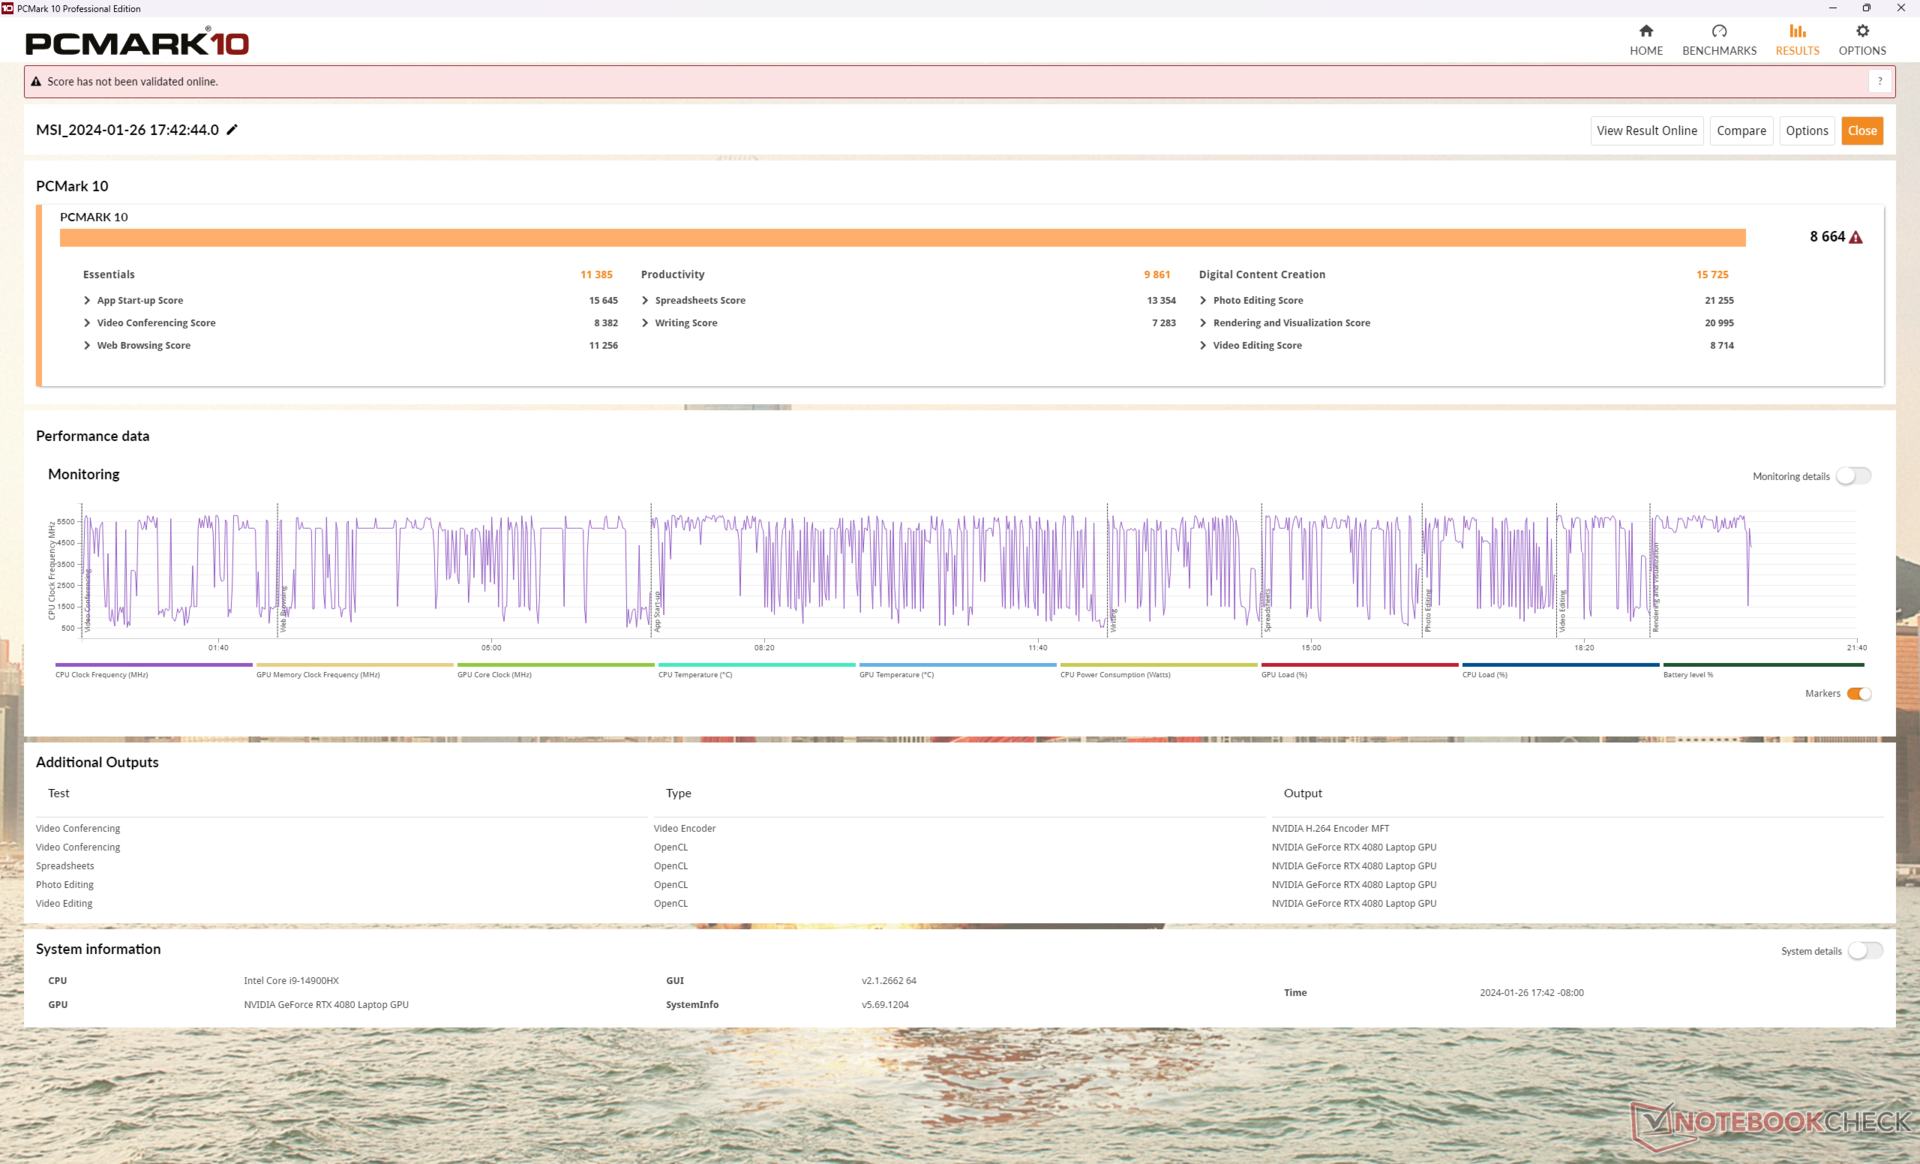
系统性能
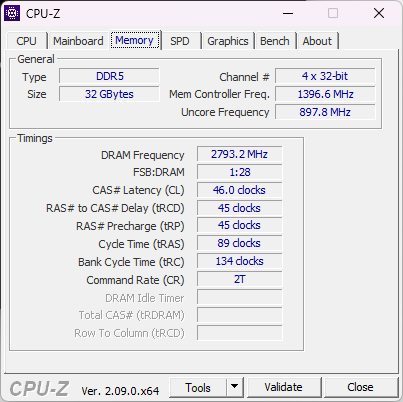
由于采用了全新的第 14 代 CPU 和全功率 175 WGeForce RTX 4080 GPU,PCMark 的成绩在中高档游戏笔记本电脑中名列前茅。内存性能也比预期的要快,读写速度比老款 Vector GP66 设计快了约 70%。
CrossMark: Overall | Productivity | Creativity | Responsiveness
WebXPRT 3: Overall
WebXPRT 4: Overall
Mozilla Kraken 1.1: Total
| PCMark 10 / Score | |
| Average Intel Core i9-14900HX, NVIDIA GeForce RTX 4080 Laptop GPU (7703 - 9223, n=7) | |
| MSI Vector 16 HX A14V | |
| MSI Vector GP66 12UGS | |
| Asus TUF Gaming A16 FA617XS | |
| Lenovo Legion 5 16IRX G9 | |
| Dell G16 7620 | |
| HP Victus 16-r0077ng | |
| PCMark 10 / Essentials | |
| Average Intel Core i9-14900HX, NVIDIA GeForce RTX 4080 Laptop GPU (11255 - 12600, n=7) | |
| MSI Vector 16 HX A14V | |
| MSI Vector GP66 12UGS | |
| Asus TUF Gaming A16 FA617XS | |
| Lenovo Legion 5 16IRX G9 | |
| HP Victus 16-r0077ng | |
| Dell G16 7620 | |
| PCMark 10 / Productivity | |
| Asus TUF Gaming A16 FA617XS | |
| Average Intel Core i9-14900HX, NVIDIA GeForce RTX 4080 Laptop GPU (6662 - 11410, n=7) | |
| MSI Vector GP66 12UGS | |
| MSI Vector 16 HX A14V | |
| Lenovo Legion 5 16IRX G9 | |
| HP Victus 16-r0077ng | |
| Dell G16 7620 | |
| PCMark 10 / Digital Content Creation | |
| MSI Vector 16 HX A14V | |
| Average Intel Core i9-14900HX, NVIDIA GeForce RTX 4080 Laptop GPU (14211 - 16246, n=7) | |
| MSI Vector GP66 12UGS | |
| Lenovo Legion 5 16IRX G9 | |
| Asus TUF Gaming A16 FA617XS | |
| Dell G16 7620 | |
| HP Victus 16-r0077ng | |
| CrossMark / Overall | |
| MSI Vector 16 HX A14V | |
| Average Intel Core i9-14900HX, NVIDIA GeForce RTX 4080 Laptop GPU (1992 - 2334, n=7) | |
| Lenovo Legion 5 16IRX G9 | |
| Dell G16 7620 | |
| Asus TUF Gaming A16 FA617XS | |
| CrossMark / Productivity | |
| MSI Vector 16 HX A14V | |
| Average Intel Core i9-14900HX, NVIDIA GeForce RTX 4080 Laptop GPU (1812 - 2204, n=7) | |
| Lenovo Legion 5 16IRX G9 | |
| Asus TUF Gaming A16 FA617XS | |
| Dell G16 7620 | |
| CrossMark / Creativity | |
| MSI Vector 16 HX A14V | |
| Average Intel Core i9-14900HX, NVIDIA GeForce RTX 4080 Laptop GPU (2327 - 2500, n=7) | |
| Lenovo Legion 5 16IRX G9 | |
| Asus TUF Gaming A16 FA617XS | |
| Dell G16 7620 | |
| CrossMark / Responsiveness | |
| MSI Vector 16 HX A14V | |
| Average Intel Core i9-14900HX, NVIDIA GeForce RTX 4080 Laptop GPU (1520 - 2254, n=7) | |
| Lenovo Legion 5 16IRX G9 | |
| Dell G16 7620 | |
| Asus TUF Gaming A16 FA617XS | |
| WebXPRT 3 / Overall | |
| Average Intel Core i9-14900HX, NVIDIA GeForce RTX 4080 Laptop GPU (310 - 345, n=7) | |
| MSI Vector 16 HX A14V | |
| Lenovo Legion 5 16IRX G9 | |
| MSI Vector GP66 12UGS | |
| HP Victus 16-r0077ng | |
| HP Victus 16-r0077ng | |
| Dell G16 7620 | |
| WebXPRT 4 / Overall | |
| Average Intel Core i9-14900HX, NVIDIA GeForce RTX 4080 Laptop GPU (300 - 321, n=7) | |
| MSI Vector 16 HX A14V | |
| Lenovo Legion 5 16IRX G9 | |
| Asus TUF Gaming A16 FA617XS | |
| Dell G16 7620 | |
| HP Victus 16-r0077ng | |
| HP Victus 16-r0077ng | |
| Mozilla Kraken 1.1 / Total | |
| Dell G16 7620 | |
| HP Victus 16-r0077ng | |
| HP Victus 16-r0077ng | |
| MSI Vector GP66 12UGS | |
| Asus TUF Gaming A16 FA617XS | |
| Lenovo Legion 5 16IRX G9 | |
| MSI Vector 16 HX A14V | |
| Average Intel Core i9-14900HX, NVIDIA GeForce RTX 4080 Laptop GPU (437 - 446, n=7) | |
* ... smaller is better
| PCMark 10 Score | 8664 points | |
Help | ||
| AIDA64 / Memory Copy | |
| MSI Vector 16 HX A14V | |
| Average Intel Core i9-14900HX (38028 - 83392, n=36) | |
| HP Victus 16-r0077ng | |
| Lenovo Legion 5 16IRX G9 | |
| Asus TUF Gaming A16 FA617XS | |
| Dell G16 7620 | |
| MSI Vector GP66 12UGS | |
| AIDA64 / Memory Read | |
| MSI Vector 16 HX A14V | |
| Average Intel Core i9-14900HX (43306 - 87568, n=36) | |
| Lenovo Legion 5 16IRX G9 | |
| HP Victus 16-r0077ng | |
| Dell G16 7620 | |
| Asus TUF Gaming A16 FA617XS | |
| MSI Vector GP66 12UGS | |
| AIDA64 / Memory Write | |
| MSI Vector 16 HX A14V | |
| Asus TUF Gaming A16 FA617XS | |
| Average Intel Core i9-14900HX (37146 - 80589, n=36) | |
| HP Victus 16-r0077ng | |
| Dell G16 7620 | |
| Lenovo Legion 5 16IRX G9 | |
| MSI Vector GP66 12UGS | |
| AIDA64 / Memory Latency | |
| Dell G16 7620 | |
| HP Victus 16-r0077ng | |
| MSI Vector GP66 12UGS | |
| Asus TUF Gaming A16 FA617XS | |
| Lenovo Legion 5 16IRX G9 | |
| Average Intel Core i9-14900HX (76.1 - 105, n=36) | |
| MSI Vector 16 HX A14V | |
* ... smaller is better
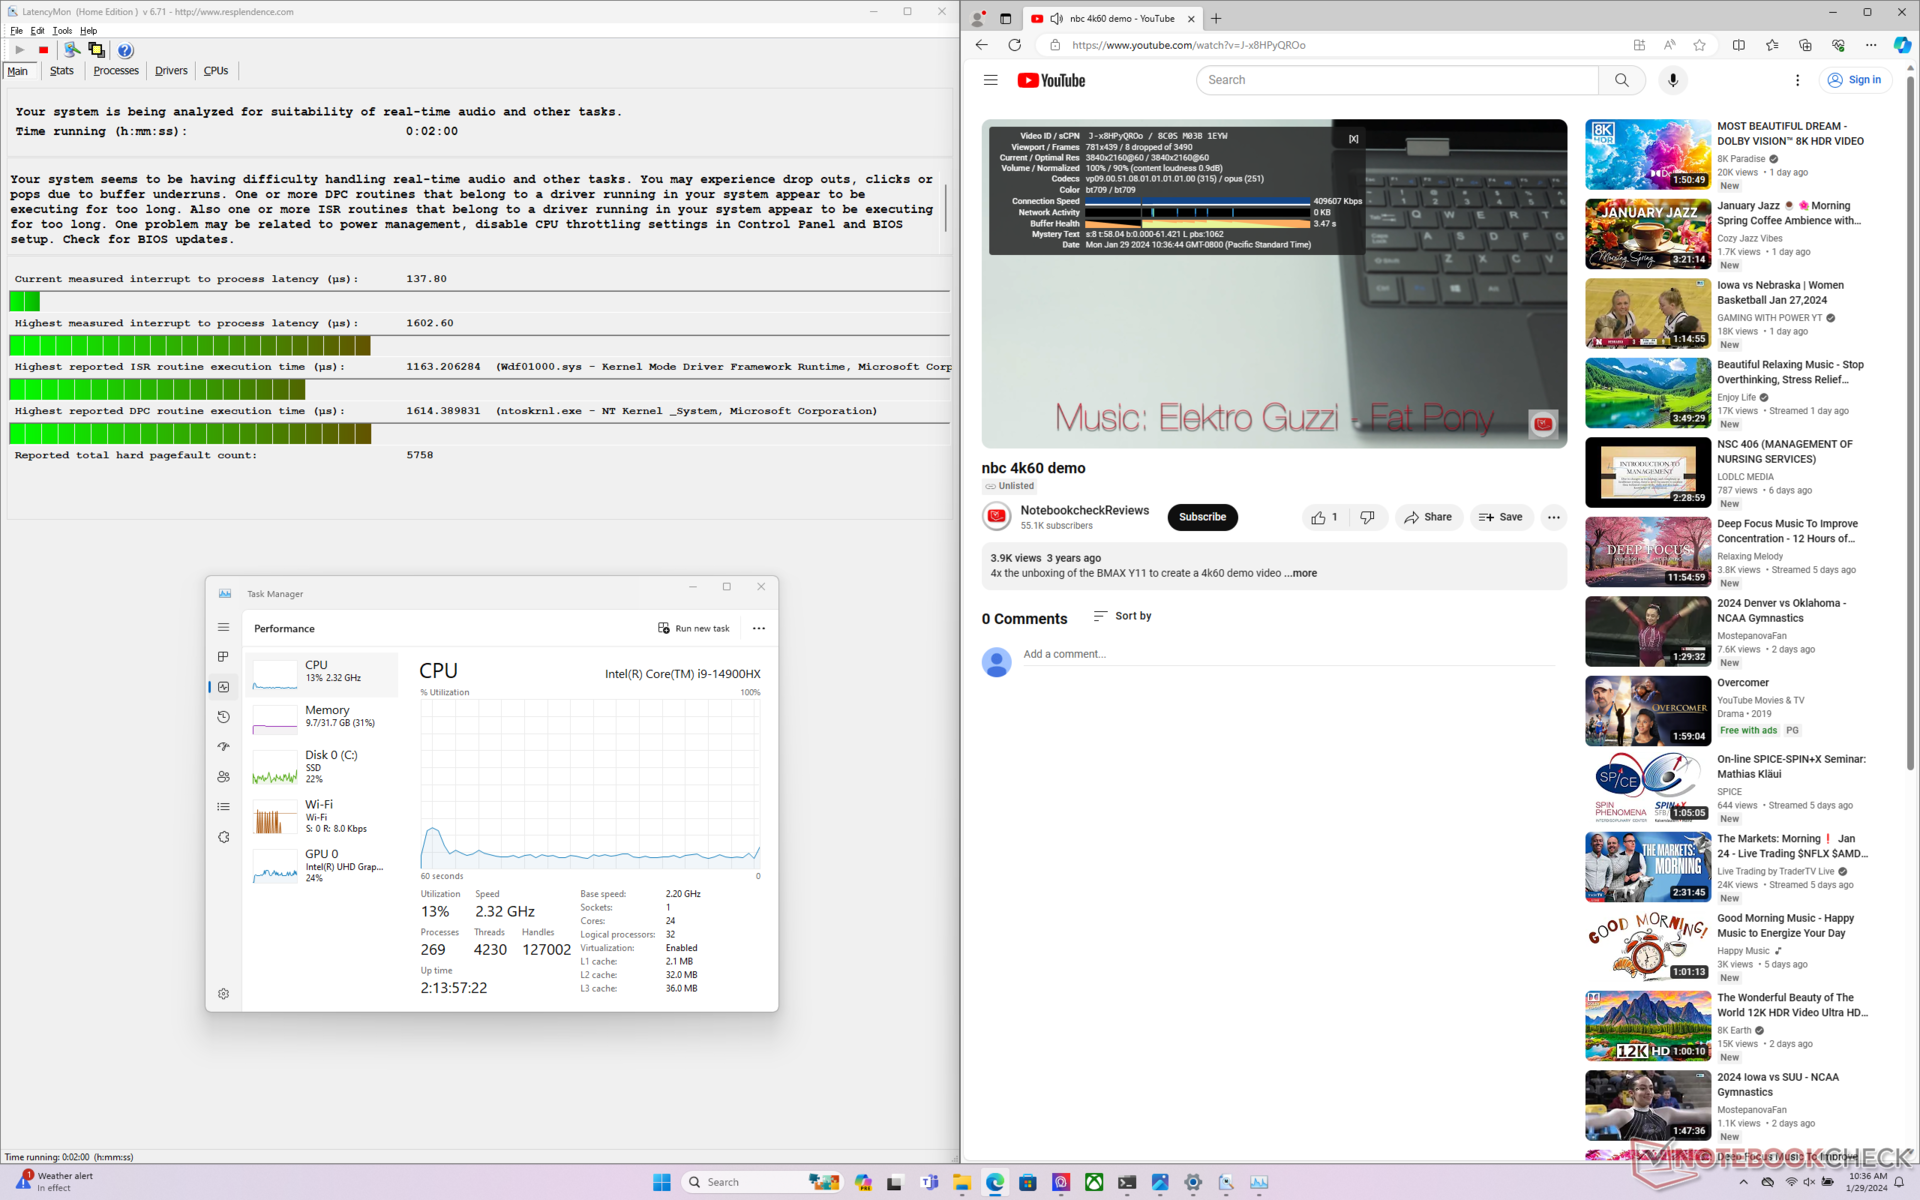
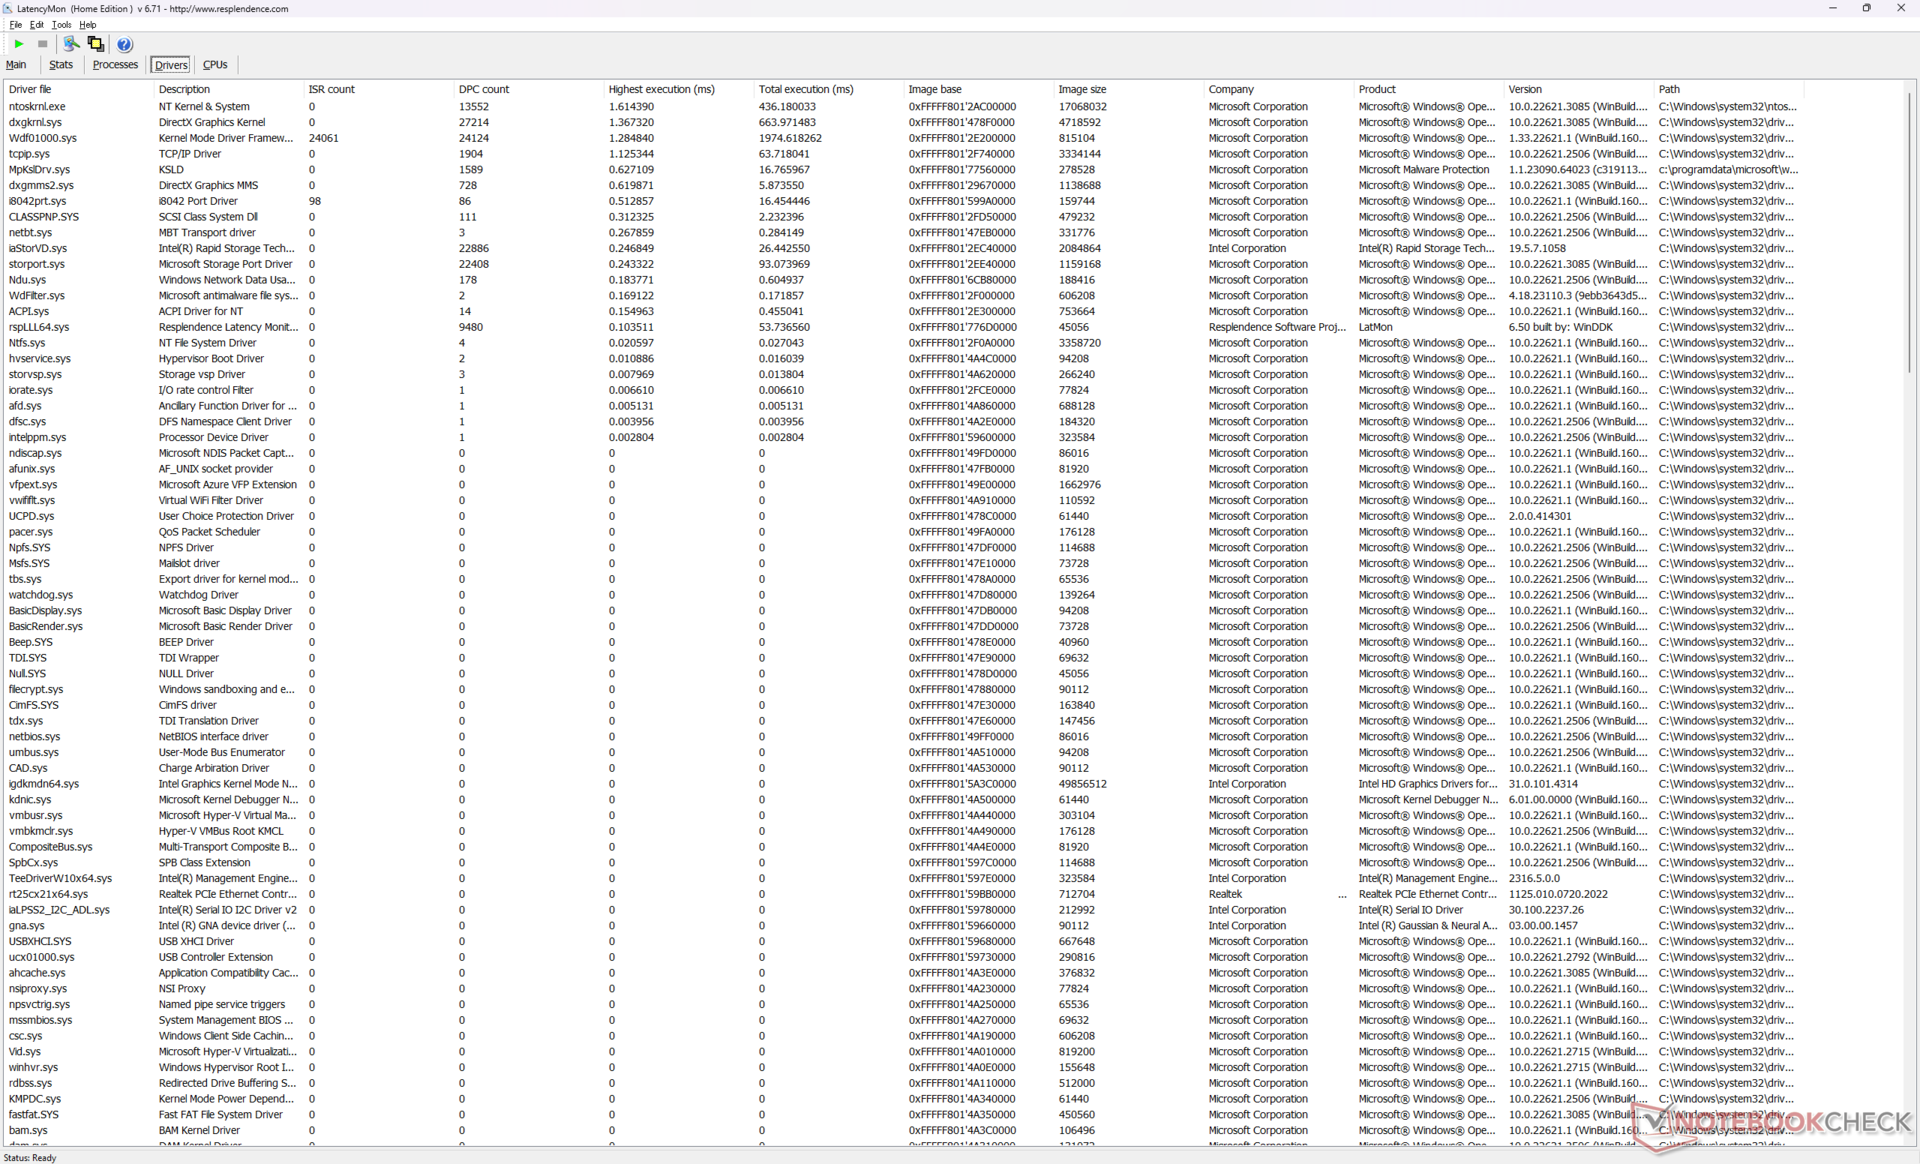
DPC 延迟
LatencyMon 显示,在打开主页的多个标签页时会出现 DPC 问题,在长达一分钟的 4K60 测试视频中会出现 8 次丢帧。掉帧现象几乎每隔一段时间就会出现一次,这表明问题与后台活动或底层驱动程序有关。
| DPC Latencies / LatencyMon - interrupt to process latency (max), Web, Youtube, Prime95 | |
| MSI Vector GP66 12UGS | |
| Lenovo Legion 5 16IRX G9 | |
| HP Victus 16-r0077ng | |
| MSI Vector 16 HX A14V | |
| Asus TUF Gaming A16 FA617XS | |
| Dell G16 7620 | |
* ... smaller is better
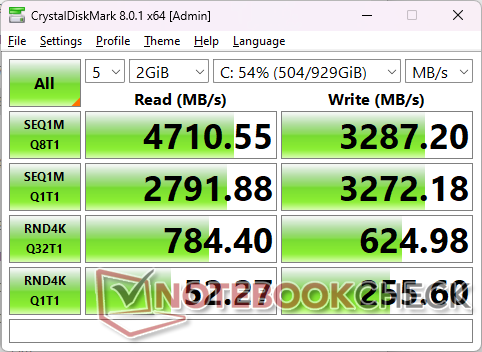
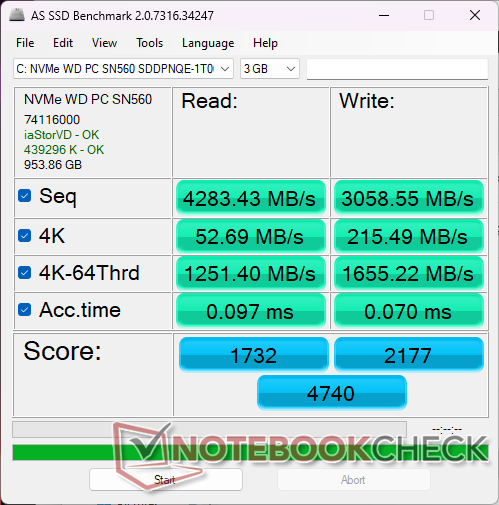
存储设备
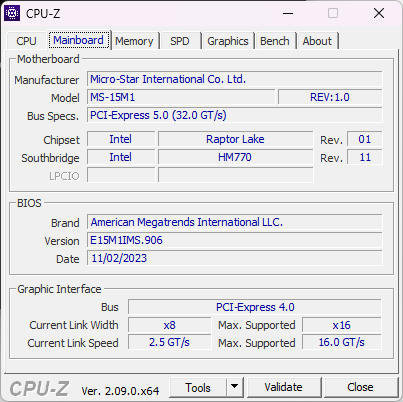
我们的测试设备配置了中端 1 TB 西部数据 PC SN560PCIe4 x4 NVMe 固态硬盘,即使在压力下也能获得 4900 MB/s 左右的稳定传输速率。该机型也支持 PCIe5 x4 固态硬盘,这与较大型的 Titan 18 HX 很相似,但 PCIe5 固态硬盘的可用性较低,这意味着目前市场上的绝大多数配置只能使用 PCIe4 硬盘。

| Drive Performance rating - Percent | |
| Lenovo Legion 5 16IRX G9 | |
| Dell G16 7620 | |
| MSI Vector GP66 12UGS | |
| HP Victus 16-r0077ng | |
| MSI Vector 16 HX A14V | |
| Asus TUF Gaming A16 FA617XS | |
* ... smaller is better
Disk Throttling: DiskSpd Read Loop, Queue Depth 8
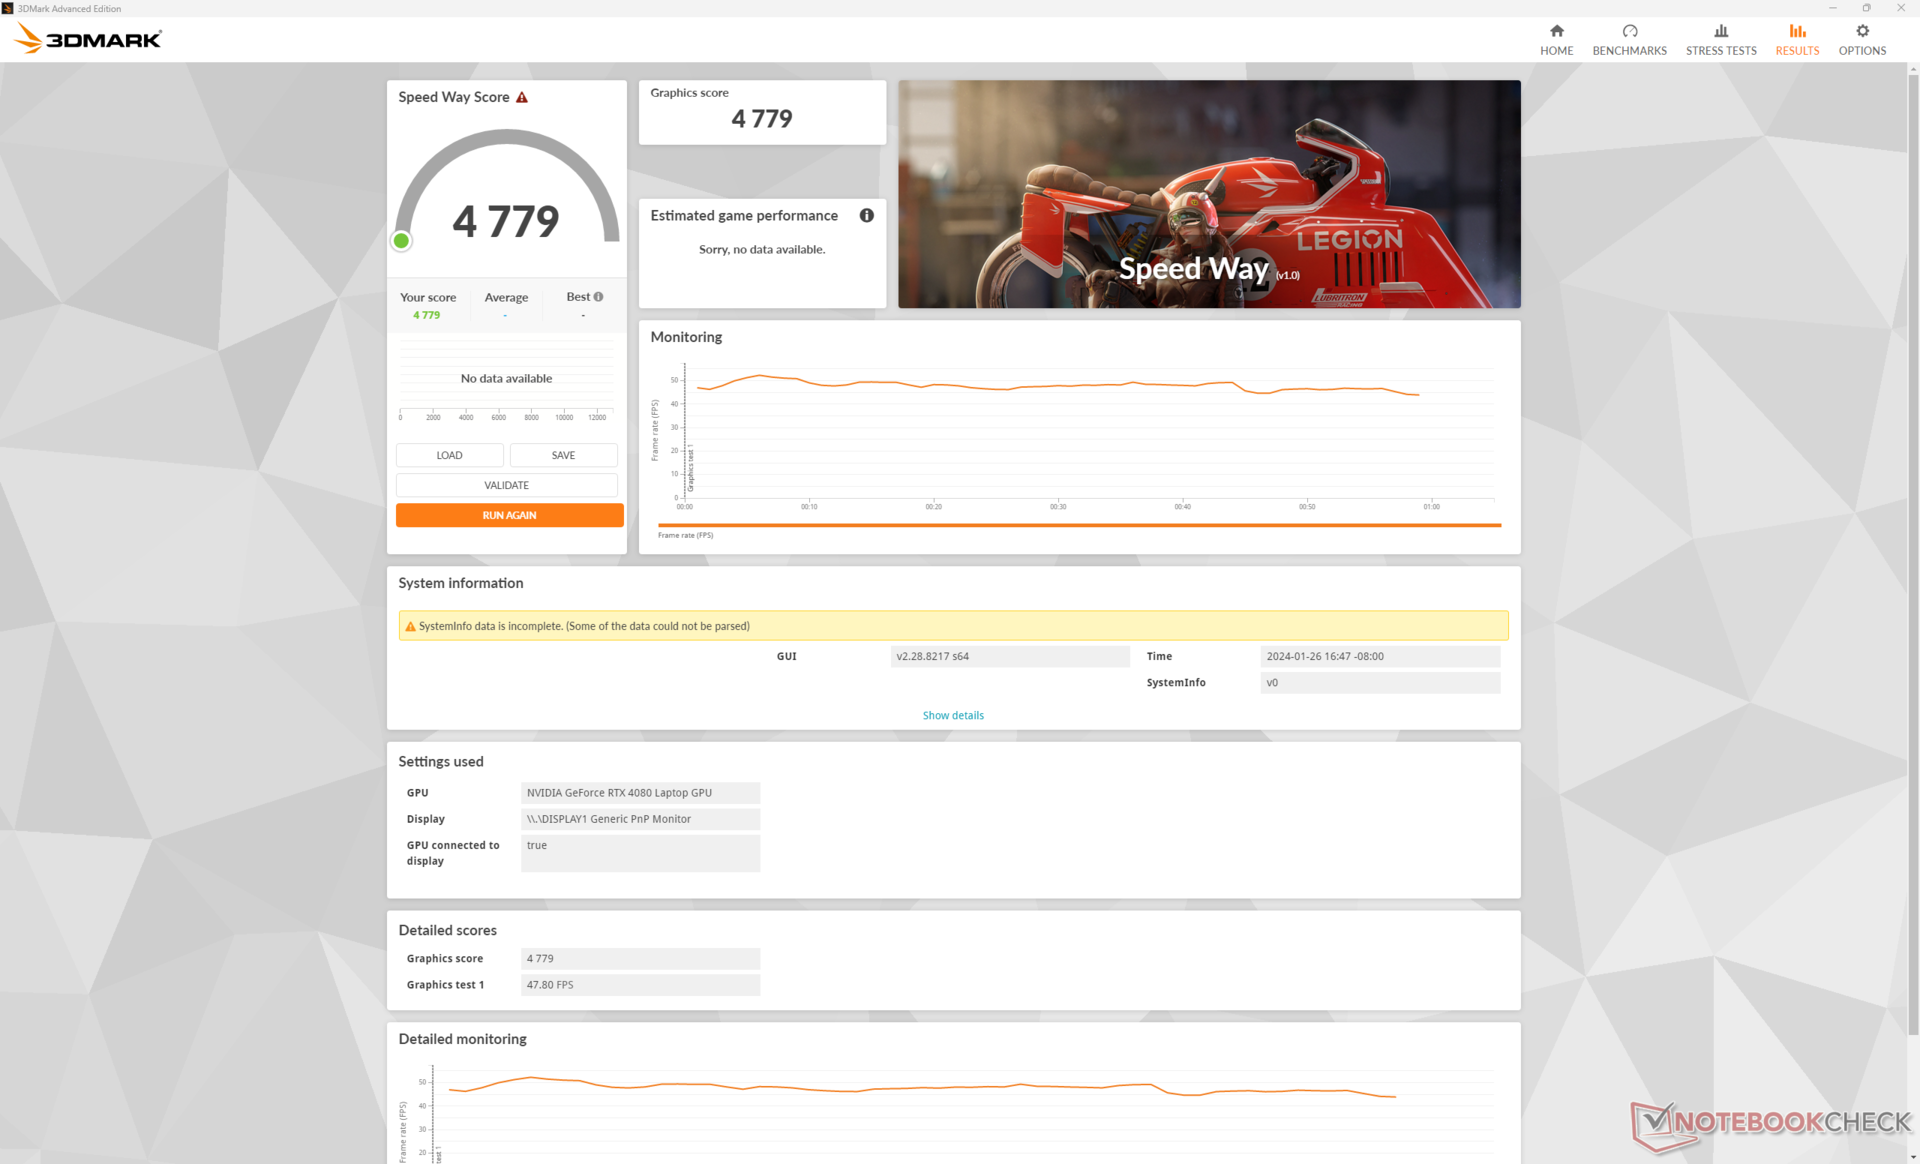
GPU 性能 - Vector 的闪光点
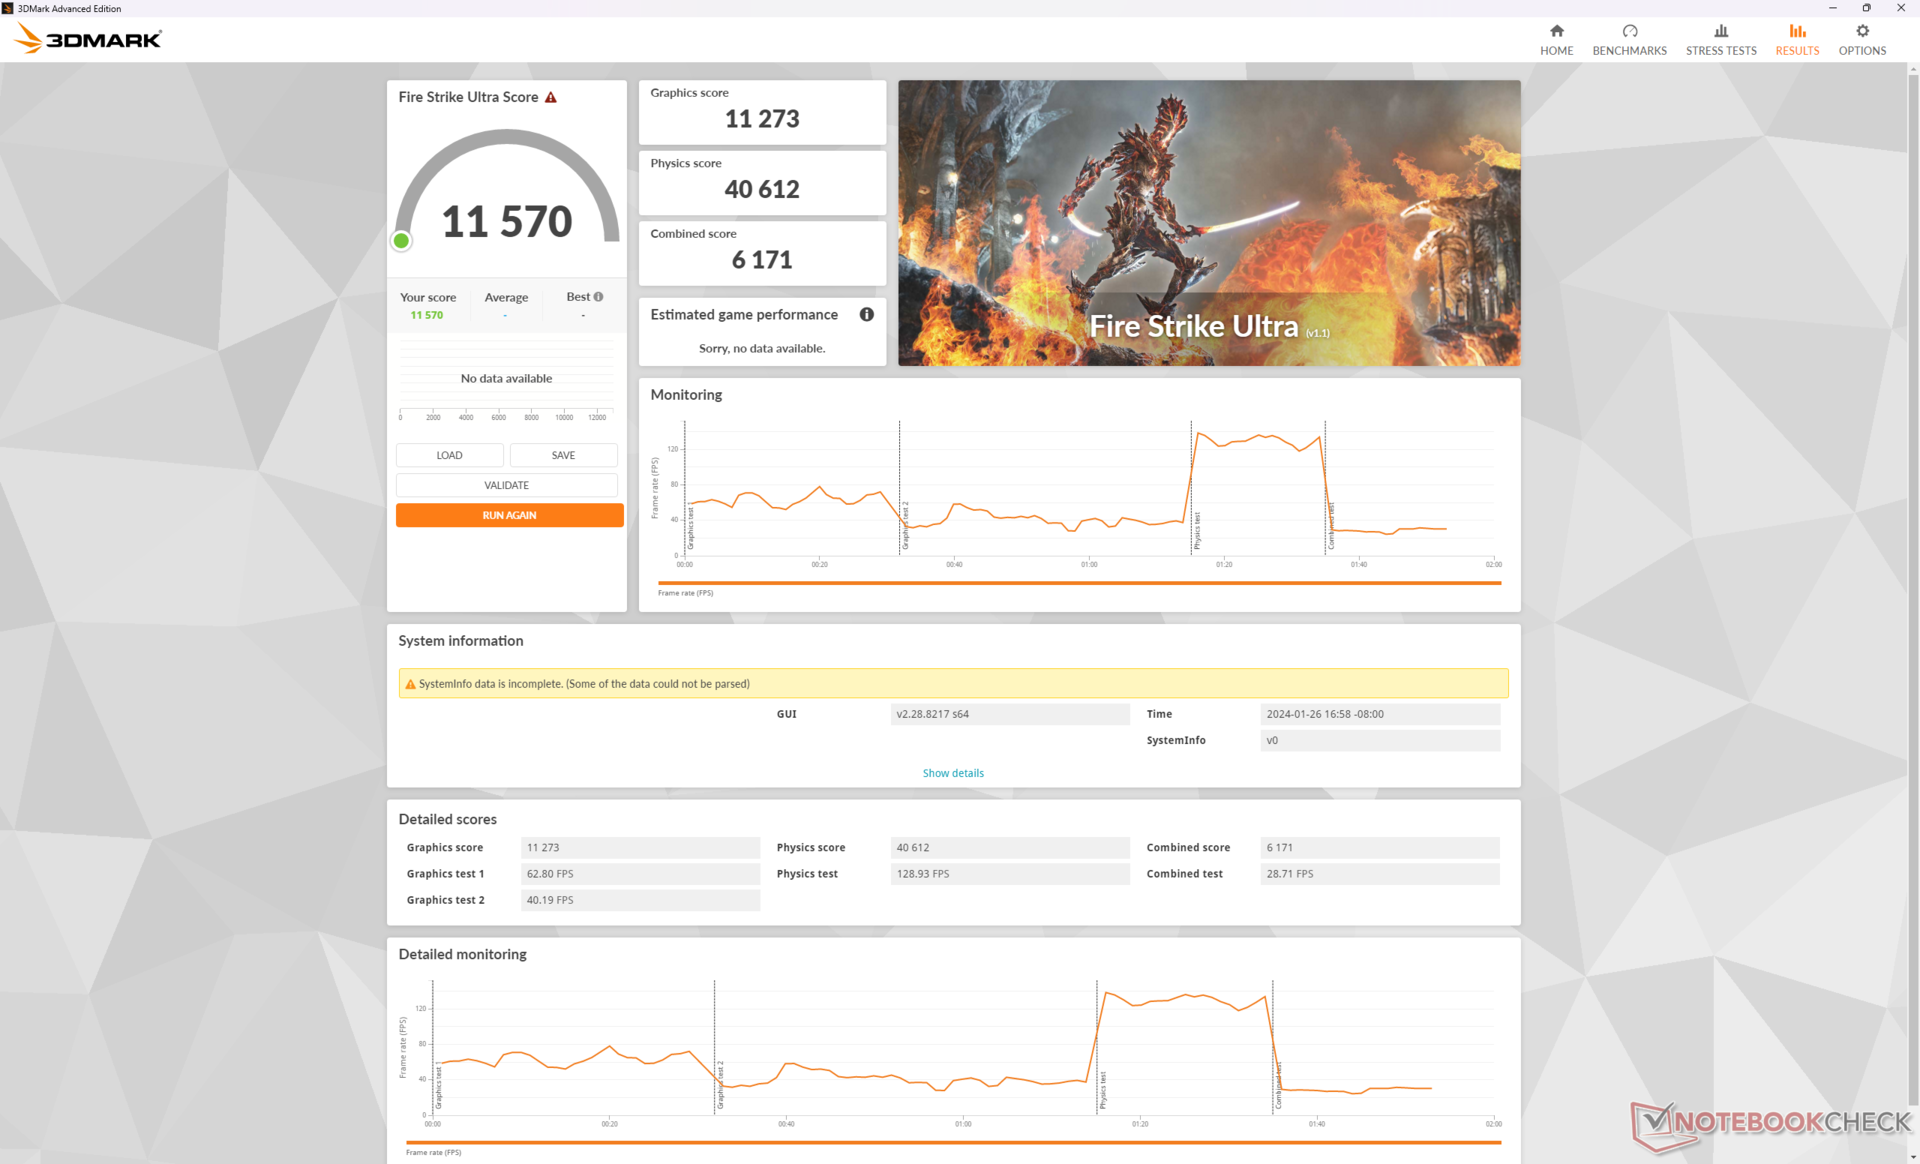
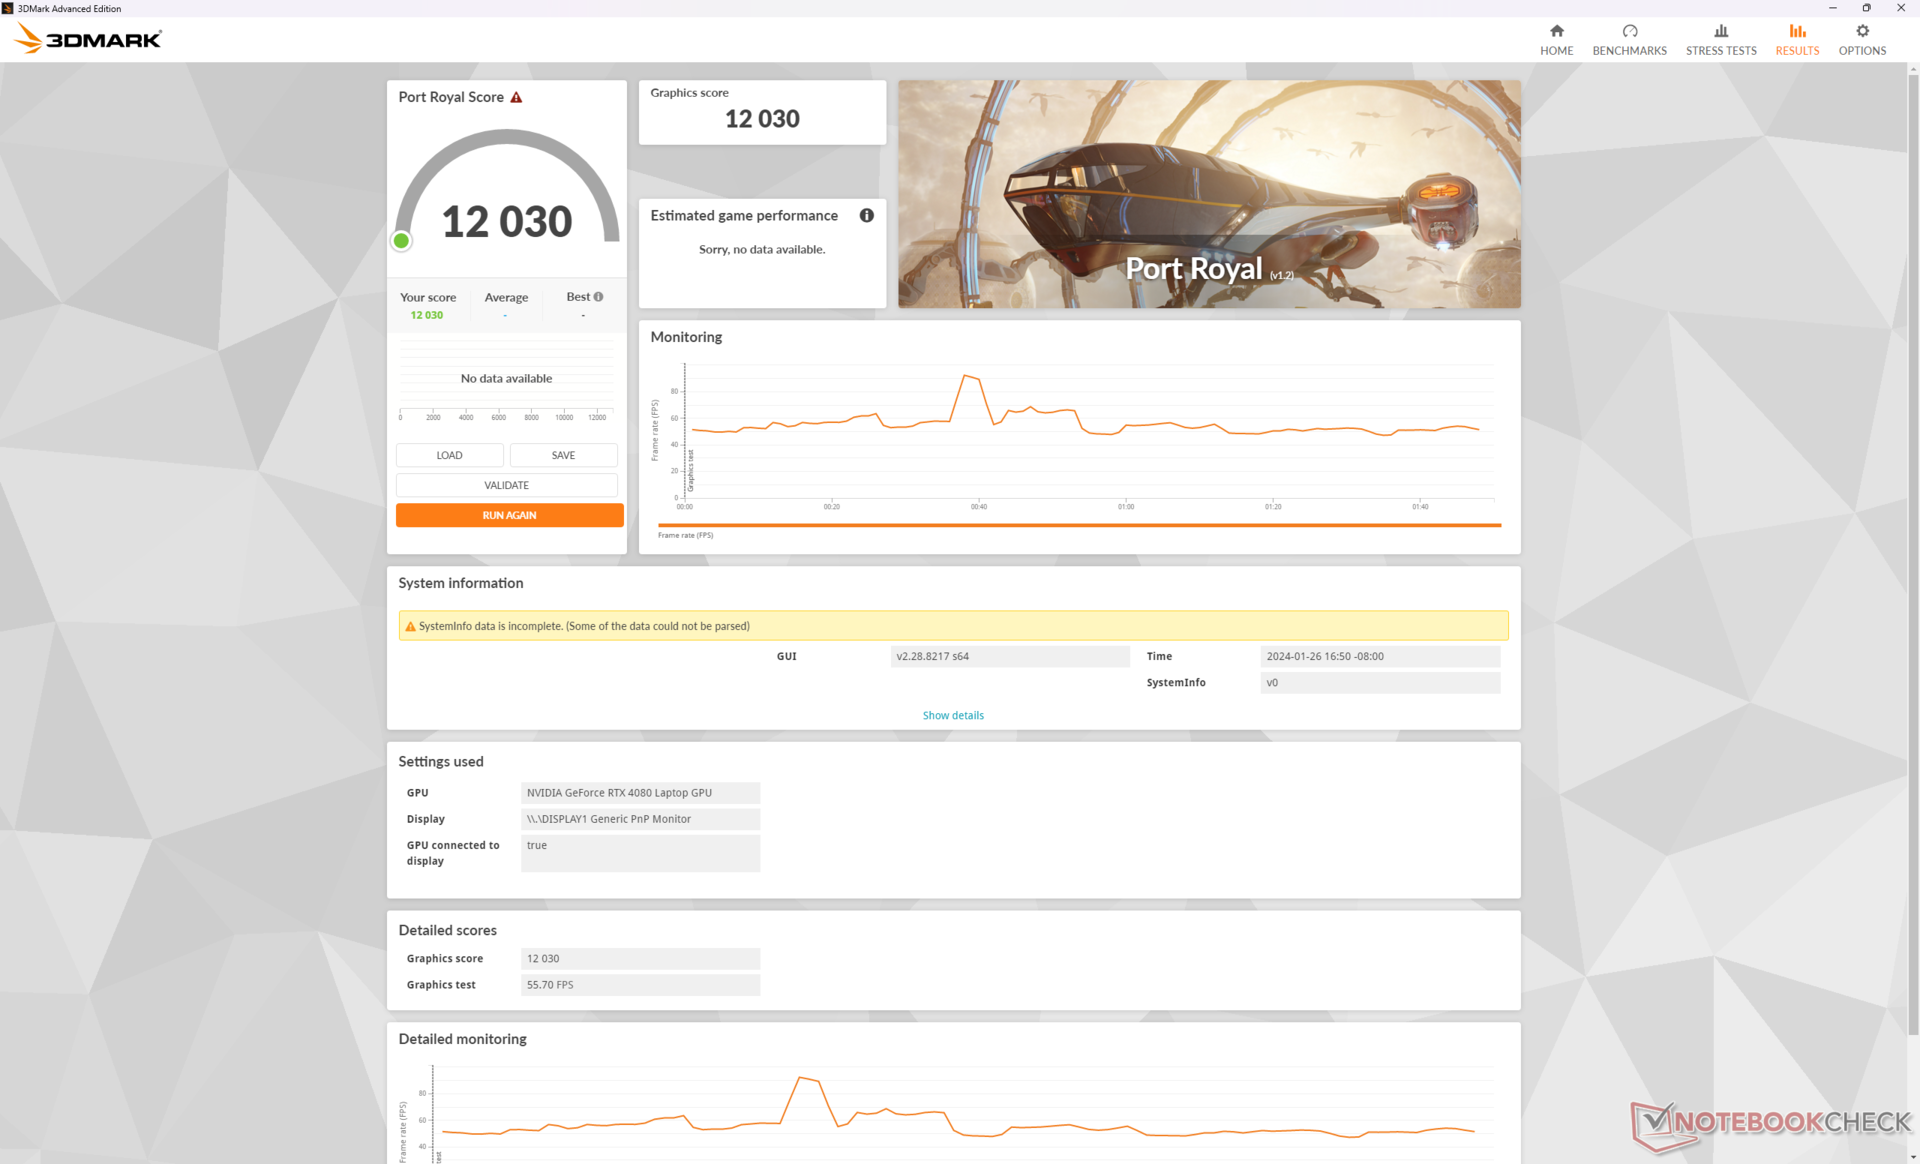
包括即将上市的 GP66 在内的大多数其他游戏笔记本电脑的 TGP 值都较低,而 Vector 16 HX 的最大值为 175 W,性能更快。因此,我们的微星系统比我们数据库中配备相同移动 RTX 4080 处理器的笔记本电脑平均快 8%到 10%。 同样的移动GeForce RTX 4080图形处理器。虽然差距不是很大,但想要尽可能提高 GPU 性能的电源用户和游戏玩家还是会考虑 Vector 16 HX,而不是采用相同图形选项的其他产品,如 HP Omen 16.
升级到 RTX 4090配置有望将图形性能提升约 10%,而降至 RTX 4070 和 RTX 4060 则会分别降低约 30% 至 35% 和 40% 至 45%。
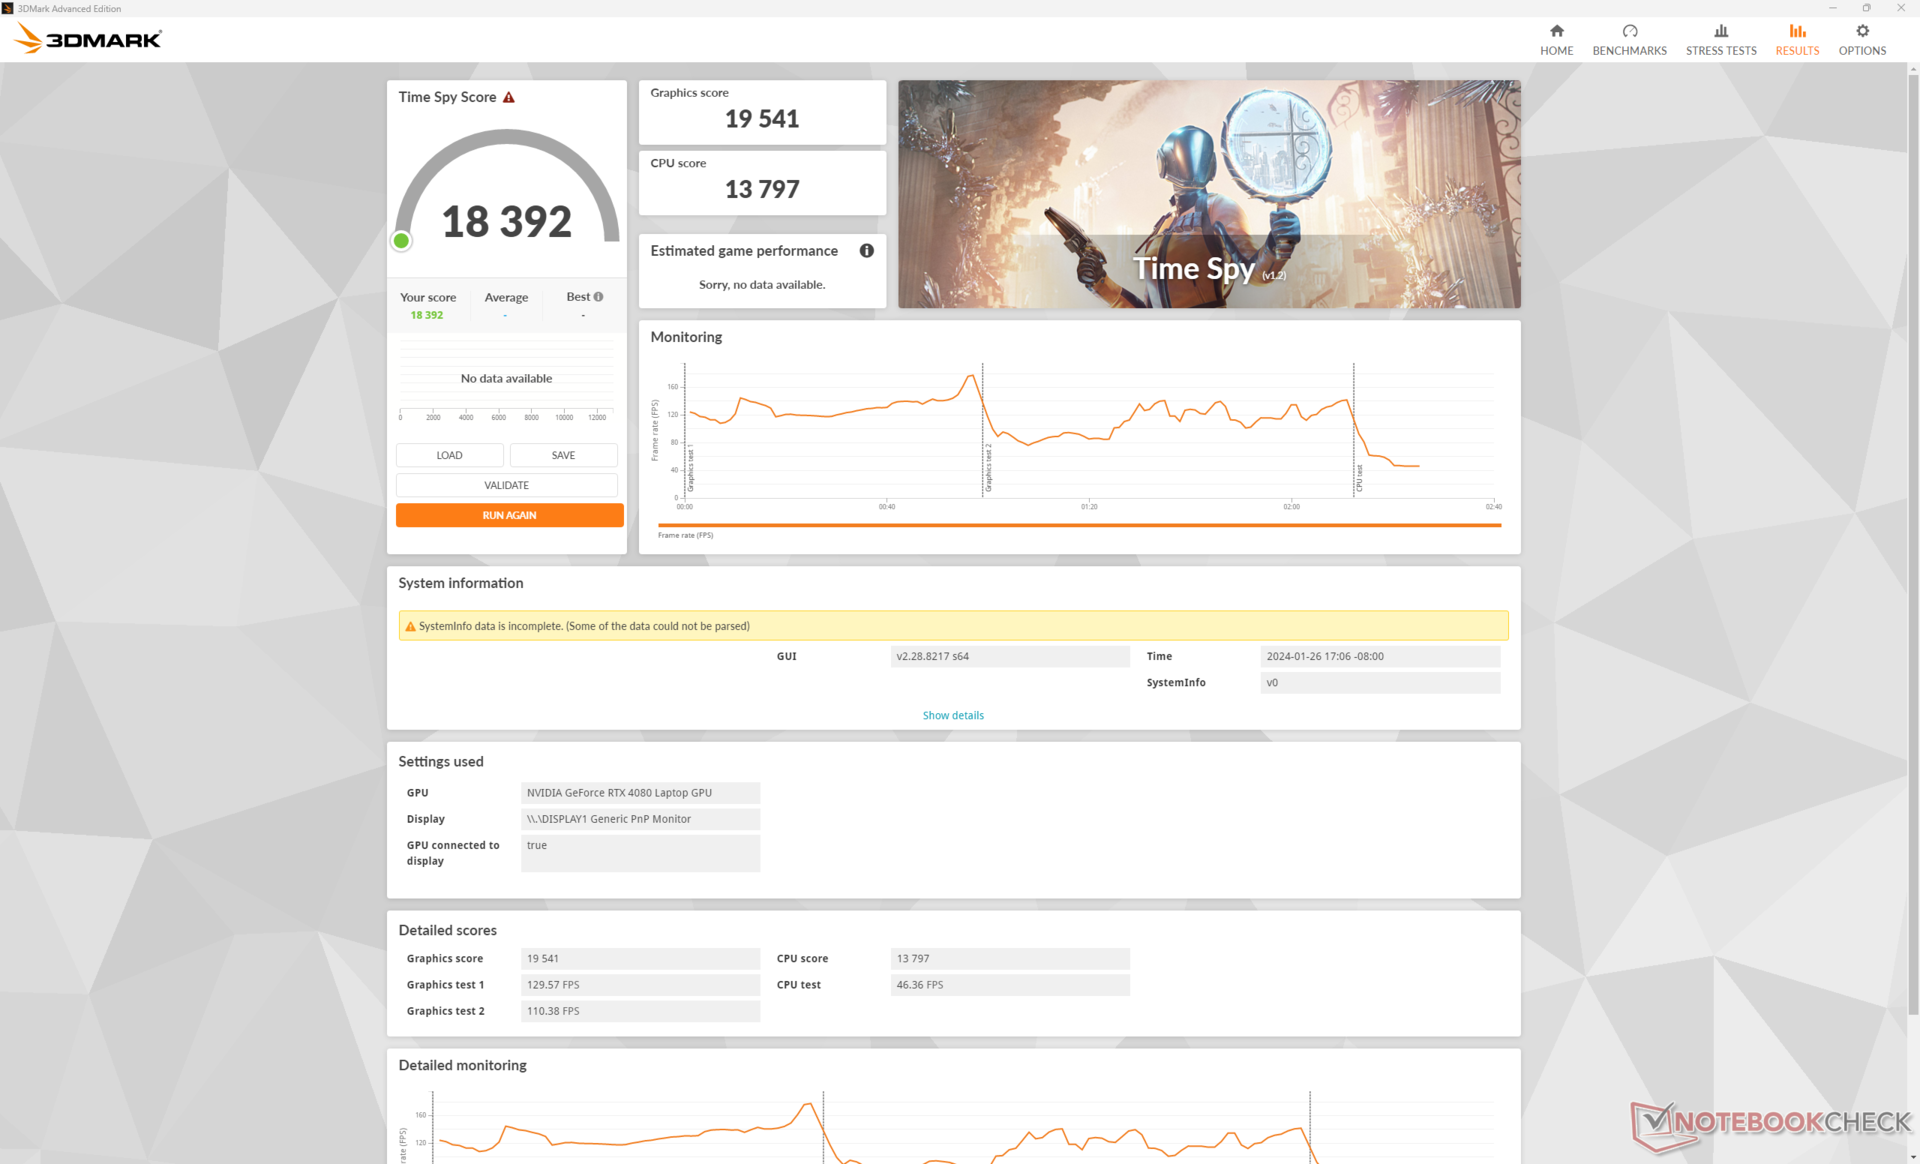
| 电源配置文件 | 物理分数 | 图形得分 | 综合得分 |
| 极致性能(开启冷却器增强功能) | 13797 | 19541 | 18392 |
| 极限性能(关闭冷却器增强功能) | 14118 (-0%) | 19471 (-0%) | 18423 (-0%) |
| 平衡模式 | 13858 (-0%) | 16466 (-16%) | 16013 (-13%) |
| 电池电量 | 8307 (-40%) | 8955 (-54%) | 8851 (-52%) |
与其他配备 Cooler Boost 的微星游戏笔记本电脑一样,根据上表中的Time Spy 分数,只要您使用极致性能模式,性能似乎不会受到该功能的影响。不过,降至平衡模式后,图形性能将降低约 16%。
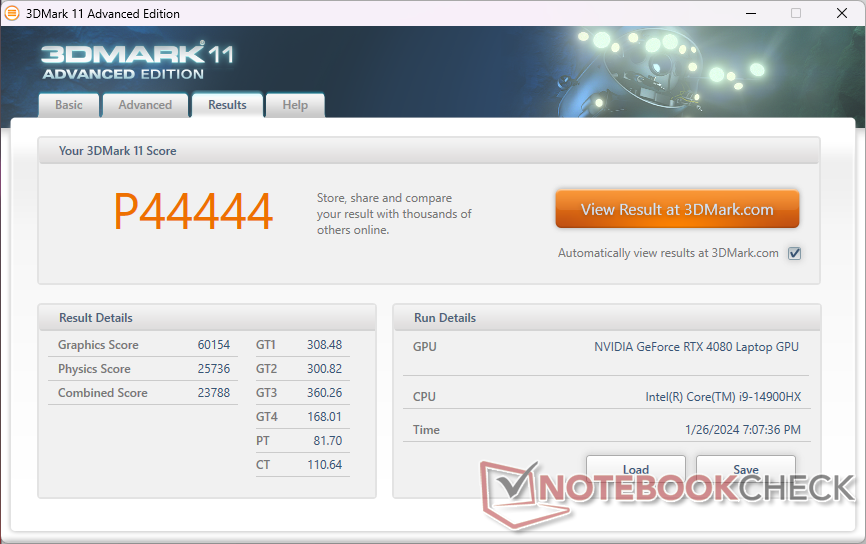
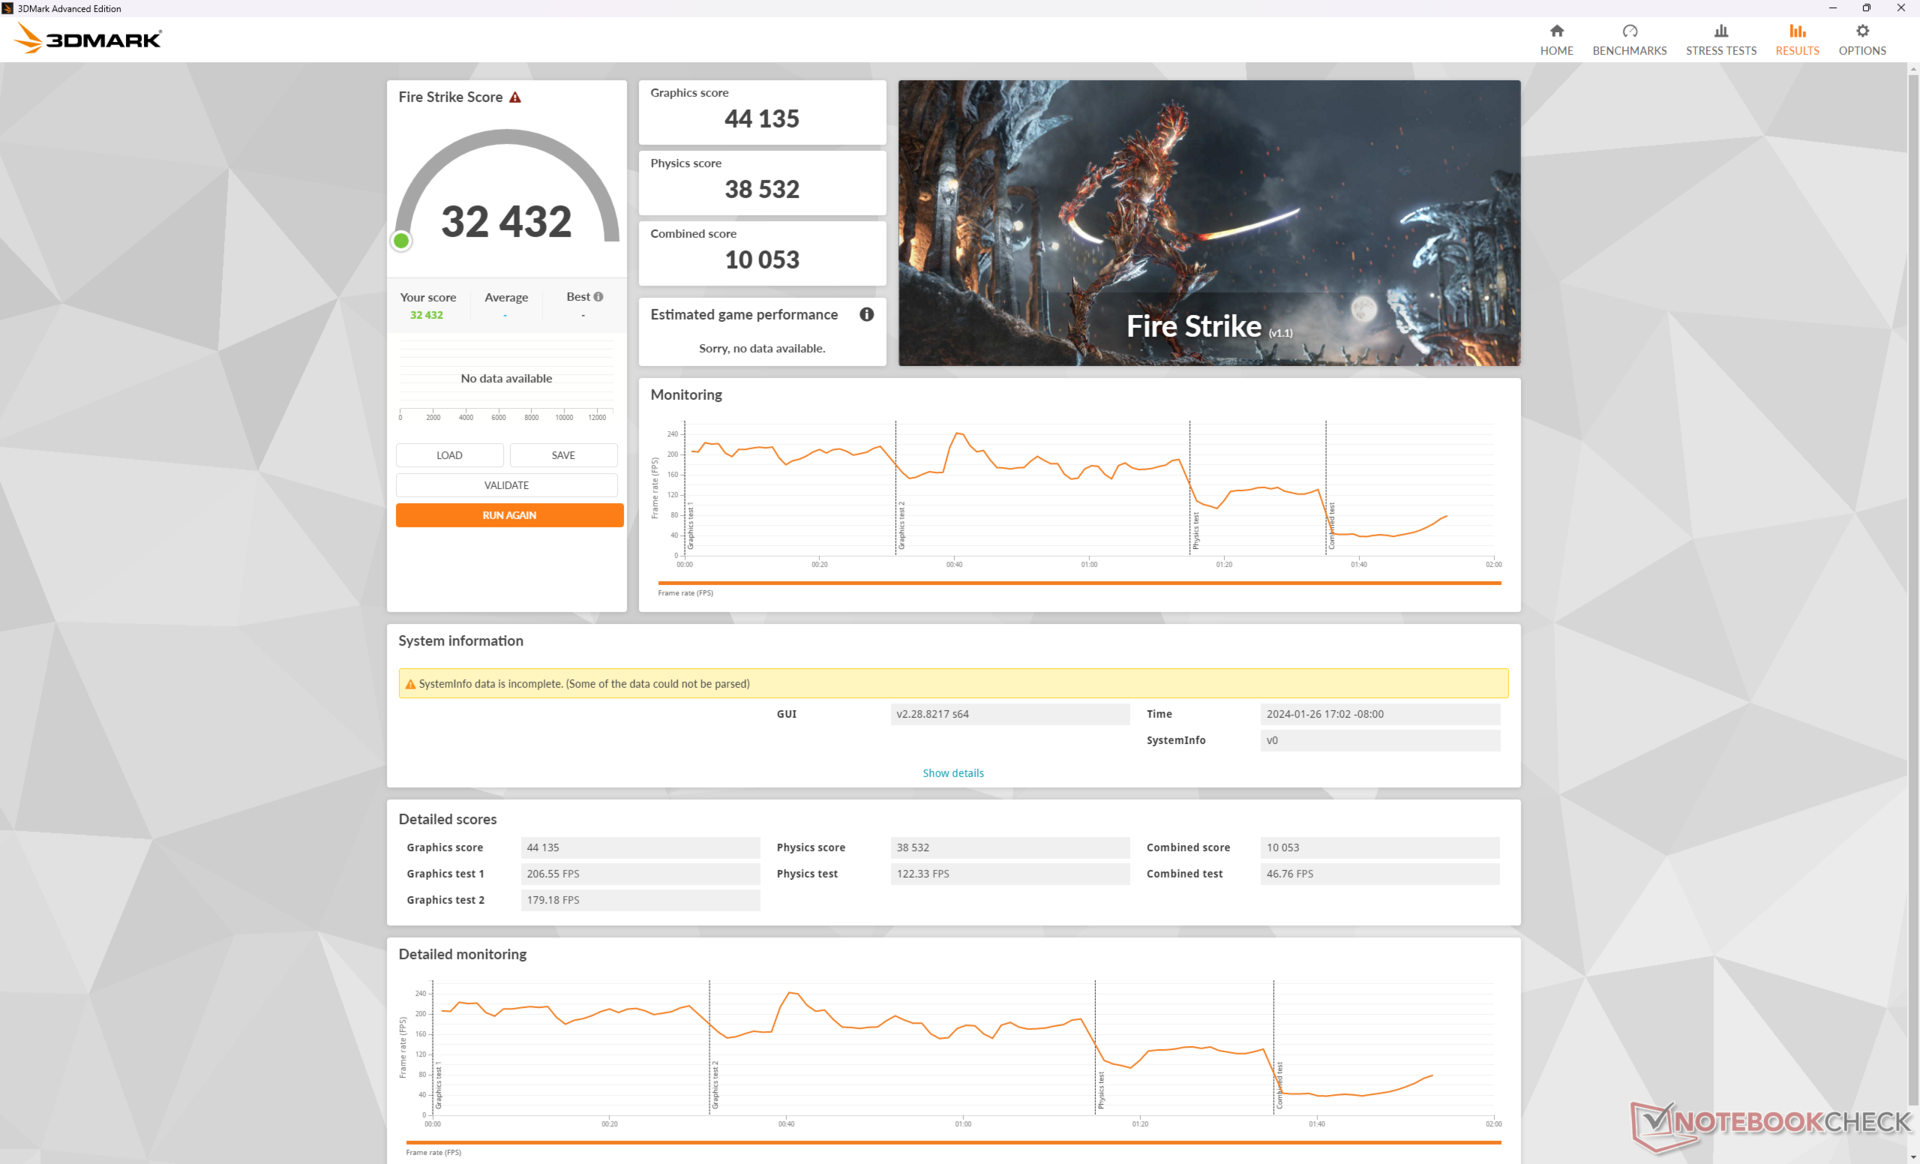
| 3DMark 11 Performance | 44444 points | |
| 3DMark Fire Strike Score | 32432 points | |
| 3DMark Time Spy Score | 18392 points | |
Help | ||
* ... smaller is better
游戏性能
在大多数设置为最大值的情况下,所有当前的游戏都能以原始 1600p 显示分辨率流畅运行。不过,由于没有 G-Sync 功能,您可能需要考虑启用 v-sync 或将帧速率限制在 120。例如,《博德之门》在 1440p 下的平均帧率为 129 FPS,如果帧率不锁定,在 240 Hz 显示屏上可能会导致屏幕撕裂。
如果在 4K 下进行游戏,建议使用 DLSS,因为移动 RTX 4080 的性能明显弱于其 台式机.赛博朋克 2077》在原生 4K Ultra RT 设置下的平均帧数仅为 18.5 FPS,但同时启用 DLSS 自动和帧生成功能后,平均帧数将提升至 75.8 FPS。
| Performance rating - Percent | |
| MSI Vector 16 HX A14V | |
| Lenovo Legion 5 16IRX G9 | |
| MSI Vector GP66 12UGS | |
| HP Victus 16-r0077ng | |
| Dell G16 7620 | |
| Asus TUF Gaming A16 FA617XS | |
| The Witcher 3 - 1920x1080 Ultra Graphics & Postprocessing (HBAO+) | |
| MSI Vector 16 HX A14V | |
| MSI Vector GP66 12UGS | |
| HP Victus 16-r0077ng | |
| Asus TUF Gaming A16 FA617XS | |
| Lenovo Legion 5 16IRX G9 | |
| Dell G16 7620 | |
| GTA V - 1920x1080 Highest AA:4xMSAA + FX AF:16x | |
| MSI Vector 16 HX A14V | |
| MSI Vector GP66 12UGS | |
| Lenovo Legion 5 16IRX G9 | |
| HP Victus 16-r0077ng | |
| Dell G16 7620 | |
| Asus TUF Gaming A16 FA617XS | |
| Final Fantasy XV Benchmark - 1920x1080 High Quality | |
| MSI Vector 16 HX A14V | |
| MSI Vector GP66 12UGS | |
| HP Victus 16-r0077ng | |
| Lenovo Legion 5 16IRX G9 | |
| Dell G16 7620 | |
| Asus TUF Gaming A16 FA617XS | |
| Strange Brigade - 1920x1080 ultra AA:ultra AF:16 | |
| MSI Vector 16 HX A14V | |
| MSI Vector GP66 12UGS | |
| Lenovo Legion 5 16IRX G9 | |
| HP Victus 16-r0077ng | |
| Asus TUF Gaming A16 FA617XS | |
| Dell G16 7620 | |
| Dota 2 Reborn - 1920x1080 ultra (3/3) best looking | |
| MSI Vector 16 HX A14V | |
| Lenovo Legion 5 16IRX G9 | |
| MSI Vector GP66 12UGS | |
| Dell G16 7620 | |
| HP Victus 16-r0077ng | |
| Asus TUF Gaming A16 FA617XS | |
| X-Plane 11.11 - 1920x1080 high (fps_test=3) | |
| MSI Vector 16 HX A14V | |
| Lenovo Legion 5 16IRX G9 | |
| MSI Vector GP66 12UGS | |
| Dell G16 7620 | |
| HP Victus 16-r0077ng | |
| Asus TUF Gaming A16 FA617XS | |
| Baldur's Gate 3 | |
| 1920x1080 High Preset AA:T | |
| MSI Vector 16 HX A14V | |
| Average NVIDIA GeForce RTX 4080 Laptop GPU (122.2 - 183.5, n=4) | |
| Framework Laptop 16 | |
| Lenovo ThinkPad Z16 Gen 2 | |
| 1920x1080 Ultra Preset AA:T | |
| MSI Vector 16 HX A14V | |
| Average NVIDIA GeForce RTX 4080 Laptop GPU (111.8 - 181.2, n=7) | |
| Framework Laptop 16 | |
| Lenovo ThinkPad Z16 Gen 2 | |
| 2560x1440 Ultra Preset AA:T | |
| MSI Vector 16 HX A14V | |
| Average NVIDIA GeForce RTX 4080 Laptop GPU (88.3 - 129.3, n=7) | |
| Framework Laptop 16 | |
| Lenovo ThinkPad Z16 Gen 2 | |
| 3840x2160 Ultra Preset AA:T | |
| MSI Vector 16 HX A14V | |
| Average NVIDIA GeForce RTX 4080 Laptop GPU (48.8 - 68.4, n=5) | |
| Framework Laptop 16 | |
Witcher 3 FPS Chart
| low | med. | high | ultra | QHD | 4K | |
|---|---|---|---|---|---|---|
| GTA V (2015) | 187.1 | 185.7 | 181.9 | 136.5 | 128.8 | 158.6 |
| The Witcher 3 (2015) | 640 | 513.3 | 384.6 | 183.3 | 121.2 | |
| Dota 2 Reborn (2015) | 217 | 194.8 | 186.7 | 175 | 168.4 | |
| Final Fantasy XV Benchmark (2018) | 232 | 219 | 178.8 | 142 | 79.5 | |
| X-Plane 11.11 (2018) | 204 | 177.4 | 137.7 | 118.1 | ||
| Far Cry 5 (2018) | 180 | 167 | 161 | 154 | 97 | |
| Strange Brigade (2018) | 505 | 405 | 378 | 349 | 248 | 123.2 |
| Tiny Tina's Wonderlands (2022) | 344 | 297.1 | 212.8 | 167.1 | 114.8 | 60.3 |
| F1 22 (2022) | 339 | 324 | 297 | 81.2 | 76.9 | 39.6 |
| Baldur's Gate 3 (2023) | 228.5 | 204.3 | 183.5 | 181.2 | 129.3 | 68.4 |
| Cyberpunk 2077 (2023) | 143.4 | 135.3 | 127.1 | 118.6 | 79.4 | 36.6 |
排放--响亮而自豪
系统噪音
即使在平衡或静音电源配置文件下在桌面上空转,系统的噪音也相当大。风扇噪音 Witcher 3在极致性能模式下,无论是否设置了 Cooler Boost,风扇噪音都会达到 62 dB(A)。在我们的数据库中,60 分贝(A)以上的笔记本电脑噪音最大,建议佩戴耳机以获得更好的游戏体验。
在平衡模式下进行游戏,风扇噪音上限将大幅降低至 54 dB(A) 范围。虽然噪音仍然很大,但远不如极致性能模式下那么严重。因此,用户可能希望在平衡模式下而不是极限性能模式下进行游戏,尽管如上所述,这会导致 GPU 性能下降 16%。
Noise level
| Idle |
| 33.5 / 33.5 / 33.5 dB(A) |
| Load |
| 52.1 / 62 dB(A) |
 | ||
30 dB silent 40 dB(A) audible 50 dB(A) loud |
||
min: | ||
| MSI Vector 16 HX A14V GeForce RTX 4080 Laptop GPU, i9-14900HX, WD PC SN560 SDDPNQE-1T00 | MSI Vector GP66 12UGS GeForce RTX 3070 Ti Laptop GPU, i9-12900H | Lenovo Legion 5 16IRX G9 GeForce RTX 4060 Laptop GPU, i7-14650HX, Samsung PM9A1 MZVL21T0HCLR | HP Victus 16-r0077ng GeForce RTX 4070 Laptop GPU, i7-13700H, Kioxia XG8 KXG80ZNV1T02 | Asus TUF Gaming A16 FA617XS Radeon RX 7600S, R9 7940HS, Micron 2400 MTFDKBA512QFM | Dell G16 7620 GeForce RTX 3060 Laptop GPU, i7-12700H, WDC PC SN810 512GB | |
|---|---|---|---|---|---|---|
| Noise | 17% | 11% | 14% | 15% | 18% | |
| off / environment * (dB) | 23.2 | 22.9 1% | 24 -3% | 25 -8% | 25 -8% | 23.2 -0% |
| Idle Minimum * (dB) | 33.5 | 23.4 30% | 24 28% | 28 16% | 25 25% | 28.3 16% |
| Idle Average * (dB) | 33.5 | 23.4 30% | 28.8 14% | 29 13% | 26 22% | 28.8 14% |
| Idle Maximum * (dB) | 33.5 | 27.4 18% | 32 4% | 30 10% | 28 16% | 28.9 14% |
| Load Average * (dB) | 52.1 | 36 31% | 45.5 13% | 43 17% | 43 17% | 32.4 38% |
| Witcher 3 ultra * (dB) | 62 | 58.2 6% | 53.1 14% | 46 26% | 51 18% | 48.3 22% |
| Load Maximum * (dB) | 62 | 58 6% | 55.7 10% | 48 23% | 53 15% | 48.1 22% |
* ... smaller is better
温度
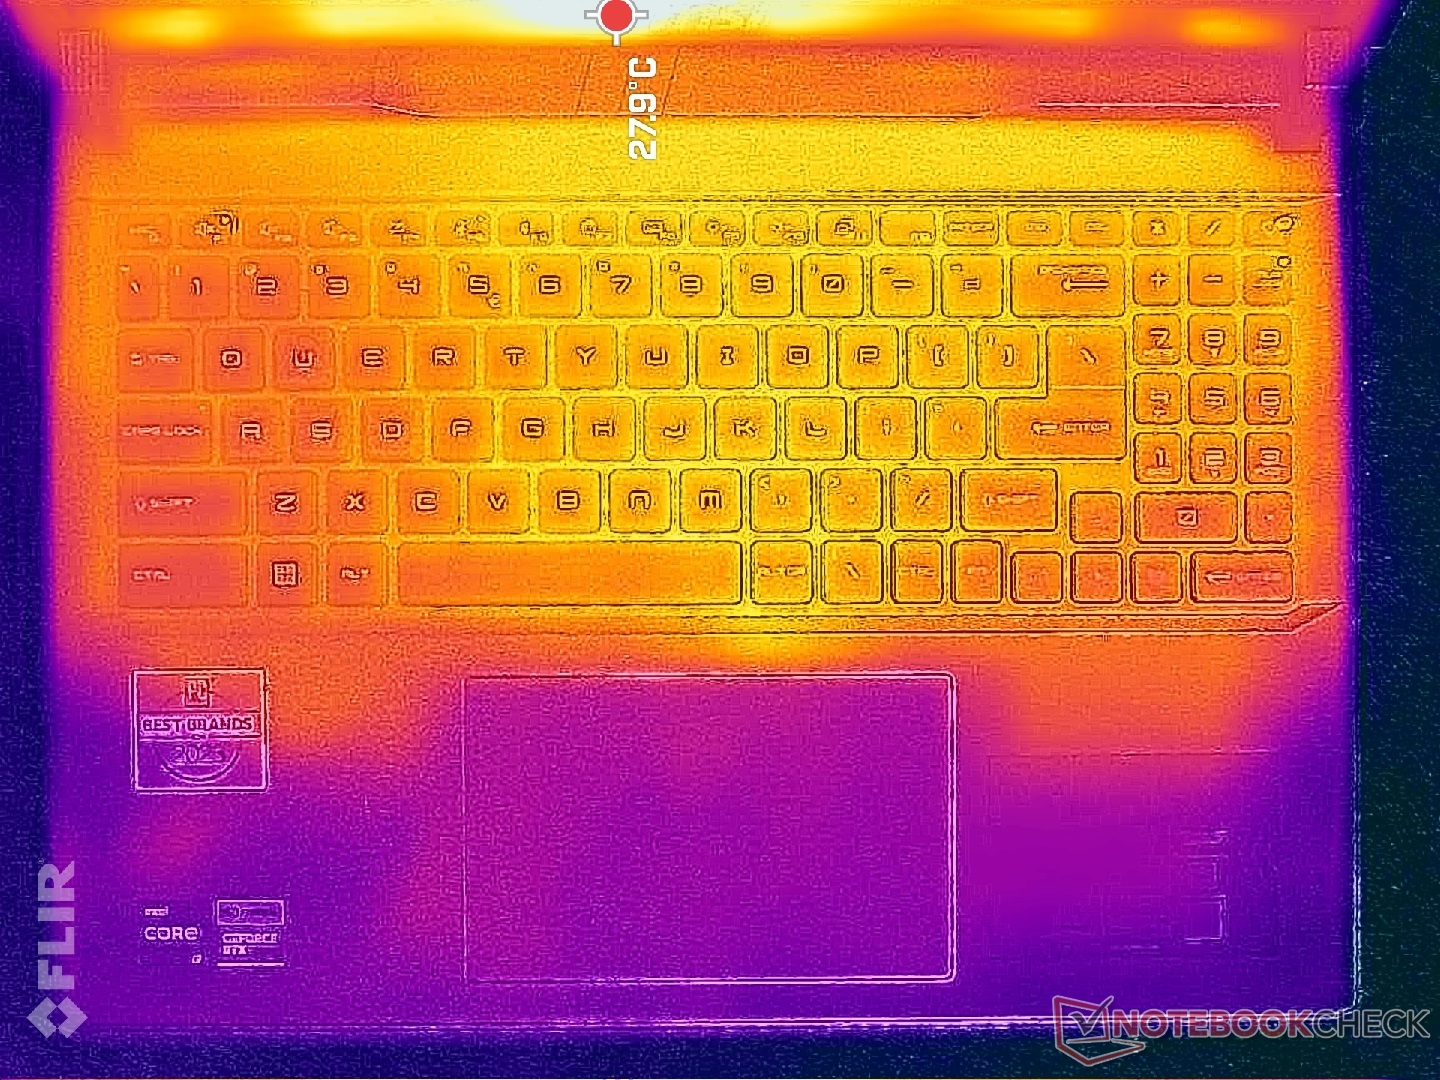
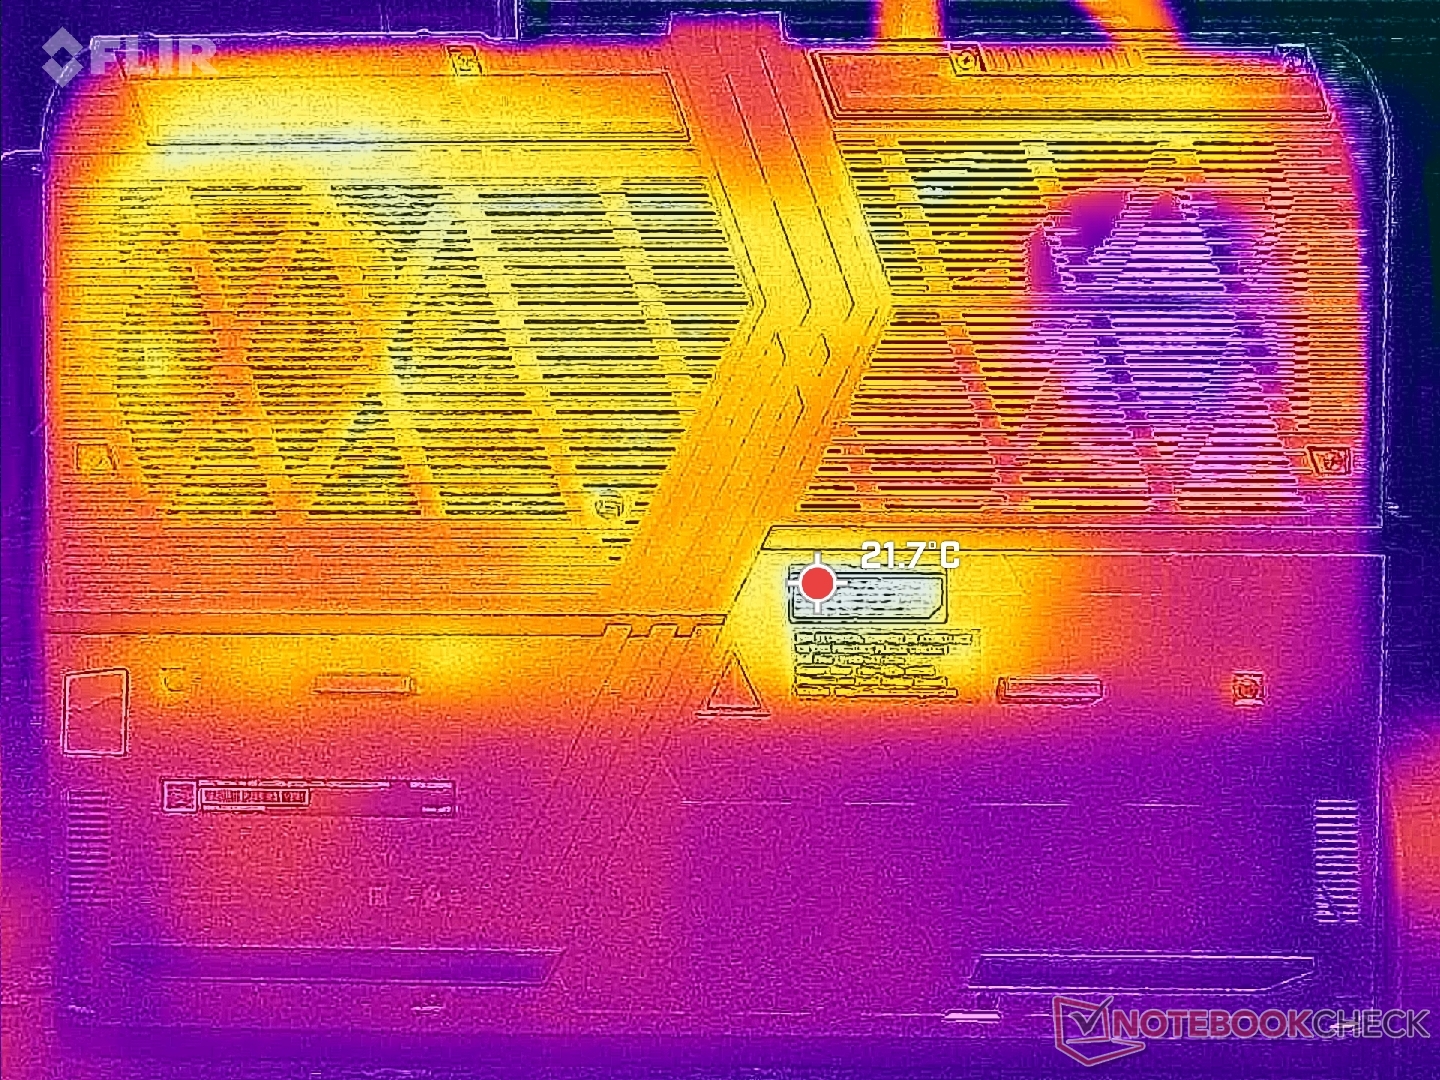
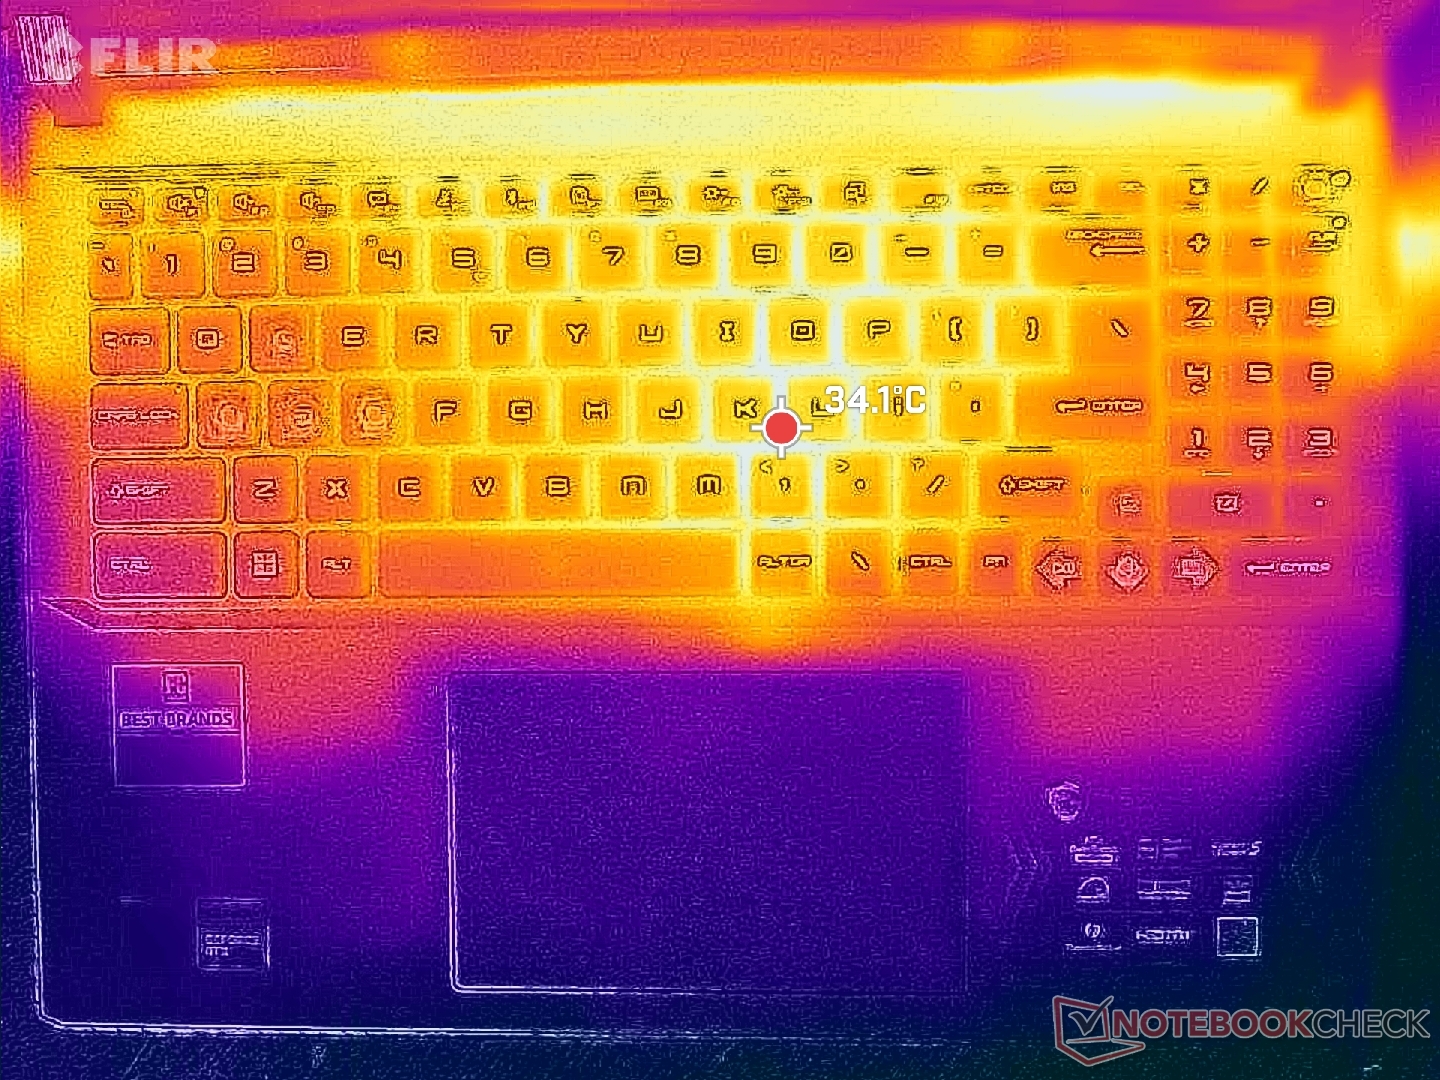
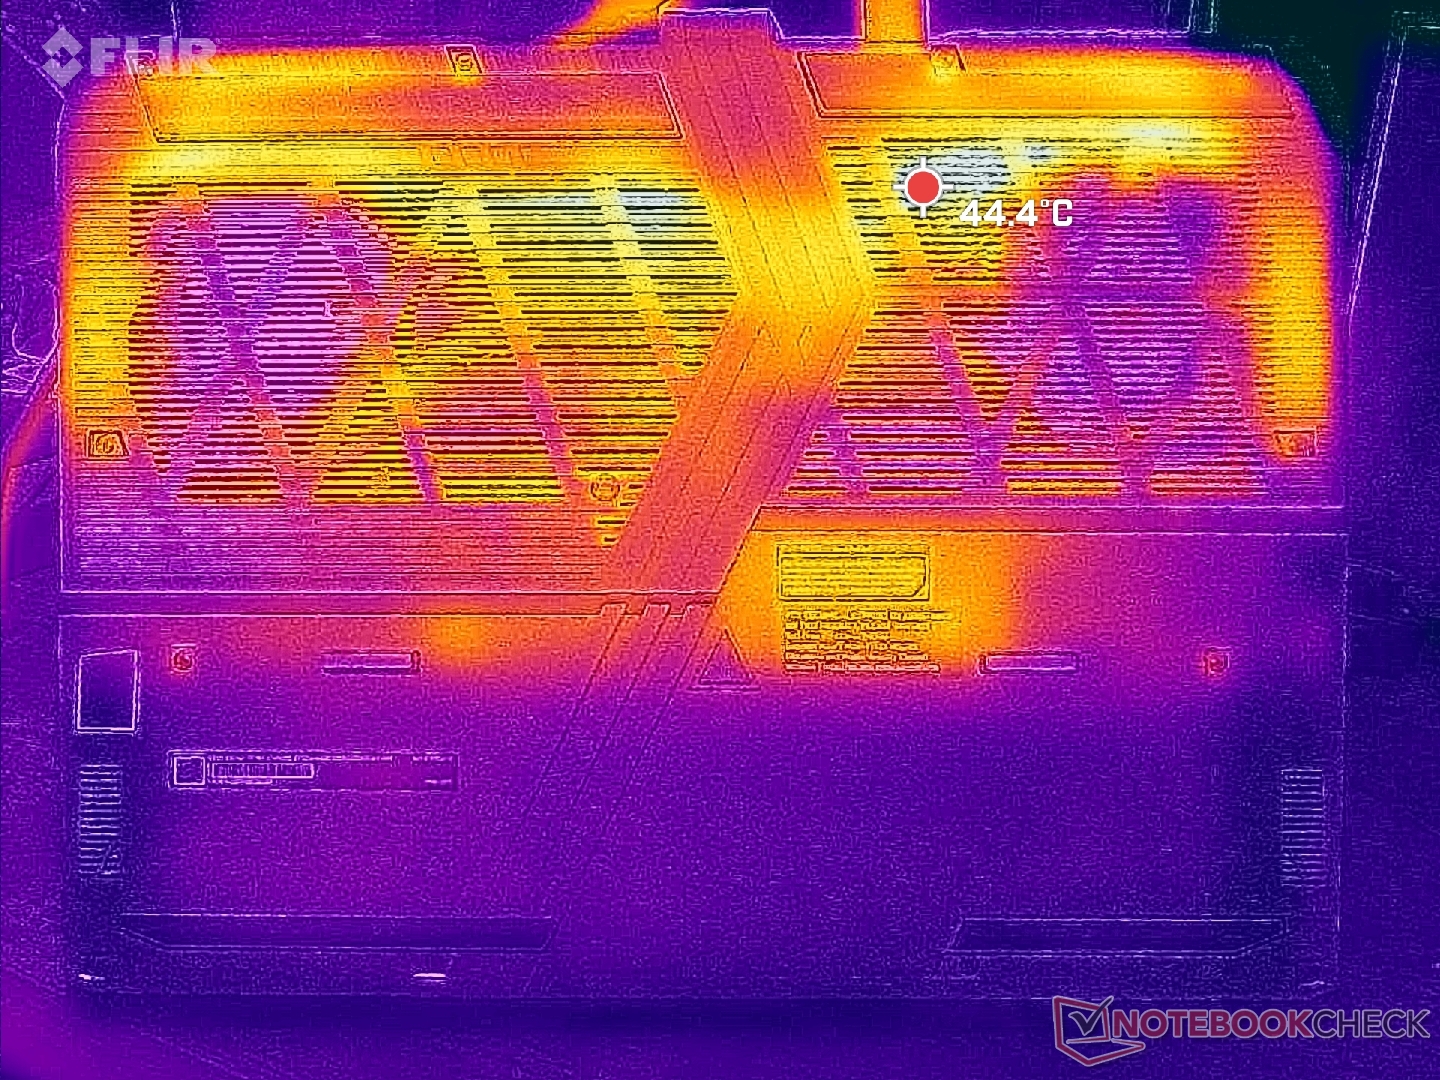
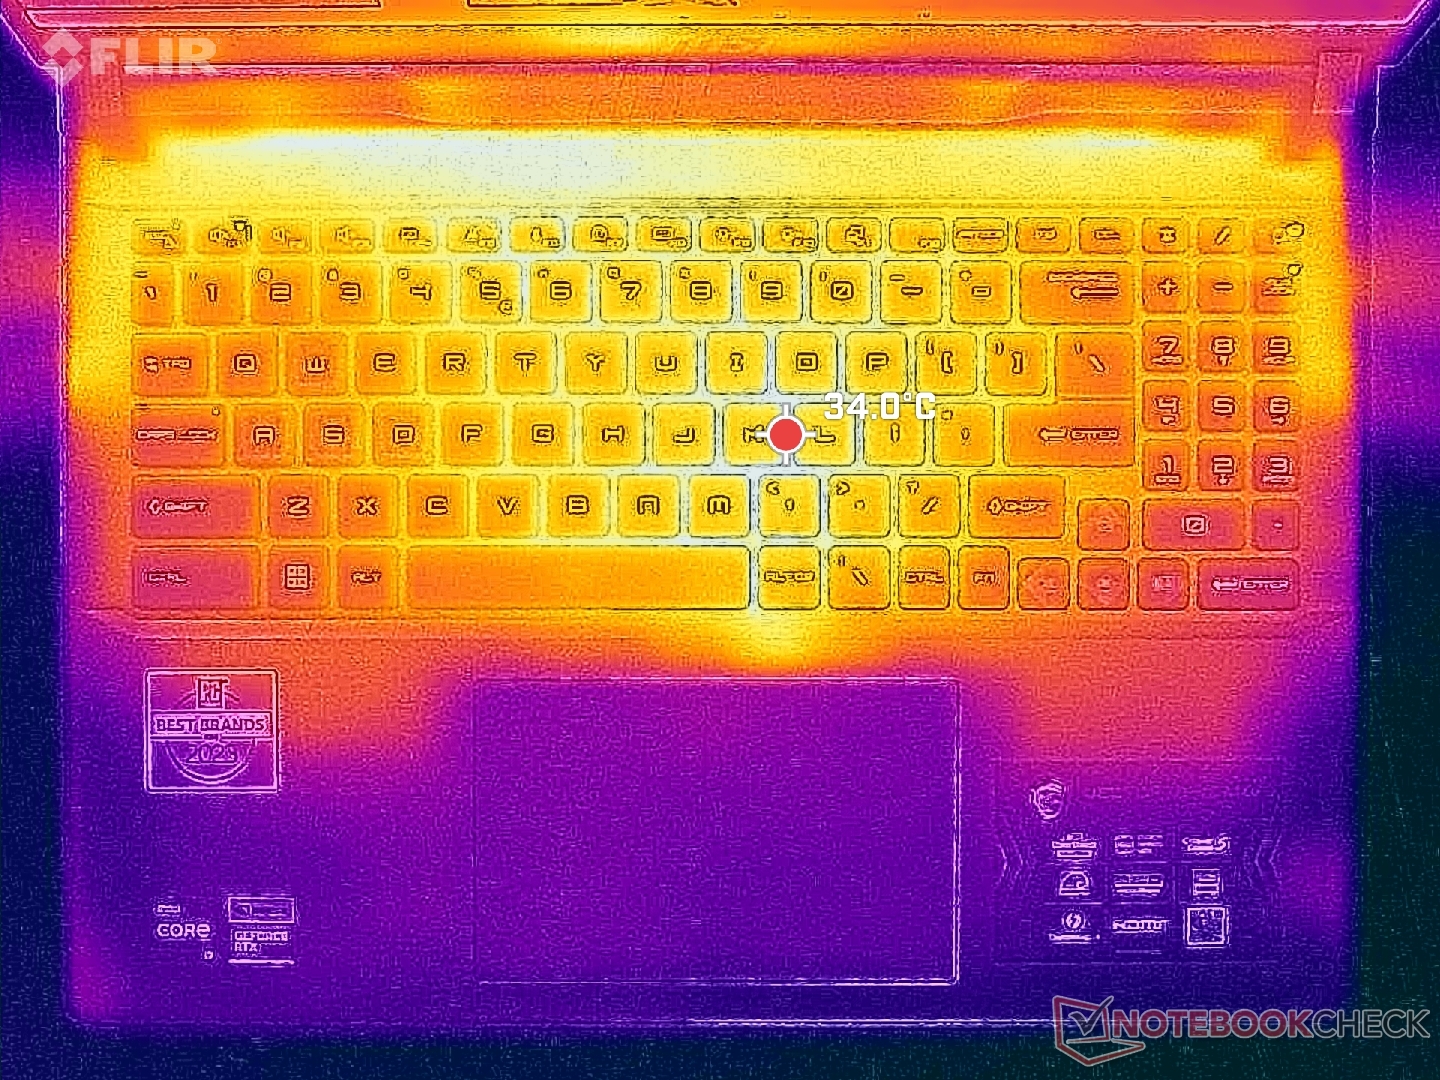
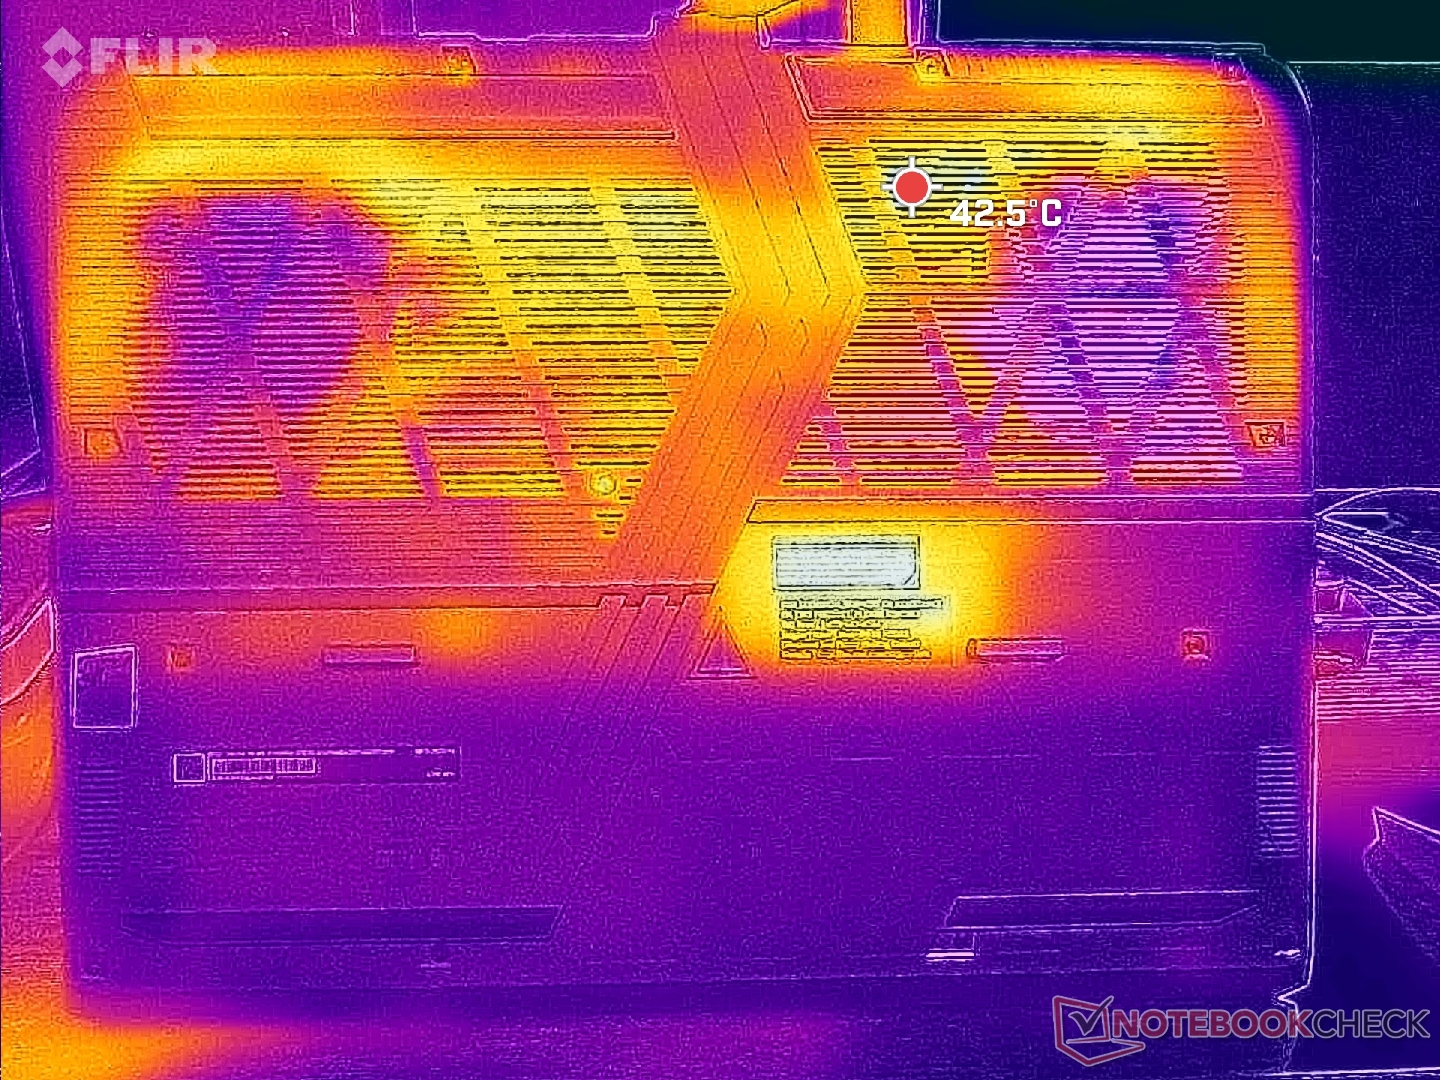
由于采用了塑料底座、充足的通风栅格和厚实的机箱设计,其表面温度比其他大多数游戏笔记本电脑都要低。事实上,这是我们测试过的配备 RTX 4080 的游戏笔记本电脑中最凉爽的一款。运行时 Witcher 3时,键盘中心的热点温度仅为 34 摄氏度,而Legion 5i 16 G9 或旧版 Vector GP66 的温度为 39 摄氏度。 Vector GP66.
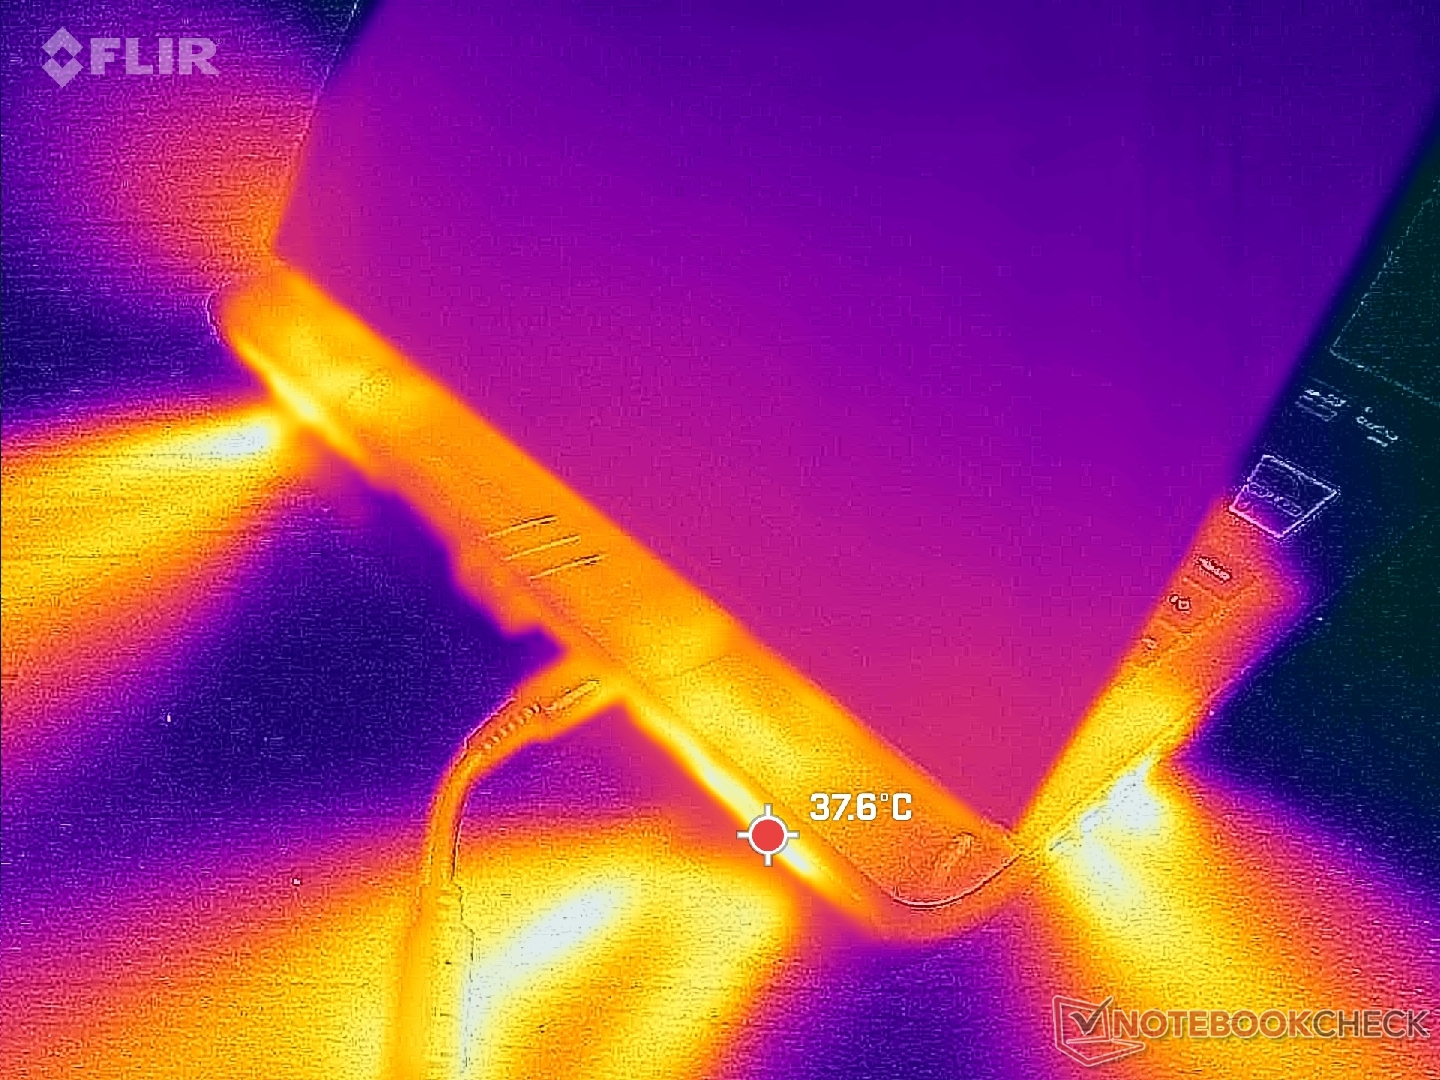
(+) The maximum temperature on the upper side is 36.4 °C / 98 F, compared to the average of 40.4 °C / 105 F, ranging from 21.2 to 68.8 °C for the class Gaming.
(+) The bottom heats up to a maximum of 35.6 °C / 96 F, compared to the average of 43.2 °C / 110 F
(+) In idle usage, the average temperature for the upper side is 24.5 °C / 76 F, compared to the device average of 33.9 °C / 93 F.
(+) Playing The Witcher 3, the average temperature for the upper side is 30.4 °C / 87 F, compared to the device average of 33.9 °C / 93 F.
(+) The palmrests and touchpad are cooler than skin temperature with a maximum of 24 °C / 75.2 F and are therefore cool to the touch.
(+) The average temperature of the palmrest area of similar devices was 28.8 °C / 83.8 F (+4.8 °C / 8.6 F).
| MSI Vector 16 HX A14V Intel Core i9-14900HX, NVIDIA GeForce RTX 4080 Laptop GPU | MSI Vector GP66 12UGS Intel Core i9-12900H, NVIDIA GeForce RTX 3070 Ti Laptop GPU | Lenovo Legion 5 16IRX G9 Intel Core i7-14650HX, NVIDIA GeForce RTX 4060 Laptop GPU | HP Victus 16-r0077ng Intel Core i7-13700H, NVIDIA GeForce RTX 4070 Laptop GPU | Asus TUF Gaming A16 FA617XS AMD Ryzen 9 7940HS, AMD Radeon RX 7600S | Dell G16 7620 Intel Core i7-12700H, NVIDIA GeForce RTX 3060 Laptop GPU | |
|---|---|---|---|---|---|---|
| Heat | -25% | -20% | -35% | -26% | -15% | |
| Maximum Upper Side * (°C) | 36.4 | 40.2 -10% | 40.4 -11% | 51 -40% | 53 -46% | 47.6 -31% |
| Maximum Bottom * (°C) | 35.6 | 43.8 -23% | 43.8 -23% | 54 -52% | 48 -35% | 54 -52% |
| Idle Upper Side * (°C) | 26.6 | 34.8 -31% | 30.3 -14% | 37 -39% | 30 -13% | 23 14% |
| Idle Bottom * (°C) | 27 | 37 -37% | 35.3 -31% | 29 -7% | 30 -11% | 24.6 9% |
* ... smaller is better
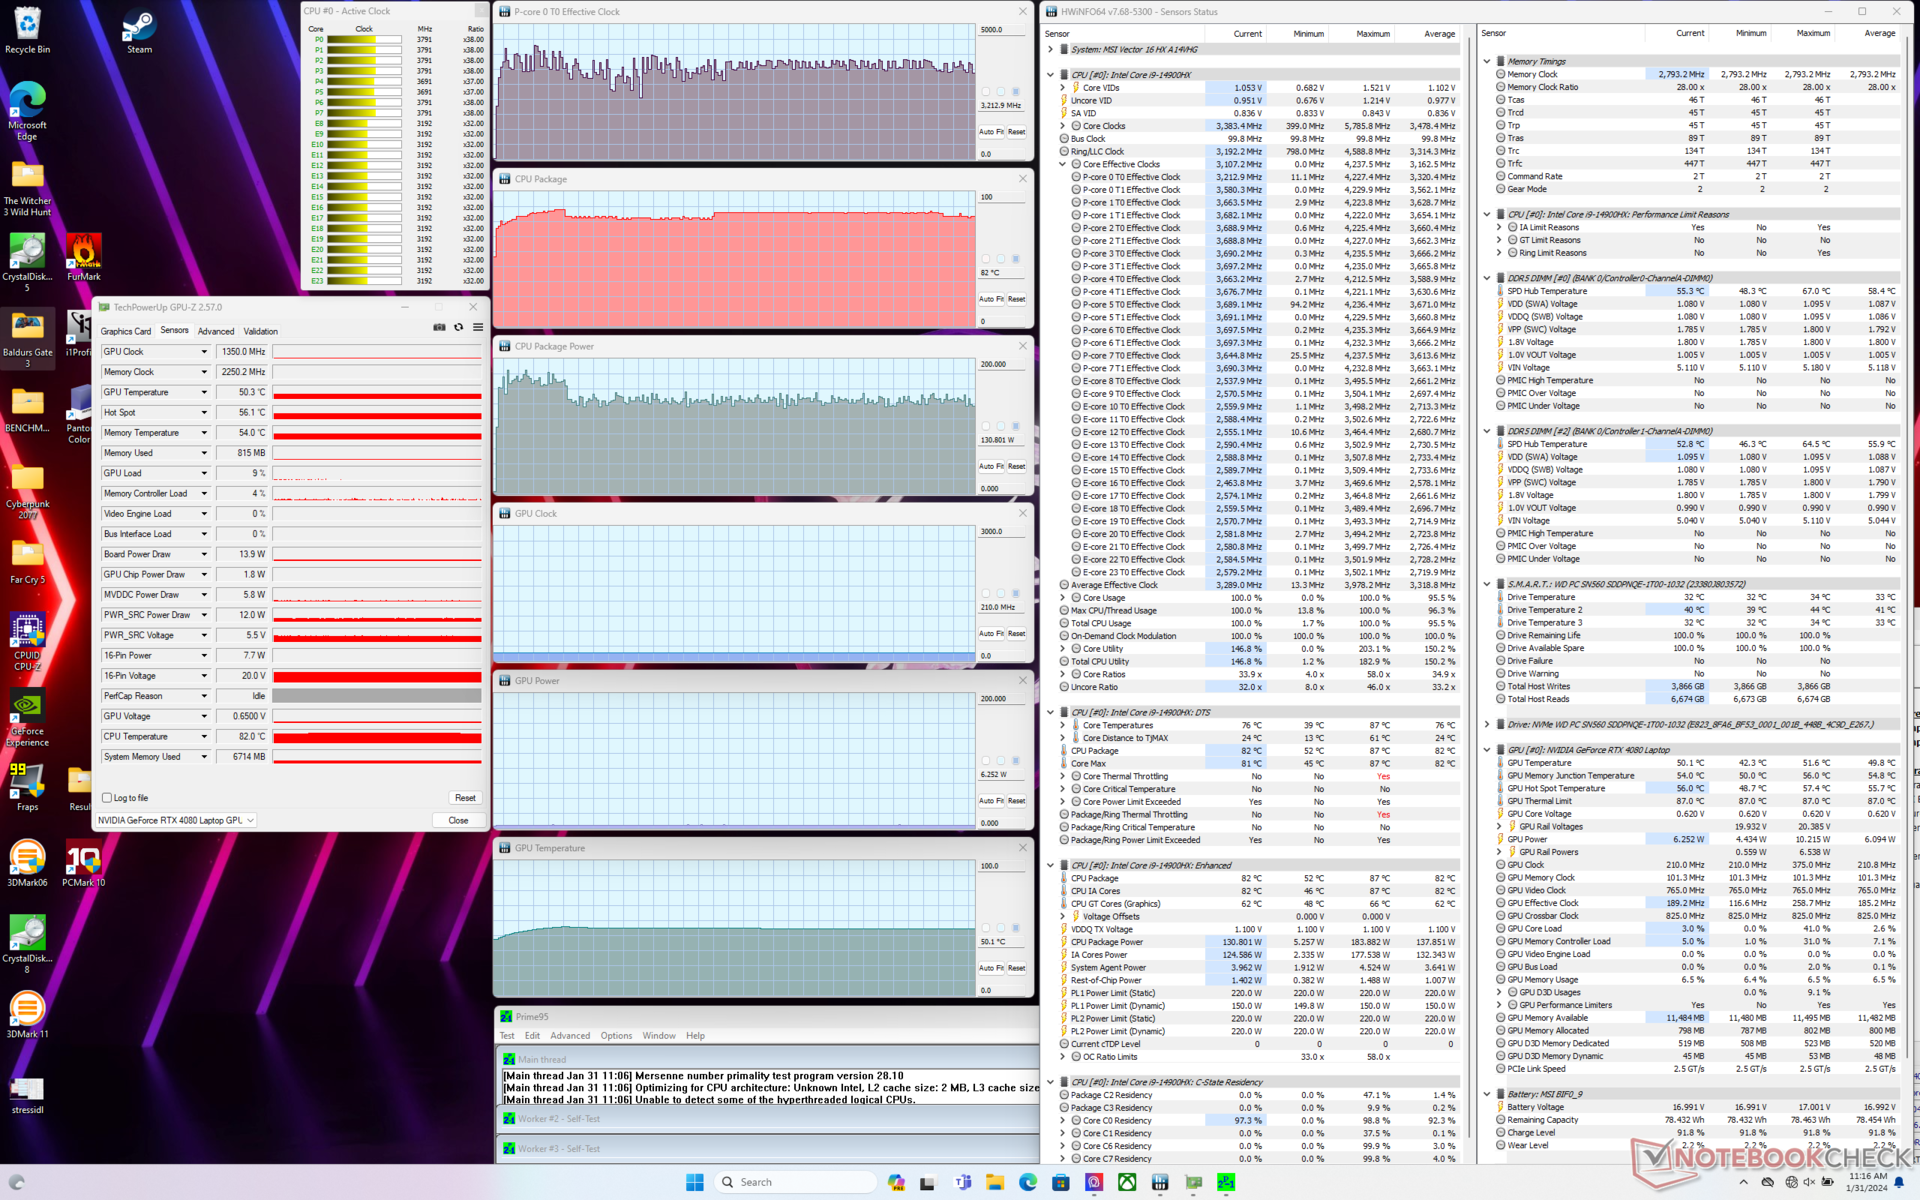
压力测试
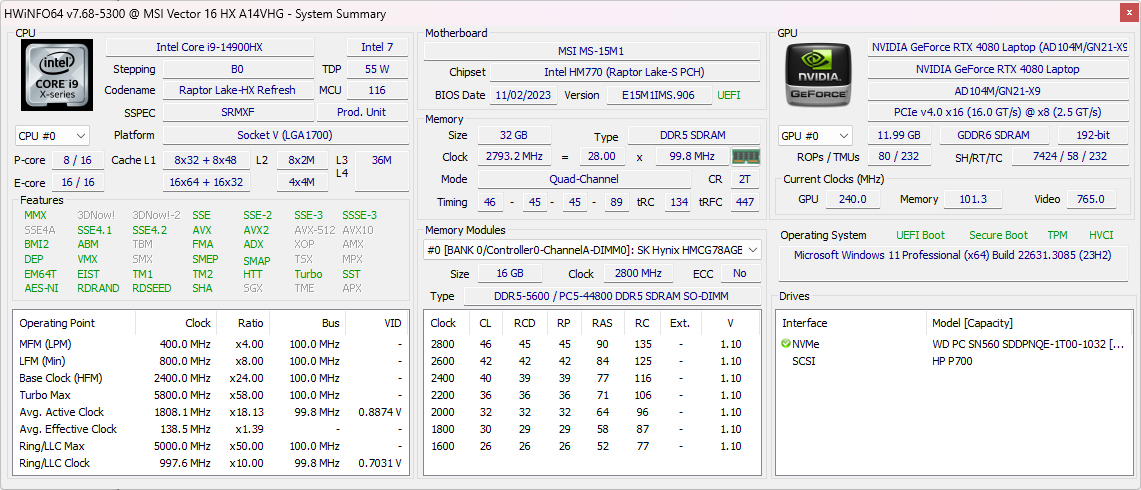
在启动 Prime95 压力测试时,CPU 会提升至 4.2 GHz 和 180 W,直到大约一分钟后核心温度达到 87 C。此后,CPU 会降至约 3.3 GHz、140 W 和 82 C。即使启用了 Cooler Boost,结果也保持不变。
根据 HWiNFO 的数据,在极限性能模式下运行Witcher 3 以代表典型的游戏负载,GPU 的时钟频率稳定在 2535 MHz,核心温度为 77 C,电路板功耗为 165 W。无论采用哪种 "Cooler Boost "设置,结果都几乎相同。然而,降至更安静的平衡模式后,GPU 时钟和电路板功耗将分别降至 2055 MHz 和 120 W,这反映了上文 GPU 性能部分提到的显著性能下降。
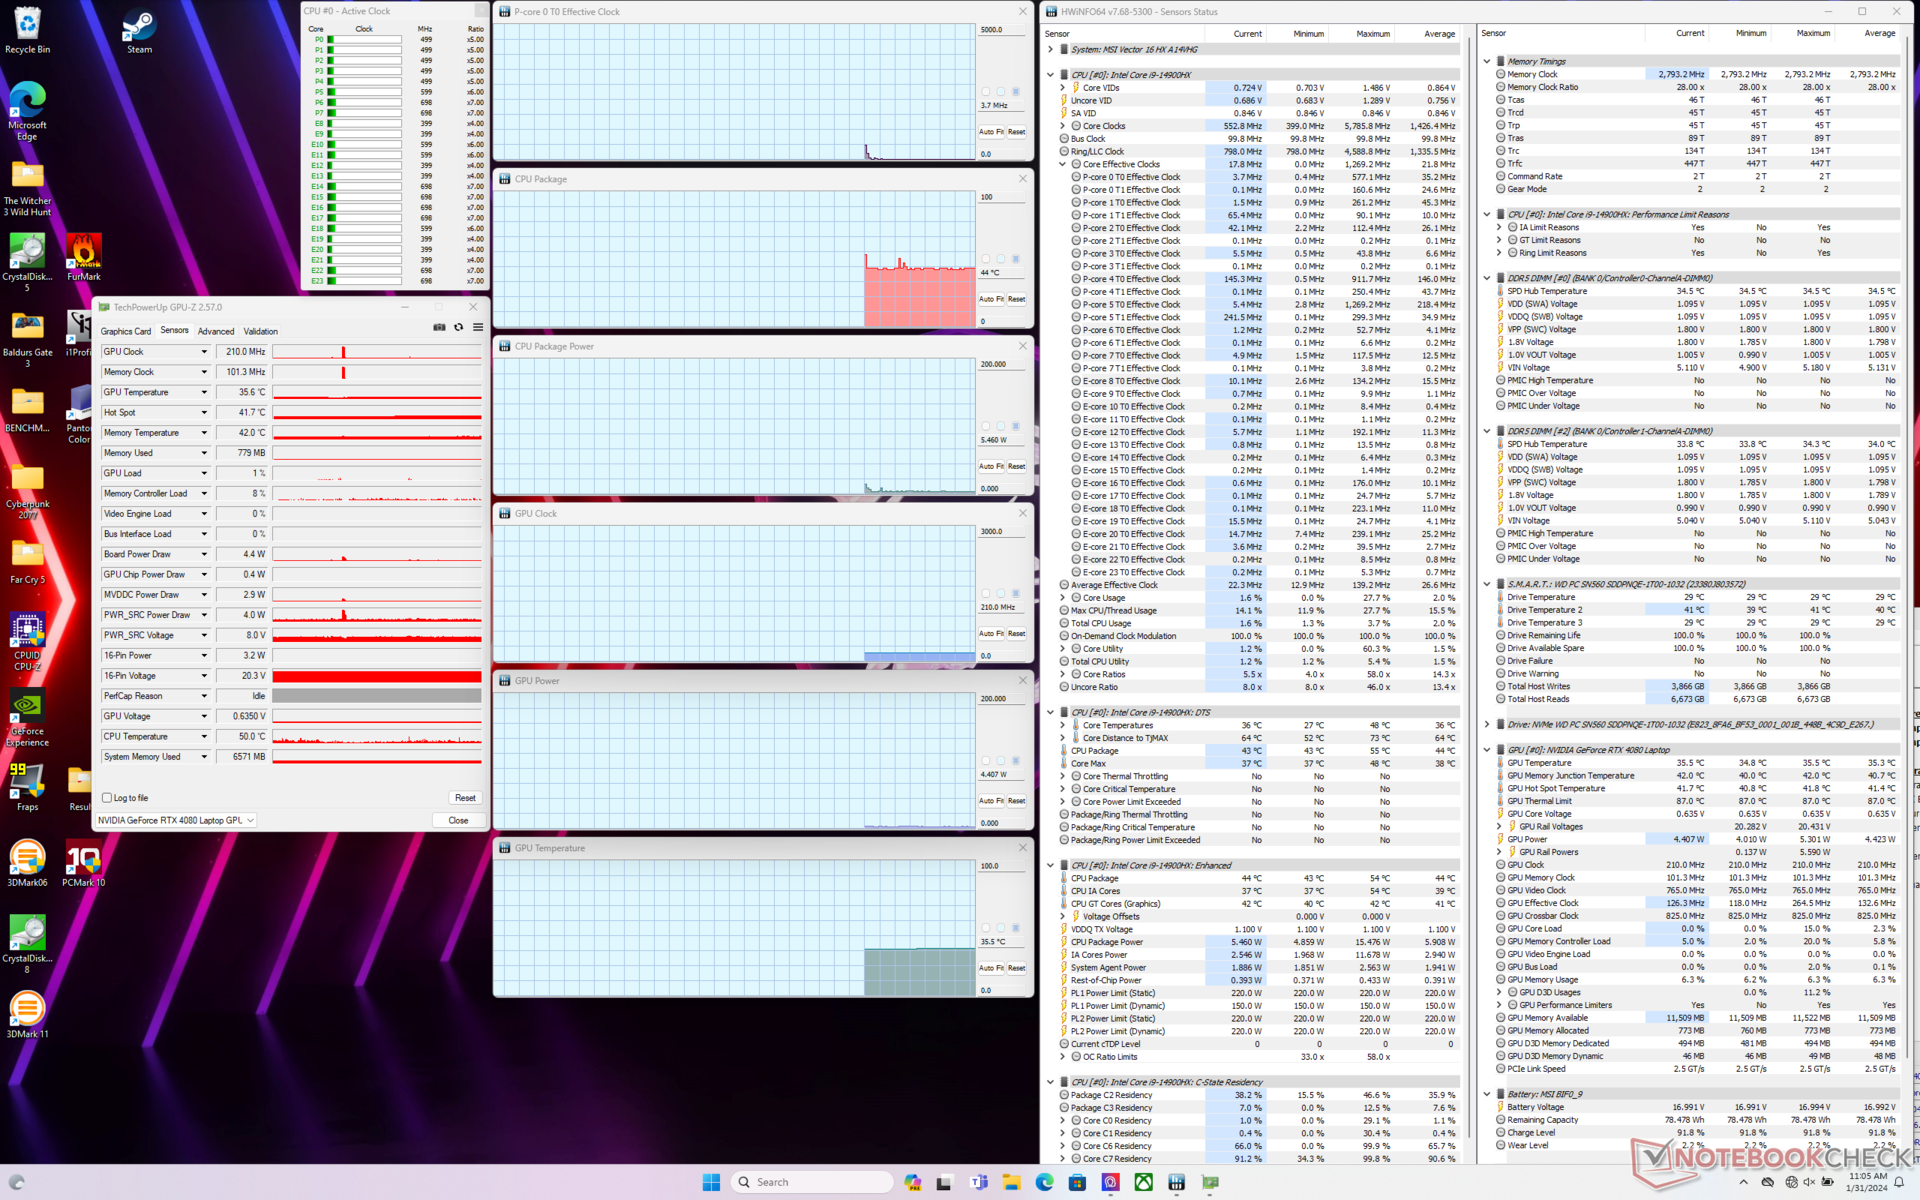
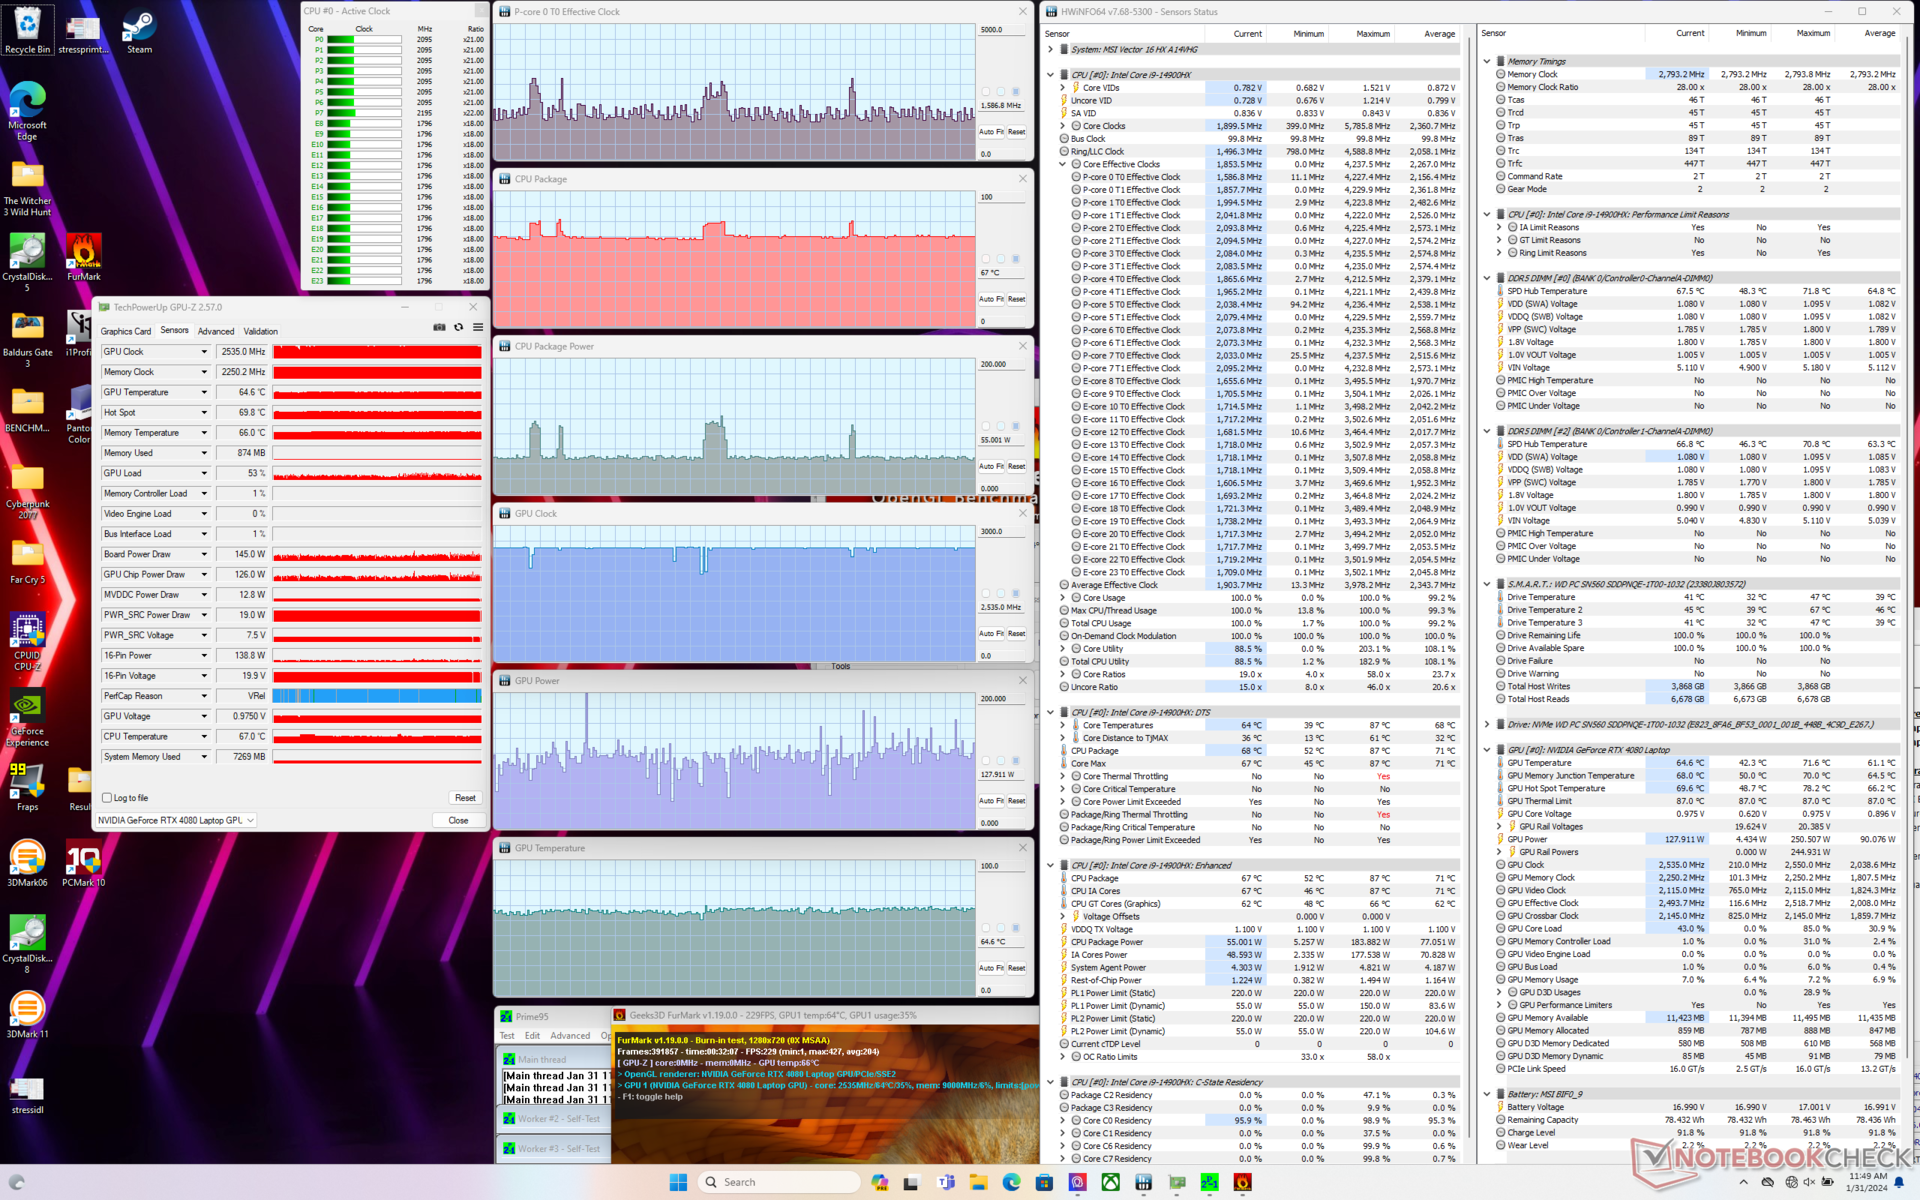
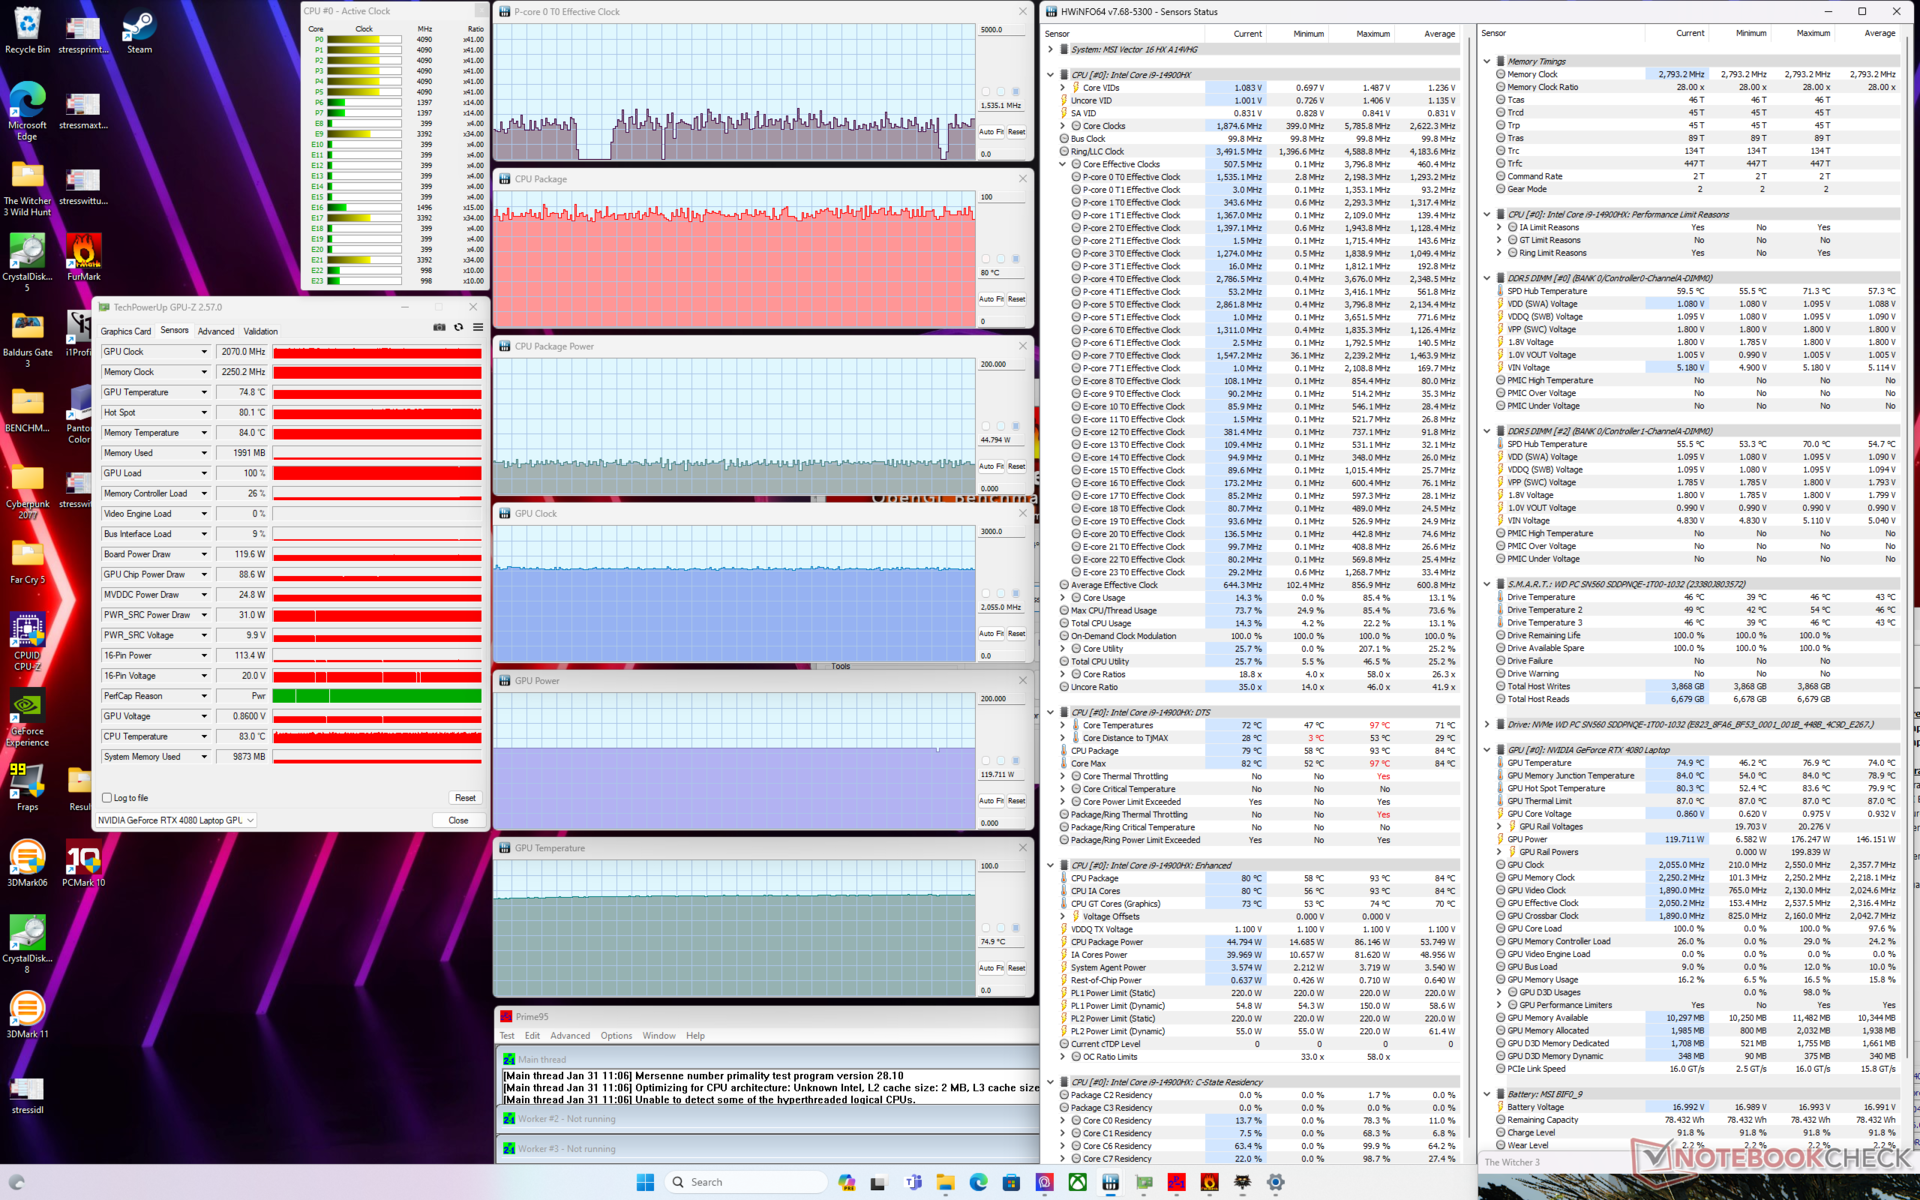
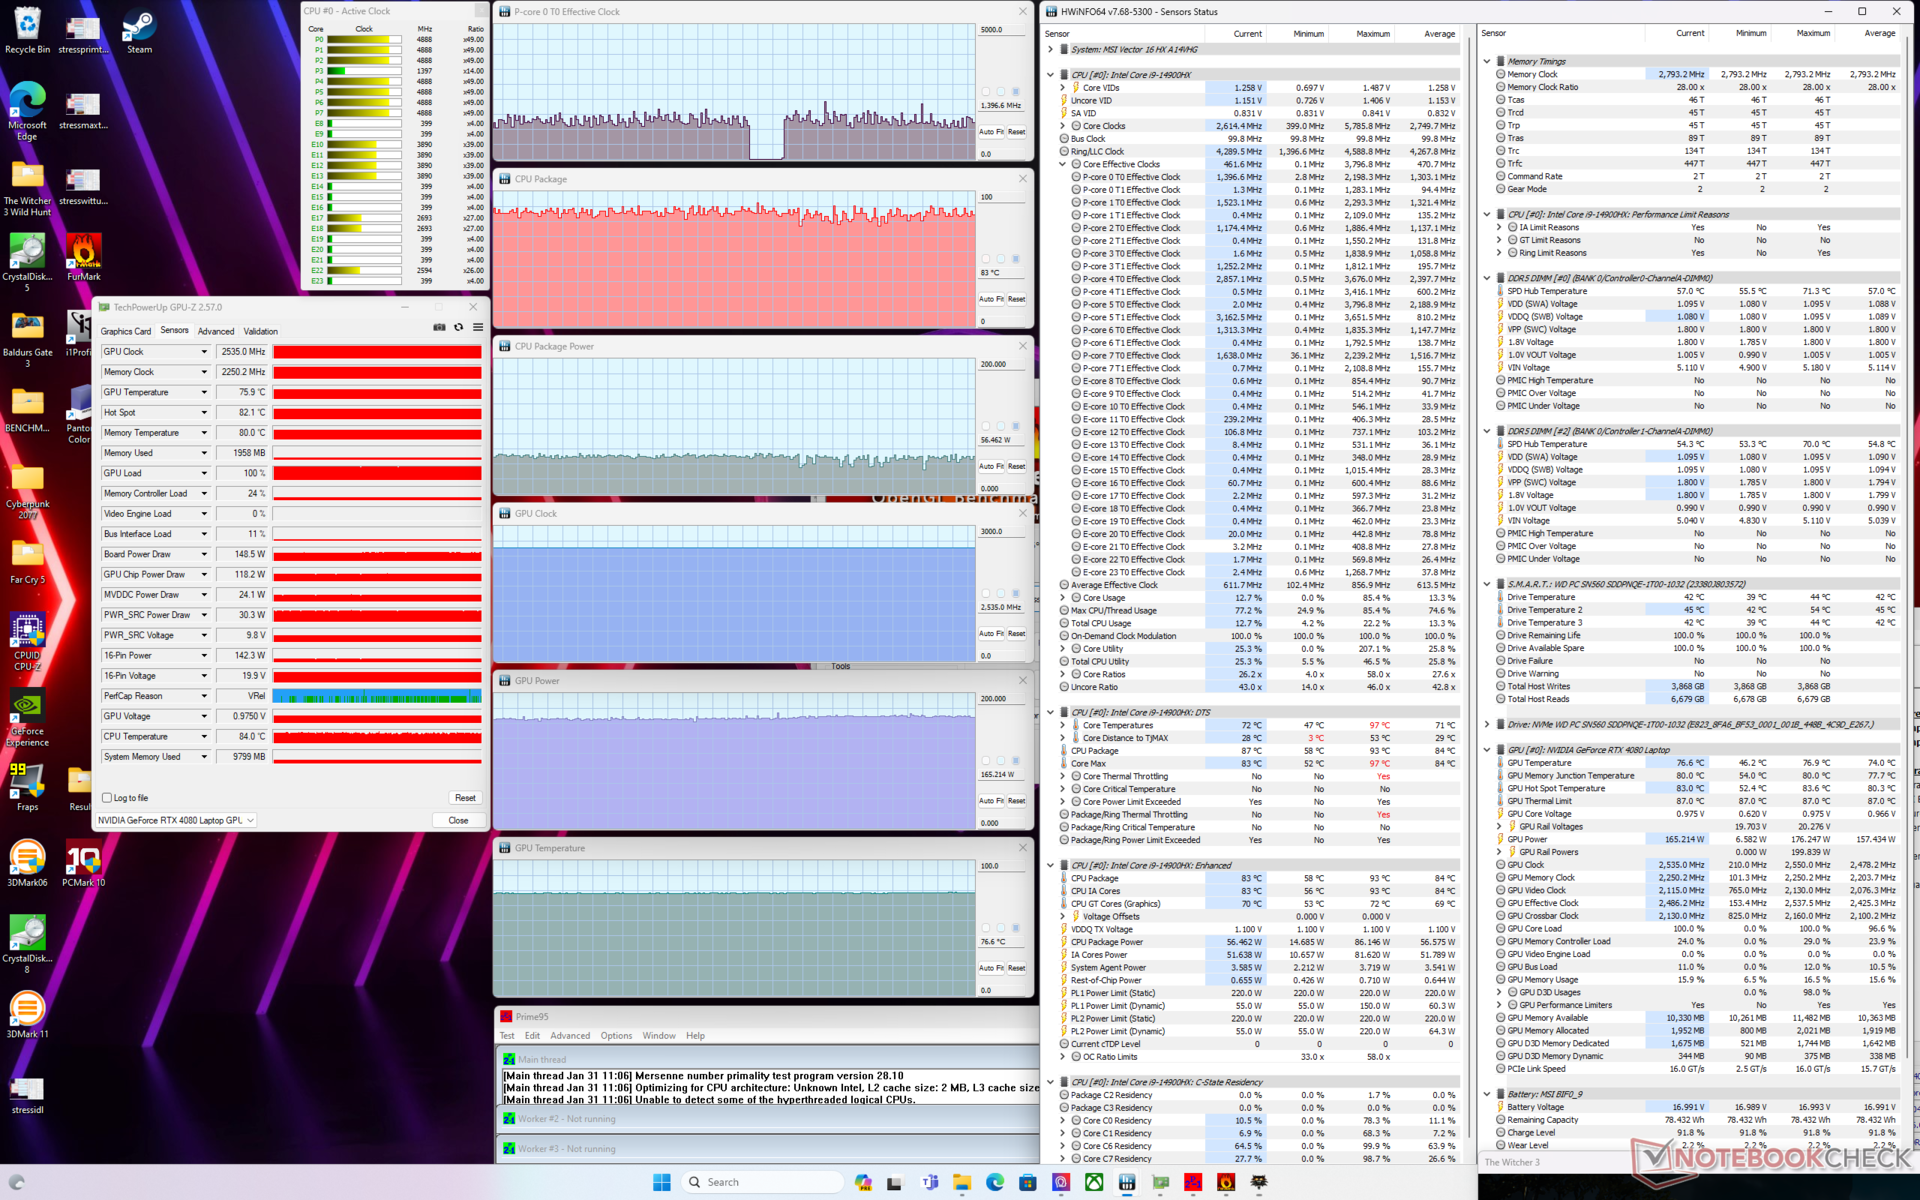
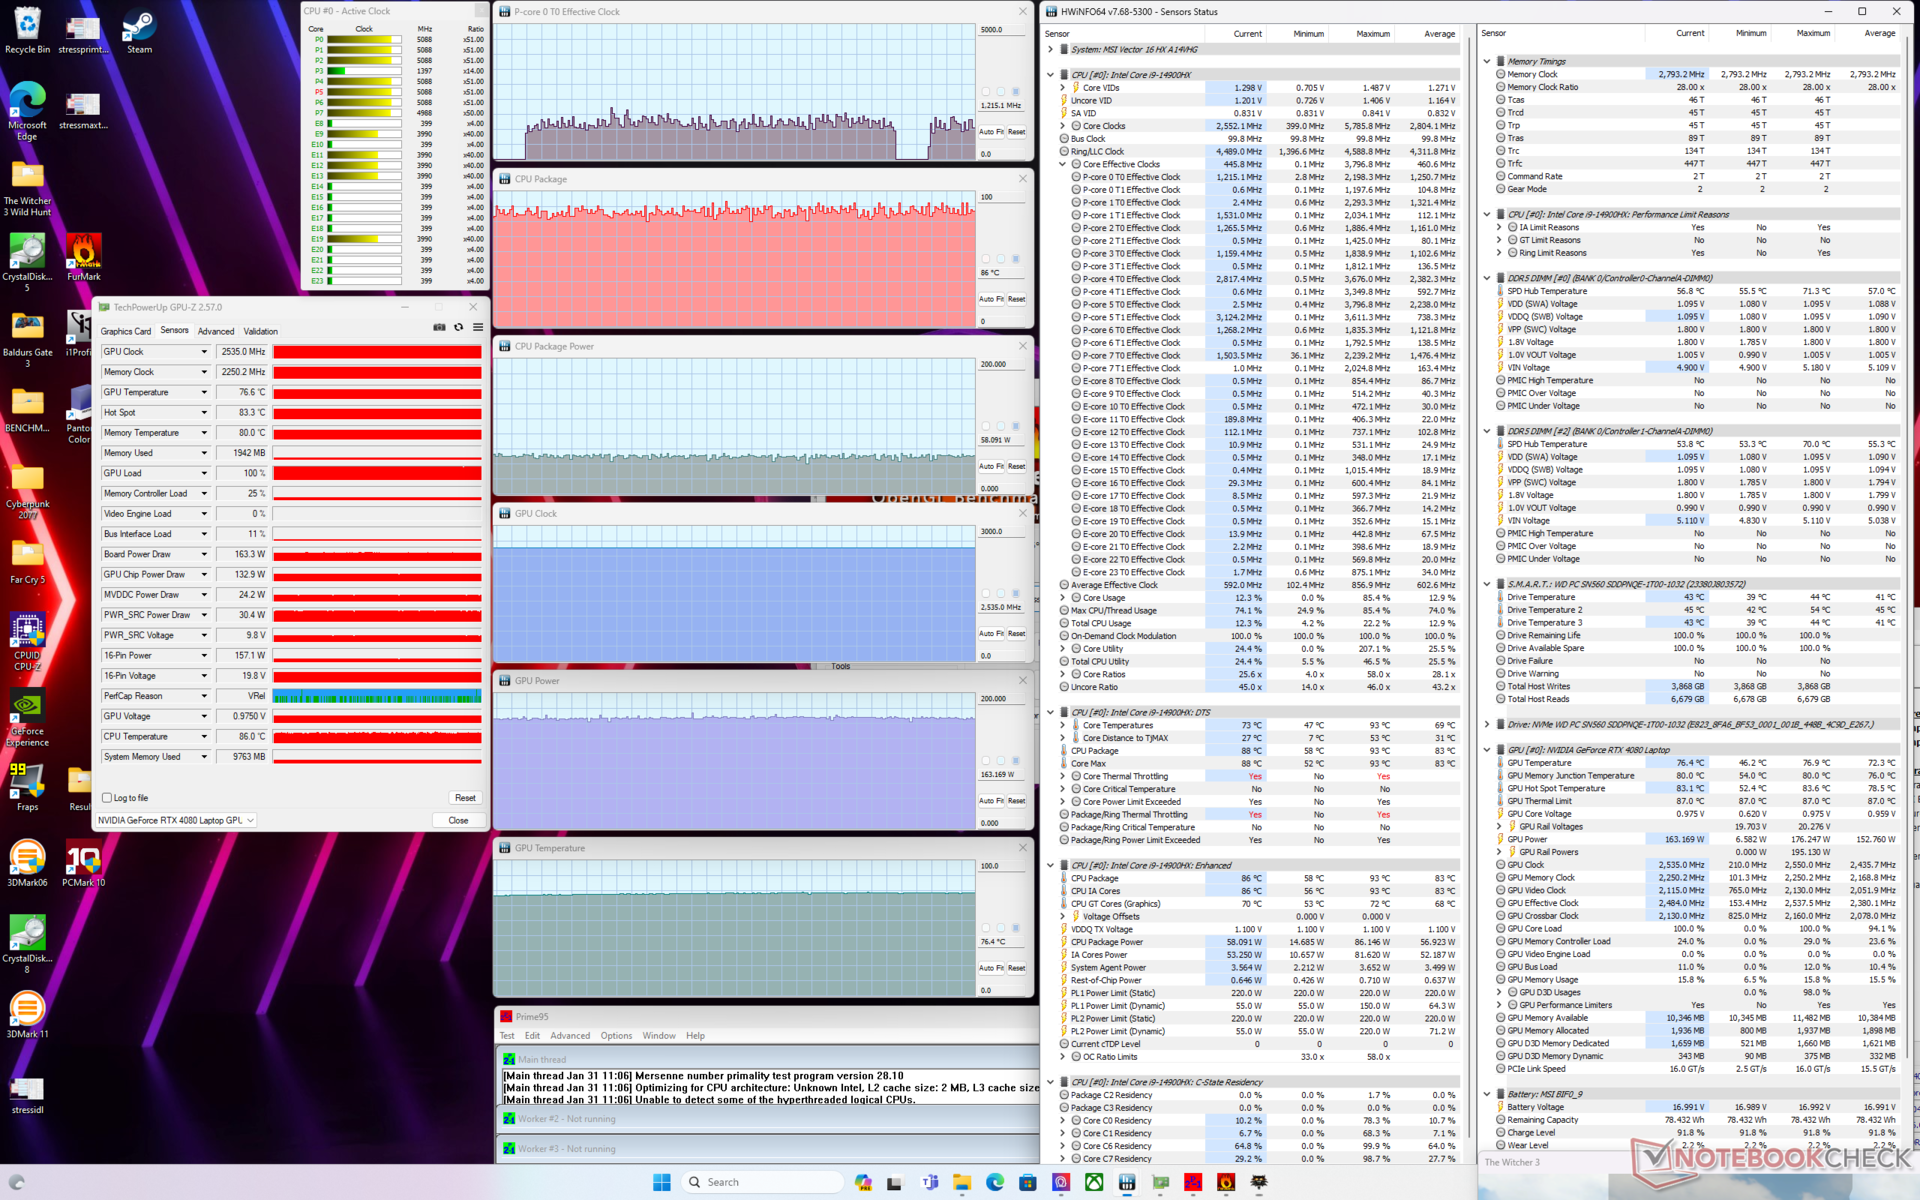
| CPU 时钟 (GHz) | GPU 时钟 (MHz) | CPU 平均温度 (°C) | GPU 平均温度(°C) | |
| 系统闲置 | -- | -- | 44 | 36 |
| Prime95 压力 | 3.3 | -- | 82 | 50 |
| Prime95 + FurMark 压力(极致性能,开启散热器升压) | ~1.7 | 2535 | 67 | 65 |
| Witcher 3 压力(平衡模式) | ~1.5 | 2055 | 81 | 75 |
| Witcher 3 压力(极致性能,冷却器增强功能关闭) | ~1.5 | 2535 | 83 | 77 |
| Witcher 3 压力(极致性能,冷却器启动) | ~1.5 | 2535 | 85 | 77 |
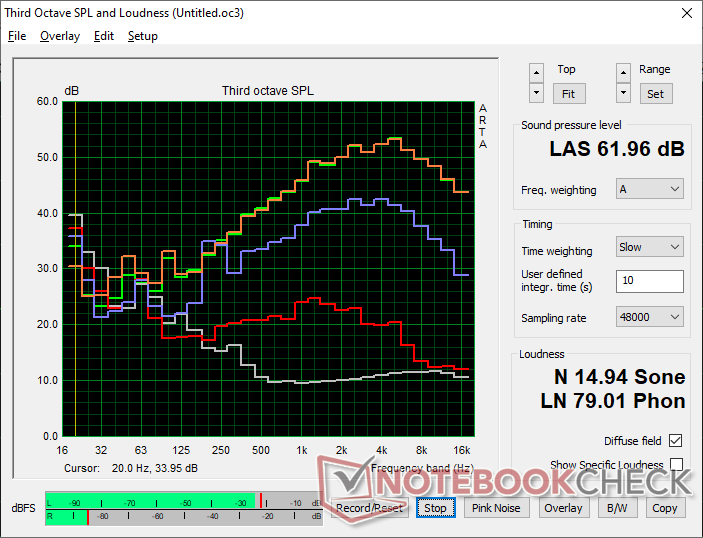
发言人
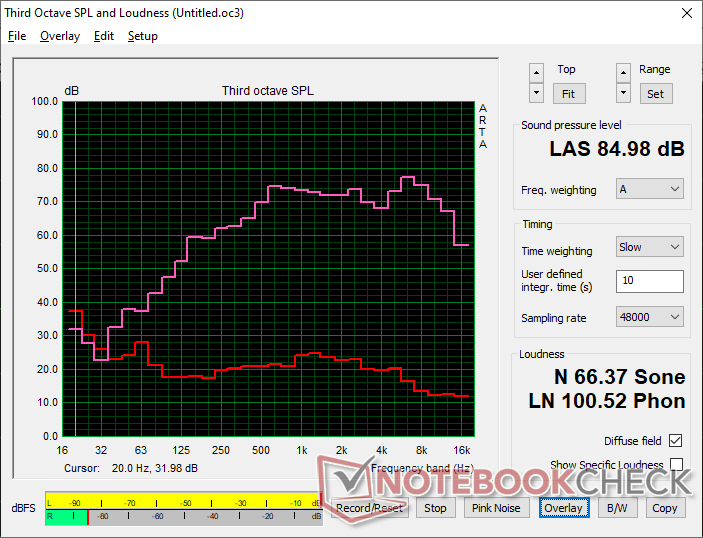
MSI Vector 16 HX A14V audio analysis
(+) | speakers can play relatively loud (85 dB)
Bass 100 - 315 Hz
(±) | reduced bass - on average 12.7% lower than median
(+) | bass is linear (6.8% delta to prev. frequency)
Mids 400 - 2000 Hz
(+) | balanced mids - only 3% away from median
(+) | mids are linear (3.6% delta to prev. frequency)
Highs 2 - 16 kHz
(+) | balanced highs - only 3.1% away from median
(+) | highs are linear (6.7% delta to prev. frequency)
Overall 100 - 16.000 Hz
(+) | overall sound is linear (12.6% difference to median)
Compared to same class
» 16% of all tested devices in this class were better, 4% similar, 81% worse
» The best had a delta of 6%, average was 18%, worst was 132%
Compared to all devices tested
» 11% of all tested devices were better, 3% similar, 86% worse
» The best had a delta of 4%, average was 23%, worst was 134%
Apple MacBook Pro 16 2021 M1 Pro audio analysis
(+) | speakers can play relatively loud (84.7 dB)
Bass 100 - 315 Hz
(+) | good bass - only 3.8% away from median
(+) | bass is linear (5.2% delta to prev. frequency)
Mids 400 - 2000 Hz
(+) | balanced mids - only 1.3% away from median
(+) | mids are linear (2.1% delta to prev. frequency)
Highs 2 - 16 kHz
(+) | balanced highs - only 1.9% away from median
(+) | highs are linear (2.7% delta to prev. frequency)
Overall 100 - 16.000 Hz
(+) | overall sound is linear (4.6% difference to median)
Compared to same class
» 0% of all tested devices in this class were better, 0% similar, 100% worse
» The best had a delta of 5%, average was 17%, worst was 45%
Compared to all devices tested
» 0% of all tested devices were better, 0% similar, 100% worse
» The best had a delta of 4%, average was 23%, worst was 134%
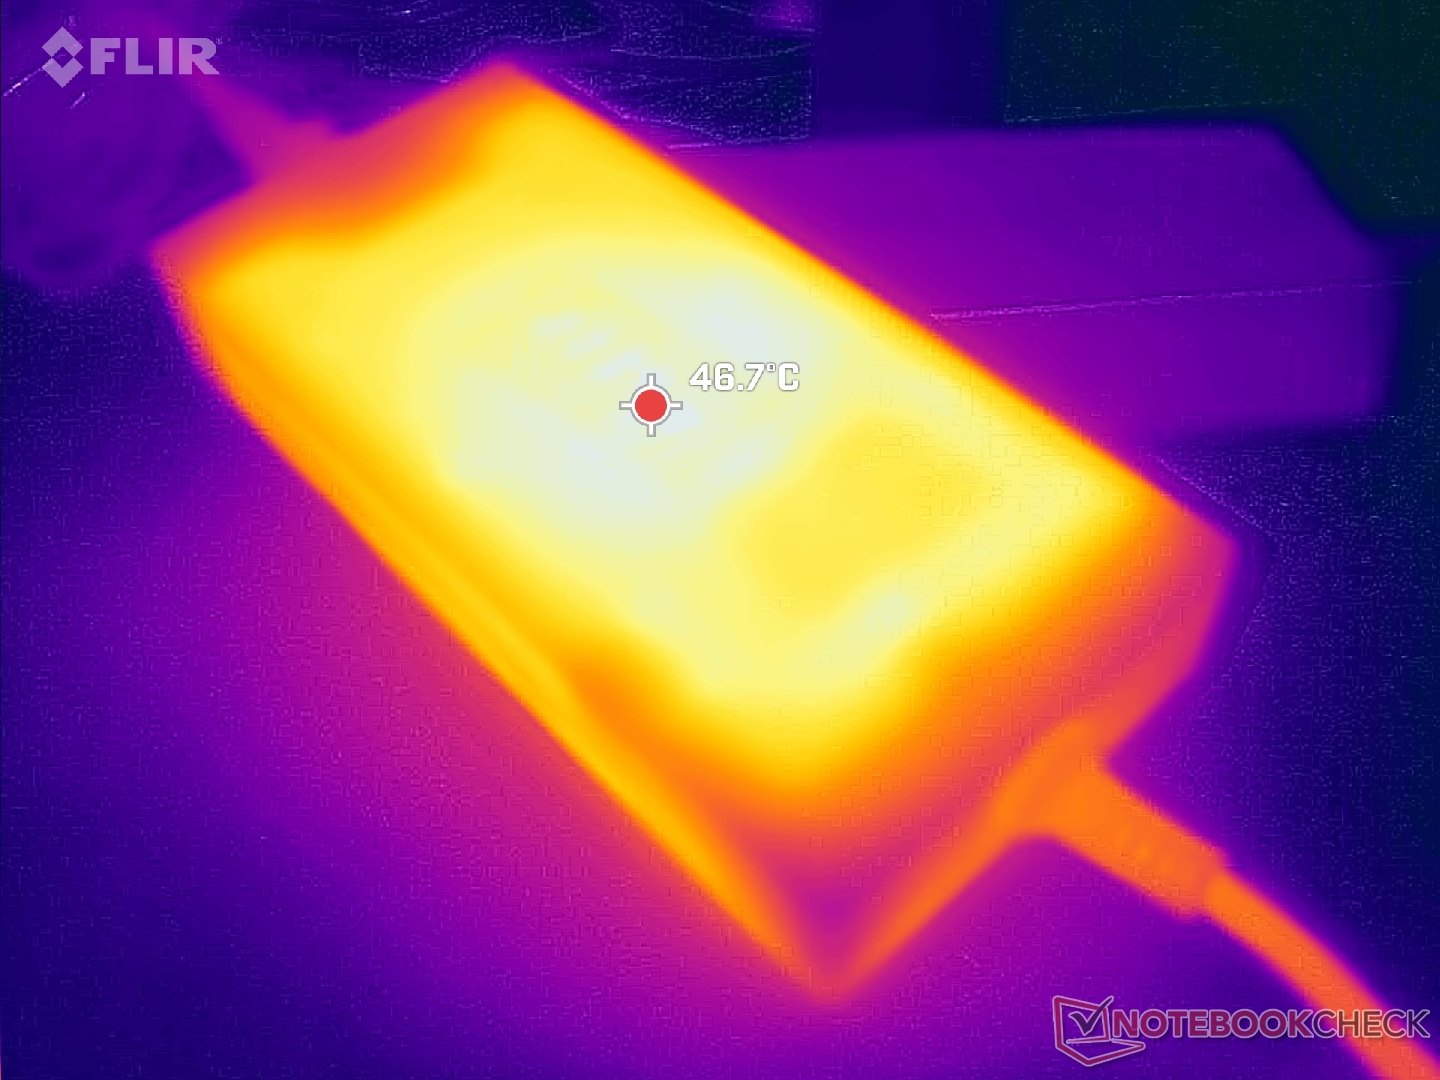
能源管理
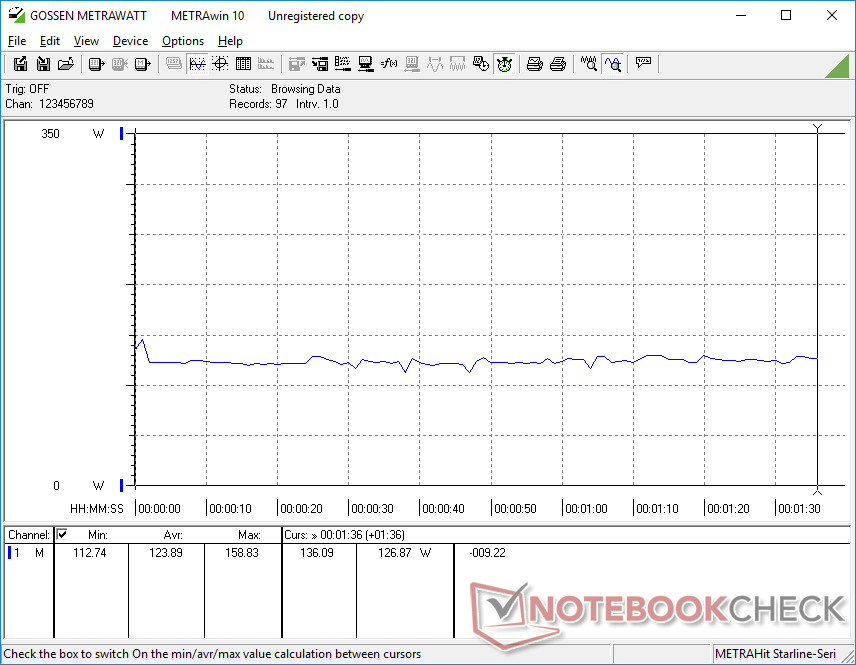
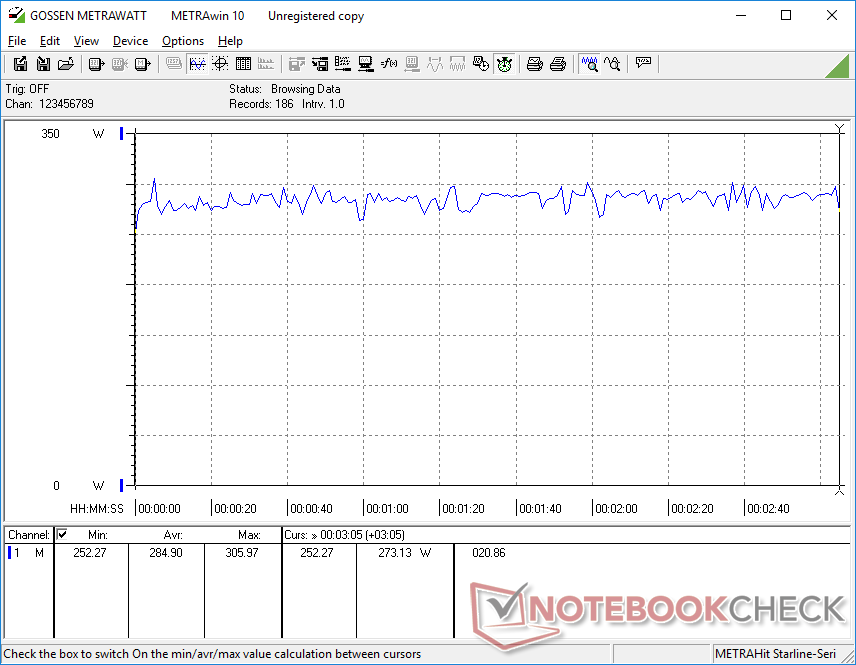
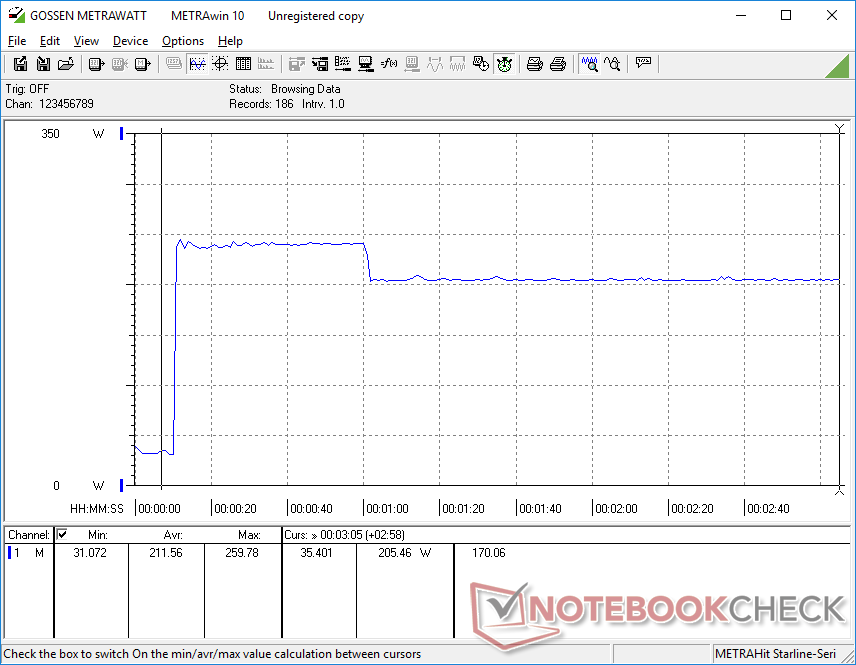
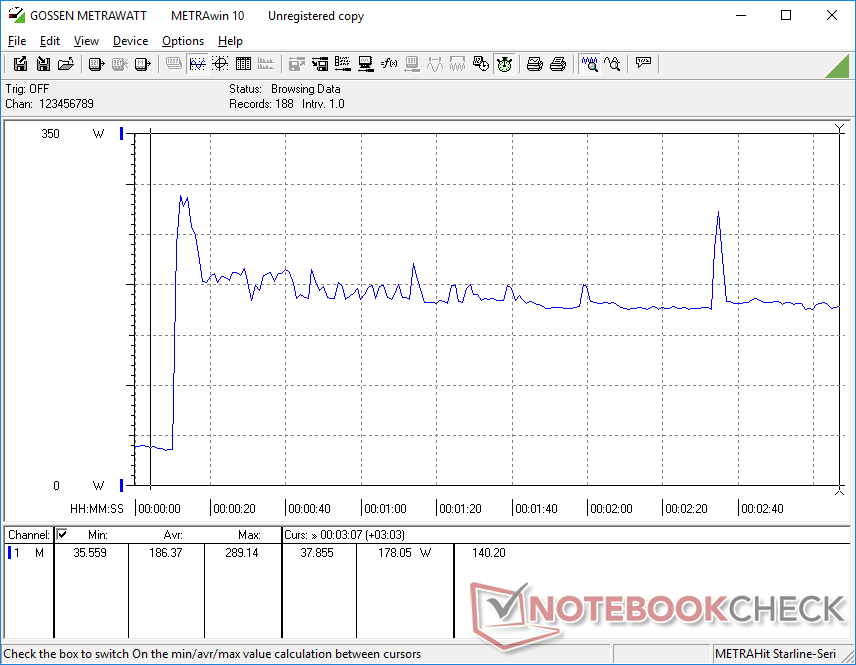
耗电量
Vector 16 HX 可能比即将推出的 Vector GP66 更快,但也更耗电。运行 Witcher 3和 Prime95 分别需要比旧型号多 27% 和 58% 的功率。即便如此,性能的提升还是远大于功率的提升,从而实现了更高的每瓦性能。
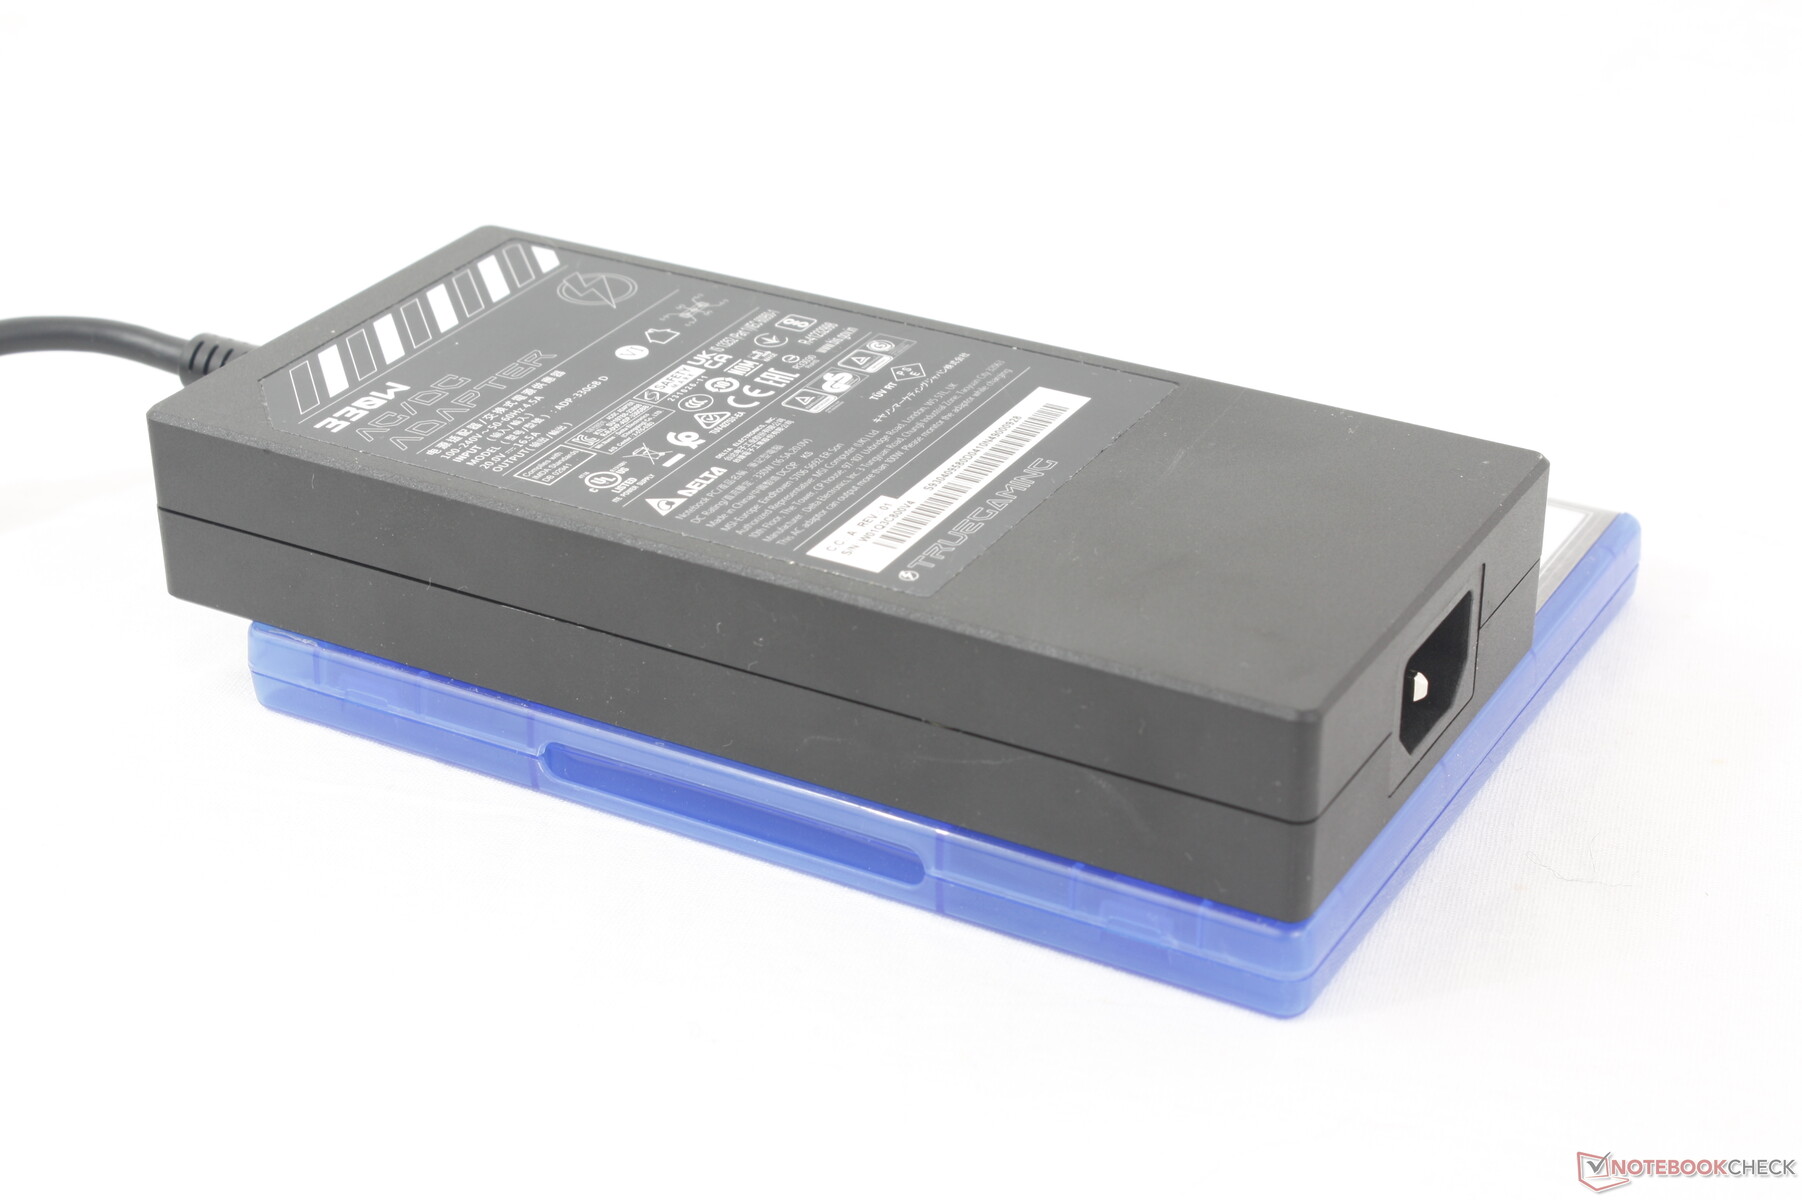
根据配置的不同,系统随附 280 瓦或 330 瓦交流适配器。新的 330 瓦交流适配器相对较薄,约为 18.5 x 8.5 x 3.2 厘米,与老款 GP66 的 280 瓦交流适配器约 18 x 8.5 x 3.5 厘米大小差不多。
| Off / Standby | |
| Idle | |
| Load |
|
Key:
min: | |
| MSI Vector 16 HX A14V i9-14900HX, GeForce RTX 4080 Laptop GPU, WD PC SN560 SDDPNQE-1T00, IPS, 2560x1600, 16" | MSI Vector GP66 12UGS i9-12900H, GeForce RTX 3070 Ti Laptop GPU, , IPS, 1920x1080, 15.6" | Lenovo Legion 5 16IRX G9 i7-14650HX, GeForce RTX 4060 Laptop GPU, Samsung PM9A1 MZVL21T0HCLR, IPS, 2560x1600, 16" | HP Victus 16-r0077ng i7-13700H, GeForce RTX 4070 Laptop GPU, Kioxia XG8 KXG80ZNV1T02, IPS, 1920x1080, 16.1" | Asus TUF Gaming A16 FA617XS R9 7940HS, Radeon RX 7600S, Micron 2400 MTFDKBA512QFM, IPS, 1920x1200, 16" | Dell G16 7620 i7-12700H, GeForce RTX 3060 Laptop GPU, WDC PC SN810 512GB, IPS, 2560x1600, 16" | |
|---|---|---|---|---|---|---|
| Power Consumption | -2% | 20% | 38% | 47% | 18% | |
| Idle Minimum * (Watt) | 15.8 | 17.5 -11% | 15.4 3% | 8 49% | 7 56% | 14.4 9% |
| Idle Average * (Watt) | 23.3 | 20.1 14% | 19.7 15% | 13 44% | 10 57% | 17.8 24% |
| Idle Maximum * (Watt) | 30 | 47.3 -58% | 20.7 31% | 22 27% | 15 50% | 31.5 -5% |
| Load Average * (Watt) | 123.9 | 107.3 13% | 102.6 17% | 86 31% | 86 31% | 101.2 18% |
| Witcher 3 ultra * (Watt) | 285 | 225 21% | 191.3 33% | 141.8 50% | 160.6 44% | 176.9 38% |
| Load Maximum * (Watt) | 306 | 277.7 9% | 246.6 19% | 233 24% | 172 44% | 242.9 21% |
* ... smaller is better
Power Consumption Witcher 3 / Stresstest
Power Consumption external Monitor
电池寿命
与旧款 Vector GP66 设计相比,电池容量从 65 Wh 大幅增加到 90 Wh,但实际运行时间却没有增加。在使用 iGPU 的情况下,在平衡电源配置文件下进行 WLAN 浏览,在自动关机前仍需约 5.5 小时。其他 16 英寸系统,如联想Legion 5 16 或 惠普 Victus 16等其他 16 英寸系统相比,每台都能多用几个小时。
使用随附的交流适配器,从空电到满电需要近 2.5 个小时。该系统可通过右侧边缘的 USB-C 接口充电。
| MSI Vector 16 HX A14V i9-14900HX, GeForce RTX 4080 Laptop GPU, 90 Wh | MSI Vector GP66 12UGS i9-12900H, GeForce RTX 3070 Ti Laptop GPU, 65 Wh | Lenovo Legion 5 16IRX G9 i7-14650HX, GeForce RTX 4060 Laptop GPU, 80 Wh | HP Victus 16-r0077ng i7-13700H, GeForce RTX 4070 Laptop GPU, 83 Wh | Asus TUF Gaming A16 FA617XS R9 7940HS, Radeon RX 7600S, 90 Wh | Dell G16 7620 i7-12700H, GeForce RTX 3060 Laptop GPU, 84 Wh | |
|---|---|---|---|---|---|---|
| Battery runtime | -17% | -4% | 29% | 60% | -31% | |
| Reader / Idle (h) | 10.7 | 7.9 -26% | 20.3 90% | 7.1 -34% | ||
| WiFi v1.3 (h) | 5.5 | 5.7 4% | 7.4 35% | 7.1 29% | 12.4 125% | 5 -9% |
| Load (h) | 1.4 | 1 -29% | 0.8 -43% | 0.9 -36% | 0.7 -50% | |
| H.264 (h) | 9.6 | 12.4 |
Pros
Cons
结论--快速而酣畅淋漓
游戏笔记本电脑在便携性和性能之间徘徊,目前的趋势是倾向于便携性。微星 Vector 16 HX 毫不掩饰地倾向于性能,即使这意味着系统更厚、更大、更响。事实上,它是目前市场上最大、最响亮的 16 英寸游戏笔记本电脑之一。
微星 Vector 16 HX 在风扇噪音和尺寸方面毫不逊色。反过来,它在性能方面也超越了其他采用相同GeForce RTX 4080 或 4090 GPU 的游戏笔记本电脑。
大尺寸和大风扇并非徒有其表,因为该机型在性能方面表现出色。175 瓦 GeForce RTX 4080 GPU比平均水平快 10%左右,甚至可以与某些配备 RTX 4090 的笔记本电脑并驾齐驱。仅凭这一点,就可能吸引那些不介意牺牲一点便携性来换取额外马力的性能猎手。它的机身也很坚固,盖子也很结实,这一点是许多更薄的替代产品所无法比拟的。
当然,还有一些方面可以做得更好。如果微星想坚持采用大尺寸设计,那么就应该让维修变得更容易,并考虑采用液冷或蒸汽腔来降低风扇噪音。数字键盘或至少方向键应该做得更大一些,就像联想笔记本电脑上的方向键一样。 联想Legion 5 16.
MSI Vector 16 HX A14V
- 02/03/2024 v7 (old)
Allen Ngo
Transparency
The selection of devices to be reviewed is made by our editorial team. The test sample was provided to the author as a loan by the manufacturer or retailer for the purpose of this review. The lender had no influence on this review, nor did the manufacturer receive a copy of this review before publication. There was no obligation to publish this review. As an independent media company, Notebookcheck is not subjected to the authority of manufacturers, retailers or publishers.
This is how Notebookcheck is testing
Every year, Notebookcheck independently reviews hundreds of laptops and smartphones using standardized procedures to ensure that all results are comparable. We have continuously developed our test methods for around 20 years and set industry standards in the process. In our test labs, high-quality measuring equipment is utilized by experienced technicians and editors. These tests involve a multi-stage validation process. Our complex rating system is based on hundreds of well-founded measurements and benchmarks, which maintains objectivity. Further information on our test methods can be found here.
Price comparison

