MSI Stealth 17 Studio回顾:一个拥有安静的RTX4080的笔记本电脑,几乎适用于各种场合
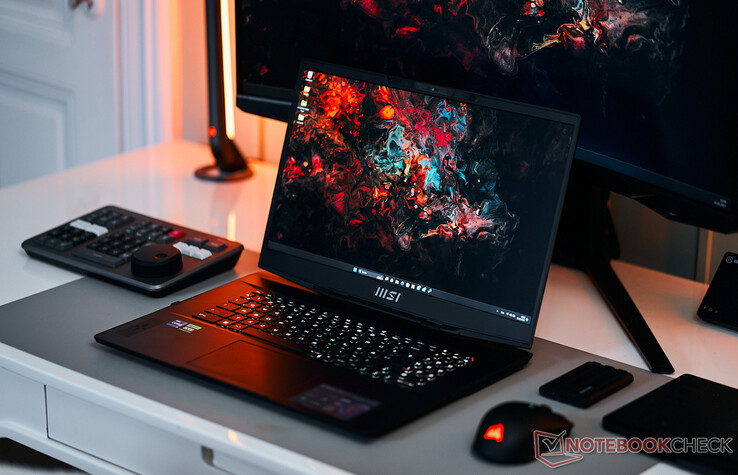
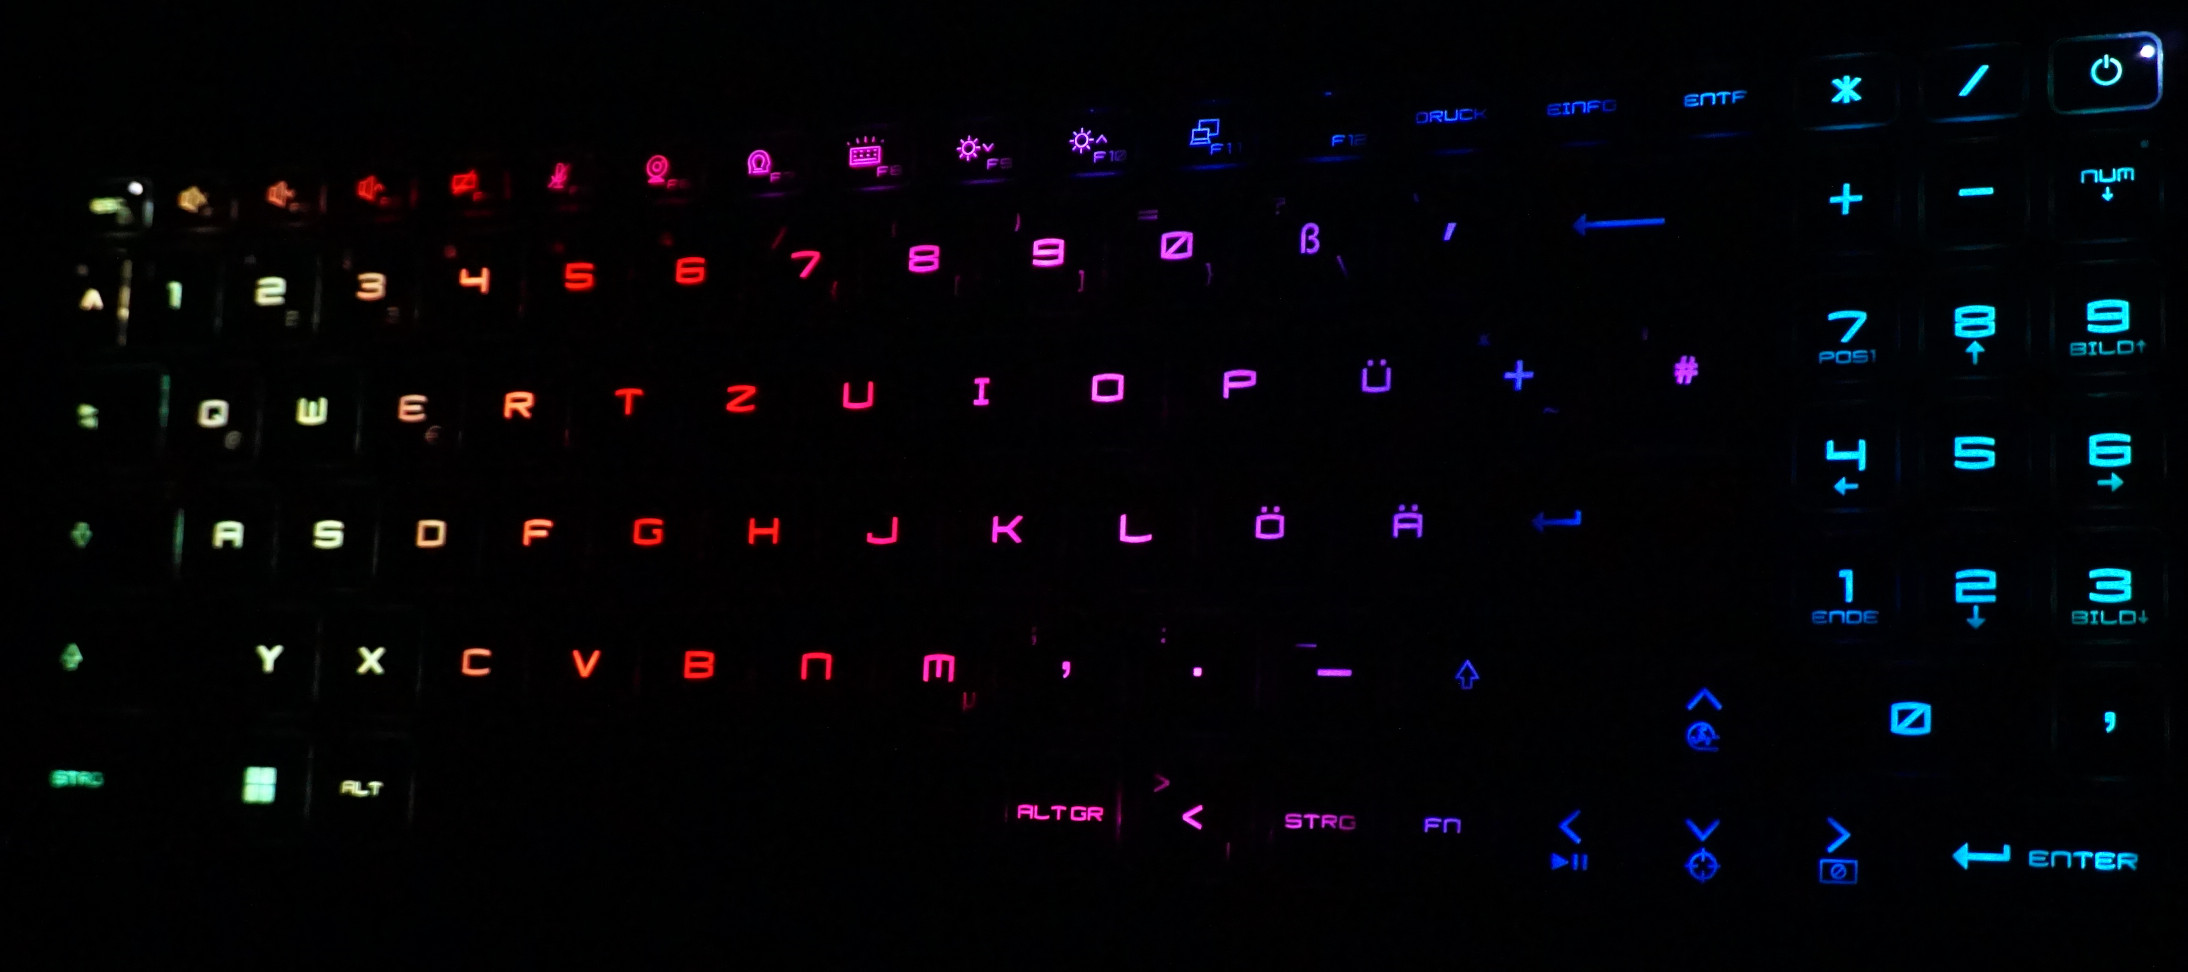
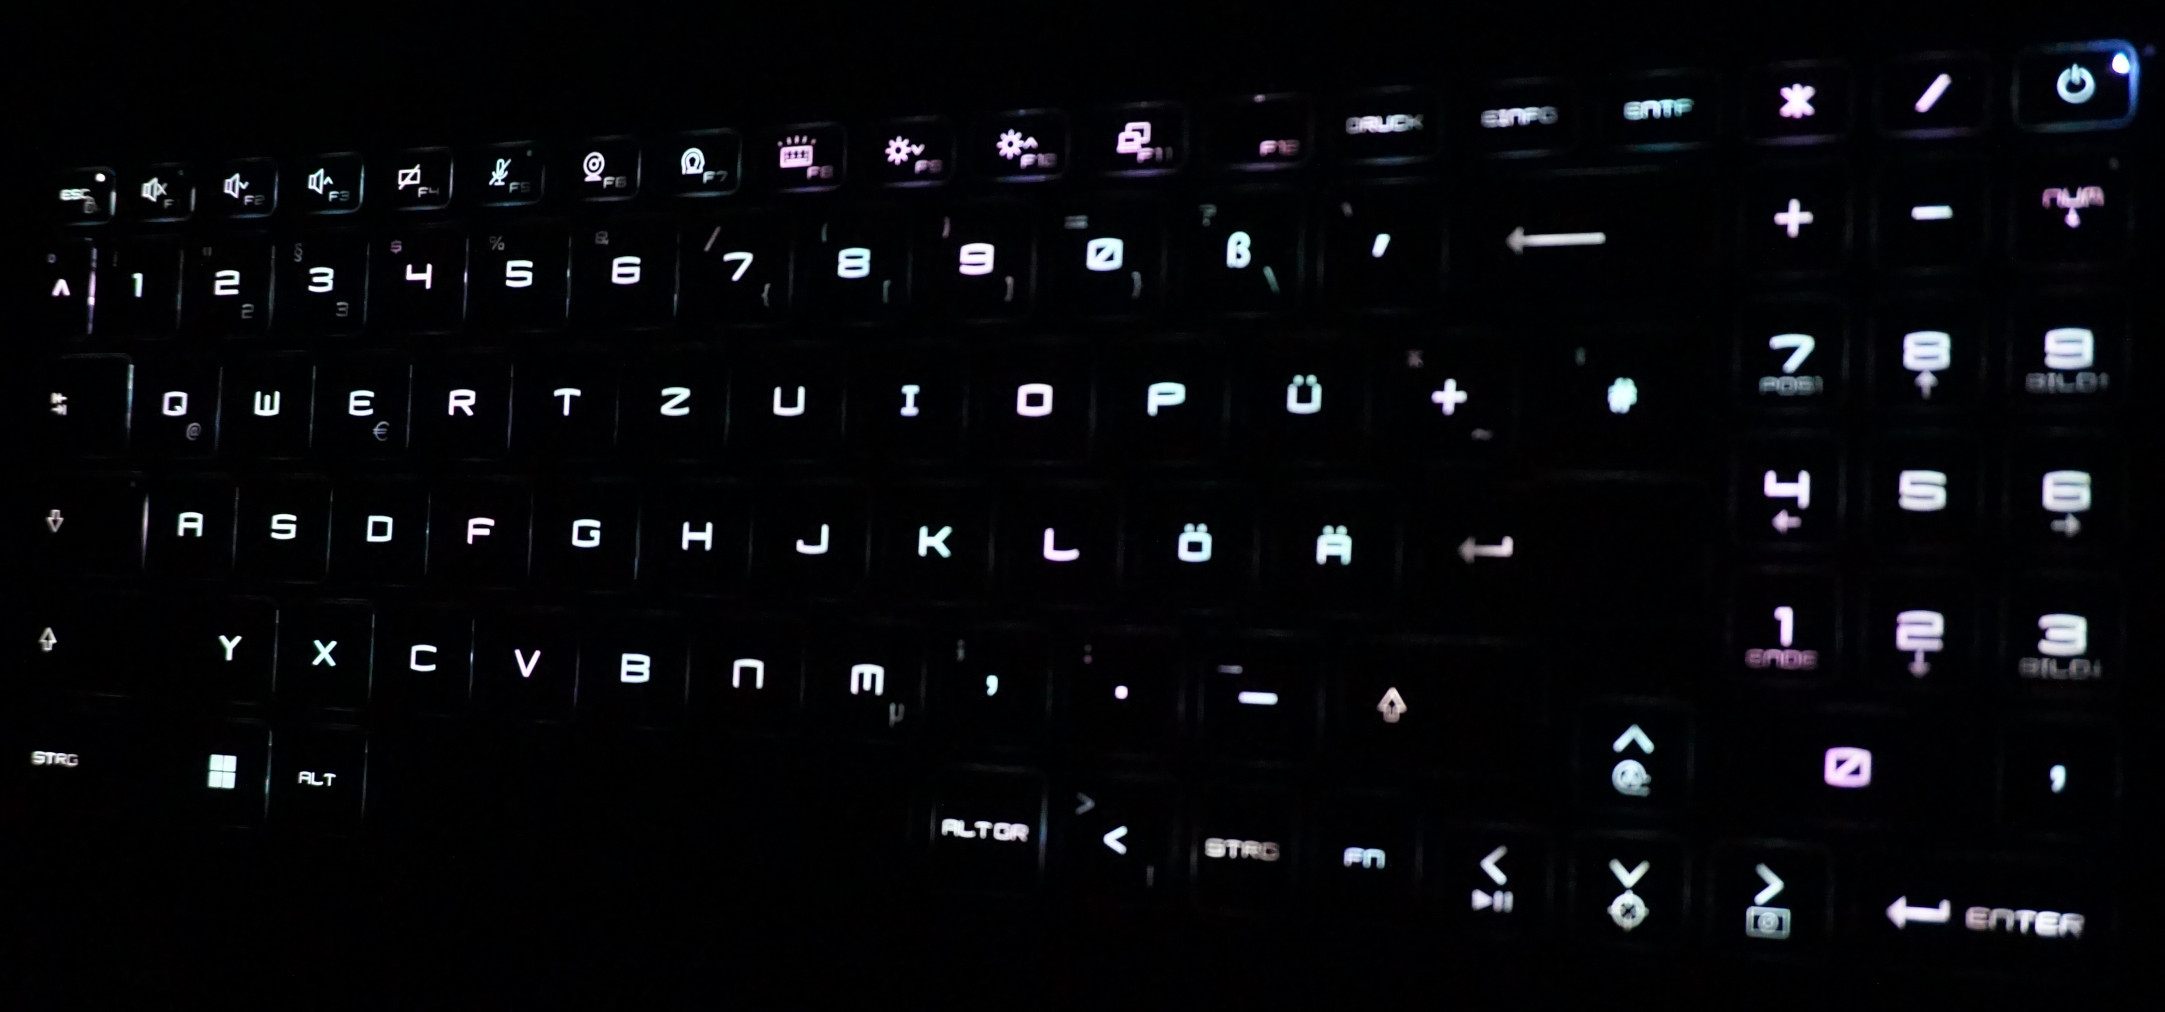
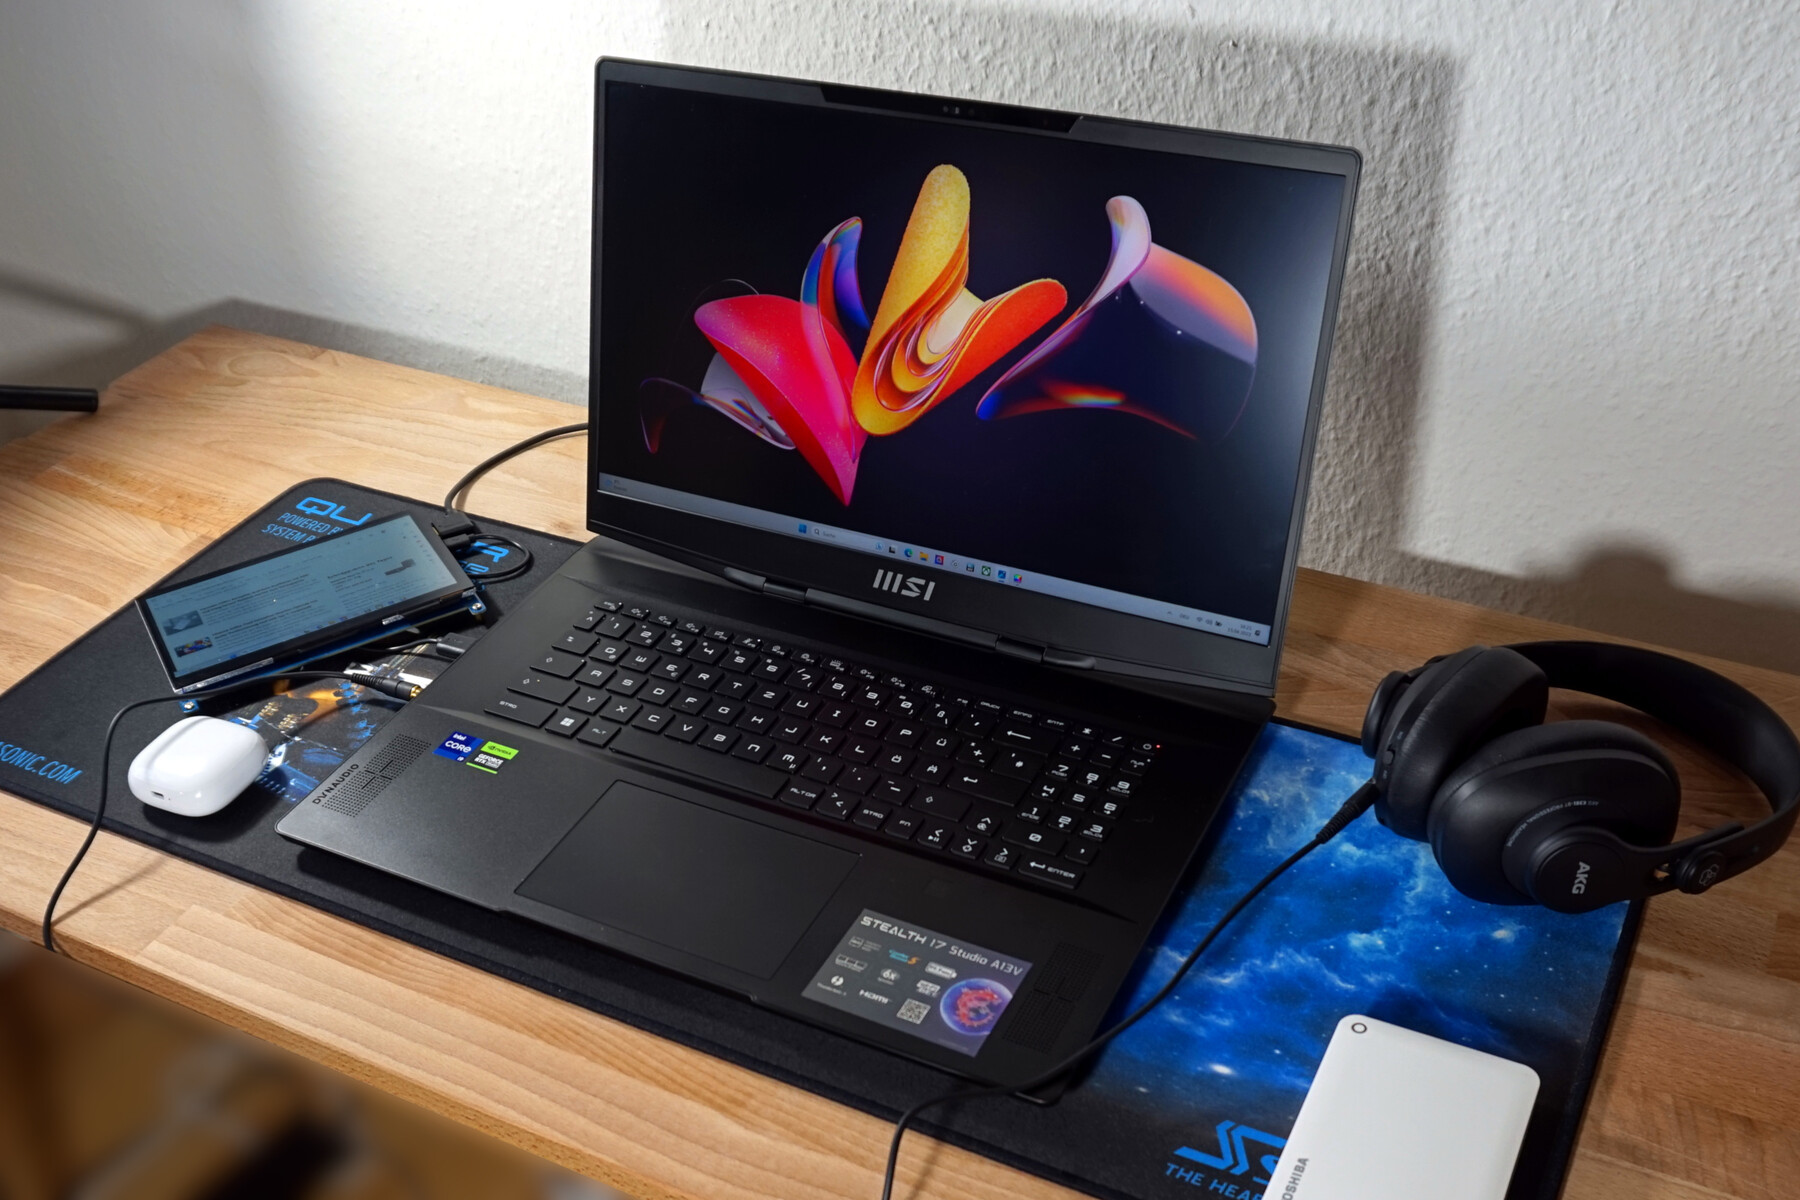
微星Stealth 17 Studio走的是一条细线。白天,它是一个相对清醒的工作设备:扁平的设计,白色的键盘背光,尽管有大量的硬件资源和大量的电力,但几乎听不到冷却噪音。到了晚上,它就变成了一个强大的游戏机:键盘灯光变成了彩虹效果,风扇启动,即使是要求很高的游戏也几乎达到100fps。
基本上,这一切似乎都是合理的。一台为创作者设计的笔记本电脑,为快速、高水平的图像和视频处理提供了充足的图形能力。这种能力在闲暇时间也应该在手。因此,微星只需将设备的谨慎外观和移动工作的最薄设计与足够强大的冷却系统和一些灯光效果相结合。最终,一个辉煌的迷你LED显示屏完美地满足了这两个世界。我们的审查揭示了它的成功程度和系统的安静程度,即使在处理快速移动的图像时也是如此。
要找到竞争对手并不那么容易,因为大多数笔记本电脑都是为游戏或内容创作而设计的。有了一个英特尔酷睿i9-13900H和一个NvidiaGeForce RTX 4080,它必须能够与一台 HP Omen 17-ck2097ng或 Razer Blade 16.看看去年高端领域的多媒体笔记本电脑也是无妨的,比如说Gigabyte Aero 16 YE5.
此外,你可以在我们的YouTube频道找到关于微星Stealth 17 Studio的视频:
潜在的竞争对手比较
Rating | Date | Model | Weight | Height | Size | Resolution | Price |
|---|---|---|---|---|---|---|---|
| 89.2 % v7 (old) | 04 / 2023 | MSI Stealth 17 Studio A13VH-014 i9-13900H, GeForce RTX 4080 Laptop GPU | 3 kg | 21.3 mm | 17.30" | 3840x2160 | |
| 91.2 % v7 (old) | 02 / 2023 | Razer Blade 16 Early 2023 i9-13950HX, GeForce RTX 4080 Laptop GPU | 2.4 kg | 21.99 mm | 16.00" | 2560x1600 | |
| 88.4 % v7 (old) | 04 / 2023 | Asus ROG Strix G17 G713PI R9 7945HX, GeForce RTX 4070 Laptop GPU | 2.8 kg | 30.7 mm | 17.30" | 2560x1440 | |
| 86 % v7 (old) | 04 / 2023 | Aorus 17X AZF i9-13900HX, GeForce RTX 4090 Laptop GPU | 2.9 kg | 21.8 mm | 17.30" | 2560x1440 | |
| 85.4 % v7 (old) | 03 / 2023 | HP Omen 17-ck2097ng i9-13900HX, GeForce RTX 4080 Laptop GPU | 2.8 kg | 27 mm | 17.30" | 2560x1440 | |
| 84.7 % v7 (old) | 03 / 2022 | Gigabyte Aero 16 YE5 i9-12900HK, GeForce RTX 3080 Ti Laptop GPU | 2.3 kg | 22.4 mm | 16.00" | 3840x2400 |
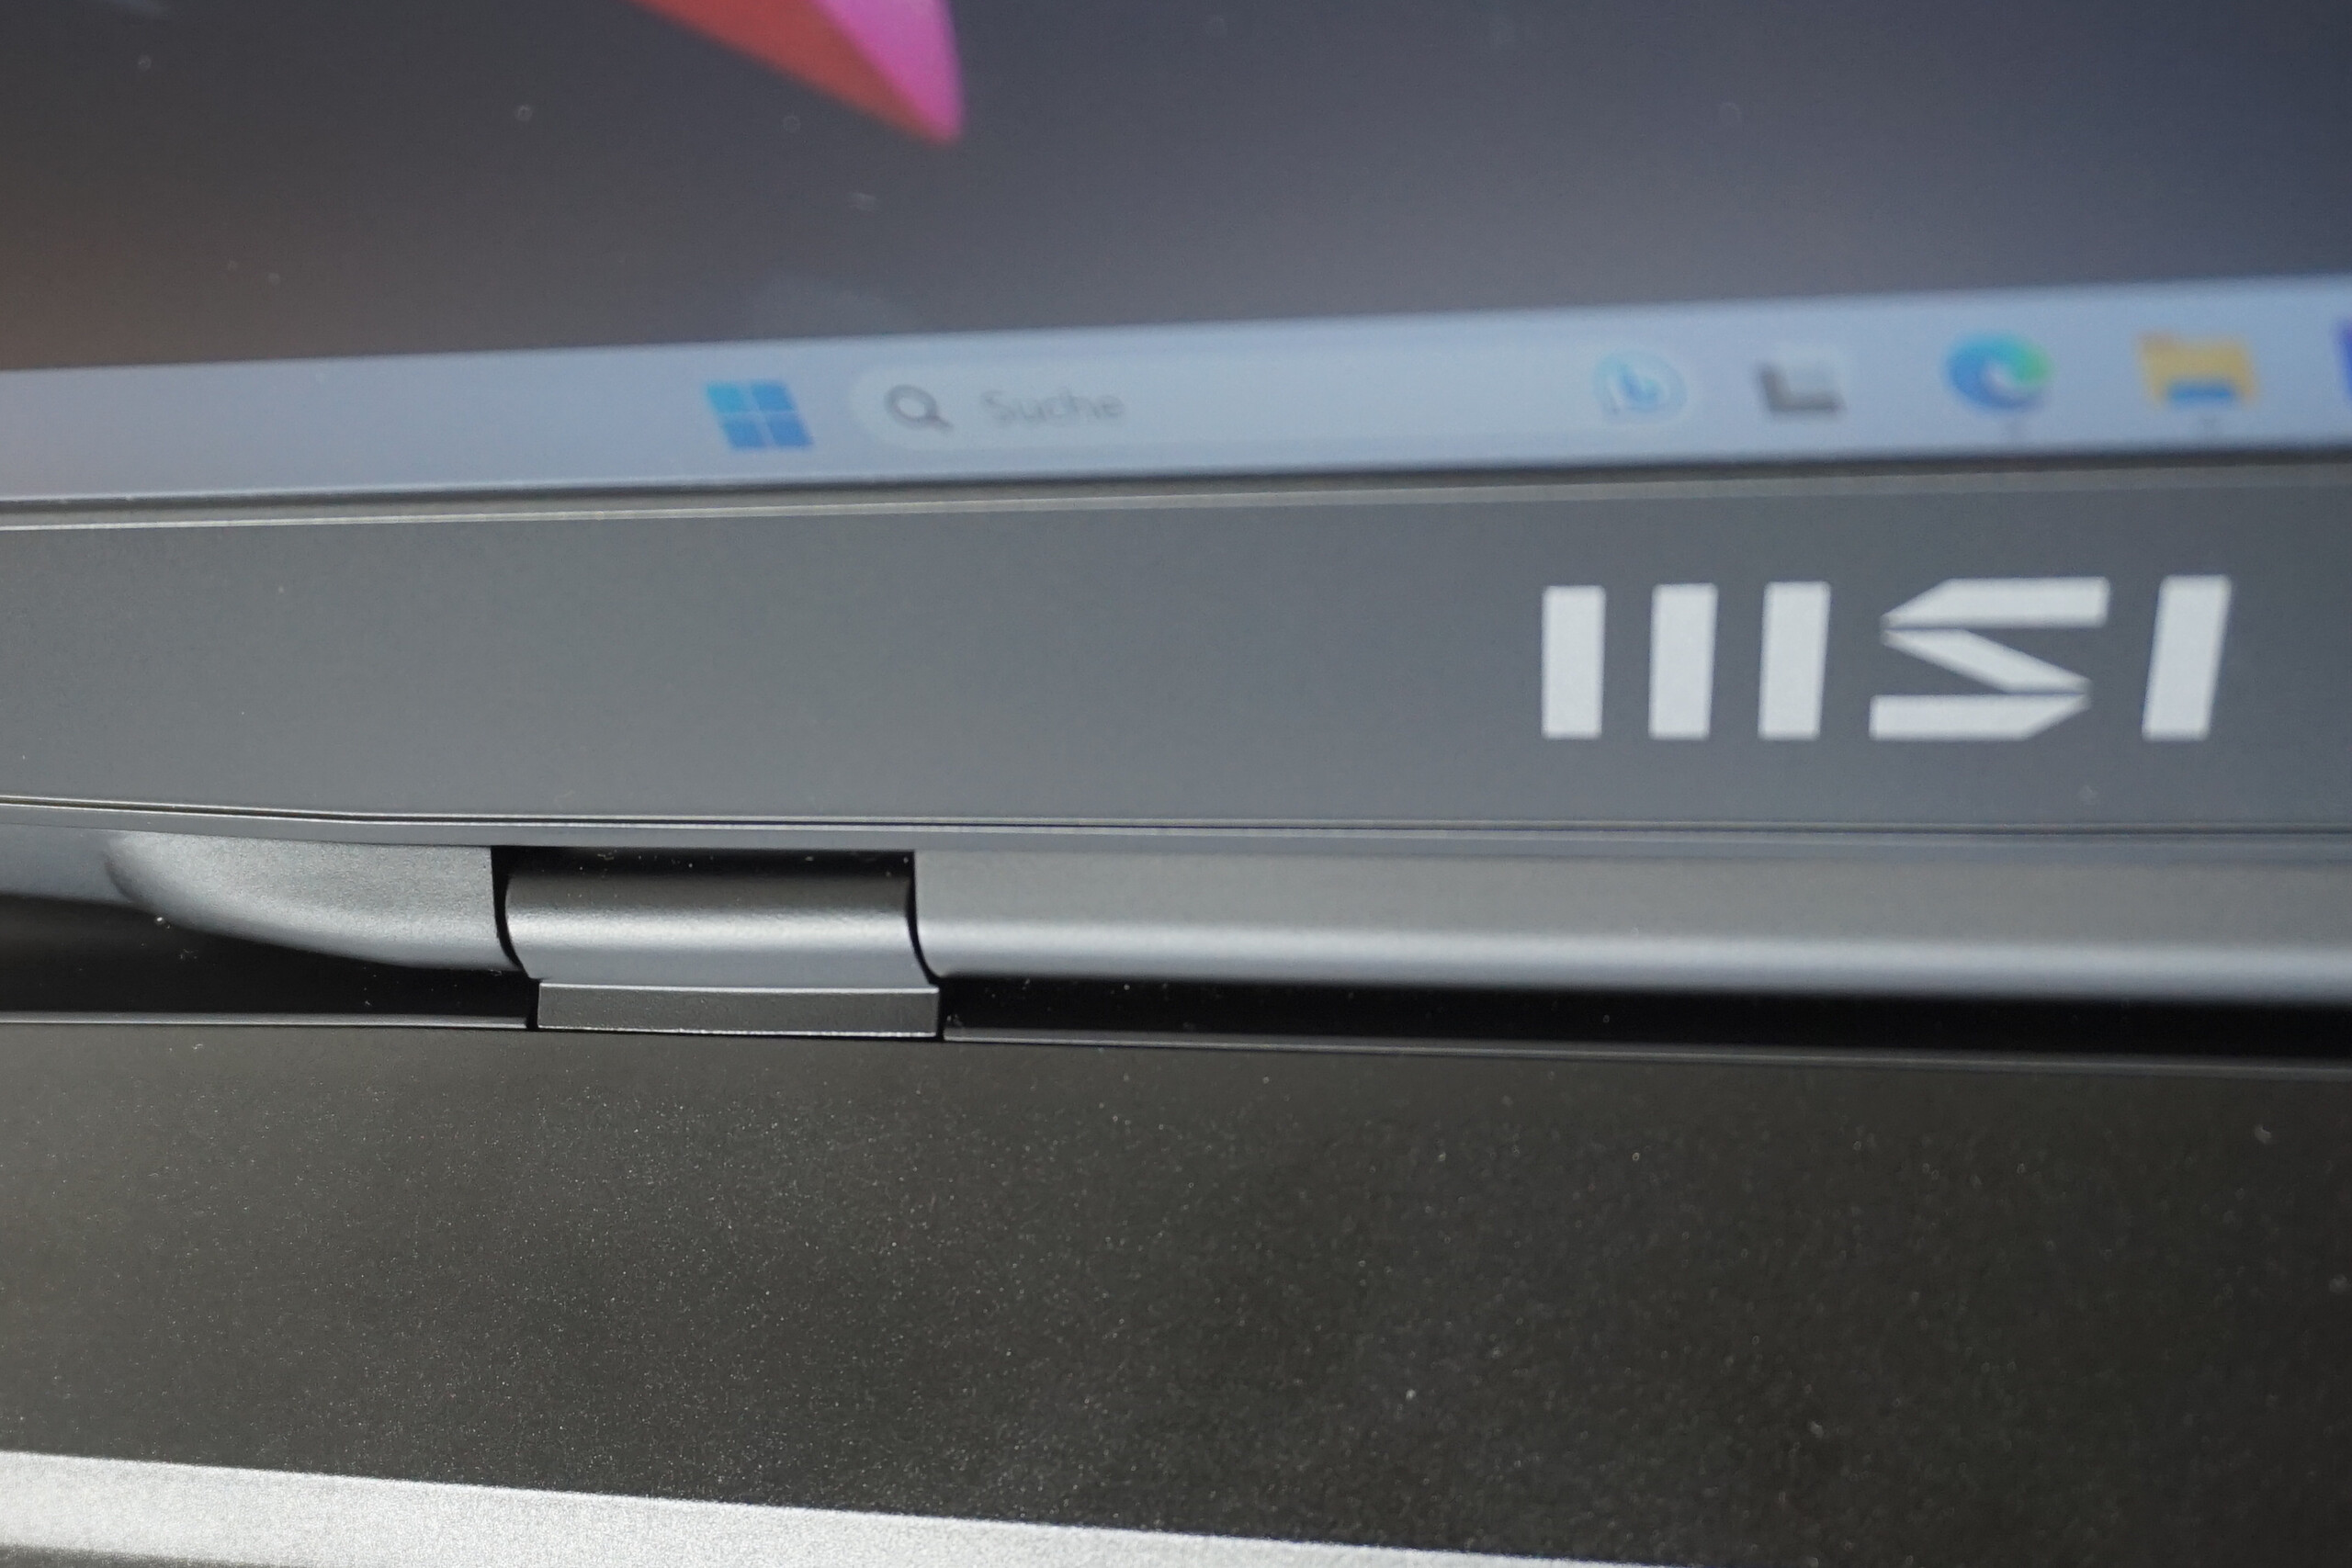
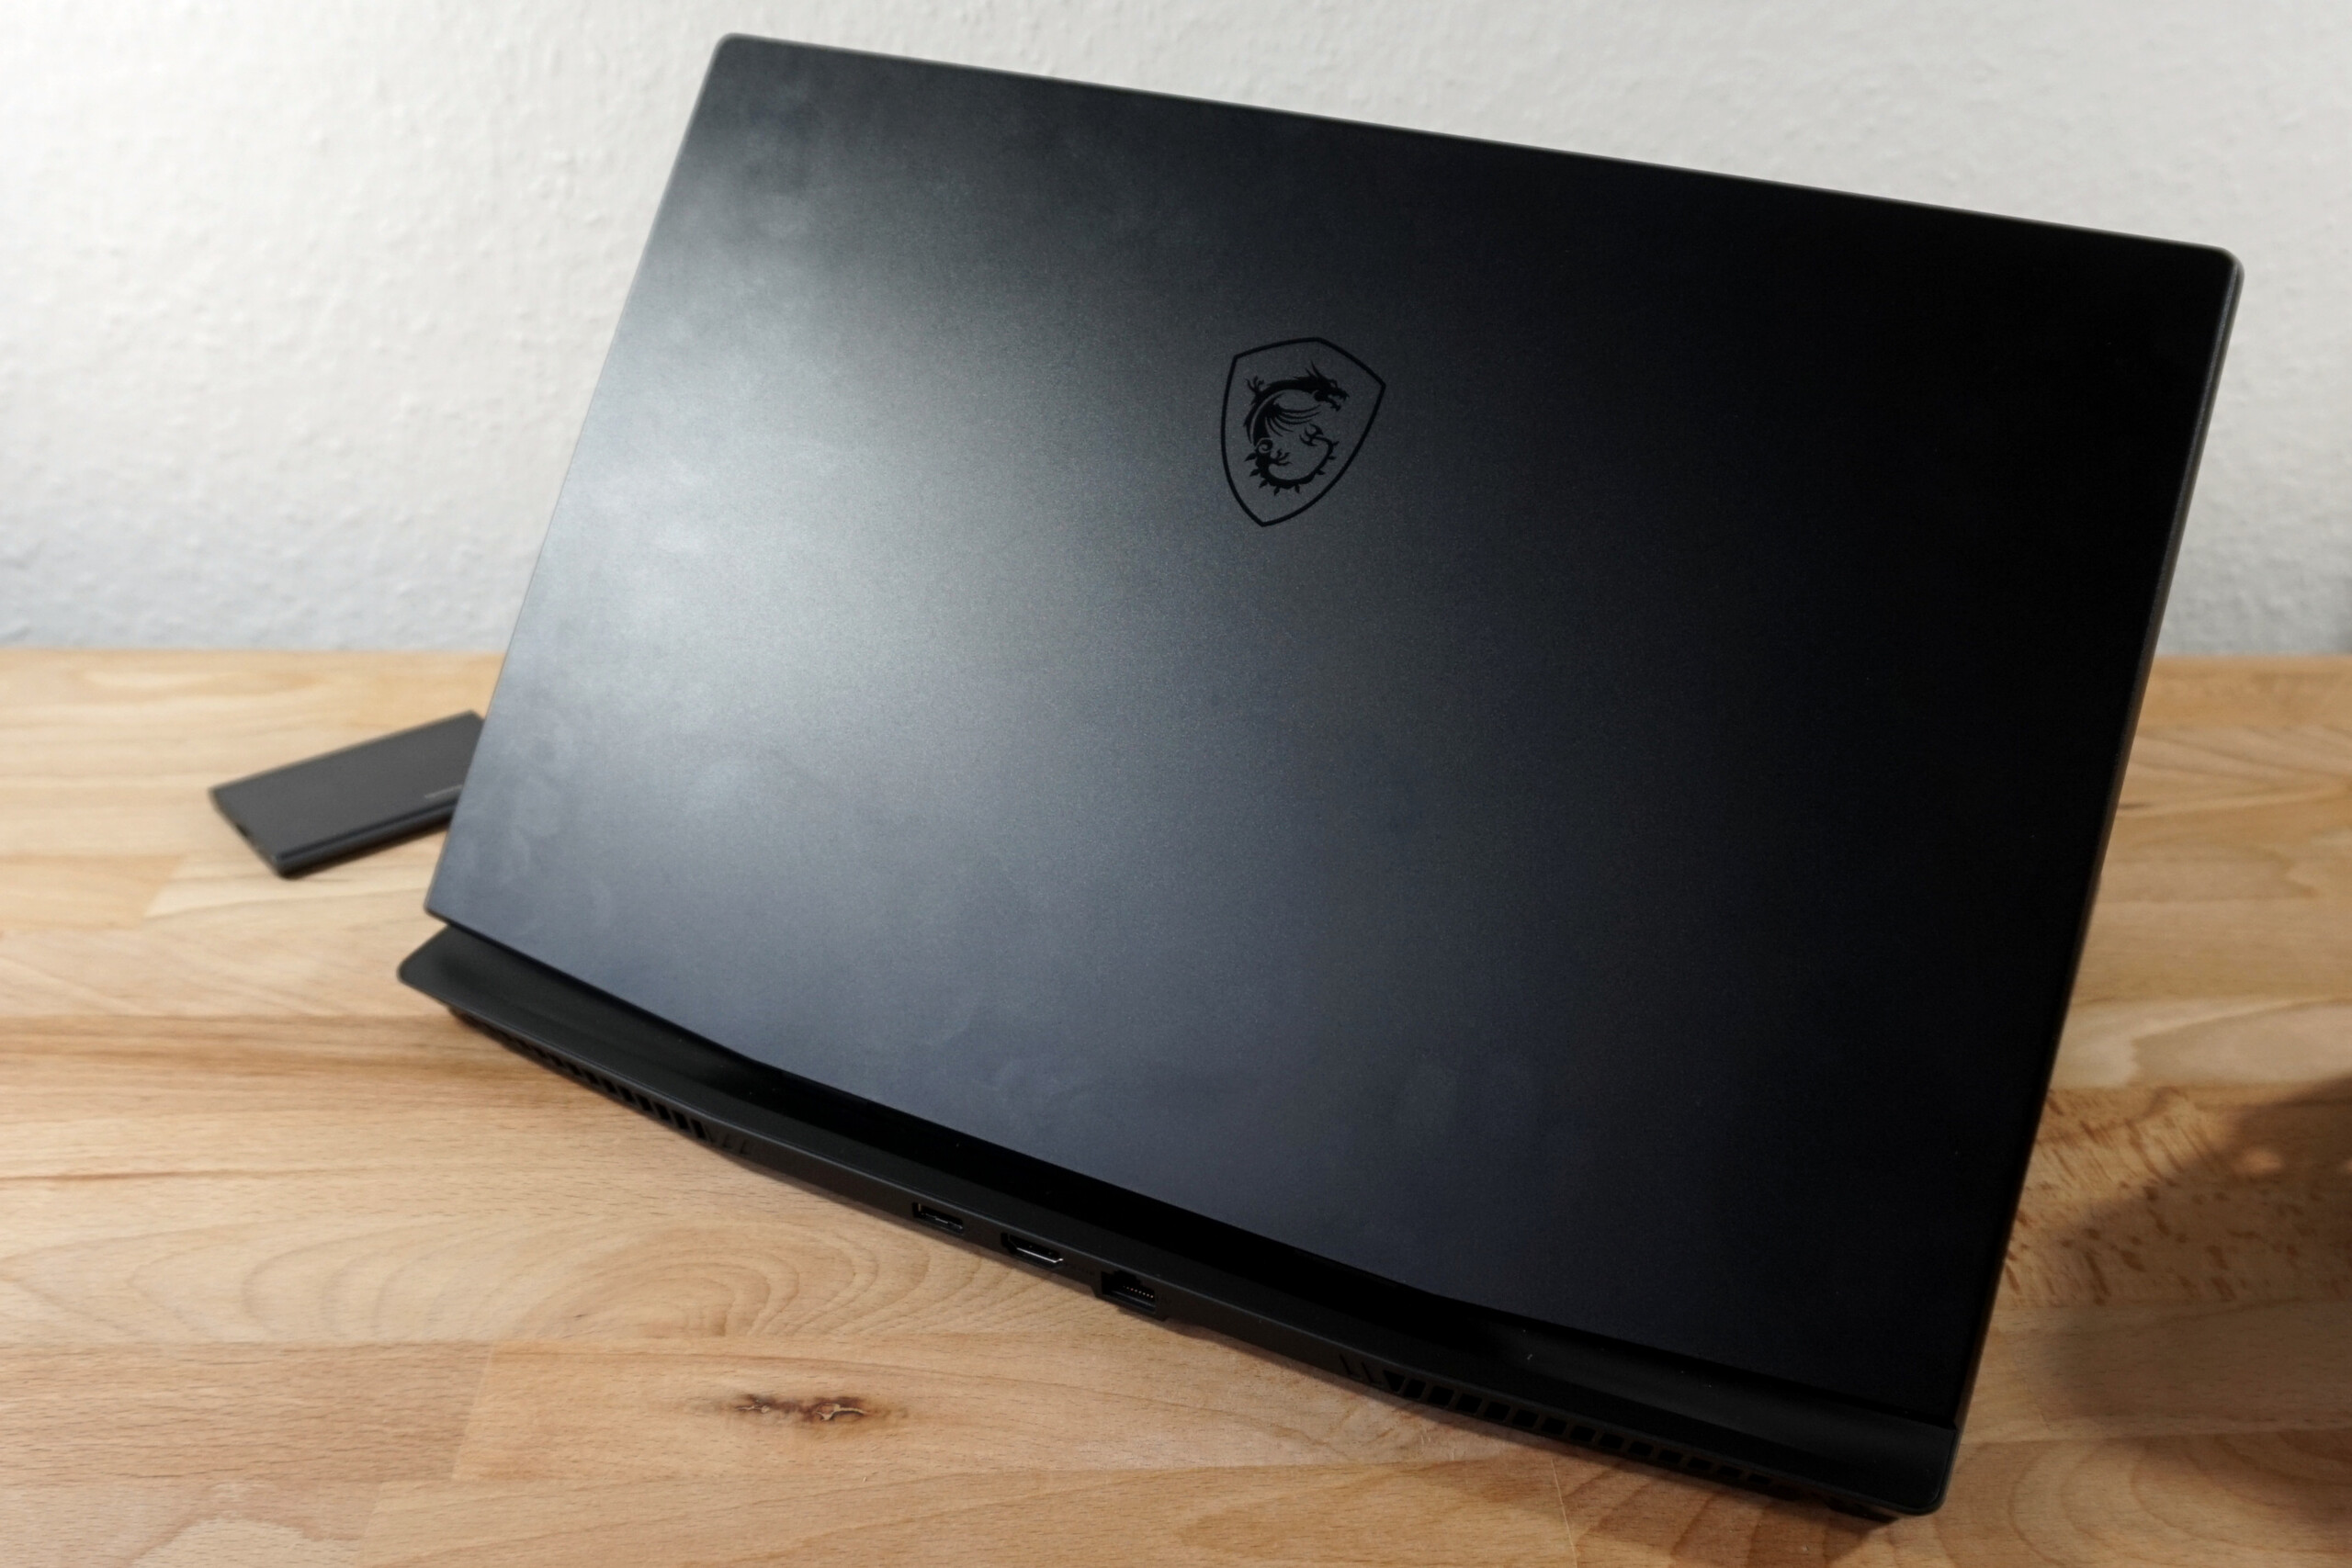
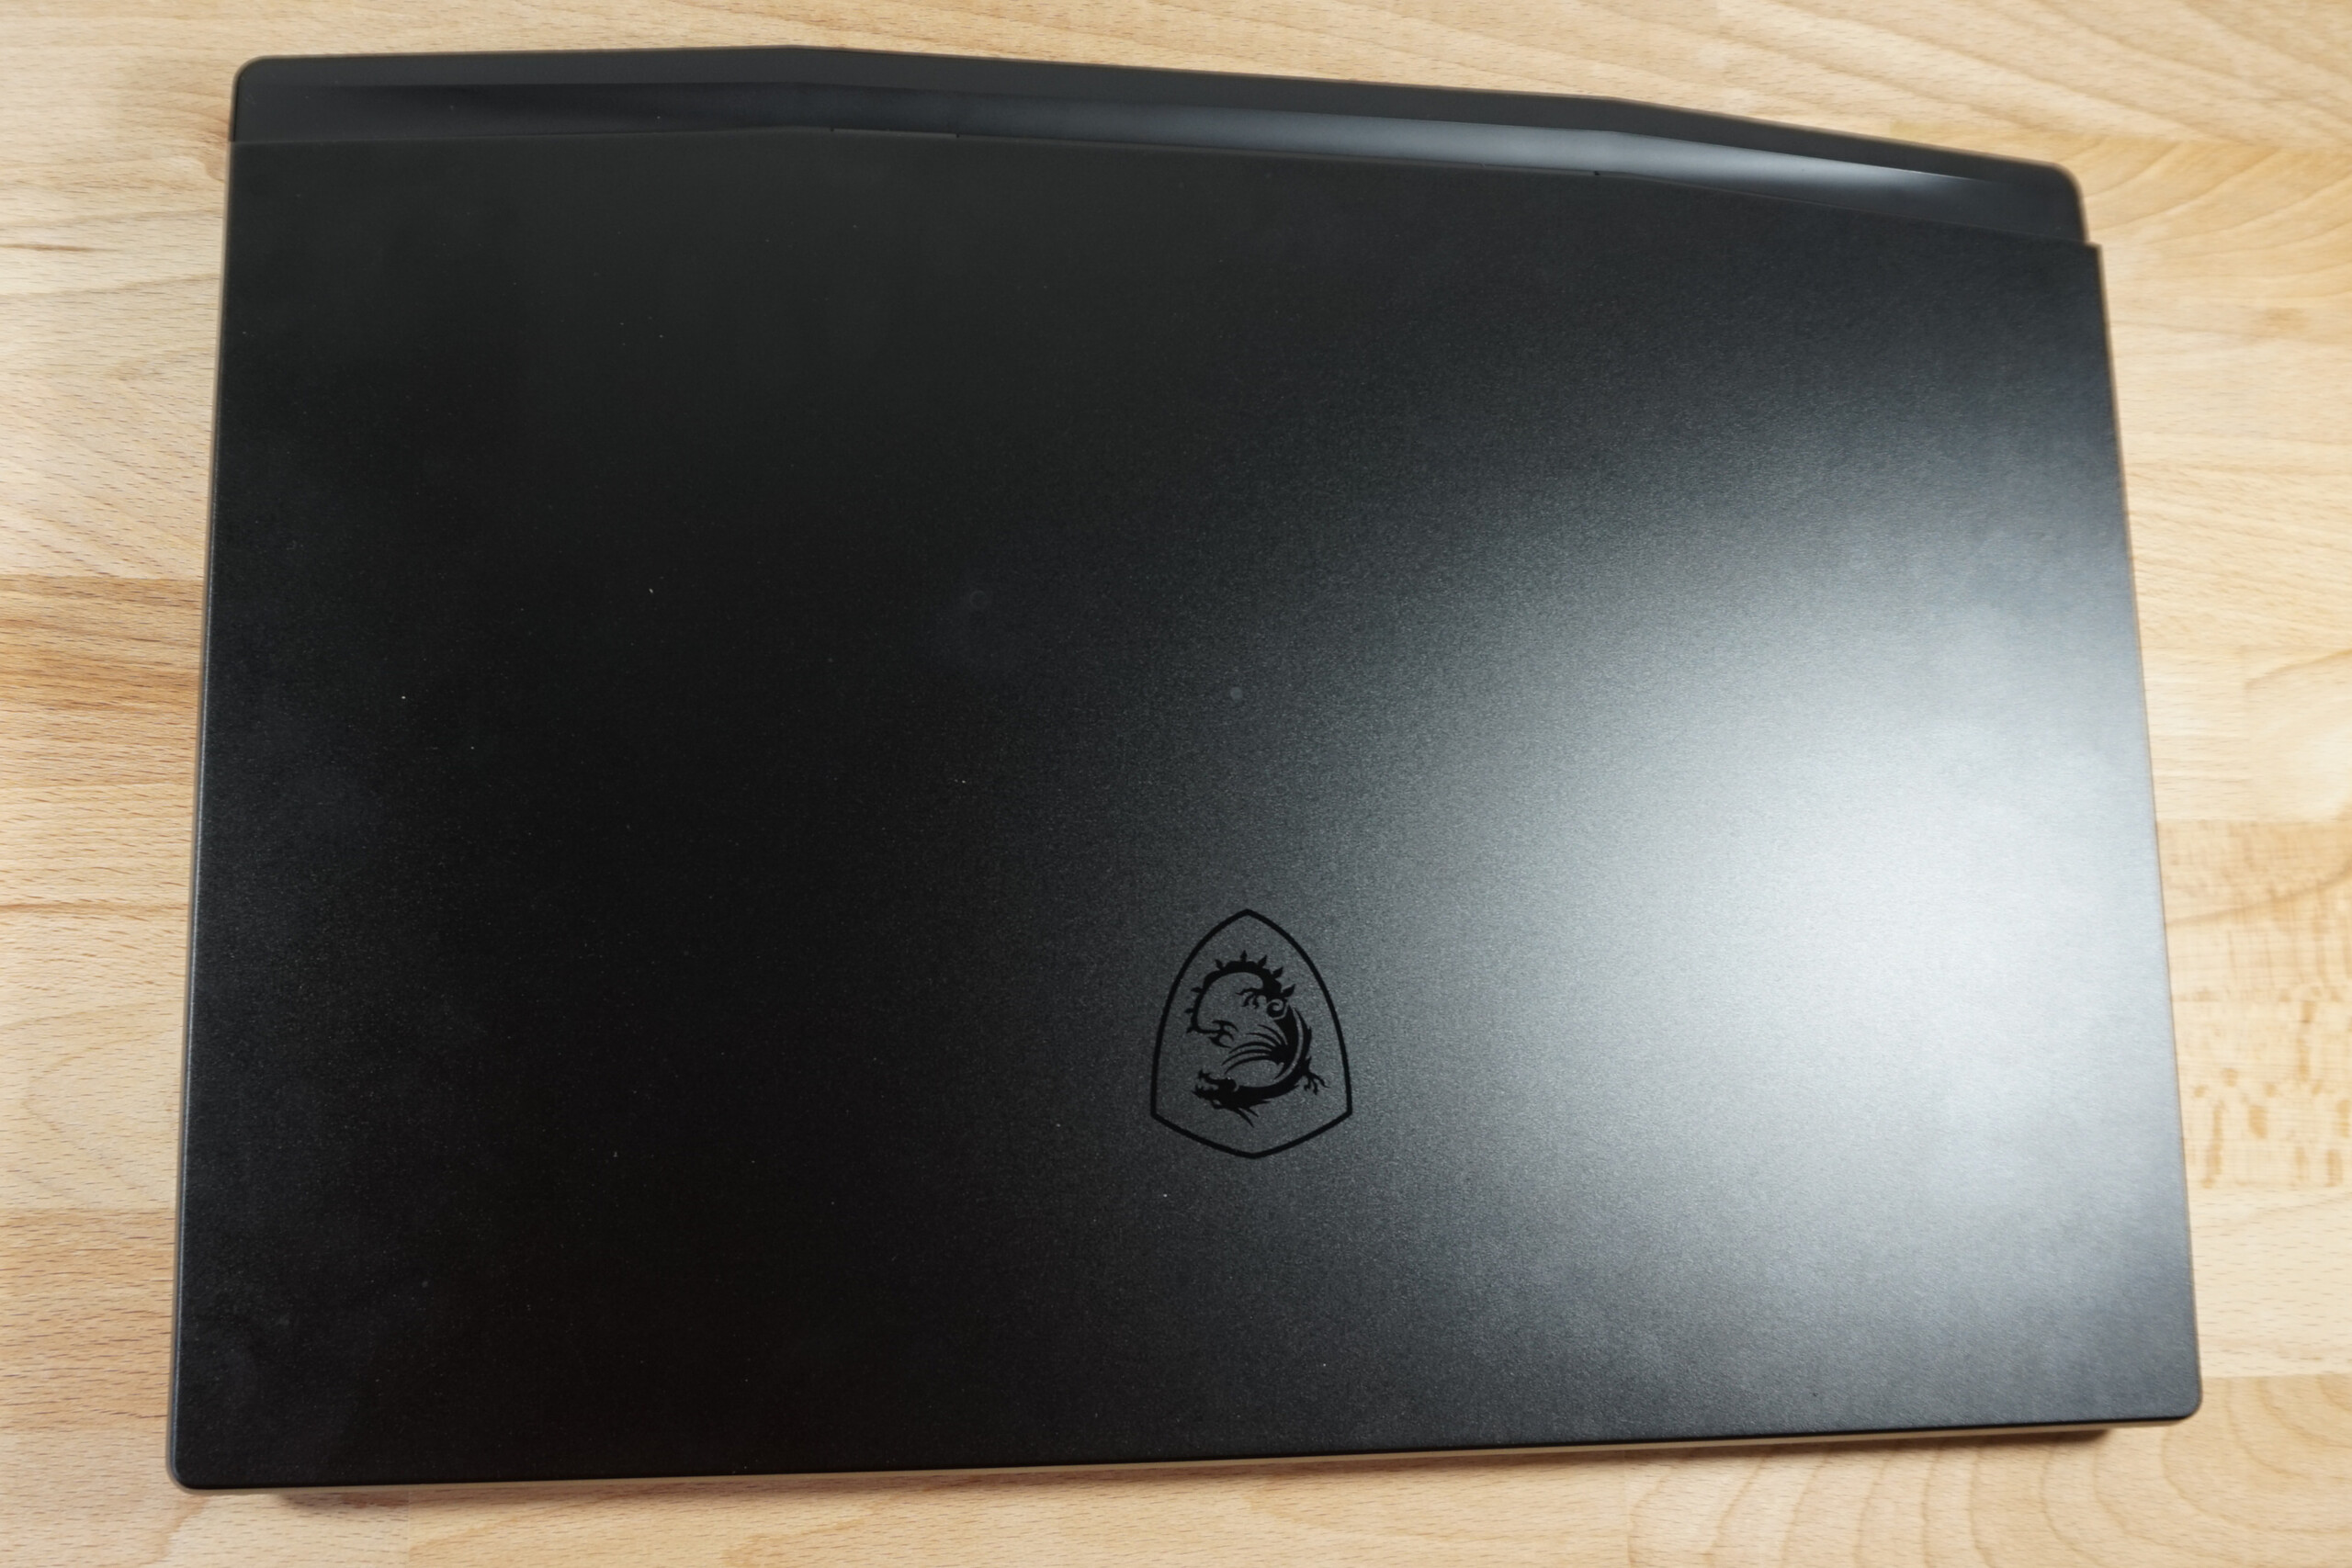
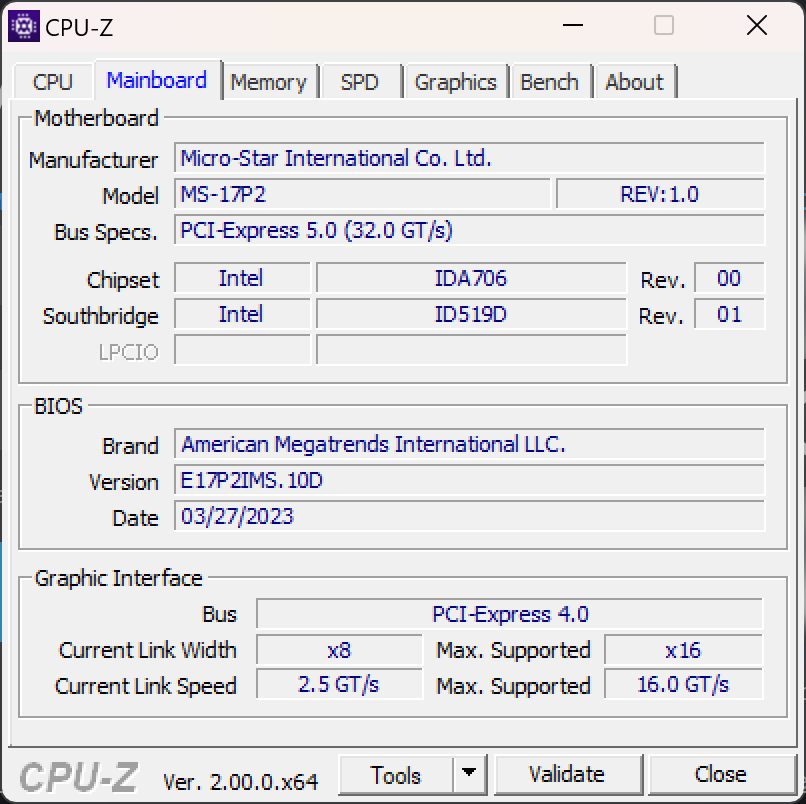
机箱 - 时尚、纤细的微星Stealth 17
微星笔记本电脑的黑色外壳基本上没有任何点缀,只有制造商的标志由于具有不同的表面纹理而从金属显示盖上突出。
键盘框架和底座也由金属组成。其他部件,如侧面零件、显示屏框架和显示屏后面的通风罩都是由塑料制成的。一切看起来都很一致,最重要的是,结构牢固。握在底座的前角,扭力很小。沉重的4K显示器也有类似的表现。在这里,稳定的结构也限制了不必要的运动。
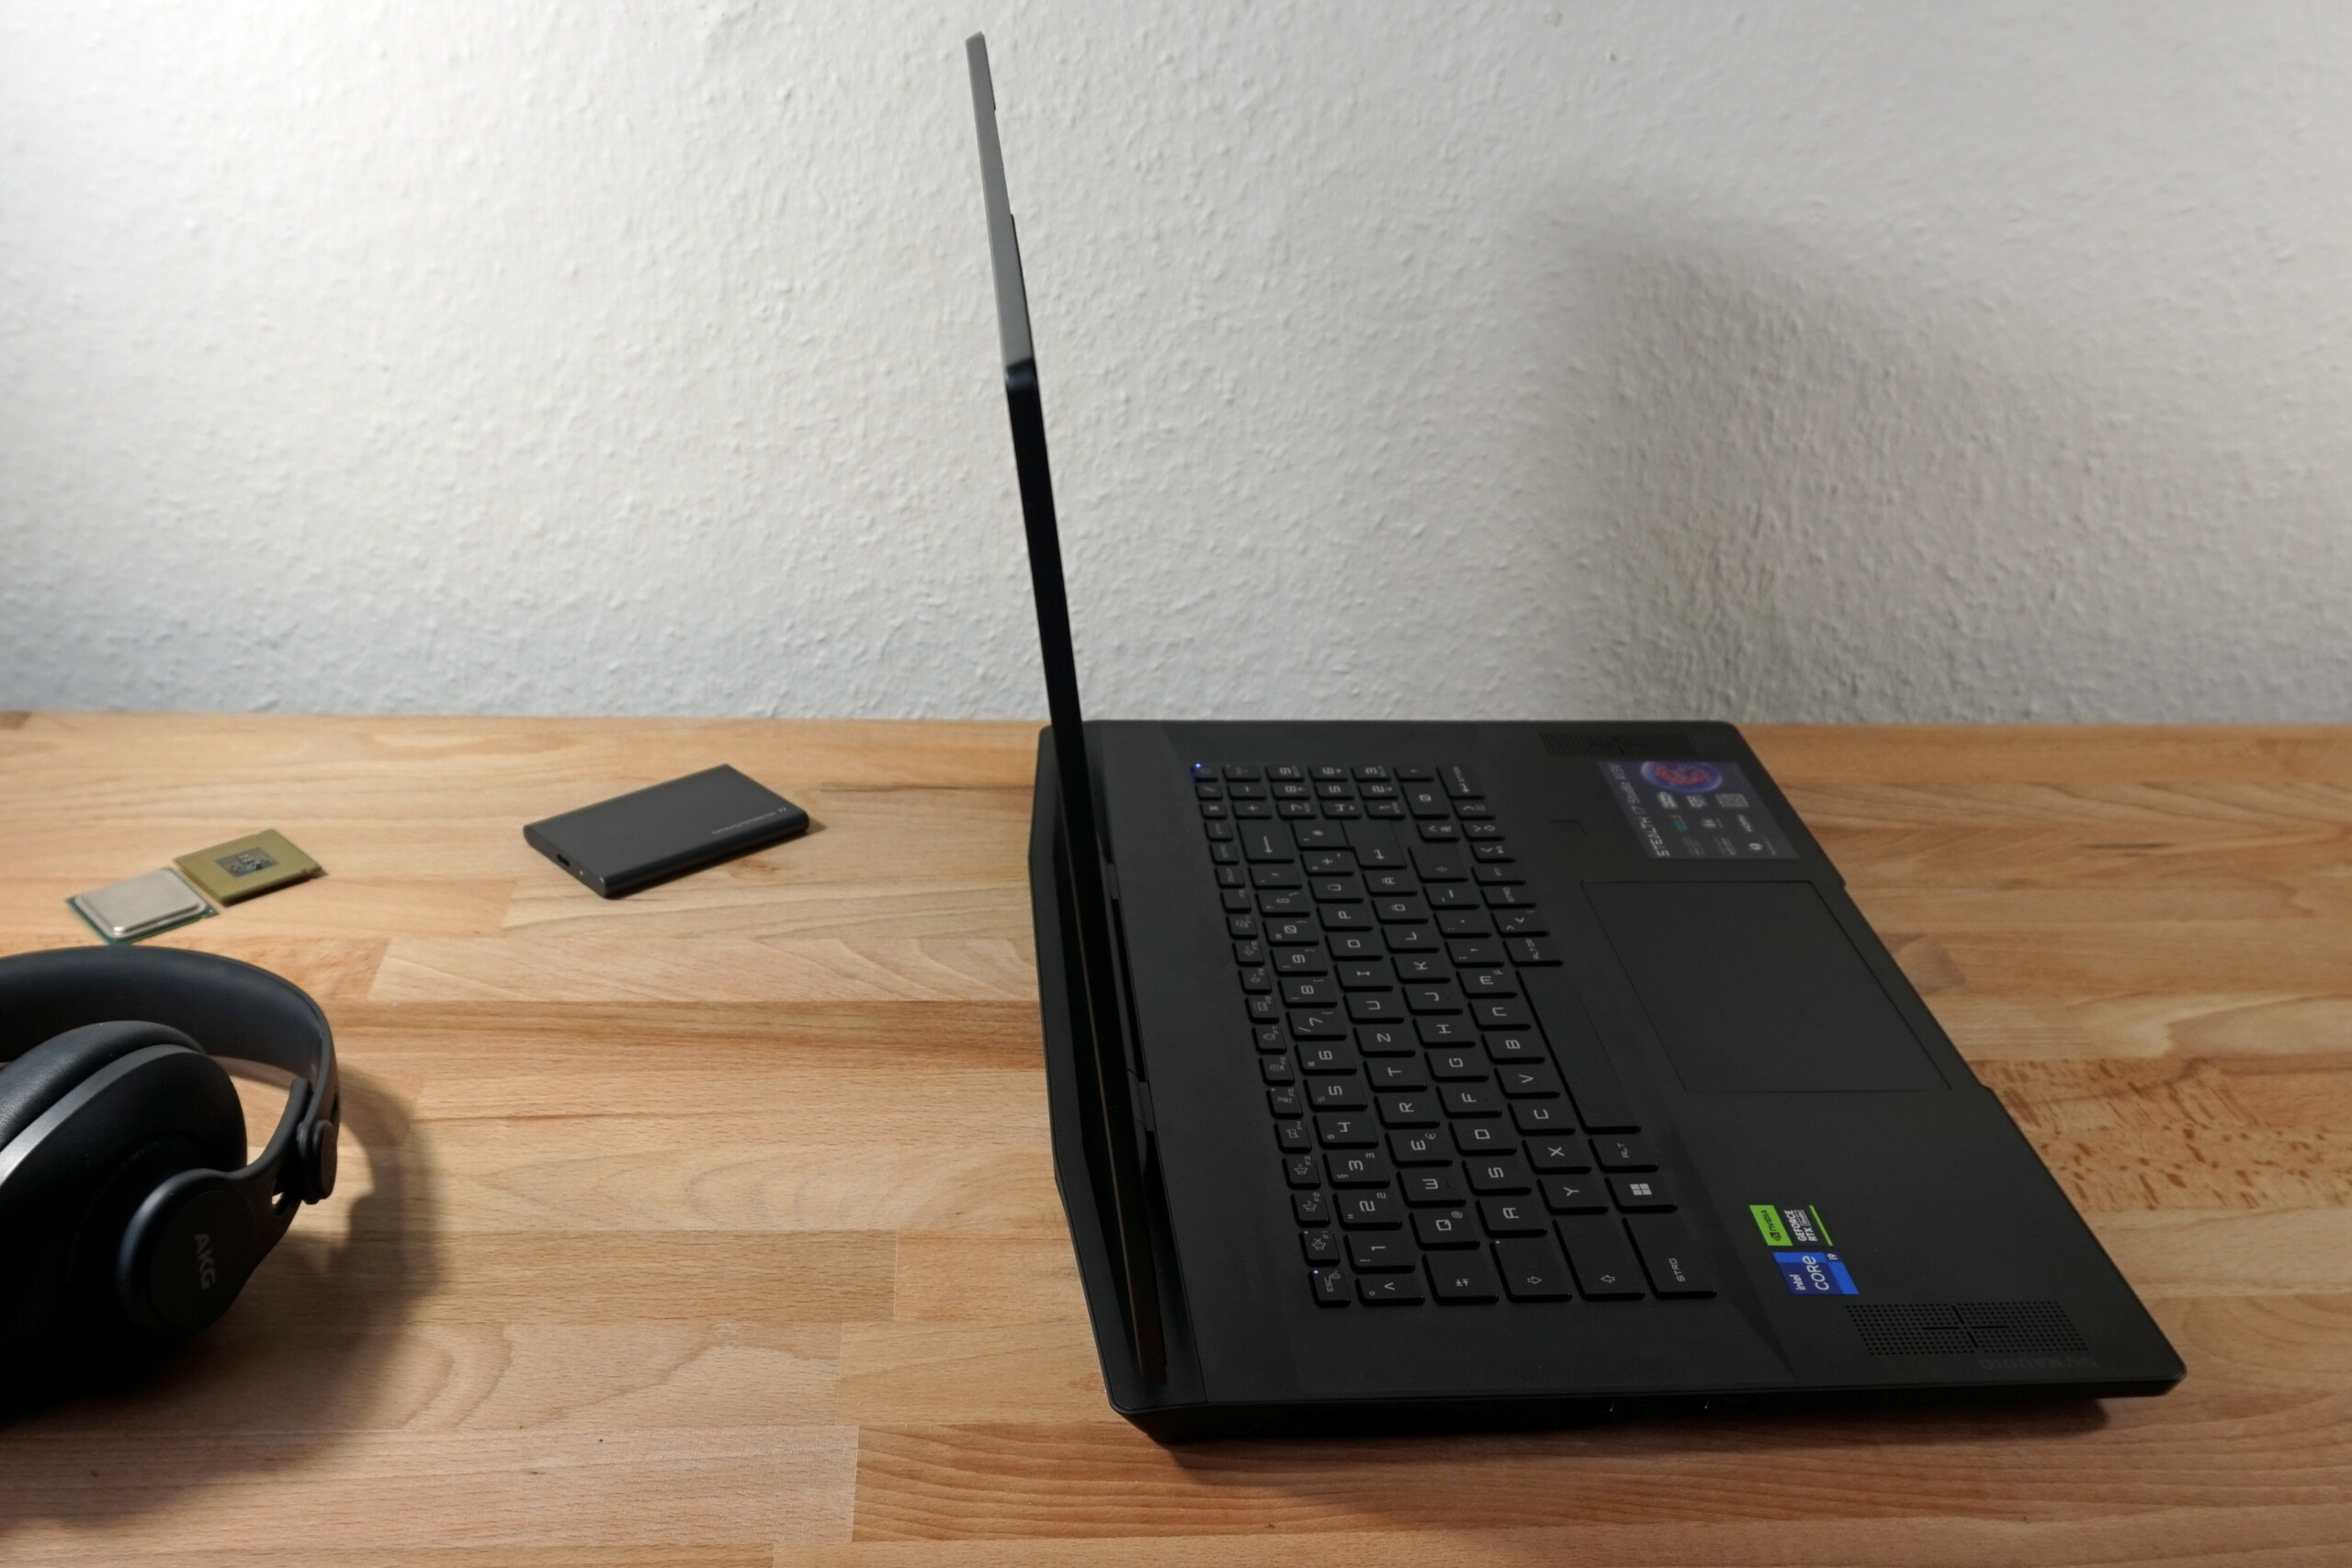
然而,屏幕的铰链给人留下了负面印象,因为它们显然被建造得太小和太弱。在大约30度的角度,笔记本电脑会自行关闭。此外,显示屏几乎总是折叠到130度的终端位置,例如,当把Stealth 17从桌子上抬起时。
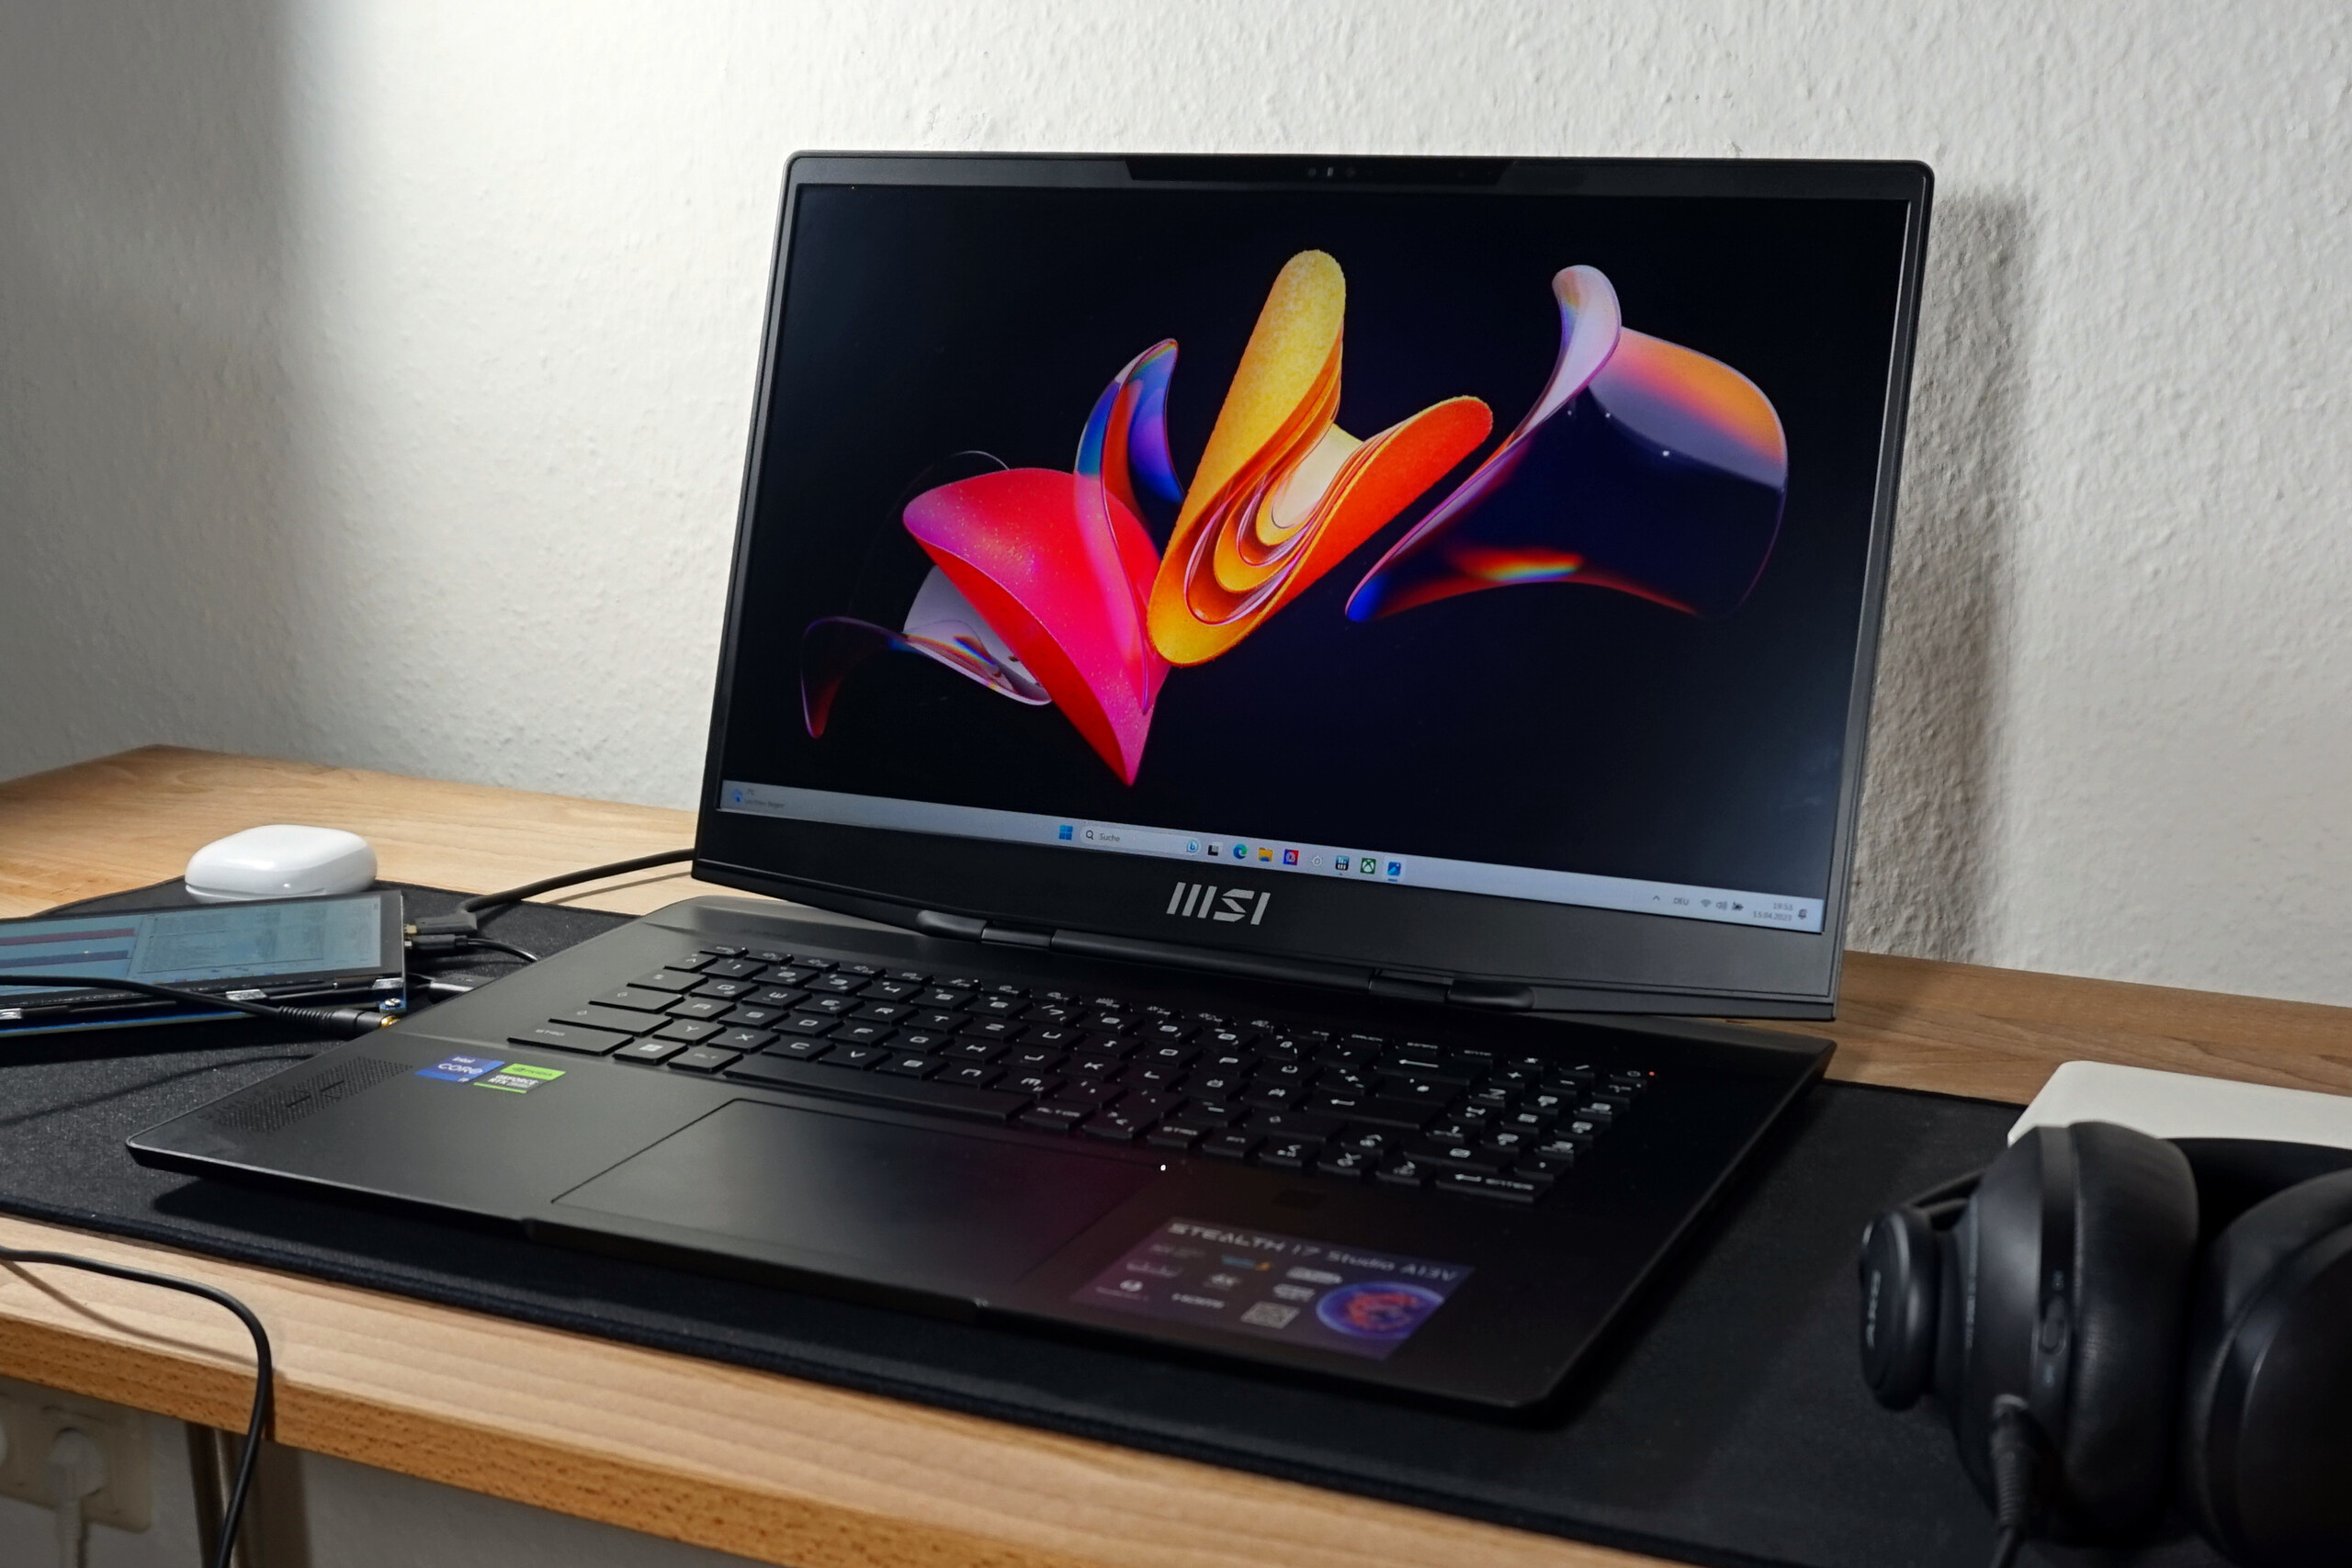
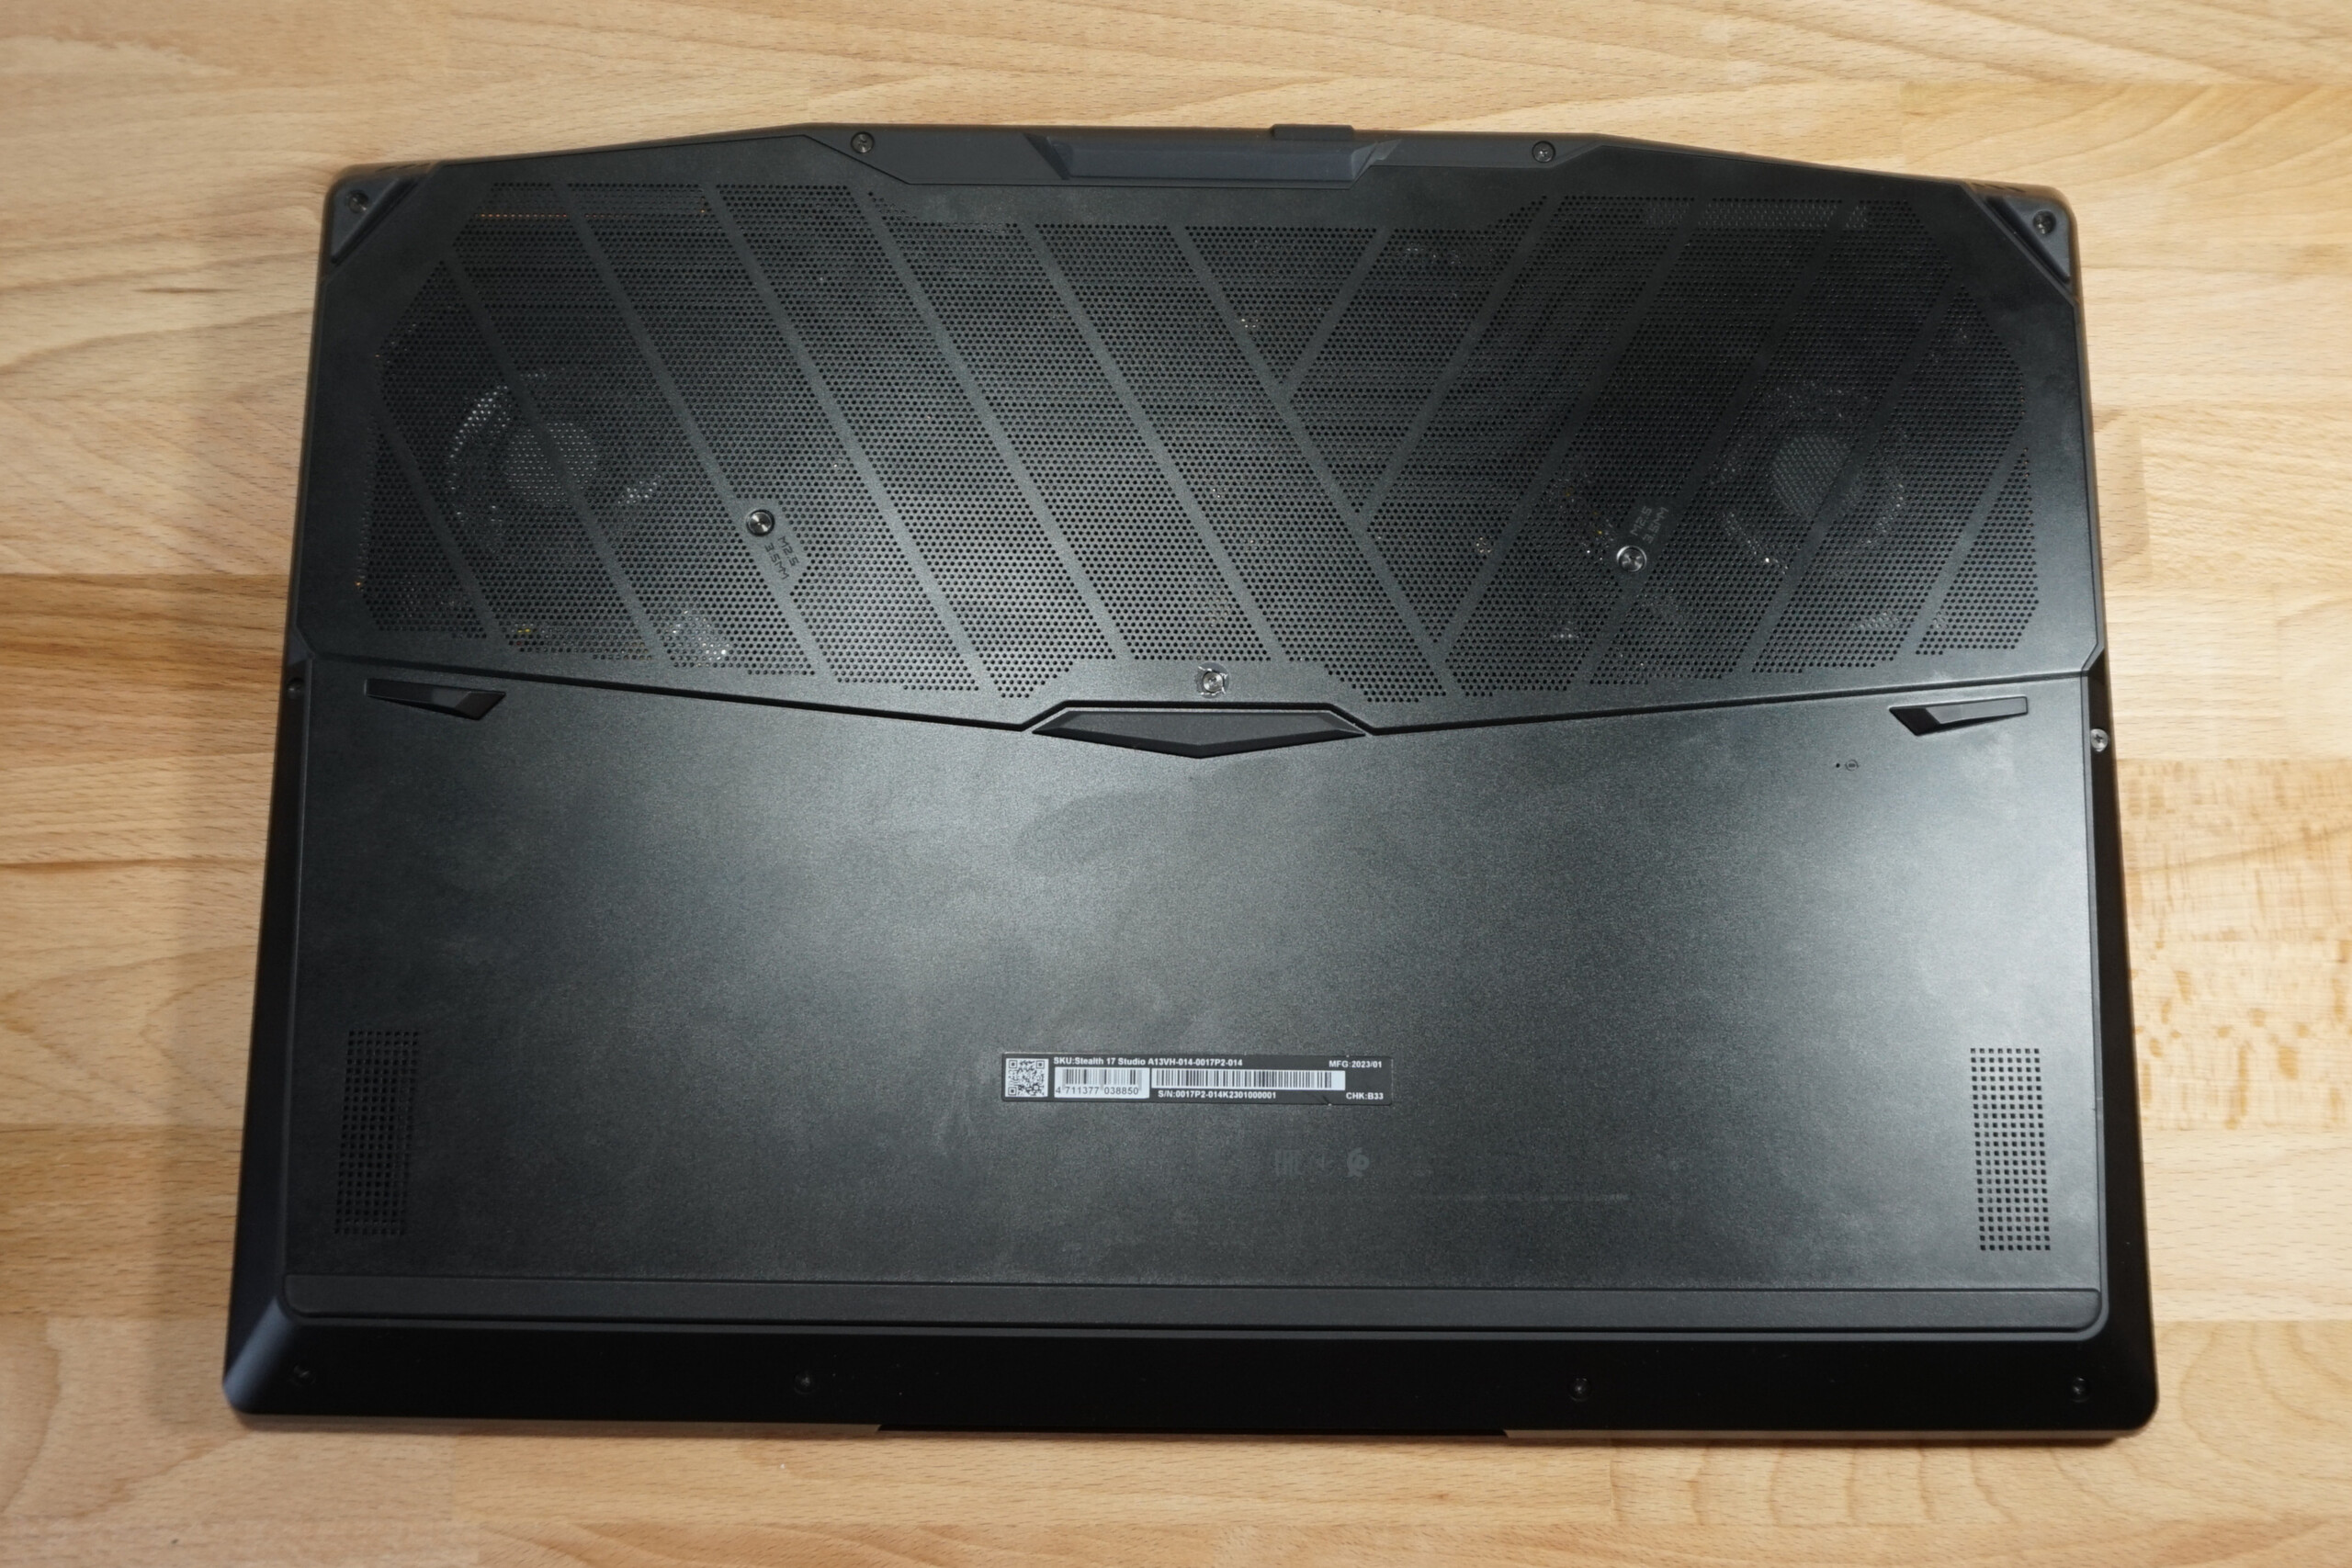
即使与其他17英寸设备相比,这个箱子也是又大又重。就深度而言,只有具有较大冷却解决方案的纯游戏笔记本电脑才会超过它。相比之下,在Stealth 17 Studio中发现的冷却系统很紧凑。
另一方面,该设备的厚度很难被打败。21毫米,这对于这个性能类别来说是非常平坦的。只是为了比较:类似的装备华硕ROG Strix G17厚50%。
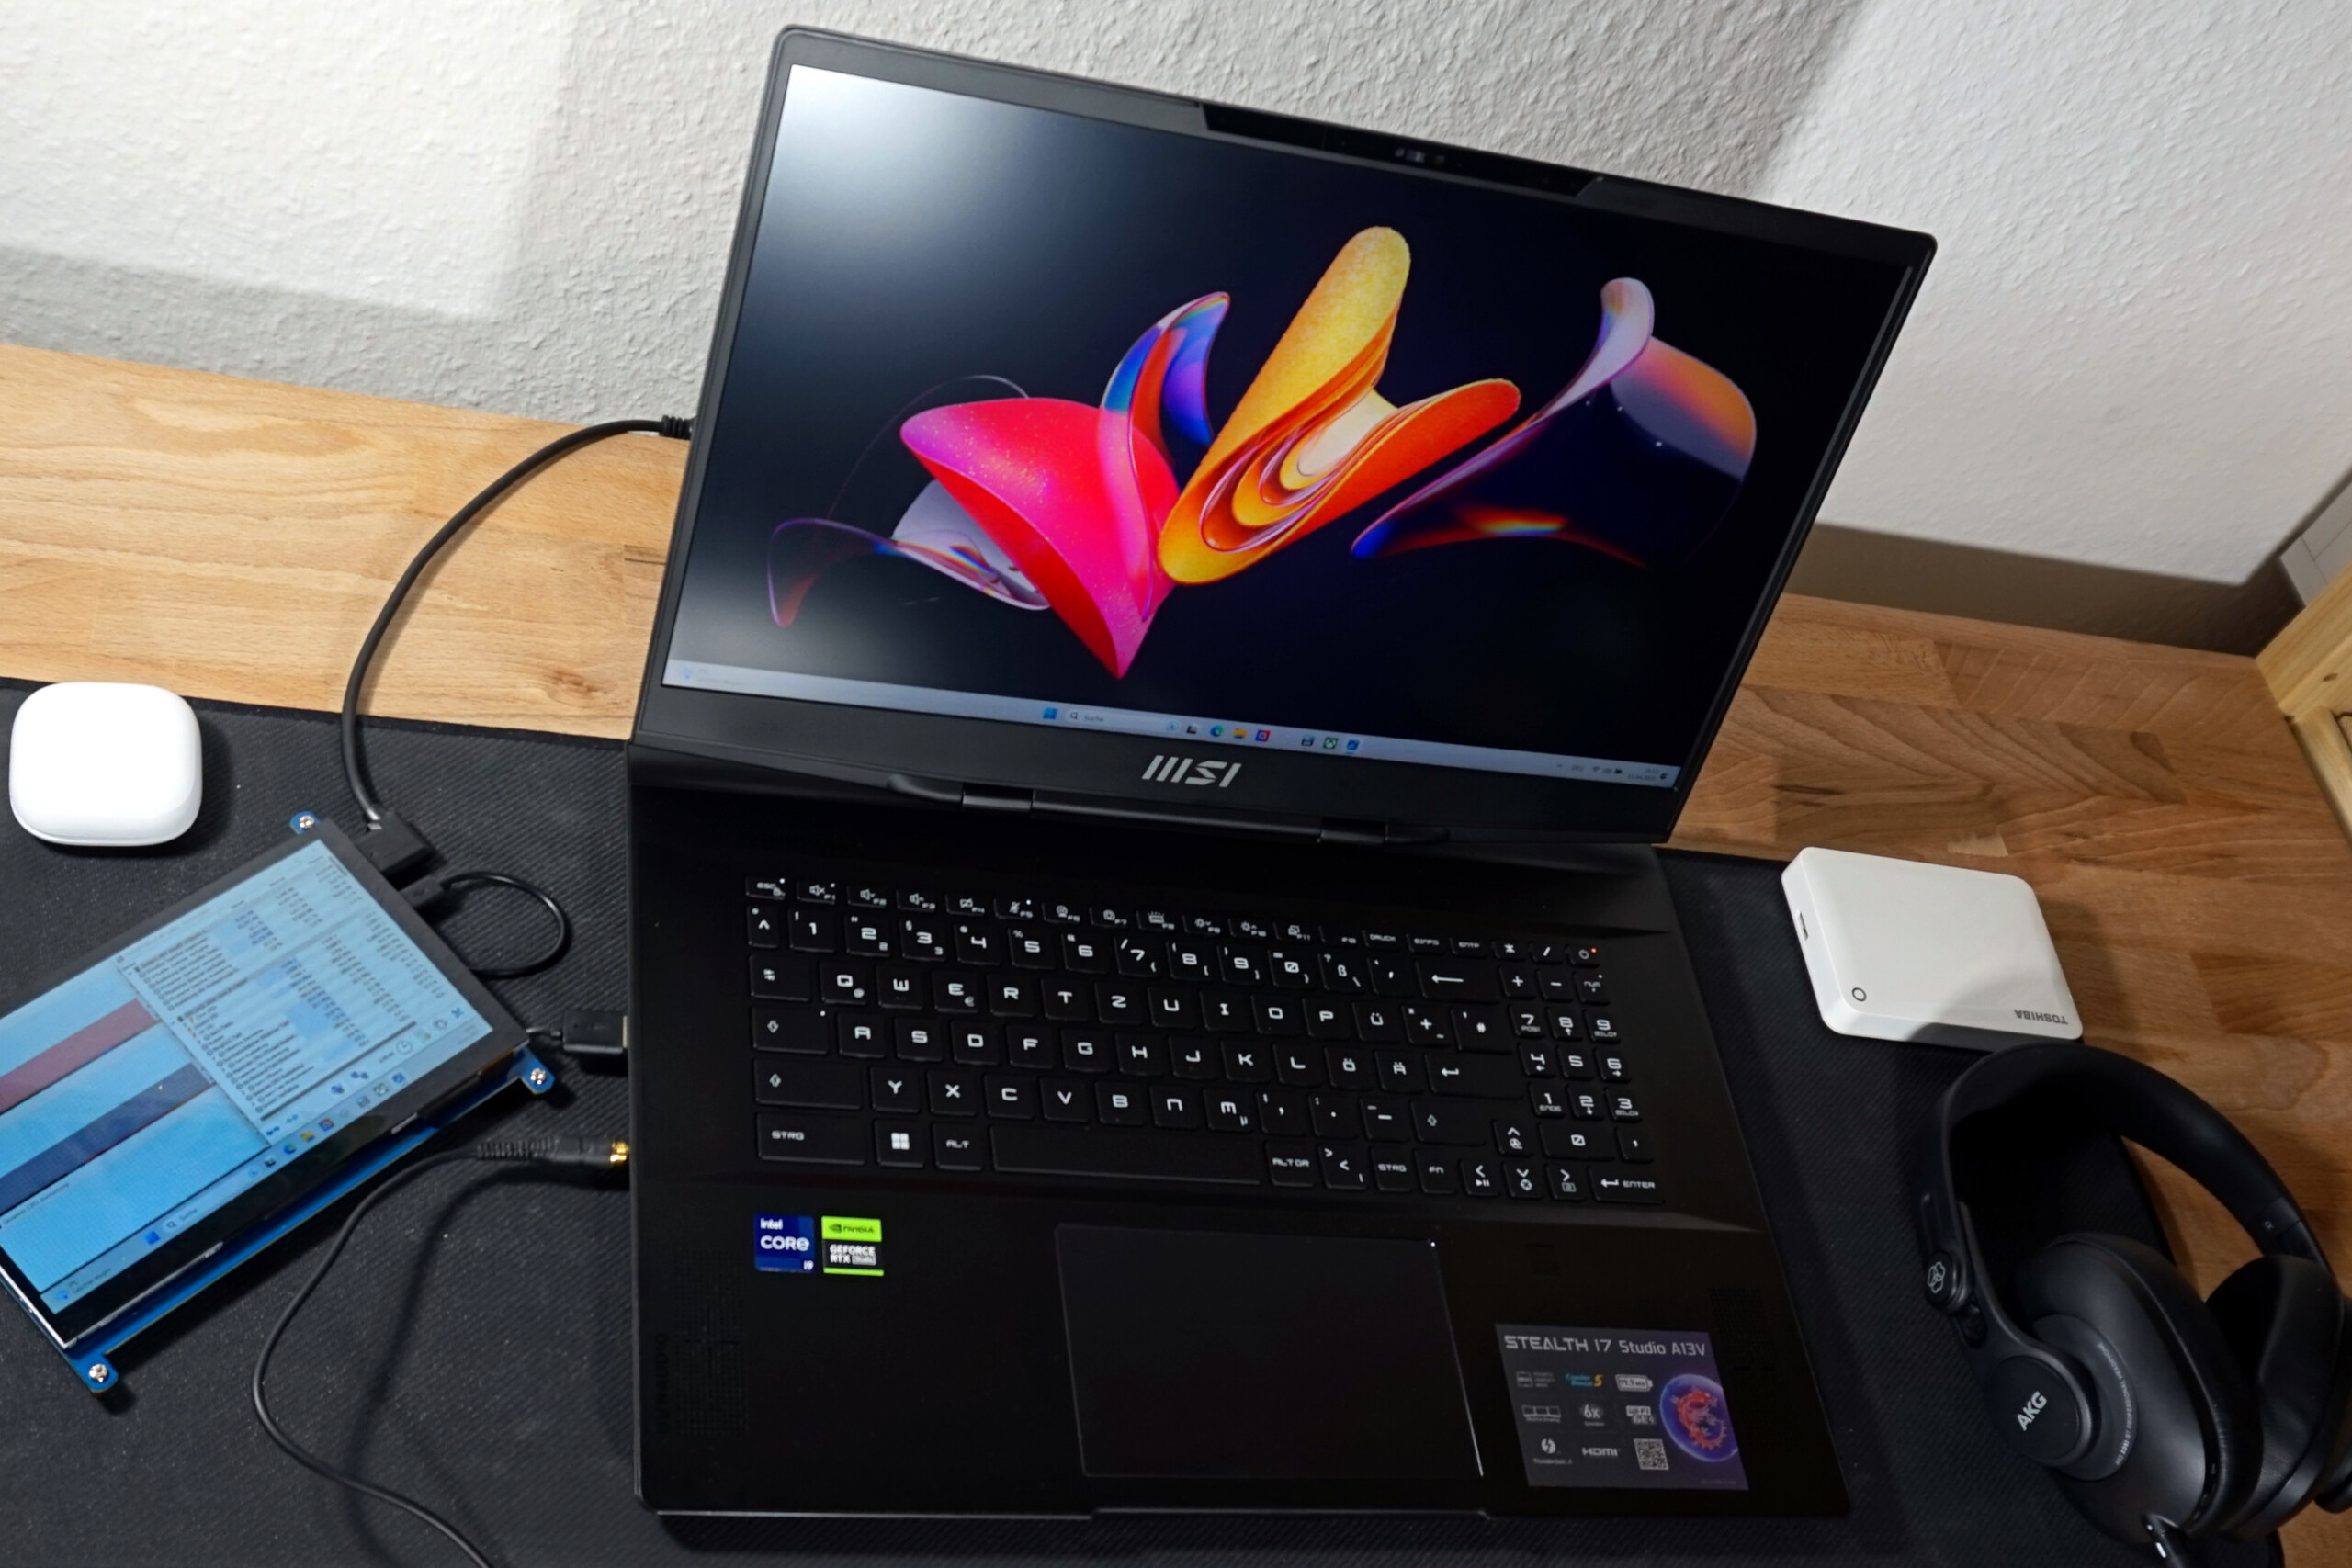
特点 - 所有你需要的创作者的笔记本电脑,和游戏一样。
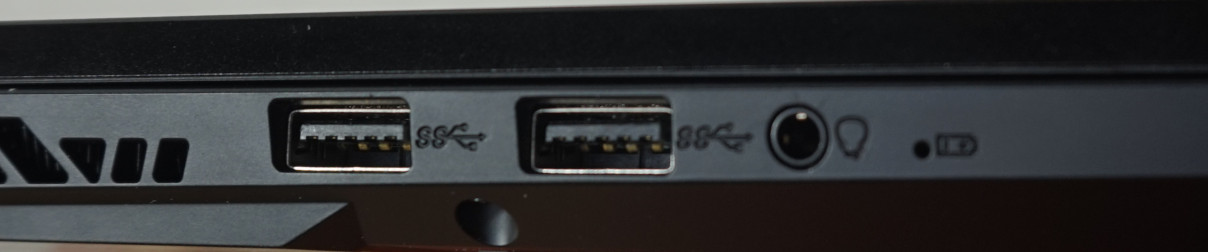
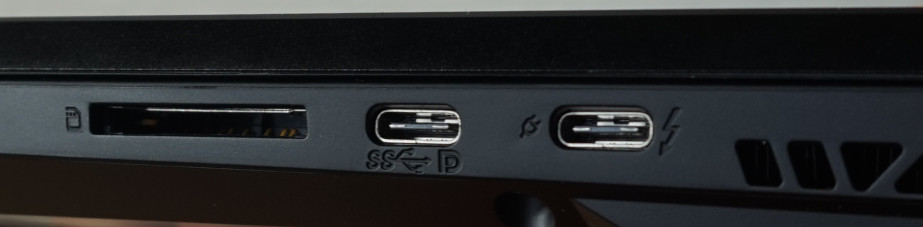
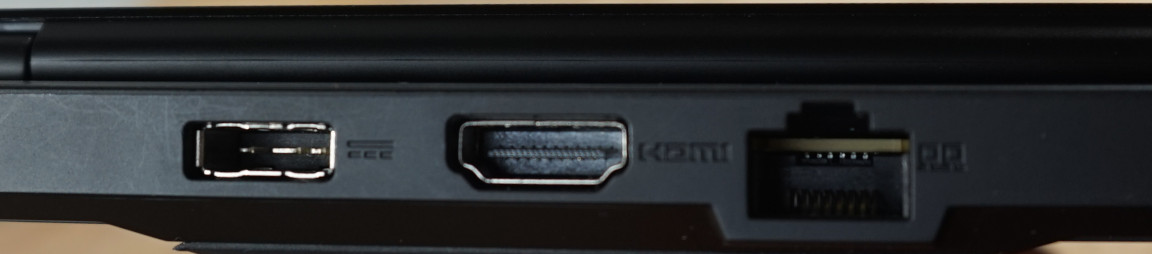
这款笔记本电脑配备了完整的端口选择。虽然有些游戏笔记本没有读卡器,但相当多的多媒体笔记本没有LAN端口。
相比之下,微星Stealth 17 Studio满足所有要求:总共有三个视频输出,四个USB端口,包括Thunderbolt 4,一个用于普通SD卡的读卡器和2.5Gbit LAN,游戏、快速数据传输和与其他设备、显示器和流媒体附件的可变连接的基本要素都被涵盖。
考虑到Stealth自称属于高水平,USB-A和USB-C端口在左右两边会更实用。此外,制造商可以选择一个专门的耳机插孔以及内置耳机接口。
SD卡阅读器
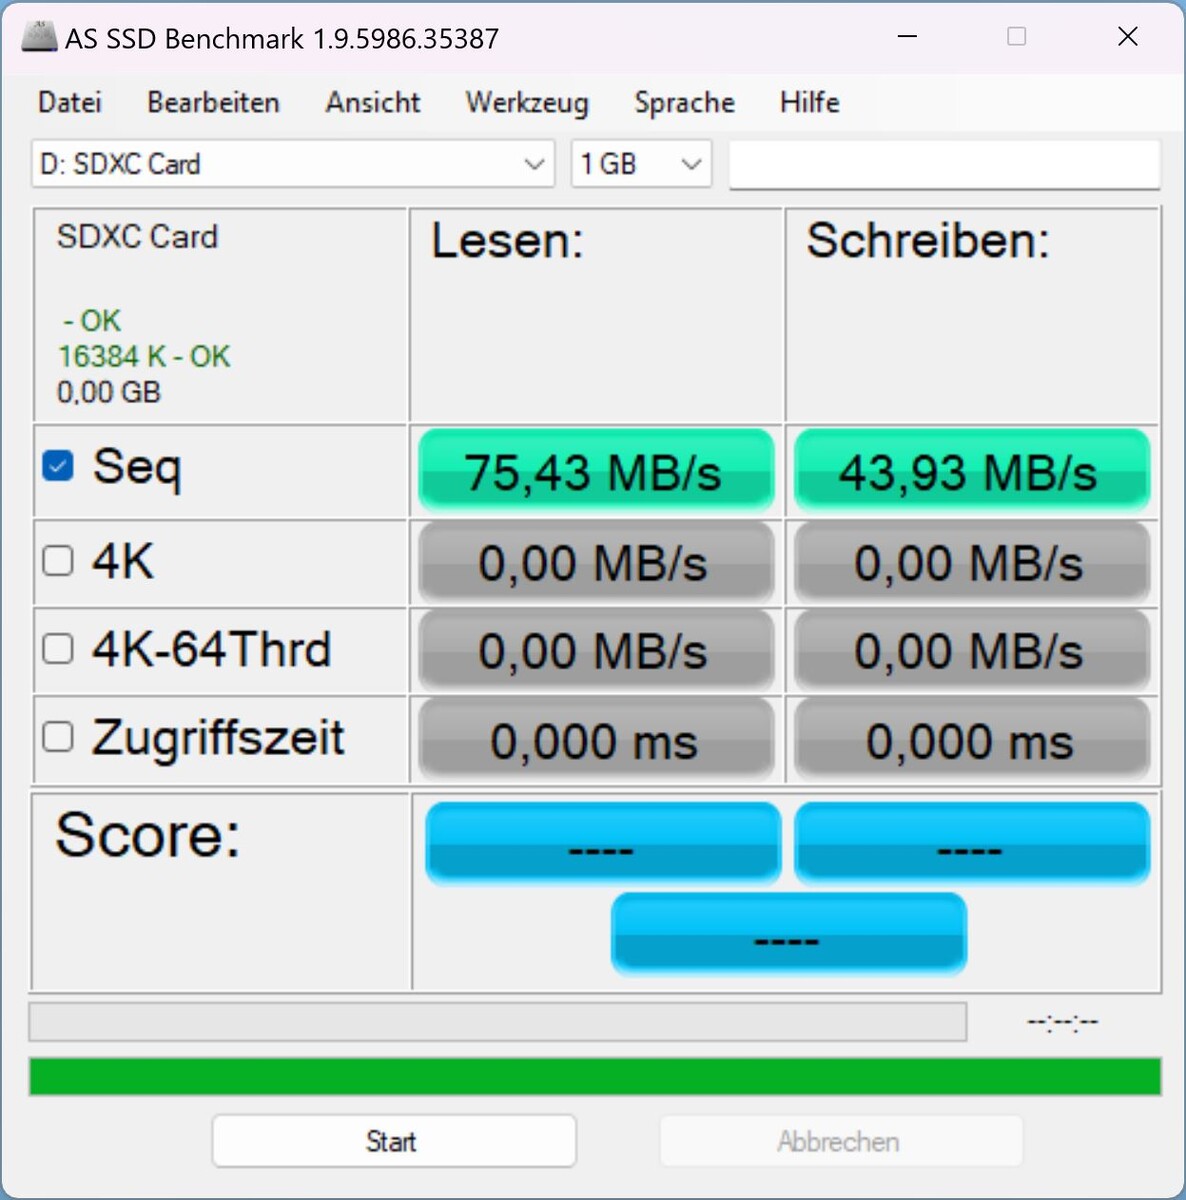
用我们的AV PRO microSD 128 GB V60参考卡测量时,读卡器的得分令人失望。读取图像文件时,Stealth 17的传输速度仅有AV PRO microSD 128 GB V60参考卡的一半以下。 Razer Blade 16 Early 2023在我们的测试中。
尽管如此,30GB图像数据的等待时间约为10分钟,在限制范围内。
| SD Card Reader | |
| average JPG Copy Test (av. of 3 runs) | |
| Average of class Gaming (20.9 - 210, n=54, last 2 years) | |
| Razer Blade 16 Early 2023 (AV PRO microSD 128 GB V60) | |
| HP Omen 17-ck2097ng (AV PRO microSD 128 GB V60) | |
| MSI Stealth 17 Studio A13VH-014 | |
| maximum AS SSD Seq Read Test (1GB) | |
| Razer Blade 16 Early 2023 (AV PRO microSD 128 GB V60) | |
| Average of class Gaming (25.5 - 261, n=51, last 2 years) | |
| HP Omen 17-ck2097ng (AV PRO microSD 128 GB V60) | |
| MSI Stealth 17 Studio A13VH-014 | |
沟通
局域网连接的工作几乎没有延迟,数据速率稳定在2500兆比特/秒,前提是额外的网络架构能够跟上。
至少在近距离的情况下,WiFi模块的表现不相上下。要求是与路由器的距离很短,并且没有来自其他无线电网络的干扰。这可以通过我们对5GHz的测量结果在不到1000兆比特/秒和6GHz几乎接近1600兆比特/秒之间的比较来证明。在5GHz范围内,附近大量的无线网络会明显降低传输速率。提升到6GHz和更宽的频段,可以有效地防止这种情况。
总而言之,Stealth 17在有线和无线网络连接方面成功地给我们留下了深刻印象。
网络摄像头
全高清分辨率的网络摄像头工作得很好,但并不突出。它能迅速适应,而且没有视觉伪影,特别是在恶劣或多变的照明条件下。视觉上不那么容易的是永久的和明显的图像噪音。总的来说,对于一台笔记本电脑来说,该相机是相当不错的。全高清分辨率确保了在旅途中的视频通话质量,只有适度的带宽要求,并在良好的照明条件下提供有吸引力的图像。
就其他硬件功能而言,对机械盖和用于通过人脸识别登录的额外红外摄像头没有任何抱怨。
麦克风的声音非常好。无论距离远近,音量都保持不变,来自不同方向的讲话也不会造成真正的问题。此外,声音听起来很自然,只有一个细微的尖锐的小声存在。


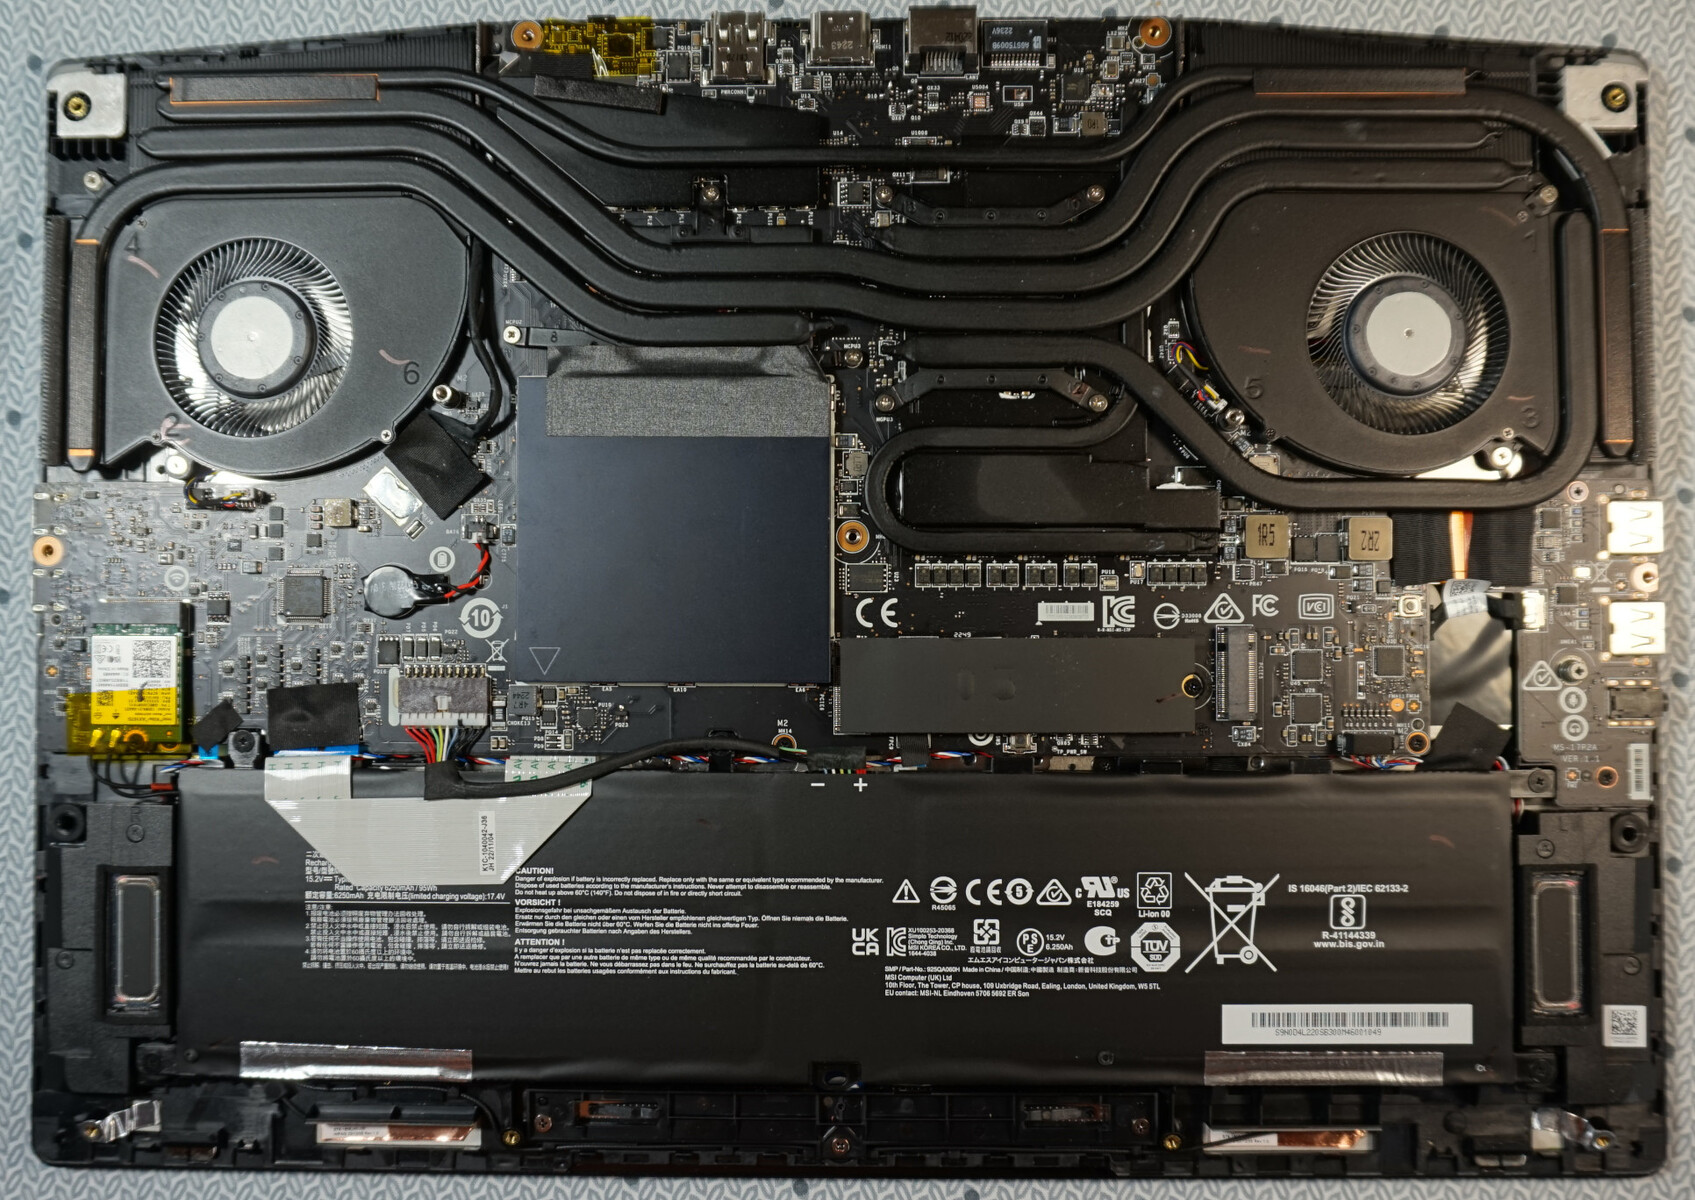
维护
如果你不被覆盖在中间螺丝上的密封圈所吓倒,打开设备是很简单的--尽管有三个不同长度的螺丝。在侧面的冷却通风口区域,机箱可以很容易地被撬开,这需要细腻的触觉而不是蛮力。
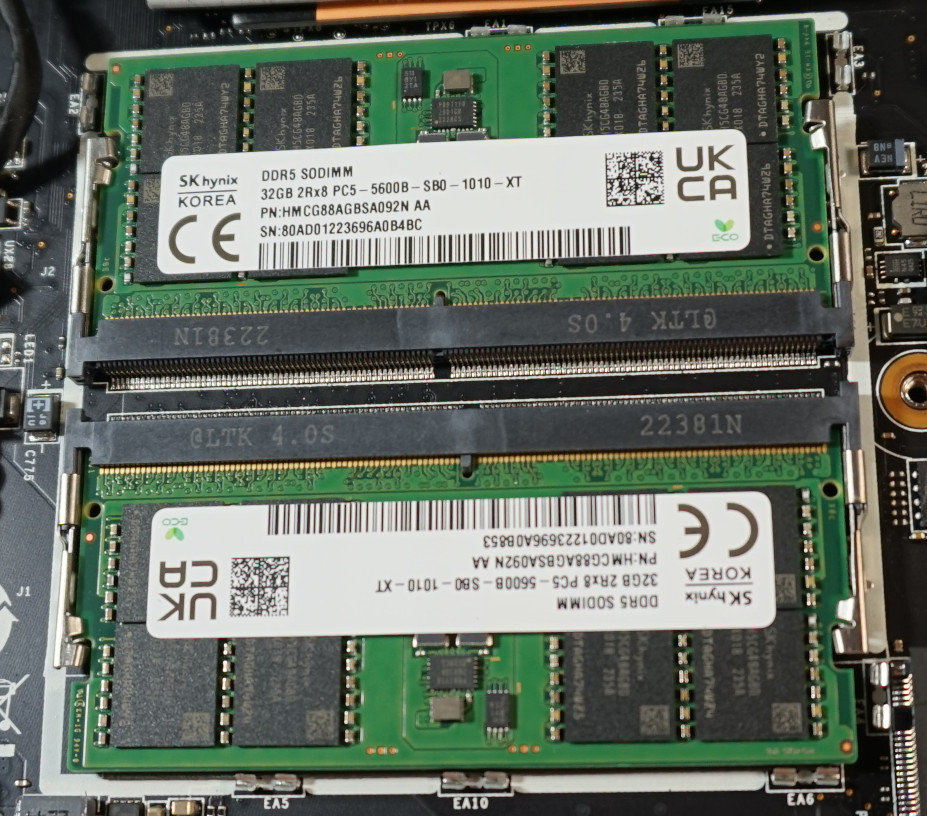
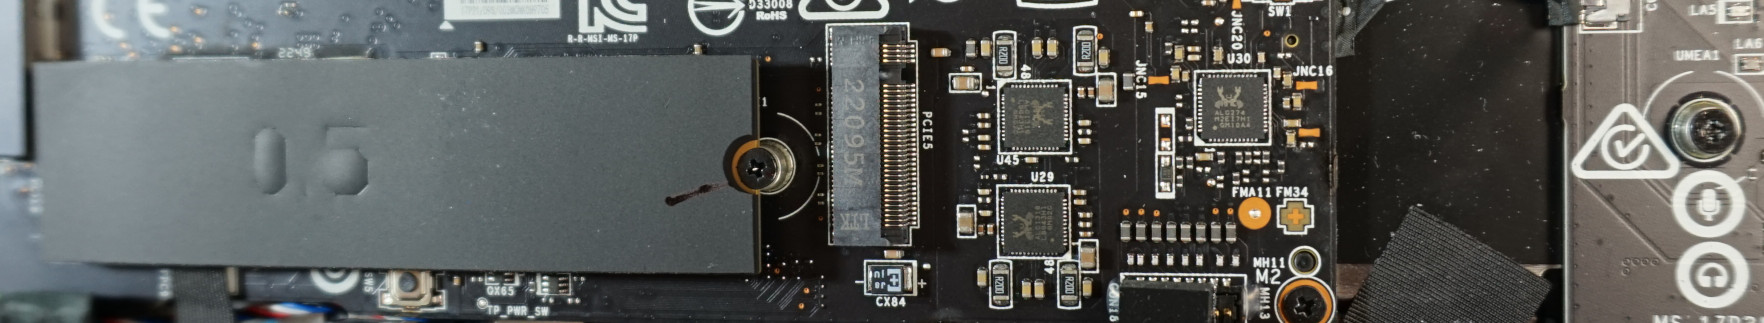
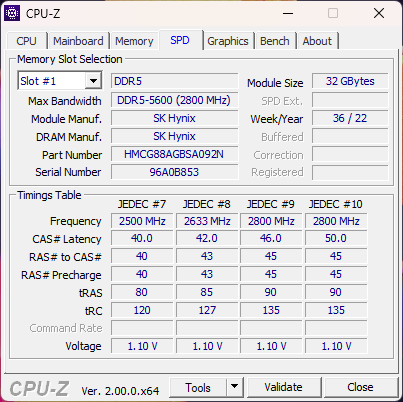
随后,风扇、电池和所有可更换的部件都可以很容易地进入。WiFi模块可以被替换。两个内存插槽允许安装最大64GB的DDR5内存,这在我们的Stealth 17评测设备中已经配置到了最大。此外,还有一个免费的M.2 SSD插槽。
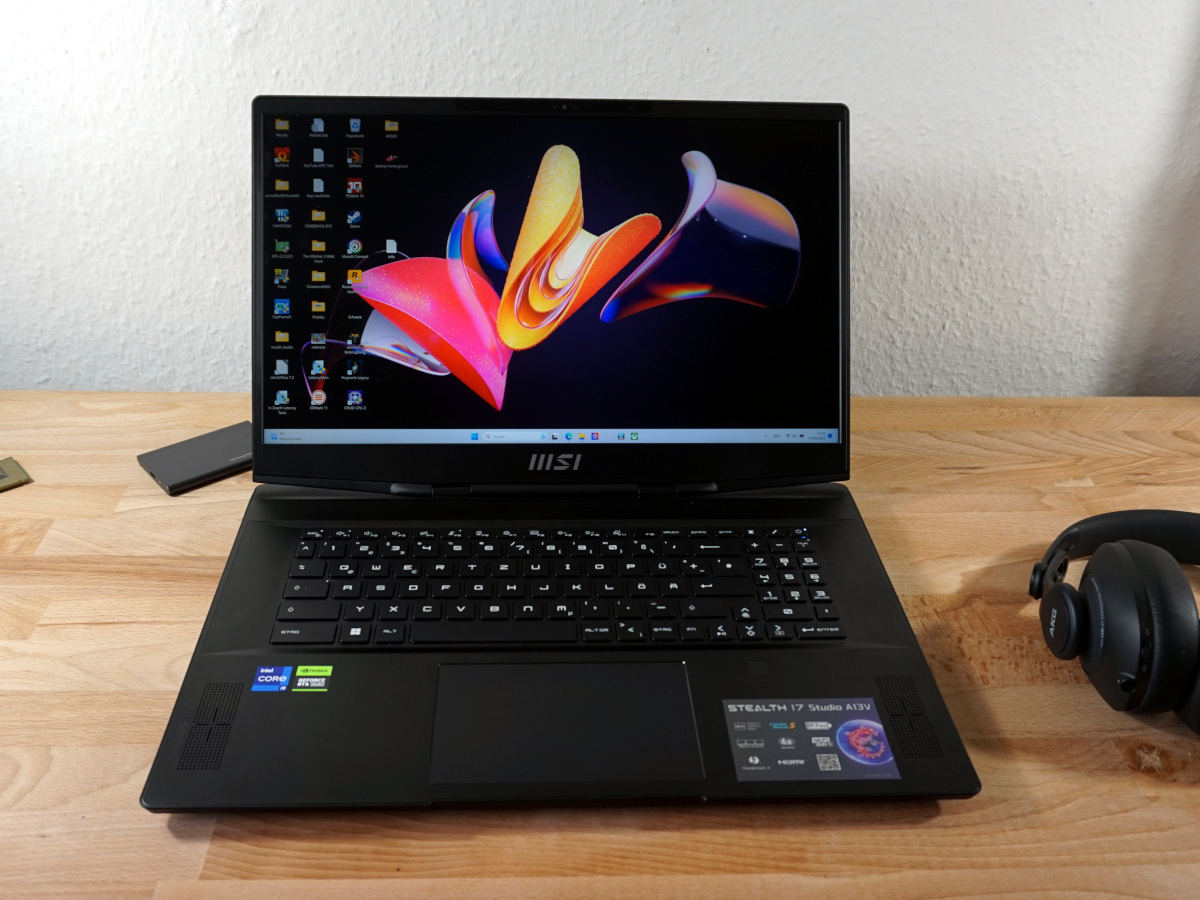
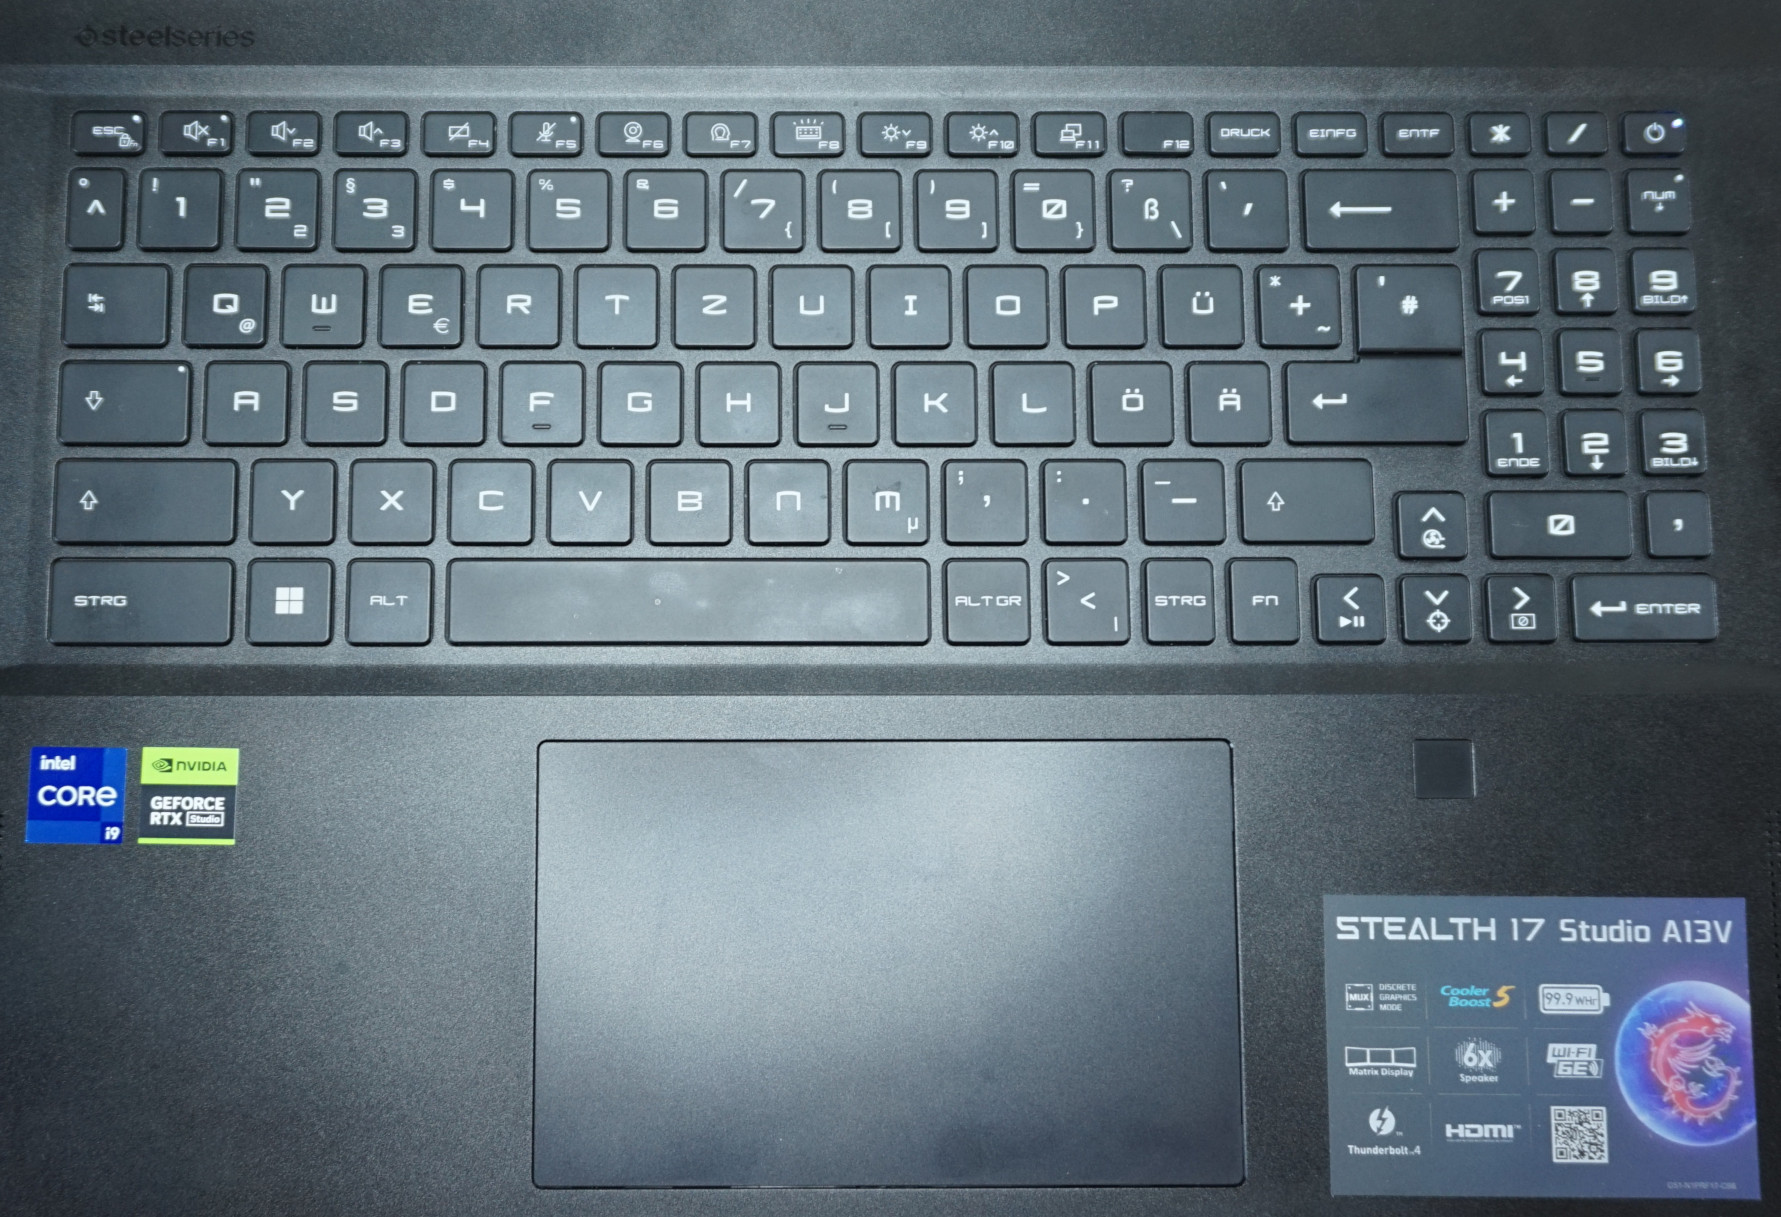
输入设备--在一个高级的、创作者的笔记本电脑中,有很多平均水平。
几乎听不到的打字噪音与安静的工作设备的整体形象非常吻合。此外,略高于平均水平的1.7毫米的键程是实实在在的,确保了快速和轻松的打字体验。键盘没有更好的,但也不比大多数商务笔记本电脑中的那种差。数字键盘显得有点过于拥挤,这在经常切换到桌面的情况下是一个负面的观点。
除此之外,每个键都可以单独背光,还可以改变颜色。此外,在SteelSeries GG客户端软件的帮助下,所有按键都可以被分配新的或额外的功能。
不幸的是,切换颜色和传感器数值的组合并不奏效。更加恼人的是不均匀的闪电。如果你的偏好是单色背光,那么按键之间的差异是很明显的,尤其是浅色的。
同样,触摸板也不符合Stealth 17的高级特性,尽管它的功能基本上没有问题。下部区域的物理按键似乎很模糊,不精确。虽然在正常情况下,我们可以看到鼠标更有可能被使用。
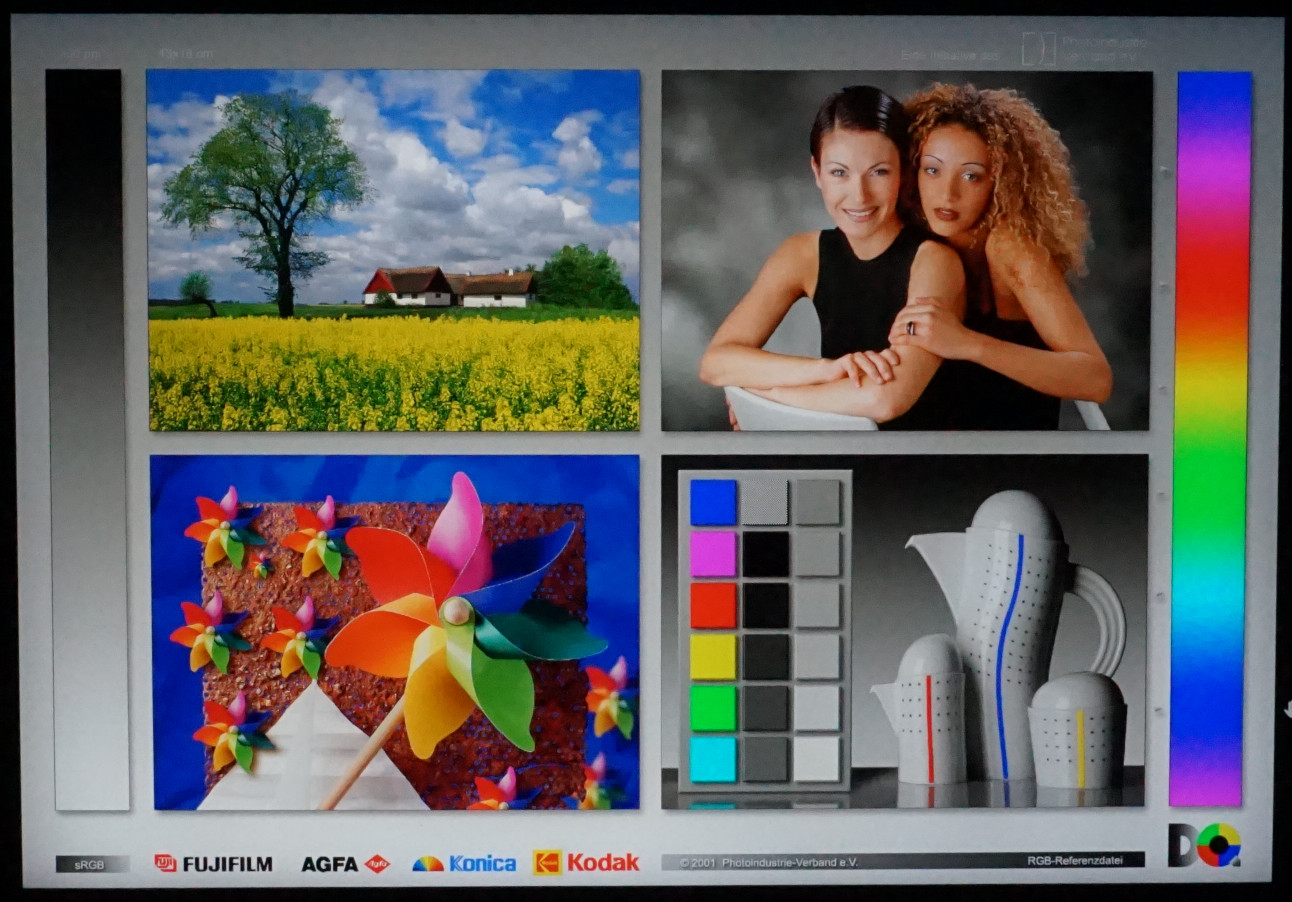
显示--Stealth 17的惊人的图像值
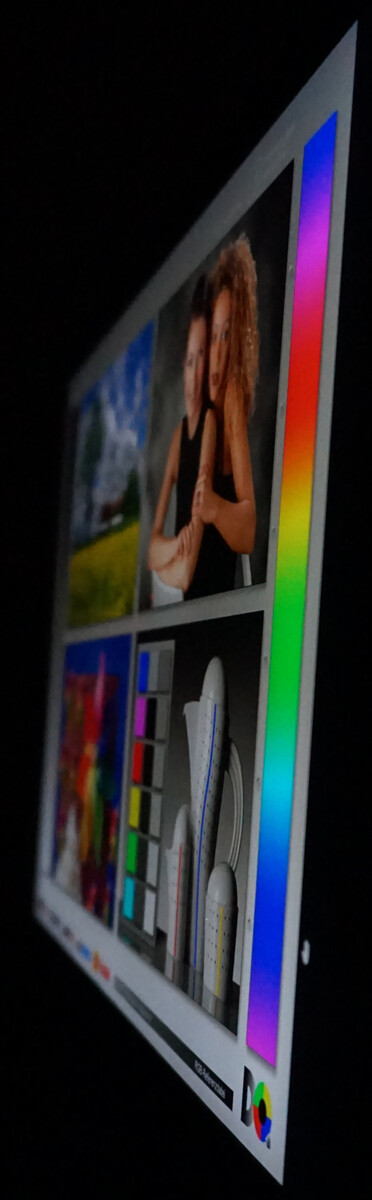
凭借其4K分辨率和(至少在纸面上)几乎100%的DCI-P3色彩空间覆盖率以及VESA DisplayHDR 1000认证,该屏幕旨在用于专业应用。特别是,高水平的视频编辑需要这样的显示属性。此外,还有144赫兹的帧率,这在游戏中也有好处。平滑移动的图像和低延迟是其结果。
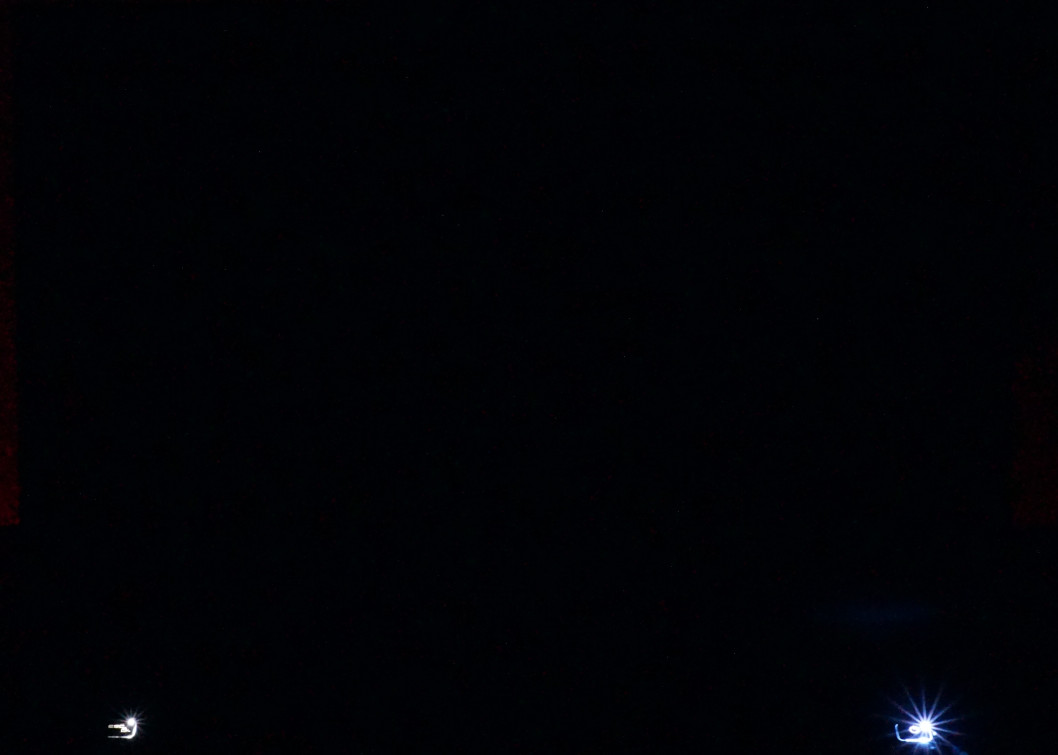
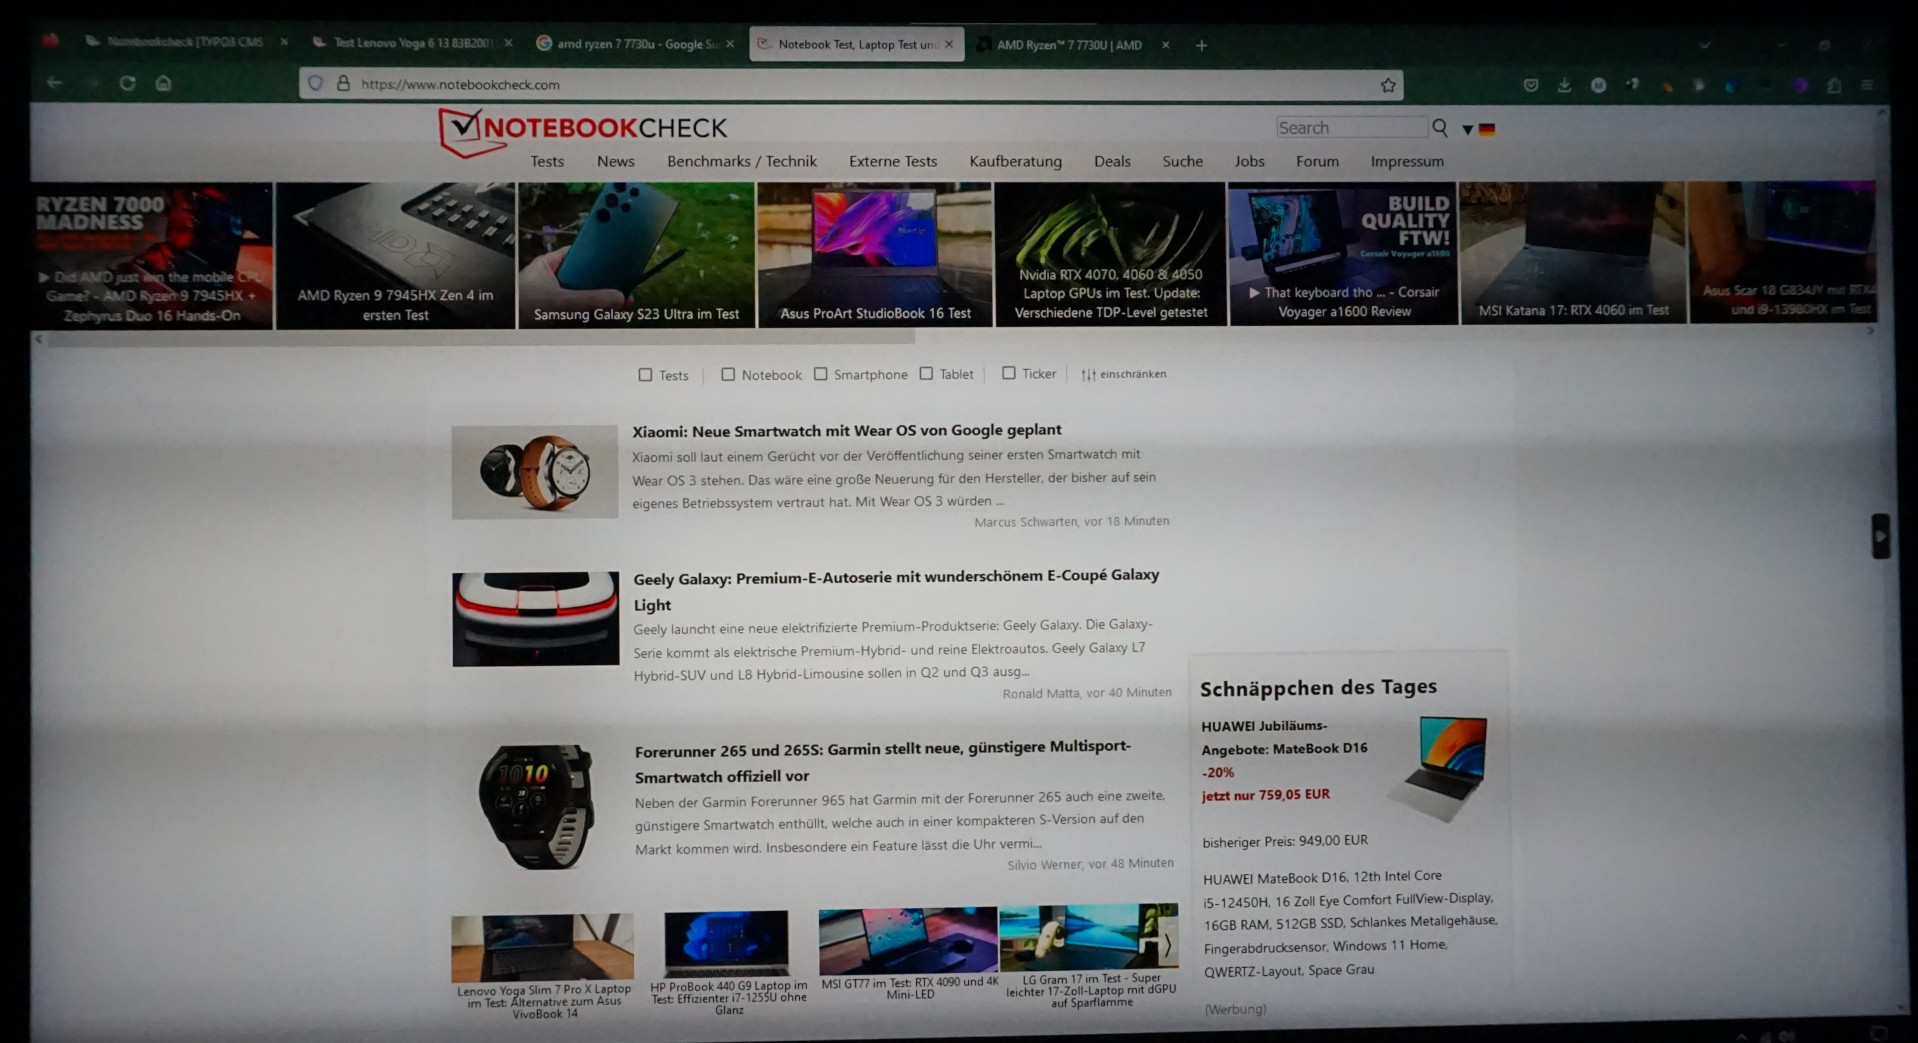
由于几乎完美的黑色水平,对比度很高,但由于残留的光线反射,永远不会完全达到零。 当涉及到视频播放和游戏时,与传统背光的区别是明显可见的。画面类似于OLED显示屏中的画面。这是我们的图像捕捉所显示的,其目的是为了揭示任何屏幕出血。在长时间的曝光中看不到一丝一毫的痕迹。
对于许多任务来说,17英寸设备的4K分辨率是太多了。Windows 11自动将放大系数设置为250%。然而,为了能够识别文本和图形,200%应该是足够的。也就是说,我们不建议低于这个数值。相比之下,在图像编辑方面,高像素密度是一个优势。
我们测量了400cd/m²,在电池模式下没有任何恶化。这仍然导致室内的精彩图像,然而,从来没有出现令人眼花缭乱的亮度。关于,对于HDR内容,峰值亮度可以更高。
| |||||||||||||||||||||||||
Brightness Distribution: 93 %
Center on Battery: 408.46 cd/m²
Contrast: 19865:1 (Black: 0.02 cd/m²)
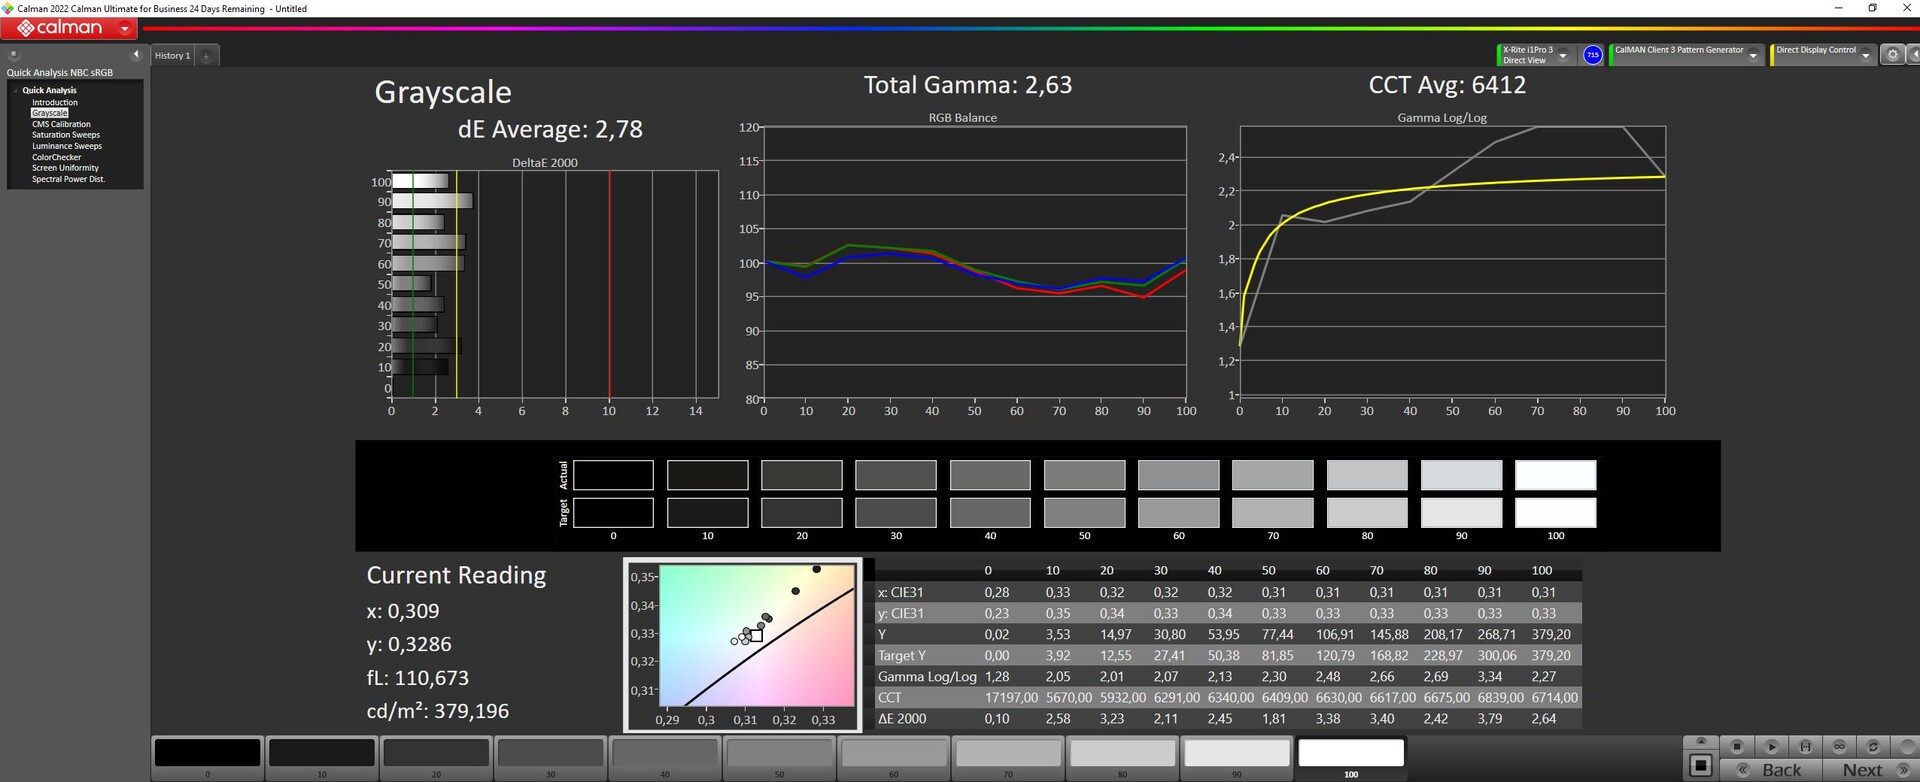
ΔE ColorChecker Calman: 2.52 | ∀{0.5-29.43 Ø4.71}
calibrated: 2.52
ΔE Greyscale Calman: 2.78 | ∀{0.09-98 Ø4.96}
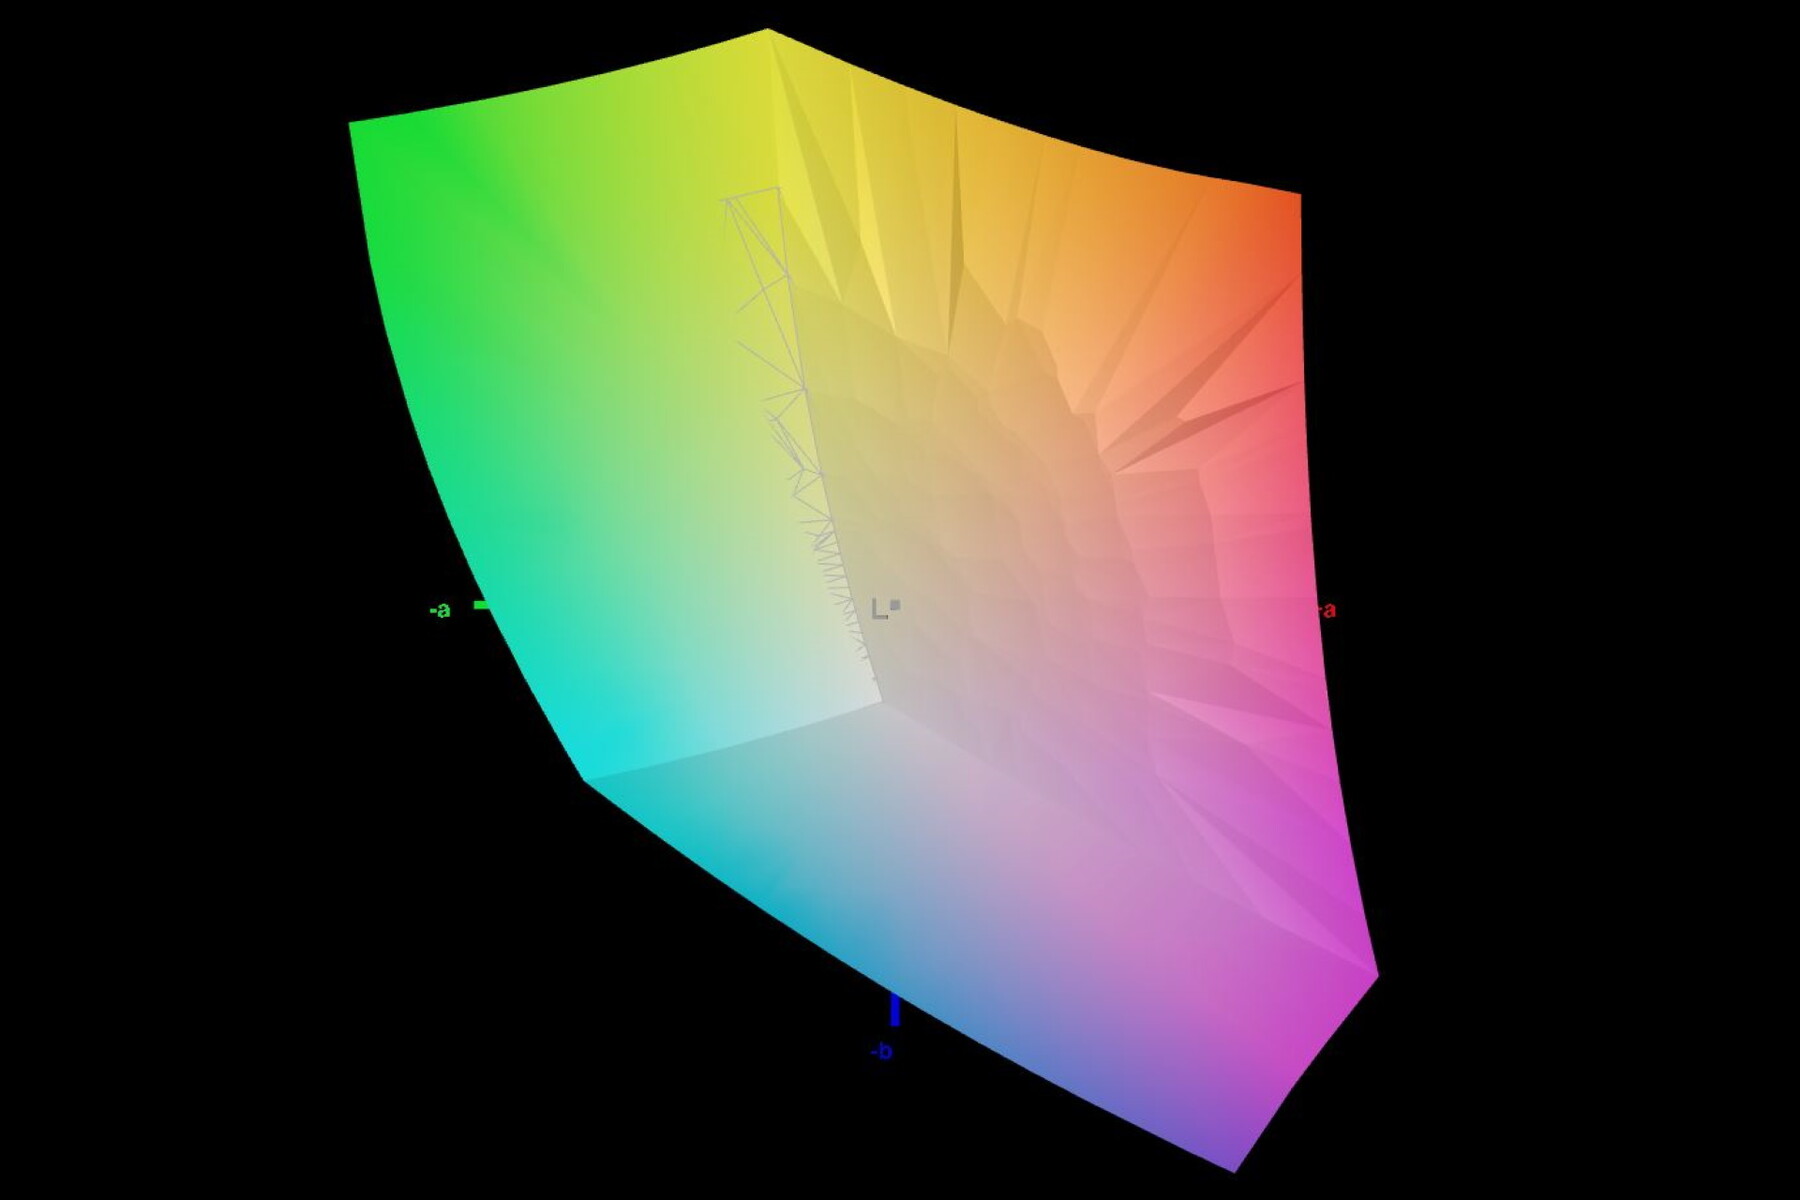
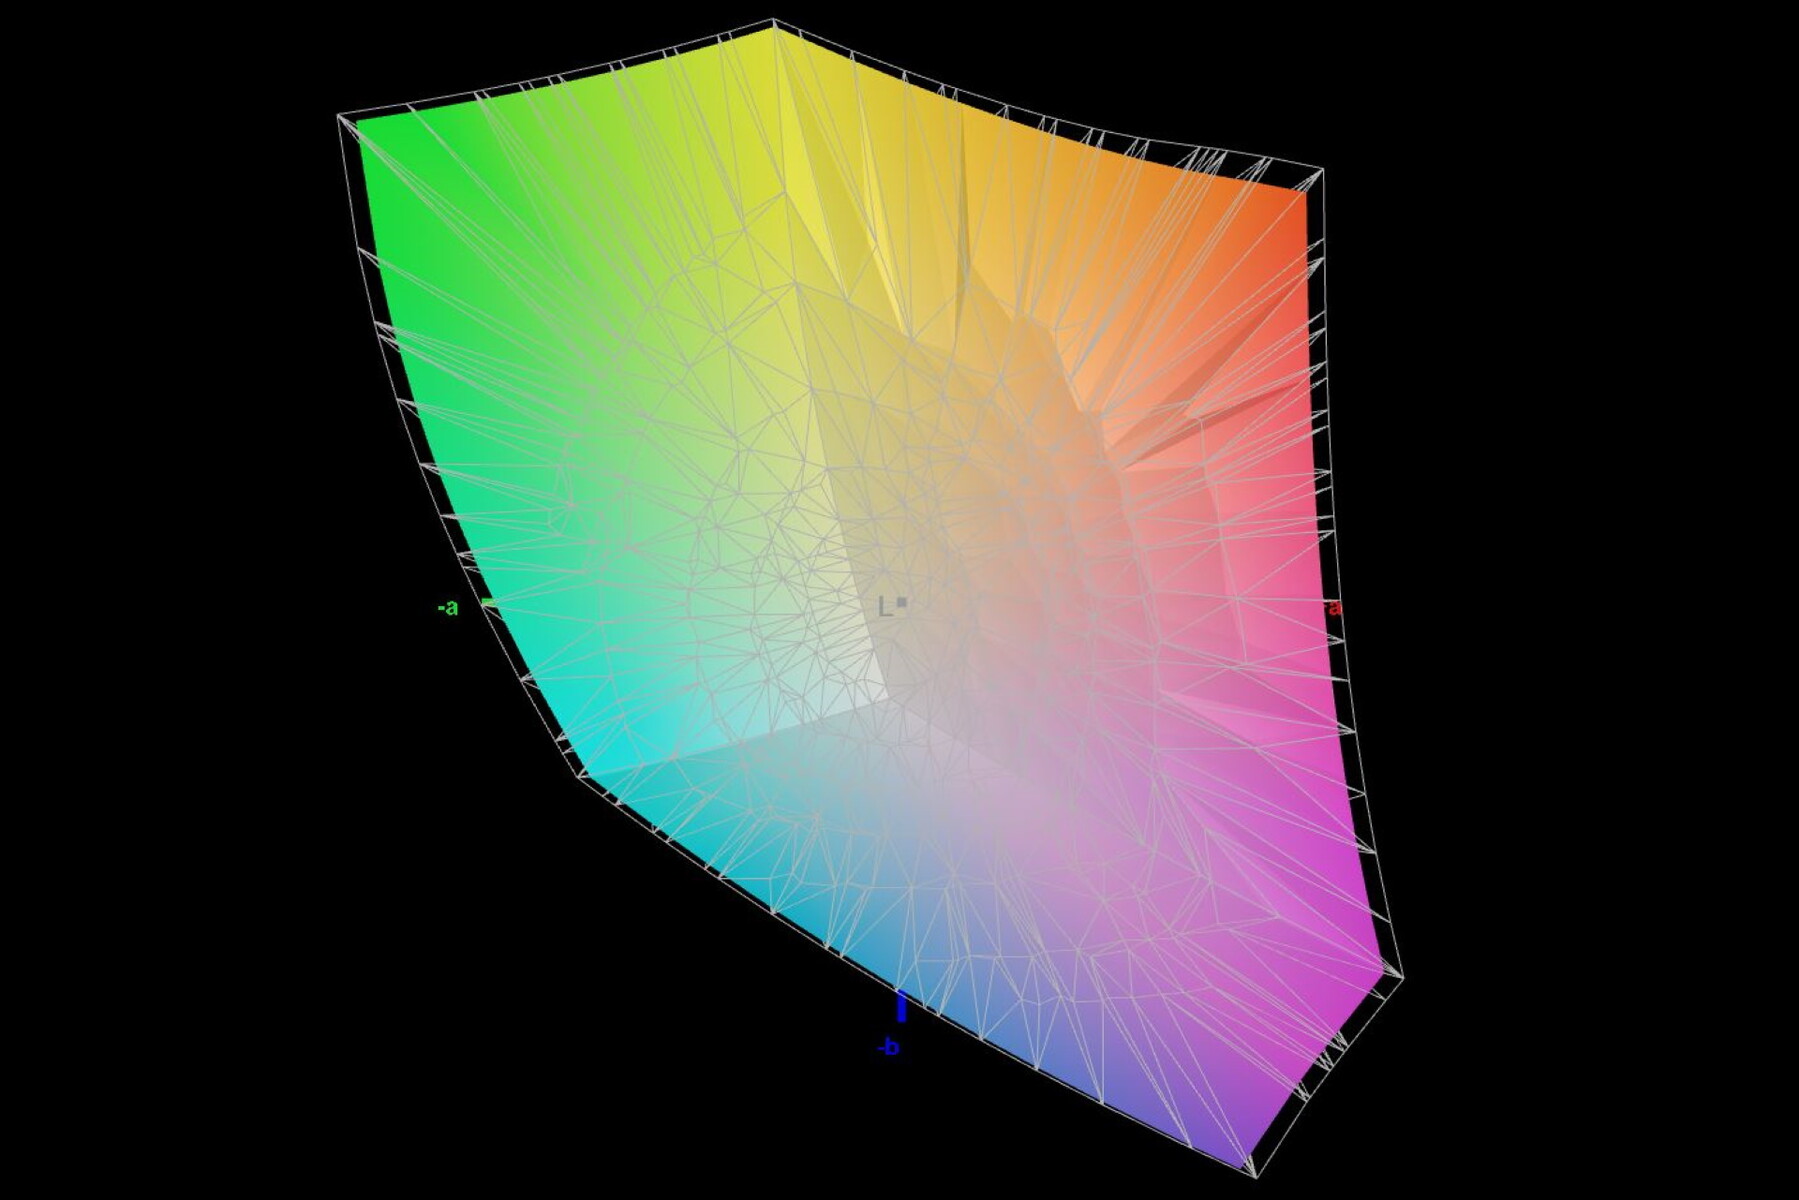
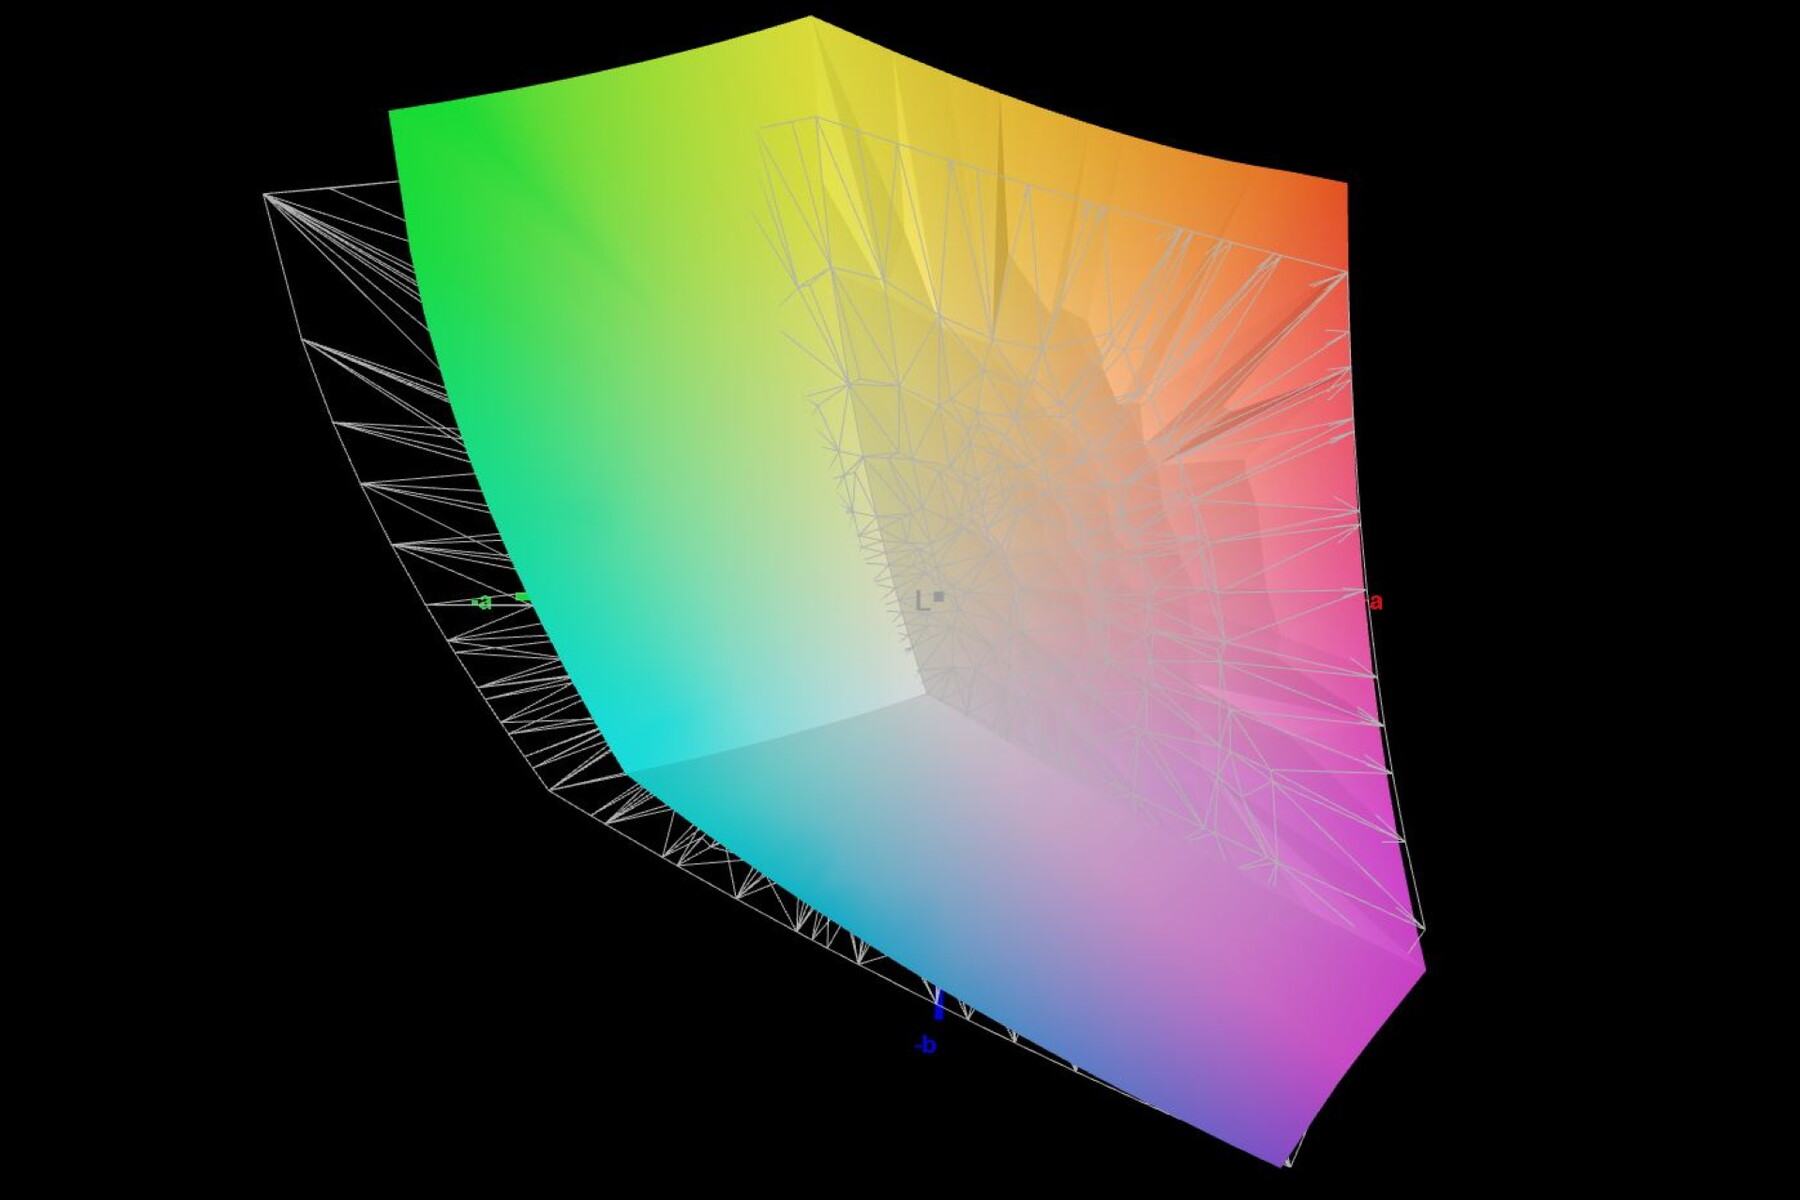
94.07% AdobeRGB 1998 (Argyll 3D)
99.1% sRGB (Argyll 3D)
92% Display P3 (Argyll 3D)
Gamma: 2.63
CCT: 6412 K
| MSI Stealth 17 Studio A13VH-014 AUO41A2 B173ZAN06.C, Mini LED, 3840x2160, 17.3" | Gigabyte Aero 16 YE5 Samsung SDC416B, AMOLED, 3840x2400, 16" | HP Omen 17-ck2097ng BOE BOE09BF, IPS, 2560x1440, 17.3" | Razer Blade 16 Early 2023 CSOT T3 MNG007DA4-1, IPS, 2560x1600, 16" | Aorus 17X AZF BOE09F9, IPS, 2560x1440, 17.3" | Asus ROG Strix G17 G713PI BOE0B69, IPS, 2560x1440, 17.3" | |
|---|---|---|---|---|---|---|
| Display | -18% | 1% | -1% | -0% | ||
| Display P3 Coverage (%) | 92 | 67.4 -27% | 98.5 7% | 96.7 5% | 98.3 7% | |
| sRGB Coverage (%) | 99.1 | 97.6 -2% | 100 1% | 99.9 1% | 100 1% | |
| AdobeRGB 1998 Coverage (%) | 94.07 | 69.6 -26% | 89.7 -5% | 84.5 -10% | 85.9 -9% | |
| Response Times | -64% | -635% | -875% | -730% | -599% | |
| Response Time Grey 50% / Grey 80% * (ms) | 46.4 ? | 2.4 ? 95% | 15.6 ? 66% | 6.6 ? 86% | 14 ? 70% | 5.3 ? 89% |
| Response Time Black / White * (ms) | 0.62 ? | 2 ? -223% | 8.9 ? -1335% | 12 ? -1835% | 10.1 ? -1529% | 8.6 ? -1287% |
| PWM Frequency (Hz) | 2400 | 60 ? | ||||
| Screen | 24% | -169% | -195% | -163% | -195% | |
| Brightness middle (cd/m²) | 397.29 | 368 -7% | 371 -7% | 456.8 15% | 294 -26% | 327 -18% |
| Brightness (cd/m²) | 392 | 368 -6% | 350 -11% | 437 11% | 276 -30% | 320 -18% |
| Brightness Distribution (%) | 93 | 93 0% | 90 -3% | 83 -11% | 90 -3% | 89 -4% |
| Black Level * (cd/m²) | 0.02 | 0.01 50% | 0.32 -1500% | 0.35 -1650% | 0.28 -1300% | 0.38 -1800% |
| Contrast (:1) | 19865 | 36800 85% | 1159 -94% | 1305 -93% | 1050 -95% | 861 -96% |
| Colorchecker dE 2000 * | 2.52 | 2.33 8% | 1.74 31% | 3.7 -47% | 2.81 -12% | 1.01 60% |
| Colorchecker dE 2000 max. * | 3.91 | 4.34 -11% | 3.59 8% | 6.42 -64% | 5.7 -46% | 4.01 -3% |
| Colorchecker dE 2000 calibrated * | 2.52 | 1.01 60% | 0.66 74% | 0.86 66% | 0.41 84% | |
| Greyscale dE 2000 * | 2.78 | 0.8 71% | 2.8 -1% | 2.6 6% | 3.4 -22% | 1.6 42% |
| Gamma | 2.63 84% | 2.119 104% | 2.19 100% | 2.3 96% | 2.301 96% | 2.168 101% |
| CCT | 6412 101% | 6569 99% | 6474 100% | 6108 106% | 7389 88% | 6659 98% |
| Total Average (Program / Settings) | -20% /
6% | -274% /
-203% | -356% /
-250% | -298% /
-209% | -265% /
-211% |
* ... smaller is better
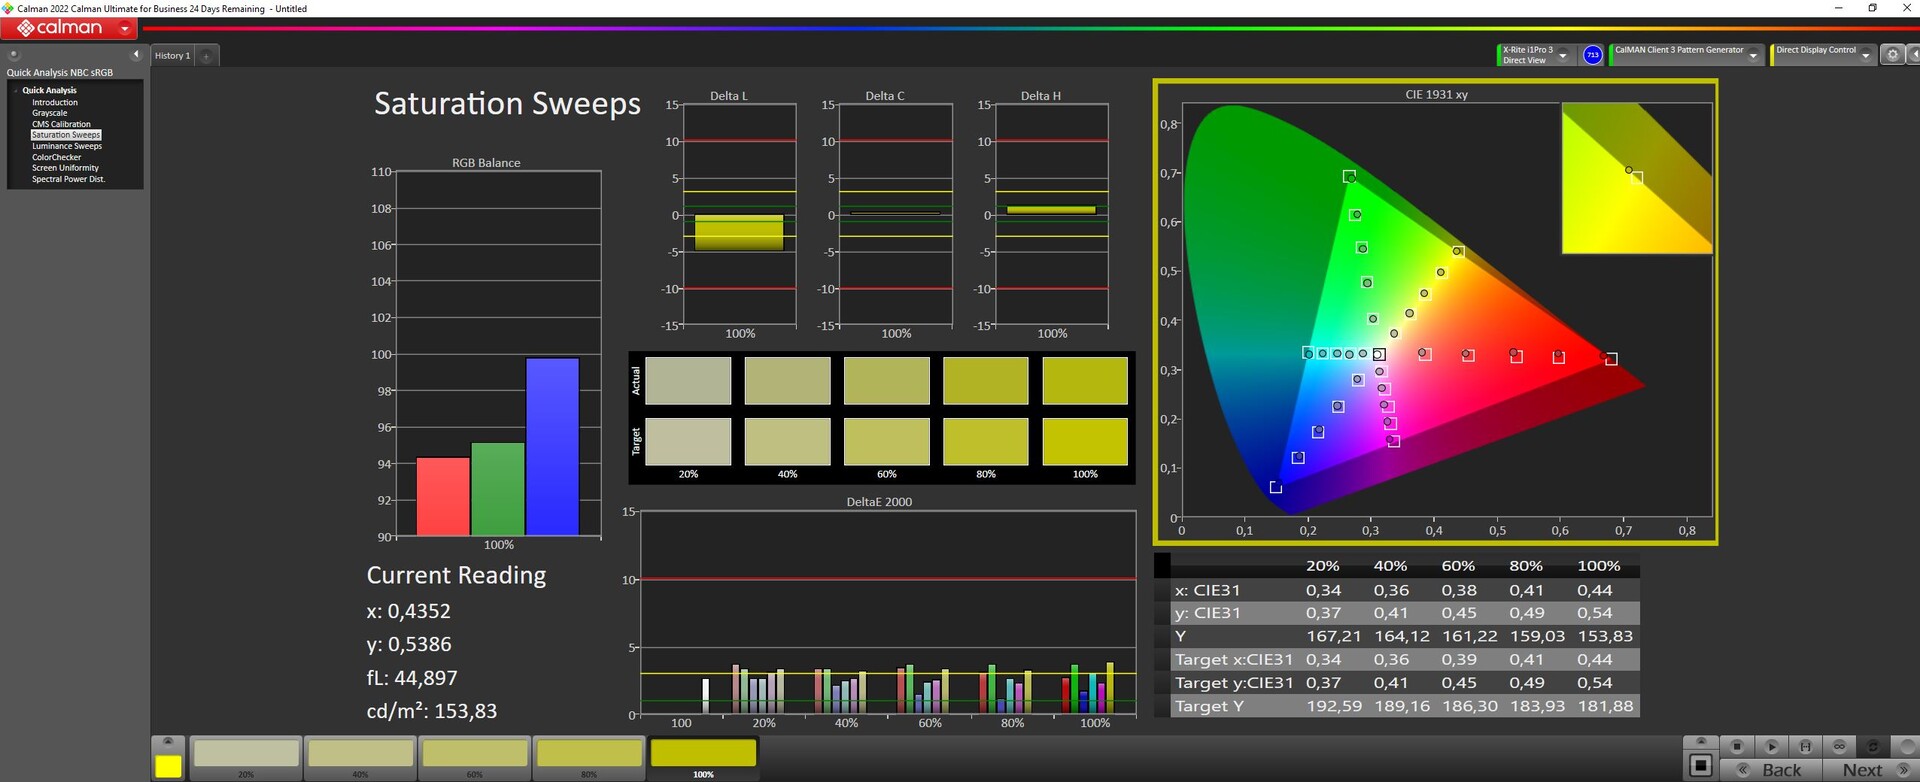
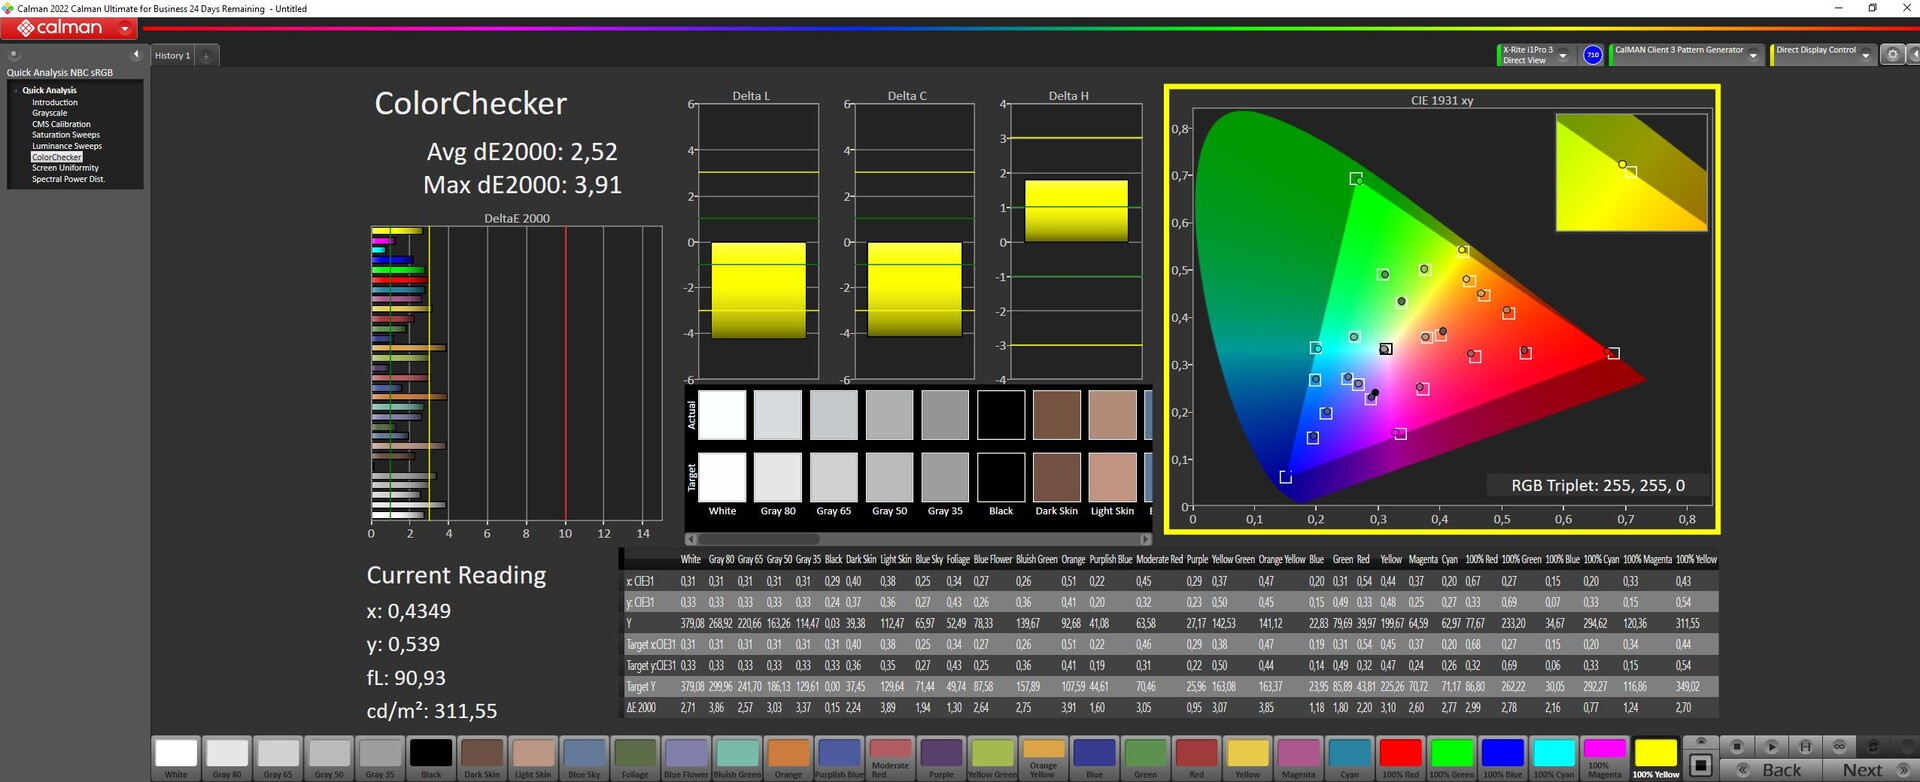
典型的色彩空间覆盖率似乎并不十分完美。特别是,DCI-P3缺乏一点光芒。该显示器属于高级类别的事实由94%的AdobeRGB冷空间覆盖率证明。大多数竞争者的IPS面板落后了不少。
从一开始,色彩再现的准确性就很好。在2.5时,测量的DeltaE值低于可感知的水平。即使是一些棕色调的最大检测偏差,对大多数人来说也应该是无法感知的。随后的校准未能带来改进。
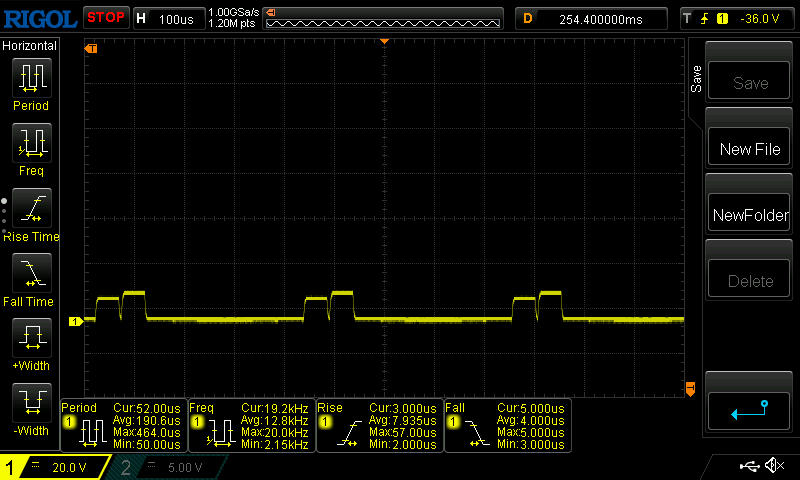
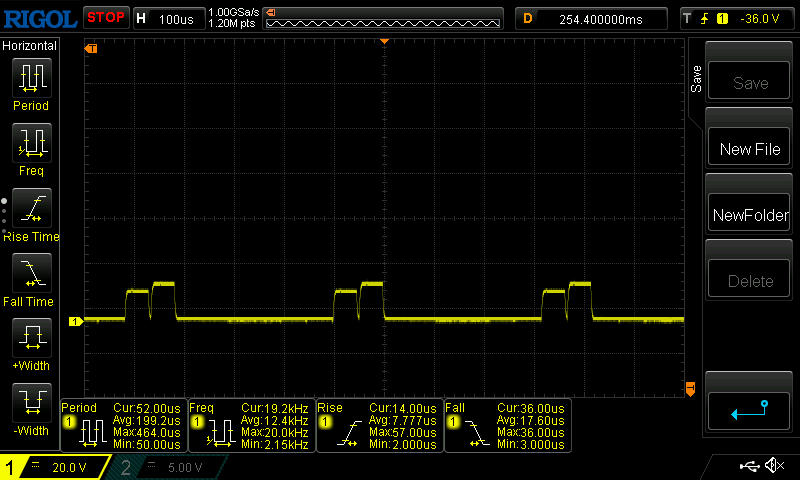
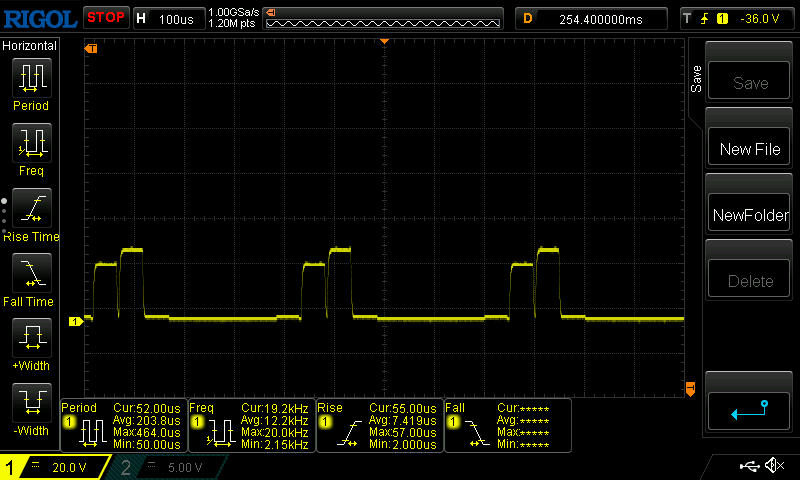
我们能够检测到频率为2.4 kHz的与PWM有关的闪烁。然而,其强度很难与典型的LED显示屏相提并论。由于迷你LED的精细光栅化,只有非常有限的区域被瞬间关闭。这并不一定意味着敏感的用户不会注意到它。
在所有的亮度水平和较短的曝光时间内,可以看到密密麻麻的略带暗色的条纹在画面上运行。看来背光灯并没有完全关闭。这是由于只有一个很小的LED区域被停用,而周围的迷你LED似乎照亮了关闭的部分。因此,变暗的程度显得明显较低。
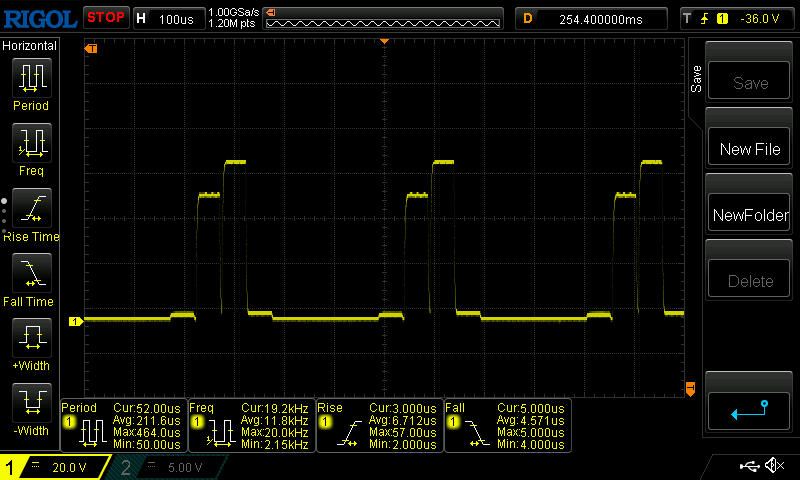
在1/500秒的曝光时间下,可以清楚地看到这一点。这在分析数据下的图像中可以看到:使用微型LED,有几个区域稍微变暗。相比之下,使用正常的LED背光,当一个更大的区域被关闭时,一个大的区域在几分之一秒内保持完全的黑色。
灰色到灰色的反应时间并不令人印象深刻--与其他迷你LED面板一样。另一方面,从亮到暗的切换是在一个非常好的水平上。


Display Response Times
| ↔ Response Time Black to White | ||
|---|---|---|
| 0.62 ms ... rise ↗ and fall ↘ combined | ↗ 0.42 ms rise | 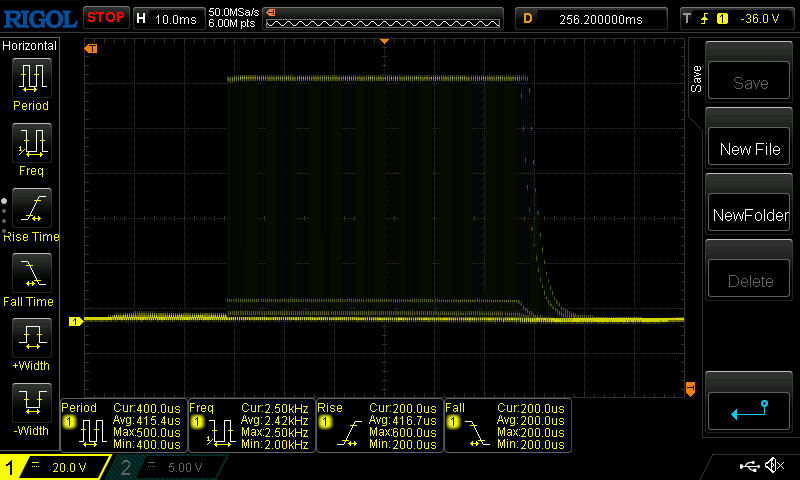 |
| ↘ 0.2 ms fall | ||
| The screen shows very fast response rates in our tests and should be very well suited for fast-paced gaming. In comparison, all tested devices range from 0.1 (minimum) to 240 (maximum) ms. » 1 % of all devices are better. This means that the measured response time is better than the average of all tested devices (19.8 ms). | ||
| ↔ Response Time 50% Grey to 80% Grey | ||
| 46.4 ms ... rise ↗ and fall ↘ combined | ↗ 24 ms rise | 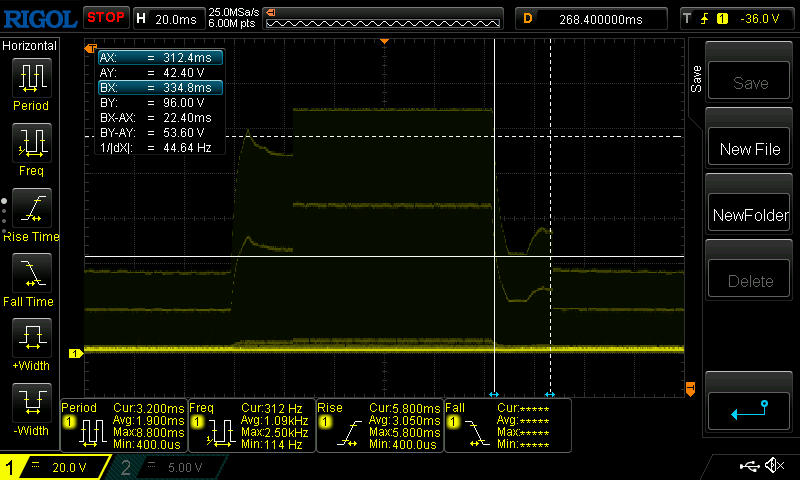 |
| ↘ 22.4 ms fall | ||
| The screen shows slow response rates in our tests and will be unsatisfactory for gamers. In comparison, all tested devices range from 0.165 (minimum) to 636 (maximum) ms. » 80 % of all devices are better. This means that the measured response time is worse than the average of all tested devices (31 ms). | ||
Screen Flickering / PWM (Pulse-Width Modulation)
| Screen flickering / PWM detected | 2400 Hz | 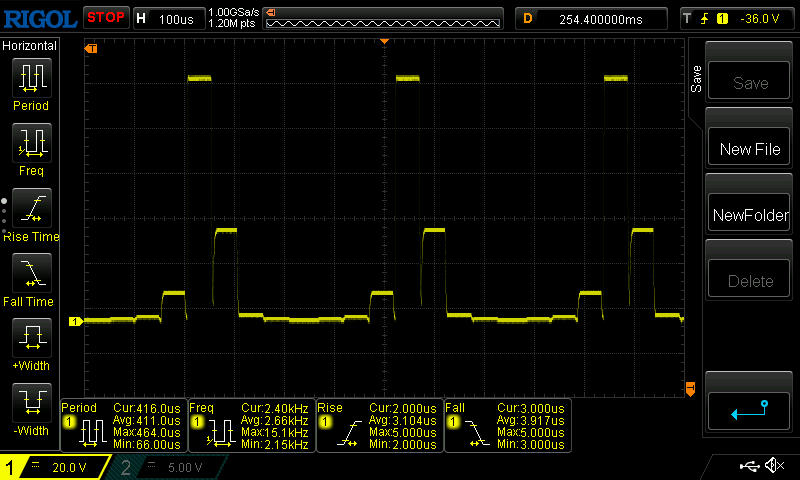 | |
The display backlight flickers at 2400 Hz (worst case, e.g., utilizing PWM) . The frequency of 2400 Hz is quite high, so most users sensitive to PWM should not notice any flickering. In comparison: 52 % of all tested devices do not use PWM to dim the display. If PWM was detected, an average of 7757 (minimum: 5 - maximum: 343500) Hz was measured. | |||
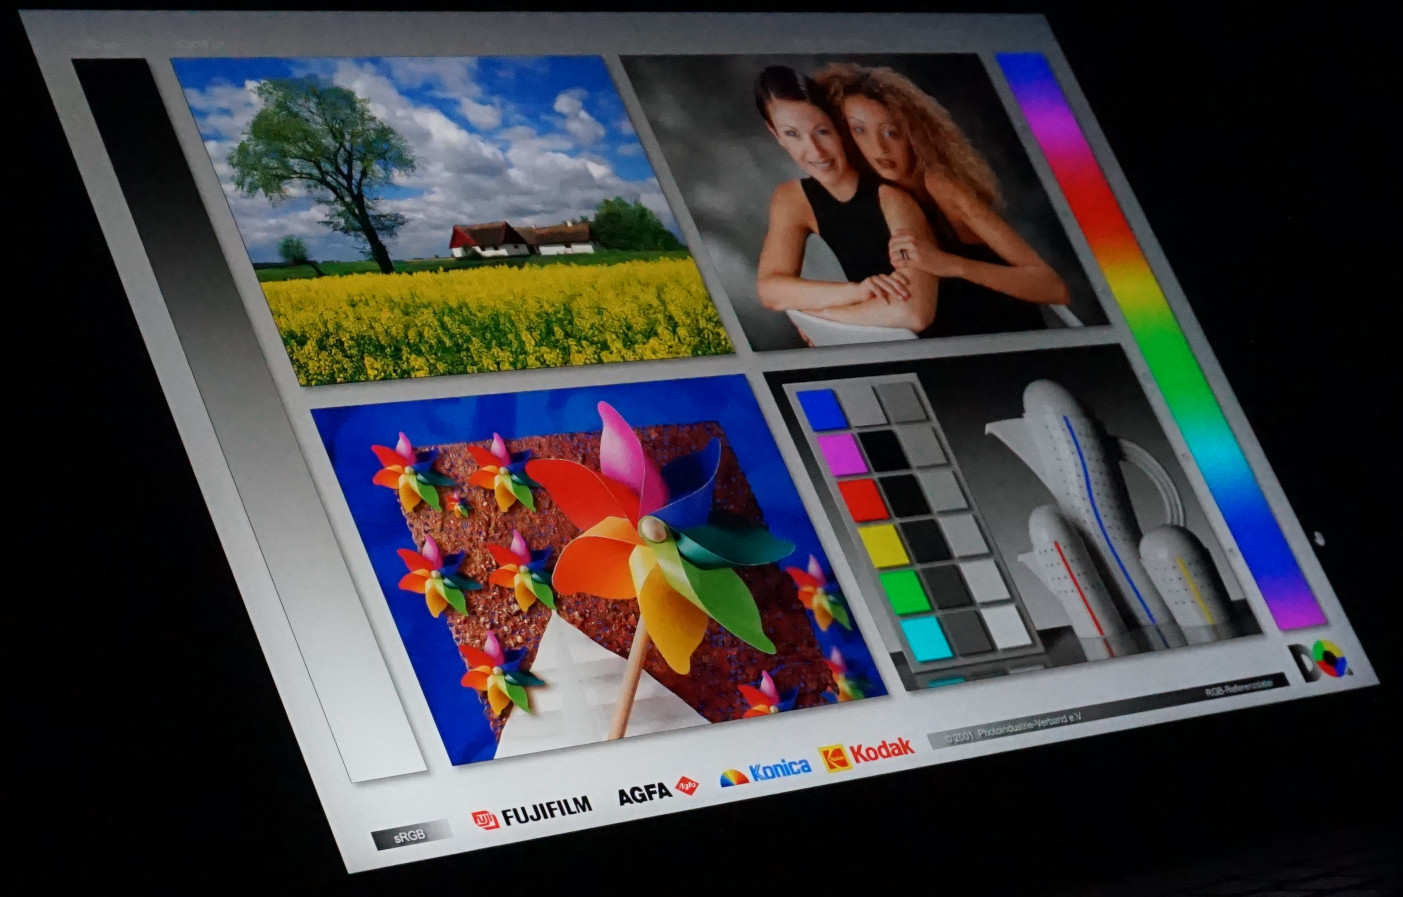
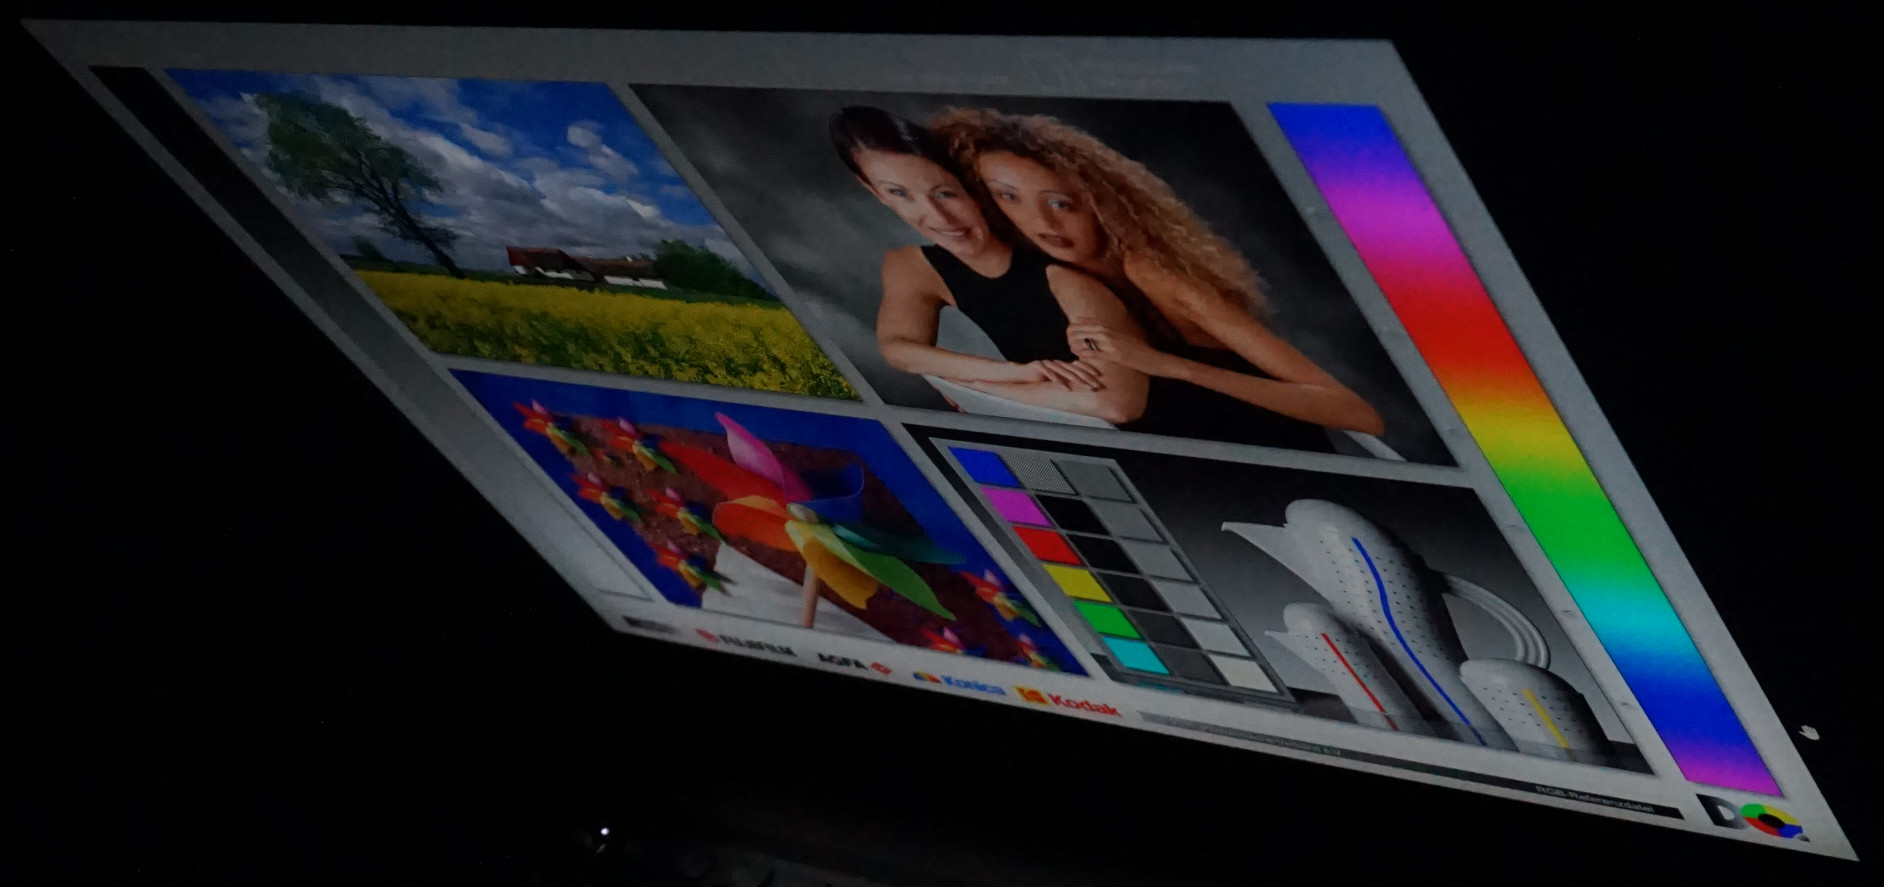
尽管有很好的对比度值,但在户外显示有问题。即使只是轻微的阴天,也应避免阳光直接投射到屏幕上,否则显示屏会变得难以辨认。在远离光线的地方,文字仍然清晰可辨,图像也足以识别。
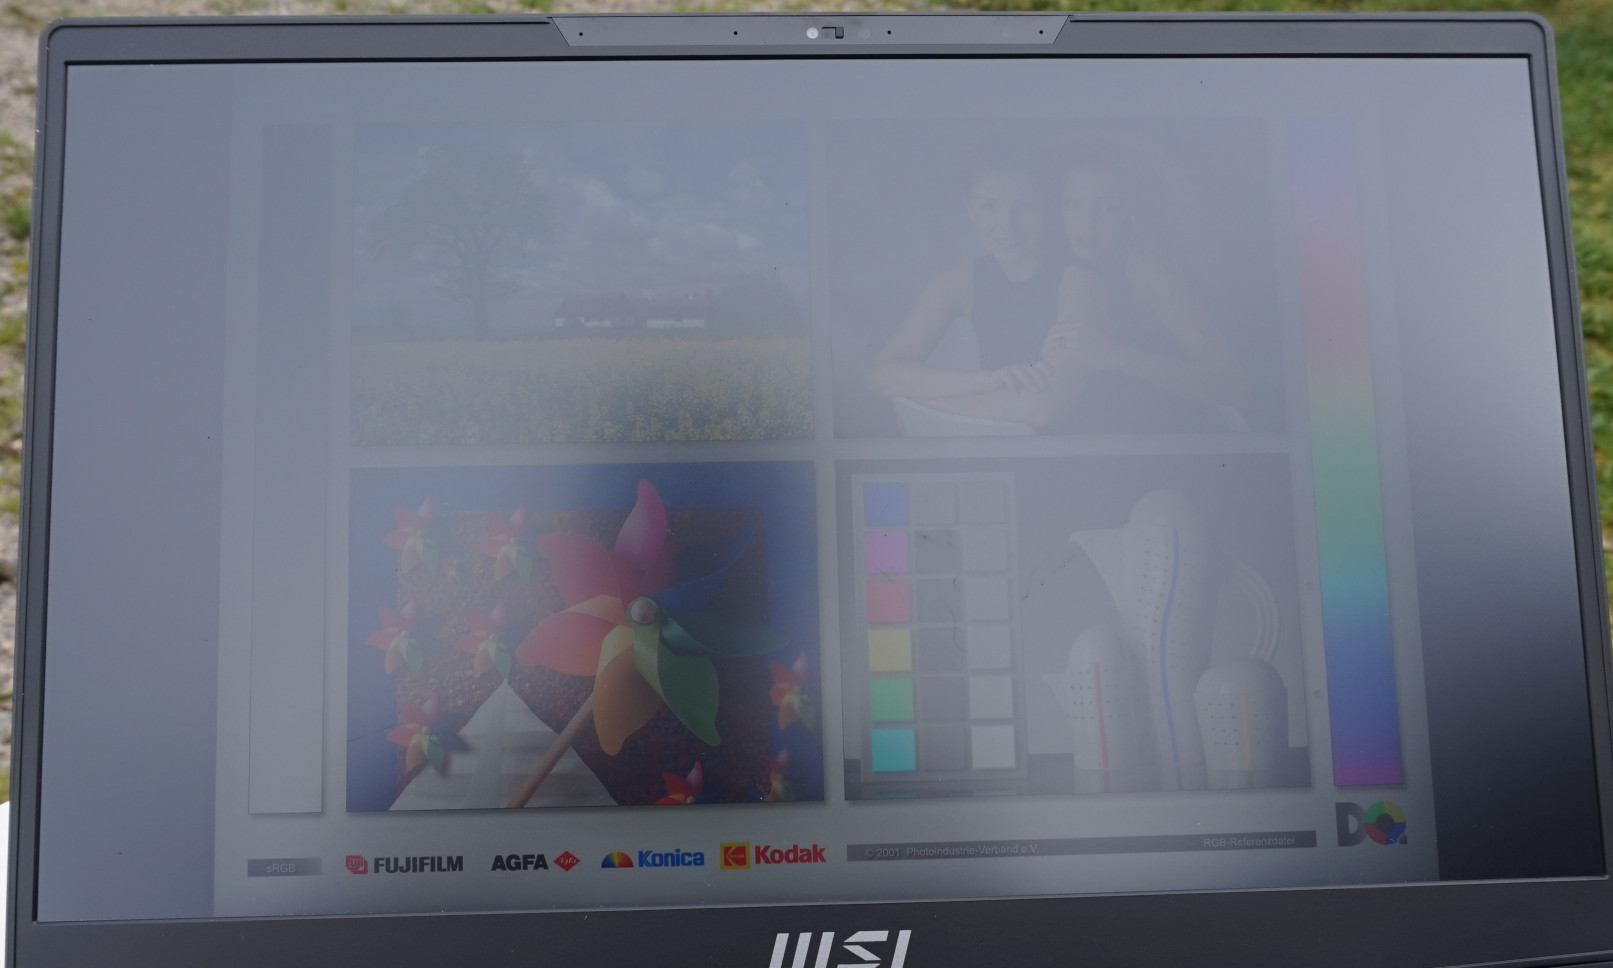
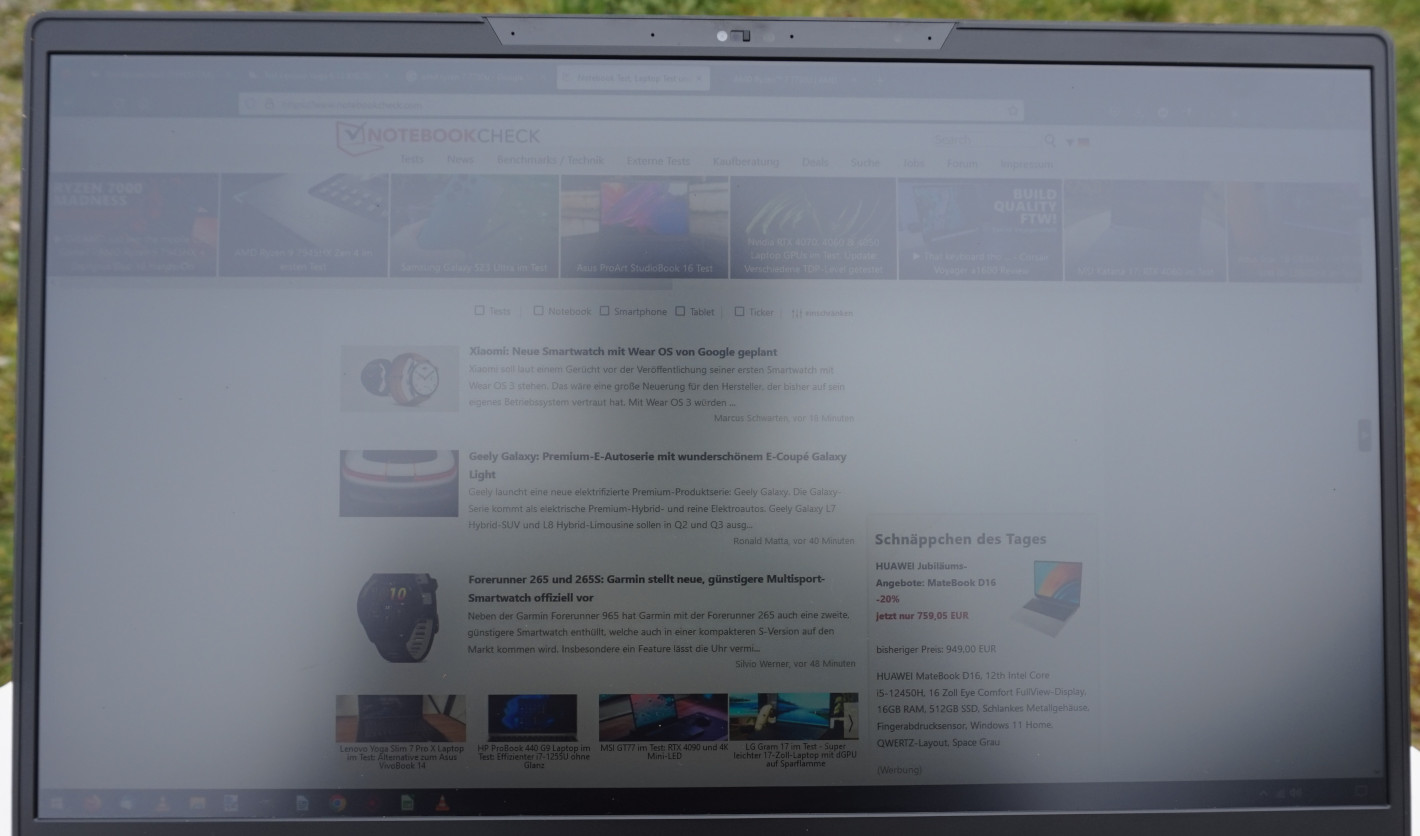
视角的稳定性非常好。即使从一个非常陡峭的广角观看,颜色和亮度也保持不变。
性能 - 硬件限制是实用的
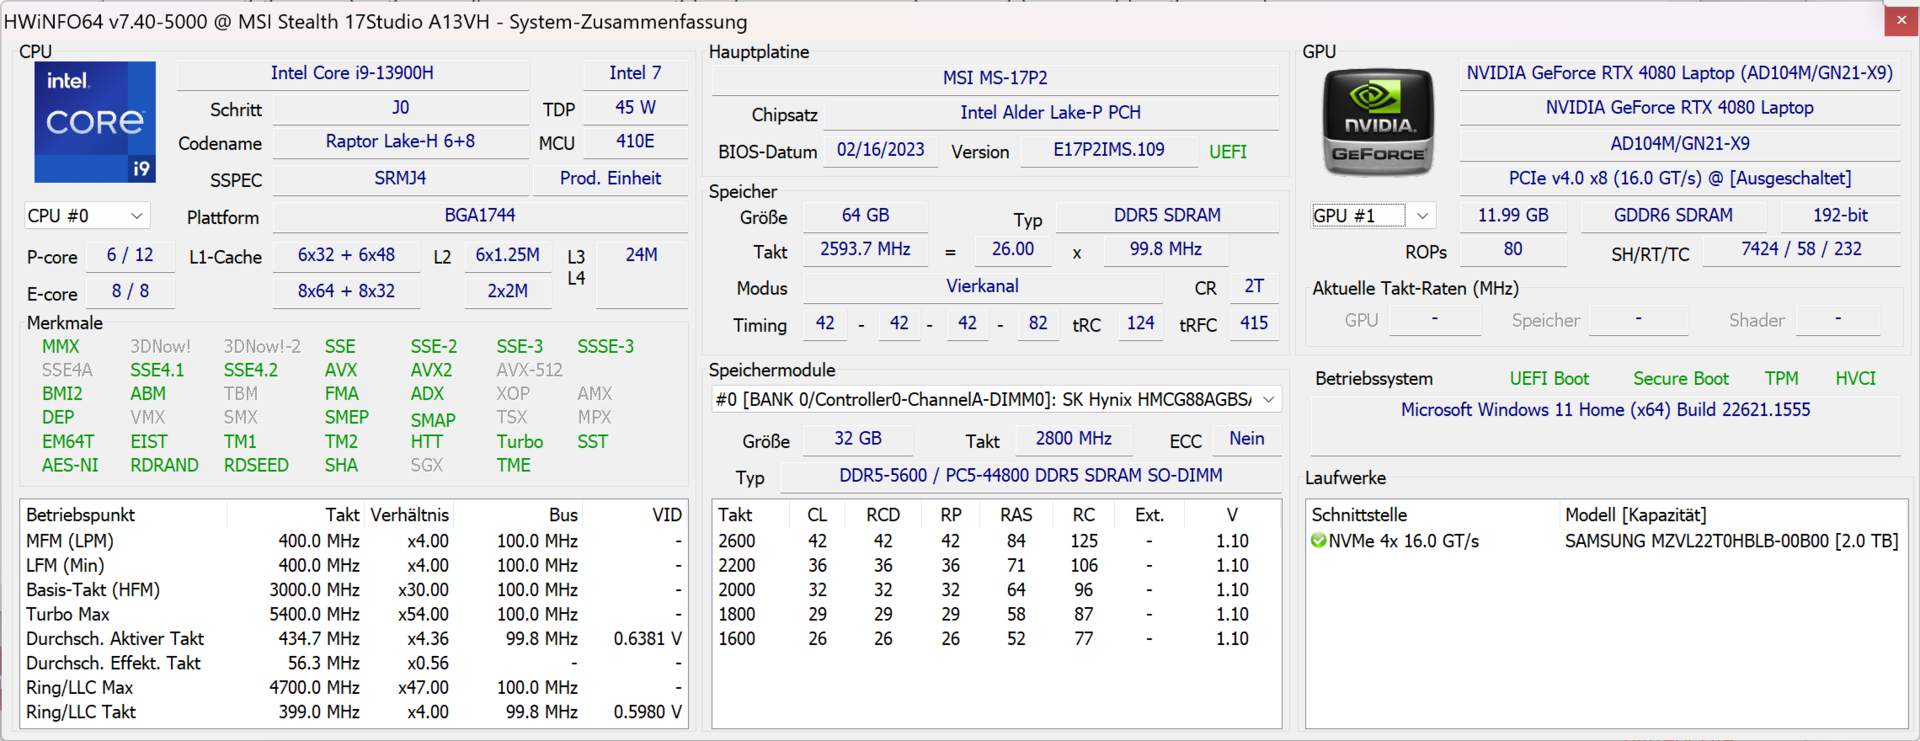
几乎没有任何东西会对英特尔酷睿i9-13900H构成问题。英特尔酷睿i9-13900H和NvidiaGeForce RTX 4080.由于高水平的计算能力、众多的计算核心和强大的图形,各种类型的应用程序以及苛刻的游戏都可以毫不费力地处理。还有64GB的内存,在进行多任务处理或编辑复杂的图像时,可以发挥自己的作用。无论什么任务,无论是安装软件还是启动程序,该机器的高运行速度都是有目共睹的。
测试条件
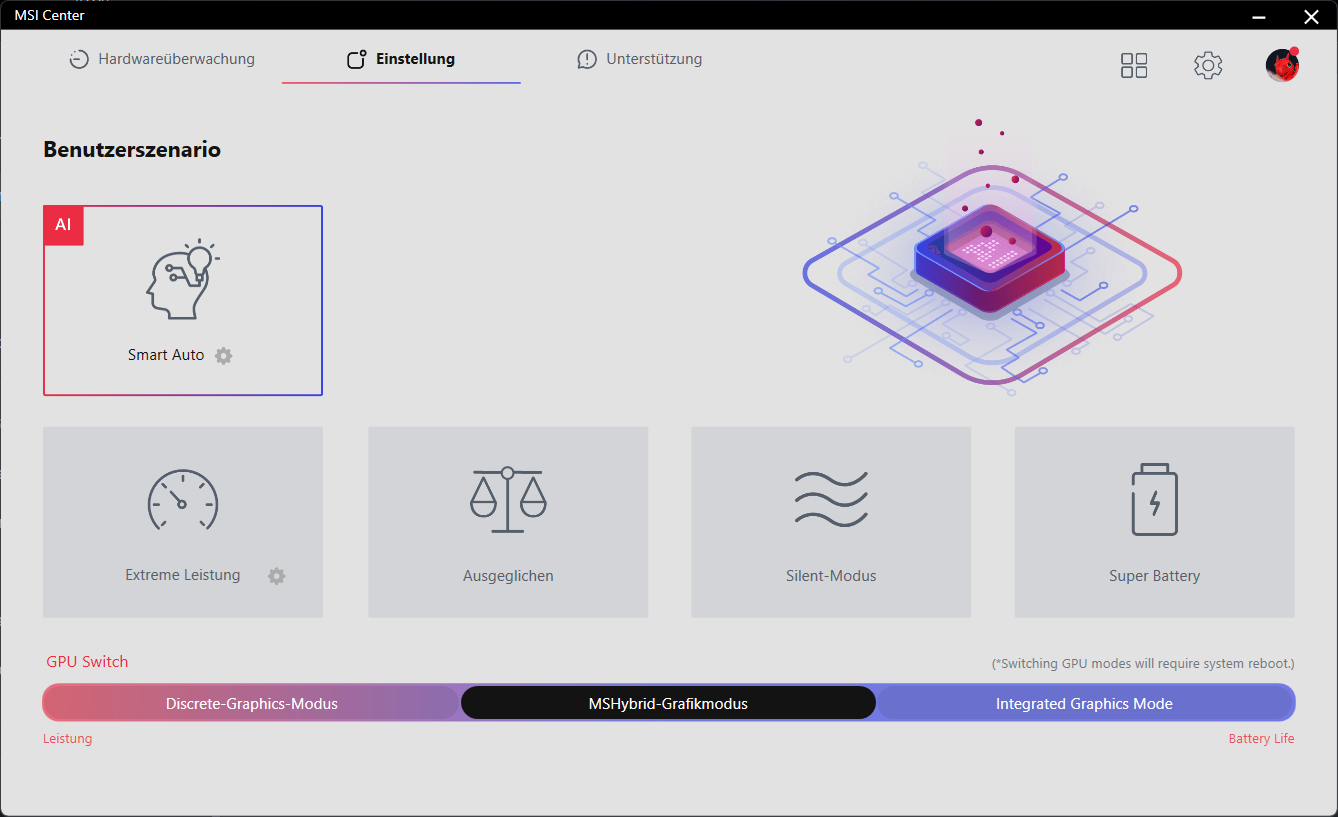
对于每个测试和基准,我们都使用了 "智能自动 "性能模式。这种模式应该能够在人工智能的帮助下独立确定所需的图形和计算能力组合以及风扇设置。
Stealth 17 Studio的声音仍然适中,很少导致风扇被打开。相比之下,"极致性能 "模式让我们想起了与游戏笔记本相关的那种行为,明显更多。然而,由于这里的目标是成功地混合游戏和工作,更安静的模式更可取。我们还可以看到,"极限性能 "并不自动带来更好的性能。相反,在整个测试过程中,自动设置的表现令人印象深刻。
值得注意的是:在整个测试期间,有必要进行两次BIOS更新。第一次更新导致了可接受的电池寿命,而以前只有一半的时间。在第二次更新后,以前由各种硬件测试可靠地触发的蓝屏消失了。
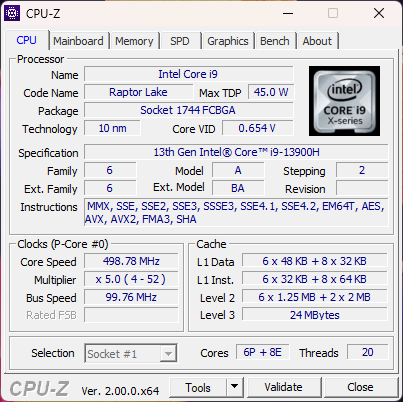
处理器
共有14个内核,20个线程,最高时钟速度为5.4GHz。英特尔酷睿i9-13900H.这使它在移动CPU的排名中名列前茅。还有一些更快的核心,如AMD Ryzen 9 7945HX或英特尔酷睿i9-13950HX.然而,它与前辈的差距,即 英特尔酷睿i9-12900H,在各种测试中被证明是10%或更多。
但即使是英特尔酷睿i9-13900HX在我们的Cinebench R15连续测试中只运行了几次,就达到了与13900H(在竞争机型中发现)类似的水平。这说明微星Stealth 17 Studio有良好的冷却和电源设置。笔记本电脑在个别测试运行之间只显示了适度的波动。
115瓦的功率消耗--在较长的时间内允许的--经常达到。此外,135瓦被允许在几分之一秒内使用。只有在 "静音 "模式下,功耗被限制在30瓦,而在电池模式下甚至允许达到45瓦。
更多的基准测试和比较值可以在我们的 CPU基准测试列表.
Cinebench R15 Multi Continuous Test
Cinebench R23: Multi Core | Single Core
Cinebench R20: CPU (Multi Core) | CPU (Single Core)
Cinebench R15: CPU Multi 64Bit | CPU Single 64Bit
Blender: v2.79 BMW27 CPU
7-Zip 18.03: 7z b 4 | 7z b 4 -mmt1
Geekbench 5.5: Multi-Core | Single-Core
HWBOT x265 Benchmark v2.2: 4k Preset
LibreOffice : 20 Documents To PDF
R Benchmark 2.5: Overall mean
| CPU Performance rating | |
| Lenovo Legion Pro 7 16IRX8H | |
| Schenker XMG Neo 16 Raptor Lake | |
| Razer Blade 16 Early 2023 | |
| Average of class Gaming | |
| Asus ROG Zephyrus M16 GU604VY-NM042X | |
| MSI Stealth 17 Studio A13VH-014 | |
| Alienware x17 R2 P48E | |
| Average Intel Core i9-13900H | |
| MSI Creator Z17 A12UGST-054 | |
| Gigabyte AERO 16 OLED BSF | |
| Razer Blade 17 Early 2022 | |
| Cinebench R23 / Single Core | |
| Schenker XMG Neo 16 Raptor Lake | |
| Lenovo Legion Pro 7 16IRX8H | |
| Razer Blade 16 Early 2023 | |
| Average of class Gaming (1166 - 2415, n=107, last 2 years) | |
| Asus ROG Zephyrus M16 GU604VY-NM042X | |
| Razer Blade 17 Early 2022 | |
| Alienware x17 R2 P48E | |
| Average Intel Core i9-13900H (1297 - 2054, n=26) | |
| MSI Creator Z17 A12UGST-054 | |
| Gigabyte AERO 16 OLED BSF | |
| MSI Stealth 17 Studio A13VH-014 | |
| Cinebench R20 / CPU (Multi Core) | |
| Lenovo Legion Pro 7 16IRX8H | |
| Schenker XMG Neo 16 Raptor Lake | |
| Average of class Gaming (4029 - 16433, n=106, last 2 years) | |
| Razer Blade 16 Early 2023 | |
| MSI Stealth 17 Studio A13VH-014 | |
| Asus ROG Zephyrus M16 GU604VY-NM042X | |
| Gigabyte AERO 16 OLED BSF | |
| Alienware x17 R2 P48E | |
| Average Intel Core i9-13900H (4935 - 7716, n=25) | |
| MSI Creator Z17 A12UGST-054 | |
| Razer Blade 17 Early 2022 | |
| Cinebench R20 / CPU (Single Core) | |
| Lenovo Legion Pro 7 16IRX8H | |
| Average of class Gaming (442 - 913, n=106, last 2 years) | |
| Schenker XMG Neo 16 Raptor Lake | |
| Asus ROG Zephyrus M16 GU604VY-NM042X | |
| Razer Blade 16 Early 2023 | |
| Alienware x17 R2 P48E | |
| Average Intel Core i9-13900H (428 - 792, n=25) | |
| MSI Creator Z17 A12UGST-054 | |
| Razer Blade 17 Early 2022 | |
| MSI Stealth 17 Studio A13VH-014 | |
| Gigabyte AERO 16 OLED BSF | |
| Cinebench R15 / CPU Multi 64Bit | |
| Schenker XMG Neo 16 Raptor Lake | |
| Schenker XMG Neo 16 Raptor Lake | |
| Lenovo Legion Pro 7 16IRX8H | |
| Razer Blade 16 Early 2023 | |
| Average of class Gaming (1578 - 6330, n=105, last 2 years) | |
| Asus ROG Zephyrus M16 GU604VY-NM042X | |
| MSI Stealth 17 Studio A13VH-014 | |
| Gigabyte AERO 16 OLED BSF | |
| Alienware x17 R2 P48E | |
| Average Intel Core i9-13900H (2061 - 3100, n=26) | |
| MSI Creator Z17 A12UGST-054 | |
| Razer Blade 17 Early 2022 | |
| Cinebench R15 / CPU Single 64Bit | |
| Lenovo Legion Pro 7 16IRX8H | |
| Average of class Gaming (188.8 - 350, n=106, last 2 years) | |
| Schenker XMG Neo 16 Raptor Lake | |
| Schenker XMG Neo 16 Raptor Lake | |
| Asus ROG Zephyrus M16 GU604VY-NM042X | |
| MSI Stealth 17 Studio A13VH-014 | |
| Razer Blade 16 Early 2023 | |
| Alienware x17 R2 P48E | |
| Average Intel Core i9-13900H (211 - 297, n=26) | |
| MSI Creator Z17 A12UGST-054 | |
| Razer Blade 17 Early 2022 | |
| Gigabyte AERO 16 OLED BSF | |
| Blender / v2.79 BMW27 CPU | |
| Razer Blade 17 Early 2022 | |
| MSI Creator Z17 A12UGST-054 | |
| Average Intel Core i9-13900H (166 - 268, n=24) | |
| Alienware x17 R2 P48E | |
| Gigabyte AERO 16 OLED BSF | |
| Asus ROG Zephyrus M16 GU604VY-NM042X | |
| MSI Stealth 17 Studio A13VH-014 | |
| Average of class Gaming (79 - 330, n=104, last 2 years) | |
| Razer Blade 16 Early 2023 | |
| Schenker XMG Neo 16 Raptor Lake | |
| Lenovo Legion Pro 7 16IRX8H | |
| 7-Zip 18.03 / 7z b 4 | |
| Lenovo Legion Pro 7 16IRX8H | |
| Schenker XMG Neo 16 Raptor Lake | |
| Razer Blade 16 Early 2023 | |
| Average of class Gaming (33491 - 148086, n=105, last 2 years) | |
| Asus ROG Zephyrus M16 GU604VY-NM042X | |
| MSI Stealth 17 Studio A13VH-014 | |
| Gigabyte AERO 16 OLED BSF | |
| Alienware x17 R2 P48E | |
| Average Intel Core i9-13900H (45045 - 79032, n=25) | |
| MSI Creator Z17 A12UGST-054 | |
| Razer Blade 17 Early 2022 | |
| 7-Zip 18.03 / 7z b 4 -mmt1 | |
| Lenovo Legion Pro 7 16IRX8H | |
| Schenker XMG Neo 16 Raptor Lake | |
| Razer Blade 16 Early 2023 | |
| Average of class Gaming (4199 - 7436, n=105, last 2 years) | |
| Asus ROG Zephyrus M16 GU604VY-NM042X | |
| MSI Stealth 17 Studio A13VH-014 | |
| Average Intel Core i9-13900H (3665 - 6600, n=25) | |
| Razer Blade 17 Early 2022 | |
| MSI Creator Z17 A12UGST-054 | |
| Alienware x17 R2 P48E | |
| Gigabyte AERO 16 OLED BSF | |
| Geekbench 5.5 / Multi-Core | |
| Lenovo Legion Pro 7 16IRX8H | |
| Schenker XMG Neo 16 Raptor Lake | |
| Razer Blade 16 Early 2023 | |
| Average of class Gaming (6460 - 28263, n=105, last 2 years) | |
| Asus ROG Zephyrus M16 GU604VY-NM042X | |
| Gigabyte AERO 16 OLED BSF | |
| MSI Stealth 17 Studio A13VH-014 | |
| Alienware x17 R2 P48E | |
| MSI Creator Z17 A12UGST-054 | |
| Average Intel Core i9-13900H (9094 - 15410, n=26) | |
| Razer Blade 17 Early 2022 | |
| Geekbench 5.5 / Single-Core | |
| Average of class Gaming (986 - 2474, n=105, last 2 years) | |
| MSI Stealth 17 Studio A13VH-014 | |
| Lenovo Legion Pro 7 16IRX8H | |
| Schenker XMG Neo 16 Raptor Lake | |
| Asus ROG Zephyrus M16 GU604VY-NM042X | |
| Average Intel Core i9-13900H (1140 - 2043, n=26) | |
| Alienware x17 R2 P48E | |
| MSI Creator Z17 A12UGST-054 | |
| Razer Blade 16 Early 2023 | |
| Razer Blade 17 Early 2022 | |
| Gigabyte AERO 16 OLED BSF | |
| HWBOT x265 Benchmark v2.2 / 4k Preset | |
| Lenovo Legion Pro 7 16IRX8H | |
| Schenker XMG Neo 16 Raptor Lake | |
| Average of class Gaming (11.5 - 44.4, n=105, last 2 years) | |
| Razer Blade 16 Early 2023 | |
| MSI Stealth 17 Studio A13VH-014 | |
| Asus ROG Zephyrus M16 GU604VY-NM042X | |
| Alienware x17 R2 P48E | |
| Gigabyte AERO 16 OLED BSF | |
| Average Intel Core i9-13900H (14.1 - 22.3, n=25) | |
| MSI Creator Z17 A12UGST-054 | |
| Razer Blade 17 Early 2022 | |
| LibreOffice / 20 Documents To PDF | |
| Gigabyte AERO 16 OLED BSF | |
| MSI Stealth 17 Studio A13VH-014 | |
| Asus ROG Zephyrus M16 GU604VY-NM042X | |
| Average of class Gaming (33.2 - 88.8, n=105, last 2 years) | |
| Average Intel Core i9-13900H (34.4 - 82.8, n=25) | |
| Razer Blade 16 Early 2023 | |
| Schenker XMG Neo 16 Raptor Lake | |
| Lenovo Legion Pro 7 16IRX8H | |
| Alienware x17 R2 P48E | |
| MSI Creator Z17 A12UGST-054 | |
| Razer Blade 17 Early 2022 | |
| R Benchmark 2.5 / Overall mean | |
| Gigabyte AERO 16 OLED BSF | |
| MSI Creator Z17 A12UGST-054 | |
| Average Intel Core i9-13900H (0.4052 - 0.723, n=25) | |
| Razer Blade 17 Early 2022 | |
| Alienware x17 R2 P48E | |
| MSI Stealth 17 Studio A13VH-014 | |
| Average of class Gaming (0.3439 - 0.759, n=106, last 2 years) | |
| Razer Blade 16 Early 2023 | |
| Asus ROG Zephyrus M16 GU604VY-NM042X | |
| Lenovo Legion Pro 7 16IRX8H | |
| Schenker XMG Neo 16 Raptor Lake | |
* ... smaller is better
AIDA64: FP32 Ray-Trace | FPU Julia | CPU SHA3 | CPU Queen | FPU SinJulia | FPU Mandel | CPU AES | CPU ZLib | FP64 Ray-Trace | CPU PhotoWorxx
| Performance rating | |
| Asus ROG Strix G17 G713PI | |
| Average of class Gaming | |
| Razer Blade 16 Early 2023 | |
| Aorus 17X AZF | |
| HP Omen 17-ck2097ng | |
| MSI Stealth 17 Studio A13VH-014 | |
| Average Intel Core i9-13900H | |
| Gigabyte Aero 16 YE5 | |
| AIDA64 / FP32 Ray-Trace | |
| Asus ROG Strix G17 G713PI | |
| Average of class Gaming (10227 - 85542, n=105, last 2 years) | |
| Razer Blade 16 Early 2023 | |
| Razer Blade 16 Early 2023 | |
| Razer Blade 16 Early 2023 | |
| MSI Stealth 17 Studio A13VH-014 | |
| Aorus 17X AZF | |
| HP Omen 17-ck2097ng | |
| Average Intel Core i9-13900H (6788 - 19557, n=25) | |
| Gigabyte Aero 16 YE5 | |
| AIDA64 / FPU Julia | |
| Asus ROG Strix G17 G713PI | |
| Average of class Gaming (51376 - 238426, n=105, last 2 years) | |
| Razer Blade 16 Early 2023 | |
| Razer Blade 16 Early 2023 | |
| Razer Blade 16 Early 2023 | |
| MSI Stealth 17 Studio A13VH-014 | |
| Aorus 17X AZF | |
| HP Omen 17-ck2097ng | |
| Average Intel Core i9-13900H (22551 - 95579, n=25) | |
| Gigabyte Aero 16 YE5 | |
| AIDA64 / CPU SHA3 | |
| Asus ROG Strix G17 G713PI | |
| Average of class Gaming (2180 - 10115, n=105, last 2 years) | |
| Razer Blade 16 Early 2023 | |
| Razer Blade 16 Early 2023 | |
| Razer Blade 16 Early 2023 | |
| Aorus 17X AZF | |
| HP Omen 17-ck2097ng | |
| MSI Stealth 17 Studio A13VH-014 | |
| Average Intel Core i9-13900H (2491 - 4270, n=25) | |
| Gigabyte Aero 16 YE5 | |
| AIDA64 / CPU Queen | |
| Asus ROG Strix G17 G713PI | |
| Razer Blade 16 Early 2023 | |
| Razer Blade 16 Early 2023 | |
| HP Omen 17-ck2097ng | |
| Aorus 17X AZF | |
| Average of class Gaming (49785 - 173351, n=90, last 2 years) | |
| Gigabyte Aero 16 YE5 | |
| Average Intel Core i9-13900H (65121 - 120936, n=25) | |
| MSI Stealth 17 Studio A13VH-014 | |
| AIDA64 / FPU SinJulia | |
| Asus ROG Strix G17 G713PI | |
| Razer Blade 16 Early 2023 | |
| Razer Blade 16 Early 2023 | |
| Razer Blade 16 Early 2023 | |
| Average of class Gaming (4424 - 33636, n=105, last 2 years) | |
| Aorus 17X AZF | |
| HP Omen 17-ck2097ng | |
| MSI Stealth 17 Studio A13VH-014 | |
| Average Intel Core i9-13900H (6108 - 11631, n=25) | |
| Gigabyte Aero 16 YE5 | |
| AIDA64 / FPU Mandel | |
| Asus ROG Strix G17 G713PI | |
| Average of class Gaming (25115 - 128721, n=105, last 2 years) | |
| Razer Blade 16 Early 2023 | |
| Razer Blade 16 Early 2023 | |
| Razer Blade 16 Early 2023 | |
| MSI Stealth 17 Studio A13VH-014 | |
| Aorus 17X AZF | |
| HP Omen 17-ck2097ng | |
| Average Intel Core i9-13900H (11283 - 48474, n=25) | |
| Gigabyte Aero 16 YE5 | |
| AIDA64 / CPU AES | |
| Aorus 17X AZF | |
| Asus ROG Strix G17 G713PI | |
| Razer Blade 16 Early 2023 | |
| Razer Blade 16 Early 2023 | |
| Razer Blade 16 Early 2023 | |
| Average of class Gaming (39258 - 247074, n=105, last 2 years) | |
| Gigabyte Aero 16 YE5 | |
| HP Omen 17-ck2097ng | |
| Average Intel Core i9-13900H (3691 - 149377, n=25) | |
| MSI Stealth 17 Studio A13VH-014 | |
| AIDA64 / CPU ZLib | |
| Asus ROG Strix G17 G713PI | |
| Razer Blade 16 Early 2023 | |
| Razer Blade 16 Early 2023 | |
| Razer Blade 16 Early 2023 | |
| Average of class Gaming (574 - 2531, n=105, last 2 years) | |
| Aorus 17X AZF | |
| HP Omen 17-ck2097ng | |
| MSI Stealth 17 Studio A13VH-014 | |
| Average Intel Core i9-13900H (789 - 1254, n=25) | |
| Gigabyte Aero 16 YE5 | |
| AIDA64 / FP64 Ray-Trace | |
| Asus ROG Strix G17 G713PI | |
| Average of class Gaming (5509 - 45446, n=105, last 2 years) | |
| Razer Blade 16 Early 2023 | |
| Razer Blade 16 Early 2023 | |
| Razer Blade 16 Early 2023 | |
| MSI Stealth 17 Studio A13VH-014 | |
| Aorus 17X AZF | |
| HP Omen 17-ck2097ng | |
| Average Intel Core i9-13900H (3655 - 10716, n=25) | |
| Gigabyte Aero 16 YE5 | |
| AIDA64 / CPU PhotoWorxx | |
| Razer Blade 16 Early 2023 | |
| Razer Blade 16 Early 2023 | |
| Razer Blade 16 Early 2023 | |
| HP Omen 17-ck2097ng | |
| MSI Stealth 17 Studio A13VH-014 | |
| Aorus 17X AZF | |
| Average of class Gaming (12271 - 89891, n=105, last 2 years) | |
| Average Intel Core i9-13900H (10871 - 50488, n=25) | |
| Gigabyte Aero 16 YE5 | |
| Asus ROG Strix G17 G713PI | |
系统性能
PCMark 10的测量值处于较高的水平。然而,Stealth 17 Studio不能跟上最好的机型,缺乏竞争对手能够短暂提供的极高的功耗。尽管如此,它的计算能力足以应付复杂的多任务处理,特别是在需要长时间的高水平性能的时刻。
CrossMark: Overall | Productivity | Creativity | Responsiveness
| PCMark 10 / Score | |
| Average of class Gaming (5828 - 12414, n=93, last 2 years) | |
| Asus ROG Zephyrus M16 GU604VY-NM042X | |
| Alienware x17 R2 P48E | |
| Gigabyte AERO 16 OLED BSF | |
| Razer Blade 16 Early 2023 | |
| Lenovo Legion Pro 7 16IRX8H | |
| MSI Stealth 17 Studio A13VH-014 | |
| Average Intel Core i9-13900H, NVIDIA GeForce RTX 4080 Laptop GPU (n=1) | |
| Razer Blade 17 Early 2022 | |
| MSI Creator Z17 A12UGST-054 | |
| PCMark 10 / Essentials | |
| Lenovo Legion Pro 7 16IRX8H | |
| Asus ROG Zephyrus M16 GU604VY-NM042X | |
| Gigabyte AERO 16 OLED BSF | |
| Alienware x17 R2 P48E | |
| Razer Blade 16 Early 2023 | |
| Average of class Gaming (8810 - 11935, n=97, last 2 years) | |
| MSI Creator Z17 A12UGST-054 | |
| Razer Blade 17 Early 2022 | |
| MSI Stealth 17 Studio A13VH-014 | |
| Average Intel Core i9-13900H, NVIDIA GeForce RTX 4080 Laptop GPU (n=1) | |
| PCMark 10 / Productivity | |
| Average of class Gaming (6845 - 25323, n=95, last 2 years) | |
| Asus ROG Zephyrus M16 GU604VY-NM042X | |
| Lenovo Legion Pro 7 16IRX8H | |
| Alienware x17 R2 P48E | |
| MSI Stealth 17 Studio A13VH-014 | |
| Average Intel Core i9-13900H, NVIDIA GeForce RTX 4080 Laptop GPU (n=1) | |
| MSI Creator Z17 A12UGST-054 | |
| Gigabyte AERO 16 OLED BSF | |
| Razer Blade 17 Early 2022 | |
| Razer Blade 16 Early 2023 | |
| PCMark 10 / Digital Content Creation | |
| Razer Blade 16 Early 2023 | |
| Average of class Gaming (7602 - 19954, n=95, last 2 years) | |
| Gigabyte AERO 16 OLED BSF | |
| Alienware x17 R2 P48E | |
| Asus ROG Zephyrus M16 GU604VY-NM042X | |
| MSI Stealth 17 Studio A13VH-014 | |
| Average Intel Core i9-13900H, NVIDIA GeForce RTX 4080 Laptop GPU (n=1) | |
| Razer Blade 17 Early 2022 | |
| Lenovo Legion Pro 7 16IRX8H | |
| MSI Creator Z17 A12UGST-054 | |
| CrossMark / Overall | |
| MSI Creator Z17 A12UGST-054 | |
| Average of class Gaming (1366 - 2409, n=94, last 2 years) | |
| Asus ROG Zephyrus M16 GU604VY-NM042X | |
| Alienware x17 R2 P48E | |
| Gigabyte AERO 16 OLED BSF | |
| Razer Blade 17 Early 2022 | |
| MSI Stealth 17 Studio A13VH-014 | |
| Average Intel Core i9-13900H, NVIDIA GeForce RTX 4080 Laptop GPU (n=1) | |
| Razer Blade 16 Early 2023 | |
| CrossMark / Productivity | |
| MSI Creator Z17 A12UGST-054 | |
| Average of class Gaming (1386 - 2254, n=94, last 2 years) | |
| Asus ROG Zephyrus M16 GU604VY-NM042X | |
| Alienware x17 R2 P48E | |
| Gigabyte AERO 16 OLED BSF | |
| Razer Blade 17 Early 2022 | |
| MSI Stealth 17 Studio A13VH-014 | |
| Average Intel Core i9-13900H, NVIDIA GeForce RTX 4080 Laptop GPU (n=1) | |
| Razer Blade 16 Early 2023 | |
| CrossMark / Creativity | |
| Average of class Gaming (1343 - 2786, n=94, last 2 years) | |
| Asus ROG Zephyrus M16 GU604VY-NM042X | |
| MSI Creator Z17 A12UGST-054 | |
| Alienware x17 R2 P48E | |
| Gigabyte AERO 16 OLED BSF | |
| MSI Stealth 17 Studio A13VH-014 | |
| Average Intel Core i9-13900H, NVIDIA GeForce RTX 4080 Laptop GPU (n=1) | |
| Razer Blade 17 Early 2022 | |
| Razer Blade 16 Early 2023 | |
| CrossMark / Responsiveness | |
| Gigabyte AERO 16 OLED BSF | |
| MSI Creator Z17 A12UGST-054 | |
| Average of class Gaming (1226 - 2334, n=94, last 2 years) | |
| Alienware x17 R2 P48E | |
| Asus ROG Zephyrus M16 GU604VY-NM042X | |
| Razer Blade 17 Early 2022 | |
| MSI Stealth 17 Studio A13VH-014 | |
| Average Intel Core i9-13900H, NVIDIA GeForce RTX 4080 Laptop GPU (n=1) | |
| Razer Blade 16 Early 2023 | |
| PCMark 10 Score | 7486 points | |
Help | ||
| AIDA64 / Memory Copy | |
| Razer Blade 16 Early 2023 | |
| Razer Blade 16 Early 2023 | |
| Razer Blade 16 Early 2023 | |
| Aorus 17X AZF | |
| HP Omen 17-ck2097ng | |
| MSI Stealth 17 Studio A13VH-014 | |
| Average of class Gaming (21750 - 129946, n=105, last 2 years) | |
| Gigabyte Aero 16 YE5 | |
| Average Intel Core i9-13900H (37448 - 74486, n=25) | |
| Asus ROG Strix G17 G713PI | |
| AIDA64 / Memory Read | |
| Aorus 17X AZF | |
| Razer Blade 16 Early 2023 | |
| Razer Blade 16 Early 2023 | |
| Razer Blade 16 Early 2023 | |
| HP Omen 17-ck2097ng | |
| MSI Stealth 17 Studio A13VH-014 | |
| Average of class Gaming (22956 - 118858, n=105, last 2 years) | |
| Gigabyte Aero 16 YE5 | |
| Average Intel Core i9-13900H (41599 - 75433, n=25) | |
| Asus ROG Strix G17 G713PI | |
| AIDA64 / Memory Write | |
| Razer Blade 16 Early 2023 | |
| Razer Blade 16 Early 2023 | |
| Razer Blade 16 Early 2023 | |
| HP Omen 17-ck2097ng | |
| Aorus 17X AZF | |
| Average of class Gaming (22297 - 135096, n=105, last 2 years) | |
| MSI Stealth 17 Studio A13VH-014 | |
| Average Intel Core i9-13900H (36152 - 88505, n=25) | |
| Gigabyte Aero 16 YE5 | |
| Asus ROG Strix G17 G713PI | |
| AIDA64 / Memory Latency | |
| Average of class Gaming (75.3 - 259, n=105, last 2 years) | |
| Razer Blade 16 Early 2023 | |
| Razer Blade 16 Early 2023 | |
| Razer Blade 16 Early 2023 | |
| MSI Stealth 17 Studio A13VH-014 | |
| Gigabyte Aero 16 YE5 | |
| Average Intel Core i9-13900H (75.8 - 102.3, n=25) | |
| Asus ROG Strix G17 G713PI | |
| HP Omen 17-ck2097ng | |
| Aorus 17X AZF | |
* ... smaller is better
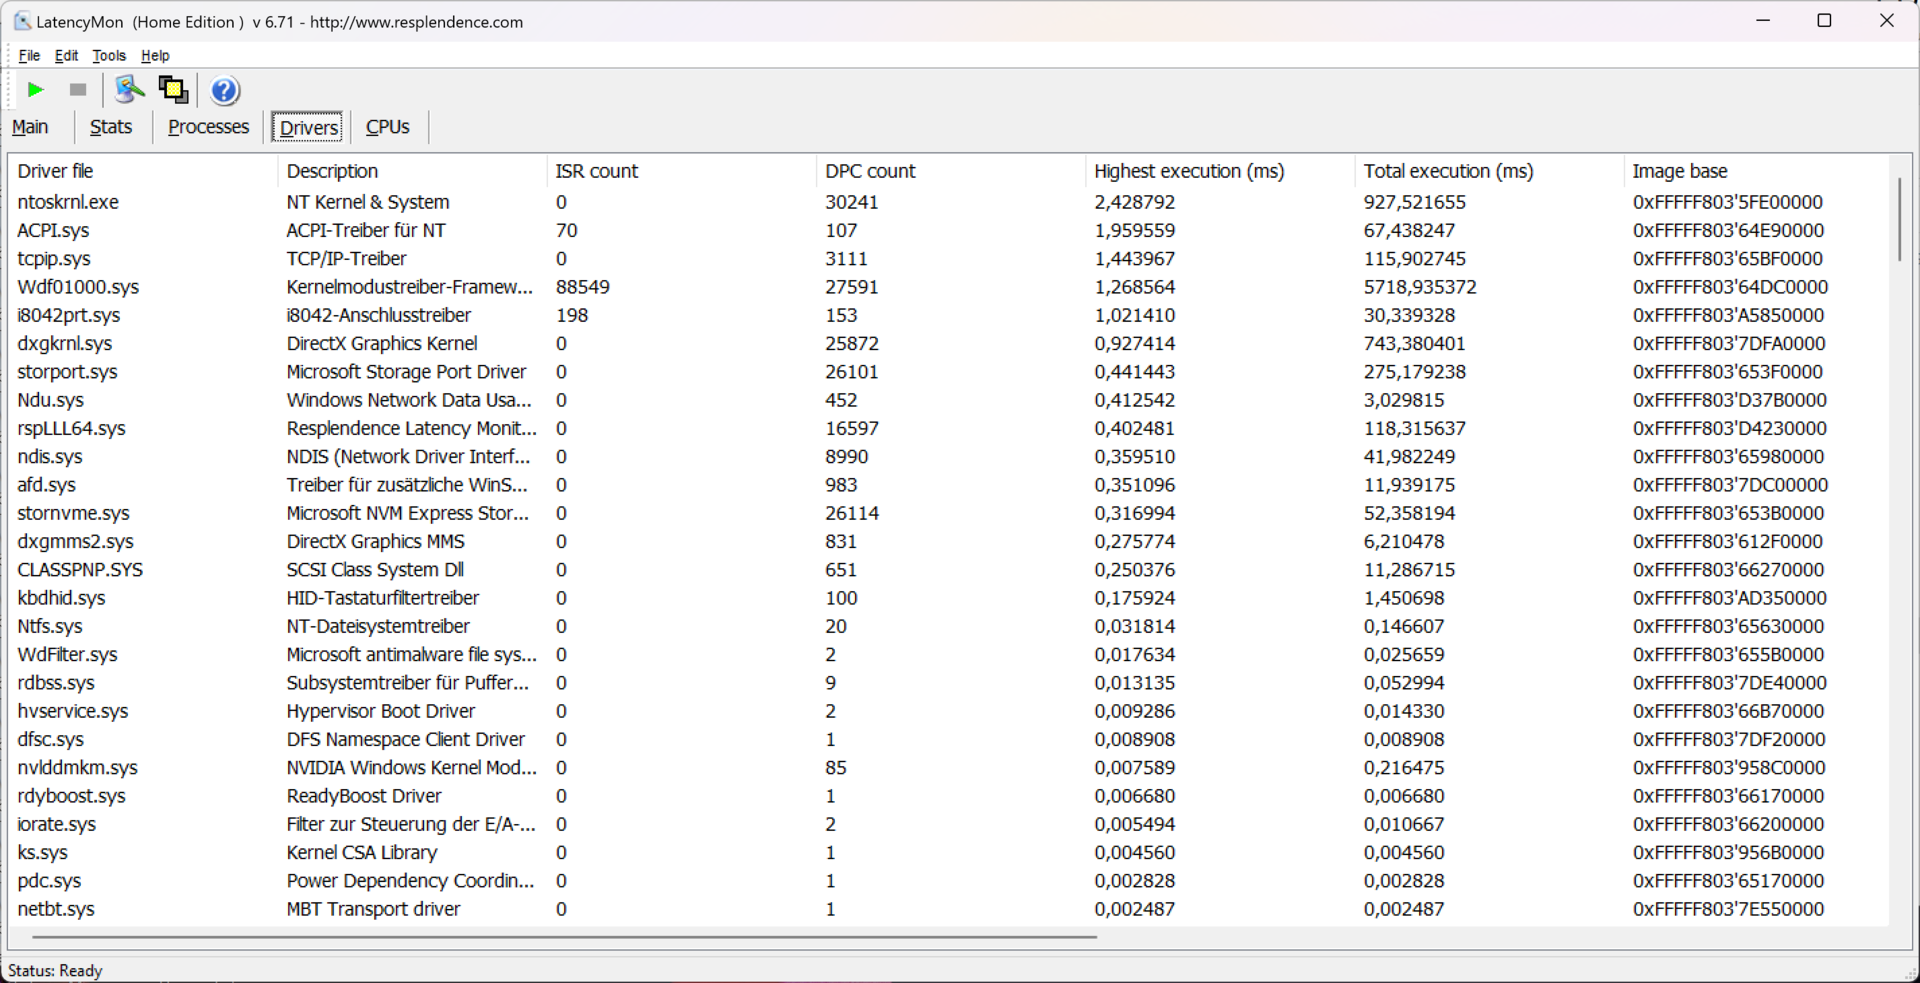
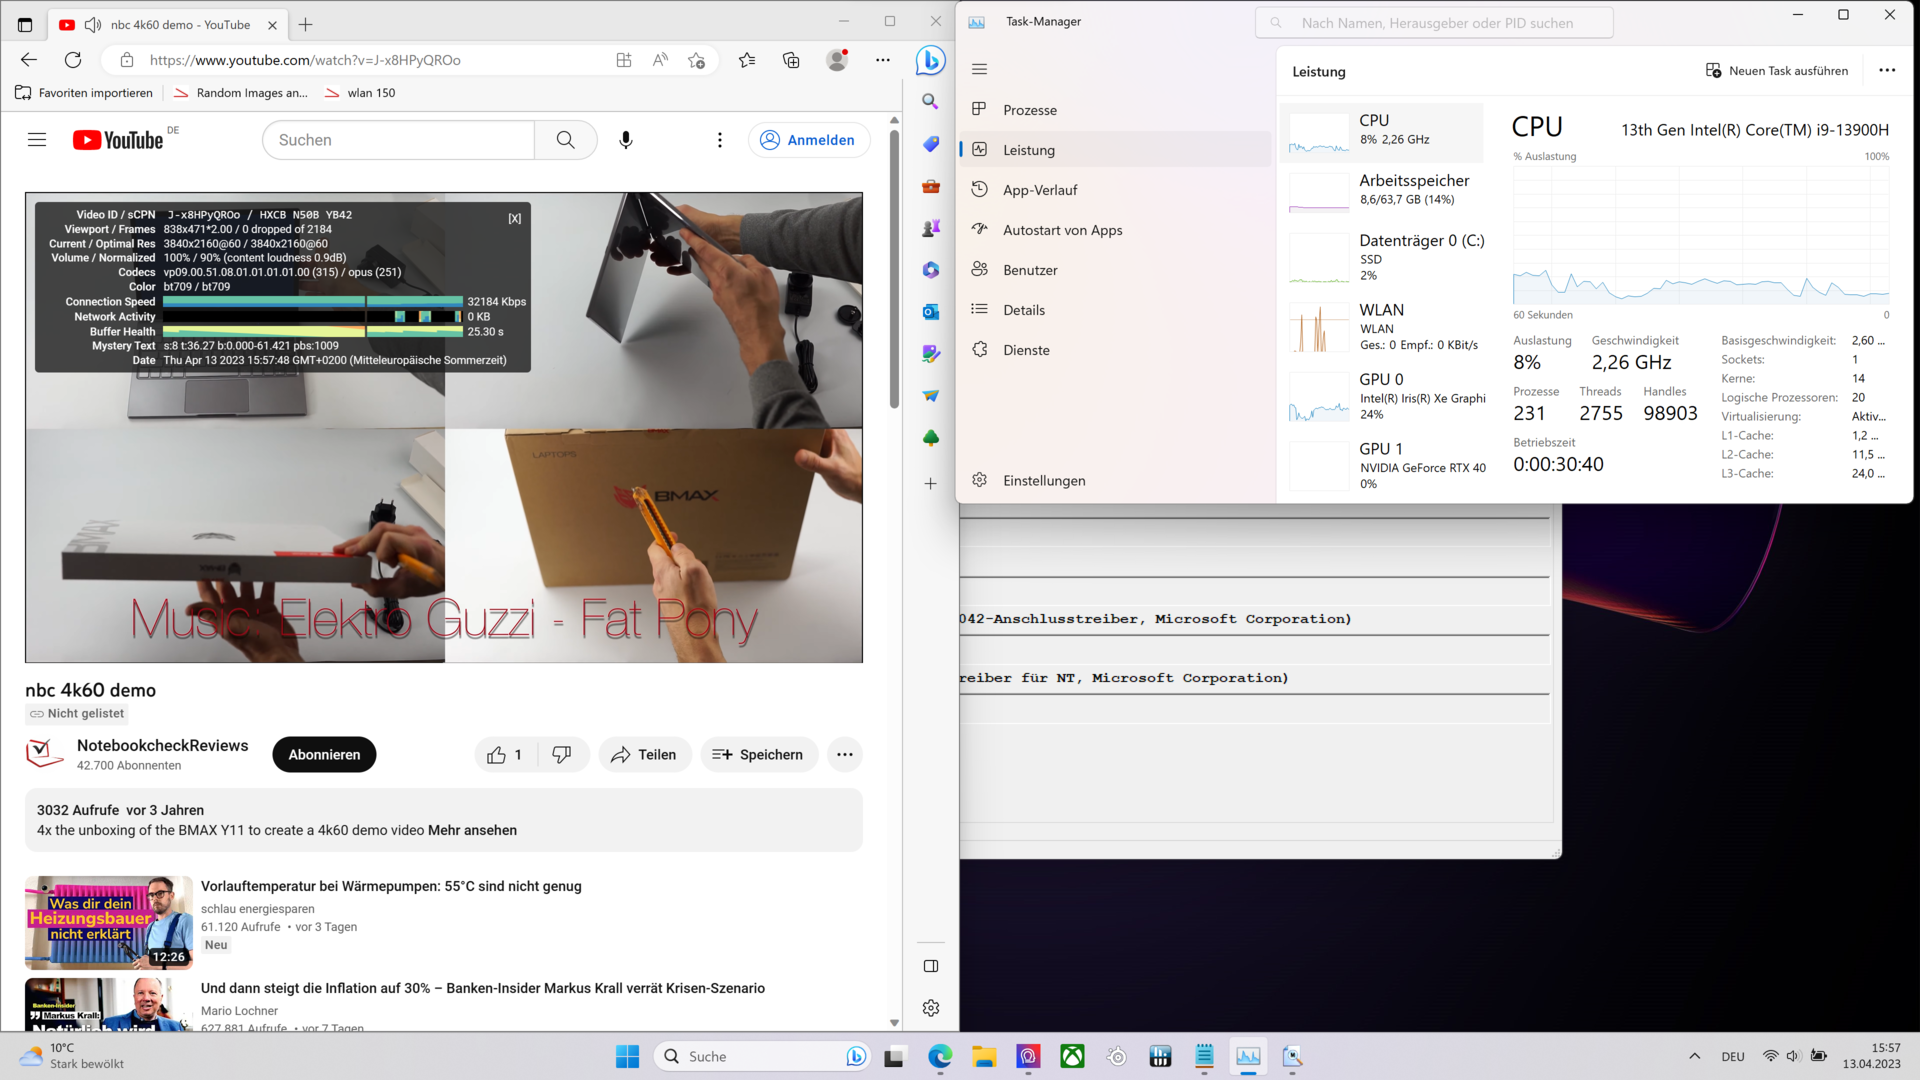
DPC延迟
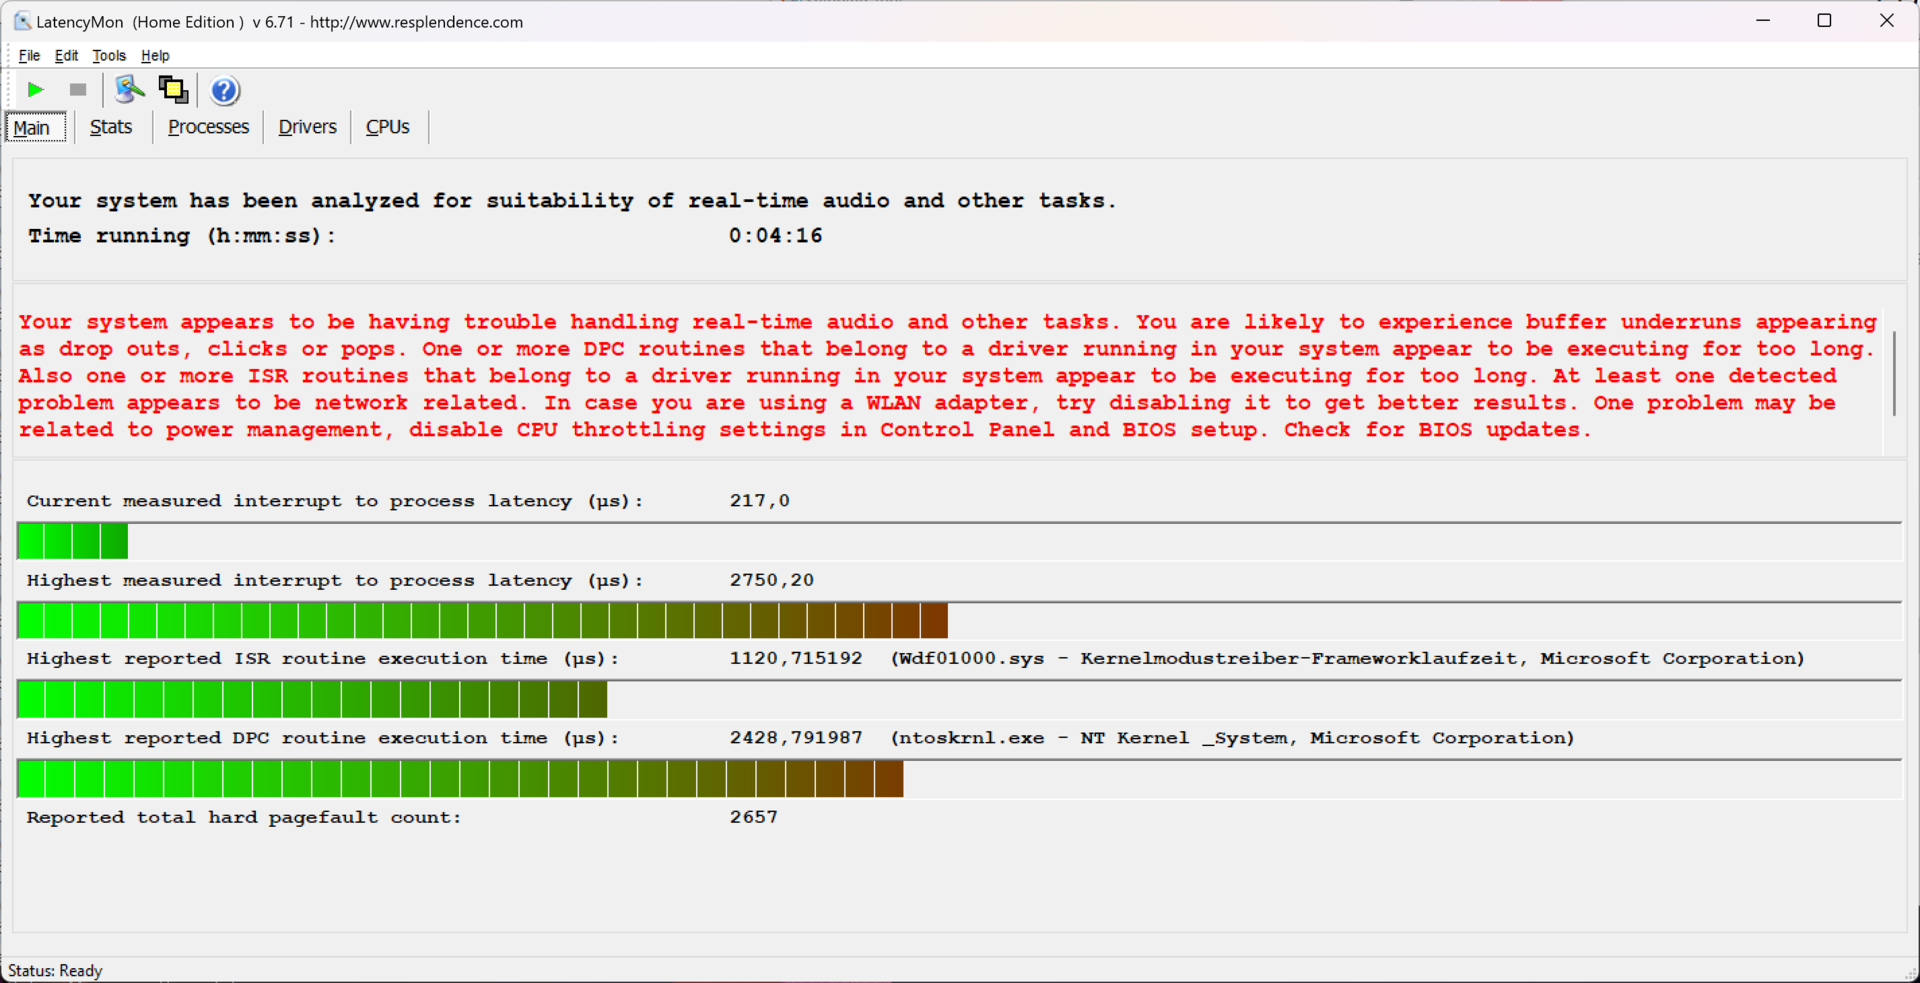
即使在用多个标签浏览时,对于实时音频处理等要求适当的任务来说,延迟也过高。随着各种驱动程序的更新,这种性能有可能向积极或消极方向改变。由于我们普遍遇到了一些不成熟的进程,可以希望这一领域的性能将得到改善。RTX 4000系列早期显卡驱动的高延迟问题似乎已经得到解决。该Gigabyte Aero 16 YE5是一个例子,多媒体笔记本电脑显然可以做得更好。
4K的视频流并没有带来任何问题。没有跳帧,而且在20%多一点的情况下,iGPU的负载不是太高。
| DPC Latencies / LatencyMon - interrupt to process latency (max), Web, Youtube, Prime95 | |
| Aorus 17X AZF | |
| MSI Stealth 17 Studio A13VH-014 | |
| Razer Blade 16 Early 2023 | |
| HP Omen 17-ck2097ng | |
| Asus ROG Strix G17 G713PI | |
| Gigabyte Aero 16 YE5 | |
* ... smaller is better
大容量存储
凭借其2TB的存储空间,NVMe SSD三星PM9A全面令人信服,在我们的排名中获得了很高的位置。
在进行连续写入时的连续测试引起了我们的注意。当设置为 "极端性能 "时(红线),由于温度过高,速度在短时间内下降。使用 "智能自动 "或AI模式(蓝线)时,传输率保持在最高水平。

* ... smaller is better
Continuous performance read: DiskSpd Read Loop, Queue Depth 8
图形卡
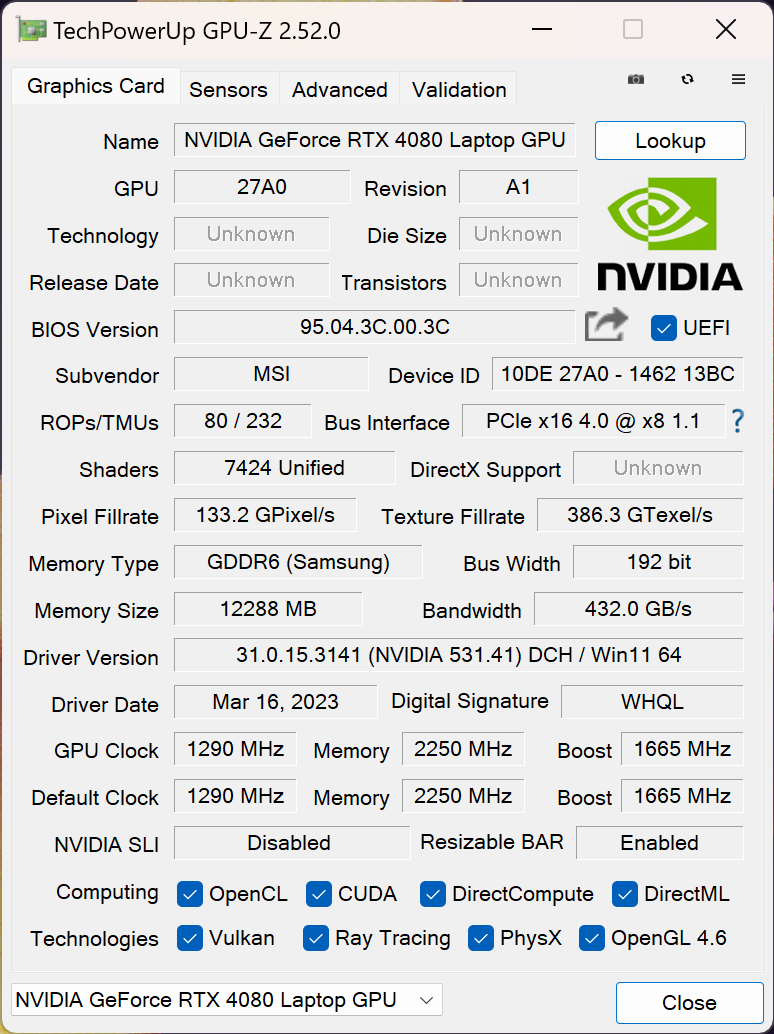
微星Stealth 17 Studio A13V可以配备目前所有可用的RTX 4000显卡。手头的A13VH-014型号配备了一个RTX 4080和12GB的VRAM。然而,与参考模型相比,其他性能值受到一定程度的遏制。
升压时钟速度为1,665,而不是2,280兆赫,而不是消耗最大允许的150瓦,它只消耗105瓦的电力。这解释了我们对RTX 4080的平均数值的明显差距。与配备NvidiaGeForce RTX 3080 Ti或RTX 4070的游戏笔记本电脑相比,尽管有这些限制,它的性能显然要高出20%。
值得注意的是,在要求严格的3DMarkTime Spy 测试中,我们观察到 "智能自动 "和 "极限 "之间几乎没有任何区别,尽管风扇噪音明显不同。在智能切换模式下,显卡获得了更多的能量,而处理器获得的能量要少一些。同时,这允许稍高的散热。在大多数游戏中,我们在AI模式下比在 "极限 "模式下取得了更好的帧率值。
减少风扇噪音的结果也很显著。"静音 "模式确保了非常安静的操作,但在当前大多数游戏中,允许在高质量设置下进行平滑渲染。出于测试目的,我们能够使用10%的扬声器可用音量进行游戏,而风扇不会干扰说话或声音效果。
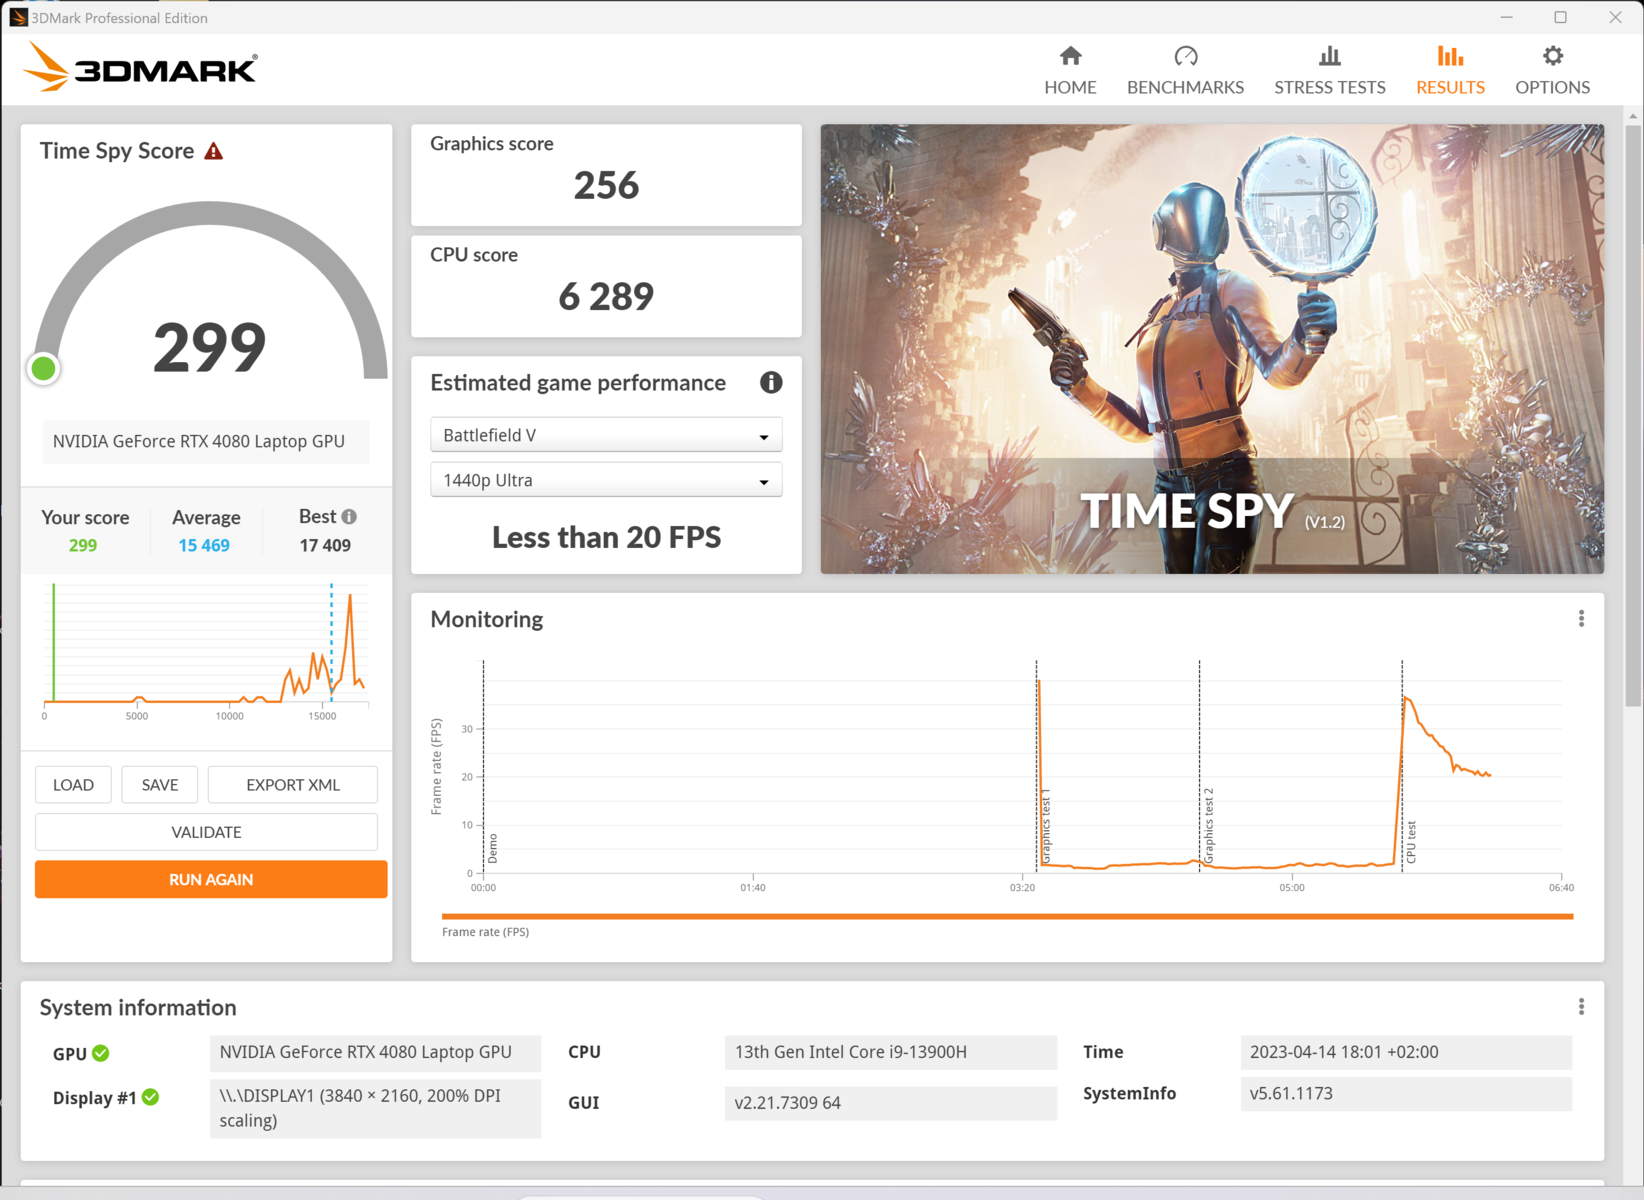
然而,我们完全建议不要在电池模式下使用该设备。我们记录的结果甚至比入门级办公室段的笔记本电脑还要差。在没有主电源连接的情况下,游戏Witcher 3 ,在全高清和超级设置下只能达到3fps。我们推测这与配置错误有关,不幸的是,我们在测试中观察到许多这样的错误。

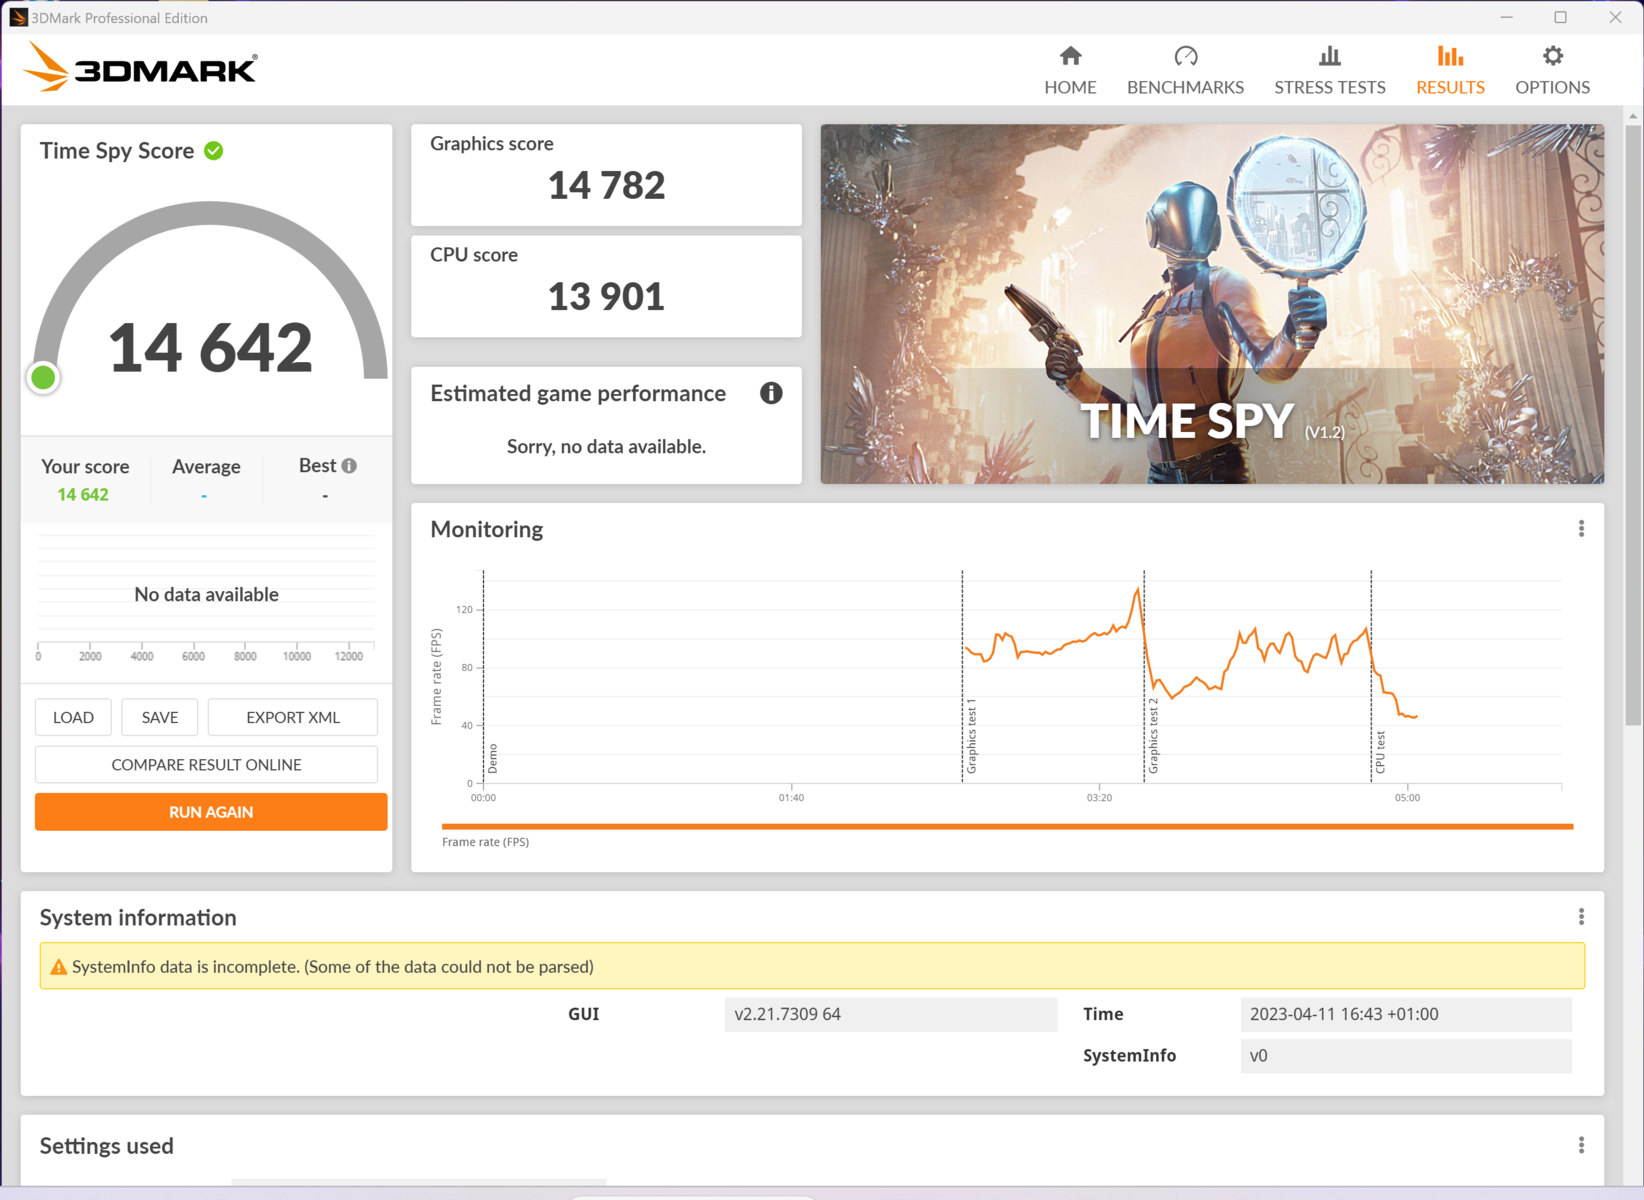
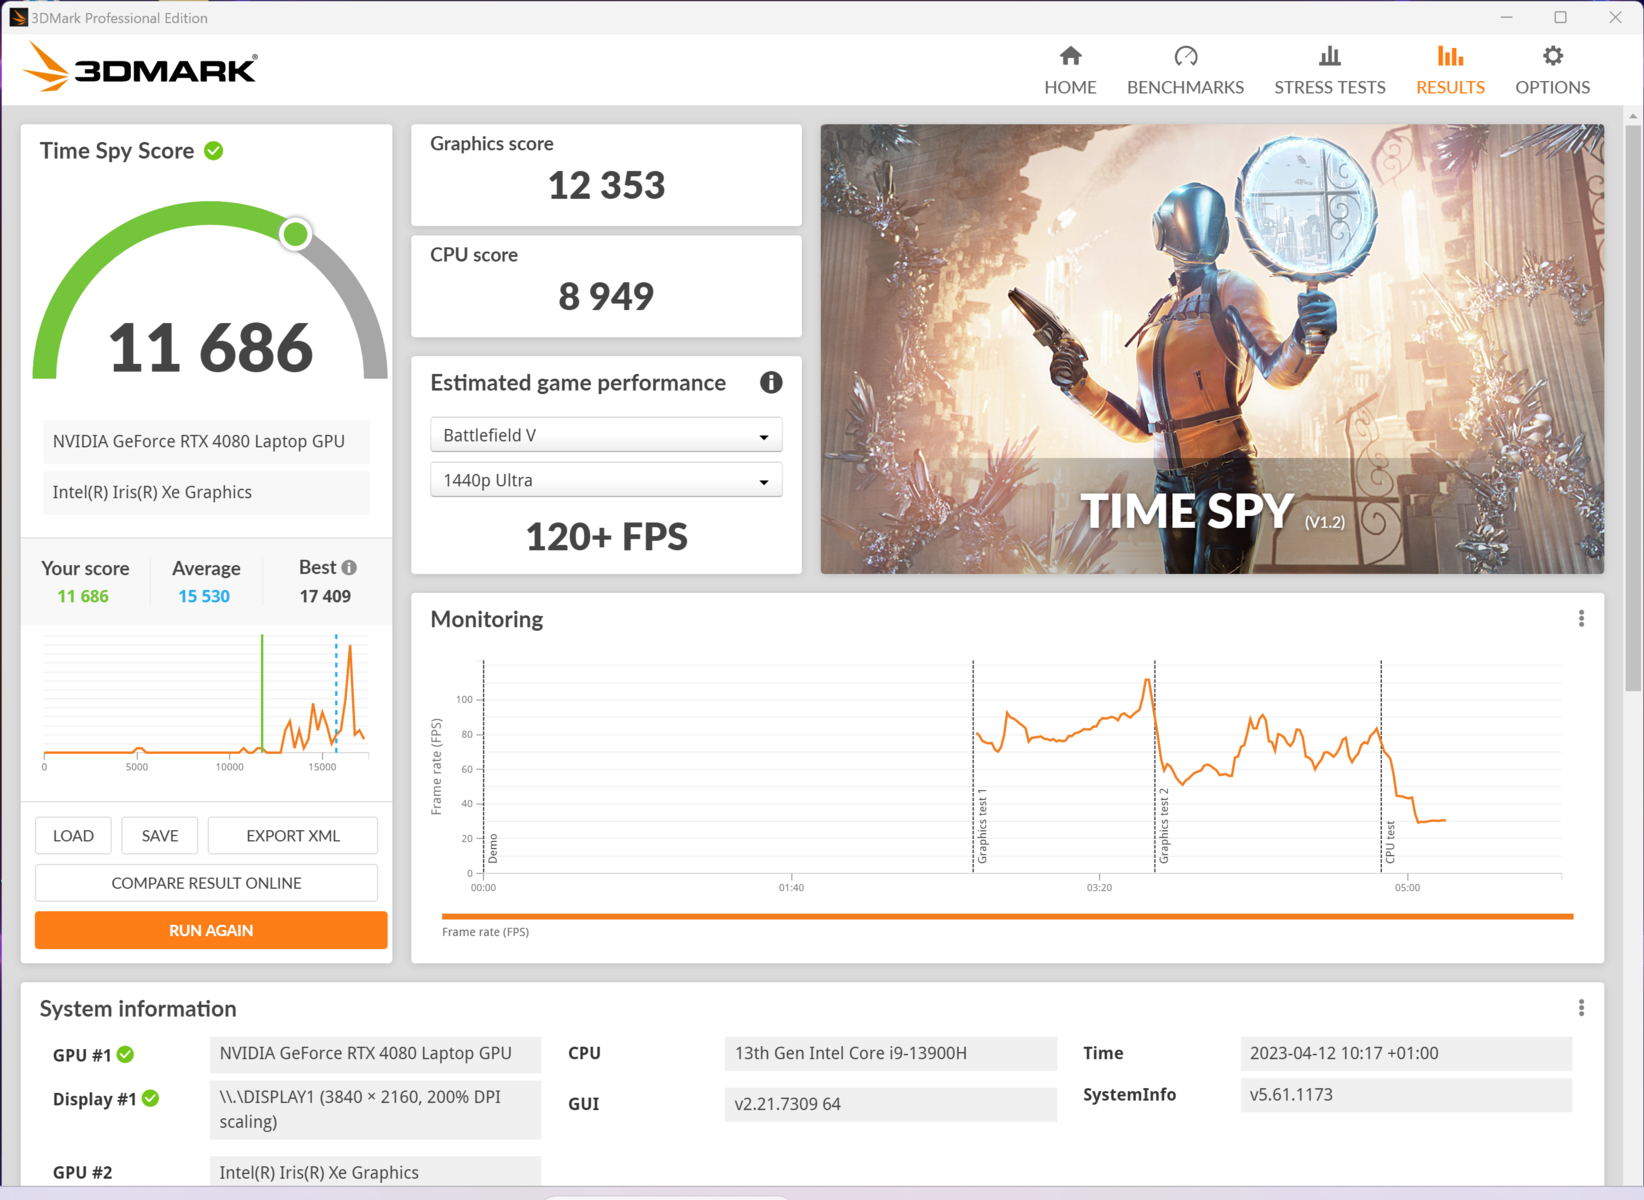
| 3DMark 11 Performance | 33542 points | |
| 3DMark Cloud Gate Standard Score | 51999 points | |
| 3DMark Fire Strike Score | 30028 points | |
| 3DMark Fire Strike Extreme Score | 16371 points | |
| 3DMark Time Spy Score | 14775 points | |
Help | ||
* ... smaller is better
| Photoshop PugetBench - Overall Score | |
| MSI Titan GT77 HX 13VI | |
| Asus Zephyrus Duo 16 GX650PY-NM006W | |
| MSI Stealth 17 Studio A13VH-014 | |
| Asus ROG Strix Scar 18 2023 G834JY-N6005W | |
| Premiere Pro PugetBench - Overall Score 0.9 | |
| MSI Stealth 17 Studio A13VH-014 | |
| Asus Zephyrus Duo 16 GX650PY-NM006W | |
| MSI Titan GT77 HX 13VI | |
游戏性能
尽管拥有不能完全访问的功率,但NvidiaGeForce RTX 4080在各种游戏、质量设置和分辨率中表现出非常好的帧率。即使是像 "霍格沃茨遗产 "这样的当前标题,在最大设置和4K下也是可以玩的,尽管43fps是非常温和的。
Stealth 17 Studio在较低的QHD分辨率下特别令人印象深刻,并且经常位于100fps以上--标记你,在最高细节设置下。
与其他纯粹以游戏为重点的笔记本电脑相比,微星的设备设法表现得像一个 Alienware x17 R2.那台机器使用较旧的RTX 3080 Ti但总是明显更响亮,并且消耗更多的电力。
额外的游戏分析、比较数据和更多信息可以在我们的 GPU基准测试列表.
| The Witcher 3 | |
| 1920x1080 High Graphics & Postprocessing (Nvidia HairWorks Off) | |
| Aorus 17X AZF | |
| Average of class Gaming (341 - 404, n=2, last 2 years) | |
| Razer Blade 16 Early 2023 | |
| Average NVIDIA GeForce RTX 4080 Laptop GPU (246 - 385, n=14) | |
| HP Omen 17-ck2097ng | |
| MSI Stealth 17 Studio A13VH-014 | |
| Asus ROG Strix G17 G713PI | |
| Gigabyte Aero 16 YE5 | |
| 1920x1080 Ultra Graphics & Postprocessing (HBAO+) | |
| Aorus 17X AZF | |
| Average of class Gaming (104.7 - 240, n=7, last 2 years) | |
| Razer Blade 16 Early 2023 | |
| Average NVIDIA GeForce RTX 4080 Laptop GPU (130.4 - 186.1, n=20) | |
| HP Omen 17-ck2097ng | |
| MSI Stealth 17 Studio A13VH-014 | |
| Asus ROG Strix G17 G713PI | |
| Gigabyte Aero 16 YE5 | |
| Far Cry 6 | |
| 1920x1080 Ultra Graphics Quality + HD Textures AA:T | |
| Average of class Gaming (n=1last 2 years) | |
| Average NVIDIA GeForce RTX 4080 Laptop GPU (118 - 156, n=5) | |
| Aorus 17X AZF | |
| Razer Blade 16 Early 2023 | |
| MSI Stealth 17 Studio A13VH-014 | |
| 2560x1440 Ultra Graphics Quality + HD Textures AA:T | |
| Average of class Gaming (n=1last 2 years) | |
| Average NVIDIA GeForce RTX 4080 Laptop GPU (100 - 141, n=5) | |
| Aorus 17X AZF | |
| Razer Blade 16 Early 2023 | |
| MSI Stealth 17 Studio A13VH-014 | |
| 3840x2160 Ultra Graphics Quality + HD Textures AA:T | |
| Aorus 17X AZF | |
| Razer Blade 16 Early 2023 | |
| Average NVIDIA GeForce RTX 4080 Laptop GPU (61 - 73, n=4) | |
| MSI Stealth 17 Studio A13VH-014 | |
| F1 22 | |
| 1920x1080 Ultra High Preset AA:T AF:16x | |
| Aorus 17X AZF | |
| Average NVIDIA GeForce RTX 4080 Laptop GPU (72.3 - 124.2, n=15) | |
| HP Omen 17-ck2097ng | |
| MSI Stealth 17 Studio A13VH-014 | |
| Asus ROG Strix G17 G713PI | |
| Average of class Gaming (40.1 - 121.2, n=4, last 2 years) | |
| 2560x1440 Ultra High Preset AA:T AF:16x | |
| Aorus 17X AZF | |
| Average NVIDIA GeForce RTX 4080 Laptop GPU (55.4 - 79, n=13) | |
| HP Omen 17-ck2097ng | |
| MSI Stealth 17 Studio A13VH-014 | |
| Average of class Gaming (42 - 77.8, n=3, last 2 years) | |
| Asus ROG Strix G17 G713PI | |
| 3840x2160 Ultra High Preset AA:T AF:16x | |
| Aorus 17X AZF | |
| Average of class Gaming (n=1last 2 years) | |
| Average NVIDIA GeForce RTX 4080 Laptop GPU (25.8 - 39.8, n=10) | |
| MSI Stealth 17 Studio A13VH-014 | |
| Hogwarts Legacy | |
| 1920x1080 Ultra Preset AA:High T | |
| Average NVIDIA GeForce RTX 4080 Laptop GPU (108 - 131, n=3) | |
| MSI Stealth 17 Studio A13VH-014 | |
| Average of class Gaming (n=1last 2 years) | |
| Asus ROG Strix G17 G713PI | |
| Aorus 17X AZF | |
| 2560x1440 Ultra Preset AA:High T | |
| Average of class Gaming (n=1last 2 years) | |
| Average NVIDIA GeForce RTX 4080 Laptop GPU (76 - 102, n=3) | |
| Aorus 17X AZF | |
| MSI Stealth 17 Studio A13VH-014 | |
| Asus ROG Strix G17 G713PI | |
| 3840x2160 Ultra Preset AA:High T | |
| Average of class Gaming (n=1last 2 years) | |
| Aorus 17X AZF | |
| MSI Stealth 17 Studio A13VH-014 | |
| Average NVIDIA GeForce RTX 4080 Laptop GPU (n=1) | |
在短时间内,Witcher 3 ,帧率几乎与RTX 4080持平,但很快就降到了仍然令人印象深刻的120fps。这几乎完全对应于一个华硕ROG Strix G17的RTX4070和明显更强大的CPU,但这也是一个相当大的更慷慨的,纯粹的游戏笔记本电脑。多媒体和创作者的笔记本电脑,即技嘉Aero 16配有RTX 3080 Ti,远远落在后面。
考虑到略微受限的功耗和时钟速度以及适度的风扇行为,这在连续测试中是一个优秀的结果。
为了更好地对风扇噪音和游戏性能进行排名,下面是微星笔记本电脑的帧率和噪音值:
| 模式 | AI | 极端 | 平衡模式 | 静音 |
| Fps (FHD, Ultra) | 127 | 135 | 134 | 114 |
| P0.1 | 48 | 50 | 52 | 61 |
| 风扇噪音(dB) | 48 | 53 | 48 | 36 |
在几乎听不到风扇声音的情况下,仍然有不错的帧率,这一点很了不起。与 "Extreme "相比,"Silent "看起来不到一半的声音。此外,CPU的性能限制似乎确保了更稳定的性能,因为P0.1值(99.9%的所有帧都高于这个值)是最好的,并带有最小的噪音排放。
Witcher 3fps diagram
| low | med. | high | ultra | QHD | 4K DLSS | 4K | |
|---|---|---|---|---|---|---|---|
| GTA V (2015) | 168.4 | 122.7 | 105.9 | 123.9 | |||
| The Witcher 3 (2015) | 274 | 145 | 66 | ||||
| Dota 2 Reborn (2015) | 140 | 136.2 | 116.7 | ||||
| Final Fantasy XV Benchmark (2018) | 134 | 105.8 | 60.8 | ||||
| X-Plane 11.11 (2018) | 106.1 | 90 | |||||
| Far Cry 5 (2018) | 158 | 136 | 116 | 75 | |||
| Strange Brigade (2018) | 301 | 269 | 192.2 | 100.9 | |||
| Horizon Zero Dawn (2020) | 113 | 106 | 86 | 62 | |||
| Assassin´s Creed Valhalla (2020) | 118 | 93 | 55 | ||||
| Far Cry 6 (2021) | 118 | 100 | 61 | ||||
| Cyberpunk 2077 1.6 (2022) | 105.2 | 94.9 | 63.39 | 29 | |||
| Tiny Tina's Wonderlands (2022) | 112.86 | 89.27 | 47.85 | ||||
| F1 22 (2022) | 203 | 91.1 | 60.4 | 25.8 | |||
| Call of Duty Modern Warfare 2 2022 (2022) | 126 | 93 | 55 | ||||
| Hogwarts Legacy (2023) | 137 | 116 | 76 | 43 |
排放 - 强大而安静的微星隐身术
噪声排放
当游戏需要最大功率时,这位创作者的笔记本电脑会变得很吵,风扇的数值略微偏向50分贝。这很吵,但这很容易被一些顶级型号的游戏笔记本所超越。在 "极限 "模式下,风扇很快就开始旋转,但如果不需要的话,很快就会恢复到最小值。
AI模式的效果更令人信服。智能管理确保冷却效果相对稳定,并且在略低于50分贝时,至少不会太吵。这样一来,尽管笔记本电脑的外形很薄,但可以保持冷却,而不会立即产生过大的喧嚣。
在某些情况下,"静音 "模式似乎非常有用。测得的36分贝是一些办公用笔记本电脑所能比拟的。无论是在办公室还是在远程工作中,这种水平的噪音都能让人集中精力工作。在游戏时,几乎要牺牲20%的最大性能,但考虑到基准,这绝不是引人注目的。这意味着你实际上可以在一个安静的环境中不戴耳机玩,该设备强大的扬声器也可以用于游戏中的声音。
作为比较,以下是我们在全高清和超清设置下测量的Witcher 3 音量水平:
| Witcher 3 超级 | AI模式 | 极限 | 平衡模式 | 无声 |
| 音量(dB) | 48 | 53 | 48 | 36 |
Noise level
| Idle |
| 24 / 24 / 24 dB(A) |
| Load |
| 34.49 / 49.66 dB(A) |
 | ||
30 dB silent 40 dB(A) audible 50 dB(A) loud |
||
min: | ||
| MSI Stealth 17 Studio A13VH-014 GeForce RTX 4080 Laptop GPU, i9-13900H, Samsung PM9A1 MZVL22T0HBLB | Gigabyte Aero 16 YE5 GeForce RTX 3080 Ti Laptop GPU, i9-12900HK, Phison ESR01TBMFCT | HP Omen 17-ck2097ng GeForce RTX 4080 Laptop GPU, i9-13900HX, SK hynix PC801 HFS001TEJ9X101N | Razer Blade 16 Early 2023 GeForce RTX 4080 Laptop GPU, i9-13950HX, SSSTC CA6-8D1024 | Aorus 17X AZF GeForce RTX 4090 Laptop GPU, i9-13900HX, Gigabyte AG470S1TB-SI B10 | Asus ROG Strix G17 G713PI GeForce RTX 4070 Laptop GPU, R9 7945HX, WD PC SN560 SDDPNQE-1T00 | |
|---|---|---|---|---|---|---|
| Noise | -20% | -18% | -1% | -23% | -12% | |
| off / environment * (dB) | 24 | 25 -4% | 24 -0% | 23 4% | 25 -4% | 25 -4% |
| Idle Minimum * (dB) | 24 | 30 -25% | 31 -29% | 23 4% | 28 -17% | 26 -8% |
| Idle Average * (dB) | 24 | 32 -33% | 32 -33% | 23 4% | 29 -21% | 29 -21% |
| Idle Maximum * (dB) | 24 | 33 -38% | 33 -38% | 23.6 2% | 34 -42% | 30 -25% |
| Load Average * (dB) | 34.49 | 45 -30% | 45 -30% | 39 -13% | 51 -48% | 46 -33% |
| Witcher 3 ultra * (dB) | 48.29 | 50 -4% | 45 7% | 51.6 -7% | 57 -18% | 46 5% |
| Load Maximum * (dB) | 49.66 | 52 -5% | 50 -1% | 51.3 -3% | 54 -9% | 47 5% |
* ... smaller is better
温度
非常克制的冷却的代价可以从始终可感知的温度上升中感受到。即使在执行简单的任务时,如查看图像或上网,该设备的底部也会变得非常热,以至于使用笔记本电脑变得不舒服。
随着高强度的使用,特别是在长时间的游戏过程中,键盘区域,甚至更多的是热管和风扇运行的后部底部,变得非常热。在所有的按键上都可以清楚地感觉到这一点,令人不快。然而,它也不能被认为是真的热。在温暖的日子里,你不会真的想使用这样的键盘,因此很难避免使用单独的键盘。
更大的热管可以防止这种情况,但也违背了笔记本电脑的薄型设计理念。
(-) The maximum temperature on the upper side is 47 °C / 117 F, compared to the average of 40.4 °C / 105 F, ranging from 21.2 to 68.8 °C for the class Gaming.
(-) The bottom heats up to a maximum of 54 °C / 129 F, compared to the average of 43.2 °C / 110 F
(+) In idle usage, the average temperature for the upper side is 27.1 °C / 81 F, compared to the device average of 33.9 °C / 93 F.
(-) Playing The Witcher 3, the average temperature for the upper side is 40.3 °C / 105 F, compared to the device average of 33.9 °C / 93 F.
(+) The palmrests and touchpad are cooler than skin temperature with a maximum of 31 °C / 87.8 F and are therefore cool to the touch.
(-) The average temperature of the palmrest area of similar devices was 28.8 °C / 83.8 F (-2.2 °C / -4 F).
| MSI Stealth 17 Studio A13VH-014 Intel Core i9-13900H, NVIDIA GeForce RTX 4080 Laptop GPU | Gigabyte Aero 16 YE5 Intel Core i9-12900HK, NVIDIA GeForce RTX 3080 Ti Laptop GPU | HP Omen 17-ck2097ng Intel Core i9-13900HX, NVIDIA GeForce RTX 4080 Laptop GPU | Razer Blade 16 Early 2023 Intel Core i9-13950HX, NVIDIA GeForce RTX 4080 Laptop GPU | Aorus 17X AZF Intel Core i9-13900HX, NVIDIA GeForce RTX 4090 Laptop GPU | Asus ROG Strix G17 G713PI AMD Ryzen 9 7945HX, NVIDIA GeForce RTX 4070 Laptop GPU | |
|---|---|---|---|---|---|---|
| Heat | -5% | 15% | 10% | 2% | 5% | |
| Maximum Upper Side * (°C) | 47 | 49 -4% | 41 13% | 40 15% | 47 -0% | 42 11% |
| Maximum Bottom * (°C) | 54 | 55 -2% | 51 6% | 37.6 30% | 51 6% | 41 24% |
| Idle Upper Side * (°C) | 30 | 33 -10% | 24 20% | 32.4 -8% | 30 -0% | 33 -10% |
| Idle Bottom * (°C) | 32 | 33 -3% | 25 22% | 31.4 2% | 31 3% | 34 -6% |
* ... smaller is better
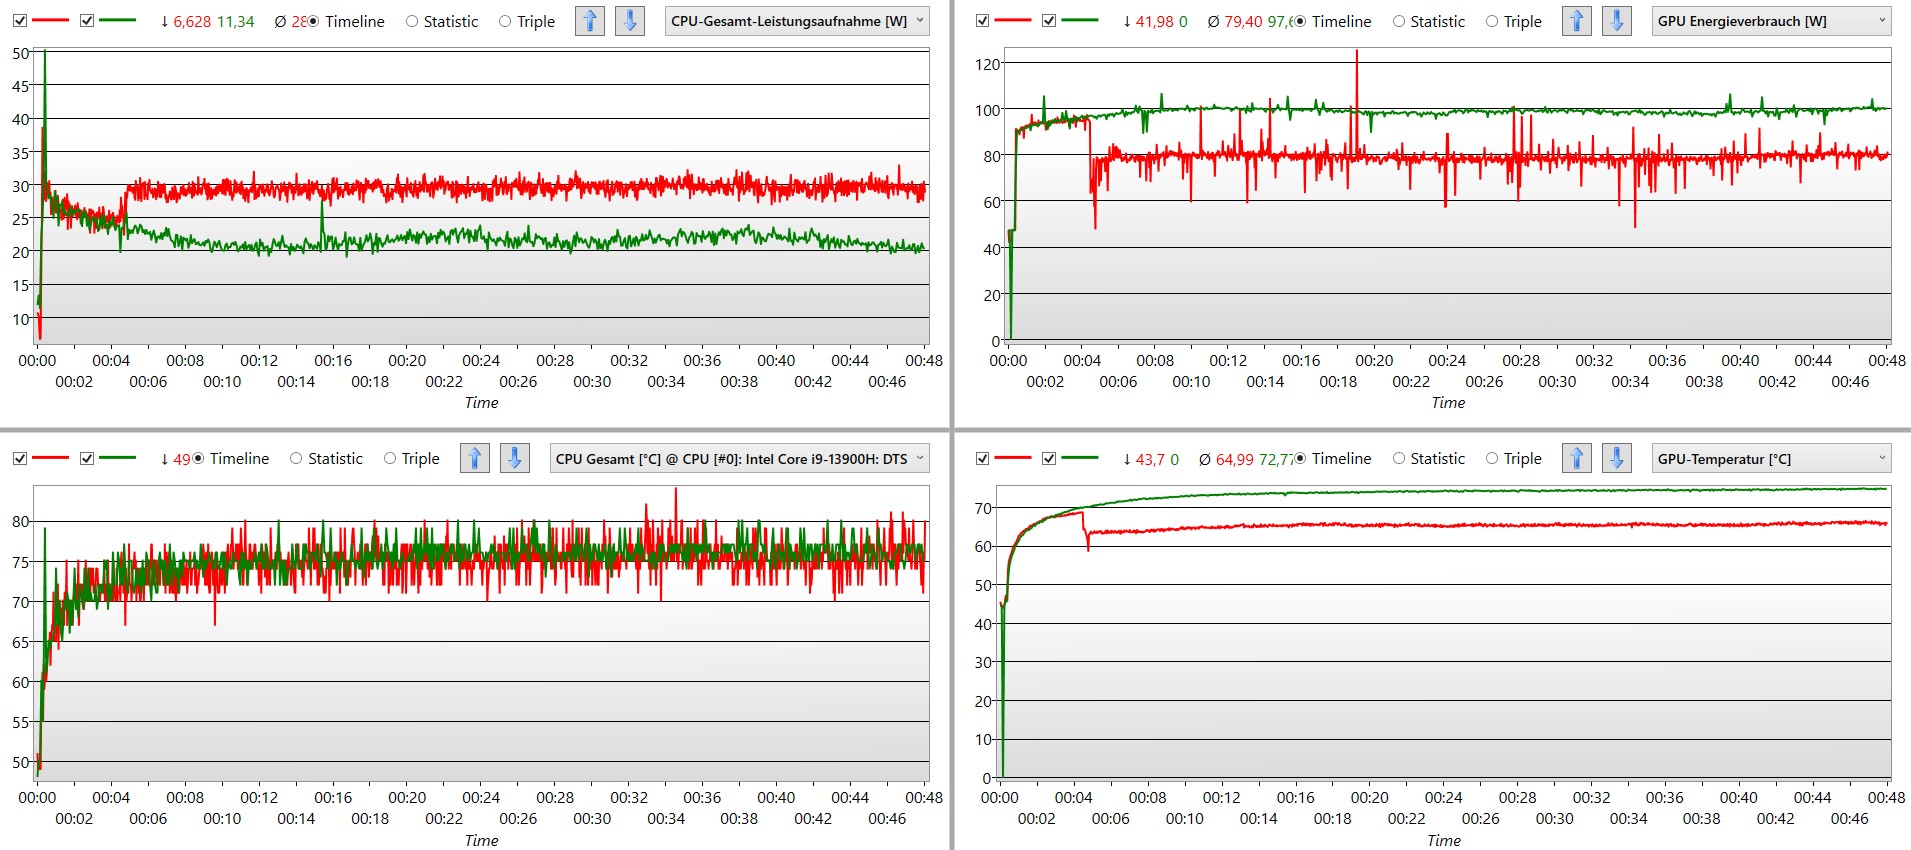
压力测试
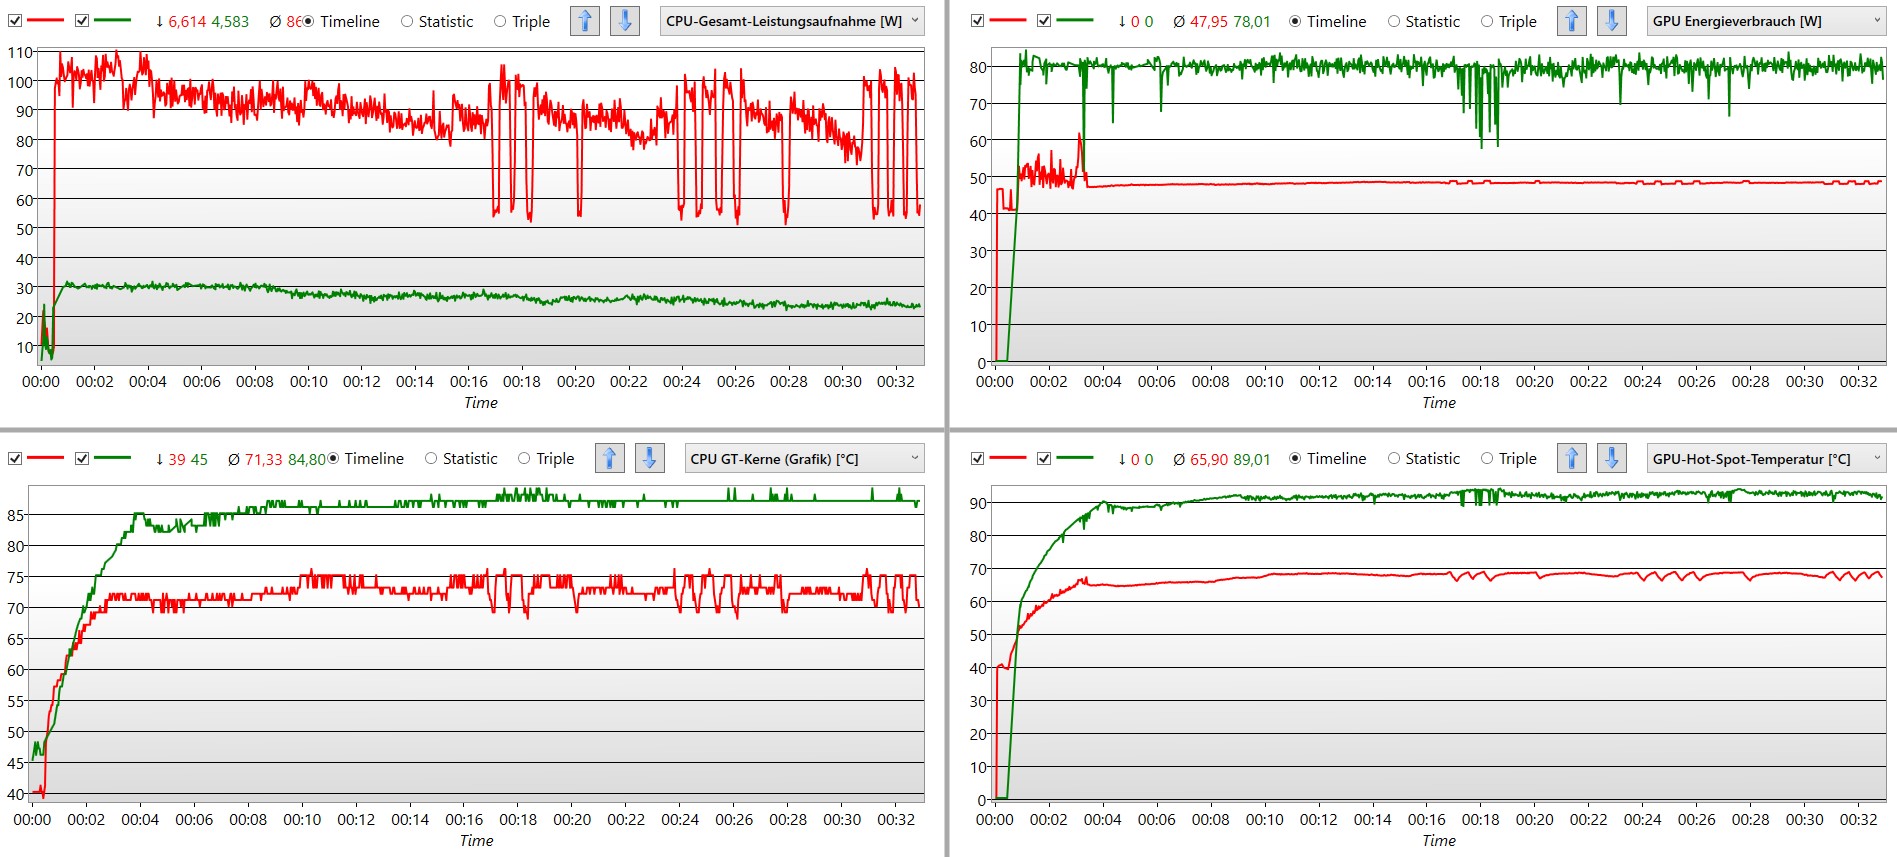
在恒定负载下,CPU可以在近15分钟内获得90瓦或更多的供应。随后,这个数值必须被节制到50瓦,一次又一次。然后,再一次达到100瓦或更多,时间很短。然后,时钟频率也增加到4000兆赫以上,并且从未低于2500兆赫。
同时,GPU几乎一直以48瓦的功率运行,几分钟后达到60瓦,并且没有出现下降或节流。该组件的温度一直保持在80℃以下。
即使在这种情况下,"静音 "模式也名副其实,即使风扇在运行,也不会出现节流现象。图形性能比其他模式下更高。作为回报,CPU只允许有25瓦左右的功率,笔记本变得非常热。
发言人
立体声扬声器的配置要比你所期望的典型的笔记本电脑驱动器好得多。除了宽带扬声器外,微星的笔记本电脑还在左右两边使用了两个低音炮
这意味着我们正在处理一个两路系统,尽管是在一个紧凑的外形因素。而且它肯定知道如何让自己被听到。非常深的低音清晰可闻,也相对响亮。声音和乐器听起来很精确。在视频游戏声音的基础上,在这种配置下,即使听音乐也是可能的和愉快的。
只有高低音和低中音可以处理更多的力量。恰恰是在这个空隙中,低音单元无法再运作,因此,例如鼓和低音吉他的存在感就消失了。否则,对于一台笔记本电脑来说,Stealth 17的扬声器几乎听起来很出色。
MSI Stealth 17 Studio A13VH-014 audio analysis
(+) | speakers can play relatively loud (82.44 dB)
Bass 100 - 315 Hz
(±) | reduced bass - on average 8% lower than median
(±) | linearity of bass is average (8.8% delta to prev. frequency)
Mids 400 - 2000 Hz
(±) | higher mids - on average 8.2% higher than median
(+) | mids are linear (6.8% delta to prev. frequency)
Highs 2 - 16 kHz
(+) | balanced highs - only 1% away from median
(+) | highs are linear (4% delta to prev. frequency)
Overall 100 - 16.000 Hz
(+) | overall sound is linear (11.6% difference to median)
Compared to same class
» 10% of all tested devices in this class were better, 3% similar, 87% worse
» The best had a delta of 6%, average was 18%, worst was 132%
Compared to all devices tested
» 8% of all tested devices were better, 2% similar, 90% worse
» The best had a delta of 4%, average was 23%, worst was 134%
Apple MacBook Pro 16 2021 M1 Pro audio analysis
(+) | speakers can play relatively loud (84.7 dB)
Bass 100 - 315 Hz
(+) | good bass - only 3.8% away from median
(+) | bass is linear (5.2% delta to prev. frequency)
Mids 400 - 2000 Hz
(+) | balanced mids - only 1.3% away from median
(+) | mids are linear (2.1% delta to prev. frequency)
Highs 2 - 16 kHz
(+) | balanced highs - only 1.9% away from median
(+) | highs are linear (2.7% delta to prev. frequency)
Overall 100 - 16.000 Hz
(+) | overall sound is linear (4.6% difference to median)
Compared to same class
» 0% of all tested devices in this class were better, 0% similar, 100% worse
» The best had a delta of 5%, average was 17%, worst was 45%
Compared to all devices tested
» 0% of all tested devices were better, 0% similar, 100% worse
» The best had a delta of 4%, average was 23%, worst was 134%
能源管理 - 经济实惠,便于携带,适用于游戏笔记本电脑
消耗功率
考虑到强大的硬件,最低14瓦的消耗可以被认为是一个非常好的价值。特别是由于微星Stealth将大部分用于其复杂的迷你LED显示屏。当进行简单的任务时,这将增加到近20瓦。采用上一代CPU的技嘉Aero 16 YE5会在这么小的功率下耗尽,尽管它确实需要为OLED显示屏供电。
我们的峰值测量为210瓦,这意味着240瓦的电源装置是理想的尺寸,以便在各种情况下为电池充电。惠普Omen 17,其CPU的HX变体和相同的图形芯片,坐拥300瓦的功率。几乎在任何情况下,Stealth 17 Studio都证明了自己在提供电源方面是经济的。
| Off / Standby | |
| Idle | |
| Load |
|
Key:
min: | |
| MSI Stealth 17 Studio A13VH-014 i9-13900H, GeForce RTX 4080 Laptop GPU, Samsung PM9A1 MZVL22T0HBLB, Mini LED, 3840x2160, 17.3" | Gigabyte Aero 16 YE5 i9-12900HK, GeForce RTX 3080 Ti Laptop GPU, Phison ESR01TBMFCT, AMOLED, 3840x2400, 16" | HP Omen 17-ck2097ng i9-13900HX, GeForce RTX 4080 Laptop GPU, SK hynix PC801 HFS001TEJ9X101N, IPS, 2560x1440, 17.3" | Razer Blade 16 Early 2023 i9-13950HX, GeForce RTX 4080 Laptop GPU, SSSTC CA6-8D1024, IPS, 2560x1600, 16" | Aorus 17X AZF i9-13900HX, GeForce RTX 4090 Laptop GPU, Gigabyte AG470S1TB-SI B10, IPS, 2560x1440, 17.3" | Asus ROG Strix G17 G713PI R9 7945HX, GeForce RTX 4070 Laptop GPU, WD PC SN560 SDDPNQE-1T00, IPS, 2560x1440, 17.3" | Average NVIDIA GeForce RTX 4080 Laptop GPU | Average of class Gaming | |
|---|---|---|---|---|---|---|---|---|
| Power Consumption | -50% | -31% | -50% | -34% | -22% | -38% | -14% | |
| Idle Minimum * (Watt) | 13.9 | 26 -87% | 16 -15% | 15.2 -9% | 11 21% | 15 -8% | 16.9 ? -22% | 13 ? 6% |
| Idle Average * (Watt) | 20 | 30 -50% | 20 -0% | 22.8 -14% | 17 15% | 20 -0% | 22 ? -10% | 19 ? 5% |
| Idle Maximum * (Watt) | 20.6 | 37 -80% | 26 -26% | 49.8 -142% | 29 -41% | 29 -41% | 34.1 ? -66% | 24.6 ? -19% |
| Load Average * (Watt) | 77 | 127 -65% | 135 -75% | 121.2 -57% | 134 -74% | 121 -57% | 117.9 ? -53% | 110.7 ? -44% |
| Witcher 3 ultra * (Watt) | 162 | 176 -9% | 215 -33% | 242 -49% | 278 -72% | 179.8 -11% | ||
| Load Maximum * (Watt) | 216 | 236 -9% | 299 -38% | 273.7 -27% | 334 -55% | 246 -14% | 297 ? -38% | 259 ? -20% |
* ... smaller is better
Power consumption Witcher 3 / stress test
Power consumption with an external monitor
电池寿命
在第一次更新BIOS之前,我们确定在降低显示亮度的情况下,WiFi测试的电池寿命为3小时多一点。
随后,微星Stealth 17显示,它在电池模式下也可以很经济。尽管计算能力仍然不错,但我们在全高清视频播放和WiFi测试中测得的时间大大超过5小时,其中每分钟更换一次网站,尽管计算能力仍然不错。至少在这个性能水平上,这可以被认为是一个非常好的结果。
在电池测试中,竞争者在Witcher 3 。然而,考虑到完全最小化的图形性能和3fps,这不是一个简单的成就。出于这个原因,我们建议不要在电池模式下玩游戏或编辑图像或视频。
"超级电池 "模式是令人失望的。它听起来很好,但我们在WiFi测试中甚至没有达到5小时。也许额外的更新会改善情况。
| MSI Stealth 17 Studio A13VH-014 i9-13900H, GeForce RTX 4080 Laptop GPU, 99 Wh | Gigabyte AERO 16 OLED BSF i9-13900H, GeForce RTX 4070 Laptop GPU, 88 Wh | Asus ROG Zephyrus M16 GU604VY-NM042X i9-13900H, GeForce RTX 4090 Laptop GPU, 90 Wh | MSI Creator Z17 A12UGST-054 i9-12900H, GeForce RTX 3070 Ti Laptop GPU, 90 Wh | Razer Blade 17 Early 2022 i9-12900H, GeForce RTX 3080 Ti Laptop GPU, 82 Wh | Alienware x17 R2 P48E i9-12900HK, GeForce RTX 3080 Ti Laptop GPU, 87 Wh | Lenovo Legion Pro 7 16IRX8H i9-13900HX, GeForce RTX 4080 Laptop GPU, 99.9 Wh | Razer Blade 16 Early 2023 i9-13950HX, GeForce RTX 4080 Laptop GPU, 95.2 Wh | Average of class Gaming | |
|---|---|---|---|---|---|---|---|---|---|
| Battery runtime | 32% | 15% | 11% | -13% | -57% | 11% | -2% | 23% | |
| H.264 (h) | 5.6 | 7.4 32% | 4.8 -14% | 5.5 -2% | 4.8 -14% | 8.32 ? 49% | |||
| WiFi v1.3 (h) | 5.6 | 7.5 34% | 4.3 -23% | 5.5 -2% | 3.8 -32% | 2 -64% | 5.1 -9% | 6.1 9% | 7.11 ? 27% |
| Witcher 3 ultra (h) | 2.6 | ||||||||
| Load (h) | 1.6 | 2.1 31% | 2.9 81% | 2.2 38% | 1.7 6% | 0.8 -50% | 2.1 31% | 1.4 -13% | 1.502 ? -6% |
Pros
Cons
评语 - 强有力,不完美
微星Stealth 17 Studio同样有能力进行高级媒体处理和玩当前的游戏。它保持了令人愉快的安静,即使在这个过程中不得不牺牲几个百分点的功率。虽然CPU设法发挥其全部潜力,但RTX 4080已经有点被束缚在RTX4070的水平上了。 RTX 4070.
正是这一招确保了效率的巨大提高,从而使高水平(如果不是最高水平)的游戏成为可能,而没有任何过度夸张的噪音产生。同样,这也适用于办公室里的工作。特别是在 "静音 "模式下,Stealth完美地克制了,即使它确实变得非常热。
不太完美:在某种程度上,Stealth 17是经过深思熟虑的。它将大量的图形处理能力和高端组件装在一个薄薄的箱子里。笔记本电脑的冷却系统可以设置成这样,从噪音上看,它甚至没有达到低音量。然而,小的缺陷掩盖了其他特别积极的印象。
此外,还有64GB内存、大型M.2固态硬盘和可扩展性选项以及144赫兹4K迷你LED显示屏等突出特点。此外,还有真正好听的扬声器和具有众多定制选项的RGB键盘。
但是:Stealth 17 Studio顶级型号(RTX 4090)的价格是3,999美元的小数目。对于这个价格,缺陷清单似乎有点太长。两个BIOS的更新是最容易原谅的。另一方面,薄弱的铰链似乎是一个设计缺陷。特别是由于与之相连的迷你LED显示屏当然拥有良好的图像质量,但绝不是超一流的图像质量,在亮度或承诺的色彩空间方面都没有给人留下深刻印象。
还有一些额外的小细节。触摸板,应该只是偶尔使用,显得不精确。键盘背光不均匀,笔记本的电源线太短,意味着PSU必须不可避免地坐在桌子上。
良好的基本概念没有受到影响,但改进似乎是不可避免的。隐身17工作室A13V的版本,在许多情况下更好,可能是下一个更小的变体。这款设备没有Mini LED和4K,而是采用了IPS、QHD分辨率、i7和RTX 4070--而且价格都要低1300美元。如果游戏是主要重点,那么华硕ROG Strix G17例如,华硕ROG Strix G17以2300美元左右的价格提供了相当多的动力,而且从远处就能辨认出是一台游戏笔记本电脑--与Stealth不同。
价格和可利用性
微星Stealth 17 Studio(32GB内存)与NvidiaGeForce RTX 4080可以在亚马逊上买到,价格为2669美元。.带有RTX4090和64GB内存的变体也可在,价格为3,999美元。.
MSI Stealth 17 Studio A13VH-014
- 04/18/2023 v7 (old)
Mario Petzold
Transparency
The selection of devices to be reviewed is made by our editorial team. The test sample was provided to the author as a loan by the manufacturer or retailer for the purpose of this review. The lender had no influence on this review, nor did the manufacturer receive a copy of this review before publication. There was no obligation to publish this review. As an independent media company, Notebookcheck is not subjected to the authority of manufacturers, retailers or publishers.
This is how Notebookcheck is testing
Every year, Notebookcheck independently reviews hundreds of laptops and smartphones using standardized procedures to ensure that all results are comparable. We have continuously developed our test methods for around 20 years and set industry standards in the process. In our test labs, high-quality measuring equipment is utilized by experienced technicians and editors. These tests involve a multi-stage validation process. Our complex rating system is based on hundreds of well-founded measurements and benchmarks, which maintains objectivity. Further information on our test methods can be found here.
Price comparison

