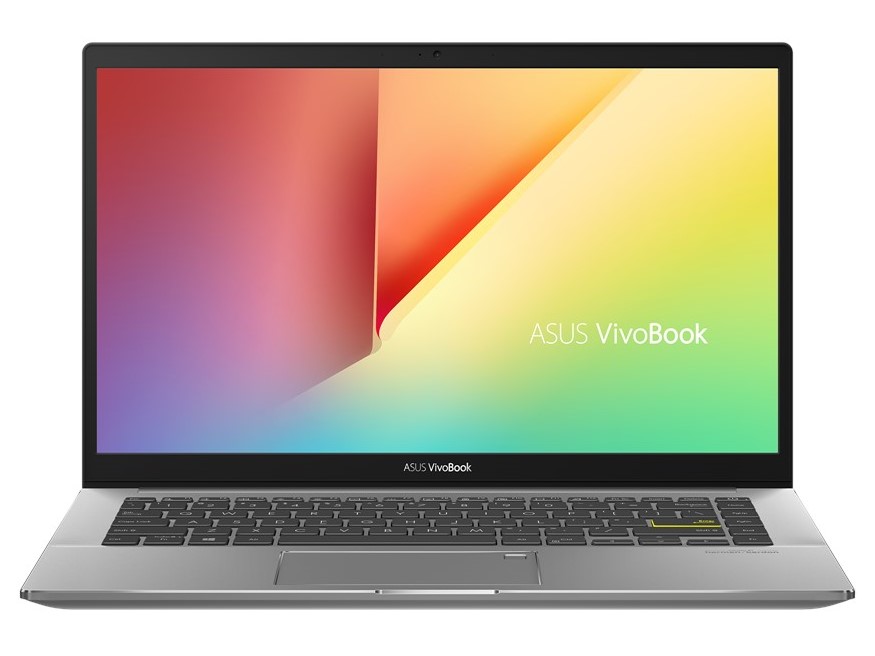
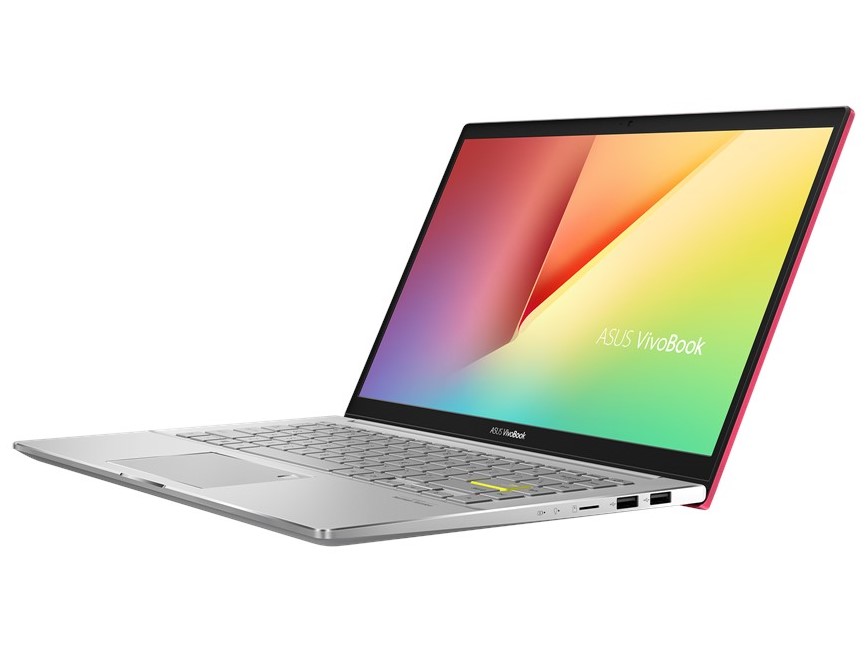
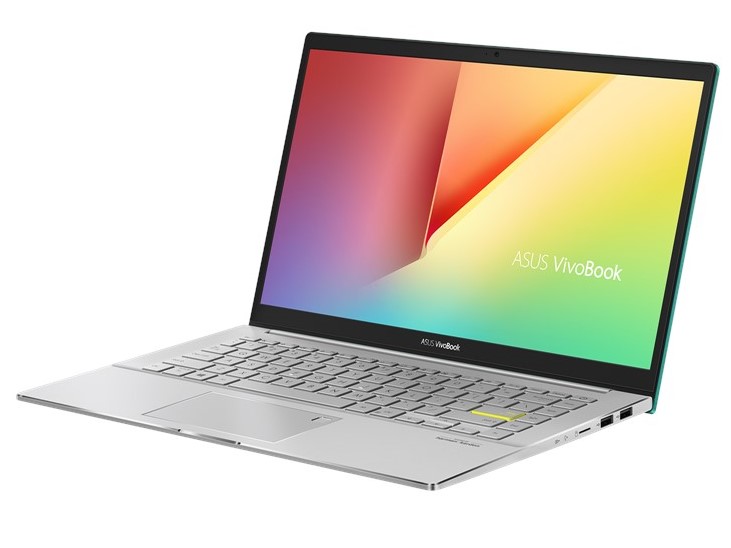
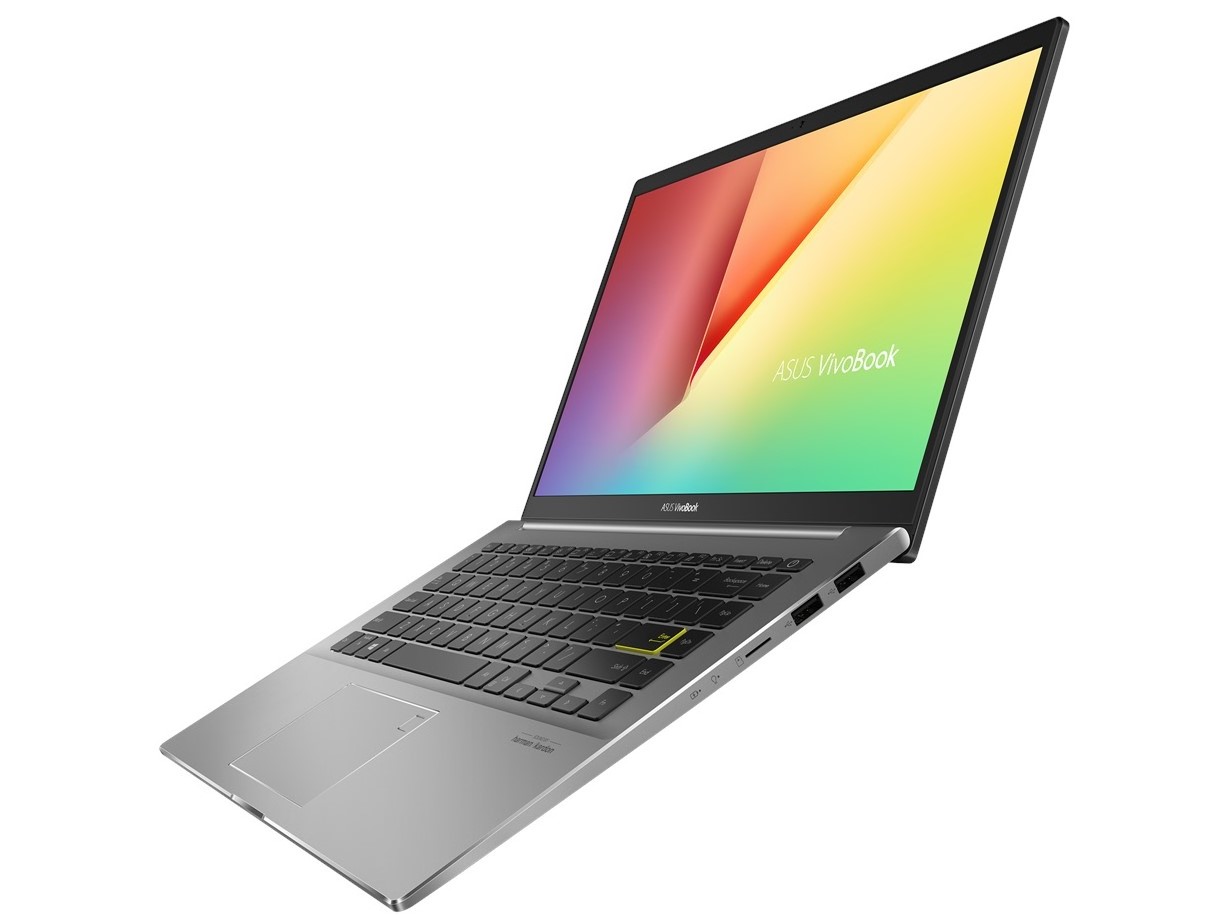
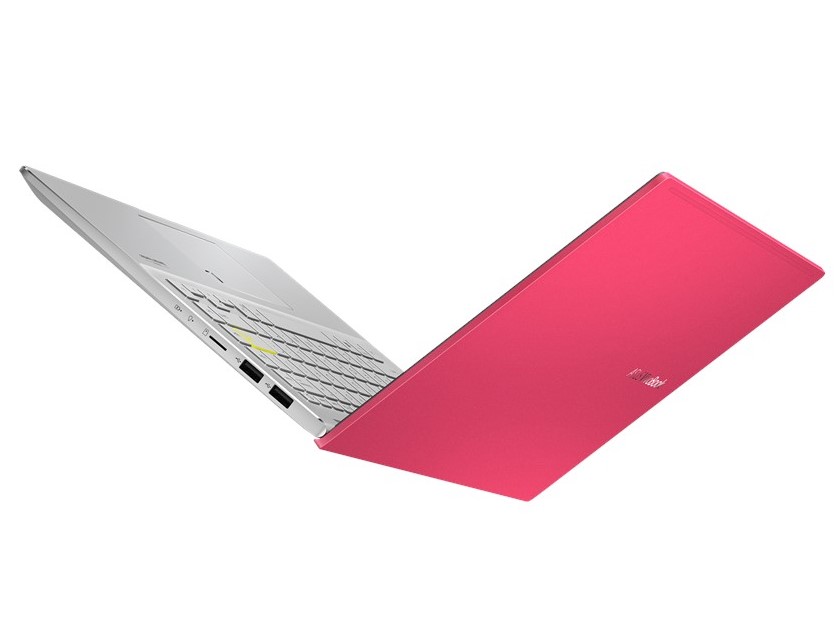
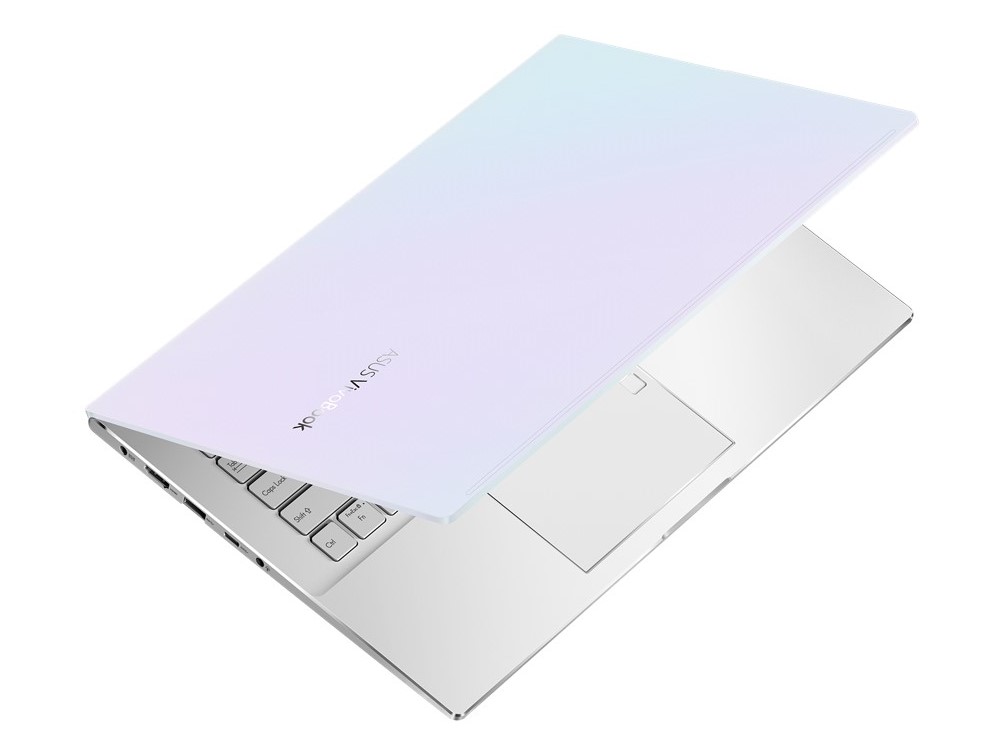
华硕VivoBook S14 S433FL笔记本电脑评测:多彩的坚固机身
Rating | Date | Model | Weight | Height | Size | Resolution | Price |
|---|---|---|---|---|---|---|---|
| 80.7 % v7 (old) | 09 / 2020 | Asus VivoBook S14 S433FL i7-10510U, GeForce MX250 | 1.4 kg | 16 mm | 14.00" | 1920x1080 | |
| 86.5 % v7 (old) | 06 / 2020 | Acer Swift 3 SF314-42-R4XJ R7 4700U, Vega 7 | 1.2 kg | 16.55 mm | 14.00" | 1920x1080 | |
| 85.6 % v7 (old) | 04 / 2020 | Schenker VIA 14 i5-10210U, UHD Graphics 620 | 1.1 kg | 16.5 mm | 14.00" | 1920x1080 | |
| 77.8 % v7 (old) | 03 / 2020 | HP Pavilion 14-ce3040ng i7-1065G7, GeForce MX250 | 1.6 kg | 18 mm | 14.00" | 1920x1080 |
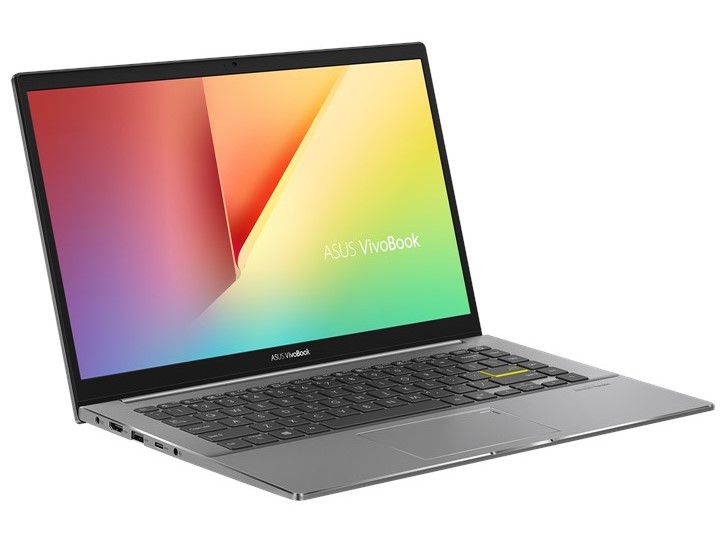
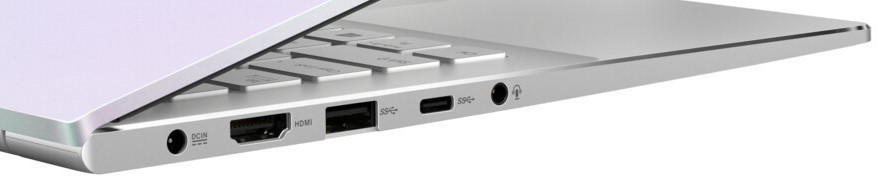
Port configuration

| SD Card Reader | |
| average JPG Copy Test (av. of 3 runs) | |
| Average of class Multimedia (23 - 531, n=43, last 2 years) | |
| Schenker VIA 14 | |
| HP Pavilion 14-ce3040ng (Toshiba Exceria Pro SDXC 64 GB UHS-II) | |
| Asus VivoBook S14 S433FL (Toshiba Exceria Pro M501 microSDXC 64GB) | |
| maximum AS SSD Seq Read Test (1GB) | |
| Average of class Multimedia (27.9 - 1455, n=42, last 2 years) | |
| Schenker VIA 14 (Toshiba Exceria pro M501 64 GB UHS-II) | |
| HP Pavilion 14-ce3040ng (Toshiba Exceria Pro SDXC 64 GB UHS-II) | |
| Asus VivoBook S14 S433FL (Toshiba Exceria Pro M501 microSDXC 64GB) | |

")
")
| |||||||||||||||||||||||||
Brightness Distribution: 68 %
Center on Battery: 216 cd/m²
Contrast: 1419:1 (Black: 0.155 cd/m²)
ΔE ColorChecker Calman: 5.23 | ∀{0.5-29.43 Ø4.73}
calibrated: 4.4
ΔE Greyscale Calman: 3.77 | ∀{0.09-98 Ø4.97}
62% sRGB (Argyll 1.6.3 3D)
40% AdobeRGB 1998 (Argyll 1.6.3 3D)
42.99% AdobeRGB 1998 (Argyll 3D)
62% sRGB (Argyll 3D)
41.55% Display P3 (Argyll 3D)
Gamma: 2.35
CCT: 6666 K
| Asus VivoBook S14 S433FL Chi Mei CMN14D4, IPS, 1920x1080, 14" | Acer Swift 3 SF314-42-R4XJ AU Optronics B140HAN04.0, IPS, 1920x1080, 14" | Schenker VIA 14 B140HAN06.2, a-Si AHVA-IPS LED, 1920x1080, 14" | HP Pavilion 14-ce3040ng AUO543D, IPS, 1920x1080, 14" | |
|---|---|---|---|---|
| Display | -10% | 65% | 59% | |
| Display P3 Coverage (%) | 41.55 | 37.2 -10% | 69.8 68% | 66.5 60% |
| sRGB Coverage (%) | 62 | 55.9 -10% | 99.6 61% | 98.4 59% |
| AdobeRGB 1998 Coverage (%) | 42.99 | 38.43 -11% | 71.6 67% | 68.2 59% |
| Response Times | -13% | -63% | -51% | |
| Response Time Grey 50% / Grey 80% * (ms) | 34 ? | 41 ? -21% | 60.8 ? -79% | 60.8 ? -79% |
| Response Time Black / White * (ms) | 24 ? | 25 ? -4% | 35.2 ? -47% | 29.6 ? -23% |
| PWM Frequency (Hz) | 250 ? | |||
| Screen | 3% | 44% | 27% | |
| Brightness middle (cd/m²) | 220 | 269 22% | 335 52% | 395 80% |
| Brightness (cd/m²) | 204 | 244 20% | 309 51% | 375 84% |
| Brightness Distribution (%) | 68 | 83 22% | 84 24% | 91 34% |
| Black Level * (cd/m²) | 0.155 | 0.23 -48% | 0.17 -10% | 0.26 -68% |
| Contrast (:1) | 1419 | 1170 -18% | 1971 39% | 1519 7% |
| Colorchecker dE 2000 * | 5.23 | 4.94 6% | 2.3 56% | 5.92 -13% |
| Colorchecker dE 2000 max. * | 21.51 | 20.37 5% | 5 77% | 9.79 54% |
| Colorchecker dE 2000 calibrated * | 4.4 | 5.03 -14% | 1 77% | 0.91 79% |
| Greyscale dE 2000 * | 3.77 | 1.71 55% | 3.9 -3% | 6.69 -77% |
| Gamma | 2.35 94% | 2.52 87% | 2.19 100% | 2.78 79% |
| CCT | 6666 98% | 6535 99% | 6556 99% | 7596 86% |
| Color Space (Percent of AdobeRGB 1998) (%) | 40 | 35 -12% | 65.5 64% | 63 58% |
| Color Space (Percent of sRGB) (%) | 62 | 56 -10% | 99.6 61% | 98 58% |
| Total Average (Program / Settings) | -7% /
-2% | 15% /
35% | 12% /
23% |
* ... smaller is better
Display Response Times
| ↔ Response Time Black to White | ||
|---|---|---|
| 24 ms ... rise ↗ and fall ↘ combined | ↗ 14 ms rise | 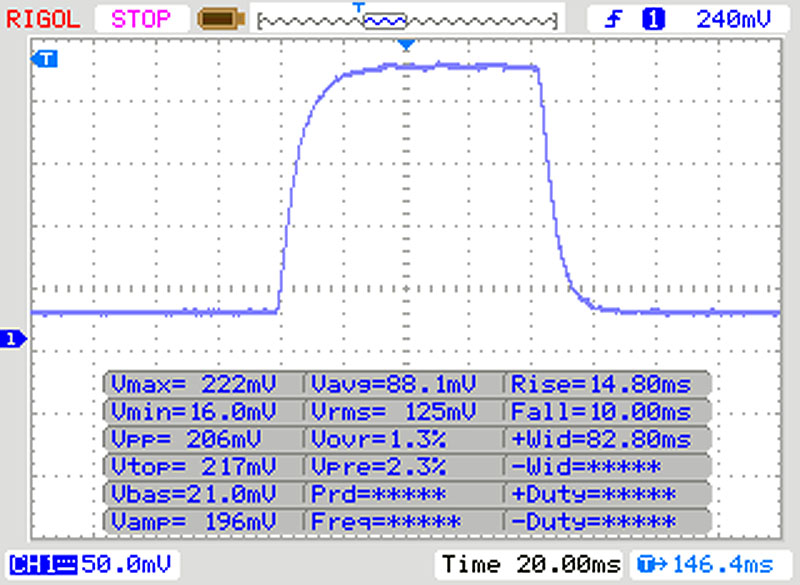 |
| ↘ 10 ms fall | ||
| The screen shows good response rates in our tests, but may be too slow for competitive gamers. In comparison, all tested devices range from 0.1 (minimum) to 240 (maximum) ms. » 54 % of all devices are better. This means that the measured response time is worse than the average of all tested devices (19.9 ms). | ||
| ↔ Response Time 50% Grey to 80% Grey | ||
| 34 ms ... rise ↗ and fall ↘ combined | ↗ 16 ms rise | 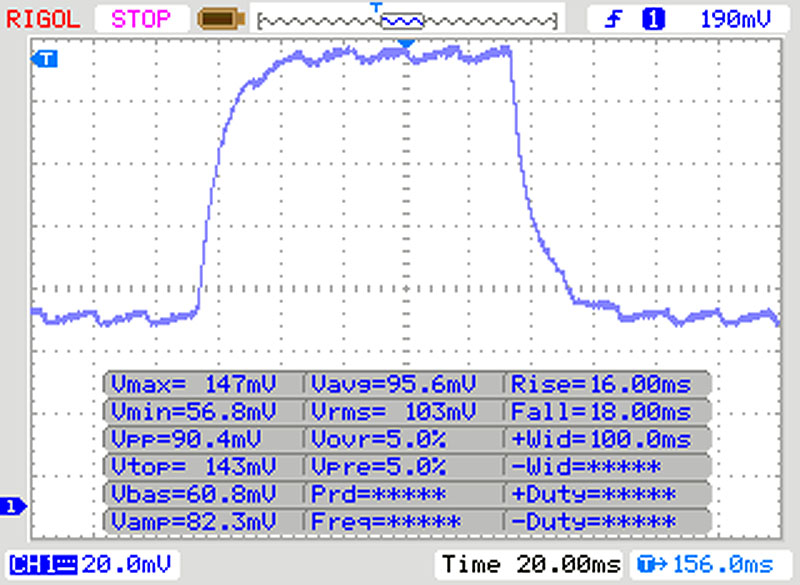 |
| ↘ 18 ms fall | ||
| The screen shows slow response rates in our tests and will be unsatisfactory for gamers. In comparison, all tested devices range from 0.165 (minimum) to 636 (maximum) ms. » 47 % of all devices are better. This means that the measured response time is similar to the average of all tested devices (31.1 ms). | ||
Screen Flickering / PWM (Pulse-Width Modulation)
| Screen flickering / PWM detected | 250 Hz | ≤ 20 % brightness setting | 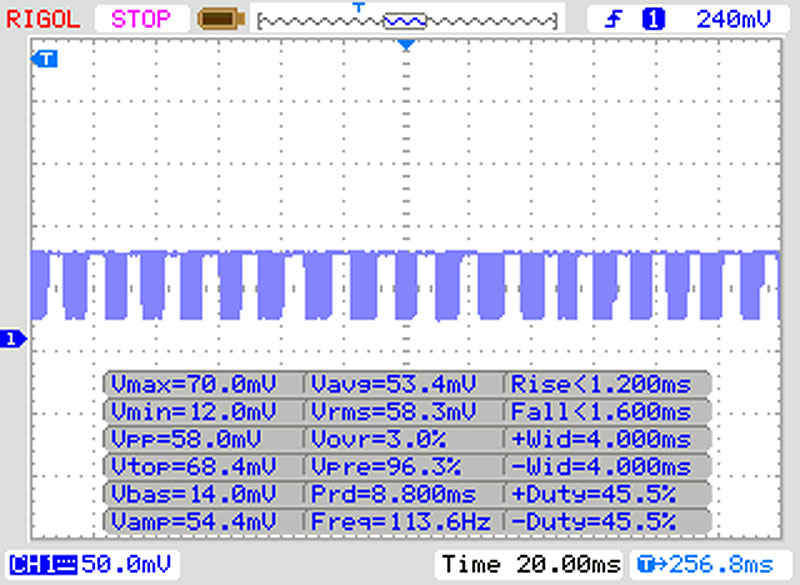 |
The display backlight flickers at 250 Hz (worst case, e.g., utilizing PWM) Flickering detected at a brightness setting of 20 % and below. There should be no flickering or PWM above this brightness setting. The frequency of 250 Hz is relatively low, so sensitive users will likely notice flickering and experience eyestrain at the stated brightness setting and below. In comparison: 52 % of all tested devices do not use PWM to dim the display. If PWM was detected, an average of 7784 (minimum: 5 - maximum: 343500) Hz was measured. | |||
Cinebench R15: CPU Single 64Bit | CPU Multi 64Bit
Blender: v2.79 BMW27 CPU
7-Zip 18.03: 7z b 4 -mmt1 | 7z b 4
Geekbench 5.5: Single-Core | Multi-Core
HWBOT x265 Benchmark v2.2: 4k Preset
LibreOffice : 20 Documents To PDF
R Benchmark 2.5: Overall mean
| Cinebench R20 / CPU (Single Core) | |
| Average of class Multimedia (425 - 853, n=64, last 2 years) | |
| HP Pavilion 14-ce3040ng | |
| Acer Swift 3 SF314-42-R4XJ | |
| Asus VivoBook S14 S433FL | |
| Average Intel Core i7-10510U (362 - 497, n=37) | |
| Schenker VIA 14 | |
| Cinebench R20 / CPU (Multi Core) | |
| Average of class Multimedia (1887 - 12912, n=64, last 2 years) | |
| Acer Swift 3 SF314-42-R4XJ | |
| HP Pavilion 14-ce3040ng | |
| Asus VivoBook S14 S433FL | |
| Average Intel Core i7-10510U (1015 - 1897, n=38) | |
| Schenker VIA 14 | |
| Cinebench R15 / CPU Single 64Bit | |
| Average of class Multimedia (184.8 - 326, n=66, last 2 years) | |
| HP Pavilion 14-ce3040ng | |
| Acer Swift 3 SF314-42-R4XJ | |
| Average Intel Core i7-10510U (113 - 202, n=42) | |
| Asus VivoBook S14 S433FL | |
| Schenker VIA 14 | |
| Cinebench R15 / CPU Multi 64Bit | |
| Average of class Multimedia (856 - 5224, n=68, last 2 years) | |
| Acer Swift 3 SF314-42-R4XJ | |
| Schenker VIA 14 | |
| HP Pavilion 14-ce3040ng | |
| Average Intel Core i7-10510U (482 - 856, n=45) | |
| Asus VivoBook S14 S433FL | |
| Blender / v2.79 BMW27 CPU | |
| Schenker VIA 14 | |
| Average Intel Core i7-10510U (628 - 1051, n=31) | |
| Asus VivoBook S14 S433FL | |
| Acer Swift 3 SF314-42-R4XJ | |
| Average of class Multimedia (100 - 557, n=65, last 2 years) | |
| 7-Zip 18.03 / 7z b 4 -mmt1 | |
| Average of class Multimedia (3666 - 7545, n=63, last 2 years) | |
| Asus VivoBook S14 S433FL | |
| Average Intel Core i7-10510U (3747 - 4981, n=31) | |
| Acer Swift 3 SF314-42-R4XJ | |
| Schenker VIA 14 | |
| 7-Zip 18.03 / 7z b 4 | |
| Average of class Multimedia (29095 - 130368, n=62, last 2 years) | |
| Acer Swift 3 SF314-42-R4XJ | |
| Average Intel Core i7-10510U (12196 - 21298, n=31) | |
| Asus VivoBook S14 S433FL | |
| Schenker VIA 14 | |
| Geekbench 5.5 / Single-Core | |
| Average of class Multimedia (805 - 2974, n=62, last 2 years) | |
| Asus VivoBook S14 S433FL | |
| Average Intel Core i7-10510U (977 - 1287, n=31) | |
| Acer Swift 3 SF314-42-R4XJ | |
| Schenker VIA 14 | |
| Geekbench 5.5 / Multi-Core | |
| Average of class Multimedia (4652 - 20422, n=62, last 2 years) | |
| Acer Swift 3 SF314-42-R4XJ | |
| Schenker VIA 14 | |
| Asus VivoBook S14 S433FL | |
| Average Intel Core i7-10510U (2474 - 4484, n=31) | |
| HWBOT x265 Benchmark v2.2 / 4k Preset | |
| Average of class Multimedia (5.26 - 36.1, n=63, last 2 years) | |
| Acer Swift 3 SF314-42-R4XJ | |
| Average Intel Core i7-10510U (3.41 - 6.04, n=31) | |
| Asus VivoBook S14 S433FL | |
| Schenker VIA 14 | |
| LibreOffice / 20 Documents To PDF | |
| Average Intel Core i7-10510U (50.7 - 77.8, n=27) | |
| Acer Swift 3 SF314-42-R4XJ | |
| Asus VivoBook S14 S433FL | |
| Average of class Multimedia (23.9 - 146.7, n=64, last 2 years) | |
| R Benchmark 2.5 / Overall mean | |
| Schenker VIA 14 | |
| Average Intel Core i7-10510U (0.637 - 0.81, n=28) | |
| Asus VivoBook S14 S433FL | |
| Acer Swift 3 SF314-42-R4XJ | |
| Average of class Multimedia (0.3604 - 0.947, n=63, last 2 years) | |
* ... smaller is better
| PCMark 10 Score | 3933 points | |
Help | ||
| DPC Latencies / LatencyMon - interrupt to process latency (max), Web, Youtube, Prime95 | |
| Schenker VIA 14 | |
| Acer Swift 3 SF314-42-R4XJ | |
| Asus VivoBook S14 S433FL | |
* ... smaller is better
| Asus VivoBook S14 S433FL Intel Optane Memory H10 with Solid State Storage 32GB + 512GB HBRPEKNX0202A(L/H) | Acer Swift 3 SF314-42-R4XJ Samsung PM991 MZVLQ1T0HALB | Schenker VIA 14 Seagate FireCuda 520 SSD ZP1000GM30002 | HP Pavilion 14-ce3040ng Toshiba XG6 KXG60ZNV1T02 | Average Intel Optane Memory H10 with Solid State Storage 32GB + 512GB HBRPEKNX0202A(L/H) | Average of class Multimedia | |
|---|---|---|---|---|---|---|
| CrystalDiskMark 5.2 / 6 | 13% | 74% | 63% | -4% | 116% | |
| Write 4K (MB/s) | 124.9 | 98.8 -21% | 201 61% | 181.6 45% | 110.3 ? -12% | 163.8 ? 31% |
| Read 4K (MB/s) | 147.9 | 32.44 -78% | 60.2 -59% | 57.4 -61% | 131.9 ? -11% | 67.5 ? -54% |
| Write Seq (MB/s) | 753 | 1582 110% | 2471 228% | 1982 163% | 569 ? -24% | 2715 ? 261% |
| Read Seq (MB/s) | 1223 | 1471 20% | 2104 72% | 1899 55% | 1372 ? 12% | 3120 ? 155% |
| Write 4K Q32T1 (MB/s) | 369.2 | 375.4 2% | 323.6 -12% | 509 38% | 387 ? 5% | 454 ? 23% |
| Read 4K Q32T1 (MB/s) | 358.1 | 491.9 37% | 551 54% | 545 52% | 375 ? 5% | 581 ? 62% |
| Write Seq Q32T1 (MB/s) | 1057 | 1574 49% | 3407 222% | 3072 191% | 1141 ? 8% | 4593 ? 335% |
| Read Seq Q32T1 (MB/s) | 2738 | 2329 -15% | 3475 27% | 3281 20% | 2439 ? -11% | 5776 ? 111% |
| AS SSD | 37% | 215% | 166% | -3% | 207% | |
| Seq Read (MB/s) | 957 | 1960 105% | 2488 160% | 2762 189% | 1056 ? 10% | 4442 ? 364% |
| Seq Write (MB/s) | 353.1 | 1547 338% | 2615 641% | 2493 606% | 429 ? 21% | 3060 ? 767% |
| 4K Read (MB/s) | 62.4 | 31.56 -49% | 72.8 17% | 52.1 -17% | 61.9 ? -1% | 61.2 ? -2% |
| 4K Write (MB/s) | 122.8 | 116.6 -5% | 172.3 40% | 147.5 20% | 105 ? -14% | 185.6 ? 51% |
| 4K-64 Read (MB/s) | 386.2 | 454.7 18% | 2052 431% | 1473 281% | 459 ? 19% | 1085 ? 181% |
| 4K-64 Write (MB/s) | 605 | 262.1 -57% | 1746 189% | 1456 141% | 644 ? 6% | 2213 ? 266% |
| Access Time Read * (ms) | 0.107 | 0.06 44% | 0.094 12% | 0.1019 ? 5% | 0.05759 ? 46% | |
| Access Time Write * (ms) | 0.046 | 0.034 26% | 0.022 52% | 0.03 35% | 0.09417 ? -105% | 0.07513 ? -63% |
| Score Read (Points) | 544 | 682 25% | 2373 336% | 1801 231% | 627 ? 15% | 1590 ? 192% |
| Score Write (Points) | 763 | 533 -30% | 2180 186% | 1853 143% | 792 ? 4% | 2705 ? 255% |
| Score Total (Points) | 1581 | 1552 -2% | 5782 266% | 4568 189% | 1732 ? 10% | 5052 ? 220% |
| Total Average (Program / Settings) | 25% /
26% | 145% /
156% | 115% /
123% | -4% /
-3% | 162% /
168% |
* ... smaller is better

Continuous load read: DiskSpd Read Loop, Queue Depth 8
| 3DMark 11 Performance | 5022 points | |
| 3DMark Fire Strike Score | 3460 points | |
| 3DMark Time Spy Score | 1282 points | |
Help | ||
| The Witcher 3 | |
| 1024x768 Low Graphics & Postprocessing | |
| Average of class Multimedia (68 - 380, n=10, last 2 years) | |
| Average NVIDIA GeForce MX250 (47.4 - 70, n=24) | |
| HP Pavilion 14-ce3040ng | |
| Acer Swift 3 SF314-42-R4XJ | |
| 1366x768 Medium Graphics & Postprocessing | |
| Average of class Multimedia (41 - 93, n=4, last 2 years) | |
| Asus VivoBook S14 S433FL | |
| Average NVIDIA GeForce MX250 (30 - 40, n=27) | |
| HP Pavilion 14-ce3040ng | |
| Acer Swift 3 SF314-42-R4XJ | |
| 1920x1080 High Graphics & Postprocessing (Nvidia HairWorks Off) | |
| Average of class Multimedia (22 - 224, n=13, last 2 years) | |
| Asus VivoBook S14 S433FL | |
| Average NVIDIA GeForce MX250 (16.3 - 23.1, n=27) | |
| HP Pavilion 14-ce3040ng | |
| Acer Swift 3 SF314-42-R4XJ | |
| 1920x1080 Ultra Graphics & Postprocessing (HBAO+) | |
| Average of class Multimedia (11 - 121, n=13, last 2 years) | |
| Asus VivoBook S14 S433FL | |
| Average NVIDIA GeForce MX250 (9 - 16, n=24) | |
| HP Pavilion 14-ce3040ng | |
| Acer Swift 3 SF314-42-R4XJ | |
| Dota 2 Reborn - 1920x1080 high (2/3) | |
| Average of class Multimedia (31.1 - 196.9, n=68, last 2 years) | |
| Asus VivoBook S14 S433FL | |
| Average NVIDIA GeForce MX250 (8.6 - 77.4, n=21) | |
| Acer Swift 3 SF314-42-R4XJ | |
| Schenker VIA 14 | |
| X-Plane 11.11 - 1920x1080 high (fps_test=3) | |
| Average of class Multimedia (16.9 - 141.1, n=62, last 2 years) | |
| Average NVIDIA GeForce MX250 (9.8 - 52.6, n=17) | |
| Asus VivoBook S14 S433FL | |
| Acer Swift 3 SF314-42-R4XJ | |
| Schenker VIA 14 | |
| low | med. | high | ultra | |
|---|---|---|---|---|
| The Witcher 3 (2015) | 36 | 21 | 13 | |
| Dota 2 Reborn (2015) | 102.4 | 90.5 | 71.3 | 63.8 |
| X-Plane 11.11 (2018) | 47.7 | 42.8 | 39.3 |
Noise level
| Idle |
| 31 / 31 / 31.3 dB(A) |
| Load |
| 43.4 / 41.5 dB(A) |
 | ||
30 dB silent 40 dB(A) audible 50 dB(A) loud |
||
min: | ||
(±) The maximum temperature on the upper side is 43 °C / 109 F, compared to the average of 36.8 °C / 98 F, ranging from 21 to 71 °C for the class Multimedia.
(±) The bottom heats up to a maximum of 44.8 °C / 113 F, compared to the average of 39.1 °C / 102 F
(+) In idle usage, the average temperature for the upper side is 25.7 °C / 78 F, compared to the device average of 31.3 °C / 88 F.
(±) Playing The Witcher 3, the average temperature for the upper side is 35.2 °C / 95 F, compared to the device average of 31.3 °C / 88 F.
(+) The palmrests and touchpad are reaching skin temperature as a maximum (33.2 °C / 91.8 F) and are therefore not hot.
(-) The average temperature of the palmrest area of similar devices was 28.7 °C / 83.7 F (-4.5 °C / -8.1 F).
Asus VivoBook S14 S433FL audio analysis
(-) | not very loud speakers (70.2 dB)
Bass 100 - 315 Hz
(-) | nearly no bass - on average 18.1% lower than median
(-) | bass is not linear (16.5% delta to prev. frequency)
Mids 400 - 2000 Hz
(+) | balanced mids - only 4.8% away from median
(±) | linearity of mids is average (7.1% delta to prev. frequency)
Highs 2 - 16 kHz
(+) | balanced highs - only 2.6% away from median
(±) | linearity of highs is average (7.3% delta to prev. frequency)
Overall 100 - 16.000 Hz
(±) | linearity of overall sound is average (19.5% difference to median)
Compared to same class
» 64% of all tested devices in this class were better, 7% similar, 29% worse
» The best had a delta of 5%, average was 17%, worst was 45%
Compared to all devices tested
» 48% of all tested devices were better, 7% similar, 44% worse
» The best had a delta of 4%, average was 24%, worst was 134%
Apple MacBook 12 (Early 2016) 1.1 GHz audio analysis
(+) | speakers can play relatively loud (83.6 dB)
Bass 100 - 315 Hz
(±) | reduced bass - on average 11.3% lower than median
(±) | linearity of bass is average (14.2% delta to prev. frequency)
Mids 400 - 2000 Hz
(+) | balanced mids - only 2.4% away from median
(+) | mids are linear (5.5% delta to prev. frequency)
Highs 2 - 16 kHz
(+) | balanced highs - only 2% away from median
(+) | highs are linear (4.5% delta to prev. frequency)
Overall 100 - 16.000 Hz
(+) | overall sound is linear (10.2% difference to median)
Compared to same class
» 7% of all tested devices in this class were better, 2% similar, 91% worse
» The best had a delta of 5%, average was 18%, worst was 53%
Compared to all devices tested
» 5% of all tested devices were better, 1% similar, 94% worse
» The best had a delta of 4%, average was 24%, worst was 134%
| Off / Standby | |
| Idle | |
| Load |
|
Key:
min: | |
| Battery Runtime - WiFi Websurfing | |
| Schenker VIA 14 | |
| Average of class Multimedia (4.37 - 26.6, n=70, last 2 years) | |
| Acer Swift 3 SF314-42-R4XJ | |
| Asus VivoBook S14 S433FL | |
| HP Pavilion 14-ce3040ng | |
Pros
Cons
总结——这台多功能笔记本代表了一种生活方式:
在我们的测试中,华硕VivoBook S14被证明是一款多功能的笔记本电脑。对于办公应用程序来说,性能已经绰绰有余,而Nvidia GeForce MX250的性能也足以满足休闲游戏玩家的需求。结合良好的续航和小巧的体积,这款14英寸笔记本电脑也是不错的移动伴侣。
华硕VivoBook S14 S433FL是一款出色的多面手,在许多情况下均具有出色的性能。
只有慢速的microSD读卡器和键盘(对于我们的喜好来说太软了)才真正值得批评。其余配置绝对足以满足这款笔记本电脑的价格水平。但是,敏感的用户在插入电源适配器时可能会听到轻微的嗡嗡声,而PWM处于低亮度水平时可能会出现问题。那些需要指纹识别和数字键盘的人需要忍受一下。
Asus VivoBook S14 S433FL
- 07/20/2020 v7 (old)
Mike Wobker
Price comparison

