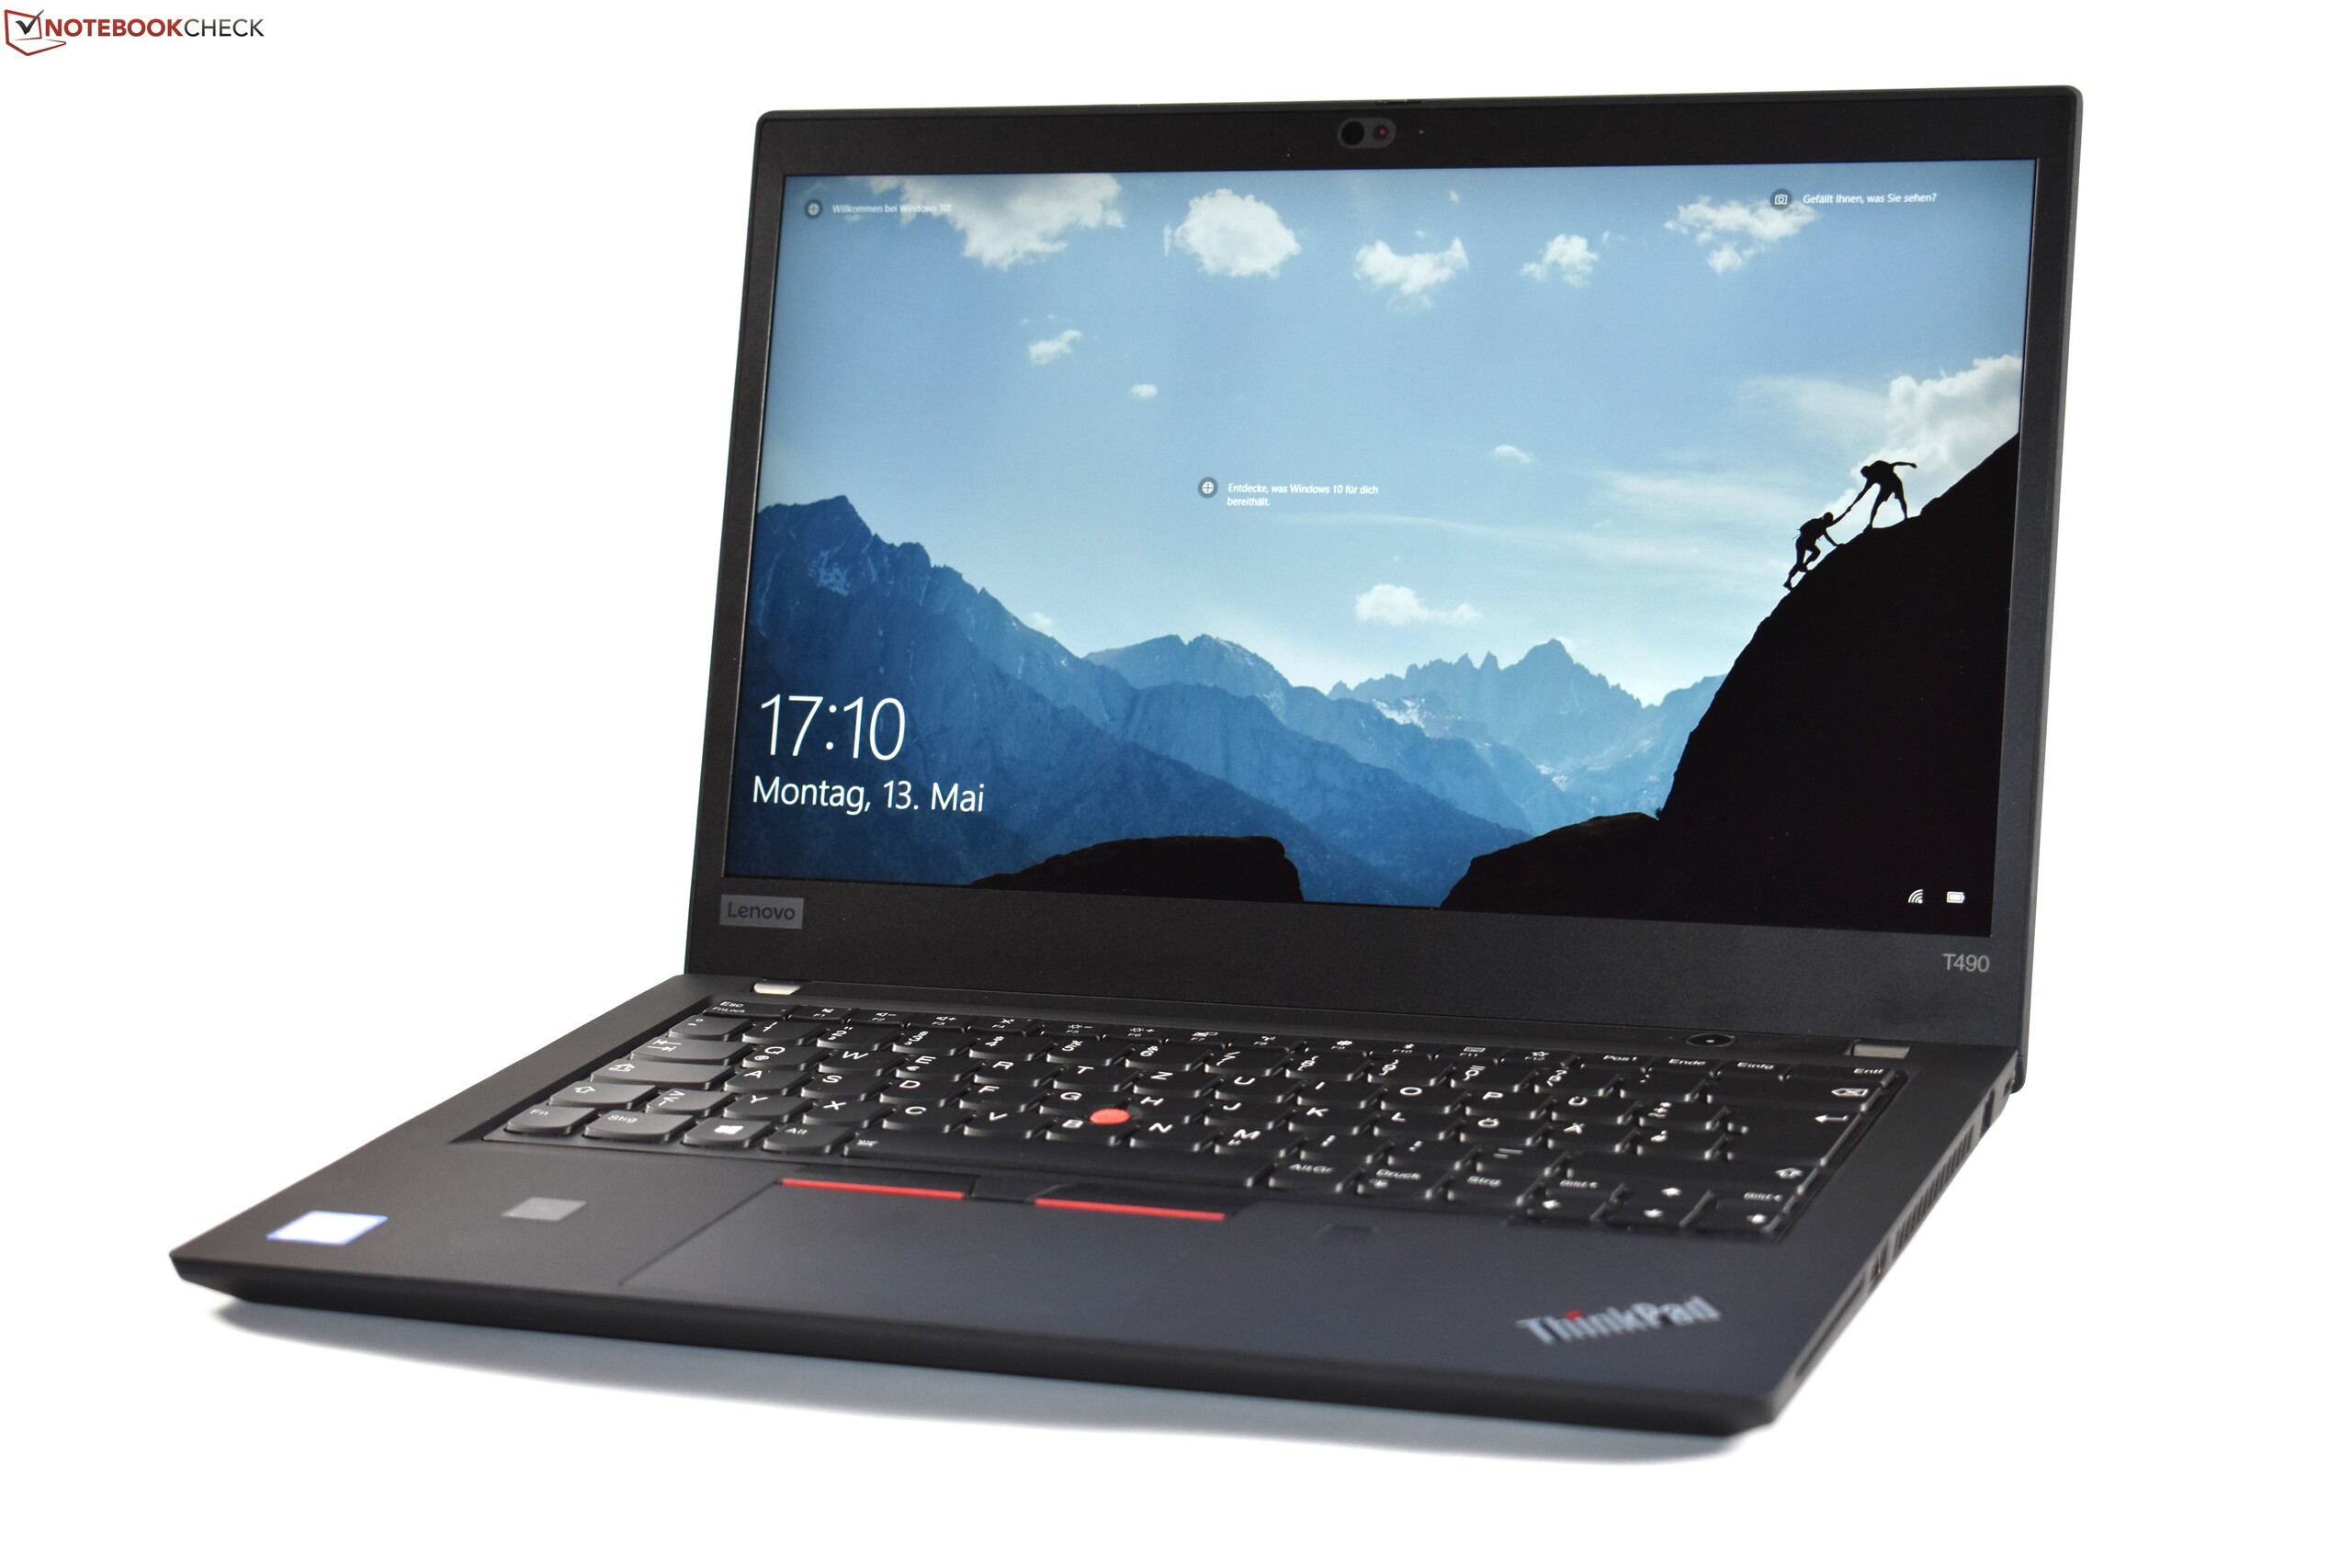
联想ThinkPad T490(i7, MX250, 低功耗FHD)笔记本电脑评测
| SD Card Reader | |
| average JPG Copy Test (av. of 3 runs) | |
| Dell Latitude 7490 (Toshiba Exceria Pro M501 UHS-II) | |
| Lenovo ThinkPad T480s-20L8S02D00 (Toshiba Exceria Pro SDXC 64 GB UHS-II) | |
| Lenovo ThinkPad T480-20L6S01V00 (Toshiba Exceria Pro SDXC 64 GB UHS-II) | |
| Lenovo ThinkPad T490-20N3S02L00 (Toshiba Exceria Pro M501) | |
| Fujitsu LifeBook U748 (Toshiba Exceria Pro SDXC 64 GB UHS-II) | |
| Lenovo ThinkPad T490s-20NYS02A00 (Toshiba Exceria Pro M501) | |
| Average of class Office (19.8 - 198.5, n=22, last 2 years) | |
| maximum AS SSD Seq Read Test (1GB) | |
| Dell Latitude 7490 (Toshiba Exceria Pro M501 UHS-II) | |
| Lenovo ThinkPad T480s-20L8S02D00 (Toshiba Exceria Pro SDXC 64 GB UHS-II) | |
| Lenovo ThinkPad T490s-20NYS02A00 (Toshiba Exceria Pro M501) | |
| Lenovo ThinkPad T480-20L6S01V00 (Toshiba Exceria Pro SDXC 64 GB UHS-II) | |
| Lenovo ThinkPad T490-20N3S02L00 (Toshiba Exceria Pro M501) | |
| Fujitsu LifeBook U748 (Toshiba Exceria Pro SDXC 64 GB UHS-II) | |
| Average of class Office (27.4 - 249, n=21, last 2 years) | |
| Networking | |
| iperf3 transmit AX12 | |
| Lenovo ThinkPad T490-20N3S02L00 | |
| Lenovo ThinkPad T490s-20NYS02A00 | |
| HP EliteBook 840 G5-3JX66EA | |
| Lenovo ThinkPad T480-20L6S01V00 | |
| Lenovo ThinkPad T480s-20L8S02D00 | |
| Dell Latitude 7490 | |
| Fujitsu LifeBook U748 | |
| iperf3 receive AX12 | |
| Lenovo ThinkPad T490-20N3S02L00 | |
| Dell Latitude 7490 | |
| Lenovo ThinkPad T490s-20NYS02A00 | |
| HP EliteBook 840 G5-3JX66EA | |
| Lenovo ThinkPad T480-20L6S01V00 | |
| Fujitsu LifeBook U748 | |
| Lenovo ThinkPad T480s-20L8S02D00 | |
| |||||||||||||||||||||||||
Brightness Distribution: 88 %
Center on Battery: 420 cd/m²
Contrast: 1742:1 (Black: 0.24 cd/m²)
ΔE ColorChecker Calman: 4.7 | ∀{0.5-29.43 Ø4.72}
calibrated: 2.1
ΔE Greyscale Calman: 5.9 | ∀{0.09-98 Ø4.97}
92.1% sRGB (Argyll 1.6.3 3D)
59.9% AdobeRGB 1998 (Argyll 1.6.3 3D)
67.4% AdobeRGB 1998 (Argyll 3D)
92.2% sRGB (Argyll 3D)
69.3% Display P3 (Argyll 3D)
Gamma: 2.06
CCT: 7350 K
Screen Flickering / PWM (Pulse-Width Modulation)
| Screen flickering / PWM detected | 2451 Hz | ≤ 50 % brightness setting | 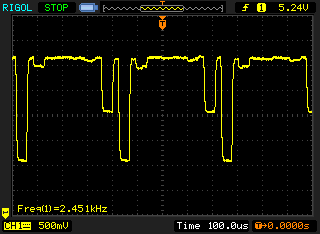 |
The display backlight flickers at 2451 Hz (worst case, e.g., utilizing PWM) Flickering detected at a brightness setting of 50 % and below. There should be no flickering or PWM above this brightness setting. The frequency of 2451 Hz is quite high, so most users sensitive to PWM should not notice any flickering. In comparison: 52 % of all tested devices do not use PWM to dim the display. If PWM was detected, an average of 7769 (minimum: 5 - maximum: 343500) Hz was measured. | |||
| Lenovo ThinkPad T490-20N3S02L00 NE140FHM-N61, , 1920x1080, 14" | Lenovo ThinkPad T480-20L6S01V00 Lenovo LP140WF6-SPB7, , 1920x1080, 14" | Lenovo ThinkPad T480s-20L8S02D00 LP140QH2-SPB1, , 2560x1440, 14" | HP EliteBook 840 G5-3JX66EA AUO3B3D, , 1920x1080, 14" | Dell Latitude 7490 AUO503D (D04YD_B140HAN), , 1920x1080, 14" | Fujitsu LifeBook U748 LG, LP140WF6-SPF1, , 1920x1080, 14" | |
|---|---|---|---|---|---|---|
| Display | -40% | 7% | -9% | 1% | ||
| Display P3 Coverage (%) | 69.3 | 39.24 -43% | 72.8 5% | 60.2 -13% | 66.6 -4% | |
| sRGB Coverage (%) | 92.2 | 58.8 -36% | 97.9 6% | 88.2 -4% | 96.8 5% | |
| AdobeRGB 1998 Coverage (%) | 67.4 | 40.56 -40% | 74.1 10% | 61.3 -9% | 67.9 1% | |
| Response Times | 49% | 43% | 37% | 37% | 47% | |
| Response Time Grey 50% / Grey 80% * (ms) | 74 ? | 35.6 ? 52% | 38.4 ? 48% | 42.4 ? 43% | 41.6 ? 44% | 39.2 ? 47% |
| Response Time Black / White * (ms) | 45.6 ? | 24.8 ? 46% | 28.4 ? 38% | 31.6 ? 31% | 32 ? 30% | 24.4 ? 46% |
| PWM Frequency (Hz) | 2451 ? | |||||
| Screen | -37% | -10% | -7% | -11% | -2% | |
| Brightness middle (cd/m²) | 418 | 307 -27% | 352 -16% | 414 -1% | 308.6 -26% | 334 -20% |
| Brightness (cd/m²) | 400 | 295 -26% | 343 -14% | 387 -3% | 294 -26% | 313 -22% |
| Brightness Distribution (%) | 88 | 90 2% | 91 3% | 87 -1% | 89 1% | 89 1% |
| Black Level * (cd/m²) | 0.24 | 0.25 -4% | 0.46 -92% | 0.25 -4% | 0.23 4% | 0.41 -71% |
| Contrast (:1) | 1742 | 1228 -30% | 765 -56% | 1656 -5% | 1342 -23% | 815 -53% |
| Colorchecker dE 2000 * | 4.7 | 5.7 -21% | 3.3 30% | 5.5 -17% | 6.07 -29% | 2.2 53% |
| Colorchecker dE 2000 max. * | 8.7 | 21.3 -145% | 7.3 16% | 9.9 -14% | 10.58 -22% | 5.7 34% |
| Colorchecker dE 2000 calibrated * | 2.1 | 4.7 -124% | 2.3 -10% | 1.67 20% | ||
| Greyscale dE 2000 * | 5.9 | 3.7 37% | 5.3 10% | 6.4 -8% | 7.3 -24% | 2.9 51% |
| Gamma | 2.06 107% | 2.11 104% | 2.22 99% | 2.31 95% | 2.061 107% | 2.34 94% |
| CCT | 7350 88% | 7353 88% | 6452 101% | 7811 83% | 7269 89% | 6855 95% |
| Color Space (Percent of AdobeRGB 1998) (%) | 59.9 | 37.4 -38% | 68.4 14% | 56.9 -5% | 62 4% | 65.3 9% |
| Color Space (Percent of sRGB) (%) | 92.1 | 58.7 -36% | 98 6% | 88.1 -4% | 97 5% | 91.8 0% |
| Total Average (Program / Settings) | -9% /
-27% | 13% /
1% | 7% /
-2% | 9% /
-3% | 23% /
6% |
* ... smaller is better
Display Response Times
| ↔ Response Time Black to White | ||
|---|---|---|
| 45.6 ms ... rise ↗ and fall ↘ combined | ↗ 22.8 ms rise | 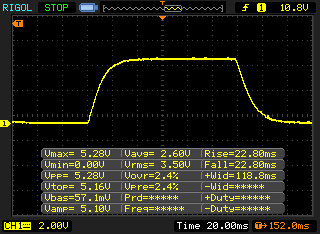 |
| ↘ 22.8 ms fall | ||
| The screen shows slow response rates in our tests and will be unsatisfactory for gamers. In comparison, all tested devices range from 0.1 (minimum) to 240 (maximum) ms. » 99 % of all devices are better. This means that the measured response time is worse than the average of all tested devices (19.8 ms). | ||
| ↔ Response Time 50% Grey to 80% Grey | ||
| 74 ms ... rise ↗ and fall ↘ combined | ↗ 33.6 ms rise | 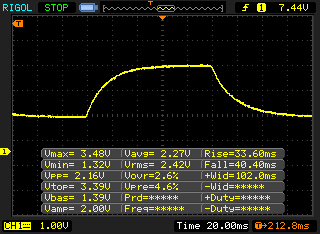 |
| ↘ 40.4 ms fall | ||
| The screen shows slow response rates in our tests and will be unsatisfactory for gamers. In comparison, all tested devices range from 0.165 (minimum) to 636 (maximum) ms. » 99 % of all devices are better. This means that the measured response time is worse than the average of all tested devices (31 ms). | ||
| PCMark 8 Home Score Accelerated v2 | 4052 points | |
| PCMark 8 Creative Score Accelerated v2 | 5740 points | |
| PCMark 8 Work Score Accelerated v2 | 5277 points | |
| PCMark 10 Score | 4341 points | |
Help | ||
| Lenovo ThinkPad T490-20N3S02L00 Toshiba XG5 KXG50ZNV512G | Lenovo ThinkPad T480-20L6S01V00 Samsung SSD PM981 MZVLB512HAJQ | Lenovo ThinkPad T480s-20L8S02D00 Samsung SSD PM981 MZVLB512HAJQ | Lenovo ThinkPad T490s-20NYS02A00 Intel SSD Pro 7600p SSDPEKKF512G8L | HP EliteBook 840 G5-3JX66EA Toshiba XG5 KXG50ZNV256G | Dell Latitude 7490 Toshiba KSG60ZMV256G | Fujitsu LifeBook U748 Samsung PM961 MZVLW256HEHP | Average Toshiba XG5 KXG50ZNV512G | |
|---|---|---|---|---|---|---|---|---|
| CrystalDiskMark 5.2 / 6 | -9% | 8% | 2% | -25% | -58% | 13% | -10% | |
| Write 4K (MB/s) | 126.6 | 153.1 21% | 155.4 23% | 122 -4% | 92.8 -27% | 79.4 -37% | 135.5 7% | 114 ? -10% |
| Read 4K (MB/s) | 43.61 | 48.3 11% | 47.61 9% | 45.56 4% | 30.67 -30% | 27.37 -37% | 43.76 0% | 35.6 ? -18% |
| Write Seq (MB/s) | 1342 | 866 -35% | 1624 21% | 1497 12% | 353.2 -74% | 343.9 -74% | 1006 -25% | 684 ? -49% |
| Read Seq (MB/s) | 1251 | 904 -28% | 1346 8% | 2385 91% | 1937 55% | 472.7 -62% | 1761 41% | 1612 ? 29% |
| Write 4K Q32T1 (MB/s) | 297.7 | 424.6 43% | 340.7 14% | 240.9 -19% | 358 20% | 206 -31% | 660 122% | 401 ? 35% |
| Read 4K Q32T1 (MB/s) | 376.4 | 403.2 7% | 449.3 19% | 338 -10% | 253.1 -33% | 188.3 -50% | 432.6 15% | 427 ? 13% |
| Write Seq Q32T1 (MB/s) | 2969 | 1725 -42% | 1965 -34% | 1528 -49% | 359.6 -88% | 343.3 -88% | 1231 -59% | 830 ? -72% |
| Read Seq Q32T1 (MB/s) | 3228 | 1780 -45% | 3398 5% | 2915 -10% | 2613 -19% | 533 -83% | 3220 0% | 2950 ? -9% |

| 3DMark 11 Performance | 4878 points | |
| 3DMark Cloud Gate Standard Score | 13642 points | |
| 3DMark Fire Strike Score | 3469 points | |
| 3DMark Time Spy Score | 1249 points | |
Help | ||
| The Witcher 3 - 1366x768 Medium Graphics & Postprocessing | |
| Average of class Office (44.7 - 54, n=3, last 2 years) | |
| Lenovo ThinkPad T490-20N3S02L00 | |
| Average NVIDIA GeForce MX250 (30 - 40, n=27) | |
| Lenovo ThinkPad T480-20L6S01V00 | |
| Lenovo ThinkPad T480s-20L8S02E00 | |
| low | med. | high | ultra | |
|---|---|---|---|---|
| BioShock Infinite (2013) | 192.9 | 114.6 | 99.7 | 38.1 |
| The Witcher 3 (2015) | 67.1 | 36.8 | 21.2 | 10.7 |
| Dota 2 Reborn (2015) | 102 | 89 | 69 | 59.7 |
| Rise of the Tomb Raider (2016) | 78.2 | 46.2 | 24.5 | 18.1 |
| X-Plane 11.11 (2018) | 55.3 | 46.3 | 41.6 |
Noise level
| Idle |
| 29.4 / 29.4 / 29.4 dB(A) |
| Load |
| 34.7 / 37.2 dB(A) |
 | ||
30 dB silent 40 dB(A) audible 50 dB(A) loud |
||
min: | ||
(-) The maximum temperature on the upper side is 45.2 °C / 113 F, compared to the average of 34.3 °C / 94 F, ranging from 21.2 to 62.5 °C for the class Office.
(-) The bottom heats up to a maximum of 56.6 °C / 134 F, compared to the average of 36.8 °C / 98 F
(+) In idle usage, the average temperature for the upper side is 21.7 °C / 71 F, compared to the device average of 29.5 °C / 85 F.
(±) Playing The Witcher 3, the average temperature for the upper side is 36.5 °C / 98 F, compared to the device average of 29.5 °C / 85 F.
(+) The palmrests and touchpad are cooler than skin temperature with a maximum of 30.8 °C / 87.4 F and are therefore cool to the touch.
(-) The average temperature of the palmrest area of similar devices was 27.5 °C / 81.5 F (-3.3 °C / -5.9 F).
Lenovo ThinkPad T490-20N3S02L00 audio analysis
(-) | not very loud speakers (70.9 dB)
Bass 100 - 315 Hz
(-) | nearly no bass - on average 20.8% lower than median
(±) | linearity of bass is average (8.7% delta to prev. frequency)
Mids 400 - 2000 Hz
(±) | higher mids - on average 5.5% higher than median
(±) | linearity of mids is average (8.8% delta to prev. frequency)
Highs 2 - 16 kHz
(+) | balanced highs - only 3.4% away from median
(±) | linearity of highs is average (7.3% delta to prev. frequency)
Overall 100 - 16.000 Hz
(±) | linearity of overall sound is average (28.9% difference to median)
Compared to same class
» 90% of all tested devices in this class were better, 2% similar, 8% worse
» The best had a delta of 7%, average was 21%, worst was 53%
Compared to all devices tested
» 87% of all tested devices were better, 2% similar, 11% worse
» The best had a delta of 4%, average was 24%, worst was 134%
HP EliteBook 840 G5-3JX66EA audio analysis
(+) | speakers can play relatively loud (85.8 dB)
Bass 100 - 315 Hz
(-) | nearly no bass - on average 24.7% lower than median
(±) | linearity of bass is average (10.1% delta to prev. frequency)
Mids 400 - 2000 Hz
(+) | balanced mids - only 3.3% away from median
(+) | mids are linear (4.9% delta to prev. frequency)
Highs 2 - 16 kHz
(±) | higher highs - on average 7.1% higher than median
(+) | highs are linear (4.3% delta to prev. frequency)
Overall 100 - 16.000 Hz
(±) | linearity of overall sound is average (20.6% difference to median)
Compared to same class
» 47% of all tested devices in this class were better, 9% similar, 43% worse
» The best had a delta of 7%, average was 21%, worst was 53%
Compared to all devices tested
» 55% of all tested devices were better, 8% similar, 37% worse
» The best had a delta of 4%, average was 24%, worst was 134%
| Off / Standby | |
| Idle | |
| Load |
|
Key:
min: | |
| Lenovo ThinkPad T490-20N3S02L00 i7-8565U, GeForce MX250, Toshiba XG5 KXG50ZNV512G, IGZO IPS LED, 1920x1080, 14" | Lenovo ThinkPad T480-20L6S01V00 i5-8550U, GeForce MX150, Samsung SSD PM981 MZVLB512HAJQ, IPS, 1920x1080, 14" | Lenovo ThinkPad T480s-20L8S02E00 i5-8550U, GeForce MX150, Samsung SSD PM981 MZVLB512HAJQ, IPS LED, 2560x1440, 14" | Lenovo ThinkPad T490s-20NYS02A00 i5-8265U, UHD Graphics 620, Intel SSD Pro 7600p SSDPEKKF512G8L, IPS, 1920x1080, 14" | HP EliteBook 840 G5-3JX66EA i5-8250U, UHD Graphics 620, Toshiba XG5 KXG50ZNV256G, IPS, 1920x1080, 14" | Dell Latitude 7490 i5-8350U, UHD Graphics 620, Toshiba KSG60ZMV256G, IPS, 1920x1080, 14" | Fujitsu LifeBook U748 i5-8250U, UHD Graphics 620, Samsung PM961 MZVLW256HEHP, IPS, 1920x1080, 14" | Average NVIDIA GeForce MX250 | Average of class Office | |
|---|---|---|---|---|---|---|---|---|---|
| Power Consumption | -21% | -15% | 4% | -9% | 26% | 1% | -32% | -23% | |
| Idle Minimum * (Watt) | 2.16 | 3.6 -67% | 3.4 -57% | 2.62 -21% | 3.2 -48% | 2 7% | 3.33 -54% | 4.1 ? -90% | 4.41 ? -104% |
| Idle Average * (Watt) | 5.04 | 7.1 -41% | 7.5 -49% | 5.16 -2% | 6.6 -31% | 4.7 7% | 6.9 -37% | 7.91 ? -57% | 7.38 ? -46% |
| Idle Maximum * (Watt) | 8.64 | 9.5 -10% | 10.8 -25% | 8.7 -1% | 9.5 -10% | 5.7 34% | 8.2 5% | 10.4 ? -20% | 8.59 ? 1% |
| Load Average * (Watt) | 63.2 | 63.9 -1% | 55.4 12% | 40 37% | 36.2 43% | 38.4 39% | 29.4 53% | 58.6 ? 7% | 43.3 ? 31% |
| Witcher 3 ultra * (Watt) | 50 | 53.9 -8% | 34 32% | ||||||
| Load Maximum * (Watt) | 67.5 | 67.3 -0% | 70.3 -4% | 64 5% | 65.6 3% | 38.9 42% | 43.4 36% | 68.9 ? -2% | 64.5 ? 4% |
* ... smaller is better
| Lenovo ThinkPad T490-20N3S02L00 i7-8565U, GeForce MX250, 50 Wh | Lenovo ThinkPad T480-20L6S01V00 i5-8550U, GeForce MX150, 72 Wh | Lenovo ThinkPad T480s-20L8S02E00 i5-8550U, GeForce MX150, 57 Wh | Lenovo ThinkPad T490s-20NYS02A00 i5-8265U, UHD Graphics 620, 57 Wh | HP EliteBook 840 G5-3JX66EA i5-8250U, UHD Graphics 620, 50 Wh | Dell Latitude 7490 i5-8350U, UHD Graphics 620, 60 Wh | Fujitsu LifeBook U748 i5-8250U, UHD Graphics 620, 50 Wh | Average of class Office | |
|---|---|---|---|---|---|---|---|---|
| Battery runtime | 58% | 1% | 34% | 20% | 0% | -5% | 50% | |
| H.264 (h) | 8.7 | 10.6 22% | 9.2 6% | 13.9 60% | 6.7 -23% | 6.6 -24% | 15 ? 72% | |
| WiFi v1.3 (h) | 9.1 | 13.2 45% | 8.8 -3% | 10.1 11% | 7.5 -18% | 9.1 0% | 6.5 -29% | 12.8 ? 41% |
| Load (h) | 1.3 | 2.7 108% | 1.3 0% | 1.7 31% | 2.6 100% | 1.8 38% | 1.793 ? 38% | |
| Reader / Idle (h) | 27.9 | 22.8 | 19 | 15.6 | 23.7 ? |
Pros
Cons

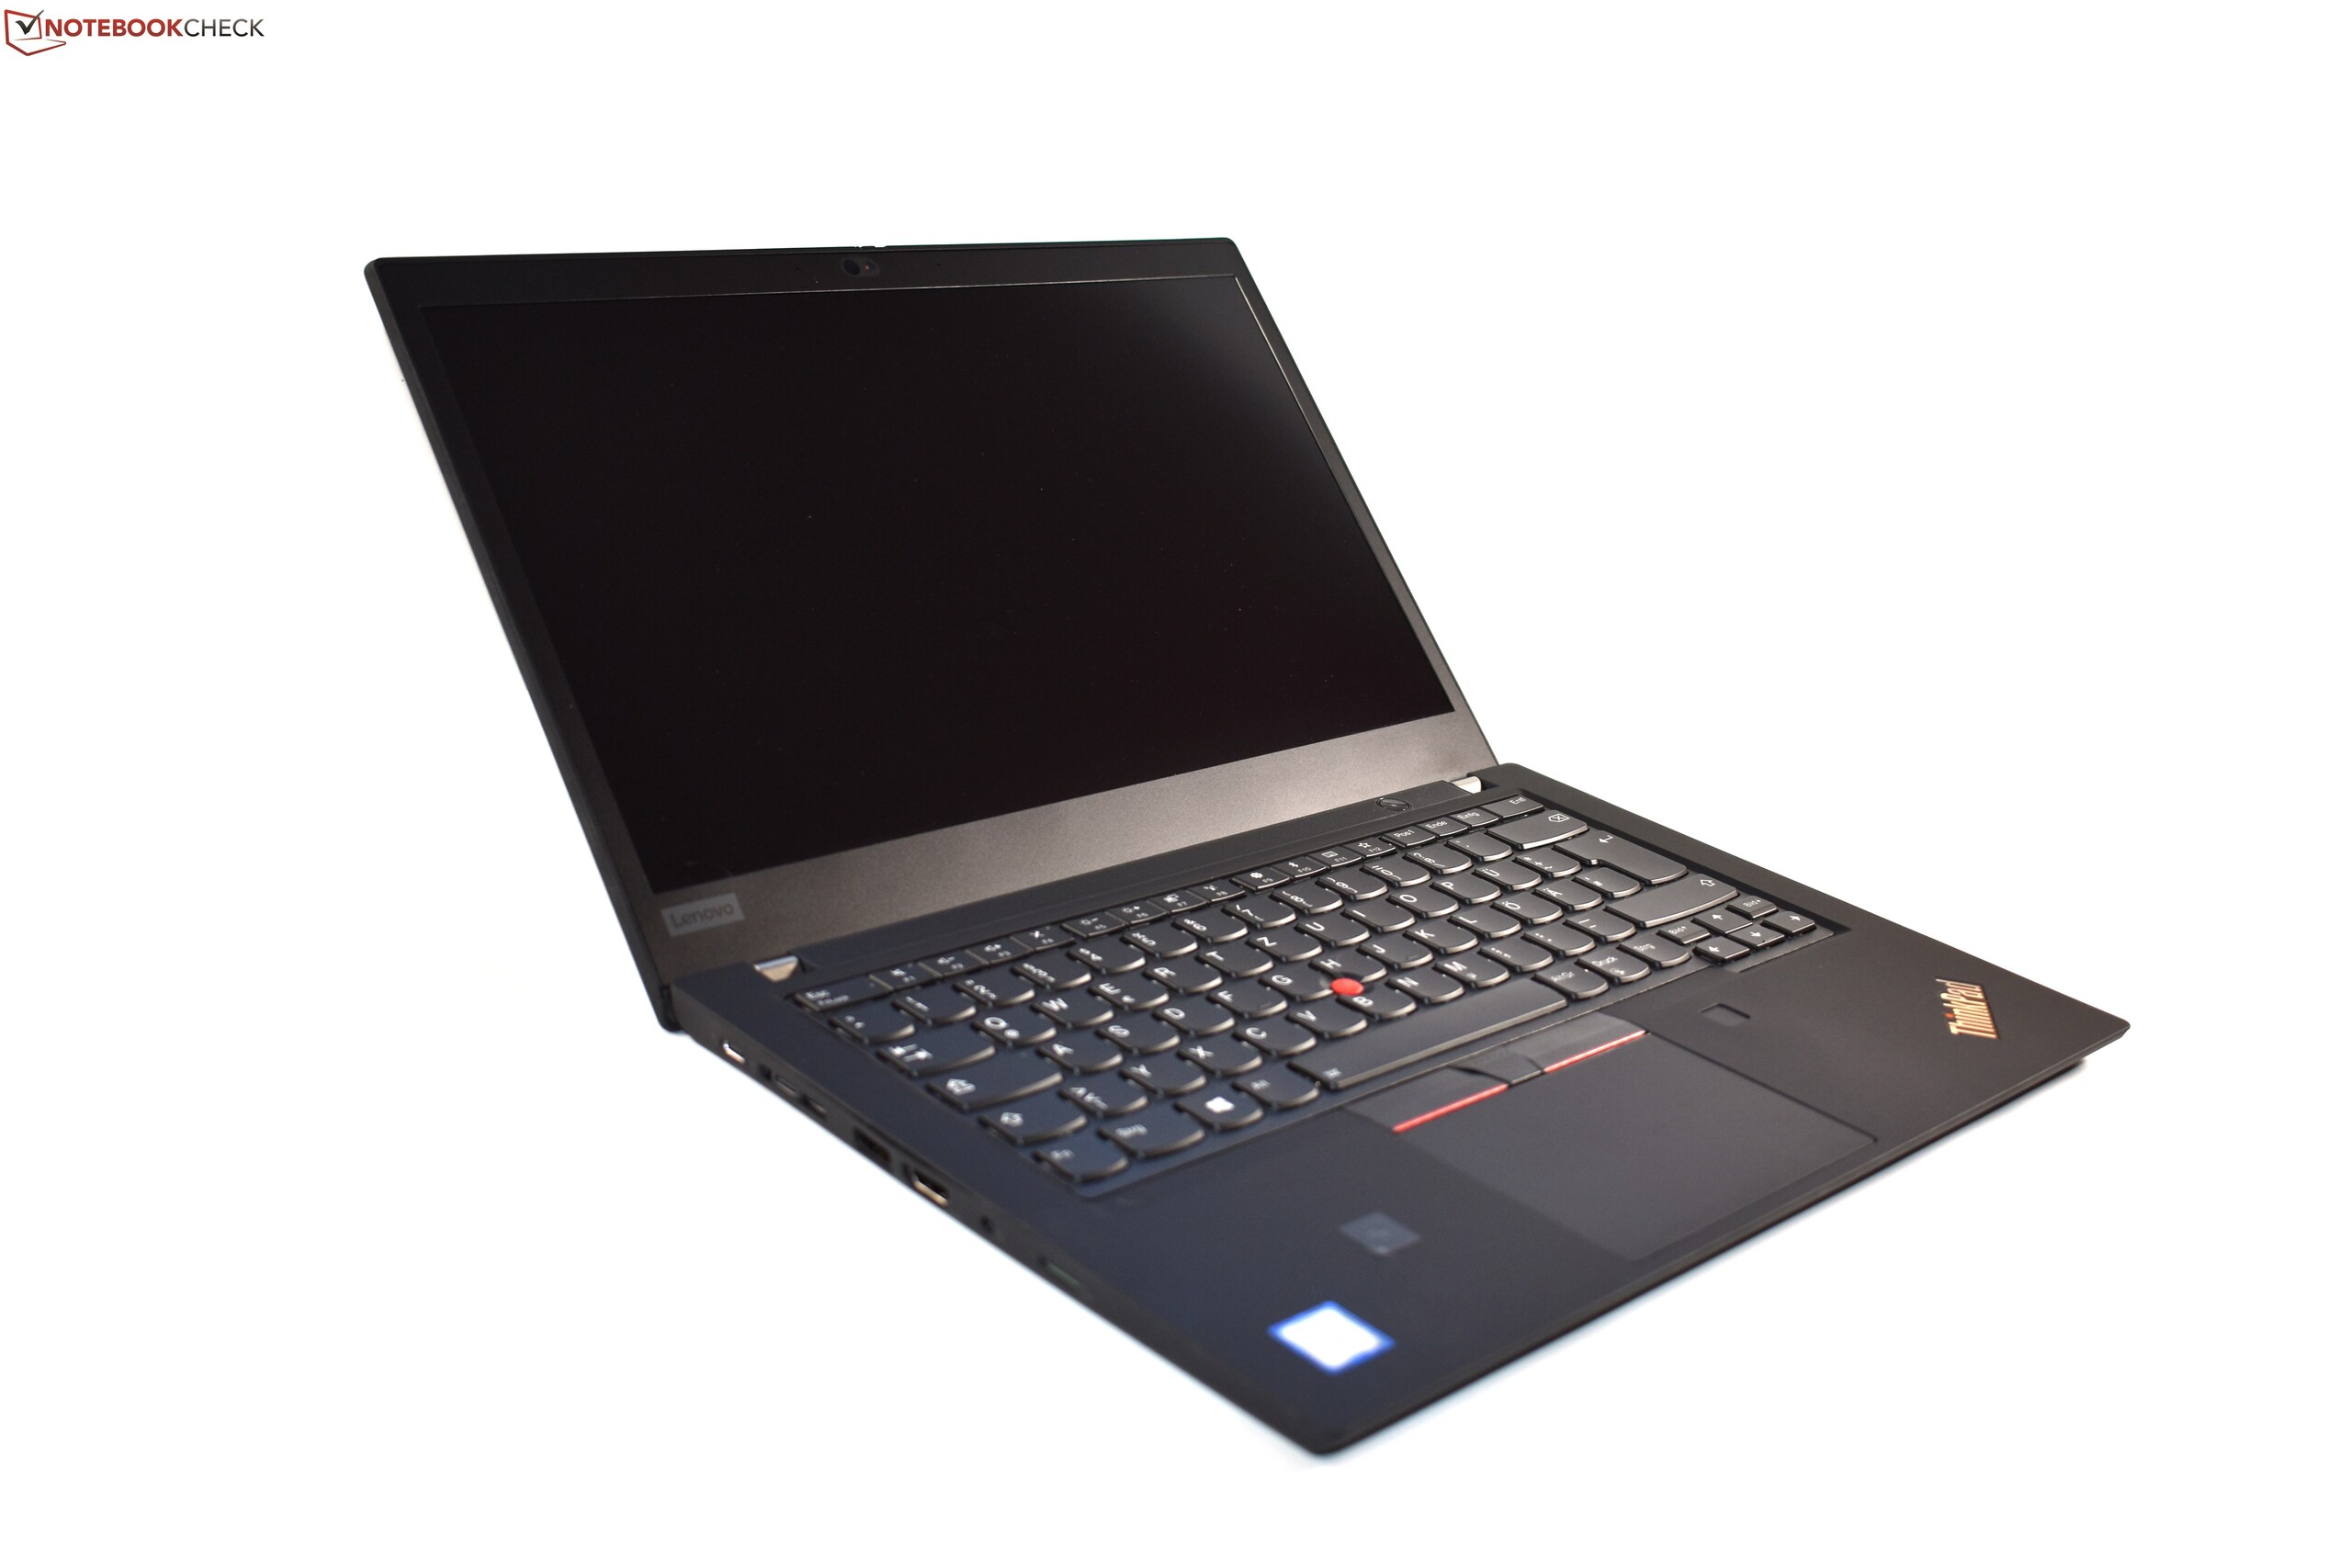
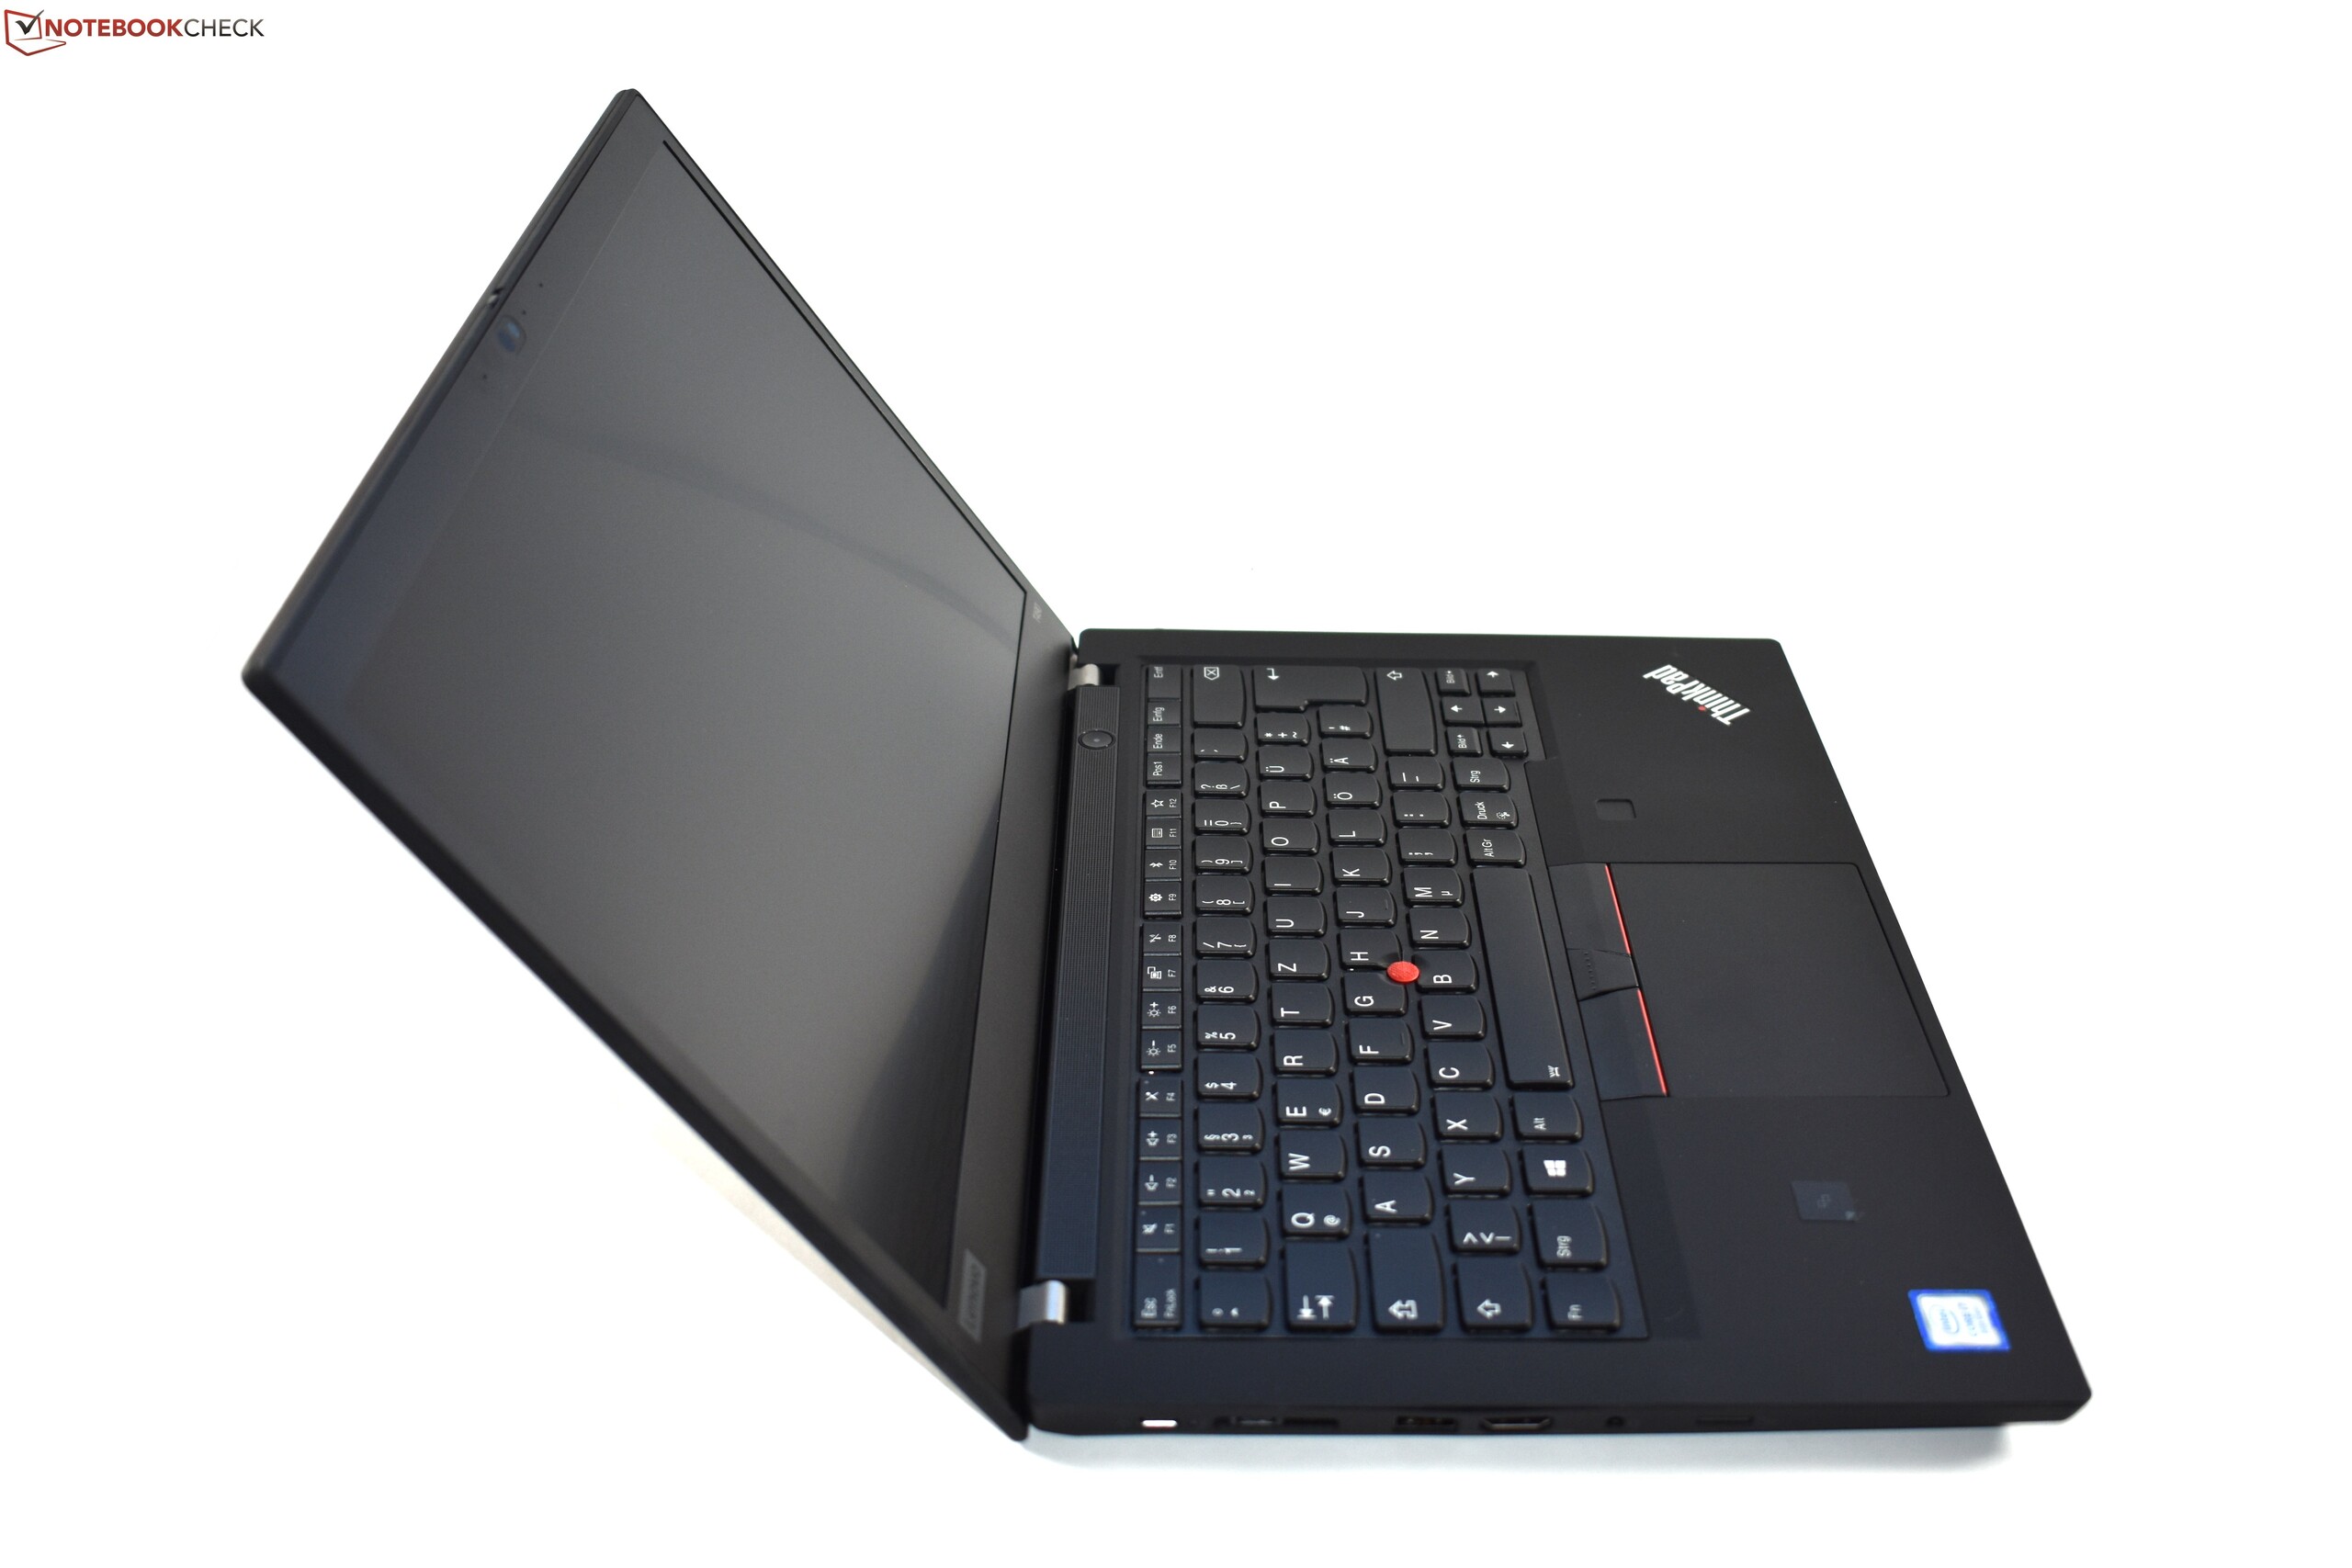
很明显,联想ThinkPad T490是ThinkPad T480的继任产品。但实际上,ThinkPad T490的设计完全不同,它更像是T480和T480s的混合体,而不是T480的直接后继产品。这种组合大多做得很好,但也存在缺陷。
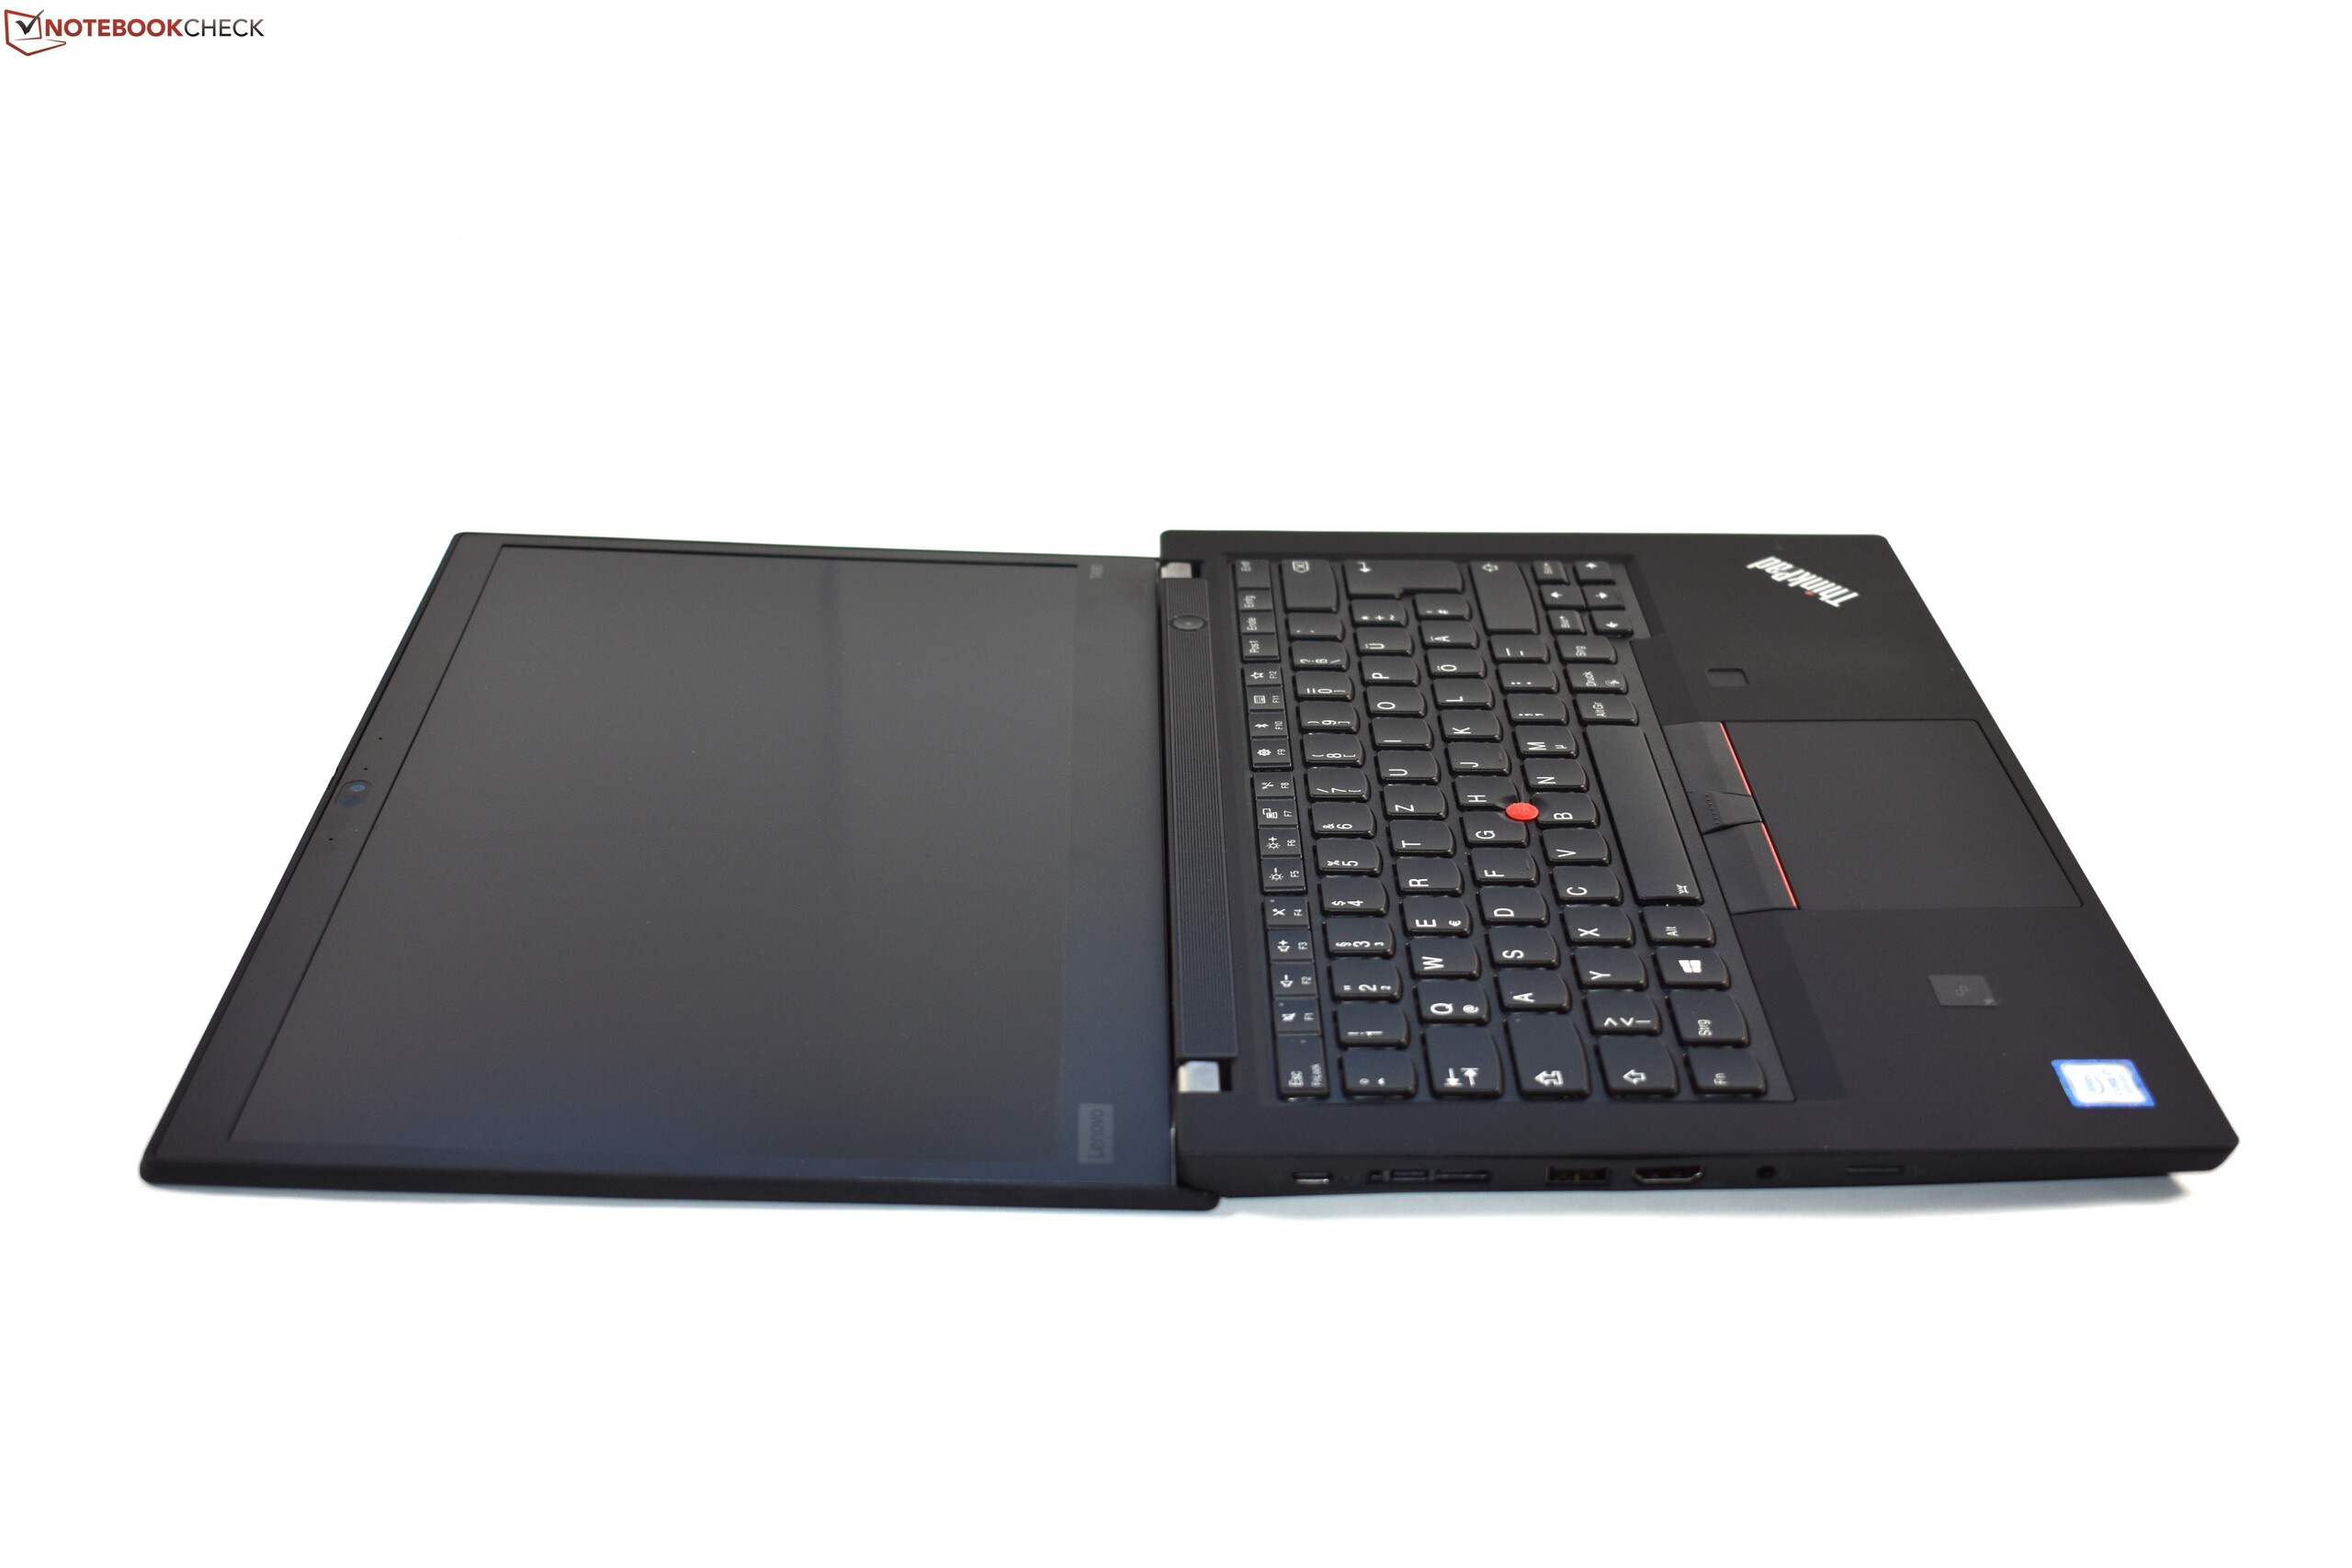
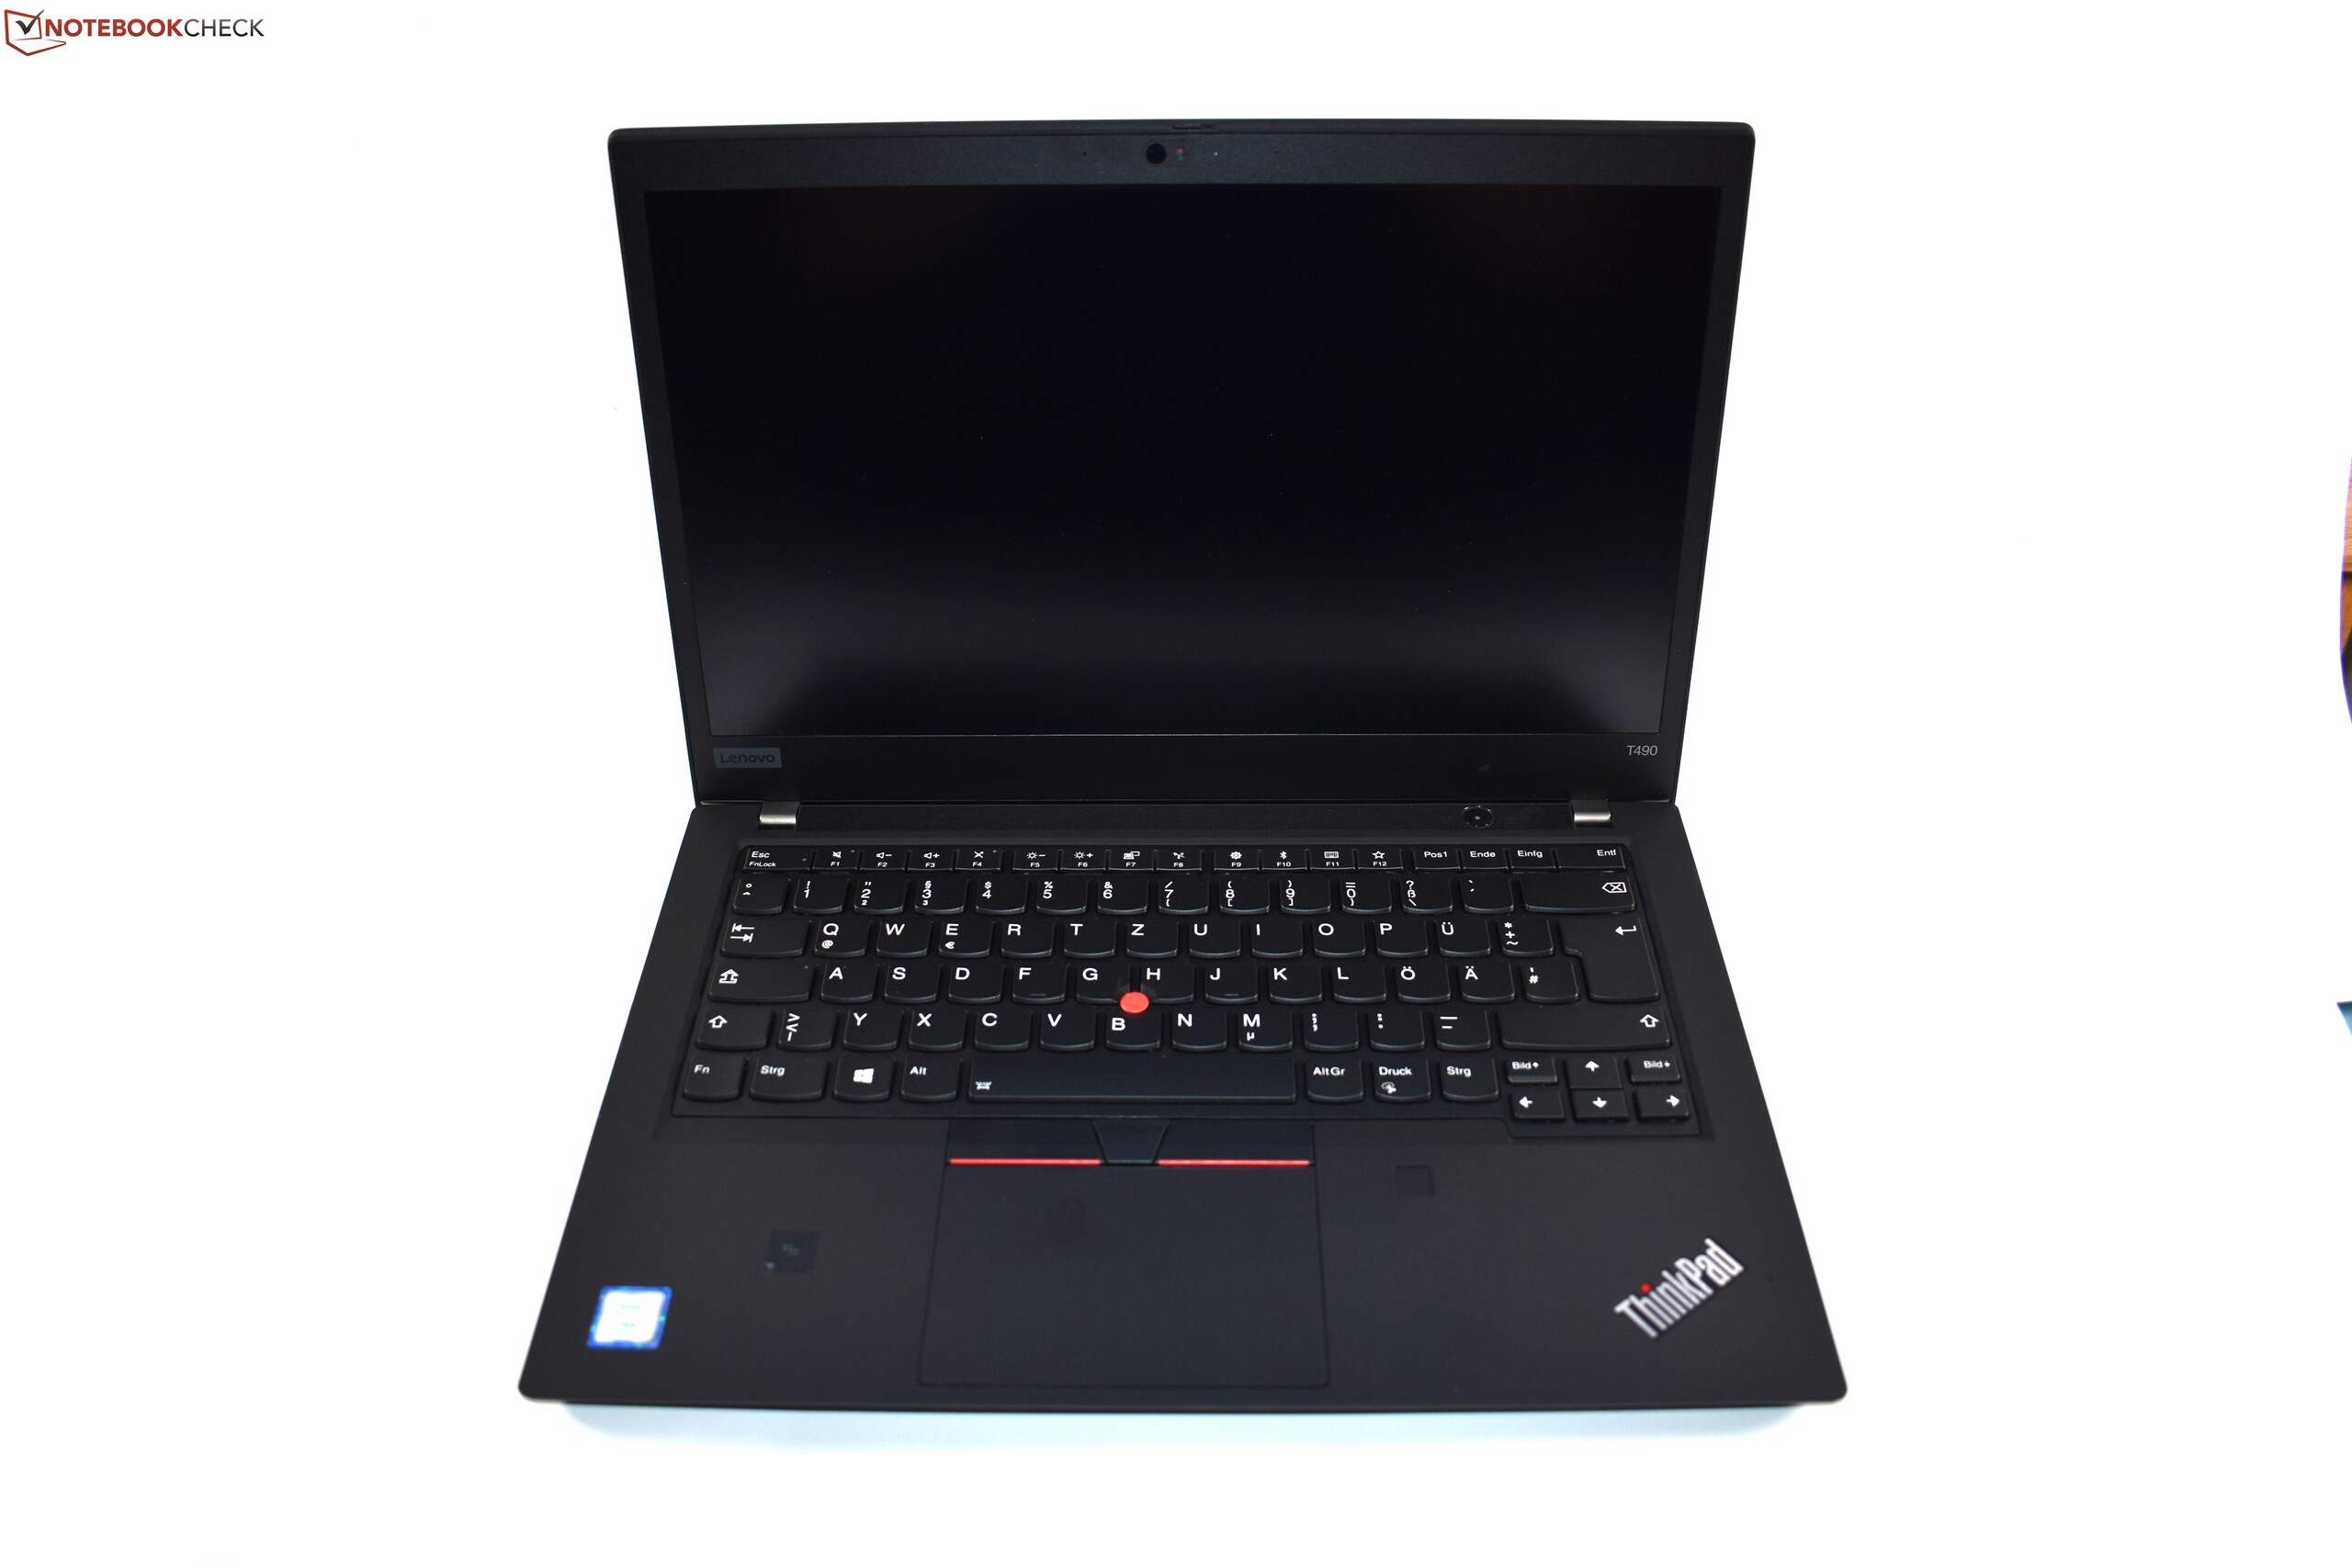
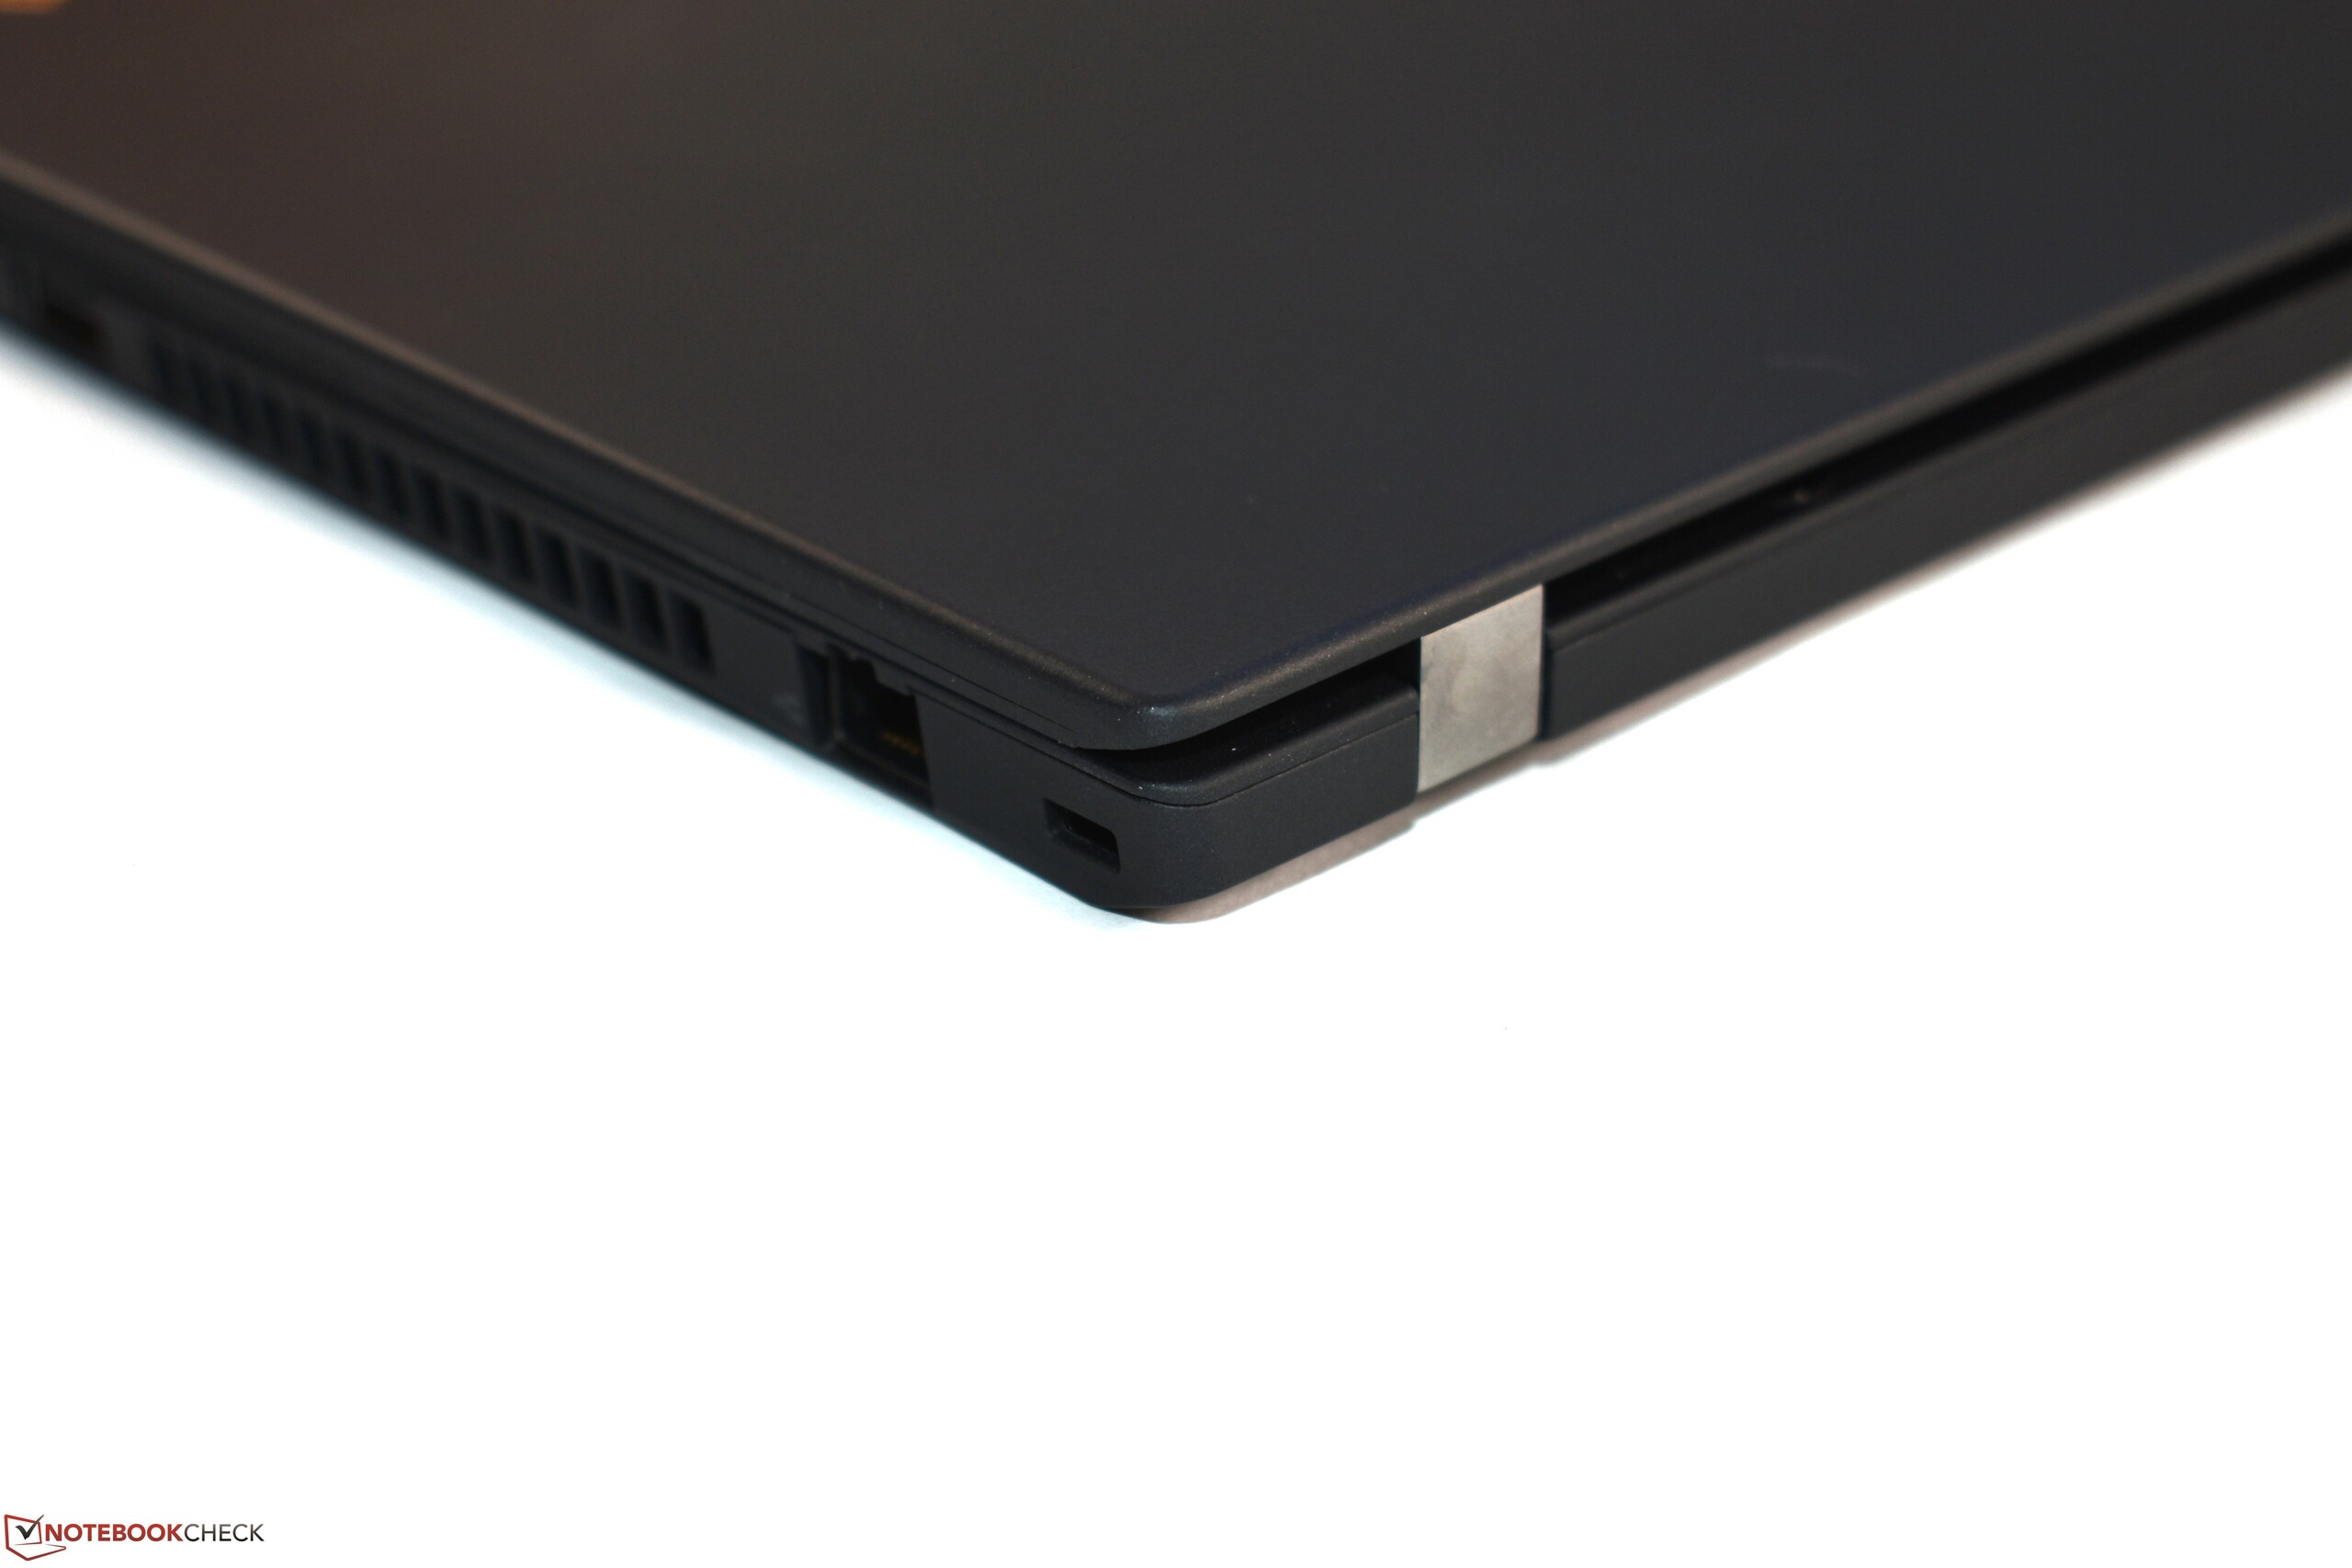
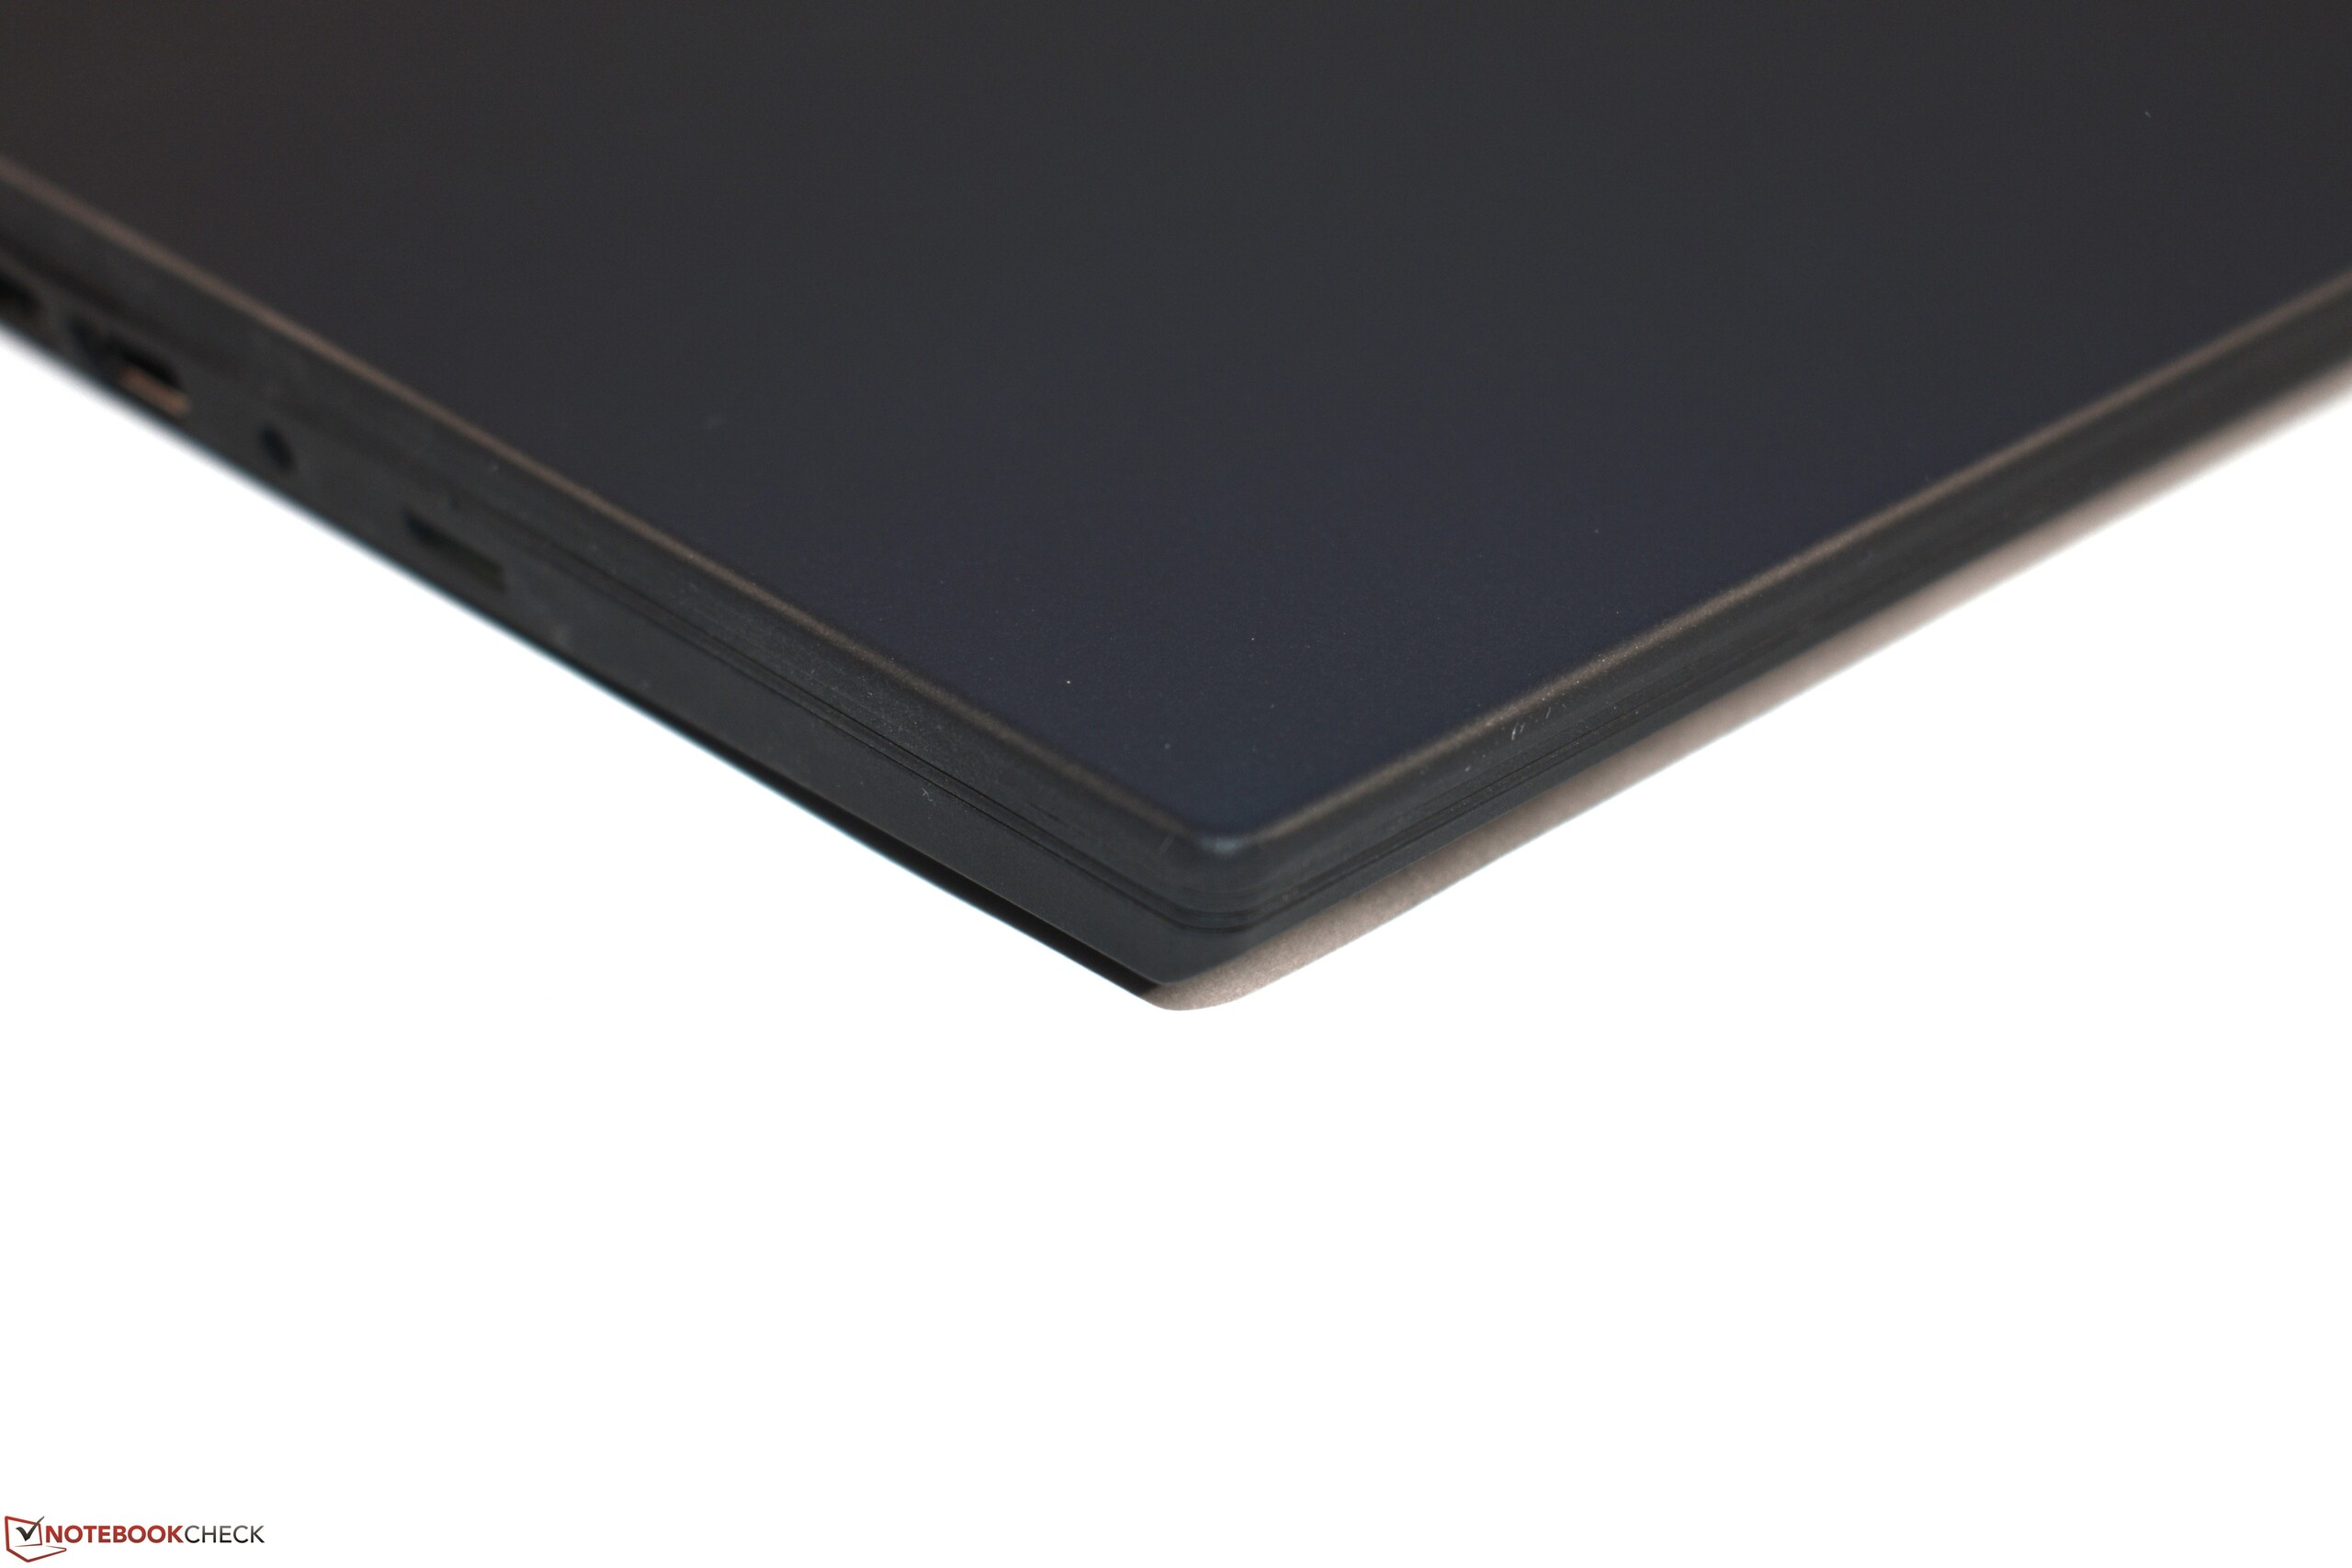
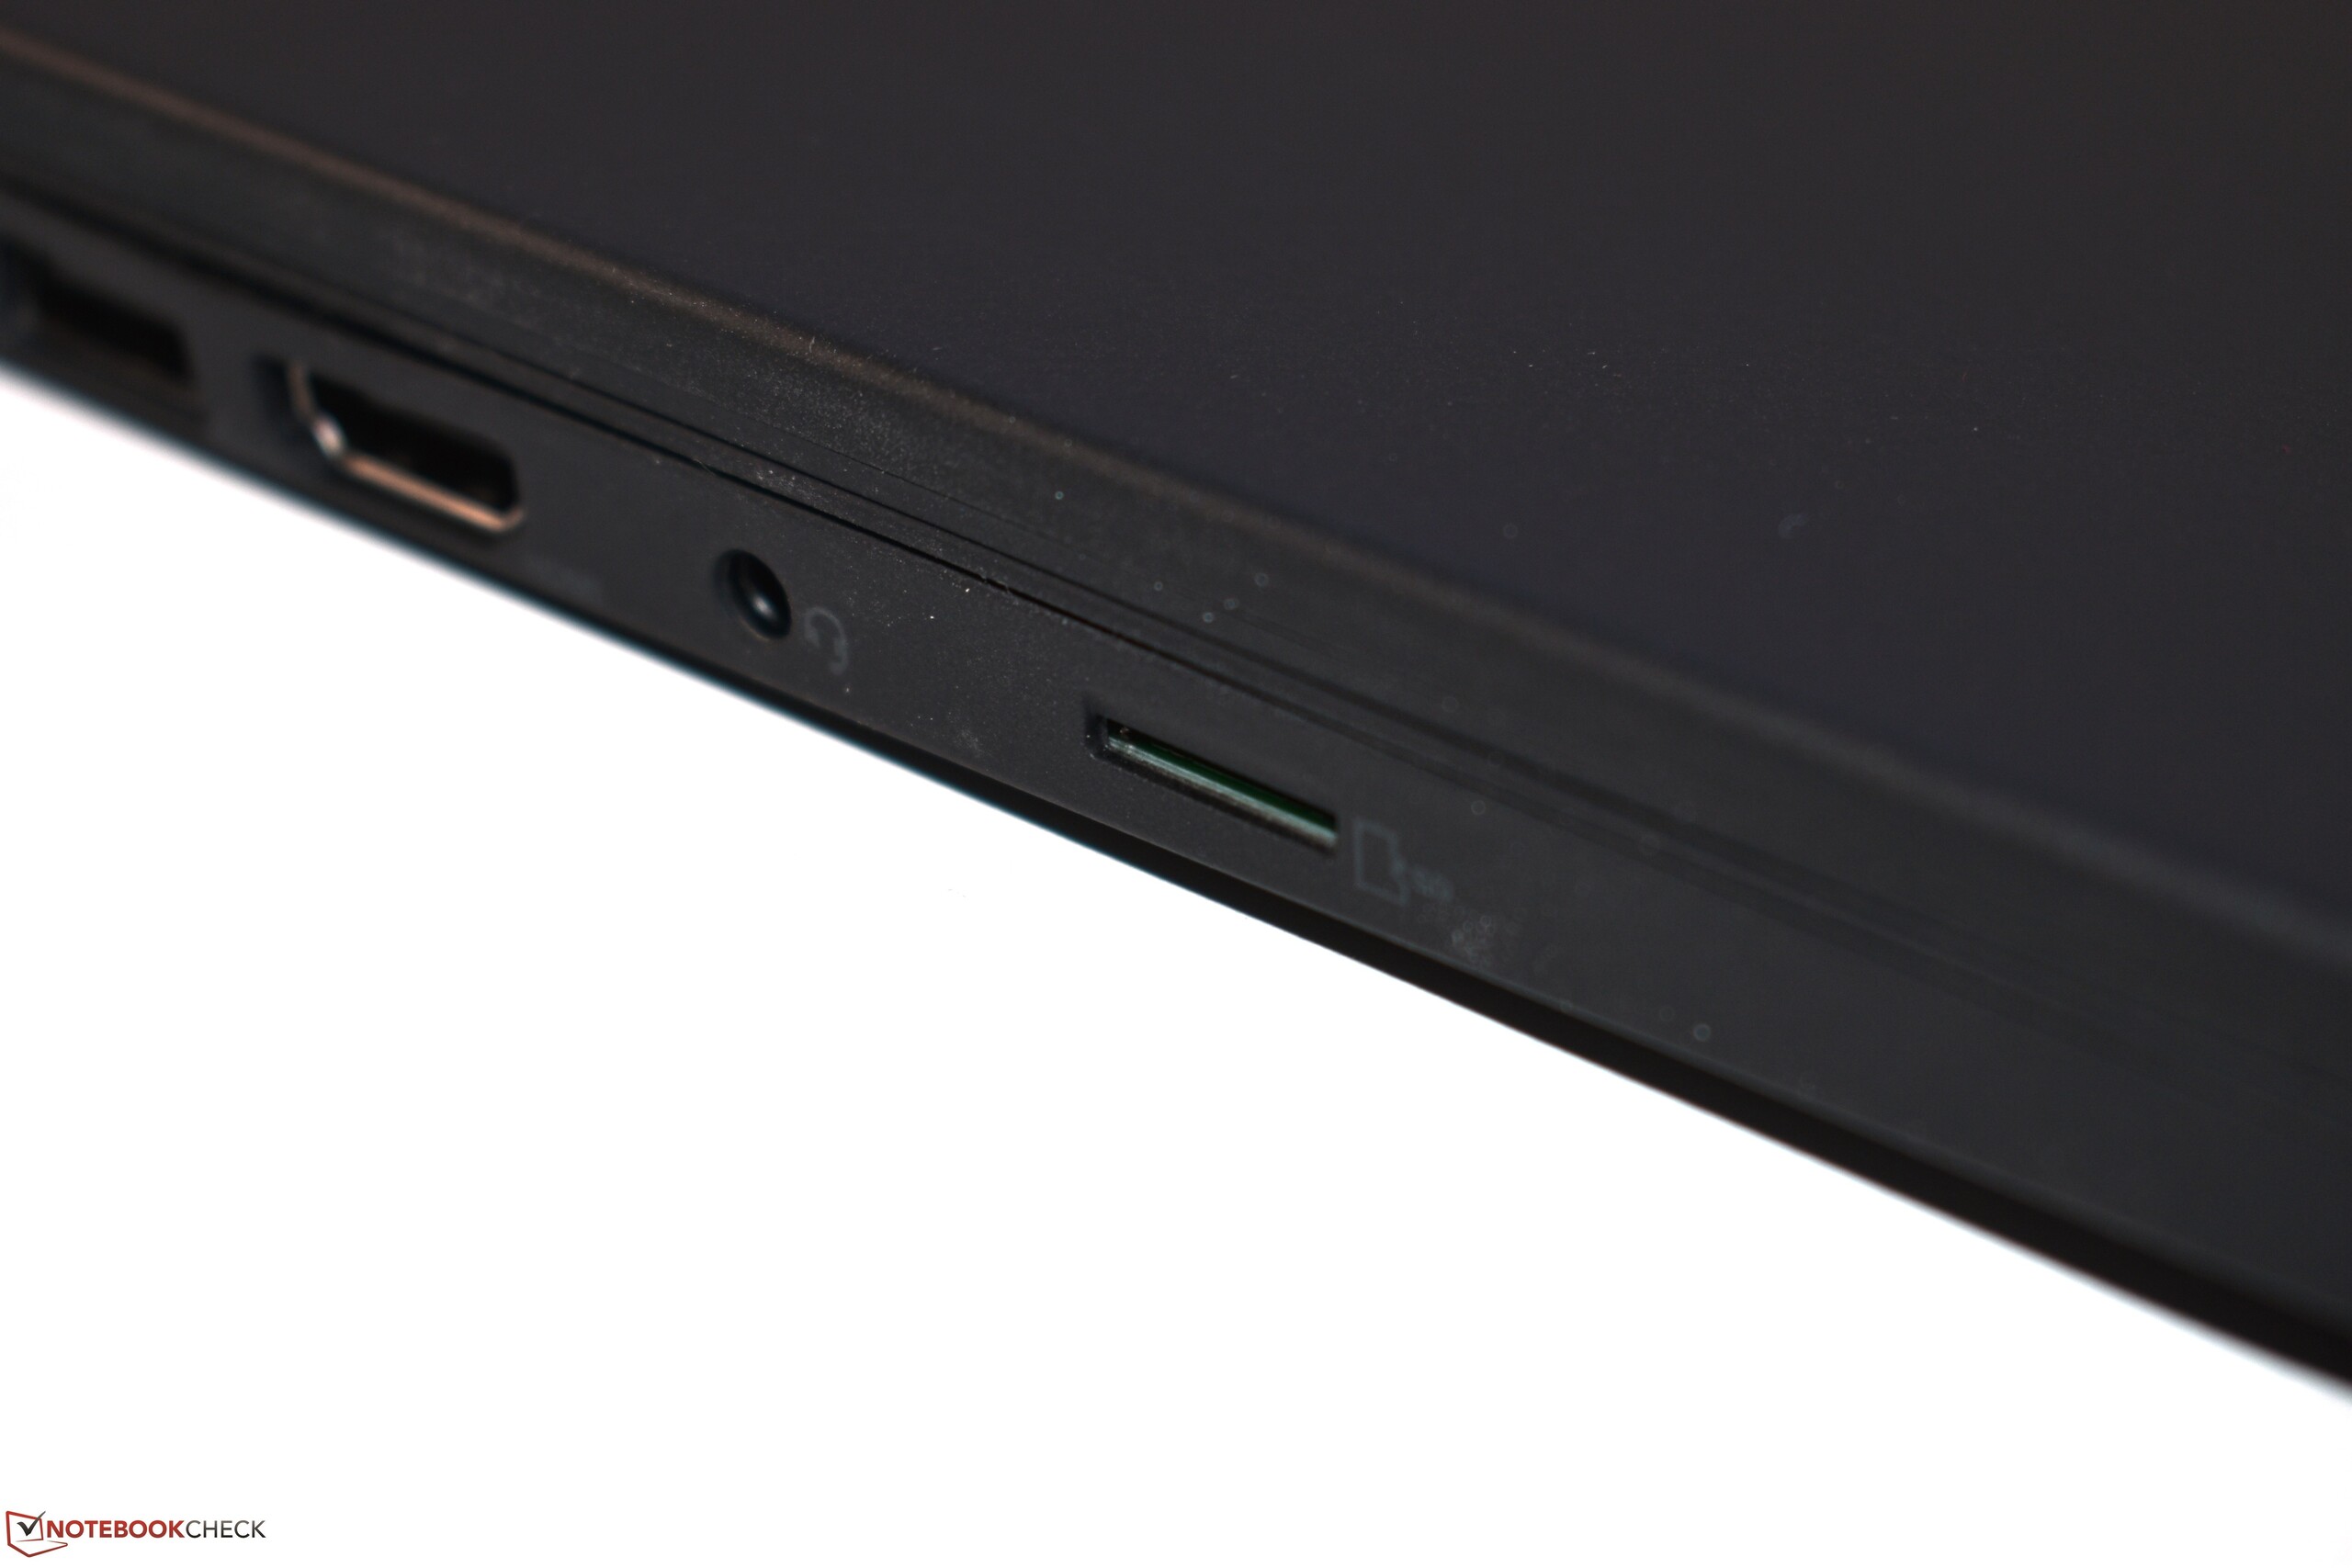
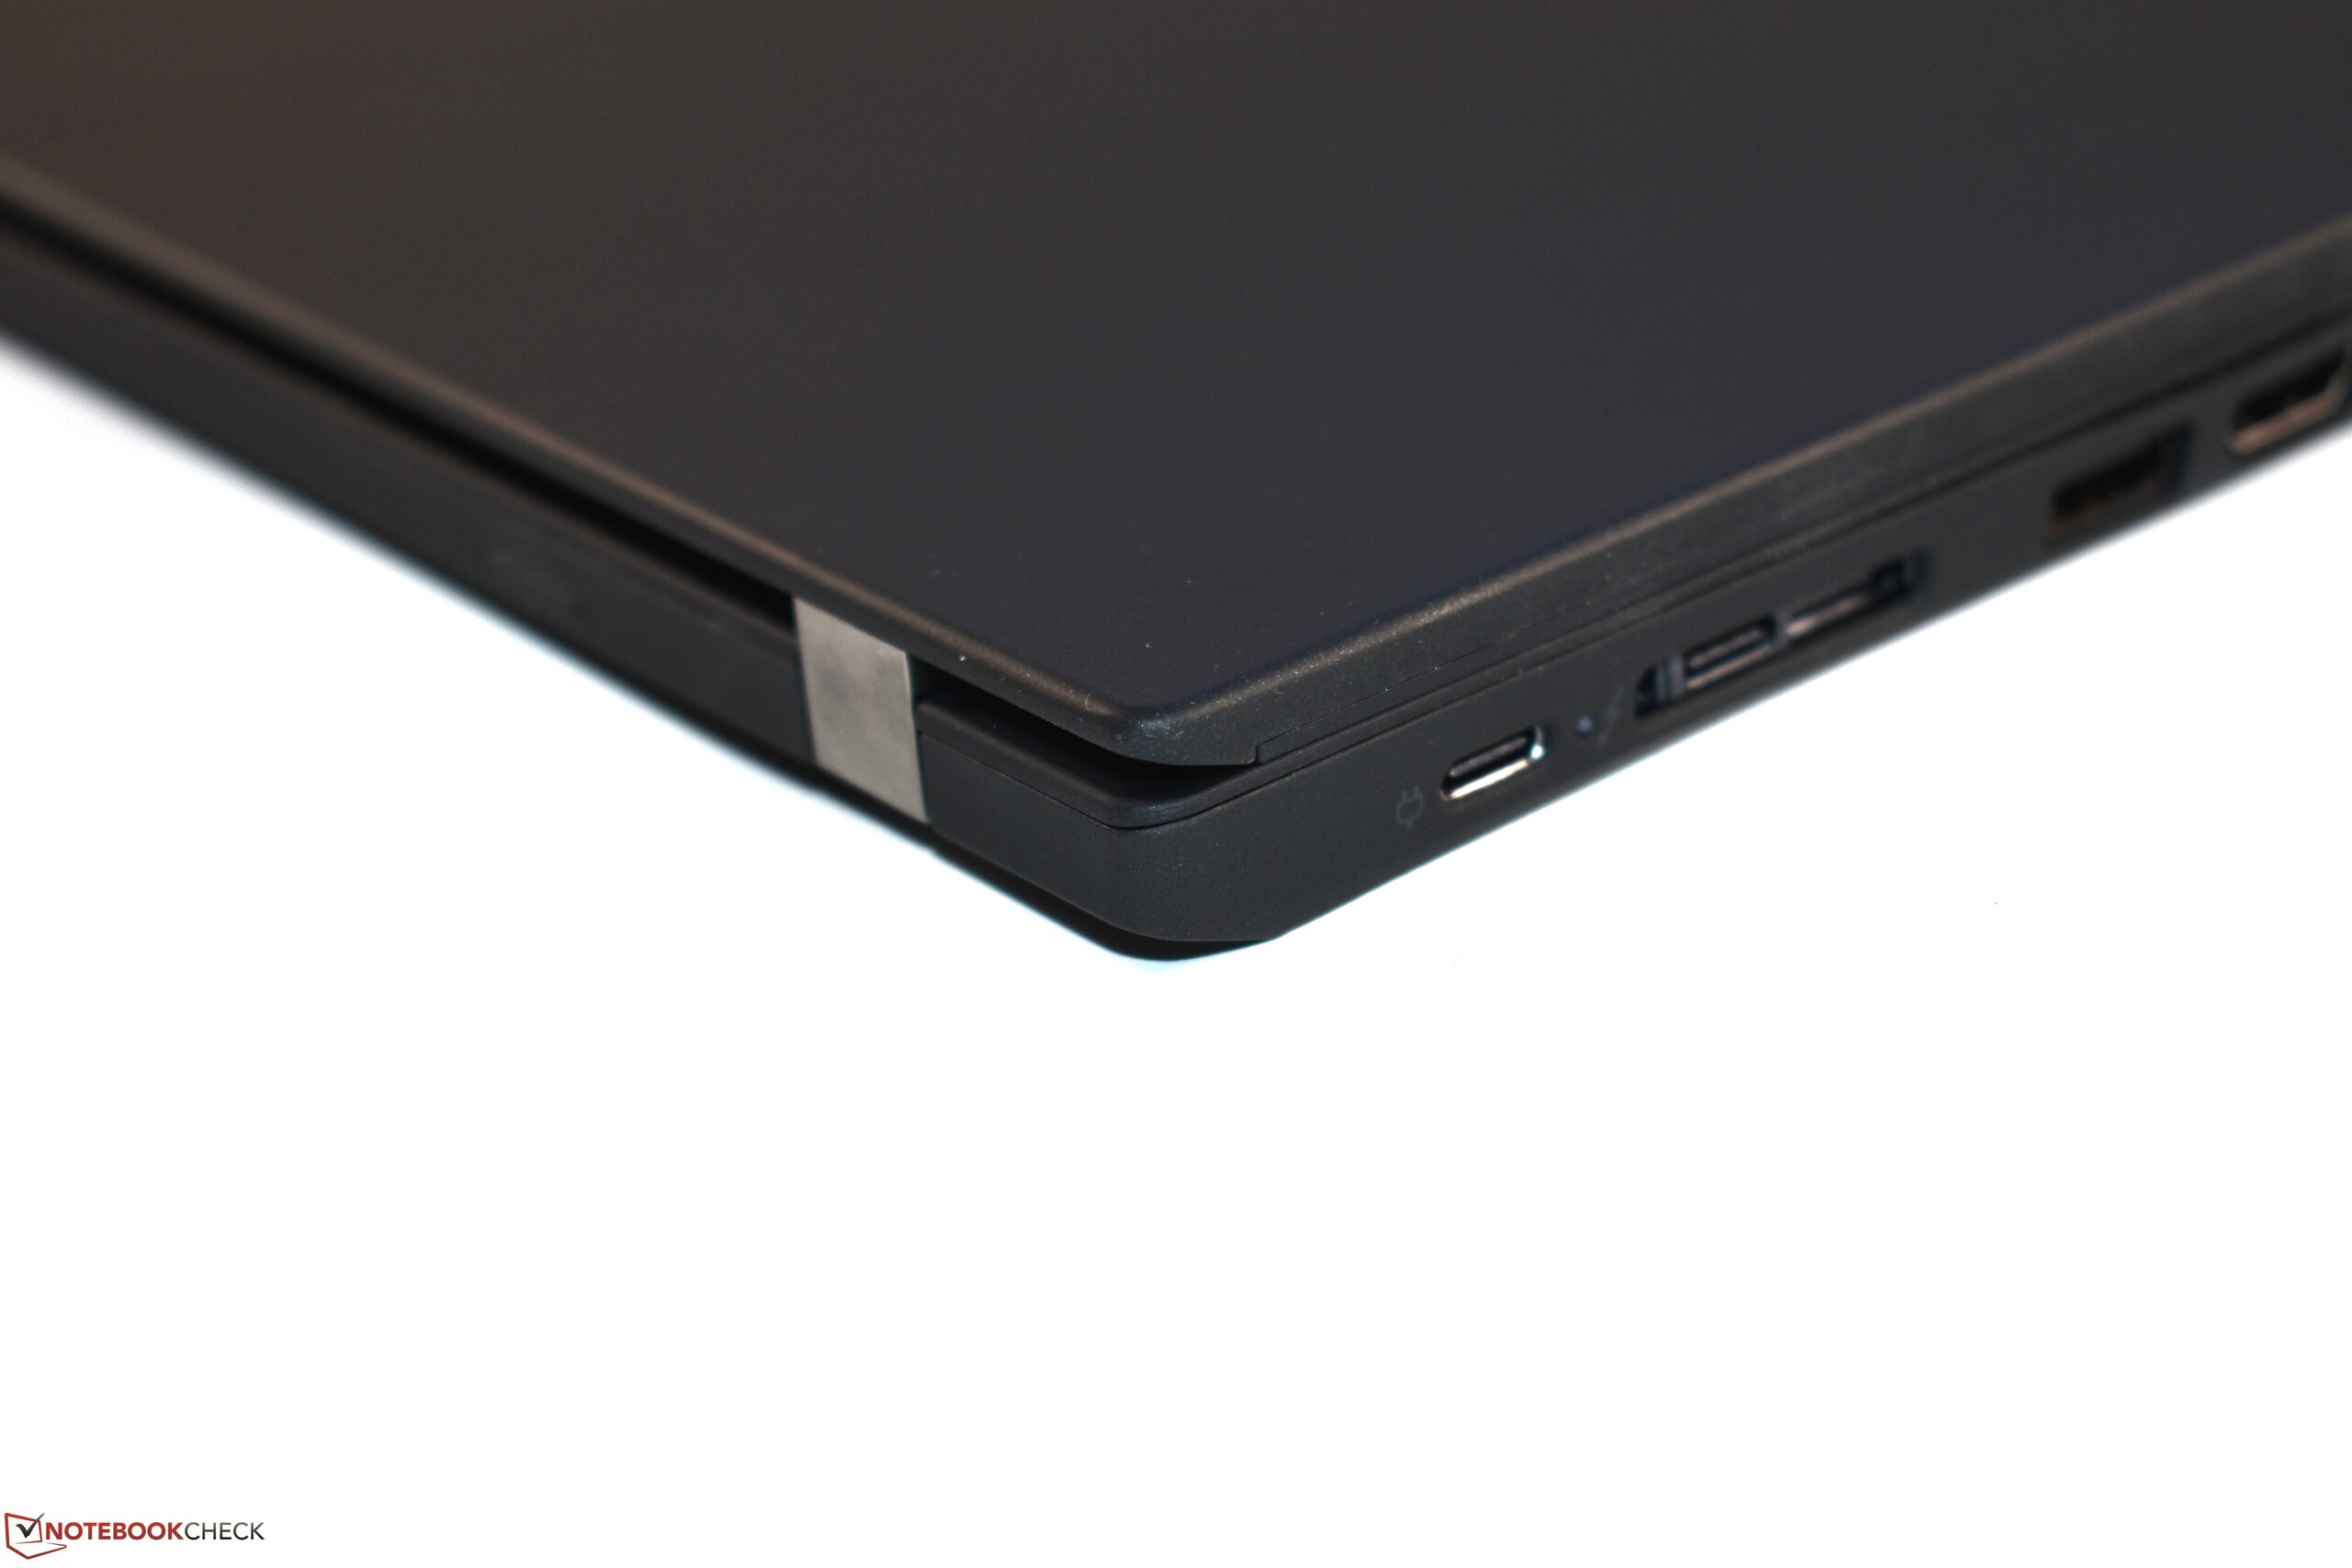
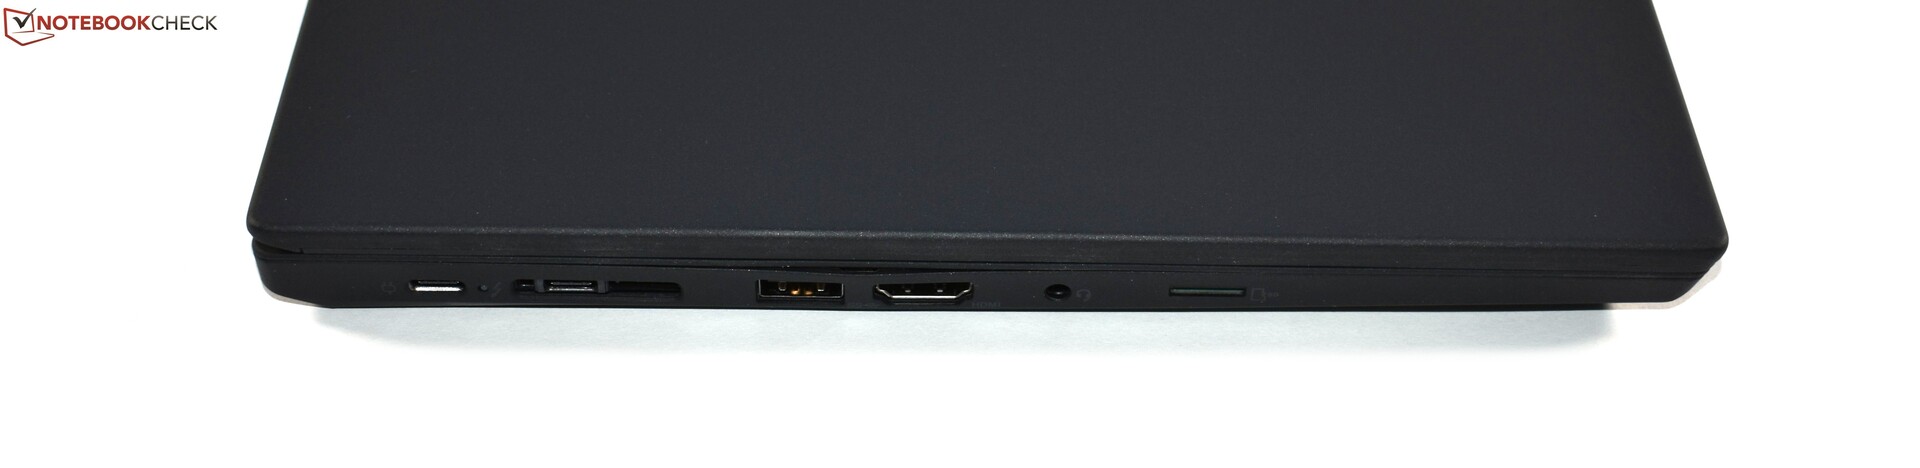
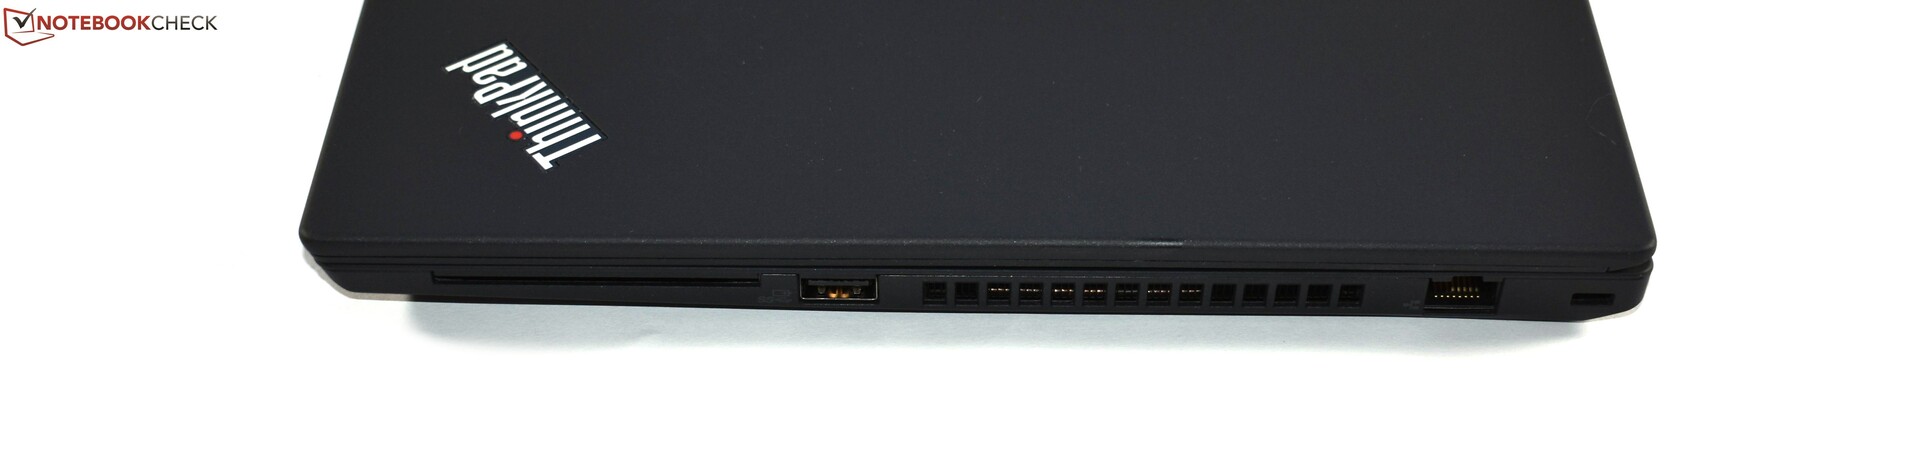
ThinkPad T490采用坚固的外壳,采用镁质增强塑料制成,比T480更轻巧,更紧凑。接口选项非常丰富,安全功能也很多,还有除了Wi-Fi之外的全尺寸RJ45以及LTE(可选)的通信选项。与所有ThinkPad一样,输入设备非常好。与较旧的ThinkPad相比,最大的改进在于屏幕。终于,联想推出了高品质的FHD屏幕,具有良好的屏幕亮度和色域。由于更高的TDP,ThinkPad T490的CPU性能高于平均水平,可选的Nvidia GeForce MX250甚至允许一些轻量级游戏,使T490更加灵活。尽管性能良好,ThinkPad T490的风扇也很安静,电池寿命也很好。最后但并非最不重要的是,我们测试的T490保修包很慷慨。
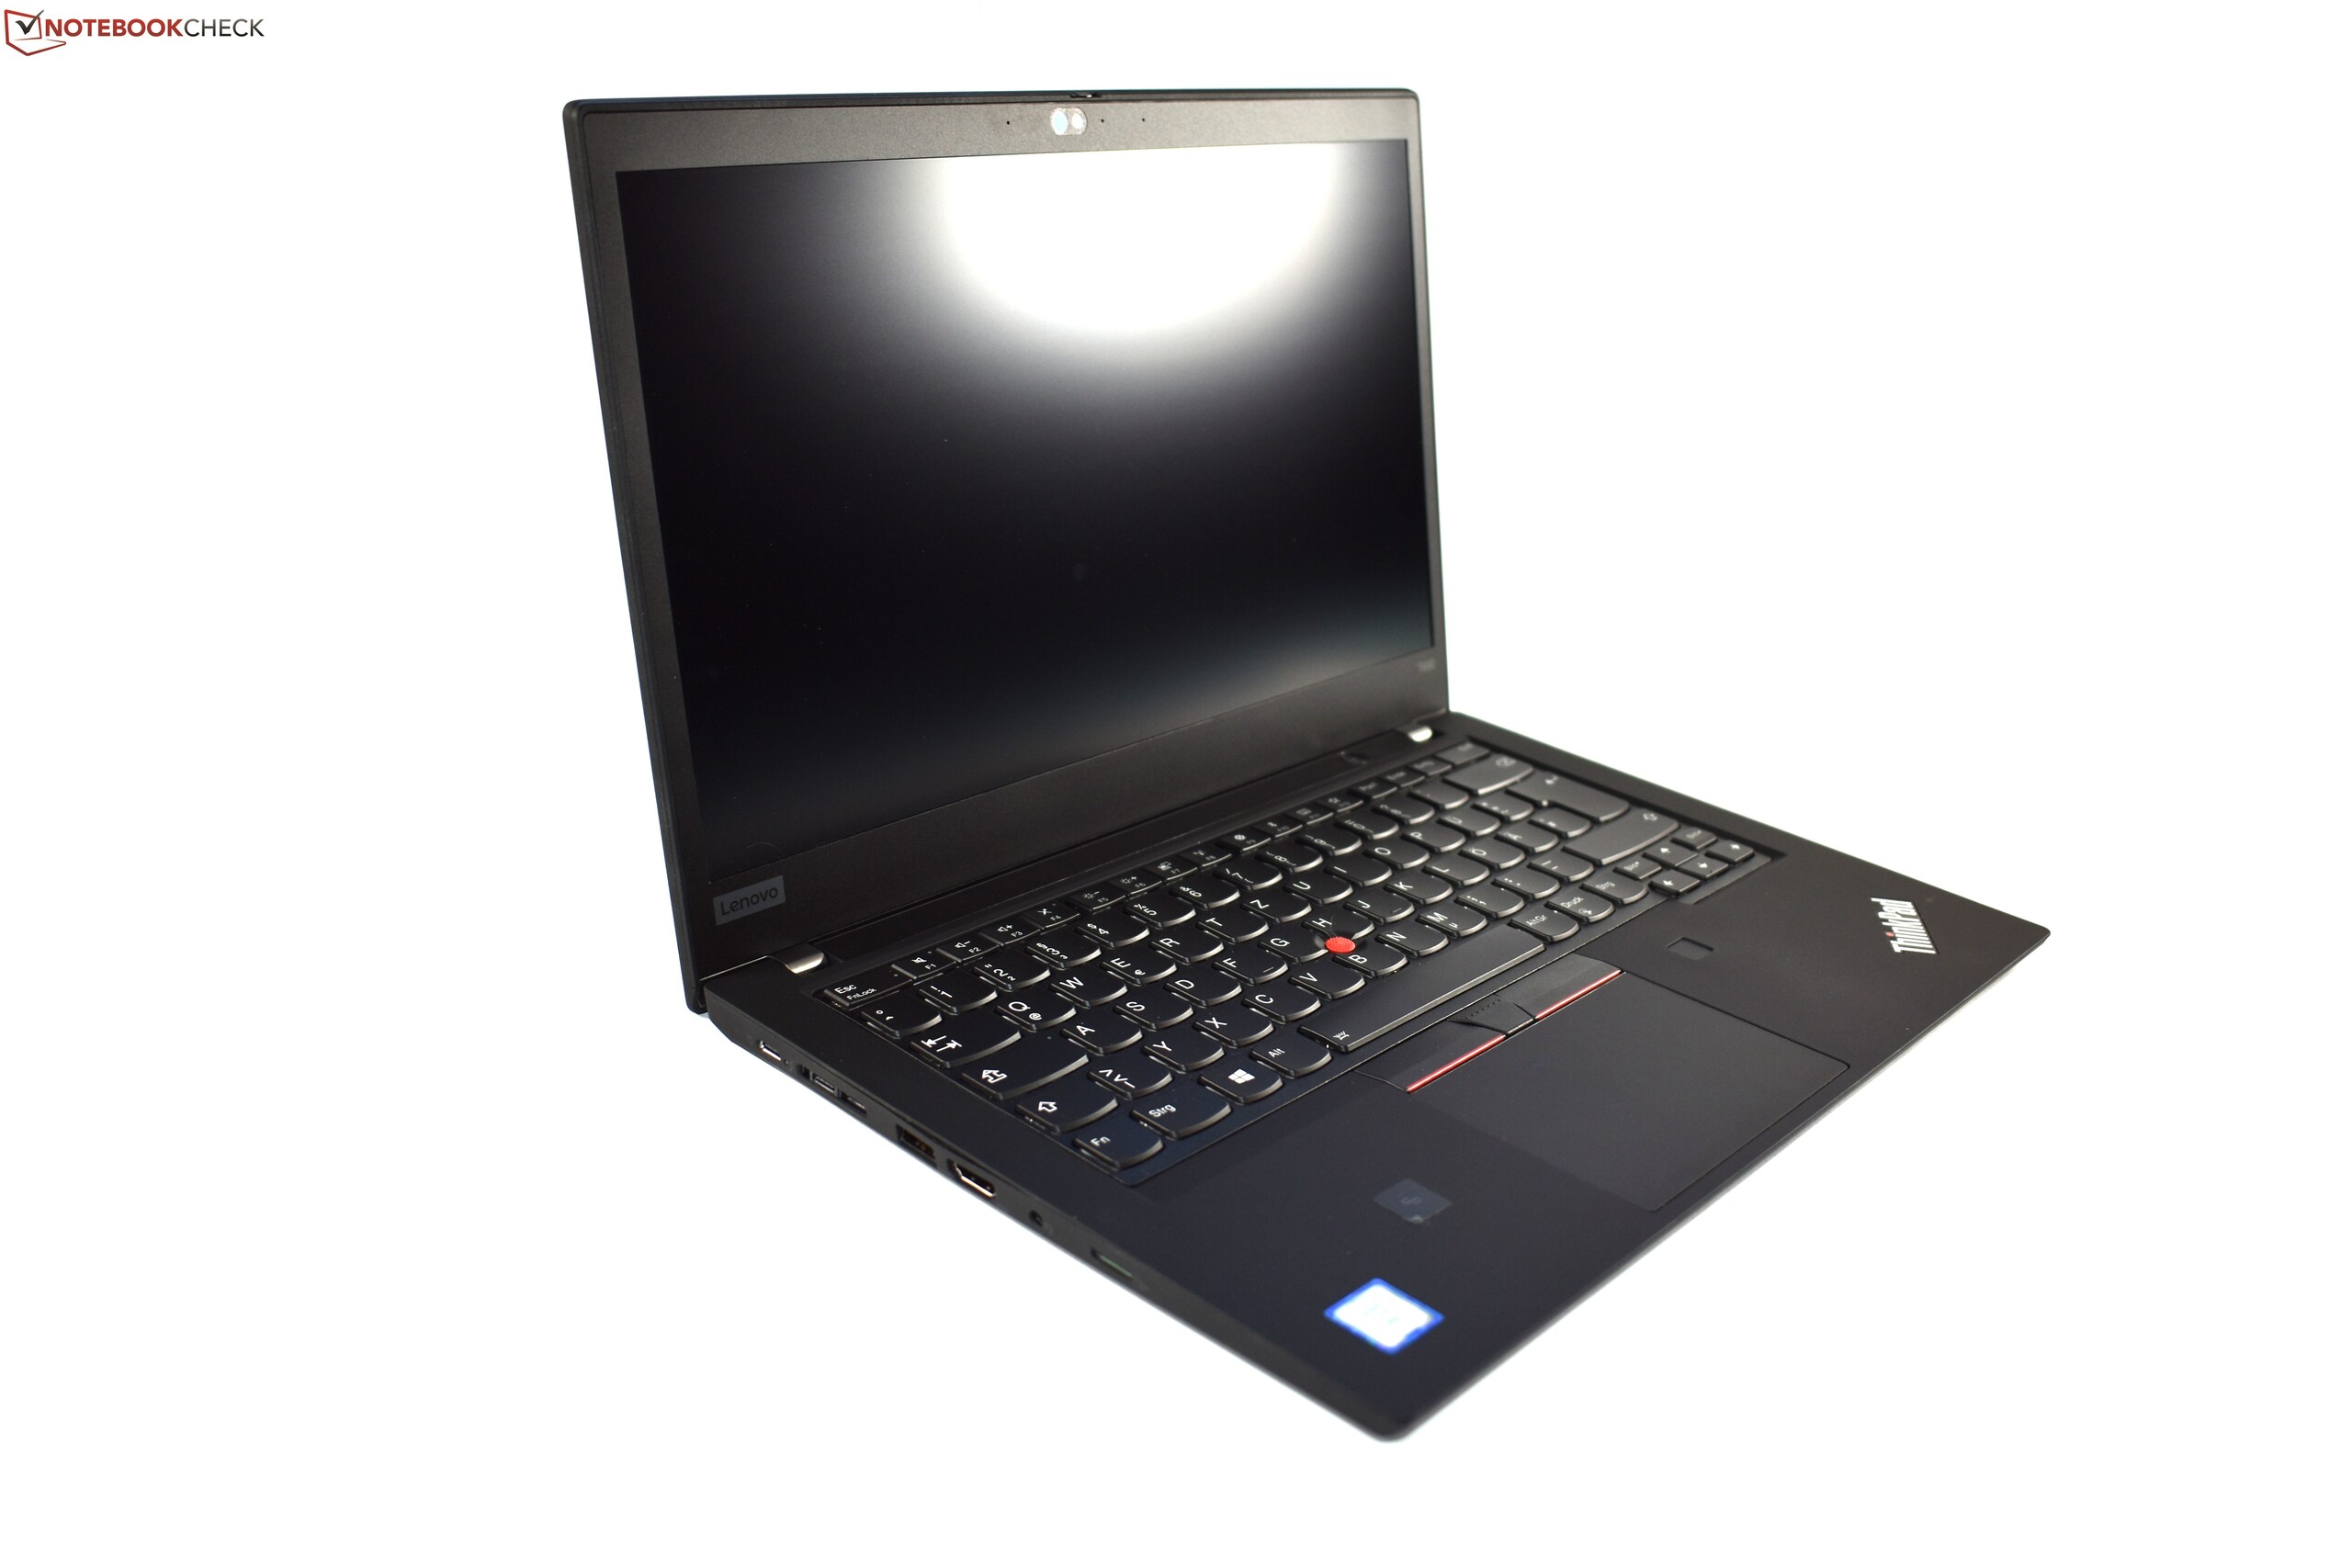
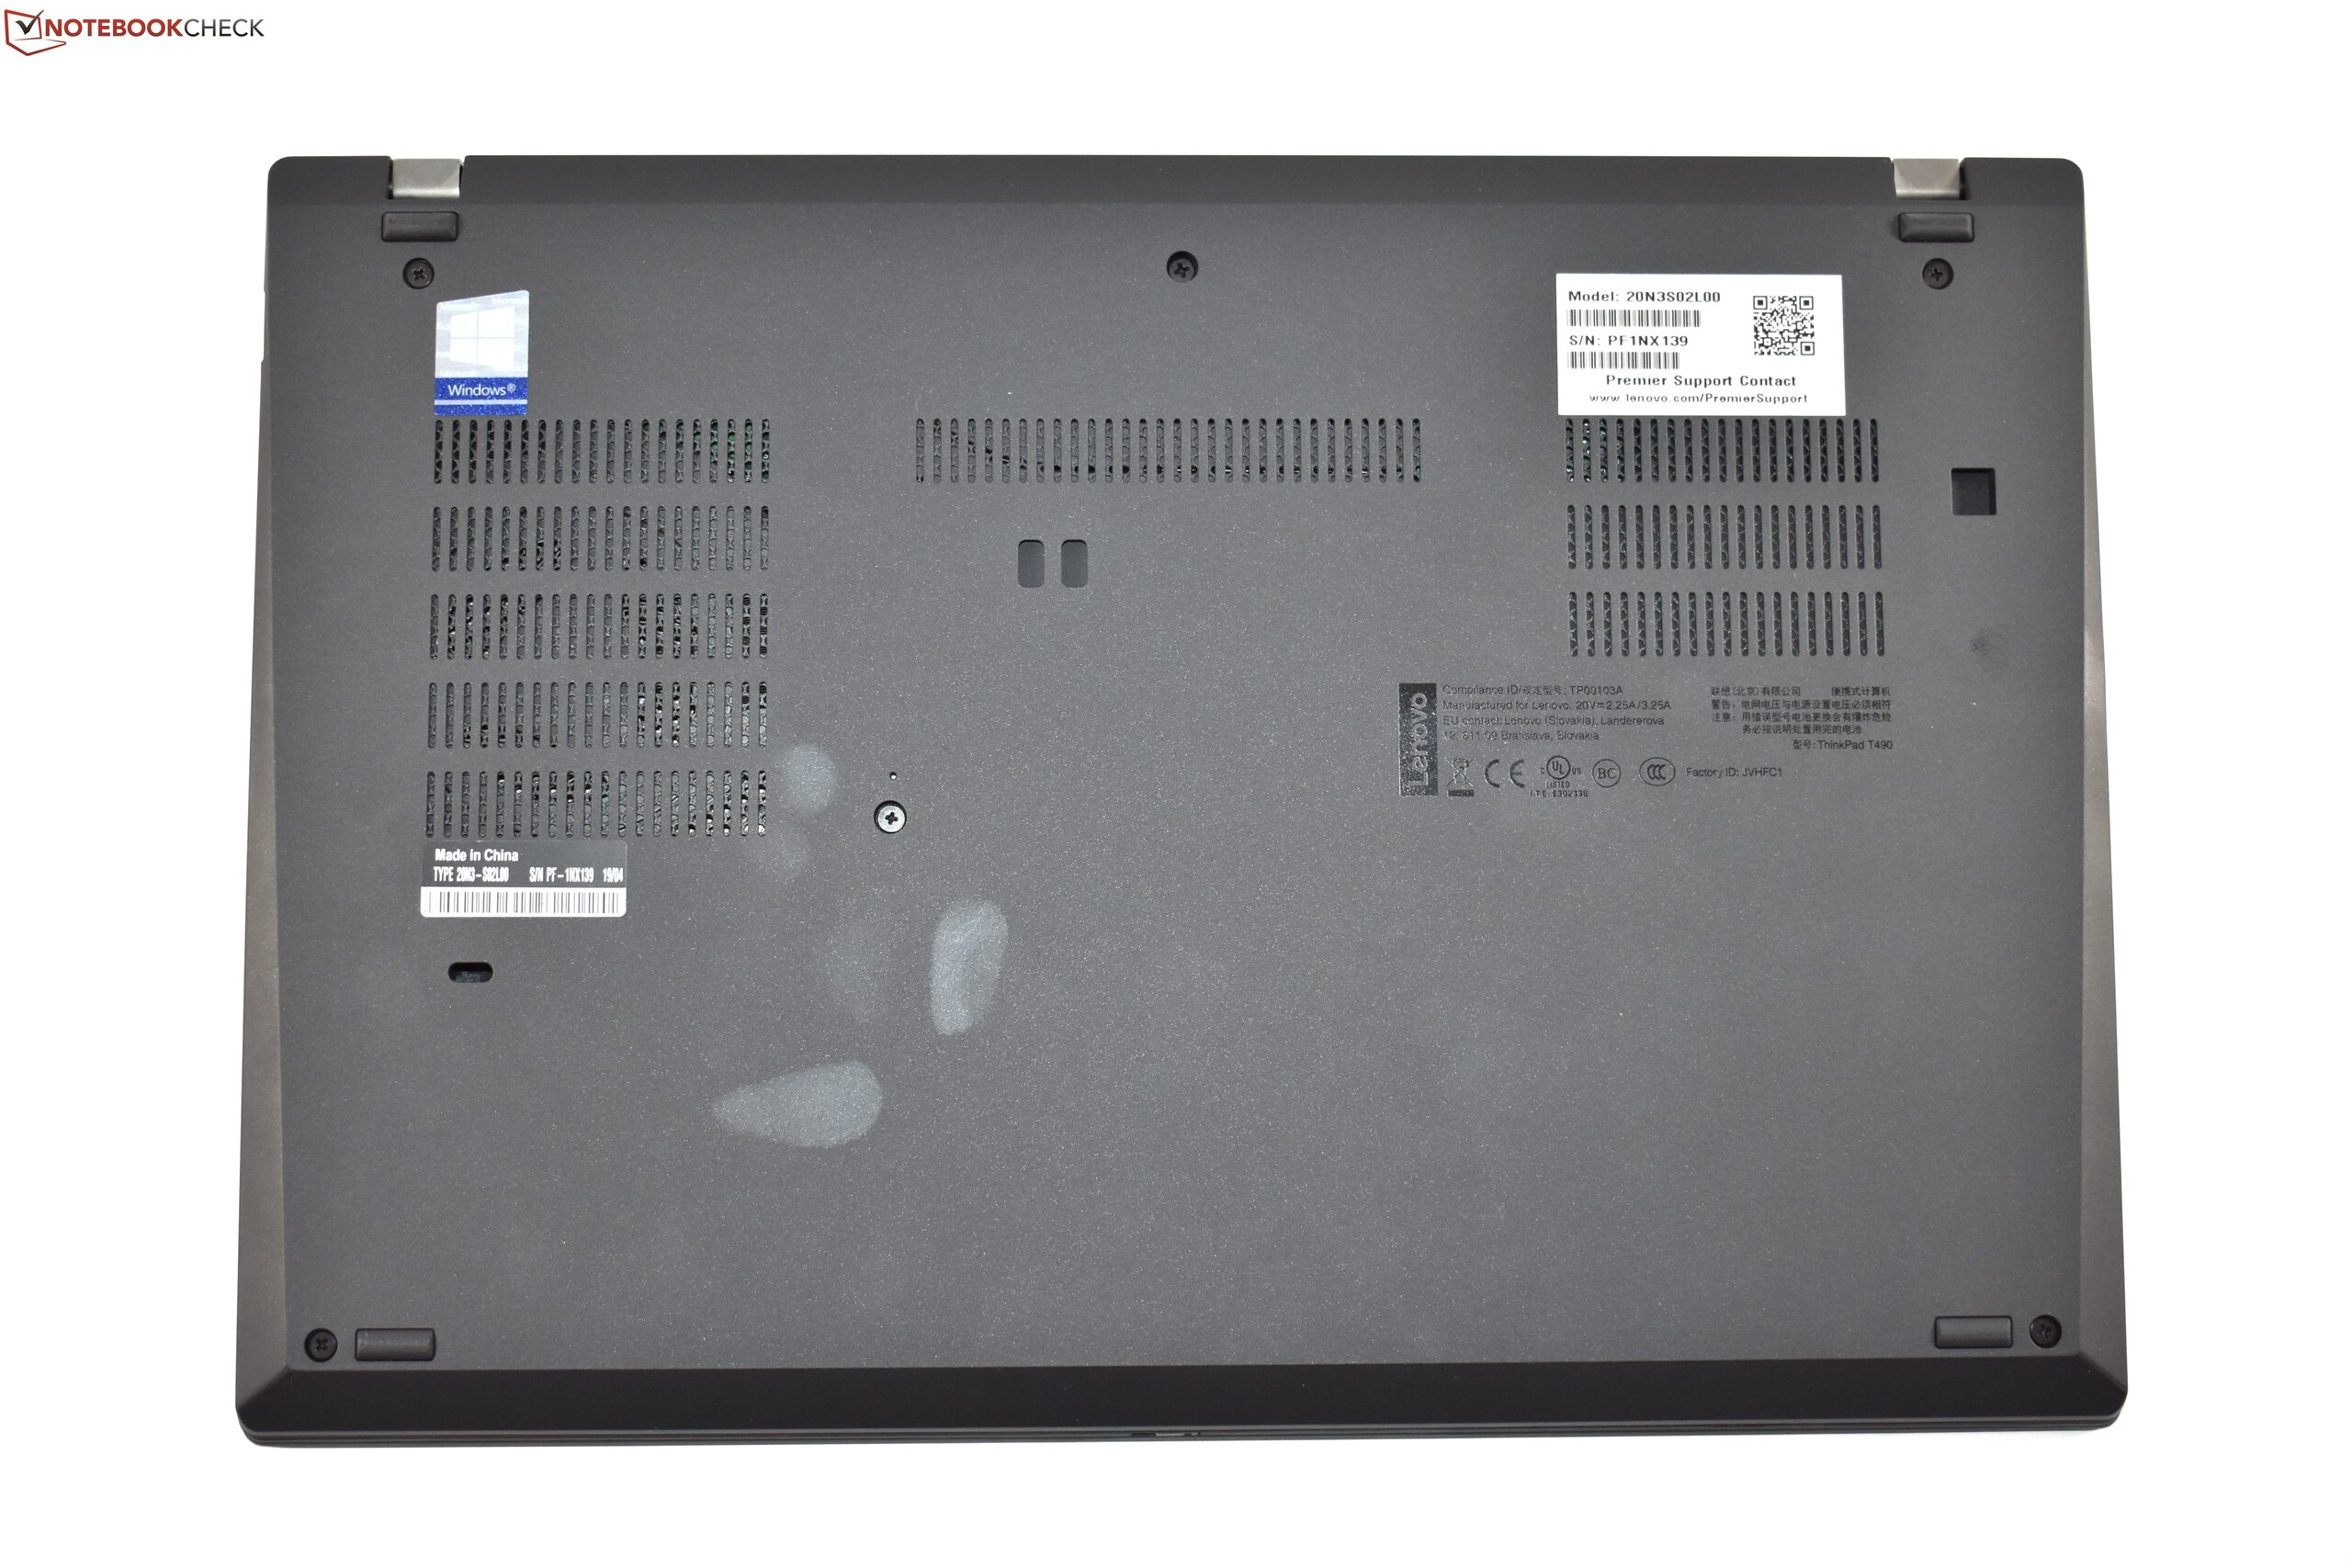
虽然屏幕是ThinkPad T490的最佳配置之一,但它的响应时间非常糟糕,快速的鼠标会导致重影现象。 T490有很多接口,但不幸的是,联想已经用microSD卡插槽取代了SD卡插槽 ——我们认为这是不必要的改变。同样令人遗憾的是,Thunderbolt 3端口是半速的。在所有最近配备14英寸屏幕的T / X ThinkPad中,T490是最易升级的型号,但很难打开D面。负载下的高温也存在问题,因为它们经常超过50°C的门槛。良好的性能和安静的风扇没有任何帮助,因为T490在压力测试中会受到限制。T490的另一个问题是它发出的噪音:它受到电流噪音和扬声器嗡嗡声的困扰。最后,我们哀悼可拆卸功能的丢失——虽然USB C电池可以提供相同的功能,但PowerBridge是一个有趣而舒适的功能。
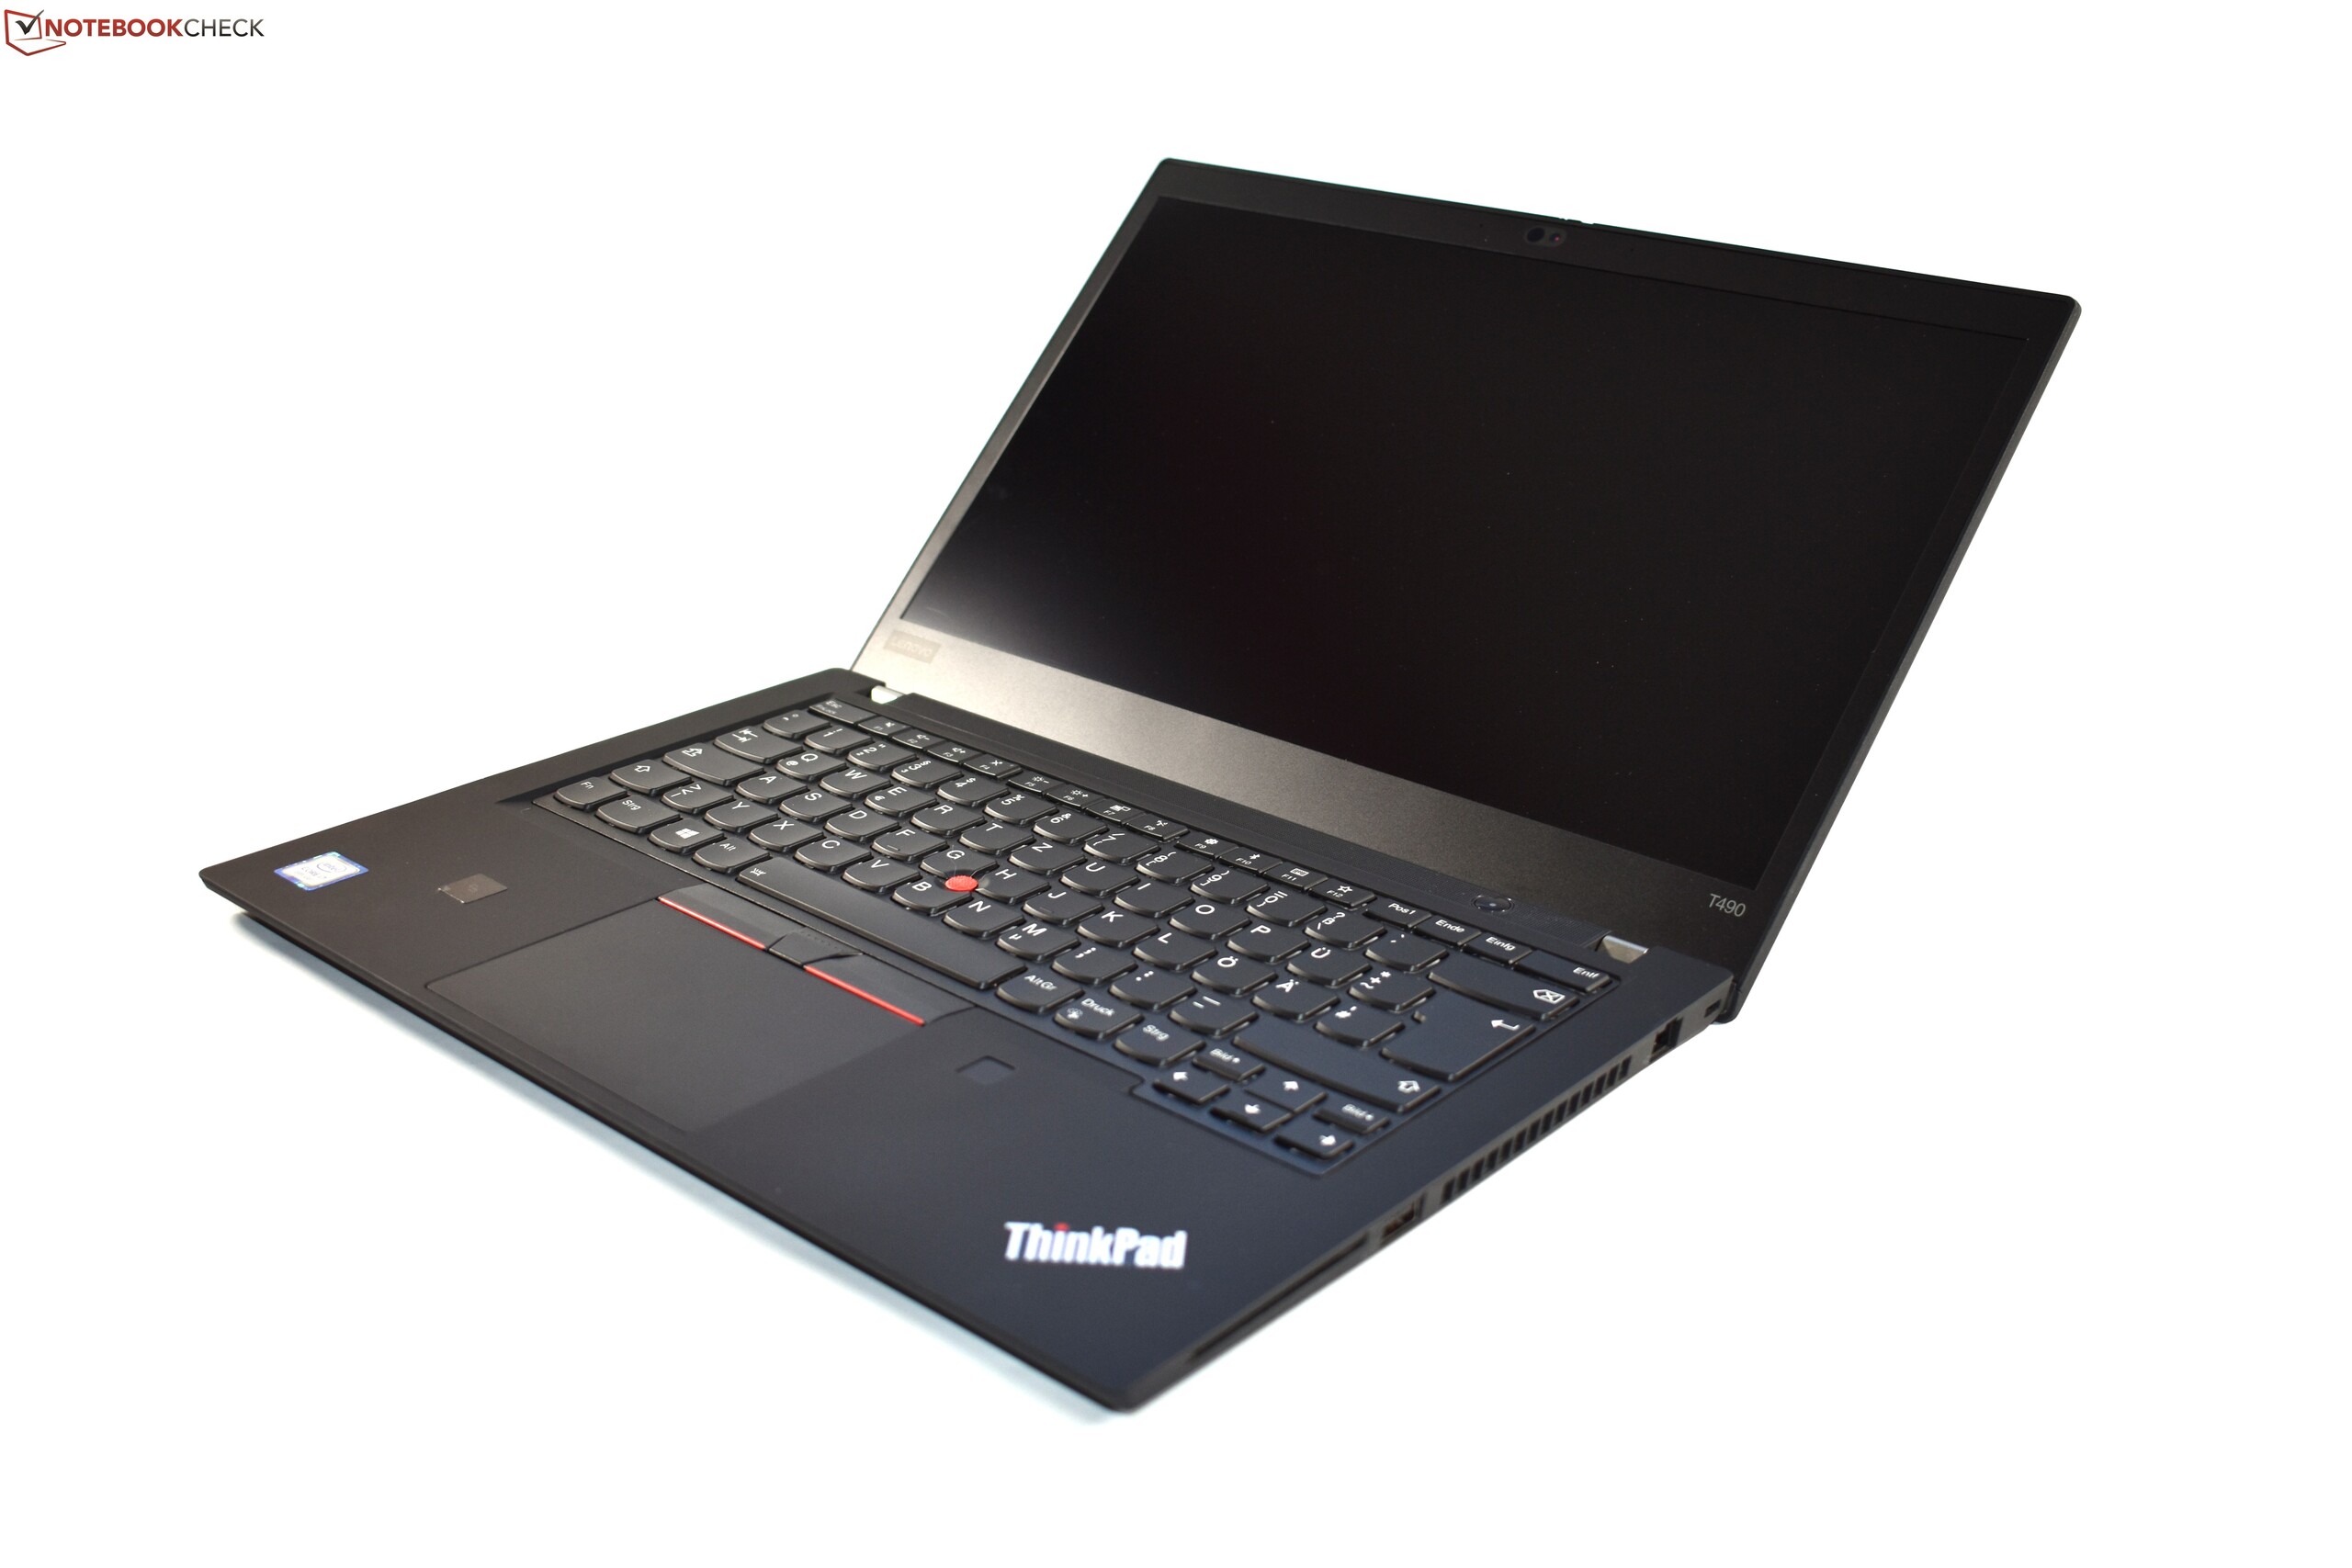
联想ThinkPad T490是传统T系列的最新型号——与之前的型号相比,联想已经做了很多改变。虽然并非所有这些改变都变得更好,但考虑到所有因素,ThinkPad T490是比T480更好的笔记本电脑。
总体而言,联想ThinkPad T490是一款非常出色的商务笔记本电脑,但联想应该通过软件更新修复扬声器的问题。此外,问题仍然是较弱的散热。我们确实给ThinkPad T490一个基本的建议,但是用户应该选择带有低功耗FHD屏幕或QHD LCD的型号。
Lenovo ThinkPad T490-20N3S02L00
- 10/22/2019 v7 (old)
Benjamin Herzig
Price comparison

