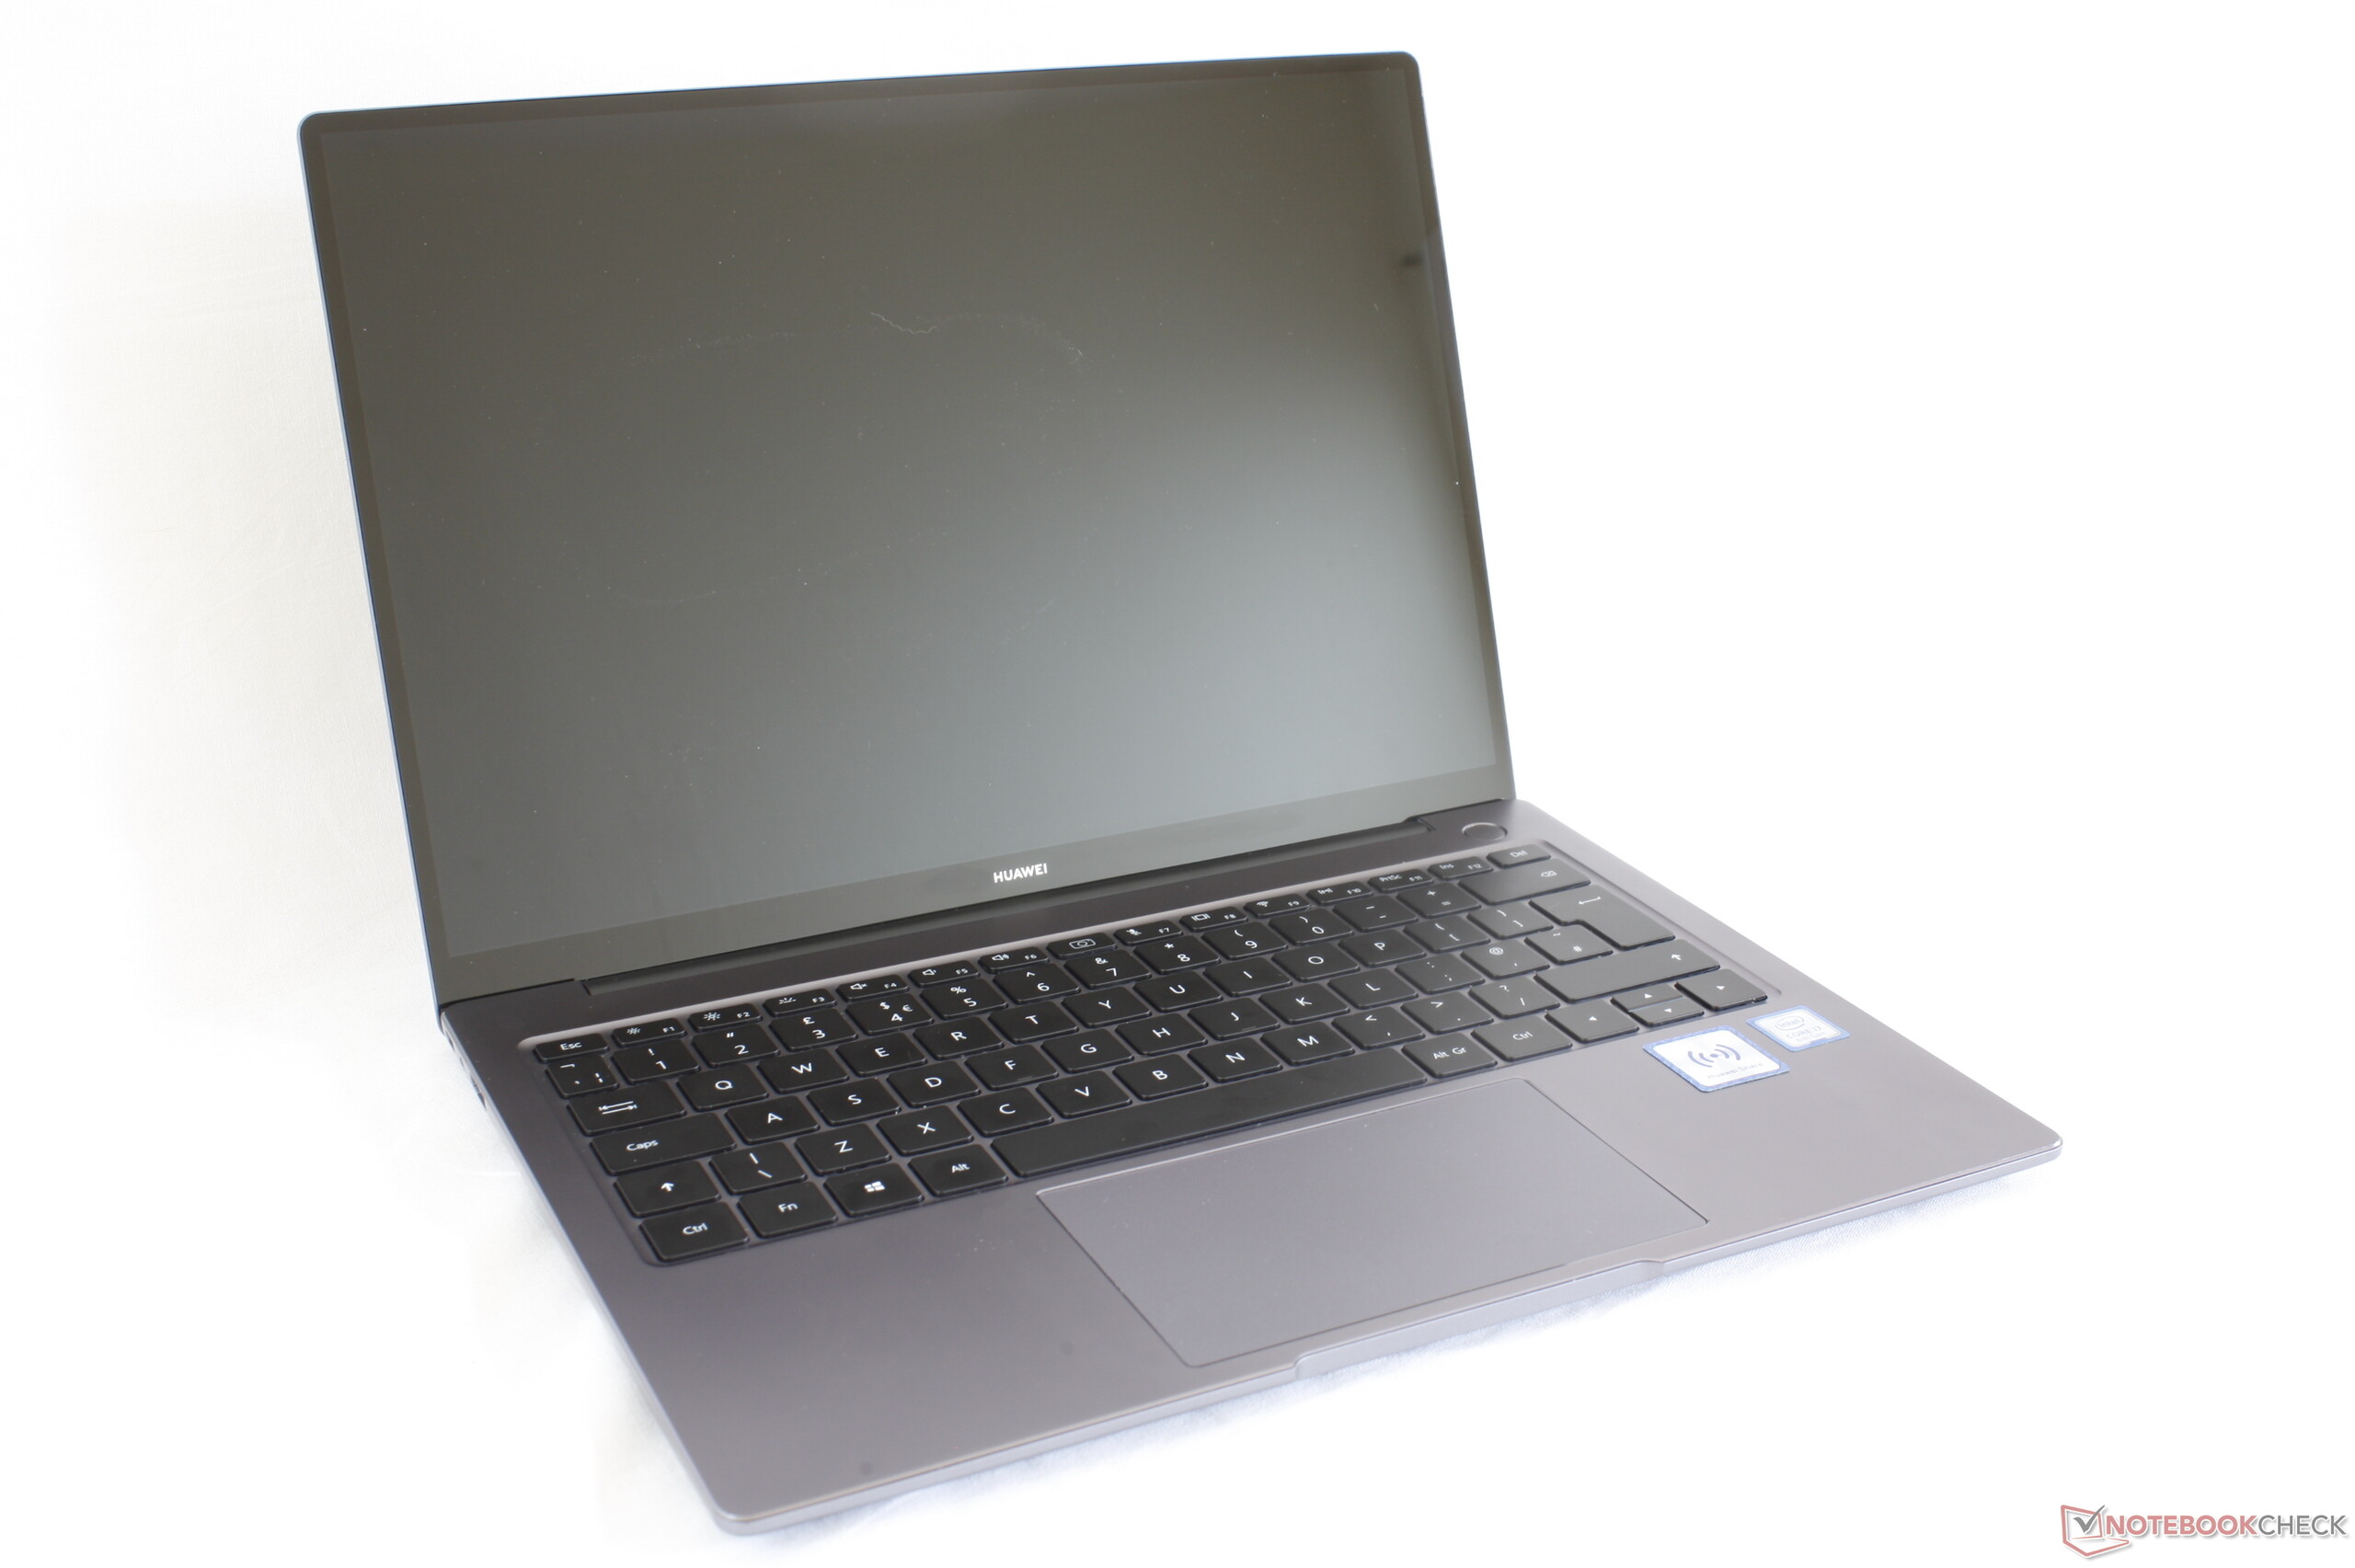
华为Matebook 14 (i7-8565U, GeForce MX250) 笔记本电脑评测
| Networking | |
| iperf3 transmit AX12 | |
| Huawei MateBook 14 KLV-W29 | |
| Asus ZenBook S13 UX392FN | |
| Huawei Matebook X Pro i5 | |
| LG Gram 14Z980-U.AAW5U1 | |
| iperf3 receive AX12 | |
| Asus ZenBook S13 UX392FN | |
| Huawei MateBook 14 KLV-W29 | |
| Huawei Matebook X Pro i5 | |
| LG Gram 14Z980-U.AAW5U1 | |
| |||||||||||||||||||||||||
Brightness Distribution: 95 %
Center on Battery: 401.7 cd/m²
Contrast: 956:1 (Black: 0.42 cd/m²)
ΔE ColorChecker Calman: 4.11 | ∀{0.5-29.43 Ø4.72}
calibrated: 1.36
ΔE Greyscale Calman: 6.1 | ∀{0.09-98 Ø4.97}
98.6% sRGB (Argyll 1.6.3 3D)
62.7% AdobeRGB 1998 (Argyll 1.6.3 3D)
68.1% AdobeRGB 1998 (Argyll 3D)
97.8% sRGB (Argyll 3D)
66.6% Display P3 (Argyll 3D)
Gamma: 2.19
CCT: 7222 K
| Huawei MateBook 14 KLV-W29 Chi Mei CMN8C02, IPS, 14", 2160x1440 | Huawei Matebook X Pro i5 Tianma XM, IPS, 13.9", 3000x2000 | LG Gram 14Z980-U.AAW5U1 LG Philips LP140WF7-SPG1, IPS, 14", 1920x1080 | Asus ZenBook S13 UX392FN Tianma XM, IPS, 13.9", 1920x1080 | Dell XPS 13 9380 2019 ID: AUO 282B B133ZAN Dell: 90NTH, IPS, 13.3", 3840x2160 | Lenovo Yoga C930-13IKB B139HAN03_0, IPS, 13.9", 1920x1080 | |
|---|---|---|---|---|---|---|
| Display | -2% | -3% | 0% | -4% | -3% | |
| Display P3 Coverage (%) | 66.6 | 65.9 -1% | 64.7 -3% | 67.5 1% | 64.7 -3% | 64.3 -3% |
| sRGB Coverage (%) | 97.8 | 95.2 -3% | 94.3 -4% | 95.8 -2% | 93.1 -5% | 94.6 -3% |
| AdobeRGB 1998 Coverage (%) | 68.1 | 67.6 -1% | 66 -3% | 69 1% | 65.3 -4% | 66.2 -3% |
| Response Times | 0% | -4% | -8% | -43% | -4% | |
| Response Time Grey 50% / Grey 80% * (ms) | 38 ? | 40.4 ? -6% | 36.8 ? 3% | 47.2 ? -24% | 58 ? -53% | 40.8 ? -7% |
| Response Time Black / White * (ms) | 27.2 ? | 25.6 ? 6% | 30 ? -10% | 24.8 ? 9% | 36 ? -32% | 27.6 ? -1% |
| PWM Frequency (Hz) | ||||||
| Screen | 9% | -6% | 21% | 1% | -17% | |
| Brightness middle (cd/m²) | 401.7 | 442.7 10% | 333.8 -17% | 466 16% | 404 1% | 316 -21% |
| Brightness (cd/m²) | 386 | 428 11% | 307 -20% | 462 20% | 389 1% | 291 -25% |
| Brightness Distribution (%) | 95 | 84 -12% | 83 -13% | 90 -5% | 85 -11% | 83 -13% |
| Black Level * (cd/m²) | 0.42 | 0.31 26% | 0.4 5% | 0.33 21% | 0.37 12% | 0.36 14% |
| Contrast (:1) | 956 | 1428 49% | 835 -13% | 1412 48% | 1092 14% | 878 -8% |
| Colorchecker dE 2000 * | 4.11 | 2.24 45% | 3.54 14% | 1.93 53% | 3.72 9% | 5.9 -44% |
| Colorchecker dE 2000 max. * | 8.93 | 7.19 19% | 5.8 35% | 4.26 52% | 7.38 17% | 12.9 -44% |
| Colorchecker dE 2000 calibrated * | 1.36 | 1.11 18% | 2.36 -74% | 1.99 -46% | 2.06 -51% | 1.3 4% |
| Greyscale dE 2000 * | 6.1 | 9.7 -59% | 4.7 23% | 1.7 72% | 4.44 27% | 8.6 -41% |
| Gamma | 2.19 100% | 1.42 155% | 2.14 103% | 2.15 102% | 2.34 94% | 2.1 105% |
| CCT | 7222 90% | 6227 104% | 6261 104% | 6382 102% | 7095 92% | 6854 95% |
| Color Space (Percent of AdobeRGB 1998) (%) | 62.7 | 61.6 -2% | 61.2 -2% | 62.2 -1% | 60 -4% | 60.7 -3% |
| Color Space (Percent of sRGB) (%) | 98.6 | 95 -4% | 94.7 -4% | 95.7 -3% | 93 -6% | 94.5 -4% |
| Total Average (Program / Settings) | 2% /
6% | -4% /
-5% | 4% /
13% | -15% /
-6% | -8% /
-13% |
* ... smaller is better
Display Response Times
| ↔ Response Time Black to White | ||
|---|---|---|
| 27.2 ms ... rise ↗ and fall ↘ combined | ↗ 17.2 ms rise | 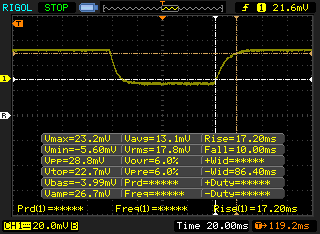 |
| ↘ 10 ms fall | ||
| The screen shows relatively slow response rates in our tests and may be too slow for gamers. In comparison, all tested devices range from 0.1 (minimum) to 240 (maximum) ms. » 69 % of all devices are better. This means that the measured response time is worse than the average of all tested devices (19.9 ms). | ||
| ↔ Response Time 50% Grey to 80% Grey | ||
| 38 ms ... rise ↗ and fall ↘ combined | ↗ 19.6 ms rise | 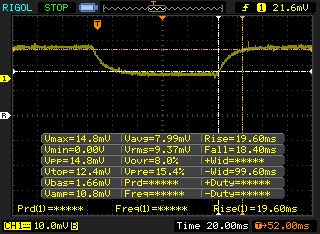 |
| ↘ 18.4 ms fall | ||
| The screen shows slow response rates in our tests and will be unsatisfactory for gamers. In comparison, all tested devices range from 0.165 (minimum) to 636 (maximum) ms. » 55 % of all devices are better. This means that the measured response time is worse than the average of all tested devices (31.1 ms). | ||
Screen Flickering / PWM (Pulse-Width Modulation)
| Screen flickering / PWM not detected |  | ||
In comparison: 52 % of all tested devices do not use PWM to dim the display. If PWM was detected, an average of 7784 (minimum: 5 - maximum: 343500) Hz was measured. | |||
| Cinebench R15 | |
| CPU Single 64Bit | |
| Huawei MateBook 14 KLV-W29 | |
| Razer Blade Stealth i7-8565U | |
| Average Intel Core i7-8565U (138.3 - 193, n=51) | |
| Lenovo Legion Y730-15ICH i5-8300H | |
| HP EliteBook 735 G5 3UN62EA | |
| Lenovo ThinkPad 13 20J1005TPB | |
| Huawei Matebook X Pro i5 | |
| Huawei MateBook X Pro, i7 | |
| CPU Multi 64Bit | |
| Lenovo Legion Y730-15ICH i5-8300H | |
| Razer Blade Stealth i7-8565U | |
| Huawei MateBook 14 KLV-W29 | |
| Huawei MateBook D 14, AMD Edition | |
| HP EliteBook 735 G5 3UN62EA | |
| Average Intel Core i7-8565U (452 - 815, n=52) | |
| Huawei Matebook X Pro i5 | |
| Huawei MateBook X Pro, i7 | |
| Lenovo ThinkPad 13 20J1005TPB | |
| PCMark 8 | |
| Home Score Accelerated v2 | |
| Razer Blade Stealth i7-8565U | |
| Huawei MateBook 14 KLV-W29 | |
| Dell XPS 13 9380 2019 | |
| Huawei Matebook X Pro i5 | |
| LG Gram 14Z980-U.AAW5U1 | |
| Huawei MateBook X Pro, i7 | |
| Average of class Subnotebook (1739 - 1828, n=2, last 2 years) | |
| Work Score Accelerated v2 | |
| Razer Blade Stealth i7-8565U | |
| Huawei MateBook 14 KLV-W29 | |
| LG Gram 14Z980-U.AAW5U1 | |
| Huawei MateBook X Pro, i7 | |
| Huawei Matebook X Pro i5 | |
| Dell XPS 13 9380 2019 | |
| Average of class Subnotebook (1609 - 1656, n=2, last 2 years) | |
| PCMark 8 Home Score Accelerated v2 | 3612 points | |
| PCMark 8 Work Score Accelerated v2 | 4796 points | |
| PCMark 10 Score | 4205 points | |
Help | ||
| Huawei MateBook 14 KLV-W29 Samsung SSD PM981 MZVLB512HAJQ | Huawei Matebook X Pro i5 Samsung PM961 MZVLW256HEHP | LG Gram 14Z980-U.AAW5U1 SK Hynix SC313 HFS256G39TNF | Dell XPS 13 9380 2019 SK hynix PC401 HFS256GD9TNG | Asus ZenBook S13 UX392FN WDC PC SN520 SDAPNUW-512G | Lenovo Yoga C930-13IKB SK hynix PC401 HFS256GD9TNG | |
|---|---|---|---|---|---|---|
| AS SSD | -25% | -70% | -45% | -15% | -55% | |
| Seq Read (MB/s) | 1225 | 2416 97% | 476.1 -61% | 2035 66% | 1224 0% | 1850 51% |
| Seq Write (MB/s) | 1386 | 1170 -16% | 487.4 -65% | 658 -53% | 907 -35% | 661 -52% |
| 4K Read (MB/s) | 56.4 | 48.33 -14% | 30.57 -46% | 39.74 -30% | 41.46 -26% | 38.04 -33% |
| 4K Write (MB/s) | 137.6 | 103.1 -25% | 66.1 -52% | 105.7 -23% | 126.2 -8% | 95 -31% |
| 4K-64 Read (MB/s) | 1190 | 1039 -13% | 352.9 -70% | 461 -61% | 1021 -14% | 434.3 -64% |
| 4K-64 Write (MB/s) | 1377 | 399.6 -71% | 263.1 -81% | 300.1 -78% | 1251 -9% | 266.3 -81% |
| Access Time Read * (ms) | 0.046 | 0.058 -26% | 0.092 -100% | 0.061 -33% | 0.053 -15% | 0.069 -50% |
| Access Time Write * (ms) | 0.026 | 0.036 -38% | 0.055 -112% | 0.051 -96% | 0.027 -4% | 0.056 -115% |
| Score Read (Points) | 1369 | 1329 -3% | 431 -69% | 704 -49% | 1185 -13% | 657 -52% |
| Score Write (Points) | 1653 | 620 -62% | 378 -77% | 471 -72% | 1468 -11% | 427 -74% |
| Score Total (Points) | 3743 | 2575 -31% | 1040 -72% | 1479 -60% | 3250 -13% | 1373 -63% |
| Copy ISO MB/s (MB/s) | 1837 | 739 -60% | 514 -72% | 893 -51% | 1404 -24% | 539 -71% |
| Copy Program MB/s (MB/s) | 473.6 | 312.3 -34% | 259.3 -45% | 287.9 -39% | 402.4 -15% | 209.7 -56% |
| Copy Game MB/s (MB/s) | 1216 | 486.3 -60% | 521 -57% | 618 -49% | 902 -26% | 340 -72% |
* ... smaller is better

| 3DMark | |
| 1280x720 Cloud Gate Standard Graphics | |
| MSI GF63 8RC-040XPL | |
| MSI GL62-6QFi781H11 | |
| MSI PX60 6QD | |
| Huawei MateBook 14 KLV-W29 | |
| Razer Blade Stealth i7-8565U | |
| Average NVIDIA GeForce MX250 (13805 - 23863, n=25) | |
| Huawei MateBook 13 i7 | |
| Huawei MateBook X Pro, i7 | |
| Asus VivoBook S410UQ-NH74 | |
| HP EliteBook 735 G5 3UN62EA | |
| LG Gram 14Z980-U.AAW5U1 | |
| 1920x1080 Fire Strike Graphics | |
| MSI GF63 8RC-040XPL | |
| MSI GL62-6QFi781H11 | |
| Razer Blade Stealth i7-8565U | |
| Huawei MateBook 14 KLV-W29 | |
| MSI PX60 6QD | |
| Huawei MateBook 13 i7 | |
| Average NVIDIA GeForce MX250 (2939 - 3885, n=29) | |
| Huawei MateBook X Pro, i7 | |
| Asus VivoBook S410UQ-NH74 | |
| HP EliteBook 735 G5 3UN62EA | |
| LG Gram 14Z980-U.AAW5U1 | |
| 3DMark 11 | |
| 1280x720 Performance GPU | |
| MSI GL62-6QFi781H11 | |
| Razer Blade Stealth i7-8565U | |
| Huawei MateBook 13 i7 | |
| Huawei MateBook 14 KLV-W29 | |
| Average NVIDIA GeForce MX250 (3585 - 4942, n=29) | |
| MSI PX60 6QD | |
| Huawei MateBook X Pro, i7 | |
| HP EliteBook 735 G5 3UN62EA | |
| Asus VivoBook S410UQ-NH74 | |
| LG Gram 14Z980-U.AAW5U1 | |
| 1280x720 Performance Combined | |
| MSI GL62-6QFi781H11 | |
| Huawei MateBook 14 KLV-W29 | |
| MSI PX60 6QD | |
| Razer Blade Stealth i7-8565U | |
| Average NVIDIA GeForce MX250 (3532 - 4638, n=29) | |
| Huawei MateBook 13 i7 | |
| Huawei MateBook X Pro, i7 | |
| Asus VivoBook S410UQ-NH74 | |
| HP EliteBook 735 G5 3UN62EA | |
| LG Gram 14Z980-U.AAW5U1 | |
| 3DMark 11 Performance | 4681 points | |
| 3DMark Cloud Gate Standard Score | 13455 points | |
| 3DMark Fire Strike Score | 3350 points | |
| 3DMark Time Spy Score | 1240 points | |
Help | ||
| The Witcher 3 - 1366x768 Medium Graphics & Postprocessing | |
| Lenovo Legion Y730-15ICH i5-8300H | |
| MSI GF63 8RC-040XPL | |
| Razer Blade Stealth i7-8565U | |
| Huawei MateBook 14 KLV-W29 | |
| Asus GL552JX-CN154H | |
| Average NVIDIA GeForce MX250 (30 - 40, n=27) | |
| Asus ZenBook S13 UX392FN | |
| Asus VivoBook S410UQ-NH74 | |
| Rise of the Tomb Raider - 1366x768 Medium Preset AF:2x | |
| Lenovo Legion Y730-15ICH i5-8300H | |
| Razer Blade Stealth i7-8565U | |
| Huawei MateBook 14 KLV-W29 | |
| Average NVIDIA GeForce MX250 (39 - 46.2, n=5) | |
| Asus ZenBook S13 UX392FN | |
| Asus VivoBook S410UQ-NH74 | |
| Dell XPS 13 9380 2019 | |
| low | med. | high | ultra | |
|---|---|---|---|---|
| The Witcher 3 (2015) | 64.5 | 36.5 | 21 | 11.9 |
| Rise of the Tomb Raider (2016) | 74.9 | 43.7 | 24.1 | 19.4 |
| Overwatch (2016) | 171.7 | 122.5 | 58 | 35 |
| Huawei MateBook 14 KLV-W29 GeForce MX250, i7-8565U, Samsung SSD PM981 MZVLB512HAJQ | Huawei Matebook X Pro i5 GeForce MX150, i5-8250U, Samsung PM961 MZVLW256HEHP | LG Gram 14Z980-U.AAW5U1 UHD Graphics 620, i5-8250U, SK Hynix SC313 HFS256G39TNF | Asus ZenBook S13 UX392FN GeForce MX150, i7-8565U, WDC PC SN520 SDAPNUW-512G | Lenovo Yoga C930-13IKB UHD Graphics 620, i5-8250U, SK hynix PC401 HFS256GD9TNG | Razer Blade Stealth i7-8565U GeForce MX150, i7-8565U, Lite-On CA3-8D256-Q11 | |
|---|---|---|---|---|---|---|
| Noise | -0% | 3% | -1% | 3% | -3% | |
| off / environment * (dB) | 28.1 | 27.9 1% | 28.2 -0% | 28.1 -0% | 29.3 -4% | 28.4 -1% |
| Idle Minimum * (dB) | 28.1 | 27.9 1% | 28.4 -1% | 28.1 -0% | 29.3 -4% | 28.5 -1% |
| Idle Average * (dB) | 28.1 | 27.9 1% | 28.4 -1% | 28.1 -0% | 29.3 -4% | 29 -3% |
| Idle Maximum * (dB) | 29.7 | 27.9 6% | 28.4 4% | 29 2% | 29.7 -0% | 29.1 2% |
| Load Average * (dB) | 31.2 | 36.2 -16% | 35.7 -14% | 41.1 -32% | 31.8 -2% | 42.8 -37% |
| Witcher 3 ultra * (dB) | 44.5 | 45 -1% | 41.1 8% | 41.4 7% | ||
| Load Maximum * (dB) | 47.5 | 45.2 5% | 34.2 28% | 41.1 13% | 32.7 31% | 41.6 12% |
* ... smaller is better
Noise level
| Idle |
| 28.1 / 28.1 / 29.7 dB(A) |
| Load |
| 31.2 / 47.5 dB(A) |
 | ||
30 dB silent 40 dB(A) audible 50 dB(A) loud |
||
min: | ||
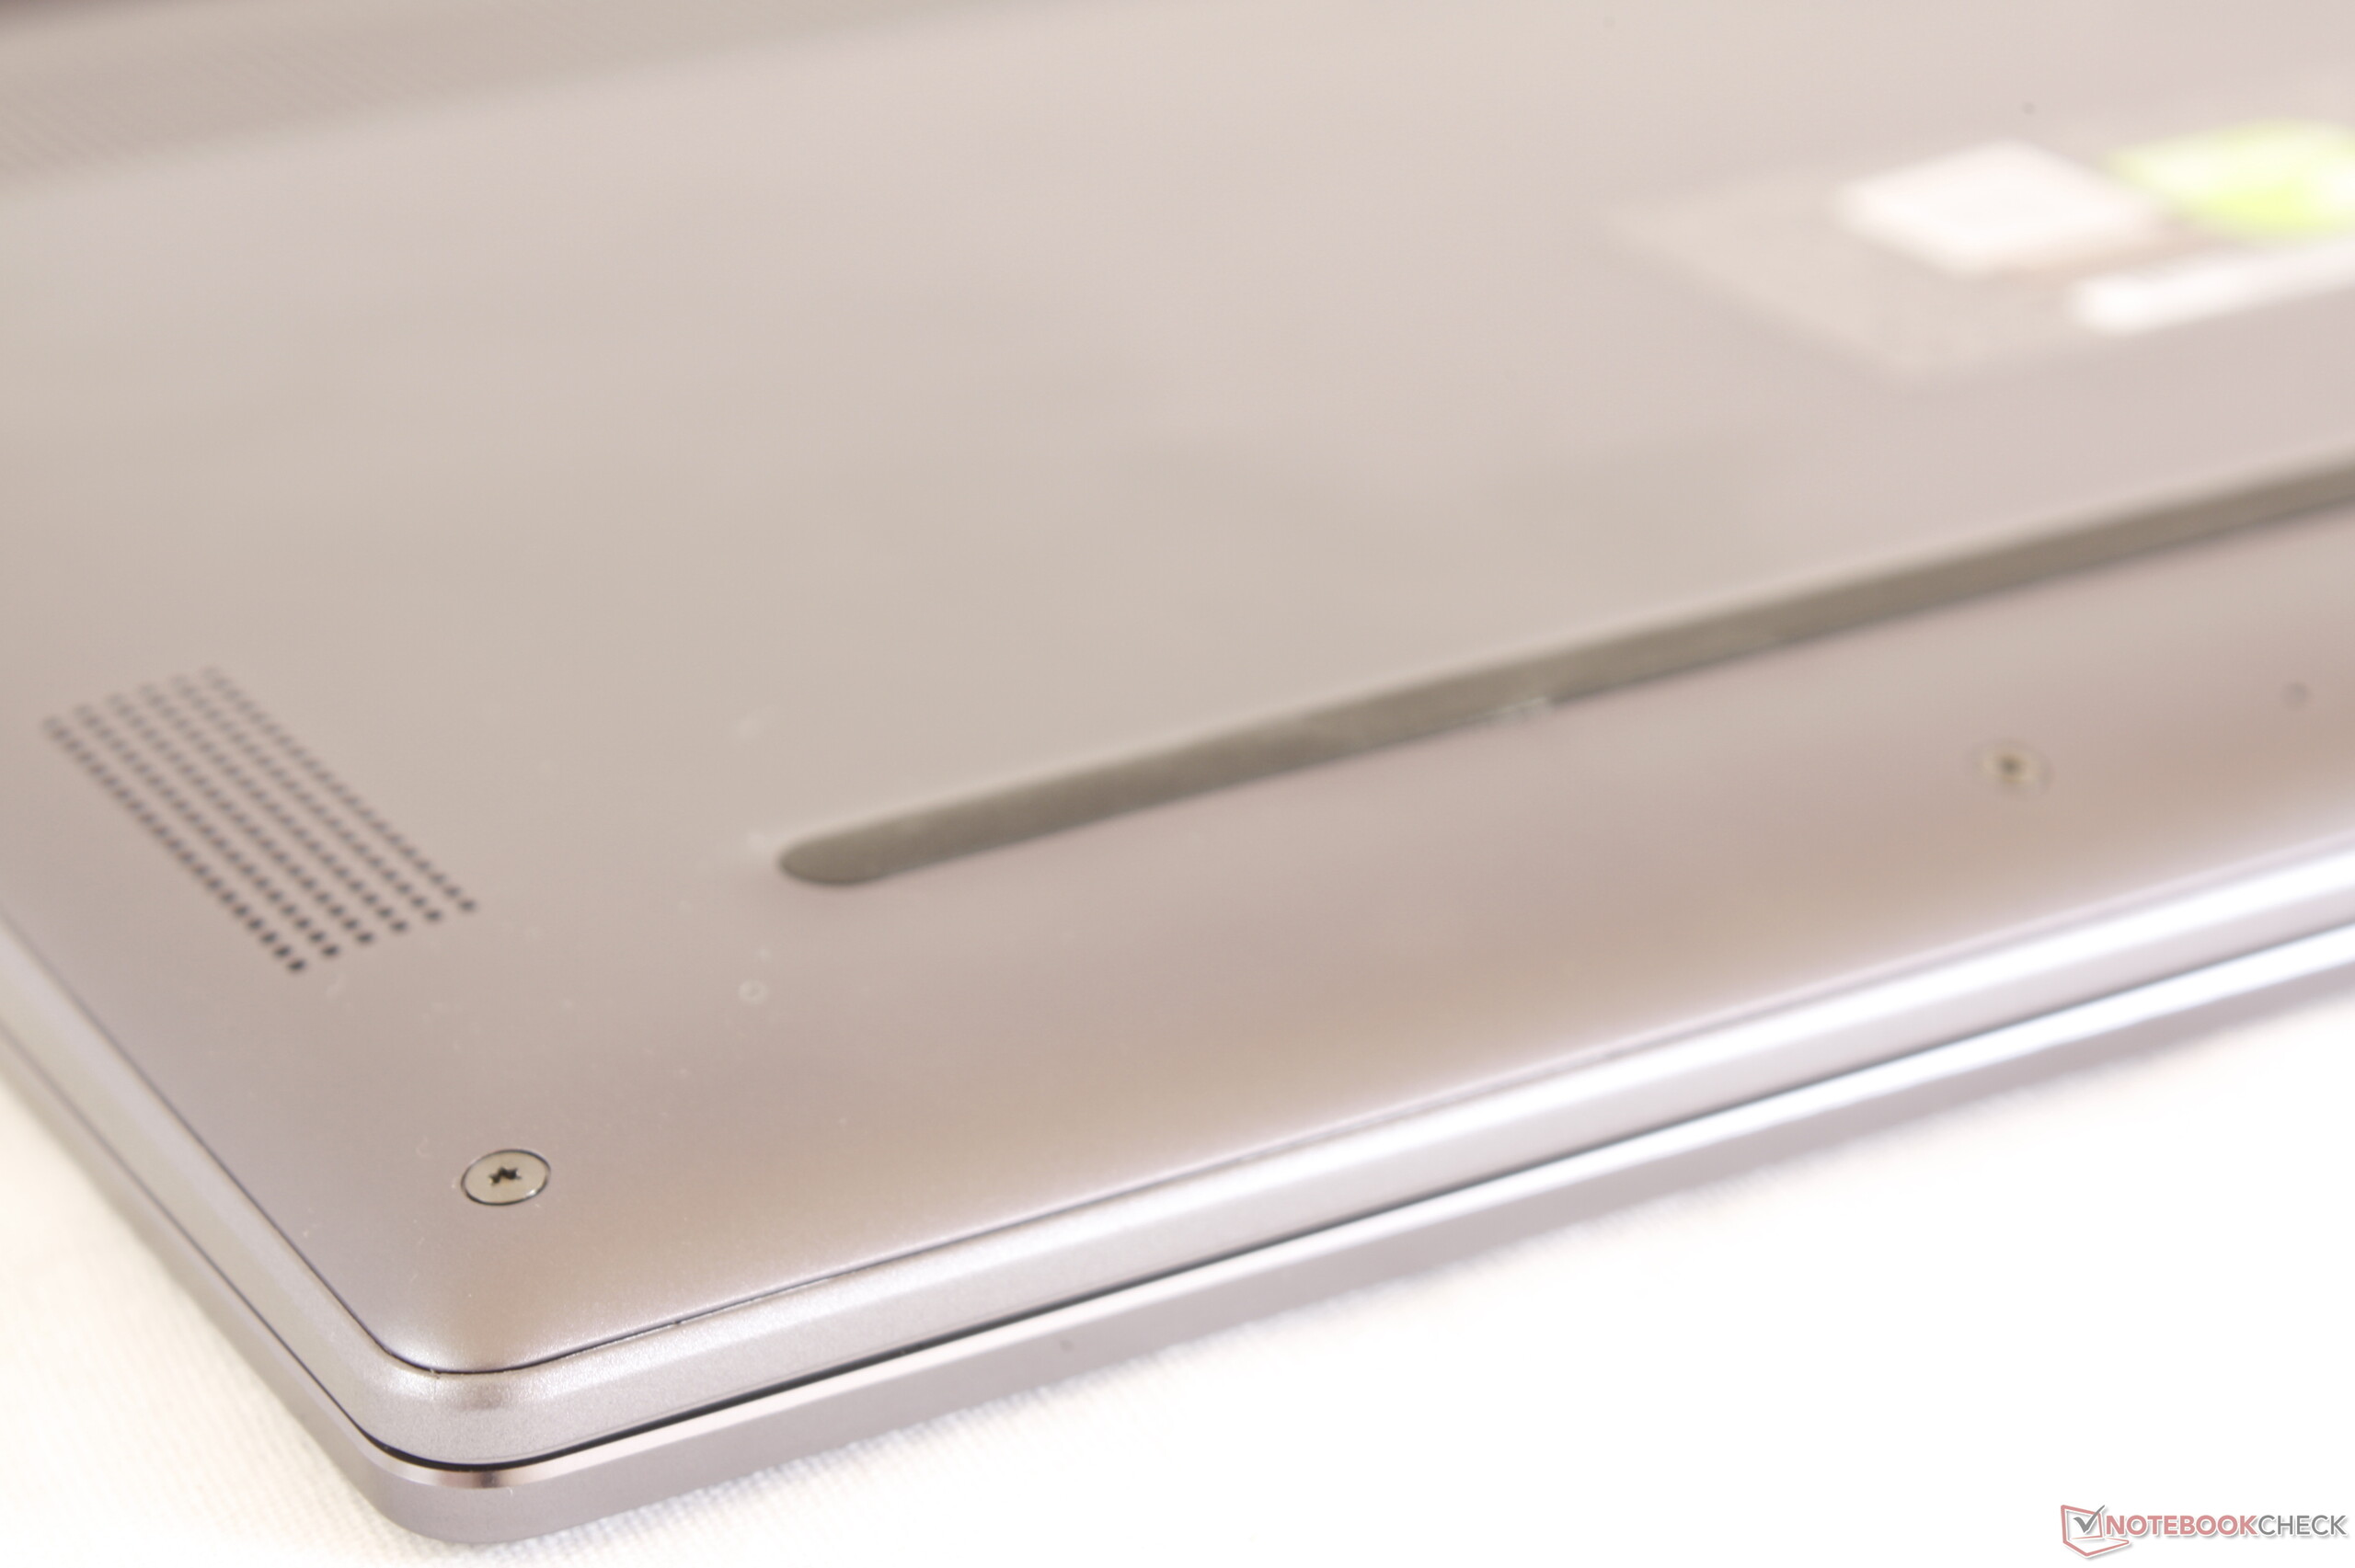
(-) The maximum temperature on the upper side is 48.2 °C / 119 F, compared to the average of 35.9 °C / 97 F, ranging from 21.4 to 59 °C for the class Subnotebook.
(-) The bottom heats up to a maximum of 53.6 °C / 128 F, compared to the average of 39.2 °C / 103 F
(+) In idle usage, the average temperature for the upper side is 30.2 °C / 86 F, compared to the device average of 30.8 °C / 87 F.
(±) Playing The Witcher 3, the average temperature for the upper side is 37.4 °C / 99 F, compared to the device average of 30.8 °C / 87 F.
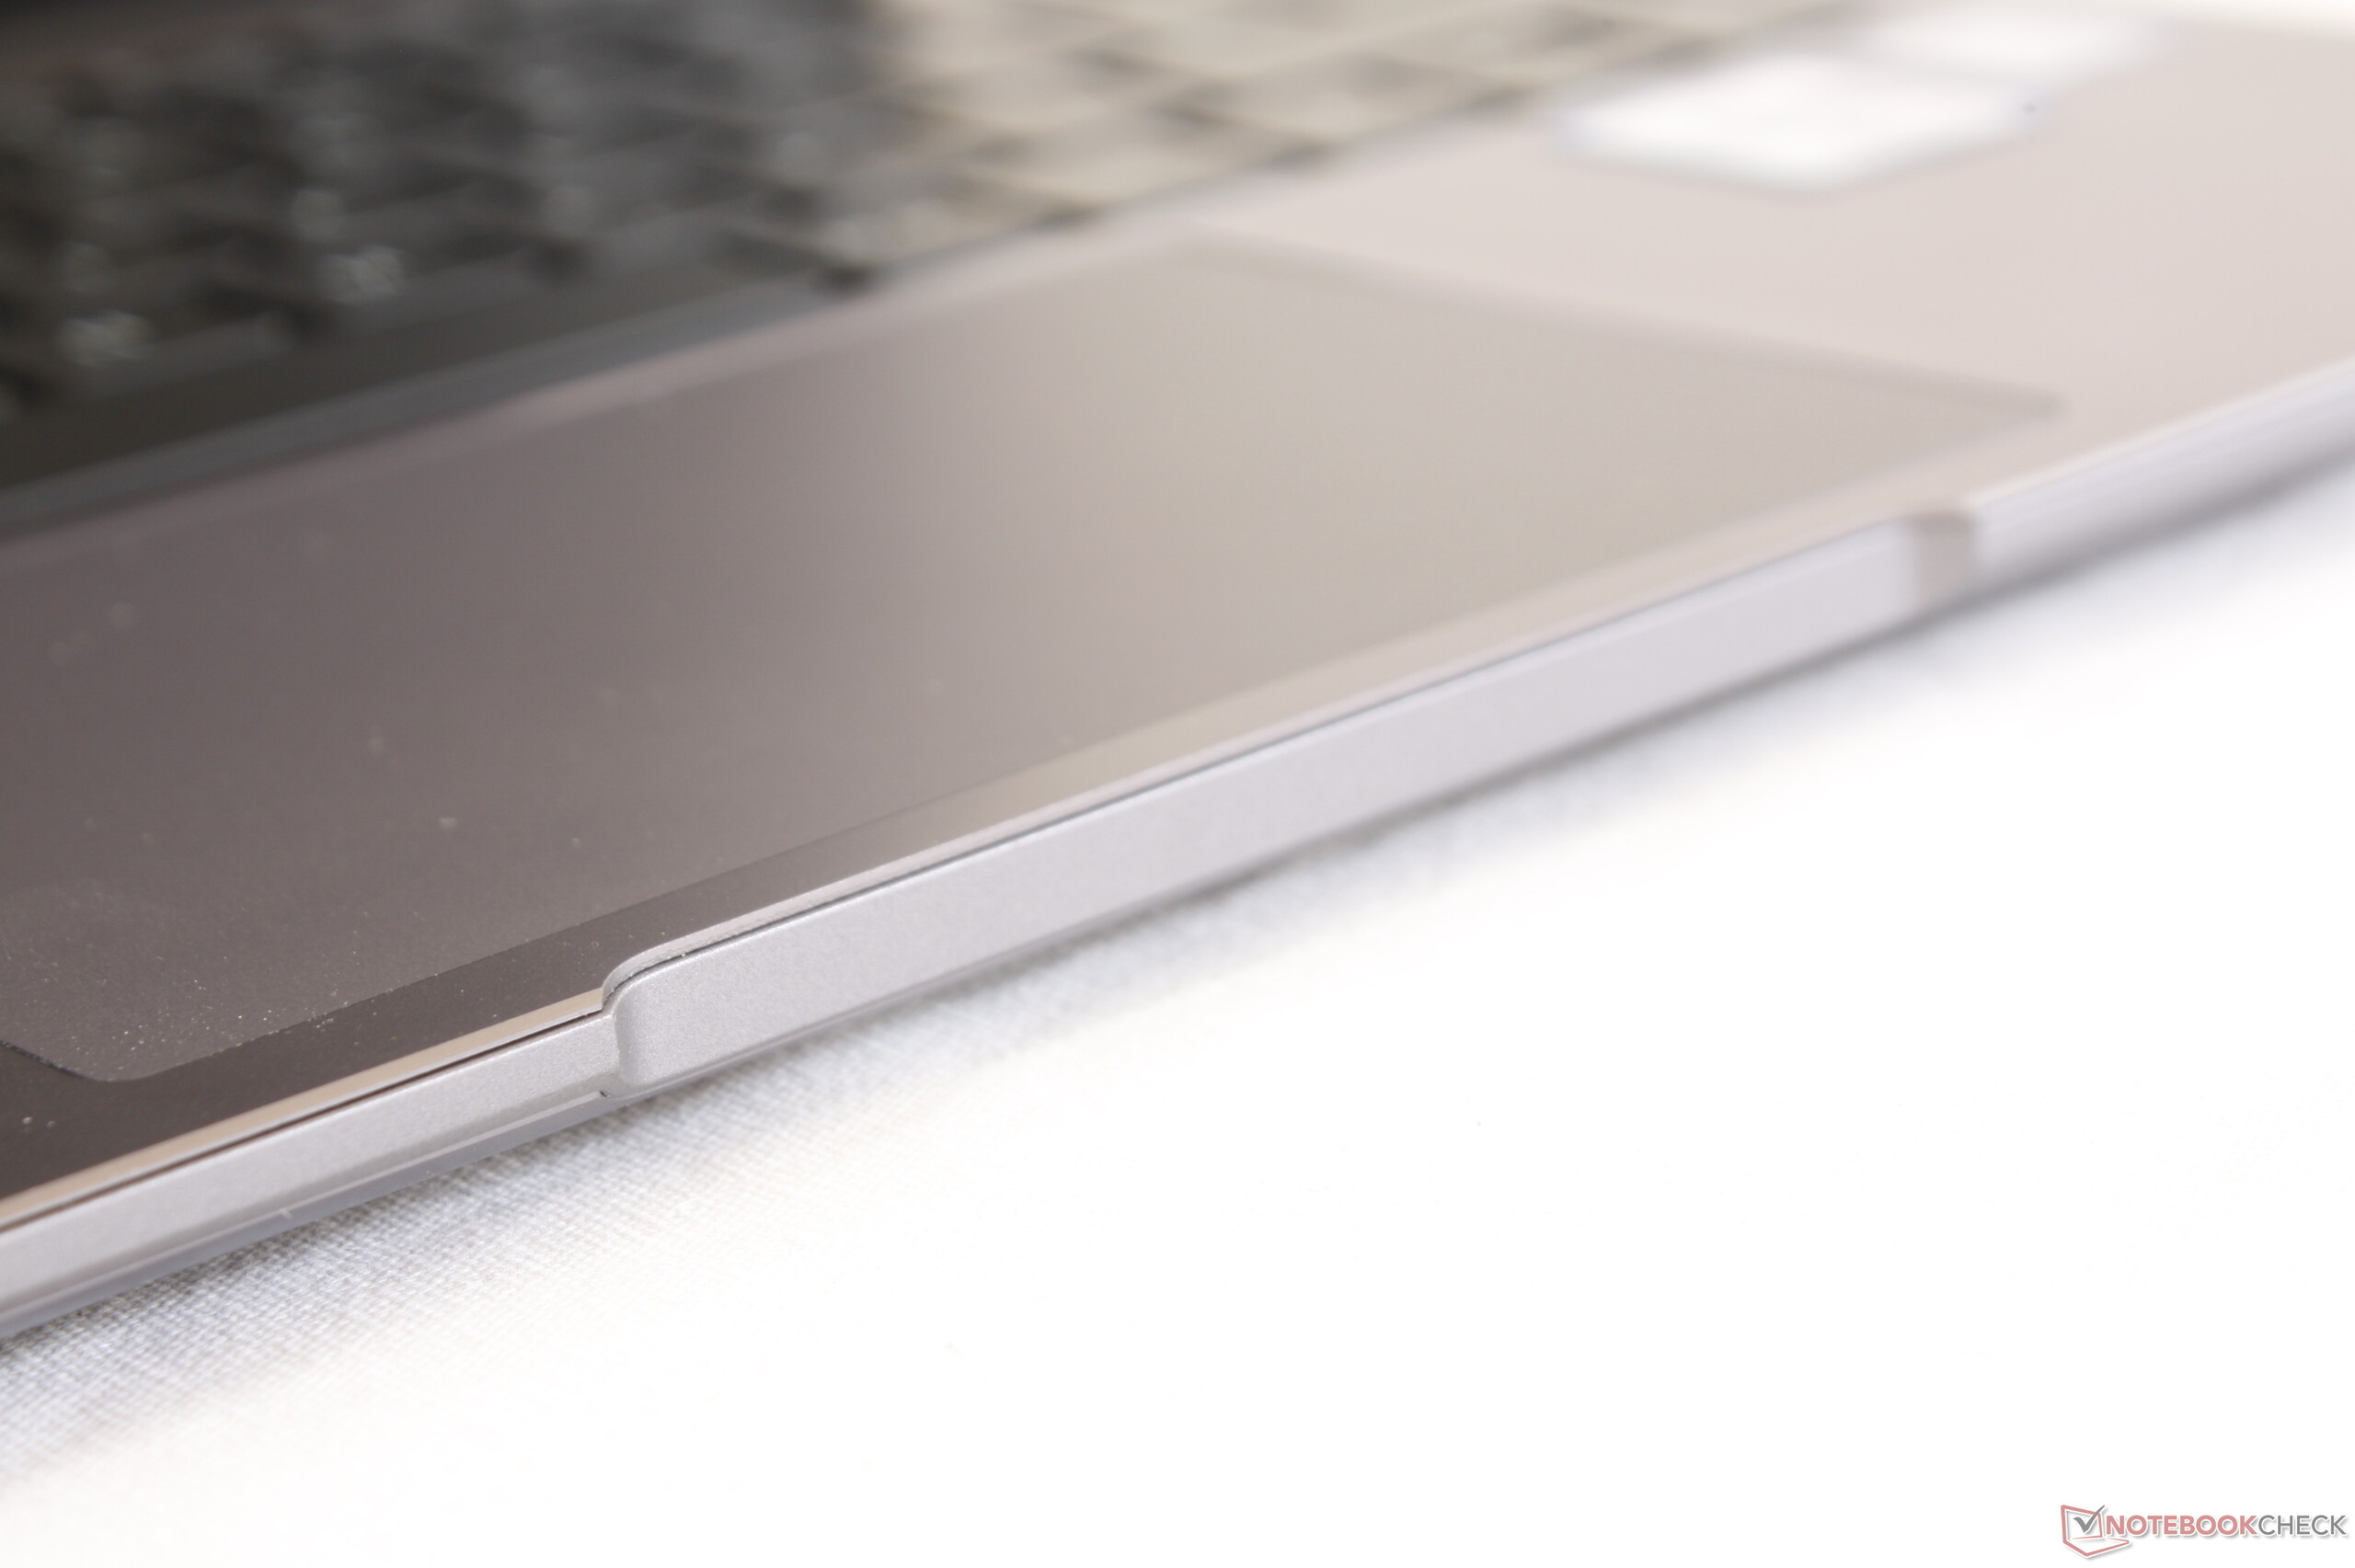
(±) The palmrests and touchpad can get very hot to the touch with a maximum of 36.8 °C / 98.2 F.
(-) The average temperature of the palmrest area of similar devices was 28.2 °C / 82.8 F (-8.6 °C / -15.4 F).
Huawei MateBook 14 KLV-W29 audio analysis
(±) | speaker loudness is average but good (74.2 dB)
Bass 100 - 315 Hz
(±) | reduced bass - on average 14.4% lower than median
(±) | linearity of bass is average (13.8% delta to prev. frequency)
Mids 400 - 2000 Hz
(±) | higher mids - on average 5.1% higher than median
(+) | mids are linear (5.4% delta to prev. frequency)
Highs 2 - 16 kHz
(+) | balanced highs - only 3.1% away from median
(+) | highs are linear (6.6% delta to prev. frequency)
Overall 100 - 16.000 Hz
(±) | linearity of overall sound is average (19.9% difference to median)
Compared to same class
» 63% of all tested devices in this class were better, 8% similar, 29% worse
» The best had a delta of 5%, average was 18%, worst was 53%
Compared to all devices tested
» 51% of all tested devices were better, 7% similar, 42% worse
» The best had a delta of 4%, average was 24%, worst was 134%
Apple MacBook 12 (Early 2016) 1.1 GHz audio analysis
(+) | speakers can play relatively loud (83.6 dB)
Bass 100 - 315 Hz
(±) | reduced bass - on average 11.3% lower than median
(±) | linearity of bass is average (14.2% delta to prev. frequency)
Mids 400 - 2000 Hz
(+) | balanced mids - only 2.4% away from median
(+) | mids are linear (5.5% delta to prev. frequency)
Highs 2 - 16 kHz
(+) | balanced highs - only 2% away from median
(+) | highs are linear (4.5% delta to prev. frequency)
Overall 100 - 16.000 Hz
(+) | overall sound is linear (10.2% difference to median)
Compared to same class
» 7% of all tested devices in this class were better, 2% similar, 91% worse
» The best had a delta of 5%, average was 18%, worst was 53%
Compared to all devices tested
» 5% of all tested devices were better, 1% similar, 94% worse
» The best had a delta of 4%, average was 24%, worst was 134%
| Off / Standby | |
| Idle | |
| Load |
|
Key:
min: | |
| Huawei MateBook 14 KLV-W29 i7-8565U, GeForce MX250, Samsung SSD PM981 MZVLB512HAJQ, IPS, 2160x1440, 14" | Huawei Matebook X Pro i5 i5-8250U, GeForce MX150, Samsung PM961 MZVLW256HEHP, IPS, 3000x2000, 13.9" | LG Gram 14Z980-U.AAW5U1 i5-8250U, UHD Graphics 620, SK Hynix SC313 HFS256G39TNF, IPS, 1920x1080, 14" | Asus ZenBook S13 UX392FN i7-8565U, GeForce MX150, WDC PC SN520 SDAPNUW-512G, IPS, 1920x1080, 13.9" | Lenovo Yoga C930-13IKB i5-8250U, UHD Graphics 620, SK hynix PC401 HFS256GD9TNG, IPS, 1920x1080, 13.9" | Razer Blade Stealth i7-8565U i7-8565U, GeForce MX150, Lite-On CA3-8D256-Q11, IPS, 1920x1080, 13.3" | |
|---|---|---|---|---|---|---|
| Power Consumption | 11% | 40% | 18% | 21% | -11% | |
| Idle Minimum * (Watt) | 3.7 | 3.5 5% | 2.7 27% | 3.4 8% | 3.3 11% | 6.7 -81% |
| Idle Average * (Watt) | 9.3 | 8.9 4% | 6 35% | 6.3 32% | 6.8 27% | 8.6 8% |
| Idle Maximum * (Watt) | 12.8 | 12.3 4% | 6.5 49% | 10.4 19% | 9.5 26% | 9.4 27% |
| Load Average * (Watt) | 58.8 | 54.2 8% | 32.5 45% | 51 13% | 40.8 31% | 64.1 -9% |
| Witcher 3 ultra * (Watt) | 55.8 | 42.4 24% | 39 30% | 63.7 -14% | ||
| Load Maximum * (Watt) | 65 | 52.1 20% | 35.5 45% | 62.7 4% | 57 12% | 64.1 1% |
* ... smaller is better
| Huawei MateBook 14 KLV-W29 i7-8565U, GeForce MX250, 57.4 Wh | Huawei Matebook X Pro i5 i5-8250U, GeForce MX150, 57.4 Wh | LG Gram 14Z980-U.AAW5U1 i5-8250U, UHD Graphics 620, 72 Wh | Dell XPS 13 9380 2019 i5-8265U, UHD Graphics 620, 52 Wh | Asus ZenBook S13 UX392FN i7-8565U, GeForce MX150, 50 Wh | Lenovo Yoga C930-13IKB i5-8250U, UHD Graphics 620, 60 Wh | |
|---|---|---|---|---|---|---|
| Battery runtime | 7% | 50% | 1% | 4% | 9% | |
| Reader / Idle (h) | 23.9 | 20.7 -13% | 37.3 56% | 17.2 -28% | 28.5 19% | 23.9 0% |
| WiFi v1.3 (h) | 8.4 | 9.3 11% | 12 43% | 8.3 -1% | 8.4 0% | 9.2 10% |
| Load (h) | 1.8 | 2.2 22% | 2.7 50% | 2.4 33% | 1.7 -6% | 2.1 17% |
Pros
Cons
MateBook 14使Microsoft Surface Laptop看起来有些过时。毫无疑问,它在功能,做工,屏幕以及特别是图形性能方面都是更优质的3:2笔记本电脑,价格相同。如果独特的宽高比和相对高性能的GPU的组合很吸引人,那么MateBook 14将适合您。
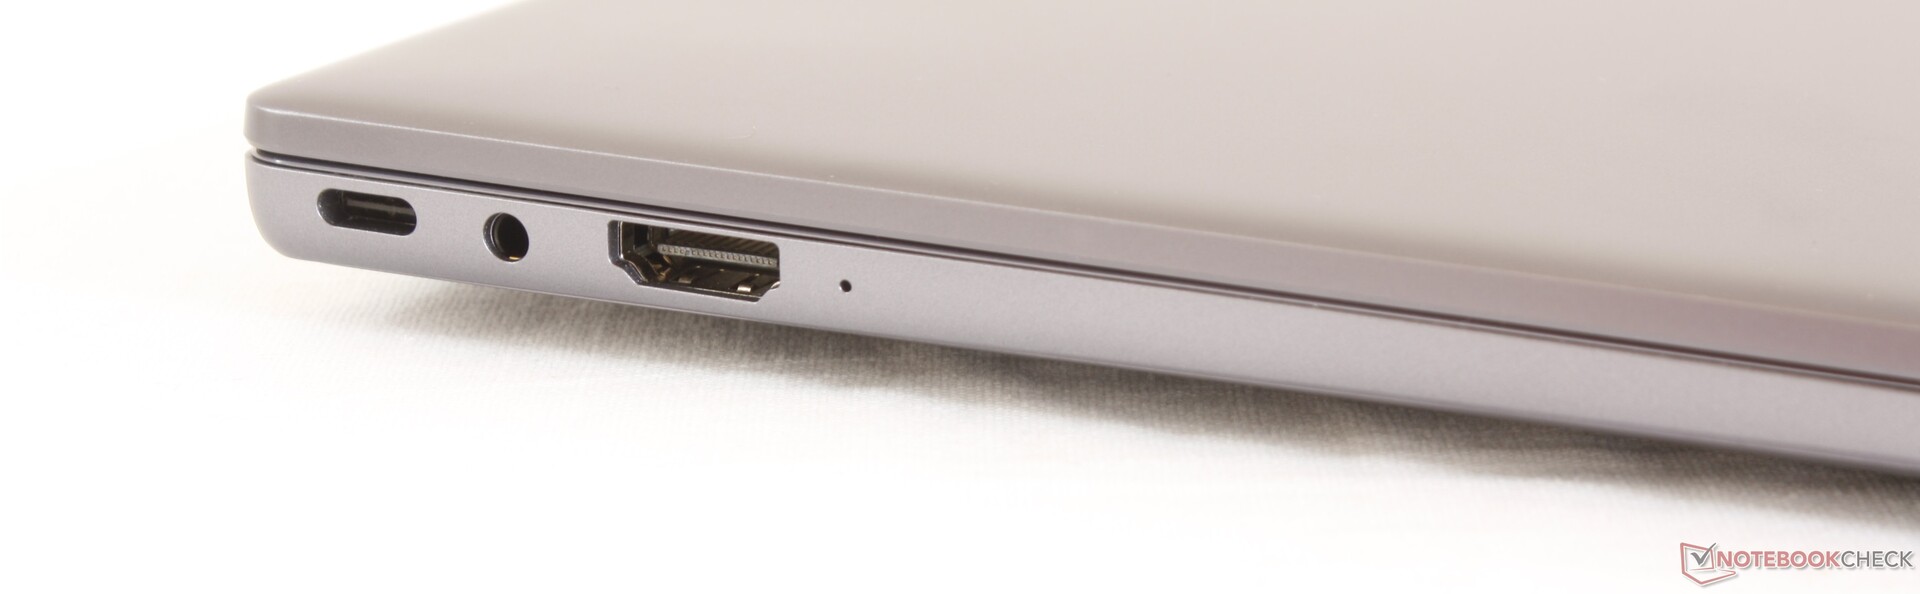
但是,如果你的目的主要是多媒体播放或游戏,而不是文字处理或浏览,那么更传统的配备雷电3接口的16:9超级本,如华硕ZenBook S13 UX392或Razer Blade Stealth将更合适。 MateBook 14中的MX250与MateBook 13中的MX150相比几乎没有提升,CPU Turbo Boost性能仍然很弱。
即将推出的2019 MateBook X Pro将采用与MateBook 14完全相同的CPU和GPU选项,但采用更加纤薄的机身,配备更多USB Type-C端口和更高分辨率的触摸屏。当然,缺点是高昂的价格,相比之下,MateBook 14的价格则略低。如果您发现MateBook X Pro很具有吸引力但是价格较高,那么MateBook 14应该是值得一看。我们更加建议使用Core i5-8265U的SKU,因为它和i7版本性能上几乎完全相同。
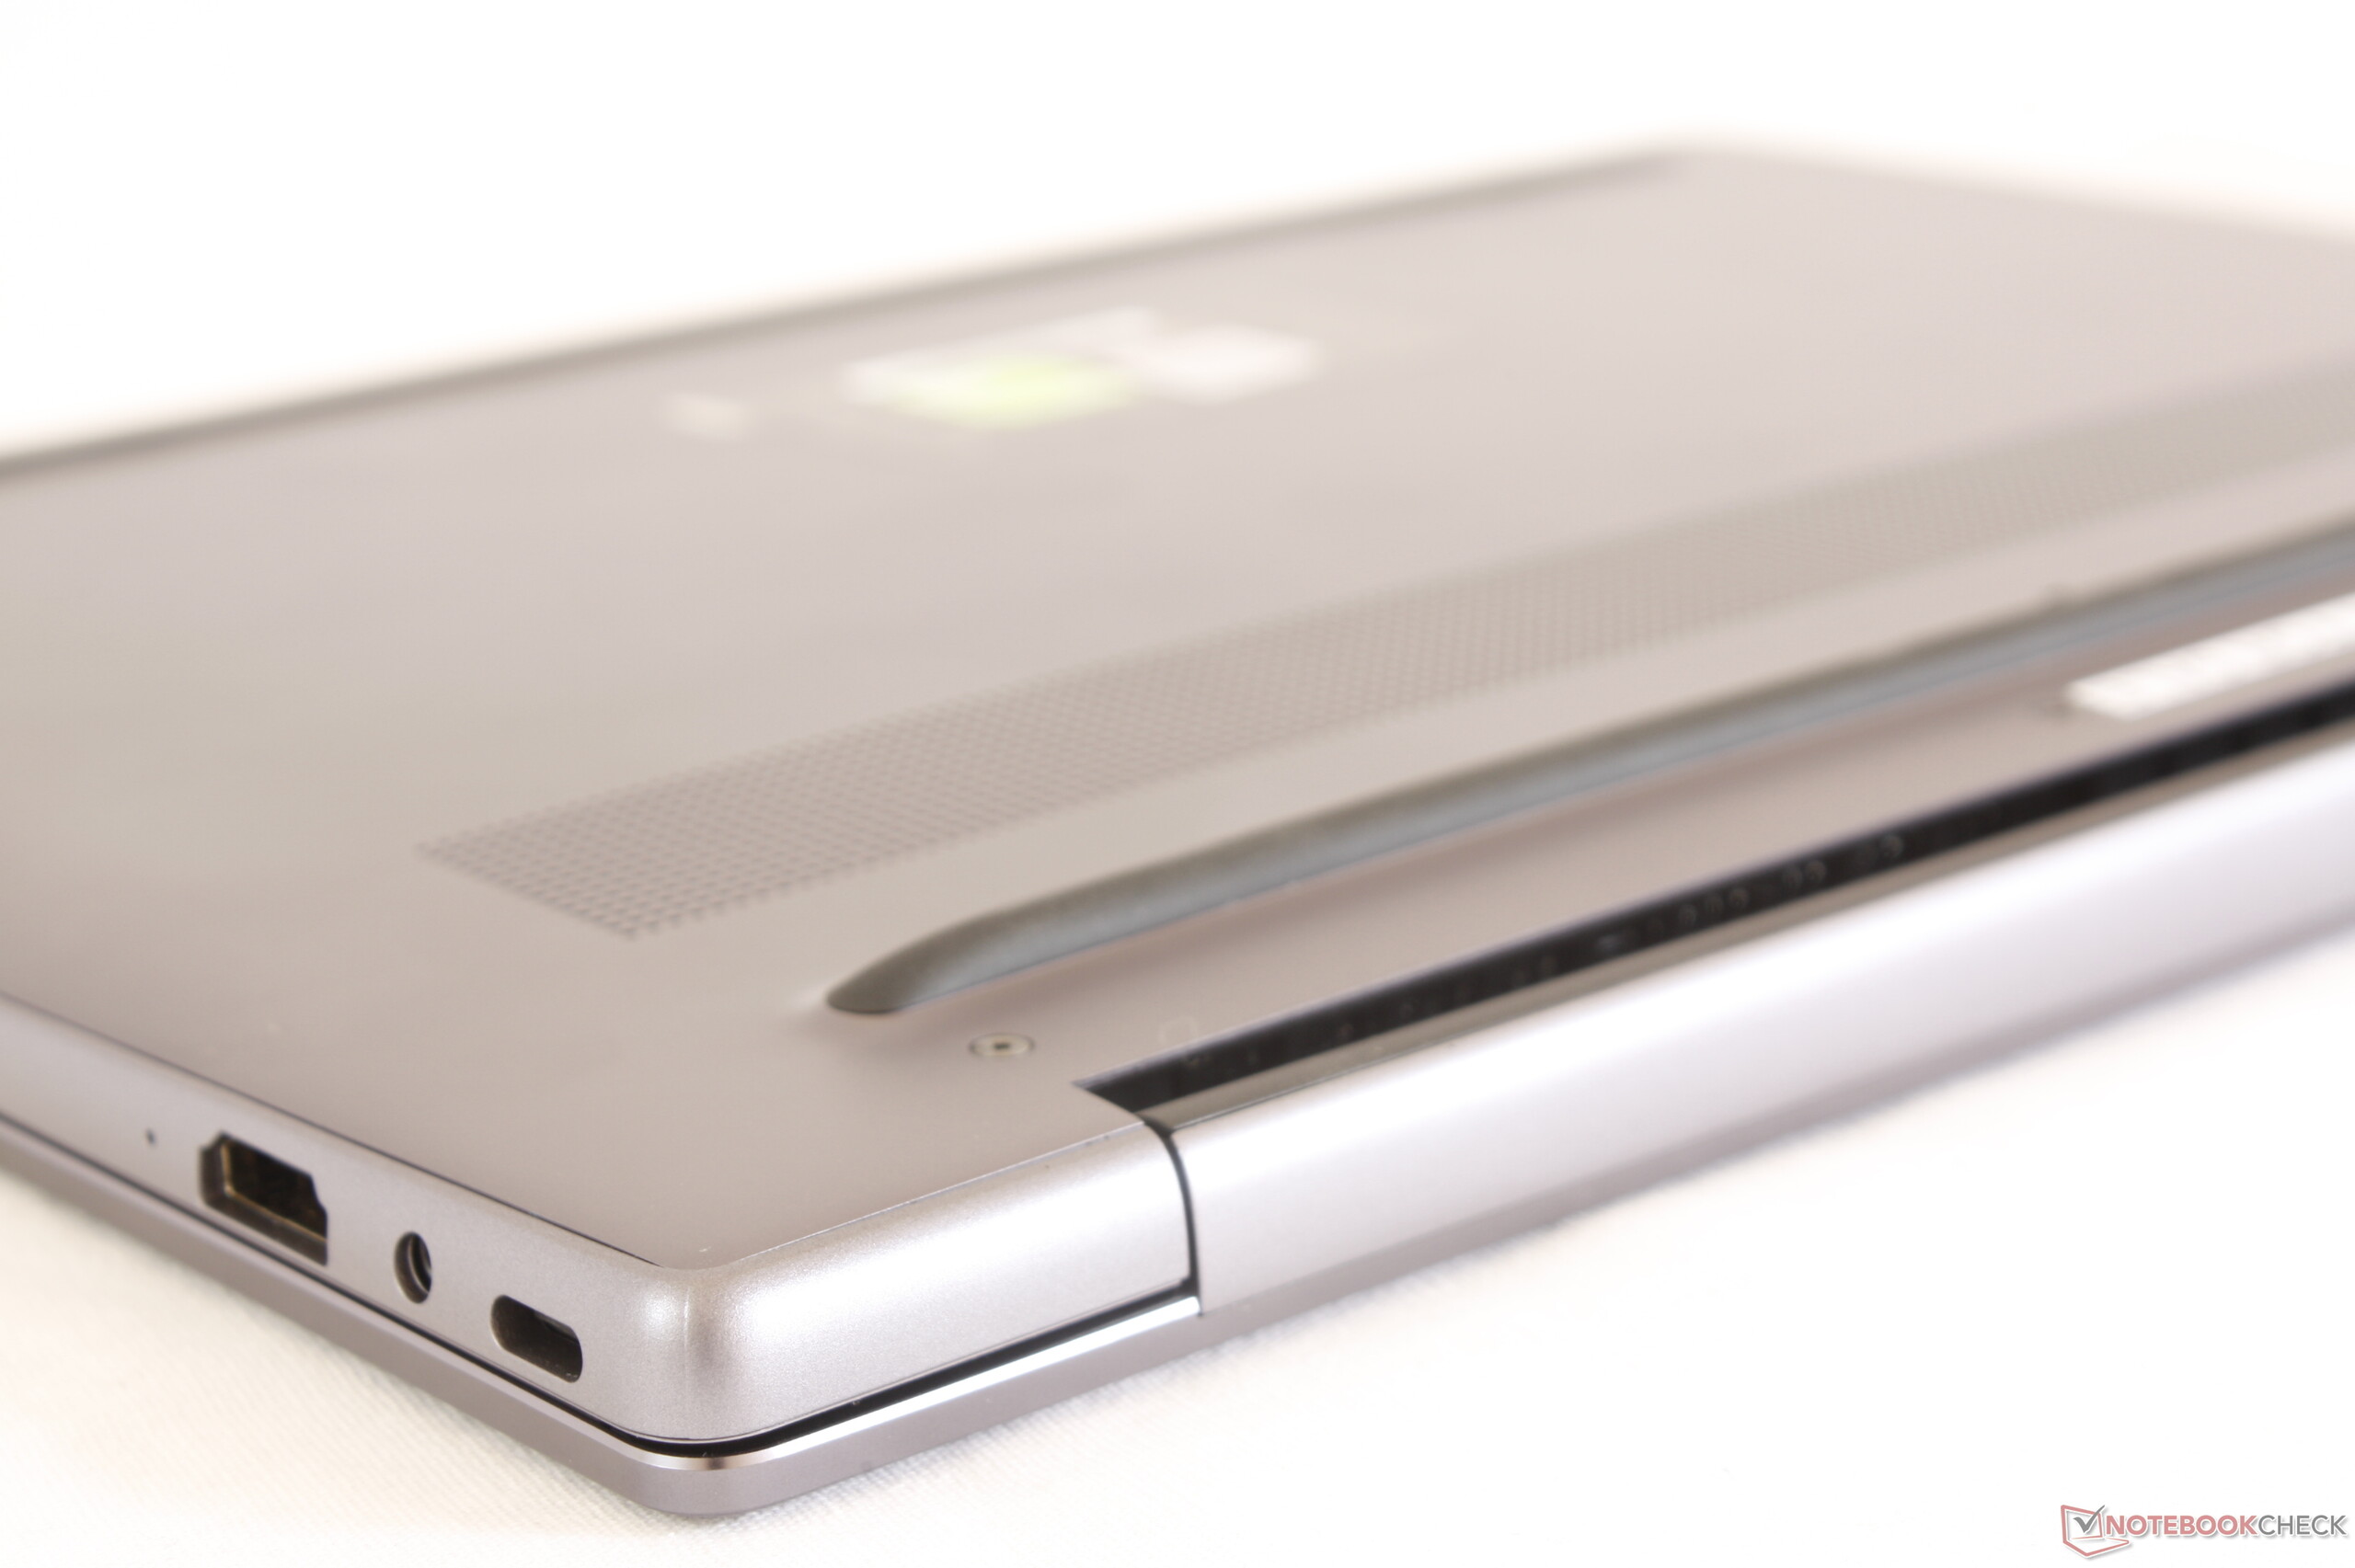
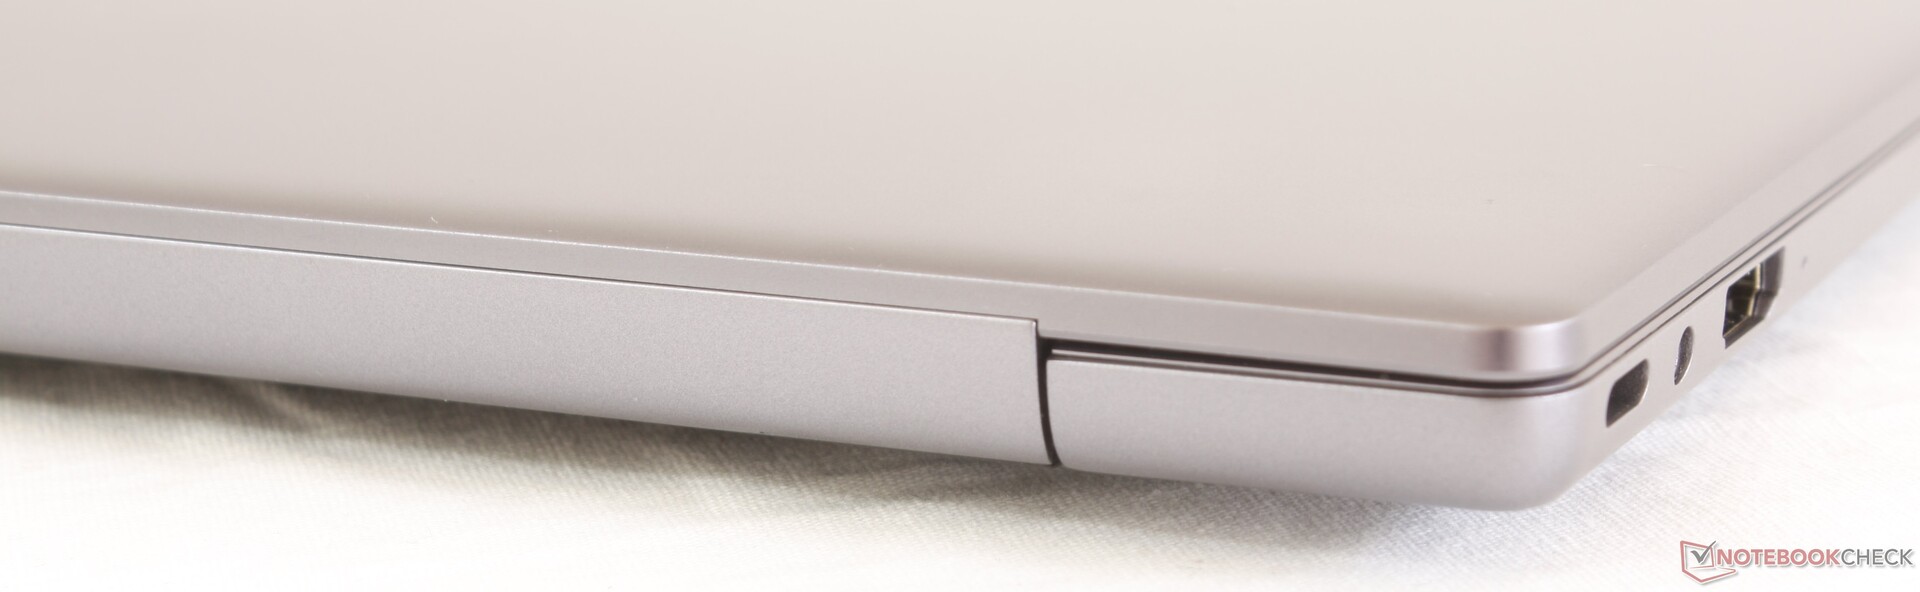
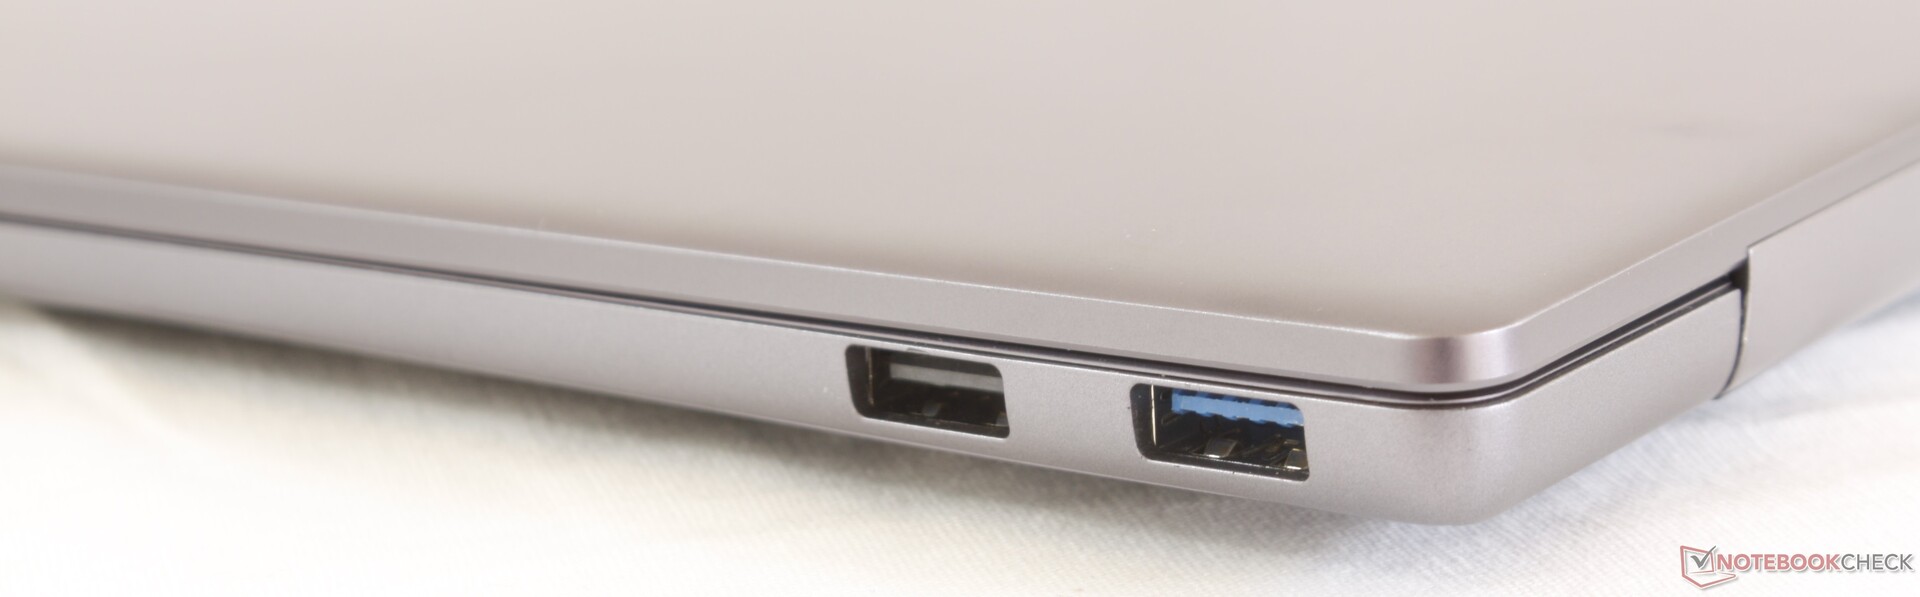
Core i7-8565U CPU和25 W的GeForce MX250 GPU与MateBook 13上的Core i7-8550U和25 W GeForce MX150提升极小。虽然它是市场上最好的3:2超极本之一,但它仍然可以在端口选项,触控板反馈和网络摄像头放置方面做得更好。
Huawei MateBook 14 KLV-W29
- 05/06/2019 v6 (old)
Allen Ngo
Price comparison

