联想ThinkPad T590商务笔记本电脑评测:大而轻,屏幕差劲。

| SD Card Reader | |
| average JPG Copy Test (av. of 3 runs) | |
| Dell Latitude 5590 (Toshiba Exceria Pro SDXC 64 GB UHS-II) | |
| Lenovo ThinkPad T580-20LAS01H00 (Toshiba Exceria Pro SDXC 64 GB UHS-II) | |
| Lenovo ThinkPad T490-20N3S02L00 (Toshiba Exceria Pro M501) | |
| Lenovo ThinkPad T590-20N4002VGE (Toshiba Exceria Pro M501 UHS-II) | |
| Fujitsu LifeBook U758 (Toshiba Exceria Pro SDXC 64 GB UHS-II) | |
| Lenovo ThinkPad T490s-20NYS02A00 (Toshiba Exceria Pro M501) | |
| Average of class Office (19.8 - 198.5, n=22, last 2 years) | |
| maximum AS SSD Seq Read Test (1GB) | |
| Dell Latitude 5590 (Toshiba Exceria Pro SDXC 64 GB UHS-II) | |
| Lenovo ThinkPad T490s-20NYS02A00 (Toshiba Exceria Pro M501) | |
| Lenovo ThinkPad T580-20LAS01H00 (Toshiba Exceria Pro SDXC 64 GB UHS-II) | |
| Fujitsu LifeBook U758 (Toshiba Exceria Pro SDXC 64 GB UHS-II) | |
| Lenovo ThinkPad T490-20N3S02L00 (Toshiba Exceria Pro M501) | |
| Lenovo ThinkPad T590-20N4002VGE (Toshiba Exceria Pro M501 UHS-II) | |
| Average of class Office (27.4 - 249, n=21, last 2 years) | |
| Networking | |
| iperf3 transmit AX12 | |
| Lenovo ThinkPad T490-20N3S02L00 | |
| HP EliteBook 850 G5 3JX58EA | |
| Lenovo ThinkPad T490s-20NYS02A00 | |
| Lenovo ThinkPad T590-20N4002VGE | |
| Fujitsu LifeBook U758 | |
| Dell Latitude 5590 | |
| Lenovo ThinkPad T580-20LAS01H00 | |
| iperf3 receive AX12 | |
| Lenovo ThinkPad T490-20N3S02L00 | |
| Lenovo ThinkPad T590-20N4002VGE | |
| Lenovo ThinkPad T490s-20NYS02A00 | |
| Fujitsu LifeBook U758 | |
| Lenovo ThinkPad T580-20LAS01H00 | |
| HP EliteBook 850 G5 3JX58EA | |
| Dell Latitude 5590 | |
| |||||||||||||||||||||||||
Brightness Distribution: 88 %
Center on Battery: 277 cd/m²
Contrast: 1200:1 (Black: 0.23 cd/m²)
ΔE ColorChecker Calman: 5.6 | ∀{0.5-29.43 Ø4.73}
calibrated: 4.7
ΔE Greyscale Calman: 3 | ∀{0.09-98 Ø4.97}
58.1% sRGB (Argyll 1.6.3 3D)
36.9% AdobeRGB 1998 (Argyll 1.6.3 3D)
40.11% AdobeRGB 1998 (Argyll 3D)
58.3% sRGB (Argyll 3D)
38.79% Display P3 (Argyll 3D)
Gamma: 2.18
CCT: 7075 K
| Lenovo ThinkPad T590-20N4002VGE LP156WFC-SPD1, , 1920x1080, 15.6" | Lenovo ThinkPad T580-20L9001AUS B156HAK02.0, , 1920x1080, 15.6" | HP EliteBook 850 G5 3JX58EA AUO24ED, , 1920x1080, 15.6" | Dell Latitude 5590 NV15N42, , 1920x1080, 15.6" | Fujitsu LifeBook U758 LG, LP156UD1-SPB1, , 3840x2160, 15.6" | Lenovo ThinkPad T490-20N3S02L00 NE140FHM-N61, , 1920x1080, 14" | Lenovo ThinkPad T490s-20NYS02A00 B140HAN05.7, , 1920x1080, 14" | |
|---|---|---|---|---|---|---|---|
| Display | -5% | 59% | 6% | 66% | 68% | 70% | |
| Display P3 Coverage (%) | 38.79 | 36.94 -5% | 63.4 63% | 41.56 7% | 65.4 69% | 69.3 79% | 67.1 73% |
| sRGB Coverage (%) | 58.3 | 55.3 -5% | 88.8 52% | 61.3 5% | 94.2 62% | 92.2 58% | 97.6 67% |
| AdobeRGB 1998 Coverage (%) | 40.11 | 38.16 -5% | 64.4 61% | 42.93 7% | 66.9 67% | 67.4 68% | 68.5 71% |
| Response Times | 5% | -3% | -45% | -5% | -84% | -55% | |
| Response Time Grey 50% / Grey 80% * (ms) | 37.2 ? | 33.2 ? 11% | 42 ? -13% | 53.2 ? -43% | 38.4 ? -3% | 74 ? -99% | 61.6 ? -66% |
| Response Time Black / White * (ms) | 27.2 ? | 27.6 ? -1% | 25 ? 8% | 39.6 ? -46% | 29.2 ? -7% | 45.6 ? -68% | 38.8 ? -43% |
| PWM Frequency (Hz) | 1000 ? | 2451 ? | |||||
| Screen | -5% | 11% | -12% | 26% | 26% | 38% | |
| Brightness middle (cd/m²) | 276 | 254.5 -8% | 402 46% | 243 -12% | 312 13% | 418 51% | 391 42% |
| Brightness (cd/m²) | 262 | 238 -9% | 383 46% | 234 -11% | 304 16% | 400 53% | 389 48% |
| Brightness Distribution (%) | 88 | 87 -1% | 88 0% | 83 -6% | 93 6% | 88 0% | 87 -1% |
| Black Level * (cd/m²) | 0.23 | 0.27 -17% | 0.41 -78% | 0.19 17% | 0.24 -4% | 0.24 -4% | 0.23 -0% |
| Contrast (:1) | 1200 | 943 -21% | 980 -18% | 1279 7% | 1300 8% | 1742 45% | 1700 42% |
| Colorchecker dE 2000 * | 5.6 | 4.58 18% | 5.25 6% | 6.6 -18% | 3.4 39% | 4.7 16% | 3.4 39% |
| Colorchecker dE 2000 max. * | 16.4 | 17.99 -10% | 8.65 47% | 22.3 -36% | 5.6 66% | 8.7 47% | 4.7 71% |
| Colorchecker dE 2000 calibrated * | 4.7 | 4.34 8% | 5.19 -10% | 5 -6% | 2.7 43% | 2.1 55% | 1.1 77% |
| Greyscale dE 2000 * | 3 | 3.3 -10% | 4 -33% | 5.2 -73% | 4 -33% | 5.9 -97% | 4 -33% |
| Gamma | 2.18 101% | 2.403 92% | 2.68 82% | 2.24 98% | 2.25 98% | 2.06 107% | 2.49 88% |
| CCT | 7075 92% | 6355 102% | 6756 96% | 6990 93% | 6977 93% | 7350 88% | 6809 95% |
| Color Space (Percent of AdobeRGB 1998) (%) | 36.9 | 35 -5% | 58 57% | 39.2 6% | 60.9 65% | 59.9 62% | 62.4 69% |
| Color Space (Percent of sRGB) (%) | 58.1 | 55 -5% | 89 53% | 60.8 5% | 94.1 62% | 92.1 59% | 97.4 68% |
| Total Average (Program / Settings) | -2% /
-4% | 22% /
18% | -17% /
-12% | 29% /
29% | 3% /
20% | 18% /
33% |
* ... smaller is better
Display Response Times
| ↔ Response Time Black to White | ||
|---|---|---|
| 27.2 ms ... rise ↗ and fall ↘ combined | ↗ 17.2 ms rise | 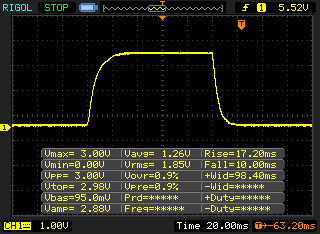 |
| ↘ 10 ms fall | ||
| The screen shows relatively slow response rates in our tests and may be too slow for gamers. In comparison, all tested devices range from 0.1 (minimum) to 240 (maximum) ms. » 69 % of all devices are better. This means that the measured response time is worse than the average of all tested devices (19.9 ms). | ||
| ↔ Response Time 50% Grey to 80% Grey | ||
| 37.2 ms ... rise ↗ and fall ↘ combined | ↗ 19.2 ms rise | 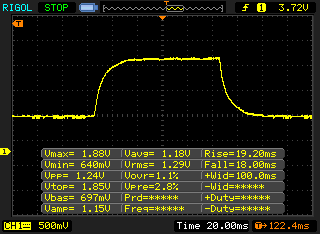 |
| ↘ 18 ms fall | ||
| The screen shows slow response rates in our tests and will be unsatisfactory for gamers. In comparison, all tested devices range from 0.165 (minimum) to 636 (maximum) ms. » 54 % of all devices are better. This means that the measured response time is worse than the average of all tested devices (31.1 ms). | ||
Screen Flickering / PWM (Pulse-Width Modulation)
| Screen flickering / PWM not detected | 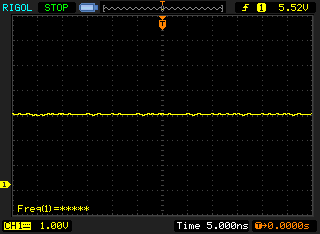 | ||
In comparison: 52 % of all tested devices do not use PWM to dim the display. If PWM was detected, an average of 7784 (minimum: 5 - maximum: 343500) Hz was measured. | |||
| Cinebench R15 | |
| CPU Single 64Bit | |
| Average of class Office (99.5 - 312, n=75, last 2 years) | |
| Lenovo ThinkPad T590-20N4002VGE | |
| Lenovo ThinkPad T490-20N3S02L00 | |
| Average Intel Core i7-8565U (138.3 - 193, n=51) | |
| Lenovo ThinkPad T580-20LAS01H00 | |
| Lenovo ThinkPad T490s-20NYS02A00 | |
| Dell Latitude 5590 | |
| HP EliteBook 850 G5 3JX58EA | |
| Fujitsu LifeBook U758 | |
| CPU Multi 64Bit | |
| Average of class Office (250 - 3380, n=75, last 2 years) | |
| Lenovo ThinkPad T590-20N4002VGE | |
| Dell Latitude 5590 | |
| Lenovo ThinkPad T490s-20NYS02A00 | |
| Lenovo ThinkPad T490-20N3S02L00 | |
| Lenovo ThinkPad T580-20LAS01H00 | |
| Average Intel Core i7-8565U (452 - 815, n=52) | |
| HP EliteBook 850 G5 3JX58EA | |
| Fujitsu LifeBook U758 | |
| PCMark 8 | |
| Home Score Accelerated v2 | |
| Average of class Office (n=1last 2 years) | |
| Lenovo ThinkPad T490s-20NYS02A00 | |
| Lenovo ThinkPad T490-20N3S02L00 | |
| Lenovo ThinkPad T590-20N4002VGE | |
| Dell Latitude 5590 | |
| Average Intel Core i7-8565U, NVIDIA GeForce MX250 (3331 - 4220, n=9) | |
| HP EliteBook 850 G5 3JX58EA | |
| Fujitsu LifeBook U758 | |
| Lenovo ThinkPad T580-20LAS01H00 | |
| Work Score Accelerated v2 | |
| Average of class Office (n=1last 2 years) | |
| Lenovo ThinkPad T490-20N3S02L00 | |
| Lenovo ThinkPad T590-20N4002VGE | |
| Average Intel Core i7-8565U, NVIDIA GeForce MX250 (4796 - 5277, n=9) | |
| Lenovo ThinkPad T490s-20NYS02A00 | |
| Dell Latitude 5590 | |
| Lenovo ThinkPad T580-20LAS01H00 | |
| Fujitsu LifeBook U758 | |
| PCMark 8 Home Score Accelerated v2 | 3885 points | |
| PCMark 8 Work Score Accelerated v2 | 5225 points | |
| PCMark 10 Score | 4547 points | |
Help | ||
| Lenovo ThinkPad T590-20N4002VGE Toshiba XG6 KXG60ZNV512G | Lenovo ThinkPad T580-20LAS01H00 Samsung SSD PM981 MZVLB512HAJQ | HP EliteBook 850 G5 3JX58EA Toshiba XG5 KXG50ZNV256G | Dell Latitude 5590 SK hynix SC311 M.2 | Fujitsu LifeBook U758 Toshiba KXG5AZNV1T02 | Lenovo ThinkPad T490-20N3S02L00 Toshiba XG5 KXG50ZNV512G | Lenovo ThinkPad T490s-20NYS02A00 Intel SSD Pro 7600p SSDPEKKF512G8L | Average Toshiba XG6 KXG60ZNV512G | |
|---|---|---|---|---|---|---|---|---|
| CrystalDiskMark 5.2 / 6 | -31% | -33% | -55% | -11% | -7% | -5% | -6% | |
| Write 4K (MB/s) | 126.2 | 131.4 4% | 95.9 -24% | 76.7 -39% | 115.3 -9% | 126.6 0% | 122 -3% | 112.8 ? -11% |
| Read 4K (MB/s) | 48.93 | 29.47 -40% | 30.91 -37% | 28.41 -42% | 28.7 -41% | 43.61 -11% | 45.56 -7% | 42.7 ? -13% |
| Write Seq (MB/s) | 1345 | 878 -35% | 312.5 -77% | 436.7 -68% | 955 -29% | 1342 0% | 1497 11% | 1489 ? 11% |
| Read Seq (MB/s) | 1373 | 883 -36% | 1966 43% | 508 -63% | 1951 42% | 1251 -9% | 2385 74% | 1771 ? 29% |
| Write 4K Q32T1 (MB/s) | 383.8 | 256 -33% | 308.8 -20% | 288.1 -25% | 543 41% | 297.7 -22% | 240.9 -37% | 345 ? -10% |
| Read 4K Q32T1 (MB/s) | 434.8 | 337.7 -22% | 248.6 -43% | 271.9 -37% | 346.6 -20% | 376.4 -13% | 338 -22% | 359 ? -17% |
| Write Seq Q32T1 (MB/s) | 2966 | 1723 -42% | 292.2 -90% | 503 -83% | 959 -68% | 2969 0% | 1528 -48% | 2257 ? -24% |
| Read Seq Q32T1 (MB/s) | 3230 | 1778 -45% | 2718 -16% | 549 -83% | 3094 -4% | 3228 0% | 2915 -10% | 2926 ? -9% |

| 3DMark 11 - 1280x720 Performance GPU | |
| Lenovo ThinkPad X1 Extreme-20MF000RGE | |
| Average of class Office (2551 - 18313, n=68, last 2 years) | |
| Lenovo ThinkPad T490-20N3S02L00 | |
| Average NVIDIA GeForce MX250 (3585 - 4942, n=29) | |
| Lenovo ThinkPad T580-20LAS01H00 | |
| Lenovo ThinkPad T590-20N4002VGE | |
| Lenovo ThinkPad T490s-20NYS02A00 | |
| HP EliteBook 850 G5 3JX58EA | |
| Fujitsu LifeBook U758 | |
| Dell Latitude 5590 | |
| 3DMark | |
| 1280x720 Cloud Gate Standard Graphics | |
| Lenovo ThinkPad X1 Extreme-20MF000RGE | |
| Average of class Office (11640 - 118515, n=37, last 2 years) | |
| Lenovo ThinkPad T590-20N4002VGE | |
| Lenovo ThinkPad T490-20N3S02L00 | |
| Average NVIDIA GeForce MX250 (13805 - 23863, n=25) | |
| Lenovo ThinkPad T580-20LAS01H00 | |
| Lenovo ThinkPad T490s-20NYS02A00 | |
| Fujitsu LifeBook U758 | |
| Dell Latitude 5590 | |
| HP EliteBook 850 G5 3JX58EA | |
| 1920x1080 Fire Strike Graphics | |
| Lenovo ThinkPad X1 Extreme-20MF000RGE | |
| Average of class Office (736 - 21871, n=73, last 2 years) | |
| Lenovo ThinkPad T490-20N3S02L00 | |
| Lenovo ThinkPad T590-20N4002VGE | |
| Average NVIDIA GeForce MX250 (2939 - 3885, n=29) | |
| Lenovo ThinkPad T580-20LAS01H00 | |
| Lenovo ThinkPad T490s-20NYS02A00 | |
| Fujitsu LifeBook U758 | |
| HP EliteBook 850 G5 3JX58EA | |
| Dell Latitude 5590 | |
| 3DMark 11 Performance | 4449 points | |
| 3DMark Cloud Gate Standard Score | 8009 points | |
| 3DMark Fire Strike Score | 3194 points | |
Help | ||
| The Witcher 3 - 1366x768 Medium Graphics & Postprocessing | |
| Lenovo ThinkPad X1 Extreme-20MF000RGE | |
| Average of class Office (44.7 - 63.9, n=4, last 2 years) | |
| Lenovo ThinkPad T590-20N4002VGE | |
| Average NVIDIA GeForce MX250 (30 - 40, n=27) | |
| Lenovo ThinkPad T580-20LAS01H00 | |
| low | med. | high | ultra | |
|---|---|---|---|---|
| BioShock Infinite (2013) | 208 | 112 | 97 | 38 |
| The Witcher 3 (2015) | 49.9 | 35.8 | 21 | 12.6 |
| Dota 2 Reborn (2015) | 71 | 21.8 | 8.6 | 7.8 |
| Civilization 6 (2016) | 123.3 | 62.2 | 22.7 | 20.3 |
| X-Plane 11.11 (2018) | 18.8 | 9.8 | 9.8 |
Noise level
| Idle |
| 29.3 / 29.3 / 31.8 dB(A) |
| Load |
| 33.5 / 35.8 dB(A) |
 | ||
30 dB silent 40 dB(A) audible 50 dB(A) loud |
||
min: | ||
(±) The maximum temperature on the upper side is 44.7 °C / 112 F, compared to the average of 34.3 °C / 94 F, ranging from 21.2 to 62.5 °C for the class Office.
(-) The bottom heats up to a maximum of 56.3 °C / 133 F, compared to the average of 36.8 °C / 98 F
(+) In idle usage, the average temperature for the upper side is 22.6 °C / 73 F, compared to the device average of 29.5 °C / 85 F.
(±) Playing The Witcher 3, the average temperature for the upper side is 36 °C / 97 F, compared to the device average of 29.5 °C / 85 F.
(+) The palmrests and touchpad are cooler than skin temperature with a maximum of 30.5 °C / 86.9 F and are therefore cool to the touch.
(-) The average temperature of the palmrest area of similar devices was 27.5 °C / 81.5 F (-3 °C / -5.4 F).
Lenovo ThinkPad T590-20N4002VGE audio analysis
(-) | not very loud speakers (70.9 dB)
Bass 100 - 315 Hz
(-) | nearly no bass - on average 16% lower than median
(±) | linearity of bass is average (7.9% delta to prev. frequency)
Mids 400 - 2000 Hz
(+) | balanced mids - only 4.3% away from median
(±) | linearity of mids is average (8.7% delta to prev. frequency)
Highs 2 - 16 kHz
(+) | balanced highs - only 4.4% away from median
(+) | highs are linear (6.5% delta to prev. frequency)
Overall 100 - 16.000 Hz
(±) | linearity of overall sound is average (25.5% difference to median)
Compared to same class
» 78% of all tested devices in this class were better, 6% similar, 16% worse
» The best had a delta of 7%, average was 21%, worst was 53%
Compared to all devices tested
» 78% of all tested devices were better, 4% similar, 17% worse
» The best had a delta of 4%, average was 24%, worst was 134%
HP EliteBook 850 G5 3JX58EA audio analysis
(±) | speaker loudness is average but good (76.4 dB)
Bass 100 - 315 Hz
(-) | nearly no bass - on average 28.1% lower than median
(±) | linearity of bass is average (11.4% delta to prev. frequency)
Mids 400 - 2000 Hz
(+) | balanced mids - only 2.1% away from median
(±) | linearity of mids is average (7.6% delta to prev. frequency)
Highs 2 - 16 kHz
(±) | higher highs - on average 5.5% higher than median
(+) | highs are linear (2.4% delta to prev. frequency)
Overall 100 - 16.000 Hz
(±) | linearity of overall sound is average (20.4% difference to median)
Compared to same class
» 45% of all tested devices in this class were better, 10% similar, 45% worse
» The best had a delta of 7%, average was 21%, worst was 53%
Compared to all devices tested
» 53% of all tested devices were better, 8% similar, 39% worse
» The best had a delta of 4%, average was 24%, worst was 134%
Lenovo ThinkPad T580-20L9001AUS audio analysis
(±) | speaker loudness is average but good (80.4 dB)
Bass 100 - 315 Hz
(±) | reduced bass - on average 7.5% lower than median
(±) | linearity of bass is average (7.8% delta to prev. frequency)
Mids 400 - 2000 Hz
(+) | balanced mids - only 3.6% away from median
(±) | linearity of mids is average (7% delta to prev. frequency)
Highs 2 - 16 kHz
(+) | balanced highs - only 2.3% away from median
(±) | linearity of highs is average (8.3% delta to prev. frequency)
Overall 100 - 16.000 Hz
(+) | overall sound is linear (12.7% difference to median)
Compared to same class
» 5% of all tested devices in this class were better, 2% similar, 93% worse
» The best had a delta of 7%, average was 21%, worst was 53%
Compared to all devices tested
» 12% of all tested devices were better, 3% similar, 86% worse
» The best had a delta of 4%, average was 24%, worst was 134%
| Off / Standby | |
| Idle | |
| Load |
|
Key:
min: | |
| Lenovo ThinkPad T590-20N4002VGE i7-8565U, GeForce MX250, Toshiba XG6 KXG60ZNV512G, aSi IPS LED, 1920x1080, 15.6" | Lenovo ThinkPad T580-20LAS01H00 i5-8550U, GeForce MX150, Samsung SSD PM981 MZVLB512HAJQ, IPS LED, 3840x2160, 15.6" | HP EliteBook 850 G5 3JX58EA i5-8250U, UHD Graphics 620, Toshiba XG5 KXG50ZNV256G, IPS LED, 1920x1080, 15.6" | Dell Latitude 5590 i5-8250U, UHD Graphics 620, SK hynix SC311 M.2, IPS, 1920x1080, 15.6" | Fujitsu LifeBook U758 i7-8650U, UHD Graphics 620, Toshiba KXG5AZNV1T02, IPS, 3840x2160, 15.6" | Lenovo ThinkPad T490-20N3S02L00 i7-8565U, GeForce MX250, Toshiba XG5 KXG50ZNV512G, IGZO IPS LED, 1920x1080, 14" | Lenovo ThinkPad T490s-20NYS02A00 i5-8265U, UHD Graphics 620, Intel SSD Pro 7600p SSDPEKKF512G8L, IPS, 1920x1080, 14" | Average NVIDIA GeForce MX250 | Average of class Office | |
|---|---|---|---|---|---|---|---|---|---|
| Power Consumption | -7% | 27% | 20% | -1% | 20% | 29% | 5% | 13% | |
| Idle Minimum * (Watt) | 4.1 | 5.3 -29% | 2.7 34% | 3.6 12% | 5.6 -37% | 2.16 47% | 2.62 36% | 4.1 ? -0% | 4.41 ? -8% |
| Idle Average * (Watt) | 8.3 | 10.2 -23% | 8.1 2% | 6.5 22% | 11.5 -39% | 5.04 39% | 5.16 38% | 7.91 ? 5% | 7.37 ? 11% |
| Idle Maximum * (Watt) | 11.8 | 13.6 -15% | 10.1 14% | 7.2 39% | 12.5 -6% | 8.64 27% | 8.7 26% | 10.4 ? 12% | 8.58 ? 27% |
| Load Average * (Watt) | 61.6 | 58.3 5% | 39 37% | 46.2 25% | 34.2 44% | 63.2 -3% | 40 35% | 58.6 ? 5% | 43 ? 30% |
| Witcher 3 ultra * (Watt) | 54.4 | 47.8 12% | 50 8% | ||||||
| Load Maximum * (Watt) | 69.4 | 65.3 6% | 37.2 46% | 68.8 1% | 47.9 31% | 67.5 3% | 64 8% | 68.9 ? 1% | 64.6 ? 7% |
* ... smaller is better
| Lenovo ThinkPad T590-20N4002VGE i7-8565U, GeForce MX250, 57 Wh | Lenovo ThinkPad T580-20LAS01H00 i5-8550U, GeForce MX150, 105 Wh | HP EliteBook 850 G5 3JX58EA i5-8250U, UHD Graphics 620, 56 Wh | Dell Latitude 5590 i5-8250U, UHD Graphics 620, 51 Wh | Fujitsu LifeBook U758 i7-8650U, UHD Graphics 620, 50 Wh | Lenovo ThinkPad T490-20N3S02L00 i7-8565U, GeForce MX250, 50 Wh | Lenovo ThinkPad T490s-20NYS02A00 i5-8265U, UHD Graphics 620, 57 Wh | Average of class Office | |
|---|---|---|---|---|---|---|---|---|
| Battery runtime | -22% | -8% | -45% | -55% | -35% | -13% | -1% | |
| H.264 (h) | 12.1 | 9.4 -22% | 10.5 -13% | 6.7 -45% | 5.9 -51% | 8.7 -28% | 13.9 15% | 15 ? 24% |
| WiFi v1.3 (h) | 10.5 | 8.7 -17% | 9.3 -11% | 7.4 -30% | 4.6 -56% | 9.1 -13% | 10.1 -4% | 12.9 ? 23% |
| Load (h) | 3.5 | 2.6 -26% | 3.5 0% | 1.4 -60% | 1.5 -57% | 1.3 -63% | 1.7 -51% | 1.794 ? -49% |
| Reader / Idle (h) | 19.7 | 17.8 | 17.4 | 9.7 | 23.7 ? |
Pros
Cons
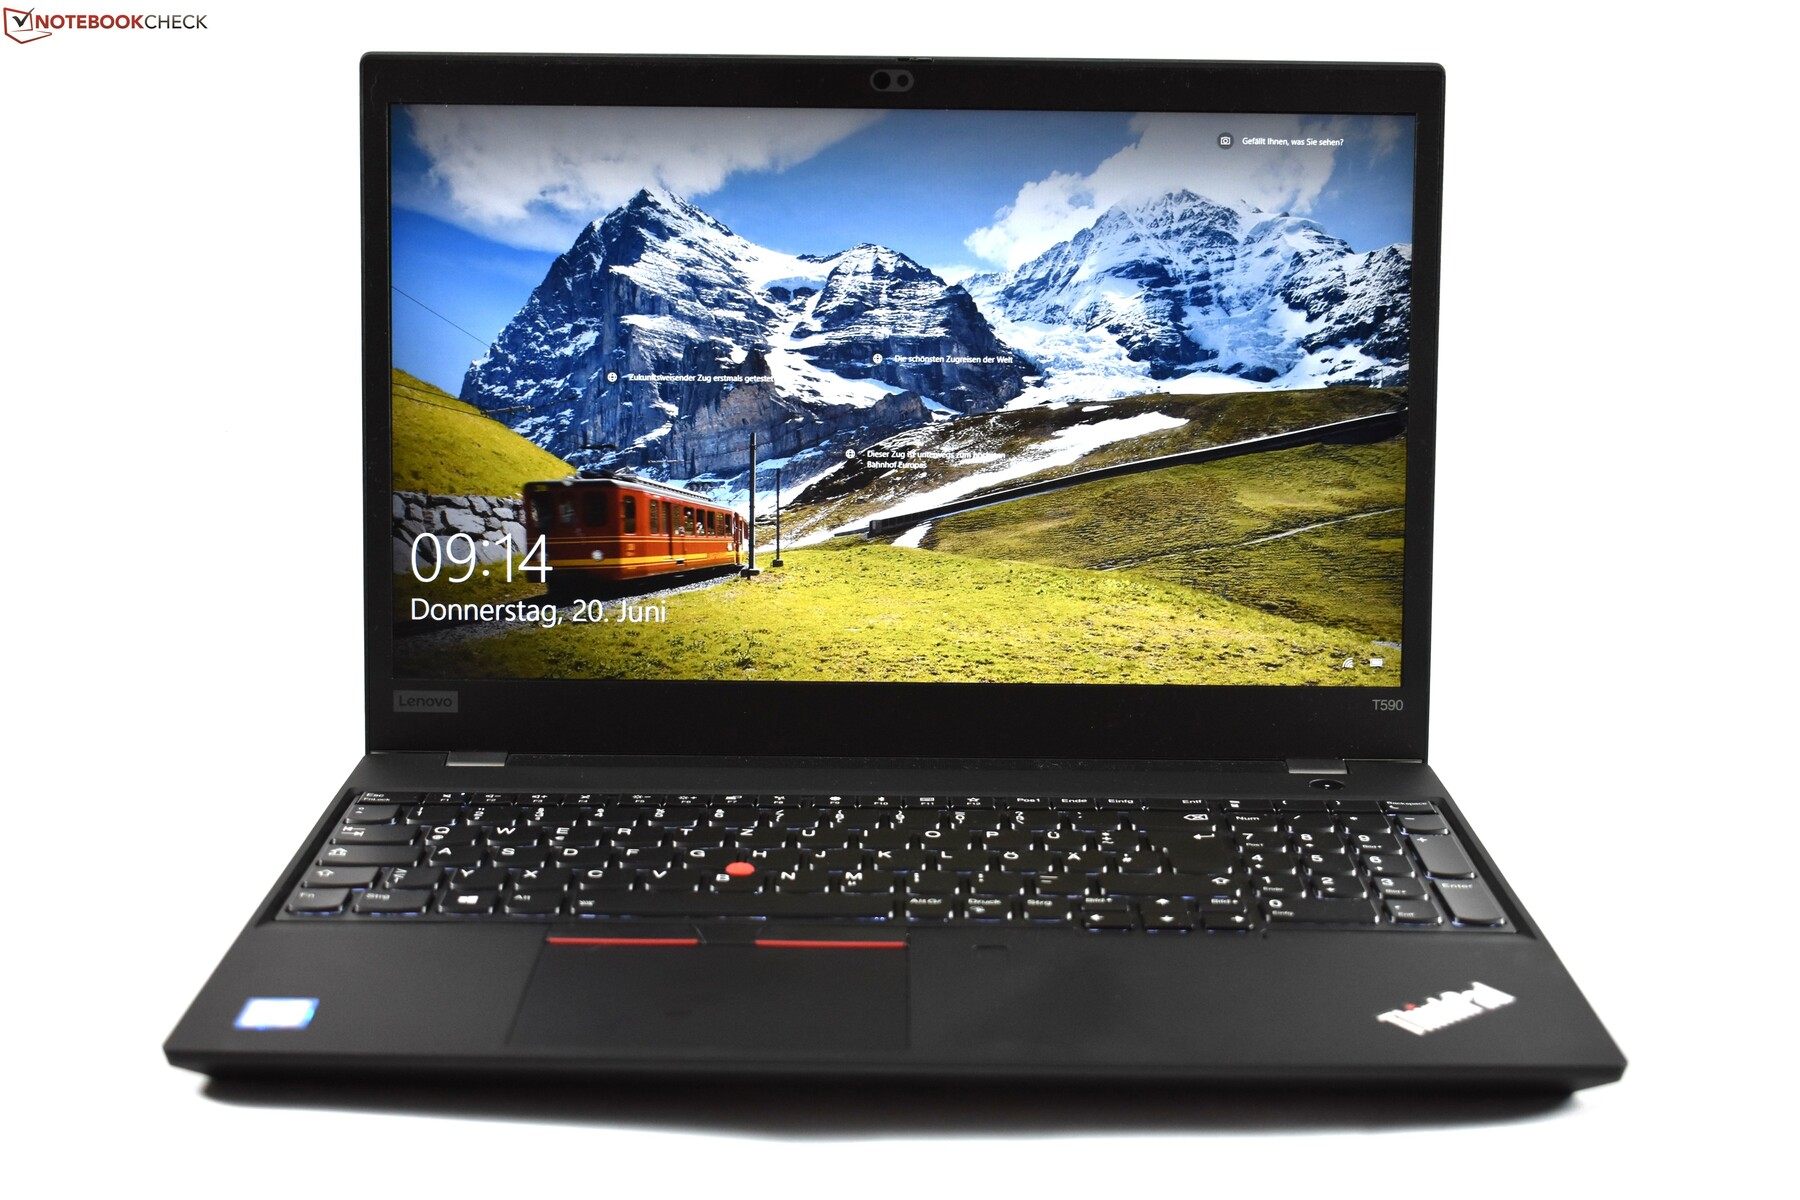
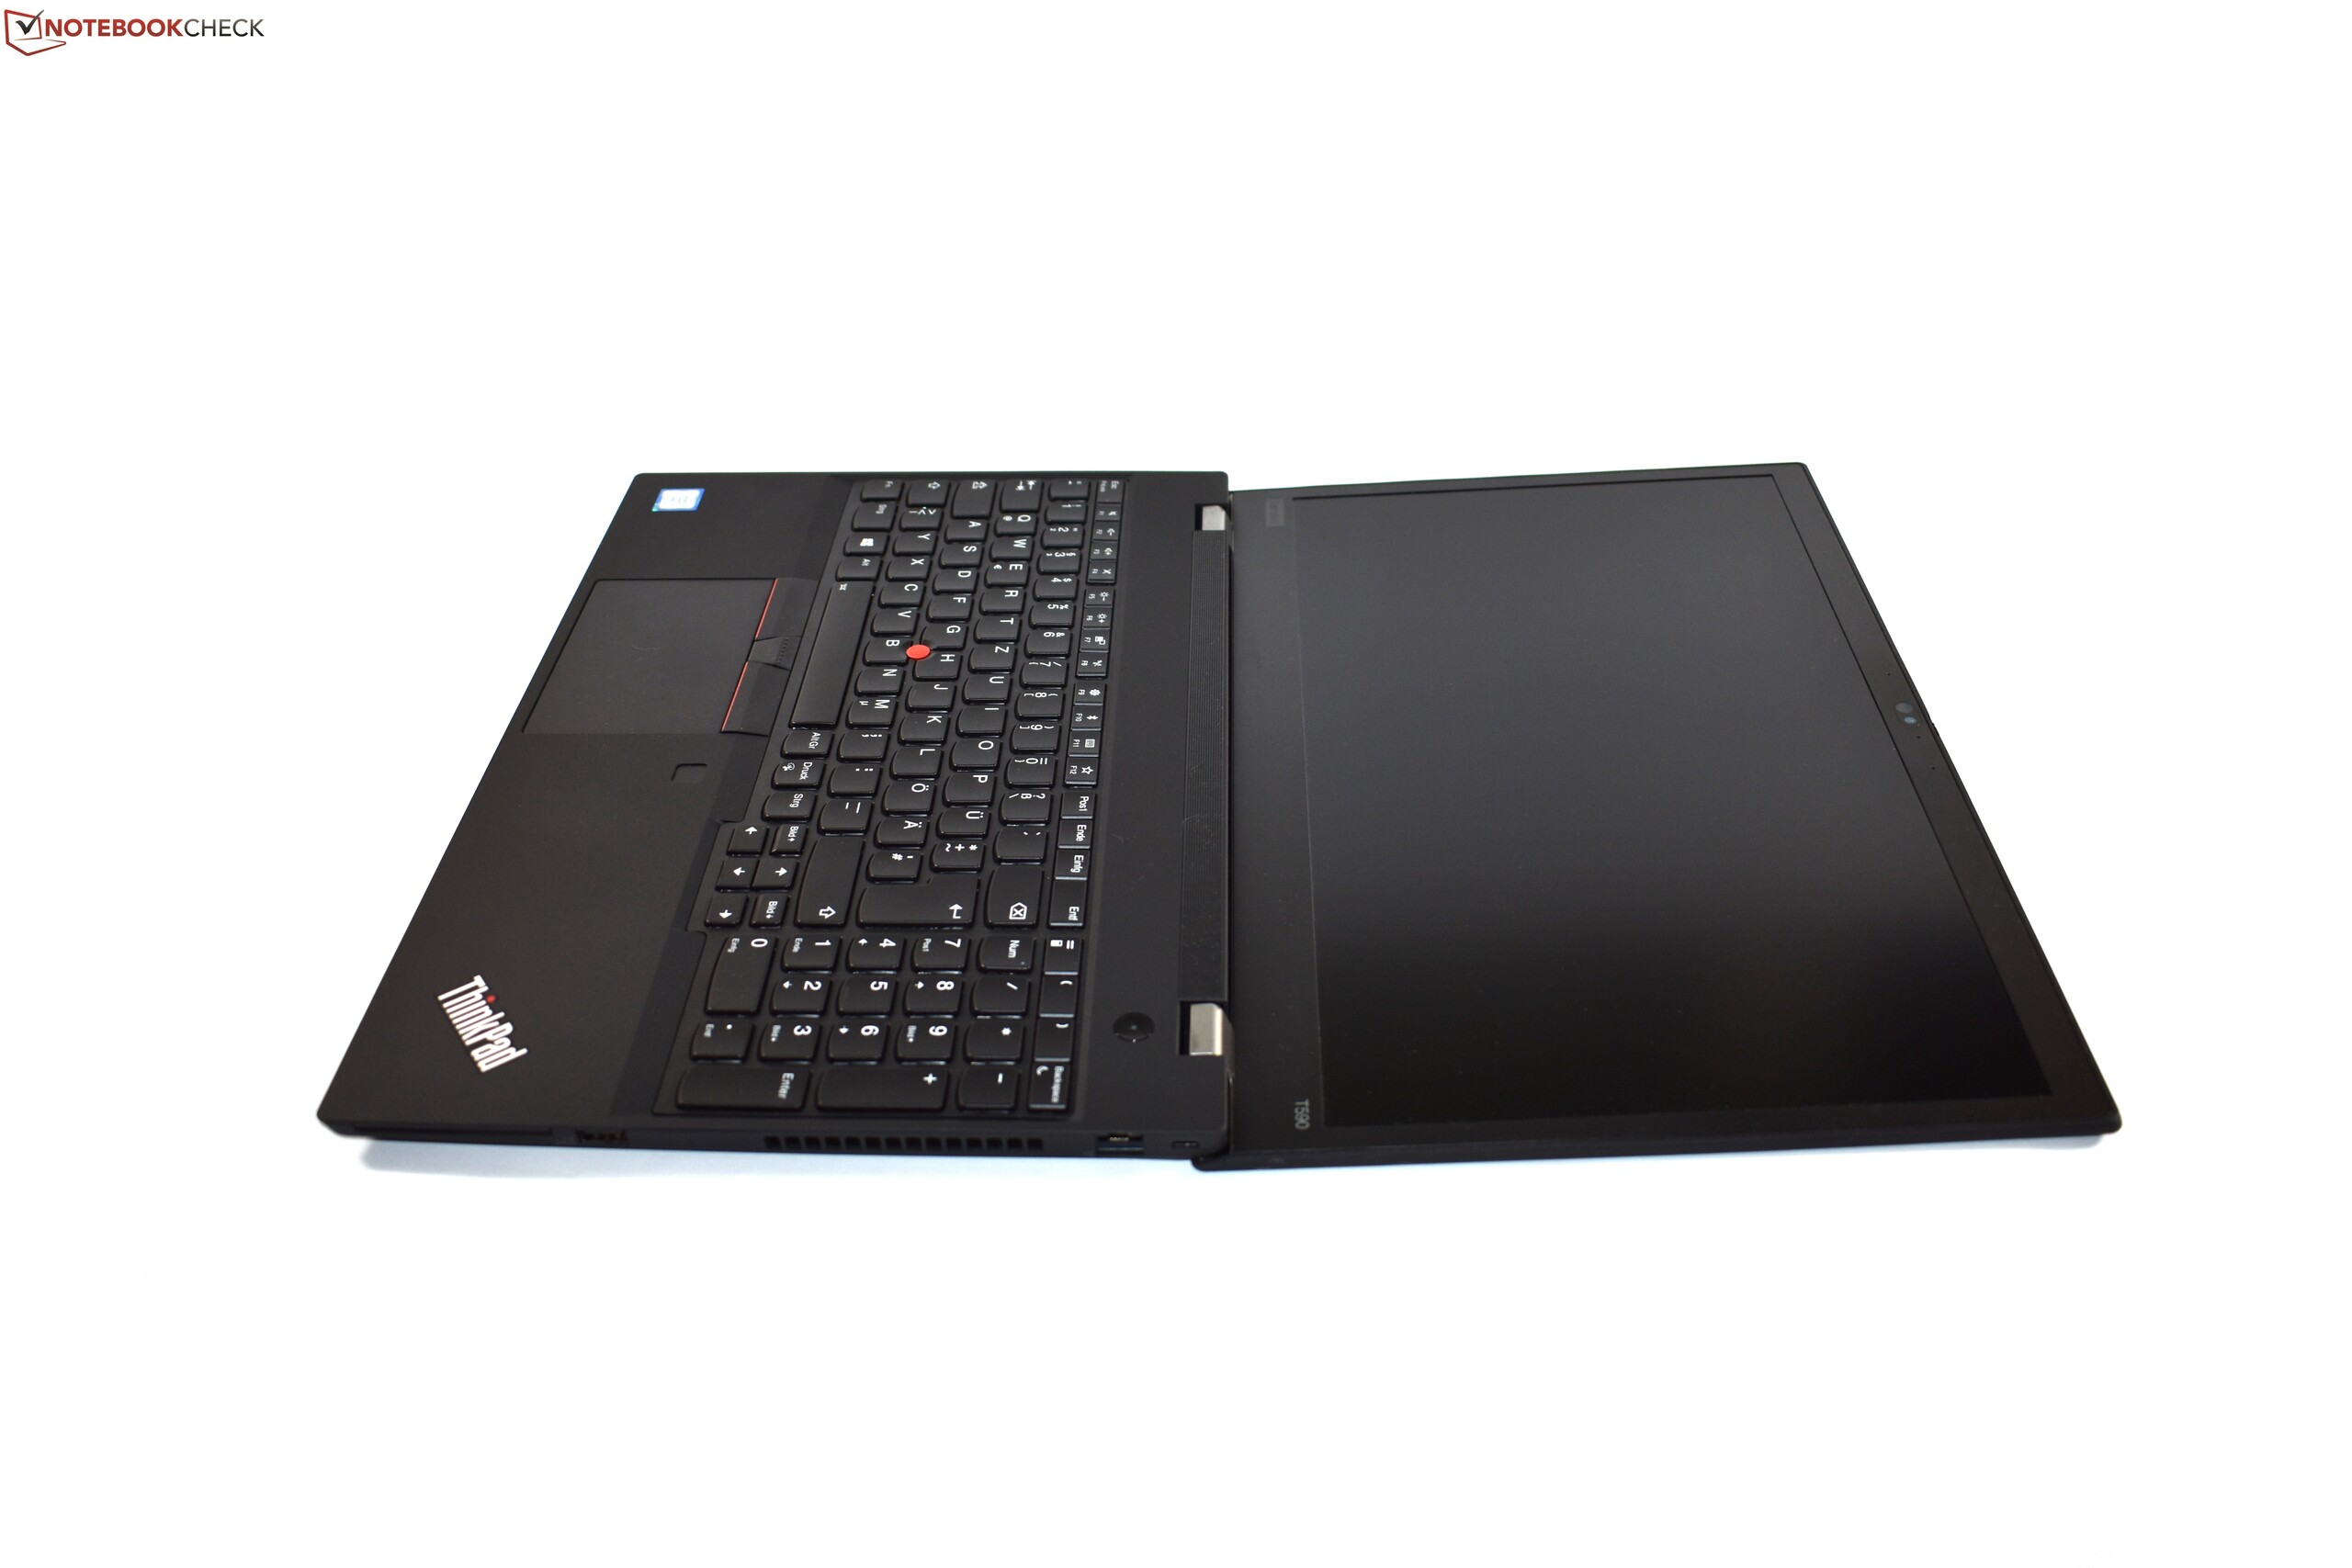
联想ThinkPad T590是T系列中最轻巧,最紧凑的15.6英寸ThinkPad。在过去,人们不得不选择较小的14英寸型号,如果他们不想使用非常厚实和沉重的笔记本电脑。现在事情并非如此。不过,较小的联想ThinkPad T490可能仍然是大多数用户的更好选择。
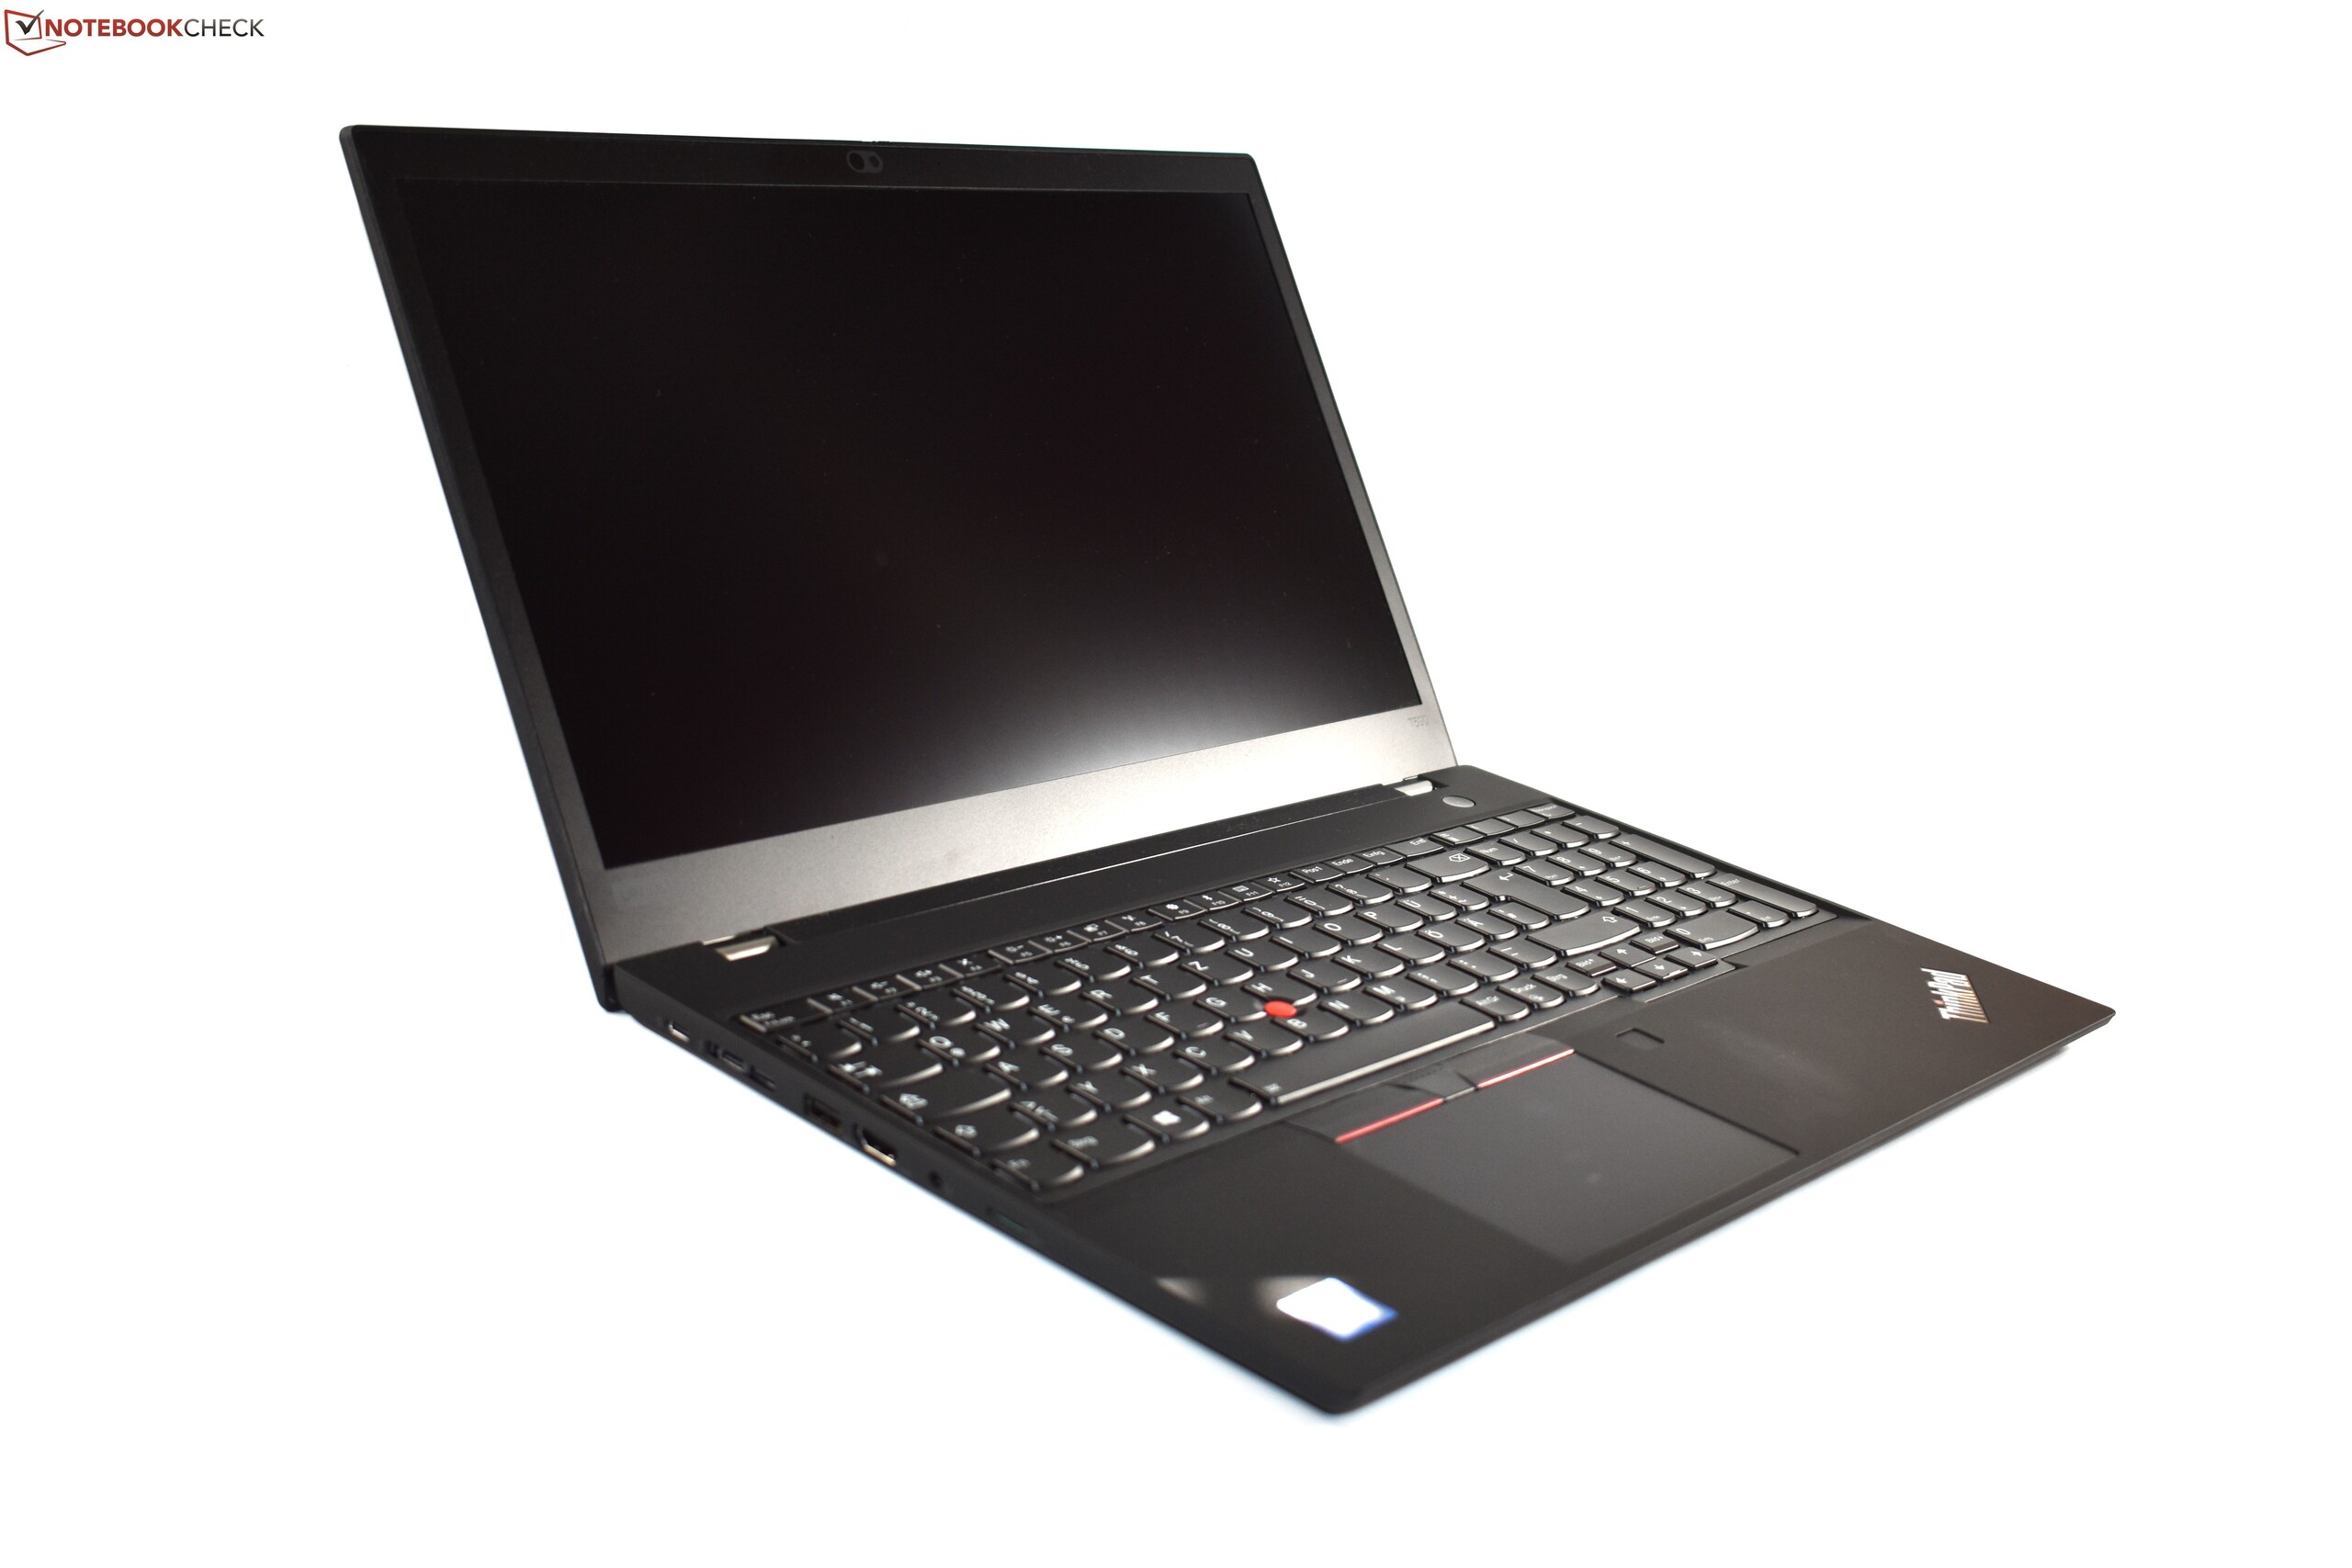
对此的一个重要因素是T490和T590在很多方面非常相似。联想使用相同的主板设计,两者的材料和结构完全相同。联想ThinkPad T590拥有更大的机身,具有充足的连接和安全选项,但ThinkPad T490也提供这些功能。优质键盘和非常舒适的输入设备也是如此,尽管T590在这个领域确实有一些优势,这要归功于它的小键盘。此外,ThinkPad T590续航时间T490,至少在FHD版本中,因为它具有更大的57 Wh电池。 ThinkPad T590提供了高于平均水平的CPU性能,而ThinkPad笔记本电脑的风扇大部分都保持安静,不过T490的情况也是如此。
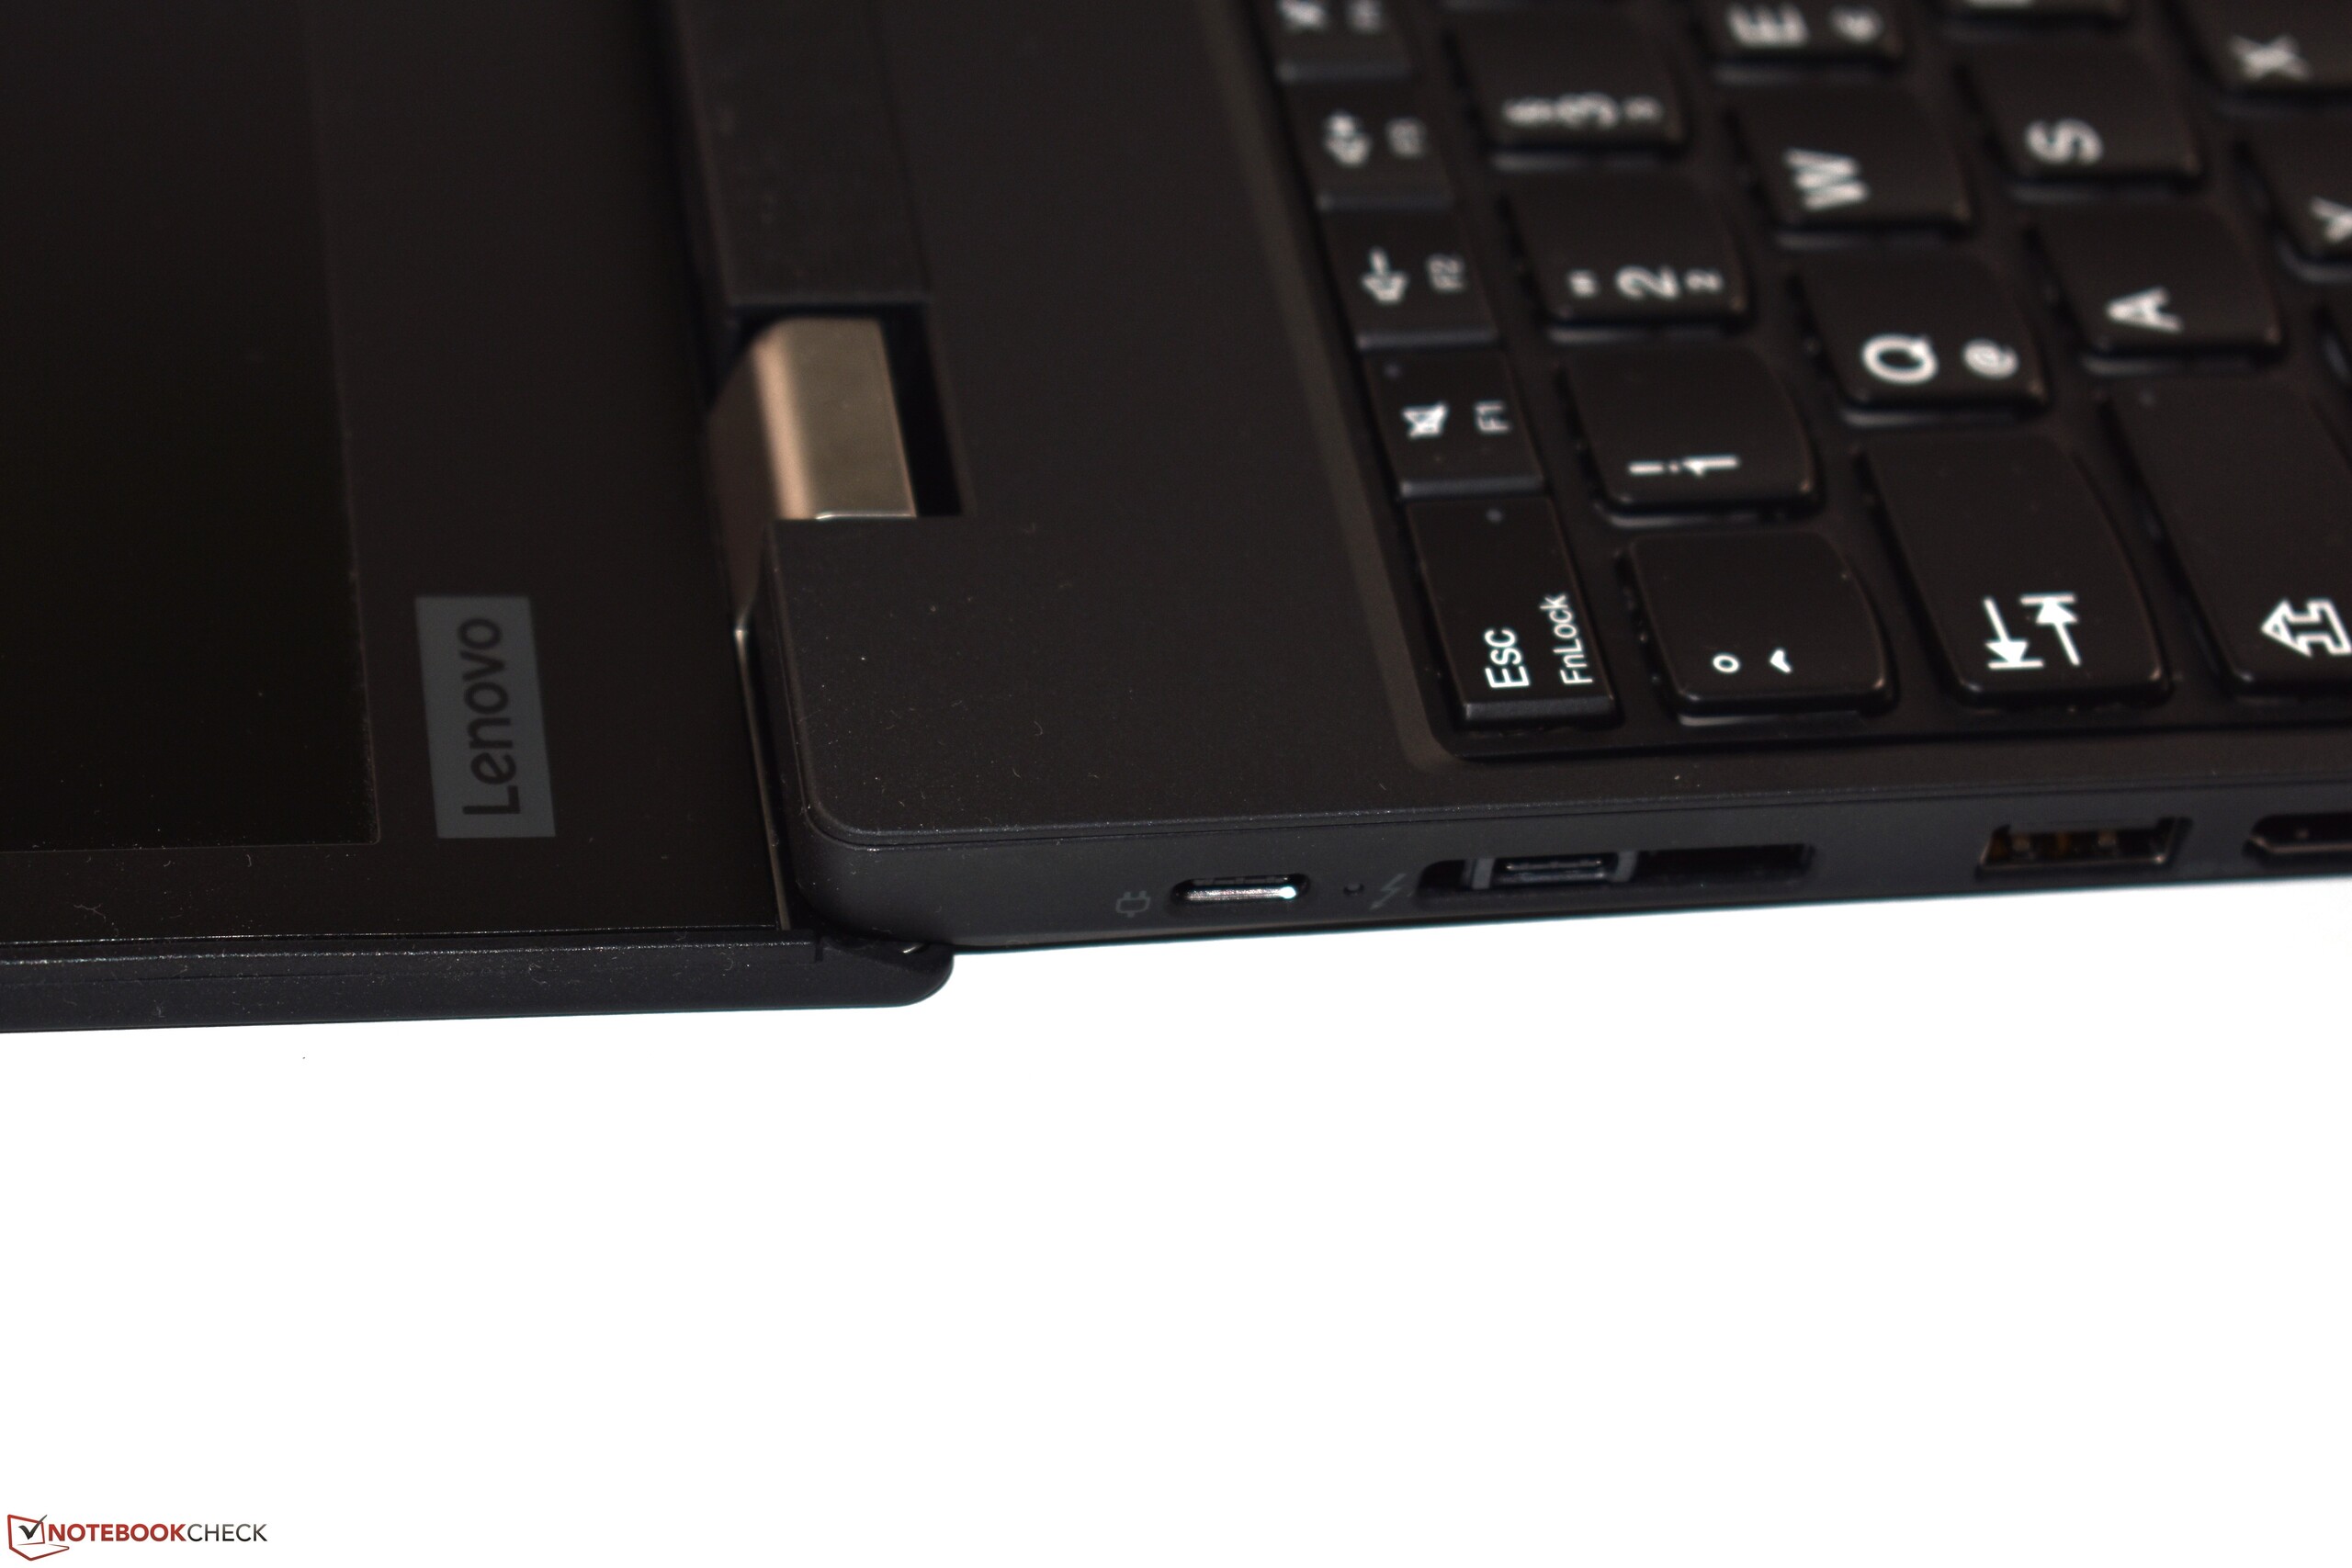
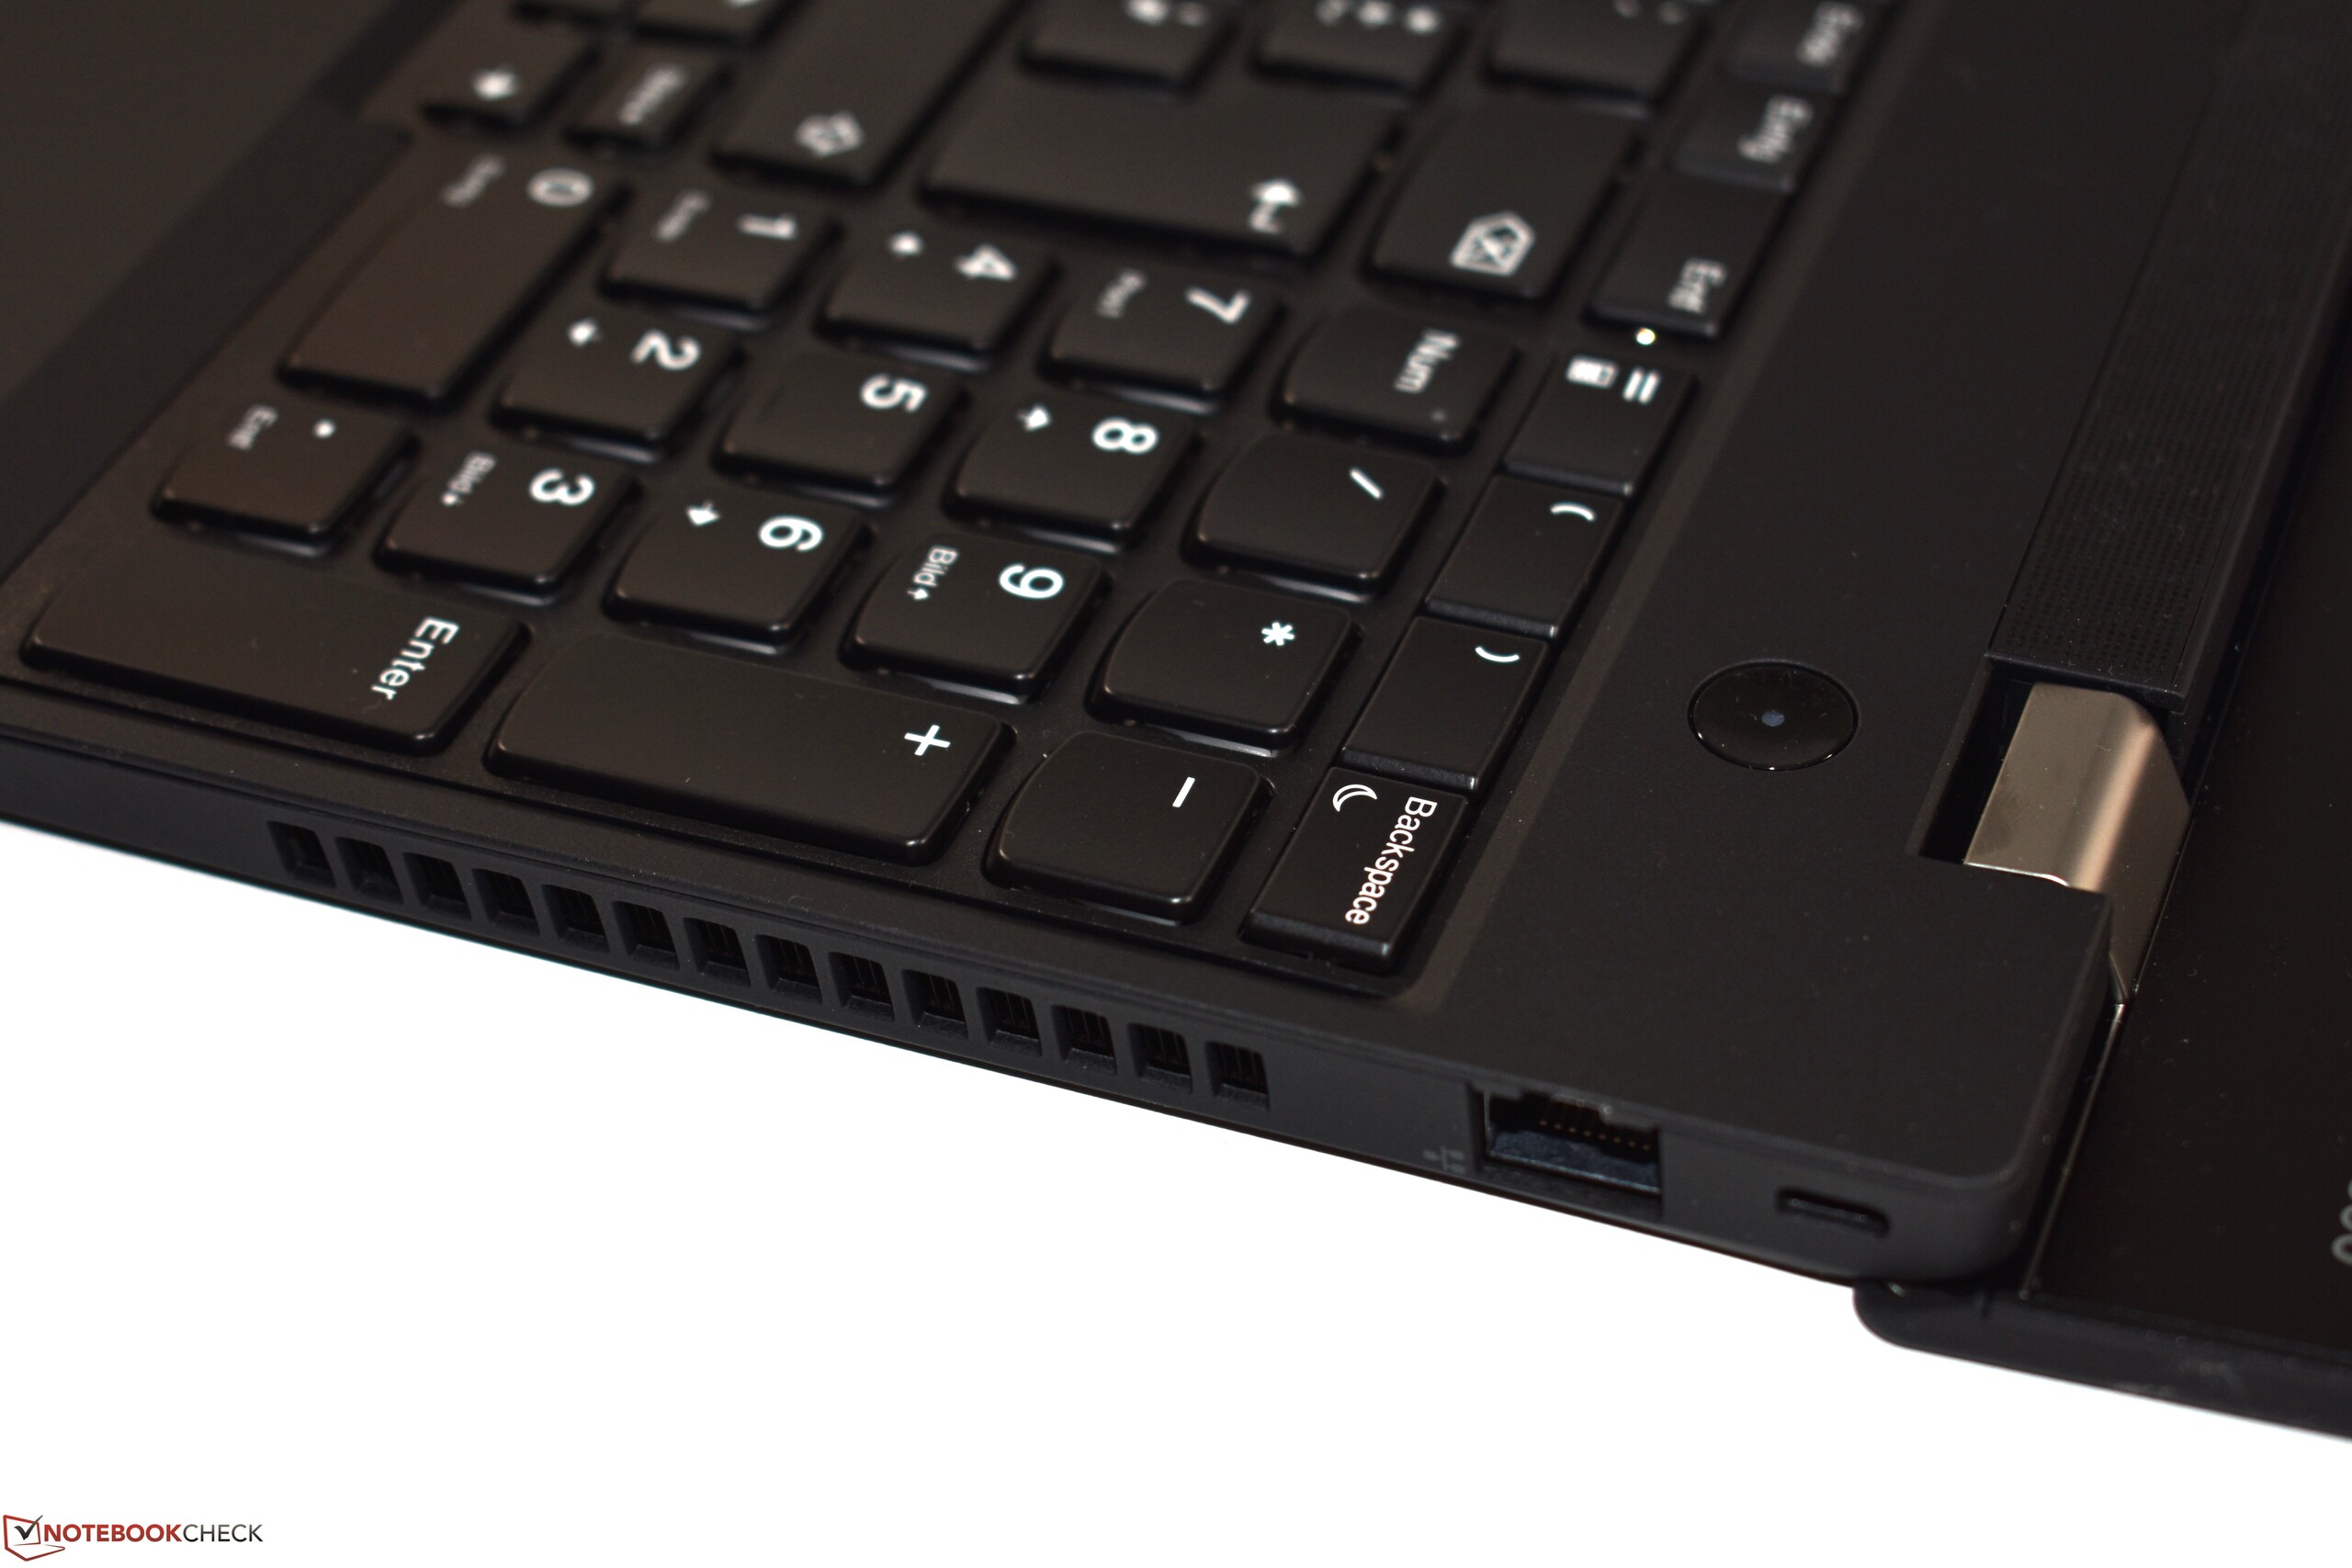
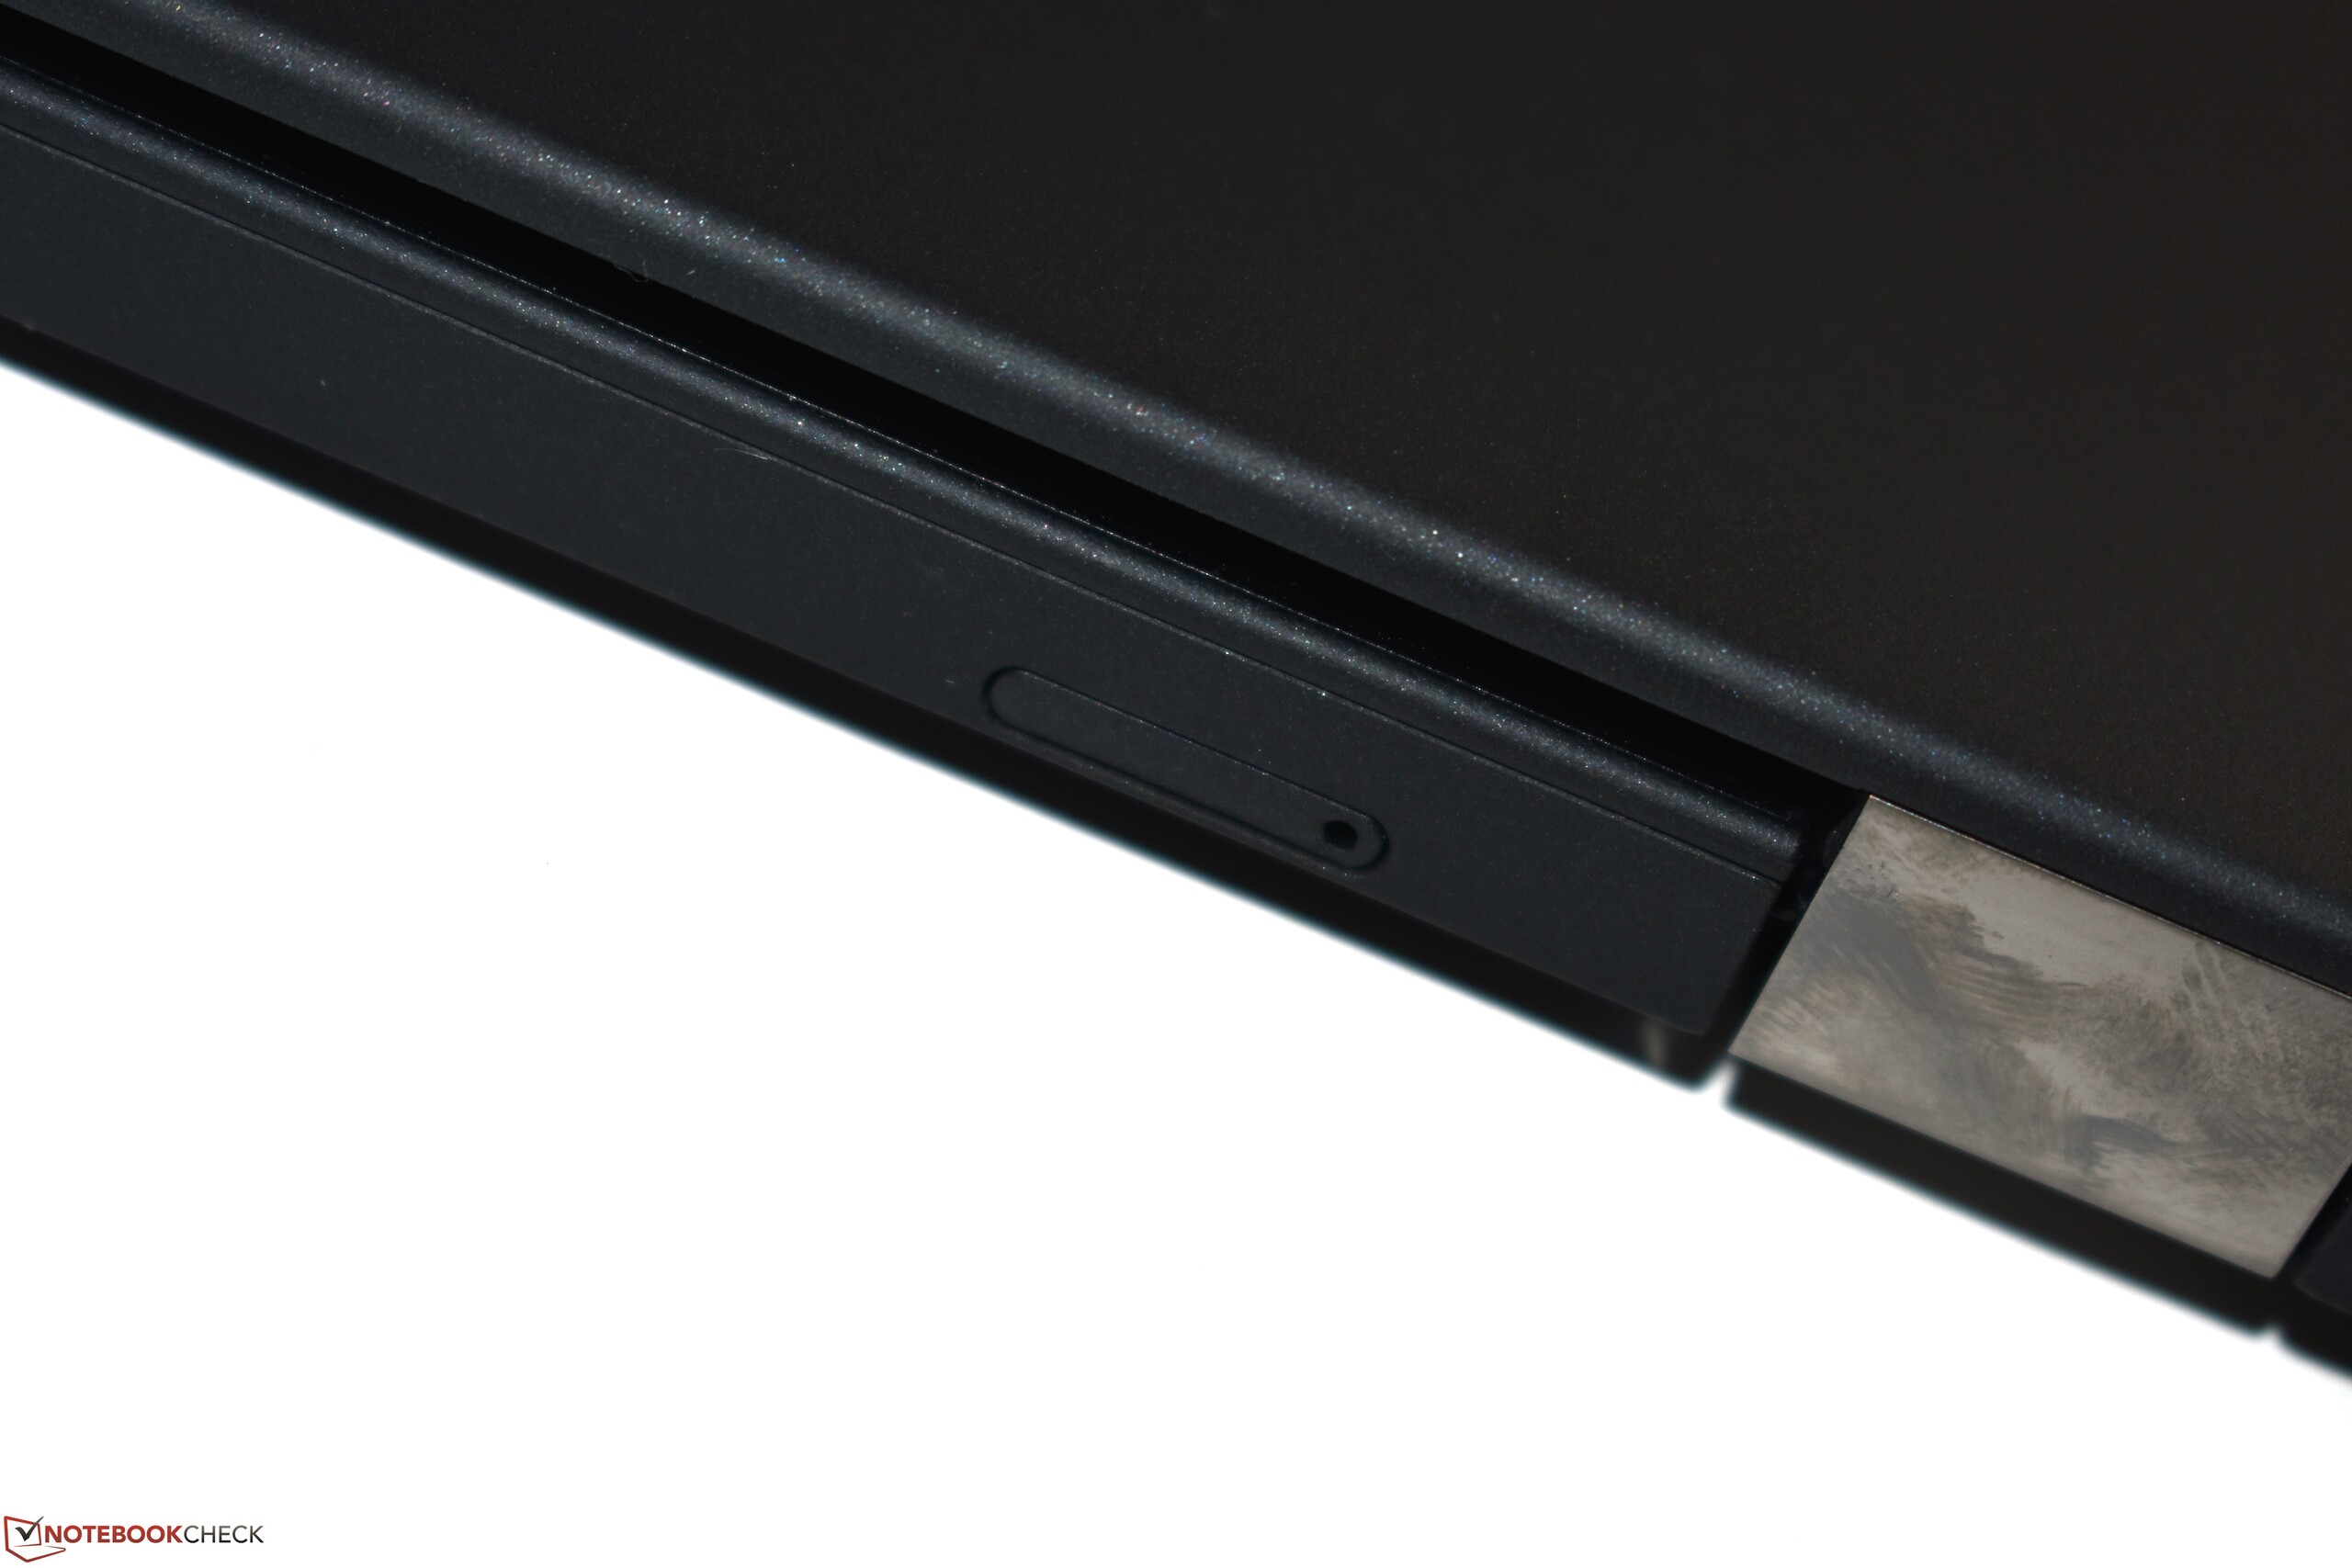
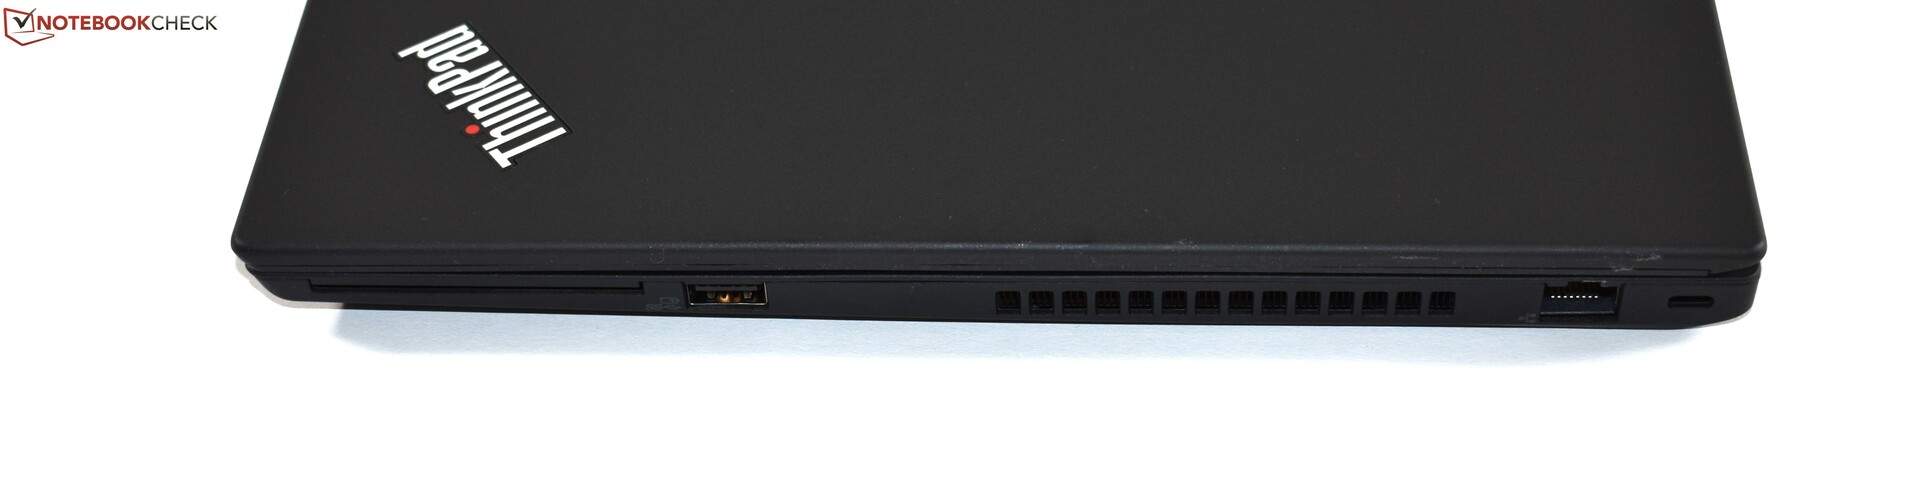
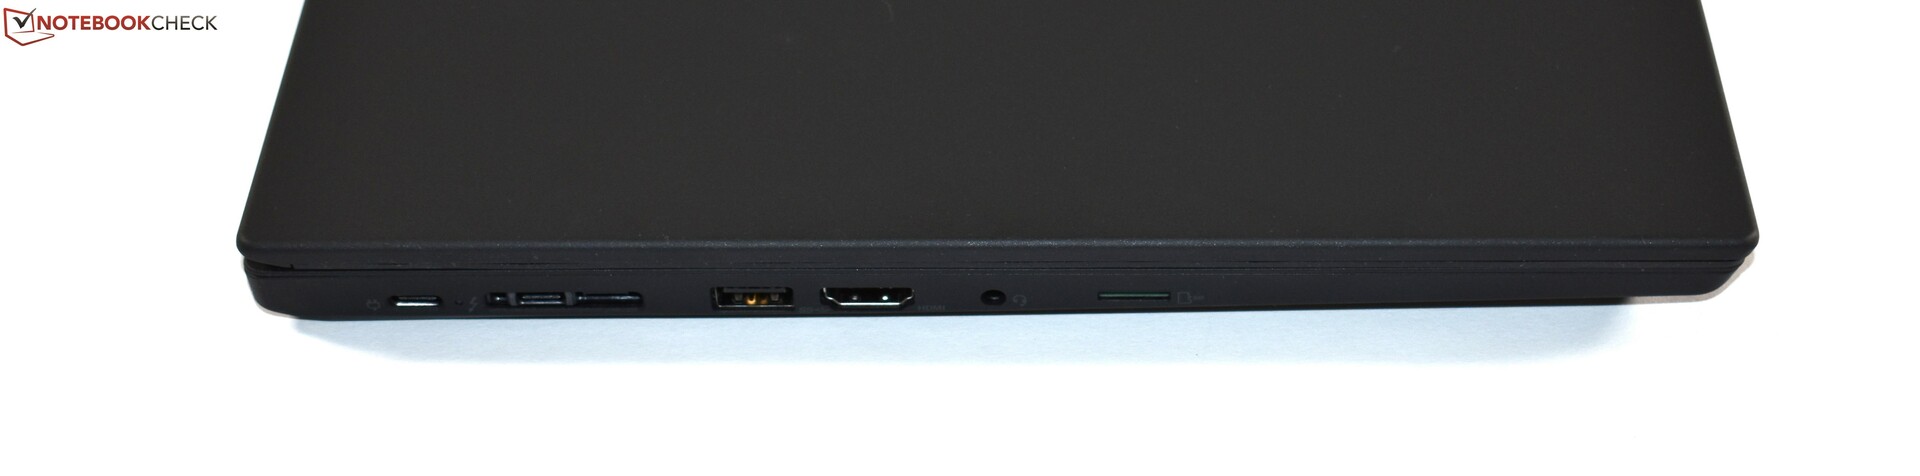
更大的屏幕可以被视为ThinkPad T590的一个优点。然而,与T490及其低功耗FHD屏幕相比,LCD面板的质量非常糟糕。色域和屏幕亮度更差。联想确实提供了一个4K UHD的面板,但绝大多数T590可能都只配备了FHD面板。其他弱点,例如难以打开的机身,microSD而不是全尺寸SD卡读卡器,高温和半速Thunderbolt 3端口。缺少的PowerBridge功能也是令人失望。
只有屏幕更好时,ThinkPad T590才是一台很好的笔记本电脑。
考虑到所有因素,我们仍然可以推荐ThinkPad T590作为同级别领先的15.6英寸笔记本电脑,因其具有出色的生产效率。尽管如此,我们认为ThinkPad T490才是更好的选择,特别是如果不需要小键盘的话。与HP EliteBook 850 G5等同级别的其他15.6英寸设备相比,ThinkPad具有更好的输入设备和更高的CPU性能,但屏幕更差——除非选择带有4K UHD屏幕的型号。
Lenovo ThinkPad T590-20N4002VGE
- 09/26/2019 v7 (old)
Benjamin Herzig
Price comparison

