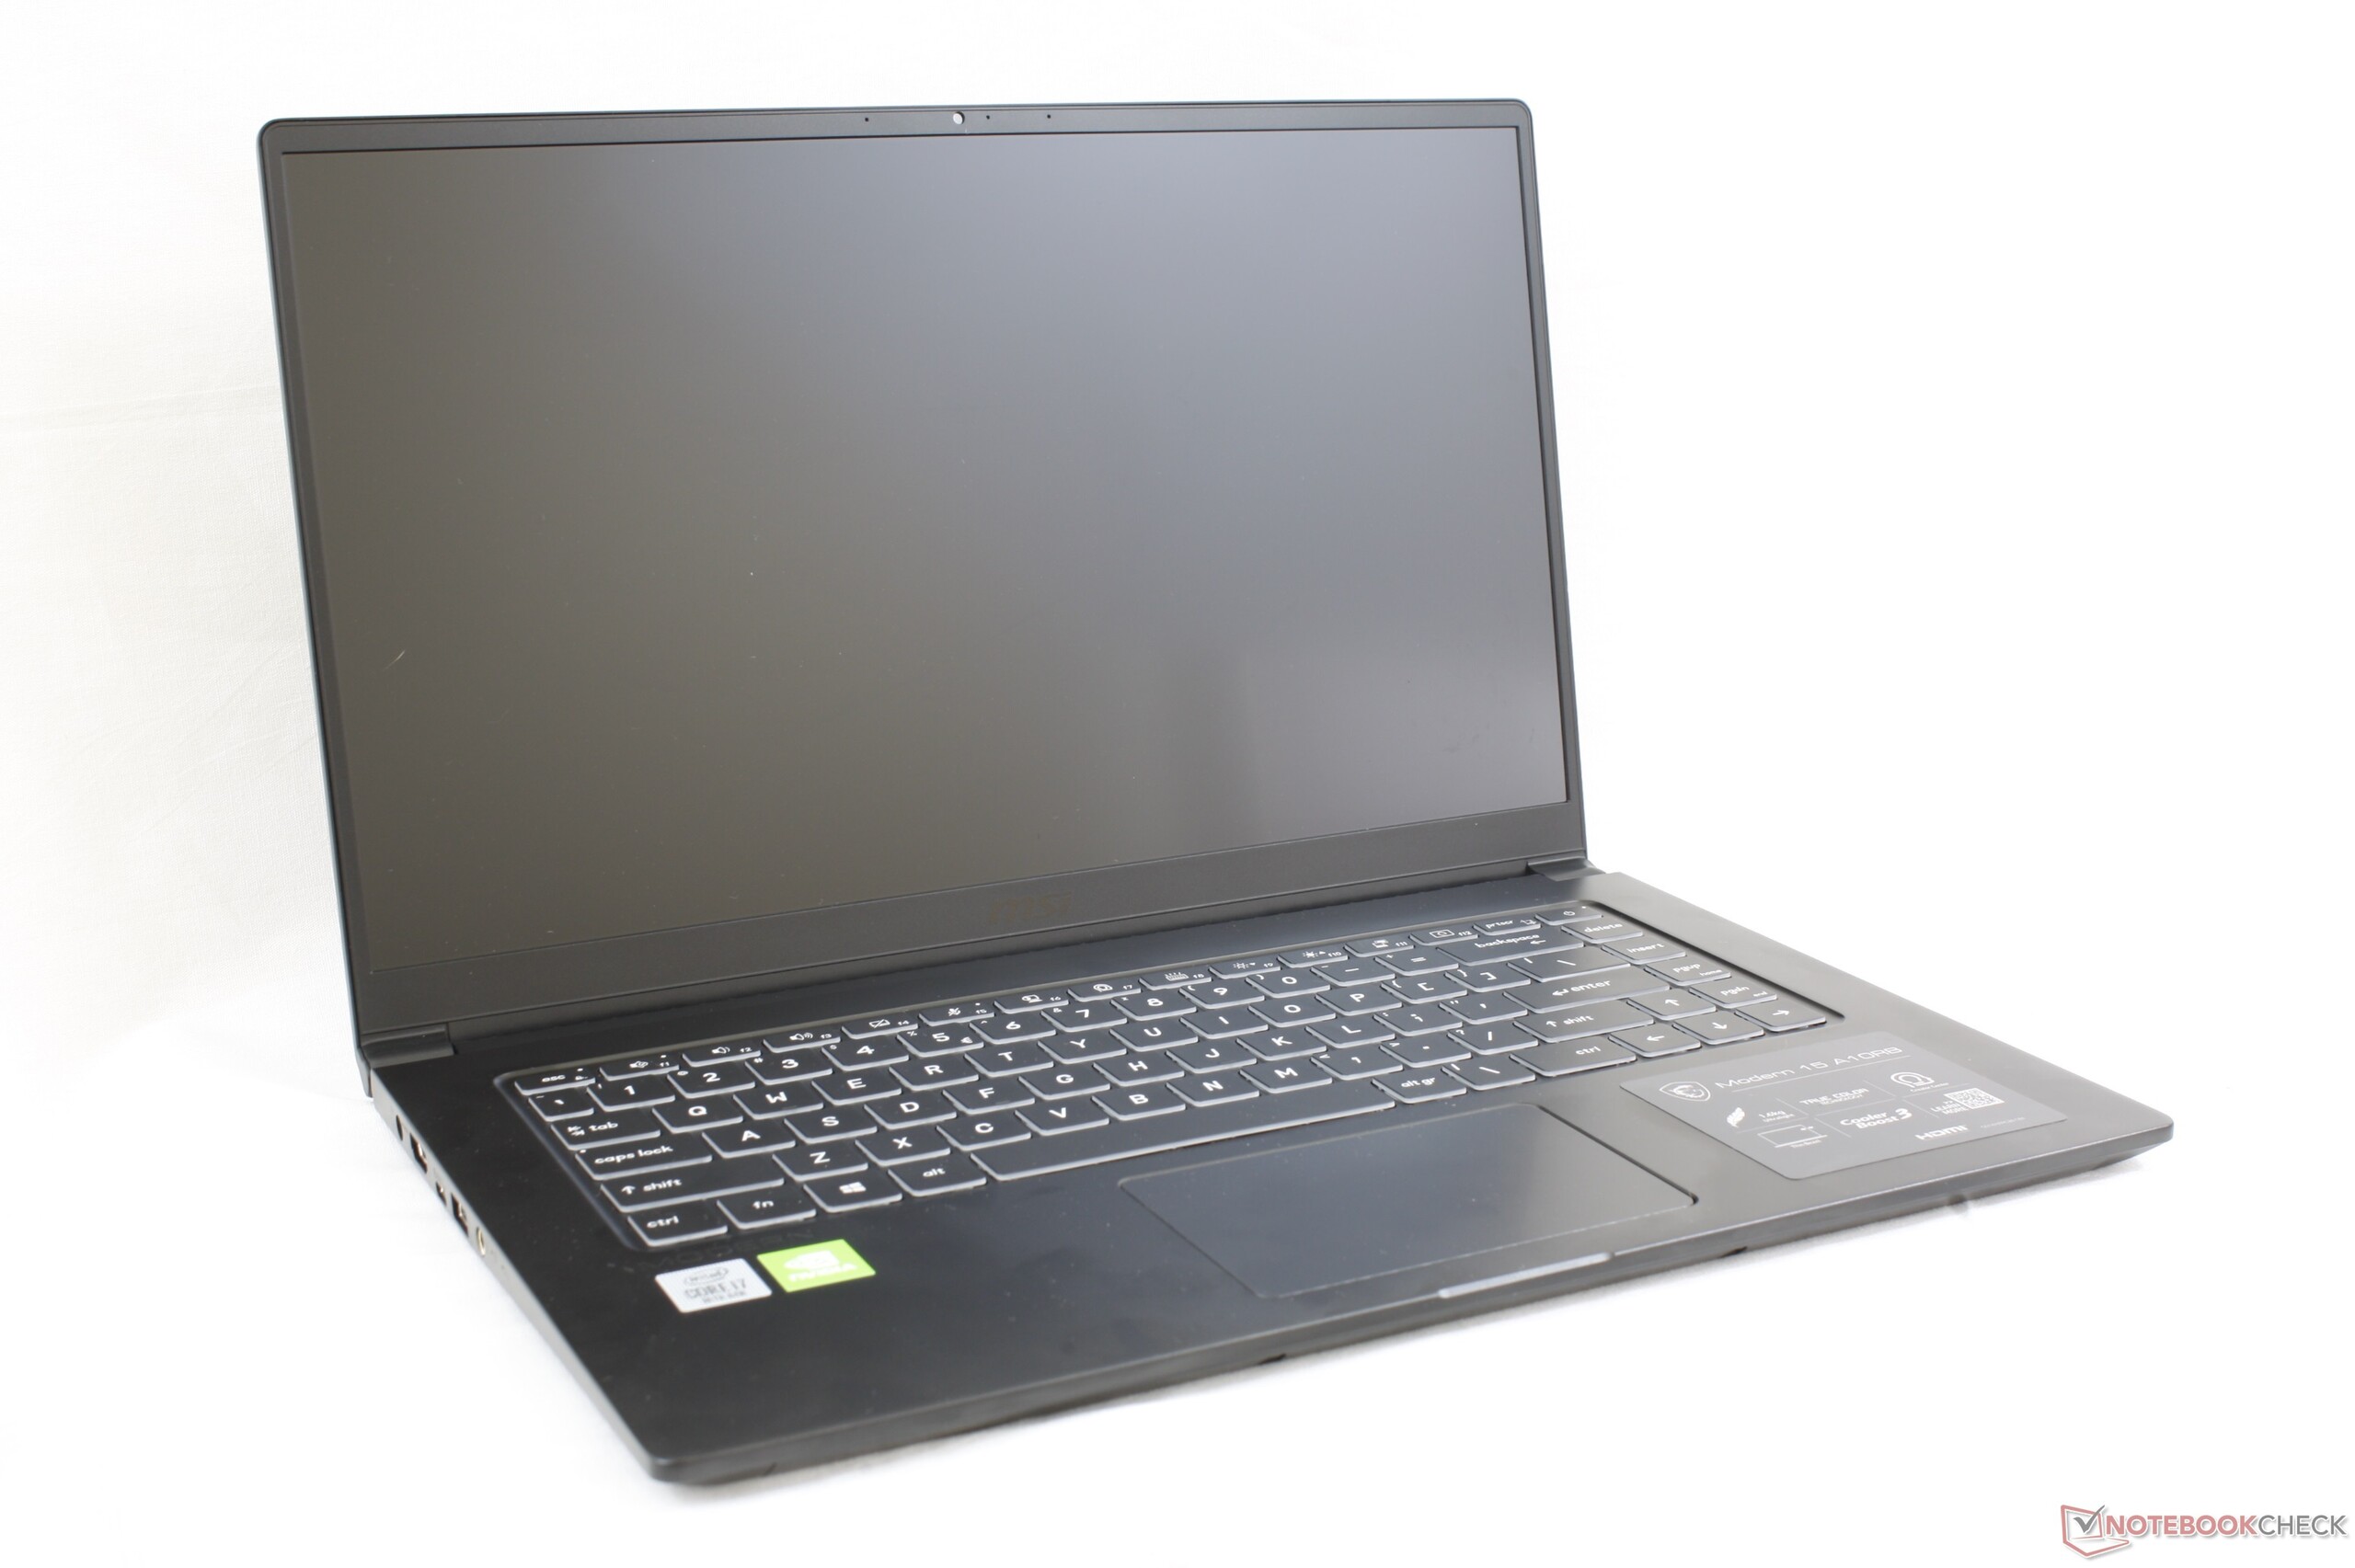
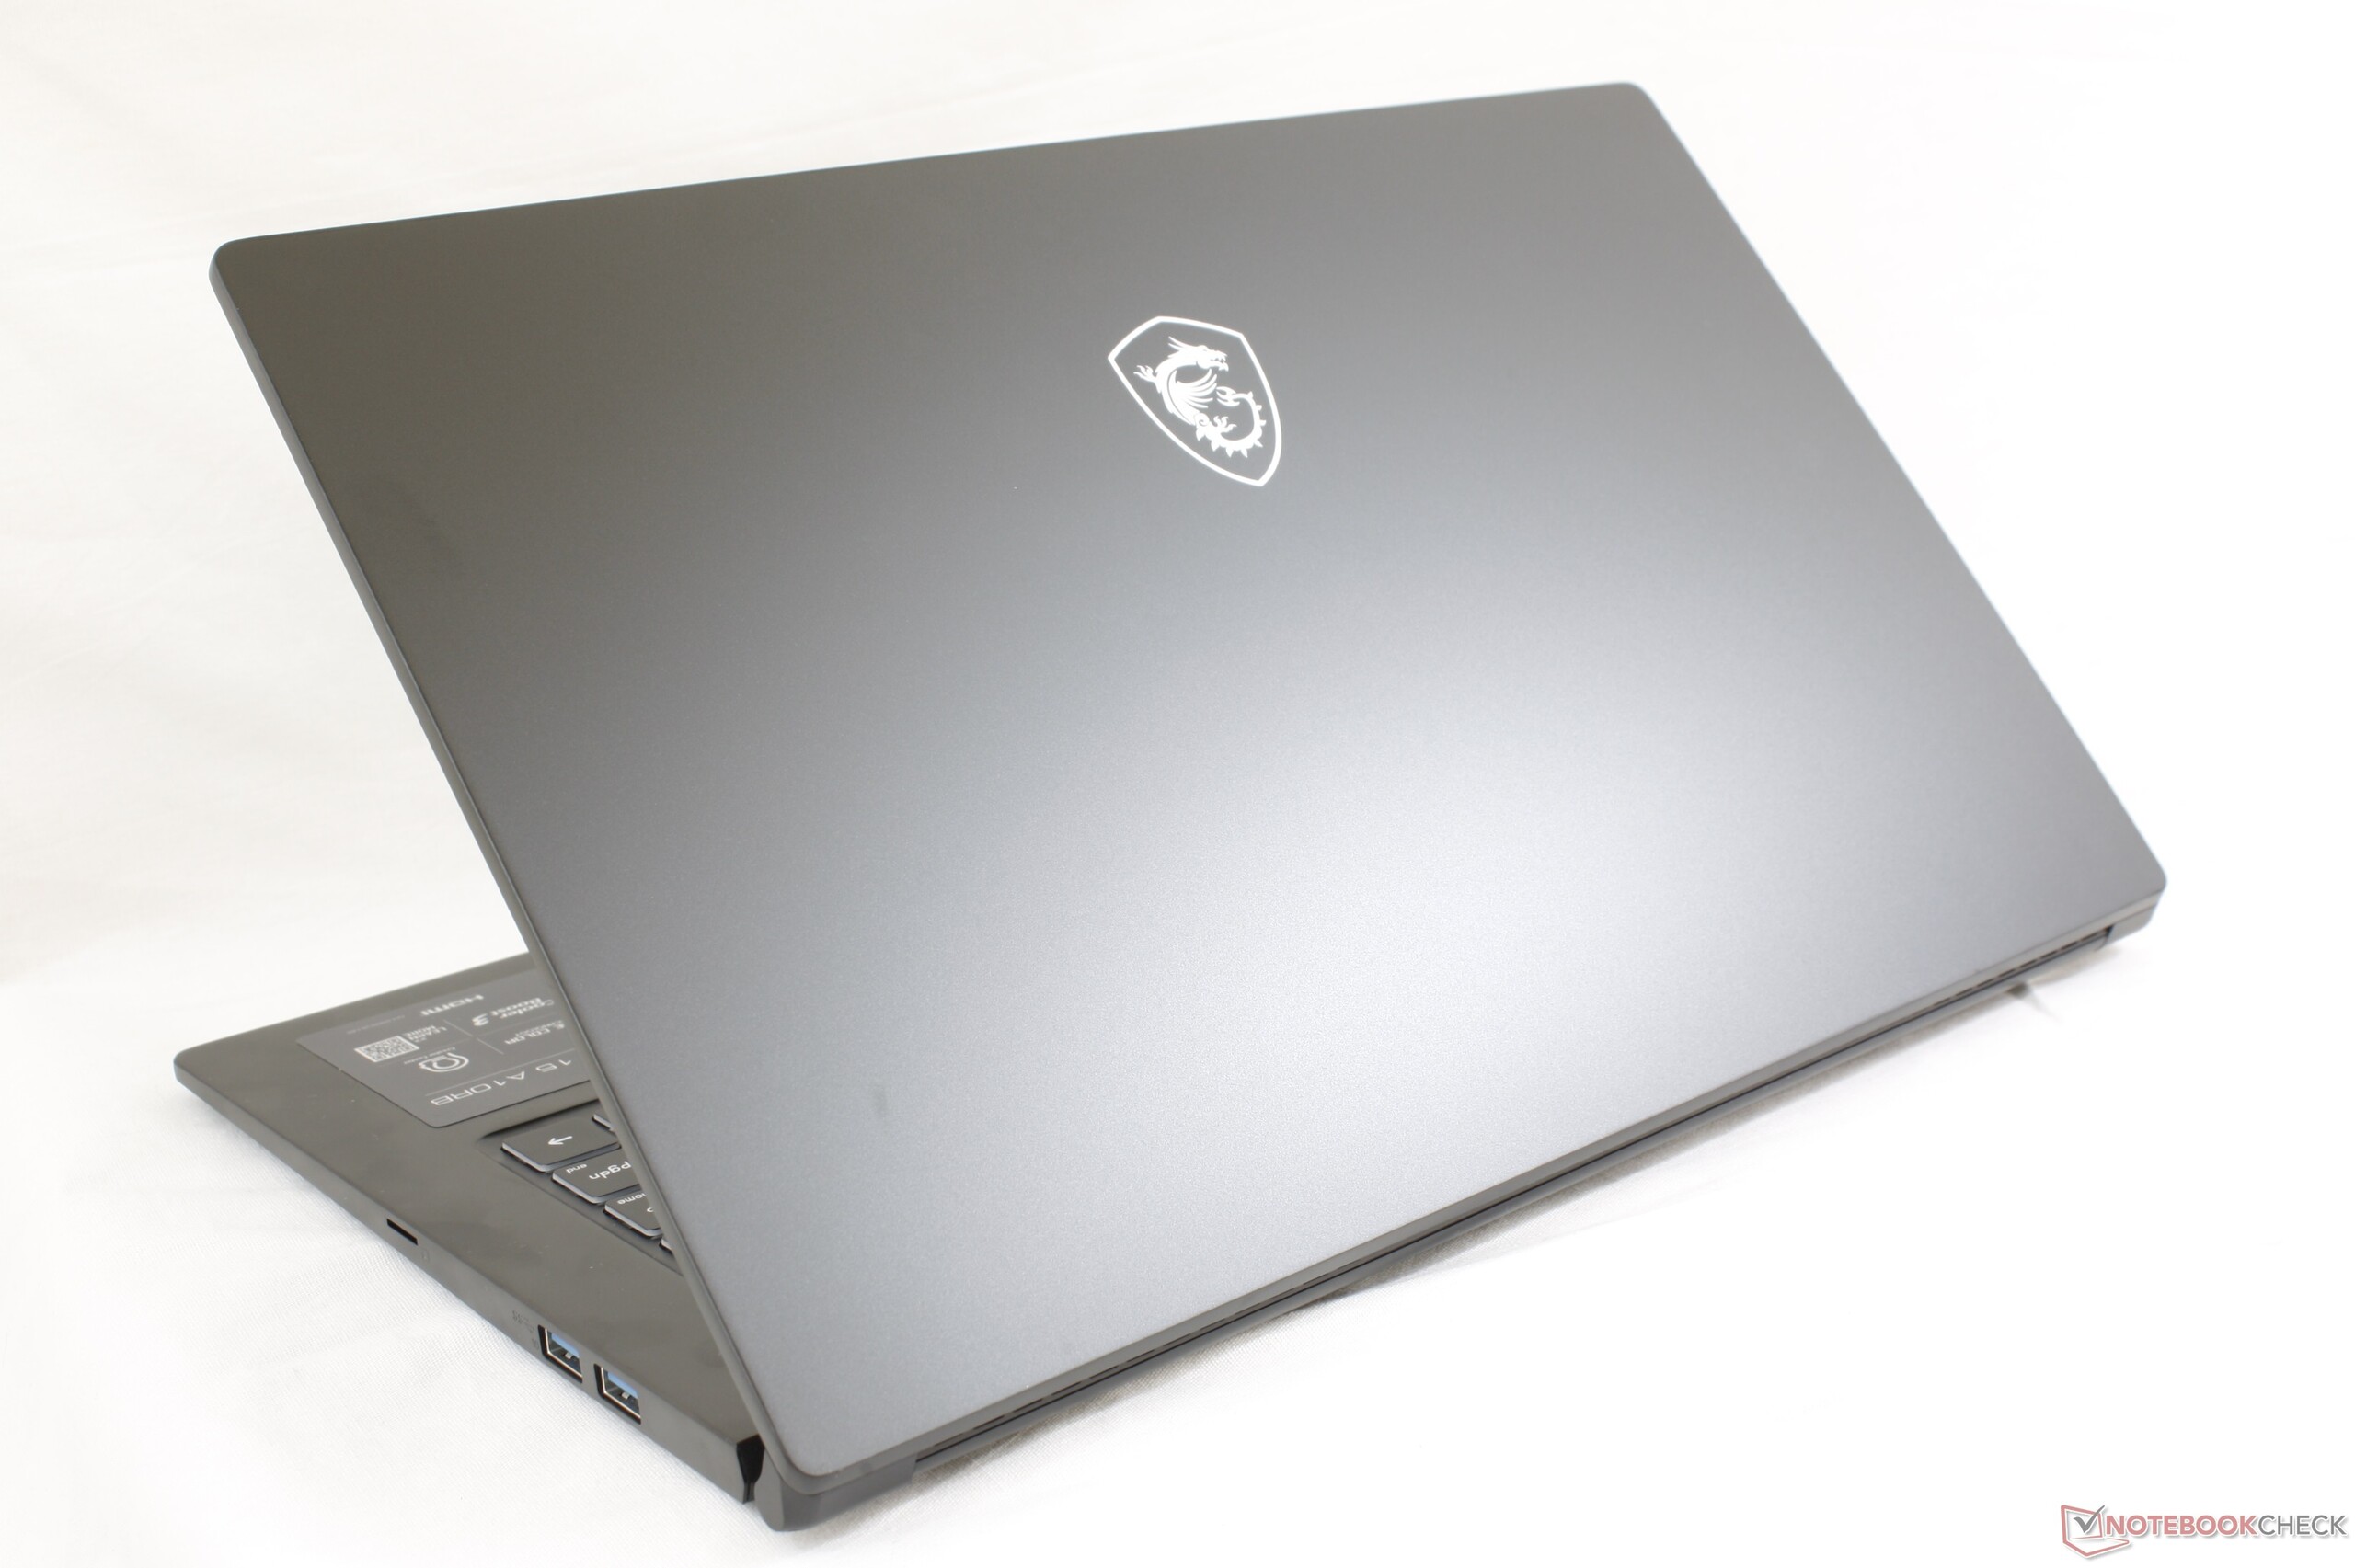
MSI Modern 15 A10RB笔记本电脑评测:Dell XPS 15青春版
Rating | Date | Model | Weight | Height | Size | Resolution | Price |
|---|---|---|---|---|---|---|---|
| 80.1 % v7 (old) | 03 / 2020 | MSI Modern 15 A10RB i7-10510U, GeForce MX250 | 1.6 kg | 15.9 mm | 15.60" | 1920x1080 | |
| 83.1 % v7 (old) | 12 / 2019 | Asus ZenBook 15 UX534FT-DB77 i7-8565U, GeForce GTX 1650 Max-Q | 1.7 kg | 18.9 mm | 15.60" | 1920x1080 | |
| 86.6 % v7 (old) | 09 / 2019 | Lenovo ThinkPad T590-20N4002VGE i7-8565U, GeForce MX250 | 1.9 kg | 19.95 mm | 15.60" | 1920x1080 | |
| 85 % v7 (old) | HP Spectre X360 15-5ZV31AV i7-10510U, GeForce MX250 | 2.1 kg | 19.3 mm | 15.60" | 3840x2160 | ||
| 85.2 % v7 (old) | 11 / 2019 | MSI Prestige 15 A10SC i7-10710U, GeForce GTX 1650 Max-Q | 1.7 kg | 16 mm | 15.60" | 3840x2160 | |
| 83.9 % v7 (old) | 12 / 2019 | Microsoft Surface Laptop 3 15 i7-1065G7 i7-1065G7, Iris Plus Graphics G7 (Ice Lake 64 EU) | 1.5 kg | 14.7 mm | 15.00" | 2496x1664 |
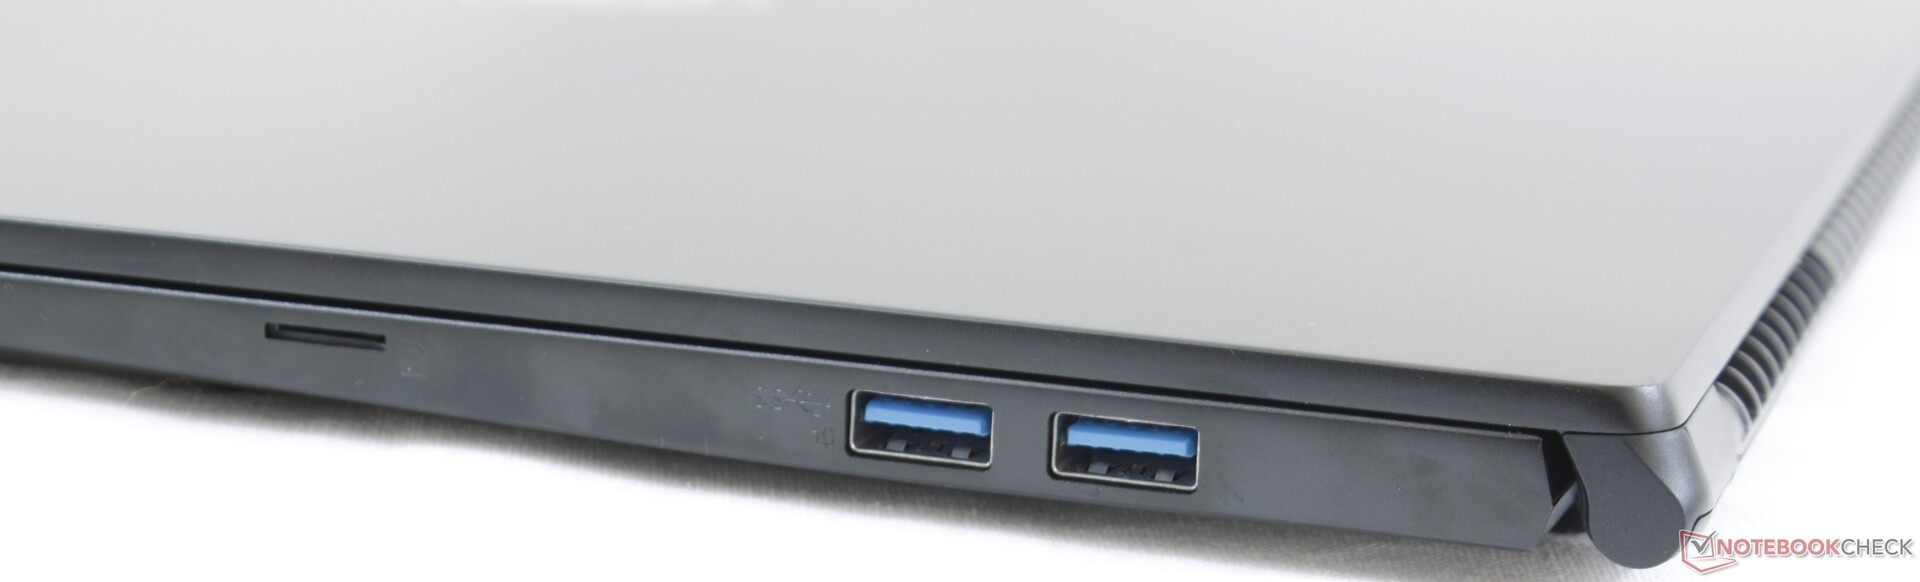
| SD Card Reader | |
| average JPG Copy Test (av. of 3 runs) | |
| Dell XPS 15 7590 i5 iGPU FHD (Toshiba Exceria Pro SDXC 64 GB UHS-II) | |
| MSI Prestige 15 A10SC (Toshiba Exceria Pro M501 UHS-II) | |
| Lenovo ThinkPad T590-20N4002VGE (Toshiba Exceria Pro M501 UHS-II) | |
| Asus ZenBook 15 UX534FT-DB77 (Toshiba Exceria Pro SDXC 64 GB UHS-II) | |
| MSI Modern 15 A10RB (Toshiba Exceria Pro M501 UHS-II) | |
| maximum AS SSD Seq Read Test (1GB) | |
| MSI Prestige 15 A10SC (Toshiba Exceria Pro M501 UHS-II) | |
| Dell XPS 15 7590 i5 iGPU FHD (Toshiba Exceria Pro SDXC 64 GB UHS-II) | |
| Lenovo ThinkPad T590-20N4002VGE (Toshiba Exceria Pro M501 UHS-II) | |
| Asus ZenBook 15 UX534FT-DB77 (Toshiba Exceria Pro SDXC 64 GB UHS-II) | |
| MSI Modern 15 A10RB (Toshiba Exceria Pro M501 UHS-II) | |
| |||||||||||||||||||||||||
Brightness Distribution: 82 %
Center on Battery: 289.4 cd/m²
Contrast: 1072:1 (Black: 0.27 cd/m²)
ΔE ColorChecker Calman: 2.32 | ∀{0.5-29.43 Ø4.71}
calibrated: 2.49
ΔE Greyscale Calman: 3 | ∀{0.09-98 Ø4.96}
92% sRGB (Argyll 1.6.3 3D)
59.8% AdobeRGB 1998 (Argyll 1.6.3 3D)
66.5% AdobeRGB 1998 (Argyll 3D)
92.1% sRGB (Argyll 3D)
66% Display P3 (Argyll 3D)
Gamma: 2.22
CCT: 6867 K
| MSI Modern 15 A10RB Chi Mei N156HCE-EN1, IPS, 15.6", 1920x1080 | Asus ZenBook 15 UX534FT-DB77 BOE NV156FHM-N63, IPS, 15.6", 1920x1080 | Dell XPS 15 7590 i5 iGPU FHD LQ156M1, IPS, 15.6", 1920x1080 | Lenovo ThinkPad T590-20N4002VGE LP156WFC-SPD1, aSi IPS LED, 15.6", 1920x1080 | HP Spectre X360 15-5ZV31AV AU Optronics AUO30EB, IPS, 15.6", 3840x2160 | MSI Prestige 15 A10SC Sharp LQ156D1JW42, IPS, 15.6", 3840x2160 | |
|---|---|---|---|---|---|---|
| Display | -3% | 3% | -39% | 3% | 25% | |
| Display P3 Coverage (%) | 66 | 66.6 1% | 66.5 1% | 38.79 -41% | 68.3 3% | 82 24% |
| sRGB Coverage (%) | 92.1 | 87.7 -5% | 98 6% | 58.3 -37% | 94.3 2% | 98.3 7% |
| AdobeRGB 1998 Coverage (%) | 66.5 | 64.1 -4% | 68.4 3% | 40.11 -40% | 68.4 3% | 96.2 45% |
| Response Times | 4% | -8% | 18% | -25% | -30% | |
| Response Time Grey 50% / Grey 80% * (ms) | 43.2 ? | 41.2 ? 5% | 52.8 ? -22% | 37.2 ? 14% | 56.8 ? -31% | 60 ? -39% |
| Response Time Black / White * (ms) | 34.4 ? | 33.2 ? 3% | 32 ? 7% | 27.2 ? 21% | 40.8 ? -19% | 41.2 ? -20% |
| PWM Frequency (Hz) | 26040 ? | 1020 ? | 26040 ? | |||
| Screen | -32% | 21% | -42% | -5% | 4% | |
| Brightness middle (cd/m²) | 289.4 | 312.6 8% | 588 103% | 276 -5% | 284.6 -2% | 464.5 61% |
| Brightness (cd/m²) | 273 | 290 6% | 555 103% | 262 -4% | 285 4% | 451 65% |
| Brightness Distribution (%) | 82 | 85 4% | 89 9% | 88 7% | 85 4% | 92 12% |
| Black Level * (cd/m²) | 0.27 | 0.31 -15% | 0.4 -48% | 0.23 15% | 0.25 7% | 0.5 -85% |
| Contrast (:1) | 1072 | 1008 -6% | 1470 37% | 1200 12% | 1138 6% | 929 -13% |
| Colorchecker dE 2000 * | 2.32 | 5.78 -149% | 2.5 -8% | 5.6 -141% | 3.52 -52% | 3.36 -45% |
| Colorchecker dE 2000 max. * | 5.76 | 8.86 -54% | 6.3 -9% | 16.4 -185% | 5.56 3% | 7.06 -23% |
| Colorchecker dE 2000 calibrated * | 2.49 | 3.78 -52% | 0.6 76% | 4.7 -89% | 3 -20% | 3.42 -37% |
| Greyscale dE 2000 * | 3 | 5.4 -80% | 4.5 -50% | 3 -0% | 3.2 -7% | 1.3 57% |
| Gamma | 2.22 99% | 2.21 100% | 2.2 100% | 2.18 101% | 2.28 96% | 2.14 103% |
| CCT | 6867 95% | 7864 83% | 6836 95% | 7075 92% | 7070 92% | 6596 99% |
| Color Space (Percent of AdobeRGB 1998) (%) | 59.8 | 57.1 -5% | 63.2 6% | 36.9 -38% | 61.1 2% | 84.8 42% |
| Color Space (Percent of sRGB) (%) | 92 | 87.4 -5% | 98 7% | 58.1 -37% | 93.8 2% | 98.3 7% |
| Total Average (Program / Settings) | -10% /
-22% | 5% /
14% | -21% /
-34% | -9% /
-6% | -0% /
4% |
* ... smaller is better
Display Response Times
| ↔ Response Time Black to White | ||
|---|---|---|
| 34.4 ms ... rise ↗ and fall ↘ combined | ↗ 20.4 ms rise | 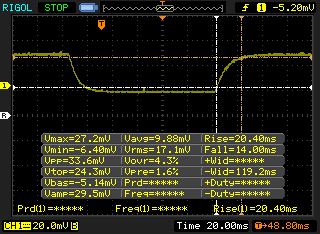 |
| ↘ 14 ms fall | ||
| The screen shows slow response rates in our tests and will be unsatisfactory for gamers. In comparison, all tested devices range from 0.1 (minimum) to 240 (maximum) ms. » 92 % of all devices are better. This means that the measured response time is worse than the average of all tested devices (19.8 ms). | ||
| ↔ Response Time 50% Grey to 80% Grey | ||
| 43.2 ms ... rise ↗ and fall ↘ combined | ↗ 22.8 ms rise | 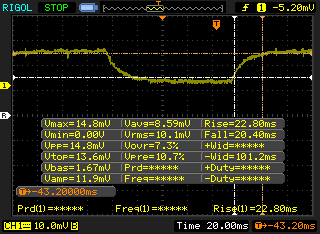 |
| ↘ 20.4 ms fall | ||
| The screen shows slow response rates in our tests and will be unsatisfactory for gamers. In comparison, all tested devices range from 0.165 (minimum) to 636 (maximum) ms. » 72 % of all devices are better. This means that the measured response time is worse than the average of all tested devices (31 ms). | ||
Screen Flickering / PWM (Pulse-Width Modulation)
| Screen flickering / PWM detected | 26040 Hz | ≤ 13 % brightness setting | 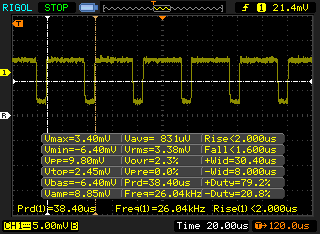 |
The display backlight flickers at 26040 Hz (worst case, e.g., utilizing PWM) Flickering detected at a brightness setting of 13 % and below. There should be no flickering or PWM above this brightness setting. The frequency of 26040 Hz is quite high, so most users sensitive to PWM should not notice any flickering. In comparison: 52 % of all tested devices do not use PWM to dim the display. If PWM was detected, an average of 7754 (minimum: 5 - maximum: 343500) Hz was measured. | |||
| Cinebench R20 | |
| CPU (Single Core) | |
| MSI Modern 15 A10RB | |
| Dell Latitude 5500 | |
| Dell XPS 13 7390 2-in-1 Core i7 | |
| Dell XPS 13 7390 Core i7-10710U | |
| Lenovo IdeaPad S740-15IRH | |
| MSI PS63 Modern 8SC | |
| Average Intel Core i7-10510U (362 - 497, n=37) | |
| MSI Modern 14 A10RB-459US | |
| Dynabook Portege A30-E-174 | |
| Walmart Motile M142 | |
| Microsoft Surface Laptop 3 15 Ryzen 5 3580U | |
| MSI Alpha 15 A3DDK-034 | |
| Dell Latitude 13 3390 | |
| Dell Inspiron 15 5000 5585 | |
| CPU (Multi Core) | |
| Lenovo IdeaPad S740-15IRH | |
| Dell XPS 13 7390 Core i7-10710U | |
| Dell XPS 13 7390 2-in-1 Core i7 | |
| MSI Modern 15 A10RB | |
| MSI Alpha 15 A3DDK-034 | |
| Microsoft Surface Laptop 3 15 Ryzen 5 3580U | |
| Dell Latitude 5500 | |
| MSI PS63 Modern 8SC | |
| Dell Inspiron 15 5000 5585 | |
| Average Intel Core i7-10510U (1015 - 1897, n=38) | |
| Walmart Motile M142 | |
| MSI Modern 14 A10RB-459US | |
| Dynabook Portege A30-E-174 | |
| Dell Latitude 13 3390 | |
| Cinebench R15 | |
| CPU Single 64Bit | |
| MSI Modern 15 A10RB | |
| Dell Latitude 5500 | |
| Lenovo IdeaPad S740-15IRH | |
| MSI PS63 Modern 8SC | |
| Dell XPS 13 7390 Core i7-10710U | |
| Average Intel Core i7-10510U (113 - 202, n=42) | |
| Dell XPS 13 7390 2-in-1 Core i7 | |
| MSI Modern 14 A10RB-459US | |
| Dynabook Portege A30-E-174 | |
| Walmart Motile M142 | |
| Dell Latitude 13 3390 | |
| MSI Alpha 15 A3DDK-034 | |
| Microsoft Surface Laptop 3 15 Ryzen 5 3580U | |
| Dell Inspiron 15 5000 5585 | |
| CPU Multi 64Bit | |
| Lenovo IdeaPad S740-15IRH | |
| Dell XPS 13 7390 Core i7-10710U | |
| Dell XPS 13 7390 2-in-1 Core i7 | |
| MSI Modern 15 A10RB | |
| MSI Alpha 15 A3DDK-034 | |
| MSI PS63 Modern 8SC | |
| Microsoft Surface Laptop 3 15 Ryzen 5 3580U | |
| Dell Latitude 5500 | |
| Dell Inspiron 15 5000 5585 | |
| Average Intel Core i7-10510U (482 - 856, n=45) | |
| Walmart Motile M142 | |
| MSI Modern 14 A10RB-459US | |
| Dell Latitude 13 3390 | |
| Dynabook Portege A30-E-174 | |
| Cinebench R11.5 | |
| CPU Single 64Bit | |
| Dell XPS 13 7390 Core i7-10710U | |
| Dell XPS 13 7390 2-in-1 Core i7 | |
| Average Intel Core i7-10510U (n=1) | |
| Microsoft Surface Laptop 3 15 Ryzen 5 3580U | |
| Dell Latitude 13 3390 | |
| Dell Inspiron 15 5000 5585 | |
| CPU Multi 64Bit | |
| Dell XPS 13 7390 Core i7-10710U | |
| Dell XPS 13 7390 2-in-1 Core i7 | |
| Microsoft Surface Laptop 3 15 Ryzen 5 3580U | |
| Dell Inspiron 15 5000 5585 | |
| Average Intel Core i7-10510U (n=1) | |
| Dell Latitude 13 3390 | |
| Cinebench R10 | |
| Rendering Multiple CPUs 32Bit | |
| Dell XPS 13 7390 Core i7-10710U | |
| Dell XPS 13 7390 2-in-1 Core i7 | |
| Average Intel Core i7-10510U (6763 - 26265, n=3) | |
| MSI Alpha 15 A3DDK-034 | |
| Microsoft Surface Laptop 3 15 Ryzen 5 3580U | |
| Dynabook Portege A30-E-174 | |
| Rendering Single 32Bit | |
| Dell XPS 13 7390 Core i7-10710U | |
| Dell XPS 13 7390 2-in-1 Core i7 | |
| Average Intel Core i7-10510U (5740 - 7748, n=3) | |
| Dynabook Portege A30-E-174 | |
| MSI Alpha 15 A3DDK-034 | |
| Microsoft Surface Laptop 3 15 Ryzen 5 3580U | |
| wPrime 2.10 - 1024m | |
| Microsoft Surface Laptop 3 15 Ryzen 5 3580U | |
| Dell XPS 13 7390 2-in-1 Core i7 | |
| Dell XPS 13 7390 Core i7-10710U | |
* ... smaller is better
| PCMark 8 | |
| Home Score Accelerated v2 | |
| Dell XPS 15 7590 i5 iGPU FHD | |
| MSI Modern 15 A10RB | |
| Lenovo ThinkPad T590-20N4002VGE | |
| Asus ZenBook 15 UX534FT-DB77 | |
| Average Intel Core i7-10510U, NVIDIA GeForce MX250 (3214 - 3958, n=8) | |
| MSI Prestige 15 A10SC | |
| HP Spectre X360 15-5ZV31AV | |
| Work Score Accelerated v2 | |
| MSI Modern 15 A10RB | |
| Lenovo ThinkPad T590-20N4002VGE | |
| Asus ZenBook 15 UX534FT-DB77 | |
| Dell XPS 15 7590 i5 iGPU FHD | |
| Average Intel Core i7-10510U, NVIDIA GeForce MX250 (4599 - 5443, n=8) | |
| HP Spectre X360 15-5ZV31AV | |
| MSI Prestige 15 A10SC | |
| PCMark 8 Home Score Accelerated v2 | 3958 points | |
| PCMark 8 Work Score Accelerated v2 | 5443 points | |
| PCMark 10 Score | 5409 points | |
Help | ||
| MSI Modern 15 A10RB WDC PC SN730 SDBPNTY-512G | Asus ZenBook 15 UX534FT-DB77 Samsung SSD PM981 MZVLB1T0HALR | Lenovo ThinkPad T590-20N4002VGE Toshiba XG6 KXG60ZNV512G | HP Spectre X360 15-5ZV31AV Intel SSD 660p 2TB SSDPEKNW020T8 | MSI Prestige 15 A10SC Samsung SSD PM981 MZVLB1T0HALR | |
|---|---|---|---|---|---|
| AS SSD | 0% | 21% | -21% | 11% | |
| Seq Read (MB/s) | 2084 | 1887 -9% | 2551 22% | 1220 -41% | 1274 -39% |
| Seq Write (MB/s) | 2442 | 1432 -41% | 2376 -3% | 1152 -53% | 1395 -43% |
| 4K Read (MB/s) | 47.52 | 52.3 10% | 52.7 11% | 52.3 10% | 50.3 6% |
| 4K Write (MB/s) | 135.8 | 146 8% | 153 13% | 146.6 8% | 119.8 -12% |
| 4K-64 Read (MB/s) | 1043 | 969 -7% | 1406 35% | 652 -37% | 1599 53% |
| 4K-64 Write (MB/s) | 955 | 1375 44% | 1439 51% | 847 -11% | 1455 52% |
| Access Time Read * (ms) | 0.062 | 0.034 45% | 0.067 -8% | 0.077 -24% | 0.044 29% |
| Access Time Write * (ms) | 0.076 | 0.075 1% | 0.027 64% | 0.106 -39% | 0.092 -21% |
| Score Read (Points) | 1299 | 1210 -7% | 1714 32% | 826 -36% | 1777 37% |
| Score Write (Points) | 1335 | 1664 25% | 1829 37% | 1109 -17% | 1714 28% |
| Score Total (Points) | 3326 | 3483 5% | 4418 33% | 2371 -29% | 4411 33% |
| Copy ISO MB/s (MB/s) | 1926 | 1375 -29% | 2625 36% | 2070 7% | 2830 47% |
| Copy Program MB/s (MB/s) | 714 | 468 -34% | 495.9 -31% | 571 -20% | 609 -15% |
| Copy Game MB/s (MB/s) | 1425 | 1287 -10% | 1384 -3% | 1219 -14% | 1424 0% |
| CrystalDiskMark 5.2 / 6 | -14% | -22% | -27% | -33% | |
| Write 4K (MB/s) | 208.4 | 141.6 -32% | 126.2 -39% | 151.5 -27% | 150.8 -28% |
| Read 4K (MB/s) | 51 | 45.28 -11% | 48.93 -4% | 59.3 16% | 47.3 -7% |
| Write Seq (MB/s) | 2687 | 1975 -26% | 1345 -50% | 1424 -47% | 981 -63% |
| Read Seq (MB/s) | 2168 | 2272 5% | 1373 -37% | 1609 -26% | 976 -55% |
| Write 4K Q32T1 (MB/s) | 489.2 | 458.6 -6% | 383.8 -22% | 393.6 -20% | 442.7 -10% |
| Read 4K Q32T1 (MB/s) | 600 | 391.4 -35% | 434.8 -28% | 369.4 -38% | 499.7 -17% |
| Write Seq Q32T1 (MB/s) | 2699 | 2393 -11% | 2966 10% | 1946 -28% | 1706 -37% |
| Read Seq Q32T1 (MB/s) | 3374 | 3464 3% | 3230 -4% | 1934 -43% | 1758 -48% |
| Write 4K Q8T8 (MB/s) | 960 | ||||
| Read 4K Q8T8 (MB/s) | 1441 | ||||
| Total Average (Program / Settings) | -7% /
-5% | -1% /
5% | -24% /
-23% | -11% /
-5% |
* ... smaller is better

| 3DMark 11 Performance | 5302 points | |
| 3DMark Cloud Gate Standard Score | 17955 points | |
| 3DMark Fire Strike Score | 3562 points | |
| 3DMark Time Spy Score | 1308 points | |
Help | ||
| Shadow of the Tomb Raider | |
| 1280x720 Lowest Preset | |
| Lenovo IdeaPad S740-15IRH | |
| MSI GL72 7QF | |
| MSI Modern 15 A10RB | |
| Average NVIDIA GeForce MX250 (24 - 56, n=8) | |
| Xiaomi Mi Notebook Pro i7 | |
| Dell Inspiron 15 5000 5585 | |
| Microsoft Surface Laptop 3 15 i7-1065G7 | |
| Microsoft Surface Laptop 3 15 Ryzen 5 3580U | |
| 1920x1080 Medium Preset | |
| Lenovo IdeaPad S740-15IRH | |
| MSI GL72 7QF | |
| MSI Modern 15 A10RB | |
| Xiaomi Mi Notebook Pro i7 | |
| Average NVIDIA GeForce MX250 (7 - 19, n=8) | |
| Dell Inspiron 15 5000 5585 | |
| Microsoft Surface Laptop 3 15 Ryzen 5 3580U | |
| 1920x1080 High Preset AA:SM | |
| Asus TUF FX705GM | |
| Lenovo IdeaPad S740-15IRH | |
| MSI GL72 7QF | |
| Dell Inspiron 15 5000 5585 | |
| MSI Modern 15 A10RB | |
| Average NVIDIA GeForce MX250 (12 - 15, n=6) | |
| Xiaomi Mi Notebook Pro i7 | |
| 1920x1080 Highest Preset AA:T | |
| Asus TUF FX705GM | |
| Lenovo IdeaPad S740-15IRH | |
| MSI GL72 7QF | |
| MSI Modern 15 A10RB | |
| Average NVIDIA GeForce MX250 (9 - 10, n=5) | |
| Xiaomi Mi Notebook Pro i7 | |
| BioShock Infinite | |
| 1280x720 Very Low Preset | |
| Lenovo IdeaPad S740-15IRH | |
| MSI Modern 15 A10RB | |
| Average NVIDIA GeForce MX250 (133.9 - 212, n=14) | |
| Dell Inspiron 15 5000 5585 | |
| Microsoft Surface Laptop 3 15 Ryzen 5 3580U | |
| Microsoft Surface Laptop 3 15 i7-1065G7 | |
| 1366x768 Medium Preset | |
| Lenovo IdeaPad S740-15IRH | |
| MSI Modern 15 A10RB | |
| Average NVIDIA GeForce MX250 (98.4 - 117.5, n=14) | |
| Microsoft Surface Laptop 3 15 i7-1065G7 | |
| 1366x768 High Preset | |
| Lenovo IdeaPad S740-15IRH | |
| MSI Modern 15 A10RB | |
| Average NVIDIA GeForce MX250 (84 - 100.5, n=14) | |
| Microsoft Surface Laptop 3 15 i7-1065G7 | |
| 1920x1080 Ultra Preset, DX11 (DDOF) | |
| Lenovo IdeaPad S740-15IRH | |
| MSI Modern 15 A10RB | |
| Average NVIDIA GeForce MX250 (32.3 - 38.1, n=14) | |
| Microsoft Surface Laptop 3 15 i7-1065G7 | |
| Dell Inspiron 15 5000 5585 | |
| Microsoft Surface Laptop 3 15 Ryzen 5 3580U | |
| Rocket League | |
| 1280x720 Performance | |
| MSI Modern 15 A10RB | |
| Average NVIDIA GeForce MX250 (175.4 - 182.9, n=3) | |
| Dell Inspiron 15 5000 5585 | |
| Microsoft Surface Laptop 3 15 Ryzen 5 3580U | |
| Microsoft Surface Laptop 3 15 i7-1065G7 | |
| 1920x1080 Performance | |
| MSI Modern 15 A10RB | |
| Average NVIDIA GeForce MX250 (n=1) | |
| Dell Inspiron 15 5000 5585 | |
| Microsoft Surface Laptop 3 15 i7-1065G7 | |
| Microsoft Surface Laptop 3 15 Ryzen 5 3580U | |
| 1920x1080 Quality AA:Medium FX | |
| Average NVIDIA GeForce MX250 (77 - 109, n=3) | |
| MSI Modern 15 A10RB | |
| Microsoft Surface Laptop 3 15 i7-1065G7 | |
| Dell Inspiron 15 5000 5585 | |
| Microsoft Surface Laptop 3 15 Ryzen 5 3580U | |
| 1920x1080 High Quality AA:High FX | |
| Average NVIDIA GeForce MX250 (52.1 - 80, n=3) | |
| MSI Modern 15 A10RB | |
| Microsoft Surface Laptop 3 15 i7-1065G7 | |
| Dell Inspiron 15 5000 5585 | |
| Microsoft Surface Laptop 3 15 Ryzen 5 3580U | |
| low | med. | high | ultra | |
|---|---|---|---|---|
| BioShock Infinite (2013) | 212.3 | 114.5 | 98.1 | 37.8 |
| The Witcher 3 (2015) | 70 | 40 | 23.1 | 12 |
| Rocket League (2017) | 182.9 | 91.2 | 60.8 | |
| Shadow of the Tomb Raider (2018) | 55 | 19 | 13 | 10 |
| MSI Modern 15 A10RB GeForce MX250, i7-10510U, WDC PC SN730 SDBPNTY-512G | Asus ZenBook 15 UX534FT-DB77 GeForce GTX 1650 Max-Q, i7-8565U, Samsung SSD PM981 MZVLB1T0HALR | Dell XPS 15 7590 i5 iGPU FHD UHD Graphics 630, i5-9300H, Toshiba XG6 KXG60ZNV512G | Lenovo ThinkPad T590-20N4002VGE GeForce MX250, i7-8565U, Toshiba XG6 KXG60ZNV512G | HP Spectre X360 15-5ZV31AV GeForce MX250, i7-10510U, Intel SSD 660p 2TB SSDPEKNW020T8 | MSI Prestige 15 A10SC GeForce GTX 1650 Max-Q, i7-10710U, Samsung SSD PM981 MZVLB1T0HALR | |
|---|---|---|---|---|---|---|
| Noise | 8% | 9% | 9% | 6% | 5% | |
| off / environment * (dB) | 28.3 | 28.4 -0% | 29.3 -4% | 29.4 -4% | 30.1 -6% | 29.3 -4% |
| Idle Minimum * (dB) | 32 | 28.4 11% | 29.3 8% | 29.3 8% | 30.1 6% | 30.1 6% |
| Idle Average * (dB) | 32 | 28.4 11% | 29.3 8% | 29.3 8% | 30.1 6% | 30.2 6% |
| Idle Maximum * (dB) | 32 | 28.4 11% | 29.8 7% | 31.8 1% | 30.1 6% | 30.2 6% |
| Load Average * (dB) | 34.5 | 33.9 2% | 32.4 6% | 33.5 3% | 30.1 13% | 31.5 9% |
| Witcher 3 ultra * (dB) | 39.5 | 39.8 -1% | 33.5 15% | 39.7 -1% | 37 6% | |
| Load Maximum * (dB) | 50.9 | 40.2 21% | 37.2 27% | 35.8 30% | 42 17% | 47 8% |
* ... smaller is better
Noise level
| Idle |
| 32 / 32 / 32 dB(A) |
| Load |
| 34.5 / 50.9 dB(A) |
 | ||
30 dB silent 40 dB(A) audible 50 dB(A) loud |
||
min: | ||
(-) The maximum temperature on the upper side is 54.2 °C / 130 F, compared to the average of 34.3 °C / 94 F, ranging from 21.2 to 62.5 °C for the class Office.
(-) The bottom heats up to a maximum of 59.4 °C / 139 F, compared to the average of 36.8 °C / 98 F
(+) In idle usage, the average temperature for the upper side is 26.2 °C / 79 F, compared to the device average of 29.5 °C / 85 F.
(-) Playing The Witcher 3, the average temperature for the upper side is 39.3 °C / 103 F, compared to the device average of 29.5 °C / 85 F.
(+) The palmrests and touchpad are reaching skin temperature as a maximum (33 °C / 91.4 F) and are therefore not hot.
(-) The average temperature of the palmrest area of similar devices was 27.5 °C / 81.5 F (-5.5 °C / -9.9 F).
MSI Modern 15 A10RB audio analysis
(+) | speakers can play relatively loud (82.1 dB)
Bass 100 - 315 Hz
(-) | nearly no bass - on average 19.1% lower than median
(±) | linearity of bass is average (12.2% delta to prev. frequency)
Mids 400 - 2000 Hz
(+) | balanced mids - only 4.4% away from median
(±) | linearity of mids is average (10.2% delta to prev. frequency)
Highs 2 - 16 kHz
(+) | balanced highs - only 1.3% away from median
(+) | highs are linear (6.8% delta to prev. frequency)
Overall 100 - 16.000 Hz
(±) | linearity of overall sound is average (20.6% difference to median)
Compared to same class
» 48% of all tested devices in this class were better, 9% similar, 43% worse
» The best had a delta of 7%, average was 21%, worst was 53%
Compared to all devices tested
» 55% of all tested devices were better, 8% similar, 37% worse
» The best had a delta of 4%, average was 23%, worst was 134%
Apple MacBook 12 (Early 2016) 1.1 GHz audio analysis
(+) | speakers can play relatively loud (83.6 dB)
Bass 100 - 315 Hz
(±) | reduced bass - on average 11.3% lower than median
(±) | linearity of bass is average (14.2% delta to prev. frequency)
Mids 400 - 2000 Hz
(+) | balanced mids - only 2.4% away from median
(+) | mids are linear (5.5% delta to prev. frequency)
Highs 2 - 16 kHz
(+) | balanced highs - only 2% away from median
(+) | highs are linear (4.5% delta to prev. frequency)
Overall 100 - 16.000 Hz
(+) | overall sound is linear (10.2% difference to median)
Compared to same class
» 7% of all tested devices in this class were better, 2% similar, 90% worse
» The best had a delta of 5%, average was 18%, worst was 53%
Compared to all devices tested
» 5% of all tested devices were better, 1% similar, 94% worse
» The best had a delta of 4%, average was 23%, worst was 134%
| Off / Standby | |
| Idle | |
| Load |
|
Key:
min: | |
| MSI Modern 15 A10RB i7-10510U, GeForce MX250, WDC PC SN730 SDBPNTY-512G, IPS, 1920x1080, 15.6" | Asus ZenBook 15 UX534FT-DB77 i7-8565U, GeForce GTX 1650 Max-Q, Samsung SSD PM981 MZVLB1T0HALR, IPS, 1920x1080, 15.6" | Dell XPS 15 7590 i5 iGPU FHD i5-9300H, UHD Graphics 630, Toshiba XG6 KXG60ZNV512G, IPS, 1920x1080, 15.6" | Lenovo ThinkPad T590-20N4002VGE i7-8565U, GeForce MX250, Toshiba XG6 KXG60ZNV512G, aSi IPS LED, 1920x1080, 15.6" | HP Spectre X360 15-5ZV31AV i7-10510U, GeForce MX250, Intel SSD 660p 2TB SSDPEKNW020T8, IPS, 3840x2160, 15.6" | MSI Prestige 15 A10SC i7-10710U, GeForce GTX 1650 Max-Q, Samsung SSD PM981 MZVLB1T0HALR, IPS, 3840x2160, 15.6" | |
|---|---|---|---|---|---|---|
| Power Consumption | -11% | 27% | 24% | 20% | -9% | |
| Idle Minimum * (Watt) | 6.6 | 5 24% | 3.79 43% | 4.1 38% | 5.2 21% | 6.1 8% |
| Idle Average * (Watt) | 9.9 | 13.2 -33% | 6.9 30% | 8.3 16% | 8.5 14% | 13.2 -33% |
| Idle Maximum * (Watt) | 14.7 | 24 -63% | 9.2 37% | 11.8 20% | 8.7 41% | 19.2 -31% |
| Load Average * (Watt) | 82.9 | 70 16% | 62 25% | 61.6 26% | 65.6 21% | 75 10% |
| Witcher 3 ultra * (Watt) | 59.4 | 63.3 -7% | 54.4 8% | 56.5 5% | 74 -25% | |
| Load Maximum * (Watt) | 109.3 | 114 -4% | 108 1% | 69.4 37% | 92.4 15% | 89.7 18% |
* ... smaller is better
| MSI Modern 15 A10RB i7-10510U, GeForce MX250, 52 Wh | Asus ZenBook 15 UX534FT-DB77 i7-8565U, GeForce GTX 1650 Max-Q, 71 Wh | Dell XPS 15 7590 i5 iGPU FHD i5-9300H, UHD Graphics 630, 97 Wh | Lenovo ThinkPad T590-20N4002VGE i7-8565U, GeForce MX250, 57 Wh | HP Spectre X360 15-5ZV31AV i7-10510U, GeForce MX250, 84 Wh | MSI Prestige 15 A10SC i7-10710U, GeForce GTX 1650 Max-Q, 82 Wh | |
|---|---|---|---|---|---|---|
| Battery runtime | 47% | 59% | 84% | 61% | 22% | |
| Reader / Idle (h) | 15.4 | 21.5 40% | 22.6 47% | 19.1 24% | ||
| WiFi v1.3 (h) | 6.5 | 8.4 29% | 14.1 117% | 10.5 62% | 10.8 66% | 7.6 17% |
| Load (h) | 1.7 | 2.9 71% | 1.7 0% | 3.5 106% | 2.9 71% | 2.1 24% |
Pros
Cons
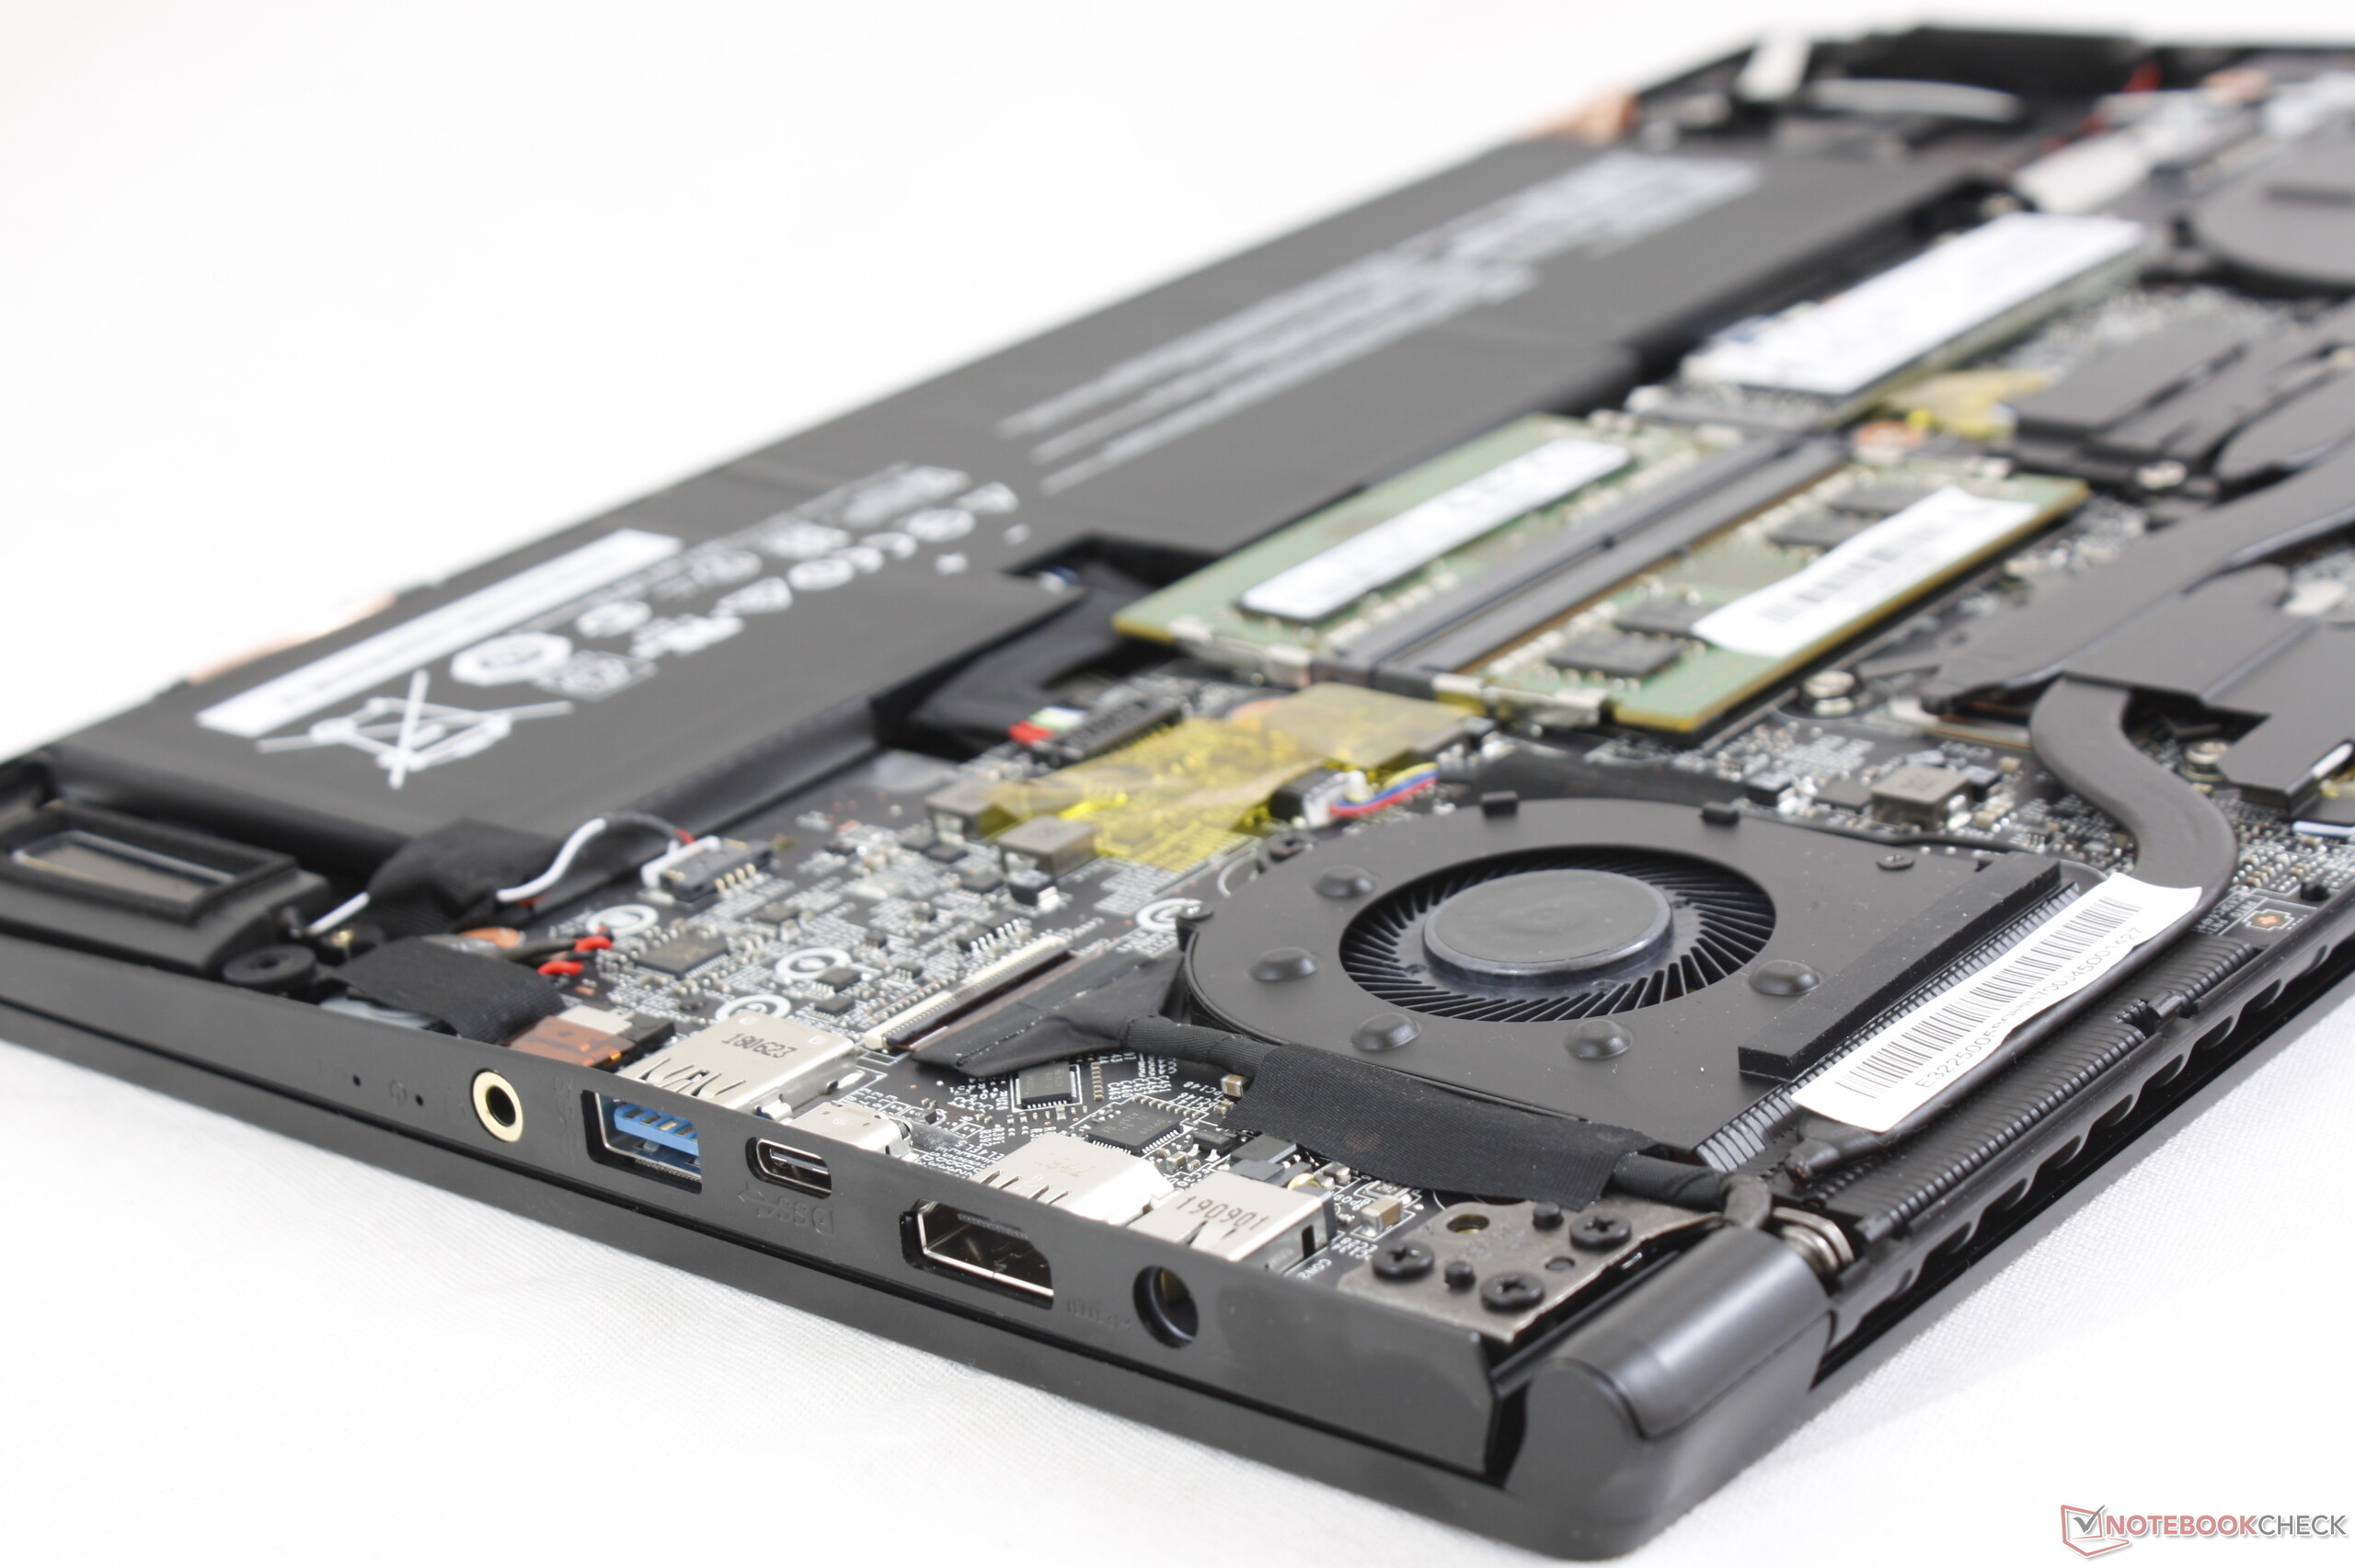
您可能要考虑购买Modern 15,而不是Dell XPS 15,HP Spectre x360 15,Microsoft Surface Laptop 3 15或MacBook Pro等更知名的笔记本电脑,因为前者重量更轻,价格更便宜且RAM和存储易于升级,这些是MSI的优势。 Core i7-10510U CPU与GeForce MX250 GPU搭配良好,它们在Modern 15上均有着高于平均的性能。
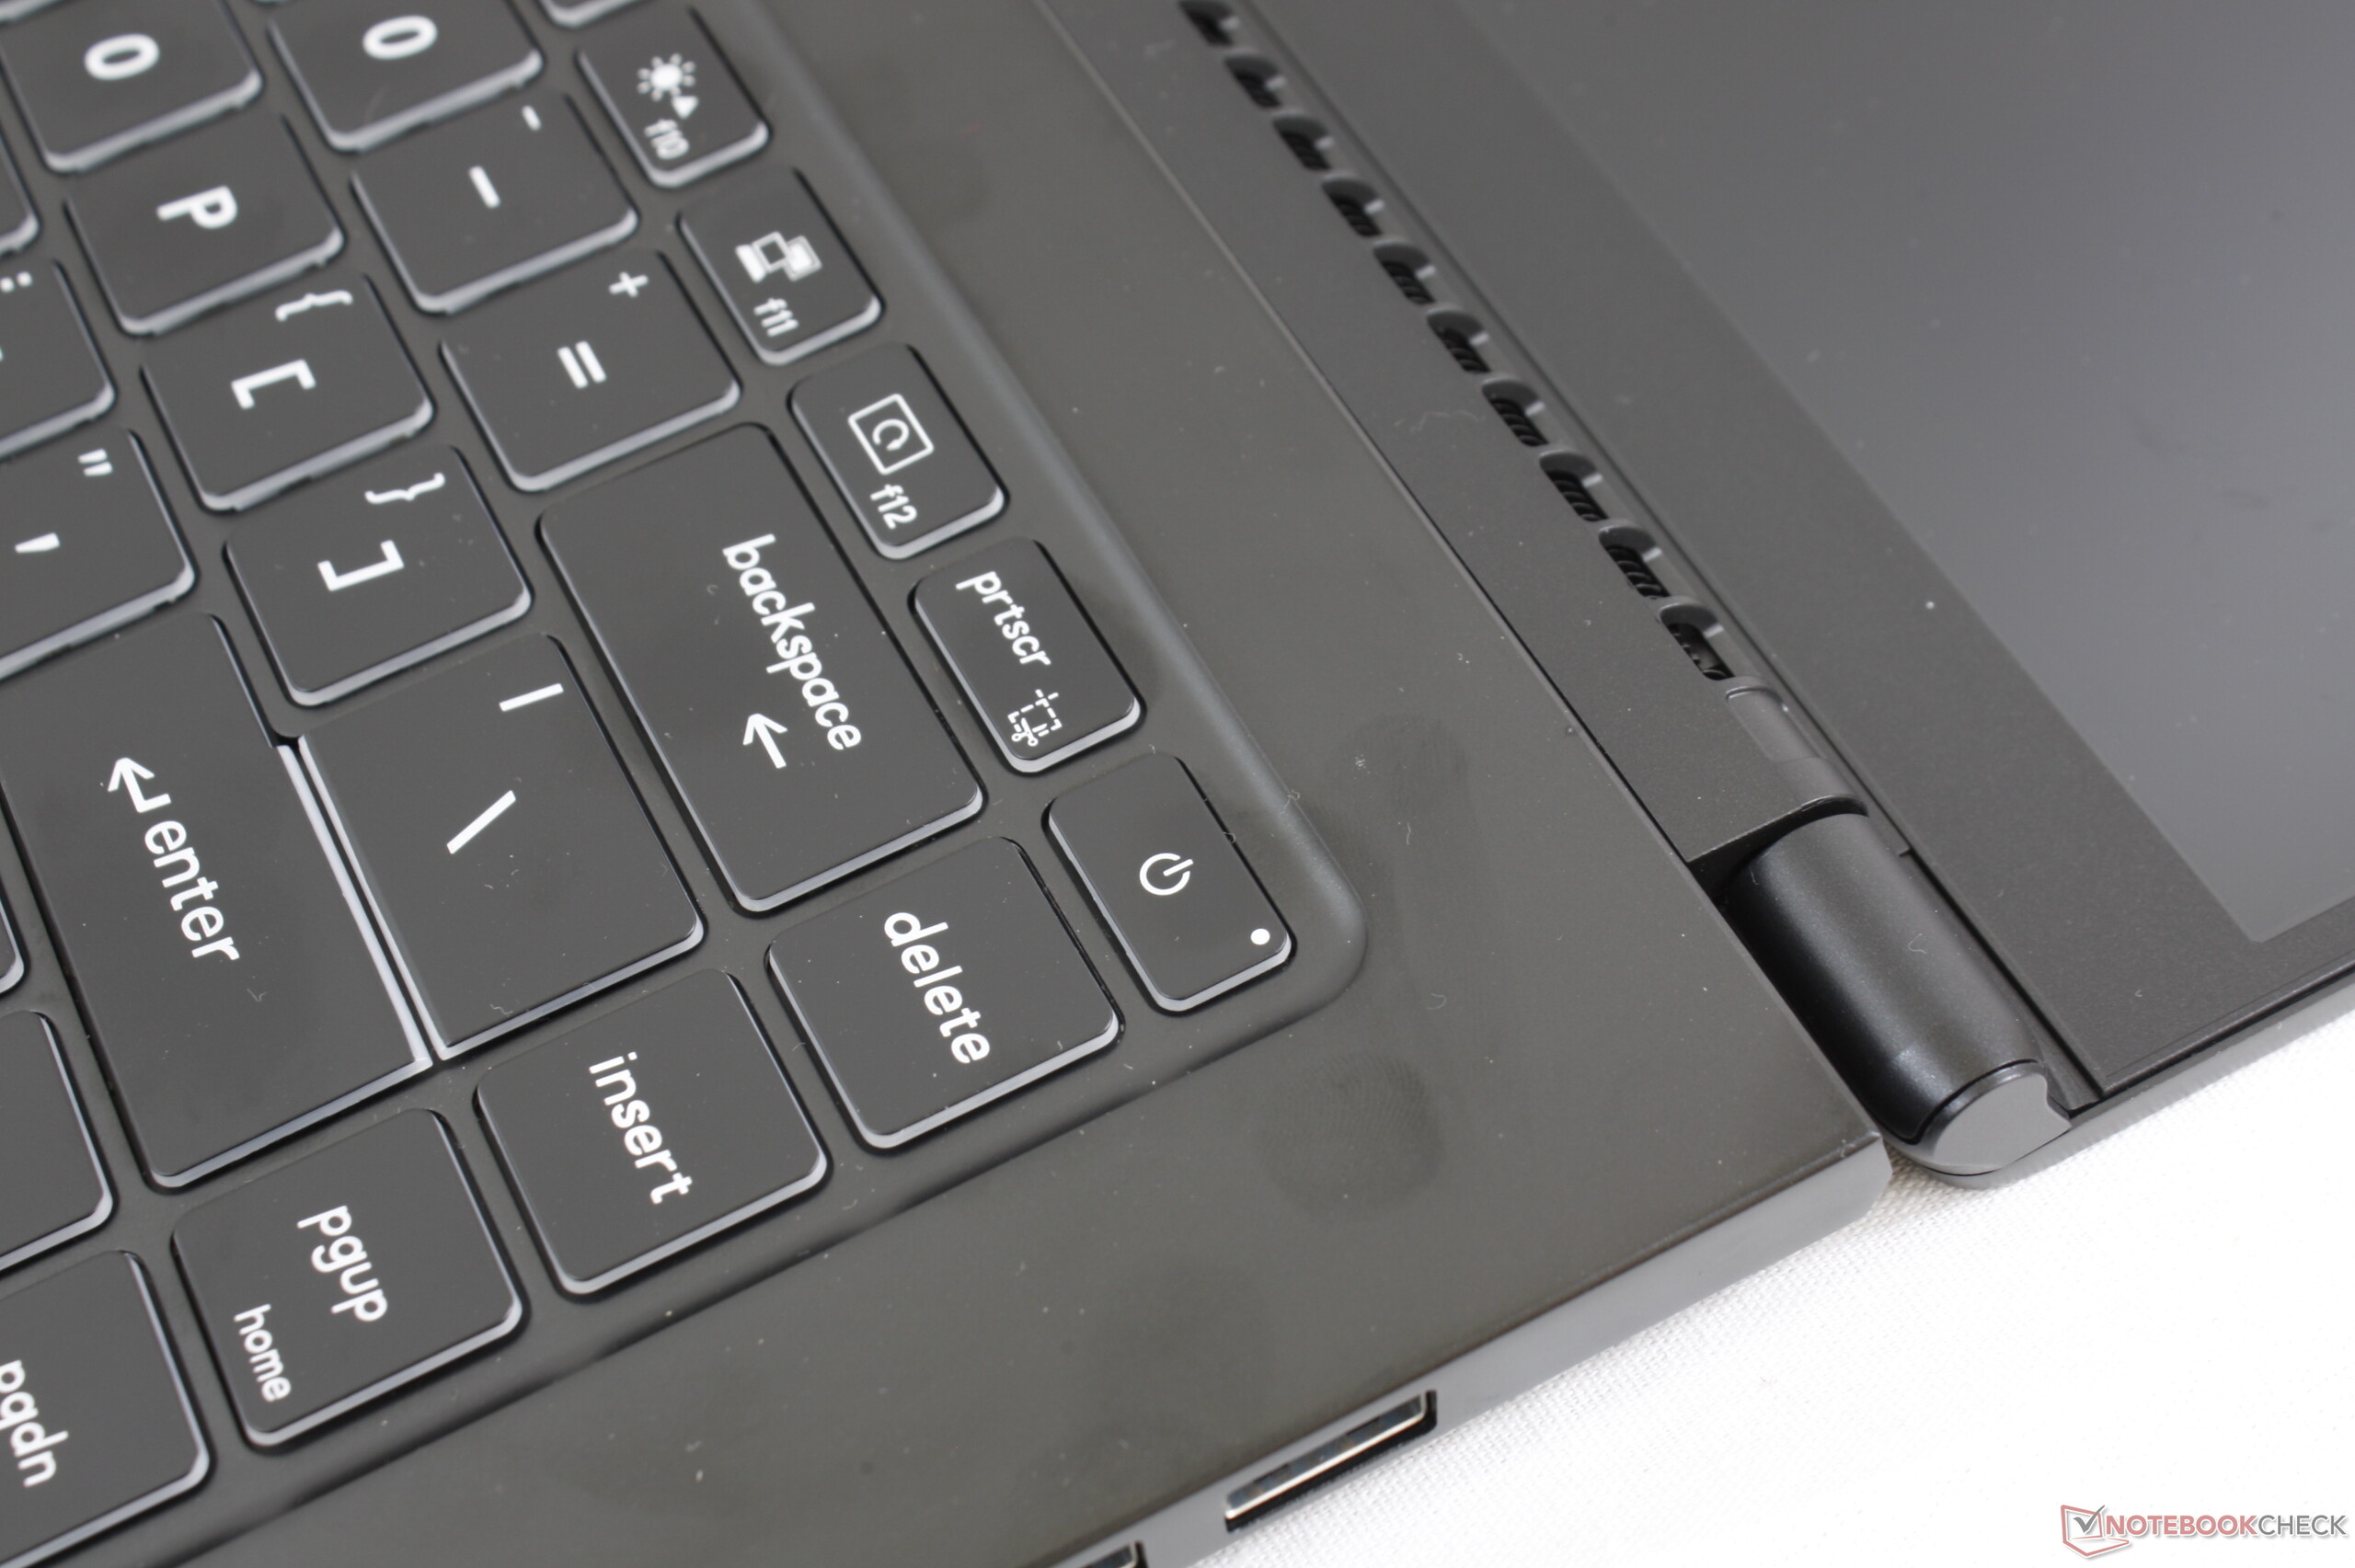
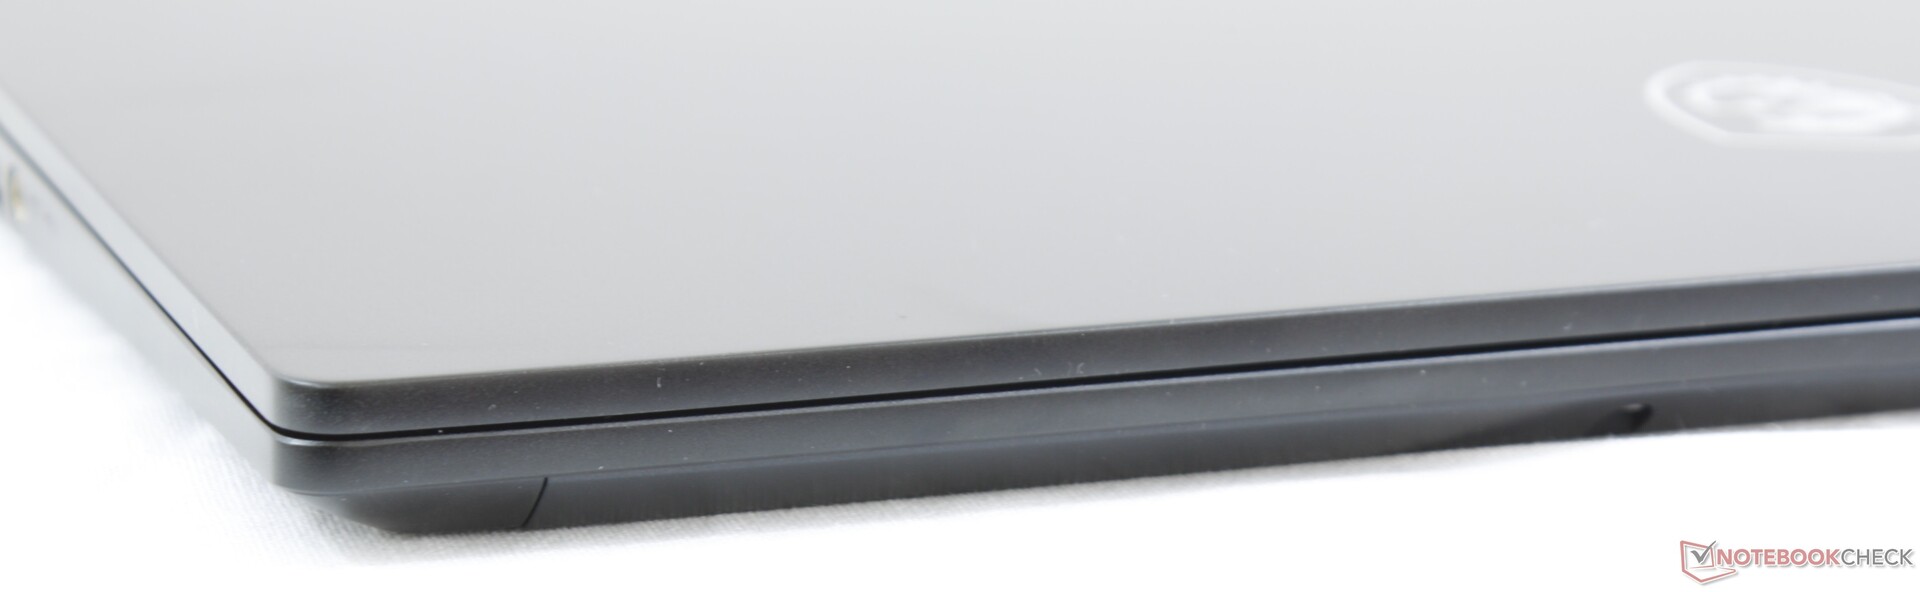
要记住的主要缺点是,与功能更强大的Core H Ultrabooks相比,它的CPU性能较差,键盘按键更软,并且缺少对Thunderbolt 3的支持。机身更容易弯曲和损坏,而显示屏的亮度却不及高端替代品。毕竟,Modern系列应该是廉价的中档笔记本电脑。
我们认为值得关注的一个烦人的方面是风扇。风扇没有理由在静音模式或省电模式下发出噪音。在如此低功耗的条件下,大多数配备Core U系列CPU的笔记本电脑都比较安静。
“如果您可以忍受这些弱点,那么对于这样一台小巧轻便的产品来说,Modern 15将被证明是一款功能强大的笔记本电脑。但是,如果要获得更高的性能或更耐用的功能,请考虑Prestige 15 或更“合适”的商务笔记本电脑,例如HP EliteBook, ThinkPad X1 Carbon或Dell Latitude 7000系列。
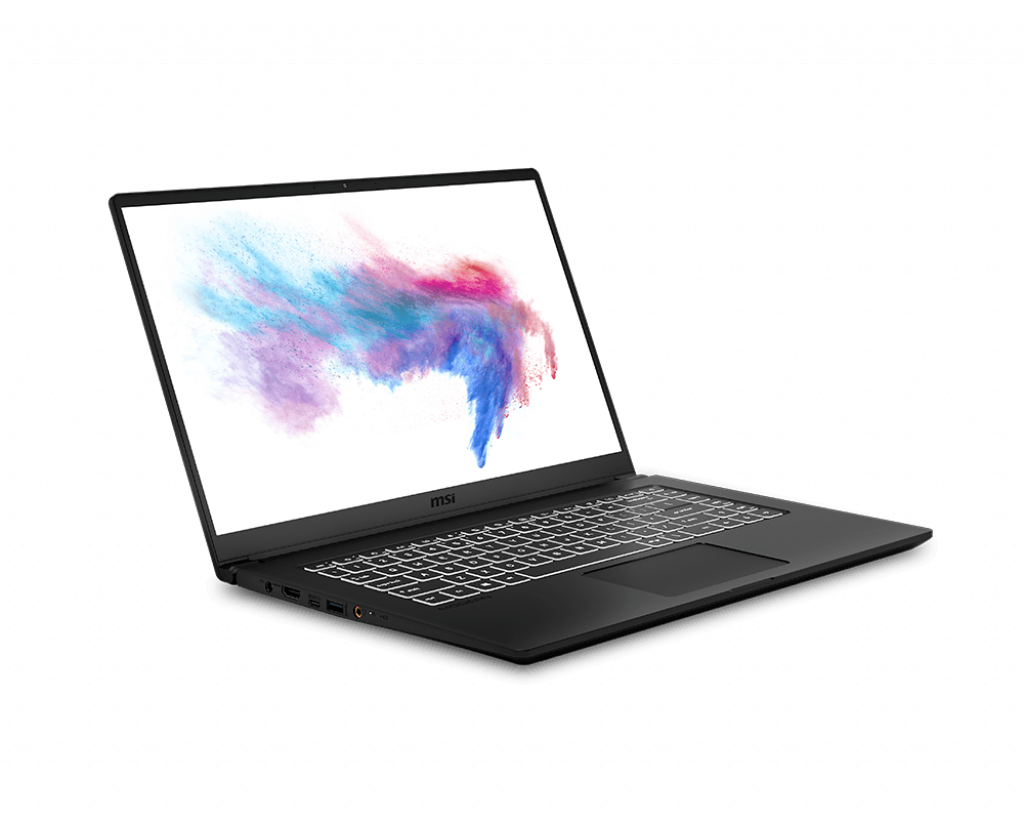
MSI Modern 15 A10RB
- 05/20/2021 v7 (old)
Allen Ngo
Price comparison

