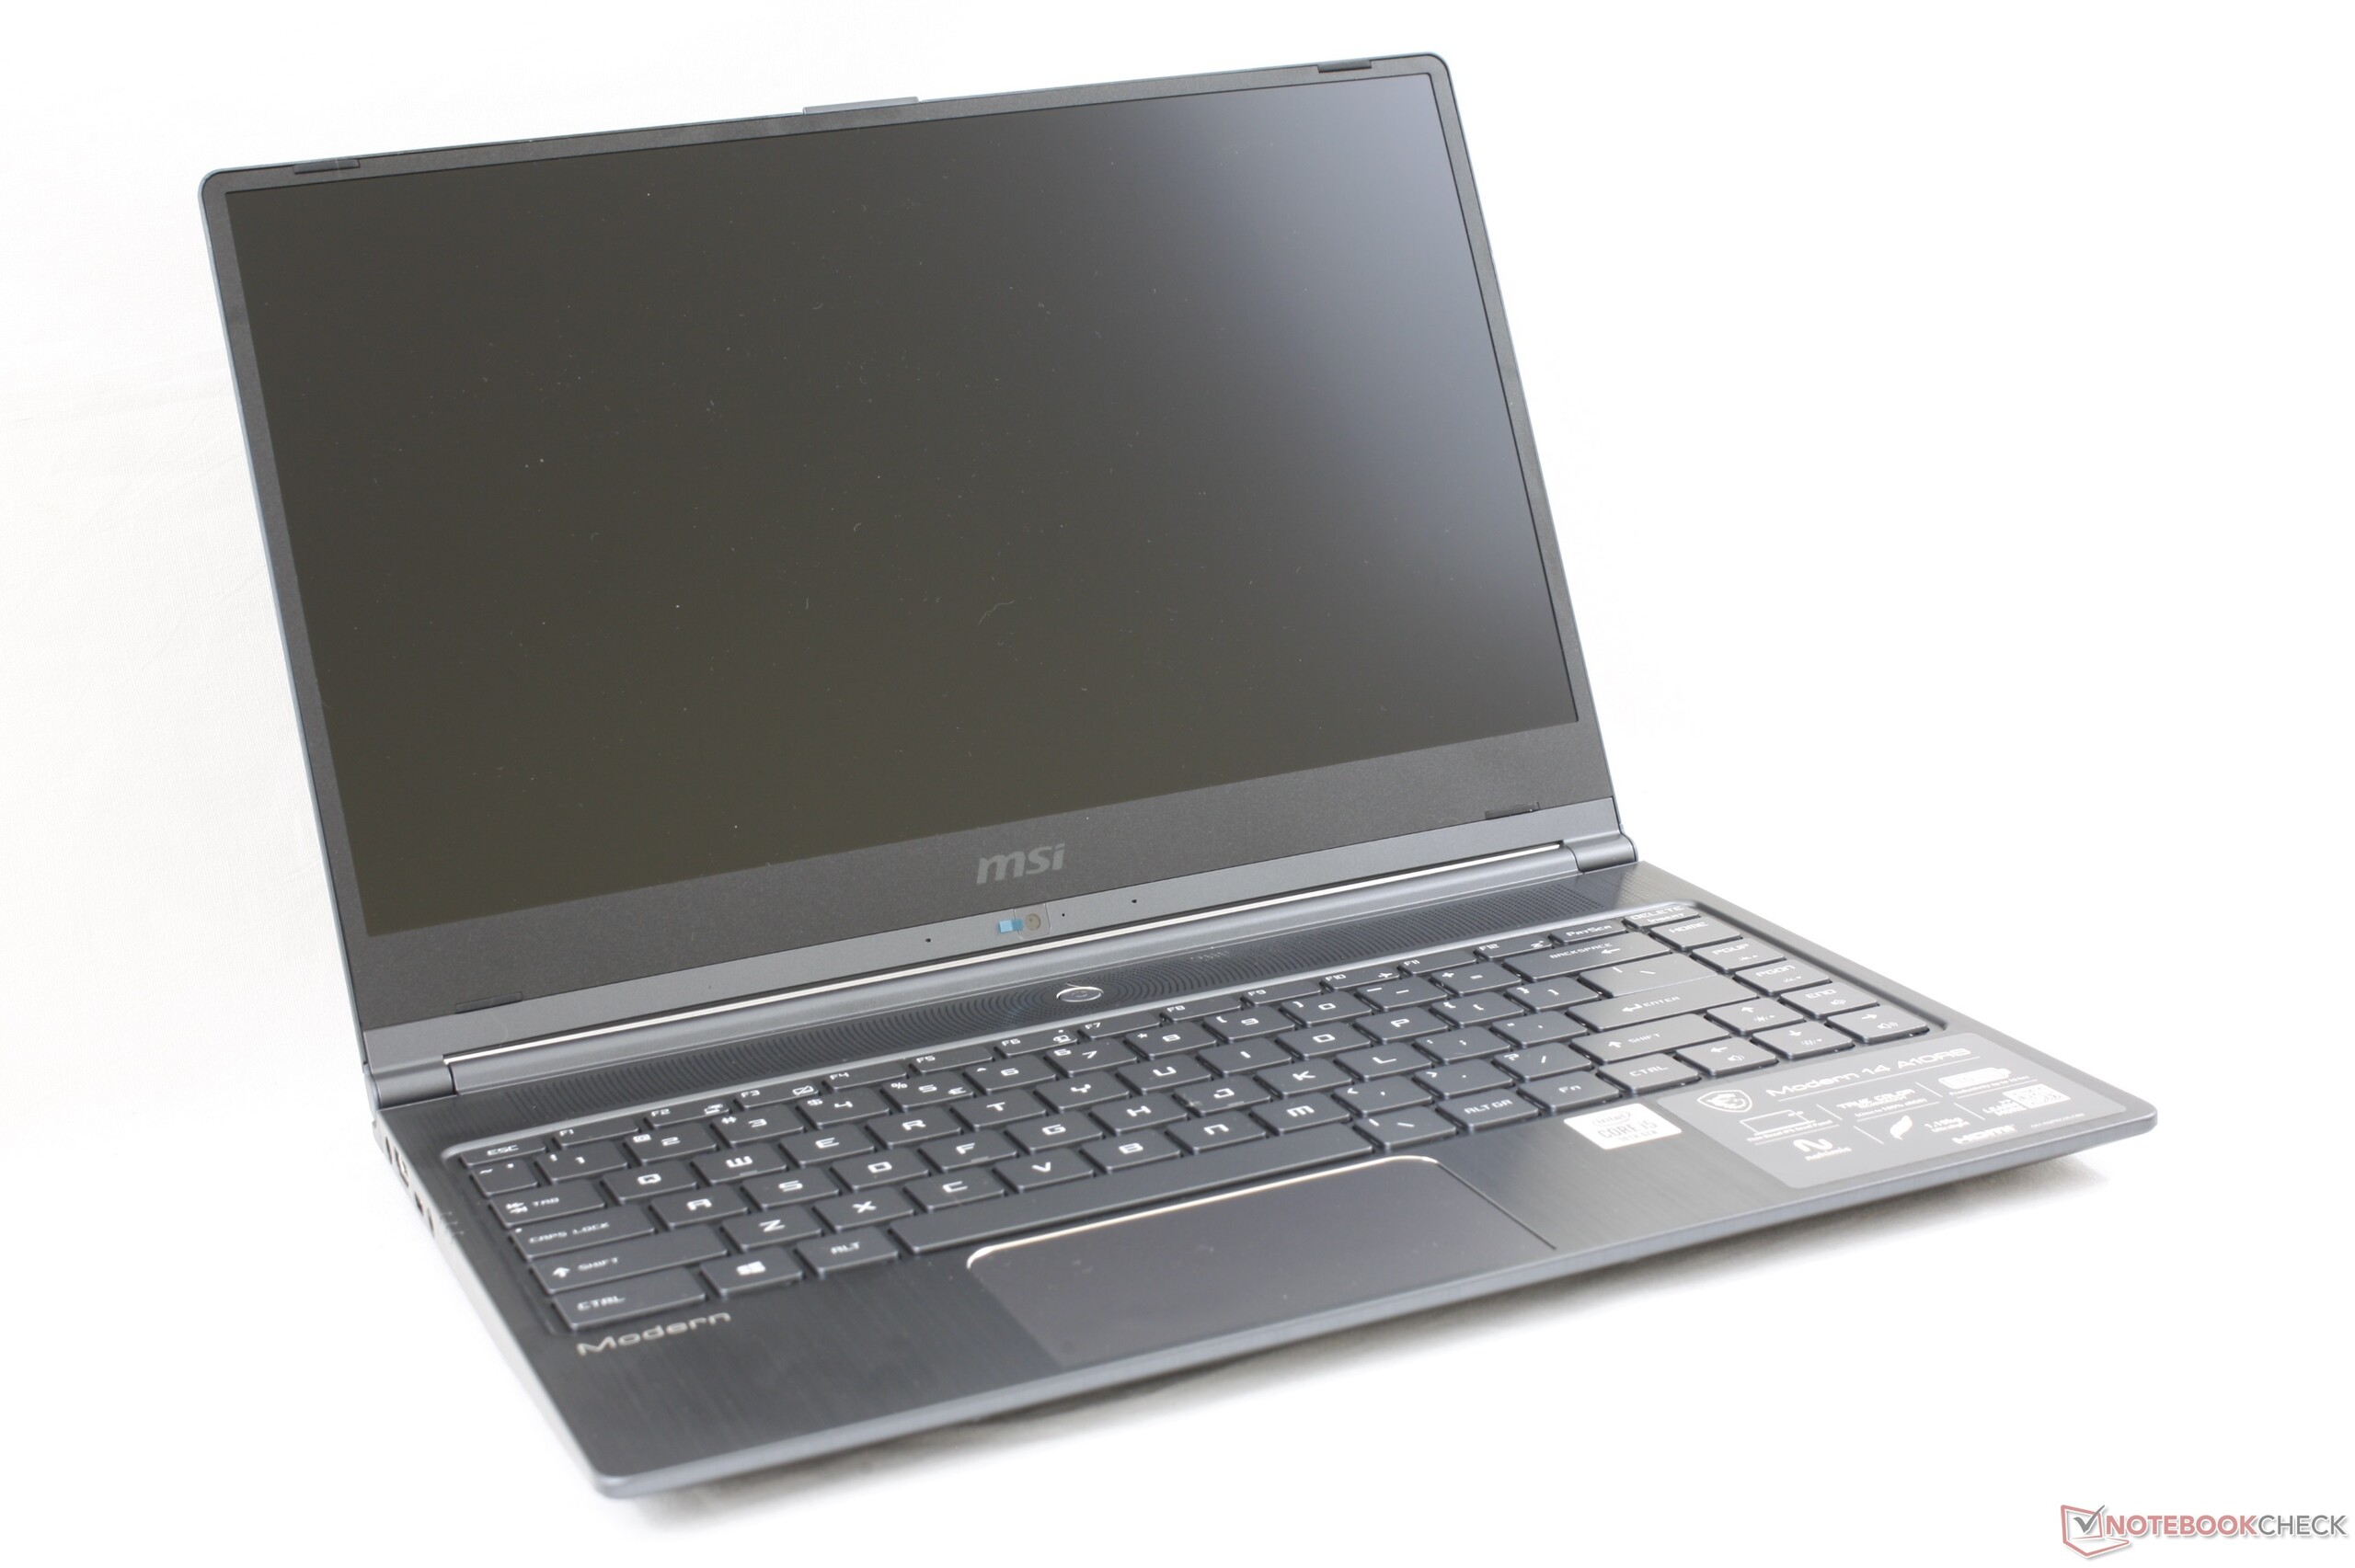
MSI Modern 14 A10RB笔记本电脑评测:比看起来还轻
Rating | Date | Model | Weight | Height | Size | Resolution | Price |
|---|---|---|---|---|---|---|---|
| 80.9 % v7 (old) | 03 / 2020 | MSI Modern 14 A10RB-459US i5-10210U, GeForce MX250 | 1.2 kg | 16 mm | 14.00" | 1920x1080 | |
| 88.2 % v7 (old) | 10 / 2019 | Lenovo Yoga C940-14IIL i7-1065G7, Iris Plus Graphics G7 (Ice Lake 64 EU) | 1.4 kg | 14.95 mm | 14.00" | 1920x1080 | |
| 89.7 % v7 (old) | 11 / 2019 | Apple MacBook Pro 16 2019 i9 5500M i9-9880H, Radeon Pro 5500M | 2 kg | 16.2 mm | 16.00" | 3072x1920 | |
| 83.7 % v7 (old) | 10 / 2019 | Asus VivoBook 14 X403FA i5-8265U, UHD Graphics 620 | 1.3 kg | 16.5 mm | 14.00" | 1920x1080 | |
| 90.1 % v7 (old) | 09 / 2019 | Lenovo ThinkPad X1 Carbon 2019-20QE000VGE i7-8665U, UHD Graphics 620 | 1.1 kg | 14.9 mm | 14.00" | 2560x1440 |

| SD Card Reader | |
| average JPG Copy Test (av. of 3 runs) | |
| Dell XPS 15 7590 9980HK GTX 1650 (Toshiba Exceria Pro SDXC 64 GB UHS-II) | |
| Asus ZenBook 15 UX534FT-DB77 (Toshiba Exceria Pro SDXC 64 GB UHS-II) | |
| MSI Modern 14 A10RB-459US (Toshiba Exceria Pro SDXC 64 GB UHS-II) | |
| maximum AS SSD Seq Read Test (1GB) | |
| Dell XPS 15 7590 9980HK GTX 1650 (Toshiba Exceria Pro SDXC 64 GB UHS-II) | |
| Asus ZenBook 15 UX534FT-DB77 (Toshiba Exceria Pro SDXC 64 GB UHS-II) | |
| MSI Modern 14 A10RB-459US (Toshiba Exceria Pro SDXC 64 GB UHS-II) | |
| Networking | |
| iperf3 transmit AX12 | |
| MSI Prestige 15 A10SC | |
| Asus ZenBook 15 UX534FT-DB77 | |
| iperf3 receive AX12 | |
| MSI Prestige 15 A10SC | |
| Asus ZenBook 15 UX534FT-DB77 | |
| |||||||||||||||||||||||||
Brightness Distribution: 87 %
Center on Battery: 324.1 cd/m²
Contrast: 1473:1 (Black: 0.22 cd/m²)
ΔE ColorChecker Calman: 1.63 | ∀{0.5-29.43 Ø4.73}
calibrated: 1.42
ΔE Greyscale Calman: 2.2 | ∀{0.09-98 Ø4.97}
95% sRGB (Argyll 1.6.3 3D)
60.2% AdobeRGB 1998 (Argyll 1.6.3 3D)
65.4% AdobeRGB 1998 (Argyll 3D)
94.8% sRGB (Argyll 3D)
64.2% Display P3 (Argyll 3D)
Gamma: 2.26
CCT: 6887 K
| MSI Modern 14 A10RB-459US Chi Mei N140HCE-EN2, IPS, 14", 1920x1080 | MSI Prestige 14 i7-10710U AUO123B, , 14", 3840x2160 | Asus ZenBook 15 UX534FT-DB77 BOE NV156FHM-N63, IPS, 15.6", 1920x1080 | Lenovo Yoga C940-14IIL LP140WF9-SPE2, IPS LED, 14", 1920x1080 | Dell XPS 15 7590 9980HK GTX 1650 Samsung 156WR04, SDCA029, OLED, 15.6", 3840x2160 | Apple MacBook Pro 16 2019 i9 5500M APPA044, IPS, 16", 3072x1920 | |
|---|---|---|---|---|---|---|
| Display | 26% | -2% | 3% | 27% | ||
| Display P3 Coverage (%) | 64.2 | 81.5 27% | 66.6 4% | 66 3% | 88.1 37% | |
| sRGB Coverage (%) | 94.8 | 99 4% | 87.7 -7% | 97.9 3% | 99.6 5% | |
| AdobeRGB 1998 Coverage (%) | 65.4 | 95.4 46% | 64.1 -2% | 67.3 3% | 91.8 40% | |
| Response Times | 1% | -6% | 94% | -16% | ||
| Response Time Grey 50% / Grey 80% * (ms) | 39.2 ? | 41.2 ? -5% | 49.6 ? -27% | 2.3 ? 94% | 52.4 ? -34% | |
| Response Time Black / White * (ms) | 35.6 ? | 33.2 ? 7% | 30 ? 16% | 2.4 ? 93% | 34.9 ? 2% | |
| PWM Frequency (Hz) | 25000 ? | 59.5 ? | 131700 | |||
| Screen | -5% | -70% | -9% | -45% | 6% | |
| Brightness middle (cd/m²) | 324.1 | 568 75% | 312.6 -4% | 384 18% | 421.2 30% | 519 60% |
| Brightness (cd/m²) | 301 | 513 70% | 290 -4% | 363 21% | 417 39% | 477 58% |
| Brightness Distribution (%) | 87 | 87 0% | 85 -2% | 90 3% | 94 8% | 86 -1% |
| Black Level * (cd/m²) | 0.22 | 0.28 -27% | 0.31 -41% | 0.17 23% | 0.39 -77% | |
| Contrast (:1) | 1473 | 2029 38% | 1008 -32% | 2259 53% | 1331 -10% | |
| Colorchecker dE 2000 * | 1.63 | 3.18 -95% | 5.78 -255% | 3.5 -115% | 6.06 -272% | 2.28 -40% |
| Colorchecker dE 2000 max. * | 4.25 | 7.01 -65% | 8.86 -108% | 5.5 -29% | 11.89 -180% | 6.54 -54% |
| Colorchecker dE 2000 calibrated * | 1.42 | 1.14 20% | 3.78 -166% | 1 30% | 0.86 39% | |
| Greyscale dE 2000 * | 2.2 | 4.79 -118% | 5.4 -145% | 4.6 -109% | 2.8 -27% | 0.9 59% |
| Gamma | 2.26 97% | 2.49 88% | 2.21 100% | 2.32 95% | 2.15 102% | 2145 0% |
| CCT | 6887 94% | 6488 100% | 7864 83% | 6884 94% | 6235 104% | 6572 99% |
| Color Space (Percent of AdobeRGB 1998) (%) | 60.2 | 85 41% | 57.1 -5% | 62 3% | 81 35% | 78 30% |
| Color Space (Percent of sRGB) (%) | 95 | 99 4% | 87.4 -8% | 97.7 3% | 99.6 5% | |
| Total Average (Program / Settings) | 11% /
1% | -24% /
-48% | -4% /
-6% | 25% /
-7% | -5% /
3% |
* ... smaller is better
Display Response Times
| ↔ Response Time Black to White | ||
|---|---|---|
| 35.6 ms ... rise ↗ and fall ↘ combined | ↗ 21.2 ms rise | 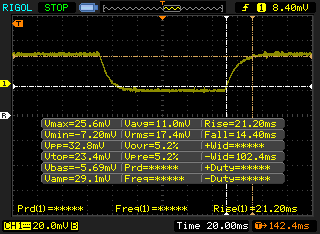 |
| ↘ 14.4 ms fall | ||
| The screen shows slow response rates in our tests and will be unsatisfactory for gamers. In comparison, all tested devices range from 0.1 (minimum) to 240 (maximum) ms. » 93 % of all devices are better. This means that the measured response time is worse than the average of all tested devices (19.9 ms). | ||
| ↔ Response Time 50% Grey to 80% Grey | ||
| 39.2 ms ... rise ↗ and fall ↘ combined | ↗ 20.8 ms rise | 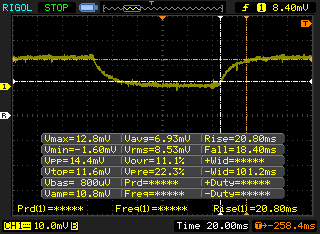 |
| ↘ 18.4 ms fall | ||
| The screen shows slow response rates in our tests and will be unsatisfactory for gamers. In comparison, all tested devices range from 0.165 (minimum) to 636 (maximum) ms. » 60 % of all devices are better. This means that the measured response time is worse than the average of all tested devices (31.1 ms). | ||
Screen Flickering / PWM (Pulse-Width Modulation)
| Screen flickering / PWM detected | 25000 Hz | ≤ 28 % brightness setting | 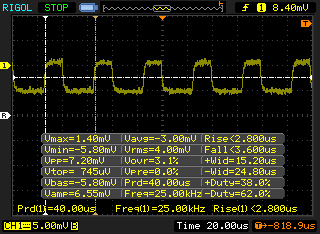 |
The display backlight flickers at 25000 Hz (worst case, e.g., utilizing PWM) Flickering detected at a brightness setting of 28 % and below. There should be no flickering or PWM above this brightness setting. The frequency of 25000 Hz is quite high, so most users sensitive to PWM should not notice any flickering. In comparison: 52 % of all tested devices do not use PWM to dim the display. If PWM was detected, an average of 7784 (minimum: 5 - maximum: 343500) Hz was measured. | |||
| Cinebench R15 | |
| CPU Single 64Bit | |
| Lenovo Yoga C740-15IML | |
| Microsoft Surface Laptop 3 15 i7-1065G7 | |
| Dell XPS 13 7390 Core i7-10710U | |
| Dell G3 3590 | |
| MSI Modern 14 A10RB-459US | |
| Average Intel Core i5-10210U (134 - 174, n=35) | |
| Dynabook Portege A30-E-174 | |
| Lenovo ThinkPad P43s-20RH001FGE | |
| Asus VivoBook 14 X403FA | |
| Walmart Motile M142 | |
| Dell Latitude 13 3390 | |
| Microsoft Surface Laptop 3 15 Ryzen 5 3580U | |
| CPU Multi 64Bit | |
| Dell XPS 13 7390 Core i7-10710U | |
| Dell G3 3590 | |
| Lenovo Yoga C740-15IML | |
| Microsoft Surface Laptop 3 15 i7-1065G7 | |
| Microsoft Surface Laptop 3 15 Ryzen 5 3580U | |
| Walmart Motile M142 | |
| Asus VivoBook 14 X403FA | |
| Average Intel Core i5-10210U (320 - 790, n=35) | |
| MSI Modern 14 A10RB-459US | |
| Dell Latitude 13 3390 | |
| Dynabook Portege A30-E-174 | |
| Lenovo ThinkPad P43s-20RH001FGE | |
| Cinebench R11.5 | |
| CPU Single 64Bit | |
| Dell XPS 13 7390 Core i7-10710U | |
| Average Intel Core i5-10210U (1.71 - 1.91, n=4) | |
| Microsoft Surface Laptop 3 15 Ryzen 5 3580U | |
| Dell Latitude 13 3390 | |
| CPU Multi 64Bit | |
| Dell XPS 13 7390 Core i7-10710U | |
| Microsoft Surface Laptop 3 15 Ryzen 5 3580U | |
| Average Intel Core i5-10210U (5.69 - 8.66, n=4) | |
| Dell Latitude 13 3390 | |
| Cinebench R10 | |
| Rendering Multiple CPUs 32Bit | |
| Dell XPS 13 7390 Core i7-10710U | |
| Asus VivoBook 14 X403FA | |
| Microsoft Surface Laptop 3 15 Ryzen 5 3580U | |
| Average Intel Core i5-10210U (15037 - 22164, n=3) | |
| Dynabook Portege A30-E-174 | |
| Lenovo ThinkPad P43s-20RH001FGE | |
| Rendering Single 32Bit | |
| Dell XPS 13 7390 Core i7-10710U | |
| Average Intel Core i5-10210U (6410 - 6613, n=3) | |
| Dynabook Portege A30-E-174 | |
| Lenovo ThinkPad P43s-20RH001FGE | |
| Asus VivoBook 14 X403FA | |
| Microsoft Surface Laptop 3 15 Ryzen 5 3580U | |
| wPrime 2.10 - 1024m | |
| Microsoft Surface Laptop 3 15 Ryzen 5 3580U | |
| Average Intel Core i5-10210U (n=1) | |
| Dell XPS 13 7390 Core i7-10710U | |
| Cinebench R20 | |
| CPU (Single Core) | |
| Lenovo Yoga C740-15IML | |
| Dell XPS 13 7390 Core i7-10710U | |
| Microsoft Surface Laptop 3 15 i7-1065G7 | |
| Dell G3 3590 | |
| MSI Modern 14 A10RB-459US | |
| Average Intel Core i5-10210U (322 - 428, n=30) | |
| Asus VivoBook 14 X403FA | |
| Dynabook Portege A30-E-174 | |
| Lenovo ThinkPad P43s-20RH001FGE | |
| Walmart Motile M142 | |
| Microsoft Surface Laptop 3 15 Ryzen 5 3580U | |
| Dell Latitude 13 3390 | |
| CPU (Multi Core) | |
| Dell XPS 13 7390 Core i7-10710U | |
| Dell G3 3590 | |
| Microsoft Surface Laptop 3 15 i7-1065G7 | |
| Lenovo Yoga C740-15IML | |
| Microsoft Surface Laptop 3 15 Ryzen 5 3580U | |
| Walmart Motile M142 | |
| Asus VivoBook 14 X403FA | |
| Average Intel Core i5-10210U (722 - 1820, n=30) | |
| MSI Modern 14 A10RB-459US | |
| Dynabook Portege A30-E-174 | |
| Dell Latitude 13 3390 | |
| Lenovo ThinkPad P43s-20RH001FGE | |
* ... smaller is better
| PCMark 8 Home Score Accelerated v2 | 3464 points | |
| PCMark 8 Work Score Accelerated v2 | 4992 points | |
| PCMark 10 Score | 4497 points | |
Help | ||
| MSI Modern 14 A10RB-459US Kingston RBUSNS8154P3512GJ | Asus ZenBook 15 UX534FT-DB77 Samsung SSD PM981 MZVLB1T0HALR | Lenovo Yoga C940-14IIL Samsung SSD PM981 MZVLB512HAJQ | Dell XPS 15 7590 9980HK GTX 1650 Toshiba XG6 KXG60ZNV1T02 | Apple MacBook Pro 16 2019 i9 5500M Apple SSD AP1024 7171 | |
|---|---|---|---|---|---|
| AS SSD | 51% | 64% | 73% | 57% | |
| Seq Read (MB/s) | 1061 | 1887 78% | 2525 138% | 1723 62% | 2531 139% |
| Seq Write (MB/s) | 953 | 1432 50% | 1253 31% | 1386 45% | 2289 140% |
| 4K Read (MB/s) | 35.59 | 52.3 47% | 59.1 66% | 43.25 22% | 15.85 -55% |
| 4K Write (MB/s) | 87 | 146 68% | 134.1 54% | 98.3 13% | 39.88 -54% |
| 4K-64 Read (MB/s) | 769 | 969 26% | 1010 31% | 1078 40% | 1267 65% |
| 4K-64 Write (MB/s) | 733 | 1375 88% | 1461 99% | 1456 99% | 1749 139% |
| Access Time Read * (ms) | 0.084 | 0.034 60% | 0.052 38% | 0.05 40% | 0.122 -45% |
| Access Time Write * (ms) | 0.136 | 0.075 45% | 0.029 79% | 0.039 71% | 0.095 30% |
| Score Read (Points) | 911 | 1210 33% | 1322 45% | 1294 42% | 1536 69% |
| Score Write (Points) | 916 | 1664 82% | 1721 88% | 1693 85% | 2018 120% |
| Score Total (Points) | 2294 | 3483 52% | 3670 60% | 3638 59% | 4317 88% |
| Copy ISO MB/s (MB/s) | 956 | 1375 44% | 2016 111% | 3182 233% | 1995 109% |
| Copy Program MB/s (MB/s) | 496.5 | 468 -6% | 542 9% | 984 98% | 584 18% |
| Copy Game MB/s (MB/s) | 872 | 1287 48% | 1278 47% | 1824 109% | 1135 30% |
| CrystalDiskMark 5.2 / 6 | 68% | 66% | 58% | 49% | |
| Write 4K (MB/s) | 107.7 | 141.6 31% | 128.4 19% | 104.3 -3% | 55.5 -48% |
| Read 4K (MB/s) | 39.73 | 45.28 14% | 46.37 17% | 45.23 14% | 16.21 -59% |
| Write Seq (MB/s) | 926 | 1975 113% | 1863 101% | 1729 87% | 1959 112% |
| Read Seq (MB/s) | 1014 | 2272 124% | 2340 131% | 1861 84% | 1763 74% |
| Write 4K Q32T1 (MB/s) | 343.6 | 458.6 33% | 451.1 31% | 509 48% | 398.5 16% |
| Read 4K Q32T1 (MB/s) | 499.1 | 391.4 -22% | 415.3 -17% | 388.5 -22% | 648 30% |
| Write Seq Q32T1 (MB/s) | 1033 | 2393 132% | 2985 189% | 2813 172% | 2727 164% |
| Read Seq Q32T1 (MB/s) | 1604 | 3464 116% | 2565 60% | 2906 81% | 3242 102% |
| Write 4K Q8T8 (MB/s) | 451.4 | ||||
| Read 4K Q8T8 (MB/s) | 1004 | ||||
| Total Average (Program / Settings) | 60% /
57% | 65% /
65% | 66% /
67% | 53% /
54% |
* ... smaller is better

| 3DMark 11 | |
| 1280x720 Performance GPU | |
| Walmart EVOO Gaming 17 | |
| Maingear Vector 15 | |
| Asus Zephyrus S GX531GM | |
| Dell XPS 15 7590 9980HK GTX 1650 | |
| Lenovo ThinkPad X1 Extreme-20MF000XGE | |
| MSI Modern 14 A10RB-459US | |
| Microsoft Surface Laptop 3 15 i7-1065G7 | |
| Average NVIDIA GeForce MX250 (3585 - 4942, n=29) | |
| Asus Zenbook 14 UX433FN-A6023T | |
| Asus VivoBook 14 X412FJ-EB023T | |
| Asus VivoBook 15 X542UF-DM143T | |
| 1280x720 Performance Combined | |
| Walmart EVOO Gaming 17 | |
| Maingear Vector 15 | |
| Dell XPS 15 7590 9980HK GTX 1650 | |
| Lenovo ThinkPad X1 Extreme-20MF000XGE | |
| Asus Zephyrus S GX531GM | |
| MSI Modern 14 A10RB-459US | |
| Average NVIDIA GeForce MX250 (3532 - 4638, n=29) | |
| Microsoft Surface Laptop 3 15 i7-1065G7 | |
| Asus Zenbook 14 UX433FN-A6023T | |
| Asus VivoBook 14 X412FJ-EB023T | |
| Asus VivoBook 15 X542UF-DM143T | |
| 3DMark 11 Performance | 5085 points | |
| 3DMark Cloud Gate Standard Score | 14266 points | |
| 3DMark Fire Strike Score | 3487 points | |
| 3DMark Time Spy Score | 1279 points | |
Help | ||
| Shadow of the Tomb Raider | |
| 1280x720 Lowest Preset | |
| Lenovo IdeaPad S740-15IRH | |
| HP Pavilion Gaming 15-ec0017ng | |
| MSI PS63 Modern 8RC | |
| MSI Modern 14 A10RB-459US | |
| Average NVIDIA GeForce MX250 (24 - 56, n=8) | |
| Asus VivoBook 14 F412FJ-EB084T | |
| Microsoft Surface Laptop 3 15 i7-1065G7 | |
| HP Envy 13-ah0003ng | |
| Microsoft Surface Laptop 3 15 Ryzen 5 3580U | |
| 1920x1080 Medium Preset | |
| Lenovo IdeaPad S740-15IRH | |
| HP Pavilion Gaming 15-ec0017ng | |
| MSI PS63 Modern 8RC | |
| MSI Modern 14 A10RB-459US | |
| Average NVIDIA GeForce MX250 (7 - 19, n=8) | |
| HP Envy 13-ah0003ng | |
| Asus VivoBook 14 F412FJ-EB084T | |
| Microsoft Surface Laptop 3 15 Ryzen 5 3580U | |
| low | med. | high | ultra | |
|---|---|---|---|---|
| BioShock Infinite (2013) | 189.7 | 117.5 | 100.5 | 37.8 |
| The Witcher 3 (2015) | 68.1 | 38 | 21.5 | 11.7 |
| Shadow of the Tomb Raider (2018) | 56 | 19 | 12 |
| MSI Modern 14 A10RB-459US GeForce MX250, i5-10210U, Kingston RBUSNS8154P3512GJ | Asus ZenBook 15 UX534FT-DB77 GeForce GTX 1650 Max-Q, i7-8565U, Samsung SSD PM981 MZVLB1T0HALR | Lenovo Yoga C940-14IIL Iris Plus Graphics G7 (Ice Lake 64 EU), i7-1065G7, Samsung SSD PM981 MZVLB512HAJQ | Apple MacBook Pro 16 2019 i9 5500M Radeon Pro 5500M, i9-9880H, Apple SSD AP1024 7171 | Lenovo ThinkPad P43s-20RH001FGE Quadro P520, i7-8565U, WDC PC SN720 SDAQNTW-256G | Lenovo ThinkPad X1 Carbon 2019-20QE000VGE UHD Graphics 620, i7-8665U, WDC PC SN720 SDAQNTW-512G | |
|---|---|---|---|---|---|---|
| Noise | 1% | 3% | -10% | 3% | 6% | |
| off / environment * (dB) | 28.7 | 28.4 1% | 29.3 -2% | 29.8 -4% | 29.2 -2% | 28.4 1% |
| Idle Minimum * (dB) | 29.5 | 28.4 4% | 29.3 1% | 29.9 -1% | 29.2 1% | 28.4 4% |
| Idle Average * (dB) | 29.5 | 28.4 4% | 29.3 1% | 29.9 -1% | 29.2 1% | 28.4 4% |
| Idle Maximum * (dB) | 29.5 | 28.4 4% | 29.3 1% | 29.9 -1% | 29.2 1% | 28.6 3% |
| Load Average * (dB) | 33.4 | 33.9 -1% | 33.3 -0% | 43 -29% | 33.3 -0% | 31.5 6% |
| Witcher 3 ultra * (dB) | 37.9 | 39.8 -5% | 45.4 -20% | |||
| Load Maximum * (dB) | 40.5 | 40.2 1% | 33.3 18% | 46.1 -14% | 33.3 18% | 33.1 18% |
* ... smaller is better
Noise level
| Idle |
| 29.5 / 29.5 / 29.5 dB(A) |
| Load |
| 33.4 / 40.5 dB(A) |
 | ||
30 dB silent 40 dB(A) audible 50 dB(A) loud |
||
min: | ||
(-) The maximum temperature on the upper side is 47.6 °C / 118 F, compared to the average of 34.3 °C / 94 F, ranging from 21.2 to 62.5 °C for the class Office.
(-) The bottom heats up to a maximum of 58.2 °C / 137 F, compared to the average of 36.8 °C / 98 F
(+) In idle usage, the average temperature for the upper side is 20.7 °C / 69 F, compared to the device average of 29.5 °C / 85 F.
(+) Playing The Witcher 3, the average temperature for the upper side is 29.1 °C / 84 F, compared to the device average of 29.5 °C / 85 F.
(+) The palmrests and touchpad are cooler than skin temperature with a maximum of 26.8 °C / 80.2 F and are therefore cool to the touch.
(±) The average temperature of the palmrest area of similar devices was 27.5 °C / 81.5 F (+0.7 °C / 1.3 F).
MSI Modern 14 A10RB-459US audio analysis
(+) | speakers can play relatively loud (84.8 dB)
Bass 100 - 315 Hz
(-) | nearly no bass - on average 25.7% lower than median
(±) | linearity of bass is average (11.6% delta to prev. frequency)
Mids 400 - 2000 Hz
(±) | higher mids - on average 8.2% higher than median
(±) | linearity of mids is average (10.7% delta to prev. frequency)
Highs 2 - 16 kHz
(+) | balanced highs - only 3.2% away from median
(±) | linearity of highs is average (7.9% delta to prev. frequency)
Overall 100 - 16.000 Hz
(-) | overall sound is not linear (30.8% difference to median)
Compared to same class
» 92% of all tested devices in this class were better, 3% similar, 5% worse
» The best had a delta of 7%, average was 21%, worst was 53%
Compared to all devices tested
» 89% of all tested devices were better, 3% similar, 8% worse
» The best had a delta of 4%, average was 24%, worst was 134%
Apple MacBook 12 (Early 2016) 1.1 GHz audio analysis
(+) | speakers can play relatively loud (83.6 dB)
Bass 100 - 315 Hz
(±) | reduced bass - on average 11.3% lower than median
(±) | linearity of bass is average (14.2% delta to prev. frequency)
Mids 400 - 2000 Hz
(+) | balanced mids - only 2.4% away from median
(+) | mids are linear (5.5% delta to prev. frequency)
Highs 2 - 16 kHz
(+) | balanced highs - only 2% away from median
(+) | highs are linear (4.5% delta to prev. frequency)
Overall 100 - 16.000 Hz
(+) | overall sound is linear (10.2% difference to median)
Compared to same class
» 7% of all tested devices in this class were better, 2% similar, 91% worse
» The best had a delta of 5%, average was 18%, worst was 53%
Compared to all devices tested
» 5% of all tested devices were better, 1% similar, 94% worse
» The best had a delta of 4%, average was 24%, worst was 134%
| Off / Standby | |
| Idle | |
| Load |
|
Key:
min: | |
| MSI Modern 14 A10RB-459US i5-10210U, GeForce MX250, Kingston RBUSNS8154P3512GJ, IPS, 1920x1080, 14" | Asus ZenBook 15 UX534FT-DB77 i7-8565U, GeForce GTX 1650 Max-Q, Samsung SSD PM981 MZVLB1T0HALR, IPS, 1920x1080, 15.6" | Lenovo Yoga C940-14IIL i7-1065G7, Iris Plus Graphics G7 (Ice Lake 64 EU), Samsung SSD PM981 MZVLB512HAJQ, IPS LED, 1920x1080, 14" | Dell XPS 15 7590 9980HK GTX 1650 i9-9980HK, GeForce GTX 1650 Mobile, Toshiba XG6 KXG60ZNV1T02, OLED, 3840x2160, 15.6" | Apple MacBook Pro 16 2019 i9 5500M i9-9880H, Radeon Pro 5500M, Apple SSD AP1024 7171, IPS, 3072x1920, 16" | Lenovo ThinkPad X1 Carbon 2019-20QE000VGE i7-8665U, UHD Graphics 620, WDC PC SN720 SDAQNTW-512G, IPS, 2560x1440, 14" | |
|---|---|---|---|---|---|---|
| Power Consumption | -79% | 2% | -90% | -70% | 7% | |
| Idle Minimum * (Watt) | 4.2 | 5 -19% | 3.2 24% | 6.2 -48% | 3.7 12% | 3 29% |
| Idle Average * (Watt) | 5.9 | 13.2 -124% | 7 -19% | 9.6 -63% | 12.1 -105% | 6.3 -7% |
| Idle Maximum * (Watt) | 7.2 | 24 -233% | 8.9 -24% | 21.2 -194% | 17 -136% | 8.9 -24% |
| Load Average * (Watt) | 63.4 | 70 -10% | 47.6 25% | 104.3 -65% | 91.5 -44% | 40.8 36% |
| Witcher 3 ultra * (Watt) | 53.5 | 63.3 -18% | 91.7 -71% | 103 -93% | ||
| Load Maximum * (Watt) | 67.4 | 114 -69% | 63.1 6% | 135.3 -101% | 102.3 -52% | 67.5 -0% |
* ... smaller is better
| MSI Modern 14 A10RB-459US i5-10210U, GeForce MX250, 50 Wh | Lenovo ThinkPad X1 Carbon 2018-20KGS5DU00 i5-8550U, UHD Graphics 620, 57 Wh | Asus ZenBook 15 UX534FT-DB77 i7-8565U, GeForce GTX 1650 Max-Q, 71 Wh | Lenovo Yoga C940-14IIL i7-1065G7, Iris Plus Graphics G7 (Ice Lake 64 EU), 60 Wh | Dell XPS 15 7590 9980HK GTX 1650 i9-9980HK, GeForce GTX 1650 Mobile, 97 Wh | Apple MacBook Pro 16 2019 i9 5500M i9-9880H, Radeon Pro 5500M, 99.8 Wh | |
|---|---|---|---|---|---|---|
| Battery runtime | 5% | 30% | -8% | 22% | -2% | |
| Reader / Idle (h) | 16.4 | 21.5 31% | 15.2 -7% | |||
| WiFi v1.3 (h) | 8.6 | 9 5% | 8.4 -2% | 10.6 23% | 7.8 -9% | 12 40% |
| Load (h) | 1.8 | 2.9 61% | 1.1 -39% | 3.3 83% | 1 -44% | |
| Witcher 3 ultra (h) | 0.9 |
Pros
Cons
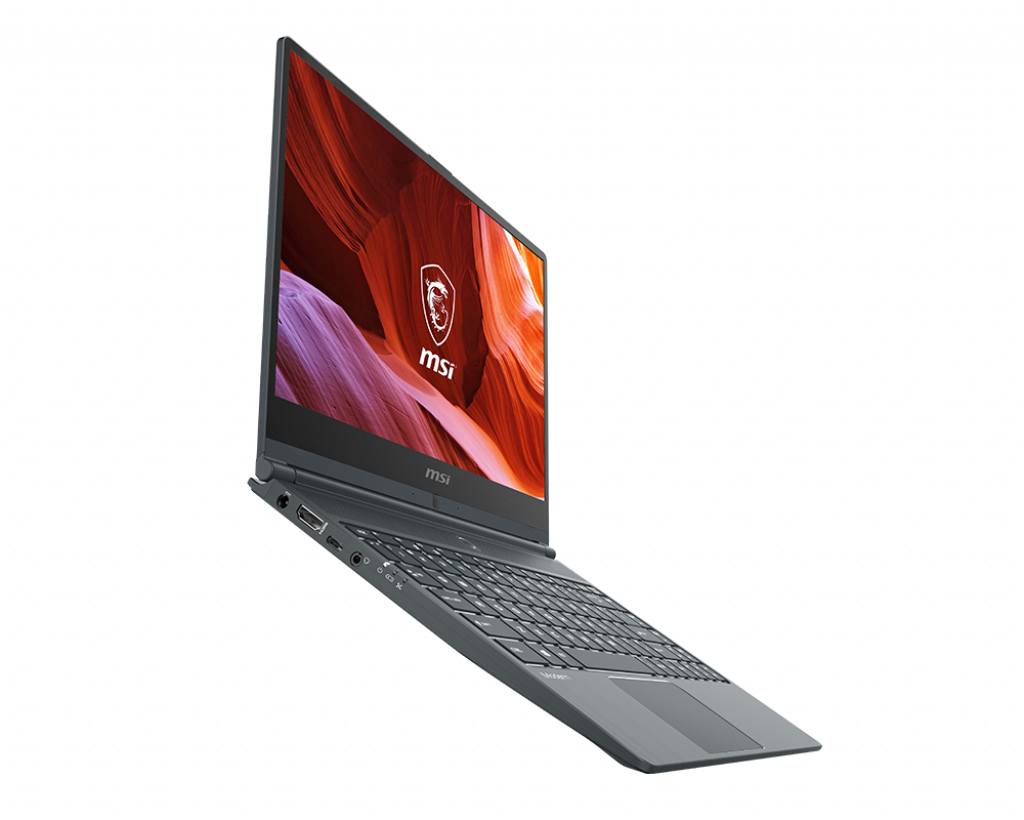

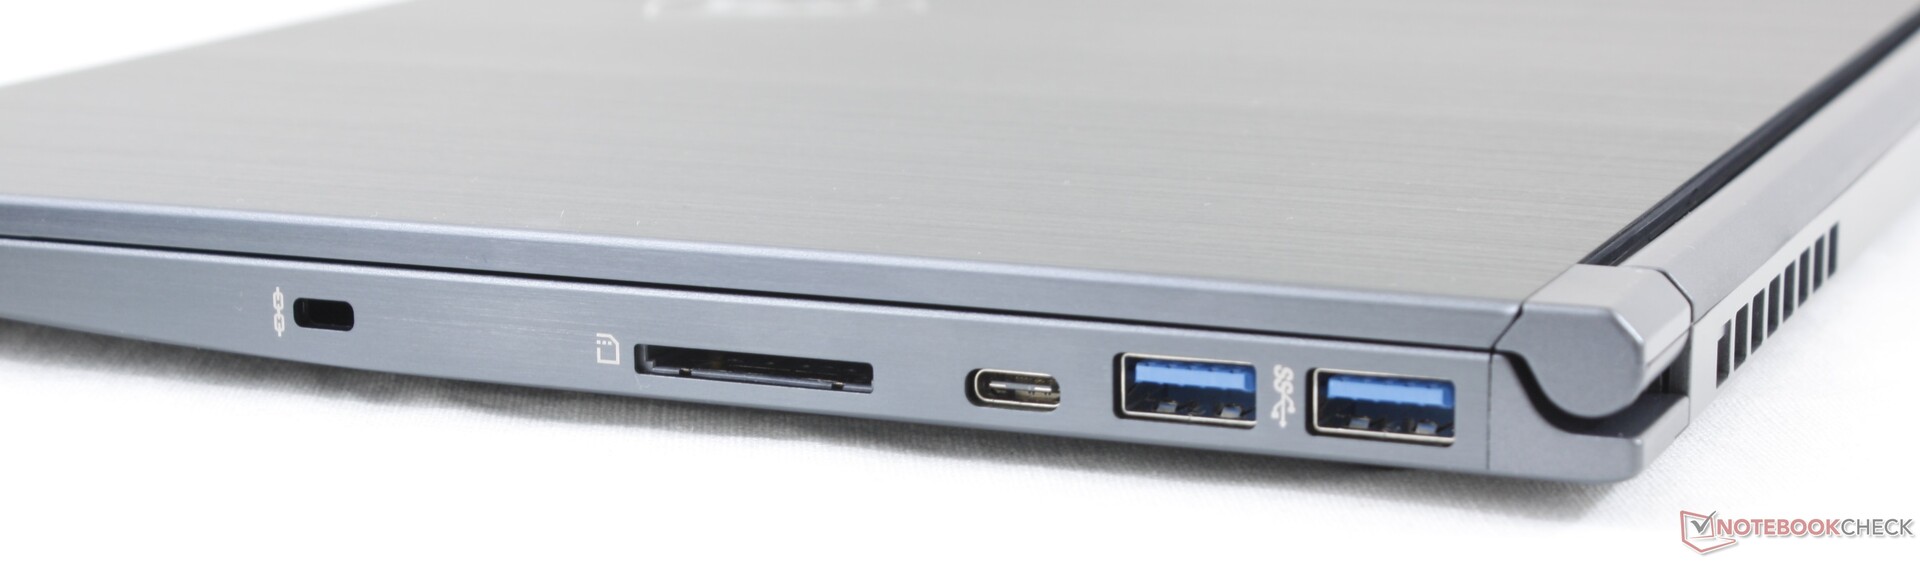
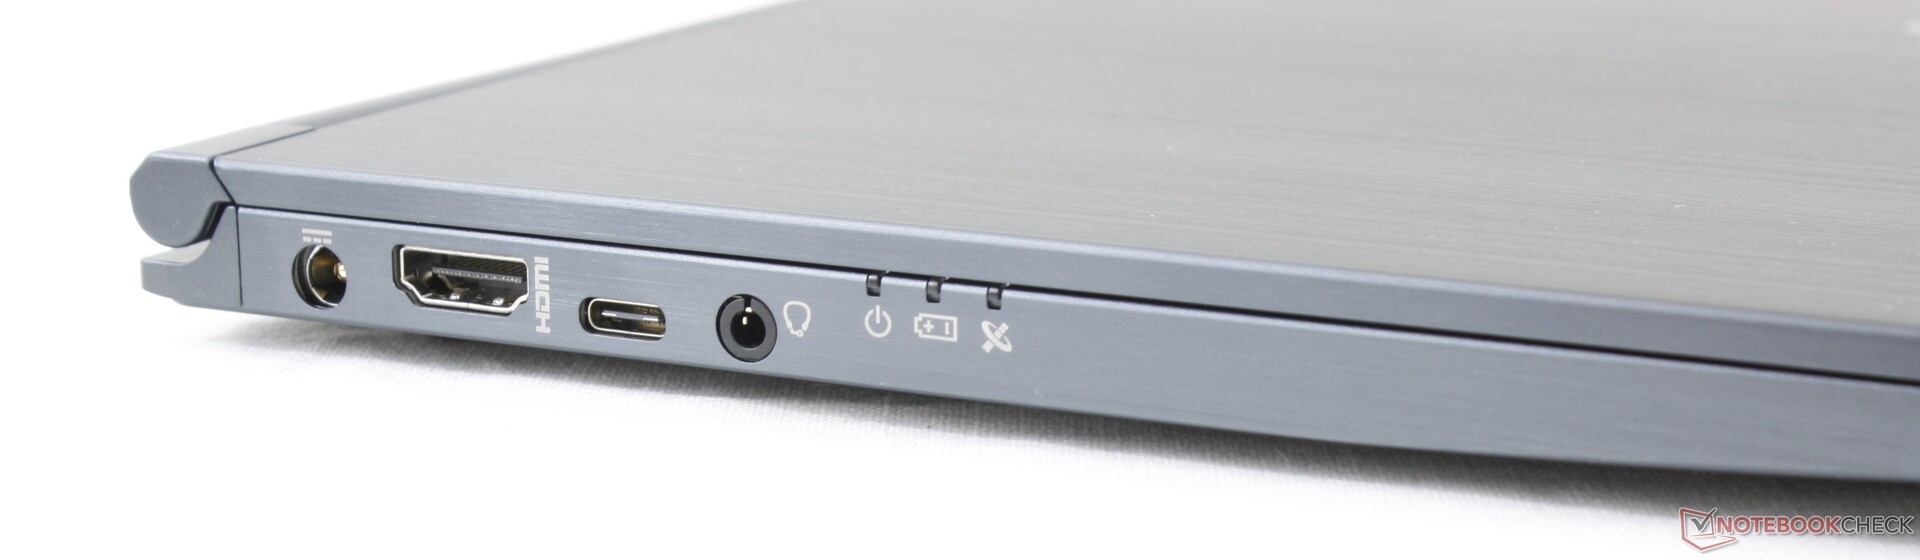
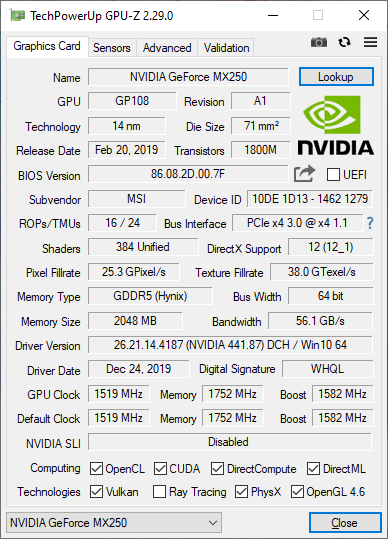
微星在做了好长时间的游戏笔记本电脑和专业笔记本电脑后,现在准备用Modern 14来打入入门级笔记本电脑市场。Modern 14的最佳特性主要是视觉效果。 14英寸显示屏经过精心校准,可以开箱即用,而便于旅行的重量,丰富的接口选择以及可选的GeForce MX250图形卡都对目标用户非常有用。
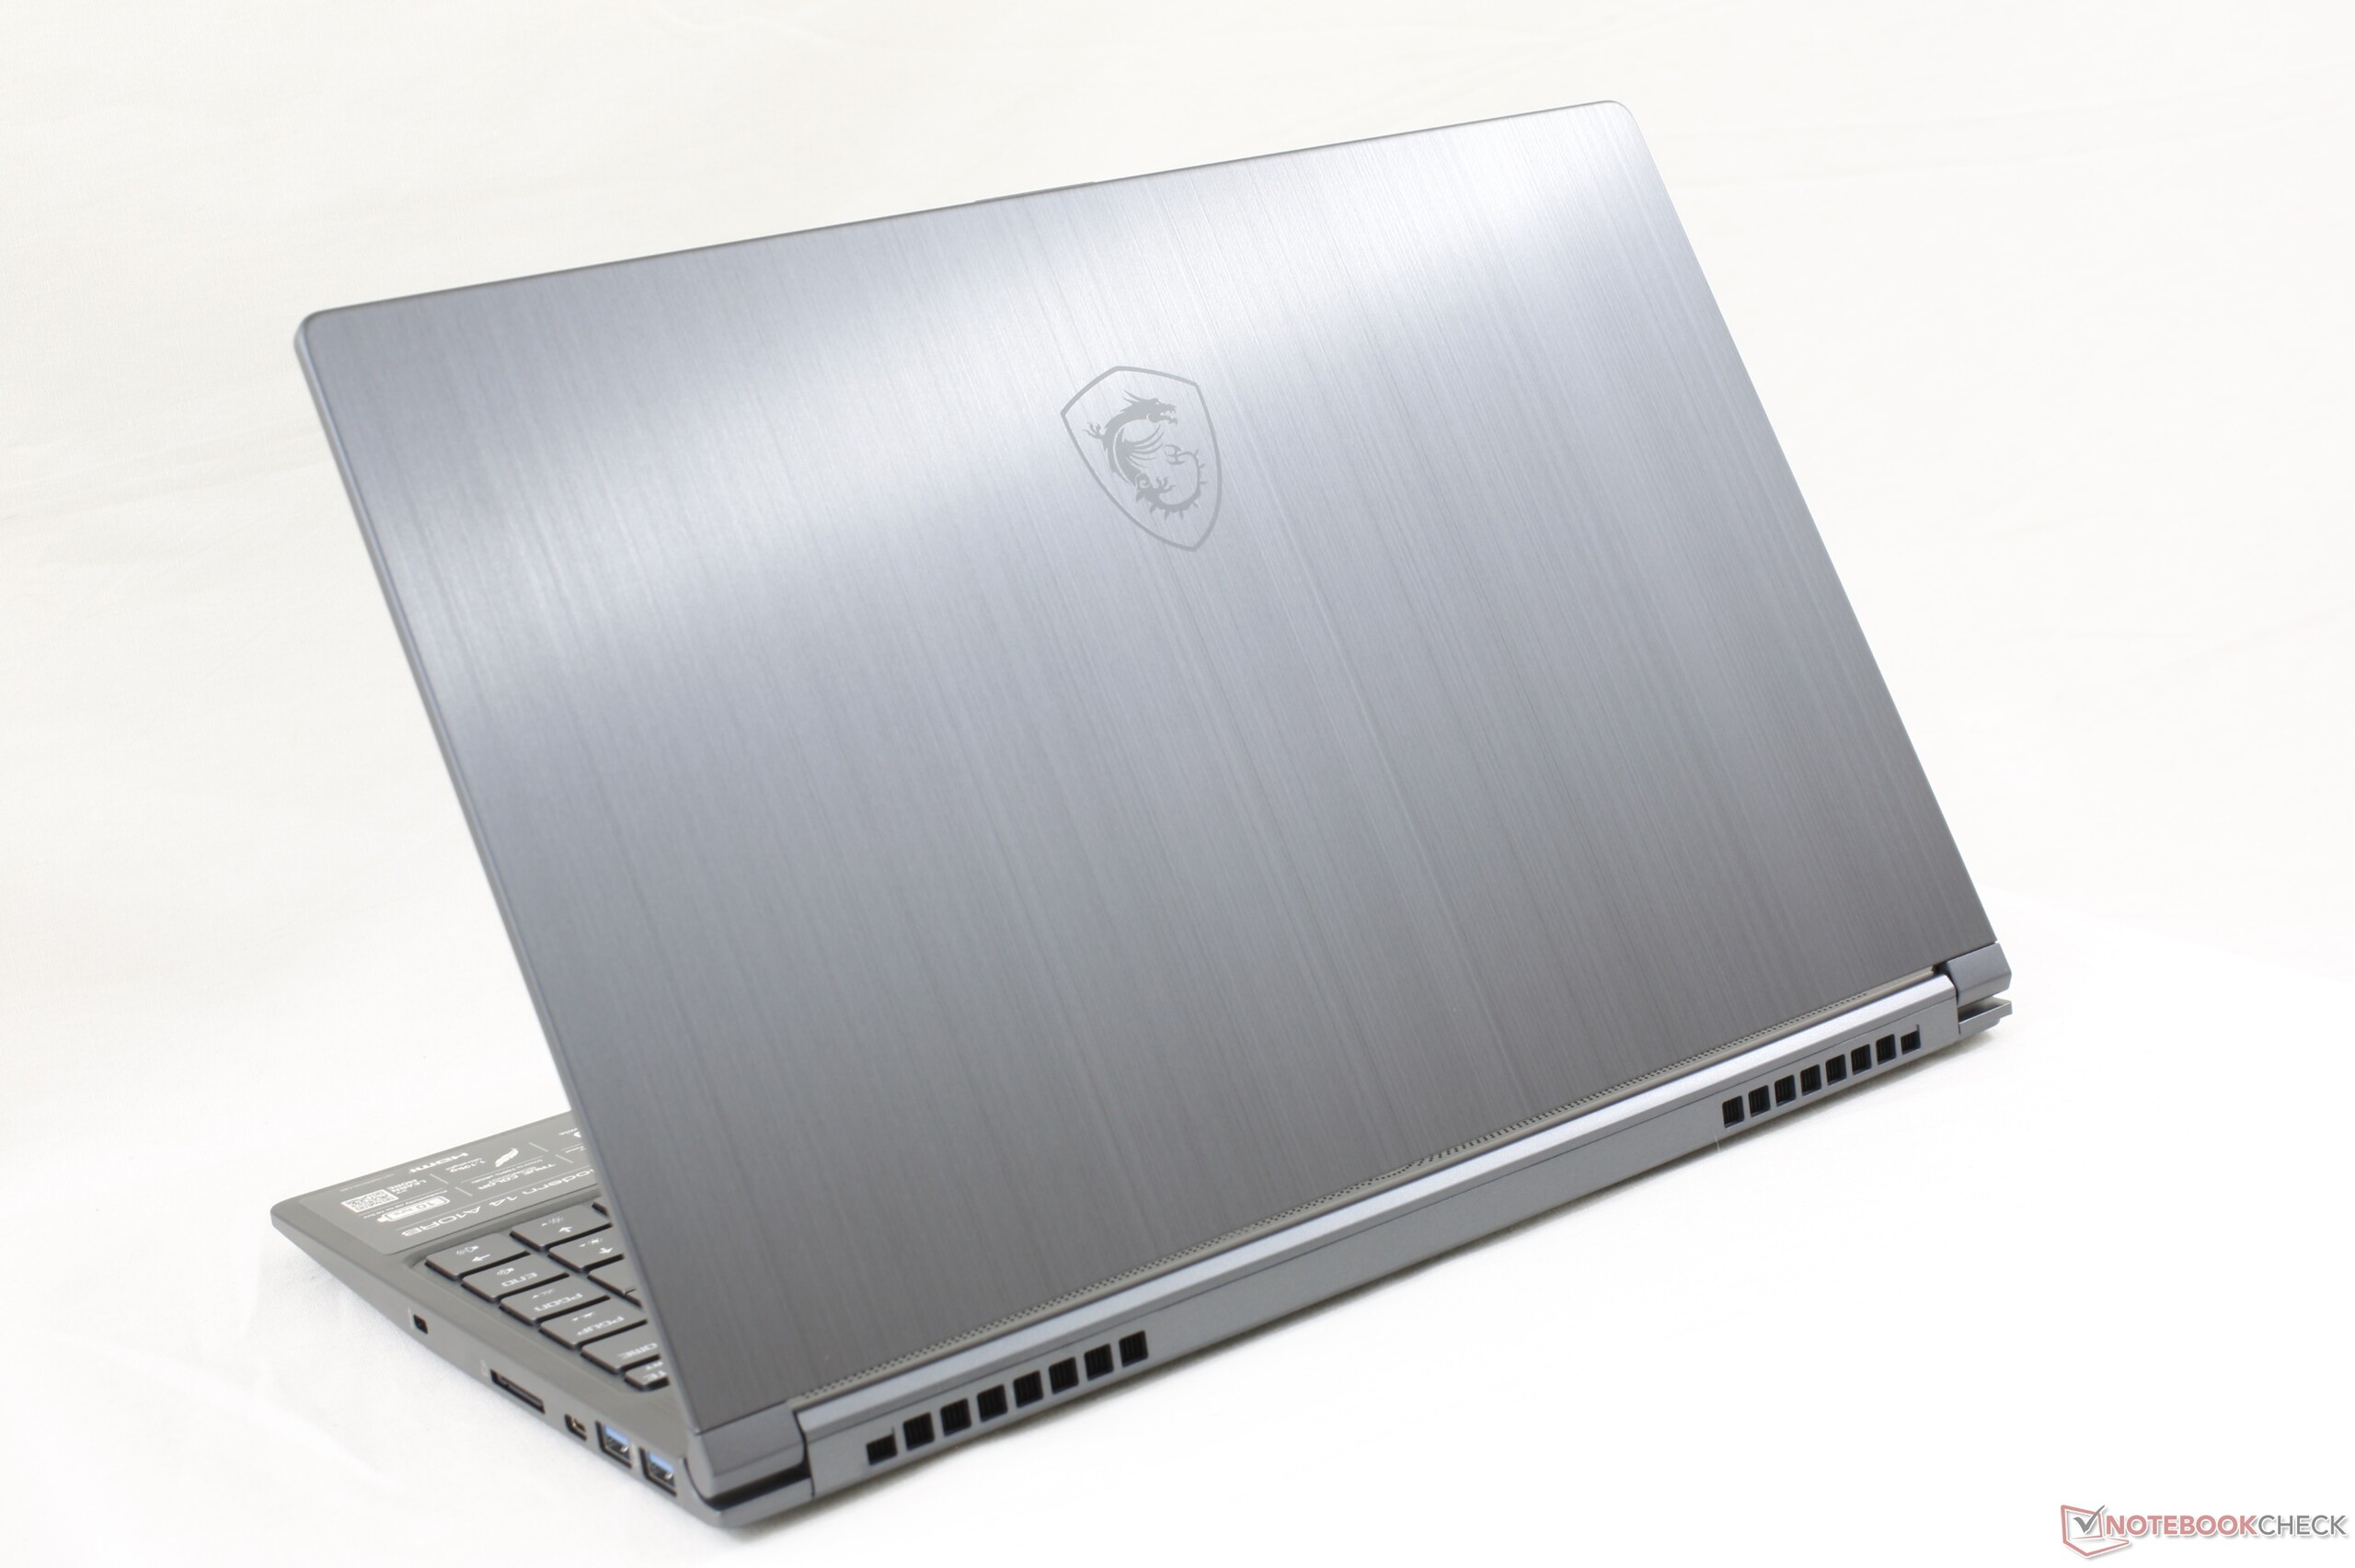
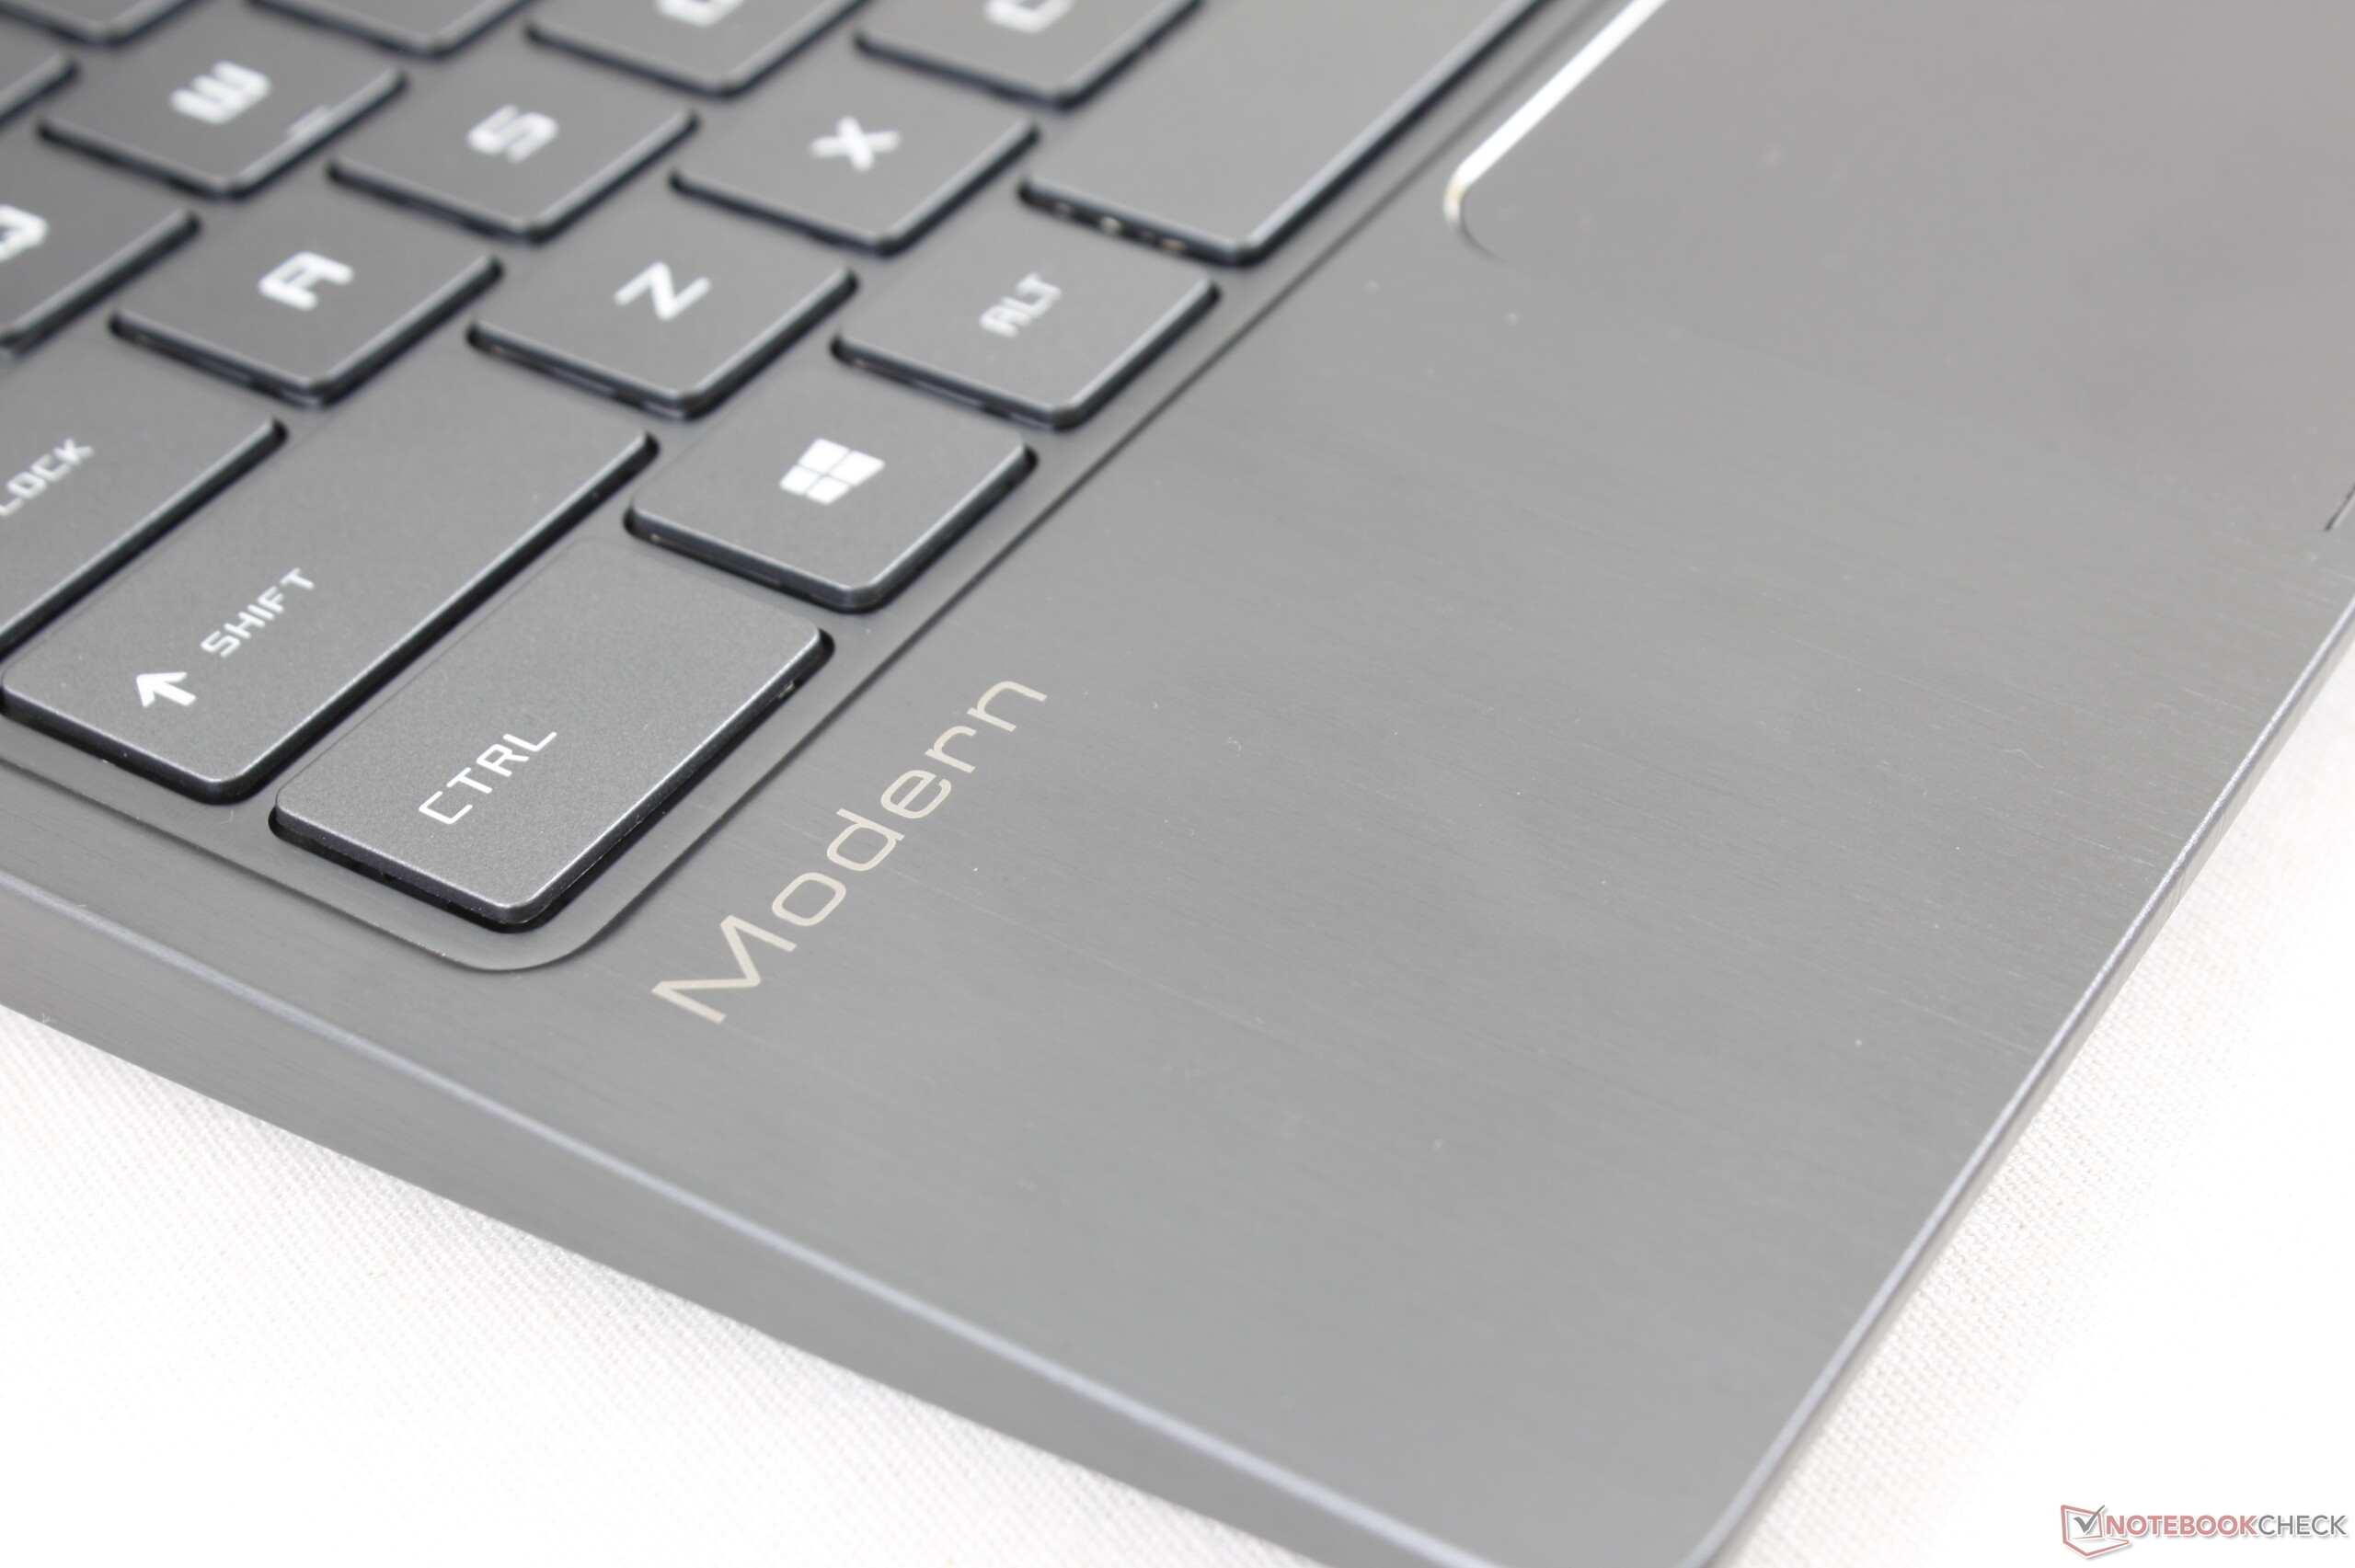
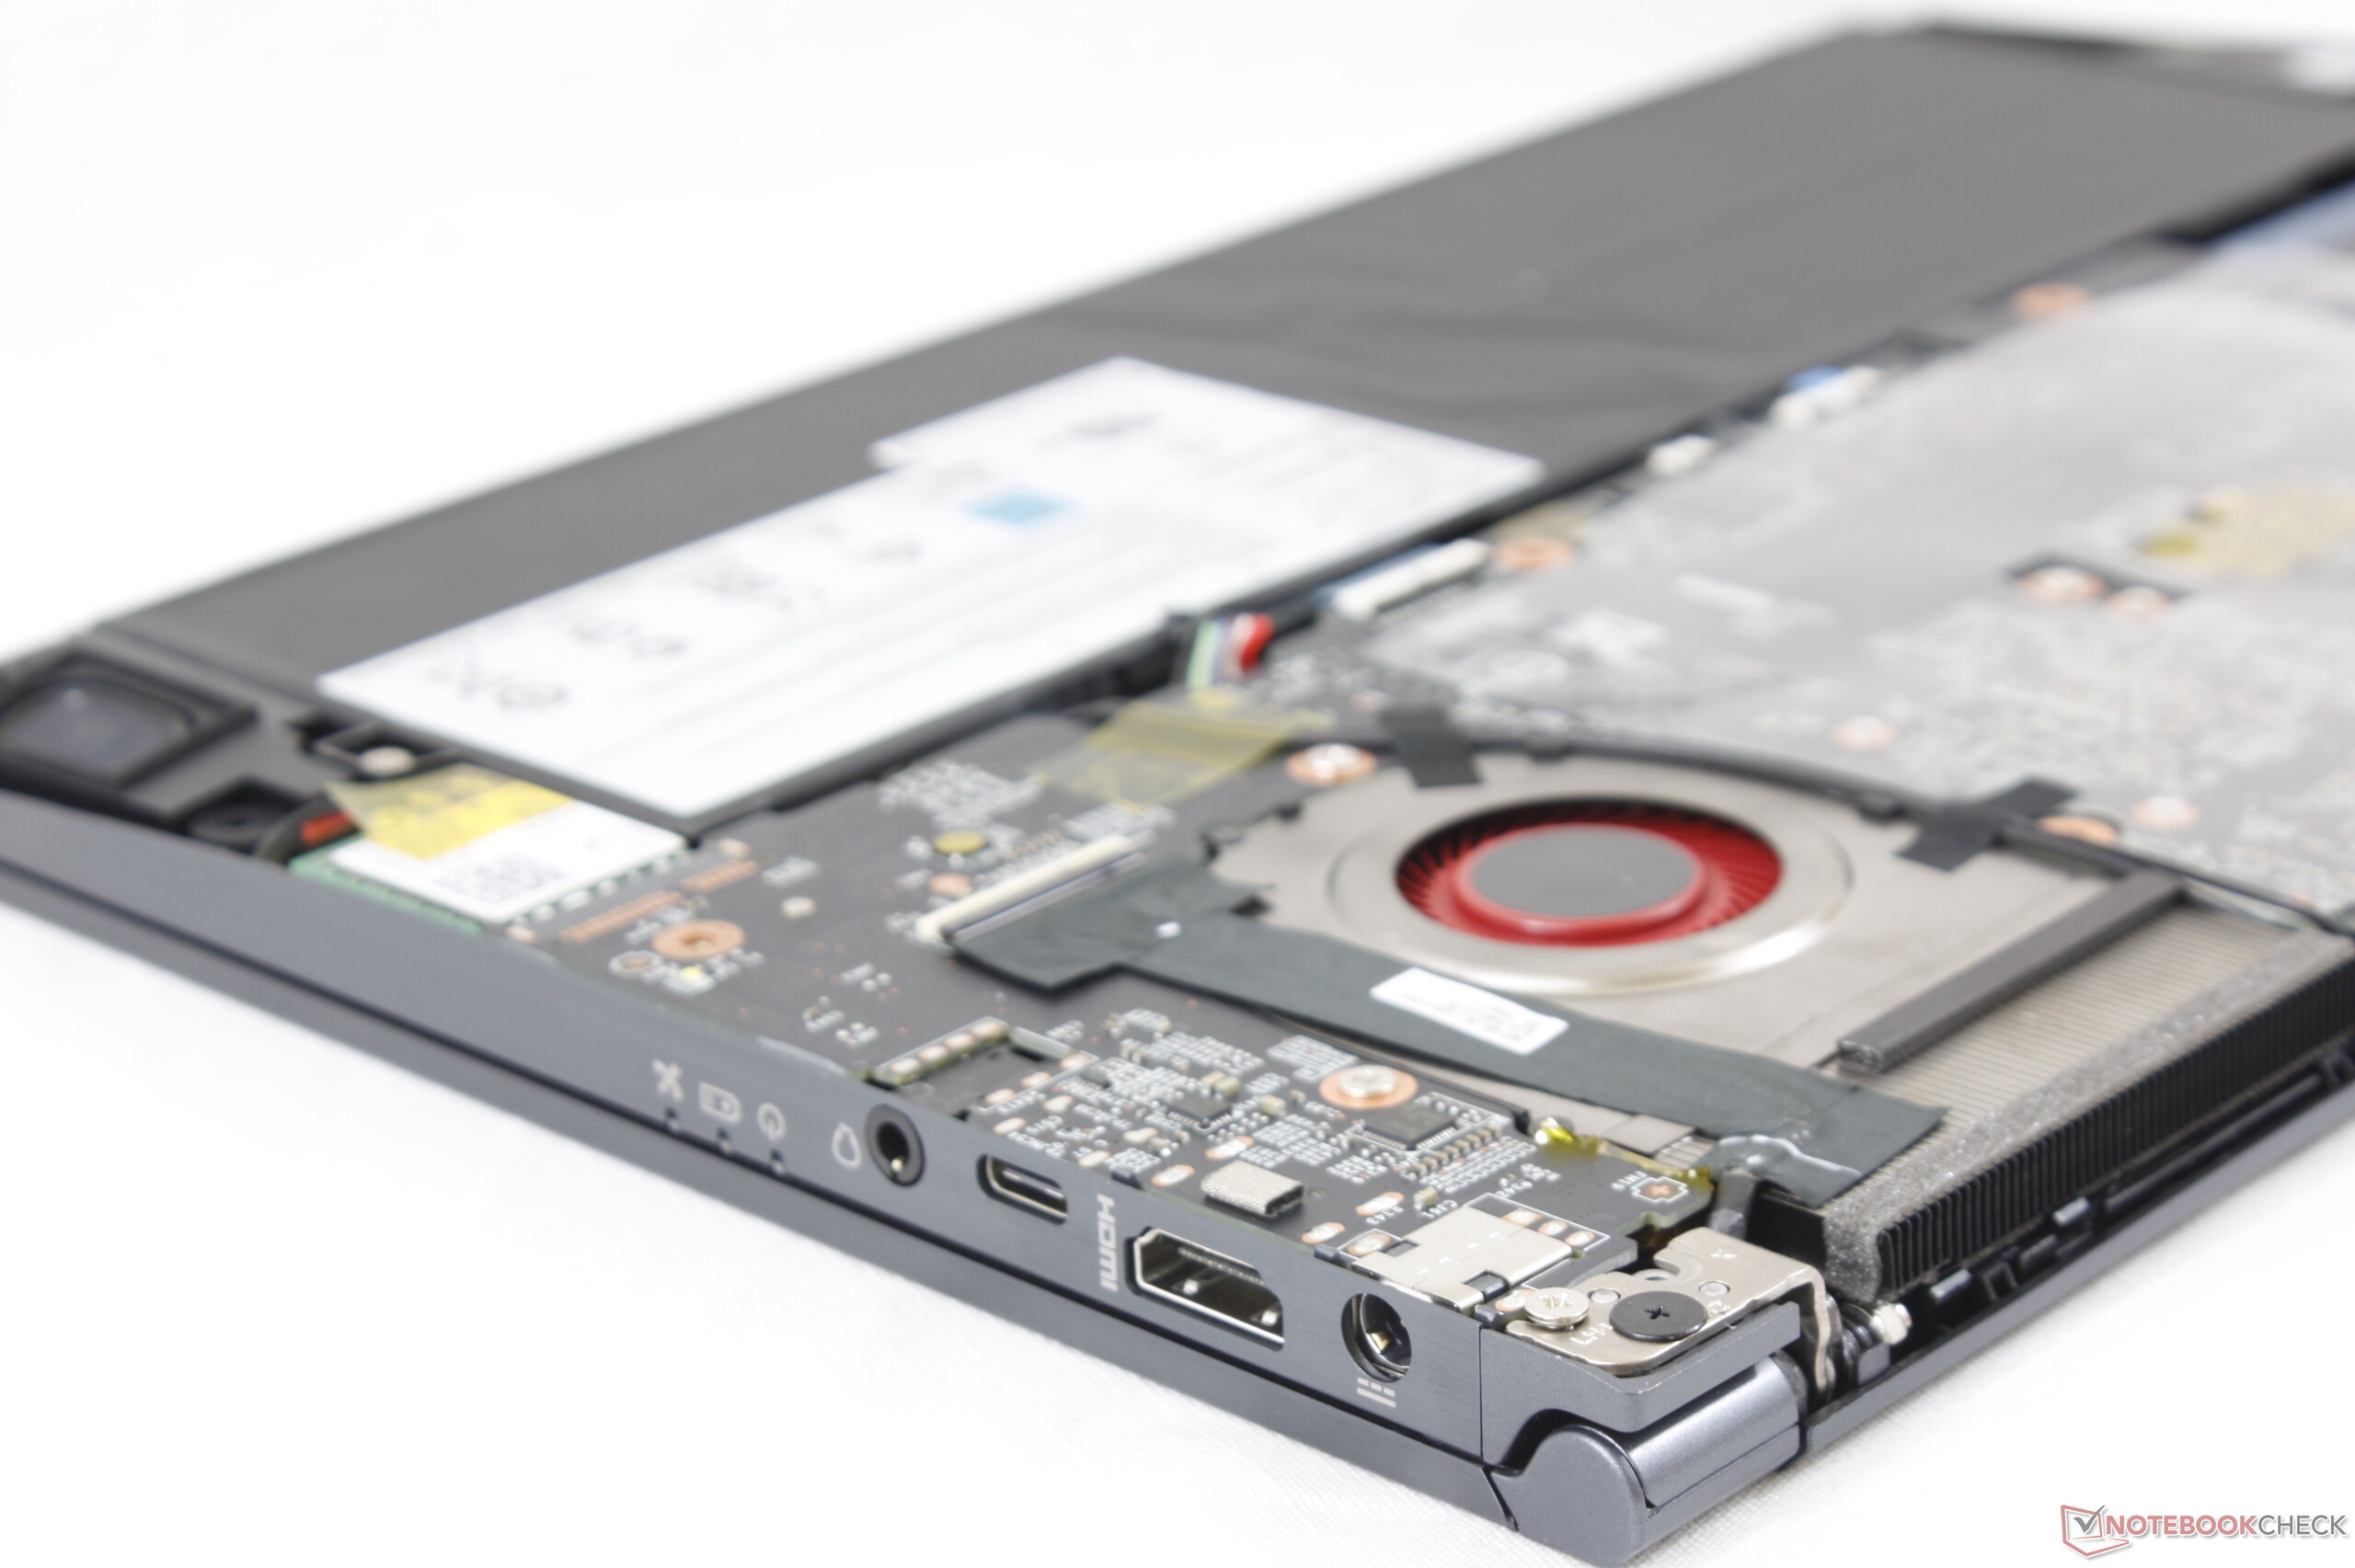
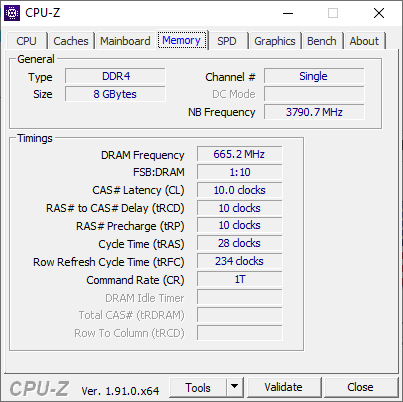
Modern 14的主要缺点是机身刚性,可升级性,单通道RAM和键盘反馈。与大多数戴尔,联想或惠普的办公笔记本电脑相比,机身会弯曲并发出响声,而常见的升级(例如RAM或存储)则更加困难。键盘偏软,反馈不够清晰。
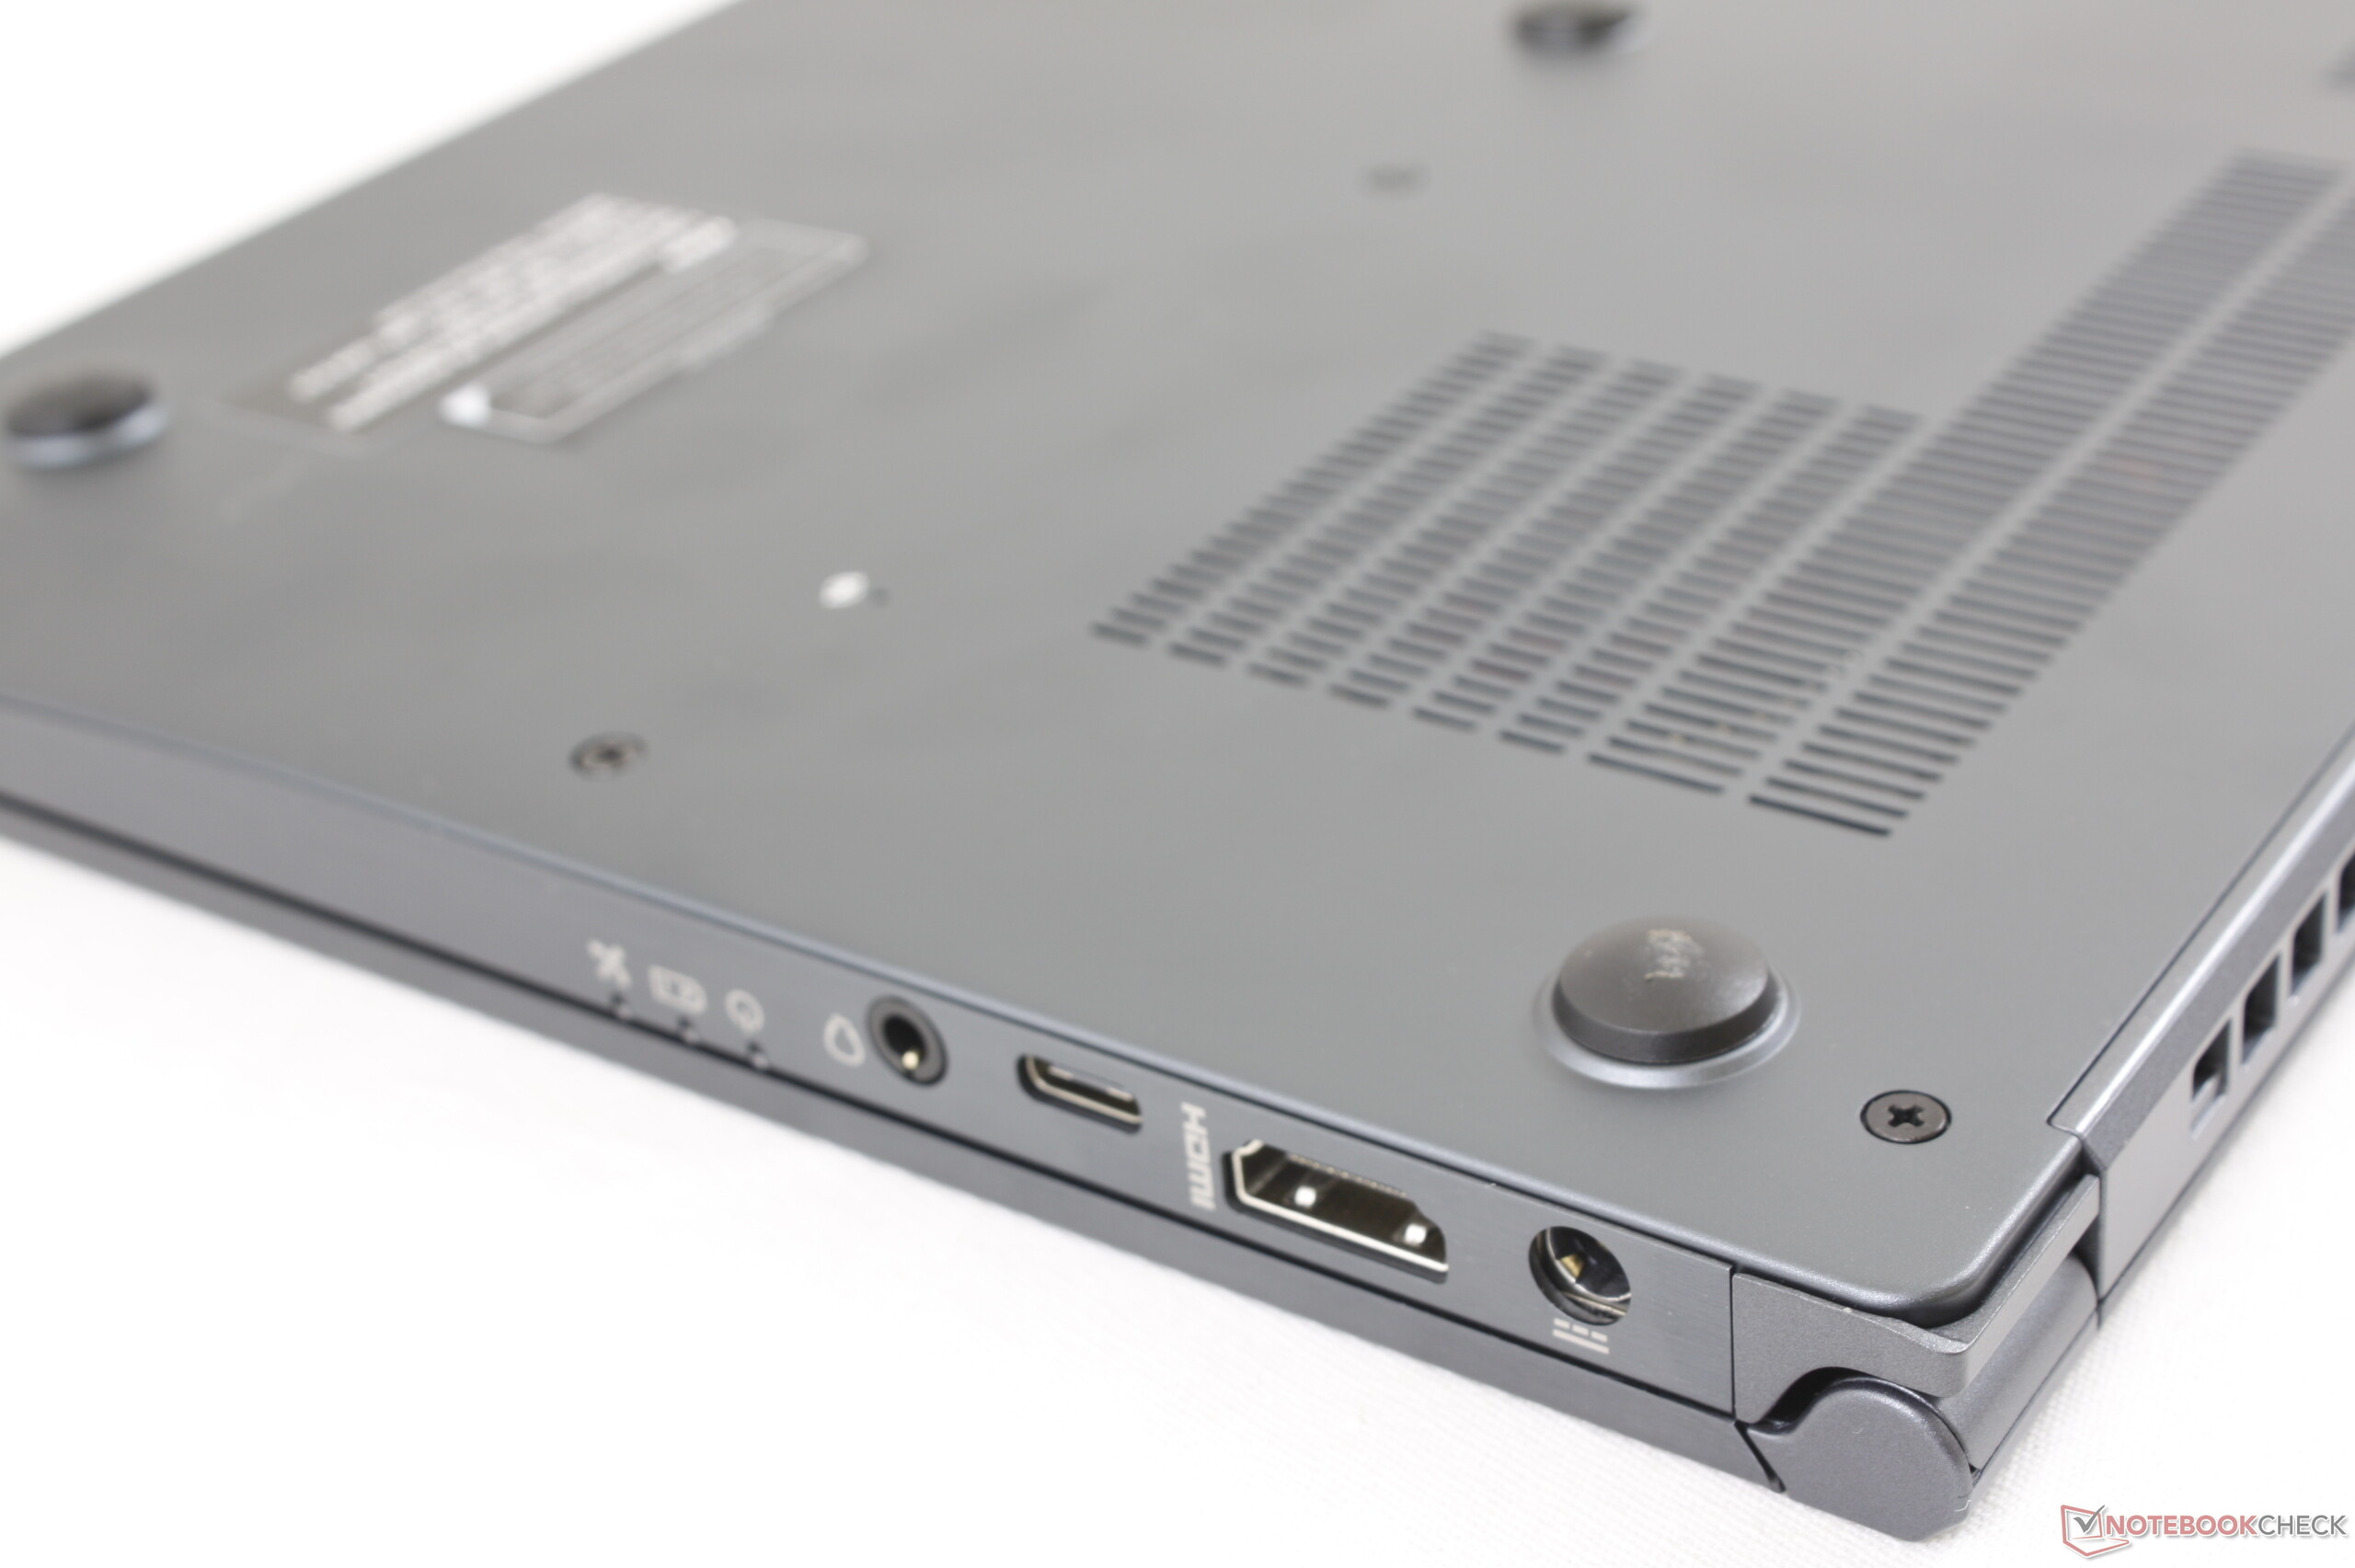
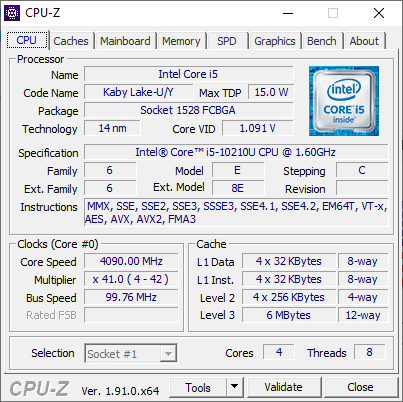
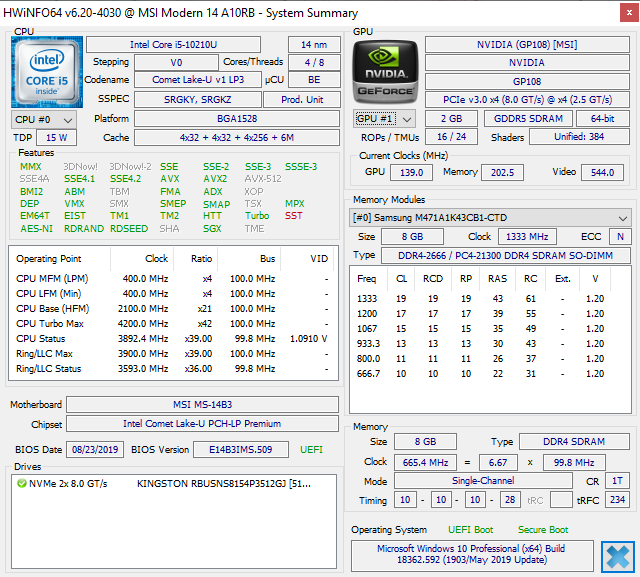
其他缺点包括“鼻孔视角”摄像头,不支持指纹读取器或Thunderbolt 3、8 GB单通道RAM以及Core i5-10210U一般般的CPU性能。只要您知道它的优缺点,不到900美元的价格,这是一个合理的选择。
“这不是你爸的老旧办公笔记本电脑。与Dell,HP或Lenovo的中端办公解决方案相比,MSI Modern 14以其时尚的设计和轻巧的外观来吸引年轻的办公用户和内容创作者。”
MSI Modern 14 A10RB-459US
- 01/27/2020 v7 (old)
Allen Ngo
Price comparison

