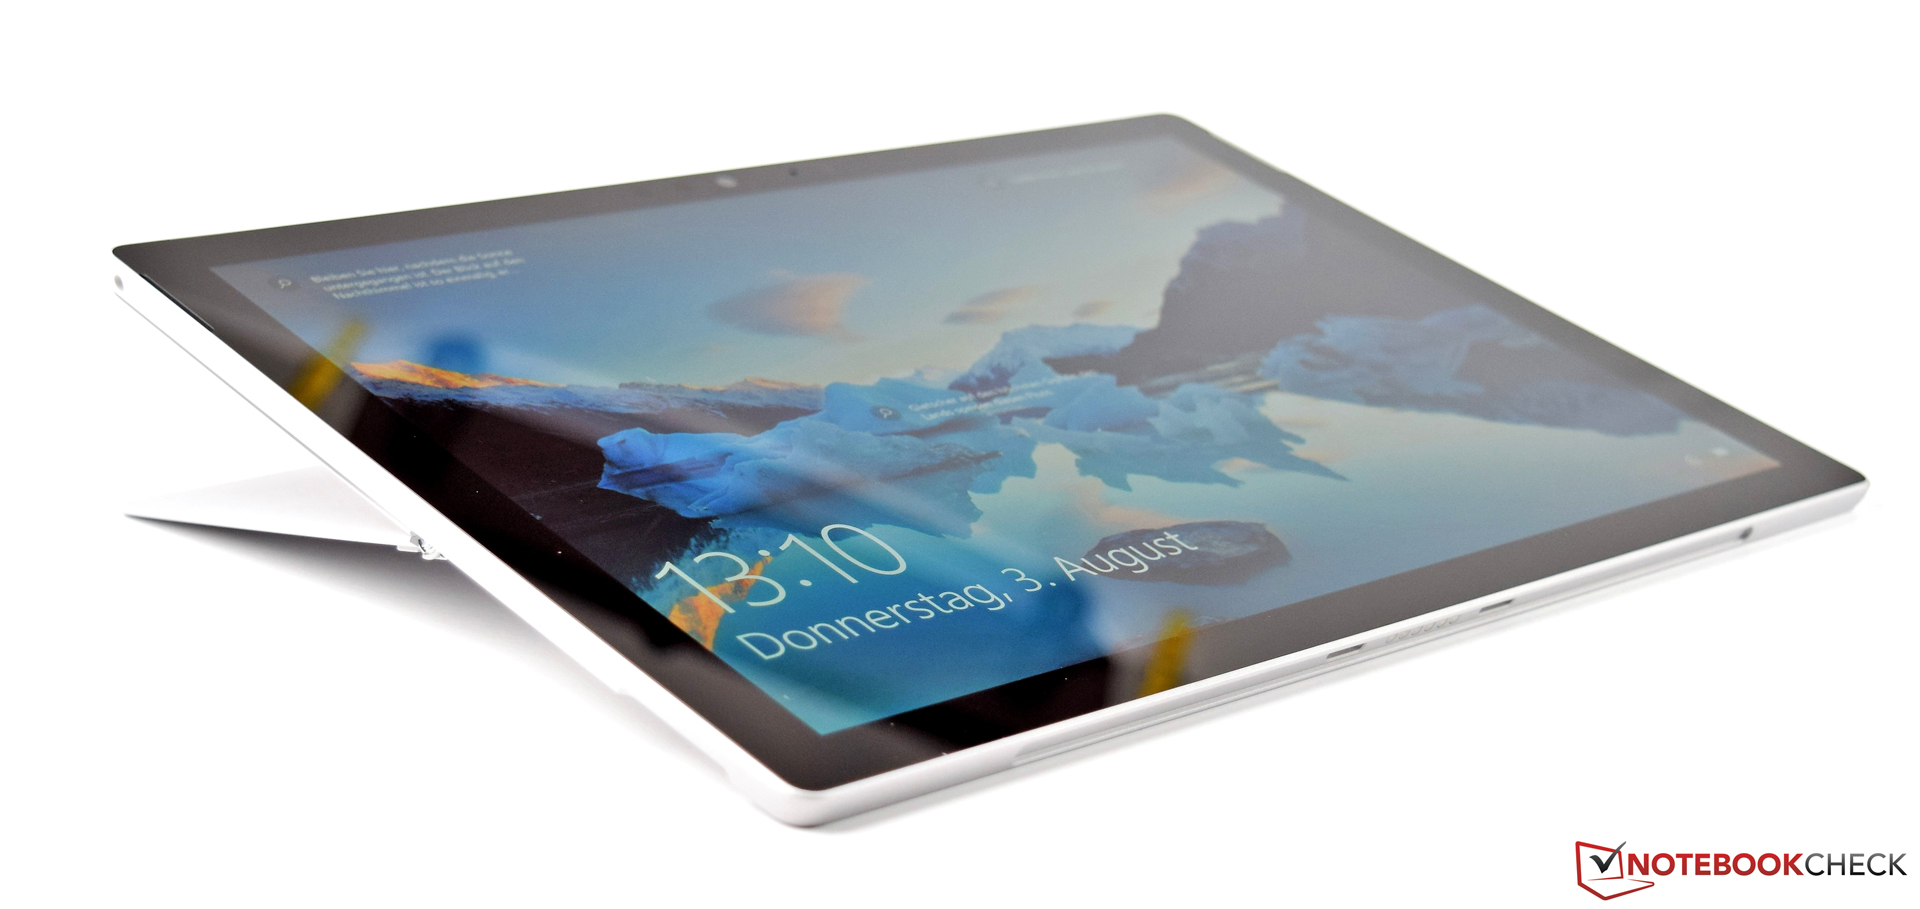
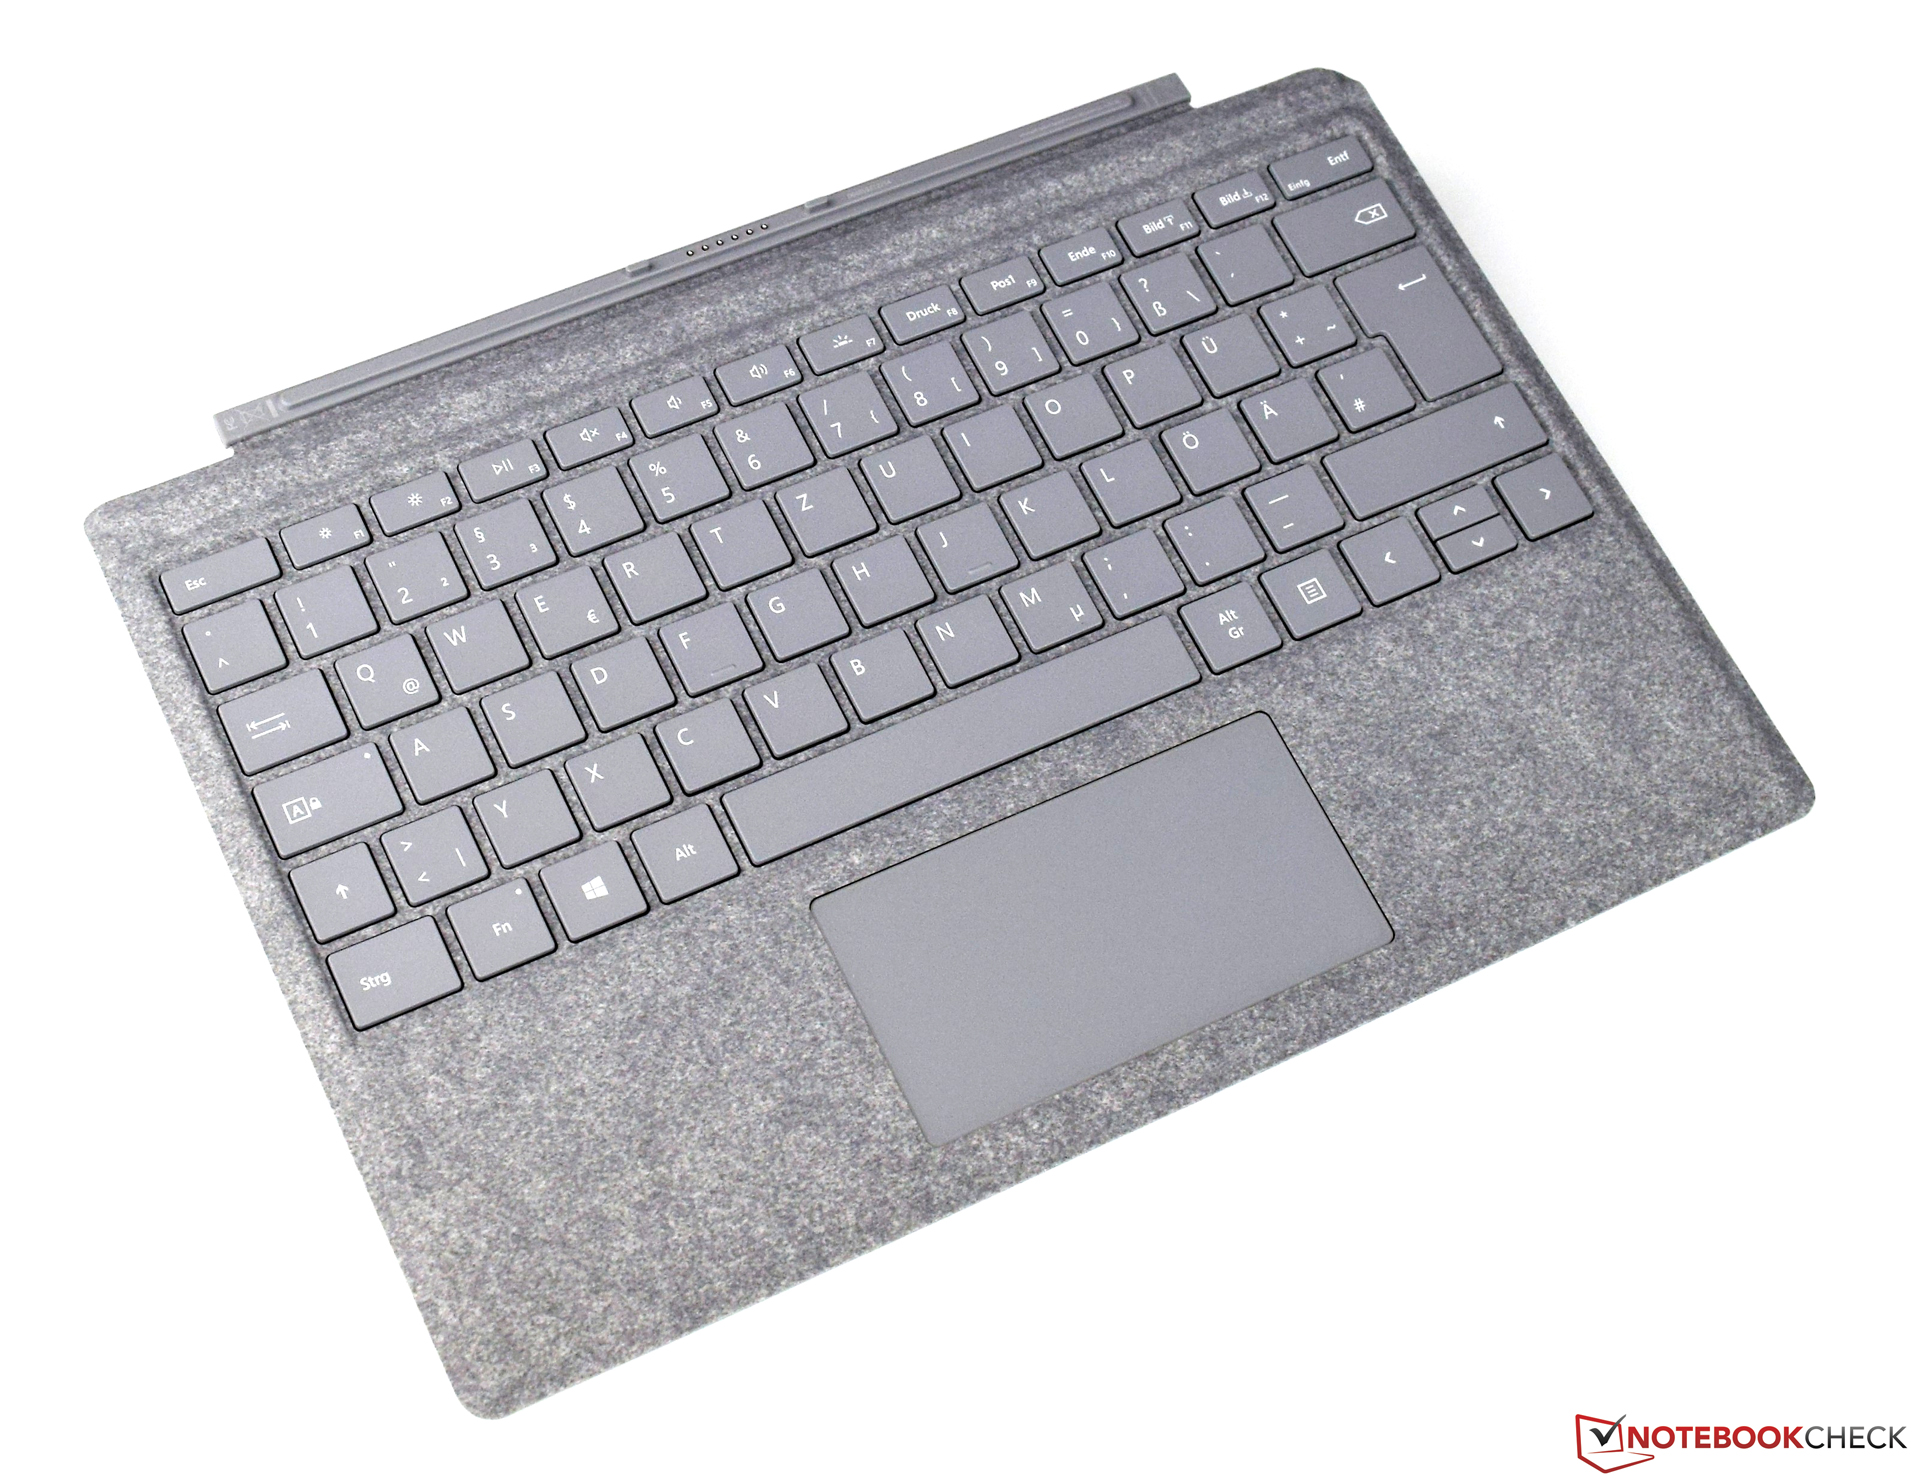
微软 Surface Pro (2017) (Core m3, 128GB, 4GB) 变形本简短评测

| SD Card Reader | |
| average JPG Copy Test (av. of 3 runs) | |
| Lenovo ThinkPad X1 Tablet Gen 2 (Toshiba Exceria Pro SDXC 64 GB UHS-II) | |
| Microsoft Surface Pro (2017) m3 (Toshiba Exceria Pro M401 64 GB) | |
| Microsoft Surface Pro (2017) i7 (Toshiba Exceria Pro M401 64 GB) | |
| maximum AS SSD Seq Read Test (1GB) | |
| Lenovo ThinkPad X1 Tablet Gen 2 (Toshiba Exceria Pro SDXC 64 GB UHS-II) | |
| Microsoft Surface Pro (2017) i7 (Toshiba Exceria Pro M401 64 GB) | |
| Microsoft Surface Pro (2017) m3 (Toshiba Exceria Pro M401 64 GB) | |
| |||||||||||||||||||||||||
Brightness Distribution: 93 %
Center on Battery: 461 cd/m²
Contrast: 1356:1 (Black: 0.34 cd/m²)
ΔE ColorChecker Calman: 3.43 | ∀{0.5-29.43 Ø4.73}
ΔE Greyscale Calman: 3.08 | ∀{0.09-98 Ø4.97}
99% sRGB (Argyll 1.6.3 3D)
64% AdobeRGB 1998 (Argyll 1.6.3 3D)
70.1% AdobeRGB 1998 (Argyll 3D)
99.2% sRGB (Argyll 3D)
68.5% Display P3 (Argyll 3D)
Gamma: 3.03
CCT: 7014 K
| Microsoft Surface Pro (2017) m3 LG Display LP123WQ112604, , 2736x1826, 12.3" | Microsoft Surface Pro (2017) i7 LG Display LP123WQ112604, , 2736x1824, 12.3" | Microsoft Surface Pro (2017) i5 LG Display LP123WQ112604, , 2736x1824, 12.3" | Lenovo Ideapad Miix 720-12IKB AUO B120YAN01 / AUO106F, , 2880x1920, 12" | HP Elite x2 1012 G1 LG Philips, , 1920x1280, 12.1" | Lenovo ThinkPad X1 Tablet Gen 2 LSN120QL01L01, , 2160x1440, 12" | Samsung Galaxy Tab Pro S W700N Digital Flat Panel (NoName), , 2160x1440, 12.1" | Acer Aspire Switch Alpha 12 SA5-271-56HM Panasonic VVX12T041N00, , 2160x1440, 12" | |
|---|---|---|---|---|---|---|---|---|
| Screen | -16% | -0% | -28% | -43% | -31% | 81% | -44% | |
| Brightness middle (cd/m²) | 461 | 482 5% | 417 -10% | 406 -12% | 322 -30% | 388.1 -16% | 363 -21% | 345 -25% |
| Brightness (cd/m²) | 444 | 466 5% | 401 -10% | 396 -11% | 319 -28% | 344 -23% | 378 -15% | 328 -26% |
| Brightness Distribution (%) | 93 | 92 -1% | 88 -5% | 88 -5% | 97 4% | 78 -16% | 90 -3% | 91 -2% |
| Black Level * (cd/m²) | 0.34 | 0.395 -16% | 0.29 15% | 0.3 12% | 0.42 -24% | 0.39 -15% | 0.03 91% | 0.38 -12% |
| Contrast (:1) | 1356 | 1220 -10% | 1438 6% | 1353 0% | 767 -43% | 995 -27% | 12100 792% | 908 -33% |
| Colorchecker dE 2000 * | 3.43 | 4 -17% | 3.63 -6% | 5.28 -54% | 6.02 -76% | 4.6 -34% | 4.8 -40% | 8.4 -145% |
| Colorchecker dE 2000 max. * | 5.55 | 7.2 -30% | 6.74 -21% | 9.83 -77% | 10.06 -81% | 9.1 -64% | 6.91 -25% | 11.9 -114% |
| Greyscale dE 2000 * | 3.08 | 5.7 -85% | 2.18 29% | 6.71 -118% | 6.29 -104% | 6.1 -98% | 5.04 -64% | 4.3 -40% |
| Gamma | 3.03 73% | 2.28 96% | 3.09 71% | 2.29 96% | 2.4 92% | 2.07 106% | 2.57 86% | 2.63 84% |
| CCT | 7014 93% | 7950 82% | 6767 96% | 6532 100% | 7712 84% | 7104 91% | 7255 90% | 7368 88% |
| Color Space (Percent of AdobeRGB 1998) (%) | 64 | 62 -3% | 63 -2% | 59 -8% | 47.8 -25% | 59 -8% | 73 14% | 62 -3% |
| Color Space (Percent of sRGB) (%) | 99 | 96 -3% | 99 0% | 91 -8% | 73.2 -26% | 91 -8% |
* ... smaller is better
Display Response Times
| ↔ Response Time Black to White | ||
|---|---|---|
| 28 ms ... rise ↗ and fall ↘ combined | ↗ 18 ms rise | 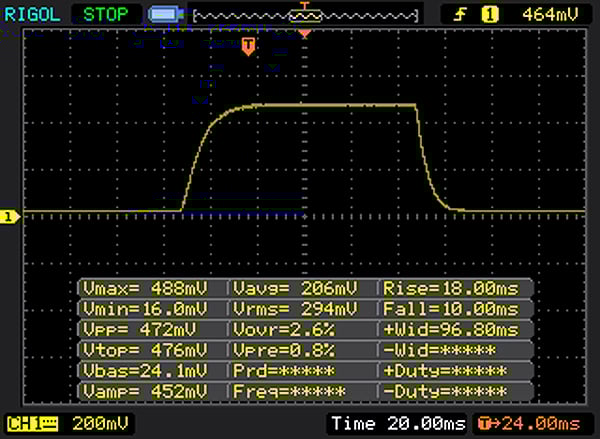 |
| ↘ 10 ms fall | ||
| The screen shows relatively slow response rates in our tests and may be too slow for gamers. In comparison, all tested devices range from 0.1 (minimum) to 240 (maximum) ms. » 71 % of all devices are better. This means that the measured response time is worse than the average of all tested devices (19.9 ms). | ||
| ↔ Response Time 50% Grey to 80% Grey | ||
| 42 ms ... rise ↗ and fall ↘ combined | ↗ 20 ms rise | 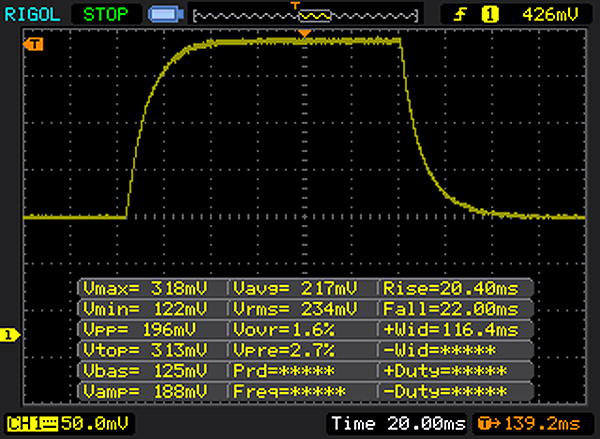 |
| ↘ 22 ms fall | ||
| The screen shows slow response rates in our tests and will be unsatisfactory for gamers. In comparison, all tested devices range from 0.165 (minimum) to 636 (maximum) ms. » 67 % of all devices are better. This means that the measured response time is worse than the average of all tested devices (31.1 ms). | ||
Screen Flickering / PWM (Pulse-Width Modulation)
| Screen flickering / PWM not detected | ||
In comparison: 52 % of all tested devices do not use PWM to dim the display. If PWM was detected, an average of 7801 (minimum: 5 - maximum: 343500) Hz was measured. | ||
* ... smaller is better
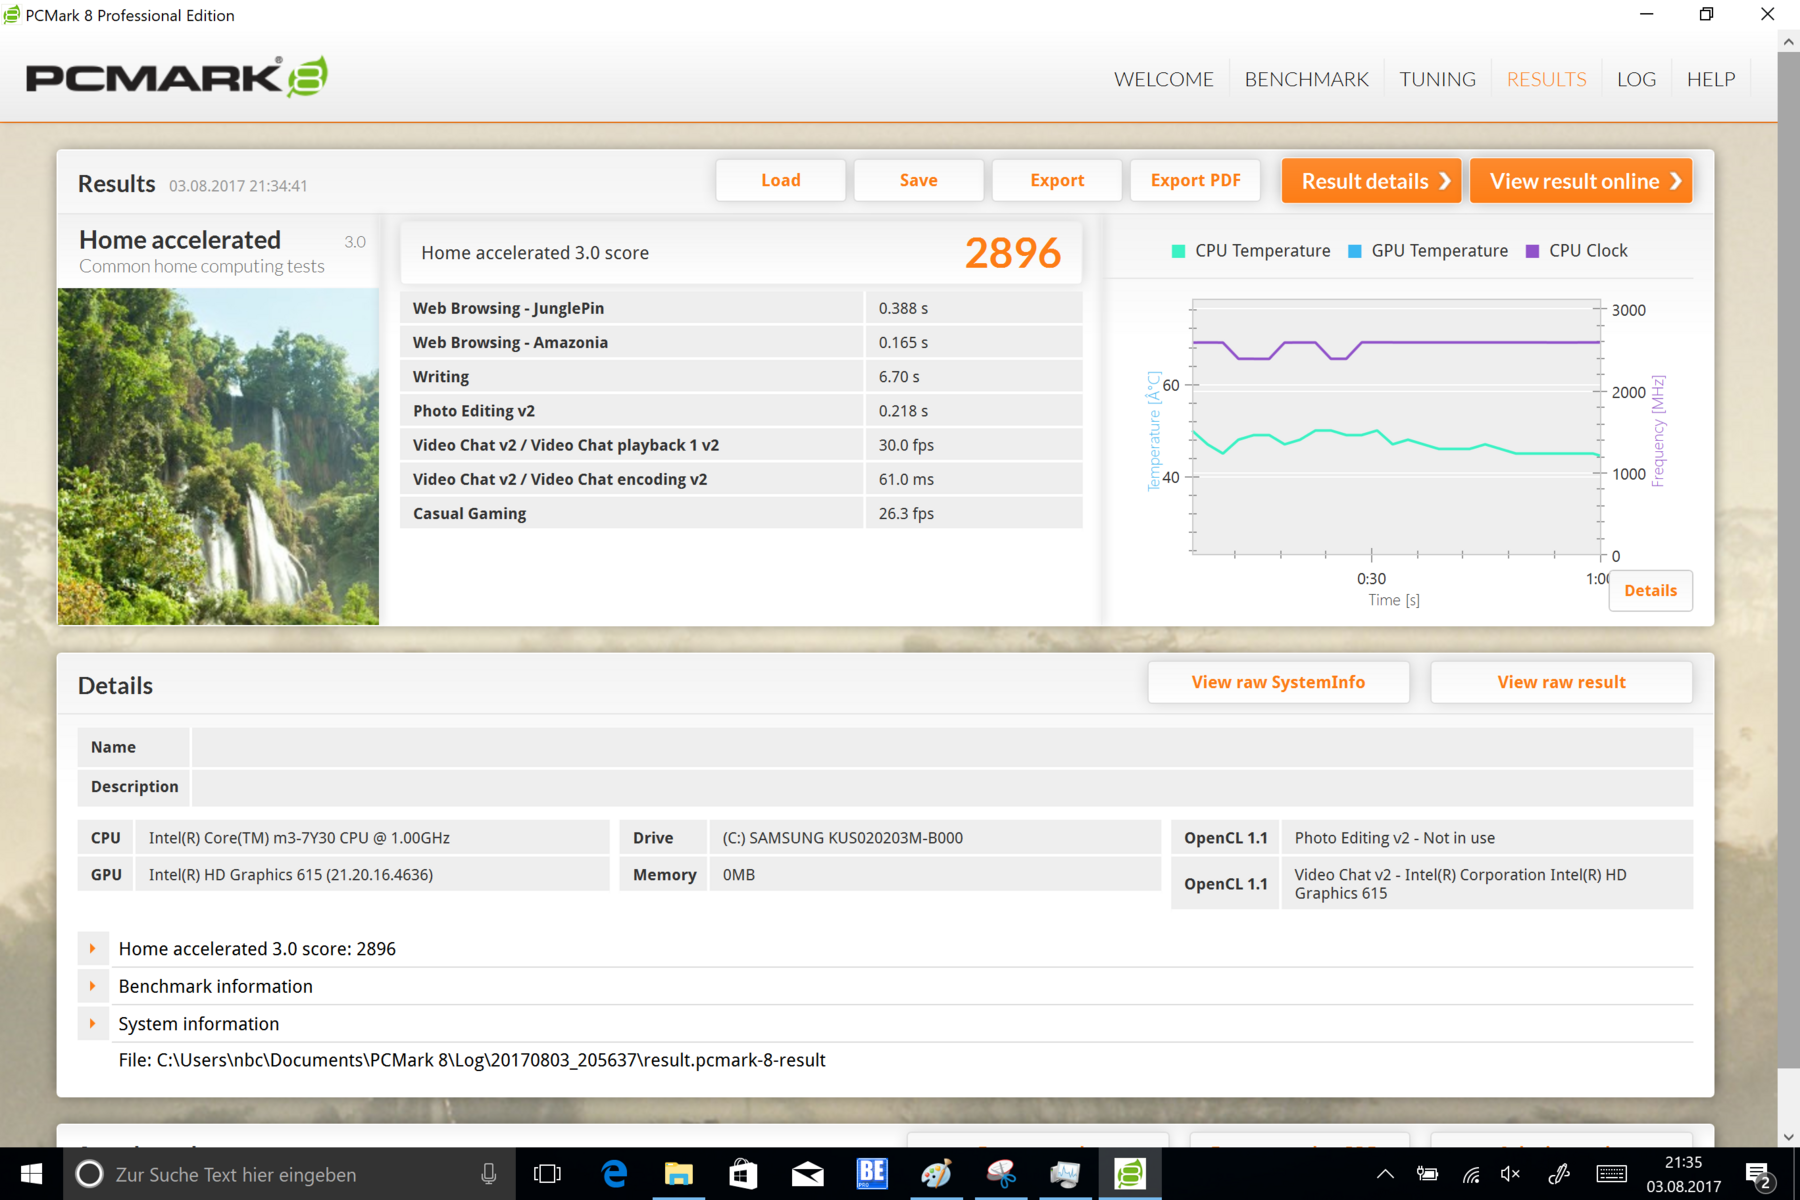
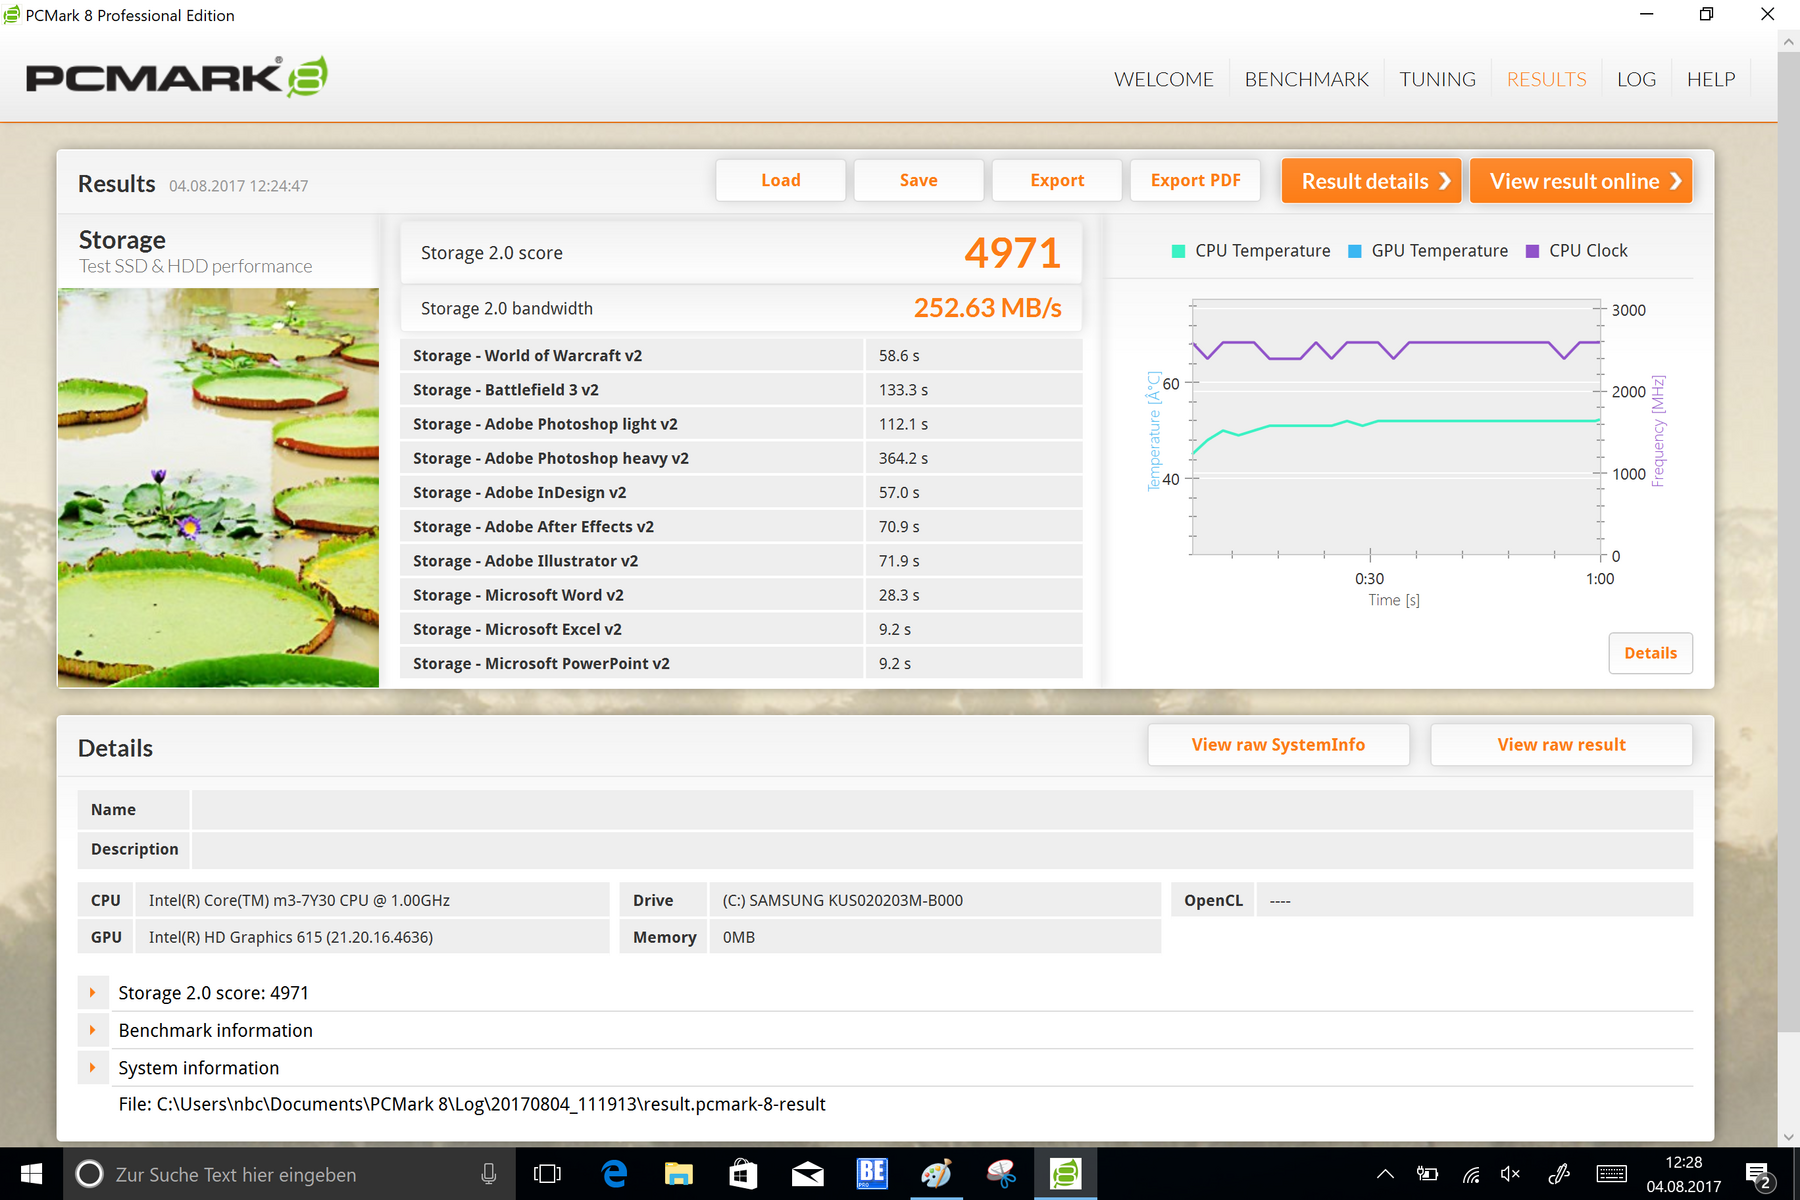
| PCMark 8 Home Score Accelerated v2 | 2896 points | |
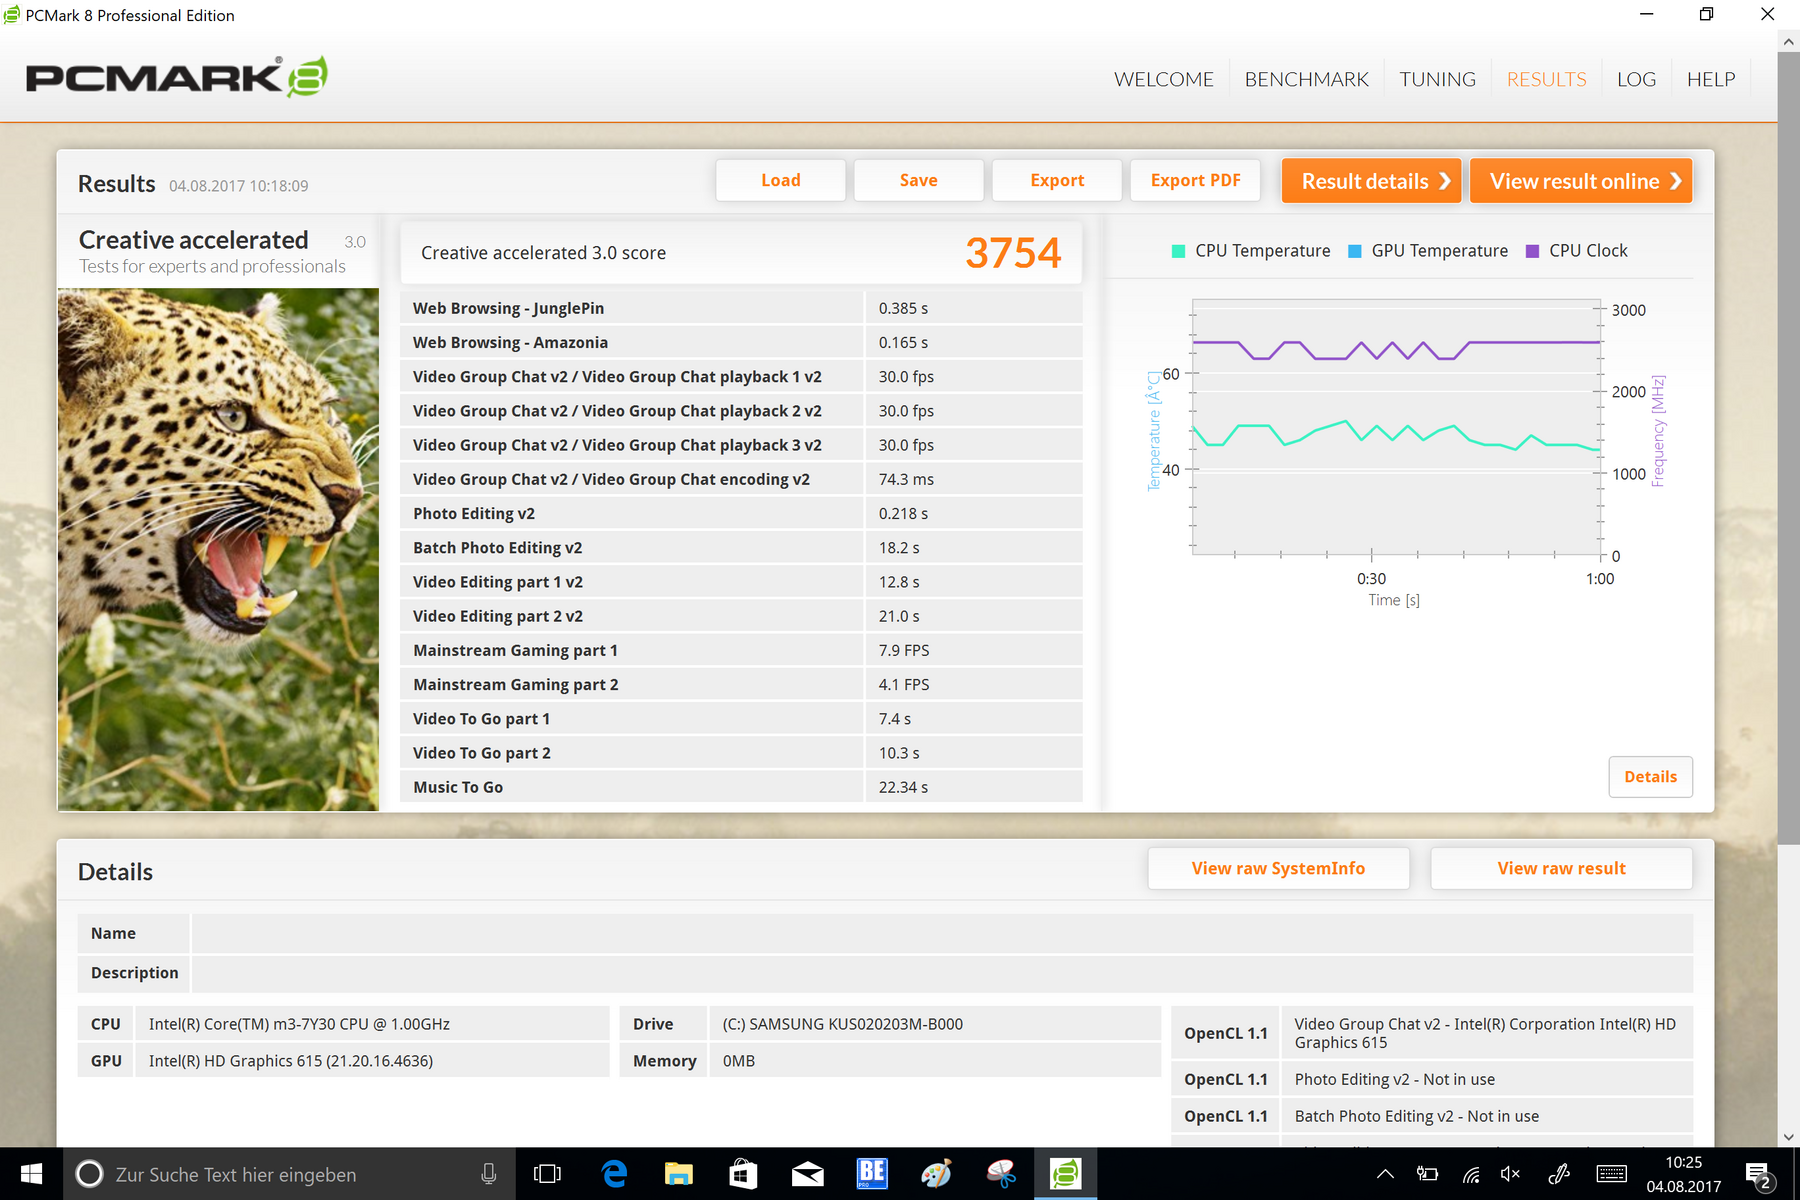
| PCMark 8 Creative Score Accelerated v2 | 3754 points | |
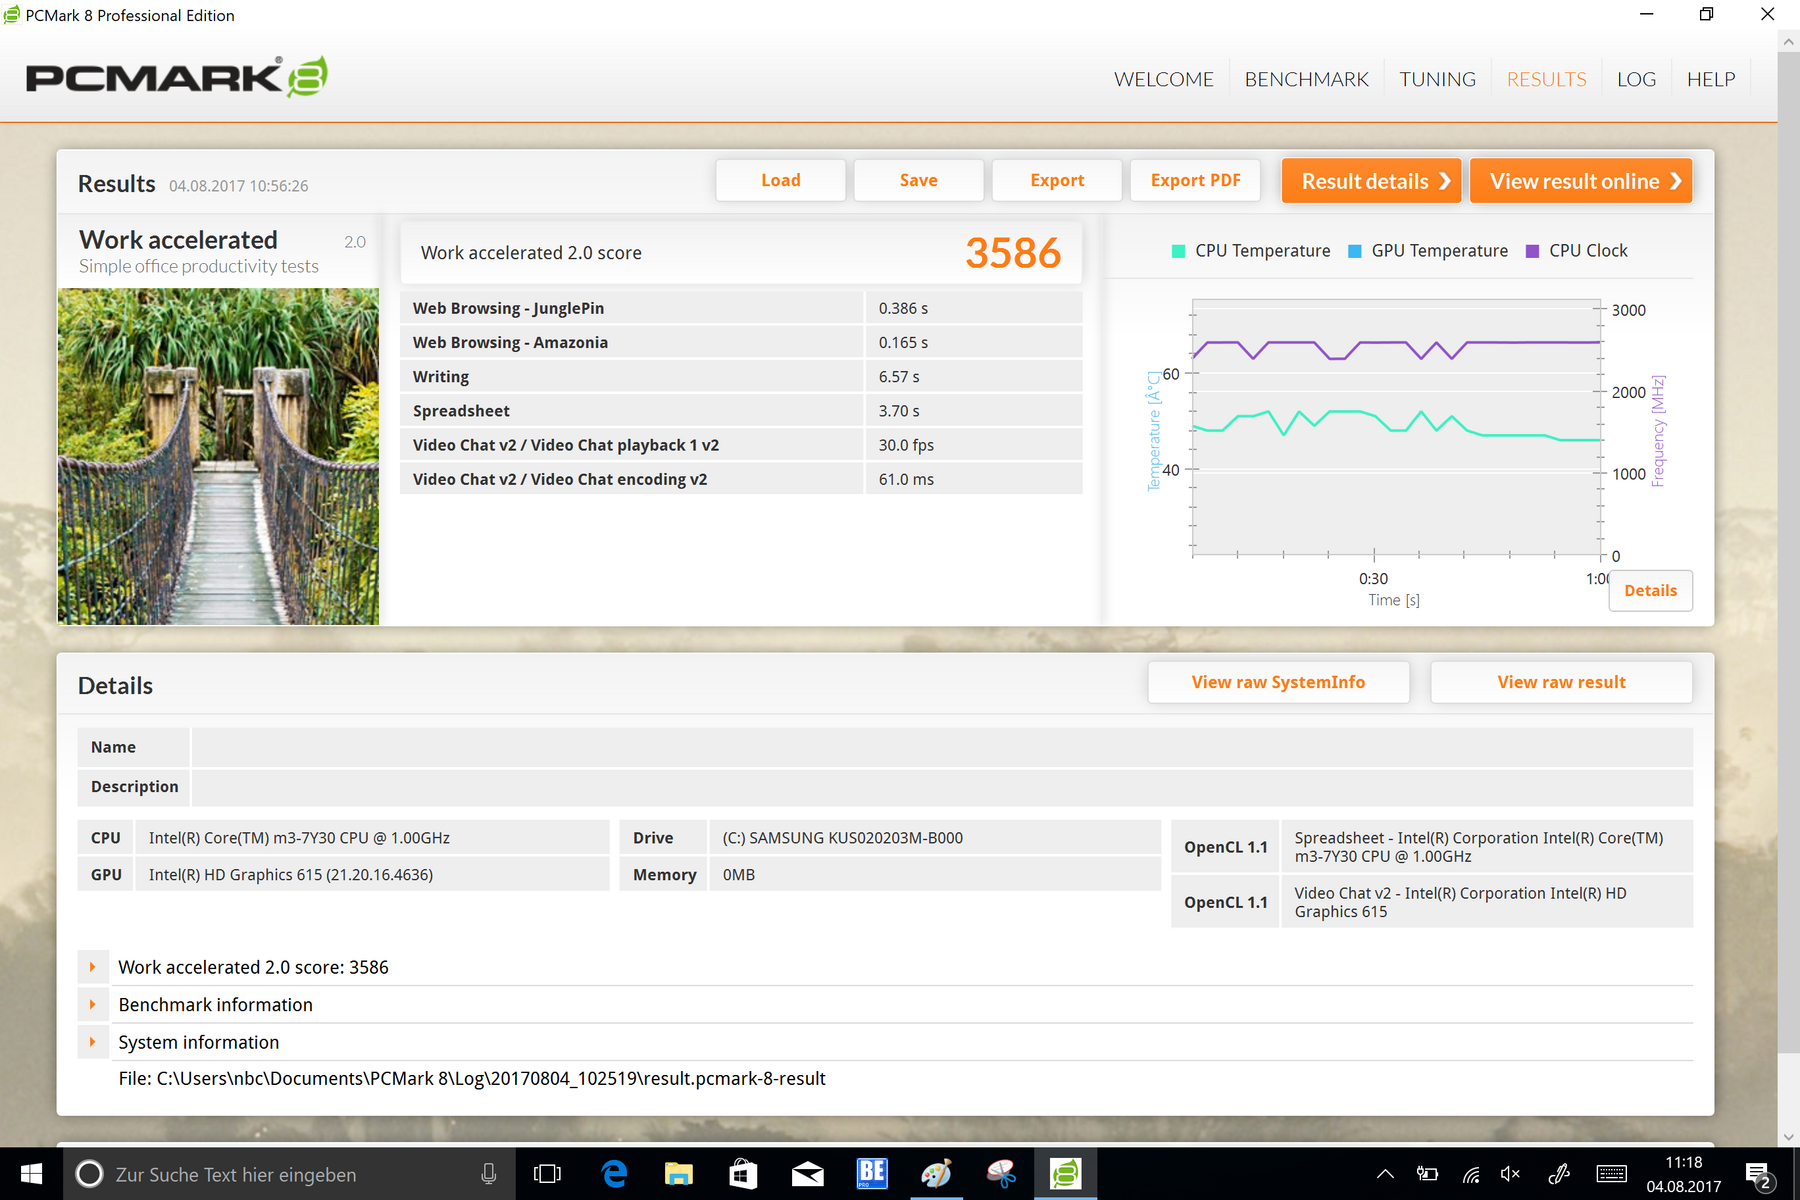
| PCMark 8 Work Score Accelerated v2 | 3586 points | |
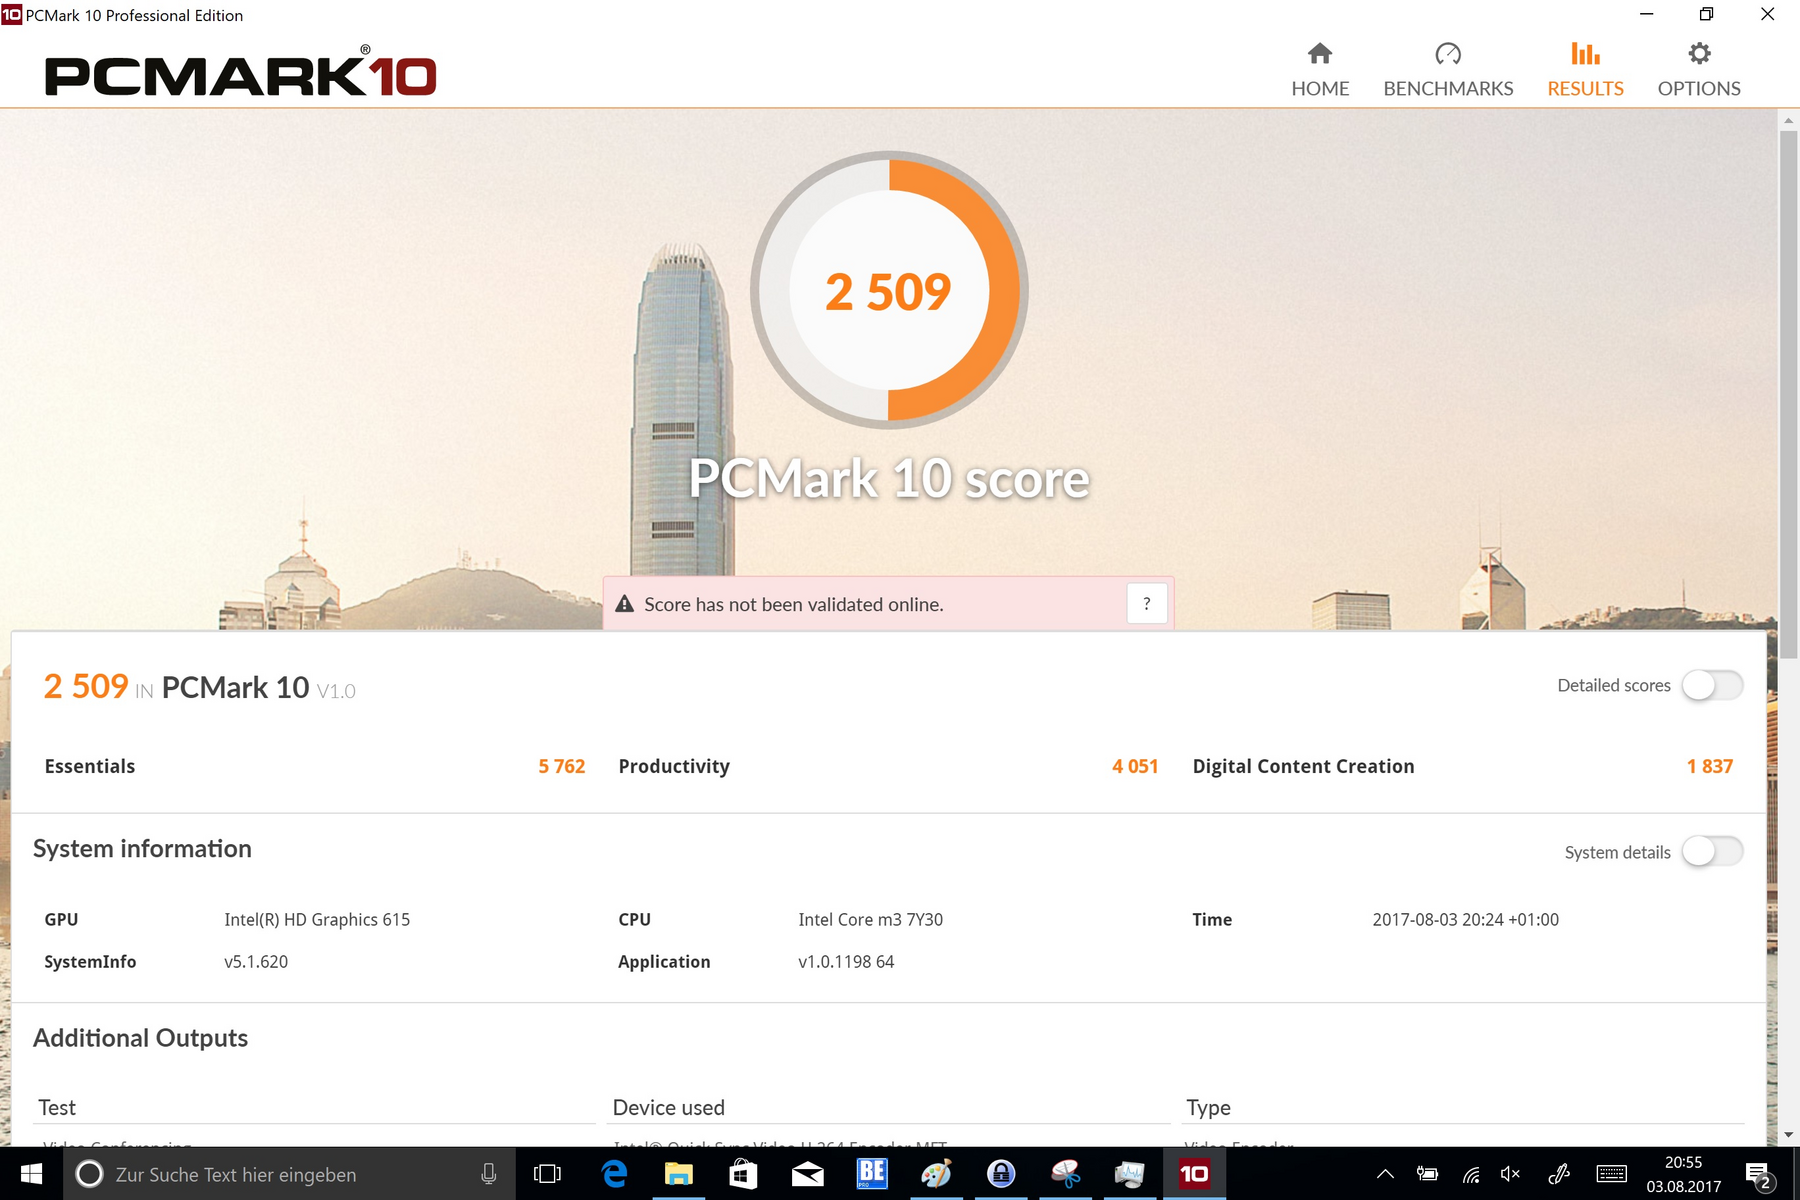
| PCMark 10 Score | 2509 points | |
Help | ||
| Microsoft Surface Pro (2017) m3 HD Graphics 615, m3-7Y30, Samsung PM971 KUS020203M | Microsoft Surface Pro (2017) i7 Iris Plus Graphics 640, i7-7660U, Samsung PM971 KUS040202M | Microsoft Surface Pro (2017) i5 HD Graphics 620, i5-7300U, Samsung PM971 KUS030202M | Lenovo Ideapad Miix 720-12IKB HD Graphics 620, i7-7500U, Samsung SSD PM961 1TB M.2 PCIe 3.0 x4 NVMe (MZVLW1T0) | HP Elite x2 1012 G1 HD Graphics 515, 6Y54, Liteon L8H-256V2G | Lenovo ThinkPad X1 Tablet Gen 2 HD Graphics 615, i5-7Y54, Samsung PM961 MZVLW256HEHP | Samsung Galaxy Tab Pro S W700N HD Graphics 515, 6Y30, Lite-On CV1-8B128 | Acer Aspire Switch Alpha 12 SA5-271-56HM HD Graphics 520, 6200U, Kingston RBU-SNS8152S3256GG2 | |
|---|---|---|---|---|---|---|---|---|
| CrystalDiskMark 3.0 | 78% | 38% | 193% | -2% | 94% | -33% | -14% | |
| Read Seq (MB/s) | 691 | 1308 89% | 723 5% | 2408 248% | 501 -27% | 1739 152% | 419.8 -39% | 518 -25% |
| Write Seq (MB/s) | 670 | 961 43% | 853 27% | 1702 154% | 297.2 -56% | 1259 88% | 162.9 -76% | 199.9 -70% |
| Read 512 (MB/s) | 261.1 | 227.5 -13% | 225 -14% | 1301 398% | 351.7 35% | 698 167% | 298.7 14% | 374.9 44% |
| Write 512 (MB/s) | 241 | 792 229% | 445 85% | 1288 434% | 295.7 23% | 869 261% | 160.9 -33% | 201 -17% |
| Read 4k (MB/s) | 40.11 | 53.6 34% | 46 15% | 53.6 34% | 28.31 -29% | 52.3 30% | 27.49 -31% | 29.3 -27% |
| Write 4k (MB/s) | 98.8 | 136.3 38% | 125 27% | 162.2 64% | 90.3 -9% | 120 21% | 48.44 -51% | 76.8 -22% |
| Read 4k QD32 (MB/s) | 301.8 | 485.6 61% | 423 40% | 504 67% | 285 -6% | 247.9 -18% | 236.2 -22% | 272 -10% |
| Write 4k QD32 (MB/s) | 172 | 421.5 145% | 373 117% | 420.8 145% | 268.4 56% | 259 51% | 135 -22% | 197.1 15% |

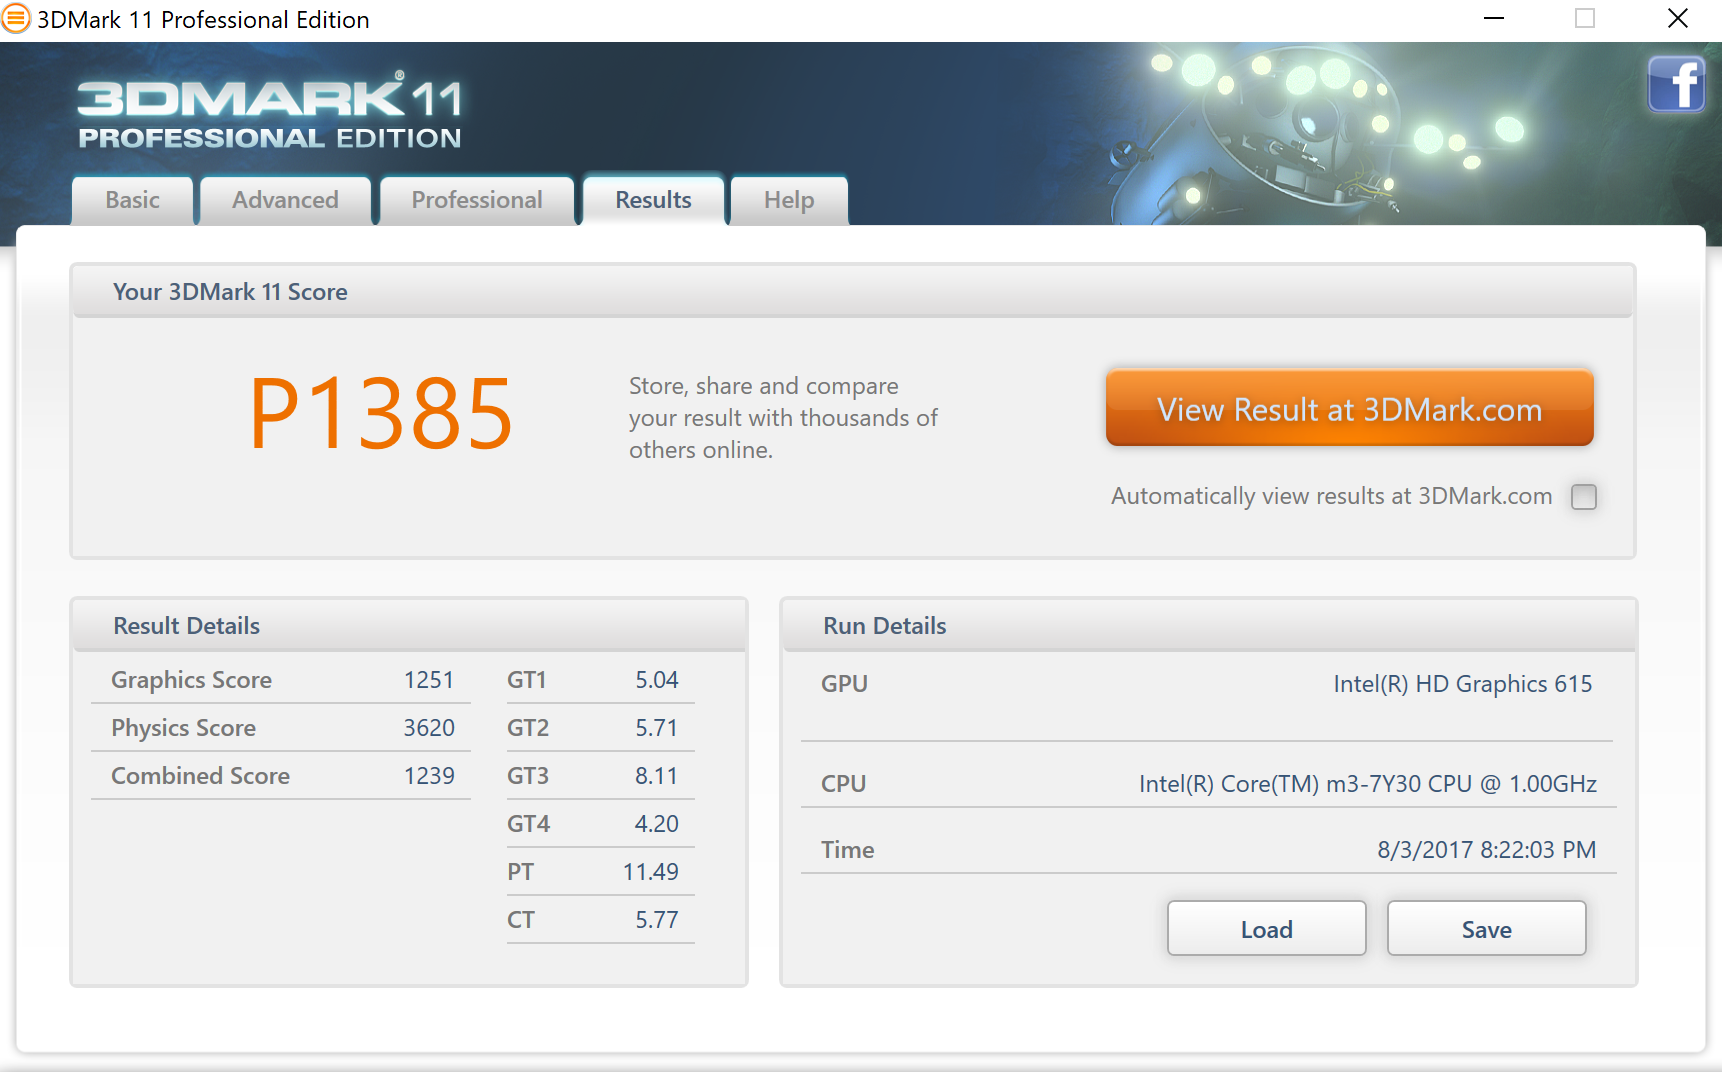
| 3DMark 11 Performance | 1385 points | |
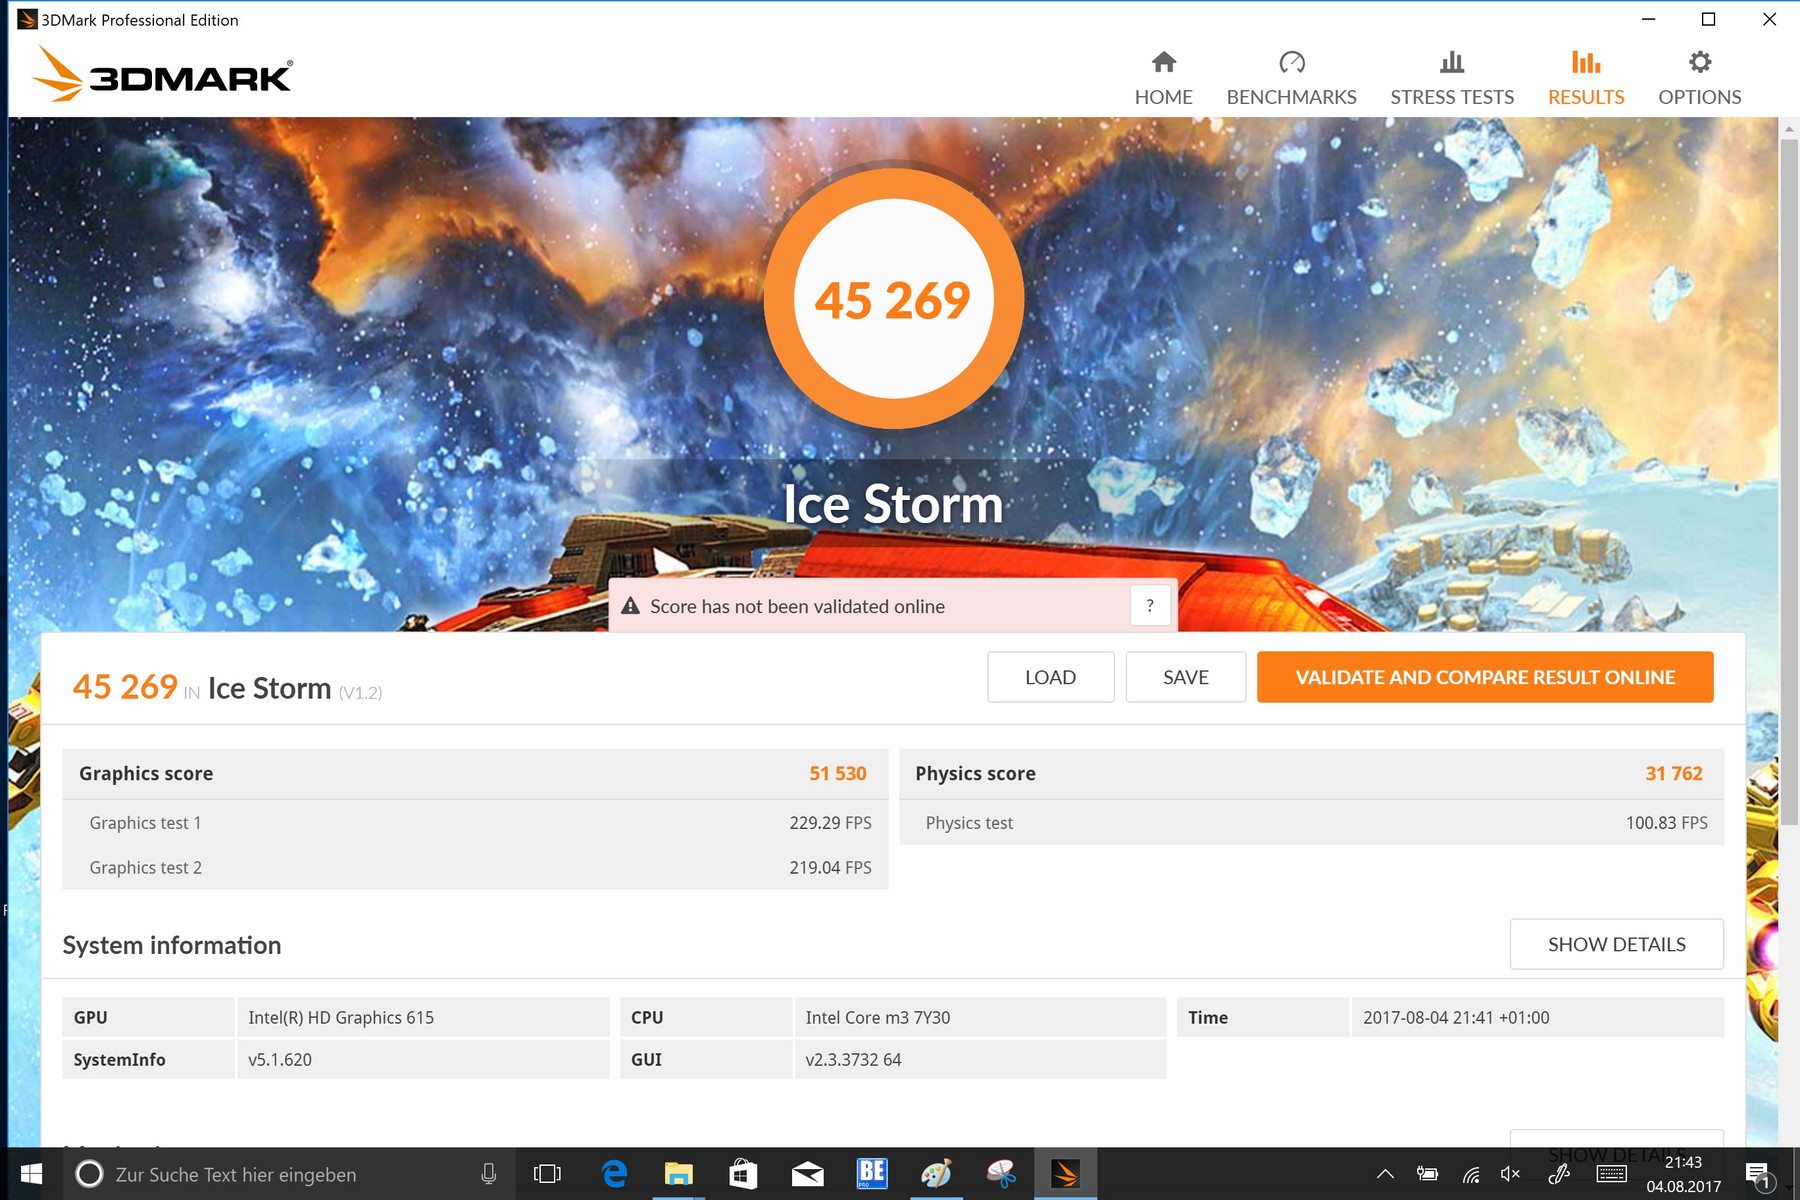
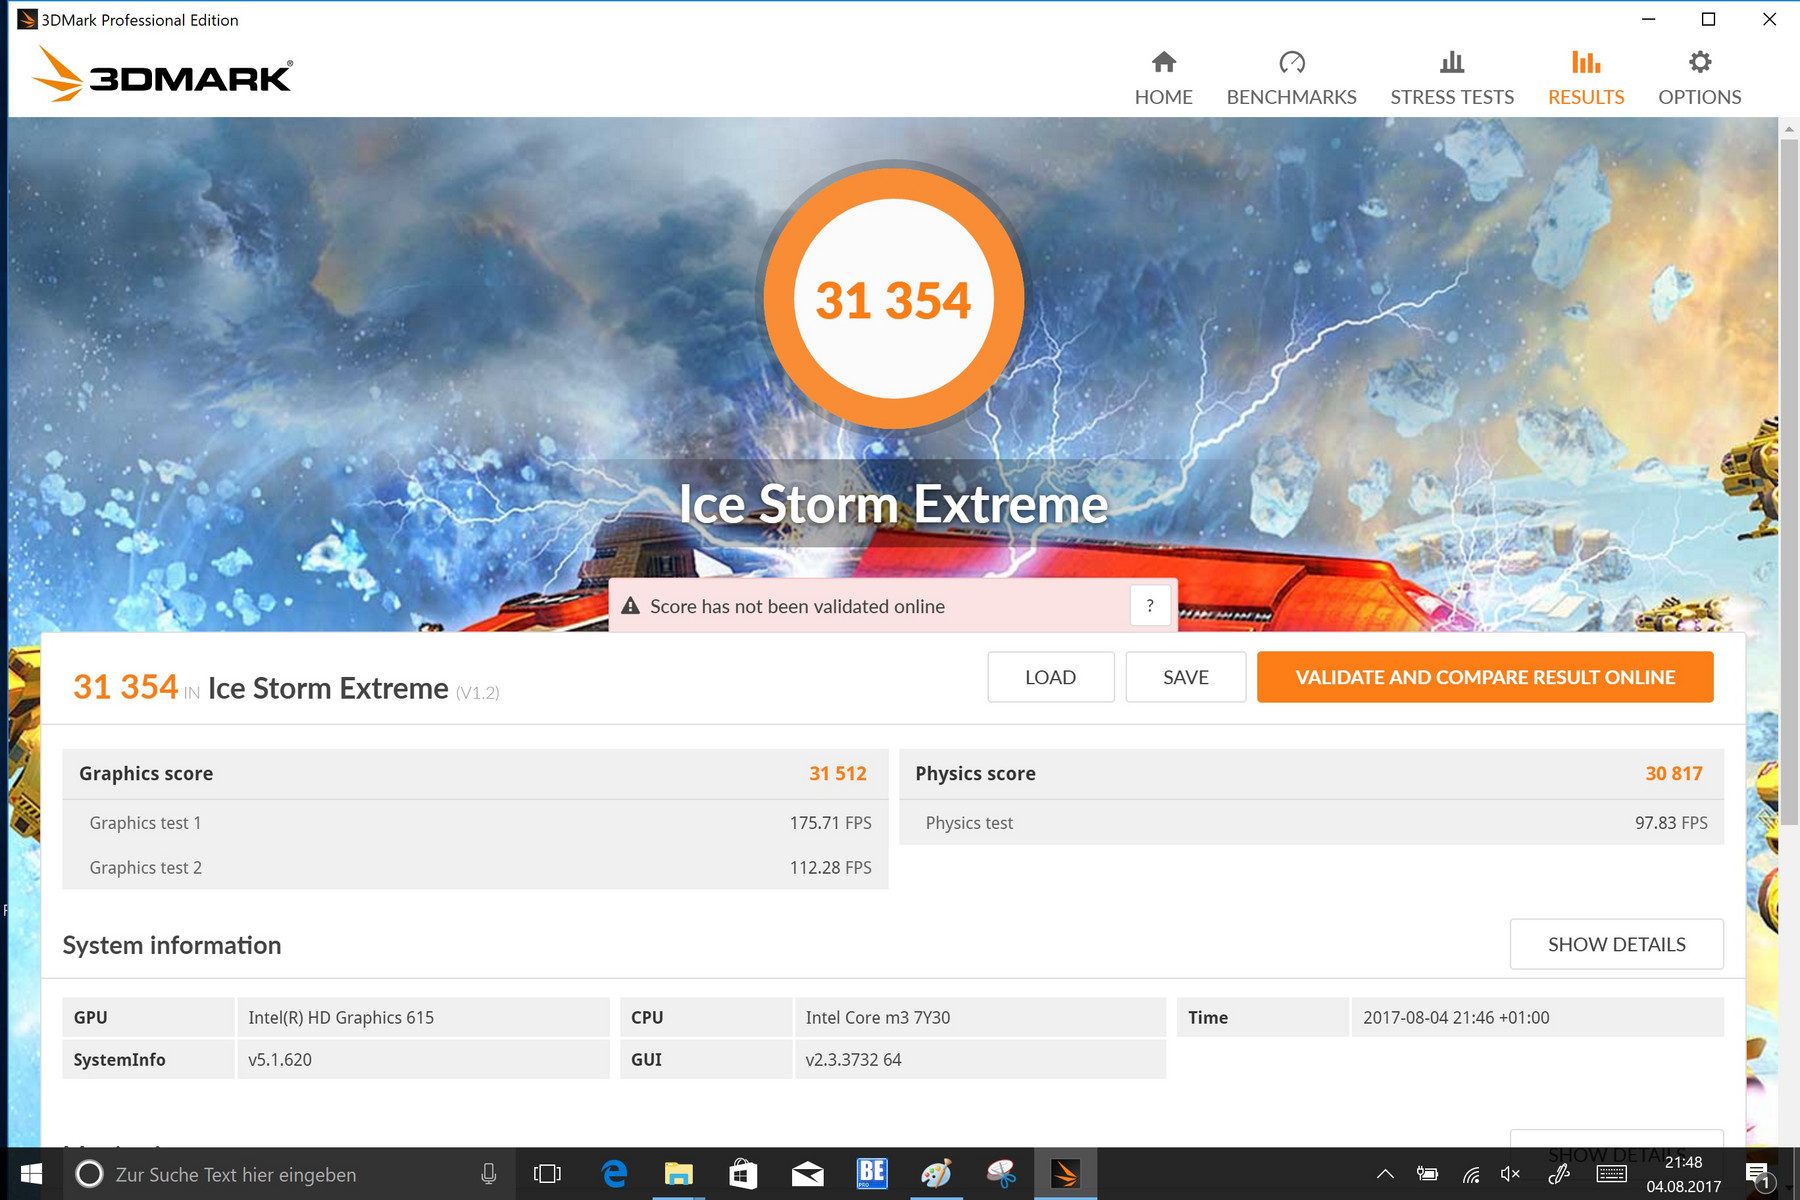
| 3DMark Ice Storm Standard Score | 45269 points | |
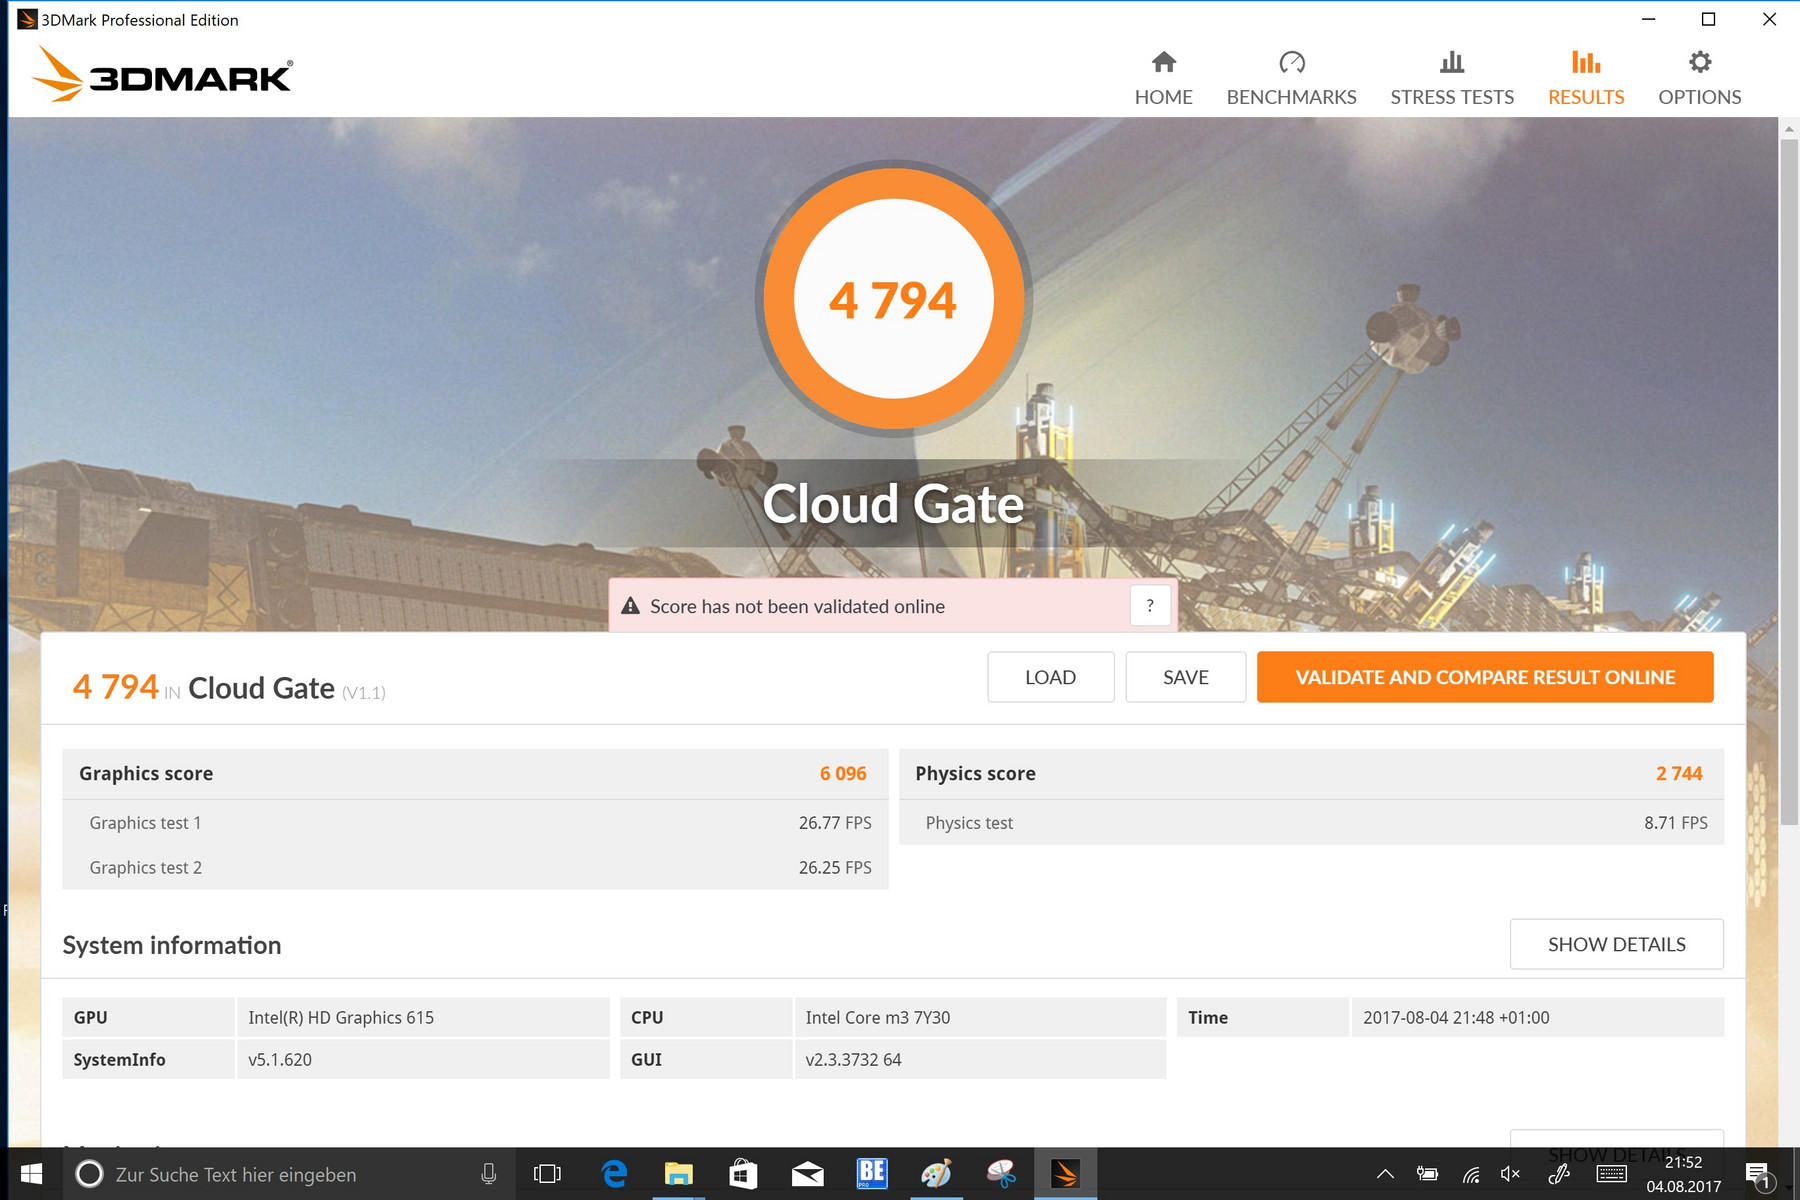
| 3DMark Cloud Gate Standard Score | 4794 points | |
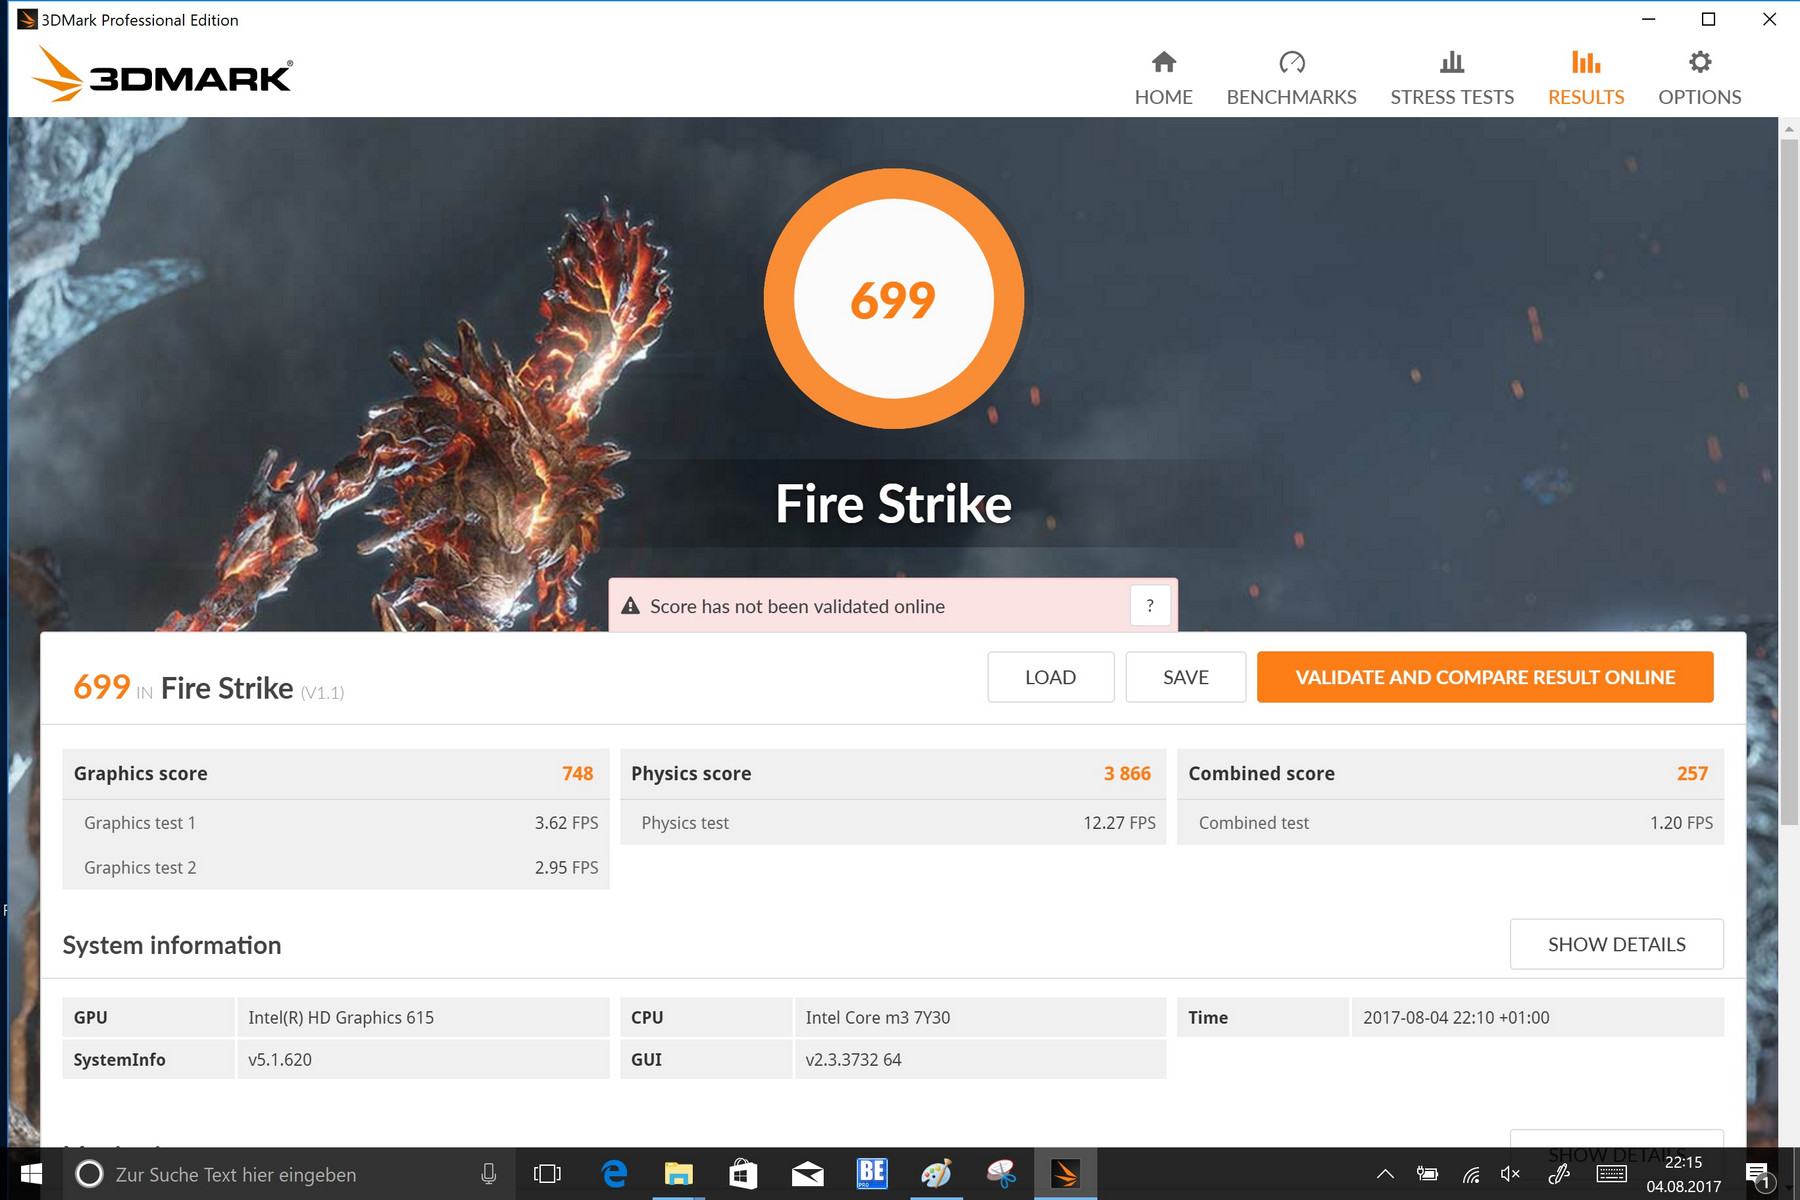
| 3DMark Fire Strike Score | 699 points | |
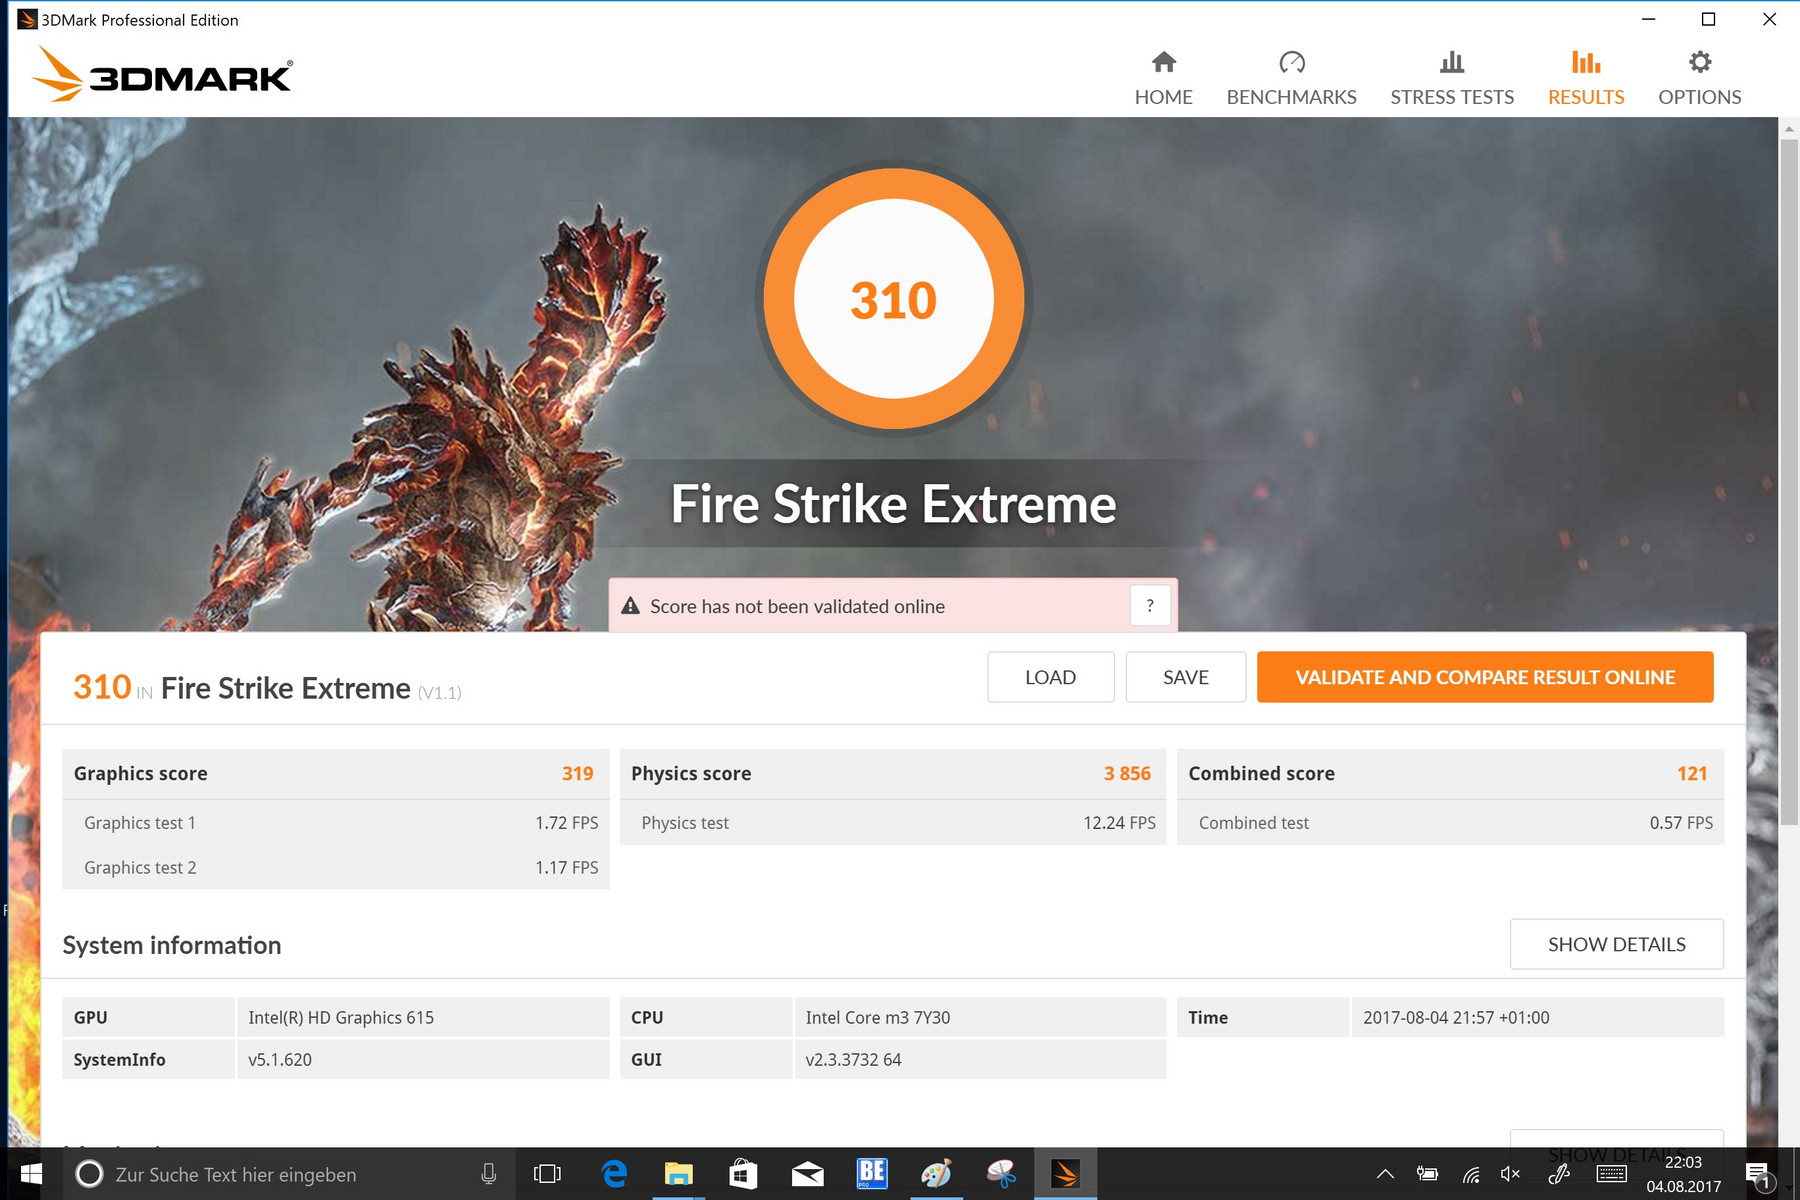
| 3DMark Fire Strike Extreme Score | 310 points | |
Help | ||
| low | med. | high | ultra | |
|---|---|---|---|---|
| BioShock Infinite (2013) | 42.6 | 25.2 | 20.8 | 4.6 |
| Battlefield 4 (2013) | 31.2 | 22.7 | 18.9 | |
| Rise of the Tomb Raider (2016) | 14.2 | 9.4 |
| Microsoft Surface Pro (2017) m3 HD Graphics 615, m3-7Y30, Samsung PM971 KUS020203M | Microsoft Surface Pro (2017) i5 HD Graphics 620, i5-7300U, Samsung PM971 KUS030202M | Microsoft Surface Pro (2017) i7 Iris Plus Graphics 640, i7-7660U, Samsung PM971 KUS040202M | Lenovo Ideapad Miix 720-12IKB HD Graphics 620, i7-7500U, Samsung SSD PM961 1TB M.2 PCIe 3.0 x4 NVMe (MZVLW1T0) | HP Elite x2 1012 G1 HD Graphics 515, 6Y54, Liteon L8H-256V2G | Lenovo ThinkPad X1 Tablet Gen 2 HD Graphics 615, i5-7Y54, Samsung PM961 MZVLW256HEHP | Samsung Galaxy Tab Pro S W700N HD Graphics 515, 6Y30, Lite-On CV1-8B128 | Acer Aspire Switch Alpha 12 SA5-271-56HM HD Graphics 520, 6200U, Kingston RBU-SNS8152S3256GG2 | |
|---|---|---|---|---|---|---|---|---|
| Heat | 1% | 6% | -3% | 8% | -3% | -8% | -2% | |
| Maximum Upper Side * (°C) | 40.5 | 39.2 3% | 42 -4% | 42 -4% | 39 4% | 47.2 -17% | 42.5 -5% | 46.7 -15% |
| Maximum Bottom * (°C) | 40.6 | 40.3 1% | 42 -3% | 43.6 -7% | 41.2 -1% | 49.8 -23% | 44.6 -10% | 51 -26% |
| Idle Upper Side * (°C) | 37.8 | 37 2% | 31 18% | 32.8 13% | 29.5 22% | 30.8 19% | 36.6 3% | 29.5 22% |
| Idle Bottom * (°C) | 32 | 32.3 -1% | 28 12% | 36.4 -14% | 29.8 7% | 29.2 9% | 38.6 -21% | 28.6 11% |
* ... smaller is better
(±) The maximum temperature on the upper side is 40.5 °C / 105 F, compared to the average of 35.4 °C / 96 F, ranging from 19.6 to 60 °C for the class Convertible.
(±) The bottom heats up to a maximum of 40.6 °C / 105 F, compared to the average of 36.9 °C / 98 F
(±) In idle usage, the average temperature for the upper side is 33 °C / 91 F, compared to the device average of 30.3 °C / 87 F.
(-) The palmrests and touchpad can get very hot to the touch with a maximum of 40.5 °C / 104.9 F.
(-) The average temperature of the palmrest area of similar devices was 28 °C / 82.4 F (-12.5 °C / -22.5 F).
Microsoft Surface Pro (2017) m3 audio analysis
(-) | not very loud speakers (68.8 dB)
Bass 100 - 315 Hz
(±) | reduced bass - on average 12.9% lower than median
(±) | linearity of bass is average (10.5% delta to prev. frequency)
Mids 400 - 2000 Hz
(+) | balanced mids - only 3.7% away from median
(±) | linearity of mids is average (9.6% delta to prev. frequency)
Highs 2 - 16 kHz
(+) | balanced highs - only 4.1% away from median
(±) | linearity of highs is average (8.6% delta to prev. frequency)
Overall 100 - 16.000 Hz
(±) | linearity of overall sound is average (19.1% difference to median)
Compared to same class
» 45% of all tested devices in this class were better, 7% similar, 48% worse
» The best had a delta of 6%, average was 20%, worst was 57%
Compared to all devices tested
» 46% of all tested devices were better, 7% similar, 47% worse
» The best had a delta of 4%, average was 24%, worst was 134%
Microsoft Surface Pro (2017) i5 audio analysis
(-) | not very loud speakers (68 dB)
Bass 100 - 315 Hz
(±) | reduced bass - on average 9.7% lower than median
(±) | linearity of bass is average (7% delta to prev. frequency)
Mids 400 - 2000 Hz
(+) | balanced mids - only 4.6% away from median
(+) | mids are linear (6.3% delta to prev. frequency)
Highs 2 - 16 kHz
(+) | balanced highs - only 2.1% away from median
(+) | highs are linear (5.2% delta to prev. frequency)
Overall 100 - 16.000 Hz
(±) | linearity of overall sound is average (18.2% difference to median)
Compared to same class
» 39% of all tested devices in this class were better, 7% similar, 54% worse
» The best had a delta of 6%, average was 20%, worst was 57%
Compared to all devices tested
» 39% of all tested devices were better, 8% similar, 53% worse
» The best had a delta of 4%, average was 24%, worst was 134%
| Off / Standby | |
| Idle | |
| Load |
|
Key:
min: | |
| Microsoft Surface Pro (2017) m3 m3-7Y30, HD Graphics 615, Samsung PM971 KUS020203M, IPS, 2736x1826, 12.3" | Microsoft Surface Pro (2017) i5 i5-7300U, HD Graphics 620, Samsung PM971 KUS030202M, IPS, 2736x1824, 12.3" | Microsoft Surface Pro (2017) i7 i7-7660U, Iris Plus Graphics 640, Samsung PM971 KUS040202M, IPS, 2736x1824, 12.3" | Lenovo Ideapad Miix 720-12IKB i7-7500U, HD Graphics 620, Samsung SSD PM961 1TB M.2 PCIe 3.0 x4 NVMe (MZVLW1T0), IPS, 2880x1920, 12" | HP Elite x2 1012 G1 6Y54, HD Graphics 515, Liteon L8H-256V2G, IPS, 1920x1280, 12.1" | Lenovo ThinkPad X1 Tablet Gen 2 i5-7Y54, HD Graphics 615, Samsung PM961 MZVLW256HEHP, IPS, 2160x1440, 12" | Samsung Galaxy Tab Pro S W700N 6Y30, HD Graphics 515, Lite-On CV1-8B128, sAMOLED, 2160x1440, 12.1" | Acer Aspire Switch Alpha 12 SA5-271-56HM 6200U, HD Graphics 520, Kingston RBU-SNS8152S3256GG2, IPS, 2160x1440, 12" | |
|---|---|---|---|---|---|---|---|---|
| Power Consumption | -2% | -40% | -7% | -4% | 4% | 17% | -38% | |
| Idle Minimum * (Watt) | 3.1 | 3.6 -16% | 4.2 -35% | 3.5 -13% | 3.7 -19% | 5 -61% | 3.4 -10% | 7.3 -135% |
| Idle Average * (Watt) | 8.8 | 8.1 8% | 10.1 -15% | 7.2 18% | 6.8 23% | 6.3 28% | 8 9% | 10 -14% |
| Idle Maximum * (Watt) | 9.8 | 8.7 11% | 14 -43% | 7.9 19% | 7.6 22% | 7.8 20% | 9 8% | 10.15 -4% |
| Load Average * (Watt) | 22.7 | 25.5 -12% | 37.4 -65% | 29.6 -30% | 22.5 1% | 19.5 14% | 12 47% | 25.2 -11% |
| Load Maximum * (Watt) | 23.6 | 23.5 -0% | 34 -44% | 30.8 -31% | 34.5 -46% | 19.6 17% | 16.1 32% | 29.3 -24% |
| Witcher 3 ultra * (Watt) | 38.1 |
* ... smaller is better

| Microsoft Surface Pro (2017) m3 m3-7Y30, HD Graphics 615, 45 Wh | Microsoft Surface Pro (2017) i5 i5-7300U, HD Graphics 620, 45 Wh | Microsoft Surface Pro (2017) i7 i7-7660U, Iris Plus Graphics 640, 45 Wh | Lenovo Ideapad Miix 720-12IKB i7-7500U, HD Graphics 620, 41 Wh | HP Elite x2 1012 G1 6Y54, HD Graphics 515, 37 Wh | Lenovo ThinkPad X1 Tablet Gen 2 i5-7Y54, HD Graphics 615, 37 Wh | Samsung Galaxy Tab Pro S W700N 6Y30, HD Graphics 515, 39.5 Wh | Acer Aspire Switch Alpha 12 SA5-271-56HM 6200U, HD Graphics 520, 37 Wh | |
|---|---|---|---|---|---|---|---|---|
| Battery runtime | 2% | -26% | -38% | -31% | -32% | -9% | -39% | |
| Reader / Idle (h) | 15.6 | 17.6 13% | 11.9 -24% | 12.2 -22% | 11 -29% | 18.5 19% | 10.7 -31% | |
| H.264 (h) | 11.1 | 10.2 -8% | 7.2 -35% | 8.6 -23% | 7.8 -30% | |||
| WiFi v1.3 (h) | 11.4 | 12.4 9% | 8.2 -28% | 5.8 -49% | 7.4 -35% | 7.4 -35% | 8.8 -23% | 5.4 -53% |
| Load (h) | 3.3 | 2.8 -15% | 1.9 -42% | 1.9 -42% | 2.2 -33% | 2.2 -33% | 1.9 -42% | |
| Witcher 3 ultra (h) | 1.9 |
Pros
Cons
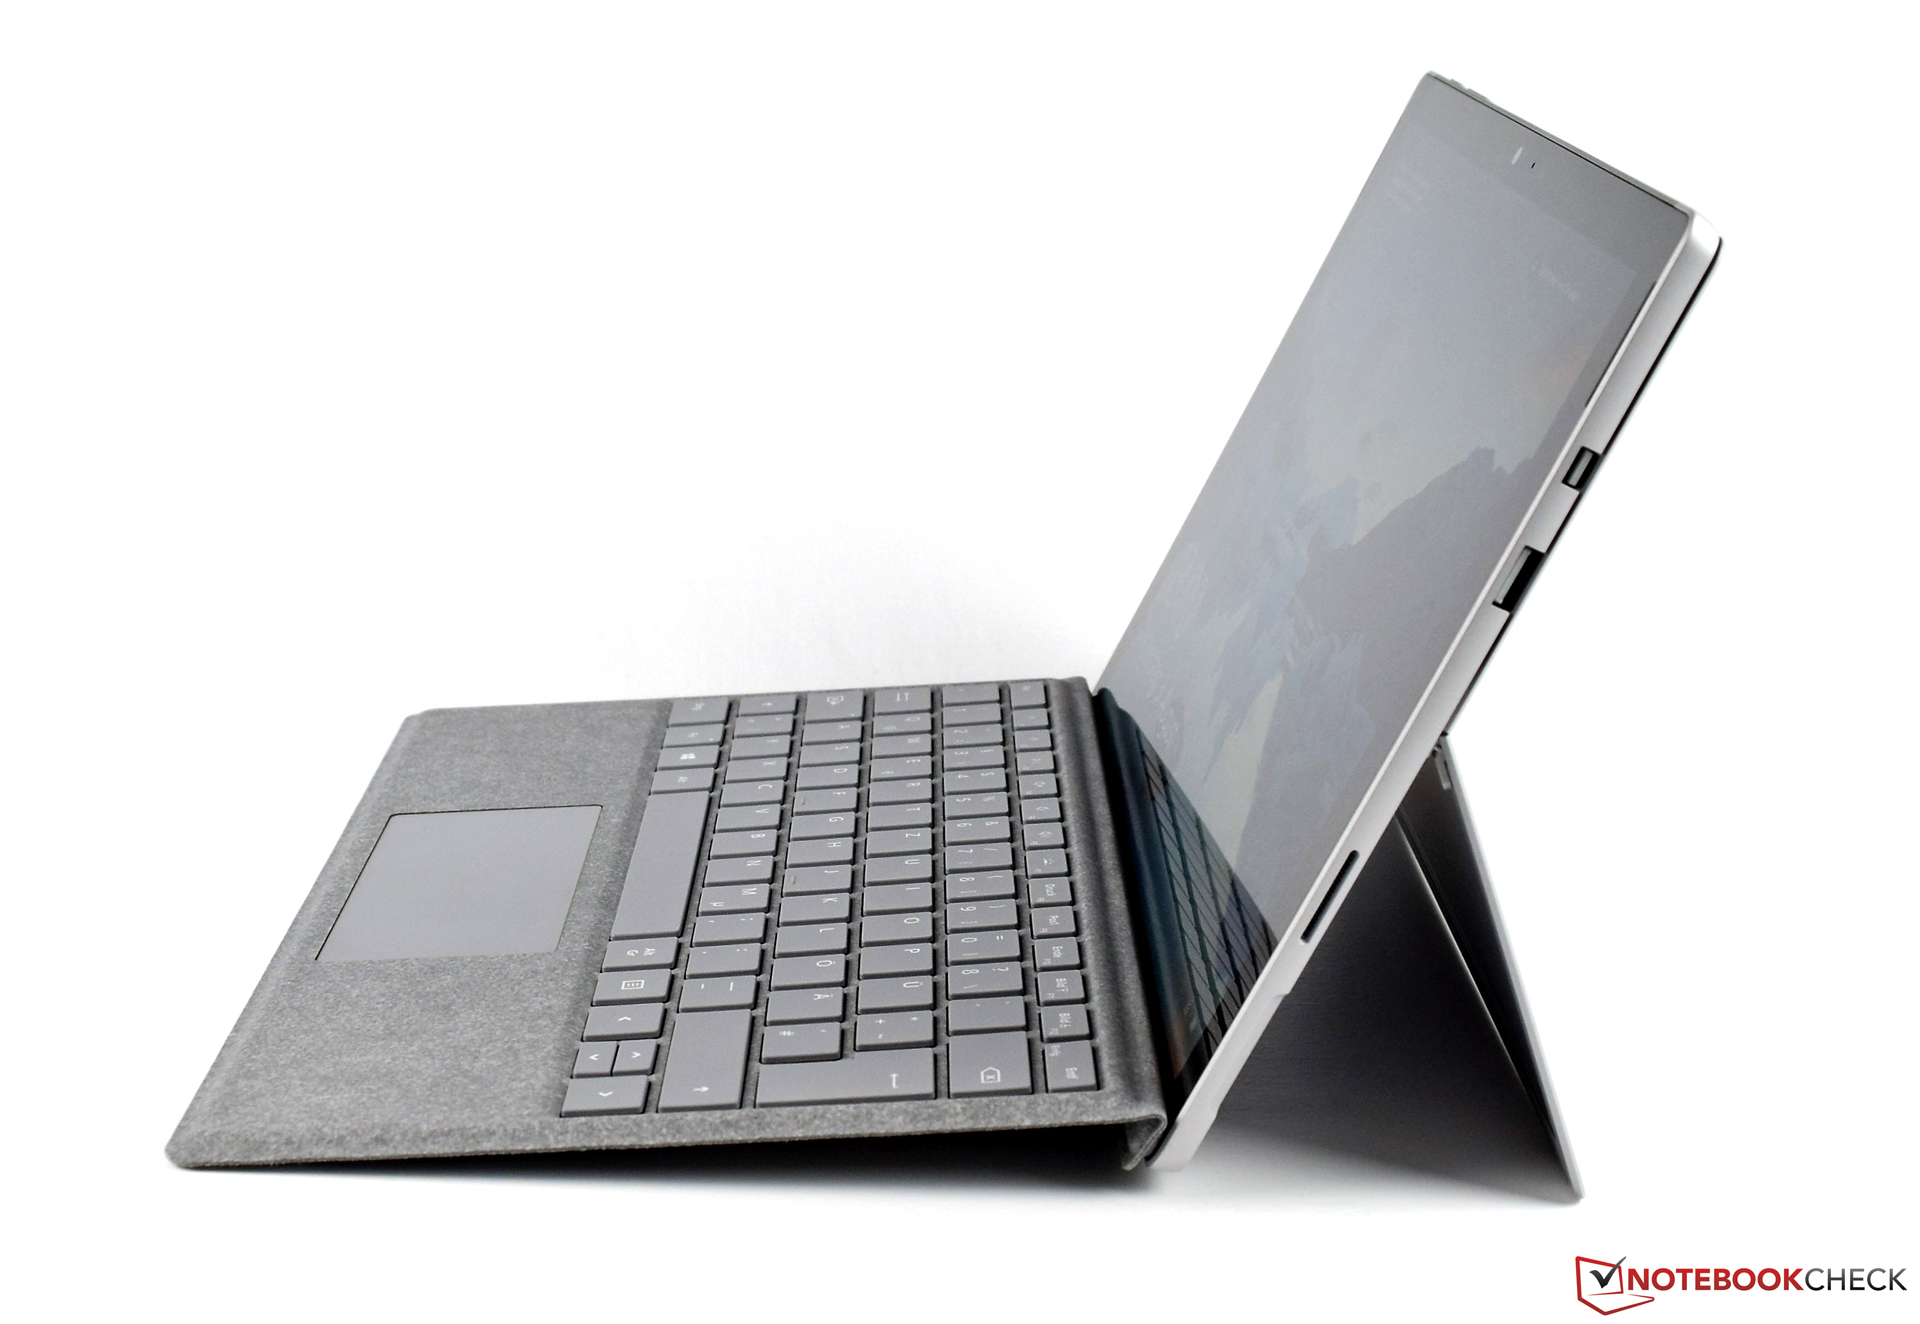
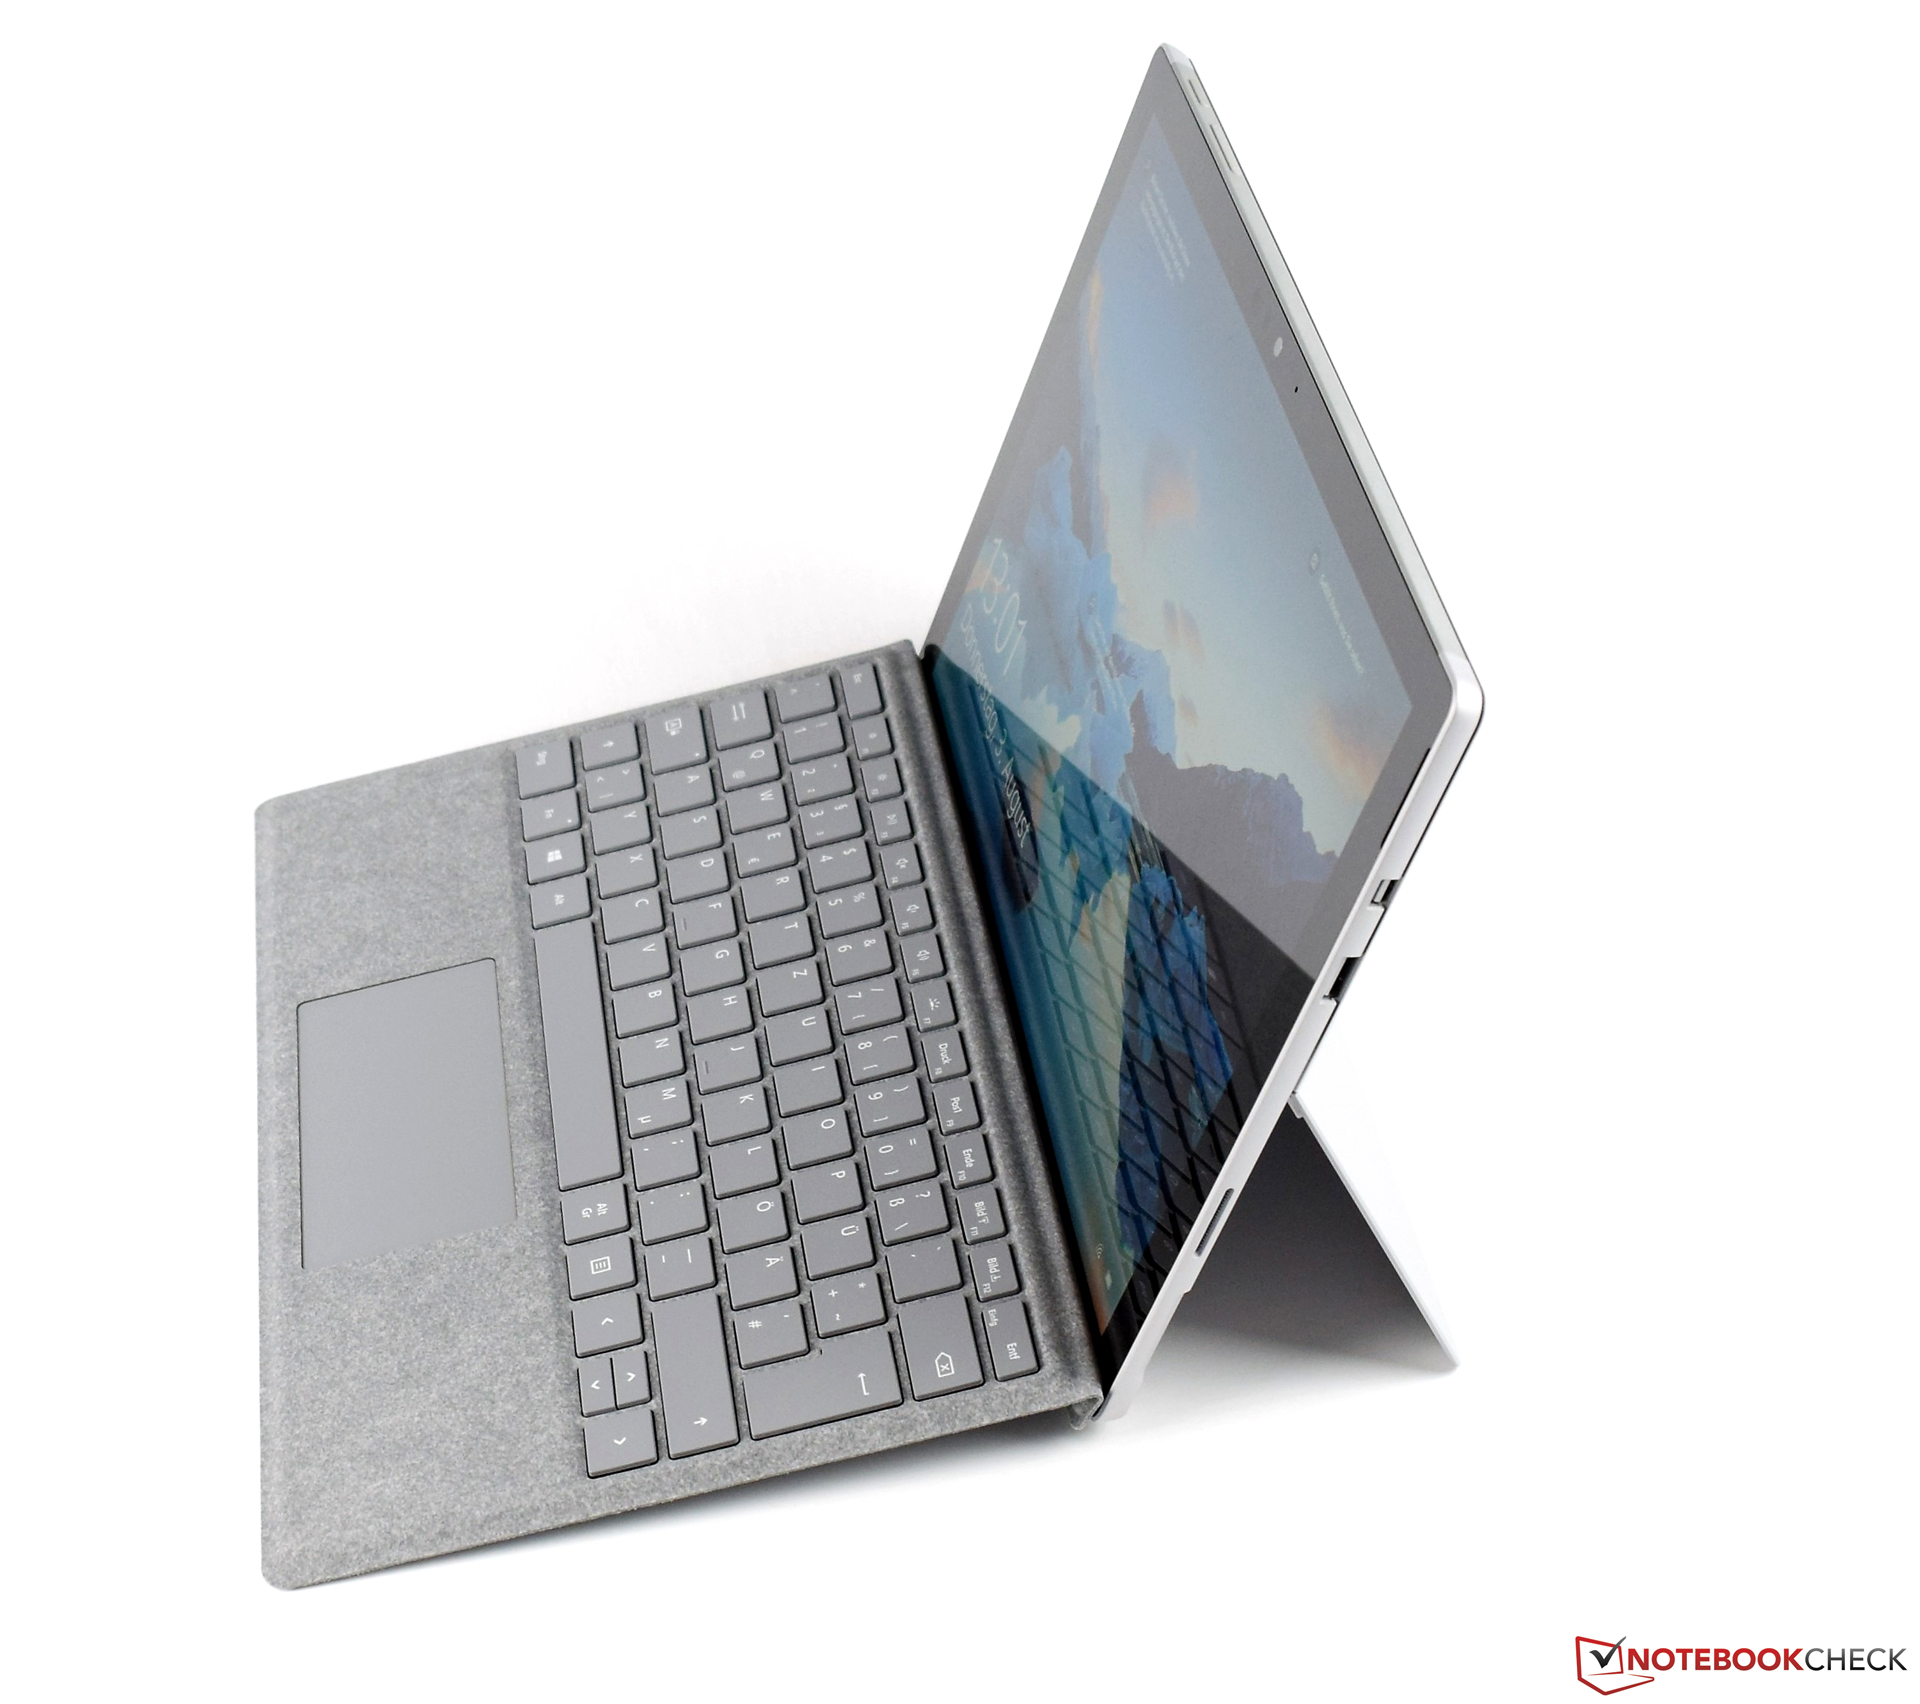
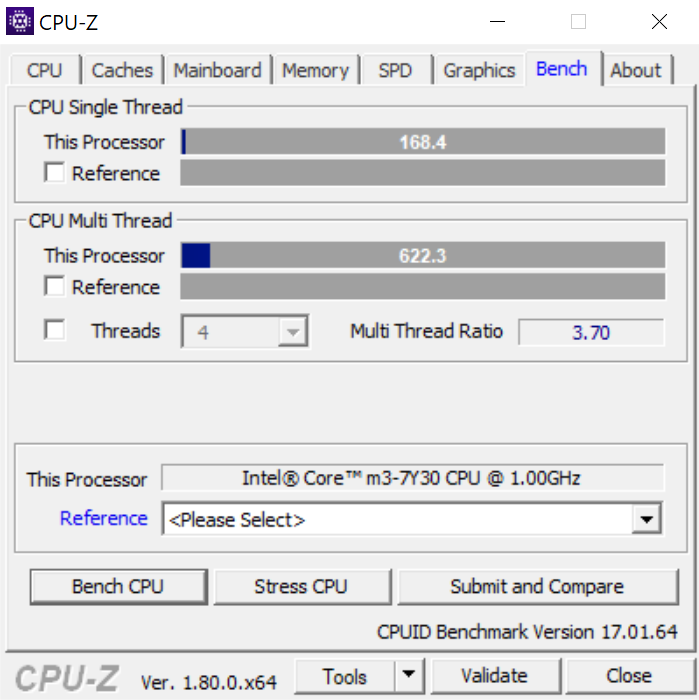
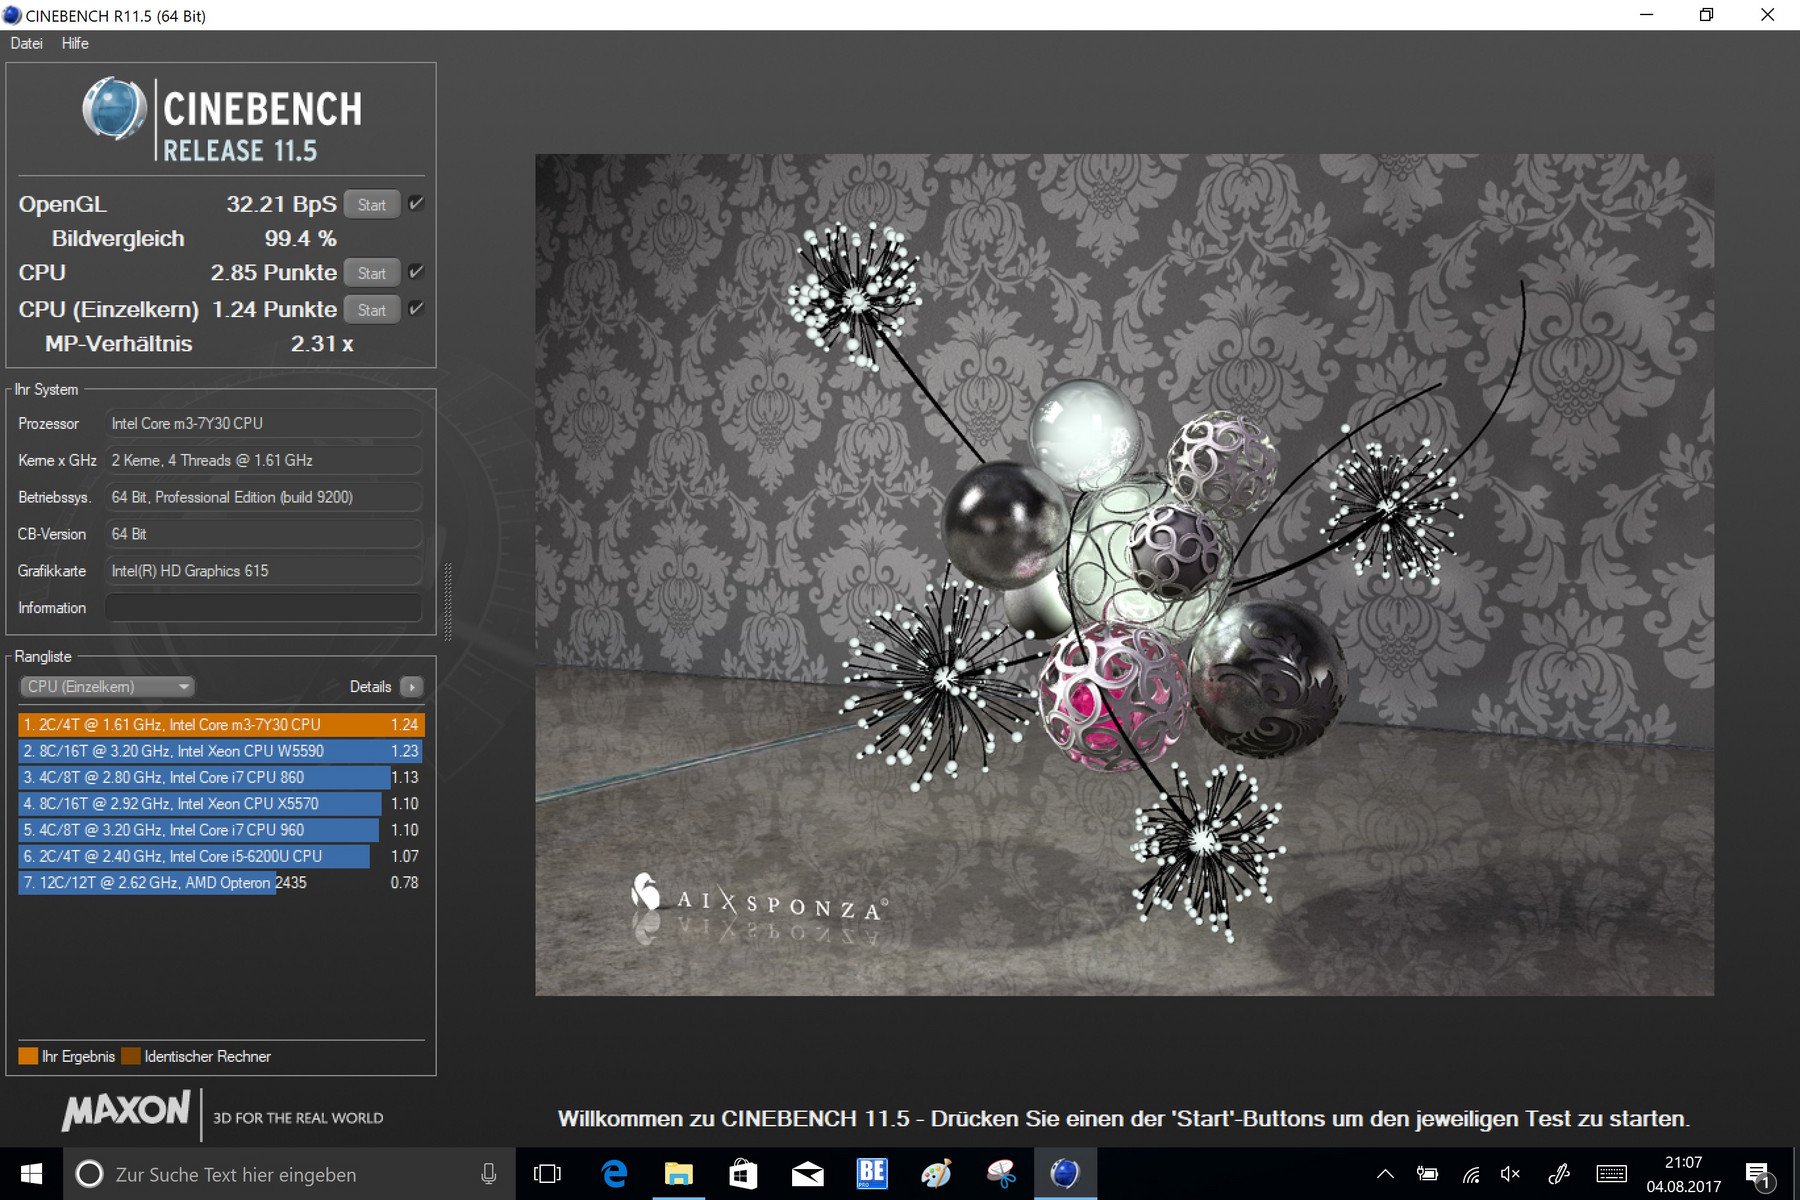
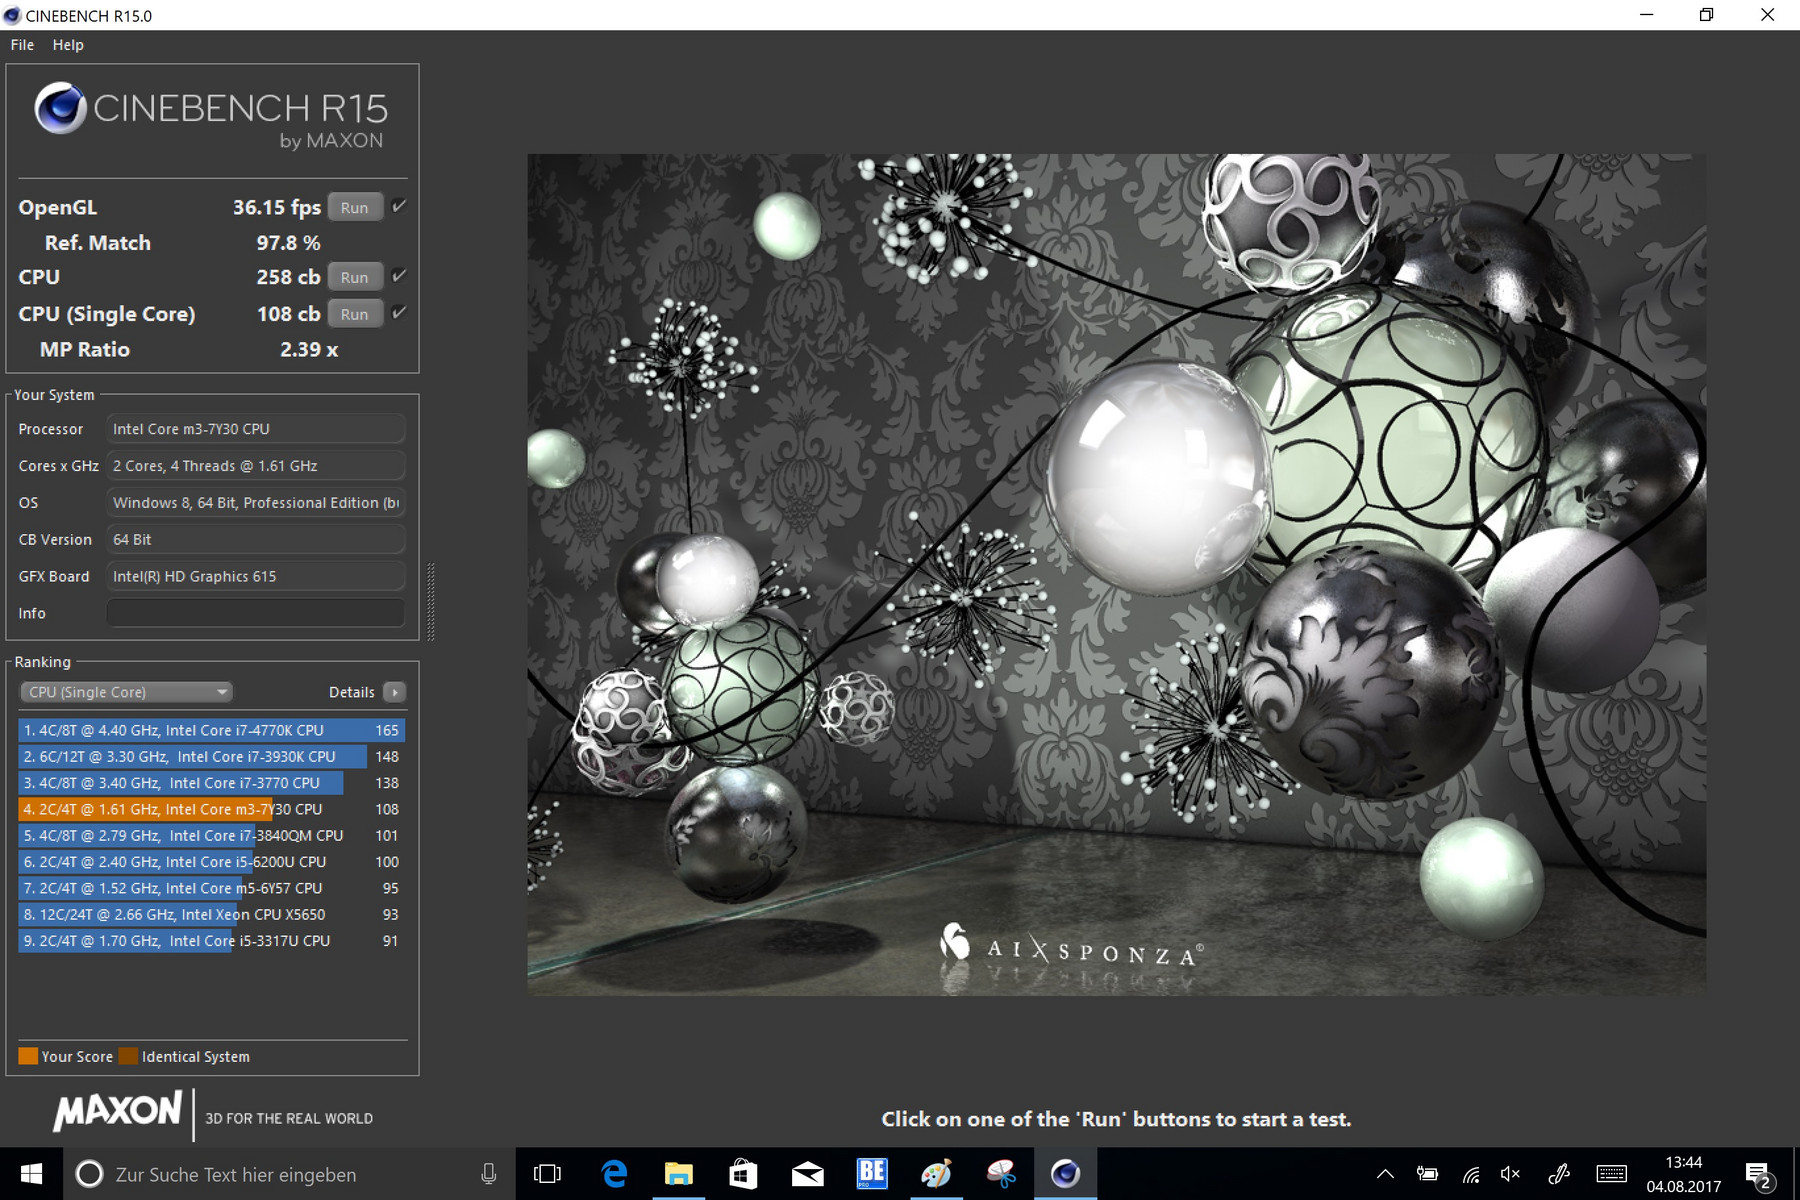
基于英特尔的酷睿m3 Y7Y30的微软Surface Pro 2017,各方面都是合适的,安装的硬件非常平衡。高效的组件可以大大改善已经很长的电池续航。但是,这是以牺牲计算能力为代价的。英特尔酷睿m3 7Y30足以满足日常工作,但不能与更快的i5和i7 Surface Pro 2017变形本竞争。然而,系统性能评价为良好,而与更快的竞品的距离通常只有几个百分点。
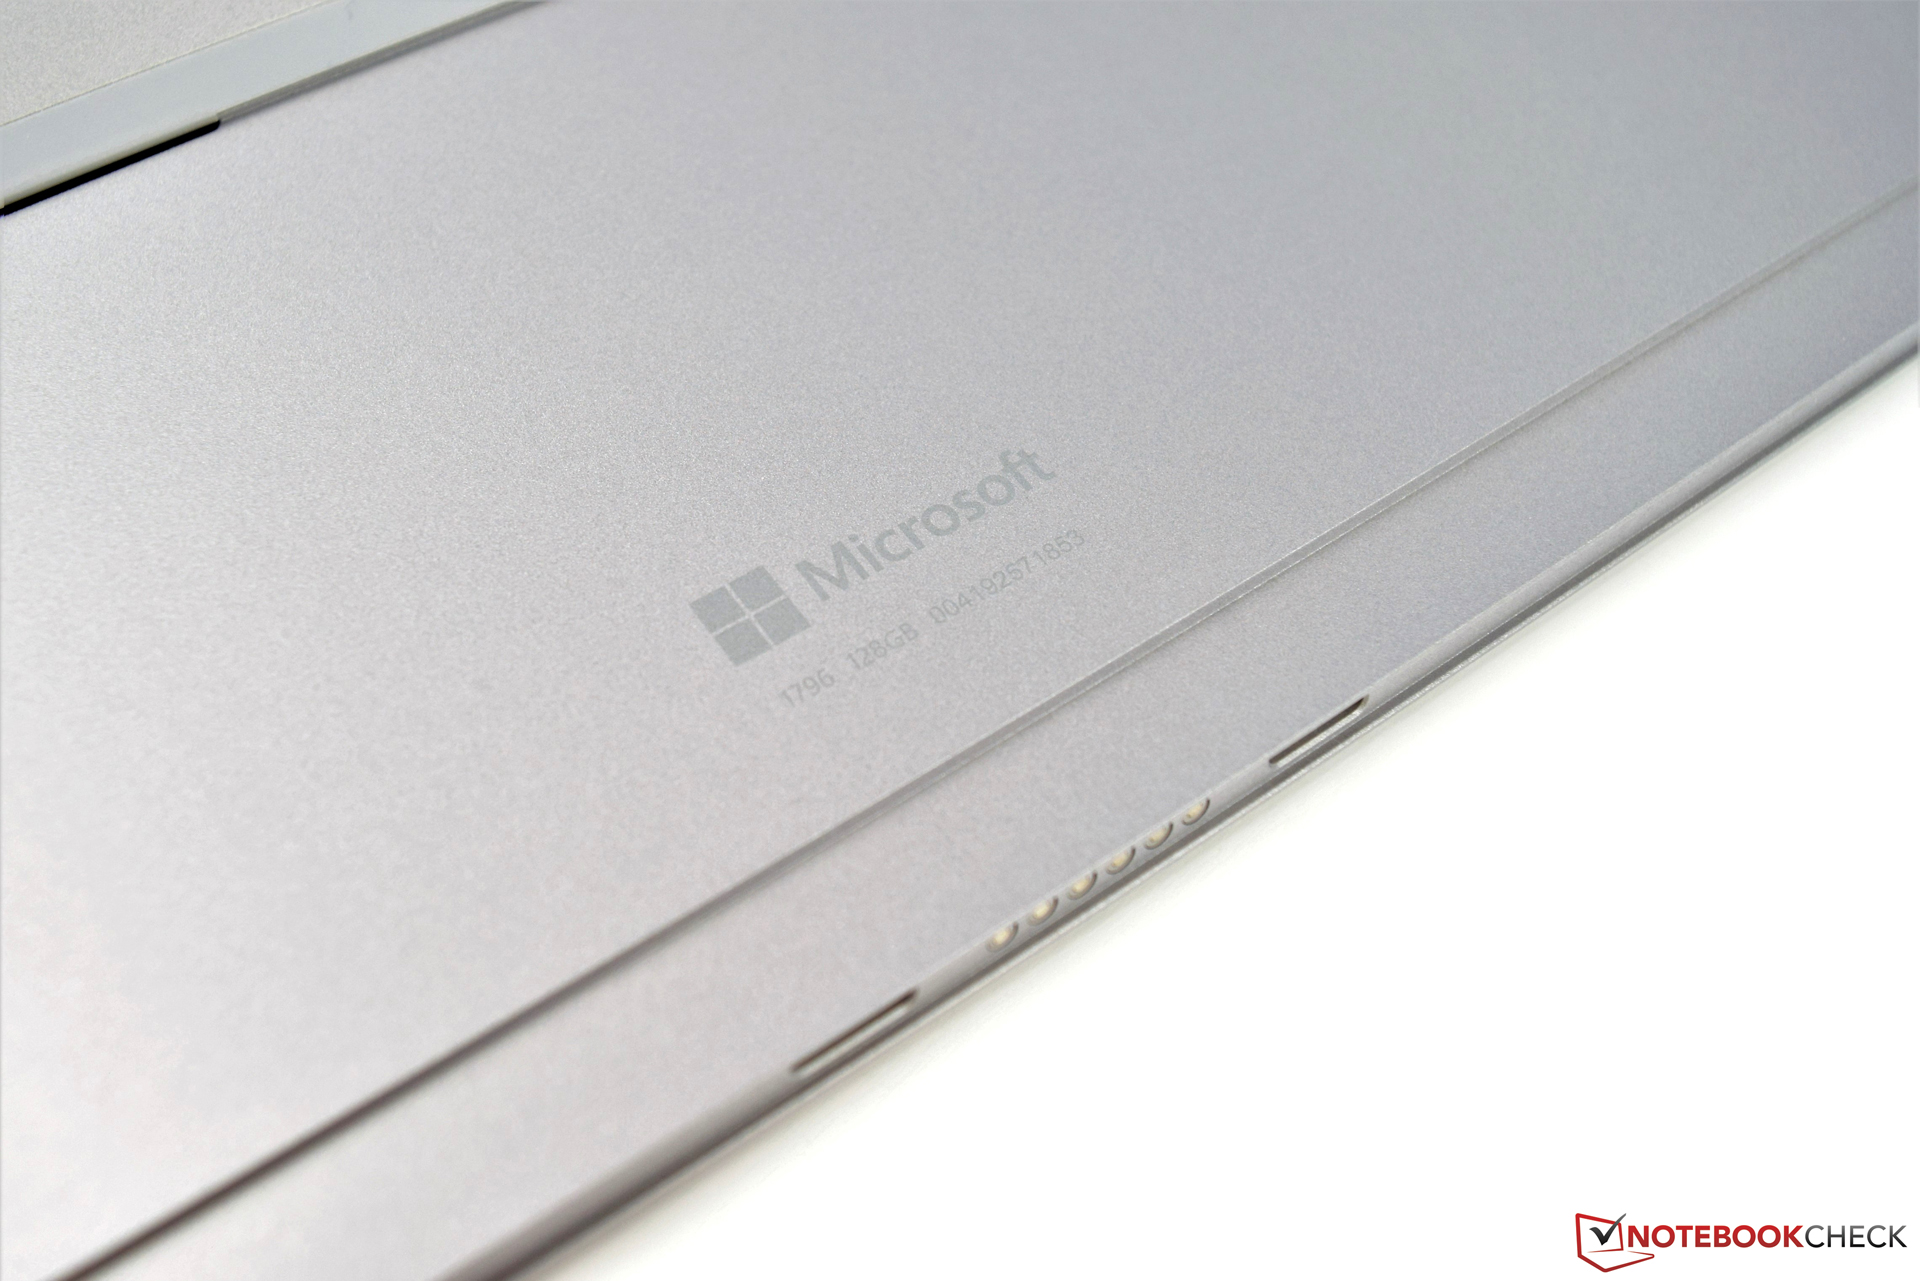
微软Surface Pro 2017入门级配置机,主要靠其价格吸引用户。唯一不足是, 制造商在此基础上不提供其他硬件配置。
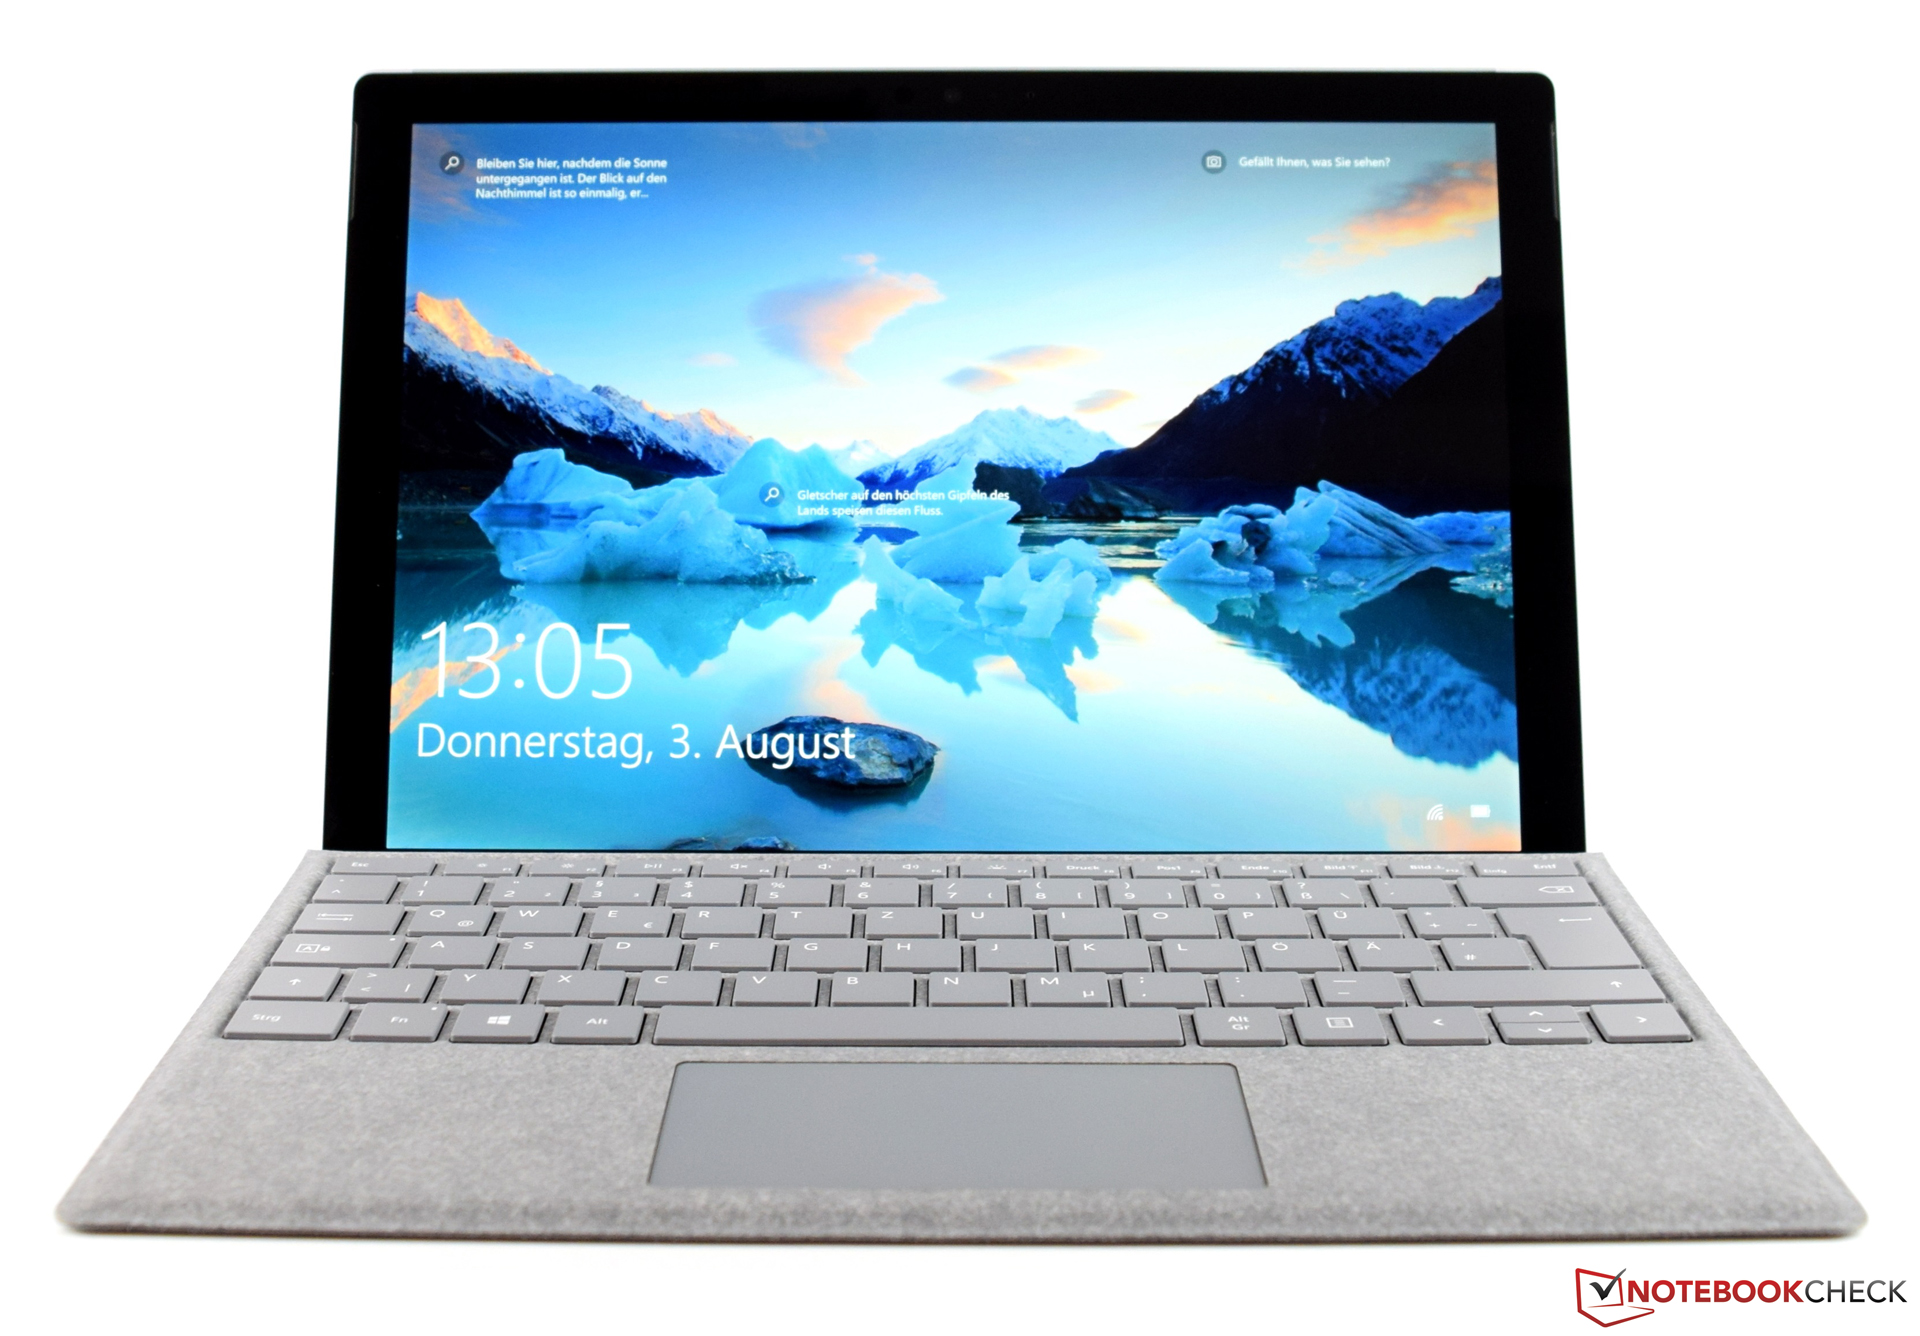
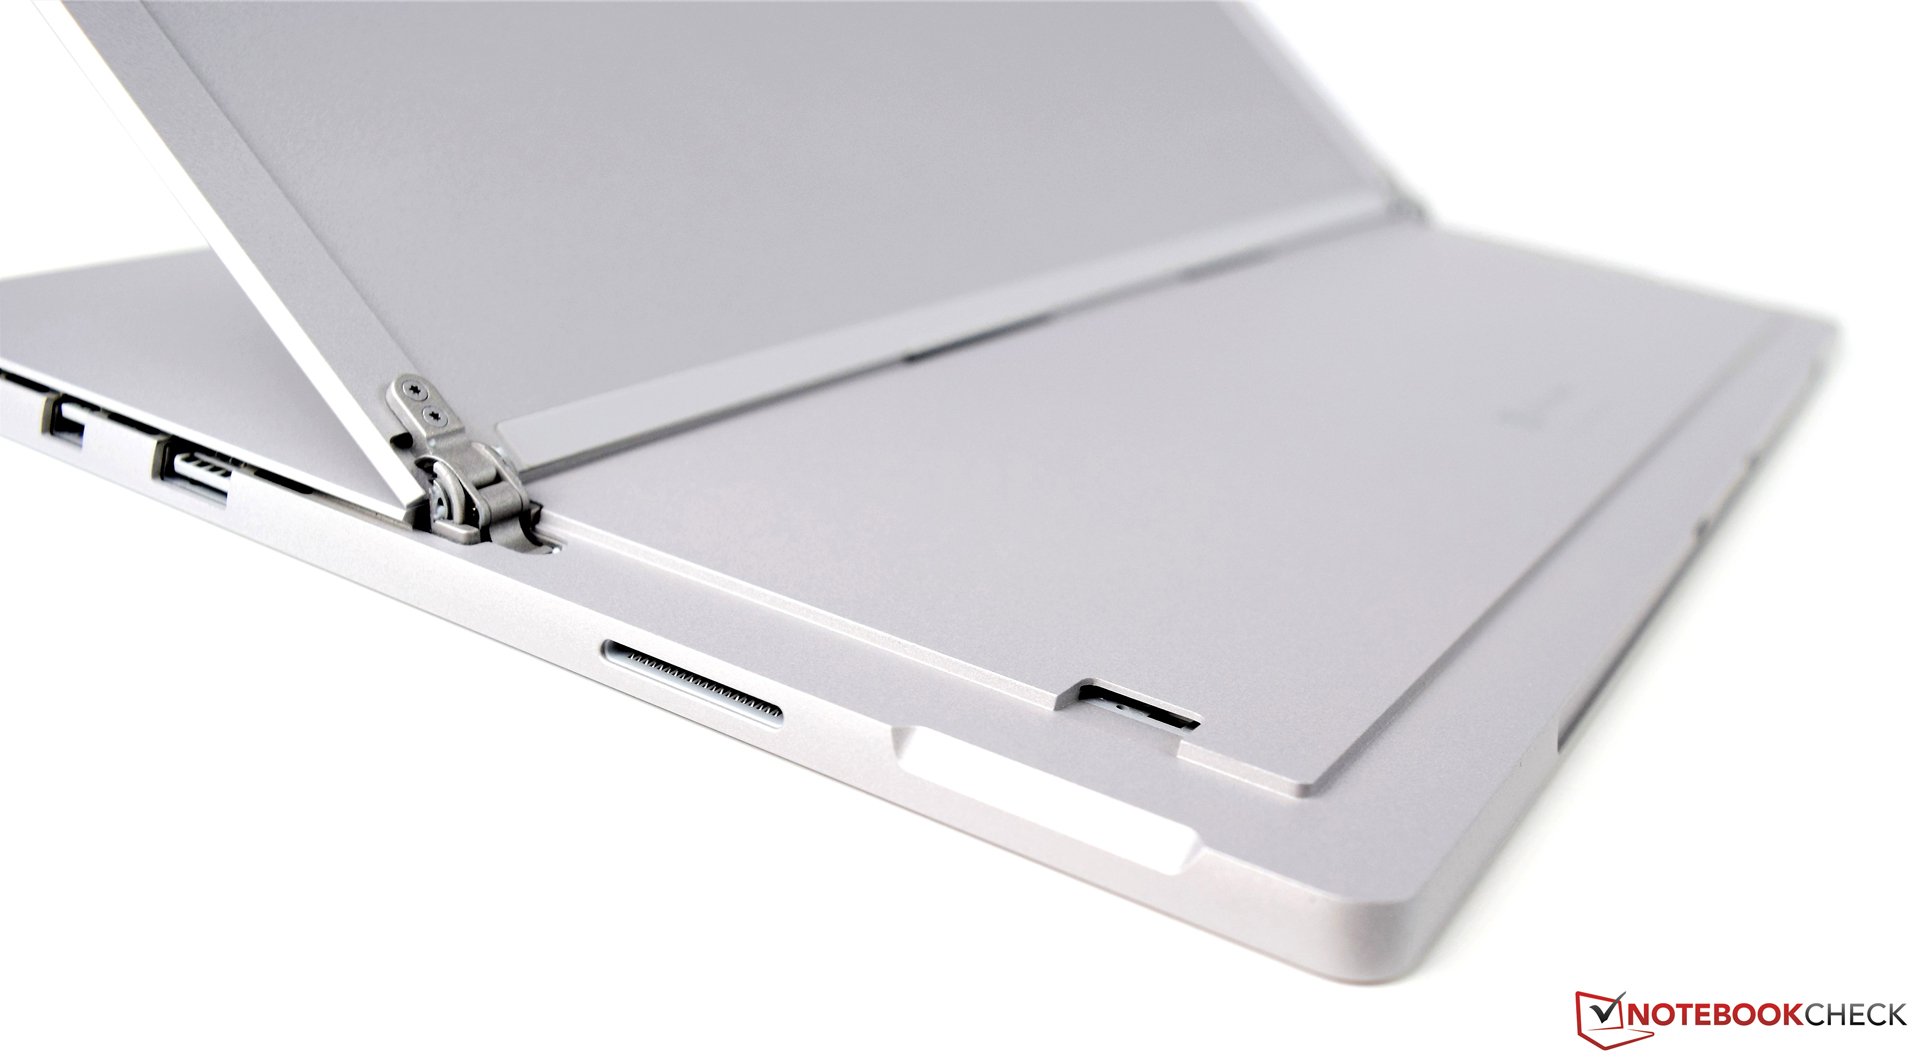
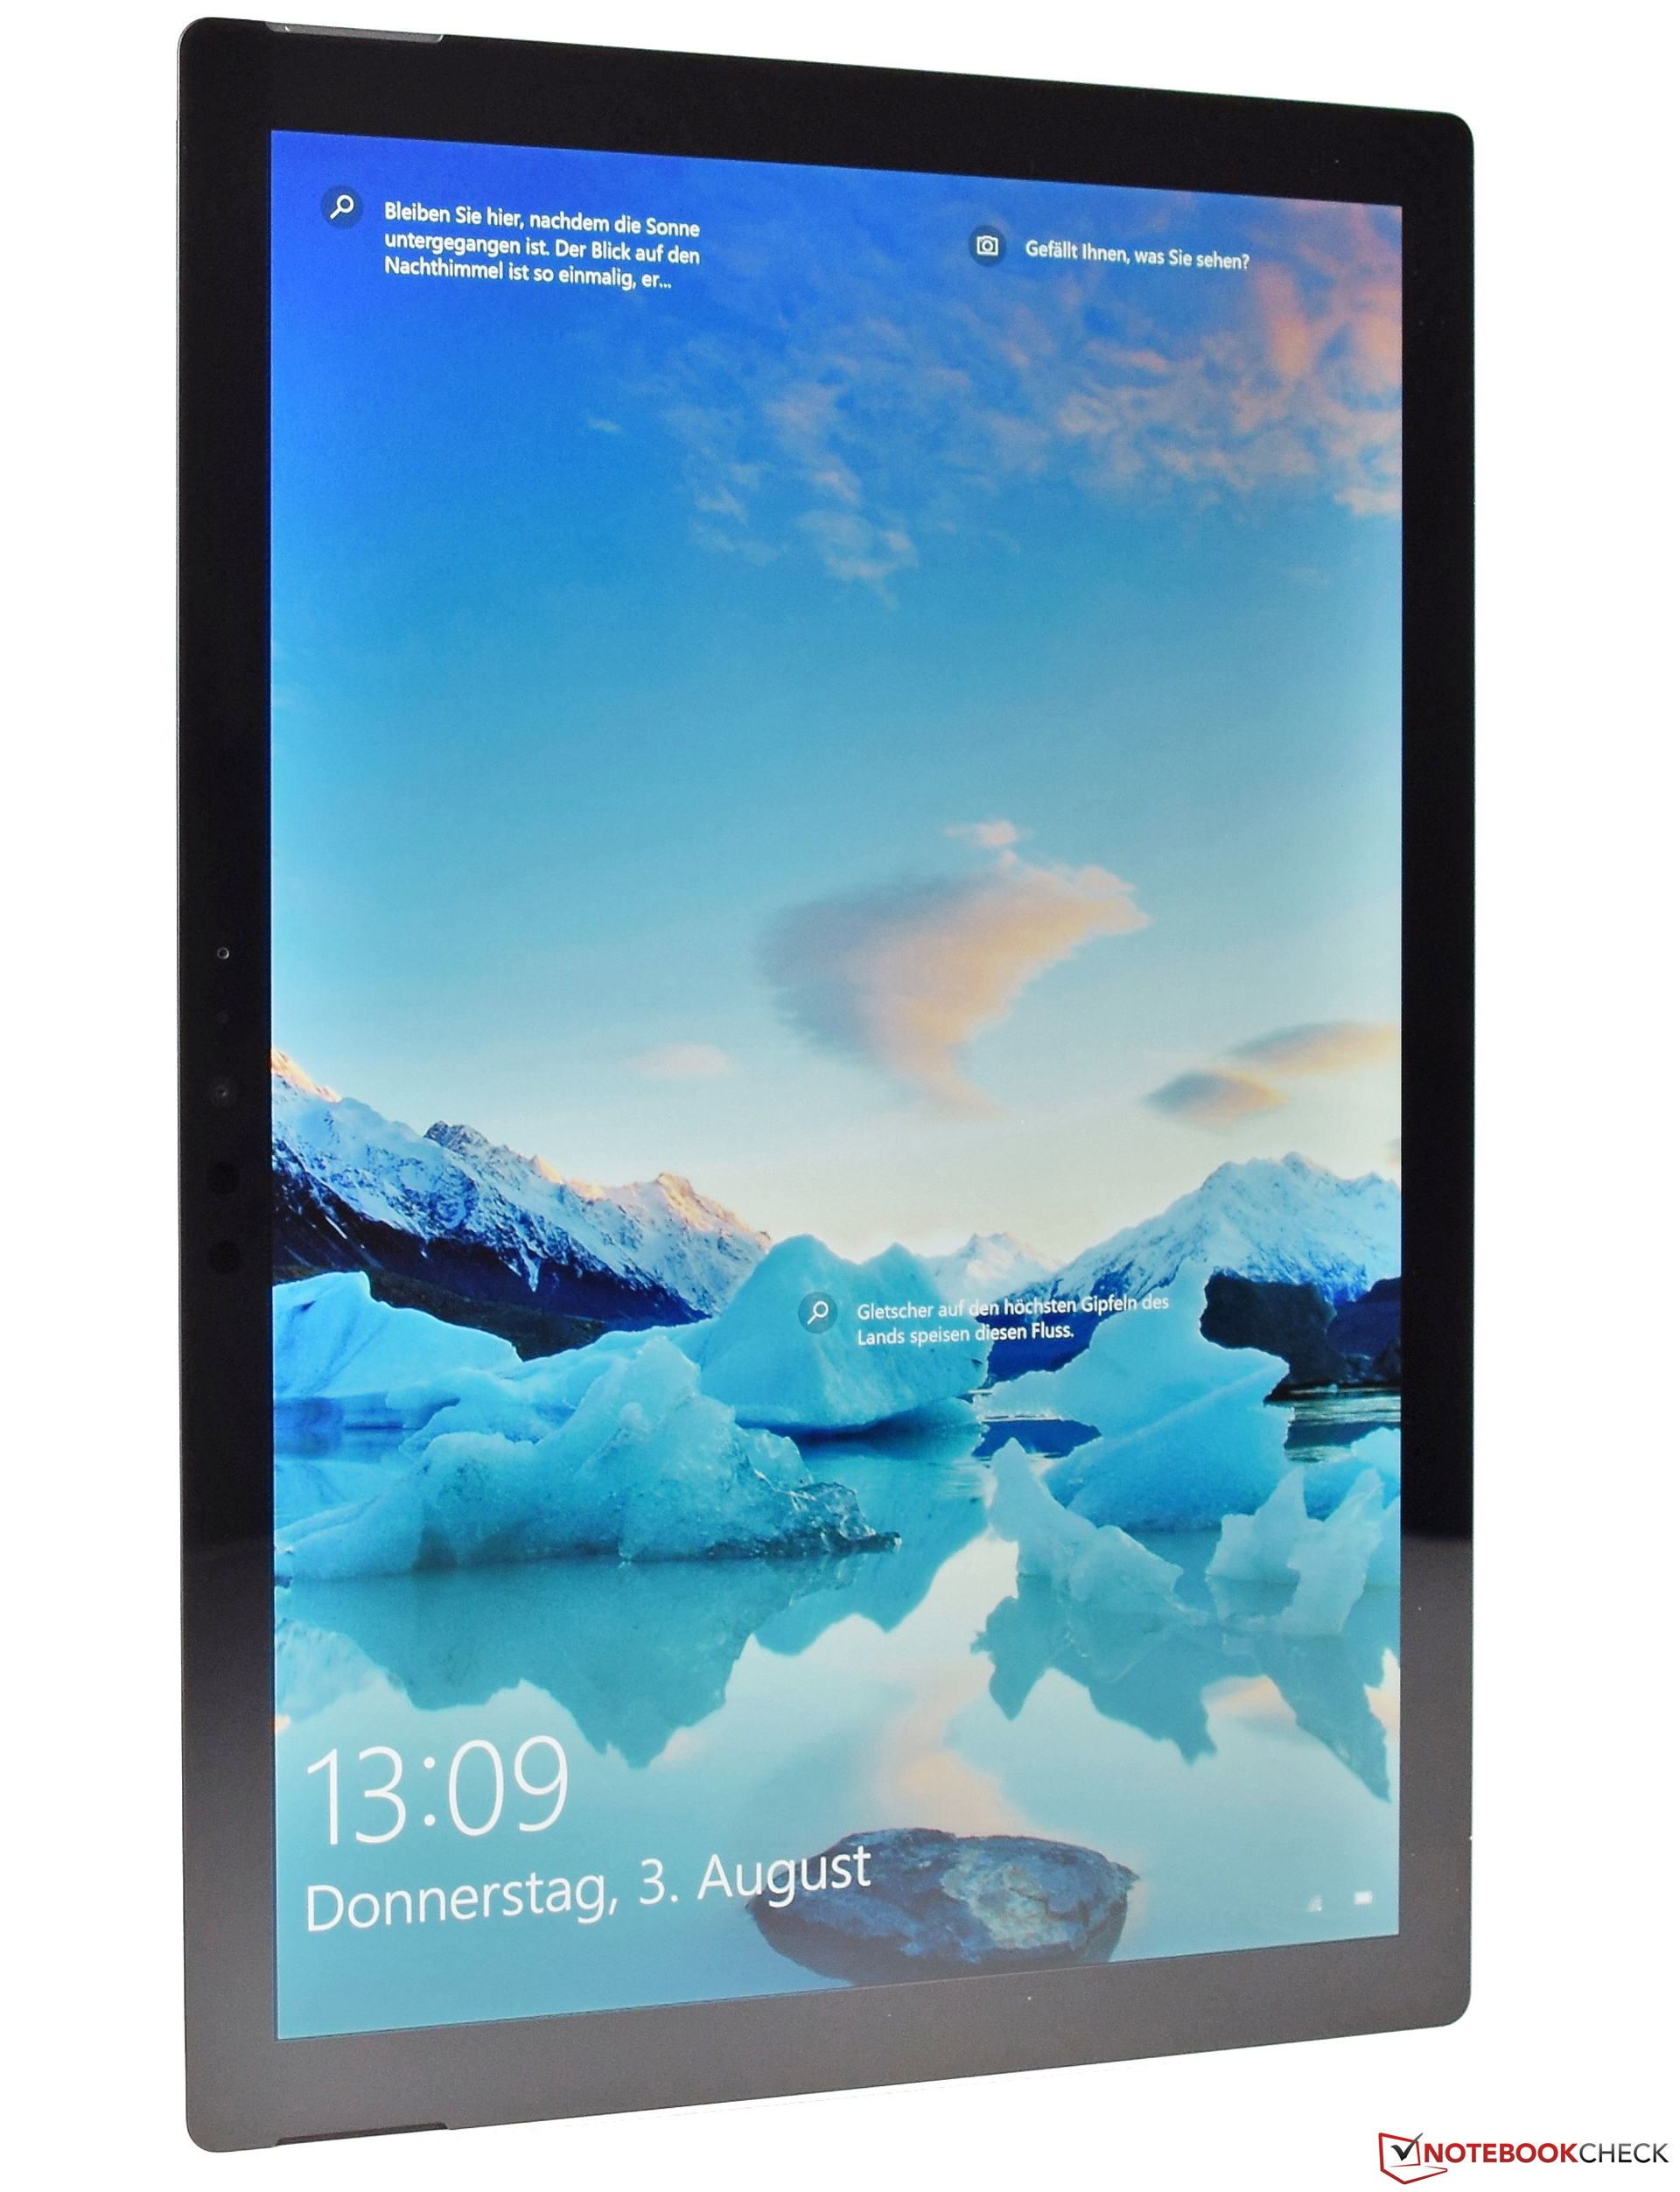
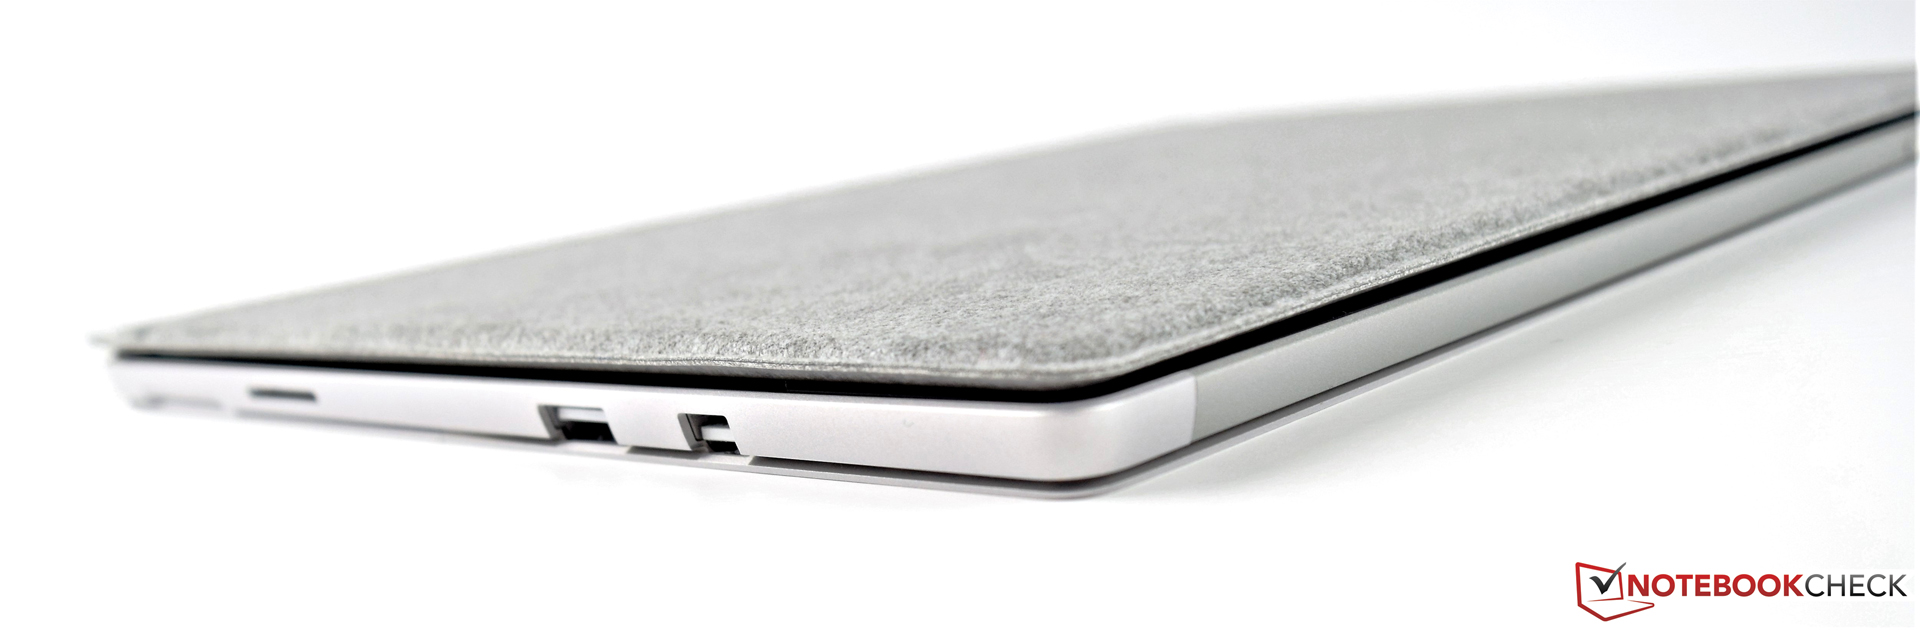
极好的屏幕给我们留下了深刻的印象。其高的色彩空间覆盖和高屏幕分辨率,肯定适合准专业领域。然而,其面板必须接受批评,因为它高度反光的表面显然限制了其户外适应性。最大问题仍然是其有限的配置选项。128 GB的固态硬盘存储空间很快就会被用满,无法更换存储设备。此外,为什么外观保持先进,但连接性没有。2017,该机至少应该配备一个支持雷电的USB Type-C端口。
注:本文是基于完整评测的缩减版本,阅读完整的英文评测,请点击这里。
Microsoft Surface Pro (2017) m3
- 08/07/2017 v6 (old)
Sebastian Bade