宏碁 Swift 7 SF713-51 笔记本电脑简短评测


| Networking | |
| iperf Server (receive) TCP 1 m | |
| Acer Swift 7 SF713-51 (jseb) | |
| Lenovo Miix 510 Pro 80U10006GE (jseb) | |
| Asus Zenbook UX330UA-FC059T | |
| Apple MacBook 12 (Early 2016) 1.1 GHz | |
| Acer Spin 7 SP714-51-M09D (jseb) | |
| iperf Client (transmit) TCP 1 m | |
| Acer Swift 7 SF713-51 (jseb) | |
| Acer Spin 7 SP714-51-M09D (jseb) | |
| Lenovo Miix 510 Pro 80U10006GE (jseb) | |
| Asus Zenbook UX330UA-FC059T (jseb) | |
| Apple MacBook 12 (Early 2016) 1.1 GHz | |
| |||||||||||||||||||||||||
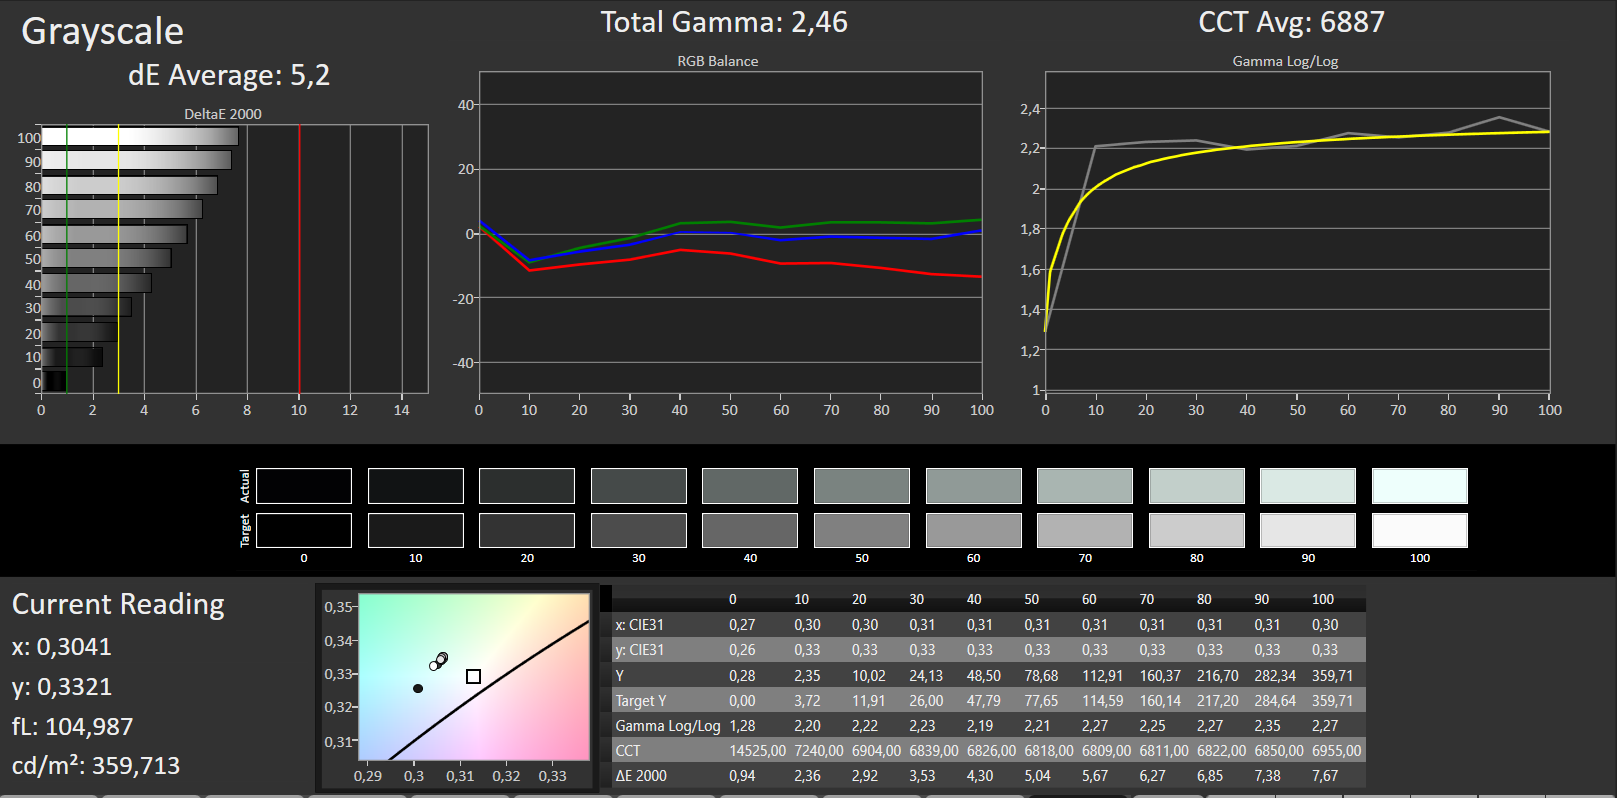
Brightness Distribution: 92 %
Center on Battery: 359 cd/m²
Contrast: 1436:1 (Black: 0.25 cd/m²)
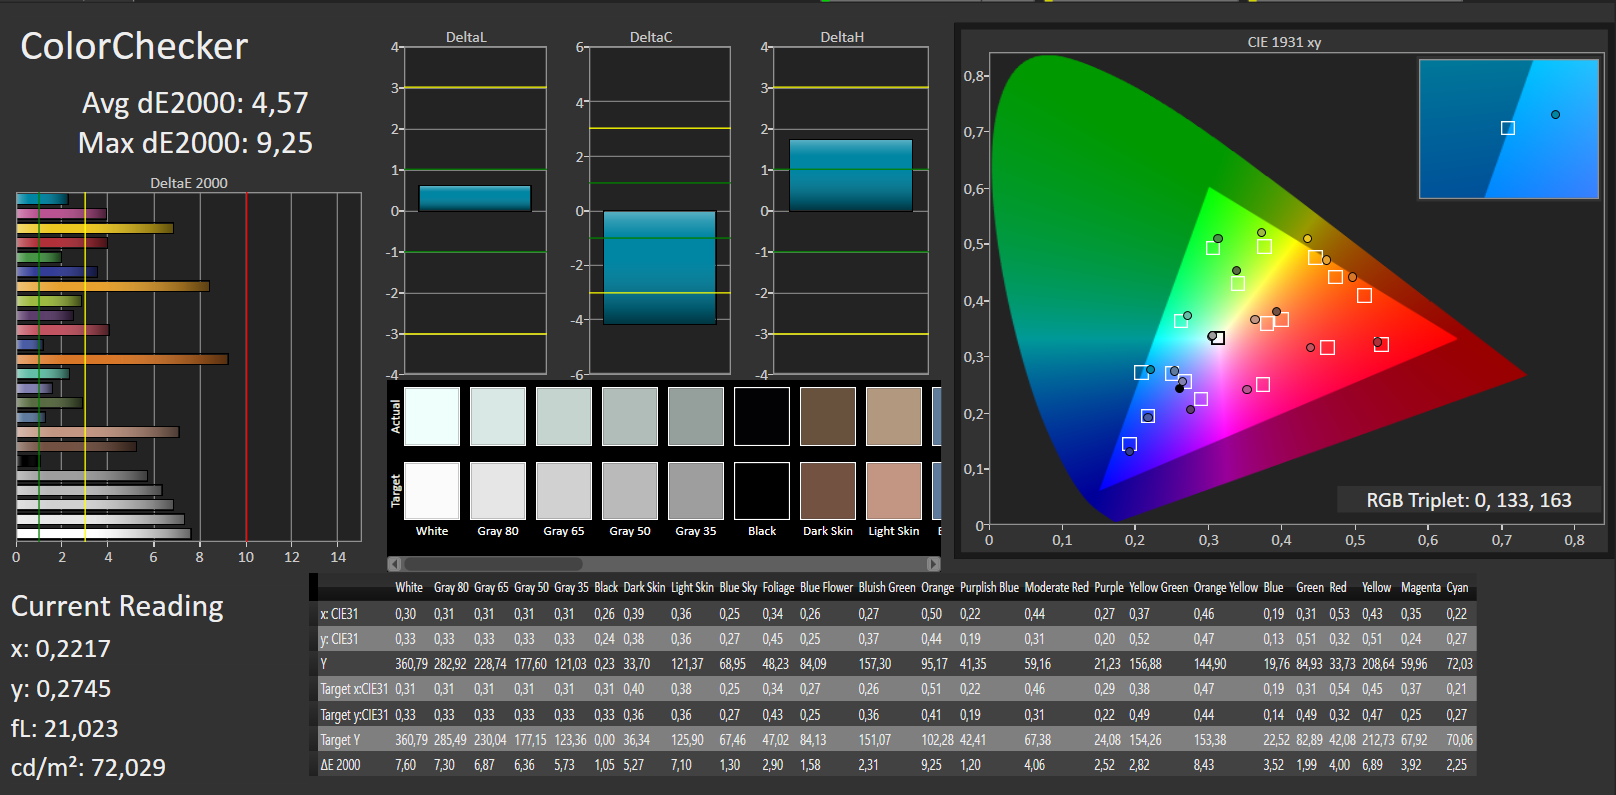
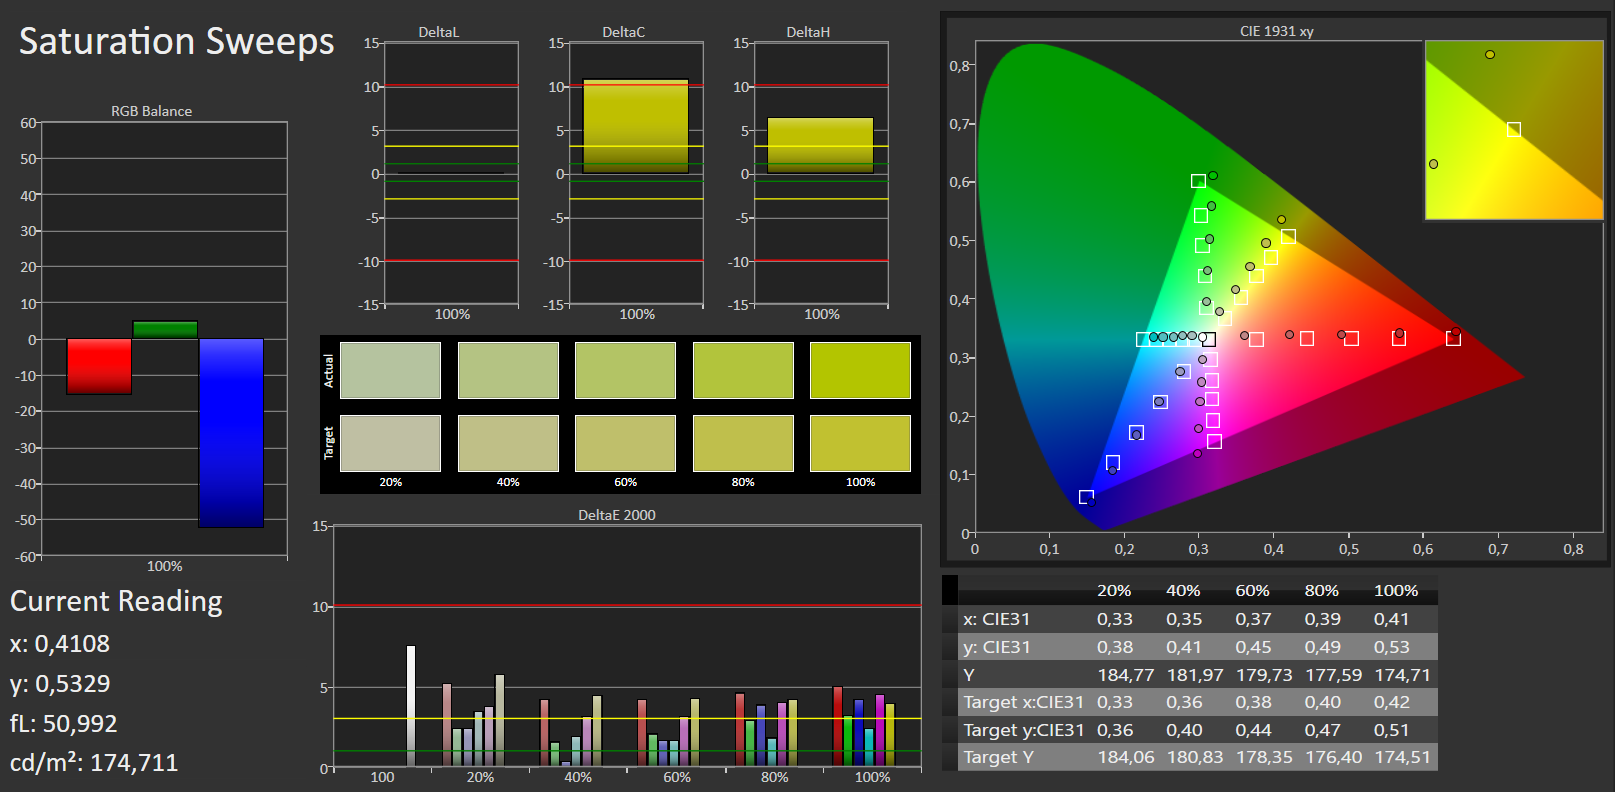
ΔE ColorChecker Calman: 4.57 | ∀{0.5-29.43 Ø4.71}
ΔE Greyscale Calman: 5.2 | ∀{0.09-98 Ø4.96}
89% sRGB (Argyll 1.6.3 3D)
58% AdobeRGB 1998 (Argyll 1.6.3 3D)
64.8% AdobeRGB 1998 (Argyll 3D)
89.1% sRGB (Argyll 3D)
64.6% Display P3 (Argyll 3D)
Gamma: 2.47
CCT: 6887 K
| Acer Swift 7 SF713-51 IPS, WLED, 1920x1080, 13.3" | Apple MacBook 12 (Early 2016) 1.1 GHz IPS, 2304x1440, 12" | HP EliteBook Folio G1 V1C37EA IPS, 1920x1080, 12.5" | Asus Zenbook UX305CA-FB055T IPS, 3200x1800, 13.3" | Acer Spin 7 SP714-51-M09D IPS, 1920x1080, 14" | |
|---|---|---|---|---|---|
| Display | 5% | -29% | -6% | -3% | |
| Display P3 Coverage (%) | 64.6 | 66.8 3% | 44.45 -31% | 59.1 -9% | 61.5 -5% |
| sRGB Coverage (%) | 89.1 | 95.4 7% | 65.2 -27% | 85.5 -4% | 89.1 0% |
| AdobeRGB 1998 Coverage (%) | 64.8 | 68 5% | 45.96 -29% | 61 -6% | 62.9 -3% |
| Response Times | -23% | 4% | -12% | -31% | |
| Response Time Grey 50% / Grey 80% * (ms) | 31 ? | 41.2 ? -33% | 32 ? -3% | 38 ? -23% | 51 ? -65% |
| Response Time Black / White * (ms) | 27 ? | 30.4 ? -13% | 24 ? 11% | 27 ? -0% | 26 ? 4% |
| PWM Frequency (Hz) | 1429 ? | ||||
| Screen | 8% | -12% | -15% | -47% | |
| Brightness middle (cd/m²) | 359 | 387 8% | 289 -19% | 390 9% | 344 -4% |
| Brightness (cd/m²) | 344 | 358 4% | 298 -13% | 352 2% | 292 -15% |
| Brightness Distribution (%) | 92 | 88 -4% | 87 -5% | 81 -12% | 72 -22% |
| Black Level * (cd/m²) | 0.25 | 0.47 -88% | 0.27 -8% | 0.69 -176% | 0.26 -4% |
| Contrast (:1) | 1436 | 823 -43% | 1070 -25% | 565 -61% | 1323 -8% |
| Colorchecker dE 2000 * | 4.57 | 1.6 65% | 4.82 -5% | 3.04 33% | 12.65 -177% |
| Colorchecker dE 2000 max. * | 9.25 | 4 57% | 10.73 -16% | 7.01 24% | 17.8 -92% |
| Greyscale dE 2000 * | 5.2 | 1 81% | 3.84 26% | 2.88 45% | 12.95 -149% |
| Gamma | 2.47 89% | 2.26 97% | 2.41 91% | 2.43 91% | 1.33 165% |
| CCT | 6887 94% | 6680 97% | 6492 100% | 6848 95% | 6441 101% |
| Color Space (Percent of AdobeRGB 1998) (%) | 58 | 61.6 6% | 42.03 -28% | 55 -5% | 58 0% |
| Color Space (Percent of sRGB) (%) | 89 | 82.2 -8% | 64.8 -27% | 85 -4% | 89 0% |
| Total Average (Program / Settings) | -3% /
3% | -12% /
-13% | -11% /
-12% | -27% /
-36% |
* ... smaller is better
Display Response Times
| ↔ Response Time Black to White | ||
|---|---|---|
| 27 ms ... rise ↗ and fall ↘ combined | ↗ 7 ms rise | 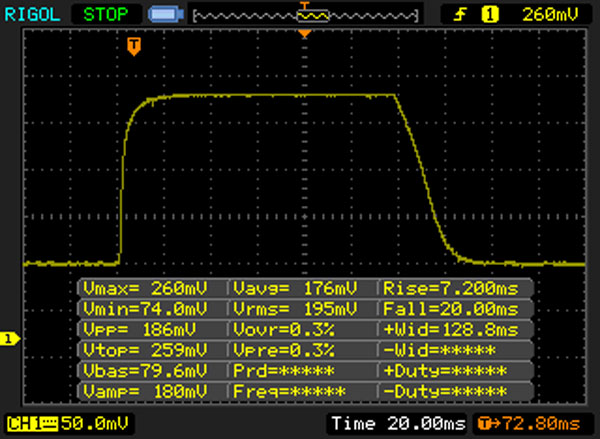 |
| ↘ 20 ms fall | ||
| The screen shows relatively slow response rates in our tests and may be too slow for gamers. In comparison, all tested devices range from 0.1 (minimum) to 240 (maximum) ms. » 68 % of all devices are better. This means that the measured response time is worse than the average of all tested devices (19.8 ms). | ||
| ↔ Response Time 50% Grey to 80% Grey | ||
| 31 ms ... rise ↗ and fall ↘ combined | ↗ 14 ms rise | 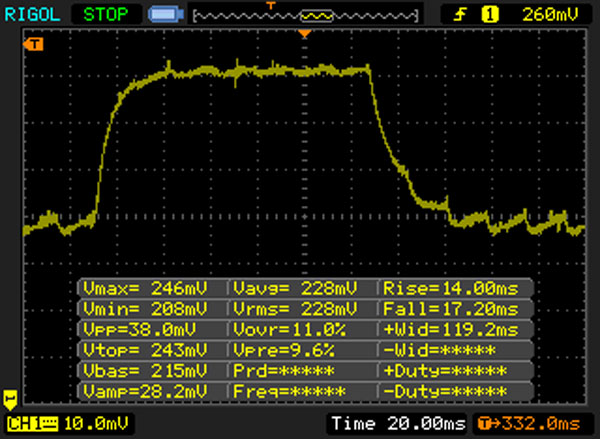 |
| ↘ 17 ms fall | ||
| The screen shows slow response rates in our tests and will be unsatisfactory for gamers. In comparison, all tested devices range from 0.165 (minimum) to 636 (maximum) ms. » 42 % of all devices are better. This means that the measured response time is similar to the average of all tested devices (30.9 ms). | ||
Screen Flickering / PWM (Pulse-Width Modulation)
| Screen flickering / PWM not detected | ||
In comparison: 52 % of all tested devices do not use PWM to dim the display. If PWM was detected, an average of 7744 (minimum: 5 - maximum: 343500) Hz was measured. | ||
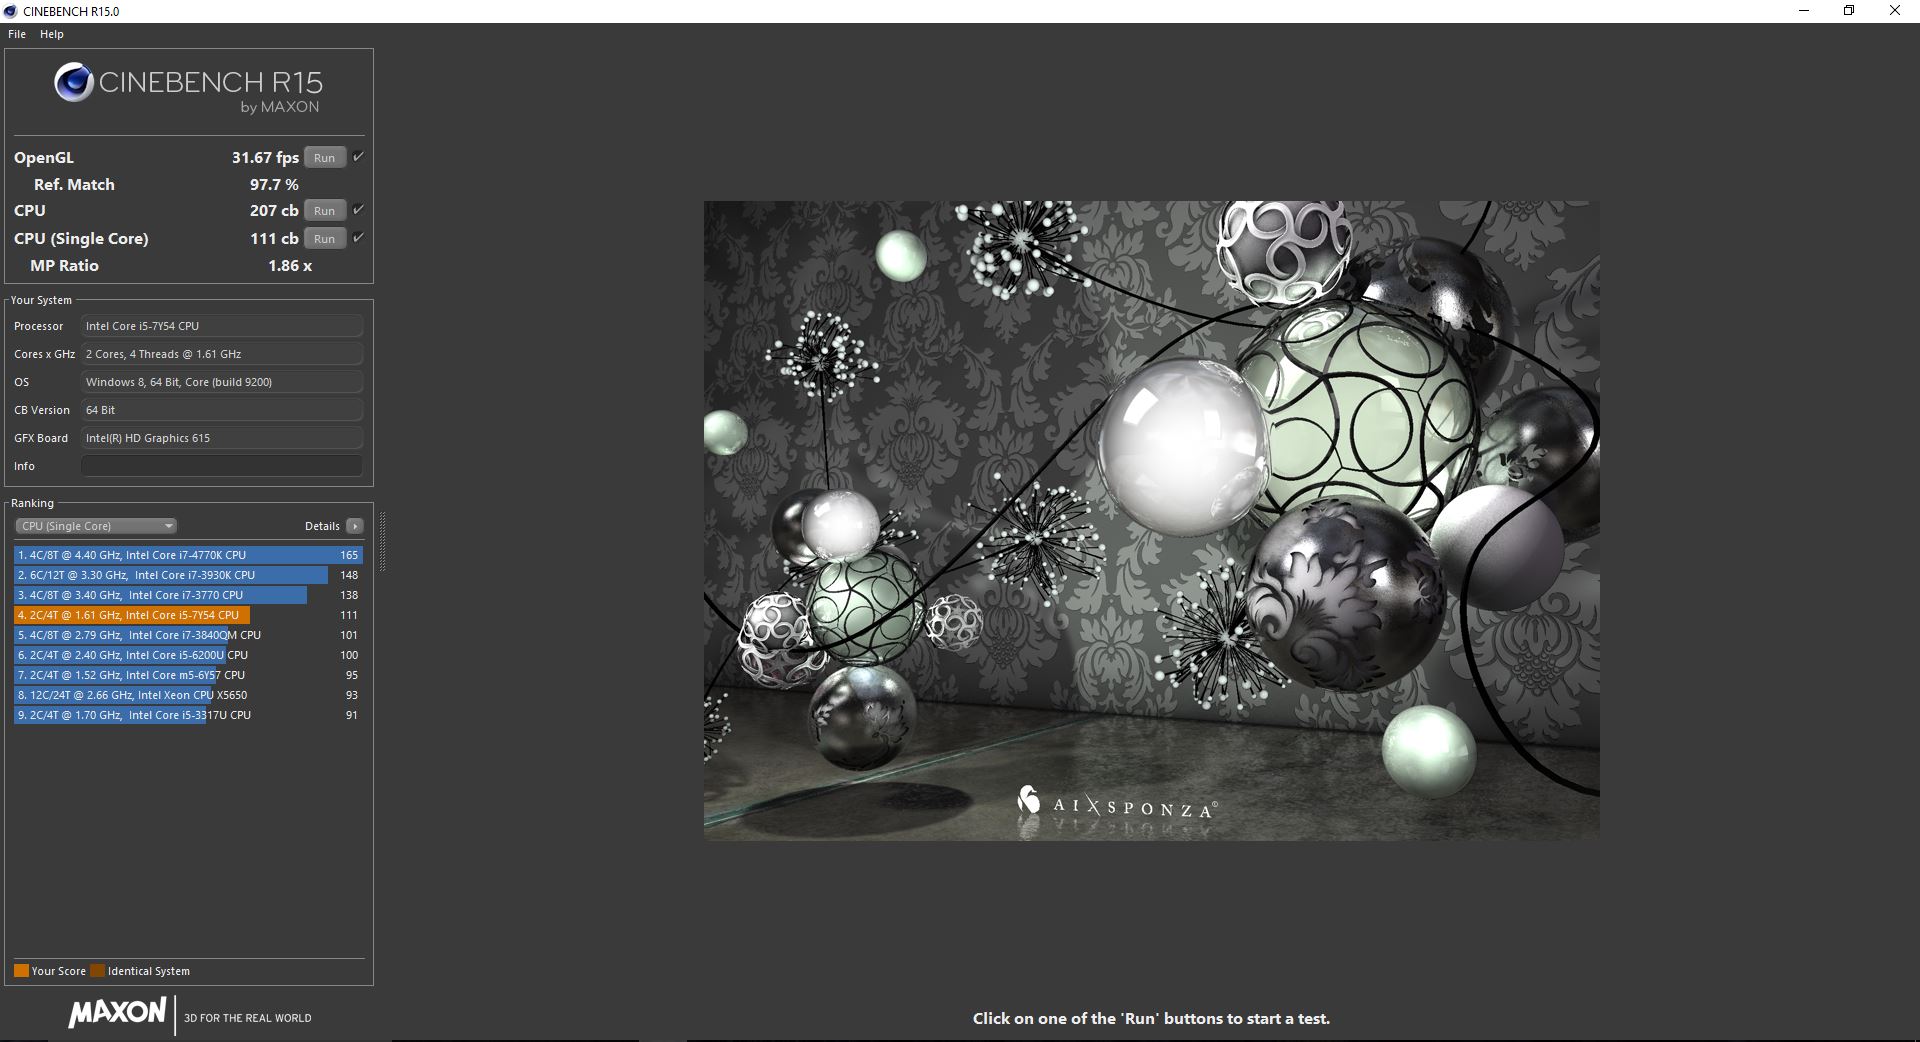
| Cinebench R15 | |
| CPU Single 64Bit | |
| HP EliteBook Folio G1 V1C37EA | |
| Acer Swift 7 SF713-51 | |
| Acer Spin 7 SP714-51-M09D | |
| Asus Zenbook UX305CA-FB055T | |
| Apple MacBook 12 (Early 2016) 1.1 GHz | |
| Apple MacBook 12 (Early 2016) 1.1 GHz | |
| CPU Multi 64Bit | |
| HP EliteBook Folio G1 V1C37EA | |
| Apple MacBook 12 (Early 2016) 1.1 GHz | |
| Asus Zenbook UX305CA-FB055T | |
| Acer Swift 7 SF713-51 | |
| Acer Spin 7 SP714-51-M09D | |
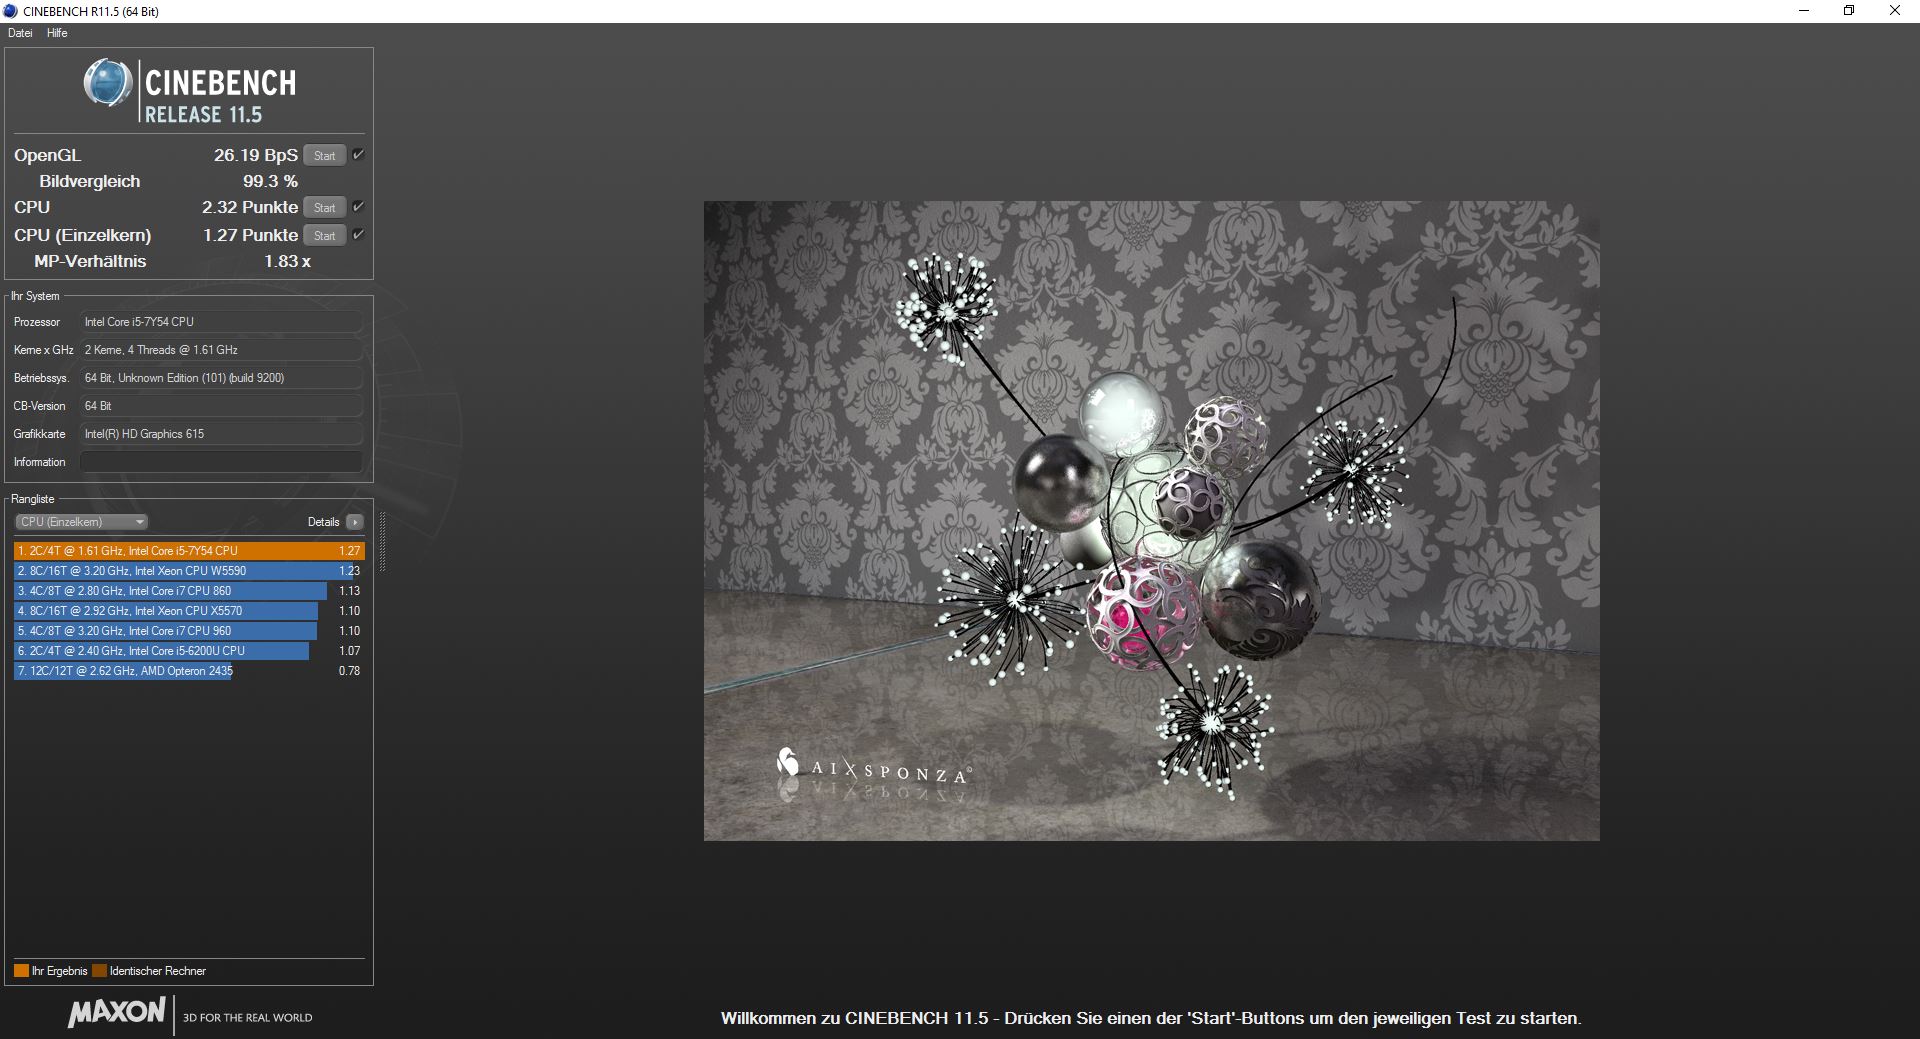
| Cinebench R11.5 | |
| CPU Single 64Bit | |
| Asus Zenbook UX305CA-FB055T | |
| Acer Swift 7 SF713-51 | |
| Acer Spin 7 SP714-51-M09D | |
| Apple MacBook 12 (Early 2016) 1.1 GHz | |
| Apple MacBook 12 (Early 2016) 1.1 GHz | |
| CPU Multi 64Bit | |
| Asus Zenbook UX305CA-FB055T | |
| Apple MacBook 12 (Early 2016) 1.1 GHz | |
| Apple MacBook 12 (Early 2016) 1.1 GHz | |
| Acer Swift 7 SF713-51 | |
| Acer Spin 7 SP714-51-M09D | |
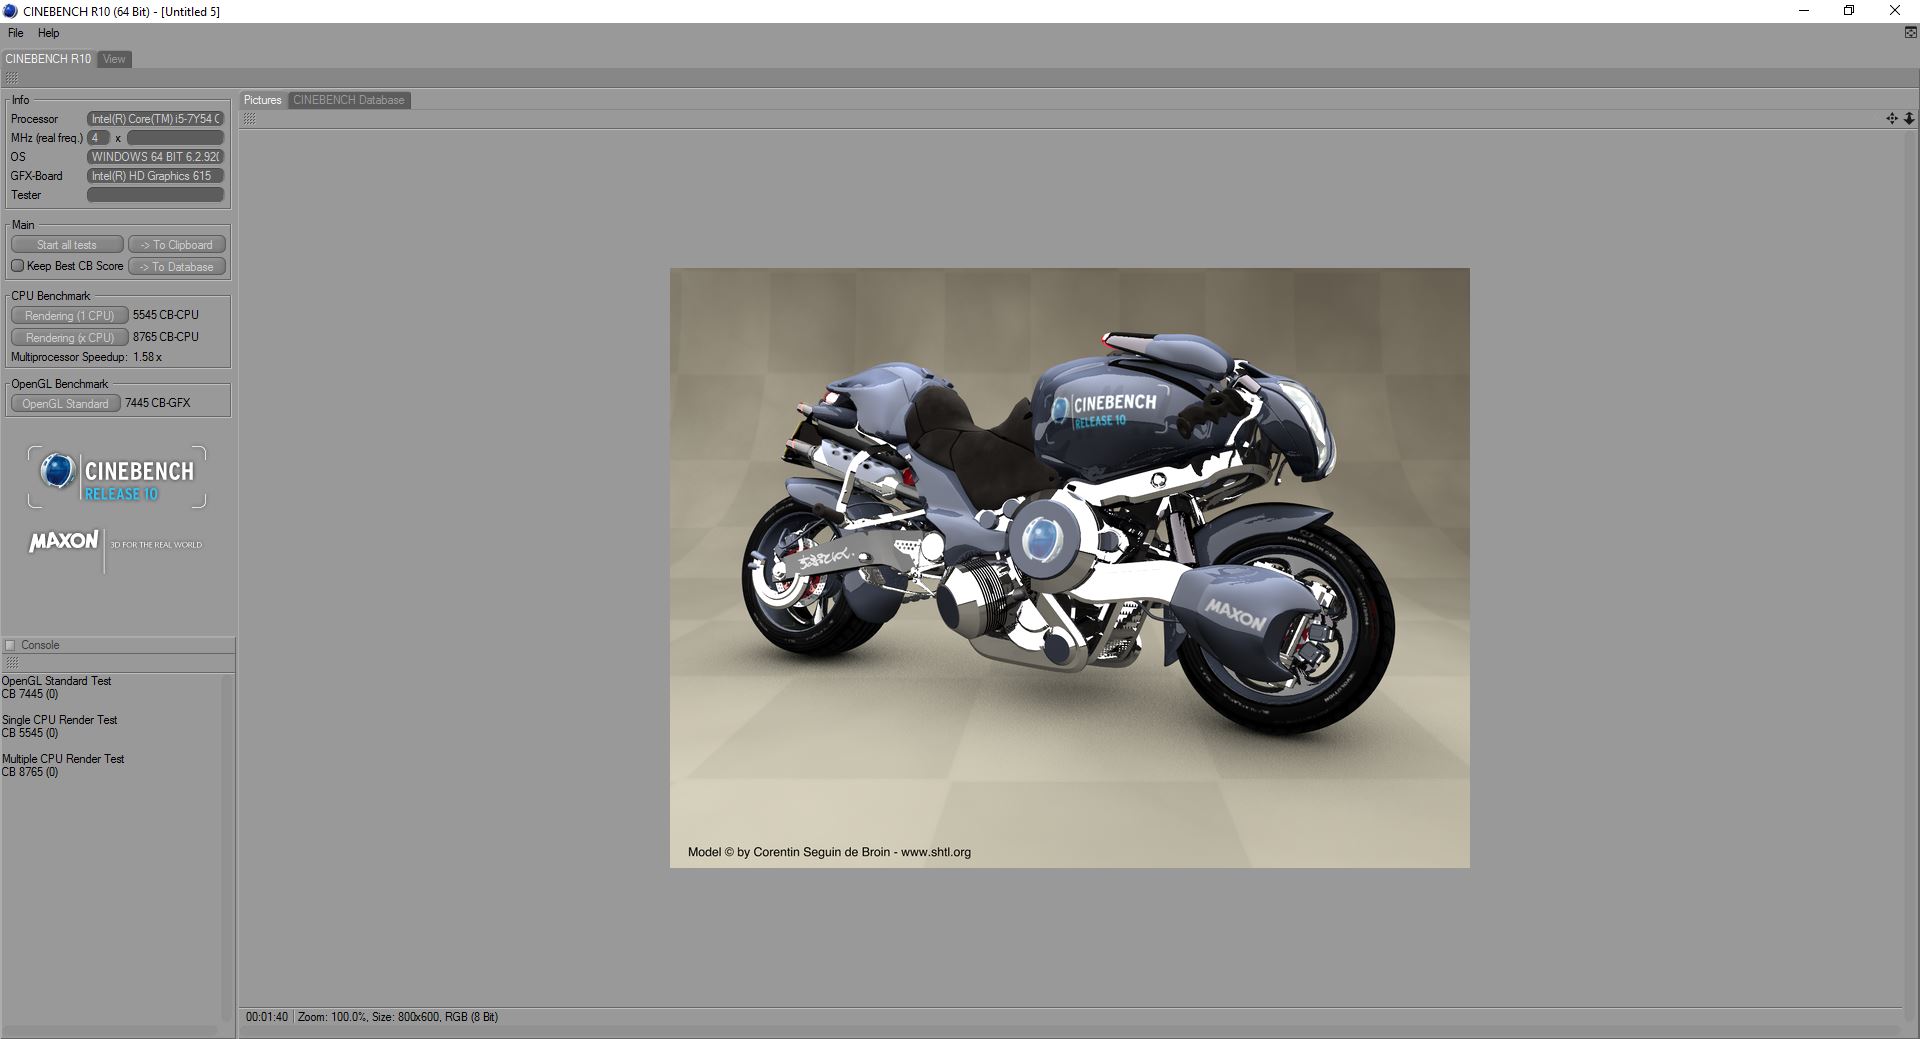
| Cinebench R10 | |
| Rendering Single CPUs 64Bit | |
| Acer Spin 7 SP714-51-M09D | |
| Acer Swift 7 SF713-51 | |
| Rendering Multiple CPUs 64Bit | |
| Acer Spin 7 SP714-51-M09D | |
| Acer Swift 7 SF713-51 | |
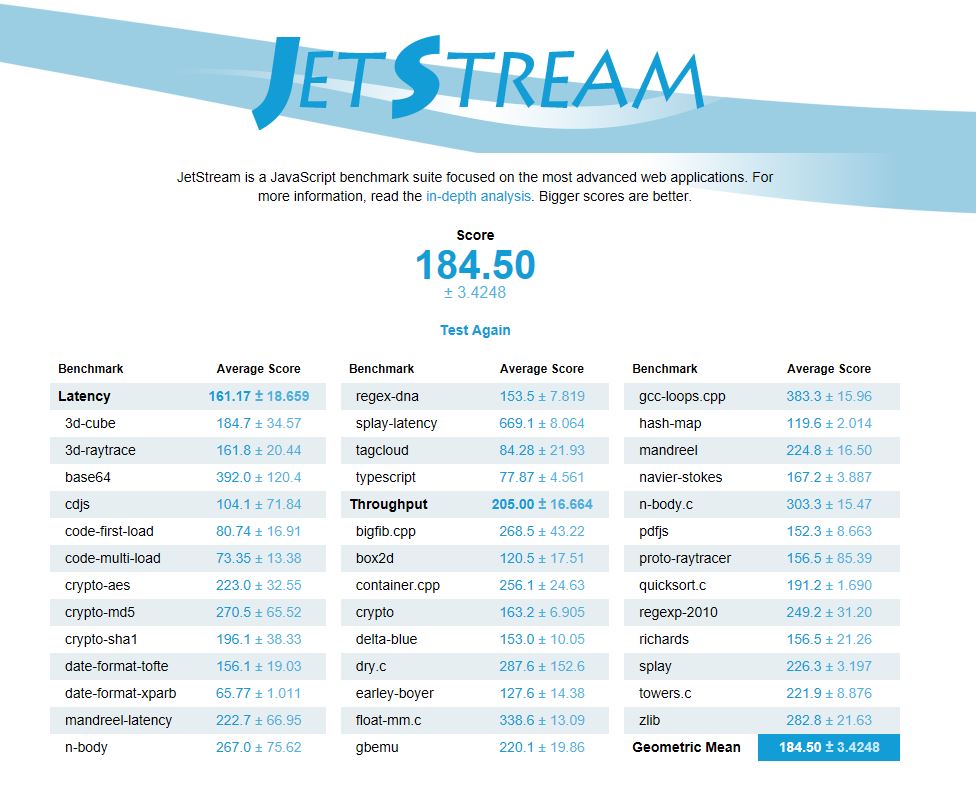
| JetStream 1.1 - 1.1 Total | |
| Asus Zenbook UX305CA-FB055T | |
| Acer Spin 7 SP714-51-M09D | |
| Acer Swift 7 SF713-51 | |
| Apple MacBook 12 (Early 2016) 1.1 GHz | |
| Apple MacBook 12 (Early 2016) 1.1 GHz | |
| HP EliteBook Folio G1 V1C37EA | |
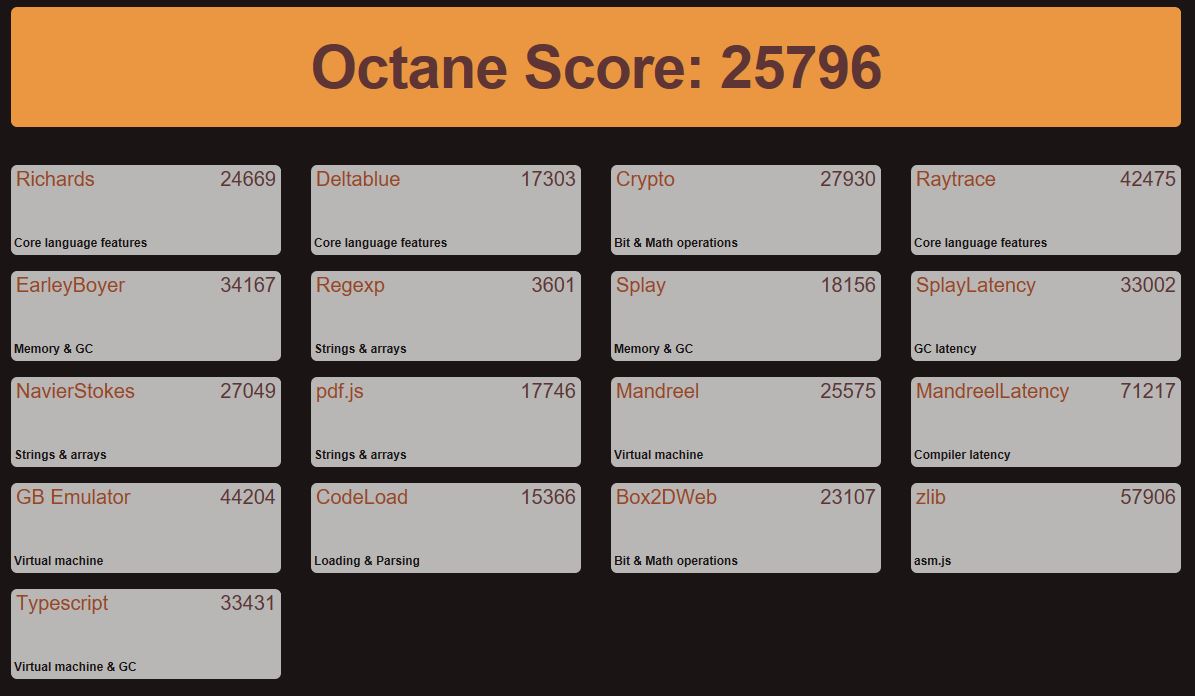
| Octane V2 - Total Score | |
| Asus Zenbook UX305CA-FB055T | |
| Acer Spin 7 SP714-51-M09D | |
| Acer Swift 7 SF713-51 | |
| HP EliteBook Folio G1 V1C37EA | |
| Apple MacBook 12 (Early 2016) 1.1 GHz | |
| Apple MacBook 12 (Early 2016) 1.1 GHz | |
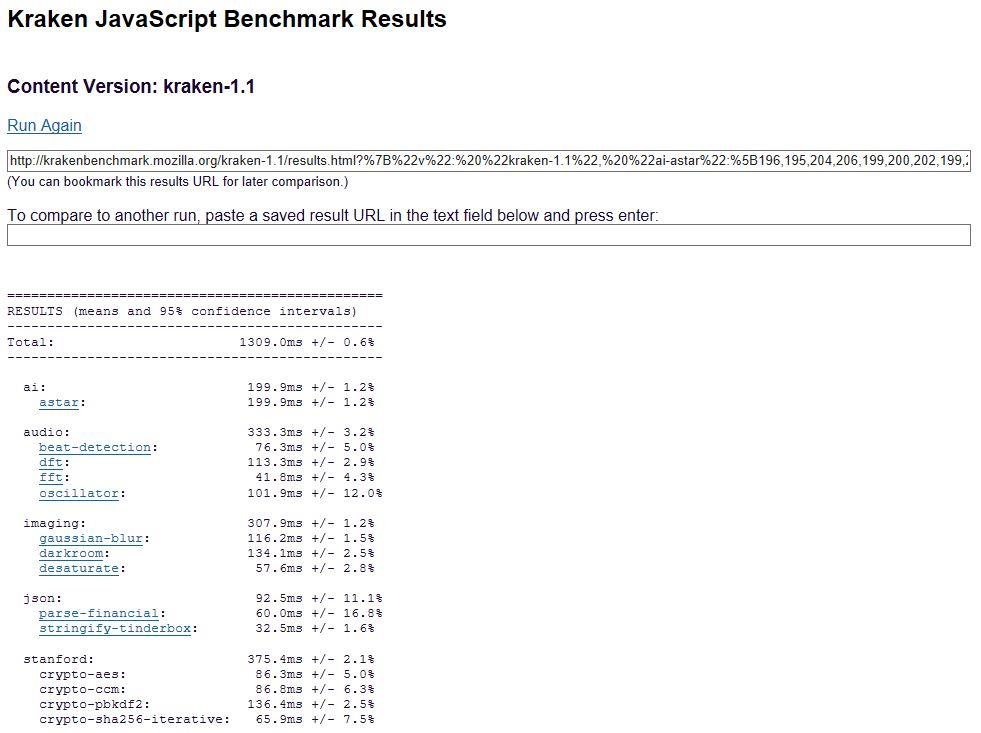
| Mozilla Kraken 1.1 - Total | |
| Apple MacBook 12 (Early 2016) 1.1 GHz | |
| Apple MacBook 12 (Early 2016) 1.1 GHz | |
| Acer Swift 7 SF713-51 | |
| HP EliteBook Folio G1 V1C37EA | |
| Acer Spin 7 SP714-51-M09D | |
| Asus Zenbook UX305CA-FB055T | |
* ... smaller is better
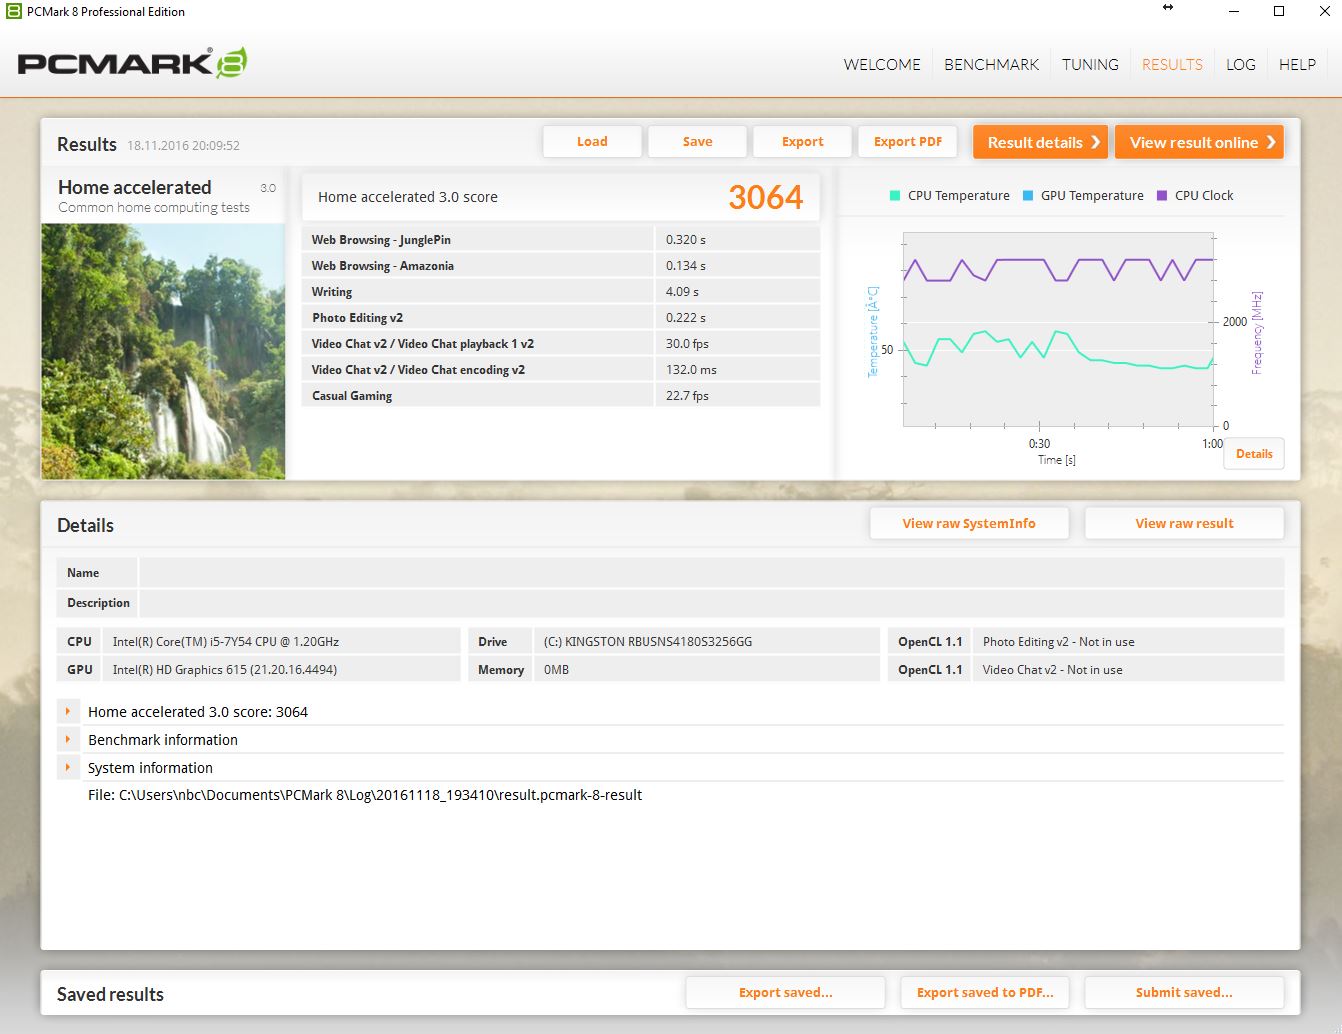
| PCMark 8 | |
| Home Score Accelerated v2 | |
| Acer Swift 7 SF713-51 | |
| HP EliteBook Folio G1 V1C37EA | |
| Acer Spin 7 SP714-51-M09D | |
| Asus Zenbook UX305CA-FB055T | |
| Apple MacBook 12 (Early 2016) 1.1 GHz | |
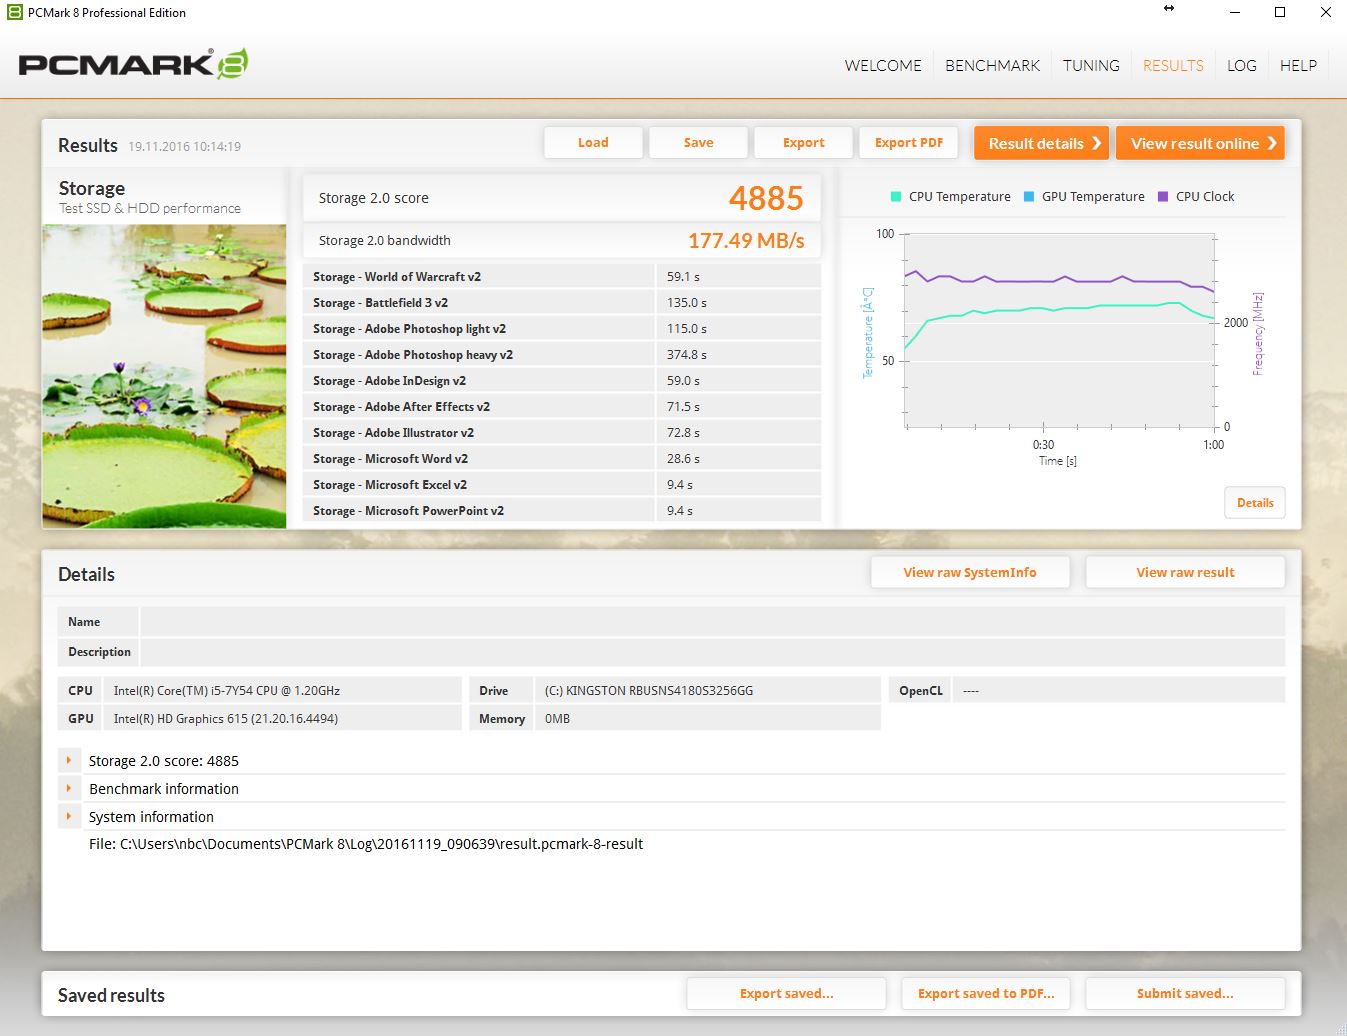
| Storage Score v2 | |
| Acer Swift 7 SF713-51 | |
| Acer Spin 7 SP714-51-M09D | |
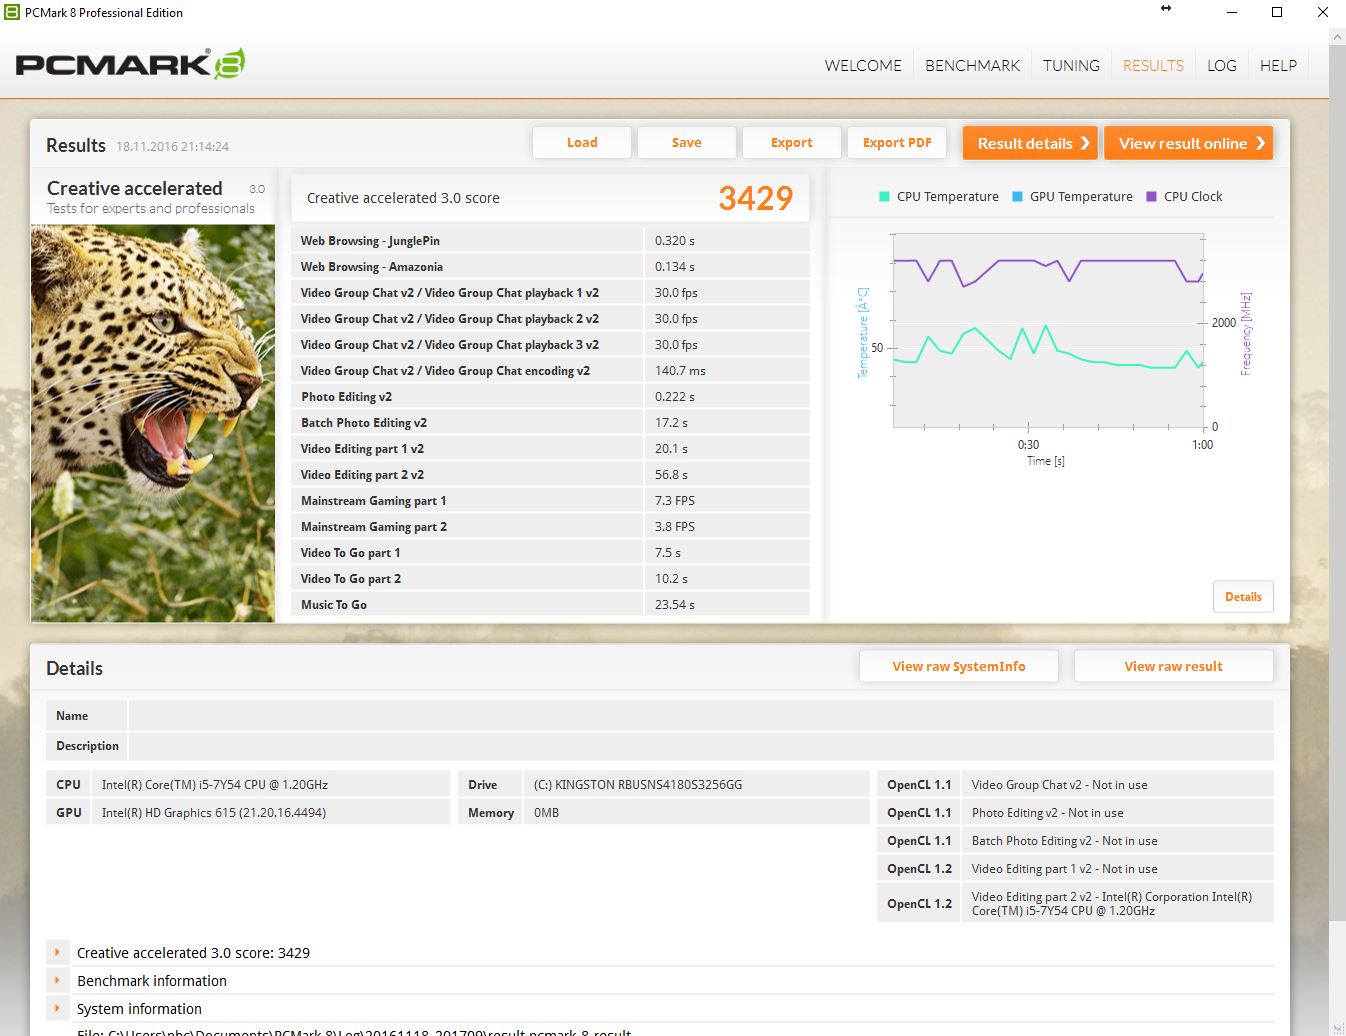
| Creative Score Accelerated v2 | |
| HP EliteBook Folio G1 V1C37EA | |
| Acer Swift 7 SF713-51 | |
| Asus Zenbook UX305CA-FB055T | |
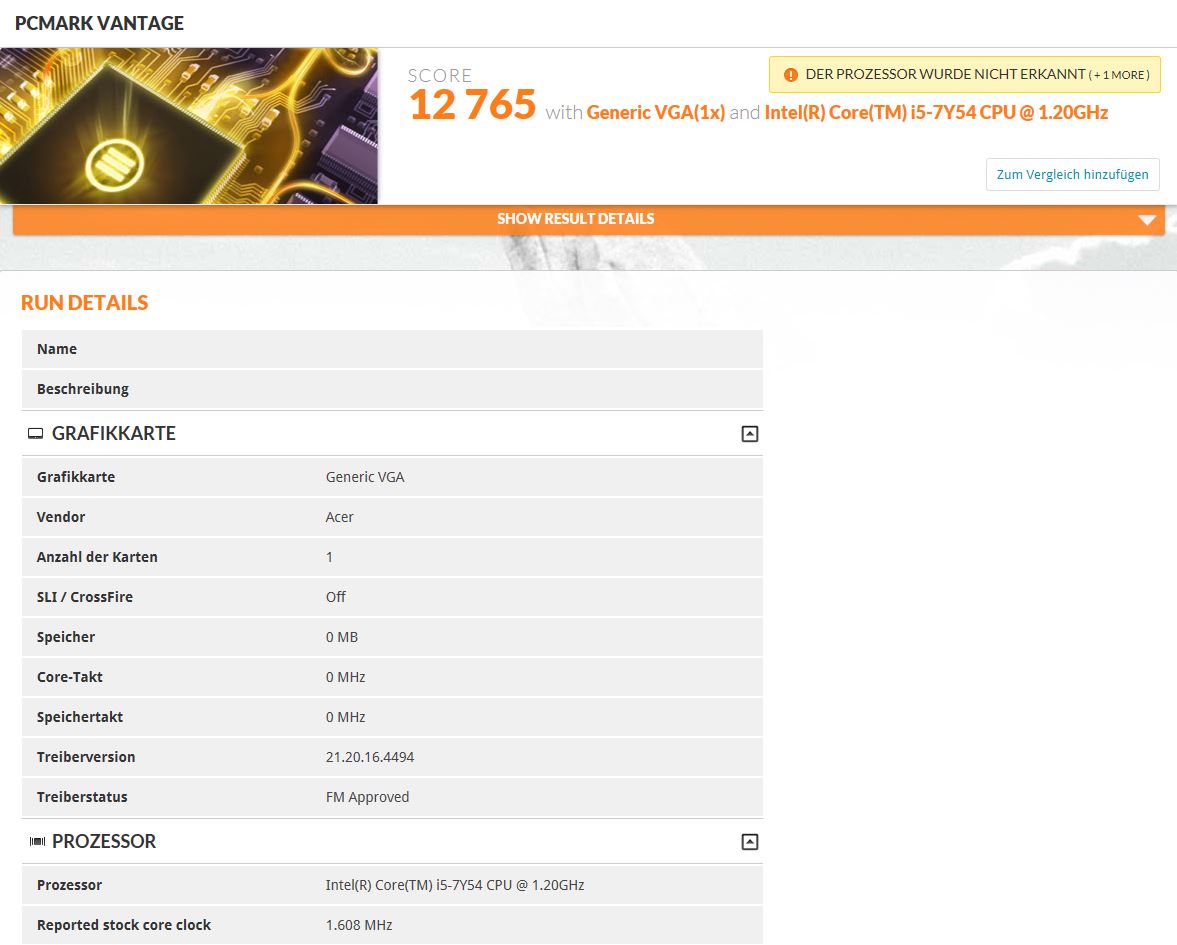
| PCMark Vantage Result | 12765 points | |
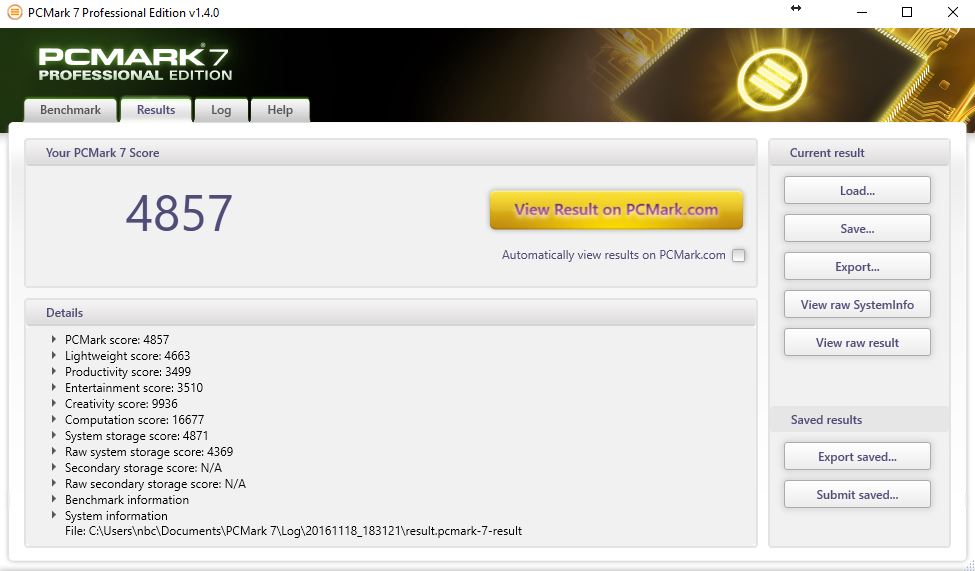
| PCMark 7 Score | 4857 points | |
| PCMark 8 Home Score Accelerated v2 | 3064 points | |
| PCMark 8 Creative Score Accelerated v2 | 3429 points | |
Help | ||
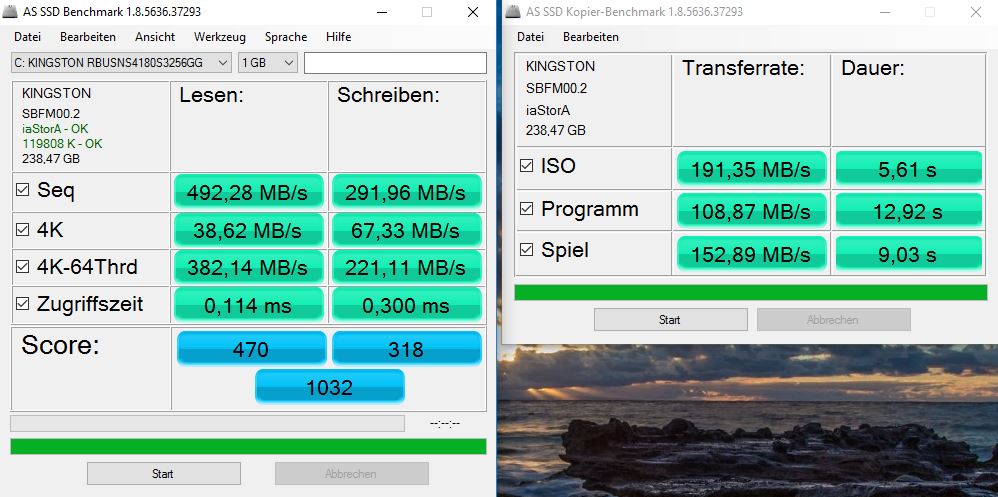
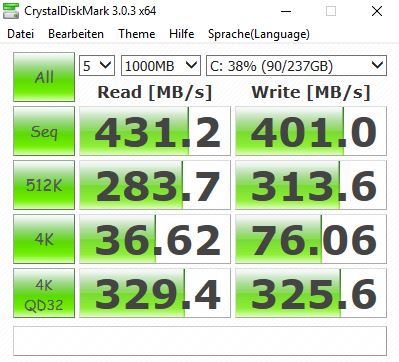
| Acer Swift 7 SF713-51 Kingston RBU-SNS4180S3256GG | Apple MacBook 12 (Early 2016) 1.1 GHz Apple SSD AP0256 | HP EliteBook Folio G1 V1C37EA Samsung SM951 MZVPV256 m.2 | Asus Zenbook UX305CA-FB055T Micron M600 MTFDDAV512MBF M.2 | Acer Spin 7 SP714-51-M09D Kingston RBUSNS4180S3256GG | |
|---|---|---|---|---|---|
| CrystalDiskMark 3.0 | 34% | 144% | 6% | 4% | |
| Read Seq (MB/s) | 431.2 | 754 75% | 1482 244% | 475.2 10% | 472.6 10% |
| Write Seq (MB/s) | 401 | 638 59% | 1232 207% | 423.7 6% | 407.7 2% |
| Read 512 (MB/s) | 283.7 | 616 117% | 1191 320% | 404.8 43% | 309.5 9% |
| Write 512 (MB/s) | 313.6 | 678 116% | 1220 289% | 396.2 26% | 368.5 18% |
| Read 4k (MB/s) | 36.62 | 14.6 -60% | 46.96 28% | 28.57 -22% | 37.57 3% |
| Write 4k (MB/s) | 76.1 | 20.5 -73% | 100.7 32% | 90.7 19% | 75.5 -1% |
| Read 4k QD32 (MB/s) | 329.4 | 464 41% | 464 41% | 288.9 -12% | 324.8 -1% |
| Write 4k QD32 (MB/s) | 325.6 | 315 -3% | 292.1 -10% | 242.3 -26% | 307.4 -6% |

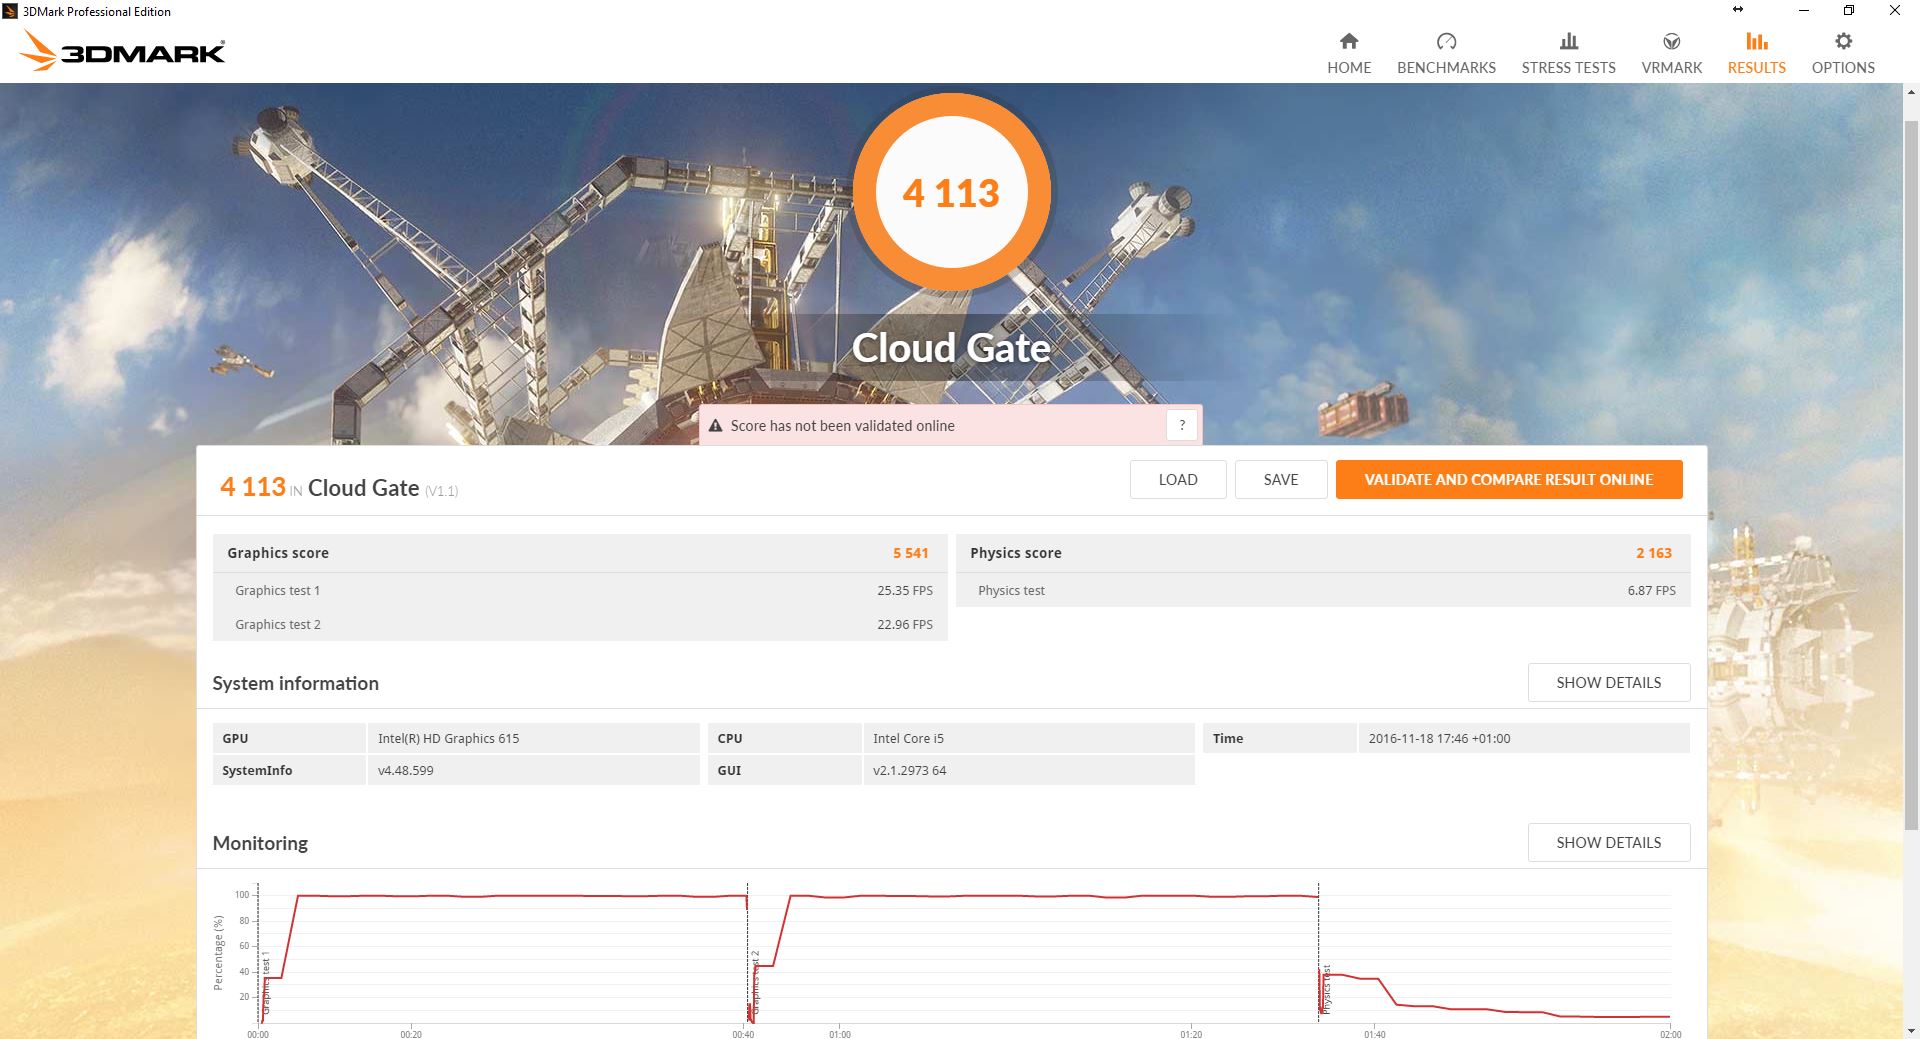
| 3DMark | |
| 1280x720 Cloud Gate Standard Graphics | |
| HP EliteBook Folio G1 V1C37EA | |
| Apple MacBook 12 (Early 2016) 1.1 GHz | |
| Acer Swift 7 SF713-51 | |
| Acer Spin 7 SP714-51-M09D | |
| Asus Zenbook UX305CA-FB055T | |
| 1920x1080 Fire Strike Graphics | |
| HP EliteBook Folio G1 V1C37EA | |
| Apple MacBook 12 (Early 2016) 1.1 GHz | |
| Acer Swift 7 SF713-51 | |
| Asus Zenbook UX305CA-FB055T | |
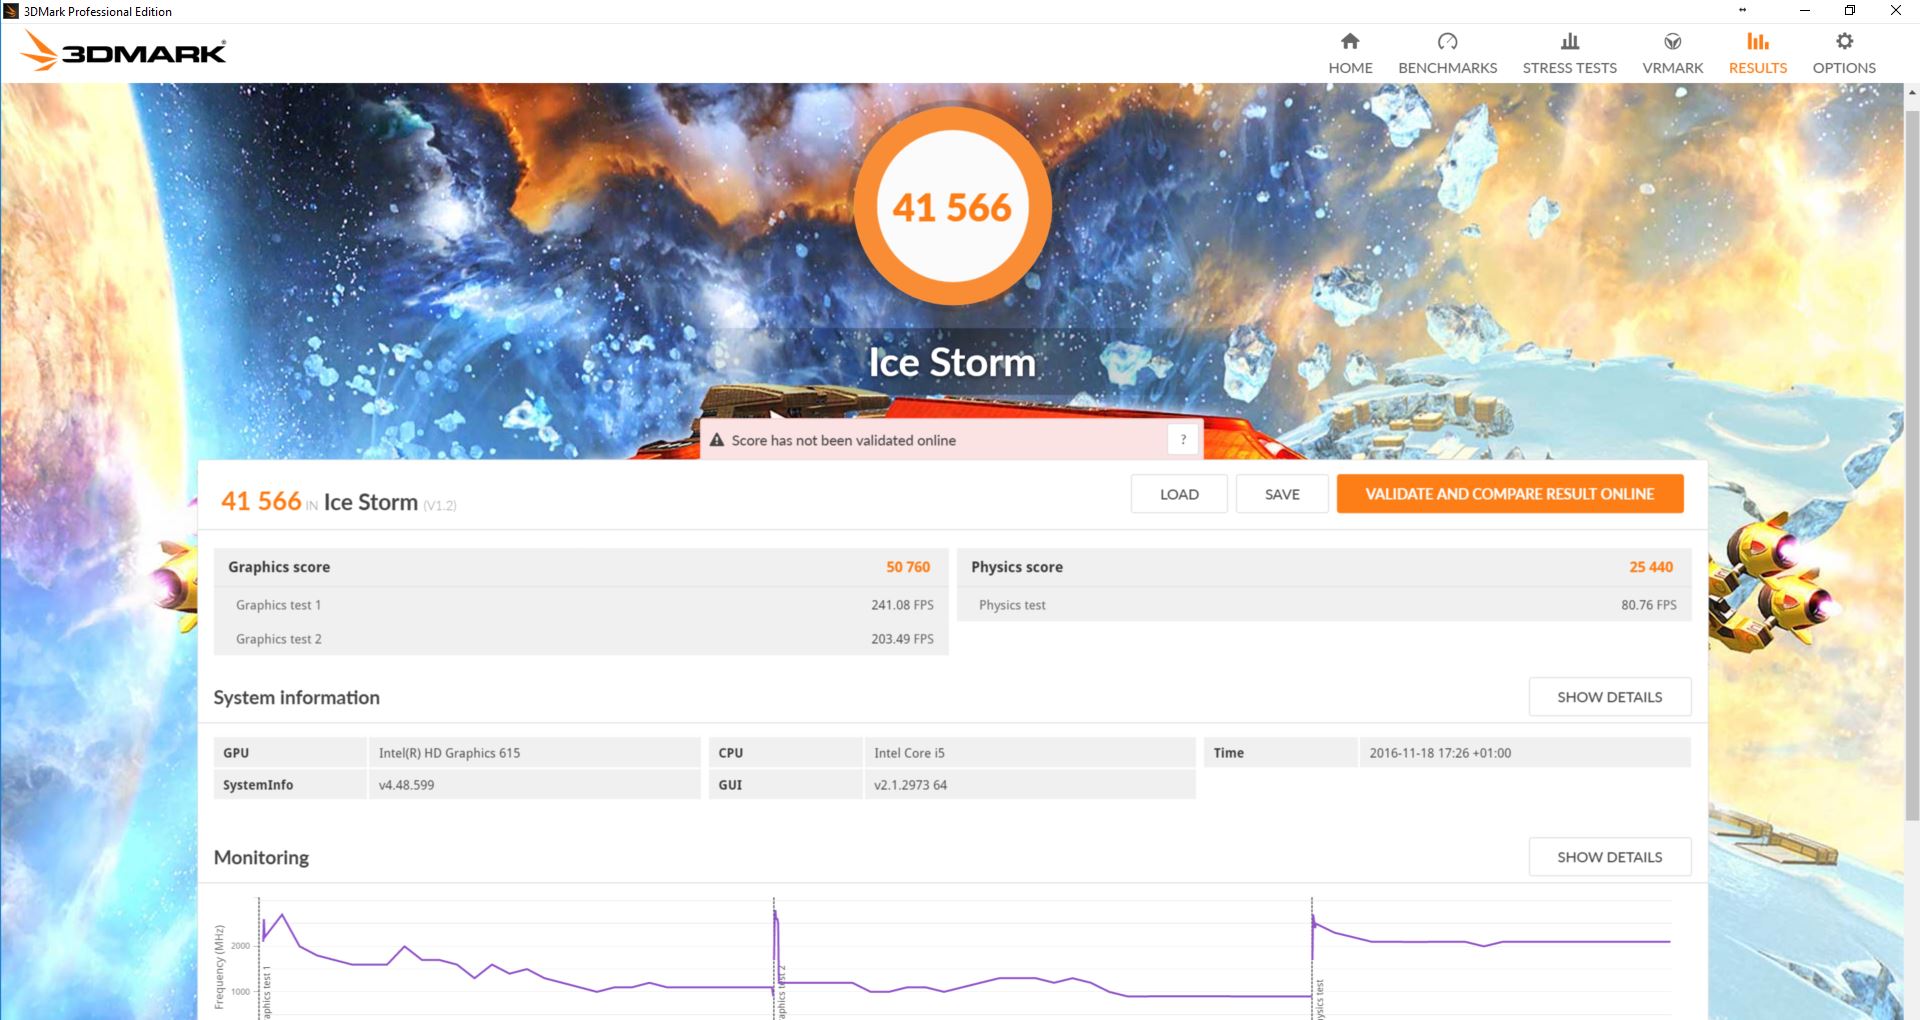
| 1280x720 Ice Storm Standard Score | |
| Acer Swift 7 SF713-51 | |
| Acer Spin 7 SP714-51-M09D | |
| Asus Zenbook UX305CA-FB055T | |
| 3DMark 11 | |
| 1280x720 Performance GPU | |
| HP EliteBook Folio G1 V1C37EA | |
| Apple MacBook 12 (Early 2016) 1.1 GHz | |
| Asus Zenbook UX305CA-FB055T | |
| Acer Swift 7 SF713-51 | |
| Acer Spin 7 SP714-51-M09D | |
| 1280x720 Performance | |
| HP EliteBook Folio G1 V1C37EA | |
| Apple MacBook 12 (Early 2016) 1.1 GHz | |
| Asus Zenbook UX305CA-FB055T | |
| Acer Swift 7 SF713-51 | |
| Acer Spin 7 SP714-51-M09D | |
| 3DMark 06 - 1280x1024 Standard Score AA:0x AF:0x | |
| Apple MacBook 12 (Early 2016) 1.1 GHz | |
| Acer Swift 7 SF713-51 | |
| Asus Zenbook UX305CA-FB055T | |
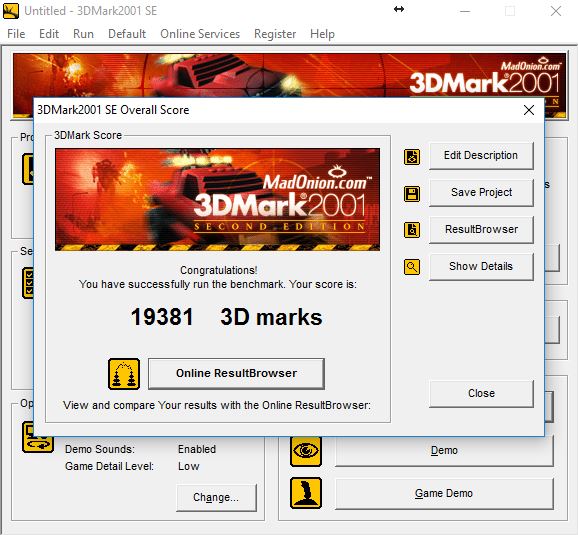
| 3DMark 2001SE Standard | 19381 points | |
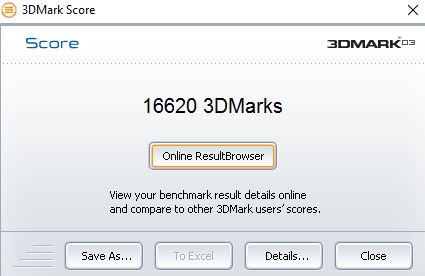
| 3DMark 03 Standard | 16620 points | |
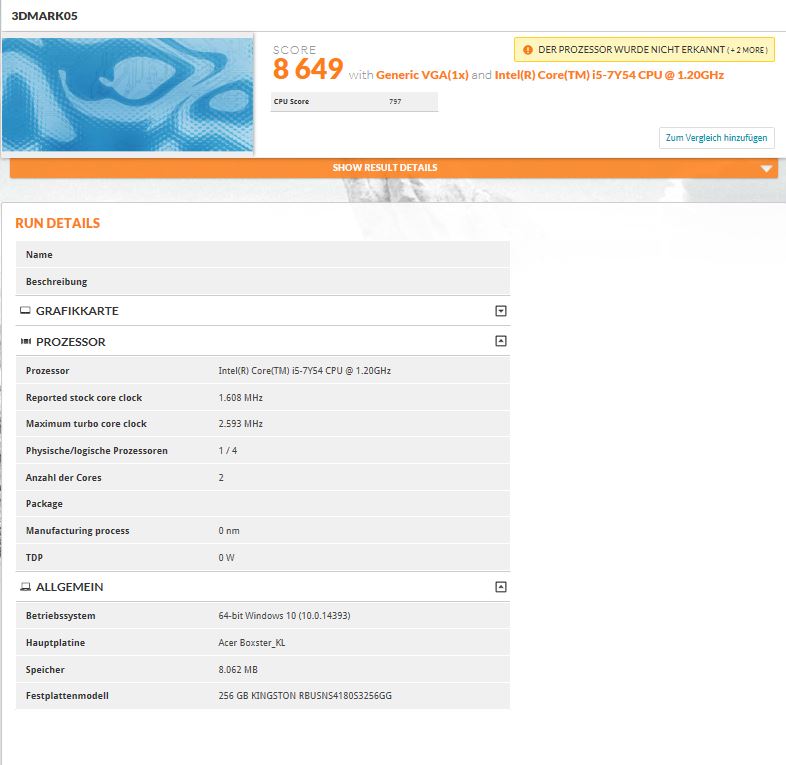
| 3DMark 05 Standard | 8649 points | |
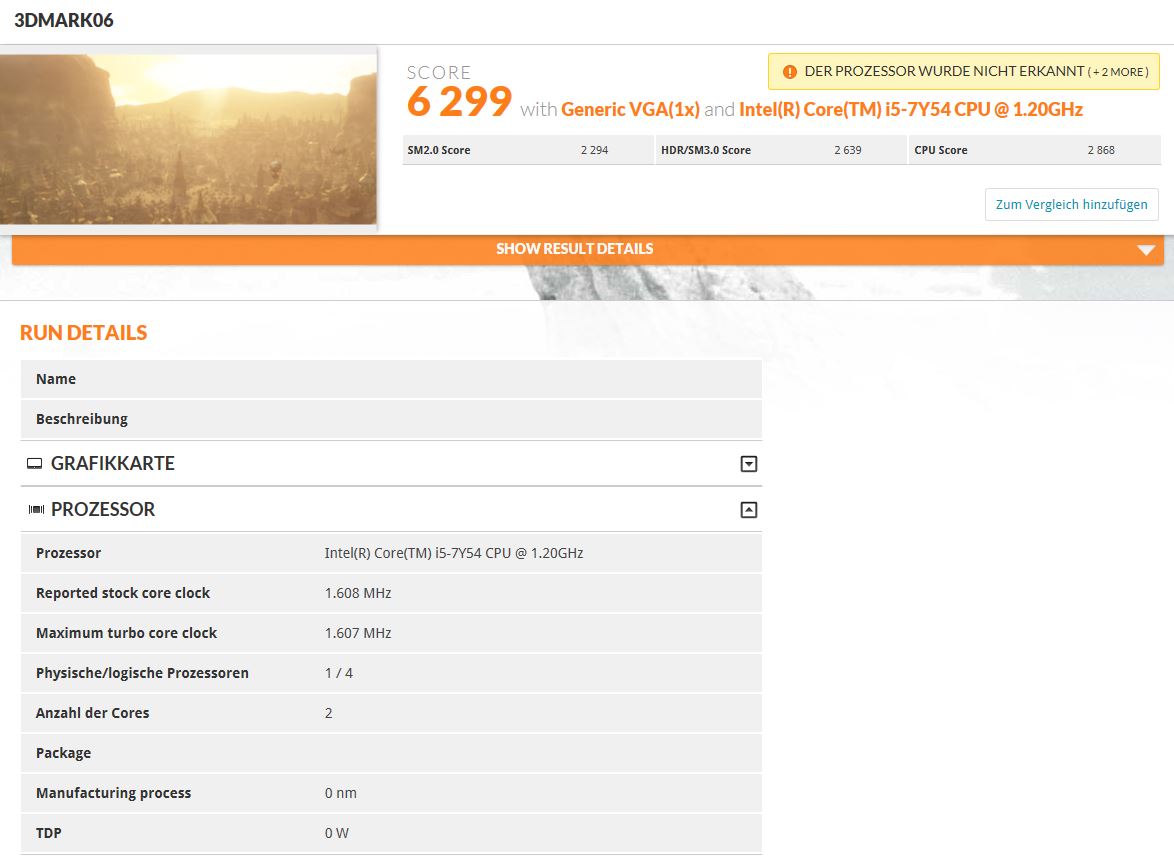
| 3DMark 06 Standard Score | 6299 points | |
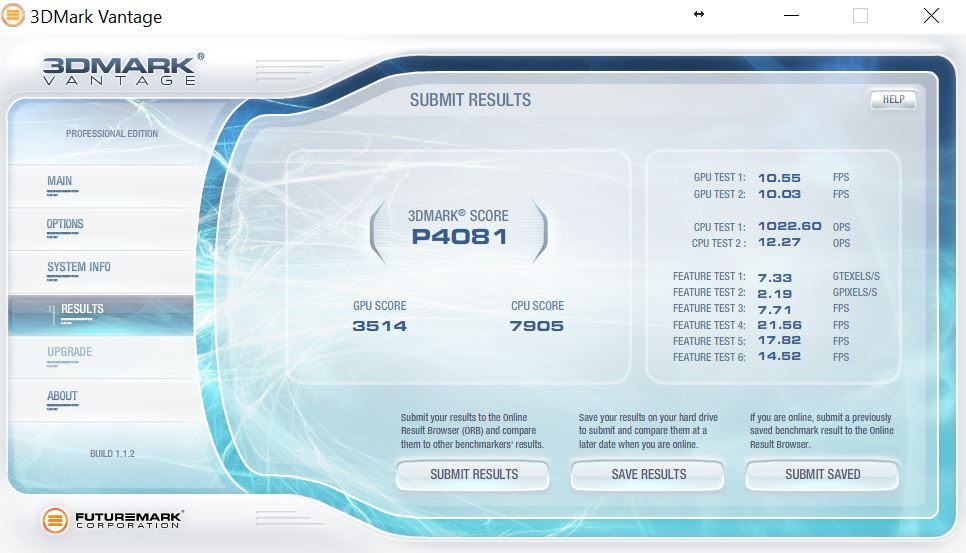
| 3DMark Vantage P Result | 4081 points | |
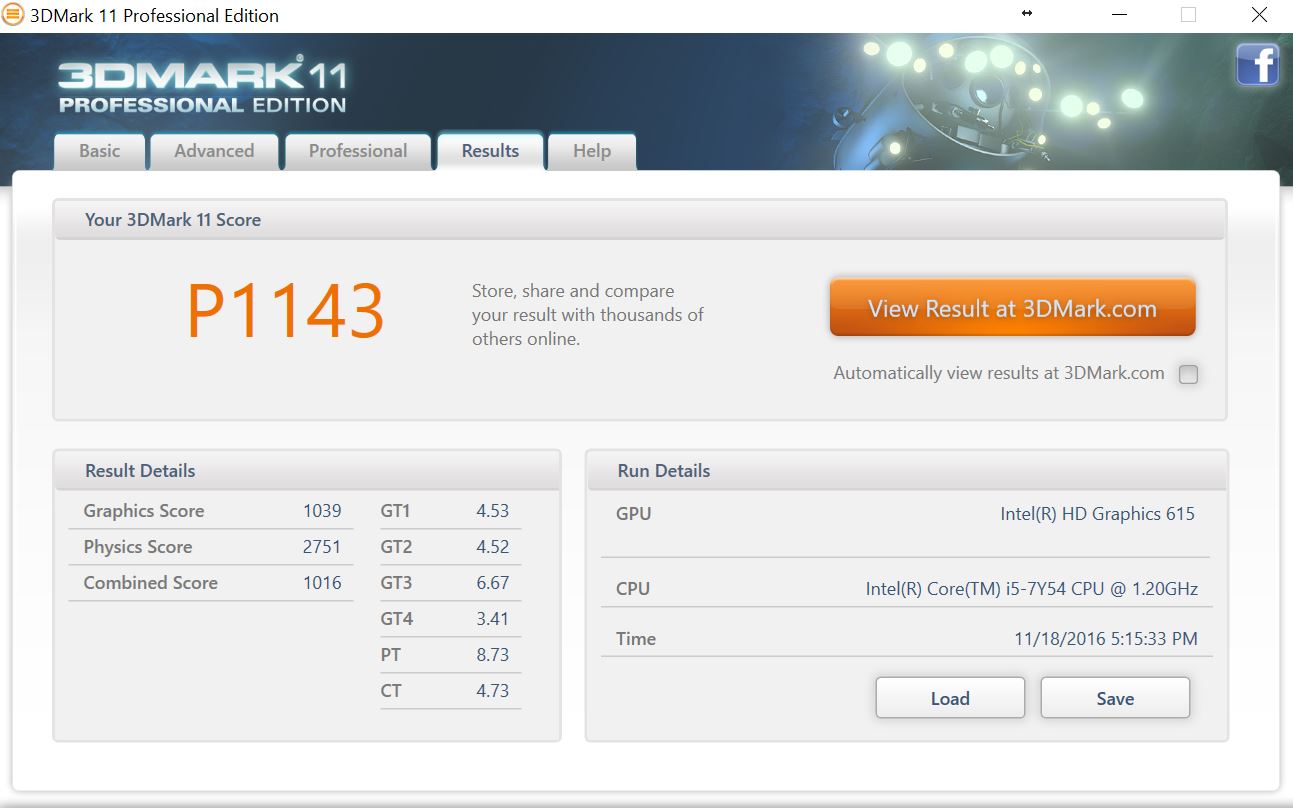
| 3DMark 11 Performance | 1143 points | |
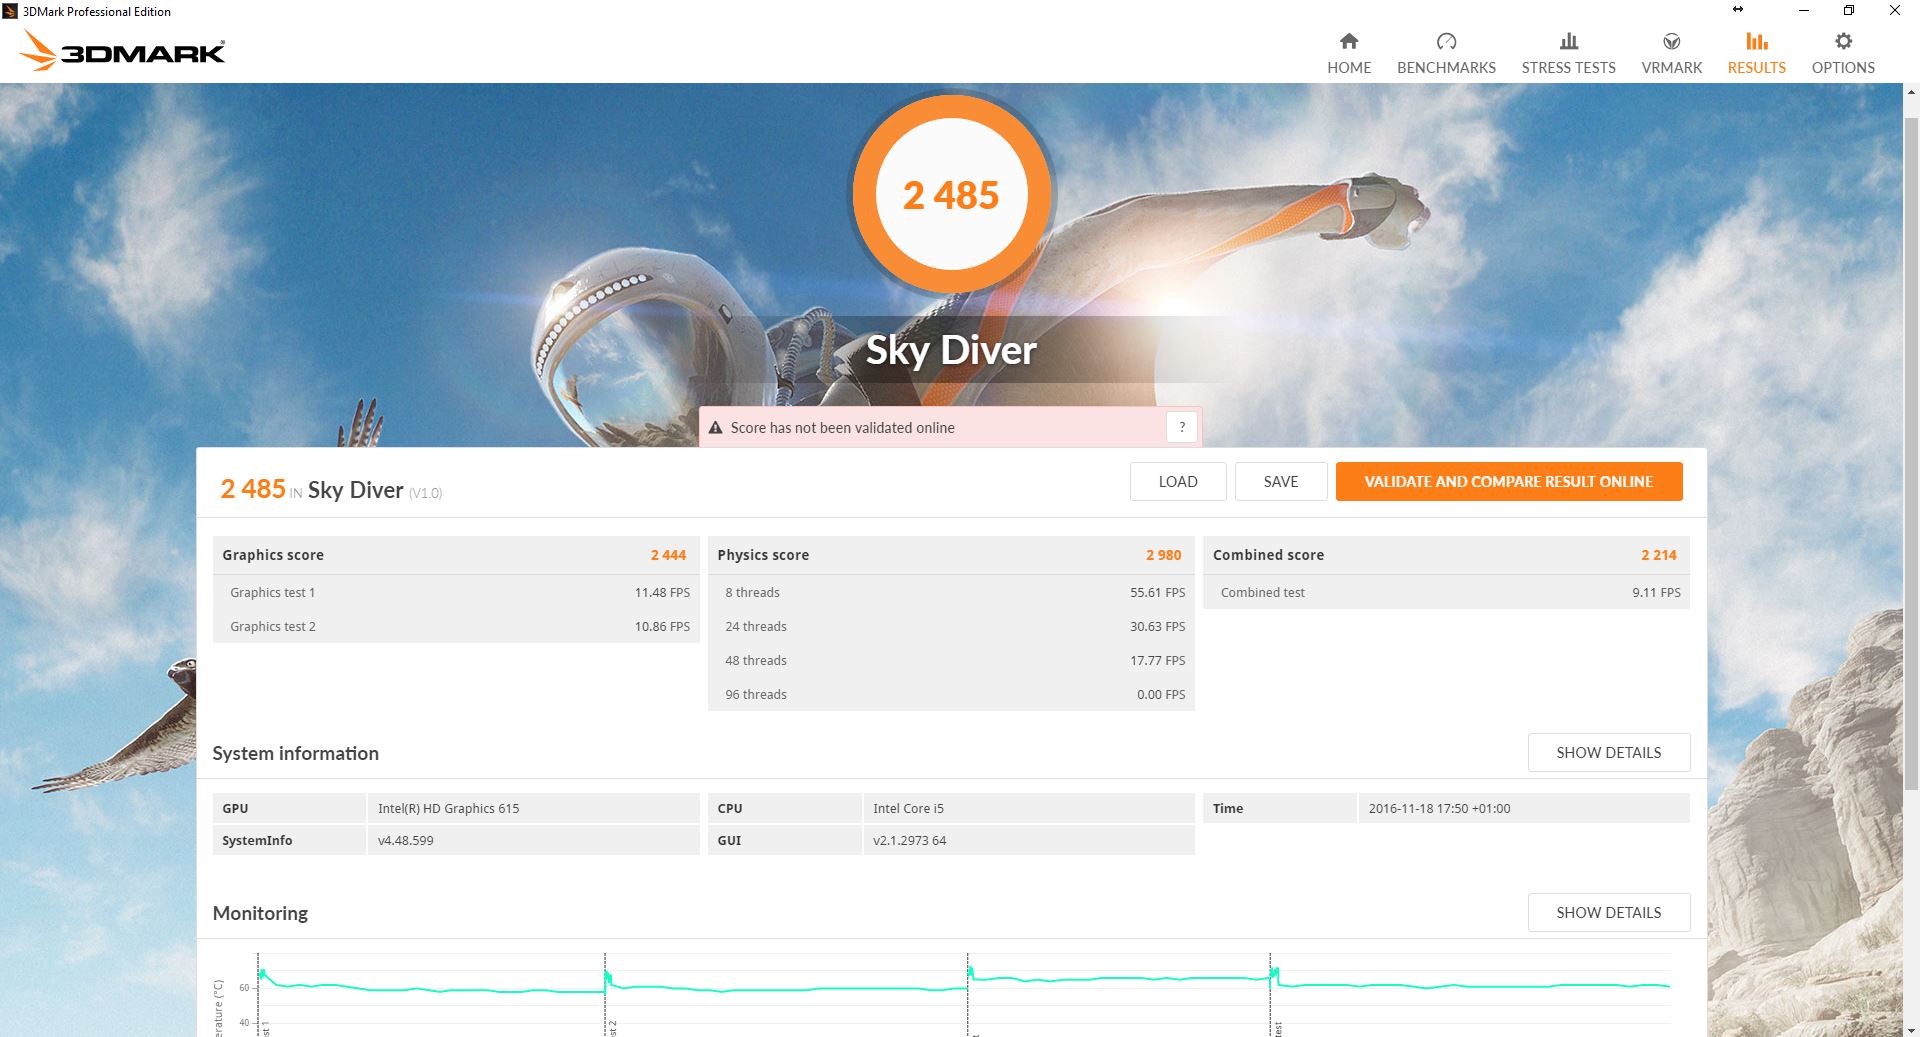
| 3DMark Ice Storm Standard Score | 41566 points | |
| 3DMark Cloud Gate Standard Score | 4113 points | |
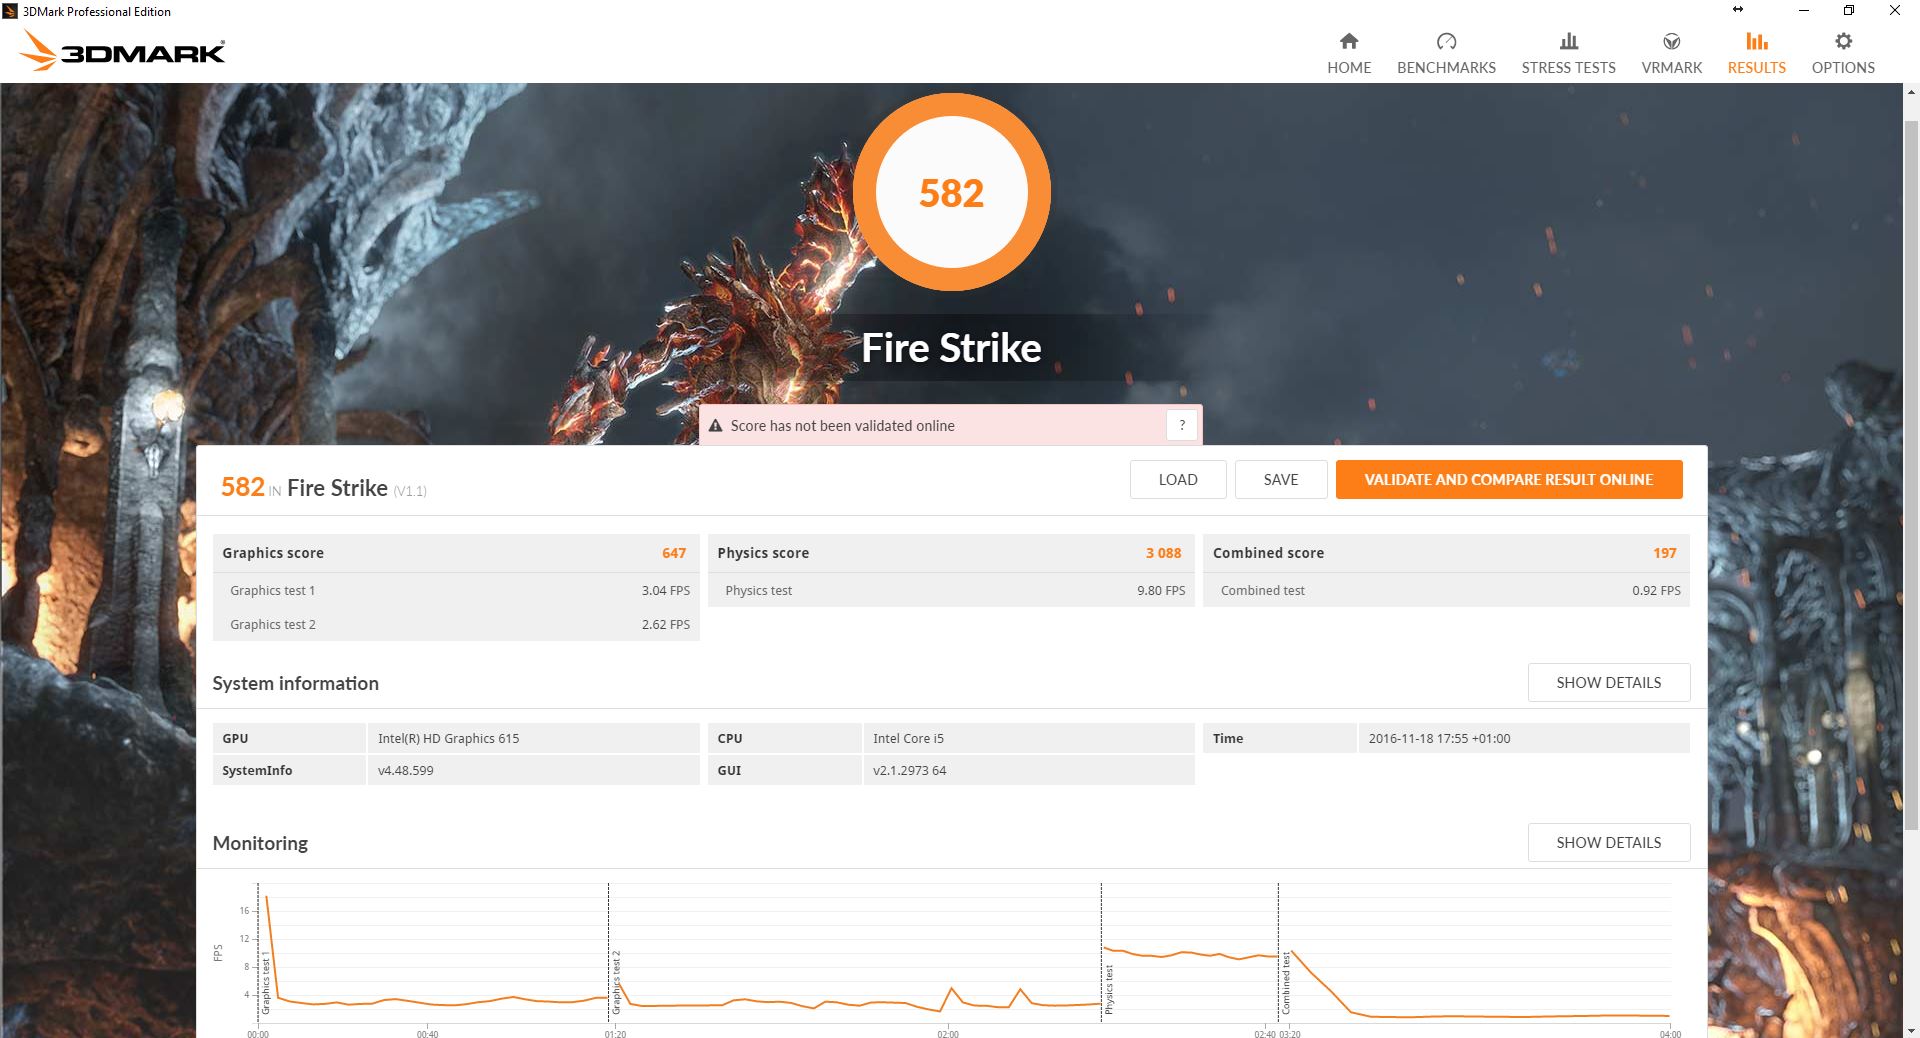
| 3DMark Fire Strike Score | 582 points | |
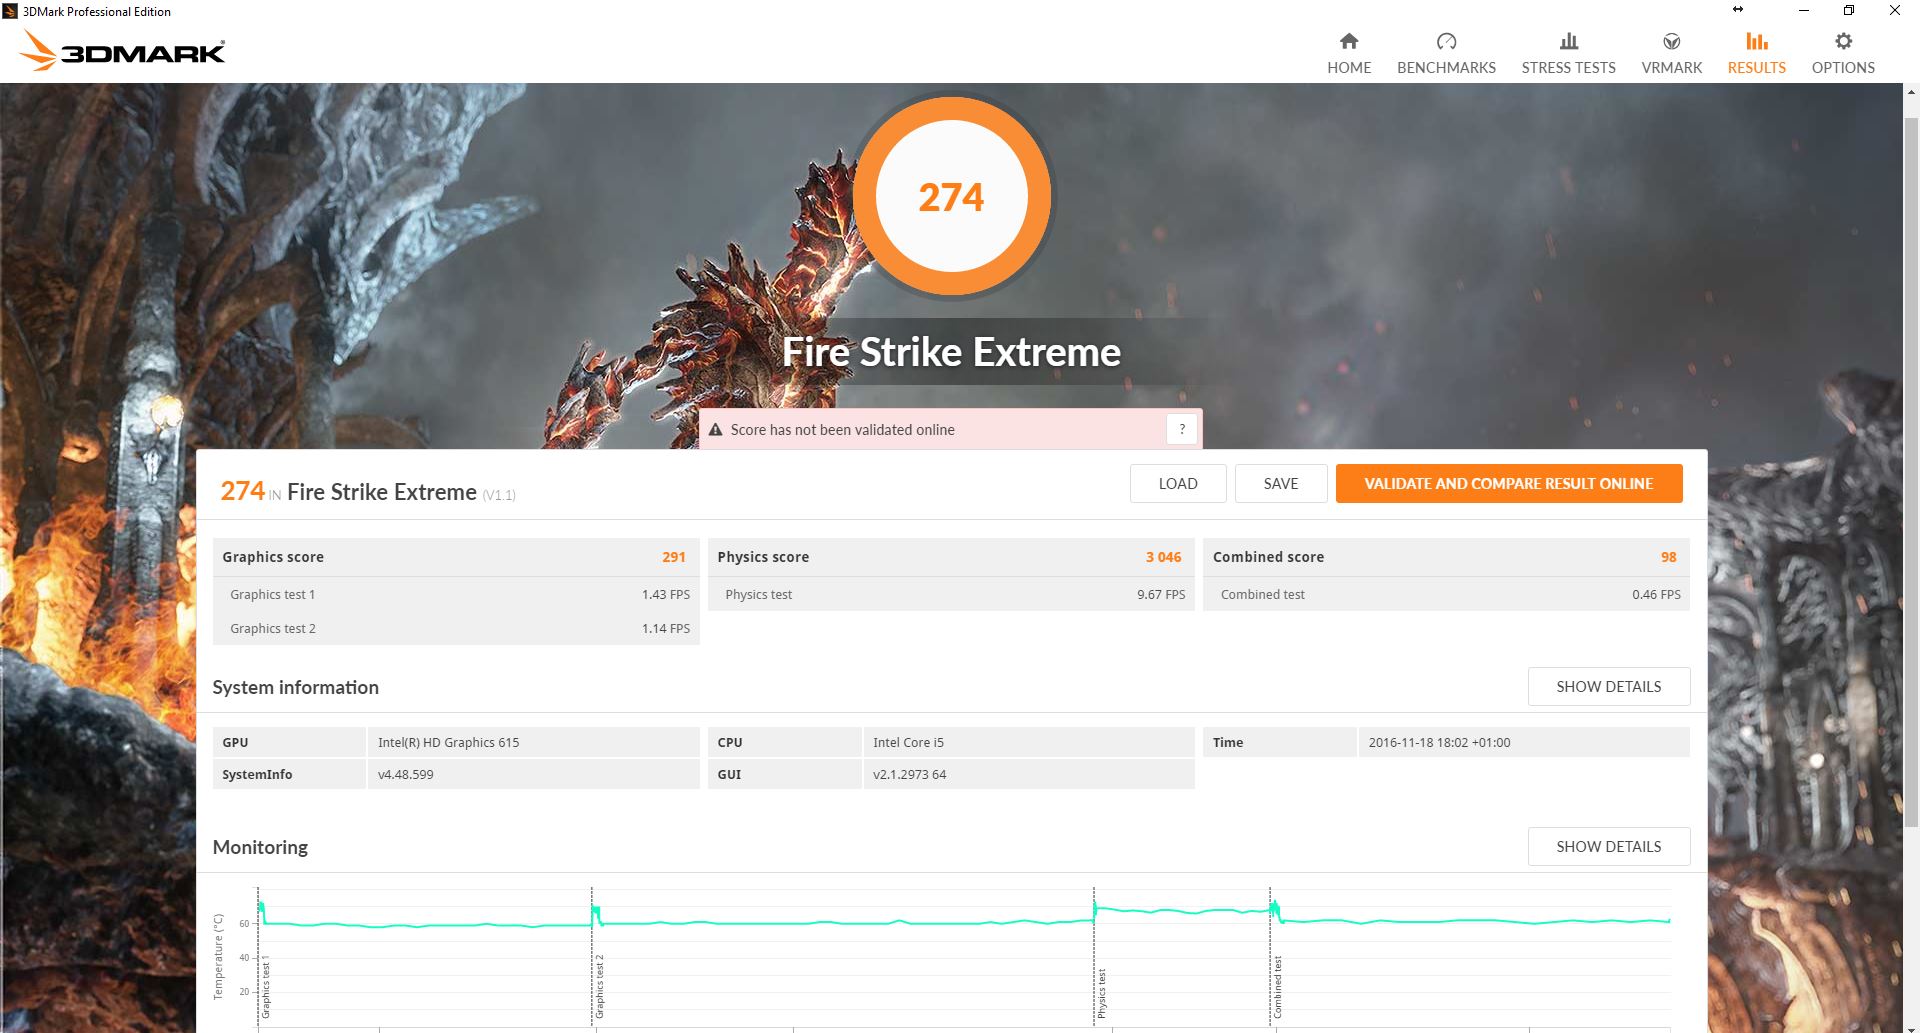
| 3DMark Fire Strike Extreme Score | 274 points | |
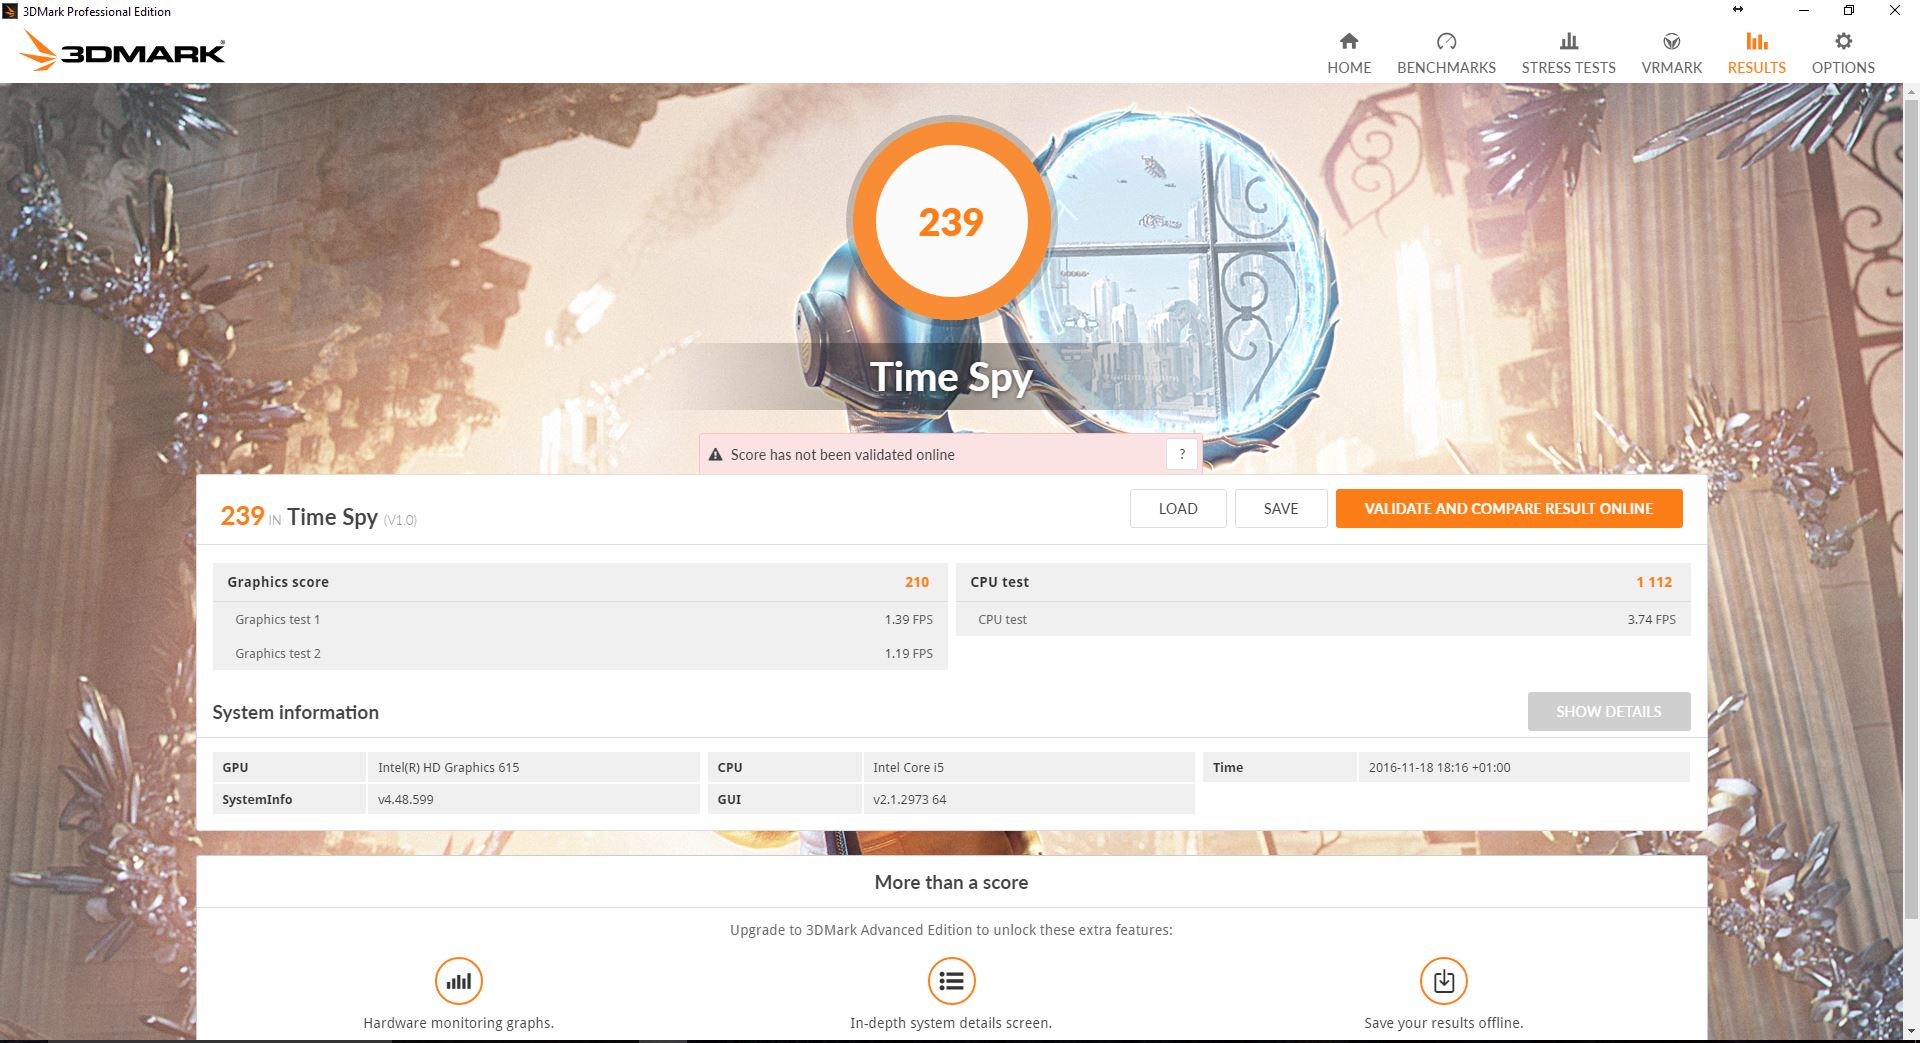
| 3DMark Time Spy Score | 239 points | |
Help | ||
| low | med. | high | ultra | |
|---|---|---|---|---|
| World of Warcraft (2005) | 88.9 | 83.2 | 60.9 | 7.9 |
| BioShock Infinite (2013) | 40.6 | 22.4 | 17.8 | 6 |
| Battlefield 4 (2013) | 29.4 | 18.3 | 17.6 | |
| Sims 4 (2014) | 147.3 | 90 | 41.5 | 28.4 |
| Dota 2 Reborn (2015) | 59.1 | 52.7 | 27.4 | 25.1 |
| Rise of the Tomb Raider (2016) | 13 | 8 |
| Acer Swift 7 SF713-51 HD Graphics 615, i5-7Y54, Kingston RBU-SNS4180S3256GG | Apple MacBook 12 (Early 2016) 1.1 GHz HD Graphics 515, 6Y30, Apple SSD AP0256 | HP EliteBook Folio G1 V1C37EA HD Graphics 515, 6Y54, Samsung SM951 MZVPV256 m.2 | Asus Zenbook UX305CA-FB055T HD Graphics 515, 6Y75, Micron M600 MTFDDAV512MBF M.2 | Acer Spin 7 SP714-51-M09D HD Graphics 615, i5-7Y54, Kingston RBUSNS4180S3256GG | |
|---|---|---|---|---|---|
| Heat | -7% | -10% | 8% | -3% | |
| Maximum Upper Side * (°C) | 45.7 | 39 15% | 42.7 7% | 39.1 14% | 46.5 -2% |
| Maximum Bottom * (°C) | 48.7 | 44 10% | 45.8 6% | 38.7 21% | 45 8% |
| Idle Upper Side * (°C) | 25.5 | 32 -25% | 32.1 -26% | 26 -2% | 27.6 -8% |
| Idle Bottom * (°C) | 25.2 | 32 -27% | 32.3 -28% | 25.7 -2% | 27.1 -8% |
* ... smaller is better
(-) The maximum temperature on the upper side is 45.7 °C / 114 F, compared to the average of 35.9 °C / 97 F, ranging from 21.4 to 59 °C for the class Subnotebook.
(-) The bottom heats up to a maximum of 48.7 °C / 120 F, compared to the average of 39.2 °C / 103 F
(+) In idle usage, the average temperature for the upper side is 23.4 °C / 74 F, compared to the device average of 30.8 °C / 87 F.
(+) The palmrests and touchpad are cooler than skin temperature with a maximum of 28.2 °C / 82.8 F and are therefore cool to the touch.
(±) The average temperature of the palmrest area of similar devices was 28.2 °C / 82.8 F (0 °C / 0 F).
Acer Swift 7 SF713-51 audio analysis
(-) | not very loud speakers (68 dB)
Bass 100 - 315 Hz
(±) | reduced bass - on average 11.9% lower than median
(±) | linearity of bass is average (12.6% delta to prev. frequency)
Mids 400 - 2000 Hz
(±) | higher mids - on average 5.4% higher than median
(+) | mids are linear (6.3% delta to prev. frequency)
Highs 2 - 16 kHz
(+) | balanced highs - only 2.4% away from median
(±) | linearity of highs is average (8.3% delta to prev. frequency)
Overall 100 - 16.000 Hz
(±) | linearity of overall sound is average (18.5% difference to median)
Compared to same class
» 55% of all tested devices in this class were better, 7% similar, 38% worse
» The best had a delta of 5%, average was 18%, worst was 53%
Compared to all devices tested
» 42% of all tested devices were better, 8% similar, 51% worse
» The best had a delta of 4%, average was 23%, worst was 134%
Apple MacBook 12 (Early 2016) 1.1 GHz audio analysis
(+) | speakers can play relatively loud (83.6 dB)
Bass 100 - 315 Hz
(±) | reduced bass - on average 11.3% lower than median
(±) | linearity of bass is average (14.2% delta to prev. frequency)
Mids 400 - 2000 Hz
(+) | balanced mids - only 2.4% away from median
(+) | mids are linear (5.5% delta to prev. frequency)
Highs 2 - 16 kHz
(+) | balanced highs - only 2% away from median
(+) | highs are linear (4.5% delta to prev. frequency)
Overall 100 - 16.000 Hz
(+) | overall sound is linear (10.2% difference to median)
Compared to same class
» 7% of all tested devices in this class were better, 2% similar, 90% worse
» The best had a delta of 5%, average was 18%, worst was 53%
Compared to all devices tested
» 5% of all tested devices were better, 1% similar, 94% worse
» The best had a delta of 4%, average was 23%, worst was 134%
| Off / Standby | |
| Idle | |
| Load |
|
Key:
min: | |
| Acer Swift 7 SF713-51 i5-7Y54, HD Graphics 615, Kingston RBU-SNS4180S3256GG, IPS, WLED, 1920x1080, 13.3" | Apple MacBook 12 (Early 2016) 1.1 GHz 6Y30, HD Graphics 515, Apple SSD AP0256, IPS, 2304x1440, 12" | HP EliteBook Folio G1 V1C37EA 6Y54, HD Graphics 515, Samsung SM951 MZVPV256 m.2, IPS, 1920x1080, 12.5" | Asus Zenbook UX305CA-FB055T 6Y75, HD Graphics 515, Micron M600 MTFDDAV512MBF M.2, IPS, 3200x1800, 13.3" | Acer Spin 7 SP714-51-M09D i5-7Y54, HD Graphics 615, Kingston RBUSNS4180S3256GG, IPS, 1920x1080, 14" | |
|---|---|---|---|---|---|
| Power Consumption | 8% | -20% | -17% | -19% | |
| Idle Minimum * (Watt) | 4.1 | 2.7 34% | 4.3 -5% | 4.2 -2% | 4.3 -5% |
| Idle Average * (Watt) | 6.4 | 2.7 58% | 6 6% | 8.4 -31% | 7.4 -16% |
| Idle Maximum * (Watt) | 6.8 | 7.2 -6% | 6.4 6% | 8.9 -31% | 8 -18% |
| Load Average * (Watt) | 16 | 22 -38% | 22.7 -42% | 15.9 1% | 22.1 -38% |
| Load Maximum * (Watt) | 18.7 | 20.5 -10% | 31.2 -67% | 22.5 -20% | 21.7 -16% |
* ... smaller is better


| Acer Swift 7 SF713-51 i5-7Y54, HD Graphics 615, 41.58 Wh | Apple MacBook 12 (Early 2016) 1.1 GHz 6Y30, HD Graphics 515, 41.4 Wh | HP EliteBook Folio G1 V1C37EA 6Y54, HD Graphics 515, 38 Wh | Asus Zenbook UX305CA-FB055T 6Y75, HD Graphics 515, 45 Wh | Acer Spin 7 SP714-51-M09D i5-7Y54, HD Graphics 615, 42 Wh | |
|---|---|---|---|---|---|
| Battery runtime | 23% | -17% | 6% | -9% | |
| Reader / Idle (h) | 13.2 | 8.8 -33% | 16.9 28% | 12.5 -5% | |
| H.264 (h) | 6.8 | 8.5 25% | 6.9 1% | 7 3% | |
| WiFi v1.3 (h) | 7.3 | 8.4 15% | 5.9 -19% | 6.7 -8% | 6.5 -11% |
| Load (h) | 3 | 3.9 30% | 2.5 -17% | 3 0% | 2.7 -10% |
Pros
Cons
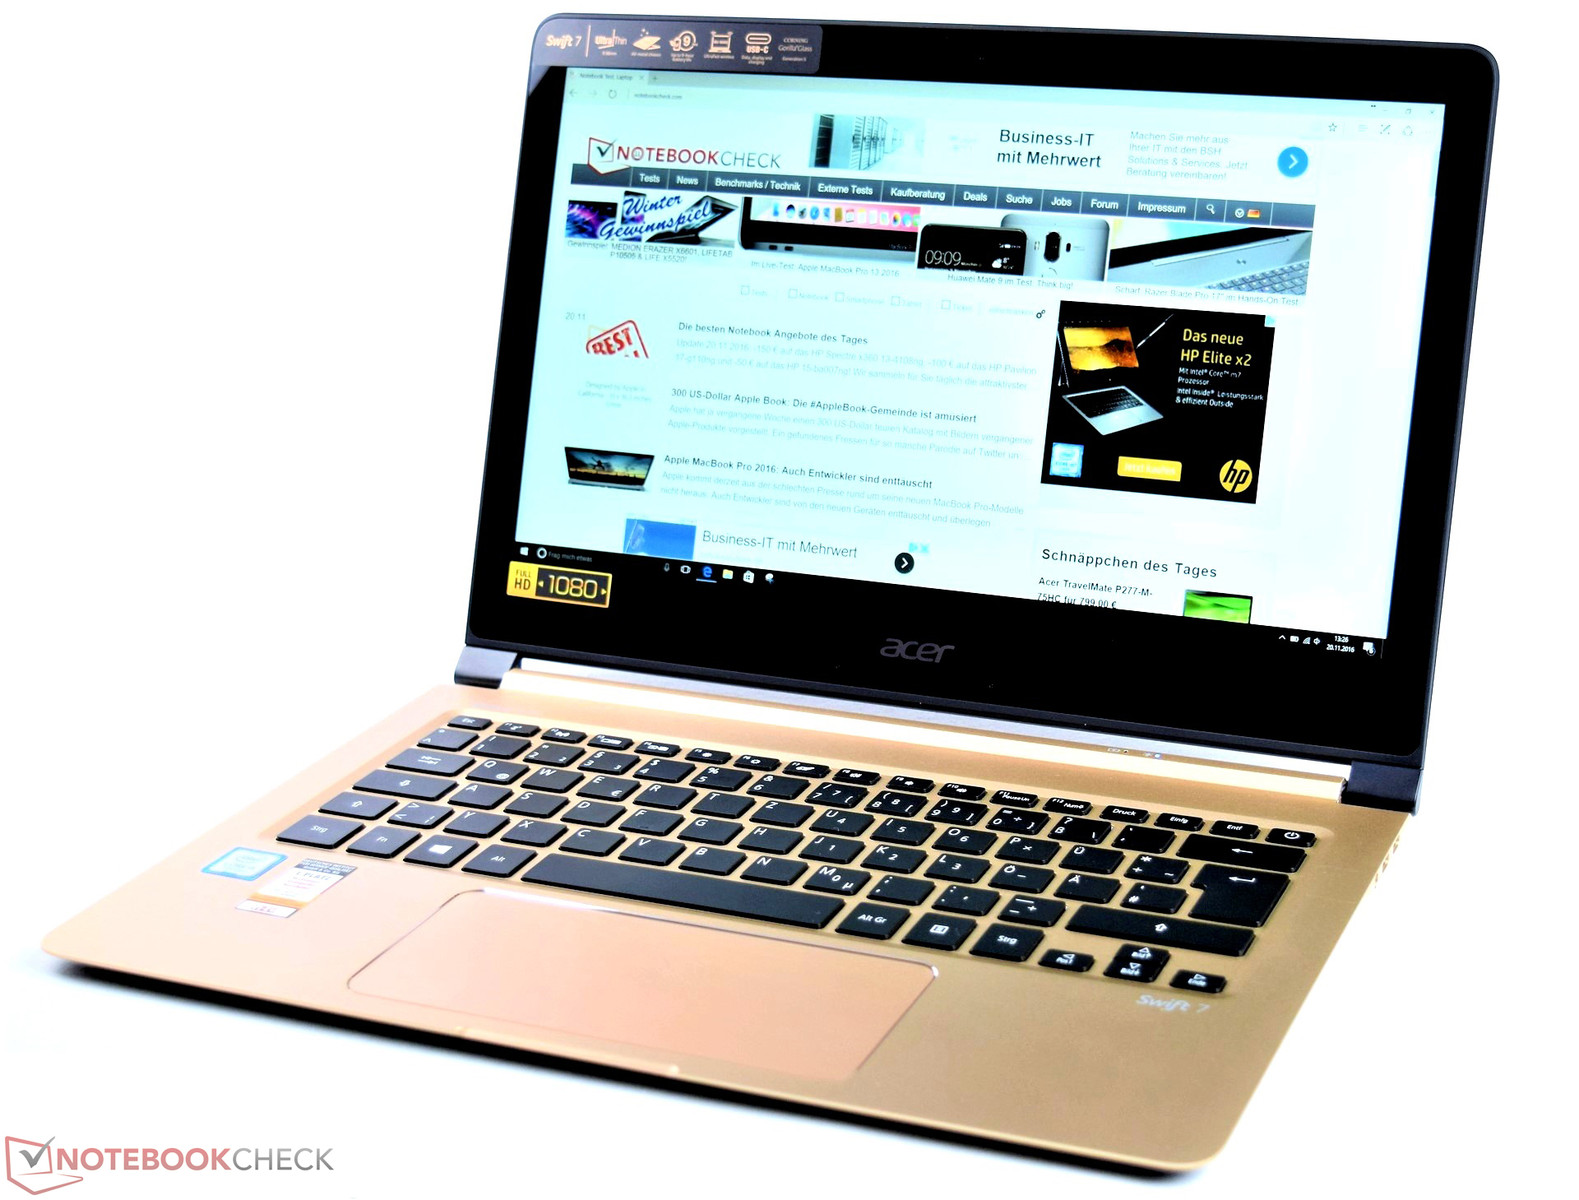
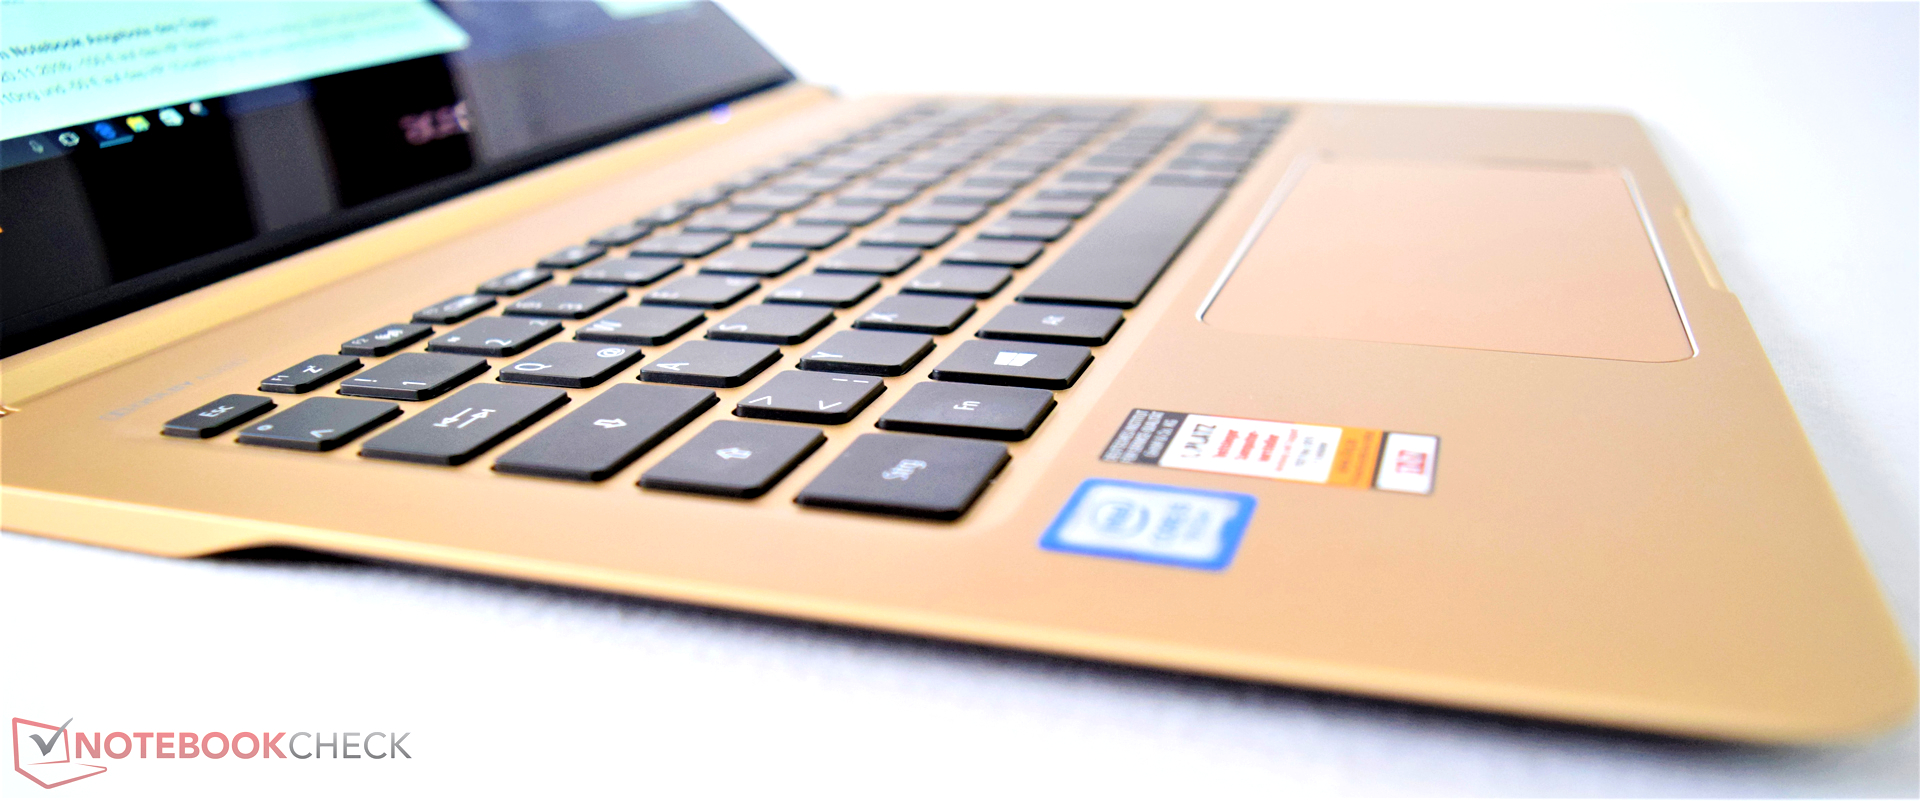
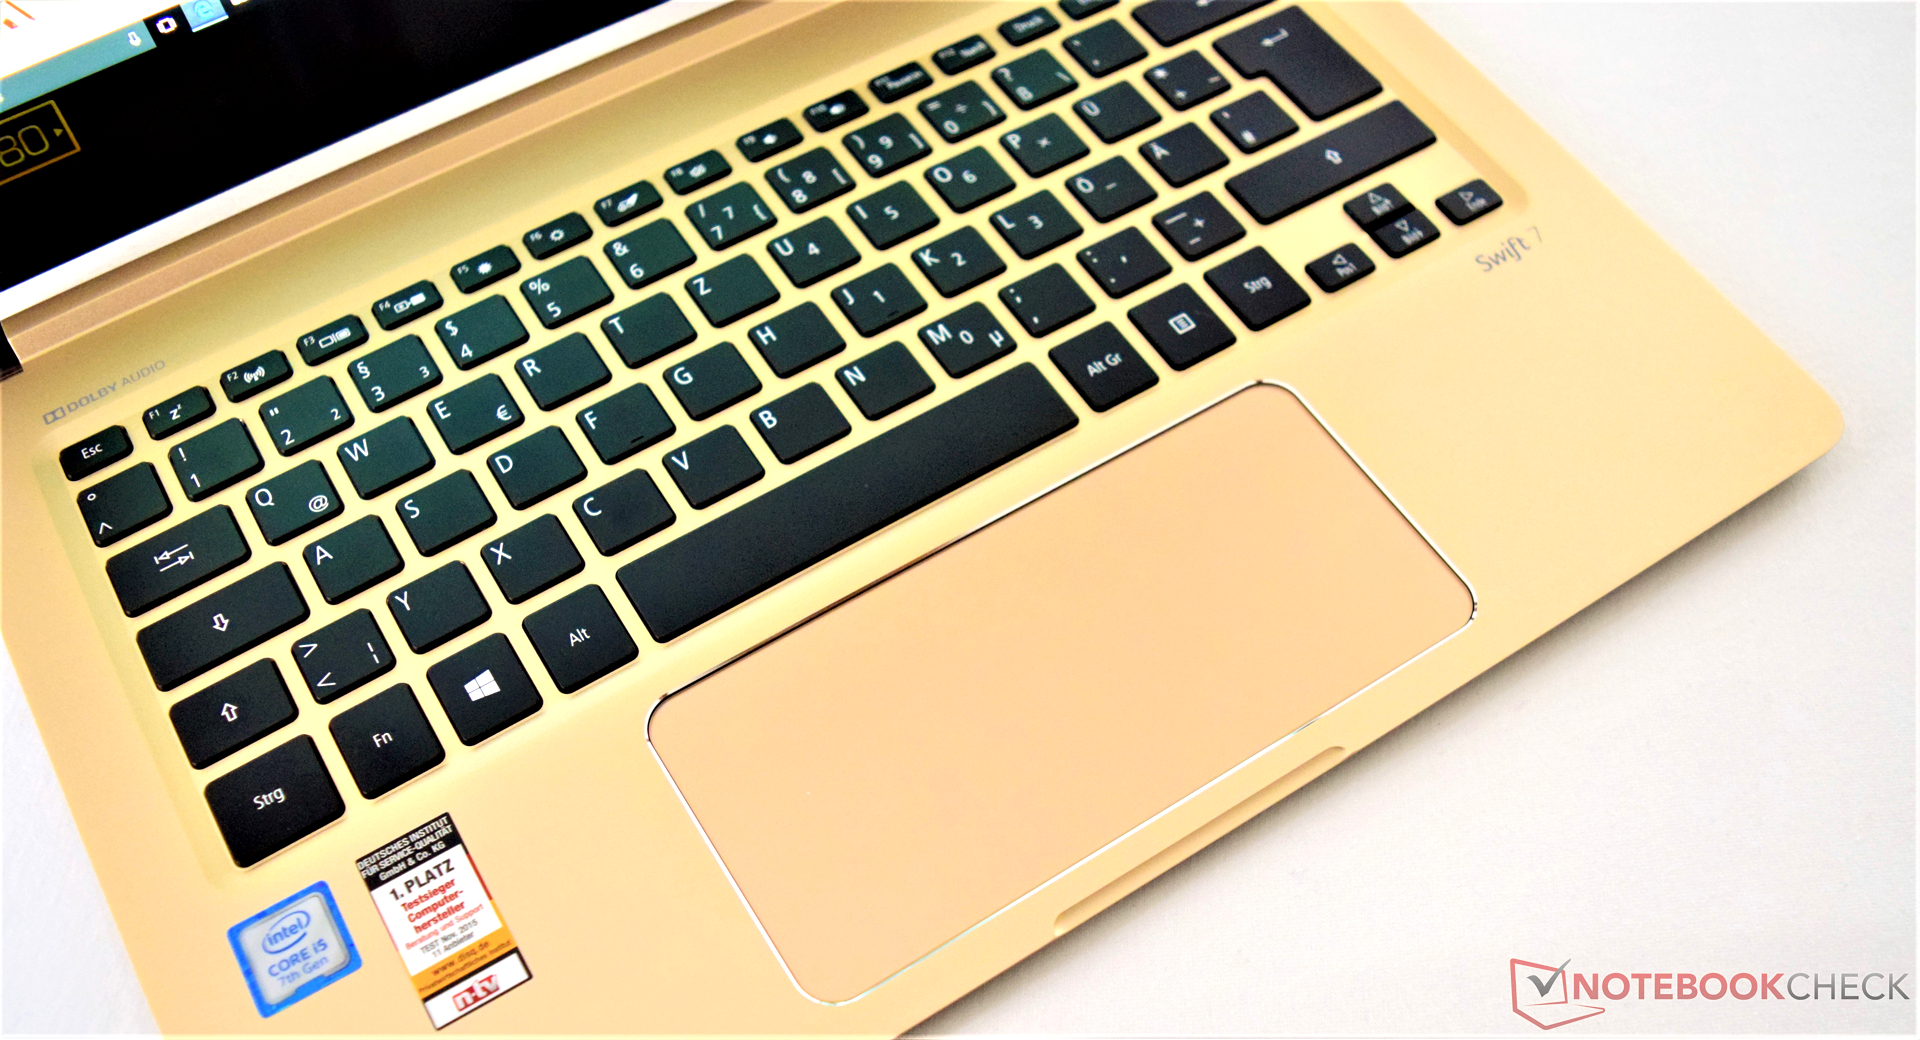
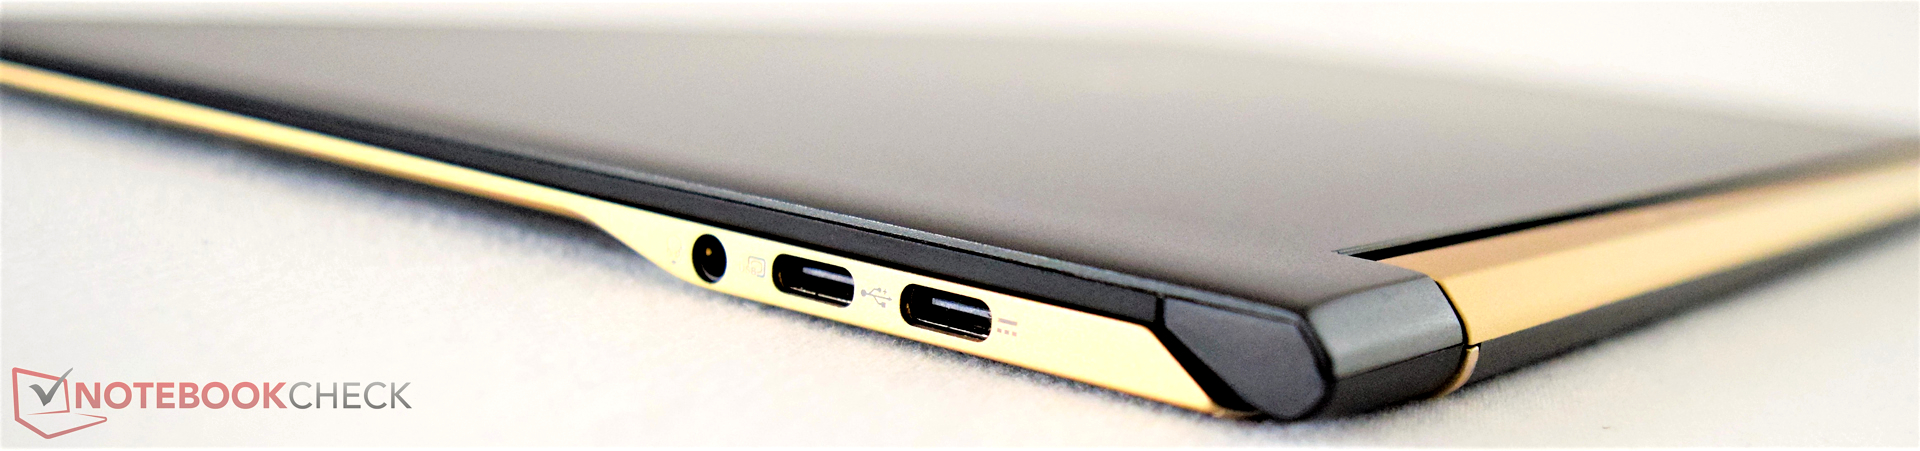
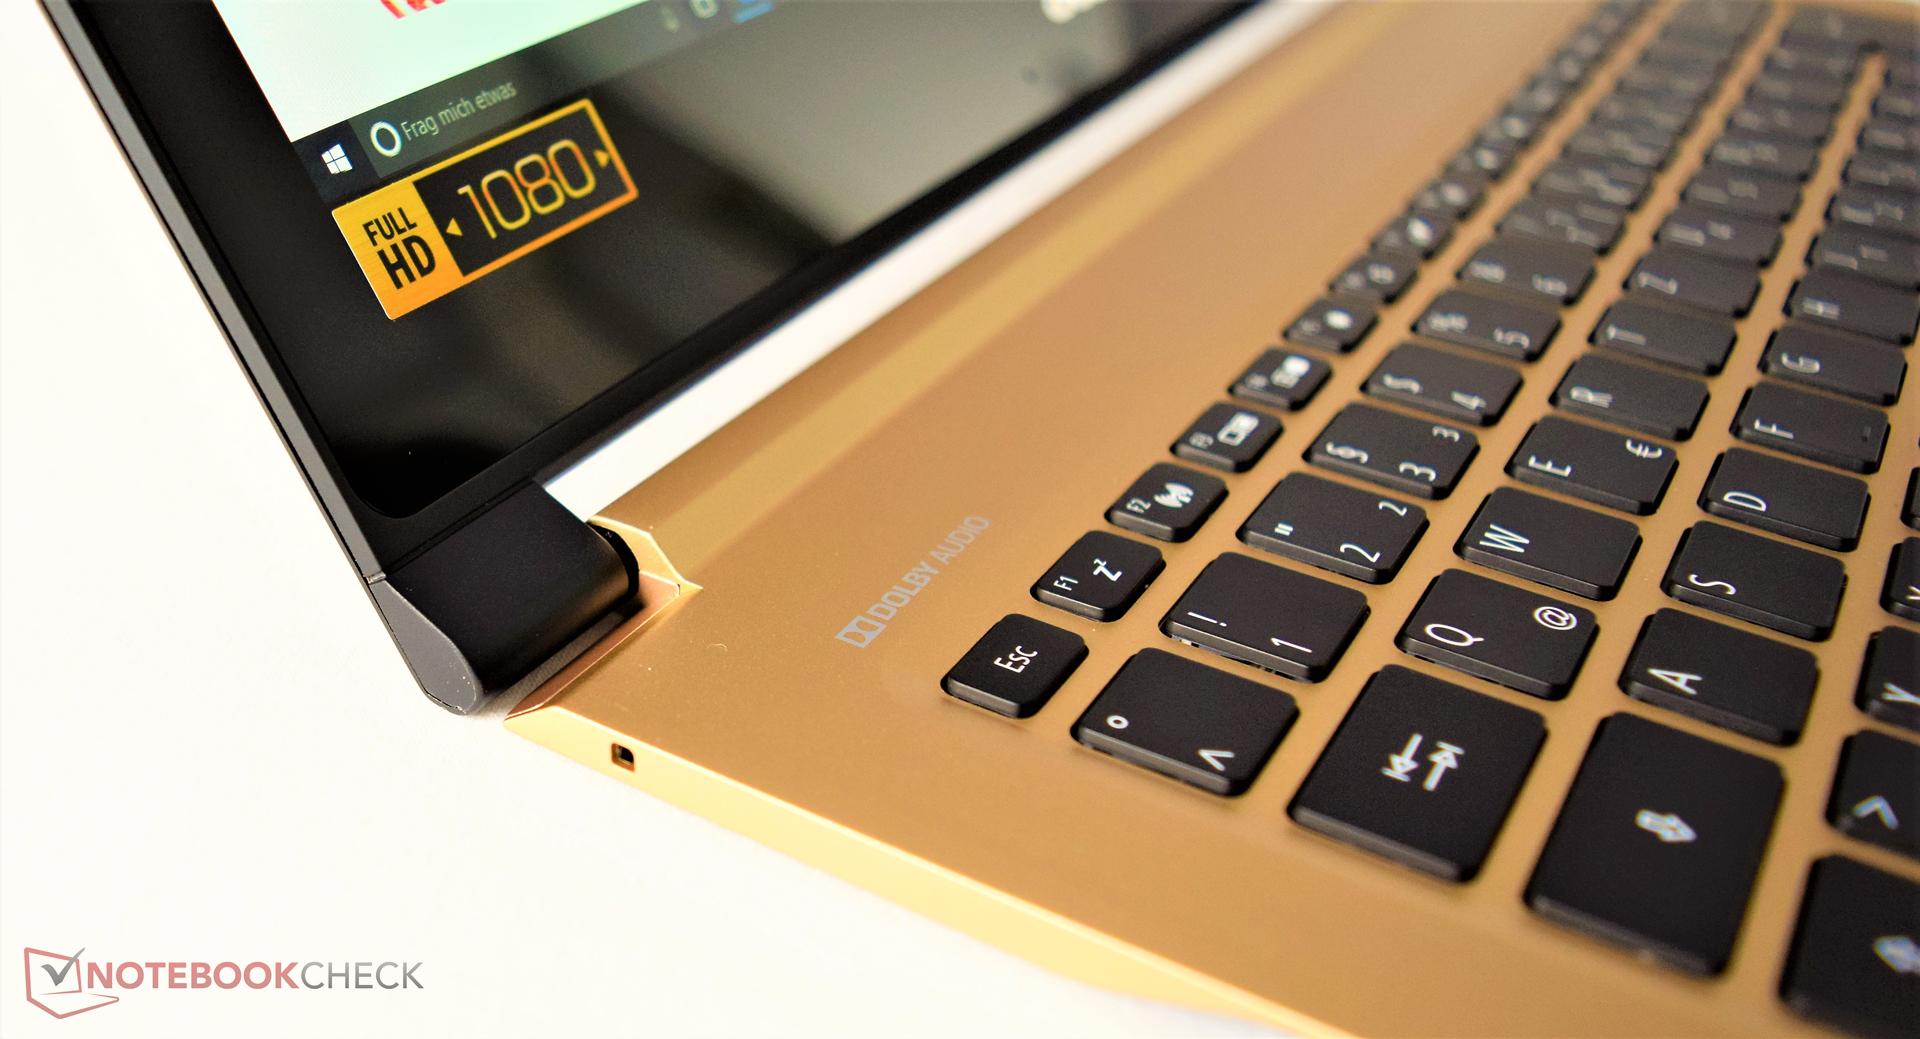
9.98毫米厚的宏碁Swift 7是世界上最薄的笔记本电脑。金色与黑色的搭配也让它机身显得十分美观大方。超薄的平面机身结构十分易于携带。整体上,这台宏碁笔记本电脑十分优秀。它的制造工艺无懈可击,性能也十分优秀(考虑到机身较薄带来的限制)。在这片评测截稿时,它的售价为1300欧元(约9454人民币)。
宏碁Swift 7是一台高品质笔记本电脑,它在我们的测试中表现可靠。它的硬件配置优秀,可以保证系统流畅运行。
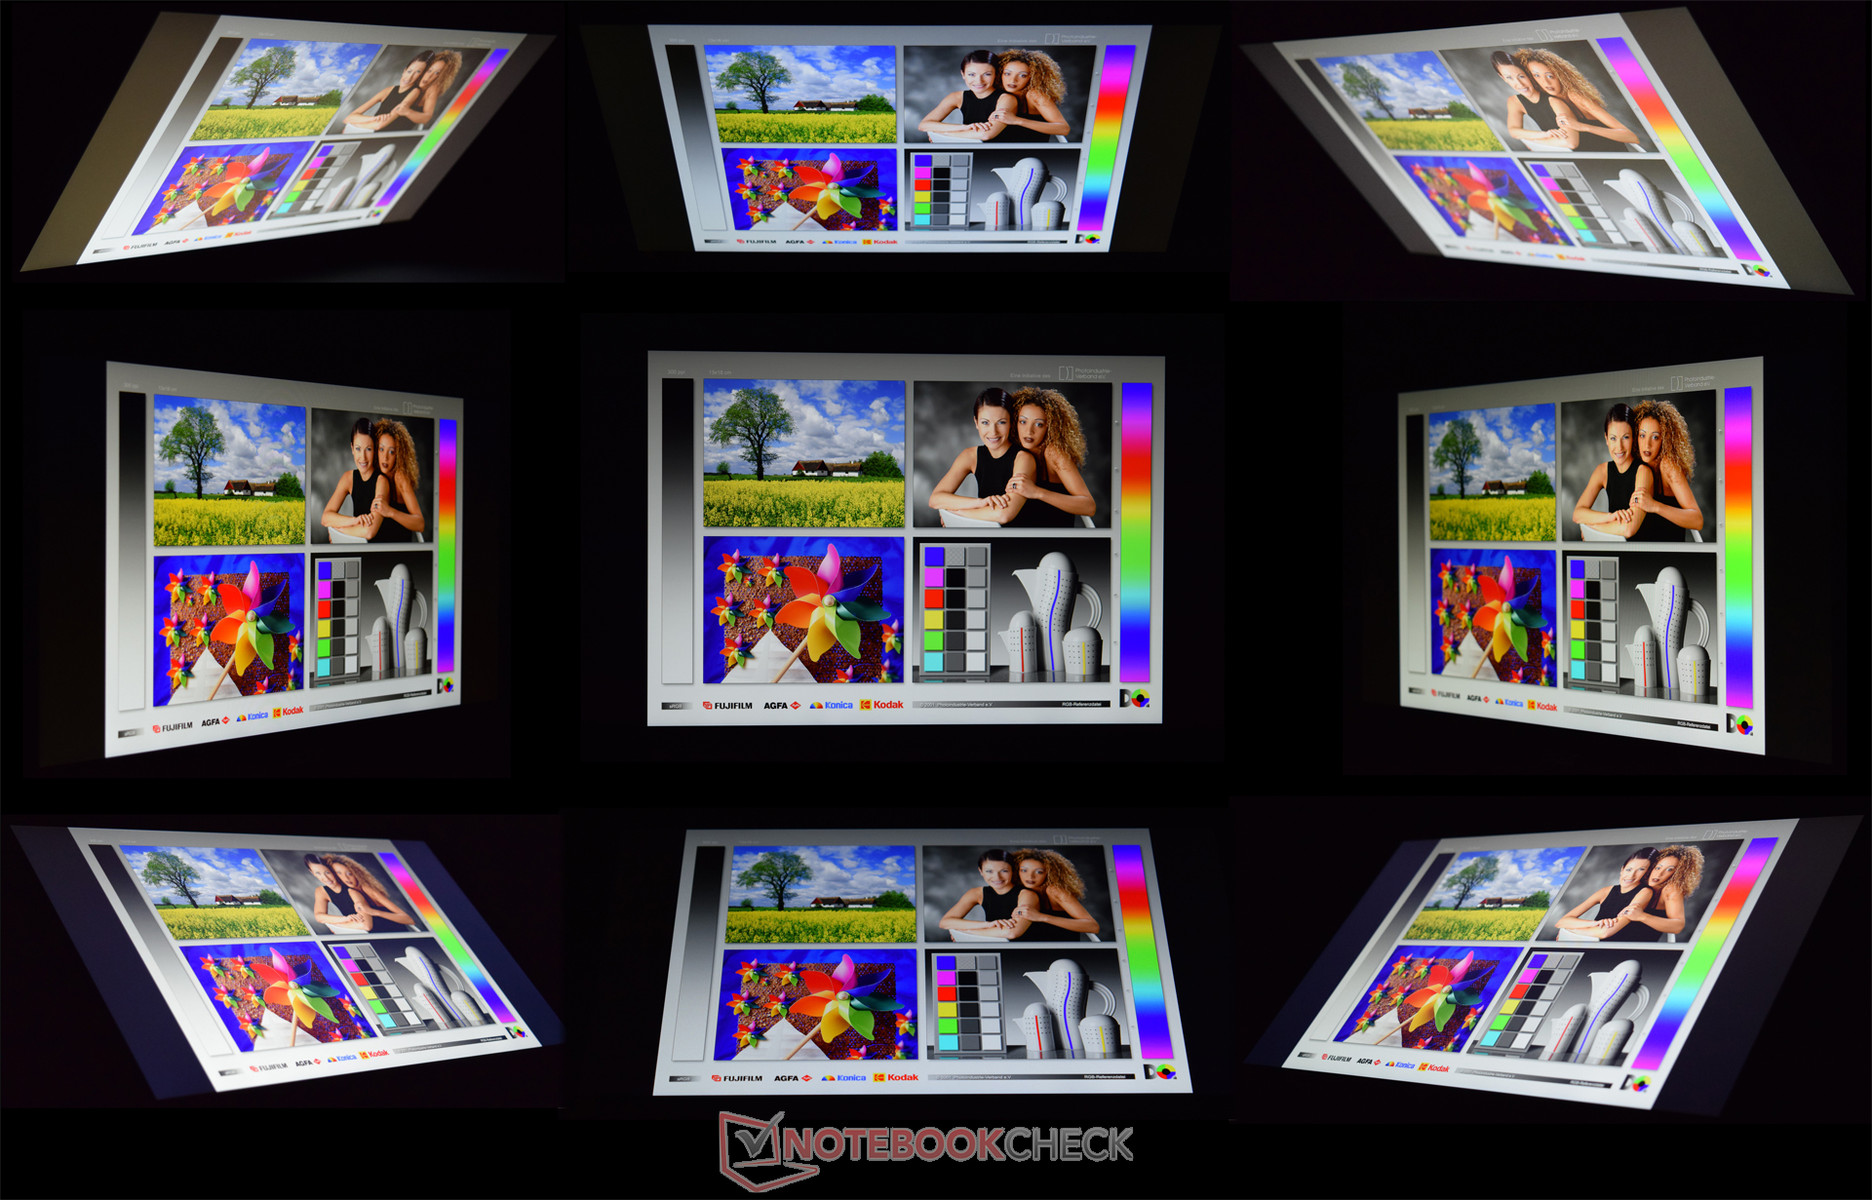
消费者需要在考虑到宏碁Swift 7的性能因素。3D游戏在这台设备上会遇到一些困难。视频编辑也几乎无法进行。这些都是这台设备的不足之处。不过,这也不是宏碁Swift 7的设计重点并不在这里。出色的IPS屏幕面板和低功耗带来的长电池续航(最多7小时)让它可以成为一台雅致便携的笔记本电脑。
注:本文是基于完整评测的缩减版本,阅读完整的英文评测,请点击这里。
Acer Swift 7 SF713-51
- 12/19/2016 v6 (old)
Sebastian Bade