戴尔 XPS 13 9365 (7Y54, QHD+) 变形本简短评测
| Networking | |
| iperf3 transmit AX12 | |
| Dell XPS 13-9365 2-in-1 | |
| HP Spectre x360 13-ac033dx | |
| Dell XPS 13 9365-4537 2-in-1 | |
| iperf3 receive AX12 | |
| HP Spectre x360 13-ac033dx | |
| Dell XPS 13-9365 2-in-1 | |
| Dell XPS 13 9365-4537 2-in-1 | |
| |||||||||||||||||||||||||
Brightness Distribution: 78 %
Center on Battery: 348 cd/m²
Contrast: 1740:1 (Black: 0.2 cd/m²)
ΔE ColorChecker Calman: 2.79 | ∀{0.5-29.43 Ø4.72}
ΔE Greyscale Calman: 3.47 | ∀{0.09-98 Ø4.97}
93% sRGB (Argyll 1.6.3 3D)
60% AdobeRGB 1998 (Argyll 1.6.3 3D)
66.1% AdobeRGB 1998 (Argyll 3D)
92.9% sRGB (Argyll 3D)
64.4% Display P3 (Argyll 3D)
Gamma: 2.54
CCT: 6564 K
| Dell XPS 13 9365-4537 2-in-1 IPS, 3200x1800, 13.3" | Dell XPS 13-9365 2-in-1 IPS, 1920x1080, 13.3" | HP Spectre x360 13-ac033dx IPS, 3840x2160, 13.3" | Lenovo Yoga 910-13IKB-80VF004CGE IPS, 3840x2160, 13.9" | |
|---|---|---|---|---|
| Display | -25% | 7% | -3% | |
| Display P3 Coverage (%) | 64.4 | 47.32 -27% | 69.4 8% | 62.2 -3% |
| sRGB Coverage (%) | 92.9 | 71.1 -23% | 96.8 4% | 90.1 -3% |
| AdobeRGB 1998 Coverage (%) | 66.1 | 48.83 -26% | 71.1 8% | 63.5 -4% |
| Response Times | -9% | -1% | 9% | |
| Response Time Grey 50% / Grey 80% * (ms) | 48 ? | 48 ? -0% | 42 ? 12% | 46 ? 4% |
| Response Time Black / White * (ms) | 28 ? | 32.8 ? -17% | 32 ? -14% | 24 ? 14% |
| PWM Frequency (Hz) | 1042 ? | |||
| Screen | -44% | -1% | -51% | |
| Brightness middle (cd/m²) | 348 | 322.6 -7% | 302.6 -13% | 348 0% |
| Brightness (cd/m²) | 306 | 306 0% | 282 -8% | 310 1% |
| Brightness Distribution (%) | 78 | 91 17% | 83 6% | 80 3% |
| Black Level * (cd/m²) | 0.2 | 0.19 5% | 0.25 -25% | 0.25 -25% |
| Contrast (:1) | 1740 | 1698 -2% | 1210 -30% | 1392 -20% |
| Colorchecker dE 2000 * | 2.79 | 7.7 -176% | 2.4 14% | 7.86 -182% |
| Colorchecker dE 2000 max. * | 5.53 | 11.1 -101% | 4.9 11% | 13.43 -143% |
| Greyscale dE 2000 * | 3.47 | 7.9 -128% | 2.8 19% | 8.25 -138% |
| Gamma | 2.54 87% | 2.88 76% | 2.2 100% | 2.05 107% |
| CCT | 6564 99% | 7044 92% | 6333 103% | 6834 95% |
| Color Space (Percent of AdobeRGB 1998) (%) | 60 | 44.1 -26% | 65.5 9% | 58 -3% |
| Color Space (Percent of sRGB) (%) | 93 | 69.9 -25% | 97.1 4% | 90 -3% |
| Total Average (Program / Settings) | -26% /
-36% | 2% /
0% | -15% /
-33% |
* ... smaller is better
Screen Flickering / PWM (Pulse-Width Modulation)
| Screen flickering / PWM not detected | ||
In comparison: 52 % of all tested devices do not use PWM to dim the display. If PWM was detected, an average of 7763 (minimum: 5 - maximum: 343500) Hz was measured. | ||
Display Response Times
| ↔ Response Time Black to White | ||
|---|---|---|
| 28 ms ... rise ↗ and fall ↘ combined | ↗ 16 ms rise | 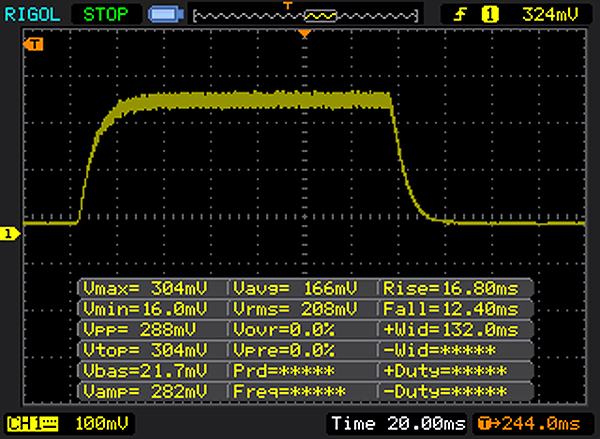 |
| ↘ 12 ms fall | ||
| The screen shows relatively slow response rates in our tests and may be too slow for gamers. In comparison, all tested devices range from 0.1 (minimum) to 240 (maximum) ms. » 71 % of all devices are better. This means that the measured response time is worse than the average of all tested devices (19.8 ms). | ||
| ↔ Response Time 50% Grey to 80% Grey | ||
| 48 ms ... rise ↗ and fall ↘ combined | ↗ 26 ms rise | 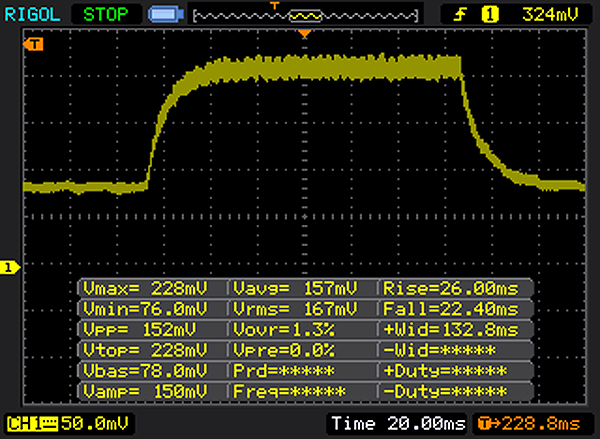 |
| ↘ 22 ms fall | ||
| The screen shows slow response rates in our tests and will be unsatisfactory for gamers. In comparison, all tested devices range from 0.165 (minimum) to 636 (maximum) ms. » 82 % of all devices are better. This means that the measured response time is worse than the average of all tested devices (31 ms). | ||
| Cinebench R10 | |
| Rendering Multiple CPUs 32Bit | |
| HP Spectre x360 13-ac033dx | |
| Dell XPS 13-9365 2-in-1 | |
| Dell XPS 13 9365-4537 2-in-1 | |
| Rendering Single 32Bit | |
| HP Spectre x360 13-ac033dx | |
| Dell XPS 13-9365 2-in-1 | |
| Dell XPS 13 9365-4537 2-in-1 | |
| Geekbench 3 | |
| 32 Bit Multi-Core Score | |
| Dell XPS 13 9365-4537 2-in-1 | |
| 32 Bit Single-Core Score | |
| Dell XPS 13 9365-4537 2-in-1 | |
| Geekbench 4.0 | |
| 64 Bit Multi-Core Score | |
| Dell XPS 13 9365-4537 2-in-1 | |
| 64 Bit Single-Core Score | |
| Dell XPS 13 9365-4537 2-in-1 | |
| Geekbench 4.4 | |
| 64 Bit Multi-Core Score | |
| Dell XPS 13 9365-4537 2-in-1 | |
| 64 Bit Single-Core Score | |
| Dell XPS 13 9365-4537 2-in-1 | |
| JetStream 1.1 - 1.1 Total | |
| Lenovo Yoga 910-13IKB-80VF004CGE | |
| HP Spectre x360 13-ac033dx | |
| Dell XPS 13 9365-4537 2-in-1 | |
| Dell XPS 13-9365 2-in-1 | |
| PCMark 8 Home Score Accelerated v2 | 2706 points | |
Help | ||
| PCMark 8 - Home Score Accelerated v2 | |
| Lenovo Yoga 910-13IKB-80VF004CGE | |
| Dell XPS 13-9365 2-in-1 | |
| HP Spectre x360 13-ac033dx | |
| Dell XPS 13 9365-4537 2-in-1 | |

| Dell XPS 13 9365-4537 2-in-1 Toshiba NVMe THNSN5256GPUK | Dell XPS 13-9365 2-in-1 Toshiba NVMe THNSN5256GPUK | HP Spectre x360 13-ac033dx Samsung PM961 NVMe MZVLW512HMJP | Lenovo Yoga 910-13IKB-80VF004CGE Samsung PM951 NVMe MZVLV512 | |
|---|---|---|---|---|
| CrystalDiskMark 3.0 | 31% | 114% | 58% | |
| Read Seq (MB/s) | 1159 | 1206 4% | 2065 78% | 1412 22% |
| Write Seq (MB/s) | 324.1 | 629 94% | 1550 378% | 578 78% |
| Read 512 (MB/s) | 528 | 966 83% | 865 64% | 701 33% |
| Write 512 (MB/s) | 373.7 | 410.7 10% | 1229 229% | 580 55% |
| Read 4k (MB/s) | 29.26 | 32.93 13% | 54.7 87% | 43.5 49% |
| Write 4k (MB/s) | 108.3 | 121.2 12% | 139.4 29% | 159.7 47% |
| Read 4k QD32 (MB/s) | 335.9 | 411 22% | 518 54% | 570 70% |
| Write 4k QD32 (MB/s) | 234.1 | 250.2 7% | 225.6 -4% | 488.7 109% |
| 3DMark 11 Performance | 1272 points | |
Help | ||
| 3DMark 11 - 1280x720 Performance GPU | |
| Lenovo Yoga 910-13IKB-80VF004CGE | |
| HP Spectre x360 13-ac033dx | |
| Dell XPS 13-9365 2-in-1 | |
| Dell XPS 13 9365-4537 2-in-1 | |
| low | med. | high | ultra | |
|---|---|---|---|---|
| Diablo III (2012) | 55.8 | 36.3 | 30.1 | 17.8 |
| Counter-Strike: GO (2012) | 99.9 | 57.3 | 39.5 | 21.9 |
| BioShock Infinite (2013) | 31.4 | 20.4 | 19.3 | 6.1 |
| GRID: Autosport (2014) | 74.9 | 24.6 | ||
| F1 2014 (2014) | 55 | 34 | ||
| GTA V (2015) | 19.9 | 16.7 | ||
| World of Warships (2015) | 49.9 | 30.2 | ||
| Anno 2205 (2015) | 15.9 | 10.2 | ||
| Rainbow Six Siege (2015) | 24.6 | 16.2 | ||
| Far Cry Primal (2016) | 12 | 5 | ||
| Mirror's Edge Catalyst (2016) | 15.5 | 9 | ||
| Civilization 6 (2016) | 20.6 | 9.2 | ||
| Farming Simulator 17 (2016) | 70.2 | 45.1 | ||
| Titanfall 2 (2016) | 19.9 | 15.9 | ||
| Resident Evil 7 (2017) | 22.2 | 9.5 | ||
| For Honor (2017) | 16.8 | 6.2 | ||
| Ghost Recon Wildlands (2017) | 9.8 | 4 | ||
| Warhammer 40.000: Dawn of War III (2017) | 11.6 | 4 | ||
| Prey (2017) | 14.3 | 6.6 |
(±) The maximum temperature on the upper side is 43.1 °C / 110 F, compared to the average of 35.4 °C / 96 F, ranging from 19.6 to 60 °C for the class Convertible.
(±) The bottom heats up to a maximum of 41.7 °C / 107 F, compared to the average of 36.9 °C / 98 F
(+) In idle usage, the average temperature for the upper side is 22.7 °C / 73 F, compared to the device average of 30.3 °C / 87 F.
(+) The palmrests and touchpad are cooler than skin temperature with a maximum of 26.8 °C / 80.2 F and are therefore cool to the touch.
(±) The average temperature of the palmrest area of similar devices was 28 °C / 82.4 F (+1.2 °C / 2.2 F).
Dell XPS 13 9365-4537 2-in-1 audio analysis
(±) | speaker loudness is average but good (73 dB)
Bass 100 - 315 Hz
(±) | reduced bass - on average 14.8% lower than median
(+) | bass is linear (4.5% delta to prev. frequency)
Mids 400 - 2000 Hz
(±) | higher mids - on average 5.2% higher than median
(+) | mids are linear (5.1% delta to prev. frequency)
Highs 2 - 16 kHz
(+) | balanced highs - only 3.4% away from median
(±) | linearity of highs is average (7.4% delta to prev. frequency)
Overall 100 - 16.000 Hz
(±) | linearity of overall sound is average (17.4% difference to median)
Compared to same class
» 33% of all tested devices in this class were better, 8% similar, 59% worse
» The best had a delta of 6%, average was 20%, worst was 57%
Compared to all devices tested
» 33% of all tested devices were better, 8% similar, 59% worse
» The best had a delta of 4%, average was 24%, worst was 134%
Apple MacBook 12 (Early 2016) 1.1 GHz audio analysis
(+) | speakers can play relatively loud (83.6 dB)
Bass 100 - 315 Hz
(±) | reduced bass - on average 11.3% lower than median
(±) | linearity of bass is average (14.2% delta to prev. frequency)
Mids 400 - 2000 Hz
(+) | balanced mids - only 2.4% away from median
(+) | mids are linear (5.5% delta to prev. frequency)
Highs 2 - 16 kHz
(+) | balanced highs - only 2% away from median
(+) | highs are linear (4.5% delta to prev. frequency)
Overall 100 - 16.000 Hz
(+) | overall sound is linear (10.2% difference to median)
Compared to same class
» 7% of all tested devices in this class were better, 2% similar, 91% worse
» The best had a delta of 5%, average was 18%, worst was 53%
Compared to all devices tested
» 5% of all tested devices were better, 1% similar, 94% worse
» The best had a delta of 4%, average was 24%, worst was 134%
| Off / Standby | |
| Idle | |
| Load |
|
Key:
min: | |
| Battery Runtime - WiFi Websurfing | |
| Dell XPS 13-9365 2-in-1 | |
| Lenovo Yoga 910-13IKB-80VF004CGE | |
| HP Spectre x360 13-ac033dx | |
| Dell XPS 13 9365-4537 2-in-1 | |
Pros
Cons
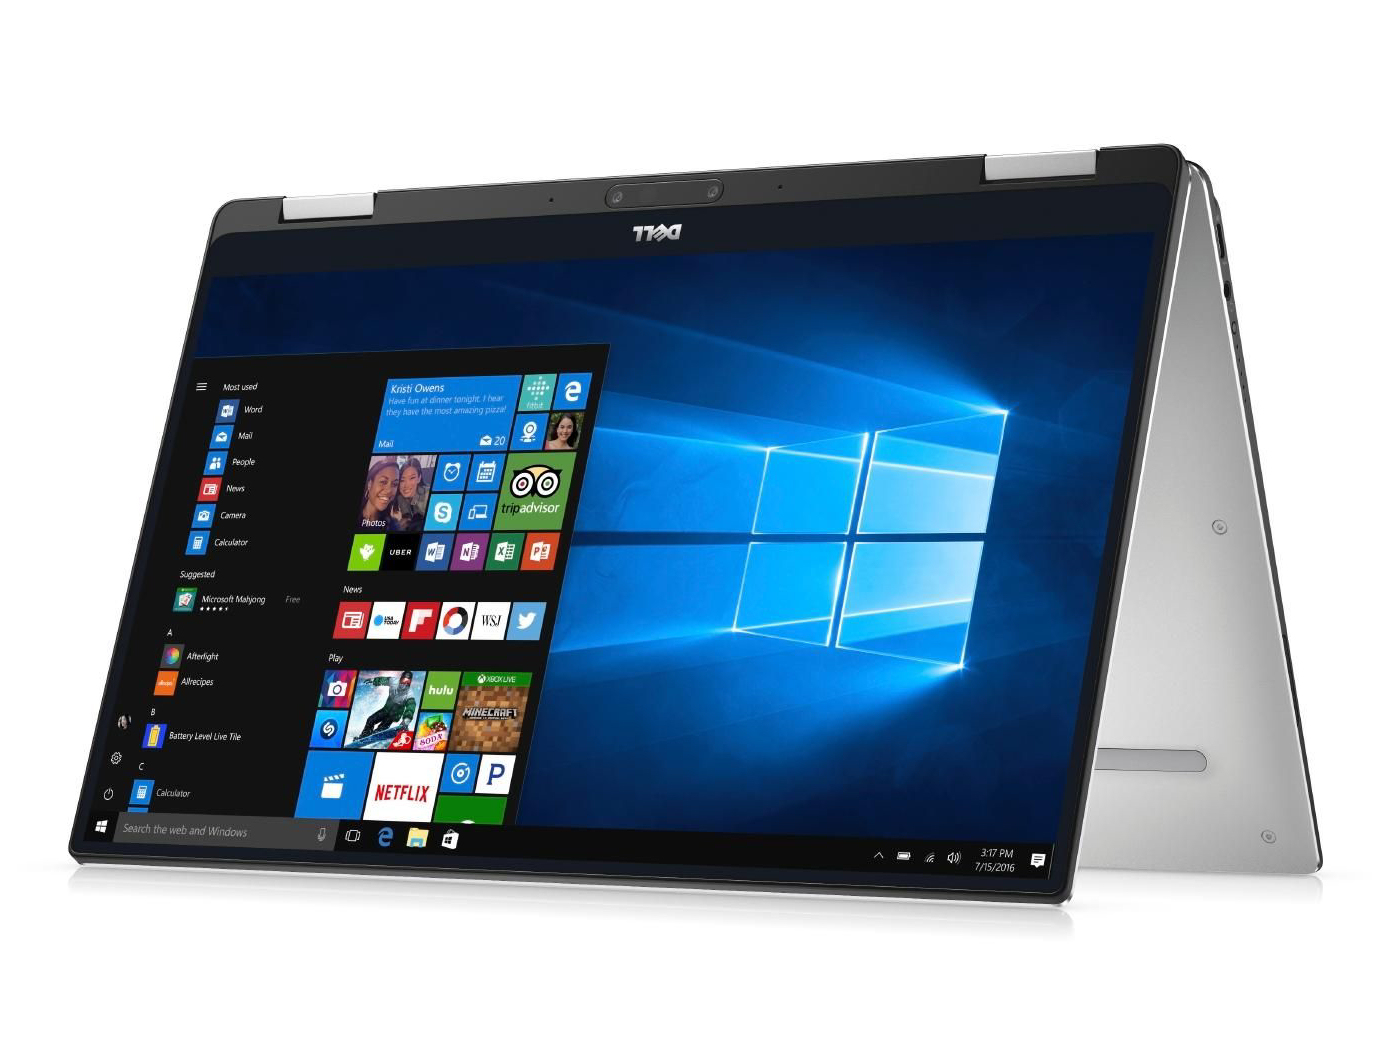
我们所测试戴尔 XPS 13是配备 酷睿 i5-7Y54 处理器的机型。它并没有比 同系列机型 上配备的名义上更强酷睿i7差别不大。毕竟,由于被动冷却,两个处理器都难以达到最大速度,在测试结果中,它们很大程度上处于同一水平。酷睿i7只能被证明在日常操作中有几乎无法注意的轻微优势。为酷睿i7处理器的支付额外费用并不值得。
由于没有风扇,电脑总是能安静地运行。而温度却不会太高。NVMe固态硬盘可确保系统的快速运行。更好固态硬盘是可行的。为此,您需要卸下计算机的底部外壳。该机的键盘同样留下了良好的整体印象。
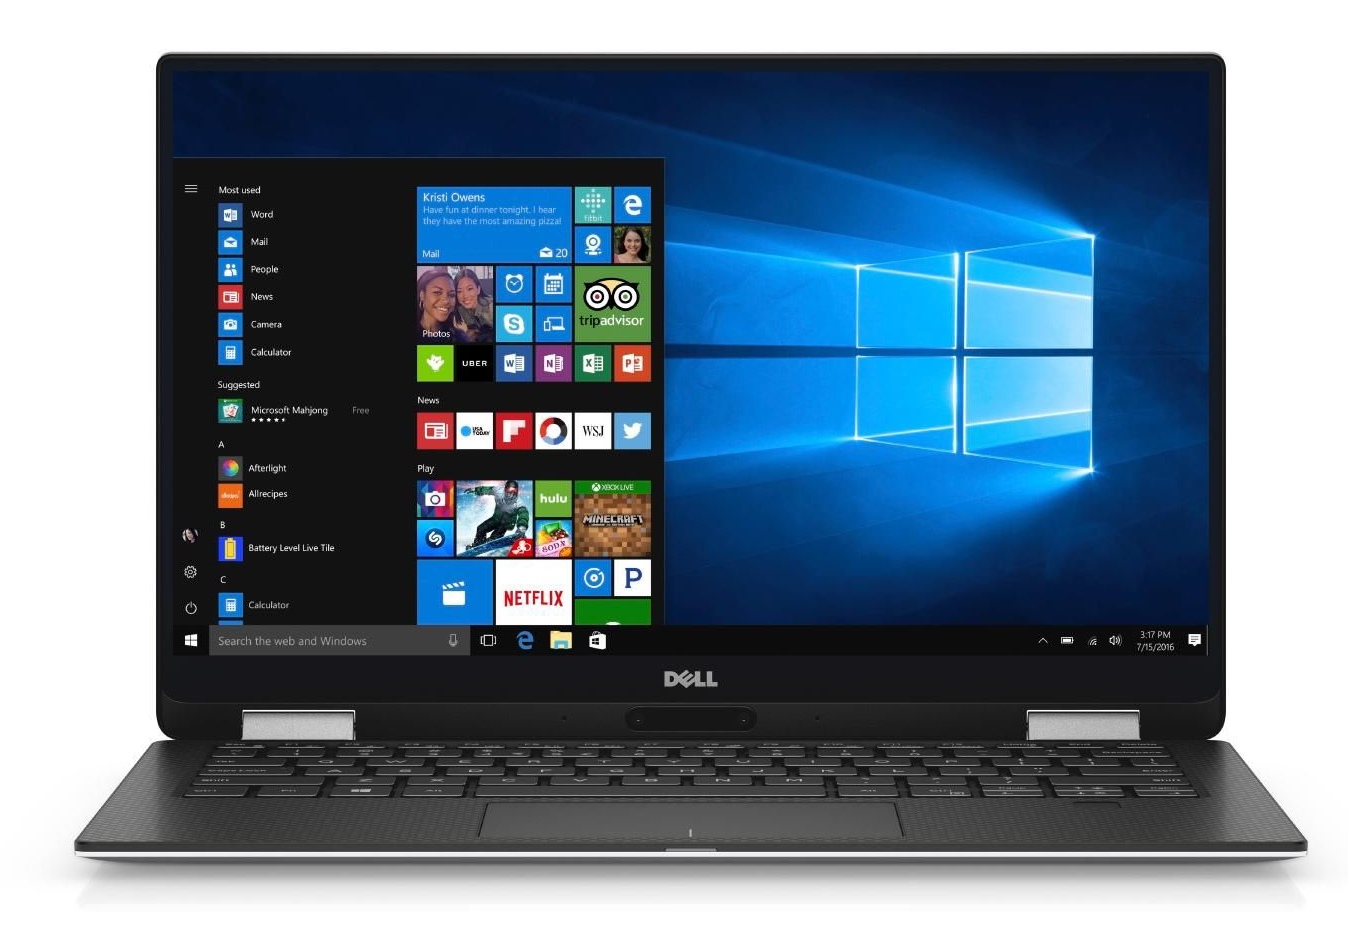
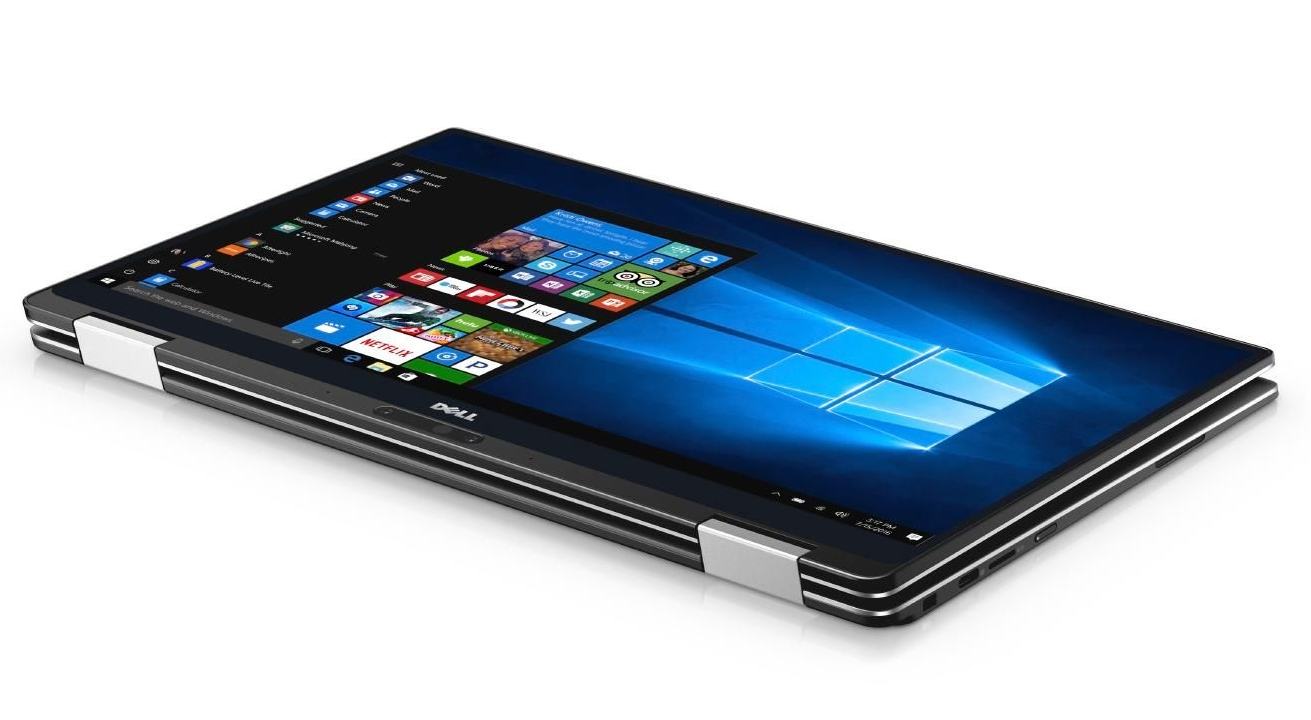
IPS显示屏具有稳定的视角和非常好的对比度。亮度值也不错,尽管它可以更高,因为该设备将被应用于各种照明条件下的不同场合。
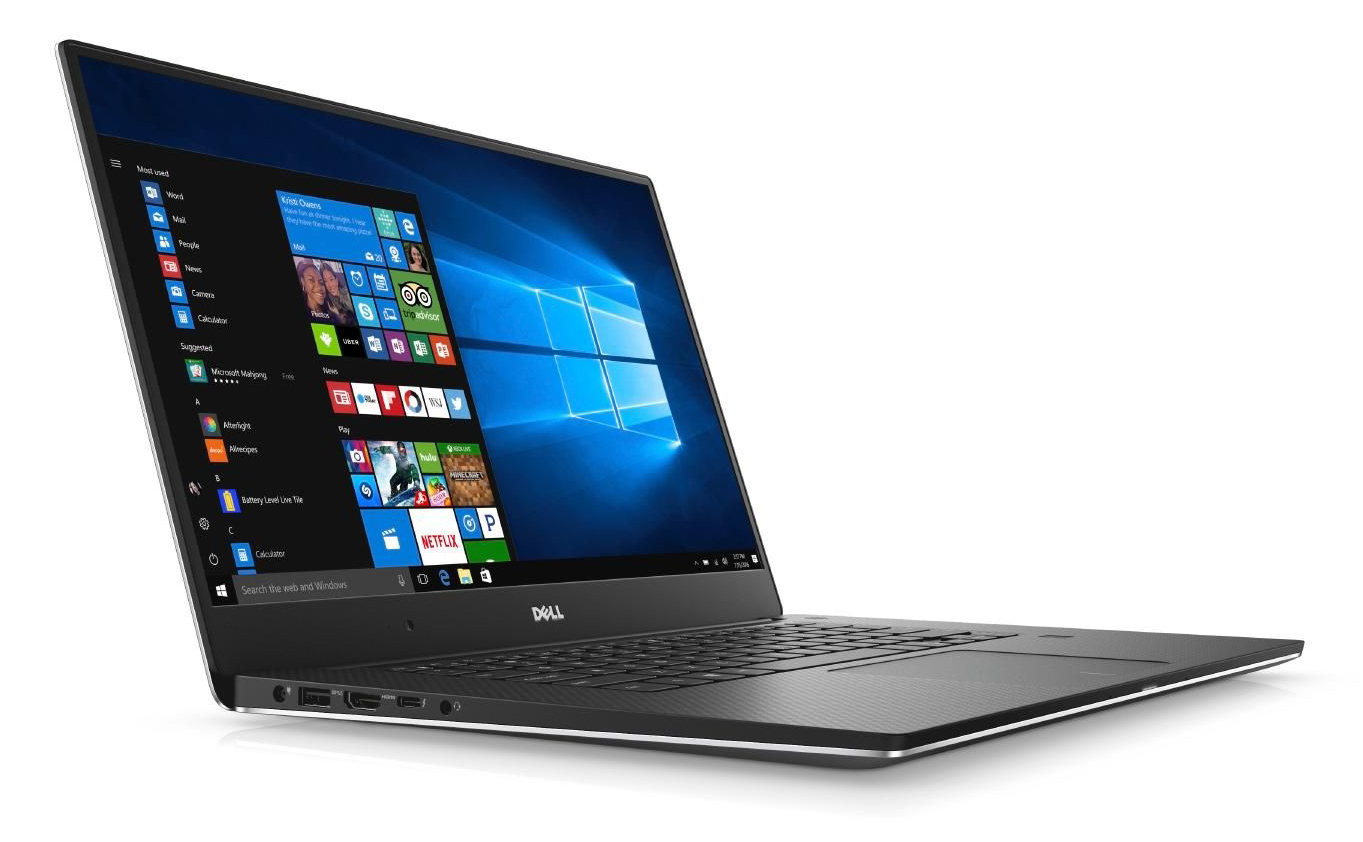
锐利的QHD +显示屏对电池续航有负面影响。
在专业的无线连接测试中,对比 全高清版本的XPS 13,电池续航时间减少了5个小时。那些需要长续航时间的用户,可以考虑选购全高清版本的机型。该机价格大约在7000元左右。
注:本文是基于完整评测的缩减版本,阅读完整的英文评测,请点击这里。
Dell XPS 13 9365-4537 2-in-1
- 05/26/2017 v6 (old)
Sascha Mölck