苹果 MacBook 12 (2017) 笔记本电脑简短评测
| |||||||||||||||||||||||||
Brightness Distribution: 88 %
Center on Battery: 387 cd/m²
Contrast: 823:1 (Black: 0.47 cd/m²)
ΔE ColorChecker Calman: 1.6 | ∀{0.5-29.43 Ø4.71}
ΔE Greyscale Calman: 1 | ∀{0.09-98 Ø4.96}
97.8% sRGB (Calman 2D)
82.2% sRGB (Argyll 1.6.3 3D)
61.6% AdobeRGB 1998 (Argyll 1.6.3 3D)
68% AdobeRGB 1998 (Argyll 3D)
95.4% sRGB (Argyll 3D)
66.8% Display P3 (Argyll 3D)
Gamma: 2.26
CCT: 6680 K
| Apple MacBook 12 2017 APPA027, , 2304x1440, 12" | Apple MacBook 12 (Early 2016) 1.1 GHz APPA027, , 2304x1440, 12" | Apple MacBook Air 13.3" 1.8 GHz (2017) 1440x900, 13.3" | Apple MacBook Pro 13 2017 Touchbar i5 APPA034, , 2560x1600, 13.3" | Apple MacBook Pro 15 2017 (2.8 GHz, 555) APPA031, , 2880x1800, 15.4" | Apple iPad Pro 12.9 2017 2732x2048, 12.9" | Apple iPad Pro 10.5 2017 2224x1668, 10.5" | |
|---|---|---|---|---|---|---|---|
| Display | |||||||
| Display P3 Coverage (%) | 66.8 | 98.6 | 97.9 | ||||
| sRGB Coverage (%) | 95.4 | 100 | 99.9 | ||||
| AdobeRGB 1998 Coverage (%) | 68 | 86.5 | 85.9 | ||||
| Response Times | -3% | -13% | -17% | -17% | 18% | 22% | |
| Response Time Grey 50% / Grey 80% * (ms) | 40.8 ? | 41.2 ? -1% | 52.4 ? -28% | 48 ? -18% | 48 ? -18% | 41.6 ? -2% | 39.6 ? 3% |
| Response Time Black / White * (ms) | 29.2 ? | 30.4 ? -4% | 28.4 ? 3% | 33.6 ? -15% | 33.8 ? -16% | 18.4 ? 37% | 17.6 ? 40% |
| PWM Frequency (Hz) | 116000 | 58000 | 119000 ? | 119000 ? | |||
| Screen | |||||||
| Brightness middle (cd/m²) | 387 | 551 | 545 | 650 | 634 | ||
| Black Level * (cd/m²) | 0.47 | 0.48 | 0.44 | 0.42 | 0.39 | ||
| Brightness (cd/m²) | 358 | 514 | 523 | 614 | 625 | ||
| Brightness Distribution (%) | 88 | 88 | 86 | 90 | 87 | ||
| Contrast (:1) | 823 | 1148 | 1239 | 1548 | 1626 | ||
| Colorchecker dE 2000 * | 1.6 | 0.8 | 1.6 | 1 | 1.9 | ||
| Colorchecker dE 2000 max. * | 4 | 1.4 | 3.8 | 1.9 | 3.9 | ||
| Greyscale dE 2000 * | 1 | 1 | 1.9 | 1.5 | 2.8 | ||
| Gamma | 2.26 97% | 2.16 102% | 2.26 97% | 2.25 98% | 2.26 97% | ||
| CCT | 6680 97% | 6672 97% | 6834 95% | 6734 97% | 7027 93% | ||
| Color Space (Percent of AdobeRGB 1998) (%) | 61.6 | ||||||
| Color Space (Percent of sRGB) (%) | 82.2 | ||||||
| Total Average (Program / Settings) | -3% /
-3% | -13% /
-13% | -17% /
-17% | -17% /
-17% | 18% /
18% | 22% /
22% |
* ... smaller is better
Display Response Times
| ↔ Response Time Black to White | ||
|---|---|---|
| 29.2 ms ... rise ↗ and fall ↘ combined | ↗ 15.8 ms rise | 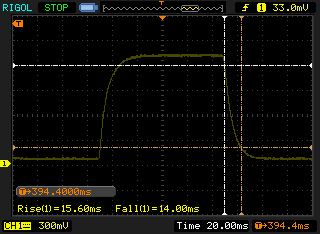 |
| ↘ 13.4 ms fall | ||
| The screen shows relatively slow response rates in our tests and may be too slow for gamers. In comparison, all tested devices range from 0.1 (minimum) to 240 (maximum) ms. » 78 % of all devices are better. This means that the measured response time is worse than the average of all tested devices (19.8 ms). | ||
| ↔ Response Time 50% Grey to 80% Grey | ||
| 40.8 ms ... rise ↗ and fall ↘ combined | ↗ 19.6 ms rise | 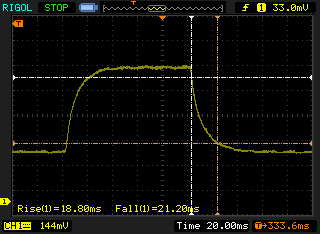 |
| ↘ 21.2 ms fall | ||
| The screen shows slow response rates in our tests and will be unsatisfactory for gamers. In comparison, all tested devices range from 0.165 (minimum) to 636 (maximum) ms. » 64 % of all devices are better. This means that the measured response time is worse than the average of all tested devices (30.9 ms). | ||
Screen Flickering / PWM (Pulse-Width Modulation)
| Screen flickering / PWM detected | 116000 Hz | 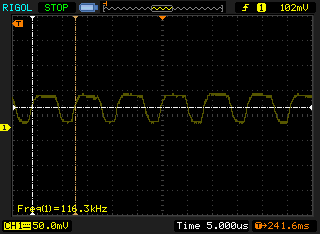 | |
The display backlight flickers at 116000 Hz (worst case, e.g., utilizing PWM) . The frequency of 116000 Hz is quite high, so most users sensitive to PWM should not notice any flickering. In comparison: 52 % of all tested devices do not use PWM to dim the display. If PWM was detected, an average of 7744 (minimum: 5 - maximum: 343500) Hz was measured. | |||
| Cinebench R15 | |
| CPU Single 64Bit | |
| Apple MacBook Pro 13 2017 Touchbar i5 | |
| Apple MacBook 12 2017 | |
| Apple MacBook Air 13.3" 1.8 GHz (2017) | |
| Apple MacBook 12 (Early 2015) 1.1 GHz | |
| Apple MacBook 12 (Early 2015) 1.1 GHz | |
| Apple MacBook 12 (Early 2015) 1.1 GHz | |
| Apple MacBook 12 (Early 2016) 1.1 GHz | |
| Apple MacBook 12 (Early 2016) 1.1 GHz | |
| CPU Multi 64Bit | |
| Apple MacBook Pro 13 2017 Touchbar i5 | |
| Apple MacBook Air 13.3" 1.8 GHz (2017) | |
| Apple MacBook 12 2017 | |
| Apple MacBook 12 (Early 2016) 1.1 GHz | |
| Apple MacBook 12 (Early 2015) 1.1 GHz | |
| Apple MacBook 12 (Early 2015) 1.1 GHz | |
| Apple MacBook 12 (Early 2015) 1.1 GHz | |
| PCMark 8 Home Score Accelerated v2 | 3078 points | |
| PCMark 8 Creative Score Accelerated v2 | 3904 points | |
| PCMark 8 Work Score Accelerated v2 | 3946 points | |
| PCMark 10 Score | 2568 points | |
Help | ||
| Apple MacBook 12 2017 Apple SSD AP0256 | Apple MacBook 12 (Early 2016) 1.1 GHz Apple SSD AP0256 | Apple MacBook Pro 13 2017 Touchbar i5 Apple SSD AP0256 | Apple MacBook Pro 15 2017 (2.8 GHz, 555) Apple SSD SM0256L | Apple MacBook Air 13.3" 1.8 GHz (2017) Apple SSD SM0128G | Asus Zenbook UX310UA-FC347T iGP Micron SSD 1100 (MTFDDAV256TBN) | Dell XPS 13 9360 FHD i5 Toshiba NVMe THNSN5256GPUK | |
|---|---|---|---|---|---|---|---|
| CrystalDiskMark 3.0 | 15% | 25% | 36% | 52% | 167% | 257% | |
| Read Seq (MB/s) | 955 | 754 -21% | 1540 61% | 1557 63% | 1390 46% | 489.4 -49% | 1233 29% |
| Write Seq (MB/s) | 899 | 638 -29% | 1353 51% | 1505 67% | 731 -19% | 431.6 -52% | 733 -18% |
| Read 4k (MB/s) | 9.721 | 14.6 50% | 9.92 2% | 10.76 11% | 16.29 68% | 26.68 174% | 29.31 202% |
| Write 4k (MB/s) | 12.78 | 20.5 60% | 10.74 -16% | 12.87 1% | 27.17 113% | 88.7 594% | 116.9 815% |
| CrystalDiskMark 5.2 / 6 | 14% | 33% | 12% | ||||
| Read Seq (MB/s) | 940 | 1509 61% | 1572 67% | 1491 59% | |||
| Write Seq (MB/s) | 867 | 1345 55% | 1473 70% | 741 -15% | |||
| Read 4K (MB/s) | 22.8 | 23.77 4% | 23.33 2% | 21.26 -7% | |||
| Write 4K (MB/s) | 95.7 | 32.94 -66% | 86.7 -9% | 105.9 11% | |||
| Total Average (Program / Settings) | 15% /
15% | 20% /
19% | 35% /
34% | 32% /
32% | 167% /
167% | 257% /
257% |

| 3DMark 11 Performance | 1324 points | |
| 3DMark Cloud Gate Standard Score | 5035 points | |
Help | ||
(+) The maximum temperature on the upper side is 38.9 °C / 102 F, compared to the average of 35.9 °C / 97 F, ranging from 21.4 to 59 °C for the class Subnotebook.
(±) The bottom heats up to a maximum of 42.5 °C / 109 F, compared to the average of 39.2 °C / 103 F
(+) In idle usage, the average temperature for the upper side is 29.1 °C / 84 F, compared to the device average of 30.8 °C / 87 F.
(+) The palmrests and touchpad are reaching skin temperature as a maximum (32.8 °C / 91 F) and are therefore not hot.
(-) The average temperature of the palmrest area of similar devices was 28.2 °C / 82.8 F (-4.6 °C / -8.2 F).
Apple MacBook 12 2017 audio analysis
(+) | speakers can play relatively loud (83.9 dB)
Bass 100 - 315 Hz
(-) | nearly no bass - on average 15% lower than median
(±) | linearity of bass is average (8.8% delta to prev. frequency)
Mids 400 - 2000 Hz
(+) | balanced mids - only 2% away from median
(+) | mids are linear (3.8% delta to prev. frequency)
Highs 2 - 16 kHz
(+) | balanced highs - only 2.3% away from median
(+) | highs are linear (3.3% delta to prev. frequency)
Overall 100 - 16.000 Hz
(+) | overall sound is linear (11.6% difference to median)
Compared to same class
» 13% of all tested devices in this class were better, 3% similar, 84% worse
» The best had a delta of 5%, average was 18%, worst was 53%
Compared to all devices tested
» 8% of all tested devices were better, 2% similar, 90% worse
» The best had a delta of 4%, average was 23%, worst was 134%
Apple MacBook 12 (Early 2016) 1.1 GHz audio analysis
(+) | speakers can play relatively loud (83.6 dB)
Bass 100 - 315 Hz
(±) | reduced bass - on average 11.3% lower than median
(±) | linearity of bass is average (14.2% delta to prev. frequency)
Mids 400 - 2000 Hz
(+) | balanced mids - only 2.4% away from median
(+) | mids are linear (5.5% delta to prev. frequency)
Highs 2 - 16 kHz
(+) | balanced highs - only 2% away from median
(+) | highs are linear (4.5% delta to prev. frequency)
Overall 100 - 16.000 Hz
(+) | overall sound is linear (10.2% difference to median)
Compared to same class
» 7% of all tested devices in this class were better, 2% similar, 90% worse
» The best had a delta of 5%, average was 18%, worst was 53%
Compared to all devices tested
» 5% of all tested devices were better, 1% similar, 94% worse
» The best had a delta of 4%, average was 23%, worst was 134%
| Off / Standby | |
| Idle | |
| Load |
|
Key:
min: | |
| Apple MacBook 12 2017 m3-7Y32, HD Graphics 615, Apple SSD AP0256, LED IPS, 2304x1440, 12" | Apple MacBook 12 (Early 2016) 1.1 GHz 6Y30, HD Graphics 515, Apple SSD AP0256, IPS, 2304x1440, 12" | Apple MacBook Air 13.3" 1.8 GHz (2017) 5350U, HD Graphics 6000, Apple SSD SM0128G, TN LED, 1440x900, 13.3" | Apple MacBook Pro 13 2017 Touchbar i5 i5-7267U, Iris Plus Graphics 650, Apple SSD AP0256, IPS, 2560x1600, 13.3" | Apple iPad Pro 12.9 2017 A10X Fusion, A10X Fusion GPU, Toshiba THGBX669D4LLDXG 64 GB NAND , IPS, 2732x2048, 12.9" | Apple iPad Pro 10.5 2017 A10X Fusion, A10X Fusion GPU, Toshiba THGBX669D4LLDXG 64 GB NAND , IPS, 2224x1668, 10.5" | |
|---|---|---|---|---|---|---|
| Power Consumption | 1% | -50% | -111% | 7% | 26% | |
| Idle Minimum * (Watt) | 2 | 2.7 -35% | 3.4 -70% | 2.8 -40% | 1.55 22% | 1.44 28% |
| Idle Average * (Watt) | 5.4 | 2.7 50% | 6.3 -17% | 10.9 -102% | 8.58 -59% | 6.12 -13% |
| Idle Maximum * (Watt) | 6.6 | 7.2 -9% | 7 -6% | 11.4 -73% | 8.59 -30% | 6.14 7% |
| Load Average * (Watt) | 22 | 22 -0% | 34.5 -57% | 55.4 -152% | 10.09 54% | 8.55 61% |
| Load Maximum * (Watt) | 20 | 20.5 -2% | 40 -100% | 57.5 -188% | 10.61 47% | 10.62 47% |
* ... smaller is better
| Apple MacBook 12 2017 m3-7Y32, HD Graphics 615, 41.4 Wh | Apple MacBook 12 (Early 2016) 1.1 GHz 6Y30, HD Graphics 515, 41.4 Wh | Apple MacBook Air 13.3" 1.8 GHz (2017) 5350U, HD Graphics 6000, 54 Wh | Apple MacBook Pro 13 2017 Touchbar i5 i5-7267U, Iris Plus Graphics 650, 49.2 Wh | Apple iPad Pro 12.9 2017 A10X Fusion, A10X Fusion GPU, 41 Wh | Apple iPad Pro 10.5 2017 A10X Fusion, A10X Fusion GPU, 30.8 Wh | |
|---|---|---|---|---|---|---|
| Battery runtime | -7% | 18% | -3% | 37% | 29% | |
| WiFi v1.3 (h) | 9 | 8.4 -7% | 10.6 18% | 8.7 -3% | 12.3 37% | 11.6 29% |
| H.264 (h) | 8.5 | 6.9 | 11.3 | 10.5 | ||
| Load (h) | 3.9 | 1.2 | 4.3 | 3.3 | ||
| Reader / Idle (h) | 48.7 | 33.9 |
Pros
Cons
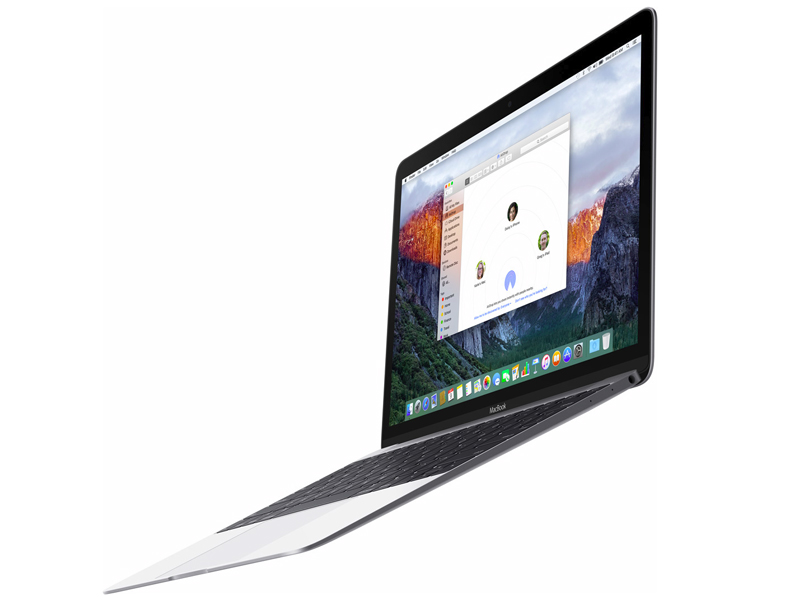
苹果新推出的这款MacBook 12离它的前代大约2年时间,那么它如何呢? 我们不会说这2年很短暂,因为其他制造商在这段时间里也没闲着,他们还提供了同样强大的便携电脑。然而,MacBook 12仍然具有许多和从前一样重要的特质。
首先,不仅高端铝制外壳的触感非常好,而且还很坚固,薄,和轻(1.3厘米,0.92公斤/约0.5英寸,约2磅)。唯一的缺点:只有一个C型USB端口,它同样用于充电。如果没有兼容的集线器或适配器,您将感到受限。
与包括新MacBook Pro在内的其他笔记本一样,键程依然偏短。当然,修改后的蝶式按键与前任相比具有显着的优势。而触摸板则实现了完全成熟的压感技术。
自第一次发布以来,屏幕一直保持不变。然而,鉴于其规格和测量值,它仍然是市场上最好的屏幕之一。 与以前的假设相反,苹果显然使用屏幕闪烁的方式进行亮度控制。然而,由于其使用的频率高,这点可以忽略不计。
处理器,显卡,和固态硬盘的性能高于前代。然而,性能提升不足以成为更换2015年或2016年旧机器的理由。长时间负载时的性能损失仍然是关键。但是,由于大概需要15分钟才能发生(满负载!),所以在实际使用中不会造成问题。
运行时很安静,拥有实际使用时间长达9小时的续航时间以及非常好的扬声器。而且机身还非常的轻薄,这仍是MacBook 12的重要优点。
苹果MacBook 12适合需要便携性的用户,他们需要频繁地移动他们的设备,并且对其性能没有很高的要求(办公时可以快速运行)。虽然在Windows系统的机器有几款的价格在1499欧元(约1710美元)的,但苹果的MacBook 12是仍然是一个具有吸引力的选择,用户需要接受它的几个缺点(缺少端口,键盘键程短,下降了的长时间运行性能)。
Apple MacBook 12 2017
- 06/27/2017 v6 (old)
J. Simon Leitner